Treasury Board and
Department of Finance
Economic, Strategic Program
Review and Fiscal Update
Economic, Strategic Program Review and Fiscal Update First Quarter 2018–2019
Published by:
Treasury Board and Department of Finance Government of New Brunswick
16.15. Box 6000
Fredericton, New Brunswick E3B 5H1
Canada
Internet: www.gnb.ca/finance July 2018
Translation:
Translation Bureau, Service New Brunswick
ISBN 978-1-4605-1882-3
2018 Economic Update
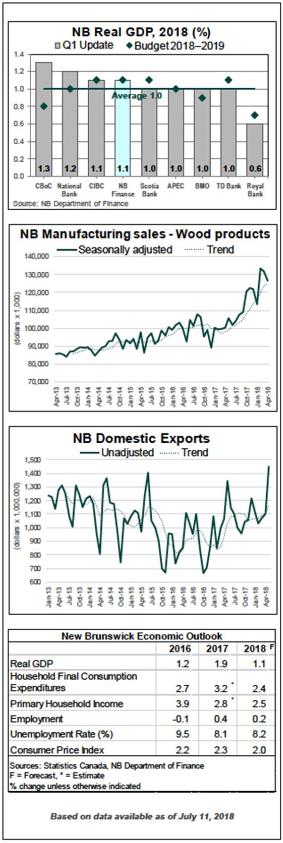
| ● The International Monetary Fund (IMF) is projecting global economic growth of 3.9 per cent in 2018. Favourable global financial conditions and U.S. fiscal policy changes will support growth. ● U.S. real GDP increased at an annual rate of 2.0 per cent in the first quarter of 2018, following a 2.9 per cent increase in the previous quarter. The IMF is projecting growth of 2.9 per cent. ● The Bank of Canada anticipates growth in Canada to moderate to 2.0 per cent in 2018 as slower growth in household spending offsets gains in business investment and exports. ● The Department of Finance projects real GDP growth for New Brunswick of 1.1 per cent for 2018, unchanged from the forecast in the 2018–2019 Budget. This is consistent with the per cent growth rate consensus among private sector forecasters. ● Labour market conditions are improving for the province. Employment is up by 0.7 per cent on a year-to-date basis, with gains in both the goods- and service-producing sectors. ● Despite the trade uncertainty with the U.S., domestic exports in New Brunswick have increased 7.9 per cent compared to prior year levels. This is mainly driven by gains in energy products and basic and industrial chemical, plastic and rubber products. ● Manufacturing sales are up by 9.5 per cent on a year-to-date basis, caused by gains in both the non-durable goods industries and the durable goods industries. Wood product manufacturing remains a bright spot, posting growth of 27.4 per cent. ● Average weekly earnings are up 3.1 per cent, on a year-to-date basis – slightly above the national growth rate of 3.0 percent. ● Consumer inflation in the province is 2.3 per cent on a year-to-date basis, slightly higher than the national rate of 2.2 per cent. |
Strategic Program Review Update
●
Strategic Program Review (SPR) was an inclusive and transparent process with input sought from the public to help identify savings and revenues in order to eliminate the province’s deficit.
●
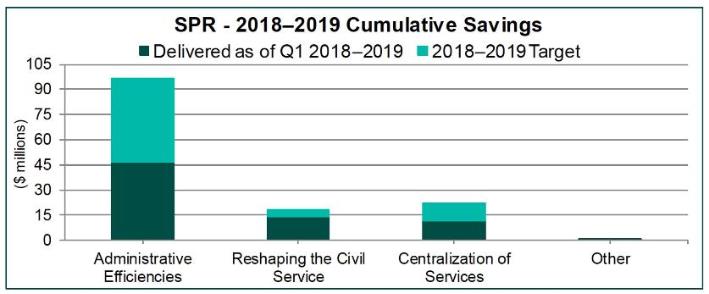
Based on first quarter information, the projected cumulative savings by March 31, 2019, will be approximately $221 million; additional savings will be realized as projects are implemented.
●
Government is on track to deliver 82.4 per cent of the cumulative savings target of $268 million for 2018–2019. The major variances include:
o
Retirement Allowance elimination for bargaining groups ($18 million under): Government does not have the constitutional power to unilaterally remove this benefit. Instead, government’s bargaining mandate includes provisions to offer additional wage increases in exchange for the elimination of this benefit. Several unions have accepted this offer; however some large bargaining groups choose to maintain the benefit through negotiation of contract agreements.
o
Centralization of common services ($14.4 million under): Mainly due to the double counting of procurement savings within other SPR initiatives.
o
Education and Early Childhood Development ($8.1 million under): New Brunswick welcomed the largest per capita share of Syrian refugees of any province in the country and as a result we have a larger student population than projected and more teachers have been hired to replace retirements than originally planned.
●
By 2020, the Strategic Program Review is expected to yield $296 million in expenditure reductions and $293 million in revenue measures, for a grand total of $589 million.
| Strategic Program Review First Quarter Projections (in $ Thousands) |
| Savings Initiatives | Achieved to date 2018–2019 | 2018–2019 Target | 2018–2019 Forecast | 2020–2021 Target | 2020–2021 Forecast |
| 2015–2016 Savings | $115,200 | $115,200 | $115,200 | $115,200 | $115,200 |
| Administrative Efficiencies | $46,602 | $96,706 | $63,550 | $102,145 | $102,145 |
| Reshaping the Civil Service | $14,026 | $20,959 | $23,278 | $24,959 | $24,959 |
| Centralization of Services | $11,801 | $34,525 | $18,446 | $52,125 | $52,125 |
| Other | $813 | $1,262 | $922 | $1,262 | $1,262 |
| Total | $188,442 | $268,652 | $221,396 | $295,691 | $295,691 |
●
Administrative Efficiencies: Projects include but are not limited to administration of Municipal Tax Warrant ($2.0 million), elimination of Municipal Fine Revenue Sharing ($1.5 million), standardization of budget processes ($1.4 million), and Vacant Bed Days policy compliance ($800,000). General administrative efficiencies such as rationalization of phone lines, computers and subscriptions, as well as continuous process improvement efforts, have resulted in savings of $41 million.
●
Reshaping the Civil Service: Projects include but are not limited to reforming Transportation and Infrastructure ($10.3 million) and rightsizing the civil service, including combining positions and eliminating unneeded positions ($3.6 million).
●
Centralization of Services: Projects include but are not limited to centralization of common services at Service New Brunswick ($9.8 million), consolidation of Lab Services ($600,000), Land Registry centralization ($400,000), and Human Resources centralization ($300,000).
●
Other: Projects include but are not limited to Visitor Information Centre closures ($195,000) and Off-Road Vehicle Enforcement ($150,000).
2018–2019 Fiscal Update
Based on first quarter information, there is a projected deficit of $187.4 million for 2018–2019. This is an improvement of $1.3 million compared to the budgeted deficit of $188.7 million.
| First Quarter Fiscal Summary |
($ Millions) | 2018–2019 Budget | 2018–2019 1st Quarter Projection | Variance from Budget |
| Revenue | 9,427.3 | 9,505.7 | 78.5 |
| Expense | 9,616.0 | 9,693.1 | 77.1 |
| Surplus (Deficit) | (188.7) | (187.4) | 1.3 |
Net debt is projected to increase by $385.4 million and is projected to reach $14.5 billion by March 31, 2019.
Revenue:
Revenue is $78.5 million higher than budget. The major variances include:
●
Conditional Grants are up $60.2 million mainly due to projected recoveries under the Disaster Financial Assistance program and the new Healthy Seniors Pilot Project.
●
Personal Income Tax revenue is up $20.0 million from budget due to a strengthened forecast base.
●
Sale of Goods and Services is up $5.0 million mainly due to increased projections of revenue from the Regional Health Authorities and Department of Health recovery levy, offset by various other accounts across departments.
●
Special Operating Agencies revenue is down $5.4 million mainly due to the timing of projects being completed.
●
Capital Revenue is down $4.1 million due to lower recoveries under the New Building Canada Fund.
●
Tobacco Tax is down $4.0 million due to lower volumes.
●
Cannabis-related revenue is down $3.9 million to reflect the October 17, 2018 legalization date. This includes reductions in the projected Cannabis Duty, revenues from the Cannabis Management Corporation, and the Cannabis Education and Awareness Fund.
Expense:
Total expenses are projected to be over budget by $77.1 million. The major variances include the following:
●
Justice and Public Safety is $51.9 million over budget due to expenses incurred under the Disaster Financial Assistance program primarily associated with the 2018 spring flood. These expenses are offset to a large extent by recoveries from the federal government.
●
Social Development is $36.6 million over budget mainly due to increased expenses in the Aging Secretariat Program (offset by federal revenue from the Healthy Seniors Pilot Project) and the high costs of the Disability Support Services program.
●
Special Purpose Accounts are over budget by $15.2 million mainly due to the reallocation of various projects from the Capital Budget to the Climate Change Fund. This is partially offset by lower Capital Account expense.
●
Other Agencies are $4.9 million over budget mainly due to increased expenditures associated with several consolidated entities (offset by an increase in revenue).
●
Post-Secondary Education, Training and Labour is $4.2 million over budget mainly due to additional expenditures in the Student Financial Assistance program.
●
Special Operating Agency Accounts are over budget by $3.2 million due to additional expenditures associated with various federal-provincial programs.
●
Amortization Expense is $3.2 million under budget mainly due to implementation delays in various projects.
●
Education and Early Childhood Development is $5.0 million under budget mainly due to lower than expected expenses in the Early Childhood Development Program.
●
Service of the Debt is $10.0 million lower primarily due to higher interest income earned.
●
General Government is under budget by $15.5 million mainly due to lower than expected expenses in Supplementary Funding Provision and Pension and Employee Benefits.
PROVINCE OF NEW BRUNSWICK
FISCAL UPDATE
Thousands
$
| | | | |
| | | |
| Revenue | | | |
| Ordinary Account | 8,946,303 | 9,033,020 | 86,717 |
| Capital Account | 48,264 | 44,121 | (4,143) |
| Special Purpose Account | 117,289 | 118,526 | 1,237 |
| Special Operating Agencies | 124,198 | 118,848 | (5,350) |
| Sinking Fund Earnings | 191,200 | 191,200 | 0 |
| Total Revenue | 9,427,254 | 9,505,715 | 78,461 |
| | | | |
| Expense | | | |
| Ordinary Account | 8,773,358 | 8,840,815 | 67,457 |
| Capital Account | 153,502 | 147,967 | (5,535) |
| Special Purpose Account | 86,099 | 101,305 | 15,206 |
| Special Operating Agencies | 117,635 | 120,844 | 3,209 |
| Amortization of Tangible Capital Assets | 485,398 | 482,173 | (3,225) |
| Total Expense | 9,615,992 | 9,693,104 | 77,112 |
| | | | |
| Surplus (Deficit) | (188,738) | (187,389) | 1,349 |
CHANGE IN NET DEBT
Thousands
$
| | | | |
| | | |
| | | | |
| Net Debt - Beginning of Year | (14,099,847) | (14,099,847) | 0 |
| | | | |
| Changes in Year | | | |
| | | | |
| Surplus (Deficit) | (188,738) | (187,389) | 1,329 |
| | | | |
| Investments in Tangible Capital Assets | (668,993) | (680,199) | (11,206) |
| | | | |
| Amortization of Tangible Capital Assets | 485,398 | 482,173 | (3,225) |
| | | | |
| (Increase) Decrease in Net Debt | (372,333) | (385,415) | (13,082) |
| | | | |
| Net Debt - End of Year | (14,472,180) | (14,485,262) | (13,082) |
APPENDIX A
ORDINARY ACCOUNT REVENUE BY SOURCE
Thousands
$
| | | | |
| | | |
| | | | |
| Taxes | | | |
| Personal Income Tax | 1,682,000 | 1,702,000 | 20,000 |
| Corporate Income Tax | 311,800 | 311,800 | 0 |
| Metallic Minerals Tax | 1,900 | 1,900 | 0 |
| Provincial Real Property Tax | 514,750 | 514,750 | 0 |
| Harmonized Sales Tax: net of credit | 1,492,500 | 1,492,500 | 0 |
| Gasoline and Motive Fuels Tax | 248,600 | 248,600 | 0 |
| Tobacco Tax | 156,000 | 152,000 | (4,000) |
| Pari-Mutuel Tax | 500 | 500 | 0 |
| Insurance Premium Tax | 57,600 | 59,600 | 2,000 |
| Real Property Transfer Tax | 25,000 | 25,000 | 3,000 |
| Financial Corporation Capital Tax | 27,000 | 27,000 | 0 |
| Cannabis Duty | 6,000 | 3,600 | (2,400) |
| Penalties and Interest | 13,000 | 13,000 | 0 |
| Subtotal - Taxes | 4,536,650 | 4,555,520 | 18,600 |
| | | | |
| Return on Investment | 264,235 | 263,451 | (9,968) |
| Licences and Permits | 158,479 | 160,900 | 3,301 |
| Sale of Goods and Services | 432,158 | 453,155 | 686 |
| Royalties | 69,730 | 69,730 | 0 |
| Agency Revenues | 160,900 | 161,100 | 200 |
| Fines and Penalties | 6,804 | 6,804 | |
| Miscellaneous | 91,578 | 92,598 | 1,020 |
| Total - Own Source Revenue | 5,736,501 | 5,762,988 | 26,487 |
| | | | |
| Unconditional Grants – Canada | | | |
| Fiscal Equalization Payments | 1,873,898 | 1,873,898 | 0 |
| Canada Health Transfer | 791,900 | 791,900 | 0 |
| Canada Social Transfer | 290,600 | 290,600 | 0 |
| Other | 1,866 | 1,866 | 0 |
| Subtotal - Unconditional Grants – Canada | 2,958,264 | 2,958,264 | 0 |
| | | | |
| Conditional Grants – Canada | 266,466 | 326,696 | 60,230 |
| | | | |
| Total - Grants from Canada | 3,224,730 | 3,284,960 | 60,230 |
| | | | |
| Subtotal | 8,961,231 | 9,047,948 | 86,717 |
| | | | |
| Inter-account Transactions | (14,928) | (14,928) | (5,553) |
| | | | |
| Ordinary Account Revenue | 8,946,303 | 9,033,020 | 86,717 |
APPENDIX B
ORDINARY ACCOUNT EXPENSE
Thousands
$
| | | | | |
| | | | |
| DEPARTMENT | | | | |
| Agriculture, Aquaculture and Fisheries | 37,196 | 38,696 | 1,500 | 4.0% |
| Education and Early Childhood Development | 1,258,007 | 1,253,007 | (5,000) | -0.4% |
| Energy and Resource Development | 101,820 | 102,820 | 1,000 | 1.0% |
| Environment and Local Government | 142,035 | 142,505 | 470 | 0.3% |
| Executive Council Office | 12,546 | 12,521 | (25) | -0.2% |
| Finance | 10,797 | 10,797 | 0 | 0.0% |
| General Government | 792,547 | 777,055 | (15,492) | -2.0% |
| Health | 2,753,251 | 2,753,351 | 0 | 0.0% |
| Justice and Public Safety | 231,885 | 283,749 | 51,864 | 22.4% |
| Legislative Assembly | 30,717 | 30,717 | 0 | 0.0% |
| Office of the Attorney General | 20,256 | 20,256 | 0 | 0.0% |
| Office of the Premier | 1,598 | 1,598 | 0 | 0.0% |
| Opportunities New Brunswick | 47,186 | 45,492 | (1,694) | -3.6% |
| Other Agencies | 386,108 | 390,997 | 4,889 | 1.3% |
| Post-Secondary Education, Training and Labour | 644,758 | 649,006 | 4,248 | 0.7% |
| Regional Development Corporation | 70,148 | 70,148 | 0 | 0.0% |
| Service of the Public Debt | 675,000 | 665,000 | (10,000) | -1.5% |
| Social Development | 1,194,547 | 1,231,147 | 36,600 | 3.1% |
| Tourism, Heritage and Culture | 62,633 | 62,693 | 60 | 0.1% |
| Transportation and Infrastructure | 307,404 | 307,404 | 0 | 0.0% |
| Treasury Board | 16,342 | 16,267 | (75) | -0.5% |
| | | | | |
| Subtotal | 8,796,881 | 8,865,226 | 63,345 | 0.8% |
| | | | | |
| Investment in Tangible Capital Assets | (7,195) | (8,083) | (888) | 12.3% |
| Inter-account Transactions | (16,328) | (16,328) | 0 | 0.0% |
| | | | | |
| Ordinary Account Expense | 8,773,358 | 8,840,815 | 67,457 | 0.8% |
APPENDIX C
CAPITAL EXPENDITURES
Thousands
$
| | | | |
| | | |
| | | | |
| Regular Capital Investments | | | |
| Agriculture, Aquaculture and Fisheries | 1,800 | 1,800 | 0 |
| Education and Early Childhood Development | 59,387 | 60,008 | 621 |
| Energy and Resource Development | 4,220 | 3,020 | (1,200) |
| Environmental and Local Government | 1,000 | 1,000 | 0 |
| Health | 96,892 | 108,606 | 11,714 |
| Justice and Public Safety | 3,215 | 3,215 | 0 |
| Legislative Assembly | 50 | 50 | 0 |
| Post-Secondary Education, Training and Labour | 6,251 | 6,251 | 0 |
| Regional Development Corporation | 28,255 | 28,255 | 0 |
| Tourism, Heritage and Culture | 2,100 | 4,600 | 2,500 |
| Transportation and Infrastructure | 374,348 | 390,670 | 16,322 |
| Regular Capital Investments | 577,518 | 607,475 | 29,957 |
| | | | |
| Strategic Infrastructure Initiative | | | |
| Agriculture, Aquaculture and Fisheries | 500 | 500 | 0 |
| Education and Early Childhood Development | 40,166 | 31,403 | (8,763) |
| Regional Development Corporation | 49,200 | 53,231 | 4,031 |
| Tourism, Heritage and Culture | 7,995 | 8,435 | 440 |
| Transportation and Infrastructure | 32,022 | 31,717 | (305) |
| Energy Retrofit and Renewable Energy | 20,250 | 0 | (20,250) |
| Strategic Infrastructure Initiative | 150,133 | 125,286 | (24,847) |
| | | | |
| Canada 150 | | | |
| Centennial Building | 10,000 | 15,500 | 5,500 |
| Memramcook Institute | 10,000 | 10,000 | 0 |
| Ministers Island | 2,495 | 2,495 | 0 |
| NB Museum | 6,000 | 3,900 | (2,100) |
| Canada 150 Investments | 28,495 | 31,895 | 3,400 |
| | | | |
| Nursing Homes (Not-for-profit) | 12,000 | 12,000 | 0 |
| | | | |
| Recoveries | | | |
| Transportation and Infrastructure | 41,690 | 37,405 | (4,285) |
| Other Departments | 5,464 | 6,022 | 558 |
| Recoveries | 47,154 | 43,427 | (3,727) |
| | | | |
| Total - Capital Expenditures | 815,300 | 820,083 | 4,783 |
| | | | |
| Investments in Tangible Capital Assets | (661,798) | (672,116) | (10,318) |
| | | | |
| Capital Account Expense | 153,502 | 147,967 | (5,535) |
Note: A number of capital projects, including Energy Retrofit and Renewable Energy, are reported under the Climate Change Fund.
APPENDIX D
CLIMATE CHANGE FUND
Thousands
$
| | | | |
| | | | |
| | | | |
| Revenue | | | |
| Revenue | 37,400 | 37,400 | 0 |
| | | | |
| Expenditures | 1,601 | 1,601 | 0 |
| Climate Change Secretariat | 20,250 | 20,250 | 0 |
| Energy Retrofit and Renewable Energy | 2,000 | 2,000 | 0 |
| Low Income Energy Efficiency Program | 6,603 | 6,969 | 366 |
| Regional Development Corporation projects | 3,140 | 3,140 | 0 |
| Transportation and Infrastructure projects | 33,594 | 33,960 | 366 |
| Total - Expenditures | | | |
| | | | |
| Funds available for future year investments | 3,806 | 3,440 | (366) |
The 2018–19 Budget has been restated to include expenditures that were contained in the Capital Budget.