2019-2020
Economic
Outlook
2019–2020 Economic Outlook
Published by:
Department of Finance and Treasury Board
Province of New Brunswick
P.O. Box 6000
Fredericton, New Brunswick E3B 5H1
Canada
Internet: www.gnb.ca/finance
Tuesday, March 19, 2019
Cover:
Service New Brunswick (SNB 12224)
Translation:
Translation Bureau, Service New Brunswick
Printing and Binding:
Printing Services, Service New Brunswick
ISBN 978-1-4605-1889-2
Printed in New Brunswick
| Note: Unless otherwise indicated, this document reflects data available up to and including March 14, 2019. |
Global Economy
●
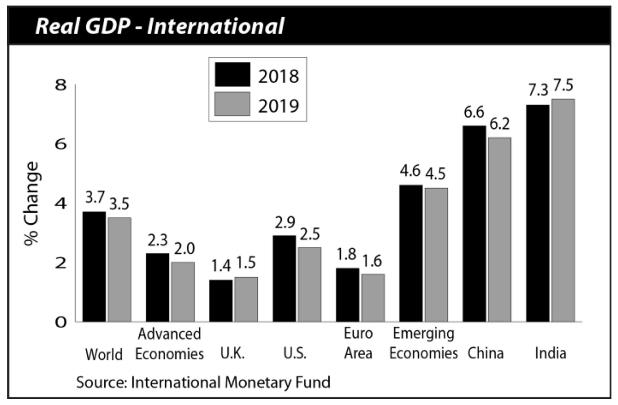
Global real Gross Domestic Product (GDP) is projected to have expanded by 3.7% in 2018 following growth of 3.8% in the previous year. According to the International Monetary Fund (IMF), advanced economies grew by 2.3%, while emerging market and developing economies registered growth of 4.6%.
●
The IMF is projecting global growth of 3.5% in 2019. Emerging market economies will once again lead in 2019, expanding by 4.5%, while advanced economies are projected to grow at a more moderate rate of 2.0%.
●
The euro area economy is expected to slow to 1.6% in 2019, due to the softening of growth in Spain, Germany and Italy.
●
India and China are once again expected to be the main drivers of growth among the emerging market and developing countries, with their economies projected to expand by 7.5% and 6.2% respectively in 2019. India’s economic outlook is expected to pick up in 2019 due to lower oil prices and a slower-than-expected pace of monetary tightening. Conversely, China’s economy is set to slow due to a combination of financial regulatory tightening and trade tensions with the U.S.
●
The IMF expects growth of 1.5% for the United Kingdom in 2019 as the positive impact from previously announced fiscal stimulus measures may offset the negative effect of prolonged uncertainty from the Brexit outcome.
●
The volatility of crude oil prices is anticipated to continue in 2019, reflecting supply influences and fears of softening global demand. According to the IMF, crude oil prices stood at around $55 per barrel as of early January, and prices are expected to remain around that level for much of the year.
●
Despite ongoing protectionist sentiments and continued trade policy uncertainty, growth in the world trade volume of goods and services is forecasted to remain unchanged at 4.0% in 2019, albeit well below the 2017 growth.
●
U.S. economic growth is expected to moderate to 2.5% in 2019, due to an unwinding of fiscal stimulus, a tightening monetary policy, and a widening trade deficit.
●
In December 2018, the U.S. Federal Reserve increased its current target range to 2.25%-2.50% for the federal funds rate – its fourth increase throughout the year. Fed officials indicate that the current policy stance is supported by strong labour market conditions and a sustained return to 2.0% inflation.
●
Despite some softening of the U.S. housing market, gains are still anticipated. The Conference Board of Canada is expecting total starts to reach 1.26 million in 2018 and is projecting a further 2.5% increase to 1.30 million in 2019.
●
A strong labour market in the U.S. will persist as a lower unemployment rate is expected in 2019.
Canadian Economy
●
Statistics Canada estimates the Canadian economy grew by 1.8% in 2018. Growth was led by government spending and exports. However, private domestic demand has weakened as consumption and residential and business investment slowed.
●
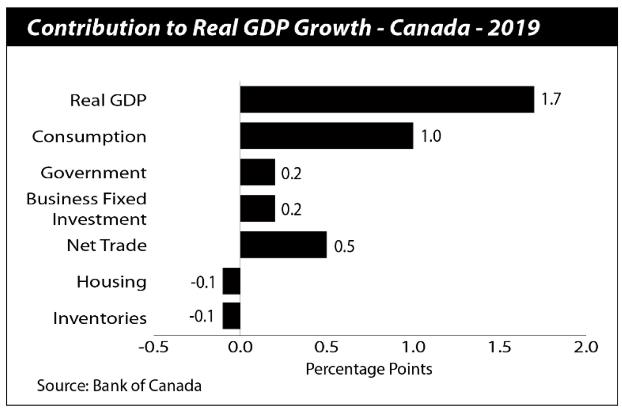
According to the Bank of Canada, the Canadian economy is set to pick up in the second quarter of 2019, leading to growth of 1.7% for the year. Expanding foreign demand, robust immigration flows, low unemployment rate, and solid non-energy investment and exports will continue to support the Canadian economy. However, softer household spending growth and the impact of lower oil prices on real income and wealth are expected to continue to limit economic growth.
●
Business investment is projected to expand modestly in 2019, driven by firms outside the energy sector investing to alleviate capacity pressures and improve productivity. Moreover, recent tax measures in Canada and in the U.S. will continue to influence investment.
●
Pending ratification, the Canada-United States-Mexico Agreement (CUSMA) will reduce some of the uncertainty surrounding global trade policy. However, lower oil prices are expected to slow investment in the energy sector, offsetting some of the gains from the non-energy sector.
●
Exports are anticipated to expand by approximately 3.0% in 2019, led by an increase of foreign demand, a lower Canadian dollar, higher production capacity, and the signing of CUSMA. However, global trade policy uncertainty and competitiveness challenges will continue to restrain export growth.
●
The consensus of private sector forecasters projects Canada’s unemployment rate will remain at 5.8% in 2019 and employment growth is expected to slow to 1.2% in 2019. Further solid wage gains are anticipated. Nonetheless, tighter mortgage guidelines and higher interest rates will moderate household spending in 2019 and 2020. A lower-than-expected savings rate in recent years suggests some additional downside risks to the consumption forecast.
●
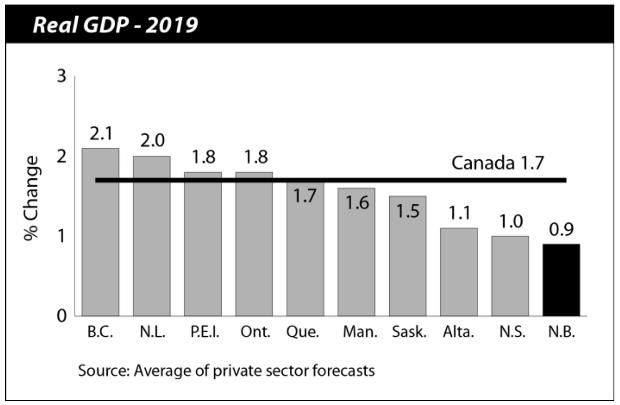
Private sector forecasts suggest economic growth will be strongest in British Columbia (+2.1%) and Newfoundland and Labrador (+2.0%), mainly supported by non-residential construction projects. Growth in seven out of ten provinces will be lower in 2019 compared to 2018. Alberta’s real GDP growth will moderate to 1.1% due to continued low oil prices.
●
Economic activity among New Brunswick’s major interprovincial trading partners is also expected to moderate in 2019. Forecasters project growth of 1.7% for Quebec, down from the 2018 level of 2.2%, owing to labour shortages and employment losses in the key aerospace industry. Similarly, Ontario’s economic growth is projected to slow in 2019 to 1.8%, partially attributed to lower residential investment.
●
In March 2019, the Bank of Canada decided to maintain its benchmark interest rate at 1.75%, the highest rate in almost a decade. With inflation expected to be below 2% in 2019 and the economy operating near capacity, the financial community anticipates no further rate hikes coming from the central bank.
●
Given the oil price decline in the last quarter of 2018, the Canadian dollar is expected to average around 75 cents US for most of 2019.
●
The Canada Mortgage and Housing Corporation projects housing starts to moderate and range from 193,700 to 204,500 units, with declines expected for both single and multi-unit starts.
Statistical Summary - Growth Rates1 (as of March 14, 2019) |
| 2017 to 2018 |
| | N.B. | Canada |
| Population and Labour | | |
| Total Population (July 1) | 0.5 | 1.4 |
| Labour Force | 0.2 | 0.8 |
| Employment | 0.3 | 1.3 |
| Unemployment Rate (%) | 8.0 | 5.8 |
| Participation Rate (%) | 61.3 | 65.4 |
| Wages and Salaries | 4.0 | 4.6 |
| Consumers and Housing | | |
| Retail Trade | 1.3 | 2.7 |
| Consumer Price Index | 2.1 | 2.3 |
| Housing Starts | 0.2 | -3.1 |
| Business | | |
| Manufacturing Sales | -1.7 | 5.4 |
| International Exports | -2.0 | 7.2 |
| Building Permits | -15.5 | 4.7 |
1 Per cent change unless otherwise indicated. Source: Statistics Canada. |
New Brunswick Economy
●
The Department of Finance and Treasury Board estimates real economic growth of 0.9% in 2018, a slight decline from the projection at the time of budget last year. This estimate is consistent with the latest consensus among private sector forecasters.
●
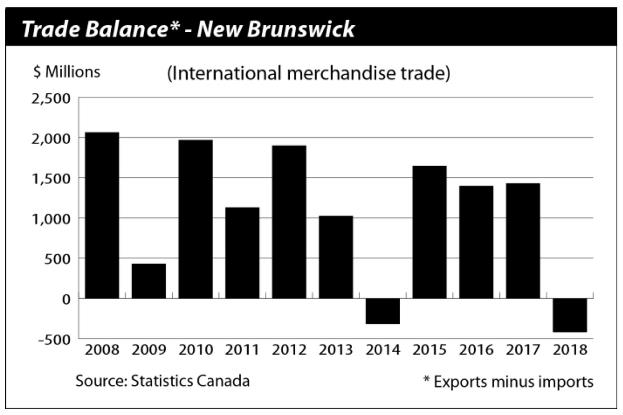
Although manufacturing sales, housing starts, and trade displayed gains to start the year, a notable slowdown was observed during the fourth quarter, offsetting a previously strong performance. However, stronger-than-expected growth was observed in income, investment in non-residential building construction, and population.
●
A decline in production at the refinery in Saint John following the explosion was a contributing factor to the trade deficit, which has restrained growth in the last quarter. In addition, challenges experienced in two mining zones of the Caribou Mine led to a loss of production and higher operating costs, lowering mining exports for 2018.
●
Employment gains in the services-producing sector permitted employment to grow for the second consecutive year, registering growth of 0.3% in 2018. Gains in both full-time and part-time employment were registered.
●
Income growth has been a bright spot for New Brunswick, where average weekly earnings are strong and registering slightly above the national average, driven by gains in the services-producing industries.
●
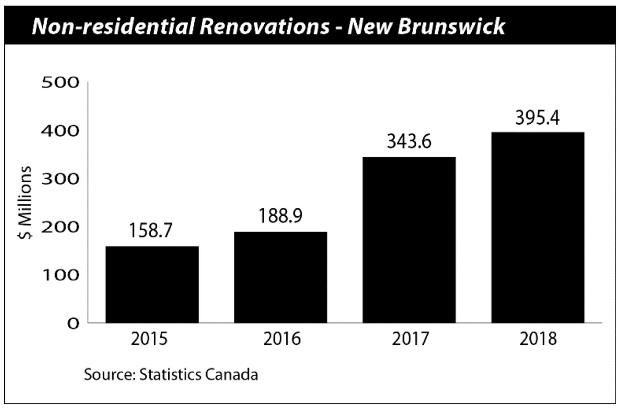
Non-residential investment supported growth in 2018 as industrial, and institutional and governmental building renovations saw notable gains.
●
Retail sales were steady throughout 2018 following strong growth in 2017. Higher sales at gasoline stations as well as food and beverage stores, when combined, account for over two thirds of gains for the year.
●
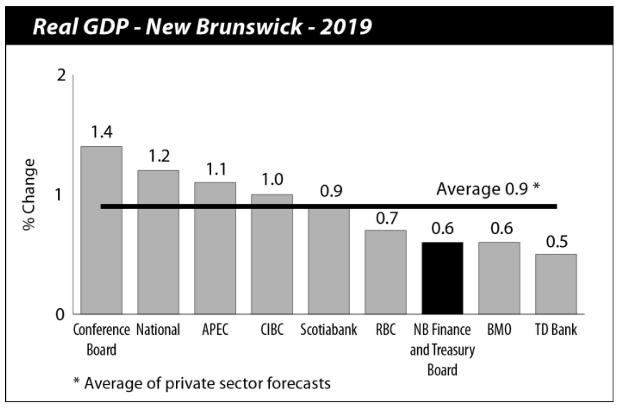
In 2019, the Department of Finance and Treasury Board anticipates real GDP growth of 0.6%, lower than the consensus among private sector forecasters of 0.9%. A slowdown that became evident as 2018 came to a close is expected to persist during the opening half of the year, moderating growth prospects in manufacturing and trade.
●
Consumption growth is projected to moderate in 2019 and 2020 as households adjust spending from recent elevated levels and increased interest rates.
●
Following two consecutive years of growth, employment is expected to be flat in 2019. Household income growth of 2.0% is anticipated.
●
Investment growth is expected to soften in 2019, as private sector investment growth is limited by the absence of major projects and continued trade uncertainty, while public sector investment recalibrates to a more sustainable level.
●
Despite the signing of the new CUSMA, investment and exports will likely be hampered until ratification and implementation of the agreement takes place in each respective country.
●
Exports of refined petroleum products will be lower for 2019 as ongoing repairs to the refinery in Saint John is expected to limit production for much of the year.
●
Modest growth is anticipated in the mining sector, since planned remediation work will continue to affect production at the Caribou Mine during the early stages of 2019. Nonetheless, current prices for zinc remain positive and Trevali Corporation anticipates regaining normal production levels during the second quarter. Moreover, production at the Restigouche mine is expected to start this year.
●
The fishing and aquaculture sectors are expected to be supported by higher prices in some fish products, more investments, and robust seafood exports. However, labour shortages may still present a barrier to growth.
●
Activity in the agriculture sector is anticipated to sustain last year’s growth level as demand for crops such as blueberries continue to expand.
●
The ongoing softwood lumber dispute between Canada and the
U.S. will continue to limit growth prospects in the forestry sector. A retreat from increased lumber prices and slower growth in U.S. housing starts are expected to be partially offset by a lower Canadian dollar, thereby limiting competitive pressures faced by industry.
New Brunswick Economic Indicators Growth Rates1, 2016 to 2023 |
| | 2016 | 2017 | 2018 | 2019 | 2020 | 2021– 2023 |
| Economic Accounts * |
| Gross Domestic Product (GDP) | 3.6 | 4.3 | 3.3 | 1.9 | 2.3 | 2.0 |
| Household Final Consumption Expenditures | 2.5 | 4.0 | 2.7 | 2.3 | 2.5 | 2.6 |
| Gross Fixed Capital Formation | 3.5 | 6.6 | 2.9 | 0.8 | 2.6 | 2.2 |
| GDP (real) | 1.4 | 1.8 | 0.9 | 0.6 | 1.1 | 0.8 |
| Income * |
| Primary Household Income | 1.9 | 3.2 | 3.4 | 2.0 | 2.8 | 2.5 |
| Population and Labour ** |
| Total Population (July 1) | 0.6 | 0.5 | 0.5 | 0.4 | 0.3 | 0.3 |
| Labour Force | -0.4 | -1.2 | 0.2 | -0.1 | 0.1 | 0.1 |
| Employment | -0.1 | 0.4 | 0.3 | 0.0 | 0.2 | 0.0 |
| Unemployment Rate (%) | 9.5 | 8.1 | 8.0 | 7.9 | 7.8 | 7.9 |
| Participation Rate (%) | 62.3 | 61.5 | 61.3 | 61.2 | 61.1 | 61.1 |
| Other ** |
Consumer Price Index Housing Starts Retail Trade | 2.2 -7.9 2.1 | 2.3 26.4 6.8 | 2.1 0.2 1.3 | 2.1 -1.9 1.6 | 2.0 0.2 2.1 | 1.9 0.3 2.0 |
1 Per cent change unless otherwise indicated. Sources: Statistics Canada and NB Finance and Treasury Board *2018–2023 **2019–2023. |
●
The aging population will continue to hinder economic growth potential with the youngest baby boomers moving into the age group 55 and over. In Canada, the province has one of the highest proportions of people in this age group (36.8%) and this is also reflected in the labour force (23.5%).
●
Natural gas development over the medium-term could boost investment spending, job creation and government revenue.
New Brunswick Economic Indicators
| New Brunswick Annual Indicators (as of March 14, 2019) |
Indicators | 2015 | | 2016 | 2017 | 2018 | 2015-16 | % Change 2016-17 |
2017-18 |
| Labour | | |
Population 15 Years and Over ('000) Labour Force ('000) Employment ('000) Full-time ('000) Part-time ('000) Goods-producing Sector ('000) Services-producing Sector ('000) Unemployment ('000) Participation Rate (%) Employment Rate (%) Unemployment Rate (%) Average Weekly Earnings ($) Wages and Salaries ($M) Employment Insurance Beneficiaries | 622.0 390.2 351.8 297.9 53.9 72.7 279.1 38.4 62.7 56.6 9.8 855.69 14,520.2 41,266 | | 623.4 388.6 351.5 296.5 55.0 72.8 278.6 37.1 62.3 56.4 9.5 875.12 14,927.0 42,886 | 624.7 383.9 352.9 301.9 51.0 73.3 279.6 31.0 61.5 56.5 8.1 887.03 15,417.7 42,786 | 627.4 384.5 353.8 302.6 51.2 73.1 280.7 30.7 61.3 56.4 8.0 912.21 16,029.2 39,688 | 0.2 -0.4 -0.1 -0.5 2.0 0.1 -0.2 -3.4 … … … 2.3 2.8 3.9 | 0.2 -1.2 0.4 1.8 -7.3 0.7 0.4 -16.4 … … … 1.4 3.3 -0.2 | 0.4 0.2 0.3 0.2 0.4 -0.3 0.4 -1.0 … … … 2.8 4.0 -7.2 |
| Consumers | | |
Retail Trade ($M) New Motor Vehicle Sales (units) New Motor Vehicle Sales ($M) Food Services and Drinking Places ($M) Consumer Price Index (2002=100) | 11,730.2 44,735 1,533.9 1,082.7 125.4 | | 11,977.9 44,984 1,619.8 1,156.8 128.2 | 12,792.1 44,801 1,717.8 1,184.3 131.2 | 12,963.9 41,311 1,638.7 1,221.1 134.0 | 2.1 0.6 5.6 6.8 2.2 | 6.8 -0.4 6.0 2.4 2.3 | 1.3 -7.8 -4.6 3.1 2.1 |
| Housing | | |
Housing Starts (units) Residential Building Permits ($M) MLS® Residential Sales (units) | 1,995 419.4 6,815 | | 1,838 479.0 7,603 | 2,324 477.6 8,092 | 2,328 468.5 8,199 | -7.9 14.2 11.6 | 26.4 -0.3 6.4 | 0.2 -1.9 1.3 |
| Business | | |
Manufacturing Sales ($M) International Exports ($M) Non-residential Building Permits ($M) Industrial and Commercial ($M) Institutional and Governmental ($M) Wholesale Trade ($M) Mining Production ($M) Farm Cash Receipts ($M) Lumber Shipments ('000 m3) | 16,903.1 12,210.2 402.6 250.8 151.7 6,441.5 444.5 575.9 3 455.6 | | 16,245.6 10,642.3 508.9 388.6 120.3 6,267.5 374.8 584.7 3 609.6 | 18,788.1 12,856.6 718.9 456.7 262.3 6,449.8 396.9 613.0 3 651.1 | 18,477.8 12,603.2 543.1 428.7 114.4 6,502.4 344.8 637.2 3 714.5 | -3.9 -12.8 26.4 54.9 -20.7 -2.7 -15.7 1.5 4.5 | 15.7 20.8 41.3 17.5 118.1 2.9 5.9 4.8 1.1 | -1.7 -2.0 -24.5 -6.1 -56.4 0.8 -13.1 3.9 1.7 |
| Demographics | | |
Population (July 1) Natural Increase (July 1-June 30) Net Migration (July 1-June 30) | 758,842 -307 4,815 | * | 763,350 -653 4,155 | 766,852 -872 4,653 | 770,633 | 0.6 … … | 0.5 … … | 0.5 … … |
… Not applicable * Includes errors related to the components of population growth (mainly migration). MLS® is a registered trademark of the Canadian Real Estate Association Sources: Statistics Canada, Natural Resources Canada, Agriculture and Agri-Food Canada, and Canadian Real Estate Association. |