UNITED STATES
SECURITIES AND EXCHANGE COMMISSION
Washington, D.C. 20549
FORM N-CSR
CERTIFIED SHAREHOLDER REPORT OF REGISTERED
MANAGEMENT INVESTMENT COMPANIES
Investment Company Act file number | 811-6094 |
|
THE LATIN AMERICA EQUITY FUND, INC. |
(Exact name of registrant as specified in charter) |
|
Eleven Madison Avenue, New York, New York | | 10010 |
(Address of principal executive offices) | | (Zip code) |
|
J. Kevin Gao, Esq.
The Latin America Equity Fund, Inc.
Eleven Madison Avenue
New York, New York 10010 |
(Name and address of agent for service) |
|
Registrant’s telephone number, including area code: | (212) 325-2000 | |
|
Date of fiscal year end: | December 31 | |
|
Date of reporting period: | January 1, 2007 to June 30, 2007 | |
| | | | | | | | | |
Item 1. Reports to Stockholders.
THE LATIN AMERICA
EQUITY FUND, INC.
SEMI-ANNUAL REPORT
JUNE 30, 2007
(unaudited)

LAQ-SAR-0607
LETTER TO SHAREHOLDERS
July 25, 2007
Dear Shareholder:
For the semi-annual period ended June 30, 2007, The Latin America Equity Fund, Inc. (the "Fund") had an increase in its net asset value (NAV) of 28.27%, assuming reinvestment of dividends and distributions, net of all fees, expenses and taxes. By comparison, the Morgan Stanley Capital International Latin America Index*("MSCI Latin America Index") had an increase of 26.97% (total return index, net of foreign taxation) for the period. Based on market price, the Fund's shares rose 19.00% during the period.
Market Review: Brazil continues to outperform
The Fund's benchmark index, the MSCI Latin America Index, rose by 26.97% in the first six months of 2007—comfortably outperforming developed markets as well as other regions of the Emerging Markets asset class.
Once again, Latin America was buoyed by strong commodity prices, especially oil and base metals. Additionally, good economic data in the major countries in the region, specifically Brazil, Mexico and Chile, further sustained the region. Further, as of June 30, 2007, sovereign debt spreads are at historically low levels.
For the six-month period, Peru, Chile and Brazil were the leading markets, while Mexico, Argentina, Colombia and Venezuela underperformed.
Brazil's continued outperformance was driven by good macro data, particularly on the inflation front, and by further interest rate cuts. The Real broke through R$2 to the dollar level. And, 10 new IPO's from Brazilian companies were priced in June alone. This brings the year-to-date total to 31 deals with a total value of US$9.3 billion.
In Mexico, the announcement of the fiscal reform proposal in June, which involved the creation of a new flat tax, disappointed the market. Additionally, there was uncertainty about how the reform proposal would impact specific sectors.
Strategic Review and Outlook: Anticipating continued economic stability
We made no major changes in strategy during the course of the period. Although our long-term outlook is bullish, we remain somewhat cautious from a short-term tactical point of view.
The Fund has been an active participant in the spate of new IPO's coming from Brazil. In June alone, the Fund participated in five IPO's, four in Brazilian companies, one in a Peruvian provider of financial services. Many of the companies coming to market are looking to raise capital in order to participate in the consolidation of fragmented domestic marketplaces (the logistics market, healthcare, homebuilding and financial services, for example).
Going forward, we continue to believe that the benefits of a prolonged period of economic stability—such as the one we are currently enjoying—will have a profound impact on consumption in Latin America. This, in turn, should sustain the equity markets in this long bull run. Additionally, we maintain our belief that the greatest impact will be felt in Brazil, where interest rates are still very high by developed-world standards. For this reason, our portfolio continues to favor names in interest sensitive areas such as homebuilding and domestic consumption.
1
LETTER TO SHAREHOLDERS (CONTINUED)
We continue to balance these positions with an underweight position in the materials sectors, particularly steel, and with our relative underexposure to Chile and Mexico.
Respectfully,
 | |  | |
|
Matthew J.K. Hickman
Chief Investment Officer** | | Keith M. Schappert
Chief Executive Officer and President*** | |
|
International investing entails special risk considerations, including currency fluctuations, lower liquidity, economic and political risks, and differences in accounting methods; these risks are generally heightened for emerging-market investments.
In addition to historical information, this report contains forward-looking statements, which may concern, among other things, domestic and foreign market, industry and economic trends and developments and government regulation and their potential impact on the Fund's investments. These statements are subject to risks and uncertainties and actual trends, developments and regulations in the future and their impact on the Fund could be materially different from those projected, anticipated or implied. The Fund has no obligation to update or revise forward-looking statements.
We wish to remind shareholders about the Fund's dividend reinvestment program known as the InvestlinkSM Program (the "Program"). The Program is sponsored and administered by Computershare Trust Company N.A. ("Computershare"), not by the Fund. Computershare will act as program administrator (the "Program Administrator") of the Program. The purpose of the Program is to provide existing shareholders with a simple and convenient way to invest additional funds and reinvest dividends in shares of the Fund's common stock. The enrollment form and information relating to the Program (including the terms and conditions) may be obtained by calling the Program Administrator at one of the following telephone numbers: (800) 730-6001 (U.S and Canada) or (781) 575-3100 (outside U.S. and Canada). All correspondence regarding the Program should be directed to: Computershare Trust Company, N.A., InvestLinkSM Program, P.O.Box 43010, Provid ence, RI 02940-3010.
* The Morgan Stanley Capital International Latin America Index is a free float-adjusted market capitalization index that is designed to measure equity-market performance in Latin America that includes reinvestment of dividends (net of taxes). It is the exclusive property of Morgan Stanley Capital International Inc. Investors cannot invest directly in an index.
** Matthew J.K. Hickman, Director, is a portfolio manager specializing in Latin American equities and is primarily responsible for management of the Fund's assets. He joined in 2003 from Compass Group Investment Advisors, where he was general manager of the private wealth management division based in Santiago, Chile. Previously, he was a financial advisor in Credit Suisse First Boston's Private Client Services channel; an equity analyst focusing on Latin American telecommunications companies and several Latin American country markets at ABN AMRO, Lehman Brothers, Bear, Stearns and James Capel; and an equity analyst and member of the management team for the Five Arrows Chile Fund at Rothschild Asset Management. Mr.Hickman holds a BA in modern languages from Cambridge University and a diploma in corporate finance from London Business School. He is fluent in Spanish, Portuguese and French. He is also the Chief Investment Officer of The Chile Fu nd, Inc.
*** Keith M. Schappert is Executive Vice Chairman and Head of Asset Management for Americas of Credit Suisse and CEO/President of the Fund. Mr. Schappert joined Credit Suisse in 2006 from Federated Investment Advisory Companies, where he was CEO and President from 2002. Prior to Federated, Mr. Schappert was CEO and President of JP Morgan Investment Management from 1994 to 2001.
2
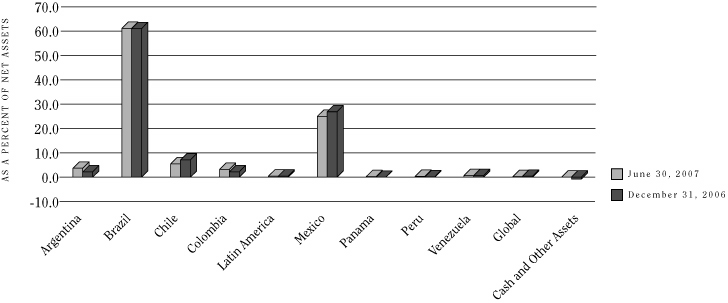
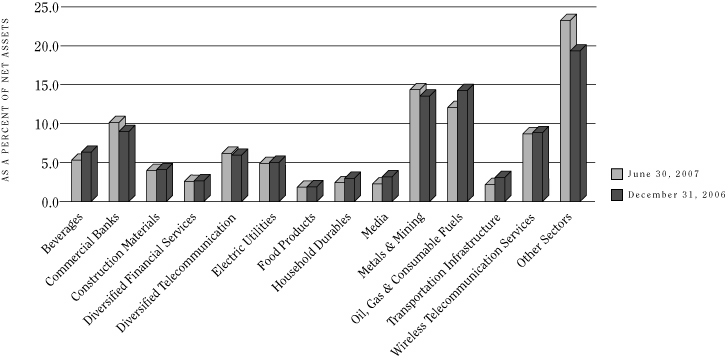
THE LATIN AMERICA EQUITY FUND, INC.
Portfolio Summary
June 30, 2007 (unaudited)
GEOGRAPHIC ASSET BREAKDOWN
SECTOR ALLOCATION
3
THE LATIN AMERICA EQUITY FUND, INC.
Portfolio Summary (continued)
June 30, 2007 (unaudited)
TOP 10 HOLDINGS, BY ISSUER
| | | Holding | | Sector | | Country | | Percent of
Net Assets | |
| | 1. | | | Petróleo Brasileiro S.A. | | Oil, Gas & Consumable Fuels | | Brazil | | | 12.1 | | |
| | 2. | | | Companhia Vale do Rio Doce | | Metals & Mining | | Brazil | | | 9.3 | | |
| | 3. | | | América Móvil S.A. de C.V. | | Wireless Telecommunication Services | | Mexico | | | 8.7 | | |
| | 4. | | | Cemex SAB de C.V. | | Construction Materials | | Mexico | | | 4.0 | | |
| | 5. | | | Tele Norte Leste Participações S.A. | | Diversified Telecommunication | | Brazil | | | 3.2 | | |
| | 6. | | | Companhia de Bebidas das Americas | | Beverages | | Brazil | | | 2.2 | | |
| | 7. | | | Banco Bradesco S.A. | | Commercial Banks | | Brazil | | | 2.0 | | |
| | 8. | | | Fomento Economico Mexicano, S.A. de C.V. | | Beverages | | Mexico | | | 1.9 | | |
| | 9. | | | Grupo Mexico SA de C.V. | | Metals & Mining | | Mexico | | | 1.8 | | |
| | 10. | | | Banco Itaú Holding Financeira S.A. | | Commercial Banks | | Brazil | | | 1.7 | | |
4
THE LATIN AMERICA EQUITY FUND, INC.
Schedule of Investments
June 30, 2007 (unaudited)
| Description | | No. of
Shares | | Value | |
| EQUITY OR EQUITY-LINKED SECURITIES-99.98% | |
| Argentina-3.64% | |
| Capital Markets-0.91% | |
| Pampa Holding SA, GDR† †† | | | 151,412 | | | $ | 3,393,294 | | |
| Energy Equipment & Services-1.47% | |
| Tenaris S.A., ADR | | | 112,600 | | | | 5,512,896 | | |
| Metals & Mining-0.72% | |
| Ternium SA, ADR | | | 89,400 | | | | 2,707,926 | | |
| Thrifts & Mortgage Finance-0.54% | |
| Banco Hipotecario S.A., ADR† | | | 192,700 | | | | 2,033,833 | | |
Total Argentina
(Cost $9,322,112) | | | | | | | 13,647,949 | | |
| Brazil-61.13% | |
| Airlines-1.62% | |
| Tam S.A., PN | | | 181,700 | | | | 6,056,667 | | |
| Beverages-2.18% | |
Companhia de Bebidas das
Americas, ADR | | | 22,600 | | | | 1,586,520 | | |
Companhia de Bebidas das
Americas, ADR, PN | | | 93,900 | | | | 6,573,000 | | |
| | | | 8,159,520 | | |
| Commercial Banks-6.90% | |
| Banco Bradesco S.A., PN | | | 303,200 | | | | 7,358,031 | | |
| Banco Daycoval SA, PN† | | | 31,000 | | | | 279,258 | | |
Banco Itaú Holding
Financeira S.A., PN | | | 139,900 | | | | 6,246,833 | | |
| Investimentos Itaú S.A., PN | | | 990,197 | | | | 6,226,005 | | |
União de Bancos Brasileiros
S.A., GDR | | | 51,200 | | | | 5,778,944 | | |
| | | | 25,889,071 | | |
| Computers & Peripherals-0.97% | |
Bematech Industria e
Comercio de Equipamentos
Eletronicos SA† | | | 222,900 | | | | 2,083,178 | | |
| Positivo Informatica SA† | | | 72,500 | | | | 1,543,354 | | |
| | | | 3,626,532 | | |
| Description | | No. of
Shares | | Value | |
| Containers & Packaging-0.36% | |
| Klabin S.A., PN | | | 383,000 | | | $ | 1,352,233 | | |
| Diversified Financial Services-1.06% | |
| Bradespar S.A., PN | | | 104,300 | | | | 3,969,465 | | |
| Diversified Telecommunication-5.86% | |
Brasil Telecom Participações
S.A. | | | 87,605 | | | | 2,451,666 | | |
| GVT Holding SA† | | | 204,000 | | | | 3,595,950 | | |
Telecomunicações de São Paulo
S.A., PN | | | 72,900 | | | | 2,377,009 | | |
| Telemar Norte Leste S.A., PNA | | | 51,200 | | | | 1,431,526 | | |
Tele Norte Leste Participações
S.A., ON | | | 303,736 | | | | 12,111,591 | | |
| | | | 21,967,742 | | |
| Electric Utilities-3.99% | |
Centrais Elétricas Brasileiras
S.A., PNB | | | 110,100,000 | | | | 3,257,840 | | |
Companhia Energética de
Minas Gerais, ADR | | | 171,300 | | | | 3,614,430 | | |
Companhia Energética de
Minas Gerais, PN | | | 43,500 | | | | 926,916 | | |
| EDP - Energias do Brasil S.A. | | | 112,700 | | | | 2,317,196 | | |
Eletropaulo Metropolitana
S.A., PNB | | | 16,510,000 | | | | 1,087,723 | | |
| Terna Participações S.A. | | | 262,600 | | | | 3,763,115 | | |
| | | | 14,967,220 | | |
| Food Products-1.84% | |
Cosan S.A. Industria e
Comercio† | | | 107,100 | | | | 1,752,748 | | |
Marfrig Frigorificos e
Comercio de Alimentos
SA† | | | 93,000 | | | | 884,128 | | |
| Perdigao S.A. | | | 163,700 | | | | 3,102,310 | | |
| Sao Martinho SA | | | 109,000 | | | | 1,148,858 | | |
| | | | 6,888,044 | | |
| Health Care Providers & Services-0.75% | |
Diagnosticos da America
S.A.† | | | 127,000 | | | | 2,809,034 | | |
See accompanying notes to financial statements.
5
THE LATIN AMERICA EQUITY FUND, INC.
Schedule of Investments (continued)
June 30, 2007 (unaudited)
| Description | | No. of
Shares/Units | | Value | |
| Household Durables-0.22% | |
| Gafisa S.A. | | | 52,000 | | | $ | 815,369 | | |
Independent Power Producers &
Energy Traders-0.64% | |
| Tractebel Energia S.A. | | | 215,800 | | | | 2,407,862 | | |
| Insurance-0.35% | |
| Clean Energy Brazil PLC† | | | 507,912 | | | | 1,212,669 | | |
Clean Energy Brazil PLC,
warrants† | | | 126,750 | | | | 95,364 | | |
| | | | 1,308,033 | | |
| Internet & Catalog Retail-0.97% | |
| Submarino S.A. | | | 87,000 | | | | 3,627,259 | | |
| Machinery-0.96% | |
| Metalfrio Solutions SA† | | | 172,500 | | | | 2,428,076 | | |
| Weg S.A. | | | 124,200 | | | | 1,174,935 | | |
| | | | 3,603,011 | | |
| Media-1.20% | |
Net Servicos de Comunicacao
SA, PN† | | | 137,057 | | | | 2,277,167 | | |
| Vivax S.A.† | | | 80,100 | | | | 2,222,921 | | |
| | | | 4,500,088 | | |
| Metals & Mining-10.96% | |
Companhia Vale do Rio Doce,
ADR, PNA | | | 926,200 | | | | 34,917,740 | | |
| Gerdau S.A., PN | | | 72,000 | | | | 1,850,467 | | |
Usinas Siderúrgicas de
Minas Gerais S.A. | | | 23,000 | | | | 1,522,586 | | |
Usinas Siderúrgicas de
Minas Gerais S.A., PNA | | | 49,000 | | | | 2,798,546 | | |
| | | | 41,089,339 | | |
| Multiline Retail-0.55% | |
| Lojas Americanas S.A., PN | | | 25,900,000 | | | | 2,070,924 | | |
| Oil, Gas & Consumable Fuels-12.04% | |
| Petróleo Brasileiro S.A., ADR | | | 423,300 | | | | 45,157,644 | | |
| Description | | No. of
Shares | | Value | |
| Paper & Forest Products-1.13% | |
| Aracruz Celulose S.A., ADR | | | 29,000 | | | $ | 1,920,960 | | |
Suzano Papel e Celulose
S.A., PN | | | 68,200 | | | | 924,206 | | |
| Wilson Sons Ltd., BDR† | | | 95,900 | | | | 1,394,185 | | |
| | | | 4,239,351 | | |
| Personal Products-0.84% | |
| Natura Cosmeticos S.A. | | | 217,500 | | | | 3,161,994 | | |
| Real Estate Management & Development-0.92% | |
Cyrela Brazil Realty S.A.
Empreendimentos e
Particpações | | | 162,200 | | | | 2,012,762 | | |
| Klabin Segall S.A. | | | 138,031 | | | | 1,447,677 | | |
| | | | 3,460,439 | | |
| Real Estate Operations/Development-0.89% | |
PDG Realty SA
Empreendimentos e
Particpações† | | | 307,600 | | | | 3,353,894 | | |
| Road & Rail-1.61% | |
| All America Latina Logistica | | | 250,500 | | | | 3,433,645 | | |
| Localiza Rent a Car SA | | | 229,100 | | | | 2,587,188 | | |
| | | | 6,020,833 | | |
| Textiles, Apparel & Luxury Goods-0.43% | |
Companhia de Tecidos Norte de
Minas S.A., PN | | | 10,100,000 | | | | 1,599,429 | | |
| Transportation-1.03% | |
| Log-in Logistica Intermodal SA† | | | 122,400 | | | | 966,617 | | |
| Tegma Gestao Logistica SA | | | 215,000 | | | | 2,902,388 | | |
| | | | 3,869,005 | | |
| Transportation Infrastructure-0.86% | |
Obrascon Huarte Lain
Brasil S.A.† | | | 170,700 | | | | 3,226,106 | | |
| Wireless Telecommunication Services-0.00% | |
| Vivo Participações S.A., ADR | | | 21 | | | | 105 | | |
Total Brazil
(Cost $104,899,365) | | | | | | | 229,196,213 | | |
See accompanying notes to financial statements.
6
THE LATIN AMERICA EQUITY FUND, INC.
Schedule of Investments (continued)
June 30, 2007 (unaudited)
| Description | | No. of
Shares/Units | | Value | |
| Chile-5.45% | |
| Airlines-0.21% | |
| Lan Airlines S.A., ADR | | | 9,500 | | | $ | 799,425 | | |
| Beverages-0.87% | |
Compañia Cervecerías
Unidas S.A. | | | 175,010 | | | | 1,282,465 | | |
Compañia Cervecerías
Unidas S.A., ADR | | | 14,400 | | | | 530,928 | | |
Embotelladora Andina
S.A., PNA | | | 294,613 | | | | 973,188 | | |
Embotelladora Andina
S.A., PNB | | | 140,000 | | | | 477,874 | | |
| | | | 3,264,455 | | |
| Commercial Banks-0.82% | |
| Banco de Chile | | | 17,280,196 | | | | 1,574,655 | | |
| Banco de Chile, rights† | | | 621,812 | | | | 9,916 | | |
| Banco Santander Chile S.A. | | | 30,613,969 | | | | 1,470,400 | | |
| | | | 3,054,971 | | |
| Electric Utilities-0.88% | |
| Enersis S.A. | | | 3,780,000 | | | | 1,514,153 | | |
| Enersis S.A., ADR | | | 88,300 | | | | 1,770,415 | | |
| | | | 3,284,568 | | |
| Food & Staples Retailing-0.31% | |
| Cencosud S.A. | | | 280,000 | | | | 1,157,209 | | |
Independent Power Producers &
Energy Traders-0.54% | |
Empresa Nacional de
Electricidad S.A. | | | 1,249,910 | | | | 2,030,941 | | |
| Industrial Conglomerates-0.38% | |
| Empresas Copec S.A. | | | 98,000 | | | | 1,438,140 | | |
| Multiline Retail-0.15% | |
| S.A.C.I. Falabella, S.A. | | | 110,350 | | | | 570,866 | | |
| Paper & Forest Products-0.44% | |
| Empresas CMPC S.A. | | | 45,000 | | | | 1,665,876 | | |
| Description | | No. of
Shares | | Value | |
| Water Utilities-0.85% | |
Inversiones Aguas
Metropolitanas S.A., ADR†† | | | 125,873 | | | $ | 3,173,510 | | |
Total Chile
(Cost $10,583,962) | | | | | | | 20,439,961 | | |
| Colombia-3.16% | |
| Commercial Banks-1.51% | |
| Bancolombia S.A., ADR | | | 126,503 | | | | 4,153,093 | | |
Corporacion Financiera
Colombiana | | | 169,417 | | | | 1,495,161 | | |
| | | | 5,648,254 | | |
| Diversified Financial Services-1.29% | |
Suramericana de
Inversiones S.A. | | | 508,346 | | | | 4,829,027 | | |
| Metals & Mining-0.36% | |
| Acerias Paz del Rio S.A.† | | | 32,217,991 | | | | 1,357,500 | | |
Total Colombia
(Cost $8,274,274) | | | | | | | 11,834,781 | | |
| Latin America-0.27% | |
| Venture Capital-0.27% | |
JPMorgan Latin America
Capital Partners (Cayman),
L.P.†‡ | | | 948,642 | | | | 244,930 | | |
JPMorgan Latin America
Capital Partners (Delaware),
L.P.†‡# | | | 1,489,801 | | | | 765,802 | | |
Total Latin America
(Cost $1,181,771) | | | | | | | 1,010,732 | | |
| Mexico-24.96% | |
| Beverages-2.25% | |
Fomento Economico Mexicano,
S.A. de C.V., ADR | | | 179,136 | | | | 7,043,628 | | |
Grupo Modelo, S.A. de C.V.,
Series C | | | 253,000 | | | | 1,379,644 | | |
| | | | 8,423,272 | | |
See accompanying notes to financial statements.
7
THE LATIN AMERICA EQUITY FUND, INC.
Schedule of Investments (continued)
June 30, 2007 (unaudited)
| Description | | No. of
Shares | | Value | |
| Construction & Engineering-1.09% | |
Empresas ICA S.A.B. de C.V.,
ADR† | | | 67,300 | | | $ | 4,104,627 | | |
| Construction Materials-3.97% | |
| Cemex SAB de C.V., ADR | | | 402,906 | | | | 14,867,231 | | |
| Diversified Telecommunication-0.33% | |
| Axtel, S.A. de C.V., CPO† | | | 36,200 | | | | 221,387 | | |
Teléfonos de México S.A.
de C.V., Class L, ADR | | | 26,600 | | | | 1,007,874 | | |
| | | | 1,229,261 | | |
| Food & Staples Retailing-1.38% | |
Wal-Mart de México, S.A. de C.V.,
Series V | | | 1,047,430 | | | | 3,979,321 | | |
Wal-Mart de México, S.A. de C.V.,
Series V, ADR | | | 31,190 | | | | 1,184,949 | | |
| | | | 5,164,270 | | |
| Hotels, Restaurants & Leisure-0.43% | |
| Alsea, S.A. de C.V. | | | 920,400 | | | | 1,620,430 | | |
| Household Durables-2.19% | |
| Consorcio ARA, S.A. de C.V. | | | 922,800 | | | | 1,487,842 | | |
Corporación GEO, S.A. de C.V.,
Series B† | | | 582,000 | | | | 3,200,691 | | |
Urbi, Desarrollos Urbanos,
S.A. de C.V.† | | | 760,257 | | | | 3,504,722 | | |
| | | | 8,193,255 | | |
| Media-1.04% | |
| Grupo Televisa S.A., ADR | | | 113,400 | | | | 3,130,974 | | |
| Grupo Televisa S.A., CPO | | | 139,500 | | | | 771,700 | | |
| | | | 3,902,674 | | |
| Metals & Mining-2.31% | |
| Baja Mining Corp.† | | | 959,500 | | | | 1,831,055 | | |
Grupo Mexico SA de C.V.,
Class B | | | 1,112,523 | | | | 6,845,058 | | |
| | | | 8,676,113 | | |
| Description | | No. of
Shares | | Value | |
| Transportation Infrastructure-1.29% | |
Grupo Aeroportuario del Centro
Norte, S.A.B. de C.V., ADR | | | 77,545 | | | $ | 2,130,161 | | |
Grupo Aeroportuario del
Pacifico S.A. de C.V., ADR | | | 55,200 | | | | 2,722,464 | | |
| | | | 4,852,625 | | |
| Wireless Telecommunication Services-8.68% | |
América Móvil S.A. de C.V.,
Series L | | | 6,695,623 | | | | 20,697,463 | | |
América Móvil S.A. de C.V.,
Series L, ADR | | | 191,000 | | | | 11,828,630 | | |
| | | | 32,526,093 | | |
Total Mexico
(Cost $44,665,685) | | | | | | | 93,559,851 | | |
| Panama-0.24% | |
| Diversified Financial Services-0.24% | |
Intergroup Financial Services
Corp.† ††
(Cost $882,000) | | | 63,000 | | | | 882,000 | | |
| Peru-0.28% | |
| Commercial Banks-0.28% | |
Credicorp Limited
(Cost $728,991) | | | 17,500 | | | | 1,070,475 | | |
| Venezuela-0.63% | |
| Commercial Banks-0.63% | |
Mercantil Servicios
Financieros, C.A., ADR
(Cost $1,240,868) | | | 363,580 | | | | 2,370,469 | | |
| Global-0.22% | |
| Venture Capital-0.22% | |
Emerging Markets
Ventures I L.P.†‡#
(Cost $1,251,940) | | | 2,237,292 | | | | 818,312 | | |
TOTAL EQUITY OR EQUITY-LINKED
SECURITIES (Cost $183,030,968) | | | | | | | 374,830,743 | | |
See accompanying notes to financial statements.
8
THE LATIN AMERICA EQUITY FUND, INC.
Schedule of Investments (continued)
June 30, 2007 (unaudited)
| Description | | No. of
Shares | | Value | |
| SHORT-TERM INVESTMENTS-1.28% | |
| Chilean Mutual Fund-0.05% | |
Fondo Mutuo Corporativo
BancoEstado
(Cost $191,626) | | | 88,879 | | | $ | 191,030 | | |
| | | Principal
Amount
(000's) | | | |
| Grand Cayman-1.23% | |
Citibank N.A., overnight deposit,
4.39%, 7/02/2007
(Cost $4,604,000) | | $ | 4,604 | | | | 4,604,000 | | |
Total Short-Term Investments
(Cost $4,795,626) | | | | | 4,795,030 | | |
Total Investments-101.26%
(Cost $187,826,594)
(Notes B,E,G) | | | | | 379,625,773 | | |
Liabilities in Excess of Cash and
Other Assets-(1.26)% | | | | | (4,724,427 | ) | |
| NET ASSETS-100.00% | | | | $ | 374,901,346 | | |
† Non-income producing security.
†† SEC Rule 144A security. Such securities are traded only among "qualified institutional buyers."
‡ Restricted security, not readily marketable; security is valued at fair value as determined in good faith by, or under the direction of, the Board of Directors under procedures established by the Board of Directors. (See Notes B and H.)
# As of June 30, 2007, the aggregate amount of open commitments for the Fund is $954,171. (See Note H.)
ADR American Depositary Receipts.
BDR Brazilian Depositary Receipts.
CPO Ordinary Participation Certificates.
GDR Global Depositary Receipts.
ON Ordinary Shares.
PN Preferred Shares.
PNA Preferred Shares, Class A.
PNB Preferred Shares, Class B.
See accompanying notes to financial statements.
9
THE LATIN AMERICA EQUITY FUND, INC.
STATEMENT OF ASSETS AND LIABILITIES
June 30, 2007 (unaudited)
| ASSETS | |
| Investments, at value (Cost $187,826,594) (Notes B,E,G) | | $ | 379,625,773 | | |
| Cash (including $80,695 of foreign currencies with a cost of $81,277) | | | 81,096 | | |
| Receivables: | |
| Dividends | | | 1,269,805 | | |
| Investments sold | | | 496,815 | | |
| Prepaid expenses | | | 3,640 | | |
| Total Assets | | | 381,477,129 | | |
| LIABILITIES | |
| Payables: | |
| Investments purchased | | | 5,577,335 | | |
| Investment advisory fees (Note C) | | | 681,663 | | |
| Administration fees (Note C) | | | 52,014 | | |
| Directors' fees | | | 40,076 | | |
| Chilean repatriation taxes | | | 23,516 | | |
| Other accrued expenses | | | 201,179 | | |
| Total Liabilities | | | 6,575,783 | | |
| NET ASSETS (applicable to 6,322,240 shares of common stock outstanding) (Note D) | | $ | 374,901,346 | | |
| NET ASSETS CONSIST OF | |
Capital stock, $0.001 par value; 6,322,240 shares issued and outstanding
(100,000,000 shares authorized) | | $ | 6,322 | | |
| Paid-in capital | | | 140,606,867 | | |
| Undistributed net investment income | | | 3,039,207 | | |
| Accumulated net realized gain on investments and foreign currency related transactions | | | 39,456,597 | | |
Net unrealized appreciation in value of investments and translation of other
assets and liabilities denominated in foreign currencies | | | 191,792,353 | | |
| Net assets applicable to shares outstanding | | $ | 374,901,346 | | |
| NET ASSET VALUE PER SHARE ($374,901,346 ÷ 6,322,240) | | $ | 59.30 | | |
| MARKET PRICE PER SHARE | | $ | 51.68 | | |
See accompanying notes to financial statements.
10
THE LATIN AMERICA EQUITY FUND, INC.
STATEMENT OF OPERATIONS
For the Six Months Ended June 30, 2007 (unaudited)
| INVESTMENT INCOME | |
| Income (Note B): | |
| Dividends | | $ | 4,613,948 | | |
| Interest | | | 119,619 | | |
| Net investment income allocated from partnerships | | | 135,144 | | |
| Less: Foreign taxes withheld | | | (313,527 | ) | |
| Total Investment Income | | | 4,555,184 | | |
| Expenses: | |
| Investment advisory fees (Note C) | | | 1,281,693 | | |
| Custodian fees | | | 194,813 | | |
| Administration fees (Note C) | | | 135,568 | | |
| Directors' fees | | | 43,985 | | |
| Audit and tax fees | | | 43,196 | | |
| Accounting fees | | | 40,662 | | |
| Legal fees | | | 27,273 | | |
| Printing (Note C) | | | 22,017 | | |
| Shareholder servicing fees | | | 9,521 | | |
| Insurance | | | 6,224 | | |
| Stock exchange listing fees | | | 881 | | |
| Miscellaneous | | | 11,950 | | |
| Brazilian taxes (Note B) | | | 78,197 | | |
| Chilean repatriation taxes (Note B) | | | 19,749 | | |
| Total Expenses | | | 1,915,729 | | |
| Less: Fee waivers (Note C) | | | (3,966 | ) | |
| Net Expenses | | | 1,911,763 | | |
| Net Investment Income | | | 2,643,421 | | |
NET REALIZED AND UNREALIZED GAIN ON INVESTMENTS AND
FOREIGN CURRENCY RELATED TRANSACTIONS | |
| Net realized gain from: | |
| Investments | | | 23,556,417 | | |
| Foreign currency related transactions | | | 6,086 | | |
Net change in unrealized appreciation in value of investments and translation
of other assets and liabilities denominated in foreign currencies | | | 56,409,660 | | |
| Net realized and unrealized gain on investments and foreign currency related transactions | | | 79,972,163 | | |
| NET INCREASE IN NET ASSETS RESULTING FROM OPERATIONS | | $ | 82,615,584 | | |
See accompanying notes to financial statements.
11
THE LATIN AMERICA EQUITY FUND, INC.
Statement of Changes in Net Assets
| | | For the
Six Months Ended
June 30, 2007
(unaudited) | | For the
Year Ended
December 31, 2006 | |
| INCREASE IN NET ASSETS | |
| Operations: | |
| Net investment income | | $ | 2,643,421 | | | $ | 3,977,407 | | |
| Net realized gain on investments and foreign currency related transactions | | | 23,562,503 | | | | 41,282,098 | | |
Net change in unrealized appreciation in value of investments
and translation of other assets and liabilities denominated in
foreign currencies | | | 56,409,660 | | | | 58,504,337 | | |
| Net increase in net assets resulting from operations | | | 82,615,584 | | | | 103,763,842 | | |
| Dividends and distributions to shareholders: | |
| Net investment income | | | — | | | | (3,540,454 | ) | |
| Net realized gain on investments | | | — | | | | (30,789,309 | ) | |
| Total dividends and distributions to shareholders | | | — | | | | (34,329,763 | ) | |
| Total increase in net assets | | | 82,615,584 | | | | 69,434,079 | | |
| NET ASSETS | |
| Beginning of period | | | 292,285,762 | | | | 222,851,683 | | |
| End of period* | | $ | 374,901,346 | | | $ | 292,285,762 | | |
* Includes undistibuted net investment income of $3,039,207 and $395,786, respectively.
See accompanying notes to financial statements.
12
This page intentionally left blank.
13
THE LATIN AMERICA EQUITY FUND, INC.
Financial Highlights§
Contained below is per share operating performance data for a share of common stock outstanding, total investment return, ratios to average net assets and other supplemental data for each period indicated. This information has been derived from information provided in the financial statements and market price data for the Fund's shares.
| | | For the
Six Months
Ended
June 30, 2007 | |
| | | (unaudited) | |
| PER SHARE OPERATING PERFORMANCE | |
| Net asset value, beginning of period | | $ | 46.23 | | |
| Net investment income/(loss) | | | 0.42 | | |
Net realized and unrealized gain/(loss) on investments
and foreign currency related transactions | | | 12.65 | | |
Net increase/(decrease) in net assets resulting from
operations | | | 13.07 | | |
| Dividends and distributions to shareholders: | |
| Net investment income | | | — | | |
Net realized gain on investments and
foreign currency related transactions | | | — | | |
| Total dividends and distributions to shareholders | | | — | | |
Anti-dilutive impact due to capital shares tendered
or repurchased | | | — | | |
| Net asset value, end of period | | $ | 59.30 | | |
| Market value, end of period | | $ | 51.68 | | |
| Total investment return (a) | | | 19.00 | % | |
| RATIOS/SUPPLEMENTAL DATA | |
| Net assets, end of period (000 omitted) | | $ | 374,901 | | |
| Ratio of expenses to average net assets (b) | | | 1.40 | %(d) | |
Ratio of expenses to average net assets, excluding
fee waivers | | | 1.40 | %(d) | |
Ratio of expenses to average net assets,
excluding taxes | | | 1.20 | %(d) | |
Ratio of net investment income/(loss) to average
net assets | | | 1.66 | %(d) | |
| Portfolio turnover rate | | | 14.12 | % | |
§ Per share amounts prior to November 10, 2000 have been restated to reflect a conversion factor of 0.9175 for shares issued in connection with the merger of The Latin America Investment Fund, Inc. and The Latin America Equity Fund, Inc.
* Based on actual shares outstanding on November 21, 2001 (prior to the 2001 tender offer) and December 31, 2001.
** Based on actual shares outstanding on November 6, 2002 (prior to the 2002 tender offer) and December 31, 2002.
† Based on average shares outstanding.
‡ Includes a $0.01 per share decrease to the Fund's net asset value per share resulting from the dilutive impact of shares issued pursuant to the Fund's automatic dividend reinvestment program.
# Impact of the Fund's self-tender program.
(a) Total investment return at market value is based on the changes in market price of a share during the period and assumes reinvestment of dividends and distributions, if any, at actual prices pursuant to the Fund's dividend reinvestment program.
(b) Ratios reflect actual expenses incurred by the Fund. Amounts are net of fee waivers and inclusive of taxes.
(c) Ratio includes the effect of a reversal of Chilean repatriation tax accrual; excluding the reversal, the ratio would have been 2.36%.
(d) Annualized.
See accompanying notes to financial statements.
14
THE LATIN AMERICA EQUITY FUND, INC.
Financial Highlights
| | | For the Years Ended December 31, | |
| | | 2006 | | 2005 | | 2004 | | 2003 | | 2002 | | 2001 | | 2000 | | 1999 | | 1998 | | 1997 | |
| PER SHARE OPERATING PERFORMANCE | |
| Net asset value, beginning of period | | $ | 35.25 | | | $ | 24.39 | | | $ | 17.74 | | | $ | 11.55 | | | $ | 15.06 | | | $ | 16.60 | | | $ | 18.57 | | | $ | 10.96 | | | $ | 18.77 | | | $ | 18.41 | | |
| Net investment income/(loss) | | | 0.63 | | | | 0.61 | | | | 0.45 | † | | | 0.34 | † | | | 0.01 | ** | | | 0.41 | * | | | (0.11 | )† | | | 0.07 | † | | | 0.16 | | | | 0.16 | | |
Net realized and unrealized gain/(loss) on investments
and foreign currency related transactions | | | 15.78 | | | | 11.03 | | | | 6.66 | | | | 5.99 | | | | (3.41 | ) | | | (1.50 | ) | | | (2.44 | ) | | | 7.07 | | | | (7.85 | )‡ | | | 2.01 | | |
Net increase/(decrease) in net assets resulting from
operations | | | 16.41 | | | | 11.64 | | | | 7.11 | | | | 6.33 | | | | (3.40 | ) | | | (1.09 | ) | | | (2.55 | ) | | | 7.14 | | | | (7.69 | ) | | | 2.17 | | |
| Dividends and distributions to shareholders: | |
| Net investment income | | | (0.56 | ) | | | (0.50 | ) | | | (0.46 | ) | | | (0.14 | ) | | | (0.21 | ) | | | (0.57 | ) | | | (0.08 | ) | | | — | | | | (0.12 | ) | | | (0.17 | ) | |
Net realized gain on investments and
foreign currency related transactions | | | (4.87 | ) | | | (0.28 | ) | | | — | | | | — | | | | — | | | | — | | | | — | | | | — | | | | — | | | | (1.64 | ) | |
| Total dividends and distributions to shareholders | | | (5.43 | ) | | | (0.78 | ) | | | (0.46 | ) | | | (0.14 | ) | | | (0.21 | ) | | | (0.57 | ) | | | (0.08 | ) | | | — | | | | (0.12 | ) | | | (1.81 | ) | |
Anti-dilutive impact due to capital shares tendered
or repurchased | | | — | | | | — | | | | — | | | | — | | | | 0.10 | # | | | 0.12 | # | | | 0.66 | | | | 0.47 | | | | — | | | | — | | |
| Net asset value, end of period | | $ | 46.23 | | | $ | 35.25 | | | $ | 24.39 | | | $ | 17.74 | | | $ | 11.55 | | | $ | 15.06 | | | $ | 16.60 | | | $ | 18.57 | | | $ | 10.96 | | | $ | 18.77 | | |
| Market value, end of period | | $ | 43.43 | | | $ | 30.46 | | | $ | 21.64 | | | $ | 15.26 | | | $ | 9.67 | | | $ | 12.15 | | | $ | 12.875 | | | $ | 13.76 | | | $ | 7.834 | | | $ | 14.918 | | |
| Total investment return (a) | | | 61.62 | % | | | 44.06 | % | | | 45.04 | % | | | 59.15 | % | | | (18.83 | )% | | | (1.07 | )% | | | (5.87 | )% | | | 75.65 | % | | | (46.63 | )% | | | 10.29 | % | |
| RATIOS/SUPPLEMENTAL DATA | |
| Net assets, end of period (000 omitted) | | $ | 292,286 | | | $ | 222,852 | | | $ | 154,214 | | | $ | 112,178 | | | $ | 73,045 | | | $ | 112,009 | | | $ | 145,281 | | | $ | 123,262 | | | $ | 86,676 | | | $ | 148,130 | | |
| Ratio of expenses to average net assets (b) | | | 1.44 | % | | | 1.33 | % | | | 1.41 | % | | | 1.37 | % | | | 3.06 | % | | | 1.51 | % | | | 2.13 | % | | | 2.14 | % | | | 2.41 | % | | | 1.89 | % | |
Ratio of expenses to average net assets, excluding
fee waivers | | | 1.45 | % | | | 1.33 | % | | | 1.41 | % | | | 1.37 | % | | | 3.06 | % | | | 1.51 | % | | | 2.19 | % | | | 2.22 | % | | | 2.60 | % | | | 2.02 | % | |
Ratio of expenses to average net assets,
excluding taxes | | | 1.19 | % | | | 1.26 | % | | | 1.40 | % | | | 1.49 | % | | | 1.52 | % | | | 1.40 | % | | | 2.03 | % | | | 2.05 | % | | | 1.77 | % | | | 1.65 | % | |
Ratio of net investment income/(loss) to average
net assets | | | 1.49 | % | | | 2.13 | % | | | 2.36 | % | | | 2.49 | %(c) | | | 0.21 | % | | | 2.52 | % | | | (0.55 | )% | | | 0.46 | % | | | 1.12 | % | | | 0.77 | % | |
| Portfolio turnover rate | | | 46.05 | % | | | 75.60 | % | | | 69.80 | % | | | 62.62 | % | | | 75.28 | % | | | 101.73 | % | | | 125.83 | % | | | 161.71 | % | | | 142.35 | % | | | 111.83 | % | |
15
THE LATIN AMERICA EQUITY FUND, INC.
NOTES TO FINANCIAL STATEMENTS
June 30, 2007 (unaudited)
Note A. Organization
The Latin America Equity Fund, Inc. (the "Fund") is registered under the Investment Company Act of 1940, as amended, as a closed-end, non-diversified management investment company.
Note B. Significant Accounting Policies
Use of Estimates: The preparation of financial statements in conformity with accounting principles generally accepted in the United States of America ("GAAP") requires management to make estimates and assumptions that affect the reported amounts of assets and liabilities and disclosure of contingent assets and liabilities at the date of the financial statements and the reported amounts of revenues and expenses during the reporting period. Actual results could differ from those estimates.
Security Valuation: The net asset value of the Fund is determined daily as of the close of regular trading on the New York Stock Exchange, Inc. (the "Exchange") on each day the Exchange is open for business. The Fund's equity investments are valued at market value, which is generally determined using the closing price on the exchange or market on which the security is primarily traded at the time of valuation (the "Valuation Time"). If no sales are reported, equity investments are generally valued at the most recent bid quotation as of the Valuation Time or at the lowest ask quotation in the case of a short sale of securities. Debt securities with a remaining maturity greater than 60 days are valued in accordance with the price supplied by a pricing service, which may use a matrix, formula or other objective method that takes into consideration market indic es, yield curves and other specific adjustments. Debt obligations that will mature in 60 days or less are valued on the basis of amortized cost, which approximates market value, unless it is determined that this method would not represent fair value. Investments in mutual funds are valued at the mutual fund's closing net asset value per share on the day of valuation.
Securities and other assets for which market quotations are not readily available, or whose values have been materially affected by events occurring before the Fund's Valuation Time, but after the close of the securities' primary market, are valued at fair value as determined in good faith by, or under the direction of, the Board of Directors under procedures established by the Board of Directors. The Fund may utilize a service provided by an independent third party which has been approved by the Board of Directors to fair value certain securities. When fair-value pricing is employed, the prices of securities used by a fund to calculate its net asset value may differ from quoted or published prices for the same securities. At June 30, 2007, the Fund held 0.49% of its net assets in securities valued at fair value as determined in good faith under procedures established by the Board of Directors with an aggregate cost of $2,433,711 and fair va lue of $1,829,044. The Fund's estimate of fair value assumes a willing buyer and a willing seller neither acting under the compulsion to buy or sell. Although these securities may be resold in privately negotiated transactions, the prices realized on such sales could differ from the prices originally paid by the Fund or the current carrying values, and the difference could be material.
Short-Term Investment: The Fund sweeps available cash into a short-term time deposit available through Brown Brothers Harriman & Co., the Fund's custodian. The short-term time deposit is a variable rate account classified as a short-term investment.
Investment Transactions and Investment Income: Investment transactions are accounted for on a trade date basis. The cost of investments sold is determined by use of the specific identification method for both financial reporting and U.S. income tax purposes. Interest income is accrued as earned; dividend income is recorded on the ex-dividend date.
16
THE LATIN AMERICA EQUITY FUND, INC.
NOTES TO FINANCIAL STATEMENTS (CONTINUED)
June 30, 2007 (unaudited)
Taxes: No provision is made for U.S. income or excise taxes as it is the Fund's intention to continue to qualify as a regulated investment company and to make the requisite distributions to its shareholders sufficient to relieve it from all or substantially all U.S. income and excise taxes.
Income received by the Fund from sources within Latin America may be subject to withholding and other taxes imposed by such countries. Also, certain Latin American countries impose taxes on funds remitted or repatriated from such countries.
Brazil imposes a Contribução Provisoria sobre Movimentaçãoes Financieras ("CPMF") tax that applies to foreign exchange transactions related to dividends carried out by financial institutions. The tax rate is 0.38%. For the six months ended June 30, 2007, the Fund incurred $78,197 of such expense.
For Chilean securities the Fund accrues foreign taxes on realized gains and repatriation taxes in an amount equal to what the Fund would owe if the securities were sold and the proceeds repatriated on the valuation date as a liability and reduction of realized/unrealized gains. Taxes on foreign income are recorded when the related income is recorded. For the six months ended June 30, 2007, the Fund accrued $19,749.
Foreign Currency Translations: The books and records of the Fund are maintained in U.S. dollars. Foreign currency amounts are translated into U.S. dollars on the following basis:
(I) market value of investment securities, assets and liabilities at the valuation date rate of exchange; and
(II) purchases and sales of investment securities, income and expenses at the relevant rates of exchange prevailing on the respective dates of such transactions.
The Fund does not isolate that portion of gains and losses on investments in equity securities which is due to changes in the foreign exchange rates from that which is due to changes in market prices of equity securities. Accordingly, realized and unrealized foreign currency gains and losses with respect to such securities are included in the reported net realized and unrealized gains and losses on investment transactions balances.
The Fund reports certain foreign currency related transactions and foreign taxes withheld on security transactions as components of realized gains for financial reporting purposes, whereas such foreign currency related transactions are treated as ordinary income for U.S. federal income tax purposes.
Net unrealized currency gains or losses from valuing foreign currency denominated assets and liabilities at period end exchange rates are reflected as a component of net unrealized appreciation/depreciation in value of investments, and translation of other assets and liabilities denominated in foreign currencies.
Net realized foreign exchange gains or losses represent foreign exchange gains and losses from transactions in foreign currencies and forward foreign currency contracts, exchange gains or losses realized between the trade date and settlement date on security transactions, and the difference between the amounts of interest and dividends recorded on the Fund's books and the U.S. dollar equivalent of the amounts actually received.
Distributions of Income and Gains: The Fund distributes at least annually to shareholders substantially all of its net investment income and net realized short-term capital gains, if any. The Fund determines annually whether to distribute any net realized long-term capital gains in excess of net realized short-term capital losses, including capital loss carryovers, if any. An additional distribution may be made to the extent necessary to avoid the payment
17
THE LATIN AMERICA EQUITY FUND, INC.
NOTES TO FINANCIAL STATEMENTS (CONTINUED)
June 30, 2007 (unaudited)
of a 4% U.S. federal excise tax. Dividends and distributions to shareholders are recorded by the Fund on the ex-dividend date.
The character of distributions made during the year from net investment income or net realized gains may differ from their ultimate characterization for U.S. income tax purposes due to U.S. generally accepted accounting principles/tax differences in the character of income and expense recognition.
Partnership Accounting Policy: The Fund records its pro-rata share of the income/(loss) and capital gains/(losses) allocated from the underlying partnerships and adjusts the cost of the underlying partnerships accordingly. These amounts are included in the Fund's Statement of Operations.
Other: The Fund invests in securities of foreign countries and governments which involve certain risks in addition to those inherent in domestic investments. Such risks generally include, among others, currency risk (fluctuations in currency exchange risk), information risk (key information may be inaccurate or unavailable) and political risk (expropriation, nationalization or the imposition of capital or currency controls or punitive taxes). Other risks in investing in foreign securities include liquidity and valuation risks.
Some countries require governmental approval for the repatriation of investment income, capital or the proceeds of sales of securities by foreign investors. In addition, if there is a deterioration in a country's balance of payments or for other reasons, a country may impose temporary restrictions on foreign capital remittances abroad. Amounts repatriated prior to the end of specified periods may be subject to taxes as imposed by a foreign country.
The Latin American securities markets are substantially smaller, less liquid and more volatile than the major securities markets in the United States. A high proportion of the securities of many companies in Latin American countries may be held by a limited number of persons, which may limit the number of securities available for the investment by the Fund. The limited liquidity of Latin American country securities markets may also affect the Fund's ability to acquire or dispose of securities at the price and time it wishes to do so.
The Fund, subject to local investment limitations, may invest up to 10% of its assets (at the time of commitment) in illiquid equity securities, including securities of private equity funds (whether in corporate or partnership form) that invest primarily in emerging markets. When investing through another investment fund, the Fund will bear its proportionate share of the expenses incurred by the fund, including management fees. Such securities are expected to be illiquid which may involve a high degree of business and financial risk and may result in substantial losses. Because of the current absence of any liquid trading market for these investments, the Fund may take longer to liquidate these positions than would be the case for publicly traded securities. Although these securities may be resold in privately negotiated transactions, the prices realized on such sales could be substantially less than those originally paid by the Fund or the current carrying values and these differences could be material. Further, companies whose securities are not publicly traded may not be subject to the disclosure and other investor protection requirements applicable to companies whose securities are publicly traded.
Note C. Agreements
Credit Suisse Asset Management, LLC ("Credit Suisse") serves as the Fund's investment adviser with respect to all investments. Credit Suisse receives as compensation for its advisory services from the Fund, an annual fee, calculated weekly and paid quarterly, equal to 1.00% of the first $100 million of the Fund's average weekly market value or net assets (whichever is lower), 0.90%
18
THE LATIN AMERICA EQUITY FUND, INC.
NOTES TO FINANCIAL STATEMENTS (CONTINUED)
June 30, 2007 (unaudited)
of the next $50 million and 0.80% of amounts over $150 million. For the six months ended June 30, 2007, Credit Suisse earned $1,281,693 for advisory services, of which Credit Suisse waived $3,966. Credit Suisse also provides certain administrative services to the Fund and is reimbursed by the Fund for costs incurred on behalf of the Fund (up to $20,000 per annum). For the six months ended June 30, 2007, Credit Suisse was reimbursed $9,878 for administrative services rendered to the Fund.
CELFIN CAPITAL Servicios Financieros S.A. ("Celfin") serves as the Fund's sub-adviser with respect to Chilean investments. As compensation for its services, Celfin is paid a fee, out of the advisory fees payable to Credit Suisse, calculated weekly and paid quarterly at an annual rate of 0.10% of the Fund's average weekly market value or net assets (whichever is lower). For the year ended December 31, 2006, these sub-advisory fees amounted to $144,715.
For the six months ended June 30, 2007, Celfin earned approximately $3,000 in brokerage commissions from portfolio transactions executed on behalf of the Fund.
Bear Stearns Funds Management Inc. ("BSFM") serves as the Fund's U.S. administrator. The Fund pays BSFM a monthly fee that is calculated weekly based on the Fund's average weekly net assets. For the six months ended June 30, 2007, BSFM earned $83,539 for administrative services.
Celfin Capital S.A. Administradora de Fondos de Capital Extranjero ("AFCE") serves as the Fund's Chilean administrator. For its services, AFCE is paid an annual fee by the Fund equal to the greater of 2,000 Unidad de Fomentos ("U.F.s") (approximately $71,000 at June 30, 2007) or 0.10% of the Fund's average weekly market value or net assets invested in Chile (whichever is lower) and an annual reimbursement of out-of-pocket expenses not to exceed 500 U.F.s. In addition, an accounting fee is also paid to AFCE. For the six months ended June 30, 2007, the administration fees and accounting fees amounted to $42,151 and $3,372 respectively.
Merrill Corporation ("Merrill"), an affiliate of Credit Suisse, has been engaged by the Fund to provide certain financial printing services. For the six months ended June 30, 2007, Merrill was paid $16,854 for its services to the Fund.
The Independent Directors receive fifty percent (50%) of their annual retainer in the form of shares purchased by the Fund's transfer agent in the open market. Directors as a group own less than 1% of the Fund's outstanding shares.
Note D. Capital Stock
The authorized capital stock of the Fund is 100,000,000 shares of common stock, $0.001 par value. Of the 6,322,240 shares outstanding at June 30, 2007, Credit Suisse owned 13,746 shares.
Note E. Investment In Securities
For the six months ended June 30, 2007, purchases and sales of securities, other than short-term investments, were $45,394,810 and $45,014,246, respectively.
Note F. Credit Facility
The Fund, together with other funds/portfolios advised by Credit Suisse (collectively, the "Participating Funds"), participates in a $50 million committed, unsecured, line of credit facility ("Credit Facility") with Deutsche Bank, A.G. as administrative agent and syndication agent and State Street Bank and Trust Company as operations agent for temporary or emergency purposes. Under the terms of the Credit Facility, the Participating Funds pay an aggregate commitment fee at a rate of 0.10% per annum on the average unused amount of the Credit Facility, which is allocated among the Participating Funds in such manner as is determined by the governing Boards of the Participating Funds. In addition, the Participating Funds pay interest on borrowings at the
19
THE LATIN AMERICA EQUITY FUND, INC.
NOTES TO FINANCIAL STATEMENTS (CONTINUED)
June 30, 2007 (unaudited)
Federal Funds rate plus 0.50%. During the six months ended June 30, 2007, the Fund had no borrowings under the Credit Facility.
Note G. Federal Income Taxes
Income and capital gain distributions are determined in accordance with federal income tax regulations, which may differ from GAAP. These differences are primarily due to differing treatments of foreign currency transactions, losses deferred due to wash sales, and excise tax regulations.
At June 30, 2007, the identified cost for federal income tax purposes, as well as the gross unrealized appreciation from investments for those securities having an excess of value over cost, gross unrealized depreciation from investments for those securities having an excess of cost over value and the net unrealized appreciation from investments were $187,934,751, $192,369,890, $(678,868) and $191,691,022, respectively.
Note H. Restricted Securities
Certain of the Fund's investments are restricted as to resale and are valued at fair value as determined in good faith by, or under the direction of, the Board of Directors under procedures established by the Board of Directors in the absence of readily ascertainable market values.
| Security | | Number
of
Units/Shares | | Acquisition
Date(s) | | Cost | | Fair
Value at
06/30/07 | | Value Per
Unit/Share | | Percent
of Net
Assets | | Distributions
Received | | Open
Commitments | |
Emerging Markets
Ventures I L.P. | | | 2,237,292 | | | 01/22/98-01/10/06 | | $ | 1,251,940 | | | $ | 818,312 | | | | 0.37 | | | | 0.22 | | | $ | 1,796,362 | | | $ | 262,708 | | |
J.P. Morgan Latin
America Capital
Partners
(Cayman), L.P. | | | 948,642 | | | 04/10/00-12/21/06 | | | 489,574 | | | | 244,930 | | | | 0.26 | | | | 0.07 | | | | 1,369,272 | | | | — | | |
J.P. Morgan Latin
America Capital
Partners
(Delaware), L.P. | | | 1,489,801 | | | 04/10/00-12/21/06 | | | 692,197 | | | | 765,802 | | | | 0.51 | | | | 0.20 | | | | 1,305,115 | | | | 691,463 | | |
| Total | | | | | | | | $ | 2,433,711 | | | $ | 1,829,044 | | | | | | | | 0.49 | | | $ | 4,470,749 | | | $ | 954,171 | | |
The Fund may incur certain costs in connection with the disposition of the above securities.
Note I. Contingencies
In the normal course of business, the Fund may provide general indemnifications pursuant to certain contracts and organizational documents. The Fund's maximum exposure under these arrangements is dependent on future claims that may be made against the Fund and, therefore, cannot be estimated: however, based on experience, the risk of loss from such claims is considered remote.
20
THE LATIN AMERICA EQUITY FUND, INC.
NOTES TO FINANCIAL STATEMENTS (CONTINUED)
June 30, 2007 (unaudited)
Note J. Recent Accounting Pronouncements
In July 2006, the Financial Accounting Standards Board ("FASB") released FASB Interpretation No. 48, Accounting for Uncertainty in Income Taxes ("FIN 48"), an interpretation of FASB Statement No. 109. FIN 48 provides guidance for how uncertain tax positions should be recognized, measured, presented and disclosed in the financial statements. FIN 48 requires the accounting and disclosure of tax positions taken or expected to be taken in the course of preparing the Fund's tax returns to determine whether the tax positions are "more likely than not" of being sustained by the applicable tax authority. Tax positions not deemed to meet the more likely than not threshold would be recorded as a tax benefit or expense in the current year. Adoption of FIN 48 is effective during the first required financial reporting period for fiscal years beginning after December 15, 2006. Management adopted FIN 48 on June 29, 2007. There was no material impact to the financial statements or disclosures thereto as a result of the adoption of this pronouncement.
On September 20, 2006, the FASB released Statement of Financial Accounting Standards No. 157 "Fair Value Measurements" ("FAS 157"). FAS 157 establishes an authoritative definition of fair value, sets out a framework for measuring fair value, and requires additional disclosures about fair-value measurements. The application of FAS 157 is required for fiscal years, beginning after November 15, 2007 and interim periods within those fiscal years. At this time, management is evaluating the implication of FAS 157 and its impact on the financial statements has not yet been determined.
21
RESULTS OF ANNUAL MEETING OF SHAREHOLDERS (UNAUDITED)
On April 26, 2007, the Annual Meeting of Shareholders of the Fund (the "Meeting") was held and the following matter was voted upon:
(1) To re-elect two directors (Mr. Torino and Mr. Haber) to the Board of Directors of the Fund:
| Name of Director | | For | | Withheld | |
| Lawrence D. Haber (Class I) | | | 3,384,265 | | | | 1,642,232 | | |
| Martin M. Torino (Class I) | | | 3,394,001 | | | | 1,632,496 | | |
In addition to the directors elected at the Meeting, James J. Cattano, Lawrence J. Fox, Steven N. Rappaport and Enrique R. Arzac continue to serve as directors of the Fund.
22
IMPORTANT PRIVACY CHOICES FOR CONSUMERS (UNAUDITED)
We are committed to maintaining the privacy of every current and prospective customer. We recognize that you entrust important personal information to us, and we wish to assure you that we take seriously our responsibilities in protecting and safeguarding this information.
In connection with making available investment products and services to current and potential customers, we may obtain nonpublic personal information about you. This information may include your name, address, e-mail address, social security number, account number, assets, income, financial situation, transaction history and other personal information.
We may collect nonpublic information about you from the following sources:
• Information we receive on applications, forms, questionnaires, web sites, agreements or in the course of establishing or maintaining a customer relationship; and
• Information about your transactions with us, our affiliates, or others.
We do not disclose any nonpublic personal information about our customers or former customers to anyone, except with your consent or as otherwise permitted by law.
In cases where we believe that additional products and services may be of interest to you, we may share the information described above with our affiliates.
We may also disclose this information to firms that perform services on our behalf. These agents and service providers are required to treat the information confidentially and use it only for the purpose for which it is provided.
We restrict access to nonpublic personal information about you to those employees, agents or other parties who need to know that information to provide products or services to you or in connection with your investments with or through us. We maintain physical, electronic and procedural safeguards that comply with federal standards to guard your nonpublic personal information.
Note: This notice is provided to clients and prospective clients of Credit Suisse Asset Management, LLC ("Credit Suisse"), and Credit Suisse Asset Management Securities, Inc., and shareholders and prospective shareholders in Credit Suisse sponsored and advised investment companies, including Credit Suisse Funds, and other consumers and customers, as applicable. This notice is not intended to be incorporated in any offering materials but is merely a statement of our current Privacy Policy, and may be amended from time to time upon notice to you. This notice is dated as of May 17, 2007.
23
PROXY VOTING AND PORTFOLIO HOLDINGS INFORMATION (UNAUDITED)
Information regarding how the Fund voted proxies related to its portfolio securities during the 12-month period ended June 30, of each year, as well as the policies and procedures that the Fund uses to determine how to vote proxies relating to its portfolio securities are available:
• By calling 1-800-293-1232;
• On the Fund's website, www.credit-suisse.com/us
• On the website of the Securities and Exchange Commission, www.sec.gov.
The Fund files a complete schedule of its portfolio holdings for the first and third quarters of its fiscal year with the SEC on Form N-Q. The Fund's Forms N-Q are available on the SEC's website at www.sec.gov and may be reviewed and copied at the SEC's Public Reference Room in Washington, DC. Information on the operation of the SEC's Public Reference Room may be obtained by calling 1-202-551-8090.
Notice is hereby given in accordance with Section 23(c) of the Investment Company Act of 1940, as amended, that The Latin America Equity Fund, Inc. may from time to time purchase shares of its capital stock in the open market.
24
OTHER FUNDS MANAGED BY CREDIT SUISSE ASSET MANAGEMENT, LLC
CLOSED-END FUNDS
Single Country
The Chile Fund, Inc. (AMEX: CH)
The First Israel Fund, Inc. (AMEX: ISL)
The Indonesia Fund, Inc. (AMEX: IF)
Multiple Country
The Emerging Markets Telecommunications Fund, Inc. (AMEX: ETF)
The Latin America Equity Fund, Inc. (AMEX: LAQ)
Fixed Income
Credit Suisse Asset Management Income Fund, Inc. (AMEX: CIK)
Credit Suisse High Yield Bond Fund (AMEX: DHY)
Literature Request—Call today for free descriptive information on the closed-end funds listed above at 1-800-293-1232 or visit our website on the Internet: www.credit-suisse.com/us.
OPEN-END FUNDS
Credit Suisse Absolute Return Fund
Credit Suisse Cash Reserve Fund
Credit Suisse Commodity Return Strategy Fund
Credit Suisse Emerging Markets Fund
Credit Suisse Global Fixed Income Fund
Credit Suisse Global Small Cap Fund
Credit Suisse High Income Fund
Credit Suisse International Focus Fund
Credit Suisse Japan Equity Fund
Credit Suisse Large Cap Blend Fund
Credit Suisse Large Cap Growth Fund
Credit Suisse Large Cap Value Fund
Credit Suisse Mid-Cap Core Fund
Credit Suisse Short Duration Bond Fund
Credit Suisse Small Cap Core Fund
Fund shares are not deposits or other obligations of Credit Suisse Asset Management, LLC or any affiliate, are not FDIC-insured and are not guaranteed by Credit Suisse Asset Management, LLC or any affiliate. Fund investments are subject to investment risks, including loss of your investment. There are special risk considerations associated with international, global, emerging-market, small-company, private equity, high-yield debt, single-industry, single-country and other special, aggressive or concentrated investment strategies. Past performance cannot guarantee future results.
More complete information about a fund, including charges and expenses, is provided in the Prospectus, which should be read carefully before investing. You may obtain copies by calling Credit Suisse Funds at 800-927-2874. Performance information current to the most recent month-end is available at www.credit-suisse.com/us.
Credit Suisse Asset Management Securities, Inc., Distributor.
25
DIRECTORS AND CORPORATE OFFICERS
| Enrique R. Arzac | | Chairman of the Board of
Directors | |
|
| James J. Cattano | | Director | |
|
| Lawrence J. Fox | | Director | |
|
| Lawrence D. Haber | | Director | |
|
| Steven N. Rappaport | | Director | |
|
| Martin M. Torino | | Director | |
|
| Keith M. Schappert | | Chief Executive
Officer and President | |
|
| Matthew J.K. Hickman | | Chief Investment Officer | |
|
J. Kevin Gao
| | Chief Legal Officer,
Senior Vice President and
Secretary | |
|
| Emidio Morizio | | Chief Compliance Officer | |
|
| Michael A. Pignataro | | Chief Financial Officer | |
|
| Robert Rizza | | Treasurer | |
|
INVESTMENT ADVISER
Credit Suisse Asset Management, LLC
Eleven Madison Avenue
New York, NY 10010
INVESTMENT SUB-ADVISER
Celfin Capital Servicios Financieros S.A.
Apoquindo 3721, Piso 19
Santiago, Chile
ADMINISTRATOR
Bear Stearns Funds Management Inc.
383 Madison Avenue
New York, NY 10179
CUSTODIAN
Brown Brothers Harriman & Co.
40 Water Street
Boston, MA 02109
SHAREHOLDER SERVICING AGENT
Computershare Trust Company, N.A.
P.O. Box 43010
Providence, RI 02940
INDEPENDENT REGISTERED PUBLIC
ACCOUNTING FIRM
PricewaterhouseCoopers LLP
100 East Pratt Street
Baltimore, MD 21202
LEGAL COUNSEL
Willkie Farr & Gallagher LLP
787 Seventh Avenue
New York, NY 10019
This report, including the financial statements herein, is sent to the shareholders of the Fund for their information. The financial information included herein is taken from the records of the Fund without examination by independent registered public accountants who do not express an opinion thereon. It is not a prospectus, circular or representation intended for use in the purchase or sale of shares of the Fund or of any securities mentioned in this report.

LAQ-SAR-0607
Item 2. Code of Ethics.
This item is inapplicable to a semi-annual report on Form N-CSR.
Item 3. Audit Committee Financial Expert.
This item is inapplicable to a semi-annual report on Form N-CSR.
Item 4. Principal Accountant Fees and Services.
This item is inapplicable to a semi-annual report on Form N-CSR.
Item 5. Audit Committee of Listed Registrants.
This item is inapplicable to a semi-annual report on Form N-CSR.
Item 6. Schedule of Investments.
Included as part of the report to shareholders filed under Item 1 of this Form.
Item 7. Disclosure of Proxy Voting Policies and Procedures for Closed-End Management Investment Companies.
This item is inapplicable to a semi-annual report on Form N-CSR.
Item 8. Portfolio Managers of Closed-End Management Investment Companies.
This item is inapplicable to a semi-annual report on Form N-CSR.
Item 9. Purchases of Equity Securities by Closed-End Management Investment Company and Affiliated Purchasers.
None.
Item 10. Submission of Matters to a Vote of Security Holders.
There have been no material changes to the procedures by which shareholders may recommend nominees to the registrant’s board of directors since the registrant last provided disclosure in response to the requirements of Item 7(d)(2)(ii)(g) of Schedule 14A in its definitive proxy statement dated March 2, 2007.
Item 11. Controls and Procedures.
(a) As of a date within 90 days from the filing date of this report, the principal executive officer and principal financial officer concluded that the registrant’s disclosure controls and procedures (as defined in Rule 30a-3(c) under the Investment Company Act of 1940 (the “Act”)) were effective based on their evaluation of the disclosure controls and procedures required by Rule 30a-3(b) under the Act and Rules 13a-15(b) or 15d-15(b) under the Securities Exchange Act of 1934.
(b) There were no changes in registrant’s internal control over financial reporting (as defined in Rule 30a-3(d) under the Act) that occurred during the registrant’s last fiscal half-year that have materially affected, or are reasonably likely to materially affect, the registrant’s internal control over financial reporting.
Item 12. Exhibits.
(a)(1) | | Not applicable. |
| | |
(a)(2) | | The certifications of the registrant as required by Rule 30a-2(a) under the Act are exhibits to this report. |
| | |
(a)(3) | | Not applicable. |
| | |
(b) | | The certifications of the registrant as required by Rule 30a-2(b) under the Act are an exhibit to this report. |
SIGNATURES
Pursuant to the requirements of the Securities Exchange Act of 1934 and the Investment Company Act of 1940, the registrant has duly caused this report to be signed on its behalf by the undersigned, thereunto duly authorized.
THE LATIN AMERICA EQUITY FUND, INC.
| | /s/Keith M. Schappert | |
| | Name: | Keith M. Schappert |
| | Title: | Chief Executive Officer |
| | Date: | September 4, 2007 |
| | | | |
Pursuant to the requirements of the Securities Exchange Act of 1934 and the Investment Company Act of 1940, this report has been signed below by the following persons on behalf of the registrant and in the capacities and on the dates indicated.
| | /s/Keith M. Schappert | |
| | Name: | Keith M. Schappert |
| | Title: | Chief Executive Officer |
| | Date: | September 4, 2007 |
| | | | |
| | /s/Michael A. Pignataro | |
| | Name: | Michael A. Pignataro |
| | Title: | Chief Financial Officer |
| | Date: | September 4, 2007 |
| | | | |