Table of Contents
UNITED STATES
SECURITIES AND EXCHANGE COMMISSION
Washington, D.C. 20549
FORM N-CSR
CERTIFIED SHAREHOLDER REPORT OF
REGISTERED MANAGEMENT INVESTMENT COMPANIES
Investment Company Act file number 811-06102
MFS SERIES TRUST VI
(Exact name of registrant as specified in charter)
111 Huntington Avenue, Boston, Massachusetts 02199
(Address of principal executive offices) (Zip code)
Christopher R. Bohane
Massachusetts Financial Services Company
111 Huntington Avenue
Boston, Massachusetts 02199
(Name and address of agents for service)
Registrant’s telephone number, including area code: (617) 954-5000
Date of fiscal year end: October 31
Date of reporting period: October 31, 2017
Table of Contents
| ITEM 1. | REPORTS TO STOCKHOLDERS. |
Table of Contents
ANNUAL REPORT
October 31, 2017

MFS® GLOBAL EQUITY FUND

LGE-ANN
Table of Contents
MFS® GLOBAL EQUITY FUND
The report is prepared for the general information of shareholders.
It is authorized for distribution to prospective investors only when preceded or accompanied by a current prospectus.
NOT FDIC INSURED • MAY LOSE VALUE • NO BANK GUARANTEE
Table of Contents

LETTER FROM THE EXECUTIVE CHAIRMAN
Dear Shareholders:
Despite policy uncertainty accompanying a new presidential administration in the United States and unease over ongoing Brexit negotiations, most markets have proved
resilient. U.S. share prices have reached new highs in recent months although the U.S. Federal Reserve has continued to gradually hike interest rates and has begun to shrink its balance sheet. However, rates in most developed markets remain very low, with major central banks outside of the U.S. just now beginning to contemplate curbing accommodative monetary policies.
Globally, we’ve experienced a year-long synchronized upturn in economic growth. Despite better growth, there are few immediate signs of worrisome inflation amid muted wage gains around the world. Emerging market economies have been boosted in part by
a weaker U.S. dollar and are recovering despite lingering concerns over the potential for restrictive U.S. trade policies. Commodity markets have recovered somewhat in response to solid global demand and robust global trade, though not enough to rekindle inflation fears.
At MFS®, we believe having a disciplined, long-term investment approach through a full market cycle is essential to capturing the best opportunities while also managing risk. In our view, such a strategy, along with the professional guidance of a financial advisor, will help you reach your investment objectives.
Respectfully,

Robert J. Manning
Executive Chairman
MFS Investment Management
December 15, 2017
The opinions expressed in this letter are subject to change and may not be relied upon for investment advice. No forecasts can be guaranteed.
1
Table of Contents
Portfolio structure
| Top ten holdings | ||||
| Thermo Fisher Scientific, Inc. | 3.0% | |||
| Bayer AG | 2.9% | |||
| Honeywell International, Inc. | 2.5% | |||
| Nestle S.A. | 2.5% | |||
| Accenture PLC, “A” | 2.4% | |||
| Visa, Inc., “A” | 2.4% | |||
| Medtronic PLC | 2.4% | |||
| LVMH Moet Hennessy Louis Vuitton SE | 2.1% | |||
| Stryker Corp. | 2.1% | |||
| Diageo PLC | 2.1% | |||
| Equity sectors | ||||
| Health Care | 18.6% | |||
| Consumer Staples | 18.1% | |||
| Financial Services | 13.0% | |||
| Leisure | 8.8% | |||
| Industrial Goods & Services | 8.2% | |||
| Basic Materials | 7.1% | |||
| Technology | 6.3% | |||
| Special Products & Services | 6.1% | |||
| Transportation | 5.7% | |||
| Retailing | 5.2% | |||
| Autos & Housing | 1.1% | |||
| Energy | 1.0% | |||
| Issuer country weightings (x) | ||||
| United States | 54.3% | |||
| France | 9.0% | |||
| United Kingdom | 8.6% | |||
| Switzerland | 8.4% | |||
| Germany | 6.7% | |||
| Netherlands | 2.4% | |||
| Sweden | 2.1% | |||
| Canada | 1.6% | |||
| Japan | 1.4% | |||
| Other Countries | 5.5% | |||
| Currency exposure weightings (y) | ||||
| United States Dollar | 56.9% | |||
| Euro | 19.5% | |||
| British Pound Sterling | 8.6% | |||
| Swiss Franc | 8.4% | |||
| Swedish Krona | 2.1% | |||
| Japanese Yen | 1.4% | |||
| South Korean Won | 1.0% | |||
| Danish Krone | 0.8% | |||
| Brazilian Real | 0.6% | |||
| Other Currencies | 0.7% | |||
2
Table of Contents
Portfolio Composition – continued
| (x) | Represents the portfolio’s exposure to issuer countries as a percentage of a portfolio’s net assets. For purposes of this presentation, United States includes Cash & Cash Equivalents. |
| (y) | Represents the portfolio’s exposure to a particular currency as a percentage of a portfolio’s net assets. For purposes of this presentation, United States Dollar includes Cash & Cash Equivalents. |
Cash & Cash Equivalents includes any cash, investments in money market funds, short-term securities, and other assets less liabilities. Please see the Statement of Assets and Liabilities for additional information related to the fund’s cash position and other assets and liabilities.
Percentages are based on net assets as of October 31, 2017.
The portfolio is actively managed and current holdings may be different.
3
Table of Contents
Summary of Results
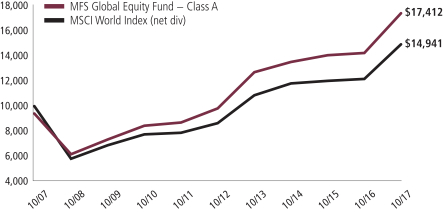
For the twelve months ended October 31, 2017, Class A shares of the MFS Global Equity Fund (“fund”) provided a total return of 22.28%, at net asset value. This compares with a return of 22.77% for the fund’s benchmark, the MSCI World Index (net div).
Market Environment
For the first time in many years, the global economy is experiencing a period of synchronized economic growth. The rebound in emerging markets (“EM”) economies has been more pronounced (despite the slight deceleration in Chinese growth at the end of the period), helped by larger economies, such as Brazil and Russia, emerging from recessions. At the same time, developed markets (“DM”) economies continued to grow at or above potential. Market confidence increased in the US after the presidential elections in November fueled, in part, by a more lenient US regulatory backdrop and hopes for a significant cut in corporate tax rates.
Globally, markets benefited from a reflation trade as commodity prices strengthened, activity and growth prospects improved, and inflation moved higher, though within moderate bounds. As a result, there have been more tightening signals and actions by DM central banks. The US Federal Reserve increased interest rates by 25 basis points during the second half of the period, bringing the total number of quarter-percent hikes in the federal funds rate to four, since December 2015. The European Central Bank announced an extension of its quantitative easing program at the end of the period, but reduced the pace of its monthly asset purchases by half. In addition, the Bank of England hiked its base rate for the first time in a decade, at period’s end. Markets have been comforted, along with central banks, by the decline in fears of a populist surge in Europe after establishment candidates won the Dutch and French elections, though a right-wing populist party gained seats in the German parliament for the first time in the post-World War II era. European growth has reflected a generally calmer political economic backdrop.
In recent months, the US dollar reversed the sharp rise seen early in the period, easing what had been a substantial headwind to earnings for multinationals. US consumer spending held up well during the second half of the period amid a modest increase in real wages and relatively low gasoline prices. However, demand for autos cooled from the record level logged early in the period, while the housing market contends with below-average inventory levels which have weighed on sales. Global trade, which was sluggish early in the period, showed signs of improvement in the period’s second half, a positive indicator of global economic activity and prospects. Early in the period, the US election resulted in a sell-off in EM assets due to fears that President Trump would follow through on various campaign threats and promises that were judged to be detrimental to EM. While President Trump withdrew the US from the Trans-Pacific Partnership and began the renegotiation of the North American Free Trade Agreement, significant additional policy action has so far been lacking on economic issues involving EM. As a result, EM resumed their upward trajectory, powered by strong inflows throughout 2017.
4
Table of Contents
Management Review – continued
Detractors from Performance
Weak stock selection in the leisure sector was a primary factor that detracted from performance relative to the MSCI World Index. Within this sector, an overweight position in advertising and marketing firm WPP Group (United Kingdom) held back relative results after the company reported disappointing organic net sales growth results and a cut in management’s outlook for 2017.
An underweight position in the technology sector further weighed on relative returns. Here, not holding strong-performing computer and personal electronics maker Apple hurt relative returns. Shares of Apple advanced during the reporting period on the back of well anticipated new product launches, including the iPhone 8, iPhone 8 Plus and iPhone X. Additionally, the company’s Services segment posted strong revenue growth, earlier in the reporting period, which also strengthened the stock.
An overweight allocation to the consumer staples sector hindered relative performance. Stock selection within this sector also had a negative impact on the fund’s relative returns. Overweight positions in beauty product manufacturer Coty, cereal and convenience foods manufacturer Kellogg and health, hygiene and home products manufacturer Reckitt Benckiser Group (United Kingdom) were among the fund’s top relative detractors over the reporting period.
Elsewhere, overweight positions in medical device maker Medtronic and automotive replacement parts distributor AutoZone detracted from relative performance. Additionally, the fund’s position in professional beauty supply retailer Sally Beauty Holdings (b) and apparel retailer Urban Outfitters (b) also weighed on relative results.
The fund’s cash and/or cash equivalents position during the period was another detractor from relative performance. Under normal market conditions, the fund strives to be fully invested and generally holds cash to buy new holdings and to provide liquidity. In a period when equity markets rose, as measured by the fund’s benchmark, holding cash hurt performance versus the benchmark, which has no cash position.
Contributors to Performance
During the reporting period, the fund’s avoidance of the poor-performing utilities & communications sector benefited relative results.
Security selection in the basic materials sector bolstered relative performance. Within this sector, overweighting pulp and paper manufacturer and consumer goods company Svenska Cellulosa (h) (Sweden) and diversified technology company 3M benefited relative performance. Shares of Svenska Cellulosa appreciated after the company reported strong earnings results during the period, notably in the Hygiene division. Higher selling prices and volumes further helped results.
Stock selection in the retailing sector aided relative returns. Within this sector, an overweight position in luxury goods company LVMH Moet Hennessy Louis Vuitton helped relative performance. Investors appeared to have reacted positively to the announcement by Bernard Arnault, Chairman and CEO of LVMH and a majority shareholder of Christian Dior, that LVMH would acquire Christian Dior Couture in order to simplify the structure between the two groups. Impressive results across all divisions, most notably in the Fashion & Leather segment, further supported the stock.
5
Table of Contents
Management Review – continued
Stock selection in the health care sector contributed to relative performance. Here, overweighting life sciences supply company Thermo Fisher Scientific, pharmaceutical company Bayer (Germany) and medical technology products and services company Stryker Corp. bolstered relative results.
Stocks in other sectors that supported relative returns included not holding shares of diversified industrial company General Electric Co. and the fund’s positions in electronics manufacturer Samsung Electronics (b) (South Korea) and aircraft engine manufacturer MTU Aero Engines (b) (Germany). An overweight position in financial services firm American Express further aided relative performance.
During the reporting period, the fund’s relative currency exposure, resulting primarily from differences between the fund’s and the benchmark’s exposures to holdings of securities denominated in foreign currencies, benefited relative performance. All of MFS’ investment decisions are driven by the fundamentals of each individual opportunity and, as such, it is common for our portfolios to have different currency exposure than the benchmark.
Respectfully,
Portfolio Manager(s)
David Mannheim, Ryan McAllister, and Roger Morley
| (b) | Security is not a benchmark constituent. |
| (h) | Security was not held in the portfolio at period end. |
The views expressed in this report are those of the portfolio manager(s) only through the end of the period of the report as stated on the cover and do not necessarily reflect the views of MFS or any other person in the MFS organization. These views are subject to change at any time based on market or other conditions, and MFS disclaims any responsibility to update such views. These views may not be relied upon as investment advice or an indication of trading intent on behalf of any MFS portfolio. References to specific securities are not recommendations of such securities, and may not be representative of any MFS portfolio’s current or future investments.
6
Table of Contents
PERFORMANCE SUMMARY THROUGH 10/31/17
The following chart illustrates a representative class of the fund’s historical performance in comparison to its benchmark(s). Performance results include the deduction of the maximum applicable sales charge and reflect the percentage change in net asset value, including reinvestment of dividends and capital gains distributions. The performance of other share classes will be greater than or less than that of the class depicted below. Benchmarks are unmanaged and may not be invested in directly. Benchmark returns do not reflect sales charges, commissions or expenses. (See Notes to Performance Summary.)
Performance data shown represents past performance and is no guarantee of future results. Investment return and principal value fluctuate so your shares, when sold, may be worth more or less than the original cost; current performance may be lower or higher than quoted. The performance shown does not reflect the deduction of taxes, if any, that a shareholder would pay on fund distributions or the redemption of fund shares.
Growth of a Hypothetical $10,000 Investment
7
Table of Contents
Performance Summary – continued
Total Returns through 10/31/17
Average annual without sales charge
| Share Class | Class Inception Date | 1-yr | 5-yr | 10-yr | Life (t) | |||||||||
| A | 9/07/93 | 22.28% | 12.10% | 6.33% | N/A | |||||||||
| B | 12/29/86 | 21.37% | 11.26% | 5.54% | N/A | |||||||||
| C | 1/03/94 | 21.36% | 11.25% | 5.53% | N/A | |||||||||
| I | 1/02/97 | 22.57% | 12.37% | 6.60% | N/A | |||||||||
| R1 | 4/01/05 | 21.37% | 11.25% | 5.54% | N/A | |||||||||
| R2 | 10/31/03 | 21.97% | 11.81% | 6.07% | N/A | |||||||||
| R3 | 4/01/05 | 22.29% | 12.09% | 6.33% | N/A | |||||||||
| R4 | 4/01/05 | 22.61% | 12.38% | 6.59% | N/A | |||||||||
| R6 | 6/01/12 | 22.71% | 12.46% | N/A | 13.80% | |||||||||
| Comparative benchmark(s) | ||||||||||||||
| MSCI World Index (net div) (f) | 22.77% | 11.56% | 4.10% | N/A | ||||||||||
| Average annual with sales charge | ||||||||||||||
| A With Initial Sales Charge (5.75%) | 15.25% | 10.78% | 5.70% | N/A | ||||||||||
| B With CDSC (Declining over six years from 4% to 0%) (v) | 17.37% | 11.00% | 5.54% | N/A | ||||||||||
| C With CDSC (1% for 12 months) (v) | 20.36% | 11.25% | 5.53% | N/A | ||||||||||
CDSC – Contingent Deferred Sales Charge.
Class I, R1, R2, R3, R4, and R6 shares do not have a sales charge.
| (f) | Source: FactSet Research Systems Inc. |
| (t) | For the period from the class inception date through the stated period end (for those share classes with less than 10 years of performance history). No comparative benchmark performance information is provided for “life” periods. (See Notes to Performance Summary.) |
| (v) | Assuming redemption at the end of the applicable period. |
Benchmark Definition(s)
MSCI World Index (net div) – a market capitalization-weighted index that is designed to measure equity market performance in the global developed markets.
It is not possible to invest directly in an index.
Notes to Performance Summary
Average annual total return represents the average annual change in value for each share class for the periods presented. Life returns are presented where the share class has less than 10 years of performance history and represent the average annual total return from the class inception date to the stated period end date. As the fund’s share classes may have different inception dates, the life returns may represent different time periods and may not be comparable. As a result, no comparative benchmark performance information is provided for life periods.
8
Table of Contents
Performance Summary – continued
Performance results reflect any applicable expense subsidies and waivers in effect during the periods shown. Without such subsidies and waivers the fund’s performance results would be less favorable. Please see the prospectus and financial statements for complete details.
Performance results do not include adjustments made for financial reporting purposes in accordance with U.S. generally accepted accounting principles and may differ from amounts reported in the financial highlights.
From time to time the fund may receive proceeds from litigation settlements, without which performance would be lower.
9
Table of Contents
Fund expenses borne by the shareholders during the period, May 1, 2017 through October 31, 2017
As a shareholder of the fund, you incur two types of costs: (1) transaction costs, including sales charges (loads) on certain purchase or redemption payments, and (2) ongoing costs, including management fees; distribution and service (12b-1) fees; and other fund expenses. This example is intended to help you understand your ongoing costs (in dollars) of investing in the fund and to compare these costs with the ongoing costs of investing in other mutual funds.
The example is based on an investment of $1,000 invested at the beginning of the period and held for the entire period May 1, 2017 through October 31, 2017.
Actual Expenses
The first line for each share class in the following table provides information about actual account values and actual expenses. You may use the information in this line, together with the amount you invested, to estimate the expenses that you paid over the period. Simply divide your account value by $1,000 (for example, an $8,600 account value divided by $1,000 = 8.6), then multiply the result by the number in the first line under the heading entitled “Expenses Paid During Period” to estimate the expenses you paid on your account during this period.
Hypothetical Example for Comparison Purposes
The second line for each share class in the following table provides information about hypothetical account values and hypothetical expenses based on the fund’s actual expense ratio and an assumed rate of return of 5% per year before expenses, which is not the fund’s actual return. The hypothetical account values and expenses may not be used to estimate the actual ending account balance or expenses you paid for the period. You may use this information to compare the ongoing costs of investing in the fund and other funds. To do so, compare this 5% hypothetical example with the 5% hypothetical examples that appear in the shareholder reports of the other funds.
Please note that the expenses shown in the table are meant to highlight your ongoing costs only and do not reflect any transactional costs, such as sales charges (loads). Therefore, the second line for each share class in the table is useful in comparing ongoing costs only, and will not help you determine the relative total costs of owning different funds. In addition, if these transactional costs were included, your costs would have been higher.
10
Table of Contents
Expense Table – continued
| Share Class | Annualized Ratio | Beginning Account Value 5/01/17 | Ending Account Value | Expenses Paid During | ||||||||
| A | Actual | 1.15% | $1,000.00 | $1,083.31 | $6.04 | |||||||
| Hypothetical (h) | 1.15% | $1,000.00 | $1,019.41 | $5.85 | ||||||||
| B | Actual | 1.90% | $1,000.00 | $1,079.27 | $9.96 | |||||||
| Hypothetical (h) | 1.90% | $1,000.00 | $1,015.63 | $9.65 | ||||||||
| C | Actual | 1.90% | $1,000.00 | $1,079.07 | $9.96 | |||||||
| Hypothetical (h) | 1.90% | $1,000.00 | $1,015.63 | $9.65 | ||||||||
| I | Actual | 0.91% | $1,000.00 | $1,084.43 | $4.78 | |||||||
| Hypothetical (h) | 0.91% | $1,000.00 | $1,020.62 | $4.63 | ||||||||
| R1 | Actual | 1.91% | $1,000.00 | $1,079.34 | $10.01 | |||||||
| Hypothetical (h) | 1.91% | $1,000.00 | $1,015.58 | $9.70 | ||||||||
| R2 | Actual | 1.41% | $1,000.00 | $1,081.86 | $7.40 | |||||||
| Hypothetical (h) | 1.41% | $1,000.00 | $1,018.10 | $7.17 | ||||||||
| R3 | Actual | 1.16% | $1,000.00 | $1,083.38 | $6.09 | |||||||
| Hypothetical (h) | 1.16% | $1,000.00 | $1,019.36 | $5.90 | ||||||||
| R4 | Actual | 0.91% | $1,000.00 | $1,084.81 | $4.78 | |||||||
| Hypothetical (h) | 0.91% | $1,000.00 | $1,020.62 | $4.63 | ||||||||
| R6 | Actual | 0.82% | $1,000.00 | $1,085.14 | $4.31 | |||||||
| Hypothetical (h) | 0.82% | $1,000.00 | $1,021.07 | $4.18 | ||||||||
| (h) | 5% class return per year before expenses. |
| (p) | “Expenses Paid During Period” are equal to each class’s annualized expense ratio, as shown above, multiplied by the average account value over the period, multiplied by 184/365 (to reflect the one-half year period). Expenses paid do not include any applicable sales charges (loads). If these transaction costs had been included, your costs would have been higher. |
11
Table of Contents
10/31/17
The Portfolio of Investments is a complete list of all securities owned by your fund. It is categorized by broad-based asset classes.
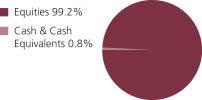
| Common Stocks - 99.2% | ||||||||
| Issuer | Shares/Par | Value ($) | ||||||
| Aerospace - 4.3% | ||||||||
| Honeywell International, Inc. | 577,306 | $ | 83,224,431 | |||||
| MTU Aero Engines AG | 145,402 | 24,516,527 | ||||||
| United Technologies Corp. | 283,658 | 33,970,882 | ||||||
|
| |||||||
| $ | 141,711,840 | |||||||
| Airlines - 1.0% | ||||||||
| Aena S.A. | 179,684 | $ | 32,965,523 | |||||
| Alcoholic Beverages - 6.4% | ||||||||
| AmBev S.A. | 2,870,678 | $ | 18,340,467 | |||||
| Carlsberg Group | 226,073 | 25,816,187 | ||||||
| Diageo PLC | 2,029,530 | 69,328,779 | ||||||
| Heineken N.V. | 321,765 | 31,356,434 | ||||||
| Pernod Ricard S.A. (l) | 448,790 | 67,307,027 | ||||||
|
| |||||||
| $ | 212,148,894 | |||||||
| Apparel Manufacturers - 3.9% | ||||||||
| Burberry Group PLC | 874,627 | $ | 22,094,313 | |||||
| Compagnie Financiere Richemont S.A. | 379,774 | 35,021,509 | ||||||
| LVMH Moet Hennessy Louis Vuitton SE | 239,580 | 71,471,046 | ||||||
|
| |||||||
| $ | 128,586,868 | |||||||
| Automotive - 1.1% | ||||||||
| Delphi Automotive PLC | 219,427 | $ | 21,806,655 | |||||
| Harley-Davidson, Inc. (l) | 294,610 | 13,946,837 | ||||||
|
| |||||||
| $ | 35,753,492 | |||||||
| Broadcasting - 3.9% | ||||||||
| Omnicom Group, Inc. | 244,424 | $ | 16,422,849 | |||||
| Walt Disney Co. | 602,795 | 58,959,379 | ||||||
| WPP Group PLC | 3,102,426 | 54,967,296 | ||||||
|
| |||||||
| $ | 130,349,524 | |||||||
| Brokerage & Asset Managers - 1.3% | ||||||||
| Deutsche Boerse AG | 158,698 | $ | 16,393,328 | |||||
| Franklin Resources, Inc. | 658,383 | 27,737,676 | ||||||
|
| |||||||
| $ | 44,131,004 | |||||||
| Business Services - 6.1% | ||||||||
| Accenture PLC, “A” | 567,519 | $ | 80,792,005 | |||||
| Adecco S.A. | 314,205 | 24,927,906 | ||||||
12
Table of Contents
Portfolio of Investments – continued
| Issuer | Shares/Par | Value ($) | ||||||
| Common Stocks - continued | ||||||||
| Business Services - continued | ||||||||
| Brenntag AG | 256,036 | $ | 14,499,109 | |||||
| Cognizant Technology Solutions Corp., “A” | 328,860 | 24,884,836 | ||||||
| Compass Group PLC | 1,662,006 | 36,488,209 | ||||||
| PayPal Holdings, Inc. (a) | 292,997 | 21,259,862 | ||||||
|
| |||||||
| $ | 202,851,927 | |||||||
| Cable TV - 2.2% | ||||||||
| Comcast Corp., “A” | 1,511,618 | $ | 54,463,597 | |||||
| Sky PLC | 1,427,832 | 17,882,816 | ||||||
|
| |||||||
| $ | 72,346,413 | |||||||
| Chemicals - 2.9% | ||||||||
| 3M Co. | 264,660 | $ | 60,922,085 | |||||
| Monsanto Co. | 295,109 | 35,737,700 | ||||||
|
| |||||||
| $ | 96,659,785 | |||||||
| Computer Software - 2.6% | ||||||||
| Check Point Software Technologies Ltd. (a) | 280,255 | $ | 32,988,816 | |||||
| Oracle Corp. | 1,056,994 | 53,800,995 | ||||||
|
| |||||||
| $ | 86,789,811 | |||||||
| Consumer Products - 6.5% | ||||||||
| Colgate-Palmolive Co. | 511,723 | $ | 36,050,885 | |||||
| Coty, Inc., “A” | 2,776,762 | 42,762,135 | ||||||
| Essity AB (a) | 2,302,281 | 68,834,810 | ||||||
| Reckitt Benckiser Group PLC | 759,303 | 67,920,336 | ||||||
|
| |||||||
| $ | 215,568,166 | |||||||
| Electrical Equipment - 3.2% | ||||||||
| Amphenol Corp. | 229,871 | $ | 19,998,777 | |||||
| Legrand S.A. | 390,194 | 28,984,580 | ||||||
| Schneider Electric S.A. | 498,477 | 43,810,113 | ||||||
| W.W. Grainger, Inc. | 62,701 | 12,395,988 | ||||||
|
| |||||||
| $ | 105,189,458 | |||||||
| Electronics - 2.1% | ||||||||
| Hoya Corp. | 365,500 | $ | 19,754,873 | |||||
| Microchip Technology, Inc. | 173,372 | 16,435,666 | ||||||
| Samsung Electronics Co. Ltd. | 13,988 | 34,433,883 | ||||||
|
| |||||||
| $ | 70,624,422 | |||||||
| Entertainment - 1.3% | ||||||||
| Time Warner, Inc. | 449,891 | $ | 44,219,786 | |||||
13
Table of Contents
Portfolio of Investments – continued
| Issuer | Shares/Par | Value ($) | ||||||
| Common Stocks - continued | ||||||||
| Food & Beverages - 5.3% | ||||||||
| Danone S.A. | 765,188 | $ | 62,517,832 | |||||
| Kellogg Co. | 492,961 | 30,824,851 | ||||||
| Nestle S.A. | 977,261 | 82,185,333 | ||||||
|
| |||||||
| $ | 175,528,016 | |||||||
| Food & Drug Stores - 0.3% | ||||||||
| Sally Beauty Holdings, Inc. | 637,934 | $ | 11,042,638 | |||||
| Gaming & Lodging - 0.9% | ||||||||
| Marriott International, Inc., “A” | 120,520 | $ | 14,399,730 | |||||
| Sands China Ltd. | 1,328,400 | 6,257,685 | ||||||
| Wynn Resorts Ltd. | 53,626 | 7,909,299 | ||||||
|
| |||||||
| $ | 28,566,714 | |||||||
| Insurance - 0.3% | ||||||||
| Swiss Re Ltd. | 112,154 | $ | 10,550,446 | |||||
| Internet - 0.9% | ||||||||
| eBay, Inc. (a) | 767,183 | $ | 28,876,768 | |||||
| Machinery & Tools - 0.8% | ||||||||
| Kubota Corp. | 1,364,000 | $ | 25,712,641 | |||||
| Major Banks - 6.3% | ||||||||
| Bank of New York Mellon Corp. | 1,041,005 | $ | 53,559,707 | |||||
| Erste Group Bank AG | 342,991 | 14,738,775 | ||||||
| Goldman Sachs Group, Inc. | 140,245 | 34,006,608 | ||||||
| State Street Corp. | 674,163 | 62,022,996 | ||||||
| UBS Group AG | 2,650,396 | 45,109,732 | ||||||
|
| |||||||
| $ | 209,437,818 | |||||||
| Medical Equipment - 13.1% | ||||||||
| Abbott Laboratories | 756,596 | $ | 41,030,201 | |||||
| Cooper Cos., Inc. | 122,798 | 29,503,447 | ||||||
| Dentsply Sirona, Inc. | 85,477 | 5,220,080 | ||||||
| Medtronic PLC | 983,930 | 79,226,044 | ||||||
| Sonova Holding AG | 71,352 | 12,880,765 | ||||||
| Stryker Corp. | 453,311 | 70,204,275 | ||||||
| Thermo Fisher Scientific, Inc. | 516,359 | 100,085,865 | ||||||
| Waters Corp. (a) | 157,779 | 30,932,573 | ||||||
| Zimmer Biomet Holdings, Inc. | 542,670 | 65,999,525 | ||||||
|
| |||||||
| $ | 435,082,775 | |||||||
| Network & Telecom - 0.6% | ||||||||
| Cisco Systems, Inc. | 635,093 | $ | 21,688,426 | |||||
14
Table of Contents
Portfolio of Investments – continued
| Issuer | Shares/Par | Value ($) | ||||||
| Common Stocks - continued | ||||||||
| Oil Services - 1.0% | ||||||||
| National Oilwell Varco, Inc. | 250,865 | $ | 8,577,074 | |||||
| NOW, Inc. (a) | 146,505 | 1,834,243 | ||||||
| Schlumberger Ltd. | 375,236 | 24,015,104 | ||||||
|
| |||||||
| $ | 34,426,421 | |||||||
| Other Banks & Diversified Financials - 5.0% | ||||||||
| American Express Co. | 511,609 | $ | 48,868,892 | |||||
| Grupo Financiero Banorte S.A. de C.V. | 1,729,539 | 10,264,423 | ||||||
| Julius Baer Group Ltd. | 328,623 | 19,434,428 | ||||||
| Kasikornbank PLC | 1,186,980 | 8,162,813 | ||||||
| Visa, Inc., “A” | 725,735 | 79,816,335 | ||||||
|
| |||||||
| $ | 166,546,891 | |||||||
| Pharmaceuticals - 5.5% | ||||||||
| Bayer AG | 737,532 | $ | 95,963,050 | |||||
| Johnson & Johnson | 101,272 | 14,118,330 | ||||||
| Merck KGaA | 225,779 | 24,166,947 | ||||||
| Roche Holding AG | 214,307 | 49,514,122 | ||||||
|
| |||||||
| $ | 183,762,449 | |||||||
| Railroad & Shipping - 3.1% | ||||||||
| Canadian National Railway Co. | 676,673 | $ | 54,465,410 | |||||
| Kansas City Southern Co. | 345,392 | 35,996,754 | ||||||
| Union Pacific Corp. | 107,767 | 12,478,341 | ||||||
|
| |||||||
| $ | 102,940,505 | |||||||
| Restaurants - 0.5% | ||||||||
| Whitbread PLC | 361,141 | $ | 17,713,452 | |||||
| Specialty Chemicals - 4.2% | ||||||||
| Akzo Nobel N.V. | 537,401 | $ | 48,664,583 | |||||
| L’Air Liquide S.A. | 150,263 | 19,131,200 | ||||||
| Linde AG (a) | 215,958 | 46,525,777 | ||||||
| Praxair, Inc. | 165,661 | 24,206,385 | ||||||
|
| |||||||
| $ | 138,527,945 | |||||||
| Specialty Stores - 1.0% | ||||||||
| AutoZone, Inc. | 26,823 | $ | 15,812,159 | |||||
| Hermes International | 13,204 | 6,852,862 | ||||||
| Urban Outfitters, Inc. (a) | 477,981 | 11,720,094 | ||||||
|
| |||||||
| $ | 34,385,115 | |||||||
| Trucking - 1.6% | ||||||||
| United Parcel Service, Inc., “B” | 465,994 | $ | 54,768,275 | |||||
| Total Common Stocks (Identified Cost, $2,270,173,154) | $ | 3,299,454,208 | ||||||
15
Table of Contents
Portfolio of Investments – continued
| Investment Companies (h) - 0.5% | ||||||||
| Issuer | Shares/Par | Value ($) | ||||||
| Money Market Funds - 0.5% | ||||||||
| MFS Institutional Money Market Portfolio, 1.13% (v) (Identified Cost, $16,561,143) | 16,562,742 | $ | 16,562,742 | |||||
| Collateral for Securities Loaned - 0.6% | ||||||||
| JPMorgan U.S. Government Money Market Fund, 0.97% (j) (Identified Cost, $19,641,106) | 19,641,106 | $ | 19,641,106 | |||||
| Other Assets, Less Liabilities - (0.3)% | (11,103,200 | ) | ||||||
| Net Assets - 100.0% | $ | 3,324,554,856 | ||||||
| (a) | Non-income producing security. |
| (h) | An affiliated issuer may be considered one in which the fund owns 5% or more of the outstanding voting securities, or a company which is under common control. At period end, the aggregate values of the fund’s investments in affiliated issuers and in unaffiliated issuers were $16,562,742 and $3,319,095,314, respectively. |
| (j) | The rate quoted is the annualized seven-day yield of the fund at period end. |
| (l) | A portion of this security is on loan. |
| (v) | Affiliated issuer that is available only to investment companies managed by MFS. The rate quoted for the MFS Institutional Money Market Portfolio is the annualized seven-day yield of the fund at period end. |
The following abbreviations are used in this report and are defined:
| PLC | Public Limited Company |
See Notes to Financial Statements
16
Table of Contents
Financial Statements
STATEMENT OF ASSETS AND LIABILITIES
At 10/31/17
This statement represents your fund’s balance sheet, which details the assets and liabilities comprising the total value of the fund.
| Assets | ||||
Investments in unaffiliated issuers, at value, including $19,081,909 of securities on loan (identified cost, $2,289,814,260) | $3,319,095,314 | |||
Investments in affiliated issuers, at value (identified cost, $16,561,143) | 16,562,742 | |||
Receivables for | ||||
Investments sold | 4,107,575 | |||
Fund shares sold | 5,335,735 | |||
Interest and dividends | 5,877,158 | |||
Other assets | 22 | |||
Total assets | $3,350,978,546 | |||
| Liabilities | ||||
Payables for | ||||
Investments purchased | $3,222,594 | |||
Fund shares reacquired | 2,223,849 | |||
Collateral for securities loaned, at value | 19,641,106 | |||
Payable to affiliates | ||||
Investment adviser | 138,560 | |||
Shareholder servicing costs | 667,391 | |||
Distribution and service fees | 24,194 | |||
Payable for independent Trustees’ compensation | 5,997 | |||
Deferred country tax expense payable | 268,642 | |||
Accrued expenses and other liabilities | 231,357 | |||
Total liabilities | $26,423,690 | |||
Net assets | $3,324,554,856 | |||
| Net assets consist of | ||||
Paid-in capital | $2,216,923,052 | |||
Unrealized appreciation (depreciation) (net of $268,642 deferred country tax) | 1,029,009,633 | |||
Accumulated net realized gain (loss) | 54,664,624 | |||
Undistributed net investment income | 23,957,547 | |||
Net assets | $3,324,554,856 | |||
Shares of beneficial interest outstanding | 75,937,051 |
17
Table of Contents
Statement of Assets and Liabilities – continued
| Net assets | Shares outstanding | Net asset value per share (a) | ||||||||||
Class A | $703,515,883 | 16,197,279 | $43.43 | |||||||||
Class B | 29,042,753 | 725,496 | 40.03 | |||||||||
Class C | 180,445,629 | 4,704,793 | 38.35 | |||||||||
Class I | 1,070,006,548 | 24,004,361 | 44.58 | |||||||||
Class R1 | 3,411,144 | 87,061 | 39.18 | |||||||||
Class R2 | 52,489,315 | 1,244,933 | 42.16 | |||||||||
Class R3 | 108,852,237 | 2,523,114 | 43.14 | |||||||||
Class R4 | 142,713,015 | 3,271,863 | 43.62 | |||||||||
Class R6 | 1,034,078,332 | 23,178,151 | 44.61 | |||||||||
| (a) | Maximum offering price per share was equal to the net asset value per share for all share classes, except for Class A, for which the maximum offering price per share was $46.08 [100 / 94.25 x $43.43]. On sales of $50,000 or more, the maximum offering price of Class A shares is reduced. A contingent deferred sales charge may be imposed on redemptions of Class A, Class B, and Class C shares. Redemption price per share was equal to the net asset value per share for Classes I, R1, R2, R3, R4, and R6. Net asset value per share is calculated using actual net assets and shares outstanding rather than amounts that have been rounded for presentation purposes. |
See Notes to Financial Statements
18
Table of Contents
Financial Statements
Year ended 10/31/17
This statement describes how much your fund earned in investment income and accrued in expenses. It also describes any gains and/or losses generated by fund operations.
| Net investment income (loss) | ||||
Income | ||||
Dividends | $57,622,565 | |||
Dividends from affiliated issuers | 333,138 | |||
Income on securities loaned | 226,441 | |||
Other | 11,357 | |||
Foreign taxes withheld | (3,420,582 | ) | ||
Total investment income | $54,772,919 | |||
Expenses | ||||
Management fee | $22,562,921 | |||
Distribution and service fees | 4,178,366 | |||
Shareholder servicing costs | 2,281,325 | |||
Administrative services fee | 475,504 | |||
Independent Trustees’ compensation | 44,188 | |||
Custodian fee | 375,805 | |||
Reimbursement of custodian expenses | (39,816 | ) | ||
Shareholder communications | 233,427 | |||
Audit and tax fees | 73,880 | |||
Legal fees | 36,689 | |||
Miscellaneous | 303,204 | |||
Total expenses | $30,525,493 | |||
Fees paid indirectly | (670 | ) | ||
Reduction of expenses by investment adviser and distributor | (260,601 | ) | ||
Net expenses | $30,264,222 | |||
Net investment income (loss) | $24,508,697 | |||
| Realized and unrealized gain (loss) | ||||
Realized gain (loss) (identified cost basis) | ||||
Unaffiliated issuers (net of $1,283 country tax) | $70,122,847 | |||
Affiliated issuers | (3,730 | ) | ||
Foreign currency | 179,623 | |||
Net realized gain (loss) | $70,298,740 | |||
Change in unrealized appreciation (depreciation) | ||||
Unaffiliated issuers (net of $243,640 increase in deferred country tax) | $491,231,875 | |||
Affiliated issuers | 1,599 | |||
Translation of assets and liabilities in foreign currencies | 114,737 | |||
Net unrealized gain (loss) | $491,348,211 | |||
Net realized and unrealized gain (loss) | $561,646,951 | |||
Change in net assets from operations | $586,155,648 |
See Notes to Financial Statements
19
Table of Contents
Financial Statements
STATEMENTS OF CHANGES IN NET ASSETS
These statements describe the increases and/or decreases in net assets resulting from operations, any distributions, and any shareholder transactions.
| Year ended | ||||||||
| 10/31/17 | 10/31/16 | |||||||
| Change in net assets | ||||||||
| From operations | ||||||||
Net investment income (loss) | $24,508,697 | $18,030,677 | ||||||
Net realized gain (loss) | 70,298,740 | 25,762,438 | ||||||
Net unrealized gain (loss) | 491,348,211 | (13,911,097 | ) | |||||
Change in net assets from operations | $586,155,648 | $29,882,018 | ||||||
| Distributions declared to shareholders | ||||||||
From net investment income | $(18,050,023 | ) | $(17,750,133 | ) | ||||
From net realized gain | (20,174,613 | ) | (23,040,223 | ) | ||||
Total distributions declared to shareholders | $(38,224,636 | ) | $(40,790,356 | ) | ||||
Change in net assets from fund share transactions | $383,351,814 | $219,549,574 | ||||||
Total change in net assets | $931,282,826 | $208,641,236 | ||||||
| Net assets | ||||||||
At beginning of period | 2,393,272,030 | 2,184,630,794 | ||||||
At end of period (including undistributed net investment income of $23,957,547 and $17,320,533, respectively) | $3,324,554,856 | $2,393,272,030 | ||||||
See Notes to Financial Statements
20
Table of Contents
Financial Statements
The financial highlights table is intended to help you understand the fund’s financial performance for the past 5 years. Certain information reflects financial results for a single fund share. The total returns in the table represent the rate that an investor would have earned (or lost) on an investment in the fund share class (assuming reinvestment of all distributions) held for the entire period.
| Class A | Year ended | |||||||||||||||||||
| 10/31/17 | 10/31/16 | 10/31/15 | 10/31/14 | 10/31/13 | ||||||||||||||||
Net asset value, beginning of period | $36.00 | $36.22 | $35.45 | $33.74 | $26.46 | |||||||||||||||
| Income (loss) from investment operations | ||||||||||||||||||||
Net investment income (loss) (d) | $0.27 | (c) | $0.26 | $0.30 | $0.26 | $0.22 | ||||||||||||||
Net realized and unrealized gain (loss) | 7.66 | 0.16 | 1.07 | 1.90 | 7.40 | |||||||||||||||
Total from investment operations | $7.93 | $0.42 | $1.37 | $2.16 | $7.62 | |||||||||||||||
| Less distributions declared to shareholders | ||||||||||||||||||||
From net investment income | $(0.21 | ) | $(0.26 | ) | $(0.26 | ) | $(0.13 | ) | $(0.27 | ) | ||||||||||
From net realized gain | (0.29 | ) | (0.38 | ) | (0.34 | ) | (0.32 | ) | (0.07 | ) | ||||||||||
Total distributions declared to shareholders | $(0.50 | ) | $(0.64 | ) | $(0.60 | ) | $(0.45 | ) | $(0.34 | ) | ||||||||||
Net asset value, end of period (x) | $43.43 | $36.00 | $36.22 | $35.45 | $33.74 | |||||||||||||||
Total return (%) (r)(s)(t)(x) | 22.28 | (c) | 1.26 | 3.94 | 6.50 | 29.12 | ||||||||||||||
| Ratios (%) (to average net assets) and Supplemental data: | ||||||||||||||||||||
Expenses before expense reductions (f) | 1.17 | (c) | 1.22 | 1.23 | 1.23 | 1.29 | ||||||||||||||
Expenses after expense reductions (f) | 1.16 | (c) | 1.21 | 1.22 | 1.22 | 1.29 | ||||||||||||||
Net investment income (loss) | 0.68 | (c) | 0.74 | 0.84 | 0.75 | 0.71 | ||||||||||||||
Portfolio turnover | 10 | 8 | 8 | 11 | 11 | |||||||||||||||
Net assets at end of period (000 omitted) | $703,516 | $655,756 | $677,704 | $592,610 | $512,447 | |||||||||||||||
See Notes to Financial Statements
21
Table of Contents
Financial Highlights – continued
| Class B | Year ended | |||||||||||||||||||
| 10/31/17 | 10/31/16 | 10/31/15 | 10/31/14 | 10/31/13 | ||||||||||||||||
Net asset value, beginning of period | $33.26 | $33.51 | $32.84 | $31.40 | $24.64 | |||||||||||||||
| Income (loss) from investment operations | ||||||||||||||||||||
Net investment income (loss) (d) | $(0.02 | )(c) | $(0.01 | ) | $0.03 | $(0.00 | )(w) | $(0.01 | ) | |||||||||||
Net realized and unrealized gain (loss) | 7.08 | 0.16 | 1.00 | 1.76 | 6.92 | |||||||||||||||
Total from investment operations | $7.06 | $0.15 | $1.03 | $1.76 | $6.91 | |||||||||||||||
| Less distributions declared to shareholders | ||||||||||||||||||||
From net investment income | $— | $(0.02 | ) | $(0.02 | ) | $— | $(0.08 | ) | ||||||||||||
From net realized gain | (0.29 | ) | (0.38 | ) | (0.34 | ) | (0.32 | ) | (0.07 | ) | ||||||||||
Total distributions declared to shareholders | $(0.29 | ) | $(0.40 | ) | $(0.36 | ) | $(0.32 | ) | $(0.15 | ) | ||||||||||
Net asset value, end of period (x) | $40.03 | $33.26 | $33.51 | $32.84 | $31.40 | |||||||||||||||
Total return (%) (r)(s)(t)(x) | 21.37 | (c) | 0.50 | 3.17 | 5.68 | 28.19 | ||||||||||||||
| Ratios (%) (to average net assets) and Supplemental data: | ||||||||||||||||||||
Expenses before expense reductions (f) | 1.92 | (c) | 1.97 | 1.98 | 1.98 | 2.04 | ||||||||||||||
Expenses after expense reductions (f) | 1.91 | (c) | 1.96 | 1.97 | 1.98 | 2.04 | ||||||||||||||
Net investment income (loss) | (0.04 | )(c) | (0.03 | ) | 0.09 | (0.01 | ) | (0.02 | ) | |||||||||||
Portfolio turnover | 10 | 8 | 8 | 11 | 11 | |||||||||||||||
Net assets at end of period (000 omitted) | $29,043 | $25,664 | $27,384 | $26,118 | $24,395 | |||||||||||||||
| Class C | Year ended | |||||||||||||||||||
| 10/31/17 | 10/31/16 | 10/31/15 | 10/31/14 | 10/31/13 | ||||||||||||||||
Net asset value, beginning of period | $31.88 | $32.19 | $31.60 | $30.22 | $23.75 | |||||||||||||||
| Income (loss) from investment operations | ||||||||||||||||||||
Net investment income (loss) (d) | $(0.02 | )(c) | $(0.01 | ) | $0.03 | $(0.00 | )(w) | $(0.02 | ) | |||||||||||
Net realized and unrealized gain (loss) | 6.78 | 0.15 | 0.95 | 1.70 | 6.66 | |||||||||||||||
Total from investment operations | $6.76 | $0.14 | $0.98 | $1.70 | $6.64 | |||||||||||||||
| Less distributions declared to shareholders | ||||||||||||||||||||
From net investment income | $— | $(0.07 | ) | $(0.05 | ) | $— | $(0.10 | ) | ||||||||||||
From net realized gain | (0.29 | ) | (0.38 | ) | (0.34 | ) | (0.32 | ) | (0.07 | ) | ||||||||||
Total distributions declared to shareholders | $(0.29 | ) | $(0.45 | ) | $(0.39 | ) | $(0.32 | ) | $(0.17 | ) | ||||||||||
Net asset value, end of period (x) | $38.35 | $31.88 | $32.19 | $31.60 | $30.22 | |||||||||||||||
Total return (%) (r)(s)(t)(x) | 21.36 | (c) | 0.48 | 3.17 | 5.70 | 28.15 | ||||||||||||||
| Ratios (%) (to average net assets) and Supplemental data: | ||||||||||||||||||||
Expenses before expense reductions (f) | 1.92 | (c) | 1.97 | 1.98 | 1.98 | 2.04 | ||||||||||||||
Expenses after expense reductions (f) | 1.91 | (c) | 1.96 | 1.97 | 1.98 | 2.04 | ||||||||||||||
Net investment income (loss) | (0.05 | )(c) | (0.03 | ) | 0.08 | (0.00 | ) | (0.06 | ) | |||||||||||
Portfolio turnover | 10 | 8 | 8 | 11 | 11 | |||||||||||||||
Net assets at end of period (000 omitted) | $180,446 | $156,837 | $140,018 | $111,902 | $74,448 | |||||||||||||||
See Notes to Financial Statements
22
Table of Contents
Financial Highlights – continued
| Class I | Year ended | |||||||||||||||||||
| 10/31/17 | 10/31/16 | 10/31/15 | 10/31/14 | 10/31/13 | ||||||||||||||||
Net asset value, beginning of period | $36.94 | $37.14 | $36.34 | $34.56 | $27.09 | |||||||||||||||
| Income (loss) from investment operations | ||||||||||||||||||||
Net investment income (loss) (d) | $0.41 | (c) | $0.34 | $0.41 | $0.35 | $0.30 | ||||||||||||||
Net realized and unrealized gain (loss) | 7.83 | 0.19 | 1.07 | 1.95 | 7.58 | |||||||||||||||
Total from investment operations | $8.24 | $0.53 | $1.48 | $2.30 | $7.88 | |||||||||||||||
| Less distributions declared to shareholders | ||||||||||||||||||||
From net investment income | $(0.31 | ) | $(0.35 | ) | $(0.34 | ) | $(0.20 | ) | $(0.34 | ) | ||||||||||
From net realized gain | (0.29 | ) | (0.38 | ) | (0.34 | ) | (0.32 | ) | (0.07 | ) | ||||||||||
Total distributions declared to shareholders | $(0.60 | ) | $(0.73 | ) | $(0.68 | ) | $(0.52 | ) | $(0.41 | ) | ||||||||||
Net asset value, end of period (x) | $44.58 | $36.94 | $37.14 | $36.34 | $34.56 | |||||||||||||||
Total return (%) (r)(s)(t)(x) | 22.60 | (c) | 1.52 | 4.17 | 6.77 | 29.44 | ||||||||||||||
| Ratios (%) (to average net assets) and Supplemental data: | ||||||||||||||||||||
Expenses before expense reductions (f) | 0.92 | (c) | 0.97 | 0.98 | 0.98 | 1.04 | ||||||||||||||
Expenses after expense reductions (f) | 0.91 | (c) | 0.96 | 0.97 | 0.98 | 1.04 | ||||||||||||||
Net investment income (loss) | 1.01 | (c) | 0.93 | 1.11 | 0.99 | 0.98 | ||||||||||||||
Portfolio turnover | 10 | 8 | 8 | 11 | 11 | |||||||||||||||
Net assets at end of period (000 omitted) | $1,070,007 | $793,470 | $671,087 | $681,259 | $638,111 | |||||||||||||||
| Class R1 | Year ended | |||||||||||||||||||
| 10/31/17 | 10/31/16 | 10/31/15 | 10/31/14 | 10/31/13 | ||||||||||||||||
Net asset value, beginning of period | $32.56 | $32.80 | $32.17 | $30.76 | $24.13 | |||||||||||||||
| Income (loss) from investment operations | ||||||||||||||||||||
Net investment income (loss) (d) | $(0.02 | )(c) | $(0.01 | ) | $0.03 | $(0.00 | )(w) | $(0.00 | )(w) | |||||||||||
Net realized and unrealized gain (loss) | 6.93 | 0.16 | 0.97 | 1.73 | 6.76 | |||||||||||||||
Total from investment operations | $6.91 | $0.15 | $1.00 | $1.73 | $6.76 | |||||||||||||||
| Less distributions declared to shareholders | ||||||||||||||||||||
From net investment income | $— | $(0.01 | ) | $(0.03 | ) | $— | $(0.06 | ) | ||||||||||||
From net realized gain | (0.29 | ) | (0.38 | ) | (0.34 | ) | (0.32 | ) | (0.07 | ) | ||||||||||
Total distributions declared to shareholders | $(0.29 | ) | $(0.39 | ) | $(0.37 | ) | $(0.32 | ) | $(0.13 | ) | ||||||||||
Net asset value, end of period (x) | $39.18 | $32.56 | $32.80 | $32.17 | $30.76 | |||||||||||||||
Total return (%) (r)(s)(t)(x) | 21.37 | (c) | 0.51 | 3.14 | 5.70 | 28.17 | ||||||||||||||
| Ratios (%) (to average net assets) and Supplemental data: | ||||||||||||||||||||
Expenses before expense reductions (f) | 1.92 | (c) | 1.97 | 1.98 | 1.98 | 2.04 | ||||||||||||||
Expenses after expense reductions (f) | 1.91 | (c) | 1.96 | 1.97 | 1.98 | 2.04 | ||||||||||||||
Net investment income (loss) | (0.05 | )(c) | (0.03 | ) | 0.10 | (0.01 | ) | (0.01 | ) | |||||||||||
Portfolio turnover | 10 | 8 | 8 | 11 | 11 | |||||||||||||||
Net assets at end of period (000 omitted) | $3,411 | $3,442 | $3,546 | $3,776 | $3,718 | |||||||||||||||
See Notes to Financial Statements
23
Table of Contents
Financial Highlights – continued
| Class R2 | Year ended | |||||||||||||||||||
| 10/31/17 | 10/31/16 | 10/31/15 | 10/31/14 | 10/31/13 | ||||||||||||||||
Net asset value, beginning of period | $34.96 | $35.19 | $34.45 | $32.81 | $25.76 | |||||||||||||||
| Income (loss) from investment operations | ||||||||||||||||||||
Net investment income (loss) (d) | $0.18 | (c) | $0.16 | $0.21 | $0.17 | $0.14 | ||||||||||||||
Net realized and unrealized gain (loss) | 7.43 | 0.16 | 1.03 | 1.85 | 7.21 | |||||||||||||||
Total from investment operations | $7.61 | $0.32 | $1.24 | $2.02 | $7.35 | |||||||||||||||
| Less distributions declared to shareholders | ||||||||||||||||||||
From net investment income | $(0.12 | ) | $(0.17 | ) | $(0.16 | ) | $(0.06 | ) | $(0.23 | ) | ||||||||||
From net realized gain | (0.29 | ) | (0.38 | ) | (0.34 | ) | (0.32 | ) | (0.07 | ) | ||||||||||
Total distributions declared to shareholders | $(0.41 | ) | $(0.55 | ) | $(0.50 | ) | $(0.38 | ) | $(0.30 | ) | ||||||||||
Net asset value, end of period (x) | $42.16 | $34.96 | $35.19 | $34.45 | $32.81 | |||||||||||||||
Total return (%) (r)(s)(t)(x) | 21.97 | (c) | 0.99 | 3.67 | 6.24 | 28.82 | ||||||||||||||
| Ratios (%) (to average net assets) and Supplemental data: | ||||||||||||||||||||
Expenses before expense reductions (f) | 1.42 | (c) | 1.47 | 1.48 | 1.48 | 1.54 | ||||||||||||||
Expenses after expense reductions (f) | 1.41 | (c) | 1.46 | 1.47 | 1.48 | 1.54 | ||||||||||||||
Net investment income (loss) | 0.45 | (c) | 0.47 | 0.59 | 0.49 | 0.48 | ||||||||||||||
Portfolio turnover | 10 | 8 | 8 | 11 | 11 | |||||||||||||||
Net assets at end of period (000 omitted) | $52,489 | $49,546 | $56,978 | $57,258 | $54,726 | |||||||||||||||
| Class R3 | Year ended | |||||||||||||||||||
| 10/31/17 | 10/31/16 | 10/31/15 | 10/31/14 | 10/31/13 | ||||||||||||||||
Net asset value, beginning of period | $35.76 | $35.98 | $35.23 | $33.55 | $26.32 | |||||||||||||||
| Income (loss) from investment operations | ||||||||||||||||||||
Net investment income (loss) (d) | $0.28 | (c) | $0.26 | $0.30 | $0.26 | $0.21 | ||||||||||||||
Net realized and unrealized gain (loss) | 7.60 | 0.16 | 1.05 | 1.88 | 7.37 | |||||||||||||||
Total from investment operations | $7.88 | $0.42 | $1.35 | $2.14 | $7.58 | |||||||||||||||
| Less distributions declared to shareholders | ||||||||||||||||||||
From net investment income | $(0.21 | ) | $(0.26 | ) | $(0.26 | ) | $(0.14 | ) | $(0.28 | ) | ||||||||||
From net realized gain | (0.29 | ) | (0.38 | ) | (0.34 | ) | (0.32 | ) | (0.07 | ) | ||||||||||
Total distributions declared to shareholders | $(0.50 | ) | $(0.64 | ) | $(0.60 | ) | $(0.46 | ) | $(0.35 | ) | ||||||||||
Net asset value, end of period (x) | $43.14 | $35.76 | $35.98 | $35.23 | $33.55 | |||||||||||||||
Total return (%) (r)(s)(t)(x) | 22.29 | (c) | 1.25 | 3.93 | 6.49 | 29.11 | ||||||||||||||
| Ratios (%) (to average net assets) and Supplemental data: | ||||||||||||||||||||
Expenses before expense reductions (f) | 1.17 | (c) | 1.22 | 1.23 | 1.23 | 1.29 | ||||||||||||||
Expenses after expense reductions (f) | 1.16 | (c) | 1.21 | 1.22 | 1.23 | 1.29 | ||||||||||||||
Net investment income (loss) | 0.70 | (c) | 0.74 | 0.84 | 0.74 | 0.67 | ||||||||||||||
Portfolio turnover | 10 | 8 | 8 | 11 | 11 | |||||||||||||||
Net assets at end of period (000 omitted) | $108,852 | $98,106 | $105,192 | $90,864 | $62,218 | |||||||||||||||
See Notes to Financial Statements
24
Table of Contents
Financial Highlights – continued
| Class R4 | Year ended | |||||||||||||||||||
| 10/31/17 | 10/31/16 | 10/31/15 | 10/31/14 | 10/31/13 | ||||||||||||||||
Net asset value, beginning of period | $36.15 | $36.37 | $35.59 | $33.87 | $26.55 | |||||||||||||||
| Income (loss) from investment operations | ||||||||||||||||||||
Net investment income (loss) (d) | $0.38 | (c) | $0.35 | $0.40 | $0.35 | $0.31 | ||||||||||||||
Net realized and unrealized gain (loss) | 7.68 | 0.16 | 1.06 | 1.89 | 7.42 | |||||||||||||||
Total from investment operations | $8.06 | $0.51 | $1.46 | $2.24 | $7.73 | |||||||||||||||
| Less distributions declared to shareholders | ||||||||||||||||||||
From net investment income | $(0.30 | ) | $(0.35 | ) | $(0.34 | ) | $(0.20 | ) | $(0.34 | ) | ||||||||||
From net realized gain | (0.29 | ) | (0.38 | ) | (0.34 | ) | (0.32 | ) | (0.07 | ) | ||||||||||
Total distributions declared to shareholders | $(0.59 | ) | $(0.73 | ) | $(0.68 | ) | $(0.52 | ) | $(0.41 | ) | ||||||||||
Net asset value, end of period (x) | $43.62 | $36.15 | $36.37 | $35.59 | $33.87 | |||||||||||||||
Total return (%) (r)(s)(t)(x) | 22.61 | (c) | 1.50 | 4.20 | 6.74 | 29.47 | ||||||||||||||
| Ratios (%) (to average net assets) and Supplemental data: | ||||||||||||||||||||
Expenses before expense reductions (f) | 0.92 | (c) | 0.97 | 0.98 | 0.98 | 1.04 | ||||||||||||||
Expenses after expense reductions (f) | 0.91 | (c) | 0.96 | 0.97 | 0.98 | 1.04 | ||||||||||||||
Net investment income (loss) | 0.96 | (c) | 0.99 | 1.11 | 0.99 | 1.02 | ||||||||||||||
Portfolio turnover | 10 | 8 | 8 | 11 | 11 | |||||||||||||||
Net assets at end of period (000 omitted) | $142,713 | $116,248 | $118,810 | $109,067 | $90,239 | |||||||||||||||
| Class R6 | Year ended | |||||||||||||||||||
| 10/31/17 | 10/31/16 | 10/31/15 | 10/31/14 | 10/31/13 | ||||||||||||||||
Net asset value, beginning of period | $36.96 | $37.17 | $36.36 | $34.58 | $27.10 | |||||||||||||||
| Income (loss) from investment operations | ||||||||||||||||||||
Net investment income (loss) (d) | $0.41 | (c) | $0.39 | $0.44 | $0.42 | $0.08 | ||||||||||||||
Net realized and unrealized gain (loss) | 7.86 | 0.16 | 1.08 | 1.90 | 7.81 | |||||||||||||||
Total from investment operations | $8.27 | $0.55 | $1.52 | $2.32 | $7.89 | |||||||||||||||
| Less distributions declared to shareholders | ||||||||||||||||||||
From net investment income | $(0.33 | ) | $(0.38 | ) | $(0.37 | ) | $(0.22 | ) | $(0.34 | ) | ||||||||||
From net realized gain | (0.29 | ) | (0.38 | ) | (0.34 | ) | (0.32 | ) | (0.07 | ) | ||||||||||
Total distributions declared to shareholders | $(0.62 | ) | $(0.76 | ) | $(0.71 | ) | $(0.54 | ) | $(0.41 | ) | ||||||||||
Net asset value, end of period (x) | $44.61 | $36.96 | $37.17 | $36.36 | $34.58 | |||||||||||||||
Total return (%) (r)(s)(t)(x) | 22.71 | (c) | 1.60 | 4.29 | 6.84 | 29.50 | ||||||||||||||
| Ratios (%) (to average net assets) and Supplemental data: | ||||||||||||||||||||
Expenses before expense reductions (f) | 0.83 | (c) | 0.87 | 0.88 | 0.90 | 0.95 | ||||||||||||||
Expenses after expense reductions (f) | 0.82 | (c) | 0.87 | 0.88 | 0.90 | 0.95 | ||||||||||||||
Net investment income (loss) | 0.99 | (c) | 1.08 | 1.19 | 1.16 | 0.24 | ||||||||||||||
Portfolio turnover | 10 | 8 | 8 | 11 | 11 | |||||||||||||||
Net assets at end of period (000 omitted) | $1,034,078 | $494,203 | $383,913 | $306,861 | $187,343 | |||||||||||||||
See Notes to Financial Statements
25
Table of Contents
Financial Highlights – continued
| (c) | Amount reflects a one-time reimbursement of expenses by the custodian (or former custodian) without which net investment income and performance would be lower and expenses would be higher. See Note 2 in the Notes to Financial Statements for additional information. |
| (d) | Per share data is based on average shares outstanding. |
| (f) | Ratios do not reflect reductions from fees paid indirectly, if applicable. |
| (r) | Certain expenses have been reduced without which performance would have been lower. |
| (s) | From time to time the fund may receive proceeds from litigation settlements, without which performance would be lower. |
| (t) | Total returns do not include any applicable sales charges. |
| (w) | Per share amount was less than $0.01. |
| (x) | The net asset values and total returns have been calculated on net assets which include adjustments made in accordance with U.S. generally accepted accounting principles required at period end for financial reporting purposes. |
See Notes to Financial Statements
26
Table of Contents
(1) Business and Organization
MFS Global Equity Fund (the fund) is a diversified series of MFS Series Trust VI (the trust). The trust is organized as a Massachusetts business trust and is registered under the Investment Company Act of 1940, as amended, as an open-end management investment company.
The fund is an investment company and accordingly follows the investment company accounting and reporting guidance of the Financial Accounting Standards Board (FASB) Accounting Standards Codification Topic 946 Financial Services – Investment Companies.
(2) Significant Accounting Policies
General – The preparation of financial statements in conformity with U.S. generally accepted accounting principles requires management to make estimates and assumptions that affect the reported amounts of assets and liabilities, and disclosure of contingent assets and liabilities at the date of the financial statements and the reported amounts of increases and decreases in net assets from operations during the reporting period. Actual results could differ from those estimates. In the preparation of these financial statements, management has evaluated subsequent events occurring after the date of the fund’s Statement of Assets and Liabilities through the date that the financial statements were issued. The fund invests in foreign securities. Investments in foreign securities are vulnerable to the effects of changes in the relative values of the local currency and the U.S. dollar and to the effects of changes in each country’s legal, political, and economic environment.
In October 2016, the Securities and Exchange Commission (SEC) released its Final Rule on Investment Company Reporting Modernization (the “Rule”). The Rule, which introduced two new regulatory reporting forms for investment companies – Form N-PORT and Form N-CEN – also contained amendments to Regulation S-X which impact financial statement presentation, particularly the presentation of derivative investments, for all reporting periods ending after August 1, 2017. The fund has adopted the Rule’s Regulation S-X amendments and believes that the fund’s financial statements are in compliance with those amendments.
Balance Sheet Offsetting – The fund’s accounting policy with respect to balance sheet offsetting is that, absent an event of default by the counterparty or a termination of the agreement, the International Swaps and Derivatives Association (ISDA) Master Agreement, or similar agreement, does not result in an offset of reported amounts of financial assets and financial liabilities in the Statement of Assets and Liabilities across transactions between the fund and the applicable counterparty. The fund’s right to setoff may be restricted or prohibited by the bankruptcy or insolvency laws of the particular jurisdiction to which a specific master netting agreement counterparty is subject. Balance sheet offsetting disclosures, to the extent applicable to the fund, have been included in the fund’s Significant Accounting Policies note under the captions for each of the fund’s in-scope financial instruments and transactions.
Investment Valuations – Equity securities, including restricted equity securities, are generally valued at the last sale or official closing price on their primary market or
27
Table of Contents
Notes to Financial Statements – continued
exchange as provided by a third-party pricing service. Equity securities, for which there were no sales reported that day, are generally valued at the last quoted daily bid quotation on their primary market or exchange as provided by a third-party pricing service. Short-term instruments with a maturity at issuance of 60 days or less may be valued at amortized cost, which approximates market value. Open-end investment companies are generally valued at net asset value per share. Securities and other assets generally valued on the basis of information from a third-party pricing service may also be valued at a broker/dealer bid quotation. Values obtained from third-party pricing services can utilize both transaction data and market information such as yield, quality, coupon rate, maturity, type of issue, trading characteristics, and other market data. The values of foreign securities and other assets and liabilities expressed in foreign currencies are converted to U.S. dollars using the mean of bid and asked prices for rates provided by a third-party pricing service.
The Board of Trustees has delegated primary responsibility for determining or causing to be determined the value of the fund’s investments (including any fair valuation) to the adviser pursuant to valuation policies and procedures approved by the Board. If the adviser determines that reliable market quotations are not readily available, investments are valued at fair value as determined in good faith by the adviser in accordance with such procedures under the oversight of the Board of Trustees. Under the fund’s valuation policies and procedures, market quotations are not considered to be readily available for most types of debt instruments and floating rate loans and many types of derivatives. These investments are generally valued at fair value based on information from third-party pricing services. In addition, investments may be valued at fair value if the adviser determines that an investment’s value has been materially affected by events occurring after the close of the exchange or market on which the investment is principally traded (such as foreign exchange or market) and prior to the determination of the fund’s net asset value, or after the halting of trading of a specific security where trading does not resume prior to the close of the exchange or market on which the security is principally traded. Events that occur on a frequent basis after foreign markets close (such as developments in foreign markets and significant movements in the U.S. markets) and prior to the determination of the fund’s net asset value may be deemed to have a material effect on the value of securities traded in foreign markets. Accordingly, the fund’s foreign equity securities may often be valued at fair value. The adviser generally relies on third-party pricing services or other information (such as the correlation with price movements of similar securities in the same or other markets; the type, cost and investment characteristics of the security; the business and financial condition of the issuer; and trading and other market data) to assist in determining whether to fair value and at what value to fair value an investment. The value of an investment for purposes of calculating the fund’s net asset value can differ depending on the source and method used to determine value. When fair valuation is used, the value of an investment used to determine the fund’s net asset value may differ from quoted or published prices for the same investment. There can be no assurance that the fund could obtain the fair value assigned to an investment if it were to sell the investment at the same time at which the fund determines its net asset value per share.
Various inputs are used in determining the value of the fund’s assets or liabilities. These inputs are categorized into three broad levels. In certain cases, the inputs used to
28
Table of Contents
Notes to Financial Statements – continued
measure fair value may fall into different levels of the fair value hierarchy. In such cases, an investment’s level within the fair value hierarchy is based on the lowest level of input that is significant to the fair value measurement. The fund’s assessment of the significance of a particular input to the fair value measurement in its entirety requires judgment, and considers factors specific to the investment. Level 1 includes unadjusted quoted prices in active markets for identical assets or liabilities. Level 2 includes other significant observable market-based inputs (including quoted prices for similar securities, interest rates, prepayment speed, and credit risk). Level 3 includes unobservable inputs, which may include the adviser’s own assumptions in determining the fair value of investments. The following is a summary of the levels used as of October 31, 2017 in valuing the fund’s assets or liabilities:
| Financial Instruments | Level 1 | Level 2 | Level 3 | Total | ||||||||||||
| Equity Securities: | ||||||||||||||||
United States | $1,778,538,046 | $— | $— | $1,778,538,046 | ||||||||||||
France | 300,074,660 | — | — | 300,074,660 | ||||||||||||
United Kingdom | 286,395,202 | — | — | 286,395,202 | ||||||||||||
Switzerland | 279,624,241 | — | — | 279,624,241 | ||||||||||||
Germany | 222,064,739 | — | — | 222,064,739 | ||||||||||||
Netherlands | 80,021,017 | — | — | 80,021,017 | ||||||||||||
Sweden | 68,834,810 | — | — | 68,834,810 | ||||||||||||
Canada | 54,465,410 | — | — | 54,465,410 | ||||||||||||
Japan | — | 45,467,513 | — | 45,467,513 | ||||||||||||
Other Countries | 141,371,874 | 42,596,696 | — | 183,968,570 | ||||||||||||
| Mutual Funds | 36,203,848 | — | — | 36,203,848 | ||||||||||||
| Total | $3,247,593,847 | $88,064,209 | $— | $3,335,658,056 | ||||||||||||
For further information regarding security characteristics, see the Portfolio of Investments.
Of the level 2 investments presented above, equity investments amounting to $88,064,209 would have been considered level 1 investments at the beginning of the period. The primary reason for changes in the classifications between levels 1 and 2 occurs when foreign equity securities are fair valued using other observable market-based inputs in place of the closing exchange price due to events occurring after the close of the exchange or market on which the investment is principally traded. The fund’s foreign equity securities may often be valued using other observable market-based inputs. The fund’s policy is to recognize transfers between the levels as of the end of the period.
Foreign Currency Translation – Purchases and sales of foreign investments, income, and expenses are converted into U.S. dollars based upon currency exchange rates prevailing on the respective dates of such transactions or on the reporting date for foreign denominated receivables and payables. Gains and losses attributable to foreign currency exchange rates on sales of securities are recorded for financial statement purposes as net realized gains and losses on investments. Gains and losses attributable to foreign exchange rate movements on receivables, payables, income and expenses are recorded for financial statement purposes as foreign currency transaction gains and
29
Table of Contents
Notes to Financial Statements – continued
losses. That portion of both realized and unrealized gains and losses on investments that results from fluctuations in foreign currency exchange rates is not separately disclosed.
Security Loans – Under its Securities Lending Agency Agreement with the fund, JPMorgan Chase and Co. (“Chase”), as lending agent, loans the securities of the fund to certain qualified institutions (the “Borrowers”) approved by the fund. Security loans can be terminated at the discretion of either the lending agent or the fund and the related securities must be returned within the earlier of the standard trade settlement period for such securities or within three business days. The loans are collateralized by cash and/or U.S. Treasury and federal agency obligations in an amount typically at least equal to the market value of the securities loaned. On loans collateralized by cash, the cash collateral is invested in a money market fund. The market value of the loaned securities is determined at the close of business of the fund and any additional required collateral is delivered to the fund on the next business day. Chase provides the fund with indemnification against Borrower default. In the event of Borrower default, Chase will, for the benefit of the fund, either purchase securities identical to those loaned or, when such purchase is commercially impracticable, pay the fund the market value of the loaned securities. In return, Chase assumes the fund’s rights to the related collateral. If the collateral value is less than the cost to purchase identical securities, Chase is responsible for the shortfall, but only to the extent that such shortfall is not due to a decline in collateral value resulting from collateral reinvestment for which the fund bears the risk of loss. At period end, the fund had investment securities on loan, all of which were classified as equity securities in the fund’s Portfolio of Investments, with a fair value of $19,081,909. The fair value of the fund’s investment securities on loan and a related liability of $19,641,106 for cash collateral received on securities loaned are both presented gross in the Statement of Assets and Liabilities. The collateral on securities loaned exceeded the value of securities on loan at period end. The liability for cash collateral for securities loaned is carried at fair value, which is categorized as level 2 within the fair value hierarchy. A portion of the income generated upon investment of the collateral is remitted to the Borrowers, and the remainder is allocated between the fund and the lending agent. On loans collateralized by U.S. Treasury and/or federal agency obligations, a fee is received from the Borrower, and is allocated between the fund and the lending agent. Income from securities lending is separately reported in the Statement of Operations. The dividend and interest income earned on the securities loaned is accounted for in the same manner as other dividend and interest income.
Indemnifications – Under the fund’s organizational documents, its officers and Trustees may be indemnified against certain liabilities and expenses arising out of the performance of their duties to the fund. Additionally, in the normal course of business, the fund enters into agreements with service providers that may contain indemnification clauses. The fund’s maximum exposure under these agreements is unknown as this would involve future claims that may be made against the fund that have not yet occurred.
Investment Transactions and Income – Investment transactions are recorded on the trade date. Interest income is recorded on the accrual basis. Dividends received in cash are recorded on the ex-dividend date. Certain dividends from foreign securities will be
30
Table of Contents
Notes to Financial Statements – continued
recorded when the fund is informed of the dividend if such information is obtained subsequent to the ex-dividend date. Dividend and interest payments received in additional securities are recorded on the ex-dividend or ex-interest date in an amount equal to the value of the security on such date.
The fund may receive proceeds from litigation settlements. Any proceeds received from litigation involving portfolio holdings are reflected in the Statement of Operations in realized gain/loss if the security has been disposed of by the fund or in unrealized gain/loss if the security is still held by the fund. Any other proceeds from litigation not related to portfolio holdings are reflected as other income in the Statement of Operations.
Fees Paid Indirectly – The fund’s custody fee may be reduced by a credit earned under an arrangement that measures the value of U.S. dollars deposited with the custodian by the fund. The amount of the credit, for the year ended October 31, 2017, is shown as a reduction of total expenses in the Statement of Operations.
Reimbursement of Expenses by Custodian – In December 2015, the fund’s custodian (or former custodian), State Street Bank and Trust Company, announced that it intended to reimburse its asset servicing clients for expense amounts that it billed in error during the period 1998 through 2015. The amount of this one-time reimbursement attributable to the fund is reflected as “Reimbursement of custodian expenses” in the Statement of Operations.
Tax Matters and Distributions – The fund intends to qualify as a regulated investment company, as defined under Subchapter M of the Internal Revenue Code, and to distribute all of its taxable income, including realized capital gains. As a result, no provision for federal income tax is required. The fund’s federal tax returns, when filed, will remain subject to examination by the Internal Revenue Service for a three year period. Management has analyzed the fund’s tax positions taken on federal and state tax returns for all open tax years and does not believe that there are any uncertain tax positions that require recognition of a tax liability. Foreign taxes, if any, have been accrued by the fund in the accompanying financial statements in accordance with the applicable foreign tax law. Foreign income taxes may be withheld by certain countries in which the fund invests. Additionally, capital gains realized by the fund on securities issued in or by certain foreign countries may be subject to capital gains tax imposed by those countries.
Distributions to shareholders are recorded on the ex-dividend date. Income and capital gain distributions are determined in accordance with income tax regulations, which may differ from U.S. generally accepted accounting principles. Certain capital accounts in the financial statements are periodically adjusted for permanent differences in order to reflect their tax character. These adjustments have no impact on net assets or net asset value per share. Temporary differences which arise from recognizing certain items of income, expense, gain or loss in different periods for financial statement and tax purposes will reverse at some time in the future. Distributions in excess of net investment income or net realized gains are temporary overdistributions for financial statement purposes resulting from differences in the recognition or classification of income or distributions for financial statement and tax purposes.
31
Table of Contents
Notes to Financial Statements – continued
Book/tax differences primarily relate to wash sale loss deferrals and treating a portion of the proceeds from redemptions as a distribution for tax purposes.
The tax character of distributions declared to shareholders for the last two fiscal years is as follows:
Year ended 10/31/17 | Year ended 10/31/16 | |||||||
| Ordinary income (including any short-term capital gains) | $18,620,315 | $17,750,133 | ||||||
| Long-term capital gains | 19,604,321 | 23,040,223 | ||||||
| Total distributions | $38,224,636 | $40,790,356 | ||||||
The federal tax cost and the tax basis components of distributable earnings were as follows:
| As of 10/31/17 | ||||
| Cost of investments | $2,318,326,018 | |||
| Gross appreciation | 1,062,289,745 | |||
| Gross depreciation | (44,957,707 | ) | ||
| Net unrealized appreciation (depreciation) | $1,017,332,038 | |||
| Undistributed ordinary income | 29,643,167 | |||
| Undistributed long-term capital gains | 60,666,922 | |||
| Other temporary differences | (10,323 | ) | ||
Multiple Classes of Shares of Beneficial Interest – The fund offers multiple classes of shares, which differ in their respective distribution and service fees. The fund’s income, realized and unrealized gain (loss), and common expenses are allocated to shareholders based on the daily net assets of each class. Dividends are declared separately for each class. Differences in per share dividend rates are generally due to differences in separate class expenses. Class B shares will convert to Class A shares approximately eight years after purchase. The fund’s distributions declared to shareholders as reported in the Statements of Changes in Net Assets are presented by class as follows:
| From net investment income | From net realized gain on investments | |||||||||||||||
| Year ended 10/31/17 | Year ended 10/31/16 | Year ended 10/31/17 | Year ended 10/31/16 | |||||||||||||
| Class A | $3,760,511 | $5,042,647 | $5,151,506 | $7,226,867 | ||||||||||||
| Class B | — | 16,608 | 216,973 | 311,442 | ||||||||||||
| Class C | — | 299,486 | 1,381,533 | 1,711,911 | ||||||||||||
| Class I | 7,027,455 | 6,250,486 | 6,555,662 | 6,860,251 | ||||||||||||
| Class R1 | — | 1,015 | 29,616 | 40,904 | ||||||||||||
| Class R2 | 165,770 | 277,569 | 400,968 | 611,633 | ||||||||||||
| Class R3 | 564,314 | 737,499 | 775,062 | 1,080,658 | ||||||||||||
| Class R4 | 964,204 | 1,126,057 | 914,309 | 1,230,561 | ||||||||||||
| Class R6 | 5,567,769 | 3,998,766 | 4,748,984 | 3,965,996 | ||||||||||||
| Total | $18,050,023 | $17,750,133 | $20,174,613 | $23,040,223 | ||||||||||||
32
Table of Contents
Notes to Financial Statements – continued
(3) Transactions with Affiliates
Investment Adviser – The fund has an investment advisory agreement with MFS to provide overall investment management and related administrative services and facilities to the fund. For the period November 1, 2016 through February 27, 2017, the management fee was computed daily and paid monthly at the following annual rates based on the fund’s average daily net assets:
| Up to $1 billion | 0.90 | % | ||
| In excess of $1 billion and up to $2 billion | 0.75 | % | ||
| In excess of $2 billion | 0.65 | % |
The investment adviser had agreed in writing to reduce its management fee to 0.60% of average daily net assets in excess of $5 billion. This written agreement terminated on February 27, 2017. For the period November 1, 2016 through February 27, 2017, the fund’s average daily net assets did not exceed $5 billion and therefore, the management fee was not reduced in accordance with this agreement. Effective February 28, 2017, the management fee is computed daily and paid monthly at the following annual rates based on the fund’s average daily net assets:
| Up to $1 billion | 0.90 | % | ||
| In excess of $1 billion and up to $2 billion | 0.75 | % | ||
| In excess of $2 billion and up to $5 billion | 0.65 | % | ||
| In excess of $5 billion | 0.60 | % |
MFS has also agreed in writing to reduce its management fee by a specified amount if certain MFS mutual fund assets exceed thresholds agreed to by MFS and the fund’s Board of Trustees. For the year ended October 31, 2017, this management fee reduction amounted to $229,052, which is included in the reduction of total expenses in the Statement of Operations. The management fee incurred for the year ended October 31, 2017 was equivalent to an annual effective rate of 0.76% of the fund’s average daily net assets.
Distributor – MFS Fund Distributors, Inc. (MFD), a wholly-owned subsidiary of MFS, as distributor, received $257,819 for the year ended October 31, 2017, as its portion of the initial sales charge on sales of Class A shares of the fund.
The Board of Trustees has adopted a distribution plan for certain share classes pursuant to Rule 12b-1 of the Investment Company Act of 1940.
The fund’s distribution plan provides that the fund will pay MFD for services provided by MFD and financial intermediaries in connection with the distribution and servicing of certain share classes. One component of the plan is a distribution fee paid to MFD and
33
Table of Contents
Notes to Financial Statements – continued
another component of the plan is a service fee paid to MFD. MFD may subsequently pay all, or a portion, of the distribution and/or service fees to financial intermediaries.
Distribution Plan Fee Table:
| Distribution Fee Rate (d) | Service Fee Rate (d) | Total Distribution Plan (d) | Annual Effective Rate (e) | Distribution and Service Fee | ||||||||||||||||
| Class A | — | 0.25% | �� | 0.25% | 0.25% | $1,674,354 | ||||||||||||||
| Class B | 0.75% | 0.25% | 1.00% | 1.00% | 274,462 | |||||||||||||||
| Class C | 0.75% | 0.25% | 1.00% | 1.00% | 1,673,877 | |||||||||||||||
| Class R1 | 0.75% | 0.25% | 1.00% | 1.00% | 32,391 | |||||||||||||||
| Class R2 | 0.25% | 0.25% | 0.50% | 0.50% | 257,240 | |||||||||||||||
| Class R3 | — | 0.25% | 0.25% | 0.25% | 266,042 | |||||||||||||||
| Total Distribution and Service Fees | $4,178,366 | |||||||||||||||||||
| (d) | In accordance with the distribution plan for certain classes, the fund pays distribution and/or service fees equal to these annual percentage rates of each class’s average daily net assets. The distribution and service fee rates disclosed by class represent the current rates in effect at the end of the reporting period. Any rate changes, if applicable, are detailed below. |
| (e) | The annual effective rates represent actual fees incurred under the distribution plan for the year ended October 31, 2017 based on each class’s average daily net assets. MFD has voluntarily agreed to rebate a portion of each class’s 0.25% service fee attributable to accounts for which MFD retains the 0.25% service fee except for accounts attributable to MFS or its affiliates’ seed money. For the year ended October 31, 2017, this rebate amounted to $30,223, $348, and $978 for Class A, Class B, and Class C, respectively, and is included in the reduction of total expenses in the Statement of Operations. |
Certain Class A shares are subject to a contingent deferred sales charge (CDSC) in the event of a shareholder redemption within 18 months of purchase. Class C shares are subject to a CDSC in the event of a shareholder redemption within 12 months of purchase. Class B shares are subject to a CDSC in the event of a shareholder redemption within six years of purchase. All contingent deferred sales charges are paid to MFD and during the year ended October 31, 2017, were as follows:
| Amount | ||||
| Class A | $11,360 | |||
| Class B | 38,716 | |||
| Class C | 21,587 | |||
Shareholder Servicing Agent – MFS Service Center, Inc. (MFSC), a wholly-owned subsidiary of MFS, receives a fee from the fund for its services as shareholder servicing agent calculated as a percentage of the average daily net assets of the fund as determined periodically under the supervision of the fund’s Board of Trustees. For the year ended October 31, 2017, the fee was $256,232, which equated to 0.0087% annually of the fund’s average daily net assets. MFSC also receives payment from the fund for out-of-pocket expenses, sub-accounting and other shareholder servicing costs which may be paid to affiliated and unaffiliated service providers. Class R6 shares do not incur sub-accounting fees. For the year ended October 31, 2017, these out-of-pocket expenses, sub-accounting and other shareholder servicing costs amounted to $2,025,093.
34
Table of Contents
Notes to Financial Statements – continued
Administrator – MFS provides certain financial, legal, shareholder communications, compliance, and other administrative services to the fund. Under an administrative services agreement, the fund reimburses MFS the costs incurred to provide these services. The fund is charged an annual fixed amount of $17,500 plus a fee based on average daily net assets. The administrative services fee incurred for the year ended October 31, 2017 was equivalent to an annual effective rate of 0.0162% of the fund’s average daily net assets.
Trustees’ and Officers’ Compensation – The fund pays compensation to independent Trustees in the form of a retainer, attendance fees, and additional compensation to Board and Committee chairpersons. The fund does not pay compensation directly to Trustees or officers of the fund who are also officers of the investment adviser, all of whom receive remuneration for their services to the fund from MFS. Certain officers and Trustees of the fund are officers or directors of MFS, MFD, and MFSC.
Prior to December 31, 2001, the fund had an unfunded defined benefit plan (“DB plan”) for independent Trustees. As of December 31, 2001, the Board took action to terminate the DB plan with respect to then-current and any future independent Trustees, such that the DB plan covers only certain of those former independent Trustees who retired on or before December 31, 2001. The DB plan resulted in a pension expense of $1,422 and is included in “Independent Trustees’ compensation” in the Statement of Operations for the year ended October 31, 2017. The liability for deferred retirement benefits payable to certain independent Trustees under the DB plan amounted to $5,945 at October 31, 2017, and is included in “Payable for independent Trustees’ compensation” in the Statement of Assets and Liabilities.
Other – This fund and certain other funds managed by MFS (the funds) have entered into a service agreement (the ISO Agreement) which provides for payment of fees solely by the funds to Tarantino LLC in return for the provision of services of an Independent Senior Officer (ISO) for the funds. Frank L. Tarantino serves as the ISO and is an officer of the funds and the sole member of Tarantino LLC. The funds can terminate the ISO Agreement with Tarantino LLC at any time under the terms of the ISO Agreement. For the year ended October 31, 2017, the fee paid by the fund under this agreement was $5,219 and is included in “Miscellaneous” expense in the Statement of Operations. MFS has agreed to bear all expenses associated with office space, other administrative support, and supplies provided to the ISO.
The fund invests in the MFS Institutional Money Market Portfolio which is managed by MFS and seeks current income consistent with preservation of capital and liquidity. This money market fund does not pay a management fee to MFS.
On March 16, 2017, MFS redeemed 131,540 shares of Class I for an aggregate amount of $5,261,584. On September 20, 2017, MFS redeemed 2,623 shares of Class I for an aggregate amount of $114,851.
The fund is permitted to engage in purchase and sale transactions with funds and accounts for which MFS serves as investment adviser or sub-adviser (“cross-trades”) pursuant to a policy adopted by the Board of Trustees. This policy has been designed to ensure that cross-trades conducted by the fund comply with Rule 17a-7 under the Investment Company Act of 1940. Under this policy, cross-trades are effected at current market prices with no remuneration paid in connection with the transaction.
35
Table of Contents
Notes to Financial Statements – continued
During the year ended October 31, 2017, the fund engaged in purchase and sale transactions pursuant to this policy, which amounted to $8,492,315 and $149,107, respectively. The sales transactions resulted in net realized gains (losses) of $25,605.
(4) Portfolio Securities
For the year ended October 31, 2017, purchases and sales of investments, other than short-term obligations, aggregated $686,458,383 and $286,756,397, respectively.
(5) Shares of Beneficial Interest
The fund’s Declaration of Trust permits the Trustees to issue an unlimited number of full and fractional shares of beneficial interest. Transactions in fund shares were as follows:
| Year ended 10/31/17 | Year ended 10/31/16 | |||||||||||||||
| Shares | Amount | Shares | Amount | |||||||||||||
| Shares sold | ||||||||||||||||
Class A | 4,157,193 | $164,714,070 | 5,033,576 | $176,359,278 | ||||||||||||
Class B | 117,063 | 4,292,108 | 107,909 | 3,492,498 | ||||||||||||
Class C | 1,028,696 | 36,433,147 | 1,572,731 | 49,094,334 | ||||||||||||
Class I | 14,304,312 | 572,868,536 | 9,998,276 | 363,575,827 | ||||||||||||
Class R1 | 15,507 | 555,499 | 30,037 | 981,755 | ||||||||||||
Class R2 | 333,352 | 12,902,824 | 395,940 | 13,566,613 | ||||||||||||
Class R3 | 906,019 | 35,571,239 | 1,027,604 | 35,733,919 | ||||||||||||
Class R4 | 911,199 | 36,953,301 | 993,421 | 34,957,939 | ||||||||||||
Class R6 | 12,234,925 | 502,449,112 | 4,010,055 | 144,279,472 | ||||||||||||
| 34,008,266 | $1,366,739,836 | 23,169,549 | $822,041,635 | |||||||||||||
| Shares issued to shareholders in reinvestment of distributions | ||||||||||||||||
Class A | 227,957 | $8,274,844 | 329,831 | $11,273,619 | ||||||||||||
Class B | 6,227 | 209,716 | 9,928 | 315,610 | ||||||||||||
Class C | 36,499 | 1,178,260 | 52,843 | 1,610,123 | ||||||||||||
Class I | 339,346 | 12,616,876 | 331,597 | 11,605,879 | ||||||||||||
Class R1 | 898 | 29,616 | 1,309 | 40,738 | ||||||||||||
Class R2 | 14,260 | 503,670 | 24,537 | 816,336 | ||||||||||||
Class R3 | 37,143 | 1,339,375 | 53,439 | 1,814,793 | ||||||||||||
Class R4 | 50,576 | 1,839,938 | 67,474 | 2,310,986 | ||||||||||||
Class R6 | 269,617 | 10,024,360 | 217,130 | 7,597,374 | ||||||||||||
| 982,523 | $36,016,655 | 1,088,088 | $37,385,458 | |||||||||||||
36
Table of Contents
Notes to Financial Statements – continued
| Year ended 10/31/17 | Year ended 10/31/16 | |||||||||||||||
| Shares | Amount | Shares | Amount | |||||||||||||
| Shares reacquired | ||||||||||||||||
Class A | (6,405,412 | ) | $(249,716,661 | ) | (5,855,874 | ) | $(205,694,182 | ) | ||||||||
Class B | (169,438 | ) | (6,186,487 | ) | (163,324 | ) | (5,278,684 | ) | ||||||||
Class C | (1,280,551 | ) | (44,752,325 | ) | (1,055,755 | ) | (33,001,005 | ) | ||||||||
Class I | (12,121,537 | ) | (506,190,522 | ) | (6,914,717 | ) | (247,749,128 | ) | ||||||||
Class R1 | (35,051 | ) | (1,198,807 | ) | (33,738 | ) | (1,092,517 | ) | ||||||||
Class R2 | (520,055 | ) | (20,015,021 | ) | (622,433 | ) | (21,266,657 | ) | ||||||||
Class R3 | (1,163,615 | ) | (46,056,948 | ) | (1,261,160 | ) | (44,049,280 | ) | ||||||||
Class R4 | (905,642 | ) | (36,748,491 | ) | (1,111,759 | ) | (38,680,418 | ) | ||||||||
Class R6 | (2,696,938 | ) | (108,539,415 | ) | (1,184,001 | ) | (43,065,648 | ) | ||||||||
| (25,298,239 | ) | $(1,019,404,677 | ) | (18,202,761 | ) | $(639,877,519 | ) | |||||||||
| Net change | ||||||||||||||||
Class A | (2,020,262 | ) | $(76,727,747 | ) | (492,467 | ) | $(18,061,285 | ) | ||||||||
Class B | (46,148 | ) | (1,684,663 | ) | (45,487 | ) | (1,470,576 | ) | ||||||||
Class C | (215,356 | ) | (7,140,918 | ) | 569,819 | 17,703,452 | ||||||||||
Class I | 2,522,121 | 79,294,890 | 3,415,156 | 127,432,578 | ||||||||||||
Class R1 | (18,646 | ) | (613,692 | ) | (2,392 | ) | (70,024 | ) | ||||||||
Class R2 | (172,443 | ) | (6,608,527 | ) | (201,956 | ) | (6,883,708 | ) | ||||||||
Class R3 | (220,453 | ) | (9,146,334 | ) | (180,117 | ) | (6,500,568 | ) | ||||||||
Class R4 | 56,133 | 2,044,748 | (50,864 | ) | (1,411,493 | ) | ||||||||||
Class R6 | 9,807,604 | 403,934,057 | 3,043,184 | 108,811,198 | ||||||||||||
| 9,692,550 | $383,351,814 | 6,054,876 | $219,549,574 | |||||||||||||
(6) Line of Credit
The fund and certain other funds managed by MFS participate in a $1.25 billion unsecured committed line of credit, subject to a $1 billion sublimit, provided by a syndication of banks under a credit agreement. Borrowings may be made for temporary financing needs. Interest is charged to each fund, based on its borrowings, generally at a rate equal to the higher of the Overnight Federal Reserve funds rate or daily one month LIBOR plus an agreed upon spread. A commitment fee, based on the average daily, unused portion of the committed line of credit, is allocated among the participating funds at the end of each calendar quarter. In addition, the fund and other funds managed by MFS have established unsecured uncommitted borrowing arrangements with certain banks for temporary financing needs. Interest is charged to each fund, based on its borrowings, at a rate equal to the Overnight Federal Reserve funds rate plus an agreed upon spread. For the year ended October 31, 2017, the fund’s commitment fee and interest expense were $19,006 and $0, respectively, and are included in “Miscellaneous” expense in the Statement of Operations.
37
Table of Contents
Notes to Financial Statements – continued
(7) Investments in Affiliated Issuers
An affiliated issuer may be considered one in which the fund owns 5% or more of the outstanding voting securities, or a company which is under common control. For the purposes of this report, the fund assumes the following to be affiliated issuers:
| Affiliated Issuers | Beginning Shares/Par Amount | Acquisitions Shares/Par Amount | Dispositions Shares/Par Amount | Ending Shares/Par Amount | ||||||||||||||||
| MFS Institutional Money Market Portfolio | 38,360,312 | 544,308,319 | (566,105,889 | ) | 16,562,742 | |||||||||||||||
| Affiliated Issuers | Realized Gain (Loss) | Change in Unrealized Appreciation (Depreciation) | Capital Gain Distributions | Dividend Income | Ending Value | |||||||||||||||
| MFS Institutional Money Market Portfolio | $(3,730 | ) | $1,599 | $— | $333,138 | $16,562,742 | ||||||||||||||
38
Table of Contents
REPORT OF INDEPENDENT REGISTERED PUBLIC ACCOUNTING FIRM
To the Board of Trustees of MFS Series Trust VI and Shareholders of MFS Global Equity Fund:
We have audited the accompanying statement of assets and liabilities, including the portfolio of investments, of MFS Global Equity Fund (the Fund) (one of the series constituting the MFS Series Trust VI) as of October 31, 2017, and the related statement of operations for the year then ended, the statements of changes in net assets for each of the two years in the period then ended and the financial highlights for each of the five years in the period then ended. These financial statements and financial highlights are the responsibility of the Fund’s management. Our responsibility is to express an opinion on these financial statements and financial highlights based on our audits.
We conducted our audits in accordance with the standards of the Public Company Accounting Oversight Board (United States). Those standards require that we plan and perform the audit to obtain reasonable assurance about whether the financial statements and financial highlights are free of material misstatement. We were not engaged to perform an audit of the Fund’s internal control over financial reporting. Our audits included consideration of internal control over financial reporting as a basis for designing audit procedures that are appropriate in the circumstances, but not for the purpose of expressing an opinion on the effectiveness of the Fund’s internal control over financial reporting. Accordingly, we express no such opinion. An audit also includes examining, on a test basis, evidence supporting the amounts and disclosures in the financial statements and financial highlights, assessing the accounting principles used and significant estimates made by management, and evaluating the overall financial statement presentation. Our procedures included confirmation of securities owned as of October 31, 2017, by correspondence with the custodian and others or by other appropriate auditing procedures where replies from others were not received. We believe that our audits provide a reasonable basis for our opinion.
In our opinion, the financial statements and financial highlights referred to above present fairly, in all material respects, the financial position of MFS Global Equity Fund (one of the series constituting the MFS Series Trust VI) at October 31, 2017, the results of its operations for the year then ended, the changes in its net assets for each of the two years in the period then ended and the financial highlights for each of the five years in the period then ended, in conformity with U.S. generally accepted accounting principles.

Boston, Massachusetts
December 15, 2017
39
Table of Contents
TRUSTEES AND OFFICERS — IDENTIFICATION AND BACKGROUND
The Trustees and Officers of the Trust, as of December 1, 2017, are listed below, together with their principal occupations during the past five years. (Their titles may have varied during that period.) The address of each Trustee and Officer is 111 Huntington Avenue, Boston, Massachusetts 02199-7618.
Name, Age | Position(s) Held with Fund | Trustee/Officer Since (h) | Number of | Principal the Past Five Years | Other Directorships | |||||
| INTERESTED TRUSTEES | ||||||||||
| Robert J. Manning (k) (age 54) | Trustee | February 2004 | 136 | Massachusetts Financial Services Company, Executive Chairman (since January 2017); Director; Chairman of the Board; Chief Executive Officer (until 2015); Co-Chief Executive Officer (2015-2016) | N/A | |||||
Robin A. Stelmach (k) (age 56) | Trustee | January 2014 | 136 | Massachusetts Financial Services Company, Vice Chair (since January 2017); Chief Operating Officer and Executive Vice President (until January 2017) | N/A | |||||
| INDEPENDENT TRUSTEES | ||||||||||
| David H. Gunning * (age 75) | Trustee and Chair of Trustees | January 2004 | 136 | Private investor | Lincoln Electric Holdings, Inc., Director; Development Alternatives, Inc., Director/Non-Executive Chairman (until 2013) | |||||
40
Table of Contents
Trustees and Officers – continued
Name, Age | Position(s) Held with Fund | Trustee/Officer Since (h) | Number of | Principal the Past Five Years | Other Directorships | |||||
Steven E. Buller (age 66) | Trustee | February 2014 | 136 | Financial Accounting Standards Advisory Council, Chairman (2014-2015); Public Company Accounting Oversight Board, Standing Advisory Group, Member (until 2014); BlackRock, Inc. (investment management), Managing Director (until 2014), BlackRock Finco UK (investment management), Director (until 2014) | N/A | |||||
John A. Caroselli (age 63) | Trustee | March 2017 | 136 | JC Global Advisors, LLC (management consulting), President (since 2015); First Capital Corporation (commercial finance), Executive Vice President (until 2015) | N/A | |||||
Maureen R. Goldfarb (age 62) | Trustee | January 2009 | 136 | Private investor | N/A | |||||
| Michael Hegarty (age 72) | Trustee | December 2004 | 136 | Private investor | Rouse Properties Inc., Director (until 2016); Capmark Financial Group Inc., Director (until 2015) | |||||
John P. Kavanaugh * (age 63) | Trustee and Vice Chair of Trustees | January 2009 | 136 | Private investor | N/A | |||||
Clarence Otis, Jr. (age 61) | Trustee | March 2017 | 136 | Darden Restaurants, Inc., Chief Executive Officer (until 2014) | VF Corporation, Director; Verizon Communications, Inc., Director; The Travelers Companies, Director; Federal Reserve Bank of Atlanta, Director (until 2015) |
41
Table of Contents
Trustees and Officers – continued
Name, Age | Position(s) Held with Fund | Trustee/Officer Since (h) | Number of | Principal the Past Five Years | Other Directorships | |||||
Maryanne L. Roepke (age 61) | Trustee | May 2014 | 136 | American Century Investments (investment management), Senior Vice President and Chief Compliance Officer (until 2014) | N/A | |||||
| Laurie J. Thomsen (age 60) | Trustee | March 2005 | 136 | Private investor | The Travelers Companies, Director; Dycom Industries, Inc., Director (since 2015) |
Name, Age | Position(s) with Fund | Trustee/Officer Since (h) | Number of | Principal the Past Five Years | ||||
| OFFICERS | ||||||||
| Christopher R. Bohane (k) (age 43) | Assistant Secretary and Assistant Clerk | July 2005 | 136 | Massachusetts Financial Services Company, Vice President and Assistant General Counsel | ||||
Kino Clark (k) (age 49) | Assistant Treasurer | January 2012 | 136 | Massachusetts Financial Services Company, Vice President | ||||
John W. Clark, Jr. (k) (age 50) | Assistant Treasurer | April 2017 | 136 | Massachusetts Financial Services Company, Vice President (since March 2017); Deutsche Bank (financial services), Department Head – Treasurer’s Office (until February 2017) | ||||
Thomas H. Connors (k) (age 58) | Assistant Secretary and Assistant Clerk | September 2012 | 136 | Massachusetts Financial Services Company, Vice President and Senior Counsel; Deutsche Investment Management Americas Inc. (financial service provider), Director and Senior Counsel (until 2012) | ||||
42
Table of Contents
Trustees and Officers – continued
Name, Age | Position(s) with Fund | Trustee/Officer Since (h) | Number of | Principal the Past Five Years | ||||
| Ethan D. Corey (k) (age 54) | Assistant Secretary and Assistant Clerk | July 2005 | 136 | Massachusetts Financial Services Company, Senior Vice President and Associate General Counsel | ||||
| David L. DiLorenzo (k) (age 49) | President | July 2005 | 136 | Massachusetts Financial Services Company, Senior Vice President | ||||
Heidi W. Hardin (k) (age 50) | Secretary and Clerk | April 2017 | 136 | Massachusetts Financial Services Company, Executive Vice President and General Counsel (since March 2017); Harris Associates (investment management), General Counsel (from September 2015 to January 2017); Janus Capital Management LLC (investment management), Senior Vice President and General Counsel (until September 2015) | ||||
Brian E. Langenfeld (k) (age 44) | Assistant Secretary and Assistant Clerk | June 2006 | 136 | Massachusetts Financial Services Company, Vice President and Senior Counsel | ||||
| Susan A. Pereira (k) (age 47) | Assistant Secretary and Assistant Clerk | July 2005 | 136 | Massachusetts Financial Services Company, Vice President and Senior Counsel | ||||
Kasey L. Phillips (k) (age 46) | Assistant Treasurer | September 2012 | 136 | Massachusetts Financial Services Company, Vice President; Wells Fargo Funds Management, LLC, Senior Vice President, Fund Treasurer (until 2012) | ||||
Matthew A. Stowe (k) (age 43) | Assistant Secretary and Assistant Clerk | October 2014 | 136 | Massachusetts Financial Services Company, Vice President and Assistant General Counsel | ||||
| Frank L. Tarantino (age 73) | Independent Senior Officer | June 2004 | 136 | Tarantino LLC (provider of compliance services), Principal | ||||
| Richard S. Weitzel (k) (age 47) | Assistant Secretary and Assistant Clerk | October 2007 | 136 | Massachusetts Financial Services Company, Senior Vice President and Associate General Counsel |
43
Table of Contents
Trustees and Officers – continued
Name, Age | Position(s) with Fund | Trustee/Officer Since (h) | Number of | Principal the Past Five Years | ||||
Martin J. Wolin (k) (age 50) | Chief Compliance Officer | July 2015 | 136 | Massachusetts Financial Services Company, Senior Vice President and Chief Compliance Officer (since July 2015); Mercer (financial service provider), Chief Risk and Compliance Officer, North America and Latin America (until June 2015) | ||||
| James O. Yost (k) (age 57) | Treasurer | September 1990 | 136 | Massachusetts Financial Services Company, Senior Vice President |
| (h) | Date first appointed to serve as Trustee/officer of an MFS Fund. Each Trustee has served continuously since appointment unless indicated otherwise. For the period from December 15, 2004 until February 22, 2005, Mr. Manning served as Advisory Trustee. Prior to January 2012, Messrs. DiLorenzo and Yost served as Assistant Treasurers of the Funds. From January 2012 through December 2016, Messrs. DiLorenzo and Yost served as Treasurer and Deputy Treasurer of the Funds, respectively. |
| (j) | Directorships or trusteeships of companies required to report to the Securities and Exchange Commission (i.e., “public companies”). |
| (k) | “Interested person” of the Trust within the meaning of the Investment Company Act of 1940 (referred to as the 1940 Act), which is the principal federal law governing investment companies like the fund, as a result of a position with MFS. The address of MFS is 111 Huntington Avenue, Boston, Massachusetts 02199-7618. |
| * | As of December 31, 2017, Mr. Gunning will retire as Trustee and Chair of Trustees, and, as of January 1, 2018, Mr. Kavanaugh will become Chair of Trustees. |
Each Trustee has been elected by shareholders and each Trustee and officer holds office until his or her successor is chosen and qualified or until his or her earlier death, resignation, retirement or removal. The Trust does not hold annual meetings for the purpose of electing Trustees, and Trustees are not elected for fixed terms. Under the terms of the Board’s retirement policy, an Independent Trustee shall retire at the end of the calendar year in which he or she reaches the earlier of 75 years of age or 15 years of service on the Board (or, in the case of any Independent Trustee who joined the Board prior to 2015, 20 years of service on the Board).
Messrs. Buller, Kavanaugh and Otis and Ms. Roepke are members of the Trust’s Audit Committee. Effective January 1, 2018, Mr. Kavanaugh is no longer a member of the Trust’s Audit Committee.
Each of the Interested Trustees and certain Officers hold comparable officer positions with certain affiliates of MFS.
44
Table of Contents
Trustees and Officers – continued
The Statement of Additional Information for a Fund includes further information about the Trustees and is available without charge upon request by calling 1-800-225-2606.
| Investment Adviser | Custodian | |
| Massachusetts Financial Services Company 111 Huntington Avenue Boston, MA 02199-7618 | JPMorgan Chase Bank, NA 4 Metrotech Center New York, NY 11245 | |
| Distributor | Independent Registered Public Accounting Firm | |
| MFS Fund Distributors, Inc. 111 Huntington Avenue Boston, MA 02199-7618 | Ernst & Young LLP 200 Clarendon Street | |
| Portfolio Manager(s) | ||
David Mannheim Ryan McAllister Roger Morley |
45
Table of Contents
BOARD REVIEW OF INVESTMENT ADVISORY AGREEMENT
The Investment Company Act of 1940 requires that both the full Board of Trustees and a majority of the non-interested (“independent”) Trustees, voting separately, annually approve the continuation of the Fund’s investment advisory agreement with MFS. The Trustees consider matters bearing on the Fund and its advisory arrangements at their meetings throughout the year, including a review of performance data at each regular meeting. In addition, the independent Trustees met several times over the course of three months beginning in May and ending in July, 2017 (“contract review meetings”) for the specific purpose of considering whether to approve the continuation of the investment advisory agreement for the Fund and the other investment companies that the Board oversees (the “MFS Funds”). The independent Trustees were assisted in their evaluation of the Fund’s investment advisory agreement by independent legal counsel, from whom they received separate legal advice and with whom they met separately from MFS during various contract review meetings. The independent Trustees were also assisted in this process by the MFS Funds’ Independent Senior Officer, a senior officer appointed by and reporting to the independent Trustees.
In connection with their deliberations regarding the continuation of the investment advisory agreement, the Trustees, including the independent Trustees, considered such information and factors as they believed, in light of the legal advice furnished to them and their own business judgment, to be relevant. The investment advisory agreement for the Fund was considered separately, although the Trustees also took into account the common interests of all MFS Funds in their review. As described below, the Trustees considered the nature, quality, and extent of the various investment advisory, administrative, and shareholder services performed by MFS under the existing investment advisory agreement and other arrangements with the Fund.
In connection with their contract review meetings, the Trustees received and relied upon materials that included, among other items: (i) information provided by Broadridge Financial Solutions, Inc. (“Broadridge”), an independent third party, on the investment performance of the Fund for various time periods ended December 31, 2016 and the investment performance of a group of funds with substantially similar investment classifications/objectives (the “Lipper performance universe”), (ii) information provided by Broadridge on the Fund’s advisory fees and other expenses and the advisory fees and other expenses of comparable funds identified by Broadridge (the “Broadridge expense group”), (iii) information provided by MFS on the advisory fees of portfolios of other clients of MFS, including institutional separate accounts and other clients, (iv) information as to whether and to what extent applicable expense waivers, reimbursements or fee “breakpoints” are observed for the Fund, (v) information regarding MFS’ financial results and financial condition, including MFS’ and certain of its affiliates’ estimated profitability from services performed for the Fund and the MFS Funds as a whole, and compared to MFS’ institutional business, (vi) MFS’ views regarding the outlook for the mutual fund industry and the strategic business plans of MFS, (vii) descriptions of various functions performed by MFS for the Funds, such as compliance monitoring and portfolio trading practices, and (viii) information regarding the overall organization of MFS, including information about MFS’ senior management and other personnel providing investment advisory,
46
Table of Contents
Board Review of Investment Advisory Agreement – continued
administrative and other services to the Fund and the other MFS Funds. The comparative performance, fee and expense information prepared and provided by Broadridge was not independently verified and the independent Trustees did not independently verify any information provided to them by MFS.
The Trustees’ conclusion as to the continuation of the investment advisory agreement was based on a comprehensive consideration of all information provided to the Trustees and not the result of any single factor. Some of the factors that figured particularly in the Trustees’ deliberations are described below, although individual Trustees may have evaluated the information presented differently from one another, giving different weights to various factors. It is also important to recognize that the fee arrangements for the Fund and other MFS Funds are the result of years of review and discussion between the independent Trustees and MFS, that certain aspects of such arrangements may receive greater scrutiny in some years than in others, and that the Trustees’ conclusions may be based, in part, on their consideration of these same arrangements during the course of the year and in prior years.
Based on information provided by Broadridge and MFS, the Trustees reviewed the Fund’s total return investment performance as well as the performance of peer groups of funds over various time periods. The Trustees placed particular emphasis on the total return performance of the Fund’s Class A shares in comparison to the performance of funds in its Lipper performance universe over the three-year period ended December 31, 2016, which the Trustees believed was a long enough period to reflect differing market conditions. The total return performance of the Fund’s Class A shares was in the 2nd quintile relative to the other funds in the universe for this three-year period (the 1st quintile being the best performers and the 5th quintile being the worst performers). The total return performance of the Fund’s Class A shares was in the 2nd quintile for the one-year period and the 1st quintile for the five-year period ended December 31, 2016 relative to the Lipper performance universe. Because of the passage of time, these performance results may differ from the performance results for more recent periods, including those shown elsewhere in this report.
In the course of their deliberations, the Trustees took into account information provided by MFS in connection with the contract review meetings, as well as during investment review meetings conducted with portfolio management personnel during the course of the year regarding the Fund’s performance. After reviewing these and related factors, the Trustees concluded, within the context of their overall conclusions regarding the investment advisory agreement, that they were satisfied with MFS’ responses and efforts relating to investment performance.
In assessing the reasonableness of the Fund’s advisory fee, the Trustees considered, among other information, the Fund’s advisory fee and the total expense ratio of the Fund’s Class A shares as a percentage of average daily net assets and the advisory fee and total expense ratios of peer groups of funds based on information provided by Broadridge. The Trustees considered that, according to the data provided by Broadridge (which takes into account any fee reductions or expense limitations that were in effect during the Fund’s last fiscal year), the Fund’s effective advisory fee rate was approximately at the Broadridge expense group median and the Fund’s total expense ratio was lower than the Broadridge expense group median.
47
Table of Contents
Board Review of Investment Advisory Agreement – continued
The Trustees also considered the advisory fees charged by MFS to any institutional separate accounts advised by MFS (“separate accounts”) and unaffiliated investment companies for which MFS serves as subadviser (“subadvised funds”) that have comparable investment strategies to the Fund, if any. In comparing these fees, the Trustees considered information provided by MFS as to the generally broader scope of services provided by MFS to the Fund, as well as the more extensive regulatory burdens imposed on MFS in managing the Fund, in comparison to separate accounts and subadvised funds. The Trustees also considered the higher demands placed on MFS’ investment personnel and trading infrastructure as a result of the daily cash in-flows and out-flows of the Fund in comparison to separate accounts.
The Trustees also considered whether the Fund may benefit from any economies of scale in the management of the Fund in the event of growth in assets of the Fund and/or growth in assets of the MFS Funds as a whole. They noted that the Fund’s advisory fee rate schedule is subject to contractual breakpoints that reduce the Fund’s advisory fee rate on average daily net assets over $1 billion, $2 billion and $5 billion. The Trustees also noted that MFS has agreed in writing to waive a portion of the management fees of certain MFS Funds, including the Fund, if the total combined assets of certain funds within the MFS Funds’ complex increase above agreed upon thresholds (the “group fee waiver”), enabling the Fund’s shareholders to share in the benefits from any economies of scale at the complex level. The group fee waiver is reviewed and renewed annually between the Board and MFS. The Trustees concluded that the breakpoints and the group fee waiver were sufficient to allow the Fund to benefit from economies of scale as its assets and overall complex assets grow.
The Trustees also considered information prepared by MFS relating to MFS’ costs and profits with respect to the Fund, the MFS Funds considered as a group, and other investment companies and accounts advised by MFS, as well as MFS’ methodologies used to determine and allocate its costs to the MFS Funds, the Fund and other accounts and products for purposes of estimating profitability.
After reviewing these and other factors described herein, the Trustees concluded, within the context of their overall conclusions regarding the investment advisory agreement, that the advisory fees charged to the Fund represent reasonable compensation in light of the services being provided by MFS to the Fund.
In addition, the Trustees considered MFS’ resources and related efforts to continue to retain, attract and motivate capable personnel to serve the Fund. The Trustees also considered current and developing conditions in the financial services industry, including the presence of large and well-capitalized companies which are spending, and appear to be prepared to continue to spend, substantial sums to engage personnel and to provide services to competing investment companies. In this regard, the Trustees also considered the financial resources of MFS and its ultimate parent, Sun Life Financial Inc. The Trustees also considered the advantages and possible disadvantages to the Fund of having an adviser that also serves other investment companies as well as other accounts.
The Trustees also considered the nature, quality, cost, and extent of administrative, transfer agency, and distribution services provided to the Fund by MFS and its affiliates under agreements and plans other than the investment advisory agreement, including
48
Table of Contents
Board Review of Investment Advisory Agreement – continued
any 12b-1 fees the Fund pays to MFS Fund Distributors, Inc., an affiliate of MFS. The Trustees also considered the nature, extent and quality of certain other services MFS performs or arranges for on the Fund’s behalf, which may include securities lending programs, directed expense payment programs, class action recovery programs, and MFS’ interaction with third-party service providers, principally custodians and sub-custodians. The Trustees concluded that the various non-advisory services provided by MFS and its affiliates on behalf of the Fund were satisfactory.
The Trustees also considered benefits to MFS from the use of the Fund’s portfolio brokerage commissions, if applicable, to pay for investment research and various other factors. Additionally, the Trustees considered so-called “fall-out benefits” to MFS such as reputational value derived from serving as investment manager to the Fund.
Based on their evaluation of factors that they deemed to be material, including those factors described above, the Board of Trustees, including the independent Trustees, concluded that the Fund’s investment advisory agreement with MFS should be continued for an additional one-year period, commencing August 1, 2017.
49
Table of Contents
PROXY VOTING POLICIES AND INFORMATION
MFS votes proxies on behalf of the fund pursuant to proxy voting policies and procedures that are available without charge, upon request, by calling 1-800-225-2606, by visiting mfs.com/proxyvoting, or by visiting the SEC’s Web site at http://www.sec.gov.
Information regarding how the fund voted proxies relating to portfolio securities during the most recent twelve-month period ended June 30 is available by August 31 of each year without charge by visiting mfs.com/proxyvoting, or by visiting the SEC’s Web site at http://www.sec.gov.
QUARTERLY PORTFOLIO DISCLOSURE
The fund will file a complete schedule of portfolio holdings with the Securities and Exchange Commission (the Commission) for the first and third quarters of each fiscal year on Form N-Q. A shareholder can obtain the quarterly portfolio holdings report at mfs.com. The fund’s Form N-Q is also available on the EDGAR database on the Commission’s Internet Web site at http://www.sec.gov, and may be reviewed and copied at the:
Public Reference Room
Securities and Exchange Commission
100 F Street, NE, Room 1580
Washington, D.C. 20549
Information on the operation of the Public Reference Room may be obtained by calling the Commission at 1-800-SEC-0330. Copies of the fund’s Form N-Q also may be obtained, upon payment of a duplicating fee, by electronic request at the following e-mail address: publicinfo@sec.gov or by writing the Public Reference Section at the above address.
From time to time, MFS may post important information about the fund or the MFS funds on the MFS web site (mfs.com). This information is available at https://www.mfs.com/en-us/what-we-do/announcements.html or at mfs.com/openendfunds by choosing the fund’s name.
50
Table of Contents
INFORMATION ABOUT FUND CONTRACTS AND LEGAL CLAIMS
The fund has entered into contractual arrangements with an investment adviser, administrator, distributor, shareholder servicing agent, 529 program manager (if applicable), and custodian who each provide services to the fund. Unless expressly stated otherwise, shareholders are not parties to, or intended beneficiaries of these contractual arrangements, and these contractual arrangements are not intended to create any shareholder right to enforce them against the service providers or to seek any remedy under them against the service providers, either directly or on behalf of the fund.
Under the Trust’s By-Laws and Declaration of Trust, any claims asserted against or on behalf of the MFS Funds, including claims against Trustees and Officers, must be brought in state and federal courts located within the Commonwealth of Massachusetts.
FEDERAL TAX INFORMATION (unaudited)
The fund will notify shareholders of amounts for use in preparing 2017 income tax forms in January 2018. The following information is provided pursuant to provisions of the Internal Revenue Code.
The fund designates the maximum amount allowable as qualified dividend income eligible to be taxed at the same rate as long-term capital gain.
The fund designates $28,469,000 as capital gain dividends paid during the fiscal year.
For corporate shareholders, 98.86% of the ordinary income dividends paid during the fiscal year qualify for the corporate dividends received deduction.
51
Table of Contents
rev. 3/16
| WHAT DOES MFS DO WITH YOUR PERSONAL INFORMATION? |  | ||
| Why? | Financial companies choose how they share your personal information. Federal law gives consumers the right to limit some but not all sharing. Federal law also requires us to tell you how we collect, share, and protect your personal information. Please read this notice carefully to understand what we do. |
| What? | The types of personal information we collect and share depend on the product or service you have with us. This information can include:
• Social Security number and account balances • Account transactions and transaction history • Checking account information and wire transfer instructions
When you are no longer our customer, we continue to share your information as described in this notice. |
| How? | All financial companies need to share customers’ personal information to run their everyday business. In the section below, we list the reasons financial companies can share their customers’ personal information; the reasons MFS chooses to share; and whether you can limit this sharing. |
| Reasons we can share your personal information | Does MFS share? | Can you limit this sharing? | ||
For our everyday business purposes – such as to process your transactions, maintain your account(s), respond to court orders and legal investigations, or report to credit bureaus | Yes | No | ||
For our marketing purposes – to offer our products and services to you | No | We don’t share | ||
For joint marketing with other financial companies | No | We don’t share | ||
For our affiliates’ everyday business purposes – information about your transactions and experiences | No | We don’t share | ||
For our affiliates’ everyday business purposes – information about your creditworthiness | No | We don’t share | ||
| For nonaffiliates to market to you | No | We don’t share |
| Questions? | Call 800-225-2606 or go to mfs.com. |
52
Table of Contents
| Page 2 |
| Who we are | ||
| Who is providing this notice? | MFS Funds, MFS Investment Management, MFS Institutional Advisors, Inc., and MFS Heritage Trust Company. | |
| What we do | ||
| How does MFS protect my personal information? | To protect your personal information from unauthorized access and use, we use security measures that comply with federal law. These measures include procedural, electronic, and physical safeguards for the protection of the personal information we collect about you. | |
| How does MFS collect my personal information? | We collect your personal information, for example, when you
• open an account or provide account information • direct us to buy securities or direct us to sell your securities • make a wire transfer
We also collect your personal information from others, such as credit bureaus, affiliates, or other companies. | |
| Why can’t I limit all sharing? | Federal law gives you the right to limit only
• sharing for affiliates’ everyday business purposes – information about your creditworthiness • affiliates from using your information to market to you • sharing for nonaffiliates to market to you
State laws and individual companies may give you additional rights to limit sharing. | |
| Definitions | ||
| Affiliates | Companies related by common ownership or control. They can be financial and nonfinancial companies.
• MFS does not share personal information with affiliates, except for everyday business purposes as described on page one of this notice. | |
| Nonaffiliates | Companies not related by common ownership or control. They can be financial and nonfinancial companies.
• MFS does not share with nonaffiliates so they can market to you. | |
| Joint marketing | A formal agreement between nonaffiliated financial companies that together market financial products or services to you.
• MFS doesn’t jointly market. | |
| Other important information | ||
| If you own an MFS product or receive an MFS service in the name of a third party such as a bank or broker-dealer, their privacy policy may apply to you instead of ours. | ||
53
Table of Contents
Save paper with eDelivery.
| MFS® will send you prospectuses, |

reports, and proxies directly via e-mail so you will get information faster with less mailbox clutter.
To sign up:
1. Go to mfs.com.
2. Log in via MFS® Access.
3. Select eDelivery.
If you own your MFS fund shares through a financial institution or a retirement plan, MFS® TALK, MFS® Access, or eDelivery may not be available to you.
WEB SITE
mfs.com
MFS TALK
1-800-637-8255
24 hours a day
ACCOUNT SERVICE AND LITERATURE
Shareholders
1-800-225-2606
Financial advisors
1-800-343-2829
Retirement plan services
1-800-637-1255
MAILING ADDRESS
MFS Service Center, Inc.
P.O. Box 55824
Boston, MA 02205-5824
OVERNIGHT MAIL
MFS Service Center, Inc.
c/o Boston Financial Data Services
30 Dan Road
Canton, MA 02021-2809
Table of Contents
ANNUAL REPORT
October 31, 2017

MFS® GLOBAL TOTAL RETURN FUND

MWT-ANN
Table of Contents
MFS® GLOBAL TOTAL RETURN FUND
The report is prepared for the general information of shareholders.
It is authorized for distribution to prospective investors only when preceded or accompanied by a current prospectus.
NOT FDIC INSURED • MAY LOSE VALUE • NO BANK GUARANTEE
Table of Contents

LETTER FROM THE EXECUTIVE CHAIRMAN
Dear Shareholders:
Despite policy uncertainty accompanying a new presidential administration in the United States and unease over ongoing Brexit negotiations, most markets have proved
resilient. U.S. share prices have reached new highs in recent months although the U.S. Federal Reserve has continued to gradually hike interest rates and has begun to shrink its balance sheet. However, rates in most developed markets remain very low, with major central banks outside of the U.S. just now beginning to contemplate curbing accommodative monetary policies.
Globally, we’ve experienced a year-long synchronized upturn in economic growth. Despite better growth, there are few immediate signs of worrisome inflation amid muted wage gains around the world. Emerging market economies have been boosted in part by
a weaker U.S. dollar and are recovering despite lingering concerns over the potential for restrictive U.S. trade policies. Commodity markets have recovered somewhat in response to solid global demand and robust global trade, though not enough to rekindle inflation fears.
At MFS®, we believe having a disciplined, long-term investment approach through a full market cycle is essential to capturing the best opportunities while also managing risk. In our view, such a strategy, along with the professional guidance of a financial advisor, will help you reach your investment objectives.
Respectfully,

Robert J. Manning
Executive Chairman
MFS Investment Management
December 15, 2017
The opinions expressed in this letter are subject to change and may not be relied upon for investment advice. No forecasts can be guaranteed.
1
Table of Contents
Portfolio structure (i)
| Top ten holdings (i) | ||||
| Philip Morris International, Inc. | 1.5% | |||
| Taiwan Semiconductor Manufacturing Co. Ltd., ADR | 1.5% | |||
| Nestle S.A. | 1.2% | |||
| JPMorgan Chase & Co. | 1.0% | |||
| Johnson & Johnson | 1.0% | |||
| Accenture PLC | 0.9% | |||
| Government of Japan, 1.5%, 3/20/2034 | 0.9% | |||
| Government of Japan, 2.2%, 9/20/2027 | 0.9% | |||
| Schneider Electric S.A. | 0.9% | |||
| Pfizer, Inc. | 0.8% | |||
| Composition including fixed income credit quality (a)(i) | ||||
| AAA | 5.0% | |||
| AA | 2.6% | |||
| A | 7.3% | |||
| BBB | 10.1% | |||
| U.S. Government | 1.6% | |||
| Federal Agencies | 3.1% | |||
| Not Rated | (0.1)% | |||
| Non-Fixed Income | 59.6% | |||
| Cash & Cash Equivalents | 10.6% | |||
| Other | 0.2% | |||
| Equity sectors | ||||
| Financial Services | 12.3% | |||
| Consumer Staples | 10.0% | |||
| Health Care | 7.1% | |||
| Technology | 5.4% | |||
| Industrial Goods & Services | 4.7% | |||
| Special Products & Services | 3.7% | |||
| Basic Materials | 3.7% | |||
| Utilities & Communications | 3.6% | |||
| Energy | 2.9% | |||
| Leisure | 2.3% | |||
| Autos & Housing | 1.9% | |||
| Transportation | 1.2% | |||
| Retailing | 0.8% | |||
| Fixed income sectors (i) | ||||
| Non-U.S. Government Bonds | 11.3% | |||
| Investment Grade Corporates | 10.2% | |||
| Mortgage-Backed Securities | 3.1% | |||
| Emerging Markets Bonds | 1.5% | |||
| U.S. Treasury Securities | 1.4% | |||
| Collateralized Debt Obligations | 0.9% | |||
| Commercial Mortgage-Backed Securities | 0.5% | |||
| Asset-Backed Securities | 0.4% | |||
| High Yield Corporates | 0.2% | |||
| U.S. Government Agencies | 0.1% | |||
2
Table of Contents
Portfolio Composition – continued
| Issuer country weightings (i)(x) | ||||
| United States | 55.5% | |||
| Japan | 7.8% | |||
| United Kingdom | 6.4% | |||
| Switzerland | 4.8% | |||
| France | 3.8% | |||
| Canada | 3.4% | |||
| Germany | 3.2% | |||
| Italy | 1.8% | |||
| Netherlands | 1.8% | |||
| Other Countries | 11.5% | |||
| Currency exposure weightings (i)(y) | ||||
| United States Dollar | 53.8% | |||
| Euro | 15.4% | |||
| Japanese Yen | 10.4% | |||
| British Pound Sterling | 6.0% | |||
| Swiss Franc | 4.8% | |||
| Taiwan Dollar | 1.7% | |||
| Canadian Dollar | 1.7% | |||
| Hong Kong Dollar | 1.0% | |||
| Swedish Krona | 0.9% | |||
| Other Currencies | 4.3% | |||
| (a) | For all securities other than those specifically described below, ratings are assigned to underlying securities utilizing ratings from Moody’s, Fitch, and Standard & Poor’s rating agencies and applying the following hierarchy: If all three agencies provide a rating, the middle rating (after dropping the highest and lowest ratings) is assigned; if two of the three agencies rate a security, the lower of the two is assigned. Ratings are shown in the S&P and Fitch scale (e.g., AAA). Securities rated BBB or higher are considered investment grade. All ratings are subject to change. U.S. Government includes securities issued by the U.S. Department of the Treasury. Federal Agencies includes rated and unrated U.S. Agency fixed-income securities, U.S. Agency mortgage-backed securities, and collateralized mortgage obligations of U.S. Agency mortgage-backed securities. Not Rated includes fixed income securities, including fixed income futures contracts, which have not been rated by any rating agency. Non-Fixed Income includes equity securities (including convertible bonds and equity derivatives) and/or commodity-linked derivatives. The fund may or may not have held all of these instruments on this date. The fund is not rated by these agencies. |
| (i) | For purposes of this presentation, the components include the value of securities, and reflect the impact of the equivalent exposure of derivative positions, if any. These amounts may be negative from time to time. Equivalent exposure is a calculated amount that translates the derivative position into a reasonable approximation of the amount of the underlying asset that the portfolio would have to hold at a given point in time to have the same price sensitivity that results from the portfolio’s ownership of the derivative contract. When dealing with derivatives, equivalent exposure is a more representative measure of the potential impact of a position on portfolio performance than value. The bond component will include any accrued interest amounts. |
| (x) | Represents the portfolio’s exposure to issuer countries as a percentage of a portfolio’s net assets. For purposes of this presentation, United States includes Cash & Cash Equivalents and Other. |
| (y) | Represents the portfolio’s exposure to a particular currency as a percentage of a portfolio’s net assets. For purposes of this presentation, United States Dollar includes Cash & Cash Equivalents and Other. |
Where the fund holds convertible bonds, they are treated as part of the equity portion of the portfolio.
Cash & Cash Equivalents includes any cash, investments in money market funds, short-term securities, and other assets less liabilities. Please see the Statement of Assets and Liabilities for additional information related to the fund’s cash position and other assets and liabilities.
3
Table of Contents
Portfolio Composition – continued
Other includes equivalent exposure from currency derivatives and/or any offsets to derivative positions.
Percentages are based on net assets as of October 31, 2017.
The portfolio is actively managed and current holdings may be different.
4
Table of Contents
Summary of Results
For the twelve months ended October 31, 2017, Class A shares of the MFS Global Total Return Fund (“fund”) provided a total return of 11.88%, at net asset value. This compares with returns of 22.77% and 1.18% for the fund’s benchmarks, the MSCI World Index (net div) and the Bloomberg Barclays Global Aggregate Bond Index (“Bloomberg Index”), respectively. The fund’s other benchmark, the MFS Global Total Return Blended Index (“Blended Index”), generated a total return of 13.72%. The Blended Index reflects the blended returns of the equity and fixed income market indices, with percentage allocations to each index designed to resemble the equity and fixed income allocations of the fund. The market indices and related percentage allocations used to compile the Blended Index are set forth in the Performance Summary.
Market Environment
For the first time in many years, the global economy is experiencing a period of synchronized economic growth. The rebound in emerging markets (“EM”) economies has been more pronounced (despite the slight deceleration in Chinese growth at the end of the period), helped by larger economies, such as Brazil and Russia, emerging from recessions. At the same time, developed markets (“DM”) economies continued to grow at or above potential. Market confidence increased in the US after the presidential elections in November fueled, in part, by a more lenient US regulatory backdrop and hopes for a significant cut in corporate tax rates.
Globally, markets benefited from a reflation trade as commodity prices strengthened, activity and growth prospects improved, and inflation moved higher, though within moderate bounds. As a result, there have been more tightening signals and actions by DM central banks. The US Federal Reserve increased interest rates by 25 basis points during the second half of the period, bringing the total number of quarter-percent hikes in the federal funds rate to four, since December 2015. The European Central Bank announced an extension of its quantitative easing program at the end of the period, but reduced the pace of its monthly asset purchases by half. In addition, the Bank of England hiked its base rate for the first time in a decade, at period’s end. Markets have been comforted, along with central banks, by the decline in fears of a populist surge in Europe after establishment candidates won the Dutch and French elections, though a right-wing populist party gained seats in the German parliament for the first time in the post-World War II era. European growth has reflected a generally calmer political economic backdrop.
In recent months, the US dollar reversed the sharp rise seen early in the period, easing what had been a substantial headwind to earnings for multinationals. US consumer spending held up well during the second half of the period amid a modest increase in real wages and relatively low gasoline prices. However, demand for autos cooled from the record level logged early in the period, while the housing market contends with below-average inventory levels which have weighed on sales. Global trade, which was sluggish early in the period, showed signs of improvement in the period’s second half, a positive indicator of global economic activity and prospects. Early in the period, the US election resulted in a sell-off in EM assets due to fears that President Trump would
5
Table of Contents
Management Review – continued
follow through on various campaign threats and promises that were judged to be detrimental to EM. While President Trump withdrew the US from the Trans-Pacific Partnership and began the renegotiation of the North American Free Trade Agreement, significant additional policy action has so far been lacking on economic issues involving EM. As a result, EM resumed their upward trajectory, powered by strong inflows throughout 2017.
Detractors from Performance
Within the equity portion of the fund, an overweight position in the consumer staples sector detracted from performance relative to the MSCI World Index. Within this sector, the fund’s overweight positions in global food company General Mills and tobacco companies Japan Tobacco (Japan) and Philip Morris International held back relative results. Shares of General Mills depreciated as the company reported weaker-than-expected results with sales and gross margins coming in below consensus estimates. Management also reduced its earnings guidance for 2018, which further pressured the stock.
Elsewhere, not holding a position in computer and personal electronics maker Apple and software giant Microsoft hindered relative performance. Shares of Apple advanced during the reporting period on the back of well-anticipated new product launches, including the iPhone 8, iPhone 8 Plus and iPhone X. In addition, the fund’s overweight positions in telecommunications company KDDI (Japan), drugstore retailer CVS Health Corp, supply chain support services and information management solutions company Brambles (Australia), marketing and corporate communications services firm Omnicom Group and logistics company Yamato Holdings (Japan) weighed on relative results.
Within the fixed income portion of the fund, the fund’s cash and/or cash equivalents position during the period was a detractor from performance relative to the Bloomberg Index. Security selection within US-based bonds, particularly industrials, further held back relative results.
Contributors to Performance
Within the equity portion of the fund, stock selection in the autos & housing sector contributed to performance relative to the MSCI World Index. However, there were no individual stocks within this sector that were among the fund’s largest relative contributors during the reporting period.
Elsewhere, avoiding shares of diversified industrial conglomerate General Electric contributed to relative returns. Shares of General Electric depreciated during the period following a cut to earnings guidance for full-year 2017 and after the company posted below-consensus estimate revenues, late in the period, following weak results in the company’s Power and Oil & Gas segments. In addition, the fund’s position in electronics manufacturers Taiwan Semiconductor (b) (Taiwan) and Samsung Electronics (b) (South Korea), and in airline company Air Canada (b) (Canada), aided relative performance. Shares of Taiwan Semiconductor rose as revenues exceeded consensus estimates, driven by improved utilization, growth in NVIDIA graphics processing units (GPUs) and strong demand for the company’s 28 nanometer product. Additionally, overweighting integrated circuits and electronic devices developer Cadence Design Systems, diversified technology company 3M, computer graphics
6
Table of Contents
Management Review – continued
processors maker NVIDIA (h), electronics manufacturer Texas Instruments and global financial services firm JPMorgan Chase, and an underweight position in telecommunication services provider AT&T (h), bolstered relative results.
Within the fixed income portion of the fund, a lesser exposure to US Treasury bonds, and a greater exposure to the industrials sector, contributed to performance relative to the Bloomberg Index.
Respectfully,
Portfolio Manager(s)
Nevin Chitkara, Pablo De La Mata, Pilar Gomez-Bravo, Steven Gorham, Richard Hawkins, Vipin Narula, Robert Persons, Jonathan Sage, Robert Spector, Benjamin Stone, and Erik Weisman
| (b) | Security is not a benchmark constituent. |
| (h) | Security was not held in the portfolio at period end. |
Note to Shareholders: Effective October 1, 2017, Vipin Narula became a Portfolio Manager of the Fund.
The views expressed in this report are those of the portfolio manager(s) only through the end of the period of the report as stated on the cover and do not necessarily reflect the views of MFS or any other person in the MFS organization. These views are subject to change at any time based on market or other conditions, and MFS disclaims any responsibility to update such views. These views may not be relied upon as investment advice or an indication of trading intent on behalf of any MFS portfolio. References to specific securities are not recommendations of such securities, and may not be representative of any MFS portfolio’s current or future investments.
7
Table of Contents
PERFORMANCE SUMMARY THROUGH 10/31/17
The following chart illustrates a representative class of the fund’s historical performance in comparison to its benchmark(s). Performance results include the deduction of the maximum applicable sales charge and reflect the percentage change in net asset value, including reinvestment of dividends and capital gains distributions. The performance of other share classes will be greater than or less than that of the class depicted below. Benchmarks are unmanaged and may not be invested in directly. Benchmark returns do not reflect sales charges, commissions or expenses. (See Notes to Performance Summary.)
Performance data shown represents past performance and is no guarantee of future results. Investment return and principal value fluctuate so your shares, when sold, may be worth more or less than the original cost; current performance may be lower or higher than quoted. The performance shown does not reflect the deduction of taxes, if any, that a shareholder would pay on fund distributions or the redemption of fund shares.
Growth of a Hypothetical $10,000 Investment
8
Table of Contents
Performance Summary – continued
Total Returns through 10/31/17
Average annual without sales charge
| Share Class | Class Inception Date | 1-yr | 5-yr | 10-yr | Life (t) | |||||||||
| A | 9/04/90 | 11.88% | 7.23% | 5.02% | N/A | |||||||||
| B | 9/07/93 | 11.11% | 6.43% | 4.26% | N/A | |||||||||
| C | 1/03/94 | 11.03% | 6.42% | 4.25% | N/A | |||||||||
| I | 1/02/97 | 12.16% | 7.49% | 5.30% | N/A | |||||||||
| R1 | 4/01/05 | 11.09% | 6.43% | 4.25% | N/A | |||||||||
| R2 | 10/31/03 | 11.59% | 6.95% | 4.77% | N/A | |||||||||
| R3 | 4/01/05 | 11.94% | 7.24% | 5.04% | N/A | |||||||||
| R4 | 4/01/05 | 12.20% | 7.50% | 5.30% | N/A | |||||||||
| R6 | 6/01/12 | 12.33% | 7.60% | N/A | 8.55% | |||||||||
| Comparative benchmark(s) | ||||||||||||||
| MSCI World Index (net div) (f) | 22.77% | 11.56% | 4.10% | N/A | ||||||||||
| MFS Global Total Return Blended Index (f)(w) | 13.72% | 7.10% | 3.99% | N/A | ||||||||||
| Bloomberg Barclays Global Aggregate Bond Index (f) | 1.18% | 0.43% | 3.11% | N/A | ||||||||||
| Average annual with sales charge | ||||||||||||||
| A With Initial Sales Charge (5.75%) | 5.45% | 5.97% | 4.40% | N/A | ||||||||||
| B With CDSC (Declining over six years from 4% to 0%) (v) | 7.11% | 6.11% | 4.26% | N/A | ||||||||||
| C With CDSC (1% for 12 months) (v) | 10.03% | 6.42% | 4.25% | N/A | ||||||||||
CDSC – Contingent Deferred Sales Charge.
Class I, R1, R2, R3, R4, and R6 shares do not have a sales charge.
| (f) | Source: FactSet Research Systems Inc. |
| (t) | For the period from the class inception date through the stated period end (for those share classes with less than 10 years of performance history). No comparative benchmark performance information is provided for “life” periods. (See Notes to Performance Summary.) |
| (v) | Assuming redemption at the end of the applicable period. |
| (w) | As of October 31, 2017, the MFS Global Total Return Blended Index was comprised of 60% MSCI World Index (net div) and 40% Bloomberg Barclays Global Aggregate Bond Index. |
Benchmark Definition(s)
Bloomberg Barclays Global Aggregate Bond Index – provides a broad-based measure of the global investment-grade fixed income markets. The three major components of this index are the U.S. Aggregate, the Pan-European Aggregate, and the Asian-Pacific Aggregate Indices. The index also includes Eurodollar and Euro-Yen corporate bonds, Canadian government, agency and corporate securities, and USD investment grade 144A securities.
9
Table of Contents
Performance Summary – continued
MSCI World Index (net div) – a market capitalization-weighted index that is designed to measure equity market performance in the global developed markets.
It is not possible to invest directly in an index.
Notes to Performance Summary
Average annual total return represents the average annual change in value for each share class for the periods presented. Life returns are presented where the share class has less than 10 years of performance history and represent the average annual total return from the class inception date to the stated period end date. As the fund’s share classes may have different inception dates, the life returns may represent different time periods and may not be comparable. As a result, no comparative benchmark performance information is provided for life periods.
Performance results reflect any applicable expense subsidies and waivers in effect during the periods shown. Without such subsidies and waivers the fund’s performance results would be less favorable. Please see the prospectus and financial statements for complete details.
Performance results do not include adjustments made for financial reporting purposes in accordance with U.S. generally accepted accounting principles and may differ from amounts reported in the financial highlights.
From time to time the fund may receive proceeds from litigation settlements, without which performance would be lower.
10
Table of Contents
Fund expenses borne by the shareholders during the period, May 1, 2017 through October 31, 2017
As a shareholder of the fund, you incur two types of costs: (1) transaction costs, including sales charges (loads) on certain purchase or redemption payments, and (2) ongoing costs, including management fees; distribution and service (12b-1) fees; and other fund expenses. This example is intended to help you understand your ongoing costs (in dollars) of investing in the fund and to compare these costs with the ongoing costs of investing in other mutual funds.
The example is based on an investment of $1,000 invested at the beginning of the period and held for the entire period May 1, 2017 through October 31, 2017.
Actual Expenses
The first line for each share class in the following table provides information about actual account values and actual expenses. You may use the information in this line, together with the amount you invested, to estimate the expenses that you paid over the period. Simply divide your account value by $1,000 (for example, an $8,600 account value divided by $1,000 = 8.6), then multiply the result by the number in the first line under the heading entitled “Expenses Paid During Period” to estimate the expenses you paid on your account during this period.
Hypothetical Example for Comparison Purposes
The second line for each share class in the following table provides information about hypothetical account values and hypothetical expenses based on the fund’s actual expense ratio and an assumed rate of return of 5% per year before expenses, which is not the fund’s actual return. The hypothetical account values and expenses may not be used to estimate the actual ending account balance or expenses you paid for the period. You may use this information to compare the ongoing costs of investing in the fund and other funds. To do so, compare this 5% hypothetical example with the 5% hypothetical examples that appear in the shareholder reports of the other funds.
Please note that the expenses shown in the table are meant to highlight your ongoing costs only and do not reflect any transactional costs, such as sales charges (loads). Therefore, the second line for each share class in the table is useful in comparing ongoing costs only, and will not help you determine the relative total costs of owning different funds. In addition, if these transactional costs were included, your costs would have been higher.
11
Table of Contents
Expense Table – continued
| Share Class | Annualized Expense Ratio | Beginning Account Value 5/01/17 | Ending Account Value 10/31/17 | Expenses Paid During Period (p) | ||||||||||||||
| A | Actual | 1.09% | $1,000.00 | $1,066.00 | $5.68 | |||||||||||||
| Hypothetical (h) | 1.09% | $1,000.00 | $1,019.71 | $5.55 | ||||||||||||||
| B | Actual | 1.84% | $1,000.00 | $1,062.49 | $9.57 | |||||||||||||
| Hypothetical (h) | 1.84% | $1,000.00 | $1,015.93 | $9.35 | ||||||||||||||
| C | Actual | 1.84% | $1,000.00 | $1,062.32 | $9.56 | |||||||||||||
| Hypothetical (h) | 1.84% | $1,000.00 | $1,015.93 | $9.35 | ||||||||||||||
| I | Actual | 0.84% | $1,000.00 | $1,067.39 | $4.38 | |||||||||||||
| Hypothetical (h) | 0.84% | $1,000.00 | $1,020.97 | $4.28 | ||||||||||||||
| R1 | Actual | 1.84% | $1,000.00 | $1,062.11 | $9.56 | |||||||||||||
| Hypothetical (h) | 1.84% | $1,000.00 | $1,015.93 | $9.35 | ||||||||||||||
| R2 | Actual | 1.34% | $1,000.00 | $1,064.67 | $6.97 | |||||||||||||
| Hypothetical (h) | 1.34% | $1,000.00 | $1,018.45 | $6.82 | ||||||||||||||
| R3 | Actual | 1.09% | $1,000.00 | $1,066.25 | $5.68 | |||||||||||||
| Hypothetical (h) | 1.09% | $1,000.00 | $1,019.71 | $5.55 | ||||||||||||||
| R4 | Actual | 0.84% | $1,000.00 | $1,067.83 | $4.38 | |||||||||||||
| Hypothetical (h) | 0.84% | $1,000.00 | $1,020.97 | $4.28 | ||||||||||||||
| R6 | Actual | 0.74% | $1,000.00 | $1,067.86 | $3.86 | |||||||||||||
| Hypothetical (h) | 0.74% | $1,000.00 | $1,021.48 | $3.77 | ||||||||||||||
| (h) | 5% class return per year before expenses. |
| (p) | “Expenses Paid During Period” are equal to each class’s annualized expense ratio, as shown above, multiplied by the average account value over the period, multiplied by 184/365 (to reflect the one-half year period). Expenses paid do not include any applicable sales charges (loads). If these transaction costs had been included, your costs would have been higher. |
12
Table of Contents
10/31/17
The Portfolio of Investments is a complete list of all securities owned by your fund. It is categorized by broad-based asset classes.
| Common Stocks - 58.9% | ||||||||
| Issuer | Shares/Par | Value ($) | ||||||
| Aerospace - 1.9% | ||||||||
| Boeing Co. | 20,570 | $ | 5,306,649 | |||||
| Honeywell International, Inc. | 109,286 | 15,754,670 | ||||||
| Lockheed Martin Corp. | 47,639 | 14,680,434 | ||||||
| United Technologies Corp. | 43,596 | 5,221,057 | ||||||
|
| |||||||
| $ | 40,962,810 | |||||||
| Airlines - 0.4% | ||||||||
| Air Canada (a) | 409,111 | $ | 8,105,478 | |||||
| Alcoholic Beverages - 1.1% | ||||||||
| Heineken N.V. | 116,818 | $ | 11,384,072 | |||||
| Pernod Ricard S.A. | 81,515 | 12,225,166 | ||||||
|
| |||||||
| $ | 23,609,238 | |||||||
| Apparel Manufacturers - 0.2% | ||||||||
| Compagnie Financiere Richemont S.A. | 51,598 | $ | 4,758,198 | |||||
| Automotive - 1.0% | ||||||||
| Delphi Automotive PLC | 49,862 | $ | 4,955,286 | |||||
| General Motors Co. | 140,216 | 6,026,484 | ||||||
| Hyundai Motor Co. | 10,535 | 1,513,933 | ||||||
| Magna International, Inc. | 105,299 | 5,744,472 | ||||||
| USS Co. Ltd. | 120,000 | 2,427,204 | ||||||
|
| |||||||
| $ | 20,667,379 | |||||||
| Biotechnology - 0.1% | ||||||||
| Celgene Corp. (a) | 28,723 | $ | 2,900,161 | |||||
| Broadcasting - 0.6% | ||||||||
| Omnicom Group, Inc. | 99,475 | $ | 6,683,725 | |||||
| WPP Group PLC | 377,634 | 6,690,738 | ||||||
|
| |||||||
| $ | 13,374,463 | |||||||
| Brokerage & Asset Managers - 0.6% | ||||||||
| Apollo Global Management LLC | 33,930 | $ | 1,071,509 | |||||
| BlackRock, Inc. | 19,459 | 9,161,881 | ||||||
| Daiwa Securities Group, Inc. | 318,000 | 1,993,825 | ||||||
|
| |||||||
| $ | 12,227,215 | |||||||
13
Table of Contents
Portfolio of Investments – continued
| Issuer | Shares/Par | Value ($) | ||||||
| Common Stocks - continued | ||||||||
| Business Services - 3.7% | ||||||||
| Accenture PLC, “A” | 141,202 | $ | 20,101,517 | |||||
| Bunzl PLC | 183,424 | 5,712,762 | ||||||
| Compass Group PLC | 559,936 | 12,293,013 | ||||||
| DXC Technology Co. | 102,275 | 9,360,208 | ||||||
| Equifax, Inc. | 23,763 | 2,578,998 | ||||||
| Experian Group Ltd. | 229,142 | 4,826,752 | ||||||
| Fidelity National Information Services, Inc. | 50,759 | 4,708,405 | ||||||
| Nomura Research Institute Ltd. | 195,100 | 8,302,941 | ||||||
| Secom Co. Ltd. | 93,800 | 7,122,103 | ||||||
| SGS S.A. | 2,009 | 4,961,836 | ||||||
|
| |||||||
| $ | 79,968,535 | |||||||
| Cable TV - 0.6% | ||||||||
| Comcast Corp., “A” | 367,606 | $ | 13,244,844 | |||||
| Chemicals - 2.2% | ||||||||
| 3M Co. | 69,262 | $ | 15,943,420 | |||||
| Givaudan S.A. | 4,560 | 10,183,611 | ||||||
| LyondellBasell Industries N.V., “A” | 17,210 | 1,781,751 | ||||||
| Monsanto Co. | 21,441 | 2,596,505 | ||||||
| Orica Ltd. | 194,375 | 3,113,348 | ||||||
| PPG Industries, Inc. | 118,995 | 13,831,979 | ||||||
|
| |||||||
| $ | 47,450,614 | |||||||
| Computer Software - 0.8% | ||||||||
| Cadence Design Systems, Inc. (a) | 275,379 | $ | 11,885,358 | |||||
| Check Point Software Technologies Ltd. (a) | 48,418 | 5,699,283 | ||||||
|
| |||||||
| $ | 17,584,641 | |||||||
| Computer Software - Systems - 1.0% | ||||||||
| Amadeus IT Group S.A. | 145,622 | $ | 9,880,818 | |||||
| Hitachi Ltd. | 263,000 | 2,092,783 | ||||||
| Hon Hai Precision Industry Co. Ltd. | 1,360,500 | 5,075,286 | ||||||
| International Business Machines Corp. | 35,722 | 5,503,331 | ||||||
|
| |||||||
| $ | 22,552,218 | |||||||
| Construction - 0.9% | ||||||||
| Geberit AG | 6,400 | $ | 2,897,048 | |||||
| Owens Corning | 38,833 | 3,211,101 | ||||||
| Persimmon PLC | 78,390 | 2,917,265 | ||||||
| Sherwin-Williams Co. | 17,911 | 7,077,532 | ||||||
| Stanley Black & Decker, Inc. | 16,019 | 2,587,869 | ||||||
|
| |||||||
| $ | 18,690,815 | |||||||
14
Table of Contents
Portfolio of Investments – continued
| Issuer | Shares/Par | Value ($) | ||||||
| Common Stocks - continued | ||||||||
| Consumer Products - 2.1% | ||||||||
| Coty, Inc., “A” | 119,956 | $ | 1,847,322 | |||||
| Essity AB (a) | 108,872 | 3,255,112 | ||||||
| Kao Corp. | 218,700 | 13,223,835 | ||||||
| Procter & Gamble Co. | 157,918 | 13,634,640 | ||||||
| Reckitt Benckiser Group PLC | 150,906 | 13,498,677 | ||||||
|
| |||||||
| $ | 45,459,586 | |||||||
| Containers - 0.3% | ||||||||
| Brambles Ltd. | 731,310 | $ | 5,299,625 | |||||
| Crown Holdings, Inc. (a) | 29,377 | 1,767,614 | ||||||
|
| |||||||
| $ | 7,067,239 | |||||||
| Electrical Equipment - 2.1% | ||||||||
| IMI PLC | 107,732 | $ | 1,748,490 | |||||
| Johnson Controls International PLC | 257,114 | 10,641,948 | ||||||
| Legrand S.A. | 82,051 | 6,094,952 | ||||||
| OMRON Corp. | 96,700 | 5,396,331 | ||||||
| Schneider Electric S.A. | 216,887 | 19,061,750 | ||||||
| Spectris PLC | 70,936 | 2,411,869 | ||||||
|
| |||||||
| $ | 45,355,340 | |||||||
| Electronics - 3.4% | ||||||||
| Analog Devices, Inc. | 44,742 | $ | 4,084,945 | |||||
| Halma PLC | 233,080 | 3,659,061 | ||||||
| Hirose Electric Co. Ltd. | 29,145 | 4,393,085 | ||||||
| Intel Corp. | 103,164 | 4,692,930 | ||||||
| Samsung Electronics Co. Ltd. | 3,290 | 8,098,905 | ||||||
| Taiwan Semiconductor Manufacturing Co. Ltd., ADR | 738,490 | 31,260,282 | ||||||
| Texas Instruments, Inc. | 166,586 | 16,107,200 | ||||||
|
| |||||||
| $ | 72,296,408 | |||||||
| Energy - Independent - 0.7% | ||||||||
| Occidental Petroleum Corp. | 56,834 | $ | 3,669,771 | |||||
| Phillips 66 | 72,110 | 6,567,779 | ||||||
| Valero Energy Corp. | 61,930 | 4,885,658 | ||||||
|
| |||||||
| $ | 15,123,208 | |||||||
| Energy - Integrated - 1.8% | ||||||||
| BP PLC | 928,810 | $ | 6,293,822 | |||||
| Chevron Corp. | 39,922 | 4,626,561 | ||||||
| China Petroleum & Chemical Corp. | 4,624,000 | 3,396,252 | ||||||
| Exxon Mobil Corp. | 135,015 | 11,253,500 | ||||||
| Galp Energia SGPS S.A. | 241,437 | 4,488,557 | ||||||
| LUKOIL PJSC, ADR | 74,816 | 3,972,730 | ||||||
15
Table of Contents
Portfolio of Investments – continued
| Issuer | Shares/Par | Value ($) | ||||||
| Common Stocks - continued | ||||||||
| Energy - Integrated - continued | ||||||||
| Suncor Energy, Inc. | 143,042 | $ | 4,856,398 | |||||
|
| |||||||
| $ | 38,887,820 | |||||||
| Engineering - Construction - 0.4% | ||||||||
| Bouygues | 79,146 | $ | 3,799,743 | |||||
| VINCI S.A. (l) | 44,438 | 4,350,731 | ||||||
|
| |||||||
| $ | 8,150,474 | |||||||
| Entertainment - 0.1% | ||||||||
| Time Warner, Inc. | 25,285 | $ | 2,485,263 | |||||
| Food & Beverages - 2.8% | ||||||||
| Danone S.A. | 80,024 | $ | 6,538,167 | |||||
| General Mills, Inc. | 168,752 | 8,761,604 | ||||||
| J.M. Smucker Co. | 25,237 | 2,676,384 | ||||||
| Marine Harvest A.S.A. | 354,305 | 6,918,664 | ||||||
| Nestle S.A. | 307,202 | 25,834,960 | ||||||
| P/f Bakkafrost | 25,693 | 1,147,818 | ||||||
| Tyson Foods, Inc., “A” | 99,429 | 7,249,368 | ||||||
|
| |||||||
| $ | 59,126,965 | |||||||
| Food & Drug Stores - 0.4% | ||||||||
| CVS Health Corp. | 59,711 | $ | 4,091,995 | |||||
| Wesfarmers Ltd. | 116,505 | 3,734,852 | ||||||
|
| |||||||
| $ | 7,826,847 | |||||||
| Forest & Paper Products - 0.1% | ||||||||
| Svenska Cellulosa Aktiebolaget | 147,160 | $ | 1,381,660 | |||||
| Gaming & Lodging - 0.2% | ||||||||
| Sands China Ltd. | 709,600 | $ | 3,342,708 | |||||
| Health Maintenance Organizations - 0.2% | ||||||||
| Cigna Corp. | 25,414 | $ | 5,012,149 | |||||
| Insurance - 3.8% | ||||||||
| Aon PLC | 99,900 | $ | 14,328,657 | |||||
| Athene Holding Ltd. (a) | 69,450 | 3,620,429 | ||||||
| Chubb Ltd. | 50,921 | 7,679,905 | ||||||
| Fairfax Financial Holdings Ltd. | 15,435 | 8,128,590 | ||||||
| Hiscox Ltd. | 135,808 | 2,575,732 | ||||||
| Legal & General Group PLC | 594,385 | 2,107,785 | ||||||
| MetLife, Inc. | 220,424 | 11,810,318 | ||||||
| Prudential Financial, Inc. | 44,678 | 4,935,132 | ||||||
16
Table of Contents
Portfolio of Investments – continued
| Issuer | Shares/Par | Value ($) | ||||||
| Common Stocks - continued | ||||||||
| Insurance - continued | ||||||||
| Travelers Cos., Inc. | 96,557 | $ | 12,788,975 | |||||
| Zurich Insurance Group AG | 42,354 | 12,927,172 | ||||||
|
| |||||||
| $ | 80,902,695 | |||||||
| Machinery & Tools - 0.3% | ||||||||
| Illinois Tool Works, Inc. | 42,178 | $ | 6,601,701 | |||||
| Major Banks - 5.0% | ||||||||
| Bank of New York Mellon Corp. | 160,111 | $ | 8,237,711 | |||||
| BNP Paribas | 56,175 | 4,386,792 | ||||||
| China Construction Bank | 9,999,000 | 8,920,583 | ||||||
| Goldman Sachs Group, Inc. | 30,742 | 7,454,320 | ||||||
| JPMorgan Chase & Co. | 222,317 | 22,367,313 | ||||||
| PNC Financial Services Group, Inc. | 40,122 | 5,488,288 | ||||||
| Royal Bank of Canada | 61,829 | 4,831,936 | ||||||
| State Street Corp. | 66,917 | 6,156,364 | ||||||
| Sumitomo Mitsui Financial Group, Inc. | 51,200 | 2,060,215 | ||||||
| Svenska Handelsbanken AB | 770,175 | 11,039,759 | ||||||
| UBS Group AG | 638,363 | 10,864,936 | ||||||
| Wells Fargo & Co. | 275,908 | 15,489,475 | ||||||
|
| |||||||
| $ | 107,297,692 | |||||||
| Medical & Health Technology & Services - 0.4% | ||||||||
| McKesson Corp. | 65,260 | $ | 8,998,049 | |||||
| Medical Equipment - 1.5% | ||||||||
| Abbott Laboratories | 179,921 | $ | 9,757,116 | |||||
| Danaher Corp. | 73,547 | 6,786,182 | ||||||
| Medtronic PLC | 143,374 | 11,544,474 | ||||||
| Thermo Fisher Scientific, Inc. | 19,996 | 3,875,825 | ||||||
|
| |||||||
| $ | 31,963,597 | |||||||
| Metals & Mining - 0.5% | ||||||||
| Rio Tinto PLC | 240,089 | $ | 11,315,251 | |||||
| Natural Gas - Distribution - 0.3% | ||||||||
| ENGIE | 402,110 | $ | 6,796,453 | |||||
| Natural Gas - Pipeline - 0.1% | ||||||||
| Williams Partners LP | 73,818 | $ | 2,734,219 | |||||
| Network & Telecom - 0.2% | ||||||||
| Cisco Systems, Inc. | 132,564 | $ | 4,527,061 | |||||
17
Table of Contents
Portfolio of Investments – continued
| Issuer | Shares/Par | Value ($) | ||||||
| Common Stocks - continued | ||||||||
| Oil Services - 0.4% | ||||||||
| Schlumberger Ltd. | 131,466 | $ | 8,413,824 | |||||
| Other Banks & Diversified Financials - 1.6% | ||||||||
| Agricultural Bank of China | 2,888,000 | $ | 1,358,597 | |||||
| American Express Co. | 51,114 | 4,882,409 | ||||||
| Barclays Africa Group Ltd. | 170,800 | 1,692,930 | ||||||
| Citigroup, Inc. | 79,433 | 5,838,326 | ||||||
| DBS Group Holdings Ltd. | 138,500 | 2,314,599 | ||||||
| ING Groep N.V. | 384,696 | 7,107,074 | ||||||
| U.S. Bancorp | 209,847 | 11,411,480 | ||||||
|
| |||||||
| $ | 34,605,415 | |||||||
| Pharmaceuticals - 4.8% | ||||||||
| Bayer AG | 127,321 | $ | 16,566,212 | |||||
| Eli Lilly & Co. | 117,381 | 9,618,199 | ||||||
| Johnson & Johnson | 159,860 | 22,286,083 | ||||||
| Merck & Co., Inc. | 96,558 | 5,319,380 | ||||||
| Novartis AG | 131,518 | 10,836,245 | ||||||
| Pfizer, Inc. | 504,871 | 17,700,777 | ||||||
| Roche Holding AG | 64,109 | 14,811,933 | ||||||
| Santen Pharmaceutical Co. Ltd. | 364,600 | 5,802,929 | ||||||
|
| |||||||
| $ | 102,941,758 | |||||||
| Printing & Publishing - 0.8% | ||||||||
| Moody’s Corp. | 48,426 | $ | 6,896,347 | |||||
| RELX N.V. | 234,762 | 5,302,438 | ||||||
| Thomson Reuters Corp. | 91,833 | 4,301,458 | ||||||
|
| |||||||
| $ | 16,500,243 | |||||||
| Railroad & Shipping - 0.2% | ||||||||
| Canadian National Railway Co. | 32,902 | $ | 2,648,282 | |||||
| Union Pacific Corp. | 23,291 | 2,696,865 | ||||||
|
| |||||||
| $ | 5,345,147 | |||||||
| Real Estate - 1.4% | ||||||||
| CK Asset Holdings Ltd. | 589,000 | $ | 4,843,278 | |||||
| Deutsche Wohnen SE | 354,963 | 15,118,847 | ||||||
| Medical Properties Trust, Inc., REIT | 333,732 | 4,415,274 | ||||||
| Public Storage, Inc., REIT | 9,728 | 2,016,128 | ||||||
| Realogy Holdings Corp. | 128,940 | 4,168,630 | ||||||
|
| |||||||
| $ | 30,562,157 | |||||||
| Restaurants - 0.0% | ||||||||
| Greggs PLC | 59,396 | $ | 1,005,018 | |||||
18
Table of Contents
Portfolio of Investments – continued
| Issuer | Shares/Par | Value ($) | ||||||
| Common Stocks - continued | ||||||||
| Specialty Chemicals - 0.6% | ||||||||
| Akzo Nobel N.V. | 58,840 | $ | 5,328,282 | |||||
| PTT Global Chemical PLC | 2,799,800 | 6,742,444 | ||||||
|
| |||||||
| $ | 12,070,726 | |||||||
| Specialty Stores - 0.2% | ||||||||
| Gap, Inc. | 203,511 | $ | 5,289,251 | |||||
| Telecommunications - Wireless - 0.9% | ||||||||
| KDDI Corp. | 523,200 | $ | 13,993,207 | |||||
| SK Telecom Co. Ltd. | 7,382 | 1,739,499 | ||||||
| Vodafone Group PLC | 954,714 | 2,733,815 | ||||||
|
| |||||||
| $ | 18,466,521 | |||||||
| Telephone Services - 0.6% | ||||||||
| Nippon Telegraph & Telephone Corp. | 70,100 | $ | 3,396,483 | |||||
| TDC A.S. | 506,809 | 2,996,466 | ||||||
| Telefonica S.A. | 152,353 | 1,598,280 | ||||||
| Verizon Communications, Inc. | 88,390 | 4,231,229 | ||||||
|
| |||||||
| $ | 12,222,458 | |||||||
| Tobacco - 3.4% | ||||||||
| Altria Group, Inc. | 241,542 | $ | 15,511,827 | |||||
| British American Tobacco PLC | 145,514 | 9,413,910 | ||||||
| Imperial Brands PLC | 36,786 | 1,500,164 | ||||||
| Japan Tobacco, Inc. | 454,300 | 15,024,565 | ||||||
| Philip Morris International, Inc. | 311,730 | 32,619,427 | ||||||
|
| |||||||
| $ | 74,069,893 | |||||||
| Trucking - 0.6% | ||||||||
| United Parcel Service, Inc., “B” | 66,071 | $ | 7,765,325 | |||||
| Yamato Holdings Co. Ltd. | 221,900 | 4,552,750 | ||||||
|
| |||||||
| $ | 12,318,075 | |||||||
| Utilities - Electric Power - 1.6% | ||||||||
| American Electric Power Co., Inc. | 107,685 | $ | 8,012,841 | |||||
| Duke Energy Corp. | 71,073 | 6,276,457 | ||||||
| Exelon Corp. | 253,980 | 10,212,536 | ||||||
| SSE PLC | 355,100 | 6,517,872 | ||||||
| Xcel Energy, Inc. | 69,867 | 3,459,814 | ||||||
|
| |||||||
| $ | 34,479,520 | |||||||
| Total Common Stocks (Identified Cost, $879,699,487) | $ | 1,267,039,000 | ||||||
19
Table of Contents
Portfolio of Investments – continued
| Bonds - 29.6% | ||||||||
| Issuer | Shares/Par | Value ($) | ||||||
| Aerospace - 0.0% | ||||||||
| Lockheed Martin Corp., 3.55%, 1/15/2026 | $ | 795,000 | $ | 825,780 | ||||
| Airlines - 0.1% | ||||||||
| Go-Ahead Group Plc, 2.5%, 7/06/2024 | GBP | 800,000 | $ | 1,052,093 | ||||
| Ryanair Ltd., 1.125%, 3/10/2023 | EUR | 850,000 | 1,012,674 | |||||
|
| |||||||
| $ | 2,064,767 | |||||||
| Apparel Manufacturers - 0.1% | ||||||||
| Coach, Inc., 4.125%, 7/15/2027 | $ | 1,604,000 | $ | 1,615,063 | ||||
| Asset-Backed & Securitized - 1.9% | ||||||||
| A Voce CLO Ltd., 2014-1A, “A1R”, FLR, 2.519%, (U.S. LIBOR-3mo. + 1.16%) 7/15/2026 (n) | $ | 3,177,000 | $ | 3,200,716 | ||||
| Cent CLO LP, 2013-17A, “A1”, FLR, 2.678%, (U.S. LIBOR-3mo. + 1.3%) 1/30/2025 (n) | 715,374 | 718,579 | ||||||
| Cent CLO LP, 2014-21A, “A1”, FLR, 2.584%, (U.S. LIBOR-3mo. + 1.21%) 7/27/2026 (n) | 2,164,336 | 2,169,798 | ||||||
| Chesapeake Funding II LLC, 2016-1A, “A2”, FLR, 2.389%, (U.S. LIBOR-1mo. + 1.15%) 3/15/2028 (n) | 1,406,460 | 1,411,310 | ||||||
| Chesapeake Funding II LLC, 2016-2A, “A2”, FLR, 2.239%, (U.S. LIBOR-1mo. + 1%) 6/15/2028 (z) | 1,222,952 | 1,229,942 | ||||||
| Commercial Mortgage Trust, 2015-LC21, “A4”, 3.708%, 7/10/2048 | 1,995,691 | 2,097,564 | ||||||
| CPS Auto Trust, 2016-D, “B”, 2.11%, 3/15/2021 (n) | 1,372,000 | 1,368,261 | ||||||
| Dryden Senior Loan Fund, 2013-26A, “A”, CLO, FLR, 2.459%, (U.S. LIBOR-3mo. + 1.1%) 7/15/2025 (n) | 1,398,195 | 1,409,350 | ||||||
| Dryden Senior Loan Fund, 2014-34A, “AR”, CLO, FLR, 2.519%, (LIBOR-3mo. + 1.16%) 10/15/2026 (n) | 2,966,973 | 2,983,469 | ||||||
| Flatiron CLO Ltd., 2013-1A, “A2R”, FLR, 3.003%, (U.S. LIBOR-3mo. + 1.65%) 1/17/2026 (n) | 3,092,916 | 3,104,539 | ||||||
| Ford Credit Floorplan Master Owner Trust, 2015-1, “A2”, FLR, 1.639%, (LIBOR-1mo. + 0.4%) 1/15/2020 | 5,562,000 | 5,566,345 | ||||||
| GS Mortgage Securities Trust, 2015-GC30, “A4”, 3.382%, 5/10/2050 | 2,298,421 | 2,365,389 | ||||||
| ING Investment Management Ltd., 2013-2A, “A1”, CLO, FLR, 2.517%, (U.S. LIBOR-3mo. + 1.15%) 4/25/2025 (n) | 1,275,940 | 1,283,783 | ||||||
| John Deere Owner Trust , “A2”, 1.15%, 10/15/2018 | 149,386 | 149,371 | ||||||
| JPMBB Commercial Mortgage Securities Trust, 2014-C26, 3.494%, 1/15/2048 | 2,620,000 | 2,711,683 | ||||||
| Morgan Stanley Capital I Trust, 2017-H1, “A5”, 3.53%, 6/15/2050 | 1,048,215 | 1,085,400 | ||||||
| Octagon Investment Partners XV, Ltd., FLR, 2.817%, (U.S. LIBOR-3mo. + 1.45%) 10/25/2025 (n) | 3,933,959 | 3,933,943 | ||||||
| Wells Fargo Commercial Mortgage Trust, 2015-C28, “A4”, 3.54%, 5/15/2048 | 2,322,687 | 2,418,386 | ||||||
20
Table of Contents
Portfolio of Investments – continued
| Issuer | Shares/Par | Value ($) | ||||||
| Bonds - continued | ||||||||
| Asset-Backed & Securitized - continued | ||||||||
| Wells Fargo Commercial Mortgage Trust, 2015-NXS1, “A5”, 3.148%, 5/15/2048 | $ | 1,013,505 | $ | 1,031,053 | ||||
|
| |||||||
| $ | 40,238,881 | |||||||
| Automotive - 0.4% | ||||||||
| Delphi Automotive PLC, 1.5%, 3/10/2025 | EUR | 800,000 | $ | 960,284 | ||||
| Ferrari N.V., 1.5%, 3/16/2023 | EUR | 1,550,000 | 1,853,335 | |||||
| General Motors Financial Co., Inc., 4.35%, 1/17/2027 | $ | 1,626,000 | 1,672,574 | |||||
| Lear Corp., 3.8%, 9/15/2027 | 526,000 | 527,768 | ||||||
| RCI Banque S.A., 1.25%, 6/08/2022 | EUR | 450,000 | 544,730 | |||||
| Valeo S.A., 1.625%, 3/18/2026 | EUR | 400,000 | 492,294 | |||||
| Volkswagen International Finance N.V., 2.7% to 12/14/2022, FLR to 12/31/2049 | EUR | 600,000 | 721,625 | |||||
| Volkswagen Leasing GmbH, 1.375%, 1/20/2025 | EUR | 1,050,000 | 1,245,133 | |||||
|
| |||||||
| $ | 8,017,743 | |||||||
| Banks & Diversified Financials (Covered Bonds) - 0.0% | ||||||||
| CaixaBank S.A., 1.125%, 1/12/2023 | EUR | 900,000 | $ | 1,046,933 | ||||
| Biotechnology - 0.0% | ||||||||
| Life Technologies Corp., 6%, 3/01/2020 | $ | 432,000 | $ | 468,700 | ||||
| Broadcasting - 0.1% | ||||||||
| ProSiebenSat.1 Media SE, 2.625%, 4/15/2021 | EUR | 1,090,000 | $ | 1,349,270 | ||||
| Relx Finance B.V., 1%, 3/22/2024 | EUR | 600,000 | 713,575 | |||||
| SES S.A., 3.6%, 4/04/2023 (n) | $ | 635,000 | 641,096 | |||||
|
| |||||||
| $ | 2,703,941 | |||||||
| Brokerage & Asset Managers - 0.2% | ||||||||
| CME Group, Inc., 3%, 3/15/2025 | $ | 991,000 | $ | 1,009,301 | ||||
| E*TRADE Financial Corp., 2.95%, 8/24/2022 | 822,000 | 822,392 | ||||||
| Intercontinental Exchange, Inc., 2.75%, 12/01/2020 | 538,000 | 548,942 | ||||||
| Intercontinental Exchange, Inc., 3.75%, 12/01/2025 | 883,000 | 928,574 | ||||||
| TD Ameritrade Holding Corp., 2.95%, 4/01/2022 | 715,000 | 728,969 | ||||||
| TD Ameritrade Holding Corp., 3.3%, 4/01/2027 | 1,150,000 | 1,164,235 | ||||||
|
| |||||||
| $ | 5,202,413 | |||||||
| Building - 0.1% | ||||||||
| Imerys S.A., 1.5%, 1/15/2027 | EUR | 700,000 | $ | 835,168 | ||||
| Martin Marietta Materials, Inc., 4.25%, 7/02/2024 | $ | 400,000 | 423,263 | |||||
| Martin Marietta Materials, Inc., 3.45%, 6/01/2027 | 544,000 | 539,863 | ||||||
| Mohawk Industries, Inc., 2%, 1/14/2022 | EUR | 800,000 | 993,407 | |||||
|
| |||||||
| $ | 2,791,701 | |||||||
21
Table of Contents
Portfolio of Investments – continued
| Issuer | Shares/Par | Value ($) | ||||||
| Bonds - continued | ||||||||
| Business Services - 0.1% | ||||||||
| Cisco Systems, Inc., 2.2%, 2/28/2021 | $ | 1,211,000 | $ | 1,214,251 | ||||
| Fidelity National Information Services, Inc., 3.875%, 6/05/2024 | 320,000 | 334,057 | ||||||
| Fidelity National Information Services, Inc., 5%, 10/15/2025 | 114,000 | 126,952 | ||||||
| Fidelity National Information Services, Inc., 3%, 8/15/2026 | 1,032,000 | 1,001,409 | ||||||
|
| |||||||
| $ | 2,676,669 | |||||||
| Cable TV - 0.3% | ||||||||
| Charter Communications Operating LLC, 6.384%, 10/23/2035 | $ | 1,175,000 | $ | 1,354,161 | ||||
| Cox Communications, Inc., 3.25%, 12/15/2022 (n) | 595,000 | 597,481 | ||||||
| Cox Communications, Inc., 4.6%, 8/15/2047 (n) | 1,347,000 | 1,337,288 | ||||||
| NBCUniversal Enterprise, Inc., 1.974%, 4/15/2019 (n) | 895,000 | 896,885 | ||||||
| NBCUniversal Media LLC, 5.15%, 4/30/2020 | 728,000 | 784,022 | ||||||
| Shaw Communications, 5.65%, 10/01/2019 | CAD | 718,000 | 592,805 | |||||
| Sky PLC, 2.5%, 9/15/2026 | EUR | 900,000 | 1,141,319 | |||||
|
| |||||||
| $ | 6,703,961 | |||||||
| Chemicals - 0.1% | ||||||||
| Air Liquide Finance Co., 2.25%, 9/27/2023 (n) | $ | 1,031,000 | $ | 1,002,712 | ||||
| LYB International Finance II B.V., 1.875%, 3/02/2022 | EUR | 1,100,000 | 1,353,382 | |||||
| LyondellBasell Industries N.V., 5%, 4/15/2019 | $ | 299,000 | 309,292 | |||||
|
| |||||||
| $ | 2,665,386 | |||||||
| Computer Software - 0.1% | ||||||||
| Microsoft Corp., 4.1%, 2/06/2037 | $ | 1,301,000 | $ | 1,422,479 | ||||
| Oracle Corp., 3.4%, 7/08/2024 | 837,000 | 876,096 | ||||||
|
| |||||||
| $ | 2,298,575 | |||||||
| Computer Software - Systems - 0.2% | ||||||||
| Apple, Inc., 2.7%, 5/13/2022 | $ | 1,598,000 | $ | 1,625,802 | ||||
| Apple, Inc., 4.5%, 2/23/2036 | 1,752,000 | 1,996,539 | ||||||
| Apple, Inc., 3.6%, 7/31/2042 | GBP | 400,000 | 618,874 | |||||
| Apple, Inc., 4.25%, 2/09/2047 | $ | 348,000 | 373,150 | |||||
|
| |||||||
| $ | 4,614,365 | |||||||
| Conglomerates - 0.1% | ||||||||
| Johnson Controls International PLC, 1.375%, 2/25/2025 | EUR | 470,000 | $ | 564,254 | ||||
| Johnson Controls International PLC, 4.5%, 2/15/2047 | $ | 284,000 | 298,553 | |||||
| Parker-Hannifin Corp., 4.1%, 3/01/2047 (n) | 727,000 | 760,080 | ||||||
| Smiths Group PLC, 2%, 2/23/2027 | EUR | 800,000 | 973,758 | |||||
|
| |||||||
| $ | 2,596,645 | |||||||
| Consumer Products - 0.2% | ||||||||
| Essity AB, 1.625%, 3/30/2027 | EUR | 1,100,000 | $ | 1,326,820 | ||||
| Newell Brands, Inc., 3.75%, 10/01/2021 (z) | EUR | 600,000 | 784,919 | |||||
22
Table of Contents
Portfolio of Investments – continued
| Issuer | Shares/Par | Value ($) | ||||||
| Bonds - continued | ||||||||
| Consumer Products - continued | ||||||||
| Reckitt Benckiser Treasury Services PLC, 3.625%, 9/21/2023 (n) | $ | 731,000 | $ | 761,766 | ||||
| Reckitt Benckiser Treasury Services PLC, 3%, 6/26/2027 (n) | 1,416,000 | 1,381,184 | ||||||
|
| |||||||
| $ | 4,254,689 | |||||||
| Consumer Services - 0.3% | ||||||||
| G4S International Finance PLC, 1.5%, 6/02/2024 | EUR | 700,000 | $ | 830,321 | ||||
| G4S International Finance PLC, 1.5%, 1/09/2023 | EUR | 1,100,000 | 1,321,425 | |||||
| Priceline Group, Inc., 3.55%, 3/15/2028 | $ | 587,000 | 591,704 | |||||
| Priceline Group, Inc., 2.15%, 11/25/2022 | EUR | 340,000 | 427,972 | |||||
| Priceline Group, Inc., 1.8%, 3/03/2027 | EUR | 1,400,000 | 1,676,933 | |||||
| Visa, Inc., 4.15%, 12/14/2035 | $ | 984,000 | 1,074,369 | |||||
| Visa, Inc., 3.65%, 9/15/2047 | 658,000 | 656,417 | ||||||
|
| |||||||
| $ | 6,579,141 | |||||||
| Containers - 0.1% | ||||||||
| DS Smith PLC, 1.375%, 7/26/2024 | EUR | 1,100,000 | $ | 1,299,402 | ||||
| Electronics - 0.2% | ||||||||
| Broadcom Corp./Broadcom Cayman Finance Ltd., 3.875%, 1/15/2027 (n) | $ | 1,771,000 | $ | 1,822,048 | ||||
| Tyco Electronics Group S.A., 2.375%, 12/17/2018 | 522,000 | 524,067 | ||||||
| Tyco Electronics Group S.A., 1.1%, 3/01/2023 | EUR | 1,025,000 | 1,227,796 | |||||
|
| |||||||
| $ | 3,573,911 | |||||||
| Emerging Market Quasi-Sovereign - 0.7% | ||||||||
| BRPL International Singapore Pte Ltd., 4.375%, 1/18/2027 | $ | 3,379,000 | $ | 3,522,118 | ||||
| CNPC General Capital Ltd., 3.4%, 4/16/2023 (n) | 3,486,000 | 3,560,860 | ||||||
| Office Cherifien des Phosphates S.A., 6.875%, 4/25/2044 (n) | 1,590,000 | 1,792,566 | ||||||
| Pertamina, 6%, 5/03/2042 (n) | 3,240,000 | 3,707,995 | ||||||
| State Grid Overseas Investment (2016) Ltd., 2.75%, 5/04/2022 (n) | 1,636,000 | 1,639,346 | ||||||
|
| |||||||
| $ | 14,222,885 | |||||||
| Emerging Market Sovereign - 0.2% | ||||||||
| Republic of Hungary, 5.375%, 2/21/2023 | $ | 3,148,000 | $ | 3,525,760 | ||||
| Republic of Indonesia, 2.875%, 7/08/2021 (z) | EUR | 400,000 | 504,380 | |||||
| Republic of Indonesia, 2.875%, 7/08/2021 | EUR | 200,000 | 252,190 | |||||
| Republic of Indonesia, 2.15%, 7/18/2024 (z) | EUR | 638,000 | 768,814 | |||||
|
| |||||||
| $ | 5,051,144 | |||||||
| Energy - Independent - 0.2% | ||||||||
| Tengizchevroil Finance Co. International Ltd., 4%, 8/15/2026 (n) | $ | 3,609,000 | $ | 3,548,766 | ||||
23
Table of Contents
Portfolio of Investments – continued
| Issuer | Shares/Par | Value ($) | ||||||
| Bonds - continued | ||||||||
| Financial Institutions - 0.1% | ||||||||
| AerCap Ireland Capital Co., 3.65%, 7/21/2027 | $ | 1,592,000 | $ | 1,590,826 | ||||
| International Lease Finance Corp., 7.125%, 9/01/2018 (n) | 569,000 | 592,762 | ||||||
|
| |||||||
| $ | 2,183,588 | |||||||
| Food & Beverages - 0.7% | ||||||||
| Anheuser-Busch InBev N.V., 1.5%, 4/18/2030 | EUR | 660,000 | $ | 781,832 | ||||
| Anheuser-Busch InBev S.A., 5.375%, 1/15/2020 | $ | 1,008,000 | 1,081,479 | |||||
| Anheuser-Busch InBev Worldwide, Inc., 3.75%, 1/15/2022 | 376,000 | 396,655 | ||||||
| Anheuser-Busch InBev Worldwide, Inc., 3.3%, 2/01/2023 | 1,251,000 | 1,287,713 | ||||||
| Anheuser-Busch InBev Worldwide, Inc., 4.7%, 2/01/2036 | 1,847,000 | 2,022,205 | ||||||
| Coca-Cola Enterprises, Inc., 1.875%, 3/18/2030 | EUR | 850,000 | 1,040,163 | |||||
| Danone S.A., 2.077%, 11/02/2021 (n) | $ | 1,298,000 | 1,275,914 | |||||
| Danone S.A., 2.589%, 11/02/2023 (n) | 3,035,000 | 2,981,345 | ||||||
| Fomento Economico Mexicano S.A.B. de C.V., 1.75%, 3/20/2023 | EUR | 1,000,000 | 1,215,335 | |||||
| Kraft Heinz Foods Co., 5.2%, 7/15/2045 | $ | 128,000 | 139,575 | |||||
| Kraft Heinz Foods Co., 4.375%, 6/01/2046 | 545,000 | 532,186 | ||||||
| PepsiCo, Inc., 3.1%, 7/17/2022 | 1,651,000 | 1,706,849 | ||||||
| Wm. Wrigley Jr. Co., 2.9%, 10/21/2019 (n) | 277,000 | 281,191 | ||||||
| Wm. Wrigley Jr. Co., 3.375%, 10/21/2020 (n) | 300,000 | 309,426 | ||||||
|
| |||||||
| $ | 15,051,868 | |||||||
| Food & Drug Stores - 0.0% | ||||||||
| Walgreens Boots Alliance, Inc., 2.7%, 11/18/2019 | $ | 1,042,000 | $ | 1,053,069 | ||||
| Gaming & Lodging - 0.1% | ||||||||
| InterContinental Hotels Group PLC, 3.75%, 8/14/2025 | GBP | 1,060,000 | $ | 1,526,946 | ||||
| Insurance - 0.1% | ||||||||
| American International Group, Inc., 1.875%, 6/21/2027 | EUR | 430,000 | $ | 512,054 | ||||
| BUPA Finance PLC, 2%, 4/05/2024 | GBP | 700,000 | 924,753 | |||||
| Hiscox Ltd., 6.125% to 11/24/2025, FLR to 11/24/2045 | GBP | 500,000 | 763,826 | |||||
| NN Group N.V. , 4.625% to 4/08/2024, FLR to 4/08/2044 | EUR | 500,000 | 674,791 | |||||
|
| |||||||
| $ | 2,875,424 | |||||||
| Insurance - Health - 0.1% | ||||||||
| Aetna, Inc., 2.8%, 6/15/2023 | $ | 1,094,000 | $ | 1,087,169 | ||||
| UnitedHealth Group, Inc., 2.7%, 7/15/2020 | 1,536,000 | 1,564,464 | ||||||
|
| |||||||
| $ | 2,651,633 | |||||||
| Insurance - Property & Casualty - 0.3% | ||||||||
| Berkshire Hathaway, Inc., 2.75%, 3/15/2023 | $ | 694,000 | $ | 703,663 | ||||
| Berkshire Hathaway, Inc., 4.5%, 2/11/2043 | 475,000 | 536,649 | ||||||
| Chubb Corp., FLR, 3.609% (LIBOR-3mo. + 2.25%), 3/29/2067 | 730,000 | 726,350 | ||||||
| Chubb INA Holdings, Inc., 2.3%, 11/03/2020 | 284,000 | 286,151 | ||||||
24
Table of Contents
Portfolio of Investments – continued
| Issuer | Shares/Par | Value ($) | ||||||
| Bonds - continued | ||||||||
| Insurance - Property & Casualty - continued | ||||||||
| Liberty Mutual Group, Inc., 4.25%, 6/15/2023 | $ | 958,000 | $ | 1,018,771 | ||||
| Liberty Mutual Group, Inc., 2.75%, 5/04/2026 | EUR | 500,000 | 635,760 | |||||
| Liberty Mutual Group, Inc., 2.75%, 5/04/2026 (z) | EUR | 280,000 | 356,026 | |||||
| Marsh & McLennan Cos., Inc., 2.55%, 10/15/2018 | $ | 293,000 | 294,733 | |||||
| Marsh & McLennan Cos., Inc., 3.5%, 6/03/2024 | 500,000 | 517,941 | ||||||
| Marsh & McLennan Cos., Inc., 4.35%, 1/30/2047 | 532,000 | 573,684 | ||||||
| QBE Capital Funding IV LP, 7.5% to 5/24/2021, FLR to 5/24/2041 | GBP | 300,000 | 448,728 | |||||
| XLIT Ltd., 3.25% to 6/29/2027, FLR to 6/29/2047 | EUR | 1,120,000 | 1,311,155 | |||||
|
| |||||||
| $ | 7,409,611 | |||||||
| International Market Quasi-Sovereign - 0.2% | ||||||||
| Israel Electric Corp. Ltd., 5.625%, 6/21/2018 (n) | $ | 735,000 | $ | 749,774 | ||||
| KFW Government Development Banks, 4%, 2/27/2025 | AUD | 300,000 | 244,495 | |||||
| Statoil A.S.A., 4.25%, 11/23/2041 | $ | 660,000 | 702,370 | |||||
| Statoil A.S.A., FLR, 1.605%, (U.S. LIBOR-3mo. + 0.29%) 5/15/2018 | 477,000 | 477,588 | ||||||
| Temasek Financial I Ltd., 2.375%, 1/23/2023 (n) | 1,450,000 | 1,443,798 | ||||||
|
| |||||||
| $ | 3,618,025 | |||||||
| International Market Sovereign - 10.8% | ||||||||
| Commonwealth of Australia, 5.75%, 5/15/2021 | AUD | 8,409,000 | $ | 7,248,010 | ||||
| Commonwealth of Australia, 2.75%, 11/21/2027 | AUD | 3,739,000 | 2,878,633 | |||||
| Commonwealth of Australia, 3.75%, 4/21/2037 | AUD | 1,200,000 | 997,455 | |||||
| Federal Republic of Germany, 2.5%, 7/04/2044 | EUR | 3,952,000 | 6,043,347 | |||||
| Federal Republic of Germany, 0.5%, 2/15/2026 | EUR | 5,017,000 | 6,026,796 | |||||
| Federal Republic of Germany, 6.25%, 1/04/2030 | EUR | 837,000 | 1,632,952 | |||||
| Federal Republic of Germany, 4%, 1/04/2037 | EUR | 1,750,000 | 3,148,036 | |||||
| Government of Canada , 0.5%, 3/01/2022 | CAD | 18,602,000 | 13,766,576 | |||||
| Government of Canada, 4.25%, 6/01/2018 | CAD | 7,496,000 | 5,913,130 | |||||
| Government of Canada, 2.5%, 6/01/2024 | CAD | 4,040,000 | 3,274,714 | |||||
| Government of Canada, 5.75%, 6/01/2033 | CAD | 4,267,000 | 4,865,127 | |||||
| Government of Canada, 4%, 6/01/2041 | CAD | 2,260,000 | 2,284,017 | |||||
| Government of Japan, 1.8%, 3/20/2043 | JPY | 854,800,000 | 9,301,875 | |||||
| Government of Japan, 0.4%, 9/20/2025 | JPY | 74,350,000 | 674,672 | |||||
| Government of Japan, 2.2%, 9/20/2027 | JPY | 1,823,700,000 | 19,401,262 | |||||
| Government of Japan, 1.7%, 9/20/2032 | JPY | 1,310,550,000 | 13,834,627 | |||||
| Government of Japan, 1.5%, 3/20/2034 | JPY | 1,932,700,000 | 19,929,901 | |||||
| Government of Japan, 2.4%, 3/20/2037 | JPY | 978,400,000 | 11,480,937 | |||||
| Government of Japan, 2%, 3/20/2052 | JPY | 197,000,000 | 2,266,267 | |||||
| Kingdom of Belgium, 4%, 3/28/2032 | EUR | 4,256,000 | 6,974,750 | |||||
| Kingdom of Belgium, 4.5%, 3/28/2026 | EUR | 912,000 | 1,432,644 | |||||
| Kingdom of Denmark, 1.75%, 11/15/2025 | DKK | 19,750,000 | 3,480,384 | |||||
| Kingdom of Spain, 5.4%, 1/31/2023 | EUR | 4,819,000 | 7,069,251 | |||||
25
Table of Contents
Portfolio of Investments – continued
| Issuer | Shares/Par | Value ($) | ||||||
| Bonds - continued | ||||||||
| International Market Sovereign - continued | ||||||||
| Kingdom of Spain, 2.75%, 10/31/2024 | EUR | 4,600,000 | $ | 6,058,791 | ||||
| Kingdom of Spain, 5.15%, 10/31/2028 | EUR | 2,202,000 | 3,484,624 | |||||
| Kingdom of the Netherlands, 5.5%, 1/15/2028 | EUR | 3,725,000 | 6,531,258 | |||||
| Republic of Austria, 1.75%, 10/20/2023 | EUR | 2,820,000 | 3,641,477 | |||||
| Republic of France, 4.75%, 4/25/2035 | EUR | 1,858,000 | 3,381,357 | |||||
| Republic of France, 4.5%, 4/25/2041 | EUR | 2,471,000 | 4,621,211 | |||||
| Republic of Ireland, 5.4%, 3/13/2025 | EUR | 504,000 | 802,109 | |||||
| Republic of Italy, 5.5%, 9/01/2022 | EUR | 11,085,000 | 15,915,390 | |||||
| Republic of Italy, 3.75%, 3/01/2021 | EUR | 6,905,000 | 9,008,243 | |||||
| Republic of Italy, 2.5%, 12/01/2024 | EUR | 5,976,000 | 7,532,083 | |||||
| United Kingdom Treasury, 4.25%, 12/07/2027 | GBP | 172,000 | 291,140 | |||||
| United Kingdom Treasury, 4.25%, 6/07/2032 | GBP | 696,000 | 1,232,755 | |||||
| United Kingdom Treasury, 4.25%, 3/07/2036 | GBP | 2,761,000 | 5,053,508 | |||||
| United Kingdom Treasury, 3.25%, 1/22/2044 | GBP | 5,259,000 | 8,853,075 | |||||
| United Kingdom Treasury, 3.75%, 7/22/2052 | GBP | 711,000 | 1,413,467 | |||||
| United Kingdom Treasury, 4%, 1/22/2060 | GBP | 700,000 | 1,560,817 | |||||
|
| |||||||
| $ | 233,306,668 | |||||||
| Local Authorities - 0.1% | ||||||||
| Province of Alberta, 4.5%, 12/01/2040 | CAD | 710,000 | $ | 673,914 | ||||
| Province of British Columbia, 2.3%, 6/18/2026 | CAD | 1,895,000 | 1,448,828 | |||||
|
| |||||||
| $ | 2,122,742 | |||||||
| Major Banks - 1.8% | ||||||||
| ABN AMRO Bank N.V., 1.8%, 6/04/2018 (n) | $ | 532,000 | $ | 531,491 | ||||
| ABN AMRO Bank N.V., 2.875%, 1/18/2028 | EUR | 500,000 | 636,570 | |||||
| Bank of America Corp., 1.75%, 6/05/2018 | $ | 2,250,000 | 2,251,130 | |||||
| Bank of America Corp., 2.625%, 4/19/2021 | 3,368,000 | 3,384,763 | ||||||
| Bank of America Corp., 3.5%, 4/19/2026 | 1,418,000 | 1,443,463 | ||||||
| Bank of America Corp., 3.248%, 10/21/2027 | 1,844,000 | 1,814,956 | ||||||
| Barclays Bank PLC, 6%, 1/14/2021 | EUR | 742,000 | 1,007,493 | |||||
| Barclays Bank PLC, 6.75% to 1/16/18, FLR to 1/16/2023 | GBP | 400,000 | 537,439 | |||||
| Credit Agricole S.A., 7.375%, 12/18/2023 | GBP | 200,000 | 343,638 | |||||
| Credit Suisse Group AG, 6.5%, 8/08/2023 (n) | $ | 1,261,000 | 1,428,083 | |||||
| Goldman Sachs Group, Inc., 2.625%, 4/25/2021 | 642,000 | 644,345 | ||||||
| Goldman Sachs Group, Inc., 5.75%, 1/24/2022 | 1,181,000 | 1,322,124 | ||||||
| Goldman Sachs Group, Inc., 3.85%, 1/26/2027 | 2,018,000 | 2,064,777 | ||||||
| HSBC Bank PLC, FLR, 1.955%, (U.S. LIBOR-3mo. + 0.64%) 5/15/2018 (n) | 1,116,000 | 1,119,333 | ||||||
| HSBC Holdings PLC, 4.375%, 11/23/2026 | 1,075,000 | 1,130,498 | ||||||
| JPMorgan Chase & Co., 4.5%, 1/24/2022 | 1,532,000 | 1,653,857 | ||||||
| JPMorgan Chase & Co., 2.95%, 10/01/2026 | 1,811,000 | 1,779,044 | ||||||
| JPMorgan Chase & Co., 3.54% to 5/01/2027, FLR to 5/01/2028 | 1,187,000 | 1,198,732 | ||||||
26
Table of Contents
Portfolio of Investments – continued
| Issuer | Shares/Par | Value ($) | ||||||
| Bonds - continued | ||||||||
| Major Banks - continued | ||||||||
| JPMorgan Chase & Co., 4.26% to 2/22/2047, FLR to 2/22/2048 | $ | 1,249,000 | $ | 1,314,591 | ||||
| Morgan Stanley, 2.2%, 12/07/2018 | 720,000 | 722,130 | ||||||
| Morgan Stanley, 2.5%, 4/21/2021 | 860,000 | 861,888 | ||||||
| Morgan Stanley, 5.5%, 7/28/2021 | 490,000 | 541,379 | ||||||
| Morgan Stanley, 3.125%, 7/27/2026 | 1,211,000 | 1,193,410 | ||||||
| Morgan Stanley, 2.625%, 3/09/2027 | GBP | 640,000 | 860,349 | |||||
| Morgan Stanley, 3.95%, 4/23/2027 | $ | 1,588,000 | 1,619,601 | |||||
| Morgan Stanley, FLR, 0.63% (LIBOR-3mo. + 0.38%), 11/09/2021 | EUR | 600,000 | 699,676 | |||||
| Nordea Bank AB, 1% to 9/07/2021, FLR to 9/07/2026 | EUR | 600,000 | 707,644 | |||||
| PNC Bank N.A., 2.6%, 7/21/2020 | $ | 857,000 | 867,480 | |||||
| UBS Group Funding (Jersey) Ltd., 1.5%, 11/30/2024 | EUR | 1,200,000 | 1,459,665 | |||||
| UBS Group Funding (Switzerland) AG, 2.859% to 8/15/2022, FLR to 8/15/2023 (n) | $ | 1,972,000 | 1,969,239 | |||||
| Wells Fargo & Co., 3.3%, 9/09/2024 | 500,000 | 508,400 | ||||||
| Wells Fargo & Co., 4.1%, 6/03/2026 | 649,000 | 675,673 | ||||||
|
| |||||||
| $ | 38,292,861 | |||||||
| Medical & Health Technology & Services - 0.5% | ||||||||
| Baxter International, Inc., 1.3%, 5/30/2025 | EUR | 930,000 | $ | 1,102,723 | ||||
| Becton, Dickinson and Co., 3.734%, 12/15/2024 | $ | 932,000 | 957,832 | |||||
| Laboratory Corp. of America Holdings, 3.2%, 2/01/2022 | 1,034,000 | 1,059,399 | ||||||
| Laboratory Corp. of America Holdings, 4.7%, 2/01/2045 | 642,000 | 667,492 | ||||||
| Northwell Healthcare, Inc., 3.979%, 11/01/2046 | 171,000 | 163,339 | ||||||
| Northwell Healthcare, Inc., 4.26%, 11/01/2047 | 1,265,000 | 1,264,711 | ||||||
| Thermo Fisher Scientific, Inc., 3.2%, 8/15/2027 | 1,983,000 | 1,969,321 | ||||||
| Thermo Fisher Scientific, Inc., 3%, 4/15/2023 | 1,872,000 | 1,894,781 | ||||||
| Thermo Fisher Scientific, Inc., 2.95%, 9/19/2026 | 617,000 | 603,930 | ||||||
|
| |||||||
| $ | 9,683,528 | |||||||
| Metals & Mining - 0.1% | ||||||||
| Cameco Corp., 5.67%, 9/02/2019 | CAD | 724,000 | $ | 585,407 | ||||
| Glencore Finance (Europe) S.A., 1.25%, 3/17/2021 | EUR | 1,010,000 | 1,214,405 | |||||
|
| |||||||
| $ | 1,799,812 | |||||||
| Midstream - 0.4% | ||||||||
| APT Pipelines Ltd., 5%, 3/23/2035 (n) | $ | 685,000 | $ | 716,141 | ||||
| Dominion Gas Holdings LLC, 2.8%, 11/15/2020 | 1,716,000 | 1,740,476 | ||||||
| Enterprise Products Operating LLC, 1.65%, 5/07/2018 | 1,350,000 | 1,349,644 | ||||||
| ONEOK, Inc., 4.95%, 7/13/2047 | 1,972,000 | 2,017,049 | ||||||
| Phillips 66 Partners LP, 3.75%, 3/01/2028 | 521,000 | 522,979 | ||||||
| Sabine Pass Liquefaction LLC, 4.2%, 3/15/2028 | 1,376,000 | 1,403,608 | ||||||
|
| |||||||
| $ | 7,749,897 | |||||||
27
Table of Contents
Portfolio of Investments – continued
| Issuer | Shares/Par | Value ($) | ||||||
| Bonds - continued | ||||||||
| Mortgage-Backed - 3.1% | ||||||||
| Fannie Mae, 3.746%, 7/01/2018 | $ | 194,980 | $ | 196,955 | ||||
| Fannie Mae, 2.578%, 9/25/2018 | 466,894 | 466,847 | ||||||
| Fannie Mae, 5.1%, 3/01/2019 | 302,921 | 310,631 | ||||||
| Fannie Mae, 5.18%, 3/01/2019 | 303,514 | 311,297 | ||||||
| Fannie Mae, 4.57%, 5/01/2019 | 215,953 | 221,449 | ||||||
| Fannie Mae, 5%, 12/01/2020 - 8/01/2040 | 2,816,923 | 3,079,808 | ||||||
| Fannie Mae, 4.5%, 3/01/2025 - 2/01/2046 | 12,269,535 | 13,202,675 | ||||||
| Fannie Mae, 5.5%, 1/01/2037 | 40,487 | 45,222 | ||||||
| Fannie Mae, 6%, 9/01/2037 - 6/01/2038 | 384,324 | 436,719 | ||||||
| Fannie Mae, 4%, 11/01/2040 - 2/01/2041 | 5,663,087 | 5,969,902 | ||||||
| Fannie Mae, 3.5%, 5/01/2043 - 1/01/2047 | 4,547,595 | 4,703,758 | ||||||
| Freddie Mac, 3.868%, 11/25/2017 | 118,569 | 118,431 | ||||||
| Freddie Mac, 2.412%, 8/25/2018 | 776,758 | 778,559 | ||||||
| Freddie Mac, 5.085%, 3/25/2019 | 589,000 | 608,352 | ||||||
| Freddie Mac, 1.883%, 5/25/2019 | 1,250,000 | 1,250,966 | ||||||
| Freddie Mac, 3.32%, 7/25/2020 | 59,997 | 60,704 | ||||||
| Freddie Mac, 3.064%, 8/25/2024 | 4,167,292 | 4,292,223 | ||||||
| Freddie Mac, 2.673%, 3/25/2026 | 3,500,000 | 3,487,149 | ||||||
| Freddie Mac, 3.243%, 4/25/2027 | 3,496,000 | 3,608,641 | ||||||
| Freddie Mac, 3.117%, 6/25/2027 | 1,483,189 | 1,515,486 | ||||||
| Freddie Mac, 3.194%, 7/25/2027 | 4,864,000 | 5,001,510 | ||||||
| Freddie Mac, 3.244%, 8/25/2027 | 4,271,000 | 4,388,312 | ||||||
| Freddie Mac, 5.5%, 7/01/2037 | 85,311 | 94,742 | ||||||
| Freddie Mac, 4.5%, 12/01/2039 - 5/01/2042 | 3,629,783 | 3,890,632 | ||||||
| Freddie Mac, 5%, 7/01/2041 | 1,902,533 | 2,091,201 | ||||||
| Freddie Mac, 3.5%, 1/01/2047 | 3,002,417 | 3,088,610 | ||||||
| Ginnie Mae, 5%, 5/15/2040 | 626,711 | 683,859 | ||||||
| Ginnie Mae, 3.5%, 6/20/2043 | 1,716,713 | 1,790,524 | ||||||
|
| |||||||
| $ | 65,695,164 | |||||||
| Municipals - 0.0% | ||||||||
| Commonwealth of Puerto Rico, Public Improvement, “C-7”, NATL, 6%, 7/01/2027 | $ | 100,000 | $ | 101,716 | ||||
| Puerto Rico Electric Power Authority Rev., “PP”, NATL, 5%, 7/01/2022 | 425,000 | 425,731 | ||||||
|
| |||||||
| $ | 527,447 | |||||||
| Natural Gas - Distribution - 0.1% | ||||||||
| Boston Gas Co., 3.15%, 8/01/2027 (n) | $ | 1,037,000 | $ | 1,036,255 | ||||
| GNL Quintero S.A., 4.634%, 7/31/2029 (n) | 1,440,000 | 1,499,400 | ||||||
|
| |||||||
| $ | 2,535,655 | |||||||
28
Table of Contents
Portfolio of Investments – continued
| Issuer | Shares/Par | Value ($) | ||||||
| Bonds - continued | ||||||||
| Network & Telecom - 0.4% | ||||||||
| AT&T, Inc., 1.8%, 9/04/2026 | EUR | 300,000 | $ | 360,952 | ||||
| AT&T, Inc., 4.9%, 8/14/2037 | $ | 1,020,000 | 1,017,833 | |||||
| AT&T, Inc., 4.25%, 6/01/2043 | GBP | 500,000 | 698,513 | |||||
| AT&T, Inc., 4.75%, 5/15/2046 | $ | 983,000 | 927,240 | |||||
| British Telecommunications PLC, 5.75%, 12/07/2028 | GBP | 315,000 | 538,150 | |||||
| Deutsche Telekom International Finance B.V., 1.5%, 4/03/2028 | EUR | 900,000 | 1,081,361 | |||||
| Empresa Nacional de Telecomunicaciones S.A., 4.75%, 8/01/2026 (n) | $ | 3,399,000 | 3,521,658 | |||||
| Verizon Communications, Inc., 4.812%, 3/15/2039 | 782,000 | 803,333 | ||||||
|
| |||||||
| $ | 8,949,040 | |||||||
| Oils - 0.2% | ||||||||
| Marathon Petroleum Corp., 3.4%, 12/15/2020 | $ | 524,000 | $ | 539,879 | ||||
| Marathon Petroleum Corp., 3.625%, 9/15/2024 | 1,138,000 | 1,166,880 | ||||||
| Neste Oyj, 1.5%, 6/07/2024 | EUR | 600,000 | 713,312 | |||||
| Phillips 66, 4.875%, 11/15/2044 | $ | 750,000 | 835,493 | |||||
|
| |||||||
| $ | 3,255,564 | |||||||
| Other Banks & Diversified Financials - 0.4% | ||||||||
| Arion Banki, 2.5%, 4/26/2019 | EUR | 274,000 | $ | 330,553 | ||||
| Belfius Bank S.A., 3.125%, 5/11/2026 | EUR | 600,000 | 767,790 | |||||
| BPCE S.A., 4.5%, 3/15/2025 (n) | $ | 300,000 | 313,246 | |||||
| BPCE S.A., 5.25%, 4/16/2029 | GBP | 600,000 | 946,306 | |||||
| Citizens Bank N.A., 2.55%, 5/13/2021 | $ | 848,000 | 851,489 | |||||
| Citizens Financial Group, Inc., 2.375%, 7/28/2021 | 1,005,000 | 997,029 | ||||||
| Deutsche Bank AG, 1.875%, 2/28/2020 | GBP | 800,000 | 1,068,318 | |||||
| ING Groep N.V., 3.95%, 3/29/2027 | $ | 1,026,000 | 1,074,110 | |||||
| Intesa Sanpaolo S.p.A., 5.25%, 1/28/2022 | GBP | 550,000 | 822,593 | |||||
| Islandsbanki, 1.75%, 9/07/2020 | EUR | 1,250,000 | 1,508,987 | |||||
|
| |||||||
| $ | 8,680,421 | |||||||
| Personal Computers & Peripherals - 0.0% | ||||||||
| Equifax, Inc., 2.3%, 6/01/2021 | $ | 534,000 | $ | 520,234 | ||||
| Pharmaceuticals - 0.1% | ||||||||
| Celgene Corp., 2.875%, 8/15/2020 | $ | 2,203,000 | $ | 2,237,026 | ||||
| Gilead Sciences, Inc., 2.35%, 2/01/2020 | 661,000 | 666,893 | ||||||
|
| |||||||
| $ | 2,903,919 | |||||||
| Real Estate - Apartment - 0.1% | ||||||||
| Grand City Properties S.A., 1.375%, 8/03/2026 | EUR | 1,100,000 | $ | 1,287,031 | ||||
| Vonovia Finance B.V., 2.125%, 7/09/2022 | EUR | 500,000 | 632,979 | |||||
|
| |||||||
| $ | 1,920,010 | |||||||
29
Table of Contents
Portfolio of Investments – continued
| Issuer | Shares/Par | Value ($) | ||||||
| Bonds - continued | ||||||||
| Real Estate - Office - 0.2% | ||||||||
| Boston Properties, Inc., REIT, 3.125%, 9/01/2023 | $ | 669,000 | $ | 678,886 | ||||
| Merlin Properties SOCIMI S.A., REIT, 2.225%, 4/25/2023 | EUR | 1,650,000 | 2,044,738 | |||||
| Merlin Properties SOCIMI S.A., REIT, 1.875%, 11/02/2026 | EUR | 600,000 | 702,973 | |||||
|
| |||||||
| $ | 3,426,597 | |||||||
| Real Estate - Retail - 0.0% | ||||||||
| Simon International Finance S.C.A., 1.375%, 11/18/2022 | EUR | 600,000 | $ | 733,331 | ||||
| Retailers - 0.3% | ||||||||
| Best Buy Co., Inc., 5.5%, 3/15/2021 | $ | 1,974,000 | $ | 2,147,284 | ||||
| Home Depot, Inc., 2.625%, 6/01/2022 | 1,400,000 | 1,424,274 | ||||||
| Home Depot, Inc., 3%, 4/01/2026 | 916,000 | 922,077 | ||||||
| Home Depot, Inc., 4.875%, 2/15/2044 | 500,000 | 583,605 | ||||||
| Kering, 1.25%, 5/10/2026 | EUR | 600,000 | 721,992 | |||||
|
| |||||||
| $ | 5,799,232 | |||||||
| Specialty Chemicals - 0.0% | ||||||||
| Ecolab, Inc., 2.625%, 7/08/2025 | EUR | 525,000 | $ | 686,222 | ||||
| Supermarkets - 0.0% | ||||||||
| Loblaw Cos. Ltd., 4.86%, 9/12/2023 | CAD | 725,000 | $ | 619,939 | ||||
| Supranational - 0.1% | ||||||||
| International Bank for Reconstruction and Development, 2.8%, 1/13/2021 | AUD | 600,000 | $ | 465,971 | ||||
| International Bank for Reconstruction and Development, 4.25%, 6/24/2025 | AUD | 440,000 | 366,672 | |||||
| International Finance Corp., 3.25%, 7/22/2019 | AUD | 635,000 | 496,103 | |||||
|
| |||||||
| $ | 1,328,746 | |||||||
| Telecommunications - Wireless - 0.2% | ||||||||
| American Tower Corp., REIT, 3.5%, 1/31/2023 | $ | 502,000 | $ | 517,184 | ||||
| American Tower Corp., REIT, 4%, 6/01/2025 | 1,250,000 | 1,298,353 | ||||||
| Crown Castle International Corp., 2.25%, 9/01/2021 | 1,466,000 | 1,452,372 | ||||||
| Crown Castle International Corp., 3.7%, 6/15/2026 | 515,000 | 516,508 | ||||||
| SBA Tower Trust, 2.898%, 10/11/2044 (n) | 588,000 | 592,543 | ||||||
|
| |||||||
| $ | 4,376,960 | |||||||
| Telephone Services - 0.1% | ||||||||
| Chorus Ltd., 1.125%, 10/18/2023 | EUR | 600,000 | $ | 708,471 | ||||
| TELUS Corp., 5.05%, 7/23/2020 | CAD | 734,000 | 611,966 | |||||
|
| |||||||
| $ | 1,320,437 | |||||||
30
Table of Contents
Portfolio of Investments – continued
| Issuer | Shares/Par | Value ($) | ||||||
| Bonds - continued | ||||||||
| Tobacco - 0.2% | ||||||||
| B.A.T. International Finance PLC, 0.875%, 10/13/2023 | EUR | 750,000 | $ | 887,982 | ||||
| B.A.T. International Finance PLC, 1.25%, 3/13/2027 | EUR | 600,000 | 696,209 | |||||
| Imperial Brands Finance PLC, 1.375%, 1/27/2025 | EUR | 550,000 | 654,141 | |||||
| Reynolds American, Inc., 8.125%, 6/23/2019 | $ | 434,000 | 475,796 | |||||
| Reynolds American, Inc., 4.45%, 6/12/2025 | 255,000 | 274,475 | ||||||
| Reynolds American, Inc., 5.7%, 8/15/2035 | 798,000 | 941,888 | ||||||
|
| |||||||
| $ | 3,930,491 | |||||||
| Transportation - Services - 0.3% | ||||||||
| Autostrade per L’Italia S.p.A., 1.125%, 11/04/2021 | EUR | 800,000 | $ | 970,099 | ||||
| Autostrade per L’Italia S.p.A., 1.75%, 6/26/2026 | EUR | 410,000 | 498,730 | |||||
| Compagnie Financiere et Industrielle des Autoroutes S.A., 0.75%, 9/09/2028 | EUR | 700,000 | 781,224 | |||||
| ERAC USA Finance LLC, 7%, 10/15/2037 (n) | $ | 627,000 | 831,649 | |||||
| Heathrow Funding Ltd., 1.875%, 7/12/2032 | EUR | 700,000 | 846,493 | |||||
| Heathrow Funding Ltd., 4.625%, 10/31/2046 | GBP | 375,000 | 634,948 | |||||
| Transurban Finance Co., 1.75%, 3/29/2028 | EUR | 800,000 | 956,715 | |||||
|
| |||||||
| $ | 5,519,858 | |||||||
| U.S. Government Agencies and Equivalents - 0.1% | ||||||||
| Small Business Administration, 5.09%, 10/01/2025 | $ | 22,665 | $ | 23,901 | ||||
| Small Business Administration, 5.21%, 1/01/2026 | 306,872 | 325,325 | ||||||
| Small Business Administration, 5.31%, 5/01/2027 | 191,803 | 203,671 | ||||||
| Small Business Administration, 2.22%, 3/01/2033 | 816,847 | 806,890 | ||||||
|
| |||||||
| $ | 1,359,787 | |||||||
| U.S. Treasury Obligations - 1.6% | ||||||||
| U.S. Treasury Bonds, 5.25%, 2/15/2029 | $ | 3,727,000 | $ | 4,777,257 | ||||
| U.S. Treasury Bonds, 4.5%, 2/15/2036 | 3,814,000 | 4,882,963 | ||||||
| U.S. Treasury Bonds, 4.5%, 8/15/2039 (f) | 8,234,600 | 10,614,592 | ||||||
| U.S. Treasury Bonds, 3.625%, 2/15/2044 | 10,100,000 | 11,570,813 | ||||||
| U.S. Treasury Notes, 1.125%, 6/15/2018 | 2,986,000 | 2,981,799 | ||||||
|
| |||||||
| $ | 34,827,424 | |||||||
| Utilities - Electric Power - 1.1% | ||||||||
| American Electric Power Co., Inc., 1.65%, 12/15/2017 | $ | 528,000 | $ | 528,052 | ||||
| CMS Energy Corp., 5.05%, 3/15/2022 | 631,000 | 693,007 | ||||||
| DTE Electric Co., 3.7%, 3/15/2045 | 700,000 | 693,052 | ||||||
| Duke Energy Corp., 2.65%, 9/01/2026 | 1,361,000 | 1,306,111 | ||||||
| Duke Energy Florida LLC, 3.2%, 1/15/2027 | 2,500,000 | 2,524,858 | ||||||
| EDP Finance B.V., 4.9%, 10/01/2019 (n) | 462,000 | 484,909 | ||||||
| EDP Finance B.V., 4.125%, 1/20/2021 | EUR | 700,000 | 920,460 | |||||
| EDP Finance B.V., 2%, 4/22/2025 | EUR | 500,000 | 622,405 | |||||
| Emera U.S. Finance LP, 2.7%, 6/15/2021 | $ | 339,000 | 340,540 | |||||
31
Table of Contents
Portfolio of Investments – continued
| Issuer | Shares/Par | Value ($) | ||||||
| Bonds - continued | ||||||||
| Utilities - Electric Power - continued | ||||||||
| Emera U.S. Finance LP, 3.55%, 6/15/2026 | $ | 387,000 | $ | 390,675 | ||||
| Enel Americas S.A., 4%, 10/25/2026 | 3,133,000 | 3,187,828 | ||||||
| Enel Finance International N.V., 5.625%, 8/14/2024 | GBP | 400,000 | 643,479 | |||||
| Enel Finance International N.V., 4.75%, 5/25/2047 (n) | $ | 1,740,000 | 1,850,644 | |||||
| Exelon Corp., 3.497%, 6/01/2022 | 636,000 | 654,571 | ||||||
| Innogy Finance B.V., 4.75%, 1/31/2034 | GBP | 700,000 | 1,133,004 | |||||
| NextEra Energy Capital Holdings, Inc., 3.55%, 5/01/2027 | $ | 1,540,000 | 1,586,145 | |||||
| PPL Capital Funding, Inc., 3.1%, 5/15/2026 | 1,269,000 | 1,252,621 | ||||||
| PPL Capital Funding, Inc., 5%, 3/15/2044 | 331,000 | 380,360 | ||||||
| PPL WEM Holdings PLC, 5.375%, 5/01/2021 (n) | 189,000 | 204,420 | ||||||
| Progress Energy, Inc., 7.05%, 3/15/2019 | 460,000 | 491,096 | ||||||
| Public Service Enterprise Group, 2%, 11/15/2021 | 1,750,000 | 1,710,966 | ||||||
| Virginia Electric & Power Co., 3.5%, 3/15/2027 | 2,000,000 | 2,074,698 | ||||||
|
| |||||||
| $ | 23,673,901 | |||||||
| Total Bonds (Identified Cost, $625,089,206) | $ | 636,977,512 | ||||||
| Convertible Preferred Stocks - 0.1% | ||||||||
| Utilities - Electric Power - 0.1% | ||||||||
| NextEra Energy, Inc., 6.123% | 15,054 | $ | 858,078 | |||||
| NextEra Energy, Inc., 6.371% | 18,726 | 1,306,139 | ||||||
| Total Convertible Preferred Stocks (Identified Cost, $2,112,955) | $ | 2,164,217 | ||||||
| Preferred Stocks - 0.6% | ||||||||
| Automotive - 0.1% | ||||||||
| Hyundai Motor Co. | 14,855 | $ | 1,498,295 | |||||
| Consumer Products - 0.5% | ||||||||
| Henkel AG & Co. KGaA | 84,786 | $ | 11,900,938 | |||||
| Total Preferred Stocks (Identified Cost, $5,603,573) | $ | 13,399,233 | ||||||
| Investment Companies (h) - 10.4% | ||||||||
| Money Market Funds - 10.4% | ||||||||
| MFS Institutional Money Market Portfolio, 1.13% (v) (Identified Cost, $222,225,316) | 222,231,761 | $ | 222,231,761 | |||||
| Collateral for Securities Loaned - 0.2% | ||||||||
| JPMorgan U.S. Government Money Market Fund, 0.97% (j) (Identified Cost, $4,092,874) | 4,092,874 | $ | 4,092,874 | |||||
| Other Assets, Less Liabilities - 0.2% | 5,219,907 | |||||||
| Net Assets - 100.0% | $ | 2,151,124,504 | ||||||
32
Table of Contents
Portfolio of Investments – continued
| (a) | Non-income producing security. |
| (f) | All or a portion of the security has been segregated as collateral for open futures contracts. |
| (h) | An affiliated issuer may be considered one in which the fund owns 5% or more of the outstanding voting securities, or a company which is under common control. At period end, the aggregate values of the fund’s investments in affiliated issuers and in unaffiliated issuers were $222,231,761 and $1,923,672,836, respectively. |
| (j) | The rate quoted is the annualized seven-day yield of the fund at period end. |
| (l) | A portion of this security is on loan. |
| (n) | Securities exempt from registration under Rule 144A of the Securities Act of 1933. These securities may be sold in the ordinary course of business in transactions exempt from registration, normally to qualified institutional buyers. At period end, the aggregate value of these securities was $68,767,042 representing 3.2% of net assets. |
| (v) | Affiliated issuer that is available only to investment companies managed by MFS. The rate quoted for the MFS Institutional Money Market Portfolio is the annualized seven-day yield of the fund at period end. |
| (z) | Restricted securities are not registered under the Securities Act of 1933 and are subject to legal restrictions on resale. These securities generally may be resold in transactions exempt from registration or to the public if the securities are subsequently registered. Disposal of these securities may involve time-consuming negotiations and prompt sale at an acceptable price may be difficult. The fund holds the following restricted securities: |
| Restricted Securities | Acquisition Date | Cost | Value | |||||||
| Chesapeake Funding II LLC, 2016-2A, “A2”, FLR (U.S. LIBOR-1mo. + 1%) 2.239%, 6/15/2028 | 6/14/16 | $1,222,952 | $1,229,942 | |||||||
| Liberty Mutual Group, Inc., 2.75%, 5/04/2026 | 4/26/16 | 314,063 | 356,026 | |||||||
| Newell Brands, Inc., 3.75%, 10/01/2021 | 9/13/16 | 739,353 | 784,919 | |||||||
| Republic of Indonesia, 2.875%, 7/08/2021 | 7/02/14 | 544,023 | 504,380 | |||||||
| Republic of Indonesia, 2.15%, 7/18/2024 | 7/11/17 | 730,075 | 768,814 | |||||||
| Total Restricted Securities | $3,644,081 | |||||||||
| % of Net assets | 0.2% | |||||||||
The following abbreviations are used in this report and are defined:
| ADR | American Depositary Receipt |
| CLO | Collateralized Loan Obligation |
| FLR | Floating rate. Interest rate resets periodically based on the parenthetically disclosed reference rate plus a spread (if any). The period-end rate reported may not be the current rate. |
| PJSC | Public Joint Stock Company |
| PLC | Public Limited Company |
| REIT | Real Estate Investment Trust |
| Insurers | ||
| NATL | National Public Finance Guarantee Corp. | |
Abbreviations indicate amounts shown in currencies other than the U.S. dollar. All amounts are stated in U.S. dollars unless otherwise indicated. A list of abbreviations is shown below:
| AUD | Australian Dollar |
| CAD | Canadian Dollar |
| CHF | Swiss Franc |
| CZK | Czech Koruna |
| DKK | Danish Krone |
33
Table of Contents
Portfolio of Investments – continued
| EUR | Euro |
| GBP | British Pound |
| ILS | Israeli Shekel |
| INR | Indian Rupee |
| JPY | Japanese Yen |
| KRW | Korean Won |
| MXN | Mexican Peso |
| MYR | Malaysian Ringgit |
| NOK | Norwegian Krone |
| NZD | New Zealand Dollar |
| PLN | Polish Zloty |
| RUB | Russian Ruble |
| SEK | Swedish Krona |
| SGD | Singapore Dollar |
| THB | Thailand Baht |
| ZAR | South African Rand |
Derivative Contracts at 10/31/17
Forward Foreign Currency Exchange Contracts at 10/31/17
| Currency Purchased | Currency Sold | Counterparty | Settlement Date | Unrealized Appreciation (Depreciation) | ||||||||||||||
| Asset Derivatives | ||||||||||||||||||
| EUR | 466,335 | USD | 545,523 | Goldman Sachs International | 1/12/2018 | $26 | ||||||||||||
| GBP | 1,134,306 | USD | 1,502,844 | Barclays Bank PLC | 1/12/2018 | 7,218 | ||||||||||||
| GBP | 594,417 | USD | 786,588 | JPMorgan Chase Bank | 1/12/2018 | 4,739 | ||||||||||||
| INR | 42,000,000 | USD | 643,777 | Barclays Bank PLC | 11/1/2017 | 4,659 | ||||||||||||
| INR | 541,228,000 | USD | 8,299,070 | Barclays Bank PLC | 11/30/2017 | 25,162 | ||||||||||||
| KRW | 10,363,620,000 | USD | 9,101,513 | Barclays Bank PLC | 11/15/2017 | 149,396 | ||||||||||||
| KRW | 99,026,000 | USD | 86,908 | JPMorgan Chase Bank | 11/15/2017 | 1,486 | ||||||||||||
| USD | 1,096,147 | DKK | 6,849,984 | Barclays Bank PLC | 1/12/2018 | 18,970 | ||||||||||||
| USD | 15,738,471 | CAD | 19,654,359 | Citibank N.A. | 1/12/2018 | 491,994 | ||||||||||||
| USD | 394,884 | JPY | 44,246,000 | Citibank N.A. | 1/12/2018 | 4,262 | ||||||||||||
| USD | 1,055,126 | EUR | 892,491 | Deutsche Bank AG | 1/12/2018 | 11,034 | ||||||||||||
| USD | 2,372,523 | NOK | 18,804,000 | Deutsche Bank AG | 1/12/2018 | 65,933 | ||||||||||||
| USD | 302,261 | CAD | 377,000 | Goldman Sachs International | 1/12/2018 | 9,811 | ||||||||||||
| USD | 608,843 | CHF | 591,000 | Goldman Sachs International | 1/12/2018 | 13,355 | ||||||||||||
| USD | 6,760,776 | EUR | 5,682,000 | Goldman Sachs International | 1/12/2018 | 113,608 | ||||||||||||
| USD | 9,480,300 | AUD | 12,194,504 | JPMorgan Chase Bank | 1/12/2018 | 153,346 | ||||||||||||
| USD | 4,184,964 | EUR | 3,515,000 | JPMorgan Chase Bank | 1/12/2018 | 72,891 | ||||||||||||
| USD | 14,382,565 | NOK | 114,544,000 | JPMorgan Chase Bank | 1/12/2018 | 332,039 | ||||||||||||
| USD | 15,735,321 | CAD | 19,654,359 | Merrill Lynch International Bank | 1/12/2018 | 488,843 | ||||||||||||
| USD | 1,551,469 | EUR | 1,303,000 | UBS AG | 1/12/2018 | 27,136 | ||||||||||||
|
| |||||||||||||||||
| $1,995,908 | ||||||||||||||||||
|
| |||||||||||||||||
34
Table of Contents
Portfolio of Investments – continued
Forward Foreign Currency Exchange Contracts at 10/31/17 - continued
| Currency Purchased | Currency Sold | Counterparty | Settlement Date | Unrealized Appreciation (Depreciation) | ||||||||||||||
| Liability Derivatives | ||||||||||||||||||
| CAD | 6,622,000 | USD | 5,225,698 | Goldman Sachs International | 1/12/2018 | $(88,813 | ) | |||||||||||
| CHF | 4,995,000 | USD | 5,167,304 | Goldman Sachs International | 1/12/2018 | (134,375 | ) | |||||||||||
| CZK | 12,895,000 | USD | 593,746 | Goldman Sachs International | 1/12/2018 | (5,566 | ) | |||||||||||
| EUR | 2,704,846 | USD | 3,218,561 | Brown Brothers Harriman Co. | 1/12/2018 | (54,259 | ) | |||||||||||
| EUR | 26,533,740 | USD | 31,475,504 | Goldman Sachs International | 1/12/2018 | (434,634 | ) | |||||||||||
| EUR | 8,500,114 | USD | 10,047,475 | Morgan Stanley Capital Services, Inc. | 1/19/2018 | (99,281 | ) | |||||||||||
| ILS | 2,402,000 | USD | 689,954 | Barclays Bank PLC | 1/12/2018 | (6,099 | ) | |||||||||||
| INR | 499,228,000 | USD | 7,761,026 | Barclays Bank PLC | 11/1/2017 | (53,471 | ) | |||||||||||
| JPY | 6,555,711,509 | USD | 58,718,206 | Goldman Sachs International | 1/12/2018 | (841,710 | ) | |||||||||||
| JPY | 44,163,088 | USD | 392,780 | JPMorgan Chase Bank | 1/12/2018 | (2,890 | ) | |||||||||||
| MXN | 40,995,289 | USD | 2,157,567 | JPMorgan Chase Bank | 1/12/2018 | (45,999 | ) | |||||||||||
| MYR | 9,437,863 | USD | 2,236,195 | Barclays Bank PLC | 11/20/2017 | (8,696 | ) | |||||||||||
| NOK | 140,206,801 | USD | 17,733,891 | Goldman Sachs International | 1/12/2018 | (535,440 | ) | |||||||||||
| NZD | 1,325,980 | USD | 936,062 | JPMorgan Chase Bank | 1/12/2018 | (29,830 | ) | |||||||||||
| PLN | 5,974,803 | USD | 1,658,627 | JPMorgan Chase Bank | 1/12/2018 | (16,348 | ) | |||||||||||
| RUB | 151,017,000 | USD | 2,611,973 | Barclays Bank PLC | 11/20/2017 | (37,484 | ) | |||||||||||
| RUB | 83,479,000 | USD | 1,444,963 | Goldman Sachs International | 11/20/2017 | (21,841 | ) | |||||||||||
| RUB | 50,020,000 | USD | 869,603 | JPMorgan Chase Bank | 11/8/2017 | (15,149 | ) | |||||||||||
| RUB | 245,669,000 | USD | 4,246,655 | JPMorgan Chase Bank | 11/20/2017 | (58,570 | ) | |||||||||||
| SEK | 31,168,843 | USD | 3,881,387 | Deutsche Bank AG | 1/12/2018 | (140,775 | ) | |||||||||||
| SGD | 2,287,000 | USD | 1,688,564 | JPMorgan Chase Bank | 1/12/2018 | (9,564 | ) | |||||||||||
| THB | 56,073,750 | USD | 1,696,916 | JPMorgan Chase Bank | 11/17/2017 | (9,567 | ) | |||||||||||
| USD | 8,328,122 | INR | 541,228,000 | Barclays Bank PLC | 11/1/2017 | (27,869 | ) | |||||||||||
| USD | 7,552,841 | EUR | 6,493,716 | Deutsche Bank AG | 1/12/2018 | (43,924 | ) | |||||||||||
| USD | 502,522 | GBP | 377,756 | Goldman Sachs International | 1/12/2018 | (372 | ) | |||||||||||
| USD | 4,415,596 | KRW | 5,000,000,000 | JPMorgan Chase Bank | 11/15/2017 | (47,569 | ) | |||||||||||
| USD | 1,451,465 | GBP | 1,100,000 | JPMorgan Chase Bank | 1/12/2018 | (12,927 | ) | |||||||||||
| ZAR | 13,302,933 | USD | 958,514 | JPMorgan Chase Bank | 1/12/2018 | (29,088 | ) | |||||||||||
|
| |||||||||||||||||
| $(2,812,110 | ) | |||||||||||||||||
|
| |||||||||||||||||
35
Table of Contents
Portfolio of Investments – continued
Futures Contracts at 10/31/17
| Description | Long/ Short | Currency | Contracts | Notional Amount | Expiration Date | Value/ Unrealized Appreciation (Depreciation) | ||||||||||||||||
| Asset Derivatives | ||||||||||||||||||||||
| Interest Rate Futures | ||||||||||||||||||||||
| U.S. Treasury Ultra Note 10 yr | Short | USD | 10 | $1,339,219 | December - 2017 | $6,211 | ||||||||||||||||
| U.S. Treasury Note 10 yr | Short | USD | 35 | 4,372,813 | December - 2017 | 62,230 | ||||||||||||||||
|
| |||||||||||||||||||||
| $68,441 | ||||||||||||||||||||||
|
| |||||||||||||||||||||
At October 31, 2017, the fund had cash collateral of $1,743,000 and other liquid securities with an aggregate value of $55,428 to cover any collateral or margin obligations for certain derivative contracts. Restricted cash in the Statement of Assets and Liabilities is comprised of cash collateral.
See Notes to Financial Statements
36
Table of Contents
Financial Statements
STATEMENT OF ASSETS AND LIABILITIES
At 10/31/17
This statement represents your fund’s balance sheet, which details the assets and liabilities comprising the total value of the fund.
| Assets | ||||
Investments in unaffiliated issuers, at value, including $3,915,382 of securities on loan (identified cost, $1,516,598,095) | $1,923,672,836 | |||
Investments in affiliated issuers, at value (identified cost, $222,225,316) | 222,231,761 | |||
Cash | 420,734 | |||
Foreign currency, at value (identified cost, $323,273) | 323,273 | |||
Restricted cash for | ||||
Forward foreign currency exchange contracts | 1,743,000 | |||
Receivables for | ||||
Forward foreign currency exchange contracts | 1,995,908 | |||
Daily variation margin on open futures contracts | 3,207 | |||
Investments sold | 1,909,384 | |||
Fund shares sold | 6,950,231 | |||
Interest and dividends | 7,714,958 | |||
Receivable from investment adviser | 49,695 | |||
Other assets | 15 | |||
Total assets | $2,167,015,002 | |||
| Liabilities | ||||
Payables for | ||||
Forward foreign currency exchange contracts | $2,812,110 | |||
Investments purchased | 6,014,045 | |||
Fund shares reacquired | 1,871,505 | |||
Collateral for securities loaned, at value | 4,092,874 | |||
Payable to affiliates | ||||
Shareholder servicing costs | 612,028 | |||
Distribution and service fees | 32,797 | |||
Payable for independent Trustees’ compensation | 3,538 | |||
Deferred country tax expense payable | 236,137 | |||
Accrued expenses and other liabilities | 215,464 | |||
Total liabilities | $15,890,498 | |||
Net assets | $2,151,124,504 | |||
| Net assets consist of | ||||
Paid-in capital | $1,734,591,253 | |||
Unrealized appreciation (depreciation) (net of $236,137 deferred country tax) | 406,110,109 | |||
Accumulated net realized gain (loss) | 8,600,006 | |||
Undistributed net investment income | 1,823,136 | |||
Net assets | $2,151,124,504 | |||
Shares of beneficial interest outstanding | 119,360,539 |
37
Table of Contents
Statement of Assets and Liabilities – continued
| Net assets | Shares outstanding | Net asset value per share (a) | ||||||||||
Class A | $781,298,200 | 43,205,367 | $18.08 | |||||||||
Class B | 48,597,586 | 2,640,367 | 18.41 | |||||||||
Class C | 337,099,163 | 18,569,166 | 18.15 | |||||||||
Class I | 585,359,616 | 32,692,516 | 17.91 | |||||||||
Class R1 | 2,577,928 | 142,576 | 18.08 | |||||||||
Class R2 | 21,141,117 | 1,181,485 | 17.89 | |||||||||
Class R3 | 21,193,081 | 1,175,320 | 18.03 | |||||||||
Class R4 | 6,063,270 | 334,827 | 18.11 | |||||||||
Class R6 | 347,794,543 | 19,418,915 | 17.91 | |||||||||
| (a) | Maximum offering price per share was equal to the net asset value per share for all share classes, except for Class A, for which the maximum offering price per share was $19.18 [100 / 94.25 x $18.08]. On sales of $50,000 or more, the maximum offering price of Class A shares is reduced. A contingent deferred sales charge may be imposed on redemptions of Class A, Class B, and Class C shares. Redemption price per share was equal to the net asset value per share for Classes I, R1, R2, R3, R4, and R6. Net asset value per share is calculated using actual net assets and shares outstanding rather than amounts that have been rounded for presentation purposes. |
See Notes to Financial Statements
38
Table of Contents
Financial Statements
Year ended 10/31/17
This statement describes how much your fund earned in investment income and accrued in expenses. It also describes any gains and/or losses generated by fund operations.
| Net investment income (loss) | ||||
Income | ||||
Dividends | $34,130,935 | |||
Interest | 15,419,296 | |||
Dividends from affiliated issuers | 1,355,414 | |||
Income on securities loaned | 97,633 | |||
Other | 21,241 | |||
Foreign taxes withheld | (2,023,987 | ) | ||
Total investment income | $49,000,532 | |||
Expenses | ||||
Management fee | $15,571,745 | |||
Distribution and service fees | 6,054,952 | |||
Shareholder servicing costs | 2,067,193 | |||
Administrative services fee | 328,479 | |||
Independent Trustees’ compensation | 33,398 | |||
Custodian fee | 355,900 | |||
Reimbursement of custodian expenses | (71,079 | ) | ||
Shareholder communications | 208,806 | |||
Audit and tax fees | 76,428 | |||
Legal fees | 26,070 | |||
Miscellaneous | 266,106 | |||
Total expenses | $24,917,998 | |||
Fees paid indirectly | (6,301 | ) | ||
Reduction of expenses by investment adviser and distributor | (2,277,703 | ) | ||
Net expenses | $22,633,994 | |||
Net investment income (loss) | $26,366,538 | |||
| Realized and unrealized gain (loss) | ||||
Realized gain (loss) (identified cost basis) | ||||
Unaffiliated issuers (net of $13,239 country tax) | $39,973,756 | |||
Affiliated issuers | (7,971 | ) | ||
Futures contracts | (141,529 | ) | ||
Forward foreign currency exchange contracts | (5,019,853 | ) | ||
Foreign currency | (21,078 | ) | ||
Net realized gain (loss) | $34,783,325 | |||
Change in unrealized appreciation (depreciation) | ||||
Unaffiliated issuers (net of $204,281 increase in deferred country tax) | $164,552,559 | |||
Affiliated issuers | 6,445 | |||
Futures contracts | 58,712 | |||
Forward foreign currency exchange contracts | 2,026,339 | |||
Translation of assets and liabilities in foreign currencies | 150,647 | |||
Net unrealized gain (loss) | $166,794,702 | |||
Net realized and unrealized gain (loss) | $201,578,027 | |||
Change in net assets from operations | $227,944,565 |
See Notes to Financial Statements
39
Table of Contents
Financial Statements
STATEMENTS OF CHANGES IN NET ASSETS
These statements describe the increases and/or decreases in net assets resulting from operations, any distributions, and any shareholder transactions.
| Year ended | ||||||||
| 10/31/17 | 10/31/16 | |||||||
| Change in net assets | ||||||||
| From operations | ||||||||
Net investment income (loss) | $26,366,538 | $25,001,076 | ||||||
Net realized gain (loss) | 34,783,325 | (14,900,619 | ) | |||||
Net unrealized gain (loss) | 166,794,702 | 54,518,324 | ||||||
Change in net assets from operations | $227,944,565 | $64,618,781 | ||||||
| Distributions declared to shareholders | ||||||||
From net investment income | $(31,624,677 | ) | $(10,030,672 | ) | ||||
From net realized gain | — | (56,436,387 | ) | |||||
Total distributions declared to shareholders | $(31,624,677 | ) | $(66,467,059 | ) | ||||
Change in net assets from fund share transactions | $64,972,378 | $370,776,475 | ||||||
Total change in net assets | $261,292,266 | $368,928,197 | ||||||
| Net assets | ||||||||
At beginning of period | 1,889,832,238 | 1,520,904,041 | ||||||
At end of period (including undistributed net investment income of $1,823,136 and $10,683,170, respectively) | $2,151,124,504 | $1,889,832,238 | ||||||
See Notes to Financial Statements
40
Table of Contents
Financial Statements
The financial highlights table is intended to help you understand the fund’s financial performance for the past 5 years (or life of a particular share class, if shorter). Certain information reflects financial results for a single fund share. The total returns in the table represent the rate that an investor would have earned (or lost) on an investment in the fund share class (assuming reinvestment of all distributions) held for the entire period.
| Class A | Year ended | |||||||||||||||||||
| 10/31/17 | 10/31/16 | 10/31/15 | 10/31/14 | 10/31/13 | ||||||||||||||||
Net asset value, beginning of period | $16.42 | $16.49 | $16.80 | $16.32 | $14.39 | |||||||||||||||
| Income (loss) from investment operations | ||||||||||||||||||||
Net investment income (loss) (d) | $0.23 | (c) | $0.26 | $0.25 | $0.32 | $0.24 | ||||||||||||||
Net realized and unrealized gain (loss) | 1.70 | 0.40 | (0.22 | ) | 0.55 | 1.91 | ||||||||||||||
Total from investment operations | $1.93 | $0.66 | $0.03 | $0.87 | $2.15 | |||||||||||||||
| Less distributions declared to shareholders | ||||||||||||||||||||
From net investment income | $(0.27 | ) | $(0.11 | ) | $(0.16 | ) | $(0.32 | ) | $(0.22 | ) | ||||||||||
From net realized gain | — | (0.62 | ) | (0.18 | ) | (0.07 | ) | — | ||||||||||||
Total distributions declared to shareholders | $(0.27 | ) | $(0.73 | ) | $(0.34 | ) | $(0.39 | ) | $(0.22 | ) | ||||||||||
Net asset value, end of period (x) | $18.08 | $16.42 | $16.49 | $16.80 | $16.32 | |||||||||||||||
Total return (%) (r)(s)(t)(x) | 11.88 | (c) | 4.21 | 0.20 | 5.41 | 15.13 | ||||||||||||||
| Ratios (%) (to average net assets) and Supplemental data: | ||||||||||||||||||||
Expenses before expense reductions (f) | 1.20 | (c) | 1.27 | 1.28 | 1.27 | 1.28 | ||||||||||||||
Expenses after expense reductions (f) | 1.08 | (c) | 1.12 | 1.13 | 1.17 | 1.22 | ||||||||||||||
Net investment income (loss) | 1.35 | (c) | 1.59 | 1.51 | 1.93 | 1.60 | ||||||||||||||
Portfolio turnover | 41 | 36 | 54 | 23 | 40 | |||||||||||||||
Net assets at end of period (000 omitted) | $781,298 | $823,267 | $802,412 | $772,769 | $657,312 | |||||||||||||||
See Notes to Financial Statements
41
Table of Contents
Financial Highlights – continued
| Class B | Year ended | |||||||||||||||||||
| 10/31/17 | 10/31/16 | 10/31/15 | 10/31/14 | 10/31/13 | ||||||||||||||||
Net asset value, beginning of period | $16.73 | $16.82 | $17.21 | $16.70 | $14.73 | |||||||||||||||
| Income (loss) from investment operations | ||||||||||||||||||||
Net investment income (loss) (d) | $0.11 | (c) | $0.14 | $0.13 | $0.20 | $0.13 | ||||||||||||||
Net realized and unrealized gain (loss) | 1.74 | 0.40 | (0.22 | ) | 0.57 | 1.95 | ||||||||||||||
Total from investment operations | $1.85 | $0.54 | $(0.09 | ) | $0.77 | $2.08 | ||||||||||||||
| Less distributions declared to shareholders | ||||||||||||||||||||
From net investment income | $(0.17 | ) | $(0.01 | ) | $(0.12 | ) | $(0.19 | ) | $(0.11 | ) | ||||||||||
From net realized gain on investments | — | (0.62 | ) | (0.18 | ) | (0.07 | ) | — | ||||||||||||
Total distributions declared to shareholders | $(0.17 | ) | $(0.63 | ) | $(0.30 | ) | $(0.26 | ) | $(0.11 | ) | ||||||||||
Net asset value, end of period (x) | $18.41 | $16.73 | $16.82 | $17.21 | $16.70 | |||||||||||||||
Total return (%) (r)(s)(t)(x) | 11.11 | (c) | 3.37 | (0.53 | ) | 4.66 | 14.20 | |||||||||||||
| Ratios (%) (to average net assets) and Supplemental data: | �� | |||||||||||||||||||
Expenses before expense reductions (f) | 1.95 | (c) | 2.02 | 2.03 | 2.01 | 2.03 | ||||||||||||||
Expenses after expense reductions (f) | 1.84 | (c) | 1.87 | 1.88 | 1.92 | 1.97 | ||||||||||||||
Net investment income (loss) | 0.61 | (c) | 0.83 | 0.75 | 1.19 | 0.86 | ||||||||||||||
Portfolio turnover | 41 | 36 | 54 | 23 | 40 | |||||||||||||||
Net assets at end of period (000 omitted) | $48,598 | $55,070 | $60,197 | $66,528 | $64,457 | |||||||||||||||
| Class C | Year ended | |||||||||||||||||||
| 10/31/17 | 10/31/16 | 10/31/15 | 10/31/14 | 10/31/13 | ||||||||||||||||
Net asset value, beginning of period | $16.51 | $16.60 | $17.00 | $16.50 | $14.56 | |||||||||||||||
| Income (loss) from investment operations | ||||||||||||||||||||
Net investment income (loss) (d) | $0.10 | (c) | $0.14 | $0.13 | $0.20 | $0.13 | ||||||||||||||
Net realized and unrealized gain (loss) | 1.71 | 0.40 | (0.23 | ) | 0.57 | 1.92 | ||||||||||||||
Total from investment operations | $1.81 | $0.54 | $(0.10 | ) | $0.77 | $2.05 | ||||||||||||||
| Less distributions declared to shareholders | ||||||||||||||||||||
From net investment income | $(0.17 | ) | $(0.01 | ) | $(0.12 | ) | $(0.20 | ) | $(0.11 | ) | ||||||||||
From net realized gain | — | (0.62 | ) | (0.18 | ) | (0.07 | ) | — | ||||||||||||
Total distributions declared to shareholders | $(0.17 | ) | $(0.63 | ) | $(0.30 | ) | $(0.27 | ) | $(0.11 | ) | ||||||||||
Net asset value, end of period (x) | $18.15 | $16.51 | $16.60 | $17.00 | $16.50 | |||||||||||||||
Total return (%) (r)(s)(t)(x) | 11.03 | (c) | 3.44 | (0.59 | ) | 4.70 | 14.19 | |||||||||||||
| Ratios (%) (to average net assets) and Supplemental data: | ||||||||||||||||||||
Expenses before expense reductions (f) | 1.95 | (c) | 2.02 | 2.03 | 2.02 | 2.03 | ||||||||||||||
Expenses after expense reductions (f) | 1.84 | (c) | 1.87 | 1.88 | 1.92 | 1.97 | ||||||||||||||
Net investment income (loss) | 0.60 | (c) | 0.84 | 0.75 | 1.17 | 0.85 | ||||||||||||||
Portfolio turnover | 41 | 36 | 54 | 23 | 40 | |||||||||||||||
Net assets at end of period (000 omitted) | $337,099 | $359,421 | $323,241 | $308,269 | $245,944 | |||||||||||||||
See Notes to Financial Statements
42
Table of Contents
Financial Highlights – continued
| Class I | Year ended | |||||||||||||||||||
| 10/31/17 | 10/31/16 | 10/31/15 | 10/31/14 | 10/31/13 | ||||||||||||||||
Net asset value, beginning of period | $16.26 | $16.34 | $16.65 | $16.17 | $14.27 | |||||||||||||||
| Income (loss) from investment operations | ||||||||||||||||||||
Net investment income (loss) (d) | $0.28 | (c) | $0.31 | $0.29 | $0.35 | $0.28 | ||||||||||||||
Net realized and unrealized gain (loss) | 1.69 | 0.38 | (0.22 | ) | 0.56 | 1.88 | ||||||||||||||
Total from investment operations | $1.97 | $0.69 | $0.07 | $0.91 | $2.16 | |||||||||||||||
| Less distributions declared to shareholders | ||||||||||||||||||||
From net investment income | $(0.32 | ) | $(0.15 | ) | $(0.20 | ) | $(0.36 | ) | $(0.26 | ) | ||||||||||
From net realized gain | — | (0.62 | ) | (0.18 | ) | (0.07 | ) | — | ||||||||||||
Total distributions declared to shareholders | $(0.32 | ) | $(0.77 | ) | $(0.38 | ) | $(0.43 | ) | $(0.26 | ) | ||||||||||
Net asset value, end of period (x) | $17.91 | $16.26 | $16.34 | $16.65 | $16.17 | |||||||||||||||
Total return (%) (r)(s)(t)(x) | 12.22 | (c) | 4.45 | 0.45 | 5.72 | 15.33 | ||||||||||||||
| Ratios (%) (to average net assets) and Supplemental data: | ||||||||||||||||||||
Expenses before expense reductions (f) | 0.95 | (c) | 1.01 | 1.03 | 1.02 | 1.03 | ||||||||||||||
Expenses after expense reductions (f) | 0.84 | (c) | 0.87 | 0.88 | 0.92 | 0.97 | ||||||||||||||
Net investment income (loss) | 1.64 | (c) | 1.92 | 1.75 | 2.14 | 1.84 | ||||||||||||||
Portfolio turnover | 41 | 36 | 54 | 23 | 40 | |||||||||||||||
Net assets at end of period (000 omitted) | $585,360 | $494,880 | $212,571 | $193,307 | $108,175 | |||||||||||||||
| Class R1 | Year ended | |||||||||||||||||||
| 10/31/17 | 10/31/16 | 10/31/15 | 10/31/14 | 10/31/13 | ||||||||||||||||
Net asset value, beginning of period | $16.44 | $16.54 | $16.93 | $16.44 | $14.50 | |||||||||||||||
| Income (loss) from investment operations | ||||||||||||||||||||
Net investment income (loss) (d) | $0.10 | (c) | $0.13 | $0.13 | $0.20 | $0.13 | ||||||||||||||
Net realized and unrealized gain (loss) | 1.71 | 0.40 | (0.23 | ) | 0.56 | 1.92 | ||||||||||||||
Total from investment operations | $1.81 | $0.53 | $(0.10 | ) | $0.76 | $2.05 | ||||||||||||||
| Less distributions declared to shareholders | ||||||||||||||||||||
From net investment income | $(0.17 | ) | $(0.01 | ) | $(0.11 | ) | $(0.20 | ) | $(0.11 | ) | ||||||||||
From net realized gain | — | (0.62 | ) | (0.18 | ) | (0.07 | ) | — | ||||||||||||
Total distributions declared to shareholders | $(0.17 | ) | $(0.63 | ) | $(0.29 | ) | $(0.27 | ) | $(0.11 | ) | ||||||||||
Net asset value, end of period (x) | $18.08 | $16.44 | $16.54 | $16.93 | $16.44 | |||||||||||||||
Total return (%) (r)(s)(t)(x) | 11.09 | (c) | 3.39 | (0.55 | ) | 4.63 | 14.26 | |||||||||||||
| Ratios (%) (to average net assets) and Supplemental data: | ||||||||||||||||||||
Expenses before expense reductions (f) | 1.95 | (c) | 2.02 | 2.03 | 2.01 | 2.03 | ||||||||||||||
Expenses after expense reductions (f) | 1.84 | (c) | 1.87 | 1.88 | 1.92 | 1.97 | ||||||||||||||
Net investment income (loss) | 0.59 | (c) | 0.81 | 0.75 | 1.18 | 0.87 | ||||||||||||||
Portfolio turnover | 41 | 36 | 54 | 23 | 40 | |||||||||||||||
Net assets at end of period (000 omitted) | $2,578 | $2,875 | $3,195 | $3,518 | $3,613 | |||||||||||||||
See Notes to Financial Statements
43
Table of Contents
Financial Highlights – continued
| Class R2 | Year ended | |||||||||||||||||||
| 10/31/17 | 10/31/16 | 10/31/15 | 10/31/14 | 10/31/13 | ||||||||||||||||
Net asset value, beginning of period | $16.26 | $16.35 | $16.68 | $16.20 | $14.29 | |||||||||||||||
| Income (loss) from investment operations | ||||||||||||||||||||
Net investment income (loss) (d) | $0.19 | (c) | $0.23 | $0.21 | $0.28 | $0.21 | ||||||||||||||
Net realized and unrealized gain (loss) | 1.68 | 0.38 | (0.22 | ) | 0.55 | 1.88 | ||||||||||||||
Total from investment operations | $1.87 | $0.61 | $(0.01 | ) | $0.83 | $2.09 | ||||||||||||||
| Less distributions declared to shareholders | ||||||||||||||||||||
From net investment income | $(0.24 | ) | $(0.08 | ) | $(0.14 | ) | $(0.28 | ) | $(0.18 | ) | ||||||||||
From net realized gain | — | (0.62 | ) | (0.18 | ) | (0.07 | ) | — | ||||||||||||
Total distributions declared to shareholders | $(0.24 | ) | $(0.70 | ) | $(0.32 | ) | $(0.35 | ) | $(0.18 | ) | ||||||||||
Net asset value, end of period (x) | $17.89 | $16.26 | $16.35 | $16.68 | $16.20 | |||||||||||||||
Total return (%) (r)(s)(t)(x) | 11.59 | (c) | 3.93 | (0.03 | ) | 5.16 | 14.79 | |||||||||||||
| Ratios (%) (to average net assets) and Supplemental data: | ||||||||||||||||||||
Expenses before expense reductions (f) | 1.45 | (c) | 1.52 | 1.53 | 1.51 | 1.53 | ||||||||||||||
Expenses after expense reductions (f) | 1.34 | (c) | 1.37 | 1.38 | 1.42 | 1.47 | ||||||||||||||
Net investment income (loss) | 1.11 | (c) | 1.40 | 1.25 | 1.69 | 1.38 | ||||||||||||||
Portfolio turnover | 41 | 36 | 54 | 23 | 40 | |||||||||||||||
Net assets at end of period (000 omitted) | $21,141 | $20,926 | $11,577 | $9,812 | $10,528 | |||||||||||||||
| Class R3 | Year ended | |||||||||||||||||||
| 10/31/17 | 10/31/16 | 10/31/15 | 10/31/14 | 10/31/13 | ||||||||||||||||
Net asset value, beginning of period | $16.37 | $16.44 | $16.75 | $16.27 | $14.35 | |||||||||||||||
| Income (loss) from investment operations | ||||||||||||||||||||
Net investment income (loss) (d) | $0.23 | (c) | $0.26 | $0.25 | $0.32 | $0.24 | ||||||||||||||
Net realized and unrealized gain (loss) | 1.71 | 0.40 | (0.22 | ) | 0.55 | 1.90 | ||||||||||||||
Total from investment operations | $1.94 | $0.66 | $0.03 | $0.87 | $2.14 | |||||||||||||||
| Less distributions declared to shareholders | ||||||||||||||||||||
From net investment income | $(0.28 | ) | $(0.11 | ) | $(0.16 | ) | $(0.32 | ) | $(0.22 | ) | ||||||||||
From net realized gain | — | (0.62 | ) | (0.18 | ) | (0.07 | ) | — | ||||||||||||
Total distributions declared to shareholders | $(0.28 | ) | $(0.73 | ) | $(0.34 | ) | $(0.39 | ) | $(0.22 | ) | ||||||||||
Net asset value, end of period (x) | $18.03 | $16.37 | $16.44 | $16.75 | $16.27 | |||||||||||||||
Total return (%) (r)(s)(t)(x) | 11.94 | (c) | 4.23 | 0.19 | 5.42 | 15.10 | ||||||||||||||
| Ratios (%) (to average net assets) and Supplemental data: | ||||||||||||||||||||
Expenses before expense reductions (f) | 1.20 | (c) | 1.27 | 1.27 | 1.27 | 1.28 | ||||||||||||||
Expenses after expense reductions (f) | 1.09 | (c) | 1.12 | 1.13 | 1.17 | 1.22 | ||||||||||||||
Net investment income (loss) | 1.35 | (c) | 1.62 | 1.50 | 1.93 | 1.59 | ||||||||||||||
Portfolio turnover | 41 | 36 | 54 | 23 | 40 | |||||||||||||||
Net assets at end of period (000 omitted) | $21,193 | $15,157 | $11,368 | $13,576 | $12,423 | |||||||||||||||
See Notes to Financial Statements
44
Table of Contents
Financial Highlights – continued
| Class R4 | Year ended | |||||||||||||||||||
| 10/31/17 | 10/31/16 | 10/31/15 | 10/31/14 | 10/31/13 | ||||||||||||||||
Net asset value, beginning of period | $16.44 | $16.51 | $16.82 | $16.33 | $14.41 | |||||||||||||||
| Income (loss) from investment operations | ||||||||||||||||||||
Net investment income (loss) (d) | $0.27 | (c) | $0.29 | $0.29 | $0.36 | $0.27 | ||||||||||||||
Net realized and unrealized gain (loss) | 1.72 | 0.41 | (0.22 | ) | 0.56 | 1.91 | ||||||||||||||
Total from investment operations | $1.99 | $0.70 | $0.07 | $0.92 | $2.18 | |||||||||||||||
| Less distributions declared to shareholders | ||||||||||||||||||||
From net investment income | $(0.32 | ) | $(0.15 | ) | $(0.20 | ) | $(0.36 | ) | $(0.26 | ) | ||||||||||
From net realized gain | — | (0.62 | ) | (0.18 | ) | (0.07 | ) | — | ||||||||||||
Total distributions declared to shareholders | $(0.32 | ) | $(0.77 | ) | $(0.38 | ) | $(0.43 | ) | $(0.26 | ) | ||||||||||
Net asset value, end of period (x) | $18.11 | $16.44 | $16.51 | $16.82 | $16.33 | |||||||||||||||
Total return (%) (r)(s)(t)(x) | 12.20 | (c) | 4.45 | 0.45 | 5.72 | 15.32 | ||||||||||||||
| Ratios (%) (to average net assets) and Supplemental data: | ||||||||||||||||||||
Expenses before expense reductions (f) | 0.95 | (c) | 1.02 | 1.03 | 1.02 | 1.04 | ||||||||||||||
Expenses after expense reductions (f) | 0.84 | (c) | 0.87 | 0.88 | 0.92 | 0.97 | ||||||||||||||
Net investment income (loss) | 1.59 | (c) | 1.79 | 1.73 | 2.14 | 1.77 | ||||||||||||||
Portfolio turnover | 41 | 36 | 54 | 23 | 40 | |||||||||||||||
Net assets at end of period (000 omitted) | $6,063 | $7,629 | $10,758 | $10,042 | $7,938 | |||||||||||||||
| Class R6 | Year ended | |||||||||||||||||||
| 10/31/17 | 10/31/16 | 10/31/15 | 10/31/14 | 10/31/13 | ||||||||||||||||
Net asset value, beginning of period | $16.26 | $16.34 | $16.65 | $16.18 | $14.27 | |||||||||||||||
| Income (loss) from investment operations | ||||||||||||||||||||
Net investment income (loss) (d) | $0.28 | (c) | $0.31 | $0.30 | $0.37 | $0.29 | ||||||||||||||
Net realized and unrealized gain (loss) | 1.70 | 0.40 | (0.21 | ) | 0.55 | 1.89 | ||||||||||||||
Total from investment operations | $1.98 | $0.71 | $0.09 | $0.92 | $2.18 | |||||||||||||||
| Less distributions declared to shareholders | ||||||||||||||||||||
From net investment income | $(0.33 | ) | $(0.17 | ) | $(0.22 | ) | $(0.38 | ) | $(0.27 | ) | ||||||||||
From net realized gain | — | (0.62 | ) | (0.18 | ) | (0.07 | ) | — | ||||||||||||
Total distributions declared to shareholders | $(0.33 | ) | $(0.79 | ) | $(0.40 | ) | $(0.45 | ) | $(0.27 | ) | ||||||||||
Net asset value, end of period (x) | $17.91 | $16.26 | $16.34 | $16.65 | $16.18 | |||||||||||||||
Total return (%) (r)(s)(t)(x) | 12.33 | (c) | 4.54 | 0.56 | 5.73 | 15.49 | ||||||||||||||
| Ratios (%) (to average net assets) and Supplemental data: | ||||||||||||||||||||
Expenses before expense reductions (f) | 0.84 | (c) | 0.92 | 0.93 | 0.93 | 0.94 | ||||||||||||||
Expenses after expense reductions (f) | 0.74 | (c) | 0.77 | 0.78 | 0.83 | 0.88 | ||||||||||||||
Net investment income (loss) | 1.63 | (c) | 1.96 | 1.85 | 2.25 | 1.95 | ||||||||||||||
Portfolio turnover | 41 | 36 | 54 | 23 | 40 | |||||||||||||||
Net assets at end of period (000 omitted) | $347,795 | $110,608 | $85,585 | $74,972 | $61,383 | |||||||||||||||
See Notes to Financial Statements
45
Table of Contents
Financial Highlights – continued
| (c) | Amount reflects a one-time reimbursement of expenses by the custodian (or former custodian) without which net investment income and performance would be lower and expenses would be higher. See Note 2 in the Notes to Financial Statements for additional information. |
| (d) | Per share data is based on average shares outstanding. |
| (f) | Ratios do not reflect reductions from fees paid indirectly, if applicable. |
| (r) | Certain expenses have been reduced without which performance would have been lower. |
| (s) | From time to time the fund may receive proceeds from litigation settlements, without which performance would be lower. |
| (t) | Total returns do not include any applicable sales charges. |
| (x) | The net asset values and total returns have been calculated on net assets which include adjustments made in accordance with U.S. generally accepted accounting principles required at period end for financial reporting purposes. |
See Notes to Financial Statements
46
Table of Contents
(1) Business and Organization
MFS Global Total Return Fund (the fund) is a diversified series of MFS Series Trust VI (the trust). The trust is organized as a Massachusetts business trust and is registered under the Investment Company Act of 1940, as amended, as an open-end management investment company.
The fund is an investment company and accordingly follows the investment company accounting and reporting guidance of the Financial Accounting Standards Board (FASB) Accounting Standards Codification Topic 946 Financial Services – Investment Companies.
(2) Significant Accounting Policies
General – The preparation of financial statements in conformity with U.S. generally accepted accounting principles requires management to make estimates and assumptions that affect the reported amounts of assets and liabilities, and disclosure of contingent assets and liabilities at the date of the financial statements and the reported amounts of increases and decreases in net assets from operations during the reporting period. Actual results could differ from those estimates. In the preparation of these financial statements, management has evaluated subsequent events occurring after the date of the fund’s Statement of Assets and Liabilities through the date that the financial statements were issued. The fund invests in foreign securities. Investments in foreign securities are vulnerable to the effects of changes in the relative values of the local currency and the U.S. dollar and to the effects of changes in each country’s legal, political, and economic environment.
In October 2016, the Securities and Exchange Commission (SEC) released its Final Rule on Investment Company Reporting Modernization (the “Rule”). The Rule, which introduced two new regulatory reporting forms for investment companies – Form N-PORT and Form N-CEN – also contained amendments to Regulation S-X which impact financial statement presentation, particularly the presentation of derivative investments, for all reporting periods ending after August 1, 2017. The fund has adopted the Rule’s Regulation S-X amendments and believes that the fund’s financial statements are in compliance with those amendments.
In March 2017, the FASB issued Accounting Standards Update 2017-08, Receivables – Nonrefundable Fees and Other Costs (Subtopic 310-20) – Premium Amortization on Purchased Callable Debt Securities (“ASU 2017-08”). For entities that hold callable debt securities at a premium, ASU 2017-08 requires that the premium be amortized to the earliest call date. ASU 2017-08 will be effective for fiscal years beginning after December 15, 2018, and interim periods within those fiscal years. Management is still evaluating the potential impacts of ASU 2017-08 but believes that adoption of ASU 2017-08 will not have a material effect on the fund’s overall financial position or its overall results of operations.
Balance Sheet Offsetting – The fund’s accounting policy with respect to balance sheet offsetting is that, absent an event of default by the counterparty or a termination of the agreement, the International Swaps and Derivatives Association (ISDA) Master Agreement, or similar agreement, does not result in an offset of reported amounts of
47
Table of Contents
Notes to Financial Statements – continued
financial assets and financial liabilities in the Statement of Assets and Liabilities across transactions between the fund and the applicable counterparty. The fund’s right to setoff may be restricted or prohibited by the bankruptcy or insolvency laws of the particular jurisdiction to which a specific master netting agreement counterparty is subject. Balance sheet offsetting disclosures, to the extent applicable to the fund, have been included in the fund’s Significant Accounting Policies note under the captions for each of the fund’s in-scope financial instruments and transactions.
Investment Valuations – Equity securities, including restricted equity securities, are generally valued at the last sale or official closing price on their primary market or exchange as provided by a third-party pricing service. Equity securities, for which there were no sales reported that day, are generally valued at the last quoted daily bid quotation on their primary market or exchange as provided by a third-party pricing service. Debt instruments and floating rate loans, including restricted debt instruments, are generally valued at an evaluated or composite bid as provided by a third-party pricing service. Short-term instruments with a maturity at issuance of 60 days or less may be valued at amortized cost, which approximates market value. Futures contracts are generally valued at last posted settlement price on their primary exchange as provided by a third-party pricing service. Futures contracts for which there were no trades that day for a particular position are generally valued at the closing bid quotation on their primary exchange as provided by a third-party pricing service. Forward foreign currency exchange contracts are generally valued at the mean of bid and asked prices for the time period interpolated from rates provided by a third-party pricing service for proximate time periods. Open-end investment companies are generally valued at net asset value per share. Securities and other assets generally valued on the basis of information from a third-party pricing service may also be valued at a broker/dealer bid quotation. Values obtained from third-party pricing services can utilize both transaction data and market information such as yield, quality, coupon rate, maturity, type of issue, trading characteristics, and other market data. The values of foreign securities and other assets and liabilities expressed in foreign currencies are converted to U.S. dollars using the mean of bid and asked prices for rates provided by a third-party pricing service.
The Board of Trustees has delegated primary responsibility for determining or causing to be determined the value of the fund’s investments (including any fair valuation) to the adviser pursuant to valuation policies and procedures approved by the Board. If the adviser determines that reliable market quotations are not readily available, investments are valued at fair value as determined in good faith by the adviser in accordance with such procedures under the oversight of the Board of Trustees. Under the fund’s valuation policies and procedures, market quotations are not considered to be readily available for most types of debt instruments and floating rate loans and many types of derivatives. These investments are generally valued at fair value based on information from third-party pricing services. In addition, investments may be valued at fair value if the adviser determines that an investment’s value has been materially affected by events occurring after the close of the exchange or market on which the investment is principally traded (such as foreign exchange or market) and prior to the determination of the fund’s net asset value, or after the halting of trading of a specific security where trading does not resume prior to the close of the exchange or market on which the
48
Table of Contents
Notes to Financial Statements – continued
security is principally traded. Events that occur on a frequent basis after foreign markets close (such as developments in foreign markets and significant movements in the U.S. markets) and prior to the determination of the fund’s net asset value may be deemed to have a material effect on the value of securities traded in foreign markets. Accordingly, the fund’s foreign equity securities may often be valued at fair value. The adviser generally relies on third-party pricing services or other information (such as the correlation with price movements of similar securities in the same or other markets; the type, cost and investment characteristics of the security; the business and financial condition of the issuer; and trading and other market data) to assist in determining whether to fair value and at what value to fair value an investment. The value of an investment for purposes of calculating the fund’s net asset value can differ depending on the source and method used to determine value. When fair valuation is used, the value of an investment used to determine the fund’s net asset value may differ from quoted or published prices for the same investment. There can be no assurance that the fund could obtain the fair value assigned to an investment if it were to sell the investment at the same time at which the fund determines its net asset value per share.
Various inputs are used in determining the value of the fund’s assets or liabilities. These inputs are categorized into three broad levels. In certain cases, the inputs used to measure fair value may fall into different levels of the fair value hierarchy. In such cases, an investment’s level within the fair value hierarchy is based on the lowest level of input that is significant to the fair value measurement. The fund’s assessment of the significance of a particular input to the fair value measurement in its entirety requires judgment, and considers factors specific to the investment. Level 1 includes unadjusted quoted prices in active markets for identical assets or liabilities. Level 2 includes other significant observable market-based inputs (including quoted prices for similar securities, interest rates, prepayment speed, and credit risk). Level 3 includes unobservable inputs, which may include the adviser’s own assumptions in determining the fair value of investments. Other financial instruments are derivative instruments, such as futures contracts and forward foreign currency exchange contracts.
49
Table of Contents
Notes to Financial Statements – continued
The following is a summary of the levels used as of October 31, 2017 in valuing the fund’s assets or liabilities:
| Financial Instruments | Level 1 | Level 2 | Level 3 | Total | ||||||||||||
| Equity Securities: | ||||||||||||||||
United States | $676,619,463 | $— | $— | $676,619,463 | ||||||||||||
Switzerland | 98,075,939 | — | — | 98,075,939 | ||||||||||||
United Kingdom | 97,221,996 | — | — | 97,221,996 | ||||||||||||
Japan | — | 89,782,256 | — | 89,782,256 | ||||||||||||
France | 63,253,755 | — | — | 63,253,755 | ||||||||||||
Germany | 43,585,997 | — | — | 43,585,997 | ||||||||||||
Canada | 38,616,614 | — | — | 38,616,614 | ||||||||||||
Taiwan | 31,260,282 | 5,075,286 | — | 36,335,568 | ||||||||||||
Netherlands | 29,121,866 | — | — | 29,121,866 | ||||||||||||
Other Countries | 82,999,822 | 26,989,174 | — | 109,988,996 | ||||||||||||
| U.S. Treasury Bonds & U.S. Government Agency & Equivalents | — | 36,187,211 | — | 36,187,211 | ||||||||||||
| Non-U.S. Sovereign Debt | — | 257,527,468 | — | 257,527,468 | ||||||||||||
| Municipal Bonds | — | 527,447 | — | 527,447 | ||||||||||||
| U.S. Corporate Bonds | — | 145,402,696 | — | 145,402,696 | ||||||||||||
| Residential Mortgage-Backed Securities | — | 65,695,164 | — | 65,695,164 | ||||||||||||
| Commercial Mortgage-Backed Securities | — | 11,709,475 | — | 11,709,475 | ||||||||||||
| Asset-Backed Securities (including CDOs) | — | 28,529,406 | — | 28,529,406 | ||||||||||||
| Foreign Bonds | — | 91,398,645 | — | 91,398,645 | ||||||||||||
| Mutual Funds | 226,324,635 | — | — | 226,324,635 | ||||||||||||
| Total | $1,387,080,369 | $758,824,228 | $— | $2,145,904,597 | ||||||||||||
| Other Financial Instruments | ||||||||||||||||
| Futures Contracts – Assets | $68,441 | $— | $— | $68,441 | ||||||||||||
| Forward Foreign Currency Exchange Contracts – Assets | — | 1,995,908 | — | 1,995,908 | ||||||||||||
| Forward Foreign Currency Exchange Contracts – Liabilities | — | (2,812,110 | ) | — | (2,812,110 | ) | ||||||||||
For further information regarding security characteristics, see the Portfolio of Investments.
Of the level 2 investments presented above, equity investments amounting to $113,011,489 would have been considered level 1 investments at the beginning of the period. The primary reason for changes in the classifications between levels 1 and 2 occurs when foreign equity securities are fair valued using other observable market-based inputs in place of the closing exchange price due to events occurring after the close of the exchange or market on which the investment is principally traded. The fund’s foreign equity securities may often be valued using other observable market-based inputs. The fund’s policy is to recognize transfers between the levels as of the end of the period.
50
Table of Contents
Notes to Financial Statements – continued
Foreign Currency Translation – Purchases and sales of foreign investments, income, and expenses are converted into U.S. dollars based upon currency exchange rates prevailing on the respective dates of such transactions or on the reporting date for foreign denominated receivables and payables. Gains and losses attributable to foreign currency exchange rates on sales of securities are recorded for financial statement purposes as net realized gains and losses on investments. Gains and losses attributable to foreign exchange rate movements on receivables, payables, income and expenses are recorded for financial statement purposes as foreign currency transaction gains and losses. That portion of both realized and unrealized gains and losses on investments that results from fluctuations in foreign currency exchange rates is not separately disclosed.
Derivatives – The fund uses derivatives for different purposes, primarily to increase or decrease exposure to a particular market or segment of the market, or security, to increase or decrease interest rate or currency exposure, or as alternatives to direct investments. Derivatives are used for hedging or non-hedging purposes. While hedging can reduce or eliminate losses, it can also reduce or eliminate gains. When the fund uses derivatives as an investment to increase market exposure, or for hedging purposes, gains and losses from derivative instruments may be substantially greater than the derivative’s original cost.
The derivative instruments used by the fund were futures contracts, purchased options, and forward foreign currency exchange contracts. Depending on the type of derivative, the fund may exit a derivative position by entering into an offsetting transaction with a counterparty or exchange, negotiating an agreement with the derivative counterparty, or novating the position to a third party. The fund may be unable to promptly close out a futures position in instances where the daily fluctuation in the price for that type of future exceeds the daily limit set by the exchange. The fund’s period end derivatives, as presented in the Portfolio of Investments and the associated Derivative Contract tables, generally are indicative of the volume of its derivative activity during the period.
The following table presents, by major type of derivative contract, the fair value, on a gross basis, of the asset and liability components of derivatives held by the fund at October 31, 2017 as reported in the Statement of Assets and Liabilities:
| Fair Value (a) | ||||||||||
| Risk | Derivative Contracts | Asset Derivatives | Liability Derivatives | |||||||
| Interest Rate | Interest Rate Futures | $68,441 | $— | |||||||
| Foreign Exchange | Forward Foreign Currency Exchange | 1,995,908 | (2,812,110 | ) | ||||||
| Total | $2,064,349 | $(2,812,110 | ) | |||||||
| (a) | The value of futures contracts includes cumulative appreciation (depreciation) as reported in the fund’s Portfolio of Investments. Only the current day net variation margin for futures contracts is separately reported within the fund’s Statement of Assets and Liabilities. |
51
Table of Contents
Notes to Financial Statements – continued
The following table presents, by major type of derivative contract, the realized gain (loss) on derivatives held by the fund for the year ended October 31, 2017 as reported in the Statement of Operations:
| Risk | Futures Contracts | Forward Foreign Currency Exchange Contracts | Investments (Purchased Options) | |||||||||
| Interest Rate | $(141,529 | ) | $— | $— | ||||||||
| Foreign Exchange | — | (5,019,853 | ) | — | ||||||||
| Equity | — | — | (108,388 | ) | ||||||||
| Total | $(141,529 | ) | $(5,019,853 | ) | $(108,388 | ) | ||||||
The following table presents, by major type of derivative contract, the change in unrealized appreciation (depreciation) on derivatives held by the fund for the year ended October 31, 2017 as reported in the Statement of Operations:
| Risk | Futures Contracts | Forward Foreign Exchange | ||||||
| Interest Rate | $58,712 | $— | ||||||
| Foreign Exchange | — | 2,026,339 | ||||||
| Total | $58,712 | $2,026,339 | ||||||
Derivative counterparty credit risk is managed through formal evaluation of the creditworthiness of all potential counterparties. On certain, but not all, uncleared derivatives, the fund attempts to reduce its exposure to counterparty credit risk whenever possible by entering into an ISDA Master Agreement on a bilateral basis. The ISDA Master Agreement gives each party to the agreement the right to terminate all transactions traded under such agreement if there is a certain deterioration in the credit quality of the other party. Upon an event of default or a termination of the ISDA Master Agreement, the non-defaulting party has the right to close out all transactions traded under such agreement and to net amounts owed under each agreement to one net amount payable by one party to the other. This right to close out and net payments across all transactions traded under the ISDA Master Agreement could result in a reduction of the fund’s credit risk to such counterparty equal to any amounts payable by the fund under the applicable transactions, if any.
Collateral and margin requirements differ by type of derivative. For cleared derivatives (e.g., futures contracts, cleared swaps, and exchange-traded options), margin requirements are set by the clearing broker and the clearing house and collateral, in the form of cash or securities, is posted by the fund directly with the clearing broker. Collateral terms are counterparty agreement specific for uncleared derivatives (e.g., forward foreign currency exchange contracts, uncleared swap agreements, and uncleared options) and collateral, in the form of cash and securities, is held in segregated accounts with the fund’s custodian in connection with these agreements. For derivatives traded under an ISDA Master Agreement, which contains a collateral support annex, the collateral requirements are netted across all transactions traded
52
Table of Contents
Notes to Financial Statements – continued
under such counterparty-specific agreement and one amount is posted from one party to the other to collateralize such obligations. Cash that has been segregated or delivered to cover the fund’s collateral or margin obligations under derivative contracts, if any, will be reported separately in the Statement of Assets and Liabilities as restricted cash for uncleared derivatives or deposits with brokers for cleared derivatives, respectively. Securities pledged as collateral or margin for the same purpose, if any, are noted in the Portfolio of Investments. The fund may be required to make payments of interest on uncovered collateral or margin obligations with the broker. Any such payments are included in “Miscellaneous” expense in the Statement of Operations.
Purchased Options – The fund purchased put options for a premium. Purchased put options entitle the holder to sell a specified number of shares or units of a particular security, currency or index at a specified price at a specified date or within a specified period of time. Purchasing put options may hedge against an anticipated decline in the value of portfolio securities or currency or decrease the fund’s exposure to an underlying instrument.
The premium paid is initially recorded as an investment in the Statement of Assets and Liabilities. That investment is subsequently marked-to-market daily with the difference between the premium paid and the market value of the purchased option being recorded as unrealized appreciation or depreciation. Premiums paid for purchased put options which have expired are treated as realized losses on investments in the Statement of Operations. Upon the exercise or closing of a purchased put option, the premium paid is offset against the proceeds on the sale of the underlying security or financial instrument in order to determine the realized gain or loss on investments.
Whether or not the option is exercised, the fund’s maximum risk of loss from purchasing an option is the amount of premium paid. All option contracts involve credit risk if the counterparty to the option contract fails to perform. For uncleared options, this risk is mitigated in cases where there is an ISDA Master Agreement between the fund and the counterparty providing for netting as described above and, where applicable, by the posting of collateral by the counterparty to the fund to cover the fund’s exposure to the counterparty under such ISDA Master Agreement.
Futures Contracts – The fund entered into futures contracts which may be used to hedge against or obtain broad market exposure, interest rate exposure, currency exposure, or to manage duration. A futures contract represents a commitment for the future purchase or sale of an asset at a specified price on a specified date.
Upon entering into a futures contract, the fund is required to deposit with the broker, either in cash or securities, an initial margin in an amount equal to a certain percentage of the notional amount of the contract. Subsequent payments (variation margin) are made or received by the fund each day, depending on the daily fluctuations in the value of the contract, and are recorded for financial statement purposes as unrealized gain or loss by the fund until the contract is closed or expires at which point the gain or loss on futures contracts is realized.
The fund bears the risk of interest rates, exchange rates or securities prices moving unexpectedly, in which case, the fund may not achieve the anticipated benefits of the futures contracts and may realize a loss. While futures contracts may present less counterparty risk to the fund since the contracts are exchange traded and the
53
Table of Contents
Notes to Financial Statements – continued
exchange’s clearinghouse guarantees payments to the broker, there is still counterparty credit risk due to the insolvency of the broker. The fund’s maximum risk of loss due to counterparty credit risk is equal to the margin posted by the fund to the broker plus any gains or minus any losses on the outstanding futures contracts.
Forward Foreign Currency Exchange Contracts – The fund entered into forward foreign currency exchange contracts for the purchase or sale of a specific foreign currency at a fixed price on a future date. These contracts may be used to hedge the fund’s currency risk or for non-hedging purposes. For hedging purposes, the fund may enter into contracts to deliver or receive foreign currency that the fund will receive from or use in its normal investment activities. The fund may also use contracts to hedge against declines in the value of foreign currency denominated securities due to unfavorable exchange rate movements. For non-hedging purposes, the fund may enter into contracts with the intent of changing the relative exposure of the fund’s portfolio of securities to different currencies to take advantage of anticipated exchange rate changes.
Forward foreign currency exchange contracts are adjusted by the daily exchange rate of the underlying currency and any unrealized gains or losses are recorded as a receivable or payable for forward foreign currency exchange contracts until the contract settlement date. On contract settlement date, any gain or loss on the contract is recorded as realized gains or losses on forward foreign currency exchange contracts.
Risks may arise upon entering into these contracts from unanticipated movements in the value of the contract and from the potential inability of counterparties to meet the terms of their contracts. Generally, the fund’s maximum risk due to counterparty credit risk is the unrealized gain on the contract due to the use of Continuous Linked Settlement, a multicurrency cash settlement system for the centralized settlement of foreign transactions. This risk is mitigated in cases where there is an ISDA Master Agreement between the fund and the counterparty providing for netting as described above and, where applicable, by the posting of collateral by the counterparty to the fund to cover the fund’s exposure to the counterparty under such ISDA Master Agreement.
Security Loans – Under its Securities Lending Agency Agreement with the fund, JPMorgan Chase and Co. (“Chase”), as lending agent, loans the securities of the fund to certain qualified institutions (the “Borrowers”) approved by the fund. Security loans can be terminated at the discretion of either the lending agent or the fund and the related securities must be returned within the earlier of the standard trade settlement period for such securities or within three business days. The loans are collateralized by cash and/or U.S. Treasury and federal agency obligations in an amount typically at least equal to the market value of the securities loaned. On loans collateralized by cash, the cash collateral is invested in a money market fund. The market value of the loaned securities is determined at the close of business of the fund and any additional required collateral is delivered to the fund on the next business day. Chase provides the fund with indemnification against Borrower default. In the event of Borrower default, Chase will, for the benefit of the fund, either purchase securities identical to those loaned or, when such purchase is commercially impracticable, pay the fund the market value of the loaned securities. In return, Chase assumes the fund’s rights to the related collateral. If the collateral value is less than the cost to purchase identical securities,
54
Table of Contents
Notes to Financial Statements – continued
Chase is responsible for the shortfall, but only to the extent that such shortfall is not due to a decline in collateral value resulting from collateral reinvestment for which the fund bears the risk of loss. At period end, the fund had investment securities on loan, all of which were classified as equity securities in the fund’s Portfolio of Investments, with a fair value of $3,915,382. The fair value of the fund’s investment securities on loan and a related liability of $4,092,874 for cash collateral received on securities loaned are both presented gross in the Statement of Assets and Liabilities. The collateral on securities loaned exceeded the value of securities on loan at period end. The liability for cash collateral for securities loaned is carried at fair value, which is categorized as level 2 within the fair value hierarchy. A portion of the income generated upon investment of the collateral is remitted to the Borrowers, and the remainder is allocated between the fund and the lending agent. On loans collateralized by U.S. Treasury and/or federal agency obligations, a fee is received from the Borrower, and is allocated between the fund and the lending agent. Income from securities lending is separately reported in the Statement of Operations. The dividend and interest income earned on the securities loaned is accounted for in the same manner as other dividend and interest income.
Indemnifications – Under the fund’s organizational documents, its officers and Trustees may be indemnified against certain liabilities and expenses arising out of the performance of their duties to the fund. Additionally, in the normal course of business, the fund enters into agreements with service providers that may contain indemnification clauses. The fund’s maximum exposure under these agreements is unknown as this would involve future claims that may be made against the fund that have not yet occurred.
Investment Transactions and Income – Investment transactions are recorded on the trade date. Interest income is recorded on the accrual basis. All premium and discount is amortized or accreted for financial statement purposes in accordance with U.S. generally accepted accounting principles. Dividends received in cash are recorded on the ex-dividend date. Certain dividends from foreign securities will be recorded when the fund is informed of the dividend if such information is obtained subsequent to the ex-dividend date. Dividend and interest payments received in additional securities are recorded on the ex-dividend or ex-interest date in an amount equal to the value of the security on such date.
The fund may receive proceeds from litigation settlements. Any proceeds received from litigation involving portfolio holdings are reflected in the Statement of Operations in realized gain/loss if the security has been disposed of by the fund or in unrealized gain/loss if the security is still held by the fund. Any other proceeds from litigation not related to portfolio holdings are reflected as other income in the Statement of Operations.
Fees Paid Indirectly – The fund’s custody fee may be reduced by a credit earned under an arrangement that measures the value of U.S. dollars deposited with the custodian by the fund. The amount of the credit, for the year ended October 31, 2017, is shown as a reduction of total expenses in the Statement of Operations.
55
Table of Contents
Notes to Financial Statements – continued
Reimbursement of Expenses by Custodian – In December 2015, the fund’s custodian (or former custodian), State Street Bank and Trust Company, announced that it intended to reimburse its asset servicing clients for expense amounts that it billed in error during the period 1998 through 2015. The amount of this one-time reimbursement attributable to the fund is reflected as “Reimbursement of custodian expenses” in the Statement of Operations.
Tax Matters and Distributions – The fund intends to qualify as a regulated investment company, as defined under Subchapter M of the Internal Revenue Code, and to distribute all of its taxable income, including realized capital gains. As a result, no provision for federal income tax is required. The fund’s federal tax returns, when filed, will remain subject to examination by the Internal Revenue Service for a three year period. Management has analyzed the fund’s tax positions taken on federal and state tax returns for all open tax years and does not believe that there are any uncertain tax positions that require recognition of a tax liability. Foreign taxes, if any, have been accrued by the fund in the accompanying financial statements in accordance with the applicable foreign tax law. Foreign income taxes may be withheld by certain countries in which the fund invests. Additionally, capital gains realized by the fund on securities issued in or by certain foreign countries may be subject to capital gains tax imposed by those countries.
Distributions to shareholders are recorded on the ex-dividend date. Income and capital gain distributions are determined in accordance with income tax regulations, which may differ from U.S. generally accepted accounting principles. Certain capital accounts in the financial statements are periodically adjusted for permanent differences in order to reflect their tax character. These adjustments have no impact on net assets or net asset value per share. Temporary differences which arise from recognizing certain items of income, expense, gain or loss in different periods for financial statement and tax purposes will reverse at some time in the future. Distributions in excess of net investment income or net realized gains are temporary overdistributions for financial statement purposes resulting from differences in the recognition or classification of income or distributions for financial statement and tax purposes.
Book/tax differences primarily relate to amortization and accretion of debt securities, passive foreign investment companies, wash sale loss deferrals, straddle loss deferrals, derivative transactions and treating a portion of the proceeds from redemptions as a distribution for tax purposes.
The tax character of distributions declared to shareholders for the last two fiscal years is as follows:
| Year ended 10/31/17 | Year ended 10/31/16 | |||||||
| Ordinary income (including any short-term capital gains) | $31,624,677 | $10,031,811 | ||||||
| Long-term capital gains | — | 56,435,248 | ||||||
| Total distributions | $31,624,677 | $66,467,059 | ||||||
56
Table of Contents
Notes to Financial Statements – continued
The federal tax cost and the tax basis components of distributable earnings were as follows:
| As of 10/31/17 | ||||
| Cost of investments | $1,759,191,387 | |||
| Gross appreciation | 405,954,150 | |||
| Gross depreciation | (19,988,701 | ) | ||
| Net unrealized appreciation (depreciation) | $385,965,449 | |||
| Undistributed ordinary income | 3,736,739 | |||
| Undistributed long-term capital gain | 26,821,692 | |||
| Other temporary differences | 9,371 | |||
Multiple Classes of Shares of Beneficial Interest – The fund offers multiple classes of shares, which differ in their respective distribution and service fees. The fund’s income, realized and unrealized gain (loss), and common expenses are allocated to shareholders based on the daily net assets of each class. Dividends are declared separately for each class. Differences in per share dividend rates are generally due to differences in separate class expenses. Class B shares will convert to Class A shares approximately eight years after purchase. The fund’s distributions declared to shareholders as reported in the Statements of Changes in Net Assets are presented by class as follows:
| From net investment income | From net realized gain on investments | |||||||||||||||
| Year ended 10/31/17 | Year ended 10/31/16 | Year ended 10/31/17 | Year ended 10/31/16 | |||||||||||||
| Class A | $12,539,744 | $5,534,277 | $— | $29,963,611 | ||||||||||||
| Class B | 503,420 | 33,230 | — | 2,167,765 | ||||||||||||
| Class C | 3,430,157 | 252,900 | — | 11,886,137 | ||||||||||||
| Class I | 10,594,750 | 2,984,240 | — | 7,835,313 | ||||||||||||
| Class R1 | 27,145 | 2,563 | — | 119,237 | ||||||||||||
| Class R2 | 304,116 | 76,649 | — | 473,698 | ||||||||||||
| Class R3 | 314,856 | 85,900 | — | 426,425 | ||||||||||||
| Class R4 | 102,552 | 74,022 | — | 356,376 | ||||||||||||
| Class R6 | 3,807,937 | 986,891 | — | 3,207,825 | ||||||||||||
| Total | $31,624,677 | $10,030,672 | $— | $56,436,387 | ||||||||||||
(3) Transactions with Affiliates
Investment Adviser –The fund has an investment advisory agreement with MFS to provide overall investment management and related administrative services and facilities to the fund. For the period from November 1, 2016 through February 27, 2017, the management fee was computed daily and paid monthly at an annual rate of 0.84% of the fund’s average daily net assets.
The investment adviser had agreed in writing to reduce its management fee to 0.75% of average daily net assets in excess of $500 million up to $1.0 billion, 0.70% of average daily net assets in excess of $1.0 billion up to $2.5 billion, and 0.65% of average daily net assets in excess of $2.5 billion. This written agreement terminated on
57
Table of Contents
Notes to Financial Statements – continued
February 27, 2017. For the period from November 1, 2016 through February 27, 2017, this management fee reduction amounted to $561,421, which is included in the reduction of total expenses in the Statement of Operations. Effective February 28, 2017, the management fee is computed daily and paid monthly at an annual rate of 0.84% of average daily net assets up to $500 million, 0.75% of average daily net assets in excess of $500 million up to $1.0 billion, 0.70% of average daily net assets in excess of $1.0 billion up to $2.5 billion, and 0.65% of average daily net assets in excess of $2.5 billion. MFS has also agreed in writing to reduce its management fee by a specified amount if certain MFS mutual fund assets exceed thresholds agreed to by MFS and the fund’s Board of Trustees. For the year ended October 31, 2017, this management fee reduction amounted to $156,585, which is included in the reduction of total expenses in the Statement of Operations. The management fee incurred for the year ended October 31, 2017 was equivalent to an annual effective rate of 0.74% of the fund’s average daily net assets.
The investment adviser has agreed in writing to pay a portion of the fund’s total annual operating expenses, excluding interest, taxes, extraordinary expenses, brokerage and transaction costs, and investment-related expenses, such that total fund operating expenses do not exceed the following rates annually of each class’s average daily net assets:
| Classes | ||||||||||||||||||||||||||||||||||
| A | B | C | I | R1 | R2 | R3 | R4 | R6 | ||||||||||||||||||||||||||
| 1.09% | 1.84 | % | 1.84 | % | 0.84 | % | 1.84 | % | 1.34 | % | 1.09 | % | 0.84 | % | 0.78 | % | ||||||||||||||||||
This written agreement will continue until modified by the fund’s Board of Trustees, but such agreement will continue at least until February 28, 2019. For the year ended October 31, 2017, this reduction amounted to $1,538,482, which is included in the reduction of total expenses in the Statement of Operations.
Distributor – MFS Fund Distributors, Inc. (MFD), a wholly-owned subsidiary of MFS, as distributor, received $288,039 for the year ended October 31, 2017, as its portion of the initial sales charge on sales of Class A shares of the fund.
The Board of Trustees has adopted a distribution plan for certain share classes pursuant to Rule 12b-1 of the Investment Company Act of 1940.
The fund’s distribution plan provides that the fund will pay MFD for services provided by MFD and financial intermediaries in connection with the distribution and servicing of certain share classes. One component of the plan is a distribution fee paid to MFD and another component of the plan is a service fee paid to MFD. MFD may subsequently pay all, or a portion, of the distribution and/or service fees to financial intermediaries.
58
Table of Contents
Notes to Financial Statements – continued
Distribution Plan Fee Table:
| Distribution Fee Rate (d) | Service Fee Rate (d) | Total Distribution Plan (d) | Annual Effective Rate (e) | Distribution and Service Fee | ||||||||||||||||
| Class A | — | 0.25% | 0.25% | 0.25% | $1,933,625 | |||||||||||||||
| Class B | 0.75% | 0.25% | 1.00% | 1.00% | 517,200 | |||||||||||||||
| Class C | 0.75% | 0.25% | 1.00% | 1.00% | 3,421,403 | |||||||||||||||
| Class R1 | 0.75% | 0.25% | 1.00% | 1.00% | 25,683 | |||||||||||||||
| Class R2 | 0.25% | 0.25% | 0.50% | 0.50% | 109,288 | |||||||||||||||
| Class R3 | — | 0.25% | 0.25% | 0.25% | 47,753 | |||||||||||||||
| Total Distribution and Service Fees | $6,054,952 | |||||||||||||||||||
| (d) | In accordance with the distribution plan for certain classes, the fund pays distribution and/or service fees equal to these annual percentage rates of each class’s average daily net assets. The distribution and service fee rates disclosed by class represent the current rates in effect at the end of the reporting period. Any rate changes, if applicable, are detailed below. |
| (e) | The annual effective rates represent actual fees incurred under the distribution plan for the year ended October 31, 2017 based on each class’s average daily net assets. MFD has voluntarily agreed to rebate a portion of each class’s 0.25% service fee attributable to accounts for which MFD retains the 0.25% service fee except for accounts attributable to MFS or its affiliates’ seed money. For the year ended October 31, 2017, this rebate amounted to $20,729, $49, and $437 for Class A, Class B, and Class C, respectively, and is included in the reduction of total expenses in the Statement of Operations. |
Certain Class A shares are subject to a contingent deferred sales charge (CDSC) in the event of a shareholder redemption within 18 months of purchase. Class C shares are subject to a CDSC in the event of a shareholder redemption within 12 months of purchase. Class B shares are subject to a CDSC in the event of a shareholder redemption within six years of purchase. All contingent deferred sales charges are paid to MFD and during the year ended October 31, 2017, were as follows:
| Amount | ||||
| Class A | $9,633 | |||
| Class B | 81,774 | |||
| Class C | 59,218 | |||
Shareholder Servicing Agent – MFS Service Center, Inc. (MFSC), a wholly-owned subsidiary of MFS, receives a fee from the fund for its services as shareholder servicing agent calculated as a percentage of the average daily net assets of the fund as determined periodically under the supervision of the fund’s Board of Trustees. For the year ended October 31, 2017, the fee was $188,639, which equated to 0.0094% annually of the fund’s average daily net assets. MFSC also receives payment from the fund for out-of-pocket expenses, sub-accounting and other shareholder servicing costs which may be paid to affiliated and unaffiliated service providers. Class R6 shares do not incur sub-accounting fees. For the year ended October 31, 2017, these out-of-pocket expenses, sub-accounting and other shareholder servicing costs amounted to $1,878,554.
59
Table of Contents
Notes to Financial Statements – continued
Administrator – MFS provides certain financial, legal, shareholder communications, compliance, and other administrative services to the fund. Under an administrative services agreement, the fund reimburses MFS the costs incurred to provide these services. The fund is charged an annual fixed amount of $17,500 plus a fee based on average daily net assets. The administrative services fee incurred for the year ended October 31, 2017 was equivalent to an annual effective rate of 0.0163% of the fund’s average daily net assets.
Trustees’ and Officers’ Compensation – The fund pays compensation to independent Trustees in the form of a retainer, attendance fees, and additional compensation to Board and Committee chairpersons. The fund does not pay compensation directly to Trustees or officers of the fund who are also officers of the investment adviser, all of whom receive remuneration for their services to the fund from MFS. Certain officers and Trustees of the fund are officers or directors of MFS, MFD, and MFSC.
Prior to December 31, 2001, the fund had an unfunded defined benefit plan (“DB plan”) for independent Trustees. As of December 31, 2001, the Board took action to terminate the DB plan with respect to then-current and any future independent Trustees, such that the DB plan covers only certain of those former independent Trustees who retired on or before December 31, 2001. The DB plan resulted in a pension expense of $836 and is included in “Independent Trustees’ compensation” in the Statement of Operations for the year ended October 31, 2017. The liability for deferred retirement benefits payable to certain independent Trustees under the DB plan amounted to $3,450 at October 31, 2017, and is included in “Payable for independent Trustees’ compensation” in the Statement of Assets and Liabilities.
Other – This fund and certain other funds managed by MFS (the funds) have entered into a service agreement (the ISO Agreement) which provides for payment of fees solely by the funds to Tarantino LLC in return for the provision of services of an Independent Senior Officer (ISO) for the funds. Frank L. Tarantino serves as the ISO and is an officer of the funds and the sole member of Tarantino LLC. The funds can terminate the ISO Agreement with Tarantino LLC at any time under the terms of the ISO Agreement. For the year ended October 31, 2017, the fee paid by the fund under this agreement was $3,586 and is included in “Miscellaneous” expense in the Statement of Operations. MFS has agreed to bear all expenses associated with office space, other administrative support, and supplies provided to the ISO.
The fund invests in the MFS Institutional Money Market Portfolio which is managed by MFS and seeks current income consistent with preservation of capital and liquidity. This money market fund does not pay a management fee to MFS.
On March 16, 2016, MFS redeemed 2,903 shares of Class I for an aggregate amount of $45,756.
On March 16, 2017, MFS redeemed 8,930 shares of Class I for an aggregate amount of $149,577.
On September 20, 2017, MFS redeemed 7,585 shares of Class I for an aggregate amount of $134,165.
60
Table of Contents
Notes to Financial Statements – continued
The fund is permitted to engage in purchase and sale transactions with funds and accounts for which MFS serves as investment adviser or sub-adviser (“cross-trades”) pursuant to a policy adopted by the Board of Trustees. This policy has been designed to ensure that cross-trades conducted by the fund comply with Rule 17a-7 under the Investment Company Act of 1940. Under this policy, cross-trades are effected at current market prices with no remuneration paid in connection with the transaction. During the year ended October 31, 2017, the fund engaged in purchase and sale transactions pursuant to this policy, which amounted to $7,209,086 and $2,110,453, respectively. The sales transactions resulted in net realized gains (losses) of $(103,155).
(4) Portfolio Securities
For the year ended October 31, 2017, purchases and sales of investments, other than purchased option transactions and short-term obligations, were as follows:
| Purchases | Sales | |||||||
| U.S. Government securities | $72,658,957 | $54,595,487 | ||||||
| Investments (non-U.S. Government securities) | $674,766,480 | $701,985,824 | ||||||
(5) Shares of Beneficial Interest
The fund’s Declaration of Trust permits the Trustees to issue an unlimited number of full and fractional shares of beneficial interest. Transactions in fund shares were as follows:
| Year ended 10/31/17 | Year ended 10/31/16 | |||||||||||||||
| Shares | Amount | Shares | Amount | |||||||||||||
| Shares sold | ||||||||||||||||
Class A | 7,763,917 | $132,890,885 | 12,441,839 | $201,091,421 | ||||||||||||
Class B | 223,540 | 3,869,939 | 353,650 | 5,806,658 | ||||||||||||
Class C | 3,086,641 | 53,182,234 | 6,189,716 | 100,560,840 | ||||||||||||
Class I | 20,906,158 | 350,758,949 | 23,296,382 | 376,006,679 | ||||||||||||
Class R1 | 17,317 | 294,335 | 29,493 | 475,109 | ||||||||||||
Class R2 | 504,925 | 8,433,502 | 831,923 | 13,472,046 | ||||||||||||
Class R3 | 629,402 | 10,626,694 | 401,819 | 6,527,476 | ||||||||||||
Class R4 | 204,120 | 3,452,000 | 199,922 | 3,235,134 | ||||||||||||
Class R6 | 16,198,131 | 272,368,850 | 2,288,714 | 36,707,972 | ||||||||||||
| 49,534,151 | $835,877,388 | 46,033,458 | $743,883,335 | |||||||||||||
| Shares issued to shareholders in reinvestment of distributions | ||||||||||||||||
Class A | 689,176 | $11,743,380 | 2,168,882 | $33,962,579 | ||||||||||||
Class B | 25,231 | 436,395 | 118,225 | 1,882,154 | ||||||||||||
Class C | 161,441 | 2,757,937 | 595,702 | 9,360,000 | ||||||||||||
Class I | 533,171 | 9,041,542 | 545,741 | 8,527,092 | ||||||||||||
Class R1 | 1,598 | 27,145 | 7,727 | 120,938 | ||||||||||||
Class R2 | 5,950 | 99,924 | 17,927 | 278,047 | ||||||||||||
Class R3 | 18,444 | 314,856 | 32,799 | 512,316 | ||||||||||||
Class R4 | 5,196 | 89,626 | 22,955 | 359,803 | ||||||||||||
Class R6 | 204,030 | 3,510,231 | 244,765 | 3,807,986 | ||||||||||||
| 1,644,237 | $28,021,036 | 3,754,723 | $58,810,915 | |||||||||||||
61
Table of Contents
Notes to Financial Statements – continued
| Year ended 10/31/17 | Year ended 10/31/16 | |||||||||||||||
| Shares | Amount | Shares | Amount | |||||||||||||
| Shares reacquired | ||||||||||||||||
Class A | (15,392,309 | ) | $(259,994,617 | ) | (13,113,692 | ) | $(213,125,586 | ) | ||||||||
Class B | (899,951 | ) | (15,693,848 | ) | (759,595 | ) | (12,517,912 | ) | ||||||||
Class C | (6,452,912 | ) | (110,635,593 | ) | (4,478,039 | ) | (72,834,112 | ) | ||||||||
Class I | (19,181,824 | ) | (324,719,762 | ) | (6,413,353 | ) | (103,135,812 | ) | ||||||||
Class R1 | (51,195 | ) | (852,750 | ) | (55,519 | ) | (889,507 | ) | ||||||||
Class R2 | (616,540 | ) | (10,479,472 | ) | (270,651 | ) | (4,257,152 | ) | ||||||||
Class R3 | (398,173 | ) | (6,824,389 | ) | (200,270 | ) | (3,180,871 | ) | ||||||||
Class R4 | (338,578 | ) | (5,552,425 | ) | (410,273 | ) | (6,463,232 | ) | ||||||||
Class R6 | (3,784,794 | ) | (64,173,190 | ) | (968,238 | ) | (15,513,591 | ) | ||||||||
| (47,116,276 | ) | $(798,926,046 | ) | (26,669,630 | ) | $(431,917,775 | ) | |||||||||
| Net change | ||||||||||||||||
Class A | (6,939,216 | ) | $(115,360,352 | ) | 1,497,029 | $21,928,414 | ||||||||||
Class B | (651,180 | ) | (11,387,514 | ) | (287,720 | ) | (4,829,100 | ) | ||||||||
Class C | (3,204,830 | ) | (54,695,422 | ) | 2,307,379 | 37,086,728 | ||||||||||
Class I | 2,257,505 | 35,080,729 | 17,428,770 | 281,397,959 | ||||||||||||
Class R1 | (32,280 | ) | (531,270 | ) | (18,299 | ) | (293,460 | ) | ||||||||
Class R2 | (105,665 | ) | (1,946,046 | ) | 579,199 | 9,492,941 | ||||||||||
Class R3 | 249,673 | 4,117,161 | 234,348 | 3,858,921 | ||||||||||||
Class R4 | (129,262 | ) | (2,010,799 | ) | (187,396 | ) | (2,868,295 | ) | ||||||||
Class R6 | 12,617,367 | 211,705,891 | 1,565,241 | 25,002,367 | ||||||||||||
| 4,062,112 | $64,972,378 | 23,118,551 | $370,776,475 | |||||||||||||
(6) Line of Credit
The fund and certain other funds managed by MFS participate in a $1.25 billion unsecured committed line of credit, subject to a $1 billion sublimit, provided by a syndication of banks under a credit agreement. Borrowings may be made for temporary financing needs. Interest is charged to each fund, based on its borrowings, generally at a rate equal to the higher of the Overnight Federal Reserve funds rate or daily one month LIBOR plus an agreed upon spread. A commitment fee, based on the average daily, unused portion of the committed line of credit, is allocated among the participating funds at the end of each calendar quarter. In addition, the fund and other funds managed by MFS have established unsecured uncommitted borrowing arrangements with certain banks for temporary financing needs. Interest is charged to each fund, based on its borrowings, at a rate equal to the Overnight Federal Reserve funds rate plus an agreed upon spread. For the year ended October 31, 2017, the fund’s commitment fee and interest expense were $13,872 and $0, respectively, and are included in “Miscellaneous” expense in the Statement of Operations.
62
Table of Contents
Notes to Financial Statements – continued
(7) Investments in Affiliated Issuers
An affiliated issuer may be considered one in which the fund owns 5% or more of the outstanding voting securities, or a company which is under common control. For the purposes of this report, the fund assumes the following to be affiliated issuers:
| Affiliated Issuers | Beginning Shares/Par Amount | Acquisitions Shares/Par Amount | Dispositions Shares/Par Amount | Ending Shares/Par Amount | ||||||||||||||||
| MFS Institutional Money Market Portfolio | 159,501,647 | 491,903,974 | (429,173,860 | ) | 222,231,761 | |||||||||||||||
| Affilated Issuers | Realized Gain (Loss) | Change in Unrealized Appreciation (Depreciation) | Capital Gain Distributions | Dividend Income | Ending Value | |||||||||||||||
| MFS Institutional Money Market Portfolio | $(7,971 | ) | $6,445 | $— | $1,355,414 | $222,231,761 | ||||||||||||||
63
Table of Contents
REPORT OF INDEPENDENT REGISTERED PUBLIC ACCOUNTING FIRM
To the Board of Trustees of MFS Series Trust VI and Shareholders of MFS Global Total Return Fund:
We have audited the accompanying statement of assets and liabilities, including the portfolio of investments, of MFS Global Total Return Fund (the Fund) (one of the series constituting the MFS Series Trust VI) as of October 31, 2017, and the related statement of operations for the year then ended, the statements of changes in net assets for each of the two years in the period then ended and the financial highlights for each of the five years in the period then ended. These financial statements and financial highlights are the responsibility of the Fund’s management. Our responsibility is to express an opinion on these financial statements and financial highlights based on our audits.
We conducted our audits in accordance with the standards of the Public Company Accounting Oversight Board (United States). Those standards require that we plan and perform the audit to obtain reasonable assurance about whether the financial statements and financial highlights are free of material misstatement. We were not engaged to perform an audit of the Fund’s internal control over financial reporting. Our audits included consideration of internal control over financial reporting as a basis for designing audit procedures that are appropriate in the circumstances, but not for the purpose of expressing an opinion on the effectiveness of the Fund’s internal control over financial reporting. Accordingly, we express no such opinion. An audit also includes examining, on a test basis, evidence supporting the amounts and disclosures in the financial statements and financial highlights, assessing the accounting principles used and significant estimates made by management, and evaluating the overall financial statement presentation. Our procedures included confirmation of securities owned as of October 31, 2017, by correspondence with the custodian and others or by other appropriate auditing procedures where replies from others were not received. We believe that our audits provide a reasonable basis for our opinion.
In our opinion, the financial statements and financial highlights referred to above present fairly, in all material respects, the financial position of MFS Global Total Return Fund (one of the series constituting the MFS Series Trust VI) at October 31, 2017, the results of its operations for the year then ended, the changes in its net assets for each of the two years in the period then ended and the financial highlights for each of the five years in the period then ended, in conformity with U.S. generally accepted accounting principles.

Boston, Massachusetts
December 15, 2017
64
Table of Contents
TRUSTEES AND OFFICERS — IDENTIFICATION AND BACKGROUND
The Trustees and Officers of the Trust, as of December 1, 2017, are listed below, together with their principal occupations during the past five years. (Their titles may have varied during that period.) The address of each Trustee and Officer is 111 Huntington Avenue, Boston, Massachusetts 02199-7618.
Name, Age | Position(s) Held with Fund | Trustee/Officer Since (h) | Number of | Principal the Past Five Years | Other Directorships | |||||
| INTERESTED TRUSTEES | ||||||||||
| Robert J. Manning (k) (age 54) | Trustee | February 2004 | 136 | Massachusetts Financial Services Company, Executive Chairman (since January 2017); Director; Chairman of the Board; Chief Executive Officer (until 2015); Co-Chief Executive Officer (2015-2016) | N/A | |||||
Robin A. Stelmach (k) (age 56) | Trustee | January 2014 | 136 | Massachusetts Financial Services Company, Vice Chair (since January 2017); Chief Operating Officer and Executive Vice President (until January 2017) | N/A | |||||
| INDEPENDENT TRUSTEES | ||||||||||
| David H. Gunning * (age 75) | Trustee and Chair of Trustees | January 2004 | 136 | Private investor | Lincoln Electric Holdings, Inc., Director; Development Alternatives, Inc., Director/Non-Executive Chairman (until 2013) | |||||
65
Table of Contents
Trustees and Officers – continued
Name, Age | Position(s) Held with Fund | Trustee/Officer Since (h) | Number of | Principal the Past Five Years | Other Directorships | |||||
Steven E. Buller (age 66) | Trustee | February 2014 | 136 | Financial Accounting Standards Advisory Council, Chairman (2014-2015); Public Company Accounting Oversight Board, Standing Advisory Group, Member (until 2014); BlackRock, Inc. (investment management), Managing Director (until 2014), BlackRock Finco UK (investment management), Director (until 2014) | N/A | |||||
John A. Caroselli (age 63) | Trustee | March 2017 | 136 | JC Global Advisors, LLC (management consulting), President (since 2015); First Capital Corporation (commercial finance), Executive Vice President (until 2015) | N/A | |||||
Maureen R. Goldfarb (age 62) | Trustee | January 2009 | 136 | Private investor | N/A | |||||
| Michael Hegarty (age 72) | Trustee | December 2004 | 136 | Private investor | Rouse Properties Inc., Director (until 2016); Capmark Financial Group Inc., Director (until 2015) | |||||
John P. Kavanaugh * (age 63) | Trustee and Vice Chair of Trustees | January 2009 | 136 | Private investor | N/A | |||||
Clarence Otis, Jr. (age 61) | Trustee | March 2017 | 136 | Darden Restaurants, Inc., Chief Executive Officer (until 2014) | VF Corporation, Director; Verizon Communications, Inc., Director; The Travelers Companies, Director; Federal Reserve Bank of Atlanta, Director (until 2015) |
66
Table of Contents
Trustees and Officers – continued
Name, Age | Position(s) Held with Fund | Trustee/Officer Since (h) | Number of | Principal the Past Five Years | Other Directorships | |||||
Maryanne L. Roepke (age 61) | Trustee | May 2014 | 136 | American Century Investments (investment management), Senior Vice President and Chief Compliance Officer (until 2014) | N/A | |||||
| Laurie J. Thomsen (age 60) | Trustee | March 2005 | 136 | Private investor | The Travelers Companies, Director; Dycom Industries, Inc., Director (since 2015) |
Name, Age | Position(s) with Fund | Trustee/Officer Since (h) | Number of | Principal the Past Five Years | ||||
| OFFICERS | ||||||||
| Christopher R. Bohane (k) (age 43) | Assistant Secretary and Assistant Clerk | July 2005 | 136 | Massachusetts Financial Services Company, Vice President and Assistant General Counsel | ||||
Kino Clark (k) (age 49) | Assistant Treasurer | January 2012 | 136 | Massachusetts Financial Services Company, Vice President | ||||
John W. Clark, Jr. (k) (age 50) | Assistant Treasurer | April 2017 | 136 | Massachusetts Financial Services Company, Vice President (since March 2017); Deutsche Bank (financial services), Department Head – Treasurer’s Office (until February 2017) | ||||
Thomas H. Connors (k) (age 58) | Assistant Secretary and Assistant Clerk | September 2012 | 136 | Massachusetts Financial Services Company, Vice President and Senior Counsel; Deutsche Investment Management Americas Inc. (financial service provider), Director and Senior Counsel (until 2012) | ||||
67
Table of Contents
Trustees and Officers – continued
Name, Age | Position(s) with Fund | Trustee/Officer Since (h) | Number of | Principal the Past Five Years | ||||
| Ethan D. Corey (k) (age 54) | Assistant Secretary and Assistant Clerk | July 2005 | 136 | Massachusetts Financial Services Company, Senior Vice President and Associate General Counsel | ||||
| David L. DiLorenzo (k) (age 49) | President | July 2005 | 136 | Massachusetts Financial Services Company, Senior Vice President | ||||
Heidi W. Hardin (k) (age 50) | Secretary and Clerk | April 2017 | 136 | Massachusetts Financial Services Company, Executive Vice President and General Counsel (since March 2017); Harris Associates (investment management), General Counsel (from September 2015 to January 2017); Janus Capital Management LLC (investment management), Senior Vice President and General Counsel (until September 2015) | ||||
Brian E. Langenfeld (k) (age 44) | Assistant Secretary and Assistant Clerk | June 2006 | 136 | Massachusetts Financial Services Company, Vice President and Senior Counsel | ||||
| Susan A. Pereira (k) (age 47) | Assistant Secretary and Assistant Clerk | July 2005 | 136 | Massachusetts Financial Services Company, Vice President and Senior Counsel | ||||
Kasey L. Phillips (k) (age 46) | Assistant Treasurer | September 2012 | 136 | Massachusetts Financial Services Company, Vice President; Wells Fargo Funds Management, LLC, Senior Vice President, Fund Treasurer (until 2012) | ||||
Matthew A. Stowe (k) (age 43) | Assistant Secretary and Assistant Clerk | October 2014 | 136 | Massachusetts Financial Services Company, Vice President and Assistant General Counsel | ||||
| Frank L. Tarantino (age 73) | Independent Senior Officer | June 2004 | 136 | Tarantino LLC (provider of compliance services), Principal | ||||
| Richard S. Weitzel (k) (age 47) | Assistant Secretary and Assistant Clerk | October 2007 | 136 | Massachusetts Financial Services Company, Senior Vice President and Associate General Counsel |
68
Table of Contents
Trustees and Officers – continued
Name, Age | Position(s) with Fund | Trustee/Officer Since (h) | Number of | Principal the Past Five Years | ||||
Martin J. Wolin (k) (age 50) | Chief Compliance Officer | July 2015 | 136 | Massachusetts Financial Services Company, Senior Vice President and Chief Compliance Officer (since July 2015); Mercer (financial service provider), Chief Risk and Compliance Officer, North America and Latin America (until June 2015) | ||||
| James O. Yost (k) (age 57) | Treasurer | September 1990 | 136 | Massachusetts Financial Services Company, Senior Vice President |
| (h) | Date first appointed to serve as Trustee/officer of an MFS Fund. Each Trustee has served continuously since appointment unless indicated otherwise. For the period from December 15, 2004 until February 22, 2005, Mr. Manning served as Advisory Trustee. Prior to January 2012, Messrs. DiLorenzo and Yost served as Assistant Treasurers of the Funds. From January 2012 through December 2016, Messrs. DiLorenzo and Yost served as Treasurer and Deputy Treasurer of the Funds, respectively. |
| (j) | Directorships or trusteeships of companies required to report to the Securities and Exchange Commission (i.e., “public companies”). |
| (k) | “Interested person” of the Trust within the meaning of the Investment Company Act of 1940 (referred to as the 1940 Act), which is the principal federal law governing investment companies like the fund, as a result of a position with MFS. The address of MFS is 111 Huntington Avenue, Boston, Massachusetts 02199-7618. |
| * | As of December 31, 2017, Mr. Gunning will retire as Trustee and Chair of Trustees, and, as of January 1, 2018, Mr. Kavanaugh will become Chair of Trustees. |
Each Trustee has been elected by shareholders and each Trustee and officer holds office until his or her successor is chosen and qualified or until his or her earlier death, resignation, retirement or removal. The Trust does not hold annual meetings for the purpose of electing Trustees, and Trustees are not elected for fixed terms. Under the terms of the Board’s retirement policy, an Independent Trustee shall retire at the end of the calendar year in which he or she reaches the earlier of 75 years of age or 15 years of service on the Board (or, in the case of any Independent Trustee who joined the Board prior to 2015, 20 years of service on the Board).
Messrs. Buller, Kavanaugh and Otis and Ms. Roepke are members of the Trust’s Audit Committee. Effective January 1, 2018, Mr. Kavanaugh is no longer a member of the Trust’s Audit Committee.
Each of the Interested Trustees and certain Officers hold comparable officer positions with certain affiliates of MFS.
69
Table of Contents
Trustees and Officers – continued
The Statement of Additional Information for a Fund includes further information about the Trustees and is available without charge upon request by calling 1-800-225-2606.
| Investment Adviser | Custodian | |
| Massachusetts Financial Services Company 111 Huntington Avenue Boston, MA 02199-7618 | JPMorgan Chase Bank, NA 4 Metrotech Center New York, NY 11245 | |
| Distributor | Independent Registered Public Accounting Firm | |
| MFS Fund Distributors, Inc. 111 Huntington Avenue Boston, MA 02199-7618 | Ernst & Young LLP 200 Clarendon Street | |
| Portfolio Manager(s) | ||
| Nevin Chitkara | ||
| Pablo De La Mata | ||
| Pilar Gomez-Bravo | ||
| Steven Gorham | ||
| Richard Hawkins | ||
| Vipin Narula | ||
| Robert Persons | ||
| Jonathan Sage | ||
| Robert Spector | ||
| Benjamin Stone | ||
| Erik Weisman |
70
Table of Contents
BOARD REVIEW OF INVESTMENT ADVISORY AGREEMENT
The Investment Company Act of 1940 requires that both the full Board of Trustees and a majority of the non-interested (“independent”) Trustees, voting separately, annually approve the continuation of the Fund’s investment advisory agreement with MFS. The Trustees consider matters bearing on the Fund and its advisory arrangements at their meetings throughout the year, including a review of performance data at each regular meeting. In addition, the independent Trustees met several times over the course of three months beginning in May and ending in July, 2017 (“contract review meetings”) for the specific purpose of considering whether to approve the continuation of the investment advisory agreement for the Fund and the other investment companies that the Board oversees (the “MFS Funds”). The independent Trustees were assisted in their evaluation of the Fund’s investment advisory agreement by independent legal counsel, from whom they received separate legal advice and with whom they met separately from MFS during various contract review meetings. The independent Trustees were also assisted in this process by the MFS Funds’ Independent Senior Officer, a senior officer appointed by and reporting to the independent Trustees.
In connection with their deliberations regarding the continuation of the investment advisory agreement, the Trustees, including the independent Trustees, considered such information and factors as they believed, in light of the legal advice furnished to them and their own business judgment, to be relevant. The investment advisory agreement for the Fund was considered separately, although the Trustees also took into account the common interests of all MFS Funds in their review. As described below, the Trustees considered the nature, quality, and extent of the various investment advisory, administrative, and shareholder services performed by MFS under the existing investment advisory agreement and other arrangements with the Fund.
In connection with their contract review meetings, the Trustees received and relied upon materials that included, among other items: (i) information provided by Broadridge Financial Solutions, Inc. (“Broadridge”), an independent third party, on the investment performance of the Fund for various time periods ended December 31, 2016 and the investment performance of a group of funds with substantially similar investment classifications/objectives (the “Lipper performance universe”), (ii) information provided by Broadridge on the Fund’s advisory fees and other expenses and the advisory fees and other expenses of comparable funds identified by Broadridge (the “Broadridge expense group”), (iii) information provided by MFS on the advisory fees of portfolios of other clients of MFS, including institutional separate accounts and other clients, (iv) information as to whether and to what extent applicable expense waivers, reimbursements or fee “breakpoints” are observed for the Fund, (v) information regarding MFS’ financial results and financial condition, including MFS’ and certain of its affiliates’ estimated profitability from services performed for the Fund and the MFS Funds as a whole, and compared to MFS’ institutional business, (vi) MFS’ views regarding the outlook for the mutual fund industry and the strategic business plans of MFS, (vii) descriptions of various functions performed by MFS for the Funds, such as compliance monitoring and portfolio trading practices, and (viii) information regarding the overall organization of MFS, including information about MFS’ senior management and other personnel providing investment advisory,
71
Table of Contents
Board Review of Investment Advisory Agreement – continued
administrative and other services to the Fund and the other MFS Funds. The comparative performance, fee and expense information prepared and provided by Broadridge was not independently verified and the independent Trustees did not independently verify any information provided to them by MFS.
The Trustees’ conclusion as to the continuation of the investment advisory agreement was based on a comprehensive consideration of all information provided to the Trustees and not the result of any single factor. Some of the factors that figured particularly in the Trustees’ deliberations are described below, although individual Trustees may have evaluated the information presented differently from one another, giving different weights to various factors. It is also important to recognize that the fee arrangements for the Fund and other MFS Funds are the result of years of review and discussion between the independent Trustees and MFS, that certain aspects of such arrangements may receive greater scrutiny in some years than in others, and that the Trustees’ conclusions may be based, in part, on their consideration of these same arrangements during the course of the year and in prior years.
Based on information provided by Broadridge and MFS, the Trustees reviewed the Fund’s total return investment performance as well as the performance of peer groups of funds over various time periods. The Trustees placed particular emphasis on the total return performance of the Fund’s Class A shares in comparison to the performance of funds in its Lipper performance universe over the three-year period ended December 31, 2016, which the Trustees believed was a long enough period to reflect differing market conditions. The total return performance of the Fund’s Class A shares was in the 4th quintile relative to the other funds in the universe for this three-year period (the 1st quintile being the best performers and the 5th quintile being the worst performers). The total return performance of the Fund’s Class A shares was in the 4th quintile for the one-year period and the 3rd quintile for the five-year period ended December 31, 2016 relative to the Lipper performance universe. Because of the passage of time, these performance results may differ from the performance results for more recent periods, including those shown elsewhere in this report.
The Trustees expressed concern to MFS about the substandard investment performance of the Fund. In the course of their deliberations, the Trustees took into account information provided by MFS in connection with the contract review meetings, as well as during investment review meetings conducted with portfolio management personnel during the course of the year, as to MFS’ efforts to improve the Fund’s performance. In addition, the Trustees requested that they receive a separate update on the Fund’s performance at each of their regular meetings. After reviewing these and related factors, the Trustees concluded, within the context of their overall conclusions regarding the investment advisory agreement, that MFS’ responses and efforts and plans to improve investment performance were sufficient to support approval of the continuance of the investment advisory agreement for an additional one-year period, but that they would continue to closely monitor the performance of the Fund.
In assessing the reasonableness of the Fund’s advisory fee, the Trustees considered, among other information, the Fund’s advisory fee and the total expense ratio of the Fund’s Class A shares as a percentage of average daily net assets and the advisory fee and total expense ratios of peer groups of funds based on information provided by Broadridge. The Trustees considered that MFS currently observes an expense limitation
72
Table of Contents
Board Review of Investment Advisory Agreement – continued
for the Fund, which may not be changed without the Trustees’ approval. The Trustees also considered that, according to the data provided by Broadridge (which takes into account any fee reductions or expense limitations that were in effect during the Fund’s last fiscal year), the Fund’s effective advisory fee rate and total expense ratio were each higher than the Broadridge expense group median.
The Trustees also considered the advisory fees charged by MFS to any institutional separate accounts advised by MFS (“separate accounts”) and unaffiliated investment companies for which MFS serves as subadviser (“subadvised funds”) that have comparable investment strategies to the Fund, if any. In comparing these fees, the Trustees considered information provided by MFS as to the generally broader scope of services provided by MFS to the Fund, as well as the more extensive regulatory burdens imposed on MFS in managing the Fund, in comparison to separate accounts and subadvised funds. The Trustees also considered the higher demands placed on MFS’ investment personnel and trading infrastructure as a result of the daily cash in-flows and out-flows of the Fund in comparison to separate accounts.
The Trustees also considered whether the Fund may benefit from any economies of scale in the management of the Fund in the event of growth in assets of the Fund and/or growth in assets of the MFS Funds as a whole. They noted that the Fund’s advisory fee rate schedule is subject to contractual breakpoints that reduce the Fund’s advisory fee rate on average daily net assets over $500 million, $1 billion and $2.5 billion. The Trustees also noted that MFS has agreed in writing to waive a portion of the management fees of certain MFS Funds, including the Fund, if the total combined assets of certain funds within the MFS Funds’ complex increase above agreed upon thresholds (the “group fee waiver”), enabling the Fund’s shareholders to share in the benefits from any economies of scale at the complex level. The group fee waiver is reviewed and renewed annually between the Board and MFS. The Trustees concluded that the breakpoints and the group fee waiver were sufficient to allow the Fund to benefit from economies of scale as its assets and overall complex assets grow.
The Trustees also considered information prepared by MFS relating to MFS’ costs and profits with respect to the Fund, the MFS Funds considered as a group, and other investment companies and accounts advised by MFS, as well as MFS’ methodologies used to determine and allocate its costs to the MFS Funds, the Fund and other accounts and products for purposes of estimating profitability.
After reviewing these and other factors described herein, the Trustees concluded, within the context of their overall conclusions regarding the investment advisory agreement, that the advisory fees charged to the Fund represent reasonable compensation in light of the services being provided by MFS to the Fund.
In addition, the Trustees considered MFS’ resources and related efforts to continue to retain, attract and motivate capable personnel to serve the Fund. The Trustees also considered current and developing conditions in the financial services industry, including the presence of large and well-capitalized companies which are spending, and appear to be prepared to continue to spend, substantial sums to engage personnel and to provide services to competing investment companies. In this regard, the Trustees also considered the financial resources of MFS and its ultimate parent, Sun Life
73
Table of Contents
Board Review of Investment Advisory Agreement – continued
Financial Inc. The Trustees also considered the advantages and possible disadvantages to the Fund of having an adviser that also serves other investment companies as well as other accounts.
The Trustees also considered the nature, quality, cost, and extent of administrative, transfer agency, and distribution services provided to the Fund by MFS and its affiliates under agreements and plans other than the investment advisory agreement, including any 12b-1 fees the Fund pays to MFS Fund Distributors, Inc., an affiliate of MFS. The Trustees also considered the nature, extent and quality of certain other services MFS performs or arranges for on the Fund’s behalf, which may include securities lending programs, directed expense payment programs, class action recovery programs, and MFS’ interaction with third-party service providers, principally custodians and sub-custodians. The Trustees concluded that the various non-advisory services provided by MFS and its affiliates on behalf of the Fund were satisfactory.
The Trustees also considered benefits to MFS from the use of the Fund’s portfolio brokerage commissions, if applicable, to pay for investment research and various other factors. Additionally, the Trustees considered so-called “fall-out benefits” to MFS such as reputational value derived from serving as investment manager to the Fund.
Based on their evaluation of factors that they deemed to be material, including those factors described above, the Board of Trustees, including the independent Trustees, concluded that the Fund’s investment advisory agreement with MFS should be continued for an additional one-year period, commencing August 1, 2017.
74
Table of Contents
PROXY VOTING POLICIES AND INFORMATION
MFS votes proxies on behalf of the fund pursuant to proxy voting policies and procedures that are available without charge, upon request, by calling 1-800-225-2606, by visiting mfs.com/proxyvoting, or by visiting the SEC’s Web site at http://www.sec.gov.
Information regarding how the fund voted proxies relating to portfolio securities during the most recent twelve-month period ended June 30 is available by August 31 of each year without charge by visiting mfs.com/proxyvoting, or by visiting the SEC’s Web site at http://www.sec.gov.
QUARTERLY PORTFOLIO DISCLOSURE
The fund will file a complete schedule of portfolio holdings with the Securities and Exchange Commission (the Commission) for the first and third quarters of each fiscal year on Form N-Q. A shareholder can obtain the quarterly portfolio holdings report at mfs.com. The fund’s Form N-Q is also available on the EDGAR database on the Commission’s Internet Web site at http://www.sec.gov, and may be reviewed and copied at the:
Public Reference Room
Securities and Exchange Commission
100 F Street, NE, Room 1580
Washington, D.C. 20549
Information on the operation of the Public Reference Room may be obtained by calling the Commission at 1-800-SEC-0330. Copies of the fund’s Form N-Q also may be obtained, upon payment of a duplicating fee, by electronic request at the following e-mail address: publicinfo@sec.gov or by writing the Public Reference Section at the above address.
From time to time, MFS may post important information about the fund or the MFS funds on the MFS web site (mfs.com). This information is available at https://www.mfs.com/en-us/what-we-do/announcements.html or at mfs.com/openendfunds by choosing the fund’s name.
75
Table of Contents
INFORMATION ABOUT FUND CONTRACTS AND LEGAL CLAIMS
The fund has entered into contractual arrangements with an investment adviser, administrator, distributor, shareholder servicing agent, 529 program manager (if applicable), and custodian who each provide services to the fund. Unless expressly stated otherwise, shareholders are not parties to, or intended beneficiaries of these contractual arrangements, and these contractual arrangements are not intended to create any shareholder right to enforce them against the service providers or to seek any remedy under them against the service providers, either directly or on behalf of the fund.
Under the Trust’s By-Laws and Declaration of Trust, any claims asserted against or on behalf of the MFS Funds, including claims against Trustees and Officers, must be brought in state and federal courts located within the Commonwealth of Massachusetts.
FEDERAL TAX INFORMATION (unaudited)
The fund will notify shareholders of amounts for use in preparing 2017 income tax forms in January 2018. The following information is provided pursuant to provisions of the Internal Revenue Code.
The fund designates the maximum amount allowable as qualified dividend income eligible to be taxed at the same rate as long-term capital gain.
The fund designates $668,345 as capital gain dividends paid during the fiscal year.
For corporate shareholders, 71.25% of the ordinary income dividends paid during the fiscal year qualify for the corporate dividends received deduction.
76
Table of Contents
rev. 3/16
| WHAT DOES MFS DO WITH YOUR PERSONAL INFORMATION? |  | ||
| Why? | Financial companies choose how they share your personal information. Federal law gives consumers the right to limit some but not all sharing. Federal law also requires us to tell you how we collect, share, and protect your personal information. Please read this notice carefully to understand what we do. |
| What? | The types of personal information we collect and share depend on the product or service you have with us. This information can include:
• Social Security number and account balances • Account transactions and transaction history • Checking account information and wire transfer instructions
When you are no longer our customer, we continue to share your information as described in this notice. |
| How? | All financial companies need to share customers’ personal information to run their everyday business. In the section below, we list the reasons financial companies can share their customers’ personal information; the reasons MFS chooses to share; and whether you can limit this sharing. |
| Reasons we can share your personal information | Does MFS share? | Can you limit this sharing? | ||
For our everyday business purposes – such as to process your transactions, maintain your account(s), respond to court orders and legal investigations, or report to credit bureaus | Yes | No | ||
For our marketing purposes – to offer our products and services to you | No | We don’t share | ||
For joint marketing with other financial companies | No | We don’t share | ||
For our affiliates’ everyday business purposes – information about your transactions and experiences | No | We don’t share | ||
For our affiliates’ everyday business purposes – information about your creditworthiness | No | We don’t share | ||
| For nonaffiliates to market to you | No | We don’t share |
| Questions? | Call 800-225-2606 or go to mfs.com. |
77
Table of Contents
| Page 2 |
| Who we are | ||
| Who is providing this notice? | MFS Funds, MFS Investment Management, MFS Institutional Advisors, Inc., and MFS Heritage Trust Company. | |
| What we do | ||
| How does MFS protect my personal information? | To protect your personal information from unauthorized access and use, we use security measures that comply with federal law. These measures include procedural, electronic, and physical safeguards for the protection of the personal information we collect about you. | |
| How does MFS collect my personal information? | We collect your personal information, for example, when you
• open an account or provide account information • direct us to buy securities or direct us to sell your securities • make a wire transfer
We also collect your personal information from others, such as credit bureaus, affiliates, or other companies. | |
| Why can’t I limit all sharing? | Federal law gives you the right to limit only
• sharing for affiliates’ everyday business purposes – information about your creditworthiness • affiliates from using your information to market to you • sharing for nonaffiliates to market to you
State laws and individual companies may give you additional rights to limit sharing. | |
| Definitions | ||
| Affiliates | Companies related by common ownership or control. They can be financial and nonfinancial companies.
• MFS does not share personal information with affiliates, except for everyday business purposes as described on page one of this notice. | |
| Nonaffiliates | Companies not related by common ownership or control. They can be financial and nonfinancial companies.
• MFS does not share with nonaffiliates so they can market to you. | |
| Joint marketing | A formal agreement between nonaffiliated financial companies that together market financial products or services to you.
• MFS doesn’t jointly market. | |
| Other important information | ||
| If you own an MFS product or receive an MFS service in the name of a third party such as a bank or broker-dealer, their privacy policy may apply to you instead of ours. | ||
78
Table of Contents
Save paper with eDelivery.
| MFS® will send you prospectuses, |

reports, and proxies directly via e-mail so you will get information faster with less mailbox clutter.
To sign up:
1. Go to mfs.com.
2. Log in via MFS® Access.
3. Select eDelivery.
If you own your MFS fund shares through a financial institution or a retirement plan, MFS® TALK, MFS® Access, or eDelivery may not be available to you.
WEB SITE
mfs.com
MFS TALK
1-800-637-8255
24 hours a day
ACCOUNT SERVICE AND LITERATURE
Shareholders
1-800-225-2606
Financial advisors
1-800-343-2829
Retirement plan services
1-800-637-1255
MAILING ADDRESS
MFS Service Center, Inc.
P.O. Box 55824
Boston, MA 02205-5824
OVERNIGHT MAIL
MFS Service Center, Inc.
c/o Boston Financial Data Services
30 Dan Road
Canton, MA 02021-2809
Table of Contents
ANNUAL REPORT
October 31, 2017

MFS® UTILITIES FUND

MMU-ANN
Table of Contents
MFS® UTILITIES FUND
The report is prepared for the general information of shareholders.
It is authorized for distribution to prospective investors only when preceded or accompanied by a current prospectus.
NOT FDIC INSURED • MAY LOSE VALUE • NO BANK GUARANTEE
Table of Contents

LETTER FROM THE EXECUTIVE CHAIRMAN
Dear Shareholders:
Despite policy uncertainty accompanying a new presidential administration in the United States and unease over ongoing Brexit negotiations, most markets have proved
resilient. U.S. share prices have reached new highs in recent months although the U.S. Federal Reserve has continued to gradually hike interest rates and has begun to shrink its balance sheet. However, rates in most developed markets remain very low, with major central banks outside of the U.S. just now beginning to contemplate curbing accommodative monetary policies.
Globally, we’ve experienced a year-long synchronized upturn in economic growth. Despite better growth, there are few immediate signs of worrisome inflation amid muted wage gains around the world. Emerging market economies have been boosted in part by
a weaker U.S. dollar and are recovering despite lingering concerns over the potential for restrictive U.S. trade policies. Commodity markets have recovered somewhat in response to solid global demand and robust global trade, though not enough to rekindle inflation fears.
At MFS®, we believe having a disciplined, long-term investment approach through a full market cycle is essential to capturing the best opportunities while also managing risk. In our view, such a strategy, along with the professional guidance of a financial advisor, will help you reach your investment objectives.
Respectfully,

Robert J. Manning
Executive Chairman
MFS Investment Management
December 15, 2017
The opinions expressed in this letter are subject to change and may not be relied upon for investment advice. No forecasts can be guaranteed.
1
Table of Contents
Portfolio structure
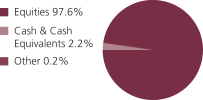
| Top ten holdings | ||||
| Exelon Corp. | 6.6% | |||
| EDP Renovaveis S.A. | 4.2% | |||
| NextEra Energy, Inc. | 4.0% | |||
| PPL Corp. | 4.0% | |||
| Enel S.p.A | 3.5% | |||
| Sempra Energy | 3.1% | |||
| Com Hem Holding AB | 2.7% | |||
| American Electric Power Co., Inc. | 2.5% | |||
| PG&E Corp. | 2.2% | |||
| American Tower Corp., REIT | 2.2% |
| Top five industries | ||||
| Utilities – Electric Power | 55.5% | |||
| Natural Gas – Pipeline | 14.7% | |||
| Telephone Services | 8.5% | |||
| Telecommunications – Wireless | 6.9% | |||
| Natural Gas – Distribution | 4.3% | |||
| Issuer country weightings (x) | ||||
| United States | 66.4% | |||
| Portugal | 4.9% | |||
| Canada | 4.6% | |||
| Italy | 3.5% | |||
| Spain | 3.0% | |||
| Sweden | 2.8% | |||
| United Kingdom | 2.1% | |||
| China | 1.8% | |||
| Brazil | 1.8% | |||
| Other Countries | 9.1% | |||
| (x) | Represents the portfolio’s exposure to issuer countries as a percentage of a portfolio’s net assets. For purposes of this presentation, United States includes Cash & Cash Equivalents and Other. |
Where the fund holds convertible bonds, they are treated as part of the equity portion of the portfolio.
Cash & Cash Equivalents includes any cash, investments in money market funds, short-term securities, and other assets less liabilities. Please see the Statement of Assets and Liabilities for additional information related to the fund’s cash position and other assets and liabilities.
Other includes equivalent exposure from currency derivatives and/or any offsets to derivative positions.
Percentages are based on net assets as of October 31, 2017.
The portfolio is actively managed and current holdings may be different.
2
Table of Contents
Summary of Results
For the twelve months ended October 31, 2017, Class A shares of the MFS Utilities Fund (“fund”) provided a total return of 14.73%, at net asset value. This compares with a return of 23.63% for the fund’s benchmark, the Standard & Poor’s 500 Stock Index, and a return of 15.40% for the fund’s other benchmark, the Standard & Poor’s 500 Utilities Index.
Market Environment
For the first time in many years, the global economy is experiencing a period of synchronized economic growth. The rebound in emerging markets (“EM”) economies has been more pronounced (despite the slight deceleration in Chinese growth at the end of the period), helped by larger economies, such as Brazil and Russia, emerging from recessions. At the same time, developed markets (“DM”) economies continued to grow at or above potential. Market confidence increased in the US after the presidential elections in November fueled, in part, by a more lenient US regulatory backdrop and hopes for a significant cut in corporate tax rates.
Globally, markets benefited from a reflation trade as commodity prices strengthened, activity and growth prospects improved, and inflation moved higher, though within moderate bounds. As a result, there have been more tightening signals and actions by DM central banks. The US Federal Reserve increased interest rates by 25 basis points during the second half of the period, bringing the total number of quarter-percent hikes in the federal funds rate to four, since December 2015. The European Central Bank announced an extension of its quantitative easing program at the end of the period, but reduced the pace of its monthly asset purchases by half. In addition, the Bank of England hiked its base rate for the first time in a decade, at period’s end. Markets have been comforted, along with central banks, by the decline in fears of a populist surge in Europe after establishment candidates won the Dutch and French elections, though a right-wing populist party gained seats in the German parliament for the first time in the post-World War II era. European growth has reflected a generally calmer political economic backdrop.
In recent months, the US dollar reversed the sharp rise seen early in the period, easing what had been a substantial headwind to earnings for multinationals. US consumer spending held up well during the second half of the period amid a modest increase in real wages and relatively low gasoline prices. However, demand for autos cooled from the record level logged early in the period, while the housing market contends with below-average inventory levels which have weighed on sales. Global trade, which was sluggish early in the period, showed signs of improvement in the period’s second half, a positive indicator of global economic activity and prospects. Early in the period, the US election resulted in a sell-off in EM assets due to fears that President Trump would follow through on various campaign threats and promises that were judged to be detrimental to EM. While President Trump withdrew the US from the Trans-Pacific Partnership and began the renegotiation of the North American Free Trade Agreement, significant additional policy action has so far been lacking on economic issues involving EM. As a result, EM resumed their upward trajectory, powered by strong inflows throughout 2017.
3
Table of Contents
Management Review – continued
Detractors from Performance
The fund’s out-of-benchmark exposure to the natural gas pipeline industry detracted from performance relative to the Standard & Poor’s 500 Utilities Index. Within this industry, holding shares of midstream oil and gas company Energy Transfer Partners (b), oil transportation and storage company Plains GP Holdings (b)(h), natural gas transmission and distributor Enbridge (b) (Canada) and midstream oil and gas company Enterprise Products Partners (b) held back relative performance. Shares of Energy Transfer Partners declined after a combination of modest execution missteps on new projects, management’s failure to modify what appeared to have been an unsustainable dividend policy, and ongoing equity issuance required to support the dividend policy.
The fund’s position in the energy – independent industry further weighed on relative results. Here, holding shares of midstream energy assets provider Western Gas Equity Partners (b) hindered relative performance. Although Western Gas Equity Partners continued to display strong fundamentals, concerns over industry health and slowing growth weighed on the company’s share performance.
Individual securities that held back relative performance included the fund’s positions in telecommunications company Frontier Communications (b) and multinational telecommunications company Altice (b). Shares of Frontier Communications traded lower after the company reported disappointing revenue trends and a substantial dividend cut. An underweight position in electricity provider NextEra Energy, and not holding shares of electric and natural gas utility company Centerpoint Energy, further weighed on relative performance.
The fund’s cash and/or cash equivalents position during the period also held back relative returns. Under normal market conditions, the fund strives to be fully invested and generally holds cash to buy new holdings and to provide liquidity. In a period when equity markets rose, as measured by the fund’s benchmark, holding cash hurt performance versus the benchmark, which has no cash position.
Contributors to Performance
Strong stock selection in the electric power industry contributed to relative performance. Within this industry, the fund’s positions in electricity and gas distributor Enel (b) (Italy) and electricity provider NextEra Energy Partners (b), and the timing of the fund’s ownership in shares of electricity and natural gas provider SCANA Corp (h), bolstered relative results. Shares of Enel appreciated as the company reported solid earnings results, driven by improved pricing and retail volumes in both its Italian and Latin American regions. Additionally, an overweight position in power generation company NRG Energy, and the fund’s underweight positions in retail electric services provider Southern Company (h), natural gas and electricity provider Pacific Gas and Electric Company (PG&E) (h) and diversified energy company FirstEnergy (h), aided relative performance.
The fund’s out-of-benchmark exposure to the wireless communications industry also supported relative results. Within this industry, holding shares of wireless telecommunications and broadcast infrastructure company Cellnex Telecom (b) (Spain) helped relative returns.
4
Table of Contents
Management Review – continued
Elsewhere, holdings of telephone service company Com Hem (b) (Sweden) and cable services provider Charter Communications (b)(h) benefited relative performance. Shares of Com Hem appreciated during the period after the company reported revenues above consensus expectations, driven by strong results in the Broadband and Pay TV segments. Additionally, private equity firm Kinnevik AB acquired an 18.5% interest in Com Hem at a premium, which further aided the stock’s performance.
During the reporting period, the fund’s relative currency exposure, resulting primarily from differences between the fund’s and the benchmark’s exposures to holdings of securities denominated in foreign currencies, benefited relative performance. All of MFS’ investment decisions are driven by the fundamentals of each individual opportunity and, as such, it is common for our portfolios to have different currency exposure than the benchmark.
Respectfully,
Portfolio Manager(s)
Claud Davis, Maura Shaughnessy, and Scott Walker
| (b) | Security is not a benchmark constituent. |
| (h) | Security was not held in the portfolio at period end. |
Note to Shareholders: Effective September 15, 2017, Scott Walker became a Portfolio Manager of the Fund.
The views expressed in this report are those of the portfolio manager(s) only through the end of the period of the report as stated on the cover and do not necessarily reflect the views of MFS or any other person in the MFS organization. These views are subject to change at any time based on market or other conditions, and MFS disclaims any responsibility to update such views. These views may not be relied upon as investment advice or an indication of trading intent on behalf of any MFS portfolio. References to specific securities are not recommendations of such securities, and may not be representative of any MFS portfolio’s current or future investments.
5
Table of Contents
PERFORMANCE SUMMARY THROUGH 10/31/17
The following chart illustrates a representative class of the fund’s historical performance in comparison to its benchmark(s). Performance results include the deduction of the maximum applicable sales charge and reflect the percentage change in net asset value, including reinvestment of dividends and capital gains distributions. The performance of other share classes will be greater than or less than that of the class depicted below. Benchmarks are unmanaged and may not be invested in directly. Benchmark returns do not reflect sales charges, commissions or expenses. (See Notes to Performance Summary.)
Performance data shown represents past performance and is no guarantee of future results. Investment return and principal value fluctuate so your shares, when sold, may be worth more or less than the original cost; current performance may be lower or higher than quoted. The performance shown does not reflect the deduction of taxes, if any, that a shareholder would pay on fund distributions or the redemption of fund shares.
Growth of a Hypothetical $10,000 Investment
6
Table of Contents
Performance Summary – continued
Total Returns through 10/31/17
Average annual without sales charge
| Share Class | Class Inception Date | 1-yr | 5-yr | 10-yr | Life (t) | |||||||||
| A | 2/14/92 | 14.73% | 8.37% | 5.27% | N/A | |||||||||
| B | 9/07/93 | 13.87% | 7.56% | 4.48% | N/A | |||||||||
| C | 1/03/94 | 13.82% | 7.55% | 4.48% | N/A | |||||||||
| I | 1/02/97 | 14.97% | 8.63% | 5.54% | N/A | |||||||||
| R1 | 4/01/05 | 13.84% | 7.55% | 4.48% | N/A | |||||||||
| R2 | 10/31/03 | 14.42% | 8.09% | 5.01% | N/A | |||||||||
| R3 | 4/01/05 | 14.74% | 8.37% | 5.27% | N/A | |||||||||
| R4 | 4/01/05 | 14.95% | 8.63% | 5.53% | N/A | |||||||||
| R6 | 6/01/12 | 15.13% | 8.74% | N/A | 10.53% | |||||||||
| Comparative benchmark(s) | ||||||||||||||
| Standard & Poor’s 500 Stock Index (f) | 23.63% | 15.18% | 7.51% | N/A | ||||||||||
| Standard & Poor’s 500 Utilities Index (f) | 15.40% | 12.46% | 6.78% | N/A | ||||||||||
| Average annual with sales charge | ||||||||||||||
| A With Initial Sales Charge (5.75%) | 8.13% | 7.09% | 4.65% | N/A | ||||||||||
| B With CDSC (Declining over six years from 4% to 0%) (v) | 9.87% | 7.26% | 4.48% | N/A | ||||||||||
| C With CDSC (1% for 12 months) (v) | 12.82% | 7.55% | 4.48% | N/A | ||||||||||
CDSC – Contingent Deferred Sales Charge.
Class I, R1, R2, R3, R4, and R6 shares do not have a sales charge.
| (f) | Source: FactSet Research Systems Inc. |
| (t) | For the period from the class inception date through the stated period end (for those share classes with less than 10 years of performance history). No comparative benchmark performance information is provided for “life” periods. (See Notes to Performance Summary.) |
| (v) | Assuming redemption at the end of the applicable period. |
Benchmark Definition(s)
Standard & Poor’s 500 Stock Index – a market capitalization-weighted index of 500 widely held equity securities, designed to measure broad U.S. equity performance.
Standard & Poor’s 500 Utilities Index – a market capitalization-weighted index designed to measure the utilities sector, including those companies considered electric, gas or water utilities, or companies that operate as independent producers and/or distributors of power.
It is not possible to invest directly in an index.
Notes to Performance Summary
Average annual total return represents the average annual change in value for each share class for the periods presented. Life returns are presented where the share class
7
Table of Contents
Performance Summary – continued
has less than 10 years of performance history and represent the average annual total return from the class inception date to the stated period end date. As the fund’s share classes may have different inception dates, the life returns may represent different time periods and may not be comparable. As a result, no comparative benchmark performance information is provided for life periods.
Performance results reflect any applicable expense subsidies and waivers in effect during the periods shown. Without such subsidies and waivers the fund’s performance results would be less favorable. Please see the prospectus and financial statements for complete details.
Performance results do not include adjustments made for financial reporting purposes in accordance with U.S. generally accepted accounting principles and may differ from amounts reported in the financial highlights.
From time to time the fund may receive proceeds from litigation settlements, without which performance would be lower.
8
Table of Contents
Fund expenses borne by the shareholders during the period, May 1, 2017 through October 31, 2017
As a shareholder of the fund, you incur two types of costs: (1) transaction costs, including sales charges (loads) on certain purchase or redemption payments, and (2) ongoing costs, including management fees; distribution and service (12b-1) fees; and other fund expenses. This example is intended to help you understand your ongoing costs (in dollars) of investing in the fund and to compare these costs with the ongoing costs of investing in other mutual funds.
The example is based on an investment of $1,000 invested at the beginning of the period and held for the entire period May 1, 2017 through October 31, 2017.
Actual Expenses
The first line for each share class in the following table provides information about actual account values and actual expenses. You may use the information in this line, together with the amount you invested, to estimate the expenses that you paid over the period. Simply divide your account value by $1,000 (for example, an $8,600 account value divided by $1,000 = 8.6), then multiply the result by the number in the first line under the heading entitled “Expenses Paid During Period” to estimate the expenses you paid on your account during this period.
Hypothetical Example for Comparison Purposes
The second line for each share class in the following table provides information about hypothetical account values and hypothetical expenses based on the fund’s actual expense ratio and an assumed rate of return of 5% per year before expenses, which is not the fund’s actual return. The hypothetical account values and expenses may not be used to estimate the actual ending account balance or expenses you paid for the period. You may use this information to compare the ongoing costs of investing in the fund and other funds. To do so, compare this 5% hypothetical example with the 5% hypothetical examples that appear in the shareholder reports of the other funds.
Please note that the expenses shown in the table are meant to highlight your ongoing costs only and do not reflect any transactional costs, such as sales charges (loads). Therefore, the second line for each share class in the table is useful in comparing ongoing costs only, and will not help you determine the relative total costs of owning different funds. In addition, if these transactional costs were included, your costs would have been higher.
9
Table of Contents
Expense Table – continued
| Share Class | Annualized Expense Ratio | Beginning Account Value 5/01/17 | Ending Account Value 10/31/17 | Expenses Paid During Period (p) 5/01/17-10/31/17 | ||||||||
| A | Actual | 0.99% | $1,000.00 | $1,075.81 | $5.18 | |||||||
| Hypothetical (h) | 0.99% | $1,000.00 | $1,020.21 | $5.04 | ||||||||
| B | Actual | 1.75% | $1,000.00 | $1,071.98 | $9.14 | |||||||
| Hypothetical (h) | 1.75% | $1,000.00 | $1,016.38 | $8.89 | ||||||||
| C | Actual | 1.75% | $1,000.00 | $1,071.47 | $9.14 | |||||||
| Hypothetical (h) | 1.75% | $1,000.00 | $1,016.38 | $8.89 | ||||||||
| I | Actual | 0.75% | $1,000.00 | $1,076.92 | $3.93 | |||||||
| Hypothetical (h) | 0.75% | $1,000.00 | $1,021.42 | $3.82 | ||||||||
| R1 | Actual | 1.75% | $1,000.00 | $1,071.55 | $9.14 | |||||||
| Hypothetical (h) | 1.75% | $1,000.00 | $1,016.38 | $8.89 | ||||||||
| R2 | Actual | 1.25% | $1,000.00 | $1,074.08 | $6.53 | |||||||
| Hypothetical (h) | 1.25% | $1,000.00 | $1,018.90 | $6.36 | ||||||||
| R3 | Actual | 1.00% | $1,000.00 | $1,075.84 | $5.23 | |||||||
| Hypothetical (h) | 1.00% | $1,000.00 | $1,020.16 | $5.09 | ||||||||
| R4 | Actual | 0.75% | $1,000.00 | $1,076.59 | $3.93 | |||||||
| Hypothetical (h) | 0.75% | $1,000.00 | $1,021.42 | $3.82 | ||||||||
| R6 | Actual | 0.66% | $1,000.00 | $1,077.35 | $3.46 | |||||||
| Hypothetical (h) | 0.66% | $1,000.00 | $1,021.88 | $3.36 | ||||||||
| (h) | 5% class return per year before expenses. |
| (p) | “Expenses Paid During Period” are equal to each class’s annualized expense ratio, as shown above, multiplied by the average account value over the period, multiplied by 184/365 (to reflect the one-half year period). Expenses paid do not include any applicable sales charges (loads). If these transaction costs had been included, your costs would have been higher. |
Notes to Expense Table
Changes to the fund’s fee arrangements occurred during the six month period. Had these fee changes been in effect throughout the entire six month period, the expense ratios would have decreased by 0.01%. For further information about the fund’s fee arrangements and changes to those fee arrangements, please see Note 3 in the Notes to Financial Statements.
10
Table of Contents
10/31/17
The Portfolio of Investments is a complete list of all securities owned by your fund. It is categorized by broad-based asset classes.
| Common Stocks - 92.7% | ||||||||
| Issuer | Shares/Par | Value ($) | ||||||
| Cable TV - 4.0% | ||||||||
| Altice USA, Inc. (a) | 2,289,313 | $ | 54,210,932 | |||||
| Comcast Corp., “A” | 1,958,005 | 70,546,920 | ||||||
| NOS, SGPS, S.A. | 4,613,008 | 27,641,090 | ||||||
|
| |||||||
| $ | 152,398,942 | |||||||
| Energy - Independent - 1.5% | ||||||||
| Enable Midstream Partners LP | 543,323 | $ | 8,198,744 | |||||
| Targa Resources Corp. | 649,138 | 26,939,227 | ||||||
| Western Gas Equity Partners LP | 586,289 | 23,187,730 | ||||||
|
| |||||||
| $ | 58,325,701 | |||||||
| Natural Gas - Distribution - 4.3% | ||||||||
| China Resources Gas Group Ltd. | 12,490,000 | $ | 45,708,398 | |||||
| Sempra Energy | 1,003,955 | 117,964,713 | ||||||
|
| |||||||
| $ | 163,673,111 | |||||||
| Natural Gas - Pipeline - 14.7% | ||||||||
| APA Group | 2,018,449 | $ | 13,232,584 | |||||
| Cheniere Energy, Inc. (a) | 1,204,401 | 56,293,703 | ||||||
| Enbridge, Inc. | 1,795,896 | 69,018,312 | ||||||
| Energy Transfer Partners LP | 3,659,373 | 63,709,684 | ||||||
| Enterprise Products Partners LP | 3,352,707 | 82,141,321 | ||||||
| EQT GP Holdings LP | 129,157 | 3,568,608 | ||||||
| EQT Midstream Partners LP | 740,838 | 54,125,624 | ||||||
| Kinder Morgan, Inc. | 1,236,568 | 22,394,246 | ||||||
| Plains All American Pipeline LP | 1,803,648 | 36,018,851 | ||||||
| SemGroup Corp., “A” | 452,892 | 11,797,837 | ||||||
| Shell Midstream Partners, LP | 591,816 | 15,038,045 | ||||||
| Tallgrass Energy GP LP | 910,236 | 22,755,900 | ||||||
| TransCanada Corp. | 1,146,508 | 54,432,691 | ||||||
| Williams Cos., Inc. | 1,400,987 | 39,928,129 | ||||||
| Williams Partners LP | 517,438 | 19,165,904 | ||||||
|
| |||||||
| $ | 563,621,439 | |||||||
| Telecommunications - Wireless - 6.3% | ||||||||
| Advanced Info Service PLC | 4,485,100 | $ | 26,259,842 | |||||
| America Movil S.A.B. de C.V., “L”, ADR | 219,592 | 3,759,415 | ||||||
| American Tower Corp., REIT | 580,754 | 83,436,927 | ||||||
| Cellnex Telecom S.A.U. | 1,833,022 | 45,511,696 | ||||||
11
Table of Contents
Portfolio of Investments – continued
| Issuer | Shares/Par | Value ($) | ||||||
| Common Stocks - continued | ||||||||
| Telecommunications - Wireless - continued | ||||||||
| KDDI Corp. | 863,700 | $ | 23,100,024 | |||||
| Millicom International Cellular S.A. SDR | 96,573 | 6,177,377 | ||||||
| Mobile TeleSystems PJSC, ADR | 3,146,081 | 33,379,919 | ||||||
| Vodafone Group PLC | 6,763,542 | 19,367,344 | ||||||
|
| |||||||
| $ | 240,992,544 | |||||||
| Telephone Services - 8.4% | ||||||||
| Bezeq - The Israel Telecommunication Corp. Ltd. | 6,602,387 | $ | 9,858,815 | |||||
| Com Hem Holding AB | 6,790,145 | 101,953,764 | ||||||
| France Telecom | 2,028,436 | 33,280,371 | ||||||
| Hellenic Telecommunications Organization S.A. | 2,149,627 | 25,540,729 | ||||||
| PT XL Axiata Tbk (a) | 75,827,725 | 18,897,527 | ||||||
| Royal KPN N.V. | 13,339,362 | 46,055,686 | ||||||
| TDC A.S. | 5,054,742 | 29,885,744 | ||||||
| Telefonica Brasil S.A., ADR | 1,084,561 | 16,702,239 | ||||||
| Telesites S.A.B. de C.V. (a) | 10,872,500 | 8,030,284 | ||||||
| TELUS Corp. | 889,976 | 32,229,811 | ||||||
|
| |||||||
| $ | 322,434,970 | |||||||
| Utilities - Electric Power - 52.0% | ||||||||
| AES Corp. | 5,655,097 | $ | 60,113,681 | |||||
| Alupar Investimento S.A., IEU | 865,200 | 4,773,900 | ||||||
| Ameren Corp. | 371,138 | 23,006,845 | ||||||
| American Electric Power Co., Inc. | 1,291,363 | 96,090,321 | ||||||
| Avangrid, Inc. | 768,857 | 39,772,973 | ||||||
| Calpine Corp. (a) | 5,123,775 | 76,549,198 | ||||||
| China Longyuan Electric Power Group Corp. | 31,250,000 | 23,152,896 | ||||||
| Covanta Holding Corp. | 1,604,604 | 25,834,124 | ||||||
| Dominion Energy, Inc. | 76,083 | 6,173,375 | ||||||
| Duke Energy Corp. | 744,920 | 65,783,885 | ||||||
| Dynegy, Inc. (a) | 3,420,882 | 42,589,981 | ||||||
| Edison International | 764,206 | 61,098,270 | ||||||
| EDP Renovaveis S.A. | 19,317,539 | 159,764,449 | ||||||
| Emera, Inc. (l) | 582,186 | 21,931,819 | ||||||
| Enel S.p.A | 21,534,125 | 133,572,435 | ||||||
| Engie Brasil Energia S.A. | 1,785,700 | 19,542,096 | ||||||
| Exelon Corp. | 6,311,298 | 253,777,292 | ||||||
| Great Plains Energy, Inc. | 811,035 | 26,626,279 | ||||||
| Iberdrola S.A. | 8,669,592 | 70,065,295 | ||||||
| Innogy SE | 418,762 | 19,487,407 | ||||||
| National Grid PLC | 634,039 | 7,629,416 | ||||||
| NextEra Energy Partners LP | 1,213,921 | 47,755,652 | ||||||
| NextEra Energy, Inc. | 990,089 | 153,533,101 | ||||||
12
Table of Contents
Portfolio of Investments – continued
| Issuer | Shares/Par | Value ($) | ||||||
| Common Stocks - continued | ||||||||
| Utilities - Electric Power - continued | ||||||||
| NRG Energy, Inc. | 3,329,520 | $ | 83,238,000 | |||||
| NRG Yield, Inc., “A” | 1,571,776 | 28,842,089 | ||||||
| NRG Yield, Inc., “C” | 959,313 | 17,843,222 | ||||||
| NTPC Ltd. | 8,181,083 | 22,893,202 | ||||||
| PG&E Corp. | 1,450,479 | 83,794,172 | ||||||
| PPL Corp. | 4,086,562 | 153,491,269 | ||||||
| Public Service Enterprise Group, Inc. | 920,208 | 45,274,233 | ||||||
| Southern Co. | 1,139,701 | 59,492,392 | ||||||
| SSE PLC | 3,006,554 | 55,185,396 | ||||||
| Vistra Energy Corp. | 101,557 | 1,974,268 | ||||||
| Westar Energy, Inc. | 38,637 | 2,066,307 | ||||||
|
| |||||||
| $ | 1,992,719,240 | |||||||
| Utilities - Water - 1.5% | ||||||||
| Companhia de Saneamento Basico do Estado de Sao Paulo | 2,872,800 | $ | 26,169,853 | |||||
| Suez Environnement | 1,879,478 | 33,058,580 | ||||||
|
| |||||||
| $ | 59,228,433 | |||||||
| Total Common Stocks (Identified Cost, $2,971,930,029) | $ | 3,553,394,380 | ||||||
| Convertible Preferred Stocks - 4.9% | ||||||||
| Energy - Independent - 0.7% | ||||||||
| Western Gas Equity Partners LP, 7.5% | 717,222 | $ | 27,254,436 | |||||
| Telecommunications - Wireless - 0.6% | ||||||||
| American Tower Corp., 5.5% | 189,710 | $ | 23,935,711 | |||||
| Telephone Services - 0.1% | ||||||||
| Frontier Communications Corp., 11.125% | 291,044 | $ | 5,785,955 | |||||
| Utilities - Electric Power - 3.5% | ||||||||
| Dominion Energy, Inc., 6.75% | 579,957 | $ | 30,349,150 | |||||
| Dynegy, Inc., 5.375% | 515,471 | 20,649,768 | ||||||
| Dynegy, Inc., 7% | 176,960 | 14,510,720 | ||||||
| NextEra Energy, Inc., 6.123% | 785,417 | 44,768,769 | ||||||
| NextEra Energy, Inc., 6.371% | 315,463 | 22,003,544 | ||||||
|
| |||||||
| $ | 132,281,951 | |||||||
| Total Convertible Preferred Stocks (Identified Cost, $224,722,567) | $ | 189,258,053 | ||||||
| Investment Companies (h) - 2.2% | ||||||||
| Money Market Funds - 2.2% | ||||||||
| MFS Institutional Money Market Portfolio, 1.13% (v) (Identified Cost, $82,914,461) | 82,914,516 | $ | 82,914,516 | |||||
13
Table of Contents
Portfolio of Investments – continued
| Issuer | Shares/Par | Value ($) | ||||||
| Collateral for Securities Loaned - 0.6% | ||||||||
| JPMorgan U.S. Government Money Market Fund, 0.97% (j) (Identified Cost, $21,129,200) | 21,129,200 | $ | 21,129,200 | |||||
| Other Assets, Less Liabilities - (0.4)% | (13,747,069 | ) | ||||||
| Net Assets - 100.0% | $ | 3,832,949,080 | ||||||
| (a) | Non-income producing security. |
| (h) | An affiliated issuer may be considered one in which the fund owns 5% or more of the outstanding voting securities, or a company which is under common control. At period end, the aggregate values of the fund’s investments in affiliated issuers and in unaffiliated issuers were $82,914,516 and $3,763,781,633, respectively. |
| (j) | The rate quoted is the annualized seven-day yield of the fund at period end. |
| (l) | A portion of this security is on loan. |
| (v) | Affiliated issuer that is available only to investment companies managed by MFS. The rate quoted for the MFS Institutional Money Market Portfolio is the annualized seven-day yield of the fund at period end. |
The following abbreviations are used in this report and are defined:
| ADR | American Depositary Receipt |
| IEU | International Equity Unit |
| PJSC | Public Joint Stock Company |
| PLC | Public Limited Company |
| REIT | Real Estate Investment Trust |
| SDR | Swedish Depository Receipt |
Abbreviations indicate amounts shown in currencies other than the U.S. dollar. All amounts are stated in U.S. dollars unless otherwise indicated. A list of abbreviations is shown below:
| CAD | Canadian Dollar |
| EUR | Euro |
| GBP | British Pound |
Derivative Contracts at 10/31/17
Forward Foreign Currency Exchange Contracts
| Currency Purchased | Currency Sold | Counterparty | Settlement Date | Unrealized Appreciation (Depreciation) | ||||||||||||||
| Asset Derivatives | ||||||||||||||||||
| EUR | 298,831 | USD | 347,584 | Barclays Bank PLC | 1/12/2018 | $2,007 | ||||||||||||
| USD | 2,044,033 | CAD | 2,577,718 | Barclays Bank PLC | 1/12/2018 | 44,420 | ||||||||||||
| USD | 54,105,201 | CAD | 67,567,116 | Citibank N.A. | 1/12/2018 | 1,691,361 | ||||||||||||
| USD | 3,855,946 | EUR | 3,252,856 | Deutsche Bank AG | 1/12/2018 | 50,546 | ||||||||||||
| USD | 3,479,875 | EUR | 2,935,095 | Goldman Sachs International | 1/12/2018 | 46,213 | ||||||||||||
| USD | 241,175,290 | EUR | 203,329,199 | JPMorgan Chase Bank N.A. | 1/12/2018 | 3,307,749 | ||||||||||||
| USD | 54,094,372 | CAD | 67,567,116 | Merrill Lynch International | 1/12/2018 | 1,680,532 | ||||||||||||
| USD | 5,773,483 | EUR | 4,870,494 | Morgan Stanley Capital Services, Inc. | 1/12/2018 | 75,667 | ||||||||||||
| USD | 104,658,303 | EUR | 88,540,408 | Morgan Stanley Capital Services, Inc. | 1/19/2018 | 1,034,154 | ||||||||||||
|
| |||||||||||||||||
| $7,932,649 | ||||||||||||||||||
|
| |||||||||||||||||
14
Table of Contents
Portfolio of Investments – continued
Forward Foreign Currency Exchange Contracts - continued
| Currency Purchased | Currency Sold | Counterparty | Settlement Date | Unrealized Appreciation (Depreciation) | ||||||||||||||
| Liability Derivatives | ||||||||||||||||||
| EUR | 1,454,300 | USD | 1,720,582 | BNP-Pariba SA | 1/12/2018 | $(19,249 | ) | |||||||||||
| EUR | 578,219 | USD | 685,864 | Deutsche Bank AG | 1/12/2018 | (9,426 | ) | |||||||||||
| EUR | 3,573 | USD | 4,255 | JPMorgan Chase Bank N.A. | 1/12/2018 | (75 | ) | |||||||||||
| EUR | 1,146,784 | USD | 1,355,321 | State Street Bank Corp. | 1/12/2018 | (13,739 | ) | |||||||||||
| USD | 50,237,266 | GBP | 37,917,722 | Barclays Bank PLC | 1/12/2018 | (241,294 | ) | |||||||||||
|
| |||||||||||||||||
| $(283,783 | ) | |||||||||||||||||
|
| |||||||||||||||||
See Notes to Financial Statements
15
Table of Contents
Financial Statements
STATEMENT OF ASSETS AND LIABILITIES
At 10/31/17
This statement represents your fund’s balance sheet, which details the assets and liabilities comprising the total value of the fund.
| Assets | ||||
Investments in unaffiliated issuers, at value, including $19,717,596 of securities on loan (identified cost, $3,217,781,796) | $3,763,781,633 | |||
Investments in affiliated issuers, at value (identified cost, $82,914,461) | 82,914,516 | |||
Cash | 3,974 | |||
Foreign currency, at value (identified cost, $472,120) | 472,120 | |||
Receivables for | ||||
Forward foreign currency exchange contracts | 7,932,649 | |||
Investments sold | 47,210,238 | |||
Fund shares sold | 1,623,914 | |||
Interest and dividends | 8,867,104 | |||
Other assets | 46 | |||
Total assets | $3,912,806,194 | |||
| Liabilities | ||||
Payables for | ||||
Distributions | $586,264 | |||
Forward foreign currency exchange contracts | 283,783 | |||
Investments purchased | 48,962,280 | |||
Fund shares reacquired | 6,162,740 | |||
Collateral for securities loaned, at value | 21,129,200 | |||
Payable to affiliates | ||||
Investment adviser | 124,830 | |||
Shareholder servicing costs | 1,460,179 | |||
Distribution and service fees | 74,181 | |||
Payable for independent Trustees’ compensation | 3,568 | |||
Deferred country tax expense payable | 764,320 | |||
Accrued expenses and other liabilities | 305,769 | |||
Total liabilities | $79,857,114 | |||
Net assets | $3,832,949,080 | |||
| Net assets consist of | ||||
Paid-in capital | $3,268,776,912 | |||
Unrealized appreciation (depreciation) (net of $764,320 deferred country tax) | 552,869,576 | |||
Accumulated net realized gain (loss) | 22,752,880 | |||
Accumulated distributions in excess of net investment income | (11,450,288 | ) | ||
Net assets | $3,832,949,080 | |||
Shares of beneficial interest outstanding | 187,393,073 |
16
Table of Contents
Statement of Assets and Liabilities – continued
| Net assets | Shares outstanding | Net asset value per share (a) | ||||||||||
Class A | $1,951,499,895 | 95,379,014 | $20.46 | |||||||||
Class B | 156,814,228 | 7,701,695 | 20.36 | |||||||||
Class C | 640,795,342 | 31,478,243 | 20.36 | |||||||||
Class I | 682,271,782 | 33,221,459 | 20.54 | |||||||||
Class R1 | 7,622,507 | 375,123 | 20.32 | |||||||||
Class R2 | 78,247,651 | 3,835,026 | 20.40 | |||||||||
Class R3 | 99,453,995 | 4,863,308 | 20.45 | |||||||||
Class R4 | 79,612,435 | 3,887,994 | 20.48 | |||||||||
Class R6 | 136,631,245 | 6,651,211 | 20.54 | |||||||||
| (a) | Maximum offering price per share was equal to the net asset value per share for all share classes, except for Class A, for which the maximum offering price per share was $21.71 [100 / 94.25 x $20.46]. On sales of $50,000 or more, the maximum offering price of Class A shares is reduced. A contingent deferred sales charge may be imposed on redemptions of Class A, Class B, and Class C shares. Redemption price per share was equal to the net asset value per share for Classes I, R1, R2, R3, R4, and R6. Net asset value per share is calculated using actual net assets and shares outstanding rather than amounts that have been rounded for presentation purposes. |
See Notes to Financial Statements
17
Table of Contents
Financial Statements
Year ended 10/31/17
This statement describes how much your fund earned in investment income and accrued in expenses. It also describes any gains and/or losses generated by fund operations.
| Net investment income (loss) | ||||
Income | ||||
Dividends | $142,585,084 | |||
Dividends from affiliated issuers | 6,747,284 | |||
Income on securities loaned | 307,144 | |||
Other | 7,808 | |||
Interest | 3,430 | |||
Foreign taxes withheld | (3,550,350 | ) | ||
Total investment income | $146,100,400 | |||
Expenses | ||||
Management fee | $23,569,165 | |||
Distribution and service fees | 14,642,573 | |||
Shareholder servicing costs | 4,742,277 | |||
Administrative services fee | 639,310 | |||
Independent Trustees’ compensation | 46,244 | |||
Custodian fee | 531,726 | |||
Reimbursement of custodian expenses | (32,643 | ) | ||
Shareholder communications | 423,305 | |||
Audit and tax fees | 73,098 | |||
Legal fees | 50,663 | |||
Miscellaneous | 286,009 | |||
Total expenses | $44,971,727 | |||
Fees paid indirectly | (69,179 | ) | ||
Reduction of expenses by investment adviser and distributor | (79,887 | ) | ||
Net expenses | $44,822,661 | |||
Net investment income (loss) | $101,277,739 | |||
| Realized and unrealized gain (loss) | ||||
Realized gain (loss) (identified cost basis) | ||||
Unaffiliated issuers (net of $95,079 country tax) | $164,311,161 | |||
Affiliated issuers | (53,467,961 | ) | ||
Forward foreign currency exchange contracts | (17,597,559 | ) | ||
Foreign currency | (192,052 | ) | ||
Net realized gain (loss) | $93,053,589 | |||
Change in unrealized appreciation (depreciation) | ||||
Unaffiliated issuers (net of $745,195 increase in deferred country tax) | $352,625,522 | |||
Affiliated issuers | 55 | |||
Forward foreign currency exchange contracts | (7,411,056 | ) | ||
Translation of assets and liabilities in foreign currencies | 17,533 | |||
Net unrealized gain (loss) | $345,232,054 | |||
Net realized and unrealized gain (loss) | $438,285,643 | |||
Change in net assets from operations | $539,563,382 | |||
See Notes to Financial Statements
18
Table of Contents
Financial Statements
STATEMENTS OF CHANGES IN NET ASSETS
These statements describe the increases and/or decreases in net assets resulting from operations, any distributions, and any shareholder transactions.
| Year ended | ||||||||
| 10/31/17 | 10/31/16 | |||||||
| Change in net assets | ||||||||
| From operations | ||||||||
Net investment income (loss) | $101,277,739 | $169,385,980 | ||||||
Net realized gain (loss) | 93,053,589 | (65,530,535 | ) | |||||
Net unrealized gain (loss) | 345,232,054 | 68,707,244 | ||||||
Change in net assets from operations | $539,563,382 | $172,562,689 | ||||||
| Distributions declared to shareholders | ||||||||
From net investment income | $(140,733,821 | ) | $(109,125,190 | ) | ||||
From net realized gain | — | (271,621,262 | ) | |||||
Total distributions declared to shareholders | $(140,733,821 | ) | $(380,746,452 | ) | ||||
Change in net assets from fund share transactions | $(873,692,573 | ) | $(679,128,254 | ) | ||||
Total change in net assets | $(474,863,012 | ) | $(887,312,017 | ) | ||||
| Net assets | ||||||||
At beginning of period | 4,307,812,092 | 5,195,124,109 | ||||||
At end of period (including accumulated distributions in excess of net investment income of $11,450,288 and undistributed net investment income of $42,209,692, respectively) | $3,832,949,080 | $4,307,812,092 | ||||||
See Notes to Financial Statements
19
Table of Contents
Financial Statements
The financial highlights table is intended to help you understand the fund’s financial performance for the past 5 years. Certain information reflects financial results for a single fund share. The total returns in the table represent the rate that an investor would have earned (or lost) on an investment in the fund share class (assuming reinvestment of all distributions) held for the entire period.
| Class A | Year ended | |||||||||||||||||||
| 10/31/17 | 10/31/16 | 10/31/15 | 10/31/14 | 10/31/13 | ||||||||||||||||
Net asset value, beginning of period | $18.49 | $19.25 | $23.34 | $21.80 | $18.61 | |||||||||||||||
| Income (loss) from investment operations | ||||||||||||||||||||
Net investment income (loss) (d) | $0.51 | (c) | $0.70 | $0.45 | $0.66 | $0.60 | ||||||||||||||
Net realized and unrealized gain (loss) | 2.15 | 0.07 | (2.73 | ) | 2.42 | 3.17 | ||||||||||||||
Total from investment operations | $2.66 | $0.77 | $(2.28 | ) | $3.08 | $3.77 | ||||||||||||||
| Less distributions declared to shareholders | ||||||||||||||||||||
From net investment income | $(0.69 | ) | $(0.46 | ) | $(0.47 | ) | $(0.64 | ) | $(0.57 | ) | ||||||||||
From net realized gain | — | (1.07 | ) | (1.34 | ) | (0.90 | ) | (0.01 | ) | |||||||||||
Total distributions declared to shareholders | $(0.69 | ) | $(1.53 | ) | $(1.81 | ) | $(1.54 | ) | $(0.58 | ) | ||||||||||
Net asset value, end of period (x) | $20.46 | $18.49 | $19.25 | $23.34 | $21.80 | |||||||||||||||
Total return (%) (r)(s)(t)(x) | 14.73 | (c) | 4.91 | (10.42 | ) | 14.99 | 20.59 | |||||||||||||
| Ratios (%) (to average net assets) and Supplemental data: | ||||||||||||||||||||
Expenses before expense reductions (f) | 1.01 | (c) | 1.00 | 0.99 | 0.97 | 1.01 | ||||||||||||||
Expenses after expense reductions (f) | 1.01 | (c) | 0.99 | 0.99 | 0.97 | 1.01 | ||||||||||||||
Net investment income (loss) | 2.64 | (c) | 3.85 | 2.10 | 2.97 | 2.97 | ||||||||||||||
Portfolio turnover | 24 | 27 | 45 | 46 | 54 | |||||||||||||||
Net assets at end of period (000 omitted) | $1,951,500 | $2,431,147 | $2,926,491 | $3,597,063 | $3,242,884 | |||||||||||||||
See Notes to Financial Statements
20
Table of Contents
Financial Highlights – continued
| Class B | Year ended | |||||||||||||||||||
| 10/31/17 | 10/31/16 | 10/31/15 | 10/31/14 | 10/31/13 | ||||||||||||||||
Net asset value, beginning of period | $18.40 | $19.16 | $23.24 | $21.71 | $18.55 | |||||||||||||||
| Income (loss) from investment operations | ||||||||||||||||||||
Net investment income (loss) (d) | $0.36 | (c) | $0.55 | $0.28 | $0.49 | $0.44 | ||||||||||||||
Net realized and unrealized gain (loss) | 2.14 | 0.08 | (2.71 | ) | 2.41 | 3.15 | ||||||||||||||
Total from investment operations | $2.50 | $0.63 | $(2.43 | ) | $2.90 | $3.59 | ||||||||||||||
| Less distributions declared to shareholders | ||||||||||||||||||||
From net investment income | $(0.54 | ) | $(0.32 | ) | $(0.31 | ) | $(0.47 | ) | $(0.42 | ) | ||||||||||
From net realized gain | — | (1.07 | ) | (1.34 | ) | (0.90 | ) | (0.01 | ) | |||||||||||
Total distributions declared to shareholders | $(0.54 | ) | $(1.39 | ) | $(1.65 | ) | $(1.37 | ) | $(0.43 | ) | ||||||||||
Net asset value, end of period (x) | $20.36 | $18.40 | $19.16 | $23.24 | $21.71 | |||||||||||||||
Total return (%) (r)(s)(t)(x) | 13.87 | (c) | 4.15 | (11.09 | ) | 14.15 | 19.60 | |||||||||||||
| Ratios (%) (to average net assets) and Supplemental data: | ||||||||||||||||||||
Expenses before expense reductions (f) | 1.76 | (c) | 1.75 | 1.74 | 1.72 | 1.76 | ||||||||||||||
Expenses after expense reductions (f) | 1.76 | (c) | 1.75 | 1.74 | 1.72 | 1.76 | ||||||||||||||
Net investment income (loss) | 1.89 | (c) | 3.05 | 1.34 | 2.23 | 2.21 | ||||||||||||||
Portfolio turnover | 24 | 27 | 45 | 46 | 54 | |||||||||||||||
Net assets at end of period (000 omitted) | $156,814 | $198,512 | $260,079 | $332,141 | $305,988 | |||||||||||||||
| Class C | Year ended | |||||||||||||||||||
| 10/31/17 | 10/31/16 | 10/31/15 | 10/31/14 | 10/31/13 | ||||||||||||||||
Net asset value, beginning of period | $18.40 | $19.16 | $23.24 | $21.71 | $18.55 | |||||||||||||||
| Income (loss) from investment operations | ||||||||||||||||||||
Net investment income (loss) (d) | $0.36 | (c) | $0.56 | $0.29 | $0.49 | $0.44 | ||||||||||||||
Net realized and unrealized gain (loss) | 2.14 | 0.07 | (2.72 | ) | 2.41 | 3.15 | ||||||||||||||
Total from investment operations | $2.50 | $0.63 | $(2.43 | ) | $2.90 | $3.59 | ||||||||||||||
| Less distributions declared to shareholders | ||||||||||||||||||||
From net investment income | $(0.54 | ) | $(0.32 | ) | $(0.31 | ) | $(0.47 | ) | $(0.42 | ) | ||||||||||
From net realized gain | — | (1.07 | ) | (1.34 | ) | (0.90 | ) | (0.01 | ) | |||||||||||
Total distributions declared to shareholders | $(0.54 | ) | $(1.39 | ) | $(1.65 | ) | $(1.37 | ) | $(0.43 | ) | ||||||||||
Net asset value, end of period (x) | $20.36 | $18.40 | $19.16 | $23.24 | $21.71 | |||||||||||||||
Total return (%) (r)(s)(t)(x) | 13.87 | (c) | 4.15 | (11.09 | ) | 14.16 | 19.61 | |||||||||||||
| Ratios (%) (to average net assets) and Supplemental data: | ||||||||||||||||||||
Expenses before expense reductions (f) | 1.76 | (c) | 1.75 | 1.74 | 1.72 | 1.76 | ||||||||||||||
Expenses after expense reductions (f) | 1.76 | (c) | 1.75 | 1.74 | 1.72 | 1.76 | ||||||||||||||
Net investment income (loss) | 1.90 | (c) | 3.09 | 1.35 | 2.21 | 2.21 | ||||||||||||||
Portfolio turnover | 24 | 27 | 45 | 46 | 54 | |||||||||||||||
Net assets at end of period (000 omitted) | $640,795 | $757,086 | $945,033 | $1,145,572 | $917,978 | |||||||||||||||
See Notes to Financial Statements
21
Table of Contents
Financial Highlights – continued
| Class I | Year ended | |||||||||||||||||||
| 10/31/17 | 10/31/16 | 10/31/15 | 10/31/14 | 10/31/13 | ||||||||||||||||
Net asset value, beginning of period | $18.56 | $19.31 | $23.41 | $21.86 | $18.67 | |||||||||||||||
| Income (loss) from investment operations | ||||||||||||||||||||
Net investment income (loss) (d) | $0.56 | (c) | $0.76 | $0.50 | $0.71 | $0.65 | ||||||||||||||
Net realized and unrealized gain (loss) | 2.16 | 0.06 | (2.73 | ) | 2.44 | 3.17 | ||||||||||||||
Total from investment operations | $2.72 | $0.82 | $(2.23 | ) | $3.15 | $3.82 | ||||||||||||||
| Less distributions declared to shareholders | ||||||||||||||||||||
From net investment income | $(0.74 | ) | $(0.50 | ) | $(0.53 | ) | $(0.70 | ) | $(0.62 | ) | ||||||||||
From net realized gain | — | (1.07 | ) | (1.34 | ) | (0.90 | ) | (0.01 | ) | |||||||||||
Total distributions declared to shareholders | $(0.74 | ) | $(1.57 | ) | $(1.87 | ) | $(1.60 | ) | $(0.63 | ) | ||||||||||
Net asset value, end of period (x) | $20.54 | $18.56 | $19.31 | $23.41 | $21.86 | |||||||||||||||
Total return (%) (r)(s)(t)(x) | 15.02 | (c) | 5.20 | (10.20 | ) | 15.28 | 20.82 | |||||||||||||
| Ratios (%) (to average net assets) and Supplemental data: | ||||||||||||||||||||
Expenses before expense reductions (f) | 0.76 | (c) | 0.75 | 0.74 | 0.72 | 0.76 | ||||||||||||||
Expenses after expense reductions (f) | 0.76 | (c) | 0.75 | 0.74 | 0.72 | 0.76 | ||||||||||||||
Net investment income (loss) | 2.86 | (c) | 4.18 | 2.33 | 3.14 | 3.21 | ||||||||||||||
Portfolio turnover | 24 | 27 | 45 | 46 | 54 | |||||||||||||||
Net assets at end of period (000 omitted) | $682,272 | $508,566 | $636,784 | $864,695 | $566,374 | |||||||||||||||
| Class R1 | Year ended | |||||||||||||||||||
| 10/31/17 | 10/31/16 | 10/31/15 | 10/31/14 | 10/31/13 | ||||||||||||||||
Net asset value, beginning of period | $18.37 | $19.13 | $23.21 | $21.68 | $18.52 | |||||||||||||||
| Income (loss) from investment operations | ||||||||||||||||||||
Net investment income (loss) (d) | $0.36 | (c) | $0.56 | $0.29 | $0.49 | $0.44 | ||||||||||||||
Net realized and unrealized gain (loss) | 2.13 | 0.08 | (2.72 | ) | 2.41 | 3.15 | ||||||||||||||
Total from investment operations | $2.49 | $0.64 | $(2.43 | ) | $2.90 | $3.59 | ||||||||||||||
| Less distributions declared to shareholders | ||||||||||||||||||||
From net investment income | $(0.54 | ) | $(0.33 | ) | $(0.31 | ) | $(0.47 | ) | $(0.42 | ) | ||||||||||
From net realized gain | — | (1.07 | ) | (1.34 | ) | (0.90 | ) | (0.01 | ) | |||||||||||
Total distributions declared to shareholders | $(0.54 | ) | $(1.40 | ) | $(1.65 | ) | $(1.37 | ) | $(0.43 | ) | ||||||||||
Net asset value, end of period (x) | $20.32 | $18.37 | $19.13 | $23.21 | $21.68 | |||||||||||||||
Total return (%) (r)(s)(t)(x) | 13.84 | (c) | 4.17 | (11.11 | ) | 14.18 | 19.63 | |||||||||||||
| Ratios (%) (to average net assets) and Supplemental data: | ||||||||||||||||||||
Expenses before expense reductions (f) | 1.76 | (c) | 1.75 | 1.74 | 1.72 | 1.76 | ||||||||||||||
Expenses after expense reductions (f) | 1.76 | (c) | 1.75 | 1.74 | 1.72 | 1.76 | ||||||||||||||
Net investment income (loss) | 1.90 | (c) | 3.14 | 1.34 | 2.21 | 2.22 | ||||||||||||||
Portfolio turnover | 24 | 27 | 45 | 46 | 54 | |||||||||||||||
Net assets at end of period (000 omitted) | $7,623 | $10,305 | $10,865 | $14,177 | $12,041 | |||||||||||||||
See Notes to Financial Statements
22
Table of Contents
Financial Highlights – continued
| Class R2 | Year ended | |||||||||||||||||||
| 10/31/17 | 10/31/16 | 10/31/15 | 10/31/14 | 10/31/13 | ||||||||||||||||
Net asset value, beginning of period | $18.44 | $19.20 | $23.29 | $21.75 | $18.58 | |||||||||||||||
| Income (loss) from investment operations | ||||||||||||||||||||
Net investment income (loss) (d) | $0.46 | (c) | $0.65 | $0.39 | $0.60 | $0.54 | ||||||||||||||
Net realized and unrealized gain (loss) | 2.14 | 0.07 | (2.72 | ) | 2.42 | 3.16 | ||||||||||||||
Total from investment operations | $2.60 | $0.72 | $(2.33 | ) | $3.02 | $3.70 | ||||||||||||||
| Less distributions declared to shareholders | ||||||||||||||||||||
From net investment income | $(0.64 | ) | $(0.41 | ) | $(0.42 | ) | $(0.58 | ) | $(0.52 | ) | ||||||||||
From net realized gain | — | (1.07 | ) | (1.34 | ) | (0.90 | ) | (0.01 | ) | |||||||||||
Total distributions declared to shareholders | $(0.64 | ) | $(1.48 | ) | $(1.76 | ) | $(1.48 | ) | $(0.53 | ) | ||||||||||
Net asset value, end of period (x) | $20.40 | $18.44 | $19.20 | $23.29 | $21.75 | |||||||||||||||
Total return (%) (r)(s)(t)(x) | 14.42 | (c) | 4.66 | (10.66 | ) | 14.74 | 20.22 | |||||||||||||
| Ratios (%) (to average net assets) and Supplemental data: | ||||||||||||||||||||
Expenses before expense reductions (f) | 1.26 | (c) | 1.25 | 1.24 | 1.22 | 1.26 | ||||||||||||||
Expenses after expense reductions (f) | 1.26 | (c) | 1.25 | 1.24 | 1.22 | 1.26 | ||||||||||||||
Net investment income (loss) | 2.39 | (c) | 3.61 | 1.84 | 2.69 | 2.71 | ||||||||||||||
Portfolio turnover | 24 | 27 | 45 | 46 | 54 | |||||||||||||||
Net assets at end of period (000 omitted) | $78,248 | $92,123 | $104,858 | $137,813 | $116,355 | |||||||||||||||
| Class R3 | Year ended | |||||||||||||||||||
| 10/31/17 | 10/31/16 | 10/31/15 | 10/31/14 | 10/31/13 | ||||||||||||||||
Net asset value, beginning of period | $18.48 | $19.24 | $23.33 | $21.79 | $18.59 | |||||||||||||||
| Income (loss) from investment operations | ||||||||||||||||||||
Net investment income (loss) (d) | $0.51 | (c) | $0.71 | $0.45 | $0.65 | $0.52 | ||||||||||||||
Net realized and unrealized gain (loss) | 2.15 | 0.06 | (2.73 | ) | 2.43 | 3.25 | ||||||||||||||
Total from investment operations | $2.66 | $0.77 | $(2.28 | ) | $3.08 | $3.77 | ||||||||||||||
| Less distributions declared to shareholders | ||||||||||||||||||||
From net investment income | $(0.69 | ) | $(0.46 | ) | $(0.47 | ) | $(0.64 | ) | $(0.56 | ) | ||||||||||
From net realized gain | — | (1.07 | ) | (1.34 | ) | (0.90 | ) | (0.01 | ) | |||||||||||
Total distributions declared to shareholders | $(0.69 | ) | $(1.53 | ) | $(1.81 | ) | $(1.54 | ) | $(0.57 | ) | ||||||||||
Net asset value, end of period (x) | $20.45 | $18.48 | $19.24 | $23.33 | $21.79 | |||||||||||||||
Total return (%) (r)(s)(t)(x) | 14.74 | (c) | 4.91 | (10.42 | ) | 15.00 | 20.61 | |||||||||||||
| Ratios (%) (to average net assets) and Supplemental data: | ||||||||||||||||||||
Expenses before expense reductions (f) | 1.01 | (c) | 0.99 | 0.99 | 0.97 | 1.00 | ||||||||||||||
Expenses after expense reductions (f) | 1.01 | (c) | 0.99 | 0.99 | 0.97 | 1.00 | ||||||||||||||
Net investment income (loss) | 2.64 | (c) | 3.91 | 2.09 | 2.93 | 2.67 | ||||||||||||||
Portfolio turnover | 24 | 27 | 45 | 46 | 54 | |||||||||||||||
Net assets at end of period (000 omitted) | $99,454 | $128,051 | $134,801 | $177,562 | $135,710 | |||||||||||||||
See Notes to Financial Statements
23
Table of Contents
Financial Highlights – continued
| Class R4 | Year ended | |||||||||||||||||||
| 10/31/17 | 10/31/16 | 10/31/15 | 10/31/14 | 10/31/13 | ||||||||||||||||
Net asset value, beginning of period | $18.51 | $19.26 | $23.35 | $21.81 | $18.63 | |||||||||||||||
| Income (loss) from investment operations | ||||||||||||||||||||
Net investment income (loss) (d) | $0.56 | (c) | $0.74 | $0.50 | $0.71 | $0.65 | ||||||||||||||
Net realized and unrealized gain (loss) | 2.15 | 0.08 | (2.72 | ) | 2.43 | 3.16 | ||||||||||||||
Total from investment operations | $2.71 | $0.82 | $(2.22 | ) | $3.14 | $3.81 | ||||||||||||||
| Less distributions declared to shareholders | ||||||||||||||||||||
From net investment income | $(0.74 | ) | $(0.50 | ) | $(0.53 | ) | $(0.70 | ) | $(0.62 | ) | ||||||||||
From net realized gain | — | (1.07 | ) | (1.34 | ) | (0.90 | ) | (0.01 | ) | |||||||||||
Total distributions declared to shareholders | $(0.74 | ) | $(1.57 | ) | $(1.87 | ) | $(1.60 | ) | $(0.63 | ) | ||||||||||
Net asset value, end of period (x) | $20.48 | $18.51 | $19.26 | $23.35 | $21.81 | |||||||||||||||
Total return (%) (r)(s)(t)(x) | 15.01 | (c) | 5.21 | (10.19 | ) | 15.26 | 20.82 | |||||||||||||
| Ratios (%) (to average net assets) and Supplemental data: | ||||||||||||||||||||
Expenses before expense reductions (f) | 0.76 | (c) | 0.74 | 0.74 | 0.72 | 0.76 | ||||||||||||||
Expenses after expense reductions (f) | 0.76 | (c) | 0.74 | 0.74 | 0.72 | 0.76 | ||||||||||||||
Net investment income (loss) | 2.89 | (c) | 4.11 | 2.33 | 3.19 | 3.22 | ||||||||||||||
Portfolio turnover | 24 | 27 | 45 | 46 | 54 | |||||||||||||||
Net assets at end of period (000 omitted) | $79,612 | $89,124 | $100,251 | $144,910 | $108,572 | |||||||||||||||
| Class R6 | Year ended | |||||||||||||||||||
| 10/31/17 | 10/31/16 | 10/31/15 | 10/31/14 | 10/31/13 | ||||||||||||||||
Net asset value, beginning of period | $18.56 | $19.31 | $23.42 | $21.86 | $18.67 | |||||||||||||||
| Income (loss) from investment operations | ||||||||||||||||||||
Net investment income (loss) (d) | $0.57 | (c) | $0.78 | $0.53 | $0.62 | $0.72 | ||||||||||||||
Net realized and unrealized gain (loss) | 2.17 | 0.06 | (2.75 | ) | 2.55 | 3.12 | ||||||||||||||
Total from investment operations | $2.74 | $0.84 | $(2.22 | ) | $3.17 | $3.84 | ||||||||||||||
| Less distributions declared to shareholders | ||||||||||||||||||||
From net investment income | $(0.76 | ) | $(0.52 | ) | $(0.55 | ) | $(0.71 | ) | $(0.64 | ) | ||||||||||
From net realized gain | — | (1.07 | ) | (1.34 | ) | (0.90 | ) | (0.01 | ) | |||||||||||
Total distributions declared to shareholders | $(0.76 | ) | $(1.59 | ) | $(1.89 | ) | $(1.61 | ) | $(0.65 | ) | ||||||||||
Net asset value, end of period (x) | $20.54 | $18.56 | $19.31 | $23.42 | $21.86 | |||||||||||||||
Total return (%) (r)(s)(t)(x) | 15.13 | (c) | 5.30 | (10.15 | ) | 15.42 | 20.95 | |||||||||||||
| Ratios (%) (to average net assets) and Supplemental data: | ||||||||||||||||||||
Expenses before expense reductions (f) | 0.66 | (c) | 0.65 | 0.63 | 0.63 | 0.65 | ||||||||||||||
Expenses after expense reductions (f) | 0.66 | (c) | 0.65 | 0.63 | 0.63 | 0.65 | ||||||||||||||
Net investment income (loss) | 2.93 | (c) | 4.31 | 2.48 | 2.71 | 3.48 | ||||||||||||||
Portfolio turnover | 24 | 27 | 45 | 46 | 54 | |||||||||||||||
Net assets at end of period (000 omitted) | $136,631 | $92,898 | $75,962 | $50,344 | $2,492 | |||||||||||||||
See Notes to Financial Statements
24
Table of Contents
Financial Highlights – continued
| (c) | Amount reflects a one-time reimbursement of expenses by the custodian (or former custodian) without which net investment income and performance would be lower and expenses would be higher. See Note 2 in the Notes to Financial Statements for additional information. |
| (d) | Per share data is based on average shares outstanding. |
| (f) | Ratios do not reflect reductions from fees paid indirectly, if applicable. |
| (r) | Certain expenses have been reduced without which performance would have been lower. |
| (s) | From time to time the fund may receive proceeds from litigation settlements, without which performance would be lower. |
| (t) | Total returns do not include any applicable sales charges. |
| (x) | The net asset values and total returns have been calculated on net assets which include adjustments made in accordance with U.S. generally accepted accounting principles required at period end for financial reporting purposes. |
See Notes to Financial Statements
25
Table of Contents
(1) Business and Organization
MFS Utilities Fund (the fund) is a diversified series of MFS Series Trust VI (the trust). The trust is organized as a Massachusetts business trust and is registered under the Investment Company Act of 1940, as amended, as an open-end management investment company.
The fund is an investment company and accordingly follows the investment company accounting and reporting guidance of the Financial Accounting Standards Board (FASB) Accounting Standards Codification Topic 946 Financial Services – Investment Companies.
(2) Significant Accounting Policies
General – The preparation of financial statements in conformity with U.S. generally accepted accounting principles requires management to make estimates and assumptions that affect the reported amounts of assets and liabilities, and disclosure of contingent assets and liabilities at the date of the financial statements and the reported amounts of increases and decreases in net assets from operations during the reporting period. Actual results could differ from those estimates. In the preparation of these financial statements, management has evaluated subsequent events occurring after the date of the fund’s Statement of Assets and Liabilities through the date that the financial statements were issued. The fund invests primarily in securities of issuers in the utility industry. Issuers in a single industry can react similarly to market, economic, political and regulatory conditions and developments. The fund invests in foreign securities. Investments in foreign securities are vulnerable to the effects of changes in the relative values of the local currency and the U.S. dollar and to the effects of changes in each country’s legal, political, and economic environment.
In October 2016, the Securities and Exchange Commission (SEC) released its Final Rule on Investment Company Reporting Modernization (the “Rule”). The Rule, which introduced two new regulatory reporting forms for investment companies – Form N-PORT and Form N-CEN – also contained amendments to Regulation S-X which impact financial statement presentation, particularly the presentation of derivative investments, for all reporting periods ending after August 1, 2017. The fund has adopted the Rule’s Regulation S-X amendments and believes that the fund’s financial statements are in compliance with those amendments.
Balance Sheet Offsetting – The fund’s accounting policy with respect to balance sheet offsetting is that, absent an event of default by the counterparty or a termination of the agreement, the International Swaps and Derivatives Association (ISDA) Master Agreement, or similar agreement, does not result in an offset of reported amounts of financial assets and financial liabilities in the Statement of Assets and Liabilities across transactions between the fund and the applicable counterparty. The fund’s right to setoff may be restricted or prohibited by the bankruptcy or insolvency laws of the particular jurisdiction to which a specific master netting agreement counterparty is subject. Balance sheet offsetting disclosures, to the extent applicable to the fund, have been included in the fund’s Significant Accounting Policies note under the captions for each of the fund’s in-scope financial instruments and transactions.
26
Table of Contents
Notes to Financial Statements – continued
Investment Valuations – Equity securities, including restricted equity securities, are generally valued at the last sale or official closing price on their primary market or exchange as provided by a third-party pricing service. Equity securities, for which there were no sales reported that day, are generally valued at the last quoted daily bid quotation on their primary market or exchange as provided by a third-party pricing service. Short-term instruments with a maturity at issuance of 60 days or less may be valued at amortized cost, which approximates market value. Forward foreign currency exchange contracts are generally valued at the mean of bid and asked prices for the time period interpolated from rates provided by a third-party pricing service for proximate time periods. Open-end investment companies are generally valued at net asset value per share. Securities and other assets generally valued on the basis of information from a third-party pricing service may also be valued at a broker/dealer bid quotation. Values obtained from third-party pricing services can utilize both transaction data and market information such as yield, quality, coupon rate, maturity, type of issue, trading characteristics, and other market data. The values of foreign securities and other assets and liabilities expressed in foreign currencies are converted to U.S. dollars using the mean of bid and asked prices for rates provided by a third-party pricing service.
The Board of Trustees has delegated primary responsibility for determining or causing to be determined the value of the fund’s investments (including any fair valuation) to the adviser pursuant to valuation policies and procedures approved by the Board. If the adviser determines that reliable market quotations are not readily available, investments are valued at fair value as determined in good faith by the adviser in accordance with such procedures under the oversight of the Board of Trustees. Under the fund’s valuation policies and procedures, market quotations are not considered to be readily available for most types of debt instruments and floating rate loans and many types of derivatives. These investments are generally valued at fair value based on information from third-party pricing services. In addition, investments may be valued at fair value if the adviser determines that an investment’s value has been materially affected by events occurring after the close of the exchange or market on which the investment is principally traded (such as foreign exchange or market) and prior to the determination of the fund’s net asset value, or after the halting of trading of a specific security where trading does not resume prior to the close of the exchange or market on which the security is principally traded. Events that occur on a frequent basis after foreign markets close (such as developments in foreign markets and significant movements in the U.S. markets) and prior to the determination of the fund’s net asset value may be deemed to have a material effect on the value of securities traded in foreign markets. Accordingly, the fund’s foreign equity securities may often be valued at fair value. The adviser generally relies on third-party pricing services or other information (such as the correlation with price movements of similar securities in the same or other markets; the type, cost and investment characteristics of the security; the business and financial condition of the issuer; and trading and other market data) to assist in determining whether to fair value and at what value to fair value an investment. The value of an investment for purposes of calculating the fund’s net asset value can differ depending on the source and method used to determine value. When fair valuation is used, the value of an investment used to determine the fund’s net asset value may differ from
27
Table of Contents
Notes to Financial Statements – continued
quoted or published prices for the same investment. There can be no assurance that the fund could obtain the fair value assigned to an investment if it were to sell the investment at the same time at which the fund determines its net asset value per share.
Various inputs are used in determining the value of the fund’s assets or liabilities. These inputs are categorized into three broad levels. In certain cases, the inputs used to measure fair value may fall into different levels of the fair value hierarchy. In such cases, an investment’s level within the fair value hierarchy is based on the lowest level of input that is significant to the fair value measurement. The fund’s assessment of the significance of a particular input to the fair value measurement in its entirety requires judgment, and considers factors specific to the investment. Level 1 includes unadjusted quoted prices in active markets for identical assets or liabilities. Level 2 includes other significant observable market-based inputs (including quoted prices for similar securities, interest rates, prepayment speed, and credit risk). Level 3 includes unobservable inputs, which may include the adviser’s own assumptions in determining the fair value of investments. Other financial instruments are derivative instruments, such as forward foreign currency exchange contracts. The following is a summary of the levels used as of October 31, 2017 in valuing the fund’s assets or liabilities:
| Financial Instruments | Level 1 | Level 2 | Level 3 | Total | ||||||||||||
| Equity Securities: | ||||||||||||||||
United States | $2,455,402,028 | $— | $— | $2,455,402,028 | ||||||||||||
Portugal | 187,405,539 | — | — | 187,405,539 | ||||||||||||
Canada | 177,612,632 | — | — | 177,612,632 | ||||||||||||
Italy | 133,572,435 | — | — | 133,572,435 | ||||||||||||
Spain | 115,576,991 | — | — | 115,576,991 | ||||||||||||
Sweden | 108,131,141 | — | — | 108,131,141 | ||||||||||||
United Kingdom | 82,182,155 | — | — | 82,182,155 | ||||||||||||
China | 68,861,294 | — | — | 68,861,294 | ||||||||||||
Brazil | 67,188,089 | — | — | 67,188,089 | ||||||||||||
Other Countries | 284,127,679 | 62,592,450 | — | 346,720,129 | ||||||||||||
| Mutual Funds | 104,043,716 | — | — | 104,043,716 | ||||||||||||
| Total | $3,784,103,699 | $62,592,450 | $— | $3,846,696,149 | ||||||||||||
| Other Financial Instruments | ||||||||||||||||
| Forward Foreign Currency Exchange Contracts – Assets | $— | $7,932,649 | $— | $7,932,649 | ||||||||||||
| Forward Foreign Currency Exchange Contracts – Liabilities | — | (283,783 | ) | — | (283,783 | ) | ||||||||||
For further information regarding security characteristics, see the Portfolio of Investments.
Of the level 2 investments presented above, equity investments amounting to $23,100,024 would have been considered level 1 investments at the beginning of the period. Of the level 1 investments presented above, equity investments amounting to $14,510,720 would have been considered level 2 investments at the beginning of the period. The primary reason for changes in the classifications between levels 1 and 2 occurs when foreign equity securities are fair valued using other observable market-based inputs in place of the closing exchange price due to events occurring
28
Table of Contents
Notes to Financial Statements – continued
after the close of the exchange or market on which the investment is principally traded. The fund’s foreign equity securities may often be valued using other observable market-based inputs. The fund’s policy is to recognize transfers between the levels as of the end of the period.
Foreign Currency Translation – Purchases and sales of foreign investments, income, and expenses are converted into U.S. dollars based upon currency exchange rates prevailing on the respective dates of such transactions or on the reporting date for
foreign denominated receivables and payables. Gains and losses attributable to foreign currency exchange rates on sales of securities are recorded for financial statement purposes as net realized gains and losses on investments. Gains and losses attributable to foreign exchange rate movements on receivables, payables, income and expenses are recorded for financial statement purposes as foreign currency transaction gains and losses. That portion of both realized and unrealized gains and losses on investments that results from fluctuations in foreign currency exchange rates is not separately disclosed.
Derivatives – The fund uses derivatives for different purposes, primarily to increase or decrease exposure to a particular market or segment of the market, or security, to increase or decrease interest rate or currency exposure, or as alternatives to direct investments. Derivatives are used for hedging or non-hedging purposes. While hedging can reduce or eliminate losses, it can also reduce or eliminate gains. When the fund uses derivatives as an investment to increase market exposure, or for hedging purposes, gains and losses from derivative instruments may be substantially greater than the derivative’s original cost.
The derivative instruments used by the fund were forward foreign currency exchange contracts. Depending on the type of derivative, the fund may exit a derivative position by entering into an offsetting transaction with a counterparty or exchange, negotiating an agreement with the derivative counterparty, or novating the position to a third party. The fund’s period end derivatives, as presented in the Portfolio of Investments and the associated Derivative Contract tables, generally are indicative of the volume of its derivative activity during the period.
The following table presents, by major type of derivative contract, the fair value, on a gross basis, of the asset and liability components of derivatives held by the fund at October 31, 2017 as reported in the Statement of Assets and Liabilities:
| Fair Value | ||||||||||
| Risk | Derivative Contracts | Asset Derivatives | Liability Derivatives | |||||||
| Foreign Exchange | Forward Foreign Currency Exchange Contracts | $7,932,649 | $ | (283,783 | ) | |||||
29
Table of Contents
Notes to Financial Statements – continued
The following table presents, by major type of derivative contract, the realized gain (loss) on derivatives held by the fund for the year ended October 31, 2017 as reported in the Statement of Operations:
| Risk | Forward Foreign Currency Exchange Contracts | |||
| Foreign Exchange | $(17,597,559 | ) | ||
The following table presents, by major type of derivative contract, the change in unrealized appreciation (depreciation) on derivatives held by the fund for the year ended October 31, 2017 as reported in the Statement of Operations:
| Risk | Forward Foreign Currency Exchange Contracts | |||
Foreign Exchange | $(7,411,056 | ) | ||
Derivative counterparty credit risk is managed through formal evaluation of the creditworthiness of all potential counterparties. On certain, but not all, uncleared derivatives, the fund attempts to reduce its exposure to counterparty credit risk whenever possible by entering into an ISDA Master Agreement on a bilateral basis. The ISDA Master Agreement gives each party to the agreement the right to terminate all transactions traded under such agreement if there is a certain deterioration in the credit quality of the other party. Upon an event of default or a termination of the ISDA Master Agreement, the non-defaulting party has the right to close out all transactions traded under such agreement and to net amounts owed under each agreement to one net amount payable by one party to the other. This right to close out and net payments across all transactions traded under the ISDA Master Agreement could result in a reduction of the fund’s credit risk to such counterparty equal to any amounts payable by the fund under the applicable transactions, if any.
Collateral and margin requirements differ by type of derivative. For cleared derivatives (e.g., futures contracts, cleared swaps, and exchange-traded options), margin requirements are set by the clearing broker and the clearing house and collateral, in the form of cash or securities, is posted by the fund directly with the clearing broker. Collateral terms are counterparty agreement specific for uncleared derivatives (e.g., forward foreign currency exchange contracts, uncleared swap agreements, and uncleared options) and collateral, in the form of cash and securities, is held in segregated accounts with the fund’s custodian in connection with these agreements. For derivatives traded under an ISDA Master Agreement, which contains a collateral support annex, the collateral requirements are netted across all transactions traded under such counterparty-specific agreement and one amount is posted from one party to the other to collateralize such obligations. Cash that has been segregated or delivered to cover the fund’s collateral or margin obligations under derivative contracts, if any, will be reported separately in the Statement of Assets and Liabilities as restricted cash for uncleared derivatives or deposits with brokers for cleared derivatives, respectively. Securities pledged as collateral or margin for the same purpose, if any, are
30
Table of Contents
Notes to Financial Statements – continued
noted in the Portfolio of Investments. The fund may be required to make payments of interest on uncovered collateral or margin obligations with the broker. Any such payments are included in “Miscellaneous” expense in the Statement of Operations.
Forward Foreign Currency Exchange Contracts – The fund entered into forward foreign currency exchange contracts for the purchase or sale of a specific foreign currency at a fixed price on a future date. These contracts may be used to hedge the fund’s currency risk or for non-hedging purposes. For hedging purposes, the fund may enter into contracts to deliver or receive foreign currency that the fund will receive from or use in its normal investment activities. The fund may also use contracts to hedge against declines in the value of foreign currency denominated securities due to
unfavorable exchange rate movements. For non-hedging purposes, the fund may enter into contracts with the intent of changing the relative exposure of the fund’s portfolio of securities to different currencies to take advantage of anticipated exchange rate changes.
Forward foreign currency exchange contracts are adjusted by the daily exchange rate of the underlying currency and any unrealized gains or losses are recorded as a receivable or payable for forward foreign currency exchange contracts until the contract settlement date. On contract settlement date, any gain or loss on the contract is recorded as realized gains or losses on forward foreign currency exchange contracts.
Risks may arise upon entering into these contracts from unanticipated movements in the value of the contract and from the potential inability of counterparties to meet the terms of their contracts. Generally, the fund’s maximum risk due to counterparty credit risk is the unrealized gain on the contract due to the use of Continuous Linked Settlement, a multicurrency cash settlement system for the centralized settlement of foreign transactions. This risk is mitigated in cases where there is an ISDA Master Agreement between the fund and the counterparty providing for netting as described above and, where applicable, by the posting of collateral by the counterparty to the fund to cover the fund’s exposure to the counterparty under such ISDA Master Agreement.
Security Loans – Under its Securities Lending Agency Agreement with the fund, JPMorgan Chase and Co. (“Chase”), as lending agent, loans the securities of the fund to certain qualified institutions (the “Borrowers”) approved by the fund. Security loans can be terminated at the discretion of either the lending agent or the fund and the related securities must be returned within the earlier of the standard trade settlement period for such securities or within three business days. The loans are collateralized by cash and/or U.S. Treasury and federal agency obligations in an amount typically at least equal to the market value of the securities loaned. On loans collateralized by cash, the cash collateral is invested in a money market fund. The market value of the loaned securities is determined at the close of business of the fund and any additional required collateral is delivered to the fund on the next business day. Chase provides the fund with indemnification against Borrower default. In the event of Borrower default, Chase will, for the benefit of the fund, either purchase securities identical to those loaned or, when such purchase is commercially impracticable, pay the fund the market value of the loaned securities. In return, Chase assumes the fund’s rights to the related collateral. If the collateral value is less than the cost to purchase identical securities, Chase is responsible for the shortfall, but only to the extent that such shortfall is not
31
Table of Contents
Notes to Financial Statements – continued
due to a decline in collateral value resulting from collateral reinvestment for which the fund bears the risk of loss. At period end, the fund had investment securities on loan, all of which were classified as equity securities in the fund’s Portfolio of Investments, with a fair value of $19,717,596. The fair value of the fund’s investment securities on loan and a related liability of $21,129,200 for cash collateral received on securities loaned are both presented gross in the Statement of Assets and Liabilities. The collateral on securities loaned exceeded the value of securities on loan at period end. The liability for cash collateral for securities loaned is carried at fair value, which is categorized as level 2 within the fair value hierarchy. A portion of the income generated upon investment of the collateral is remitted to the Borrowers, and the remainder is allocated between the fund and the lending agent. On loans collateralized by U.S. Treasury and/or federal agency obligations, a fee is received from the Borrower,
and is allocated between the fund and the lending agent. Income from securities lending is separately reported in the Statement of Operations. The dividend and interest income earned on the securities loaned is accounted for in the same manner as other dividend and interest income.
Indemnifications – Under the fund’s organizational documents, its officers and Trustees may be indemnified against certain liabilities and expenses arising out of the performance of their duties to the fund. Additionally, in the normal course of business, the fund enters into agreements with service providers that may contain indemnification clauses. The fund’s maximum exposure under these agreements is unknown as this would involve future claims that may be made against the fund that have not yet occurred.
Investment Transactions and Income – Investment transactions are recorded on the trade date. Interest income is recorded on the accrual basis. All premium and discount is amortized or accreted for financial statement purposes in accordance with U.S. generally accepted accounting principles. Dividends received in cash are recorded on the ex-dividend date. Certain dividends from foreign securities will be recorded when the fund is informed of the dividend if such information is obtained subsequent to the ex-dividend date. Dividend and interest payments received in additional securities are recorded on the ex-dividend or ex-interest date in an amount equal to the value of the security on such date.
The fund may receive proceeds from litigation settlements. Any proceeds received from litigation involving portfolio holdings are reflected in the Statement of Operations in realized gain/loss if the security has been disposed of by the fund or in unrealized gain/loss if the security is still held by the fund. Any other proceeds from litigation not related to portfolio holdings are reflected as other income in the Statement of Operations.
Fees Paid Indirectly – The fund’s custody fee may be reduced by a credit earned under an arrangement that measures the value of U.S. dollars deposited with the custodian by the fund. The amount of the credit, for the year ended October 31, 2017, is shown as a reduction of total expenses in the Statement of Operations.
Reimbursement of Expenses by Custodian – In December 2015, the fund’s custodian (or former custodian), State Street Bank and Trust Company, announced that it intended to reimburse its asset servicing clients for expense amounts that it billed in
32
Table of Contents
Notes to Financial Statements – continued
error during the period 1998 through 2015. The amount of this one-time reimbursement attributable to the fund is reflected as “Reimbursement of custodian expenses” in the Statement of Operations.
Tax Matters and Distributions – The fund intends to qualify as a regulated investment company, as defined under Subchapter M of the Internal Revenue Code, and to distribute all of its taxable income, including realized capital gains. As a result, no provision for federal income tax is required. The fund’s federal tax returns, when filed, will remain subject to examination by the Internal Revenue Service for a three year period. Management has analyzed the fund’s tax positions taken on federal and state tax returns for all open tax years and does not believe that there are any uncertain tax positions that require recognition of a tax liability. Foreign taxes, if any, have been accrued by the fund in the accompanying financial statements in accordance with the applicable foreign tax law. Foreign income taxes may be withheld by certain countries in which the fund invests. Additionally, capital gains realized by the fund on securities issued in or by certain foreign countries may be subject to capital gains tax imposed by those countries.
Distributions to shareholders are recorded on the ex-dividend date. Income and capital gain distributions are determined in accordance with income tax regulations, which may differ from U.S. generally accepted accounting principles. Certain capital accounts in the financial statements are periodically adjusted for permanent differences in order to reflect their tax character. These adjustments have no impact on net assets or net asset value per share. Temporary differences which arise from recognizing certain items of income, expense, gain or loss in different periods for financial statement and tax purposes will reverse at some time in the future. Distributions in excess of net investment income or net realized gains are temporary overdistributions for financial statement purposes resulting from differences in the recognition or classification of income or distributions for financial statement and tax purposes.
Book/tax differences primarily relate to certain preferred stock treated as debt for tax purposes, partnership adjustments, wash sales loss deferrals, and derivative transactions.
The tax character of distributions declared to shareholders for the last two fiscal years is as follows:
| Year ended | Year ended | |||||||
| 10/31/17 | 10/31/16 | |||||||
| Ordinary income (including any short-term capital gains) | $138,993,782 | $112,449,974 | ||||||
| Long-term capital gains | 1,740,039 | 268,296,478 | ||||||
| Total distributions | $140,733,821 | $380,746,452 | ||||||
33
Table of Contents
Notes to Financial Statements – continued
The federal tax cost and the tax basis components of distributable earnings were as follows:
| As of 10/31/17 | ||||
| Cost of investments | $3,391,772,389 | |||
| Gross appreciation | 666,949,374 | |||
| Gross depreciation | (204,376,748 | ) | ||
| Net unrealized appreciation (depreciation) | $462,572,626 | |||
| Undistributed long-term capital gain | 14,613,588 | |||
| Other temporary differences | 86,985,954 | |||
Multiple Classes of Shares of Beneficial Interest – The fund offers multiple classes of shares, which differ in their respective distribution and service fees. The fund’s income, realized and unrealized gain (loss), and common expenses are allocated to shareholders based on the daily net assets of each class. Dividends are declared separately for each class. Differences in per share dividend rates are generally due to differences in separate class expenses. Class B shares will convert to Class A shares approximately eight years after purchase. The fund’s distributions declared to shareholders as reported in the Statements of Changes in Net Assets are presented by class as follows:
| From net investment income | From net realized gain on investments | |||||||||||||||
| Year ended 10/31/17 | Year ended 10/31/16 | Year ended 10/31/17 | Year ended 10/31/16 | |||||||||||||
| Class A | $79,134,554 | $65,828,401 | $— | $154,785,763 | ||||||||||||
| Class B | 4,981,115 | 4,130,970 | — | 13,994,855 | ||||||||||||
| Class C | 19,770,266 | 14,786,360 | — | 49,747,414 | ||||||||||||
| Class I | 22,401,656 | 13,542,032 | — | 29,518,128 | ||||||||||||
| Class R1 | 254,278 | 193,047 | — | 607,802 | ||||||||||||
| Class R2 | 2,878,587 | 2,262,198 | — | 5,814,941 | ||||||||||||
| Class R3 | 3,906,930 | 3,256,213 | — | 7,116,727 | ||||||||||||
| Class R4 | 3,267,838 | 2,625,833 | — | 5,454,803 | ||||||||||||
| Class R6 | 4,138,597 | 2,500,136 | — | 4,580,829 | ||||||||||||
| Total | $140,733,821 | $109,125,190 | $— | $271,621,262 | ||||||||||||
(3) Transactions with Affiliates
Investment Adviser – The fund has an investment advisory agreement with MFS to provide overall investment management and related administrative services and facilities to the fund. For the period November 1, 2016 through February 27, 2017, the management fee was computed daily and paid monthly at the following annual rates based on the fund’s average daily net assets:
| Up to $3 billion | 0.60% | |||
| In excess of $3 billion | 0.55% |
The investment adviser had agreed in writing to reduce its management fee to 0.50% of average daily net assets in excess of $10 billion. This written agreement terminated on February 27, 2017. For the period November 1, 2016 through February 27, 2017,
34
Table of Contents
Notes to Financial Statements – continued
the fund’s average daily net assets did not exceed $10 billion and therefore, the management fee was not reduced in accordance with this agreement. Effective February 28, 2017, the management fee is computed daily and paid monthly at the following annual rates based on the fund’s average daily net assets:
| Up to $3 billion | 0.60 | % | ||
| In excess of $3 billion and up to $10 billion | 0.55 | % | ||
| In excess of $10 billion | 0.50 | % |
Effective October 1, 2017, MFS has agreed in writing to reduce its management fee by a specified amount if certain MFS mutual fund assets exceed thresholds agreed to by MFS and the fund’s Board of Trustees. For the period October 1, 2017 through October 31, 2017, this management fee reduction amounted to $28,503, which is included in the reduction of total expenses in the Statement of Operations. The management fee incurred for the year ended October 31, 2017 was equivalent to an annual effective rate of 0.59% of the fund’s average daily net assets.
Distributor – MFS Fund Distributors, Inc. (MFD), a wholly-owned subsidiary of MFS, as distributor, received $256,773 for the year ended October 31, 2017, as its portion of the initial sales charge on sales of Class A shares of the fund.
The Board of Trustees has adopted a distribution plan for certain share classes pursuant to Rule 12b-1 of the Investment Company Act of 1940.
The fund’s distribution plan provides that the fund will pay MFD for services provided by MFD and financial intermediaries in connection with the distribution and servicing of certain share classes. One component of the plan is a distribution fee paid to MFD and another component of the plan is a service fee paid to MFD. MFD may subsequently pay all, or a portion, of the distribution and/or service fees to financial intermediaries.
Distribution Plan Fee Table:
| Distribution Fee Rate (d) | Service Fee Rate (d) | Total Distribution Plan (d) | Annual Effective Rate (e) | Distribution and Service Fee | ||||||||||||||||
| Class A | — | 0.25% | 0.25% | 0.25% | $5,328,341 | |||||||||||||||
| Class B | 0.75% | 0.25% | 1.00% | 1.00% | 1,712,315 | |||||||||||||||
| Class C | 0.75% | 0.25% | 1.00% | 1.00% | 6,824,552 | |||||||||||||||
| Class R1 | 0.75% | 0.25% | 1.00% | 1.00% | 86,487 | |||||||||||||||
| Class R2 | 0.25% | 0.25% | 0.50% | 0.50% | 423,005 | |||||||||||||||
| Class R3 | — | 0.25% | 0.25% | 0.25% | 267,873 | |||||||||||||||
| Total Distribution and Service Fees | $14,642,573 | |||||||||||||||||||
| (d) | In accordance with the distribution plan for certain classes, the fund pays distribution and/or service fees equal to these annual percentage rates of each class’s average daily net assets. The distribution and service fee rates disclosed by class represent the current rates in effect at the end of the reporting period. Any rate changes, if applicable, are detailed below. |
| (e) | The annual effective rates represent actual fees incurred under the distribution plan for the year ended October 31, 2017 based on each class’s average daily net assets. MFD has voluntarily agreed to rebate a portion of each class’s 0.25% service fee attributable to accounts for which MFD retains the 0.25% service fee except for accounts attributable to MFS or its affiliates’ seed money. For the year ended October 31, 2017, this rebate amounted to $47,571, $990, $2,546, $59, and $218 for Class A, Class B, Class C, Class R2, and Class R3, respectively, and is included in the reduction of total expenses in the Statement of Operations. |
35
Table of Contents
Notes to Financial Statements – continued
Certain Class A shares are subject to a contingent deferred sales charge (CDSC) in the event of a shareholder redemption within 18 months of purchase. Class C shares are subject to a CDSC in the event of a shareholder redemption within 12 months of
purchase. Class B shares are subject to a CDSC in the event of a shareholder redemption within six years of purchase. All contingent deferred sales charges are paid to MFD and during the year ended October 31, 2017, were as follows:
| Amount | ||||
| Class A | $7,903 | |||
| Class B | 283,682 | |||
| Class C | 29,708 | |||
Shareholder Servicing Agent – MFS Service Center, Inc. (MFSC), a wholly-owned subsidiary of MFS, receives a fee from the fund for its services as shareholder servicing agent calculated as a percentage of the average daily net assets of the fund as determined periodically under the supervision of the fund’s Board of Trustees. For the year ended October 31, 2017, the fee was $561,087, which equated to 0.0140% annually of the fund’s average daily net assets. MFSC also receives payment from the fund for out-of-pocket expenses, sub-accounting and other shareholder servicing costs which may be paid to affiliated and unaffiliated service providers. Class R6 shares do not incur sub-accounting fees. For the year ended October 31, 2017, these out-of-pocket expenses, sub-accounting and other shareholder servicing costs amounted to $4,181,190.
Administrator – MFS provides certain financial, legal, shareholder communications, compliance, and other administrative services to the fund. Under an administrative services agreement, the fund reimburses MFS the costs incurred to provide these services. The fund is charged an annual fixed amount of $17,500 plus a fee based on average daily net assets. The administrative services fee incurred for the year ended October 31, 2017 was equivalent to an annual effective rate of 0.0159% of the fund’s average daily net assets.
Trustees’ and Officers’ Compensation – The fund pays compensation to independent Trustees in the form of a retainer, attendance fees, and additional compensation to Board and Committee chairpersons. The fund does not pay compensation directly to Trustees or officers of the fund who are also officers of the investment adviser, all of whom receive remuneration for their services to the fund from MFS. Certain officers and Trustees of the fund are officers or directors of MFS, MFD, and MFSC.
Prior to December 31, 2001, the fund had an unfunded defined benefit plan (“DB plan”) for independent Trustees. As of December 31, 2001, the Board took action to terminate the DB plan with respect to then-current and any future independent Trustees, such that the DB plan covers only certain of those former independent Trustees who retired on or before December 31, 2001. The DB plan resulted in a pension expense of $1,016 and is included in “Independent Trustees’ compensation” in the Statement of Operations for the year ended October 31, 2017. The liability for deferred retirement benefits payable to certain independent Trustees under the DB plan amounted to $3,432 at October 31, 2017, and is included in “Payable for independent Trustees’ compensation” in the Statement of Assets and Liabilities.
36
Table of Contents
Notes to Financial Statements – continued
Other – This fund and certain other funds managed by MFS (the funds) have entered into a service agreement (the ISO Agreement) which provides for payment of fees solely by the funds to Tarantino LLC in return for the provision of services of an Independent Senior Officer (ISO) for the funds. Frank L. Tarantino serves as the ISO and is an officer of the funds and the sole member of Tarantino LLC. The funds can terminate the ISO Agreement with Tarantino LLC at any time under the terms of the ISO Agreement. For the year ended October 31, 2017, the fee paid by the fund under this agreement was $7,574 and is included in “Miscellaneous” expense in the Statement of Operations. MFS has agreed to bear all expenses associated with office space, other administrative support, and supplies provided to the ISO.
The fund invests in the MFS Institutional Money Market Portfolio which is managed by MFS and seeks current income consistent with preservation of capital and liquidity. This money market fund does not pay a management fee to MFS.
On March 16, 2016, MFS purchased 98,756 shares of Class I for an aggregate amount of $1,751,936.
On March 16, 2017, MFS redeemed 45,165 shares of Class I for an aggregate amount of $863,094.
On September 20, 2017, MFS redeemed 10,149 shares of Class I for an aggregate amount of $208,156.
The fund is permitted to engage in purchase and sale transactions with funds and accounts for which MFS serves as investment adviser or sub-adviser (“cross-trades”) pursuant to a policy adopted by the Board of Trustees. This policy has been designed to ensure that cross-trades conducted by the fund comply with Rule 17a-7 under the Investment Company Act of 1940. Under this policy, cross-trades are effected at current market prices with no remuneration paid in connection with the transaction. During the year ended October 31, 2017, the fund engaged in purchase and sale transactions pursuant to this policy, which amounted to $852,337 and $15,335,328, respectively. The sales transactions resulted in net realized gains (losses) of $3,359,272.
(4) Portfolio Securities
For the year ended October 31, 2017, purchases and sales of investments, other than short-term obligations, aggregated $926,494,002 and $1,797,408,836, respectively.
37
Table of Contents
Notes to Financial Statements – continued
(5) Shares of Beneficial Interest
The fund’s Declaration of Trust permits the Trustees to issue an unlimited number of full and fractional shares of beneficial interest. Transactions in fund shares were as follows:
| Year ended 10/31/17 | Year ended 10/31/16 | |||||||||||||||
| Shares | Amount | Shares | Amount | |||||||||||||
| Shares sold | ||||||||||||||||
Class A | 9,957,655 | $189,795,382 | 17,786,980 | $317,732,046 | ||||||||||||
Class B | 387,186 | 7,341,442 | 853,191 | 15,042,902 | ||||||||||||
Class C | 1,329,414 | 25,256,099 | 3,378,411 | 59,417,580 | ||||||||||||
Class I | 18,093,011 | 345,398,901 | 11,754,843 | 215,115,235 | ||||||||||||
Class R1 | 98,187 | 1,849,298 | 166,413 | 2,972,152 | ||||||||||||
Class R2 | 787,958 | 15,025,759 | 1,436,909 | 25,801,987 | ||||||||||||
Class R3 | 1,003,786 | 19,101,338 | 2,176,048 | 39,313,698 | ||||||||||||
Class R4 | 905,068 | 17,235,598 | 1,988,114 | 36,111,425 | ||||||||||||
Class R6 | 4,026,494 | 77,262,344 | 2,208,898 | 39,706,478 | ||||||||||||
| 36,588,759 | $698,266,161 | 41,749,807 | $751,213,503 | |||||||||||||
| Shares issued to shareholders in reinvestment of distributions | ||||||||||||||||
Class A | 4,012,761 | $75,432,404 | 12,397,367 | $209,777,837 | ||||||||||||
Class B | 231,671 | 4,306,157 | 955,736 | 15,971,548 | ||||||||||||
Class C | 916,802 | 17,068,040 | 3,253,023 | 54,384,726 | ||||||||||||
Class I | 1,005,791 | 19,227,860 | 2,035,049 | 34,648,447 | ||||||||||||
Class R1 | 13,687 | 253,640 | 47,904 | 800,808 | ||||||||||||
Class R2 | 146,369 | 2,743,012 | 459,216 | 7,736,453 | ||||||||||||
Class R3 | 207,407 | 3,902,652 | 612,011 | 10,370,428 | ||||||||||||
Class R4 | 163,143 | 3,084,349 | 447,306 | 7,598,567 | ||||||||||||
Class R6 | 162,517 | 3,133,571 | 288,871 | 4,939,804 | ||||||||||||
| 6,860,148 | $129,151,685 | 20,496,483 | $346,228,618 | |||||||||||||
| Shares reacquired | ||||||||||||||||
Class A | (50,064,656 | ) | $(954,003,801 | ) | (50,768,874 | ) | $(910,512,997 | ) | ||||||||
Class B | (3,705,442 | ) | (70,060,687 | ) | (4,594,577 | ) | (83,055,368 | ) | ||||||||
Class C | (11,917,071 | ) | (226,504,305 | ) | (14,808,103 | ) | (264,263,094 | ) | ||||||||
Class I | (13,279,348 | ) | (256,166,648 | ) | (19,364,733 | ) | (343,188,191 | ) | ||||||||
Class R1 | (297,873 | ) | (5,619,517 | ) | (221,186 | ) | (3,976,596 | ) | ||||||||
Class R2 | (2,094,684 | ) | (40,122,884 | ) | (2,362,413 | ) | (42,491,242 | ) | ||||||||
Class R3 | (3,276,213 | ) | (61,756,043 | ) | (2,867,208 | ) | (51,830,199 | ) | ||||||||
Class R4 | (1,995,928 | ) | (38,381,000 | ) | (2,824,947 | ) | (51,257,876 | ) | ||||||||
Class R6 | (2,541,837 | ) | (48,495,534 | ) | (1,426,694 | ) | (25,994,812 | ) | ||||||||
| (89,173,052 | ) | $(1,701,110,419 | ) | (99,238,735 | ) | $(1,776,570,375 | ) | |||||||||
38
Table of Contents
Notes to Financial Statements – continued
| Year ended 10/31/17 | Year ended 10/31/16 | |||||||||||||||
| Shares | Amount | Shares | Amount | |||||||||||||
| Net change | ||||||||||||||||
Class A | (36,094,240 | ) | $(688,776,015 | ) | (20,584,527 | ) | $(383,003,114 | ) | ||||||||
Class B | (3,086,585 | ) | (58,413,088 | ) | (2,785,650 | ) | (52,040,918 | ) | ||||||||
Class C | (9,670,855 | ) | (184,180,166 | ) | (8,176,669 | ) | (150,460,788 | ) | ||||||||
Class I | 5,819,454 | 108,460,113 | (5,574,841 | ) | (93,424,509 | ) | ||||||||||
Class R1 | (185,999 | ) | (3,516,579 | ) | (6,869 | ) | (203,636 | ) | ||||||||
Class R2 | (1,160,357 | ) | (22,354,113 | ) | (466,288 | ) | (8,952,802 | ) | ||||||||
Class R3 | (2,065,020 | ) | (38,752,053 | ) | (79,149 | ) | (2,146,073 | ) | ||||||||
Class R4 | (927,717 | ) | (18,061,053 | ) | (389,527 | ) | (7,547,884 | ) | ||||||||
Class R6 | 1,647,174 | 31,900,381 | 1,071,075 | 18,651,470 | ||||||||||||
| (45,724,145 | ) | $(873,692,573 | ) | (36,992,445 | ) | $(679,128,254 | ) | |||||||||
(6) Line of Credit
The fund and certain other funds managed by MFS participate in a $1.25 billion unsecured committed line of credit, subject to a $1 billion sublimit, provided by a syndication of banks under a credit agreement. Borrowings may be made for temporary financing needs. Interest is charged to each fund, based on its borrowings, generally at a rate equal to the higher of the Overnight Federal Reserve funds rate or daily one month LIBOR plus an agreed upon spread. A commitment fee, based on the average daily, unused portion of the committed line of credit, is allocated among the participating funds at the end of each calendar quarter. In addition, the fund and other funds managed by MFS have established unsecured uncommitted borrowing arrangements with certain banks for temporary financing needs. Interest is charged to each fund, based on its borrowings, at a rate equal to the Overnight Federal Reserve funds rate plus an agreed upon spread. For the year ended October 31, 2017, the fund’s commitment fee and interest expense were $29,059 and $0, respectively, and are included in “Miscellaneous” expense in the Statement of Operations.
(7) Investments in Affiliated Issuers
An affiliated issuer may be considered one in which the fund owns 5% or more of the outstanding voting securities, or a company which is under common control. For the purposes of this report, the fund assumes the following to be affiliated issuers:
| Affiliated Issuers | Beginning Shares/Par Amount | Acquisitions Shares/Par Amount | Dispositions Shares/Par Amount | Ending Shares/Par Amount | ||||||||||||||||
| Dynegy, Inc.* | 6,321,005 | 216,845 | (2,424,537 | ) | 4,113,313 | |||||||||||||||
| MFS Institutional Money Market Portfolio | 121,487,367 | 710,766,524 | (749,339,375 | ) | 82,914,516 | |||||||||||||||
| NRG Yield, Inc., “A” * | 1,824,899 | — | (253,123 | ) | 1,571,776 | |||||||||||||||
39
Table of Contents
Notes to Financial Statements – continued
| Affiliated Issuers | Realized Gain (Loss) | Change in Unrealized Appreciation (Depreciation) | Capital Gain Distributions | Dividend Income | Ending Value | |||||||||||||||
| Dynegy, Inc.* | $(51,645,385) | $— | $— | $4,326,511 | $— | |||||||||||||||
| MFS Institutional Money Market Portfolio | 236 | 55 | — | 536,245 | 82,914,516 | |||||||||||||||
| NRG Yield, Inc., “A” * | (1,822,812 | ) | — | — | 1,884,528 | — | ||||||||||||||
| $(53,467,961 | ) | $55 | $— | $6,747,284 | $82,914,516 | |||||||||||||||
| * | No longer considered an affiliated issuer as of period end. |
40
Table of Contents
REPORT OF INDEPENDENT REGISTERED PUBLIC ACCOUNTING FIRM
To the Board of Trustees of MFS Series Trust VI and
Shareholders of MFS Utilities Fund:
We have audited the accompanying statement of assets and liabilities, including the portfolio of investments, of MFS Utilities Fund (the Fund) (one of the series constituting the MFS Series Trust VI) as of October 31, 2017, and the related statement of operations for the year then ended, the statements of changes in net assets for each of the two years in the period then ended and the financial highlights for each of the five years in the period then ended. These financial statements and financial highlights are the responsibility of the Fund’s management. Our responsibility is to express an opinion on these financial statements and financial highlights based on our audits.
We conducted our audits in accordance with the standards of the Public Company Accounting Oversight Board (United States). Those standards require that we plan and perform the audit to obtain reasonable assurance about whether the financial statements and financial highlights are free of material misstatement. We were not engaged to perform an audit of the Fund’s internal control over financial reporting. Our audits included consideration of internal control over financial reporting as a basis for designing audit procedures that are appropriate in the circumstances, but not for the purpose of expressing an opinion on the effectiveness of the Fund’s internal control over financial reporting. Accordingly, we express no such opinion. An audit also includes examining, on a test basis, evidence supporting the amounts and disclosures in the financial statements and financial highlights, assessing the accounting principles used and significant estimates made by management, and evaluating the overall financial statement presentation. Our procedures included confirmation of securities owned as of October 31, 2017, by correspondence with the custodian and others or by other appropriate auditing procedures where replies from others were not received. We believe that our audits provide a reasonable basis for our opinion.
In our opinion, the financial statements and financial highlights referred to above present fairly, in all material respects, the financial position of MFS Utilities Fund (one of the series constituting the MFS Series Trust VI) at October 31, 2017, the results of its operations for the year then ended, the changes in its net assets for each of the two years in the period then ended and the financial highlights for each of the five years in the period then ended, in conformity with U.S. generally accepted accounting principles.

Boston, Massachusetts
December 15, 2017
41
Table of Contents
TRUSTEES AND OFFICERS — IDENTIFICATION AND BACKGROUND
The Trustees and Officers of the Trust, as of December 1, 2017, are listed below, together with their principal occupations during the past five years. (Their titles may have varied during that period.) The address of each Trustee and Officer is 111 Huntington Avenue, Boston, Massachusetts 02199-7618.
Name, Age | Position(s) Held with Fund | Trustee/Officer Since (h) | Number of | Principal the Past Five Years | Other Directorships | |||||
| INTERESTED TRUSTEES | ||||||||||
| Robert J. Manning (k) (age 54) | Trustee | February 2004 | 136 | Massachusetts Financial Services Company, Executive Chairman (since January 2017); Director; Chairman of the Board; Chief Executive Officer (until 2015); Co-Chief Executive Officer (2015-2016) | N/A | |||||
Robin A. Stelmach (k) (age 56) | Trustee | January 2014 | 136 | Massachusetts Financial Services Company, Vice Chair (since January 2017); Chief Operating Officer and Executive Vice President (until January 2017) | N/A | |||||
| INDEPENDENT TRUSTEES | ||||||||||
| David H. Gunning * (age 75) | Trustee and Chair of Trustees | January 2004 | 136 | Private investor | Lincoln Electric Holdings, Inc., Director; Development Alternatives, Inc., Director/Non-Executive Chairman (until 2013) | |||||
42
Table of Contents
Trustees and Officers – continued
Name, Age | Position(s) Held with Fund | Trustee/Officer Since (h) | Number of | Principal the Past Five Years | Other Directorships | |||||
Steven E. Buller (age 66) | Trustee | February 2014 | 136 | Financial Accounting Standards Advisory Council, Chairman (2014-2015); Public Company Accounting Oversight Board, Standing Advisory Group, Member (until 2014); BlackRock, Inc. (investment management), Managing Director (until 2014), BlackRock Finco UK (investment management), Director (until 2014) | N/A | |||||
John A. Caroselli (age 63) | Trustee | March 2017 | 136 | JC Global Advisors, LLC (management consulting), President (since 2015); First Capital Corporation (commercial finance), Executive Vice President (until 2015) | N/A | |||||
Maureen R. Goldfarb (age 62) | Trustee | January 2009 | 136 | Private investor | N/A | |||||
| Michael Hegarty (age 72) | Trustee | December 2004 | 136 | Private investor | Rouse Properties Inc., Director (until 2016); Capmark Financial Group Inc., Director (until 2015) | |||||
John P. Kavanaugh * (age 63) | Trustee and Vice Chair of Trustees | January 2009 | 136 | Private investor | N/A | |||||
Clarence Otis, Jr. (age 61) | Trustee | March 2017 | 136 | Darden Restaurants, Inc., Chief Executive Officer (until 2014) | VF Corporation, Director; Verizon Communications, Inc., Director; The Travelers Companies, Director; Federal Reserve Bank of Atlanta, Director (until 2015) |
43
Table of Contents
Trustees and Officers – continued
Name, Age | Position(s) Held with Fund | Trustee/Officer Since (h) | Number of | Principal the Past Five Years | Other Directorships | |||||
Maryanne L. Roepke (age 61) | Trustee | May 2014 | 136 | American Century Investments (investment management), Senior Vice President and Chief Compliance Officer (until 2014) | N/A | |||||
| Laurie J. Thomsen (age 60) | Trustee | March 2005 | 136 | Private investor | The Travelers Companies, Director; Dycom Industries, Inc., Director (since 2015) |
Name, Age | Position(s) with Fund | Trustee/Officer Since (h) | Number of | Principal the Past Five Years | ||||
| OFFICERS | ||||||||
| Christopher R. Bohane (k) (age 43) | Assistant Secretary and Assistant Clerk | July 2005 | 136 | Massachusetts Financial Services Company, Vice President and Assistant General Counsel | ||||
Kino Clark (k) (age 49) | Assistant Treasurer | January 2012 | 136 | Massachusetts Financial Services Company, Vice President | ||||
John W. Clark, Jr. (k) (age 50) | Assistant Treasurer | April 2017 | 136 | Massachusetts Financial Services Company, Vice President (since March 2017); Deutsche Bank (financial services), Department Head – Treasurer’s Office (until February 2017) | ||||
Thomas H. Connors (k) (age 58) | Assistant Secretary and Assistant Clerk | September 2012 | 136 | Massachusetts Financial Services Company, Vice President and Senior Counsel; Deutsche Investment Management Americas Inc. (financial service provider), Director and Senior Counsel (until 2012) | ||||
44
Table of Contents
Trustees and Officers – continued
Name, Age | Position(s) with Fund | Trustee/Officer Since (h) | Number of | Principal the Past Five Years | ||||
| Ethan D. Corey (k) (age 54) | Assistant Secretary and Assistant Clerk | July 2005 | 136 | Massachusetts Financial Services Company, Senior Vice President and Associate General Counsel | ||||
| David L. DiLorenzo (k) (age 49) | President | July 2005 | 136 | Massachusetts Financial Services Company, Senior Vice President | ||||
Heidi W. Hardin (k) (age 50) | Secretary and Clerk | April 2017 | 136 | Massachusetts Financial Services Company, Executive Vice President and General Counsel (since March 2017); Harris Associates (investment management), General Counsel (from September 2015 to January 2017); Janus Capital Management LLC (investment management), Senior Vice President and General Counsel (until September 2015) | ||||
Brian E. Langenfeld (k) (age 44) | Assistant Secretary and Assistant Clerk | June 2006 | 136 | Massachusetts Financial Services Company, Vice President and Senior Counsel | ||||
| Susan A. Pereira (k) (age 47) | Assistant Secretary and Assistant Clerk | July 2005 | 136 | Massachusetts Financial Services Company, Vice President and Senior Counsel | ||||
Kasey L. Phillips (k) (age 46) | Assistant Treasurer | September 2012 | 136 | Massachusetts Financial Services Company, Vice President; Wells Fargo Funds Management, LLC, Senior Vice President, Fund Treasurer (until 2012) | ||||
Matthew A. Stowe (k) (age 43) | Assistant Secretary and Assistant Clerk | October 2014 | 136 | Massachusetts Financial Services Company, Vice President and Assistant General Counsel | ||||
| Frank L. Tarantino (age 73) | Independent Senior Officer | June 2004 | 136 | Tarantino LLC (provider of compliance services), Principal | ||||
| Richard S. Weitzel (k) (age 47) | Assistant Secretary and Assistant Clerk | October 2007 | 136 | Massachusetts Financial Services Company, Senior Vice President and Associate General Counsel |
45
Table of Contents
Trustees and Officers – continued
Name, Age | Position(s) with Fund | Trustee/Officer Since (h) | Number of | Principal the Past Five Years | ||||
Martin J. Wolin (k) (age 50) | Chief Compliance Officer | July 2015 | 136 | Massachusetts Financial Services Company, Senior Vice President and Chief Compliance Officer (since July 2015); Mercer (financial service provider), Chief Risk and Compliance Officer, North America and Latin America (until June 2015) | ||||
| James O. Yost (k) (age 57) | Treasurer | September 1990 | 136 | Massachusetts Financial Services Company, Senior Vice President |
| (h) | Date first appointed to serve as Trustee/officer of an MFS Fund. Each Trustee has served continuously since appointment unless indicated otherwise. For the period from December 15, 2004 until February 22, 2005, Mr. Manning served as Advisory Trustee. Prior to January 2012, Messrs. DiLorenzo and Yost served as Assistant Treasurers of the Funds. From January 2012 through December 2016, Messrs. DiLorenzo and Yost served as Treasurer and Deputy Treasurer of the Funds, respectively. |
| (j) | Directorships or trusteeships of companies required to report to the Securities and Exchange Commission (i.e., “public companies”). |
| (k) | “Interested person” of the Trust within the meaning of the Investment Company Act of 1940 (referred to as the 1940 Act), which is the principal federal law governing investment companies like the fund, as a result of a position with MFS. The address of MFS is 111 Huntington Avenue, Boston, Massachusetts 02199-7618. |
| * | As of December 31, 2017, Mr. Gunning will retire as Trustee and Chair of Trustees, and, as of January 1, 2018, Mr. Kavanaugh will become Chair of Trustees. |
Each Trustee has been elected by shareholders and each Trustee and officer holds office until his or her successor is chosen and qualified or until his or her earlier death, resignation, retirement or removal. The Trust does not hold annual meetings for the purpose of electing Trustees, and Trustees are not elected for fixed terms. Under the terms of the Board’s retirement policy, an Independent Trustee shall retire at the end of the calendar year in which he or she reaches the earlier of 75 years of age or 15 years of service on the Board (or, in the case of any Independent Trustee who joined the Board prior to 2015, 20 years of service on the Board).
Messrs. Buller, Kavanaugh and Otis and Ms. Roepke are members of the Trust’s Audit Committee. Effective January 1, 2018, Mr. Kavanaugh is no longer a member of the Trust’s Audit Committee.
Each of the Interested Trustees and certain Officers hold comparable officer positions with certain affiliates of MFS.
46
Table of Contents
Trustees and Officers – continued
The Statement of Additional Information for a Fund includes further information about the Trustees and is available without charge upon request by calling 1-800-225-2606.
| Investment Adviser | Custodian | |
| Massachusetts Financial Services Company | JPMorgan Chase Bank, NA | |
| 111 Huntington Avenue | 4 Metrotech Center | |
| Boston, MA 02199-7618 | New York, NY 11245 | |
| Distributor | Independent Registered Public Accounting Firm | |
| MFS Fund Distributors, Inc. | Ernst & Young LLP | |
| 111 Huntington Avenue | 200 Clarendon Street | |
| Boston, MA 02199-7618 | Boston, MA 02116 | |
| Portfolio Manager(s) | ||
| Claud Davis | ||
| Maura Shaughnessy | ||
| Scott Walker |
47
Table of Contents
BOARD REVIEW OF INVESTMENT ADVISORY AGREEMENT
The Investment Company Act of 1940 requires that both the full Board of Trustees and a majority of the non-interested (“independent”) Trustees, voting separately, annually approve the continuation of the Fund’s investment advisory agreement with MFS. The Trustees consider matters bearing on the Fund and its advisory arrangements at their meetings throughout the year, including a review of performance data at each regular meeting. In addition, the independent Trustees met several times over the course of three months beginning in May and ending in July, 2017 (“contract review meetings”) for the specific purpose of considering whether to approve the continuation of the investment advisory agreement for the Fund and the other investment companies that the Board oversees (the “MFS Funds”). The independent Trustees were assisted in their evaluation of the Fund’s investment advisory agreement by independent legal counsel, from whom they received separate legal advice and with whom they met separately from MFS during various contract review meetings. The independent Trustees were also assisted in this process by the MFS Funds’ Independent Senior Officer, a senior officer appointed by and reporting to the independent Trustees.
In connection with their deliberations regarding the continuation of the investment advisory agreement, the Trustees, including the independent Trustees, considered such information and factors as they believed, in light of the legal advice furnished to them and their own business judgment, to be relevant. The investment advisory agreement for the Fund was considered separately, although the Trustees also took into account the common interests of all MFS Funds in their review. As described below, the Trustees considered the nature, quality, and extent of the various investment advisory, administrative, and shareholder services performed by MFS under the existing investment advisory agreement and other arrangements with the Fund.
In connection with their contract review meetings, the Trustees received and relied upon materials that included, among other items: (i) information provided by Broadridge Financial Solutions, Inc. (“Broadridge”), an independent third party, on the investment performance of the Fund for various time periods ended December 31, 2016 and the investment performance of a group of funds with substantially similar investment classifications/objectives (the “Lipper performance universe”), (ii) information provided by Broadridge on the Fund’s advisory fees and other expenses and the advisory fees and other expenses of comparable funds identified by Broadridge (the “Broadridge expense group”), (iii) information provided by MFS on the advisory fees of portfolios of other clients of MFS, including institutional separate accounts and other clients, (iv) information as to whether and to what extent applicable expense waivers, reimbursements or fee “breakpoints” are observed for the Fund, (v) information regarding MFS’ financial results and financial condition, including MFS’ and certain of its affiliates’ estimated profitability from services performed for the Fund and the MFS Funds as a whole, and compared to MFS’ institutional business, (vi) MFS’ views regarding the outlook for the mutual fund industry and the strategic business plans of MFS, (vii) descriptions of various functions performed by MFS for the Funds, such as compliance monitoring and portfolio trading practices, and (viii) information regarding the overall organization of MFS, including information about MFS’ senior management and other personnel providing investment advisory,
48
Table of Contents
Board Review of Investment Advisory Agreement – continued
administrative and other services to the Fund and the other MFS Funds. The comparative performance, fee and expense information prepared and provided by Broadridge was not independently verified and the independent Trustees did not independently verify any information provided to them by MFS.
The Trustees’ conclusion as to the continuation of the investment advisory agreement was based on a comprehensive consideration of all information provided to the Trustees and not the result of any single factor. Some of the factors that figured particularly in the Trustees’ deliberations are described below, although individual Trustees may have evaluated the information presented differently from one another, giving different weights to various factors. It is also important to recognize that the fee arrangements for the Fund and other MFS Funds are the result of years of review and discussion between the independent Trustees and MFS, that certain aspects of such arrangements may receive greater scrutiny in some years than in others, and that the Trustees’ conclusions may be based, in part, on their consideration of these same arrangements during the course of the year and in prior years.
Based on information provided by Broadridge and MFS, the Trustees reviewed the Fund’s total return investment performance as well as the performance of peer groups of funds over various time periods. The Trustees placed particular emphasis on the total return performance of the Fund’s Class A shares in comparison to the performance of funds in its Lipper performance universe over the three-year period ended December 31, 2016, which the Trustees believed was a long enough period to reflect differing market conditions. The total return performance of the Fund’s Class A shares was in the 4th quintile relative to the other funds in the universe for this three-year period (the 1st quintile being the best performers and the 5th quintile being the worst performers). The total return performance of the Fund’s Class A shares was in the 4th quintile for each of the one- and five-year periods ended December 31, 2016 relative to the Lipper performance universe. Because of the passage of time, these performance results may differ from the performance results for more recent periods, including those shown elsewhere in this report.
The Trustees expressed continued concern to MFS about the substandard investment performance of the Fund. In the course of their deliberations, the Trustees took into account information provided by MFS in connection with the contract review meetings, as well as during investment review meetings conducted with portfolio management personnel during the course of the year, as to MFS’ efforts to improve the Fund’s performance. In addition, the Trustees requested that they receive a separate update on the Fund’s performance at each of their regular meetings. After reviewing these and related factors, the Trustees concluded, within the context of their overall conclusions regarding the investment advisory agreement, that MFS’ responses and efforts and plans to improve investment performance were sufficient to support approval of the continuance of the investment advisory agreement for an additional one-year period, but that they would continue to closely monitor the performance of the Fund.
In assessing the reasonableness of the Fund’s advisory fee, the Trustees considered, among other information, the Fund’s advisory fee and the total expense ratio of the Fund’s Class A shares as a percentage of average daily net assets and the advisory fee and total expense ratios of peer groups of funds based on information provided by Broadridge. The Trustees considered that, according to the data provided by
49
Table of Contents
Board Review of Investment Advisory Agreement – continued
Broadridge (which takes into account any fee reductions or expense limitations that were in effect during the Fund’s last fiscal year), the Fund’s effective advisory fee rate was approximately at the Broadridge expense group median and the Fund’s total expense ratio was lower than the Broadridge expense group median.
The Trustees also considered the advisory fees charged by MFS to any institutional separate accounts advised by MFS (“separate accounts”) and unaffiliated investment companies for which MFS serves as subadviser (“subadvised funds”) that have comparable investment strategies to the Fund, if any. In comparing these fees, the Trustees considered information provided by MFS as to the generally broader scope of services provided by MFS to the Fund, as well as the more extensive regulatory burdens imposed on MFS in managing the Fund, in comparison to separate accounts and subadvised funds. The Trustees also considered the higher demands placed on MFS’ investment personnel and trading infrastructure as a result of the daily cash in-flows and out-flows of the Fund in comparison to separate accounts.
The Trustees also considered whether the Fund may benefit from any economies of scale in the management of the Fund in the event of growth in assets of the Fund. They noted that the Fund’s advisory fee rate schedule is subject to contractual breakpoints that reduce the Fund’s advisory fee rate on average daily net assets over $3 billion and $10 billion. The Trustees also noted that MFS, effective October 1, 2017, has agreed in writing to waive a portion of the management fees of certain MFS Funds, including the Fund, if the total combined assets of certain funds within the MFS Funds’ complex increase above agreed upon thresholds (the “group fee waiver”), enabling the Fund’s shareholders to share in the benefits from any economies of scale at the complex level. The group fee waiver is reviewed and renewed annually between the Board and MFS. The Trustees concluded that the breakpoints and the group fee waiver were sufficient to allow the Fund to benefit from economies of scale as its assets grow.
The Trustees also considered information prepared by MFS relating to MFS’ costs and profits with respect to the Fund, the MFS Funds considered as a group, and other investment companies and accounts advised by MFS, as well as MFS’ methodologies used to determine and allocate its costs to the MFS Funds, the Fund and other accounts and products for purposes of estimating profitability.
After reviewing these and other factors described herein, the Trustees concluded, within the context of their overall conclusions regarding the investment advisory agreement, that the advisory fees charged to the Fund represent reasonable compensation in light of the services being provided by MFS to the Fund.
In addition, the Trustees considered MFS’ resources and related efforts to continue to retain, attract and motivate capable personnel to serve the Fund. The Trustees also considered current and developing conditions in the financial services industry, including the presence of large and well-capitalized companies which are spending, and appear to be prepared to continue to spend, substantial sums to engage personnel and to provide services to competing investment companies. In this regard, the Trustees also considered the financial resources of MFS and its ultimate parent, Sun Life Financial Inc. The Trustees also considered the advantages and possible disadvantages to the Fund of having an adviser that also serves other investment companies as well as other accounts.
50
Table of Contents
Board Review of Investment Advisory Agreement – continued
The Trustees also considered the nature, quality, cost, and extent of administrative, transfer agency, and distribution services provided to the Fund by MFS and its affiliates under agreements and plans other than the investment advisory agreement, including any 12b-1 fees the Fund pays to MFS Fund Distributors, Inc., an affiliate of MFS. The Trustees also considered the nature, extent and quality of certain other services MFS performs or arranges for on the Fund’s behalf, which may include securities lending programs, directed expense payment programs, class action recovery programs, and MFS’ interaction with third-party service providers, principally custodians and sub-custodians. The Trustees concluded that the various non-advisory services provided by MFS and its affiliates on behalf of the Fund were satisfactory.
The Trustees also considered benefits to MFS from the use of the Fund’s portfolio brokerage commissions, if applicable, to pay for investment research and various other factors. Additionally, the Trustees considered so-called “fall-out benefits” to MFS such as reputational value derived from serving as investment manager to the Fund.
Based on their evaluation of factors that they deemed to be material, including those factors described above, the Board of Trustees, including the independent Trustees, concluded that the Fund’s investment advisory agreement with MFS should be continued for an additional one-year period, commencing August 1, 2017.
51
Table of Contents
PROXY VOTING POLICIES AND INFORMATION
MFS votes proxies on behalf of the fund pursuant to proxy voting policies and procedures that are available without charge, upon request, by calling 1-800-225-2606, by visiting mfs.com/proxyvoting, or by visiting the SEC’s Web site at http://www.sec.gov.
Information regarding how the fund voted proxies relating to portfolio securities during the most recent twelve-month period ended June 30 is available by August 31 of each year without charge by visiting mfs.com/proxyvoting, or by visiting the SEC’s Web site at http://www.sec.gov.
QUARTERLY PORTFOLIO DISCLOSURE
The fund will file a complete schedule of portfolio holdings with the Securities and Exchange Commission (the Commission) for the first and third quarters of each fiscal year on Form N-Q. A shareholder can obtain the quarterly portfolio holdings report at mfs.com. The fund’s Form N-Q is also available on the EDGAR database on the Commission’s Internet Web site at http://www.sec.gov, and may be reviewed and copied at the:
Public Reference Room
Securities and Exchange Commission
100 F Street, NE, Room 1580
Washington, D.C. 20549
Information on the operation of the Public Reference Room may be obtained by calling the Commission at 1-800-SEC-0330. Copies of the fund’s Form N-Q also may be obtained, upon payment of a duplicating fee, by electronic request at the following e-mail address: publicinfo@sec.gov or by writing the Public Reference Section at the above address.
From time to time, MFS may post important information about the fund or the MFS funds on the MFS web site (mfs.com). This information is available at https://www.mfs.com/en-us/what-we-do/announcements.html or at mfs.com/openendfunds by choosing the fund’s name.
52
Table of Contents
INFORMATION ABOUT FUND CONTRACTS AND LEGAL CLAIMS
The fund has entered into contractual arrangements with an investment adviser, administrator, distributor, shareholder servicing agent, 529 program manager (if applicable), and custodian who each provide services to the fund. Unless expressly stated otherwise, shareholders are not parties to, or intended beneficiaries of these contractual arrangements, and these contractual arrangements are not intended to create any shareholder right to enforce them against the service providers or to seek any remedy under them against the service providers, either directly or on behalf of the fund.
Under the Trust’s By-Laws and Declaration of Trust, any claims asserted against or on behalf of the MFS Funds, including claims against Trustees and Officers, must be brought in state and federal courts located within the Commonwealth of Massachusetts.
FEDERAL TAX INFORMATION (unaudited)
The fund will notify shareholders of amounts for use in preparing 2017 income tax forms in January 2018. The following information is provided pursuant to provisions of the Internal Revenue Code.
The fund designates the maximum amount allowable as qualified dividend income eligible to be taxed at the same rate as long-term capital gain.
The fund designates $2,444,000 as capital gain dividends paid during the fiscal year.
For corporate shareholders, 90.73% of the ordinary income dividends paid during the fiscal year qualify for the corporate dividends received deduction.
53
Table of Contents
rev. 3/16
| WHAT DOES MFS DO WITH YOUR PERSONAL INFORMATION? |  | ||
| Why? | Financial companies choose how they share your personal information. Federal law gives consumers the right to limit some but not all sharing. Federal law also requires us to tell you how we collect, share, and protect your personal information. Please read this notice carefully to understand what we do. |
| What? | The types of personal information we collect and share depend on the product or service you have with us. This information can include:
• Social Security number and account balances • Account transactions and transaction history • Checking account information and wire transfer instructions
When you are no longer our customer, we continue to share your information as described in this notice. |
| How? | All financial companies need to share customers’ personal information to run their everyday business. In the section below, we list the reasons financial companies can share their customers’ personal information; the reasons MFS chooses to share; and whether you can limit this sharing. |
| Reasons we can share your personal information | Does MFS share? | Can you limit this sharing? | ||
For our everyday business purposes – such as to process your transactions, maintain your account(s), respond to court orders and legal investigations, or report to credit bureaus | Yes | No | ||
For our marketing purposes – to offer our products and services to you | No | We don’t share | ||
For joint marketing with other financial companies | No | We don’t share | ||
For our affiliates’ everyday business purposes – information about your transactions and experiences | No | We don’t share | ||
For our affiliates’ everyday business purposes – information about your creditworthiness | No | We don’t share | ||
| For nonaffiliates to market to you | No | We don’t share |
| Questions? | Call 800-225-2606 or go to mfs.com. |
54
Table of Contents
| Page 2 |
| Who we are | ||
| Who is providing this notice? | MFS Funds, MFS Investment Management, MFS Institutional Advisors, Inc., and MFS Heritage Trust Company. | |
| What we do | ||
| How does MFS protect my personal information? | To protect your personal information from unauthorized access and use, we use security measures that comply with federal law. These measures include procedural, electronic, and physical safeguards for the protection of the personal information we collect about you. | |
| How does MFS collect my personal information? | We collect your personal information, for example, when you
• open an account or provide account information • direct us to buy securities or direct us to sell your securities • make a wire transfer
We also collect your personal information from others, such as credit bureaus, affiliates, or other companies. | |
| Why can’t I limit all sharing? | Federal law gives you the right to limit only
• sharing for affiliates’ everyday business purposes – information about your creditworthiness • affiliates from using your information to market to you • sharing for nonaffiliates to market to you
State laws and individual companies may give you additional rights to limit sharing. | |
| Definitions | ||
| Affiliates | Companies related by common ownership or control. They can be financial and nonfinancial companies.
• MFS does not share personal information with affiliates, except for everyday business purposes as described on page one of this notice. | |
| Nonaffiliates | Companies not related by common ownership or control. They can be financial and nonfinancial companies.
• MFS does not share with nonaffiliates so they can market to you. | |
| Joint marketing | A formal agreement between nonaffiliated financial companies that together market financial products or services to you.
• MFS doesn’t jointly market. | |
| Other important information | ||
| If you own an MFS product or receive an MFS service in the name of a third party such as a bank or broker-dealer, their privacy policy may apply to you instead of ours. | ||
55
Table of Contents
Save paper with eDelivery.
| MFS® will send you prospectuses, |

reports, and proxies directly via e-mail so you will get information faster with less mailbox clutter.
To sign up:
1. Go to mfs.com.
2. Log in via MFS® Access.
3. Select eDelivery.
If you own your MFS fund shares through a financial institution or a retirement plan, MFS® TALK, MFS® Access, or eDelivery may not be available to you.
WEB SITE
mfs.com
MFS TALK
1-800-637-8255
24 hours a day
ACCOUNT SERVICE AND LITERATURE
Shareholders
1-800-225-2606
Financial advisors
1-800-343-2829
Retirement plan services
1-800-637-1255
MAILING ADDRESS
MFS Service Center, Inc.
P.O. Box 55824
Boston, MA 02205-5824
OVERNIGHT MAIL
MFS Service Center, Inc.
c/o Boston Financial Data Services
30 Dan Road
Canton, MA 02021-2809
Table of Contents
| ITEM 2. | CODE OF ETHICS. |
The Registrant has adopted a Code of Ethics (the “Code”) pursuant to Section 406 of the Sarbanes-Oxley Act and as defined in Form N-CSR that applies to the Registrant’s principal executive officer and principal financial and accounting officer. Effective January 1, 2017, the Code was amended to (i) clarify that the term “for profit” company as used in Section II.B of the Code excludes the investment adviser and its subsidiaries and pooled investment vehicles sponsored by the investment adviser or its subsidiaries, (ii) align the Code’s provisions regarding receipt of gifts and entertainment in Section II.B of the Code with the gifts and entertainment policy of the Funds’ investment adviser, and (iii) make other administrative changes. During the period covered by the report, the Registrant has not granted a waiver, including an implicit waiver, from any provision of the Code.
A copy of the amended Code effective as of January 1, 2017 is filed as an exhibit to this Form N-CSR.
| ITEM 3. | AUDIT COMMITTEE FINANCIAL EXPERT. |
Messrs. Steven E. Buller, John P. Kavanaugh and Clarence Otis, Jr. and Ms. Maryanne L. Roepke, members of the Audit Committee, have been determined by the Board of Trustees in their reasonable business judgment to meet the definition of “audit committee financial expert” as such term is defined in Form N-CSR. In addition, Messrs. Buller, Kavanaugh, and Otis and Ms. Roepke are “independent” members of the Audit Committee (as such term has been defined by the Securities and Exchange Commission in regulations implementing Section 407 of the Sarbanes-Oxley Act of 2002). The Securities and Exchange Commission has stated that the designation of a person as an audit committee financial expert pursuant to this Item 3 on the Form N-CSR does not impose on such a person any duties, obligations or liability that are greater than the duties, obligations or liability imposed on such person as a member of the Audit Committee and the Board of Trustees in the absence of such designation or identification.
Effective January 1, 2018, Mr. Kavanaugh will no longer be a member of the Audit Committee.
| ITEM 4. | PRINCIPAL ACCOUNTANT FEES AND SERVICES. |
Items 4(a) through 4(d) and 4(g):
The Board of Trustees has appointed Ernst & Young LLP (“E&Y”) to serve as independent accountants to the series of the Registrant (each a “Fund” and collectively the “Funds”). The tables below set forth the audit fees billed to each Fund as well as fees for non-audit services provided to each Fund and/or to each Fund’s investment adviser, Massachusetts Financial Services Company (“MFS”) and to various entities either controlling, controlled by, or under common control with MFS that provide ongoing services to the Fund (“MFS Related Entities”).
Table of Contents
For the fiscal years ended October 31, 2017 and 2016, audit fees billed to each Fund by E&Y were as follows:
| Audit Fees | ||||||||
| 2017 | 2016 | |||||||
Fees billed by E&Y: | ||||||||
MFS Global Equity Fund | 50,088 | 48,653 | ||||||
MFS Global Total Return Fund | 58,434 | 56,755 | ||||||
MFS Utilities Fund | 45,814 | 44,503 | ||||||
|
|
|
| |||||
Total | 154,336 | 149,911 | ||||||
For the fiscal years ended October 31, 2017 and 2016, fees billed by E&Y for audit-related, tax and other services provided to each Fund and for audit-related, tax and other services provided to MFS and MFS Related Entities were as follows:
| Audit-Related Fees1 | Tax Fees2 | All Other Fees3 | ||||||||||||||||||||||
| 2017 | 2016 | 2017 | 2016 | 2017 | 2016 | |||||||||||||||||||
Fees billed by E&Y: | ||||||||||||||||||||||||
To MFS Global Equity Fund | 0 | 0 | 10,019 | 9,409 | 1,755 | 1,856 | ||||||||||||||||||
To MFS Global Total Return Fund | 0 | 0 | 12,538 | 10,697 | 1,565 | 1,606 | ||||||||||||||||||
To MFS Utilities Fund | 0 | 0 | 14,834 | 8,678 | 2,513 | 3,184 | ||||||||||||||||||
Total fees billed by E&Y To above Funds | 0 | 0 | 37,391 | 28,784 | 5,833 | 6,646 | ||||||||||||||||||
| Audit-Related Fees1 | Tax Fees2 | All Other Fees3 | ||||||||||||||||||||||
| 2017 | 2016 | 2017 | 2016 | 2017 | 2016 | |||||||||||||||||||
Fees billed by E&Y: | ||||||||||||||||||||||||
To MFS and MFS Related Entities of MFS Global Equity Fund* | 1,603,983 | 1,612,499 | 0 | 0 | 101,450 | 116,023 | ||||||||||||||||||
To MFS and MFS Related Entities of MFS Global Total Return Fund* | 1,603,983 | 1,612,499 | 0 | 0 | 101,450 | 116,023 | ||||||||||||||||||
To MFS and MFS Related Entities of MFS Utilities Fund* | 1,603,983 | 1,612,499 | 0 | 0 | 101,450 | 116,023 | ||||||||||||||||||
| Aggregate fees for non-audit services: | ||||||||
| 2017 | 2016 | |||||||
Fees billed by E&Y: | ||||||||
To MFS Global Equity Fund, MFS and MFS Related Entities# | 1,849,207 | 1,865,387 | ||||||
To MFS Global Total Return Fund, MFS and MFS Related Entities# | 1,851,536 | 1,866,425 | ||||||
To MFS Utilities Fund, MFS and MFS Related Entities# | 1,854,780 | 1,865,984 | ||||||
| * | This amount reflects the fees billed to MFS and MFS Related Entities for non-audit services relating directly to the operations and financial reporting of the Fund (portions of which services also related to the operations and financial reporting of other funds within the MFS Funds complex). |
Table of Contents
| # | This amount reflects the aggregate fees billed by E&Y for non-audit services rendered to the Fund and for non-audit services rendered to MFS and the MFS Related Entities. |
| 1 | The fees included under “Audit-Related Fees” are fees related to assurance and related services that are reasonably related to the performance of the audit or review of financial statements, but not reported under “Audit Fees,” including accounting consultations, agreed-upon procedure reports, attestation reports, comfort letters and internal control reviews. |
| 2 | The fees included under “Tax Fees” are fees associated with tax compliance, tax advice and tax planning, including services relating to the filing or amendment of federal, state or local income tax returns, regulated investment company qualification reviews and tax distribution and analysis. |
| 3 | The fees included under “All Other Fees” are fees for products and services provided by E&Y other than those reported under “Audit Fees,” “Audit-Related Fees” and “Tax Fees,” including fees for services related to review of internal controls and review of Rule 38a-1 compliance program. |
Item 4(e)(1):
Set forth below are the policies and procedures established by the Audit Committee of the Board of Trustees relating to the pre-approval of audit and non-audit related services:
To the extent required by applicable law, pre-approval by the Audit Committee of the Board is needed for all audit and permissible non-audit services rendered to the Funds and all permissible non-audit services rendered to MFS or MFS Related Entities if the services relate directly to the operations and financial reporting of the Registrant. Pre-approval is currently on an engagement-by-engagement basis. In the event pre-approval of such services is necessary between regular meetings of the Audit Committee and it is not practical to wait to seek pre-approval at the next regular meeting of the Audit Committee, pre-approval of such services may be referred to the Chair of the Audit Committee for approval; provided that the Chair may not pre-approve any individual engagement for such services exceeding $50,000 or multiple engagements for such services in the aggregate exceeding $100,000 in each period between regular meetings of the Audit Committee. Any engagement pre-approved by the Chair between regular meetings of the Audit Committee shall be presented for ratification by the entire Audit Committee at its next regularly scheduled meeting.
Item 4(e)(2):
None, or 0%, of the services relating to the Audit-Related Fees, Tax Fees and All Other Fees paid by the Fund and MFS and MFS Related Entities relating directly to the operations and financial reporting of the Registrant disclosed above were approved by the audit committee pursuant to paragraphs (c)(7)(i)(C) of Rule 2-01 of Regulation S-X (which permits audit committee approval after the start of the engagement with respect to services other than audit, review or attest services, if certain conditions are satisfied).
Item 4(f): Not applicable.
Table of Contents
Item 4(h): The Registrant’s Audit Committee has considered whether the provision by a Registrant’s independent registered public accounting firm of non-audit services to MFS and MFS Related Entities that were not pre-approved by the Committee (because such services did not relate directly to the operations and financial reporting of the Registrant) was compatible with maintaining the independence of the independent registered public accounting firm as the Registrant’s principal auditors.
| ITEM 5. | AUDIT COMMITTEE OF LISTED REGISTRANTS. |
Not applicable to the Registrant.
| ITEM 6. | INVESTMENTS |
A schedule of investments of each series of the Registrant is included as part of the report to shareholders of such series under Item 1 of this Form N-CSR.
| ITEM 7. | DISCLOSURE OF PROXY VOTING POLICIES AND PROCEDURES FOR CLOSED-END MANAGEMENT INVESTMENT COMPANIES. |
Not applicable to the Registrant.
| ITEM 8. | PORTFOLIO MANAGERS OF CLOSED-END MANAGEMENT INVESTMENT COMPANIES. |
Not applicable to the Registrant.
| ITEM 9. | PURCHASES OF EQUITY SECURITIES BY CLOSED-END MANAGEMENT INVESTMENT COMPANY AND AFFILIATED PURCHASERS. |
Not applicable to the Registrant.
| ITEM 10. | SUBMISSION OF MATTERS TO A VOTE OF SECURITY HOLDERS. |
There were no material changes to the procedures by which shareholders may send recommendations to the Board for nominees to the Registrant’s Board since the Registrant last provided disclosure as to such procedures in response to the requirements of Item 407 (c)(2)(iv) of Regulation S-K or this Item.
Table of Contents
| ITEM 11. | CONTROLS AND PROCEDURES. |
| (a) | Based upon their evaluation of the effectiveness of the registrant’s disclosure controls and procedures (as defined in Rule 30a-3(c) under the Investment Company Act of 1940 (the “Act”)) as conducted within 90 days of the filing date of this report on Form N-CSR, the registrant’s principal financial officer and principal executive officer have concluded that those disclosure controls and procedures provide reasonable assurance that the material information required to be disclosed by the registrant on this report is recorded, processed, summarized and reported within the time periods specified in the Securities and Exchange Commission’s rules and forms. |
| (b) | There were no changes in the registrant’s internal controls over financial reporting (as defined in Rule 30a-3(d) under the Act) that occurred during the second fiscal quarter of the period covered by the report that have materially affected, or are reasonably likely to materially affect, the registrant’s internal control over financial reporting. |
| ITEM 12. | DISCLOSURE OF SECURITIES LENDING ACTIVITIES FOR CLOSED-END MANAGEMENT INVESTMENT COMPANIES. |
Not applicable to the Registrant.
| ITEM 13. | EXHIBITS. |
| (a) | File the exhibits listed below as part of this form. Letter or number the exhibits in the sequence indicated. |
| (1) | Any code of ethics, or amendment thereto, that is the subject of the disclosure required by Item 2, to the extent that the registrant intends to satisfy the Item 2 requirements through filing of an exhibit: Code of Ethics attached hereto. |
| (2) | A separate certification for each principal executive officer and principal financial officer of the registrant as required by Rule 30a-2(a) under the Act (17 CFR 270.30a-2): Attached hereto. |
| (b) | If the report is filed under Section 13(a) or 15(d) of the Exchange Act, provide the certifications required by Rule 30a-2(b) under the Act (17 CFR 270.30a-2(b)), Rule 13a-14(b) or Rule 15d-14(b) under the Exchange Act (17 CFR 240.13a-14(b) or 240.15d-14(b)) and Section 1350 of Chapter 63 of Title 18 of the United States Code (18 U.S.C. 1350) as an exhibit. A certification furnished pursuant to this paragraph will not be deemed “filed” for the purposes of Section 18 of the Exchange Act (15 U.S.C. 78r), or otherwise subject to the liability of that section. Such certification will not be deemed to be incorporated by reference into any filing under the Securities Act of 1933 or the Exchange Act, except to the extent that the registrant specifically incorporates it by reference: Attached hereto. |
Table of Contents
Notice
A copy of the Amended and Restated Declaration of Trust, as amended, of the Registrant is on file with the Secretary of State of The Commonwealth of Massachusetts and notice is hereby given that this instrument is executed on behalf of the Registrant by an officer of the Registrant as an officer and not individually and the obligations of or arising out of this instrument are not binding upon any of the Trustees or shareholders individually, but are binding only upon the assets and property of the respective constituent series of the Registrant.
Table of Contents
SIGNATURES
Pursuant to the requirements of the Securities Exchange Act of 1934 and the Investment Company Act of 1940, the registrant has duly caused this report to be signed on its behalf by the undersigned, thereunto duly authorized.
(Registrant): MFS SERIES TRUST VI
| By (Signature and Title)* | DAVID L. DILORENZO | |
| David L. DiLorenzo, President |
Date: December 15, 2017
Pursuant to the requirements of the Securities Exchange Act of 1934 and the Investment Company Act of 1940, this report has been signed below by the following persons on behalf of the registrant and in the capacities and on the dates indicated.
| By (Signature and Title)* | DAVID L. DILORENZO | |
| David L. DiLorenzo, President (Principal Executive Officer) |
Date: December 15, 2017
| By (Signature and Title)* | JAMES O. YOST | |
| James O. Yost, Treasurer (Principal Financial Officer and Accounting Officer) |
Date: December 15, 2017
| * | Print name and title of each signing officer under his or her signature. |