UNITED STATES
SECURITIES AND EXCHANGE COMMISSION
Washington, D.C. 20549
FORMN-CSR
CERTIFIED SHAREHOLDER REPORT OF
REGISTERED MANAGEMENT INVESTMENT COMPANIES
Investment Company Act file number811-06102
MFS SERIES TRUST VI
(Exact name of registrant as specified in charter)
111 Huntington Avenue, Boston, Massachusetts 02199
(Address of principal executive offices) (Zip code)
Christopher R. Bohane
Massachusetts Financial Services Company
111 Huntington Avenue
Boston, Massachusetts 02199
(Name and address of agents for service)
Registrant’s telephone number, including area code: (617)954-5000
Date of fiscal year end: October 31
Date of reporting period: October 31, 2019
| ITEM 1. | REPORTS TO STOCKHOLDERS. |
Annual Report
October 31, 2019

MFS® Global Equity Fund

Beginning on January 1, 2021, as permitted by regulations adopted by the U.S. Securities and Exchange Commission, paper copies of the fund’s annual and semiannual shareholder reports will no longer be sent by mail, unless you specifically request paper copies of the reports. Instead, the complete reports will be made available on the fund’s Web site (funds.mfs.com), and you will be notified by mail each time a report is posted and provided with a Web site link to access the report.
If you are already signed up to receive shareholder reports by email, you will not be affected by this change and you need not take any action. You may sign up to receive shareholder reports and other communications from the fund by email by contacting your financial intermediary (such as a broker-dealer or bank) or, if you hold your shares directly with the fund, by calling 1-800-225-2606 or by logging on to MFS Access at mfs.com.
Beginning on January 1, 2019, you may elect to receive all future reports in paper free of charge. Contact your financial intermediary to request that you continue to receive paper copies of your shareholder reports. If you invest directly with the fund, you can call 1-800-225-2606 or send an email request to orderliterature@mfs.com to let the fund know that you wish to continue receiving paper copies of your shareholder reports. Your election to receive reports in paper will apply to all funds held in your account if you invest through your financial intermediary or all funds held with the MFS fund complex if you invest directly.
LGE-ANN
MFS® Global Equity Fund
CONTENTS
The report is prepared for the general information of shareholders.
It is authorized for distribution to prospective investors only when preceded or accompanied by a current prospectus.
NOT FDIC INSURED• MAY LOSE VALUE• NO BANK GUARANTEE

LETTER FROM THE EXECUTIVE CHAIR
Dear Shareholders:
Slowing global growth, low inflation, and trade friction between the United States and China have been hallmarks of the past 12 months. After experiencing an uptick in
market volatility in late 2018, markets steadied during 2019, thanks in large measure to the adoption of a dovish policy stance on the part of global central banks, focused on supporting economic growth. The U.S. and China have repeatedly raised tariffs on each other, though preliminary steps toward an interim trade agreement have been undertaken, modestly easing tensions in recent months. While British Prime Minister Boris Johnson has negotiated a reworked withdrawal agreement with the European Union, Parliament has not yet approved the deal, leading the EU to grant the United Kingdom a Brexit delay until no later than January 31, 2020. Uncertainty over Brexit, along with the ripple effects from the trade conflict, have hampered business
confidence and investment in the U.K. and Europe, though investors hope that greater clarity regarding the Brexit outcome will emerge after a British parliamentary election in December.
Markets expect that the longest economic expansion in U.S. history will continue for the time being, albeit at a slower pace. In an effort to prolong the expansion, the U.S. Federal Reserve lowered interest rates three times between July and October. Similarly, the European Central Bank loosened policy in September. While the monetary policy environment remains quite accommodative, tentative signs of easing trade tensions and receding global recession fears have helped push global interest rates modestly higher from therecord-low levels posted late in the summer as investors grew less risk averse.
Here at MFS®, we aim to help our clients navigate the growing complexity of the markets and world economies. Our long-term investment philosophy and commitment to responsible allocation of capital allow us to wade through the noise to uncover what we believe are the best, most durable investment opportunities in the market. Through our powerful global investment platform, we combine collective expertise, thoughtful risk management and long-term discipline with the purpose of creating sustainable value for investors.
Respectfully,

Robert J. Manning
Executive Chair
MFS Investment Management
December 16, 2019
The opinions expressed in this letter are subject to change and may not be relied upon for investment advice. No forecasts can be guaranteed.
1
PORTFOLIO COMPOSITION
Portfolio structure

| | | | |
| Top ten holdings | |
| Thermo Fisher Scientific, Inc. | | | 3.2% | |
| Visa, Inc., “A” | | | 3.1% | |
| Medtronic PLC | | | 3.0% | |
| Comcast Corp., “A” | | | 3.0% | |
| Nestle S.A. | | | 2.8% | |
| LVMH Moet Hennessy Louis Vuitton SE | | | 2.6% | |
| Accenture PLC, “A” | | | 2.5% | |
| Honeywell International, Inc. | | | 2.5% | |
| Schneider Electric SE | | | 2.3% | |
| Essity AB | | | 2.2% | |
|
| GICS equity sectors (g) | |
| Health Care | | | 20.4% | |
| Industrials | | | 19.1% | |
| Consumer Staples | | | 15.9% | |
| Information Technology | | | 12.6% | |
| Financials | | | 9.2% | |
| Consumer Discretionary | | | 9.1% | |
| Communication Services | | | 6.6% | |
| Materials | | | 5.7% | |
| Energy | | | 0.5% | |
| Real Estate | | | 0.2% | |
| | | | |
| Issuer country weightings (x) | |
| United States | | | 55.6% | |
| France | | | 11.1% | |
| Switzerland | | | 7.7% | |
| United Kingdom | | | 6.9% | |
| Germany | | | 4.7% | |
| Japan | | | 3.0% | |
| Sweden | | | 2.2% | |
| Netherlands | | | 2.1% | |
| Canada | | | 1.8% | |
| Other Countries | | | 4.9% | |
|
| Currency exposure weightings (y) | |
| United States Dollar | | | 56.9% | |
| Euro | | | 21.0% | |
| Swiss Franc | | | 7.7% | |
| British Pound Sterling | | | 6.9% | |
| Japanese Yen | | | 3.0% | |
| Swedish Krona | | | 2.2% | |
| South Korean Won | | | 0.8% | |
| Danish Krone | | | 0.6% | |
| Brazilian Real | | | 0.3% | |
| Other Currencies | | | 0.6% | |
| (g) | The Global Industry Classification Standard (GICS®) was developed by and/or is the exclusive property of MSCI, Inc. and S&P Global Market Intelligence Inc. (“S&P Global Market Intelligence”). GICS is a service mark of MSCI and S&P Global Market Intelligence and has been licensed for use by MFS. |
2
Portfolio Composition – continued
| (x) | Represents the portfolio’s exposure to issuer countries as a percentage of a portfolio’s net assets. For purposes of this presentation, United States includes Cash & Cash Equivalents. |
| (y) | Represents the portfolio’s exposure to a particular currency as a percentage of a portfolio’s net assets. For purposes of this presentation, United States Dollar includes Cash & Cash Equivalents. |
Cash & Cash Equivalents includes any cash, investments in money market funds, short-term securities, and other assets less liabilities. Please see the Statement of Assets and Liabilities for additional information related to the fund’s cash position and other assets and liabilities.
Percentages are based on net assets as of October 31, 2019.
The portfolio is actively managed and current holdings may be different.
3
MANAGEMENT REVIEW
Summary of Results
For the twelve months ended October 31, 2019, Class A shares of the MFS Global Equity Fund (fund) provided a total return of 16.67%, at net asset value. This compares with a return of 12.69% for the fund’s benchmark, the MSCI World Index (net div).
Market Environment
Fading fears of a near-term global recession, hopes for a partial trade deal between the United States and China and dramatically lower odds of ano-deal Brexit helped bolster market sentiment late in the period, after providing headwinds for many months prior. Changes in market sentiment, largely driven by uncertainty over the outcome of trade negotiations between the United States and China, contributed to periodic bouts of volatility during the reporting period. The global economy decelerated, led by weakness in China and Europe, although the pace of the slowdown moderated.
The deteriorating global growth backdrop, along with declining inflationary pressures, prompted the US Federal Reserve to adopt a more dovish posture beginning in early 2019, resulting in the first interest rate cut in over a decade at the end of July, followed by additional cuts in September and October. The Fed’s actions led to a sharp decline in long-term interest rates during the period’s second half, inverting portions of the US Treasury yield curve for a time. The Fed indicated in October that further rate cuts are unlikely unless the outlook for the economy materially worsens.
Globally, central banks have tilted more dovish as well, with the European Central Bank unveiling a package of easing measures, which included cutting overnight rates deeper into negative territory, restarting its bond-buying program and lengthening the term of cheap loans to banks to three years from two. The central banks of India and Australia are among those that have cut rates several times in recent months, although China has been more cautious in increasing liquidity as it continues to attempt to deleverage its economy, cutting rates only marginally.
Emerging markets experienced considerable volatility through the end of 2018, as tighter global financial conditions exposed structural weakness in some countries. Those conditions improved in 2019, as the Fed became more dovish, but significant trade friction between the US and China weighed on sentiment for much of the year, although hopes for a partial trade deal improved sentiment late in the period. Idiosyncratic factors negatively impacted some emerging economies, such as Argentina and Turkey.
From a geopolitical perspective, Brexit uncertainty has receded. While British Prime Minister Boris Johnson has negotiated a reworked withdrawal agreement with the European Union, Parliament has not yet approved the deal, leading the EU to grant the United Kingdom a Brexit delay until no later than January 31, 2020. A UK general election, scheduled for December 12, may bring some clarity to the situation. Hopes for a limited trade agreement between the US and China, as well as fading global recession fears, were supportive factors for risk assets at period end.
Contributors to Performance
Security selection in both thehealth care andconsumer staples sectors was a primary factor that contributed to performance relative to the MSCI World Index. Within the
4
Management Review – continued
health care sector, the fund’s overweight positions in life sciences supply company Thermo Fisher Scientific, precision instrument and machine manufacturer Olympus (Japan) and medical equipment manufacturers, Stryker and Medtronic (United Kingdom), benefited relative returns. The stock price of Thermo Fisher advanced during the period as the company’s earnings, which were supported by strong organic growth and efficient operational performance, topped expectations. Within theconsumer staples sector, overweight positions in personal care products maker Essity (Sweden) and global food company Nestle (Switzerland) aided relative results. The stock price of Essity rose on the back of favorable pricing trends, notably in the first half of the reporting period, and earnings results that came in ahead of consensus estimates.
An underweight position in the poor-performingenergysector also supported relative results. However, there were no individual stocks within this sector that were among the fund’s top relative contributors during the reporting period.
Elsewhere, overweight positions in luxury goods company LVMH Moet Hennessy Louis Vuitton (France), railroad company Kansas City Southern, global payments technology company Visa and electrical distribution equipment manufacturer Schneider Electric (France) further helped relative performance. Strength in LVMH Moet Hennessy Louis Vuitton’s fashion and leather goods division helped drive solid corporate results and appeared to have buoyed investor sentiment.
Detractors from Performance
Security selection and an underweight position in theinformation technology sector weakened relative performance during the reporting period. Within this sector, not holding shares of strong-performing software giant Microsoft, and an overweight position in custom IT consulting and technology services provider Cognizant Technology Solutions, held back relative returns. The stock price of Cognizant Technology Solutions declined over the period, as shifts in spending patterns from a few large clients negatively impacted the company’s financial services and health care segments.
Stock selection in thefinancials sector further weighed on relative results, led by the fund’s overweight positions in electronic brokerage firm TD Ameritrade Holding, investment management and banking firm UBS Group (Switzerland), custody bank State Street and global financial services provider Bank of New York Mellon. The stock price of TD Ameritrade declined over the reporting period on the back of weaker-than-expected trading revenues, interest rate deductions that weighed on income from interest earning assets and from the news that the company would follow in its competitor’s footsteps and lower its trading commissions to zero.
Stocks in other sectors that held back relative returns included the fund’s overweight positions in household products manufacturer Reckitt Benckiser Group (United Kingdom), diversified technology company 3M and oil field services company Schlumberger. Not holding shares of household products maker Procter & Gamble also weakened the fund’s relative performance.
Respectfully,
Portfolio Manager(s)
Ryan McAllister and Roger Morley
5
Management Review – continued
The views expressed in this report are those of the portfolio manager(s) only through the end of the period of the report as stated on the cover and do not necessarily reflect the views of MFS or any other person in the MFS organization. These views are subject to change at any time based on market or other conditions, and MFS disclaims any responsibility to update such views. These views may not be relied upon as investment advice or an indication of trading intent on behalf of any MFS portfolio. References to specific securities are not recommendations of such securities, and may not be representative of any MFS portfolio’s current or future investments.
6
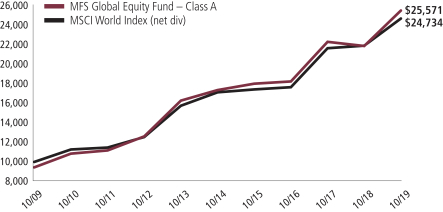
PERFORMANCE SUMMARYTHROUGH 10/31/19
The following chart illustrates a representative class of the fund’s historical performance in comparison to its benchmark(s). Performance results include the deduction of the maximum applicable sales charge and reflect the percentage change in net asset value, including reinvestment of dividends and capital gains distributions. The performance of other share classes will be greater than or less than that of the class depicted below. Benchmarks are unmanaged and may not be invested in directly. Benchmark returns do not reflect sales charges, commissions or expenses. (See Notes to Performance Summary.)
Performance data shown represents past performance and is no guarantee of future results. Investment return and principal value fluctuate so your shares, when sold, may be worth more or less than the original cost; current performance may be lower or higher than quoted. The performance shown does not reflect the deduction of taxes, if any, that a shareholder would pay on fund distributions or the redemption of fund shares.
Growth of a Hypothetical $10,000 Investment
7
Performance Summary – continued
Total Returns through 10/31/19
Average annual without sales charge
| | | | | | | | | | | | | | |
| | | Share Class | | Class Inception Date | | 1-yr | | 5-yr | | 10-yr | | Life (t) | | |
| | | A | | 9/07/93 | | 16.67% | | 8.03% | | 10.50% | | N/A | | |
| | | B | | 12/29/86 | | 15.79% | | 7.23% | | 9.66% | | N/A | | |
| | | C | | 1/03/94 | | 15.78% | | 7.22% | | 9.67% | | N/A | | |
| | | I | | 1/02/97 | | 16.94% | | 8.30% | | 10.77% | | N/A | | |
| | | R1 | | 4/01/05 | | 15.77% | | 7.22% | | 9.67% | | N/A | | |
| | | R2 | | 10/31/03 | | 16.36% | | 7.76% | | 10.23% | | N/A | | |
| | | R3 | | 4/01/05 | | 16.65% | | 8.03% | | 10.49% | | N/A | | |
| | | R4 | | 4/01/05 | | 16.93% | | 8.30% | | 10.76% | | N/A | | |
| | | R6 | | 6/01/12 | | 17.07% | | 8.40% | | N/A | | 12.01% | | |
| | | | | |
| Comparative benchmark(s) | | | | | | | | | | |
| | | MSCI World Index (net div) (f) | | 12.69% | | 7.58% | | 9.48% | | N/A | | |
| | | | | |
| Average annual with sales charge | | | | | | | | | | |
| | | A
With Initial Sales Charge (5.75%) | | 9.97% | | 6.76% | | 9.84% | | N/A | | |
| | | B
With CDSC (Declining over six years from 4% to 0%) (v) | | 11.79% | | 6.92% | | 9.66% | | N/A | | |
| | | C
With CDSC (1% for 12 months) (v) | | 14.78% | | 7.22% | | 9.67% | | N/A | | |
CDSC – Contingent Deferred Sales Charge.
Class I, R1, R2, R3, R4, and R6 shares do not have a sales charge.
| (f) | Source: FactSet Research Systems Inc. |
| (t) | For the period from the class inception date through the stated period end (for those share classes with less than 10 years of performance history). No comparative benchmark performance information is provided for “life” periods. (See Notes to Performance Summary.) |
| (v) | Assuming redemption at the end of the applicable period. |
Benchmark Definition(s)
MSCI World Index (net div) – a market capitalization-weighted index that is designed to measure equity market performance in the global developed markets. Morgan Stanley Capital International (“MSCI”) makes no express or implied warranties or representations and shall have no liability whatsoever with respect to any MSCI data contained herein. The MSCI data may not be further redistributed or used as a basis for other indices or any securities or financial products. This report is not approved, reviewed, or produced by MSCI.
It is not possible to invest directly in an index.
Notes to Performance Summary
Average annual total return represents the average annual change in value for each share class for the periods presented. Life returns are presented where the share class
8
Performance Summary – continued
has less than 10 years of performance history and represent the average annual total return from the class inception date to the stated period end date. As the fund’s share classes may have different inception dates, the life returns may represent different time periods and may not be comparable. As a result, no comparative benchmark performance information is provided for life periods.
Performance results reflect any applicable expense subsidies and waivers in effect during the periods shown. Without such subsidies and waivers the fund’s performance results would be less favorable. Please see the prospectus and financial statements for complete details.
Performance results do not include adjustments made for financial reporting purposes in accordance with U.S. generally accepted accounting principles and may differ from amounts reported in the financial highlights.
From time to time the fund may receive proceeds from litigation settlements, without which performance would be lower.
9
EXPENSE TABLE
Fund expenses borne by the shareholders during the period, May 1, 2019 through October 31, 2019
As a shareholder of the fund, you incur two types of costs: (1) transaction costs, including sales charges (loads) on certain purchase or redemption payments, and (2) ongoing costs, including management fees; distribution and service(12b-1) fees; and other fund expenses. This example is intended to help you understand your ongoing costs (in dollars) of investing in the fund and to compare these costs with the ongoing costs of investing in other mutual funds.
The example is based on an investment of $1,000 invested at the beginning of the period and held for the entire period May 1, 2019 through October 31, 2019.
Actual Expenses
The first line for each share class in the following table provides information about actual account values and actual expenses. You may use the information in this line, together with the amount you invested, to estimate the expenses that you paid over the period. Simply divide your account value by $1,000 (for example, an $8,600 account value divided by $1,000 = 8.6), then multiply the result by the number in the first line under the heading entitled “Expenses Paid During Period” to estimate the expenses you paid on your account during this period.
Hypothetical Example for Comparison Purposes
The second line for each share class in the following table provides information about hypothetical account values and hypothetical expenses based on the fund’s actual expense ratio and an assumed rate of return of 5% per year before expenses, which is not the fund’s actual return. The hypothetical account values and expenses may not be used to estimate the actual ending account balance or expenses you paid for the period. You may use this information to compare the ongoing costs of investing in the fund and other funds. To do so, compare this 5% hypothetical example with the 5% hypothetical examples that appear in the shareholder reports of the other funds.
Please note that the expenses shown in the table are meant to highlight your ongoing costs only and do not reflect any transactional costs, such as sales charges (loads). Therefore, the second line for each share class in the table is useful in comparing ongoing costs only, and will not help you determine the relative total costs of owning different funds. In addition, if these transactional costs were included, your costs would have been higher.
10
Expense Table – continued
| | | | | | | | | | | | | | | | | | |
Share
Class | | | | Annualized
Expense Ratio | | | Beginning
Account Value
5/01/19 | | | Ending Account Value
10/31/19 | | | Expenses Paid During
Period (p) 5/01/19-10/31/19 | |
| A | | Actual | | | 1.14% | | | | $1,000.00 | | | | $1,039.27 | | | | $5.86 | |
| | Hypothetical (h) | | | 1.14% | | | | $1,000.00 | | | | $1,019.46 | | | | $5.80 | |
| B | | Actual | | | 1.89% | | | | $1,000.00 | | | | $1,035.31 | | | | $9.70 | |
| | Hypothetical (h) | | | 1.89% | | | | $1,000.00 | | | | $1,015.68 | | | | $9.60 | |
| C | | Actual | | | 1.89% | | | | $1,000.00 | | | | $1,035.47 | | | | $9.70 | |
| | Hypothetical (h) | | | 1.89% | | | | $1,000.00 | | | | $1,015.68 | | | | $9.60 | |
| I | | Actual | | | 0.89% | | | | $1,000.00 | | | | $1,040.66 | | | | $4.58 | |
| | Hypothetical (h) | | | 0.89% | | | | $1,000.00 | | | | $1,020.72 | | | | $4.53 | |
| R1 | | Actual | | | 1.89% | | | | $1,000.00 | | | | $1,035.38 | | | | $9.70 | |
| | Hypothetical (h) | | | 1.89% | | | | $1,000.00 | | | | $1,015.68 | | | | $9.60 | |
| R2 | | Actual | | | 1.39% | | | | $1,000.00 | | | | $1,037.89 | | | | $7.14 | |
| | Hypothetical (h) | | | 1.39% | | | | $1,000.00 | | | | $1,018.20 | | | | $7.07 | |
| R3 | | Actual | | | 1.14% | | | | $1,000.00 | | | | $1,039.09 | | | | $5.86 | |
| | Hypothetical (h) | | | 1.14% | | | | $1,000.00 | | | | $1,019.46 | | | | $5.80 | |
| R4 | | Actual | | | 0.89% | | | | $1,000.00 | | | | $1,040.51 | | | | $4.58 | |
| | Hypothetical (h) | | | 0.89% | | | | $1,000.00 | | | | $1,020.72 | | | | $4.53 | |
| R6 | | Actual | | | 0.81% | | | | $1,000.00 | | | | $1,041.09 | | | | $4.17 | |
| | Hypothetical (h) | | | 0.81% | | | | $1,000.00 | | | | $1,021.12 | | | | $4.13 | |
| (h) | 5% class return per year before expenses. |
| (p) | “Expenses Paid During Period” are equal to each class’s annualized expense ratio, as shown above, multiplied by the average account value over the period, multiplied by 184/365 (to reflect theone-half year period). Expenses paid do not include any applicable sales charges (loads). If these transaction costs had been included, your costs would have been higher. |
11
PORTFOLIO OF INVESTMENTS
10/31/19
The Portfolio of Investments is a complete list of all securities owned by your fund. It is categorized by broad-based asset classes.
| | | | | | | | |
| Common Stocks - 99.3% | | | | | | | | |
| | |
| Issuer | | Shares/Par | | | Value ($) | |
| Aerospace - 4.3% | | | | | | | | |
| Honeywell International, Inc. | | | 426,345 | | | $ | 73,642,572 | |
| MTU Aero Engines AG | | | 86,258 | | | | 23,031,129 | |
| United Technologies Corp. | | | 222,765 | | | | 31,984,599 | |
| | | | | | | | |
| | | | | | | $ | 128,658,300 | |
| Airlines - 1.2% | | | | | | | | |
| Aena S.A. | | | 186,992 | | | $ | 34,306,833 | |
| | |
| Alcoholic Beverages - 5.5% | | | | | | | | |
| Ambev S.A. | | | 2,159,578 | | | $ | 9,358,800 | |
| Carlsberg Group | | | 124,306 | | | | 17,487,606 | |
| Diageo PLC | | | 1,501,128 | | | | 61,533,262 | |
| Heineken N.V. | | | 254,649 | | | | 25,975,557 | |
| Pernod Ricard S.A. | | | 277,204 | | | | 51,166,910 | |
| | | | | | | | |
| | | | | | | $ | 165,522,135 | |
| Apparel Manufacturers - 4.2% | | | | | | | | |
| Burberry Group PLC | | | 598,766 | | | $ | 15,853,499 | |
| Compagnie Financiere Richemont S.A. | | | 395,254 | | | | 31,091,445 | |
| LVMH Moet Hennessy Louis Vuitton SE | | | 184,932 | | | | 78,892,407 | |
| | | | | | | | |
| | | | | | | $ | 125,837,351 | |
| Automotive - 0.8% | | | | | | | | |
| Aptiv PLC | | | 172,323 | | | $ | 15,431,525 | |
| Harley-Davidson, Inc. | | | 231,366 | | | | 9,002,451 | |
| | | | | | | | |
| | | | | | | $ | 24,433,976 | |
| Broadcasting - 3.5% | | | | | | | | |
| Omnicom Group, Inc. | | | 175,373 | | | $ | 13,537,042 | |
| Walt Disney Co. | | | 473,389 | | | | 61,502,699 | |
| WPP Group PLC | | | 2,447,922 | | | | 30,542,259 | |
| | | | | | | | |
| | | | | | | $ | 105,582,000 | |
| Brokerage & Asset Managers - 1.2% | | | | | | | | |
| Deutsche Boerse AG | | | 86,891 | | | $ | 13,465,579 | |
| TD Ameritrade Holding Corp. | | | 562,500 | | | | 21,588,750 | |
| | | | | | | | |
| | | | | | | $ | 35,054,329 | |
| Business Services - 7.0% | | | | | | | | |
| Accenture PLC, “A” | | | 403,064 | | | $ | 74,736,127 | |
| Adecco S.A. | | | 246,754 | | | | 14,627,647 | |
12
Portfolio of Investments – continued
| | | | | | | | |
| | |
| Issuer | | Shares/Par | | | Value ($) | |
| Common Stocks - continued | | | | | | | | |
| Business Services - continued | | | | | | | | |
| Brenntag AG | | | 308,703 | | | $ | 15,493,340 | |
| Cognizant Technology Solutions Corp., “A” | | | 467,858 | | | | 28,511,266 | |
| Compass Group PLC | | | 1,053,959 | | | | 28,069,453 | |
| Equifax, Inc. | | | 201,632 | | | | 27,565,111 | |
| PayPal Holdings, Inc. (a) | | | 191,222 | | | | 19,906,210 | |
| | | | | | | | |
| | | | | | | $ | 208,909,154 | |
| Cable TV - 3.0% | | | | | | | | |
| Comcast Corp., “A” | | | 2,025,412 | | | $ | 90,778,966 | |
| | |
| Chemicals - 2.6% | | | | | | | | |
| 3M Co. | | | 244,329 | | | $ | 40,311,842 | |
| PPG Industries, Inc. | | | 302,327 | | | | 37,827,154 | |
| | | | | | | | |
| | | | | | | $ | 78,138,996 | |
| Computer Software - 2.6% | | | | | | | | |
| Check Point Software Technologies Ltd. (a) | | | 313,780 | | | $ | 35,272,010 | |
| Oracle Corp. | | | 793,790 | | | | 43,253,617 | |
| | | | | | | | |
| | | | | | | $ | 78,525,627 | |
| Consumer Products - 5.1% | | | | | | | | |
| Colgate-Palmolive Co. | | | 462,701 | | | $ | 31,741,289 | |
| Essity AB | | | 2,080,140 | | | | 64,909,450 | |
| Reckitt Benckiser Group PLC | | | 731,861 | | | | 56,539,681 | |
| | | | | | | | |
| | | | | | | $ | 153,190,420 | |
| Electrical Equipment - 4.0% | | | | | | | | |
| Amphenol Corp., “A” | | | 164,901 | | | $ | 16,544,517 | |
| Legrand S.A. | | | 411,381 | | | | 32,107,750 | |
| Resideo Technologies, Inc. (a) | | | 72,442 | | | | 690,372 | |
| Schneider Electric SE | | | 744,495 | | | | 69,133,715 | |
| | | | | | | | |
| | | | | | | $ | 118,476,354 | |
| Electronics - 1.9% | | | | | | | | |
| Hoya Corp. | | | 230,100 | | | $ | 20,416,174 | |
| Microchip Technology, Inc. | | | 136,154 | | | | 12,837,961 | |
| Samsung Electronics Co. Ltd. | | | 567,246 | | | | 24,516,998 | |
| | | | | | | | |
| | | | | | | $ | 57,771,133 | |
| Food & Beverages - 5.3% | | | | | | | | |
| Danone S.A. | | | 592,344 | | | $ | 49,125,284 | |
| Kellogg Co. | | | 389,028 | | | | 24,714,949 | |
| Nestle S.A. | | | 779,666 | | | | 83,238,138 | |
| | | | | | | | |
| | | | | | | $ | 157,078,371 | |
13
Portfolio of Investments – continued
| | | | | | | | |
| | |
| Issuer | | Shares/Par | | | Value ($) | |
| Common Stocks - continued | | | | | | | | |
| Gaming & Lodging - 1.1% | | | | | | | | |
| Marriott International, Inc., “A” | | | 170,425 | | | $ | 21,567,284 | |
| Sands China Ltd. | | | 1,043,600 | | | | 5,104,188 | |
| Wynn Resorts Ltd. | | | 42,115 | | | | 5,110,234 | |
| | | | | | | | |
| | | | | | | $ | 31,781,706 | |
| Insurance - 1.2% | | | | | | | | |
| Aon PLC | | | 182,811 | | | $ | 35,311,773 | |
| | |
| Internet - 0.8% | | | | | | | | |
| eBay, Inc. | | | 648,985 | | | $ | 22,876,721 | |
| | |
| Machinery & Tools - 1.3% | | | | | | | | |
| Kubota Corp. | | | 2,471,200 | | | $ | 39,213,716 | |
| | |
| Major Banks - 4.8% | | | | | | | | |
| Bank of New York Mellon Corp. | | | 840,844 | | | $ | 39,309,457 | |
| Erste Group Bank AG | | | 269,359 | | | | 9,514,178 | |
| Goldman Sachs Group, Inc. | | | 156,145 | | | | 33,318,220 | |
| State Street Corp. | | | 568,817 | | | | 37,581,739 | |
| UBS Group AG | | | 2,081,429 | | | | 24,559,385 | |
| | | | | | | | |
| | | | | | | $ | 144,282,979 | |
| Medical Equipment - 15.1% | | | | | | | | |
| Abbott Laboratories | | | 531,015 | | | $ | 44,398,164 | |
| Cooper Cos., Inc. | | | 101,510 | | | | 29,539,410 | |
| EssilorLuxottica | | | 84,555 | | | | 12,900,813 | |
| Medtronic PLC | | | 834,729 | | | | 90,901,988 | |
| Olympus Corp. | | | 2,104,600 | | | | 28,608,411 | |
| Sonova Holding AG | | | 29,800 | | | | 6,826,964 | |
| Stryker Corp. | | | 260,910 | | | | 56,427,006 | |
| Thermo Fisher Scientific, Inc. | | | 314,938 | | | | 95,104,977 | |
| Waters Corp. (a) | | | 153,105 | | | | 32,400,080 | |
| Zimmer Biomet Holdings, Inc. | | | 384,646 | | | | 53,169,617 | |
| | | | | | | | |
| | | | | | | $ | 450,277,430 | |
| Network & Telecom - 0.9% | | | | | | | | |
| Cisco Systems, Inc. | | | 565,258 | | | $ | 26,855,408 | |
| | |
| Oil Services - 0.5% | | | | | | | | |
| National Oilwell Varco, Inc. | | | 197,012 | | | $ | 4,456,411 | |
| NOW, Inc. (a) | | | 115,055 | | | | 1,212,680 | |
| Schlumberger Ltd. | | | 294,682 | | | | 9,633,155 | |
| | | | | | | | |
| | | | | | | $ | 15,302,246 | |
14
Portfolio of Investments – continued
| | | | | | | | |
| | |
| Issuer | | Shares/Par | | | Value ($) | |
| Common Stocks - continued | | | | | | | | |
| Other Banks & Diversified Financial - 5.1% | | | | | |
| American Express Co. | | | 314,902 | | | $ | 36,931,707 | |
| Grupo Financiero Banorte S.A. de C.V. | | | 1,358,254 | | | | 7,413,858 | |
| Julius Baer Group Ltd. | | | 258,078 | | | | 11,385,255 | |
| Kasikornbank PLC | | | 931,980 | | | | 4,305,720 | |
| Visa, Inc., “A” | | | 521,006 | | | | 93,187,133 | |
| | | | | | | | |
| | | | | | | $ | 153,223,673 | |
| Pharmaceuticals - 5.1% | | | | | | | | |
| Bayer AG | | | 720,814 | | | $ | 55,937,022 | |
| Johnson & Johnson | | | 79,533 | | | | 10,501,537 | |
| Merck KGaA | | | 223,910 | | | | 26,695,797 | |
| Roche Holding AG | | | 192,066 | | | | 57,785,290 | |
| | | | | | | | |
| | | | | | | $ | 150,919,646 | |
| Railroad & Shipping - 4.5% | | | | | | | | |
| Canadian National Railway Co. | | | 593,246 | | | $ | 53,018,395 | |
| Kansas City Southern Co. | | | 433,393 | | | | 61,013,066 | |
| Union Pacific Corp. | | | 112,658 | | | | 18,640,393 | |
| | | | | | | | |
| | | | | | | $ | 132,671,854 | |
| Real Estate - 0.2% | | | | | | | | |
| Deutsche Wohnen SE | | | 150,343 | | | $ | 5,654,087 | |
| | |
| Restaurants - 0.5% | | | | | | | | |
| Whitbread PLC | | | 283,614 | | | $ | 14,919,277 | |
| | |
| Specialty Chemicals - 4.4% | | | | | | | | |
| Akzo Nobel N.V. | | | 414,141 | | | $ | 38,129,139 | |
| L’Air Liquide S.A. | | | 236,643 | | | | 31,433,817 | |
| Linde PLC | | | 244,551 | | | | 48,344,535 | |
| Linde PLC | | | 72,268 | | | | 14,334,358 | |
| | | | | | | | |
| | | | | | | $ | 132,241,849 | |
| Specialty Stores - 0.4% | | | | | | | | |
| Hermes International | | | 9,338 | | | $ | 6,717,463 | |
| Sally Beauty Holdings, Inc. (a) | | | 370,103 | | | | 5,736,596 | |
| | | | | | | | |
| | | | | | | $ | 12,454,059 | |
| Trucking - 1.2% | | | | | | | | |
| United Parcel Service, Inc., “B” | | | 314,030 | | | $ | 36,166,835 | |
| Total Common Stocks (Identified Cost, $1,824,225,912) | | | $ | 2,966,417,204 | |
15
Portfolio of Investments – continued
| | | | | | | | |
| Investment Companies (h) - 0.4% | | | | | | | | |
| | |
| Issuer | | Shares/Par | | | Value ($) | |
| Money Market Funds - 0.4% | | | | | | | | |
MFS Institutional Money Market Portfolio, 1.89% (v)
(Identified Cost, $10,669,426) | | | 10,669,374 | | | $ | 10,670,441 | |
| | |
| Other Assets, Less Liabilities - 0.3% | | | | | | | 9,409,357 | |
| Net Assets - 100.0% | | | | | | $ | 2,986,497,002 | |
| (a) | Non-income producing security. |
| (h) | An affiliated issuer, which may be considered one in which the fund owns 5% or more of the outstanding voting securities, or a company which is under common control. At period end, the aggregate values of the fund’s investments in affiliated issuers and in unaffiliated issuers were $10,670,441 and $2,966,417,204, respectively. |
| (v) | Affiliated issuer that is available only to investment companies managed by MFS. The rate quoted for the MFS Institutional Money Market Portfolio is the annualizedseven-day yield of the fund at period end. |
See Notes to Financial Statements
16
Financial Statements
STATEMENT OF ASSETS AND LIABILITIES
At 10/31/19
This statement represents your fund’s balance sheet, which details the assets and liabilities comprising the total value of the fund.
| | | | |
| Assets | | | | |
Investments in unaffiliated issuers, at value (identified cost, $1,824,225,912) | | | $2,966,417,204 | |
Investments in affiliated issuers, at value (identified cost, $10,669,426) | | | 10,670,441 | |
Receivables for | | | | |
Investments sold | | | 1,410,753 | |
Fund shares sold | | | 40,478,401 | |
Dividends | | | 7,580,346 | |
Total assets | | | $3,026,557,145 | |
| |
| Liabilities | | | | |
Payables for | | | | |
Investments purchased | | | $1,080,027 | |
Fund shares reacquired | | | 37,796,518 | |
Payable to affiliates | | | | |
Investment adviser | | | 123,896 | |
Administrative services fee | | | 2,089 | |
Shareholder servicing costs | | | 822,133 | |
Distribution and service fees | | | 21,422 | |
Payable for independent Trustees’ compensation | | | 4,277 | |
Deferred country tax expense payable | | | 5,214 | |
Accrued expenses and other liabilities | | | 204,567 | |
Total liabilities | | | $40,060,143 | |
Net assets | | | $2,986,497,002 | |
| |
| Net assets consist of | | | | |
Paid-in capital | | | $1,791,859,393 | |
Total distributable earnings (loss) | | | 1,194,637,609 | |
Net assets | | | $2,986,497,002 | |
Shares of beneficial interest outstanding | | | 64,618,594 | |
17
Statement of Assets and Liabilities – continued
| | | | | | | | | | | | |
| | | |
| | | Net assets | | | Shares
outstanding | | | Net asset value
per share (a) | |
| Class A | | | $721,140,884 | | | | 15,750,252 | | | | $45.79 | |
| Class B | | | 22,592,018 | | | | 538,837 | | | | 41.93 | |
| Class C | | | 143,768,756 | | | | 3,594,412 | | | | 40.00 | |
| Class I | | | 947,284,226 | | | | 20,116,880 | | | | 47.09 | |
| Class R1 | | | 2,485,325 | | | | 60,661 | | | | 40.97 | |
| Class R2 | | | 37,041,887 | | | | 834,722 | | | | 44.38 | |
| Class R3 | | | 91,018,759 | | | | 2,002,110 | | | | 45.46 | |
| Class R4 | | | 97,860,821 | | | | 2,128,216 | | | | 45.98 | |
| Class R6 | | | 923,304,326 | | | | 19,592,504 | | | | 47.13 | |
| (a) | Maximum offering price per share was equal to the net asset value per share for all share classes, except for Class A, for which the maximum offering price per share was $48.58 [100 / 94.25 x $45.79]. On sales of $50,000 or more, the maximum offering price of Class A shares is reduced. A contingent deferred sales charge may be imposed on redemptions of Class A, Class B, and Class C shares. Redemption price per share was equal to the net asset value per share for Classes I, R1, R2, R3, R4, and R6. |
See Notes to Financial Statements
18
Financial Statements
STATEMENT OF OPERATIONS
Year ended 10/31/19
This statement describes how much your fund earned in investment income and accrued in expenses. It also describes any gains and/or losses generated by fund operations.
| | | | |
| Net investment income (loss) | | | | |
Income | | | | |
Dividends | | | $64,831,634 | |
Dividends from affiliated issuers | | | 305,689 | |
Income on securities loaned | | | 84,909 | |
Other | | | 1,391 | |
Foreign taxes withheld | | | (3,685,203 | ) |
Total investment income | | | $61,538,420 | |
Expenses | | | | |
Management fee | | | $22,184,672 | |
Distribution and service fees | | | 3,875,292 | |
Shareholder servicing costs | | | 2,152,328 | |
Administrative services fee | | | 395,116 | |
Independent Trustees’ compensation | | | 47,075 | |
Custodian fee | | | 310,206 | |
Shareholder communications | | | 150,212 | |
Audit and tax fees | | | 65,648 | |
Legal fees | | | 25,064 | |
Miscellaneous | | | 285,829 | |
Total expenses | | | $29,491,442 | |
Fees paid indirectly | | | (1,413 | ) |
Reduction of expenses by investment adviser and distributor | | | (309,686 | ) |
Net expenses | | | $29,180,343 | |
Net investment income (loss) | | | $32,358,077 | |
| |
| Realized and unrealized gain (loss) | | | | |
Realized gain (loss) (identified cost basis) | | | | |
Unaffiliated issuers (net of $13,063 country tax) | | | $99,960,386 | |
Affiliated issuers | | | 7,792 | |
Foreign currency | | | (103,862 | ) |
Net realized gain (loss) | | | $99,864,316 | |
Change in unrealized appreciation or depreciation | | | | |
Unaffiliated issuers (net of $126,436 decrease in deferred country tax) | | | $312,304,087 | |
Affiliated issuers | | | 1,014 | |
Translation of assets and liabilities in foreign currencies | | | 117,154 | |
Net unrealized gain (loss) | | | $312,422,255 | |
Net realized and unrealized gain (loss) | | | $412,286,571 | |
Change in net assets from operations | | | $444,644,648 | |
See Notes to Financial Statements
19
Financial Statements
STATEMENTS OF CHANGES IN NET ASSETS
These statements describe the increases and/or decreases in net assets resulting from operations, any distributions, and any shareholder transactions.
| | | | | | | | |
| | | Year ended | |
| | | 10/31/19 | | | 10/31/18 | |
| Change in net assets | | | | | | |
| | |
| From operations | | | | | | | | |
Net investment income (loss) | | | $32,358,077 | | | | $33,344,236 | |
Net realized gain (loss) | | | 99,864,316 | | | | 127,748,250 | |
Net unrealized gain (loss) | | | 312,422,255 | | | | (199,283,976 | ) |
Change in net assets from operations | | | $444,644,648 | | | | $(38,191,490 | ) |
Total distributions to shareholders | | | $(150,150,375 | ) | | | $(93,073,314 | ) |
Change in net assets from fund share transactions | | | $(167,592,578 | ) | | | $(333,694,745 | ) |
Total change in net assets | | | $126,901,695 | | | | $(464,959,549 | ) |
| | |
| Net assets | | | | | | | | |
At beginning of period | | | 2,859,595,307 | | | | 3,324,554,856 | |
At end of period | | | $2,986,497,002 | | | | $2,859,595,307 | |
See Notes to Financial Statements
20
Financial Statements
FINANCIAL HIGHLIGHTS
The financial highlights table is intended to help you understand the fund’s financial performance for the past 5 years. Certain information reflects financial results for a single fund share. The total returns in the table represent the rate that an investor would have earned (or lost) on an investment in the fund share class (assuming reinvestment of all distributions) held for the entire period.
| | | | | | | | | | | | | | | | | | | | |
| Class A | | Year ended | |
| | | | | |
| | | 10/31/19 | | | 10/31/18 | | | 10/31/17 | | | 10/31/16 | | | 10/31/15 | |
Net asset value, beginning of period | | | $41.44 | | | | $43.43 | | | | $36.00 | | | | $36.22 | | | | $35.45 | |
| | | |
| Income (loss) from investment operations | | | | | | | | | | | | | |
Net investment income (loss) (d) | | | $0.42 | | | | $0.40 | | | | $0.27 | (c) | | | $0.26 | | | | $0.30 | |
Net realized and unrealized gain (loss) | | | 6.10 | | | | (1.23 | ) | | | 7.66 | | | | 0.16 | | | | 1.07 | |
Total from investment operations | | | $6.52 | | | | $(0.83 | ) | | | $7.93 | | | | $0.42 | | | | $1.37 | |
| | | |
| Less distributions declared to shareholders | | | | | | | | | | | | | |
From net investment income | | | $(0.42 | ) | | | $(0.29 | ) | | | $(0.21 | ) | | | $(0.26 | ) | | | $(0.26 | ) |
From net realized gain | | | (1.75 | ) | | | (0.87 | ) | | | (0.29 | ) | | | (0.38 | ) | | | (0.34 | ) |
Total distributions declared to shareholders | | | $(2.17 | ) | | | $(1.16 | ) | | | $(0.50 | ) | | | $(0.64 | ) | | | $(0.60 | ) |
Net asset value, end of period (x) | | | $45.79 | | | | $41.44 | | | | $43.43 | | | | $36.00 | | | | $36.22 | |
Total return (%) (r)(s)(t)(x) | | | 16.67 | | | | (1.99 | ) | | | 22.28 | (c) | | | 1.26 | | | | 3.94 | |
| | | |
Ratios (%) (to average net assets)
and Supplemental data: | | | | | | | | | | | | | |
Expenses before expense reductions (f) | | | 1.17 | | | | 1.16 | | | | 1.17 | (c) | | | 1.22 | | | | 1.23 | |
Expenses after expense reductions (f) | | | 1.15 | | | | 1.15 | | | | 1.16 | (c) | | | 1.21 | | | | 1.22 | |
Net investment income (loss) | | | 0.98 | | | | 0.91 | | | | 0.68 | (c) | | | 0.74 | | | | 0.84 | |
Portfolio turnover | | | 7 | | | | 12 | | | | 10 | | | | 8 | | | | 8 | |
Net assets at end of period (000 omitted) | | | $721,141 | | | | $671,000 | | | | $703,516 | | | | $655,756 | | | | $677,704 | |
See Notes to Financial Statements
21
Financial Highlights – continued
| | | | | | | | | | | | | | | | | | | | |
| Class B | | Year ended | |
| | | | | |
| | | 10/31/19 | | | 10/31/18 | | | 10/31/17 | | | 10/31/16 | | | 10/31/15 | |
Net asset value, beginning of period | | | $38.09 | | | | $40.03 | | | | $33.26 | | | | $33.51 | | | | $32.84 | |
| | | | |
| Income (loss) from investment operations | | | | | | | | | | | | | | | | | |
Net investment income (loss) (d) | | | $0.10 | | | | $0.06 | | | | $(0.02 | )(c) | | | $(0.01 | ) | | | $0.03 | |
Net realized and unrealized gain (loss) | | | 5.60 | | | | (1.12 | ) | | | 7.08 | | | | 0.16 | | | | 1.00 | |
Total from investment operations | | | $5.70 | | | | $(1.06 | ) | | | $7.06 | | | | $0.15 | | | | $1.03 | |
| | | | |
| Less distributions declared to shareholders | | | | | | | | | | | | | | | | | |
From net investment income | | | $(0.11 | ) | | | $(0.01 | ) | | | $— | | | | $(0.02 | ) | | | $(0.02 | ) |
From net realized gain | | | (1.75 | ) | | | (0.87 | ) | | | (0.29 | ) | | | (0.38 | ) | | | (0.34 | ) |
Total distributions declared to shareholders | | | $(1.86 | ) | | | $(0.88 | ) | | | $(0.29 | ) | | | $(0.40 | ) | | | $(0.36 | ) |
Net asset value, end of period (x) | | | $41.93 | | | | $38.09 | | | | $40.03 | | | | $33.26 | | | | $33.51 | |
Total return (%) (r)(s)(t)(x) | | | 15.79 | | | | (2.73 | ) | | | 21.37 | (c) | | | 0.50 | | | | 3.17 | |
| | | | | |
Ratios (%) (to average net assets)
and Supplemental data: | | | | | | | | | | | | | | | | | | | | |
Expenses before expense reductions (f) | | | 1.92 | | | | 1.91 | | | | 1.92 | (c) | | | 1.97 | | | | 1.98 | |
Expenses after expense reductions (f) | | | 1.91 | | | | 1.90 | | | | 1.91 | (c) | | | 1.96 | | | | 1.97 | |
Net investment income (loss) | | | 0.24 | | | | 0.15 | | | | (0.04 | )(c) | | | (0.03 | ) | | | 0.09 | |
Portfolio turnover | | | 7 | | | | 12 | | | | 10 | | | | 8 | | | | 8 | |
Net assets at end of period (000 omitted) | | | $22,592 | | | | $24,726 | | | | $29,043 | | | | $25,664 | | | | $27,384 | |
| |
| Class C | | Year ended | |
| | | | | |
| | | 10/31/19 | | | 10/31/18 | | | 10/31/17 | | | 10/31/16 | | | 10/31/15 | |
Net asset value, beginning of period | | | $36.44 | | | | $38.35 | | | | $31.88 | | | | $32.19 | | | | $31.60 | |
| | | | |
| Income (loss) from investment operations | | | | | | | | | | | | | | | | | |
Net investment income (loss) (d) | | | $0.09 | | | | $0.06 | | | | $(0.02 | )(c) | | | $(0.01 | ) | | | $0.03 | |
Net realized and unrealized gain (loss) | | | 5.34 | | | | (1.07 | ) | | | 6.78 | | | | 0.15 | | | | 0.95 | |
Total from investment operations | | | $5.43 | | | | $(1.01 | ) | | | $6.76 | | | | $0.14 | | | | $0.98 | |
| | | | |
| Less distributions declared to shareholders | | | | | | | | | | | | | | | | | |
From net investment income | | | $(0.12 | ) | | | $(0.03 | ) | | | $— | | | | $(0.07 | ) | | | $(0.05 | ) |
From net realized gain | | | (1.75 | ) | | | (0.87 | ) | | | (0.29 | ) | | | (0.38 | ) | | | (0.34 | ) |
Total distributions declared to shareholders | | | $(1.87 | ) | | | $(0.90 | ) | | | $(0.29 | ) | | | $(0.45 | ) | | | $(0.39 | ) |
Net asset value, end of period (x) | | | $40.00 | | | | $36.44 | | | | $38.35 | | | | $31.88 | | | | $32.19 | |
Total return (%) (r)(s)(t)(x) | | | 15.78 | | | | (2.72 | ) | | | 21.36 | (c) | | | 0.48 | | | | 3.17 | |
| | | |
Ratios (%) (to average net assets)
and Supplemental data: | | | | | | | | | | | | | |
Expenses before expense reductions (f) | | | 1.92 | | | | 1.91 | | | | 1.92 | (c) | | | 1.97 | | | | 1.98 | |
Expenses after expense reductions (f) | | | 1.91 | | | | 1.90 | | | | 1.91 | (c) | | | 1.96 | | | | 1.97 | |
Net investment income (loss) | | | 0.23 | | | | 0.16 | | | | (0.05 | )(c) | | | (0.03 | ) | | | 0.08 | |
Portfolio turnover | | | 7 | | | | 12 | | | | 10 | | | | 8 | | | | 8 | |
Net assets at end of period (000 omitted) | | | $143,769 | | | | $149,669 | | | | $180,446 | | | | $156,837 | | | | $140,018 | |
See Notes to Financial Statements
22
Financial Highlights – continued
| | | | | | | | | | | | | | | | | | | | |
| Class I | | Year ended | |
| | | | | |
| | | 10/31/19 | | | 10/31/18 | | | 10/31/17 | | | 10/31/16 | | | 10/31/15 | |
Net asset value, beginning of period | | | $42.57 | | | | $44.58 | | | | $36.94 | | | | $37.14 | | | | $36.34 | |
| | |
| Income (loss) from investment operations | | | | | | | | | |
Net investment income (loss) (d) | | | $0.53 | | | | $0.52 | | | | $0.41 | (c) | | | $0.34 | | | | $0.41 | |
Net realized and unrealized gain (loss) | | | 6.27 | | | | (1.27 | ) | | | 7.83 | | | | 0.19 | | | | 1.07 | |
Total from investment operations | | | $6.80 | | | | $(0.75 | ) | | | $8.24 | | | | $0.53 | | | | $1.48 | |
| | | |
| Less distributions declared to shareholders | | | | | | | | | | | | | |
From net investment income | | | $(0.53 | ) | | | $(0.39 | ) | | | $(0.31 | ) | | | $(0.35 | ) | | | $(0.34 | ) |
From net realized gain | | | (1.75 | ) | | | (0.87 | ) | | | (0.29 | ) | | | (0.38 | ) | | | (0.34 | ) |
Total distributions declared to shareholders | | | $(2.28 | ) | | | $(1.26 | ) | | | $(0.60 | ) | | | $(0.73 | ) | | | $(0.68 | ) |
Net asset value, end of period (x) | | | $47.09 | | | | $42.57 | | | | $44.58 | | | | $36.94 | | | | $37.14 | |
Total return (%) (r)(s)(t)(x) | | | 16.94 | | | | (1.76 | ) | | | 22.60 | (c) | | | 1.52 | | | | 4.17 | |
| | | |
Ratios (%) (to average net assets)
and Supplemental data: | | | | | | | | | | | | | |
Expenses before expense reductions (f) | | | 0.92 | | | | 0.91 | | | | 0.92 | (c) | | | 0.97 | | | | 0.98 | |
Expenses after expense reductions (f) | | | 0.91 | | | | 0.90 | | | | 0.91 | (c) | | | 0.96 | | | | 0.97 | |
Net investment income (loss) | | | 1.21 | | | | 1.17 | | | | 1.01 | (c) | | | 0.93 | | | | 1.11 | |
Portfolio turnover | | | 7 | | | | 12 | | | | 10 | | | | 8 | | | | 8 | |
Net assets at end of period (000 omitted) | | | $947,284 | | | | $935,292 | | | | $1,070,007 | | | | $793,470 | | | | $671,087 | |
| |
| Class R1 | | Year ended | |
| | | | | |
| | | 10/31/19 | | | 10/31/18 | | | 10/31/17 | | | 10/31/16 | | | 10/31/15 | |
Net asset value, beginning of period | | | $37.25 | | | | $39.18 | | | | $32.56 | | | | $32.80 | | | | $32.17 | |
| | |
| Income (loss) from investment operations | | | | | | | | | |
Net investment income (loss) (d) | | | $0.09 | | | | $0.06 | | | | $(0.02 | )(c) | | | $(0.01 | ) | | | $0.03 | |
Net realized and unrealized gain (loss) | | | 5.47 | | | | (1.09 | ) | | | 6.93 | | | | 0.16 | | | | 0.97 | |
Total from investment operations | | | $5.56 | | | | $(1.03 | ) | | | $6.91 | | | | $0.15 | | | | $1.00 | |
| | | |
| Less distributions declared to shareholders | | | | | | | | | | | | | |
From net investment income | | | $(0.09 | ) | | | $(0.03 | ) | | | $— | | | | $(0.01 | ) | | | $(0.03 | ) |
From net realized gain | | | (1.75 | ) | | | (0.87 | ) | | | (0.29 | ) | | | (0.38 | ) | | | (0.34 | ) |
Total distributions declared to shareholders | | | $(1.84 | ) | | | $(0.90 | ) | | | $(0.29 | ) | | | $(0.39 | ) | | | $(0.37 | ) |
Net asset value, end of period (x) | | | $40.97 | | | | $37.25 | | | | $39.18 | | | | $32.56 | | | | $32.80 | |
Total return (%) (r)(s)(t)(x) | | | 15.77 | | | | (2.73 | ) | | | 21.37 | (c) | | | 0.51 | | | | 3.14 | |
| | | |
Ratios (%) (to average net assets)
and Supplemental data: | | | | | | | | | | | | | |
Expenses before expense reductions (f) | | | 1.92 | | | | 1.91 | | | | 1.92 | (c) | | | 1.97 | | | | 1.98 | |
Expenses after expense reductions (f) | | | 1.91 | | | | 1.90 | | | | 1.91 | (c) | | | 1.96 | | | | 1.97 | |
Net investment income (loss) | | | 0.22 | | | | 0.16 | | | | (0.05 | )(c) | | | (0.03 | ) | | | 0.10 | |
Portfolio turnover | | | 7 | | | | 12 | | | | 10 | | | | 8 | | | | 8 | |
Net assets at end of period (000 omitted) | | | $2,485 | | | | $2,538 | | | | $3,411 | | | | $3,442 | | | | $3,546 | |
See Notes to Financial Statements
23
Financial Highlights – continued
| | | | | | | | | | | | | | | | | | | | |
| Class R2 | | Year ended | |
| | | | | |
| | | 10/31/19 | | | 10/31/18 | | | 10/31/17 | | | 10/31/16 | | | 10/31/15 | |
Net asset value, beginning of period | | | $40.21 | | | | $42.16 | | | | $34.96 | | | | $35.19 | | | | $34.45 | |
| | |
| Income (loss) from investment operations | | | | | | | | | |
Net investment income (loss) (d) | | | $0.31 | | | | $0.28 | | | | $0.18 | (c) | | | $0.16 | | | | $0.21 | |
Net realized and unrealized gain (loss) | | | 5.91 | | | | (1.19 | ) | | | 7.43 | | | | 0.16 | | | | 1.03 | |
Total from investment operations | | | $6.22 | | | | $(0.91 | ) | | | $7.61 | | | | $0.32 | | | | $1.24 | |
| | | |
| Less distributions declared to shareholders | | | | | | | | | | | | | |
From net investment income | | | $(0.30 | ) | | | $(0.17 | ) | | | $(0.12 | ) | | | $(0.17 | ) | | | $(0.16 | ) |
From net realized gain | | | (1.75 | ) | | | (0.87 | ) | | | (0.29 | ) | | | (0.38 | ) | | | (0.34 | ) |
Total distributions declared to shareholders | | | $(2.05 | ) | | | $(1.04 | ) | | | $(0.41 | ) | | | $(0.55 | ) | | | $(0.50 | ) |
Net asset value, end of period (x) | | | $44.38 | | | | $40.21 | | | | $42.16 | | | | $34.96 | | | | $35.19 | |
Total return (%) (r)(s)(t)(x) | | | 16.36 | | | | (2.24 | ) | | | 21.97 | (c) | | | 0.99 | | | | 3.67 | |
| | | |
Ratios (%) (to average net assets)
and Supplemental data: | | | | | | | | | | | | | |
Expenses before expense reductions (f) | | | 1.42 | | | | 1.41 | | | | 1.42 | (c) | | | 1.47 | | | | 1.48 | |
Expenses after expense reductions (f) | | | 1.41 | | | | 1.40 | | | | 1.41 | (c) | | | 1.46 | | | | 1.47 | |
Net investment income (loss) | | | 0.76 | | | | 0.66 | | | | 0.45 | (c) | | | 0.47 | | | | 0.59 | |
Portfolio turnover | | | 7 | | | | 12 | | | | 10 | | | | 8 | | | | 8 | |
Net assets at end of period (000 omitted) | | | $37,042 | | | | $40,944 | | | | $52,489 | | | | $49,546 | | | | $56,978 | |
| |
| Class R3 | | Year ended | |
| | | | | |
| | | 10/31/19 | | | 10/31/18 | | | 10/31/17 | | | 10/31/16 | | | 10/31/15 | |
Net asset value, beginning of period | | | $41.16 | | | | $43.14 | | | | $35.76 | | | | $35.98 | | | | $35.23 | |
| | |
| Income (loss) from investment operations | | | | | | | | | |
Net investment income (loss) (d) | | | $0.41 | | | | $0.39 | | | | $0.28 | (c) | | | $0.26 | | | | $0.30 | |
Net realized and unrealized gain (loss) | | | 6.06 | | | | (1.21 | ) | | | 7.60 | | | | 0.16 | | | | 1.05 | |
Total from investment operations | | | $6.47 | | | | $(0.82 | ) | | | $7.88 | | | | $0.42 | | | | $1.35 | |
| | | |
| Less distributions declared to shareholders | | | | | | | | | | | | | |
From net investment income | | | $(0.42 | ) | | | $(0.29 | ) | | | $(0.21 | ) | | | $(0.26 | ) | | | $(0.26 | ) |
From net realized gain | | | (1.75 | ) | | | (0.87 | ) | | | (0.29 | ) | | | (0.38 | ) | | | (0.34 | ) |
Total distributions declared to shareholders | | | $(2.17 | ) | | | $(1.16 | ) | | | $(0.50 | ) | | | $(0.64 | ) | | | $(0.60 | ) |
Net asset value, end of period (x) | | | $45.46 | | | | $41.16 | | | | $43.14 | | | | $35.76 | | | | $35.98 | |
Total return (%) (r)(s)(t)(x) | | | 16.65 | | | | (2.00 | ) | | | 22.29 | (c) | | | 1.25 | | | | 3.93 | |
| | | |
Ratios (%) (to average net assets)
and Supplemental data: | | | | | | | | | | | | | |
Expenses before expense reductions (f) | | | 1.17 | | | | 1.16 | | | | 1.17 | (c) | | | 1.22 | | | | 1.23 | |
Expenses after expense reductions (f) | | | 1.16 | | | | 1.15 | | | | 1.16 | (c) | | | 1.21 | | | | 1.22 | |
Net investment income (loss) | | | 0.97 | | | | 0.90 | | | | 0.70 | (c) | | | 0.74 | | | | 0.84 | |
Portfolio turnover | | | 7 | | | | 12 | | | | 10 | | | | 8 | | | | 8 | |
Net assets at end of period (000 omitted) | | | $91,019 | | | | $90,003 | | | | $108,852 | | | | $98,106 | | | | $105,192 | |
See Notes to Financial Statements
24
Financial Highlights – continued
| | | | | | | | | | | | | | | | | | | | |
| Class R4 | | Year ended | |
| | | | | |
| | | 10/31/19 | | | 10/31/18 | | | 10/31/17 | | | 10/31/16 | | | 10/31/15 | |
Net asset value, beginning of period | | | $41.63 | | | | $43.62 | | | | $36.15 | | | | $36.37 | | | | $35.59 | |
| | |
| Income (loss) from investment operations | | | | | | | | | |
Net investment income (loss) (d) | | | $0.54 | | | | $0.51 | | | | $0.38 | (c) | | | $0.35 | | | | $0.40 | |
Net realized and unrealized gain (loss) | | | 6.09 | | | | (1.23 | ) | | | 7.68 | | | | 0.16 | | | | 1.06 | |
Total from investment operations | | | $6.63 | | | | $(0.72 | ) | | | $8.06 | | | | $0.51 | | | | $1.46 | |
| | | |
| Less distributions declared to shareholders | | | | | | | | | | | | | |
From net investment income | | | $(0.53 | ) | | | $(0.40 | ) | | | $(0.30 | ) | | | $(0.35 | ) | | | $(0.34 | ) |
From net realized gain | | | (1.75 | ) | | | (0.87 | ) | | | (0.29 | ) | | | (0.38 | ) | | | (0.34 | ) |
Total distributions declared to shareholders | | | $(2.28 | ) | | | $(1.27 | ) | | | $(0.59 | ) | | | $(0.73 | ) | | | $(0.68 | ) |
Net asset value, end of period (x) | | | $45.98 | | | | $41.63 | | | | $43.62 | | | | $36.15 | | | | $36.37 | |
Total return (%) (r)(s)(t)(x) | | | 16.93 | | | | (1.75 | ) | | | 22.61 | (c) | | | 1.50 | | | | 4.20 | |
| | | |
Ratios (%) (to average net assets)
and Supplemental data: | | | | | | | | | | | | | |
Expenses before expense reductions (f) | | | 0.92 | | | | 0.91 | | | | 0.92 | (c) | | | 0.97 | | | | 0.98 | |
Expenses after expense reductions (f) | | | 0.91 | | | | 0.90 | | | | 0.91 | (c) | | | 0.96 | | | | 0.97 | |
Net investment income (loss) | | | 1.25 | | | | 1.16 | | | | 0.96 | (c) | | | 0.99 | | | | 1.11 | |
Portfolio turnover | | | 7 | | | | 12 | | | | 10 | | | | 8 | | | | 8 | |
Net assets at end of period (000 omitted) | | | $97,861 | | | | $136,066 | | | | $142,713 | | | | $116,248 | | | | $118,810 | |
| |
| Class R6 | | Year ended | |
| | | | | |
| | | 10/31/19 | | | 10/31/18 | | | 10/31/17 | | | 10/31/16 | | | 10/31/15 | |
Net asset value, beginning of period | | | $42.61 | | | | $44.61 | | | | $36.96 | | | | $37.17 | | | | $36.36 | |
| | | |
| Income (loss) from investment operations | | | | | | | | | | | | | |
Net investment income (loss) (d) | | | $0.59 | | | | $0.54 | | | | $0.41 | (c) | | | $0.39 | | | | $0.44 | |
Net realized and unrealized gain (loss) | | | 6.26 | | | | (1.24 | ) | | | 7.86 | | | | 0.16 | | | | 1.08 | |
Total from investment operations | | | $6.85 | | | | $(0.70 | ) | | | $8.27 | | | | $0.55 | | | | $1.52 | |
| | | |
| Less distributions declared to shareholders | | | | | | | | | | | | | |
From net investment income | | | $(0.58 | ) | | | $(0.43 | ) | | | $(0.33 | ) | | | $(0.38 | ) | | | $(0.37 | ) |
From net realized gain | | | (1.75 | ) | | | (0.87 | ) | | | (0.29 | ) | | | (0.38 | ) | | | (0.34 | ) |
Total distributions declared to shareholders | | | $(2.33 | ) | | | $(1.30 | ) | | | $(0.62 | ) | | | $(0.76 | ) | | | $(0.71 | ) |
Net asset value, end of period (x) | | | $47.13 | | | | $42.61 | | | | $44.61 | | | | $36.96 | | | | $37.17 | |
Total return (%) (r)(s)(t)(x) | | | 17.07 | | | | (1.66 | ) | | | 22.71 | (c) | | | 1.60 | | | | 4.29 | |
| | | |
Ratios (%) (to average net assets)
and Supplemental data: | | | | | | | | | | | | | |
Expenses before expense reductions (f) | | | 0.83 | | | | 0.81 | | | | 0.83 | (c) | | | 0.87 | | | | 0.88 | |
Expenses after expense reductions (f) | | | 0.82 | | | | 0.80 | | | | 0.82 | (c) | | | 0.87 | | | | 0.88 | |
Net investment income (loss) | | | 1.35 | | | | 1.20 | | | | 0.99 | (c) | | | 1.08 | | | | 1.19 | |
Portfolio turnover | | | 7 | | | | 12 | | | | 10 | | | | 8 | | | | 8 | |
Net assets at end of period (000 omitted) | | | $923,304 | | | | $809,357 | | | | $1,034,078 | | | | $494,203 | | | | $383,913 | |
See Notes to Financial Statements
25
Financial Highlights – continued
| (c) | Amount reflects aone-time reimbursement of expenses by the custodian (or former custodian) without which net investment income and performance would be lower and expenses would be higher. |
| (d) | Per share data is based on average shares outstanding. |
| (f) | Ratios do not reflect reductions from fees paid indirectly, if applicable. |
| (r) | Certain expenses have been reduced without which performance would have been lower. |
| (s) | From time to time the fund may receive proceeds from litigation settlements, without which performance would be lower. |
| (t) | Total returns do not include any applicable sales charges. |
| (x) | The net asset values and total returns have been calculated on net assets which include adjustments made in accordance with U.S. generally accepted accounting principles required at period end for financial reporting purposes. |
See Notes to Financial Statements
26
NOTES TO FINANCIAL STATEMENTS
(1) Business and Organization
MFS Global Equity Fund (the fund) is a diversified series of MFS Series Trust VI (the trust). The trust is organized as a Massachusetts business trust and is registered under the Investment Company Act of 1940, as amended, as anopen-end management investment company.
The fund is an investment company and accordingly follows the investment company accounting and reporting guidance of the Financial Accounting Standards Board (FASB) Accounting Standards Codification Topic 946 Financial Services – Investment Companies.
(2) Significant Accounting Policies
General– The preparation of financial statements in conformity with U.S. generally accepted accounting principles requires management to make estimates and assumptions that affect the reported amounts of assets and liabilities, and disclosure of contingent assets and liabilities at the date of the financial statements and the reported amounts of increases and decreases in net assets from operations during the reporting period. Actual results could differ from those estimates. In the preparation of these financial statements, management has evaluated subsequent events occurring after the date of the fund’s Statement of Assets and Liabilities through the date that the financial statements were issued. The fund invests in foreign securities. Investments in foreign securities are vulnerable to the effects of changes in the relative values of the local currency and the U.S. dollar and to the effects of changes in each country’s market, economic, industrial, political, regulatory, geopolitical, and other conditions.
Balance Sheet Offsetting– The fund’s accounting policy with respect to balance sheet offsetting is that, absent an event of default by the counterparty or a termination of the agreement, the International Swaps and Derivatives Association (ISDA) Master Agreement, or similar agreement, does not result in an offset of reported amounts of financial assets and financial liabilities in the Statement of Assets and Liabilities across transactions between the fund and the applicable counterparty. The fund’s right to setoff may be restricted or prohibited by the bankruptcy or insolvency laws of the particular jurisdiction to which a specific master netting agreement counterparty is subject. Balance sheet offsetting disclosures, to the extent applicable to the fund, have been included in the fund’s Significant Accounting Policies note under the captions for each of the fund’sin-scope financial instruments and transactions.
Investment Valuations– Equity securities, including restricted equity securities, are generally valued at the last sale or official closing price on their primary market or exchange as provided by a third-party pricing service. Equity securities, for which there were no sales reported that day, are generally valued at the last quoted daily bid quotation on their primary market or exchange as provided by a third-party pricing service. Short-term instruments with a maturity at issuance of 60 days or less may be valued at amortized cost, which approximates market value.Open-end investment companies are generally valued at net asset value per share. Securities and other assets generally valued on the basis of information from a third-party pricing service may also be valued at a broker/dealer bid quotation. In determining values, third-party pricing
27
Notes to Financial Statements – continued
services can utilize both transaction data and market information such as yield, quality, coupon rate, maturity, type of issue, trading characteristics, and other market data. The values of foreign securities and other assets and liabilities expressed in foreign currencies are converted to U.S. dollars using the mean of bid and asked prices for rates provided by a third-party pricing service.
The Board of Trustees has delegated primary responsibility for determining or causing to be determined the value of the fund’s investments (including any fair valuation) to the adviser pursuant to valuation policies and procedures approved by the Board. If the adviser determines that reliable market quotations are not readily available, investments are valued at fair value as determined in good faith by the adviser in accordance with such procedures under the oversight of the Board of Trustees. Under the fund’s valuation policies and procedures, market quotations are not considered to be readily available for most types of debt instruments and floating rate loans and many types of derivatives. These investments are generally valued at fair value based on information from third-party pricing services. In addition, investments may be valued at fair value if the adviser determines that an investment’s value has been materially affected by events occurring after the close of the exchange or market on which the investment is principally traded (such as foreign exchange or market) and prior to the determination of the fund’s net asset value, or after the halt of trading of a specific security where trading does not resume prior to the close of the exchange or market on which the security is principally traded. Events that occur after foreign markets close (such as developments in foreign markets and significant movements in the U.S. markets) and prior to the determination of the fund’s net asset value may be deemed to have a material effect on the value of securities traded in foreign markets. Accordingly, the fund’s foreign equity securities may often be valued at fair value. The adviser generally relies on third-party pricing services or other information (such as the correlation with price movements of similar securities in the same or other markets; the type, cost and investment characteristics of the security; the business and financial condition of the issuer; and trading and other market data) to assist in determining whether to fair value and at what value to fair value an investment. The value of an investment for purposes of calculating the fund’s net asset value can differ depending on the source and method used to determine value. When fair valuation is used, the value of an investment used to determine the fund’s net asset value may differ from quoted or published prices for the same investment. There can be no assurance that the fund could obtain the fair value assigned to an investment if it were to sell the investment at the same time at which the fund determines its net asset value per share.
Various inputs are used in determining the value of the fund’s assets or liabilities. These inputs are categorized into three broad levels. In certain cases, the inputs used to measure fair value may fall into different levels of the fair value hierarchy. In such cases, an investment’s level within the fair value hierarchy is based on the lowest level of input that is significant to the fair value measurement. The fund’s assessment of the significance of a particular input to the fair value measurement in its entirety requires judgment, and considers factors specific to the investment. Level 1 includes unadjusted quoted prices in active markets for identical assets or liabilities. Level 2 includes other significant observable market-based inputs (including quoted prices for similar securities, interest rates, prepayment speed, and credit risk). Level 3 includes
28
Notes to Financial Statements – continued
unobservable inputs, which may include the adviser’s own assumptions in determining the fair value of investments. The following is a summary of the levels used as of October 31, 2019 in valuing the fund’s assets or liabilities:
| | | | | | | | | | | | | | | | |
| | | | |
| Financial Instruments | | Level 1 | | | Level 2 | | | Level 3 | | | Total | |
| Equity Securities: | | | | | | | | | | | | | | | | |
United States | | | $1,640,139,503 | | | | $— | | | | $— | | | | $1,640,139,503 | |
France | | | 331,478,159 | | | | — | | | | — | | | | 331,478,159 | |
Switzerland | | | 229,514,124 | | | | — | | | | — | | | | 229,514,124 | |
United Kingdom | | | 207,457,431 | | | | — | | | | — | | | | 207,457,431 | |
Germany | | | 140,276,954 | | | | — | | | | — | | | | 140,276,954 | |
Japan | | | — | | | | 88,238,301 | | | | — | | | | 88,238,301 | |
Sweden | | | 64,909,450 | | | | — | | | | — | | | | 64,909,450 | |
Netherlands | | | 64,104,696 | | | | — | | | | — | | | | 64,104,696 | |
Canada | | | 53,018,395 | | | | — | | | | — | | | | 53,018,395 | |
Other Countries | | | 117,659,005 | | | | 29,621,186 | | | | — | | | | 147,280,191 | |
| Mutual Funds | | | 10,670,441 | | | | — | | | | — | | | | 10,670,441 | |
| Total | | | $2,859,228,158 | | | | $117,859,487 | | | | $— | | | | $2,977,087,645 | |
For further information regarding security characteristics, see the Portfolio of Investments.
Foreign Currency Translation– Purchases and sales of foreign investments, income, and expenses are converted into U.S. dollars based upon currency exchange rates prevailing on the respective dates of such transactions or on the reporting date for foreign denominated receivables and payables. Gains and losses attributable to foreign currency exchange rates on sales of securities are recorded for financial statement purposes as net realized gains and losses on investments. Gains and losses attributable to foreign exchange rate movements on receivables, payables, income and expenses are recorded for financial statement purposes as foreign currency transaction gains and losses. That portion of both realized and unrealized gains and losses on investments that results from fluctuations in foreign currency exchange rates is not separately disclosed.
Security Loans– Under its Securities Lending Agency Agreement with the fund, JPMorgan Chase and Co., as lending agent, loans the securities of the fund to certain qualified institutions (the “Borrowers”) approved by the fund. Security loans can be terminated at the discretion of either the lending agent or the fund and the related securities must be returned within the earlier of the standard trade settlement period for such securities or within three business days. The loans are collateralized by cash and/or U.S. Treasury and federal agency obligations in an amount typically at least equal to the market value of the securities loaned. On loans collateralized by cash, the cash collateral is invested in a money market fund. The market value of the loaned securities is determined at the close of business of the fund and any additional required collateral is delivered to the fund on the next business day. The lending agent provides the fund with indemnification against Borrower default. In the event of Borrower default, the lending agent will, for the benefit of the fund, either purchase securities identical to those loaned or, when such purchase is commercially impracticable, pay the fund the market value of the loaned securities. In return, the lending agent assumes
29
Notes to Financial Statements – continued
the fund’s rights to the related collateral. If the collateral value is less than the cost to purchase identical securities, the lending agent is responsible for the shortfall, but only to the extent that such shortfall is not due to a decline in collateral value resulting from collateral reinvestment for which the fund bears the risk of loss. A portion of the income generated upon investment of the collateral is remitted to the Borrowers, and the remainder is allocated between the fund and the lending agent. On loans collateralized by U.S. Treasury and/or federal agency obligations, a fee is received from the Borrower, and is allocated between the fund and the lending agent. Income from securities lending is separately reported in the Statement of Operations. The dividend and interest income earned on the securities loaned is accounted for in the same manner as other dividend and interest income. At October 31, 2019, there were no securities on loan or collateral outstanding.
Indemnifications– Under the fund’s organizational documents, its officers and Trustees may be indemnified against certain liabilities and expenses arising out of the performance of their duties to the fund. Additionally, in the normal course of business, the fund enters into agreements with service providers that may contain indemnification clauses. The fund’s maximum exposure under these agreements is unknown as this would involve future claims that may be made against the fund that have not yet occurred.
Investment Transactions and Income– Investment transactions are recorded on the trade date. Interest income is recorded on the accrual basis. Dividends received in cash are recorded on theex-dividend date. Certain dividends from foreign securities will be recorded when the fund is informed of the dividend if such information is obtained subsequent to theex-dividend date. Dividend payments received in additional securities are recorded on theex-dividend date in an amount equal to the value of the security on such date.
The fund may receive proceeds from litigation settlements. Any proceeds received from litigation involving portfolio holdings are reflected in the Statement of Operations in realized gain/loss if the security has been disposed of by the fund or in unrealized gain/loss if the security is still held by the fund. Any other proceeds from litigation not related to portfolio holdings are reflected as other income in the Statement of Operations.
Fees Paid Indirectly– The fund’s custody fee may be reduced by a credit earned under an arrangement that measures the value of U.S. dollars deposited with the custodian by the fund. The amount of the credit, for the year ended October 31, 2019, is shown as a reduction of total expenses in the Statement of Operations.
Tax Matters and Distributions– The fund intends to qualify as a regulated investment company, as defined under Subchapter M of the Internal Revenue Code, and to distribute all of its taxable income, including realized capital gains. As a result, no provision for federal income tax is required. The fund’s federal tax returns, when filed, will remain subject to examination by the Internal Revenue Service for a three year period. Management has analyzed the fund’s tax positions taken on federal and state tax returns for all open tax years and does not believe that there are any uncertain tax positions that require recognition of a tax liability. Foreign taxes, if any, have been accrued by the fund in the accompanying financial statements in accordance with the
30
Notes to Financial Statements – continued
applicable foreign tax law. Foreign income taxes may be withheld by certain countries in which the fund invests. Additionally, capital gains realized by the fund on securities issued in or by certain foreign countries may be subject to capital gains tax imposed by those countries.
Distributions to shareholders are recorded on theex-dividend date. Income and capital gain distributions are determined in accordance with income tax regulations, which may differ from U.S. generally accepted accounting principles. Certain capital accounts in the financial statements are periodically adjusted for permanent differences in order to reflect their tax character. These adjustments have no impact on net assets or net asset value per share. Temporary differences which arise from recognizing certain items of income, expense, gain or loss in different periods for financial statement and tax purposes will reverse at some time in the future.
Book/tax differences primarily relate to wash sale loss deferrals, treating a portion of the proceeds from redemptions as a distribution for tax purposes, and redemptionsin-kind.
The tax character of distributions declared to shareholders for the last two fiscal years is as follows:
| | | | | | | | |
| | |
| | | Year ended
10/31/19 | | | Year ended
10/31/18 | |
| Ordinary income (including any short-term capital gains) | | | $35,150,548 | | | | $32,405,740 | |
| Long-term capital gains | | | 114,999,827 | | | | 60,667,574 | |
| | |
| Total distributions | | | $150,150,375 | | | | $93,073,314 | |
The federal tax cost and the tax basis components of distributable earnings were as follows:
| | | | |
| |
| As of 10/31/19 | | | |
| |
| Cost of investments | | | $1,846,547,757 | |
| Gross appreciation | | | 1,195,014,843 | |
| |
| Gross depreciation | | | (64,474,955 | ) |
| Net unrealized appreciation (depreciation) | | | $1,130,539,888 | |
| |
| Undistributed ordinary income | | | 30,295,094 | |
| Undistributed long-term capital gain | | | 33,890,102 | |
| Other temporary differences | | | (87,475 | ) |
Multiple Classes of Shares of Beneficial Interest– The fund offers multiple classes of shares, which differ in their respective distribution and service fees. The fund’s income, realized and unrealized gain (loss), and common expenses are allocated to shareholders based on the daily net assets of each class. Dividends are declared separately for each class. Differences in per share dividend rates are generally due to differences in separate class expenses. Class B shares will convert to Class A shares approximately eight years after purchase. Class C shares will convert to Class A shares
31
Notes to Financial Statements – continued
approximately ten years after purchase. The fund’s distributions declared to shareholders as reported in the Statements of Changes in Net Assets are presented by class as follows:
| | | | | | | | |
| | |
| | | Year
ended
10/31/19 | | | Year
ended
10/31/18 | |
| Class A | | | $34,533,060 | | | | $18,892,006 | |
| Class B | | | 1,180,565 | | | | 640,118 | |
| Class C | | | 7,530,989 | | | | 4,215,307 | |
| Class I | | | 48,190,668 | | | | 30,524,519 | |
| Class R1 | | | 133,156 | | | | 78,129 | |
| Class R2 | | | 2,042,306 | | | | 1,234,246 | |
| Class R3 | | | 4,541,220 | | | | 2,895,810 | |
| Class R4 | | | 7,338,749 | | | | 4,109,675 | |
| Class R6 | | | 44,659,662 | | | | 30,483,504 | |
| Total | | | $150,150,375 | | | | $93,073,314 | |
(3) Transactions with Affiliates
Investment Adviser– The fund has an investment advisory agreement with MFS to provide overall investment management and related administrative services and facilities to the fund. The management fee is computed daily and paid monthly at the following annual rates based on the fund’s average daily net assets:
| | | | |
| Up to $1 billion | | | 0.90 | % |
| In excess of $1 billion and up to $2 billion | | | 0.75 | % |
| In excess of $2 billion and up to $5 billion | | | 0.65 | % |
| In excess of $5 billion | | | 0.60 | % |
MFS has agreed in writing to reduce its management fee by a specified amount if certain MFS mutual fund assets exceed thresholds agreed to by MFS and the fund’s Board of Trustees. For the year ended October 31, 2019, this management fee reduction amounted to $278,732, which is included in the reduction of total expenses in the Statement of Operations. The management fee incurred for the year ended October 31, 2019 was equivalent to an annual effective rate of 0.76% of the fund’s average daily net assets.
Distributor– MFS Fund Distributors, Inc. (MFD), a wholly-owned subsidiary of MFS, as distributor, received $120,090 for the year ended October 31, 2019, as its portion of the initial sales charge on sales of Class A shares of the fund.
The Board of Trustees has adopted a distribution plan for certain share classes pursuant to Rule12b-1 of the Investment Company Act of 1940.
The fund’s distribution plan provides that the fund will pay MFD for services provided by MFD and financial intermediaries in connection with the distribution and servicing of certain share classes. One component of the plan is a distribution fee paid to MFD and another component of the plan is a service fee paid to MFD. MFD may subsequently pay all, or a portion, of the distribution and/or service fees to financial intermediaries.
32
Notes to Financial Statements – continued
Distribution Plan Fee Table:
| | | | | | | | | | | | | | | | | | | | |
| | | | | |
| | | Distribution
Fee Rate (d) | | | Service
Fee Rate (d) | | | Total
Distribution
Plan (d) | | | Annual
Effective
Rate (e) | | | Distribution
and Service
Fee | |
| Class A | | | — | | | | 0.25% | | | | 0.25% | | | | 0.25% | | | | $1,724,341 | |
| Class B | | | 0.75% | | | | 0.25% | | | | 1.00% | | | | 1.00% | | | | 238,125 | |
| Class C | | | 0.75% | | | | 0.25% | | | | 1.00% | | | | 1.00% | | | | 1,464,287 | |
| Class R1 | | | 0.75% | | | | 0.25% | | | | 1.00% | | | | 1.00% | | | | 24,576 | |
| Class R2 | | | 0.25% | | | | 0.25% | | | | 0.50% | | | | 0.50% | | | | 200,249 | |
| Class R3 | | | — | | | | 0.25% | | | | 0.25% | | | | 0.25% | | | | 223,714 | |
| Total Distribution and Service Fees | | | | | | | | | | | | $3,875,292 | |
| (d) | In accordance with the distribution plan for certain classes, the fund pays distribution and/or service fees equal to these annual percentage rates of each class’s average daily net assets. The distribution and service fee rates disclosed by class represent the current rates in effect at the end of the reporting period. Any rate changes, if applicable, are detailed below. |
| (e) | The annual effective rates represent actual fees incurred under the distribution plan for the year ended October 31, 2019 based on each class’s average daily net assets. MFD has voluntarily agreed to rebate a portion of each class’s 0.25% service fee attributable to accounts for which MFD retains the 0.25% service fee except for accounts attributable to MFS or its affiliates’ seed money. For the year ended October 31, 2019, this rebate amounted to $29,682, $429, and $843 for Class A, Class B, and Class C, respectively, and is included in the reduction of total expenses in the Statement of Operations. |
Certain Class A shares are subject to a contingent deferred sales charge (CDSC) in the event of a shareholder redemption within 18 months of purchase. Class B shares are subject to a CDSC in the event of a shareholder redemption within six years of purchase. Class C shares are subject to a CDSC in the event of a shareholder redemption within 12 months of purchase. All contingent deferred sales charges are paid to MFD and during the year ended October 31, 2019, were as follows:
| | | | |
| |
| | | Amount | |
| Class A | | | $8,691 | |
| Class B | | | 30,637 | |
| Class C | | | 13,975 | |
Shareholder Servicing Agent– MFS Service Center, Inc. (MFSC), a wholly-owned subsidiary of MFS, receives a fee from the fund for its services as shareholder servicing agent calculated as a percentage of the average daily net assets of the fund as determined periodically under the supervision of the fund’s Board of Trustees. For the year ended October 31, 2019, the fee was $165,833, which equated to 0.0058% annually of the fund’s average daily net assets. MFSC also receives payment from the fund forout-of-pocket expenses,sub-accounting and other shareholder servicing costs which may be paid to affiliated and unaffiliated service providers. Class R6 shares do not incursub-accounting fees. For the year ended October 31, 2019, theseout-of-pocket expenses,sub-accounting and other shareholder servicing costs amounted to $1,986,495.
Administrator– MFS provides certain financial, legal, shareholder communications, compliance, and other administrative services to the fund. Under an administrative services agreement, the fund reimburses MFS the costs incurred to provide these
services. The fund is charged an annual fixed amount of $17,500 plus a fee based on
33
Notes to Financial Statements – continued
average daily net assets. The administrative services fee incurred for the year ended October 31, 2019 was equivalent to an annual effective rate of 0.0137% of the fund’s average daily net assets.
Trustees’ and Officers’ Compensation– The fund pays compensation to independent Trustees in the form of a retainer, attendance fees, and additional compensation to Board and Committee chairpersons. The fund does not pay compensation directly to Trustees or officers of the fund who are also officers of the investment adviser, all of whom receive remuneration from MFS for their services to the fund. Certain officers and Trustees of the fund are officers or directors of MFS, MFD, and MFSC.
Prior to December 31, 2001, the fund had an unfunded defined benefit plan (“DB plan”) for independent Trustees. As of December 31, 2001, the Board took action to terminate the DB plan with respect to then-current and any future independent Trustees, such that the DB plan covers only certain of those former independent Trustees who retired on or before December 31, 2001. The DB plan resulted in a pension expense of $1,705 and is included in “Independent Trustees’ compensation” in the Statement of Operations for the year ended October 31, 2019. The liability for deferred retirement benefits payable to those former independent Trustees under the DB plan amounted to $4,265 at October 31, 2019, and is included in “Payable for independent Trustees’ compensation” in the Statement of Assets and Liabilities.
Other– This fund and certain other funds managed by MFS (the funds) had entered into a service agreement (the ISO Agreement) which provided for payment of fees solely by the funds to Tarantino LLC in return for the provision of services of an Independent Senior Officer (ISO) for the funds. Frank L. Tarantino served as the ISO and was an officer of the funds and the sole member of Tarantino LLC. Effective June 30, 2019, Mr. Tarantino retired from his position as ISO for the funds, and the ISO Agreement was terminated. For the year ended October 31, 2019, the fee paid by the fund under this agreement was $4,000 and is included in “Miscellaneous” expense in the Statement of Operations. MFS had agreed to bear all expenses associated with office space, other administrative support, and supplies provided to the ISO.
The fund invests in the MFS Institutional Money Market Portfolio which is managed by MFS and seeks current income consistent with preservation of capital and liquidity. This money market fund does not pay a management fee to MFS.
The fund is permitted to engage in purchase and sale transactions with funds and accounts for which MFS serves as investment adviser orsub-adviser (“cross-trades”) pursuant to a policy adopted by the Board of Trustees. This policy has been designed to ensure that cross-trades conducted by the fund comply with Rule17a-7 under the Investment Company Act of 1940. During the year ended October 31, 2019, the fund engaged in purchase and sale transactions pursuant to this policy, which amounted to $65,799 and $793,901, respectively. The sales transactions resulted in net realized gains (losses) of $9,967.
(4) Portfolio Securities
For the year ended October 31, 2019, purchases and sales of investments, other thanin-kind transactions and short-term obligations, aggregated $192,627,585 and $391,913,075, respectively.
34
Notes to Financial Statements – continued
(5) Shares of Beneficial Interest
The fund’s Declaration of Trust permits the Trustees to issue an unlimited number of full and fractional shares of beneficial interest. Transactions in fund shares were as follows:
| | | | | | | | | | | | | | | | |
| | | Year ended
10/31/19 | | | Year ended
10/31/18 | |
| | | | |
| | | Shares | | | Amount | | | Shares | | | Amount | |
| Shares sold | | | | | | | | | | | | | | | | |
Class A | | | 1,834,787 | | | | $77,780,471 | | | | 2,864,502 | | | | $124,994,713 | |
Class B | | | 21,732 | | | | 828,744 | | | | 65,490 | | | | 2,642,429 | |
Class C | | | 403,014 | | | | 14,852,786 | | | | 764,864 | | | | 29,511,781 | |
Class I | | | 6,060,092 | | | | 261,939,568 | | | | 5,933,741 | | | | 265,674,692 | |
Class R1 | | | 9,074 | | | | 339,632 | | | | 7,354 | | | | 290,220 | |
Class R2 | | | 186,212 | | | | 7,658,921 | | | | 210,731 | | | | 8,953,510 | |
Class R3 | | | 609,310 | | | | 26,048,949 | | | | 513,201 | | | | 22,256,413 | |
Class R4 | | | 558,516 | | | | 23,967,656 | | | | 663,792 | | | | 29,092,007 | |
Class R6 | | | 4,633,798 | | | | 206,816,959 | | | | 4,887,034 | | | | 217,932,872 | |
| | | 14,316,535 | | | | $620,233,686 | | | | 15,910,709 | | | | $701,348,637 | |
| | | | |
| Shares issued to shareholders in reinvestment of distributions | | | | | | | | | | | | | | | | |
Class A | | | 818,404 | | | | $31,786,855 | | | | 402,196 | | | | $17,286,370 | |
Class B | | | 32,088 | | | | 1,148,743 | | | | 15,640 | | | | 622,014 | |
Class C | | | 193,314 | | | | 6,601,665 | | | | 97,978 | | | | 3,727,079 | |
Class I | | | 1,110,657 | | | | 44,270,813 | | | | 639,357 | | | | 28,163,671 | |
Class R1 | | | 3,807 | | | | 133,156 | | | | 2,009 | | | | 78,129 | |
Class R2 | | | 47,826 | | | | 1,804,464 | | | | 26,170 | | | | 1,093,652 | |
Class R3 | | | 117,770 | | | | 4,541,220 | | | | 67,606 | | | | 2,886,104 | |
Class R4 | | | 184,471 | | | | 7,179,608 | | | | 94,740 | | | | 4,081,380 | |
Class R6 | | | 1,090,631 | | | | 43,461,647 | | | | 677,110 | | | | 29,833,465 | |
| | | 3,598,968 | | | | $140,928,171 | | | | 2,022,806 | | | | $87,771,864 | |
| | | | |
| Shares reacquired | | | | | | | | | | | | | | | | |
Class A | | | (3,093,163 | ) | | | $(130,594,134 | ) | | | (3,273,753 | ) | | | $(143,127,341 | ) |
Class B | | | (164,089 | ) | | | (6,417,048 | ) | | | (157,520 | ) | | | (6,344,810 | ) |
Class C | | | (1,109,138 | ) | | | (41,137,311 | ) | | | (1,460,413 | ) | | | (56,092,959 | ) |
Class I | | | (9,024,403 | ) | | | (380,492,105 | ) | | | (8,606,925 | ) | | | (383,948,578 | ) |
Class R1 | | | (20,356 | ) | | | (737,374 | ) | | | (28,288 | ) | | | (1,078,932 | ) |
Class R2 | | | (417,577 | ) | | | (17,485,740 | ) | | | (463,573 | ) | | | (19,671,067 | ) |
Class R3 | | | (911,470 | ) | | | (38,697,353 | ) | | | (917,421 | ) | | | (39,811,959 | ) |
Class R4 | | | (1,883,374 | ) | | | (83,382,426 | ) | | | (761,792 | ) | | | (33,351,273 | ) |
Class R6 | | | (5,124,654 | ) | | | (229,810,944 | ) | | | (9,749,566 | ) | | | (439,388,327 | ) |
| | | (21,748,224 | ) | | | $(928,754,435 | ) | | | (25,419,251 | ) | | | $(1,122,815,246 | ) |
35
Notes to Financial Statements – continued
| | | | | | | | | | | | | | | | |
| | | Year ended
10/31/19 | | | Year ended
10/31/18 | |
| | | | |
| | | Shares | | | Amount | | | Shares | | | Amount | |
| Net change | | | | | | | | | | | | | | | | |
Class A | | | (439,972 | ) | | | $(21,026,808 | ) | | | (7,055 | ) | | | $(846,258 | ) |
Class B | | | (110,269 | ) | | | (4,439,561 | ) | | | (76,390 | ) | | | (3,080,367 | ) |
Class C | | | (512,810 | ) | | | (19,682,860 | ) | | | (597,571 | ) | | | (22,854,099 | ) |
Class I | | | (1,853,654 | ) | | | (74,281,724 | ) | | | (2,033,827 | ) | | | (90,110,215 | ) |
Class R1 | | | (7,475 | ) | | | (264,586 | ) | | | (18,925 | ) | | | (710,583 | ) |
Class R2 | | | (183,539 | ) | | | (8,022,355 | ) | | | (226,672 | ) | | | (9,623,905 | ) |
Class R3 | | | (184,390 | ) | | | (8,107,184 | ) | | | (336,614 | ) | | | (14,669,442 | ) |
Class R4 | | | (1,140,387 | ) | | | (52,235,162 | ) | | | (3,260 | ) | | | (177,886 | ) |
Class R6 | | | 599,775 | | | | 20,467,662 | | | | (4,185,422 | ) | | | (191,621,990 | ) |
| | | (3,832,721 | ) | | | $(167,592,578 | ) | | | (7,485,736 | ) | | | $(333,694,745 | ) |
Class T shares were not publicly available for sale during the period. Please see the fund’s prospectus for details.
Effective June 1, 2019, purchases of the fund’s Class B shares are closed to new and existing investors subject to certain exceptions. Please see the fund’s prospectus for details.
(6) Line of Credit
The fund and certain other funds managed by MFS participate in a $1.25 billion unsecured committed line of credit, subject to a $1 billion sublimit, provided by a syndicate of banks under a credit agreement. Borrowings may be made for temporary financing needs. Interest is charged to each fund, based on its borrowings, generally at a rate equal to the highest of one month LIBOR, the Federal Funds Effective Rate and the Overnight Bank Funding Rate, plus an agreed upon spread. A commitment fee, based on the average daily, unused portion of the committed line of credit, is allocated among the participating funds. In addition, the fund and other funds managed by MFS have established unsecured uncommitted borrowing arrangements with certain banks for temporary financing needs. Interest is charged to each fund, based on its borrowings, at rates equal to customary reference rates plus an agreed upon spread. For the year ended October 31, 2019, the fund’s commitment fee and interest expense were $16,072 and $0, respectively, and are included in “Miscellaneous” expense in the Statement of Operations.
36
Notes to Financial Statements – continued
(7) Investments in Affiliated Issuers
An affiliated issuer may be considered one in which the fund owns 5% or more of the outstanding voting securities, or a company which is under common control. For the purposes of this report, the following were affiliated issuers:
| | | | | | | | | | | | | | | | | | | | | | | | |
| | | | | | |
| Affiliated Issuers | | Beginning
Value | | | Purchases | | | Sales
Proceeds | | | Realized
Gain
(Loss) | | | Change in
Unrealized
Appreciation or
Depreciation | | | Ending
Value | |
| MFS Institutional Money Market Portfolio | | | $4,015,260 | | | | $338,779,283 | | | | $332,132,908 | | | | $7,792 | | | | $1,014 | | | | $10,670,441 | |
| | | | | | |
| Affiliated Issuers | | | | | | | | | | | | | | Dividend
Income | | | Capital Gain
Distributions | |
| MFS Institutional Money Market Portfolio | | | | | | | | | | | | $305,689 | | | | $— | |
(8) Redemptions In-Kind
On July 1, 2019, the fund recorded a redemption in-kind of portfolio securities and cash that was valued at $96,265,804. The redeeming shareholder generally receives a pro rata share of the securities held by the fund. The distribution of such securities generated a realized gain of $55,021,827 for the fund, which is included in Net realized gain (loss) in the Statement of Operations. For tax purposes, no gains or losses were recognized.
37
REPORT OF INDEPENDENT REGISTERED PUBLIC ACCOUNTING FIRM
To the Shareholders of MFS Global Equity Fund and the Board of Trustees of MFS Series Trust VI
Opinion on the Financial Statements
We have audited the accompanying statement of assets and liabilities of MFS Global Equity Fund (the “Fund”) (one of the funds constituting MFS Series Trust VI (the “Trust”)), including the portfolio of investments, as of October 31, 2019,and the related statement of operations for the year then ended, the statements of changes in net assets for each of the two years in the period then ended, the financial highlights for each of the five years in the period then ended and the related notes (collectively referred to as the “financial statements”). In our opinion, the financial statements present fairly, in all material respects, the financial position of the Fund (one of the funds constituting MFS Series Trust VI) at October 31, 2019, the results of its operations for the year then ended, the changes in its net assets for each of the two years in the period then ended and its financial highlights for each of the five years in the period then ended, in conformity with U.S. generally accepted accounting principles.
Basis for Opinion
These financial statements are the responsibility of the Trust’s management. Our responsibility is to express an opinion on the Fund’s financial statements based on our audits. We are a public accounting firm registered with the Public Company Accounting Oversight Board (United States) (“PCAOB”) and are required to be independent with respect to the Trust in accordance with the U.S. federal securities laws and the applicable rules and regulations of the Securities and Exchange Commission and the PCAOB.
We conducted our audits in accordance with the standards of the PCAOB. Those standards require that we plan and perform the audit to obtain reasonable assurance about whether the financial statements are free of material misstatement, whether due to error or fraud. The Trust is not required to have, nor were we engaged to perform, an audit of the Trust’s internal control over financial reporting. As part of our audits, we are required to obtain an understanding of internal control over financial reporting but not for the purpose of expressing an opinion on the effectiveness of the Trust’s internal control over financial reporting. Accordingly, we express no such opinion.
Our audits included performing procedures to assess the risks of material misstatement of the financial statements, whether due to error or fraud, and performing procedures that respond to those risks. Such procedures included examining, on a test basis, evidence regarding the amounts and disclosures in the financial statements. Our procedures included confirmation of securities owned as of October 31, 2019,by correspondence with the custodian andothers or by other appropriate auditing procedures where replies from others were not received. Our audits also included
38
Report of Independent Registered Public Accounting Firm – continued
evaluating the accounting principles used and significant estimates made by management, as well as evaluating the overall presentation of the financial statements. We believe that our audits provide a reasonable basis for our opinion.

We have served as the auditor of one or more MFS investment companies since 1993.
Boston, Massachusetts
December 16, 2019
39
TRUSTEES AND OFFICERS — IDENTIFICATION AND BACKGROUND
The Trustees and Officers of the Trust, as of December 1, 2019, are listed below, together with their principal occupations during the past five years. (Their titles may have varied during that period.) The address of each Trustee and Officer is 111 Huntington Avenue, Boston, Massachusetts 02199-7618.
| | | | | | | | | | |
Name, Age | | Position(s)
Held with Fund | | Trustee/Officer Since (h) | | Number of
MFS Funds
overseen
by the
Trustee | | Principal Occupations During the Past Five Years | | Other Directorships
During the Past
Five Years (j) |
| INTERESTED TRUSTEES |
Robert J. Manning (k)
(age 56) | | Trustee | | February 2004 | | 133 | | Massachusetts Financial Services Company, Executive Chairman (since January 2017); Director; Chairman of the Board; Chief Executive Officer (until 2015);Co-Chief Executive Officer (2015-2016) | | N/A |
| | | | | |
Robin A. Stelmach (k) (age 58) | | Trustee | | January 2014 | | 133 | | Massachusetts Financial Services Company, Vice Chair (since January 2017); Chief Operating Officer and Executive Vice President (until January 2017) | | N/A |
| INDEPENDENT TRUSTEES |
John P. Kavanaugh (age 65) | | Trustee and Chair of Trustees | | January 2009 | | 133 | | Private investor | | N/A |
| | | | | |
Steven E. Buller (age 68) | | Trustee | | February 2014 | | 133 | | Financial Accounting Standards Advisory Council, Chairman (2014-2015); Public Company Accounting Oversight Board, Standing Advisory Group, Member (until 2014); BlackRock, Inc. (investment management), Managing Director (until 2014), BlackRock Finco UK (investment management), Director (until 2014) | | N/A |
40
Trustees and Officers – continued
| | | | | | | | | | |
Name, Age | | Position(s)
Held with Fund | | Trustee/Officer Since (h) | | Number of
MFS Funds
overseen
by the
Trustee | | Principal Occupations During the Past Five Years | | Other Directorships
During the Past
Five Years (j) |
John A. Caroselli (age 65) | | Trustee | | March 2017 | | 133 | | JC Global Advisors, LLC (management consulting), President (since 2015); First Capital Corporation (commercial finance), Executive Vice President (until 2015) | | N/A |
| | | | | |
Maureen R. Goldfarb (age 64) | | Trustee | | January 2009 | | 133 | | Private investor | | N/A |
| | | | | |
Michael Hegarty* (age 74) | | Trustee | | December 2004 | | 133 | | Private investor | | Rouse Properties Inc., Director (until 2016); Capmark Financial Group Inc., Director (until 2015) |
| | | | | |
Peter D. Jones (age 64) | | Trustee | | January 2019 | | 133 | | Franklin Templeton Distributors, Inc. (investment management), President (until 2015); Franklin Templeton Institutional, LLC (investment management), Chairman (until 2015) | | N/A |
| | | | | |
James W. Kilman, Jr. (age 58) | | Trustee | | January 2019 | | 133 | | Burford Capital Limited (finance and investment management), Chief Financial Officer (since 2019); KielStrand Capital LLC (family office and merchant bank), Chief Executive Officer (since 2016); Morgan Stanley & Co. (financial services), Vice Chairman of Investment Banking,Co-Head of Diversified Financials Coverage – Financial Institutions Investment Banking Group (until 2016) | | Alpha-En Corporation, Director (since 2016) |
41
Trustees and Officers – continued
| | | | | | | | | | |
Name, Age | | Position(s)
Held with Fund | | Trustee/Officer Since (h) | | Number of
MFS Funds
overseen
by the
Trustee | | Principal Occupations During the Past Five Years | | Other Directorships
During the Past
Five Years (j) |
Clarence Otis, Jr. (age 63) | | Trustee | | March 2017 | | 133 | | Darden Restaurants, Inc., Chief Executive Officer (until 2014) | | VF Corporation, Director; Verizon Communications, Inc., Director; The Travelers Companies, Director; Federal Reserve Bank of Atlanta, Director (until 2015) |
| | | | | |
Maryanne L. Roepke (age 63) | | Trustee | | May 2014 | | 133 | | American Century Investments (investment management), Senior Vice President and Chief Compliance Officer (until 2014) | | N/A |
| | | | | |
Laurie J. Thomsen (age 62) | | Trustee | | March 2005 | | 133 | | Private investor | | The Travelers Companies, Director; Dycom Industries, Inc., Director (since 2015) |
| | | | | | | | |
Name, Age | | Position(s) Held with Fund | | Trustee/Officer
Since (h) | | Number of
MFS Funds
for which
the Person is an Officer | | Principal
Occupations During the Past Five Years |
| OFFICERS | | | | | | | | |
Christopher R. Bohane (k) (age 45) | | Assistant Secretary and Assistant Clerk | | July 2005 | | 133 | | Massachusetts Financial Services Company, Vice President and Assistant General Counsel |
| | | | |
Kino Clark (k) (age 51) | | Assistant Treasurer | | January 2012 | | 133 | | Massachusetts Financial Services Company, Vice President |
| | | | |
John W. Clark, Jr. (k) (age 52) | | Assistant Treasurer | | April 2017 | | 133 | | Massachusetts Financial Services Company, Vice President (since March 2017); Deutsche Bank (financial services), Department Head – Treasurer’s Office (until February 2017) |
42
Trustees and Officers – continued
| | | | | | | | |
Name, Age | | Position(s) Held with Fund | | Trustee/Officer
Since (h) | | Number of
MFS Funds
for which
the Person is an Officer | | Principal
Occupations During the Past Five Years |
Thomas H. Connors (k) (age 60) | | Assistant Secretary and Assistant Clerk | | September 2012 | | 133 | | Massachusetts Financial Services Company, Vice President and Senior Counsel |
| | | | |
David L. DiLorenzo (k) (age 51) | | President | | July 2005 | | 133 | | Massachusetts Financial Services Company, Senior Vice President |
| | | | |
Heidi W. Hardin (k) (age 52) | | Secretary and Clerk | | April 2017 | | 133 | | Massachusetts Financial Services Company, Executive Vice President and General Counsel (since March 2017); Harris Associates (investment management), General Counsel (from September 2015 to January 2017); Janus Capital Management LLC (investment management), Senior Vice President and General Counsel (until September 2015) |
| | | | |
Brian E. Langenfeld (k) (age 46) | | Assistant Secretary and Assistant Clerk | | June 2006 | | 133 | | Massachusetts Financial Services Company, Vice President and Senior Counsel |
| | | | |
Amanda S. Mooradian (k) (age 40) | | Assistant Secretary and Assistant Clerk | | September 2018 | | 133 | | Massachusetts Financial Services Company, Assistant Vice President and Counsel |
| | | | |
Susan A. Pereira (k) (age 49) | | Assistant Secretary and Assistant Clerk | | July 2005 | | 133 | | Massachusetts Financial Services Company, Vice President and Assistant General Counsel |
| | | | |
Kasey L. Phillips (k) (age 48) | | Assistant Treasurer | | September 2012 | | 133 | | Massachusetts Financial Services Company, Vice President |
| | | | |
Matthew A. Stowe (k) (age 45) | | Assistant Secretary and Assistant Clerk | | October 2014 | | 133 | | Massachusetts Financial Services Company, Vice President and Assistant General Counsel |
| | | | |
Martin J. Wolin (k) (age 52) | | Chief Compliance Officer | | July 2015 | | 133 | | Massachusetts Financial Services Company, Senior Vice President and Chief Compliance Officer (since July 2015); Mercer (financial service provider), Chief Risk and Compliance Officer, North America and Latin America (until June 2015) |
43
Trustees and Officers – continued
| | | | | | | | |
Name, Age | | Position(s) Held with Fund | | Trustee/Officer
Since (h) | | Number of
MFS Funds
for which
the Person is an Officer | | Principal
Occupations During the Past Five Years |
James O. Yost (k) (age 59) | | Treasurer | | September 1990 | | 133 | | Massachusetts Financial Services Company, Senior Vice President |
| (h) | Date first appointed to serve as Trustee/officer of an MFS Fund. Each Trustee has served continuously since appointment unless indicated otherwise. For the period from December 15, 2004 until February 22, 2005, Mr. Manning served as Advisory Trustee. From January 2012 through December 2016, Messrs. DiLorenzo and Yost served as Treasurer and Deputy Treasurer of the Funds, respectively. |
| (j) | Directorships or trusteeships of companies required to report to the Securities and Exchange Commission (i.e., “public companies”). |
| (k) | “Interested person” of the Trust within the meaning of the Investment Company Act of 1940 (referred to as the 1940 Act), which is the principal federal law governing investment companies like the fund, as a result of a position with MFS. The address of MFS is 111 Huntington Avenue, Boston, Massachusetts 02199-7618. |
| * | As of December 31, 2019, Mr. Hegarty will retire as Trustee. |
Each Trustee (other than Messrs. Jones and Kilman) has been elected by shareholders and each Trustee and Officer holds office until his or her successor is chosen and qualified or until his or her earlier death, resignation, retirement or removal. Messrs. Jones and Kilman became Trustees of the Funds on January 1, 2019. The Trust does not hold annual meetings for the purpose of electing Trustees, and Trustees are not elected for fixed terms. Under the terms of the Board’s retirement policy, an Independent Trustee shall retire at the end of the calendar year in which he or she reaches the earlier of 75 years of age or 15 years of service on the Board (or, in the case of any Independent Trustee who joined the Board prior to 2015, 20 years of service on the Board).
Messrs. Buller, Hegarty, Kilman and Otis and Ms. Roepke are members of the Trust’s Audit Committee. As of December 31, 2019, Mr. Hegarty will retire as Trustee and will no longer be a member of the Trust’s Audit Committee.
Each of the Interested Trustees and certain Officers hold comparable officer positions with certain affiliates of MFS.
The Statement of Additional Information for a Fund includes further information about the Trustees and is available without charge upon request by calling1-800-225-2606.
| | |
| Investment Adviser | | Custodian |
Massachusetts Financial Services Company
111 Huntington Avenue Boston, MA 02199-7618 | | JPMorgan Chase Bank, NA 4 Metrotech Center New York, NY 11245 |
| Distributor | | Independent Registered Public Accounting Firm |
MFS Fund Distributors, Inc.
111 Huntington Avenue Boston, MA 02199-7618 | | Ernst & Young LLP 200 Clarendon Street Boston, MA 02116 |
| Portfolio Manager(s) | | |
Ryan McAllister Roger Morley | | |
44
BOARD REVIEW OF INVESTMENT ADVISORY AGREEMENT
The Investment Company Act of 1940 requires that both the full Board of Trustees and a majority of thenon-interested (“independent”) Trustees, voting separately, annually approve the continuation of the Fund’s investment advisory agreement with MFS. The Trustees consider matters bearing on the Fund and its advisory arrangements at their meetings throughout the year, including a review of performance data at each regular meeting. In addition, the independent Trustees met several times over the course of three months beginning in May and ending in July, 2019 (“contract review meetings”) for the specific purpose of considering whether to approve the continuation of the investment advisory agreement for the Fund and the other investment companies that the Board oversees (the “MFS Funds”). The independent Trustees were assisted in their evaluation of the Fund’s investment advisory agreement by independent legal counsel, from whom they received separate legal advice and with whom they met separately from MFS during various contract review meetings. The independent Trustees were also assisted in this process by the MFS Funds’ Independent Senior Officer, a senior officer appointed by and reporting to the independent Trustees.
In connection with their deliberations regarding the continuation of the investment advisory agreement, the Trustees, including the independent Trustees, considered such information and factors as they believed, in light of the legal advice furnished to them and their own business judgment, to be relevant. The investment advisory agreement for the Fund was considered separately, although the Trustees also took into account the common interests of all MFS Funds in their review. As described below, the Trustees considered the nature, quality, and extent of the various investment advisory, administrative, and shareholder services performed by MFS under the existing investment advisory agreement and other arrangements with the Fund.
In connection with their contract review meetings, the Trustees received and relied upon materials that included, among other items: (i) information provided by Broadridge Financial Solutions, Inc. (“Broadridge”), an independent third party, on the investment performance of the Fund for various time periods ended December 31, 2018 and the investment performance of a group of funds with substantially similar investment classifications/objectives (the “Broadridge performance universe”), (ii) information provided by Broadridge on the Fund’s advisory fees and other expenses and the advisory fees and other expenses of comparable funds identified by Broadridge as well as all other funds in the same investment classification/category (the “Broadridge expense group and universe”), (iii) information provided by MFS on the advisory fees of portfolios of other clients of MFS, including institutional separate accounts and other clients, (iv) information as to whether and to what extent applicable expense waivers, reimbursements or fee “breakpoints” are observed for the Fund, (v) information regarding MFS’ financial results and financial condition, including MFS’ and certain of its affiliates’ estimated profitability from services performed for the Fund and the MFS Funds as a whole, and compared to MFS’ institutional business, (vi) MFS’ views regarding the outlook for the mutual fund industry and the strategic business plans of MFS, (vii) descriptions of various functions performed by MFS for the Funds, such as compliance monitoring and portfolio trading practices, and (viii) information regarding the overall organization of MFS, including information about MFS’ senior management
45
Board Review of Investment Advisory Agreement – continued
and other personnel providing investment advisory, administrative and other services to the Fund and the other MFS Funds. The comparative performance, fee and expense information prepared and provided by Broadridge was not independently verified and the independent Trustees did not independently verify any information provided to them by MFS.
The Trustees’ conclusion as to the continuation of the investment advisory agreement was based on a comprehensive consideration of all information provided to the Trustees and not the result of any single factor. Some of the factors that figured particularly in the Trustees’ deliberations are described below, although individual Trustees may have evaluated the information presented differently from one another, giving different weights to various factors. It is also important to recognize that the fee arrangements for the Fund and other MFS Funds are the result of years of review and discussion between the independent Trustees and MFS, that certain aspects of such arrangements may receive greater scrutiny in some years than in others, and that the Trustees’ conclusions may be based, in part, on their consideration of these same arrangements during the course of the year and in prior years.
Based on information provided by Broadridge and MFS, the Trustees reviewed the Fund’s total return investment performance as well as the Broadridge performance universe over various time periods. The Trustees placed particular emphasis on the total return performance of the Fund’s Class A shares in comparison to the performance of funds in its Broadridge performance universe over the five-year period ended December 31, 2018, which the Trustees believed was a long enough period to reflect differing market conditions. The total return performance of the Fund’s Class A shares was in the 2nd quintile relative to the other funds in the universe for this five-year period (the 1st quintile being the best performers and the 5th quintile being the worst performers). The total return performance of the Fund’s Class A shares was in the 3rd quintile for theone-year period and the 2nd quintile for the three-year period ended December 31, 2018 relative to the Broadridge performance universe. Because of the passage of time, these performance results may differ from the performance results for more recent periods, including those shown elsewhere in this report.
In the course of their deliberations, the Trustees took into account information provided by MFS in connection with the contract review meetings, as well as during investment review meetings conducted with portfolio management personnel during the course of the year regarding the Fund’s performance. After reviewing these and related factors, the Trustees concluded, within the context of their overall conclusions regarding the investment advisory agreement, that they were satisfied with MFS’ responses and efforts relating to investment performance.
In assessing the reasonableness of the Fund’s advisory fee, the Trustees considered, among other information, the Fund’s advisory fee and the total expense ratio of the Fund’s Class A shares as a percentage of average daily net assets and the advisory fee and total expense ratios of the Broadridge expense group based on information provided by Broadridge. The Trustees considered that, according to the data provided by Broadridge (which takes into account any fee reductions or expense limitations that were in effect during the Fund’s last fiscal year), the Fund’s effective advisory fee rate was higher than the Broadridge expense group median and the Fund’s total expense ratio was lower than the Broadridge expense group median.
46
Board Review of Investment Advisory Agreement – continued
The Trustees also considered the advisory fees charged by MFS to any institutional separate accounts advised by MFS (“separate accounts”) and unaffiliated investment companies for which MFS serves as subadviser (“subadvised funds”) that have comparable investment strategies to the Fund, if any. In comparing these fees, the Trustees considered information provided by MFS as to the generally broader scope of services provided by MFS to the Fund, as well as the more extensive regulatory burdens imposed on MFS in managing the Fund, in comparison to separate accounts and subadvised funds. The Trustees also considered the higher demands placed on MFS’ investment personnel and trading infrastructure as a result of the daily cashin-flows andout-flows of the Fund in comparison to separate accounts.
The Trustees also considered whether the Fund may benefit from any economies of scale in the management of the Fund in the event of growth in assets of the Fund and/or growth in assets of the MFS Funds as a whole. They noted that the Fund’s advisory fee rate schedule is subject to contractual breakpoints that reduce the Fund’s advisory fee rate on average daily net assets over $1 billion, $2 billion and $5 billion. The Trustees also noted that MFS has agreed in writing to waive a portion of the management fees of certain MFS Funds, including the Fund, if the total combined assets of certain funds within the MFS Funds’ complex increase above agreed upon thresholds (the “group fee waiver”), enabling the Fund’s shareholders to share in the benefits from any economies of scale at the complex level. The group fee waiver is reviewed and renewed annually between the Board and MFS. The Trustees concluded that the breakpoints and the group fee waiver were sufficient to allow the Fund to benefit from economies of scale as its assets and overall complex assets grow.
The Trustees also considered information prepared by MFS relating to MFS’ costs and profits with respect to the Fund, the MFS Funds considered as a group, and other investment companies and accounts advised by MFS, as well as MFS’ methodologies used to determine and allocate its costs to the MFS Funds, the Fund and other accounts and products for purposes of estimating profitability.
After reviewing these and other factors described herein, the Trustees concluded, within the context of their overall conclusions regarding the investment advisory agreement, that the advisory fees charged to the Fund represent reasonable compensation in light of the services being provided by MFS to the Fund.
In addition, the Trustees considered MFS’ resources and related efforts to continue to retain, attract and motivate capable personnel to serve the Fund. The Trustees also considered current and developing conditions in the financial services industry, including the presence of large and well-capitalized companies which are spending, and appear to be prepared to continue to spend, substantial sums to engage personnel and to provide services to competing investment companies. In this regard, the Trustees also considered the financial resources of MFS and its ultimate parent, Sun Life Financial Inc. The Trustees also considered the advantages and possible disadvantages to the Fund of having an adviser that also serves other investment companies as well as other accounts.
The Trustees also considered the nature, quality, cost, and extent of administrative, transfer agency, and distribution services provided to the Fund by MFS and its affiliates under agreements and plans other than the investment advisory agreement, including
47
Board Review of Investment Advisory Agreement – continued
any12b-1 fees the Fund pays to MFS Fund Distributors, Inc., an affiliate of MFS. The Trustees also considered the nature, extent and quality of certain other services MFS performs or arranges for on the Fund’s behalf, which may include securities lending programs, directed expense payment programs, class action recovery programs, and MFS’ interaction with third-party service providers, principally custodians andsub-custodians. The Trustees concluded that the variousnon-advisory services provided by MFS and its affiliates on behalf of the Fund were satisfactory.
The Trustees consideredso-called“fall-out benefits” to MFS such as reputational value derived from serving as investment manager to the MFS Funds. The Trustees also considered that, effective January 3, 2018, MFS had discontinued its historic practice of obtaining investment research from portfolio brokerage commissions paid by certain MFS Funds and would thereafter directly pay for or voluntarily reimburse a Fund, if applicable, for the costs of external research acquired through the use of the Fund’s portfolio brokerage commissions.
Based on their evaluation of factors that they deemed to be material, including those factors described above, the Board of Trustees, including the independent Trustees, concluded that the Fund’s investment advisory agreement with MFS should be continued for an additionalone-year period, commencing August 1, 2019.
48
PROXY VOTING POLICIES AND INFORMATION
MFS votes proxies on behalf of the fund pursuant to proxy voting policies and procedures that are available without charge, upon request, by calling1-800-225-2606, by visitingmfs.com/proxyvoting,or by visiting the SEC’s Web site athttp://www.sec.gov.
Information regarding how the fund voted proxies relating to portfolio securities during the most recent twelve-month period ended June 30 is available by August 31 of each year without charge by visitingmfs.com/proxyvoting,or by visiting the SEC’s Web site athttp://www.sec.gov.
QUARTERLY PORTFOLIO DISCLOSURE
The fund files a complete schedule of portfolio holdings with the SEC for the first and third quarters of each fiscal year on Form N-Q or as an exhibit to its reports onForm N-PORT (for first and third fiscal quarters ending March 31, 2019 or after). The fund’s Form N-Q or Form N-PORT reports are available on the SEC’s website athttp://www.sec.gov.A shareholder can obtain the portfolio holdings report for the first and third quarters of the fund’s fiscal year atmfs.com/openendfunds by choosing the fund’s name and then selecting the “Resources” tab and clicking on “Prospectus and Reports”.
FURTHER INFORMATION
From time to time, MFS may post important information about the fund or the MFS funds on the MFS web site (mfs.com). This information is available athttps://www.mfs.com/en-us/what-we-do/announcements.htmlor atmfs.com/openendfundsby choosing the fund’s name.
INFORMATION ABOUT FUND CONTRACTS AND LEGAL CLAIMS
The fund has entered into contractual arrangements with an investment adviser, administrator, distributor, shareholder servicing agent, 529 program manager (if applicable), and custodian who each provide services to the fund. Unless expressly stated otherwise, shareholders are not parties to, or intended beneficiaries of these contractual arrangements, and these contractual arrangements are not intended to create any shareholder right to enforce them against the service providers or to seek any remedy under them against the service providers, either directly or on behalf of the fund.
Under the Trust’s By-Laws and Declaration of Trust, any claims asserted against or on behalf of the MFS Funds, including claims against Trustees and Officers, must be brought in state and federal courts located within the Commonwealth of Massachusetts.
FEDERAL TAX INFORMATION (unaudited)
The fund will notify shareholders of amounts for use in preparing 2019 income tax forms in January 2020. The following information is provided pursuant to provisions of the Internal Revenue Code.
The fund designates the maximum amount allowable as qualified dividend income eligible to be taxed at the same rate as long-term capital gain.
The fund designates $130,621,000 as capital gain dividends paid during the fiscal year.
For corporate shareholders, 67.89% of the ordinary income dividends paid during the fiscal year qualify for the corporate dividends received deduction.
Income derived from foreign sources was $43,734,549. The fund intends to pass through foreign tax credits of $3,592,141 for the fiscal year.
49
rev. 3/16
| | | | |
| | | |
FACTS | | WHAT DOES MFS DO WITH YOUR PERSONAL INFORMATION? | |  |
| | |
| Why? | | Financial companies choose how they share your personal information. Federal law gives consumers the right to limit some but not all sharing. Federal law also requires us to tell you how we collect, share, and protect your personal information. Please read this notice carefully to understand what we do. |
| | |
| What? | | The types of personal information we collect and share depend on the product or service you have with us. This information can include: • Social Security number and account balances • Account transactions and transaction history • Checking account information and wire transfer instructions When you areno longer our customer, we continue to share your information as described in this notice. |
| | |
| How? | | All financial companies need to share customers’ personal information to run their everyday business. In the section below, we list the reasons financial companies can share their customers’ personal information; the reasons MFS chooses to share; and whether you can limit this sharing. |
| | | | |
Reasons we can share your
personal information | | Does MFS
share? | | Can you limit
this sharing? |
For our everyday business purposes – such as to process your transactions, maintain your account(s), respond to court orders and legal investigations, or report to credit bureaus | | Yes | | No |
For our marketing purposes – to offer our products and services to you | | No | | We don’t share |
For joint marketing with other financial companies | | No | | We don’t share |
For our affiliates’ everyday business purposes – information about your transactions and experiences | | No | | We don’t share |
For our affiliates’ everyday business purposes – information about your creditworthiness | | No | | We don’t share |
| For nonaffiliates to market to you | | No | | We don’t share |
| | |
| | |
| Questions? | | Call800-225-2606 or go tomfs.com. |
50
| | |
| Who we are |
| Who is providing this notice? | | MFS Funds, MFS Investment Management, MFS Institutional Advisors, Inc., and MFS Heritage Trust Company. |
| | |
| What we do |
| How does MFS protect my personal information? | | To protect your personal information from unauthorized access and use, we use security measures that comply with federal law. These measures include procedural, electronic, and physical safeguards for the protection of the personal information we collect about you. |
| How does MFS collect my personal information? | | We collect your personal information, for example, when you • open an account or provide account information • direct us to buy securities or direct us to sell your securities • make a wire transfer We also collect your personal information from others, such as credit bureaus, affiliates, or other companies. |
| Why can’t I limit all sharing? | | Federal law gives you the right to limit only • sharing for affiliates’ everyday business purposes – information about your creditworthiness • affiliates from using your information to market to you • sharing for nonaffiliates to market to you State laws and individual companies may give you additional rights to limit sharing. |
| | |
| Definitions |
| Affiliates | | Companies related by common ownership or control. They can be financial and nonfinancial companies. • MFS does not share personal information with affiliates, except for everyday business purposes as described on page one of this notice. |
| Nonaffiliates | | Companies not related by common ownership or control. They can be financial and nonfinancial companies. • MFS does not share with nonaffiliates so they can market to you. |
| Joint marketing | | A formal agreement between nonaffiliated financial companies that together market financial products or services to you. • MFS doesn’t jointly market. |
| | |
| Other important information |
| If you own an MFS product or receive an MFS service in the name of a third party such as a bank or broker-dealer, their privacy policy may apply to you instead of ours. |
51
Save paper with eDelivery.

| MFS® will send you prospectuses, |
reports, and proxies directly viae-mail so you will get information faster with less mailbox clutter.
To sign up:
1. Go to mfs.com.
2. Log in via MFS® Access.
3. Select eDelivery.
If you own your MFS fund shares through a financial institution or a retirement plan, MFS® TALK, MFS® Access, or eDelivery may not be available to you.
CONTACT
WEB SITE
mfs.com
MFS TALK
1-800-637-8255
24 hours a day
ACCOUNT SERVICE AND LITERATURE
Shareholders
1-800-225-2606
Financial advisors
1-800-343-2829
Retirement plan services
1-800-637-1255
MAILING ADDRESS
MFS Service Center, Inc.
P.O. Box 219341
Kansas City, MO 64121-9341
OVERNIGHT MAIL
MFS Service Center, Inc.
Suite 219341
430 W 7th Street
Kansas City, MO 64105-1407
Annual Report
October 31, 2019

MFS® Global Total Return Fund

Beginning on January 1, 2021, as permitted by regulations adopted by the U.S. Securities and Exchange Commission, paper copies of the fund’s annual and semiannual shareholder reports will no longer be sent by mail, unless you specifically request paper copies of the reports. Instead, the complete reports will be made available on the fund’s Web site (funds.mfs.com), and you will be notified by mail each time a report is posted and provided with a Web site link to access the report.
If you are already signed up to receive shareholder reports by email, you will not be affected by this change and you need not take any action. You may sign up to receive shareholder reports and other communications from the fund by email by contacting your financial intermediary (such as a broker-dealer or bank) or, if you hold your shares directly with the fund, by calling 1-800-225-2606 or by logging on to MFS Access at mfs.com.
Beginning on January 1, 2019, you may elect to receive all future reports in paper free of charge. Contact your financial intermediary to request that you continue to receive paper copies of your shareholder reports. If you invest directly with the fund, you can call 1-800-225-2606 or send an email request to orderliterature@mfs.com to let the fund know that you wish to continue receiving paper copies of your shareholder reports. Your election to receive reports in paper will apply to all funds held in your account if you invest through your financial intermediary or all funds held with the MFS fund complex if you invest directly.
MWT-ANN
MFS® Global Total Return Fund
CONTENTS
The report is prepared for the general information of shareholders.
It is authorized for distribution to prospective investors only when preceded or accompanied by a current prospectus.
NOT FDIC INSURED• MAY LOSE VALUE• NO BANK GUARANTEE

LETTER FROM THE EXECUTIVE CHAIR
Dear Shareholders:
Slowing global growth, low inflation, and trade friction between the United States and China have been hallmarks of the past 12 months. After experiencing an uptick in
market volatility in late 2018, markets steadied during 2019, thanks in large measure to the adoption of a dovish policy stance on the part of global central banks, focused on supporting economic growth. The U.S. and China have repeatedly raised tariffs on each other, though preliminary steps toward an interim trade agreement have been undertaken, modestly easing tensions in recent months. While British Prime Minister Boris Johnson has negotiated a reworked withdrawal agreement with the European Union, Parliament has not yet approved the deal, leading the EU to grant the United Kingdom a Brexit delay until no later than January 31, 2020. Uncertainty over Brexit, along with the ripple effects from the trade conflict, have hampered business
confidence and investment in the U.K. and Europe, though investors hope that greater clarity regarding the Brexit outcome will emerge after a British parliamentary election in December.
Markets expect that the longest economic expansion in U.S. history will continue for the time being, albeit at a slower pace. In an effort to prolong the expansion, the U.S. Federal Reserve lowered interest rates three times between July and October. Similarly, the European Central Bank loosened policy in September. While the monetary policy environment remains quite accommodative, tentative signs of easing trade tensions and receding global recession fears have helped push global interest rates modestly higher from therecord-low levels posted late in the summer as investors grew less risk averse.
Here at MFS®, we aim to help our clients navigate the growing complexity of the markets and world economies. Our long-term investment philosophy and commitment to responsible allocation of capital allow us to wade through the noise to uncover what we believe are the best, most durable investment opportunities in the market. Through our powerful global investment platform, we combine collective expertise, thoughtful risk management and long-term discipline with the purpose of creating sustainable value for investors.
Respectfully,

Robert J. Manning
Executive Chair
MFS Investment Management
December 16, 2019
The opinions expressed in this letter are subject to change and may not be relied upon for investment advice. No forecasts can be guaranteed.
1
PORTFOLIO COMPOSITION
Portfolio structure (i)
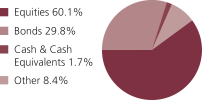
| | | | |
| Top ten holdings (i) | |
| U.S. Treasury Notes, 2%, 11/15/2026 | | | 2.0% | |
| U.S. Treasury Notes, 2.375%, 5/15/2029 | | | 1.8% | |
| Taiwan Semiconductor Manufacturing Co. Ltd., ADR | | | 1.7% | |
| U.S. Treasury Notes, 3.5%, 2/15/2039 | | | 1.5% | |
| Roche Holding AG | | | 1.5% | |
| Government of Japan, 1.8%, 9/20/2030 | | | 1.4% | |
| U.S. Treasury Note 5 yr Future- DEC 2019 | | | (1.3)% | |
| Euro-Bund 10 yr Future - DEC 2019 | | | (1.6)% | |
| Euro-Bobl 5 yr Future - DEC 2019 | | | (2.1)% | |
| U.S. Treasury Ultra 10 yr Future- DEC 2019 | | | (3.6)% | |
|
| Composition including fixed income credit quality (a)(i) | |
| AAA | | | 4.8% | |
| AA | | | 2.9% | |
| A | | | 6.5% | |
| BBB | | | 12.0% | |
| D (o) | | | 0.0% | |
| U.S. Government | | | 7.1% | |
| Federal Agencies | | | 3.7% | |
| Not Rated | | | (7.2)% | |
| Non-Fixed Income | | | 60.1% | |
| Cash & Cash Equivalents | | | 1.7% | |
| Other | | | 8.4% | |
| | | | |
| GICS equity sectors (g) | |
| Financials | | | 11.0% | |
| Health Care | | | 9.7% | |
| Industrials | | | 9.6% | |
| Information Technology | | | 7.5% | |
| Consumer Staples | | | 7.3% | |
| Consumer Discretionary | | | 3.6% | |
| Communication Services | | | 3.2% | |
| Materials | | | 2.7% | |
| Energy | | | 2.6% | |
| Utilities | | | 1.6% | |
| Real Estate | | | 1.3% | |
| |
| Fixed income sectors (i) | | | | |
| Investment Grade Corporates | | | 9.6% | |
| Non-U.S. Government Bonds | | | 9.3% | |
| Mortgage-Backed Securities | | | 3.6% | |
| Emerging Markets Bonds | | | 3.2% | |
| U.S. Treasury Securities | | | 2.0% | |
| Collateralized Debt Obligations | | | 0.7% | |
| Commercial Mortgage-Backed Securities | | | 0.6% | |
| High Yield Corporates | | | 0.6% | |
| Municipal Bonds | | | 0.1% | |
| U.S. Government Agencies | | | 0.1% | |
2
Portfolio Composition – continued
| | | | |
| Issuer country weightings (i)(x) | |
| United States | | | 54.8% | |
| Japan | | | 9.1% | |
| Switzerland | | | 5.5% | |
| United Kingdom | | | 5.3% | |
| France | | | 4.7% | |
| Canada | | | 4.1% | |
| Italy | | | 2.3% | |
| Spain | | | 1.8% | |
| Taiwan | | | 1.7% | |
| Other Countries | | | 10.7% | |
| | | | |
| Currency exposure weightings (i)(y) | |
| United States Dollar | | | 51.3% | |
| Euro | | | 17.1% | |
| Japanese Yen | | | 11.7% | |
| Swiss Franc | | | 5.3% | |
| British Pound Sterling | | | 4.8% | |
| Canadian Dollar | | | 2.7% | |
| Taiwan Dollar | | | 1.7% | |
| South Korean Won | | | 0.9% | |
| Chinese Yuan Offshore | | | 0.8% | |
| Other Currencies | | | 3.7% | |
| (a) | For all securities other than those specifically described below, ratings are assigned to underlying securities utilizing ratings from Moody’s, Fitch, and Standard & Poor’s rating agencies and applying the following hierarchy: If all three agencies provide a rating, the middle rating (after dropping the highest and lowest ratings) is assigned; if two of the three agencies rate a security, the lower of the two is assigned. Ratings are shown in the S&P and Fitch scale (e.g., AAA). Securities rated BBB or higher are considered investment grade. All ratings are subject to change. U.S. Government includes securities issued by the U.S. Department of the Treasury. Federal Agencies includes rated and unrated U.S. Agency fixed-income securities, U.S. Agency mortgage-backed securities, and collateralized mortgage obligations of U.S. Agency mortgage-backed securities. Not Rated includes fixed income securities and fixed income derivatives, which have not been rated by any rating agency.Non-Fixed Income includes equity securities (including convertible bonds and equity derivatives) and/or commodity-linked derivatives. The fund may or may not have held all of these instruments on this date. The fund is not rated by these agencies. |
| (g) | The Global Industry Classification Standard (GICS®) was developed by and/or is the exclusive property of MSCI, Inc. and S&P Global Market Intelligence Inc. (“S&P Global Market Intelligence”). GICS is a service mark of MSCI and S&P Global Market Intelligence and has been licensed for use by MFS. |
| (i) | For purposes of this presentation, the components include the value of securities, and reflect the impact of the equivalent exposure of derivative positions, if any. These amounts may be negative from time to time. Equivalent exposure is a calculated amount that translates the derivative position into a reasonable approximation of the amount of the underlying asset that the portfolio would have to hold at a given point in time to have the same price sensitivity that results from the portfolio’s ownership of the derivative contract. When dealing with derivatives, equivalent exposure is a more representative measure of the potential impact of a position on portfolio performance than value. The bond component will include any accrued interest amounts. |
| (x) | Represents the portfolio’s exposure to issuer countries as a percentage of a portfolio’s net assets. For purposes of this presentation, United States includes Cash & Cash Equivalents and Other. |
| (y) | Represents the portfolio’s exposure to a particular currency as a percentage of a portfolio’s net assets. For purposes of this presentation, United States Dollar includes Cash & Cash Equivalents. |
3
Portfolio Composition – continued
Where the fund holds convertible bonds, they are treated as part of the equity portion of the portfolio.
Cash & Cash Equivalents includes any cash, investments in money market funds, short-term securities, and other assets less liabilities. Please see the Statement of Assets and Liabilities for additional information related to the fund’s cash position and other assets and liabilities.
Other includes equivalent exposure from currency derivatives and/or any offsets to derivative positions.
Percentages are based on net assets as of October 31, 2019.
The portfolio is actively managed and current holdings may be different.
4
MANAGEMENT REVIEW
Summary of Results
For the twelve months ended October 31, 2019, Class A shares of the MFS Global Total Return Fund (fund) provided a total return of 12.03%, at net asset value. This compares with returns of 12.69% and 9.54% for the fund’s benchmarks, the MSCI World Index (net div) and the Bloomberg Barclays Global Aggregate Bond Index (Bloomberg Index), respectively. The fund’s other benchmark, the MFS Global Total Return Blended Index (Blended Index), generated a total return of 11.77%. The Blended Index reflects the blended returns of the equity and fixed income market indices, with percentage allocations to each index designed to resemble the equity and fixed income allocations of the fund. The market indices and related percentage allocations used to compile the Blended Index are set forth in the Performance Summary.
Market Environment
Fading fears of a near-term global recession, hopes for a partial trade deal between the United States and China and dramatically lower odds of ano-deal Brexit helped bolster market sentiment late in the period, after providing headwinds for many months prior. Changes in market sentiment, largely driven by uncertainty over the outcome of trade negotiations between the United States and China, contributed to periodic bouts of volatility during the reporting period. The global economy decelerated, led by weakness in China and Europe, although the pace of the slowdown moderated.
The deteriorating global growth backdrop, along with declining inflationary pressures, prompted the US Federal Reserve to adopt a more dovish posture beginning in early 2019, resulting in the first interest rate cut in over a decade at the end of July, followed by additional cuts in September and October. The Fed’s actions led to a sharp decline in long-term interest rates during the period’s second half, inverting portions of the US Treasury yield curve for a time. The Fed indicated in October that further rate cuts are unlikely unless the outlook for the economy materially worsens.
Globally, central banks have tilted more dovish as well, with the European Central Bank unveiling a package of easing measures, which included cutting overnight rates deeper into negative territory, restarting its bond-buying program and lengthening the term of cheap loans to banks to three years from two. The central banks of India and Australia are among those that have cut rates several times in recent months, although China has been more cautious in increasing liquidity as it continues to attempt to deleverage its economy, cutting rates only marginally.
Emerging markets experienced considerable volatility through the end of 2018, as tighter global financial conditions exposed structural weakness in some countries. Those conditions improved in 2019, as the Fed became more dovish, but significant trade friction between the US and China weighed on sentiment for much of the year, although hopes for a partial trade deal improved sentiment late in the period. Idiosyncratic factors negatively impacted some emerging economies, such as Argentina and Turkey.
From a geopolitical perspective, Brexit uncertainty has receded. While British Prime Minister Boris Johnson has negotiated a reworked withdrawal agreement with the
5
Management Review – continued
European Union, Parliament has not yet approved the deal, leading the EU to grant the United Kingdom a Brexit delay until no later than January 31, 2020. A UK general election, scheduled for December 12, may bring some clarity to the situation. Hopes for a limited trade agreement between the US and China, as well as fading global recession fears, were supportive factors for risk assets at period end.
Detractors from Performance
Within the equity portion of the fund, stock selection in theconsumer staples sector detracted from performance relative to the MSCI World Index. Within this sector, the fund’s overweight positions in tobacco companies Philip Morris International and Japan Tobacco (Japan) weakened relative returns. The stock price of Philip Morris came under pressure as concerns over the safety of vaping ande-cigarette products, which arose following multiple deaths and illnesses, created regulatory uncertainty and forced the company to back out of merger talks with competitor Altria.
Security selection and, to a lesser extent, an underweight position in thestrong-performingreal estate sector also weighed on relative performance. Notably, the fund’s overweight position in real estate company Deutsche Wohnen (Germany) hindered relative results as the stock price declined on the back of rental income growth concerns following the announcement that the German government would cap and freeze rents for the next five years.
Stocks in other sectors that further weighed on relative results included not holding shares of software giant Microsoft and the timing of the fund’s overweight position in information technology company DXC Technology (h). Overweight positions in pharmaceutical giant Pfizer, investment management and banking firm UBS Group (Switzerland) and oil field services company Schlumberger, as well as holding shares of poor-performing biochemical product producer PTT Global Chemical (b) (Thailand) and integrated energy and chemical company China Petroleum & Chemical (b) (China), also held back relative returns.
Within the fixed income portion of the fund, the fund’s foreign currency exposure, notably to the Japanese yen, Norwegian krona and the euro, detracted from returns relative to the Bloomberg Index.
Contributors to Performance
Within the equity portion of the fund, stock selection in both theindustrials andfinancials sectors benefited performance relative to the MSCI World Index. Within theindustrials sector, the timing of the fund’s overweight position in airline company Air Canada (Canada) and an overweight position in electrical distribution equipment manufacturer Schneider Electric (France) lifted relative returns. Within thefinancials sector, overweight positions in credit rating agency Moody’s and risk management and human capital consulting services provider Aon aided relative returns. The stock price of Aon rose on the back of strong organic growth and a cost reduction program, which improved corporate margins.
Elsewhere, the fund’s holdings of semiconductor manufacturer Taiwan Semiconductor Manufacturing (b) (Taiwan), and overweight positions in food catering company Compass Group (United Kingdom), pharmaceutical and diagnostic company Roche Holding (Switzerland), global food company Nestle (Switzerland), paint and coating
6
Management Review – continued
manufacturer Sherwin-Williams and business system services company Nomura Research Institute (Japan), supported relative results. The stock price of Taiwan Semiconductor Manufacturing advanced on the back of strong demand from Huawei and management’s favorable outlook for sales of 7nm processor chips.
Within the fixed income portion of the fund, and relative to the Bloomberg Index, the fund’s yield curve (y) positioning, notably along the US, Euro and Australian yield curves, benefited relative results. Asset allocation and security selection also supported relative performance, led by the fund’s greater-than-benchmark allocation and favorable security selection in “BBB” rated (r) bonds, and lesser relative exposure and positive security selection in “AA” rated securities. From a sector perspective, bond selection was strong within both thetreasury (peripheral Europe in particular) andindustrials sectors.
Respectfully,
Portfolio Manager(s)
Nevin Chitkara, Pilar Gomez-Bravo, Steven Gorham, Andy Li, Vipin Narula, Robert Persons, Jonathan Sage, Robert Spector, and Erik Weisman
| (b) | Security is not a benchmark constituent. |
| (h) | Security was not held in the portfolio at period end. |
| (r) | Bonds rated “BBB”, “Baa”, or higher are considered investment grade; bonds rated “BB”, “Ba”, or below are considerednon-investment grade. The source for bond quality ratings is Moody’s Investors Service, Standard & Poor’s and Fitch, Inc. and are applied using the following hierarchy: If all three agencies provide a rating, the middle rating (after dropping the highest and lowest ratings) is assigned; if two of the three agencies rate a security, the lower of the two is assigned. Ratings are shown in the S&P and Fitch scale (e.g., AAA). For securities which are not rated by any of the three agencies, the security is considered Not Rated. |
| (y) | A yield curve graphically depicts the yields of different maturity bonds of the same credit quality and type; a normal yield curve is upward sloping, with short-term rates lower than long-term rates. |
Note to Shareholders: Effective February 1, 2019, Andy Li was added as a Portfolio Manager of the Fund. Effective December 31, 2019, Henry Peabody, Jr., will be added as a Portfolio Manager of the Fund. Effective December 31, 2020, Nevin Chitkara will no longer be a Portfolio Manager of the Fund.
The views expressed in this report are those of the portfolio manager(s) only through the end of the period of the report as stated on the cover and do not necessarily reflect the views of MFS or any other person in the MFS organization. These views are subject to change at any time based on market or other conditions, and MFS disclaims any responsibility to update such views. These views may not be relied upon as investment advice or an indication of trading intent on behalf of any MFS portfolio. References to specific securities are not recommendations of such securities, and may not be representative of any MFS portfolio’s current or future investments.
7
PERFORMANCE SUMMARYTHROUGH 10/31/19
The following chart illustrates a representative class of the fund’s historical performance in comparison to its benchmark(s). Performance results include the deduction of the maximum applicable sales charge and reflect the percentage change in net asset value, including reinvestment of dividends and capital gains distributions. The performance of other share classes will be greater than or less than that of the class depicted below. Benchmarks are unmanaged and may not be invested in directly. Benchmark returns do not reflect sales charges, commissions or expenses. (See Notes to Performance Summary.)
Performance data shown represents past performance and is no guarantee of future results. Investment return and principal value fluctuate so your shares, when sold, may be worth more or less than the original cost; current performance may be lower or higher than quoted. The performance shown does not reflect the deduction of taxes, if any, that a shareholder would pay on fund distributions or the redemption of fund shares.
Growth of a Hypothetical $10,000 Investment
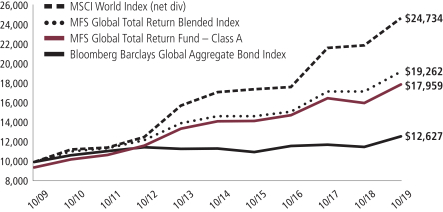
8
Performance Summary – continued
Total Returns through 10/31/19
Average annual without sales charge
| | | | | | | | | | | | | | |
| | | Share Class | | Class Inception Date | | 1-yr | | 5-yr | | 10-yr | | Life (t) | | |
| | | A | | 9/04/90 | | 12.03% | | 4.86% | | 6.66% | | N/A | | |
| | | B | | 9/07/93 | | 11.21% | | 4.07% | | 5.86% | | N/A | | |
| | | C | | 1/03/94 | | 11.14% | | 4.08% | | 5.86% | | N/A | | |
| | | I | | 1/02/97 | | 12.26% | | 5.12% | | 6.92% | | N/A | | |
| | | R1 | | 4/01/05 | | 11.18% | | 4.08% | | 5.86% | | N/A | | |
| | | R2 | | 10/31/03 | | 11.74% | | 4.60% | | 6.39% | | N/A | | |
| | | R3 | | 4/01/05 | | 12.01% | | 4.87% | | 6.66% | | N/A | | |
| | | R4 | | 4/01/05 | | 12.30% | | 5.13% | | 6.92% | | N/A | | |
| | | R6 | | 6/01/12 | | 12.44% | | 5.23% | | N/A | | 7.45% | | |
| | | | | |
| Comparative benchmark(s) | | | | | | | | | | |
| | | MSCI World Index (net div) (f) | | 12.69% | | 7.58% | | 9.48% | | N/A | | |
| | | MFS Global Total Return Blended Index (f)(w) | | 11.77% | | 5.55% | | 6.78% | | N/A | | |
| | | Bloomberg Barclays Global Aggregate Bond Index (f) | | 9.54% | | 2.13% | | 2.36% | | N/A | | |
| | | | | |
| Average annual with sales charge | | | | | | | | | | |
| | | A
With Initial Sales Charge (5.75%) | | 5.59% | | 3.63% | | 6.03% | | N/A | | |
| | | B
With CDSC (Declining over six years from 4% to 0%) (v) | | 7.21% | | 3.73% | | 5.86% | | N/A | | |
| | | C
With CDSC (1% for 12 months) (v) | | 10.14% | | 4.08% | | 5.86% | | N/A | | |
CDSC – Contingent Deferred Sales Charge.
Class I, R1, R2, R3, R4, and R6 shares do not have a sales charge.
| (f) | Source: FactSet Research Systems Inc. |
| (t) | For the period from the class inception date through the stated period end (for those share classes with less than 10 years of performance history). No comparative benchmark performance information is provided for “life” periods. (See Notes to Performance Summary.) |
| (v) | Assuming redemption at the end of the applicable period. |
| (w) | As of October 31, 2019, the MFS Global Total Return Blended Index (a custom index) was comprised of 60% MSCI World Index (net div) and 40% Bloomberg Barclays Global Aggregate Bond Index. |
Benchmark Definition(s)
Bloomberg Barclays Global Aggregate Bond Index – provides a broad-based measure of the global investment-grade fixed income markets. The three major components of this index are the U.S. Aggregate, the Pan-European Aggregate, and the Asian-Pacific Aggregate Indices. The index also includes Eurodollar and Euro-Yen corporate bonds, Canadian government, agency and corporate securities, and USD investment grade 144A securities. BLOOMBERG® is a trademark and service mark of Bloomberg Finance L.P. and its affiliates (collectively “Bloomberg”). BARCLAYS® is a trademark and service
9
Performance Summary – continued
mark of Barclays Bank Plc (collectively with its affiliates, “Barclays”), used under license. Bloomberg or Bloomberg’s licensors, including Barclays, own all proprietary rights in the Bloomberg Barclays Indices. Neither Bloomberg nor Barclays approves or endorses this material, or guarantees the accuracy or completeness of any information herein, or makes any warranty, express or implied, as to the results to be obtained therefrom, and, to the maximum extent allowed by law, neither shall have any liability or responsibility for injury or damages arising in connection therewith.
MSCI World Index (net div) – a market capitalization-weighted index that is designed to measure equity market performance in the global developed markets. Morgan Stanley Capital International (“MSCI”) makes no express or implied warranties or representations and shall have no liability whatsoever with respect to any MSCI data contained herein. The MSCI data may not be further redistributed or used as a basis for other indices or any securities or financial products. This report is not approved, reviewed, or produced by MSCI.
It is not possible to invest directly in an index.
Notes to Performance Summary
Average annual total return represents the average annual change in value for each share class for the periods presented. Life returns are presented where the share class has less than 10 years of performance history and represent the average annual total return from the class inception date to the stated period end date. As the fund’s share classes may have different inception dates, the life returns may represent different time periods and may not be comparable. As a result, no comparative benchmark performance information is provided for life periods.
Performance results reflect any applicable expense subsidies and waivers in effect during the periods shown. Without such subsidies and waivers the fund’s performance results would be less favorable. Please see the prospectus and financial statements for complete details.
Performance results do not include adjustments made for financial reporting purposes in accordance with U.S. generally accepted accounting principles and may differ from amounts reported in the financial highlights.
From time to time the fund may receive proceeds from litigation settlements, without which performance would be lower.
10
EXPENSE TABLE
Fund expenses borne by the shareholders during the period, May 1, 2019 through October 31, 2019
As a shareholder of the fund, you incur two types of costs: (1) transaction costs, including sales charges (loads) on certain purchase or redemption payments, and (2) ongoing costs, including management fees; distribution and service(12b-1) fees; and other fund expenses. This example is intended to help you understand your ongoing costs (in dollars) of investing in the fund and to compare these costs with the ongoing costs of investing in other mutual funds.
The example is based on an investment of $1,000 invested at the beginning of the period and held for the entire period May 1, 2019 through October 31, 2019.
Actual Expenses
The first line for each share class in the following table provides information about actual account values and actual expenses. You may use the information in this line, together with the amount you invested, to estimate the expenses that you paid over the period. Simply divide your account value by $1,000 (for example, an $8,600 account value divided by $1,000 = 8.6), then multiply the result by the number in the first line under the heading entitled “Expenses Paid During Period” to estimate the expenses you paid on your account during this period.
Hypothetical Example for Comparison Purposes
The second line for each share class in the following table provides information about hypothetical account values and hypothetical expenses based on the fund’s actual expense ratio and an assumed rate of return of 5% per year before expenses, which is not the fund’s actual return. The hypothetical account values and expenses may not be used to estimate the actual ending account balance or expenses you paid for the period. You may use this information to compare the ongoing costs of investing in the fund and other funds. To do so, compare this 5% hypothetical example with the 5% hypothetical examples that appear in the shareholder reports of the other funds.
Please note that the expenses shown in the table are meant to highlight your ongoing costs only and do not reflect any transactional costs, such as sales charges (loads). Therefore, the second line for each share class in the table is useful in comparing ongoing costs only, and will not help you determine the relative total costs of owning different funds. In addition, if these transactional costs were included, your costs would have been higher.
11
Expense Table – continued
| | | | | | | | | | | | | | | | | | |
Share
Class | | | | Annualized
Expense
Ratio | | | Beginning
Account Value
5/01/19 | | | Ending
Account Value
10/31/19 | | | Expenses
Paid During
Period (p)
5/01/19-10/31/19 | |
| A | | Actual | | | 1.09% | | | | $1,000.00 | | | | $1,046.60 | | | | $5.62 | |
| | Hypothetical (h) | | | 1.09% | | | | $1,000.00 | | | | $1,019.71 | | | | $5.55 | |
| B | | Actual | | | 1.84% | | | | $1,000.00 | | | | $1,042.70 | | | | $9.47 | |
| | Hypothetical (h) | | | 1.84% | | | | $1,000.00 | | | | $1,015.93 | | | | $9.35 | |
| C | | Actual | | | 1.84% | | | | $1,000.00 | | | | $1,042.84 | | | | $9.47 | |
| | Hypothetical (h) | | | 1.84% | | | | $1,000.00 | | | | $1,015.93 | | | | $9.35 | |
| I | | Actual | | | 0.84% | | | | $1,000.00 | | | | $1,047.85 | | | | $4.34 | |
| | Hypothetical (h) | | | 0.84% | | | | $1,000.00 | | | | $1,020.97 | | | | $4.28 | |
| R1 | | Actual | | | 1.84% | | | | $1,000.00 | | | | $1,042.76 | | | | $9.47 | |
| | Hypothetical (h) | | | 1.84% | | | | $1,000.00 | | | | $1,015.93 | | | | $9.35 | |
| R2 | | Actual | | | 1.34% | | | | $1,000.00 | | | | $1,045.22 | | | | $6.91 | |
| | Hypothetical (h) | | | 1.34% | | | | $1,000.00 | | | | $1,018.45 | | | | $6.82 | |
| R3 | | Actual | | | 1.09% | | | | $1,000.00 | | | | $1,046.76 | | | | $5.62 | |
| | Hypothetical (h) | | | 1.09% | | | | $1,000.00 | | | | $1,019.71 | | | | $5.55 | |
| R4 | | Actual | | | 0.84% | | | | $1,000.00 | | | | $1,048.39 | | | | $4.34 | |
| | Hypothetical (h) | | | 0.84% | | | | $1,000.00 | | | | $1,020.97 | | | | $4.28 | |
| R6 | | Actual | | | 0.76% | | | | $1,000.00 | | | | $1,048.89 | | | | $3.92 | |
| | Hypothetical (h) | | | 0.76% | | | | $1,000.00 | | | | $1,021.37 | | | | $3.87 | |
| (h) | 5% class return per year before expenses. |
| (p) | “Expenses Paid During Period” are equal to each class’s annualized expense ratio, as shown above, multiplied by the average account value over the period, multiplied by 184/365 (to reflect theone-half year period). Expenses paid do not include any applicable sales charges (loads). If these transaction costs had been included, your costs would have been higher. |
12
PORTFOLIO OF INVESTMENTS
10/31/19
The Portfolio of Investments is a complete list of all securities owned by your fund. It is categorized by broad-based asset classes.
| | | | | | | | |
| Common Stocks - 59.3% | | | | | | | | |
| | |
| Issuer | | Shares/Par | | | Value ($) | |
| Aerospace - 2.0% | | | | | | | | |
| Honeywell International, Inc. | | | 86,560 | | | $ | 14,951,509 | |
| Lockheed Martin Corp. | | | 36,182 | | | | 13,629,036 | |
| Northrop Grumman Corp. | | | 11,726 | | | | 4,133,180 | |
| United Technologies Corp. | | | 34,530 | | | | 4,957,817 | |
| | | | | | | | |
| | | | | | | $ | 37,671,542 | |
| Airlines - 0.4% | | | | | | | | |
| Air Canada (a) | | | 182,985 | | | $ | 6,515,828 | |
| | |
| Alcoholic Beverages - 1.4% | | | | | | | | |
| Diageo PLC | | | 90,689 | | | $ | 3,717,464 | |
| Heineken N.V. | | | 92,524 | | | | 9,437,942 | |
| Molson Coors Brewing Co. | | | 31,787 | | | | 1,675,811 | |
| Pernod Ricard S.A. | | | 60,314 | | | | 11,132,888 | |
| | | | | | | | |
| | | | | | | $ | 25,964,105 | |
| Apparel Manufacturers - 0.3% | | | | | | | | |
| Compagnie Financiere Richemont S.A. | | | 72,460 | | | $ | 5,699,844 | |
| | |
| Automotive - 1.0% | | | | | | | | |
| Aptiv PLC | | | 53,426 | | | $ | 4,784,298 | |
| Lear Corp. | | | 13,371 | | | | 1,574,703 | |
| Magna International, Inc. | | | 161,203 | | | | 8,667,828 | |
| USS Co. Ltd. | | | 153,500 | | | | 2,966,520 | |
| | | | | | | | |
| | | | | | | $ | 17,993,349 | |
| Biotechnology - 0.2% | | | | | | | | |
| Biogen, Inc. (a) | | | 12,339 | | | $ | 3,685,783 | |
| | |
| Broadcasting - 0.2% | | | | | | | | |
| Omnicom Group, Inc. | | | 27,828 | | | $ | 2,148,043 | |
| Publicis Groupe | | | 42,147 | | | | 1,812,103 | |
| | | | | | | | |
| | | | | | | $ | 3,960,146 | |
| Brokerage & Asset Managers - 0.9% | | | | | | | | |
| BlackRock, Inc. | | | 15,411 | | | $ | 7,115,259 | |
| Charles Schwab Corp. | | | 121,916 | | | | 4,963,200 | |
| Invesco Ltd. | | | 102,438 | | | | 1,723,007 | |
| TMX Group Ltd. | | | 33,740 | | | | 2,947,991 | |
| | | | | | | | |
| | | | | | | $ | 16,749,457 | |
13
Portfolio of Investments – continued
| | | | | | | | |
| | |
| Issuer | | Shares/Par | | | Value ($) | |
| Common Stocks - continued | | | | | | | | |
| Business Services - 4.6% | | | | | | | | |
| Accenture PLC, “A” | | | 84,801 | | | $ | 15,723,801 | |
| Bunzl PLC | | | 111,320 | | | | 2,895,503 | |
| CGI, Inc. (a) | | | 48,057 | | | | 3,735,537 | |
| Cognizant Technology Solutions Corp., “A” | | | 69,122 | | | | 4,212,295 | |
| Compass Group PLC | | | 443,492 | | | | 11,811,254 | |
| Equifax, Inc. | | | 40,522 | | | | 5,539,763 | |
| Experian PLC | | | 181,489 | | | | 5,708,028 | |
| Fidelity National Information Services, Inc. | | | 40,203 | | | | 5,297,147 | |
| Fiserv, Inc. (a) | | | 81,463 | | | | 8,646,483 | |
| Nomura Research Institute Ltd. | | | 302,100 | | | | 6,420,571 | |
| Secom Co. Ltd. | | | 101,200 | | | | 9,364,466 | |
| SGS S.A. | | | 1,182 | | | | 3,076,914 | |
| Thomson Reuters Corp. | | | 43,603 | | | | 2,932,738 | |
| | | | | | | | |
| | | | | | | $ | 85,364,500 | |
| Cable TV - 1.0% | | | | | | | | |
| Comcast Corp., “A” | | | 396,161 | | | $ | 17,755,936 | |
| | |
| Chemicals - 1.5% | | | | | | | | |
| 3M Co. | | | 59,986 | | | $ | 9,897,090 | |
| Givaudan S.A. | | | 1,899 | | | | 5,576,688 | |
| PPG Industries, Inc. | | | 94,250 | | | | 11,792,560 | |
| | | | | | | | |
| | | | | | | $ | 27,266,338 | |
| Computer Software - 0.2% | | | | | | | | |
| Adobe Systems, Inc. (a) | | | 10,682 | | | $ | 2,968,848 | |
| | |
| Computer Software - Systems - 0.9% | | | | | | | | |
| Amadeus IT Group S.A. | | | 106,372 | | | $ | 7,870,358 | |
| Hitachi Ltd. | | | 173,000 | | | | 6,450,426 | |
| Panasonic Corp. | | | 196,700 | | | | 1,654,531 | |
| | | | | | | | |
| | | | | | | $ | 15,975,315 | |
| Construction - 0.9% | | | | | | | | |
| Sherwin-Williams Co. | | | 15,669 | | | $ | 8,967,682 | |
| Stanley Black & Decker, Inc. | | | 47,288 | | | | 7,156,093 | |
| | | | | | | | |
| | | | | | | $ | 16,123,775 | |
| Consumer Products - 1.6% | | | | | | | | |
| Colgate-Palmolive Co. | | | 55,974 | | | $ | 3,839,816 | |
| Kao Corp. | | | 81,400 | | | | 6,547,904 | |
| Kimberly-Clark Corp. | | | 76,216 | | | | 10,127,582 | |
| Reckitt Benckiser Group PLC | | | 111,842 | | | | 8,640,317 | |
| | | | | | | | |
| | | | | | | $ | 29,155,619 | |
14
Portfolio of Investments – continued
| | | | | | | | |
| | |
| Issuer | | Shares/Par | | | Value ($) | |
| Common Stocks - continued | | | | | | | | |
| Containers - 0.4% | | | | | | | | |
| Amcor Ltd. | | | 521,808 | | | $ | 4,968,356 | |
| Amcor PLC | | | 225,198 | | | | 2,143,885 | |
| | | | | | | | |
| | | | | | | $ | 7,112,241 | |
| Electrical Equipment - 2.2% | | | | | | | | |
| Johnson Controls International PLC | | | 164,135 | | | $ | 7,111,970 | |
| Legrand S.A. | | | 67,091 | | | | 5,236,365 | |
| OMRON Corp. | | | 68,100 | | | | 3,981,287 | |
| Schneider Electric SE | | | 237,183 | | | | 22,024,784 | |
| Spectris PLC | | | 53,876 | | | | 1,669,335 | |
| | | | | | | | |
| | | | | | | $ | 40,023,741 | |
| Electronics - 3.8% | | | | | | | | |
| Analog Devices, Inc. | | | 63,092 | | | $ | 6,727,500 | |
| Hoya Corp. | | | 57,300 | | | | 5,084,080 | |
| Kyocera Corp. | | | 70,500 | | | | 4,614,052 | |
| NXP Semiconductors N.V. | | | 17,644 | | | | 2,005,770 | |
| Samsung Electronics Co. Ltd. | | | 146,702 | | | | 6,340,622 | |
| Taiwan Semiconductor Manufacturing Co. Ltd., ADR | | | 590,024 | | | | 30,462,939 | |
| Texas Instruments, Inc. | | | 121,921 | | | | 14,385,459 | |
| | | | | | | | |
| | | | | | | $ | 69,620,422 | |
| Energy - Independent - 0.2% | | | | | | | | |
| Marathon Petroleum Corp. | | | 19,405 | | | $ | 1,240,950 | |
| Phillips 66 | | | 15,925 | | | | 1,860,358 | |
| | | | | | | | |
| | | | | | | $ | 3,101,308 | |
| Energy - Integrated - 2.0% | | | | | | | | |
| BP PLC | | | 433,000 | | | $ | 2,744,418 | |
| Chevron Corp. | | | 30,321 | | | | 3,521,481 | |
| China Petroleum & Chemical Corp. | | | 9,466,000 | | | | 5,398,405 | |
| Eni S.p.A. | | | 368,488 | | | | 5,576,926 | |
| Exxon Mobil Corp. | | | 104,907 | | | | 7,088,566 | |
| Galp Energia SGPS S.A. | | | 212,758 | | | | 3,388,487 | |
| LUKOIL PJSC, ADR | | | 28,488 | | | | 2,619,756 | |
| Suncor Energy, Inc. | | | 192,219 | | | | 5,715,053 | |
| | | | | | | | |
| | | | | | | $ | 36,053,092 | |
| Food & Beverages - 2.3% | | | | | | | | |
| Danone S.A. | | | 85,633 | | | $ | 7,101,862 | |
| General Mills, Inc. | | | 153,227 | | | | 7,793,125 | |
| J.M. Smucker Co. | | | 51,369 | | | | 5,428,676 | |
| Mowi A.S.A. | | | 39,546 | | | | 964,122 | |
| Nestle S.A. | | | 199,426 | | | | 21,290,975 | |
| | | | | | | | |
| | | | | | | $ | 42,578,760 | |
15
Portfolio of Investments – continued
| | | | | | | | |
| | |
| Issuer | | Shares/Par | | | Value ($) | |
| Common Stocks - continued | | | | | | | | |
| Food & Drug Stores - 0.2% | | | | | | | | |
| Wesfarmers Ltd. | | | 116,313 | | | $ | 3,180,776 | |
| | |
| Gaming & Lodging - 0.1% | | | | | | | | |
| Marriott International, Inc., “A” | | | 17,977 | | | $ | 2,274,989 | |
| | |
| Health Maintenance Organizations - 0.5% | | | | | | | | |
| Cigna Corp. | | | 49,875 | | | $ | 8,900,693 | |
| | |
| Insurance - 3.7% | | | | | | | | |
| Aon PLC | | | 93,239 | | | $ | 18,010,045 | |
| AXA S.A. | | | 64,407 | | | | 1,701,368 | |
| Chubb Ltd. | | | 61,407 | | | | 9,359,655 | |
| Hiscox Ltd. | | | 103,147 | | | | 1,989,475 | |
| Legal & General Group PLC | | | 493,430 | | | | 1,685,477 | |
| Manulife Financial Corp. | | | 144,427 | | | | 2,689,845 | |
| Marsh & McLennan Cos., Inc. | | | 37,797 | | | | 3,916,525 | |
| MetLife, Inc. | | | 94,901 | | | | 4,440,418 | |
| Prudential Financial, Inc. | | | 24,152 | | | | 2,201,213 | |
| Samsung Fire & Marine Insurance Co. Ltd. | | | 7,371 | | | | 1,365,982 | |
| Travelers Cos., Inc. | | | 76,475 | | | | 10,022,813 | |
| Zurich Insurance Group AG | | | 24,869 | | | | 9,718,195 | |
| | | | | | | | |
| | | | | | | $ | 67,101,011 | |
| Machinery & Tools - 1.7% | | | | | | | | |
| AGCO Corp. | | | 19,458 | | | $ | 1,492,234 | |
| Eaton Corp. PLC | | | 162,709 | | | | 14,173,581 | |
| Illinois Tool Works, Inc. | | | 56,613 | | | | 9,543,820 | |
| Kubota Corp. | | | 364,200 | | | | 5,779,231 | |
| PT United Tractors Tbk | | | 658,100 | | | | 1,016,194 | |
| | | | | | | | |
| | | | | | | $ | 32,005,060 | |
| Major Banks - 3.6% | | | | | | | | |
| ABSA Group Ltd. | | | 375,033 | | | $ | 3,844,023 | |
| Bank of New York Mellon Corp. | | | 126,814 | | | | 5,928,555 | |
| China Construction Bank | | | 7,648,000 | | | | 6,149,997 | |
| Goldman Sachs Group, Inc. | | | 22,373 | | | | 4,773,951 | |
| JPMorgan Chase & Co. | | | 162,187 | | | | 20,260,400 | |
| PNC Financial Services Group, Inc. | | | 31,778 | | | | 4,661,833 | |
| Royal Bank of Canada | | | 38,930 | | | | 3,140,094 | |
| State Street Corp. | | | 63,930 | | | | 4,223,855 | |
| UBS Group AG | | | 689,968 | | | | 8,141,133 | |
| Wells Fargo & Co. | | | 113,969 | | | | 5,884,219 | |
| | | | | | | | |
| | | | | | | $ | 67,008,060 | |
16
Portfolio of Investments – continued
| | | | | | | | |
| | |
| Issuer | | Shares/Par | | | Value ($) | |
| Common Stocks - continued | | | | | | | | |
| Medical & Health Technology & Services - 0.7% | | | | | | | | |
| HCA Healthcare, Inc. | | | 56,539 | | | $ | 7,550,218 | |
| McKesson Corp. | | | 17,299 | | | | 2,300,767 | |
| Sonic Healthcare Ltd. | | | 165,362 | | | | 3,247,178 | |
| | | | | | | | |
| | | | | | | $ | 13,098,163 | |
| Medical Equipment - 2.2% | | | | | | | | |
| Abbott Laboratories | | | 104,160 | | | $ | 8,708,818 | |
| Becton, Dickinson and Co. | | | 11,405 | | | | 2,919,680 | |
| Danaher Corp. | | | 58,251 | | | | 8,028,153 | |
| EssilorLuxottica | | | 21,377 | | | | 3,261,554 | |
| Medtronic PLC | | | 122,577 | | | | 13,348,635 | |
| Thermo Fisher Scientific, Inc. | | | 15,836 | | | | 4,782,155 | |
| | | | | | | | |
| | | | | | | $ | 41,048,995 | |
| Metals & Mining - 0.2% | | | | | | | | |
| POSCO | | | 5,069 | | | $ | 914,127 | |
| Rio Tinto PLC | | | 49,184 | | | | 2,557,339 | |
| | | | | | | | |
| | | | | | | $ | 3,471,466 | |
| Natural Gas - Pipeline - 0.3% | | | | | | | | |
| Enterprise Products Partners LP | | | 130,449 | | | $ | 3,395,587 | |
| EQM Midstream Partners LP | | | 51,767 | | | | 1,546,798 | |
| | | | | | | | |
| | | | | | | $ | 4,942,385 | |
| Network & Telecom - 0.2% | | | | | | | | |
| Cisco Systems, Inc. | | | 85,394 | | | $ | 4,057,069 | |
| | |
| Oil Services - 0.1% | | | | | | | | |
| Schlumberger Ltd. | | | 83,861 | | | $ | 2,741,416 | |
| | |
| Other Banks & Diversified Financials - 2.4% | | | | | | | | |
| BB&T Corp. | | | 169,932 | | | $ | 9,014,893 | |
| Citigroup, Inc. | | | 211,490 | | | | 15,197,671 | |
| DBS Group Holdings Ltd. | | | 271,700 | | | | 5,181,149 | |
| KBC Group N.V. | | | 55,893 | | | | 3,919,780 | |
| Komercni Banka A.S. | | | 12,654 | | | | 427,734 | |
| Sberbank of Russia, ADR | | | 61,615 | | | | 905,741 | |
| U.S. Bancorp | | | 166,206 | | | | 9,477,066 | |
| | | | | | | | |
| | | | | | | $ | 44,124,034 | |
| Pharmaceuticals - 5.9% | | | | | | | | |
| AbbVie, Inc. | | | 20,974 | | | $ | 1,668,482 | |
| Bayer AG | | | 153,181 | | | | 11,887,240 | |
| Bristol-Myers Squibb Co. | | | 87,021 | | | | 4,992,395 | |
| Eli Lilly & Co. | | | 63,500 | | | | 7,235,825 | |
17
Portfolio of Investments – continued
| | | | | | | | |
| | |
| Issuer | | Shares/Par | | | Value ($) | |
| Common Stocks - continued | | | | | | | | |
| Pharmaceuticals - continued | | | | | | | | |
| Johnson & Johnson | | | 140,743 | | | $ | 18,583,706 | |
| Novartis AG | | | 124,984 | | | | 10,907,118 | |
| Novo Nordisk A.S., “B” | | | 119,125 | | | | 6,505,923 | |
| Pfizer, Inc. | | | 402,405 | | | | 15,440,280 | |
| Roche Holding AG | | | 88,488 | | | | 26,622,644 | |
| Santen Pharmaceutical Co. Ltd. | | | 284,100 | | | | 5,027,937 | |
| | | | | | | | |
| | | | | | | $ | 108,871,550 | |
| Printing & Publishing - 0.9% | | | | | | | | |
| Moody’s Corp. | | | 30,315 | | | $ | 6,690,217 | |
| RELX PLC | | | 237,186 | | | | 5,703,343 | |
| Wolters Kluwer N.V. | | | 53,426 | | | | 3,933,869 | |
| | | | | | | | |
| | | | | | | $ | 16,327,429 | |
| Railroad & Shipping - 0.5% | | | | | | | | |
| Canadian National Railway Co. | | | 26,059 | | | $ | 2,328,893 | |
| Union Pacific Corp. | | | 43,937 | | | | 7,269,816 | |
| | | | | | | | |
| | | | | | | $ | 9,598,709 | |
| Real Estate - 1.3% | | | | | | | | |
| Daito Trust Construction Co. Ltd. | | | 13,400 | | | $ | 1,773,475 | |
| Daiwa House Industry Co. Ltd. | | | 56,900 | | | | 1,951,951 | |
| Deutsche Wohnen SE | | | 179,135 | | | | 6,736,894 | |
| Grand City Properties S.A. | | | 91,554 | | | | 2,140,229 | |
| Longfor Properties Co. Ltd. | | | 277,500 | | | | 1,148,681 | |
| Medical Properties Trust, Inc., REIT | | | 70,661 | | | | 1,464,803 | |
| Public Storage, Inc., REIT | | | 7,706 | | | | 1,717,359 | |
| STORE Capital Corp., REIT | | | 71,235 | | | | 2,885,017 | |
| Unibail-Rodamco-Westfield, REIT | | | 24,145 | | | | 3,733,695 | |
| | | | | | | | |
| | | | | | | $ | 23,552,104 | |
| Restaurants - 0.5% | | | | | | | | |
| Greggs PLC | | | 99,402 | | | $ | 2,286,784 | |
| Starbucks Corp. | | | 70,385 | | | | 5,951,756 | |
| U.S. Foods Holding Corp. (a) | | | 33,906 | | | | 1,345,051 | |
| | | | | | | | |
| | | | | | | $ | 9,583,591 | |
| Specialty Chemicals - 0.7% | | | | | | | | |
| Akzo Nobel N.V. | | | 73,892 | | | $ | 6,803,090 | |
| Corteva, Inc. | | | 19,334 | | | | 510,031 | |
| DuPont de Nemours, Inc. | | | 19,333 | | | | 1,274,238 | |
| PTT Global Chemical PLC | | | 2,905,800 | | | | 4,907,958 | |
| | | | | | | | |
| | | | | | | $ | 13,495,317 | |
18
Portfolio of Investments – continued
| | | | | | | | |
| | |
| Issuer | | Shares/Par | | | Value ($) | |
| Common Stocks - continued | | | | | | | | |
| Specialty Stores - 0.6% | | | | | | | | |
| Dufry AG | | | 21,474 | | | $ | 1,862,894 | |
| Target Corp. | | | 85,386 | | | | 9,128,617 | |
| | | | | | | | |
| | | | | | | $ | 10,991,511 | |
| Telecommunications - Wireless - 1.6% | | | | | | | | |
| KDDI Corp. | | | 778,400 | | | $ | 21,585,282 | |
| Vodafone Group PLC | | | 3,448,066 | | | | 7,030,196 | |
| | | | | | | | |
| | | | | | | $ | 28,615,478 | |
| Telephone Services - 0.5% | | | | | | | | |
| Koninklijke KPN N.V. | | | 531,693 | | | $ | 1,648,532 | |
| TELUS Corp. | | | 94,777 | | | | 3,371,272 | |
| TELUS Corp. | | | 33,298 | | | | 1,184,410 | |
| Verizon Communications, Inc. | | | 48,681 | | | | 2,943,740 | |
| | | | | | | | |
| | | | | | | $ | 9,147,954 | |
| Tobacco - 1.4% | | | | | | | | |
| Imperial Brands PLC | | | 99,910 | | | $ | 2,190,277 | |
| Japan Tobacco, Inc. | | | 377,700 | | | | 8,567,055 | |
| Philip Morris International, Inc. | | | 187,669 | | | | 15,283,764 | |
| | | | | | | | |
| | | | | | | $ | 26,041,096 | |
| Utilities - Electric Power - 1.5% | | | | | | | | |
| Duke Energy Corp. | | | 91,655 | | | $ | 8,639,400 | |
| Exelon Corp. | | | 192,961 | | | | 8,777,796 | |
| Iberdrola S.A. | | | 248,266 | | | | 2,549,613 | |
| NextEra Energy, Inc. | | | 4,730 | | | | 1,127,348 | |
| SSE PLC | | | 143,930 | | | | 2,392,954 | |
| Xcel Energy, Inc. | | | 61,409 | | | | 3,900,086 | |
| | | | | | | | |
| | | | | | | $ | 27,387,197 | |
| Total Common Stocks (Identified Cost, $737,065,395) | | | $ | 1,088,906,002 | |
| | |
| Bonds - 38.0% | | | | | | | | |
| Aerospace - 0.1% | | | | | | | | |
| Huntington Ingalls Industries, Inc., 3.483%, 12/01/2027 | | $ | 630,000 | | | $ | 658,413 | |
| L3Harris Technologies, Inc., 3.85%, 6/15/2023 (n) | | | 1,094,000 | | | | 1,155,311 | |
| Lockheed Martin Corp., 3.55%, 1/15/2026 | | | 795,000 | | | | 858,682 | |
| | | | | | | | |
| | | | | | | $ | 2,672,406 | |
| Apparel Manufacturers - 0.0% | | | | | | | | |
| Tapestry, Inc., 4.125%, 7/15/2027 | | $ | 549,000 | | | $ | 559,251 | |
| | |
| Asset-Backed & Securitized - 1.3% | | | | | | | | |
| Commercial Mortgage Trust, 2015-LC21, “A4”, 3.708%, 7/10/2048 | | $ | 1,995,691 | | | $ | 2,143,920 | |
19
Portfolio of Investments – continued
| | | | | | | | |
| | |
| Issuer | | Shares/Par | | | Value ($) | |
| Bonds - continued | | | | | | |
| Asset-Backed & Securitized - continued | | | | | | | | |
| Dryden Senior Loan Fund,2013-26A, “AR”, CLO, FLR, 2.901% (LIBOR - 3mo. + 0.9%), 4/15/2029 (z) | | $ | 2,569,000 | | | $ | 2,563,826 | |
| Dryden Senior Loan Fund,2018-55A, “A1”, CLO, FLR, 3.02% (LIBOR - 3mo. + 1.02%), 4/15/2031 (n) | | | 2,966,973 | | | | 2,944,305 | |
| Fort CRE LLC,2018-1A, “A1”, FLR, 3.173% (LIBOR - 1mo. + 1.35%), 11/16/2035 (n) | | | 1,254,500 | | | | 1,254,498 | |
| JPMBB Commercial Mortgage Securities Trust,2014-C26, 3.494%, 1/15/2048 | | | 2,620,000 | | | | 2,777,916 | |
| KKR Real Estate Financial Trust, Inc.,2018-FL1, “A”, FLR, 2.977% (LIBOR - 1mo. + 1.1%), 6/15/2036 (n) | | | 1,648,500 | | | | 1,649,530 | |
| Magnetite CLO Ltd.,2012-7A, “A1R2”, FLR, 2.801% (LIBOR - 3mo. + 0.8%), 1/15/2028 (n) | | | 2,978,000 | | | | 2,966,168 | |
| Octagon Investment Partners XVII Ltd.,2013-1A, “BR2”, FLR, 3.339% (LIBOR - 3mo. + 1.4%), 1/25/2031 (n) | | | 4,314,000 | | | | 4,211,918 | |
| Wells Fargo Commercial Mortgage Trust,2015-C28, “A4”, 3.54%, 5/15/2048 | | | 2,322,687 | | | | 2,473,409 | |
| Wells Fargo Commercial Mortgage Trust, 2015-NXS1, “A5”, 3.148%, 5/15/2048 | | | 1,013,505 | | | | 1,059,286 | |
| | | | | | | | |
| | | | | | | $ | 24,044,776 | |
| Automotive - 0.4% | | | | | | | | |
| Continental AG, 0%, 9/12/2023 | | EUR | 760,000 | | | $ | 842,187 | |
| Ferrari N.V., 1.5%, 3/16/2023 | | | 850,000 | | | | 980,051 | |
| Ford Motor Credit Co. LLC, 1.514%, 2/17/2023 | | | 300,000 | | | | 333,831 | |
| General Motors Co., 6.75%, 4/01/2046 | | $ | 850,000 | | | | 981,007 | |
| Lear Corp., 3.8%, 9/15/2027 | | | 695,000 | | | | 703,881 | |
| Lear Corp., 4.25%, 5/15/2029 | | | 574,000 | | | | 591,881 | |
| Volkswagen Financial Services AG, 1.5%, 10/01/2024 | | EUR | 765,000 | | | | 889,201 | |
| Volkswagen International Finance N.V., 1.875%, 3/30/2027 | | | 500,000 | | | | 595,639 | |
| Volkswagen Leasing GmbH, 1.5%, 6/19/2026 | | | 450,000 | | | | 521,624 | |
| | | | | | | | |
| | | | | | | $ | 6,439,302 | |
| Broadcasting - 0.3% | | | | | | | | |
| Discovery, Inc., 4.125%, 5/15/2029 | | $ | 348,000 | | | $ | 370,319 | |
| Fox Corp., 4.709%, 1/25/2029 (n) | | | 217,000 | | | | 246,891 | |
| MMS USA Financing, Inc., 1.75%, 6/13/2031 | | EUR | 1,800,000 | | | | 2,074,290 | |
| SES S.A., 1.625%, 3/22/2026 | | | 1,100,000 | | | | 1,308,488 | |
| SES S.A., 0.875%, 11/04/2027 | | | 300,000 | | | | 335,189 | |
| WPP Finance, 1.375%, 3/20/2025 | | | 700,000 | | | | 814,921 | |
| | | | | | | | |
| | | | | | | $ | 5,150,098 | |
| Brokerage & Asset Managers - 0.2% | | | | | | | | |
| E*TRADE Financial Corp., 2.95%, 8/24/2022 | | $ | 599,000 | | | $ | 610,232 | |
| Euroclear Investments S.A., 2.625% to 4/11/2028, FLR (EUR Swap Rate - 5yr. + 1.659%) to 4/11/2048 | | EUR | 700,000 | | | | 856,048 | |
20
Portfolio of Investments – continued
| | | | | | | | |
| | |
| Issuer | | Shares/Par | | | Value ($) | |
| Bonds - continued | | | | | | | | |
| Brokerage & Asset Managers - continued | | | | | | | | |
| Intercontinental Exchange, Inc., 3.75%, 12/01/2025 | | $ | 883,000 | | | $ | 959,475 | |
| Low Income Investment Fund, 3.386%, 7/01/2026 | | | 285,000 | | | | 293,293 | |
| Low Income Investment Fund, 3.711%, 7/01/2029 | | | 760,000 | | | | 790,834 | |
| TD Ameritrade Holding Corp., 2.95%, 4/01/2022 | | | 715,000 | | | | 730,815 | |
| | | | | | | | |
| | | | | | | $ | 4,240,697 | |
| Building - 0.1% | | | | | | | | |
| CRH America Finance, Inc., 4.5%, 4/04/2048 (n) | | $ | 1,033,000 | | | $ | 1,124,615 | |
| Imerys S.A., 1.5%, 1/15/2027 | | EUR | 600,000 | | | | 692,106 | |
| Martin Marietta Materials, Inc., 3.45%, 6/01/2027 | | $ | 544,000 | | | | 563,207 | |
| | | | | | | | |
| | | | | | | $ | 2,379,928 | |
| Business Services - 0.2% | | | | | | | | |
| Euronet Worldwide, Inc., 1.375%, 5/22/2026 | | EUR | 1,700,000 | | | $ | 1,890,451 | |
| Fidelity National Information Services, Inc., 3.875%, 6/05/2024 | | $ | 320,000 | | | | 342,169 | |
| Fidelity National Information Services, Inc., 2.602%, 5/21/2025 | | GBP | 100,000 | | | | 136,012 | |
| Fidelity National Information Services, Inc., 5%, 10/15/2025 | | $ | 114,000 | | | | 130,279 | |
| Fidelity National Information Services, Inc., 3%, 8/15/2026 | | | 1,032,000 | | | | 1,066,768 | |
| Fidelity National Information Services, Inc., 1.5%, 5/21/2027 | | EUR | 100,000 | | | | 118,505 | |
| Fidelity National Information Services, Inc., 3.36%, 5/21/2031 | | GBP | 200,000 | | | | 286,646 | |
| Fiserv, Inc., 4.4%, 7/01/2049 | | $ | 311,000 | | | | 348,301 | |
| | | | | | | | |
| | | | | | | $ | 4,319,131 | |
| Cable TV - 0.2% | | | | | | | | |
| Charter Communications Operating LLC/Charter Communications Operating Capital Corp., 6.384%, 10/23/2035 | | $ | 743,000 | | | $ | 913,505 | |
| Cox Communications, Inc., 3.25%, 12/15/2022 (n) | | | 595,000 | | | | 614,095 | |
| Eutelsat S.A., 2.25%, 7/13/2027 | | EUR | 1,300,000 | | | | 1,527,056 | |
| | | | | | | | |
| | | | | | | $ | 3,054,656 | |
| Chemicals - 0.1% | | | | | | | | |
| Sherwin-Williams Co., 3.8%, 8/15/2049 | | $ | 515,000 | | | $ | 523,468 | |
| Symrise AG, 1.25%, 11/29/2025 | | EUR | 630,000 | | | | 730,119 | |
| | | | | | | | |
| | | | | | | $ | 1,253,587 | |
| Computer Software - 0.3% | | | | | | | | |
| Dassault Systemes SE, 0.125%, 9/16/2026 | | EUR | 500,000 | | | $ | 556,819 | |
| Dassault Systemes SE, 0.375%, 9/16/2029 | | | 400,000 | | | | 444,881 | |
| Dell International LLC/EMC Corp., 4.9%, 10/01/2026 (n) | | $ | 1,422,000 | | | | 1,542,857 | |
| Microsoft Corp., 4.1%, 2/06/2037 | | | 2,140,000 | | | | 2,533,898 | |
21
Portfolio of Investments – continued
| | | | | | | | |
| | |
| Issuer | | Shares/Par | | | Value ($) | |
| Bonds - continued | | | | | | | | |
| Computer Software - continued | | | | | | | | |
| Microsoft Corp., 3.95%, 8/08/2056 | | $ | 406,000 | | | $ | 480,582 | |
| | | | | | | | |
| | | | | | | $ | 5,559,037 | |
| Computer Software - Systems - 0.1% | | | | | | | | |
| Apple, Inc., 2.7%, 5/13/2022 | | $ | 598,000 | | | $ | 612,076 | |
| Apple, Inc., 4.5%, 2/23/2036 | | | 781,000 | | | | 949,894 | |
| Apple, Inc., 4.25%, 2/09/2047 | | | 348,000 | | | | 416,924 | |
| | | | | | | | |
| | | | | | | $ | 1,978,894 | |
| Conglomerates - 0.2% | | | | | | | | |
| Alstom S.A., 0.25%, 10/14/2026 | | EUR | 300,000 | | | $ | 332,382 | |
| Illinois Tool Works, Inc., 1%, 6/05/2031 | | | 530,000 | | | | 616,329 | |
| Roper Technologies, Inc., 4.2%, 9/15/2028 | | $ | 787,000 | | | | 871,554 | |
| Roper Technologies, Inc. , 2.95%, 9/15/2029 | | | 417,000 | | | | 422,528 | |
| United Technologies Corp., 3.65%, 8/16/2023 | | | 1,076,000 | | | | 1,138,157 | |
| Wabtec Corp., 4.95%, 9/15/2028 | | | 747,000 | | | | 824,471 | |
| | | | | | | | |
| | | | | | | $ | 4,205,421 | |
| Consumer Products - 0.2% | | | | | | | | |
| Reckitt Benckiser Treasury Services PLC, 3.625%, 9/21/2023 (n) | | $ | 731,000 | | | $ | 765,123 | |
| Reckitt Benckiser Treasury Services PLC, 3%, 6/26/2027 (n) | | | 1,016,000 | | | | 1,050,032 | |
| Whirlpool Corp., 4.75%, 2/26/2029 | | | 1,454,000 | | | | 1,636,859 | |
| | | | | | | | |
| | | | | | | $ | 3,452,014 | |
| Consumer Services - 0.4% | | | | | | | | |
| Booking Holdings, Inc., 3.55%, 3/15/2028 | | $ | 587,000 | | | $ | 632,344 | |
| Experian Finance PLC, 4.25%, 2/01/2029 (n) | | | 1,333,000 | | | | 1,499,664 | |
| G4S International Finance PLC, 1.5%, 1/09/2023 | | EUR | 900,000 | | | | 1,026,762 | |
| IHS Markit Ltd., 3.625%, 5/01/2024 | | $ | 292,000 | | | | 305,283 | |
| IHS Markit Ltd., 4.25%, 5/01/2029 | | | 438,000 | | | | 471,818 | |
| ManpowerGroup, Inc., 1.75%, 6/22/2026 | | EUR | 900,000 | | | | 1,076,521 | |
| Visa, Inc., 4.15%, 12/14/2035 | | | 984,000 | | | | 1,184,131 | |
| Visa, Inc., 3.65%, 9/15/2047 | | | 658,000 | | | | 741,263 | |
| | | | | | | | |
| | | | | | | $ | 6,937,786 | |
| Containers - 0.0% | | | | | | | | |
| DS Smith PLC, 0.875%, 9/12/2026 | | EUR | 650,000 | | | $ | 714,362 | |
| | |
| Electronics - 0.2% | | | | | | | | |
| Broadcom Corp./Broadcom Cayman Finance Ltd., 3.875%, 1/15/2027 | | $ | 1,771,000 | | | $ | 1,788,351 | |
| Broadcom, Inc., 4.25%, 4/15/2026 (n) | | | 1,194,000 | | | | 1,246,474 | |
| Texas Instruments, Inc., 2.25%, 9/04/2029 | | | 480,000 | | | | 473,697 | |
| | | | | | | | |
| | | | | | | $ | 3,508,522 | |
22
Portfolio of Investments – continued
| | | | | | | | |
| | |
| Issuer | | Shares/Par | | | Value ($) | |
| Bonds - continued | | | | | | | | |
| Emerging Market Quasi-Sovereign - 0.7% | | | | | | | | |
| Export-Import Bank of India, 3.375%, 8/05/2026 | | $ | 1,200,000 | | | $ | 1,229,681 | |
| Export-Import Bank of India, 3.875%, 2/01/2028 | | | 1,000,000 | | | | 1,055,405 | |
| MDGH - GMTN B.V. (United Arab Emirates), 2.5%, 11/07/2024 | | | 763,000 | | | | 761,093 | |
| NTPC Ltd. (Republic of India), 4.25%, 2/26/2026 | | | 600,000 | | | | 634,806 | |
| Power Finance Corp. Ltd. (Republic of India), 3.75%, 12/06/2027 | | | 850,000 | | | | 850,704 | |
| PT Pertamina (Persero) (Republic of Indonesia), 3.65%, 7/30/2029 | | | 1,050,000 | | | | 1,077,666 | |
| PT Pertamina (Persero) (Republic of Indonesia), 6%, 5/03/2042 (n) | | | 3,240,000 | | | | 3,886,907 | |
| State Bank of India (London), 4.375%, 1/24/2024 | | | 800,000 | | | | 843,401 | |
| State Grid Overseas Investment (2016) Ltd. (People’s Republic of China), 3.5%, 5/04/2027 | | | 1,939,000 | | | | 2,040,732 | |
| | | | | | | | |
| | | | | | | $ | 12,380,395 | |
| Emerging Market Sovereign - 1.5% | | | | | | | | |
| Oriental Republic of Uruguay, 4.375%, 1/23/2031 | | $ | 3,798,000 | | | $ | 4,236,707 | |
| Republic of Croatia, 1.125%, 6/19/2029 | | EUR | 3,900,000 | | | | 4,563,648 | |
| Republic of Hungary, 5.375%, 2/21/2023 | | $ | 3,148,000 | | | | 3,445,360 | |
| Republic of Indonesia, 8.25%, 5/15/2029 | | IDR | 91,845,000,000 | | | | 7,114,012 | |
| Republic of Indonesia, 8.375%, 3/15/2034 | | | 75,690,000,000 | | | | 5,829,268 | |
| Republic of Indonesia, 7.5%, 6/15/2035 | | | 24,500,000,000 | | | | 1,751,673 | |
| State of Qatar, 4%, 3/14/2029 (n) | | $ | 878,000 | | | | 973,489 | |
| | | | | | | | |
| | | | | | | $ | 27,914,157 | |
| Energy - Independent - 0.2% | | | | | | | | |
| Tengizchevroil Finance Co. International Ltd., 4%, 8/15/2026 (n) | | $ | 3,609,000 | | | $ | 3,782,708 | |
| | |
| Energy - Integrated - 0.1% | | | | | | | | |
| Eni S.p.A., 4.25%, 5/09/2029 (n) | | $ | 607,000 | | | $ | 666,860 | |
| OMV AG, 1%, 7/03/2034 | | EUR | 330,000 | | | | 373,160 | |
| | | | | | | | |
| | | | | | | $ | 1,040,020 | |
| Financial Institutions - 0.2% | | | | | | | | |
| AerCap Ireland Capital Ltd., 3.65%, 7/21/2027 | | $ | 904,000 | | | $ | 931,550 | |
| Avolon Holdings Funding Ltd., 4.375%, 5/01/2026 (n) | | | 587,000 | | | | 621,011 | |
| GE Capital International Funding Co., 3.373%, 11/15/2025 | | | 1,916,000 | | | | 1,971,457 | |
| | | | | | | | |
| | | | | | | $ | 3,524,018 | |
| Food & Beverages - 0.6% | | | | | | | | |
| Anheuser-Busch InBev N.V., 1.5%, 4/18/2030 | | EUR | 660,000 | | | $ | 802,459 | |
| Anheuser-Busch InBev S.A./N.V., 1.65%, 3/28/2031 | | | 530,000 | | | | 651,802 | |
| Anheuser-Busch InBev Worldwide, Inc., 3.3%, 2/01/2023 | | $ | 1,124,000 | | | | 1,169,375 | |
23
Portfolio of Investments – continued
| | | | | | | | |
| | |
| Issuer | | Shares/Par | | | Value ($) | |
| Bonds - continued | | | | | | | | |
| Food & Beverages - continued | | | | | | | | |
| Anheuser-Busch InBev Worldwide, Inc., 4.375%, 4/15/2038 | | $ | 426,000 | | | $ | 475,856 | |
| Anheuser-Busch InBev Worldwide, Inc., 5.55%, 1/23/2049 | | | 602,000 | | | | 795,006 | |
| Constellation Brands, Inc., 4.4%, 11/15/2025 | | | 1,243,000 | | | | 1,373,742 | |
| Danone S.A., 2.077%, 11/02/2021 (n) | | | 1,298,000 | | | | 1,298,174 | |
| Danone S.A., 2.589%, 11/02/2023 (n) | | | 3,035,000 | | | | 3,087,715 | |
| PepsiCo, Inc., 3.1%, 7/17/2022 | | | 651,000 | | | | 673,481 | |
| Wm. Wrigley Jr. Co., 3.375%, 10/21/2020 (n) | | | 300,000 | | | | 303,973 | |
| | | | | | | | |
| | | | | | | $ | 10,631,583 | |
| Forest & Paper Products - 0.1% | | | | | | | | |
| Celulosa Arauco y Constitucion, 4.2%, 1/29/2030 (z) | | $ | 516,000 | | | $ | 514,968 | |
| Suzano Austria GmbH, 6%, 1/15/2029 | | | 1,279,000 | | | | 1,413,295 | |
| | | | | | | | |
| | | | | | | $ | 1,928,263 | |
| Gaming & Lodging - 0.0% | | | | | | | | |
| Las Vegas Sands Corp., 3.9%, 8/08/2029 | | $ | 408,000 | | | $ | 419,764 | |
| | |
| Industrial - 0.0% | | | | | | | | |
| Investor AB, 1.5%, 6/20/2039 | | EUR | 320,000 | | | $ | 385,159 | |
| | |
| Insurance - 0.2% | | | | | | | | |
| American International Group, Inc., 1.875%, 6/21/2027 | | EUR | 850,000 | | | $ | 1,024,680 | |
| Argentum Netherlands B.V. for Zurich Insurance Co. Ltd., 3.5% to 10/01/2026, FLR (EURIBOR - 3mo. + 3.95%) to 10/01/2046 | | | 700,000 | | | | 899,222 | |
| Assicurazioni Generali S.p.A., 2.124%, 10/01/2030 | | | 200,000 | | | | 226,251 | |
| La Mondiale, 4.375% to 10/24/2029, FLR (EUR Swap Rate - 5yr. + 4.411%) to 4/24/2029 | | | 100,000 | | | | 114,948 | |
| M&G PLC, 3.875% to 7/20/2024, FLR (GBP GovernmentYield-5yr. + 3.5%) to 7/20/2029, FLR (GBP Government Yield - 5yr. + 4.5%) to 7/20/2049 | | GBP | 150,000 | | | | 198,740 | |
| NN Group N.V., 4.625% to 4/08/2024, FLR (EURIBOR - 3mo. + 3.95%) to 4/08/2044 | | EUR | 700,000 | | | | 883,178 | |
| | | | | | | | |
| | | | | | | $ | 3,347,019 | |
| Insurance - Property & Casualty - 0.3% | | | | | | | | |
| Berkshire Hathaway, Inc., 2.75%, 3/15/2023 | | $ | 694,000 | | | $ | 714,852 | |
| Berkshire Hathaway, Inc., 4.5%, 2/11/2043 | | | 475,000 | | | | 577,551 | |
| Chubb INA Holdings, Inc., 0.875%, 6/15/2027 | | EUR | 100,000 | | | | 114,957 | |
| Chubb INA Holdings, Inc., 2.5%, 3/15/2038 | | | 618,000 | | | | 833,007 | |
| Hartford Financial Services Group, Inc., 3.6%, 8/19/2049 | | $ | 813,000 | | | | 830,259 | |
| Marsh & McLennan Cos., Inc., 1.979%, 3/21/2030 | | EUR | 120,000 | | | | 147,238 | |
| Marsh & McLennan Cos., Inc., 4.35%, 1/30/2047 | | $ | 532,000 | | | | 616,012 | |
| Progressive Corp., 4.125%, 4/15/2047 | | | 908,000 | | | | 1,063,068 | |
24
Portfolio of Investments – continued
| | | | | | | | |
| | |
| Issuer | | Shares/Par | | | Value ($) | |
| Bonds - continued | | | | | | | | |
| Insurance - Property & Casualty - continued | | | | | | | | |
| QBE Capital Funding IV LP, 7.5% to 5/24/2021, FLR (GBP Swap Rate - 10yr. + 4.003%) to 5/24/2041 | | GBP | 300,000 | | | $ | 408,519 | |
| QBE Insurance Group Ltd., 6.115%, 5/24/2042 | | | 100,000 | | | | 141,334 | |
| | | | | | | | |
| | | | | | | $ | 5,446,797 | |
| International Market Quasi-Sovereign - 0.3% | | | | | | | | |
| Electricite de France S.A., 5.875%, 12/31/2165 | | GBP | 1,400,000 | | | $ | 1,958,569 | |
| Islandsbanki (Republic of Iceland), 1.125%, 1/19/2024 | | EUR | 1,300,000 | | | | 1,453,871 | |
| KFW Government Development Banks (Federal Republic of Germany), 4%, 2/27/2025 | | AUD | 300,000 | | | | 234,508 | |
| KFW Government Development Banks (Federal Republic of Germany), 1.125%, 6/15/2037 | | EUR | 1,910,000 | | | | 2,458,435 | |
| Vattenfall AB (Kingdom of Sweden), 0.5%, 6/24/2026 | | | 170,000 | | | | 192,473 | |
| | | | | | | | |
| | | | | | | $ | 6,297,856 | |
| International Market Sovereign - 12.7% | | | | | | | | |
| Commonwealth of Australia, 2.75%, 6/21/2035 | | AUD | 14,604,000 | | | $ | 12,026,045 | |
| Federal Republic of Germany, 0.25%, 8/15/2028 | | EUR | 2,185,000 | | | | 2,595,502 | |
| Federal Republic of Germany, 3.25%, 7/04/2042 | | | 646,000 | | | | 1,263,095 | |
| Federal Republic of Germany, 2.5%, 7/04/2044 | | | 4,220,000 | | | | 7,603,053 | |
| Federal Republic of Germany, 2.5%, 8/15/2046 | | | 2,639,000 | | | | 4,866,196 | |
| Government of Canada, 1.5%, 6/01/2026 | | CAD | 24,253,000 | | | | 18,511,165 | |
| Government of Canada, 5%, 6/01/2033 | | | 1,890,000 | | | | 2,187,068 | |
| Government of Canada, 5.75%, 6/01/2033 | | | 6,150,000 | | | | 7,101,753 | |
| Government of Japan, 1.8%, 9/20/2030 | | JPY | 2,262,600,000 | | | | 25,282,077 | |
| Government of Japan, 1.8%, 6/20/2031 | | | 2,056,600,000 | | | | 23,169,173 | |
| Government of Japan, 2.4%, 3/20/2037 | | | 785,850,000 | | | | 10,068,035 | |
| Government of Japan, 0.5%, 6/20/2038 | | | 494,450,000 | | | | 4,829,621 | |
| Government of Japan, 2.3%, 3/20/2040 | | | 752,000,000 | | | | 9,814,578 | |
| Kingdom of Belgium, 1.6%, 6/22/2047 | | EUR | 1,260,000 | | | | 1,745,024 | |
| Kingdom of Spain, 1.95%, 7/30/2030 | | | 2,445,000 | | | | 3,201,063 | |
| Kingdom of Spain, 1.85%, 7/30/2035 | | | 9,660,000 | | | | 12,694,120 | |
| Kingdom of Spain, 5.15%, 10/31/2044 | | | 1,403,000 | | | | 3,001,803 | |
| Kingdom of Sweden, 2.25%, 6/01/2032 | | SEK | 33,030,000 | | | | 4,385,300 | |
| Republic of France, 1.25%, 5/25/2036 | | EUR | 6,470,000 | | | | 8,358,860 | |
| Republic of France, 1.5%, 5/25/2050 | | | 3,175,000 | | | | 4,313,648 | |
| Republic of Italy, 2.1%, 7/15/2026 | | | 10,560,000 | | | | 12,919,427 | |
| Republic of Italy, 3.5%, 3/01/2030 | | | 458,000 | | | | 634,843 | |
| Republic of Italy, 4%, 2/01/2037 | | | 3,460,000 | | | | 5,249,691 | |
| Republic of Italy, 3.1%, 3/01/2040 | | | 6,560,000 | | | | 8,975,310 | |
| Republic of Italy, 3.45%, 3/01/2048 | | | 1,410,000 | | | | 2,088,074 | |
| Republic of New Zealand, 2.75%, 4/15/2037 | | NZD | 7,260,000 | | | | 5,396,529 | |
| Republic of Portugal, 2.25%, 4/18/2034 | | EUR | 4,418,000 | | | | 6,095,237 | |
| Republic of Portugal, 4.1%, 4/15/2037 | | | 1,510,000 | | | | 2,609,861 | |
25
Portfolio of Investments – continued
| | | | | | | | |
| | |
| Issuer | | Shares/Par | | | Value ($) | |
| Bonds - continued | | | | | | | | |
| International Market Sovereign - continued | | | | | | | | |
| United Kingdom Treasury, 0.875%, 10/22/2029 | | GBP | 12,060,000 | | | $ | 15,998,096 | |
| United Kingdom Treasury, 1.75%, 9/07/2037 | | | 3,690,000 | | | | 5,343,413 | |
| | | | | | | | |
| | | | | | | $ | 232,327,660 | |
| Local Authorities - 0.1% | | | | | | | | |
| Province of Alberta, 4.5%, 12/01/2040 | | CAD | 710,000 | | | $ | 708,221 | |
| Province of British Columbia, 2.3%, 6/18/2026 | | | 1,895,000 | | | | 1,472,089 | |
| | | | | | | | |
| | | | | | | $ | 2,180,310 | |
| Machinery & Tools - 0.0% | | | | | | | | |
| Atlas Copco Finance DAC, 0.125%, 9/03/2029 | | EUR | 100,000 | | | $ | 108,229 | |
| John Deere Cash Management S.A., 1.65%, 6/13/2039 | | | 550,000 | | | | 669,794 | |
| | | | | | | | |
| | | | | | | $ | 778,023 | |
| Major Banks - 1.4% | | | | | | | | |
| Bank of America Corp., 3.366% to 1/23/2025, FLR (LIBOR - 3mo. + 0.81%) to 1/23/2026 | | $ | 1,749,000 | | | $ | 1,829,559 | |
| Bank of Ireland Group PLC, 0.75% to 7/08/2023, FLR (EUR Swap Rate - 1yr. + 1.15%) to 7/08/2024 | | EUR | 300,000 | | | | 336,175 | |
| Bankinter S.A., 0.875%, 7/08/2026 | | | 800,000 | | | | 902,135 | |
| Barclays PLC, 3.125%, 1/17/2024 | | GBP | 750,000 | | | | 1,019,162 | |
| Credit Agricole S.A., 1.25%, 10/02/2024 | | | 600,000 | | | | 772,990 | |
| Credit Suisse Group AG, 1.25% to 7/17/2024, FLR (EUR Swap Rate - 1yr. + 0.75%) to 7/17/2025 | | EUR | 850,000 | | | | 986,105 | |
| Credit Suisse Group AG, 1%, 6/24/2027 | | | 450,000 | | | | 515,446 | |
| Credit Suisse Group AG, 3.869%, 1/12/2029 (n) | | $ | 1,500,000 | | | | 1,602,794 | |
| Erste Group Bank AG, 0.875%, 5/22/2026 | | EUR | 500,000 | | | | 573,244 | |
| HSBC Holdings PLC, 4.375%, 11/23/2026 | | $ | 1,075,000 | | | | 1,161,607 | |
| JPMorgan Chase & Co., 4.5%, 1/24/2022 | | | 1,532,000 | | | | 1,613,976 | |
| JPMorgan Chase & Co., 2.95%, 10/01/2026 | | | 1,811,000 | | | | 1,869,201 | |
| JPMorgan Chase & Co., 3.54%, 5/01/2028 | | | 1,187,000 | | | | 1,258,282 | |
| Morgan Stanley, 5.5%, 7/28/2021 | | | 490,000 | | | | 518,432 | |
| Morgan Stanley, 3.125%, 1/23/2023 | | | 1,982,000 | | | | 2,039,335 | |
| Morgan Stanley, 3.95%, 4/23/2027 | | | 1,588,000 | | | | 1,691,667 | |
| Nationwide Building Society, 1.5%, 3/08/2026 | | EUR | 400,000 | | | | 467,426 | |
| Raiffeisen Bank International AG, 1.5% to 3/12/2025, FLR (EUR Swap Rate - 5yr. + 2.1%) to 3/12/2030 | | | 300,000 | | | | 333,312 | |
| Sumitomo Mitsui Financial Group, Inc., 0.465%, 5/30/2024 | | | 400,000 | | | | 450,009 | |
| Sumitomo Mitsui Financial Group, Inc., 3.544%, 1/17/2028 Svenska Handelsbanken AB, 5.25%, 12/29/2049 | | $
| 996,000
1,291,000 |
| |
| 1,064,055
1,305,214 |
|
| UBS Group Funding (Switzerland) AG, 2.859%, 8/15/2023 (n) | | | 600,000 | | | | 608,622 | |
| UniCredit S.p.A., 1.625%, 7/03/2025 | | EUR | 900,000 | | | | 1,032,635 | |
| UniCredito Italiano S.p.A., 6.572%, 1/14/2022 (n) | | $ | 742,000 | | | | 798,833 | |
| | | | | | | | |
| | | | | | | $ | 24,750,216 | |
26
Portfolio of Investments – continued
| | | | | | | | |
| | |
| Issuer | | Shares/Par | | | Value ($) | |
| Bonds - continued | | | | | | | | |
| Medical & Health Technology & Services - 0.6% | | | | | | | | |
| Alcon, Inc., 3.8%, 9/23/2049 (n) | | $ | 231,000 | | | $ | 240,310 | |
| Becton Dickinson Euro Finance S.à r.l., 0.632%, 6/04/2023 | | EUR | 140,000 | | | | 157,643 | |
| Becton, Dickinson and Co., 1.401%, 5/24/2023 | | | 900,000 | | | | 1,039,916 | |
| Cigna Corp., 4.125%, 11/15/2025 | | $ | 1,074,000 | | | | 1,163,216 | |
| HCA, Inc., 5.125%, 6/15/2039 | | | 454,000 | | | | 498,618 | |
| Laboratory Corp. of America Holdings, 3.2%, 2/01/2022 | | | 1,034,000 | | | | 1,056,838 | |
| Laboratory Corp. of America Holdings, 4.7%, 2/01/2045 | | | 642,000 | | | | 716,404 | |
| Medtronic PLC, 1.75%, 7/02/2049 | | EUR | 1,500,000 | | | | 1,685,045 | |
| Northwell Healthcare, Inc., 4.26%, 11/01/2047 | | $ | 667,000 | | | | 738,078 | |
| Thermo Fisher Scientific, Inc., 3%, 4/15/2023 | | | 1,872,000 | | | | 1,931,895 | |
| Thermo Fisher Scientific, Inc., 2.95%, 9/19/2026 | | | 617,000 | | | | 641,339 | |
| Thermo Fisher Scientific, Inc., 0.875%, 10/01/2031 | | EUR | 350,000 | | | | 391,703 | |
| | | | | | | | |
| | | | | | | $ | 10,261,005 | |
| Medical Equipment - 0.1% | | | | | | | | |
| Abbott Ireland Financing Co., 1.5%, 9/27/2026 | | EUR | 700,000 | | | $ | 839,277 | |
| DH Europe Finance II S.à r.l., 0.45%, 3/18/2028 | | | 250,000 | | | | 276,260 | |
| DH Europe Finance II S.à r.l., 1.35%, 9/18/2039 | | | 350,000 | | | | 379,425 | |
| DH Europe Finance II S.à r.l., 1.8%, 9/18/2049 | | | 250,000 | | | | 272,130 | |
| | | | | | | | |
| | | | | | | $ | 1,767,092 | |
| Midstream - 0.4% | | | | | | | | |
| APT Pipelines Ltd., 5%, 3/23/2035 (n) | | $ | 685,000 | | | $ | 765,181 | |
| GNL Quintero S.A., 4.634%, 7/31/2029 (n) | | | 1,440,000 | | | | 1,521,360 | |
| MPLX LP, 4.5%, 4/15/2038 | | | 833,000 | | | | 851,184 | |
| ONEOK, Inc., 4.95%, 7/13/2047 | | | 1,972,000 | | | | 2,135,283 | |
| Plains All American Pipeline, 3.55%, 12/15/2029 | | | 667,000 | | | | 637,715 | |
| Sabine Pass Liquefaction LLC, 4.2%, 3/15/2028 | | | 1,376,000 | | | | 1,451,643 | |
| | | | | | | | |
| | | | | | | $ | 7,362,366 | |
| Mortgage-Backed - 3.6% | | | | | | | | |
| Fannie Mae, 4.5%, 3/01/2025 - 2/01/2046 | | $ | 8,697,787 | | | $ | 9,420,742 | |
| Fannie Mae, 2.5%, 10/01/2034 | | | 4,242,287 | | | | 4,295,566 | |
| Fannie Mae, 3%, 11/01/2034 | | | 3,530,000 | | | | 3,628,015 | |
| Fannie Mae, 5.5%, 1/01/2037 | | | 27,627 | | | | 31,006 | |
| Fannie Mae, 6%, 9/01/2037 - 6/01/2038 | | | 286,547 | | | | 326,881 | |
| Fannie Mae, 5%, 4/01/2040 - 8/01/2040 | | | 1,946,930 | | | | 2,150,162 | |
| Fannie Mae, 4%, 11/01/2040 - 2/01/2041 | | | 4,216,870 | | | | 4,511,764 | |
| Fannie Mae, 3.5%, 5/01/2043 - 1/01/2047 | | | 3,514,057 | | | | 3,700,036 | |
| Freddie Mac, 3.224%, 3/25/2027 | | | 4,500,000 | | | | 4,832,085 | |
| Freddie Mac, 3.194%, 7/25/2027 | | | 3,914,000 | | | | 4,205,319 | |
| Freddie Mac, 3.286%, 11/25/2027 | | | 2,576,000 | | | | 2,781,558 | |
| Freddie Mac, 3.35%, 1/25/2028 | | | 2,733,000 | | | | 2,964,156 | |
| Freddie Mac, 3.6%, 1/25/2028 | | | 3,300,000 | | | | 3,639,610 | |
| Freddie Mac, 3.9%, 4/25/2028 | | | 3,240,000 | | | | 3,644,735 | |
27
Portfolio of Investments – continued
| | | | | | | | |
| | |
| Issuer | | Shares/Par | | | Value ($) | |
| Bonds - continued | | | | | | | | |
| Mortgage-Backed - continued | | | | | | | | |
| Freddie Mac, 3.926%, 7/25/2028 | | $ | 2,900,000 | | | $ | 3,278,963 | |
| Freddie Mac, 5.5%, 7/01/2037 | | | 56,000 | | | | 62,942 | |
| Freddie Mac, 4.5%, 12/01/2039 - 5/01/2042 | | | 2,577,358 | | | | 2,795,039 | |
| Freddie Mac, 5%, 7/01/2041 | | | 1,227,925 | | | | 1,355,526 | |
| Freddie Mac, 3.5%, 1/01/2047 | | | 2,280,483 | | | | 2,376,921 | |
| Ginnie Mae, 5%, 5/15/2040 | | | 441,313 | | | | 494,362 | |
| Ginnie Mae, 3.5%, 6/20/2043 | | | 1,228,307 | | | | 1,305,017 | |
| Ginnie Mae, 3%, 10/20/2049 | | | 4,200,000 | | | | 4,324,911 | |
| | | | | | | | |
| | | | | | | $ | 66,125,316 | |
| Municipals - 0.2% | | | | | | | | |
| Commonwealth of Puerto Rico, Public Improvement,“C-7”, NATL, 6%, 7/01/2027 | | $ | 100,000 | | | $ | 103,017 | |
| New Jersey Economic Development Authority State Pension Funding Rev., “A”, NATL, 7.425%, 2/15/2029 | | | 801,000 | | | | 1,020,210 | |
| Oklahoma Development Finance Authority, Health System Rev. (OU Medicine Project), “C”, AGM, 4.65%, 8/15/2030 | | | 992,000 | | | | 1,179,488 | |
| Puerto Rico Electric Power Authority Rev., “PP”, 5%, 7/01/2022 | | | 425,000 | | | | 432,182 | |
| | | | | | | | |
| | | | | | | $ | 2,734,897 | |
| Natural Gas - Distribution - 0.1% | | | | | | | | |
| Boston Gas Co., 3.15%, 8/01/2027 (n) | | $ | 1,037,000 | | | $ | 1,082,367 | |
| Infraestructura Energética Nova, S.A.B. de C.V., 4.875%, 1/14/2048 | | | 1,000,000 | | | | 952,500 | |
| | | | | | | | |
| | | | | | | $ | 2,034,867 | |
| Network & Telecom - 0.1% | | | | | | | | |
| AT&T, Inc., 4.75%, 5/15/2046 | | $ | 983,000 | | | $ | 1,091,366 | |
| Verizon Communications, Inc., 0.875%, 3/19/2032 | | EUR | 550,000 | | | | 614,437 | |
| | | | | | | | |
| | | | | | | $ | 1,705,803 | |
| Oils - 0.2% | | | | | | | | |
| Marathon Petroleum Corp., 5.125%, 12/15/2026 | | $ | 740,000 | | | $ | 845,695 | |
| Neste Oyj, 1.5%, 6/07/2024 | | EUR | 1,100,000 | | | | 1,284,805 | |
| Phillips 66, 4.875%, 11/15/2044 | | $ | 750,000 | | | | 899,279 | |
| | | | | | | | |
| | | | | | | $ | 3,029,779 | |
| Other Banks & Diversified Financials - 0.6% | | | | | | | | |
| AIB Group PLC, 1.25%, 5/28/2024 | | EUR | 275,000 | | | $ | 315,311 | |
| Belfius Bank S.A., 3.125%, 5/11/2026 | | | 600,000 | | | | 763,336 | |
| BPCE S.A., 5.25%, 4/16/2029 | | GBP | 700,000 | | | | 1,120,978 | |
| Citizens Financial Group, Inc., 2.375%, 7/28/2021 | | $ | 1,005,000 | | | | 1,009,376 | |
| Commerzbank AG, 0.625%, 8/28/2024 | | EUR | 370,000 | | | | 419,548 | |
| Commerzbank AG, 4%, 3/23/2026 | | | 500,000 | | | | 635,380 | |
28
Portfolio of Investments – continued
| | | | | | | | |
| | |
| Issuer | | Shares/Par | | | Value ($) | |
| Bonds - continued | | | | | | | | |
| Other Banks & Diversified Financials - continued | | | | | | | | |
| Groupe BPCE S.A., 4.5%, 3/15/2025 (n) | | $ | 950,000 | | | $ | 1,019,281 | |
| Groupe BPCE S.A., 0.5%, 2/24/2027 | | EUR | 400,000 | | | | 442,979 | |
| Intesa Sanpaolo S.p.A., 5.25%, 1/28/2022 | | GBP | 550,000 | | | | 764,712 | |
| KBC Group N.V., 0.5% to 12/03/2024, FLR (EUR Swap Rate - 5yr. + 1.1%) to 12/03/2029 | | EUR | 300,000 | | | | 329,581 | |
| Macquarie Group Ltd., 1.25%, 3/05/2025 | | | 700,000 | | | | 808,644 | |
| UBS AG, 5.125%, 5/15/2024 | | $ | 1,730,000 | | | | 1,859,750 | |
| Virgin Money U.K. PLC, 4%, 9/03/2027 | | GBP | 680,000 | | | | 893,885 | |
| | | | | | | | |
| | | | | | | $ | 10,382,761 | |
| Pharmaceuticals - 0.1% | | | | | | | | |
| Allergan PLC, 2.625%, 11/15/2028 | | EUR | 710,000 | | | $ | 909,909 | |
| | |
| Real Estate - Apartment - 0.1% | | | | | | | | |
| Grand City Properties S.A., 1.375%, 8/03/2026 | | EUR | 1,100,000 | | | $ | 1,268,486 | |
| Grand City Properties S.A., 2.5%, 10/24/2069 | | | 900,000 | | | | 1,023,072 | |
| | | | | | | | |
| | | | | | | $ | 2,291,558 | |
| Real Estate - Office - 0.1% | | | | | | | | |
| Boston Properties, Inc., REIT, 3.125%, 9/01/2023 | | $ | 669,000 | | | $ | 692,243 | |
| Merlin Properties SOCIMI S.A., REIT, 1.875%, 11/02/2026 | | EUR | 1,156,000 | | | | 1,384,178 | |
| | | | | | | | |
| | | | | | | $ | 2,076,421 | |
| Real Estate - Other - 0.0% | | | | | | | | |
| SELP Finance S.à r.l., 1.5%, 12/20/2026 | | EUR | 730,000 | | | $ | 840,953 | |
| | |
| Retailers - 0.1% | | | | | | | | |
| AA Bond Co. Ltd., 2.875%, 1/31/2022 | | GBP | 375,000 | | | $ | 468,863 | |
| AA Bond Co. Ltd., 2.75%, 7/31/2023 | | | 1,200,000 | | | | 1,447,056 | |
| Home Depot, Inc., 4.875%, 2/15/2044 | | $ | 500,000 | | | | 640,578 | |
| | | | | | | | |
| | | | | | | $ | 2,556,497 | |
| Specialty Stores - 0.1% | | | | | | | | |
| Richemont International S.A., 1.5%, 3/26/2030 | | EUR | 850,000 | | | $ | 1,048,086 | |
| | |
| Supermarkets - 0.0% | | | | | | | | |
| Loblaw Cos. Ltd., 4.86%, 9/12/2023 | | CAD | 725,000 | | | $ | 594,972 | |
| | |
| Supranational - 0.1% | | | | | | | | |
| International Bank for Reconstruction and Development, 2.8%, 1/13/2021 | | AUD | 600,000 | | | $ | 421,638 | |
| International Bank for Reconstruction and Development, 4.25%, 6/24/2025 | | | 440,000 | | | | 350,570 | |
| West African Development Bank, 4.7%, 10/22/2031 | | $ | 726,000 | | | | 730,588 | |
| | | | | | | | |
| | | | | | | $ | 1,502,796 | |
29
Portfolio of Investments – continued
| | | | | | | | |
| | |
| Issuer | | Shares/Par | | | Value ($) | |
| Bonds - continued | | | | | | | | |
| Telecommunications - Wireless - 0.5% | | | | | | | | |
| American Tower Corp., REIT, 3.5%, 1/31/2023 | | $ | 502,000 | | | $ | 522,129 | |
| American Tower Corp., REIT, 4%, 6/01/2025 | | | 1,250,000 | | | | 1,344,162 | |
| Crown Castle International Corp., 2.25%, 9/01/2021 | | | 1,466,000 | | | | 1,470,323 | |
| Crown Castle International Corp., 3.7%, 6/15/2026 | | | 515,000 | | | | 546,236 | |
| Empresa Nacional de Telecomunicaciones S.A., 4.75%, 8/01/2026 (n) | | | 3,399,000 | | | | 3,544,837 | |
| Tele2 AB, 2.125%, 5/15/2028 | | EUR | 1,350,000 | | | | 1,655,489 | |
| Vodafone Group PLC, 2.5%, 5/24/2039 | | | 600,000 | | | | 742,983 | |
| | | | | | | | |
| | | | | | | $ | 9,826,159 | |
| Tobacco - 0.1% | | | | | | | | |
| Altria Group, Inc., 1.7%, 6/15/2025 | | EUR | 430,000 | | | $ | 492,846 | |
| Imperial Brands Finance PLC, 1.375%, 1/27/2025 | | | 550,000 | | | | 628,487 | |
| Philip Morris International, Inc., 1.45%, 8/01/2039 | | | 1,000,000 | | | | 1,053,839 | |
| | | | | | | | |
| | | | | | | $ | 2,175,172 | |
| Transportation - Services - 0.3% | | | | | | | | |
| Abertis Infraestructuras S.A., 2.375%, 9/27/2027 | | EUR | 500,000 | | | $ | 603,336 | |
| Adani Ports and Special Economic Zone Ltd., 4.375%, 7/03/2029 | | $ | 560,000 | | | | 584,008 | |
| ERAC USA Finance LLC, 7%, 10/15/2037 (n) | | | 627,000 | | | | 888,864 | |
| Heathrow Funding Ltd., 4.625%, 10/31/2046 | | GBP | 375,000 | | | | 688,161 | |
| Transurban Finance Co., 1.75%, 3/29/2028 | | EUR | 850,000 | | | | 1,026,976 | |
| Vinci S.A., 3.75%, 4/10/2029 (z) | | $ | 1,334,000 | | | | 1,471,319 | |
| | | | | | | | |
| | | | | | | $ | 5,262,664 | |
| U.S. Government Agencies and Equivalents - 0.0% | | | | | |
| Small Business Administration, 5.31%, 5/01/2027 | | $ | 99,501 | | | $ | 106,539 | |
| Small Business Administration, 2.22%, 3/01/2033 | | | 598,210 | | | | 600,450 | |
| | | | | | | | |
| | | | | | | $ | 706,989 | |
| U.S. Treasury Obligations - 7.0% | | | | | | | | |
| U.S. Treasury Bonds, 3.5%, 2/15/2039 | | $ | 22,510,000 | | | $ | 27,938,779 | |
| U.S. Treasury Bonds, 3.125%, 2/15/2043 | | | 12,260,000 | | | | 14,450,038 | |
| U.S. Treasury Bonds, 2.25%, 8/15/2049 | | | 1,571,100 | | | | 1,596,017 | |
| U.S. Treasury Notes, 2%, 11/15/2026 (f) | | | 35,192,000 | | | | 36,119,914 | |
| U.S. Treasury Notes, 2.25%, 11/15/2027 | | | 15,377,000 | | | | 16,089,988 | |
| U.S. Treasury Notes, 2.375%, 5/15/2029 | | | 30,360,000 | | | | 32,192,274 | |
| | | | | | | | |
| | | | | | | $ | 128,387,010 | |
| Utilities - Electric Power - 0.9% | | | | | | | | |
| Consorcio Transmantaro S.A., 4.7%, 4/16/2034 (n) | | $ | 200,000 | | | $ | 218,752 | |
| Duke Energy Corp., 3.75%, 9/01/2046 | | | 1,040,000 | | | | 1,076,490 | |
| Emera U.S. Finance LP, 2.7%, 6/15/2021 | | | 339,000 | | | | 341,989 | |
| Emera U.S. Finance LP, 3.55%, 6/15/2026 | | | 387,000 | | | | 406,469 | |
30
Portfolio of Investments – continued
| | | | | | | | |
| | |
| Issuer | | Shares/Par | | | Value ($) | |
| Bonds - continued | | | | | | | | |
| Utilities - Electric Power - continued | | | | | | | | |
| Enel Americas S.A., 4%, 10/25/2026 | | $ | 3,133,000 | | | $ | 3,238,770 | |
| Enel Finance International N.V., 0.375%, 6/17/2027 | | EUR | 350,000 | | | | 390,409 | |
| Enel Finance International N.V., 3.5%, 4/06/2028 (n) | | $ | 875,000 | | | | 901,275 | |
| Enel Finance International N.V., 4.75%, 5/25/2047 (n) | | | 456,000 | | | | 518,234 | |
| Evergy, Inc., 2.9%, 9/15/2029 | | | 1,406,000 | | | | 1,413,780 | |
| Exelon Corp., 3.497%, 6/01/2022 | | | 636,000 | | | | 654,476 | |
| innogy Finance B.V., 1.5%, 7/31/2029 | | EUR | 1,200,000 | | | | 1,454,112 | |
| innogy Finance B.V., 4.75%, 1/31/2034 | | GBP | 600,000 | | | | 997,030 | |
| LLPL Capital Pte. Ltd., 6.875%, 2/04/2039 (n) | | $ | 644,307 | | | | 753,065 | |
| PPL Capital Funding, Inc., 5%, 3/15/2044 | | | 331,000 | | | | 389,901 | |
| PPL WEM Holdings PLC, 5.375%, 5/01/2021 (n) | | | 189,000 | | | | 195,365 | |
| Virginia Electric & Power Co., 3.5%, 3/15/2027 | | | 2,000,000 | | | | 2,150,216 | |
| Virginia Electric & Power Co., 2.875%, 7/15/2029 | | | 544,000 | | | | 560,636 | |
| | | | | | | | |
| | | | | | | $ | 15,660,969 | |
| Utilities - Other - 0.0% | | | | | | | | |
| Suez S.A., 1.625% to 9/12/2026, FLR (EUR ICE Swap Rate - 5yr. + 2.151%) to 9/12/2031, FLR (EUR ICE Swap Rate - 5yr. + 3.151%) to 6/01/2026 | | EUR | 400,000 | | | $ | 443,914 | |
| Total Bonds (Identified Cost, $669,654,223) | | | | | | $ | 697,291,771 | |
| | |
| Preferred Stocks - 0.6% | | | | | | | | |
| Consumer Products - 0.5% | | | | | | | | |
| Henkel AG & Co. KGaA | | | 85,921 | | | $ | 8,929,224 | |
| | |
| Electronics - 0.1% | | | | | | | | |
| Samsung Electronics Co. Ltd. | | | 68,908 | | | $ | 2,413,780 | |
Total Preferred Stocks
(Identified Cost, $6,360,941) | | | $ | 11,343,004 | |
| | |
| Convertible Preferred Stocks - 0.1% | | | | | | | | |
| Medical Equipment - 0.0% | | | | | | | | |
| Danaher Corp., 4.75% | | | 499 | | | $ | 554,050 | |
| | |
| Utilities - Electric Power - 0.1% | | | | | | | | |
| CenterPoint Energy, Inc., 7% | | | 39,539 | | | $ | 2,016,489 | |
Total Convertible Preferred Stocks
(Identified Cost, $2,525,691) | | | | | | $ | 2,570,539 | |
| | |
| Investment Companies (h) - 2.0% | | | | | | | | |
| Money Market Funds - 2.0% | | | | | | | | |
| MFS Institutional Money Market Portfolio, 1.89% (v) (Identified Cost, $35,716,407) | | | 35,719,939 | | | $ | 35,723,511 | |
31
Portfolio of Investments – continued
| | | | | | | | | | | | | | | | | | |
| Purchased Options - 0.0% | | | | | | | | | | | | | |
| | | | | |
Underlying/Expiration Date/Exercise Price | | Put/Call | | Counterparty | | | Notional
Amount | | | Par Amount/
Number of
Contracts | | | Value ($) | |
| Market Index Securities - 0.0% | | | | | | | | | | | | | |
Markit iTraxx Europe Index - December 2019 @ EUR 50 (Premiums Paid, $15,085) | | Call | |
| Goldman Sachs
International |
| | $ | 22,640,590 | | | EUR | 20,300,000 | | | $ | 20,974 | |
| | |
| Written Options (see table below) - 0.0% | | | | | | | | | |
| (Premiums Received, $5,615) | | | | | | | | | | | $ | (1,818 | ) |
| | | |
| Other Assets, Less Liabilities - (0.0)% | | | | | | | | | | | | (549,254 | ) |
| Net Assets - 100.0% | | | | | | | | | | | | | | $ | 1,835,304,729 | |
| (a) | Non-income producing security. |
| (f) | All or a portion of the security has been segregated as collateral for open futures contracts. |
| (h) | An affiliated issuer, which may be considered one in which the fund owns 5% or more of the outstanding voting securities, or a company which is under common control. At period end, the aggregate values of the fund’s investments in affiliated issuers and in unaffiliated issuers were $35,723,511 and $1,800,132,290, respectively. |
| (n) | Securities exempt from registration under Rule 144A of the Securities Act of 1933. These securities may be sold in the ordinary course of business in transactions exempt from registration, normally to qualified institutional buyers. At period end, the aggregate value of these securities was $51,551,458, representing 2.8% of net assets. |
| (v) | Affiliated issuer that is available only to investment companies managed by MFS. The rate quoted for the MFS Institutional Money Market Portfolio is the annualizedseven-day yield of the fund at period end. |
| (z) | Restricted securities are not registered under the Securities Act of 1933 and are subject to legal restrictions on resale. These securities generally may be resold in transactions exempt from registration or to the public if the securities are subsequently registered. Disposal of these securities may involve time-consuming negotiations and prompt sale at an acceptable price may be difficult. The fund holds the following restricted securities: |
| | | | | | | | | | |
| Restricted Securities | | Acquisition Date | | Cost | | | Value | |
| Celulosa Arauco y Constitucion, 4.2%, 1/29/2030 | | 10/24/2019-10/25/2019 | | | $517,350 | | | | $514,968 | |
| Dryden Senior Loan Fund,2013-26A, “AR”, CLO, FLR, 2.901% (LIBOR - 3mo. + 0.9%), 4/15/2029 | | 4/09/2018 | | | 2,569,000 | | | | 2,563,826 | |
| Vinci S.A., 3.75%, 4/10/2029 | | 4/03/2019 | | | 1,330,846 | | | | 1,471,319 | |
| Total Restricted Securities | | | | | | | | | $4,550,113 | |
| % of Net assets | | | | | | | | | 0.2% | |
The following abbreviations are used in this report and are defined:
| ADR | | American Depositary Receipt |
| AGM | | Assured Guaranty Municipal |
| CLO | | Collateralized Loan Obligation |
| EURIBOR | | Euro Interbank Offered Rate |
| FLR | | Floating Rate. Interest rate resets periodically based on the parenthetically disclosed reference rate plus a spread (if any). Theperiod-end rate reported may not be the current rate. All reference rates are USD unless otherwise noted. |
32
Portfolio of Investments – continued
| ICE | | Intercontinental Exchange |
| LIBOR | | London Interbank Offered Rate |
| NATL | | National Public Finance Guarantee Corp. |
| REIT | | Real Estate Investment Trust |
Abbreviations indicate amounts shown in currencies other than the U.S. dollar. All amounts are stated in U.S. dollars unless otherwise indicated. A list of abbreviations is shown below:
| CNH | | Chinese Yuan Renminbi (Offshore) |
Derivative Contracts at 10/31/19
Written Options
| | | | | | | | | | | | | | | | | | | | | | | | |
| Underlying | | Put/ Call | | | Counterparty | | Par Amount/
Number of
Contracts | | Notional
Amount | | | Exercise
Price | | | Expiration
Date | | | Value | |
| Liability Derivatives | | | | | | | | | | | | | | | | | | |
| | | | | |
| Market Index Securities | | | | | | | | | | | | | | | | | | |
| Markit iTraxx Europe Index | | | Put | | | Goldman Sachs
International | | EUR(7,500,000) | | | $(8,364,750 | ) | | | EUR80 | | | | December - 2019 | | | | $(1,818 | ) |
| | | | | | | | | | | | | | | | | | | | | | | | |
Forward Foreign Currency Exchange Contracts
| | | | | | | | | | | | | | | | | | | | |
Currency Purchased | | | | | | Currency Sold | | Counterparty | | Settlement
Date | | | Unrealized
Appreciation
(Depreciation) | |
| Asset Derivatives | | | | | | | | | | | | | | | | | |
| AUD | | | 5,174,000 | | | | USD | | | 3,560,549 | | Merrill Lynch International | | | 12/13/2019 | | | | $9,964 | |
| CAD | | | 6,112,534 | | | | USD | | | 4,635,611 | | Citibank N.A. | | | 12/13/2019 | | | | 6,027 | |
| CHF | | | 4,266,000 | | | | USD | | | 4,312,685 | | Brown Brothers Harriman | | | 12/13/2019 | | | | 25,147 | |
33
Portfolio of Investments – continued
Forward Foreign Currency Exchange Contracts - continued
| | | | | | | | | | | | | | | | | | |
Currency Purchased | | | | | Currency Sold | | Counterparty | | Settlement
Date | | | Unrealized
Appreciation
(Depreciation) | |
| Asset Derivatives - continued | | | | | | | | | | |
| CNH | | | 28,345,000 | | | USD | | 3,994,223 | | Barclays Bank PLC | | | 1/15/2020 | | | | $19,190 | |
| CNH | | | 77,516,000 | | | USD | | 10,921,746 | | JPMorgan Chase Bank N.A. | | | 1/15/2020 | | | | 53,864 | |
| CZK | | | 12,895,000 | | | USD | | 547,363 | | Citibank N.A. | | | 12/13/2019 | | | | 16,445 | |
| CZK | | | 6,560,000 | | | USD | | 284,830 | | Deutsche Bank AG | | | 12/13/2019 | | | | 1,993 | |
| DKK | | | 13,065,598 | | | USD | | 1,927,926 | | Citibank N.A. | | | 12/13/2019 | | | | 28,466 | |
| EUR | | | 1,250,000 | | | USD | | 1,394,668 | | Citibank N.A. | | | 12/13/2019 | | | | 3,257 | |
| EUR | | | 19,871,037 | | | USD | | 21,869,666 | | Merrill Lynch International | | | 12/13/2019 | | | | 352,918 | |
| EUR | | | 4,847,000 | | | USD | | 5,395,189 | | UBS AG | | | 12/13/2019 | | | | 25,409 | |
| GBP | | | 3,386,491 | | | USD | | 4,361,445 | | Deutsche Bank AG | | | 12/13/2019 | | | | 31,061 | |
| GBP | | | 1,397,000 | | | USD | | 1,791,055 | | Goldman Sachs International | | | 12/13/2019 | | | | 20,948 | |
| IDR | | | 169,649,172,000 | | | USD | | 12,036,281 | | JPMorgan Chase Bank N.A. | | | 11/05/2019 | | | | 48,170 | |
| INR | | | 259,680,000 | | | USD | | 3,631,437 | | JPMorgan Chase Bank N.A. | | | 11/04/2019 | | | | 29,700 | |
| JPY | | | 155,006,251 | | | USD | | 1,430,826 | | UBS AG | | | 12/13/2019 | | | | 8,185 | |
| KRW | | | 6,329,479,000 | | | USD | | 5,240,069 | | JPMorgan Chase Bank N.A. | | | 12/03/2019 | | | | 203,371 | |
| MXN | | | 113,289,885 | | | USD | | 5,728,039 | | Goldman Sachs International | | | 12/13/2019 | | | | 125,310 | |
| NZD | | | 5,736,000 | | | USD | | 3,643,140 | | JPMorgan Chase Bank N.A. | | | 12/13/2019 | | | | 37,197 | |
| PLN | | | 6,279,803 | | | USD | | 1,591,624 | | HSBC Bank | | | 12/13/2019 | | | | 52,478 | |
| SGD | | | 2,292,000 | | | USD | | 1,660,606 | | UBS AG | | | 12/13/2019 | | | | 24,813 | |
| THB | | | 71,457,750 | | | USD | | 2,347,264 | | JPMorgan Chase Bank N.A. | | | 12/16/2019 | | | | 22,654 | |
| USD | | | 3,560,860 | | | CAD | | 4,685,419 | | UBS AG | | | 12/13/2019 | | | | 2,922 | |
| USD | | | 3,522,427 | | | CLP | | 2,545,306,000 | | JPMorgan Chase Bank N.A. | | | 11/25/2019 | | | | 88,390 | |
| USD | | | 111,856 | | | EUR | | 100,000 | | UBS AG | | | 12/13/2019 | | | | 22 | |
| USD | | | 3,670,908 | | | INR | | 259,680,000 | | JPMorgan Chase Bank N.A. | | | 11/04/2019 | | | | 9,769 | |
| USD | | | 15,547,483 | | | JPY | | 1,659,376,697 | | Deutsche Bank AG | | | 12/13/2019 | | | | 142,541 | |
| USD | | | 6,388,188 | | | JPY | | 680,000,000 | | Merrill Lynch International | | | 12/13/2019 | | | | 75,360 | |
| USD | | | 3,555,738 | | | NOK | | 32,582,000 | | Deutsche Bank AG | | | 12/13/2019 | | | | 11,826 | |
| USD | | | 3,637,621 | | | NOK | | 33,201,000 | | JPMorgan Chase Bank N.A. | | | 12/13/2019 | | | | 26,381 | |
| | | | | | | | | | | | | | | | | | |
| | | | | | | | | | | | | | | | | $1,503,778 | |
| | | | | | | | | | | | | | | | | | |
34
Portfolio of Investments – continued
Forward Foreign Currency Exchange Contracts - continued
| | | | | | | | | | | | | | | | | | |
Currency Purchased | | | | | Currency Sold | | Counterparty | | Settlement
Date | | | Unrealized
Appreciation
(Depreciation) | |
| Liability Derivatives | | | | | | | | | | | | |
| CAD | | | 9,429,000 | | | USD | | 7,180,755 | | Goldman Sachs International | | | 12/13/2019 | | | | $(20,712 | ) |
| CLP | | | 2,849,953,000 | | | USD | | 3,934,226 | | Citibank N.A. | | | 11/25/2019 | | | | (89,169 | ) |
| ILS | | | 2,402,000 | | | USD | | 687,411 | | BNP Paribas S.A. | | | 12/13/2019 | | | | (4,530 | ) |
| INR | | | 259,680,000 | | | USD | | 3,636,465 | | JPMorgan Chase Bank N.A. | | | 1/30/2020 | | | | (7,455 | ) |
| JPY | | | 134,125,087 | | | USD | | 1,256,282 | | Citibank N.A. | | | 12/13/2019 | | | | (11,122 | ) |
| JPY | | | 7,907,739,901 | | | USD | | 74,150,471 | | HSBC Bank | | | 12/13/2019 | | | | (738,405 | ) |
| NOK | | | 3,658,495 | | | USD | | 398,984 | | HSBC Bank | | | 12/13/2019 | | | | (1,053 | ) |
| RUB | | | 73,875,000 | | | USD | | 1,141,094 | | JPMorgan Chase Bank N.A. | | | 1/27/2020 | | | | (1,608 | ) |
| USD | | | 7,616,993 | | | AUD | | 11,298,746 | | Merrill Lynch International | | | 12/13/2019 | | | | (180,130 | ) |
| USD | | | 576,491 | | | AUD | | 853,000 | | UBS AG | | | 12/13/2019 | | | | (12,154 | ) |
| USD | | | 3,530,193 | | | CAD | | 4,652,000 | | Barclays Bank PLC | | | 12/13/2019 | | | | (2,368 | ) |
| USD | | | 20,153,721 | | | CAD | | 26,808,379 | | Citibank N.A. | | | 12/13/2019 | | | | (203,597 | ) |
| USD | | | 661,933 | | | EUR | | 598,062 | | Credit Suisse Group | | | 12/13/2019 | | | | (6,904 | ) |
| USD | | | 4,652,117 | | | EUR | | 4,168,967 | | Deutsche Bank AG | | | 12/13/2019 | | | | (10,208 | ) |
| USD | | | 1,162,102 | | | EUR | | 1,050,284 | | Morgan Stanley Capital Services, Inc. | | | 12/13/2019 | | | | (12,473 | ) |
| USD | | | 1,684,294 | | | EUR | | 1,522,675 | | UBS AG | | | 12/13/2019 | | | | (18,575 | ) |
| USD | | | 500,518 | | | GBP | | 386,000 | | Brown Brothers Harriman | | | 12/13/2019 | | | | (150 | ) |
| USD | | | 4,567,735 | | | GBP | | 3,735,035 | | Citibank N.A. | | | 12/13/2019 | | | | (276,855 | ) |
| USD | | | 1,784,241 | | | GBP | | 1,448,452 | | JPMorgan Chase Bank N.A. | | | 12/13/2019 | | | | (94,499 | ) |
| USD | | | 17,848 | | | GBP | | 13,856 | | UBS AG | | | 12/13/2019 | | | | (125 | ) |
| USD | | | 11,820,594 | | | IDR | | 169,649,172,000 | | JPMorgan Chase Bank N.A. | | | 11/05/2019 | | | | (263,855 | ) |
| USD | | | 7,104,420 | | | IDR | | 100,328,614,000 | | JPMorgan Chase Bank N.A. | | | 12/04/2019 | | | | (21,572 | ) |
| USD | | | 1,439,459 | | | JPY | | 155,070,000 | | Brown Brothers Harriman | | | 12/13/2019 | | | | (145 | ) |
| USD | | | 3,621,238 | | | JPY | | 391,208,000 | | Citibank N.A. | | | 12/13/2019 | | | | (10,569 | ) |
| USD | | | 12,078,414 | | | NZD | | 19,158,858 | | Citibank N.A. | | | 12/13/2019 | | | | (214,309 | ) |
| USD | | | 3,190,868 | | | SEK | | 31,354,558 | | Brown Brothers Harriman | | | 12/13/2019 | | | | (63,893 | ) |
| USD | | | 5,266,063 | | | SEK | | 52,171,417 | | Merrill Lynch International | | | 12/13/2019 | | | | (149,594 | ) |
| | | | | | | | | | | | | | | | | | |
| | | | | | | | | | | | | | | | | $(2,416,029 | ) |
| | | | | | | | | | | | | | | | | | |
35
Portfolio of Investments – continued
Futures Contracts
| | | | | | | | | | | | | | | | | | | | | | |
| Description | | Long/
Short | | | Currency | | | Contracts | | Notional
Amount | | | Expiration
Date | | | Value/ Unrealized
Appreciation
(Depreciation) | |
| Asset Derivatives | | | | | | | | | | | | | | | | | | | |
| | | | | |
| Interest Rate Futures | | | | | | | | | | | | | | | | | | | |
| Euro-Bobl 5 yr | | | Short | | | | EUR | | | 251 | | | $37,685,563 | | | | December - 2019 | | | | $556,516 | |
| Euro-Bund 10 yr | | | Short | | | | EUR | | | 156 | | | 29,883,973 | | | | December - 2019 | | | | 553,127 | |
| Euro-Buxl 30 yr | | | Short | | | | EUR | | | 22 | | | 5,151,705 | | | | December - 2019 | | | | 314,509 | |
| U.S. Treasury Bond | | | Short | | | | USD | | | 7 | | | 1,129,625 | | | | December - 2019 | | | | 31,037 | |
| U.S. Treasury Note 10 yr | | | Short | | | | USD | | | 142 | | | 18,502,156 | | | | December - 2019 | | | | 222,331 | |
| U.S. Treasury Note 5 yr | | | Short | | | | USD | | | 204 | | | 24,317,437 | | | | December - 2019 | | | | 166,624 | |
| U.S. Treasury Ultra Bond | | | Short | | | | USD | | | 25 | | | 4,743,750 | | | | December - 2019 | | | | 182,536 | |
| U.S. Treasury Ultra Note 10 yr | | | Short | | | | USD | | | 459 | | | 65,228,203 | | | | December - 2019 | | | | 1,026,956 | |
| | | | | | | | | | | | | | | | | | | | | | |
| | | | | | | | | | | | | | | | | | | | | $3,053,636 | |
| | | | | | | | | | | | | | | | | | | | | | |
| Liability Derivatives | | | | | | | | | | | | | | | | | | | |
| | | | | |
| Interest Rate Futures | | | | | | | | | | | | | | | | | | | |
| U.S. Treasury Note 2 yr | | | Long | | | | USD | | | 100 | | | $21,560,156 | | | | December - 2019 | | | | $(39,416 | ) |
| | | | | | | | | | | | | | | | | | | | | | |
Uncleared Swap Agreements
| | | | | | | | | | | | | | | | | | | | | | | | | | |
Maturity
Date | | Notional
Amount | | Counter- party | | Cash
Flows to Receive/
Frequency | | Cash
Flows to Pay/
Frequency | | Unrealized
Appreciation
(Depreciation) | | | Net Unamortized
Upfront
Payments
(Receipts) | | | Value | |
| Asset Derivatives | | | | | | | | | | | | | | | | | | | | | |
| | | | | |
| Credit Default Swaps | | | | | | | | | | | | | | | | |
| 6/20/24 | | EUR | | | 910,000 | | | | | JPMorgan Chase Bank N.A. | | 5.00%/Quarterly | | (1) | | | $3,150 | | | | $170,237 | | | | $173,387 | |
| | | | | | | | | | | | | | | | | | | | | | | | | | |
| (1) | Fund, as protection seller, to pay notional amount upon a defined credit event by a reference obligation specified in Glencore PLC, 3.375%, 9/30/2020, a BBB rated bond. The fund entered into the contract to gain issuer exposure. The credit ratings presented here are an indicator of the current payment/performance risk of the related swap agreement, the reference obligation for which may be either a single security or, in the case of a credit default index, a basket of securities issued by corporate or sovereign issuers. Ratings are assigned to each reference security, including each individual security within a reference basket of securities, utilizing ratings from Moody’s, Fitch, and Standard & Poor’s rating agencies and applying the following hierarchy: If all three agencies provide a rating, the middle rating (after dropping the highest and lowest ratings) is assigned; if two of the three agencies rate a security, the lower of the two is assigned. Ratings are shown in the S&P and Fitch scale (e.g., AAA). The ratings for a credit default index are calculated by MFS as a weighted average of the external credit ratings of the individual securities that compose the index’s reference basket of securities. |
At October 31, 2019, the fund had cash collateral of $540,000 and other liquid securities with an aggregate value of $2,316,517 to cover any collateral or margin obligations for certain derivative contracts. Restricted cash and/or deposits with brokers in the Statement of Assets and Liabilities are comprised of cash collateral.
See Notes to Financial Statements
36
Financial Statements
STATEMENT OF ASSETS AND LIABILITIES
At 10/31/19
This statement represents your fund’s balance sheet, which details the assets and liabilities comprising the total value of the fund.
| | | | |
| Assets | | | | |
Investments in unaffiliated issuers, at value (identified cost, $1,415,621,335) | | | $1,800,132,290 | |
Investments in affiliated issuers, at value (identified cost, $35,716,407) | | | 35,723,511 | |
Cash | | | 22,428 | |
Foreign currency, at value (identified cost, $80,586) | | | 80,586 | |
Restricted cash for | | | | |
Forward foreign currency exchange contracts | | | 540,000 | |
Receivables for | | | | |
Forward foreign currency exchange contracts | | | 1,503,778 | |
Investments sold | | | 19,632 | |
Fund shares sold | | | 2,820,419 | |
Interest and dividends | | | 9,062,389 | |
Uncleared swaps, at value (net of unamortized premiums paid, $170,237) | | | 173,387 | |
Total assets | | | $1,850,078,420 | |
| |
| Liabilities | | | | |
Payables for | | | | |
Forward foreign currency exchange contracts | | | $2,416,029 | |
Net daily variation margin on open futures contracts | | | 1,108,084 | |
Investments purchased | | | 8,270,199 | |
Fund shares reacquired | | | 2,049,394 | |
Written options | | | 1,818 | |
Payable to affiliates | | | | |
Investment adviser | | | 25,398 | |
Administrative services fee | | | 1,304 | |
Shareholder servicing costs | | | 654,011 | |
Distribution and service fees | | | 24,134 | |
Payable for independent Trustees’ compensation | | | 10 | |
Deferred country tax expense payable | | | 26,667 | |
Accrued expenses and other liabilities | | | 196,643 | |
Total liabilities | | | $14,773,691 | |
Net assets | | | $1,835,304,729 | |
| |
| Net assets consist of | | | | |
Paid-in capital | | | $1,411,640,663 | |
Total distributable earnings (loss) | | | 423,664,066 | |
Net assets | | | $1,835,304,729 | |
Shares of beneficial interest outstanding | | | 99,534,080 | |
37
Statement of Assets and Liabilities – continued
| | | | | | | | | | | | |
| | | |
| | | Net assets | | | Shares
outstanding | | | Net asset value
per share (a) | |
Class A | | | $754,092,373 | | | | 40,738,941 | | | | $18.51 | |
Class B | | | 28,393,100 | | | | 1,503,885 | | | | 18.88 | |
Class C | | | 211,089,894 | | | | 11,347,450 | | | | 18.60 | |
Class I | | | 569,767,295 | | | | 31,110,656 | | | | 18.31 | |
Class R1 | | | 2,482,684 | | | | 134,137 | | | | 18.51 | |
Class R2 | | | 11,285,818 | | | | 616,302 | | | | 18.31 | |
Class R3 | | | 20,299,974 | | | | 1,100,030 | | | | 18.45 | |
Class R4 | | | 7,569,830 | | | | 408,376 | | | | 18.54 | |
Class R6 | | | 230,323,761 | | | | 12,574,303 | | | | 18.32 | |
| (a) | Maximum offering price per share was equal to the net asset value per share for all share classes, except for Class A, for which the maximum offering price per share was $19.64 [100 / 94.25 x $18.51]. On sales of $50,000 or more, the maximum offering price of Class A shares is reduced. A contingent deferred sales charge may be imposed on redemptions of Class A, Class B, and Class C shares. Redemption price per share was equal to the net asset value per share for Classes I, R1, R2, R3, R4, and R6. |
See Notes to Financial Statements
38
Financial Statements
STATEMENT OF OPERATIONS
Year ended 10/31/19
This statement describes how much your fund earned in investment income and accrued in expenses. It also describes any gains and/or losses generated by fund operations.
| | | | |
| Net investment income (loss) | | | | |
Income | | | | |
Dividends | | | $34,819,317 | |
Interest | | | 18,149,801 | |
Dividends from affiliated issuers | | | 1,315,328 | |
Income on securities loaned | | | 98,132 | |
Other | | | 25,421 | |
Foreign taxes withheld | | | (2,121,972 | ) |
Total investment income | | | $52,286,027 | |
Expenses | | | | |
Management fee | | | $14,098,326 | |
Distribution and service fees | | | 4,636,669 | |
Shareholder servicing costs | | | 1,758,690 | |
Administrative services fee | | | 261,573 | |
Independent Trustees’ compensation | | | 34,754 | |
Custodian fee | | | 257,746 | |
Shareholder communications | | | 123,599 | |
Audit and tax fees | | | 81,885 | |
Legal fees | | | 16,442 | |
Miscellaneous | | | 236,047 | |
Total expenses | | | $21,505,731 | |
Fees paid indirectly | | | (50,989 | ) |
Reduction of expenses by investment adviser and distributor | | | (1,322,579 | ) |
Net expenses | | | $20,132,163 | |
Net investment income (loss) | | | $32,153,864 | |
| |
| Realized and unrealized gain (loss) | | | | |
Realized gain (loss) (identified cost basis) | | | | |
Unaffiliated issuers (net of $46,858 country tax) | | | $62,290,932 | |
Affiliated issuers | | | 1,568 | |
Written options | | | 239,814 | |
Futures contracts | | | (12,426,406 | ) |
Swap agreements | | | 8,112 | |
Forward foreign currency exchange contracts | | | (2,391,983 | ) |
Foreign currency | | | 38,655 | |
Net realized gain (loss) | | | $47,760,692 | |
Change in unrealized appreciation or depreciation | | | | |
Unaffiliated issuers (net of $137,426 decrease in deferred country tax) | | | $122,440,734 | |
Affiliated issuers | | | 4,162 | |
Written options | | | 3,797 | |
Futures contracts | | | 2,290,215 | |
Swap agreements | | | 3,150 | |
Forward foreign currency exchange contracts | | | 585,562 | |
Translation of assets and liabilities in foreign currencies | | | 113,489 | |
Net unrealized gain (loss) | | | $125,441,109 | |
Net realized and unrealized gain (loss) | | | $173,201,801 | |
Change in net assets from operations | | | $205,355,665 | |
See Notes to Financial Statements
39
Financial Statements
STATEMENTS OF CHANGES IN NET ASSETS
These statements describe the increases and/or decreases in net assets resulting from operations, any distributions, and any shareholder transactions.
| | | | | | | | |
| | | Year ended | |
| | | 10/31/19 | | | 10/31/18 | |
| Change in net assets | | | | | | |
| | |
| From operations | | | | | | | | |
Net investment income (loss) | | | $32,153,864 | | | | $33,506,605 | |
Net realized gain (loss) | | | 47,760,692 | | | | 41,808,378 | |
Net unrealized gain (loss) | | | 125,441,109 | | | | (144,950,913 | ) |
Change in net assets from operations | | | $205,355,665 | | | | $(69,635,930 | ) |
Total distributions to shareholders | | | $(57,630,110 | ) | | | $(63,697,258 | ) |
Change in net assets from fund share transactions | | | $(409,379,454 | ) | | | $79,167,312 | |
Total change in net assets | | | $(261,653,899 | ) | | | $(54,165,876 | ) |
| | |
| Net assets | | | | | | | | |
At beginning of period | | | 2,096,958,628 | | | | 2,151,124,504 | |
At end of period | | | $1,835,304,729 | | | | $2,096,958,628 | |
See Notes to Financial Statements
40
Financial Statements
FINANCIAL HIGHLIGHTS
The financial highlights table is intended to help you understand the fund’s financial performance for the past 5 years. Certain information reflects financial results for a single fund share. The total returns in the table represent the rate that an investor would have earned (or lost) on an investment in the fund share class (assuming reinvestment of all distributions) held for the entire period.
| | | | | | | | | | | | | | | | | | | | |
| Class A | | Year ended | |
| | | | | |
| | | 10/31/19 | | | 10/31/18 | | | 10/31/17 | | | 10/31/16 | | | 10/31/15 | |
Net asset value, beginning of period | | | $17.02 | | | | $18.08 | | | | $16.42 | | | | $16.49 | | | | $16.80 | |
| | |
| Income (loss) from investment operations | | | | | | | | | |
Net investment income (loss) (d) | | | $0.30 | | | | $0.27 | | | | $0.23 | (c) | | | $0.26 | | | | $0.25 | |
Net realized and unrealized gain (loss) | | | 1.70 | | | | (0.81 | ) | | | 1.70 | | | | 0.40 | | | | (0.22 | ) |
Total from investment operations | | | $2.00 | | | | $(0.54 | ) | | | $1.93 | | | | $0.66 | | | | $0.03 | |
| | |
| Less distributions declared to shareholders | | | | | | | | | |
From net investment income | | | $(0.23 | ) | | | $(0.28 | ) | | | $(0.27 | ) | | | $(0.11 | ) | | | $(0.16 | ) |
From net realized gain | | | (0.28 | ) | | | (0.24 | ) | | | — | | | | (0.62 | ) | | | (0.18 | ) |
Total distributions declared to shareholders | | | $(0.51 | ) | | | $(0.52 | ) | | | $(0.27 | ) | | | $(0.73 | ) | | | $(0.34 | ) |
Net asset value, end of period (x) | | | $18.51 | | | | $17.02 | | | | $18.08 | | | | $16.42 | | | | $16.49 | |
Total return (%) (r)(s)(t)(x) | | | 12.03 | | | | (3.12 | ) | | | 11.88 | (c) | | | 4.21 | | | | 0.20 | |
| | |
Ratios (%) (to average net assets)
and Supplemental data: | | | | | | | | | |
Expenses before expense reductions (f) | | | 1.16 | | | | 1.15 | | | | 1.20 | (c) | | | 1.27 | | | | 1.28 | |
Expenses after expense reductions (f) | | | 1.09 | | | | 1.09 | | | | 1.08 | (c) | | | 1.12 | | | | 1.13 | |
Net investment income (loss) | | | 1.70 | | | | 1.48 | | | | 1.35 | (c) | | | 1.59 | | | | 1.51 | |
Portfolio turnover | | | 65 | | | | 52 | | | | 41 | | | | 36 | | | | 54 | |
Net assets at end of period (000 omitted) | | | $754,092 | | | | $731,699 | | | | $781,298 | | | | $823,267 | | | | $802,412 | |
See Notes to Financial Statements
41
Financial Highlights – continued
| | | | | | | | | | | | | | | | | | | | |
| Class B | | Year ended | |
| | | | | |
| | | 10/31/19 | | | 10/31/18 | | | 10/31/17 | | | 10/31/16 | | | 10/31/15 | |
Net asset value, beginning of period | | | $17.34 | | | | $18.41 | | | | $16.73 | | | | $16.82 | | | | $17.21 | |
| | |
| Income (loss) from investment operations | | | | | | | | | |
Net investment income (loss) (d) | | | $0.17 | | | | $0.13 | | | | $0.11 | (c) | | | $0.14 | | | | $0.13 | |
Net realized and unrealized gain (loss) | | | 1.73 | | | | (0.83 | ) | | | 1.74 | | | | 0.40 | | | | (0.22 | ) |
Total from investment operations | | | $1.90 | | | | $(0.70 | ) | | | $1.85 | | | | $0.54 | | | | $(0.09 | ) |
| | |
| Less distributions declared to shareholders | | | | | | | | | |
From net investment income | | | $(0.08 | ) | | | $(0.13 | ) | | | $(0.17 | ) | | | $(0.01 | ) | | | $(0.12 | ) |
From net realized gain | | | (0.28 | ) | | | (0.24 | ) | | | — | | | | (0.62 | ) | | | (0.18 | ) |
Total distributions declared to shareholders | | | $(0.36 | ) | | | $(0.37 | ) | | | $(0.17 | ) | | | $(0.63 | ) | | | $(0.30 | ) |
Net asset value, end of period (x) | | | $18.88 | | | | $17.34 | | | | $18.41 | | | | $16.73 | | | | $16.82 | |
Total return (%) (r)(s)(t)(x) | | | 11.21 | | | | (3.90 | ) | | | 11.11 | (c) | | | 3.37 | | | | (0.53 | ) |
| | |
Ratios (%) (to average net assets)
and Supplemental data: | | | | | | | | | |
Expenses before expense reductions (f) | | | 1.91 | | | | 1.90 | | | | 1.95 | (c) | | | 2.02 | | | | 2.03 | |
Expenses after expense reductions (f) | | | 1.84 | | | | 1.84 | | | | 1.84 | (c) | | | 1.87 | | | | 1.88 | |
Net investment income (loss) | | | 0.96 | | | | 0.72 | | | | 0.61 | (c) | | | 0.83 | | | | 0.75 | |
Portfolio turnover | | | 65 | | | | 52 | | | | 41 | | | | 36 | | | | 54 | |
Net assets at end of period (000 omitted) | | | $28,393 | | | | $36,088 | | | | $48,598 | | | | $55,070 | | | | $60,197 | |
| |
| Class C | | Year ended | |
| | | | | |
| | | 10/31/19 | | | 10/31/18 | | | 10/31/17 | | | 10/31/16 | | | 10/31/15 | |
Net asset value, beginning of period | | | $17.10 | | | | $18.15 | | | | $16.51 | | | | $16.60 | | | | $17.00 | |
| | |
| Income (loss) from investment operations | | | | | | | | | |
Net investment income (loss) (d) | | | $0.17 | | | | $0.13 | | | | $0.10 | (c) | | | $0.14 | | | | $0.13 | |
Net realized and unrealized gain (loss) | | | 1.70 | | | | (0.80 | ) | | | 1.71 | | | | 0.40 | | | | (0.23 | ) |
Total from investment operations | | | $1.87 | | | | $(0.67 | ) | | | $1.81 | | | | $0.54 | | | | $(0.10 | ) |
| | |
| Less distributions declared to shareholders | | | | | | | | | |
From net investment income | | | $(0.09 | ) | | | $(0.14 | ) | | | $(0.17 | ) | | | $(0.01 | ) | | | $(0.12 | ) |
From net realized gain | | | (0.28 | ) | | | (0.24 | ) | | | — | | | | (0.62 | ) | | | (0.18 | ) |
Total distributions declared to shareholders | | | $(0.37 | ) | | | $(0.38 | ) | | | $(0.17 | ) | | | $(0.63 | ) | | | $(0.30 | ) |
Net asset value, end of period (x) | | | $18.60 | | | | $17.10 | | | | $18.15 | | | | $16.51 | | | | $16.60 | |
Total return (%) (r)(s)(t)(x) | | | 11.14 | | | | (3.81 | ) | | | 11.03 | (c) | | | 3.44 | | | | (0.59 | ) |
| | |
Ratios (%) (to average net assets)
and Supplemental data: | | | | | | | | | |
Expenses before expense reductions (f) | | | 1.91 | | | | 1.90 | | | | 1.95 | (c) | | | 2.02 | | | | 2.03 | |
Expenses after expense reductions (f) | | | 1.84 | | | | 1.84 | | | | 1.84 | (c) | | | 1.87 | | | | 1.88 | |
Net investment income (loss) | | | 0.96 | | | | 0.72 | | | | 0.60 | (c) | | | 0.84 | | | | 0.75 | |
Portfolio turnover | | | 65 | | | | 52 | | | | 41 | | | | 36 | | | | 54 | |
Net assets at end of period (000 omitted) | | | $211,090 | | | | $255,464 | | | | $337,099 | | | | $359,421 | | | | $323,241 | |
See Notes to Financial Statements
42
Financial Highlights – continued
| | | | | | | | | | | | | | | | | | | | |
| Class I | | Year ended | |
| | | | | |
| | | 10/31/19 | | | 10/31/18 | | | 10/31/17 | | | 10/31/16 | | | 10/31/15 | |
Net asset value, beginning of period | | | $16.85 | | | | $17.91 | | | | $16.26 | | | | $16.34 | | | | $16.65 | |
| | |
| Income (loss) from investment operations | | | | | | | | | |
Net investment income (loss) (d) | | | $0.34 | | | | $0.31 | | | | $0.28 | (c) | | | $0.31 | | | | $0.29 | |
Net realized and unrealized gain (loss) | | | 1.67 | | | | (0.81 | ) | | | 1.69 | | | | 0.38 | | | | (0.22 | ) |
Total from investment operations | | | $2.01 | | | | $(0.50 | ) | | | $1.97 | | | | $0.69 | | | | $0.07 | |
| | |
| Less distributions declared to shareholders | | | | | | | | | |
From net investment income | | | $(0.27 | ) | | | $(0.32 | ) | | | $(0.32 | ) | | | $(0.15 | ) | | | $(0.20 | ) |
From net realized gain | | | (0.28 | ) | | | (0.24 | ) | | | — | | | | (0.62 | ) | | | (0.18 | ) |
Total distributions declared to shareholders | | | $(0.55 | ) | | | $(0.56 | ) | | | $(0.32 | ) | | | $(0.77 | ) | | | $(0.38 | ) |
Net asset value, end of period (x) | | | $18.31 | | | | $16.85 | | | | $17.91 | | | | $16.26 | | | | $16.34 | |
Total return (%) (r)(s)(t)(x) | | | 12.26 | | | | (2.90 | ) | | | 12.22 | (c) | | | 4.45 | | | | 0.45 | |
| | |
Ratios (%) (to average net assets)
and Supplemental data: | | | | | | | | | |
Expenses before expense reductions (f) | | | 0.91 | | | | 0.90 | | | | 0.95 | (c) | | | 1.01 | | | | 1.03 | |
Expenses after expense reductions (f) | | | 0.84 | | | | 0.84 | | | | 0.84 | (c) | | | 0.87 | | | | 0.88 | |
Net investment income (loss) | | | 1.94 | | | | 1.75 | | | | 1.64 | (c) | | | 1.92 | | | | 1.75 | |
Portfolio turnover | | | 65 | | | | 52 | | | | 41 | | | | 36 | | | | 54 | |
Net assets at end of period (000 omitted) | | | $569,767 | | | | $667,895 | | | | $585,360 | | | | $494,880 | | | | $212,571 | |
| |
| Class R1 | | Year ended | |
| | | | | |
| | | 10/31/19 | | | 10/31/18 | | | 10/31/17 | | | 10/31/16 | | | 10/31/15 | |
Net asset value, beginning of period | | | $17.02 | | | | $18.08 | | | | $16.44 | | | | $16.54 | | | | $16.93 | |
| | |
| Income (loss) from investment operations | | | | | | | | | |
Net investment income (loss) (d) | | | $0.17 | | | | $0.12 | | | | $0.10 | (c) | | | $0.13 | | | | $0.13 | |
Net realized and unrealized gain (loss) | | | 1.69 | | | | (0.80 | ) | | | 1.71 | | | | 0.40 | | | | (0.23 | ) |
Total from investment operations | | | $1.86 | | | | $(0.68 | ) | | | $1.81 | | | | $0.53 | | | | $(0.10 | ) |
| | |
| Less distributions declared to shareholders | | | | | | | | | |
From net investment income | | | $(0.09 | ) | | | $(0.14 | ) | | | $(0.17 | ) | | | $(0.01 | ) | | | $(0.11 | ) |
From net realized gain | | | (0.28 | ) | | | (0.24 | ) | | | — | | | | (0.62 | ) | | | (0.18 | ) |
Total distributions declared to shareholders | | | $(0.37 | ) | | | $(0.38 | ) | | | $(0.17 | ) | | | $(0.63 | ) | | | $(0.29 | ) |
Net asset value, end of period (x) | | | $18.51 | | | | $17.02 | | | | $18.08 | | | | $16.44 | | | | $16.54 | |
Total return (%) (r)(s)(t)(x) | | | 11.18 | | | | (3.84 | ) | | | 11.09 | (c) | | | 3.39 | | | | (0.55 | ) |
| | |
Ratios (%) (to average net assets)
and Supplemental data: | | | | | | | | | |
Expenses before expense reductions (f) | | | 1.91 | | | | 1.90 | | | | 1.95 | (c) | | | 2.02 | | | | 2.03 | |
Expenses after expense reductions (f) | | | 1.84 | | | | 1.84 | | | | 1.84 | (c) | | | 1.87 | | | | 1.88 | |
Net investment income (loss) | | | 0.96 | | | | 0.65 | | | | 0.59 | (c) | | | 0.81 | | | | 0.75 | |
Portfolio turnover | | | 65 | | | | 52 | | | | 41 | | | | 36 | | | | 54 | |
Net assets at end of period (000 omitted) | | | $2,483 | | | | $2,352 | | | | $2,578 | | | | $2,875 | | | | $3,195 | |
See Notes to Financial Statements
43
Financial Highlights – continued
| | | | | | | | | | | | | | | | | | | | |
| Class R2 | | Year ended | |
| | | | | |
| | | 10/31/19 | | | 10/31/18 | | | 10/31/17 | | | 10/31/16 | | | 10/31/15 | |
Net asset value, beginning of period | | | $16.84 | | | | $17.89 | | | | $16.26 | | | | $16.35 | | | | $16.68 | |
| | |
| Income (loss) from investment operations | | | | | | | | | |
Net investment income (loss) (d) | | | $0.25 | | | | $0.22 | | | | $0.19 | (c) | | | $0.23 | | | | $0.21 | |
Net realized and unrealized gain (loss) | | | 1.68 | | | | (0.80 | ) | | | 1.68 | | | | 0.38 | | | | (0.22 | ) |
Total from investment operations | | | $1.93 | | | | $(0.58 | ) | | | $1.87 | | | | $0.61 | | | | $(0.01 | ) |
| | |
| Less distributions declared to shareholders | | | | | | | | | |
From net investment income | | | $(0.18 | ) | | | $(0.23 | ) | | | $(0.24 | ) | | | $(0.08 | ) | | | $(0.14 | ) |
From net realized gain | | | (0.28 | ) | | | (0.24 | ) | | | — | | | | (0.62 | ) | | | (0.18 | ) |
Total distributions declared to shareholders | | | $(0.46 | ) | | | $(0.47 | ) | | | $(0.24 | ) | | | $(0.70 | ) | | | $(0.32 | ) |
Net asset value, end of period (x) | | | $18.31 | | | | $16.84 | | | | $17.89 | | | | $16.26 | | | | $16.35 | |
Total return (%) (r)(s)(t)(x) | | | 11.74 | | | | (3.37 | ) | | | 11.59 | (c) | | | 3.93 | | | | (0.03 | ) |
| | |
Ratios (%) (to average net assets)
and Supplemental data: | | | | | | | | | |
Expenses before expense reductions (f) | | | 1.41 | | | | 1.40 | | | | 1.45 | (c) | | | 1.52 | | | | 1.53 | |
Expenses after expense reductions (f) | | | 1.34 | | | | 1.34 | | | | 1.34 | (c) | | | 1.37 | | | | 1.38 | |
Net investment income (loss) | | | 1.44 | | | | 1.21 | | | | 1.11 | (c) | | | 1.40 | | | | 1.25 | |
Portfolio turnover | | | 65 | | | | 52 | | | | 41 | | | | 36 | | | | 54 | |
Net assets at end of period (000 omitted) | | | $11,286 | | | | $13,788 | | | | $21,141 | | | | $20,926 | | | | $11,577 | |
| |
| Class R3 | | Year ended | |
| | | | | |
| | | 10/31/19 | | | 10/31/18 | | | 10/31/17 | | | 10/31/16 | | | 10/31/15 | |
Net asset value, beginning of period | | | $16.97 | | | | $18.03 | | | | $16.37 | | | | $16.44 | | | | $16.75 | |
| | |
| Income (loss) from investment operations | | | | | | | | | |
Net investment income (loss) (d) | | | $0.30 | | | | $0.26 | | | | $0.23 | (c) | | | $0.26 | | | | $0.25 | |
Net realized and unrealized gain (loss) | | | 1.69 | | | | (0.80 | ) | | | 1.71 | | | | 0.40 | | | | (0.22 | ) |
Total from investment operations | | | $1.99 | | | | $(0.54 | ) | | | $1.94 | | | | $0.66 | | | | $0.03 | |
| | |
| Less distributions declared to shareholders | | | | | | | | | |
From net investment income | | | $(0.23 | ) | | | $(0.28 | ) | | | $(0.28 | ) | | | $(0.11 | ) | | | $(0.16 | ) |
From net realized gain | | | (0.28 | ) | | | (0.24 | ) | | | — | | | | (0.62 | ) | | | (0.18 | ) |
Total distributions declared to shareholders | | | $(0.51 | ) | | | $(0.52 | ) | | | $(0.28 | ) | | | $(0.73 | ) | | | $(0.34 | ) |
Net asset value, end of period (x) | | | $18.45 | | | | $16.97 | | | | $18.03 | | | | $16.37 | | | | $16.44 | |
Total return (%) (r)(s)(t)(x) | | | 12.01 | | | | (3.14 | ) | | | 11.94 | (c) | | | 4.23 | | | | 0.19 | |
| | |
Ratios (%) (to average net assets)
and Supplemental data: | | | | | | | | | |
Expenses before expense reductions (f) | | | 1.16 | | | | 1.15 | | | | 1.20 | (c) | | | 1.27 | | | | 1.27 | |
Expenses after expense reductions (f) | | | 1.09 | | | | 1.09 | | | | 1.09 | (c) | | | 1.12 | | | | 1.13 | |
Net investment income (loss) | | | 1.69 | | | | 1.47 | | | | 1.35 | (c) | | | 1.62 | | | | 1.50 | |
Portfolio turnover | | | 65 | | | | 52 | | | | 41 | | | | 36 | | | | 54 | |
Net assets at end of period (000 omitted) | | | $20,300 | | | | $18,795 | | | | $21,193 | | | | $15,157 | | | | $11,368 | |
See Notes to Financial Statements
44
Financial Highlights – continued
| | | | | | | | | | | | | | | | | | | | |
| Class R4 | | Year ended | |
| | | | | |
| | | 10/31/19 | | | 10/31/18 | | | 10/31/17 | | | 10/31/16 | | | 10/31/15 | |
Net asset value, beginning of period | | | $17.05 | | | | $18.11 | | | | $16.44 | | | | $16.51 | | | | $16.82 | |
| | |
| Income (loss) from investment operations | | | | | | | | | |
Net investment income (loss) (d) | | | $0.34 | | | | $0.31 | | | | $0.27 | (c) | | | $0.29 | | | | $0.29 | |
Net realized and unrealized gain (loss) | | | 1.70 | | | | (0.81 | ) | | | 1.72 | | | | 0.41 | | | | (0.22 | ) |
Total from investment operations | | | $2.04 | | | | $(0.50 | ) | | | $1.99 | | | | $0.70 | | | | $0.07 | |
| | |
| Less distributions declared to shareholders | | | | | | | | | |
From net investment income | | | $(0.27 | ) | | | $(0.32 | ) | | | $(0.32 | ) | | | $(0.15 | ) | | | $(0.20 | ) |
From net realized gain | | | (0.28 | ) | | | (0.24 | ) | | | — | | | | (0.62 | ) | | | (0.18 | ) |
Total distributions declared to shareholders | | | $(0.55 | ) | | | $(0.56 | ) | | | $(0.32 | ) | | | $(0.77 | ) | | | $(0.38 | ) |
Net asset value, end of period (x) | | | $18.54 | | | | $17.05 | | | | $18.11 | | | | $16.44 | | | | $16.51 | |
Total return (%) (r)(s)(t)(x) | | | 12.30 | | | | (2.87 | ) | | | 12.20 | (c) | | | 4.45 | | | | 0.45 | |
| | |
Ratios (%) (to average net assets)
and Supplemental data: | | | | | | | | | |
Expenses before expense reductions (f) | | | 0.91 | | | | 0.90 | | | | 0.95 | (c) | | | 1.02 | | | | 1.03 | |
Expenses after expense reductions (f) | | | 0.84 | | | | 0.84 | | | | 0.84 | (c) | | | 0.87 | | | | 0.88 | |
Net investment income (loss) | | | 1.95 | | | | 1.71 | | | | 1.59 | (c) | | | 1.79 | | | | 1.73 | |
Portfolio turnover | | | 65 | | | | 52 | | | | 41 | | | | 36 | | | | 54 | |
Net assets at end of period (000 omitted) | | | $7,570 | | | | $7,514 | | | | $6,063 | | | | $7,629 | | | | $10,758 | |
| |
| Class R6 | | Year ended | |
| | | | | |
| | | 10/31/19 | | | 10/31/18 | | | 10/31/17 | | | 10/31/16 | | | 10/31/15 | |
Net asset value, beginning of period | | | $16.85 | | | | $17.91 | | | | $16.26 | | | | $16.34 | | | | $16.65 | |
| | |
| Income (loss) from investment operations | | | | | | | | | |
Net investment income (loss) (d) | | | $0.35 | | | | $0.33 | | | | $0.28 | (c) | | | $0.31 | | | | $0.30 | |
Net realized and unrealized gain (loss) | | | 1.69 | | | | (0.81 | ) | | | 1.70 | | | | 0.40 | | | | (0.21 | ) |
Total from investment operations | | | $2.04 | | | | $(0.48 | ) | | | $1.98 | | | | $0.71 | | | | $0.09 | |
| | |
| Less distributions declared to shareholders | | | | | | | | | |
From net investment income | | | $(0.29 | ) | | | $(0.34 | ) | | | $(0.33 | ) | | | $(0.17 | ) | | | $(0.22 | ) |
From net realized gain | | | (0.28 | ) | | | (0.24 | ) | | | — | | | | (0.62 | ) | | | (0.18 | ) |
Total distributions declared to shareholders | | | $(0.57 | ) | | | $(0.58 | ) | | | $(0.33 | ) | | | $(0.79 | ) | | | $(0.40 | ) |
Net asset value, end of period (x) | | | $18.32 | | | | $16.85 | | | | $17.91 | | | | $16.26 | | | | $16.34 | |
Total return (%) (r)(s)(t)(x) | | | 12.44 | | | | (2.82 | ) | | | 12.33 | (c) | | | 4.54 | | | | 0.56 | |
| | |
Ratios (%) (to average net assets)
and Supplemental data: | | | | | | | | | |
Expenses before expense reductions (f) | | | 0.82 | | | | 0.81 | | | | 0.84 | (c) | | | 0.92 | | | | 0.93 | |
Expenses after expense reductions (f) | | | 0.75 | | | | 0.75 | | | | 0.74 | (c) | | | 0.77 | | | | 0.78 | |
Net investment income (loss) | | | 2.03 | | | | 1.83 | | | | 1.63 | (c) | | | 1.96 | | | | 1.85 | |
Portfolio turnover | | | 65 | | | | 52 | | | | 41 | | | | 36 | | | | 54 | |
Net assets at end of period (000 omitted) | | | $230,324 | | | | $363,364 | | | | $347,795 | | | | $110,608 | | | | $85,585 | |
See Notes to Financial Statements
45
Financial Highlights – continued
| (c) | Amount reflects aone-time reimbursement of expenses by the custodian (or former custodian) without which net investment income and performance would be lower and expenses would be higher. |
| (d) | Per share data is based on average shares outstanding. |
| (f) | Ratios do not reflect reductions from fees paid indirectly, if applicable. |
| (r) | Certain expenses have been reduced without which performance would have been lower. |
| (s) | From time to time the fund may receive proceeds from litigation settlements, without which performance would be lower. |
| (t) | Total returns do not include any applicable sales charges. |
| (x) | The net asset values and total returns have been calculated on net assets which include adjustments made in accordance with U.S. generally accepted accounting principles required at period end for financial reporting purposes. |
See Notes to Financial Statements
46
NOTES TO FINANCIAL STATEMENTS
(1) Business and Organization
MFS Global Total Return Fund (the fund) is a diversified series of MFS Series Trust VI (the trust). The trust is organized as a Massachusetts business trust and is registered under the Investment Company Act of 1940, as amended, as anopen-end management investment company.
The fund is an investment company and accordingly follows the investment company accounting and reporting guidance of the Financial Accounting Standards Board (FASB) Accounting Standards Codification Topic 946 Financial Services – Investment Companies.
(2) Significant Accounting Policies
General– The preparation of financial statements in conformity with U.S. generally accepted accounting principles requires management to make estimates and assumptions that affect the reported amounts of assets and liabilities, and disclosure of contingent assets and liabilities at the date of the financial statements and the reported amounts of increases and decreases in net assets from operations during the reporting period. Actual results could differ from those estimates. In the preparation of these financial statements, management has evaluated subsequent events occurring after the date of the fund’s Statement of Assets and Liabilities through the date that the financial statements were issued. The fund invests in foreign securities. Investments in foreign securities are vulnerable to the effects of changes in the relative values of the local currency and the U.S. dollar and to the effects of changes in each country’s market, economic, industrial, political, regulatory, geopolitical, and other conditions.
In March 2017, the FASB issued Accounting Standards Update 2017-08, Receivables – Nonrefundable Fees and Other Costs (Subtopic 310-20) – Premium Amortization on Purchased Callable Debt Securities (“ASU 2017-08”). For entities that purchased callable debt securities at a premium, ASU 2017-08 requires that the premium be amortized to the earliest call date. ASU 2017-08 will be effective for fiscal years beginning after December 15, 2018, and interim periods within those fiscal years. Management has evaluated the potential impacts of ASU 2017-08 and believes that adoption of ASU 2017-08 will not have a material effect on the fund’s overall financial position or its overall results of operations.
Balance Sheet Offsetting– The fund’s accounting policy with respect to balance sheet offsetting is that, absent an event of default by the counterparty or a termination of the agreement, the International Swaps and Derivatives Association (ISDA) Master Agreement, or similar agreement, does not result in an offset of reported amounts of financial assets and financial liabilities in the Statement of Assets and Liabilities across transactions between the fund and the applicable counterparty. The fund’s right to setoff may be restricted or prohibited by the bankruptcy or insolvency laws of the particular jurisdiction to which a specific master netting agreement counterparty is subject. Balance sheet offsetting disclosures, to the extent applicable to the fund, have been included in the fund’s Significant Accounting Policies note under the captions for each of the fund’sin-scope financial instruments and transactions.
47
Notes to Financial Statements – continued
Investment Valuations– Equity securities, including restricted equity securities, are generally valued at the last sale or official closing price on their primary market or exchange as provided by a third-party pricing service. Equity securities, for which there were no sales reported that day, are generally valued at the last quoted daily bid quotation on their primary market or exchange as provided by a third-party pricing service. Debt instruments and floating rate loans, including restricted debt instruments, are generally valued at an evaluated or composite bid as provided by a third-party pricing service. Short-term instruments with a maturity at issuance of 60 days or less may be valued at amortized cost, which approximates market value. Exchange-traded options are generally valued at the last sale or official closing price on their primary exchange as provided by a third-party pricing service. Exchange-traded options for which there were no sales reported that day are generally valued at the last daily bid quotation on their primary exchange as provided by a third-party pricing service. Options not traded on an exchange are generally valued at a broker/dealer bid quotation. Foreign currency options are generally valued at valuations provided by a third-party pricing service. Futures contracts are generally valued at last posted settlement price on their primary exchange as provided by a third-party pricing service. Futures contracts for which there were no trades that day for a particular position are generally valued at the closing bid quotation on their primary exchange as provided by a third-party pricing service. Forward foreign currency exchange contracts are generally valued at the mean of bid and asked prices for the time period interpolated from rates provided by a third-party pricing service for proximate time periods. Swap agreements are generally valued at valuations provided by a third-party pricing service, which for cleared swaps includes an evaluation of any trading activity at the clearinghouses.Open-end investment companies are generally valued at net asset value per share. Securities and other assets generally valued on the basis of information from athird-party pricing service may also be valued at a broker/dealer bid quotation. In determining values, third-party pricing services can utilize both transaction data and market information such as yield, quality, coupon rate, maturity, type of issue, trading characteristics, and other market data. The values of foreign securities and other assets and liabilities expressed in foreign currencies are converted to U.S. dollars using the mean of bid and asked prices for rates provided by a third-party pricing service.
The Board of Trustees has delegated primary responsibility for determining or causing to be determined the value of the fund’s investments (including any fair valuation) to the adviser pursuant to valuation policies and procedures approved by the Board. If the adviser determines that reliable market quotations are not readily available, investments are valued at fair value as determined in good faith by the adviser in accordance with such procedures under the oversight of the Board of Trustees. Under the fund’s valuation policies and procedures, market quotations are not considered to be readily available for most types of debt instruments and floating rate loans and many types of derivatives. These investments are generally valued at fair value based on information from third-party pricing services. In addition, investments may be valued at fair value if the adviser determines that an investment’s value has been materially affected by events occurring after the close of the exchange or market on which the investment is principally traded (such as foreign exchange or market) and prior to the determination of the fund’s net asset value, or after the halt of trading of a specific security where
48
Notes to Financial Statements – continued
trading does not resume prior to the close of the exchange or market on which the security is principally traded. Events that occur after foreign markets close (such as developments in foreign markets and significant movements in the U.S. markets) and prior to the determination of the fund’s net asset value may be deemed to have a material effect on the value of securities traded in foreign markets. Accordingly, the fund’s foreign equity securities may often be valued at fair value. The adviser generally relies on third-party pricing services or other information (such as the correlation with price movements of similar securities in the same or other markets; the type, cost and investment characteristics of the security; the business and financial condition of the issuer; and trading and other market data) to assist in determining whether to fair value and at what value to fair value an investment. The value of an investment for purposes of calculating the fund’s net asset value can differ depending on the source and method used to determine value. When fair valuation is used, the value of an investment used to determine the fund’s net asset value may differ from quoted or published prices for the same investment. There can be no assurance that the fund could obtain the fair value assigned to an investment if it were to sell the investment at the same time at which the fund determines its net asset value per share.
Various inputs are used in determining the value of the fund’s assets or liabilities. These inputs are categorized into three broad levels. In certain cases, the inputs used to measure fair value may fall into different levels of the fair value hierarchy. In such cases, an investment’s level within the fair value hierarchy is based on the lowest level of input that is significant to the fair value measurement. The fund’s assessment of the significance of a particular input to the fair value measurement in its entirety requires judgment, and considers factors specific to the investment. Level 1 includes unadjusted quoted prices in active markets for identical assets or liabilities. Level 2 includes other significant observable market-based inputs (including quoted prices for similar securities, interest rates, prepayment speed, and credit risk). Level 3 includes unobservable inputs, which may include the adviser’s own assumptions in determining the fair value of investments. Other financial instruments are derivative instruments,
49
Notes to Financial Statements – continued
such as futures contracts, forward foreign currency exchange contracts, swap agreements, and written options. The following is a summary of the levels used as of October 31, 2019 in valuing the fund’s assets or liabilities:
| | | | | | | | | | | | | | | | |
| | | | |
| Financial Instruments | | Level 1 | | | Level 2 | | | Level 3 | | | Total | |
| Equity Securities: | | | | | | | | | | | | | | | | |
United States | | | $587,106,703 | | | | $4,968,356 | | | | $— | | | | $592,075,059 | |
Switzerland | | | 92,896,405 | | | | — | | | | — | | | | 92,896,405 | |
Japan | | | — | | | | 91,768,768 | | | | — | | | | 91,768,768 | |
United Kingdom | | | 63,022,164 | | | | — | | | | — | | | | 63,022,164 | |
France | | | 56,004,619 | | | | — | | | | — | | | | 56,004,619 | |
Canada | | | 43,229,489 | | | | — | | | | — | | | | 43,229,489 | |
Taiwan | | | 30,462,939 | | | | — | | | | — | | | | 30,462,939 | |
Germany | | | 29,693,587 | | | | — | | | | — | | | | 29,693,587 | |
Netherlands | | | 23,829,203 | | | | — | | | | — | | | | 23,829,203 | |
Other Countries | | | 39,588,657 | | | | 40,248,655 | | | | — | | | | 79,837,312 | |
| U.S. Treasury Bonds & U.S. Government Agencies & Equivalents | | | — | | | | 129,093,999 | | | | — | | | | 129,093,999 | |
| Non-U.S. Sovereign Debt | | | — | | | | 280,422,864 | | | | — | | | | 280,422,864 | |
| Municipal Bonds | | | — | | | | 2,734,897 | | | | — | | | | 2,734,897 | |
| U.S. Corporate Bonds | | | — | | | | 96,350,890 | | | | — | | | | 96,350,890 | |
| Residential Mortgage-Backed Securities | | | — | | | | 66,125,316 | | | | — | | | | 66,125,316 | |
| Commercial Mortgage-Backed Securities | | | — | | | | 11,358,559 | | | | — | | | | 11,358,559 | |
| Asset-Backed Securities | | | | | | | | | | | | | | | | |
| (including CDOs) | | | — | | | | 12,686,217 | | | | — | | | | 12,686,217 | |
| Foreign Bonds | | | — | | | | 98,540,003 | | | | — | | | | 98,540,003 | |
| Mutual Funds | | | 35,723,511 | | | | — | | | | — | | | | 35,723,511 | |
| Total | | | $1,001,557,277 | | | | $834,298,524 | | | | $— | | | | $1,835,855,801 | |
| | | |
| Other Financial Instruments | | | | | | | | | | |
| Futures Contracts – Assets | | | $3,053,636 | | | | $— | | | | $— | | | | $3,053,636 | |
| Futures Contracts – Liabilities | | | (39,416 | ) | | | — | | | | — | | | | (39,416 | ) |
| Forward Foreign Currency Exchange Contracts – Assets | | | — | | | | 1,503,778 | | | | — | | | | 1,503,778 | |
| Forward Foreign Currency Exchange Contracts – Liabilities | | | — | | | | (2,416,029 | ) | | | — | | | | (2,416,029 | ) |
| Swap Agreements – Assets | | | — | | | | 173,387 | | | | — | | | | 173,387 | |
| Written Options – Liabilities | | | — | | | | (1,818 | ) | | | — | | | | (1,818 | ) |
For further information regarding security characteristics, see the Portfolio of Investments.
Inflation-Adjusted Debt Securities– The fund invests in inflation-adjusted debt securities issued by the U.S. Treasury. The fund also invests in inflation-adjusted debt securities issued by U.S. Government agencies and instrumentalities other than the U.S. Treasury and by other entities such as U.S. and foreign corporations and foreign governments. The principal value of these debt securities is adjusted through income according to changes in the Consumer Price Index or another general price or wage index. These debt securities typically pay a fixed rate of interest, but this fixed rate is applied to the inflation-adjusted principal amount. The principal paid at maturity of the
50
Notes to Financial Statements – continued
debt security is typically equal to the inflation-adjusted principal amount, or the security’s original par value, whichever is greater. Other types of inflation-adjusted securities may use other methods to adjust for other measures of inflation.
Foreign Currency Translation– Purchases and sales of foreign investments, income, and expenses are converted into U.S. dollars based upon currency exchange rates prevailing on the respective dates of such transactions or on the reporting date for foreign denominated receivables and payables. Gains and losses attributable to foreign currency exchange rates on sales of securities are recorded for financial statement purposes as net realized gains and losses on investments. Gains and losses attributable to foreign exchange rate movements on receivables, payables, income and expenses are recorded for financial statement purposes as foreign currency transaction gains and losses. That portion of both realized and unrealized gains and losses on investments that results from fluctuations in foreign currency exchange rates is not separately disclosed.
Derivatives– The fund uses derivatives primarily to increase or decrease exposure to a particular market or segment of the market, or security, to increase or decrease interest rate or currency exposure, or as alternatives to direct investments. Derivatives are used for hedging ornon-hedging purposes. While hedging can reduce or eliminate losses, it can also reduce or eliminate gains. When the fund uses derivatives as an investment to increase market exposure, or for hedging purposes, gains and losses from derivative instruments may be substantially greater than the derivative’s original cost.
The derivative instruments used by the fund during the period were written options, purchased options, futures contracts, forward foreign currency exchange contracts, and swap agreements. Depending on the type of derivative, the fund may exit a derivative position by entering into an offsetting transaction with a counterparty or exchange, negotiating an agreement with the derivative counterparty, or novating the position to a third party. The fund may be unable to promptly close out a futures position in instances where the daily fluctuation in the price for that type of future exceeds the daily limit set by the exchange. The fund’s period end derivatives, as presented in the Portfolio of Investments and the associated Derivative Contract tables, generally are indicative of the volume of its derivative activity during the period.
The following table presents, by major type of derivative contract, the fair value, on a gross basis, of the asset and liability components of derivatives held by the fund at October 31, 2019 as reported in the Statement of Assets and Liabilities:
| | | | | | | | | | |
| | | | | Fair Value (a) | |
| | | |
| Risk | | Derivative Contracts | | Asset Derivatives | | | Liability Derivatives | |
| Interest Rate | | Interest Rate Futures | | | $3,053,636 | | | | $(39,416 | ) |
| Foreign Exchange | | Forward Foreign Currency Exchange Contracts | | | 1,503,778 | | | | (2,416,029 | ) |
| Credit | | Purchased Credit Options | | | 20,974 | | | | — | |
| Credit | | Written Credit Options | | | — | | | | (1,818 | ) |
| Credit | | Credit Default Swaps | | | 173,387 | | | | — | |
| Total | | | | | $4,751,775 | | | $ | (2,457,263 | ) |
| (a) | The value of purchased options outstanding is included in investments in unaffiliated issuers, at value, within the fund’s Statement of Assets and Liabilities. Values presented in this table for |
51
Notes to Financial Statements – continued
| | futures contracts correspond to the values reported in the fund’s Portfolio of Investments. Only the current day net variation margin for futures contracts is separately reported within the fund’s Statement of Assets and Liabilities. |
The following table presents, by major type of derivative contract, the realized gain (loss) on derivatives held by the fund for the year ended October 31, 2019 as reported in the Statement of Operations:
| | | | | | | | | | | | | | | | | | | | |
| | | | | |
| Risk | | Futures
Contracts | | | Swap
Agreements | | | Forward
Foreign
Currency
Exchange
Contracts | | | Unaffiliated
Issuers
(Purchased
Options) | | | Written
Options | |
| Interest Rate | | | $(12,426,406 | ) | | | $— | | | | $— | | | | $— | | | | $— | |
| Foreign Exchange | | | — | | | | — | | | | (2,391,983 | ) | | | — | | | | — | |
| Credit | | | — | | | | 8,112 | | | | — | | | | (397,929 | ) | | | 239,814 | |
| Total | | | $(12,426,406 | ) | | | $8,112 | | | | $(2,391,983 | ) | | | $(397,929 | ) | | | $239,814 | |
The following table presents, by major type of derivative contract, the change in unrealized appreciation or depreciation on derivatives held by the fund for the year ended October 31, 2019 as reported in the Statement of Operations:
| | | | | | | | | | | | | | | | | | | | |
| | | | | |
| Risk | | Futures
Contracts | | | Swap
Agreements | | | Forward
Foreign
Currency
Exchange
Contracts | | | Unaffiliated
Issuers
(Purchased
Options) | | | Written
Options | |
| Interest Rate | | | $2,290,215 | | | | $— | | | | $— | | | | $— | | | | $— | |
| Foreign Exchange | | | — | | | | — | | | | 585,562 | | | | — | | | | — | |
| Credit | | | — | | | | 3,150 | | | | — | | | | 9,686 | | | | 3,797 | |
| Total | | | $2,290,215 | | | | $3,150 | | | | $585,562 | | | | $9,686 | | | | $3,797 | |
Derivative counterparty credit risk is managed through formal evaluation of the creditworthiness of all potential counterparties. On certain, but not all, uncleared derivatives, the fund attempts to reduce its exposure to counterparty credit risk whenever possible by entering into an ISDA Master Agreement on a bilateral basis. The ISDA Master Agreement gives each party to the agreement the right to terminate all transactions traded under such agreement if there is a specified deterioration in the credit quality of the other party. Upon an event of default or a termination of the ISDA Master Agreement, thenon-defaulting party has the right to close out all transactions traded under such agreement and to net amounts owed under each agreement to one net amount payable by one party to the other. This right to close out and net payments across all transactions traded under the ISDA Master Agreement could result in a reduction of the fund’s credit risk to such counterparty equal to any amounts payable by the fund under the applicable transactions, if any.
Collateral and margin requirements differ by type of derivative. For cleared derivatives (e.g., futures contracts, cleared swaps, and exchange-traded options), margin requirements are set by the clearing broker and the clearing house and collateral, in the form of cash or securities, is posted by the fund directly with the clearing broker. Collateral terms are counterparty agreement specific for uncleared derivatives (e.g., forward foreign currency exchange contracts, uncleared swap agreements, and
52
Notes to Financial Statements – continued
uncleared options) and collateral, in the form of cash and securities, is held in segregated accounts with the fund’s custodian in connection with these agreements. For derivatives traded under an ISDA Master Agreement, which contains a collateral support annex, the collateral requirements are netted across all transactions traded under such counterparty-specific agreement and an amount is posted from one party to the other to collateralize such obligations. Cash that has been segregated or delivered to cover the fund’s collateral or margin obligations under derivative contracts, if any, will be reported separately in the Statement of Assets and Liabilities as restricted cash for uncleared derivatives and/or deposits with brokers for cleared derivatives. Securities pledged as collateral or margin for the same purpose, if any, are noted in the Portfolio of Investments. The fund may be required to make payments of interest on uncovered collateral or margin obligations with the broker. Any such payments are included in “Miscellaneous” expense in the Statement of Operations.
Written Options– In exchange for a premium, the fund wrote put options on securities for which it anticipated the price would increase. At the time the option was written, the fund believed the premium received exceeded the potential loss that could result from adverse price changes in the options’ underlying securities. In a written option, the fund as the option writer grants the buyer the right to purchase from, or sell to, the fund a specified number of shares or units of a particular security, currency or index at a specified price within a specified period of time.
The premium received is initially recorded as a liability in the Statement of Assets and Liabilities. The option is subsequentlymarked-to-market daily with the difference between the premium received and the market value of the written option being recorded as unrealized appreciation or depreciation. When a written option expires, the fund realizes a gain equal to the amount of the premium received. The difference between the premium received and the amount paid on effecting a closing transaction is considered a realized gain or loss. When a written put option is exercised, the premium reduces the cost basis of the security purchased by the fund.
At the initiation of the written option contract, for exchange traded options, the fund is required to deposit securities or cash as collateral with the custodian for the benefit of the broker or directly with the clearing broker, based on the type of option. For uncleared options, the fund may post collateral subject to the terms of an ISDA Master Agreement as generally described above if the market value of the options contract moves against it. The fund, as writer of an option, may have no control over whether the underlying securities may be sold (call) or purchased (put) and, as a result, bears the market risk of an unfavorable change in the price of the securities underlying the written option. Losses from writing options can exceed the premium received and can exceed the potential loss from an ordinary buy and sell transaction. Although the fund’s market risk may be significant, the maximum counterparty credit risk to the fund is equal to the market value of any collateral posted to the broker. For uncleared options, this risk is mitigated in cases where there is an ISDA Master Agreement between the fund and the counterparty providing for netting as described above.
Purchased Options– The fund purchased call and put options for a premium. Purchased call and put options entitle the holder to buy and sell a specified number of shares or units of a particular security, currency or index at a specified price at a
53
Notes to Financial Statements – continued
specified date or within a specified period of time. Purchasing call options may hedge against an anticipated increase in the dollar cost of securities or currency to be acquired or increase the fund’s exposure to an underlying instrument. Purchasing put options may hedge against an anticipated decline in the value of portfolio securities or currency or decrease the fund’s exposure to an underlying instrument.
The premium paid is initially recorded as an investment in the Statement of Assets and Liabilities. That investment is subsequentlymarked-to-market daily with the difference between the premium paid and the market value of the purchased option being recorded as unrealized appreciation or depreciation. Premiums paid for purchased call and put options which have expired are treated as realized losses on investments in the Statement of Operations. Upon the exercise or closing of a purchased call option, the premium paid is added to the cost of the security or financial instrument purchased. Upon the exercise or closing of a purchased put option, the premium paid is offset against the proceeds on the sale of the underlying security or financial instrument in order to determine the realized gain or loss on investments.
Whether or not the option is exercised, the fund’s maximum risk of loss from purchasing an option is the amount of premium paid. All option contracts involve credit risk if the counterparty to the option contract fails to perform. For uncleared options, this risk is mitigated in cases where there is an ISDA Master Agreement between the fund and the counterparty providing for netting as described above and, where applicable, by the posting of collateral by the counterparty to the fund to cover the fund’s exposure to the counterparty under such ISDA Master Agreement.
Futures Contracts– The fund entered into futures contracts which may be used to hedge against or obtain broad market exposure, interest rate exposure, currency exposure, or to manage duration. A futures contract represents a commitment for the future purchase or sale of an asset at a specified price on a specified date.
Upon entering into a futures contract, the fund is required to deposit with the broker, either in cash or securities, an initial margin in an amount equal to a specified percentage of the notional amount of the contract. Subsequent payments (variation margin) are made or received by the fund each day, depending on the daily fluctuations in the value of the contract, and are recorded for financial statement purposes as unrealized gain or loss by the fund until the contract is closed or expires at which point the gain or loss on futures contracts is realized.
The fund bears the risk of interest rates, exchange rates or securities prices moving unexpectedly, in which case, the fund may not achieve the anticipated benefits of the futures contracts and may realize a loss. While futures contracts may present less counterparty risk to the fund since the contracts are exchange traded and the exchange’s clearinghouse guarantees payments to the broker, there is still counterparty credit risk due to the insolvency of the broker. The fund’s maximum risk of loss due to counterparty credit risk is equal to the margin posted by the fund to the broker plus any gains or minus any losses on the outstanding futures contracts.
Forward Foreign Currency Exchange Contracts– The fund entered into forward foreign currency exchange contracts for the purchase or sale of a specific foreign currency at a fixed price on a future date. These contracts may be used to hedge the fund’s currency risk or fornon-hedging purposes. For hedging purposes, the fund may
54
Notes to Financial Statements – continued
enter into contracts to deliver or receive foreign currency that the fund will receive from or use in its normal investment activities. The fund may also use contracts to hedge against declines in the value of foreign currency denominated securities due to unfavorable exchange rate movements. Fornon-hedging purposes, the fund may enter into contracts with the intent of changing the relative exposure of the fund’s portfolio of securities to different currencies to take advantage of anticipated exchange rate changes.
Forward foreign currency exchange contracts are adjusted by the daily exchange rate of the underlying currency and any unrealized gains or losses are recorded as a receivable or payable for forward foreign currency exchange contracts until the contract settlement date. On contract settlement date, any gain or loss on the contract is recorded as realized gains or losses on forward foreign currency exchange contracts.
Risks may arise upon entering into these contracts from unanticipated movements in the value of the contract and from the potential inability of counterparties to meet the terms of their contracts. Generally, the fund’s maximum risk due to counterparty credit risk is the unrealized gain on the contract due to the use of Continuous Linked Settlement, a multicurrency cash settlement system for the centralized settlement of foreign transactions. This risk is mitigated in cases where there is an ISDA Master Agreement between the fund and the counterparty providing for netting as described above and, where applicable, by the posting of collateral by the counterparty to the fund to cover the fund’s exposure to the counterparty under such ISDA Master Agreement.
Swap Agreements– During the period the fund entered into swap agreements. Swap agreements generally involve a periodic exchange of cash payments on a net basis, at specified intervals or upon the occurrence of specified events, between the fund and a counterparty. Certain swap agreements may be entered into as a bilateral contract (“uncleared swaps”) while others are required to be centrally cleared (“cleared swaps”). In a cleared swap transaction, the ultimate counterparty to the transaction is a clearinghouse (the “clearinghouse”). The contract is transferred and accepted by the clearinghouse immediately following execution of the swap contract with an executing broker. Thereafter, throughout the term of the cleared swap, the fund interfaces indirectly with the clearinghouse through a clearing broker and has counterparty risk to the clearing broker as well.
Both cleared and uncleared swap agreements are marked to market daily. The value of uncleared swap agreements is reported in the Statement of Assets and Liabilities as “Uncleared swaps, at value” which includes any related interest accruals to be paid or received by the fund. For cleared swaps, payments (variation margin) are made or received by the fund each day, depending on the daily fluctuations in the value of the cleared swap, such that only the current day net receivable or payable for variation margin is reported in the Statement of Assets and Liabilities.
For both cleared and uncleared swaps, the periodic exchange of net cash payments, at specified intervals or upon the occurrence of specified events as stipulated by the agreement, is recorded as realized gain or loss on swap agreements in the Statement of Operations. Premiums paid or received at the inception of the agreements are amortized using the effective interest method over the term of the agreement as
55
Notes to Financial Statements – continued
realized gain or loss on swap agreements in the Statement of Operations. A liquidation payment received or made upon early termination is recorded as a realized gain or loss on swap agreements in the Statement of Operations. The change in unrealized appreciation or depreciation on swap agreements in the Statement of Operations reflects the aggregate change over the reporting period in the value of swaps net of any unamortized premiums paid or received.
Risks related to swap agreements include the possible lack of a liquid market, unfavorable market and interest rate movements of the underlying instrument and the failure of the counterparty to perform under the terms of the agreements. The fund’s maximum risk of loss from counterparty credit risk is the discounted net value of the cash flows to be received from/paid to the counterparty over the contract’s remaining life, to the extent that the amount is positive. To address counterparty risk, uncleared swap agreements are limited to only highly-rated counterparties. Risk is further reduced by having an ISDA Master Agreement between the fund and the counterparty providing for netting as described above and, where applicable, by the posting of collateral by the counterparty to the fund to cover the fund’s exposure to the counterparty under such ISDA Master Agreement. The fund’s counterparty risk due to cleared swaps is mitigated by the fact that the clearinghouse is the true counterparty to the transaction and the regulatory requirement safeguards in the event of a clearing broker bankruptcy.
The fund entered into credit default swap agreements in order to manage its exposure to the market or certain sectors of the market, to reduce its credit risk exposure to defaults of corporate and sovereign issuers or to create exposure to corporate or sovereign issuers to which it is not otherwise exposed. In a credit default swap agreement, the protection buyer can make an upfront payment and will make a stream of payments to the protection seller based on a fixed percentage applied to the agreement notional amount in exchange for the right to receive a specified return upon the occurrence of a defined credit event on the reference obligation (which may be either a single security or a basket of securities issued by corporate or sovereign issuers) and, with respect to the cases where physical settlement applies, the delivery by the buyer to the seller of a defined deliverable obligation. Although agreement-specific, credit events generally consist of a combination of the following: bankruptcy, failure to pay, restructuring, obligation acceleration, obligation default, or repudiation/moratorium, each as defined in the 2003 ISDA Credit Derivatives Definitions as amended by the relevant agreement. Restructuring is generally not applicable when the reference obligation is issued by a North American corporation and obligation acceleration, obligation default, or repudiation/moratorium are generally only applicable when the reference obligation is issued by a sovereign entity or an entity in an emerging country. Upon determination of the final price for the deliverable obligation (or upon delivery of the deliverable obligation in the case of physical settlement), the difference between the value of the deliverable obligation and the swap agreement’s notional amount is recorded as realized gain or loss on swap agreements in the Statement of Operations.
Credit default swap agreements are considered to have credit-risk-related contingent features since they trigger payment by the protection seller to the protection buyer upon the occurrence of a defined credit event. The maximum amount of future,
56
Notes to Financial Statements – continued
undiscounted payments that the fund, as protection seller, could be required to make is equal to the swap agreement’s notional amount. The protection seller’s payment obligation would be offset to the extent of the value of the agreement’s deliverable obligation. At October 31, 2019, the fund did not hold any credit default swap agreements at an unrealized loss where it is the protection seller. The fund’s maximum risk of loss from counterparty risk, either as the protection seller or as the protection buyer, is the fair value of the agreement.
Security Loans– Under its Securities Lending Agency Agreement with the fund, JPMorgan Chase and Co., as lending agent, loans the securities of the fund to certain qualified institutions (the “Borrowers”) approved by the fund. Security loans can be terminated at the discretion of either the lending agent or the fund and the related securities must be returned within the earlier of the standard trade settlement period for such securities or within three business days. The loans are collateralized by cash and/or U.S. Treasury and federal agency obligations in an amount typically at least equal to the market value of the securities loaned. On loans collateralized by cash, the cash collateral is invested in a money market fund. The market value of the loaned securities is determined at the close of business of the fund and any additional required collateral is delivered to the fund on the next business day. The lending agent provides the fund with indemnification against Borrower default. In the event of Borrower default, the lending agent will, for the benefit of the fund, either purchase securities identical to those loaned or, when such purchase is commercially impracticable, pay the fund the market value of the loaned securities. In return, the lending agent assumes the fund’s rights to the related collateral. If the collateral value is less than the cost to purchase identical securities, the lending agent is responsible for the shortfall, but only to the extent that such shortfall is not due to a decline in collateral value resulting from collateral reinvestment for which the fund bears the risk of loss. A portion of the income generated upon investment of the collateral is remitted to the Borrowers, and the remainder is allocated between the fund and the lending agent. On loans collateralized by U.S. Treasury and/or federal agency obligations, a fee is received from the Borrower, and is allocated between the fund and the lending agent. Income from securities lending is separately reported in the Statement of Operations. The dividend and interest income earned on the securities loaned is accounted for in the same manner as other dividend and interest income. At October 31, 2019, there were no securities on loan or collateral outstanding.
Indemnifications– Under the fund’s organizational documents, its officers and Trustees may be indemnified against certain liabilities and expenses arising out of the performance of their duties to the fund. Additionally, in the normal course of business, the fund enters into agreements with service providers that may contain indemnification clauses. The fund’s maximum exposure under these agreements is unknown as this would involve future claims that may be made against the fund that have not yet occurred.
Investment Transactions and Income– Investment transactions are recorded on the trade date. Interest income is recorded on the accrual basis. All premium and discount is amortized or accreted for financial statement purposes in accordance with U.S. generally accepted accounting principles. Dividends received in cash are recorded on theex-dividend date. Certain dividends from foreign securities will be recorded when
57
Notes to Financial Statements – continued
the fund is informed of the dividend if such information is obtained subsequent to theex-dividend date. Dividend and interest payments received in additional securities are recorded on theex-dividend orex-interest date in an amount equal to the value of the security on such date.
The fund may receive proceeds from litigation settlements. Any proceeds received from litigation involving portfolio holdings are reflected in the Statement of Operations in realized gain/loss if the security has been disposed of by the fund or in unrealized gain/loss if the security is still held by the fund. Any other proceeds from litigation not related to portfolio holdings are reflected as other income in the Statement of Operations.
Fees Paid Indirectly– The fund’s custody fee may be reduced by a credit earned under an arrangement that measures the value of U.S. dollars deposited with the custodian by the fund. The amount of the credit, for the year ended October 31, 2019, is shown as a reduction of total expenses in the Statement of Operations.
Tax Matters and Distributions– The fund intends to qualify as a regulated investment company, as defined under Subchapter M of the Internal Revenue Code, and to distribute all of its taxable income, including realized capital gains. As a result, no provision for federal income tax is required. The fund’s federal tax returns, when filed, will remain subject to examination by the Internal Revenue Service for a three year period. Management has analyzed the fund’s tax positions taken on federal and state tax returns for all open tax years and does not believe that there are any uncertain tax positions that require recognition of a tax liability. Foreign taxes, if any, have been accrued by the fund in the accompanying financial statements in accordance with the applicable foreign tax law. Foreign income taxes may be withheld by certain countries in which the fund invests. Additionally, capital gains realized by the fund on securities issued in or by certain foreign countries may be subject to capital gains tax imposed by those countries.
Distributions to shareholders are recorded on theex-dividend date. Income and capital gain distributions are determined in accordance with income tax regulations, which may differ from U.S. generally accepted accounting principles. Certain capital accounts in the financial statements are periodically adjusted for permanent differences in order to reflect their tax character. These adjustments have no impact on net assets or net asset value per share. Temporary differences which arise from recognizing certain items of income, expense, gain or loss in different periods for financial statement and tax purposes will reverse at some time in the future.
Book/tax differences primarily relate to amortization and accretion of debt securities, passive foreign investment companies, wash sale loss deferrals, straddle loss deferrals, derivative transactions, and treating a portion of the proceeds from redemptions as a distribution for tax purposes.
58
Notes to Financial Statements – continued
The tax character of distributions declared to shareholders for the last two fiscal years is as follows:
| | | | | | | | |
| | |
| | | Year ended
10/31/19 | | | Year ended
10/31/18 | |
| Ordinary income (including any short-term capital gains) | | | $24,424,379 | | | | $32,594,612 | |
| Long-term capital gains | | | 33,205,731 | | | | 31,102,646 | |
| | |
| Total distributions | | | $57,630,110 | | | | $63,697,258 | |
The federal tax cost and the tax basis components of distributable earnings were as follows:
| | | | |
| |
| As of 10/31/19 | | | |
| |
| Cost of investments | | | $1,472,788,097 | |
| Gross appreciation | | | 388,630,159 | |
| |
| Gross depreciation | | | (23,288,917 | ) |
| Net unrealized appreciation (depreciation) | | | $365,341,242 | |
| |
| Undistributed ordinary income | | | 8,295,755 | |
| Undistributed long-term capital gain | | | 49,951,387 | |
| Other temporary differences | | | 75,682 | |
Multiple Classes of Shares of Beneficial Interest– The fund offers multiple classes of shares, which differ in their respective distribution and service fees. The fund’s income, realized and unrealized gain (loss), and common expenses are allocated to shareholders based on the daily net assets of each class. Dividends are declared separately for each class. Differences in per share dividend rates are generally due to differences in separate class expenses. Class B shares will convert to Class A shares approximately eight years after purchase. Class C shares will convert to Class A shares approximately ten years after purchase. The fund’s distributions declared to shareholders as reported in the Statements of Changes in Net Assets are presented by class as follows:
| | | | | | | | |
| | |
| | | Year
ended
10/31/19 | | | Year
ended
10/31/18 | |
| Class A | | | $21,078,171 | | | | $22,250,415 | |
| Class B | | | 699,714 | | | | 911,967 | |
| Class C | | | 5,099,930 | | | | 6,700,328 | |
| Class I | | | 19,428,182 | | | | 20,678,091 | |
| Class R1 | | | 50,294 | | | | 46,891 | |
| Class R2 | | | 354,632 | | | | 467,468 | |
| Class R3 | | | 548,357 | | | | 563,178 | |
| Class R4 | | | 242,029 | | | | 187,106 | |
| Class R6 | | | 10,128,801 | | | | 11,891,814 | |
| Total | | | $57,630,110 | | | | $63,697,258 | |
(3) Transactions with Affiliates
Investment Adviser– The fund has an investment advisory agreement with MFS to provide overall investment management and related administrative services and
59
Notes to Financial Statements – continued
facilities to the fund. The management fee is computed daily and paid monthly at the following annual rates based on the fund’s average daily net assets:
| | | | |
| Up to $500 million | | | 0.84 | % |
| In excess of $500 million and up to $1 billion | | | 0.75 | % |
| In excess of $1 billion and up to $2.5 billion | | | 0.70 | % |
| In excess of $2.5 billion | | | 0.65 | % |
MFS has agreed in writing to reduce its management fee by a specified amount if certain MFS mutual fund assets exceed thresholds agreed to by MFS and the fund’s Board of Trustees. For the year ended October 31, 2019, this management fee reduction amounted to $182,315, which is included in the reduction of total expenses in the Statement of Operations. The management fee incurred for the year ended October 31, 2019 was equivalent to an annual effective rate of 0.74% of the fund’s average daily net assets.
The investment adviser has agreed in writing to pay a portion of the fund’s total annual operating expenses, excluding interest, taxes, extraordinary expenses, brokerage and transaction costs, and investment-related expenses, such that total fund operating expenses do not exceed the following rates annually of each class’s average daily net assets:
| | | | | | | | | | | | | | | | | | | | | | | | | | | | | | | | |
| Classes | |
| | | | | | | | |
| A | | B | | | C | | | I | | | R1 | | | R2 | | | R3 | | | R4 | | | R6 | |
| 1.09% | | | 1.84% | | | | 1.84% | | | | 0.84% | | | | 1.84% | | | | 1.34% | | | | 1.09% | | | | 0.84% | | | | 0.78% | |
This written agreement will continue until modified by the fund’s Board of Trustees, but such agreement will continue at least until February 28, 2021. For the year ended October 31, 2019, this reduction amounted to $1,123,863, which is included in the reduction of total expenses in the Statement of Operations.
Distributor– MFS Fund Distributors, Inc. (MFD), a wholly-owned subsidiary of MFS, as distributor, received $108,242 for the year ended October 31, 2019, as its portion of the initial sales charge on sales of Class A shares of the fund.
The Board of Trustees has adopted a distribution plan for certain share classes pursuant to Rule12b-1 of the Investment Company Act of 1940.
The fund’s distribution plan provides that the fund will pay MFD for services provided by MFD and financial intermediaries in connection with the distribution and servicing of certain share classes. One component of the plan is a distribution fee paid to MFD and another component of the plan is a service fee paid to MFD. MFD may subsequently pay all, or a portion, of the distribution and/or service fees to financial intermediaries.
60
Notes to Financial Statements – continued
Distribution Plan Fee Table:
| | | | | | | | | | | | | | | | | | | | |
| | | | | |
| | | Distribution
Fee Rate (d) | | | Service
Fee Rate (d) | | | Total
Distribution
Plan (d) | | | Annual
Effective
Rate (e) | | | Distribution
and Service
Fee | |
| Class A | | | — | | | | 0.25% | | | | 0.25% | | | | 0.25% | | | | $1,837,353 | |
| Class B | | | 0.75% | | | | 0.25% | | | | 1.00% | | | | 1.00% | | | | 323,021 | |
| Class C | | | 0.75% | | | | 0.25% | | | | 1.00% | | | | 1.00% | | | | 2,342,043 | |
| Class R1 | | | 0.75% | | | | 0.25% | | | | 1.00% | | | | 1.00% | | | | 24,093 | |
| Class R2 | | | 0.25% | | | | 0.25% | | | | 0.50% | | | | 0.50% | | | | 62,748 | |
| Class R3 | | | — | | | | 0.25% | | | | 0.25% | | | | 0.25% | | | | 47,411 | |
| Total Distribution and Service Fees | | | | | | | | | | | | $4,636,669 | |
| (d) | In accordance with the distribution plan for certain classes, the fund pays distribution and/or service fees equal to these annual percentage rates of each class’s average daily net assets. The distribution and service fee rates disclosed by class represent the current rates in effect at the end of the reporting period. Any rate changes, if applicable, are detailed below. |
| (e) | The annual effective rates represent actual fees incurred under the distribution plan for the year ended October 31, 2019 based on each class’s average daily net assets. MFD has voluntarily agreed to rebate a portion of each class’s 0.25% service fee attributable to accounts for which MFD retains the 0.25% service fee except for accounts attributable to MFS or its affiliates’ seed money. For the year ended October 31, 2019, this rebate amounted to $15,347, $238, $811, and $5 for Class A, Class B, Class C, and Class R1, respectively, and is included in the reduction of total expenses in the Statement of Operations. |
Certain Class A shares are subject to a contingent deferred sales charge (CDSC) in the event of a shareholder redemption within 18 months of purchase. Class B shares are subject to a CDSC in the event of a shareholder redemption within six years of purchase. Class C shares are subject to a CDSC in the event of a shareholder redemption within 12 months of purchase. All contingent deferred sales charges are paid to MFD and during the year ended October 31, 2019, were as follows:
| | | | |
| |
| | | Amount | |
| Class A | | | $19,824 | |
| Class B | | | 35,571 | |
| Class C | | | 17,785 | |
Shareholder Servicing Agent– MFS Service Center, Inc. (MFSC), a wholly-owned subsidiary of MFS, receives a fee from the fund for its services as shareholder servicing agent calculated as a percentage of the average daily net assets of the fund as determined periodically under the supervision of the fund’s Board of Trustees. For the year ended October 31, 2019, the fee was $124,645, which equated to 0.0066% annually of the fund’s average daily net assets. MFSC also receives payment from the fund forout-of-pocket expenses,sub-accounting and other shareholder servicing costs which may be paid to affiliated and unaffiliated service providers. Class R6 shares do not incursub-accounting fees. For the year ended October 31, 2019, theseout-of-pocket expenses,sub-accounting and other shareholder servicing costs amounted to $1,634,045.
Administrator– MFS provides certain financial, legal, shareholder communications, compliance, and other administrative services to the fund. Under an administrative services agreement, the fund reimburses MFS the costs incurred to provide these services. The fund is charged an annual fixed amount of $17,500 plus a fee based on
61
Notes to Financial Statements – continued
average daily net assets. The administrative services fee incurred for the year ended October 31, 2019 was equivalent to an annual effective rate of 0.0139% of the fund’s average daily net assets.
Trustees’ and Officers’ Compensation– The fund pays compensation to independent Trustees in the form of a retainer, attendance fees, and additional compensation to Board and Committee chairpersons. The fund does not pay compensation directly to Trustees or officers of the fund who are also officers of the investment adviser, all of whom receive remuneration from MFS for their services to the fund. Certain officers and Trustees of the fund are officers or directors of MFS, MFD, and MFSC.
Prior to December 31, 2001, the fund had an unfunded defined benefit plan (“DB plan”) for independent Trustees. As of December 31, 2001, the Board took action to terminate the DB plan with respect to then-current and any future independent Trustees, such that the DB plan covers only certain of those former independent Trustees who retired on or before December 31, 2001. The DB plan resulted in a net decrease in pension expense of $1,601 and is included in “Independent Trustees’ compensation” in the Statement of Operations for the year ended October 31, 2019. Effective June 30, 2019, the fund no longer participates in the DB plan.
Other– This fund and certain other funds managed by MFS (the funds) had entered into a service agreement (the ISO Agreement) which provided for payment of fees solely by the funds to Tarantino LLC in return for the provision of services of an Independent Senior Officer (ISO) for the funds. Frank L. Tarantino served as the ISO and was an officer of the funds and the sole member of Tarantino LLC. Effective June 30, 2019, Mr. Tarantino retired from his position as ISO for the funds, and the ISO Agreement was terminated. For the year ended October 31, 2019, the fee paid by the fund under this agreement was $2,914 and is included in “Miscellaneous” expense in the Statement of Operations. MFS had agreed to bear all expenses associated with office space, other administrative support, and supplies provided to the ISO.
The fund invests in the MFS Institutional Money Market Portfolio which is managed by MFS and seeks current income consistent with preservation of capital and liquidity. This money market fund does not pay a management fee to MFS.
The fund is permitted to engage in purchase and sale transactions with funds and accounts for which MFS serves as investment adviser orsub-adviser (“cross-trades”) pursuant to a policy adopted by the Board of Trustees. This policy has been designed to ensure that cross-trades conducted by the fund comply with Rule17a-7 under the Investment Company Act of 1940. During the year ended October 31, 2019, the fund engaged in purchase and sale transactions pursuant to this policy, which amounted to $912,132 and $2,892,430, respectively. The sales transactions resulted in net realized gains (losses) of $124,179.
(4) Portfolio Securities
For the year ended October 31, 2019, purchases and sales of investments, other than purchased option transactions and short-term obligations, were as follows:
| | | | | | | | |
| | |
| | | Purchases | | | Sales | |
| U.S. Government securities | | | $316,552,901 | | | | $419,926,929 | |
| Non-U.S. Government securities | | | $871,556,292 | | | | $1,189,635,707 | |
62
Notes to Financial Statements – continued
(5) Shares of Beneficial Interest
The fund’s Declaration of Trust permits the Trustees to issue an unlimited number of full and fractional shares of beneficial interest. Transactions in fund shares were as follows:
| | | | | | | | | | | | | | | | |
| | | Year ended
10/31/19 | | | Year ended
10/31/18 | |
| | | | |
| | | Shares | | | Amount | | | Shares | | | Amount | |
| Shares sold | | | | | | | | | | | | | | | | |
Class A | | | 4,418,454 | | | | $77,613,898 | | | | 7,655,177 | | | | $137,643,105 | |
Class B | | | 61,768 | | | | 1,087,926 | | | | 172,706 | | | | 3,178,519 | |
Class C | | | 773,331 | | | | 13,424,163 | | | | 2,462,634 | | | | 44,793,638 | |
Class I | | | 6,200,550 | | | | 107,048,409 | | | | 14,331,061 | | | | 256,048,617 | |
Class R1 | | | 21,339 | | | | 376,746 | | | | 93,172 | | | | 1,651,598 | |
Class R2 | | | 168,665 | | | | 2,884,793 | | | | 275,535 | | | | 4,924,415 | |
Class R3 | | | 181,852 | | | | 3,208,700 | | | | 342,806 | | | | 6,080,609 | |
Class R4 | | | 83,825 | | | | 1,460,247 | | | | 273,422 | | | | 4,894,903 | |
Class R6 | | | 2,751,747 | | | | 47,665,379 | | | | 5,283,105 | | | | 94,303,397 | |
| | | 14,661,531 | | | | $254,770,261 | | | | 30,889,618 | | | | $553,518,801 | |
| | | |
Shares issued to shareholders in
reinvestment of distributions | | | | | | | | | | | | | |
Class A | | | 1,174,588 | | | | $19,722,923 | | | | 1,157,923 | | | | $20,709,343 | |
Class B | | | 37,066 | | | | 624,807 | | | | 44,425 | | | | 812,206 | |
Class C | | | 256,657 | | | | 4,265,970 | | | | 314,403 | | | | 5,668,272 | |
Class I | | | 988,476 | | | | 16,409,283 | | | | 985,503 | | | | 17,423,658 | |
Class R1 | | | 3,026 | | | | 50,294 | | | | 2,607 | | | | 46,891 | |
Class R2 | | | 9,565 | | | | 158,113 | | | | 9,199 | | | | 163,102 | |
Class R3 | | | 32,748 | | | | 548,357 | | | | 31,535 | | | | 563,178 | |
Class R4 | | | 14,309 | | | | 240,763 | | | | 10,476 | | | | 186,946 | |
Class R6 | | | 573,344 | | | | 9,443,019 | | | | 639,171 | | | | 11,307,672 | |
| | | 3,089,779 | | | | $51,463,529 | | | | 3,195,242 | | | | $56,881,268 | |
| | | | |
| Shares reacquired | | | | | | | | | | | | | | | | |
Class A | | | (7,835,531 | ) | | | $(137,164,202 | ) | | | (9,037,037 | ) | | | $(162,259,764 | ) |
Class B | | | (675,535 | ) | | | (12,113,743 | ) | | | (776,912 | ) | | | (14,236,975 | ) |
Class C | | | (4,624,280 | ) | | | (81,529,601 | ) | | | (6,404,461 | ) | | | (115,151,235 | ) |
Class I | | | (15,717,569 | ) | | | (268,962,652 | ) | | | (8,369,881 | ) | | | (147,934,160 | ) |
Class R1 | | | (28,411 | ) | | | (502,048 | ) | | | (100,172 | ) | | | (1,790,775 | ) |
Class R2 | | | (380,487 | ) | | | (6,559,776 | ) | | | (647,660 | ) | | | (11,598,807 | ) |
Class R3 | | | (221,806 | ) | | | (3,845,818 | ) | | | (442,425 | ) | | | (7,918,900 | ) |
Class R4 | | | (130,489 | ) | | | (2,278,846 | ) | | | (177,994 | ) | | | (3,236,446 | ) |
Class R6 | | | (12,309,324 | ) | | | (202,656,558 | ) | | | (3,782,655 | ) | | | (67,105,695 | ) |
| | | (41,923,432 | ) | | | $(715,613,244 | ) | | | (29,739,197 | ) | | | $(531,232,757 | ) |
63
Notes to Financial Statements – continued
| | | | | | | | | | | | | | | | |
| | | Year ended
10/31/19 | | | Year ended
10/31/18 | |
| | | | |
| | | Shares | | | Amount | | | Shares | | | Amount | |
| Net change | | | | | | | | | | | | | | | | |
Class A | | | (2,242,489 | ) | | | $(39,827,381 | ) | | | (223,937 | ) | | | $(3,907,316 | ) |
Class B | | | (576,701 | ) | | | (10,401,010 | ) | | | (559,781 | ) | | | (10,246,250 | ) |
Class C | | | (3,594,292 | ) | | | (63,839,468 | ) | | | (3,627,424 | ) | | | (64,689,325 | ) |
Class I | | | (8,528,543 | ) | | | (145,504,960 | ) | | | 6,946,683 | | | | 125,538,115 | |
Class R1 | | | (4,046 | ) | | | (75,008 | ) | | | (4,393 | ) | | | (92,286 | ) |
Class R2 | | | (202,257 | ) | | | (3,516,870 | ) | | | (362,926 | ) | | | (6,511,290 | ) |
Class R3 | | | (7,206 | ) | | | (88,761 | ) | | | (68,084 | ) | | | (1,275,113 | ) |
Class R4 | | | (32,355 | ) | | | (577,836 | ) | | | 105,904 | | | | 1,845,403 | |
Class R6 | | | (8,984,233 | ) | | | (145,548,160 | ) | | | 2,139,621 | | | | 38,505,374 | |
| | | (24,172,122 | ) | | | $(409,379,454 | ) | | | 4,345,663 | | | | $79,167,312 | |
Class T shares were not publicly available for sale during the period. Please see the fund’s prospectus for details.
Effective June 1, 2019, purchases of the fund’s Class B shares are closed to new and existing investors subject to certain exceptions. Please see the fund’s prospectus for details.
(6) Line of Credit
The fund and certain other funds managed by MFS participate in a $1.25 billion unsecured committed line of credit, subject to a $1 billion sublimit, provided by a syndicate of banks under a credit agreement. Borrowings may be made for temporary financing needs. Interest is charged to each fund, based on its borrowings, generally at a rate equal to the highest of one month LIBOR, the Federal Funds Effective Rate and the Overnight Bank Funding Rate, plus an agreed upon spread. A commitment fee, based on the average daily, unused portion of the committed line of credit, is allocated among the participating funds. In addition, the fund and other funds managed by MFS have established unsecured uncommitted borrowing arrangements with certain banks for temporary financing needs. Interest is charged to each fund, based on its borrowings, at rates equal to customary reference rates plus an agreed upon spread. For the year ended October 31, 2019, the fund’s commitment fee and interest expense were $11,324 and $0, respectively, and are included in “Miscellaneous” expense in the Statement of Operations.
64
Notes to Financial Statements – continued
(7) Investments in Affiliated Issuers
An affiliated issuer may be considered one in which the fund owns 5% or more of the outstanding voting securities, or a company which is under common control. For the purposes of this report, the following were affiliated issuers:
| | | | | | | | | | | | | | | | | | | | | | | | |
| | | | | | |
| Affiliated Issuers | | Beginning
Value | | | Purchases | | | Sales
Proceeds | | | Realized
Gain
(Loss) | | | Change in
Unrealized
Appreciation or
Depreciation | | | Ending
Value | |
| MFS Institutional Money Market Portfolio | | | $45,719,572 | | | | $586,101,643 | | | | $596,103,434 | | | | $1,568 | | | | $4,162 | | | | $35,723,511 | |
| | | | | | |
| Affiliated Issuers | | | | | | | | | | | | | | Dividend
Income | | | Capital Gain
Distributions | |
| MFS Institutional Money Market Portfolio | | | | | | | | | | | | | | | | $1,315,328 | | | | $— | |
65
REPORT OF INDEPENDENT REGISTERED PUBLIC ACCOUNTING FIRM
To the Shareholders of MFS Global Total Return Fund and the Board of Trustees of MFS Series Trust VI
Opinion on the Financial Statements
We have audited the accompanying statement of assets and liabilities of MFS Global Total Return Fund (the “Fund”) (one of the funds constituting MFS Series Trust VI (the “Trust”)), including the portfolio of investments, as of October 31, 2019,and the related statement of operations for the year then ended, the statements of changes in net assets for each of the two years in the period then ended, the financial highlights for each of the five years in the period then ended and the related notes (collectively referred to as the “financial statements”). In our opinion, the financial statements present fairly, in all material respects, the financial position of the Fund (one of the funds constituting MFS Series Trust VI) at October 31, 2019, the results of its operations for the year then ended, the changes in its net assets for each of the two years in the period then ended and its financial highlights for each of the five years in the period then ended, in conformity with U.S. generally accepted accounting principles.
Basis for Opinion
These financial statements are the responsibility of the Trust’s management. Our responsibility is to express an opinion on the Fund’s financial statements based on our audits. We are a public accounting firm registered with the Public Company Accounting Oversight Board (United States) (“PCAOB”) and are required to be independent with respect to the Trust in accordance with the U.S. federal securities laws and the applicable rules and regulations of the Securities and Exchange Commission and the PCAOB.
We conducted our audits in accordance with the standards of the PCAOB. Those standards require that we plan and perform the audit to obtain reasonable assurance about whether the financial statements are free of material misstatement, whether due to error or fraud. The Trust is not required to have, nor were we engaged to perform, an audit of the Trust’s internal control over financial reporting. As part of our audits, we are required to obtain an understanding of internal control over financial reporting but not for the purpose of expressing an opinion on the effectiveness of the Trust’s internal control over financial reporting. Accordingly, we express no such opinion.
Our audits included performing procedures to assess the risks of material misstatement of the financial statements, whether due to error or fraud, and performing procedures that respond to those risks. Such procedures included examining, on a test basis, evidence regarding the amounts and disclosures in the financial statements. Our procedures included confirmation of securities owned as of October 31, 2019,by correspondence with the custodian andothers or by other appropriate auditing procedures where replies from others were not received. Our audits also included
66
Report of Independent Registered Public Accounting Firm – continued
evaluating the accounting principles used and significant estimates made by management, as well as evaluating the overall presentation of the financial statements. We believe that our audits provide a reasonable basis for our opinion.

We have served as the auditor of one or more MFS investment companies since 1993.
Boston, Massachusetts December 16, 2019
67
TRUSTEES AND OFFICERS — IDENTIFICATION AND BACKGROUND
The Trustees and Officers of the Trust, as of December 1, 2019, are listed below, together with their principal occupations during the past five years. (Their titles may have varied during that period.) The address of each Trustee and Officer is 111 Huntington Avenue, Boston, Massachusetts 02199-7618.
| | | | | | | | | | |
Name, Age | | Position(s)
Held with Fund | | Trustee/Officer Since (h) | | Number of
MFS Funds
overseen
by the
Trustee | | Principal Occupations During the Past Five Years | | Other Directorships
During the Past
Five Years (j) |
| INTERESTED TRUSTEES |
Robert J. Manning (k)
(age 56) | | Trustee | | February 2004 | | 133 | | Massachusetts Financial Services Company, Executive Chairman (since January 2017); Director; Chairman of the Board; Chief Executive Officer (until 2015);Co-Chief Executive Officer (2015-2016) | | N/A |
| | | | | |
Robin A. Stelmach (k) (age 58) | | Trustee | | January 2014 | | 133 | | Massachusetts Financial Services Company, Vice Chair (since January 2017); Chief Operating Officer and Executive Vice President (until January 2017) | | N/A |
| INDEPENDENT TRUSTEES |
John P. Kavanaugh (age 65) | | Trustee and Chair of Trustees | | January 2009 | | 133 | | Private investor | | N/A |
| | | | | |
Steven E. Buller (age 68) | | Trustee | | February 2014 | | 133 | | Financial Accounting Standards Advisory Council, Chairman (2014-2015); Public Company Accounting Oversight Board, Standing Advisory Group, Member (until 2014); BlackRock, Inc. (investment management), Managing Director (until 2014), BlackRock Finco UK (investment management), Director (until 2014) | | N/A |
68
Trustees and Officers – continued
| | | | | | | | | | |
Name, Age | | Position(s)
Held with Fund | | Trustee/Officer Since (h) | | Number of
MFS Funds
overseen
by the
Trustee | | Principal Occupations During the Past Five Years | | Other Directorships
During the Past
Five Years (j) |
John A. Caroselli (age 65) | | Trustee | | March 2017 | | 133 | | JC Global Advisors, LLC (management consulting), President (since 2015); First Capital Corporation (commercial finance), Executive Vice President (until 2015) | | N/A |
| | | | | |
Maureen R. Goldfarb (age 64) | | Trustee | | January 2009 | | 133 | | Private investor | | N/A |
| | | | | |
Michael Hegarty* (age 74) | | Trustee | | December 2004 | | 133 | | Private investor | | Rouse Properties Inc., Director (until 2016); Capmark Financial Group Inc., Director (until 2015) |
| | | | | |
Peter D. Jones (age 64) | | Trustee | | January 2019 | | 133 | | Franklin Templeton Distributors, Inc. (investment management), President (until 2015); Franklin Templeton Institutional, LLC (investment management), Chairman (until 2015) | | N/A |
| | | | | |
James W. Kilman, Jr. (age 58) | | Trustee | | January 2019 | | 133 | | Burford Capital Limited (finance and investment management), Chief Financial Officer (since 2019); KielStrand Capital LLC (family office and merchant bank), Chief Executive Officer (since 2016); Morgan Stanley & Co. (financial services), Vice Chairman of Investment Banking,Co-Head of Diversified Financials Coverage – Financial Institutions Investment Banking Group (until 2016) | | Alpha-En Corporation, Director (since 2016) |
69
Trustees and Officers – continued
| | | | | | | | | | |
Name, Age | | Position(s)
Held with Fund | | Trustee/Officer Since (h) | | Number of
MFS Funds
overseen
by the
Trustee | | Principal Occupations During the Past Five Years | | Other Directorships
During the Past
Five Years (j) |
Clarence Otis, Jr. (age 63) | | Trustee | | March 2017 | | 133 | | Darden Restaurants, Inc., Chief Executive Officer (until 2014) | | VF Corporation, Director; Verizon Communications, Inc., Director; The Travelers Companies, Director; Federal Reserve Bank of Atlanta, Director (until 2015) |
| | | | | |
Maryanne L. Roepke (age 63) | | Trustee | | May 2014 | | 133 | | American Century Investments (investment management), Senior Vice President and Chief Compliance Officer (until 2014) | | N/A |
| | | | | |
Laurie J. Thomsen (age 62) | | Trustee | | March 2005 | | 133 | | Private investor | | The Travelers Companies, Director; Dycom Industries, Inc., Director (since 2015) |
| | | | | | | | |
Name, Age | | Position(s) Held with Fund | | Trustee/Officer
Since (h) | | Number of
MFS Funds
for which
the Person is an Officer | | Principal
Occupations During the Past Five Years |
| OFFICERS | | | | | | | | |
Christopher R. Bohane (k) (age 45) | | Assistant Secretary and Assistant Clerk | | July 2005 | | 133 | | Massachusetts Financial Services Company, Vice President and Assistant General Counsel |
| | | | |
Kino Clark (k) (age 51) | | Assistant Treasurer | | January 2012 | | 133 | | Massachusetts Financial Services Company, Vice President |
| | | | |
John W. Clark, Jr. (k) (age 52) | | Assistant Treasurer | | April 2017 | | 133 | | Massachusetts Financial Services Company, Vice President (since March 2017); Deutsche Bank (financial services), Department Head – Treasurer’s Office (until February 2017) |
70
Trustees and Officers – continued
| | | | | | | | |
Name, Age | | Position(s) Held with Fund | | Trustee/Officer
Since (h) | | Number of
MFS Funds
for which
the Person is an Officer | | Principal
Occupations During the Past Five Years |
Thomas H. Connors (k) (age 60) | | Assistant Secretary and Assistant Clerk | | September 2012 | | 133 | | Massachusetts Financial Services Company, Vice President and Senior Counsel |
| | | | |
David L. DiLorenzo (k) (age 51) | | President | | July 2005 | | 133 | | Massachusetts Financial Services Company, Senior Vice President |
| | | | |
Heidi W. Hardin (k) (age 52) | | Secretary and Clerk | | April 2017 | | 133 | | Massachusetts Financial Services Company, Executive Vice President and General Counsel (since March 2017); Harris Associates (investment management), General Counsel (from September 2015 to January 2017); Janus Capital Management LLC (investment management), Senior Vice President and General Counsel (until September 2015) |
| | | | |
Brian E. Langenfeld (k) (age 46) | | Assistant Secretary and Assistant Clerk | | June 2006 | | 133 | | Massachusetts Financial Services Company, Vice President and Senior Counsel |
| | | | |
Amanda S. Mooradian (k) (age 40) | | Assistant Secretary and Assistant Clerk | | September 2018 | | 133 | | Massachusetts Financial Services Company, Assistant Vice President and Counsel |
| | | | |
Susan A. Pereira (k) (age 49) | | Assistant Secretary and Assistant Clerk | | July 2005 | | 133 | | Massachusetts Financial Services Company, Vice President and Assistant General Counsel |
| | | | |
Kasey L. Phillips (k) (age 48) | | Assistant Treasurer | | September 2012 | | 133 | | Massachusetts Financial Services Company, Vice President |
| | | | |
Matthew A. Stowe (k) (age 45) | | Assistant Secretary and Assistant Clerk | | October 2014 | | 133 | | Massachusetts Financial Services Company, Vice President and Assistant General Counsel |
| | | | |
Martin J. Wolin (k) (age 52) | | Chief Compliance Officer | | July 2015 | | 133 | | Massachusetts Financial Services Company, Senior Vice President and Chief Compliance Officer (since July 2015); Mercer (financial service provider), Chief Risk and Compliance Officer, North America and Latin America (until June 2015) |
71
Trustees and Officers – continued
| | | | | | | | |
Name, Age | | Position(s) Held with Fund | | Trustee/Officer
Since (h) | | Number of
MFS Funds
for which
the Person is an Officer | | Principal
Occupations During the Past Five Years |
James O. Yost (k) (age 59) | | Treasurer | | September 1990 | | 133 | | Massachusetts Financial Services Company, Senior Vice President |
| (h) | Date first appointed to serve as Trustee/officer of an MFS Fund. Each Trustee has served continuously since appointment unless indicated otherwise. For the period from December 15, 2004 until February 22, 2005, Mr. Manning served as Advisory Trustee. From January 2012 through December 2016, Messrs. DiLorenzo and Yost served as Treasurer and Deputy Treasurer of the Funds, respectively. |
| (j) | Directorships or trusteeships of companies required to report to the Securities and Exchange Commission (i.e., “public companies”). |
| (k) | “Interested person” of the Trust within the meaning of the Investment Company Act of 1940 (referred to as the 1940 Act), which is the principal federal law governing investment companies like the fund, as a result of a position with MFS. The address of MFS is 111 Huntington Avenue, Boston, Massachusetts 02199-7618. |
| * | As of December 31, 2019, Mr. Hegarty will retire as Trustee. |
Each Trustee (other than Messrs. Jones and Kilman) has been elected by shareholders and each Trustee and Officer holds office until his or her successor is chosen and qualified or until his or her earlier death, resignation, retirement or removal. Messrs. Jones and Kilman became Trustees of the Funds on January 1, 2019. The Trust does not hold annual meetings for the purpose of electing Trustees, and Trustees are not elected for fixed terms. Under the terms of the Board’s retirement policy, an Independent Trustee shall retire at the end of the calendar year in which he or she reaches the earlier of 75 years of age or 15 years of service on the Board (or, in the case of any Independent Trustee who joined the Board prior to 2015, 20 years of service on the Board).
Messrs. Buller, Hegarty, Kilman and Otis and Ms. Roepke are members of the Trust’s Audit Committee. As of December 31, 2019, Mr. Hegarty will retire as Trustee and will no longer be a member of the Trust’s Audit Committee.
Each of the Interested Trustees and certain Officers hold comparable officer positions with certain affiliates of MFS.
72
Trustees and Officers – continued
The Statement of Additional Information for a Fund includes further information about the Trustees and is available without charge upon request by calling1-800-225-2606.
| | |
| Investment Adviser | | Custodian |
Massachusetts Financial Services Company
111 Huntington Avenue Boston, MA 02199-7618 | | JPMorgan Chase Bank, NA 4 Metrotech Center New York, NY 11245 |
| Distributor | | Independent Registered Public Accounting Firm |
MFS Fund Distributors, Inc.
111 Huntington Avenue Boston, MA 02199-7618 | | Ernst & Young LLP 200 Clarendon Street Boston, MA 02116 |
| Portfolio Manager(s) | | |
Nevin Chitkara Pilar Gomez-Bravo Steven Gorham Andy Li Vipin Narula Robert Persons Jonathan Sage Robert Spector Erik Weisman | | |
73
BOARD REVIEW OF INVESTMENT ADVISORY AGREEMENT
The Investment Company Act of 1940 requires that both the full Board of Trustees and a majority of thenon-interested (“independent”) Trustees, voting separately, annually approve the continuation of the Fund’s investment advisory agreement with MFS. The Trustees consider matters bearing on the Fund and its advisory arrangements at their meetings throughout the year, including a review of performance data at each regular meeting. In addition, the independent Trustees met several times over the course of three months beginning in May and ending in July, 2019 (“contract review meetings”) for the specific purpose of considering whether to approve the continuation of the investment advisory agreement for the Fund and the other investment companies that the Board oversees (the “MFS Funds”). The independent Trustees were assisted in their evaluation of the Fund’s investment advisory agreement by independent legal counsel, from whom they received separate legal advice and with whom they met separately from MFS during various contract review meetings. The independent Trustees were also assisted in this process by the MFS Funds’ Independent Senior Officer, a senior officer appointed by and reporting to the independent Trustees.
In connection with their deliberations regarding the continuation of the investment advisory agreement, the Trustees, including the independent Trustees, considered such information and factors as they believed, in light of the legal advice furnished to them and their own business judgment, to be relevant. The investment advisory agreement for the Fund was considered separately, although the Trustees also took into account the common interests of all MFS Funds in their review. As described below, the Trustees considered the nature, quality, and extent of the various investment advisory, administrative, and shareholder services performed by MFS under the existing investment advisory agreement and other arrangements with the Fund.
In connection with their contract review meetings, the Trustees received and relied upon materials that included, among other items: (i) information provided by Broadridge Financial Solutions, Inc. (“Broadridge”), an independent third party, on the investment performance of the Fund for various time periods ended December 31, 2018 and the investment performance of a group of funds with substantially similar investment classifications/objectives (the “Broadridge performance universe”), (ii) information provided by Broadridge on the Fund’s advisory fees and other expenses and the advisory fees and other expenses of comparable funds identified by Broadridge as well as all other funds in the same investment classification/category (the “Broadridge expense group and universe”), (iii) information provided by MFS on the advisory fees of portfolios of other clients of MFS, including institutional separate accounts and other clients, (iv) information as to whether and to what extent applicable expense waivers, reimbursements or fee “breakpoints” are observed for the Fund, (v) information regarding MFS’ financial results and financial condition, including MFS’ and certain of its affiliates’ estimated profitability from services performed for the Fund and the MFS Funds as a whole, and compared to MFS’ institutional business, (vi) MFS’ views regarding the outlook for the mutual fund industry and the strategic business plans of MFS, (vii) descriptions of various functions performed by MFS for the Funds, such as compliance monitoring and portfolio trading practices, and (viii) information regarding the overall organization of MFS, including information
74
Board Review of Investment Advisory Agreement – continued
about MFS’ senior management and other personnel providing investment advisory, administrative and other services to the Fund and the other MFS Funds. The comparative performance, fee and expense information prepared and provided by Broadridge was not independently verified and the independent Trustees did not independently verify any information provided to them by MFS.
The Trustees’ conclusion as to the continuation of the investment advisory agreement was based on a comprehensive consideration of all information provided to the Trustees and not the result of any single factor. Some of the factors that figured particularly in the Trustees’ deliberations are described below, although individual Trustees may have evaluated the information presented differently from one another, giving different weights to various factors. It is also important to recognize that the fee arrangements for the Fund and other MFS Funds are the result of years of review and discussion between the independent Trustees and MFS, that certain aspects of such arrangements may receive greater scrutiny in some years than in others, and that the Trustees’ conclusions may be based, in part, on their consideration of these same arrangements during the course of the year and in prior years.
Based on information provided by Broadridge and MFS, the Trustees reviewed the Fund’s total return investment performance as well as the Broadridge performance universe over various time periods. The Trustees placed particular emphasis on the total return performance of the Fund’s Class A shares in comparison to the performance of funds in its Broadridge performance universe over the five-year period ended December 31, 2018, which the Trustees believed was a long enough period to reflect differing market conditions. The total return performance of the Fund’s Class A shares was in the 4th quintile relative to the other funds in the universe for this five-year period (the 1st quintile being the best performers and the 5th quintile being the worst performers). The total return performance of the Fund’s Class A shares was in the 4th quintile for each of theone- and three-year periods ended December 31, 2018 relative to the Broadridge performance universe. Because of the passage of time, these performance results may differ from the performance results for more recent periods, including those shown elsewhere in this report.
The Trustees expressed concern to MFS about the substandard investment performance of the Fund. In the course of their deliberations, the Trustees took into account information provided by MFS in connection with the contract review meetings, as well as during investment review meetings conducted with portfolio management personnel during the course of the year, as to MFS’ efforts to improve the Fund’s performance. In addition, the Trustees requested that they receive a separate update on the Fund’s performance at each of their regular meetings. After reviewing these and related factors, the Trustees concluded, within the context of their overall conclusions regarding the investment advisory agreement, that MFS’ responses and efforts and plans to improve investment performance were sufficient to support approval of the continuance of the investment advisory agreement for an additionalone-year period but that they would continue to closely monitor the performance of the Fund.
In assessing the reasonableness of the Fund’s advisory fee, the Trustees considered, among other information, the Fund’s advisory fee and the total expense ratio of the Fund’s Class A shares as a percentage of average daily net assets and the advisory fee and total expense ratios of the Broadridge expense group based on information
75
Board Review of Investment Advisory Agreement – continued
provided by Broadridge. The Trustees considered that MFS currently observes an expense limitation for the Fund, which may not be changed without the Trustees’ approval. The Trustees also considered that, according to the data provided by Broadridge (which takes into account any fee reductions or expense limitations that were in effect during the Fund’s last fiscal year), the Fund’s effective advisory fee rate was higher than the Broadridge expense group median and the Fund’s total expense ratio was approximately at the Broadridge expense group median.
The Trustees also considered the advisory fees charged by MFS to any institutional separate accounts advised by MFS (“separate accounts”) and unaffiliated investment companies for which MFS serves as subadviser (“subadvised funds”) that have comparable investment strategies to the Fund, if any. In comparing these fees, the Trustees considered information provided by MFS as to the generally broader scope of services provided by MFS to the Fund, as well as the more extensive regulatory burdens imposed on MFS in managing the Fund, in comparison to separate accounts and subadvised funds. The Trustees also considered the higher demands placed on MFS’ investment personnel and trading infrastructure as a result of the daily cashin-flows andout-flows of the Fund in comparison to separate accounts.
The Trustees also considered whether the Fund may benefit from any economies of scale in the management of the Fund in the event of growth in assets of the Fund and/or growth in assets of the MFS Funds as a whole. They noted that the Fund’s advisory fee rate schedule is subject to contractual breakpoints that reduce the Fund’s advisory fee rate on average daily net assets over $500 million, $1 billion and $2.5 billion. The Trustees also noted that MFS has agreed in writing to waive a portion of the management fees of certain MFS Funds, including the Fund, if the total combined assets of certain funds within the MFS Funds’ complex increase above agreed upon thresholds (the “group fee waiver”), enabling the Fund’s shareholders to share in the benefits from any economies of scale at the complex level. The group fee waiver is reviewed and renewed annually between the Board and MFS. The Trustees concluded that the breakpoints and the group fee waiver were sufficient to allow the Fund to benefit from economies of scale as its assets and overall complex assets grow.
The Trustees also considered information prepared by MFS relating to MFS’ costs and profits with respect to the Fund, the MFS Funds considered as a group, and other investment companies and accounts advised by MFS, as well as MFS’ methodologies used to determine and allocate its costs to the MFS Funds, the Fund and other accounts and products for purposes of estimating profitability.
After reviewing these and other factors described herein, the Trustees concluded, within the context of their overall conclusions regarding the investment advisory agreement, that the advisory fees charged to the Fund represent reasonable compensation in light of the services being provided by MFS to the Fund.
In addition, the Trustees considered MFS’ resources and related efforts to continue to retain, attract and motivate capable personnel to serve the Fund. The Trustees also considered current and developing conditions in the financial services industry, including the presence of large and well-capitalized companies which are spending, and appear to be prepared to continue to spend, substantial sums to engage personnel and to provide services to competing investment companies. In this regard, the
76
Board Review of Investment Advisory Agreement – continued
Trustees also considered the financial resources of MFS and its ultimate parent, Sun Life Financial Inc. The Trustees also considered the advantages and possible disadvantages to the Fund of having an adviser that also serves other investment companies as well as other accounts.
The Trustees also considered the nature, quality, cost, and extent of administrative, transfer agency, and distribution services provided to the Fund by MFS and its affiliates under agreements and plans other than the investment advisory agreement, including any12b-1 fees the Fund pays to MFS Fund Distributors, Inc., an affiliate of MFS. The Trustees also considered the nature, extent and quality of certain other services MFS performs or arranges for on the Fund’s behalf, which may include securities lending programs, directed expense payment programs, class action recovery programs, and MFS’ interaction with third-party service providers, principally custodians andsub-custodians. The Trustees concluded that the variousnon-advisory services provided by MFS and its affiliates on behalf of the Fund were satisfactory.
The Trustees consideredso-called“fall-out benefits” to MFS such as reputational value derived from serving as investment manager to the MFS Funds. The Trustees also considered that, effective January 3, 2018, MFS had discontinued its historic practice of obtaining investment research from portfolio brokerage commissions paid by certain MFS Funds and would thereafter directly pay for or voluntarily reimburse a Fund, if applicable, for the costs of external research acquired through the use of the Fund’s portfolio brokerage commissions.
Based on their evaluation of factors that they deemed to be material, including those factors described above, the Board of Trustees, including the independent Trustees, concluded that the Fund’s investment advisory agreement with MFS should be continued for an additionalone-year period, commencing August 1, 2019.
77
PROXY VOTING POLICIES AND INFORMATION
MFS votes proxies on behalf of the fund pursuant to proxy voting policies and procedures that are available without charge, upon request, by calling1-800-225-2606, by visitingmfs.com/proxyvoting,or by visiting the SEC’s Web site athttp://www.sec.gov.
Information regarding how the fund voted proxies relating to portfolio securities during the most recent twelve-month period ended June 30 is available by August 31 of each year without charge by visitingmfs.com/proxyvoting,or by visiting the SEC’s Web site athttp://www.sec.gov.
QUARTERLY PORTFOLIO DISCLOSURE
The fund files a complete schedule of portfolio holdings with the SEC for the first and third quarters of each fiscal year on Form N-Q or as an exhibit to its reports onForm N-PORT (for first and third fiscal quarters ending March 31, 2019 or after). The fund’s Form N-Q or Form N-PORT reports are available on the SEC’s website athttp://www.sec.gov.A shareholder can obtain the portfolio holdings report for the first and third quarters of the fund’s fiscal year atmfs.com/openendfunds by choosing the fund’s name and then selecting the “Resources” tab and clicking on “Prospectus and Reports”.
FURTHER INFORMATION
From time to time, MFS may post important information about the fund or the MFS funds on the MFS web site (mfs.com). This information is available athttps://www.mfs.com/en-us/what-we-do/announcements.htmlor atmfs.com/openendfundsby choosing the fund’s name.
INFORMATION ABOUT FUND CONTRACTS AND LEGAL CLAIMS
The fund has entered into contractual arrangements with an investment adviser, administrator, distributor, shareholder servicing agent, 529 program manager (if applicable), and custodian who each provide services to the fund. Unless expressly stated otherwise, shareholders are not parties to, or intended beneficiaries of these contractual arrangements, and these contractual arrangements are not intended to create any shareholder right to enforce them against the service providers or to seek any remedy under them against the service providers, either directly or on behalf of the fund.
Under the Trust’s By-Laws and Declaration of Trust, any claims asserted against or on behalf of the MFS Funds, including claims against Trustees and Officers, must be brought in state and federal courts located within the Commonwealth of Massachusetts.
FEDERAL TAX INFORMATION (unaudited)
The fund will notify shareholders of amounts for use in preparing 2019 income tax forms in January 2020. The following information is provided pursuant to provisions of the Internal Revenue Code.
The fund designates the maximum amount allowable as qualified dividend income eligible to be taxed at the same rate as long-term capital gain.
The fund designates $38,783,000 as capital gain dividends paid during the fiscal year.
For corporate shareholders, 41.25% of the ordinary income dividends paid during the fiscal year qualify for the corporate dividends received deduction.
The fund designates the maximum amount allowable as Section 199A dividends as defined in Proposed Treasury Regulation§1.199A-3(d).
78
rev. 3/16
| | | | |
| | | |
FACTS | | WHAT DOES MFS DO WITH YOUR PERSONAL INFORMATION? | |  |
| | |
| Why? | | Financial companies choose how they share your personal information. Federal law gives consumers the right to limit some but not all sharing. Federal law also requires us to tell you how we collect, share, and protect your personal information. Please read this notice carefully to understand what we do. |
| | |
| What? | | The types of personal information we collect and share depend on the product or service you have with us. This information can include: • Social Security number and account balances • Account transactions and transaction history • Checking account information and wire transfer instructions When you areno longer our customer, we continue to share your information as described in this notice. |
| | |
| How? | | All financial companies need to share customers’ personal information to run their everyday business. In the section below, we list the reasons financial companies can share their customers’ personal information; the reasons MFS chooses to share; and whether you can limit this sharing. |
| | | | |
Reasons we can share your
personal information | | Does MFS
share? | | Can you limit
this sharing? |
For our everyday business purposes – such as to process your transactions, maintain your account(s), respond to court orders and legal investigations, or report to credit bureaus | | Yes | | No |
For our marketing purposes – to offer our products and services to you | | No | | We don’t share |
For joint marketing with other financial companies | | No | | We don’t share |
For our affiliates’ everyday business purposes – information about your transactions and experiences | | No | | We don’t share |
For our affiliates’ everyday business purposes – information about your creditworthiness | | No | | We don’t share |
| For nonaffiliates to market to you | | No | | We don’t share |
| | |
| | |
| Questions? | | Call800-225-2606 or go tomfs.com. |
79
| | |
| Who we are |
| Who is providing this notice? | | MFS Funds, MFS Investment Management, MFS Institutional Advisors, Inc., and MFS Heritage Trust Company. |
| | |
| What we do |
| How does MFS protect my personal information? | | To protect your personal information from unauthorized access and use, we use security measures that comply with federal law. These measures include procedural, electronic, and physical safeguards for the protection of the personal information we collect about you. |
| How does MFS collect my personal information? | | We collect your personal information, for example, when you • open an account or provide account information • direct us to buy securities or direct us to sell your securities • make a wire transfer We also collect your personal information from others, such as credit bureaus, affiliates, or other companies. |
| Why can’t I limit all sharing? | | Federal law gives you the right to limit only • sharing for affiliates’ everyday business purposes – information about your creditworthiness • affiliates from using your information to market to you • sharing for nonaffiliates to market to you State laws and individual companies may give you additional rights to limit sharing. |
| | |
| Definitions |
| Affiliates | | Companies related by common ownership or control. They can be financial and nonfinancial companies. • MFS does not share personal information with affiliates, except for everyday business purposes as described on page one of this notice. |
| Nonaffiliates | | Companies not related by common ownership or control. They can be financial and nonfinancial companies. • MFS does not share with nonaffiliates so they can market to you. |
| Joint marketing | | A formal agreement between nonaffiliated financial companies that together market financial products or services to you. • MFS doesn’t jointly market. |
| | |
| Other important information |
| If you own an MFS product or receive an MFS service in the name of a third party such as a bank or broker-dealer, their privacy policy may apply to you instead of ours. |
80
Save paper with eDelivery.

| MFS® will send you prospectuses, |
reports, and proxies directly viae-mail so you will get information faster with less mailbox clutter.
To sign up:
1. Go to mfs.com.
2. Log in via MFS® Access.
3. Select eDelivery.
If you own your MFS fund shares through a financial institution or a retirement plan, MFS® TALK, MFS® Access, or eDelivery may not be available to you.
CONTACT
WEB SITE
mfs.com
MFS TALK
1-800-637-8255
24 hours a day
ACCOUNT SERVICE AND LITERATURE
Shareholders
1-800-225-2606
Financial advisors
1-800-343-2829
Retirement plan services
1-800-637-1255
MAILING ADDRESS
MFS Service Center, Inc.
P.O. Box 219341
Kansas City, MO 64121-9341
OVERNIGHT MAIL
MFS Service Center, Inc.
Suite 219341
430 W 7th Street
Kansas City, MO 64105-1407
Annual Report
October 31, 2019

MFS® Utilities Fund

Beginning on January 1, 2021, as permitted by regulations adopted by the U.S. Securities and Exchange Commission, paper copies of the fund’s annual and semiannual shareholder reports will no longer be sent by mail, unless you specifically request paper copies of the reports. Instead, the complete reports will be made available on the fund’s Web site (funds.mfs.com), and you will be notified by mail each time a report is posted and provided with a Web site link to access the report.
If you are already signed up to receive shareholder reports by email, you will not be affected by this change and you need not take any action. You may sign up to receive shareholder reports and other communications from the fund by email by contacting your financial intermediary (such as a broker-dealer or bank) or, if you hold your shares directly with the fund, by calling 1-800-225-2606 or by logging on to MFS Access at mfs.com.
Beginning on January 1, 2019, you may elect to receive all future reports in paper free of charge. Contact your financial intermediary to request that you continue to receive paper copies of your shareholder reports. If you invest directly with the fund, you can call 1-800-225-2606 or send an email request to orderliterature@mfs.com to let the fund know that you wish to continue receiving paper copies of your shareholder reports. Your election to receive reports in paper will apply to all funds held in your account if you invest through your financial intermediary or all funds held with the MFS fund complex if you invest directly.
MMU-ANN
MFS® Utilities Fund
CONTENTS
The report is prepared for the general information of shareholders.
It is authorized for distribution to prospective investors only when preceded or accompanied by a current prospectus.
NOT FDIC INSURED• MAY LOSE VALUE• NO BANK GUARANTEE

LETTER FROM THE EXECUTIVE CHAIR
Dear Shareholders:
Slowing global growth, low inflation, and trade friction between the United States and China have been hallmarks of the past 12 months. After experiencing an uptick in
market volatility in late 2018, markets steadied during 2019, thanks in large measure to the adoption of a dovish policy stance on the part of global central banks, focused on supporting economic growth. The U.S. and China have repeatedly raised tariffs on each other, though preliminary steps toward an interim trade agreement have been undertaken, modestly easing tensions in recent months. While British Prime Minister Boris Johnson has negotiated a reworked withdrawal agreement with the European Union, Parliament has not yet approved the deal, leading the EU to grant the United Kingdom a Brexit delay until no later than January 31, 2020. Uncertainty over Brexit, along with the ripple effects from the trade conflict, have hampered business
confidence and investment in the U.K. and Europe, though investors hope that greater clarity regarding the Brexit outcome will emerge after a British parliamentary election in December.
Markets expect that the longest economic expansion in U.S. history will continue for the time being, albeit at a slower pace. In an effort to prolong the expansion, the U.S. Federal Reserve lowered interest rates three times between July and October. Similarly, the European Central Bank loosened policy in September. While the monetary policy environment remains quite accommodative, tentative signs of easing trade tensions and receding global recession fears have helped push global interest rates modestly higher from therecord-low levels posted late in the summer as investors grew less risk averse.
Here at MFS®, we aim to help our clients navigate the growing complexity of the markets and world economies. Our long-term investment philosophy and commitment to responsible allocation of capital allow us to wade through the noise to uncover what we believe are the best, most durable investment opportunities in the market. Through our powerful global investment platform, we combine collective expertise, thoughtful risk management and long-term discipline with the purpose of creating sustainable value for investors.
Respectfully,

Robert J. Manning
Executive Chair
MFS Investment Management
December 16, 2019
The opinions expressed in this letter are subject to change and may not be relied upon for investment advice. No forecasts can be guaranteed.
1
PORTFOLIO COMPOSITION
Portfolio structure
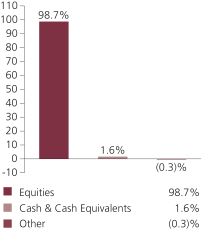
| | | | |
| Top ten holdings | |
| NextEra Energy, Inc. | | | 6.2% | |
| EDP Renovaveis S.A. | | | 5.4% | |
| Exelon Corp. | | | 4.7% | |
| FirstEnergy Corp. | | | 4.5% | |
| Dominion Energy, Inc. | | | 4.1% | |
| Entergy Corp. | | | 3.4% | |
| Public Service Enterprise Group, Inc. | | | 3.3% | |
| Vistra Energy Corp. | | | 2.7% | |
| American Electric Power Co., Inc. | | | 2.7% | |
| Enel S.p.A. | | | 2.6% | |
| | | | |
| Top five industries | |
| Utilities – Electric Power | | | 65.3% | |
| Natural Gas – Pipeline | | | 10.5% | |
| Telecommunications – Wireless | | | 8.0% | |
| Cable TV | | | 6.0% | |
| Natural Gas – Distribution | | | 5.9% | |
|
| Issuer country weightings (x) | |
| United States | | | 64.6% | |
| Canada | | | 8.1% | |
| Portugal | | | 7.3% | |
| United Kingdom | | | 3.9% | |
| Spain | | | 3.3% | |
| Italy | | | 2.6% | |
| Sweden | | | 2.2% | |
| Germany | | | 1.4% | |
| China | | | 1.1% | |
| Other Countries | | | 5.5% | |
| (x) | Represents the portfolio’s exposure to issuer countries as a percentage of a portfolio’s net assets. For purposes of this presentation, United States includes Cash & Cash Equivalents and Other. |
Where the fund holds convertible bonds, they are treated as part of the equity portion of the portfolio.
Cash & Cash Equivalents includes any cash, investments in money market funds, short-term securities, and other assets less liabilities. Please see the Statement of Assets and Liabilities for additional information related to the fund’s cash position and other assets and liabilities.
Other includes equivalent exposure from currency derivatives and/or any offsets to derivative positions and may be negative.
Percentages are based on net assets as of October 31, 2019.
The portfolio is actively managed and current holdings may be different.
2
MANAGEMENT REVIEW
Summary of Results
For the twelve months ended October 31, 2019, Class A shares of the MFS Utilities Fund (fund) provided a total return of 21.94%, at net asset value. This compares with a return of 14.33% for the fund’s benchmark, the Standard & Poor’s 500 Stock Index, and a return of 23.71% for the fund’s other benchmark, the Standard & Poor’s 500 Utilities Index.
Market Environment
Fading fears of a near-term global recession, hopes for a partial trade deal between the United States and China and dramatically lower odds of ano-deal Brexit helped bolster market sentiment late in the period, after providing headwinds for many months prior. Changes in market sentiment, largely driven by uncertainty over the outcome of trade negotiations between the United States and China, contributed to periodic bouts of volatility during the reporting period. The global economy decelerated, led by weakness in China and Europe, although the pace of the slowdown moderated.
The deteriorating global growth backdrop, along with declining inflationary pressures, prompted the US Federal Reserve to adopt a more dovish posture beginning in early 2019, resulting in the first interest rate cut in over a decade at the end of July, followed by additional cuts in September and October. The Fed’s actions led to a sharp decline in long-term interest rates during the period’s second half, inverting portions of the US Treasury yield curve for a time. The Fed indicated in October that further rate cuts are unlikely unless the outlook for the economy materially worsens.
Globally, central banks have tilted more dovish as well, with the European Central Bank unveiling a package of easing measures, which included cutting overnight rates deeper into negative territory, restarting its bond-buying program and lengthening the term of cheap loans to banks to three years from two. The central banks of India and Australia are among those that have cut rates several times in recent months, although China has been more cautious in increasing liquidity as it continues to attempt to deleverage its economy, cutting rates only marginally.
Emerging markets experienced considerable volatility through the end of 2018, as tighter global financial conditions exposed structural weakness in some countries. Those conditions improved in 2019, as the Fed became more dovish, but significant trade friction between the US and China weighed on sentiment for much of the year, although hopes for a partial trade deal improved sentiment late in the period. Idiosyncratic factors negatively impacted some emerging economies, such as Argentina and Turkey.
From a geopolitical perspective, Brexit uncertainty has receded. While British Prime Minister Boris Johnson has negotiated a reworked withdrawal agreement with the European Union, Parliament has not yet approved the deal, leading the EU to grant the United Kingdom a Brexit delay until no later than January 31, 2020. A UK general election, scheduled for December 12, may bring some clarity to the situation. Hopes for a limited trade agreement between the US and China, as well as fading global recession fears, were supportive factors for risk assets at period end.
3
Management Review – continued
Detractors from Performance
The fund’s out-of-benchmark exposure to the natural gas pipeline industry held back performance results, relative to the Standard & Poor’s 500 Utilities Index, led by the fund’s positions in natural gas pipelines operator EQM Midstream Partners (b), natural gas and petrochemical products manufacturer Enterprise Products Partners (b), natural gas services provider Cheniere Energy (b)and natural gas gatherer Equitrans Midstream (b). The stock price of EQM Midstream Partners declined during the reporting period after the company revised its 2019 earnings guidance due to a slower ramp up of the company’s water handling business.
Elsewhere, avoiding strong-performing retail electric services provider Southern Company, electricity and natural gas distributor WEC Energy Group and water services provider American Water Works weighed on relative results. The stock price of Southern Company appreciated as the company’s earnings beat consensus estimates, driven by the colder-than-normal weather and positive tax impacts of asset sales. Management reaffirmed its full-year adjusted earnings per share guidance and noted that it continues to make progress on its Vogtle construction project, hitting major milestones. The fund’s underweight position in electricity provider NextEra Energy, and holdings of cable and mobile services provider Millicom International Cellular (b)(Sweden), further detracted from relative performance. The stock price of Millicom International Cellular fell after the company reported financial results below market estimates, driven in part by weak performance in Latin America, where mobile competition and regulatory changes negatively affected the company’s business.
The fund’s cash and/or cash equivalents position during the period was also a detractor from relative performance. Under normal market conditions, the fund strives to be fully invested and generally holds cash to buy new holdings and to provide liquidity. In a period when equity markets rose, as measured by the fund’s benchmark, holding cash hurt performance versus the benchmark, which has no cash position.
Contributors to Performance
The fund’sout-of-benchmark allocation to both thecable TVandwireless communicationsindustries contributed to relative results. Withincable TV, the fund’s holdings of cable and telecommunications company Altice USA (b)aided relative performance as the company reported earnings results that were ahead of estimates. The primary drivers of the outperformance were higher-than-expected broadband subscribers and lower-than-anticipated video losses. The company also raised its revenue growth guidance figures, mainly due to recent acquisitions, which further supported the stock price. Within thewireless communicationsindustry, the fund’s holdings of telecommunications services provider Cellnex Telecom (b) (Spain) and broadcast and communication tower management firm American Tower (b) strengthened relative results.
The combination of an underweight allocation and favorable security selection within theelectric powerindustry bolstered relative returns. Here, underweight positions in utility company PG&E (h)and power & natural gas distributor Duke Energy contributed to relative performance. PG&E’s stock price declined over the year as the company announced it would file for Chapter 11 bankruptcy due to liabilities resulting from catastrophic wildfires that occurred in northern California. The fund’s holdings of
4
Management Review – continued
electricity and gas distributor Enel (b) (Italy), electric utility company Iberdrola (b) (Spain) and electricity and gas supplier RWE (b) (Germany) also boosted relative results. The stock price of RWE appreciated during the reporting period after the company reported first-half 2019 operating profit and adjusted net income results that were above consensus estimates, driven by strong performance in its Supply & Trading business segment.
Elsewhere, the fund’s holdings of gas distributor China Resources Gas Group (b) (Hong Kong) and energy infrastructure services provider TC Energy (b) (Canada) further aided relative performance.
Respectfully,
Portfolio Manager(s)
Claud Davis and J. Scott Walker
| (b) | Security is not a benchmark constituent. |
| (h) | Security was not held in the portfolio at period end. |
Note to Shareholders: Effective August 1, 2019, Maura Shaughnessy was removed as a Portfolio Manager of the Fund.
The views expressed in this report are those of the portfolio manager(s) only through the end of the period of the report as stated on the cover and do not necessarily reflect the views of MFS or any other person in the MFS organization. These views are subject to change at any time based on market or other conditions, and MFS disclaims any responsibility to update such views. These views may not be relied upon as investment advice or an indication of trading intent on behalf of any MFS portfolio. References to specific securities are not recommendations of such securities, and may not be representative of any MFS portfolio’s current or future investments.
5
PERFORMANCE SUMMARYTHROUGH 10/31/19
The following chart illustrates a representative class of the fund’s historical performance in comparison to its benchmark(s). Performance results include the deduction of the maximum applicable sales charge and reflect the percentage change in net asset value, including reinvestment of dividends and capital gains distributions. The performance of other share classes will be greater than or less than that of the class depicted below. Benchmarks are unmanaged and may not be invested in directly. Benchmark returns do not reflect sales charges, commissions or expenses. (See Notes to Performance Summary.)
Performance data shown represents past performance and is no guarantee of future results. Investment return and principal value fluctuate so your shares, when sold, may be worth more or less than the original cost; current performance may be lower or higher than quoted. The performance shown does not reflect the deduction of taxes, if any, that a shareholder would pay on fund distributions or the redemption of fund shares.
Growth of a Hypothetical $10,000 Investment
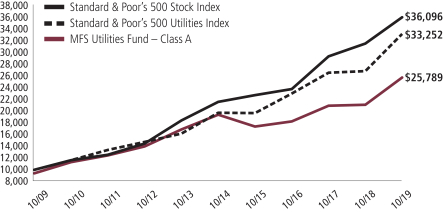
6
Performance Summary – continued
Total Returns through 10/31/19
Average annual without sales charge
| | | | | | | | | | | | | | |
| | | Share Class | | Class Inception Date | | 1-yr | | 5-yr | | 10-yr | | Life (t) | | |
| | | A | | 2/14/92 | | 21.94% | | 5.83% | | 10.59% | | N/A | | |
| | | B | | 9/07/93 | | 21.02% | | 5.04% | | 9.76% | | N/A | | |
| | | C | | 1/03/94 | | 21.02% | | 5.04% | | 9.76% | | N/A | | |
| | | I | | 1/02/97 | | 22.26% | | 6.10% | | 10.87% | | N/A | | |
| | | R1 | | 4/01/05 | | 21.03% | | 5.04% | | 9.76% | | N/A | | |
| | | R2 | | 10/31/03 | | 21.59% | | 5.56% | | 10.31% | | N/A | | |
| | | R3 | | 4/01/05 | | 21.92% | | 5.83% | | 10.59% | | N/A | | |
| | | R4 | | 4/01/05 | | 22.22% | | 6.10% | | 10.86% | | N/A | | |
| | | R6 | | 6/01/12 | | 22.29% | | 6.19% | | N/A | | 10.74% | | |
| | | | | |
| Comparative benchmark(s) | | | | | | | | | | |
| | | Standard & Poor’s 500 Stock Index (f) | | 14.33% | | 10.78% | | 13.70% | | N/A | | |
| | | Standard & Poor’s 500 Utilities Index (f) | | 23.71% | | 10.98% | | 12.77% | | N/A | | |
| | | | | |
| Average annual with sales charge | | | | | | | | | | |
| | | A
With Initial Sales Charge (5.75%) | | 14.93% | | 4.59% | | 9.94% | | N/A | | |
| | | B
With CDSC (Declining over six years from 4% to 0%) (v) | | 17.02% | | 4.71% | | 9.76% | | N/A | | |
| | | C
With CDSC (1% for 12 months) (v) | | 20.02% | | 5.04% | | 9.76% | | N/A | | |
CDSC – Contingent Deferred Sales Charge.
Class I, R1, R2, R3, R4, and R6 shares do not have a sales charge.
| (f) | Source: FactSet Research Systems Inc. |
| (t) | For the period from the class inception date through the stated period end (for those share classes with less than 10 years of performance history). No comparative benchmark performance information is provided for “life” periods. (See Notes to Performance Summary.) |
| (v) | Assuming redemption at the end of the applicable period. |
Benchmark Definition(s)
Standard & Poor’s 500 Stock Index – a market capitalization-weighted index of 500 widely held equity securities, designed to measure broad U.S. equity performance.(b)
Standard & Poor’s 500 Utilities Index – a market capitalization-weighted index designed to measure the utilities sector, including those companies considered electric, gas or water utilities, or companies that operate as independent producers and/or distributors of power.(b)
It is not possible to invest directly in an index.
| (b) | “Standard & Poor’s®” and “S&P®” are registered trademarks of Standard & Poor’s Financial Services LLC (“S&P”) and Dow Jones is a registered trademark of Dow Jones Trademark Holdings LLC (“Dow Jones”) and have been licensed for use by S&P Dow Jones Indices LLC |
7
Performance Summary – continued
| | and sublicensed for certain purposed by Massachusetts Financial Services Company. The S&P 500® is a product of S&P Dow Jones Indices LLC, and has been licensed for use by Massachusetts Financial Services Company. Massachusetts Financial Services Company’s product(s) is not sponsored, endorsed, sold, or promoted by S&P Dow Jones Indices LLC, Dow Jones, S&P, or their respective affiliates, and neither S&P Dow Jones Indices LLC, Dow Jones, S&P, nor their respective affiliates make any representation regarding the advisability of investing in such product(s). |
Notes to Performance Summary
Average annual total return represents the average annual change in value for each share class for the periods presented. Life returns are presented where the share class has less than 10 years of performance history and represent the average annual total return from the class inception date to the stated period end date. As the fund’s share classes may have different inception dates, the life returns may represent different time periods and may not be comparable. As a result, no comparative benchmark performance information is provided for life periods.
Performance results reflect any applicable expense subsidies and waivers in effect during the periods shown. Without such subsidies and waivers the fund’s performance results would be less favorable. Please see the prospectus and financial statements for complete details.
Performance results do not include adjustments made for financial reporting purposes in accordance with U.S. generally accepted accounting principles and may differ from amounts reported in the financial highlights.
From time to time the fund may receive proceeds from litigation settlements, without which performance would be lower.
8
EXPENSE TABLE
Fund expenses borne by the shareholders during the period, May 1, 2019 through October 31, 2019
As a shareholder of the fund, you incur two types of costs: (1) transaction costs, including sales charges (loads) on certain purchase or redemption payments, and (2) ongoing costs, including management fees; distribution and service(12b-1) fees; and other fund expenses. This example is intended to help you understand your ongoing costs (in dollars) of investing in the fund and to compare these costs with the ongoing costs of investing in other mutual funds.
The example is based on an investment of $1,000 invested at the beginning of the period and held for the entire period May 1, 2019 through October 31, 2019.
Actual Expenses
The first line for each share class in the following table provides information about actual account values and actual expenses. You may use the information in this line, together with the amount you invested, to estimate the expenses that you paid over the period. Simply divide your account value by $1,000 (for example, an $8,600 account value divided by $1,000 = 8.6), then multiply the result by the number in the first line under the heading entitled “Expenses Paid During Period” to estimate the expenses you paid on your account during this period.
Hypothetical Example for Comparison Purposes
The second line for each share class in the following table provides information about hypothetical account values and hypothetical expenses based on the fund’s actual expense ratio and an assumed rate of return of 5% per year before expenses, which is not the fund’s actual return. The hypothetical account values and expenses may not be used to estimate the actual ending account balance or expenses you paid for the period. You may use this information to compare the ongoing costs of investing in the fund and other funds. To do so, compare this 5% hypothetical example with the 5% hypothetical examples that appear in the shareholder reports of the other funds.
Please note that the expenses shown in the table are meant to highlight your ongoing costs only and do not reflect any transactional costs, such as sales charges (loads). Therefore, the second line for each share class in the table is useful in comparing ongoing costs only, and will not help you determine the relative total costs of owning different funds. In addition, if these transactional costs were included, your costs would have been higher.
9
Expense Table – continued
| | | | | | | | | | | | | | | | | | |
Share
Class | | | | Annualized
Expense
Ratio | | | Beginning
Account Value
5/01/19 | | | Ending
Account Value
10/31/19 | | | Expenses
Paid During
Period (p)
5/01/19-10/31/19 | |
| A | | Actual | | | 0.98% | | | | $1,000.00 | | | | $1,082.11 | | | | $5.14 | |
| | Hypothetical (h) | | | 0.98% | | | | $1,000.00 | | | | $1,020.27 | | | | $4.99 | |
| B | | Actual | | | 1.73% | | | | $1,000.00 | | | | $1,077.88 | | | | $9.06 | |
| | Hypothetical (h) | | | 1.73% | | | | $1,000.00 | | | | $1,016.48 | | | | $8.79 | |
| C | | Actual | | | 1.73% | | | | $1,000.00 | | | | $1,078.33 | | | | $9.06 | |
| | Hypothetical (h) | | | 1.73% | | | | $1,000.00 | | | | $1,016.48 | | | | $8.79 | |
| I | | Actual | | | 0.73% | | | | $1,000.00 | | | | $1,083.56 | | | | $3.83 | |
| | Hypothetical (h) | | | 0.73% | | | | $1,000.00 | | | | $1,021.53 | | | | $3.72 | |
| R1 | | Actual | | | 1.73% | | | | $1,000.00 | | | | $1,078.10 | | | | $9.06 | |
| | Hypothetical (h) | | | 1.73% | | | | $1,000.00 | | | | $1,016.48 | | | | $8.79 | |
| R2 | | Actual | | | 1.23% | | | | $1,000.00 | | | | $1,081.00 | | | | $6.45 | |
| | Hypothetical (h) | | | 1.23% | | | | $1,000.00 | | | | $1,019.00 | | | | $6.26 | |
| R3 | | Actual | | | 0.98% | | | | $1,000.00 | | | | $1,081.86 | | | | $5.14 | |
| | Hypothetical (h) | | | 0.98% | | | | $1,000.00 | | | | $1,020.27 | | | | $4.99 | |
| R4 | | Actual | | | 0.73% | | | | $1,000.00 | | | | $1,083.37 | | | | $3.83 | |
| | Hypothetical (h) | | | 0.73% | | | | $1,000.00 | | | | $1,021.53 | | | | $3.72 | |
| R6 | | Actual | | | 0.65% | | | | $1,000.00 | | | | $1,083.99 | | | | $3.41 | |
| | Hypothetical (h) | | | 0.65% | | | | $1,000.00 | | | | $1,021.93 | | | | $3.31 | |
| (h) | 5% class return per year before expenses. |
| (p) | “Expenses Paid During Period” are equal to each class’s annualized expense ratio, as shown above, multiplied by the average account value over the period, multiplied by 184/365 (to reflect theone-half year period). Expenses paid do not include any applicable sales charges (loads). If these transaction costs had been included, your costs would have been higher. |
10
PORTFOLIO OF INVESTMENTS
10/31/19
The Portfolio of Investments is a complete list of all securities owned by your fund. It is categorized by broad-based asset classes.
| | | | | | | | |
| Common Stocks - 95.7% | | | | | | | | |
| | |
| Issuer | | Shares/Par | | | Value ($) | |
| Cable TV - 6.0% | | | | | | | | |
| Altice USA, Inc., “A” (a) | | | 2,528,377 | | | $ | 78,253,268 | |
| Charter Communications, Inc., “A” (a) | | | 92,553 | | | | 43,301,847 | |
| Comcast Corp., “A” | | | 1,454,016 | | | | 65,168,997 | |
| NOS, SGPS S.A. | | | 5,241,790 | | | | 31,130,846 | |
| | | | | | | | |
| | | | | | | $ | 217,854,958 | |
| Natural Gas - Distribution - 4.4% | | | | | | | | |
| China Resources Gas Group Ltd. | | | 6,332,000 | | | $ | 38,121,556 | |
| NiSource, Inc. | | | 1,279,347 | | | | 35,872,890 | |
| Sempra Energy | | | 582,593 | | | | 84,190,514 | |
| | | | | | | | |
| | | | | | | $ | 158,184,960 | |
| Natural Gas - Pipeline - 10.5% | | | | | | | | |
| Cheniere Energy, Inc. (a) | | | 1,094,988 | | | $ | 67,396,511 | |
| Enbridge, Inc. | | | 1,310,327 | | | | 47,723,321 | |
| Enterprise Products Partners LP | | | 3,077,861 | | | | 80,116,722 | |
| EQM Midstream Partners LP | | | 1,056,988 | | | | 31,582,801 | |
| Equitrans Midstream Corp. | | | 1,085,684 | | | | 15,112,721 | |
| Plains All American Pipeline LP | | | 1,708,235 | | | | 30,970,301 | |
| TC Energy Corp. | | | 1,551,006 | | | | 78,180,312 | |
| Williams Cos., Inc. | | | 1,294,863 | | | | 28,888,394 | |
| | | | | | | | |
| | | | | | | $ | 379,971,083 | |
| Telecommunications - Wireless - 8.0% | | | | | | | | |
| Advanced Info Service Public Co. Ltd. | | | 4,735,600 | | | $ | 35,914,966 | |
| American Tower Corp., REIT | | | 171,243 | | | | 37,344,673 | |
| Cellnex Telecom S.A. | | | 872,586 | | | | 37,623,725 | |
| KDDI Corp. | | | 1,142,100 | | | | 31,670,801 | |
| Millicom International Cellular S.A. | | | 62,573 | | | | 2,826,422 | |
| Millicom International Cellular S.A., SDR | | | 723,154 | | | | 32,953,360 | |
| Mobile TeleSystems PJSC, ADR | | | 1,783,822 | | | | 15,965,207 | |
| Rogers Communications, Inc. | | | 588,572 | | | | 27,710,386 | |
| Tele2 AB, “B” | | | 3,070,068 | | | | 43,893,544 | |
| Vodafone Group PLC | | | 11,027,027 | | | | 22,482,794 | |
| | | | | | | | |
| | | | | | | $ | 288,385,878 | |
| Telephone Services - 3.0% | | | | | | | | |
| Hellenic Telecommunications Organization S.A. | | | 1,869,807 | | | $ | 28,361,382 | |
| Koninklijke KPN N.V. | | | 5,532,213 | | | | 17,152,814 | |
| PT XL Axiata Tbk (a) | | | 36,572,225 | | | | 9,235,233 | |
11
Portfolio of Investments – continued
| | | | | | | | |
| | |
| Issuer | | Shares/Par | | | Value ($) | |
| Common Stocks - continued | | | | | | | | |
| Telephone Services - continued | | | | | | | | |
| Telesites S.A.B. de C.V. (a) | | | 13,591,800 | | | $ | 8,888,563 | |
| TELUS Corp. | | | 1,282,564 | | | | 45,621,535 | |
| | | | | | | | |
| | | | | | | $ | 109,259,527 | |
| Utilities - Electric Power - 63.8% | | | | | | | | |
| AES Corp. | | | 2,881,794 | | | $ | 49,134,588 | |
| AltaGas Ltd. (l) | | | 3,920,458 | | | | 57,031,338 | |
| American Electric Power Co., Inc. | | | 1,034,820 | | | | 97,676,660 | |
| CenterPoint Energy, Inc. | | | 3,109,714 | | | | 90,399,386 | |
| Clearway Energy, Inc., “A” | | | 824,881 | | | | 14,163,207 | |
| CLP Holdings Ltd. | | | 857,500 | | | | 8,889,551 | |
| Dominion Energy, Inc. | | | 1,809,702 | | | | 149,390,900 | |
| Duke Energy Corp. | | | 584,187 | | | | 55,065,467 | |
| Edison International | | | 1,057,002 | | | | 66,485,426 | |
| EDP Renovaveis S.A. | | | 17,044,549 | | | | 194,280,006 | |
| Emera, Inc. (l) | | | 864,121 | | | | 35,775,961 | |
| Enel S.p.A. | | | 12,298,457 | | | | 95,192,295 | |
| Energias de Portugal S.A. | | | 9,161,809 | | | | 37,705,031 | |
| Entergy Corp. | | | 1,017,369 | | | | 123,589,986 | |
| Equatorial Energia S.A. | | | 593,600 | | | | 15,079,408 | |
| Evergy, Inc. | | | 1,116,318 | | | | 71,343,883 | |
| Exelon Corp. | | | 3,758,826 | | | | 170,988,995 | |
| FirstEnergy Corp. | | | 3,343,624 | | | | 161,563,912 | |
| Iberdrola S.A. | | | 7,994,488 | | | | 82,100,852 | |
| National Grid PLC | | | 4,605,264 | | | | 53,766,407 | |
| Neoenergia S.A. | | | 2,352,100 | | | | 12,292,736 | |
| NextEra Energy Partners LP | | | 814,595 | | | | 42,929,156 | |
| NextEra Energy, Inc. | | | 946,434 | | | | 225,573,079 | |
| NRG Energy, Inc. | | | 1,095,897 | | | | 43,967,388 | |
| NTPC Ltd. | | | 8,820,038 | | | | 15,220,523 | |
| Public Service Enterprise Group, Inc. | | | 1,906,073 | | | | 120,673,482 | |
| RWE AG | | | 1,683,962 | | | | 51,329,096 | |
| SSE PLC | | | 3,925,387 | | | | 65,262,765 | |
| Vistra Energy Corp. | | | 3,643,290 | | | | 98,478,129 | |
| | | | | | | | |
| | | | | | | $ | 2,305,349,613 | |
| Total Common Stocks (Identified Cost, $2,623,084,608) | | | $ | 3,459,006,019 | |
| | |
| Convertible Preferred Stocks - 3.0% | | | | | | | | |
| Natural Gas - Distribution - 1.5% | | | | | | | | |
| Sempra Energy, 6% | | | 172,694 | | | $ | 20,037,685 | |
| Sempra Energy, 6.75% | | | 173,133 | | | | 20,116,323 | |
| South Jersey Industries, Inc., 7.25% | | | 306,488 | | | | 15,630,888 | |
| | | | | | | | |
| | | | | | | $ | 55,784,896 | |
12
Portfolio of Investments – continued
| | | | | | | | |
| | |
| Issuer | | Shares/Par | | | Value ($) | |
| Convertible Preferred Stocks - continued | | | | | | | | |
| Utilities - Electric Power - 1.5% | | | | | | | | |
| American Electric Power Co., Inc., 6.125% | | | 56,750 | | | $ | 3,120,682 | |
| CenterPoint Energy, Inc., 7% | | | 489,898 | | | | 24,984,798 | |
| Dominion Energy, Inc., 6.75% | | | 235,146 | | | | 25,210,003 | |
| | | | | | | | |
| | | | | | | $ | 53,315,483 | |
Total Convertible Preferred Stocks
(Identified Cost, $101,144,783) | | | $ | 109,100,379 | |
| | |
| Investment Companies (h) - 1.4% | | | | | | | | |
| Money Market Funds - 1.4% | | | | | | | | |
MFS Institutional Money Market Portfolio, 1.89% (v)
(Identified Cost, $50,094,360) | | | 50,096,585 | | | $ | 50,101,595 | |
| | |
| Collateral for Securities Loaned - 1.3% | | | | | | | | |
| JPMorgan U.S. Government Money Market Fund, 1.74% (j) (Identified Cost, $45,627,434) | | | 45,627,434 | | | $ | 45,627,434 | |
| | |
| Other Assets, Less Liabilities - (1.4)% | | | | | | | (51,402,098 | ) |
| Net Assets - 100.0% | | | | | | $ | 3,612,433,329 | |
| (a) | Non-income producing security. |
| (h) | An affiliated issuer, which may be considered one in which the fund owns 5% or more of the outstanding voting securities, or a company which is under common control. At period end, the aggregate values of the fund’s investments in affiliated issuers and in unaffiliated issuers were $50,101,595 and $3,613,733,832, respectively. |
| (j) | The rate quoted is the annualizedseven-day yield of the fund at period end. |
| (l) | A portion of this security is on loan. See Note 2 for additional information. |
| (v) | Affiliated issuer that is available only to investment companies managed by MFS. The rate quoted for the MFS Institutional Money Market Portfolio is the annualizedseven-day yield of the fund at period end. |
The following abbreviations are used in this report and are defined:
| ADR | | American Depositary Receipt |
| REIT | | Real Estate Investment Trust |
| SDR | | Swedish Depository Receipt |
Abbreviations indicate amounts shown in currencies other than the U.S. dollar. All amounts are stated in U.S. dollars unless otherwise indicated. A list of abbreviations is shown below:
13
Portfolio of Investments – continued
Derivative Contracts at 10/31/19
Forward Foreign Currency Exchange Contracts
| | | | | | | | | | | | | | | | | | |
Currency
Purchased | | | Currency Sold | | Counterparty | | Settlement
Date | | | Unrealized
Appreciation
(Depreciation) | |
| Asset Derivatives | | | | | | | | | | |
| EUR | | | 2,637,939 | | | USD | | 2,911,678 | | Citibank N.A. | | | 12/13/2019 | | | | $38,436 | |
| GBP | | | 884,786 | | | USD | | 1,132,565 | | Merrill Lynch International | | | 12/13/2019 | | | | 15,060 | |
| USD | | | 543,551 | | | CAD | | 713,718 | | Citibank N.A. | | | 12/13/2019 | | | | 1,580 | |
| USD | | | 6,127,990 | | | CAD | | 8,017,720 | | Morgan Stanley Capital Services, Inc. | | | 12/13/2019 | | | | 39,622 | |
| | | | | | | | | | | | | | | | | | |
| | | | | | | | | | | | | | | | | $94,698 | |
| | | | | | | | | | | | | | | | | | |
| Liability Derivatives | | | | | | | | | | |
| CAD | | | 3,074,592 | | | USD | | 2,355,540 | | State Street Bank Corp. | | | 12/13/2019 | | | | $(20,805 | ) |
| USD | | | 186,466,628 | | | CAD | | 248,030,949 | | Citibank N.A. | | | 12/13/2019 | | | | (1,879,150 | ) |
| USD | | | 453,270 | | | CAD | | 598,316 | | HSBC Bank | | | 12/13/2019 | | | | (1,070 | ) |
| USD | | | 868,212 | | | CAD | | 1,145,846 | | Merrill Lynch International | | | 12/13/2019 | | | | (1,902 | ) |
| USD | | | 670,675 | | | CAD | | 885,254 | | State Street Bank Corp. | | | 12/13/2019 | | | | (1,555 | ) |
| USD | | | 53,810,417 | | | EUR | | 48,834,433 | | BNP Paribas S.A. | | | 12/13/2019 | | | | (803,106 | ) |
| USD | | | 278,092 | | | EUR | | 248,912 | | Brown Brothers Harriman | | | 12/13/2019 | | | | (277 | ) |
| USD | | | 8,304,965 | | | EUR | | 7,455,056 | | Citibank N.A. | | | 12/13/2019 | | | | (32,326 | ) |
| USD | | | 98,556,541 | | | EUR | | 88,540,407 | | Deutsche Bank AG | | | 11/18/2019 | | | | (286,197 | ) |
| USD | | | 193,930,163 | | | EUR | | 175,963,738 | | Deutsche Bank AG | | | 12/13/2019 | | | | (2,857,210 | ) |
| USD | | | 712,598 | | | EUR | | 639,600 | | Morgan Stanley Capital Services, Inc. | | | 12/13/2019 | | | | (2,692 | ) |
| USD | | | 3,549,495 | | | GBP | | 2,754,258 | | Brown Brothers Harriman | | | 12/13/2019 | | | | (22,962 | ) |
| USD | | | 81,310,375 | | | GBP | | 66,386,221 | | Deutsche Bank AG | | | 12/13/2019 | | | | (4,796,997 | ) |
| USD | | | 48,132,233 | | | SEK | | 476,850,843 | | Merrill Lynch International | | | 12/13/2019 | | | | (1,367,300 | ) |
| USD | | | 1,109,441 | | | SEK | | 10,756,070 | | State Street Bank Corp. | | | 12/13/2019 | | | | (7,094 | ) |
| | | | | | | | | | | | | | | | | | |
| | | | | | | | | | | | | | | | | $(12,080,643 | ) |
| | | | | | | | | | | | | | | | | | |
At October 31, 2019, the fund had cash collateral of $10,877,000 to cover any collateral for certain derivative contracts. Restricted cash and/or deposits with brokers in the Statement of Assets and Liabilities are comprised of cash collateral.
See Notes to Financial Statements
14
Financial Statements
STATEMENT OF ASSETS AND LIABILITIES
At 10/31/19
This statement represents your fund’s balance sheet, which details the assets and liabilities comprising the total value of the fund.
| | | | |
| Assets | | | | |
Investments in unaffiliated issuers, at value, including $61,792,912 of securities on loan (identified cost, $2,769,856,825) | | | $3,613,733,832 | |
Investments in affiliated issuers, at value (identified cost, $50,094,360) | | | 50,101,595 | |
Cash | | | 399,980 | |
Foreign currency, at value (identified cost, $619,713) | | | 580,171 | |
Restricted cash for | | | | |
Forward foreign currency exchange contracts | | | 10,877,000 | |
Receivables for | | | | |
Forward foreign currency exchange contracts | | | 94,698 | |
Fund shares sold | | | 2,317,988 | |
Interest and dividends | | | 7,204,409 | |
Total assets | | | $3,685,309,673 | |
| |
| Liabilities | | | | |
Payables for | | | | |
Distributions | | | $494,215 | |
Forward foreign currency exchange contracts | | | 12,080,643 | |
Investments purchased | | | 7,687,683 | |
Fund shares reacquired | | | 3,736,527 | |
Collateral for securities loaned, at value (c) | | | 45,627,434 | |
Payable to affiliates | | | | |
Investment adviser | | | 114,373 | |
Administrative services fee | | | 2,497 | |
Shareholder servicing costs | | | 1,282,483 | |
Distribution and service fees | | | 58,004 | |
Payable for independent Trustees’ compensation | | | 11 | |
Deferred country tax expense payable | | | 1,541,733 | |
Accrued expenses and other liabilities | | | 250,741 | |
Total liabilities | | | $72,876,344 | |
Net assets | | | $3,612,433,329 | |
| |
| Net assets consist of | | | | |
Paid-in capital | | | $2,598,797,387 | |
Total distributable earnings (loss) | | | 1,013,635,942 | |
Net assets | | | $3,612,433,329 | |
Shares of beneficial interest outstanding | | | 153,431,857 | |
| (c) | Non-cash collateral is not included. |
15
Statement of Assets and Liabilities – continued
| | | | | | | | | | | | |
| | | |
| | | Net assets | | | Shares
outstanding | | | Net asset value
per share (a) | |
Class A | | | $1,956,523,972 | | | | 83,110,638 | | | | $23.54 | |
Class B | | | 99,924,136 | | | | 4,266,110 | | | | 23.42 | |
Class C | | | 370,035,505 | | | | 15,799,382 | | | | 23.42 | |
Class I | | | 698,558,294 | | | | 29,552,551 | | | | 23.64 | |
Class R1 | | | 6,560,778 | | | | 280,777 | | | | 23.37 | |
Class R2 | | | 59,224,275 | | | | 2,523,278 | | | | 23.47 | |
Class R3 | | | 279,638,881 | | | | 11,887,238 | | | | 23.52 | |
Class R4 | | | 49,530,093 | | | | 2,102,152 | | | | 23.56 | |
Class R6 | | | 92,437,395 | | | | 3,909,731 | | | | 23.64 | |
| (a) | Maximum offering price per share was equal to the net asset value per share for all share classes, except for Class A, for which the maximum offering price per share was $24.98 [100 / 94.25 x $23.54]. On sales of $50,000 or more, the maximum offering price of Class A shares is reduced. A contingent deferred sales charge may be imposed on redemptions of Class A, Class B, and Class C shares. Redemption price per share was equal to the net asset value per share for Classes I, R1, R2, R3, R4, and R6. |
See Notes to Financial Statements
16
Financial Statements
STATEMENT OF OPERATIONS
Year ended 10/31/19
This statement describes how much your fund earned in investment income and accrued in expenses. It also describes any gains and/or losses generated by fund operations.
| | | | |
| Net investment income (loss) | | | | |
Income | | | | |
Dividends | | | $120,544,250 | |
Dividends from affiliated issuers | | | 1,897,577 | |
Income on securities loaned | | | 282,453 | |
Other | | | 180,296 | |
Foreign taxes withheld | | | (8,333,129 | ) |
Total investment income | | | $114,571,447 | |
Expenses | | | | |
Management fee | | | $19,497,952 | |
Distribution and service fees | | | 10,360,887 | |
Shareholder servicing costs | | | 3,493,161 | |
Administrative services fee | | | 448,205 | |
Independent Trustees’ compensation | | | 44,585 | |
Custodian fee | | | 438,153 | |
Shareholder communications | | | 168,822 | |
Audit and tax fees | | | 67,547 | |
Legal fees | | | 30,411 | |
Miscellaneous | | | 251,135 | |
Total expenses | | | $34,800,858 | |
Fees paid indirectly | | | (94,360 | ) |
Reduction of expenses by investment adviser and distributor | | | (379,086 | ) |
Net expenses | | | $34,327,412 | |
Net investment income (loss) | | | $80,244,035 | |
| |
| Realized and unrealized gain (loss) | | | | |
Realized gain (loss) (identified cost basis) | | | | |
Unaffiliated issuers (net of $84,766 country tax) | | | $130,778,949 | |
Affiliated issuers | | | 17,730 | |
Forward foreign currency exchange contracts | | | 40,038,458 | |
Foreign currency | | | 6,987,424 | |
Net realized gain (loss) | | | $177,822,561 | |
Change in unrealized appreciation or depreciation | | | | |
Unaffiliated issuers (net of $1,013,246 increase in deferred country tax) | | | $409,688,444 | |
Affiliated issuers | | | 7,022 | |
Forward foreign currency exchange contracts | | | (23,016,639 | ) |
Translation of assets and liabilities in foreign currencies | | | (116,877 | ) |
Net unrealized gain (loss) | | | $386,561,950 | |
Net realized and unrealized gain (loss) | | | $564,384,511 | |
Change in net assets from operations | | | $644,628,546 | |
See Notes to Financial Statements
17
Financial Statements
STATEMENTS OF CHANGES IN NET ASSETS
These statements describe the increases and/or decreases in net assets resulting from operations, any distributions, and any shareholder transactions.
| | | | | | | | |
| | | Year ended | |
| | | 10/31/19 | | | 10/31/18 | |
| Change in net assets | | | | | | |
| | |
| From operations | | | | | | | | |
Net investment income (loss) | | | $80,244,035 | | | | $89,738,553 | |
Net realized gain (loss) | | | 177,822,561 | | | | 45,936,011 | |
Net unrealized gain (loss) | | | 386,561,950 | | | | (109,056,961 | ) |
Change in net assets from operations | | | $644,628,546 | | | | $26,617,603 | |
Total distributions to shareholders | | | $(123,392,257 | ) | | | $(95,278,043 | ) |
Change in net assets from fund share transactions | | | $(46,064,734 | ) | | | $(627,026,866 | ) |
Total change in net assets | | | $475,171,555 | | | | $(695,687,306 | ) |
| | |
| Net assets | | | | | | | | |
At beginning of period | | | 3,137,261,774 | | | | 3,832,949,080 | |
At end of period | | | $3,612,433,329 | | | | $3,137,261,774 | |
See Notes to Financial Statements
18
Financial Statements
FINANCIAL HIGHLIGHTS
The financial highlights table is intended to help you understand the fund’s financial performance for the past 5 years. Certain information reflects financial results for a single fund share. The total returns in the table represent the rate that an investor would have earned (or lost) on an investment in the fund share class (assuming reinvestment of all distributions) held for the entire period.
| | | | | | | | | | | | | | | | | | | | |
| Class A | | Year ended | |
| | | | | |
| | | 10/31/19 | | | 10/31/18 | | | 10/31/17 | | | 10/31/16 | | | 10/31/15 | |
Net asset value, beginning of period | | | $20.08 | | | | $20.46 | | | | $18.49 | | | | $19.25 | | | | $23.34 | |
| | |
| Income (loss) from investment operations | | | | | | | | | |
Net investment income (loss) (d) | | | $0.55 | | | | $0.55 | | | | $0.51 | (c) | | | $0.70 | | | | $0.45 | |
Net realized and unrealized gain (loss) | | | 3.73 | | | | (0.35 | ) | | | 2.15 | | | | 0.07 | | | | (2.73 | ) |
Total from investment operations | | | $4.28 | | | | $0.20 | | | | $2.66 | | | | $0.77 | | | | $(2.28 | ) |
| | |
| Less distributions declared to shareholders | | | | | | | | | |
From net investment income | | | $(0.49 | ) | | | $(0.50 | ) | | | $(0.69 | ) | | | $(0.46 | ) | | | $(0.47 | ) |
From net realized gain | | | (0.33 | ) | | | (0.08 | ) | | | — | | | | (1.07 | ) | | | (1.34 | ) |
Total distributions declared to shareholders | | | $(0.82 | ) | | | $(0.58 | ) | | | $(0.69 | ) | | | $(1.53 | ) | | | $(1.81 | ) |
Net asset value, end of period (x) | | | $23.54 | | | | $20.08 | | | | $20.46 | | | | $18.49 | | | | $19.25 | |
Total return (%) (r)(s)(t)(x) | | | 21.94 | | | | 0.98 | | | | 14.73 | (c) | | | 4.91 | | | | (10.42 | ) |
| | |
Ratios (%) (to average net assets)
and Supplemental data: | | | | | | | | | |
Expenses before expense reductions (f) | | | 1.00 | | | | 1.00 | | | | 1.01 | (c) | | | 1.00 | | | | 0.99 | |
Expenses after expense reductions (f) | | | 0.99 | | | | 0.99 | | | | 1.01 | (c) | | | 0.99 | | | | 0.99 | |
Net investment income (loss) | | | 2.51 | | | | 2.70 | | | | 2.64 | (c) | | | 3.85 | | | | 2.10 | |
Portfolio turnover | | | 30 | | | | 23 | | | | 24 | | | | 27 | | | | 45 | |
Net assets at end of period (000 omitted) | | | $1,956,524 | | | | $1,706,956 | | | | $1,951,500 | | | | $2,431,147 | | | | $2,926,491 | |
See Notes to Financial Statements
19
Financial Highlights – continued
| | | | | | | | | | | | | | | | | | | | |
| Class B | | Year ended | |
| | | | | |
| | | 10/31/19 | | | 10/31/18 | | | 10/31/17 | | | 10/31/16 | | | 10/31/15 | |
Net asset value, beginning of period | | | $19.98 | | | | $20.36 | | | | $18.40 | | | | $19.16 | | | | $23.24 | |
| | |
| Income (loss) from investment operations | | | | | | | | | |
Net investment income (loss) (d) | | | $0.38 | | | | $0.39 | | | | $0.36 | (c) | | | $0.55 | | | | $0.28 | |
Net realized and unrealized gain (loss) | | | 3.72 | | | | (0.35 | ) | | | 2.14 | | | | 0.08 | | | | (2.71 | ) |
Total from investment operations | | | $4.10 | | | | $0.04 | | | | $2.50 | | | | $0.63 | | | | $(2.43 | ) |
| | |
| Less distributions declared to shareholders | | | | | | | | | |
From net investment income | | | $(0.33 | ) | | | $(0.34 | ) | | | $(0.54 | ) | | | $(0.32 | ) | | | $(0.31 | ) |
From net realized gain | | | (0.33 | ) | | | (0.08 | ) | | | — | | | | (1.07 | ) | | | (1.34 | ) |
Total distributions declared to shareholders | | | $(0.66 | ) | | | $(0.42 | ) | | | $(0.54 | ) | | | $(1.39 | ) | | | $(1.65 | ) |
Net asset value, end of period (x) | | | $23.42 | | | | $19.98 | | | | $20.36 | | | | $18.40 | | | | $19.16 | |
Total return (%) (r)(s)(t)(x) | | | 21.02 | | | | 0.22 | | | | 13.87 | (c) | | | 4.15 | | | | (11.09 | ) |
| | |
Ratios (%) (to average net assets)
and Supplemental data: | | | | | | | | | |
Expenses before expense reductions (f) | | | 1.75 | | | | 1.75 | | | | 1.76 | (c) | | | 1.75 | | | | 1.74 | |
Expenses after expense reductions (f) | | | 1.74 | | | | 1.74 | | | | 1.76 | (c) | | | 1.75 | | | | 1.74 | |
Net investment income (loss) | | | 1.76 | | | | 1.94 | | | �� | 1.89 | (c) | | | 3.05 | | | | 1.34 | |
Portfolio turnover | | | 30 | | | | 23 | | | | 24 | | | | 27 | | | | 45 | |
Net assets at end of period (000 omitted) | | | $99,924 | | | | $113,779 | | | | $156,814 | | | | $198,512 | | | | $260,079 | |
| |
| Class C | | Year ended | |
| | | | | |
| | | 10/31/19 | | | 10/31/18 | | | 10/31/17 | | | 10/31/16 | | | 10/31/15 | |
Net asset value, beginning of period | | | $19.98 | | | | $20.36 | | | | $18.40 | | | | $19.16 | | | | $23.24 | |
| | |
| Income (loss) from investment operations | | | | | | | | | |
Net investment income (loss) (d) | | | $0.38 | | | | $0.38 | | | | $0.36 | (c) | | | $0.56 | | | | $0.29 | |
Net realized and unrealized gain (loss) | | | 3.72 | | | | (0.34 | ) | | | 2.14 | | | | 0.07 | | | | (2.72 | ) |
Total from investment operations | | | $4.10 | | | | $0.04 | | | | $2.50 | | | | $0.63 | | | | $(2.43 | ) |
| | |
| Less distributions declared to shareholders | | | | | | | | | |
From net investment income | | | $(0.33 | ) | | | $(0.34 | ) | | | $(0.54 | ) | | | $(0.32 | ) | | | $(0.31 | ) |
From net realized gain | | | (0.33 | ) | | | (0.08 | ) | | | — | | | | (1.07 | ) | | | (1.34 | ) |
Total distributions declared to shareholders | | | $(0.66 | ) | | | $(0.42 | ) | | | $(0.54 | ) | | | $(1.39 | ) | | | $(1.65 | ) |
Net asset value, end of period (x) | | | $23.42 | | | | $19.98 | | | | $20.36 | | | | $18.40 | | | | $19.16 | |
Total return (%) (r)(s)(t)(x) | | | 21.02 | | | | 0.21 | | | | 13.87 | (c) | | | 4.15 | | | | (11.09 | ) |
| | |
Ratios (%) (to average net assets)
and Supplemental data: | | | | | | | | | |
Expenses before expense reductions (f) | | | 1.75 | | | | 1.75 | | | | 1.76 | (c) | | | 1.75 | | | | 1.74 | |
Expenses after expense reductions (f) | | | 1.74 | | | | 1.74 | | | | 1.76 | (c) | | | 1.75 | | | | 1.74 | |
Net investment income (loss) | | | 1.75 | | | | 1.91 | | | | 1.90 | (c) | | | 3.09 | | | | 1.35 | |
Portfolio turnover | | | 30 | | | | 23 | | | | 24 | | | | 27 | | | | 45 | |
Net assets at end of period (000 omitted) | | | $370,036 | | | | $424,769 | | | | $640,795 | | | | $757,086 | | | | $945,033 | |
See Notes to Financial Statements
20
Financial Highlights – continued
| | | | | | | | | | | | | | | | | | | | |
| Class I | | Year ended | |
| | | | | |
| | | 10/31/19 | | | 10/31/18 | | | 10/31/17 | | | 10/31/16 | | | 10/31/15 | |
Net asset value, beginning of period | | | $20.16 | | | | $20.54 | | | | $18.56 | | | | $19.31 | | | | $23.41 | |
| | |
| Income (loss) from investment operations | | | | | | | | | |
Net investment income (loss) (d) | | | $0.60 | | | | $0.60 | | | | $0.56 | (c) | | | $0.76 | | | | $0.50 | |
Net realized and unrealized gain (loss) | | | 3.76 | | | | (0.35 | ) | | | 2.16 | | | | 0.06 | | | | (2.73 | ) |
Total from investment operations | | | $4.36 | | | | $0.25 | | | | $2.72 | | | | $0.82 | | | | $(2.23 | ) |
| | |
| Less distributions declared to shareholders | | | | | | | | | |
From net investment income | | | $(0.55 | ) | | | $(0.55 | ) | | | $(0.74 | ) | | | $(0.50 | ) | | | $(0.53 | ) |
From net realized gain | | | (0.33 | ) | | | (0.08 | ) | | | — | | | | (1.07 | ) | | | (1.34 | ) |
Total distributions declared to shareholders | | | $(0.88 | ) | | | $(0.63 | ) | | | $(0.74 | ) | | | $(1.57 | ) | | | $(1.87 | ) |
Net asset value, end of period (x) | | | $23.64 | | | | $20.16 | | | | $20.54 | | | | $18.56 | | | | $19.31 | |
Total return (%) (r)(s)(t)(x) | | | 22.26 | | | | 1.22 | | | | 15.02 | (c) | | | 5.20 | | | | (10.20 | ) |
| | |
Ratios (%) (to average net assets)
and Supplemental data: | | | | | | | | | |
Expenses before expense reductions (f) | | | 0.75 | | | | 0.75 | | | | 0.76 | (c) | | | 0.75 | | | | 0.74 | |
Expenses after expense reductions (f) | | | 0.74 | | | | 0.74 | | | | 0.76 | (c) | | | 0.75 | | | | 0.74 | |
Net investment income (loss) | | | 2.77 | | | | 2.93 | | | | 2.86 | (c) | | | 4.18 | | | | 2.33 | |
Portfolio turnover | | | 30 | | | | 23 | | | | 24 | | | | 27 | | | | 45 | |
Net assets at end of period (000 omitted) | | | $698,558 | | | | $587,221 | | | | $682,272 | | | | $508,566 | | | | $636,784 | |
| |
| Class R1 | | Year ended | |
| | | | | |
| | | 10/31/19 | | | 10/31/18 | | | 10/31/17 | | | 10/31/16 | | | 10/31/15 | |
Net asset value, beginning of period | | | $19.94 | | | | $20.32 | | | | $18.37 | | | | $19.13 | | | | $23.21 | |
| | |
| Income (loss) from investment operations | | | | | | | | | |
Net investment income (loss) (d) | | | $0.38 | | | | $0.39 | | | | $0.36 | (c) | | | $0.56 | | | | $0.29 | |
Net realized and unrealized gain (loss) | | | 3.71 | | | | (0.34 | ) | | | 2.13 | | | | 0.08 | | | | (2.72 | ) |
Total from investment operations | | | $4.09 | | | | $0.05 | | | | $2.49 | | | | $0.64 | | | | $(2.43 | ) |
| | |
| Less distributions declared to shareholders | | | | | | | | | |
From net investment income | | | $(0.33 | ) | | | $(0.35 | ) | | | $(0.54 | ) | | | $(0.33 | ) | | | $(0.31 | ) |
From net realized gain | | | (0.33 | ) | | | (0.08 | ) | | | — | | | | (1.07 | ) | | | (1.34 | ) |
Total distributions declared to shareholders | | | $(0.66 | ) | | | $(0.43 | ) | | | $(0.54 | ) | | | $(1.40 | ) | | | $(1.65 | ) |
Net asset value, end of period (x) | | | $23.37 | | | | $19.94 | | | | $20.32 | | | | $18.37 | | | | $19.13 | |
Total return (%) (r)(s)(t)(x) | | | 21.03 | | | | 0.23 | | | | 13.84 | (c) | | | 4.17 | | | | (11.11 | ) |
| | |
Ratios (%) (to average net assets)
and Supplemental data: | | | | | | | | | |
Expenses before expense reductions (f) | | | 1.75 | | | | 1.75 | | | | 1.76 | (c) | | | 1.75 | | | | 1.74 | |
Expenses after expense reductions (f) | | | 1.74 | | | | 1.74 | | | | 1.76 | (c) | | | 1.75 | | | | 1.74 | |
Net investment income (loss) | | | 1.77 | | | | 1.93 | | | | 1.90 | (c) | | | 3.14 | | | | 1.34 | |
Portfolio turnover | | | 30 | | | | 23 | | | | 24 | | | | 27 | | | | 45 | |
Net assets at end of period (000 omitted) | | | $6,561 | | | | $6,453 | | | | $7,623 | | | | $10,305 | | | | $10,865 | |
See Notes to Financial Statements
21
Financial Highlights – continued
| | | | | | | | | | | | | | | | | | | | |
| Class R2 | | Year ended | |
| | | | | |
| | | 10/31/19 | | | 10/31/18 | | | 10/31/17 | | | 10/31/16 | | | 10/31/15 | |
Net asset value, beginning of period | | | $20.03 | | | | $20.40 | | | | $18.44 | | | | $19.20 | | | | $23.29 | |
| | |
| Income (loss) from investment operations | | | | | | | | | |
Net investment income (loss) (d) | | | $0.49 | | | | $0.50 | | | | $0.46 | (c) | | | $0.65 | | | | $0.39 | |
Net realized and unrealized gain (loss) | | | 3.72 | | | | (0.35 | ) | | | 2.14 | | | | 0.07 | | | | (2.72 | ) |
Total from investment operations | | | $4.21 | | | | $0.15 | | | | $2.60 | | | | $0.72 | | | | $(2.33 | ) |
| | |
| Less distributions declared to shareholders | | | | | | | | | |
From net investment income | | | $(0.44 | ) | | | $(0.44 | ) | | | $(0.64 | ) | | | $(0.41 | ) | | | $(0.42 | ) |
From net realized gain | | | (0.33 | ) | | | (0.08 | ) | | | — | | | | (1.07 | ) | | | (1.34 | ) |
Total distributions declared to shareholders | | | $(0.77 | ) | | | $(0.52 | ) | | | $(0.64 | ) | | | $(1.48 | ) | | | $(1.76 | ) |
Net asset value, end of period (x) | | | $23.47 | | | | $20.03 | | | | $20.40 | | | | $18.44 | | | | $19.20 | |
Total return (%) (r)(s)(t)(x) | | | 21.59 | | | | 0.77 | | | | 14.42 | (c) | | | 4.66 | | | | (10.66 | ) |
| | |
Ratios (%) (to average net assets)
and Supplemental data: | | | | | | | | | |
Expenses before expense reductions (f) | | | 1.25 | | | | 1.25 | | | | 1.26 | (c) | | | 1.25 | | | | 1.24 | |
Expenses after expense reductions (f) | | | 1.24 | | | | 1.24 | | | | 1.26 | (c) | | | 1.25 | | | | 1.24 | |
Net investment income (loss) | | | 2.26 | | | | 2.46 | | | | 2.39 | (c) | | | 3.61 | | | | 1.84 | |
Portfolio turnover | | | 30 | | | | 23 | | | | 24 | | | | 27 | | | | 45 | |
Net assets at end of period (000 omitted) | | | $59,224 | | | | $57,733 | | | | $78,248 | | | | $92,123 | | | | $104,858 | |
| |
| Class R3 | | Year ended | |
| | | | | |
| | | 10/31/19 | | | 10/31/18 | | | 10/31/17 | | | 10/31/16 | | | 10/31/15 | |
Net asset value, beginning of period | | | $20.07 | | | | $20.45 | | | | $18.48 | | | | $19.24 | | | | $23.33 | |
| | |
| Income (loss) from investment operations | | | | | | | | | |
Net investment income (loss) (d) | | | $0.57 | | | | $0.55 | | | | $0.51 | (c) | | | $0.71 | | | | $0.45 | |
Net realized and unrealized gain (loss) | | | 3.71 | | | | (0.35 | ) | | | 2.15 | | | | 0.06 | | | | (2.73 | ) |
Total from investment operations | | | $4.28 | | | | $0.20 | | | | $2.66 | | | | $0.77 | | | | $(2.28 | ) |
| | |
| Less distributions declared to shareholders | | | | | | | | | |
From net investment income | | | $(0.50 | ) | | | $(0.50 | ) | | | $(0.69 | ) | | | $(0.46 | ) | | | $(0.47 | ) |
From net realized gain | | | (0.33 | ) | | | (0.08 | ) | | | — | | | | (1.07 | ) | | | (1.34 | ) |
Total distributions declared to shareholders | | | $(0.83 | ) | | | $(0.58 | ) | | | $(0.69 | ) | | | $(1.53 | ) | | | $(1.81 | ) |
Net asset value, end of period (x) | | | $23.52 | | | | $20.07 | | | | $20.45 | | | | $18.48 | | | | $19.24 | |
Total return (%) (r)(s)(t)(x) | | | 21.92 | | | | 0.97 | | | | 14.74 | (c) | | | 4.91 | | | | (10.42 | ) |
| | |
Ratios (%) (to average net assets)
and Supplemental data: | | | | | | | | | |
Expenses before expense reductions (f) | | | 1.00 | | | | 1.00 | | | | 1.01 | (c) | | | 0.99 | | | | 0.99 | |
Expenses after expense reductions (f) | | | 0.99 | | | | 0.99 | | | | 1.01 | (c) | | | 0.99 | | | | 0.99 | |
Net investment income (loss) | | | 2.63 | | | | 2.71 | | | | 2.64 | (c) | | | 3.91 | | | | 2.09 | |
Portfolio turnover | | | 30 | | | | 23 | | | | 24 | | | | 27 | | | | 45 | |
Net assets at end of period (000 omitted) | | | $279,639 | | | | $72,490 | | | | $99,454 | | | | $128,051 | | | | $134,801 | |
See Notes to Financial Statements
22
Financial Highlights – continued
| | | | | | | | | | | | | | | | | | | | |
| Class R4 | | Year ended | |
| | | | | |
| | | 10/31/19 | | | 10/31/18 | | | 10/31/17 | | | 10/31/16 | | | 10/31/15 | |
Net asset value, beginning of period | | | $20.10 | | | | $20.48 | | | | $18.51 | | | | $19.26 | | | | $23.35 | |
| | |
| Income (loss) from investment operations | | | | | | | | | |
Net investment income (loss) (d) | | | $0.60 | | | | $0.61 | | | | $0.56 | (c) | | | $0.74 | | | | $0.50 | |
Net realized and unrealized gain (loss) | | | 3.74 | | | | (0.36 | ) | | | 2.15 | | | | 0.08 | | | | (2.72 | ) |
Total from investment operations | | | $4.34 | | | | $0.25 | | | | $2.71 | | | | $0.82 | | | | $(2.22 | ) |
| | |
| Less distributions declared to shareholders | | | | | | | | | |
From net investment income | | | $(0.55 | ) | | | $(0.55 | ) | | | $(0.74 | ) | | | $(0.50 | ) | | | $(0.53 | ) |
From net realized gain | | | (0.33 | ) | | | (0.08 | ) | | | — | | | | (1.07 | ) | | | (1.34 | ) |
Total distributions declared to shareholders | | | $(0.88 | ) | | | $(0.63 | ) | | | $(0.74 | ) | | | $(1.57 | ) | | | $(1.87 | ) |
Net asset value, end of period (x) | | | $23.56 | | | | $20.10 | | | | $20.48 | | | | $18.51 | | | | $19.26 | |
Total return (%) (r)(s)(t)(x) | | | 22.22 | | | | 1.22 | | | | 15.01 | (c) | | | 5.21 | | | | (10.19 | ) |
| | |
Ratios (%) (to average net assets)
and Supplemental data: | | | | | | | | | |
Expenses before expense reductions (f) | | | 0.75 | | | | 0.75 | | | | 0.76 | (c) | | | 0.74 | | | | 0.74 | |
Expenses after expense reductions (f) | | | 0.74 | | | | 0.74 | | | | 0.76 | (c) | | | 0.74 | | | | 0.74 | |
Net investment income (loss) | | | 2.76 | | | | 3.01 | | | | 2.89 | (c) | | | 4.11 | | | | 2.33 | |
Portfolio turnover | | | 30 | | | | 23 | | | | 24 | | | | 27 | | | | 45 | |
Net assets at end of period (000 omitted) | | | $49,530 | | | | $48,109 | | | | $79,612 | | | | $89,124 | | | | $100,251 | |
| |
| Class R6 | | Year ended | |
| | | | | |
| | | 10/31/19 | | | 10/31/18 | | | 10/31/17 | | | 10/31/16 | | | 10/31/15 | |
Net asset value, beginning of period | | | $20.17 | | | | $20.54 | | | | $18.56 | | | | $19.31 | | | | $23.42 | |
| | |
| Income (loss) from investment operations | | | | | | | | | |
Net investment income (loss) (d) | | | $0.61 | | | | $0.61 | | | | $0.57 | (c) | | | $0.78 | | | | $0.53 | |
Net realized and unrealized gain (loss) | | | 3.76 | | | | (0.34 | ) | | | 2.17 | | | | 0.06 | | | | (2.75 | ) |
Total from investment operations | | | $4.37 | | | | $0.27 | | | | $2.74 | | | | $0.84 | | | | $(2.22 | ) |
| | |
| Less distributions declared to shareholders | | | | | | | | | |
From net investment income | | | $(0.57 | ) | | | $(0.56 | ) | | | $(0.76 | ) | | | $(0.52 | ) | | | $(0.55 | ) |
From net realized gain | | | (0.33 | ) | | | (0.08 | ) | | | — | | | | (1.07 | ) | | | (1.34 | ) |
Total distributions declared to shareholders | | | $(0.90 | ) | | | $(0.64 | ) | | | $(0.76 | ) | | | $(1.59 | ) | | | $(1.89 | ) |
Net asset value, end of period (x) | | | $23.64 | | | | $20.17 | | | | $20.54 | | | | $18.56 | | | | $19.31 | |
Total return (%) (r)(s)(t)(x) | | | 22.29 | | | | 1.36 | | | | 15.13 | (c) | | | 5.30 | | | | (10.15 | ) |
| | |
Ratios (%) (to average net assets)
and Supplemental data: | | | | | | | | | |
Expenses before expense reductions (f) | | | 0.66 | | | | 0.66 | | | | 0.66 | (c) | | | 0.65 | | | | 0.63 | |
Expenses after expense reductions (f) | | | 0.65 | | | | 0.65 | | | | 0.66 | (c) | | | 0.65 | | | | 0.63 | |
Net investment income (loss) | | | 2.84 | | | | 3.02 | | | | 2.93 | (c) | | | 4.31 | | | | 2.48 | |
Portfolio turnover | | | 30 | | | | 23 | | | | 24 | | | | 27 | | | | 45 | |
Net assets at end of period (000 omitted) | | | $92,437 | | | | $119,752 | | | | $136,631 | | | | $92,898 | | | | $75,962 | |
See Notes to Financial Statements
23
Financial Highlights – continued
| (c) | Amount reflects aone-time reimbursement of expenses by the custodian (or former custodian) without which net investment income and performance would be lower and expenses would be higher. |
| (d) | Per share data is based on average shares outstanding. |
| (f) | Ratios do not reflect reductions from fees paid indirectly, if applicable. |
| (r) | Certain expenses have been reduced without which performance would have been lower. |
| (s) | From time to time the fund may receive proceeds from litigation settlements, without which performance would be lower. |
| (t) | Total returns do not include any applicable sales charges. |
| (x) | The net asset values and total returns have been calculated on net assets which include adjustments made in accordance with U.S. generally accepted accounting principles required at period end for financial reporting purposes. |
See Notes to Financial Statements
24
NOTES TO FINANCIAL STATEMENTS
(1) Business and Organization
MFS Utilities Fund (the fund) is a diversified series of MFS Series Trust VI (the trust). The trust is organized as a Massachusetts business trust and is registered under the Investment Company Act of 1940, as amended, as anopen-end management investment company.
The fund is an investment company and accordingly follows the investment company accounting and reporting guidance of the Financial Accounting Standards Board (FASB) Accounting Standards Codification Topic 946 Financial Services – Investment Companies.
(2) Significant Accounting Policies
General– The preparation of financial statements in conformity with U.S. generally accepted accounting principles requires management to make estimates and assumptions that affect the reported amounts of assets and liabilities, and disclosure of contingent assets and liabilities at the date of the financial statements and the reported amounts of increases and decreases in net assets from operations during the reporting period. Actual results could differ from those estimates. In the preparation of these financial statements, management has evaluated subsequent events occurring after the date of the fund’s Statement of Assets and Liabilities through the date that the financial statements were issued. The fund invests primarily in securities of issuers in the utility industry. Issuers in a single industry can react similarly to market, currency, political, economic, regulatory, geopolitical, and other conditions. The value of stocks in the utilities sector can be very volatile due to supply and/or demand for services or fuel, financing costs, conservation efforts, the negative impact of regulation, and other factors. The fund invests in foreign securities. Investments in foreign securities are vulnerable to the effects of changes in the relative values of the local currency and the U.S. dollar and to the effects of changes in each country’s market, economic, industrial, political, regulatory, geopolitical, and other conditions.
Balance Sheet Offsetting– The fund’s accounting policy with respect to balance sheet offsetting is that, absent an event of default by the counterparty or a termination of the agreement, the International Swaps and Derivatives Association (ISDA) Master Agreement, or similar agreement, does not result in an offset of reported amounts of financial assets and financial liabilities in the Statement of Assets and Liabilities across transactions between the fund and the applicable counterparty. The fund’s right to setoff may be restricted or prohibited by the bankruptcy or insolvency laws of the particular jurisdiction to which a specific master netting agreement counterparty is subject. Balance sheet offsetting disclosures, to the extent applicable to the fund, have been included in the fund’s Significant Accounting Policies note under the captions for each of the fund’sin-scope financial instruments and transactions.
Investment Valuations– Equity securities, including restricted equity securities, are generally valued at the last sale or official closing price on their primary market or exchange as provided by a third-party pricing service. Equity securities, for which there were no sales reported that day, are generally valued at the last quoted daily bid quotation on their primary market or exchange as provided by a third-party pricing service. Short-term instruments with a maturity at issuance of 60 days or less may be
25
Notes to Financial Statements – continued
valued at amortized cost, which approximates market value. Exchange-traded options are generally valued at the last sale or official closing price on their primary exchange as provided by a third-party pricing service. Exchange-traded options for which there were no sales reported that day are generally valued at the last daily bid quotation on their primary exchange as provided by a third-party pricing service. Options not traded on an exchange are generally valued at a broker/dealer bid quotation. Foreign currency options are generally valued at valuations provided by a third-party pricing service. Forward foreign currency exchange contracts are generally valued at the mean of bid and asked prices for the time period interpolated from rates provided by a third-party pricing service for proximate time periods.Open-end investment companies are generally valued at net asset value per share. Securities and other assets generally valued on the basis of information from a third-party pricing service may also be valued at a broker/dealer bid quotation. In determining values, third-party pricing services can utilize both transaction data and market information such as yield, quality, coupon rate, maturity, type of issue, trading characteristics, and other market data. The values of foreign securities and other assets and liabilities expressed in foreign currencies are converted to U.S. dollars using the mean of bid and asked prices for rates provided by a third-party pricing service.
The Board of Trustees has delegated primary responsibility for determining or causing to be determined the value of the fund’s investments (including any fair valuation) to the adviser pursuant to valuation policies and procedures approved by the Board. If the adviser determines that reliable market quotations are not readily available, investments are valued at fair value as determined in good faith by the adviser in accordance with such procedures under the oversight of the Board of Trustees. Under the fund’s valuation policies and procedures, market quotations are not considered to be readily available for most types of debt instruments and floating rate loans and many types of derivatives. These investments are generally valued at fair value based on information from third-party pricing services. In addition, investments may be valued at fair value if the adviser determines that an investment’s value has been materially affected by events occurring after the close of the exchange or market on which the investment is principally traded (such as foreign exchange or market) and prior to the determination of the fund’s net asset value, or after the halt of trading of a specific security where trading does not resume prior to the close of the exchange or market on which the security is principally traded. Events that occur after foreign markets close (such as developments in foreign markets and significant movements in the U.S. markets) and prior to the determination of the fund’s net asset value may be deemed to have a material effect on the value of securities traded in foreign markets. Accordingly, the fund’s foreign equity securities may often be valued at fair value. The adviser generally relies on third-party pricing services or other information (such as the correlation with price movements of similar securities in the same or other markets; the type, cost and investment characteristics of the security; the business and financial condition of the issuer; and trading and other market data) to assist in determining whether to fair value and at what value to fair value an investment. The value of an investment for purposes of calculating the fund’s net asset value can differ depending on the source and method used to determine value. When fair valuation is used, the value of an investment used to determine the fund’s net asset value may differ from quoted or
26
Notes to Financial Statements – continued
published prices for the same investment. There can be no assurance that the fund could obtain the fair value assigned to an investment if it were to sell the investment at the same time at which the fund determines its net asset value per share.
Various inputs are used in determining the value of the fund’s assets or liabilities. These inputs are categorized into three broad levels. In certain cases, the inputs used to measure fair value may fall into different levels of the fair value hierarchy. In such cases, an investment’s level within the fair value hierarchy is based on the lowest level of input that is significant to the fair value measurement. The fund’s assessment of the significance of a particular input to the fair value measurement in its entirety requires judgment, and considers factors specific to the investment. Level 1 includes unadjusted quoted prices in active markets for identical assets or liabilities. Level 2 includes other significant observable market-based inputs (including quoted prices for similar securities, interest rates, prepayment speed, and credit risk). Level 3 includes unobservable inputs, which may include the adviser’s own assumptions in determining the fair value of investments. Other financial instruments are derivative instruments, such as forward foreign currency exchange contracts. The following is a summary of the levels used as of October 31, 2019 in valuing the fund’s assets or liabilities:
| | | | | | | | | | | | | | | | |
| | | | |
| Financial Instruments | | Level 1 | | | Level 2 | | | Level 3 | | | Total | |
| Equity Securities: | | | | | | | | | | | | | | | | |
United States | | | $2,288,723,662 | | | | $— | | | | $— | | | | $2,288,723,662 | |
Canada | | | 292,042,853 | | | | — | | | | — | | | | 292,042,853 | |
Portugal | | | 263,115,883 | | | | — | | | | — | | | | 263,115,883 | |
United Kingdom | | | 141,511,966 | | | | — | | | | — | | | | 141,511,966 | |
Spain | | | 119,724,577 | | | | — | | | | — | | | | 119,724,577 | |
Italy | | | 95,192,295 | | | | — | | | | — | | | | 95,192,295 | |
Sweden | | | 79,673,326 | | | | — | | | | — | | | | 79,673,326 | |
Germany | | | 51,329,096 | | | | — | | | | — | | | | 51,329,096 | |
China | | | — | | | | 38,121,556 | | | | — | | | | 38,121,556 | |
Other Countries | | | 112,960,633 | | | | 85,710,551 | | | | — | | | | 198,671,184 | |
| Mutual Funds | | | 95,729,029 | | | | — | | | | — | | | | 95,729,029 | |
| Total | | | $3,540,003,320 | | | | $123,832,107 | | | | $— | | | | $3,663,835,427 | |
| | | | |
| Other Financial Instruments | | | | | | | | | | | | |
| | | | |
| Forward Foreign Currency Exchange Contracts – Assets | | | $— | | | | $94,698 | | | | $— | | | | $94,698 | |
| Forward Foreign Currency Exchange Contracts – Liabilities | | | — | | | | (12,080,643 | ) | | | — | | | | (12,080,643 | ) |
For further information regarding security characteristics, see the Portfolio of Investments.
Foreign Currency Translation– Purchases and sales of foreign investments, income, and expenses are converted into U.S. dollars based upon currency exchange rates prevailing on the respective dates of such transactions or on the reporting date for foreign denominated receivables and payables. Gains and losses attributable to foreign currency exchange rates on sales of securities are recorded for financial statement purposes as net realized gains and losses on investments. Gains and losses attributable to foreign exchange rate movements on receivables, payables, income and expenses
27
Notes to Financial Statements – continued
are recorded for financial statement purposes as foreign currency transaction gains and losses. That portion of both realized and unrealized gains and losses on investments that results from fluctuations in foreign currency exchange rates is not separately disclosed.
Derivatives– The fund uses derivatives primarily to increase or decrease exposure to a particular market or segment of the market, or security, to increase or decrease interest rate or currency exposure, or as alternatives to direct investments. Derivatives are used for hedging ornon-hedging purposes. While hedging can reduce or eliminate losses, it can also reduce or eliminate gains. When the fund uses derivatives as an investment to increase market exposure, or for hedging purposes, gains and losses from derivative instruments may be substantially greater than the derivative’s original cost.
The derivative instruments used by the fund during the period were purchased options and forward foreign currency exchange contracts. Depending on the type of derivative, the fund may exit a derivative position by entering into an offsetting transaction with a counterparty or exchange, negotiating an agreement with the derivative counterparty, or novating the position to a third party. The fund’s period end derivatives, as presented in the Portfolio of Investments and the associated Derivative Contract tables, generally are indicative of the volume of its derivative activity during the period.
The following table presents, by major type of derivative contract, the fair value, on a gross basis, of the asset and liability components of derivatives held by the fund at October 31, 2019 as reported in the Statement of Assets and Liabilities:
| | | | | | | | | | |
| | | | | Fair Value | |
| | | |
| Risk | | Derivative Contracts | | Asset Derivatives | | | Liability Derivatives | |
| Foreign Exchange | | Forward Foreign Currency Exchange Contracts | | | $94,698 | | | | $(12,080,643) | |
The following table presents, by major type of derivative contract, the realized gain (loss) on derivatives held by the fund for the year ended October 31, 2019 as reported in the Statement of Operations:
| | | | | | | | |
| | |
| Risk | | Forward
Foreign
Currency
Exchange
Contracts | | | Unaffiliated
Issuers
(Purchased
Options) | |
| Interest Rate | | | $— | | | | $(4,364,890 | ) |
| Foreign Exchange | | | 40,038,458 | | | | — | |
| Total | | | $40,038,458 | | | | $(4,364,890 | ) |
28
Notes to Financial Statements – continued
The following table presents, by major type of derivative contract, the change in unrealized appreciation or depreciation on derivatives held by the fund for the year ended October 31, 2019 as reported in the Statement of Operations:
| | | | | | | | |
| | |
| Risk | | Forward
Foreign Currency
Exchange
Contracts | | | Unaffiliated
Issuers
(Purchased
Options) | |
| Interest Rate | | | $— | | | | $1,120,715 | |
| Foreign Exchange | | | (23,016,639 | ) | | | — | |
| Total | | | $(23,016,639 | ) | | | $1,120,715 | |
Derivative counterparty credit risk is managed through formal evaluation of the creditworthiness of all potential counterparties. On certain, but not all, uncleared derivatives, the fund attempts to reduce its exposure to counterparty credit risk whenever possible by entering into an ISDA Master Agreement on a bilateral basis. The ISDA Master Agreement gives each party to the agreement the right to terminate all transactions traded under such agreement if there is a specified deterioration in the credit quality of the other party. Upon an event of default or a termination of the ISDA Master Agreement, thenon-defaulting party has the right to close out all transactions traded under such agreement and to net amounts owed under each agreement to one net amount payable by one party to the other. This right to close out and net payments across all transactions traded under the ISDA Master Agreement could result in a reduction of the fund’s credit risk to such counterparty equal to any amounts payable by the fund under the applicable transactions, if any.
Collateral and margin requirements differ by type of derivative. For cleared derivatives (e.g., futures contracts, cleared swaps, and exchange-traded options), margin requirements are set by the clearing broker and the clearing house and collateral, in the form of cash or securities, is posted by the fund directly with the clearing broker. Collateral terms are counterparty agreement specific for uncleared derivatives (e.g., forward foreign currency exchange contracts, uncleared swap agreements, and uncleared options) and collateral, in the form of cash and securities, is held in segregated accounts with the fund’s custodian in connection with these agreements. For derivatives traded under an ISDA Master Agreement, which contains a collateral support annex, the collateral requirements are netted across all transactions traded under such counterparty-specific agreement and an amount is posted from one party to the other to collateralize such obligations. Cash that has been segregated or delivered to cover the fund’s collateral or margin obligations under derivative contracts, if any, will be reported separately in the Statement of Assets and Liabilities as restricted cash for uncleared derivatives and/or deposits with brokers for cleared derivatives. Securities pledged as collateral or margin for the same purpose, if any, are noted in the Portfolio of Investments. The fund may be required to make payments of interest on uncovered collateral or margin obligations with the broker. Any such payments are included in “Miscellaneous” expense in the Statement of Operations.
Purchased Options– The fund purchased call and put options for a premium. Purchased call and put options entitle the holder to buy and sell a specified number of shares or units of a particular security, currency or index at a specified price at a
29
Notes to Financial Statements – continued
specified date or within a specified period of time. Purchasing call options may hedge against an anticipated increase in the dollar cost of securities or currency to be acquired or increase the fund’s exposure to an underlying instrument. Purchasing put options may hedge against an anticipated decline in the value of portfolio securities or currency or decrease the fund’s exposure to an underlying instrument.
The premium paid is initially recorded as an investment in the Statement of Assets and Liabilities. That investment is subsequentlymarked-to-market daily with the difference between the premium paid and the market value of the purchased option being recorded as unrealized appreciation or depreciation. Premiums paid for purchased call and put options which have expired are treated as realized losses on investments in the Statement of Operations. Upon the exercise or closing of a purchased call option, the premium paid is added to the cost of the security or financial instrument purchased. Upon the exercise or closing of a purchased put option, the premium paid is offset against the proceeds on the sale of the underlying security or financial instrument in order to determine the realized gain or loss on investments.
Whether or not the option is exercised, the fund’s maximum risk of loss from purchasing an option is the amount of premium paid. All option contracts involve credit risk if the counterparty to the option contract fails to perform. For uncleared options, this risk is mitigated in cases where there is an ISDA Master Agreement between the fund and the counterparty providing for netting as described above and, where applicable, by the posting of collateral by the counterparty to the fund to cover the fund’s exposure to the counterparty under such ISDA Master Agreement.
Forward Foreign Currency Exchange Contracts– The fund entered into forward foreign currency exchange contracts for the purchase or sale of a specific foreign currency at a fixed price on a future date. These contracts may be used to hedge the fund’s currency risk or fornon-hedging purposes. For hedging purposes, the fund may enter into contracts to deliver or receive foreign currency that the fund will receive from or use in its normal investment activities. The fund may also use contracts to hedge against declines in the value of foreign currency denominated securities due to unfavorable exchange rate movements. Fornon-hedging purposes, the fund may enter into contracts with the intent of changing the relative exposure of the fund’s portfolio of securities to different currencies to take advantage of anticipated exchange rate changes.
Forward foreign currency exchange contracts are adjusted by the daily exchange rate of the underlying currency and any unrealized gains or losses are recorded as a receivable or payable for forward foreign currency exchange contracts until the contract settlement date. On contract settlement date, any gain or loss on the contract is recorded as realized gains or losses on forward foreign currency exchange contracts.
Risks may arise upon entering into these contracts from unanticipated movements in the value of the contract and from the potential inability of counterparties to meet the terms of their contracts. Generally, the fund’s maximum risk due to counterparty credit risk is the unrealized gain on the contract due to the use of Continuous Linked Settlement, a multicurrency cash settlement system for the centralized settlement of foreign transactions. This risk is mitigated in cases where there is an ISDA Master Agreement between the fund and the counterparty providing for netting as described
30
Notes to Financial Statements – continued
above and, where applicable, by the posting of collateral by the counterparty to the fund to cover the fund’s exposure to the counterparty under such ISDA Master Agreement.
Security Loans– Under its Securities Lending Agency Agreement with the fund, JPMorgan Chase and Co., as lending agent, loans the securities of the fund to certain qualified institutions (the “Borrowers”) approved by the fund. Security loans can be terminated at the discretion of either the lending agent or the fund and the related securities must be returned within the earlier of the standard trade settlement period for such securities or within three business days. The loans are collateralized by cash and/or U.S. Treasury and federal agency obligations in an amount typically at least equal to the market value of the securities loaned. On loans collateralized by cash, the cash collateral is invested in a money market fund. The market value of the loaned securities is determined at the close of business of the fund and any additional required collateral is delivered to the fund on the next business day. The lending agent provides the fund with indemnification against Borrower default. In the event of Borrower default, the lending agent will, for the benefit of the fund, either purchase securities identical to those loaned or, when such purchase is commercially impracticable, pay the fund the market value of the loaned securities. In return, the lending agent assumes the fund’s rights to the related collateral. If the collateral value is less than the cost to purchase identical securities, the lending agent is responsible for the shortfall, but only to the extent that such shortfall is not due to a decline in collateral value resulting from collateral reinvestment for which the fund bears the risk of loss. At period end, the fund had investment securities on loan, all of which were classified as equity securities in the fund’s Portfolio of Investments, with a fair value of $61,792,912. The fair value of the fund’s investment securities on loan and a related liability of $45,627,434 for cash collateral received on securities loaned are both presented gross in the Statement of Assets and Liabilities. Additionally, these loans were collateralized by U.S. Treasury Obligations of $18,388,141 held by the lending agent. The collateral on securities loaned exceeded the value of securities on loan at period end. The liability for cash collateral for securities loaned is carried at fair value, which is categorized as level 2 within the fair value hierarchy. A portion of the income generated upon investment of the collateral is remitted to the Borrowers, and the remainder is allocated between the fund and the lending agent. On loans collateralized by U.S. Treasury and/or federal agency obligations, a fee is received from the Borrower, and is allocated between the fund and the lending agent. Income from securities lending is separately reported in the Statement of Operations. The dividend and interest income earned on the securities loaned is accounted for in the same manner as other dividend and interest income.
Indemnifications– Under the fund’s organizational documents, its officers and Trustees may be indemnified against certain liabilities and expenses arising out of the performance of their duties to the fund. Additionally, in the normal course of business, the fund enters into agreements with service providers that may contain indemnification clauses. The fund’s maximum exposure under these agreements is unknown as this would involve future claims that may be made against the fund that have not yet occurred.
31
Notes to Financial Statements – continued
Investment Transactions and Income– Investment transactions are recorded on the trade date. Interest income is recorded on the accrual basis. All premium and discount is amortized or accreted for financial statement purposes in accordance with U.S. generally accepted accounting principles. Dividends received in cash are recorded on theex-dividend date. Certain dividends from foreign securities will be recorded when the fund is informed of the dividend if such information is obtained subsequent to theex-dividend date. Dividend payments received in additional securities are recorded on theex-dividend date in an amount equal to the value of the security on such date.
The fund may receive proceeds from litigation settlements. Any proceeds received from litigation involving portfolio holdings are reflected in the Statement of Operations in realized gain/loss if the security has been disposed of by the fund or in unrealized gain/loss if the security is still held by the fund. Any other proceeds from litigation not related to portfolio holdings are reflected as other income in the Statement of Operations.
Fees Paid Indirectly– The fund’s custody fee may be reduced by a credit earned under an arrangement that measures the value of U.S. dollars deposited with the custodian by the fund. The amount of the credit, for the year ended October 31, 2019, is shown as a reduction of total expenses in the Statement of Operations.
Tax Matters and Distributions– The fund intends to qualify as a regulated investment company, as defined under Subchapter M of the Internal Revenue Code, and to distribute all of its taxable income, including realized capital gains. As a result, no provision for federal income tax is required. The fund’s federal tax returns, when filed, will remain subject to examination by the Internal Revenue Service for a three year period. Management has analyzed the fund’s tax positions taken on federal and state tax returns for all open tax years and does not believe that there are any uncertain tax positions that require recognition of a tax liability. Foreign taxes, if any, have been accrued by the fund in the accompanying financial statements in accordance with the applicable foreign tax law. Foreign income taxes may be withheld by certain countries in which the fund invests. Additionally, capital gains realized by the fund on securities issued in or by certain foreign countries may be subject to capital gains tax imposed by those countries.
Distributions to shareholders are recorded on theex-dividend date. Income and capital gain distributions are determined in accordance with income tax regulations, which may differ from U.S. generally accepted accounting principles. Certain capital accounts in the financial statements are periodically adjusted for permanent differences in order to reflect their tax character. These adjustments have no impact on net assets or net asset value per share. Temporary differences which arise from recognizing certain items of income, expense, gain or loss in different periods for financial statement and tax purposes will reverse at some time in the future.
Book/tax differences primarily relate to wash sale loss deferrals, derivative transactions, treating a portion of the proceeds from redemptions as a distribution for tax purposes, partnership adjustments, and certain preferred stock treated as debt for tax purposes.
32
Notes to Financial Statements – continued
The tax character of distributions declared to shareholders for the last two fiscal years is as follows:
| | | | | | | | |
| | |
| | | Year ended
10/31/19 | | | Year ended
10/31/18 | |
| Ordinary income (including any short-term capital gains) | | | $72,453,572 | | | | $80,663,527 | |
| Long-term capital gains | | | 50,938,685 | | | | 14,614,516 | |
| | |
| Total distributions | | | $123,392,257 | | | | $95,278,043 | |
The federal tax cost and the tax basis components of distributable earnings were as follows:
| | | | |
| |
| As of 10/31/19 | | | |
| |
| Cost of investments | | | $2,888,565,278 | |
| Gross appreciation | | | 858,525,150 | |
| |
| Gross depreciation | | | (95,240,946 | ) |
| Net unrealized appreciation (depreciation) | | | $763,284,204 | |
| |
| Undistributed ordinary income | | | 14,026,323 | |
| Undistributed long-term capital gain | | | 147,592,733 | |
| Other temporary differences | | | 88,732,682 | |
Multiple Classes of Shares of Beneficial Interest– The fund offers multiple classes of shares, which differ in their respective distribution and service fees. The fund’s income, realized and unrealized gain (loss), and common expenses are allocated to shareholders based on the daily net assets of each class. Dividends are declared separately for each class. Differences in per share dividend rates are generally due to differences in separate class expenses. Class B shares will convert to Class A shares approximately eight years after purchase. Class C shares will convert to Class A shares
approximately ten years after purchase. The fund’s distributions declared to shareholders as reported in the Statements of Changes in Net Assets are presented by class as follows:
| | | | | | | | |
| | |
| | | Year
ended
10/31/19 | | | Year
ended
10/31/18 | |
| Class A | | | $68,888,762 | | | | $51,620,326 | |
| Class B | | | 3,478,223 | | | | 2,810,443 | |
| Class C | | | 13,183,028 | | | | 11,146,202 | |
| Class I | | | 25,710,076 | | | | 19,407,196 | |
| Class R1 | | | 208,534 | | | | 148,512 | |
| Class R2 | | | 2,094,107 | | | | 1,759,166 | |
| Class R3 | | | 3,274,915 | | | | 2,397,426 | |
| Class R4 | | | 2,009,776 | | | | 2,008,311 | |
| Class R6 | | | 4,544,836 | | | | 3,980,461 | |
| Total | | | $123,392,257 | | | | $95,278,043 | |
33
Notes to Financial Statements – continued
(3) Transactions with Affiliates
Investment Adviser– The fund has an investment advisory agreement with MFS to provide overall investment management and related administrative services and facilities to the fund. The management fee is computed daily and paid monthly at the following annual rates based on the fund’s average daily net assets:
| | | | |
| Up to $3 billion | | | 0.60 | % |
| In excess of $3 billion and up to $10 billion | | | 0.55 | % |
| In excess of $10 billion | | | 0.50 | % |
MFS has agreed in writing to reduce its management fee by a specified amount if certain MFS mutual fund assets exceed thresholds agreed to by MFS and the fund’s Board of Trustees. For the year ended October 31, 2019, this management fee reduction amounted to $317,404, which is included in the reduction of total expenses in the Statement of Operations. The management fee incurred for the year ended October 31, 2019 was equivalent to an annual effective rate of 0.59% of the fund’s average daily net assets.
Distributor– MFS Fund Distributors, Inc. (MFD), a wholly-owned subsidiary of MFS, as distributor, received $236,213 for the year ended October 31, 2019, as its portion of the initial sales charge on sales of Class A shares of the fund.
The Board of Trustees has adopted a distribution plan for certain share classes pursuant to Rule12b-1 of the Investment Company Act of 1940.
The fund’s distribution plan provides that the fund will pay MFD for services provided by MFD and financial intermediaries in connection with the distribution and servicing of certain share classes. One component of the plan is a distribution fee paid to MFD and another component of the plan is a service fee paid to MFD. MFD may subsequently pay all, or a portion, of the distribution and/or service fees to financial intermediaries.
Distribution Plan Fee Table:
| | | | | | | | | | | | | | | | | | | | |
| | | | | |
| | | Distribution
Fee Rate (d) | | | Service
Fee Rate (d) | | | Total
Distribution
Plan (d) | | | Annual
Effective
Rate (e) | | | Distribution
and Service
Fee | |
| Class A | | | — | | | | 0.25% | | | | 0.25% | | | | 0.25% | | | | $4,520,331 | |
| Class B | | | 0.75% | | | | 0.25% | | | | 1.00% | | | | 1.00% | | | | 1,088,755 | |
| Class C | | | 0.75% | | | | 0.25% | | | | 1.00% | | | | 1.00% | | | | 4,202,267 | |
| Class R1 | | | 0.75% | | | | 0.25% | | | | 1.00% | | | | 1.00% | | | | 66,781 | |
| Class R2 | | | 0.25% | | | | 0.25% | | | | 0.50% | | | | 0.50% | | | | 288,345 | |
| Class R3 | | | — | | | | 0.25% | | | | 0.25% | | | | 0.25% | | | | 194,408 | |
| Total Distribution and Service Fees | | | | | | | | | | | | $10,360,887 | |
| (d) | In accordance with the distribution plan for certain classes, the fund pays distribution and/or service fees equal to these annual percentage rates of each class’s average daily net assets. The distribution and service fee rates disclosed by class represent the current rates in effect at the end of the reporting period. Any rate changes, if applicable, are detailed below. |
| (e) | The annual effective rates represent actual fees incurred under the distribution plan for the year ended October 31, 2019 based on each class’s average daily net assets. MFD has voluntarily agreed to rebate a portion of each class’s 0.25% service fee attributable to accounts for which MFD retains the 0.25% service fee except for accounts attributable to MFS or its affiliates’ seed money. For the year ended October 31, 2019, this rebate amounted to |
34
Notes to Financial Statements – continued
| | $60,100, $799, $437, $7, $242, and $97 for Class A, Class B, Class C, Class R1, Class R2, and Class R3, respectively, and is included in the reduction of total expenses in the Statement of Operations. |
Certain Class A shares are subject to a contingent deferred sales charge (CDSC) in the event of a shareholder redemption within 18 months of purchase. Class B shares are subject to a CDSC in the event of a shareholder redemption within six years of purchase. Class C shares are subject to a CDSC in the event of a shareholder redemption within 12 months of purchase. All contingent deferred sales charges are paid to MFD and during the year ended October 31, 2019, were as follows:
| | | | |
| |
| | | Amount | |
| Class A | | | $1,979 | |
| Class B | | | 91,179 | |
| Class C | | | 8,680 | |
Shareholder Servicing Agent– MFS Service Center, Inc. (MFSC), a wholly-owned subsidiary of MFS, receives a fee from the fund for its services as shareholder servicing agent calculated as a percentage of the average daily net assets of the fund as determined periodically under the supervision of the fund’s Board of Trustees. For the year ended October 31, 2019, the fee was $421,390, which equated to 0.0129% annually of the fund’s average daily net assets. MFSC also receives payment from the fund forout-of-pocket expenses,sub-accounting and other shareholder servicing costs which may be paid to affiliated and unaffiliated service providers. Class R6 shares do not incursub-accounting fees. For the year ended October 31, 2019, theseout-of-pocket expenses,sub-accounting and other shareholder servicing costs amounted to $3,071,771.
Administrator– MFS provides certain financial, legal, shareholder communications, compliance, and other administrative services to the fund. Under an administrative services agreement, the fund reimburses MFS the costs incurred to provide these services. The fund is charged an annual fixed amount of $17,500 plus a fee based on average daily net assets. The administrative services fee incurred for the year ended October 31, 2019 was equivalent to an annual effective rate of 0.0137% of the fund’s average daily net assets.
Trustees’ and Officers’ Compensation– The fund pays compensation to independent Trustees in the form of a retainer, attendance fees, and additional compensation to Board and Committee chairpersons. The fund does not pay compensation directly to Trustees or officers of the fund who are also officers of the investment adviser, all of whom receive remuneration from MFS for their services to the fund. Certain officers and Trustees of the fund are officers or directors of MFS, MFD, and MFSC.
Prior to December 31, 2001, the fund had an unfunded defined benefit plan (“DB plan”) for independent Trustees. As of December 31, 2001, the Board took action to terminate the DB plan with respect to then-current and any future independent Trustees, such that the DB plan covers only certain of those former independent Trustees who retired on or before December 31, 2001. The DB plan resulted in a net decrease in pension expense of $1,504 and is included in “Independent Trustees’ compensation” in the Statement of Operations for the year ended October 31, 2019. Effective June 30, 2019, the fund no longer participates in the DB plan.
35
Notes to Financial Statements – continued
Other– This fund and certain other funds managed by MFS (the funds) had entered into a service agreement (the ISO Agreement) which provided for payment of fees solely by the funds to Tarantino LLC in return for the provision of services of an Independent Senior Officer (ISO) for the funds. Frank L. Tarantino served as the ISO and was an officer of the funds and the sole member of Tarantino LLC. Effective June 30, 2019, Mr. Tarantino retired from his position as ISO for the funds, and the ISO Agreement was terminated. For the year ended October 31, 2019, the fee paid by the fund under this agreement was $4,857 and is included in “Miscellaneous” expense in the Statement of Operations. MFS had agreed to bear all expenses associated with office space, other administrative support, and supplies provided to the ISO.
The fund invests in the MFS Institutional Money Market Portfolio which is managed by MFS and seeks current income consistent with preservation of capital and liquidity. This money market fund does not pay a management fee to MFS.
The fund is permitted to engage in purchase and sale transactions with funds and accounts for which MFS serves as investment adviser orsub-adviser (“cross-trades”) pursuant to a policy adopted by the Board of Trustees. This policy has been designed to ensure that cross-trades conducted by the fund comply with Rule17a-7 under the Investment Company Act of 1940. During the year ended October 31, 2019, the fund engaged in purchase and sale transactions pursuant to this policy, which amounted to $6,651,212 and $5,490,935, respectively. The sales transactions resulted in net realized gains (losses) of $1,733,225.
The adviser has voluntarily undertaken to reimburse the fund from its own resources on a quarterly basis for the cost of investment research embedded in the cost of the fund’s securities trades. This agreement may be rescinded at any time. For the year ended October 31, 2019, this reimbursement amounted to $179,366, which is included in “Other” income in the Statement of Operations.
(4) Portfolio Securities
For the year ended October 31, 2019, purchases and sales of investments, other than purchased option transactions and short-term obligations, aggregated $947,282,018 and $1,091,447,459, respectively.
36
Notes to Financial Statements – continued
(5) Shares of Beneficial Interest
The fund’s Declaration of Trust permits the Trustees to issue an unlimited number of full and fractional shares of beneficial interest. Transactions in fund shares were as follows:
| | | | | | | | | | | | | | | | |
| | | Year ended
10/31/19 | | | Year ended
10/31/18 | |
| | | | |
| | | Shares | | | Amount | | | Shares | | | Amount | |
| Shares sold | | | | | | | | | | | | | | | | |
Class A | | | 8,633,077 | | | | $191,155,371 | | | | 9,483,688 | | | | $190,923,340 | |
Class B | | | 142,775 | | | | 2,985,411 | | | | 208,958 | | | | 4,197,865 | |
Class C | | | 977,697 | | | | 21,100,917 | | | | 856,362 | | | | 17,238,952 | |
Class I | | | 7,075,879 | | | | 154,493,253 | | | | 6,668,871 | | | | 135,754,618 | |
Class R1 | | | 41,411 | | | | 886,853 | | | | 59,022 | | | | 1,188,822 | |
Class R2 | | | 555,796 | | | | 12,045,800 | | | | 502,059 | | | | 10,114,933 | |
Class R3 | | | 9,463,796 | | | | 222,522,761 | | | | 611,162 | | | | 12,401,462 | |
Class R4 | | | 493,425 | | | | 10,764,501 | | | | 527,917 | | | | 10,705,921 | |
Class R6 | | | 1,496,541 | | | | 32,536,531 | | | | 1,154,462 | | | | 23,517,533 | |
| | | 28,880,397 | | | | $648,491,398 | | | | 20,072,501 | | | | $406,043,446 | |
| | | |
Shares issued to shareholders in
reinvestment of distributions | | | | | | | | | | | | | |
Class A | | | 3,143,327 | | | | $65,471,621 | | | | 2,421,915 | | | | $48,943,953 | |
Class B | | | 148,824 | | | | 3,035,943 | | | | 121,582 | | | | 2,442,900 | |
Class C | | | 577,719 | | | | 11,793,647 | | | | 501,289 | | | | 10,062,344 | |
Class I | | | 1,059,483 | | | | 22,254,241 | | | | 826,466 | | | | 16,764,866 | |
Class R1 | | | 10,219 | | | | 208,529 | | | | 7,404 | | | | 148,492 | |
Class R2 | | | 97,288 | | | | 2,010,455 | | | | 83,253 | | | | 1,677,013 | |
Class R3 | | | 155,077 | | | | 3,274,136 | | | | 118,753 | | | | 2,397,337 | |
Class R4 | | | 92,312 | | | | 1,924,903 | | | | 94,765 | | | | 1,915,500 | |
Class R6 | | | 167,574 | | | | 3,473,660 | | | | 156,898 | | | | 3,184,085 | |
| | | 5,451,823 | | | | $113,447,135 | | | | 4,332,325 | | | | $87,536,490 | |
| | | | |
| Shares reacquired | | | | | | | | | | | | | | | | |
Class A | | | (13,660,135 | ) | | | $(295,840,095 | ) | | | (22,290,248 | ) | | | $(450,202,107 | ) |
Class B | | | (1,719,037 | ) | | | (37,191,663 | ) | | | (2,338,687 | ) | | | (46,950,692 | ) |
Class C | | | (7,014,134 | ) | | | (154,840,663 | ) | | | (11,577,794 | ) | | | (231,532,275 | ) |
Class I | | | (7,707,892 | ) | | | (168,078,651 | ) | | | (11,591,715 | ) | | | (234,318,774 | ) |
Class R1 | | | (94,469 | ) | | | (2,039,331 | ) | | | (117,933 | ) | | | (2,367,556 | ) |
Class R2 | | | (1,012,700 | ) | | | (21,673,896 | ) | | | (1,537,444 | ) | | | (31,016,403 | ) |
Class R3 | | | (1,342,973 | ) | | | (29,036,185 | ) | | | (1,981,885 | ) | | | (40,147,444 | ) |
Class R4 | | | (877,046 | ) | | | (19,012,426 | ) | | | (2,117,215 | ) | | | (42,896,914 | ) |
Class R6 | | | (3,692,405 | ) | | | (80,290,357 | ) | | | (2,024,550 | ) | | | (41,174,637 | ) |
| | | (37,120,791 | ) | | | $(808,003,267 | ) | | | (55,577,471 | ) | | | $(1,120,606,802 | ) |
37
Notes to Financial Statements – continued
| | | | | | | | | | | | | | | | |
| | | Year ended
10/31/19 | | | Year ended
10/31/18 | |
| | | | |
| | | Shares | | | Amount | | | Shares | | | Amount | |
| Net change | | | | | | | | | | | | | | | | |
Class A | | | (1,883,731 | ) | | | $(39,213,103 | ) | | | (10,384,645 | ) | | | $(210,334,814 | ) |
Class B | | | (1,427,438 | ) | | | (31,170,309 | ) | | | (2,008,147 | ) | | | (40,309,927 | ) |
Class C | | | (5,458,718 | ) | | | (121,946,099 | ) | | | (10,220,143 | ) | | | (204,230,979 | ) |
Class I | | | 427,470 | | | | 8,668,843 | | | | (4,096,378 | ) | | | (81,799,290 | ) |
Class R1 | | | (42,839 | ) | | | (943,949 | ) | | | (51,507 | ) | | | (1,030,242 | ) |
Class R2 | | | (359,616 | ) | | | (7,617,641 | ) | | | (952,132 | ) | | | (19,224,457 | ) |
Class R3 | | | 8,275,900 | | | | 196,760,712 | | | | (1,251,970 | ) | | | (25,348,645 | ) |
Class R4 | | | (291,309 | ) | | | (6,323,022 | ) | | | (1,494,533 | ) | | | (30,275,493 | ) |
Class R6 | | | (2,028,290 | ) | | | (44,280,166 | ) | | | (713,190 | ) | | | (14,473,019 | ) |
| | | (2,788,571 | ) | | | $(46,064,734 | ) | | | (31,172,645 | ) | | | $(627,026,866 | ) |
Class T shares were not publicly available for sale during the period. Please see the fund’s prospectus for details.
Effective June 1, 2019, purchases of the fund’s Class B shares are closed to new and existing investors subject to certain exceptions. Please see the fund’s prospectus for details.
(6) Line of Credit
The fund and certain other funds managed by MFS participate in a $1.25 billion unsecured committed line of credit, subject to a $1 billion sublimit, provided by a syndicate of banks under a credit agreement. Borrowings may be made for temporary financing needs. Interest is charged to each fund, based on its borrowings, generally at a rate equal to the highest of one month LIBOR, the Federal Funds Effective Rate and the Overnight Bank Funding Rate, plus an agreed upon spread. A commitment fee, based on the average daily, unused portion of the committed line of credit, is allocated among the participating funds. In addition, the fund and other funds managed by MFS have established unsecured uncommitted borrowing arrangements with certain banks for temporary financing needs. Interest is charged to each fund, based on its borrowings, at rates equal to customary reference rates plus an agreed upon spread. For the year ended October 31, 2019, the fund’s commitment fee and interest expense were $18,651 and $0, respectively, and are included in “Miscellaneous” expense in the Statement of Operations.
38
Notes to Financial Statements – continued
(7) Investments in Affiliated Issuers
An affiliated issuer may be considered one in which the fund owns 5% or more of the outstanding voting securities, or a company which is under common control. For the purposes of this report, the following were affiliated issuers:
| | | | | | | | | | | | | | | | | | | | | | | | |
| | | | | | |
| Affiliated Issuers | | Beginning
Value | | | Purchases | | | Sales
Proceeds | | | Realized
Gain
(Loss) | | | Change in
Unrealized
Appreciation or
Depreciation | | | Ending
Value | |
| MFS Institutional Money Market Portfolio | | | $63,836,853 | | | | $661,623,329 | | | | $675,383,339 | | | | $17,730 | | | | $7,022 | | | | $50,101,595 | |
| | | | | | |
| Affiliated Issuers | | | | | | | | | | | | | | Dividend
Income | | | Capital Gain
Distributions | |
| MFS Institutional Money Market Portfolio | | | | | | | | | | | | $1,897,577 | | | | $— | |
39
REPORT OF INDEPENDENT REGISTERED PUBLIC ACCOUNTING FIRM
To the Shareholders of MFS Utilities Fund and the Board of Trustees of MFS Series Trust VI
Opinion on the Financial Statements
We have audited the accompanying statement of assets and liabilities of MFS Utilities Fund (the “Fund”) (one of the funds constituting MFS Series Trust VI (the “Trust”)), including the portfolio of investments, as of October 31, 2019,and the related statement of operations for the year then ended, the statements of changes in net assets for each of the two years in the period then ended, the financial highlights for each of the five years in the period then ended and the related notes (collectively referred to as the “financial statements”). In our opinion, the financial statements present fairly, in all material respects, the financial position of the Fund (one of the funds constituting MFS Series Trust VI) at October 31, 2019, the results of its operations for the year then ended, the changes in its net assets for each of the two years in the period then ended and its financial highlights for each of the five years in the period then ended, in conformity with U.S. generally accepted accounting principles.
Basis for Opinion
These financial statements are the responsibility of the Trust’s management. Our responsibility is to express an opinion on the Fund’s financial statements based on our audits. We are a public accounting firm registered with the Public Company Accounting Oversight Board (United States) (“PCAOB”) and are required to be independent with respect to the Trust in accordance with the U.S. federal securities laws and the applicable rules and regulations of the Securities and Exchange Commission and the PCAOB.
We conducted our audits in accordance with the standards of the PCAOB. Those standards require that we plan and perform the audit to obtain reasonable assurance about whether the financial statements are free of material misstatement, whether due to error or fraud. The Trust is not required to have, nor were we engaged to perform, an audit of the Trust’s internal control over financial reporting. As part of our audits, we are required to obtain an understanding of internal control over financial reporting but not for the purpose of expressing an opinion on the effectiveness of the Trust’s internal control over financial reporting. Accordingly, we express no such opinion.
Our audits included performing procedures to assess the risks of material misstatement of the financial statements, whether due to error or fraud, and performing procedures that respond to those risks. Such procedures included examining, on a test basis, evidence regarding the amounts and disclosures in the financial statements. Our procedures included confirmation of securities owned as of October 31, 2019,by correspondence with the custodian andothers or by other appropriate auditing procedures where replies from others were not received. Our audits also included
40
Report of Independent Registered Public Accounting Firm – continued
evaluating the accounting principles used and significant estimates made by management, as well as evaluating the overall presentation of the financial statements. We believe that our audits provide a reasonable basis for our opinion.

We have served as the auditor of one or more MFS investment companies since 1993.
Boston, Massachusetts
December 16, 2019
41
TRUSTEES AND OFFICERS — IDENTIFICATION AND BACKGROUND
The Trustees and Officers of the Trust, as of December 1, 2019, are listed below, together with their principal occupations during the past five years. (Their titles may have varied during that period.) The address of each Trustee and Officer is 111 Huntington Avenue, Boston, Massachusetts 02199-7618.
| | | | | | | | | | |
Name, Age | | Position(s)
Held with Fund | | Trustee/Officer Since (h) | | Number of
MFS Funds
overseen
by the
Trustee | | Principal Occupations During the Past Five Years | | Other Directorships
During the Past
Five Years (j) |
| INTERESTED TRUSTEES |
Robert J. Manning (k)
(age 56) | | Trustee | | February 2004 | | 133 | | Massachusetts Financial Services Company, Executive Chairman (since January 2017); Director; Chairman of the Board; Chief Executive Officer (until 2015);Co-Chief Executive Officer (2015-2016) | | N/A |
| | | | | |
Robin A. Stelmach (k) (age 58) | | Trustee | | January 2014 | | 133 | | Massachusetts Financial Services Company, Vice Chair (since January 2017); Chief Operating Officer and Executive Vice President (until January 2017) | | N/A |
| INDEPENDENT TRUSTEES |
John P. Kavanaugh (age 65) | | Trustee and Chair of Trustees | | January 2009 | | 133 | | Private investor | | N/A |
| | | | | |
Steven E. Buller (age 68) | | Trustee | | February 2014 | | 133 | | Financial Accounting Standards Advisory Council, Chairman (2014-2015); Public Company Accounting Oversight Board, Standing Advisory Group, Member (until 2014); BlackRock, Inc. (investment management), Managing Director (until 2014), BlackRock Finco UK (investment management), Director (until 2014) | | N/A |
42
Trustees and Officers – continued
| | | | | | | | | | |
Name, Age | | Position(s)
Held with Fund | | Trustee/Officer Since (h) | | Number of
MFS Funds
overseen
by the
Trustee | | Principal Occupations During the Past Five Years | | Other Directorships
During the Past
Five Years (j) |
John A. Caroselli (age 65) | | Trustee | | March 2017 | | 133 | | JC Global Advisors, LLC (management consulting), President (since 2015); First Capital Corporation (commercial finance), Executive Vice President (until 2015) | | N/A |
| | | | | |
Maureen R. Goldfarb (age 64) | | Trustee | | January 2009 | | 133 | | Private investor | | N/A |
| | | | | |
Michael Hegarty* (age 74) | | Trustee | | December 2004 | | 133 | | Private investor | | Rouse Properties Inc., Director (until 2016); Capmark Financial Group Inc., Director (until 2015) |
| | | | | |
Peter D. Jones (age 64) | | Trustee | | January 2019 | | 133 | | Franklin Templeton Distributors, Inc. (investment management), President (until 2015); Franklin Templeton Institutional, LLC (investment management), Chairman (until 2015) | | N/A |
| | | | | |
James W. Kilman, Jr. (age 58) | | Trustee | | January 2019 | | 133 | | Burford Capital Limited (finance and investment management), Chief Financial Officer (since 2019); KielStrand Capital LLC (family office and merchant bank), Chief Executive Officer (since 2016); Morgan Stanley & Co. (financial services), Vice Chairman of Investment Banking,Co-Head of Diversified Financials Coverage – Financial Institutions Investment Banking Group (until 2016) | | Alpha-En Corporation, Director (since 2016) |
43
Trustees and Officers – continued
| | | | | | | | | | |
Name, Age | | Position(s)
Held with Fund | | Trustee/Officer Since (h) | | Number of
MFS Funds
overseen
by the
Trustee | | Principal Occupations During the Past Five Years | | Other Directorships
During the Past
Five Years (j) |
Clarence Otis, Jr. (age 63) | | Trustee | | March 2017 | | 133 | | Darden Restaurants, Inc., Chief Executive Officer (until 2014) | | VF Corporation, Director; Verizon Communications, Inc., Director; The Travelers Companies, Director; Federal Reserve Bank of Atlanta, Director (until 2015) |
| | | | | |
Maryanne L. Roepke (age 63) | | Trustee | | May 2014 | | 133 | | American Century Investments (investment management), Senior Vice President and Chief Compliance Officer (until 2014) | | N/A |
| | | | | |
Laurie J. Thomsen (age 62) | | Trustee | | March 2005 | | 133 | | Private investor | | The Travelers Companies, Director; Dycom Industries, Inc., Director (since 2015) |
| | | | | | | | |
Name, Age | | Position(s) Held with Fund | | Trustee/Officer
Since (h) | | Number of
MFS Funds
for which
the Person is an Officer | | Principal
Occupations During the Past Five Years |
| OFFICERS | | | | | | | | |
Christopher R. Bohane (k) (age 45) | | Assistant Secretary and Assistant Clerk | | July 2005 | | 133 | | Massachusetts Financial Services Company, Vice President and Assistant General Counsel |
| | | | |
Kino Clark (k) (age 51) | | Assistant Treasurer | | January 2012 | | 133 | | Massachusetts Financial Services Company, Vice President |
| | | | |
John W. Clark, Jr. (k) (age 52) | | Assistant Treasurer | | April 2017 | | 133 | | Massachusetts Financial Services Company, Vice President (since March 2017); Deutsche Bank (financial services), Department Head – Treasurer’s Office (until February 2017) |
44
Trustees and Officers – continued
| | | | | | | | |
Name, Age | | Position(s) Held with Fund | | Trustee/Officer
Since (h) | | Number of
MFS Funds
for which
the Person is an Officer | | Principal
Occupations During the Past Five Years |
Thomas H. Connors (k) (age 60) | | Assistant Secretary and Assistant Clerk | | September 2012 | | 133 | | Massachusetts Financial Services Company, Vice President and Senior Counsel |
| | | | |
David L. DiLorenzo (k) (age 51) | | President | | July 2005 | | 133 | | Massachusetts Financial Services Company, Senior Vice President |
| | | | |
Heidi W. Hardin (k) (age 52) | | Secretary and Clerk | | April 2017 | | 133 | | Massachusetts Financial Services Company, Executive Vice President and General Counsel (since March 2017); Harris Associates (investment management), General Counsel (from September 2015 to January 2017); Janus Capital Management LLC (investment management), Senior Vice President and General Counsel (until September 2015) |
| | | | |
Brian E. Langenfeld (k) (age 46) | | Assistant Secretary and Assistant Clerk | | June 2006 | | 133 | | Massachusetts Financial Services Company, Vice President and Senior Counsel |
| | | | |
Amanda S. Mooradian (k) (age 40) | | Assistant Secretary and Assistant Clerk | | September 2018 | | 133 | | Massachusetts Financial Services Company, Assistant Vice President and Counsel |
| | | | |
Susan A. Pereira (k) (age 49) | | Assistant Secretary and Assistant Clerk | | July 2005 | | 133 | | Massachusetts Financial Services Company, Vice President and Assistant General Counsel |
| | | | |
Kasey L. Phillips (k) (age 48) | | Assistant Treasurer | | September 2012 | | 133 | | Massachusetts Financial Services Company, Vice President |
| | | | |
Matthew A. Stowe (k) (age 45) | | Assistant Secretary and Assistant Clerk | | October 2014 | | 133 | | Massachusetts Financial Services Company, Vice President and Assistant General Counsel |
| | | | |
Martin J. Wolin (k) (age 52) | | Chief Compliance Officer | | July 2015 | | 133 | | Massachusetts Financial Services Company, Senior Vice President and Chief Compliance Officer (since July 2015); Mercer (financial service provider), Chief Risk and Compliance Officer, North America and Latin America (until June 2015) |
45
Trustees and Officers – continued
| | | | | | | | |
Name, Age | | Position(s) Held with Fund | | Trustee/Officer
Since (h) | | Number of
MFS Funds
for which
the Person is an Officer | | Principal
Occupations During the Past Five Years |
James O. Yost (k) (age 59) | | Treasurer | | September 1990 | | 133 | | Massachusetts Financial Services Company, Senior Vice President |
| (h) | Date first appointed to serve as Trustee/officer of an MFS Fund. Each Trustee has served continuously since appointment unless indicated otherwise. For the period from December 15, 2004 until February 22, 2005, Mr. Manning served as Advisory Trustee. From January 2012 through December 2016, Messrs. DiLorenzo and Yost served as Treasurer and Deputy Treasurer of the Funds, respectively. |
| (j) | Directorships or trusteeships of companies required to report to the Securities and Exchange Commission (i.e., “public companies”). |
| (k) | “Interested person” of the Trust within the meaning of the Investment Company Act of 1940 (referred to as the 1940 Act), which is the principal federal law governing investment companies like the fund, as a result of a position with MFS. The address of MFS is 111 Huntington Avenue, Boston, Massachusetts 02199-7618. |
| * | As of December 31, 2019, Mr. Hegarty will retire as Trustee. |
Each Trustee (other than Messrs. Jones and Kilman) has been elected by shareholders and each Trustee and Officer holds office until his or her successor is chosen and qualified or until his or her earlier death, resignation, retirement or removal. Messrs. Jones and Kilman became Trustees of the Funds on January 1, 2019. The Trust does not hold annual meetings for the purpose of electing Trustees, and Trustees are not elected for fixed terms. Under the terms of the Board’s retirement policy, an Independent Trustee shall retire at the end of the calendar year in which he or she reaches the earlier of 75 years of age or 15 years of service on the Board (or, in the case of any Independent Trustee who joined the Board prior to 2015, 20 years of service on the Board).
Messrs. Buller, Hegarty, Kilman and Otis and Ms. Roepke are members of the Trust’s Audit Committee. As of December 31, 2019, Mr. Hegarty will retire as Trustee and will no longer be a member of the Trust’s Audit Committee.
Each of the Interested Trustees and certain Officers hold comparable officer positions with certain affiliates of MFS.
The Statement of Additional Information for a Fund includes further information about the Trustees and is available without charge upon request by calling1-800-225-2606.
| | |
| Investment Adviser | | Custodian |
Massachusetts Financial Services Company
111 Huntington Avenue Boston, MA 02199-7618 | | JPMorgan Chase Bank, NA 4 Metrotech Center New York, NY 11245 |
| Distributor | | Independent Registered Public Accounting Firm |
MFS Fund Distributors, Inc.
111 Huntington Avenue Boston, MA 02199-7618 | | Ernst & Young LLP 200 Clarendon Street Boston, MA 02116 |
| Portfolio Manager(s) | | |
Claud Davis J. Scott Walker | | |
46
BOARD REVIEW OF INVESTMENT ADVISORY AGREEMENT
The Investment Company Act of 1940 requires that both the full Board of Trustees and a majority of thenon-interested (“independent”) Trustees, voting separately, annually approve the continuation of the Fund’s investment advisory agreement with MFS. The Trustees consider matters bearing on the Fund and its advisory arrangements at their meetings throughout the year, including a review of performance data at each regular meeting. In addition, the independent Trustees met several times over the course of three months beginning in May and ending in July, 2019 (“contract review meetings”) for the specific purpose of considering whether to approve the continuation of the investment advisory agreement for the Fund and the other investment companies that the Board oversees (the “MFS Funds”). The independent Trustees were assisted in their evaluation of the Fund’s investment advisory agreement by independent legal counsel, from whom they received separate legal advice and with whom they met separately from MFS during various contract review meetings. The independent Trustees were also assisted in this process by the MFS Funds’ Independent Senior Officer, a senior officer appointed by and reporting to the independent Trustees.
In connection with their deliberations regarding the continuation of the investment advisory agreement, the Trustees, including the independent Trustees, considered such information and factors as they believed, in light of the legal advice furnished to them and their own business judgment, to be relevant. The investment advisory agreement for the Fund was considered separately, although the Trustees also took into account the common interests of all MFS Funds in their review. As described below, the Trustees considered the nature, quality, and extent of the various investment advisory, administrative, and shareholder services performed by MFS under the existing investment advisory agreement and other arrangements with the Fund.
In connection with their contract review meetings, the Trustees received and relied upon materials that included, among other items: (i) information provided by Broadridge Financial Solutions, Inc. (“Broadridge”), an independent third party, on the investment performance of the Fund for various time periods ended December 31, 2018 and the investment performance of a group of funds with substantially similar investment classifications/objectives (the “Broadridge performance universe”), (ii) information provided by Broadridge on the Fund’s advisory fees and other expenses and the advisory fees and other expenses of comparable funds identified by Broadridge as well as all other funds in the same investment classification/category (the “Broadridge expense group and universe”), (iii) information provided by MFS on the advisory fees of portfolios of other clients of MFS, including institutional separate accounts and other clients, (iv) information as to whether and to what extent applicable expense waivers, reimbursements or fee “breakpoints” are observed for the Fund, (v) information regarding MFS’ financial results and financial condition, including MFS’ and certain of its affiliates’ estimated profitability from services performed for the Fund and the MFS Funds as a whole, and compared to MFS’ institutional business, (vi) MFS’ views regarding the outlook for the mutual fund industry and the strategic business plans of MFS, (vii) descriptions of various functions performed by MFS for the Funds, such as compliance monitoring and portfolio trading practices, and (viii) information regarding the overall organization of MFS, including information
47
Board Review of Investment Advisory Agreement – continued
about MFS’ senior management and other personnel providing investment advisory, administrative and other services to the Fund and the other MFS Funds. The comparative performance, fee and expense information prepared and provided by Broadridge was not independently verified and the independent Trustees did not independently verify any information provided to them by MFS.
The Trustees’ conclusion as to the continuation of the investment advisory agreement was based on a comprehensive consideration of all information provided to the Trustees and not the result of any single factor. Some of the factors that figured particularly in the Trustees’ deliberations are described below, although individual Trustees may have evaluated the information presented differently from one another, giving different weights to various factors. It is also important to recognize that the fee arrangements for the Fund and other MFS Funds are the result of years of review and discussion between the independent Trustees and MFS, that certain aspects of such arrangements may receive greater scrutiny in some years than in others, and that the Trustees’ conclusions may be based, in part, on their consideration of these same arrangements during the course of the year and in prior years.
Based on information provided by Broadridge and MFS, the Trustees reviewed the Fund’s total return investment performance as well as the Broadridge performance universe over various time periods. The Trustees placed particular emphasis on the total return performance of the Fund’s Class A shares in comparison to the performance of funds in its Broadridge performance universe over the five-year period ended December 31, 2018, which the Trustees believed was a long enough period to reflect differing market conditions. The total return performance of the Fund’s Class A shares was in the 5th quintile relative to the other funds in the universe for this five-year period (the 1st quintile being the best performers and the 5th quintile being the worst performers). The total return performance of the Fund’s Class A shares was in the 4th quintile for each of theone- and three-year periods ended December 31, 2018 relative to the Broadridge performance universe. Because of the passage of time, these performance results may differ from the performance results for more recent periods, including those shown elsewhere in this report.
The Trustees expressed continued concern to MFS about the substandard investment performance of the Fund. In the course of their deliberations, the Trustees took into account information provided by MFS in connection with the contract review meetings, as well as during investment review meetings conducted with portfolio management personnel during the course of the year, as to MFS’ efforts to improve the Fund’s performance. In addition, the Trustees requested that they receive a separate update on the Fund’s performance at each of their regular meetings. After reviewing these and related factors, the Trustees concluded, within the context of their overall conclusions regarding the investment advisory agreement, that MFS’ responses and efforts and plans to improve investment performance were sufficient to support approval of the continuance of the investment advisory agreement for an additionalone-year period, but that they would continue to closely monitor the performance of the Fund.
In assessing the reasonableness of the Fund’s advisory fee, the Trustees considered, among other information, the Fund’s advisory fee and the total expense ratio of the Fund’s Class A shares as a percentage of average daily net assets and the advisory fee
48
Board Review of Investment Advisory Agreement – continued
and total expense ratios of the Broadridge expense group based on information provided by Broadridge. The Trustees considered that, according to the data provided by Broadridge (which takes into account any fee reductions or expense limitations that were in effect during the Fund’s last fiscal year), the Fund’s effective advisory fee rate was approximately at the Broadridge expense group median and the Fund’s total expense ratio was lower than the Broadridge expense group median.
The Trustees also considered the advisory fees charged by MFS to any institutional separate accounts advised by MFS (“separate accounts”) and unaffiliated investment companies for which MFS serves as subadviser (“subadvised funds”) that have comparable investment strategies to the Fund, if any. In comparing these fees, the Trustees considered information provided by MFS as to the generally broader scope of services provided by MFS to the Fund, as well as the more extensive regulatory burdens imposed on MFS in managing the Fund, in comparison to separate accounts and subadvised funds. The Trustees also considered the higher demands placed on MFS’ investment personnel and trading infrastructure as a result of the daily cashin-flows andout-flows of the Fund in comparison to separate accounts.
The Trustees also considered whether the Fund may benefit from any economies of scale in the management of the Fund in the event of growth in assets of the Fund and/or growth in assets of the MFS Funds as a whole. They noted that the Fund’s advisory fee rate schedule is subject to contractual breakpoints that reduce the Fund’s advisory fee rate on average daily net assets over $3 billion and $10 billion. The Trustees also noted that MFS has agreed in writing to waive a portion of the management fees of certain MFS Funds, including the Fund, if the total combined assets of certain funds within the MFS Funds’ complex increase above agreed upon thresholds (the “group fee waiver”), enabling the Fund’s shareholders to share in the benefits from any economies of scale at the complex level. The group fee waiver is reviewed and renewed annually between the Board and MFS. The Trustees concluded that the breakpoints and the group fee waiver were sufficient to allow the Fund to benefit from economies of scale as its assets and overall complex assets grow.
The Trustees also considered information prepared by MFS relating to MFS’ costs and profits with respect to the Fund, the MFS Funds considered as a group, and other investment companies and accounts advised by MFS, as well as MFS’ methodologies used to determine and allocate its costs to the MFS Funds, the Fund and other accounts and products for purposes of estimating profitability.
After reviewing these and other factors described herein, the Trustees concluded, within the context of their overall conclusions regarding the investment advisory agreement, that the advisory fees charged to the Fund represent reasonable compensation in light of the services being provided by MFS to the Fund.
In addition, the Trustees considered MFS’ resources and related efforts to continue to retain, attract and motivate capable personnel to serve the Fund. The Trustees also considered current and developing conditions in the financial services industry, including the presence of large and well-capitalized companies which are spending, and appear to be prepared to continue to spend, substantial sums to engage personnel and to provide services to competing investment companies. In this regard, the Trustees also considered the financial resources of MFS and its ultimate parent, Sun Life
49
Board Review of Investment Advisory Agreement – continued
Financial Inc. The Trustees also considered the advantages and possible disadvantages to the Fund of having an adviser that also serves other investment companies as well as other accounts.
The Trustees also considered the nature, quality, cost, and extent of administrative, transfer agency, and distribution services provided to the Fund by MFS and its affiliates under agreements and plans other than the investment advisory agreement, including any12b-1 fees the Fund pays to MFS Fund Distributors, Inc., an affiliate of MFS. The Trustees also considered the nature, extent and quality of certain other services MFS performs or arranges for on the Fund’s behalf, which may include securities lending programs, directed expense payment programs, class action recovery programs, and MFS’ interaction with third-party service providers, principally custodians andsub-custodians. The Trustees concluded that the variousnon-advisory services provided by MFS and its affiliates on behalf of the Fund were satisfactory.
The Trustees consideredso-called“fall-out benefits” to MFS such as reputational value derived from serving as investment manager to the MFS Funds. The Trustees also considered that, effective January 3, 2018, MFS had discontinued its historic practice of obtaining investment research from portfolio brokerage commissions paid by certain MFS Funds and would thereafter directly pay for or voluntarily reimburse a Fund, if applicable, for the costs of external research acquired through the use of the Fund’s portfolio brokerage commissions.
Based on their evaluation of factors that they deemed to be material, including those factors described above, the Board of Trustees, including the independent Trustees, concluded that the Fund’s investment advisory agreement with MFS should be continued for an additionalone-year period, commencing August 1, 2019.
50
PROXY VOTING POLICIES AND INFORMATION
MFS votes proxies on behalf of the fund pursuant to proxy voting policies and procedures that are available without charge, upon request, by calling1-800-225-2606, by visitingmfs.com/proxyvoting,or by visiting the SEC’s Web site athttp://www.sec.gov.
Information regarding how the fund voted proxies relating to portfolio securities during the most recent twelve-month period ended June 30 is available by August 31 of each year without charge by visitingmfs.com/proxyvoting,or by visiting the SEC’s Web site athttp://www.sec.gov.
QUARTERLY PORTFOLIO DISCLOSURE
The fund files a complete schedule of portfolio holdings with the SEC for the first and third quarters of each fiscal year on Form N-Q or as an exhibit to its reports onForm N-PORT (for first and third fiscal quarters ending March 31, 2019 or after). The fund’s Form N-Q or Form N-PORT reports are available on the SEC’s website athttp://www.sec.gov.A shareholder can obtain the portfolio holdings report for the first and third quarters of the fund’s fiscal year atmfs.com/openendfunds by choosing the fund’s name and then selecting the “Resources” tab and clicking on “Prospectus and Reports”.
FURTHER INFORMATION
From time to time, MFS may post important information about the fund or the MFS funds on the MFS web site (mfs.com). This information is available athttps://www.mfs.com/en-us/what-we-do/announcements.htmlor atmfs.com/openendfundsby choosing the fund’s name.
INFORMATION ABOUT FUND CONTRACTS AND LEGAL CLAIMS
The fund has entered into contractual arrangements with an investment adviser, administrator, distributor, shareholder servicing agent, 529 program manager (if applicable), and custodian who each provide services to the fund. Unless expressly stated otherwise, shareholders are not parties to, or intended beneficiaries of these contractual arrangements, and these contractual arrangements are not intended to create any shareholder right to enforce them against the service providers or to seek any remedy under them against the service providers, either directly or on behalf of the fund.
Under the Trust’s By-Laws and Declaration of Trust, any claims asserted against or on behalf of the MFS Funds, including claims against Trustees and Officers, must be brought in state and federal courts located within the Commonwealth of Massachusetts.
FEDERAL TAX INFORMATION (unaudited)
The fund will notify shareholders of amounts for use in preparing 2019 income tax forms in January 2020. The following information is provided pursuant to provisions of the Internal Revenue Code.
The fund designates the maximum amount allowable as qualified dividend income eligible to be taxed at the same rate as long-term capital gain.
The fund designates $58,023,000 as capital gain dividends paid during the fiscal year.
For corporate shareholders, 66.04% of the ordinary income dividends paid during the fiscal year qualify for the corporate dividends received deduction.
The fund designates the maximum amount allowable as Section 199A dividends as defined in Proposed Treasury Regulation §1.199A-3(d).
51
rev. 3/16
| | | | |
| | | |
FACTS | | WHAT DOES MFS DO WITH YOUR PERSONAL INFORMATION? | |  |
| | |
| Why? | | Financial companies choose how they share your personal information. Federal law gives consumers the right to limit some but not all sharing. Federal law also requires us to tell you how we collect, share, and protect your personal information. Please read this notice carefully to understand what we do. |
| | |
| What? | | The types of personal information we collect and share depend on the product or service you have with us. This information can include: • Social Security number and account balances • Account transactions and transaction history • Checking account information and wire transfer instructions When you areno longer our customer, we continue to share your information as described in this notice. |
| | |
| How? | | All financial companies need to share customers’ personal information to run their everyday business. In the section below, we list the reasons financial companies can share their customers’ personal information; the reasons MFS chooses to share; and whether you can limit this sharing. |
| | | | |
Reasons we can share your
personal information | | Does MFS
share? | | Can you limit
this sharing? |
For our everyday business purposes – such as to process your transactions, maintain your account(s), respond to court orders and legal investigations, or report to credit bureaus | | Yes | | No |
For our marketing purposes – to offer our products and services to you | | No | | We don’t share |
For joint marketing with other financial companies | | No | | We don’t share |
For our affiliates’ everyday business purposes – information about your transactions and experiences | | No | | We don’t share |
For our affiliates’ everyday business purposes – information about your creditworthiness | | No | | We don’t share |
| For nonaffiliates to market to you | | No | | We don’t share |
| | |
| | |
| Questions? | | Call800-225-2606 or go tomfs.com. |
52
| | |
| Who we are |
| Who is providing this notice? | | MFS Funds, MFS Investment Management, MFS Institutional Advisors, Inc., and MFS Heritage Trust Company. |
| | |
| What we do |
| How does MFS protect my personal information? | | To protect your personal information from unauthorized access and use, we use security measures that comply with federal law. These measures include procedural, electronic, and physical safeguards for the protection of the personal information we collect about you. |
| How does MFS collect my personal information? | | We collect your personal information, for example, when you • open an account or provide account information • direct us to buy securities or direct us to sell your securities • make a wire transfer We also collect your personal information from others, such as credit bureaus, affiliates, or other companies. |
| Why can’t I limit all sharing? | | Federal law gives you the right to limit only • sharing for affiliates’ everyday business purposes – information about your creditworthiness • affiliates from using your information to market to you • sharing for nonaffiliates to market to you State laws and individual companies may give you additional rights to limit sharing. |
| | |
| Definitions |
| Affiliates | | Companies related by common ownership or control. They can be financial and nonfinancial companies. • MFS does not share personal information with affiliates, except for everyday business purposes as described on page one of this notice. |
| Nonaffiliates | | Companies not related by common ownership or control. They can be financial and nonfinancial companies. • MFS does not share with nonaffiliates so they can market to you. |
| Joint marketing | | A formal agreement between nonaffiliated financial companies that together market financial products or services to you. • MFS doesn’t jointly market. |
| | |
| Other important information |
| If you own an MFS product or receive an MFS service in the name of a third party such as a bank or broker-dealer, their privacy policy may apply to you instead of ours. |
53
Save paper with eDelivery.

| MFS® will send you prospectuses, |
reports, and proxies directly viae-mail so you will get information faster with less mailbox clutter.
To sign up:
1. Go to mfs.com.
2. Log in via MFS® Access.
3. Select eDelivery.
If you own your MFS fund shares through a financial institution or a retirement plan, MFS® TALK, MFS® Access, or eDelivery may not be available to you.
CONTACT
WEB SITE
mfs.com
MFS TALK
1-800-637-8255
24 hours a day
ACCOUNT SERVICE AND LITERATURE
Shareholders
1-800-225-2606
Financial advisors
1-800-343-2829
Retirement plan services
1-800-637-1255
MAILING ADDRESS
MFS Service Center, Inc.
P.O. Box 219341
Kansas City, MO 64121-9341
OVERNIGHT MAIL
MFS Service Center, Inc.
Suite 219341
430 W 7th Street
Kansas City, MO 64105-1407
The Registrant has adopted a Code of Ethics (the “Code”) pursuant to Section 406 of the Sarbanes-Oxley Act and as defined in FormN-CSR that applies to the Registrant’s principal executive officer and principal financial and accounting officer. During the period covered by this report, the Registrant has not amended any provision in the Code that relates to an element of the Code’s definition enumerated in paragraph (b) of Item 2 of this FormN-CSR. During the period covered by this report, the Registrant did not grant a waiver, including an implicit waiver, from any provision of the Code.
A copy of the Code is filed as an exhibit to this FormN-CSR.
| ITEM 3. | AUDIT COMMITTEE FINANCIAL EXPERT. |
Messrs. Steven E. Buller, Michael Hegarty, James Kilman, and Clarence Otis, Jr. and Ms. Maryanne L. Roepke, members of the Audit Committee, have been determined by the Board of Trustees in their reasonable business judgment to meet the definition of “audit committee financial expert” as such term is defined in FormN-CSR. In addition, Messrs. Buller, Hegarty, Kilman, and Otis and Ms. Roepke are “independent” members of the Audit Committee (as such term has been defined by the Securities and Exchange Commission in regulations implementing Section 407 of the Sarbanes-Oxley Act of 2002). The Securities and Exchange Commission has stated that the designation of a person as an audit committee financial expert pursuant to this Item 3 on the FormN-CSR does not impose on such a person any duties, obligations or liability that are greater than the duties, obligations or liability imposed on such person as a member of the Audit Committee and the Board of Trustees in the absence of such designation or identification.
As of December 31, 2019, Mr. Hegarty will retire as Trustee and will no longer be a member of the Audit Committee.
| ITEM 4. | PRINCIPAL ACCOUNTANT FEES AND SERVICES. |
Items 4(a) through 4(d) and 4(g):
The Board of Trustees has appointed Ernst & Young LLP (“E&Y”) to serve as independent accountants to the series of the Registrant (each a “Fund” and collectively the “Funds”). The tables below set forth the audit fees billed to each Fund as well as fees fornon-audit services provided to each Fund and/or to each Fund’s investment adviser, Massachusetts Financial Services Company (“MFS”) and to various entities either controlling, controlled by, or under common control with MFS that provide ongoing services to the Fund (“MFS Related Entities”).
For the fiscal years ended October 31, 2019 and 2018, audit fees billed to each Fund by E&Y were as follows:
| | | | | | | | |
| | | Audit Fees | |
| | | 2019 | | | 2018 | |
Fees billed by E&Y: | | | | | | | | |
MFS Global Equity Fund | | | 52,330 | | | | 51,173 | |
MFS Global Total Return Fund | | | 61,056 | | | | 59,702 | |
MFS Utilities Fund | | | 47,862 | | | | 46,804 | |
| | | | | | | | |
Total | | | 161,248 | | | | 157,679 | |
For the fiscal years ended October 31, 2019 and 2018, fees billed by E&Y for audit-related, tax and other services provided to each Fund and for audit-related, tax and other services provided to MFS and MFS Related Entities were as follows:
| | | | | | | | | | | | | | | | | | | | | | | | |
| | | Audit-Related Fees1 | | | Tax Fees2 | | | All Other Fees3 | |
| | | 2019 | | | 2018 | | | 2019 | | | 2018 | | | 2019 | | | 2018 | |
Fees billed by E&Y: | | | | | | | | | | | | | | | | | | | | | | | | |
To MFS Global Equity Fund | | | 0 | | | | 0 | | | | 9,951 | | | | 9,735 | | | | 1,852 | | | | 1,881 | |
To MFS Global Total Return Fund | | | 0 | | | | 0 | | | | 11,319 | | | | 11,071 | | | | 1,591 | | | | 1,603 | |
To MFS Utilities Fund | | | 0 | | | | 0 | | | | 9,176 | | | | 8,977 | | | | 1,918 | | | | 2,182 | |
Total fees billed by E&Y To above Funds | | | 0 | | | | 0 | | | | 30,446 | | | | 29,783 | | | | 5,361 | | | | 5,666 | |
| | | |
| | | Audit-Related Fees1 | | | Tax Fees2 | | | All Other Fees3 | |
| | | 2019 | | | 2018 | | | 2019 | | | 2018 | | | 2019 | | | 2018 | |
Fees billed by E&Y: | | | | | | | | | | | | | | | | | | | | | | | | |
To MFS and MFS Related Entities of MFS Global Equity Fund* | | | 1,679,277 | | | | 1,728,076 | | | | 0 | | | | 0 | | | | 104,750 | | | | 34,150 | |
To MFS and MFS Related Entities of MFS Global Total Return Fund* | | | 1,679,277 | | | | 1,728,076 | | | | 0 | | | | 0 | | | | 104,750 | | | | 34,150 | |
To MFS and MFS Related Entities of MFS Utilities Fund* | | | 1,679,277 | | | | 1,728,076 | | | | 0 | | | | 0 | | | | 104,750 | | | | 34,150 | |
| | | | | | | | |
| | | Aggregate fees for non-audit
services: | |
| | | 2019 | | | 2018 | |
Fees billed by E&Y: | | | | | | | | |
To MFS Global Equity Fund, MFS and MFS Related Entities# | | | 2,021,030 | | | | 1,971,542 | |
To MFS Global TotalReturn Fund, MFS and MFS Related Entities# | | | 2,022,137 | | | | 1,972,600 | |
To MFS Utilities Fund, MFS and MFS Related Entities# | | | 2,020,321 | | | | 1,971,085 | |
| * | This amount reflects the fees billed to MFS and MFS Related Entities fornon-audit services relating directly to the operations and financial reporting of the Fund (portions of which services also related to the operations and financial reporting of other funds within the MFS Funds complex). |
| # | This amount reflects the aggregate fees billed by E&Y fornon-audit services rendered to the Fund and fornon-audit services rendered to MFS and the MFS Related Entities. |
| 1 | The fees included under “Audit-Related Fees” are fees related to assurance and related services that are reasonably related to the performance of the audit or review of financial statements, but not reported under “Audit Fees,” including accounting consultations, agreed-upon procedure reports, attestation reports, comfort letters and internal control reviews. |
| 2 | The fees included under “Tax Fees” are fees associated with tax compliance, tax advice and tax planning, including services relating to the filing or amendment of federal, state or local income tax returns, regulated investment company qualification reviews and tax distribution and analysis. |
| 3 | The fees included under “All Other Fees” are fees for products and services provided by E&Y other than those reported under “Audit Fees,” “Audit-Related Fees” and “Tax Fees,” including fees for services related to review of internal controls and review of Rule38a-1 compliance program. |
Item 4(e)(1):
Set forth below are the policies and procedures established by the Audit Committee of the Board of Trustees relating to thepre-approval of audit andnon-audit related services:
To the extent required by applicable law,pre-approval by the Audit Committee of the Board is needed for all audit and permissiblenon-audit services rendered to the Funds and all permissiblenon-audit services rendered to MFS or MFS Related Entities if the services relate directly to the operations and financial reporting of the Registrant.Pre-approval is currently on anengagement-by-engagement basis. In the eventpre-approval of such services is necessary between regular meetings of the Audit Committee and it is not practical to wait to seekpre-approval at the next regular meeting of the Audit Committee,pre-approval of such services may be referred to the Chair of the Audit Committee for approval; provided that the Chair may notpre-approve any individual engagement for such services exceeding $50,000 or multiple engagements for such services in the aggregate exceeding $100,000 in each period between regular meetings of the Audit Committee. Any engagementpre-approved by the Chair between regular meetings of the Audit Committee shall be presented for ratification by the entire Audit Committee at its next regularly scheduled meeting.
Item 4(e)(2):
None, or 0%, of the services relating to the Audit-Related Fees, Tax Fees and All Other Fees paid by the Fund and MFS and MFS Related Entities relating directly to the operations and financial reporting of the Registrant disclosed above were approved by the audit committee pursuant to paragraphs (c)(7)(i)(C) of Rule2-01 of RegulationS-X (which permits audit committee approval after the start of the engagement with respect to services other than audit, review or attest services, if certain conditions are satisfied).
Item 4(f):
Not applicable.
Item 4(h):
The Registrant’s Audit Committee has considered whether the provision by a Registrant’s independent registered public accounting firm ofnon-audit services to MFS and MFS Related Entities that were notpre-approved by the Committee (because such services did not relate directly to the operations and financial reporting of the Registrant) was compatible with maintaining the independence of the independent registered public accounting firm as the Registrant’s principal auditors.
| ITEM 5. | AUDIT COMMITTEE OF LISTED REGISTRANTS. |
Not applicable to the Registrant.
A schedule of investments of each series of the Registrant is included as part of the report to shareholders of such series under Item 1 of this FormN-CSR.
| ITEM 7. | DISCLOSURE OF PROXY VOTING POLICIES AND PROCEDURES FORCLOSED-END MANAGEMENT INVESTMENT COMPANIES. |
Not applicable to the Registrant.
| ITEM 8. | PORTFOLIO MANAGERS OFCLOSED-END MANAGEMENT INVESTMENT COMPANIES. |
Not applicable to the Registrant.
| ITEM 9. | PURCHASES OF EQUITY SECURITIES BYCLOSED-END MANAGEMENT INVESTMENT COMPANY AND AFFILIATED PURCHASERS. |
Not applicable to the Registrant.
| ITEM 10. | SUBMISSION OF MATTERS TO A VOTE OF SECURITY HOLDERS. |
There were no material changes to the procedures by which shareholders may send recommendations to the Board for nominees to the Registrant’s Board since the Registrant last provided disclosure as to such procedures in response to the requirements of Item 407 (c)(2)(iv) of RegulationS-K or this Item.
| ITEM 11. | CONTROLS AND PROCEDURES. |
| (a) | Based upon their evaluation of the effectiveness of the registrant’s disclosure controls and procedures (as defined in Rule30a-3(c) under the Investment Company Act of 1940 (the “Act”)) as conducted within 90 days of the filing date of this report on FormN-CSR, the registrant’s principal financial officer and principal executive officer have concluded that those disclosure controls and procedures provide reasonable assurance that the material information required to be disclosed by the registrant on this report is recorded, processed, summarized and reported within the time periods specified in the Securities and Exchange Commission’s rules and forms. |
| (b) | There were no changes in the registrant’s internal controls over financial reporting (as defined in Rule30a-3(d) under the Act) that occurred during the period covered by the report that have materially affected, or are reasonably likely to materially affect, the registrant’s internal control over financial reporting. |
| ITEM 12. | DISCLOSURE OF SECURITIES LENDING ACTIVITIES FORCLOSED-END MANAGEMENT INVESTMENT COMPANIES. |
Not applicable to the Registrant.
| | |
| (a) | | (1) Any code of ethics, or amendment thereto, that is the subject of the disclosure required by Item 2, to the extent that the registrant intends to satisfy the Item 2 requirements through filing of an exhibit: Attached hereto asEX-99.COE. |
| |
| | (2) A separate certification for each principal executive officer and principal financial officer of the registrant as required by Rule30a-2(a) under the Act (17 CFR270.30a-2): Attached hereto asEX-99.302CERT. |
| |
| | (3) Any written solicitation to purchase securities under Rule23c-1 under the Act (17 CFR270.23c-1) sent or given during the period covered by the report by or on behalf of the registrant to 10 or more persons. Not applicable. |
| |
| | (4) Change in the registrant’s independent public accountant. Not applicable. |
| |
(b) | | If the report is filed under Section 13(a) or 15(d) of the Exchange Act, provide the certifications required by Rule30a-2(b) under the Act (17 CFR270.30a-2(b)), Rule13a-14(b) or Rule15d-14(b) under the Exchange Act (17 CFR240.13a-14(b) or240.15d-14(b)) and Section 1350 of Chapter 63 of Title 18 of the United States Code (18 U.S.C. 1350) as an exhibit. A certification furnished pursuant to this paragraph will not be deemed “filed” for the purposes of Section 18 of the Exchange Act (15 U.S.C. 78r), or otherwise subject to the liability of that section. Such certification will not be deemed to be incorporated by reference into any filing under the Securities Act of 1933 or the Exchange Act, except to the extent that the registrant specifically incorporates it by reference. Attached hereto asEX-99.906CERT. |
Notice
A copy of the Amended and Restated Declaration of Trust, as amended, of the Registrant is on file with the Secretary of State of The Commonwealth of Massachusetts and notice is hereby given that this instrument is executed on behalf of the Registrant by an officer of the Registrant as an officer and not individually and the obligations of or arising out of this instrument are not binding upon any of the Trustees or shareholders individually, but are binding only upon the assets and property of the respective constituent series of the Registrant.
SIGNATURES
Pursuant to the requirements of the Securities Exchange Act of 1934 and the Investment Company Act of 1940, the registrant has duly caused this report to be signed on its behalf by the undersigned, thereunto duly authorized.
(Registrant): MFS SERIES TRUST VI
| | |
| By (Signature and Title)* | | DAVID L. DILORENZO |
| | David L. DiLorenzo, President |
Date: December 16, 2019
Pursuant to the requirements of the Securities Exchange Act of 1934 and the Investment Company Act of 1940, this report has been signed below by the following persons on behalf of the registrant and in the capacities and on the dates indicated.
| | |
| By (Signature and Title)* | | DAVID L. DILORENZO |
| | David L. DiLorenzo, President (Principal Executive Officer) |
Date: December 16, 2019
| | |
| By (Signature and Title)* | | JAMES O. YOST |
| | James O. Yost, Treasurer (Principal Financial Officer and Accounting Officer) |
Date: December 16, 2019
| * | Print name and title of each signing officer under his or her signature. |