UNITED STATES
SECURITIES AND EXCHANGE COMMISSION
Washington, D.C. 20549
FORM N-CSR
CERTIFIED SHAREHOLDER REPORT OF
REGISTERED MANAGEMENT INVESTMENT COMPANIES
Investment Company Act file number 811-06102
MFS SERIES TRUST VI
(Exact name of registrant as specified in charter)
111 Huntington Avenue, Boston, Massachusetts 02199
(Address of principal executive offices) (Zip code)
Christopher R. Bohane
Massachusetts Financial Services Company
111 Huntington Avenue
Boston, Massachusetts 02199
(Name and address of agents for service)
Registrant’s telephone number, including area code: (617) 954-5000
Date of fiscal year end: October 31
Date of reporting period: October 31, 2021
| ITEM 1. | REPORTS TO STOCKHOLDERS. |
Item 1(a):


| 1 | |
| 2 | |
| 4 | |
| 6 | |
| 9 | |
| 11 | |
| 16 | |
| 18 | |
| 19 | |
| 20 | |
| 26 | |
| 37 | |
| 39 | |
| 44 | |
| 48 | |
| 48 | |
| 48 | |
| 48 | |
| 48 | |
| 50 |
| back cover |


| Thermo Fisher Scientific, Inc. | 3.6% |
| Schneider Electric SE | 3.0% |
| Accenture PLC, “A” | 2.9% |
| Comcast Corp., “A” | 2.8% |
| Medtronic PLC | 2.7% |
| Visa, Inc., “A” | 2.7% |
| Roche Holding AG | 2.5% |
| Nestle S.A. | 2.5% |
| LVMH Moet Hennessy Louis Vuitton SE | 2.4% |
| Diageo PLC | 2.4% |
| Industrials | 20.0% |
| Health Care | 19.9% |
| Information Technology | 15.3% |
| Consumer Staples | 13.6% |
| Financials | 9.4% |
| Consumer Discretionary | 8.4% |
| Communication Services | 6.9% |
| Materials | 6.0% |
| Equity Warrants (o) | 0.0% |
| United States | 56.8% |
| France | 11.2% |
| Switzerland | 8.3% |
| United Kingdom | 6.8% |
| Germany | 3.8% |
| Canada | 3.0% |
| Netherlands | 2.8% |
| Japan | 2.1% |
| Sweden | 1.6% |
| Other Countries | 3.6% |
| United States Dollar | 58.8% |
| Euro | 20.9% |
| Swiss Franc | 8.3% |
| British Pound Sterling | 6.8% |
| Japanese Yen | 2.1% |
| Swedish Krona | 1.6% |
| South Korean Won | 0.8% |
| Danish Krone | 0.5% |
| Mexican Peso | 0.2% |
| (g) | The Global Industry Classification Standard (GICS®) was developed by and/or is the exclusive property of MSCI, Inc. and S&P Global Market Intelligence Inc. (“S&P Global Market Intelligence”). GICS is a service mark of MSCI and S&P Global Market Intelligence and has been licensed for use by MFS. MFS has applied its own internal sector/industry classification methodology for equity securities and non-equity securities that are unclassified by GICS. |
| (o) | Less than 0.1%. |
| (x) | Represents the portfolio’s exposure to issuer countries as a percentage of a portfolio’s net assets. For purposes of this presentation, United States includes Cash & Cash Equivalents and Other. |
| (y) | Represents the portfolio’s exposure to a particular currency as a percentage of a portfolio's net assets. For purposes of this presentation, United States Dollar includes Cash & Cash Equivalents. |
Ryan McAllister and Roger Morley
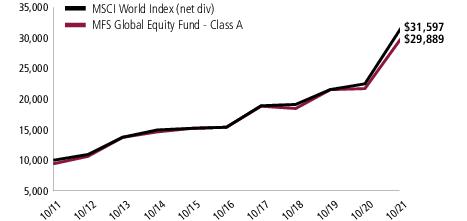
| Share Class | Class Inception Date | 1-yr | 5-yr | 10-yr | Life (t) |
| A | 9/07/93 | 37.58% | 14.17% | 12.23% | N/A |
| B | 12/29/86 | 36.56% | 13.32% | 11.40% | N/A |
| C | 1/03/94 | 36.54% | 13.31% | 11.40% | N/A |
| I | 1/02/97 | 37.91% | 14.45% | 12.51% | N/A |
| R1 | 4/01/05 | 36.57% | 13.31% | 11.40% | N/A |
| R2 | 10/31/03 | 37.22% | 13.88% | 11.96% | N/A |
| R3 | 4/01/05 | 37.60% | 14.17% | 12.23% | N/A |
| R4 | 4/01/05 | 37.94% | 14.45% | 12.51% | N/A |
| R6 | 6/01/12 | 38.06% | 14.56% | N/A | 13.29% |
| MSCI World Index (net div) (f) | 40.42% | 15.45% | 12.19% | N/A |
| A With Initial Sales Charge (5.75%) | 29.67% | 12.82% | 11.57% | N/A |
| B With CDSC (Declining over six years from 4% to 0%) (v) | 32.56% | 13.07% | 11.40% | N/A |
| C With CDSC (1% for 12 months) (v) | 35.54% | 13.31% | 11.40% | N/A |
| (f) | Source: FactSet Research Systems Inc. |
| (t) | For the period from the class inception date through the stated period end (for those share classes with less than 10 years of performance history). No comparative benchmark performance information is provided for “life” periods. (See Notes to Performance Summary.) |
| (v) | Assuming redemption at the end of the applicable period. |
| (e) | Morgan Stanley Capital International (“MSCI”) makes no express or implied warranties or representations and shall have no liability whatsoever with respect to any MSCI data contained herein. The MSCI data may not be further redistributed or used as a basis for other indices or any securities or financial products. This report is not approved, reviewed, or produced by MSCI. |
May 1, 2021 through October 31, 2021
| Share Class | Annualized Expense Ratio | Beginning Account Value 5/01/21 | Ending Account Value 10/31/21 | Expenses Paid During Period (p) 5/01/21-10/31/21 | |
| A | Actual | 1.12% | $1,000.00 | $1,049.22 | $5.78 |
| Hypothetical (h) | 1.12% | $1,000.00 | $1,019.56 | $5.70 | |
| B | Actual | 1.87% | $1,000.00 | $1,045.39 | $9.64 |
| Hypothetical (h) | 1.87% | $1,000.00 | $1,015.78 | $9.50 | |
| C | Actual | 1.87% | $1,000.00 | $1,045.33 | $9.64 |
| Hypothetical (h) | 1.87% | $1,000.00 | $1,015.78 | $9.50 | |
| I | Actual | 0.87% | $1,000.00 | $1,050.70 | $4.50 |
| Hypothetical (h) | 0.87% | $1,000.00 | $1,020.82 | $4.43 | |
| R1 | Actual | 1.87% | $1,000.00 | $1,045.50 | $9.64 |
| Hypothetical (h) | 1.87% | $1,000.00 | $1,015.78 | $9.50 | |
| R2 | Actual | 1.37% | $1,000.00 | $1,047.90 | $7.07 |
| Hypothetical (h) | 1.37% | $1,000.00 | $1,018.30 | $6.97 | |
| R3 | Actual | 1.12% | $1,000.00 | $1,049.41 | $5.79 |
| Hypothetical (h) | 1.12% | $1,000.00 | $1,019.56 | $5.70 | |
| R4 | Actual | 0.87% | $1,000.00 | $1,050.75 | $4.50 |
| Hypothetical (h) | 0.87% | $1,000.00 | $1,020.82 | $4.43 | |
| R6 | Actual | 0.78% | $1,000.00 | $1,051.17 | $4.03 |
| Hypothetical (h) | 0.78% | $1,000.00 | $1,021.27 | $3.97 |
| (h) | 5% class return per year before expenses. |
| (p) | “Expenses Paid During Period” are equal to each class’s annualized expense ratio, as shown above, multiplied by the average account value over the period, multiplied by 184/365 (to reflect the one-half year period). Expenses paid do not include any applicable sales charges (loads). If these transaction costs had been included, your costs would have been higher. |
| Issuer | Shares/Par | Value ($) | ||
| Common Stocks – 99.5% | ||||
| Aerospace & Defense – 3.2% | ||||
| Honeywell International, Inc. | 370,419 | $ 80,981,002 | ||
| MTU Aero Engines Holding AG | 72,156 | 16,044,363 | ||
| Rolls-Royce Holdings PLC (a) | 13,051,354 | 23,548,510 | ||
| $120,573,875 | ||||
| Airlines – 0.8% | ||||
| Aena S.A. (a) | 190,647 | $ 31,217,951 | ||
| Alcoholic Beverages – 5.8% | ||||
| Carlsberg Group | 114,443 | $ 18,878,204 | ||
| Diageo PLC | 1,822,727 | 90,599,988 | ||
| Heineken N.V. | 511,592 | 56,667,982 | ||
| Pernod Ricard S.A. | 247,274 | 56,798,146 | ||
| $222,944,320 | ||||
| Apparel Manufacturers – 4.3% | ||||
| Burberry Group PLC | 888,217 | $ 23,448,333 | ||
| Compagnie Financiere Richemont S.A. | 391,833 | 48,401,390 | ||
| LVMH Moet Hennessy Louis Vuitton SE | 115,977 | 90,791,806 | ||
| $162,641,529 | ||||
| Automotive – 0.6% | ||||
| Aptiv PLC (a) | 127,787 | $ 22,093,094 | ||
| Broadcasting – 2.7% | ||||
| Omnicom Group, Inc. | 115,674 | $ 7,875,086 | ||
| Walt Disney Co. (a) | 386,792 | 65,394,924 | ||
| WPP Group PLC | 2,045,635 | 29,563,288 | ||
| $102,833,298 | ||||
| Brokerage & Asset Managers – 2.0% | ||||
| Charles Schwab Corp. | 738,259 | $ 60,559,386 | ||
| Deutsche Boerse AG | 100,749 | 16,724,495 | ||
| $77,283,881 | ||||
| Business Services – 10.3% | ||||
| Accenture PLC, “A” | 305,225 | $ 109,511,678 | ||
| Adecco S.A. | 227,180 | 11,430,955 | ||
| Brenntag AG | 209,357 | 19,903,453 | ||
| Cognizant Technology Solutions Corp., “A” | 508,510 | 39,709,546 | ||
| Compass Group PLC (a) | 1,170,165 | 24,822,154 | ||
| Equifax, Inc. | 192,997 | 53,543,158 | ||
| Issuer | Shares/Par | Value ($) | ||
| Common Stocks – continued | ||||
| Business Services – continued | ||||
| Fidelity National Information Services, Inc. | 428,037 | $ 47,400,817 | ||
| Fiserv, Inc. (a) | 485,394 | 47,806,455 | ||
| PayPal Holdings, Inc. (a) | 167,708 | 39,007,204 | ||
| $393,135,420 | ||||
| Cable TV – 2.8% | ||||
| Comcast Corp., “A” | 2,095,871 | $ 107,790,646 | ||
| Chemicals – 2.3% | ||||
| 3M Co. | 271,569 | $ 48,523,949 | ||
| PPG Industries, Inc. | 249,325 | 40,034,115 | ||
| $88,558,064 | ||||
| Computer Software – 2.8% | ||||
| Check Point Software Technologies Ltd. (a) | 299,769 | $ 35,852,372 | ||
| Oracle Corp. | 730,820 | 70,114,871 | ||
| $105,967,243 | ||||
| Computer Software - Systems – 1.2% | ||||
| Cisco Systems, Inc. | 275,510 | $ 15,420,295 | ||
| Samsung Electronics Co. Ltd. | 522,249 | 31,288,982 | ||
| $46,709,277 | ||||
| Construction – 0.5% | ||||
| Otis Worldwide Corp. | 239,709 | $ 19,251,030 | ||
| Consumer Products – 4.3% | ||||
| Colgate-Palmolive Co. | 400,286 | $ 30,497,790 | ||
| Essity AB | 1,889,921 | 61,134,147 | ||
| International Flavors & Fragrances, Inc. | 145,361 | 21,433,479 | ||
| Reckitt Benckiser Group PLC | 626,769 | 50,822,560 | ||
| $163,887,976 | ||||
| Electrical Equipment – 4.7% | ||||
| Amphenol Corp., “A” | 303,636 | $ 23,310,136 | ||
| Legrand S.A. | 407,443 | 44,387,427 | ||
| Schneider Electric SE | 655,015 | 112,746,684 | ||
| $180,444,247 | ||||
| Electronics – 1.1% | ||||
| Hoya Corp. | 149,900 | $ 22,051,306 | ||
| Microchip Technology, Inc. | 250,706 | 18,574,807 | ||
| $40,626,113 | ||||
| Issuer | Shares/Par | Value ($) | ||
| Common Stocks – continued | ||||
| Food & Beverages – 4.0% | ||||
| Danone S.A. | 928,170 | $ 60,461,551 | ||
| Nestle S.A. | 711,595 | 93,900,074 | ||
| $154,361,625 | ||||
| Gaming & Lodging – 1.1% | ||||
| Marriott International, Inc., “A” (a) | 144,260 | $ 23,084,485 | ||
| Whitbread PLC (a) | 392,737 | 17,575,604 | ||
| $40,660,089 | ||||
| Insurance – 2.5% | ||||
| Aon PLC | 168,309 | $ 53,845,415 | ||
| Willis Towers Watson PLC | 164,647 | 39,890,675 | ||
| $93,736,090 | ||||
| Internet – 1.1% | ||||
| eBay, Inc. | 541,424 | $ 41,538,049 | ||
| Machinery & Tools – 1.4% | ||||
| Carrier Global Corp. | 205,091 | $ 10,711,903 | ||
| Kubota Corp. | 2,008,500 | 42,820,490 | ||
| $53,532,393 | ||||
| Major Banks – 2.9% | ||||
| Erste Group Bank AG | 282,924 | $ 12,133,931 | ||
| Goldman Sachs Group, Inc. | 157,944 | 65,286,153 | ||
| UBS AG | 1,916,310 | 34,837,243 | ||
| $112,257,327 | ||||
| Medical Equipment – 14.8% | ||||
| Abbott Laboratories | 456,364 | $ 58,820,756 | ||
| Boston Scientific Corp. (a) | 1,173,648 | 50,619,438 | ||
| Cooper Cos., Inc. | 90,466 | 37,717,085 | ||
| EssilorLuxottica | 77,847 | 16,099,413 | ||
| Medtronic PLC | 868,954 | 104,152,826 | ||
| Olympus Corp. | 664,200 | 14,373,093 | ||
| Sonova Holding AG | 33,127 | 13,687,139 | ||
| Stryker Corp. | 246,209 | 65,508,829 | ||
| Thermo Fisher Scientific, Inc. | 217,058 | 137,412,908 | ||
| Waters Corp. (a) | 92,754 | 34,091,733 | ||
| Zimmer Biomet Holdings, Inc. | 216,876 | 31,039,293 | ||
| $563,522,513 | ||||
| Issuer | Shares/Par | Value ($) | ||
| Common Stocks – continued | ||||
| Other Banks & Diversified Financials – 4.6% | ||||
| American Express Co. | 278,535 | $ 48,403,812 | ||
| Grupo Financiero Banorte S.A. de C.V. | 1,250,504 | 7,917,389 | ||
| Julius Baer Group Ltd. | 237,604 | 17,174,129 | ||
| Visa, Inc., “A” | 491,404 | 104,064,625 | ||
| $177,559,955 | ||||
| Pharmaceuticals – 5.0% | ||||
| Bayer AG | 663,632 | $ 37,337,609 | ||
| Merck KGaA | 242,313 | 57,199,244 | ||
| Roche Holding AG | 246,564 | 95,342,927 | ||
| $189,879,780 | ||||
| Printing & Publishing – 0.1% | ||||
| Wolters Kluwer N.V. | 55,190 | $ 5,782,799 | ||
| Railroad & Shipping – 5.3% | ||||
| Canadian National Railway Co. | 578,765 | $ 76,923,656 | ||
| Canadian Pacific Railway Ltd. | 478,350 | 37,024,290 | ||
| Kansas City Southern Co. | 173,683 | 53,885,151 | ||
| Union Pacific Corp. | 141,717 | 34,210,484 | ||
| $202,043,581 | ||||
| Specialty Chemicals – 4.4% | ||||
| Akzo Nobel N.V. | 383,934 | $ 44,125,351 | ||
| L'Air Liquide S.A. | 195,084 | 32,528,587 | ||
| Linde PLC | 225,151 | 72,486,464 | ||
| Linde PLC | 59,441 | 18,973,567 | ||
| $168,113,969 | ||||
| Specialty Stores – 0.4% | ||||
| Hermes International | 8,596 | $ 13,618,626 | ||
| Telecommunications - Wireless – 1.4% | ||||
| Liberty Broadband Corp. (a) | 333,386 | $ 54,158,556 | ||
| Trucking – 1.1% | ||||
| United Parcel Service, Inc., “B” | 197,512 | $ 42,162,887 | ||
| Total Common Stocks (Identified Cost, $1,867,257,147) | $3,798,886,203 | |||
| Issuer | Strike Price | First Exercise | Shares/Par | Value ($) |
| Warrants – 0.0% | ||||
| Apparel Manufacturers – 0.0% | ||||
| Compagnie Financiere Richemont S.A. (1 share for 2 warrants, Expiration 12/04/23) (a) (Identified Cost, $0) | CHF 67.00 | 11/20/23 | 846,954 | $ 610,517 |
| Investment Companies (h) – 0.2% | ||||
| Money Market Funds – 0.2% | ||||
| MFS Institutional Money Market Portfolio, 0.04% (v) (Identified Cost, $7,189,905) | 7,189,905 | $ 7,189,905 | ||
| Other Assets, Less Liabilities – 0.3% | 10,766,422 | |||
| Net Assets – 100.0% | $3,817,453,047 | |||
| (a) | Non-income producing security. | |||
| (h) | An affiliated issuer, which may be considered one in which the fund owns 5% or more of the outstanding voting securities, or a company which is under common control. At period end, the aggregate values of the fund's investments in affiliated issuers and in unaffiliated issuers were $7,189,905 and $3,799,496,720, respectively. | |||
| (v) | Affiliated issuer that is available only to investment companies managed by MFS. The rate quoted for the MFS Institutional Money Market Portfolio is the annualized seven-day yield of the fund at period end. |
| Abbreviations indicate amounts shown in currencies other than the U.S. dollar. All amounts are stated in U.S. dollars unless otherwise indicated. A list of abbreviations is shown below: | |
| CHF | Swiss Franc |
| Assets | |
| Investments in unaffiliated issuers, at value (identified cost, $1,867,257,147) | $3,799,496,720 |
| Investments in affiliated issuers, at value (identified cost, $7,189,905) | 7,189,905 |
| Receivables for | |
| Investments sold | 68,202 |
| Fund shares sold | 4,584,952 |
| Dividends | 10,927,837 |
| Total assets | $3,822,267,616 |
| Liabilities | |
| Payable to custodian | $597 |
| Payables for | |
| Fund shares reacquired | 3,542,672 |
| Payable to affiliates | |
| Investment adviser | 304,845 |
| Administrative services fee | 5,569 |
| Shareholder servicing costs | 683,979 |
| Distribution and service fees | 42,247 |
| Payable for independent Trustees' compensation | 3,773 |
| Accrued expenses and other liabilities | 230,887 |
| Total liabilities | $4,814,569 |
| Net assets | $3,817,453,047 |
| Net assets consist of | |
| Paid-in capital | $1,711,026,260 |
| Total distributable earnings (loss) | 2,106,426,787 |
| Net assets | $3,817,453,047 |
| Shares of beneficial interest outstanding | 61,892,193 |
| Net assets | Shares outstanding | Net asset value per share (a) | |
| Class A | $857,803,582 | 14,119,188 | $60.75 |
| Class B | 15,165,754 | 274,352 | 55.28 |
| Class C | 112,938,812 | 2,147,849 | 52.58 |
| Class I | 1,245,750,162 | 19,902,565 | 62.59 |
| Class R1 | 2,080,810 | 38,537 | 54.00 |
| Class R2 | 36,791,040 | 625,147 | 58.85 |
| Class R3 | 88,285,177 | 1,463,629 | 60.32 |
| Class R4 | 95,163,511 | 1,558,021 | 61.08 |
| Class R6 | 1,363,474,199 | 21,762,905 | 62.65 |
| (a) | Maximum offering price per share was equal to the net asset value per share for all share classes, except for Class A, for which the maximum offering price per share was $64.46 [100 / 94.25 x $60.75]. On sales of $50,000 or more, the maximum offering price of Class A shares is reduced. A contingent deferred sales charge may be imposed on redemptions of Class A, Class B, and Class C shares. Redemption price per share was equal to the net asset value per share for Classes I, R1, R2, R3, R4, and R6. |
| Net investment income (loss) | |
| Income | |
| Dividends | $54,044,899 |
| Income on securities loaned | 36,659 |
| Dividends from affiliated issuers | 9,001 |
| Other | 386 |
| Foreign taxes withheld | (3,510,543) |
| Total investment income | $50,580,402 |
| Expenses | |
| Management fee | $26,773,357 |
| Distribution and service fees | 3,849,859 |
| Shareholder servicing costs | 2,486,493 |
| Administrative services fee | 468,139 |
| Independent Trustees' compensation | 49,645 |
| Custodian fee | 329,790 |
| Shareholder communications | 157,913 |
| Audit and tax fees | 123,489 |
| Legal fees | 19,478 |
| Miscellaneous | 237,674 |
| Total expenses | $34,495,837 |
| Fees paid indirectly | (9) |
| Reduction of expenses by investment adviser and distributor | (438,609) |
| Net expenses | $34,057,219 |
| Net investment income (loss) | $16,523,183 |
| Realized and unrealized gain (loss) | |
| Realized gain (loss) (identified cost basis) | |
| Unaffiliated issuers | $186,893,675 |
| Foreign currency | (81,721) |
| Net realized gain (loss) | $186,811,954 |
| Change in unrealized appreciation or depreciation | |
| Unaffiliated issuers | $863,667,166 |
| Translation of assets and liabilities in foreign currencies | (29,649) |
| Net unrealized gain (loss) | $863,637,517 |
| Net realized and unrealized gain (loss) | $1,050,449,471 |
| Change in net assets from operations | $1,066,972,654 |
| Year ended | ||
| 10/31/21 | 10/31/20 | |
| Change in net assets | ||
| From operations | ||
| Net investment income (loss) | $16,523,183 | $20,677,286 |
| Net realized gain (loss) | 186,811,954 | 71,820,605 |
| Net unrealized gain (loss) | 863,637,517 | (73,221,313) |
| Change in net assets from operations | $1,066,972,654 | $19,276,578 |
| Total distributions to shareholders | $(81,529,939) | $(66,891,427) |
| Change in net assets from fund share transactions | $(30,794,218) | $(76,077,603) |
| Total change in net assets | $954,648,497 | $(123,692,452) |
| Net assets | ||
| At beginning of period | 2,862,804,550 | 2,986,497,002 |
| At end of period | $3,817,453,047 | $2,862,804,550 |
| Class A | Year ended | ||||
| 10/31/21 | 10/31/20 | 10/31/19 | 10/31/18 | 10/31/17 | |
| Net asset value, beginning of period | $45.22 | $45.79 | $41.44 | $43.43 | $36.00 |
| Income (loss) from investment operations | |||||
| Net investment income (loss) (d) | $0.17 | $0.25 | $0.42 | $0.40 | $0.27(c) |
| Net realized and unrealized gain (loss) | 16.60 | 0.16(g) | 6.10 | (1.23) | 7.66 |
| Total from investment operations | $16.77 | $0.41 | $6.52 | $(0.83) | $7.93 |
| Less distributions declared to shareholders | |||||
| From net investment income | $(0.23) | $(0.45) | $(0.42) | $(0.29) | $(0.21) |
| From net realized gain | (1.01) | (0.53) | (1.75) | (0.87) | (0.29) |
| Total distributions declared to shareholders | $(1.24) | $(0.98) | $(2.17) | $(1.16) | $(0.50) |
| Net asset value, end of period (x) | $60.75 | $45.22 | $45.79 | $41.44 | $43.43 |
| Total return (%) (r)(s)(t)(x) | 37.58 | 0.83 | 16.67 | (1.99) | 22.28(c) |
| Ratios (%) (to average net assets) and Supplemental data: | |||||
| Expenses before expense reductions (f) | 1.14 | 1.16 | 1.17 | 1.16 | 1.17(c) |
| Expenses after expense reductions (f) | 1.13 | 1.15 | 1.15 | 1.15 | 1.16(c) |
| Net investment income (loss) | 0.29 | 0.55 | 0.98 | 0.91 | 0.68(c) |
| Portfolio turnover | 10 | 9 | 7 | 12 | 10 |
| Net assets at end of period (000 omitted) | $857,804 | $667,074 | $721,141 | $671,000 | $703,516 |
| Class B | Year ended | ||||
| 10/31/21 | 10/31/20 | 10/31/19 | 10/31/18 | 10/31/17 | |
| Net asset value, beginning of period | $41.35 | $41.93 | $38.09 | $40.03 | $33.26 |
| Income (loss) from investment operations | |||||
| Net investment income (loss) (d) | $(0.23) | $(0.09) | $0.10 | $0.06 | $(0.02)(c) |
| Net realized and unrealized gain (loss) | 15.17 | 0.15(g) | 5.60 | (1.12) | 7.08 |
| Total from investment operations | $14.94 | $0.06 | $5.70 | $(1.06) | $7.06 |
| Less distributions declared to shareholders | |||||
| From net investment income | $— | $(0.11) | $(0.11) | $(0.01) | $— |
| From net realized gain | (1.01) | (0.53) | (1.75) | (0.87) | (0.29) |
| Total distributions declared to shareholders | $(1.01) | $(0.64) | $(1.86) | $(0.88) | $(0.29) |
| Net asset value, end of period (x) | $55.28 | $41.35 | $41.93 | $38.09 | $40.03 |
| Total return (%) (r)(s)(t)(x) | 36.56 | 0.08 | 15.79 | (2.73) | 21.37(c) |
| Ratios (%) (to average net assets) and Supplemental data: | |||||
| Expenses before expense reductions (f) | 1.89 | 1.91 | 1.92 | 1.91 | 1.92(c) |
| Expenses after expense reductions (f) | 1.87 | 1.90 | 1.91 | 1.90 | 1.91(c) |
| Net investment income (loss) | (0.45) | (0.21) | 0.24 | 0.15 | (0.04)(c) |
| Portfolio turnover | 10 | 9 | 7 | 12 | 10 |
| Net assets at end of period (000 omitted) | $15,166 | $15,902 | $22,592 | $24,726 | $29,043 |
| Class C | Year ended | ||||
| 10/31/21 | 10/31/20 | 10/31/19 | 10/31/18 | 10/31/17 | |
| Net asset value, beginning of period | $39.38 | $40.00 | $36.44 | $38.35 | $31.88 |
| Income (loss) from investment operations | |||||
| Net investment income (loss) (d) | $(0.22) | $(0.08) | $0.09 | $0.06 | $(0.02)(c) |
| Net realized and unrealized gain (loss) | 14.43 | 0.14(g) | 5.34 | (1.07) | 6.78 |
| Total from investment operations | $14.21 | $0.06 | $5.43 | $(1.01) | $6.76 |
| Less distributions declared to shareholders | |||||
| From net investment income | $— | $(0.15) | $(0.12) | $(0.03) | $— |
| From net realized gain | (1.01) | (0.53) | (1.75) | (0.87) | (0.29) |
| Total distributions declared to shareholders | $(1.01) | $(0.68) | $(1.87) | $(0.90) | $(0.29) |
| Net asset value, end of period (x) | $52.58 | $39.38 | $40.00 | $36.44 | $38.35 |
| Total return (%) (r)(s)(t)(x) | 36.54 | 0.09 | 15.78 | (2.72) | 21.36(c) |
| Ratios (%) (to average net assets) and Supplemental data: | |||||
| Expenses before expense reductions (f) | 1.89 | 1.91 | 1.92 | 1.91 | 1.92(c) |
| Expenses after expense reductions (f) | 1.87 | 1.90 | 1.91 | 1.90 | 1.91(c) |
| Net investment income (loss) | (0.46) | (0.19) | 0.23 | 0.16 | (0.05)(c) |
| Portfolio turnover | 10 | 9 | 7 | 12 | 10 |
| Net assets at end of period (000 omitted) | $112,939 | $110,351 | $143,769 | $149,669 | $180,446 |
| Class I | Year ended | ||||
| 10/31/21 | 10/31/20 | 10/31/19 | 10/31/18 | 10/31/17 | |
| Net asset value, beginning of period | $46.55 | $47.09 | $42.57 | $44.58 | $36.94 |
| Income (loss) from investment operations | |||||
| Net investment income (loss) (d) | $0.31 | $0.37 | $0.53 | $0.52 | $0.41(c) |
| Net realized and unrealized gain (loss) | 17.08 | 0.18(g) | 6.27 | (1.27) | 7.83 |
| Total from investment operations | $17.39 | $0.55 | $6.80 | $(0.75) | $8.24 |
| Less distributions declared to shareholders | |||||
| From net investment income | $(0.34) | $(0.56) | $(0.53) | $(0.39) | $(0.31) |
| From net realized gain | (1.01) | (0.53) | (1.75) | (0.87) | (0.29) |
| Total distributions declared to shareholders | $(1.35) | $(1.09) | $(2.28) | $(1.26) | $(0.60) |
| Net asset value, end of period (x) | $62.59 | $46.55 | $47.09 | $42.57 | $44.58 |
| Total return (%) (r)(s)(t)(x) | 37.91 | 1.10 | 16.94 | (1.76) | 22.60(c) |
| Ratios (%) (to average net assets) and Supplemental data: | |||||
| Expenses before expense reductions (f) | 0.89 | 0.91 | 0.92 | 0.91 | 0.92(c) |
| Expenses after expense reductions (f) | 0.88 | 0.90 | 0.91 | 0.90 | 0.91(c) |
| Net investment income (loss) | 0.53 | 0.80 | 1.21 | 1.17 | 1.01(c) |
| Portfolio turnover | 10 | 9 | 7 | 12 | 10 |
| Net assets at end of period (000 omitted) | $1,245,750 | $908,819 | $947,284 | $935,292 | $1,070,007 |
| Class R1 | Year ended | ||||
| 10/31/21 | 10/31/20 | 10/31/19 | 10/31/18 | 10/31/17 | |
| Net asset value, beginning of period | $40.41 | $40.97 | $37.25 | $39.18 | $32.56 |
| Income (loss) from investment operations | |||||
| Net investment income (loss) (d) | $(0.23) | $(0.09) | $0.09 | $0.06 | $(0.02)(c) |
| Net realized and unrealized gain (loss) | 14.83 | 0.15(g) | 5.47 | (1.09) | 6.93 |
| Total from investment operations | $14.60 | $0.06 | $5.56 | $(1.03) | $6.91 |
| Less distributions declared to shareholders | |||||
| From net investment income | $— | $(0.09) | $(0.09) | $(0.03) | $— |
| From net realized gain | (1.01) | (0.53) | (1.75) | (0.87) | (0.29) |
| Total distributions declared to shareholders | $(1.01) | $(0.62) | $(1.84) | $(0.90) | $(0.29) |
| Net asset value, end of period (x) | $54.00 | $40.41 | $40.97 | $37.25 | $39.18 |
| Total return (%) (r)(s)(t)(x) | 36.57 | 0.08 | 15.77 | (2.73) | 21.37(c) |
| Ratios (%) (to average net assets) and Supplemental data: | |||||
| Expenses before expense reductions (f) | 1.89 | 1.91 | 1.92 | 1.91 | 1.92(c) |
| Expenses after expense reductions (f) | 1.87 | 1.90 | 1.91 | 1.90 | 1.91(c) |
| Net investment income (loss) | (0.46) | (0.23) | 0.22 | 0.16 | (0.05)(c) |
| Portfolio turnover | 10 | 9 | 7 | 12 | 10 |
| Net assets at end of period (000 omitted) | $2,081 | $1,556 | $2,485 | $2,538 | $3,411 |
| Class R2 | Year ended | ||||
| 10/31/21 | 10/31/20 | 10/31/19 | 10/31/18 | 10/31/17 | |
| Net asset value, beginning of period | $43.83 | $44.38 | $40.21 | $42.16 | $34.96 |
| Income (loss) from investment operations | |||||
| Net investment income (loss) (d) | $0.02 | $0.13 | $0.31 | $0.28 | $0.18(c) |
| Net realized and unrealized gain (loss) | 16.09 | 0.16(g) | 5.91 | (1.19) | 7.43 |
| Total from investment operations | $16.11 | $0.29 | $6.22 | $(0.91) | $7.61 |
| Less distributions declared to shareholders | |||||
| From net investment income | $(0.08) | $(0.31) | $(0.30) | $(0.17) | $(0.12) |
| From net realized gain | (1.01) | (0.53) | (1.75) | (0.87) | (0.29) |
| Total distributions declared to shareholders | $(1.09) | $(0.84) | $(2.05) | $(1.04) | $(0.41) |
| Net asset value, end of period (x) | $58.85 | $43.83 | $44.38 | $40.21 | $42.16 |
| Total return (%) (r)(s)(t)(x) | 37.22 | 0.59 | 16.36 | (2.24) | 21.97(c) |
| Ratios (%) (to average net assets) and Supplemental data: | |||||
| Expenses before expense reductions (f) | 1.39 | 1.41 | 1.42 | 1.41 | 1.42(c) |
| Expenses after expense reductions (f) | 1.38 | 1.40 | 1.41 | 1.40 | 1.41(c) |
| Net investment income (loss) | 0.04 | 0.30 | 0.76 | 0.66 | 0.45(c) |
| Portfolio turnover | 10 | 9 | 7 | 12 | 10 |
| Net assets at end of period (000 omitted) | $36,791 | $27,772 | $37,042 | $40,944 | $52,489 |
| Class R3 | Year ended | ||||
| 10/31/21 | 10/31/20 | 10/31/19 | 10/31/18 | 10/31/17 | |
| Net asset value, beginning of period | $44.89 | $45.46 | $41.16 | $43.14 | $35.76 |
| Income (loss) from investment operations | |||||
| Net investment income (loss) (d) | $0.16 | $0.24 | $0.41 | $0.39 | $0.28(c) |
| Net realized and unrealized gain (loss) | 16.49 | 0.17(g) | 6.06 | (1.21) | 7.60 |
| Total from investment operations | $16.65 | $0.41 | $6.47 | $(0.82) | $7.88 |
| Less distributions declared to shareholders | |||||
| From net investment income | $(0.21) | $(0.45) | $(0.42) | $(0.29) | $(0.21) |
| From net realized gain | (1.01) | (0.53) | (1.75) | (0.87) | (0.29) |
| Total distributions declared to shareholders | $(1.22) | $(0.98) | $(2.17) | $(1.16) | $(0.50) |
| Net asset value, end of period (x) | $60.32 | $44.89 | $45.46 | $41.16 | $43.14 |
| Total return (%) (r)(s)(t)(x) | 37.60 | 0.83 | 16.65 | (2.00) | 22.29(c) |
| Ratios (%) (to average net assets) and Supplemental data: | |||||
| Expenses before expense reductions (f) | 1.14 | 1.16 | 1.17 | 1.16 | 1.17(c) |
| Expenses after expense reductions (f) | 1.13 | 1.15 | 1.16 | 1.15 | 1.16(c) |
| Net investment income (loss) | 0.29 | 0.54 | 0.97 | 0.90 | 0.70(c) |
| Portfolio turnover | 10 | 9 | 7 | 12 | 10 |
| Net assets at end of period (000 omitted) | $88,285 | $70,852 | $91,019 | $90,003 | $108,852 |
| Class R4 | Year ended | ||||
| 10/31/21 | 10/31/20 | 10/31/19 | 10/31/18 | 10/31/17 | |
| Net asset value, beginning of period | $45.44 | $45.98 | $41.63 | $43.62 | $36.15 |
| Income (loss) from investment operations | |||||
| Net investment income (loss) (d) | $0.30 | $0.36 | $0.54 | $0.51 | $0.38(c) |
| Net realized and unrealized gain (loss) | 16.69 | 0.17(g) | 6.09 | (1.23) | 7.68 |
| Total from investment operations | $16.99 | $0.53 | $6.63 | $(0.72) | $8.06 |
| Less distributions declared to shareholders | |||||
| From net investment income | $(0.34) | $(0.54) | $(0.53) | $(0.40) | $(0.30) |
| From net realized gain | (1.01) | (0.53) | (1.75) | (0.87) | (0.29) |
| Total distributions declared to shareholders | $(1.35) | $(1.07) | $(2.28) | $(1.27) | $(0.59) |
| Net asset value, end of period (x) | $61.08 | $45.44 | $45.98 | $41.63 | $43.62 |
| Total return (%) (r)(s)(t)(x) | 37.94 | 1.09 | 16.93 | (1.75) | 22.61(c) |
| Ratios (%) (to average net assets) and Supplemental data: | |||||
| Expenses before expense reductions (f) | 0.89 | 0.91 | 0.92 | 0.91 | 0.92(c) |
| Expenses after expense reductions (f) | 0.88 | 0.90 | 0.91 | 0.90 | 0.91(c) |
| Net investment income (loss) | 0.53 | 0.80 | 1.25 | 1.16 | 0.96(c) |
| Portfolio turnover | 10 | 9 | 7 | 12 | 10 |
| Net assets at end of period (000 omitted) | $95,164 | $84,424 | $97,861 | $136,066 | $142,713 |
| Class R6 | Year ended | ||||
| 10/31/21 | 10/31/20 | 10/31/19 | 10/31/18 | 10/31/17 | |
| Net asset value, beginning of period | $46.58 | $47.13 | $42.61 | $44.61 | $36.96 |
| Income (loss) from investment operations | |||||
| Net investment income (loss) (d) | $0.36 | $0.41 | $0.59 | $0.54 | $0.41(c) |
| Net realized and unrealized gain (loss) | 17.11 | 0.17(g) | 6.26 | (1.24) | 7.86 |
| Total from investment operations | $17.47 | $0.58 | $6.85 | $(0.70) | $8.27 |
| Less distributions declared to shareholders | |||||
| From net investment income | $(0.39) | $(0.60) | $(0.58) | $(0.43) | $(0.33) |
| From net realized gain | (1.01) | (0.53) | (1.75) | (0.87) | (0.29) |
| Total distributions declared to shareholders | $(1.40) | $(1.13) | $(2.33) | $(1.30) | $(0.62) |
| Net asset value, end of period (x) | $62.65 | $46.58 | $47.13 | $42.61 | $44.61 |
| Total return (%) (r)(s)(t)(x) | 38.06 | 1.17 | 17.07 | (1.66) | 22.71(c) |
| Ratios (%) (to average net assets) and Supplemental data: | |||||
| Expenses before expense reductions (f) | 0.80 | 0.82 | 0.83 | 0.81 | 0.83(c) |
| Expenses after expense reductions (f) | 0.78 | 0.81 | 0.82 | 0.80 | 0.82(c) |
| Net investment income (loss) | 0.63 | 0.89 | 1.35 | 1.20 | 0.99(c) |
| Portfolio turnover | 10 | 9 | 7 | 12 | 10 |
| Net assets at end of period (000 omitted) | $1,363,474 | $976,055 | $923,304 | $809,357 | $1,034,078 |
| (c) | Amount reflects a one-time reimbursement of expenses by the custodian (or former custodian) without which net investment income and performance would be lower and expenses would be higher. |
| (d) | Per share data is based on average shares outstanding. |
| (f) | Ratios do not reflect reductions from fees paid indirectly, if applicable. |
| (g) | The per share amount varies from the net realized and unrealized gain/loss for the period because of the timing of sales of fund shares and the per share amount of realized and unrealized gains and losses at such time. |
| (r) | Certain expenses have been reduced without which performance would have been lower. |
| (s) | From time to time the fund may receive proceeds from litigation settlements, without which performance would be lower. |
| (t) | Total returns do not include any applicable sales charges. |
| (x) | The net asset values and total returns have been calculated on net assets which include adjustments made in accordance with U.S. generally accepted accounting principles required at period end for financial reporting purposes. |
| Financial Instruments | Level 1 | Level 2 | Level 3 | Total |
| Equity Securities: | ||||
| United States | $2,150,898,562 | $— | $— | $2,150,898,562 |
| France | 427,432,240 | — | — | 427,432,240 |
| Switzerland | 315,384,374 | — | — | 315,384,374 |
| United Kingdom | 260,380,437 | — | — | 260,380,437 |
| Germany | 147,209,164 | — | — | 147,209,164 |
| Canada | 113,947,946 | — | — | 113,947,946 |
| Netherlands | 106,576,132 | — | — | 106,576,132 |
| Japan | — | 79,244,889 | — | 79,244,889 |
| Sweden | 61,134,147 | — | — | 61,134,147 |
| Other Countries | 105,999,847 | 31,288,982 | — | 137,288,829 |
| Mutual Funds | 7,189,905 | — | — | 7,189,905 |
| Total | $3,696,152,754 | $110,533,871 | $— | $3,806,686,625 |
| Year ended 10/31/21 | Year ended 10/31/20 | |
| Ordinary income (including any short-term capital gains) | $19,000,381 | $33,000,388 |
| Long-term capital gains | 62,529,558 | 33,891,039 |
| Total distributions | $81,529,939 | $66,891,427 |
| As of 10/31/21 | |
| Cost of investments | $1,884,690,428 |
| Gross appreciation | 1,975,182,594 |
| Gross depreciation | (53,186,397) |
| Net unrealized appreciation (depreciation) | $1,921,996,197 |
| Undistributed ordinary income | 19,228,189 |
| Undistributed long-term capital gain | 164,943,373 |
| Other temporary differences | 259,028 |
| Total distributable earnings (loss) | $2,106,426,787 |
| Year ended 10/31/21 | Year ended 10/31/20 | ||
| Class A | $18,069,813 | $15,257,290 | |
| Class B | 379,523 | 332,572 | |
| Class C | 2,775,096 | 2,427,174 | |
| Class I | 26,343,700 | 20,515,399 | |
| Class R1 | 38,933 | 31,441 | |
| Class R2 | 669,457 | 671,597 | |
| Class R3 | 1,864,571 | 1,994,284 | |
| Class R4 | 2,144,683 | 2,161,587 | |
| Class R6 | 29,244,163 | 23,500,083 | |
| Total | $81,529,939 | $66,891,427 |
| Up to $1 billion | 0.90% |
| In excess of $1 billion and up to $2 billion | 0.75% |
| In excess of $2 billion and up to $5 billion | 0.65% |
| In excess of $5 billion | 0.60% |
| Distribution Fee Rate (d) | Service Fee Rate (d) | Total Distribution Plan (d) | Annual Effective Rate (e) | Distribution and Service Fee | |
| Class A | — | 0.25% | 0.25% | 0.25% | $ 2,063,031 |
| Class B | 0.75% | 0.25% | 1.00% | 1.00% | 172,750 |
| Class C | 0.75% | 0.25% | 1.00% | 1.00% | 1,198,589 |
| Class R1 | 0.75% | 0.25% | 1.00% | 1.00% | 19,783 |
| Class R2 | 0.25% | 0.25% | 0.50% | 0.50% | 181,616 |
| Class R3 | — | 0.25% | 0.25% | 0.25% | 214,090 |
| Total Distribution and Service Fees | $3,849,859 |
| (d) | In accordance with the distribution plan for certain classes, the fund pays distribution and/or service fees equal to these annual percentage rates of each class’s average daily net assets. The distribution and service fee rates disclosed by class represent the current rates in effect at the end of the reporting period. Any rate changes, if applicable, are detailed below. |
| (e) | The annual effective rates represent actual fees incurred under the distribution plan for the year ended October 31, 2021 based on each class's average daily net assets. MFD has voluntarily agreed to rebate a portion of each class's 0.25% service fee attributable to accounts for which there is no financial intermediary specified on the account except for accounts attributable to MFS or its affiliates' seed money. For the year ended October 31, 2021, this rebate amounted to $432, $5, $2, and $12 for Class A, Class B, Class C, and Class R2, respectively, and is included in the reduction of total expenses in the Statement of Operations. |
| Amount | |
| Class A | $11,661 |
| Class B | 9,787 |
| Class C | 4,491 |
| Year ended 10/31/21 | Year ended 10/31/20 | ||||
| Shares | Amount | Shares | Amount | ||
| Shares sold | |||||
| Class A | 1,775,292 | $99,973,867 | 2,062,029 | $91,464,449 | |
| Class B | 2,428 | 120,744 | 2,606 | 106,338 | |
| Class C | 175,401 | 8,503,213 | 302,426 | 11,783,499 | |
| Class I | 4,491,898 | 262,991,444 | 6,865,754 | 306,885,476 | |
| Class R1 | 2,992 | 149,109 | 9,220 | 368,033 | |
| Class R2 | 200,658 | 10,698,239 | 134,019 | 5,895,820 | |
| Class R3 | 360,080 | 19,887,781 | 448,540 | 19,864,316 | |
| Class R4 | 253,665 | 14,349,731 | 505,937 | 22,515,810 | |
| Class R6 | 4,956,206 | 289,184,502 | 5,586,226 | 258,159,146 | |
| 12,218,620 | $705,858,630 | 15,916,757 | $717,042,887 | ||
| Shares issued to shareholders in reinvestment of distributions | |||||
| Class A | 326,776 | $16,721,145 | 305,365 | $14,217,807 | |
| Class B | 7,844 | 367,633 | 7,548 | 323,425 | |
| Class C | 58,709 | 2,617,845 | 51,964 | 2,120,668 | |
| Class I | 462,774 | 24,341,891 | 387,697 | 18,535,791 | |
| Class R1 | 850 | 38,933 | 751 | 31,441 | |
| Class R2 | 13,177 | 654,619 | 13,739 | 621,256 | |
| Class R3 | 36,697 | 1,864,571 | 43,148 | 1,994,284 | |
| Class R4 | 40,089 | 2,057,798 | 44,261 | 2,066,111 | |
| Class R6 | 533,533 | 28,069,162 | 470,482 | 22,493,742 | |
| 1,480,449 | $76,733,597 | 1,324,955 | $62,404,525 | ||
| Year ended 10/31/21 | Year ended 10/31/20 | ||||
| Shares | Amount | Shares | Amount | ||
| Shares reacquired | |||||
| Class A | (2,733,635) | $(155,336,243) | (3,366,891) | $(147,063,778) | |
| Class B | (120,501) | (6,250,746) | (164,410) | (6,623,338) | |
| Class C | (888,750) | (43,001,502) | (1,146,313) | (44,353,628) | |
| Class I | (4,577,295) | (263,218,385) | (7,845,143) | (349,278,053) | |
| Class R1 | (3,798) | (194,160) | (32,139) | (1,334,423) | |
| Class R2 | (222,391) | (12,159,216) | (348,777) | (15,301,223) | |
| Class R3 | (511,349) | (28,176,012) | (915,597) | (40,775,067) | |
| Class R4 | (593,510) | (32,317,749) | (820,637) | (36,807,117) | |
| Class R6 | (4,679,404) | (272,732,432) | (4,696,642) | (213,988,388) | |
| (14,330,633) | $(813,386,445) | (19,336,549) | $(855,525,015) | ||
| Net change | |||||
| Class A | (631,567) | $(38,641,231) | (999,497) | $(41,381,522) | |
| Class B | (110,229) | (5,762,369) | (154,256) | (6,193,575) | |
| Class C | (654,640) | (31,880,444) | (791,923) | (30,449,461) | |
| Class I | 377,377 | 24,114,950 | (591,692) | (23,856,786) | |
| Class R1 | 44 | (6,118) | (22,168) | (934,949) | |
| Class R2 | (8,556) | (806,358) | (201,019) | (8,784,147) | |
| Class R3 | (114,572) | (6,423,660) | (423,909) | (18,916,467) | |
| Class R4 | (299,756) | (15,910,220) | (270,439) | (12,225,196) | |
| Class R6 | 810,335 | 44,521,232 | 1,360,066 | 66,664,500 | |
| (631,564) | $(30,794,218) | (2,094,837) | $(76,077,603) | ||
| Affiliated Issuers | Beginning Value | Purchases | Sales Proceeds | Realized Gain (Loss) | Change in Unrealized Appreciation or Depreciation | Ending Value |
| MFS Institutional Money Market Portfolio | $17,796,799 | $346,469,367 | $357,076,261 | $— | $— | $7,189,905 |
| Affiliated Issuers | Dividend Income | Capital Gain Distributions |
| MFS Institutional Money Market Portfolio | $9,001 | $— |

December 15, 2021
| Name, Age | Position(s) Held with Fund | Trustee/Officer Since(h) | Number of MFS Funds overseen by the Trustee | Principal Occupations During the Past Five Years | Other Directorships During the Past Five Years (j) | |||||
| INTERESTED TRUSTEES | ||||||||||
| Robert J. Manning (k) (age 58) | Trustee | February 2004 | 135 | Massachusetts Financial Services Company, Non-Executive Chairman (since January 2021); Director; Chairman of the Board; Executive Chairman (January 2017-2020); Co-Chief Executive Officer (2015-2016) | N/A | |||||
| Michael W. Roberge (k) (age 55) | Trustee | January 2021 | 135 | Massachusetts Financial Services Company, Chairman (since January 2021); Chief Executive Officer (since January 2017); Director; President (until December 2018); Chief Investment Officer (until December 2018); Co-Chief Executive Officer (until December 2016) | N/A | |||||
| INDEPENDENT TRUSTEES | ||||||||||
| John P. Kavanaugh (age 67) | Trustee and Chair of Trustees | January 2009 | 135 | Private investor | N/A | |||||
| Steven E. Buller (age 70) | Trustee | February 2014 | 135 | Private investor | N/A | |||||
| John A. Caroselli (age 67) | Trustee | March 2017 | 135 | Private investor; JC Global Advisors, LLC (management consulting), President (since 2015) | N/A | |||||
| Maureen R. Goldfarb (age 66) | Trustee | January 2009 | 135 | Private investor | N/A | |||||
| Peter D. Jones (age 66) | Trustee | January 2019 | 135 | Private investor | N/A | |||||
| Name, Age | Position(s) Held with Fund | Trustee/Officer Since(h) | Number of MFS Funds overseen by the Trustee | Principal Occupations During the Past Five Years | Other Directorships During the Past Five Years (j) | |||||
| James W. Kilman, Jr. (age 60) | Trustee | January 2019 | 135 | Burford Capital Limited (finance and investment management), Senior Advisor (since May 3, 2021), Chief Financial Officer (2019 - May 2, 2021); KielStrand Capital LLC (family office), Chief Executive Officer (since 2016); Morgan Stanley & Co. (financial services), Vice Chairman of Investment Banking, Co-Head of Diversified Financials Coverage – Financial Institutions Investment Banking Group (until 2016) | Alpha-En Corporation, Director (2016-2019) | |||||
| Clarence Otis, Jr. (age 65) | Trustee | March 2017 | 135 | Private investor | VF Corporation, Director; Verizon Communications, Inc., Director; The Travelers Companies, Director | |||||
| Maryanne L. Roepke (age 65) | Trustee | May 2014 | 135 | Private investor | N/A | |||||
| Laurie J. Thomsen (age 64) | Trustee | March 2005 | 135 | Private investor | The Travelers Companies, Director; Dycom Industries, Inc., Director |
| Name, Age | Position(s) Held with Fund | Trustee/Officer Since(h) | Number of MFS Funds for which the Person is an Officer | Principal Occupations During the Past Five Years | ||||
| OFFICERS | ||||||||
| Christopher R. Bohane (k) (age 47) | Assistant Secretary and Assistant Clerk | July 2005 | 135 | Massachusetts Financial Services Company, Senior Vice President and Associate General Counsel | ||||
| Kino Clark (k) (age 53) | Assistant Treasurer | January 2012 | 135 | Massachusetts Financial Services Company, Vice President |
| Name, Age | Position(s) Held with Fund | Trustee/Officer Since(h) | Number of MFS Funds for which the Person is an Officer | Principal Occupations During the Past Five Years | ||||
| John W. Clark, Jr. (k) (age 54) | Assistant Treasurer | April 2017 | 135 | Massachusetts Financial Services Company, Vice President (since March 2017); Deutsche Bank (financial services), Department Head - Treasurer's Office (until February 2017) | ||||
| Thomas H. Connors (k) (age 62) | Assistant Secretary and Assistant Clerk | September 2012 | 135 | Massachusetts Financial Services Company, Vice President and Senior Counsel | ||||
| David L. DiLorenzo (k) (age 53) | President | July 2005 | 135 | Massachusetts Financial Services Company, Senior Vice President | ||||
| Heidi W. Hardin (k) (age 54) | Secretary and Clerk | April 2017 | 135 | Massachusetts Financial Services Company, Executive Vice President and General Counsel (since March 2017); Harris Associates (investment management), General Counsel (until January 2017) | ||||
| Brian E. Langenfeld (k) (age 48) | Assistant Secretary and Assistant Clerk | June 2006 | 135 | Massachusetts Financial Services Company, Vice President and Senior Counsel | ||||
| Amanda S. Mooradian (k) (age 42) | Assistant Secretary and Assistant Clerk | September 2018 | 135 | Massachusetts Financial Services Company, Assistant Vice President and Senior Counsel | ||||
| Susan A. Pereira (k) (age 51) | Assistant Secretary and Assistant Clerk | July 2005 | 135 | Massachusetts Financial Services Company, Vice President and Assistant General Counsel | ||||
| Kasey L. Phillips (k) (age 50) | Assistant Treasurer | September 2012 | 135 | Massachusetts Financial Services Company, Vice President | ||||
| Matthew A. Stowe (k) (age 47) | Assistant Secretary and Assistant Clerk | October 2014 | 135 | Massachusetts Financial Services Company, Vice President and Assistant General Counsel | ||||
| Martin J. Wolin (k) (age 54) | Chief Compliance Officer | July 2015 | 135 | Massachusetts Financial Services Company, Senior Vice President and Chief Compliance Officer |
| Name, Age | Position(s) Held with Fund | Trustee/Officer Since(h) | Number of MFS Funds for which the Person is an Officer | Principal Occupations During the Past Five Years | ||||
| James O. Yost (k) (age 61) | Treasurer | September 1990 | 135 | Massachusetts Financial Services Company, Senior Vice President |
| (h) | Date first appointed to serve as Trustee/Officer of an MFS Fund. Each Trustee has served continuously since appointment unless indicated otherwise. For the period from December 15, 2004 until February 22, 2005, Mr. Manning served as Advisory Trustee. From January 2012 through December 2016, Messrs. DiLorenzo and Yost served as Treasurer and Deputy Treasurer of the Funds, respectively. |
| (j) | Directorships or trusteeships of companies required to report to the Securities and Exchange Commission (i.e., “public companies”). |
| (k) | “Interested person” of the Trust within the meaning of the Investment Company Act of 1940 (referred to as the 1940 Act), which is the principal federal law governing investment companies like the fund, as a result of a position with MFS. The address of MFS is 111 Huntington Avenue, Boston, Massachusetts 02199-7618. |
| Investment Adviser | Custodian |
| Massachusetts Financial Services Company 111 Huntington Avenue Boston, MA 02199-7618 | JPMorgan Chase Bank, NA 4 Metrotech Center New York, NY 11245 |
| Distributor | Independent Registered Public Accounting Firm |
| MFS Fund Distributors, Inc. 111 Huntington Avenue Boston, MA 02199-7618 | Ernst & Young LLP 200 Clarendon Street Boston, MA 02116 |
| Portfolio Manager(s) | |
| Ryan McAllister Roger Morley |
| FACTS | WHAT DOES MFS DO WITH YOUR PERSONAL INFORMATION? |
| Why? | Financial companies choose how they share your personal information. Federal law gives consumers the right to limit some but not all sharing. Federal law also requires us to tell you how we collect, share, and protect your personal information. Please read this notice carefully to understand what we do. |
| What? | The types of personal information we collect and share depend on the product or service you have with us. This information can include: |
| • Social Security number and account balances | |
| • Account transactions and transaction history | |
| • Checking account information and wire transfer instructions | |
| When you are no longer our customer, we continue to share your information as described in this notice. |
| How? | All financial companies need to share customers' personal information to run their everyday business. In the section below, we list the reasons financial companies can share their customers' personal information; the reasons MFS chooses to share; and whether you can limit this sharing. |
| Reasons we can share your personal information | Does MFS share? | Can you limit this sharing? |
| For our everyday business purposes – such as to process your transactions, maintain your account(s), respond to court orders and legal investigations, or report to credit bureaus | Yes | No |
| For our marketing purposes – to offer our products and services to you | No | We don't share |
| For joint marketing with other financial companies | No | We don't share |
| For our affiliates' everyday business purposes – information about your transactions and experiences | No | We don't share |
| For our affiliates' everyday business purposes – information about your creditworthiness | No | We don't share |
| For nonaffiliates to market to you | No | We don't share |
| Questions? | Call 800-225-2606 or go to mfs.com. |

| Who we are | |
| Who is providing this notice? | MFS Funds, MFS Investment Management, MFS Institutional Advisors, Inc., and MFS Heritage Trust Company. |
| What we do | |
| How does MFS protect my personal information? | To protect your personal information from unauthorized access and use, we use security measures that comply with federal law. These measures include procedural, electronic, and physical safeguards for the protection of the personal information we collect about you. |
| How does MFS collect my personal information? | We collect your personal information, for example, when you |
| • open an account or provide account information | |
| • direct us to buy securities or direct us to sell your securities | |
| • make a wire transfer | |
| We also collect your personal information from others, such as credit bureaus, affiliates, or other companies. | |
| Why can't I limit all sharing? | Federal law gives you the right to limit only |
| • sharing for affiliates' everyday business purposes – information about your creditworthiness | |
| • affiliates from using your information to market to you | |
| • sharing for nonaffiliates to market to you | |
| State laws and individual companies may give you additional rights to limit sharing. | |
| Definitions | |
| Affiliates | Companies related by common ownership or control. They can be financial and nonfinancial companies. |
| • MFS does not share personal information with affiliates, except for everyday business purposes as described on page one of this notice. | |
| Nonaffiliates | Companies not related by common ownership or control. They can be financial and nonfinancial companies. |
| • MFS does not share with nonaffiliates so they can market to you. | |
| Joint marketing | A formal agreement between nonaffiliated financial companies that together market financial products or services to you. |
| • MFS doesn't jointly market. | |
| Other important information |
| If you own an MFS product or receive an MFS service in the name of a third party such as a bank or broker-dealer, their privacy policy may apply to you instead of ours. |


Return Fund

Return Fund
| 1 | |
| 2 | |
| 5 | |
| 8 | |
| 11 | |
| 13 | |
| 42 | |
| 44 | |
| 46 | |
| 47 | |
| 53 | |
| 73 | |
| 75 | |
| 80 | |
| 84 | |
| 84 | |
| 84 | |
| 84 | |
| 84 | |
| 86 |
| back cover |


| U.S. Treasury Note 2 yr Future - DEC 2021 | 4.0% |
| Euro-Bobl 5 yr Future - DEC 2021 | 3.1% |
| Johnson & Johnson | 1.7% |
| Roche Holding AG | 1.7% |
| Government of Japan, 1.7%, 3/20/2032 | 1.2% |
| Schneider Electric SE | 1.2% |
| U.S. Treasury 10 yr IRS Option, Pay 1.75%, 9/19/22 | (1.9)% |
| U.S. Treasury Ultra Note 10 yr Future - DEC 2021 | (2.3)% |
| U.S. Treasury Note 5 yr Future - DEC 2021 | (3.1)% |
| Euro-Bund 10 yr Future - DEC 2021 | (3.7)% |
| AAA | 3.7% |
| AA | 3.3% |
| A | 8.6% |
| BBB | 13.5% |
| D (o) | 0.0% |
| U.S. Government | 3.8% |
| Federal Agencies | 3.1% |
| Not Rated | (4.2)% |
| Non-Fixed Income | 59.7% |
| Cash & Cash Equivalents | 3.1% |
| Other | 5.4% |
| Financials | 13.3% |
| Industrials | 9.9% |
| Health Care | 8.8% |
| Consumer Staples | 7.8% |
| Information Technology | 7.3% |
| Communication Services | 3.3% |
| Consumer Discretionary | 2.9% |
| Materials | 2.7% |
| Energy | 1.7% |
| Utilities | 1.7% |
| Real Estate | 0.2% |
| Convertible Debt | 0.1% |
| Investment Grade Corporates | 11.1% |
| Non-U.S. Government Bonds | 9.2% |
| Emerging Markets Bonds | 6.0% |
| Mortgage-Backed Securities | 3.1% |
| Commercial Mortgage-Backed Securities | 1.7% |
| Collateralized Debt Obligations | 0.9% |
| Municipal Bonds | 0.3% |
| High Yield Corporates | 0.3% |
| Asset-Backed Securities | 0.2% |
| U.S. Government Agencies (o) | 0.0% |
| U.S. Treasury Securities | (1.1)% |
| United States | 52.2% |
| Japan | 7.0% |
| United Kingdom | 6.1% |
| Switzerland | 4.9% |
| France | 3.8% |
| China | 3.4% |
| Italy | 2.9% |
| Canada | 2.7% |
| Spain | 2.0% |
| Other Countries | 15.0% |
| United States Dollar | 51.4% |
| Euro | 15.7% |
| Japanese Yen | 9.1% |
| British Pound Sterling | 5.6% |
| Swiss Franc | 4.7% |
| Canadian Dollar | 2.9% |
| Chinese Renminbi | 2.3% |
| South Korean Won | 1.3% |
| Taiwan Dollar | 0.9% |
| Other Currencies | 6.1% |
| (a) | For all securities other than those specifically described below, ratings are assigned to underlying securities utilizing ratings from Moody’s, Fitch, and Standard & Poor’s rating agencies and applying the following hierarchy: If all three agencies provide a rating, the middle rating (after dropping the highest and lowest ratings) is assigned; if two of the three agencies rate a security, the lower of the two is assigned. If none of the 3 rating agencies above assign a rating, but the security is rated by DBRS Morningstar, then the DBRS Morningstar rating is assigned. If none of the 4 rating agencies listed above rate the security, but the security is rated by the Kroll Bond Rating Agency (KBRA), then the KBRA rating is assigned. Ratings are shown in the S&P and Fitch scale (e.g., AAA). Securities rated BBB or higher are considered investment grade. All ratings are subject to change. U.S. Government includes securities issued by the U.S. Department of the Treasury. Federal Agencies includes rated and unrated U.S. Agency fixed-income securities, U.S. Agency mortgage-backed securities, and collateralized mortgage obligations of U.S. Agency mortgage-backed securities. |
| (g) | The Global Industry Classification Standard (GICS®) was developed by and/or is the exclusive property of MSCI, Inc. and S&P Global Market Intelligence Inc. (“S&P Global Market Intelligence”). GICS is a service mark of MSCI and S&P Global Market Intelligence and has been licensed for use by MFS. MFS has applied its own internal sector/industry classification methodology for equity securities and non-equity securities that are unclassified by GICS. |
| (i) | For purposes of this presentation, the components include the value of securities, and reflect the impact of the equivalent exposure of derivative positions, if any. These amounts may be negative from time to time. Equivalent exposure is a calculated amount that translates the derivative position into a reasonable approximation of the amount of the underlying asset that the portfolio would have to hold at a given point in time to have the same price sensitivity that results from the portfolio’s ownership of the derivative contract. When dealing with derivatives, equivalent exposure is a more representative measure of the potential impact of a position on portfolio performance than value. The bond component will include any accrued interest amounts. |
| (o) | Less than 0.1%. |
| (x) | Represents the portfolio’s exposure to issuer countries as a percentage of a portfolio’s net assets. For purposes of this presentation, United States includes Cash & Cash Equivalents and Other. |
| (y) | Represents the portfolio’s exposure to a particular currency as a percentage of a portfolio's net assets. For purposes of this presentation, United States Dollar includes Cash & Cash Equivalents. |
| (r) | Securities rated “BBB”, “Baa”, or higher are considered investment grade; securities rated “BB”, “Ba”, or below are considered non-investment grade. Ratings are assigned to underlying securities utilizing ratings from Moody's, Fitch, and Standard & Poor's and applying the following hierarchy: If all three agencies provide a rating, the middle rating (after dropping the highest and lowest ratings) is assigned; if two of the three agencies rate a security, the lower of the two is assigned. If none of the 3 rating agencies above assign a rating, but the security is rated by DBRS Morningstar, then the DBRS Morningstar rating is assigned. If none of the 4 rating agencies listed above rate the security, but the security is rated by the Kroll Bond Rating Agency (KBRA), then the KBRA rating is assigned. Ratings are shown in the S&P and Fitch scale (e.g., AAA). For securities that are not rated by any of the rating agencies, the security is considered Not Rated. |
| (y) | A yield curve graphically depicts the yields of different maturity bonds of the same credit quality and type; a normal yield curve is upward sloping, with short-term rates lower than long-term rates. |
| Share Class | Class Inception Date | 1-yr | 5-yr | 10-yr | Life (t) |
| A | 9/04/90 | 19.88% | 8.01% | 7.32% | N/A |
| B | 9/07/93 | 18.96% | 7.21% | 6.52% | N/A |
| C | 1/03/94 | 19.00% | 7.21% | 6.52% | N/A |
| I | 1/02/97 | 20.23% | 8.29% | 7.59% | N/A |
| R1 | 4/01/05 | 18.99% | 7.21% | 6.52% | N/A |
| R2 | 10/31/03 | 19.61% | 7.75% | 7.05% | N/A |
| R3 | 4/01/05 | 19.88% | 8.03% | 7.33% | N/A |
| R4 | 4/01/05 | 20.19% | 8.29% | 7.59% | N/A |
| R6 | 6/01/12 | 20.26% | 8.39% | N/A | 8.07% |
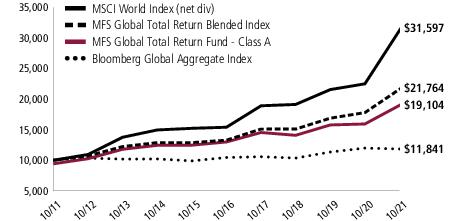
| MSCI World Index (net div) (f) | 40.42% | 15.45% | 12.19% | N/A |
| MFS Global Total Return Blended Index (f)(w) | 22.30% | 10.38% | 8.09% | N/A |
| Bloomberg Global Aggregate Index (f) | (1.24)% | 2.52% | 1.70% | N/A |
| A With Initial Sales Charge (5.75%) | 12.98% | 6.74% | 6.69% | N/A |
| B With CDSC (Declining over six years from 4% to 0%) (v) | 14.96% | 6.90% | 6.52% | N/A |
| C With CDSC (1% for 12 months) (v) | 18.00% | 7.21% | 6.52% | N/A |
| (f) | Source: FactSet Research Systems Inc. |
| (t) | For the period from the class inception date through the stated period end (for those share classes with less than 10 years of performance history). No comparative benchmark performance information is provided for “life” periods. (See Notes to Performance Summary.) |
| (v) | Assuming redemption at the end of the applicable period. |
| (w) | As of October 31, 2021, the MFS Global Total Return Blended Index (a custom index) was comprised of 60% MSCI World Index (net div) and 40% Bloomberg Global Aggregate Index. |
| (a) | Source: Bloomberg Index Services Limited. BLOOMBERG® is a trademark and service mark of Bloomberg Finance L.P. and its affiliates (collectively “Bloomberg”). Bloomberg or Bloomberg's licensors own all proprietary rights in the Bloomberg Indices. Bloomberg neither approves or endorses this material, or guarantees the accuracy or completeness of any information herein, or makes any warranty, express or implied, as to the results to be obtained therefrom and, to the maximum extent allowed by law, neither shall have any liability or responsibility for injury or damages arising in connection therewith. |
| (e) | Morgan Stanley Capital International (“MSCI”) makes no express or implied warranties or representations and shall have no liability whatsoever with respect to any MSCI data contained herein. The MSCI data may not be further redistributed or used as a basis for other indices or any securities or financial products. This report is not approved, reviewed, or produced by MSCI. |
May 1, 2021 through October 31, 2021
| Share Class | Annualized Expense Ratio | Beginning Account Value 5/01/21 | Ending Account Value 10/31/21 | Expenses Paid During Period (p) 5/01/21-10/31/21 | |
| A | Actual | 1.09% | $1,000.00 | $1,025.07 | $5.56 |
| Hypothetical (h) | 1.09% | $1,000.00 | $1,019.71 | $5.55 | |
| B | Actual | 1.84% | $1,000.00 | $1,021.04 | $9.37 |
| Hypothetical (h) | 1.84% | $1,000.00 | $1,015.93 | $9.35 | |
| C | Actual | 1.84% | $1,000.00 | $1,021.49 | $9.38 |
| Hypothetical (h) | 1.84% | $1,000.00 | $1,015.93 | $9.35 | |
| I | Actual | 0.84% | $1,000.00 | $1,026.63 | $4.29 |
| Hypothetical (h) | 0.84% | $1,000.00 | $1,020.97 | $4.28 | |
| R1 | Actual | 1.84% | $1,000.00 | $1,021.33 | $9.37 |
| Hypothetical (h) | 1.84% | $1,000.00 | $1,015.93 | $9.35 | |
| R2 | Actual | 1.34% | $1,000.00 | $1,024.10 | $6.84 |
| Hypothetical (h) | 1.34% | $1,000.00 | $1,018.45 | $6.82 | |
| R3 | Actual | 1.09% | $1,000.00 | $1,025.67 | $5.57 |
| Hypothetical (h) | 1.09% | $1,000.00 | $1,019.71 | $5.55 | |
| R4 | Actual | 0.84% | $1,000.00 | $1,026.77 | $4.29 |
| Hypothetical (h) | 0.84% | $1,000.00 | $1,020.97 | $4.28 | |
| R6 | Actual | 0.75% | $1,000.00 | $1,027.05 | $3.83 |
| Hypothetical (h) | 0.75% | $1,000.00 | $1,021.42 | $3.82 |
| (h) | 5% class return per year before expenses. |
| (p) | “Expenses Paid During Period” are equal to each class’s annualized expense ratio, as shown above, multiplied by the average account value over the period, multiplied by 184/365 (to reflect the one-half year period). Expenses paid do not include any applicable sales charges (loads). If these transaction costs had been included, your costs would have been higher. |
| Issuer | Shares/Par | Value ($) | ||
| Common Stocks – 59.2% | ||||
| Aerospace & Defense – 1.6% | ||||
| Honeywell International, Inc. | 55,142 | $ 12,055,144 | ||
| L3Harris Technologies, Inc. | 24,042 | 5,542,643 | ||
| Lockheed Martin Corp. | 19,913 | 6,617,488 | ||
| Northrop Grumman Corp. | 13,404 | 4,788,177 | ||
| $29,003,452 | ||||
| Alcoholic Beverages – 1.4% | ||||
| Diageo PLC | 196,808 | $ 9,782,487 | ||
| Heineken N.V. | 60,870 | 6,742,443 | ||
| Kirin Holdings Co. Ltd. | 86,500 | 1,505,769 | ||
| Pernod Ricard S.A. | 34,233 | 7,863,224 | ||
| $25,893,923 | ||||
| Apparel Manufacturers – 0.8% | ||||
| Adidas AG | 17,166 | $ 5,621,776 | ||
| Compagnie Financiere Richemont S.A. | 75,561 | 9,333,714 | ||
| $14,955,490 | ||||
| Automotive – 1.3% | ||||
| Aptiv PLC (a) | 32,162 | $ 5,560,488 | ||
| Lear Corp. | 26,702 | 4,588,739 | ||
| LKQ Corp. | 131,855 | 7,262,573 | ||
| Magna International, Inc. | 79,817 | 6,492,548 | ||
| $23,904,348 | ||||
| Biotechnology – 0.1% | ||||
| Biogen, Inc. (a) | 5,514 | $ 1,470,474 | ||
| Brokerage & Asset Managers – 1.5% | ||||
| BlackRock, Inc. | 4,513 | $ 4,257,835 | ||
| Cboe Global Markets, Inc. | 45,550 | 6,009,867 | ||
| Charles Schwab Corp. | 156,633 | 12,848,605 | ||
| IG Group Holdings PLC | 25,048 | 272,007 | ||
| NASDAQ, Inc. | 22,642 | 4,751,877 | ||
| $28,140,191 | ||||
| Business Services – 2.6% | ||||
| Accenture PLC, “A” | 28,483 | $ 10,219,415 | ||
| Amdocs Ltd. | 61,792 | 4,809,889 | ||
| CGI, Inc. (a) | 68,866 | 6,152,089 | ||
| Equifax, Inc. | 11,050 | 3,065,601 | ||
| Issuer | Shares/Par | Value ($) | ||
| Common Stocks – continued | ||||
| Business Services – continued | ||||
| Experian PLC | 90,834 | $ 4,160,685 | ||
| Fidelity National Information Services, Inc. | 53,322 | 5,904,878 | ||
| Fiserv, Inc. (a) | 54,642 | ��� 5,381,691 | ||
| Nomura Research Institute Ltd. | 84,400 | 3,390,423 | ||
| Secom Co. Ltd. | 73,800 | 5,018,625 | ||
| $48,103,296 | ||||
| Cable TV – 0.8% | ||||
| Comcast Corp., “A” | 288,774 | $ 14,851,647 | ||
| Chemicals – 0.7% | ||||
| Eastman Chemical Co. | 21,947 | $ 2,283,147 | ||
| PPG Industries, Inc. | 68,702 | 11,031,480 | ||
| $13,314,627 | ||||
| Computer Software – 0.6% | ||||
| Adobe Systems, Inc. (a) | 2,029 | $ 1,319,580 | ||
| Microsoft Corp. | 30,945 | 10,261,981 | ||
| $11,581,561 | ||||
| Computer Software - Systems – 2.3% | ||||
| Amadeus IT Group S.A. (a) | 91,822 | $ 6,139,498 | ||
| Asustek Computer, Inc. | 68,000 | 865,508 | ||
| Compal Electronics | 932,000 | 820,337 | ||
| Fujitsu Ltd. | 45,400 | 7,835,475 | ||
| Hitachi Ltd. | 241,500 | 13,926,394 | ||
| Hon Hai Precision Industry Co. Ltd. | 939,000 | 3,633,503 | ||
| Samsung Electronics Co. Ltd. | 155,777 | 9,332,912 | ||
| $42,553,627 | ||||
| Construction – 1.1% | ||||
| Masco Corp. | 121,597 | $ 7,970,683 | ||
| Stanley Black & Decker, Inc. | 35,940 | 6,459,496 | ||
| Vulcan Materials Co. | 33,782 | 6,422,634 | ||
| $20,852,813 | ||||
| Consumer Products – 1.7% | ||||
| Colgate-Palmolive Co. | 181,292 | $ 13,812,638 | ||
| Kimberly-Clark Corp. | 71,968 | 9,319,136 | ||
| Reckitt Benckiser Group PLC | 107,016 | 8,677,562 | ||
| $31,809,336 | ||||
| Containers – 0.1% | ||||
| Graphic Packaging Holding Co. | 59,654 | $ 1,188,904 | ||
| Issuer | Shares/Par | Value ($) | ||
| Common Stocks – continued | ||||
| Electrical Equipment – 2.0% | ||||
| Johnson Controls International PLC | 139,361 | $ 10,224,917 | ||
| Legrand S.A. | 48,905 | 5,327,781 | ||
| Schneider Electric SE | 127,626 | 21,968,059 | ||
| $37,520,757 | ||||
| Electronics – 3.0% | ||||
| Intel Corp. | 194,630 | $ 9,536,870 | ||
| Kyocera Corp. | 67,700 | 3,964,079 | ||
| NXP Semiconductors N.V. | 33,888 | 6,806,744 | ||
| Taiwan Semiconductor Manufacturing Co. Ltd., ADR | 135,825 | 15,443,302 | ||
| Texas Instruments, Inc. | 100,975 | 18,930,793 | ||
| $54,681,788 | ||||
| Energy - Independent – 0.8% | ||||
| ConocoPhillips | 123,658 | $ 9,211,285 | ||
| Hess Corp. | 54,093 | 4,466,459 | ||
| $13,677,744 | ||||
| Energy - Integrated – 0.8% | ||||
| China Petroleum & Chemical Corp. | 16,656,000 | $ 8,103,737 | ||
| Eni S.p.A. | 349,162 | 5,006,642 | ||
| LUKOIL PJSC, ADR | 6,039 | 615,978 | ||
| Suncor Energy, Inc. | 47,370 | 1,245,874 | ||
| $14,972,231 | ||||
| Food & Beverages – 2.6% | ||||
| Archer Daniels Midland Co. | 36,320 | $ 2,333,197 | ||
| Coca-Cola FEMSA S.A.B. de C.V. | 1,798 | 96,643 | ||
| Danone S.A. | 116,196 | 7,569,077 | ||
| General Mills, Inc. | 162,468 | 10,040,522 | ||
| J.M. Smucker Co. | 77,105 | 9,473,120 | ||
| JBS S.A. | 163,357 | 1,130,283 | ||
| Nestle S.A. | 124,241 | 16,394,493 | ||
| $47,037,335 | ||||
| Food & Drug Stores – 0.5% | ||||
| Albertsons Cos., Inc., “A” (l) | 79,838 | $ 2,470,986 | ||
| Tesco PLC | 1,954,017 | 7,217,585 | ||
| $9,688,571 | ||||
| Gaming & Lodging – 0.0% | ||||
| Tabcorp Holdings Ltd. | 199,175 | $ 745,592 | ||
| Issuer | Shares/Par | Value ($) | ||
| Common Stocks – continued | ||||
| General Merchandise – 0.2% | ||||
| BIM Birlesik Magazalar A.S. | 272,357 | $ 1,760,660 | ||
| Wal-Mart de Mexico S.A.B. de C.V. | 283,769 | 989,774 | ||
| $2,750,434 | ||||
| Health Maintenance Organizations – 0.5% | ||||
| Cigna Corp. | 45,140 | $ 9,642,355 | ||
| Insurance – 4.2% | ||||
| Aon PLC | 58,717 | $ 18,784,743 | ||
| Chubb Ltd. | 62,770 | 12,264,003 | ||
| Equitable Holdings, Inc. | 107,257 | 3,593,109 | ||
| Everest Re Group Ltd. | 6,567 | 1,717,271 | ||
| Fairfax Financial Holdings Ltd. | 3,328 | 1,347,899 | ||
| Hartford Financial Services Group, Inc. | 35,211 | 2,567,938 | ||
| Manulife Financial Corp. | 494,969 | 9,642,617 | ||
| Marsh & McLennan Cos., Inc. | 16,495 | 2,751,366 | ||
| MetLife, Inc. | 57,025 | 3,581,170 | ||
| NN Group N.V. | 10,635 | 569,461 | ||
| Samsung Fire & Marine Insurance Co. Ltd. | 19,614 | 3,877,313 | ||
| Travelers Cos., Inc. | 50,716 | 8,159,190 | ||
| Willis Towers Watson PLC | 37,237 | 9,021,780 | ||
| $77,877,860 | ||||
| Internet – 0.1% | ||||
| Gartner, Inc. (a) | 3,490 | $ 1,158,366 | ||
| Leisure & Toys – 0.2% | ||||
| Brunswick Corp. | 21,524 | $ 2,003,669 | ||
| DeNA Co. Ltd. | 32,000 | 592,271 | ||
| Nintendo Co. Ltd. | 2,600 | 1,149,469 | ||
| Polaris, Inc. | 5,542 | 637,053 | ||
| $4,382,462 | ||||
| Machinery & Tools – 2.4% | ||||
| Eaton Corp. PLC | 130,635 | $ 21,523,423 | ||
| Ingersoll Rand, Inc. | 186,480 | 10,025,165 | ||
| Kubota Corp. | 307,300 | 6,551,524 | ||
| PACCAR, Inc. | 27,433 | 2,458,545 | ||
| Regal Beloit Corp. | 17,996 | 2,741,331 | ||
| $43,299,988 | ||||
| Major Banks – 6.0% | ||||
| Bank of America Corp. | 319,128 | $ 15,247,936 | ||
| BNP Paribas | 174,173 | 11,657,817 | ||
| China Construction Bank Corp. | 4,296,000 | 2,928,982 | ||
| Issuer | Shares/Par | Value ($) | ||
| Common Stocks – continued | ||||
| Major Banks – continued | ||||
| DBS Group Holdings Ltd. | 432,300 | $ 10,073,673 | ||
| Goldman Sachs Group, Inc. | 36,159 | 14,946,323 | ||
| JPMorgan Chase & Co. | 108,756 | 18,476,557 | ||
| Mitsubishi UFJ Financial Group, Inc. | 1,225,000 | 6,704,997 | ||
| NatWest Group PLC | 3,205,677 | 9,699,943 | ||
| UBS AG | 1,098,325 | 19,966,819 | ||
| $109,703,047 | ||||
| Medical & Health Technology & Services – 0.4% | ||||
| HCA Healthcare, Inc. | 6,612 | $ 1,656,042 | ||
| McKesson Corp. | 17,400 | 3,617,112 | ||
| Quest Diagnostics, Inc. | 18,831 | 2,764,014 | ||
| $8,037,168 | ||||
| Medical Equipment – 1.9% | ||||
| Becton, Dickinson and Co. | 29,295 | $ 7,018,789 | ||
| Boston Scientific Corp. (a) | 157,684 | 6,800,911 | ||
| Danaher Corp. | 11,472 | 3,576,626 | ||
| Medtronic PLC | 89,349 | 10,709,371 | ||
| Thermo Fisher Scientific, Inc. | 9,463 | 5,990,741 | ||
| $34,096,438 | ||||
| Metals & Mining – 1.0% | ||||
| Fortescue Metals Group Ltd. | 200,537 | $ 2,094,879 | ||
| Glencore PLC | 277,820 | 1,388,719 | ||
| POSCO | 2,339 | 591,306 | ||
| Rio Tinto PLC | 192,003 | 11,983,430 | ||
| Vale S.A. | 195,000 | 2,474,211 | ||
| $18,532,545 | ||||
| Natural Gas - Distribution – 0.2% | ||||
| Italgas S.p.A. | 270,696 | $ 1,717,956 | ||
| UGI Corp. | 27,828 | 1,208,013 | ||
| $2,925,969 | ||||
| Natural Gas - Pipeline – 0.2% | ||||
| Equitrans Midstream Corp. | 148,308 | $ 1,529,056 | ||
| Pembina Pipeline Corp. | 51,699 | 1,711,464 | ||
| $3,240,520 | ||||
| Other Banks & Diversified Financials – 1.5% | ||||
| Hana Financial Group, Inc. | 6,553 | $ 251,567 | ||
| KB Financial Group, Inc. | 7,687 | 370,398 | ||
| KBC Group N.V. | 67,612 | 6,296,527 | ||
| Issuer | Shares/Par | Value ($) | ||
| Common Stocks – continued | ||||
| Other Banks & Diversified Financials – continued | ||||
| Sberbank of Russia, ADR | 152,260 | $ 3,048,245 | ||
| SLM Corp. | 120,374 | 2,208,863 | ||
| Synchrony Financial | 21,029 | 976,797 | ||
| Tisco Financial Group PCL | 788,900 | 2,193,205 | ||
| Truist Financial Corp. | 199,404 | 12,656,172 | ||
| $28,001,774 | ||||
| Pharmaceuticals – 5.9% | ||||
| Bayer AG | 155,926 | $ 8,772,790 | ||
| Johnson & Johnson | 194,689 | 31,710,944 | ||
| Merck & Co., Inc. | 240,704 | 21,193,987 | ||
| Novartis AG | 72,849 | 6,018,238 | ||
| Novo Nordisk A.S., “B” | 64,827 | 7,095,207 | ||
| Organon & Co. | 67,794 | 2,491,429 | ||
| Roche Holding AG | 78,486 | 30,349,463 | ||
| $107,632,058 | ||||
| Printing & Publishing – 0.8% | ||||
| RELX PLC | 176,860 | $ 5,485,398 | ||
| Transcontinental, Inc. | 33,254 | 526,647 | ||
| Wolters Kluwer N.V. | 88,348 | 9,257,089 | ||
| $15,269,134 | ||||
| Railroad & Shipping – 0.9% | ||||
| Canadian Pacific Railway Ltd. | 110,660 | $ 8,565,062 | ||
| Union Pacific Corp. | 32,027 | 7,731,318 | ||
| $16,296,380 | ||||
| Real Estate – 0.2% | ||||
| Extra Space Storage, Inc., REIT | 11,110 | $ 2,192,781 | ||
| National Storage Affiliates Trust, REIT | 13,252 | 827,720 | ||
| $3,020,501 | ||||
| Restaurants – 0.2% | ||||
| Yum China Holdings, Inc. | 72,680 | $ 4,148,574 | ||
| Specialty Chemicals – 0.6% | ||||
| Akzo Nobel N.V. | 55,686 | $ 6,399,965 | ||
| Axalta Coating Systems Ltd. (a) | 124,565 | 3,885,183 | ||
| $10,285,148 | ||||
| Specialty Stores – 0.4% | ||||
| Home Depot, Inc. | 17,675 | $ 6,570,505 | ||
| Issuer | Shares/Par | Value ($) | ||
| Common Stocks – continued | ||||
| Telecommunications - Wireless – 2.0% | ||||
| KDDI Corp. | 681,100 | $ 21,113,952 | ||
| Mobile TeleSystems PJSC, ADR | 90,945 | 835,785 | ||
| T-Mobile USA, Inc. (a) | 59,623 | 6,858,434 | ||
| Turkcell Iletisim Hizmetleri A.S. | 331,595 | 527,365 | ||
| Vodafone Group PLC | 4,806,391 | 7,106,640 | ||
| $36,442,176 | ||||
| Telephone Services – 0.4% | ||||
| Hellenic Telecommunications Organization S.A. | 158,957 | $ 2,811,440 | ||
| PT Telekom Indonesia | 5,185,200 | 1,390,772 | ||
| Quebecor, Inc., “B” | 133,774 | 3,409,205 | ||
| $7,611,417 | ||||
| Tobacco – 1.1% | ||||
| British American Tobacco PLC | 150,710 | $ 5,252,262 | ||
| Imperial Brands PLC | 147,816 | 3,119,367 | ||
| Japan Tobacco, Inc. | 259,700 | 5,093,743 | ||
| Philip Morris International, Inc. | 78,531 | 7,424,321 | ||
| $20,889,693 | ||||
| Utilities - Electric Power – 1.6% | ||||
| CLP Holdings Ltd. | 303,000 | $ 2,965,548 | ||
| Duke Energy Corp. | 66,811 | 6,815,390 | ||
| E.ON SE | 691,888 | 8,770,854 | ||
| Energias do Brasil S.A. | 141,052 | 489,851 | ||
| Energisa S.A., IEU | 61,000 | 428,226 | ||
| ENGIE Energía Brasil S.A. | 102,600 | 707,354 | ||
| Exelon Corp. | 87,711 | 4,665,348 | ||
| Iberdrola S.A. | 181,507 | 2,143,333 | ||
| Transmissora Alianca de Energia Eletrica S.A., IEU | 279,265 | 1,814,000 | ||
| $28,799,904 | ||||
| Total Common Stocks (Identified Cost, $693,789,297) | $ 1,086,562,123 | |||
| Bonds – 36.9% | ||||
| Asset-Backed & Securitized – 2.7% | ||||
| ACREC 2021-FL1 Ltd., “C”, FLR, 2.235% (LIBOR - 1mo. + 2.15%), 10/16/2036 (n) | $ | 1,125,500 | $ 1,126,555 | |
| Arbor Multi-Family Mortgage Securities Trust, Inc., 2021-MF2, “A5”, 2.513%, 6/15/2054 (n) | 1,275,000 | 1,305,674 | ||
| Arbor Multi-Family Mortgage Securities Trust, Inc., 2021-MF3, “A5”, 2.574%, 10/15/2054 (i)(n) | 2,100,000 | 2,157,512 | ||
| Issuer | Shares/Par | Value ($) | ||
| Bonds – continued | ||||
| Asset-Backed & Securitized – continued | ||||
| Arbor Realty Trust, Inc., CLO, 2019-FL2, “AS”, FLR, 1.614% (LIBOR - 1mo. + 1.45%), 9/15/2034 (n) | $ | 1,000,000 | $ 1,000,304 | |
| Arbor Realty Trust, Inc., CLO, 2021-FL1, “B”, FLR, 1.59% (LIBOR - 1mo. + 1.5%), 12/15/2035 (n) | 423,000 | 423,130 | ||
| Arbor Realty Trust, Inc., CLO, 2021-FL2, “B”, FLR, 1.69% (LIBOR - 1mo. + 1.6%), 5/15/2036 (n) | 289,000 | 289,177 | ||
| Arbor Realty Trust, Inc., CLO, 2021-FL2, “C”, FLR, 2.04% (LIBOR - 1mo. + 1.95%), 5/15/2036 (n) | 857,500 | 858,291 | ||
| Bank, 2021-BN35, “XA”, 1.054%, 6/15/2064 (i) | 6,225,498 | 497,763 | ||
| Barclays Commercial Mortgage Securities LLC, 2020-C7, “XA”, 1.627%, 4/15/2053 (i) | 1,441,980 | 144,583 | ||
| BBCMS Mortgage Trust, 2021-C10, “XA”, 1.309%, 7/15/2054 (i) | 5,894,485 | 572,156 | ||
| BBCMS Mortgage Trust, 2021-C9, “XA”, 1.64%, 2/15/2054 (i) | 5,423,927 | 650,816 | ||
| Benchmark Mortgage Trust, 2021-B24, “XA”, 1.155%, 3/15/2054 (i) | 4,617,516 | 383,255 | ||
| Benchmark Mortgage Trust, 2021-B25, “A5”, 2.577%, 4/15/2054 | 1,720,000 | 1,775,362 | ||
| Benchmark Mortgage Trust, 2021-B26, “XA”, 0.999%, 6/15/2054 (i) | 10,661,387 | 704,974 | ||
| Benchmark Mortgage Trust, 2021-B27, “XA”, 1.272%, 7/15/2054 (i) | 14,041,160 | 1,334,407 | ||
| Benchmark Mortgage Trust, 2021-B28, “XA”, 1.293%, 8/15/2054 (i) | 13,294,720 | 1,283,623 | ||
| BPCRE Holder LLC, FLR, 1.635% (LIBOR - 1mo. + 1.55%), 2/15/2037 (n) | 1,393,000 | 1,392,157 | ||
| Business Jet Securities LLC, 2020-1A, “A”, 2.981%, 11/15/2035 (n) | 472,900 | 475,423 | ||
| Business Jet Securities LLC, 2021-1A, “A”, 2.162%, 4/15/2036 (n) | 443,495 | 445,108 | ||
| BXMT Ltd., 2021-FL4, “AS”, FLR, 1.386% (LIBOR - 1mo. + 1.3%), 5/15/2038 (n) | 1,400,000 | 1,400,087 | ||
| BXMT Ltd., 2021-FL4, “B”, FLR, 1.636% (LIBOR - 1mo. + 1.55%), 5/15/2038 (n) | 1,996,500 | 1,996,495 | ||
| Capital Automotive, 2020-1A, “A4”, REIT, 3.19%, 2/15/2050 (n) | 522,792 | 529,825 | ||
| CF Hippolyta Issuer LLC, 2020-1, “A1”, 1.69%, 7/15/2060 (n) | 380,440 | 380,429 | ||
| Commercial Mortgage Pass-Through Certificates, 2020-BN28, “A4”, 1.844%, 3/15/2063 | 452,210 | 441,123 | ||
| Commercial Mortgage Pass-Through Certificates, 2020-BN29, “A4”, 1.997%, 11/15/2053 | 2,019,803 | 1,991,053 | ||
| Issuer | Shares/Par | Value ($) | ||
| Bonds – continued | ||||
| Asset-Backed & Securitized – continued | ||||
| Commercial Mortgage Pass-Through Certificates, 2021-BN32, “XA”, 0.784%, 4/15/2054 (i) | $ | 6,801,543 | $ 394,532 | |
| Commercial Mortgage Pass-Through Certificates, 2021-BN34, “A5”, 2.438%, 6/15/2063 | 1,822,000 | 1,860,264 | ||
| Commercial Mortgage Pass-Through Certificates, 2021-BN34, “XA”, 0.979%, 6/15/2063 (i) | 6,615,066 | 496,610 | ||
| Credit Acceptance Auto Loan Trust, 2021-3A, “A”, 1%, 5/15/2030 (n) | 1,579,000 | 1,572,491 | ||
| FS Rialto 2019-FL1 Issuer Ltd., 2021-FL2, “AS”, FLR, 1.636% (LIBOR - 1mo. + 1.6%), 4/16/2028 (n) | 1,454,000 | 1,454,443 | ||
| LoanCore Ltd., 2021-CRE5, “AS”, FLR, 1.84% (LIBOR - 1mo. + 1.75%), 7/15/2036 (n) | 1,850,000 | 1,850,569 | ||
| LoanCore Ltd., 2021-CRE5, “B”, FLR, 2.09% (LIBOR - 1mo. + 2%), 7/15/2036 (n) | 782,000 | 781,999 | ||
| MF1 CLO Ltd., 2020-FL3, “AS”, FLR, 3.014% (LIBOR - 1mo. + 2.85%), 7/15/2035 (z) | 714,500 | 724,104 | ||
| MF1 CLO Ltd., 2021-FL5, “AS”, FLR, 1.364% (LIBOR - 1mo. + 1.2%), 7/15/2036 (n) | 1,360,000 | 1,358,746 | ||
| MF1 CLO Ltd., 2021-FL5, “B”, FLR, 1.614% (LIBOR - 1mo. + 1.45%), 7/15/2036 (n) | 1,977,500 | 1,976,287 | ||
| MF1 CLO Ltd., 2021-FL5, “C”, FLR, 1.864% (LIBOR - 1mo. + 1.7%), 7/15/2036 (n) | 225,000 | 224,931 | ||
| MF1 CLO Ltd., 2021-FL6, “AS”, FLR, 1.536% (LIBOR - 1mo. + 1.45%), 7/16/2036 (n) | 2,200,000 | 2,198,885 | ||
| Morgan Stanley Capital I Trust, 2021-L5, “XA”, 1.301%, 5/15/2054 (i) | 4,682,537 | 439,301 | ||
| Morgan Stanley Capital I Trust, 2021-L6, “XA”, 1.239%, 6/15/2054 (i) | 9,790,387 | 835,177 | ||
| Multi-Family Housing Mortgage, MF1-2021, “B”, FLR, 1.735% (LIBOR - 1mo. + 1.65%), 7/16/2036 (n) | 2,200,000 | 2,199,824 | ||
| PFP III Ltd., 2021-7, “AS”, FLR, 1.236% (LIBOR - 1mo. + 1.15%), 4/14/2038 (n) | 1,235,438 | 1,230,122 | ||
| PFP III Ltd., 2021-7, “B”, FLR, 1.485% (LIBOR - 1mo. + 1.4%), 4/14/2038 (n) | 484,976 | 482,888 | ||
| PFP III Ltd., 2021-8, “B”, FLR, 1.587% (LIBOR - 1mo. + 1.5%), 8/09/2037 (n) | 507,000 | 506,691 | ||
| Starwood Commercial Mortgage, 2021-FL2, “A”, FLR, 1.286% (LIBOR - 1mo. + 1.2%), 4/18/2038 (n) | 1,400,000 | 1,400,514 | ||
| Starwood Commercial Mortgage, 2021-FL2, “AS”, FLR, 1.536% (LIBOR - 1mo. + 1.45%), 4/18/2038 (n) | 1,400,000 | 1,400,534 | ||
| TPG Real Estate Finance, 2021-FL4, “A”, FLR, 1.286% (LIBOR - 1mo. + 1.2%), 3/15/2038 (n) | 651,000 | �� 650,397 | ||
| Issuer | Shares/Par | Value ($) | ||
| Bonds – continued | ||||
| Asset-Backed & Securitized – continued | ||||
| TPG Real Estate Finance, 2021-FL4, “AS”, FLR, 1.486% (LIBOR - 1mo. + 1.4%), 3/15/2038 (n) | $ | 700,000 | $ 700,000 | |
| Wells Fargo Commercial Mortgage Trust, 2020-C58, “A4”, 2.092%, 7/15/2053 | 876,000 | 869,732 | ||
| Wells Fargo Commercial Mortgage Trust, 2021-C60, 1.559%, 8/15/2054 (i) | 6,994,733 | 824,398 | ||
| $49,992,721 | ||||
| Automotive – 0.4% | ||||
| Daimler AG, 0.75%, 9/10/2030 | EUR | 390,000 | $ 459,770 | |
| Daimler Finance North America LLC, 1.45%, 3/02/2026 (n) | $ | 771,000 | 767,349 | |
| Ferrari N.V., 1.5%, 5/27/2025 | EUR | 919,000 | 1,097,779 | |
| Hyundai Capital America, 2%, 6/15/2028 (n) | $ | 1,809,000 | 1,762,774 | |
| Hyundai Capital America, 6.375%, 4/08/2030 (n) | 978,000 | 1,240,413 | ||
| Lear Corp., 3.8%, 9/15/2027 | 190,000 | 207,517 | ||
| Volkswagen International Finance N.V., 3.5% to 3/20/2030, FLR (EUR Swap Rate - 15yr. + 3.06%) to 3/20/2050, FLR (EUR Swap Rate - 15yr. + 3.81%) to 12/29/2166 | EUR | 960,000 | 1,190,859 | |
| $6,726,461 | ||||
| Broadcasting – 0.1% | ||||
| Discovery, Inc., 4.125%, 5/15/2029 | $ | 718,000 | $ 797,310 | |
| Prosus N.V., 1.539%, 8/03/2028 | EUR | 500,000 | 579,912 | |
| Prosus N.V., 3.68%, 1/21/2030 (n) | $ | 387,000 | 397,915 | |
| Walt Disney Co., 3.5%, 5/13/2040 | 658,000 | 726,870 | ||
| $2,502,007 | ||||
| Brokerage & Asset Managers – 0.1% | ||||
| Intercontinental Exchange, Inc., 3%, 9/15/2060 | $ | 1,090,000 | $ 1,058,983 | |
| Low Income Investment Fund, 3.386%, 7/01/2026 | 285,000 | 297,529 | ||
| Low Income Investment Fund, 3.711%, 7/01/2029 | 760,000 | 807,066 | ||
| LSEG Netherlands B.V., 0.25%, 4/06/2028 | EUR | 430,000 | 489,766 | |
| $2,653,344 | ||||
| Building – 0.2% | ||||
| Holcim Finance (Luxembourg) S.A., 0.625%, 4/06/2030 | EUR | 840,000 | $ 949,133 | |
| Holcim Finance (Luxembourg) S.A., 0.5%, 4/23/2031 | 475,000 | 521,370 | ||
| Holcim Sterling Finance (Netherlands) B.V., 2.25%, 4/04/2034 | GBP | 850,000 | 1,144,295 | |
| Vulcan Materials Co., 3.5%, 6/01/2030 | $ | 908,000 | 990,513 | |
| $3,605,311 | ||||
| Issuer | Shares/Par | Value ($) | ||
| Bonds – continued | ||||
| Business Services – 0.3% | ||||
| Equinix, Inc., REIT, 1%, 3/15/2033 | EUR | 600,000 | $ 677,217 | |
| Euronet Worldwide, Inc., 1.375%, 5/22/2026 | 1,105,000 | 1,297,450 | ||
| Fiserv, Inc., 4.4%, 7/01/2049 | $ | 281,000 | 339,321 | |
| Mastercard, Inc., 3.85%, 3/26/2050 | 542,000 | 658,929 | ||
| NXP Semiconductors N.V., 3.4%, 5/01/2030 (n) | 1,430,000 | 1,536,804 | ||
| Verisk Analytics, Inc., 4%, 6/15/2025 | 747,000 | 814,147 | ||
| $5,323,868 | ||||
| Cable TV – 0.2% | ||||
| Charter Communications Operating LLC/Charter Communications Operating Capital Corp., 6.384%, 10/23/2035 | $ | 643,000 | $ 835,129 | |
| Charter Communications Operating LLC/Charter Communications Operating Capital Corp., 4.8%, 3/01/2050 | 486,000 | 552,390 | ||
| Comcast Corp., 3.75%, 4/01/2040 | 928,000 | 1,039,705 | ||
| Eutelsat S.A., 2.25%, 7/13/2027 | EUR | 900,000 | 1,083,348 | |
| Eutelsat S.A., 1.5%, 10/13/2028 | 500,000 | 584,864 | ||
| $4,095,436 | ||||
| Chemicals – 0.1% | ||||
| Alpek SAB de C.V., 3.25%, 2/25/2031 (n) | $ | 501,000 | $ 495,995 | |
| LYB International Finance III, LLC, 4.2%, 5/01/2050 | 726,000 | 849,916 | ||
| Sherwin-Williams Co., 3.8%, 8/15/2049 | 450,000 | 515,879 | ||
| $1,861,790 | ||||
| Computer Software – 0.2% | ||||
| Microsoft Corp., 3.125%, 11/03/2025 | $ | 1,316,000 | $ 1,411,940 | |
| Microsoft Corp., 2.921%, 3/17/2052 | 1,212,000 | 1,283,155 | ||
| Microsoft Corp., 3.041%, 3/17/2062 | 412,000 | 443,120 | ||
| $3,138,215 | ||||
| Computer Software - Systems – 0.2% | ||||
| Apple, Inc., 2.9%, 9/12/2027 | $ | 2,007,000 | $ 2,144,779 | |
| Apple, Inc., 4.5%, 2/23/2036 | 557,000 | 696,136 | ||
| $2,840,915 | ||||
| Conglomerates – 0.2% | ||||
| Carrier Global Corp., 2.722%, 2/15/2030 | $ | 708,000 | $ 726,612 | |
| Carrier Global Corp., 3.577%, 4/05/2050 | 590,000 | 639,168 | ||
| Westinghouse Air Brake Technologies Corp., 4.95%, 9/15/2028 | 1,314,000 | 1,511,500 | ||
| $2,877,280 | ||||
| Issuer | Shares/Par | Value ($) | ||
| Bonds – continued | ||||
| Consumer Products – 0.1% | ||||
| JAB Holdings B.V., 1%, 7/14/2031 | EUR | 800,000 | $ 898,867 | |
| JAB Holdings B.V., 2.25%, 12/19/2039 | 500,000 | 604,522 | ||
| Reckitt Benckiser Treasury Services PLC, 3%, 6/26/2027 (n) | $ | 1,016,000 | 1,080,961 | |
| $2,584,350 | ||||
| Consumer Services – 0.1% | ||||
| AA Bond Co. Ltd., 3.25%, 7/31/2028 | GBP | 600,000 | $ 831,136 | |
| Booking Holdings, Inc., 0.5%, 3/08/2028 | EUR | 100,000 | 115,340 | |
| $946,476 | ||||
| Containers – 0.0% | ||||
| DS Smith PLC, 2.875%, 7/26/2029 | GBP | 490,000 | $ 694,998 | |
| Electrical Equipment – 0.0% | ||||
| Arrow Electronics, Inc., 3.25%, 9/08/2024 | $ | 647,000 | $ 679,732 | |
| Electronics – 0.2% | ||||
| ASML Holding N.V., 0.625%, 5/07/2029 | EUR | 212,000 | $ 249,179 | |
| Broadcom, Inc., 4.15%, 11/15/2030 | $ | 479,000 | 526,614 | |
| Broadcom, Inc., 3.419%, 4/15/2033 (n) | 844,000 | 871,443 | ||
| Broadcom, Inc., 3.469%, 4/15/2034 (n) | 780,000 | 804,710 | ||
| Broadcom, Inc., 3.137%, 11/15/2035 (n) | 957,000 | 940,555 | ||
| Broadcom, Inc., 3.187%, 11/15/2036 (n) | 26,000 | 25,559 | ||
| Infineon Technologies AG, 1.625%, 6/24/2029 | EUR | 900,000 | 1,105,623 | |
| $4,523,683 | ||||
| Emerging Market Quasi-Sovereign – 0.8% | ||||
| China Construction Bank Corp. (Hong Kong Branch), 1.25%, 8/04/2025 | $ | 1,700,000 | $ 1,676,897 | |
| Emirates Development Bank PJSC, 1.639%, 6/15/2026 | 1,730,000 | 1,723,512 | ||
| Export-Import Bank of India, 3.375%, 8/05/2026 | 1,200,000 | 1,262,404 | ||
| Export-Import Bank of India, 3.875%, 2/01/2028 | 1,000,000 | 1,070,084 | ||
| First Abu Dhabi Bank PJSC, 0.125%, 2/16/2026 | EUR | 1,200,000 | 1,380,958 | |
| MDGH - GMTN B.V. (United Arab Emirates), 2.5%, 11/07/2024 | $ | 763,000 | 793,520 | |
| MDGH - GMTN B.V. (United Arab Emirates), 1%, 3/10/2034 | EUR | 1,540,000 | 1,771,161 | |
| MDGH - GMTN RSC Ltd. (United Arab Emirates), 2.5%, 6/03/2031 | $ | 1,460,000 | 1,469,601 | |
| Ooredoo International Finance Ltd. (State of Qatar), 2.625%, 4/08/2031 | 820,000 | 827,306 | ||
| PT Pertamina (Persero) (Republic of Indonesia), 3.65%, 7/30/2029 | 1,050,000 | 1,112,884 | ||
| Issuer | Shares/Par | Value ($) | ||
| Bonds – continued | ||||
| Emerging Market Quasi-Sovereign – continued | ||||
| Qatar Petroleum, 2.25%, 7/12/2031 | $ | 1,171,000 | $ 1,153,435 | |
| Qatar Petroleum, 3.125%, 7/12/2041 | 776,000 | 783,133 | ||
| $15,024,895 | ||||
| Emerging Market Sovereign – 3.9% | ||||
| Oriental Republic of Uruguay, 4.375%, 1/23/2031 | $ | 2,450,000 | $ 2,829,579 | |
| Oriental Republic of Uruguay, 8.25%, 5/21/2031 | UYU | 104,366,000 | 2,344,663 | |
| People's Republic of China, 3.03%, 3/11/2026 | CNY | 46,050,000 | 7,260,937 | |
| People's Republic of China, 2.68%, 5/21/2030 | 127,710,000 | 19,352,975 | ||
| People's Republic of China, 3.27%, 11/19/2030 | 97,730,000 | 15,593,458 | ||
| Republic of Chile, 4.7%, 9/01/2030 | CLP | 1,655,000,000 | 1,859,574 | |
| Republic of Croatia, 1.5%, 6/17/2031 | EUR | 3,935,000 | 4,722,754 | |
| Republic of Croatia, 1.75%, 3/04/2041 | 1,388,000 | 1,628,917 | ||
| Republic of Korea, 1.875%, 6/10/2029 | KRW | 11,926,970,000 | 9,682,688 | |
| State of Qatar, 4%, 3/14/2029 (n) | $ | 878,000 | 988,839 | |
| State of Qatar, 3.75%, 4/16/2030 | 1,230,000 | 1,371,450 | ||
| State of Qatar, 4.4%, 4/16/2050 | 299,000 | 364,418 | ||
| United Arab Emirates International Government, 3.25%, 10/19/2061 | 720,000 | 725,702 | ||
| United Mexican States, 2.659%, 5/24/2031 | 2,213,000 | 2,135,766 | ||
| United Mexican States, 3.771%, 5/24/2061 | 1,036,000 | 953,897 | ||
| $71,815,617 | ||||
| Energy - Independent – 0.3% | ||||
| Diamondback Energy, Inc., 4.4%, 3/24/2051 | $ | 1,153,000 | $ 1,328,777 | |
| Tengizchevroil Finance Co. International Ltd., 4%, 8/15/2026 (n) | 3,609,000 | 3,865,737 | ||
| $5,194,514 | ||||
| Energy - Integrated – 0.4% | ||||
| BP Capital Markets B.V., 0.933%, 12/04/2040 | EUR | 282,000 | $ 300,858 | |
| Cenovus Energy, Inc., 2.65%, 1/15/2032 | $ | 939,000 | 915,777 | |
| Eni S.p.A., 4.25%, 5/09/2029 (n) | 607,000 | 687,934 | ||
| Eni S.p.A., 2.625% to 1/13/2026, FLR (EUR Swap Rate - 5yr. + 3.167%) to 1/13/2031, FLR (EUR Swap Rate - 5yr. + 3.417%) to 1/13/2046, FLR (EUR Swap Rate - 5yr. + 4.167%) to 1/13/2170 | EUR | 240,000 | 288,191 | |
| Eni S.p.A., 2.75%, 5/11/2170 | 1,020,000 | 1,180,558 | ||
| Galp Energia SGPS S.A., 2%, 1/15/2026 | 1,300,000 | 1,572,665 | ||
| MOL PLC, 1.5%, 10/08/2027 | 920,000 | 1,089,823 | ||
| Issuer | Shares/Par | Value ($) | ||
| Bonds – continued | ||||
| Energy - Integrated – continued | ||||
| OMV AG, 2.5% to 9/01/2026, FLR (EUR Swap Rate - 5yr. + 2.82%) to 9/01/2030, FLR (EUR Swap Rate - 5yr. + 3.82%) to 9/01/2070 | EUR | 400,000 | $ 482,630 | |
| $6,518,436 | ||||
| Financial Institutions – 0.8% | ||||
| AerCap Ireland Capital DAC/AerCap Global Aviation Trust, 3.3%, 1/30/2032 | $ | 367,000 | $ 373,517 | |
| AerCap Ireland Capital DAC/AerCap Global Aviation Trust, 3.85%, 10/29/2041 | 293,000 | 303,342 | ||
| Air Lease Corp., 3.125%, 12/01/2030 | 1,075,000 | 1,097,967 | ||
| Avolon Holdings Funding Ltd., 4.25%, 4/15/2026 (n) | 509,000 | 546,993 | ||
| Avolon Holdings Funding Ltd., 4.375%, 5/01/2026 (n) | 537,000 | 579,471 | ||
| Avolon Holdings Funding Ltd., 2.75%, 2/21/2028 (n) | 665,000 | 658,441 | ||
| Canary Wharf Group Investment Holdings PLC, 3.375%, 4/23/2028 | GBP | 952,000 | 1,317,503 | |
| CTP B.V., 0.75%, 2/18/2027 | EUR | 325,000 | 372,154 | |
| CTP N.V., 1.25%, 6/21/2029 | 560,000 | 640,006 | ||
| CTP N.V., 1.5%, 9/27/2031 | 1,050,000 | 1,186,269 | ||
| EXOR N.V., 2.25%, 4/29/2030 | 600,000 | 758,070 | ||
| EXOR N.V., 0.875%, 1/19/2031 | 500,000 | 563,608 | ||
| GE Capital International Funding Co., 3.373%, 11/15/2025 | $ | 1,716,000 | 1,851,310 | |
| Grand City Properties S.A., 1.5%, 12/09/2069 | EUR | 500,000 | 560,660 | |
| Logicor Financing S.à r.l., 0.875%, 1/14/2031 | 275,000 | 301,389 | ||
| SBB Treasury Oyj, 0.75%, 12/14/2028 | 590,000 | 656,245 | ||
| SBB Treasury Oyj, 1.125%, 11/26/2029 | 450,000 | 508,232 | ||
| VGP N.V., 1.5%, 4/08/2029 | 1,000,000 | 1,126,499 | ||
| Vonovia SE, 1.5%, 6/14/2041 | 800,000 | 911,229 | ||
| Vonovia SE, 1.625%, 9/01/2051 | 500,000 | 547,713 | ||
| $14,860,618 | ||||
| Food & Beverages – 0.5% | ||||
| Anheuser-Busch InBev S.A./N.V., 1.65%, 3/28/2031 | EUR | 430,000 | $ 533,044 | |
| Anheuser-Busch InBev Worldwide, Inc., 4.375%, 4/15/2038 | $ | 446,000 | 525,649 | |
| Anheuser-Busch InBev Worldwide, Inc., 5.55%, 1/23/2049 | 512,000 | 718,168 | ||
| Bacardi Ltd., 5.15%, 5/15/2038 (n) | 658,000 | 813,394 | ||
| Constellation Brands, Inc., 4.4%, 11/15/2025 | 1,053,000 | 1,167,586 | ||
| Constellation Brands, Inc., 3.15%, 8/01/2029 | 1,006,000 | 1,068,662 | ||
| Constellation Brands, Inc., 2.25%, 8/01/2031 | 850,000 | 831,509 | ||
| JDE Peet's N.V., 0.5%, 1/16/2029 | EUR | 500,000 | 564,174 | |
| PepsiCo, Inc., 0.75%, 10/14/2033 | 590,000 | 675,383 | ||
| Issuer | Shares/Par | Value ($) | ||
| Bonds – continued | ||||
| Food & Beverages – continued | ||||
| PT Indofood CBP Sukses Makmur Tbk, 3.398%, 6/09/2031 | $ | 1,680,000 | $ 1,670,198 | |
| $8,567,767 | ||||
| Gaming & Lodging – 0.1% | ||||
| Las Vegas Sands Corp., 3.9%, 8/08/2029 | $ | 984,000 | $ 1,001,277 | |
| Marriott International, Inc., 2.85%, 4/15/2031 | 606,000 | 610,304 | ||
| Whitbread Group PLC, 3%, 5/31/2031 | GBP | 550,000 | 757,435 | |
| $2,369,016 | ||||
| Industrial – 0.2% | ||||
| CPI Property Group S.A., 2.75%, 1/22/2028 | GBP | 450,000 | $ 619,598 | |
| CPI Property Group S.A., 1.5%, 1/27/2031 | EUR | 1,005,000 | 1,111,912 | |
| Trustees of the University of Pennsylvania, 2.396%, 10/01/2050 | $ | 1,588,000 | 1,557,739 | |
| $3,289,249 | ||||
| Insurance – 0.5% | ||||
| Aflac, Inc., 3.6%, 4/01/2030 | $ | 1,004,000 | $ 1,114,838 | |
| AIA Group Ltd., 0.88%, 9/09/2033 | EUR | 600,000 | 679,458 | |
| Argentum Zurich Insurance, 3.5% to 10/01/2026, FLR (EURIBOR - 3mo. + 3.95%) to 10/01/2046 | 600,000 | 780,170 | ||
| Aviva PLC, 3.875% to 7/03/2024, FLR (EUR Swap Rate - 5yr. + 3.48%) to 7/03/2044 | 600,000 | 754,457 | ||
| Aviva PLC, 4% to 6/03/2035, FLR (GBP Government Yield - 5yr. + 4.7%) to 6/03/2055 | GBP | 927,000 | 1,379,787 | |
| CNP Assurances S.A., 2% to 7/27/2030, FLR (EURIBOR - 3mo. + 3%) to 7/27/2050 | EUR | 500,000 | 592,999 | |
| Credit Agricole Assurances S.A., 2%, 7/17/2030 | 300,000 | 357,984 | ||
| Credit Agricole Assurances S.A., 1.5%, 10/06/2031 | 1,300,000 | 1,474,878 | ||
| La Mondiale, 4.375% to 10/24/2029, FLR (EUR Swap Rate - 5yr. + 4.411%) to 4/24/2069 | 500,000 | 625,687 | ||
| Swiss Life Finance I Ltd., 0.5%, 9/15/2031 | 719,000 | 809,311 | ||
| Zurich Finance (Ireland) DAC, 1.875% to 9/17/2030, FLR (EURIBOR - 3mo. + 2.95%) to 9/17/2050 | 804,000 | 959,770 | ||
| $9,529,339 | ||||
| Insurance - Property & Casualty – 0.3% | ||||
| Berkshire Hathaway, Inc., 0.5%, 1/15/2041 | EUR | 325,000 | $ 333,381 | |
| Hartford Financial Services Group, Inc., 3.6%, 8/19/2049 | $ | 728,000 | 808,482 | |
| Marsh & McLennan Cos., Inc., 2.25%, 11/15/2030 | 1,075,000 | 1,074,407 | ||
| Progressive Corp., 4.125%, 4/15/2047 | 823,000 | 1,011,208 | ||
| QBE Insurance Group Ltd., 2.5%, 9/13/2038 | GBP | 738,000 | 974,858 | |
| Issuer | Shares/Par | Value ($) | ||
| Bonds – continued | ||||
| Insurance - Property & Casualty – continued | ||||
| QBE Insurance Group Ltd., 6.115% to 5/24/2022, FLR (GBP Swap Rate-5yr. + 5%) to 5/24/2042 | GBP | 100,000 | $ 140,425 | |
| Willis North America, Inc., 3.875%, 9/15/2049 | $ | 943,000 | 1,046,770 | |
| $5,389,531 | ||||
| International Market Quasi-Sovereign – 0.4% | ||||
| Deutsche Bahn Finance GmbH (Federal Republic of Germany), 1.375%, 4/16/2040 | EUR | 195,000 | $ 242,138 | |
| Deutsche Bahn Finance GmbH (Federal Republic of Germany), 0.625%, 12/08/2050 | 350,000 | 362,681 | ||
| Electricite de France S.A., 2.875% to 3/15/2027, FLR (EUR Swap Rate - 5yr. + 3.373%) to 3/15/2031, FLR (EUR Swap Rate - 5yr. + 3.623%) to 3/15/2047, FLR (EUR Swap Rate - 5yr. + 4.373%) to 3/15/2070 | 1,400,000 | 1,655,995 | ||
| Electricite de France S.A., 5.875% to 1/22/2029, FLR (GBP Swap Rate - 15yr. + 3.046%) to 1/22/2049, FLR (GBP Swap Rate - 15yr. + 3.796%) to 12/31/2165 | GBP | 800,000 | 1,212,743 | |
| Electricite de France S.A., 2.625% to 6/01/2028, FLR (EUR Swap Rate - 5yr. + 2.86%) to 6/01/2033, FLR (EUR Swap Rate - 5yr. + 3.11%) to 6/01/2048, FLR (EUR Swap Rate - 5yr. + 3.86%) to 6/01/2170 | EUR | 800,000 | 926,095 | |
| La Banque Postale S.A., 0.875% to 1/26/2026, FLR (EUR Swap Rate - 5yr. + 1.38%) to 1/26/2031 | 600,000 | 690,780 | ||
| Landsbankinn Bank (Republic of Iceland), 0.375%, 5/23/2025 | 623,000 | 717,095 | ||
| Ontario Teachers' Cadillac Fairview Properties, 2.5%, 10/15/2031 (n) | $ | 927,000 | 928,937 | |
| $6,736,464 | ||||
| International Market Sovereign – 8.8% | ||||
| Commonwealth of Australia, 3.25%, 6/21/2039 | AUD | 8,262,000 | $ 6,793,614 | |
| Commonwealth of Australia, 1.75%, 6/21/2051 | 4,890,000 | 2,912,452 | ||
| Federal Republic of Germany, 0.5%, 4/15/2030 | EUR | 8,747,263 | 12,376,483 | |
| Federal Republic of Germany, 1.25%, 8/15/2048 | 1,869,000 | 2,826,359 | ||
| Government of Bermuda, 2.375%, 8/20/2030 (n) | $ | 418,000 | 413,820 | |
| Government of Japan, 1.7%, 3/20/2032 | JPY | 2,149,900,000 | 21,943,033 | |
| Government of Japan, 0.4%, 3/20/2036 | 285,000,000 | 2,544,183 | ||
| Government of Japan, 2.4%, 3/20/2037 | 42,800,000 | 492,759 | ||
| Government of Japan, 2.3%, 3/20/2040 | 1,613,550,000 | 18,820,527 | ||
| Government of Japan, 0.6%, 9/20/2050 | 536,250,000 | 4,619,866 | ||
| Government of Canada, 4%, 12/01/2031 | CAD | 246 | 283 | |
| Kingdom of Belgium, 0.4%, 6/22/2040 (n) | EUR | 7,015,000 | 7,773,776 | |
| Kingdom of Spain, 1.25%, 10/31/2030 (n) | 10,633,000 | 13,116,647 | ||
| Kingdom of Spain, 1.85%, 7/30/2035 | 9,837,000 | 12,858,337 | ||
| Issuer | Shares/Par | Value ($) | ||
| Bonds – continued | ||||
| International Market Sovereign – continued | ||||
| Kingdom of Spain, 1.2%, 10/31/2040 (n) | EUR | 827,000 | $ 974,855 | |
| Republic of Cyprus, 0%, 2/09/2026 | 4,094,000 | 4,701,050 | ||
| Republic of Cyprus, 0.625%, 1/21/2030 | 2,535,000 | 2,958,903 | ||
| Republic of Italy, 0.5%, 7/15/2028 | 9,050,000 | 10,279,681 | ||
| Republic of Italy, 1.65%, 3/01/2032 | 6,066,000 | 7,322,029 | ||
| Republic of Italy, 1.45%, 3/01/2036 | 7,844,000 | 9,065,433 | ||
| Republic of Italy, 1.7%, 9/01/2051 | 7,808,000 | 8,663,020 | ||
| United Kingdom Treasury, 0.375%, 10/22/2030 | GBP | 4,102,000 | 5,314,851 | |
| United Kingdom Treasury, 1.75%, 9/07/2037 | 1,716,000 | 2,546,170 | ||
| United Kingdom Treasury, 1.75%, 1/22/2049 | 941,000 | 1,469,360 | ||
| $160,787,491 | ||||
| Leisure & Toys – 0.0% | ||||
| Ubisoft Entertainment S.A., 0.878%, 11/24/2027 | EUR | 400,000 | $ 453,096 | |
| Local Authorities – 0.3% | ||||
| Government of Ontario, 1.9%, 12/02/2051 | CAD | 5,793,000 | $ 3,855,322 | |
| Province of Alberta, 4.5%, 12/01/2040 | 710,000 | 716,586 | ||
| Province of British Columbia, 2.95%, 6/18/2050 | 600,000 | 508,676 | ||
| $5,080,584 | ||||
| Machinery & Tools – 0.1% | ||||
| CNH Industrial Capital LLC, 1.875%, 1/15/2026 | $ | 1,156,000 | $ 1,165,772 | |
| John Deere Capital Corp., 2.8%, 7/18/2029 | 628,000 | 668,735 | ||
| $1,834,507 | ||||
| Major Banks – 1.8% | ||||
| Australia and New Zealand Banking Group Ltd., 2.57%, 11/25/2035 (n) | $ | 1,034,000 | $ 996,606 | |
| Bank of America Corp., 3.366% to 1/23/2025, FLR (LIBOR - 3mo. + 0.81%) to 1/23/2026 | 1,469,000 | 1,558,622 | ||
| Bank of America Corp., 3.419% to 12/20/2027, FLR (LIBOR - 3mo. + 1.04%) to 12/20/2028 | 1,125,000 | 1,202,894 | ||
| Bank of America Corp., 0.694%, 3/22/2031 | EUR | 610,000 | 690,262 | |
| Bank of America Corp., 2.687% to 4/22/2031, FLR (SOFR + 1.32%) to 4/22/2032 | $ | 2,876,000 | 2,911,738 | |
| Barclays PLC, 1.125%, 3/22/2031 | EUR | 400,000 | 459,873 | |
| Barclays PLC, 1.106% to 5/12/2031, FLR (EUR Swap Rate - 1yr. + 1%) to 5/12/2032 | 600,000 | 685,984 | ||
| CaixaBank S.A., 2.75% to 7/14/2023, FLR (EUR Swap Rate - 5yr. + 2.35%) to 7/14/2028 | 800,000 | 959,600 | ||
| Commonwealth Bank of Australia, 2.688%, 3/11/2031 (n) | $ | 1,471,000 | 1,455,585 | |
| Issuer | Shares/Par | Value ($) | ||
| Bonds – continued | ||||
| Major Banks – continued | ||||
| Credit Suisse Group AG, 3.091% to 5/14/2031, FLR (SOFR + 1.73%) to 5/14/2032 (n) | $ | 351,000 | $ 357,375 | |
| Erste Group Bank AG, 1% to 6/10/2025, FLR (EUR ICE Swap Rate - 5yr. + 1.3%) to 6/10/2030 | EUR | 700,000 | 813,570 | |
| Erste Group Bank AG, 1.625% to 9/08/2026, FLR (EUR ICE Swap Rate - 5yr. + 2.1%) to 9/08/2031 | 500,000 | 594,283 | ||
| Goldman Sachs Group, Inc., 2.383% to 7/21/2031, FLR (SOFR + 1.248%) to 7/21/2032 | $ | 1,092,000 | 1,073,349 | |
| HSBC Holdings PLC, 2.099% to 6/04/2025, FLR (SOFR + 1.929%) to 6/04/2026 | 1,029,000 | 1,041,780 | ||
| HSBC Holdings PLC, 4.375%, 11/23/2026 | 2,161,000 | 2,376,066 | ||
| JPMorgan Chase & Co., 2.95%, 10/01/2026 | 1,596,000 | 1,688,632 | ||
| Mitsubishi UFJ Financial Group, Inc., 1.412%, 7/17/2025 | 2,681,000 | 2,675,306 | ||
| Mitsubishi UFJ Financial Group, Inc., 2.494% to 10/13/2031, FLR (CMT - 1yr. + 0.97%) to 10/13/2032 | 484,000 | 482,419 | ||
| Morgan Stanley, 3.125%, 1/23/2023 | 1,757,000 | 1,811,685 | ||
| Morgan Stanley, 1.593% to 5/04/2026, FLR (SOFR + 0.879%) to 5/04/2027 | 2,003,000 | 1,984,335 | ||
| Morgan Stanley, 3.622% to 4/01/2030, FLR (SOFR + 3.12%) to 4/01/2031 | 522,000 | 570,203 | ||
| Morgan Stanley, 1.102%, 4/29/2033 | EUR | 645,000 | 741,661 | |
| NatWest Group PLC, 0.78% to 2/26/2029, FLR (EURIBOR - 3mo. + 0.949%) to 2/26/2030 | 305,000 | 346,322 | ||
| NatWest Group PLC, 1.043%, 9/14/2032 | 300,000 | 340,192 | ||
| Nordea Bank Abp, 0.625% to 8/18/2026, FLR (EUR Swap Rate - 5yr. + 0.92%) to 8/18/2031 | 940,000 | 1,076,769 | ||
| Nordea Bank Abp, 2.408%, 12/09/2032 | GBP | 420,000 | 554,412 | |
| UBS Group Funding (Switzerland) AG, 2.859%, 8/15/2023 (n) | $ | 600,000 | 610,401 | |
| UniCredit S.p.A., 2.2% to 7/22/2026, FLR (EURIBOR - 3mo. + 2.55%) to 7/22/2027 | EUR | 746,000 | 906,766 | |
| Wells Fargo & Co., 2.125%, 9/24/2031 | GBP | 1,030,000 | 1,399,322 | |
| Wells Fargo & Co., 3.9%, 5/01/2045 | $ | 811,000 | 952,133 | |
| $33,318,145 | ||||
| Medical & Health Technology & Services – 0.4% | ||||
| Alcon, Inc., 3.8%, 9/23/2049 (n) | $ | 231,000 | $ 260,889 | |
| Becton Dickinson Euro Finance S.à r.l., 0.334%, 8/13/2028 | EUR | 228,000 | 257,965 | |
| Becton Dickinson Euro Finance S.à r.l., 1.213%, 2/12/2036 | 175,000 | 199,109 | ||
| Issuer | Shares/Par | Value ($) | ||
| Bonds – continued | ||||
| Medical & Health Technology & Services – continued | ||||
| Becton Dickinson Euro Finance S.à r.l., 1.336%, 8/13/2041 | EUR | 340,000 | $ 378,536 | |
| HCA, Inc., 5.125%, 6/15/2039 | $ | 399,000 | 494,301 | |
| Laboratory Corp. of America Holdings, 3.6%, 2/01/2025 | 1,075,000 | 1,145,163 | ||
| Laboratory Corp. of America Holdings, 4.7%, 2/01/2045 | 567,000 | 700,000 | ||
| Memorial Sloan-Kettering Cancer Center, 2.955%, 1/01/2050 | 670,000 | 690,628 | ||
| New York Society for the Relief of the Ruptured & Crippled, 2.667%, 10/01/2050 | 1,300,000 | 1,237,676 | ||
| ProMedica Toledo Hospital, “B”, AGM, 6.015%, 11/15/2048 | 590,000 | 865,024 | ||
| Thermo Fisher Scientific, Inc., 1.75%, 10/15/2028 | 1,119,000 | 1,102,424 | ||
| $7,331,715 | ||||
| Medical Equipment – 0.1% | ||||
| Boston Scientific Corp., 0.625%, 12/01/2027 | EUR | 300,000 | $ 346,543 | |
| DH Europe Finance II S.à r.l., 0.45%, 3/18/2028 | 250,000 | 287,068 | ||
| Thermo Fisher Scientific Finance I B.V., 1.125%, 10/18/2033 | 580,000 | 673,342 | ||
| Thermo Fisher Scientific Finance I B.V., 2%, 10/18/2051 | 270,000 | 333,010 | ||
| $1,639,963 | ||||
| Metals & Mining – 0.2% | ||||
| Anglo American Capital PLC, 5.625%, 4/01/2030 (n) | $ | 1,815,000 | $ 2,171,030 | |
| Glencore Funding LLC, 2.85%, 4/27/2031 (n) | 1,032,000 | 1,033,340 | ||
| $3,204,370 | ||||
| Midstream – 0.3% | ||||
| Enterprise Products Partners LP, 3.125%, 7/31/2029 | $ | 872,000 | $ 929,815 | |
| Galaxy Pipeline Assets Bidco Ltd., 2.16%, 3/31/2034 (n) | 1,095,000 | 1,066,562 | ||
| Plains All American Pipeline LP/PAA Finance Corp., 3.55%, 12/15/2029 | 1,445,000 | 1,507,686 | ||
| Sabine Pass Liquefaction LLC, 4.2%, 3/15/2028 | 1,216,000 | 1,348,306 | ||
| Sabine Pass Liquefaction LLC, 4.5%, 5/15/2030 | 689,000 | 785,096 | ||
| $5,637,465 | ||||
| Mortgage-Backed – 3.1% | ||||
| Fannie Mae, 4.5%, 3/01/2025 - 2/01/2046 | $ | 4,261,182 | $ 4,739,700 | |
| Fannie Mae, 5.5%, 1/01/2037 | 16,010 | 18,631 | ||
| Fannie Mae, 6%, 9/01/2037 - 6/01/2038 | 154,268 | 180,529 | ||
| Issuer | Shares/Par | Value ($) | ||
| Bonds – continued | ||||
| Mortgage-Backed – continued | ||||
| Fannie Mae, 5%, 4/01/2040 - 8/01/2040 | $ | 1,185,977 | $ 1,351,432 | |
| Fannie Mae, 4%, 11/01/2040 - 2/01/2041 | 1,263,449 | 1,391,546 | ||
| Fannie Mae, 3.5%, 5/01/2043 - 12/01/2046 | 1,907,262 | 2,055,427 | ||
| Fannie Mae, UMBS, 2.5%, 3/01/2050 - 7/01/2050 | 776,571 | 804,575 | ||
| Freddie Mac, 1.368%, 3/25/2027 (i) | 1,523,000 | 104,446 | ||
| Freddie Mac, 3.224%, 3/25/2027 | 4,500,000 | 4,904,738 | ||
| Freddie Mac, 3.194%, 7/25/2027 | 3,914,000 | 4,279,397 | ||
| Freddie Mac, 3.286%, 11/25/2027 | 2,576,000 | 2,840,605 | ||
| Freddie Mac, 3.9%, 4/25/2028 | 940,000 | 1,074,021 | ||
| Freddie Mac, 1.798%, 4/25/2030 (i) | 3,170,226 | 438,688 | ||
| Freddie Mac, 1.868%, 4/25/2030 (i) | 2,614,093 | 376,146 | ||
| Freddie Mac, 1.662%, 5/25/2030 (i) | 3,298,344 | 427,705 | ||
| Freddie Mac, 1.796%, 5/25/2030 (i) | 7,375,798 | 1,030,130 | ||
| Freddie Mac, 1.342%, 6/25/2030 (i) | 3,056,884 | 322,894 | ||
| Freddie Mac, 1.6%, 8/25/2030 (i) | 2,713,457 | 345,576 | ||
| Freddie Mac, 1.17%, 9/25/2030 (i) | 1,752,322 | 166,715 | ||
| Freddie Mac, 1.081%, 11/25/2030 (i) | 3,594,105 | 320,919 | ||
| Freddie Mac, 0.33%, 1/25/2031 (i) | 13,689,738 | 362,310 | ||
| Freddie Mac, 0.529%, 3/25/2031 (i) | 16,858,347 | 728,761 | ||
| Freddie Mac, 0.938%, 7/25/2031 (i) | 3,177,082 | 266,293 | ||
| Freddie Mac, 0.955%, 9/25/2031 (i) | 4,021,884 | 307,745 | ||
| Freddie Mac, 5.5%, 7/01/2037 | 31,655 | 37,008 | ||
| Freddie Mac, 4.5%, 12/01/2039 - 5/01/2042 | 1,268,035 | 1,414,685 | ||
| Freddie Mac, 5%, 7/01/2041 | 488,259 | 553,160 | ||
| Freddie Mac, 3.5%, 1/01/2047 | 893,545 | 953,369 | ||
| Freddie Mac, UMBS, 3%, 6/01/2050 | 117,655 | 124,326 | ||
| Freddie Mac, UMBS, 2.5%, 10/01/2051 | 125,000 | 129,449 | ||
| Ginnie Mae, 5%, 5/15/2040 | 178,316 | 205,324 | ||
| Ginnie Mae, 3.5%, 6/20/2043 | 661,289 | 711,507 | ||
| Ginnie Mae, 3%, 6/20/2051 - 11/20/2051 | 893,975 | 933,680 | ||
| Ginnie Mae, 2.5%, 7/20/2051 - 9/20/2051 | 1,585,944 | 1,631,218 | ||
| Ginnie Mae, TBA, 2.5%, 11/15/2051 | 950,000 | 976,552 | ||
| Ginnie Mae, TBA, 3%, 11/15/2051 - 12/15/2051 | 1,250,000 | 1,297,043 | ||
| Ginnie Mae, TBA, 3.5%, 11/15/2051 | 1,075,000 | 1,124,467 | ||
| Ginnie Mae, TBA, 4%, 11/15/2051 | 850,000 | 900,834 | ||
| Ginnie Mae, TBA, 2%, 12/15/2051 | 950,000 | 959,890 | ||
| UMBS, TBA, 2%, 11/25/2036 - 1/25/2052 | 6,475,000 | 6,476,940 | ||
| UMBS, TBA, 2.5%, 11/25/2036 - 1/25/2052 | 4,720,000 | 4,852,232 | ||
| UMBS, TBA, 3%, 11/25/2036 - 1/25/2052 | 4,300,000 | 4,483,263 | ||
| $56,603,876 | ||||
| Issuer | Shares/Par | Value ($) | ||
| Bonds – continued | ||||
| Municipals – 0.3% | ||||
| Massachusetts Educational Financing Authority, Education Loan Subordinate Rev., “A”, 2.641%, 7/01/2037 | $ | 1,235,000 | $ 1,245,141 | |
| Michigan Finance Authority Hospital Rev. (Trinity Health Credit Group), 3.384%, 12/01/2040 | 945,000 | 1,031,464 | ||
| New Jersey Economic Development Authority State Pension Funding Rev., “A”, NPFG, 7.425%, 2/15/2029 | 801,000 | 1,015,239 | ||
| Oklahoma Development Finance Authority, Health System Rev. (OU Medicine Project), “C”, AGM, 4.65%, 8/15/2030 | 992,000 | 1,159,328 | ||
| Puerto Rico Electric Power Authority Rev., “PP”, NPFG, 5%, 7/01/2022 | 425,000 | 430,876 | ||
| State of Florida, “A”, 2.154%, 7/01/2030 | 1,258,000 | 1,255,710 | ||
| $6,137,758 | ||||
| Natural Gas - Distribution – 0.2% | ||||
| Boston Gas Co., 3.15%, 8/01/2027 (n) | $ | 857,000 | $ 899,526 | |
| Infraestructura Energética Nova S.A.B. de C.V., 4.875%, 1/14/2048 | 710,000 | 725,975 | ||
| National Grid PLC, 1.125%, 1/14/2033 | GBP | 925,000 | 1,128,240 | |
| $2,753,741 | ||||
| Natural Gas - Pipeline – 0.2% | ||||
| APT Pipelines Ltd., 0.75%, 3/15/2029 | EUR | 970,000 | $ 1,096,126 | |
| APT Pipelines Ltd., 1.25%, 3/15/2033 | 1,475,000 | 1,665,896 | ||
| APT Pipelines Ltd., 2.5%, 3/15/2036 | GBP | 850,000 | 1,147,152 | |
| $3,909,174 | ||||
| Network & Telecom – 0.2% | ||||
| AT&T, Inc., 4.25%, 6/01/2043 | GBP | 580,000 | $ 996,880 | |
| AT&T, Inc., 3.5%, 9/15/2053 | $ | 1,442,000 | 1,464,898 | |
| Verizon Communications, Inc., 2.1%, 3/22/2028 | 649,000 | 650,798 | ||
| $3,112,576 | ||||
| Oil Services – 0.0% | ||||
| Halliburton Co., 5%, 11/15/2045 | $ | 516,000 | $ 639,262 | |
| Oils – 0.1% | ||||
| Neste Oyj, 1.5%, 6/07/2024 | EUR | 800,000 | $ 950,550 | |
| Neste Oyj, 0.75%, 3/25/2028 | 900,000 | 1,027,411 | ||
| Phillips 66, 4.875%, 11/15/2044 | $ | 568,000 | 715,664 | |
| $2,693,625 | ||||
| Issuer | Shares/Par | Value ($) | ||
| Bonds – continued | ||||
| Other Banks & Diversified Financials – 0.7% | ||||
| Bank Hapoalim B.M., 3.255% to 1/21/2027, FLR (CMT - 5yr. + 2.155%) to 1/21/2032 (n) | $ | 702,000 | $ 701,137 | |
| Banque Federative du Credit Mutuel S.A., 0.625%, 11/03/2028 | EUR | 600,000 | 688,884 | |
| Belfius Bank S.A., 0.375%, 2/13/2026 | 1,000,000 | 1,155,006 | ||
| Belfius Bank S.A., 1.25%, 4/06/2034 | 700,000 | 794,364 | ||
| Deutsche Bank AG, 1.875% to 12/22/2027, FLR (SONIA + 1.634%) to 12/22/2028 | GBP | 100,000 | 133,352 | |
| Deutsche Bank AG, 1.375% to 2/17/2031, FLR (EURIBOR - 3mo. + 1.5%) to 2/17/2032 | EUR | 400,000 | 461,107 | |
| Groupe BPCE S.A., 4.5%, 3/15/2025 (n) | $ | 950,000 | 1,034,665 | |
| Groupe des Assurances du Credit Mutuel, 1.875%, 4/21/2042 | EUR | 700,000 | 805,272 | |
| Intesa Sanpaolo S.p.A., 2.625%, 3/11/2036 | GBP | 1,240,000 | 1,679,974 | |
| KBC Group N.V., 0.625% to 12/07/2026, FLR (EUR Swap Rate - 5yr. + 0.95%) to 12/07/2031 | EUR | 900,000 | 1,023,358 | |
| Macquarie Group Ltd., 0.95%, 5/21/2031 | 1,240,000 | 1,413,532 | ||
| UBS AG, 5.125%, 5/15/2024 | $ | 1,530,000 | 1,660,931 | |
| Virgin Money UK PLC, 5.125% to 12/11/2025, FLR (GBP Government Yield - 5yr. + 5.25%) to 12/11/2030 | GBP | 950,000 | 1,416,483 | |
| Virgin Money UK PLC, 2.625% to 8/19/2026, FLR (GBP Government Yield - 5yr. + 2.25%) to 8/19/2031 | 220,000 | 299,103 | ||
| $13,267,168 | ||||
| Printing & Publishing – 0.0% | ||||
| Wolters Kluwer N.V., 0.75%, 7/03/2030 | EUR | 389,000 | $ 453,424 | |
| Railroad & Shipping – 0.1% | ||||
| Wabtec Transportation Netherlands B.V., 1.25%, 12/03/2027 | EUR | 1,259,000 | $ 1,475,343 | |
| Real Estate - Office – 0.1% | ||||
| Corporate Office Property LP, REIT, 2.25%, 3/15/2026 | $ | 675,000 | $ 686,367 | |
| Corporate Office Property LP, REIT, 2%, 1/15/2029 | 425,000 | 412,232 | ||
| Corporate Office Property LP, REIT, 2.75%, 4/15/2031 | 868,000 | 871,345 | ||
| $1,969,944 | ||||
| Real Estate - Other – 0.2% | ||||
| EPR Properties, REIT, 3.6%, 11/15/2031 | $ | 725,000 | $ 726,772 | |
| Lexington Realty Trust Co., 2.7%, 9/15/2030 | 881,000 | 884,510 | ||
| Sun Communities, Inc., 2.7%, 7/15/2031 | 526,000 | 527,713 | ||
| W.P. Carey, Inc., REIT, 2.4%, 2/01/2031 | 1,296,000 | 1,278,687 | ||
| $3,417,682 | ||||
| Issuer | Shares/Par | Value ($) | ||
| Bonds – continued | ||||
| Real Estate - Retail – 0.2% | ||||
| Brixmor Operating Partnership LP, REIT, 4.05%, 7/01/2030 | $ | 1,174,000 | $ 1,297,603 | |
| Hammerson Ireland Finance Designated Activity Co., 1.75%, 6/03/2027 | EUR | 662,000 | 762,104 | |
| Regency Centers Corp., 3.7%, 6/15/2030 | $ | 591,000 | 647,707 | |
| Spirit Realty, LP, 3.2%, 1/15/2027 | 531,000 | 559,484 | ||
| $3,266,898 | ||||
| Retailers – 0.2% | ||||
| Best Buy Co., Inc., 1.95%, 10/01/2030 | $ | 1,357,000 | $ 1,310,226 | |
| Home Depot, Inc., 4.875%, 2/15/2044 | 496,000 | 654,801 | ||
| Kohl's Corp., 3.375%, 5/01/2031 | 944,000 | 958,372 | ||
| $2,923,399 | ||||
| Supermarkets – 0.1% | ||||
| Auchan Holding S.A., 3.25%, 7/23/2027 | EUR | 500,000 | $ 647,277 | |
| Loblaw Cos. Ltd., 4.86%, 9/12/2023 | CAD | 725,000 | 616,355 | |
| $1,263,632 | ||||
| Supranational – 0.6% | ||||
| Corporacion Andina de Fomento, 1.625%, 9/23/2025 | $ | 1,020,000 | $ 1,027,981 | |
| European Financial Stability Facility, 1.45%, 9/05/2040 | EUR | 1,560,000 | 2,133,122 | |
| European Union, 0%, 7/04/2035 | 4,630,000 | 5,122,753 | ||
| International Bank for Reconstruction and Development, 4.25%, 6/24/2025 | AUD | 440,000 | 361,131 | |
| West African Development Bank, 4.7%, 10/22/2031 | $ | 1,759,000 | 1,915,129 | |
| West African Development Bank, 2.75%, 1/22/2033 | EUR | 628,000 | 766,085 | |
| $11,326,201 | ||||
| Telecommunications - Wireless – 0.3% | ||||
| American Tower Corp., REIT, 4%, 6/01/2025 | $ | 1,100,000 | $ 1,189,911 | |
| American Tower Corp., REIT, 0.5%, 1/15/2028 | EUR | 690,000 | 783,881 | |
| Crown Castle International Corp., 1.35%, 7/15/2025 | $ | 501,000 | 498,922 | |
| Crown Castle International Corp., 4.45%, 2/15/2026 | 1,922,000 | 2,124,104 | ||
| Crown Castle International Corp., 3.7%, 6/15/2026 | 425,000 | 458,995 | ||
| Vantage Towers AG, 0.75%, 3/31/2030 | EUR | 300,000 | 341,394 | |
| Vodafone Group PLC, 3.375%, 8/08/2049 | GBP | 470,000 | 740,397 | |
| $6,137,604 | ||||
| Telephone Services – 0.1% | ||||
| TELUS Corp., 2.85%, 11/13/2031 | CAD | 1,775,000 | $ 1,407,121 | |
| Tobacco – 0.0% | ||||
| B.A.T. International Finance PLC, 2.25%, 6/26/2028 | GBP | 416,000 | $ 557,008 | |
| Issuer | Shares/Par | Value ($) | ||
| Bonds – continued | ||||
| Transportation - Services – 0.3% | ||||
| Abertis Infraestructuras S.A., 1.875%, 3/26/2032 | EUR | 1,000,000 | $ 1,211,742 | |
| Element Fleet Management Corp., 1.6%, 4/06/2024 (n) | $ | 1,835,000 | 1,847,472 | |
| ERAC USA Finance LLC, 7%, 10/15/2037 (n) | 537,000 | 800,072 | ||
| Vinci S.A., 3.75%, 4/10/2029 (n) | 1,334,000 | 1,479,363 | ||
| $5,338,649 | ||||
| U.S. Government Agencies and Equivalents – 0.0% | ||||
| Small Business Administration, 5.31%, 5/01/2027 | $ | 47,659 | $ 51,150 | |
| Small Business Administration, 2.22%, 3/01/2033 | 361,192 | 368,468 | ||
| $419,618 | ||||
| U.S. Treasury Obligations – 3.7% | ||||
| U.S. Treasury Bonds, 2.375%, 11/15/2049 | $ | 15,507,000 | $ 16,966,839 | |
| U.S. Treasury Notes, 1.25%, 3/31/2028 | 11,325,600 | 11,214,556 | ||
| U.S. Treasury Notes, 2.375%, 5/15/2029 (f) | 17,563,700 | 18,686,816 | ||
| U.S. Treasury Notes, 1.125%, 8/15/2040 | 16,498,000 | 14,252,725 | ||
| U.S. Treasury Notes, TIPS, 0.125%, 1/15/2031 | 6,884,446 | 7,635,102 | ||
| $68,756,038 | ||||
| Utilities - Electric Power – 0.9% | ||||
| American Electric Power Co., Inc., 2.3%, 3/01/2030 | $ | 1,460,000 | $ 1,443,507 | |
| Duke Energy Corp., 3.75%, 9/01/2046 | 910,000 | 990,266 | ||
| Enel Americas S.A., 4%, 10/25/2026 | 3,133,000 | 3,343,538 | ||
| Enel Finance International N.V., 0.5%, 6/17/2030 | EUR | 880,000 | 1,000,269 | |
| Enel Finance International N.V., 0.875%, 9/28/2034 | 1,220,000 | 1,377,837 | ||
| Enel Finance International N.V., 4.75%, 5/25/2047 (n) | $ | 456,000 | 576,642 | |
| Enel S.p.A., 2.25% to 3/10/2027, FLR (EUR Swap Rate - 5yr. + 2.679%) to 3/10/2032, FLR (EUR Swap Rate - 5yr. + 2.929%) to 3/10/2047, FLR (EUR Swap Rate - 5yr. + 3.679%) to 3/10/2070 | EUR | 875,000 | 1,047,732 | |
| Enel S.p.A., 1.875%, 3/08/2170 | 1,025,000 | 1,153,844 | ||
| Evergy, Inc., 2.9%, 9/15/2029 | $ | 1,246,000 | 1,298,689 | |
| Jersey Central Power & Light Co., 2.75%, 3/01/2032 (n) | 758,000 | 774,768 | ||
| Southern California Edison Co., 3.65%, 2/01/2050 | 478,000 | 515,446 | ||
| Virginia Electric & Power Co., 3.5%, 3/15/2027 | 1,800,000 | 1,962,551 | ||
| Virginia Electric & Power Co., 2.875%, 7/15/2029 | 454,000 | 477,695 | ||
| $15,962,784 | ||||
| Total Bonds (Identified Cost, $678,215,854) | $ 677,421,894 | |||
| Issuer | Shares/Par | Value ($) | ||
| Preferred Stocks – 0.4% | ||||
| Computer Software - Systems – 0.1% | ||||
| Samsung Electronics Co. Ltd. | 48,690 | $ 2,672,532 | ||
| Consumer Products – 0.3% | ||||
| Henkel AG & Co. KGaA | 62,632 | $ 5,602,513 | ||
| Total Preferred Stocks (Identified Cost, $4,457,661) | $ 8,275,045 | |||
| Convertible Preferred Stocks – 0.1% | ||||
| Medical Equipment – 0.1% | ||||
| Boston Scientific Corp., 5.5% | 10,817 | $ 1,266,021 | ||
| Danaher Corp., 4.75% | 499 | 1,040,540 | ||
| Total Convertible Preferred Stocks (Identified Cost, $1,649,219) | $ 2,306,561 | |||
| Investment Companies (h) – 3.1% | ||||
| Money Market Funds – 3.1% | ||||
| MFS Institutional Money Market Portfolio, 0.04% (v) (Identified Cost, $57,312,909) | 57,314,626 | $ 57,314,626 | ||
| Underlying/Expiration Date/Exercise Price | Put/Call | Counterparty | Notional Amount | Par Amount/ Number of Contracts | |
| Purchased Options – 0.1% | |||||
| Other – 0.1% | |||||
| U.S. Treasury 10 yr - Interest Rate Swap - Fund pays 1.75%, Fund receives FLR (3-month LIBOR) – September 2022 (Premiums Paid, $638,370) | Put | Merrill Lynch International | $ 73,800,000 | $ 73,800,000 | $1,923,802 |
| Issuer | Shares/Par | |||
| Collateral for Securities Loaned – 0.1% | ||||
| JPMorgan U.S. Government Money Market Fund, 0.03% (j) (Identified Cost, $1,214,400) | 1,214,400 | $ 1,214,400 | ||
| Other Assets, Less Liabilities – 0.1% | 1,770,109 | |||
| Net Assets – 100.0% | $1,836,788,560 | |||
| (a) | Non-income producing security. |
| (f) | All or a portion of the security has been segregated as collateral for open futures contracts. |
| (h) | An affiliated issuer, which may be considered one in which the fund owns 5% or more of the outstanding voting securities, or a company which is under common control. At period end, the aggregate values of the fund's investments in affiliated issuers and in unaffiliated issuers were $57,314,626 and $1,777,703,825, respectively. |
| (i) | Interest only security for which the fund receives interest on notional principal (Par amount). Par amount shown is the notional principal and does not reflect the cost of the security. |
| (j) | The rate quoted is the annualized seven-day yield of the fund at period end. |
| (l) | A portion of this security is on loan. See Note 2 for additional information. |
| (n) | Securities exempt from registration under Rule 144A of the Securities Act of 1933. These securities may be sold in the ordinary course of business in transactions exempt from registration, normally to qualified institutional buyers. At period end, the aggregate value of these securities was $91,108,243, representing 5.0% of net assets. |
| (v) | Affiliated issuer that is available only to investment companies managed by MFS. The rate quoted for the MFS Institutional Money Market Portfolio is the annualized seven-day yield of the fund at period end. |
| (z) | Restricted securities are not registered under the Securities Act of 1933 and are subject to legal restrictions on resale. These securities generally may be resold in transactions exempt from registration or to the public if the securities are subsequently registered. Disposal of these securities may involve time-consuming negotiations and prompt sale at an acceptable price may be difficult. The fund holds the following restricted securities: |
| Restricted Securities | Acquisition Date | Cost | Value |
| MF1 CLO Ltd., 2020-FL3, “AS”, FLR, 3.014% (LIBOR - 1mo. + 2.85%), 7/15/2035 | 6/12/2020 | $714,500 | $724,104 |
| % of Net assets | 0.0% |
| The following abbreviations are used in this report and are defined: | |
| ADR | American Depositary Receipt |
| AGM | Assured Guaranty Municipal |
| CLO | Collateralized Loan Obligation |
| CMT | Constant Maturity Treasury |
| EURIBOR | Euro Interbank Offered Rate |
| FLR | Floating Rate. Interest rate resets periodically based on the parenthetically disclosed reference rate plus a spread (if any). The period-end rate reported may not be the current rate. All reference rates are USD unless otherwise noted. |
| ICE | Intercontinental Exchange |
| IEU | International Equity Unit |
| LIBOR | London Interbank Offered Rate |
| NPFG | National Public Finance Guarantee Corp. |
| PCL | Public Company Limited |
| REIT | Real Estate Investment Trust |
| SOFR | Secured Overnight Financing Rate |
| SONIA | Sterling Overnight Index Average |
| TBA | To Be Announced |
| TIPS | Treasury Inflation Protected Security |
| UMBS | Uniform Mortgage-Backed Security |
| Abbreviations indicate amounts shown in currencies other than the U.S. dollar. All amounts are stated in U.S. dollars unless otherwise indicated. A list of abbreviations is shown below: | |
| AUD | Australian Dollar |
| CAD | Canadian Dollar |
| CHF | Swiss Franc |
| CLP | Chilean Peso |
| CNH | Chinese Yuan Renminbi (Offshore) |
| CNY | China Yuan Renminbi |
| COP | Colombian Peso |
| CZK | Czech Koruna |
| DKK | Danish Krone |
| EUR | Euro |
| GBP | British Pound |
| HUF | Hungarian Forint |
| IDR | Indonesian Rupiah |
| ILS | Israeli Shekel |
| JPY | Japanese Yen |
| KRW | South Korean Won |
| MXN | Mexican Peso |
| NOK | Norwegian Krone |
| NZD | New Zealand Dollar |
| PLN | Polish Zloty |
| RUB | Russian Ruble |
| SEK | Swedish Krona |
| SGD | Singapore Dollar |
| THB | Thai Baht |
| TWD | Taiwan Dollar |
| UYU | Uruguayan Peso |
| Forward Foreign Currency Exchange Contracts | ||||||
| Currency Purchased | Currency Sold | Counterparty | Settlement Date | Unrealized Appreciation (Depreciation) | ||
| Asset Derivatives | ||||||
| AUD | 12,685,261 | USD | 9,385,964 | Deutsche Bank AG | 1/14/2022 | $158,811 |
| AUD | 1,279,947 | USD | 936,244 | UBS AG | 1/14/2022 | 26,827 |
| CAD | 10,129,307 | USD | 8,058,742 | Citibank N.A. | 1/14/2022 | 127,114 |
| CHF | 3,213,000 | USD | 3,468,383 | Merrill Lynch International | 1/14/2022 | 48,993 |
| CNH | 4,300,000 | USD | 662,227 | Goldman Sachs International | 1/14/2022 | 4,680 |
| CNH | 34,909,000 | USD | 5,366,297 | HSBC Bank | 1/14/2022 | 47,897 |
| COP | 2,567,260,000 | USD | 666,307 | Goldman Sachs International | 12/10/2021 | 13,599 |
| DKK | 8,708,598 | USD | 1,353,751 | Merrill Lynch International | 1/14/2022 | 2,381 |
| GBP | 1,948,804 | USD | 2,667,158 | Deutsche Bank AG | 1/14/2022 | 656 |
| GBP | 6,942,796 | USD | 9,454,547 | JPMorgan Chase Bank N.A. | 1/14/2022 | 49,790 |
| IDR | 31,790,358,660 | USD | 2,220,617 | Citibank N.A. | 11/22/2021 | 18,950 |
| IDR | 9,500,000,000 | USD | 662,483 | JPMorgan Chase Bank N.A. | 1/28/2022 | 2,318 |
| ILS | 3,400,000 | USD | 1,050,936 | BNP Paribas S.A. | 1/14/2022 | 24,362 |
| KRW | 969,828,000 | USD | 818,973 | Barclays Bank PLC | 12/13/2021 | 10,142 |
| KRW | 1,030,172,000 | USD | 870,740 | JPMorgan Chase Bank N.A. | 11/05/2021 | 10,770 |
| MXN | 110,468,516 | USD | 5,268,258 | Goldman Sachs International | 1/14/2022 | 35,034 |
| NOK | 102,790,638 | USD | 11,968,125 | Deutsche Bank AG | 1/14/2022 | 190,848 |
| NZD | 6,839,952 | USD | 4,792,278 | Goldman Sachs International | 1/14/2022 | 102,872 |
| SEK | 63,049,000 | USD | 7,206,097 | Goldman Sachs International | 1/14/2022 | 144,375 |
| SEK | 14,418,378 | USD | 1,668,984 | HSBC Bank | 1/14/2022 | 11,961 |
| Forward Foreign Currency Exchange Contracts - continued | ||||||
| Currency Purchased | Currency Sold | Counterparty | Settlement Date | Unrealized Appreciation (Depreciation) | ||
| Asset Derivatives - continued | ||||||
| SGD | 1,900,000 | USD | 1,401,278 | HSBC Bank | 1/14/2022 | $7,237 |
| THB | 68,750,000 | USD | 2,041,574 | JPMorgan Chase Bank N.A. | 11/18/2021 | 18,951 |
| TWD | 204,112,000 | USD | 7,333,584 | Barclays Bank PLC | 11/22/2021 | 6,331 |
| USD | 286,802 | CAD | 354,000 | Deutsche Bank AG | 1/14/2022 | 722 |
| USD | 178,383 | CLP | 140,211,000 | JPMorgan Chase Bank N.A. | 11/22/2021 | 6,432 |
| USD | 4,350,045 | CNH | 28,002,000 | HSBC Bank | 1/14/2022 | 7,089 |
| USD | 8,583,074 | EUR | 7,381,106 | Deutsche Bank AG | 1/14/2022 | 33,756 |
| USD | 603,383 | EUR | 520,918 | JPMorgan Chase Bank N.A. | 1/14/2022 | 20 |
| USD | 2,205,427 | EUR | 1,885,000 | NatWest Markets PLC | 1/14/2022 | 22,088 |
| USD | 4,486,451 | EUR | 3,860,395 | UBS AG | 1/14/2022 | 15,070 |
| USD | 152,724 | GBP | 110,429 | Deutsche Bank AG | 1/14/2022 | 1,552 |
| USD | 1,145,504 | GBP | 830,000 | HSBC Bank | 1/14/2022 | 9,276 |
| USD | 554,964 | JPY | 63,126,556 | Brown Brothers Harriman | 1/14/2022 | 552 |
| USD | 999,519 | JPY | 113,478,387 | Goldman Sachs International | 1/14/2022 | 2,891 |
| USD | 1,623,888 | JPY | 180,000,000 | UBS AG | 1/14/2022 | 43,031 |
| USD | 1,454,147 | KRW | 1,698,604,000 | JPMorgan Chase Bank N.A. | 12/01/2021 | 1,747 |
| USD | 1,770,848 | PLN | 6,995,000 | JPMorgan Chase Bank N.A. | 1/14/2022 | 20,639 |
| USD | 7,258,512 | TWD | 201,460,000 | Barclays Bank PLC | 11/22/2021 | 13,964 |
| $1,243,728 | ||||||
| Liability Derivatives | ||||||
| CAD | 10,959,796 | USD | 8,869,201 | Brown Brothers Harriman | 1/14/2022 | $(12,197) |
| CAD | 5,073,545 | USD | 4,111,208 | Morgan Stanley Capital Services, Inc. | 1/14/2022 | (11,094) |
| CLP | 423,301,000 | USD | 537,902 | Goldman Sachs International | 11/22/2021 | (18,776) |
| CNH | 23,461,000 | USD | 3,654,523 | HSBC Bank | 12/13/2021 | (5,053) |
| CNH | 46,058,000 | USD | 7,176,577 | JPMorgan Chase Bank N.A. | 1/14/2022 | (33,235) |
| CZK | 133,226,000 | USD | 6,032,056 | BNP Paribas S.A. | 1/14/2022 | (47,721) |
| EUR | 1,702,983 | USD | 1,979,305 | Deutsche Bank AG | 1/14/2022 | (6,791) |
| EUR | 106,459 | USD | 124,636 | HSBC Bank | 1/14/2022 | (1,328) |
| EUR | 8,061,034 | USD | 9,375,630 | JPMorgan Chase Bank N.A. | 1/14/2022 | (38,772) |
| EUR | 6,184,000 | USD | 7,240,174 | Merrill Lynch International | 1/14/2022 | (77,429) |
| EUR | 5,225,202 | USD | 6,069,486 | UBS AG | 1/14/2022 | (17,289) |
| GBP | 122,446 | USD | 169,262 | Brown Brothers Harriman | 1/14/2022 | (1,640) |
| GBP | 1,650,309 | USD | 2,269,194 | Deutsche Bank AG | 1/14/2022 | (10,004) |
| HUF | 731,285,000 | USD | 2,342,504 | Brown Brothers Harriman | 1/14/2022 | (260) |
| JPY | 5,702,189,211 | USD | 51,251,810 | JPMorgan Chase Bank N.A. | 1/14/2022 | (1,172,133) |
| PLN | 11,894,803 | USD | 2,988,494 | Citibank N.A. | 1/14/2022 | (12,313) |
| RUB | 80,411,000 | USD | 1,101,928 | Citibank N.A. | 4/25/2022 | (9,865) |
| THB | 118,000,000 | USD | 3,537,170 | JPMorgan Chase Bank N.A. | 11/18/2021 | (560) |
| USD | 6,514,486 | AUD | 8,928,173 | Citibank N.A. | 1/14/2022 | (203,343) |
| USD | 4,114,683 | AUD | 5,505,892 | Deutsche Bank AG | 1/14/2022 | (28,118) |
| USD | 3,149,012 | CAD | 3,900,000 | Goldman Sachs International | 1/14/2022 | (2,718) |
| USD | 11,239,054 | CAD | 13,917,169 | HSBC Bank | 1/14/2022 | (7,909) |
| USD | 1,792,415 | CNH | 11,708,000 | HSBC Bank | 12/17/2021 | (28,159) |
| USD | 3,611,125 | CNH | 23,461,000 | JPMorgan Chase Bank N.A. | 12/13/2021 | (38,345) |
| Forward Foreign Currency Exchange Contracts - continued | ||||||
| Currency Purchased | Currency Sold | Counterparty | Settlement Date | Unrealized Appreciation (Depreciation) | ||
| Liability Derivatives - continued | ||||||
| USD | 5,864,287 | EUR | 5,064,703 | Deutsche Bank AG | 1/14/2022 | $(2,008) |
| USD | 34,044,856 | EUR | 29,413,343 | JPMorgan Chase Bank N.A. | 1/14/2022 | (23,751) |
| USD | 8,126,495 | GBP | 5,965,716 | Deutsche Bank AG | 1/14/2022 | (40,269) |
| USD | 3,563,726 | JPY | 406,000,000 | Barclays Bank PLC | 1/14/2022 | (1,983) |
| USD | 1,000,682 | JPY | 114,246,796 | UBS AG | 1/14/2022 | (2,694) |
| USD | 722,323 | KRW | 855,887,150 | Barclays Bank PLC | 11/05/2021 | (10,053) |
| USD | 1,788,681 | KRW | 2,126,742,000 | JPMorgan Chase Bank N.A. | 12/13/2021 | (29,490) |
| USD | 11,143,544 | NOK | 95,500,000 | JPMorgan Chase Bank N.A. | 1/14/2022 | (153,031) |
| USD | 6,038,171 | SEK | 52,709,250 | JPMorgan Chase Bank N.A. | 1/14/2022 | (106,857) |
| USD | 880,034 | TWD | 24,516,000 | Barclays Bank PLC | 1/21/2022 | (1,873) |
| USD | 2,729,506 | TWD | 75,984,000 | JPMorgan Chase Bank N.A. | 1/21/2022 | (3,846) |
| $(2,160,907) | ||||||
| Futures Contracts | ||||||
| Description | Long/ Short | Currency | Contracts | Notional Amount | Expiration Date | Value/Unrealized Appreciation (Depreciation) |
| Asset Derivatives | ||||||
| Interest Rate Futures | ||||||
| Euro-Bund 10 yr | Short | EUR | 346 | $67,243,965 | December – 2021 | $1,612,475 |
| Euro-Buxl 30 yr | Short | EUR | 34 | 8,213,750 | December – 2021 | 33,398 |
| U.S. Treasury Bond | Short | USD | 36 | 5,790,375 | December – 2021 | 63,472 |
| U.S. Treasury Note 10 yr | Short | USD | 110 | 14,377,344 | December – 2021 | 176,470 |
| U.S. Treasury Note 5 yr | Short | USD | 463 | 56,370,250 | December – 2021 | 801,200 |
| U.S. Treasury Ultra Note 10 yr | Short | USD | 293 | 42,494,156 | December – 2021 | 754,284 |
| $3,441,299 | ||||||
| Liability Derivatives | ||||||
| Interest Rate Futures | ||||||
| Euro-Bobl 5 yr | Long | EUR | 370 | $57,211,827 | December – 2021 | $(795,438) |
| Long Gilt 10 yr | Long | GBP | 51 | 8,718,923 | December – 2021 | (188,382) |
| U.S. Treasury Note 2 yr | Long | USD | 331 | 72,571,750 | December – 2021 | (271,867) |
| U.S. Treasury Ultra Bond | Short | USD | 38 | 7,463,438 | December – 2021 | (31,781) |
| $(1,287,468) | ||||||
| Assets | |
| Investments in unaffiliated issuers, at value, including $1,224,289 of securities on loan (identified cost, $1,379,964,801) | $1,777,703,825 |
| Investments in affiliated issuers, at value (identified cost, $57,312,909) | 57,314,626 |
| Cash | 62,712 |
| Foreign currency, at value (identified cost, $210,446) | 210,236 |
| Restricted cash for | |
| Forward foreign currency exchange contracts | 1,500,000 |
| Receivables for | |
| Forward foreign currency exchange contracts | 1,243,728 |
| Net daily variation margin on open futures contracts | 30,023 |
| Investments sold | 39,514,487 |
| TBA sale commitments | 6,630,804 |
| Fund shares sold | 1,590,807 |
| Interest and dividends | 9,080,683 |
| Other assets | 13 |
| Total assets | $1,894,881,944 |
| Liabilities | |
| Payables for | |
| Forward foreign currency exchange contracts | $2,160,907 |
| Investments purchased | 23,634,143 |
| TBA purchase commitments | 28,478,027 |
| Fund shares reacquired | 1,859,135 |
| Collateral for securities loaned, at value | 1,214,400 |
| Payable to affiliates | |
| Investment adviser | 24,949 |
| Administrative services fee | 2,743 |
| Shareholder servicing costs | 452,000 |
| Distribution and service fees | 38,065 |
| Payable for independent Trustees' compensation | 66 |
| Deferred country tax expense payable | 12,660 |
| Accrued expenses and other liabilities | 216,289 |
| Total liabilities | $58,093,384 |
| Net assets | $1,836,788,560 |
| Net assets consist of | |
| Paid-in capital | $1,303,755,751 |
| Total distributable earnings (loss) | 533,032,809 |
| Net assets | $1,836,788,560 |
| Shares of beneficial interest outstanding | 92,377,784 |
| Net assets | Shares outstanding | Net asset value per share (a) | |
| Class A | $810,476,704 | 40,556,089 | $19.98 |
| Class B | 17,638,089 | 862,344 | 20.45 |
| Class C | 116,520,160 | 5,792,458 | 20.12 |
| Class I | 597,469,030 | 30,259,156 | 19.75 |
| Class R1 | 2,432,055 | 121,721 | 19.98 |
| Class R2 | 5,046,928 | 255,424 | 19.76 |
| Class R3 | 19,529,015 | 980,588 | 19.92 |
| Class R4 | 6,057,579 | 302,623 | 20.02 |
| Class R6 | 261,619,000 | 13,247,381 | 19.75 |
| (a) | Maximum offering price per share was equal to the net asset value per share for all share classes, except for Class A, for which the maximum offering price per share was $21.20 [100 / 94.25 x $19.98]. On sales of $50,000 or more, the maximum offering price of Class A shares is reduced. A contingent deferred sales charge may be imposed on redemptions of Class A, Class B, and Class C shares. Redemption price per share was equal to the net asset value per share for Classes I, R1, R2, R3, R4, and R6. |
| Net investment income (loss) | |
| Income | |
| Dividends | $30,305,167 |
| Interest | 13,374,417 |
| Dividends from affiliated issuers | 40,389 |
| Income on securities loaned | 7,477 |
| Foreign taxes withheld | (1,031,176) |
| Total investment income | $42,696,274 |
| Expenses | |
| Management fee | $13,759,406 |
| Distribution and service fees | 3,623,807 |
| Shareholder servicing costs | 1,659,092 |
| Administrative services fee | 244,646 |
| Independent Trustees' compensation | 27,449 |
| Custodian fee | 292,972 |
| Shareholder communications | 99,034 |
| Audit and tax fees | 127,649 |
| Legal fees | 9,587 |
| Miscellaneous | 208,707 |
| Total expenses | $20,052,349 |
| Fees paid indirectly | (1,632) |
| Reduction of expenses by investment adviser and distributor | (1,273,309) |
| Net expenses | $18,777,408 |
| Net investment income (loss) | $23,918,866 |
| Realized and unrealized gain (loss) | |
| Realized gain (loss) (identified cost basis) | |
| Unaffiliated issuers (net of $9,034 country tax) | $169,149,485 |
| Written options | 107,446 |
| Futures contracts | 2,527,338 |
| Swap agreements | 64,819 |
| Forward foreign currency exchange contracts | (3,064,764) |
| Foreign currency | (370,393) |
| Net realized gain (loss) | $168,413,931 |
| Change in unrealized appreciation or depreciation | |
| Unaffiliated issuers (net of $6,803 decrease in deferred country tax) | $130,205,721 |
| Futures contracts | 1,924,622 |
| Forward foreign currency exchange contracts | (1,671,572) |
| Translation of assets and liabilities in foreign currencies | 15,983 |
| Net unrealized gain (loss) | $130,474,754 |
| Net realized and unrealized gain (loss) | $298,888,685 |
| Change in net assets from operations | $322,807,551 |
| Year ended | ||
| 10/31/21 | 10/31/20 | |
| Change in net assets | ||
| From operations | ||
| Net investment income (loss) | $23,918,866 | $22,274,998 |
| Net realized gain (loss) | 168,413,931 | 105,322,757 |
| Net unrealized gain (loss) | 130,474,754 | (118,133,608) |
| Change in net assets from operations | $322,807,551 | $9,464,147 |
| Total distributions to shareholders | $(127,898,152) | $(78,502,749) |
| Change in net assets from fund share transactions | $(8,865,770) | $(115,521,196) |
| Total change in net assets | $186,043,629 | $(184,559,798) |
| Net assets | ||
| At beginning of period | 1,650,744,931 | 1,835,304,729 |
| At end of period | $1,836,788,560 | $1,650,744,931 |
| Class A | Year ended | ||||
| 10/31/21 | 10/31/20 | 10/31/19 | 10/31/18 | 10/31/17 | |
| Net asset value, beginning of period | $17.90 | $18.51 | $17.02 | $18.08 | $16.42 |
| Income (loss) from investment operations | |||||
| Net investment income (loss) (d) | $0.24 | $0.22 | $0.30 | $0.27 | $0.23(c) |
| Net realized and unrealized gain (loss) | 3.22 | (0.03) | 1.70 | (0.81) | 1.70 |
| Total from investment operations | $3.46 | $0.19 | $2.00 | $(0.54) | $1.93 |
| Less distributions declared to shareholders | |||||
| From net investment income | $(0.35) | $(0.29) | $(0.23) | $(0.28) | $(0.27) |
| From net realized gain | (1.03) | (0.51) | (0.28) | (0.24) | — |
| Total distributions declared to shareholders | $(1.38) | $(0.80) | $(0.51) | $(0.52) | $(0.27) |
| Net asset value, end of period (x) | $19.98 | $17.90 | $18.51 | $17.02 | $18.08 |
| Total return (%) (r)(s)(t)(x) | 19.88 | 1.00 | 12.03 | (3.12) | 11.88(c) |
| Ratios (%) (to average net assets) and Supplemental data: | |||||
| Expenses before expense reductions (f) | 1.16 | 1.17 | 1.16 | 1.15 | 1.20(c) |
| Expenses after expense reductions (f) | 1.09 | 1.09 | 1.09 | 1.09 | 1.08(c) |
| Net investment income (loss) | 1.24 | 1.26 | 1.70 | 1.48 | 1.35(c) |
| Portfolio turnover | 94 | 89 | 65 | 52 | 41 |
| Net assets at end of period (000 omitted) | $810,477 | $698,352 | $754,092 | $731,699 | $781,298 |
| Class B | Year ended | ||||
| 10/31/21 | 10/31/20 | 10/31/19 | 10/31/18 | 10/31/17 | |
| Net asset value, beginning of period | $18.29 | $18.88 | $17.34 | $18.41 | $16.73 |
| Income (loss) from investment operations | |||||
| Net investment income (loss) (d) | $0.10 | $0.09 | $0.17 | $0.13 | $0.11(c) |
| Net realized and unrealized gain (loss) | 3.29 | (0.03) | 1.73 | (0.83) | 1.74 |
| Total from investment operations | $3.39 | $0.06 | $1.90 | $(0.70) | $1.85 |
| Less distributions declared to shareholders | |||||
| From net investment income | $(0.20) | $(0.14) | $(0.08) | $(0.13) | $(0.17) |
| From net realized gain | (1.03) | (0.51) | (0.28) | (0.24) | — |
| Total distributions declared to shareholders | $(1.23) | $(0.65) | $(0.36) | $(0.37) | $(0.17) |
| Net asset value, end of period (x) | $20.45 | $18.29 | $18.88 | $17.34 | $18.41 |
| Total return (%) (r)(s)(t)(x) | 18.96 | 0.26 | 11.21 | (3.90) | 11.11(c) |
| Ratios (%) (to average net assets) and Supplemental data: | |||||
| Expenses before expense reductions (f) | 1.91 | 1.92 | 1.91 | 1.90 | 1.95(c) |
| Expenses after expense reductions (f) | 1.84 | 1.84 | 1.84 | 1.84 | 1.84(c) |
| Net investment income (loss) | 0.49 | 0.51 | 0.96 | 0.72 | 0.61(c) |
| Portfolio turnover | 94 | 89 | 65 | 52 | 41 |
| Net assets at end of period (000 omitted) | $17,638 | $19,630 | $28,393 | $36,088 | $48,598 |
| Class C | Year ended | ||||
| 10/31/21 | 10/31/20 | 10/31/19 | 10/31/18 | 10/31/17 | |
| Net asset value, beginning of period | $18.01 | $18.60 | $17.10 | $18.15 | $16.51 |
| Income (loss) from investment operations | |||||
| Net investment income (loss) (d) | $0.10 | $0.09 | $0.17 | $0.13 | $0.10(c) |
| Net realized and unrealized gain (loss) | 3.24 | (0.03) | 1.70 | (0.80) | 1.71 |
| Total from investment operations | $3.34 | $0.06 | $1.87 | $(0.67) | $1.81 |
| Less distributions declared to shareholders | |||||
| From net investment income | $(0.20) | $(0.14) | $(0.09) | $(0.14) | $(0.17) |
| From net realized gain | (1.03) | (0.51) | (0.28) | (0.24) | — |
| Total distributions declared to shareholders | $(1.23) | $(0.65) | $(0.37) | $(0.38) | $(0.17) |
| Net asset value, end of period (x) | $20.12 | $18.01 | $18.60 | $17.10 | $18.15 |
| Total return (%) (r)(s)(t)(x) | 19.00 | 0.28 | 11.14 | (3.81) | 11.03(c) |
| Ratios (%) (to average net assets) and Supplemental data: | |||||
| Expenses before expense reductions (f) | 1.91 | 1.92 | 1.91 | 1.90 | 1.95(c) |
| Expenses after expense reductions (f) | 1.84 | 1.84 | 1.84 | 1.84 | 1.84(c) |
| Net investment income (loss) | 0.49 | 0.52 | 0.96 | 0.72 | 0.60(c) |
| Portfolio turnover | 94 | 89 | 65 | 52 | 41 |
| Net assets at end of period (000 omitted) | $116,520 | $144,961 | $211,090 | $255,464 | $337,099 |
| Class I | Year ended | ||||
| 10/31/21 | 10/31/20 | 10/31/19 | 10/31/18 | 10/31/17 | |
| Net asset value, beginning of period | $17.70 | $18.31 | $16.85 | $17.91 | $16.26 |
| Income (loss) from investment operations | |||||
| Net investment income (loss) (d) | $0.29 | $0.27 | $0.34 | $0.31 | $0.28(c) |
| Net realized and unrealized gain (loss) | 3.19 | (0.04) | 1.67 | (0.81) | 1.69 |
| Total from investment operations | $3.48 | $0.23 | $2.01 | $(0.50) | $1.97 |
| Less distributions declared to shareholders | |||||
| From net investment income | $(0.40) | $(0.33) | $(0.27) | $(0.32) | $(0.32) |
| From net realized gain | (1.03) | (0.51) | (0.28) | (0.24) | — |
| Total distributions declared to shareholders | $(1.43) | $(0.84) | $(0.55) | $(0.56) | $(0.32) |
| Net asset value, end of period (x) | $19.75 | $17.70 | $18.31 | $16.85 | $17.91 |
| Total return (%) (r)(s)(t)(x) | 20.23 | 1.27 | 12.26 | (2.90) | 12.22(c) |
| Ratios (%) (to average net assets) and Supplemental data: | |||||
| Expenses before expense reductions (f) | 0.91 | 0.92 | 0.91 | 0.90 | 0.95(c) |
| Expenses after expense reductions (f) | 0.84 | 0.84 | 0.84 | 0.84 | 0.84(c) |
| Net investment income (loss) | 1.49 | 1.50 | 1.94 | 1.75 | 1.64(c) |
| Portfolio turnover | 94 | 89 | 65 | 52 | 41 |
| Net assets at end of period (000 omitted) | $597,469 | $524,907 | $569,767 | $667,895 | $585,360 |
| Class R1 | Year ended | ||||
| 10/31/21 | 10/31/20 | 10/31/19 | 10/31/18 | 10/31/17 | |
| Net asset value, beginning of period | $17.90 | $18.51 | $17.02 | $18.08 | $16.44 |
| Income (loss) from investment operations | |||||
| Net investment income (loss) (d) | $0.10 | $0.09 | $0.17 | $0.12 | $0.10(c) |
| Net realized and unrealized gain (loss) | 3.22 | (0.03) | 1.69 | (0.80) | 1.71 |
| Total from investment operations | $3.32 | $0.06 | $1.86 | $(0.68) | $1.81 |
| Less distributions declared to shareholders | |||||
| From net investment income | $(0.21) | $(0.16) | $(0.09) | $(0.14) | $(0.17) |
| From net realized gain | (1.03) | (0.51) | (0.28) | (0.24) | — |
| Total distributions declared to shareholders | $(1.24) | $(0.67) | $(0.37) | $(0.38) | $(0.17) |
| Net asset value, end of period (x) | $19.98 | $17.90 | $18.51 | $17.02 | $18.08 |
| Total return (%) (r)(s)(t)(x) | 18.99 | 0.23 | 11.18 | (3.84) | 11.09(c) |
| Ratios (%) (to average net assets) and Supplemental data: | |||||
| Expenses before expense reductions (f) | 1.91 | 1.92 | 1.91 | 1.90 | 1.95(c) |
| Expenses after expense reductions (f) | 1.84 | 1.84 | 1.84 | 1.84 | 1.84(c) |
| Net investment income (loss) | 0.49 | 0.51 | 0.96 | 0.65 | 0.59(c) |
| Portfolio turnover | 94 | 89 | 65 | 52 | 41 |
| Net assets at end of period (000 omitted) | $2,432 | $2,396 | $2,483 | $2,352 | $2,578 |
| Class R2 | Year ended | ||||
| 10/31/21 | 10/31/20 | 10/31/19 | 10/31/18 | 10/31/17 | |
| Net asset value, beginning of period | $17.71 | $18.31 | $16.84 | $17.89 | $16.26 |
| Income (loss) from investment operations | |||||
| Net investment income (loss) (d) | $0.19 | $0.18 | $0.25 | $0.22 | $0.19(c) |
| Net realized and unrealized gain (loss) | 3.19 | (0.04) | 1.68 | (0.80) | 1.68 |
| Total from investment operations | $3.38 | $0.14 | $1.93 | $(0.58) | $1.87 |
| Less distributions declared to shareholders | |||||
| From net investment income | $(0.30) | $(0.23) | $(0.18) | $(0.23) | $(0.24) |
| From net realized gain | (1.03) | (0.51) | (0.28) | (0.24) | — |
| Total distributions declared to shareholders | $(1.33) | $(0.74) | $(0.46) | $(0.47) | $(0.24) |
| Net asset value, end of period (x) | $19.76 | $17.71 | $18.31 | $16.84 | $17.89 |
| Total return (%) (r)(s)(t)(x) | 19.61 | 0.75 | 11.74 | (3.37) | 11.59(c) |
| Ratios (%) (to average net assets) and Supplemental data: | |||||
| Expenses before expense reductions (f) | 1.41 | 1.42 | 1.41 | 1.40 | 1.45(c) |
| Expenses after expense reductions (f) | 1.34 | 1.34 | 1.34 | 1.34 | 1.34(c) |
| Net investment income (loss) | 0.99 | 1.00 | 1.44 | 1.21 | 1.11(c) |
| Portfolio turnover | 94 | 89 | 65 | 52 | 41 |
| Net assets at end of period (000 omitted) | $5,047 | $4,997 | $11,286 | $13,788 | $21,141 |
| Class R3 | Year ended | ||||
| 10/31/21 | 10/31/20 | 10/31/19 | 10/31/18 | 10/31/17 | |
| Net asset value, beginning of period | $17.85 | $18.45 | $16.97 | $18.03 | $16.37 |
| Income (loss) from investment operations | |||||
| Net investment income (loss) (d) | $0.24 | $0.22 | $0.30 | $0.26 | $0.23(c) |
| Net realized and unrealized gain (loss) | 3.21 | (0.02) | 1.69 | (0.80) | 1.71 |
| Total from investment operations | $3.45 | $0.20 | $1.99 | $(0.54) | $1.94 |
| Less distributions declared to shareholders | |||||
| From net investment income | $(0.35) | $(0.29) | $(0.23) | $(0.28) | $(0.28) |
| From net realized gain | (1.03) | (0.51) | (0.28) | (0.24) | — |
| Total distributions declared to shareholders | $(1.38) | $(0.80) | $(0.51) | $(0.52) | $(0.28) |
| Net asset value, end of period (x) | $19.92 | $17.85 | $18.45 | $16.97 | $18.03 |
| Total return (%) (r)(s)(t)(x) | 19.88 | 1.05 | 12.01 | (3.14) | 11.94(c) |
| Ratios (%) (to average net assets) and Supplemental data: | |||||
| Expenses before expense reductions (f) | 1.16 | 1.17 | 1.16 | 1.15 | 1.20(c) |
| Expenses after expense reductions (f) | 1.09 | 1.09 | 1.09 | 1.09 | 1.09(c) |
| Net investment income (loss) | 1.24 | 1.25 | 1.69 | 1.47 | 1.35(c) |
| Portfolio turnover | 94 | 89 | 65 | 52 | 41 |
| Net assets at end of period (000 omitted) | $19,529 | $19,799 | $20,300 | $18,795 | $21,193 |
| Class R4 | Year ended | ||||
| 10/31/21 | 10/31/20 | 10/31/19 | 10/31/18 | 10/31/17 | |
| Net asset value, beginning of period | $17.93 | $18.54 | $17.05 | $18.11 | $16.44 |
| Income (loss) from investment operations | |||||
| Net investment income (loss) (d) | $0.29 | $0.27 | $0.34 | $0.31 | $0.27(c) |
| Net realized and unrealized gain (loss) | 3.23 | (0.04) | 1.70 | (0.81) | 1.72 |
| Total from investment operations | $3.52 | $0.23 | $2.04 | $(0.50) | $1.99 |
| Less distributions declared to shareholders | |||||
| From net investment income | $(0.40) | $(0.33) | $(0.27) | $(0.32) | $(0.32) |
| From net realized gain | (1.03) | (0.51) | (0.28) | (0.24) | — |
| Total distributions declared to shareholders | $(1.43) | $(0.84) | $(0.55) | $(0.56) | $(0.32) |
| Net asset value, end of period (x) | $20.02 | $17.93 | $18.54 | $17.05 | $18.11 |
| Total return (%) (r)(s)(t)(x) | 20.19 | 1.25 | 12.30 | (2.87) | 12.20(c) |
| Ratios (%) (to average net assets) and Supplemental data: | |||||
| Expenses before expense reductions (f) | 0.91 | 0.92 | 0.91 | 0.90 | 0.95(c) |
| Expenses after expense reductions (f) | 0.84 | 0.84 | 0.84 | 0.84 | 0.84(c) |
| Net investment income (loss) | 1.50 | 1.51 | 1.95 | 1.71 | 1.59(c) |
| Portfolio turnover | 94 | 89 | 65 | 52 | 41 |
| Net assets at end of period (000 omitted) | $6,058 | $6,461 | $7,570 | $7,514 | $6,063 |
| Class R6 | Year ended | ||||
| 10/31/21 | 10/31/20 | 10/31/19 | 10/31/18 | 10/31/17 | |
| Net asset value, beginning of period | $17.71 | $18.32 | $16.85 | $17.91 | $16.26 |
| Income (loss) from investment operations | |||||
| Net investment income (loss) (d) | $0.31 | $0.28 | $0.35 | $0.33 | $0.28(c) |
| Net realized and unrealized gain (loss) | 3.18 | (0.03) | 1.69 | (0.81) | 1.70 |
| Total from investment operations | $3.49 | $0.25 | $2.04 | $(0.48) | $1.98 |
| Less distributions declared to shareholders | |||||
| From net investment income | $(0.42) | $(0.35) | $(0.29) | $(0.34) | $(0.33) |
| From net realized gain | (1.03) | (0.51) | (0.28) | (0.24) | — |
| Total distributions declared to shareholders | $(1.45) | $(0.86) | $(0.57) | $(0.58) | $(0.33) |
| Net asset value, end of period (x) | $19.75 | $17.71 | $18.32 | $16.85 | $17.91 |
| Total return (%) (r)(s)(t)(x) | 20.26 | 1.36 | 12.44 | (2.82) | 12.33(c) |
| Ratios (%) (to average net assets) and Supplemental data: | |||||
| Expenses before expense reductions (f) | 0.82 | 0.83 | 0.82 | 0.81 | 0.84(c) |
| Expenses after expense reductions (f) | 0.75 | 0.75 | 0.75 | 0.75 | 0.74(c) |
| Net investment income (loss) | 1.58 | 1.60 | 2.03 | 1.83 | 1.63(c) |
| Portfolio turnover | 94 | 89 | 65 | 52 | 41 |
| Net assets at end of period (000 omitted) | $261,619 | $229,244 | $230,324 | $363,364 | $347,795 |
| (c) | Amount reflects a one-time reimbursement of expenses by the custodian (or former custodian) without which net investment income and performance would be lower and expenses would be higher. |
| (d) | Per share data is based on average shares outstanding. |
| (f) | Ratios do not reflect reductions from fees paid indirectly, if applicable. |
| (r) | Certain expenses have been reduced without which performance would have been lower. |
| (s) | From time to time the fund may receive proceeds from litigation settlements, without which performance would be lower. |
| (t) | Total returns do not include any applicable sales charges. |
| (x) | The net asset values and total returns have been calculated on net assets which include adjustments made in accordance with U.S. generally accepted accounting principles required at period end for financial reporting purposes. |
| Financial Instruments | Level 1 | Level 2 | Level 3 | Total |
| Equity Securities: | ||||
| United States | $600,239,324 | $— | $— | $600,239,324 |
| Switzerland | 82,062,727 | — | — | 82,062,727 |
| Japan | 5,093,743 | 71,752,978 | — | 76,846,721 |
| United Kingdom | 74,146,085 | — | — | 74,146,085 |
| France | 54,385,958 | — | — | 54,385,958 |
| Canada | 39,093,405 | — | — | 39,093,405 |
| Germany | 28,767,933 | — | — | 28,767,933 |
| Netherlands | 22,968,958 | — | — | 22,968,958 |
| Taiwan | 15,443,302 | 5,319,348 | — | 20,762,650 |
| Other Countries | 58,511,185 | 39,358,783 | — | 97,869,968 |
| U.S. Treasury Bonds & U.S. Government Agencies & Equivalents | — | 71,099,458 | — | 71,099,458 |
| Non - U.S. Sovereign Debt | — | 265,690,668 | — | 265,690,668 |
| Municipal Bonds | — | 6,137,758 | — | 6,137,758 |
| U.S. Corporate Bonds | — | 107,547,053 | — | 107,547,053 |
| Residential Mortgage-Backed Securities | — | 56,603,876 | — | 56,603,876 |
| Commercial Mortgage-Backed Securities | — | 30,453,982 | — | 30,453,982 |
| Asset-Backed Securities (including CDOs) | — | 19,538,739 | — | 19,538,739 |
| Foreign Bonds | — | 122,274,162 | — | 122,274,162 |
| Mutual Funds | 58,529,026 | — | — | 58,529,026 |
| Total | $1,039,241,646 | $795,776,805 | $— | $1,835,018,451 |
| Other Financial Instruments | ||||
| Futures Contracts – Assets | $3,441,299 | $— | $— | $3,441,299 |
| Futures Contracts – Liabilities | (1,287,468) | — | — | (1,287,468) |
| Forward Foreign Currency Exchange Contracts – Assets | — | 1,243,728 | — | 1,243,728 |
| Forward Foreign Currency Exchange Contracts – Liabilities | — | (2,160,907) | — | (2,160,907) |
| Fair Value (a) | |||
| Risk | Derivative Contracts | Asset Derivatives | Liability Derivatives |
| Interest Rate | Futures Contracts | $3,441,299 | $(1,287,468) |
| Interest Rate | Purchased Option Contracts | 1,923,802 | — |
| Foreign Exchange | Forward Foreign Currency Exchange Contracts | 1,243,728 | (2,160,907) |
| Total | $6,608,829 | $(3,448,375) | |
| (a) | The value of purchased options outstanding is included in investments in unaffiliated issuers, at value, within the Statement of Assets and Liabilities. Values presented in this table for futures contracts correspond to the values reported in the Portfolio of Investments. Only the current day net variation margin for futures contracts is separately reported within the Statement of Assets and Liabilities. |
| Risk | Futures Contracts | Swap Agreements | Forward Foreign Currency Exchange Contracts | Written Options | Unaffiliated Issuers (Purchased Options) |
| Interest Rate | $2,527,338 | $ — | $ — | $ — | $ — |
| Foreign Exchange | — | — | (3,064,764) | — | — |
| Credit | — | 64,819 | — | 107,446 | (253,149) |
| Total | $2,527,338 | $64,819 | $(3,064,764) | $107,446 | $(253,149) |
| Risk | Futures Contracts | Forward Foreign Currency Exchange Contracts | Unaffiliated Issuers (Purchased Options) |
| Interest Rate | $1,924,622 | $ — | $962,680 |
| Foreign Exchange | — | (1,671,572) | — |
| Total | $1,924,622 | $(1,671,572) | $962,680 |
| Year ended 10/31/21 | Year ended 10/31/20 | |
| Ordinary income (including any short-term capital gains) | $35,867,262 | $28,550,130 |
| Long-term capital gains | 92,030,890 | 49,952,619 |
| Total distributions | $127,898,152 | $78,502,749 |
| As of 10/31/21 | |
| Cost of investments | $1,456,261,259 |
| Gross appreciation | 404,630,701 |
| Gross depreciation | (24,636,857) |
| Net unrealized appreciation (depreciation) | $ 379,993,844 |
| Undistributed ordinary income | 17,238,485 |
| Undistributed long-term capital gain | 135,633,098 |
| Other temporary differences | 167,382 |
| Total distributable earnings (loss) | $ 533,032,809 |
| Year ended 10/31/21 | Year ended 10/31/20 | ||
| Class A | $53,672,718 | $31,986,644 | |
| Class B | 1,273,029 | 934,603 | |
| Class C | 9,445,301 | 7,110,833 | |
| Class I | 42,285,015 | 25,929,291 | |
| Class R1 | 164,770 | 89,659 | |
| Class R2 | 361,052 | 394,419 | |
| Class R3 | 1,519,960 | 881,022 | |
| Class R4 | 497,220 | 338,767 | |
| Class R6 | 18,679,087 | 10,837,511 | |
| Total | $127,898,152 | $78,502,749 |
| Up to $500 million | 0.84% |
| In excess of $500 million and up to $1 billion | 0.75% |
| In excess of $1 billion and up to $2.5 billion | 0.70% |
| In excess of $2.5 billion | 0.65% |
| Classes | ||||||||
| A | B | C | I | R1 | R2 | R3 | R4 | R6 |
| 1.09% | 1.84% | 1.84% | 0.84% | 1.84% | 1.34% | 1.09% | 0.84% | 0.78% |
| Distribution Fee Rate (d) | Service Fee Rate (d) | Total Distribution Plan (d) | Annual Effective Rate (e) | Distribution and Service Fee | |
| Class A | — | 0.25% | 0.25% | 0.25% | $ 1,982,543 |
| Class B | 0.75% | 0.25% | 1.00% | 1.00% | 196,813 |
| Class C | 0.75% | 0.25% | 1.00% | 1.00% | 1,342,689 |
| Class R1 | 0.75% | 0.25% | 1.00% | 1.00% | 25,283 |
| Class R2 | 0.25% | 0.25% | 0.50% | 0.50% | 26,485 |
| Class R3 | — | 0.25% | 0.25% | 0.25% | 49,994 |
| Total Distribution and Service Fees | $3,623,807 |
| (d) | In accordance with the distribution plan for certain classes, the fund pays distribution and/or service fees equal to these annual percentage rates of each class’s average daily net assets. The distribution and service fee rates disclosed by class represent the current rates in effect at the end of the reporting period. Any rate changes, if applicable, are detailed below. |
| (e) | The annual effective rates represent actual fees incurred under the distribution plan for the year ended October 31, 2021 based on each class's average daily net assets. MFD has voluntarily agreed to rebate a portion of each class's 0.25% service fee attributable to accounts for which there is no financial intermediary specified on the account except for accounts attributable to MFS or its affiliates' seed money. For the year ended October 31, 2021, this rebate amounted to $339, $8, and $2 for Class A, Class B, and Class C, respectively, and is included in the reduction of total expenses in the Statement of Operations. |
| Amount | |
| Class A | $3,419 |
| Class B | 8,075 |
| Class C | 2,822 |
| Purchases | Sales | |
| U.S. Government securities | $485,732,404 | $497,402,075 |
| Non-U.S. Government securities | 1,156,513,535 | 1,282,464,030 |
| Year ended 10/31/21 | Year ended 10/31/20 | ||||
| Shares | Amount | Shares | Amount | ||
| Shares sold | |||||
| Class A | 4,373,697 | $84,778,727 | 4,464,127 | $79,824,616 | |
| Class B | 4,856 | 93,924 | 6,252 | 115,884 | |
| Class C | 374,840 | 7,327,015 | 481,533 | 8,740,188 | |
| Class I | 5,299,816 | 101,702,117 | 6,500,510 | 113,328,499 | |
| Class R1 | 10,650 | 208,208 | 17,411 | 308,290 | |
| Class R2 | 41,301 | 792,127 | 76,072 | 1,343,414 | |
| Class R3 | 152,610 | 2,961,078 | 351,291 | 6,298,909 | |
| Class R4 | 70,946 | 1,392,577 | 67,166 | 1,208,555 | |
| Class R6 | 2,836,265 | 54,659,503 | 3,283,901 | 57,400,817 | |
| 13,164,981 | $253,915,276 | 15,248,263 | $268,569,172 | ||
| Shares issued to shareholders in reinvestment of distributions | |||||
| Class A | 2,617,171 | $49,281,894 | 1,644,550 | $29,777,127 | |
| Class B | 61,966 | 1,190,152 | 45,822 | 855,887 | |
| Class C | 456,350 | 8,622,444 | 323,077 | 5,939,528 | |
| Class I | 1,946,797 | 36,241,395 | 1,230,716 | 21,994,988 | |
| Class R1 | 8,773 | 164,770 | 4,910 | 89,659 | |
| Class R2 | 16,877 | 313,997 | 11,612 | 208,954 | |
| Class R3 | 81,087 | 1,519,960 | 48,816 | 881,022 | |
| Class R4 | 26,086 | 491,887 | 18,645 | 337,555 | |
| Class R6 | 855,542 | 15,932,843 | 533,493 | 9,522,107 | |
| 6,070,649 | $113,759,342 | 3,861,641 | $69,606,827 | ||
| Shares reacquired | |||||
| Class A | (5,442,782) | $(105,840,131) | (7,839,615) | $(137,914,440) | |
| Class B | (277,760) | (5,539,888) | (482,677) | (8,650,815) | |
| Class C | (3,088,516) | (60,085,012) | (4,102,276) | (73,060,903) | |
| Class I | (6,637,545) | (127,588,510) | (9,191,794) | (156,851,341) | |
| Class R1 | (31,518) | (612,574) | (22,642) | (399,261) | |
| Class R2 | (84,828) | (1,629,465) | (421,912) | (7,406,840) | |
| Class R3 | (362,528) | (6,909,193) | (390,718) | (6,849,193) | |
| Class R4 | (154,759) | (3,027,858) | (133,837) | (2,402,478) | |
| Class R6 | (3,392,351) | (65,307,757) | (3,443,772) | (60,161,924) | |
| (19,472,587) | $(376,540,388) | (26,029,243) | $(453,697,195) | ||
| Year ended 10/31/21 | Year ended 10/31/20 | ||||
| Shares | Amount | Shares | Amount | ||
| Net change | |||||
| Class A | 1,548,086 | $28,220,490 | (1,730,938) | $(28,312,697) | |
| Class B | (210,938) | (4,255,812) | (430,603) | (7,679,044) | |
| Class C | (2,257,326) | (44,135,553) | (3,297,666) | (58,381,187) | |
| Class I | 609,068 | 10,355,002 | (1,460,568) | (21,527,854) | |
| Class R1 | (12,095) | (239,596) | (321) | (1,312) | |
| Class R2 | (26,650) | (523,341) | (334,228) | (5,854,472) | |
| Class R3 | (128,831) | (2,428,155) | 9,389 | 330,738 | |
| Class R4 | (57,727) | (1,143,394) | (48,026) | (856,368) | |
| Class R6 | 299,456 | 5,284,589 | 373,622 | 6,761,000 | |
| (236,957) | $(8,865,770) | (6,919,339) | $(115,521,196) | ||
| Affiliated Issuers | Beginning Value | Purchases | Sales Proceeds | Realized Gain (Loss) | Change in Unrealized Appreciation or Depreciation | Ending Value |
| MFS Institutional Money Market Portfolio | $53,853,362 | $788,722,791 | $785,261,527 | $— | $— | $57,314,626 |
| Affiliated Issuers | Dividend Income | Capital Gain Distributions |
| MFS Institutional Money Market Portfolio | $40,389 | $— |

December 15, 2021
| Name, Age | Position(s) Held with Fund | Trustee/Officer Since(h) | Number of MFS Funds overseen by the Trustee | Principal Occupations During the Past Five Years | Other Directorships During the Past Five Years (j) | |||||
| INTERESTED TRUSTEES | ||||||||||
| Robert J. Manning (k) (age 58) | Trustee | February 2004 | 135 | Massachusetts Financial Services Company, Non-Executive Chairman (since January 2021); Director; Chairman of the Board; Executive Chairman (January 2017-2020); Co-Chief Executive Officer (2015-2016) | N/A | |||||
| Michael W. Roberge (k) (age 55) | Trustee | January 2021 | 135 | Massachusetts Financial Services Company, Chairman (since January 2021); Chief Executive Officer (since January 2017); Director; President (until December 2018); Chief Investment Officer (until December 2018); Co-Chief Executive Officer (until December 2016) | N/A | |||||
| INDEPENDENT TRUSTEES | ||||||||||
| John P. Kavanaugh (age 67) | Trustee and Chair of Trustees | January 2009 | 135 | Private investor | N/A | |||||
| Steven E. Buller (age 70) | Trustee | February 2014 | 135 | Private investor | N/A | |||||
| John A. Caroselli (age 67) | Trustee | March 2017 | 135 | Private investor; JC Global Advisors, LLC (management consulting), President (since 2015) | N/A | |||||
| Maureen R. Goldfarb (age 66) | Trustee | January 2009 | 135 | Private investor | N/A | |||||
| Peter D. Jones (age 66) | Trustee | January 2019 | 135 | Private investor | N/A | |||||
| Name, Age | Position(s) Held with Fund | Trustee/Officer Since(h) | Number of MFS Funds overseen by the Trustee | Principal Occupations During the Past Five Years | Other Directorships During the Past Five Years (j) | |||||
| James W. Kilman, Jr. (age 60) | Trustee | January 2019 | 135 | Burford Capital Limited (finance and investment management), Senior Advisor (since May 3, 2021), Chief Financial Officer (2019 - May 2, 2021); KielStrand Capital LLC (family office), Chief Executive Officer (since 2016); Morgan Stanley & Co. (financial services), Vice Chairman of Investment Banking, Co-Head of Diversified Financials Coverage – Financial Institutions Investment Banking Group (until 2016) | Alpha-En Corporation, Director (2016-2019) | |||||
| Clarence Otis, Jr. (age 65) | Trustee | March 2017 | 135 | Private investor | VF Corporation, Director; Verizon Communications, Inc., Director; The Travelers Companies, Director | |||||
| Maryanne L. Roepke (age 65) | Trustee | May 2014 | 135 | Private investor | N/A | |||||
| Laurie J. Thomsen (age 64) | Trustee | March 2005 | 135 | Private investor | The Travelers Companies, Director; Dycom Industries, Inc., Director |
| Name, Age | Position(s) Held with Fund | Trustee/Officer Since(h) | Number of MFS Funds for which the Person is an Officer | Principal Occupations During the Past Five Years | ||||
| OFFICERS | ||||||||
| Christopher R. Bohane (k) (age 47) | Assistant Secretary and Assistant Clerk | July 2005 | 135 | Massachusetts Financial Services Company, Senior Vice President and Associate General Counsel | ||||
| Kino Clark (k) (age 53) | Assistant Treasurer | January 2012 | 135 | Massachusetts Financial Services Company, Vice President |
| Name, Age | Position(s) Held with Fund | Trustee/Officer Since(h) | Number of MFS Funds for which the Person is an Officer | Principal Occupations During the Past Five Years | ||||
| John W. Clark, Jr. (k) (age 54) | Assistant Treasurer | April 2017 | 135 | Massachusetts Financial Services Company, Vice President (since March 2017); Deutsche Bank (financial services), Department Head - Treasurer's Office (until February 2017) | ||||
| Thomas H. Connors (k) (age 62) | Assistant Secretary and Assistant Clerk | September 2012 | 135 | Massachusetts Financial Services Company, Vice President and Senior Counsel | ||||
| David L. DiLorenzo (k) (age 53) | President | July 2005 | 135 | Massachusetts Financial Services Company, Senior Vice President | ||||
| Heidi W. Hardin (k) (age 54) | Secretary and Clerk | April 2017 | 135 | Massachusetts Financial Services Company, Executive Vice President and General Counsel (since March 2017); Harris Associates (investment management), General Counsel (until January 2017) | ||||
| Brian E. Langenfeld (k) (age 48) | Assistant Secretary and Assistant Clerk | June 2006 | 135 | Massachusetts Financial Services Company, Vice President and Senior Counsel | ||||
| Amanda S. Mooradian (k) (age 42) | Assistant Secretary and Assistant Clerk | September 2018 | 135 | Massachusetts Financial Services Company, Assistant Vice President and Senior Counsel | ||||
| Susan A. Pereira (k) (age 51) | Assistant Secretary and Assistant Clerk | July 2005 | 135 | Massachusetts Financial Services Company, Vice President and Assistant General Counsel | ||||
| Kasey L. Phillips (k) (age 50) | Assistant Treasurer | September 2012 | 135 | Massachusetts Financial Services Company, Vice President | ||||
| Matthew A. Stowe (k) (age 47) | Assistant Secretary and Assistant Clerk | October 2014 | 135 | Massachusetts Financial Services Company, Vice President and Assistant General Counsel | ||||
| Martin J. Wolin (k) (age 54) | Chief Compliance Officer | July 2015 | 135 | Massachusetts Financial Services Company, Senior Vice President and Chief Compliance Officer |
| Name, Age | Position(s) Held with Fund | Trustee/Officer Since(h) | Number of MFS Funds for which the Person is an Officer | Principal Occupations During the Past Five Years | ||||
| James O. Yost (k) (age 61) | Treasurer | September 1990 | 135 | Massachusetts Financial Services Company, Senior Vice President |
| (h) | Date first appointed to serve as Trustee/Officer of an MFS Fund. Each Trustee has served continuously since appointment unless indicated otherwise. For the period from December 15, 2004 until February 22, 2005, Mr. Manning served as Advisory Trustee. From January 2012 through December 2016, Messrs. DiLorenzo and Yost served as Treasurer and Deputy Treasurer of the Funds, respectively. |
| (j) | Directorships or trusteeships of companies required to report to the Securities and Exchange Commission (i.e., “public companies”). |
| (k) | “Interested person” of the Trust within the meaning of the Investment Company Act of 1940 (referred to as the 1940 Act), which is the principal federal law governing investment companies like the fund, as a result of a position with MFS. The address of MFS is 111 Huntington Avenue, Boston, Massachusetts 02199-7618. |
| Investment Adviser | Custodian |
| Massachusetts Financial Services Company 111 Huntington Avenue Boston, MA 02199-7618 | JPMorgan Chase Bank, NA 4 Metrotech Center New York, NY 11245 |
| Distributor | Independent Registered Public Accounting Firm |
| MFS Fund Distributors, Inc. 111 Huntington Avenue Boston, MA 02199-7618 | Ernst & Young LLP 200 Clarendon Street Boston, MA 02116 |
| Portfolio Manager(s) | |
| Pilar Gomez-Bravo Steven Gorham Andy Li Johnathan Munko Vipin Narula Henry Peabody Jonathan Sage Robert Spector Erik Weisman |
| FACTS | WHAT DOES MFS DO WITH YOUR PERSONAL INFORMATION? |
| Why? | Financial companies choose how they share your personal information. Federal law gives consumers the right to limit some but not all sharing. Federal law also requires us to tell you how we collect, share, and protect your personal information. Please read this notice carefully to understand what we do. |
| What? | The types of personal information we collect and share depend on the product or service you have with us. This information can include: |
| • Social Security number and account balances | |
| • Account transactions and transaction history | |
| • Checking account information and wire transfer instructions | |
| When you are no longer our customer, we continue to share your information as described in this notice. |
| How? | All financial companies need to share customers' personal information to run their everyday business. In the section below, we list the reasons financial companies can share their customers' personal information; the reasons MFS chooses to share; and whether you can limit this sharing. |
| Reasons we can share your personal information | Does MFS share? | Can you limit this sharing? |
| For our everyday business purposes – such as to process your transactions, maintain your account(s), respond to court orders and legal investigations, or report to credit bureaus | Yes | No |
| For our marketing purposes – to offer our products and services to you | No | We don't share |
| For joint marketing with other financial companies | No | We don't share |
| For our affiliates' everyday business purposes – information about your transactions and experiences | No | We don't share |
| For our affiliates' everyday business purposes – information about your creditworthiness | No | We don't share |
| For nonaffiliates to market to you | No | We don't share |
| Questions? | Call 800-225-2606 or go to mfs.com. |

| Who we are | |
| Who is providing this notice? | MFS Funds, MFS Investment Management, MFS Institutional Advisors, Inc., and MFS Heritage Trust Company. |
| What we do | |
| How does MFS protect my personal information? | To protect your personal information from unauthorized access and use, we use security measures that comply with federal law. These measures include procedural, electronic, and physical safeguards for the protection of the personal information we collect about you. |
| How does MFS collect my personal information? | We collect your personal information, for example, when you |
| • open an account or provide account information | |
| • direct us to buy securities or direct us to sell your securities | |
| • make a wire transfer | |
| We also collect your personal information from others, such as credit bureaus, affiliates, or other companies. | |
| Why can't I limit all sharing? | Federal law gives you the right to limit only |
| • sharing for affiliates' everyday business purposes – information about your creditworthiness | |
| • affiliates from using your information to market to you | |
| • sharing for nonaffiliates to market to you | |
| State laws and individual companies may give you additional rights to limit sharing. | |
| Definitions | |
| Affiliates | Companies related by common ownership or control. They can be financial and nonfinancial companies. |
| • MFS does not share personal information with affiliates, except for everyday business purposes as described on page one of this notice. | |
| Nonaffiliates | Companies not related by common ownership or control. They can be financial and nonfinancial companies. |
| • MFS does not share with nonaffiliates so they can market to you. | |
| Joint marketing | A formal agreement between nonaffiliated financial companies that together market financial products or services to you. |
| • MFS doesn't jointly market. | |
| Other important information |
| If you own an MFS product or receive an MFS service in the name of a third party such as a bank or broker-dealer, their privacy policy may apply to you instead of ours. |


| 1 | |
| 2 | |
| 3 | |
| 5 | |
| 8 | |
| 10 | |
| 14 | |
| 16 | |
| 17 | |
| 18 | |
| 24 | |
| 38 | |
| 40 | |
| 45 | |
| 49 | |
| 49 | |
| 49 | |
| 49 | |
| 49 | |
| 51 |
| back cover |


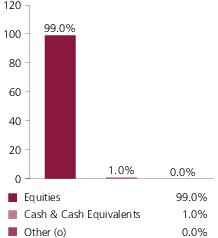
| NextEra Energy, Inc. | 9.2% |
| Southern Co. | 5.6% |
| Exelon Corp. | 5.4% |
| EDP Renovaveis S.A. | 4.9% |
| Dominion Energy, Inc. | 4.9% |
| Duke Energy Corp. | 3.9% |
| PG&E Corp. | 3.5% |
| Sempra Energy | 3.5% |
| Iberdrola S.A. | 3.3% |
| Edison International | 3.1% |
| Utilities - Electric Power | 84.8% |
| Telecommunications - Wireless | 7.6% |
| Natural Gas - Distribution | 3.0% |
| Cable TV | 1.9% |
| Telephone Services | 1.2% |
| United States | 68.3% |
| Portugal | 6.5% |
| Spain | 6.0% |
| United Kingdom | 4.6% |
| Germany | 4.3% |
| Italy | 3.0% |
| Canada | 2.2% |
| Brazil | 0.9% |
| Thailand | 0.7% |
| Other Countries | 3.5% |
| (o) | Less than 0.1%. |
| (x) | Represents the portfolio’s exposure to issuer countries as a percentage of a portfolio’s net assets. For purposes of this presentation, United States includes Cash & Cash Equivalents and Other. |
| (b) | Security is not a benchmark constituent. |
| (h) | Security was not held in the portfolio at period end. |
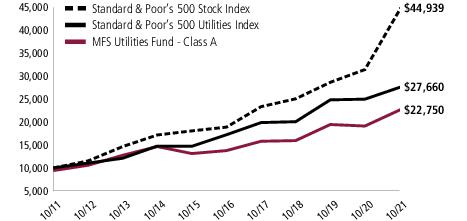
| Share Class | Class Inception Date | 1-yr | 5-yr | 10-yr | Life (t) |
| A | 2/14/92 | 18.90% | 10.55% | 9.21% | N/A |
| B | 9/07/93 | 18.02% | 9.72% | 8.39% | N/A |
| C | 1/03/94 | 18.00% | 9.71% | 8.39% | N/A |
| I | 1/02/97 | 19.23% | 10.82% | 9.49% | N/A |
| R1 | 4/01/05 | 18.06% | 9.72% | 8.40% | N/A |
| R2 | 10/31/03 | 18.60% | 10.27% | 8.94% | N/A |
| R3 | 4/01/05 | 18.91% | 10.55% | 9.21% | N/A |
| R4 | 4/01/05 | 19.19% | 10.82% | 9.48% | N/A |
| R6 | 6/01/12 | 19.31% | 10.93% | N/A | 10.26% |
| Standard & Poor’s 500 Stock Index (f) | 42.91% | 18.93% | 16.21% | N/A |
| Standard & Poor’s 500 Utilities Index (f) | 10.68% | 9.93% | 10.71% | N/A |
| A With Initial Sales Charge (5.75%) | 12.06% | 9.25% | 8.57% | N/A |
| B With CDSC (Declining over six years from 4% to 0%) (v) | 14.02% | 9.44% | 8.39% | N/A |
| C With CDSC (1% for 12 months) (v) | 17.00% | 9.71% | 8.39% | N/A |
| (f) | Source: FactSet Research Systems Inc. |
| (t) | For the period from the class inception date through the stated period end (for those share classes with less than 10 years of performance history). No comparative benchmark performance information is provided for “life” periods. (See Notes to Performance Summary.) |
| (v) | Assuming redemption at the end of the applicable period. |
| (g) | “Standard & Poor's®” and “S&P®” are registered trademarks of Standard & Poor's Financial Services LLC (“S&P”) and Dow Jones is a registered trademark of Dow Jones Trademark Holdings LLC (“Dow Jones”) and have been licensed for use by S&P Dow Jones Indices LLC |
May 1, 2021 through October 31, 2021
| Share Class | Annualized Expense Ratio | Beginning Account Value 5/01/21 | Ending Account Value 10/31/21 | Expenses Paid During Period (p) 5/01/21-10/31/21 | |
| A | Actual | 0.99% | $1,000.00 | $1,031.89 | $5.07 |
| Hypothetical (h) | 0.99% | $1,000.00 | $1,020.21 | $5.04 | |
| B | Actual | 1.74% | $1,000.00 | $1,027.60 | $8.89 |
| Hypothetical (h) | 1.74% | $1,000.00 | $1,016.43 | $8.84 | |
| C | Actual | 1.74% | $1,000.00 | $1,027.68 | $8.89 |
| Hypothetical (h) | 1.74% | $1,000.00 | $1,016.43 | $8.84 | |
| I | Actual | 0.74% | $1,000.00 | $1,032.98 | $3.79 |
| Hypothetical (h) | 0.74% | $1,000.00 | $1,021.48 | $3.77 | |
| R1 | Actual | 1.74% | $1,000.00 | $1,028.00 | $8.89 |
| Hypothetical (h) | 1.74% | $1,000.00 | $1,016.43 | $8.84 | |
| R2 | Actual | 1.24% | $1,000.00 | $1,030.32 | $6.35 |
| Hypothetical (h) | 1.24% | $1,000.00 | $1,018.95 | $6.31 | |
| R3 | Actual | 0.99% | $1,000.00 | $1,031.47 | $5.07 |
| Hypothetical (h) | 0.99% | $1,000.00 | $1,020.21 | $5.04 | |
| R4 | Actual | 0.74% | $1,000.00 | $1,033.10 | $3.79 |
| Hypothetical (h) | 0.74% | $1,000.00 | $1,021.48 | $3.77 | |
| R6 | Actual | 0.65% | $1,000.00 | $1,033.42 | $3.33 |
| Hypothetical (h) | 0.65% | $1,000.00 | $1,021.93 | $3.31 |
| (h) | 5% class return per year before expenses. |
| (p) | “Expenses Paid During Period” are equal to each class’s annualized expense ratio, as shown above, multiplied by the average account value over the period, multiplied by 184/365 (to reflect the one-half year period). Expenses paid do not include any applicable sales charges (loads). If these transaction costs had been included, your costs would have been higher. |
| Issuer | Shares/Par | Value ($) | ||
| Common Stocks – 98.4% | ||||
| Cable TV – 1.9% | ||||
| Charter Communications, Inc., “A” (a) | 92,794 | $ 62,625,743 | ||
| Natural Gas - Distribution – 3.0% | ||||
| Atmos Energy Corp. | 615,520 | $ 56,701,702 | ||
| China Resources Gas Group Ltd. | 3,670,000 | 19,757,304 | ||
| UGI Corp. | 419,748 | 18,221,261 | ||
| $94,680,267 | ||||
| Natural Gas - Pipeline – 0.5% | ||||
| Equitrans Midstream Corp. | 1,572,226 | $ 16,209,650 | ||
| Telecommunications - Wireless – 7.6% | ||||
| Advanced Info Service Public Co. Ltd. | 4,248,100 | $ 24,196,215 | ||
| Cellnex Telecom S.A. | 1,397,612 | 85,919,707 | ||
| KDDI Corp. | 585,400 | 18,147,273 | ||
| Rogers Communications, Inc. | 638,732 | 29,707,025 | ||
| SBA Communications Corp., REIT | 161,011 | 55,601,929 | ||
| T-Mobile USA, Inc. (a) | 252,240 | 29,015,167 | ||
| $242,587,316 | ||||
| Telephone Services – 1.2% | ||||
| Hellenic Telecommunications Organization S.A. | 1,220,149 | $ 21,580,531 | ||
| NOS, SGPS S.A. | 892,616 | 3,481,510 | ||
| Telesites S.A.B. de C.V. | 14,690,804 | 13,400,685 | ||
| $38,462,726 | ||||
| Utilities - Electric Power – 84.2% | ||||
| AES Corp. | 2,598,030 | $ 65,288,494 | ||
| ALLETE, Inc. | 247,676 | 15,241,981 | ||
| Alliant Energy Corp. | 1,144,104 | 64,721,963 | ||
| American Electric Power Co., Inc. | 610,625 | 51,726,044 | ||
| CenterPoint Energy, Inc. | 3,083,668 | 80,298,715 | ||
| CLP Holdings Ltd. | 2,053,000 | 20,093,304 | ||
| Dominion Energy, Inc. | 2,062,813 | 156,629,391 | ||
| DTE Energy Co. | 531,189 | 60,210,273 | ||
| Duke Energy Corp. | 1,218,552 | 124,304,489 | ||
| E.ON SE | 5,038,561 | 63,872,306 | ||
| Edison International | 1,559,343 | 98,129,455 | ||
| EDP Renovaveis S.A. | 5,628,310 | 156,802,466 | ||
| Electricite de France S.A. | 1,325,192 | 19,501,366 | ||
| Emera, Inc. (l) | 852,690 | 39,671,857 | ||
| Issuer | Shares/Par | Value ($) | ||
| Common Stocks – continued | ||||
| Utilities - Electric Power – continued | ||||
| Enel S.p.A. | 11,674,650 | $ 97,656,299 | ||
| Energias de Portugal S.A. | 8,226,319 | 46,445,007 | ||
| Energisa S.A., IEU | 1,002,900 | 7,040,451 | ||
| Entergy Corp. | 224,386 | 23,116,246 | ||
| Equatorial Energia S.A. | 3,330,800 | 13,503,084 | ||
| Evergy, Inc. | 1,005,343 | 64,090,616 | ||
| Exelon Corp. | 3,245,178 | 172,611,018 | ||
| FirstEnergy Corp. | 1,852,738 | 71,385,995 | ||
| Iberdrola S.A. | 8,890,828 | 104,987,698 | ||
| National Grid PLC | 4,816,980 | 61,664,169 | ||
| Neoenergia S.A. | 2,903,100 | 7,973,006 | ||
| NextEra Energy Partners LP | 103,230 | 8,908,749 | ||
| NextEra Energy, Inc. | 3,443,769 | 293,856,809 | ||
| PG&E Corp. (a) | 9,762,761 | 113,248,028 | ||
| Pinnacle West Capital Corp. | 576,273 | 37,163,846 | ||
| Portland General Electric Co. | 332,060 | 16,373,879 | ||
| Public Service Enterprise Group, Inc. | 935,049 | 59,656,126 | ||
| RWE AG | 1,895,587 | 72,904,504 | ||
| Sempra Energy | 883,098 | 112,709,798 | ||
| Southern Co. | 2,843,141 | 177,184,547 | ||
| SSE PLC | 3,847,717 | 86,543,310 | ||
| Vistra Corp. | 1,124,012 | 22,019,395 | ||
| $ 2,687,534,684 | ||||
| Total Common Stocks (Identified Cost, $2,189,550,611) | $3,142,100,386 | |||
| Convertible Preferred Stocks – 0.6% | ||||
| Utilities - Electric Power – 0.6% | ||||
| DTE Energy Co., 6.25% | 175,400 | $ 8,854,192 | ||
| NextEra Energy, Inc., 5.279% | 175,500 | 9,559,485 | ||
| Total Convertible Preferred Stocks (Identified Cost, $14,864,754) | $ 18,413,677 | |||
| Investment Companies (h) – 0.7% | ||||
| Money Market Funds – 0.7% | ||||
| MFS Institutional Money Market Portfolio, 0.04% (v) (Identified Cost, $21,815,025) | 21,815,024 | $ 21,815,025 | ||
| Collateral for Securities Loaned – 0.7% | ||||
| JPMorgan U.S. Government Money Market Fund, 0.03% (j) (Identified Cost, $21,125,395) | 21,125,395 | $ 21,125,395 | ||
| Other Assets, Less Liabilities – (0.4)% | (11,821,148) | |||
| Net Assets – 100.0% | $3,191,633,335 | |||
| (a) | Non-income producing security. | |||
| (h) | An affiliated issuer, which may be considered one in which the fund owns 5% or more of the outstanding voting securities, or a company which is under common control. At period end, the aggregate values of the fund's investments in affiliated issuers and in unaffiliated issuers were $21,815,025 and $3,181,639,458, respectively. | |||
| (j) | The rate quoted is the annualized seven-day yield of the fund at period end. | |||
| (l) | A portion of this security is on loan. See Note 2 for additional information. | |||
| (v) | Affiliated issuer that is available only to investment companies managed by MFS. The rate quoted for the MFS Institutional Money Market Portfolio is the annualized seven-day yield of the fund at period end. |
| The following abbreviations are used in this report and are defined: | |
| IEU | International Equity Unit |
| REIT | Real Estate Investment Trust |
| Abbreviations indicate amounts shown in currencies other than the U.S. dollar. All amounts are stated in U.S. dollars unless otherwise indicated. A list of abbreviations is shown below: | |
| CAD | Canadian Dollar |
| EUR | Euro |
| GBP | British Pound |
| Forward Foreign Currency Exchange Contracts | ||||||
| Currency Purchased | Currency Sold | Counterparty | Settlement Date | Unrealized Appreciation (Depreciation) | ||
| Asset Derivatives | ||||||
| EUR | 532,300 | USD | 616,118 | JPMorgan Chase Bank N.A. | 1/14/2022 | $430 |
| EUR | 214,227 | USD | 247,571 | Morgan Stanley Capital Services, Inc. | 1/14/2022 | 562 |
| EUR | 274,377 | USD | 317,634 | State Street Bank Corp. | 1/14/2022 | 169 |
| GBP | 933,785 | USD | 1,271,307 | Citibank N.A. | 1/14/2022 | 6,997 |
| USD | 103,973,001 | EUR | 88,540,407 | Barclays Bank PLC | 11/12/2021 | 1,600,417 |
| USD | 1,189,498 | EUR | 1,026,388 | Credit Suisse Group | 1/14/2022 | 663 |
| USD | 107,755,894 | EUR | 92,674,508 | Goldman Sachs International | 1/14/2022 | 413,745 |
| USD | 95,966,152 | EUR | 82,628,293 | HSBC Bank | 1/14/2022 | 260,237 |
| USD | 40,915,944 | EUR | 35,184,707 | JPMorgan Chase Bank N.A. | 1/14/2022 | 162,536 |
| USD | 9,511,458 | EUR | 8,182,170 | Merrill Lynch International | 1/14/2022 | 34,292 |
| USD | 32,801,264 | EUR | 28,208,279 | State Street Bank Corp. | 1/14/2022 | 128,446 |
| USD | 10,184,049 | EUR | 8,792,185 | UBS AG | 1/14/2022 | 321 |
| $2,608,815 | ||||||
| Liability Derivatives | ||||||
| EUR | 219,005 | USD | 254,305 | HSBC Bank | 1/14/2022 | $(638) |
| EUR | 433,705 | USD | 507,551 | Merrill Lynch International | 1/14/2022 | (5,204) |
| EUR | 1,764,354 | USD | 2,060,278 | Morgan Stanley Capital Services, Inc. | 1/14/2022 | (16,679) |
| EUR | 78,107 | USD | 90,472 | State Street Bank Corp. | 1/14/2022 | (2) |
| EUR | 884,582 | USD | 1,025,474 | UBS AG | 1/14/2022 | (889) |
| USD | 44,350,271 | CAD | 55,770,244 | JPMorgan Chase Bank N.A. | 1/14/2022 | (719,663) |
| USD | 15,601,781 | EUR | 13,481,840 | Morgan Stanley Capital Services, Inc. | 1/14/2022 | (13,836) |
| Forward Foreign Currency Exchange Contracts - continued | ||||||
| Currency Purchased | Currency Sold | Counterparty | Settlement Date | Unrealized Appreciation (Depreciation) | ||
| Liability Derivatives - continued | ||||||
| USD | 97,112,186 | GBP | 71,312,788 | JPMorgan Chase Bank N.A. | 1/14/2022 | $(511,414) |
| $(1,268,325) | ||||||
| Assets | |
| Investments in unaffiliated issuers, at value, including $19,804,877 of securities on loan (identified cost, $2,225,540,760) | $3,181,639,458 |
| Investments in affiliated issuers, at value (identified cost, $21,815,025) | 21,815,025 |
| Cash | 322,346 |
| Restricted cash for | |
| Forward foreign currency exchange contracts | 3,060,000 |
| Receivables for | |
| Forward foreign currency exchange contracts | 2,608,815 |
| Investments sold | 9,900,403 |
| Fund shares sold | 1,371,779 |
| Interest and dividends | 4,275,872 |
| Other assets | 27 |
| Total assets | $3,224,993,725 |
| Liabilities | |
| Payables for | |
| Forward foreign currency exchange contracts | $1,268,325 |
| Investments purchased | 1,632,934 |
| Fund shares reacquired | 7,703,704 |
| Collateral for securities loaned, at value | 21,125,395 |
| Payable to affiliates | |
| Investment adviser | 204,948 |
| Administrative services fee | 4,694 |
| Shareholder servicing costs | 879,036 |
| Distribution and service fees | 84,161 |
| Payable for independent Trustees' compensation | 223 |
| Deferred country tax expense payable | 246,880 |
| Accrued expenses and other liabilities | 210,090 |
| Total liabilities | $33,360,390 |
| Net assets | $3,191,633,335 |
| Net assets consist of | |
| Paid-in capital | $2,108,510,153 |
| Total distributable earnings (loss) | 1,083,123,182 |
| Net assets | $3,191,633,335 |
| Shares of beneficial interest outstanding | 130,451,187 |
| Net assets | Shares outstanding | Net asset value per share (a) | |
| Class A | $1,951,571,002 | 79,822,627 | $24.45 |
| Class B | 49,749,626 | 2,047,098 | 24.30 |
| Class C | 149,760,962 | 6,162,381 | 24.30 |
| Class I | 687,187,836 | 27,969,870 | 24.57 |
| Class R1 | 5,126,025 | 211,600 | 24.23 |
| Class R2 | 41,967,534 | 1,722,577 | 24.36 |
| Class R3 | 201,005,778 | 8,227,845 | 24.43 |
| Class R4 | 25,766,035 | 1,052,491 | 24.48 |
| Class R6 | 79,498,537 | 3,234,698 | 24.58 |
| (a) | Maximum offering price per share was equal to the net asset value per share for all share classes, except for Class A, for which the maximum offering price per share was $25.94 [100 / 94.25 x $24.45]. On sales of $50,000 or more, the maximum offering price of Class A shares is reduced. A contingent deferred sales charge may be imposed on redemptions of Class A, Class B, and Class C shares. Redemption price per share was equal to the net asset value per share for Classes I, R1, R2, R3, R4, and R6. |
| Net investment income (loss) | |
| Income | |
| Dividends | $97,542,230 |
| Other | 148,654 |
| Income on securities loaned | 40,189 |
| Dividends from affiliated issuers | 11,883 |
| Foreign taxes withheld | (3,233,093) |
| Total investment income | $94,509,863 |
| Expenses | |
| Management fee | $18,953,080 |
| Distribution and service fees | 7,894,692 |
| Shareholder servicing costs | 3,568,565 |
| Administrative services fee | 415,940 |
| Independent Trustees' compensation | 43,857 |
| Custodian fee | 379,548 |
| Shareholder communications | 134,879 |
| Audit and tax fees | 65,382 |
| Legal fees | 18,237 |
| Miscellaneous | 205,797 |
| Total expenses | $31,679,977 |
| Fees paid indirectly | (2,312) |
| Reduction of expenses by investment adviser and distributor | (388,334) |
| Net expenses | $31,289,331 |
| Net investment income (loss) | $63,220,532 |
| Realized and unrealized gain (loss) | |
| Realized gain (loss) (identified cost basis) | |
| Unaffiliated issuers (net of $57,122 country tax) | $85,488,921 |
| Forward foreign currency exchange contracts | 3,900,324 |
| Foreign currency | (133,859) |
| Net realized gain (loss) | $89,255,386 |
| Change in unrealized appreciation or depreciation | |
| Unaffiliated issuers (net of $94,718 increase in deferred country tax) | $397,042,296 |
| Forward foreign currency exchange contracts | (4,940,890) |
| Translation of assets and liabilities in foreign currencies | (42,029) |
| Net unrealized gain (loss) | $392,059,377 |
| Net realized and unrealized gain (loss) | $481,314,763 |
| Change in net assets from operations | $544,535,295 |
| Year ended | ||
| 10/31/21 | 10/31/20 | |
| Change in net assets | ||
| From operations | ||
| Net investment income (loss) | $63,220,532 | $79,023,714 |
| Net realized gain (loss) | 89,255,386 | 98,771,100 |
| Net unrealized gain (loss) | 392,059,377 | (265,288,542) |
| Change in net assets from operations | $544,535,295 | $(87,493,728) |
| Total distributions to shareholders | $(161,630,114) | $(225,254,336) |
| Change in net assets from fund share transactions | $(204,657,745) | $(286,299,366) |
| Total change in net assets | $178,247,436 | $(599,047,430) |
| Net assets | ||
| At beginning of period | 3,013,385,899 | 3,612,433,329 |
| At end of period | $3,191,633,335 | $3,013,385,899 |
| Class A | Year ended | ||||
| 10/31/21 | 10/31/20 | 10/31/19 | 10/31/18 | 10/31/17 | |
| Net asset value, beginning of period | $21.65 | $23.54 | $20.08 | $20.46 | $18.49 |
| Income (loss) from investment operations | |||||
| Net investment income (loss) (d) | $0.46 | $0.54 | $0.55 | $0.55 | $0.51(c) |
| Net realized and unrealized gain (loss) | 3.52 | (0.93) | 3.73 | (0.35) | 2.15 |
| Total from investment operations | $3.98 | $(0.39) | $4.28 | $0.20 | $2.66 |
| Less distributions declared to shareholders | |||||
| From net investment income | $(0.26) | $(0.31) | $(0.49) | $(0.50) | $(0.69) |
| From net realized gain | (0.92) | (1.19) | (0.33) | (0.08) | — |
| Total distributions declared to shareholders | $(1.18) | $(1.50) | $(0.82) | $(0.58) | $(0.69) |
| Net asset value, end of period (x) | $24.45 | $21.65 | $23.54 | $20.08 | $20.46 |
| Total return (%) (r)(s)(t)(x) | 18.90 | (1.70) | 21.94 | 0.98 | 14.73(c) |
| Ratios (%) (to average net assets) and Supplemental data: | |||||
| Expenses before expense reductions (f) | 1.00 | 1.00 | 1.00 | 1.00 | 1.01(c) |
| Expenses after expense reductions (f) | 0.99 | 0.99 | 0.99 | 0.99 | 1.01(c) |
| Net investment income (loss) | 1.98 | 2.51 | 2.51 | 2.70 | 2.64(c) |
| Portfolio turnover | 12 | 30 | 30 | 23 | 24 |
| Net assets at end of period (000 omitted) | $1,951,571 | $1,744,515 | $1,956,524 | $1,706,956 | $1,951,500 |
| Class B | Year ended | ||||
| 10/31/21 | 10/31/20 | 10/31/19 | 10/31/18 | 10/31/17 | |
| Net asset value, beginning of period | $21.53 | $23.42 | $19.98 | $20.36 | $18.40 |
| Income (loss) from investment operations | |||||
| Net investment income (loss) (d) | $0.30 | $0.38 | $0.38 | $0.39 | $0.36(c) |
| Net realized and unrealized gain (loss) | 3.49 | (0.93) | 3.72 | (0.35) | 2.14 |
| Total from investment operations | $3.79 | $(0.55) | $4.10 | $0.04 | $2.50 |
| Less distributions declared to shareholders | |||||
| From net investment income | $(0.10) | $(0.15) | $(0.33) | $(0.34) | $(0.54) |
| From net realized gain | (0.92) | (1.19) | (0.33) | (0.08) | — |
| Total distributions declared to shareholders | $(1.02) | $(1.34) | $(0.66) | $(0.42) | $(0.54) |
| Net asset value, end of period (x) | $24.30 | $21.53 | $23.42 | $19.98 | $20.36 |
| Total return (%) (r)(s)(t)(x) | 18.02 | (2.45) | 21.02 | 0.22 | 13.87(c) |
| Ratios (%) (to average net assets) and Supplemental data: | |||||
| Expenses before expense reductions (f) | 1.75 | 1.75 | 1.75 | 1.75 | 1.76(c) |
| Expenses after expense reductions (f) | 1.74 | 1.74 | 1.74 | 1.74 | 1.76(c) |
| Net investment income (loss) | 1.27 | 1.75 | 1.76 | 1.94 | 1.89(c) |
| Portfolio turnover | 12 | 30 | 30 | 23 | 24 |
| Net assets at end of period (000 omitted) | $49,750 | $63,594 | $99,924 | $113,779 | $156,814 |
| Class C | Year ended | ||||
| 10/31/21 | 10/31/20 | 10/31/19 | 10/31/18 | 10/31/17 | |
| Net asset value, beginning of period | $21.53 | $23.42 | $19.98 | $20.36 | $18.40 |
| Income (loss) from investment operations | |||||
| Net investment income (loss) (d) | $0.30 | $0.38 | $0.38 | $0.38 | $0.36(c) |
| Net realized and unrealized gain (loss) | 3.49 | (0.93) | 3.72 | (0.34) | 2.14 |
| Total from investment operations | $3.79 | $(0.55) | $4.10 | $0.04 | $2.50 |
| Less distributions declared to shareholders | |||||
| From net investment income | $(0.10) | $(0.15) | $(0.33) | $(0.34) | $(0.54) |
| From net realized gain | (0.92) | (1.19) | (0.33) | (0.08) | — |
| Total distributions declared to shareholders | $(1.02) | $(1.34) | $(0.66) | $(0.42) | $(0.54) |
| Net asset value, end of period (x) | $24.30 | $21.53 | $23.42 | $19.98 | $20.36 |
| Total return (%) (r)(s)(t)(x) | 18.00 | (2.45) | 21.02 | 0.21 | 13.87(c) |
| Ratios (%) (to average net assets) and Supplemental data: | |||||
| Expenses before expense reductions (f) | 1.75 | 1.75 | 1.75 | 1.75 | 1.76(c) |
| Expenses after expense reductions (f) | 1.74 | 1.74 | 1.74 | 1.74 | 1.76(c) |
| Net investment income (loss) | 1.28 | 1.76 | 1.75 | 1.91 | 1.90(c) |
| Portfolio turnover | 12 | 30 | 30 | 23 | 24 |
| Net assets at end of period (000 omitted) | $149,761 | $230,614 | $370,036 | $424,769 | $640,795 |
| Class I | Year ended | ||||
| 10/31/21 | 10/31/20 | 10/31/19 | 10/31/18 | 10/31/17 | |
| Net asset value, beginning of period | $21.74 | $23.64 | $20.16 | $20.54 | $18.56 |
| Income (loss) from investment operations | |||||
| Net investment income (loss) (d) | $0.53 | $0.60 | $0.60 | $0.60 | $0.56(c) |
| Net realized and unrealized gain (loss) | 3.54 | (0.94) | 3.76 | (0.35) | 2.16 |
| Total from investment operations | $4.07 | $(0.34) | $4.36 | $0.25 | $2.72 |
| Less distributions declared to shareholders | |||||
| From net investment income | $(0.32) | $(0.37) | $(0.55) | $(0.55) | $(0.74) |
| From net realized gain | (0.92) | (1.19) | (0.33) | (0.08) | — |
| Total distributions declared to shareholders | $(1.24) | $(1.56) | $(0.88) | $(0.63) | $(0.74) |
| Net asset value, end of period (x) | $24.57 | $21.74 | $23.64 | $20.16 | $20.54 |
| Total return (%) (r)(s)(t)(x) | 19.23 | (1.49) | 22.26 | 1.22 | 15.02(c) |
| Ratios (%) (to average net assets) and Supplemental data: | |||||
| Expenses before expense reductions (f) | 0.75 | 0.75 | 0.75 | 0.75 | 0.76(c) |
| Expenses after expense reductions (f) | 0.74 | 0.74 | 0.74 | 0.74 | 0.76(c) |
| Net investment income (loss) | 2.24 | 2.76 | 2.77 | 2.93 | 2.86(c) |
| Portfolio turnover | 12 | 30 | 30 | 23 | 24 |
| Net assets at end of period (000 omitted) | $687,188 | $626,500 | $698,558 | $587,221 | $682,272 |
| Class R1 | Year ended | ||||
| 10/31/21 | 10/31/20 | 10/31/19 | 10/31/18 | 10/31/17 | |
| Net asset value, beginning of period | $21.47 | $23.37 | $19.94 | $20.32 | $18.37 |
| Income (loss) from investment operations | |||||
| Net investment income (loss) (d) | $0.28 | $0.37 | $0.38 | $0.39 | $0.36(c) |
| Net realized and unrealized gain (loss) | 3.51 | (0.92) | 3.71 | (0.34) | 2.13 |
| Total from investment operations | $3.79 | $(0.55) | $4.09 | $0.05 | $2.49 |
| Less distributions declared to shareholders | |||||
| From net investment income | $(0.11) | $(0.16) | $(0.33) | $(0.35) | $(0.54) |
| From net realized gain | (0.92) | (1.19) | (0.33) | (0.08) | — |
| Total distributions declared to shareholders | $(1.03) | $(1.35) | $(0.66) | $(0.43) | $(0.54) |
| Net asset value, end of period (x) | $24.23 | $21.47 | $23.37 | $19.94 | $20.32 |
| Total return (%) (r)(s)(t)(x) | 18.06 | (2.48) | 21.03 | 0.23 | 13.84(c) |
| Ratios (%) (to average net assets) and Supplemental data: | |||||
| Expenses before expense reductions (f) | 1.75 | 1.75 | 1.75 | 1.75 | 1.76(c) |
| Expenses after expense reductions (f) | 1.74 | 1.74 | 1.74 | 1.74 | 1.76(c) |
| Net investment income (loss) | 1.23 | 1.75 | 1.77 | 1.93 | 1.90(c) |
| Portfolio turnover | 12 | 30 | 30 | 23 | 24 |
| Net assets at end of period (000 omitted) | $5,126 | $5,171 | $6,561 | $6,453 | $7,623 |
| Class R2 | Year ended | ||||
| 10/31/21 | 10/31/20 | 10/31/19 | 10/31/18 | 10/31/17 | |
| Net asset value, beginning of period | $21.58 | $23.47 | $20.03 | $20.40 | $18.44 |
| Income (loss) from investment operations | |||||
| Net investment income (loss) (d) | $0.41 | $0.48 | $0.49 | $0.50 | $0.46(c) |
| Net realized and unrealized gain (loss) | 3.50 | (0.92) | 3.72 | (0.35) | 2.14 |
| Total from investment operations | $3.91 | $(0.44) | $4.21 | $0.15 | $2.60 |
| Less distributions declared to shareholders | |||||
| From net investment income | $(0.21) | $(0.26) | $(0.44) | $(0.44) | $(0.64) |
| From net realized gain | (0.92) | (1.19) | (0.33) | (0.08) | — |
| Total distributions declared to shareholders | $(1.13) | $(1.45) | $(0.77) | $(0.52) | $(0.64) |
| Net asset value, end of period (x) | $24.36 | $21.58 | $23.47 | $20.03 | $20.40 |
| Total return (%) (r)(s)(t)(x) | 18.60 | (1.96) | 21.59 | 0.77 | 14.42(c) |
| Ratios (%) (to average net assets) and Supplemental data: | |||||
| Expenses before expense reductions (f) | 1.25 | 1.25 | 1.25 | 1.25 | 1.26(c) |
| Expenses after expense reductions (f) | 1.24 | 1.24 | 1.24 | 1.24 | 1.26(c) |
| Net investment income (loss) | 1.74 | 2.26 | 2.26 | 2.46 | 2.39(c) |
| Portfolio turnover | 12 | 30 | 30 | 23 | 24 |
| Net assets at end of period (000 omitted) | $41,968 | $41,020 | $59,224 | $57,733 | $78,248 |
| Class R3 | Year ended | ||||
| 10/31/21 | 10/31/20 | 10/31/19 | 10/31/18 | 10/31/17 | |
| Net asset value, beginning of period | $21.63 | $23.52 | $20.07 | $20.45 | $18.48 |
| Income (loss) from investment operations | |||||
| Net investment income (loss) (d) | $0.47 | $0.54 | $0.57 | $0.55 | $0.51(c) |
| Net realized and unrealized gain (loss) | 3.51 | (0.93) | 3.71 | (0.35) | 2.15 |
| Total from investment operations | $3.98 | $(0.39) | $4.28 | $0.20 | $2.66 |
| Less distributions declared to shareholders | |||||
| From net investment income | $(0.26) | $(0.31) | $(0.50) | $(0.50) | $(0.69) |
| From net realized gain | (0.92) | (1.19) | (0.33) | (0.08) | — |
| Total distributions declared to shareholders | $(1.18) | $(1.50) | $(0.83) | $(0.58) | $(0.69) |
| Net asset value, end of period (x) | $24.43 | $21.63 | $23.52 | $20.07 | $20.45 |
| Total return (%) (r)(s)(t)(x) | 18.91 | (1.71) | 21.92 | 0.97 | 14.74(c) |
| Ratios (%) (to average net assets) and Supplemental data: | |||||
| Expenses before expense reductions (f) | 1.00 | 1.00 | 1.00 | 1.00 | 1.01(c) |
| Expenses after expense reductions (f) | 0.99 | 0.99 | 0.99 | 0.99 | 1.01(c) |
| Net investment income (loss) | 1.99 | 2.51 | 2.63 | 2.71 | 2.64(c) |
| Portfolio turnover | 12 | 30 | 30 | 23 | 24 |
| Net assets at end of period (000 omitted) | $201,006 | $201,509 | $279,639 | $72,490 | $99,454 |
| Class R4 | Year ended | ||||
| 10/31/21 | 10/31/20 | 10/31/19 | 10/31/18 | 10/31/17 | |
| Net asset value, beginning of period | $21.67 | $23.56 | $20.10 | $20.48 | $18.51 |
| Income (loss) from investment operations | |||||
| Net investment income (loss) (d) | $0.53 | $0.60 | $0.60 | $0.61 | $0.56(c) |
| Net realized and unrealized gain (loss) | 3.52 | (0.93) | 3.74 | (0.36) | 2.15 |
| Total from investment operations | $4.05 | $(0.33) | $4.34 | $0.25 | $2.71 |
| Less distributions declared to shareholders | |||||
| From net investment income | $(0.32) | $(0.37) | $(0.55) | $(0.55) | $(0.74) |
| From net realized gain | (0.92) | (1.19) | (0.33) | (0.08) | — |
| Total distributions declared to shareholders | $(1.24) | $(1.56) | $(0.88) | $(0.63) | $(0.74) |
| Net asset value, end of period (x) | $24.48 | $21.67 | $23.56 | $20.10 | $20.48 |
| Total return (%) (r)(s)(t)(x) | 19.19 | (1.46) | 22.22 | 1.22 | 15.01(c) |
| Ratios (%) (to average net assets) and Supplemental data: | |||||
| Expenses before expense reductions (f) | 0.75 | 0.75 | 0.75 | 0.75 | 0.76(c) |
| Expenses after expense reductions (f) | 0.74 | 0.74 | 0.74 | 0.74 | 0.76(c) |
| Net investment income (loss) | 2.25 | 2.76 | 2.76 | 3.01 | 2.89(c) |
| Portfolio turnover | 12 | 30 | 30 | 23 | 24 |
| Net assets at end of period (000 omitted) | $25,766 | $24,920 | $49,530 | $48,109 | $79,612 |
| Class R6 | Year ended | ||||
| 10/31/21 | 10/31/20 | 10/31/19 | 10/31/18 | 10/31/17 | |
| Net asset value, beginning of period | $21.75 | $23.64 | $20.17 | $20.54 | $18.56 |
| Income (loss) from investment operations | |||||
| Net investment income (loss) (d) | $0.54 | $0.61 | $0.61 | $0.61 | $0.57(c) |
| Net realized and unrealized gain (loss) | 3.54 | (0.92) | 3.76 | (0.34) | 2.17 |
| Total from investment operations | $4.08 | $(0.31) | $4.37 | $0.27 | $2.74 |
| Less distributions declared to shareholders | |||||
| From net investment income | $(0.33) | $(0.39) | $(0.57) | $(0.56) | $(0.76) |
| From net realized gain | (0.92) | (1.19) | (0.33) | (0.08) | — |
| Total distributions declared to shareholders | $(1.25) | $(1.58) | $(0.90) | $(0.64) | $(0.76) |
| Net asset value, end of period (x) | $24.58 | $21.75 | $23.64 | $20.17 | $20.54 |
| Total return (%) (r)(s)(t)(x) | 19.31 | (1.36) | 22.29 | 1.36 | 15.13(c) |
| Ratios (%) (to average net assets) and Supplemental data: | |||||
| Expenses before expense reductions (f) | 0.66 | 0.66 | 0.66 | 0.66 | 0.66(c) |
| Expenses after expense reductions (f) | 0.65 | 0.65 | 0.65 | 0.65 | 0.66(c) |
| Net investment income (loss) | 2.29 | 2.84 | 2.84 | 3.02 | 2.93(c) |
| Portfolio turnover | 12 | 30 | 30 | 23 | 24 |
| Net assets at end of period (000 omitted) | $79,499 | $75,542 | $92,437 | $119,752 | $136,631 |
| (c) | Amount reflects a one-time reimbursement of expenses by the custodian (or former custodian) without which net investment income and performance would be lower and expenses would be higher. |
| (d) | Per share data is based on average shares outstanding. |
| (f) | Ratios do not reflect reductions from fees paid indirectly, if applicable. |
| (r) | Certain expenses have been reduced without which performance would have been lower. |
| (s) | From time to time the fund may receive proceeds from litigation settlements, without which performance would be lower. |
| (t) | Total returns do not include any applicable sales charges. |
| (x) | The net asset values and total returns have been calculated on net assets which include adjustments made in accordance with U.S. generally accepted accounting principles required at period end for financial reporting purposes. |
| Financial Instruments | Level 1 | Level 2 | Level 3 | Total |
| Equity Securities: | ||||
| United States | $2,145,664,986 | $— | $— | $2,145,664,986 |
| Portugal | 206,728,983 | — | — | 206,728,983 |
| Spain | 190,907,405 | — | — | 190,907,405 |
| United Kingdom | 148,207,479 | — | — | 148,207,479 |
| Germany | 136,776,810 | — | — | 136,776,810 |
| Italy | 97,656,299 | — | — | 97,656,299 |
| Canada | 69,378,882 | — | — | 69,378,882 |
| Brazil | 28,516,541 | — | — | 28,516,541 |
| Thailand | — | 24,196,215 | — | 24,196,215 |
| Other Countries | 74,575,886 | 37,904,577 | — | 112,480,463 |
| Mutual Funds | 42,940,420 | — | — | 42,940,420 |
| Total | $3,141,353,691 | $62,100,792 | $— | $3,203,454,483 |
| Other Financial Instruments | ||||
| Forward Foreign Currency Exchange Contracts – Assets | $— | $2,608,815 | $— | $2,608,815 |
| Forward Foreign Currency Exchange Contracts – Liabilities | — | (1,268,325) | — | (1,268,325) |
| Fair Value | |||
| Risk | Derivative Contracts | Asset Derivatives | Liability Derivatives |
| Foreign Exchange | Forward Foreign Currency Exchange Contracts | $2,608,815 | $(1,268,325) |
| Risk | Forward Foreign Currency Exchange Contracts |
| Foreign Exchange | $3,900,324 |
| Risk | Forward Foreign Currency Exchange Contracts |
| Foreign Exchange | $(4,940,890) |
| Year ended 10/31/21 | Year ended 10/31/20 | |
| Ordinary income (including any short-term capital gains) | $35,726,050 | $48,830,086 |
| Long-term capital gains | 125,904,064 | 176,424,250 |
| Total distributions | $161,630,114 | $225,254,336 |
| As of 10/31/21 | |
| Cost of investments | $2,258,724,382 |
| Gross appreciation | 965,878,030 |
| Gross depreciation | (19,807,439) |
| Net unrealized appreciation (depreciation) | $ 946,070,591 |
| Undistributed ordinary income | 23,603,383 |
| Undistributed long-term capital gain | 113,496,113 |
| Other temporary differences | (46,905) |
| Total distributable earnings (loss) | $1,083,123,182 |
| Year ended 10/31/21 | Year ended 10/31/20 | ||
| Class A | $94,477,039 | $124,296,158 | |
| Class B | 2,887,495 | 5,340,809 | |
| Class C | 10,265,504 | 20,315,084 | |
| Class I | 35,337,329 | 45,518,799 | |
| Class R1 | 240,493 | 377,701 | |
| Class R2 | 2,050,092 | 3,503,734 | |
| Class R3 | 10,618,983 | 16,863,415 | |
| Class R4 | 1,386,227 | 2,724,606 | |
| Class R6 | 4,366,952 | 6,314,030 | |
| Total | $161,630,114 | $225,254,336 |
| Up to $3 billion | 0.60% |
| In excess of $3 billion and up to $10 billion | 0.55% |
| In excess of $10 billion | 0.50% |
| Distribution Fee Rate (d) | Service Fee Rate (d) | Total Distribution Plan (d) | Annual Effective Rate (e) | Distribution and Service Fee | |
| Class A | — | 0.25% | 0.25% | 0.25% | $ 4,776,812 |
| Class B | 0.75% | 0.25% | 1.00% | 1.00% | 581,751 |
| Class C | 0.75% | 0.25% | 1.00% | 1.00% | 1,761,959 |
| Class R1 | 0.75% | 0.25% | 1.00% | 1.00% | 51,784 |
| Class R2 | 0.25% | 0.25% | 0.50% | 0.50% | 208,909 |
| Class R3 | — | 0.25% | 0.25% | 0.25% | 513,477 |
| Total Distribution and Service Fees | $7,894,692 |
| (d) | In accordance with the distribution plan for certain classes, the fund pays distribution and/or service fees equal to these annual percentage rates of each class’s average daily net assets. The distribution and service fee rates disclosed by class represent the current rates in effect at the end of the reporting period. Any rate changes, if applicable, are detailed below. |
| (e) | The annual effective rates represent actual fees incurred under the distribution plan for the year ended October 31, 2021 based on each class's average daily net assets. MFD has voluntarily agreed to rebate a portion of each class's 0.25% service fee attributable to accounts for which there is no financial intermediary specified on the account except for accounts attributable to MFS or its affiliates' seed money. For the year ended October 31, 2021, this rebate amounted to $1,169, $50, $5, $55, $6, and $64 for Class A, Class B, Class C, Class R1, Class R2, and Class R3, respectively, and is included in the reduction of total expenses in the Statement of Operations. |
| Amount | |
| Class A | $3,911 |
| Class B | 25,755 |
| Class C | 5,812 |
| Year ended 10/31/21 | Year ended 10/31/20 | ||||
| Shares | Amount | Shares | Amount | ||
| Shares sold | |||||
| Class A | 7,874,900 | $180,815,780 | 8,208,261 | $175,835,077 | |
| Class B | 14,845 | 335,287 | 38,789 | 827,910 | |
| Class C | 513,953 | 11,949,650 | 757,028 | 16,465,110 | |
| Class I | 4,844,245 | 112,942,915 | 6,660,790 | 143,615,462 | |
| Class R1 | 44,031 | 1,017,001 | 71,085 | 1,530,447 | |
| Class R2 | 348,948 | 8,065,585 | 378,555 | 8,221,959 | |
| Class R3 | 915,406 | 21,468,572 | 863,414 | 18,779,058 | |
| Class R4 | 212,326 | 4,877,568 | 354,595 | 7,700,832 | |
| Class R6 | 1,163,315 | 27,227,539 | 964,865 | 21,303,243 | |
| 15,931,969 | $368,699,897 | 18,297,382 | $394,279,098 | ||
| Shares issued to shareholders in reinvestment of distributions | |||||
| Class A | 3,919,494 | $88,691,610 | 5,314,607 | $118,323,319 | |
| Class B | 116,278 | 2,605,823 | 211,649 | 4,717,683 | |
| Class C | 451,868 | 10,123,119 | 806,571 | 17,971,808 | |
| Class I | 1,373,518 | 31,251,843 | 1,800,295 | 40,214,092 | |
| Class R1 | 10,756 | 240,493 | 17,007 | 377,693 | |
| Class R2 | 90,390 | 2,036,094 | 153,685 | 3,421,186 | |
| Class R3 | 469,846 | 10,618,947 | 756,956 | 16,863,343 | |
| Class R4 | 55,445 | 1,256,825 | 114,645 | 2,564,559 | |
| Class R6 | 131,172 | 2,987,409 | 194,468 | 4,345,663 | |
| 6,618,767 | $149,812,163 | 9,369,883 | $208,799,346 | ||
| Shares reacquired | |||||
| Class A | (12,553,103) | $(292,087,220) | (16,052,170) | $(341,612,028) | |
| Class B | (1,037,361) | (23,985,070) | (1,563,212) | (33,277,541) | |
| Class C | (5,513,991) | (124,958,158) | (6,652,430) | (141,067,822) | |
| Class I | (7,059,825) | (164,223,053) | (9,201,704) | (193,594,078) | |
| Class R1 | (83,982) | (1,929,069) | (128,074) | (2,648,049) | |
| Class R2 | (617,443) | (14,268,315) | (1,154,836) | (24,400,870) | |
| Class R3 | (2,472,316) | (57,585,546) | (4,192,699) | (89,423,643) | |
| Class R4 | (365,253) | (8,494,981) | (1,421,419) | (30,245,064) | |
| Class R6 | (1,533,100) | (35,638,393) | (1,595,753) | (33,108,715) | |
| (31,236,374) | $(723,169,805) | (41,962,297) | $(889,377,810) | ||
| Year ended 10/31/21 | Year ended 10/31/20 | ||||
| Shares | Amount | Shares | Amount | ||
| Net change | |||||
| Class A | (758,709) | $(22,579,830) | (2,529,302) | $(47,453,632) | |
| Class B | (906,238) | (21,043,960) | (1,312,774) | (27,731,948) | |
| Class C | (4,548,170) | (102,885,389) | (5,088,831) | (106,630,904) | |
| Class I | (842,062) | (20,028,295) | (740,619) | (9,764,524) | |
| Class R1 | (29,195) | (671,575) | (39,982) | (739,909) | |
| Class R2 | (178,105) | (4,166,636) | (622,596) | (12,757,725) | |
| Class R3 | (1,087,064) | (25,498,027) | (2,572,329) | (53,781,242) | |
| Class R4 | (97,482) | (2,360,588) | (952,179) | (19,979,673) | |
| Class R6 | (238,613) | (5,423,445) | (436,420) | (7,459,809) | |
| (8,685,638) | $(204,657,745) | (14,295,032) | $(286,299,366) | ||
| Affiliated Issuers | Beginning Value | Purchases | Sales Proceeds | Realized Gain (Loss) | Change in Unrealized Appreciation or Depreciation | Ending Value |
| MFS Institutional Money Market Portfolio | $14,784,441 | $341,784,786 | $334,754,202 | $— | $— | $21,815,025 |
| Affiliated Issuers | Dividend Income | Capital Gain Distributions |
| MFS Institutional Money Market Portfolio | $11,883 | $— |
MFS Series Trust VI

December 15, 2021
| Name, Age | Position(s) Held with Fund | Trustee/Officer Since(h) | Number of MFS Funds overseen by the Trustee | Principal Occupations During the Past Five Years | Other Directorships During the Past Five Years (j) | |||||
| INTERESTED TRUSTEES | ||||||||||
| Robert J. Manning (k) (age 58) | Trustee | February 2004 | 135 | Massachusetts Financial Services Company, Non-Executive Chairman (since January 2021); Director; Chairman of the Board; Executive Chairman (January 2017-2020); Co-Chief Executive Officer (2015-2016) | N/A | |||||
| Michael W. Roberge (k) (age 55) | Trustee | January 2021 | 135 | Massachusetts Financial Services Company, Chairman (since January 2021); Chief Executive Officer (since January 2017); Director; President (until December 2018); Chief Investment Officer (until December 2018); Co-Chief Executive Officer (until December 2016) | N/A | |||||
| INDEPENDENT TRUSTEES | ||||||||||
| John P. Kavanaugh (age 67) | Trustee and Chair of Trustees | January 2009 | 135 | Private investor | N/A | |||||
| Steven E. Buller (age 70) | Trustee | February 2014 | 135 | Private investor | N/A | |||||
| John A. Caroselli (age 67) | Trustee | March 2017 | 135 | Private investor; JC Global Advisors, LLC (management consulting), President (since 2015) | N/A | |||||
| Maureen R. Goldfarb (age 66) | Trustee | January 2009 | 135 | Private investor | N/A | |||||
| Peter D. Jones (age 66) | Trustee | January 2019 | 135 | Private investor | N/A | |||||
| Name, Age | Position(s) Held with Fund | Trustee/Officer Since(h) | Number of MFS Funds overseen by the Trustee | Principal Occupations During the Past Five Years | Other Directorships During the Past Five Years (j) | |||||
| James W. Kilman, Jr. (age 60) | Trustee | January 2019 | 135 | Burford Capital Limited (finance and investment management), Senior Advisor (since May 3, 2021), Chief Financial Officer (2019 - May 2, 2021); KielStrand Capital LLC (family office), Chief Executive Officer (since 2016); Morgan Stanley & Co. (financial services), Vice Chairman of Investment Banking, Co-Head of Diversified Financials Coverage – Financial Institutions Investment Banking Group (until 2016) | Alpha-En Corporation, Director (2016-2019) | |||||
| Clarence Otis, Jr. (age 65) | Trustee | March 2017 | 135 | Private investor | VF Corporation, Director; Verizon Communications, Inc., Director; The Travelers Companies, Director | |||||
| Maryanne L. Roepke (age 65) | Trustee | May 2014 | 135 | Private investor | N/A | |||||
| Laurie J. Thomsen (age 64) | Trustee | March 2005 | 135 | Private investor | The Travelers Companies, Director; Dycom Industries, Inc., Director |
| Name, Age | Position(s) Held with Fund | Trustee/Officer Since(h) | Number of MFS Funds for which the Person is an Officer | Principal Occupations During the Past Five Years | ||||
| OFFICERS | ||||||||
| Christopher R. Bohane (k) (age 47) | Assistant Secretary and Assistant Clerk | July 2005 | 135 | Massachusetts Financial Services Company, Senior Vice President and Associate General Counsel | ||||
| Kino Clark (k) (age 53) | Assistant Treasurer | January 2012 | 135 | Massachusetts Financial Services Company, Vice President |
| Name, Age | Position(s) Held with Fund | Trustee/Officer Since(h) | Number of MFS Funds for which the Person is an Officer | Principal Occupations During the Past Five Years | ||||
| John W. Clark, Jr. (k) (age 54) | Assistant Treasurer | April 2017 | 135 | Massachusetts Financial Services Company, Vice President (since March 2017); Deutsche Bank (financial services), Department Head - Treasurer's Office (until February 2017) | ||||
| Thomas H. Connors (k) (age 62) | Assistant Secretary and Assistant Clerk | September 2012 | 135 | Massachusetts Financial Services Company, Vice President and Senior Counsel | ||||
| David L. DiLorenzo (k) (age 53) | President | July 2005 | 135 | Massachusetts Financial Services Company, Senior Vice President | ||||
| Heidi W. Hardin (k) (age 54) | Secretary and Clerk | April 2017 | 135 | Massachusetts Financial Services Company, Executive Vice President and General Counsel (since March 2017); Harris Associates (investment management), General Counsel (until January 2017) | ||||
| Brian E. Langenfeld (k) (age 48) | Assistant Secretary and Assistant Clerk | June 2006 | 135 | Massachusetts Financial Services Company, Vice President and Senior Counsel | ||||
| Amanda S. Mooradian (k) (age 42) | Assistant Secretary and Assistant Clerk | September 2018 | 135 | Massachusetts Financial Services Company, Assistant Vice President and Senior Counsel | ||||
| Susan A. Pereira (k) (age 51) | Assistant Secretary and Assistant Clerk | July 2005 | 135 | Massachusetts Financial Services Company, Vice President and Assistant General Counsel | ||||
| Kasey L. Phillips (k) (age 50) | Assistant Treasurer | September 2012 | 135 | Massachusetts Financial Services Company, Vice President | ||||
| Matthew A. Stowe (k) (age 47) | Assistant Secretary and Assistant Clerk | October 2014 | 135 | Massachusetts Financial Services Company, Vice President and Assistant General Counsel | ||||
| Martin J. Wolin (k) (age 54) | Chief Compliance Officer | July 2015 | 135 | Massachusetts Financial Services Company, Senior Vice President and Chief Compliance Officer |
| Name, Age | Position(s) Held with Fund | Trustee/Officer Since(h) | Number of MFS Funds for which the Person is an Officer | Principal Occupations During the Past Five Years | ||||
| James O. Yost (k) (age 61) | Treasurer | September 1990 | 135 | Massachusetts Financial Services Company, Senior Vice President |
| (h) | Date first appointed to serve as Trustee/Officer of an MFS Fund. Each Trustee has served continuously since appointment unless indicated otherwise. For the period from December 15, 2004 until February 22, 2005, Mr. Manning served as Advisory Trustee. From January 2012 through December 2016, Messrs. DiLorenzo and Yost served as Treasurer and Deputy Treasurer of the Funds, respectively. |
| (j) | Directorships or trusteeships of companies required to report to the Securities and Exchange Commission (i.e., “public companies”). |
| (k) | “Interested person” of the Trust within the meaning of the Investment Company Act of 1940 (referred to as the 1940 Act), which is the principal federal law governing investment companies like the fund, as a result of a position with MFS. The address of MFS is 111 Huntington Avenue, Boston, Massachusetts 02199-7618. |
| Investment Adviser | Custodian |
| Massachusetts Financial Services Company 111 Huntington Avenue Boston, MA 02199-7618 | JPMorgan Chase Bank, NA 4 Metrotech Center New York, NY 11245 |
| Distributor | Independent Registered Public Accounting Firm |
| MFS Fund Distributors, Inc. 111 Huntington Avenue Boston, MA 02199-7618 | Ernst & Young LLP 200 Clarendon Street Boston, MA 02116 |
| Portfolio Manager(s) | |
| Claud Davis J. Scott Walker |
| FACTS | WHAT DOES MFS DO WITH YOUR PERSONAL INFORMATION? |
| Why? | Financial companies choose how they share your personal information. Federal law gives consumers the right to limit some but not all sharing. Federal law also requires us to tell you how we collect, share, and protect your personal information. Please read this notice carefully to understand what we do. |
| What? | The types of personal information we collect and share depend on the product or service you have with us. This information can include: |
| • Social Security number and account balances | |
| • Account transactions and transaction history | |
| • Checking account information and wire transfer instructions | |
| When you are no longer our customer, we continue to share your information as described in this notice. |
| How? | All financial companies need to share customers' personal information to run their everyday business. In the section below, we list the reasons financial companies can share their customers' personal information; the reasons MFS chooses to share; and whether you can limit this sharing. |
| Reasons we can share your personal information | Does MFS share? | Can you limit this sharing? |
| For our everyday business purposes – such as to process your transactions, maintain your account(s), respond to court orders and legal investigations, or report to credit bureaus | Yes | No |
| For our marketing purposes – to offer our products and services to you | No | We don't share |
| For joint marketing with other financial companies | No | We don't share |
| For our affiliates' everyday business purposes – information about your transactions and experiences | No | We don't share |
| For our affiliates' everyday business purposes – information about your creditworthiness | No | We don't share |
| For nonaffiliates to market to you | No | We don't share |
| Questions? | Call 800-225-2606 or go to mfs.com. |

| Who we are | |
| Who is providing this notice? | MFS Funds, MFS Investment Management, MFS Institutional Advisors, Inc., and MFS Heritage Trust Company. |
| What we do | |
| How does MFS protect my personal information? | To protect your personal information from unauthorized access and use, we use security measures that comply with federal law. These measures include procedural, electronic, and physical safeguards for the protection of the personal information we collect about you. |
| How does MFS collect my personal information? | We collect your personal information, for example, when you |
| • open an account or provide account information | |
| • direct us to buy securities or direct us to sell your securities | |
| • make a wire transfer | |
| We also collect your personal information from others, such as credit bureaus, affiliates, or other companies. | |
| Why can't I limit all sharing? | Federal law gives you the right to limit only |
| • sharing for affiliates' everyday business purposes – information about your creditworthiness | |
| • affiliates from using your information to market to you | |
| • sharing for nonaffiliates to market to you | |
| State laws and individual companies may give you additional rights to limit sharing. | |
| Definitions | |
| Affiliates | Companies related by common ownership or control. They can be financial and nonfinancial companies. |
| • MFS does not share personal information with affiliates, except for everyday business purposes as described on page one of this notice. | |
| Nonaffiliates | Companies not related by common ownership or control. They can be financial and nonfinancial companies. |
| • MFS does not share with nonaffiliates so they can market to you. | |
| Joint marketing | A formal agreement between nonaffiliated financial companies that together market financial products or services to you. |
| • MFS doesn't jointly market. | |
| Other important information |
| If you own an MFS product or receive an MFS service in the name of a third party such as a bank or broker-dealer, their privacy policy may apply to you instead of ours. |

Item 1(b):
Not applicable
| ITEM 2. | CODE OF ETHICS. |
The Registrant has adopted a Code of Ethics (the “Code”) pursuant to Section 406 of the Sarbanes-Oxley Act and as defined in Form N-CSR that applies to the Registrant’s principal executive officer and principal financial and accounting officer. During the period covered by this report, the Registrant has not amended any provision in the Code that relates to an element of the Code’s definition enumerated in paragraph (b) of Item 2 of this Form N-CSR. During the period covered by this report, the Registrant did not grant a waiver, including an implicit waiver, from any provision of the Code.
A copy of the Code is filed as an exhibit to this Form N-CSR.
| ITEM 3. | AUDIT COMMITTEE FINANCIAL EXPERT. |
Messrs. Steven E. Buller, James Kilman, and Clarence Otis, Jr. and Ms. Maryanne L. Roepke, members of the Audit Committee, have been determined by the Board of Trustees in their reasonable business judgment to meet the definition of “audit committee financial expert” as such term is defined in Form N-CSR. In addition, Messrs. Buller, Kilman, and Otis and Ms. Roepke are “independent” members of the Audit Committee (as such term has been defined by the Securities and Exchange Commission in regulations implementing Section 407 of the Sarbanes-Oxley Act of 2002). The Securities and Exchange Commission has stated that the designation of a person as an audit committee financial expert pursuant to this Item 3 on the Form N-CSR does not impose on such a person any duties, obligations or liability that are greater than the duties, obligations or liability imposed on such person as a member of the Audit Committee and the Board of Trustees in the absence of such designation or identification.
| ITEM 4. | PRINCIPAL ACCOUNTANT FEES AND SERVICES. |
Items 4(a) through 4(d) and 4(g):
The Board of Trustees has appointed Ernst & Young LLP (“E&Y”) to serve as independent accountants to the series of the Registrant (each a “Fund” and collectively the “Funds”). The tables below set forth the audit fees billed to each Fund as well as fees for non-audit services provided to each Fund and/or to each Fund’s investment adviser, Massachusetts Financial Services Company (“MFS”) and to various entities either controlling, controlled by, or under common control with MFS that provide ongoing services to the Fund (“MFS Related Entities”).
For the fiscal years ended October 31, 2021 and 2020, audit fees billed to each Fund by E&Y were as follows:
| Audit Fees | ||||||||
| 2021 | 2020 | |||||||
Fees billed by E&Y: | ||||||||
MFS Global Equity Fund | 53,941 | 53,207 | ||||||
MFS Global Total Return Fund | 62,939 | 62,081 | ||||||
MFS Utilities Fund | 49,332 | 48,662 | ||||||
|
|
|
| |||||
Total | 166,212 | 163,950 | ||||||
For the fiscal years ended October 31, 2021 and 2020, fees billed by E&Y for audit-related, tax and other services provided to each Fund and for audit-related, tax and other services provided to MFS and MFS Related Entities were as follows:
| Audit-Related Fees1 | Tax Fees2 | All Other Fees3 | ||||||||||||||||||||||
| 2021 | 2020 | 2021 | 2020 | 2021 | 2020 | |||||||||||||||||||
Fees billed by E&Y: | ||||||||||||||||||||||||
To MFS Global Equity Fund | 0 | 0 | 10,256 | 10,106 | 1,713 | 1,782 | ||||||||||||||||||
To MFS Global Total Return Fund | 0 | 0 | 11,665 | 11,495 | 1,412 | 1,505 | ||||||||||||||||||
To MFS Utilities Fund | 0 | 0 | 9,456 | 9,316 | 1,757 | 1,889 | ||||||||||||||||||
Total fees billed by E&Y To above Funds | 0 | 0 | 31,377 | 30,917 | 4,882 | 5,176 | ||||||||||||||||||
| Audit-Related Fees1 | Tax Fees2 | All Other Fees3 | ||||||||||||||||||||||
| 2021 | 2020 | 2021 | 2020 | 2021 | 2020 | |||||||||||||||||||
Fees billed by E&Y: | ||||||||||||||||||||||||
To MFS and MFS Related Entities of MFS Global Equity Fund* | 1,663,649 | 1,790,828 | 0 | 0 | 110,620 | 104,750 | ||||||||||||||||||
To MFS and MFS Related Entities of MFS Global Total Return Fund* | 1,663,649 | 1,790,828 | 0 | 0 | 110,620 | 104,750 | ||||||||||||||||||
To MFS and MFS Related Entities of MFS Utilities Fund* | 1,663,649 | 1,790,828 | 0 | 0 | 110,620 | 104,750 | ||||||||||||||||||
Aggregate fees for non-audit services: | ||||||||
| 2021 | 2020 | |||||||
Fees billed by E&Y: | ||||||||
To MFS Global Equity Fund, MFS and MFS Related Entities# | 2,002,937 | 2,118,196 | ||||||
To MFS Global Total Return Fund, MFS and MFS Related Entities# | 2,004,047 | 2,119,308 | ||||||
To MFS Utilities Fund, MFS and MFS Related Entities# | 2,002,182 | 2,117,513 | ||||||
| * | This amount reflects the fees billed to MFS and MFS Related Entities for non-audit services relating directly to the operations and financial reporting of the Fund (portions of which services also related to the operations and financial reporting of other funds within the MFS Funds complex). |
| # | This amount reflects the aggregate fees billed by E&Y for non-audit services rendered to the Fund and for non-audit services rendered to MFS and the MFS Related Entities. |
| 1 | The fees included under “Audit-Related Fees” are fees related to assurance and related services that are reasonably related to the performance of the audit or review of financial statements, but not reported under ‘‘Audit Fees,’’ including accounting consultations, agreed-upon procedure reports, attestation reports, comfort letters and internal control reviews. |
| 2 | The fees included under “Tax Fees” are fees associated with tax compliance, tax advice and tax planning, including services relating to the filing or amendment of federal, state or local income tax returns, regulated investment company qualification reviews and tax distribution and analysis. |
| 3 | The fees included under “All Other Fees” are fees for products and services provided by E&Y other than those reported under “Audit Fees,” “Audit-Related Fees” and “Tax Fees,” including fees for services related to review of internal controls and review of Rule 38a-1 compliance program. |
Item 4(e)(1):
Set forth below are the policies and procedures established by the Audit Committee of the Board of Trustees relating to the pre-approval of audit and non-audit related services:
To the extent required by applicable law, pre-approval by the Audit Committee of the Board is needed for all audit and permissible non-audit services rendered to the Funds and all permissible non-audit services rendered to MFS or MFS Related Entities if the services relate directly to the operations and financial reporting of the Registrant. Pre-approval is currently on an engagement-by-engagement basis. In the event pre-approval of such services is necessary between regular meetings of the Audit Committee and it is not practical to wait to seek pre-approval at the next regular meeting of the Audit Committee, pre-approval of such services may be referred to the Chair of the Audit Committee for approval; provided that the Chair may not pre-approve any individual engagement for such services exceeding $50,000 or multiple engagements for such services in the aggregate exceeding $100,000 in each period between regular meetings of the Audit Committee. Any engagement pre-approved by the Chair between regular meetings of the Audit Committee shall be presented for ratification by the entire Audit Committee at its next regularly scheduled meeting.
Item 4(e)(2):
None, or 0%, of the services relating to the Audit-Related Fees, Tax Fees and All Other Fees paid by the Fund and MFS and MFS Related Entities relating directly to the operations and financial reporting of the Registrant disclosed above were approved by the audit committee pursuant to paragraphs (c)(7)(i)(C) of Rule 2-01 of Regulation S-X (which permits audit committee approval after the start of the engagement with respect to services other than audit, review or attest services, if certain conditions are satisfied).
Item 4(f):
Not applicable.
Item 4(h):
The Registrant’s Audit Committee has considered whether the provision by a Registrant’s independent registered public accounting firm of non-audit services to MFS and MFS Related Entities that were not pre-approved by the Committee (because such services did not relate directly to the operations and financial reporting of the Registrant) was compatible with maintaining the independence of the independent registered public accounting firm as the Registrant’s principal auditors.
| ITEM 5. | AUDIT COMMITTEE OF LISTED REGISTRANTS. |
Not applicable to the Registrant.
| ITEM 6. | INVESTMENTS |
A schedule of investments of each series of the Registrant is included as part of the report to shareholders of such series under Item 1(a) of this Form N-CSR.
| ITEM 7. | DISCLOSURE OF PROXY VOTING POLICIES AND PROCEDURES FOR CLOSED-END MANAGEMENT INVESTMENT COMPANIES. |
Not applicable to the Registrant.
| ITEM 8. | PORTFOLIO MANAGERS OF CLOSED-END MANAGEMENT INVESTMENT COMPANIES. |
Not applicable to the Registrant.
| ITEM 9. | PURCHASES OF EQUITY SECURITIES BY CLOSED-END MANAGEMENT INVESTMENT COMPANY AND AFFILIATED PURCHASERS. |
Not applicable to the Registrant.
| ITEM 10. | SUBMISSION OF MATTERS TO A VOTE OF SECURITY HOLDERS. |
There were no material changes to the procedures by which shareholders may send recommendations to the Board for nominees to the Registrant’s Board since the Registrant last provided disclosure as to such procedures in response to the requirements of Item 407 (c)(2)(iv) of Regulation S-K or this Item.
| ITEM 11. | CONTROLS AND PROCEDURES. |
| (a) | Based upon their evaluation of the effectiveness of the registrant’s disclosure controls and procedures (as defined in Rule 30a-3(c) under the Investment Company Act of 1940 (the “Act”)) as conducted within 90 days of the filing date of this report on Form N-CSR, the registrant’s principal financial officer and principal executive officer have concluded that those disclosure controls and procedures provide reasonable assurance that the material information required to be disclosed by the registrant on this report is recorded, processed, summarized and reported within the time periods specified in the Securities and Exchange Commission’s rules and forms. |
| (b) | There were no changes in the registrant’s internal controls over financial reporting (as defined in Rule 30a-3(d) under the Act) that occurred during the period covered by the report that have materially affected, or are reasonably likely to materially affect, the registrant’s internal control over financial reporting. |
| ITEM 12. | DISCLOSURE OF SECURITIES LENDING ACTIVITIES FOR CLOSED-END MANAGEMENT INVESTMENT COMPANIES. |
Not applicable to the Registrant.
| ITEM 13. | EXHIBITS. |
| (a) | (1) | Any code of ethics, or amendment thereto, that is the subject of the disclosure required by Item 2, to the extent that the registrant intends to satisfy the Item 2 requirements through filing of an exhibit: Attached hereto as EX-99.COE . | ||
| (2) | A separate certification for each principal executive officer and principal financial officer of the registrant as required by Rule 30a-2(a) under the Act (17 CFR 270.30a-2): Attached hereto as EX-99.302CERT . | |||
| (3) | Any written solicitation to purchase securities under Rule 23c-1 under the Act (17 CFR 270.23c-1) sent or given during the period covered by the report by or on behalf of the registrant to 10 or more persons. Not applicable. | |||
| (4) | Change in the registrant’s independent public accountant. Not applicable. | |||
| (b) | If the report is filed under Section 13(a) or 15(d) of the Exchange Act, provide the certifications required by Rule 30a-2(b) under the Act (17 CFR 270.30a-2(b)), Rule 13a-14(b) or Rule 15d-14(b) under the Exchange Act (17 CFR 240.13a-14(b) or 240.15d-14(b)) and Section 1350 of Chapter 63 of Title 18 of the United States Code (18 U.S.C. 1350) as an exhibit. A certification furnished pursuant to this paragraph will not be deemed “filed” for the purposes of Section 18 of the Exchange Act (15 U.S.C. 78r), or otherwise subject to the liability of that section. Such certification will not be deemed to be incorporated by reference into any filing under the Securities Act of 1933 or the Exchange Act, except to the extent that the registrant specifically incorporates it by reference. Attached hereto as EX-99.906CERT. | |||
Notice
A copy of the Amended and Restated Declaration of Trust, as amended, of the Registrant is on file with the Secretary of State of The Commonwealth of Massachusetts and notice is hereby given that this instrument is executed on behalf of the Registrant by an officer of the Registrant as an officer and not individually and the obligations of or arising out of this instrument are not binding upon any of the Trustees or shareholders individually, but are binding only upon the assets and property of the respective constituent series of the Registrant.
SIGNATURES
Pursuant to the requirements of the Securities Exchange Act of 1934 and the Investment Company Act of 1940, the registrant has duly caused this report to be signed on its behalf by the undersigned, thereunto duly authorized.
(Registrant): MFS SERIES TRUST VI
| By (Signature and Title)* | /S/ DAVID L. DILORENZO | |
| David L. DiLorenzo, President |
Date: December 15, 2021
Pursuant to the requirements of the Securities Exchange Act of 1934 and the Investment Company Act of 1940, this report has been signed below by the following persons on behalf of the registrant and in the capacities and on the dates indicated.
| By (Signature and Title)* | /S/ DAVID L. DILORENZO | |
| David L. DiLorenzo, President (Principal Executive Officer) |
Date: December 15, 2021
| By (Signature and Title)* | /S/ JAMES O. YOST | |
| James O. Yost, Treasurer (Principal Financial Officer and Accounting Officer) |
Date: December 15, 2021
| * | Print name and title of each signing officer under his or her signature. |