UNITED STATES
SECURITIES AND EXCHANGE COMMISSION Washington, D.C. 20549
FORM N-CSR
CERTIFIED SHAREHOLDER REPORT OF REGISTERED MANAGEMENT INVESTMENT COMPANIES
Investment Company Act file number 811-06102
MFS SERIES TRUST VI
(Exact name of registrant as specified in charter)
111 Huntington Avenue, Boston, Massachusetts 02199 (Address of principal executive offices) (Zip code)
Christopher R. Bohane
Massachusetts Financial Services Company
111Huntington Avenue Boston, Massachusetts 02199
(Name and address of agents for service)
Registrant's telephone number, including area code: (617) 954-5000
Date of fiscal year end: October 31
Date of reporting period: October 31, 2023
ITEM 1. REPORTS TO STOCKHOLDERS.
Item 1(a):
Annual Report
October 31, 2023
| 1 |
| 2 |
| 4 |
| 7 |
| 9 |
| 12 |
| 14 |
| 15 |
| 16 |
| 22 |
| 35 |
| 37 |
| 41 |
| 45 |
| 45 |
| 45 |
| 45 |
| 45 |
| 47 |
The report is prepared for the general information of shareholders. It is authorized for distribution to prospective investors only when preceded or accompanied by a current prospectus.
NOT FDIC INSURED • MAY LOSE VALUE • NO BANK GUARANTEE
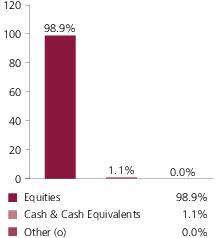
Portfolio structure
Top five industries
| Utilities - Electric Power | 83.0% |
| Telecommunications - Wireless | 6.2% |
| Energy - Renewables | 4.6% |
| Natural Gas - Distribution | 2.7% |
| Utilities - Water | 1.8% |
Top ten holdings
| NextEra Energy, Inc. | 11.3% |
| PG&E Corp. | 6.4% |
| Dominion Energy, Inc. | 5.2% |
| Southern Co. | 5.2% |
| Sempra Energy | 4.2% |
| DTE Energy Co. | 4.2% |
| Edison International | 3.7% |
| RWE AG | 3.6% |
| PPL Corp. | 3.5% |
| Ameren Corp. | 3.4% |
Issuer country weightings (x)
| United States | 74.3% |
| Germany | 5.3% |
| Portugal | 4.6% |
| United Kingdom | 4.4% |
| Spain | 3.3% |
| Italy | 2.3% |
| France | 1.4% |
| Canada | 1.0% |
| Brazil | 1.0% |
| Other Countries | 2.4% |
(o) Less than 0.1%
| (x) | Represents the portfolio’s exposure to issuer countries as a percentage of a portfolio’s net assets. For purposes of this presentation, United States includes Cash & Cash Equivalents and Other. |
Where the fund holds convertible bonds, they are treated as part of the equity portion of the portfolio.
Cash & Cash Equivalents includes any cash, investments in money market funds, short-term securities, and other assets less liabilities. Please see the Statement of Assets and Liabilities for additional information related to the fund’s cash position and other assets and liabilities.
Other includes equivalent exposure from currency derivatives and/or any offsets to derivative positions and may be negative.
Percentages are based on net assets as of October 31, 2023.
The portfolio is actively managed and current holdings may be different.
Management Review
Summary of Results
For the twelve months ended October 31, 2023, Class A shares of the MFS Utilities Fund (fund) provided a total return of -6.06%, at net asset value. This compares with a return of 10.14% for the fund’s benchmark, the Standard & Poor’s 500 Stock Index, and a return of -7.72% for the fund’s other benchmark, the Standard & Poor’s 500 Utilities Index.
Market Environment
During the reporting period, central banks around the world had to combat the strongest inflationary pressures in four decades, fueled by the global fiscal response to the pandemic, disrupted supply chains and the dislocations to energy markets stemming from the war in Ukraine. Interest rates rose substantially, but the effects of a tighter monetary policy may not have been fully experienced yet, given that monetary policy works with long and variable lags. Strains resulting from the abrupt tightening of monetary policy began to affect some parts of the economy, most acutely among small and regional US banks, which suffered from deposit flight as depositors sought higher yields on their savings. Additionally, activity in the US housing sector has slowed as a result of higher mortgage rates. China’s abandonment of its Zero-COVID policy ushered in a brief uptick in economic activity in the world’s second-largest economy in early 2023, although its momentum soon stalled as the focus turned to the country’s highly indebted property development sector. In developed markets, consumer demand for services remained stronger than the demand for goods.
Policymakers found themselves in the difficult position of trying to restrain inflation without tipping economies into recession. Despite the challenging macroeconomic and geopolitical environment, central banks remained focused on controlling price pressures while also confronting increasing financial stability concerns. Central banks had to juggle achieving their inflation mandates while using macroprudential tools to keep banking systems liquid, a potentially difficult balancing act, and one that suggested that we may be nearing a peak in policy rates.
Against an environment of relatively tight labor markets, tighter global financial conditions and volatile materials prices, investor anxiety appeared to have increased over the potential that corporate profit margins may be past peak for this cycle. That said, signs that supply chains have generally normalized, coupled with low levels of unemployment across developed markets and hopes that inflation levels have peaked, were supportive factors for the macroeconomic backdrop.
Detractors from Performance
Relative to the Standard & Poor’s 500 Utilities Index, the fund’s overweight allocation to the energy - renewables industry detracted from performance. Here, holdings of renewable energy companies EDP Renovaveis(b) (Portugal) and Orsted(b) (Denmark) held back relative results. The share price of EDP Renovaveis declined as investors attributed a lower value to future growth in a higher interest rate environment.
The fund’s allocation to both the wireless communications and cable TV industries, for which the benchmark has no exposure, also weakened relative returns. Within the wireless communications industry, the fund’s holdings of real estate investment trust SBA Communications(b) dampened relative results. Although SBA Communications
Management Review - continued
posted revenue results in line with investor expectations, its stock price declined as a result of moderating carrier investment in wireless networks. Within the cable TV industry, holdings of cable services provider Charter Communications(b)(h) also weighed on relative performance.
Stocks in other industries that detracted from relative performance included the fund’s underweight positions in power & natural gas distributor Duke Energy(h), retail electric services provider Southern Company, electricity and natural gas provider Public Service Enterprise Group, utility services provider Exelon and clean & renewable energy generator Constellation Energy. The stock price of Constellation Energy advanced as the company reported financial results above consensus estimates, driven by higher energy prices. Not owning shares of strong-performing energy products and services supplier Consolidated Edison further held back the fund’s relative results.
Contributors to Performance
Stock selection within the electric power industry contributed to relative performance. Within this industry, holdings of electricity and gas distributor Enel(b) (Italy), power and gas company E.ON(b) (Germany), electric utility company Iberdrola(b) (Spain), electric services provider SSE(b) (United Kingdom) and electricity and gas provider National Grid(b) (United Kingdom) strengthened relative results. The fund’s overweight position in utility company PG&E, underweight position in electricity provider NextEra Energy and avoidance of poor-performing natural gas and electricity distributor Eversource Energy further lifted relative performance. Although Eversource Energy posted better-than-expected earnings per share figures, the stock price declined as regulatory conditions deteriorated in some jurisdictions and the company impaired the carrying value of its offshore wind investment.
Stock selection and the fund’s underweight position in the water utilities industry also benefited relative returns. Here, the fund’s holdings of water and waste management services provider Veolia Environnement(b) (France), and its avoidance of weak-performing water and wastewater services company American Water Works, contributed to relative performance.
Respectfully,
Portfolio Manager(s)
Claud Davis and J. Scott Walker
| (b) | Security is not a benchmark constituent. |
| (h) | Security was not held at period end. |
The views expressed in this report are those of the portfolio manager(s) only through the end of the period of the report as stated on the cover and do not necessarily reflect the views of MFS or any other person in the MFS organization. These views are subject to change at any time based on market or other conditions, and MFS disclaims any responsibility to update such views. These views may not be relied upon as investment advice or an indication of trading intent on behalf of any MFS portfolio. References to specific securities are not recommendations of such securities, and may not be representative of any MFS portfolio’s current or future investments.
Performance Summary THROUGH 10/31/23
The following chart illustrates a representative class of the fund’s historical performance in comparison to its benchmark(s). Performance results include the deduction of the maximum applicable sales charge and reflect the percentage change in net asset value, including reinvestment of dividends and capital gains distributions. The performance of other share classes will be greater than or less than that of the class depicted below. Benchmarks are unmanaged and may not be invested in directly. Benchmark returns do not reflect sales charges, commissions or expenses. (See Notes to Performance Summary.)
Performance data shown represents past performance and is no guarantee of future results. Investment return and principal value fluctuate so your shares, when sold, may be worth more or less than the original cost; current performance may be lower or higher than quoted. The performance shown does not reflect the deduction of taxes, if any, that a shareholder would pay on fund distributions or the redemption of fund shares.
Growth of a Hypothetical $10,000 Investment
Performance Summary - continued
Total Returns through 10/31/23
Average annual without sales charge
| Share Class | Class Inception Date | 1-yr | 5-yr | 10-yr |
| A | 2/14/1992 | (6.06)% | 5.90% | 5.25% |
| B | 9/07/1993 | (6.76)% | 5.11% | 4.46% |
| C | 1/03/1994 | (6.77)% | 5.11% | 4.46% |
| I | 1/02/1997 | (5.84)% | 6.17% | 5.51% |
| R1 | 4/01/2005 | (6.75)% | 5.11% | 4.46% |
| R2 | 10/31/2003 | (6.33)% | 5.63% | 4.98% |
| R3 | 4/01/2005 | (6.07)% | 5.90% | 5.25% |
| R4 | 4/01/2005 | (5.81)% | 6.17% | 5.51% |
| R6 | 6/01/2012 | (5.79)% | 6.25% | 5.61% |
Comparative benchmark(s)
| Standard & Poor’s 500 Stock Index (f) | 10.14% | 11.01% | 11.18% |
| Standard & Poor’s 500 Utilities Index (f) | (7.72)% | 5.51% | 8.05% |
Average annual with sales charge
| | | | |
A
With Initial Sales Charge (5.75%) | (11.46)% | 4.66% | 4.63% |
B
With CDSC (Declining over six years from 4% to 0%) (v) | (10.21)% | 4.79% | 4.46% |
C
With CDSC (1% for 12 months) (v) | (7.63)% | 5.11% | 4.46% |
CDSC – Contingent Deferred Sales Charge.
Class I, R1, R2, R3, R4, and R6 shares do not have a sales charge.
| (f) | Source: FactSet Research Systems Inc. |
| (v) | Assuming redemption at the end of the applicable period. |
Benchmark Definition(s)
Standard & Poor's 500 Stock Index(g) – a market capitalization-weighted index of 500 widely held equity securities, designed to measure broad U.S. equity performance.
Standard & Poor's 500 Utilities Index(g) – a market capitalization-weighted index designed to measure the utilities sector, including those companies considered electric, gas or water utilities, or companies that operate as independent producers and/or distributors of power.
It is not possible to invest directly in an index.
| (g) | “Standard & Poor's®” and “S&P®” are registered trademarks of Standard & Poor's Financial Services LLC (“S&P”) and Dow Jones is a registered trademark of Dow Jones Trademark Holdings LLC (“Dow Jones”) and have been licensed for use by S&P Dow Jones Indices LLC and sublicensed for certain purposes by MFS. The S&P 500® is a product of S&P Dow Jones |
Performance Summary - continued
Indices LLC, and has been licensed for use by MFS. MFS's product(s) is not sponsored, endorsed, sold, or promoted by S&P Dow Jones Indices LLC, Dow Jones, S&P, or their respective affiliates, and neither S&P Dow Jones Indices LLC, Dow Jones, S&P, nor their respective affiliates make any representation regarding the advisability of investing in such product(s).
Notes to Performance Summary
Average annual total return represents the average annual change in value for each share class for the periods presented.
Performance results reflect any applicable expense subsidies and waivers in effect during the periods shown. Without such subsidies and waivers the fund's performance results would be less favorable. Please see the prospectus and financial statements for complete details.
Performance results do not include adjustments made for financial reporting purposes in accordance with U.S. generally accepted accounting principles and may differ from amounts reported in the financial highlights.
From time to time the fund may receive proceeds from litigation settlements, without which performance would be lower.
Expense Table
Fund expenses borne by the shareholders during the period,
May 1, 2023 through October 31, 2023
As a shareholder of the fund, you incur two types of costs: (1) transaction costs, including sales charges (loads) on certain purchase or redemption payments, and (2) ongoing costs, including management fees; distribution and service (12b-1) fees; and other fund expenses. This example is intended to help you understand your ongoing costs (in dollars) of investing in the fund and to compare these costs with the ongoing costs of investing in other mutual funds.
The example is based on an investment of $1,000 invested at the beginning of the period and held for the entire period May 1, 2023 through October 31, 2023.
Actual Expenses
The first line for each share class in the following table provides information about actual account values and actual expenses. You may use the information in this line, together with the amount you invested, to estimate the expenses that you paid over the period. Simply divide your account value by $1,000 (for example, an $8,600 account value divided by $1,000 = 8.6), then multiply the result by the number in the first line under the heading entitled “Expenses Paid During Period” to estimate the expenses you paid on your account during this period.
Hypothetical Example for Comparison Purposes
The second line for each share class in the following table provides information about hypothetical account values and hypothetical expenses based on the fund’s actual expense ratio and an assumed rate of return of 5% per year before expenses, which is not the fund’s actual return. The hypothetical account values and expenses may not be used to estimate the actual ending account balance or expenses you paid for the period. You may use this information to compare the ongoing costs of investing in the fund and other funds. To do so, compare this 5% hypothetical example with the 5% hypothetical examples that appear in the shareholder reports of the other funds.
Please note that the expenses shown in the table are meant to highlight your ongoing costs only and do not reflect any transactional costs, such as sales charges (loads). Therefore, the second line for each share class in the table is useful in comparing ongoing costs only, and will not help you determine the relative total costs of owning different funds. In addition, if these transactional costs were included, your costs would have been higher.
Expense Table - continued
Share
Class | | Annualized
Expense
Ratio | Beginning
Account Value
5/01/23 | Ending
Account Value
10/31/23 | Expenses
Paid During
Period (p)
5/01/23-10/31/23 |
| A | Actual | 1.01% | $1,000.00 | $867.46 | $4.75 |
| Hypothetical (h) | 1.01% | $1,000.00 | $1,020.11 | $5.14 |
| B | Actual | 1.76% | $1,000.00 | $863.79 | $8.27 |
| Hypothetical (h) | 1.76% | $1,000.00 | $1,016.33 | $8.94 |
| C | Actual | 1.76% | $1,000.00 | $863.96 | $8.27 |
| Hypothetical (h) | 1.76% | $1,000.00 | $1,016.33 | $8.94 |
| I | Actual | 0.76% | $1,000.00 | $868.46 | $3.58 |
| Hypothetical (h) | 0.76% | $1,000.00 | $1,021.37 | $3.87 |
| R1 | Actual | 1.76% | $1,000.00 | $863.96 | $8.27 |
| Hypothetical (h) | 1.76% | $1,000.00 | $1,016.33 | $8.94 |
| R2 | Actual | 1.26% | $1,000.00 | $865.78 | $5.93 |
| Hypothetical (h) | 1.26% | $1,000.00 | $1,018.85 | $6.41 |
| R3 | Actual | 1.01% | $1,000.00 | $867.32 | $4.75 |
| Hypothetical (h) | 1.01% | $1,000.00 | $1,020.11 | $5.14 |
| R4 | Actual | 0.76% | $1,000.00 | $868.38 | $3.58 |
| Hypothetical (h) | 0.76% | $1,000.00 | $1,021.37 | $3.87 |
| R6 | Actual | 0.68% | $1,000.00 | $868.48 | $3.20 |
| Hypothetical (h) | 0.68% | $1,000.00 | $1,021.78 | $3.47 |
| (h) | 5% class return per year before expenses. |
| (p) | “Expenses Paid During Period” are equal to each class’s annualized expense ratio, as shown above, multiplied by the average account value over the period, multiplied by 184/365 (to reflect the one-half year period). Expenses paid do not include any applicable sales charges (loads). If these transaction costs had been included, your costs would have been higher. |
Portfolio of Investments
10/31/23
The Portfolio of Investments is a complete list of all securities owned by your fund. It is categorized by broad-based asset classes.
| Issuer | | | Shares/Par | Value ($) |
| Common Stocks – 98.9% |
| Energy - Renewables – 4.6% | |
| AES Corp. | | 1,273,315 | $18,972,394 |
| EDP Renovaveis S.A. | | 4,998,846 | 80,763,143 |
| Orsted A/S | | 338,845 | 16,418,085 |
| | | | | $116,153,622 |
| Natural Gas - Distribution – 2.7% | |
| Atmos Energy Corp. | | 366,233 | $39,428,645 |
| China Resources Gas Group Ltd. | | 4,478,200 | 13,248,181 |
| Southwest Gas Holdings, Inc. | | 238,431 | 13,974,441 |
| | | | | $66,651,267 |
| Telecommunications - Wireless – 6.2% | |
| Cellnex Telecom S.A. | | 2,077,761 | $61,242,827 |
| Rogers Communications, Inc. | | 699,848 | 25,929,829 |
| SBA Communications Corp., REIT | | 328,695 | 68,575,638 |
| | | | | $155,748,294 |
| Telephone Services – 0.6% | |
| Hellenic Telecommunications Organization S.A. | | 1,010,698 | $14,148,421 |
| Utilities - Electric Power – 83.0% | |
| Alliant Energy Corp. | | 1,353,116 | $66,018,530 |
| Ameren Corp. | | 1,105,736 | 83,715,273 |
| American Electric Power Co., Inc. | | 892,701 | 67,434,633 |
| CenterPoint Energy, Inc. | | 807,148 | 21,696,138 |
| CLP Holdings Ltd. | | 2,221,000 | 16,300,950 |
| Constellation Energy | | 726,565 | 82,043,720 |
| Dominion Energy, Inc. | | 3,238,373 | 130,571,199 |
| DTE Energy Co. | | 1,084,476 | 104,521,797 |
| E.ON SE | | 3,636,403 | 43,170,948 |
| Edison International | | 1,464,363 | 92,342,731 |
| Enel S.p.A. | | 9,123,598 | 58,011,786 |
| Energias de Portugal S.A. | | 8,037,599 | 33,903,080 |
| Energisa S.A., IEU | | 1,358,200 | 12,556,295 |
| Equatorial Energia S.A. | | 2,045,000 | 12,817,375 |
| Evergy, Inc. | | 1,029,911 | 50,609,826 |
| Exelon Corp. | | 1,063,516 | 41,413,313 |
| Iberdrola S.A. | | 1,802,467 | 20,086,937 |
| National Grid PLC | | 3,685,532 | 43,799,953 |
| NextEra Energy, Inc. | | 4,826,759 | 281,400,050 |
| PG&E Corp. (a) | | 9,724,508 | 158,509,480 |
Portfolio of Investments – continued
| Issuer | | | Shares/Par | Value ($) |
| Common Stocks – continued |
| Utilities - Electric Power – continued | |
| Pinnacle West Capital Corp. | | 551,800 | $40,932,524 |
| Portland General Electric Co. | | 761,830 | 30,488,437 |
| PPL Corp. | | 3,520,314 | 86,494,115 |
| Public Service Enterprise Group, Inc. | | 676,097 | 41,681,380 |
| RWE AG | | 2,364,634 | 90,356,462 |
| Sempra Energy | | 1,501,254 | 105,132,818 |
| Southern Co. | | 1,917,308 | 129,034,828 |
| SSE PLC | | 2,762,108 | 54,997,098 |
| Xcel Energy, Inc. | | 1,155,537 | 68,488,678 |
| | | | | $2,068,530,354 |
| Utilities - Water – 1.8% | |
| United Utilities Group PLC | | 786,554 | $10,186,496 |
| Veolia Environnement S.A. | | 1,236,277 | 33,903,901 |
| | | | | $44,090,397 |
| Total Common Stocks (Identified Cost, $2,118,788,320) | | $2,465,322,355 |
| Investment Companies (h) – 1.1% |
| Money Market Funds – 1.1% | |
| MFS Institutional Money Market Portfolio, 5.43% (v) (Identified Cost, $28,402,282) | | | 28,399,090 | $28,401,929 |
|
|
| Other Assets, Less Liabilities – (0.0)% | | (291,419) |
| Net Assets – 100.0% | $2,493,432,865 |
| (a) | Non-income producing security. | | | |
| (h) | An affiliated issuer, which may be considered one in which the fund owns 5% or more of the outstanding voting securities, or a company which is under common control. At period end, the aggregate values of the fund's investments in affiliated issuers and in unaffiliated issuers were $28,401,929 and $2,465,322,355, respectively. | | | |
| (v) | Affiliated issuer that is available only to investment companies managed by MFS. The rate quoted for the MFS Institutional Money Market Portfolio is the annualized seven-day yield of the fund at period end. | | | |
| The following abbreviations are used in this report and are defined: |
| IEU | International Equity Unit |
| REIT | Real Estate Investment Trust |
| Abbreviations indicate amounts shown in currencies other than the U.S. dollar. All amounts are stated in U.S. dollars unless otherwise indicated. A list of abbreviations is shown below: |
| CAD | Canadian Dollar |
| EUR | Euro |
| GBP | British Pound |
Portfolio of Investments – continued
Derivative Contracts at 10/31/23
| Forward Foreign Currency Exchange Contracts |
Currency
Purchased | Currency
Sold | Counterparty | Settlement
Date | Unrealized
Appreciation
(Depreciation) |
| Asset Derivatives |
| USD | 17,656,214 | CAD | 24,060,918 | State Street Bank Corp. | 1/19/2024 | $280,777 |
| USD | 3,230,101 | EUR | 3,035,589 | HSBC Bank | 1/19/2024 | 5,874 |
| USD | 268,345,111 | EUR | 252,406,167 | State Street Bank Corp. | 1/19/2024 | 253,920 |
| USD | 71,387,262 | GBP | 58,566,859 | Deutsche Bank AG | 1/19/2024 | 155,307 |
| | | | | | | $695,878 |
| Liability Derivatives |
| GBP | 4,085,063 | USD | 4,993,721 | Morgan Stanley Capital Services, Inc. | 1/19/2024 | $(25,263) |
At October 31, 2023, the fund had cash collateral of $33,000 to cover any collateral or margin obligations for certain derivative contracts. Restricted cash and/or deposits with brokers in the Statement of Assets and Liabilities are comprised of cash collateral.
See Notes to Financial Statements
Financial Statements
Statement of Assets and Liabilities
At 10/31/23
This statement represents your fund’s balance sheet, which details the assets and liabilities comprising the total value of the fund.
| Assets | |
| Investments in unaffiliated issuers, at value (identified cost, $2,118,788,320) | $2,465,322,355 |
| Investments in affiliated issuers, at value (identified cost, $28,402,282) | 28,401,929 |
| Restricted cash for | |
| Forward foreign currency exchange contracts | 33,000 |
| Receivables for | |
| Forward foreign currency exchange contracts | 695,878 |
| Fund shares sold | 1,205,223 |
| Dividends | 3,298,974 |
| Other assets | 1 |
| Total assets | $2,498,957,360 |
| Liabilities | |
| Payables for | |
| Distributions | $447 |
| Forward foreign currency exchange contracts | 25,263 |
| Fund shares reacquired | 3,916,041 |
| Payable to affiliates | |
| Investment adviser | 79,175 |
| Administrative services fee | 1,987 |
| Shareholder servicing costs | 880,090 |
| Distribution and service fees | 28,916 |
| Payable for independent Trustees' compensation | 847 |
| Accrued expenses and other liabilities | 591,729 |
| Total liabilities | $5,524,495 |
| Net assets | $2,493,432,865 |
| Net assets consist of | |
| Paid-in capital | $2,059,206,480 |
| Total distributable earnings (loss) | 434,226,385 |
| Net assets | $2,493,432,865 |
| Shares of beneficial interest outstanding | 126,187,470 |
Statement of Assets and Liabilities – continued
| | Net assets | Shares
outstanding | Net asset value
per share (a) |
| Class A | $1,577,694,940 | 79,932,608 | $19.74 |
| Class B | 15,415,745 | 784,906 | 19.64 |
| Class C | 65,272,171 | 3,325,205 | 19.63 |
| Class I | 541,543,715 | 27,284,182 | 19.85 |
| Class R1 | 4,373,232 | 223,943 | 19.53 |
| Class R2 | 29,316,394 | 1,490,868 | 19.66 |
| Class R3 | 162,192,716 | 8,224,833 | 19.72 |
| Class R4 | 17,643,135 | 892,639 | 19.77 |
| Class R6 | 79,980,817 | 4,028,286 | 19.85 |
| (a) | Maximum offering price per share was equal to the net asset value per share for all share classes, except for Class A, for which the maximum offering price per share was $20.94 [100 / 94.25 x $19.74]. On sales of $50,000 or more, the maximum offering price of Class A shares is reduced. A contingent deferred sales charge may be imposed on redemptions of Class A, Class B, and Class C shares. Redemption price per share was equal to the net asset value per share for Classes I, R1, R2, R3, R4, and R6. |
See Notes to Financial Statements
Financial Statements
Statement of Operations
Year ended 10/31/23
This statement describes how much your fund earned in investment income and accrued in expenses. It also describes any gains and/or losses generated by fund operations.
| Net investment income (loss) | |
| Income | |
| Dividends | $90,687,132 |
| Dividends from affiliated issuers | 907,612 |
| Other | 178,331 |
| Income on securities loaned | 12,260 |
| Total investment income | $91,785,335 |
| Expenses | |
| Management fee | $17,978,726 |
| Distribution and service fees | 6,486,760 |
| Shareholder servicing costs | 3,292,247 |
| Administrative services fee | 445,868 |
| Independent Trustees' compensation | 51,467 |
| Custodian fee | 269,650 |
| Shareholder communications | 150,396 |
| Audit and tax fees | 74,642 |
| Legal fees | 16,321 |
| Miscellaneous | 1,056,481 |
| Total expenses | $29,822,558 |
| Fees paid indirectly | (23,267) |
| Reduction of expenses by investment adviser and distributor | (385,254) |
| Net expenses | $29,414,037 |
| Net investment income (loss) | $62,371,298 |
| Realized and unrealized gain (loss) |
| Realized gain (loss) (identified cost basis) | |
| Unaffiliated issuers | $124,535,108 |
| Affiliated issuers | 11,178 |
| Forward foreign currency exchange contracts | (25,399,272) |
| Foreign currency | (338,163) |
| Net realized gain (loss) | $98,808,851 |
| Change in unrealized appreciation or depreciation | |
| Unaffiliated issuers | $(316,323,579) |
| Affiliated issuers | (1,934) |
| Forward foreign currency exchange contracts | 3,051,495 |
| Translation of assets and liabilities in foreign currencies | 84,935 |
| Net unrealized gain (loss) | $(313,189,083) |
| Net realized and unrealized gain (loss) | $(214,380,232) |
| Change in net assets from operations | $(152,008,934) |
See Notes to Financial Statements
Financial Statements
Statements of Changes in Net Assets
These statements describe the increases and/or decreases in net assets resulting from operations, any distributions, and any shareholder transactions.
| | Year ended |
| | 10/31/23 | 10/31/22 |
| Change in net assets | | |
| From operations | | |
| Net investment income (loss) | $62,371,298 | $56,239,937 |
| Net realized gain (loss) | 98,808,851 | 224,894,811 |
| Net unrealized gain (loss) | (313,189,083) | (296,877,774) |
| Change in net assets from operations | $(152,008,934) | $(15,743,026) |
| Total distributions to shareholders | $(265,632,104) | $(196,277,058) |
| Change in net assets from fund share transactions | $(176,816,792) | $108,277,444 |
| Total change in net assets | $(594,457,830) | $(103,742,640) |
| Net assets | | |
| At beginning of period | 3,087,890,695 | 3,191,633,335 |
| At end of period | $2,493,432,865 | $3,087,890,695 |
See Notes to Financial Statements
Financial Statements
Financial Highlights
The financial highlights table is intended to help you understand the fund's financial performance for the past 5 years. Certain information reflects financial results for a single fund share. The total returns in the table represent the rate that an investor would have earned (or lost) on an investment in the fund share class (assuming reinvestment of all distributions) held for the entire period.
| Class A | Year ended |
| | 10/31/23 | 10/31/22 | 10/31/21 | 10/31/20 | 10/31/19 |
| Net asset value, beginning of period | $22.88 | $24.45 | $21.65 | $23.54 | $20.08 |
| Income (loss) from investment operations |
| Net investment income (loss) (d) | $0.45 | $0.41 | $0.46 | $0.54 | $0.55 |
| Net realized and unrealized gain (loss) | (1.61) | (0.48) | 3.52 | (0.93) | 3.73 |
| Total from investment operations | $(1.16) | $(0.07) | $3.98 | $(0.39) | $4.28 |
| Less distributions declared to shareholders |
| From net investment income | $(0.44) | $(0.44) | $(0.26) | $(0.31) | $(0.49) |
| From net realized gain | (1.54) | (1.06) | (0.92) | (1.19) | (0.33) |
| Total distributions declared to shareholders | $(1.98) | $(1.50) | $(1.18) | $(1.50) | $(0.82) |
| Net asset value, end of period (x) | $19.74 | $22.88 | $24.45 | $21.65 | $23.54 |
| Total return (%) (r)(s)(t)(x) | (6.06) | (0.50) | 18.90 | (1.70) | 21.94 |
Ratios (%) (to average net assets)
and Supplemental data: |
| Expenses before expense reductions (f) | 1.03 | 1.00 | 1.00 | 1.00 | 1.00 |
| Expenses after expense reductions (f) | 1.02 | 0.99 | 0.99 | 0.99 | 0.99 |
| Net investment income (loss) | 2.04 | 1.72 | 1.98 | 2.51 | 2.51 |
| Portfolio turnover | 15 | 23 | 12 | 30 | 30 |
| Net assets at end of period (000 omitted) | $1,577,695 | $1,861,665 | $1,951,571 | $1,744,515 | $1,956,524 |
See Notes to Financial Statements
Financial Highlights – continued
| Class B | Year ended |
| | 10/31/23 | 10/31/22 | 10/31/21 | 10/31/20 | 10/31/19 |
| Net asset value, beginning of period | $22.75 | $24.30 | $21.53 | $23.42 | $19.98 |
| Income (loss) from investment operations |
| Net investment income (loss) (d) | $0.29 | $0.24 | $0.30 | $0.38 | $0.38 |
| Net realized and unrealized gain (loss) | (1.60) | (0.49) | 3.49 | (0.93) | 3.72 |
| Total from investment operations | $(1.31) | $(0.25) | $3.79 | $(0.55) | $4.10 |
| Less distributions declared to shareholders |
| From net investment income | $(0.26) | $(0.24) | $(0.10) | $(0.15) | $(0.33) |
| From net realized gain | (1.54) | (1.06) | (0.92) | (1.19) | (0.33) |
| Total distributions declared to shareholders | $(1.80) | $(1.30) | $(1.02) | $(1.34) | $(0.66) |
| Net asset value, end of period (x) | $19.64 | $22.75 | $24.30 | $21.53 | $23.42 |
| Total return (%) (r)(s)(t)(x) | (6.76) | (1.24) | 18.02 | (2.45) | 21.02 |
Ratios (%) (to average net assets)
and Supplemental data: |
| Expenses before expense reductions (f) | 1.78 | 1.75 | 1.75 | 1.75 | 1.75 |
| Expenses after expense reductions (f) | 1.77 | 1.74 | 1.74 | 1.74 | 1.74 |
| Net investment income (loss) | 1.30 | 1.01 | 1.27 | 1.75 | 1.76 |
| Portfolio turnover | 15 | 23 | 12 | 30 | 30 |
| Net assets at end of period (000 omitted) | $15,416 | $31,760 | $49,750 | $63,594 | $99,924 |
| Class C | Year ended |
| | 10/31/23 | 10/31/22 | 10/31/21 | 10/31/20 | 10/31/19 |
| Net asset value, beginning of period | $22.75 | $24.30 | $21.53 | $23.42 | $19.98 |
| Income (loss) from investment operations |
| Net investment income (loss) (d) | $0.28 | $0.24 | $0.30 | $0.38 | $0.38 |
| Net realized and unrealized gain (loss) | (1.60) | (0.49) | 3.49 | (0.93) | 3.72 |
| Total from investment operations | $(1.32) | $(0.25) | $3.79 | $(0.55) | $4.10 |
| Less distributions declared to shareholders |
| From net investment income | $(0.26) | $(0.24) | $(0.10) | $(0.15) | $(0.33) |
| From net realized gain | (1.54) | (1.06) | (0.92) | (1.19) | (0.33) |
| Total distributions declared to shareholders | $(1.80) | $(1.30) | $(1.02) | $(1.34) | $(0.66) |
| Net asset value, end of period (x) | $19.63 | $22.75 | $24.30 | $21.53 | $23.42 |
| Total return (%) (r)(s)(t)(x) | (6.77) | (1.23) | 18.00 | (2.45) | 21.02 |
Ratios (%) (to average net assets)
and Supplemental data: |
| Expenses before expense reductions (f) | 1.78 | 1.75 | 1.75 | 1.75 | 1.75 |
| Expenses after expense reductions (f) | 1.77 | 1.74 | 1.74 | 1.74 | 1.74 |
| Net investment income (loss) | 1.29 | 1.00 | 1.28 | 1.76 | 1.75 |
| Portfolio turnover | 15 | 23 | 12 | 30 | 30 |
| Net assets at end of period (000 omitted) | $65,272 | $104,022 | $149,761 | $230,614 | $370,036 |
See Notes to Financial Statements
Financial Highlights – continued
| Class I | Year ended |
| | 10/31/23 | 10/31/22 | 10/31/21 | 10/31/20 | 10/31/19 |
| Net asset value, beginning of period | $23.00 | $24.57 | $21.74 | $23.64 | $20.16 |
| Income (loss) from investment operations |
| Net investment income (loss) (d) | $0.51 | $0.47 | $0.53 | $0.60 | $0.60 |
| Net realized and unrealized gain (loss) | (1.62) | (0.48) | 3.54 | (0.94) | 3.76 |
| Total from investment operations | $(1.11) | $(0.01) | $4.07 | $(0.34) | $4.36 |
| Less distributions declared to shareholders |
| From net investment income | $(0.50) | $(0.50) | $(0.32) | $(0.37) | $(0.55) |
| From net realized gain | (1.54) | (1.06) | (0.92) | (1.19) | (0.33) |
| Total distributions declared to shareholders | $(2.04) | $(1.56) | $(1.24) | $(1.56) | $(0.88) |
| Net asset value, end of period (x) | $19.85 | $23.00 | $24.57 | $21.74 | $23.64 |
| Total return (%) (r)(s)(t)(x) | (5.84) | (0.24) | 19.23 | (1.49) | 22.26 |
Ratios (%) (to average net assets)
and Supplemental data: |
| Expenses before expense reductions (f) | 0.78 | 0.75 | 0.75 | 0.75 | 0.75 |
| Expenses after expense reductions (f) | 0.77 | 0.74 | 0.74 | 0.74 | 0.74 |
| Net investment income (loss) | 2.30 | 1.96 | 2.24 | 2.76 | 2.77 |
| Portfolio turnover | 15 | 23 | 12 | 30 | 30 |
| Net assets at end of period (000 omitted) | $541,544 | $714,999 | $687,188 | $626,500 | $698,558 |
| Class R1 | Year ended |
| | 10/31/23 | 10/31/22 | 10/31/21 | 10/31/20 | 10/31/19 |
| Net asset value, beginning of period | $22.65 | $24.23 | $21.47 | $23.37 | $19.94 |
| Income (loss) from investment operations |
| Net investment income (loss) (d) | $0.28 | $0.23 | $0.28 | $0.37 | $0.38 |
| Net realized and unrealized gain (loss) | (1.58) | (0.49) | 3.51 | (0.92) | 3.71 |
| Total from investment operations | $(1.30) | $(0.26) | $3.79 | $(0.55) | $4.09 |
| Less distributions declared to shareholders |
| From net investment income | $(0.28) | $(0.26) | $(0.11) | $(0.16) | $(0.33) |
| From net realized gain | (1.54) | (1.06) | (0.92) | (1.19) | (0.33) |
| Total distributions declared to shareholders | $(1.82) | $(1.32) | $(1.03) | $(1.35) | $(0.66) |
| Net asset value, end of period (x) | $19.53 | $22.65 | $24.23 | $21.47 | $23.37 |
| Total return (%) (r)(s)(t)(x) | (6.75) | (1.27) | 18.06 | (2.48) | 21.03 |
Ratios (%) (to average net assets)
and Supplemental data: |
| Expenses before expense reductions (f) | 1.78 | 1.75 | 1.75 | 1.75 | 1.75 |
| Expenses after expense reductions (f) | 1.77 | 1.74 | 1.74 | 1.74 | 1.74 |
| Net investment income (loss) | 1.29 | 0.96 | 1.23 | 1.75 | 1.77 |
| Portfolio turnover | 15 | 23 | 12 | 30 | 30 |
| Net assets at end of period (000 omitted) | $4,373 | $5,243 | $5,126 | $5,171 | $6,561 |
See Notes to Financial Statements
Financial Highlights – continued
| Class R2 | Year ended |
| | 10/31/23 | 10/31/22 | 10/31/21 | 10/31/20 | 10/31/19 |
| Net asset value, beginning of period | $22.80 | $24.36 | $21.58 | $23.47 | $20.03 |
| Income (loss) from investment operations |
| Net investment income (loss) (d) | $0.40 | $0.35 | $0.41 | $0.48 | $0.49 |
| Net realized and unrealized gain (loss) | (1.61) | (0.47) | 3.50 | (0.92) | 3.72 |
| Total from investment operations | $(1.21) | $(0.12) | $3.91 | $(0.44) | $4.21 |
| Less distributions declared to shareholders |
| From net investment income | $(0.39) | $(0.38) | $(0.21) | $(0.26) | $(0.44) |
| From net realized gain | (1.54) | (1.06) | (0.92) | (1.19) | (0.33) |
| Total distributions declared to shareholders | $(1.93) | $(1.44) | $(1.13) | $(1.45) | $(0.77) |
| Net asset value, end of period (x) | $19.66 | $22.80 | $24.36 | $21.58 | $23.47 |
| Total return (%) (r)(s)(t)(x) | (6.33) | (0.72) | 18.60 | (1.96) | 21.59 |
Ratios (%) (to average net assets)
and Supplemental data: |
| Expenses before expense reductions (f) | 1.28 | 1.25 | 1.25 | 1.25 | 1.25 |
| Expenses after expense reductions (f) | 1.27 | 1.24 | 1.24 | 1.24 | 1.24 |
| Net investment income (loss) | 1.79 | 1.47 | 1.74 | 2.26 | 2.26 |
| Portfolio turnover | 15 | 23 | 12 | 30 | 30 |
| Net assets at end of period (000 omitted) | $29,316 | $38,534 | $41,968 | $41,020 | $59,224 |
| Class R3 | Year ended |
| | 10/31/23 | 10/31/22 | 10/31/21 | 10/31/20 | 10/31/19 |
| Net asset value, beginning of period | $22.86 | $24.43 | $21.63 | $23.52 | $20.07 |
| Income (loss) from investment operations |
| Net investment income (loss) (d) | $0.45 | $0.41 | $0.47 | $0.54 | $0.57 |
| Net realized and unrealized gain (loss) | (1.61) | (0.48) | 3.51 | (0.93) | 3.71 |
| Total from investment operations | $(1.16) | $(0.07) | $3.98 | $(0.39) | $4.28 |
| Less distributions declared to shareholders |
| From net investment income | $(0.44) | $(0.44) | $(0.26) | $(0.31) | $(0.50) |
| From net realized gain | (1.54) | (1.06) | (0.92) | (1.19) | (0.33) |
| Total distributions declared to shareholders | $(1.98) | $(1.50) | $(1.18) | $(1.50) | $(0.83) |
| Net asset value, end of period (x) | $19.72 | $22.86 | $24.43 | $21.63 | $23.52 |
| Total return (%) (r)(s)(t)(x) | (6.07) | (0.49) | 18.91 | (1.71) | 21.92 |
Ratios (%) (to average net assets)
and Supplemental data: |
| Expenses before expense reductions (f) | 1.03 | 1.00 | 1.00 | 1.00 | 1.00 |
| Expenses after expense reductions (f) | 1.02 | 0.99 | 0.99 | 0.99 | 0.99 |
| Net investment income (loss) | 2.05 | 1.71 | 1.99 | 2.51 | 2.63 |
| Portfolio turnover | 15 | 23 | 12 | 30 | 30 |
| Net assets at end of period (000 omitted) | $162,193 | $217,043 | $201,006 | $201,509 | $279,639 |
See Notes to Financial Statements
Financial Highlights – continued
| Class R4 | Year ended |
| | 10/31/23 | 10/31/22 | 10/31/21 | 10/31/20 | 10/31/19 |
| Net asset value, beginning of period | $22.91 | $24.48 | $21.67 | $23.56 | $20.10 |
| Income (loss) from investment operations |
| Net investment income (loss) (d) | $0.51 | $0.48 | $0.53 | $0.60 | $0.60 |
| Net realized and unrealized gain (loss) | (1.61) | (0.49) | 3.52 | (0.93) | 3.74 |
| Total from investment operations | $(1.10) | $(0.01) | $4.05 | $(0.33) | $4.34 |
| Less distributions declared to shareholders |
| From net investment income | $(0.50) | $(0.50) | $(0.32) | $(0.37) | $(0.55) |
| From net realized gain | (1.54) | (1.06) | (0.92) | (1.19) | (0.33) |
| Total distributions declared to shareholders | $(2.04) | $(1.56) | $(1.24) | $(1.56) | $(0.88) |
| Net asset value, end of period (x) | $19.77 | $22.91 | $24.48 | $21.67 | $23.56 |
| Total return (%) (r)(s)(t)(x) | (5.81) | (0.24) | 19.19 | (1.46) | 22.22 |
Ratios (%) (to average net assets)
and Supplemental data: |
| Expenses before expense reductions (f) | 0.78 | 0.75 | 0.75 | 0.75 | 0.75 |
| Expenses after expense reductions (f) | 0.77 | 0.74 | 0.74 | 0.74 | 0.74 |
| Net investment income (loss) | 2.29 | 1.98 | 2.25 | 2.76 | 2.76 |
| Portfolio turnover | 15 | 23 | 12 | 30 | 30 |
| Net assets at end of period (000 omitted) | $17,643 | $23,369 | $25,766 | $24,920 | $49,530 |
| Class R6 | Year ended |
| | 10/31/23 | 10/31/22 | 10/31/21 | 10/31/20 | 10/31/19 |
| Net asset value, beginning of period | $23.01 | $24.58 | $21.75 | $23.64 | $20.17 |
| Income (loss) from investment operations |
| Net investment income (loss) (d) | $0.53 | $0.49 | $0.54 | $0.61 | $0.61 |
| Net realized and unrealized gain (loss) | (1.63) | (0.48) | 3.54 | (0.92) | 3.76 |
| Total from investment operations | $(1.10) | $0.01 | $4.08 | $(0.31) | $4.37 |
| Less distributions declared to shareholders |
| From net investment income | $(0.52) | $(0.52) | $(0.33) | $(0.39) | $(0.57) |
| From net realized gain | (1.54) | (1.06) | (0.92) | (1.19) | (0.33) |
| Total distributions declared to shareholders | $(2.06) | $(1.58) | $(1.25) | $(1.58) | $(0.90) |
| Net asset value, end of period (x) | $19.85 | $23.01 | $24.58 | $21.75 | $23.64 |
| Total return (%) (r)(s)(t)(x) | (5.79) | (0.15) | 19.31 | (1.36) | 22.29 |
Ratios (%) (to average net assets)
and Supplemental data: |
| Expenses before expense reductions (f) | 0.69 | 0.66 | 0.66 | 0.66 | 0.66 |
| Expenses after expense reductions (f) | 0.68 | 0.65 | 0.65 | 0.65 | 0.65 |
| Net investment income (loss) | 2.40 | 2.04 | 2.29 | 2.84 | 2.84 |
| Portfolio turnover | 15 | 23 | 12 | 30 | 30 |
| Net assets at end of period (000 omitted) | $79,981 | $91,255 | $79,499 | $75,542 | $92,437 |
See Notes to Financial Statements
Financial Highlights – continued
| (d) | Per share data is based on average shares outstanding. |
| (f) | Ratios do not reflect reductions from fees paid indirectly, if applicable. See Note 2 in the Notes to Financial Statements for additional information. |
| (r) | Certain expenses have been reduced without which performance would have been lower. |
| (s) | From time to time the fund may receive proceeds from litigation settlements, without which performance would be lower. |
| (t) | Total returns do not include any applicable sales charges. |
| (x) | The net asset values and total returns have been calculated on net assets which include adjustments made in accordance with U.S. generally accepted accounting principles required at period end for financial reporting purposes. |
See Notes to Financial Statements
Notes to Financial Statements
(1) Business and Organization
MFS Utilities Fund (the fund) is a diversified series of MFS Series Trust VI (the trust). The trust is organized as a Massachusetts business trust and is registered under the Investment Company Act of 1940, as amended, as an open-end management investment company.
The fund is an investment company and accordingly follows the investment company accounting and reporting guidance of the Financial Accounting Standards Board (FASB) Accounting Standards Codification Topic 946 Financial Services - Investment Companies.
(2) Significant Accounting Policies
General — The preparation of financial statements in conformity with U.S. generally accepted accounting principles requires management to make estimates and assumptions that affect the reported amounts of assets and liabilities, and disclosure of contingent assets and liabilities at the date of the financial statements and the reported amounts of increases and decreases in net assets from operations during the reporting period. Actual results could differ from those estimates. In the preparation of these financial statements, management has evaluated subsequent events occurring after the date of the fund’s Statement of Assets and Liabilities through the date that the financial statements were issued. The fund invests primarily in securities of issuers in the utility industry. Issuers in a single industry can react similarly to market, currency, political, economic, regulatory, geopolitical, environmental, public health, and other conditions. The value of stocks in the utilities sector can be very volatile due to supply and/or demand for services or fuel, financing costs, conservation efforts, the negative impact of regulation, and other factors. The fund invests in foreign securities. Investments in foreign securities are vulnerable to the effects of changes in the relative values of the local currency and the U.S. dollar and to the effects of changes in each country’s market, economic, industrial, political, regulatory, geopolitical, environmental, public health, and other conditions.
Balance Sheet Offsetting — The fund's accounting policy with respect to balance sheet offsetting is that, absent an event of default by the counterparty or a termination of the agreement, the International Swaps and Derivatives Association (ISDA) Master Agreement, or similar agreement, does not result in an offset of reported amounts of financial assets and financial liabilities in the Statement of Assets and Liabilities across transactions between the fund and the applicable counterparty. The fund's right to setoff may be restricted or prohibited by the bankruptcy or insolvency laws of the particular jurisdiction to which a specific master netting agreement counterparty is subject. Balance sheet offsetting disclosures, to the extent applicable to the fund, have been included in the fund’s Significant Accounting Policies note under the captions for each of the fund’s in-scope financial instruments and transactions.
Investment Valuations — Subject to its oversight, the fund's Board of Trustees has delegated primary responsibility for determining or causing to be determined the value of the fund’s investments to MFS as the fund's adviser, pursuant to the fund’s valuation policy and procedures which have been adopted by the adviser and approved by the Board. In accordance with Rule 2a-5 under the Investment Company Act of 1940, the Board of Trustees designated the adviser as the “valuation designee” of the fund. If the
Notes to Financial Statements - continued
adviser, as valuation designee, determines that reliable market quotations are not readily available for an investment, the investment is valued at fair value as determined in good faith by the adviser in accordance with the adviser’s fair valuation policy and procedures.
Under the fund's valuation policy and procedures, equity securities, including restricted equity securities, are generally valued at the last sale or official closing price on their primary market or exchange as provided by a third-party pricing service. Equity securities, for which there were no sales reported that day, are generally valued at the last quoted daily bid quotation on their primary market or exchange as provided by a third-party pricing service. Short-term instruments with a maturity at issuance of 60 days or less may be valued at amortized cost, which approximates market value.
Forward foreign currency exchange contracts are generally valued at the mean of bid and asked prices for the time period interpolated from rates provided by a third-party pricing service for proximate time periods. Open-end investment companies are generally valued at net asset value per share. The values of foreign securities and other assets and liabilities expressed in foreign currencies are converted to U.S. dollars using the mean of bid and asked prices for rates provided by a third-party pricing service.
Under the fund’s valuation policy and procedures, market quotations are not considered to be readily available for debt instruments, floating rate loans, and many types of derivatives. These investments are generally valued at fair value based on information from third-party pricing services or otherwise determined by the adviser in accordance with the adviser’s fair valuation policy and procedures. Securities and other assets generally valued on the basis of information from a third-party pricing service may also be valued at a broker/dealer bid quotation. In determining values, third-party pricing services can utilize both transaction data and market information such as yield, quality, coupon rate, maturity, type of issue, trading characteristics, spreads and other market data. An investment may also be valued at fair value if the adviser determines that the investment’s value has been materially affected by events occurring after the close of the exchange or market on which the investment is principally traded (such as foreign exchange or market) and prior to the determination of the fund’s net asset value, or after the halt of trading of a specific security where trading does not resume prior to the close of the exchange or market on which the security is principally traded. Events that occur after foreign markets close (such as developments in foreign markets and significant movements in the U.S. markets) and prior to the determination of the fund’s net asset value may be deemed to have a material effect on the value of securities traded in foreign markets. Accordingly, the fund’s foreign equity securities may often be valued at fair value. The adviser generally relies on third-party pricing services or other information (such as the correlation with price movements of similar securities in the same or other markets; the type, cost and investment characteristics of the security; the business and financial condition of the issuer; and trading and other market data) to assist in determining whether to fair value and at what value to fair value an investment. The value of an investment for purposes of calculating the fund’s net asset value can differ depending on the source and method used to determine value. When fair valuation is used, the value of an investment used to determine the fund’s net asset value may differ from quoted or published prices for the same investment. There can be no assurance that the fund could obtain the fair value assigned to an investment if it were to sell the investment at the same time at which the fund determines its net asset value per share.
Notes to Financial Statements - continued
Various inputs are used in determining the value of the fund's assets or liabilities. These inputs are categorized into three broad levels. In certain cases, the inputs used to measure fair value may fall into different levels of the fair value hierarchy. In such cases, an investment's level within the fair value hierarchy is based on the lowest level of input that is significant to the fair value measurement. The fund's assessment of the significance of a particular input to the fair value measurement in its entirety requires judgment, and considers factors specific to the investment. Level 1 includes unadjusted quoted prices in active markets for identical assets or liabilities. Level 2 includes other significant observable market-based inputs (including quoted prices for similar securities, interest rates, prepayment speed, and credit risk). Level 3 includes significant unobservable inputs, which may include the adviser's own assumptions in determining the fair value of investments. Other financial instruments are derivative instruments, such as forward foreign currency exchange contracts. The following is a summary of the levels used as of October 31, 2023 in valuing the fund's assets and liabilities:
| Financial Instruments | Level 1 | Level 2 | Level 3 | Total |
| Equity Securities: | | | | |
| United States | $1,823,480,588 | $— | $— | $1,823,480,588 |
| Germany | 43,170,948 | 90,356,462 | — | 133,527,410 |
| Portugal | — | 114,666,223 | — | 114,666,223 |
| United Kingdom | — | 108,983,547 | — | 108,983,547 |
| Spain | — | 81,329,764 | — | 81,329,764 |
| Italy | — | 58,011,786 | — | 58,011,786 |
| France | — | 33,903,901 | — | 33,903,901 |
| Canada | 25,929,829 | — | — | 25,929,829 |
| Brazil | 25,373,670 | — | — | 25,373,670 |
| Other Countries | 27,396,602 | 32,719,035 | — | 60,115,637 |
| Mutual Funds | 28,401,929 | — | — | 28,401,929 |
| Total | $1,973,753,566 | $519,970,718 | $— | $2,493,724,284 |
| Other Financial Instruments | | | | |
| Forward Foreign Currency Exchange Contracts – Assets | $— | $695,878 | $— | $695,878 |
| Forward Foreign Currency Exchange Contracts – Liabilities | — | (25,263) | — | (25,263) |
For further information regarding security characteristics, see the Portfolio of Investments.
Foreign Currency Translation — Purchases and sales of foreign investments, income, and expenses are converted into U.S. dollars based upon currency exchange rates prevailing on the respective dates of such transactions or on the reporting date for foreign denominated receivables and payables. Gains and losses attributable to foreign currency exchange rates on sales of securities are recorded for financial statement purposes as net realized gains and losses on investments. Gains and losses attributable to foreign exchange rate movements on receivables, payables, income and expenses are recorded for financial statement purposes as foreign currency transaction gains and losses. That portion of both realized and unrealized gains and losses on investments that results from fluctuations in foreign currency exchange rates is not separately disclosed.
Notes to Financial Statements - continued
Derivatives — The fund uses derivatives primarily to increase or decrease exposure to a particular market or segment of the market, or security, to increase or decrease interest rate or currency exposure, or as alternatives to direct investments. Derivatives are used for hedging or non-hedging purposes. While hedging can reduce or eliminate losses, it can also reduce or eliminate gains. When the fund uses derivatives as an investment to increase market exposure, or for hedging purposes, gains and losses from derivative instruments may be substantially greater than the derivative’s original cost.
The derivative instruments used by the fund during the period were forward foreign currency exchange contracts. Depending on the type of derivative, a fund may exit a derivative position by entering into an offsetting transaction with a counterparty or exchange, negotiating an agreement with the derivative counterparty, or novating the position to a third party. The fund's period end derivatives, as presented in the Portfolio of Investments and the associated Derivative Contract tables, generally are indicative of the volume of its derivative activity during the period.
The following table presents, by major type of derivative contract, the fair value, on a gross basis, of the asset and liability components of derivatives held by the fund at October 31, 2023 as reported in the Statement of Assets and Liabilities:
| | | Fair Value |
| Risk | Derivative Contracts | Asset Derivatives | Liability Derivatives |
| Foreign Exchange | Forward Foreign Currency Exchange Contracts | $695,878 | $(25,263) |
The following table presents, by major type of derivative contract, the realized gain (loss) on derivatives held by the fund for the year ended October 31, 2023 as reported in the Statement of Operations:
| Risk | Forward Foreign
Currency
Exchange
Contracts |
| Foreign Exchange | $(25,399,272) |
The following table presents, by major type of derivative contract, the change in unrealized appreciation or depreciation on derivatives held by the fund for the year ended October 31, 2023 as reported in the Statement of Operations:
| Risk | Forward Foreign
Currency
Exchange
Contracts |
| Foreign Exchange | $3,051,495 |
Derivative counterparty credit risk is managed through formal evaluation of the creditworthiness of all potential counterparties. On certain, but not all, uncleared derivatives, the fund attempts to reduce its exposure to counterparty credit risk whenever possible by entering into an ISDA Master Agreement on a bilateral basis. The ISDA Master Agreement gives each party to the agreement the right to terminate all transactions traded under such agreement if there is a specified deterioration in the credit quality of the other party. Upon an event of default or a termination of the ISDA Master Agreement, the non-defaulting party has the right to close out all transactions
Notes to Financial Statements - continued
traded under such agreement and to net amounts owed under each agreement to one net amount payable by one party to the other. This right to close out and net payments across all transactions traded under the ISDA Master Agreement could result in a reduction of the fund's credit risk to such counterparty equal to any amounts payable by the fund under the applicable transactions, if any.
Collateral and margin requirements differ by type of derivative. For cleared derivatives (e.g., futures contracts, cleared swaps, and exchange-traded options), margin requirements are set by the clearing broker and the clearing house and collateral, in the form of cash or securities, is posted by the fund directly with the clearing broker. Collateral terms are counterparty agreement specific for uncleared derivatives (e.g., forward foreign currency exchange contracts, uncleared swap agreements, and uncleared options) and collateral, in the form of cash and securities, is held in segregated accounts with the fund's custodian in connection with these agreements. For derivatives traded under an ISDA Master Agreement, which contains a credit support annex, the collateral requirements are netted across all transactions traded under such counterparty-specific agreement and an amount is posted from one party to the other to collateralize such obligations. Cash that has been segregated or delivered to cover the fund's collateral or margin obligations under derivative contracts, if any, will be reported separately in the Statement of Assets and Liabilities as restricted cash for uncleared derivatives and/or deposits with brokers for cleared derivatives. Securities pledged as collateral or margin for the same purpose, if any, are noted in the Portfolio of Investments. The fund may be required to make payments of interest on uncovered collateral or margin obligations with the broker. Any such payments are included in “Miscellaneous” expense in the Statement of Operations.
Forward Foreign Currency Exchange Contracts — The fund entered into forward foreign currency exchange contracts for the purchase or sale of a specific foreign currency at a fixed price on a future date. These contracts may be used to hedge the fund’s currency risk or for non-hedging purposes. For hedging purposes, the fund may enter into contracts to deliver or receive foreign currency that the fund will receive from or use in its normal investment activities. The fund may also use contracts to hedge against declines in the value of foreign currency denominated securities due to unfavorable exchange rate movements. For non-hedging purposes, the fund may enter into contracts with the intent of changing the relative exposure of the fund’s portfolio of securities to different currencies to take advantage of anticipated exchange rate changes.
Forward foreign currency exchange contracts are adjusted by the daily exchange rate of the underlying currency and any unrealized gains or losses are recorded as a receivable or payable for forward foreign currency exchange contracts until the contract settlement date. On contract settlement date, any gain or loss on the contract is recorded as realized gains or losses on forward foreign currency exchange contracts.
Risks may arise upon entering into these contracts from unanticipated movements in the value of the contract and from the potential inability of counterparties to meet the terms of their contracts. Generally, the fund’s maximum risk due to counterparty credit risk is the unrealized gain on the contract due to the use of Continuous Linked Settlement, a multicurrency cash settlement system for the centralized settlement of foreign transactions. This risk is mitigated in cases where there is an ISDA Master
Notes to Financial Statements - continued
Agreement between the fund and the counterparty providing for netting as described above and, where applicable, by the posting of collateral by the counterparty to the fund to cover the fund’s exposure to the counterparty under such ISDA Master Agreement.
Security Loans — Under its Securities Lending Agency Agreement with the fund, JPMorgan Chase and Co., as lending agent, loans the securities of the fund to certain qualified institutions (the “Borrowers”) approved by the fund. Security loans can be terminated at the discretion of either the lending agent or the fund and the related securities must be returned within the earlier of the standard trade settlement period for such securities or within three business days. The loans are collateralized by cash and/or U.S. Treasury and federal agency obligations in an amount typically at least equal to the market value of the securities loaned. On loans collateralized by cash, the cash collateral is invested in a money market fund. The market value of the loaned securities is determined at the close of business of the fund and any additional required collateral is delivered to the fund on the next business day. The lending agent provides the fund with indemnification against Borrower default. In the event of Borrower default, the lending agent will, for the benefit of the fund, either purchase securities identical to those loaned or, when such purchase is commercially impracticable, pay the fund the market value of the loaned securities. In return, the lending agent assumes the fund's rights to the related collateral. If the collateral value is less than the cost to purchase identical securities, the lending agent is responsible for the shortfall, but only to the extent that such shortfall is not due to a decline in collateral value resulting from collateral reinvestment for which the fund bears the risk of loss. A portion of the income generated upon investment of the collateral is remitted to the Borrowers, and the remainder is allocated between the fund and the lending agent. On loans collateralized by U.S. Treasury and/or federal agency obligations, a fee is received from the Borrower, and is allocated between the fund and the lending agent. Income from securities lending is separately reported in the Statement of Operations. The dividend and interest income earned on the securities loaned is accounted for in the same manner as other dividend and interest income. At October 31, 2023, there were no securities on loan or collateral outstanding.
Indemnifications — Under the fund's organizational documents, its officers and Trustees may be indemnified against certain liabilities and expenses arising out of the performance of their duties to the fund. Additionally, in the normal course of business, the fund enters into agreements with service providers that may contain indemnification clauses. The fund's maximum exposure under these agreements is unknown as this would involve future claims that may be made against the fund that have not yet occurred.
Investment Transactions and Income — Dividends received in cash are recorded on the ex-dividend date. Certain dividends from foreign securities will be recorded when the fund is informed of the dividend if such information is obtained subsequent to the ex-dividend date. Dividend payments received in additional securities are recorded on the ex-dividend date in an amount equal to the value of the security on such date.
Notes to Financial Statements - continued
The fund may receive proceeds from litigation settlements. Any proceeds received from litigation involving portfolio holdings are reflected in the Statement of Operations in realized gain/loss if the security has been disposed of by the fund or in unrealized gain/loss if the security is still held by the fund. Any other proceeds from litigation not related to portfolio holdings are reflected as other income in the Statement of Operations.
Investment transactions are recorded on the trade date. In determining the net gain or loss on securities sold, the cost of securities is determined on the identified cost basis.
Fees Paid Indirectly — The fund's custody fee may be reduced by a credit earned under an arrangement that measures the value of U.S. dollars deposited with the custodian by the fund. The amount of the credit, for the year ended October 31, 2023, is shown as a reduction of total expenses in the Statement of Operations.
Tax Matters and Distributions — The fund intends to qualify as a regulated investment company, as defined under Subchapter M of the Internal Revenue Code, and to distribute all of its taxable income, including realized capital gains. As a result, no provision for federal income tax is required. The fund’s federal tax returns, when filed, will remain subject to examination by the Internal Revenue Service for a three year period. Management has analyzed the fund’s tax positions taken on federal and state tax returns for all open tax years and does not believe that there are any uncertain tax positions that require recognition of a tax liability. Foreign taxes, if any, have been accrued by the fund in the accompanying financial statements in accordance with the applicable foreign tax law. Foreign income taxes may be withheld by certain countries in which the fund invests. Additionally, capital gains realized by the fund on securities issued in or by certain foreign countries may be subject to capital gains tax imposed by those countries.
Distributions to shareholders are recorded on the ex-dividend date. Income and capital gain distributions are determined in accordance with income tax regulations, which may differ from U.S. generally accepted accounting principles. Certain capital accounts in the financial statements are periodically adjusted for permanent differences in order to reflect their tax character. These adjustments have no impact on net assets or net asset value per share. Temporary differences which arise from recognizing certain items of income, expense, gain or loss in different periods for financial statement and tax purposes will reverse at some time in the future.
Book/tax differences primarily relate to wash sale loss deferrals, derivative transactions and treating a portion of the proceeds from redemptions as a distribution for tax purposes.
The tax character of distributions declared to shareholders for the last two fiscal years is as follows:
| | Year ended
10/31/23 | Year ended
10/31/22 |
| Ordinary income (including any short-term capital gains) | $93,849,189 | $82,777,891 |
| Long-term capital gains | 171,782,915 | 113,499,167 |
| Total distributions | $265,632,104 | $196,277,058 |
Notes to Financial Statements - continued
The federal tax cost and the tax basis components of distributable earnings were as follows:
| As of 10/31/23 | |
| Cost of investments | $2,154,542,514 |
| Gross appreciation | 567,884,987 |
| Gross depreciation | (228,032,602) |
| Net unrealized appreciation (depreciation) | $339,852,385 |
| Undistributed ordinary income | 2,445,285 |
| Undistributed long-term capital gain | 92,054,469 |
| Other temporary differences | (125,754) |
| Total distributable earnings (loss) | $434,226,385 |
Multiple Classes of Shares of Beneficial Interest — The fund offers multiple classes of shares, which differ in their respective distribution and service fees. The fund's income, realized and unrealized gain (loss), and common expenses are allocated to shareholders based on the daily net assets of each class. Dividends are declared separately for each class. Differences in per share dividend rates are generally due to differences in separate class expenses. Class B and Class C shares will convert to Class A shares approximately eight years after purchase. The fund’s distributions declared to shareholders as reported in the Statements of Changes in Net Assets are presented by class as follows:
| | Year
ended
10/31/23 | | Year
ended
10/31/22 |
| Class A | $160,751,122 | | $118,840,841 |
| Class B | 2,313,008 | | 2,497,443 |
| Class C | 7,771,832 | | 7,663,422 |
| Class I | 62,204,043 | | 45,070,737 |
| Class R1 | 422,727 | | 280,651 |
| Class R2 | 3,216,519 | | 2,436,847 |
| Class R3 | 18,299,129 | | 12,473,140 |
| Class R4 | 2,046,142 | | 1,636,567 |
| Class R6 | 8,607,582 | | 5,377,410 |
| Total | $265,632,104 | | $196,277,058 |
(3) Transactions with Affiliates
Investment Adviser — The fund has an investment advisory agreement with MFS to provide overall investment management and related administrative services and facilities to the fund. The management fee is computed daily and paid monthly at the following annual rates based on the fund's average daily net assets:
| Up to $3 billion | 0.60% |
| In excess of $3 billion and up to $10 billion | 0.55% |
| In excess of $10 billion | 0.50% |
MFS has agreed in writing to reduce its management fee by a specified amount if certain MFS mutual fund assets exceed thresholds agreed to by MFS and the fund's Board of Trustees. MFS has also agreed in writing to waive at least 0.01% of its
Notes to Financial Statements - continued
management fee as part of this agreement. The agreement to waive at least 0.01% of the management fee will continue until modified by the fund's Board of Trustees, but such agreement will continue at least until February 28, 2025. For the year ended October 31, 2023, this management fee reduction amounted to $384,673, which is included in the reduction of total expenses in the Statement of Operations. The management fee incurred for the year ended October 31, 2023 was equivalent to an annual effective rate of 0.59% of the fund's average daily net assets.
Distributor — MFS Fund Distributors, Inc. (MFD), a wholly-owned subsidiary of MFS, as distributor, received $121,140 for the year ended October 31, 2023, as its portion of the initial sales charge on sales of Class A shares of the fund.
The Board of Trustees has adopted a distribution plan for certain share classes pursuant to Rule 12b-1 of the Investment Company Act of 1940.
The fund's distribution plan provides that the fund will pay MFD for services provided by MFD and financial intermediaries in connection with the distribution and servicing of certain share classes. One component of the plan is a distribution fee paid to MFD and another component of the plan is a service fee paid to MFD. MFD may subsequently pay all, or a portion, of the distribution and/or service fees to financial intermediaries. The distribution and service fees are computed daily and paid monthly.
Distribution Plan Fee Table:
| | Distribution
Fee Rate (d) | Service
Fee Rate (d) | Total
Distribution
Plan (d) | Annual
Effective
Rate (e) | Distribution
and Service
Fee |
| Class A | — | 0.25% | 0.25% | 0.25% | $ 4,605,205 |
| Class B | 0.75% | 0.25% | 1.00% | 1.00% | 245,216 |
| Class C | 0.75% | 0.25% | 1.00% | 1.00% | 886,579 |
| Class R1 | 0.75% | 0.25% | 1.00% | 1.00% | 51,437 |
| Class R2 | 0.25% | 0.25% | 0.50% | 0.50% | 184,998 |
| Class R3 | — | 0.25% | 0.25% | 0.25% | 513,325 |
| Total Distribution and Service Fees | | | | | $6,486,760 |
| (d) | In accordance with the distribution plan for certain classes, the fund pays distribution and/or service fees equal to these annual percentage rates of each class’s average daily net assets. The distribution and service fee rates disclosed by class represent the current rates in effect at the end of the reporting period. Any rate changes, if applicable, are detailed below. |
| (e) | The annual effective rates represent actual fees incurred under the distribution plan for the year ended October 31, 2023 based on each class's average daily net assets. MFD has voluntarily agreed to rebate a portion of each class's 0.25% service fee attributable to accounts for which there is no financial intermediary specified on the account except for accounts attributable to MFS or its affiliates' seed money. For the year ended October 31, 2023, this rebate amounted to $526, $9, $1, $8, and $37 for Class A, Class C, Class R1, Class R2, and Class R3 shares, respectively, and is included in the reduction of total expenses in the Statement of Operations. |
Certain Class A shares are subject to a contingent deferred sales charge (CDSC) in the event of a shareholder redemption within 18 months of purchase. Class B shares are subject to a CDSC in the event of a shareholder redemption within six years of
Notes to Financial Statements - continued
purchase. Class C shares are subject to a CDSC in the event of a shareholder redemption within 12 months of purchase. All contingent deferred sales charges are paid to MFD and during the year ended October 31, 2023, were as follows:
| | Amount |
| Class A | $14,109 |
| Class B | 7,598 |
| Class C | 5,726 |
Shareholder Servicing Agent — MFS Service Center, Inc. (MFSC), a wholly-owned subsidiary of MFS, receives a fee from the fund for its services as shareholder servicing agent calculated as a percentage of the average daily net assets of the fund as determined periodically under the supervision of the fund's Board of Trustees. For the year ended October 31, 2023, the fee was $475,434, which equated to 0.0159% annually of the fund's average daily net assets. MFSC also receives reimbursement from the fund for out-of-pocket expenses, sub-accounting and other shareholder servicing costs which may be paid to affiliated and unaffiliated service providers. Class R6 shares do not incur sub-accounting fees. For the year ended October 31, 2023, these out-of-pocket expenses, sub-accounting and other shareholder servicing costs amounted to $2,816,813.
Administrator — MFS provides certain financial, legal, shareholder communications, compliance, and other administrative services to the fund. Under an administrative services agreement, the fund reimburses MFS the costs incurred to provide these services. The fund is charged an annual fixed amount of $17,500 plus a fee based on average daily net assets. The administrative services fee is computed daily and paid monthly. The administrative services fee incurred for the year ended October 31, 2023 was equivalent to an annual effective rate of 0.0149% of the fund's average daily net assets.
Trustees’ and Officers’ Compensation — The fund pays compensation to independent Trustees in the form of a retainer, attendance fees, and additional compensation to Board and Committee chairpersons. Independent Trustees’ compensation is accrued daily and paid subsequent to each Trustee Board meeting. The fund does not pay compensation directly to Trustees or officers of the fund who are also officers of the investment adviser, all of whom receive remuneration from MFS for their services to the fund. Certain officers and Trustees of the fund are officers or directors of MFS, MFD, and MFSC.
Other — The fund invests in the MFS Institutional Money Market Portfolio which is managed by MFS and seeks current income consistent with preservation of capital and liquidity. This money market fund does not pay a management fee to MFS but does incur investment and operating costs.
During the year ended October 31, 2023, pursuant to a policy adopted by the Board of Trustees and designed to comply with Rule 17a-7 under the Investment Company Act of 1940 (the “Act”) and relevant guidance, the fund engaged in sale transactions with funds and accounts for which MFS serves as investment adviser or sub-adviser (“cross-trades”) which amounted to $5,957,690. The sales transactions resulted in net realized gains (losses) of $1,735,406.
Notes to Financial Statements - continued
The adviser has voluntarily undertaken to reimburse the fund from its own resources on a quarterly basis for the cost of investment research embedded in the cost of the fund’s securities trades. This agreement may be rescinded at any time. For the year ended October 31, 2023, this reimbursement amounted to $190,630, which is included in “Other” income in the Statement of Operations.
(4) Portfolio Securities
For the year ended October 31, 2023, purchases and sales of investments, other than short-term obligations, aggregated $452,521,610 and $851,472,131, respectively.
(5) Shares of Beneficial Interest
The fund's Declaration of Trust permits the Trustees to issue an unlimited number of full and fractional shares of beneficial interest. Transactions in fund shares were as follows:
| | Year ended
10/31/23 | | Year ended
10/31/22 |
| | Shares | Amount | | Shares | Amount |
| Shares sold | | | | | |
| Class A | 4,796,589 | $106,992,035 | | 7,478,168 | $179,884,785 |
| Class B | 7,536 | 171,909 | | 43,661 | 1,048,357 |
| Class C | 375,446 | 8,322,311 | | 597,097 | 14,271,307 |
| Class I | 4,578,967 | 102,594,336 | | 7,048,453 | 170,317,492 |
| Class R1 | 38,303 | 828,926 | | 82,864 | 1,964,491 |
| Class R2 | 287,270 | 6,376,483 | | 627,288 | 14,931,561 |
| Class R3 | 988,153 | 22,030,961 | | 2,424,571 | 58,848,253 |
| Class R4 | 221,473 | 4,921,731 | | 352,125 | 8,538,962 |
| Class R6 | 1,831,292 | 40,481,361 | | 1,488,939 | 36,258,768 |
| | 13,125,029 | $292,720,053 | | 20,143,166 | $486,063,976 |
Shares issued to shareholders
in reinvestment of distributions | | | | | |
| Class A | 6,714,491 | $151,749,623 | | 4,678,261 | $111,893,470 |
| Class B | 98,094 | 2,218,952 | | 97,379 | 2,320,230 |
| Class C | 335,224 | 7,572,693 | | 315,384 | 7,513,890 |
| Class I | 2,485,945 | 56,454,099 | | 1,678,213 | 40,313,039 |
| Class R1 | 18,818 | 422,727 | | 11,825 | 280,651 |
| Class R2 | 142,325 | 3,209,777 | | 101,968 | 2,431,781 |
| Class R3 | 810,072 | 18,299,128 | | 522,110 | 12,473,140 |
| Class R4 | 84,021 | 1,900,015 | | 61,134 | 1,463,038 |
| Class R6 | 314,707 | 7,136,290 | | 182,369 | 4,381,030 |
| | 11,003,697 | $248,963,304 | | 7,648,643 | $183,070,269 |
Notes to Financial Statements - continued
| | Year ended
10/31/23 | | Year ended
10/31/22 |
| | Shares | Amount | | Shares | Amount |
| Shares reacquired | | | | | |
| Class A | (12,945,924) | $(284,475,630) | | (10,611,604) | $(254,322,484) |
| Class B | (716,557) | (15,787,942) | | (792,305) | (18,917,727) |
| Class C | (1,957,718) | (43,300,133) | | (2,502,609) | (59,515,715) |
| Class I | (10,870,683) | (238,097,656) | | (5,606,583) | (134,488,508) |
| Class R1 | (64,602) | (1,408,134) | | (74,865) | (1,771,476) |
| Class R2 | (628,944) | (13,853,428) | | (761,616) | (18,145,589) |
| Class R3 | (3,068,105) | (67,178,020) | | (1,679,813) | (40,151,114) |
| Class R4 | (432,874) | (9,511,513) | | (445,731) | (10,785,473) |
| Class R6 | (2,084,437) | (44,887,693) | | (939,282) | (22,758,715) |
| | (32,769,844) | $(718,500,149) | | (23,414,408) | $(560,856,801) |
| Net change | | | | | |
| Class A | (1,434,844) | $(25,733,972) | | 1,544,825 | $37,455,771 |
| Class B | (610,927) | (13,397,081) | | (651,265) | (15,549,140) |
| Class C | (1,247,048) | (27,405,129) | | (1,590,128) | (37,730,518) |
| Class I | (3,805,771) | (79,049,221) | | 3,120,083 | 76,142,023 |
| Class R1 | (7,481) | (156,481) | | 19,824 | 473,666 |
| Class R2 | (199,349) | (4,267,168) | | (32,360) | (782,247) |
| Class R3 | (1,269,880) | (26,847,931) | | 1,266,868 | 31,170,279 |
| Class R4 | (127,380) | (2,689,767) | | (32,472) | (783,473) |
| Class R6 | 61,562 | 2,729,958 | | 732,026 | 17,881,083 |
| | (8,641,118) | $(176,816,792) | | 4,377,401 | $108,277,444 |
Effective June 1, 2019, purchases of the funds Class B shares were closed to new and existing investors subject to certain exceptions. Effective September 29, 2023, purchases of Class R1 and R2 shares were closed to new eligible investors.
(6) Line of Credit
The fund and certain other funds managed by MFS participate in a $1.45 billion unsecured committed line of credit of which $1.2 billion is reserved for use by the fund and certain other MFS U.S. funds. The line of credit is provided by a syndicate of banks under a credit agreement. Borrowings may be made for temporary financing needs. Interest is charged to each fund, based on its borrowings, generally at a rate equal to the highest of 1) Daily Simple SOFR (Secured Overnight Financing Rate) plus 0.10%, 2) the Federal Funds Effective Rate, or 3) the Overnight Bank Funding Rate, each plus an agreed upon spread. A commitment fee, based on the average daily unused portion of the committed line of credit, is allocated among the participating funds. The line of credit expires on March 14, 2024 unless extended or renewed. In addition, the fund and other funds managed by MFS have established unsecured uncommitted borrowing arrangements with certain banks for temporary financing needs. Interest is charged to each fund, based on its borrowings, at rates equal to customary reference rates plus an
Notes to Financial Statements - continued
agreed upon spread. For the year ended October 31, 2023, the fund’s commitment fee and interest expense were $16,524 and $0, respectively, and are included in “Miscellaneous” expense in the Statement of Operations.
(7) Investments in Affiliated Issuers
An affiliated issuer may be considered one in which the fund owns 5% or more of the outstanding voting securities, or a company which is under common control. For the purposes of this report, the following were affiliated issuers:
| Affiliated Issuers | Beginning
Value | Purchases | Sales
Proceeds | Realized
Gain
(Loss) | Change in
Unrealized
Appreciation or
Depreciation | Ending
Value |
| MFS Institutional Money Market Portfolio | $25,673,112 | $422,280,869 | $419,561,296 | $11,178 | $(1,934) | $28,401,929 |
| Affiliated Issuers | Dividend
Income | Capital Gain
Distributions |
| MFS Institutional Money Market Portfolio | $907,612 | $— |
Report of Independent Registered Public Accounting Firm
To the Shareholders of MFS Utilities Fund and the Board of Trustees of
MFS Series Trust VI
Opinion on the Financial Statements
We have audited the accompanying statement of assets and liabilities of MFS Utilities Fund (the “Fund”) (one of the funds constituting MFS Series Trust VI (the “Trust”)), including the portfolio of investments, as of October 31, 2023, and the related statement of operations for the year then ended, the statements of changes in net assets for each of the two years in the period then ended, the financial highlights for each of the five years in the period then ended and the related notes (collectively referred to as the “financial statements”). In our opinion, the financial statements present fairly, in all material respects, the financial position of the Fund (one of the funds constituting MFS Series Trust VI) at October 31, 2023, the results of its operations for the year then ended, the changes in its net assets for each of the two years in the period then ended and its financial highlights for each of the five years in the period then ended, in conformity with U.S. generally accepted accounting principles.
Basis for Opinion
These financial statements are the responsibility of the Trust’s management. Our responsibility is to express an opinion on the Fund’s financial statements based on our audits. We are a public accounting firm registered with the Public Company Accounting Oversight Board (United States) (“PCAOB”) and are required to be independent with respect to the Trust in accordance with the U.S. federal securities laws and the applicable rules and regulations of the Securities and Exchange Commission and the PCAOB.
We conducted our audits in accordance with the standards of the PCAOB. Those standards require that we plan and perform the audit to obtain reasonable assurance about whether the financial statements are free of material misstatement, whether due to error or fraud. The Trust is not required to have, nor were we engaged to perform, an audit of the Trust’s internal control over financial reporting. As part of our audits, we are required to obtain an understanding of internal control over financial reporting but not for the purpose of expressing an opinion on the effectiveness of the Trust’s internal control over financial reporting. Accordingly, we express no such opinion.
Report of Independent Registered Public Accounting Firm – continued
Our audits included performing procedures to assess the risks of material misstatement of the financial statements, whether due to error or fraud, and performing procedures that respond to those risks. Such procedures included examining, on a test basis, evidence regarding the amounts and disclosures in the financial statements. Our procedures included confirmation of securities owned as of October 31, 2023, by correspondence with the custodian, brokers and others; when replies were not received from brokers and others, we performed other auditing procedures. Our audits also included evaluating the accounting principles used and significant estimates made by management, as well as evaluating the overall presentation of the financial statements. We believe that our audits provide a reasonable basis for our opinion.
We have served as the auditor of one or more MFS investment companies since 1993.
Boston, Massachusetts
December 14, 2023
Trustees and Officers — Identification and Background
The Trustees and Officers of the Trust, as of December 1, 2023, are listed below, together with their principal occupations during the past five years. (Their titles may have varied during that period.) The address of each Trustee and Officer is 111 Huntington Avenue, Boston, Massachusetts 02199-7618.
| Name, Age | | Position(s) Held with Fund | | Trustee/Officer Since(h) | | Number of MFS Funds overseen by the Trustee | | Principal Occupations During
the Past Five Years | | Other Directorships During
the Past Five Years (j) |
| INTERESTED TRUSTEE | | | | | | | | | | |
Michael W. Roberge (k)
(age 57) | | Trustee | | January 2021 | | 136 | | Massachusetts Financial Services Company, Chairman (since January 2021); Chief Executive Officer (since January 2017); Director; Chairman of the Board (since January 2022); President (until December 2018); Chief Investment Officer (until December 2018) | | N/A |
| INDEPENDENT TRUSTEES | | | | | | | | | | |
John P. Kavanaugh
(age 69) | | Trustee and Chair of Trustees | | January 2009 | | 136 | | Private investor | | N/A |
Steven E. Buller
(age 72) | | Trustee | | February 2014 | | 136 | | Private investor | | N/A |
John A. Caroselli
(age 69) | | Trustee | | March 2017 | | 136 | | Private investor; JC Global Advisors, LLC (management consulting), President (since 2015) | | N/A |
Maureen R. Goldfarb
(age 68) | | Trustee | | January 2009 | | 136 | | Private investor | | N/A |
Peter D. Jones
(age 68) | | Trustee | | January 2019 | | 136 | | Private investor | | N/A |
James W. Kilman, Jr.
(age 62) | | Trustee | | January 2019 | | 136 | | Burford Capital Limited (finance and investment management), Senior Advisor (since May 3, 2021), Chief Financial Officer (2019 - May 2, 2021); KielStrand Capital LLC (family office), Chief Executive Officer (since 2016) | | Alpha-En Corporation, Director (2016-2019) |
Trustees and Officers - continued
| Name, Age | | Position(s) Held with Fund | | Trustee/Officer Since(h) | | Number of MFS Funds overseen by the Trustee | | Principal Occupations During
the Past Five Years | | Other Directorships During
the Past Five Years (j) |
Clarence Otis, Jr.
(age 67) | | Trustee | | March 2017 | | 136 | | Private investor | | VF Corporation, Director; Verizon Communications, Inc., Director; The Travelers Companies, Director |
Maryanne L. Roepke
(age 67) | | Trustee | | May 2014 | | 136 | | Private investor | | N/A |
Laurie J. Thomsen
(age 66) | | Trustee | | March 2005 | | 136 | | Private investor | | The Travelers Companies, Director; Dycom Industries, Inc., Director |
| Name, Age | | Position(s) Held with
Fund | | Trustee/Officer Since(h) | | Number of MFS Funds for which the Person is an Officer | | Principal Occupations During
the Past Five Years |
| OFFICERS | | | | | | | | |
Christopher R. Bohane (k)
(age 49) | | Assistant Secretary and Assistant Clerk | | July 2005 | | 136 | | Massachusetts Financial Services Company, Senior Vice President and Senior Managing Counsel |
Kino Clark (k)
(age 55) | | Assistant Treasurer | | January 2012 | | 136 | | Massachusetts Financial Services Company, Vice President |
John W. Clark, Jr. (k)
(age 56) | | Assistant Treasurer | | April 2017 | | 136 | | Massachusetts Financial Services Company, Vice President |
David L. DiLorenzo (k)
(age 55) | | President | | July 2005 | | 136 | | Massachusetts Financial Services Company, Senior Vice President |
Heidi W. Hardin (k)
(age 56) | | Secretary and Clerk | | April 2017 | | 136 | | Massachusetts Financial Services Company, Executive Vice President and General Counsel |
Brian E. Langenfeld (k)
(age 50) | | Assistant Secretary and Assistant Clerk | | June 2006 | | 136 | | Massachusetts Financial Services Company, Vice President and Managing Counsel |
Trustees and Officers - continued
| Name, Age | | Position(s) Held with
Fund | | Trustee/Officer Since(h) | | Number of MFS Funds for which the Person is an Officer | | Principal Occupations During
the Past Five Years |
Rosa E. Licea-Mailloux (k)
(age 47) | | Chief Compliance Officer | | March 2022 | | 136 | | Massachusetts Financial Services Company, Vice President (since 2018); Director of Corporate Compliance (2018-2021), Senior Director Compliance (2021-2022), Senior Managing Director of North American Compliance & Chief Compliance Officer (since March 2022); Natixis Investment Managers (investment management), Funds Chief Compliance Officer, Deputy General Counsel & Senior Vice President (until 2018) |
Amanda S. Mooradian (k)
(age 44) | | Assistant Secretary and Assistant Clerk | | September 2018 | | 136 | | Massachusetts Financial Services Company, Assistant Vice President and Senior Counsel |
Susan A. Pereira (k)
(age 53) | | Assistant Secretary and Assistant Clerk | | July 2005 | | 136 | | Massachusetts Financial Services Company, Vice President and Managing Counsel |
Kasey L. Phillips (k)
(age 52) | | Assistant Treasurer | | September 2012 | | 136 | | Massachusetts Financial Services Company, Vice President |
Matthew A. Stowe (k)
(age 49) | | Assistant Secretary and Assistant Clerk | | October 2014 | | 136 | | Massachusetts Financial Services Company, Vice President and Senior Managing Counsel |
William B. Wilson (k)
(age 41) | | Assistant Secretary and Assistant Clerk | | October 2022 | | 136 | | Massachusetts Financial Services Company, Assistant Vice President and Senior Counsel |
James O. Yost (k)
(age 63) | | Treasurer | | September 1990 | | 136 | | Massachusetts Financial Services Company, Senior Vice President |
| (h) | Date first appointed to serve as Trustee/Officer of an MFS Fund. Each Trustee has served continuously since appointment unless indicated otherwise. From January 2012 through December 2016, Messrs. DiLorenzo and Yost served as Treasurer and Deputy Treasurer of the Funds, respectively. |
| (j) | Directorships or trusteeships of companies required to report to the Securities and Exchange Commission (i.e., “public companies”). |
| (k) | “Interested person” of the Trust within the meaning of the Investment Company Act of 1940 (referred to as the 1940 Act), which is the principal federal law governing investment companies like the fund, as a result of a position with MFS. The address of MFS is 111 Huntington Avenue, Boston, Massachusetts 02199-7618. |
Trustees and Officers - continued
Each Trustee (other than Messrs. Jones, Kilman and Roberge) has been elected by shareholders and each Trustee and Officer holds office until his or her successor is chosen and qualified or until his or her earlier death, resignation, retirement or removal. Mr. Roberge became a Trustee of the Funds on January 1, 2021 and Messrs. Jones and Kilman became Trustees of the Funds on January 1, 2019. The Trust does not hold annual meetings for the purpose of electing Trustees, and Trustees are not elected for fixed terms. Under the terms of the Board's retirement policy, an Independent Trustee shall retire at the end of the calendar year in which he or she reaches the earlier of 75 years of age or 15 years of service on the Board (or, in the case of any Independent Trustee who joined the Board prior to 2015, 20 years of service on the Board).
Messrs. Buller, Kilman and Otis and Ms. Roepke are members of the Trust’s Audit Committee.
Each of the Interested Trustees and certain Officers hold comparable officer positions with certain affiliates of MFS.
The Statement of Additional Information for a Fund includes further information about the Trustees and is available without charge upon request by calling 1-800-225-2606.
| Investment Adviser | Custodian |
Massachusetts Financial Services Company
111 Huntington Avenue
Boston, MA 02199-7618 | JPMorgan Chase Bank, NA
4 Metrotech Center
New York, NY 11245 |
| Distributor | Independent Registered Public Accounting Firm |
MFS Fund Distributors, Inc.
111 Huntington Avenue
Boston, MA 02199-7618 | Ernst & Young LLP
200 Clarendon Street
Boston, MA 02116 |
| Portfolio Manager(s) | |
Claud Davis
J. Scott Walker | |
Board Review of Investment Advisory Agreement
MFS Utilities Fund
The Investment Company Act of 1940 requires that both the full Board of Trustees and a majority of the non-interested (“independent”) Trustees, voting separately, annually approve the continuation of the Fund’s investment advisory agreement with MFS. The Trustees consider matters bearing on the Fund and its advisory arrangements at their meetings throughout the year, including a review of performance data at each regular meeting. In addition, the independent Trustees met several times over the course of three months beginning in May and ending in July, 2023 (“contract review meetings”) for the specific purpose of considering whether to approve the continuation of the investment advisory agreement for the Fund and the other investment companies that the Board oversees (the “MFS Funds”). The independent Trustees were assisted in their evaluation of the Fund’s investment advisory agreement by independent legal counsel, from whom they received separate legal advice and with whom they met separately from MFS during various contract review meetings. The independent Trustees were also assisted in this process by an independent consultant who was retained by and reported to the independent Trustees.
In connection with their deliberations regarding the continuation of the investment advisory agreement, the Trustees, including the independent Trustees, considered such information and factors as they believed, in light of the legal advice furnished to them and their own business judgment, to be relevant. The investment advisory agreement for the Fund was considered separately, although the Trustees also took into account the common interests of all MFS Funds in their review. As described below, the Trustees considered the nature, quality, and extent of the various investment advisory, administrative, and shareholder services performed by MFS under the existing investment advisory agreement and other arrangements with the Fund.
In connection with their contract review meetings, the Trustees received and relied upon materials that included, among other items: (i) information provided by Broadridge Financial Solutions, Inc. (“Broadridge”), an independent third party, on the investment performance of the Fund for various time periods ended December 31, 2022 and the investment performance of a group of funds with substantially similar investment classifications/objectives (the “Broadridge performance universe”), (ii) information provided by Broadridge on the Fund’s advisory fees and other expenses and the advisory fees and other expenses of comparable funds identified by Broadridge as well as all other funds in the same investment classification/category (the “Broadridge expense group and universe”), (iii) information provided by MFS on the advisory fees of portfolios of other clients of MFS, including institutional separate accounts and other clients, (iv) information as to whether and to what extent applicable expense waivers, reimbursements or fee “breakpoints” are observed for the Fund, (v) information regarding MFS’ financial results and financial condition, including MFS’ and certain of its affiliates’ estimated profitability from services performed for the Fund and the MFS Funds as a whole, and compared to MFS’ institutional business, (vi) MFS’ views regarding the outlook for the mutual fund industry and the strategic business plans of MFS, (vii) descriptions of various functions performed by MFS for the Funds, such as compliance monitoring and portfolio trading practices, and (viii) information regarding the overall organization of MFS, including information about
Board Review of Investment Advisory Agreement - continued
MFS’ senior management and other personnel providing investment advisory, administrative and other services to the Fund and the other MFS Funds. The comparative performance, fee and expense information prepared and provided by Broadridge was not independently verified and the independent Trustees did not independently verify any information provided to them by MFS.
The Trustees’ conclusion as to the continuation of the investment advisory agreement was based on a comprehensive consideration of all information provided to the Trustees and not the result of any single factor. Some of the factors that figured particularly in the Trustees’ deliberations are described below, although individual Trustees may have evaluated the information presented differently from one another, giving different weights to various factors. It is also important to recognize that the fee arrangements for the Fund and other MFS Funds are the result of years of review and discussion between the independent Trustees and MFS, that certain aspects of such arrangements may receive greater scrutiny in some years than in others, and that the Trustees’ conclusions may be based, in part, on their consideration of these same arrangements during the course of the year and in prior years.
Based on information provided by Broadridge and MFS, the Trustees reviewed the Fund’s total return investment performance as well as the Broadridge performance universe over various time periods. The Trustees placed particular emphasis on the total return performance of the Fund’s Class I shares in comparison to the performance of funds in its Broadridge performance universe over the five-year period ended December 31, 2022, which the Trustees believed was a long enough period to reflect differing market conditions. The total return performance of the Fund’s Class I shares was in the 2nd quintile relative to the other funds in the universe for this five-year period (the 1st quintile being the best performers and the 5th quintile being the worst performers). The total return performance of the Fund’s Class I shares was in the 3rd quintile for the one-year period and the 1st quintile for the three-year period ended December 31, 2022 relative to the Broadridge performance universe. Because of the passage of time, these performance results may differ from the performance results for more recent periods, including those shown elsewhere in this report.
In the course of their deliberations, the Trustees took into account information provided by MFS in connection with the contract review meetings, as well as during investment review meetings conducted with portfolio management personnel during the course of the year regarding the Fund’s performance. After reviewing these and related factors, the Trustees concluded, within the context of their overall conclusions regarding the investment advisory agreement, that they were satisfied with MFS’ responses and efforts relating to investment performance.
In assessing the reasonableness of the Fund’s advisory fee, the Trustees considered, among other information, the Fund’s advisory fee and the total expense ratio of the Fund’s Class I shares as a percentage of average daily net assets and the advisory fee and total expense ratios of the Broadridge expense group based on information provided by Broadridge. The Trustees considered that, according to the data provided by Broadridge (which takes into account any fee reductions or expense limitations that were in effect during the Fund’s last fiscal year), the Fund’s effective advisory fee rate and total expense ratio were each approximately at the Broadridge expense group median.
Board Review of Investment Advisory Agreement - continued
The Trustees also considered the advisory fees charged by MFS to any institutional separate accounts advised by MFS (“separate accounts”) and unaffiliated investment companies for which MFS serves as subadviser (“subadvised funds”) that have comparable investment strategies to the Fund, if any. In comparing these fees, the Trustees considered information provided by MFS as to the generally broader scope of services provided by MFS to the Fund, as well as the more extensive regulatory burdens imposed on MFS in managing the Fund, in comparison to separate accounts and subadvised funds. The Trustees also considered the higher demands placed on MFS’ investment personnel and trading infrastructure as a result of the daily cash in-flows and out-flows of the Fund in comparison to separate accounts.
The Trustees also considered whether the Fund may benefit from any economies of scale in the management of the Fund in the event of growth in assets of the Fund and/or growth in assets of the MFS Funds as a whole. They noted that the Fund’s advisory fee rate schedule is subject to contractual breakpoints that reduce the Fund’s advisory fee rate on average daily net assets over $3 billion and $10 billion. The Trustees also noted that MFS has agreed in writing to waive a portion of the management fees of certain MFS Funds, including the Fund, if the total combined assets of certain funds within the MFS Funds’ complex increase above agreed upon thresholds (the “group fee waiver”), enabling the Fund’s shareholders to share in the benefits from any economies of scale at the complex level. The group fee waiver is reviewed and renewed annually between the Board and MFS. The Trustees concluded that the breakpoints and the group fee waiver were sufficient to allow the Fund to benefit from economies of scale as its assets and overall complex assets grow.
The Trustees also considered information prepared by MFS relating to MFS’ costs and profits with respect to the Fund, the MFS Funds considered as a group, and other investment companies and accounts advised by MFS, as well as MFS’ methodologies used to determine and allocate its costs to the MFS Funds, the Fund and other accounts and products for purposes of estimating profitability.
After reviewing these and other factors described herein, the Trustees concluded, within the context of their overall conclusions regarding the investment advisory agreement, that the advisory fees charged to the Fund represent reasonable compensation in light of the services being provided by MFS to the Fund.
In addition, the Trustees considered MFS’ resources and related efforts to continue to retain, attract and motivate capable personnel to serve the Fund. The Trustees also considered current and developing conditions in the financial services industry, including the presence of large and well-capitalized companies which are spending, and appear to be prepared to continue to spend, substantial sums to engage personnel and to provide services to competing investment companies. In this regard, the Trustees also considered the financial resources of MFS and its ultimate parent, Sun Life Financial Inc. The Trustees also considered the advantages and possible disadvantages to the Fund of having an adviser that also serves other investment companies as well as other accounts.
The Trustees also considered the nature, quality, cost, and extent of administrative, transfer agency, and distribution services provided to the Fund by MFS and its affiliates under agreements and plans other than the investment advisory agreement, including any 12b-1 fees the Fund pays to MFS Fund Distributors, Inc., an affiliate of MFS. The Trustees also considered the nature, extent and quality of certain other services
Board Review of Investment Advisory Agreement - continued
MFS performs or arranges for on the Fund’s behalf, which may include securities lending programs, directed expense payment programs, class action recovery programs, and MFS’ interaction with third-party service providers, principally custodians and sub-custodians. The Trustees concluded that the various non-advisory services provided by MFS and its affiliates on behalf of the Fund were satisfactory.
The Trustees considered so-called “fall-out benefits” to MFS such as reputational value derived from serving as investment manager to the MFS Funds. The Trustees also considered that MFS discontinued its historic practice of obtaining investment research from portfolio brokerage commissions paid by certain MFS Funds effective January 2018, and directly pays or voluntarily reimburses a Fund, if applicable, for the costs of external research acquired through the use of the Fund’s portfolio brokerage commissions.
Based on their evaluation of factors that they deemed to be material, including those factors described above, the Board of Trustees, including the independent Trustees, concluded that the Fund’s investment advisory agreement with MFS should be continued for an additional one-year period, commencing August 1, 2023.
Proxy Voting Policies and Information
MFS votes proxies on behalf of the fund pursuant to proxy voting policies and procedures that are available without charge, upon request, by calling 1-800-225-2606, by visiting mfs.com/proxyvoting, or by visiting the SEC’s Web site at http://www.sec.gov.
Information regarding how the fund voted proxies relating to portfolio securities during the most recent twelve-month period ended June 30 is available by August 31 of each year without charge by visiting mfs.com/proxyvoting, or by visiting the SEC’s Web site at http://www.sec.gov.
Quarterly Portfolio Disclosure
The fund files a complete schedule of portfolio holdings with the SEC for the first and third quarters of each fiscal year as an exhibit to its reports on Form N-PORT. The fund's Form N-PORT reports are available on the SEC's Web site at http://www.sec.gov. A shareholder can obtain the portfolio holdings report for the first and third quarters of the fund's fiscal year at mfs.com/openendfunds by choosing the fund's name and then scrolling to the “Resources” section and clicking on the “Prospectus and Reports” tab.
Further Information
From time to time, MFS may post important information about the fund or the MFS Funds on the MFS Web site (mfs.com). This information is available at https://www.mfs.com/announcements or at mfs.com/openendfunds by choosing the fund’s name and then scrolling to the “Resources” section and clicking on the “Announcements” tab, if any.
Information About Fund Contracts and Legal Claims
The fund has entered into contractual arrangements with an investment adviser, administrator, distributor, shareholder servicing agent, and custodian who each provide services to the fund. Unless expressly stated otherwise, shareholders are not parties to, or intended beneficiaries of these contractual arrangements, and these contractual arrangements are not intended to create any shareholder right to enforce them against the service providers or to seek any remedy under them against the service providers, either directly or on behalf of the fund.
Under the Trust’s By-Laws and Declaration of Trust, any claims asserted against or on behalf of the MFS Funds, including claims against Trustees and Officers, must be brought in state and federal courts located within the Commonwealth of Massachusetts.
Federal Tax Information (unaudited)
The fund will notify shareholders of amounts for use in preparing 2023 income tax forms in January 2024. The following information is provided pursuant to provisions of the Internal Revenue Code.
The fund designates the maximum amount allowable as qualified dividend income eligible to be taxed at the same rate as long-term capital gain.
The fund designates $195,124,000 as capital gain dividends paid during the fiscal year.
For corporate shareholders, 68.04% of the ordinary income dividends paid during the prior calendar year qualify for the corporate dividends received deduction.
Federal Tax Information (unaudited) - continued
The fund designates the maximum amount allowable as Section 199A dividends as defined in Proposed Treasury Regulation §1.199A-3(d).
| FACTS | WHAT DOES MFS DO WITH YOUR PERSONAL INFORMATION? |
| Why? | Financial companies choose how they share your personal information. Federal law gives consumers the right to limit some but not all sharing. Federal law also requires us to tell you how we collect, share, and protect your personal information. Please read this notice carefully to understand what we do. |
| What? | The types of personal information we collect and share depend on the product or service you have with us. This information can include: |
| • Social Security number and account balances |
| • Account transactions and transaction history |
| • Checking account information and wire transfer instructions |
| When you are no longer our customer, we continue to share your information as described in this notice. |
| How? | All financial companies need to share customers' personal information to run their everyday business. In the section below, we list the reasons financial companies can share their customers' personal information; the reasons MFS chooses to share; and whether you can limit this sharing. |
Reasons we can share your
personal information | Does MFS share? | Can you limit
this sharing? |
For our everyday business purposes –
such as to process your transactions, maintain your
account(s), respond to court orders and legal
investigations, or report to credit bureaus | Yes | No |
For our marketing purposes –
to offer our products and services to you | No | We don't share |
For joint marketing with other
financial companies | No | We don't share |
For our affiliates' everyday business purposes –
information about your transactions and experiences | No | We don't share |
For our affiliates' everyday business purposes –
information about your creditworthiness | No | We don't share |
| For nonaffiliates to market to you | No | We don't share |
| Questions? | Call 800-225-2606 or go to mfs.com. |
| Who we are |
| Who is providing this notice? | MFS Funds, MFS Investment Management, MFS Institutional Advisors, Inc., and MFS Heritage Trust Company. |
| What we do |
How does MFS
protect my personal
information? | To protect your personal information from unauthorized access and use, we use security measures that comply with federal law. These measures include procedural, electronic, and physical safeguards for the protection of the personal information we collect about you. |
How does MFS
collect my personal
information? | We collect your personal information, for example, when you |
| • open an account or provide account information |
| • direct us to buy securities or direct us to sell your securities |
| • make a wire transfer |
| We also collect your personal information from others, such as credit bureaus, affiliates, or other companies. |
| Why can't I limit all sharing? | Federal law gives you the right to limit only |
| • sharing for affiliates' everyday business purposes – information about your creditworthiness |
| • affiliates from using your information to market to you |
| • sharing for nonaffiliates to market to you |
| State laws and individual companies may give you additional rights to limit sharing. |
| Definitions |
| Affiliates | Companies related by common ownership or control. They can be financial and nonfinancial companies. |
| • MFS does not share personal information with affiliates, except for everyday business purposes as described on page one of this notice. |
| Nonaffiliates | Companies not related by common ownership or control. They can be financial and nonfinancial companies. |
| • MFS does not share with nonaffiliates so they can market to you. |
| Joint marketing | A formal agreement between nonaffiliated financial companies that together market financial products or services to you. |
| • MFS doesn't jointly market. |
| Other important information |
| If you own an MFS product or receive an MFS service in the name of a third party such as a bank or broker-dealer, their privacy policy may apply to you instead of ours. |
Save paper with eDelivery.
MFS® will send you prospectuses, reports, and proxies directly via e-mail so you will get information faster with less mailbox clutter.
To sign up:
1. Go to mfs.com.
2. Log in via MFS® Access.
3. Select eDelivery.
If you own your MFS fund shares through a financial institution or a retirement plan, MFS® TALK, MFS® Access, or eDelivery may not be available to you.
CONTACT
WEB SITE
mfs.com
MFS TALK
1-800-637-8255
24 hours a day
ACCOUNT SERVICE AND LITERATURE
Shareholders
1-800-225-2606
Financial advisors
1-800-343-2829
Retirement plan services
1-800-637-1255
MAILING ADDRESS
MFS Service Center, Inc.
P.O. Box 219341
Kansas City, MO 64121-9341
OVERNIGHT MAIL
MFS Service Center, Inc.
Suite 219341
430 W 7th Street
Kansas City, MO 64105-1407
Annual Report
October 31, 2023
| 1 |
| 3 |
| 6 |
| 9 |
| 11 |
| 16 |
| 18 |
| 20 |
| 21 |
| 27 |
| 38 |
| 40 |
| 44 |
| 48 |
| 48 |
| 48 |
| 48 |
| 48 |
| 50 |
The report is prepared for the general information of shareholders. It is authorized for distribution to prospective investors only when preceded or accompanied by a current prospectus.
NOT FDIC INSURED • MAY LOSE VALUE • NO BANK GUARANTEE
Portfolio structure
Top ten holdings
| Visa, Inc., “A” | 3.1% |
| Linde PLC | 2.9% |
| Schneider Electric SE | 2.7% |
| Comcast Corp., “A” | 2.6% |
| Accenture PLC, “A” | 2.5% |
| Thermo Fisher Scientific, Inc. | 2.3% |
| Medtronic PLC | 2.3% |
| Willis Towers Watson PLC | 2.3% |
| Roche Holding AG | 2.3% |
| Alphabet, Inc., “A” | 2.1% |
GICS equity sectors (g)
| Industrials | 19.1% |
| Financials | 18.2% |
| Health Care | 17.9% |
| Consumer Staples | 11.6% |
| Information Technology | 9.2% |
| Communication Services | 8.4% |
| Consumer Discretionary | 7.5% |
| Materials | 7.1% |
| Equity Warrants (o) | 0.0% |
Issuer country weightings (x)
| United States | 52.9% |
| France | 11.0% |
| Switzerland | 9.0% |
| United Kingdom | 8.3% |
| Germany | 3.8% |
| Canada | 3.5% |
| Japan | 2.6% |
| Netherlands | 2.5% |
| Spain | 1.5% |
| Other Countries | 4.9% |
Currency exposure weightings (y)
| United States Dollar | 57.7% |
| Euro | 19.3% |
| Swiss Franc | 9.0% |
| British Pound Sterling | 8.3% |
| Japanese Yen | 2.6% |
| Swedish Krona | 1.2% |
| South Korean Won | 1.1% |
| Danish Krone | 0.5% |
| Mexican Peso | 0.3% |
| (g) | The Global Industry Classification Standard (GICS®) was developed by and/or is the exclusive property of MSCI, Inc. and S&P Global Market Intelligence Inc. (“S&P Global Market Intelligence”). GICS is a service mark of MSCI and S&P Global Market Intelligence and has been licensed for use by MFS. MFS has applied its own internal sector/industry classification methodology for equity securities and non-equity securities that are unclassified by GICS. |
Portfolio Composition - continued
| (x) | Represents the portfolio’s exposure to issuer countries as a percentage of a portfolio’s net assets. For purposes of this presentation, United States includes Cash & Cash Equivalents and Other. |
| (y) | Represents the portfolio’s exposure to a particular currency as a percentage of a portfolio's net assets. For purposes of this presentation, United States Dollar includes Cash & Cash Equivalents. |
Cash & Cash Equivalents includes any cash, investments in money market funds, short-term securities, and other assets less liabilities. Please see the Statement of Assets and Liabilities for additional information related to the fund’s cash position and other assets and liabilities.
Other includes equivalent exposure from currency derivatives and/or any offsets to derivative positions and may be negative.
Percentages are based on net assets as of October 31, 2023.
The portfolio is actively managed and current holdings may be different.
Management Review
Summary of Results
For the twelve months ended October 31, 2023, Class A shares of the MFS Global Equity Fund (fund) provided a total return of 4.40%, at net asset value. This compares with a return of 10.48% for the fund’s benchmark, the MSCI World Index (net div).
Market Environment
During the reporting period, central banks around the world had to combat the strongest inflationary pressures in four decades, fueled by the global fiscal response to the pandemic, disrupted supply chains and the dislocations to energy markets stemming from the war in Ukraine. Interest rates rose substantially, but the effects of a tighter monetary policy may not have been fully experienced yet, given that monetary policy works with long and variable lags. Strains resulting from the abrupt tightening of monetary policy began to affect some parts of the economy, most acutely among small and regional US banks, which suffered from deposit flight as depositors sought higher yields on their savings. Additionally, activity in the US housing sector has slowed as a result of higher mortgage rates. China’s abandonment of its Zero-COVID policy ushered in a brief uptick in economic activity in the world’s second-largest economy in early 2023, although its momentum soon stalled as the focus turned to the country’s highly indebted property development sector. In developed markets, consumer demand for services remained stronger than the demand for goods.
Policymakers found themselves in the difficult position of trying to restrain inflation without tipping economies into recession. Despite the challenging macroeconomic and geopolitical environment, central banks remained focused on controlling price pressures while also confronting increasing financial stability concerns. Central banks had to juggle achieving their inflation mandates while using macroprudential tools to keep banking systems liquid, a potentially difficult balancing act, and one that suggested that we may be nearing a peak in policy rates.
Against an environment of relatively tight labor markets, tighter global financial conditions and volatile materials prices, investor anxiety appeared to have increased over the potential that corporate profit margins may be past peak for this cycle. That said, signs that supply chains have generally normalized, coupled with low levels of unemployment across developed markets and hopes that inflation levels have peaked, were supportive factors for the macroeconomic backdrop.
Detractors from Performance
Relative to the MSCI World Index, the fund’s underweight position and stock selection in the information technology sector detracted from performance. Within this sector, not holding shares of computer graphics processor maker NVIDIA and software giant Microsoft weakened relative returns as both stocks outperformed the benchmark. The stock price of Microsoft advanced as the company exceeded both top-line and bottom-line financial results and increased guidance for revenue growth, driven by its emphasis on further AI (artificial intelligence) investments and their implementation in client-facing businesses.
Stock selection and an overweight position in the health care sector also hindered relative results, led by the fund’s overweight positions in pharmaceutical and diagnostic company Roche Holding (Switzerland), medical device maker Medtronic, analytical
Management Review - continued
instruments and life sciences solutions provider Thermo Fisher Scientific and precision instruments and machines manufacturer Olympus (Japan). The stock price of Roche Holding declined due to strong foreign exchange headwinds and weaker-than-expected sales of the company's cancer drug, Tecentriq.
Stock selection within the communication services sector was another factor that dampened the fund’s relative performance. Here, not holding shares of strong-performing social networking service provider Meta Platforms detracted from relative returns.
Elsewhere, the fund’s overweight positions in financial services provider Charles Schwab, global banking and payments technology provider Fidelity National Information Services and flavors, fragrances and cosmetics producer International Flavors & Fragrances held back relative results.
Contributors to Performance
Not owning any stocks within the energy or real estate sectors contributed to relative performance as both sectors underperformed the benchmark. There were no individual stocks within either sector, in the fund or in the benchmark, that were among the fund's top relative contributors over the reporting period.
Individual stocks in other sectors that benefited relative returns included the fund's overweight holdings of diversified industrial manufacturer Rolls-Royce (United Kingdom), global wealth management and investment bank UBS (Switzerland), cable services provider Comcast, industrial gas supplier Linde (United Kingdom), enterprise software products maker Oracle, electrical distribution equipment manufacturer Schneider Electric (France) and luxury goods company Richemont (Switzerland). The share price of Rolls Royce appreciated during the period as the company’s earnings exceeded consensus estimates, led by stronger-than-expected cash flows and solid performance in its civil aerospace division. The stock price of UBS advanced as investors appeared to have responded positively after the company announced that it had voluntarily terminated the government guarantee agreement related to its Credit Suisse acquisition. Not holding shares of weak-performing electric vehicle manufacturer Tesla, pharmaceutical giant Pfizer and diversified medical products maker Johnson & Johnson also strengthened relative performance.
During the reporting period, the fund’s relative currency exposure, resulting primarily from differences between the fund's and the benchmark's exposures to holdings of securities denominated in foreign currencies, was another contributor to relative performance. All of MFS’ investment decisions are driven by the fundamentals of each individual opportunity and as such, it is common for our funds to have different currency exposure than the benchmark.
Respectfully,
Portfolio Manager(s)
Ryan McAllister and Roger Morley
The views expressed in this report are those of the portfolio manager(s) only through the end of the period of the report as stated on the cover and do not necessarily reflect the views of MFS or any other person in the MFS organization. These views are subject to change at any time based on market or other conditions, and MFS disclaims any responsibility to update such views. These
Management Review - continued
views may not be relied upon as investment advice or an indication of trading intent on behalf of any MFS portfolio. References to specific securities are not recommendations of such securities, and may not be representative of any MFS portfolio’s current or future investments.
Performance Summary THROUGH 10/31/23
The following chart illustrates a representative class of the fund’s historical performance in comparison to its benchmark(s). Performance results include the deduction of the maximum applicable sales charge and reflect the percentage change in net asset value, including reinvestment of dividends and capital gains distributions. The performance of other share classes will be greater than or less than that of the class depicted below. Benchmarks are unmanaged and may not be invested in directly. Benchmark returns do not reflect sales charges, commissions or expenses. (See Notes to Performance Summary.)
Performance data shown represents past performance and is no guarantee of future results. Investment return and principal value fluctuate so your shares, when sold, may be worth more or less than the original cost; current performance may be lower or higher than quoted. The performance shown does not reflect the deduction of taxes, if any, that a shareholder would pay on fund distributions or the redemption of fund shares.
Growth of a Hypothetical $10,000 Investment
Performance Summary - continued
Total Returns through 10/31/23
Average annual without sales charge
| Share Class | Class Inception Date | 1-yr | 5-yr | 10-yr |
| A | 9/07/1993 | 4.40% | 6.08% | 6.08% |
| B | 12/29/1986 | 3.61% | 5.29% | 5.29% |
| C | 1/03/1994 | 3.60% | 5.28% | 5.28% |
| I | 1/02/1997 | 4.64% | 6.34% | 6.34% |
| R1 | 4/01/2005 | 3.60% | 5.28% | 5.28% |
| R2 | 10/31/2003 | 4.13% | 5.81% | 5.81% |
| R3 | 4/01/2005 | 4.38% | 6.08% | 6.08% |
| R4 | 4/01/2005 | 4.64% | 6.34% | 6.34% |
| R6 | 6/01/2012 | 4.73% | 6.44% | 6.44% |
Comparative benchmark(s)
| MSCI World Index (net div) (f) | 10.48% | 8.27% | 7.53% |
Average annual with sales charge
| | | | |
A
With Initial Sales Charge (5.75%) | (1.61)% | 4.83% | 5.45% |
B
With CDSC (Declining over six years from 4% to 0%) (v) | (0.18)% | 4.96% | 5.29% |
C
With CDSC (1% for 12 months) (v) | 2.66% | 5.28% | 5.28% |
CDSC – Contingent Deferred Sales Charge.
Class I, R1, R2, R3, R4, and R6 shares do not have a sales charge.
| (f) | Source: FactSet Research Systems Inc. |
| (v) | Assuming redemption at the end of the applicable period. |
Benchmark Definition(s)
MSCI World Index(e) (net div) – a market capitalization-weighted index that is designed to measure equity market performance in the global developed markets.
It is not possible to invest directly in an index.
| (e) | Morgan Stanley Capital International (“MSCI”) makes no express or implied warranties or representations and shall have no liability whatsoever with respect to any MSCI data contained herein. The MSCI data may not be further redistributed or used as a basis for other indices or any securities or financial products. This report is not approved, reviewed, or produced by MSCI. |
Notes to Performance Summary
Average annual total return represents the average annual change in value for each share class for the periods presented.
Performance results reflect any applicable expense subsidies and waivers in effect during the periods shown. Without such subsidies and waivers the fund's performance results would be less favorable. Please see the prospectus and financial statements for complete details.
Performance Summary - continued
Performance results do not include adjustments made for financial reporting purposes in accordance with U.S. generally accepted accounting principles and may differ from amounts reported in the financial highlights.
From time to time the fund may receive proceeds from litigation settlements, without which performance would be lower.
Expense Table
Fund expenses borne by the shareholders during the period,
May 1, 2023 through October 31, 2023
As a shareholder of the fund, you incur two types of costs: (1) transaction costs, including sales charges (loads) on certain purchase or redemption payments, and (2) ongoing costs, including management fees; distribution and service (12b-1) fees; and other fund expenses. This example is intended to help you understand your ongoing costs (in dollars) of investing in the fund and to compare these costs with the ongoing costs of investing in other mutual funds.
The example is based on an investment of $1,000 invested at the beginning of the period and held for the entire period May 1, 2023 through October 31, 2023.
Actual Expenses
The first line for each share class in the following table provides information about actual account values and actual expenses. You may use the information in this line, together with the amount you invested, to estimate the expenses that you paid over the period. Simply divide your account value by $1,000 (for example, an $8,600 account value divided by $1,000 = 8.6), then multiply the result by the number in the first line under the heading entitled “Expenses Paid During Period” to estimate the expenses you paid on your account during this period.
Hypothetical Example for Comparison Purposes
The second line for each share class in the following table provides information about hypothetical account values and hypothetical expenses based on the fund’s actual expense ratio and an assumed rate of return of 5% per year before expenses, which is not the fund’s actual return. The hypothetical account values and expenses may not be used to estimate the actual ending account balance or expenses you paid for the period. You may use this information to compare the ongoing costs of investing in the fund and other funds. To do so, compare this 5% hypothetical example with the 5% hypothetical examples that appear in the shareholder reports of the other funds.
Please note that the expenses shown in the table are meant to highlight your ongoing costs only and do not reflect any transactional costs, such as sales charges (loads). Therefore, the second line for each share class in the table is useful in comparing ongoing costs only, and will not help you determine the relative total costs of owning different funds. In addition, if these transactional costs were included, your costs would have been higher.
Expense Table - continued
Share
Class | | Annualized
Expense
Ratio | Beginning
Account Value
5/01/23 | Ending
Account Value
10/31/23 | Expenses
Paid During
Period (p)
5/01/23-10/31/23 |
| A | Actual | 1.25% | $1,000.00 | $899.86 | $5.99 |
| Hypothetical (h) | 1.25% | $1,000.00 | $1,018.90 | $6.36 |
| B | Actual | 2.00% | $1,000.00 | $896.50 | $9.56 |
| Hypothetical (h) | 2.00% | $1,000.00 | $1,015.12 | $10.16 |
| C | Actual | 2.00% | $1,000.00 | $896.38 | $9.56 |
| Hypothetical (h) | 2.00% | $1,000.00 | $1,015.12 | $10.16 |
| I | Actual | 1.00% | $1,000.00 | $900.93 | $4.79 |
| Hypothetical (h) | 1.00% | $1,000.00 | $1,020.16 | $5.09 |
| R1 | Actual | 2.00% | $1,000.00 | $896.47 | $9.56 |
| Hypothetical (h) | 2.00% | $1,000.00 | $1,015.12 | $10.16 |
| R2 | Actual | 1.50% | $1,000.00 | $898.81 | $7.18 |
| Hypothetical (h) | 1.50% | $1,000.00 | $1,017.64 | $7.63 |
| R3 | Actual | 1.25% | $1,000.00 | $899.86 | $5.99 |
| Hypothetical (h) | 1.25% | $1,000.00 | $1,018.90 | $6.36 |
| R4 | Actual | 0.99% | $1,000.00 | $900.96 | $4.74 |
| Hypothetical (h) | 0.99% | $1,000.00 | $1,020.21 | $5.04 |
| R6 | Actual | 0.90% | $1,000.00 | $901.39 | $4.31 |
| Hypothetical (h) | 0.90% | $1,000.00 | $1,020.67 | $4.58 |
| (h) | 5% class return per year before expenses. |
| (p) | “Expenses Paid During Period” are equal to each class’s annualized expense ratio, as shown above, multiplied by the average account value over the period, multiplied by 184/365 (to reflect the one-half year period). Expenses paid do not include any applicable sales charges (loads). If these transaction costs had been included, your costs would have been higher. |
Portfolio of Investments
10/31/23
The Portfolio of Investments is a complete list of all securities owned by your fund. It is categorized by broad-based asset classes.
| Issuer | | | Shares/Par | Value ($) |
| Common Stocks – 99.0% |
| Aerospace & Defense – 3.4% | |
| Honeywell International, Inc. | | 268,994 | $49,295,841 |
| MTU Aero Engines Holding AG | | 52,377 | 9,809,358 |
| Rolls-Royce Holdings PLC (a) | | 7,078,464 | 18,531,980 |
| | | | | $77,637,179 |
| Airlines – 0.9% | |
| Aena S.A. | | 138,391 | $20,055,708 |
| Alcoholic Beverages – 5.6% | |
| Carlsberg Group | | 92,855 | $11,079,510 |
| Diageo PLC | | 1,226,864 | 46,492,332 |
| Heineken N.V. | | 416,798 | 37,449,144 |
| Pernod Ricard S.A. | | 200,622 | 35,670,441 |
| | | | | $130,691,427 |
| Apparel Manufacturers – 4.2% | |
| Burberry Group PLC | | 665,855 | $13,719,150 |
| Compagnie Financiere Richemont S.A. | | 296,714 | 35,033,702 |
| LVMH Moet Hennessy Louis Vuitton SE | | 68,214 | 48,818,544 |
| | | | | $97,571,396 |
| Automotive – 0.3% | |
| Aptiv PLC (a) | | 92,760 | $8,088,672 |
| Broadcasting – 1.9% | |
| Omnicom Group, Inc. | | 83,966 | $6,289,893 |
| Walt Disney Co. (a) | | 309,988 | 25,291,921 |
| WPP Group PLC | | 1,484,925 | 12,790,758 |
| | | | | $44,372,572 |
| Brokerage & Asset Managers – 3.2% | |
| Charles Schwab Corp. | | 851,529 | $44,313,569 |
| Deutsche Boerse AG | | 73,135 | 12,010,019 |
| London Stock Exchange Group PLC | | 179,635 | 18,078,334 |
| | | | | $74,401,922 |
| Business Services – 8.8% | |
| Accenture PLC, “A” | | 193,505 | $57,488,400 |
| Adecco S.A. | | 164,911 | 6,238,030 |
| Brenntag AG | | 151,973 | 11,275,481 |
| Cognizant Technology Solutions Corp., “A” | | 369,127 | 23,797,618 |
| Compass Group PLC | | 570,454 | 14,394,058 |
Portfolio of Investments – continued
| Issuer | | | Shares/Par | Value ($) |
| Common Stocks – continued |
| Business Services – continued | |
| Equifax, Inc. | | 89,585 | $15,190,928 |
| Experian PLC | | 471,186 | 14,333,368 |
| Fidelity National Information Services, Inc. | | 345,091 | 16,947,419 |
| Fiserv, Inc. (a) | | 207,602 | 23,614,728 |
| Intertek Group PLC | | 299,118 | 13,961,628 |
| PayPal Holdings, Inc. (a) | | 121,738 | 6,306,028 |
| | | | | $203,547,686 |
| Cable TV – 2.6% | |
| Comcast Corp., “A” | | 1,433,335 | $59,182,402 |
| Chemicals – 1.8% | |
| 3M Co. | | 197,132 | $17,929,156 |
| PPG Industries, Inc. | | 193,694 | 23,779,812 |
| | | | | $41,708,968 |
| Computer Software – 3.2% | |
| Check Point Software Technologies Ltd. (a) | | 215,745 | $28,963,766 |
| Oracle Corp. | | 440,958 | 45,595,057 |
| | | | | $74,558,823 |
| Computer Software - Systems – 1.1% | |
| Samsung Electronics Co. Ltd. | | 518,397 | $25,850,217 |
| Construction – 0.6% | |
| Otis Worldwide Corp. | | 174,005 | $13,434,926 |
| Consumer Products – 3.7% | |
| Essity AB | | 1,229,309 | $28,005,794 |
| International Flavors & Fragrances, Inc. | | 407,568 | 27,857,273 |
| Reckitt Benckiser Group PLC | | 435,413 | 29,189,931 |
| | | | | $85,052,998 |
| Electrical Equipment – 4.7% | |
| Amphenol Corp., “A” | | 220,409 | $17,753,945 |
| Legrand S.A. | | 341,756 | 29,519,717 |
| Schneider Electric SE | | 406,393 | 62,492,974 |
| | | | | $109,766,636 |
| Electronics – 1.0% | |
| Hoya Corp. | | 108,900 | $10,475,802 |
| Microchip Technology, Inc. | | 181,986 | 12,973,782 |
| | | | | $23,449,584 |
Portfolio of Investments – continued
| Issuer | | | Shares/Par | Value ($) |
| Common Stocks – continued |
| Food & Beverages – 3.5% | |
| Danone S.A. | | 529,240 | $31,524,969 |
| Nestle S.A. | | 455,801 | 49,173,587 |
| | | | | $80,698,556 |
| Gaming & Lodging – 1.2% | |
| Marriott International, Inc., “A” | | 84,768 | $15,983,854 |
| Whitbread PLC | | 285,087 | 11,558,262 |
| | | | | $27,542,116 |
| Insurance – 3.7% | |
| Aon PLC | | 108,768 | $33,652,819 |
| Willis Towers Watson PLC | | 222,500 | 52,485,525 |
| | | | | $86,138,344 |
| Internet – 2.8% | |
| Alphabet, Inc., “A” (a) | | 398,445 | $49,439,056 |
| eBay, Inc. | | 393,018 | 15,418,096 |
| | | | | $64,857,152 |
| Machinery & Tools – 1.3% | |
| Carrier Global Corp. | | 148,879 | $7,095,573 |
| Kubota Corp. | | 1,697,600 | 22,592,291 |
| | | | | $29,687,864 |
| Major Banks – 4.2% | |
| Erste Group Bank AG | | 375,366 | $13,404,648 |
| Goldman Sachs Group, Inc. | | 139,832 | 42,454,394 |
| UBS AG | | 1,772,116 | 41,339,308 |
| | | | | $97,198,350 |
| Medical Equipment – 12.8% | |
| Abbott Laboratories | | 331,275 | $31,322,051 |
| Boston Scientific Corp. (a) | | 762,406 | 39,027,563 |
| Cooper Cos., Inc. | | 65,670 | 20,472,622 |
| EssilorLuxottica | | 56,510 | 10,220,024 |
| Medtronic PLC | | 759,529 | 53,592,366 |
| Olympus Corp. | | 1,979,500 | 26,531,552 |
| Sonova Holding AG | | 54,633 | 12,946,013 |
| Stryker Corp. | | 80,539 | 21,763,249 |
| Thermo Fisher Scientific, Inc. | | 121,715 | 54,135,181 |
| Waters Corp. (a) | | 113,120 | 26,982,514 |
| | | | | $296,993,135 |
Portfolio of Investments – continued
| Issuer | | | Shares/Par | Value ($) |
| Common Stocks – continued |
| Other Banks & Diversified Financials – 5.1% | |
| American Express Co. | | 196,223 | $28,654,445 |
| Grupo Financiero Banorte S.A. de C.V. | | 907,741 | 7,367,057 |
| Julius Baer Group Ltd. | | 175,213 | 10,376,759 |
| Visa, Inc., “A” | | 304,742 | 71,644,844 |
| | | | | $118,043,105 |
| Pharmaceuticals – 4.6% | |
| Bayer AG | | 481,729 | $20,702,169 |
| Merck KGaA | | 227,923 | 34,329,884 |
| Roche Holding AG | | 202,788 | 52,389,747 |
| | | | | $107,421,800 |
| Railroad & Shipping – 4.8% | |
| Canadian National Railway Co. (l) | | 343,153 | $36,298,724 |
| Canadian Pacific Kansas City Ltd. | | 638,259 | 45,297,241 |
| Union Pacific Corp. | | 140,039 | 29,073,497 |
| | | | | $110,669,462 |
| Specialty Chemicals – 4.8% | |
| Akzo Nobel N.V. | | 304,416 | $20,445,039 |
| L'Air Liquide S.A. | | 146,886 | 25,174,529 |
| Linde PLC | | 174,735 | 66,776,728 |
| | | | | $112,396,296 |
| Specialty Stores – 0.5% | |
| Hermes International | | 5,595 | $10,492,394 |
| Telecommunications - Wireless – 1.9% | |
| Cellnex Telecom S.A. | | 491,472 | $14,486,331 |
| Liberty Broadband Corp. (a) | | 343,838 | 28,645,144 |
| | | | | $43,131,475 |
| Trucking – 0.8% | |
| United Parcel Service, Inc., “B” | | 138,342 | $19,540,808 |
| Total Common Stocks (Identified Cost, $1,430,413,393) | | $2,294,181,973 |
| | Strike
Price | First
Exercise | | |
| Warrants – 0.0% | | | | |
| Apparel Manufacturers – 0.0% |
| Compagnie Financiere Richemont S.A. (1 share for 2 warrants, Expiration 12/04/23) (a) (Identified Cost, $0) | CHF 67 | 11/20/23 | 846,954 | $556,784 |
Portfolio of Investments – continued
| Issuer | | | Shares/Par | Value ($) |
| Investment Companies (h) – 0.4% |
| Money Market Funds – 0.4% | |
| MFS Institutional Money Market Portfolio, 5.43% (v) (Identified Cost, $8,971,834) | | | 8,971,829 | $8,972,726 |
|
|
| Other Assets, Less Liabilities – 0.6% | | 14,461,288 |
| Net Assets – 100.0% | $2,318,172,771 |
| (a) | Non-income producing security. | | | |
| (h) | An affiliated issuer, which may be considered one in which the fund owns 5% or more of the outstanding voting securities, or a company which is under common control. At period end, the aggregate values of the fund's investments in affiliated issuers and in unaffiliated issuers were $8,972,726 and $2,294,738,757, respectively. | | | |
| (l) | A portion of this security is on loan. See Note 2 for additional information. | | | |
| (v) | Affiliated issuer that is available only to investment companies managed by MFS. The rate quoted for the MFS Institutional Money Market Portfolio is the annualized seven-day yield of the fund at period end. | | | |
| Abbreviations indicate amounts shown in currencies other than the U.S. dollar. All amounts are stated in U.S. dollars unless otherwise indicated. A list of abbreviations is shown below: |
| CHF | Swiss Franc |
See Notes to Financial Statements
Financial Statements
Statement of Assets and Liabilities
At 10/31/23
This statement represents your fund’s balance sheet, which details the assets and liabilities comprising the total value of the fund.
| Assets | |
| Investments in unaffiliated issuers, at value, including $6,547,782 of securities on loan (identified cost, $1,430,413,393) | $2,294,738,757 |
| Investments in affiliated issuers, at value (identified cost, $8,971,834) | 8,972,726 |
| Cash | 36 |
| Foreign currency, at value (identified cost, $106) | 106 |
| Receivables for | |
| Investments sold | 9,793,825 |
| Fund shares sold | 2,369,354 |
| Interest and dividends | 10,327,857 |
| Total assets | $2,326,202,661 |
| Liabilities | |
| Payables for | |
| Investments purchased | $4,170,961 |
| Fund shares reacquired | 2,168,464 |
| Payable to affiliates | |
| Investment adviser | 98,893 |
| Administrative services fee | 1,847 |
| Shareholder servicing costs | 589,095 |
| Distribution and service fees | 12,636 |
| Payable for independent Trustees' compensation | 3,147 |
| Accrued expenses and other liabilities | 984,847 |
| Total liabilities | $8,029,890 |
| Net assets | $2,318,172,771 |
| Net assets consist of | |
| Paid-in capital | $1,259,443,309 |
| Total distributable earnings (loss) | 1,058,729,462 |
| Net assets | $2,318,172,771 |
| Shares of beneficial interest outstanding | 51,817,296 |
Statement of Assets and Liabilities – continued
| | Net assets | Shares
outstanding | Net asset value
per share (a) |
| Class A | $627,081,226 | 14,272,675 | $43.94 |
| Class B | 5,106,114 | 130,442 | 39.14 |
| Class C | 48,232,758 | 1,305,715 | 36.94 |
| Class I | 825,333,477 | 18,150,279 | 45.47 |
| Class R1 | 953,461 | 25,028 | 38.10 |
| Class R2 | 21,903,662 | 517,014 | 42.37 |
| Class R3 | 47,923,960 | 1,099,772 | 43.58 |
| Class R4 | 37,593,980 | 850,400 | 44.21 |
| Class R6 | 704,044,133 | 15,465,971 | 45.52 |
| (a) | Maximum offering price per share was equal to the net asset value per share for all share classes, except for Class A, for which the maximum offering price per share was $46.62 [100 / 94.25 x $43.94]. On sales of $50,000 or more, the maximum offering price of Class A shares is reduced. A contingent deferred sales charge may be imposed on redemptions of Class A, Class B, and Class C shares. Redemption price per share was equal to the net asset value per share for Classes I, R1, R2, R3, R4, and R6. |
See Notes to Financial Statements
Financial Statements
Statement of Operations
Year ended 10/31/23
This statement describes how much your fund earned in investment income and accrued in expenses. It also describes any gains and/or losses generated by fund operations.
| Net investment income (loss) | |
| Income | |
| Dividends | $50,964,663 |
| Tax reclaims | 4,723,073 |
| Dividends from affiliated issuers | 511,087 |
| Interest | 193,272 |
| Income on securities loaned | 27,173 |
| Other | 1,287 |
| Foreign taxes withheld | (3,442,069) |
| Total investment income | $52,978,486 |
| Expenses | |
| Management fee | $20,672,851 |
| Distribution and service fees | 2,700,786 |
| Shareholder servicing costs | 1,977,091 |
| Administrative services fee | 393,967 |
| Independent Trustees' compensation | 45,268 |
| Custodian fee | 240,792 |
| Shareholder communications | 162,641 |
| Audit and tax fees | 76,856 |
| Legal fees | 13,368 |
| Miscellaneous | 1,246,142 |
| Total expenses | $27,529,762 |
| Fees paid indirectly | (134) |
| Reduction of expenses by investment adviser and distributor | (339,031) |
| Net expenses | $27,190,597 |
| Net investment income (loss) | $25,787,889 |
Statement of Operations – continued
| Realized and unrealized gain (loss) |
| Realized gain (loss) (identified cost basis) | |
| Unaffiliated issuers | $209,979,353 |
| Affiliated issuers | 6,776 |
| Foreign currency | (34,686) |
| Net realized gain (loss) | $209,951,443 |
| Change in unrealized appreciation or depreciation | |
| Unaffiliated issuers | $(96,132,599) |
| Affiliated issuers | 892 |
| Translation of assets and liabilities in foreign currencies | 501,854 |
| Net unrealized gain (loss) | $(95,629,853) |
| Net realized and unrealized gain (loss) | $114,321,590 |
| Change in net assets from operations | $140,109,479 |
See Notes to Financial Statements
Financial Statements
Statements of Changes in Net Assets
These statements describe the increases and/or decreases in net assets resulting from operations, any distributions, and any shareholder transactions.
| | Year ended |
| | 10/31/23 | 10/31/22 |
| Change in net assets | | |
| From operations | | |
| Net investment income (loss) | $25,787,889 | $17,910,316 |
| Net realized gain (loss) | 209,951,443 | 245,538,621 |
| Net unrealized gain (loss) | (95,629,853) | (972,704,215) |
| Change in net assets from operations | $140,109,479 | $(709,255,278) |
| Total distributions to shareholders | $(226,391,945) | $(184,733,937) |
| Change in net assets from fund share transactions | $(194,461,889) | $(324,546,706) |
| Total change in net assets | $(280,744,355) | $(1,218,535,921) |
| Net assets | | |
| At beginning of period | 2,598,917,126 | 3,817,453,047 |
| At end of period | $2,318,172,771 | $2,598,917,126 |
See Notes to Financial Statements
Financial Statements
Financial Highlights
The financial highlights table is intended to help you understand the fund's financial performance for the past 5 years. Certain information reflects financial results for a single fund share. The total returns in the table represent the rate that an investor would have earned (or lost) on an investment in the fund share class (assuming reinvestment of all distributions) held for the entire period.
| Class A | Year ended |
| | 10/31/23 | 10/31/22 | 10/31/21 | 10/31/20 | 10/31/19 |
| Net asset value, beginning of period | $45.88 | $60.75 | $45.22 | $45.79 | $41.44 |
| Income (loss) from investment operations |
| Net investment income (loss) (d) | $0.38 | $0.22 | $0.17 | $0.25 | $0.42 |
| Net realized and unrealized gain (loss) | 1.75 | (12.07) | 16.60 | 0.16(g) | 6.10 |
| Total from investment operations | $2.13 | $(11.85) | $16.77 | $0.41 | $6.52 |
| Less distributions declared to shareholders |
| From net investment income | $(0.24) | $(0.18) | $(0.23) | $(0.45) | $(0.42) |
| From net realized gain | (3.83) | (2.84) | (1.01) | (0.53) | (1.75) |
| Total distributions declared to shareholders | $(4.07) | $(3.02) | $(1.24) | $(0.98) | $(2.17) |
| Net asset value, end of period (x) | $43.94 | $45.88 | $60.75 | $45.22 | $45.79 |
| Total return (%) (r)(s)(t)(x) | 4.40 | (20.50) | 37.58 | 0.83 | 16.67 |
Ratios (%) (to average net assets)
and Supplemental data: |
| Expenses before expense reductions (f) | 1.22 | 1.16 | 1.14 | 1.16 | 1.17 |
| Expenses after expense reductions (f) | 1.21 | 1.15 | 1.13 | 1.15 | 1.15 |
| Net investment income (loss) | 0.81 | 0.42 | 0.29 | 0.55 | 0.98 |
| Portfolio turnover | 8 | 8 | 10 | 9 | 7 |
| Net assets at end of period (000 omitted) | $627,081 | $649,695 | $857,804 | $667,074 | $721,141 |
See Notes to Financial Statements
Financial Highlights – continued
| Class B | Year ended |
| | 10/31/23 | 10/31/22 | 10/31/21 | 10/31/20 | 10/31/19 |
| Net asset value, beginning of period | $41.36 | $55.28 | $41.35 | $41.93 | $38.09 |
| Income (loss) from investment operations |
| Net investment income (loss) (d) | $0.02 | $(0.17) | $(0.23) | $(0.09) | $0.10 |
| Net realized and unrealized gain (loss) | 1.59 | (10.91) | 15.17 | 0.15(g) | 5.60 |
| Total from investment operations | $1.61 | $(11.08) | $14.94 | $0.06 | $5.70 |
| Less distributions declared to shareholders |
| From net investment income | $— | $— | $— | $(0.11) | $(0.11) |
| From net realized gain | (3.83) | (2.84) | (1.01) | (0.53) | (1.75) |
| Total distributions declared to shareholders | $(3.83) | $(2.84) | $(1.01) | $(0.64) | $(1.86) |
| Net asset value, end of period (x) | $39.14 | $41.36 | $55.28 | $41.35 | $41.93 |
| Total return (%) (r)(s)(t)(x) | 3.58 | (21.09) | 36.56 | 0.08 | 15.79 |
Ratios (%) (to average net assets)
and Supplemental data: |
| Expenses before expense reductions (f) | 1.96 | 1.91 | 1.89 | 1.91 | 1.92 |
| Expenses after expense reductions (f) | 1.95 | 1.90 | 1.87 | 1.90 | 1.91 |
| Net investment income (loss) | 0.04 | (0.36) | (0.45) | (0.21) | 0.24 |
| Portfolio turnover | 8 | 8 | 10 | 9 | 7 |
| Net assets at end of period (000 omitted) | $5,106 | $7,439 | $15,166 | $15,902 | $22,592 |
| Class C | Year ended |
| | 10/31/23 | 10/31/22 | 10/31/21 | 10/31/20 | 10/31/19 |
| Net asset value, beginning of period | $39.23 | $52.58 | $39.38 | $40.00 | $36.44 |
| Income (loss) from investment operations |
| Net investment income (loss) (d) | $0.02 | $(0.15) | $(0.22) | $(0.08) | $0.09 |
| Net realized and unrealized gain (loss) | 1.52 | (10.36) | 14.43 | 0.14(g) | 5.34 |
| Total from investment operations | $1.54 | $(10.51) | $14.21 | $0.06 | $5.43 |
| Less distributions declared to shareholders |
| From net investment income | $— | $— | $— | $(0.15) | $(0.12) |
| From net realized gain | (3.83) | (2.84) | (1.01) | (0.53) | (1.75) |
| Total distributions declared to shareholders | $(3.83) | $(2.84) | $(1.01) | $(0.68) | $(1.87) |
| Net asset value, end of period (x) | $36.94 | $39.23 | $52.58 | $39.38 | $40.00 |
| Total return (%) (r)(s)(t)(x) | 3.60 | (21.09) | 36.54 | 0.09 | 15.78 |
Ratios (%) (to average net assets)
and Supplemental data: |
| Expenses before expense reductions (f) | 1.96 | 1.91 | 1.89 | 1.91 | 1.92 |
| Expenses after expense reductions (f) | 1.95 | 1.90 | 1.87 | 1.90 | 1.91 |
| Net investment income (loss) | 0.04 | (0.35) | (0.46) | (0.19) | 0.23 |
| Portfolio turnover | 8 | 8 | 10 | 9 | 7 |
| Net assets at end of period (000 omitted) | $48,233 | $66,875 | $112,939 | $110,351 | $143,769 |
See Notes to Financial Statements
Financial Highlights – continued
| Class I | Year ended |
| | 10/31/23 | 10/31/22 | 10/31/21 | 10/31/20 | 10/31/19 |
| Net asset value, beginning of period | $47.36 | $62.59 | $46.55 | $47.09 | $42.57 |
| Income (loss) from investment operations |
| Net investment income (loss) (d) | $0.51 | $0.36 | $0.31 | $0.37 | $0.53 |
| Net realized and unrealized gain (loss) | 1.79 | (12.45) | 17.08 | 0.18(g) | 6.27 |
| Total from investment operations | $2.30 | $(12.09) | $17.39 | $0.55 | $6.80 |
| Less distributions declared to shareholders |
| From net investment income | $(0.36) | $(0.30) | $(0.34) | $(0.56) | $(0.53) |
| From net realized gain | (3.83) | (2.84) | (1.01) | (0.53) | (1.75) |
| Total distributions declared to shareholders | $(4.19) | $(3.14) | $(1.35) | $(1.09) | $(2.28) |
| Net asset value, end of period (x) | $45.47 | $47.36 | $62.59 | $46.55 | $47.09 |
| Total return (%) (r)(s)(t)(x) | 4.64 | (20.30) | 37.91 | 1.10 | 16.94 |
Ratios (%) (to average net assets)
and Supplemental data: |
| Expenses before expense reductions (f) | 0.97 | 0.91 | 0.89 | 0.91 | 0.92 |
| Expenses after expense reductions (f) | 0.96 | 0.90 | 0.88 | 0.90 | 0.91 |
| Net investment income (loss) | 1.05 | 0.67 | 0.53 | 0.80 | 1.21 |
| Portfolio turnover | 8 | 8 | 10 | 9 | 7 |
| Net assets at end of period (000 omitted) | $825,333 | $946,778 | $1,245,750 | $908,819 | $947,284 |
See Notes to Financial Statements
Financial Highlights – continued
| Class R1 | Year ended |
| | 10/31/23 | 10/31/22 | 10/31/21 | 10/31/20 | 10/31/19 |
| Net asset value, beginning of period | $40.35 | $54.00 | $40.41 | $40.97 | $37.25 |
| Income (loss) from investment operations |
| Net investment income (loss) (d) | $0.01 | $(0.17) | $(0.23) | $(0.09) | $0.09 |
| Net realized and unrealized gain (loss) | 1.57 | (10.64) | 14.83 | 0.15(g) | 5.47 |
| Total from investment operations | $1.58 | $(10.81) | $14.60 | $0.06 | $5.56 |
| Less distributions declared to shareholders |
| From net investment income | $— | $— | $— | $(0.09) | $(0.09) |
| From net realized gain | (3.83) | (2.84) | (1.01) | (0.53) | (1.75) |
| Total distributions declared to shareholders | $(3.83) | $(2.84) | $(1.01) | $(0.62) | $(1.84) |
| Net asset value, end of period (x) | $38.10 | $40.35 | $54.00 | $40.41 | $40.97 |
| Total return (%) (r)(s)(t)(x) | 3.60 | (21.09) | 36.57 | 0.08 | 15.77 |
Ratios (%) (to average net assets)
and Supplemental data: |
| Expenses before expense reductions (f) | 1.97 | 1.91 | 1.89 | 1.91 | 1.92 |
| Expenses after expense reductions (f) | 1.95 | 1.90 | 1.87 | 1.90 | 1.91 |
| Net investment income (loss) | 0.03 | (0.36) | (0.46) | (0.23) | 0.22 |
| Portfolio turnover | 8 | 8 | 10 | 9 | 7 |
| Net assets at end of period (000 omitted) | $953 | $1,260 | $2,081 | $1,556 | $2,485 |
| Class R2 | Year ended |
| | 10/31/23 | 10/31/22 | 10/31/21 | 10/31/20 | 10/31/19 |
| Net asset value, beginning of period | $44.36 | $58.85 | $43.83 | $44.38 | $40.21 |
| Income (loss) from investment operations |
| Net investment income (loss) (d) | $0.25 | $0.08 | $0.02 | $0.13 | $0.31 |
| Net realized and unrealized gain (loss) | 1.70 | (11.68) | 16.09 | 0.16(g) | 5.91 |
| Total from investment operations | $1.95 | $(11.60) | $16.11 | $0.29 | $6.22 |
| Less distributions declared to shareholders |
| From net investment income | $(0.11) | $(0.05) | $(0.08) | $(0.31) | $(0.30) |
| From net realized gain | (3.83) | (2.84) | (1.01) | (0.53) | (1.75) |
| Total distributions declared to shareholders | $(3.94) | $(2.89) | $(1.09) | $(0.84) | $(2.05) |
| Net asset value, end of period (x) | $42.37 | $44.36 | $58.85 | $43.83 | $44.38 |
| Total return (%) (r)(s)(t)(x) | 4.13 | (20.70) | 37.22 | 0.59 | 16.36 |
Ratios (%) (to average net assets)
and Supplemental data: |
| Expenses before expense reductions (f) | 1.47 | 1.41 | 1.39 | 1.41 | 1.42 |
| Expenses after expense reductions (f) | 1.45 | 1.40 | 1.38 | 1.40 | 1.41 |
| Net investment income (loss) | 0.56 | 0.16 | 0.04 | 0.30 | 0.76 |
| Portfolio turnover | 8 | 8 | 10 | 9 | 7 |
| Net assets at end of period (000 omitted) | $21,904 | $24,652 | $36,791 | $27,772 | $37,042 |
See Notes to Financial Statements
Financial Highlights – continued
| Class R3 | Year ended |
| | 10/31/23 | 10/31/22 | 10/31/21 | 10/31/20 | 10/31/19 |
| Net asset value, beginning of period | $45.54 | $60.32 | $44.89 | $45.46 | $41.16 |
| Income (loss) from investment operations |
| Net investment income (loss) (d) | $0.36 | $0.21 | $0.16 | $0.24 | $0.41 |
| Net realized and unrealized gain (loss) | 1.75 | (11.97) | 16.49 | 0.17(g) | 6.06 |
| Total from investment operations | $2.11 | $(11.76) | $16.65 | $0.41 | $6.47 |
| Less distributions declared to shareholders |
| From net investment income | $(0.24) | $(0.18) | $(0.21) | $(0.45) | $(0.42) |
| From net realized gain | (3.83) | (2.84) | (1.01) | (0.53) | (1.75) |
| Total distributions declared to shareholders | $(4.07) | $(3.02) | $(1.22) | $(0.98) | $(2.17) |
| Net asset value, end of period (x) | $43.58 | $45.54 | $60.32 | $44.89 | $45.46 |
| Total return (%) (r)(s)(t)(x) | 4.38 | (20.50) | 37.60 | 0.83 | 16.65 |
Ratios (%) (to average net assets)
and Supplemental data: |
| Expenses before expense reductions (f) | 1.21 | 1.16 | 1.14 | 1.16 | 1.17 |
| Expenses after expense reductions (f) | 1.20 | 1.15 | 1.13 | 1.15 | 1.16 |
| Net investment income (loss) | 0.76 | 0.41 | 0.29 | 0.54 | 0.97 |
| Portfolio turnover | 8 | 8 | 10 | 9 | 7 |
| Net assets at end of period (000 omitted) | $47,924 | $66,160 | $88,285 | $70,852 | $91,019 |
| Class R4 | Year ended |
| | 10/31/23 | 10/31/22 | 10/31/21 | 10/31/20 | 10/31/19 |
| Net asset value, beginning of period | $46.16 | $61.08 | $45.44 | $45.98 | $41.63 |
| Income (loss) from investment operations |
| Net investment income (loss) (d) | $0.48 | $0.35 | $0.30 | $0.36 | $0.54 |
| Net realized and unrealized gain (loss) | 1.76 | (12.13) | 16.69 | 0.17(g) | 6.09 |
| Total from investment operations | $2.24 | $(11.78) | $16.99 | $0.53 | $6.63 |
| Less distributions declared to shareholders |
| From net investment income | $(0.36) | $(0.30) | $(0.34) | $(0.54) | $(0.53) |
| From net realized gain | (3.83) | (2.84) | (1.01) | (0.53) | (1.75) |
| Total distributions declared to shareholders | $(4.19) | $(3.14) | $(1.35) | $(1.07) | $(2.28) |
| Net asset value, end of period (x) | $44.21 | $46.16 | $61.08 | $45.44 | $45.98 |
| Total return (%) (r)(s)(t)(x) | 4.64 | (20.29) | 37.94 | 1.09 | 16.93 |
Ratios (%) (to average net assets)
and Supplemental data: |
| Expenses before expense reductions (f) | 0.96 | 0.91 | 0.89 | 0.91 | 0.92 |
| Expenses after expense reductions (f) | 0.95 | 0.90 | 0.88 | 0.90 | 0.91 |
| Net investment income (loss) | 1.02 | 0.67 | 0.53 | 0.80 | 1.25 |
| Portfolio turnover | 8 | 8 | 10 | 9 | 7 |
| Net assets at end of period (000 omitted) | $37,594 | $70,784 | $95,164 | $84,424 | $97,861 |
See Notes to Financial Statements
Financial Highlights – continued
| Class R6 | Year ended |
| | 10/31/23 | 10/31/22 | 10/31/21 | 10/31/20 | 10/31/19 |
| Net asset value, beginning of period | $47.42 | $62.65 | $46.58 | $47.13 | $42.61 |
| Income (loss) from investment operations |
| Net investment income (loss) (d) | $0.55 | $0.39 | $0.36 | $0.41 | $0.59 |
| Net realized and unrealized gain (loss) | 1.79 | (12.43) | 17.11 | 0.17(g) | 6.26 |
| Total from investment operations | $2.34 | $(12.04) | $17.47 | $0.58 | $6.85 |
| Less distributions declared to shareholders |
| From net investment income | $(0.41) | $(0.35) | $(0.39) | $(0.60) | $(0.58) |
| From net realized gain | (3.83) | (2.84) | (1.01) | (0.53) | (1.75) |
| Total distributions declared to shareholders | $(4.24) | $(3.19) | $(1.40) | $(1.13) | $(2.33) |
| Net asset value, end of period (x) | $45.52 | $47.42 | $62.65 | $46.58 | $47.13 |
| Total return (%) (r)(s)(t)(x) | 4.73 | (20.22) | 38.06 | 1.17 | 17.07 |
Ratios (%) (to average net assets)
and Supplemental data: |
| Expenses before expense reductions (f) | 0.88 | 0.82 | 0.80 | 0.82 | 0.83 |
| Expenses after expense reductions (f) | 0.86 | 0.80 | 0.78 | 0.81 | 0.82 |
| Net investment income (loss) | 1.14 | 0.73 | 0.63 | 0.89 | 1.35 |
| Portfolio turnover | 8 | 8 | 10 | 9 | 7 |
| Net assets at end of period (000 omitted) | $704,044 | $765,274 | $1,363,474 | $976,055 | $923,304 |
| (d) | Per share data is based on average shares outstanding. |
| (f) | Ratios do not reflect reductions from fees paid indirectly, if applicable. See Note 2 in the Notes to Financial Statements for additional information. |
| (g) | The per share amount varies from the net realized and unrealized gain/loss for the period because of the timing of sales of fund shares and the per share amount of realized and unrealized gains and losses at such time. |
| (r) | Certain expenses have been reduced without which performance would have been lower. |
| (s) | From time to time the fund may receive proceeds from litigation settlements, without which performance would be lower. |
| (t) | Total returns do not include any applicable sales charges. |
| (x) | The net asset values and total returns have been calculated on net assets which include adjustments made in accordance with U.S. generally accepted accounting principles required at period end for financial reporting purposes. |
See Notes to Financial Statements
Notes to Financial Statements
(1) Business and Organization
MFS Global Equity Fund (the fund) is a diversified series of MFS Series Trust VI (the trust). The trust is organized as a Massachusetts business trust and is registered under the Investment Company Act of 1940, as amended, as an open-end management investment company.
The fund is an investment company and accordingly follows the investment company accounting and reporting guidance of the Financial Accounting Standards Board (FASB) Accounting Standards Codification Topic 946 Financial Services - Investment Companies.
(2) Significant Accounting Policies
General — The preparation of financial statements in conformity with U.S. generally accepted accounting principles requires management to make estimates and assumptions that affect the reported amounts of assets and liabilities, and disclosure of contingent assets and liabilities at the date of the financial statements and the reported amounts of increases and decreases in net assets from operations during the reporting period. Actual results could differ from those estimates. In the preparation of these financial statements, management has evaluated subsequent events occurring after the date of the fund’s Statement of Assets and Liabilities through the date that the financial statements were issued. The fund invests in foreign securities. Investments in foreign securities are vulnerable to the effects of changes in the relative values of the local currency and the U.S. dollar and to the effects of changes in each country’s market, economic, industrial, political, regulatory, geopolitical, environmental, public health, and other conditions.
Balance Sheet Offsetting — The fund's accounting policy with respect to balance sheet offsetting is that, absent an event of default by the counterparty or a termination of the agreement, the International Swaps and Derivatives Association (ISDA) Master Agreement, or similar agreement, does not result in an offset of reported amounts of financial assets and financial liabilities in the Statement of Assets and Liabilities across transactions between the fund and the applicable counterparty. The fund's right to setoff may be restricted or prohibited by the bankruptcy or insolvency laws of the particular jurisdiction to which a specific master netting agreement counterparty is subject. Balance sheet offsetting disclosures, to the extent applicable to the fund, have been included in the fund’s Significant Accounting Policies note under the captions for each of the fund’s in-scope financial instruments and transactions.
Investment Valuations — Subject to its oversight, the fund's Board of Trustees has delegated primary responsibility for determining or causing to be determined the value of the fund’s investments to MFS as the fund's adviser, pursuant to the fund’s valuation policy and procedures which have been adopted by the adviser and approved by the Board. In accordance with Rule 2a-5 under the Investment Company Act of 1940, the Board of Trustees designated the adviser as the “valuation designee” of the fund. If the adviser, as valuation designee, determines that reliable market quotations are not readily available for an investment, the investment is valued at fair value as determined in good faith by the adviser in accordance with the adviser’s fair valuation policy and procedures.
Notes to Financial Statements - continued
Under the fund's valuation policy and procedures, equity securities, including restricted equity securities, are generally valued at the last sale or official closing price on their primary market or exchange as provided by a third-party pricing service. Equity securities, for which there were no sales reported that day, are generally valued at the last quoted daily bid quotation on their primary market or exchange as provided by a third-party pricing service. Short-term instruments with a maturity at issuance of 60 days or less may be valued at amortized cost, which approximates market value.
Open-end investment companies are generally valued at net asset value per share. The values of foreign securities and other assets and liabilities expressed in foreign currencies are converted to U.S. dollars using the mean of bid and asked prices for rates provided by a third-party pricing service.
Under the fund’s valuation policy and procedures, market quotations are not considered to be readily available for debt instruments, floating rate loans, and many types of derivatives. These investments are generally valued at fair value based on information from third-party pricing services or otherwise determined by the adviser in accordance with the adviser’s fair valuation policy and procedures. Securities and other assets generally valued on the basis of information from a third-party pricing service may also be valued at a broker/dealer bid quotation. In determining values, third-party pricing services can utilize both transaction data and market information such as yield, quality, coupon rate, maturity, type of issue, trading characteristics, spreads and other market data. An investment may also be valued at fair value if the adviser determines that the investment’s value has been materially affected by events occurring after the close of the exchange or market on which the investment is principally traded (such as foreign exchange or market) and prior to the determination of the fund’s net asset value, or after the halt of trading of a specific security where trading does not resume prior to the close of the exchange or market on which the security is principally traded. Events that occur after foreign markets close (such as developments in foreign markets and significant movements in the U.S. markets) and prior to the determination of the fund’s net asset value may be deemed to have a material effect on the value of securities traded in foreign markets. Accordingly, the fund’s foreign equity securities may often be valued at fair value. The adviser generally relies on third-party pricing services or other information (such as the correlation with price movements of similar securities in the same or other markets; the type, cost and investment characteristics of the security; the business and financial condition of the issuer; and trading and other market data) to assist in determining whether to fair value and at what value to fair value an investment. The value of an investment for purposes of calculating the fund’s net asset value can differ depending on the source and method used to determine value. When fair valuation is used, the value of an investment used to determine the fund’s net asset value may differ from quoted or published prices for the same investment. There can be no assurance that the fund could obtain the fair value assigned to an investment if it were to sell the investment at the same time at which the fund determines its net asset value per share.
Various inputs are used in determining the value of the fund's assets or liabilities. These inputs are categorized into three broad levels. In certain cases, the inputs used to measure fair value may fall into different levels of the fair value hierarchy. In such cases, an investment's level within the fair value hierarchy is based on the lowest level of input that is significant to the fair value measurement. The fund's assessment of the significance of a particular input to the fair value measurement in its entirety requires judgment, and considers factors specific to the investment. Level 1 includes unadjusted
Notes to Financial Statements - continued
quoted prices in active markets for identical assets or liabilities. Level 2 includes other significant observable market-based inputs (including quoted prices for similar securities, interest rates, prepayment speed, and credit risk). Level 3 includes significant unobservable inputs, which may include the adviser's own assumptions in determining the fair value of investments. The following is a summary of the levels used as of October 31, 2023 in valuing the fund's assets and liabilities:
| Financial Instruments | Level 1 | Level 2 | Level 3 | Total |
| Equity Securities: | | | | |
| United States | $1,203,291,699 | $— | $— | $1,203,291,699 |
| France | — | 253,913,592 | — | 253,913,592 |
| Switzerland | 41,896,092 | 166,157,838 | — | 208,053,930 |
| United Kingdom | 36,610,314 | 156,439,487 | — | 193,049,801 |
| Germany | 67,424,742 | 20,702,169 | — | 88,126,911 |
| Canada | 81,595,965 | — | — | 81,595,965 |
| Japan | — | 59,599,645 | — | 59,599,645 |
| Netherlands | — | 57,894,183 | — | 57,894,183 |
| Spain | — | 34,542,039 | — | 34,542,039 |
| Other Countries | 77,741,265 | 36,929,727 | — | 114,670,992 |
| Mutual Funds | 8,972,726 | — | — | 8,972,726 |
| Total | $1,517,532,803 | $786,178,680 | $— | $2,303,711,483 |
For further information regarding security characteristics, see the Portfolio of Investments.
Foreign Currency Translation — Purchases and sales of foreign investments, income, and expenses are converted into U.S. dollars based upon currency exchange rates prevailing on the respective dates of such transactions or on the reporting date for foreign denominated receivables and payables. Gains and losses attributable to foreign currency exchange rates on sales of securities are recorded for financial statement purposes as net realized gains and losses on investments. Gains and losses attributable to foreign exchange rate movements on receivables, payables, income and expenses are recorded for financial statement purposes as foreign currency transaction gains and losses. That portion of both realized and unrealized gains and losses on investments that results from fluctuations in foreign currency exchange rates is not separately disclosed.
Security Loans — Under its Securities Lending Agency Agreement with the fund, JPMorgan Chase and Co., as lending agent, loans the securities of the fund to certain qualified institutions (the “Borrowers”) approved by the fund. Security loans can be terminated at the discretion of either the lending agent or the fund and the related securities must be returned within the earlier of the standard trade settlement period for such securities or within three business days. The loans are collateralized by cash and/or U.S. Treasury and federal agency obligations in an amount typically at least equal to the market value of the securities loaned. On loans collateralized by cash, the cash collateral is invested in a money market fund. The market value of the loaned securities is determined at the close of business of the fund and any additional required collateral is delivered to the fund on the next business day. The lending agent provides the fund with indemnification against Borrower default. In the event of Borrower default, the lending agent will, for the benefit of the fund, either purchase securities identical to those loaned or, when such purchase is commercially impracticable, pay the
Notes to Financial Statements - continued
fund the market value of the loaned securities. In return, the lending agent assumes the fund's rights to the related collateral. If the collateral value is less than the cost to purchase identical securities, the lending agent is responsible for the shortfall, but only to the extent that such shortfall is not due to a decline in collateral value resulting from collateral reinvestment for which the fund bears the risk of loss. At period end, the fund had investment securities on loan, all of which were classified as equity securities in the fund’s Portfolio of Investments, with a fair value of $6,547,782. The fair value of the fund’s investment securities on loan is presented gross in the Statement of Assets and Liabilities. These loans were collateralized by U.S. Treasury Obligations of $6,744,828 held by the lending agent. The collateral on securities loaned exceeded the value of securities on loan at period end. A portion of the income generated upon investment of the collateral is remitted to the Borrowers, and the remainder is allocated between the fund and the lending agent. On loans collateralized by U.S. Treasury and/or federal agency obligations, a fee is received from the Borrower, and is allocated between the fund and the lending agent. Income from securities lending is separately reported in the Statement of Operations. The dividend and interest income earned on the securities loaned is accounted for in the same manner as other dividend and interest income.
Indemnifications — Under the fund's organizational documents, its officers and Trustees may be indemnified against certain liabilities and expenses arising out of the performance of their duties to the fund. Additionally, in the normal course of business, the fund enters into agreements with service providers that may contain indemnification clauses. The fund's maximum exposure under these agreements is unknown as this would involve future claims that may be made against the fund that have not yet occurred.
Investment Transactions and Income — Dividends received in cash are recorded on the ex-dividend date. Certain dividends from foreign securities will be recorded when the fund is informed of the dividend if such information is obtained subsequent to the ex-dividend date. Dividend payments received in additional securities are recorded on the ex-dividend date in an amount equal to the value of the security on such date.
The fund may receive proceeds from litigation settlements. Any proceeds received from litigation involving portfolio holdings are reflected in the Statement of Operations in realized gain/loss if the security has been disposed of by the fund or in unrealized gain/loss if the security is still held by the fund. Any other proceeds from litigation not related to portfolio holdings are reflected as other income in the Statement of Operations.
Investment transactions are recorded on the trade date. In determining the net gain or loss on securities sold, the cost of securities is determined on the identified cost basis.
Fees Paid Indirectly — The fund's custody fee may be reduced by a credit earned under an arrangement that measures the value of U.S. dollars deposited with the custodian by the fund. The amount of the credit, for the year ended October 31, 2023, is shown as a reduction of total expenses in the Statement of Operations.
Tax Matters and Distributions — The fund intends to qualify as a regulated investment company, as defined under Subchapter M of the Internal Revenue Code, and to distribute all of its taxable income, including realized capital gains. As a result, no provision for federal income tax is required. The fund’s federal tax returns, when filed, will remain subject to examination by the Internal Revenue Service for a three
Notes to Financial Statements - continued
year period. Management has analyzed the fund’s tax positions taken on federal and state tax returns for all open tax years and does not believe that there are any uncertain tax positions that require recognition of a tax liability. Foreign taxes, if any, have been accrued by the fund in the accompanying financial statements in accordance with the applicable foreign tax law. Foreign income taxes may be withheld by certain countries in which the fund invests. Additionally, capital gains realized by the fund on securities issued in or by certain foreign countries may be subject to capital gains tax imposed by those countries.
The fund has filed tax reclaims for previously withheld taxes on dividends earned in certain European Union (EU) countries. These additional filings are subject to various administrative proceedings by the local jurisdictions' tax authorities within the EU, as well as a number of related judicial proceedings. These reclaims are recorded only when certainty exists as to the likelihood of receipt and the potential timing of payment. For the year ended October 31, 2023, the fund recorded reclaims for previously withheld foreign taxes from France and Spain of $4,723,073 and related interest of $193,272, which are reflected as Tax reclaims and Interest income, respectively, in the Statement of Operations.
Distributions to shareholders are recorded on the ex-dividend date. Income and capital gain distributions are determined in accordance with income tax regulations, which may differ from U.S. generally accepted accounting principles. Certain capital accounts in the financial statements are periodically adjusted for permanent differences in order to reflect their tax character. These adjustments have no impact on net assets or net asset value per share. Temporary differences which arise from recognizing certain items of income, expense, gain or loss in different periods for financial statement and tax purposes will reverse at some time in the future.
Book/tax differences primarily relate to wash sale loss deferrals and treating a portion of the proceeds from redemptions as a distribution for tax purposes.
The tax character of distributions declared to shareholders for the last two fiscal years is as follows:
| | Year ended
10/31/23 | Year ended
10/31/22 |
| Ordinary income (including any short-term capital gains) | $17,800,892 | $19,789,607 |
| Long-term capital gains | 208,591,053 | 164,944,330 |
| Total distributions | $226,391,945 | $184,733,937 |
Notes to Financial Statements - continued
The federal tax cost and the tax basis components of distributable earnings were as follows:
| As of 10/31/23 | |
| Cost of investments | $1,453,004,027 |
| Gross appreciation | 973,811,170 |
| Gross depreciation | (123,103,714) |
| Net unrealized appreciation (depreciation) | $850,707,456 |
| Undistributed ordinary income | 23,211,863 |
| Undistributed long-term capital gain | 183,091,278 |
| Other temporary differences | 1,718,865 |
| Total distributable earnings (loss) | $1,058,729,462 |
Multiple Classes of Shares of Beneficial Interest — The fund offers multiple classes of shares, which differ in their respective distribution and service fees. The fund's income, realized and unrealized gain (loss), and common expenses are allocated to shareholders based on the daily net assets of each class. Dividends are declared separately for each class. Differences in per share dividend rates are generally due to differences in separate class expenses. Class B and Class C shares will convert to Class A shares approximately eight years after purchase. The fund’s distributions declared to shareholders as reported in the Statements of Changes in Net Assets are presented by class as follows:
| | Year
ended
10/31/23 | | Year
ended
10/31/22 |
| Class A | $56,773,747 | | $42,467,364 |
| Class B | 669,191 | | 742,277 |
| Class C | 6,363,794 | | 5,994,793 |
| Class I | 79,956,425 | | 62,197,001 |
| Class R1 | 120,143 | | 109,269 |
| Class R2 | 2,165,712 | | 1,785,958 |
| Class R3 | 5,734,624 | | 4,368,531 |
| Class R4 | 6,351,042 | | 4,886,283 |
| Class R6 | 68,257,267 | | 62,182,461 |
| Total | $226,391,945 | | $184,733,937 |
(3) Transactions with Affiliates
Investment Adviser — The fund has an investment advisory agreement with MFS to provide overall investment management and related administrative services and facilities to the fund. The management fee is computed daily and paid monthly at the following annual rates based on the fund's average daily net assets:
| Up to $1 billion | 0.90% |
| In excess of $1 billion and up to $2 billion | 0.75% |
| In excess of $2 billion and up to $5 billion | 0.65% |
| In excess of $5 billion | 0.60% |
Notes to Financial Statements - continued
MFS has agreed in writing to reduce its management fee by a specified amount if certain MFS mutual fund assets exceed thresholds agreed to by MFS and the fund's Board of Trustees. MFS has also agreed in writing to waive at least 0.01% of its management fee as part of this agreement. The agreement to waive at least 0.01% of the management fee will continue until modified by the fund's Board of Trustees, but such agreement will continue at least until February 28, 2025. For the year ended October 31, 2023, this management fee reduction amounted to $338,804, which is included in the reduction of total expenses in the Statement of Operations. The management fee incurred for the year ended October 31, 2023 was equivalent to an annual effective rate of 0.77% of the fund's average daily net assets.
Distributor — MFS Fund Distributors, Inc. (MFD), a wholly-owned subsidiary of MFS, as distributor, received $47,843 for the year ended October 31, 2023, as its portion of the initial sales charge on sales of Class A shares of the fund.
The Board of Trustees has adopted a distribution plan for certain share classes pursuant to Rule 12b-1 of the Investment Company Act of 1940.
The fund's distribution plan provides that the fund will pay MFD for services provided by MFD and financial intermediaries in connection with the distribution and servicing of certain share classes. One component of the plan is a distribution fee paid to MFD and another component of the plan is a service fee paid to MFD. MFD may subsequently pay all, or a portion, of the distribution and/or service fees to financial intermediaries. The distribution and service fees are computed daily and paid monthly.
Distribution Plan Fee Table:
| | Distribution
Fee Rate (d) | Service
Fee Rate (d) | Total
Distribution
Plan (d) | Annual
Effective
Rate (e) | Distribution
and Service
Fee |
| Class A | — | 0.25% | 0.25% | 0.25% | $ 1,723,101 |
| Class B | 0.75% | 0.25% | 1.00% | 1.00% | 67,619 |
| Class C | 0.75% | 0.25% | 1.00% | 1.00% | 621,554 |
| Class R1 | 0.75% | 0.25% | 1.00% | 1.00% | 10,776 |
| Class R2 | 0.25% | 0.25% | 0.50% | 0.50% | 126,347 |
| Class R3 | — | 0.25% | 0.25% | 0.25% | 151,389 |
| Total Distribution and Service Fees | | | | | $2,700,786 |
| (d) | In accordance with the distribution plan for certain classes, the fund pays distribution and/or service fees equal to these annual percentage rates of each class’s average daily net assets. The distribution and service fee rates disclosed by class represent the current rates in effect at the end of the reporting period. Any rate changes, if applicable, are detailed below. |
| (e) | The annual effective rates represent actual fees incurred under the distribution plan for the year ended October 31, 2023 based on each class's average daily net assets. MFD has voluntarily agreed to rebate a portion of each class's 0.25% service fee attributable to accounts for which there is no financial intermediary specified on the account except for accounts attributable to MFS or its affiliates' seed money. For the year ended October 31, 2023, this rebate amounted to $215 and $12 for Class A and Class R2 shares, respectively, and is included in the reduction of total expenses in the Statement of Operations. |
Certain Class A shares are subject to a contingent deferred sales charge (CDSC) in the event of a shareholder redemption within 18 months of purchase. Class B shares are subject to a CDSC in the event of a shareholder redemption within six years of
Notes to Financial Statements - continued
purchase. Class C shares are subject to a CDSC in the event of a shareholder redemption within 12 months of purchase. All contingent deferred sales charges are paid to MFD and during the year ended October 31, 2023, were as follows:
| | Amount |
| Class A | $7,767 |
| Class B | 1,722 |
| Class C | 2,267 |
Shareholder Servicing Agent — MFS Service Center, Inc. (MFSC), a wholly-owned subsidiary of MFS, receives a fee from the fund for its services as shareholder servicing agent calculated as a percentage of the average daily net assets of the fund as determined periodically under the supervision of the fund's Board of Trustees. For the year ended October 31, 2023, the fee was $175,989, which equated to 0.0067% annually of the fund's average daily net assets. MFSC also receives reimbursement from the fund for out-of-pocket expenses, sub-accounting and other shareholder servicing costs which may be paid to affiliated and unaffiliated service providers. Class R6 shares do not incur sub-accounting fees. For the year ended October 31, 2023, these out-of-pocket expenses, sub-accounting and other shareholder servicing costs amounted to $1,801,102.
Administrator — MFS provides certain financial, legal, shareholder communications, compliance, and other administrative services to the fund. Under an administrative services agreement, the fund reimburses MFS the costs incurred to provide these services. The fund is charged an annual fixed amount of $17,500 plus a fee based on average daily net assets. The administrative services fee is computed daily and paid monthly. The administrative services fee incurred for the year ended October 31, 2023 was equivalent to an annual effective rate of 0.0149% of the fund's average daily net assets.
Trustees’ and Officers’ Compensation — The fund pays compensation to independent Trustees in the form of a retainer, attendance fees, and additional compensation to Board and Committee chairpersons. Independent Trustees’ compensation is accrued daily and paid subsequent to each Trustee Board meeting. The fund does not pay compensation directly to Trustees or officers of the fund who are also officers of the investment adviser, all of whom receive remuneration from MFS for their services to the fund. Certain officers and Trustees of the fund are officers or directors of MFS, MFD, and MFSC.
Prior to December 31, 2001, the fund had an unfunded defined benefit plan (“DB plan”) for independent Trustees. As of December 31, 2001, the Board took action to terminate the DB plan with respect to then-current and any future independent Trustees, such that the DB plan covers only certain of those former independent Trustees who retired on or before December 31, 2001. The DB plan resulted in a pension expense of $297 and is included in “Independent Trustees’ compensation” in the Statement of Operations for the year ended October 31, 2023. The liability for deferred retirement benefits payable to those former independent Trustees under the DB plan amounted to $2,945 at October 31, 2023, and is included in “Payable for independent Trustees’ compensation” in the Statement of Assets and Liabilities. The deferred retirement benefits compensation fee is accrued daily and paid monthly.
Notes to Financial Statements - continued
Other — The fund invests in the MFS Institutional Money Market Portfolio which is managed by MFS and seeks current income consistent with preservation of capital and liquidity. This money market fund does not pay a management fee to MFS but does incur investment and operating costs.
During the year ended October 31, 2023, pursuant to a policy adopted by the Board of Trustees and designed to comply with Rule 17a-7 under the Investment Company Act of 1940 (the “Act”) and relevant guidance, the fund engaged in purchase and sale transactions with funds and accounts for which MFS serves as investment adviser or sub-adviser (“cross-trades”) which amounted to $3,333,061 and $1,444,838, respectively. The sales transactions resulted in net realized gains (losses) of $1,044,593.
(4) Portfolio Securities
For the year ended October 31, 2023, purchases and sales of investments, other than short-term obligations, aggregated $211,303,113 and $620,058,560, respectively.
(5) Shares of Beneficial Interest
The fund's Declaration of Trust permits the Trustees to issue an unlimited number of full and fractional shares of beneficial interest. Transactions in fund shares were as follows:
| | Year ended
10/31/23 | | Year ended
10/31/22 |
| | Shares | Amount | | Shares | Amount |
| Shares sold | | | | | |
| Class A | 1,227,799 | $57,549,982 | | 1,598,114 | $83,819,854 |
| Class B | 4,783 | 190,941 | | 723 | 36,283 |
| Class C | 96,909 | 3,831,635 | | 129,420 | 5,937,150 |
| Class I | 3,500,747 | 170,322,941 | | 4,668,176 | 247,307,932 |
| Class R1 | 1,957 | 80,231 | | 7,916 | 345,974 |
| Class R2 | 68,253 | 3,103,653 | | 121,943 | 6,225,015 |
| Class R3 | 236,317 | 11,088,509 | | 352,981 | 18,279,571 |
| Class R4 | 158,710 | 7,523,626 | | 204,357 | 10,632,175 |
| Class R6 | 3,188,324 | 155,442,861 | | 4,027,793 | 214,466,893 |
| | 8,483,799 | $409,134,379 | | 11,111,423 | $587,050,847 |
Notes to Financial Statements - continued
| | Year ended
10/31/23 | | Year ended
10/31/22 |
| | Shares | Amount | | Shares | Amount |
Shares issued to shareholders
in reinvestment of distributions | | | | | |
| Class A | 1,160,093 | $52,401,412 | | 684,451 | $39,129,987 |
| Class B | 16,253 | 658,392 | | 13,838 | 717,887 |
| Class C | 158,815 | 6,071,575 | | 114,666 | 5,642,648 |
| Class I | 1,595,642 | 74,420,734 | | 972,259 | 57,246,629 |
| Class R1 | 3,047 | 120,143 | | 2,159 | 109,269 |
| Class R2 | 49,186 | 2,146,951 | | 31,891 | 1,766,786 |
| Class R3 | 128,005 | 5,734,624 | | 76,992 | 4,368,531 |
| Class R4 | 138,049 | 6,259,160 | | 83,542 | 4,793,659 |
| Class R6 | 1,401,301 | 65,370,701 | | 1,012,072 | 59,611,019 |
| | 4,650,391 | $213,183,692 | | 2,991,870 | $173,386,415 |
| Shares reacquired | | | | | |
| Class A | (2,274,823) | $(106,529,462) | | (2,242,147) | $(115,135,541) |
| Class B | (70,451) | (2,969,780) | | (109,056) | (5,147,616) |
| Class C | (654,700) | (26,003,459) | | (687,244) | (30,353,116) |
| Class I | (6,935,650) | (337,880,178) | | (5,553,460) | (291,363,232) |
| Class R1 | (11,212) | (434,867) | | (17,376) | (780,110) |
| Class R2 | (156,128) | (7,077,120) | | (223,278) | (11,264,562) |
| Class R3 | (717,381) | (33,399,644) | | (440,771) | (22,596,576) |
| Class R4 | (979,885) | (46,422,945) | | (312,394) | (15,826,474) |
| Class R6 | (5,262,278) | (256,062,505) | | (10,664,146) | (592,516,741) |
| | (17,062,508) | $(816,779,960) | | (20,249,872) | $(1,084,983,968) |
| Net change | | | | | |
| Class A | 113,069 | $3,421,932 | | 40,418 | $7,814,300 |
| Class B | (49,415) | (2,120,447) | | (94,495) | (4,393,446) |
| Class C | (398,976) | (16,100,249) | | (443,158) | (18,773,318) |
| Class I | (1,839,261) | (93,136,503) | | 86,975 | 13,191,329 |
| Class R1 | (6,208) | (234,493) | | (7,301) | (324,867) |
| Class R2 | (38,689) | (1,826,516) | | (69,444) | (3,272,761) |
| Class R3 | (353,059) | (16,576,511) | | (10,798) | 51,526 |
| Class R4 | (683,126) | (32,640,159) | | (24,495) | (400,640) |
| Class R6 | (672,653) | (35,248,943) | | (5,624,281) | (318,438,829) |
| | (3,928,318) | $(194,461,889) | | (6,146,579) | $(324,546,706) |
Effective June 1, 2019, purchases of the fund’s Class B shares were closed to new and existing investors subject to certain exceptions. Effective September 29, 2023, purchases of Class R1 and Class R2 shares were closed to new eligible investors.
Notes to Financial Statements - continued
(6) Line of Credit
The fund and certain other funds managed by MFS participate in a $1.45 billion unsecured committed line of credit of which $1.2 billion is reserved for use by the fund and certain other MFS U.S. funds. The line of credit is provided by a syndicate of banks under a credit agreement. Borrowings may be made for temporary financing needs. Interest is charged to each fund, based on its borrowings, generally at a rate equal to the highest of 1) Daily Simple SOFR (Secured Overnight Financing Rate) plus 0.10%, 2) the Federal Funds Effective Rate, or 3) the Overnight Bank Funding Rate, each plus an agreed upon spread. A commitment fee, based on the average daily unused portion of the committed line of credit, is allocated among the participating funds. The line of credit expires on March 14, 2024 unless extended or renewed. In addition, the fund and other funds managed by MFS have established unsecured uncommitted borrowing arrangements with certain banks for temporary financing needs. Interest is charged to each fund, based on its borrowings, at rates equal to customary reference rates plus an agreed upon spread. For the year ended October 31, 2023, the fund’s commitment fee and interest expense were $13,982 and $0, respectively, and are included in “Miscellaneous” expense in the Statement of Operations.
(7) Investments in Affiliated Issuers
An affiliated issuer may be considered one in which the fund owns 5% or more of the outstanding voting securities, or a company which is under common control. For the purposes of this report, the following were affiliated issuers:
| Affiliated Issuers | Beginning
Value | Purchases | Sales
Proceeds | Realized
Gain
(Loss) | Change in
Unrealized
Appreciation or
Depreciation | Ending
Value |
| MFS Institutional Money Market Portfolio | $8,194,314 | $393,720,608 | $392,949,864 | $6,776 | $892 | $8,972,726 |
| Affiliated Issuers | Dividend
Income | Capital Gain
Distributions |
| MFS Institutional Money Market Portfolio | $511,087 | $— |
Report of Independent Registered Public Accounting Firm
To the Shareholders of MFS Global Equity Fund and the Board of Trustees of
MFS Series Trust VI
Opinion on the Financial Statements
We have audited the accompanying statement of assets and liabilities of MFS Global Equity Fund (the “Fund”) (one of the funds constituting MFS Series Trust VI (the “Trust”)), including the portfolio of investments, as of October 31, 2023, and the related statement of operations for the year then ended, the statements of changes in net assets for each of the two years in the period then ended, the financial highlights for each of the five years in the period then ended and the related notes (collectively referred to as the “financial statements”). In our opinion, the financial statements present fairly, in all material respects, the financial position of the Fund (one of the funds constituting MFS Series Trust VI) at October 31, 2023, the results of its operations for the year then ended, the changes in its net assets for each of the two years in the period then ended and its financial highlights for each of the five years in the period then ended, in conformity with U.S. generally accepted accounting principles.
Basis for Opinion
These financial statements are the responsibility of the Trust’s management. Our responsibility is to express an opinion on the Fund’s financial statements based on our audits. We are a public accounting firm registered with the Public Company Accounting Oversight Board (United States) (“PCAOB”) and are required to be independent with respect to the Trust in accordance with the U.S. federal securities laws and the applicable rules and regulations of the Securities and Exchange Commission and the PCAOB.
We conducted our audits in accordance with the standards of the PCAOB. Those standards require that we plan and perform the audit to obtain reasonable assurance about whether the financial statements are free of material misstatement, whether due to error or fraud. The Trust is not required to have, nor were we engaged to perform, an audit of the Trust’s internal control over financial reporting. As part of our audits, we are required to obtain an understanding of internal control over financial reporting but not for the purpose of expressing an opinion on the effectiveness of the Trust’s internal control over financial reporting. Accordingly, we express no such opinion.
Report of Independent Registered Public Accounting Firm – continued
Our audits included performing procedures to assess the risks of material misstatement of the financial statements, whether due to error or fraud, and performing procedures that respond to those risks. Such procedures included examining, on a test basis, evidence regarding the amounts and disclosures in the financial statements. Our procedures included confirmation of securities owned as of October 31, 2023, by correspondence with the custodian, brokers and others; when replies were not received from brokers and others, we performed other auditing procedures. Our audits also included evaluating the accounting principles used and significant estimates made by management, as well as evaluating the overall presentation of the financial statements. We believe that our audits provide a reasonable basis for our opinion.
We have served as the auditor of one or more MFS investment companies since 1993.
Boston, Massachusetts
December 14, 2023
Trustees and Officers — Identification and Background
The Trustees and Officers of the Trust, as of December 1, 2023, are listed below, together with their principal occupations during the past five years. (Their titles may have varied during that period.) The address of each Trustee and Officer is 111 Huntington Avenue, Boston, Massachusetts 02199-7618.
| Name, Age | | Position(s) Held with Fund | | Trustee/Officer Since(h) | | Number of MFS Funds overseen by the Trustee | | Principal Occupations During
the Past Five Years | | Other Directorships During
the Past Five Years (j) |
| INTERESTED TRUSTEE | | | | | | | | | | |
Michael W. Roberge (k)
(age 57) | | Trustee | | January 2021 | | 136 | | Massachusetts Financial Services Company, Chairman (since January 2021); Chief Executive Officer (since January 2017); Director; Chairman of the Board (since January 2022); President (until December 2018); Chief Investment Officer (until December 2018) | | N/A |
| INDEPENDENT TRUSTEES | | | | | | | | | | |
John P. Kavanaugh
(age 69) | | Trustee and Chair of Trustees | | January 2009 | | 136 | | Private investor | | N/A |
Steven E. Buller
(age 72) | | Trustee | | February 2014 | | 136 | | Private investor | | N/A |
John A. Caroselli
(age 69) | | Trustee | | March 2017 | | 136 | | Private investor; JC Global Advisors, LLC (management consulting), President (since 2015) | | N/A |
Maureen R. Goldfarb
(age 68) | | Trustee | | January 2009 | | 136 | | Private investor | | N/A |
Peter D. Jones
(age 68) | | Trustee | | January 2019 | | 136 | | Private investor | | N/A |
James W. Kilman, Jr.
(age 62) | | Trustee | | January 2019 | | 136 | | Burford Capital Limited (finance and investment management), Senior Advisor (since May 3, 2021), Chief Financial Officer (2019 - May 2, 2021); KielStrand Capital LLC (family office), Chief Executive Officer (since 2016) | | Alpha-En Corporation, Director (2016-2019) |
Trustees and Officers - continued
| Name, Age | | Position(s) Held with Fund | | Trustee/Officer Since(h) | | Number of MFS Funds overseen by the Trustee | | Principal Occupations During
the Past Five Years | | Other Directorships During
the Past Five Years (j) |
Clarence Otis, Jr.
(age 67) | | Trustee | | March 2017 | | 136 | | Private investor | | VF Corporation, Director; Verizon Communications, Inc., Director; The Travelers Companies, Director |
Maryanne L. Roepke
(age 67) | | Trustee | | May 2014 | | 136 | | Private investor | | N/A |
Laurie J. Thomsen
(age 66) | | Trustee | | March 2005 | | 136 | | Private investor | | The Travelers Companies, Director; Dycom Industries, Inc., Director |
| Name, Age | | Position(s) Held with
Fund | | Trustee/Officer Since(h) | | Number of MFS Funds for which the Person is an Officer | | Principal Occupations During
the Past Five Years |
| OFFICERS | | | | | | | | |
Christopher R. Bohane (k)
(age 49) | | Assistant Secretary and Assistant Clerk | | July 2005 | | 136 | | Massachusetts Financial Services Company, Senior Vice President and Senior Managing Counsel |
Kino Clark (k)
(age 55) | | Assistant Treasurer | | January 2012 | | 136 | | Massachusetts Financial Services Company, Vice President |
John W. Clark, Jr. (k)
(age 56) | | Assistant Treasurer | | April 2017 | | 136 | | Massachusetts Financial Services Company, Vice President |
David L. DiLorenzo (k)
(age 55) | | President | | July 2005 | | 136 | | Massachusetts Financial Services Company, Senior Vice President |
Heidi W. Hardin (k)
(age 56) | | Secretary and Clerk | | April 2017 | | 136 | | Massachusetts Financial Services Company, Executive Vice President and General Counsel |
Brian E. Langenfeld (k)
(age 50) | | Assistant Secretary and Assistant Clerk | | June 2006 | | 136 | | Massachusetts Financial Services Company, Vice President and Managing Counsel |
Trustees and Officers - continued
| Name, Age | | Position(s) Held with
Fund | | Trustee/Officer Since(h) | | Number of MFS Funds for which the Person is an Officer | | Principal Occupations During
the Past Five Years |
Rosa E. Licea-Mailloux (k)
(age 47) | | Chief Compliance Officer | | March 2022 | | 136 | | Massachusetts Financial Services Company, Vice President (since 2018); Director of Corporate Compliance (2018-2021), Senior Director Compliance (2021-2022), Senior Managing Director of North American Compliance & Chief Compliance Officer (since March 2022); Natixis Investment Managers (investment management), Funds Chief Compliance Officer, Deputy General Counsel & Senior Vice President (until 2018) |
Amanda S. Mooradian (k)
(age 44) | | Assistant Secretary and Assistant Clerk | | September 2018 | | 136 | | Massachusetts Financial Services Company, Assistant Vice President and Senior Counsel |
Susan A. Pereira (k)
(age 53) | | Assistant Secretary and Assistant Clerk | | July 2005 | | 136 | | Massachusetts Financial Services Company, Vice President and Managing Counsel |
Kasey L. Phillips (k)
(age 52) | | Assistant Treasurer | | September 2012 | | 136 | | Massachusetts Financial Services Company, Vice President |
Matthew A. Stowe (k)
(age 49) | | Assistant Secretary and Assistant Clerk | | October 2014 | | 136 | | Massachusetts Financial Services Company, Vice President and Senior Managing Counsel |
William B. Wilson (k)
(age 41) | | Assistant Secretary and Assistant Clerk | | October 2022 | | 136 | | Massachusetts Financial Services Company, Assistant Vice President and Senior Counsel |
James O. Yost (k)
(age 63) | | Treasurer | | September 1990 | | 136 | | Massachusetts Financial Services Company, Senior Vice President |
| (h) | Date first appointed to serve as Trustee/Officer of an MFS Fund. Each Trustee has served continuously since appointment unless indicated otherwise. From January 2012 through December 2016, Messrs. DiLorenzo and Yost served as Treasurer and Deputy Treasurer of the Funds, respectively. |
| (j) | Directorships or trusteeships of companies required to report to the Securities and Exchange Commission (i.e., “public companies”). |
| (k) | “Interested person” of the Trust within the meaning of the Investment Company Act of 1940 (referred to as the 1940 Act), which is the principal federal law governing investment companies like the fund, as a result of a position with MFS. The address of MFS is 111 Huntington Avenue, Boston, Massachusetts 02199-7618. |
Trustees and Officers - continued
Each Trustee (other than Messrs. Jones, Kilman and Roberge) has been elected by shareholders and each Trustee and Officer holds office until his or her successor is chosen and qualified or until his or her earlier death, resignation, retirement or removal. Mr. Roberge became a Trustee of the Funds on January 1, 2021 and Messrs. Jones and Kilman became Trustees of the Funds on January 1, 2019. The Trust does not hold annual meetings for the purpose of electing Trustees, and Trustees are not elected for fixed terms. Under the terms of the Board's retirement policy, an Independent Trustee shall retire at the end of the calendar year in which he or she reaches the earlier of 75 years of age or 15 years of service on the Board (or, in the case of any Independent Trustee who joined the Board prior to 2015, 20 years of service on the Board).
Messrs. Buller, Kilman and Otis and Ms. Roepke are members of the Trust’s Audit Committee.
Each of the Interested Trustees and certain Officers hold comparable officer positions with certain affiliates of MFS.
The Statement of Additional Information for a Fund includes further information about the Trustees and is available without charge upon request by calling 1-800-225-2606.
| Investment Adviser | Custodian |
Massachusetts Financial Services Company
111 Huntington Avenue
Boston, MA 02199-7618 | JPMorgan Chase Bank, NA
4 Metrotech Center
New York, NY 11245 |
| Distributor | Independent Registered Public Accounting Firm |
MFS Fund Distributors, Inc.
111 Huntington Avenue
Boston, MA 02199-7618 | Ernst & Young LLP
200 Clarendon Street
Boston, MA 02116 |
| Portfolio Manager(s) | |
Ryan McAllister
Roger Morley | |
Board Review of Investment Advisory Agreement
MFS Global Equity Fund
The Investment Company Act of 1940 requires that both the full Board of Trustees and a majority of the non-interested (“independent”) Trustees, voting separately, annually approve the continuation of the Fund’s investment advisory agreement with MFS. The Trustees consider matters bearing on the Fund and its advisory arrangements at their meetings throughout the year, including a review of performance data at each regular meeting. In addition, the independent Trustees met several times over the course of three months beginning in May and ending in July, 2023 (“contract review meetings”) for the specific purpose of considering whether to approve the continuation of the investment advisory agreement for the Fund and the other investment companies that the Board oversees (the “MFS Funds”). The independent Trustees were assisted in their evaluation of the Fund’s investment advisory agreement by independent legal counsel, from whom they received separate legal advice and with whom they met separately from MFS during various contract review meetings. The independent Trustees were also assisted in this process by an independent consultant who was retained by and reported to the independent Trustees.
In connection with their deliberations regarding the continuation of the investment advisory agreement, the Trustees, including the independent Trustees, considered such information and factors as they believed, in light of the legal advice furnished to them and their own business judgment, to be relevant. The investment advisory agreement for the Fund was considered separately, although the Trustees also took into account the common interests of all MFS Funds in their review. As described below, the Trustees considered the nature, quality, and extent of the various investment advisory, administrative, and shareholder services performed by MFS under the existing investment advisory agreement and other arrangements with the Fund.
In connection with their contract review meetings, the Trustees received and relied upon materials that included, among other items: (i) information provided by Broadridge Financial Solutions, Inc. (“Broadridge”), an independent third party, on the investment performance of the Fund for various time periods ended December 31, 2022 and the investment performance of a group of funds with substantially similar investment classifications/objectives (the “Broadridge performance universe”), (ii) information provided by Broadridge on the Fund’s advisory fees and other expenses and the advisory fees and other expenses of comparable funds identified by Broadridge as well as all other funds in the same investment classification/category (the “Broadridge expense group and universe”), (iii) information provided by MFS on the advisory fees of portfolios of other clients of MFS, including institutional separate accounts and other clients, (iv) information as to whether and to what extent applicable expense waivers, reimbursements or fee “breakpoints” are observed for the Fund, (v) information regarding MFS’ financial results and financial condition, including MFS’ and certain of its affiliates’ estimated profitability from services performed for the Fund and the MFS Funds as a whole, and compared to MFS’ institutional business, (vi) MFS’ views regarding the outlook for the mutual fund industry and the strategic business plans of MFS, (vii) descriptions of various functions performed by MFS for the Funds, such as compliance monitoring and portfolio trading practices, and (viii) information regarding the overall organization of MFS, including information about
Board Review of Investment Advisory Agreement - continued
MFS’ senior management and other personnel providing investment advisory, administrative and other services to the Fund and the other MFS Funds. The comparative performance, fee and expense information prepared and provided by Broadridge was not independently verified and the independent Trustees did not independently verify any information provided to them by MFS.
The Trustees’ conclusion as to the continuation of the investment advisory agreement was based on a comprehensive consideration of all information provided to the Trustees and not the result of any single factor. Some of the factors that figured particularly in the Trustees’ deliberations are described below, although individual Trustees may have evaluated the information presented differently from one another, giving different weights to various factors. It is also important to recognize that the fee arrangements for the Fund and other MFS Funds are the result of years of review and discussion between the independent Trustees and MFS, that certain aspects of such arrangements may receive greater scrutiny in some years than in others, and that the Trustees’ conclusions may be based, in part, on their consideration of these same arrangements during the course of the year and in prior years.
Based on information provided by Broadridge and MFS, the Trustees reviewed the Fund’s total return investment performance as well as the Broadridge performance universe over various time periods. The Trustees placed particular emphasis on the total return performance of the Fund’s Class I shares in comparison to the performance of funds in its Broadridge performance universe over the five-year period ended December 31, 2022, which the Trustees believed was a long enough period to reflect differing market conditions. The total return performance of the Fund’s Class I shares was in the 2nd quintile relative to the other funds in the universe for this five-year period (the 1st quintile being the best performers and the 5th quintile being the worst performers). The total return performance of the Fund’s Class I shares was in the 3rd quintile for the one-year period and the 4th quintile for the three-year period ended December 31, 2022 relative to the Broadridge performance universe. Because of the passage of time, these performance results may differ from the performance results for more recent periods, including those shown elsewhere in this report.
In the course of their deliberations, the Trustees took into account information provided by MFS in connection with the contract review meetings, as well as during investment review meetings conducted with portfolio management personnel during the course of the year regarding the Fund’s performance. After reviewing these and related factors, the Trustees concluded, within the context of their overall conclusions regarding the investment advisory agreement, that they were satisfied with MFS’ responses and efforts relating to investment performance.
In assessing the reasonableness of the Fund’s advisory fee, the Trustees considered, among other information, the Fund’s advisory fee and the total expense ratio of the Fund’s Class I shares as a percentage of average daily net assets and the advisory fee and total expense ratios of the Broadridge expense group based on information provided by Broadridge. The Trustees considered that, according to the data provided by Broadridge (which takes into account any fee reductions or expense limitations that were in effect during the Fund’s last fiscal year), the Fund’s effective advisory fee rate was approximately at the Broadridge expense group median and the Fund’s total expense ratio was higher than the Broadridge expense group median.
Board Review of Investment Advisory Agreement - continued
The Trustees also considered the advisory fees charged by MFS to any institutional separate accounts advised by MFS (“separate accounts”) and unaffiliated investment companies for which MFS serves as subadviser (“subadvised funds”) that have comparable investment strategies to the Fund, if any. In comparing these fees, the Trustees considered information provided by MFS as to the generally broader scope of services provided by MFS to the Fund, as well as the more extensive regulatory burdens imposed on MFS in managing the Fund, in comparison to separate accounts and subadvised funds. The Trustees also considered the higher demands placed on MFS’ investment personnel and trading infrastructure as a result of the daily cash in-flows and out-flows of the Fund in comparison to separate accounts.
The Trustees also considered whether the Fund may benefit from any economies of scale in the management of the Fund in the event of growth in assets of the Fund and/or growth in assets of the MFS Funds as a whole. They noted that the Fund’s advisory fee rate schedule is subject to contractual breakpoints that reduce the Fund’s advisory fee rate on average daily net assets over $1 billion, $2 billion and $5 billion. The Trustees also noted that MFS has agreed in writing to waive a portion of the management fees of certain MFS Funds, including the Fund, if the total combined assets of certain funds within the MFS Funds’ complex increase above agreed upon thresholds (the “group fee waiver”), enabling the Fund’s shareholders to share in the benefits from any economies of scale at the complex level. The group fee waiver is reviewed and renewed annually between the Board and MFS. The Trustees concluded that the breakpoints and the group fee waiver were sufficient to allow the Fund to benefit from economies of scale as its assets and overall complex assets grow.
The Trustees also considered information prepared by MFS relating to MFS’ costs and profits with respect to the Fund, the MFS Funds considered as a group, and other investment companies and accounts advised by MFS, as well as MFS’ methodologies used to determine and allocate its costs to the MFS Funds, the Fund and other accounts and products for purposes of estimating profitability.
After reviewing these and other factors described herein, the Trustees concluded, within the context of their overall conclusions regarding the investment advisory agreement, that the advisory fees charged to the Fund represent reasonable compensation in light of the services being provided by MFS to the Fund.
In addition, the Trustees considered MFS’ resources and related efforts to continue to retain, attract and motivate capable personnel to serve the Fund. The Trustees also considered current and developing conditions in the financial services industry, including the presence of large and well-capitalized companies which are spending, and appear to be prepared to continue to spend, substantial sums to engage personnel and to provide services to competing investment companies. In this regard, the Trustees also considered the financial resources of MFS and its ultimate parent, Sun Life Financial Inc. The Trustees also considered the advantages and possible disadvantages to the Fund of having an adviser that also serves other investment companies as well as other accounts.
The Trustees also considered the nature, quality, cost, and extent of administrative, transfer agency, and distribution services provided to the Fund by MFS and its affiliates under agreements and plans other than the investment advisory agreement, including any 12b-1 fees the Fund pays to MFS Fund Distributors, Inc., an affiliate of MFS. The Trustees also considered the nature, extent and quality of certain other services
Board Review of Investment Advisory Agreement - continued
MFS performs or arranges for on the Fund’s behalf, which may include securities lending programs, directed expense payment programs, class action recovery programs, and MFS’ interaction with third-party service providers, principally custodians and sub-custodians. The Trustees concluded that the various non-advisory services provided by MFS and its affiliates on behalf of the Fund were satisfactory.
The Trustees considered so-called “fall-out benefits” to MFS such as reputational value derived from serving as investment manager to the MFS Funds. The Trustees also considered that MFS discontinued its historic practice of obtaining investment research from portfolio brokerage commissions paid by certain MFS Funds effective January 2018, and directly pays or voluntarily reimburses a Fund, if applicable, for the costs of external research acquired through the use of the Fund’s portfolio brokerage commissions.
Based on their evaluation of factors that they deemed to be material, including those factors described above, the Board of Trustees, including the independent Trustees, concluded that the Fund’s investment advisory agreement with MFS should be continued for an additional one-year period, commencing August 1, 2023.
Proxy Voting Policies and Information
MFS votes proxies on behalf of the fund pursuant to proxy voting policies and procedures that are available without charge, upon request, by calling 1-800-225-2606, by visiting mfs.com/proxyvoting, or by visiting the SEC’s Web site at http://www.sec.gov.
Information regarding how the fund voted proxies relating to portfolio securities during the most recent twelve-month period ended June 30 is available by August 31 of each year without charge by visiting mfs.com/proxyvoting, or by visiting the SEC’s Web site at http://www.sec.gov.
Quarterly Portfolio Disclosure
The fund files a complete schedule of portfolio holdings with the SEC for the first and third quarters of each fiscal year as an exhibit to its reports on Form N-PORT. The fund's Form N-PORT reports are available on the SEC's Web site at http://www.sec.gov. A shareholder can obtain the portfolio holdings report for the first and third quarters of the fund's fiscal year at mfs.com/openendfunds by choosing the fund's name and then scrolling to the “Resources” section and clicking on the “Prospectus and Reports” tab.
Further Information
From time to time, MFS may post important information about the fund or the MFS Funds on the MFS Web site (mfs.com). This information is available at https://www.mfs.com/announcements or at mfs.com/openendfunds by choosing the fund’s name and then scrolling to the “Resources” section and clicking on the “Announcements” tab, if any.
Information About Fund Contracts and Legal Claims
The fund has entered into contractual arrangements with an investment adviser, administrator, distributor, shareholder servicing agent, and custodian who each provide services to the fund. Unless expressly stated otherwise, shareholders are not parties to, or intended beneficiaries of these contractual arrangements, and these contractual arrangements are not intended to create any shareholder right to enforce them against the service providers or to seek any remedy under them against the service providers, either directly or on behalf of the fund.
Under the Trust’s By-Laws and Declaration of Trust, any claims asserted against or on behalf of the MFS Funds, including claims against Trustees and Officers, must be brought in state and federal courts located within the Commonwealth of Massachusetts.
Federal Tax Information (unaudited)
The fund will notify shareholders of amounts for use in preparing 2023 income tax forms in January 2024. The following information is provided pursuant to provisions of the Internal Revenue Code.
The fund designates the maximum amount allowable as qualified dividend income eligible to be taxed at the same rate as long-term capital gain.
The fund designates $258,874,000 as capital gain dividends paid during the fiscal year.
For corporate shareholders, 93.87% of the ordinary income dividends paid during the prior calendar year qualify for the corporate dividends received deduction.
Federal Tax Information (unaudited) - continued
Income derived from foreign sources was $34,537,491. The fund intends to pass through foreign tax credits of $678,214 for the fiscal year.
| FACTS | WHAT DOES MFS DO WITH YOUR PERSONAL INFORMATION? |
| Why? | Financial companies choose how they share your personal information. Federal law gives consumers the right to limit some but not all sharing. Federal law also requires us to tell you how we collect, share, and protect your personal information. Please read this notice carefully to understand what we do. |
| What? | The types of personal information we collect and share depend on the product or service you have with us. This information can include: |
| • Social Security number and account balances |
| • Account transactions and transaction history |
| • Checking account information and wire transfer instructions |
| When you are no longer our customer, we continue to share your information as described in this notice. |
| How? | All financial companies need to share customers' personal information to run their everyday business. In the section below, we list the reasons financial companies can share their customers' personal information; the reasons MFS chooses to share; and whether you can limit this sharing. |
Reasons we can share your
personal information | Does MFS share? | Can you limit
this sharing? |
For our everyday business purposes –
such as to process your transactions, maintain your
account(s), respond to court orders and legal
investigations, or report to credit bureaus | Yes | No |
For our marketing purposes –
to offer our products and services to you | No | We don't share |
For joint marketing with other
financial companies | No | We don't share |
For our affiliates' everyday business purposes –
information about your transactions and experiences | No | We don't share |
For our affiliates' everyday business purposes –
information about your creditworthiness | No | We don't share |
| For nonaffiliates to market to you | No | We don't share |
| Questions? | Call 800-225-2606 or go to mfs.com. |
| Who we are |
| Who is providing this notice? | MFS Funds, MFS Investment Management, MFS Institutional Advisors, Inc., and MFS Heritage Trust Company. |
| What we do |
How does MFS
protect my personal
information? | To protect your personal information from unauthorized access and use, we use security measures that comply with federal law. These measures include procedural, electronic, and physical safeguards for the protection of the personal information we collect about you. |
How does MFS
collect my personal
information? | We collect your personal information, for example, when you |
| • open an account or provide account information |
| • direct us to buy securities or direct us to sell your securities |
| • make a wire transfer |
| We also collect your personal information from others, such as credit bureaus, affiliates, or other companies. |
| Why can't I limit all sharing? | Federal law gives you the right to limit only |
| • sharing for affiliates' everyday business purposes – information about your creditworthiness |
| • affiliates from using your information to market to you |
| • sharing for nonaffiliates to market to you |
| State laws and individual companies may give you additional rights to limit sharing. |
| Definitions |
| Affiliates | Companies related by common ownership or control. They can be financial and nonfinancial companies. |
| • MFS does not share personal information with affiliates, except for everyday business purposes as described on page one of this notice. |
| Nonaffiliates | Companies not related by common ownership or control. They can be financial and nonfinancial companies. |
| • MFS does not share with nonaffiliates so they can market to you. |
| Joint marketing | A formal agreement between nonaffiliated financial companies that together market financial products or services to you. |
| • MFS doesn't jointly market. |
| Other important information |
| If you own an MFS product or receive an MFS service in the name of a third party such as a bank or broker-dealer, their privacy policy may apply to you instead of ours. |
Save paper with eDelivery.
MFS® will send you prospectuses, reports, and proxies directly via e-mail so you will get information faster with less mailbox clutter.
To sign up:
1. Go to mfs.com.
2. Log in via MFS® Access.
3. Select eDelivery.
If you own your MFS fund shares through a financial institution or a retirement plan, MFS® TALK, MFS® Access, or eDelivery may not be available to you.
CONTACT
WEB SITE
mfs.com
MFS TALK
1-800-637-8255
24 hours a day
ACCOUNT SERVICE AND LITERATURE
Shareholders
1-800-225-2606
Financial advisors
1-800-343-2829
Retirement plan services
1-800-637-1255
MAILING ADDRESS
MFS Service Center, Inc.
P.O. Box 219341
Kansas City, MO 64121-9341
OVERNIGHT MAIL
MFS Service Center, Inc.
Suite 219341
430 W 7th Street
Kansas City, MO 64105-1407
Annual Report
October 31, 2023
MFS® Global Total
Return Fund
MFS® Global Total
Return Fund
| 1 |
| 4 |
| 7 |
| 10 |
| 12 |
| 43 |
| 45 |
| 47 |
| 48 |
| 54 |
| 75 |
| 77 |
| 81 |
| 85 |
| 85 |
| 85 |
| 85 |
| 85 |
| 87 |
The report is prepared for the general information of shareholders. It is authorized for distribution to prospective investors only when preceded or accompanied by a current prospectus.
NOT FDIC INSURED • MAY LOSE VALUE • NO BANK GUARANTEE
Portfolio structure (i)
Top ten holdings (i)
| U.S. Treasury Note 2 yr Future - DEC 2023 | 2.7% |
| Euro-Bobl 5 yr Future - Dec 2023 | 2.6% |
| U.S. Treasury Note 10 yr Future - Dec 2023 | 1.8% |
| Government of Japan, 2.4%, 6/20/2028 | 1.4% |
| Comcast Corp., “A” | 1.4% |
| Cigna Group | 1.2% |
| Roche Holding AG | 1.2% |
| Republic of Korea, 1.875%, 6/10/2029 | 1.2% |
| People’s Republic of China, 2.88%, 2/25/2033 | 1.1% |
| Johnson & Johnson | 1.1% |
Composition including fixed income credit quality (a)(i)
| AAA | 4.8% |
| AA | 4.3% |
| A | 10.7% |
| BBB | 10.3% |
| BB | 0.4% |
| CCC | 0.1% |
| U.S. Government | 1.2% |
| Federal Agencies | 4.8% |
| Not Rated | 9.2% |
| Non-Fixed Income | 60.1% |
| Cash & Cash Equivalents | 1.2% |
| Other | (7.1)% |
GICS equity sectors (g)
| Financials | 13.5% |
| Industrials | 8.6% |
| Health Care | 7.9% |
| Consumer Staples | 6.8% |
| Information Technology | 5.9% |
| Energy | 4.9% |
| Communication Services | 4.3% |
| Materials | 3.1% |
| Consumer Discretionary | 2.5% |
| Utilities | 2.3% |
| Real Estate | 0.3% |
Portfolio Composition - continued
Fixed income sectors (i)
| Non-U.S. Government Bonds | 13.1% |
| Investment Grade Corporates | 10.7% |
| Emerging Markets Bonds | 7.6% |
| U.S. Treasury Securities | 5.9% |
| Mortgage-Backed Securities | 4.8% |
| Collateralized Debt Obligations | 1.5% |
| Commercial Mortgage-Backed Securities | 1.2% |
| Municipal Bonds | 0.7% |
| Asset-Backed Securities | 0.5% |
| U.S. Government Agencies (o) | 0.0% |
| High Yield Corporates | (0.2)% |
Issuer country weightings (i)(x)
| United States | 47.1% |
| Japan | 7.2% |
| United Kingdom | 7.1% |
| France | 5.2% |
| Germany | 3.4% |
| Switzerland | 3.3% |
| China | 3.2% |
| South Korea | 3.2% |
| Canada | 2.8% |
| Other Countries | 17.5% |
Currency exposure weightings (i)(y)
| United States Dollar | 52.9% |
| Euro | 17.5% |
| Japanese Yen | 8.6% |
| British Pound Sterling | 5.2% |
| Swiss Franc | 3.4% |
| Canadian Dollar | 2.8% |
| Chinese Renminbi | 2.3% |
| Chinese Yuan Offshore (HK) | 1.3% |
| South Korean Won | 1.3% |
| Other Currencies | 4.7% |
| (a) | For all securities other than those specifically described below, ratings are assigned to underlying securities utilizing ratings from Moody’s, Fitch, and Standard & Poor’s rating agencies and applying the following hierarchy: If all three agencies provide a rating, the middle rating (after dropping the highest and lowest ratings) is assigned; if two of the three agencies rate a security, the lower of the two is assigned. If none of the 3 rating agencies above assign a rating, but the security is rated by DBRS Morningstar, then the DBRS Morningstar rating is assigned. If none of the 4 rating agencies listed above rate the security, but the security is rated by the Kroll Bond Rating Agency (KBRA), then the KBRA rating is assigned. Ratings are shown in the S&P and Fitch scale (e.g., AAA). Securities rated BBB or higher are considered investment grade. All ratings are subject to change. U.S. Government includes securities issued by the U.S. Department of the Treasury. Federal Agencies includes rated and unrated U.S. Agency fixed-income securities, U.S. Agency mortgage-backed securities, and collateralized mortgage obligations of U.S. Agency mortgage-backed securities. |
Not Rated includes fixed income securities and fixed income derivatives that have not been rated by any rating agency. Non-Fixed Income includes equity securities (including convertible bonds and equity derivatives), ETFs and Options on ETFs, and/or commodity-linked derivatives.
The fund may or may not have held all of these instruments on this date. The fund is not rated by these agencies.
Portfolio Composition - continued
| (g) | The Global Industry Classification Standard (GICS®) was developed by and/or is the exclusive property of MSCI, Inc. and S&P Global Market Intelligence Inc. (“S&P Global Market Intelligence”). GICS is a service mark of MSCI and S&P Global Market Intelligence and has been licensed for use by MFS. MFS has applied its own internal sector/industry classification methodology for equity securities and non-equity securities that are unclassified by GICS. |
| (i) | For purposes of this presentation, the components include the value of securities, and reflect the impact of the equivalent exposure of derivative positions, if any. These amounts may be negative from time to time. Equivalent exposure is a calculated amount that translates the derivative position into a reasonable approximation of the amount of the underlying asset that the portfolio would have to hold at a given point in time to have the same price sensitivity that results from the portfolio’s ownership of the derivative contract. When dealing with derivatives, equivalent exposure is a more representative measure of the potential impact of a position on portfolio performance than value. The bond component will include any accrued interest amounts. |
| (x) | Represents the portfolio’s exposure to issuer countries as a percentage of a portfolio’s net assets. For purposes of this presentation, United States includes Cash & Cash Equivalents and Other. |
| (y) | Represents the portfolio’s exposure to a particular currency as a percentage of a portfolio's net assets. For purposes of this presentation, United States Dollar includes Cash & Cash Equivalents. |
Where the fund holds convertible bonds, they are treated as part of the equity portion of the portfolio.
Cash & Cash Equivalents includes any cash, investments in money market funds, short-term securities, and other assets less liabilities. Please see the Statement of Assets and Liabilities for additional information related to the fund’s cash position and other assets and liabilities.
Other includes equivalent exposure from currency derivatives and/or any offsets to derivative positions and may be negative.
Percentages are based on net assets as of October 31, 2023.
The portfolio is actively managed and current holdings may be different.
Management Review
Summary of Results
For the twelve months ended October 31, 2023, Class A shares of the MFS Global Total Return Fund (fund) provided a total return of 3.99%, at net asset value. This compares with returns of 10.48% and 1.72% for the fund’s benchmarks, the MSCI World Index (net div) and the Bloomberg Global Aggregate Index (Bloomberg Index), respectively. The fund’s other benchmark, the MFS Global Total Return Blended Index (Blended Index), generated a total return of 7.01%. The Blended Index reflects the blended returns of the equity and fixed income market indices, with percentage allocations to each index designed to resemble the equity and fixed income allocations of the fund. The market indices and related percentage allocations used to compile the Blended Index are set forth in the Performance Summary.
Market Environment
During the reporting period, central banks around the world had to combat the strongest inflationary pressures in four decades, fueled by the global fiscal response to the pandemic, disrupted supply chains and the dislocations to energy markets stemming from the war in Ukraine. Interest rates rose substantially, but the effects of a tighter monetary policy may not have been fully experienced yet, given that monetary policy works with long and variable lags. Strains resulting from the abrupt tightening of monetary policy began to affect some parts of the economy, most acutely among small and regional US banks, which suffered from deposit flight as depositors sought higher yields on their savings. Additionally, activity in the US housing sector has slowed as a result of higher mortgage rates. China’s abandonment of its Zero-COVID policy ushered in a brief uptick in economic activity in the world’s second-largest economy in early 2023, although its momentum soon stalled as the focus turned to the country’s highly indebted property development sector. In developed markets, consumer demand for services remained stronger than the demand for goods.
Policymakers found themselves in the difficult position of trying to restrain inflation without tipping economies into recession. Despite the challenging macroeconomic and geopolitical environment, central banks remained focused on controlling price pressures while also confronting increasing financial stability concerns. Central banks had to juggle achieving their inflation mandates while using macroprudential tools to keep banking systems liquid, a potentially difficult balancing act, and one that suggested that we may be nearing a peak in policy rates.
Against an environment of relatively tight labor markets, tighter global financial conditions and volatile materials prices, investor anxiety appeared to have increased over the potential that corporate profit margins may be past peak for this cycle. That said, signs that supply chains have generally normalized, coupled with low levels of unemployment across developed markets and hopes that inflation levels have peaked, were supportive factors for the macroeconomic backdrop.
Detractors from Performance
Within the equity portion of the fund, an underweight position and stock selection in the information technology sector detracted from the fund's performance relative to the MSCI World Index. Within this sector, the underweight position in computer graphics processor maker NVIDIA held back relative returns. The stock price of NVIDIA
Management Review - continued
climbed as the company reported earnings per share results well above expectations, primarily driven by stronger-than-expected revenue growth within its data center, generative AI, and networking segments. The fund’s underweight position in software giant Microsoft further weakened relative results.
Security selection within the communication services sector held back relative returns. Here, not owning shares of social networking service provider Meta Platforms weakened relative performance. The share price of Meta Platforms rose as the company cited plans to cut costs and invest in artificial intelligence, including adding generative AI to text, image, and video generators across its network of apps, including Facebook and Instagram.
Stock selection within the health care sector also detracted from relative performance, led by the fund’s overweight holdings of pharmaceutical and diagnostic company Roche Holding (Switzerland), diversified medical products maker Johnson & Johnson and crop science and pharmaceuticals company Bayer (Germany). The fund’s out-of-benchmark allocation to global pharmaceutical firm Organon(b) was also among the fund’s top relative detractors for the reporting period.
Stocks in other sectors that weighed on relative results included the fund's overweight positions in financial services provider Charles Schwab and global food company General Mills. Not owning shares of strong-performing internet retailer Amazon.com further dampened the fund’s relative performance.
Within the fixed income portion of the fund, a shorter duration(d) stance to both the U.S. and New Zealand yield curves(y), and the fund’s overweight exposure to the UK yield curve, detracted from performance relative to the Bloomberg Index.
Contributors to Performance
Within the equity portion of the fund, stock selection and an overweight position in the energy sector contributed to the fund's performance relative to the MSCI World Index, led by its overweight position in energy company Eni (Italy). The stock price of Eni appreciated as the company posted above-consensus earnings per share results, driven by strong performance in its gas and power segment. The company also raised its full-year guidance, which further supported the stock.
Security selection within the utilities sector also aided relative results, with the fund’s overweight holding of power and gas company E.ON (Germany) leading the way.
Elsewhere, the fund’s overweight positions in investment management and banking firm UBS (Switzerland), diversified financial services firm Mitsubishi UFJ Financial Group (Japan), global banking group BNP Paribas (France), diversified industrial manufacturer Eaton, cable services provider Comcast and oilfield technologies company Tesco contributed to relative performance. Not owning shares of electric vehicle manufacturer Tesla also benefited the fund’s relative returns. The stock price of Tesla declined as the company reported below-consensus earnings due to higher-than-expected operating expenses. The company also reported a decline in shipments from Tesla China, which reflected a slowdown in production and shipments as the factory prepares for downtime related to upgrades. The fund’s holdings of semiconductor manufacturer Taiwan Semiconductor Manufacturing(b) (Taiwan) further strengthened relative performance.
Management Review - continued
During the reporting period, the fund’s relative currency exposure within the equity portion of the fund, resulting primarily from differences between the fund's and the benchmark's exposures to holdings of securities denominated in foreign currencies, was another contributor to relative performance. All of MFS’ investment decisions are driven by the fundamentals of each individual opportunity and as such, it is common for our funds to have different currency exposure than the benchmark.
Within the fixed income portion of the fund, an overweight allocation to both financial and industrials sector within corporate credit contributed to the fund’s performance relative to the Bloomberg Index. Favorable bond selection within financial and industrials, particularly in “BBB” rated(r) securities, further strengthened relative results. Additionally, yield curve positioning within both Korea and the Eurozone contributed to performance.
Respectfully,
Portfolio Manager(s)
Pilar Gomez-Bravo, Steven Gorham, Andy Li, John Mitchell, Johnathan Munko, Jonathan Sage, David Shindler, Robert Spector, and Erik Weisman
Note to Shareholders: Effective January 20, 2023, John Mitchell was added as a Portfolio Manager and Henry Peabody is no longer a Portfolio Manager of the fund.
| (b) | Security is not a benchmark constituent. |
| (d) | Duration is a measure of how much a bond’s price is likely to fluctuate with general changes in interest rates, e.g., if rates rise 1.00%, a bond with a 5-year duration is likely to lose about 5.00% of its value. |
| (r) | Securities rated “BBB”, “Baa”, or higher are considered investment grade; securities rated “BB”, “Ba”, or below are considered non-investment grade. Ratings are assigned to underlying securities utilizing ratings from Moody's, Fitch, and Standard & Poor's and applying the following hierarchy: If all three agencies provide a rating, the middle rating (after dropping the highest and lowest ratings) is assigned; if two of the three agencies rate a security, the lower of the two is assigned. If none of the 3 rating agencies above assign a rating, but the security is rated by DBRS Morningstar, then the DBRS Morningstar rating is assigned. If none of the 4 rating agencies listed above rate the security, but the security is rated by the Kroll Bond Rating Agency (KBRA), then the KBRA rating is assigned. Ratings are shown in the S&P and Fitch scale (e.g., AAA). For securities that are not rated by any of the rating agencies, the security is considered Not Rated. |
| (y) | A yield curve graphically depicts the yields of different maturity bonds of the same credit quality and type; a normal yield curve is upward sloping, with short-term rates lower than long-term rates. |
The views expressed in this report are those of the portfolio manager(s) only through the end of the period of the report as stated on the cover and do not necessarily reflect the views of MFS or any other person in the MFS organization. These views are subject to change at any time based on market or other conditions, and MFS disclaims any responsibility to update such views. These views may not be relied upon as investment advice or an indication of trading intent on behalf of any MFS portfolio. References to specific securities are not recommendations of such securities, and may not be representative of any MFS portfolio’s current or future investments.
Performance Summary THROUGH 10/31/23
The following chart illustrates a representative class of the fund’s historical performance in comparison to its benchmark(s). Performance results include the deduction of the maximum applicable sales charge and reflect the percentage change in net asset value, including reinvestment of dividends and capital gains distributions. The performance of other share classes will be greater than or less than that of the class depicted below. Benchmarks are unmanaged and may not be invested in directly. Benchmark returns do not reflect sales charges, commissions or expenses. (See Notes to Performance Summary.)
Performance data shown represents past performance and is no guarantee of future results. Investment return and principal value fluctuate so your shares, when sold, may be worth more or less than the original cost; current performance may be lower or higher than quoted. The performance shown does not reflect the deduction of taxes, if any, that a shareholder would pay on fund distributions or the redemption of fund shares.
Growth of a Hypothetical $10,000 Investment
Performance Summary - continued
Total Returns through 10/31/23
Average annual without sales charge
| Share Class | Class Inception Date | 1-yr | 5-yr | 10-yr |
| A | 9/04/1990 | 3.99% | 3.76% | 3.68% |
| B | 9/07/1993 | 3.25% | 2.98% | 2.90% |
| C | 1/03/1994 | 3.21% | 2.97% | 2.90% |
| I | 1/02/1997 | 4.24% | 4.01% | 3.94% |
| R1 | 4/01/2005 | 3.28% | 2.98% | 2.90% |
| R2 | 10/31/2003 | 3.74% | 3.50% | 3.42% |
| R3 | 4/01/2005 | 4.00% | 3.76% | 3.68% |
| R4 | 4/01/2005 | 4.30% | 4.01% | 3.94% |
| R6 | 6/01/2012 | 4.33% | 4.10% | 4.03% |
Comparative benchmark(s)
| MSCI World Index (net div) (f) | 10.48% | 8.27% | 7.53% |
| MFS Global Total Return Blended Index (f)(w) | 7.01% | 4.49% | 4.39% |
| Bloomberg Global Aggregate Index (f) | 1.72% | (1.64)% | (0.66)% |
Average annual with sales charge
| | | | |
A
With Initial Sales Charge (5.75%) | (1.99)% | 2.54% | 3.07% |
B
With CDSC (Declining over six years from 4% to 0%) (v) | (0.75)% | 2.65% | 2.90% |
C
With CDSC (1% for 12 months) (v) | 2.21% | 2.97% | 2.90% |
CDSC – Contingent Deferred Sales Charge.
Class I, R1, R2, R3, R4, and R6 shares do not have a sales charge.
| (f) | Source: FactSet Research Systems Inc. |
| (v) | Assuming redemption at the end of the applicable period. |
| (w) | The MFS Global Total Return Blended Index (a custom index) was comprised of the following at the beginning and at the end of the reporting period: |
| | 10/31/23 |
| MSCI World Index (net div) | 60% |
| Bloomberg Global Aggregate Index | 40% |
Benchmark Definition(s)
Bloomberg Global Aggregate Index(a) – provides a broad-based measure of the global investment-grade fixed income markets. The three major components of this index are the U.S. Aggregate, the Pan-European Aggregate, and the Asian-Pacific Aggregate Indices. The index also includes Eurodollar and Euro-Yen corporate bonds, Canadian government, agency and corporate securities, and USD investment grade 144A securities.
Performance Summary - continued
MSCI World Index(e) (net div) – a market capitalization-weighted index that is designed to measure equity market performance in the global developed markets.
It is not possible to invest directly in an index.
| (a) | Source: Bloomberg Index Services Limited. BLOOMBERG® is a trademark and service mark of Bloomberg Finance L.P. and its affiliates (collectively “Bloomberg”). Bloomberg or Bloomberg's licensors own all proprietary rights in the Bloomberg Indices. Bloomberg neither approves or endorses this material, or guarantees the accuracy or completeness of any information herein, or makes any warranty, express or implied, as to the results to be obtained therefrom and, to the maximum extent allowed by law, neither shall have any liability or responsibility for injury or damages arising in connection therewith. |
| (e) | Morgan Stanley Capital International (“MSCI”) makes no express or implied warranties or representations and shall have no liability whatsoever with respect to any MSCI data contained herein. The MSCI data may not be further redistributed or used as a basis for other indices or any securities or financial products. This report is not approved, reviewed, or produced by MSCI. |
Notes to Performance Summary
Average annual total return represents the average annual change in value for each share class for the periods presented.
Performance results reflect any applicable expense subsidies and waivers in effect during the periods shown. Without such subsidies and waivers the fund's performance results would be less favorable. Please see the prospectus and financial statements for complete details.
Performance results do not include adjustments made for financial reporting purposes in accordance with U.S. generally accepted accounting principles and may differ from amounts reported in the financial highlights.
From time to time the fund may receive proceeds from litigation settlements, without which performance would be lower.
Expense Table
Fund expenses borne by the shareholders during the period,
May 1, 2023 through October 31, 2023
As a shareholder of the fund, you incur two types of costs: (1) transaction costs, including sales charges (loads) on certain purchase or redemption payments, and (2) ongoing costs, including management fees; distribution and service (12b-1) fees; and other fund expenses. This example is intended to help you understand your ongoing costs (in dollars) of investing in the fund and to compare these costs with the ongoing costs of investing in other mutual funds.
The example is based on an investment of $1,000 invested at the beginning of the period and held for the entire period May 1, 2023 through October 31, 2023.
Actual Expenses
The first line for each share class in the following table provides information about actual account values and actual expenses. You may use the information in this line, together with the amount you invested, to estimate the expenses that you paid over the period. Simply divide your account value by $1,000 (for example, an $8,600 account value divided by $1,000 = 8.6), then multiply the result by the number in the first line under the heading entitled “Expenses Paid During Period” to estimate the expenses you paid on your account during this period.
Hypothetical Example for Comparison Purposes
The second line for each share class in the following table provides information about hypothetical account values and hypothetical expenses based on the fund’s actual expense ratio and an assumed rate of return of 5% per year before expenses, which is not the fund’s actual return. The hypothetical account values and expenses may not be used to estimate the actual ending account balance or expenses you paid for the period. You may use this information to compare the ongoing costs of investing in the fund and other funds. To do so, compare this 5% hypothetical example with the 5% hypothetical examples that appear in the shareholder reports of the other funds.
Please note that the expenses shown in the table are meant to highlight your ongoing costs only and do not reflect any transactional costs, such as sales charges (loads). Therefore, the second line for each share class in the table is useful in comparing ongoing costs only, and will not help you determine the relative total costs of owning different funds. In addition, if these transactional costs were included, your costs would have been higher.
Expense Table - continued
Share
Class | | Annualized
Expense
Ratio | Beginning
Account Value
5/01/23 | Ending
Account Value
10/31/23 | Expenses
Paid During
Period (p)
5/01/23-10/31/23 |
| A | Actual | 1.12% | $1,000.00 | $941.69 | $5.48 |
| Hypothetical (h) | 1.12% | $1,000.00 | $1,019.56 | $5.70 |
| B | Actual | 1.87% | $1,000.00 | $938.05 | $9.13 |
| Hypothetical (h) | 1.87% | $1,000.00 | $1,015.78 | $9.50 |
| C | Actual | 1.87% | $1,000.00 | $938.34 | $9.14 |
| Hypothetical (h) | 1.87% | $1,000.00 | $1,015.78 | $9.50 |
| I | Actual | 0.87% | $1,000.00 | $942.70 | $4.26 |
| Hypothetical (h) | 0.87% | $1,000.00 | $1,020.82 | $4.43 |
| R1 | Actual | 1.87% | $1,000.00 | $938.32 | $9.14 |
| Hypothetical (h) | 1.87% | $1,000.00 | $1,015.78 | $9.50 |
| R2 | Actual | 1.37% | $1,000.00 | $940.29 | $6.70 |
| Hypothetical (h) | 1.37% | $1,000.00 | $1,018.30 | $6.97 |
| R3 | Actual | 1.12% | $1,000.00 | $941.96 | $5.48 |
| Hypothetical (h) | 1.12% | $1,000.00 | $1,019.56 | $5.70 |
| R4 | Actual | 0.87% | $1,000.00 | $942.93 | $4.26 |
| Hypothetical (h) | 0.87% | $1,000.00 | $1,020.82 | $4.43 |
| R6 | Actual | 0.78% | $1,000.00 | $943.14 | $3.82 |
| Hypothetical (h) | 0.78% | $1,000.00 | $1,021.27 | $3.97 |
| (h) | 5% class return per year before expenses. |
| (p) | “Expenses Paid During Period” are equal to each class’s annualized expense ratio, as shown above, multiplied by the average account value over the period, multiplied by 184/365 (to reflect the one-half year period). Expenses paid do not include any applicable sales charges (loads). If these transaction costs had been included, your costs would have been higher. |
Notes to Expense Table
Expense ratios include 0.03% of tax reclaim recovery expenses that are outside of the expense limitation arrangement (See Note 3 of the Notes to Financial Statements).
Portfolio of Investments
10/31/23
The Portfolio of Investments is a complete list of all securities owned by your fund. It is categorized by broad-based asset classes.
| Issuer | | | Shares/Par | Value ($) |
| Common Stocks – 59.3% |
| Aerospace & Defense – 1.3% | |
| General Dynamics Corp. | | 36,424 | $8,789,475 |
| Honeywell International, Inc. | | 20,556 | 3,767,093 |
| L3Harris Technologies, Inc. | | 17,010 | 3,051,764 |
| | | | | $15,608,332 |
| Alcoholic Beverages – 1.3% | |
| Diageo PLC | | 155,648 | $5,898,322 |
| Heineken N.V. | | 42,237 | 3,794,978 |
| Kirin Holdings Co. Ltd. | | 194,900 | 2,733,590 |
| Pernod Ricard S.A. | | 16,912 | 3,006,941 |
| | | | | $15,433,831 |
| Apparel Manufacturers – 0.3% | |
| Compagnie Financiere Richemont S.A. | | 32,965 | $3,892,253 |
| Automotive – 1.3% | |
| Aptiv PLC (a) | | 48,103 | $4,194,582 |
| Bridgestone Corp. | | 50,900 | 1,920,547 |
| Lear Corp. | | 24,384 | 3,164,068 |
| LKQ Corp. | | 104,614 | 4,594,647 |
| Stellantis N.V. | | 95,704 | 1,789,862 |
| Tofas Turk Otomobil Fabriikasi A.S. | | 75,276 | 645,597 |
| | | | | $16,309,303 |
| Biotechnology – 0.1% | |
| Biogen, Inc. (a) | | 2,617 | $621,642 |
| Gilead Sciences, Inc. | | 15,160 | 1,190,667 |
| | | | | $1,812,309 |
| Broadcasting – 0.8% | |
| Omnicom Group, Inc. | | 125,801 | $9,423,753 |
| Brokerage & Asset Managers – 1.6% | |
| Bank of New York Mellon Corp. | | 78,329 | $3,328,983 |
| Cboe Global Markets, Inc. | | 25,067 | 4,108,231 |
| Charles Schwab Corp. | | 185,430 | 9,649,777 |
| CME Group, Inc. | | 12,633 | 2,696,640 |
| | | | | $19,783,631 |
Portfolio of Investments – continued
| Issuer | | | Shares/Par | Value ($) |
| Common Stocks – continued |
| Business Services – 1.8% | |
| Accenture PLC, “A” | | 14,635 | $4,347,912 |
| CGI, Inc. (a) | | 25,024 | 2,415,874 |
| Experian PLC | | 80,301 | 2,442,738 |
| Fidelity National Information Services, Inc. | | 44,549 | 2,187,801 |
| Fiserv, Inc. (a) | | 38,662 | 4,397,802 |
| SCSK Corp. | | 16,700 | 285,928 |
| Secom Co. Ltd. | | 77,800 | 5,410,487 |
| Verisk Analytics, Inc., “A” | | 4,835 | 1,099,286 |
| | | | | $22,587,828 |
| Cable TV – 1.3% | |
| Comcast Corp., “A” | | 401,901 | $16,594,492 |
| Chemicals – 0.5% | |
| Nutrien Ltd. | | 8,901 | $478,058 |
| PPG Industries, Inc. | | 43,198 | 5,303,418 |
| | | | | $5,781,476 |
| Computer Software – 1.0% | |
| Dun & Bradstreet Holdings, Inc. | | 317,860 | $2,784,454 |
| Microsoft Corp. | | 27,432 | 9,275,033 |
| | | | | $12,059,487 |
| Computer Software - Systems – 2.7% | |
| Amadeus IT Group S.A. | | 39,006 | $2,228,494 |
| Capgemini | | 29,675 | 5,259,890 |
| Fujitsu Ltd. | | 35,400 | 4,582,924 |
| Hitachi Ltd. | | 125,300 | 7,962,347 |
| Hon Hai Precision Industry Co. Ltd. | | 1,074,000 | 3,208,276 |
| Lenovo Group Ltd. | | 1,620,000 | 1,893,681 |
| Samsung Electronics Co. Ltd. | | 150,635 | 7,511,516 |
| Seagate Technology Holdings PLC | | 8,816 | 601,692 |
| | | | | $33,248,820 |
| Construction – 1.4% | |
| Anhui Conch Cement Co. Ltd. | | 717,000 | $1,795,751 |
| Compagnie de Saint-Gobain | | 22,490 | 1,228,457 |
| Heidelberg Materials AG | | 29,626 | 2,146,661 |
| Masco Corp. | | 116,001 | 6,042,492 |
| Stanley Black & Decker, Inc. | | 37,348 | 3,176,447 |
| Techtronic Industries Co. Ltd. | | 197,000 | 1,786,645 |
| Zhejiang Supor Co. Ltd. | | 98,300 | 673,369 |
| | | | | $16,849,822 |
Portfolio of Investments – continued
| Issuer | | | Shares/Par | Value ($) |
| Common Stocks – continued |
| Consumer Products – 1.6% | |
| Colgate-Palmolive Co. | | 62,992 | $4,731,959 |
| Kenvue, Inc. | | 205,033 | 3,813,614 |
| Kimberly-Clark Corp. | | 60,694 | 7,261,430 |
| Reckitt Benckiser Group PLC | | 66,624 | 4,466,449 |
| | | | | $20,273,452 |
| Electrical Equipment – 1.5% | |
| Johnson Controls International PLC | | 137,916 | $6,760,642 |
| Legrand S.A. | | 34,602 | 2,988,803 |
| Mitsubishi Electric Corp. | | 64,900 | 756,085 |
| Schneider Electric SE | | 52,892 | 8,133,453 |
| | | | | $18,638,983 |
| Electronics – 2.7% | |
| Analog Devices, Inc. | | 6,805 | $1,070,631 |
| Broadcom, Inc. | | 967 | 813,605 |
| Intel Corp. | | 155,050 | 5,659,325 |
| Kyocera Corp. | | 95,200 | 4,701,786 |
| Lam Research Corp. | | 4,132 | 2,430,525 |
| Novatek Microelectronics Corp. | | 99,000 | 1,395,432 |
| NVIDIA Corp. | | 2,763 | 1,126,751 |
| NXP Semiconductors N.V. | | 36,129 | 6,229,724 |
| Taiwan Semiconductor Manufacturing Co. Ltd., ADR | | 43,958 | 3,794,015 |
| Texas Instruments, Inc. | | 41,534 | 5,898,243 |
| | | | | $33,120,037 |
| Energy - Independent – 2.5% | |
| ConocoPhillips | | 86,010 | $10,217,988 |
| Hess Corp. | | 46,770 | 6,753,588 |
| Phillips 66 | | 59,327 | 6,767,431 |
| Pioneer Natural Resources Co. | | 15,237 | 3,641,643 |
| Valero Energy Corp. | | 24,144 | 3,066,288 |
| | | | | $30,446,938 |
| Energy - Integrated – 2.4% | |
| China Petroleum & Chemical Corp. | | 5,704,000 | $2,915,690 |
| Eni S.p.A. | | 658,336 | 10,746,919 |
| Exxon Mobil Corp. | | 12,398 | 1,312,328 |
| LUKOIL PJSC (a)(u) | | 8,038 | 0 |
| PetroChina Co. Ltd. | | 2,856,000 | 1,861,359 |
| Petroleo Brasileiro S.A., ADR | | 143,087 | 1,978,893 |
| Suncor Energy, Inc. | | 211,984 | 6,865,117 |
| TotalEnergies SE | | 64,280 | 4,305,052 |
| | | | | $29,985,358 |
Portfolio of Investments – continued
| Issuer | | | Shares/Par | Value ($) |
| Common Stocks – continued |
| Engineering - Construction – 0.1% | |
| ACS Actividades de Construcción y Servicios S.A. | | 21,416 | $774,301 |
| Doosan Bobcat, Inc. | | 24,453 | 701,606 |
| | | | | $1,475,907 |
| Food & Beverages – 1.4% | |
| Archer Daniels Midland Co. | | 31,551 | $2,258,105 |
| Danone S.A. | | 82,211 | 4,897,021 |
| General Mills, Inc. | | 101,131 | 6,597,786 |
| J.M. Smucker Co. | | 25,749 | 2,931,266 |
| | | | | $16,684,178 |
| Food & Drug Stores – 0.9% | |
| BIM Birlesik Magazalar A.S. | | 148,708 | $1,439,191 |
| Tesco PLC | | 2,651,058 | 8,711,475 |
| Wesfarmers Ltd. | | 25,824 | 835,328 |
| | | | | $10,985,994 |
| Forest & Paper Products – 0.1% | |
| Weyerhaeuser Co., REIT | | 51,310 | $1,472,084 |
| Health Maintenance Organizations – 1.2% | |
| Cigna Group | | 48,453 | $14,981,668 |
| Insurance – 3.8% | |
| Aon PLC | | 40,020 | $12,382,188 |
| China Pacific Insurance Co. Ltd. | | 253,600 | 624,824 |
| Chubb Ltd. | | 32,950 | 7,071,729 |
| DB Insurance Co. Ltd. | | 6,721 | 439,564 |
| Equitable Holdings, Inc. | | 134,845 | 3,582,832 |
| Hartford Financial Services Group, Inc. | | 23,131 | 1,698,972 |
| Manulife Financial Corp. | | 394,769 | 6,871,984 |
| MetLife, Inc. | | 47,441 | 2,846,934 |
| Samsung Fire & Marine Insurance Co. Ltd. | | 17,084 | 3,281,788 |
| Travelers Cos., Inc. | | 6,233 | 1,043,654 |
| Willis Towers Watson PLC | | 26,348 | 6,215,230 |
| | | | | $46,059,699 |
| Internet – 0.6% | |
| Alphabet, Inc., “A” (a) | | 58,840 | $7,300,867 |
| Machinery & Tools – 2.0% | |
| Eaton Corp. PLC | | 43,769 | $9,100,013 |
| Ingersoll Rand, Inc. | | 79,971 | 4,852,640 |
| Kubota Corp. | | 217,400 | 2,893,240 |
| Regal Rexnord Corp. | | 35,136 | 4,160,454 |
Portfolio of Investments – continued
| Issuer | | | Shares/Par | Value ($) |
| Common Stocks – continued |
| Machinery & Tools – continued | |
| Timken Co. | | 8,525 | $589,248 |
| Volvo Group | | 146,101 | 2,894,082 |
| | | | | $24,489,677 |
| Major Banks – 6.4% | |
| ABN AMRO Group N.V., GDR | | 338,544 | $4,548,027 |
| Bank of America Corp. | | 294,375 | 7,753,838 |
| BNP Paribas | | 194,801 | 11,190,197 |
| DBS Group Holdings Ltd. | | 279,100 | 6,710,673 |
| Erste Group Bank AG | | 27,364 | 977,192 |
| Goldman Sachs Group, Inc. | | 31,515 | 9,568,269 |
| JPMorgan Chase & Co. | | 73,153 | 10,172,656 |
| Mitsubishi UFJ Financial Group, Inc. | | 1,041,900 | 8,754,408 |
| NatWest Group PLC | | 2,474,325 | 5,380,326 |
| Regions Financial Corp. | | 56,617 | 822,645 |
| UBS AG | | 528,584 | 12,330,624 |
| | | | | $78,208,855 |
| Medical & Health Technology & Services – 0.6% | |
| ICON PLC (a) | | 11,525 | $2,811,639 |
| McKesson Corp. | | 9,352 | 4,258,527 |
| | | | | $7,070,166 |
| Medical Equipment – 1.0% | |
| Becton, Dickinson and Co. | | 18,892 | $4,775,520 |
| Boston Scientific Corp. (a) | | 43,113 | 2,206,955 |
| Medtronic PLC | | 74,713 | 5,271,749 |
| | | | | $12,254,224 |
| Metals & Mining – 1.6% | |
| Glencore PLC | | 1,055,449 | $5,582,302 |
| PT United Tractors Tbk | | 193,800 | 307,312 |
| Rio Tinto PLC | | 151,099 | 9,630,674 |
| United States Steel Corp. | | 59,365 | 2,011,880 |
| Vale S.A. | | 125,900 | 1,723,033 |
| | | | | $19,255,201 |
| Other Banks & Diversified Financials – 1.2% | |
| China Construction Bank Corp. | | 2,210,000 | $1,250,702 |
| Julius Baer Group Ltd. | | 62,874 | 3,723,630 |
| KB Financial Group, Inc. | | 18,172 | 692,946 |
| M&T Bank Corp. | | 10,342 | 1,166,061 |
| Northern Trust Corp. | | 68,062 | 4,485,966 |
| Sberbank of Russia PJSC (a)(u) | | 780,516 | 0 |
Portfolio of Investments – continued
| Issuer | | | Shares/Par | Value ($) |
| Common Stocks – continued |
| Other Banks & Diversified Financials – continued | |
| Truist Financial Corp. | | 106,179 | $3,011,236 |
| | | | | $14,330,541 |
| Pharmaceuticals – 5.0% | |
| AbbVie, Inc. | | 42,107 | $5,944,666 |
| Bayer AG | | 181,457 | 7,798,064 |
| Johnson & Johnson | | 92,124 | 13,665,674 |
| Merck & Co., Inc. | | 9,996 | 1,026,589 |
| Novartis AG | | 38,708 | 3,613,728 |
| Organon & Co. | | 224,569 | 3,321,376 |
| Pfizer, Inc. | | 199,674 | 6,102,037 |
| Roche Holding AG | | 57,859 | 14,947,721 |
| Sandoz Group AG (a) | | 8,831 | 229,597 |
| Sanofi | | 45,642 | 4,165,590 |
| | | | | $60,815,042 |
| Printing & Publishing – 0.6% | |
| RELX PLC | | 87,309 | $3,044,366 |
| Wolters Kluwer N.V. | | 30,563 | 3,930,050 |
| | | | | $6,974,416 |
| Railroad & Shipping – 0.5% | |
| A.P. Moller-Maersk A/S | | 248 | $412,235 |
| Union Pacific Corp. | | 26,876 | 5,579,726 |
| | | | | $5,991,961 |
| Real Estate – 0.2% | |
| Brixmor Property Group, Inc., REIT | | 53,090 | $1,103,741 |
| Broadstone Net Lease, Inc., REIT | | 24,814 | 351,118 |
| NNN REIT, Inc. | | 28,543 | 1,036,967 |
| | | | | $2,491,826 |
| Restaurants – 0.3% | |
| Sodexo | | 29,208 | $3,091,945 |
| Texas Roadhouse, Inc. | | 10,865 | 1,103,232 |
| | | | | $4,195,177 |
| Specialty Chemicals – 0.5% | |
| Akzo Nobel N.V. | | 39,400 | $2,646,164 |
| Axalta Coating Systems Ltd. (a) | | 88,135 | 2,311,781 |
| Chemours Co. | | 24,457 | 589,658 |
| Nitto Denko Corp. | | 18,100 | 1,173,558 |
| | | | | $6,721,161 |
Portfolio of Investments – continued
| Issuer | | | Shares/Par | Value ($) |
| Common Stocks – continued |
| Specialty Stores – 0.3% | |
| Home Depot, Inc. | | 7,194 | $2,048,060 |
| Ross Stores, Inc. | | 10,273 | 1,191,360 |
| | | | | $3,239,420 |
| Telecommunications - Wireless – 1.2% | |
| KDDI Corp. | | 305,600 | $9,116,528 |
| T-Mobile USA, Inc. | | 43,520 | 6,260,787 |
| | | | | $15,377,315 |
| Telephone Services – 0.3% | |
| Hellenic Telecommunications Organization S.A. | | 128,166 | $1,794,152 |
| Quebecor, Inc., “B” | | 84,195 | 1,737,025 |
| | | | | $3,531,177 |
| Tobacco – 1.1% | |
| British American Tobacco PLC | | 170,924 | $5,098,175 |
| Japan Tobacco, Inc. | | 158,500 | 3,700,048 |
| Philip Morris International, Inc. | | 55,563 | 4,953,997 |
| | | | | $13,752,220 |
| Utilities - Electric Power – 2.3% | |
| Duke Energy Corp. | | 38,309 | $3,405,287 |
| E.ON SE | | 397,126 | 4,714,633 |
| Edison International | | 75,183 | 4,741,040 |
| Iberdrola S.A. | | 409,269 | 4,560,949 |
| National Grid PLC | | 378,871 | 4,502,615 |
| PG&E Corp. (a) | | 312,223 | 5,089,235 |
| Vistra Corp. | | 28,476 | 931,735 |
| | | | | $27,945,494 |
| Total Common Stocks (Identified Cost, $566,327,576) | | $727,454,375 |
| Bonds – 38.3% |
| Aerospace & Defense – 0.2% |
| Boeing Co., 5.805%, 5/01/2050 | | $ | 582,000 | $501,044 |
| HEICO Corp., 5.35%, 8/01/2033 | | | 672,000 | 616,798 |
| Thales S.A., 3.625%, 6/14/2029 | | EUR | 800,000 | 824,302 |
| Thales S.A., 4.25%, 10/18/2031 | | | 600,000 | 631,279 |
| | | | | $2,573,423 |
Portfolio of Investments – continued
| Issuer | | | Shares/Par | Value ($) |
| Bonds – continued |
| Apparel Manufacturers – 0.1% |
| LVMH SE, 3.5%, 9/07/2033 | | EUR | 300,000 | $306,217 |
| Tapestry, Inc., 3.05%, 3/15/2032 | | $ | 448,000 | 321,432 |
| | | | | $627,649 |
| Asset-Backed & Securitized – 3.2% |
| 3650R Commercial Mortgage Trust, 2021-PF1, “XA”, 1.02%, 11/15/2054 (i) | | $ | 7,197,979 | $352,010 |
| ACREC 2021-FL1 Ltd., “C”, FLR, 7.599% ((SOFR - 1mo. + 0.11448%) + 2.15%), 10/16/2036 (n) | | | 1,125,500 | 1,076,211 |
| Arbor Realty Trust, Inc., CLO, 2021-FL1, “B”, FLR, 6.948% ((SOFR - 1mo. + 0.11448%) + 1.5%), 12/15/2035 (n) | | | 423,000 | 410,678 |
| Arbor Realty Trust, Inc., CLO, 2021-FL2, “B”, FLR, 7.049% ((SOFR - 1mo. + 0.11448%) + 1.6%), 5/15/2036 (n) | | | 289,000 | 279,881 |
| Arbor Realty Trust, Inc., CLO, 2021-FL2, “C”, FLR, 7.398% ((SOFR - 1mo. + 0.11448%) + 1.95%), 5/15/2036 (n) | | | 857,500 | 810,838 |
| Arbor Realty Trust, Inc., CLO, 2022-FL1, “B”, FLR, 7.42% (SOFR - 30 day + 2.1%), 1/15/2037 (n) | | | 1,712,000 | 1,657,196 |
| Arbor Realty Trust, Inc., CLO, 2022-FL1, “C”, FLR, 7.62% (SOFR - 30 day + 2.3%), 1/15/2037 (n) | | | 1,648,500 | 1,574,533 |
| AREIT 2022-CRE6 Trust, “B”, FLR, 7.171% (SOFR - 30 day + 1.85%), 1/20/2037 (n) | | | 620,000 | 600,211 |
| AREIT 2022-CRE6 Trust, “C”, FLR, 7.471% (SOFR - 30 day + 2.15%), 1/20/2037 (n) | | | 312,000 | 300,207 |
| BBCMS Mortgage Trust, 2020-C7, “XA”, 1.616%, 4/15/2053 (i) | | | 1,426,416 | 89,910 |
| BBCMS Mortgage Trust, 2021-C10, “XA”, 1.287%, 7/15/2054 (i) | | | 5,816,384 | 358,055 |
| BBCMS Mortgage Trust, 2021-C9, “XA”, 1.612%, 2/15/2054 (i) | | | 5,334,972 | 430,848 |
| BBCMS Mortgage Trust, 2022-C18, “AS”, 6.149%, 12/15/2055 | | | 584,994 | 561,487 |
| Benchmark 2021-B24 Mortgage Trust, “XA”, 1.147%, 3/15/2054 (i) | | | 4,602,030 | 251,057 |
| Benchmark 2021-B26 Mortgage Trust, “XA”, 0.885%, 6/15/2054 (i) | | | 10,647,246 | 466,058 |
| Benchmark 2021-B27 Mortgage Trust, “XA”, 1.262%, 7/15/2054 (i) | | | 13,929,118 | 897,400 |
| Benchmark 2021-B28 Mortgage Trust, “XA”, 1.275%, 8/15/2054 (i) | | | 13,136,703 | 855,892 |
Portfolio of Investments – continued
| Issuer | | | Shares/Par | Value ($) |
| Bonds – continued |
| Asset-Backed & Securitized – continued |
| Benchmark 2022-B37 Mortgage Trust, “AS”, 5.751%, 11/15/2055 | | $ | 226,000 | $207,929 |
| Brazos Securitization LLC, 5.413%, 9/01/2050 (n) | | | 522,000 | 463,477 |
| BSPRT 2021-FL7 Issuer Ltd., “B”, FLR, 7.499% ((SOFR - 1mo. + 0.11448%) + 2.05%), 12/15/2038 (n) | | | 388,000 | 379,390 |
| BSPRT 2021-FL7 Issuer Ltd., “C”, FLR, 7.748% ((SOFR - 1mo. + 0.11448%) + 2.3%), 12/15/2038 (n) | | | 352,000 | 342,736 |
| Business Jet Securities LLC, 2020-1A, “A”, 2.981%, 11/15/2035 (n) | | | 147,619 | 139,194 |
| Business Jet Securities LLC, 2021-1A, “A”, 2.162%, 4/15/2036 (n) | | | 252,935 | 230,559 |
| BXMT 2021-FL4 Ltd., “AS”, FLR, 6.749% ((SOFR - 1mo. + 0.11448%) + 1.3%), 5/15/2038 (n) | | | 1,400,000 | 1,302,634 |
| BXMT 2021-FL4 Ltd., “B”, FLR, 7% ((SOFR - 1mo. + 0.11448%) + 1.55%), 5/15/2038 (n) | | | 1,996,500 | 1,830,709 |
| Capital Automotive, 2020-1A, “A4”, REIT, 3.19%, 2/15/2050 (n) | | | 517,878 | 490,571 |
| CF Hippolyta Issuer LLC, 2020-1, “A1”, 1.69%, 7/15/2060 (n) | | | 367,188 | 333,027 |
| Chesapeake Funding II LLC, 2023-1A, “A1”, 5.65%, 5/15/2035 (n) | | | 565,522 | 561,267 |
| CNH Equipment Trust 2023-A, “A2”, 5.34%, 9/15/2026 | | | 325,248 | 323,498 |
| Commercial Mortgage Pass-Through Certificates, 2021-BN32, “XA”, 0.774%, 4/15/2054 (i) | | | 6,770,135 | 259,050 |
| Commercial Mortgage Pass-Through Certificates, 2021-BN34, “XA”, 0.974%, 6/15/2063 (i) | | | 6,597,631 | 327,351 |
| Commercial Mortgage Pass-Through Certificates, 2021-BN35, “XA”, 1.041%, 6/15/2064 (i) | | | 6,167,793 | 330,214 |
| Commercial Mortgage Pass-Through Certificates, 2022-BNK41, “AS”, 3.79%, 4/15/2065 | | | 1,304,000 | 1,034,498 |
| Commercial Mortgage Pass-Through Certificates, 2023-BNK46, “A4”, 5.745%, 8/15/2056 | | | 1,721,000 | 1,641,204 |
| Credit Acceptance Auto Loan Trust, 2021-3A, “A”, 1%, 5/15/2030 (n) | | | 927,058 | 910,240 |
| DT Auto Owner Trust, 2023-1A, “A”, 5.48%, 4/15/2027 (n) | | | 392,616 | 390,975 |
| Fortress CBO Investments Ltd., 2022-FL3, “AS”, FLR, 7.57% (SOFR - 30 day + 2.25%), 2/23/2039 (n) | | | 592,000 | 573,787 |
| FS Rialto 2021-FL2 Issuer Ltd., “AS”, FLR, 6.999% ((SOFR - 1mo. + 0.11448%) + 1.55%), 5/16/2038 (n) | | | 1,454,000 | 1,403,533 |
| GreatAmerica Leasing Receivables Funding LLC, 2023-1, “A2”, 5.35%, 2/16/2026 (n) | | | 302,000 | 299,632 |
Portfolio of Investments – continued
| Issuer | | | Shares/Par | Value ($) |
| Bonds – continued |
| Asset-Backed & Securitized – continued |
| MF1 2021-FL5 Ltd., “AS”, FLR, 6.65% ((SOFR - 1mo. + 0.11448%) + 1.2%), 7/15/2036 (n) | | $ | 1,360,000 | $1,328,889 |
| MF1 2021-FL5 Ltd., “B”, FLR, 6.9% ((SOFR - 1mo. + 0.11448%) + 1.45%), 7/15/2036 (n) | | | 1,977,500 | 1,925,471 |
| MF1 2021-FL5 Ltd., “C”, FLR, 7.149% ((SOFR - 1mo. + 0.11448%) + 1.7%), 7/15/2036 (n) | | | 225,000 | 215,259 |
| MF1 2021-FL6 Ltd., “AS”, FLR, 6.899% ((SOFR - 1mo. + 0.11448%) + 1.45%), 7/16/2036 (n) | | | 2,200,000 | 2,137,993 |
| MF1 2021-FL6 Ltd., “B”, FLR, 7.099% ((SOFR - 1mo. + 0.11448%) + 1.65%), 7/16/2036 (n) | | | 1,400,000 | 1,344,203 |
| MF1 2022-FL8 Ltd., “A”, FLR, 6.684% (SOFR - 1mo. + 1.35%), 2/19/2037 (n) | | | 500,000 | 490,123 |
| MF1 2022-FL8 Ltd., “B”, FLR, 7.284% (SOFR - 30 day + 1.95%), 2/19/2037 (n) | | | 604,312 | 584,571 |
| Morgan Stanley Capital I Trust, 2021-L5, “XA”, 1.291%, 5/15/2054 (i) | | | 4,658,292 | 283,425 |
| Morgan Stanley Capital I Trust, 2021-L6, “XA”, 1.211%, 6/15/2054 (i) | | | 9,605,704 | 529,979 |
| Navistar Financial Dealer Note Master Owner Trust, 2022-1, “A”, FLR, 6.571% (SOFR - 30 day + 1.25%), 5/25/2027 (n) | | | 525,000 | 525,597 |
| RAC Bond Co. PLC, 4.87%, 5/06/2026 | | GBP | 530,000 | 603,351 |
| Starwood Commercial Mortgage, 2021-FL2, “A”, FLR, 6.649% ((SOFR - 1mo. + 0.11448%) + 1.2%), 4/18/2038 (n) | | $ | 1,400,000 | 1,358,163 |
| Starwood Commercial Mortgage, 2021-FL2, “AS”, FLR, 6.899% ((SOFR - 1mo. + 0.11448%) + 1.45%), 4/18/2038 (n) | | | 1,400,000 | 1,302,696 |
| TPG Real Estate Finance, 2021-FL4, “AS”, FLR, 6.85% ((SOFR - 1mo. + 0.11448%) + 1.4%), 3/15/2038 (n) | | | 700,000 | 680,586 |
| Wells Fargo Commercial Mortgage Trust, 2021-C60, “XA”, 1.527%, 8/15/2054 (i) | | | 6,860,009 | 513,854 |
| Westlake Automobile Receivables Trust, 2023-1A, “A2B”, FLR, 6.17% (SOFR - 1mo. + 0.85%), 6/15/2026 (n) | | | 219,763 | 219,825 |
| | | | | $38,791,932 |
Portfolio of Investments – continued
| Issuer | | | Shares/Par | Value ($) |
| Bonds – continued |
| Automotive – 0.1% |
| Hyundai Capital America, 6.375%, 4/08/2030 (n) | | $ | 366,000 | $360,290 |
| LKQ Corp., 6.25%, 6/15/2033 | | | 359,000 | 335,246 |
| Volkswagen International Finance N.V., 7.5% to 9/06/2028, FLR (EUR Swap Rate - 5yr. + 4.292%) to 9/06/2033, FLR (EUR Swap Rate - 5yr. + 4.542%) to 9/06/2048, FLR (EUR Swap Rate - 5yr. + 5.292%) to 9/06/2172 | | EUR | 300,000 | 320,874 |
| | | | | $1,016,410 |
| Broadcasting – 0.3% |
| Discovery Communications LLC, 4.125%, 5/15/2029 | | $ | 835,000 | $735,029 |
| Prosus N.V., 3.68%, 1/21/2030 (n) | | | 587,000 | 465,364 |
| Ubisoft Entertainment S.A., 0.878%, 11/24/2027 | | EUR | 2,100,000 | 1,787,038 |
| Walt Disney Co., 3.5%, 5/13/2040 | | $ | 658,000 | 472,999 |
| WarnerMedia Holdings, Inc., 4.279%, 3/15/2032 | | | 831,000 | 688,995 |
| | | | | $4,149,425 |
| Brokerage & Asset Managers – 0.3% |
| Charles Schwab Corp., 5.643% to 5/19/2028, FLR (SOFR - 1 day + 2.210%) to 5/19/2029 | | $ | 410,000 | $394,686 |
| Charles Schwab Corp., 6.136% to 8/24/2033, FLR (SOFR - 1 day+ 2.01%) to 8/24/2034 | | | 377,000 | 353,099 |
| Low Income Investment Fund, 3.386%, 7/01/2026 | | | 285,000 | 262,382 |
| Low Income Investment Fund, 3.711%, 7/01/2029 | | | 760,000 | 658,901 |
| LPL Holdings, Inc., 4%, 3/15/2029 (n) | | | 994,000 | 854,707 |
| LSEG Netherlands B.V., 4.231%, 9/29/2030 | | EUR | 510,000 | 540,339 |
| | | | | $3,064,114 |
| Building – 0.1% |
| Holcim Sterling Finance (Netherlands) B.V., 2.25%, 4/04/2034 | | GBP | 850,000 | $706,084 |
| Vulcan Materials Co., 3.5%, 6/01/2030 | | $ | 908,000 | 774,793 |
| | | | | $1,480,877 |
| Business Services – 0.2% |
| Corning, Inc., 4.125%, 5/15/2031 | | EUR | 460,000 | $473,094 |
| Euronet Worldwide, Inc., 1.375%, 5/22/2026 | | | 825,000 | 788,045 |
| Fiserv, Inc., 4.4%, 7/01/2049 | | $ | 281,000 | 203,875 |
| Mastercard, Inc., 3.85%, 3/26/2050 | | | 542,000 | 396,018 |
| | | | | $1,861,032 |
Portfolio of Investments – continued
| Issuer | | | Shares/Par | Value ($) |
| Bonds – continued |
| Cable TV – 0.2% |
| Charter Communications Operating LLC/Charter Communications Operating Capital Corp., 6.384%, 10/23/2035 | | $ | 709,000 | $640,801 |
| Charter Communications Operating LLC/Charter Communications Operating Capital Corp., 4.8%, 3/01/2050 | | | 405,000 | 266,973 |
| Cox Communications, Inc., 5.45%, 9/15/2028 (n) | | | 700,000 | 681,870 |
| SES S.A., 3.5%, 1/14/2029 | | EUR | 580,000 | 572,395 |
| | | | | $2,162,039 |
| Chemicals – 0.1% |
| Alpek SAB de C.V., 3.25%, 2/25/2031 (n) | | $ | 501,000 | $382,450 |
| LYB International Finance III, LLC, 4.2%, 5/01/2050 | | | 306,000 | 202,440 |
| | | | | $584,890 |
| Computer Software – 0.0% |
| Microsoft Corp., 2.921%, 3/17/2052 | | $ | 753,000 | $464,833 |
| Computer Software - Systems – 0.1% |
| Apple, Inc., 2.9%, 9/12/2027 | | $ | 608,000 | $559,016 |
| Apple, Inc., 4.5%, 2/23/2036 | | | 204,000 | 188,645 |
| | | | | $747,661 |
| Conglomerates – 0.4% |
| Assa Abloy AB, 3.875%, 9/13/2030 | | EUR | 350,000 | $368,946 |
| Assa Abloy AB, 4.125%, 9/13/2035 | | | 390,000 | 408,007 |
| Johnson Controls International PLC, 4.25%, 5/23/2035 | | | 460,000 | 469,895 |
| nVent Finance S.à r.l., 5.65%, 5/15/2033 | | $ | 775,000 | 703,580 |
| Regal Rexnord Corp., 6.05%, 4/15/2028 (n) | | | 1,155,000 | 1,104,865 |
| Siemens Financieringsmaatschappij N.V., 3.625%, 2/24/2043 | | EUR | 500,000 | 476,963 |
| Veralto Corp., 4.15%, 9/19/2031 | | | 457,000 | 471,701 |
| Westinghouse Air Brake Technologies Corp., 4.7%, 9/15/2028 | | $ | 1,384,000 | 1,290,437 |
| | | | | $5,294,394 |
| Consumer Products – 0.1% |
| JAB Holdings B.V., 2.25%, 12/19/2039 | | EUR | 900,000 | $631,717 |
| Kenvue, Inc., 5.05%, 3/22/2053 | | $ | 931,000 | 799,910 |
| | | | | $1,431,627 |
| Consumer Services – 0.0% |
| Securitas Treasury Ireland DAC, 4.375%, 3/06/2029 | | EUR | 370,000 | $389,052 |
Portfolio of Investments – continued
| Issuer | | | Shares/Par | Value ($) |
| Bonds – continued |
| Containers – 0.0% |
| DS Smith PLC, 4.5%, 7/27/2030 | | EUR | 490,000 | $505,922 |
| Electrical Equipment – 0.1% |
| Arrow Electronics, Inc., 3.25%, 9/08/2024 | | $ | 647,000 | $630,326 |
| Electronics – 0.0% |
| Intel Corp., 5.7%, 2/10/2053 | | $ | 385,000 | $344,549 |
| Emerging Market Quasi-Sovereign – 0.5% |
| Bank Gospodarstwa Krajowego (Republic of Poland), 6.25%, 10/31/2028 (n) | | $ | 539,000 | $544,304 |
| Bank Gospodarstwa Krajowego (Republic of Poland), 5.375%, 5/22/2033 (n) | | | 753,000 | 699,349 |
| Corporación Nacional del Cobre de Chile, 5.95%, 1/08/2034 (n) | | | 557,000 | 517,394 |
| Emirates NBD Bank PJSC, 5.875%, 10/11/2028 | | | 737,000 | 729,630 |
| First Abu Dhabi Bank PJSC, 6.32%, 4/04/2034 | | | 690,000 | 675,337 |
| Magyar Export-Import Bank PLC (Republic of Hungary), 6.125%, 12/04/2027 (n) | | | 314,000 | 307,125 |
| Qatar Petroleum, 3.125%, 7/12/2041 | | | 776,000 | 509,599 |
| REC Ltd. (Republic of India), 5.625%, 4/11/2028 (n) | | | 612,000 | 595,177 |
| SPP-Distribucia A.S. (Republic of Slovakia), 1%, 6/09/2031 | | EUR | 2,200,000 | 1,629,497 |
| | | | | $6,207,412 |
| Emerging Market Sovereign – 6.2% |
| Czech Republic, 2.5%, 8/25/2028 | | CZK | 31,590,000 | $1,243,818 |
| Czech Republic, 2%, 10/13/2033 | | | 34,000,000 | 1,157,817 |
| Oriental Republic of Uruguay, 8.25%, 5/21/2031 | | UYU | 121,835,000 | 2,769,561 |
| Oriental Republic of Uruguay, 9.75%, 7/20/2033 | | | 40,347,000 | 999,937 |
| People's Republic of China, 3.13%, 11/21/2029 | | CNY | 92,930,000 | 13,074,429 |
| People's Republic of China, 2.88%, 2/25/2033 | | | 100,220,000 | 13,944,473 |
| Republic of Chile, 4.125%, 7/05/2034 | | EUR | 810,000 | 807,094 |
| Republic of Hungary, 5.5%, 6/16/2034 (n) | | $ | 640,000 | 569,472 |
| Republic of Korea, 2.375%, 12/10/2027 | | KRW | 1,900,000,000 | 1,315,424 |
| Republic of Korea, 1.875%, 6/10/2029 | | | 21,686,970,000 | 14,182,149 |
| Republic of Korea, 1.375%, 6/10/2030 | | | 16,761,200,000 | 10,367,244 |
| Republic of Peru, 7.3%, 8/12/2033 | | PEN | 9,629,000 | 2,454,247 |
| Socialist Republic of Romania, 6.375%, 9/18/2033 | | EUR | 790,000 | 823,782 |
| United Mexican States, 7.5%, 6/03/2027 | | MXN | 154,900,000 | 7,861,933 |
| United Mexican States, 2.659%, 5/24/2031 | | $ | 642,000 | 500,080 |
| United Mexican States, 7.75%, 5/29/2031 | | MXN | 66,000,000 | 3,187,761 |
| United Mexican States, 6.338%, 5/04/2053 | | $ | 433,000 | 378,538 |
Portfolio of Investments – continued
| Issuer | | | Shares/Par | Value ($) |
| Bonds – continued |
| Emerging Market Sovereign – continued |
| United Mexican States, 3.771%, 5/24/2061 | | $ | 770,000 | $434,021 |
| | | | | $76,071,780 |
| Energy - Independent – 0.4% |
| Occidental Petroleum Corp., 6.45%, 9/15/2036 | | $ | 640,000 | $621,619 |
| Santos Finance Ltd., 6.875%, 9/19/2033 (n) | | | 555,000 | 528,680 |
| Tengizchevroil Finance Co. International Ltd., 4%, 8/15/2026 (n) | | | 3,609,000 | 3,216,269 |
| | | | | $4,366,568 |
| Energy - Integrated – 0.1% |
| BP Capital Markets America, Inc., 4.812%, 2/13/2033 | | $ | 489,000 | $446,795 |
| BP Capital Markets B.V., 4.323%, 5/12/2035 | | EUR | 610,000 | 621,739 |
| BP Capital Markets B.V., 0.933%, 12/04/2040 | | | 440,000 | 259,753 |
| | | | | $1,328,287 |
| Engineering - Construction – 0.1% |
| John Deere Bank S.A., 5.125%, 10/18/2028 | | GBP | 505,000 | $609,081 |
| Financial Institutions – 0.3% |
| AerCap Ireland Capital DAC/AerCap Global Aviation Trust, 5.75%, 6/06/2028 | | $ | 596,000 | $572,175 |
| Avolon Holdings Funding Ltd., 4.375%, 5/01/2026 (n) | | | 537,000 | 500,547 |
| Corporacion Inmobiliaria Vesta S.A.B. de C.V., 3.625%, 5/13/2031 | | | 285,000 | 227,594 |
| CTP N.V., 0.875%, 1/20/2026 | | EUR | 650,000 | 611,430 |
| Grand City Properties S.A., 1.5%, 12/09/2069 | | | 900,000 | 426,245 |
| Samhallsbyggnadsbolaget i Norden AB, 1.75%, 1/14/2025 | | | 610,000 | 555,630 |
| Samhallsbyggnadsbolaget i Norden AB, 2.375%, 9/04/2026 | | | 565,000 | 429,484 |
| SBB Treasury Oyj, 0.75%, 12/14/2028 | | | 590,000 | 346,475 |
| VGP N.V., 1.5%, 4/08/2029 | | | 500,000 | 390,975 |
| | | | | $4,060,555 |
| Food & Beverages – 0.7% |
| Anheuser-Busch InBev S.A./N.V., 2%, 1/23/2035 | | EUR | 985,000 | $847,651 |
| Anheuser-Busch InBev Worldwide, Inc., 4%, 4/13/2028 | | $ | 974,000 | 915,961 |
| Anheuser-Busch InBev Worldwide, Inc., 4.375%, 4/15/2038 | | | 446,000 | 368,929 |
Portfolio of Investments – continued
| Issuer | | | Shares/Par | Value ($) |
| Bonds – continued |
| Food & Beverages – continued |
| Anheuser-Busch InBev Worldwide, Inc., 5.55%, 1/23/2049 | | $ | 512,000 | $464,496 |
| Bacardi Ltd., 5.15%, 5/15/2038 (n) | | | 658,000 | 552,100 |
| Bacardi-Martini B.V., 5.4%, 6/15/2033 (n) | | | 572,000 | 522,652 |
| Carlsberg Breweries A/S, 4.25%, 10/05/2033 | | EUR | 318,000 | 334,067 |
| Constellation Brands, Inc., 3.15%, 8/01/2029 | | $ | 899,000 | 776,231 |
| Constellation Brands, Inc., 2.25%, 8/01/2031 | | | 400,000 | 303,964 |
| JBS USA Lux S.A./JBS USA Food Co./JBS USA Finance, Inc., 3%, 2/02/2029 | | | 621,000 | 511,279 |
| JM Smucker Co., 6.5%, 11/15/2053 | | | 631,000 | 594,952 |
| Kraft Heinz Foods Co., 3.875%, 5/15/2027 | | | 857,000 | 803,405 |
| Pernod Ricard S.A., 3.75%, 9/15/2033 | | EUR | 400,000 | 408,276 |
| PT Indofood CBP Sukses Makmur Tbk, 3.398%, 6/09/2031 | | $ | 988,000 | 783,470 |
| | | | | $8,187,433 |
| Gaming & Lodging – 0.1% |
| Marriott International, Inc., 2.85%, 4/15/2031 | | $ | 1,076,000 | $845,562 |
| VICI Properties LP, REIT, 4.95%, 2/15/2030 | | | 770,000 | 686,440 |
| | | | | $1,532,002 |
| Industrial – 0.0% |
| Arcadis N.V., 4.875%, 2/28/2028 | | EUR | 477,000 | $502,236 |
| Insurance – 0.4% |
| AIA Group Ltd., 0.88%, 9/09/2033 | | EUR | 843,000 | $717,458 |
| Allianz SE, 3.2% to 4/30/2028, FLR (CMT - 5yr. + 2.165%) to 4/30/2171 (n) | | $ | 800,000 | 568,939 |
| ASR Nederland N.V., 7% to 12/07/2033, FLR (EUR Swap Rate - 5yr. + 5.3%) to 12/07/2043 | | EUR | 740,000 | 801,550 |
| Axa S.A., 5.5% to 7/11/2033, FLR (EURIBOR - 3mo. + 3.6%) to 7/11/2043 | | | 580,000 | 602,013 |
| Corebridge Financial, Inc., 4.35%, 4/05/2042 | | $ | 982,000 | 712,005 |
| Equitable Holdings, Inc., 5.594%, 1/11/2033 | | | 724,000 | 666,651 |
| Groupe des Assurances du Credit Mutuel, 1.85% to 4/21/2032, FLR (EURIBOR - 3mo. + 2.65%) to 4/21/2042 | | EUR | 1,000,000 | 768,498 |
| | | | | $4,837,114 |
| Insurance - Health – 0.0% |
| UnitedHealth Group, Inc., 4.625%, 7/15/2035 | | $ | 184,000 | $163,578 |
Portfolio of Investments – continued
| Issuer | | | Shares/Par | Value ($) |
| Bonds – continued |
| Insurance - Property & Casualty – 0.3% |
| American International Group, Inc., 5.125%, 3/27/2033 | | $ | 586,000 | $532,884 |
| Aon Corp./Aon Global Holdings PLC, 3.9%, 2/28/2052 | | | 718,000 | 482,747 |
| Arthur J. Gallagher & Co., 6.5%, 2/15/2034 (w) | | | 354,000 | 351,352 |
| Arthur J. Gallagher & Co., 6.75%, 2/15/2054 (w) | | | 389,000 | 382,231 |
| Fairfax Financial Holdings Ltd., 4.25%, 12/06/2027 | | CAD | 1,360,000 | 917,798 |
| QBE Insurance Group Ltd., 2.5% to 9/13/2028, FLR (GBP Government Yield - 5yr. + 2.061%) to 9/13/2038 | | GBP | 738,000 | 716,863 |
| RenaissanceRe Holdings Ltd., 5.75%, 6/05/2033 | | $ | 756,000 | 695,493 |
| | | | | $4,079,368 |
| International Market Quasi-Sovereign – 0.5% |
| Belfius Bank S.A., 4.125%, 9/12/2029 | | EUR | 400,000 | $419,657 |
| Electricite de France S.A., 6.25%, 5/23/2033 (n) | | $ | 700,000 | 680,387 |
| Electricite de France S.A., 5.875% to 1/22/2029, FLR (GBP Swap Rate - 15yr. + 3.323%) to 1/22/2049, FLR (GBP Swap Rate - 15yr. + 4.073%) to 12/31/2165 | | GBP | 800,000 | 799,786 |
| La Banque Postale S.A., 4%, 5/03/2028 | | EUR | 600,000 | 632,649 |
| Landsbankinn hf. (Republic of Iceland), 0.375%, 5/23/2025 | | | 333,000 | 326,649 |
| Landsbankinn hf. (Republic of Iceland), 6.375%, 3/12/2027 | | | 490,000 | 522,727 |
| Logicor Financing S.à r.l., 1.625%, 1/17/2030 | | | 610,000 | 482,738 |
| Logicor Financing S.à r.l., 0.875%, 1/14/2031 | | | 275,000 | 196,244 |
| NBN Co. Ltd., 4.375%, 3/15/2033 | | | 353,000 | 369,348 |
| NBN Co. Ltd. (Commonwealth of Australia), 5.75%, 10/06/2028 (n) | | $ | 790,000 | 790,363 |
| Ontario Teachers' Cadillac Fairview Properties, 2.5%, 10/15/2031 (n) | | | 927,000 | 684,793 |
| P3 Group S.à r.l., 1.625%, 1/26/2029 | | EUR | 680,000 | 570,757 |
| | | | | $6,476,098 |
| International Market Sovereign – 9.3% |
| Commonwealth of Australia, 3.25%, 6/21/2039 | | AUD | 5,698,000 | $2,866,653 |
| Federal Republic of Germany, 1.7%, 8/15/2032 | | EUR | 2,492,000 | 2,427,725 |
| Government of Bermuda, 2.375%, 8/20/2030 (n) | | $ | 418,000 | 330,805 |
| Government of Bermuda, 5%, 7/15/2032 (n) | | | 1,331,000 | 1,211,302 |
| Government of Canada, 2%, 6/01/2032 | | CAD | 1,308,000 | 801,014 |
| Government of Japan, 2.1%, 12/20/2027 | | JPY | 174,200,000 | 1,231,795 |
| Government of Japan, 2.4%, 6/20/2028 | | | 2,417,000,000 | 17,399,689 |
| Government of Japan, 0.3%, 12/20/2039 | | | 1,195,500,000 | 6,558,273 |
| Government of Japan, 2.3%, 3/20/2040 | | | 206,150,000 | 1,517,085 |
Portfolio of Investments – continued
| Issuer | | | Shares/Par | Value ($) |
| Bonds – continued |
| International Market Sovereign – continued |
| Government of Japan, 1.7%, 6/20/2044 | | JPY | 701,450,000 | $4,609,509 |
| Government of Japan, 0.3%, 6/20/2046 | | | 270,700,000 | 1,301,378 |
| Government of New Zealand, 1.5%, 5/15/2031 | | NZD | 10,989,000 | 4,836,920 |
| Government of New Zealand, 3.5%, 4/14/2033 | | | 12,284,000 | 6,083,947 |
| Government of New Zealand , 2%, 5/15/2032 | | | 7,058,000 | 3,134,159 |
| Kingdom of Belgium, 3%, 6/22/2033 (n) | | EUR | 2,921,000 | 2,977,529 |
| Kingdom of Belgium, 0.4%, 6/22/2040 | | | 2,617,000 | 1,602,149 |
| Kingdom of Spain, 2.55%, 10/31/2032 | | | 4,596,000 | 4,422,039 |
| Kingdom of Spain, 3.15%, 4/30/2033 | | | 11,572,000 | 11,600,281 |
| Kingdom of Spain, 3.9%, 7/30/2039 (n) | | | 3,866,000 | 3,904,926 |
| Kingdom of Spain, 1%, 10/31/2050 | | | 1,075,000 | 526,870 |
| Kingdom of Sweden, 1%, 11/12/2026 | | SEK | 29,945,000 | 2,520,086 |
| Kingdom of Sweden, 0.75%, 5/12/2028 | | | 63,500,000 | 5,160,803 |
| Kingdom of Sweden, 1.75%, 11/11/2033 | | | 29,985,000 | 2,411,167 |
| Kingdom of the Netherlands, 2.5%, 7/15/2033 (n) | | EUR | 2,496,000 | 2,500,038 |
| Republic of Austria, 2.9%, 2/20/2033 (n) | | | 2,431,000 | 2,464,488 |
| Republic of Finland, 0.5%, 9/15/2028 (n) | | | 5,375,000 | 5,027,448 |
| Republic of Italy, 0.5%, 7/15/2028 | | | 2,790,000 | 2,517,591 |
| United Kingdom Treasury, 0.375%, 10/22/2030 | | GBP | 11,799,000 | 10,944,406 |
| United Kingdom Treasury, 1.75%, 9/07/2037 | | | 589,000 | 497,622 |
| United Kingdom Treasury, 1.25%, 10/22/2041 | | | 715,000 | 492,663 |
| | | | | $113,880,360 |
| Local Authorities – 0.0% |
| Province of British Columbia, 2.95%, 6/18/2050 | | CAD | 600,000 | $307,626 |
| Machinery & Tools – 0.2% |
| Ashtead Capital, Inc., 5.95%, 10/15/2033 (n) | | $ | 881,000 | $803,793 |
| CNH Industrial Capital LLC, 1.875%, 1/15/2026 | | | 671,000 | 615,792 |
| CNH Industrial Capital LLC, 5.5%, 1/12/2029 | | | 727,000 | 704,674 |
| | | | | $2,124,259 |
| Major Banks – 1.7% |
| Banco de Sabadell S.A., 5%, 6/07/2029 | | EUR | 700,000 | $745,317 |
| Bank of America Corp., 4.134%, 6/12/2028 | | | 491,000 | 517,740 |
| Bank of America Corp., 5.202% to 4/25/2033, FLR (SOFR - 1 day + 1.63%) to 4/25/2029 | | $ | 1,089,000 | 1,035,383 |
| Bank of America Corp., 2.687% to 4/22/2031, FLR (SOFR - 1 day + 1.32%) to 4/22/2032 | | | 1,032,000 | 791,285 |
| Bank of Ireland Group PLC, 5% to 7/04/2030, FLR (EUR ICE Swap Rate - 1yr. + 2.05%) to 7/04/2031 | | EUR | 610,000 | 643,728 |
| BNP Paribas S.A., FLR, 5.971% (LIBOR - 6mo. + 0.075%), 3/23/2172 | | $ | 1,670,000 | 1,531,390 |
Portfolio of Investments – continued
| Issuer | | | Shares/Par | Value ($) |
| Bonds – continued |
| Major Banks – continued |
| Capital One Financial Corp., 6.377% to 6/08/2033, FLR (SOFR - 1 day + 2.860%) to 6/08/2034 | | $ | 495,000 | $451,405 |
| Commonwealth Bank of Australia, 2.688%, 3/11/2031 (n) | | | 1,471,000 | 1,091,295 |
| Goldman Sachs Group, Inc., 2.383% to 7/21/2031, FLR (SOFR - 1 day + 1.248%) to 7/21/2032 | | | 429,000 | 318,425 |
| Goldman Sachs Group, Inc., 3.436% to 2/24/2042, FLR (SOFR - 1 day + 1.632%) to 2/24/2043 | | | 362,000 | 239,133 |
| HSBC Holdings PLC, 2.099% to 6/04/2025, FLR (SOFR - 1 day + 1.929%) to 6/04/2026 | | | 1,029,000 | 958,833 |
| HSBC Holdings PLC, 4.856% to 5/23/2032, FLR (EURIBOR - 3mo. + 1.942%) to 5/23/2033 | | EUR | 810,000 | 844,884 |
| JPMorgan Chase & Co., 1.47% to 9/22/2026, FLR (SOFR - 1 day + 0.765%) to 9/22/2027 | | $ | 581,000 | 506,130 |
| JPMorgan Chase & Co., 1.953% to 2/04/2031, FLR (SOFR - 1 day + 1.065%) to 2/04/2032 | | | 1,056,000 | 784,499 |
| JPMorgan Chase & Co., 3.109% to 4/22/2050, FLR (SOFR - 1 day + 2.44%) to 4/22/2051 | | | 677,000 | 398,773 |
| Lloyds Banking Group PLC, 4.75%, 9/21/2031 | | EUR | 450,000 | 467,870 |
| mBank S.A., 0.966% to 9/21/2026, FLR (EURIBOR - 3mo. + 1.25%) to 9/21/2027 | | | 1,000,000 | 861,505 |
| Mitsubishi UFJ Financial Group, Inc., 1.412%, 7/17/2025 | | $ | 1,681,000 | 1,553,281 |
| Mitsubishi UFJ Financial Group, Inc., 2.494% to 10/13/2031, FLR (CMT - 1yr. + 0.97%) to 10/13/2032 | | | 484,000 | 364,080 |
| Morgan Stanley, 3.125%, 7/27/2026 | | | 534,000 | 494,029 |
| Morgan Stanley, 1.593% to 5/04/2026, FLR (SOFR - 1 day + 0.879%) to 5/04/2027 | | | 673,000 | 598,011 |
| Morgan Stanley, 3.622% to 4/01/2030, FLR (SOFR - 1 day + 3.12%) to 4/01/2031 | | | 423,000 | 358,144 |
| Morgan Stanley, 5.424% to 7/21/2033, FLR (SOFR - 1 day + 1.88%) to 7/21/2034 | | | 344,000 | 313,962 |
| Société Générale S.A., 5.625%, 6/02/2033 | | EUR | 500,000 | 510,789 |
| Toronto-Dominion Bank, 4.108%, 6/08/2027 | | $ | 884,000 | 828,779 |
| UBS Group AG, 2.746% to 2/11/2032, FLR (CMT - 1yr. + 1.1%) to 2/11/2033 (n) | | | 1,448,000 | 1,060,257 |
| Unicaja Banco S.A., 1%, 12/01/2026 | | EUR | 300,000 | 290,624 |
| Unicaja Banco S.A., 5.13% to 2/21/2028, FLR (EUR Swap Rate - 1yr. + 2.15%) to 2/21/2029 | | | 700,000 | 723,464 |
| UniCredit S.p.A., 2.569% to 9/22/2025, FLR (CMT - 1yr. + 2.3%) to 9/22/2026 (n) | | $ | 1,030,000 | 944,027 |
Portfolio of Investments – continued
| Issuer | | | Shares/Par | Value ($) |
| Bonds – continued |
| Major Banks – continued |
| Wells Fargo & Co., 3.35% to 3/02/2032, FLR (SOFR - 1 day + 1.5%) to 3/02/2033 | | $ | 738,000 | $581,077 |
| Wells Fargo & Co., 3.9%, 5/01/2045 | | | 316,000 | 219,592 |
| | | | | $21,027,711 |
| Medical & Health Technology & Services – 0.4% |
| Alcon Finance Corp., 3.8%, 9/23/2049 (n) | | $ | 231,000 | $156,529 |
| Becton, Dickinson and Co., 4.298%, 8/22/2032 | | | 326,000 | 286,335 |
| CVS Health Corp., 5.25%, 1/30/2031 | | | 242,000 | 227,761 |
| CVS Health Corp., 5.625%, 2/21/2053 | | | 636,000 | 538,964 |
| HCA, Inc., 5.25%, 6/15/2026 | | | 369,000 | 360,276 |
| HCA, Inc., 5.125%, 6/15/2039 | | | 354,000 | 291,204 |
| Laboratory Corp. of America Holdings, 3.6%, 2/01/2025 | | | 589,000 | 571,952 |
| Memorial Sloan-Kettering Cancer Center, 2.955%, 1/01/2050 | | | 670,000 | 396,482 |
| New York Society for the Relief of the Ruptured & Crippled, 2.667%, 10/01/2050 | | | 1,300,000 | 685,159 |
| ProMedica Toledo Hospital, “B”, AGM, 6.015%, 11/15/2048 | | | 590,000 | 538,796 |
| Thermo Fisher Scientific Finance I B.V., 2%, 10/18/2051 | | EUR | 630,000 | 387,276 |
| Thermo Fisher Scientific, Inc., 1.75%, 10/15/2028 | | $ | 288,000 | 240,832 |
| Thermo Fisher Scientific, Inc., 4.977%, 8/10/2030 | | | 533,000 | 508,421 |
| | | | | $5,189,987 |
| Medical Equipment – 0.1% |
| Fresenius SE & Co. KGaA, 5.125%, 10/05/2030 | | EUR | 880,000 | $951,399 |
| Metals & Mining – 0.2% |
| Anglo American Capital PLC, 5.625%, 4/01/2030 (n) | | $ | 572,000 | $542,617 |
| Anglo American Capital PLC, 4.75%, 9/21/2032 | | EUR | 1,060,000 | 1,093,526 |
| Glencore Funding LLC, 2.85%, 4/27/2031 (n) | | $ | 808,000 | 627,240 |
| | | | | $2,263,383 |
| Midstream – 0.4% |
| Columbia Pipelines Operating Co. LLC, 5.927%, 8/15/2030 (n) | | $ | 698,000 | $673,971 |
| Columbia Pipelines Operating Co. LLC, 6.036%, 11/15/2033 (n) | | | 369,000 | 350,419 |
| Enbridge, Inc., 5.7%, 3/08/2033 | | | 427,000 | 399,259 |
| Enbridge, Inc., 8.5% to 1/15/2034, FLR (CMT - 5yr. + 4.431%) to 1/15/2054, FLR (CMT - 5yr. + 5.181%) to 1/15/2084 | | | 614,000 | 588,192 |
Portfolio of Investments – continued
| Issuer | | | Shares/Par | Value ($) |
| Bonds – continued |
| Midstream – continued |
| Energy Transfer LP, 5.55%, 2/15/2028 | | $ | 478,000 | $464,042 |
| Galaxy Pipeline Assets Bidco Ltd., 2.16%, 3/31/2034 (n) | | | 930,137 | 753,003 |
| Sabine Pass Liquefaction LLC, 4.2%, 3/15/2028 | | | 705,000 | 648,687 |
| Targa Resources Corp., 4.2%, 2/01/2033 | | | 201,000 | 166,601 |
| Targa Resources Corp., 4.95%, 4/15/2052 | | | 583,000 | 425,397 |
| | | | | $4,469,571 |
| Mortgage-Backed – 4.7% | |
| Fannie Mae, 4.5%, 3/01/2025 - 2/01/2046 | | $ | 2,898,856 | $2,659,810 |
| Fannie Mae, 5.5%, 1/01/2037 | | | 10,296 | 10,116 |
| Fannie Mae, 6%, 9/01/2037 - 6/01/2038 | | | 116,561 | 116,312 |
| Fannie Mae, 5%, 4/01/2040 - 8/01/2040 | | | 788,435 | 752,830 |
| Fannie Mae, 4%, 11/01/2040 - 2/01/2041 | | | 883,174 | 786,133 |
| Fannie Mae, 3.5%, 5/01/2043 - 12/01/2046 | | | 1,367,521 | 1,180,909 |
| Fannie Mae, UMBS, 2%, 10/01/2036 - 7/01/2052 | | | 6,559,963 | 5,018,706 |
| Fannie Mae, UMBS, 2.5%, 4/01/2037 - 6/01/2052 | | | 5,338,287 | 4,128,946 |
| Fannie Mae, UMBS, 3%, 5/01/2037 - 6/01/2052 | | | 3,094,996 | 2,486,427 |
| Fannie Mae, UMBS, 1.5%, 4/01/2052 | | | 1,033,075 | 719,501 |
| Fannie Mae, UMBS, 3.5%, 5/01/2052 - 7/01/2052 | | | 41,721 | 34,978 |
| Fannie Mae, UMBS, 4.5%, 8/01/2052 - 10/01/2052 | | | 1,294,175 | 1,156,731 |
| Fannie Mae, UMBS, 5.5%, 11/01/2052 | | | 2,306,172 | 2,189,163 |
| Fannie Mae, UMBS, 6%, 12/01/2052 | | | 161,422 | 157,673 |
| Freddie Mac, 1.366%, 3/25/2027 (i) | | | 1,523,000 | 61,781 |
| Freddie Mac, 3.224%, 3/25/2027 | | | 1,500,000 | 1,403,382 |
| Freddie Mac, 3.194%, 7/25/2027 | | | 3,914,000 | 3,627,310 |
| Freddie Mac, 3.286%, 11/25/2027 | | | 2,576,000 | 2,380,551 |
| Freddie Mac, 1.799%, 4/25/2030 (i) | | | 3,170,226 | 299,649 |
| Freddie Mac, 1.868%, 4/25/2030 (i) | | | 2,614,093 | 250,114 |
| Freddie Mac, 1.665%, 5/25/2030 (i) | | | 3,298,344 | 290,005 |
| Freddie Mac, 1.798%, 5/25/2030 (i) | | | 7,375,798 | 691,613 |
| Freddie Mac, 1.341%, 6/25/2030 (i) | | | 3,056,884 | 220,599 |
| Freddie Mac, 1.6%, 8/25/2030 (i) | | | 2,713,457 | 236,092 |
| Freddie Mac, 1.169%, 9/25/2030 (i) | | | 1,752,322 | 113,383 |
| Freddie Mac, 1.081%, 11/25/2030 (i) | | | 3,594,105 | 218,363 |
| Freddie Mac, 0.327%, 1/25/2031 (i) | | | 13,654,313 | 239,359 |
| Freddie Mac, 0.515%, 3/25/2031 (i) | | | 16,725,581 | 481,826 |
| Freddie Mac, 0.938%, 7/25/2031 (i) | | | 3,177,082 | 182,225 |
| Freddie Mac, 0.536%, 9/25/2031 (i) | | | 13,281,588 | 457,152 |
| Freddie Mac, 0.855%, 9/25/2031 (i) | | | 4,021,884 | 209,682 |
| Freddie Mac, 0.568%, 12/25/2031 (i) | | | 3,294,996 | 116,647 |
| Freddie Mac, 5.5%, 7/01/2037 | | | 20,552 | 20,218 |
| Freddie Mac, 4.5%, 12/01/2039 - 5/01/2042 | | | 896,314 | 828,336 |
Portfolio of Investments – continued
| Issuer | | | Shares/Par | Value ($) |
| Bonds – continued |
| Mortgage-Backed – continued | |
| Freddie Mac, 5%, 7/01/2041 | | $ | 312,231 | $298,837 |
| Freddie Mac, UMBS, 2%, 5/01/2037 - 3/01/2052 | | | 558,689 | 411,371 |
| Freddie Mac, UMBS, 3.5%, 1/01/2047 | | | 611,027 | 524,666 |
| Freddie Mac, UMBS, 3%, 6/01/2050 - 6/01/2052 | | | 1,047,610 | 840,799 |
| Freddie Mac, UMBS, 2.5%, 10/01/2051 - 9/01/2052 | | | 1,908,606 | 1,469,061 |
| Freddie Mac, UMBS, 4%, 5/01/2052 - 10/01/2052 | | | 1,217,702 | 1,053,650 |
| Freddie Mac, UMBS, 4.5%, 9/01/2052 | | | 269,259 | 240,659 |
| Freddie Mac, UMBS, 5.5%, 10/01/2052 | | | 386,615 | 367,073 |
| Freddie Mac, UMBS, 6%, 11/01/2052 | | | 473,123 | 463,177 |
| Ginnie Mae, 5%, 5/15/2040 - 4/20/2053 | | | 780,697 | 730,295 |
| Ginnie Mae, 3.5%, 6/20/2043 - 11/20/2052 | | | 722,122 | 624,992 |
| Ginnie Mae, 2.5%, 8/20/2051 - 10/20/2052 | | | 3,339,911 | 2,662,799 |
| Ginnie Mae, 3%, 10/20/2051 - 11/20/2052 | | | 2,372,375 | 1,957,776 |
| Ginnie Mae, 2%, 1/20/2052 - 6/20/2052 | | | 1,736,137 | 1,339,955 |
| Ginnie Mae, 4%, 7/20/2052 - 10/20/2052 | | | 1,417,232 | 1,246,249 |
| Ginnie Mae, 4.5%, 9/20/2052 - 11/20/2052 | | | 1,415,621 | 1,279,878 |
| Ginnie Mae, 5.5%, 2/20/2053 - 7/20/2053 | | | 908,330 | 869,459 |
| Ginnie Mae, TBA, 3.5%, 11/15/2053 | | | 1,150,000 | 980,076 |
| Ginnie Mae, TBA, 6%, 11/15/2053 | | | 250,000 | 244,919 |
| Ginnie Mae, TBA, 6.5%, 11/15/2053 | | | 425,000 | 424,019 |
| UMBS, TBA, 2%, 11/25/2038 - 11/25/2053 | | | 2,008,241 | 1,482,926 |
| UMBS, TBA, 2.5%, 11/25/2053 | | | 2,519,837 | 1,932,794 |
| UMBS, TBA, 3.5%, 11/25/2053 | | | 775,000 | 645,288 |
| UMBS, TBA, 5%, 11/25/2053 | | | 500,000 | 460,938 |
| UMBS, TBA, 5.5%, 11/25/2053 | | | 100,000 | 94,844 |
| UMBS, TBA, 6%, 11/25/2053 | | | 1,575,000 | 1,532,530 |
| UMBS, TBA, 6.5%, 11/25/2053 | | | 275,000 | 273,323 |
| | | | | $58,178,875 |
| Municipals – 0.7% |
| Colorado Housing & Finance Authority Rev., Single Family Mortgage Class I, Taxable, “D-1”, GNMA, 5%, 11/01/2047 | | $ | 710,000 | $681,044 |
| Connecticut Higher Education Supplemental Loan Authority Rev., Taxable (Chesla Loan Program), “C”, 4.668%, 11/15/2034 | | | 1,200,000 | 1,057,453 |
| Iowa Student Loan Liquidity Corp. Rev., Taxable, “A”, 5.08%, 12/01/2039 | | | 640,000 | 576,709 |
| Massachusetts Educational Financing Authority, Education Loan Rev., Taxable, Issue M, “A”, 2.641%, 7/01/2037 | | | 1,235,000 | 1,045,309 |
Portfolio of Investments – continued
| Issuer | | | Shares/Par | Value ($) |
| Bonds – continued |
| Municipals – continued |
| Massachusetts Educational Financing Authority, Education Loan Rev., Taxable, Issue M, “A”, 4.949%, 7/01/2038 | | $ | 1,815,000 | $1,684,789 |
| Massachusetts Housing Finance Agency, Single Family Housing Rev., Taxable, “226”, 5.562%, 12/01/2052 | | | 1,080,000 | 1,046,238 |
| Michigan Finance Authority Hospital Rev., Taxable (Trinity Health Credit Group), 3.384%, 12/01/2040 | | | 585,000 | 425,175 |
| Minnesota Housing Finance Agency, Residential Housing, Taxable, “G”, 4.337%, 1/01/2047 | | | 1,005,000 | 944,780 |
| Oklahoma Development Finance Authority, Health System Rev., Taxable (OU Medicine Project), “C”, AGM, 4.65%, 8/15/2030 | | | 992,000 | 874,126 |
| | | | | $8,335,623 |
| Natural Gas - Distribution – 0.1% |
| Boston Gas Co., 3.15%, 8/01/2027 (n) | | $ | 310,000 | $276,818 |
| Engie S.A., 4.5%, 9/06/2042 | | EUR | 300,000 | 300,378 |
| Engie S.A., 4.25%, 1/11/2043 | | | 300,000 | 291,670 |
| Infraestructura Energética Nova S.A.B. de C.V., 4.875%, 1/14/2048 | | $ | 710,000 | 495,900 |
| | | | | $1,364,766 |
| Natural Gas - Pipeline – 0.1% |
| APA Infrastructure Ltd., 0.75%, 3/15/2029 | | EUR | 970,000 | $832,874 |
| APA Infrastructure Ltd., 2.5%, 3/15/2036 | | GBP | 1,140,000 | 888,195 |
| | | | | $1,721,069 |
| Network & Telecom – 0.1% |
| Orange S.A., 3.875%, 9/11/2035 | | EUR | 800,000 | $818,687 |
| Oils – 0.0% |
| Neste Oyj, 3.875%, 3/16/2029 | | EUR | 220,000 | $230,764 |
| Other Banks & Diversified Financials – 0.8% |
| ABANCA Corp. Bancaria S.A., 5.875%, 4/02/2030 | | EUR | 900,000 | $937,639 |
| AIB Group PLC, 6.608% to 9/13/2028, FLR (SOFR - 1 day + 2.33%) to 9/13/2029 (n) | | $ | 705,000 | 689,522 |
| AIB Group PLC, 5.25%, 10/23/2031 | | EUR | 560,000 | 596,568 |
| Banque Federative du Credit Mutuel S.A., 4.125%, 9/18/2030 | | | 400,000 | 418,218 |
| BPCE S.A., 2.277% to 1/20/2031, FLR (SOFR - 1 day + 1.312%) to 1/20/2032 (n) | | $ | 960,000 | 694,985 |
| BPCE S.A., 4.75% to 6/14/2033, FLR (EURIBOR - 3mo. + 1.83%) to 6/14/2034 | | EUR | 400,000 | 415,968 |
Portfolio of Investments – continued
| Issuer | | | Shares/Par | Value ($) |
| Bonds – continued |
| Other Banks & Diversified Financials – continued |
| CaixaBank S.A., 4.25%, 9/06/2030 | | EUR | 400,000 | $417,943 |
| CaixaBank, S.A., 5% to 7/19/2028, FLR (EURIBOR - 3mo. + 1.65%) to 7/19/2029 | | | 500,000 | 529,106 |
| Deutsche Bank AG, 1.875% to 2/23/2027, FLR (EURIBOR - 3mo. + 1.38%) to 2/23/2028 | | | 200,000 | 190,044 |
| Deutsche Bank AG, 6.125% to 12/12/2029, FLR (SONIA + 2.621%) to 12/12/2030 | | GBP | 600,000 | 680,949 |
| Deutsche Bank AG, 1.375% to 2/17/2031, FLR (EURIBOR - 3mo. + 1.5%) to 2/17/2032 | | EUR | 400,000 | 314,927 |
| Deutsche Bank AG, 4%, 6/24/2032 | | | 700,000 | 666,603 |
| Groupe BPCE S.A., 4.5%, 3/15/2025 (n) | | $ | 950,000 | 916,438 |
| Intesa Sanpaolo S.p.A., 4.875%, 5/19/2030 | | EUR | 400,000 | 419,811 |
| Intesa Sanpaolo S.p.A., 5.125%, 8/29/2031 | | | 810,000 | 853,662 |
| Manufacturers and Traders Trust Co., 4.7%, 1/27/2028 | | $ | 650,000 | 589,015 |
| Virgin Money UK PLC, 7.625% to 8/23/2028, FLR (GBP Government Yield - 1yr. + 3.05%) to 8/23/2029 | | GBP | 560,000 | 682,724 |
| | | | | $10,014,122 |
| Pharmaceuticals – 0.1% |
| Pfizer Investment Enterprises Pte. Ltd., 4.75%, 5/19/2033 | | $ | 682,000 | $626,760 |
| Pollution Control – 0.1% |
| Waste Management, Inc., 4.625%, 2/15/2033 | | $ | 907,000 | $822,582 |
| Precious Metals & Minerals – 0.1% |
| Northern Star Resources Ltd. Co., 6.125%, 4/11/2033 (n) | | $ | 719,000 | $657,205 |
| Real Estate - Office – 0.1% |
| Corporate Office Property LP, REIT, 2.25%, 3/15/2026 | | $ | 675,000 | $610,386 |
| Corporate Office Property LP, REIT, 2%, 1/15/2029 | | | 425,000 | 322,910 |
| Corporate Office Property LP, REIT, 2.75%, 4/15/2031 | | | 173,000 | 126,799 |
| | | | | $1,060,095 |
| Real Estate - Other – 0.1% |
| EPR Properties, REIT, 3.6%, 11/15/2031 | | $ | 725,000 | $521,861 |
| Extra Space Storage LP, 5.5%, 7/01/2030 | | | 668,000 | 631,849 |
| Lexington Realty Trust Co., 2.7%, 9/15/2030 | | | 677,000 | 514,082 |
| | | | | $1,667,792 |
Portfolio of Investments – continued
| Issuer | | | Shares/Par | Value ($) |
| Bonds – continued |
| Real Estate - Retail – 0.2% |
| Spirit Realty, LP, REIT, 3.2%, 1/15/2027 | | $ | 531,000 | $480,581 |
| STORE Capital Corp., REIT, 2.7%, 12/01/2031 | | | 949,000 | 636,075 |
| WEA Finance LLC, 2.875%, 1/15/2027 (n) | | | 800,000 | 684,413 |
| | | | | $1,801,069 |
| Retailers – 0.1% |
| AutoZone, Inc., 4.75%, 8/01/2032 | | $ | 558,000 | $495,485 |
| Home Depot, Inc., 4.875%, 2/15/2044 | | | 281,000 | 236,456 |
| Home Depot, Inc., 3.625%, 4/15/2052 | | | 471,000 | 313,667 |
| | | | | $1,045,608 |
| Specialty Chemicals – 0.1% |
| Covestro AG, 1.375%, 6/12/2030 | | EUR | 670,000 | $608,176 |
| International Flavors & Fragrances, Inc., 1.832%, 10/15/2027 (n) | | $ | 429,000 | 355,699 |
| | | | | $963,875 |
| Specialty Stores – 0.0% |
| DICK'S Sporting Goods, 3.15%, 1/15/2032 | | $ | 661,000 | $498,825 |
| Supranational – 0.4% |
| European Financial Stability Facility, 3%, 9/04/2034 | | EUR | 2,642,000 | $2,648,138 |
| European Union, 3.25%, 7/04/2034 | | | 2,413,000 | 2,473,280 |
| International Bank for Reconstruction and Development, 4.25%, 6/24/2025 | | AUD | 440,000 | 276,742 |
| | | | | $5,398,160 |
| Telecommunications - Wireless – 0.3% |
| Crown Castle, Inc., REIT, 1.35%, 7/15/2025 | | $ | 501,000 | $462,233 |
| Crown Castle, Inc., REIT, 4.45%, 2/15/2026 | | | 483,000 | 465,301 |
| Rogers Communications, Inc., 3.8%, 3/15/2032 | | | 828,000 | 671,468 |
| TDF Infrastructure S.A.S., 5.625%, 7/21/2028 | | EUR | 300,000 | 316,932 |
| T-Mobile USA, Inc., 3.875%, 4/15/2030 | | $ | 863,000 | 751,417 |
| T-Mobile USA, Inc., 5.75%, 1/15/2034 | | | 627,000 | 594,863 |
| Vodafone Group PLC, 3.375%, 8/08/2049 | | GBP | 650,000 | 481,104 |
| Vodafone Group PLC, 5.625%, 2/10/2053 | | $ | 581,000 | 488,664 |
| | | | | $4,231,982 |
| Telephone Services – 0.1% |
| Deutsche Telekom AG, 1.375%, 7/05/2034 | | EUR | 110,000 | $91,458 |
| TELUS Corp., 2.85%, 11/13/2031 | | CAD | 1,775,000 | 1,025,014 |
| | | | | $1,116,472 |
Portfolio of Investments – continued
| Issuer | | | Shares/Par | Value ($) |
| Bonds – continued |
| Tobacco – 0.1% |
| B.A.T. International Finance PLC, 2.25%, 1/16/2030 | | EUR | 650,000 | $580,973 |
| Philip Morris International, Inc., 5.125%, 11/17/2027 | | $ | 822,000 | 801,255 |
| | | | | $1,382,228 |
| Transportation - Services – 0.4% |
| Aeroporti Di Roma S.p.A, 4.875%, 7/10/2033 | | EUR | 830,000 | $844,350 |
| Autostrade per l'Italia S.p.A., 4.75%, 1/24/2031 | | | 730,000 | 745,499 |
| Autostrade per l'Italia S.p.A., 5.125%, 6/14/2033 | | | 310,000 | 315,871 |
| Holding d'Infrastructures de Transport, 1.475%, 1/18/2031 | | | 800,000 | 672,716 |
| Sydney Airport Finance Co. Pty Ltd., 4.375%, 5/03/2033 | | | 622,000 | 644,904 |
| Transurban Finance Co. Pty Ltd., 4.225%, 4/26/2033 | | | 620,000 | 634,914 |
| Triton International Ltd., 3.15%, 6/15/2031 (n) | | $ | 769,000 | 560,317 |
| United Parcel Service, 5.05%, 3/03/2053 | | | 814,000 | 698,833 |
| | | | | $5,117,404 |
| U.S. Government Agencies and Equivalents – 0.0% |
| Small Business Administration, 5.31%, 5/01/2027 | | $ | 20,762 | $20,248 |
| U.S. Treasury Obligations – 1.1% |
| U.S. Treasury Bonds, 3.875%, 5/15/2043 (f) | | $ | 15,833,000 | $13,148,812 |
| U.S. Treasury Bonds, 3.625%, 5/15/2053 | | | 1,007,000 | 784,988 |
| | | | | $13,933,800 |
| Utilities - Electric Power – 1.1% |
| American Electric Power Co., Inc., 5.699%, 8/15/2025 | | $ | 331,000 | $328,281 |
| American Electric Power Co., Inc., 2.3%, 3/01/2030 | | | 511,000 | 401,542 |
| Berkshire Hathaway Energy Co., 5.15%, 11/15/2043 | | | 163,000 | 137,255 |
| Berkshire Hathaway Energy Co., 4.6%, 5/01/2053 | | | 136,000 | 100,762 |
| Bruce Power LP, 2.68%, 12/21/2028 | | CAD | 1,600,000 | 1,009,866 |
| Duke Energy Corp., 3.75%, 9/01/2046 | | $ | 515,000 | 335,551 |
| E.ON International Finance B.V., 5.875%, 10/30/2037 | | GBP | 500,000 | 573,129 |
| EDP Servicios Financieros Espana S.A., 4.375%, 4/04/2032 | | EUR | 382,000 | 401,333 |
| Enel Americas S.A., 4%, 10/25/2026 | | $ | 1,835,000 | 1,713,229 |
| Enel Finance International N.V., 2.25%, 7/12/2031 (n) | | | 580,000 | 424,925 |
| Enel Finance International N.V., 4.5%, 2/20/2043 | | EUR | 420,000 | 402,809 |
| Enel Finance International N.V., 4.75%, 5/25/2047 (n) | | $ | 456,000 | 330,383 |
Portfolio of Investments – continued
| Issuer | | | Shares/Par | Value ($) |
| Bonds – continued |
| Utilities - Electric Power – continued |
| Enel S.p.A., 2.25% to 3/10/2027, FLR (EUR Swap Rate - 5yr. + 2.679%) to 3/10/2032, FLR (EUR Swap Rate - 5yr. + 2.929%) to 3/10/2047, FLR (EUR Swap Rate - 5yr. + 3.679%) to 3/10/2070 | | EUR | 645,000 | $595,459 |
| Enel S.p.A., 1.875%, 3/08/2170 | | | 685,000 | 522,761 |
| Florida Power & Light Co., 2.875%, 12/04/2051 | | $ | 549,000 | 311,309 |
| Georgia Power Co., 4.95%, 5/17/2033 | | | 835,000 | 762,155 |
| Jersey Central Power & Light Co., 2.75%, 3/01/2032 (n) | | | 548,000 | 420,247 |
| National Grid Electricity Transmission PLC, 2%, 4/17/2040 | | GBP | 820,000 | 562,157 |
| National Grid PLC, 4.275%, 1/16/2035 | | EUR | 390,000 | 390,782 |
| NextEra Energy Capital Holdings, Inc., 6.051%, 3/01/2025 | | $ | 398,000 | 397,772 |
| NextEra Energy Capital Holdings, Inc., 5.749%, 9/01/2025 | | | 358,000 | 356,317 |
| Pacific Gas & Electric Co., 6.1%, 1/15/2029 | | | 460,000 | 442,585 |
| Pacific Gas & Electric Co., 6.4%, 6/15/2033 | | | 274,000 | 257,133 |
| PPL Electric Utilities Corp, 1st Mortgage, 5.25%, 5/15/2053 | | | 735,000 | 632,563 |
| Southern Co., 1.875%, 9/15/2081 | | EUR | 100,000 | 84,119 |
| SSE PLC, 4%, 9/05/2031 | | | 550,000 | 572,729 |
| Virginia Electric & Power Co., 3.5%, 3/15/2027 | | $ | 575,000 | 534,304 |
| Xcel Energy, Inc., 4.6%, 6/01/2032 | | | 379,000 | 335,037 |
| | | | | $13,336,494 |
| Total Bonds (Identified Cost, $520,394,193) | | $469,100,468 |
| Preferred Stocks – 0.8% |
| Consumer Products – 0.6% | | | | |
| Henkel AG & Co. KGaA | | 92,743 | $6,680,784 |
| Metals & Mining – 0.2% | | | | |
| Gerdau S.A. | | 672,185 | $2,902,458 |
| Total Preferred Stocks (Identified Cost, $8,141,180) | | $9,583,242 |
| Investment Companies (h) – 1.5% |
| Money Market Funds – 1.5% | |
| MFS Institutional Money Market Portfolio, 5.43% (v) (Identified Cost, $18,636,725) | | | 18,636,755 | $18,638,618 |
Portfolio of Investments – continued
| Underlying/Expiration Date/Exercise Price | Put/Call | Counterparty | Notional
Amount | Par Amount/
Number of
Contracts | Value ($) |
| Purchased Options – 0.0% | |
| Market Index Securities – 0.0% | |
| iTraxx Europe Crossover Series 40 Index Credit Default Swap-Fund pays 5%, Fund receives notional amount upon a defined credit event of an index constituent – November 2023 @ 4.375% (Premiums Paid, $91,452) | Put | Goldman Sachs International | $ 8,690,727 | EUR 8,010,000 | $84,741 |
|
|
| Other Assets, Less Liabilities – 0.1% | | 917,986 |
| Net Assets – 100.0% | $1,225,779,430 |
| (a) | Non-income producing security. | | | |
| (f) | All or a portion of the security has been segregated as collateral for open futures contracts. | | | |
| (h) | An affiliated issuer, which may be considered one in which the fund owns 5% or more of the outstanding voting securities, or a company which is under common control. At period end, the aggregate values of the fund's investments in affiliated issuers and in unaffiliated issuers were $18,638,618 and $1,206,222,826, respectively. | | | |
| (i) | Interest only security for which the fund receives interest on notional principal (Par amount). Par amount shown is the notional principal and does not reflect the cost of the security. | | | |
| (n) | Securities exempt from registration under Rule 144A of the Securities Act of 1933. These securities may be sold in the ordinary course of business in transactions exempt from registration, normally to qualified institutional buyers. At period end, the aggregate value of these securities was $75,032,598, representing 6.1% of net assets. | | | |
| (u) | The security was valued using significant unobservable inputs and is considered level 3 under the fair value hierarchy. For further information about the fund’s level 3 holdings, please see Note 2 in the Notes to Financial Statements. | | | |
| (v) | Affiliated issuer that is available only to investment companies managed by MFS. The rate quoted for the MFS Institutional Money Market Portfolio is the annualized seven-day yield of the fund at period end. | | | |
| (w) | When-issued security. | | | |
| The following abbreviations are used in this report and are defined: |
| ADR | American Depositary Receipt |
| AGM | Assured Guaranty Municipal |
| CLO | Collateralized Loan Obligation |
| CMT | Constant Maturity Treasury |
| EURIBOR | Euro Interbank Offered Rate |
| FLR | Floating Rate. Interest rate resets periodically based on the parenthetically disclosed reference rate plus a spread (if any). The period-end rate reported may not be the current rate. All reference rates are USD unless otherwise noted. |
| GDR | Global Depositary Receipt |
| GNMA | Government National Mortgage Assn. |
| ICE | Intercontinental Exchange |
Portfolio of Investments – continued
| LIBOR | London Interbank Offered Rate |
| REIT | Real Estate Investment Trust |
| SOFR | Secured Overnight Financing Rate |
| SONIA | Sterling Overnight Index Average |
| TBA | To Be Announced |
| UMBS | Uniform Mortgage-Backed Security |
| Abbreviations indicate amounts shown in currencies other than the U.S. dollar. All amounts are stated in U.S. dollars unless otherwise indicated. A list of abbreviations is shown below: |
| AUD | Australian Dollar |
| CAD | Canadian Dollar |
| CHF | Swiss Franc |
| CLP | Chilean Peso |
| CNH | Chinese Yuan Renminbi (Offshore) |
| CNY | China Yuan Renminbi |
| COP | Colombian Peso |
| CZK | Czech Koruna |
| DKK | Danish Krone |
| EUR | Euro |
| GBP | British Pound |
| HUF | Hungarian Forint |
| IDR | Indonesian Rupiah |
| JPY | Japanese Yen |
| KRW | South Korean Won |
| MXN | Mexican Peso |
| NOK | Norwegian Krone |
| NZD | New Zealand Dollar |
| PEN | Peruvian Nuevo Sol |
| PLN | Polish Zloty |
| SEK | Swedish Krona |
| SGD | Singapore Dollar |
| THB | Thai Baht |
| TWD | Taiwan Dollar |
| UYU | Uruguayan Peso |
Derivative Contracts at 10/31/23
| Forward Foreign Currency Exchange Contracts |
Currency
Purchased | Currency
Sold | Counterparty | Settlement
Date | Unrealized
Appreciation
(Depreciation) |
| Asset Derivatives |
| AUD | 917,542 | USD | 582,979 | JPMorgan Chase Bank N.A. | 1/19/2024 | $600 |
| AUD | 1,730,667 | USD | 1,098,021 | State Street Bank Corp. | 1/19/2024 | 2,723 |
| CLP | 230,670,610 | USD | 245,771 | Barclays Bank PLC | 1/16/2024 | 10,744 |
| COP | 2,054,532,379 | USD | 477,271 | Citibank N.A. | 1/17/2024 | 13,062 |
| EUR | 807,900 | USD | 856,544 | HSBC Bank | 1/19/2024 | 1,561 |
| EUR | 99,920 | USD | 105,671 | JPMorgan Chase Bank N.A. | 1/19/2024 | 459 |
| EUR | 2,811,109 | USD | 2,973,870 | UBS AG | 1/19/2024 | 11,927 |
| GBP | 1,114,639 | USD | 1,354,672 | HSBC Bank | 1/19/2024 | 1,009 |
| GBP | 406,302 | USD | 492,908 | State Street Bank Corp. | 1/19/2024 | 1,256 |
| HUF | 139,879,951 | USD | 379,426 | Goldman Sachs International | 1/19/2024 | 3,211 |
Portfolio of Investments – continued
| Forward Foreign Currency Exchange Contracts - continued |
Currency
Purchased | Currency
Sold | Counterparty | Settlement
Date | Unrealized
Appreciation
(Depreciation) |
| Asset Derivatives - continued |
| SGD | 1,538,303 | USD | 1,126,358 | State Street Bank Corp. | 1/19/2024 | $1,219 |
| TWD | 514,131 | USD | 15,941 | Goldman Sachs International | 1/30/2024 | 90 |
| TWD | 514,131 | USD | 15,851 | Goldman Sachs International | 11/02/2023 | 0 |
| USD | 487,032 | AUD | 762,110 | JPMorgan Chase Bank N.A. | 1/19/2024 | 2,312 |
| USD | 9,303,292 | EUR | 8,752,332 | Barclays Bank PLC | 1/19/2024 | 7,072 |
| USD | 599,477 | EUR | 564,096 | Brown Brothers Harriman | 1/19/2024 | 327 |
| USD | 1,395,727 | EUR | 1,309,754 | HSBC Bank | 1/19/2024 | 4,582 |
| USD | 79,555 | EUR | 74,790 | Merrill Lynch International | 1/19/2024 | 117 |
| USD | 735,499 | EUR | 690,152 | Morgan Stanley Capital Services, Inc. | 1/19/2024 | 2,460 |
| USD | 318,406 | EUR | 299,543 | State Street Bank Corp. | 1/19/2024 | 249 |
| USD | 404,379 | GBP | 332,034 | Deutsche Bank AG | 1/19/2024 | 542 |
| USD | 1,844,251 | GBP | 1,512,661 | State Street Bank Corp. | 1/19/2024 | 4,477 |
| USD | 934,098 | JPY | 138,517,488 | JPMorgan Chase Bank N.A. | 1/19/2024 | 7,896 |
| USD | 18,478,096 | KRW | 24,454,281,140 | Citibank N.A. | 1/26/2024 | 277,850 |
| USD | 2,767,341 | KRW | 3,513,167,366 | Citibank N.A. | 11/09/2023 | 165,188 |
| USD | 18,743,639 | NZD | 31,653,532 | State Street Bank Corp. | 1/19/2024 | 297,220 |
| USD | 8,720,564 | SEK | 94,727,093 | UBS AG | 1/19/2024 | 200,850 |
| USD | 15,851 | TWD | 514,131 | Citibank N.A. | 11/02/2023 | 0 |
| | | | | | | $1,019,003 |
| Liability Derivatives |
| CAD | 1,693,393 | USD | 1,241,496 | JPMorgan Chase Bank N.A. | 1/19/2024 | $(18,623) |
| CAD | 13,991,277 | USD | 10,264,579 | UBS AG | 1/19/2024 | (160,867) |
| CHF | 2,610,060 | USD | 2,928,252 | State Street Bank Corp. | 1/19/2024 | (32,625) |
| CNH | 110,168,005 | USD | 15,106,138 | Goldman Sachs International | 1/19/2024 | (16,844) |
| CNH | 8,783,000 | USD | 1,204,285 | Merrill Lynch International | 1/19/2024 | (1,311) |
| DKK | 7,971,327 | USD | 1,136,338 | State Street Bank Corp. | 1/19/2024 | (1,015) |
| EUR | 17,312,377 | USD | 18,402,191 | Barclays Bank PLC | 1/19/2024 | (13,988) |
| EUR | 111,506 | USD | 118,715 | HSBC Bank | 1/19/2024 | (280) |
| EUR | 642,915 | USD | 684,628 | JPMorgan Chase Bank N.A. | 1/19/2024 | (1,761) |
| IDR | 37,084,257,298 | USD | 2,450,232 | Citibank N.A. | 11/09/2023 | (115,811) |
| JPY | 3,053,996,930 | USD | 20,718,324 | Barclays Bank PLC | 1/19/2024 | (297,663) |
| NOK | 13,579,113 | USD | 1,246,050 | Deutsche Bank AG | 1/19/2024 | (27,706) |
| NOK | 3,926,036 | USD | 359,118 | Merrill Lynch International | 1/19/2024 | (6,867) |
| NZD | 317,324 | USD | 187,762 | State Street Bank Corp. | 1/19/2024 | (2,838) |
| PLN | 4,899,803 | USD | 1,167,520 | HSBC Bank | 1/19/2024 | (7,282) |
| SEK | 1,977,000 | USD | 182,104 | State Street Bank Corp. | 1/19/2024 | (4,294) |
| THB | 117,563,348 | USD | 3,317,250 | JPMorgan Chase Bank N.A. | 11/13/2023 | (60,440) |
| TWD | 514,131 | USD | 16,474 | Citibank N.A. | 11/02/2023 | (623) |
| USD | 5,036,196 | AUD | 7,937,892 | State Street Bank Corp. | 1/19/2024 | (12,491) |
| USD | 1,687,258 | CZK | 39,406,759 | HSBC Bank | 1/19/2024 | (7,412) |
| USD | 699,277 | EUR | 659,876 | Citibank N.A. | 1/19/2024 | (1,605) |
| USD | 1,240,215 | EUR | 1,174,512 | JPMorgan Chase Bank N.A. | 1/19/2024 | (7,285) |
| USD | 92,026 | EUR | 86,835 | State Street Bank Corp. | 1/19/2024 | (205) |
| USD | 590,779 | EUR | 557,441 | UBS AG | 1/19/2024 | (1,302) |
Portfolio of Investments – continued
| Forward Foreign Currency Exchange Contracts - continued |
Currency
Purchased | Currency
Sold | Counterparty | Settlement
Date | Unrealized
Appreciation
(Depreciation) |
| Liability Derivatives - continued |
| USD | 7,159,011 | GBP | 5,908,471 | UBS AG | 1/19/2024 | $(27,168) |
| USD | 194,169 | IDR | 3,094,898,823 | Morgan Stanley Capital Services, Inc. | 11/09/2023 | (652) |
| USD | 2,394,642 | KRW | 3,235,640,613 | Citibank N.A. | 11/09/2023 | (1,951) |
| USD | 6,031,991 | MXN | 111,352,371 | HSBC Bank | 1/19/2024 | (61,059) |
| USD | 2,255,749 | PEN | 8,760,203 | Barclays Bank PLC | 1/29/2024 | (16,618) |
| USD | 1,598,100 | THB | 57,587,528 | Barclays Bank PLC | 1/16/2024 | (6,462) |
| USD | 15,840 | TWD | 514,131 | Goldman Sachs International | 11/02/2023 | (11) |
| | | | | | | $(915,059) |
| Futures Contracts |
| Description | Long/
Short | Currency | Contracts | Notional
Amount | Expiration
Date | Value/Unrealized
Appreciation
(Depreciation) |
| Asset Derivatives |
| Interest Rate Futures | | |
| Australian Bond 10 yr | Short | AUD | 45 | $3,089,926 | December – 2023 | $189,149 |
| Euro-Bund 10 yr | Short | EUR | 55 | 7,506,638 | December – 2023 | 155,261 |
| Euro-Schatz 2 yr | Short | EUR | 97 | 10,794,710 | December – 2023 | 26,473 |
| U.S. Treasury Bond 30 yr | Short | USD | 87 | 9,521,062 | December – 2023 | 314,021 |
| | | | | | | $684,904 |
| Liability Derivatives |
| Interest Rate Futures | | |
| Canadian Treasury Bond 10 yr | Long | CAD | 108 | $8,950,741 | December – 2023 | $(294,702) |
| Euro-Bobl 5 yr | Long | EUR | 259 | 31,869,030 | December – 2023 | (64,905) |
| Euro-BTP 10 yr | Long | EUR | 21 | 2,449,099 | December – 2023 | (100,481) |
| Euro-Buxl 30 yr | Long | EUR | 30 | 3,822,492 | December – 2023 | (344,160) |
| Long Gilt 10 yr | Long | GBP | 74 | 8,379,118 | December – 2023 | (96,322) |
| U.S. Treasury Note 10 yr | Long | USD | 203 | 21,552,891 | December – 2023 | (736,246) |
| U.S. Treasury Note 2 yr | Long | USD | 165 | 33,399,610 | December – 2023 | (50,821) |
| U.S. Treasury Note 5 yr | Long | USD | 41 | 4,283,539 | December – 2023 | (29,294) |
| U.S. Treasury Ultra Bond 30 yr | Long | USD | 37 | 4,164,813 | December – 2023 | (171,267) |
| U.S. Treasury Ultra Note 10 yr | Long | USD | 35 | 3,808,984 | December – 2023 | (72,279) |
| | | | | | | $(1,960,477) |
Portfolio of Investments – continued
| Uncleared Swap Agreements |
Maturity
Date | Notional
Amount | Counterparty | Cash Flows
to Receive/
Frequency | Cash Flows
to Pay/
Frequency | Unrealized
Appreciation
(Depreciation) | | Net Unamortized
Upfront Payments
(Receipts) | | Value |
| Asset Derivatives | | | | | |
| Credit Default Swaps | | | | | |
| 6/20/28 | EUR | 1,020,000 | Barclays Bank PLC | 5.00%/Quarterly | (1) | $16,049 | | $138,765 | | $154,814 |
(1) Fund, as protection seller, to pay notional amount upon a defined credit event by Glencore Funding LLC, 1.75%, 3/17/25, a BBB+ rated bond. The fund entered into the contract to gain issuer exposure.
The credit ratings presented here are an indicator of the current payment/performance risk of the related swap agreement, the reference obligation for which may be either a single security or, in the case of a credit default swap index, a basket of securities issued by corporate or sovereign issuers. Ratings are assigned to each reference security, including each individual security within a reference basket of securities, utilizing ratings from Moody’s, Fitch, and Standard & Poor’s rating agencies and applying the following hierarchy: If all three agencies provide a rating, the middle rating (after dropping the highest and lowest ratings) is assigned; if two of the three agencies rate a security, the lower of the two is assigned. If none of the 3 rating agencies above assign a rating, but the security is rated by DBRS Morningstar, than the DBRS Morningstar rating is assigned. If none of the 4 rating agencies listed above rate the security, but the security is rated by the Kroll Bond Rating Agency (KBRA), then the KBRA rating is assigned. Ratings are shown in the S&P and Fitch scale (e.g., AAA). The ratings for a credit default swap index are calculated by MFS as a weighted average of the external credit ratings of the individual securities that compose the index’s reference basket of securities.
At October 31, 2023, the fund had cash collateral of $30,000 and other liquid securities with an aggregate value of $2,016,381 to cover any collateral or margin obligations for certain derivative contracts. Restricted cash and/or deposits with brokers in the Statement of Assets and Liabilities are comprised of cash collateral.
See Notes to Financial Statements
Financial Statements
Statement of Assets and Liabilities
At 10/31/23
This statement represents your fund’s balance sheet, which details the assets and liabilities comprising the total value of the fund.
| Assets | |
| Investments in unaffiliated issuers, at value (identified cost, $1,094,954,401) | $1,206,222,826 |
| Investments in affiliated issuers, at value (identified cost, $18,636,725) | 18,638,618 |
| Cash | 147,934 |
| Foreign currency, at value (identified cost, $40) | 40 |
| Restricted cash for | |
| Forward foreign currency exchange contracts | 30,000 |
| Receivables for | |
| Forward foreign currency exchange contracts | 1,019,003 |
| Net daily variation margin on open futures contracts | 25,203 |
| Investments sold | 2,932,354 |
| TBA sale commitments | 1,520,328 |
| Fund shares sold | 681,289 |
| Interest and dividends | 8,427,867 |
| Uncleared swaps, at value (net of unamortized premiums paid, $138,765) | 154,814 |
| Receivable from investment adviser | 40,586 |
| Total assets | $1,239,840,862 |
| Liabilities | |
| Payables for | |
| Forward foreign currency exchange contracts | $915,059 |
| Investments purchased | 20,671 |
| When-issued investments purchased | 737,471 |
| TBA purchase commitments | 9,704,730 |
| Fund shares reacquired | 1,845,115 |
| Payable to affiliates | |
| Administrative services fee | 1,014 |
| Shareholder servicing costs | 356,168 |
| Distribution and service fees | 11,367 |
| Payable for independent Trustees' compensation | 36 |
| Accrued expenses and other liabilities | 469,801 |
| Total liabilities | $14,061,432 |
| Net assets | $1,225,779,430 |
| Net assets consist of | |
| Paid-in capital | $1,094,976,240 |
| Total distributable earnings (loss) | 130,803,190 |
| Net assets | $1,225,779,430 |
| Shares of beneficial interest outstanding | 78,929,125 |
Statement of Assets and Liabilities – continued
| | Net assets | Shares
outstanding | Net asset value
per share (a) |
| Class A | $594,255,313 | 38,024,629 | $15.63 |
| Class B | 6,176,018 | 387,626 | 15.93 |
| Class C | 46,525,688 | 2,976,227 | 15.63 |
| Class I | 346,646,969 | 22,489,992 | 15.41 |
| Class R1 | 2,346,896 | 151,357 | 15.51 |
| Class R2 | 3,765,902 | 244,626 | 15.39 |
| Class R3 | 11,987,849 | 770,122 | 15.57 |
| Class R4 | 3,447,355 | 220,169 | 15.66 |
| Class R6 | 210,627,440 | 13,664,377 | 15.41 |
| (a) | Maximum offering price per share was equal to the net asset value per share for all share classes, except for Class A, for which the maximum offering price per share was $16.58 [100 / 94.25 x $15.63]. On sales of $50,000 or more, the maximum offering price of Class A shares is reduced. A contingent deferred sales charge may be imposed on redemptions of Class A, Class B, and Class C shares. Redemption price per share was equal to the net asset value per share for Classes I, R1, R2, R3, R4, and R6. |
See Notes to Financial Statements
Financial Statements
Statement of Operations
Year ended 10/31/23
This statement describes how much your fund earned in investment income and accrued in expenses. It also describes any gains and/or losses generated by fund operations.
| Net investment income (loss) | |
| Income | |
| Dividends | $26,329,627 |
| Interest | 19,543,000 |
| Dividends from affiliated issuers | 1,128,561 |
| Income on securities loaned | 41,834 |
| Other | 17,289 |
| Foreign taxes withheld | (445,622) |
| Total investment income | $46,614,689 |
| Expenses | |
| Management fee | $10,497,711 |
| Distribution and service fees | 2,381,017 |
| Shareholder servicing costs | 1,241,921 |
| Administrative services fee | 208,366 |
| Independent Trustees' compensation | 24,249 |
| Custodian fee | 228,743 |
| Shareholder communications | 85,335 |
| Audit and tax fees | 93,261 |
| Legal fees | 6,516 |
| Miscellaneous | 442,772 |
| Total expenses | $15,209,891 |
| Fees paid indirectly | (36,883) |
| Reduction of expenses by investment adviser and distributor | (1,362,561) |
| Net expenses | $13,810,447 |
| Net investment income (loss) | $32,804,242 |
Statement of Operations – continued
| Realized and unrealized gain (loss) |
| Realized gain (loss) (identified cost basis) | |
| Unaffiliated issuers (net of $20,567 foreign capital gains tax) | $33,387,626 |
| Affiliated issuers | 5,042 |
| Written options | 45,849 |
| Futures contracts | (2,673,439) |
| Swap agreements | 348,125 |
| Forward foreign currency exchange contracts | (1,790,332) |
| Foreign currency | 59,098 |
| Net realized gain (loss) | $29,381,969 |
| Change in unrealized appreciation or depreciation | |
| Unaffiliated issuers (net of $9,064 decrease in deferred foreign capital gains tax) | $5,337,692 |
| Affiliated issuers | 388 |
| Written options | (40,158) |
| Futures contracts | (4,486,948) |
| Swap agreements | 40,714 |
| Forward foreign currency exchange contracts | (839,640) |
| Translation of assets and liabilities in foreign currencies | 164,046 |
| Net unrealized gain (loss) | $176,094 |
| Net realized and unrealized gain (loss) | $29,558,063 |
| Change in net assets from operations | $62,362,305 |
See Notes to Financial Statements
Financial Statements
Statements of Changes in Net Assets
These statements describe the increases and/or decreases in net assets resulting from operations, any distributions, and any shareholder transactions.
| | Year ended |
| | 10/31/23 | 10/31/22 |
| Change in net assets | | |
| From operations | | |
| Net investment income (loss) | $32,804,242 | $26,808,907 |
| Net realized gain (loss) | 29,381,969 | 8,752,132 |
| Net unrealized gain (loss) | 176,094 | (289,313,380) |
| Change in net assets from operations | $62,362,305 | $(253,752,341) |
| Total distributions to shareholders | $(50,986,419) | $(158,295,050) |
| Change in net assets from fund share transactions | $(151,511,199) | $(58,826,426) |
| Total change in net assets | $(140,135,313) | $(470,873,817) |
| Net assets | | |
| At beginning of period | 1,365,914,743 | 1,836,788,560 |
| At end of period | $1,225,779,430 | $1,365,914,743 |
See Notes to Financial Statements
Financial Statements
Financial Highlights
The financial highlights table is intended to help you understand the fund's financial performance for the past 5 years. Certain information reflects financial results for a single fund share. The total returns in the table represent the rate that an investor would have earned (or lost) on an investment in the fund share class (assuming reinvestment of all distributions) held for the entire period.
| Class A | Year ended |
| | 10/31/23 | 10/31/22 | 10/31/21 | 10/31/20 | 10/31/19 |
| Net asset value, beginning of period | $15.57 | $19.98 | $17.90 | $18.51 | $17.02 |
| Income (loss) from investment operations |
| Net investment income (loss) (d) | $0.38 | $0.27 | $0.24 | $0.22 | $0.30 |
| Net realized and unrealized gain (loss) | 0.26 | (2.96) | 3.22 | (0.03) | 1.70 |
| Total from investment operations | $0.64 | $(2.69) | $3.46 | $0.19 | $2.00 |
| Less distributions declared to shareholders |
| From net investment income | $(0.16) | $(0.09) | $(0.35) | $(0.29) | $(0.23) |
| From net realized gain | (0.42) | (1.63) | (1.03) | (0.51) | (0.28) |
| Total distributions declared to shareholders | $(0.58) | $(1.72) | $(1.38) | $(0.80) | $(0.51) |
| Net asset value, end of period (x) | $15.63 | $15.57 | $19.98 | $17.90 | $18.51 |
| Total return (%) (r)(s)(t)(x) | 4.06 | (14.80) | 19.88 | 1.00 | 12.03 |
Ratios (%) (to average net assets)
and Supplemental data: |
| Expenses before expense reductions (f) | 1.21 | 1.18 | 1.16 | 1.17 | 1.16 |
| Expenses after expense reductions (f) | 1.11 | 1.09 | 1.09 | 1.09 | 1.09 |
| Net investment income (loss) | 2.32 | 1.59 | 1.24 | 1.26 | 1.70 |
| Portfolio turnover | 69 | 70 | 94 | 89 | 65 |
| Net assets at end of period (000 omitted) | $594,255 | $626,577 | $810,477 | $698,352 | $754,092 |
See Notes to Financial Statements
Financial Highlights – continued
| Class B | Year ended |
| | 10/31/23 | 10/31/22 | 10/31/21 | 10/31/20 | 10/31/19 |
| Net asset value, beginning of period | $15.89 | $20.45 | $18.29 | $18.88 | $17.34 |
| Income (loss) from investment operations |
| Net investment income (loss) (d) | $0.26 | $0.14 | $0.10 | $0.09 | $0.17 |
| Net realized and unrealized gain (loss) | 0.27 | (3.03) | 3.29 | (0.03) | 1.73 |
| Total from investment operations | $0.53 | $(2.89) | $3.39 | $0.06 | $1.90 |
| Less distributions declared to shareholders |
| From net investment income | $(0.07) | $(0.04) | $(0.20) | $(0.14) | $(0.08) |
| From net realized gain | (0.42) | (1.63) | (1.03) | (0.51) | (0.28) |
| Total distributions declared to shareholders | $(0.49) | $(1.67) | $(1.23) | $(0.65) | $(0.36) |
| Net asset value, end of period (x) | $15.93 | $15.89 | $20.45 | $18.29 | $18.88 |
| Total return (%) (r)(s)(t)(x) | 3.25 | (15.43) | 18.96 | 0.26 | 11.21 |
Ratios (%) (to average net assets)
and Supplemental data: |
| Expenses before expense reductions (f) | 1.95 | 1.93 | 1.91 | 1.92 | 1.91 |
| Expenses after expense reductions (f) | 1.85 | 1.84 | 1.84 | 1.84 | 1.84 |
| Net investment income (loss) | 1.53 | 0.80 | 0.49 | 0.51 | 0.96 |
| Portfolio turnover | 69 | 70 | 94 | 89 | 65 |
| Net assets at end of period (000 omitted) | $6,176 | $9,966 | $17,638 | $19,630 | $28,393 |
| Class C | Year ended |
| | 10/31/23 | 10/31/22 | 10/31/21 | 10/31/20 | 10/31/19 |
| Net asset value, beginning of period | $15.61 | $20.12 | $18.01 | $18.60 | $17.10 |
| Income (loss) from investment operations |
| Net investment income (loss) (d) | $0.25 | $0.14 | $0.10 | $0.09 | $0.17 |
| Net realized and unrealized gain (loss) | 0.26 | (2.98) | 3.24 | (0.03) | 1.70 |
| Total from investment operations | $0.51 | $(2.84) | $3.34 | $0.06 | $1.87 |
| Less distributions declared to shareholders |
| From net investment income | $(0.07) | $(0.04) | $(0.20) | $(0.14) | $(0.09) |
| From net realized gain | (0.42) | (1.63) | (1.03) | (0.51) | (0.28) |
| Total distributions declared to shareholders | $(0.49) | $(1.67) | $(1.23) | $(0.65) | $(0.37) |
| Net asset value, end of period (x) | $15.63 | $15.61 | $20.12 | $18.01 | $18.60 |
| Total return (%) (r)(s)(t)(x) | 3.21 | (15.43) | 19.00 | 0.28 | 11.14 |
Ratios (%) (to average net assets)
and Supplemental data: |
| Expenses before expense reductions (f) | 1.95 | 1.93 | 1.91 | 1.92 | 1.91 |
| Expenses after expense reductions (f) | 1.85 | 1.84 | 1.84 | 1.84 | 1.84 |
| Net investment income (loss) | 1.55 | 0.81 | 0.49 | 0.52 | 0.96 |
| Portfolio turnover | 69 | 70 | 94 | 89 | 65 |
| Net assets at end of period (000 omitted) | $46,526 | $67,989 | $116,520 | $144,961 | $211,090 |
See Notes to Financial Statements
Financial Highlights – continued
| Class I | Year ended |
| | 10/31/23 | 10/31/22 | 10/31/21 | 10/31/20 | 10/31/19 |
| Net asset value, beginning of period | $15.37 | $19.75 | $17.70 | $18.31 | $16.85 |
| Income (loss) from investment operations |
| Net investment income (loss) (d) | $0.42 | $0.31 | $0.29 | $0.27 | $0.34 |
| Net realized and unrealized gain (loss) | 0.24 | (2.93) | 3.19 | (0.04) | 1.67 |
| Total from investment operations | $0.66 | $(2.62) | $3.48 | $0.23 | $2.01 |
| Less distributions declared to shareholders |
| From net investment income | $(0.20) | $(0.13) | $(0.40) | $(0.33) | $(0.27) |
| From net realized gain | (0.42) | (1.63) | (1.03) | (0.51) | (0.28) |
| Total distributions declared to shareholders | $(0.62) | $(1.76) | $(1.43) | $(0.84) | $(0.55) |
| Net asset value, end of period (x) | $15.41 | $15.37 | $19.75 | $17.70 | $18.31 |
| Total return (%) (r)(s)(t)(x) | 4.24 | (14.59) | 20.23 | 1.27 | 12.26 |
Ratios (%) (to average net assets)
and Supplemental data: |
| Expenses before expense reductions (f) | 0.96 | 0.93 | 0.91 | 0.92 | 0.91 |
| Expenses after expense reductions (f) | 0.86 | 0.84 | 0.84 | 0.84 | 0.84 |
| Net investment income (loss) | 2.56 | 1.83 | 1.49 | 1.50 | 1.94 |
| Portfolio turnover | 69 | 70 | 94 | 89 | 65 |
| Net assets at end of period (000 omitted) | $346,647 | $420,715 | $597,469 | $524,907 | $569,767 |
| Class R1 | Year ended |
| | 10/31/23 | 10/31/22 | 10/31/21 | 10/31/20 | 10/31/19 |
| Net asset value, beginning of period | $15.49 | $19.98 | $17.90 | $18.51 | $17.02 |
| Income (loss) from investment operations |
| Net investment income (loss) (d) | $0.26 | $0.15 | $0.10 | $0.09 | $0.17 |
| Net realized and unrealized gain (loss) | 0.26 | (2.97) | 3.22 | (0.03) | 1.69 |
| Total from investment operations | $0.52 | $(2.82) | $3.32 | $0.06 | $1.86 |
| Less distributions declared to shareholders |
| From net investment income | $(0.08) | $(0.04) | $(0.21) | $(0.16) | $(0.09) |
| From net realized gain | (0.42) | (1.63) | (1.03) | (0.51) | (0.28) |
| Total distributions declared to shareholders | $(0.50) | $(1.67) | $(1.24) | $(0.67) | $(0.37) |
| Net asset value, end of period (x) | $15.51 | $15.49 | $19.98 | $17.90 | $18.51 |
| Total return (%) (r)(s)(t)(x) | 3.28 | (15.43) | 18.99 | 0.23 | 11.18 |
Ratios (%) (to average net assets)
and Supplemental data: |
| Expenses before expense reductions (f) | 1.96 | 1.93 | 1.91 | 1.92 | 1.91 |
| Expenses after expense reductions (f) | 1.86 | 1.84 | 1.84 | 1.84 | 1.84 |
| Net investment income (loss) | 1.57 | 0.87 | 0.49 | 0.51 | 0.96 |
| Portfolio turnover | 69 | 70 | 94 | 89 | 65 |
| Net assets at end of period (000 omitted) | $2,347 | $2,218 | $2,432 | $2,396 | $2,483 |
See Notes to Financial Statements
Financial Highlights – continued
| Class R2 | Year ended |
| | 10/31/23 | 10/31/22 | 10/31/21 | 10/31/20 | 10/31/19 |
| Net asset value, beginning of period | $15.36 | $19.76 | $17.71 | $18.31 | $16.84 |
| Income (loss) from investment operations |
| Net investment income (loss) (d) | $0.33 | $0.23 | $0.19 | $0.18 | $0.25 |
| Net realized and unrealized gain (loss) | 0.26 | (2.93) | 3.19 | (0.04) | 1.68 |
| Total from investment operations | $0.59 | $(2.70) | $3.38 | $0.14 | $1.93 |
| Less distributions declared to shareholders |
| From net investment income | $(0.14) | $(0.07) | $(0.30) | $(0.23) | $(0.18) |
| From net realized gain | (0.42) | (1.63) | (1.03) | (0.51) | (0.28) |
| Total distributions declared to shareholders | $(0.56) | $(1.70) | $(1.33) | $(0.74) | $(0.46) |
| Net asset value, end of period (x) | $15.39 | $15.36 | $19.76 | $17.71 | $18.31 |
| Total return (%) (r)(s)(t)(x) | 3.74 | (14.98) | 19.61 | 0.75 | 11.74 |
Ratios (%) (to average net assets)
and Supplemental data: |
| Expenses before expense reductions (f) | 1.46 | 1.43 | 1.41 | 1.42 | 1.41 |
| Expenses after expense reductions (f) | 1.36 | 1.34 | 1.34 | 1.34 | 1.34 |
| Net investment income (loss) | 2.06 | 1.35 | 0.99 | 1.00 | 1.44 |
| Portfolio turnover | 69 | 70 | 94 | 89 | 65 |
| Net assets at end of period (000 omitted) | $3,766 | $4,022 | $5,047 | $4,997 | $11,286 |
| Class R3 | Year ended |
| | 10/31/23 | 10/31/22 | 10/31/21 | 10/31/20 | 10/31/19 |
| Net asset value, beginning of period | $15.52 | $19.92 | $17.85 | $18.45 | $16.97 |
| Income (loss) from investment operations |
| Net investment income (loss) (d) | $0.37 | $0.27 | $0.24 | $0.22 | $0.30 |
| Net realized and unrealized gain (loss) | 0.26 | (2.95) | 3.21 | (0.02) | 1.69 |
| Total from investment operations | $0.63 | $(2.68) | $3.45 | $0.20 | $1.99 |
| Less distributions declared to shareholders |
| From net investment income | $(0.16) | $(0.09) | $(0.35) | $(0.29) | $(0.23) |
| From net realized gain | (0.42) | (1.63) | (1.03) | (0.51) | (0.28) |
| Total distributions declared to shareholders | $(0.58) | $(1.72) | $(1.38) | $(0.80) | $(0.51) |
| Net asset value, end of period (x) | $15.57 | $15.52 | $19.92 | $17.85 | $18.45 |
| Total return (%) (r)(s)(t)(x) | 4.00 | (14.78) | 19.88 | 1.05 | 12.01 |
Ratios (%) (to average net assets)
and Supplemental data: |
| Expenses before expense reductions (f) | 1.20 | 1.18 | 1.16 | 1.17 | 1.16 |
| Expenses after expense reductions (f) | 1.10 | 1.09 | 1.09 | 1.09 | 1.09 |
| Net investment income (loss) | 2.26 | 1.59 | 1.24 | 1.25 | 1.69 |
| Portfolio turnover | 69 | 70 | 94 | 89 | 65 |
| Net assets at end of period (000 omitted) | $11,988 | $16,923 | $19,529 | $19,799 | $20,300 |
See Notes to Financial Statements
Financial Highlights – continued
| Class R4 | Year ended |
| | 10/31/23 | 10/31/22 | 10/31/21 | 10/31/20 | 10/31/19 |
| Net asset value, beginning of period | $15.60 | $20.02 | $17.93 | $18.54 | $17.05 |
| Income (loss) from investment operations |
| Net investment income (loss) (d) | $0.43 | $0.32 | $0.29 | $0.27 | $0.34 |
| Net realized and unrealized gain (loss) | 0.25 | (2.98) | 3.23 | (0.04) | 1.70 |
| Total from investment operations | $0.68 | $(2.66) | $3.52 | $0.23 | $2.04 |
| Less distributions declared to shareholders |
| From net investment income | $(0.20) | $(0.13) | $(0.40) | $(0.33) | $(0.27) |
| From net realized gain | (0.42) | (1.63) | (1.03) | (0.51) | (0.28) |
| Total distributions declared to shareholders | $(0.62) | $(1.76) | $(1.43) | $(0.84) | $(0.55) |
| Net asset value, end of period (x) | $15.66 | $15.60 | $20.02 | $17.93 | $18.54 |
| Total return (%) (r)(s)(t)(x) | 4.30 | (14.59) | 20.19 | 1.25 | 12.30 |
Ratios (%) (to average net assets)
and Supplemental data: |
| Expenses before expense reductions (f) | 0.96 | 0.93 | 0.91 | 0.92 | 0.91 |
| Expenses after expense reductions (f) | 0.86 | 0.84 | 0.84 | 0.84 | 0.84 |
| Net investment income (loss) | 2.59 | 1.88 | 1.50 | 1.51 | 1.95 |
| Portfolio turnover | 69 | 70 | 94 | 89 | 65 |
| Net assets at end of period (000 omitted) | $3,447 | $5,018 | $6,058 | $6,461 | $7,570 |
| Class R6 | Year ended |
| | 10/31/23 | 10/31/22 | 10/31/21 | 10/31/20 | 10/31/19 |
| Net asset value, beginning of period | $15.37 | $19.75 | $17.71 | $18.32 | $16.85 |
| Income (loss) from investment operations |
| Net investment income (loss) (d) | $0.43 | $0.33 | $0.31 | $0.28 | $0.35 |
| Net realized and unrealized gain (loss) | 0.25 | (2.93) | 3.18 | (0.03) | 1.69 |
| Total from investment operations | $0.68 | $(2.60) | $3.49 | $0.25 | $2.04 |
| Less distributions declared to shareholders |
| From net investment income | $(0.22) | $(0.15) | $(0.42) | $(0.35) | $(0.29) |
| From net realized gain | (0.42) | (1.63) | (1.03) | (0.51) | (0.28) |
| Total distributions declared to shareholders | $(0.64) | $(1.78) | $(1.45) | $(0.86) | $(0.57) |
| Net asset value, end of period (x) | $15.41 | $15.37 | $19.75 | $17.71 | $18.32 |
| Total return (%) (r)(s)(t)(x) | 4.33 | (14.50) | 20.26 | 1.36 | 12.44 |
Ratios (%) (to average net assets)
and Supplemental data: |
| Expenses before expense reductions (f) | 0.87 | 0.84 | 0.82 | 0.83 | 0.82 |
| Expenses after expense reductions (f) | 0.77 | 0.75 | 0.75 | 0.75 | 0.75 |
| Net investment income (loss) | 2.66 | 1.94 | 1.58 | 1.60 | 2.03 |
| Portfolio turnover | 69 | 70 | 94 | 89 | 65 |
| Net assets at end of period (000 omitted) | $210,627 | $212,487 | $261,619 | $229,244 | $230,324 |
See Notes to Financial Statements
Financial Highlights – continued
| (d) | Per share data is based on average shares outstanding. |
| (f) | Ratios do not reflect reductions from fees paid indirectly, if applicable. See Note 2 in the Notes to Financial Statements for additional information. |
| (r) | Certain expenses have been reduced without which performance would have been lower. |
| (s) | From time to time the fund may receive proceeds from litigation settlements, without which performance would be lower. |
| (t) | Total returns do not include any applicable sales charges. |
| (x) | The net asset values and total returns have been calculated on net assets which include adjustments made in accordance with U.S. generally accepted accounting principles required at period end for financial reporting purposes. |
See Notes to Financial Statements
Notes to Financial Statements
(1) Business and Organization
MFS Global Total Return Fund (the fund) is a diversified series of MFS Series Trust VI (the trust). The trust is organized as a Massachusetts business trust and is registered under the Investment Company Act of 1940, as amended, as an open-end management investment company.
The fund is an investment company and accordingly follows the investment company accounting and reporting guidance of the Financial Accounting Standards Board (FASB) Accounting Standards Codification Topic 946 Financial Services - Investment Companies.
(2) Significant Accounting Policies
General — The preparation of financial statements in conformity with U.S. generally accepted accounting principles requires management to make estimates and assumptions that affect the reported amounts of assets and liabilities, and disclosure of contingent assets and liabilities at the date of the financial statements and the reported amounts of increases and decreases in net assets from operations during the reporting period. Actual results could differ from those estimates. In the preparation of these financial statements, management has evaluated subsequent events occurring after the date of the fund’s Statement of Assets and Liabilities through the date that the financial statements were issued. The fund invests in foreign securities. Investments in foreign securities are vulnerable to the effects of changes in the relative values of the local currency and the U.S. dollar and to the effects of changes in each country’s market, economic, industrial, political, regulatory, geopolitical, environmental, public health, and other conditions.
Balance Sheet Offsetting — The fund's accounting policy with respect to balance sheet offsetting is that, absent an event of default by the counterparty or a termination of the agreement, the International Swaps and Derivatives Association (ISDA) Master Agreement, or similar agreement, does not result in an offset of reported amounts of financial assets and financial liabilities in the Statement of Assets and Liabilities across transactions between the fund and the applicable counterparty. The fund's right to setoff may be restricted or prohibited by the bankruptcy or insolvency laws of the particular jurisdiction to which a specific master netting agreement counterparty is subject. Balance sheet offsetting disclosures, to the extent applicable to the fund, have been included in the fund’s Significant Accounting Policies note under the captions for each of the fund’s in-scope financial instruments and transactions.
Investment Valuations — Subject to its oversight, the fund's Board of Trustees has delegated primary responsibility for determining or causing to be determined the value of the fund’s investments to MFS as the fund's adviser, pursuant to the fund’s valuation policy and procedures which have been adopted by the adviser and approved by the Board. In accordance with Rule 2a-5 under the Investment Company Act of 1940, the Board of Trustees designated the adviser as the “valuation designee” of the fund. If the adviser, as valuation designee, determines that reliable market quotations are not readily available for an investment, the investment is valued at fair value as determined in good faith by the adviser in accordance with the adviser’s fair valuation policy and procedures.
Notes to Financial Statements - continued
Under the fund's valuation policy and procedures, equity securities, including restricted equity securities, are generally valued at the last sale or official closing price on their primary market or exchange as provided by a third-party pricing service. Equity securities, for which there were no sales reported that day, are generally valued at the last quoted daily bid quotation on their primary market or exchange as provided by a third-party pricing service. Debt instruments and floating rate loans, including restricted debt instruments, are generally valued at an evaluated or composite bid as provided by a third-party pricing service. Short-term instruments with a maturity at issuance of 60 days or less may be valued at amortized cost, which approximates market value.
Exchange-traded options are generally valued at the last sale or official closing price on their primary exchange as provided by a third-party pricing service. Exchange-traded options for which there were no sales reported that day are generally valued at the last daily bid quotation on their primary exchange as provided by a third-party pricing service. For put options, the position may be valued at the last daily ask quotation if there are no trades reported during the day. Options not traded on an exchange are generally valued at a broker/dealer bid quotation. Foreign currency options are generally valued at valuations provided by a third-party pricing service. Futures contracts are generally valued at last posted settlement price on their primary exchange as provided by a third-party pricing service. Futures contracts for which there were no trades that day for a particular position are generally valued at the closing bid quotation on their primary exchange as provided by a third-party pricing service.
Forward foreign currency exchange contracts are generally valued at the mean of bid and asked prices for the time period interpolated from rates provided by a third-party pricing service for proximate time periods. Swap agreements are generally valued using valuations provided by a third-party pricing service, which for cleared swaps includes an evaluation of any trading activity at the clearinghouses. Open-end investment companies are generally valued at net asset value per share. The values of foreign securities and other assets and liabilities expressed in foreign currencies are converted to U.S. dollars using the mean of bid and asked prices for rates provided by a third-party pricing service.
Under the fund’s valuation policy and procedures, market quotations are not considered to be readily available for debt instruments, floating rate loans, and many types of derivatives. These investments are generally valued at fair value based on information from third-party pricing services or otherwise determined by the adviser in accordance with the adviser’s fair valuation policy and procedures. Securities and other assets generally valued on the basis of information from a third-party pricing service may also be valued at a broker/dealer bid quotation. In determining values, third-party pricing services can utilize both transaction data and market information such as yield, quality, coupon rate, maturity, type of issue, trading characteristics, spreads and other market data. An investment may also be valued at fair value if the adviser determines that the investment’s value has been materially affected by events occurring after the close of the exchange or market on which the investment is principally traded (such as foreign exchange or market) and prior to the determination of the fund’s net asset value, or after the halt of trading of a specific security where trading does not resume prior to the close of the exchange or market on which the security is principally traded. Events that occur after foreign markets close (such as developments in foreign markets and significant movements in the U.S. markets) and prior to the determination of the fund’s net asset value may be deemed to have a material effect on the value of securities traded in foreign markets. Accordingly, the fund’s foreign equity securities
Notes to Financial Statements - continued
may often be valued at fair value. The adviser generally relies on third-party pricing services or other information (such as the correlation with price movements of similar securities in the same or other markets; the type, cost and investment characteristics of the security; the business and financial condition of the issuer; and trading and other market data) to assist in determining whether to fair value and at what value to fair value an investment. The value of an investment for purposes of calculating the fund’s net asset value can differ depending on the source and method used to determine value. When fair valuation is used, the value of an investment used to determine the fund’s net asset value may differ from quoted or published prices for the same investment. There can be no assurance that the fund could obtain the fair value assigned to an investment if it were to sell the investment at the same time at which the fund determines its net asset value per share.
Various inputs are used in determining the value of the fund's assets or liabilities. These inputs are categorized into three broad levels. In certain cases, the inputs used to measure fair value may fall into different levels of the fair value hierarchy. In such cases, an investment's level within the fair value hierarchy is based on the lowest level of input that is significant to the fair value measurement. The fund's assessment of the significance of a particular input to the fair value measurement in its entirety requires judgment, and considers factors specific to the investment. Level 1 includes unadjusted quoted prices in active markets for identical assets or liabilities. Level 2 includes other significant observable market-based inputs (including quoted prices for similar securities, interest rates, prepayment speed, and credit risk). Level 3 includes significant unobservable inputs, which may include the adviser's own assumptions in determining the fair value of investments. Other financial instruments are derivative instruments, such as futures contracts, forward foreign currency exchange contracts, and swap agreements. The following is a summary of the levels used as of October 31, 2023 in valuing the fund's assets and liabilities:
Notes to Financial Statements - continued
| Financial Instruments | Level 1 | Level 2 | Level 3 | Total |
| Equity Securities: | | | | |
| United States | $410,108,543 | $— | $— | $410,108,543 |
| United Kingdom | 10,680,477 | 44,076,965 | — | 54,757,442 |
| Japan | — | 53,991,476 | — | 53,991,476 |
| France | 11,190,197 | 37,077,152 | — | 48,267,349 |
| Switzerland | 12,560,221 | 26,177,332 | — | 38,737,553 |
| Germany | 13,542,078 | 7,798,064 | — | 21,340,142 |
| Canada | 18,368,058 | — | — | 18,368,058 |
| Netherlands | — | 14,919,219 | — | 14,919,219 |
| South Korea | 1,394,552 | 11,232,868 | — | 12,627,420 |
| Other Countries | 31,178,440 | 32,741,975 | 0 | 63,920,415 |
| U.S. Treasury Bonds & U.S. Government Agencies & Equivalents | — | 13,954,048 | — | 13,954,048 |
| Non - U.S. Sovereign Debt | — | 208,033,810 | — | 208,033,810 |
| Municipal Bonds | — | 8,335,623 | — | 8,335,623 |
| U.S. Corporate Bonds | — | 61,159,783 | — | 61,159,783 |
| Residential Mortgage-Backed Securities | — | 58,178,875 | — | 58,178,875 |
| Commercial Mortgage-Backed Securities | — | 14,500,193 | — | 14,500,193 |
| Asset-Backed Securities (including CDOs) | — | 24,291,739 | — | 24,291,739 |
| Foreign Bonds | — | 80,731,138 | — | 80,731,138 |
| Mutual Funds | 18,638,618 | — | — | 18,638,618 |
| Total | $527,661,184 | $697,200,260 | $0 | $1,224,861,444 |
| Other Financial Instruments | | | | |
| Futures Contracts – Assets | $684,904 | $— | $— | $684,904 |
| Futures Contracts – Liabilities | (1,960,477) | — | — | (1,960,477) |
| Forward Foreign Currency Exchange Contracts – Assets | — | 1,019,003 | — | 1,019,003 |
| Forward Foreign Currency Exchange Contracts – Liabilities | — | (915,059) | — | (915,059) |
| Swap Agreements – Assets | — | 154,814 | — | 154,814 |
For further information regarding security characteristics, see the Portfolio of Investments. At October 31, 2023, the fund held two level 3 securities valued at $0, which were also held and valued at $0 at October 31, 2022.
Foreign Currency Translation — Purchases and sales of foreign investments, income, and expenses are converted into U.S. dollars based upon currency exchange rates prevailing on the respective dates of such transactions or on the reporting date for foreign denominated receivables and payables. Gains and losses attributable to foreign currency exchange rates on sales of securities are recorded for financial statement purposes as net realized gains and losses on investments. Gains and losses attributable to foreign exchange rate movements on receivables, payables, income and expenses
Notes to Financial Statements - continued
are recorded for financial statement purposes as foreign currency transaction gains and losses. That portion of both realized and unrealized gains and losses on investments that results from fluctuations in foreign currency exchange rates is not separately disclosed.
Derivatives — The fund uses derivatives primarily to increase or decrease exposure to a particular market or segment of the market, or security, to increase or decrease interest rate or currency exposure, or as alternatives to direct investments. Derivatives are used for hedging or non-hedging purposes. While hedging can reduce or eliminate losses, it can also reduce or eliminate gains. When the fund uses derivatives as an investment to increase market exposure, or for hedging purposes, gains and losses from derivative instruments may be substantially greater than the derivative’s original cost.
The derivative instruments used by the fund during the period were written options, purchased options, futures contracts, forward foreign currency exchange contracts, and swap agreements. Depending on the type of derivative, a fund may exit a derivative position by entering into an offsetting transaction with a counterparty or exchange, negotiating an agreement with the derivative counterparty, or novating the position to a third party. The fund may be unable to promptly close out a futures position in instances where the daily fluctuation in the price for that type of future exceeds the daily limit set by the exchange. The fund's period end derivatives, as presented in the Portfolio of Investments and the associated Derivative Contract tables, generally are indicative of the volume of its derivative activity during the period.
The following table presents, by major type of derivative contract, the fair value, on a gross basis, of the asset and liability components of derivatives held by the fund at October 31, 2023 as reported in the Statement of Assets and Liabilities:
| | | Fair Value (a) |
| Risk | Derivative Contracts | Asset Derivatives | Liability Derivatives |
| Credit | Purchased Option Contracts | $84,741 | $— |
| Interest Rate | Futures Contracts | 684,904 | (1,960,477) |
| Foreign Exchange | Forward Foreign Currency Exchange Contracts | 1,019,003 | (915,059) |
| Credit | Uncleared Swap Agreements | 154,814 | — |
| Total | | $1,943,462 | $(2,875,536) |
| (a) | The value of purchased options outstanding is included in investments in unaffiliated issuers, at value, within the Statement of Assets and Liabilities. Values presented in this table for futures contracts correspond to the values reported in the Portfolio of Investments. Only the current day net variation margin for futures contracts is reported separately within the Statement of Assets and Liabilities. |
Notes to Financial Statements - continued
The following table presents, by major type of derivative contract, the realized gain (loss) on derivatives held by the fund for the year ended October 31, 2023 as reported in the Statement of Operations:
| Risk | Futures
Contracts | Swap
Agreements | Forward Foreign
Currency
Exchange
Contracts | Unaffiliated Issuers
(Purchased
Options) | Written
Options |
| Interest Rate | $(2,673,439) | $— | $— | $— | $— |
| Foreign Exchange | — | — | (1,790,332) | — | — |
| Credit | — | 348,125 | — | 117,457 | 45,849 |
| Total | $(2,673,439) | $348,125 | $(1,790,332) | $117,457 | $45,849 |
The following table presents, by major type of derivative contract, the change in unrealized appreciation or depreciation on derivatives held by the fund for the year ended October 31, 2023 as reported in the Statement of Operations:
| Risk | Futures
Contracts | Swap
Agreements | Forward Foreign
Currency
Exchange
Contracts | Unaffiliated Issuers
(Purchased
Options) | Written
Options |
| Interest Rate | $(4,486,948) | $— | $— | $— | $— |
| Foreign Exchange | — | — | (839,640) | — | — |
| Credit | — | 40,714 | — | (60,926) | (40,158) |
| Total | $(4,486,948) | $40,714 | $(839,640) | $(60,926) | $(40,158) |
Derivative counterparty credit risk is managed through formal evaluation of the creditworthiness of all potential counterparties. On certain, but not all, uncleared derivatives, the fund attempts to reduce its exposure to counterparty credit risk whenever possible by entering into an ISDA Master Agreement on a bilateral basis. The ISDA Master Agreement gives each party to the agreement the right to terminate all transactions traded under such agreement if there is a specified deterioration in the credit quality of the other party. Upon an event of default or a termination of the ISDA Master Agreement, the non-defaulting party has the right to close out all transactions traded under such agreement and to net amounts owed under each agreement to one net amount payable by one party to the other. This right to close out and net payments across all transactions traded under the ISDA Master Agreement could result in a reduction of the fund's credit risk to such counterparty equal to any amounts payable by the fund under the applicable transactions, if any.
Collateral and margin requirements differ by type of derivative. For cleared derivatives (e.g., futures contracts, cleared swaps, and exchange-traded options), margin requirements are set by the clearing broker and the clearing house and collateral, in the form of cash or securities, is posted by the fund directly with the clearing broker. Collateral terms are counterparty agreement specific for uncleared derivatives (e.g., forward foreign currency exchange contracts, uncleared swap agreements, and uncleared options) and collateral, in the form of cash and securities, is held in segregated accounts with the fund's custodian in connection with these agreements. For derivatives traded under an ISDA Master Agreement, which contains a credit support annex, the collateral requirements are netted across all transactions traded under such counterparty-specific agreement and an amount is posted from one party to the other to collateralize such obligations. Cash that has been segregated or
Notes to Financial Statements - continued
delivered to cover the fund's collateral or margin obligations under derivative contracts, if any, will be reported separately in the Statement of Assets and Liabilities as restricted cash for uncleared derivatives and/or deposits with brokers for cleared derivatives. Securities pledged as collateral or margin for the same purpose, if any, are noted in the Portfolio of Investments. The fund may be required to make payments of interest on uncovered collateral or margin obligations with the broker. Any such payments are included in “Miscellaneous” expense in the Statement of Operations.
Written Options — In exchange for a premium, the fund wrote put options on securities for which it anticipated the price would increase. At the time the option was written, the fund believed the premium received exceeded the potential loss that could result from adverse price changes in the options’ underlying securities. In a written option, the fund as the option writer grants the buyer the right to purchase from, or sell to, the fund a specified number of shares or units of a particular security, currency or index at a specified price within a specified period of time.
The premium received is initially recorded as a liability in the Statement of Assets and Liabilities. The option is subsequently marked-to-market daily with the difference between the premium received and the market value of the written option being recorded as unrealized appreciation or depreciation. When a written option expires, the fund realizes a gain equal to the amount of the premium received. The difference between the premium received and the amount paid on effecting a closing transaction is considered a realized gain or loss. When a written put option is exercised, the premium reduces the cost basis of the security purchased by the fund.
At the initiation of the written option contract, for exchange traded options, the fund is required to deposit securities or cash as collateral with the custodian for the benefit of the broker or directly with the clearing broker, based on the type of option. For uncleared options, the fund may post collateral subject to the terms of an ISDA Master Agreement as generally described above if the market value of the options contract moves against it. The fund, as writer of an option, may have no control over whether the underlying securities may be sold (call) or purchased (put) and, as a result, bears the market risk of an unfavorable change in the price of the securities underlying the written option. Losses from writing options can exceed the premium received and can exceed the potential loss from an ordinary buy and sell transaction. Although the fund’s market risk may be significant, the maximum counterparty credit risk to the fund is equal to the market value of any collateral posted to the broker. For uncleared options, this risk is mitigated in cases where there is an ISDA Master Agreement between the fund and the counterparty providing for netting as described above.
Purchased Options — The fund purchased call and put options for a premium. Purchased call and put options entitle the holder to buy and sell a specified number of shares or units of a particular security, currency or index at a specified price at a specified date or within a specified period of time. Purchasing call options may hedge against an anticipated increase in the dollar cost of securities or currency to be acquired or increase the fund’s exposure to an underlying instrument. Purchasing put options may hedge against an anticipated decline in the value of portfolio securities or currency or decrease the fund's exposure to an underlying instrument.
The premium paid is initially recorded as an investment in the Statement of Assets and Liabilities. That investment is subsequently marked-to-market daily with the difference between the premium paid and the market value of the purchased option being recorded as unrealized appreciation or depreciation. Premiums paid for purchased call
Notes to Financial Statements - continued
and put options which have expired are treated as realized losses on investments in the Statement of Operations. Upon the exercise or closing of a purchased call option, the premium paid is added to the cost of the security or financial instrument purchased. Upon the exercise or closing of a purchased put option, the premium paid is offset against the proceeds on the sale of the underlying security or financial instrument in order to determine the realized gain or loss on investments.
Whether or not the option is exercised, the fund's maximum risk of loss from purchasing an option is the amount of premium paid. All option contracts involve credit risk if the counterparty to the option contract fails to perform. For uncleared options, this risk is mitigated in cases where there is an ISDA Master Agreement between the fund and the counterparty providing for netting as described above and, where applicable, by the posting of collateral by the counterparty to the fund to cover the fund’s exposure to the counterparty under such ISDA Master Agreement.
Futures Contracts — The fund entered into futures contracts which may be used to hedge against or obtain broad market exposure, interest rate exposure, currency exposure, or to manage duration. A futures contract represents a commitment for the future purchase or sale of an asset at a specified price on a specified date.
Upon entering into a futures contract, the fund is required to deposit with the broker, either in cash or securities, an initial margin in an amount equal to a specified percentage of the notional amount of the contract. Subsequent payments (variation margin) are made or received by the fund each day, depending on the daily fluctuations in the value of the contract, and are recorded for financial statement purposes as unrealized gain or loss by the fund until the contract is closed or expires at which point the gain or loss on futures contracts is realized.
The fund bears the risk of interest rates, exchange rates or securities prices moving unexpectedly, in which case, the fund may not achieve the anticipated benefits of the futures contracts and may realize a loss. While futures contracts may present less counterparty risk to the fund since the contracts are exchange traded and the exchange’s clearinghouse guarantees payments to the broker, there is still counterparty credit risk due to the insolvency of the broker. The fund’s maximum risk of loss due to counterparty credit risk is equal to the margin posted by the fund to the broker plus any gains or minus any losses on the outstanding futures contracts.
Forward Foreign Currency Exchange Contracts — The fund entered into forward foreign currency exchange contracts for the purchase or sale of a specific foreign currency at a fixed price on a future date. These contracts may be used to hedge the fund’s currency risk or for non-hedging purposes. For hedging purposes, the fund may enter into contracts to deliver or receive foreign currency that the fund will receive from or use in its normal investment activities. The fund may also use contracts to hedge against declines in the value of foreign currency denominated securities due to unfavorable exchange rate movements. For non-hedging purposes, the fund may enter into contracts with the intent of changing the relative exposure of the fund’s portfolio of securities to different currencies to take advantage of anticipated exchange rate changes.
Notes to Financial Statements - continued
Forward foreign currency exchange contracts are adjusted by the daily exchange rate of the underlying currency and any unrealized gains or losses are recorded as a receivable or payable for forward foreign currency exchange contracts until the contract settlement date. On contract settlement date, any gain or loss on the contract is recorded as realized gains or losses on forward foreign currency exchange contracts.
Risks may arise upon entering into these contracts from unanticipated movements in the value of the contract and from the potential inability of counterparties to meet the terms of their contracts. Generally, the fund’s maximum risk due to counterparty credit risk is the unrealized gain on the contract due to the use of Continuous Linked Settlement, a multicurrency cash settlement system for the centralized settlement of foreign transactions. This risk is mitigated in cases where there is an ISDA Master Agreement between the fund and the counterparty providing for netting as described above and, where applicable, by the posting of collateral by the counterparty to the fund to cover the fund’s exposure to the counterparty under such ISDA Master Agreement.
Swap Agreements — The fund entered into swap agreements which generally involve a periodic exchange of cash payments on a net basis, at specified intervals or upon the occurrence of specified events, between the fund and a counterparty. Certain swap agreements may be entered into as a bilateral contract (“uncleared swaps”) while others are required to be centrally cleared (“cleared swaps”).
Both cleared and uncleared swap agreements are marked to market daily. The value of uncleared swap agreements is reported in the Statement of Assets and Liabilities as “Uncleared swaps, at value” which includes any related interest accruals to be paid or received by the fund. For cleared swaps, payments (variation margin) are made or received by the fund each day, depending on the daily fluctuations in the value of the cleared swap, such that only the current day net receivable or payable for variation margin is reported in the Statement of Assets and Liabilities.
For both cleared and uncleared swaps, premiums paid or received at the inception of the agreements are amortized over the term of the agreement as realized gain or loss on swap agreements in the Statement of Operations. The periodic exchange of net cash payments, as well as any liquidation payment received or made upon early termination, are recorded as a realized gain or loss on swap agreements in the Statement of Operations. The change in unrealized appreciation or depreciation on swap agreements in the Statement of Operations reflects the aggregate change over the reporting period in the value of swaps net of any unamortized premiums paid or received.
Risks related to swap agreements include the possible lack of a liquid market, unfavorable market and interest rate movements of the underlying instrument and the failure of the counterparty to perform under the terms of the agreements. The fund's maximum risk of loss from counterparty credit risk is the discounted net value of the cash flows to be received from/paid to the counterparty over the contract's remaining life, to the extent that the amount is positive. To address counterparty risk, uncleared swap agreements are limited to only highly-rated counterparties. Risk is further reduced by having an ISDA Master Agreement (“ISDA”) between the fund and the counterparty and, where applicable, by the posting of collateral by the counterparty to
Notes to Financial Statements - continued
the fund to cover the fund’s exposure to the counterparty under such ISDA. The fund's counterparty risk due to cleared swaps is mitigated by the fact that the clearinghouse is the true counterparty to the transaction and the regulatory requirement safeguards in the event of a clearing broker bankruptcy.
The fund entered into credit default swap agreements in order to manage its exposure to the market or certain sectors of the market, to reduce its credit risk exposure to defaults of corporate and sovereign issuers or to create exposure to corporate or sovereign issuers to which it is not otherwise exposed. A credit default swap’s reference obligation may be either a single security or a basket of securities issued by corporate or sovereign issuers. At the inception of the agreement, the protection buyer may make an upfront payment to or receive an upfront payment from the protection seller. Over the term of the agreement, the protection buyer will make a series of periodic payments to the protection seller based on a fixed percentage applied to the agreement’s notional amount in exchange for a promise from the protection seller to make a specific payment should a defined credit event occur with respect to the reference obligation. Although agreement-specific, credit events generally consist of a combination of the following: bankruptcy, failure to pay, restructuring, obligation acceleration, obligation default, or repudiation/moratorium. If a defined credit event occurs, the protection buyer will either (i) receive from the protection seller an amount equal to the agreement’s notional amount and deliver the reference obligation (i.e., physical settlement) or (ii) receive from the protection seller a net settlement of cash equal to the agreement’s notional amount less the recovery value of the reference obligation. Upon determination of the final price for the reference obligation (or upon delivery of the reference obligation in the case of physical settlement), the difference between the recovery value of the reference obligation and the agreement’s notional amount is recorded as realized gain or loss on swap agreements in the Statement of Operations.
Credit default swap agreements are considered to have credit-risk-related contingent features since they trigger payment by the protection seller to the protection buyer upon the occurrence of a defined credit event. The maximum amount of future, undiscounted payments that the fund, as protection seller, could be required to make is equal to the swap agreement’s notional amount. The protection seller’s payment obligation would be offset to the extent of the value of the agreement’s deliverable obligation. At October 31, 2023, the fund did not hold any credit default swap agreements at an unrealized loss where it is the protection seller. The fund’s maximum risk of loss from counterparty risk, either as the protection seller or as the protection buyer, is the fair value of the agreement.
Mortgage-Backed/Asset-Backed Securities — The fund invests a significant portion of its assets in asset-backed and/or mortgage-backed securities. For these securities, the value of the debt instrument also depends on the credit quality and adequacy of the underlying assets or collateral as well as whether there is a security interest in the underlying assets or collateral. Enforcing rights, if any, against the underlying assets or collateral may be difficult. U.S. Government securities not supported as to the payment of principal or interest by the U.S. Treasury, such as those issued by Fannie Mae, Freddie Mac, and the Federal Home Loan Banks, are subject to greater credit risk than are U.S. Government securities supported by the U.S. Treasury, such as those issued by Ginnie Mae.
Notes to Financial Statements - continued
Security Loans — Under its Securities Lending Agency Agreement with the fund, JPMorgan Chase and Co., as lending agent, loans the securities of the fund to certain qualified institutions (the “Borrowers”) approved by the fund. Security loans can be terminated at the discretion of either the lending agent or the fund and the related securities must be returned within the earlier of the standard trade settlement period for such securities or within three business days. The loans are collateralized by cash and/or U.S. Treasury and federal agency obligations in an amount typically at least equal to the market value of the securities loaned. On loans collateralized by cash, the cash collateral is invested in a money market fund. The market value of the loaned securities is determined at the close of business of the fund and any additional required collateral is delivered to the fund on the next business day. The lending agent provides the fund with indemnification against Borrower default. In the event of Borrower default, the lending agent will, for the benefit of the fund, either purchase securities identical to those loaned or, when such purchase is commercially impracticable, pay the fund the market value of the loaned securities. In return, the lending agent assumes the fund's rights to the related collateral. If the collateral value is less than the cost to purchase identical securities, the lending agent is responsible for the shortfall, but only to the extent that such shortfall is not due to a decline in collateral value resulting from collateral reinvestment for which the fund bears the risk of loss. A portion of the income generated upon investment of the collateral is remitted to the Borrowers, and the remainder is allocated between the fund and the lending agent. On loans collateralized by U.S. Treasury and/or federal agency obligations, a fee is received from the Borrower, and is allocated between the fund and the lending agent. Income from securities lending is separately reported in the Statement of Operations. The dividend and interest income earned on the securities loaned is accounted for in the same manner as other dividend and interest income. At October 31, 2023, there were no securities on loan or collateral outstanding.
Indemnifications — Under the fund's organizational documents, its officers and Trustees may be indemnified against certain liabilities and expenses arising out of the performance of their duties to the fund. Additionally, in the normal course of business, the fund enters into agreements with service providers that may contain indemnification clauses. The fund's maximum exposure under these agreements is unknown as this would involve future claims that may be made against the fund that have not yet occurred.
Investment Transactions and Income — Interest income is recorded on the accrual basis. All premium and discount is amortized or accreted for financial statement purposes in accordance with U.S. generally accepted accounting principles. Dividends received in cash are recorded on the ex-dividend date. Certain dividends from foreign securities will be recorded when the fund is informed of the dividend if such information is obtained subsequent to the ex-dividend date. Dividend and interest payments received in additional securities are recorded on the ex-dividend or ex-interest date in an amount equal to the value of the security on such date.
The fund may receive proceeds from litigation settlements. Any proceeds received from litigation involving portfolio holdings are reflected in the Statement of Operations in realized gain/loss if the security has been disposed of by the fund or in unrealized gain/loss if the security is still held by the fund. Any other proceeds from litigation not related to portfolio holdings are reflected as other income in the Statement of Operations.
Notes to Financial Statements - continued
Investment transactions are recorded on the trade date. In determining the net gain or loss on securities sold, the cost of securities is determined on the identified cost basis.
The fund may purchase or sell mortgage-backed securities on a “To Be Announced” (TBA) basis. A TBA transaction is subject to extended settlement and typically does not designate the actual security to be delivered, but instead includes an approximate principal amount. The price of the TBA security and the date that it will be settled are fixed at the time the transaction is negotiated. The value of the security varies with market fluctuations and no interest accrues to the fund until settlement takes place. TBA purchase and sale commitments are held at carrying amount, which approximates fair value and are categorized as level 2 within the fair value hierarchy and included in TBA purchase and TBA sale commitments in the Statement of Assets and Liabilities, as applicable. Losses may arise as a result of changes in the value of the TBA investment prior to settlement date or due to counterparty non-performance.
The fund may also enter into mortgage dollar rolls, typically TBA dollar rolls, in which the fund sells TBA mortgage-backed securities to financial institutions and simultaneously agrees to repurchase similar (same issuer, type and coupon) securities at a later date at an agreed-upon price. During the period between the sale and repurchase, the fund will not be entitled to receive interest and principal payments on the securities sold. The fund accounts for dollar roll transactions as purchases and sales and realizes gains and losses on these transactions. Dollar roll transactions involve the risk that the market value of the securities that the fund is required to purchase may decline below the agreed upon repurchase price of those securities.
The fund may purchase or sell securities on a when-issued or delayed delivery basis. In these extended settlement transactions, the receipt or delivery of the securities by the fund and related payments occur at a future date, usually beyond the customary settlement period. The price of such security and the date that the security will be settled are generally fixed at the time the transaction is negotiated. The value of the security varies with market fluctuations and for debt securities no interest accrues to the fund until settlement takes place. When the fund sells securities on a when-issued or delayed delivery basis, the fund typically owns or has the right to acquire securities equivalent in kind and amount to the securities sold. Purchase and sale commitments for when-issued or delayed delivery securities are held at carrying amount, which approximates fair value and are categorized as level 2 within the fair value hierarchy, and included in When-issued investments purchased and When-issued investments sold in the Statement of Assets and Liabilities, as applicable. Losses may arise due to changes in the value of the underlying securities prior to settlement date or if the counterparty does not perform under the contract’s terms, or if the issuer does not issue the securities due to political, economic or other factors.
To mitigate the counterparty credit risk on TBA transactions, mortgage dollar rolls, and other types of forward settling mortgage-backed and asset-backed security transactions, the fund whenever possible enters into a Master Securities Forward Transaction Agreement (“MSFTA”) on a bilateral basis with each of the counterparties with whom it undertakes a significant volume of transactions. The MSFTA gives each party to the agreement the right to terminate all transactions traded under such agreement if there is a specified deterioration in the credit quality of the other party. Upon an event of default or a termination of the MSFTA, the non-defaulting party has the right to close out all transactions traded under such agreement and to net amounts owed under each transaction to one net amount payable by one party to the other.
Notes to Financial Statements - continued
This right to close out and net payments across all transactions traded under the MSFTA could result in a reduction of the fund's credit risk to such counterparty equal to any amounts payable by the fund under the applicable transactions, if any.
For mortgage-backed and asset-backed securities traded under a MSFTA, the collateral and margining requirements are contract specific. Collateral amounts across all transactions traded under such agreement are netted and an amount is posted from one party to the other to collateralize such obligations. Cash that has been pledged to cover the fund's collateral or margin obligations under a MSFTA, if any, will be reported separately on the Statement of Assets and Liabilities as restricted cash. Securities pledged as collateral or margin for the same purpose, if any, are noted in the Portfolio of Investments.
Fees Paid Indirectly — The fund's custody fee may be reduced by a credit earned under an arrangement that measures the value of U.S. dollars deposited with the custodian by the fund. The amount of the credit, for the year ended October 31, 2023, is shown as a reduction of total expenses in the Statement of Operations.
Tax Matters and Distributions — The fund intends to qualify as a regulated investment company, as defined under Subchapter M of the Internal Revenue Code, and to distribute all of its taxable income, including realized capital gains. As a result, no provision for federal income tax is required. The fund’s federal tax returns, when filed, will remain subject to examination by the Internal Revenue Service for a three year period. Management has analyzed the fund’s tax positions taken on federal and state tax returns for all open tax years and does not believe that there are any uncertain tax positions that require recognition of a tax liability. Foreign taxes, if any, have been accrued by the fund in the accompanying financial statements in accordance with the applicable foreign tax law. Foreign income taxes may be withheld by certain countries in which the fund invests. Additionally, capital gains realized by the fund on securities issued in or by certain foreign countries may be subject to capital gains tax imposed by those countries.
Distributions to shareholders are recorded on the ex-dividend date. Income and capital gain distributions are determined in accordance with income tax regulations, which may differ from U.S. generally accepted accounting principles. Certain capital accounts in the financial statements are periodically adjusted for permanent differences in order to reflect their tax character. These adjustments have no impact on net assets or net asset value per share. Temporary differences which arise from recognizing certain items of income, expense, gain or loss in different periods for financial statement and tax purposes will reverse at some time in the future.
Book/tax differences primarily relate to amortization and accretion of debt securities, wash sale loss deferrals, derivative transactions, and treating a portion of the proceeds from redemptions as a distribution for tax purposes.
Notes to Financial Statements - continued
The tax character of distributions declared to shareholders for the last two fiscal years is as follows:
| | Year ended
10/31/23 | Year ended
10/31/22 |
| Ordinary income (including any short-term capital gains) | $14,800,157 | $17,459,790 |
| Long-term capital gains | 36,186,262 | 140,835,260 |
| Total distributions | $50,986,419 | $158,295,050 |
The federal tax cost and the tax basis components of distributable earnings were as follows:
| As of 10/31/23 | |
| Cost of investments | $1,124,041,890 |
| Gross appreciation | 193,442,417 |
| Gross depreciation | (93,639,678) |
| Net unrealized appreciation (depreciation) | $99,802,739 |
| Undistributed ordinary income | 6,231,092 |
| Undistributed long-term capital gain | 24,888,708 |
| Other temporary differences | (119,349) |
| Total distributable earnings (loss) | $130,803,190 |
Multiple Classes of Shares of Beneficial Interest — The fund offers multiple classes of shares, which differ in their respective distribution and service fees. The fund's income, realized and unrealized gain (loss), and common expenses are allocated to shareholders based on the daily net assets of each class. Dividends are declared separately for each class. Differences in per share dividend rates are generally due to differences in separate class expenses. Class B and Class C shares will convert to Class A shares approximately eight years after purchase. The fund’s distributions declared to shareholders as reported in the Statements of Changes in Net Assets are presented by class as follows:
| | Year
ended
10/31/23 | | Year
ended
10/31/22 |
| Class A | $23,123,756 | | $68,656,802 |
| Class B | 284,885 | | 1,395,204 |
| Class C | 1,982,662 | | 9,401,182 |
| Class I | 15,815,599 | | 52,489,854 |
| Class R1 | 72,878 | | 202,464 |
| Class R2 | 137,019 | | 431,823 |
| Class R3 | 579,745 | | 1,760,140 |
| Class R4 | 191,718 | | 513,036 |
| Class R6 | 8,798,157 | | 23,444,545 |
| Total | $50,986,419 | | $158,295,050 |
Notes to Financial Statements - continued
(3) Transactions with Affiliates
Investment Adviser — The fund has an investment advisory agreement with MFS to provide overall investment management and related administrative services and facilities to the fund. The management fee is computed daily and paid monthly at the following annual rates based on the fund's average daily net assets:
| Up to $500 million | 0.84% |
| In excess of $500 million and up to $1 billion | 0.75% |
| In excess of $1 billion and up to $2.5 billion | 0.70% |
| In excess of $2.5 billion | 0.65% |
MFS has agreed in writing to reduce its management fee by a specified amount if certain MFS mutual fund assets exceed thresholds agreed to by MFS and the fund's Board of Trustees. MFS has also agreed in writing to waive at least 0.01% of its management fee as part of this agreement. The agreement to waive at least 0.01% of the management fee will continue until modified by the fund's Board of Trustees, but such agreement will continue at least until February 28, 2025. For the year ended October 31, 2023, this management fee reduction amounted to $174,961, which is included in the reduction of total expenses in the Statement of Operations. The management fee incurred for the year ended October 31, 2023 was equivalent to an annual effective rate of 0.76% of the fund's average daily net assets.
The investment adviser has agreed in writing to pay a portion of the fund’s total annual operating expenses, excluding interest, taxes, extraordinary expenses, brokerage and transaction costs, certain tax reclaim recovery expenses (including contingency fees and closing agreement expenses), and investment-related expenses, such that total fund operating expenses do not exceed the following rates annually of each class’s average daily net assets:
| Classes |
| A | B | C | I | R1 | R2 | R3 | R4 | R6 |
| 1.09% | 1.84% | 1.84% | 0.84% | 1.84% | 1.34% | 1.09% | 0.84% | 0.77% |
This written agreement will continue until modified by the fund’s Board of Trustees, but such agreement will continue at least until February 28, 2025. For the year ended October 31, 2023, this reduction amounted to $1,187,475, which is included in the reduction of total expenses in the Statement of Operations.
Distributor — MFS Fund Distributors, Inc. (MFD), a wholly-owned subsidiary of MFS, as distributor, received $26,984 for the year ended October 31, 2023, as its portion of the initial sales charge on sales of Class A shares of the fund.
The Board of Trustees has adopted a distribution plan for certain share classes pursuant to Rule 12b-1 of the Investment Company Act of 1940.
The fund's distribution plan provides that the fund will pay MFD for services provided by MFD and financial intermediaries in connection with the distribution and servicing of certain share classes. One component of the plan is a distribution fee paid to MFD and another component of the plan is a service fee paid to MFD. MFD may subsequently pay all, or a portion, of the distribution and/or service fees to financial intermediaries. The distribution and service fees are computed daily and paid monthly.
Notes to Financial Statements - continued
Distribution Plan Fee Table:
| | Distribution
Fee Rate (d) | Service
Fee Rate (d) | Total
Distribution
Plan (d) | Annual
Effective
Rate (e) | Distribution
and Service
Fee |
| Class A | — | 0.25% | 0.25% | 0.25% | $ 1,609,120 |
| Class B | 0.75% | 0.25% | 1.00% | 1.00% | 85,260 |
| Class C | 0.75% | 0.25% | 1.00% | 1.00% | 605,094 |
| Class R1 | 0.75% | 0.25% | 1.00% | 1.00% | 24,098 |
| Class R2 | 0.25% | 0.25% | 0.50% | 0.50% | 19,680 |
| Class R3 | — | 0.25% | 0.25% | 0.25% | 37,765 |
| Total Distribution and Service Fees | | | | | $2,381,017 |
| (d) | In accordance with the distribution plan for certain classes, the fund pays distribution and/or service fees equal to these annual percentage rates of each class’s average daily net assets. The distribution and service fee rates disclosed by class represent the current rates in effect at the end of the reporting period. Any rate changes, if applicable, are detailed below. |
| (e) | The annual effective rates represent actual fees incurred under the distribution plan for the year ended October 31, 2023 based on each class's average daily net assets. MFD has voluntarily agreed to rebate a portion of each class's 0.25% service fee attributable to accounts for which there is no financial intermediary specified on the account except for accounts attributable to MFS or its affiliates' seed money. For the year ended October 31, 2023, this rebate amounted to $120, $2, and $3 for Class A, Class B, and Class C shares, respectively, and is included in the reduction of total expenses in the Statement of Operations. |
Certain Class A shares are subject to a contingent deferred sales charge (CDSC) in the event of a shareholder redemption within 18 months of purchase. Class B shares are subject to a CDSC in the event of a shareholder redemption within six years of purchase. Class C shares are subject to a CDSC in the event of a shareholder redemption within 12 months of purchase. All contingent deferred sales charges are paid to MFD and during the year ended October 31, 2023, were as follows:
| | Amount |
| Class A | $3,147 |
| Class B | 4,104 |
| Class C | 1,108 |
Shareholder Servicing Agent — MFS Service Center, Inc. (MFSC), a wholly-owned subsidiary of MFS, receives a fee from the fund for its services as shareholder servicing agent calculated as a percentage of the average daily net assets of the fund as determined periodically under the supervision of the fund's Board of Trustees. For the year ended October 31, 2023, the fee was $139,053, which equated to 0.0102% annually of the fund's average daily net assets. MFSC also receives reimbursement from the fund for out-of-pocket expenses, sub-accounting and other shareholder servicing costs which may be paid to affiliated and unaffiliated service providers. Class R6 shares do not incur sub-accounting fees. For the year ended October 31, 2023, these out-of-pocket expenses, sub-accounting and other shareholder servicing costs amounted to $1,102,868.
Administrator — MFS provides certain financial, legal, shareholder communications, compliance, and other administrative services to the fund. Under an administrative services agreement, the fund reimburses MFS the costs incurred to provide these
Notes to Financial Statements - continued
services. The fund is charged an annual fixed amount of $17,500 plus a fee based on average daily net assets. The administrative services fee is computed daily and paid monthly. The administrative services fee incurred for the year ended October 31, 2023 was equivalent to an annual effective rate of 0.0153% of the fund's average daily net assets.
Trustees’ and Officers’ Compensation — The fund pays compensation to independent Trustees in the form of a retainer, attendance fees, and additional compensation to Board and Committee chairpersons. Independent Trustees’ compensation is accrued daily and paid subsequent to each Trustee Board meeting. The fund does not pay compensation directly to Trustees or officers of the fund who are also officers of the investment adviser, all of whom receive remuneration from MFS for their services to the fund. Certain officers and Trustees of the fund are officers or directors of MFS, MFD, and MFSC.
Other — The fund invests in the MFS Institutional Money Market Portfolio which is managed by MFS and seeks current income consistent with preservation of capital and liquidity. This money market fund does not pay a management fee to MFS but does incur investment and operating costs.
During the year ended October 31, 2023, pursuant to a policy adopted by the Board of Trustees and designed to comply with Rule 17a-7 under the Investment Company Act of 1940 (the “Act”) and relevant guidance, the fund engaged in purchase transactions with funds and accounts for which MFS serves as investment adviser or sub-adviser (“cross-trades”) which amounted to $2,934,748.
(4) Portfolio Securities
For the year ended October 31, 2023, purchases and sales of investments, other than purchased options with an expiration date of less than one year from the time of purchase and short-term obligations, were as follows:
| | Purchases | Sales |
| U.S. Government securities | $171,982,372 | $179,984,198 |
| Non-U.S. Government securities | 743,641,410 | 893,049,157 |
Notes to Financial Statements - continued
(5) Shares of Beneficial Interest
The fund's Declaration of Trust permits the Trustees to issue an unlimited number of full and fractional shares of beneficial interest. Transactions in fund shares were as follows:
| | Year ended
10/31/23 | | Year ended
10/31/22 |
| | Shares | Amount | | Shares | Amount |
| Shares sold | | | | | |
| Class A | 4,385,363 | $71,942,607 | | 3,771,994 | $64,677,221 |
| Class B | 351 | 5,790 | | 5,507 | 102,053 |
| Class C | 259,304 | 4,269,677 | | 255,357 | 4,527,459 |
| Class I | 5,164,381 | 83,511,300 | | 5,139,242 | 86,292,529 |
| Class R1 | 14,804 | 240,975 | | 21,398 | 367,881 |
| Class R2 | 36,974 | 593,941 | | 63,108 | 1,068,831 |
| Class R3 | 204,978 | 3,360,366 | | 444,377 | 7,751,250 |
| Class R4 | 54,348 | 890,174 | | 83,054 | 1,432,904 |
| Class R6 | 2,508,090 | 40,623,689 | | 2,700,201 | 46,303,733 |
| | 12,628,593 | $205,438,519 | | 12,484,238 | $212,523,861 |
Shares issued to shareholders
in reinvestment of distributions | | | | | |
| Class A | 1,306,339 | $21,128,002 | | 3,412,193 | $62,646,092 |
| Class B | 16,883 | 277,897 | | 69,343 | 1,307,804 |
| Class C | 117,574 | 1,900,464 | | 481,998 | 8,926,539 |
| Class I | 861,591 | 13,745,118 | | 2,495,468 | 45,091,003 |
| Class R1 | 4,540 | 72,878 | | 11,016 | 202,464 |
| Class R2 | 7,792 | 124,178 | | 21,167 | 383,969 |
| Class R3 | 36,011 | 579,745 | | 96,252 | 1,760,140 |
| Class R4 | 11,833 | 191,686 | | 27,897 | 511,648 |
| Class R6 | 457,584 | 7,298,682 | | 1,113,319 | 20,094,105 |
| | 2,820,147 | $45,318,650 | | 7,728,653 | $140,923,764 |
| Shares reacquired | | | | | |
| Class A | (7,896,820) | $(129,373,751) | | (7,510,529) | $(128,190,321) |
| Class B | (256,638) | (4,310,697) | | (310,164) | (5,425,742) |
| Class C | (1,756,771) | (28,819,759) | | (2,173,693) | (37,247,487) |
| Class I | (10,910,638) | (175,975,026) | | (10,519,208) | (175,966,814) |
| Class R1 | (11,156) | (180,197) | | (10,966) | (192,539) |
| Class R2 | (61,968) | (998,101) | | (77,871) | (1,314,763) |
| Class R3 | (561,629) | (9,263,681) | | (430,455) | (7,576,772) |
| Class R4 | (167,621) | (2,763,725) | | (91,965) | (1,563,826) |
| Class R6 | (3,126,540) | (50,583,431) | | (3,235,658) | (54,795,787) |
| | (24,749,781) | $(402,268,368) | | (24,360,509) | $(412,274,051) |
Notes to Financial Statements - continued
| | Year ended
10/31/23 | | Year ended
10/31/22 |
| | Shares | Amount | | Shares | Amount |
| Net change | | | | | |
| Class A | (2,205,118) | $(36,303,142) | | (326,342) | $(867,008) |
| Class B | (239,404) | (4,027,010) | | (235,314) | (4,015,885) |
| Class C | (1,379,893) | (22,649,618) | | (1,436,338) | (23,793,489) |
| Class I | (4,884,666) | (78,718,608) | | (2,884,498) | (44,583,282) |
| Class R1 | 8,188 | 133,656 | | 21,448 | 377,806 |
| Class R2 | (17,202) | (279,982) | | 6,404 | 138,037 |
| Class R3 | (320,640) | (5,323,570) | | 110,174 | 1,934,618 |
| Class R4 | (101,440) | (1,681,865) | | 18,986 | 380,726 |
| Class R6 | (160,866) | (2,661,060) | | 577,862 | 11,602,051 |
| | (9,301,041) | $(151,511,199) | | (4,147,618) | $(58,826,426) |
Effective June 1, 2019, purchases of the fund’s Class B shares were closed to new and existing investors subject to certain exceptions. Effective September 29, 2023, purchases of Class R1 and Class R2 shares were closed to new eligible investors.
(6) Line of Credit
The fund and certain other funds managed by MFS participate in a $1.45 billion unsecured committed line of credit of which $1.2 billion is reserved for use by the fund and certain other MFS U.S. funds. The line of credit is provided by a syndicate of banks under a credit agreement. Borrowings may be made for temporary financing needs. Interest is charged to each fund, based on its borrowings, generally at a rate equal to the highest of 1) Daily Simple SOFR (Secured Overnight Financing Rate) plus 0.10%, 2) the Federal Funds Effective Rate, or 3) the Overnight Bank Funding Rate, each plus an agreed upon spread. A commitment fee, based on the average daily unused portion of the committed line of credit, is allocated among the participating funds. The line of credit expires on March 14, 2024 unless extended or renewed. In addition, the fund and other funds managed by MFS have established unsecured uncommitted borrowing arrangements with certain banks for temporary financing needs. Interest is charged to each fund, based on its borrowings, at rates equal to customary reference rates plus an agreed upon spread. For the year ended October 31, 2023, the fund’s commitment fee and interest expense were $7,322 and $0, respectively, and are included in “Miscellaneous” expense in the Statement of Operations.
Notes to Financial Statements - continued
(7) Investments in Affiliated Issuers
An affiliated issuer may be considered one in which the fund owns 5% or more of the outstanding voting securities, or a company which is under common control. For the purposes of this report, the following were affiliated issuers:
| Affiliated Issuers | Beginning
Value | Purchases | Sales
Proceeds | Realized
Gain
(Loss) | Change in
Unrealized
Appreciation or
Depreciation | Ending
Value |
| MFS Institutional Money Market Portfolio | $35,384,108 | $494,141,170 | $510,892,090 | $5,042 | $388 | $18,638,618 |
| Affiliated Issuers | Dividend
Income | Capital Gain
Distributions |
| MFS Institutional Money Market Portfolio | $1,128,561 | $— |
(8) LIBOR Transition
The London Interbank Offered Rate (LIBOR) was intended to represent the rate at which contributing banks may obtain short-term borrowings from each other in the London interbank market. Certain of the fund's investments, payment obligations, and financing terms were historically based on LIBOR. In 2017, the United Kingdom Financial Conduct Authority (FCA) announced plans to transition away from LIBOR by the end of 2021. LIBOR's administrator, ICE Benchmark Administration (IBA), ceased publication (on a representative basis) of many of its LIBOR settings as of December 31, 2021 and ceased publication (on a representative basis) of the remaining U.S. dollar LIBOR settings as of June 30, 2023. In addition, global regulators announced that, with limited exceptions, no new LIBOR-based contracts should be entered into after 2021. Although the FCA has announced that it will require the IBA to continue to publish certain select LIBOR rates on a synthetic basis after the relevant cessation dates, such synthetic rates are not considered to be representative of the underlying market and economic reality they are intended to measure, are expected to be published for a limited time period, and are intended solely for use on a limited basis for legacy transactions.
Regulators and industry groups have implemented measures to facilitate the transition away from LIBOR and other interbank offered rates to alternative reference rates, such as the Secured Overnight Financing Rate (SOFR). SOFR is a broad measure of the cost of borrowing cash overnight collateralized by U.S. Treasury securities in the repurchase agreement (repo) market. SOFR is published in various forms including as a daily, compounded, and forward-looking term rate. The transition to alternative reference rates may affect the liquidity and valuation of investments that were tied to LIBOR or other interbank offered rates and may lead to other consequences affecting securities and credit markets more broadly. For example, while some investments that were tied to LIBOR provided for an alternative or “fallback” rate-setting methodology in the event LIBOR is not available, there is uncertainty regarding the effectiveness of any such alternative methodologies to replace LIBOR and certain investments tied to LIBOR may not have fallback provisions. While legislation passed in the United States facilitates by operation of law the replacement of U.S. dollar LIBOR settings in certain legacy instruments with a specified replacement rate, such as SOFR, there is uncertainty
Notes to Financial Statements - continued
regarding the effectiveness of such legislation. There also remains uncertainty regarding the willingness and ability of parties to add or amend fallback provisions in certain other legacy instruments maturing after the cessation of the applicable LIBOR rates, which could create market and litigation risk.
It is difficult to quantify or predict the impact on the fund resulting from the transition from LIBOR to alternative reference rates and the potential effects of the transition from LIBOR on the fund, or on certain instruments in which the fund invests, are not known. The transition process may involve, among other things, increased volatility or illiquidity in markets for instruments that relied on LIBOR to determine interest rates. The transition may also result in a reduction in value of certain LIBOR-related investments held by the fund or reduce the effectiveness of related transactions such as hedges. Any such effects of the transition away from LIBOR and the adoption of alternative reference rates, as well as other unforeseen effects, could have an adverse impact on the fund's performance.
With respect to the fund’s accounting for investments, including investments in certain debt instruments and derivatives, as well as borrowings by the fund and any other contractual arrangements of the fund that undergo reference rate-related modifications as a result of the transition, management has and will continue to rely upon the relief provided by FASB Codification Topic 848 – Reference Rate Reform (Topic 848). The guidance in Topic 848 permits the fund to account for such contract modifications made on or before December 31, 2024 as a continuation of the existing contracts. The situation remains fluid, and management believes, based on best available information, that the impact of the transition will not be material to the fund.
(9) Russia and Ukraine Conflict
The fund invests in securities and/or derivative instruments that are economically tied to Russia and/or Ukraine. Escalation of the conflict between Russia and Ukraine in late February 2022 caused market volatility and disruption in the tradability of Russian securities, including closure of the local securities market, temporary restriction on securities sales by non-residents, and disruptions to clearance and payment systems. To the extent that the fund is unable to sell securities, whether due to market constraints or to the sanctions imposed on Russia by the United States and other countries, those securities are considered illiquid and the value of those securities reflects their illiquid classification. Management continues to monitor these events and to evaluate the related impacts on fund performance.
Report of Independent Registered Public Accounting Firm
To the Shareholders of MFS Global Total Return Fund and the Board of Trustees of MFS Series Trust VI
Opinion on the Financial Statements
We have audited the accompanying statement of assets and liabilities of MFS Global Total Return Fund (the “Fund”) (one of the funds constituting MFS Series Trust VI (the “Trust”)), including the portfolio of investments, as of October 31, 2023, and the related statement of operations for the year then ended, the statements of changes in net assets for each of the two years in the period then ended, the financial highlights for each of the five years in the period then ended and the related notes (collectively referred to as the “financial statements”). In our opinion, the financial statements present fairly, in all material respects, the financial position of the Fund (one of the funds constituting MFS Series Trust VI) at October 31, 2023, the results of its operations for the year then ended, the changes in its net assets for each of the two years in the period then ended and its financial highlights for each of the five years in the period then ended, in conformity with U.S. generally accepted accounting principles.
Basis for Opinion
These financial statements are the responsibility of the Trust’s management. Our responsibility is to express an opinion on the Fund’s financial statements based on our audits. We are a public accounting firm registered with the Public Company Accounting Oversight Board (United States) (“PCAOB”) and are required to be independent with respect to the Trust in accordance with the U.S. federal securities laws and the applicable rules and regulations of the Securities and Exchange Commission and the PCAOB.
We conducted our audits in accordance with the standards of the PCAOB. Those standards require that we plan and perform the audit to obtain reasonable assurance about whether the financial statements are free of material misstatement, whether due to error or fraud. The Trust is not required to have, nor were we engaged to perform, an audit of the Trust’s internal control over financial reporting. As part of our audits, we are required to obtain an understanding of internal control over financial reporting but not for the purpose of expressing an opinion on the effectiveness of the Trust’s internal control over financial reporting. Accordingly, we express no such opinion.
Report of Independent Registered Public Accounting Firm – continued
Our audits included performing procedures to assess the risks of material misstatement of the financial statements, whether due to error or fraud, and performing procedures that respond to those risks. Such procedures included examining, on a test basis, evidence regarding the amounts and disclosures in the financial statements. Our procedures included confirmation of securities owned as of October 31, 2023, by correspondence with the custodian, brokers and others; when replies were not received from brokers and others, we performed other auditing procedures. Our audits also included evaluating the accounting principles used and significant estimates made by management, as well as evaluating the overall presentation of the financial statements. We believe that our audits provide a reasonable basis for our opinion.
We have served as the auditor of one or more MFS investment companies since 1993.
Boston, Massachusetts
December 14, 2023
Trustees and Officers — Identification and Background
The Trustees and Officers of the Trust, as of December 1, 2023, are listed below, together with their principal occupations during the past five years. (Their titles may have varied during that period.) The address of each Trustee and Officer is 111 Huntington Avenue, Boston, Massachusetts 02199-7618.
| Name, Age | | Position(s) Held with Fund | | Trustee/Officer Since(h) | | Number of MFS Funds overseen by the Trustee | | Principal Occupations During
the Past Five Years | | Other Directorships During
the Past Five Years (j) |
| INTERESTED TRUSTEE | | | | | | | | | | |
Michael W. Roberge (k)
(age 57) | | Trustee | | January 2021 | | 136 | | Massachusetts Financial Services Company, Chairman (since January 2021); Chief Executive Officer (since January 2017); Director; Chairman of the Board (since January 2022); President (until December 2018); Chief Investment Officer (until December 2018) | | N/A |
| INDEPENDENT TRUSTEES | | | | | | | | | | |
John P. Kavanaugh
(age 69) | | Trustee and Chair of Trustees | | January 2009 | | 136 | | Private investor | | N/A |
Steven E. Buller
(age 72) | | Trustee | | February 2014 | | 136 | | Private investor | | N/A |
John A. Caroselli
(age 69) | | Trustee | | March 2017 | | 136 | | Private investor; JC Global Advisors, LLC (management consulting), President (since 2015) | | N/A |
Maureen R. Goldfarb
(age 68) | | Trustee | | January 2009 | | 136 | | Private investor | | N/A |
Peter D. Jones
(age 68) | | Trustee | | January 2019 | | 136 | | Private investor | | N/A |
James W. Kilman, Jr.
(age 62) | | Trustee | | January 2019 | | 136 | | Burford Capital Limited (finance and investment management), Senior Advisor (since May 3, 2021), Chief Financial Officer (2019 - May 2, 2021); KielStrand Capital LLC (family office), Chief Executive Officer (since 2016) | | Alpha-En Corporation, Director (2016-2019) |
Trustees and Officers - continued
| Name, Age | | Position(s) Held with Fund | | Trustee/Officer Since(h) | | Number of MFS Funds overseen by the Trustee | | Principal Occupations During
the Past Five Years | | Other Directorships During
the Past Five Years (j) |
Clarence Otis, Jr.
(age 67) | | Trustee | | March 2017 | | 136 | | Private investor | | VF Corporation, Director; Verizon Communications, Inc., Director; The Travelers Companies, Director |
Maryanne L. Roepke
(age 67) | | Trustee | | May 2014 | | 136 | | Private investor | | N/A |
Laurie J. Thomsen
(age 66) | | Trustee | | March 2005 | | 136 | | Private investor | | The Travelers Companies, Director; Dycom Industries, Inc., Director |
| Name, Age | | Position(s) Held with
Fund | | Trustee/Officer Since(h) | | Number of MFS Funds for which the Person is an Officer | | Principal Occupations During
the Past Five Years |
| OFFICERS | | | | | | | | |
Christopher R. Bohane (k)
(age 49) | | Assistant Secretary and Assistant Clerk | | July 2005 | | 136 | | Massachusetts Financial Services Company, Senior Vice President and Senior Managing Counsel |
Kino Clark (k)
(age 55) | | Assistant Treasurer | | January 2012 | | 136 | | Massachusetts Financial Services Company, Vice President |
John W. Clark, Jr. (k)
(age 56) | | Assistant Treasurer | | April 2017 | | 136 | | Massachusetts Financial Services Company, Vice President |
David L. DiLorenzo (k)
(age 55) | | President | | July 2005 | | 136 | | Massachusetts Financial Services Company, Senior Vice President |
Heidi W. Hardin (k)
(age 56) | | Secretary and Clerk | | April 2017 | | 136 | | Massachusetts Financial Services Company, Executive Vice President and General Counsel |
Brian E. Langenfeld (k)
(age 50) | | Assistant Secretary and Assistant Clerk | | June 2006 | | 136 | | Massachusetts Financial Services Company, Vice President and Managing Counsel |
Trustees and Officers - continued
| Name, Age | | Position(s) Held with
Fund | | Trustee/Officer Since(h) | | Number of MFS Funds for which the Person is an Officer | | Principal Occupations During
the Past Five Years |
Rosa E. Licea-Mailloux (k)
(age 47) | | Chief Compliance Officer | | March 2022 | | 136 | | Massachusetts Financial Services Company, Vice President (since 2018); Director of Corporate Compliance (2018-2021), Senior Director Compliance (2021-2022), Senior Managing Director of North American Compliance & Chief Compliance Officer (since March 2022); Natixis Investment Managers (investment management), Funds Chief Compliance Officer, Deputy General Counsel & Senior Vice President (until 2018) |
Amanda S. Mooradian (k)
(age 44) | | Assistant Secretary and Assistant Clerk | | September 2018 | | 136 | | Massachusetts Financial Services Company, Assistant Vice President and Senior Counsel |
Susan A. Pereira (k)
(age 53) | | Assistant Secretary and Assistant Clerk | | July 2005 | | 136 | | Massachusetts Financial Services Company, Vice President and Managing Counsel |
Kasey L. Phillips (k)
(age 52) | | Assistant Treasurer | | September 2012 | | 136 | | Massachusetts Financial Services Company, Vice President |
Matthew A. Stowe (k)
(age 49) | | Assistant Secretary and Assistant Clerk | | October 2014 | | 136 | | Massachusetts Financial Services Company, Vice President and Senior Managing Counsel |
William B. Wilson (k)
(age 41) | | Assistant Secretary and Assistant Clerk | | October 2022 | | 136 | | Massachusetts Financial Services Company, Assistant Vice President and Senior Counsel |
James O. Yost (k)
(age 63) | | Treasurer | | September 1990 | | 136 | | Massachusetts Financial Services Company, Senior Vice President |
| (h) | Date first appointed to serve as Trustee/Officer of an MFS Fund. Each Trustee has served continuously since appointment unless indicated otherwise. From January 2012 through December 2016, Messrs. DiLorenzo and Yost served as Treasurer and Deputy Treasurer of the Funds, respectively. |
| (j) | Directorships or trusteeships of companies required to report to the Securities and Exchange Commission (i.e., “public companies”). |
| (k) | “Interested person” of the Trust within the meaning of the Investment Company Act of 1940 (referred to as the 1940 Act), which is the principal federal law governing investment companies like the fund, as a result of a position with MFS. The address of MFS is 111 Huntington Avenue, Boston, Massachusetts 02199-7618. |
Trustees and Officers - continued
Each Trustee (other than Messrs. Jones, Kilman and Roberge) has been elected by shareholders and each Trustee and Officer holds office until his or her successor is chosen and qualified or until his or her earlier death, resignation, retirement or removal. Mr. Roberge became a Trustee of the Funds on January 1, 2021 and Messrs. Jones and Kilman became Trustees of the Funds on January 1, 2019. The Trust does not hold annual meetings for the purpose of electing Trustees, and Trustees are not elected for fixed terms. Under the terms of the Board's retirement policy, an Independent Trustee shall retire at the end of the calendar year in which he or she reaches the earlier of 75 years of age or 15 years of service on the Board (or, in the case of any Independent Trustee who joined the Board prior to 2015, 20 years of service on the Board).
Messrs. Buller, Kilman and Otis and Ms. Roepke are members of the Trust’s Audit Committee.
Each of the Interested Trustees and certain Officers hold comparable officer positions with certain affiliates of MFS.
The Statement of Additional Information for a Fund includes further information about the Trustees and is available without charge upon request by calling 1-800-225-2606.
| Investment Adviser | Custodian |
Massachusetts Financial Services Company
111 Huntington Avenue
Boston, MA 02199-7618 | JPMorgan Chase Bank, NA
4 Metrotech Center
New York, NY 11245 |
| Distributor | Independent Registered Public Accounting Firm |
MFS Fund Distributors, Inc.
111 Huntington Avenue
Boston, MA 02199-7618 | Ernst & Young LLP
200 Clarendon Street
Boston, MA 02116 |
| Portfolio Manager(s) | |
Pilar Gomez-Bravo
Steven Gorham
Andy Li
John Mitchell
Johnathan Munko
Jonathan Sage
David Shindler
Robert Spector
Erik Weisman | |
Board Review of Investment Advisory Agreement
MFS Global Total Return Fund
The Investment Company Act of 1940 requires that both the full Board of Trustees and a majority of the non-interested (“independent”) Trustees, voting separately, annually approve the continuation of the Fund’s investment advisory agreement with MFS. The Trustees consider matters bearing on the Fund and its advisory arrangements at their meetings throughout the year, including a review of performance data at each regular meeting. In addition, the independent Trustees met several times over the course of three months beginning in May and ending in July, 2023 (“contract review meetings”) for the specific purpose of considering whether to approve the continuation of the investment advisory agreement for the Fund and the other investment companies that the Board oversees (the “MFS Funds”). The independent Trustees were assisted in their evaluation of the Fund’s investment advisory agreement by independent legal counsel, from whom they received separate legal advice and with whom they met separately from MFS during various contract review meetings. The independent Trustees were also assisted in this process by an independent consultant who was retained by and reported to the independent Trustees.
In connection with their deliberations regarding the continuation of the investment advisory agreement, the Trustees, including the independent Trustees, considered such information and factors as they believed, in light of the legal advice furnished to them and their own business judgment, to be relevant. The investment advisory agreement for the Fund was considered separately, although the Trustees also took into account the common interests of all MFS Funds in their review. As described below, the Trustees considered the nature, quality, and extent of the various investment advisory, administrative, and shareholder services performed by MFS under the existing investment advisory agreement and other arrangements with the Fund.
In connection with their contract review meetings, the Trustees received and relied upon materials that included, among other items: (i) information provided by Broadridge Financial Solutions, Inc. (“Broadridge”), an independent third party, on the investment performance of the Fund for various time periods ended December 31, 2022 and the investment performance of a group of funds with substantially similar investment classifications/objectives (the “Broadridge performance universe”), (ii) information provided by Broadridge on the Fund’s advisory fees and other expenses and the advisory fees and other expenses of comparable funds identified by Broadridge as well as all other funds in the same investment classification/category (the “Broadridge expense group and universe”), (iii) information provided by MFS on the advisory fees of portfolios of other clients of MFS, including institutional separate accounts and other clients, (iv) information as to whether and to what extent applicable expense waivers, reimbursements or fee “breakpoints” are observed for the Fund, (v) information regarding MFS’ financial results and financial condition, including MFS’ and certain of its affiliates’ estimated profitability from services performed for the Fund and the MFS Funds as a whole, and compared to MFS’ institutional business, (vi) MFS’ views regarding the outlook for the mutual fund industry and the strategic business plans of MFS, (vii) descriptions of various functions performed by MFS for the Funds, such as compliance monitoring and portfolio trading practices, and (viii) information regarding the overall organization of MFS, including information about
Board Review of Investment Advisory Agreement - continued
MFS’ senior management and other personnel providing investment advisory, administrative and other services to the Fund and the other MFS Funds. The comparative performance, fee and expense information prepared and provided by Broadridge was not independently verified and the independent Trustees did not independently verify any information provided to them by MFS.
The Trustees’ conclusion as to the continuation of the investment advisory agreement was based on a comprehensive consideration of all information provided to the Trustees and not the result of any single factor. Some of the factors that figured particularly in the Trustees’ deliberations are described below, although individual Trustees may have evaluated the information presented differently from one another, giving different weights to various factors. It is also important to recognize that the fee arrangements for the Fund and other MFS Funds are the result of years of review and discussion between the independent Trustees and MFS, that certain aspects of such arrangements may receive greater scrutiny in some years than in others, and that the Trustees’ conclusions may be based, in part, on their consideration of these same arrangements during the course of the year and in prior years.
Based on information provided by Broadridge and MFS, the Trustees reviewed the Fund’s total return investment performance as well as the Broadridge performance universe over various time periods. The Trustees placed particular emphasis on the total return performance of the Fund’s Class I shares in comparison to the performance of funds in its Broadridge performance universe over the five-year period ended December 31, 2022, which the Trustees believed was a long enough period to reflect differing market conditions. The total return performance of the Fund’s Class I shares was in the 2nd quintile relative to the other funds in the universe for this five-year period (the 1st quintile being the best performers and the 5th quintile being the worst performers). The total return performance of the Fund’s Class I shares was in the 2nd quintile for each of the one- and three- year periods ended December 31, 2022 relative to the Broadridge performance universe. Because of the passage of time, these performance results may differ from the performance results for more recent periods, including those shown elsewhere in this report.
In the course of their deliberations, the Trustees took into account information provided by MFS in connection with the contract review meetings, as well as during investment review meetings conducted with portfolio management personnel during the course of the year regarding the Fund’s performance. After reviewing these and related factors, the Trustees concluded, within the context of their overall conclusions regarding the investment advisory agreement, that they were satisfied with MFS’ responses and efforts relating to investment performance.
In assessing the reasonableness of the Fund’s advisory fee, the Trustees considered, among other information, the Fund’s advisory fee and the total expense ratio of the Fund’s Class I shares as a percentage of average daily net assets and the advisory fee and total expense ratios of the Broadridge expense group based on information provided by Broadridge. The Trustees considered that MFS currently observes an expense limitation for the Fund, which may not be changed without the Trustees’ approval. The Trustees also considered that, according to the data provided by
Board Review of Investment Advisory Agreement - continued
Broadridge (which takes into account any fee reductions or expense limitations that were in effect during the Fund’s last fiscal year), the Fund’s effective advisory fee rate and total expense ratio were each approximately at the Broadridge expense group median.
The Trustees also considered the advisory fees charged by MFS to any institutional separate accounts advised by MFS (“separate accounts”) and unaffiliated investment companies for which MFS serves as subadviser (“subadvised funds”) that have comparable investment strategies to the Fund, if any. In comparing these fees, the Trustees considered information provided by MFS as to the generally broader scope of services provided by MFS to the Fund, as well as the more extensive regulatory burdens imposed on MFS in managing the Fund, in comparison to separate accounts and subadvised funds. The Trustees also considered the higher demands placed on MFS’ investment personnel and trading infrastructure as a result of the daily cash in-flows and out-flows of the Fund in comparison to separate accounts.
The Trustees also considered whether the Fund may benefit from any economies of scale in the management of the Fund in the event of growth in assets of the Fund and/or growth in assets of the MFS Funds as a whole. They noted that the Fund’s advisory fee rate schedule is subject to contractual breakpoints that reduce the Fund’s advisory fee rate on average daily net assets over $500 million, $1 billion and $2.5 billion. The Trustees also noted that MFS has agreed in writing to waive a portion of the management fees of certain MFS Funds, including the Fund, if the total combined assets of certain funds within the MFS Funds’ complex increase above agreed upon thresholds (the “group fee waiver”), enabling the Fund’s shareholders to share in the benefits from any economies of scale at the complex level. The group fee waiver is reviewed and renewed annually between the Board and MFS. The Trustees concluded that the breakpoints and the group fee waiver were sufficient to allow the Fund to benefit from economies of scale as its assets and overall complex assets grow.
The Trustees also considered information prepared by MFS relating to MFS’ costs and profits with respect to the Fund, the MFS Funds considered as a group, and other investment companies and accounts advised by MFS, as well as MFS’ methodologies used to determine and allocate its costs to the MFS Funds, the Fund and other accounts and products for purposes of estimating profitability.
After reviewing these and other factors described herein, the Trustees concluded, within the context of their overall conclusions regarding the investment advisory agreement, that the advisory fees charged to the Fund represent reasonable compensation in light of the services being provided by MFS to the Fund.
In addition, the Trustees considered MFS’ resources and related efforts to continue to retain, attract and motivate capable personnel to serve the Fund. The Trustees also considered current and developing conditions in the financial services industry, including the presence of large and well-capitalized companies which are spending, and appear to be prepared to continue to spend, substantial sums to engage personnel and to provide services to competing investment companies. In this regard, the Trustees also considered the financial resources of MFS and its ultimate parent, Sun Life Financial Inc. The Trustees also considered the advantages and possible disadvantages to the Fund of having an adviser that also serves other investment companies as well as other accounts.
Board Review of Investment Advisory Agreement - continued
The Trustees also considered the nature, quality, cost, and extent of administrative, transfer agency, and distribution services provided to the Fund by MFS and its affiliates under agreements and plans other than the investment advisory agreement, including any 12b-1 fees the Fund pays to MFS Fund Distributors, Inc., an affiliate of MFS. The Trustees also considered the nature, extent and quality of certain other services MFS performs or arranges for on the Fund’s behalf, which may include securities lending programs, directed expense payment programs, class action recovery programs, and MFS’ interaction with third-party service providers, principally custodians and sub-custodians. The Trustees concluded that the various non-advisory services provided by MFS and its affiliates on behalf of the Fund were satisfactory.
The Trustees considered so-called “fall-out benefits” to MFS such as reputational value derived from serving as investment manager to the MFS Funds. The Trustees also considered that MFS discontinued its historic practice of obtaining investment research from portfolio brokerage commissions paid by certain MFS Funds effective January 2018, and directly pays or voluntarily reimburses a Fund, if applicable, for the costs of external research acquired through the use of the Fund’s portfolio brokerage commissions.
Based on their evaluation of factors that they deemed to be material, including those factors described above, the Board of Trustees, including the independent Trustees, concluded that the Fund’s investment advisory agreement with MFS should be continued for an additional one-year period, commencing August 1, 2023.
Proxy Voting Policies and Information
MFS votes proxies on behalf of the fund pursuant to proxy voting policies and procedures that are available without charge, upon request, by calling 1-800-225-2606, by visiting mfs.com/proxyvoting, or by visiting the SEC’s Web site at http://www.sec.gov.
Information regarding how the fund voted proxies relating to portfolio securities during the most recent twelve-month period ended June 30 is available by August 31 of each year without charge by visiting mfs.com/proxyvoting, or by visiting the SEC’s Web site at http://www.sec.gov.
Quarterly Portfolio Disclosure
The fund files a complete schedule of portfolio holdings with the SEC for the first and third quarters of each fiscal year as an exhibit to its reports on Form N-PORT. The fund's Form N-PORT reports are available on the SEC's Web site at http://www.sec.gov. A shareholder can obtain the portfolio holdings report for the first and third quarters of the fund's fiscal year at mfs.com/openendfunds by choosing the fund's name and then scrolling to the “Resources” section and clicking on the “Prospectus and Reports” tab.
Further Information
From time to time, MFS may post important information about the fund or the MFS Funds on the MFS Web site (mfs.com). This information is available at https://www.mfs.com/announcements or at mfs.com/openendfunds by choosing the fund’s name and then scrolling to the “Resources” section and clicking on the “Announcements” tab, if any.
Information About Fund Contracts and Legal Claims
The fund has entered into contractual arrangements with an investment adviser, administrator, distributor, shareholder servicing agent, and custodian who each provide services to the fund. Unless expressly stated otherwise, shareholders are not parties to, or intended beneficiaries of these contractual arrangements, and these contractual arrangements are not intended to create any shareholder right to enforce them against the service providers or to seek any remedy under them against the service providers, either directly or on behalf of the fund.
Under the Trust’s By-Laws and Declaration of Trust, any claims asserted against or on behalf of the MFS Funds, including claims against Trustees and Officers, must be brought in state and federal courts located within the Commonwealth of Massachusetts.
Federal Tax Information (unaudited)
The fund will notify shareholders of amounts for use in preparing 2023 income tax forms in January 2024. The following information is provided pursuant to provisions of the Internal Revenue Code.
The fund designates the maximum amount allowable as qualified dividend income eligible to be taxed at the same rate as long-term capital gain.
The fund designates $43,436,000 as capital gain dividends paid during the fiscal year.
For corporate shareholders, 100.00% of the ordinary income dividends paid during the prior calendar year qualify for the corporate dividends received deduction.
Federal Tax Information (unaudited) - continued
The fund designates the maximum amount allowable as Section 199A dividends as defined in Proposed Treasury Regulation §1.199A-3(d).
The fund intends to pass through the maximum amount allowable as Section 163(j) Interest Dividends as defined in Treasury Regulation §1.163(j)-1(b).
| FACTS | WHAT DOES MFS DO WITH YOUR PERSONAL INFORMATION? |
| Why? | Financial companies choose how they share your personal information. Federal law gives consumers the right to limit some but not all sharing. Federal law also requires us to tell you how we collect, share, and protect your personal information. Please read this notice carefully to understand what we do. |
| What? | The types of personal information we collect and share depend on the product or service you have with us. This information can include: |
| • Social Security number and account balances |
| • Account transactions and transaction history |
| • Checking account information and wire transfer instructions |
| When you are no longer our customer, we continue to share your information as described in this notice. |
| How? | All financial companies need to share customers' personal information to run their everyday business. In the section below, we list the reasons financial companies can share their customers' personal information; the reasons MFS chooses to share; and whether you can limit this sharing. |
Reasons we can share your
personal information | Does MFS share? | Can you limit
this sharing? |
For our everyday business purposes –
such as to process your transactions, maintain your
account(s), respond to court orders and legal
investigations, or report to credit bureaus | Yes | No |
For our marketing purposes –
to offer our products and services to you | No | We don't share |
For joint marketing with other
financial companies | No | We don't share |
For our affiliates' everyday business purposes –
information about your transactions and experiences | No | We don't share |
For our affiliates' everyday business purposes –
information about your creditworthiness | No | We don't share |
| For nonaffiliates to market to you | No | We don't share |
| Questions? | Call 800-225-2606 or go to mfs.com. |
| Who we are |
| Who is providing this notice? | MFS Funds, MFS Investment Management, MFS Institutional Advisors, Inc., and MFS Heritage Trust Company. |
| What we do |
How does MFS
protect my personal
information? | To protect your personal information from unauthorized access and use, we use security measures that comply with federal law. These measures include procedural, electronic, and physical safeguards for the protection of the personal information we collect about you. |
How does MFS
collect my personal
information? | We collect your personal information, for example, when you |
| • open an account or provide account information |
| • direct us to buy securities or direct us to sell your securities |
| • make a wire transfer |
| We also collect your personal information from others, such as credit bureaus, affiliates, or other companies. |
| Why can't I limit all sharing? | Federal law gives you the right to limit only |
| • sharing for affiliates' everyday business purposes – information about your creditworthiness |
| • affiliates from using your information to market to you |
| • sharing for nonaffiliates to market to you |
| State laws and individual companies may give you additional rights to limit sharing. |
| Definitions |
| Affiliates | Companies related by common ownership or control. They can be financial and nonfinancial companies. |
| • MFS does not share personal information with affiliates, except for everyday business purposes as described on page one of this notice. |
| Nonaffiliates | Companies not related by common ownership or control. They can be financial and nonfinancial companies. |
| • MFS does not share with nonaffiliates so they can market to you. |
| Joint marketing | A formal agreement between nonaffiliated financial companies that together market financial products or services to you. |
| • MFS doesn't jointly market. |
| Other important information |
| If you own an MFS product or receive an MFS service in the name of a third party such as a bank or broker-dealer, their privacy policy may apply to you instead of ours. |
Save paper with eDelivery.
MFS® will send you prospectuses, reports, and proxies directly via e-mail so you will get information faster with less mailbox clutter.
To sign up:
1. Go to mfs.com.
2. Log in via MFS® Access.
3. Select eDelivery.
If you own your MFS fund shares through a financial institution or a retirement plan, MFS® TALK, MFS® Access, or eDelivery may not be available to you.
CONTACT
WEB SITE
mfs.com
MFS TALK
1-800-637-8255
24 hours a day
ACCOUNT SERVICE AND LITERATURE
Shareholders
1-800-225-2606
Financial advisors
1-800-343-2829
Retirement plan services
1-800-637-1255
MAILING ADDRESS
MFS Service Center, Inc.
P.O. Box 219341
Kansas City, MO 64121-9341
OVERNIGHT MAIL
MFS Service Center, Inc.
Suite 219341
430 W 7th Street
Kansas City, MO 64105-1407
Item 1(b):
Not applicable.
ITEM 2. CODE OF ETHICS.
The Registrant has adopted a Code of Ethics (the "Code") pursuant to Section 406 of the Sarbanes-Oxley Act and as defined in Form N-CSR that applies to the Registrant's principal executive officer and principal financial and accounting officer. During the period covered by this report, the Registrant has not amended any provision in the Code that relates to an element of the Code's definition enumerated in paragraph
(b)of Item 2 of this Form N-CSR. During the period covered by this report, the Registrant did not grant a waiver, including an implicit waiver, from any provision of the Code.
A copy of the Code is attached hereto as EX-99.COE.
ITEM 3. AUDIT COMMITTEE FINANCIAL EXPERT.
Messrs. Steven E. Buller, James Kilman, and Clarence Otis, Jr. and Ms. Maryanne L. Roepke, members of the Audit Committee, have been determined by the Board of Trustees in their reasonable business judgment to meet the definition of "audit committee financial expert" as such term is defined in Form N-CSR. In addition, Messrs. Buller, Kilman, and Otis and Ms. Roepke are "independent" members of the Audit Committee (as such term has been defined by the Securities and Exchange Commission in regulations implementing Section 407 of the Sarbanes-Oxley Act of 2002). The Securities and Exchange Commission has stated that the designation of a person as an audit committee financial expert pursuant to this Item 3 on the Form N-CSR does not impose on such a person any duties, obligations or liability that are greater than the duties, obligations or liability imposed on such person as a member of the Audit Committee and the Board of Trustees in the absence of such designation or identification.
ITEM 4. PRINCIPAL ACCOUNTANT FEES AND SERVICES.
Items 4(a) through 4(d) and 4(g):
The Board of Trustees has appointed Ernst & Young LLP ("E&Y") to serve as independent accountants to the series of the Registrant (each a "Fund" and collectively the "Funds"). The tables below set forth the audit fees billed to each Fund as well as fees for non-audit services provided to each Fund and/or to each Fund's investment adviser, Massachusetts Financial Services Company ("MFS") and to various entities either controlling, controlled by, or under common control with MFS that provide ongoing services to the Fund ("MFS Related Entities").
For the fiscal years ended October 31, 2023 and 2022, audit fees billed to each Fund by E&Y were as follows:
Fees billed by E&Y: | | Audit Fees |
| 2023 | | 2022 |
MFS Global Equity Fund | 61,404 | | 56,811 |
MFS Global Total Return Fund | 71,665 | | 66,294 |
MFS Utilities Fund | 56,148 | | 51,953 |
Total | 189,217 | | 175,058 |
For the fiscal years ended October 31, 2023 and 2022, fees billed by E&Y for audit-related, tax and other services provided to each Fund and for audit-related, tax and other services provided to MFS and MFS Related Entities were as follows:
Fees billed by E&Y: | Audit-Related Fees1 | | | | Tax Fees2 | | All Other Fees3 | |
| 2023 | 2022 | | | 2023 | | 2022 | | 2023 | 2022 | |
To MFS Global Equity Fund | 0 | 0 | | | 636 | | 632 | | 0 | 591 | |
To MFS Global Total Return | 0 | 0 | | | 636 | | 632 | | 0 | 302 | |
Fund | | | | | | | | | | | | | |
To MFS Utilities Fund | 0 | 0 | | | 636 | | 632 | | 0 | 523 | |
Total fees billed by E&Y | 0 | 0 | | | 1,908 | | 1,896 | | 0 | 1,416 | |
To above Funds | | | | | | | | | | | | | |
| | | | | | | | | |
Fees billed by E&Y: | Audit-Related Fees1 | | | Tax Fees2 | | All Other Fees3 |
| 2023 | | 2022 | | | 2023 | | 2022 | | 2023 | 2022 | |
To MFS and MFS Related | | | | | | | | | | | | | |
Entities of MFS Global | 0 | | 662,511 | | | 0 | | 0 | | 3,600 | 111,415 | |
Equity Fund* | | | | | | | | | | | | | |
To MFS and MFS Related | | | | | | | | | | | | | |
Entities of MFS Global | 0 | | 662,511 | | | 0 | | 0 | | 3,600 | 111,415 | |
Total Return Fund* | | | | | | | | | | | | | |
To MFS and MFS Related | | | | | | | | | | | | | |
Entities of MFS Utilities | 0 | | 662,511 | | | 0 | | 0 | | 3,600 | 111,415 | |
Fund* | | | | | | | | | | | | | |
| | | | | | | | |
Fees billed by E&Y: | | | | | | | | Aggregate fees for non-audit services: |
| | | | | | | | 2023 | | | 2022 |
To MFS Global Equity Fund, MFS and | | | | | | | 298,986 | | 905,579 |
MFS Related Entities# | | | | | | | | | | | | | |
To MFS Global Total Return Fund, MFS and MFS Related | | | 298,986 | | 905,290 |
Entities# | | | | | | | | | | | | | |
To MFS Utilities Fund, MFS and MFS | | | | | | | 298,986 | | 905,511 |
Related Entities# | | | | | | | | | | | | | |
*This amount reflects the fees billed to MFS and MFS Related Entities for non-audit services relating directly to the operations and financial reporting of the Fund (portions of which services also related to the operations and financial reporting of other funds within the MFS Funds complex).
# This amount reflects the aggregate fees billed by E&Y for non-audit services rendered to the Fund and for non-audit services rendered to MFS and the MFS Related Entities.
1 The fees included under "Audit-Related Fees" are fees related to assurance and related services that are reasonably related to the performance of the audit or review of financial statements, but not reported under ''Audit Fees,'' including accounting consultations, agreed-upon procedure reports, attestation reports, comfort letters and internal control reviews.
2The fees included under "Tax Fees" are fees associated with tax compliance, tax advice and tax planning, including services relating to the filing or amendment of federal, state or local income tax returns, regulated investment company qualification reviews and tax
distribution and analysis.
3The fees included under "All Other Fees" are fees for products and services provided by E&Y other than those reported under "Audit Fees," "Audit-Related Fees" and "Tax Fees," including fees for services related to review of internal controls and review of Rule 38a-
1 compliance program.
Item 4(e)(1):
Set forth below are the policies and procedures established by the Audit Committee of the Board of Trustees relating to the pre- approval of audit and non-audit related services:
To the extent required by applicable law, pre-approval by the Audit Committee of the Board is needed for all audit and permissible non-audit services rendered to the Funds and all permissible non-audit services rendered to MFS or MFS Related Entities if the services relate directly to the operations and financial reporting of the Registrant. Pre-approval is currently on an engagement-by- engagement basis. In the event pre-approval of such services is necessary between regular meetings of the Audit Committee and it is not practical to wait to seek pre-approval at the next regular meeting of the Audit Committee, pre-approval of such services may be referred to the Chair of the Audit Committee for approval; provided that the Chair may not pre-approve any individual engagement for such services exceeding $50,000 or multiple engagements for such services in the aggregate exceeding $100,000 in each period between regular meetings of the Audit Committee. Any engagement pre-approved by the Chair between regular meetings of the Audit Committee shall be presented for ratification by the entire Audit Committee at its next regularly scheduled meeting.
Item 4(e)(2):
None, or 0%, of the services relating to the Audit-Related Fees, Tax Fees and All Other Fees paid by the Fund and MFS and MFS Related Entities relating directly to the operations and financial reporting of the Registrant disclosed above were approved by the audit committee pursuant to paragraphs (c)(7)(i)(C) of Rule 2-01 of Regulation S-X (which permits audit committee approval after the start of the engagement with respect to services other than audit, review or attest services, if certain conditions are satisfied).
Item 4(f):
Not applicable.
Item 4(h):
The Registrant's Audit Committee has considered whether the provision by a Registrant's independent registered public accounting firm of non-audit services to MFS and MFS Related Entities that were not pre-approved by the Committee (because such services did not relate directly to the operations and financial reporting of the Registrant) was compatible with maintaining the independence of the independent registered public accounting firm as the Registrant's principal auditors.
Item 4(i):
Not applicable.
Item 4(j):
Not applicable.
ITEM 5. AUDIT COMMITTEE OF LISTED REGISTRANTS.
Not applicable to the Registrant.
ITEM 6. INVESTMENTS
A schedule of investments for each series covered by this Form N-CSR is included as part of the report to shareholders of such series under Item 1(a) of this Form N-CSR.
ITEM 7. DISCLOSURE OF PROXY VOTING POLICIES AND PROCEDURES FOR CLOSED-END MANAGEMENT INVESTMENT COMPANIES.
Not applicable to the Registrant.
ITEM 8. PORTFOLIO MANAGERS OF CLOSED-END MANAGEMENT INVESTMENT COMPANIES.
Not applicable to the Registrant.
ITEM 9. PURCHASES OF EQUITY SECURITIES BY CLOSED-END MANAGEMENT INVESTMENT COMPANY AND AFFILIATED PURCHASERS.
Not applicable to the Registrant.
ITEM 10. SUBMISSION OF MATTERS TO A VOTE OF SECURITY HOLDERS.
There were no material changes to the procedures by which shareholders may send recommendations to the Board for nominees to the Registrant's Board since the Registrant last provided disclosure as to such procedures in response to the requirements of Item 407 (c)(2)(iv) of Regulation S-K or this Item.
ITEM 11. CONTROLS AND PROCEDURES.
(a)Based upon their evaluation of the effectiveness of the registrant's disclosure controls and procedures (as defined in Rule 30a-3(c) under the Investment Company Act of 1940 (the "Act")) as conducted within 90 days of the filing date of this report on Form N-CSR, the Registrant's principal financial officer and principal executive officer have concluded that those disclosure controls and procedures provide reasonable assurance that the material information required to be disclosed by the Registrant on this report is recorded, processed, summarized and reported within the time periods specified in the Securities and Exchange Commission's rules and forms.
(b)There were no changes in the Registrant's internal controls over financial reporting (as defined in Rule 30a-3(d) under the Act) that occurred during the period covered by the report that have materially affected, or are reasonably likely to materially affect, the Registrant's internal control over financial reporting.
ITEM 12. DISCLOSURE OF SECURITIES LENDING ACTIVITIES FOR CLOSED-END MANAGEMENT INVESTMENT COMPANIES.
Not applicable to the Registrant.
ITEM 13. RECOVERY OF ERRONEOUSLY AWARDED COMPENSATION.
Not Applicable.
ITEM 14. EXHIBITS.
(a)(1) Any code of ethics, or amendment thereto, that is the subject of the disclosure required by Item 2, to the extent that the registrant intends to satisfy the Item 2 requirements through filing of an exhibit: Attached hereto as EX-99.COE.
(2)A separate certification for each principal executive officer and principal financial officer of the registrant as required by Rule 30a-2(a) under the Act (17 CFR 270.30a-2): Attached hereto as EX-99.302CERT.
(3)Any written solicitation to purchase securities under Rule 23c-1 under the Act (17 CFR 270.23c-1) sent or given during the period covered by the report by or on behalf of the registrant to 10 or more persons. Not applicable.
(4)Change in the registrant's independent public accountant. Not applicable.
(b)If the report is filed under Section 13(a) or 15(d) of the Exchange Act, provide the certifications required by Rule 30a-2(b) under the Act (17 CFR 270.30a-2(b)), Rule 13a-14(b) or Rule 15d-14(b) under the Exchange Act (17 CFR 240.13a-14(b) or 240.15d-14(b)) and Section 1350 of Chapter 63 of Title 18 of the United States Code (18 U.S.C. 1350) as an exhibit. A certification furnished pursuant to this paragraph will not be deemed "filed" for the purposes of Section 18 of the Exchange Act (15 U.S.C. 78r), or otherwise subject to the liability of that section. Such certification will not be deemed to be incorporated by reference into any filing under the Securities Act of 1933 or the Exchange Act, except to the extent that the registrant specifically incorporates it by reference. Attached hereto as EX-99.906CERT.
Notice
A copy of the Amended and Restated Declaration of Trust, as amended, of the Registrant is on file with the Secretary of State of The Commonwealth of Massachusetts and notice is hereby given that this instrument is executed on behalf of the Registrant by an officer of the Registrant as an officer and not individually and the obligations of or arising out of this instrument are not binding upon any of the Trustees or shareholders individually, but are binding only upon the assets and property of the respective constituent series of the Registrant.
SIGNATURES
Pursuant to the requirements of the Securities Exchange Act of 1934 and the Investment Company Act of 1940, the registrant has duly caused this report to be signed on its behalf by the undersigned, thereunto duly authorized.
(Registrant) MFS SERIES TRUST VI
By (Signature and Title)*
/S/ DAVID L. DILORENZO
David L. DiLorenzo, President
Date: December 14, 2023
Pursuant to the requirements of the Securities Exchange Act of 1934 and the Investment Company Act of 1940, this report has been signed below by the following persons on behalf of the registrant and in the capacities and on the dates indicated.
By (Signature and Title)*
/S/ DAVID L. DILORENZO
David L. DiLorenzo, President (Principal Executive Officer)
Date: December 14, 2023
By (Signature and Title)*
/S/ JAMES O. YOST
James O. Yost, Treasurer (Principal Financial Officer and Accounting Officer) Date: December 14, 2023
* Print name and title of each signing officer under his or her signature.