Exhibit 15.2
RioTinto
2016 Annual report
riotinto.com/ar2016
Contents Cautionary statement about forward-looking statements This document contains certain forward-looking statements with respect to the financial condition, results of operations and business of the Rio Tinto Group. These statements are forward-looking statements within the meaning of Section 27A of the US Securities Act of 1933, and Section 21E of the US Securities Exchange Act of 1934. The words “intend”, “aim”, “project”, “anticipate”, “estimate”, “plan”, “believes”, “expects”, “may”, “should”, “will”, “target”, “set to” or similar expressions, commonly identify such forward-looking statements. Examples of forward-looking statements in this Annual report include those regarding estimated ore reserves, anticipated production or construction dates, costs, outputs and productive lives of assets or similar factors. Forward-looking statements involve known and unknown risks, uncertainties, assumptions and other factors set forth in this document that are beyond the Group’s control. For example, future ore reserves will be based in part on market prices that may vary significantly from current levels. These may materially affect the timing and feasibility of particular developments. Other factors include the ability to produce and transport products profitably, demand for our products, changes to the assumptions regarding the recoverable value of our tangible and intangible assets, the effect of foreign currency exchange rates on market prices and operating costs, and activities by governmental authorities, such as changes in taxation or regulation, and political uncertainty. In light of these risks, uncertainties and assumptions, actual results could be materially different from projected future results expressed or implied by these forward-looking statements which speak only as to the date of this Annual report. Except as required by applicable regulations or by law, the Group does not undertake any obligation to publicly update or revise any forward-looking statements, whether as a result of new information or future events. The Group cannot guarantee that its forward-looking statements will not differ materially from actual results. Performance highlights 1 Group overview 2 Chairman’s letter 4 Chief executive’s statement 5 Market environment 7 Group strategy 8 Business model 10 Key performance indicators 12 Risk management 14 Principal risks and uncertainties 16 Portfolio management 22 Sustainable development 24 Independent limited assurance report 31 Product groups Iron Ore 32 Aluminium 34 Copper & Diamonds 36 Energy & Minerals 38 Growth & Innovation 40 Five year review 42 Contents 218 Metals and minerals production 219 234 Mines and production facilities 236 Contents 44 Directors’ report 45 Board of directors 50 Executive Committee 53 Corporate governance 55 Remuneration Report Annual statement by the Remuneration Committee chairman 67 Remuneration Policy Report 70 Remuneration Implementation Report 78 Shareholder information 244 UK Listing Rules cross reference table 250 Financial calendar 251 Contact details 252 Contents 109 Group income statement 110 Group statement of comprehensive income 111 Group cash flow statement 112 Group balance sheet 113 Group statement of changes in equity 114 Notes to the 2016 financial statements 116 Rio Tinto plc Company balance sheet 195 Rio Tinto financial information by business unit 199 Australian Corporations Act – summary of ASIC relief 204 Directors’ declaration 205 Auditor’s independence declaration 206 Independent auditors’ report 207 Financial summary 2007-2016 215 Summary financial data 217 To be more environmentally friendly, Rio Tinto is reducing the print run of all publications. We encourage you to visit the website to learn more about the Group’s performance in 2016 and to view all available PDFs of this Annual report and the Strategic report. riotinto.com/ar2016 Strategic report 01 Production, reserves and operations 218 Directors’ report 44 Additional information 244 Financial statements 109 Key Page reference for more information within this report KPI Denotes key performance indicators This Annual report, which includes the Group’s 2016 Strategic report, complies with Australian and UK reporting requirements. Copies of Rio Tinto’s shareholder documents – the 2016 Annual report and 2016 Strategic report, along with the 2017 Notices of annual general meeting – are available to view on the Group’s website at: riotinto.com/ar2016 and riotinto.com/agm2017 For this Annual report on Form 20-F, certain pages of the Annual report have been omitted. The Form 20-F is consistent with the page numbering of the Annual report.
Performance highlights
|
| Cash generation of US$8.5 billion and US$3.6 billion of shareholder returns |
Rio Tinto’s 2016 results show that it has kept its commitment to deliver superior shareholder returns, and maximise cash and productivity. At the same time, the Group strengthened its portfolio and advanced its high-value growth projects.
Rio Tinto enters 2017 in good shape and will deliver US$5 billion of extra free cash flow over the next five years from its mine-to-market productivity programme. The Group’s value over volume approach, coupled with a robust balance sheet and world-class assets, places Rio Tinto in a strong position to deliver superior shareholder returns through the cycle.
2016 highlights
| – | | Generating strong operating cash flow of US$8.5 billion. |
| – | | Delivering underlying earnings of US$5.1 billion. |
| – | | Achieving US$1.6 billion of pre-tax sustainable operating cash cost improvements. (1) |
| – | | Investing in three major growth projects in bauxite, copper and iron ore. |
| – | | Optimising the portfolio with disposals of US$1.3 billion announced or completed in 2016 and up to US$2.45 billion announced to date in 2017. |
| – | | Strengthening the balance sheet further with net debt reduced to US$9.6 billion. |
| – | | Returning cash to shareholders with US$3.6 billion announced for 2016: |
| | – | | full year dividend of 170 US cents per share, equivalent to US$3.1 billion. |
| | – | | share buy-back of US$0.5 billion in Rio Tinto plc shares over the course of 2017. |
| | – | | in total, representing 70 per cent of 2016 underlying earnings. |
| – | | Generating free cash flow (2) of US$5.8 billion which included US$0.3 billion of sales of property, plant and equipment. |
| – | | Receiving US$0.8 billion in net proceeds from disposals in 2016, with up to US$2.6 billion expected in 2017, including the Coal & Allied transaction for up to US$2.45 billion. |
| | | | | | | | | | | | | | | | | | |
| | | | | | | Year to 31 December | | 2016 | | | 2015 | | | Change | |
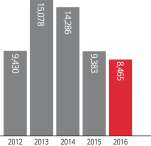
| KPI | |  | | 112 | | Net cash generated from operating activities (US$ millions) | | | 8,465 | | | | 9,383 | | | | -10% | |
| KPI | | | | 130 | | Underlying earnings (3)(US$ millions) | | | 5,100 | | | | 4,540 | | | | +12% | |
| | | | | | Net earnings/(loss) (US$ millions) | | | 4,617 | | | | (866 | ) | | | n/a | |
| KPI | | | | 128 | | Capital expenditure (4)(US$ millions) | | | (3,012 | ) | | | (4,685 | ) | | | -36% | |
| | | | | | Underlying earnings per share (US cents) | | | 283.8 | | | | 248.8 | | | | +14% | |
| | | | | | Basic earnings/(loss) per share (US cents) | | | 256.9 | | | | (47.5 | ) | | | n/a | |
| | | | | | | Ordinary dividend per share (US cents) | | | 170.0 | | | | 215.0 | | | | -21% | |
| | | | | | | | | | | | | | | | | | |
| | | | | | | At 31 December | | 2016 | | | 2015 | | | Change | |
| KPI | | | | 145 | | Net debt (5, 7)(US$ millions) | | | 9,587 | | | | 13,783 | | | | -30% | |
| | | | | | | Gearing ratio (6,7) | | | 17% | | | | 24% | | | | | |
| The | financial results are prepared in accordance with IFRS. |
| (1) | Operating cash cost improvements represent the difference between the current and prior year full cash cost of sales per unit based on the prior year volume sold. |
| (2) | Free cash flow is defined as Net cash generated from operating activities less Purchases of property, plant and equipment (PP&E) plus Sales of PP&E. It is a key financial indicator which management uses internally to assess performance. |
| (3) | Underlying earnings is a key financial performance indicator which management uses internally to assess performance. It is presented here to provide greater understanding of the underlying business performance of the Group’s operations. Net and underlying earnings relate to profit attributable to the owners of Rio Tinto. Underlying earnings is defined and reconciled to net earnings on page 130. Additionally, underlying EBITDA is a key financial indicator which management uses internally to assess performance. It excludes the same items that are excluded in arriving at underlying earnings. |
| (4) | Capital expenditure is presented gross, before taking into account any disposals of property, plant and equipment. |
| (5) | Net debt is defined and reconciled to the balance sheet on page 145. |
| (6) | Gearing ratio is defined as net debt divided by the sum of net debt and total equity at each period end. |
| (7) | These financial performance indicators are those which management use internally to assess performance, and therefore are considered relevant to users of the accounts. |
| | | | |
| 2016 Annual report | | riotinto.com | | 1 |
| | | | | | | | | | | | | | | | |
| | | | | | | | |
| STRATEGIC REPORT | | | | DIRECTORS’ REPORT | | | | FINANCIAL STATEMENTS | | | | PRODUCTION, RESERVES AND OPERATIONS | | | | ADDITIONAL INFORMATION |
Group overview
Introduction to Rio Tinto
At Rio Tinto, as pioneers in mining and metals, we produce materials essential to human progress.
We have been in business for more than 140 years and remain focused on the long term. Our approach is driven by a clear strategy, with the goal of delivering superior value for our shareholders through the cycle (see page 8). Our strategy plays to our strengths: world-class assets, talented employees, a strong balance sheet and operating excellence.
Our approach is underpinned by our values of safety, teamwork, respect, integrity and excellence. Combined with the strength provided by our people and our assets, our values help form the foundations of ourlong-term success.
We have a 51,000-strong workforce in around 35 countries. We seek to foster a culture where our people keep their safety, and that of their workmates, contractors and communities, at the top of their minds; where every person understands how they can create and preserve value for the business; where diversity and innovation are embraced; and where our values guide everything we do.
We find, mine, process and market mineral resources, producing a diverse suite of minerals and metals that enable the world to grow and develop. These products give us exposure to markets around the world, and across the economic development spectrum, from basic infrastructure needs, through industrial growth, to consumer-led demand.
Under our Group-wide organisational structure, our four product groups – Aluminium, Copper & Diamonds, Energy & Minerals and Iron Ore – are complemented by our Growth & Innovation group. Supporting these are our central support functions, shared services, and headquarters-based activities.
Our contribution to sustainable development is integral to how we do business. It is a fundamental consideration in how we manage the business, seeking long-term mutually beneficial outcomes for our business and our stakeholders. Find out more on page 24.
Iron Ore
Rio Tinto operates a world-class iron ore business, supplying the global seaborne iron ore trade. We are well positioned to benefit from continuing demand across China and the developing world. The Iron Ore product group’s operations are located in the Pilbara region of Western Australia, where it hasindustry-leading margins, and in 2016 marked 50 years since their first contracted shipment.
Products
Iron ore
Iron ore is the key ingredient in the production of steel, one of the most fundamental and durable products for modern-day living, with uses from railways to paperclips.
Strategic advantages
| – | | Strong presence in key markets. |
| – | | Proximity to key Asian markets. |
| – | | World-class assets, comprising an exclusive, integrated supply chain with extensive optionality. |
| – | | A premium product suite, which drives strong customer relationships, supported by technical and commercial marketing expertise. |
| – | | Low cost position with a Pilbara cash unit cost of US$13.7 in 2016. |
| – | | Strong mineral resources provide multiple high-quality, low-cost options to sustain and grow our Pilbara operations. |
| – | | Employees driving sustainable productivity improvements: costs, quality and revenue. |
| – | | Industry leader in supply chain management, responsible mining and technology and innovation. |
| | |
| Key production locations | | Key sales destinations |
– Australia | | – China |
| | – Japan |
| | | – South Korea |
Full operating review32
Aluminium
Building on more than a century of experience and expertise, Rio Tinto is a global leader in the aluminium industry. Our business includes high-quality bauxite mines, large-scale alumina refineries, and some of the world’s lowest-cost, most technologically-advanced aluminium smelters.
Products
Bauxite
Bauxite is the ore used to make aluminium. It is refined into alumina which is smelted into aluminium metal. Our wholly and partly owned bauxite mines are located in Australia, Brazil and Guinea.
Alumina
Alumina (aluminium oxide) is extracted from bauxite via a refining process. Approximately four tonnes of bauxite are required to produce two tonnes of alumina, which in turn makes one tonne of aluminium metal. Our wholly and partly owned alumina refineries are located in Australia, Brazil and Canada.
Aluminium
Aluminium is a versatile modern metal. Light, strong, flexible, corrosion-resistant and infinitely recyclable, aluminium is one of the most widely used metals in the world. Its largest markets are transportation, machinery and construction. Our smelters are mainly concentrated in Canada. We also have smelters in France, Australia, New Zealand, Iceland and Oman.
Strategic advantages
| – | | Access to the largest and best-quality bauxite ore reserves in the industry, strategically located to serve growing Chinese bauxite demand. |
| – | | One of the lowest-cost bauxite producers. |
| – | | Outstanding hydropower position, which delivers significant cost and other advantages in an energy intensive industry and today’s carbon-constrained world. |
| – | | Rio Tinto has a low first-quartile average cost position for aluminium smelting, with industry-leading smelting technology. |
| | |
| Key production locations | | Key sales destinations |
– Canada | | – Asia |
– Australia | | – Americas |
– Europe | | – Europe |
Full operating review34
| | | | |
| 2 | | riotinto.com | | 2016 Annual report |
Copper & Diamonds(a)
Rio Tinto’s Copper & Diamonds product group has managed operations in Australia, Canada, Mongolia and the US, and non-managed operations in Chile and Indonesia. By-products of the group’s copper production include gold, silver, molybdenum and others such as sulphuric acid, rhenium, lead carbonate and selenium.
Products
Copper
Copper makes a positive impact on many of society’s challenges. It is the primary conductor in the world’s electrical infrastructure, and carries voices, data and vital information to all corners of the world. It is a key component of green technologies, from wind energy and solar collection to high-efficiency buildings and electric vehicles.
Diamonds
Diamonds are an important component in both affordable and higher-end jewellery. We are able to service all established and emerging markets as we produce the full range of diamonds in terms of size, quality and colour distribution.
Gold
Gold is the ultimate store of value. It is used in jewellery, as a financial instrument, and supports the medical industry.
Silver
Also a precious metal, silver has the highest electrical and thermal conductivity of any metal and is used in many electronic devices. It is also used in aerospace and medical applications, to make jewellery and as an investment.
Molybdenum
Molybdenum enhances toughness,high-temperature strength and corrosion resistance when combined with other metals. It is frequently used to produce stainless steel and other metal alloys.
Strategic advantages
| – | | A portfolio of high-quality copper assets. |
| – | | Attractive copper growth opportunities. |
| – | | Fully integrated global copper and diamond exploration, mining, and sales and marketing business. |
| – | | A strong and trusted supplier of copper and diamonds in markets where we have an established presence and in those where we are developing new opportunities. |
| – | | Leading technology and processes for underground mining. |
| | |
| Key production locations | | Key sales destinations |
– Australia – Chile – Mongolia – North America – Indonesia | | – Australia – China – India – Japan – North America – Europe |
| |
| |
| |
| |
| |
Full operating review36
Energy & Minerals(a)
Rio Tinto’s Energy & Minerals product group comprises mining, refining and marketing operations in 14 countries, across six sectors: borates, coal, iron ore concentrate and pellets, salt, titanium dioxide and uranium. Energy & Minerals also includes the Jadar lithium-borate project in Serbia and the Simandou iron ore project in Guinea.
Products
Borates
Refined borates are used in hundreds of products and processes. They are a vital ingredient of many building materials and are essential micro-nutrients for crops. They are also commonly used in glass and ceramic applications including fibreglass, television screens, floor and wall tiles, andheat-resistant glass.
Coal
Coal is a cost-effective and abundant energy source that plays an important role in the global energy mix. Thermal coal is used for electricity generation in power stations. The thermal coal from the Hunter Valley operations features the low ash and sulphur properties for modern lower-emissions power stations. We also produce high-value coking or metallurgical coal, which is mixed in furnaces with iron ore to produce steel.
Salt
Salt is one of the basic raw materials for the chemicals industry and is indispensable to a wide array of automotive, construction and electronic products, as well as for water treatment, food and healthcare.
Titanium dioxide
The minerals ilmenite and rutile, together with titanium dioxide slag, can be transformed into a white titanium dioxide pigment or titanium metal. The white pigment is a key component in paints, plastics, paper, inks, textiles, food, sunscreen and cosmetics. Titanium metal is light weight, chemically inert and strong, making it ideal for use in medical applications and in the aerospace industry.
Uranium
Uranium is one of the most powerful energy sources, and is used in the production of clean, stable, base-load electricity. After uranium is mined, it is processed into uranium oxide. This product is sold for processing into fuel rods for use in nuclear power stations.
Other products from the Energy & Minerals product group include high-purity ductile iron, steel billets, metal powders and zircon.
Strategic advantages
| – | | Industry-leading businesses operating in attractive markets. |
| – | | Demand-led, integrated operations that are responsive to the changing external environment. |
| – | | Minerals business poised to benefit from mid- to late-development-cycle demand growth as consumption increases in emerging markets. |
| – | | A lean, scalable operating model running cash-focused businesses. |
| | |
| Key production locations | | Key sales destinations |
– North America – Australia – Africa | | – North America – China – Japan – South Korea – Europe |
Full operating review38
Growth & Innovation(a)
The Growth & Innovation group operates through the entire life cycle of Rio Tinto’s mines and assets, optimising value from the time of the initial exploration concept through to when we close a mine or processing facility.
Growth & Innovation works in close partnership with Rio Tinto’s product groups, and is accountable for finding, evaluating, developing and delivering a portfolio of Tier 1 growth options. It also provides technical support to Rio Tinto operations to improve productivity, manage technical risk and drive innovation and automation initiatives.
Full operating review40
| (a) | The Copper & Diamonds and Energy & Minerals product groups, and the Growth & Innovation group, were formed in July 2016 in a reorganisation of Rio Tinto’s company structure. |
| | | | |
| 2016 Annual report | | riotinto.com | | 3 |
| | | | | | | | | | | | | | | | |
| | | | | | | | |
| STRATEGIC REPORT | | | | DIRECTORS’ REPORT | | | | FINANCIAL STATEMENTS | | | | PRODUCTION, RESERVES AND OPERATIONS | | | | ADDITIONAL INFORMATION |
Chairman’s letter
Dear shareholders,
In 2016, your company delivered a strong performance despite challenging macroeconomic conditions and significant geopolitical uncertainty, which led to commodity price volatility throughout the year.
Change was a feature of 2016, both in the external environment and within the company. It is critical that, in uncertain times, a long-term perspective prevails.
It is pleasing to report we made progress against each of our strategic priorities during 2016, delivering robust earnings and cash generation, while maintaining balance sheet strength and progressing our high-value growth options.
Strength through the cycle
In 2016, average prices for our products were slightly down on the previous year, yet we achieved underlying earnings of US$5.1 billion, up 12 per cent on 2015. At US$8.5 billion, operating cash flow was, however, ten per cent lower than in 2015, primarily due to interest paid on bond early redemptions and working capital movements.
During the year, your company continued to realise considerable savings from its cost reduction programme. The Group has now achieved US$7.8 billion in pre-tax operating cash cost improvements and reductions in exploration and evaluation expenditure compared with 2012.
Returns to shareholders
Last year, in response to a deterioration in the pricing environment and exceptional volatility, we determined that it was no longer appropriate to maintain our progressive dividend policy. We announced a new dividend policy with a more flexible approach which better reflects our underlying earnings profile and outlook.
It balances three factors: maintaining a strong balance sheet; reinvesting for future growth; and rewarding shareholders. We expect total cash returns to shareholders to be in the range of 40-60 per cent of underlying earnings in aggregate through the cycle.
In February 2017, we announced cash returns to shareholders of US$3.6 billion with respect to 2016. This comprises total dividends of US$3.1 billion and a share buy-back of US$500 million in Rio Tinto plc shares, representing, in aggregate, 70 per cent of 2016 underlying earnings.
Global growth
After five years of global GDP growth below the long-term average, and with the impact of interest rate policy stimulus nearing saturation, growth is now increasingly influenced by geopolitical matters. The tectonic political shifts in the UK and the US during 2016 are yet to translate into clear global economic impacts but there is no doubt that these events have contributed to a high level of uncertainty across the globe.
However, if we look to the long term, we believe there is plenty of opportunity. Over the next 15 years the world is expected to consume more copper than in the past
20 years, almost as much steel as in the past 30 years, and almost as much aluminium as in the past 40 years.
Consistent strategy
Given the increasing complexity and uncertainty in the external environment, we are focusing more than ever on understanding the macro trends that may impact our company and our industry in the future.
During the year, the board and management reviewed these global trends and our strategy to address them. In September, the board endorsed the company’s ten-year strategy. This remains consistent; our aim is to generate value by focusing on assets that are long life, low cost and expandable.
Economic and social contribution
While delivering shareholder value is our primary objective, there is no doubt that we need to get better at explaining the economic and social contribution we make to our host countries, particularly during uncertain times.
In 2016, your company paid US$4 billion in taxes and royalties worldwide, with payments over the past five years of more than US$32 billion. Over the past five years, Rio Tinto’s direct economic contribution has exceeded US$235(a) billion of which almost half was through payments to suppliers for goods and services.
Our stakeholders have an increasing interest in how we are preparing for – and how we contribute to – a low-carbon future. In response to a shareholder resolution at our 2016 annual general meeting, this month we will publish our first climate change report, which provides information on our approach.
Board and management
Over the last 12 months, we made a number of changes at both the board and management levels. In May 2016, Richard Goodmanson stepped down as a non-executive director and in February of this year, we announced that Robert Brown and Anne Lauvergeon will also step down from the board at the Rio Tinto Limited annual general meeting on 4 May 2017. Richard, Bob and Anne contributed significantly to the board over the years and we wish them well for the future.
In February 2017, we appointed three new independent non-executive directors to the board. Former Sasol Ltd chief executive David Constable and former Centrica plc chief executive Sam Laidlaw joined on 10 February 2017. Royal Dutch Shell plc chief financial officer Simon Henry will join the board with effect from 1 July 2017.
On 1 July 2016, Sam Walsh retired as chief executive of Rio Tinto, and I thank him for the significant service and transformative leadership he gave to the company during his three-and-a-half-year tenure as chief executive. Since taking over as chief executive in July, Jean-Sébastien Jacques has set about driving a new era of productivity, performance
and growth. During the first eight months in his role, J-S and our newly shaped executive team have continued the focus on generating cash, while maintaining a disciplined approach to capital allocation and balance sheet strength, and progressing our high-value growth options.
In 2016, your board visited Mongolia to see our management teams and employees in action. Site visits by the board allow us to meet with the company’s dedicated employees and we continue to be greatly impressed by their expertise and commitment.
Regulatory matters
I cannot reflect on 2016 without acknowledging the events of the final months of the year. On 9 November 2016, we announced, following an investigation supported by external counsel, that we had notified the relevant authorities in the US, UK and Australia about contractual payments totalling US$10.5 million made to a consultant who had provided advisory services in 2011 on the Simandou project in Guinea.
On 1 December 2016, Rio Tinto confirmed that it was co-operating with relevant authorities in connection with an investigation into the impairment included in the company’s accounts in 2012 in respect of Rio Tinto Coal Mozambique.
The outcome of the regulatory investigations, and any potential litigation, is uncertain. There is unfortunately little more I can say at this time, other than to assure you that the board is giving these matters its full and proper attention, and that we are continuing to co-operate fully with the relevant authorities. Under my chairmanship, we have established a dedicated board committee to monitor progress.
National pride, international spirit
Despite the changes and uncertainties of the past year, the world remains deeply connected through bilateral agreements, shared cultural histories and friendship. These factors will be the foundations of future global growth.
National pride and international spirit have gone hand in hand since Rio Tinto’s formation 144 years ago. That spirit continues today, as we partner with our stakeholders to build enduring businesses. On behalf of my fellow directors I would like to thank our hard-working employees and you, our shareholders, for your ongoing support.

Jan du Plessis
Chairman
1 March 2017
| (a) | Summarised on page 26. |
| | | | |
| 4 | | riotinto.com | | 2016 Annual report |
Chief executive’s statement
Dear shareholders,
It is a privilege to serve as chief executive of a great company with world-class assets, talented employees and a commitment to delivering value to our shareholders over the short, medium and long term.
Safety comes first
At Rio Tinto, safety comes first. Our ambition is clear: all of our employees and contractors must return home safely at the end of each and every day.
In 2016, most aspects of our safety performance improved, but this is still not good enough.
It is a real concern that fatalities continue to occur in the sector and at our operations. These deaths are devastating losses for family, friends and colleagues.
In June, we had a tragic fatality at one of our iron ore operations in Western Australia. One of our colleagues was crushed while working on a drill rig. We completed a full investigation into this event and have shared the learnings across Rio Tinto to seek to prevent an incident like this from happening again.
At the operations of our non-managed joint arrangements Alumar, Grasberg and Escondida, six people died during the year. We have shared our fatality prevention initiatives with ourjoint-venture partners and learn from their efforts as well.
During 2016, we deployed our critical risk management (CRM) system across more than 60 sites and completed more than 1.3 million safety verifications.
CRM is an important tool in our drive to eliminate fatalities across our organisation.
In 2016, our lost time injury numbers decreased and we have reduced our all injury frequency rate by 64 per cent over the last decade.
We must continue to learn and share information, for the benefit of our people, our contractors, and our partners.
For us, safety comes first and our drive to improve continues.
Value over volume
In 2016, your company delivered on its commitments. Most importantly, we met our commitment to deliver superior shareholder returns. In February 2017, we announced total dividends for 2016 of 170 US cents per share, well in excess of the previously indicated 110 US cents per share minimum, and a share buy-back of US$0.5 billion.
We maximised cash from our world-class assets and focused on value over volume. We delivered US$1.6 billion in cost savings, and we progressed our three high-value growth projects, Oyu Tolgoi underground, Silvergrass and Amrun, while maintaining tight control of our capital expenditure, which in 2016 totalled US$3.0 billion.
Our success in generating cash, controlling capex, and actively strengthening the portfolio, meant that we closed the year with net debt of US$9.6 billion. This is a reduction of US$4.2 billion compared with December 2015.
This strong performance was delivered against a backdrop of significant commodity price volatility and geopolitical uncertainty. We see this continuing into 2017 which is why we intend to maintain our strong balance sheet, the foundation of a resilient business.
Our team around the world is focused on our four Ps – portfolio, performance, people and partners. Relentless and consistent delivery against each of these will underpin our aim to deliver superior shareholder returns through the cycle.
Profitable performance from our world-class assets
The external environment for our businesses remained challenging in 2016. The goal of our financial planning is to set objectives for your company that are resilient against various macroeconomic and commodity pricing scenarios.
Notwithstanding a significant lift in some commodity prices in the latter part of 2016, from a very low base, the average prices for the year were slightly lower than in 2015.
Our aim is to maximise cash and productivity across our entire portfolio of assets.
We made good progress during 2016 with underlying EBITDA of US$13.5 billion, representing a margin of 38 per cent for the Group, compared with 34 per cent in 2015.
In 2016, our Iron Ore business delivered cash from operations of US$5.6 billion and delivered industry-leading margins. This group delivered cost savings of US$315 million for the year.
The Pilbara infrastructure investments of recent years are essentially complete. In June, we announced the US$338 million Silvergrass investment which will provide new ore later in 2017, and complement our Pilbara blend.
Our Aluminium group has world-leading positions in bauxite, alumina and aluminium, and achieved a solid financial performance in 2016, driven by productivity and cash cost improvements.
With its low-carbon footprint, our aluminium business is among the best positioned in the world, but the price declines of the past year continue to pose industry-wide challenges.
In Aluminium, all of our assets were free cash flow positive, despite lower realised prices in the first half. This product group reduced operating costs by more than US$480 million against a full year target of US$300 million.
The Copper & Diamonds product group delivered cash from operations of US$987 million and had underlying EBITDA margins from its operations of 31 per cent.
The Energy & Minerals product group matched production with market demand, generating significant free cash flow in 2016 of US$1.3 billion, due to improved prices in some commodities, including coal.
The Australian coal portfolio, which has delivered a reduction in unit costs of more than 40 per cent over the last four years, benefited from higher coking coal prices.
Driving productivity
Our aim is to deliver strong performance under any market conditions. Since 2012, we have reduced our annual cost run rate by more than US$7 billion, and we are well on track to deliver on our promise of US$2 billion in cost savings across 2016 and 2017.
It is energising to be leading a business where continuous improvement and efficiency are part of the culture, and we are taking every opportunity to generate value, from mine to market.
Cutting costs can only deliver so much – we must also lift productivity. Increasing themine-to-market productivity of our US$50 billion asset base is the highest return available to us. As such, we have promised to deliver an additional US$5 billion of productivity-driven free cash flow over the next five years.
We will boost productivity across the entire organisation, through harnessing technology and through improved operation and utilisation of our fixed assets, organisational resources and systems. We will continue focusing on value, not volume, and using our commercial excellence to achieve premium pricing for our quality products such as the Pilbara blend.
Our new centre of commercial excellence in Singapore is focused on generating more of these types of initiatives, with the aim of maximising value across our customer and supplier chains throughout the business.
Investing in future growth
The competitive advantage of our strong balance sheet has meant that our cost and productivity drive is not at the expense of growth, and we seek to continue to invest wisely where we see opportunities for attractive returns.
In 2016, we progressed our three compelling growth projects, which play to the company’s strengths. In line with our strategy, they are all multi-decade in outlook and offer highly attractive returns.
In May, work began on the underground development at Oyu Tolgoi in Mongolia.
First production is expected in 2020. When the underground is fully ramped up in 2027, the company expects it to produce more than 500,000 tonnes of copper a year. The mine also benefits from significant gold by-products, with an average gold grade of 0.35 grams per tonne.
| | | | |
| 2016 Annual report | | riotinto.com | | 5 |
| | | | | | | | | | | | | | | | |
| | | | | | | | |
| STRATEGIC REPORT | | | | DIRECTORS’ REPORT | | | | FINANCIAL STATEMENTS | | | | PRODUCTION, RESERVES AND OPERATIONS | | | | ADDITIONAL INFORMATION |
Chief executive’s statement
continued
The new Silvergrass iron ore mine will take the total number of mines in the Pilbara to 16. Our integrated system also includes 1,700 kilometres of rail and four ports to serve more than 100 customers globally.
In Cape York, Australia, the Amrun bauxite project is progressing well, with 70 per cent of the US$1.9 billion spend to occur in 2017 and 2018. It builds on our expertise as a reliable supplier of quality bauxite from Cape York, which Rio Tinto first discovered in the region over six decades ago.
As the next generation of deposits becomes more difficult to find and develop, we continue our focus on exploration. Rio Tinto has one of the largest exploration programmes in the industry, and in 2016 we were active in 14 countries across a range of commodities.
Portfolio of world-class businesses
At Rio Tinto our strategy is centred onworld-class assets – those that are long life, low cost and expandable.
During the year, we strengthened our portfolio. We announced or completed disposals of more than US$1.3 billion in the year, including completing the sale of Lochaber in the UK in December. In January 2017, we announced the divestment of our thermal coal business in Australia for up to US$2.45 billion, which, subject to approvals, should complete later this year.
In June 2016, we announced a reorganisation of our product group structure which saw the formation of the Copper & Diamonds group to help maximise our technical underground mining expertise. We also created the Energy & Minerals group which now holds a suite of premium coking coal and speciality mineral products and will act as an incubator for emerging opportunities.
The Iron Ore group is now focused on our operations in Western Australia, and the Aluminium group retains its focus on value creation from its high-quality bauxite, alumina and aluminium businesses.
The product groups are complemented by a newly shaped Growth & Innovation group, to drive our productivity agenda, project delivery expertise and the deployment of new technologies.
People with purpose
My new role has provided me with an opportunity to visit many sites and meet our great teams around the world. Our people work hard for their families, their communities, and our company.
We know there is more to be achieved. I would like to thank our 51,000 people for their efforts during 2016 and their commitment to stepping up further in 2017.
Our employee engagement score, measured in our 2016 People Survey, was lower than we would have liked, but we will use the insights this provides to improve our leadership and direct our initiatives to build engagement.
We will focus on developing our employees in 2017, building commercial and technical expertise, as these are key enablers of our performance.
How we do things is as important as what we do. Integrity andThe way we work – our global code of business conduct – guide our actions, and, at Rio Tinto, commitment to them isnon-negotiable.
We renewed our focus on graduates in 2016 as part of our broader commitment to grow our diversity and critical capability for the future.
We are a global organisation with all the strengths this provides and we must do more to attract the next generation, and people from the places where we are operating, to become part of our company.
In 2016, we made some changes to the Executive Committee. The new team offers a strong and diverse perspective with deep industry expertise and global knowledge.
Strengthening our partnerships
Last year, we celebrated a number of significant milestones which testify to thelong-term nature of our investment, commitment and partnerships with local communities and governments.
During 2016, I met with many stakeholders, including visiting Australia, China, and Canada to meet customers and business partners.
Our Rössing uranium mine in Namibia and Richards Bay Minerals operation in South Africa both celebrated their 40th anniversaries.
And in Australia, we marked the 50th anniversary of the company’s first contracted shipment of iron ore from the Pilbara to Japan.
These businesses were all pioneered on foundations of partnership between our company, government, business partners and communities.
In 2017, we will also mark 30 years of the Channar Mining Joint Venture with China’s Sinosteel Corporation in the Pilbara, and the 145th anniversary of our borates operations in the US.
Our operations take years to plan and decades to deliver. The benefits of taxes, wages and procurement are shared across generations.
In an increasingly complex and uncertain world, which brings significant risks to our ongoing success, it is critical we partner expertly with customers, governments, communities and our suppliers. Our operations and our people make a material difference in the communities in which we have the privilege to work and live.
Looking to the future
Rio Tinto is in a strong position. Our robust balance sheet, world-class assets, our focus on the drivers of performance and our talented employees will keep us resilient in times of volatility.
We can, however, be confident about the medium and long term megatrends of population growth and urbanisation.
Combined with the large infrastructure deficits that exist in both advanced and emerging economies, the long-term view is positive for our industry.
Regardless of the pace of economic growth or change in the years ahead, Rio Tinto’s purpose will continue to be to produce materials essential to human progress, as we have done since the company was founded.
In 2017, we will do all we can to improve safety and our cash performance, drive our productivity agenda, and again deliver strong returns to our shareholders.
Thank you for your ongoing support and confidence in your company.

Jean-Sébastien Jacques
Chief executive
1 March 2017
| | | | |
| 6 | | riotinto.com | | 2016 Annual report |
Market environment
Global economy
For the fifth year in a row, global GDP growth underperformed the long-term average, expanding at approximately three per cent in 2016, yet still exceeded initial expectations.
At the start of the year, concerns over a second wave of collapsing oil prices, negative interest rates in Japan and Europe, the possibility of a hard landing in China and revived expectations of a US recession pushed market expectations down sharply. In the first few months the S&P 500 fell by more than ten per cent from its 2015 close and commodity prices hit fresh lows.
Meanwhile, an expansion was taking shape in China as new fiscal support was released in tandem with relaxed housing purchase and mortgage restrictions. The resulting property market surge reversed the deflationary conditions of the previous two years. Bymid-2016, job growth, rising real incomes and higher corporate earnings in the US were supporting a modest improvement in economic growth. Europe and Japan��s economic performance also picked up, while the downturn in many emerging markets appeared to bottom out. This levelling-off set the stage for a sustained pick-up in commodity prices and equities. It also provided room for the Federal Reserve Bank to raise the benchmark rate later in the year and allowed a prolonged strengthening of the US dollar.
China’s economic performance beat consensus expectations, with full year growth of 6.7 per cent. The end of deflation allowed Chinese industrial profits to improve substantially, though production growth remained relatively weak. Improved balance sheets provided some support to investment growth though it remains below trend. While consumer price inflation remained modest during 2016, surging commodity prices, particularly oil, drove a substantial reflation in producer prices. The short-term property cycle appeared to have peaked by October. Even so, completion of projects under construction prevented a sudden downward correction, and the market has moved into a more balanced position.
After signs of weakening momentum in the third quarter, the global economy finished 2016 with improved manufacturing and business sentiment. The new US administration’s plans for fiscal stimulus, corporate tax reform and reduced regulation also helped to buoy market sentiment atyear-end. Europe also enjoyed a modest improvement in demand, though banking sector issues continue to constrain recovery. Though negative rates persist in Japan, inflation and growth appear to have improved following fiscal stimulus measures.
Despite the apparent improvement, other events signalled increasing risk. The December increase in the US benchmark rate drove up Treasury bond yields, with negative
implications for borrowing and credit. Higher rates pushed the dollar up against other currencies, a negative signal for commodity prices. Finally, the re-emergence of inflation in the US, Europe and China supports expectations of further increases in US benchmark rates.
Drivers of commodity prices
Long-term structural economic trends are important drivers of commodity prices through their effects on demand. The economic development and urbanisation of emerging countries goes through an initialinvestment-led growth phase, which benefits commodities such as steel and copper used in construction and infrastructure. As economies evolve, other commodities such as light metals, energy products and industrial minerals tend to take over as the main enablers of consumption-led growth.
The long-term nature of mining tends to result in cyclical investment patterns, translating into commodity price cyclicality. Over the past three years, the industry moved into the low phase of the cycle. Investments made during the previous period of high prices and margins have started to deliver new supply, into a context of decelerating Chinese demand. With markets for most metals and minerals moving into oversupply, the industry has shifted from capital investment toward strategies focused on strengthening balance sheets through productivity and cost reduction initiatives.
Commodity markets
Most commodity prices increased for the first time in a number of years in 2016, despite numerous political and macro shocks to the global economy.
Iron ore prices started the year at around US$40/dry metric tonne CFR (cost and freight) and ended the year around US$80. Following a weak start, China’s crude steel production increased in the second half of the year by nearly four per cent compared with 2015. This helped absorb new iron ore supply from Roy Hill and Minas Rio. The improved demand was underpinned by an increased appetite for Chinese steel demand as China’s government expanded lending, eased monetary policy and supported the property sector. China also eliminated inefficient steelmaking capacity, supporting steel prices and profitability.
Hard coking coal prices almost quadrupled to US$310/tonne from January to November. Healthy Chinese steel demand contributed to the spike, but the main driver was China’s supply curtailment through the implementation of the “276 Directive”, restricting coal mines to operating 276 days of the year. The thermal coal market was also affected, with prices more than doubling to US$110/tonne FOB (free on board) Newcastle. The directive was relaxed in the second half and prices have since moderated.
Price increases for industrial metals were less dramatic. Copper prices dipped below US$2/pound in early 2016 before rising 25 per cent by year-end. Over one million tonnes of new mine supply entered the market, and was accommodated through demand growth, lower scrap availability and mine curtailments.
Aluminium prices started 2016 below US$1,500/tonne and ended the year about 15 per cent higher. Margins remained under pressure, however, as higher energy and alumina costs offset the price increase. The alumina price rallied from less than US$200/tonne to US$350/tonne as refinery curtailments caught up with the ten per cent cutback of global smelting capacity announced in 2015. Bauxite did not match these increases, with the average Chinese import price falling moderately to just under US$50/tonne as new supply from Guinea, Australia and Brazil replaced volumes lost to Malaysia’s export ban.
Outlook
The global economy starts 2017 with improved manufacturing conditions but also evidence that cost pressures and tighter credit conditions in the US, the UK and China are affecting corporate profit growth. Europe’s economy has gained momentum, though the pick-up in household consumption remains very weak and is vulnerable to inflation. Meanwhile, Japan should benefit from a planned fiscal policy expansion. China is facing the wind-down of its short-term property cycle and renewed policy calls to constrain credit growth and push through heavy industry restructuring and capacity reduction. At the same time, the Chinese government is working hard to keep growth relatively stable ahead of the 2017 mid-term leadership transition, with growth this year likely to be only slightly weaker. The stronger dollar, higher interest rates and inflation will constrain the pace of US recovery. However, should the new US Administration follow through with fiscal expansion, there is potential for higher US growth later in the year. Further strengthening of the dollar and higher interest rates and inflation could ensue for the global economy.
Overall, the reflationary conditions that dominated global commodity markets in 2016 may be reaching their limits, though positive sentiment and further steel and coal capacity cuts in China may provide further support. Consensus now points to moderate downside risk for commodity prices in the short to medium run. This context continues to favour producers at the lower end of the cost curve and those that can improve productivity. Longer-term demand prospects remain positive. The attractiveness of growth opportunities in some commodities is amplified by stronger mine depletion resulting from recent cutbacks in capital expenditure.
| | | | |
| 2016 Annual report | | riotinto.com | | 7 |
| | | | | | | | | | | | | | | | |
| | | | | | | | |
| STRATEGIC REPORT | | | | DIRECTORS’ REPORT | | | | FINANCIAL STATEMENTS | | | | PRODUCTION, RESERVES AND OPERATIONS | | | | ADDITIONAL INFORMATION |
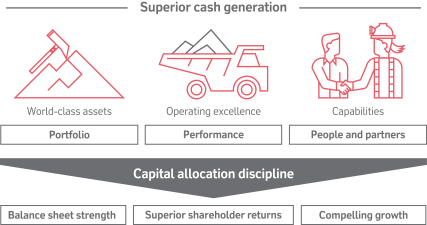
Group strategy
Improved market conditions, but uncertainty remains
By comparison with recent periods, the mining sector enjoyed a relatively buoyant year in 2016, with equity valuations improving considerably across large parts of the sector. Prices for a number of commodities improved during 2016, aided by a combination of fiscal stimulus in China, policy-driven capacity reductions and new supply entering the market at a slower rate. This supportive environment allowed us to generate strong cash flow and further strengthen our financial position.
We continued to focus on productivity, cost reductions and capital discipline in 2016, in order to maximise our cash generation and the return on every dollar we invest. Similar strategic approaches played out across large parts of the mining sector – allowing many companies facing financial distress at the beginning of 2016 to pay down debt and regain some financial stability. However, our early and consistent action in these areas has positioned us favourably, and allowed us to continue investing in our most attractive organic growth opportunities where others have not been able to do so. We enter 2017 in good shape.
Despite some renewed optimism for the sector during 2016, we remain cautious. Recent commodity price rises have been helped by discrete fiscal policy decisions that could quickly be unwound. In addition, the geopolitical landscape remains uncertain, and major political transitions could impact our markets and operating environments during 2017. Elsewhere, we are seeing an increased threat of rent-seeking, resource nationalism and the adverse application of regulatory laws to previously settled practices. These include Indonesia’s proposed revision to its mining legislation, a mooted production tax increase in Western Australia and the application of EU tax regulations on competitiveness. Accordingly, we will continue to adopt a conservative approach to our financial management and capital spending.
|
A clear strategy to deliver value through the cycle |
| |
 |
|
A clear and effective strategy is critical for us to perform strongly under a range of industry conditions. Our goal is to deliver superior value for our shareholders through the cycle, and we believe the best way to do this is to focus on the “four Ps”:portfolio, performance, people andpartners. We couple this with our disciplined approach to capital allocation. This ensures that every dollar we generate is applied to the highest-returning opportunity – whether that be for maintaining our balance sheet strength, investing in compelling growth opportunities or delivering superior shareholder returns.
Superior cash generation
At the heart of our approach is a portfolio of world-class assets – from our Pilbara iron ore business, to our Queensland bauxite ore reserves, our Canadian aluminium smelters and our global suite of copper mines. These are multi-decade assets that deliver attractive returns throughout the cycle, while providing material opportunities for growth over the long term. We use a clear strategic framework to assess our existing assets and new opportunities – taking into account the industry attractiveness and the competitive advantage of each asset, and its capacity to deliver strong and stable returns.
In 2016, we:
| – | | Invested US$1.3 billion in compelling growth opportunities. |
| – | | Announced an increase to our Pilbara iron ore reserves in Western Australia. |
| – | | Agreed the sale of our aluminium smelter and hydroelectric facilities at Lochaber in Scotland. |
| – | | Signed anon-binding agreement to sell our interest in the Simandou project in Guinea. |
| – | | Completed the sales of our Mount Pleasant thermal coal assets and of our interest in the Bengalla coal joint venture. |
Safety is our number one priority and is core to everything we do. Awell-run operation is a safe operation.
We seek to generate value at all stages of the value chain – from mine through to market. We prioritise value over volume in all of our operating and investment decisions. We have delivered substantial cost savings over recent years and this remains a key focus area.
Beyond this, we continue to increase the productivity of our existing assets, as a substantial andlow-risk source of incremental returns.
We have established a leading position in the development and use of technology and innovation – allowing us to deliver more tonnes more cheaply and with less risk. As the industry faces increasingly complex geological, environmental and cost pressures, our technology advantage will be an increasingly important value driver.
Our commercial activities ensure we reap the maximum value from each of our businesses. Our marketing teams workhand-in-hand with our operations, so that our resource management is fully aligned to the market.
Over the years we have leveraged our understanding of customer needs to create new markets for our products, includinghigh-temperature Weipa bauxite, and champagne and pink diamonds. We deploy industry-leading capabilities in supply chain optimisation and a variety of logistics solutions across the Group – and havein-house centres of excellence forvalue-in-use analysis, pricing and contracting strategies. Together, these activities allow us to manage risk and capture value in all market conditions.
In 2016, we:
| – | | Completed more than 1.3 million safety critical control verifications in our critical risk management programme. |
| – | | Committed to generating US$5.0 billion of additional free cash flow over the next five years from mine-to-market productivity improvements. |
| – | | Achieved a further US$1.6 billion of operating cash cost reductions, as part of our target of US$2.0 billion over 2016 and 2017. |
| | | | |
| 8 | | riotinto.com | | 2016 Annual report |
| | | | | | | | |
| | | | – Strengthened our organisational structure, by adjusting our product groups to better align our assets with the business strategy, help drive further efficiencies and optimise performance. – Appointed executives responsible for Health, Safety & Environment and Growth & Innovation to our Executive Committee. | | In 2016, we adhered to our disciplined capital allocation framework, resulting in: sustaining capital of US$1.7 billion, dividends of US$2.7 billion, reduced net debt by US$4.2 billion and compelling growth capital of US$1.3 billion. Balance sheet strength In a cyclical and capital-intensive industry such as mining, a strong balance sheet is essential in order to preserve optionality and generate shareholder value at all points in the cycle. We have a guidance range for net gearing of between 20 and 30 per cent. At 31 December 2016, we were below the guidance range at 17 per cent and intend to retain a conservative stance given the uncertain macroeconomic outlook. In 2016, we: – Reduced our net debt from US$13.8 billion to US$9.6 billion. – Reduced our gearing ratio from 24 per cent to 17 per cent. – Reduced our gross debt by US$5.4 billion. Quality growth We have a high-quality pipeline of near-term and longer dated projects across the portfolio. By reinforcing capital discipline and reshaping our projects, we have retained significant,high-quality growth despite further reducing our capital expenditure. Our project pipeline has a compelling internal rate of return. In 2016, we: – Reduced capital expenditure from US$4.7 billion in 2015 to US$3.0 billion. – Approved US$338 million to complete the development of the Silvergrass iron ore mine in Western Australia. – Approved US$5.3 billion capital expenditure to develop the underground copper and gold mine at Oyu Tolgoi. Superior shareholder returns We are committed to delivering superior returns to shareholders over the long term, and the cash returns we pay out to shareholders are a vital component of this. In a cyclical industry such as mining, we believe the most prudent way to deliver strong returns is to allow the overall level of returns to vary with the cycle. Accordingly, we aim to deliver shareholders total cash returns of 40 to 60 per cent of underlying earnings through the cycle. This policy is sustainable during cyclical lows, and allows shareholders to participate more fully in the upside during high points in the cycle. In 2016, we: – Adopted a new shareholder returns policy, designed to deliver superior cash returns to shareholders over the long term. – Paid US$2.7 billion in dividends to shareholders. In February 2017 we announced shareholder returns of US$3.6 billion with respect to 2016. | | Our 2017 strategic priorities Throughout 2017, we will continue to focus on the four Ps and our value over volume approach, to generate superior cash flow and maintain our balance sheet strength today and into the future. We will maintain our focus on safety as our number one priority – as measured both by the elimination of fatalities and minimising our all injury frequency rate and lost time injuries. Our strong focus on costs and performance will continue in 2017, as we work towards delivering operating cash cost savings of US$2.0 billion over 2016 and 2017. Beyond this, we will seek to extract productivity gains across our entire value chain, as part of our commitment to deliver US$5.0 billion of incremental cash flow from mine-to-market productivity improvements by 2021. We will continue to shape our world-class portfolio of assets, ensuring that we focus only on the highest returning assets in our preferred industry sectors and seeking to exit assets that do not fit these criteria. We will progress our high returning growth projects, including the Amrun bauxite project, the underground expansion at Oyu Tolgoi and our Silvergrass iron ore mine. We expect to invest around US$5.0 billion in capital expenditure during 2017. Investing in our people and our partnerships with external stakeholders will be a key focus during 2017. We are investing more in developing employees at all levels of the organisation – from our graduate intake to our top leaders. This is fundamental as we seek to build the technical and commercial capabilities that will enable us to unlock maximum value from our assets. In addition, we will continue building and maintaining strong partnerships across all stages of the value chain, founded on trusted relationships and our reputation for doing things the right way. Strong partnerships allow us to access and execute new opportunities, maximise value from our existing assets and managelicence-to-operate risks. We enter 2017 with a sense of cautious optimism. The long-term outlook for our key commodities remains strong and ourworld-class assets, operating excellence and commercial capabilities place us in a strong position relative to peers. However, thenear-term environment is marked by uncertainty – with geopolitical risk at both a macro level and a local level, and government policies impacting supply and demand in a number of key commodities. In this context, a conservative approach remains prudent and we will maintain our balance sheet strength and resilience to downside risks as core priorities. |
| | | | 3. People | | |
| | | | As our industry evolves, new capabilities will be required and we must attract, develop and retain the right people to meet this challenge. We are strengthening our technical and commercial capabilities in particular, and establishing centres of excellence around these areas. Beyond this, we are committed to building a diverse and inclusive workforce at all levels of the organisation. In 2016, we: – Appointed a Human Resources Group executive to our Executive Committee. – Announced we would be doubling our annual graduate intake. | | |
| | | | 4. Partners | | |
| | | | As a global company, the environment in which we operate is becoming more complex. In order to secure access to new resources, while managing the unique risk profiles of our businesses across the globe, we must partner with a range of external stakeholders. These include our customers, suppliers, investors, governments and local communities (see “Delivering value for all of our stakeholders” on page 11). Partnerships are relevant at all stages of the value chain and mining life cycle – from exploration, through to operations, marketing and mine closure. Successful partnerships enable us to secure and maintain our licence to operate and are a key long-term success factor for our industry. In 2016, we: – Extended our Channar Mining joint venture in Australia’s Pilbara region and agreed to supply up to 70 million tonnes of iron ore to Sinosteel Corporation over the next five years. – Marked 50 years since our first contracted iron ore shipment left the Pilbara, destined for a customer in Japan. – Appointed a Corporate Relations Group executive to our Executive Committee, strengthening our focus on external & internal stakeholder engagement. Capital allocation discipline We adopt a consistent and disciplined approach to capital allocation. Our first allocation is to sustaining capital. Secondly we fund dividends for our shareholders. Finally, we assess the best use of the remaining capital between compelling growth, debt reduction and further cash returns to shareholders. At each stage, we apply stringent governance and assessment criteria to ensure that every dollar is spent in the right way. | | |
| | | | | | | | | | | | | | | | |
| | | | | | | | |
| STRATEGIC REPORT | | | | DIRECTORS’ REPORT | | | | FINANCIAL STATEMENTS | | | | PRODUCTION, RESERVES AND OPERATIONS | | | | ADDITIONAL INFORMATION |
| | | | |
| 2016 Annual report | | riotinto.com | | 9 |
Business model
| | | | | | | | | | | | | | | | | | |
| | | | | | |
How we create value | | | | | | | | | | | | |
Rio Tinto owns a global and diversified portfolio of world-class assets: the result of investment decisions made in line with our longstanding strategy (see page 8). We create value through the way we find, develop and operate these assets, how we market the minerals and metals they produce, and the legacy we leave at the end of their lives. | | | | | | To optimise the value of our portfolio over time, we pursue opportunities for productivity improvements, cost reductions and focused growth. We are committed to running and growing our business in ways that are increasingly safer, smarter and more sustainable. Our competitive advantages stem from our portfolio of world-class assets, our strong balance sheet, and the operating and | | | | | | commercial excellence achieved by our excellent teams. Coupled with our framework for managing risk effectively, these provide strength across the cycle, and through the challenges that the external environment presents. Our approach is described in our business life cycle below, along with examples showing some of the ways we differentiate ourselves. |
| | | | | | |
| | | | | | | | | | | | |

|
Ourin-house exploration team has amulti-decade track record of discovery of orebodies in both greenfield and brownfield settings. To maintain our focus on targets that are important to Rio Tinto, we run most exploration programmes ourselves, but we will partner with others if it gives us access to skills or opportunities that we do notpossess in-house. Our exploration teams are often the first contact with communities we may work alongside for decades, so we explore respectfully and make sure we engage with them from an early stage. Using our orebody knowledge, we develop our resources and position our products in the marketplace in ways that add value and support the Group’s investmentdecision-making. Our geological expertise gives us the confidence to keep looking for the most elusive discoveries. We have a strong tradition of developing innovative technologies to resolve specific exploration challenges. We apply these technologies, together with our tried and tested exploration techniques, to drive future discovery success. | | | | | | Our approach is to develop orebodies so that they deliver value over the long term. We apply rigorous assessment and review processes that aim to ensure we only approve investments that offer attractive returns well above our cost of capital. We assess the spectrum of risk and how we will manage it (see page 14). Once we have confirmed the value of a resource and received internal and external approvals to develop it, the project moves into the implementation phase. The product groups work in partnership with Rio Tinto Projects – part of the Growth & Innovation group (see page 40). As we develop an operation, we plan the most efficient configuration for mining the orebody and getting the products to market. We work closely with our customers to create demand that maximises the value of the deposit over its lifetime. We also work in partnership with host governments and communities, identifying ways in which we can deliver mutual benefits from the development of our operations. | | | | | | We create value by operating our assets safely and efficiently, and by building on our leadership position inlow-cost operations. With a global operating model, we can apply standard processes and systems across the Group in areas such as health, safety, environment and communities, procurement, operations and maintenance. This extends the life of our equipment and optimises the extraction of ore, meaning higher production, lower costs and maximised value. Our operations bring benefit to local economies by providing employment opportunities, procurement, and the transparent payment of tax and royalties. Our commitment to technology and innovation also sets Rio Tinto apart. It enables us to take advantage of opportunities that may not be available to others, improves our productivity and helps us tailor our products to customer needs. We can use our network of partnerships with academia, technology suppliers and other experts to tap into knowledge and technical prowess that augment our own capabilities. |
Differentiation in action | | | | | | Differentiation in action | | | | | | Differentiation in action |
Our Resistate Indicator Minerals technology helps us prioritise porphyry copper exploration and related commercial opportunities. At our facility in Bundoora, Australia, we have the capacity to generate high quality trace element analyses of mineral grains, using high levels of automation. There is no equivalent commercial facility able to generate these types of data at this quality and at the rate or cost we can. | | | | | | World-class capability in underground mining is critical for our successful, safe and productive growth. The combination of our copper and diamonds businesses in 2016 is giving us the opportunity to transfer best practices in underground mining and block caving. Growth & Innovation’s new underground centre of excellence will support our future mine developments, including the Oyu Tolgoi underground project in Mongolia. | | | | | | It has been 50 years since our first export of iron ore from our Pilbara operations in Western Australia. Our integrated network of mines, rail, ports and related infrastructure is fully owned or managed by Rio Tinto for our exclusive use, providing unique optionality, and we are supported by strong joint venture partners. We are optimising our entire Pilbara system to deliver the best value, through focusing on revenue, operating cost and capital expenditure. |
| | | | |
| 10 | | riotinto.com | | 2016 Annual report |
| | | | | | | | | | |
| | | | Delivering value for all of our stakeholders To be successful, we must continue to build strong partnerships at all stages of our business model. Through our global footprint and diverse portfolio, we are able to create value for our stakeholders in a variety of ways. Customers We supply our customers with the right products at the right time, so they can add value by turning them into the end products that society needs to sustain and enhance modern life. Shareholders Our primary objective is on delivering superior shareholder returns through the cycle. We do this by balancing disciplined investment with prudent management of our balance sheet and shareholder returns – as shown in our approach to capital allocation (see page 8). Communities Our operations create jobs for local communities and can open up new markets for local suppliers. Communities often benefit from the infrastructure we put in place and once our operations are closed, we restore the sites – for instance for community use, new industry, or back to native vegetation. Our people We invest in our people throughout their careers, offering diverse employment prospects, opportunities for development, and competitive rewards and benefits that have a clear link to performance. Governments We are often a major economic and social contributor to the local, state and national jurisdictions in which we operate. Our tax and sovereign equity contributions enable governments to develop and maintain public works, services and institutions. We help create growth that endures far beyond the active life of our operations. Suppliers By seeking the right balance of global, national and local supply capability, and supporting local supplier development wherever possible, we drive value for our shareholders and deliver economic benefits for the communities in which we operate. |
| | | |
| | | |
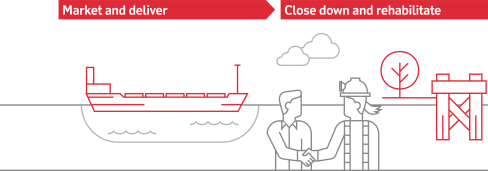
Our business is based on the supply ofhigh-quality products that have been developed to meet our customers’ needs. The minerals and metals we supply – mostly to industrial companies that process them further – are the building blocks ofvalue-added goods. Our diverse portfolio allows us to respond to demand throughout countries’ economic development cycles, including in infrastructure, transport, machinery, energy and consumer goods. Rio Tinto’s marketing teams work with our operations to align our resource management with market needs and to make sure we improve our products and services in a way that maximises value to customers. We are strengthening our commercial capabilities, including through creating a commercial centre of excellence in Singapore, supported by strong sales presence in each of the markets we serve. What we learn from our markets and customers helps us to refine our investment decisions. In many cases we deliver products ourselves, with logistics capabilities that include our own networks of rail, ports and ships. | | | | | | Closure planning is part of every asset’s life cycle. We start planning for closure from the earliest stages of development to help optimise outcomes and minimise risk. We aim progressively to rehabilitate where we can, before closure. When a resource reaches the end of its life, we seek to minimise its financial, social and environmental impact by finding sustainable and beneficial future land uses. We identify post-closure options that take into account stakeholders’ concerns whilst fulfilling regulatory requirements. | | | |
| | | | | | | | | |
Differentiation in action | | | | | | Differentiation in action | | | |
With the launch of our RenewAl™ brand, Rio Tinto became the first producer to market certified low carbon footprint aluminium. Our advanced AP Technology™ for aluminium smelting, and our largely carbon-free energy profile afforded by our hydropower portfolio, lie at the heart of RenewAl™. Production of RenewAl™ has a carbon dioxide footprint three times lower than the industry average. | | | | | | Open-cut mining was completed at Energy Resources of Australia in 2012, but closure planning began soon after the Ranger mine started producing uranium in 1981. In 2016, Pit 1 – which has been backfilled with tailings – was capped with laterite, a type of clay material. A custom-built,27-metre dredge also completed commissioning and is now transferring tailings to Pit 3. | | | |
| | | | | | | | | | |
| | | | |
| 2016 Annual report | | riotinto.com | | 11 |
| | | | | | | | | | | | | | | | |
| | | | | | | | |
| STRATEGIC REPORT | | | | DIRECTORS’ REPORT | | | | FINANCIAL STATEMENTS | | | | PRODUCTION, RESERVES AND OPERATIONS | | | | ADDITIONAL INFORMATION |
Key performance indicators
| | | | | | | | | | | | |
Our key performance indicators (KPIs) enable us to measure our financial and sustainable development performance. Their relevance to our strategy and our performance against these measures in 2016 are explained on these pages. Some KPIs are used as a measure in the long-term incentive arrangements for the remuneration of executives. These are identified with this symbol: 
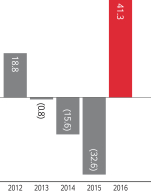
See the Remuneration Report 67 | | | | All injury frequency rate (AIFR) | | | | Total shareholder return (TSR) (a) | | | | Net cash generated from operating activities(b) |
| | | Per 200,000 hours worked | | | | % | | | | US$ millions |
| | | Relevance to strategy | | | | Relevance to strategy | | | | Relevance to strategy |
| | | Safety is our number one priority and is core to everything we do. Our goal is zero harm, including, above all, the elimination of workplace fatalities. We are committed to reinforcing our strong safety culture and a key part of this is improving safety leadership. | | | | The aim of our strategy is to maximise shareholder returns through the cycle. This KPI measures performance in terms of shareholder value. We also measure relative TSR performance against the Euromoney Global Mining Index of peers and the MSCI World Index of large global companies. | | | | Net cash generated from operating activities is a measure demonstrating conversion of underlying earnings to cash. It provides additional insight to how we are managing costs and increasing efficiency and productivity across the business. |
| | | Performance | | | | Performance | | | | Performance |
KPI trend data The Group’s performance against each KPI, and explanations of the actions taken by management to maintain and improve performance against them, are covered in more detail in later sections of this Annual report. Explanations of the actions taken by management to maintain and improve performance against each KPI support the data. | | | | 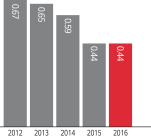
| | | | 
| | | | 
|
Notes: (a) The data presented in this table accounts for the dual corporate structure of Rio Tinto. In 2016, the approach used to weight the two Rio Tinto listings, and produce a Group TSR figure, was adjusted. This approach is consistent with the methodology used for the Performance Share Plan (PSP). The figures in this table are in some cases slightly different to equivalent tables presented in prior years’ reports. (b) The accounting information in these charts is extracted from the financial statements. (c) Underlying earnings is a key financial performance indicator which management uses internally to assess performance. It is presented here as a measure of earnings to provide greater understanding of the underlying business performance of the Group’s operations. Items excluded from net earnings to arrive at underlying earnings are explained in note 2 to the 2016 financial statements. Both net earnings and underlying earnings deal with amounts attributable to the owners of Rio Tinto. However, IFRS requires that the profit for the year reported in the income statement should also include earnings attributable tonon-controlling interests in subsidiaries. | | | | Our AIFR has improved by 34 per cent over the last five years. At 0.44, our AIFR remained the same in 2016 as in 2015. However, we did not meet our goal of zero fatalities and one of our colleagues died while working at Rio Tinto managed operations in 2016. | | | | Rio Tinto’s TSR performance from 2012 to 2016 was impacted by weakness in commodity prices. Rio Tinto plc and Rio Tinto Limited share prices recovered during 2016, supported by an improvement in the global macro environment and rising commodity prices, particularly in the second half of the year. The Group recorded a TSR of 41.3 per cent in 2016 and outperformed the Euromoney Global Mining Index of peers over the four-year period by 17 percentage points but significantly underperformed the MSCI World Index over the same timeframe. | | | | Net cash from operating activities of US$8.5 billion was ten per cent loweryear-on-year. 2015 benefited from a significant working capital reduction while 2016 saw a rebound in receivables driven by higher prices at the end of the year. In addition, there was an increase in interest paid of US$0.5 billion to US$1.3 billion in 2016, mainly related to early redemption costs associated with the bond purchase programmes. |
| | | Definition | | | | Definition | | | | Definition |
| | | AIFR is calculated based on the number of injuries per 200,000 hours worked. This includes medical treatment cases, restrictedwork-day andlost-day injuries for employees and contractors. | | | | TSR combines share price appreciation and dividends paid to show the total return to the shareholder. | | | | Net cash generated from operating activities represents the cash generated by the Group’s consolidated operations, after payment of interest, taxes, and dividends tonon-controlling interests in subsidiaries. |
| | | More information | | | | More information | | | | More information |
| | | 26 to 27 | | | | 95 | | | | 112 |
| | | | |
| 12 | | riotinto.com | | 2016 Annual report |
| | | | | | | | | | | | |
Underlying earnings (b)(c)
| | | | Net debt | | | | Capital expenditure (b) | | | | Greenhouse gas (GHG) emissions intensity |
US$ millions | | | | US$ millions | | | | US$ millions | | | | Indexed relative to 2008 (2008 being equivalent to 100) |
Relevance to strategy | | | | Relevance to strategy | | | | Relevance to strategy | | | | Relevance to strategy |
| Underlying earnings gives insight to cost management, production growth and performance efficiency on a like-for-like basis. We are focused on reducing operating costs, increasing productivity and generating maximum revenue from each of our assets. | | | | Net debt is a measure of how we are managing our balance sheet and capital structure. A strong balance sheet is essential to remaining robust through the cycle and creating the ability to deliver appropriate shareholder returns. | | | | We are committed to a disciplined and rigorous investment process – investing capital only in assets that, after prudent assessment, offer attractive returns that are well above our cost of capital. | | | | We are committed to reducing the energy intensity of our operations and the carbon intensity of our energy, including through the development and implementation of innovative technologies. Our GHG performance is an important indicator of this commitment and our ability to manage exposure to future climate policy and legislative costs. |
Performance | | | | Performance | | | | Performance | | | | Performance |
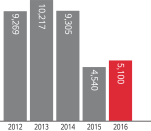
| | | | 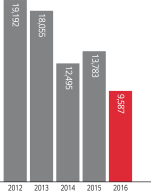
| | | | 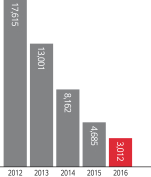
| | | | 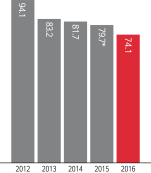
|
| Underlying earnings of US$5.1 billion were US$0.6 billion higher than 2015, with the impact of lower prices (US$0.5 billionpost-tax) more than offset by cash cost improvements. | | | | Net debt decreased from US$13.8 billion to US$9.6 billion, principally as net cash generated from operating activities exceeded capital expenditure and cash returns to shareholders. | | | | Total capital expenditure of US$3.0 billion in 2016 included US$1.7 billion of sustaining capital expenditure. Development capital expenditure focused on three growth projects, the Silvergrass iron ore development, Oyu Tolgoi underground copper project and the Amrun bauxite project. | | | | There was a seven per cent reduction in GHG emissions intensity in 2016 versus 2015. This is largely a result of full production at our modernised Kitimat smelter, and efficiency gains at Rio Tinto Kennecott and the Oyu Tolgoi copper-gold mine. We are on track to meet our target of a 24 per cent reduction in total GHG emissions intensity between 2008 and 2020. |
| | | | | | | | | | | | * Number restated from 78.9 following the application from 1 January 2015 of updated global warming potentials from the IPCC’s fourth assessment report |
Definition | | | | Definition | | | | Definition | | | | Definition |
| Items excluded from net earnings to arrive at underlying earnings are explained in note 2 “Operating segments” to the 2016 financial statements. | | | | Net debt is calculated as: the net borrowings after adjusting for cash and cash equivalents, other liquid investment and derivatives related to net debt. This is further explained in note 24 “Consolidated net debt” to the 2016 financial statements. | | | | Capital expenditure comprises the cash outflow on purchases of property, plant and equipment, and intangible assets. | | | | Our GHG emissions intensity measure is the change in total GHG emissions per unit of commodity production relative to a base year. Total GHG emissions are direct emissions, plus emissions from imports of electricity and steam, minus electricity and steam exports and net carbon credits purchased from, or sold to, recognised sources. |
| | | | | | |
More information | | | | More information | | | | More information | | | | More information |
| 129 | | | | 145 | | | | 128 | | | | 28 |
| | | | |
| 2016 Annual report | | riotinto.com | | 13 |
| | | | | | | | | | | | | | | | |
| | | | | | | | |
| STRATEGIC REPORT | | | | DIRECTORS’ REPORT | | | | FINANCIAL STATEMENTS | | | | PRODUCTION, RESERVES AND OPERATIONS | | | | ADDITIONAL INFORMATION |
Risk management
Rio Tinto is exposed to a variety of risks that can have financial, operational and compliance impacts on our business performance, reputation and licence to operate. The board recognises that creating shareholder value is the reward for taking and accepting risk. The effective management of risk is therefore critical to supporting the delivery of the Group’s strategic objectives.
Risk management framework
Rio Tinto’s risk management framework reflects our belief that managing risk effectively is an integral part of how the Group creates value, and fundamental to the Group’s business success. The responsibility for identifying and managing risks lies with all of Rio Tinto’s employees and business leaders. They operate within the Group-wide framework to manage risks within approved limits.
The framework includes clearly defined oversight responsibilities for the board and the Executive Committee, who are supported by the Risk Management Committee and central support functions including Group Risk and Group Internal Audit, to enable effective risk identification, evaluation and management across Rio Tinto.
This approach reflects a “three lines of defence” model for the management of risks and controls:
| – | | First line of defence: ownership of risk by employees and business leaders. |
| – | | Second line of defence: control of risk framework by central support functions and the Risk Management Committee. |
| – | | Third line of defence: assurance of systems of internal control by Group Internal Audit. |
The key risk management responsibilities throughout the Group are outlined below.
Approach
The Group’s approach to risk management, underpinned by the Risk policy and standards, is aimed at embedding a risk-aware culture in all decision-making, and a commitment to managing risk in a proactive and effective manner. This includes the early identification and evaluation of risks, the management and mitigation of risks before they materialise, and dealing with them effectively in the event they do materialise. Accountability for risk management is clear throughout the Group and is a key performance area of line managers.
To support risk understanding and management at all levels, the Group Risk function provides the necessary infrastructure to support the management and reporting of material risks within the Group, and escalates key issues through the management team and ultimately to the board where appropriate. Group Risk also supports the Risk Management Committee in its review of risk.
The process for identifying, evaluating and managing material business risks is designed to manage, rather than eliminate, risk and where appropriate accept risk to generate returns. Certain risks, for example natural disasters, cannot be managed using internal controls. Such major risks are transferred to third parties in the international insurance markets, to the extent considered appropriate or possible.
The Group has material investments in a number of jointly controlled entities. Where Rio Tinto does not have managerial control, it is not always able to ensure that management will comply with Rio Tinto policies and standards.
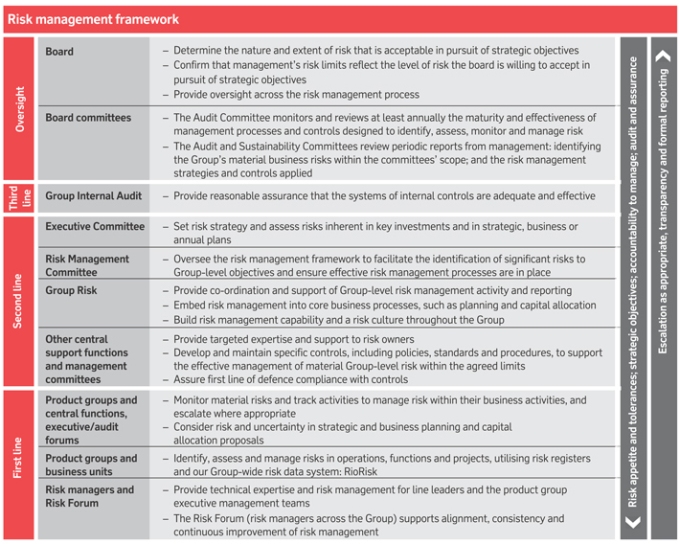
| | | | |
| 14 | | riotinto.com | | 2016 Annual report |
Principal risks and uncertainties
The principal risks and uncertainties outlined in this section reflect the inherent risks that could materially affect Rio Tinto or its ability to meet its strategic objectives, either directly or by triggering a succession of events that in aggregate become material to the Group.
Effects on the Group in the following respects may be positive or negative:
Business model
The basis on which the Group generates or preserves value over the longer term, given its market positioning as a global diversified mining and processing business.
Future performance
The Group’s ability to deliver its financial plan in the short to medium term.
Solvency
The Group’s ability to maintain an appropriate capital structure to meet its financial liabilities in full.
Liquidity
The Group’s ability to meet its financial liabilities as they fall due.
Health, safety, environment and communities (HSEC)
The Group’s ability to send our employees and contractors home safe and healthy every day and to work with our communities and partners to achieve our sustainable development goals.
Group reputation
The Group’s ability to maintain investor confidence and licence to operate.
Rio Tinto’s business units and functions assess the potential economic andnon-economic consequences of their respective risks using the framework defined by the Group’s Risk standard. Once identified, each principal risk or uncertainty is reviewed and monitored by the relevant internal experts and by the Risk Management Committee, the relevant board committees and the board.
There may be additional risks unknown to Rio Tinto and other risks currently not believed to be material which could turn out to be material. A number of them, particulary those with longer-term potential impacts, are, referred
to in the sustainable development section of this Annual report on pages 24 to 30.
2016 movements
As illustrated in the summary table below, the Group’s exposure to a number of principal risks and uncertainties has changed through 2016. Market uncertainties were greater than planned, with greater upside movement in commodity prices and demand than forecast. With greater than planned cash flow, our balance sheet strengthened, decreasing our liquidity risk. Geopolitical uncertainty increased, as did the threat of greaterrent-seeking and resource nationalism. Uncertainty regarding the performance and outlook of our joint venture operations also increased. Further detail on movements and monitoring of these exposures is provided in the relevant section of the Strategic report, including the Market environment, Group strategy, product group overviews, the Directors’ report and the Notes to the 2016 financial statements.
Assessment
The board confirms that, with the assistance of management, it has carried out a robust assessment of the principal risks of the Group as detailed below and has also tested the financial plans of the Group for each of these principal risks, and for a series of severe but plausible scenarios, made up of the concurrence or close sequence of a number of principal and material risks.
The Group will continue to monitor the potential impacts of the UK’s departure from the European Union as a result of the referendum that took place in June 2016, but no material impacts are expected at this time.
Longer-term viability statement
Current business planning processes within Rio Tinto require the preparation of detailed financial plans over a three-year time horizon. The Group’s strategy is developed, and capital investment decisions are made, based on an assessment of cash flows over a multi-decade horizon, with financial investment capacity regularly tested to ensure capital commitments can be funded in line with the Group’s capital allocation model. Thismulti-year planning approach reflects our business model of
investing in, and operating, long-life mining assets, whose outputs we sell into commodity markets over which we have limited influence.
The planning process requires modelling under a series of macroeconomic scenarios and assumptions of both internal and external parameters. Key assumptions include: projections of economic growth, and thus commodity demand in major markets, primarily China; commodity prices and exchange rates, often correlated; cost and supply parameters for major inputs such as labour and fuel; and a series of assumptions around the schedule and cost of implementation of organic and inorganic growth programmes.
Reflecting the speed and degree of change possible in a number of these parameters, such as Chinese demand, commodity prices, and exchange rates, Rio Tinto has deemed athree-year period of assessment appropriate for the longer-term viability statement, consistent with the Group’s detailed planning horizon.
Robust stress-testing has been undertaken, as part of the business planning process, to further test and confirm the longer-term viability of the Group, beyond commodity price and exchange rate movements. Production and social licence to operate related assumptions were also stressed, individually and collectively, to levels considered severe but plausible and well beyond those expected in the normal course of business.
The viability of the Group under these scenarios remained sound with the use of a suite of management actions available to redress the situation, including accessing lines of credit, changing capital allocation levers, and, if necessary, selling (down) assets.
Therefore, taking into account the Group’s current position and principal risks, the directors have assessed the prospects of the Group, over the next three years, and have a reasonable expectation that the Group will be able to continue to operate and meet its liabilities as they fall due over that period.
It is impossible to foresee all risks, and the combinations in which they could manifest, and there may be risks that currently or individually do not appear material that could turn out to be material, particularly if occurring in close sequence.
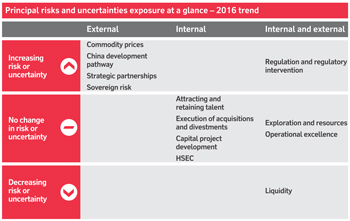
| | | | |
| 2016 Annual report | | riotinto.com | | 15 |
| | | | | | | | | | | | | | | | |
| | | | | | | | |
| STRATEGIC REPORT | | | | DIRECTORS’ REPORT | | | | FINANCIAL STATEMENTS | | | | PRODUCTION, RESERVES AND OPERATIONS | | | | ADDITIONAL INFORMATION |
Principal risks and uncertainties
The principal risks and uncertainties in this section have been categorised into Financial risks (Market, Financial and Strategic); Operational risks (HSEC, Resources, Operations, Projects and People); and Compliance risks (Stakeholder, Governance).
The principal risks and uncertainties should be considered in connection with any forward-looking statements in this Annual report and the cautionary statement on the inside front cover.
| | | | | | | | | | |
| Inherent risk and uncertainty | | Risk exposure 2016 trend | | Potential impact on viability, HSEC and reputation | | Potential upside impact
(opportunities) | | | | |
| Market risks | | | | | | | | | | |
| | | |
Rio Tinto operates in global markets and accepts the impact of exchange rate movements
and market-driven prices for our commodities, seeking premiums where possible. | | | | | | |
Commodity prices, driven by demand and supply for the Group’s products, vary outside of expectations over time. Exchange rate variations and geopolitical issues may offset or exacerbate this risk. Anticipating and responding to market movements is inherently uncertain and outcomes may vary. | | 
Price uncertainty has increased. Prices stronger than forecast. | | – Business model – Future performance – Solvency – Liquidity – Group reputation | | A rise in commodity prices, or favourable exchange rate movement, allows the Group to pursue strategic capital expansions, pay down debt and/or increase returns to shareholders. Capturing above-planned returns from commercial excellence activities would deliver additional cash flow to the Group. | | | | |
| China’s development pathway could impact demand for the Group’s products outside of expectations. | |
Demand stronger than forecast. | | – Business model – Future performance | | Strong growth, positive policy decisions and reforms drive demand for commodities, resulting in rising prices which enable capital expansion and increased shareholder returns in the short to medium term. | | | | |
| | | | | |
| Financial risks | | | | | | | | | | |
| | | |
Rio Tinto maintains a strong balance sheet and liquidity position to preserve financial
flexibility through the cycle. | | | | | | |
External events and internal discipline may impact Group liquidity. | | 
Balance sheet strengthened by stronger than forecast cash flows driven by higher commodity prices. | | – Future performance – Solvency – Liquidity – Group reputation | | Favourable market conditions and strong internal discipline could increase Group liquidity and/or balance sheet strength and allow it to pursue investment opportunities and enhance returns to shareholders. | | | | |
| | | | |
| 16 | | riotinto.com | | 2016 Annual report |
| | | | | | |
| | Potential downside impact
(threats) | | Mitigating actions include: |
| | |
| |
| | |
| | Falling commodity prices, or adverse exchange rate movements, reduce cash flow, limiting profitability and dividend payments. These may trigger impairments and/or impact rating agency metrics. Extended subdued prices may reflect a longer-term fall in demand for the Group’s products, and consequent reduced revenue streams may limit investment opportunities. Failure to deliver planned returns from commercial excellence activities would negatively impact cash flows for the Group. An economic slowdown in China, and/or a material change in policy, results in a slowdown in demand and reduced investment opportunities. | | | | – Pursue low cost production, allowing profitable supply throughout the commodity price cycle. – Maintain a diverse portfolio of commodities across a number of geographies. – Maintain global portfolio of customers and contracts. – Maintain a strong balance sheet. – Monitor multiple leading indicators and undertake detailed industry analysis to develop more accurate assumptions in our commodity price and exchange rate forecasting used for capital allocation and planning process, and Commercial Excellence activities. – Comply with the Group’s Treasury policy and standard, which outlines the fundamental principles that govern the Group’s financial risk management practices. – Closely coordinate market-facing commercial excellence resources in the Group. – Apply strong governance reflecting relevant regulatory frameworks and jurisdictions. |
| | |
| | | | |
| | |
| | The Group’s ability to raise sufficient funds for planned expenditure, such as capital growth and/or mergers and acquisitions, as well as the ability to weather a major economic downturn could be compromised by a weak balance sheet and/or inadequate access to liquidity. | | – Comply with the Group’s Treasury policy and standard, which outlines the fundamental principles that govern the Group’s financial risk management practices. – Maintain a net gearing ratio of 20 to 30 per cent and other financial metrics commensurate with a strong investment-grade credit rating. |
| | | | – Manage the liquidity and financing structure of the Group using forecasts and sensitivity analysis tools to actively monitor, determine and enable access to the appropriate level, sources and types of financing required. |
| | | | – Subject funds invested by the Group to credit limits and maturity profiles based on board-approved frameworks, to promote diversification and maintain appropriate liquidity. |
| | | | – Embed Finance teams within the business support management and develop accurate financial reporting and tracking of our business performance. |
| | | | – Report financial performance monthly to senior management and the board. |
| | | | – Seek board approval of the financial strategy, long-term planning and cash flow forecasting. |
| | | | | – Apply a dividend policy which allows shareholder returns to adjust with the cycle. |
| | | | |
| 2016 Annual report | | riotinto.com | | 17 |
| | | | | | | | | | | | | | | | |
| | | | | | | | |
| STRATEGIC REPORT | | | | DIRECTORS’ REPORT | | | | FINANCIAL STATEMENTS | | | | PRODUCTION, RESERVES AND OPERATIONS | | | | ADDITIONAL INFORMATION |
Principal risks and uncertainties
continued
| | | | | | | | | | |
Financial risks continued | | |
| Inherent risk and uncertainty | | Risk exposure 2016 trend | | Potential impact on viability, HSEC and reputation | | Potential upside impact (opportunities) | | | | |
| Strategic risks | | | | | | | | | | |
| | | |
Rio Tinto enforces disciplined capital allocation to the best returning opportunities
(organic and inorganic growth projects or returns to shareholders). | | | | | | |
Rio Tinto’s ability to secure planned value by successfully executing divestments and acquisitions may vary. | |  | | – Business model – Future performance – Solvency – Liquidity – Group reputation | | Proceeds realised from divested assets are greater than planned, allowing more capital to be redeployed into higher returning or more productive uses. The Group is successful in acquiring businesses that provide cash flow and/or future growth optionality, above that anticipated at the time of acquisition. | | | | |
The Group’s ability to develop new projects successfully may vary. | | | | – Future performance – HSEC – Group reputation – Solvency | | An ability to develop projects on time and within budget enhances licence to operate and investor confidence. | | | | |
| | | | | | | | | | |
Operational risks | | |
| Inherent risk and uncertainty | | Risk exposure 2016 trend | | Potential impact on viability, HSEC and reputation | | Potential upside impact (opportunities) | | | | |
| HSEC risks | | | | | | | | | | |
| | | |
Rio Tinto’s operations are inherently dangerous. We lead responsibly to preserve our social licence
to operate and ensure our employees and contractors go home safe and healthy. | | | | | | |
Our operations and projects are inherently hazardous with the potential to cause illness or injury, damage to the environment, disruption to a community or a threat to personal security. | | | | – Future performance – HSEC – Group reputation | | Delivering leading health, safety, environment and communities performance is essential to our business success. Meeting or exceeding our commitments in these areas contributes to sustainable development and underpins our continued access to resources, capital and a diverse workforce to sustain the organisation. | | | | |
| | | | | | Good performance in legacy management (of closed sites) and closure can enhance our reputation and enable us to maintain access to land, resources, people and capital, so we can continue to establish new projects with the support of local communities. | | | | |
| Resources risks | | | | | | | | | | |
| | | |
Rio Tinto invests materially to accurately identify new deposits and develop orebody knowledge,
underpinning our operations and projects. | | | | | | |
The success of the Group’s exploration activity may vary. In addition, estimates of ore reserves are based on uncertain assumptions that, if changed, could result in the need to restate ore reserves and mine plans. | | | | – Business model – Future performance – Group reputation | | The discovery of a new viable orebody can significantly improve future growth options. | | | | |
| | | | | | The volume of ore is based on the available geological, commercial and technical information which is by its nature, incomplete. As new information comes to light the economic viability of some ore reserves and mine plans can be restated upwards. As a result, projects may be more successful and of longer duration than initially anticipated. | | | | |
| | | | |
| 18 | | riotinto.com | | 2016 Annual report |
| | | | |
| | | |
| | Potential downside impact
(threats) | | Mitigating actions include: |
| | | | |
| | |
| | | | |
| | Divestment and acquisition activity incurs transaction costs that cannot be recouped, or may result in value destruction by realising less than planned value for divestments or paying more than fair value for acquisitions. This could result in unforeseen pressure on the Group’s cash position or reduce the Group’s ability to expand operations. The Group may also be liable for the past acts, omissions or liabilities of assets it has acquired that were unforeseen or greater than anticipated at the time of acquisition. The Group may also face liabilities for divested entities if the buyer fails to honour commitments or the Group agrees to retain certain liabilities. A delay or overrun in the project schedule could negatively impact the Group’s profitability, cash flows, ability to repay project-specific indebtedness, asset carrying values, growth aspirations and relationships with key stakeholders. | | – Complete detailed, independent due diligence on all material potential divestments and acquisitions, including technical review, commercial review and functional sign-offs, before consideration by the Investment Committee and board where appropriate. – Resource Business Development team appropriately, supported by external specialists as required. – Involve business unit leaders early in process to recognise integration planning and synergies, or separation threats and opportunities. – Undertake post-investment reviews on divestments and acquisitions, to identify key learnings to embed into future initiatives. – Consistently approach development of large-scale capital projects, through a specialised projects division. – Follow rigorous project approval and stage-gating process, including monitoring and status evaluation, as articulated in Project evaluation standard and guidance. – Ensure effective stakeholder management in project development. |
| | |
| | | | |
| | | | | |
| | Potential downside impact
(threats) | | Mitigating actions include: |
| | | | |
| | |
| | | | |
| | Failure to manage our health, safety, environment or community risks, could result in a catastrophic event or other long-term damage which could in turn harm the Group’s financial performance and licence to operate. Recognised hazards and threats include, among others, underground operations, aviation, pit slope instability, tailings facilities, vector-borne and pandemic disease, chemicals, gases, vehicles and machinery, extreme natural environments, endangered flora or fauna, areas of cultural heritage significance, water supply stress and climate change. | | – Continue focus on HSEC as a core priority at all operations, and projects, overseen by the Sustainability Committee. – Clearly define and ensure compliance with Group HSEC strategy, policy and performance standards. – Regularly review and audit HSEC processes, training and controls to promote and improve effectiveness, at managed andnon-managed operations. |
| | | – Monitor HSEC performance measurement metrics at the Group level monthly. – Report, investigate and share learnings from HSEC incidents. – Build safety targets into personal performance metrics to incentivise safe behaviour and effective risk management (see Remuneration Implementation Report). – Develop mutually beneficial partnerships with local communities and establish appropriate social performance targets. – Report annually on performance on greenhouse gas emissions, water, land use and rehabilitation, among others. – Focus on fatality elimination through implementation of a programme to verify safety risk controls. |
| | | | |
| | |
| | | | |
| | A failure to discover new viable orebodies could undermine future growth prospects. The risk that new information comes to light or operating conditions change means that the economic viability of some ore reserves and mine plans can be restated downwards. As a result, projects may be less successful and of shorter duration than initially anticipated, and/or the asset value may be impaired. | | – Comply with the Group’s resources and reserves standard. – Recruit and retain skilled and experienced exploration and evaluation personnel. – Provide stable funding for exploration activities. – Prioritise the exploration portfolio continuously. – Utilise new technologies where appropriate. – Develop and leverage and manage third-party partnerships. – Coordinate orebody knowledge through active Group-wide leadership forum. |
| | | |
| | | | |
| 2016 Annual report | | riotinto.com | | 19 |
| | | | | | | | | | | | | | | | |
| | | | | | | | |
| STRATEGIC REPORT | | | | DIRECTORS’ REPORT | | | | FINANCIAL STATEMENTS | | | | PRODUCTION, RESERVES AND OPERATIONS | | | | ADDITIONAL INFORMATION |
Principal risks and uncertainties
continued
| | | | | | | | | | |
| Operational riskscontinued | | |
| Inherent risk and uncertainty | | Risk exposure 2016 trend | | Potential impact on viability, HSEC and reputation | | Potential upside impact
(opportunities) | | | | |
| Operations, projects and people risks | | | | |
Rio Tinto seeks to achieve operational and commercial excellence, and to attract and retain
the best people in the industry. | | | | |
Operational excellence is derived
from high operational and human
productivity. Productivity which is driven by optimisation of the balance of people,
process and systems may vary. | | | | – Future performance – Liquidity – HSEC – Group reputation | | Improved productivity and innovation from new systems can decrease costs and increase output, delivering additional cash flow. Development and retention of talent enhances productivity, financial and HSEC outcomes. | | | | |
Attracting and retaining talent as the company and industry evolves presents a constant challenge. | | | | – Business model – Future performance – Group reputation | | Leveraging the evolving company and market to attract a diverse and engaged workforce will deliver a competitive advantage to the Group. | | | | |
| Compliance risks | | | | |
| Inherent risk and uncertainty | | Risk exposure 2016 trend | | Potential impact on viability,
HSEC and reputation | | Potential upside impact
(opportunities) | | | | |
| Stakeholder risks | | | | |
Rio Tinto recognises positive engagement with a range of stakeholders, and seeks to develop collaborative
and mutually beneficial partnerships that underpin our social licence to operate. | | | | |
Strategic partnerships and third parties influence the Group’s supply, operations and reputation. The Group’s ability to control the actions of these parties varies. | | | | – Business model – Future performance – HSEC – Group reputation | | Joint venture and third parties offer opportunities to increase shareholder returns, reduce political risk and reduce operational risks. | | | | |
The Group’s operations are located across a number of jurisdictions, which exposes the Group to a wide range of economic, political, societal and regulatory environments. | | | | – Business model – Future performance – Group reputation | | Proactive engagement with governments, communities and other stakeholders can increase access to new resources, support stable and predictable investment frameworks and operational environments, and shape mutually beneficial policies and legal/regulatory frameworks. | | | | |
| Governance risks | | | | |
Rio Tinto employees operate in compliance withThe way we work– our global code of business conduct,
the Group delegation of authorities and all Group policies, standards and procedures. | | | | |
The Group’s reputation and regulatory licences are dependent upon appropriate business conduct and are threatened by a public allegation or regulatory investigation. | | | | – Business model – Future performance – Group reputation | | Good corporate citizens are acknowledged to operate to a high ethical standard, thus attracting talent. Securing access to resources and investment opportunities. | | | | |
| | | | |
| 20 | | riotinto.com | | 2016 Annual report |
| | | | |
| | | | | |
| | Potential downside impact
(threats) | | Mitigating actions include: |
| | | | |
| | | | |
| | | Business interruption may arise from a number of circumstances, including: – Operational difficulties such as extended industrial dispute, delayed development, bottlenecks or interruptions to infrastructure for power, water and transportation, throughout the value chain. – Operational failure such as a process safety incident, major pit slope, dump or tailings/water impoundment failure, underground incident. – Cyber breach/incident of commercial and operational systems. – Natural disasters such as earthquakes, subsidence, drought, flood, fire, storm and climate change can impact mines, smelters, refineries and infrastructure installations. Any of these events could result in a significant HSEC incident, an interruption to operations, or the inability to deliver products and a commercial loss. | | – Preserve geographically diverse portfolio limiting physical events/disruptions to a specific business, single infrastructure or logistical event. – Comply with slope geotechnical, tailings management, underground mining and process safety technical and safety standards, supported by subject matter experts and audit protocols, reducing the risk (likelihood and consequence) of operational failure. – Comply with the Acceptable use of information and electronic resources standard, supported by periodic reviews of IT infrastructure and security controls by dedicated(in-house) cyber-security team. – Operate under strong human resources and employee relations framework. – Undertake business resilience planning and preparedness exercises for execution of plans, across all operations. For certain risks involving higher-value losses the Group purchases insurance. Risks not transferred to the external insurance market are retained within the business. |
| | The inability to attract or retain key talent will constrain the Group’s ability to reach its goals within planned timeframes. | | – Improve HR processes in recruitment, development and leadership training. – Introduce employee engagement programme and metrics, to enhance engagement. – Enhance focus on inclusion and diversity, at all levels of the Group. – Refresh Group purpose and values statements. |
| | | | | |
| | Potential downside impact
(threats) | | Mitigating actions include: |
| | | | |
| | | | |
| | | Joint venture partners may hinder growth by not agreeing to support
investment decisions. Fornon-managed operations, controlling
partners may take action contrary to the Group’s interests or
standards and policies, resulting in adverse impact to health and
safety, performance, cyber integrity, reputation or legal liability. | | – Approach investments and partnerships with a long term relationship rather than transactional. – Shape governance structures to ensure appropriate influence and engagement. – Maintain strong focus on contractor management. – Actively participate within the governance structures of joint ventures to promote, where possible, compliance with the Group’s policies and alignment with strategic priorities. – Participate in strategic partnerships or financing structures to moderate political risk. – Maintain geographically diverse portoflio to reduce exposure to changes in these environments. – Monitor jurisdictional, including sovereign, risks and take appropriate action. – Develop long-term relationships with a range of international and national stakeholders. – Comply with Group policies and standards which provide guidance concerning risk management, human rights, cyber threat, data privacy, business integrity and external communications. – Undertake rigorous third-party due diligence. |
| | Adverse actions by governments and others can result in operational/project delays or loss of licence to operate. Other potential actions can include expropriation, changes in taxation, and export or foreign investment restrictions, which may threaten the investment proposition, title, or carrying value of assets. Legal frameworks with respect to policies such as energy, climate change and mineral law may also change in a way that increases costs. | |
| | |
| | |
| | |
| | |
| | |
| | |
| | | | |
| | | | |
| | | Fines may be imposed against Group companies for breaching antitrust rules, anti-corruption legislation, sanctions or human rights violations or for other inappropriate business conduct. A serious allegation or formal investigation by increasingly connected regulatory authorities (regardless of ultimate finding) could result in a loss in share price value, and/or loss of business. Other consequences could include the criminal prosecution of individuals, imprisonment and/ or personal fines, and reputational damage to the Group. There may also be considerable cost and disruption in responding to allegations or investigations and taking remedial action. | | – Identify and meet our regulatory obligations and respond to emerging requirements. – Comply with Group policies, standards and procedures which provide guidance to our businesses and drive compliance with regulatory obligations. – Dedicate legal and compliance teams to assist Group businesses in complying with regulatory obligations and internal standards and procedures. – Maintain appropriate oversight and reporting, supported by training and awareness, to drive compliance with regulatory obligations. – Continue to develop and deploy training across relevant sectors of the workforce. |
| | | | |
| 2016 Annual report | | riotinto.com | | 21 |
| | | | | | | | | | | | | | | | |
| | | | | | | | |
| STRATEGIC REPORT | | | | DIRECTORS’ REPORT | | | | FINANCIAL STATEMENTS | | | | PRODUCTION, RESERVES AND OPERATIONS | | | | ADDITIONAL INFORMATION |
Portfolio management
Rio Tinto has a programme of high-quality projects delivering industry-leading returns across a broad range of commodities. In 2016, Rio Tinto approved two additional capital projects: the Oyu Tolgoi underground mine development in Mongolia and the Silvergrass iron ore development in the Pilbara region of Western Australia. In 2016, Rio Tinto funded its capital expenditure with net cash generated from operating activities and aims to continue funding its capital programme from internal sources, except for the Oyu Tolgoi underground development for which there is a separate project financing arrangement.
| | | | | | |
| (Rio Tinto 100% owned unless otherwise stated) | | Total
approved
capital cost
(100%) | | Approved
capital
remaining to
be spent from
1 January
2017 | | Status/milestones |
In production | | | | | | |
| Investment in Nammuldi Incremental Tonnes (NIT) projects in the Pilbara, to maintain the Pilbara blend. | | US$0.2bn | | – | | NIT1, with five million tonnes annual capacity, commenced production in the fourth quarter of 2015. NIT2, which took annual mine capacity from five to ten million tonnes, was delivered in October 2016. |
Ongoing and approved | | | | | | |
| Copper & Diamonds | | | | | | |
| Construction of a desalination facility to ensure continued water supply and sustain operations at Escondida (Rio Tinto 30%), Chile. | | US$1.0bn (Rio Tinto share) | | US$0.1bn (Rio Tinto share) | | Approved in July 2013, the project is designed to provide a long-term sustainable supply of water for the operations. It remains on schedule and on budget and is 99 per cent complete, with commissioning scheduled in 2017. |
| Grasberg project funding to 2017. | | US$0.2bn (Rio Tinto share) | | US$0.1bn (Rio Tinto share) | | Investment to continue thepre-production construction of the Grasberg Block Cave, the Deep Mill Level Zone underground mines and the associated common infrastructure. Rio Tinto’s final share of capital expenditure will be influenced in part by its share of production over the period of investment. |
| Remediation of the east wall at Rio Tinto Kennecott, US. | | US$0.3bn | | – | | Following the pit wall slide in 2013, mine operations have focused on remediation from the slide and the east wall of Bingham Canyon, including significant deweighting and dewatering activities. There is a small amount of dewatering activity scheduled to be completed in 2017. |
| Investment to extend mine life at Rio Tinto Kennecott, US beyond 2019. | | US$0.7bn | | US$0.6bn | | Funding for the continuation of open pit mining via the push back of the south wall has been approved and will largely consist of simple mine stripping activities. |
| Development of A21 pipe at the Diavik Diamond Mine in Canada (Rio Tinto 60%). | | US$0.2bn (Rio Tinto share) | | US$0.1bn (Rio Tinto share) | | Approved in November 2014, the development of the A21 pipe is expected to ensure the continuation of existing production levels. First carats are planned formid-2018. |
| Development of the Oyu Tolgoi underground mine in Mongolia (Rio Tinto 34%) where average copper grades of 1.66 per cent are more than three times higher than the open pit. | | US$5.3bn | | US$5.1bn | | Approved in May 2016, first production from the underground is expected in 2020. Contractor mobilisation commenced in the third quarter of 2016. Work on the underground mine development, accommodation camp, conveyor to surface decline, sinking of shaft #2 and shaft #5 and critical facilities are continuing to progress. The focus is on completing the underground crusher and dewatering system to enable increased lateral development rates. |
| | | | |
| 22 | | riotinto.com | | 2016 Annual report |
|
| Major capital projectscontinued |
| | | | | | |
| (Rio Tinto 100% owned unless otherwise stated) | | Total
approved
capital cost
(100%) | | Approved
capital
remaining to
be spent from
1 January
2017 | | Status/milestones |
Ongoing and approved continued | | | | | | |
| Aluminium | | | | | | |
| Investment in the Amrun bauxite mine on the Cape York Peninsula in north Queensland with a planned initial output of 22.8 million tonnes a year. | | US$1.9bn | | US$1.7bn | | Approved in December 2015, output includes an expected 10 million tonne increase in annual exports with production commencing in the first half of 2019. |
| Investment in the Compagnie des Bauxites de Guinée (CBG) bauxite mine to expand from 14.5 to 18.5 million tonnes a year. Rio Tinto’s share of capex is $0.3bn. | | US$0.7bn (100%) | | US$0.6bn (100%) | | Approved in 2016. Financing completed in November 2016. First incremental shipment expected in June 2018. |
| Iron Ore | | | | | | |
| Development of the Silvergrass iron ore mine in the Pilbara, to maintain the Pilbara blend. | | US$0.3bn | | US$0.3bn | | The US$338m approval in August 2016 is expected to add 10 million tonnes of annual capacity with commissioning anticipated for the second half of 2017. |
|
| Material acquisitions and divestments |
| | | | | | |
| Asset | | Consideration
US$m | | | Status |
Divested in 2016 | | | | | | |
| Bengalla Joint Venture | | | 599 | | | Sold to New Hope Corporation Limited |
| Lochaber | | | 410 | (a) | | Sold to SIMEC |
Divested in 2014 | | | | | | |
| Clermont Joint Venture | | | 1,015 | (a) | | Sold to GS Coal Pty Ltd |
| Rio Tinto Coal Mozambique | | | 50 | (a) | | Sold to International Coal Ventures Private Limited (ICVL) |
| SØRAL | | | Undisclosed | | | Sold to Norsk Hydro |
| Alucam | | | Undisclosed | | | Sold to the Government of Cameroon |
| (a) | Before working capital and completion adjustments. |
There were no material acquisitions in 2016 or 2015. There were no material divestments completed during 2015.
Further information on acquisitions and divestments is included in note 37 to the financial statements on page 165.
| | | | |
| 2016 Annual report | | riotinto.com | | 23 |
| | | | | | | | | | | | | | | | |
| | | | | | | | |
| STRATEGIC REPORT | | | | DIRECTORS’ REPORT | | | | FINANCIAL STATEMENTS | | | | PRODUCTION, RESERVES AND OPERATIONS | | | | ADDITIONAL INFORMATION |
Sustainable development
Producing minerals and metals is vital for sustaining and growing social wellbeing. It is essential for human progress. Our activities can affect people, communities and the environment. We work in partnership with those affected to share the wealth and benefits our business creates and to minimise negative impacts.
Rio Tinto’s contribution to sustainable development underpins our ongoing commercial results. It benefits our shareholders, partners, neighbouring communities, suppliers, customers, employees and society.
We recognise that we can always improve, and work in partnership to find smarter ways of operating. To achieve our goals we look beyond our business and industry, seeking innovative solutions that we can adopt to manage our impacts. We participate in industry organisations such as the International Council on Mining & Metals (ICMM), and global initiatives such as the Extractive Industries Transparency Initiative and B20 taskforces and summits which support the work of the G20, to help drive change and set sustainability standards that reflect societal expectations and challenges. We also work in partnership withnon-government organisations to help us better understand and meet the needs of stakeholders.
Our global code of business conduct,The way we work, sets out the behaviour we expect of our people, consistent with Rio Tinto’s values: safety, teamwork, respect, integrity and excellence. Together our code of conduct and our values are the foundation of our business.
Our Sustainability Committee ensures our approach is consistent with Rio Tinto’s vision and values, that material risks (both local and global) are managed effectively, and that our activities contribute to sustainable development. Further information on this committee can be found on page 61 of the Directors’ report.
A summary of our 2016 performance follows. Greater detail, including disclosure of performance metrics and the materiality assessment, is contained in our 2016 Sustainable development report, available atriotinto.com/sd2016
Materiality
Every year we rank the sustainability issues that matter most to our business and stakeholders. This helps focus our response and aligns our report with the Global Reporting Initiative (GRI) G4 Guidelines.
In 2016, to compile this ranking, we combined feedback from our internal subject matter experts and discipline leaders, stakeholder expectations and analysis of the external environment. The Sustainability Committee reviewed and approved the assessment.
Our materiality ranking scheme comprises three tiers:
| – | | Highly material aspects that are core to our sustainability performance, to our business and stakeholders. These aspects are described in this Annual report. |
| – | | Material aspects that could have localised or moderate impacts on our overall sustainability performance and to stakeholders. These aspects are described in our Sustainable development report. |
| – | | Other issues considered important across Rio Tinto and to specific stakeholders. |
Performance overview
Tragically, one colleague lost his life while working at the Paraburdoo iron ore operation in 2016. This incident reinforces the importance of strong safety standards, procedures and leadership. Our ongoing reduction in the number of work-related injuries gives us confidence that our safety processes and culture are strong. Furthermore, by continuing to implement critical risk management (CRM), eliminating fatalities is achievable.
Our performance is assessed globally by external agencies. In 2016, Rio Tinto has again been recognised by the Dow Jones Sustainability Index Metals & Mining Sustainability Leaders group and the FTSE4Good indices.
| | | | |
| 24 | | riotinto.com | | 2016 Annual report |
We aim to improve our performance each year. Some highlights and examples of our progress in 2016 included:
| – | | Rolling out the CRM programme across more than 60 operational sites, resulting in 1.3 million risk verifications. |
| – | | At 0.44 our all injury frequency rate (AIFR) per 200,000 hours worked was the same as in 2015, the lowest rate in our company history, and we recorded 14 fewer lost time injuries than in 2015. |
| – | | 25.9 per cent reduction in our greenhouse gas emissions intensity from 2008 – a seven per cent improvement from 2015. |
| – | | Meeting our 2016 target of graduate gender diversity and intake of nationals from regions where we are developing new businesses. |
| – | | Introducing a new global Communities and Social Performance (CSP) target to our procurement practices for 2016-2020, with 100 per cent of businesses on track. |
| – | | Achieving an Elevate Reconciliation Action Plan (RAP), the highest possible phase in Reconciliation Australia’s RAP programme. |
| – | | Publishing theWhy agreements matter best practice guide and our Know your supplier procedure. |
| – | | Developing our first modern slavery statement in compliance with the UK Modern Slavery Act 2015 and our new climate change report. |
| – | | Reviewing our water management practices, opportunities and obligations to ensure responsible oversight of this resource. |
| – | | A seven per cent improvement in managed operations on track to meet their local water performance targets by 2018. |
| – | | Implementing a number of updated technical standards and procedures, including those covering the Management of tailings and water storage facilities, geotechnical risk and rail safety. |
| – | | Receiving endorsement from the ICMM tailings review group on Rio Tinto’s safe tailings governance practices. |
At 19.2 per cent, we fell just short of our target for 20 per cent of women in senior management positions and we did not meet our targets foryear-on-year reductions in reporting of new cases of occupational illness (the rate increased by 36 per cent from 2015). Actions to address these shortfalls are covered later in the report.
Our employee engagement score was lower than we would have liked but provides hard data for us to improve our leadership and provides direction for our 2017 initiatives in that area.
We reported one significant environmental incident. There was an alleged breach of Warkworth Mining Limited’s Environmental Protection Licence conditions in relation to the partial failure of a sediment dam at the Mount Thorley Warkworth mine. The incident did not result in any environmental harm. We paid US$57,618 in fines related to environmental compliance. Further information on the Group’s environmental regulation, including incidents and fines, is in the Directors’ report on page 48.
We set targets to communicate across the company the areas where we need to improve in sustainability performance and to stretch our thinking as to what is possible and acceptable. Our performance against these targets is summarised below. Actions to maintain or improve performance in these areas is described in the following pages. Further information on the risk framework we apply to identify these metrics can be found on pages 14 to 23.
| | |
| Targets | | Outcomes in 2016 |
| Our goal is zero harm, including, above all, the elimination of workplace fatalities. | | One fatality at managed operations in 2016. |
| |
| Performance against this goal is measured by the number of fatalities and ayear-on-year improvement in our all injury frequency rate (AIFR) per 200,000 hours worked. | | AIFR remains the same as 2015. |
| Ayear-on-year improvement in the rate of new cases of occupational illness per 10,000 employees annually. | | 36 per cent increase in the rate of new cases of occupational illness compared with 2015. |
| By the end of 2018, all managed operations will be effectively controlling exposure to all identified material health risks by verifying that critical controls are reducing harmful exposure. | | 57 per cent of businesses identified and consolidated critical control management plans for their material health risks with the remainder on track to achieve our end of 2018 goal. |
| Our diversity goal is to employ people based on job requirements that represent the diversity of our surrounding communities. | | |
| |
| We are targeting: | | |
– Women to represent 20 per cent of our senior management by 2016. | | – Women represented 19.2 per cent of our senior management in 2016. |
– Women to represent 40 per cent of our 2016 graduate intake. | | – Women represented ten per cent of our Executive committee in 2016. From 1 January 2017, women represented 27.3 per cent of our Executive Committee. |
– 15 per cent of our 2016 graduate intake to be nationals from regions where we are developing new businesses. | |
| | – Women represented 46.4 per cent of our 2016 graduate intake. |
| | | – 36.2 per cent of our 2016 graduate intake were nationals from regions where we are developing new businesses. |
| From 2016 all operations will locally report on an annual basis, and will demonstrably achieve by 2020: | | 100 per cent of sites established their Communities and Social Performance targets in 2016. |
– Progress against a locally defined target that demonstrates the local economic benefits of employment and procurement of goods and services. | | |
– Effective capture and management of community complaints withyear-on-year reduction in repeat and significant complaints. | | |
| 24 per cent reduction in total greenhouse gas emissions intensity between 2008 and 2020. | | We are on track to meet our 2020 target. Seven per cent reduction in greenhouse gas emissions intensity in 2016 versus 2015. |
| All managed operations with material water risk will have achieved their approved local water performance targets by 2018. | | 67 per cent of managed operations are on track to meet their approved local water performance targets. |
| | | | |
| 2016 Annual report | | riotinto.com | | 25 |
| | | | | | | | | | | | | | | | |
| | | | | | | | |
| STRATEGIC REPORT | | | | DIRECTORS’ REPORT | | | | FINANCIAL STATEMENTS | | | | PRODUCTION, RESERVES AND OPERATIONS | | | | ADDITIONAL INFORMATION |
Sustainable development
continued
Performance data
A summary of our performance data is provided in the table below. The data are reported for calendar years and unless stated otherwise represent 100 per cent of the parameters at each managed operation even though Rio Tinto may have only partial ownership.
Data reported in previous years may be modified if verification processes detect material errors, or if changes are required to ensure comparability over time.
We have incorporated the requirements of the ten principles of the ICMM and the mandatory requirements set out in the ICMM position
statements into our own policies, strategies and standards. We report in accordance with the GRI G4 guidelines.
Further information on our data definitions, our GRI G4 report and our alignment with the ICMM are available online at riotinto.com/sd2016.
Performance data 2012-2016(a)
| | | | | | | | | | | | | | | | | | | | |
| | | 2016 | | | 2015 | | | 2014 | | | 2013 | | | 2012 | |
| Social | | | | | | | | | | | | | | | | | | | | |
| Fatalities at managed operations from safety incidents | | | 1 | | | | 4 | | | | 2 | | | | 3 | | | | 2 | |
| Fatalities at managed operations from health incidents | | | – | | | | – | | | | – | | | | – | | | | 1 | |
| All injury frequency rate (per 200,000 hours worked) | | | 0.44 | | | | 0.44 | | | | 0.59 | | | | 0.65 | | | | 0.67 | |
| Number of lost time injuries | | | 206 | | | | 220 | | | | 381 | | | | 500 | | | | 535 | |
| Lost time injury frequency rate (per 200,000 hours worked) | | | 0.26 | | | | 0.25 | | | | 0.37 | | | | 0.42 | | | | 0.37 | |
| New cases of occupational illness (per 10,000 employees) | | | 44 | | | | 31 | * | | | 17 | | | | 16 | | | | 15 | |
| Employees (number)(b) | | | 51,000 | | | | 55,000 | | | | 60,000 | | | | 66,000 | | | | 71,000 | |
| Environment | | | | | | | | | | | | | | | | | | | | |
| Greenhouse gas emissions intensity (indexed relative to 2008) | | | 74.1 | | | | 79.7 | *# | | | 81.7 | | | | 83.2 | | | | 94.1 | |
| Total energy use (petajoules) | | | 454 | | | | 433 | | | | 450 | | | | 484 | | | | 502 | |
| Freshwater used (billion litres) | | | 467 | | | | 460 | * | | | 465 | | | | 436 | | | | 446 | |
| Land footprint – disturbed (square kilometres) | | | 3,696 | | | | 3,629 | | | | 3,592 | | | | 3,556 | | | | 3,530 | |
| Land footprint – rehabilitated (square kilometres) | | | 541 | | | | 533 | | | | 502 | | | | 472 | | | | 446 | |
| Direct economic contribution | | | | | | | | | | | | | | | | | | | | |
| Value add (US$ million)(c)(d) | | | 19,515 | | | | 18,888 | | | | 29,178 | | | | 31,818 | | | | 26,195 | |
| Payments to suppliers (US$ million)(c) | | | 15,637 | | | | 17,896 | | | | 21,370 | | | | 26,054 | | | | 30,271 | |
| Community contributions (US$ million) | | | 166 | | | | 184 | | | | 264 | | | | 332 | | | | 291 | |
| * | Numbers restated from those originally published to ensure comparability over time. |
| # | Number restated from 78.9 following the application from 1 January 2015 of updated global warming potentials from the IPCC’s fourth assessment report. |
| (a) | Data reported in previous years may be modified if verification processes detect material errors, or if changes are required to ensure comparability over time. Wherever possible, data for operations acquired prior to 1 October of the reporting period are included. Divested operations are included in data collection processes up until the transfer of management control. |
| (b) | These figures include the Group’s share of joint ventures and associates (rounded to the nearest thousand). |
| (c) | These figures include the Group’s share of joint ventures and associates. |
| (d) | Value add is the sum of labour, payments to governments and returns on capital invested in operations. |
There will always be opportunities to improve and to contribute further to sustainable development.
2017 priorities
Our priorities for 2017 are to:
| – | | Maintain momentum of the CRM programme and achieve our firstfatality-free year. |
| – | | Collaborate with our joint venture partners to improve safety performance across our managed andnon-managed sites, such as with PT Freeport Indonesia on the implementation of a fatality prevention programme at the Grasberg joint operation in Indonesia. |
| – | | Reduce new cases of occupational illnesses, with a particular focus on stress,noise-induced hearing loss and fitness for work. |
| – | | Continue the focus on our technical risk standards such as those covering process safety, water and tailings management, and geotechnical events. |
| – | | Implement measures to improve employee engagement. |
| – | | Increase our graduate intake for 2017. |
| – | | Strengthen our understanding and improve |
| | | the management and disclosure of resilience to climate change risks. |
| – | | Meet the expectations of the new ICMM position statement on water stewardship for transparent water governance and water management at operations. |
| – | | Participate in the tailings committee of the Australian National Committee on Large Dams to further improve industry guidelines on tailings dams. |
| – | | Strengthen processes to manage human rights risk across our value chain through our third-party due diligence project. |
| – | | Strengthen integration of human rights considerations in incident reporting, impact assessments, and complaints handling. |
| – | | Progress the closure planning for facilities nearing the end of their economically viable life. |
Our people
Safety
The safety of our people is Rio Tinto’s highest priority and we believe all safety incidents are preventable. We work to create a safe environment through strong safety systems, processes and tools, and verifications of critical controls – together with visible and caring
leadership. We take a balanced approach to safety, which is focused on the three core areas of fatality elimination, injury reduction and catastrophic risk prevention including process safety.
CRM is crucial to achieving our fatality prevention goal. It is a dedicated fatality prevention programme which involves every person at our operational sites checking that critical controls are in place for jobs that include a fatality risk, and that they are working effectively. In 2016 every Rio Tinto managed operation rolled out CRM and over 1.3 million critical control verifications were completed.
Whilst we have maintained our injury performance, we are yet to achieve a fatality free year. In June we experienced a fatality within our managed operations when an employee was killed while undertaking maintenance on a drill at the Paraburdoo iron ore operation in the Pilbara, Western Australia. This tragedy continues to impact family, friends, workmates and the local community. The business provided immediate support and counselling services and continues to do so. A full investigation has been completed and the learnings have been shared across Rio Tinto to prevent an incident like this being repeated.
| | | | |
| 26 | | riotinto.com | | 2016 Annual report |
The all injury frequency rate (AIFR), which includes data for employees and contractors, was 0.44 per 200,000 hours worked for the 2016 year. Over the last five years, we have reduced our AIFR by 34 per cent. Although we had 14 fewer lost time injuries in 2016 when compared with 2015, due to a reduction in our workforce hours, our lost time injury frequency rate (LTIFR) was 0.26 per 200,000 hours worked in 2016 – a four per cent increase compared with 2015.
Catastrophic risks are managed and assured through a suite of standards, deep dives and external reviews. Process safety is one such risk and its management involves designing, operating and maintaining our processes for preventing a catastrophic release of hazardous materials or energy. There were no process safety incidents with a major or catastrophic consequence in 2016. We progressed the implementation of our Process safety standard, updated in 2015, to reduce process safety risks.
Rio Tinto is required to disclose mine safety violations or other regulatory matters in accordance with Sections 1503(a) of the Dodd-Frank Wall Street Reform and Consumer Protections Act that are included in the Exhibit 16.1 to this filing.
Health
We aim to eliminate occupational illness and to create workplaces that protect health and promote wellbeing. Guided by our health standards, we identify emerging health issues and key occupational health risks, and apply controls to mitigate these. Our focus areas in 2016 were occupational illness reduction, health risk management, wellness and mental health, and the control of vector-borne and infectious diseases.
In 2016, the rate of new cases of occupational illness increased by 36 per cent from 2015. This further increase is due to increased reporting of noise-induced hearing loss (NIHL) and a number of previously unreported historic NIHLs being identified and reported in 2016. An increasing awareness of medical surveillance and tighter reporting requirements of health incidents also contributed to the increase. The main types of occupational illnesses in 2016 were noise-induced hearing loss (60 per cent), musculoskeletal disorders (11 per cent) and stress (23 per cent).
Our health risk management programme helps operational sites manage their material health risks effectively by verifying that critical controls are reducing harmful exposure for employees and contractors. During 2016, businesses identified and consolidated critical control management plans for their material health risks.
We are implementing a range of wellness and mental health programmes and working to improve how we measure their effectiveness. Fatigue remains a critical risk and, during 2016, in conjunction with the Central Queensland University in Australia and the University of Witwatersrand in South Africa, we began a study of management attitudes to fatigue across a number of sites in Africa and Australia.
We are working with local governments and health organisations to ensure effective education in, control of and, where necessary, treatment of our employees, contractors and
communities surrounding our operations for vector-borne and infectious diseases such as tuberculosis, Ebola, malaria and HIV/AIDS and, more recently, Zika. During 2016, we contributed to the international response to the Zika virus by preparing our business resilience teams. We also continued to collect data for the epidemiological study of the workforce at the Rössing uranium mine in Namibia, which has gained approval by the Ethics Committee of the University of Manchester and the University of Witwatersrand.
Employee relations
In 2016, we employed 51,000 people, including the Group’s share of joint ventures and associates, in around 35 countries. Of these, approximately 28,000 were located in Australasia, 13,000 in North America, 6,000 in Africa, 2,000 in Europe, and 2,000 in Central and South America. See page 201 for a breakdown of employees by business units.
We understand the relationship between employee engagement and the productivity of our business, and are focused on increasing engagement levels with all employees and their representatives. We want to be a preferred employer. In our 2016 survey of employee engagement, the results indicated that our leaders have more to do in addressing the impacts of past organisational change and headcount reductions. We were, however, very pleased with the level of engagement at our newest large project, Oyu Tolgoi, and with strong recognition across the Group on our approach to safety.
We value the strength that a diverse workforce and an inclusive culture bring to our business. We employ people on the basis of job requirements and do not discriminate on grounds of age, ethnic or social origin, gender, sexual orientation, politics, religion, disability or any other status. We do not employ forced, bonded or child labour. We recognise the right of all employees to choose to belong to a union and to seek to bargain collectively. We employ people with disabilities and make considerable efforts to offer suitable alternative employment and retraining to employees who become disabled and can no longer perform their regular duties.
We remain one of the largest private sector employers of Indigenous Australians, with over 1,467 full-time Indigenous employees who represented approximately 8.3 per cent of our Australian employees in 2016. Our local employment commitments are often managed through directly negotiated agreements with Traditional Owners.
In 2016, women represented 46.4 per cent (female: 32; male: 37) of our graduate intake, 27.3 per cent (female: 3; male: 8) of the board, 19.2 per cent (female: 100; male: 420) of our senior management, and 18.2 per cent (female: 7,933; male: 35,701)(a) of our total workforce. Further information on inclusion and diversity can be found in the Corporate governance section on page 63.
Communities and regional development
Our Communities and Social Performance (CSP) standard is the basis on which we build relationships and local knowledge, engage with communities and develop programmes that reflect mutually agreed priorities. Our framework is founded on trust and mutual respect and we use it to identify and manage social risks, and to build relationships that secure community support for our work.
Agreements are the basis of many of our relationships. Across the business we have negotiated more than 40 participation agreements and more than 120 global exploration access agreements. In 2016 we launched a new guide,Why agreements matter, which describes practices related to community agreements. This guide supports our commitment to build strong community relationships and publicly shares the lessons we have learned over the past two decades of agreement making.
Our partnership with Australia’s Northern Territory Government, Developing East Arnhem Limited (DEAL), won a National Economic Development Excellence Award for best rural and remote initiative. We created DEAL to help generate new economic activity in the East Arnhem region following curtailment of the Gove alumina refinery. DEAL’s housing programme allows businesses to rent properties to accommodate employees and their familes and has helped generate more than 200 jobs in the region. The revenue DEAL derives from the housing assets is reinvested in local economic development initiatives.
Sharing the wealth and benefits that our operations create is also fundamental to our approach. In addition to the taxes and royalties
paid to both regional and federal governments in 2016 (see ourTaxes paid in 2016 report, which will be published later this year on the Group’s website), we also contributed to 1,294 programmes covering a wide range of sectors such as health, education, environmental protection, housing, agricultural and business development. Our business spent US$166 million on community contribution programmes. This was a decrease in overall community contributions of ten per cent compared with 2015 due to lower agreement-related payments flowing from lower commodity prices.
We introduced a new CSP target for
2016-2020 aimed at capacity-building in our local communities. It requires all operations to develop locally tailored employment, procurement and complaint management targets, and report annually on progress. At the end of 2016, all sites had established their targets.
During 2016, Rio Tinto launched its second Reconciliation Action Plan (RAP), which outlines how we will build deeper engagement between Indigenous communities and
| (a) | Gender distribution for our total workforce is based on managed operations (excludesnon-managed operations and joint ventures) as of 31 December 2016. Less than one per cent of the workforce gender is undeclared. |
| | | | |
| 2016 Annual report | | riotinto.com | | 27 |
| | | | | | | | | | | | | | | | |
| | | | | | | | |
| STRATEGIC REPORT | | | | DIRECTORS’ REPORT | | | | FINANCIAL STATEMENTS | | | | PRODUCTION, RESERVES AND OPERATIONS | | | | ADDITIONAL INFORMATION |
Sustainable development
continued
our operations around Australia. The2016-2019 RAP sets stretch targets for Indigenous employment, education and training, and business development. At the end of 2016, the total national percentage of Aboriginal and Torres Strait Islander people employed by Rio Tinto in Australia was 8.3 per cent compared with our eight per cent target by December 2019. The Group is the first resources company to obtain an Elevate RAP, the highest possible phase achievable in Reconciliation Australia’s RAP programme.
Protecting the environment
Climate change and energy
We acknowledge the changing global climate, and support the intent and aspirations of the Paris Agreement to limit global warming to less than two degrees Celsius abovepre-industrial levels. We are aiming for a substantial decarbonisation of our business by 2050 and are taking steps to reduce emissions, manage risk and build resilience to climate change. This work is supported by our climate change position statement.
Our climate change programme focuses on reducing the energy intensity of our operations and the carbon intensity of our energy. Our total greenhouse gas (GHG) emissions were 32 million tonnes of carbon dioxide equivalent (CO2-e) in 2016, 0.3 million tonnes higher than in 2015. The majority of our GHG emissions are generated as a result of energy use (electricity, fuel) and chemical processes (anodes and reductants) at our operations. The majority (68 per cent) of the electricity we use is from hydro, wind and solar power, which is similar to previous years.
Transportation, processing and use of our products also contribute to GHG emissions. In 2016, the three most significant sources of indirect emissions associated with our products were:
| – | | Approximately 6 million tonnes of CO2-e associated with third-party transport of our products and raw materials, representing a ten per cent increase versus 2015. |
| – | | An estimated 102 million tonnes of CO2-e associated with customers using our coal in electricity generation and steel production, representing a 13 per cent decrease versus 2015. |
| – | | Approximately 524 million tonnes of CO2-e associated with customers using our iron ore to produce steel (these emissions are not all in addition to thecoal-use emissions above, as some customers use both our iron ore and our coal to produce steel), representing a three per cent increase versus 2015. |
In 2016, our shareholders passed a resolution to report on our progress in addressing climate resilience. Our new climate change report will provide information on what we are doing to prepare our business for alow-carbon future under five areas: operational emissions management; asset portfolio resilience to post-
2035 scenarios;low-carbon energy R&D and investment strategies; key performance indicators; and public policy activities. In 2016 we commenced work on identifying appropriate scenarios against which to test our business resilience. The focus in 2017 will be on applying these scenarios to our assets and products.
Operational environment performance
We manage ongoing environmental aspects at our operations to avoid or minimise related health or environmental impacts, including air emissions, noise, water discharge and waste. We have our own internal environmental and occupational health standards and are subject to various environmental regulations. Our air quality protection standard is designed to prevent breaches under normal and worst-case weather conditions, with the focus on controlling and monitoring our air emissions at their source and understanding impacts on local airsheds.
We have mechanisms to record and enable us to respond to complaints, disputes and grievances about issues such as noise and dust. While the overall number of recorded grievances is low, we work with communities neighbouring our operations to understand the impact and improve our practices. Our air quality monitoring information is made publicly available through site-specific websites and community monitoring programmes.
We look for opportunities to reuse or recycle our waste. Where that is not possible, we manage it in facilities suited to its specific physical nature and risks whilst also minimising disposal costs and avoiding future liabilities. In 2016, we disposed of or stored 1,781 million tonnes of mineral waste (predominantly waste rock and tailings) and 529,123 tonnes ofnon-mineral waste. About one fifth of our mineral waste has the potential to react with air and water or break down to create potentially harmful contaminants, such as acidic and metalliferous drainage (AMD). Our controls are designed to prevent AMD impacts.
Our water resource management programme focuses on site-specific risks, such as security of water supply, managing the quality of water returned to the environment during operations and at closure, and balancing operational needs with those of local communities, Traditional Owners and regulatory requirements.
We carry out an annual assessment of performance against site-specific water targets, which have been established for those sites where water is a material risk for the business, and focus efforts on operations that may need to improve. At the end of 2016, 67 per cent of managed operations were on track to meet their local water performance targets by 2018.
To ensure we are maintaining the right emphasis on long-term water management, we completed a detailed analysis of ourwater-related risks during 2016. The outcomes
of this will see us adopt further improvements in water governance and planning processes. During the year we supported the development of the new ICMM position statement on Water Stewardship.
Management of tailings and structures
We operate tailings and large water storage facilities at 33 sites and currently have closed impoundments that we continue to monitor at five sites. We continue to review and audit operations (including with independent external reviews) to ensure that practices at all managed tailings and major water storage facilities are in full compliance with all relevant industry standards as well as our Management of tailings and water storage facilities standard. Assurance over these storage facilities by internal and independent third-party reviews remains a focus.
During 2016, we participated in the ICMM review of tailings dam management amongst its member companies by sharing practices, protocols and assurance processes. The resultant ICMM position statement on tailings management is consistent with our own approach. It outlines principles for preventing catastrophic failures of tailings dams through risk control for planning and design, implementation and operation, monitoring and inspection, and disaster management. Since the principles identified in ICMM’s position statement are already incorporated in our standard, it was not necessary for the Rio Tinto standard to be updated.
Economic contributions
Equitably sharing the wealth that our operations create provides substantial benefits and long-term opportunities for the communities, regions and countries in which we operate. Our contributions include the transparent payment of tax to local and national governments, dividends to shareholders, the direct and indirect employment we generate, and investment in community programmes. The payments we make to our suppliers also represent a significant part of our global economic contribution. The figures in this section include the Group’s share of joint ventures and associates.
Globally, the Group’s direct economic contribution was US$35.1 billion in 2016. This includes:
| – | | US$19.5 billion in value add, made up of payments to employees, payments to governments and returns on capital. |
| – | | US$15.6 billion as payments to suppliers. |
During 2016, our capital investment was US$3.0 billion.
We are a major employer and tax contributor to local, state and national jurisdictions. We promote governance over the benefits of mining that flow through to host communities and governments by being transparent in the payments we make and by striving to provide local employment and procurement
| | | | |
| 28 | | riotinto.com | | 2016 Annual report |
opportunities. Details of the payments we made to governments will be published in ourTaxes paid in 2016 report, and made available online.
Governance
Business integrity
We are firmly committed to operating with integrity and being accountable for our actions. The key principles that guide our behaviour in theThe way we work are supported by standards that cover antitrust, business integrity, conflicts of interest, data privacy, fraud and third party due diligence. All of these are supported by workforce training. During 2016 we began a review of our company’s purpose and vision in consultation with our employees and included safety and excellence into our values.
We maintain a strict stance against bribery and corruption. We remain dedicated to open and transparent dealings with our stakeholders. Our integrity and compliance programme is aligned with the risk-based approach included in our business integrity standard. We update our training materials and delivery to ensure they remain engaging and relevant to the risks employees encounter.
Speak-OUT, the Group’s confidential and independently-operated whistleblowing programme, enables employees, suppliers contractors and community members to report anonymously, subject to local law, any significant concerns about the business, or behaviour of individuals. This could include suspicion around safety violations, environmental procedures, human rights, financial reporting or business integrity issues in general. We are committed to a culture of transparency and encourage employees to speak up about their issues and concerns, whether through their management, human resources or throughSpeak-OUT.
In 2016, 674 incidents were reported throughSpeak-OUT, compliance managers and/or management, representing an increase of approximately 12 per cent on last year. The increase is mainly due to a higher volume of incidents raised outside of the hotline. Twenty six per cent of cases raised this year were substantiated, resulting in corrective and preventative actions.
Information on the Group’s operational, financial and sustainable development performance is issued on time through a number of channels, such as media releases and regulatory filings. We communicate views to governments and others on matters affecting our business interests.
Human rights
We respect and support human rights consistent with the Universal Declaration of Human Rights, wherever we operate. We have our own human rights policy and procedures and have made voluntary commitments to the OECD Guidelines for Multinational Enterprises, the UN Global Compact and the Voluntary
Principles on Security and Human Rights (VPSHR). Our human rights approach is consistent with the United Nations Guiding Principles on Business and Human Rights (UNGPs). Where our standards and procedures are stricter than local laws, we seek to apply our own standards.
Our most salient human rights issues are those relating to security, land access and resettlement, Indigenous people’s rights including cultural heritage, environment including access to water, labour rights andin-migration-related impacts on local communities such as access to health services. In 2016 we engaged with investors, civil society and community members on issues related to our own operations and to our business partners such as land access, cultural heritage, environment and labour rights.
Human rights considerations are included in our business processes and we conduct standalone studies and programmes at high-risk sites when required. In 2016 we updated our human rights training. The introductory module will be required to be undertaken by all employees as part of our business integrity training from 2017. Function-specific modules around communities, procurement, security and inclusion and diversity will also be made available.
To support our Communities and Social Performance target for 2016-2020, sites began collecting data relating to the effective capture and management of community complaints. All sites are required to have a complaints, disputes and grievance mechanism in place in line with the effectiveness criteria for operational-level grievance mechanisms in the UNGPs. We strive to achieve the free, prior and informed consent of Indigenous communities as defined in the 2012 International Finance Corporation Performance Standard 7 and the ICMM position statement on Indigenous Peoples and Mining.
In 2016, our newSupplier code of conduct was launched, which clearly outlines expectations of our suppliers, their subsidiaries andsub-contractors including around human and labour rights. The code is available on our website and we distributed 32,000 copies to our current suppliers. We continue to work to ensure we have a comprehensive approach on responsible supply chains and human rights. Work also progressed on third-party due diligence including in relation to suppliers. We launched ourKnow your supplier procedure which establishes a process to understand legal, ethical and reputational risks arising from use of a supplier.
We developed our first annual modern slavery statement in compliance with the UK Modern Slavery Act 2015. The statement outlines the steps taken in 2016 to ensure that slavery and human trafficking are not taking place in any of our operations or supply chains. This will be published online at riotinto.com in March 2017.
We provide training for security personnel and conduct security and human rights analysis in support of our security arrangements. Our online VPSHR training is mandatory for all security personnel at high risk sites and is strongly recommended for all our other businesses. During the year we conducted VPSHR and Use of Force training for security providers at three of our locations in South Africa and Guinea.
Non-managed operations and arrangements
We hold interests in companies and joint arrangements that we do not manage, the two largest being the Escondida copper mine in Chile and the Grasberg copper-gold mine in Indonesia. We actively engage with our partners through formal governance structures and technical exchanges and endeavour to ensure that the principles inThe way we work are applied. We also encourage our partners to embed a strong safety, security and human rights culture in their workforces.
Escondida
Rio Tinto has a 30 per cent interest in Escondida, which is managed by BHP Billiton. Our seats on the Owners’ Council enable us regular input on strategic and policy matters. Sadly, there was one fatality in 2016, whereby a maintainer was fatally injured when working on the mill.
Construction of the Escondida Water Supply desalination project progressed well in 2016. Initialstart-up milestones have been met and the plant is on track to be fully operational in 2017. By utilising seawater, the plant will significantly reduce demand on fresh groundwater resources around the mine.
Grasberg
PT Freeport Indonesia (PTFI), a subsidiary of Freeport-McMoRan Copper & Gold, Inc., owns and operates the Grasberg mine in Papua, Indonesia. We have a joint operation interest attributable to the 1995 mine expansion, which entitles Rio Tinto to a 40 per cent share of production above specified levels until the end of 2021 and 40 per cent of all production after 2021 (this date is subject to extension under certain conditions). We engage with PTFI through four forums: the Operating, Technical and Sustainable Development committees and the Tailings Management board.
The largest of these, the multidisciplinary Technical Committee, enables discussion of joint operation activities such as environmental management, orebody knowledge, project execution, worker health and safety, communities, mine planning, processing and tailings management. Rio Tinto is represented by a senior environmental manager on the PTFI tailings management board, which meets twice a year at Grasberg and includes third-party experts. A Rio Tinto senior manager also works closely with PTFI on key safety improvement activities such as fatality prevention programmes.
| | | | |
| 2016 Annual report | | riotinto.com | | 29 |
| | | | | | | | | | | | | | | | |
| | | | | | | | |
| STRATEGIC REPORT | | | | DIRECTORS’ REPORT | | | | FINANCIAL STATEMENTS | | | | PRODUCTION, RESERVES AND OPERATIONS | | | | ADDITIONAL INFORMATION |
Sustainable development
continued
Tragically, there were four fatalities at PTFI operations in 2016: one electrician was fatally injured whilst performing routine maintenance on a transmission line; one worker was struck by a moving forklift; one worker fell approximately six metres when checking a power supply fault; and one mine operator who was not properly secured in a bulldozer was thrown from the machine when it slid down a bench slope. We worked with the PTFI team to share fatality prevention initiatives including CRM and “learning critical lessons” to ensure the circumstances leading to these incidents are not repeated.
Closure
Our planning for closure starts early to ensure that post-closure outcomes are achievable and that impacts and risks are minimised. The work is overseen by our Closure Steering Committee to ensure good closure processes and governance.
We work with local communities and regulators to evaluate potential post-closure land uses and agree on closure objectives. During 2016, we continued detailed closure planning for a number of large mines that will reach the end of their commercially viable life over the next ten years.
We manage a range ofnon-operational sites, including those inherited through acquisitions and mergers, some of which are remotely located or are former industrial or brownfield sites. During 2016, 11 of the sites progressed to the point where we can relinquish them. In many jurisdictions we maintain long-term responsibility for monitoring and managing the sites. We are also learning from the
commitments and expectations associated with operations we have relinquished.
We aim to progressively rehabilitate land as we operate at a mine site. In 2016, 26 per cent of our disturbed land (excluding land disturbed for hydroelectricity dams) had been rehabilitated.
Our industry is entering a new stage in mine closure, with many of our peers also planning to close large operations over the next decade. In many jurisdictions where we operate, regulatory frameworks for large mine closure remain undeveloped or untested. In collaboration with our peers, we are improving our understanding of opportunities, seeking solutions to challenges and engaging governments to establish good closure policies and regulations.
Assurance
We engaged an independent external assurance organisation, PricewaterhouseCoopers, to provide the directors of Rio Tinto with assurance on selected sustainable development subject matters, as explained on the next page.
PricewaterhouseCoopers’ assurance statement satisfies the requirements of subject matters 1 to 4 of the ICMM assurance procedure.
Further information on external auditors and internal assurance is included in the Directors’ report under the Corporate governance section on pages 60 and 66.
| | | | |
| 30 | | riotinto.com | | 2016 Annual report |
Independent limited assurance report
| | |

| | What we found Based on the work described below, nothing has come to our attention that causes us to believe that the selected subject matter for the year ended 31 December 2016 has not been prepared, in all material respects, in accordance with the Reporting criteria. |
To the directors of Rio Tinto plc and Rio Tinto Limited (together Rio Tinto)
What we did
Rio Tinto engaged us to perform a limited assurance engagement on the selected subject matter within the Sustainable development sections of the Rio Tinto 2016 Annual report and the Rio Tinto 2016 Strategic report for the year ended 31 December 2016.
Selected subject matter
| – | | Rio Tinto’s assertion that it has incorporated the requirements of the 10 sustainable development principles of the International Council on Mining & Metals (ICMM) and the mandatory requirements set out in ICMM Position Statements into its own policies |
| – | | Rio Tinto’s assertions regarding the approach that it has adopted to identify and prioritise its material sustainable development risks and opportunities |
| – | | Rio Tinto’s assertions regarding the existence and status of implementation of systems and approaches used to manage the following selected sustainable development risk areas: |
| | – | | Greenhouse gas emissions |
| – | | The following Rio Tinto performance data related to the selected sustainable development risk areas: |
| | – | | All injury frequency rate |
| | – | | Lost time injury frequency rate |
| | – | | Number of lost time injuries |
| | – | | Total greenhouse gas emissions |
| | – | | Greenhouse gas emissions intensity |
| | – | | Percentage of managed operations with material water risk that are on track to achieving their approved local water performance targets |
Reporting criteria
The subject matter above has been assessed against the ICMM Sustainable Development
Framework and the definitions and approaches within the Glossary which will be presented at www.riotinto.com/sd2016/glossary as at 2 March 2017.
Independence and Quality Control
We have complied with relevant independence requirements and other ethical requirements of theCode for Ethics for Professional Accountantsissued by the International Ethics Standards Board for Accountants, which is founded on fundamental principles of integrity, objectivity, professional competence and due care, confidentiality and professional behaviour.
PricewaterhouseCoopers applies International Standard on Quality Control 1 and accordingly maintains a comprehensive system of quality control including documented policies and procedures regarding compliance with ethical requirements, professional standards and applicable legal and regulatory requirements.
Responsibilities
PricewaterhouseCoopers
Our responsibility is to express a conclusion based on the work we performed.
Rio Tinto
Rio Tinto management is responsible for the preparation and presentation of the selected subject matter in accordance with the Reporting criteria.
What our work involved
We conducted our work in accordance with the International Standard on Assurance Engagements 3000 (Revised)Assurance Engagements Other than Audits or Reviews of Historical Financial Informationand (for selected subject matter relating to greenhouse gas emissions) the International Standard on Assurance Engagements 3410 Assurance Engagements on Greenhouse Gas Statements. These Standards require that we comply with independence and ethical requirements and plan the engagement so that it will be performed effectively.
Main procedures performed
| – | | Making enquiries of relevant management of Rio Tinto regarding the processes and controls for capturing, collating and reporting the performance data within the selected subject matter, and evaluating the design and effectiveness of these processes and controls |
| – | | Validating the operation of controls over the accuracy of injury classification and assessing the final injury classification applied for a sample of injuries reported during the year ended 31 December 2016 |
| – | | Testing the arithmetic accuracy of a sample of calculations of performance data within the selected subject matter |
| – | | Assessing the appropriateness of the greenhouse gas emission factors applied in calculating the Total greenhouse gas emissions and Greenhouse gas emissions intensity |
| – | | Testing performance data, on a selective basis, substantively at both an operational and corporate level, which included testing at a selection of operations from across Aluminium, Copper & Diamonds, Energy & Minerals, and Iron Ore |
| – | | Undertaking analytical procedures over the performance data within the selected subject matter |
| – | | Making enquiries of relevant management and reviewing a sample of relevant management information and documentation supporting assertions made in the selected subject matter |
We believe that the information we have obtained is sufficient and appropriate to provide a basis for our conclusion.
|
 |
| Liza Maimone |
| Partner |
| 1 March 2017 |
|
 |
| PricewaterhouseCoopers |
| Canberra |
Liability limited by a scheme approved under Professional Standards Legislation
| | | | |
Inherent limitations Inherent limitations exist in all assurance engagements due to the selective testing of the information being examined. Therefore fraud, error ornon-compliance may occur and not be detected. Additionally,non-financial data may be subject to more inherent limitations than financial data, given both its nature and the methods used for determining, calculating and sampling or estimating such data. | | Restriction on use This report has been prepared in accordance with our engagement terms to assist Rio Tinto in reporting its sustainable development performance. We do not accept or assume responsibility for the consequences of any reliance on this report for any other purpose or to any other person or organisation. Any reliance on this report by any third party is entirely at its own risk. We consent to the inclusion of this report in the Rio Tinto 2016 Annual report and the Rio Tinto 2016 Strategic report to assist Rio Tinto’s members in assessing whether the directors have discharged their responsibilities by commissioning an independent assurance report in connection with the selected subject matter. | | Limited assurance This engagement is aimed at obtaining limited assurance for our conclusions. As a limited assurance engagement is restricted primarily to enquiries and analytical procedures and the work is substantially less detailed than that undertaken for a reasonable assurance engagement, the level of assurance is lower than would be obtained in a reasonable assurance engagement. |
| | | | |
| 2016 Annual report | | riotinto.com | | 31 |
| | | | | | | | | | | | | | | | |
| | | | | | | | |
| STRATEGIC REPORT | | | | DIRECTORS’ REPORT | | | | FINANCIAL STATEMENTS | | | | PRODUCTION, RESERVES AND OPERATIONS | | | | ADDITIONAL INFORMATION |
Iron Ore
Financial performance
| | | | | | | | |
| | | 2016
US$ million | | | 2015
US$ million | |
| Gross revenue (a) | | | 14,605 | | | | 13,952 | |
| Net cash generated from operating activities | | | 5,644 | | | | 5,844 | |
| Underlying earnings | | | 4,611 | | | | 3,940 | |
| Capital expenditure (a) | | | 868 | | | | 1,608 | |
| Net operating assets | | | 16,339 | | | | 16,850 | |
| Underlying EBITDA | | | 8,526 | | | | 7,675 | |
Iron Ore Company of Canada and Simandou are reported within Energy & Minerals (see page 38), reflecting management responsibility.
| (a) | Gross revenue and capital expenditure are defined on page 202 under Notes to financial information by business unit. |
Strategy and priorities
The Iron Ore product group’s vision and strategy is focused on delivering optimal value from its integrated system of assets.
These strategic principles guide the business:
| – | | Safety is the number one priority. |
| – | | Focus on value over volume to ensure the optimum outcome based on the combination of revenue, operating costs and capital expenditure. |
| – | | Engaged employees are the key to success. |
| – | | Mine-to-market productivity is an important driver of cash generation. |
| – | | Making a lasting and positive contribution will build strong partnerships. |
The group’s strategic priorities are to:
| – | | Run safe and fatality-free operations. |
| – | | Employ a workforce of fully engaged people. |
| – | | Sustain the competitive advantage of premium Pilbara Blend products. |
| – | | Realise the full potential of the system to maximise cash flow and productivity from the existing asset base. |
| – | | Harness innovation and technology to help drive superior performance. |
| – | | Follow a disciplined, value-accretive approach to growth. |
| – | | Engage with its highly valued partners and support sustainable local and regional investment. |
Safety
The tragic death of a colleague at the Paraburdoo operations in June was a sobering reminder of the critical risks in the business. A maintainer died following the unexpected movement of a hydraulic arm while carrying out maintenance work on a drill rig. The business is implementing the learnings from this incident, so that the same or a similar accident can never happen again. This terrible event strengthened the resolve of the business to fully implement the critical risk management fatality elimination programme which was rolled out in 2016. This programme aims to ensure key risks are identified and the right
protections are in place before any job starts. Critical control checklists were fully implemented across all operations and operational leaders and team members are actively verifying tasks to ensure that critical controls are in place.
The all injury frequency rate stayed consistent in 2016 at 0.45 compared with 0.45 in 2015. A focus by frontline leaders on visible leadership in the field has been maintained and will help drive the rate down.
In 2016, Iron Ore continued to work to sustain the employee wellbeing strategy through training and educating leaders in how to manage fitness for work, understand mental wellness and build resilience.
The Yandicoogina team was named the winner of the 2016 Safety and Health Innovation award by the Chamber of Minerals and Energy of Western Australia for its breakthrough project to reduce manual handling injuries.
Greenhouse gas emissions
Throughout 2016, Iron Ore continued to reduce its greenhouse gas emissions intensity across mine, rail and port operations compared with the baseline target set in 2008. Since 2008, the product group’s greenhouse gas emissions intensity has improved by 2.2 per cent.
Review of operations
In the Pilbara, Rio Tinto operates the world’s largest integrated portfolio of iron ore assets. This system comprises 15 mines, four independent port terminals, over 1,700km of the largest privately owned heavy freight railway in Australia, and supporting infrastructure, all linked by the Operations Centre in Perth.
In 2016, Rio Tinto celebrated 50 years since the first shipment of iron ore from the Pilbara operations. Events were held in regional Western Australia, Perth and internationally to recognise and acknowledge the significant contribution of past and present employees, customers, suppliers, communities and other partners who helped shape theworld-class business.
Rio Tinto Marine delivers shipping services to the wider Rio Tinto Group, including Iron Ore.
In 2016, Iron Ore’s underlying earnings increased by US$671 million, up 17 per cent on 2015. This was achieved through record sales volumes, continued cash cost savings and higher iron ore prices.
Iron Ore shipments for 2016 met the guidance at 327.6 million tonnes (Rio Tinto share: 268.9 million tonnes), an increase of three per cent on 2015, attributable to the newly expanded infrastructure and minimal weather events.
Production of 329.5 million tonnes (Rio Tinto share: 270.7 million tonnes) in 2016 was six per cent higher than in 2015. The strong production performance in 2016 follows the ramp up of expanded mines, operational
productivity improvement projects across most sites and minimal weather events.
Contestable iron ore demand in 2016 increased by around 80 million tonnes to 1.8 billion tonnes.Rest-of-world contestable demand recovered from a weak start to the year to be slightly higher than 2015 levels. Additional demand was met predominantly by expansions from the top six producers which netted around 55 million tonnes in 2016. Notably, theramp-ups of Roy Hill and Minas Rio added almost 30 million tonnes.
In 2016, the iron ore price averaged around US$58.40 per dry metric tonne (Platts 62 per cent Fe CFR), up from an average of around US$55.50 per dry metric tonne in 2015. This masks a significant range in iron ore prices during 2016. Prices ranged from a low of US$39.25 per dry metric tonne inmid-January to a peak of US$83.95 per dry metric tonne inmid-December.
Rio Tinto Marine shipped 281 million tonnes of dry bulk cargo on behalf of the entire Rio Tinto Group, an increase of six per cent on 2015. By volume, Rio Tinto is the largest dry bulk shipping business in the world, operating 17 vessels of its own and contracting a fleet of around 200 vessels at any given time.
Average freight rates in 2016 tracked below 2015 and forward voyage rate curves are flat, reflecting ongoing vessel oversupply and low bunker fuel prices.
A strong pipeline of initiatives in 2016 resulted inpre-tax cash cost reductions of US$318 million. Iron Ore has now delivered US$1.4 billion of cumulative savings compared with the 2012 base, making a significant contribution to the wider Rio Tinto Grouppre-tax savings.
Further efficiency improvements reduced the Pilbara cash unit costs to US$13.7 per tonne in 2016, compared with US$14.9 per tonne in 2015. Cost savings initiatives included optimising system maintenance shut intervals and alignment, and improving contracting arrangements such as theten-year integrated facilities management agreement signed in 2016 that is expected to deliver more than US$75 million in cash benefits during 2016 and 2017. Productivity improvements included increasing effective utilisation across the Pilbara fleet, increasing payloads and reducing ore car dumper cycle times.
Iron Ore continues to be a leader in safe autonomous mining technologies. The Operations Centre controls and operates major assets including autonomous haul trucks and drills, processing plants, train loading and unloading, and stockyard stacking and reclaiming machines.
The automated truck fleet continues to provide advantages relating to safety, productivity and operating costs. On average, each of the 72 autonomous haul trucks, which is 20 per cent of the fleet, operated an additional 1,000 hours and at 15 per cent lower cost in 2016 than comparable conventional haul trucks.
| | | | |
| 32 | | riotinto.com | | 2016 Annual report |
The performance of autonomous trucks and increased utilisation of all trucks, together with improvements in payload, has reduced fleet requirements, resulting in lower capital expenditure and operating costs.
Iron Ore continues to consider the optimal size of its automated truck fleet, including new purchases and evaluatingmanned-to-autonomous conversion for the existing fleet.
Autonomous drills at West Angelas also operated for an average 1,000 more hours per drill compared with conventional drills. Autonomous drills are now being deployed at Yandicoogina.
Further progress was made with the AutoHaul® project in 2016, bringing it closer to implementation. This will deliver a step change in the safety controls and productivity of rail operations. One hundred per cent of planned territory track is now AutoHaul® enabled. Since testing began in 2014, more than 600,000 kilometres of track has been covered in AutoHaul® mode with a driver in attendance. The implementation of AutoHaul® will transition to the rail operations team in 2017 and its use is expected to progressively expand during the year. Full implementation is scheduled for the end of 2018.
Iron Ore maintained its focus on supporting local communities, Aboriginal Traditional Owners, businesses and people within its operational footprint. The product group continued actively implementing participation agreements with Traditional Owners in the Pilbara, which secure land access for the life of mining operations. In 2016, along with Pilbara Traditional Owners, Iron Ore completedfive-year reviews of the Participation Agreements and Regional Framework Deed. It also finalised the Participation Agreement with the Banjima people, its tenth agreement in the Pilbara. Relationships with Pilbara Traditional Owners are integral to Iron Ore’s privilege to operate and it has now signed agreements with all Native Title Claim groups who hold interests in areas of the Pilbara in which it operates. These agreements incorporate mutual obligations to deliver outcomes in employment, financial compensation, education and training, heritage surveys and practices, environmental care and land use.
Iron Ore remains one of the largestprivate-sector employers of Indigenous people in Australia, with approximately 900 Indigenous employees, including 380 Pilbara Aboriginal people. In 2016, Rio Tinto launched its elevate Reconciliation Action Plan – the first industry group to launch a RAP at this level – where it publicly committed to meeting eight per cent Indigenous employment across Australia by the end of 2018. Indigenous employment was 7.8 per cent across Iron Ore as at December 2016.
Iron Ore continues to support programmes and initiatives across the Pilbara, and itsfly-in,fly-out (FIFO) source communities in regional Western Australia and Perth. Its award-winning Community Infrastructure and Services Partnership with Pilbara local governments continued its success during 2016 with the delivery of key community infrastructure projects. The Partnerships with the City of Karratha and the Shire of Ashburton work to deliver real benefits to the community to ensure the Pilbara is a great place to live through a shared vision of improving town amenities and revitalising communities.
Development projects
Iron Ore’s mineral resources position continues to support sustaining production and growth options in the Pilbara. Managing this base efficiently forms the basis of creating a development sequence which maximises the value of its assets and maintains the required delivery of customer product. Ore reserves are being maintained in line with mine production. Given their significance to the business and customers, the focus continues on the premium Pilbara Blend products.
Iron Ore has invested over US$14 billion in Pilbara mines and infrastructure growth, increasing production by more than 50 per cent and expanding port operations to 360 million tonne capacity. With the completion of the ports development the focus has shifted to productivity-driven growth supported bylow-capital-cost brownfield developments.
Since 2012, Iron Ore has followed a disciplined, value-accretive,low-cost brownfield approach to the expansion of Pilbara operations. Most recently, efforts have been concentrated on the Nammuldi Incremental Tonnes (NIT) project which was fully commissioned in 2016 and provides 10 million tonnes of high-grade,low-phosphorus ore annually.
The balance of the full Silvergrass mine comprises the installation of a satellite crusher and overland conveyor, increased autonomous mining capacity and the expansion of Nammuldinon-process infrastructure. It will add an extra 10 million tonne capacity to the NIT expansion with first ore expected in the second half of 2017. Following approval of the final capital allocation for the full Silvergrass project in August 2016, the overall capital intensity is around US$29 per tonne. Replacing the road trains being used at Nammuldi with a conveyor will also significantly reduce operating costs.
A number of sustaining mine developments also progressed in 2016. The West Angelas Deposit F project will use existing processing and plant infrastructure to support total production of 35 million tonnes per year from the West Angelas mine.
Yandicoogina Oxbow is being built as a supporting mine for the Yandicoogina operations, assisting in sustaining current production rates of 56 million tonnes per year. Yandicoogina Oxbow will use existing facilities and will expand the Yandicoogina autonomous truck fleet.
The Iron Ore group continues to invest in community infrastructure in regional towns. The A$18 million Dampier Community Hub was officially opened in July while the A$4.6 million Paraburdoo Childcare Centre opened in October. The Red Earth Arts Precinct commenced construction in the fourth quarter which will provide state of the art theatre and library services. These projects were made possible through financial contributions from Rio Tinto and the State Government’s Royalties for Regions programme and local government.
Rio Tinto will contribute A$8 million towards the construction and operation of the A$14.5 million Paraburdoo Community Hub. The Shire of Ashburton secured remaining funds for the project in the fourth quarter of 2016. Construction is expected to commence in 2017, with completion of the Paraburdoo Community Hub in 2018. Various other civic projects were also unveiled during the year.
Outlook
Iron ore and steel, along with a number of other commodity prices, experienced strong price appreciation towards the end of 2016. Several factors have buoyed China’s steel demand such as downstream restocking, higher inflation expectations and a supportive credit and monetary environment.Rest-of-world steel output has been supported by a considerable improvement in macroeconomic conditions across advanced economies in the fourth quarter of 2016.
China’s current high rates of steel production are anticipated to unwind somewhat in 2017 in part due to an expected gradual withdrawal in stimulus. Over the longer term, there is still room for Chinese steel production to grow – driven by manufactured goods such as automobiles and machinery, and increasing replacement requirements. Steel production in the worldex-China will continue to grow with capacity expansions in India, the Middle East and ASEAN coming to fruition and stronger macroeconomic conditions in other key steel markets.
Over the next few years, Rio Tinto expects further supply fromlow-cost producers and new entrants. In addition, the Group expects to see further exits as the significant input cost deflation experienced in 2015, particularly in oil and exchange rates, begin to reverse.
| | | | |
| 2016 Annual report | | riotinto.com | | 33 |
| | | | | | | | | | | | | | | | |
| | | | | | | | |
| STRATEGIC REPORT | | | | DIRECTORS’ REPORT | | | | FINANCIAL STATEMENTS | | | | PRODUCTION, RESERVES AND OPERATIONS | | | | ADDITIONAL INFORMATION |
Aluminium
Financial performance
| | | | | | | | |
| | | 2016
US$ million | | | 2015
US$ million | |
| Gross revenue | | | 9,458 | | | | 10,117 | |
| Net cash generated from operating activities | | | 2,074 | | | | 2,413 | |
| Underlying earnings | | | 947 | | | | 1,118 | |
| Capital expenditure | | | 916 | | | | 1,682 | |
| Net operating assets | | | 15,782 | | | | 15,949 | |
| Underlying EBITDA | | | 2,472 | | | | 2,742 | |
Strategy and priorities
Rio Tinto’s Aluminium product group continues to focus on deliveringindustry-leading performance and value creation throughout the cycle. The product group benefits from a sector-leading bauxite position, large-scale alumina refineries and a low first-quartile average cost smelter portfolio. Aluminium’s strategy focuses on:
| – | | Safety as the number one priority. |
| – | | Prioritising value over volume. |
Each of the three areas of the business – bauxite, alumina and primary metal – has its own targets and strategies, summarised below:
| – | | In bauxite, the emphasis is on capturing value from expanding seaborne demand. This involves continuing to enhance performance and output at current operations while developing Tier 1 growth opportunities such as the Amrun project. |
| – | | In alumina, providing security of supply to the group’s smelter portfolio is essential. The focus is on aggressively driving down costs to improve the refineries’ positioning on the industry cost curve. |
| – | | In primary metal, the Aluminium group focuses on leveraging itslow-cost,low-carbon power position – a significant and sustainable competitive advantage. |
The three product areas are supported by a single global commercial organisation that focuses on maximising value from mine to market, while providing customers withhigher-margin, value-added products and services.
Safety
In 2016, Aluminium achieved a second consecutive fatality-free year. The product group’s all injury frequency rate continued its downward trend, ending the year at 0.46 compared with the 0.48 rate recorded at the end of 2015. The group is striving to improve its overall safety performance further, with the ultimate goal of achieving a zero harm workplace. To that end, it has deployed a comprehensive systems-based approach, including the roll-out of the critical risk management fatality elimination programme during 2016.
Greenhouse gas emissions
Rio Tinto’s Aluminium group has one of the lowest carbon footprints in the aluminium industry. Since 2008, the group has reduced greenhouse gas (GHG) emissions by 45 per cent in absolute terms and 36 per cent in intensity. GHG emissions intensity of the group’s primary aluminium production reduced by 39 per cent in 2016 compared with 2008, due to portfolio management and the ramp-up of the modernised Kitimat smelter in 2016. Compared with the global aluminium industry, Rio Tinto offers a metal with one of the lowest GHG footprints based on a life cycle analysis approach(a). This GHG footprint is 50 per cent lower than the global industry average, thanks tolow-carbon sources of electricity andworld-leading technology. Almost 80 per cent of the Aluminium group’s total power needs are supplied by low-carbon sources, with 55 per cent coming from self-generated hydropower, compared with 35 per cent for the industry. This unique combination enables the Aluminium group to respond to increasing market demand for responsible metal produced with a low carbon dioxide footprint through Rio Tinto’s globally available RenewAl™ brand.
Review of operations
The quality of its assets combined with a robust, highly disciplined performance management system enabled the Aluminium group to reinforce its position as a sector-leading business in 2016 and to deliver superior results, despite the ongoing market challenges.
The product group achieved underlying earnings of US$947 million (2015: US$1,118 million). This performance was driven by the ongoing strength of the group’s operational performance and the continued delivery of strong cash cost savings. This helped largely to offset the ten per cent reduction in Rio Tinto’s average realised price for primary metal products – including regional and product premia (US$1,849 per tonne in 2016 compared with US$2,058 per tonne in 2015). Cash cost improvements of US$481 million(pre-tax), a 48 per cent increase compared with 2015 savings, are evidence of the efficiency momentum within the Aluminium group. Savings realised over the past four years now total more than US$1.6 billion, further entrenching the group’s superior integrated EBITDA margins. The resilience of the group’s underlying EBITDA, combined with further reductions in working capital levels, resulted in net cash generated from operating activities of US$2,074 million.
| (a) | Life cycle analysis approach takes into account the entire production process, electricity generation, and the product’s use andend-of-life. |
At the end of 2016, the Aluminium product group was carrying out some 1,200 value improvement initiatives across its operations. These are designed to strengthen margins further through production and procurement efficiencies and reduced support costs.
All three of the Aluminium group’s product segments demonstrated strong operational performance and delivered strongyear-on-year production increases. In 2016, the Aluminium product group delivered more than 29 million tonnes of bauxite to third parties. This represented a ten per cent increase on 2015 levels and reinforced Rio Tinto’s position as the largest single seaborne bauxite supplier in the world. Record production achieved at the Weipa and Gove mines in Australia contributed to a nine per cent increase in Rio Tinto’s global bauxite production. Alumina production increased by five per cent in 2016 due primarily to operational improvements driving record production at Yarwun (up 11 per cent). Production records were also realised at the Jonquière and São Luis refineries.
Rio Tinto’s aluminium production for 2016 was ten per cent higher than in 2015, reflecting the successfulramp-up of the modernised and expanded Kitimat smelter. This delivered its full nameplate capacity of 420,000 tonnes from the second quarter, while ongoing production creep through productivity improvements helped to deliver annual production records at ten smelters.
In 2016, Rio Tinto completed the sale of its Carbone Savoie cathode blocks business in France, and its Lochaber smelter and hydropower facilities in the UK. The divestments reflect the Aluminium group’s determination to continue refining its portfolio to ensure the most effective use of capital.
| | | | |
| 34 | | riotinto.com | | 2016 Annual report |
Development projects
The Aluminium group’s development pipeline focuses on its competitive advantages in energy and bauxite.
In 2016, construction commenced on the Amrun bauxite project, south of the Embley River in Cape York, Queensland, Australia. With mining costs projected to be in the first quartile of the cost curve, Amrun is an exceptional project: long life, low cost and expandable; and strategically placed to satisfy increasing demand for seaborne bauxite. With an approved capital cost of US$1.9 billion, the project includes a mine plus port facilities and infrastructure that could be leveraged for future expansions. At the end of 2016, the project was 25 per cent complete and proceeding on time and on budget, having met all major project milestones for the year. Planned initial output for Amrun is 22.8 million tonnes per annum beginning in 2019. The project will partly replace the depleting East Weipa mine with lower-cost production, while also delivering additional volumes of around 10 Mt/a.
A US$0.7 billion expansion currently under way by the joint-venture Compagnie des Bauxites de Guinée will further enhance Rio Tinto’s strong bauxite position.
The Kitimat Modernisation Project was successfully completed at the end of Q1 2016, and the modernised and expanded smelter reached full nameplate capacity in April 2016. Output at the smelter, which uses the Aluminium group’s wholly owned Kemano hydropower resource and high-efficiency AP smelting technology, has been increased by 48 per cent while overall environmental emissions have been reduced by nearly 50 per cent. Energy efficiency has also increased by 33 per cent. Kitimat is already positioned in the lowest decile of the industry cost curve.
Outlook
The long-term outlook for aluminium remains strong. The consensus view foresees a steady increase in demand, averaging two to three per cent per year over the next 15 years. This translates into additional consumption of 25.8 Mt (around 1.7 Mt/a) compared with a 2015 base of 56.6 Mt.
This outlook is driven mainly by rising utilisation intensity and more diverseend-use applications. In the automotive sector, for example, manufacturers are planning to use significantly more aluminium in the future to make lighter vehicles that consume less fuel and produce fewer emissions.
Developing economies, where current consumption is low, also provide solid growth potential for aluminium. In India, for example, consumption is less than two kilograms of aluminium per capita compared with 20 kilograms in more developed economies.
Despite this positive long-term view, 2016 was another difficult year for the aluminium industry, with London Metal Exchange (LME) prices remaining at levels last seen during the global financial crisis.
Looking forward, while China continues to add smelting capacity, the global market is moving back towards balance after eight years of working through excess inventory and capacity overhang. Atyear-end 2016, stocks were down to 11 weeks of supply, compared with a high of 16 weeks in 2009, and the downward trend appears set to continue.
Prospects for bauxite – a sector where Rio Tinto maintains a very strong competitive position – are positive. The projected growth rate, driven mostly by seaborne bauxite traded into the China market, is outpacing that of aluminium. This is due to both a desire by China to be self-sufficient in alumina, and the continuing depletion and reduction in quality of China’s bauxite resource position.
| | | | |
| 2016 Annual report | | riotinto.com | | 35 |
| | | | | | | | | | | | | | | | |
| | | | | | | | |
| STRATEGIC REPORT | | | | DIRECTORS’ REPORT | | | | FINANCIAL STATEMENTS | | | | PRODUCTION, RESERVES AND OPERATIONS | | | | ADDITIONAL INFORMATION |
Copper & Diamonds
Financial performance
| | | | | | | | |
| | | 2016
US$ million | | | 2015
US$ million | |
| Gross revenue | | | 4,524 | | | | 5,592 | |
| Net cash generated from operating activities(1) | | | 987 | | | | 1,575 | |
| Underlying (loss)/ earnings | | | (18 | ) | | | 370 | |
| Capital expenditure | | | 924 | | | | 806 | |
| Net operating assets | | | 11,531 | | | | 11,552 | |
| Underlying EBITDA | | | 1,387 | | | | 1,833 | |
| (1) | Net cash generated from operating activities excludes the operating cash flows from equity accounted units (mainly Escondida) but includes dividends from equity accounted units. |
Strategy and priorities
The Copper & Diamonds product group’s strategy is to deliver sustainable value by:
| – | | driving continuous improvements in safety, the number one priority; |
| – | | focusing on value over volume at our existing operations; |
| – | | driving improvements in productivity and commercial excellence; |
| – | | developing copper brownfield growth options and new, world-class greenfield projects inlow-risk jurisdictions; |
| – | | focusing on cost control and cash generation; and |
| – | | developing strong leaders and an aligned, capable, engaged, diverse and collaborative workforce. |
Safety
In 2016, there were zero fatalities in the Copper & Diamonds group’s managed operations, and the all injury frequency rate was 0.38 compared with 0.45 in 2015.
Sadly, the Grasberg and Escondida mines, in which we are a joint venture partner, suffered fatal incidents during 2016. At Grasberg there were four fatalities. Further details are included on page 30.
Rio Tinto continues to support PT Freeport Indonesia, Grasberg’s managing partner, in developing and implementing safety programmes and initiatives.
Copper & Diamonds continued to embed the company’s critical risk management fatality elimination programme, which is aimed at identifying and mitigating the common dangers that can lead to fatalities, into all its operations.
Greenhouse gas emissions
The Copper & Diamonds group’s 2016 greenhouse gas (GHG) emissions were 3.3 million tonnes of carbon dioxide equivalent (tCO2-e), which is 0.1 million tonnes CO2-e less than 2015. The emissions intensity improved at Rio Tinto Kennecott and the Oyu Tolgoi copper-gold mine while marginally deteriorating for Diamonds. This was due to increased intensity at the Diavik Diamond Mine.
Review of operations
Rio Tinto combined its copper and diamonds businesses in July. At the end of 2016, the integrated Copper & Diamonds group had four copper assets and two diamonds assets in production.
In 2016, both total mined copper and total diamonds production increased by four per cent. The product group produced 523 thousand tonnes of mined copper (Rio Tinto share), and 18 million carats of rough diamonds (Rio Tinto share) in 2016. Copper & Diamonds also produced 294 thousand ounces of mined gold, 4,210 thousand ounces of mined silver and 2.8 thousand tonnes of molybdenum as byproducts. Rio Tinto is now the world’s seventh largest copper supplier and remains one of the largest diamond producers.
The Copper & Diamonds group’s underlying loss of US$18 million (compared with underlying earnings of US$370 million in 2015) was driven by lower prices. This includes US$114 million ofone-offnon-cash asset write-downs which concludes the asset portfolio review at Rio Tinto Kennecott. The group generatedpre-tax cash cost improvements of US$278 million in 2016, delivering US$78 million in free cash flow. All Copper & Diamonds managed operations were cash flow positive in challenging market conditions.
The Bunder diamond project in India was closed down at the end of 2016 and project assets have been approved to be gifted to the State Government of Madhya Pradesh in 2017.
In June 2016, Rio Tinto transferred its 53.8 per cent shareholding Bougainville Copper Limited (BCL) to an independent trustee.
Operating assets
Copper
Rio Tinto Kennecott
(Rio Tinto: 100 per cent)
Kennecott supplies approximately eight per cent of US refined copper requirements. In 2016, Kennecott produced 156 thousand tonnes of refined copper, 135 thousand ounces of refined gold, and 2.8 thousand tonnes of molybdenum.
Mined copper production in 2016 was significantly higher than 2015 as mining progressed through an area of higher grades.
In addition, the operation maximised smelter utilisation by receipt of 315 thousand tonnes of third-party concentrate for tolling in 2016.
Oyu Tolgoi
(Rio Tinto: 50.8 per cent interest in Turquoise Hill Resources)
Located in Mongolia’s South Gobi Desert, Oyu Tolgoi is one of the world’s largest copper-gold mines. In 2016, Oyu Tolgoi’sopen-pit mine produced 201 thousand tonnes of copper, 300 thousand ounces of mined gold and 1,420 thousand ounces of silver (100 per cent basis). Mined copper production for 2016 was in line with 2015, as the impact of lower grades was offset by higher throughput, a new record for the mill.
Escondida
(Rio Tinto: 30 per cent interest)
Located in Chile’s Atacama Desert, Escondida is the world’s largest copper-producing mine. In 2016, Escondida produced 1,011 thousand tonnes of mined copper (100 per cent basis). Mined copper production at Escondida in 2016 was 12 per cent below 2015 due to lower grades and slightly reduced mill throughput.
Grasberg
(A joint operation that gives Rio Tinto a 40 per cent share of production above specified levels until the end of 2021 and 40 per cent of all production thereafter under the Participation Agreement. This date is subject to extension under certain conditions including force majeure.)
Grasberg is owned and operated by PT Freeport Indonesia (PTFI), a subsidiary ofUS-based Freeport-McMoRan, Inc. Located in the province of Papua, Indonesia, it is one of the world’s largest copper mines. Rio Tinto’s share of mined copper production at Grasberg was nil in 2016 due to the minimum production threshold not being met.
On 12 January 2017, the Government of Indonesia issued new mining regulations to address exports of unrefined metals, including copper concentrates, and other matters related to the mining sector. These regulations impact PTFI’s operating rights, including its right to continue to export concentrate without restriction, and may have a significant impact on Rio Tinto’s share of production in 2017.
| | | | |
| 36 | | riotinto.com | | 2016 Annual report |
PTFI continues to engage with Indonesian government officials and has advised that if it is prohibited from exporting copper concentrate it would be required to reduce production to match domestic smelting capacity, resulting in near-term actions to reduce its workforce, significantly reduce costs and suspend future investments on its underground development projects and new smelter. PTFI has indicated that it will consider legal action to enforce its contractual rights should it fail to reach a mutually satisfactory agreement with the Indonesian government.
Diamonds
Argyle Diamond Mine
(Rio Tinto: 100 per cent)
Located in the remote east Kimberley region of Western Australia, Argyle is one of the world’s largest producers of diamonds by volume. Ramp-up of production from the underground mine delivered a four per cent increase in carat production compared with 2015. However, the combination of lower-than-expected volumes and prices has led to a pre-tax impairment charge of US$241 million to property, plant and equipment and intangible assets being recorded.
Diavik Diamond Mine
(Rio Tinto: 60 per cent)
Diavik is located in Canada’s remote
Northwest Territories, 220km south of the Arctic Circle. At Diavik, carats recovered in 2016 were four per cent higher than 2015 due to higher ore throughput offsetting lower grades.
Development projects
Rio Tinto Kennecott
Through improved utilisation and payload, Kennecott will drive an approximately five per cent improvement in truck productivity, which equates to around 12 million tonnes of additional material moved in 2017.
Kennecott is in the process of executing the South Pushback project, which is key to unlocking the existing ore reserve and potential growth options.
Grasberg
Work continues to develop the large-scale, high-grade underground orebodies located beneath and proximal to the Grasberg open pit. The underground orebodies are expected to ramp up over several years following the anticipated transition from the Grasberg open pit.
Oyu Tolgoi
Development of Oyu Tolgoi’s underground mine was approved in May 2016, with first production expected in 2020. When the underground is fully ramped up in 2027, the company expects it to produce more than 500,000 tonnes of copper a year.
Diavik
The development of the A21 kimberlite pipe at Diavik is advancing as planned, with first production expected in 2018. A21 will provide an important source of incremental production to maintain current volumes through to the end of mine life.
Resolution Copper
(Rio Tinto: 55 per cent)
The Resolution Copper project, located in Arizona, US, is one of the world’s largest undeveloped copper deposits. Drilling, proposed development and engineering studies continue and in March 2016, the National Environmental Policy Act (NEPA) process formally began for the proposed development.
Operational & Technical Support
In 2016, the Copper & Diamonds group formed an Operational & Technical Support team to improve the safety, cash flow and long-term value of its assets by delivering productivity improvements. The team works across Copper & Diamonds’ managed andnon-managed operations in four disciplines: resource strategy, surface mining, underground mining and ore processing.
Outlook
Copper
After reaching multi-year lows in early 2016, the copper market saw an improvement in the fourth quarter of 2016 and this momentum has continued in the first months of 2017. Rio Tinto continues to expect near-term volatility in the copper market before a structural deficit emerges going into the next decade. The Group expects China to continue to be a key driver of commodity markets in the next decade, after which, demand from emerging markets, including India, South East Asia, the Middle East, Latin America and Africa, will begin to ramp up. In the developed world, green technologies should drive increased demand over time. Meanwhile, supply growth will continue to be constrained by lower grades and the depletion of mature mines and often higher cost and more challenging development options.
Diamonds
The diamond market outlook for 2017 is positive, although macro events, currency movements, policy choices and short-term supply availability will continue to impact market confidence and trading conditions.
However, medium to long-term fundamentals for the diamond industry remain positive. Support for future price growth can be attributable to a declining global mineral resource base, exacerbated by limited exploration investment and success, resulting in reductions in supply over the medium to longer term. Demand in India and China is expected to pick up as market conditions improve. Demand in mature markets is expected to continue to grow in line with GDP growth.
| | | | |
| 2016 Annual report | | riotinto.com | | 37 |
| | | | | | | | | | | | | | | | |
| | | | | | | | |
| STRATEGIC REPORT | | | | DIRECTORS’ REPORT | | | | FINANCIAL STATEMENTS | | | | PRODUCTION, RESERVES AND OPERATIONS | | | | ADDITIONAL INFORMATION |
Energy & Minerals
Financial performance
| | | | | | | | |
| | | 2016 US$ million | | | 2015 US$ million | |
| Gross revenue | | | 6,734 | | | | 7,140 | |
| Net cash generated from operating activities | | | 1,431 | | | | 1,482 | |
| Underlying earnings | | | 610 | | | | 175 | |
| Capital expenditure | | | 141 | | | | 552 | |
| Net operating assets | | | 7,283 | | | | 7,621 | |
| Underlying EBITDA | | | 1,803 | | | | 1,235 | |
Iron Ore Company of Canada and Simandou are reported within Energy & Minerals, reflecting management responsibility.
Strategy and priorities
The Energy & Minerals product group has an attractive portfolio of high-quality mining, refining and marketing operations and projects that connect customers and consumers around the world with products that enhance their quality of life. Demand growth for industrial minerals typically comesmid-to-late in the economic development cycle, following peak requirements for commodities such as iron ore and copper.
The product group’s strategy is focused on operatinglow-cost,demand-led businesses. Through its integrated marketing strategies and insight, the product group creates and grows global markets for its products to deliver value for Rio Tinto and its shareholders. Energy & Minerals’ strategy focuses on:
| – | | Safety as the number one priority. |
| – | | Prioritising value over volume. |
| – | | Operatingdemand-led, integrated operations that can respond quickly to the changing external environment. |
| – | | Creating and growing global markets through technical research and development and market insight. |
| – | | Improving operating performance by driving productivity, reducing costs and streamlining the organisation. |
| – | | Strengthening its position in traditional segments and entering attractive new markets. |
Safety
In its pursuit of zero harm, Energy & Minerals continues to focus on fostering a culture of accountability and awareness among employees and improving contractor safety. The product group’s health and safety target continues to be on fatality elimination. This has resulted in an emphasis on critical controls and robust process safety, including rolling out and implementing the critical risk management fatality elimination programme across the business. In 2016, there were no fatalities in the product group and a significant reduction in potential fatal incidents. However, the all injury frequency rate rose to 0.47 in 2016 from 0.46 in 2015.
With a workforce spanning multiple geographies, languages and cultures, Energy &
Minerals faces health and safety challenges. Managers use innovative strategies and visible safety leadership to address these and to train the workforce.
Greenhouse gas emissions
Overall greenhouse gas (GHG) emissions intensity across the product group was marginally higher in 2016 compared with 2015 but still an improvement over 2008 (base year). Rio Tinto Coal Australia’s (RTCA) emissions intensity increased to 0.066 tonnes of carbon dioxide equivalent per tonne of coal produced, compared with 0.062 tonnes in 2015.
Review of operations
The Energy & Minerals product group’s underlying earnings of US$610 million were US$435 million higher than 2015. This reflected further cash cost improvements and weaker exchange rates while volumes were slightly higher overall. Prices for coal and iron ore were volatile but increased significantly in the second half of the year. This impact was offset by lower prices for uranium, titanium dioxide feedstocks, zircon and borates.Pre-tax cash cost improvements in the product group were US$342 million and the group has now delivered US$1.4 billion of cumulative savings compared with the 2012 base.
Net cash generated from operating activities of US$1,431 million was three per cent lower than in 2015, as the benefit of cash cost savings and weaker exchange rates was offset by the expensing of all Simandou study costs from the start of 2016, and the absence ofone-off reductions in working capital achieved in 2015. The decline in capital expenditure reflected continued capital discipline across the product group and the net proceeds from the sale of Mount Pleasant thermal coal assets of US$192 million. Free cash flow during the year was US$1,294 million, 40 per cent higher than in 2015.
Borates
Rio Tinto Borates (Rio Tinto: 100 per cent) supplies over 30 per cent of the world’s refined borates from its world-class deposit in Boron, California. It also has borates refineries and/or shipping facilities in China, France, Malaysia, the Netherlands, Spain and the US together with the Jadar lithium-borate project (Rio Tinto: 100 per cent) in Serbia. Rio Tinto Borates production of 503,000 tonnes boric oxide equivalent was six per cent higher than in 2015, driven primarily by higher market demand. Gross revenue of US$620 million was essentially flat with 2015, and earnings of US$117 million were 14 per cent higher due to lower costs.
Coal
In Queensland, Rio Tinto Coal Australia (RTCA) manages the Hail Creek (Rio Tinto: 82 per cent) and Kestrel (Rio Tinto: 80 per cent) coal mines. In New South Wales, RTCA manages Coal & Allied’s coal mines, Hunter Valley Operations (Rio Tinto: 67.6 per cent) and the combined
Mount Thorley (Rio Tinto: 80 per cent) and Warkworth (Rio Tinto: 55.57 per cent) operations. On 30 September 2015, Rio Tinto announced a restructure of Coal & Allied which included changes in Rio Tinto’s interests in Hunter Valley Operations and, indirectly, in Warkworth. The restructure completed on 3 February 2016 and resulted in Rio Tinto taking a 100 per cent stake in Coal & Allied. The ownership shown above reflects these changes.
Hard coking coal production of 8.1 million tonnes was four per cent higher than in 2015 due to longwall and plant outperformance at Kestrel. Semi-soft coking coal production of 4.1 million tonnes was 12 per cent higher due to mine production sequencing at Hunter Valley Operations and Mount Thorley Warkworth. Thermal coal production of 17.3 million tonnes was seven per cent lower than in 2015 as increased production from Hail Creek, Kestrel and Mount Thorley Warkworth partially offset lower volumes which resulted from the restructure of Coal & Allied and the divestment of Bengalla in early 2016. Revenue fell four per cent to US$2,634 million as the impact of higher prices and sales volumes was offset by the impact of the Coal & Allied restructure. However, earnings increased from US$48 million to US$382 million, driven by higher prices, cash cost savings and favourable exchange rates.
On 30 September 2015, Rio Tinto reached a binding agreement for the sale of its interest in the Bengalla Joint Venture to New Hope Corporation Limited. The sale completed on 1 March 2016 for US$616.7 million. In January 2016, Rio Tinto signed an agreement for the sale of its Mount Pleasant thermal coal assets to MACH Energy Australia Pty Ltd for US$220.7 million plus royalties. The sale completed on 5 August 2016. In February 2016, Rio Tinto signed an agreement to sell its 74 per cent interest in Zululand Anthracite Colliery (ZAC), an anthracite coal mine in South Africa, to Menar Holding. The sale completed on 2 September 2016.
On 24 January 2017, Rio Tinto announced that it had reached a binding agreement for the sale of its wholly owned subsidiary Coal & Allied Industries Limited to Yancoal Australia Limited for up to US$2.45 billion. The transaction is subject to certain conditions precedent being satisfied, including approvals from the Australian Government, Chinese regulatory agencies, the New South Wales Government and shareholder approval. Subject to all approvals and other conditions precedent being satisfied, it is expected that the transaction will complete in the second half of 2017.
| | | | |
| 38 | | riotinto.com | | 2016 Annual report |
Iron Ore Company of Canada (IOC)
IOC operates a mine, concentrator and pelletising plant in the Canadian province of Newfoundland and Labrador, together with rail and port facilities in Sept-Îles, Quebec. IOC continued as a supplier of high-quality, premium pellets and high-quality, low contaminant concentrate. The company remains focused on increasing production to nameplate capacity following completion of the Concentrate Expansion Project in 2014 and further increasing productivity. IOC achieved full year production of 10.7 million tonnes of saleable production (concentrate and pellets) (Rio Tinto share), an increase of three per cent over 2015. Revenues were two per cent lower than 2015, however, earnings increased from US$12 million to US$64 million, reflecting cash cost savings and favourable exchange rates.
Iron & Titanium
Rio Tinto Iron & Titanium (RTIT) is the world’s largest producer of high-grade titanium dioxide feedstocks. It mines ilmenite at its wholly owned Rio Tinto Fer et Titane (RTFT) operation in Canada, its managed Richards Bay Minerals (RBM) operation in South Africa (Rio Tinto: 74 per cent), and its QIT Madagascar Minerals operation (Rio Tinto: 80 per cent). RTIT produces high-grade titanium dioxide feedstocks at its world-class metallurgical complexes at RTFT and RBM as well as valuableco-products that include high-purity ductile iron, steel billets, metal powders and zircon. At 1 million tonnes, titanium dioxide slag production was four per cent lower in 2016 than in 2015, as RTIT continues to optimise production to match demand. Two of nine furnaces at RTFT and one of four furnaces at RBM are currently idled. RTIT’s revenues reduced by ten per cent due to lower sales volumes and prices for titanium dioxide feedstocks, metallic products and zircon. Earnings fell by 26 per cent to US$86 million.
Salt
Dampier Salt (Rio Tinto: 68 per cent), the world’s largest solar salt exporter, produces industrial salt by solar evaporation of seawater at Dampier and Port Hedland, and from underground brine at Lake MacLeod, all in Western Australia. Salt is sold principally to base chemical industry markets in Asia. Salt production of 5.2 million tonnes (Rio Tinto share) was six per cent lower than in 2015 as a result of lower market demand. Earnings were in line with 2015 at US$25 million.
Uranium
The Uranium business comprises Energy Resources of Australia Ltd (ERA, Rio Tinto: 68.4 per cent), which operates the Ranger Mine in the Northern Territory of Australia and Rössing Uranium Limited (Rio Tinto: 68.6 per cent) in Namibia, together with the Roughrider project (Rio Tinto: 100 per cent) in Canada’s Athabasca Basin.
Uranium production of 6.3 million pounds (Rio Tinto share) was 29 per cent higher than in 2015 due to increased mill throughput, grade and recovery. Revenues fell four per cent due to lower prices, however, earnings of US$10 million were US$52 million more favourable than 2015, including the effect of cash cost savings and lower depreciation at ERA following the impairment recognised in 2015.
Development projects
The Jadar project in Serbia is alithium-borate deposit that was discovered by Rio Tinto in 2004. If developed, it could supply a significant proportion of global demand for lithium and borates. Findings so far are encouraging and prefeasibility assessments are ongoing to confirm the economic business case and advance the environmental and socio-economic impact assessments for the project.
Work continued on the feasibility study for the Zulti South mine expansion at RBM, which will maintainlow-cost RBM smelting capacity. The group entered into a joint venture with Savannah Resources Plc to conduct further evaluation work on its ilmenite tenements in Mozambique.
Rio Tinto remains in discussion with North Atlantic Potash Inc. (NAPI), a subsidiary of JSC Acron, a world leader in fertiliser production, regarding the optimum development pathway for their exploration joint venture in Saskatchewan, Canada.
Simfer (owned 42.8 per cent indirectly by Rio Tinto) completed the integrated Bankable Feasibility Studies for the mine, rail, port and infrastructure elements of the Simandou iron ore project in May 2016 in accordance with its obligations under the Investment Framework. On 28 October 2016, Rio Tinto and Chinalco signed anon-binding agreement to sell Rio Tinto’s entire stake in the Simandou project in Guinea to Chinalco. The Heads of Agreement sets out the proposed principal terms of the sale with the aim of signing a binding agreement within six months. If the sale occurs, Rio Tinto expects to receive payments ofUS$1.1-1.3 billion depending on the timing of the development of the project.
Outlook
Whilst markets remain volatile, the medium to long term outlook continues to be positive across all products as urbanisation and rising standards of living, particularly in China, drive higher levels of demand.
Last year saw dramatic changes in the supply and demand balance driving spot prices for both thermal and metallurgical coal from very low levels early in 2016, to short-term record highs in November. The changing market dynamics were primarily driven by Chinese policies which are likely to continue to affect coal markets in the short to medium term. Even though market prices are at higher levels for both thermal and metallurgical coal, producers remain wary as potential exists for pricing to revert to levels seen in late 2015 and early 2016.
Uranium prices fell through the latter half of 2016, due to lacklustre demand growth and oversupply. Demand outlook was muted as Japan made slow progress restarting its offline reactors, additional reactor closures were announced in the US, and no new Chinese reactors were approved in 2016. Strong uranium production and surplus secondary material have exacerbated the price weakness and it will likely take some time for the market to rebalance and prices to recover.
Even though titanium dioxide market conditions remained challenging in 2016, there are signs of improving demand fundamentals with excess titanium dioxide pigment and feedstock inventories across the supply chain starting to normalise and pigment prices rising, albeit with ongoing latent capacity in the feedstock market. In response to the challenging market, RTIT has taken action at a number of its operations, including flexing production capacity to align with demand, optimising working capital, and structural cost reductions. In the medium to long term, demand for titanium dioxide feedstock is expected to grow, in line with improving global economic conditions, urbanisation and demand growth in emerging markets, supported by rising per capita incomes.
Long-term borate sector fundamentals remain attractive. Near-term demand is stable, with North American housing-related sectors and global glass and agricultural demand performing well. Rio Tinto Borates is focused upon increasing refined borate capacity to meetabove-GDP global demand growth while improving safety performance and its cost position.
| | | | |
| 2016 Annual report | | riotinto.com | | 39 |
| | | | | | | | | | | | | | | | |
| | | | | | | | |
| STRATEGIC REPORT | | | | DIRECTORS’ REPORT | | | | FINANCIAL STATEMENTS | | | | PRODUCTION, RESERVES AND OPERATIONS | | | | ADDITIONAL INFORMATION |
Growth & Innovation
Growth & Innovation was formed in July 2016, bringing together Exploration and Technology & Innovation. It supports Rio Tinto’s assets in achieving superior performance throughout their life cycle, to ensure the Group is managing risk effectively and generating maximum cash. Growth & Innovation partners with the Rio Tinto product groups to optimise value from the time of the initial exploration concept through to closure of a mine or processing facility.
Strategy and priorities
Growth & Innovation is accountable for finding, evaluating, developing and optimising assets so they are safe, productive and profitable. Centralised technical knowledge and experience enable Growth & Innovation to deliver portfolio growth effectively, drive innovative solutions to operational and business challenges and provide support for quality decision-making.
Safety is the number one priority. Growth & Innovation works with and through the product groups to deliver results in line with the Rio Tinto strategy in the following areas:
| – | | Finding: exploring, discovering or acquiring new Tier 1 resources. |
| – | | Evaluating: ensuring the right projects proceed with the optimal business case. |
| – | | Developing: delivering major capital projects safely and efficiently, on time, on budget and ready for a seamless handover to operations. |
| – | | Optimising: leading a step change in Group productivity as well as providing technical services to operations, replicating best practice, building technical capability, managing strategic technical risk and overseeing the Group’s innovation and automation platforms. |
Safety
In 2016, Growth & Innovation achieved a fatality free year. The all injury frequency rate was 0.57 against 0.44 in 2015. Exploration achieved excellent results with four months injury free from September. However, Rio Tinto Projects reported a disappointing all injury frequency rate of 0.66 compared with 0.46 in 2015.
During 2016, the focus on fatality prevention continued in Growth & Innovation with further implementation and embedding of the critical risk management programme. Exploration completed five successful pilots of critical risk management and the programme will be rolled out across all of Exploration in 2017. The Projects team continued embedding the critical risk management fatality elimination programme, reporting high levels of leader engagement and consistently identifying opportunities to strengthen critical controls for fatality risks.
Growth & Innovation continued to build capability and improve the management of
major hazard risks across the Group.
Performance
Exploration
Exploration creates value for Rio Tinto by discovering or acquiring well-located,high-grade Tier 1 resources. Its work includes both greenfield exploration to identify completely new business opportunities and brownfield exploration to sustain or grow existing Rio Tinto businesses. Exploration also provides orebody knowledge and resource evaluation support to a range of projects within the company as well as potential acquisitions.
Increasingly complex community, sustainability and investment requirements mean it typically takes more than a decade to progress from initial exploration through to discovery, evaluation and then to a final development decision. Exploration’s comprehensive approach to stakeholder and community engagement contributes to the Group’s social licence to operate. Rio Tinto has continued to invest in exploration despite the difficult market conditions of the last few years. Maintaining this core exploration capability and applying a rigorous prioritisation process have consistently delivered Tier 1 discoveries, which in the last ten years include:
| | | | | | |
| Year | | Discovery | | Commodity | | Location |
| 2008 | | Sulawesi | | Nickel | | Indonesia |
| 2008 | | Mutamba | | Titanium | | Mozambique |
| 2009 | | Jadar | | Lithium/ borates | | Serbia |
| 2011 | | Amargosa | | Bauxite | | Brazil |
| 2013 | | KP405 | | Potash | | Canada |
| 2014 | | Yandi Braid | | Iron ore | | Australia |
| 2015 | | Mount Thorley Warkworth/ Hunter Valley | | Coking coal | | Australia |
At the end of 2016, the Exploration group was active in 14 countries and continued to assess opportunities across a range of commodities including copper, nickel, iron ore, bauxite, coking coal, uranium, diamonds and mineral sands. During the year, Exploration increased its commercial activity, establishing joint ventures in the US, Chile, Serbia, Kazakhstan, Canada, Mexico, Papua New Guinea and Australia. Divestment activities continued for projects that do not meet Rio Tinto’s investment criteria, reinforcing the approach of treating Exploration like a business. In the past decade the Group has spent around US$1.7 billion on greenfield exploration and in turn generated US$2.2 billion from divestments of exploration projects that the company decided did not meet these criteria.
In 2016, the Group reduced its exploration and evaluation expenditure to US$497 million(a). This represented a 14 per cent decrease compared with 2015 expenditure of US$576 million. Of the 2016 spend,
US$206 million relates to centrally controlled exploration and evaluation activity. In total, Rio Tinto’s 2016 exploration and evaluation activity covered eight commodities across a range of greenfield and brownfield environments. In recent years, Rio Tinto has shifted the emphasis of Exploration expenditure to projects in the OECD and Peru in line with the increasing focus on copper exploration.
At the Roughrider uranium project in Saskatchewan, orebody knowledge continued to progress, with resource modelling, drilling activities and identification of new exploration targets. At the Sanxai bauxite project in Laos, ongoing exploration improved understanding of resource quality, while infrastructure studies continued to assess options for moving future ore to a suitable port for export. At the La Granja copper project in Peru ongoing orebody knowledge and brownfield exploration progressed with drill testing of new geophysical and geochemical targets within the orbit. At the Tamarack nickel project in the US, drilling and exploration activities continued, providing greater confidence in resource quality. Brownfield projects again generated good drilling results at iron ore projects in the Pilbara and for bauxite in the Weipa region in Australia. In 2016, the five year exploration partnership with Chinalco in China concluded. Exploration retains a presence in the country to monitor exploration opportunities and options for future partnerships.
Evaluation
Discoveries that align to company strategy progress to evaluation to ensure “the right project” is undertaken. Business objectives of investment returns are balanced with technical and resource certainty and stakeholder requirements to manage overall project risk. The goal is to minimise uncertainty associated with the resource and to develop the optimal technical solutions using proven methods or new innovation to bring the project to market.
In collaboration with business units, Growth & Innovation applies a range of strategic planning processes and expertise to identify, analyse and select the optimal configuration and timing of greenfield and brownfield projects. During the year, this support was provided to projects in the Aluminium and Copper & Diamonds product groups.
In 2016, extensive work was also done on a pilot process for the Jadar project to enable production of both borates and lithium from the newly discovered mineral jadarite. At Oyu Tolgoi, the Group’s experience in block caving enabled more efficient mine design, to enhance productivity and safety.
| (a) | An additional US$21 million gain on disposal of undeveloped evaluation projects was recorded separately in profit/(loss) relating to interest in undeveloped projects in the income statement. |
| | | | |
| 40 | | riotinto.com | | 2016 Annual report |
To maximise value, Growth & Innovation looks beyond the technical solution, reviewing capital intensity and project timing to ensure all aspects of each project are optimised. The Amrun bauxite and Silvergrass iron ore projects in Australia benefited from these reviews in 2016.
Engagement with a broad range of stakeholders during evaluation protects and enhances our licence to operate. The enduring relationships built during exploration and evaluation are essential to future operational success.
The Group’s major evaluation projects in 2016 were:
| | | | |
| Project | | Commodity | | Country |
| La Granja | | Copper | | Peru |
| Resolution | | Copper | | US |
| Pilbara | | Iron ore | | Australia |
| Bowen Basin | | Coking coal | | Australia |
| Zulti South | | Mineral sands | | South Africa |
| Jadar | | Lithium/borates | | Serbia |
| Simandou | | Iron ore | | Guinea |
| Weipa | | Bauxite | | Australia |
Projects
Rio Tinto has a central major capital projects team that uses standardised project management systems and processes to deliver projects safely and efficiently, on time and on budget and ready for a seamless handover to operations upon completion.
In 2016, the US$1.9 billion Amrun bauxite project in the Weipa region in Australia advanced to schedule in both engineering and construction. All major contracts have been committed as planned, and site establishment continued with the construction of the accommodation village progressing to plan. The 40 kilometre main access road was completed in December and the river terminals are expected to be operational in Q1 2017.
In 2016, the Oyu Tolgoi underground project ramped up significantly. More than 2,800 personnel were mobilised, with 87 per cent of these Mongolian nationals. Works on underground mine development, the accommodation camp, conveyor to surface decline, sinking of shaft #2 and shaft #5, and critical facilities continue to progress.
During the year, a range of projects were completed in the Pilbara for the Iron Ore business including Cape Lambert Port B, the Pilbara Fuel Infrastructure project, Yandi Billiard South and phase two of the Nammuldi Incremental Tonnes project, which was delivered in October. The Silvergrass project commenced and is on schedule to be completed in 2017, increasing the Nammuldi operation by ten million tonnes per annum by adding a primary crushing facility and nine kilometres of overland conveying system to integrate with the existing processing plant.
| | |
The Yandicoogina Oxbow project progressed in 2016. Upon completion it will sustain Yandicoogina fines production by opening access to a new orebody. Construction is more than 50 per cent complete and three months ahead of the construction plan. Construction of the Cape Lambert 80 megawattgas-fired power station is ahead of plan – 70 per cent complete at the end of 2016 with planned completion in Q1 2018. Following delays to the project schedule due to software issues in early 2016, the AutoHaul® project regained stability in the second half of 2016 with improved reliability, and all relevant parts of the rail network are now enabled for autonomous trains. In 2017, the AutoHaul® trains will operate extensively in automated mode, with a driver on board until all safety and reliability systems are thoroughly demonstrated. In 2016, the Holden Environmental Remediation project was completed and received the 2015 Environmental Excellence Award from the American Exploration & Mining Association for cleaning up the historic site in Washington State in the US. The East Waste Rock Extension project at Kennecott was also completed in 2016. Productivity and innovation In 2016, Rio Tinto committed to a target of US$5 billion of free cash flow frommine-to-market productivity improvements over the next five years. Growth & Innovation will lead this step change in productivity and technical excellence across the Group, building upon the cost reduction and transformation achievements of the businesses to deliver further sustainable gains. The productivity remit in Rio Tinto has multiple streams including mining, processing, infrastructure and asset management. In 2016, the focus was on replication of leading practice, progressing integrated operations and commencing redesign of the value chain. | | All work in this space is underpinned by a technical excellence programme to ensure improvements are sustainable. Rio Tinto continues to progress its Mine of the Future™ automation and innovation programme, leveraging a partnership with the University of Sydney to deliver innovative tools to support Rio Tinto operations in the delivery of improved productivity. The Mine Automation System (MAS) and RTVis™ orebody visualisation software is now implemented at 85 per cent of surface mining sites, helping operators in the field make better real-time decisions as well as supporting longer-term work like mine planning. Outlook In Exploration, challenges are expected to continue in relation to timely access to ground and the decreasing grade and quality of potential orebodies. For 2017, exploration projects at a more advanced stage are listed in the table at the base of the page. In project evaluation and development, work will continue to deliver priority Group projects on schedule and on budget including Amrun, Silvergrass, the Oyu Tolgoi underground and AutoHaul® projects as well as the progression of studies for the Jadar project in Serbia. The productivity programme will gain momentum in 2017 in pursuit of savings targets, driving improvements in key metrics like effective utilisation of plant and equipment, payload, maintenance intervals and processing rates. The Group’s approach to integrated operations will be advanced, to leverage a wealth of real-time data to enable quicker and better decision making across the whole value chain. Work will also continue to centralise technical expertise to better support operational performance and problem solving. In 2017, a centre of excellence for underground mining will be progressed to support Oyu Tolgoi as well as future Rio Tinto underground mine developments, such as Resolution in the US. |
2017 exploration projects
| | | | | | | | |
| Project | | Commodity | | Country | | Type | | Stage |
| Tamarack | | Nickel | | US | | Greenfield | | Project of Merit |
| Roughrider | | Uranium | | Canada | | Greenfield | | Order of Magnitude |
| Sanxai | | Bauxite | | Laos | | Greenfield | | Project of Merit |
| Stargrove | | Diamonds | | Canada | | Greenfield | | Project of Merit |
| La Granja orbit | | Copper | | Peru | | Greenfield | | Project of Merit |
| Pilbara | | Iron ore | | Australia | | Brownfield | | Project of Merit |
| Weipa | | Bauxite | | Australia | | Brownfield | | Project of Merit |
| | | | |
| 2016 Annual report | | riotinto.com | | 41 |
| | | | | | | | | | | | | | | | |
| | | | | | | | |
| STRATEGIC REPORT | | | | DIRECTORS’ REPORT | | | | FINANCIAL STATEMENTS | | | | PRODUCTION, RESERVES AND OPERATIONS | | | | ADDITIONAL INFORMATION |
Five year review
Selected financial data
The selected consolidated financial information below has been derived from the historical audited consolidated financial statements of the Rio Tinto Group. The selected consolidated financial data should be read in conjunction with, and qualified in their entirety by reference to, the 2016 financial statements and notes thereto. The financial statements as included on pages 110 to 194 have been prepared in accordance with IFRS as defined in note 1.
Rio Tinto Group
Income statement data
| | | | | | | | | | | | | | | | | | | | |
For the years ended 31 December Amounts in accordance with IFRS | | 2016
US$m | | | 2015
US$m | | | 2014
US$m | | | 2013
US$m | | | 2012
US$m | |
| Consolidated sales revenue | | | 33,781 | | | | 34,829 | | | | 47,664 | | | | 51,171 | | | | 50,942 | |
| Group operating profit/(loss)(a) | | | 6,795 | | | | 3,615 | | | | 11,346 | | | | 7,430 | | | | (1,925 | ) |
| | | | | |
| Profit/(loss) for the year from continuing operations | | | 4,776 | | | | (1,719 | ) | | | 6,499 | | | | 1,079 | | | | (3,020 | ) |
| Loss after tax from discontinued operations | | | – | | | | – | | | | – | | | | – | | | | (7 | ) |
| Profit/(loss) for the year | | | 4,776 | | | | (1,719 | ) | | | 6,499 | | | | 1,079 | | | | (3,027 | ) |
| | | | | |
| Basic earnings/(losses) per share(b) | | | | | | | | | | | | | | | | | | | | |
– From continuing operations (US cents) | | | 256.9 | | | | (47.5 | ) | | | 353.1 | | | | 198.4 | | | | (163.4 | ) |
– From discontinued operations (US cents) | | | – | | | | – | | | | – | | | | – | | | | (0.4 | ) |
| Basic earnings/(losses) for the year per share (US cents) | | | 256.9 | | | | (47.5 | ) | | | 353.1 | | | | 198.4 | | | | (163.8 | ) |
| | | | | |
| Diluted earnings/(losses) per share(b) | | | | | | | | | | | | | | | | | | | | |
– Profit/(loss) from continuing operations (US cents) | | | 255.3 | | | | (47.5 | ) | | | 351.2 | | | | 197.3 | | | | (163.4 | ) |
| – Loss after tax from discontinued operations (US cents) | | | – | | | | – | | | | – | | | | – | | | | (0.4 | ) |
| Diluted earnings/(losses) for the year per share (US cents) | | | 255.3 | | | | (47.5 | ) | | | 351.2 | | | | 197.3 | | | | (163.8 | ) |
| | | | | | | | | | | | | | | | | | | | |
| Dividends per share | | 2016 | | | 2015 | | | 2014 | | | 2013 | | | 2012 | |
| Dividends declared in respect of the year | | | | | | | | | | | | | | | | | | | | |
| US cents | | | | | | | | | | | | | | | | | | | | |
– interim | | | 45.0 | | | | 107.5 | | | | 96.0 | | | | 83.5 | | | | 72.5 | |
– final | | | 125.0 | | | | 107.5 | | | | 119.0 | | | | 108.5 | | | | 94.5 | |
| UK pence | | | | | | | | | | | | | | | | | | | | |
– interim | | | 33.80 | | | | 68.92 | | | | 56.9 | | | | 54.3 | | | | 46.4 | |
– final | | | 100.56 | | | | 74.21 | | | | 78.0 | | | | 65.8 | | | | 60.3 | |
| Australian cents | | | | | | | | | | | | | | | | | | | | |
| – interim | | | 59.13 | | | | 144.91 | | | | 103.1 | | | | 93.0 | | | | 68.5 | |
| – final | | | 163.62 | | | | 151.89 | | | | 153.0 | | | | 120.14 | | | | 91. 7 | |
| | | | | |
| Dividends paid during the year (US cents) | | | | | | | | | | | | | | | | | | | | |
– ordinary | | | 152.5 | | | | 226.5 | | | | 204.5 | | | | 178.0 | | | | 163.5 | |
| | | | | |
| Weighted average number of shares – basic (millions) | | | 1,797.3 | | | | 1,824.7 | | | | 1,848.4 | | | | 1,847.3 | | | | 1,849.1 | |
| Weighted average number of shares – diluted (millions)(b) | | | 1,808.6 | | | | 1,824.7 | | | | 1,858.7 | | | | 1,857.7 | | | | 1,849.1 | |
Balance sheet data | | | | | | | | | | | | | | | | | | | | |
at 31 December
Amounts in accordance with IFRS | | 2016
US$m | | | 2015
US$m | | | 2014
US$m | | | 2013
US$m | | | 2012
US$m | |
| Total assets | | | 89,263 | | | | 91,564 | | | | 107,827 | | | | 111,025 | | | | 118,437 | |
| Share capital/premium | | | 8,443 | | | | 8,474 | | | | 9,053 | | | | 9,410 | | | | 10,189 | |
| Total equity/net assets | | | 45,730 | | | | 44,128 | | | | 54,594 | | | | 53,502 | | | | 57,740 | |
| Equity attributable to owners of Rio Tinto | | | 39,290 | | | | 37,349 | | | | 46,285 | | | | 45,886 | | | | 46,553 | |
| (a) | Group operating profit or loss includes the effects of charges and reversals resulting from impairments (other than impairments of equity accounted units) and profit and loss on disposals of interests in businesses. Group operating loss or profit amounts shown above excludes equity accounted operations, finance items, tax and discontinued operations. |
| (b) | The effects of dilutive securities has not been taken into account when calculating diluted loss per share for the years ended 31 December 2015 and 2012, in accordance with IAS 33 “Earnings Per Share”. |
| | | | |
| 42 | | riotinto.com | | 2016 Annual report |
Directors’ approval statement
This Strategic report is delivered in accordance with a resolution of the board, and has been signed on behalf of the board by:
|
|
| Jan du Plessis |
| Chairman |
|
| 1 March 2017 |
| | | | |
| 2016 Annual report | | riotinto.com | | 43 |
| | | | | | | | | | | | | | | | |
| | | | | | | | |
| STRATEGIC REPORT | | | | DIRECTORS’ REPORT | | | | FINANCIAL STATEMENTS | | | | PRODUCTION, RESERVES AND OPERATIONS | | | | ADDITIONAL INFORMATION |
Contents
Directors’ report
| | | | |
| 44 | | riotinto.com | | 2016 Annual report |
Directors’ report
The directors present their report and audited consolidated financial statements for the year ended 31 December 2016.
Dual listed structure and constitutional documents
An explanation of the dual listed companies (DLC) structure of Rio Tinto plc and Rio Tinto Limited, and aspects of the Companies’ constitutional provisions can be found on pages244 to 250. That section provides a description of voting arrangements, including restrictions which may apply in respect of the shares of either Company under specified circumstances.
Operating and financial review
The Strategic report set out on pages 1 to 43 provides a comprehensive review of Rio Tinto’s operations, its financial position and its business strategies and prospects, and is incorporated by reference into, and forms part of, this Directors’ report.
Rio Tinto’s principal activities during 2016 were minerals and metals exploration, development, production and processing.
Page 42 of the Strategic report provide a comprehensive review of the performance of Rio Tinto’s operations for the year ended 31 December 2016 and the outlook for those operations.
The subsidiary and associated undertakings principally affecting the profits or net assets of the Group in the year are listed in notes 33 to 36 to the financial statements.
Significant changes and events affecting the Group during 2016 and until the date of this report have been:
Financial
| – | | On 2 August 2016, Rio Tinto approved an incremental US$338 million investment in the development of the Silvergrass mine in its Pilbara iron ore operations in Western Australia. |
| – | | On 24 November 2016, Rio Tinto outlined a new US$5 billion mine-to-market productivity push under its long-term strategy focused on cash generation. |
| – | | During 2016, Rio Tinto completed three USD denominated bond purchase programmes, totalling US$7.5 billion nominal value. In addition, it repaid US$1.5 billion of maturing US dollar denominated bonds in June 2016. In May 2016, Oyu Tolgoi LLC drew down a net US$4.3 billion under the project financing facility, signed in December 2015. |
| – | | On 8 February 2017, Rio Tinto announced the commencement of a US$500 million sharebuy-back of Rio Tinto plc shares, expected to complete over the period from 1 March 2017 to 31 December 2017. Any shares repurchased will be immediately cancelled. |
People
Executive Committee
| – | | On 17 March 2016, we announced that Sam Walsh, chief executive, would retire from the business on 1 July 2016 and be succeeded by Copper & Coal chief executive Jean-Sébastien Jacques. |
| – | | On 21 June 2016, Rio Tinto reorganised its product group structure which now includes Aluminium, Copper & Diamonds, Energy & Minerals and Iron Ore. These groups are complemented by a newly shaped Growth & Innovation group, which focuses on future assets and technical support. As a result of the reorganisation, we appointed Stephen McIntosh and Chris Salisbury to the Executive Committee as Growth & Innovation, Group executive and Iron Ore chief executive, respectively. Andrew Harding and Greg Lilleyman left the company. |
| – | | On 16 November 2016, Rio Tinto terminated the contracts of Energy & Minerals chief executive, Alan Davies and Legal & Regulatory Group executive, Debra Valentine. Bold Baatar was appointed as Energy & Minerals chief executive. |
| – | | On 8 December 2016, Rio Tinto appointed Vera Kirikova – Human Resources Group executive and Simone Niven – Corporate Relations Group executive to its Executive Committee. Hugo Bague – Organisational Resources Group executive will leave the company on 31 March 2017. |
Board
| – | | On 5 May 2016, Richard Goodmanson retired as anon-executive director of Rio Tinto plc and Rio Tinto Limited. |
| – | | On 10 February 2017, Rio Tinto appointed to the board David Constable and Sam Laidlaw with immediate effect and announced that Simon Henry will join the board with effect from 1 July 2017. Robert Brown and Anne Lauvergeon will not seek re-election at the 2017 annual general meetings. |
Regulatory
| – | | On 9 November 2016, Rio Tinto contacted the regulatory authorities concerning contractual payments totalling US$10.5 million made to a consultant who had provided advisory services in 2011 on the Simandou project in Guinea. |
| – | | On 1 December 2016, Rio Tinto confirmed that it wasco-operating with inquiries from the relevant authorities concerning the impairment included in the company’s 2012 accounts in respect of Rio Tinto Coal Mozambique. |
Transactions
| – | | On 27 January 2016, Rio Tinto announced that it had reached a binding agreement for the sale of its Mount Pleasant thermal coal assets to MACH Energy Australia Pty Limited. Completion took place on 5 August 2016 for US$220.7 million plus royalties. |
| – | | On 1 March 2016, Rio Tinto announced that it had completed the sale of its 40 per cent interest in Bengalla Joint Venture in Australia for US$616.7 million to New Hope Corporation Limited. |
| – | | On 15 April 2016, Rio Tinto and Sinosteel Corporation announced the extension of the historic Channar Mining Joint Venture in Australia’s Pilbara region. The Channar joint venture extension, together with a separate agreement for Rio Tinto to supply iron ore from the Pilbara, will enable sales of up to 70 million tonnes of iron ore to Sinosteel Corporation over the next five years. |
| – | | On 6 May 2016, Rio Tinto announced the approval of a US$5.3 billion investment in the Oyu Tolgoi underground mine. |
| – | | On 28 October 2016, Rio Tinto agreednon-binding Heads of Agreement to sell its stake in the Simandou project to Chinalco. If the sale occurs, Rio Tinto expects to receive payments of US$1.1-1.3 billion depending on the timing of the development of the project, with the initial payment for shares to commence at the time of first commercial production on a per tonne basis. |
| – | | On 23 November 2016, Rio Tinto agreed the sale of its assets at Lochaber, Scotland to SIMEC for US$410 million. |
| – | | On 24 January 2017, Rio Tinto announced that it had entered into a binding agreement for the sale of its Australian wholly owned subsidiary, Coal & Allied Industries Limited, to Yancoal Australia Limited for up to US$2.45 billion. This will require shareholder approval as Yancoal Australia Limited is considered to be a related party of Rio Tinto as a consequence of Chinalco being a 10.1 per cent shareholder in the Rio Tinto Group. Subject to all approvals and other conditions precedent being satisfied, it is expected that the transaction will complete in the second half of 2017. |
Details of events after the balance sheet date are further described in note 43 to the financial statements.
| | | | |
| 2016 Annual report | | riotinto.com | | 45 |
| | | | | | | | | | | | | | | | |
| | | | | | | | | |
| STRATEGIC REPORT | | | | DIRECTORS’ REPORT DIRECTORS’ REPORT | | | | FINANCIAL STATEMENTS | | | | PRODUCTION, RESERVES AND OPERATIONS | | | | ADDITIONAL INFORMATION |
Directors’ report
continued
Risk identification, assessment and management
The Group’s principal risks and uncertainties are set out on pages 16 to 21. The Group’s approach to risk management is discussed on page 14.
Share capital
Details of the Group’s share capital as at 31 December 2016 can be found in notes 27 and 28 to the financial statements. Details of the rights and obligations attached to each class of shares can be found on pages 244 to 245 under the heading “Voting”.
Where, under an employee share plan operated by the Company, participants are the beneficial owners of the shares, but not the registered owners, the voting rights are normally exercised by the registered owner at the direction of the participant.
Details of certain restrictions on holding shares in Rio Tinto and certain consequences triggered on a change of control are described on page 245 under the heading “Limitations on ownership of shares and merger obligations”. There are no other restrictions on the transfer of ordinary Rio Tinto shares save for:
| – | | restrictions that may from time to time be imposed by laws, regulations or Rio Tinto policy (for example, those relating to market abuse or insider dealing or share trading or those relating to Australian foreign investment); |
| – | | restrictions on the transfer of shares that may be imposed following a failure to supply information required to be disclosed, or where registration of the transfer may breach a court order or a law, or in relation to unmarketable parcels of shares; |
| – | | restrictions on the transfer of shares held under certain employee share plans while they remain subject to the plan. |
At the annual general meetings held in 2016, shareholders authorised:
| – | | theon-market purchase by Rio Tinto plc or Rio Tinto Limited or its subsidiaries, of up to 137,431,729 Rio Tinto plc shares (representing approximately ten per cent of Rio Tinto plc’s issued share capital, excluding Rio Tinto plc shares held in Treasury at that time); |
| – | | theoff-market purchase by Rio Tinto plc of up to 137,431,729 Rio Tinto plc shares acquired by Rio Tinto Limited or its subsidiaries under the above authority; and |
| – | | theoff-market and/oron-marketbuy-back by Rio Tinto Limited of up to 42.4 million Rio Tinto Limited shares (representing approximately ten per cent of Rio Tinto Limited’s issued share capital at the time). |
Purchases
Rio Tinto plc shares of 10p each and Rio Tinto plc American Depositary Receipts (ADRs)
| | | | | | | | | | | | | | | | | | | | | | | | |
| | | Total number (a)
of shares
purchased | | | Average price (b)
paid per share
US$ | | | Total number
of shares
purchased to
satisfy company
dividend
reinvestment
plans | | | Total number
of shares
purchased to
satisfy employee
share plans | | | Total number (c)
of shares
purchased as
part of publicly
announced plans
or programmes | | | Maximum
number of
shares that may
be purchased
under plans
or programmes | |
| 2016 | | | | | | | | | | | | | | | | | | | | | | | | |
| 1 to 31 Jan | | | – | | | | – | | | | – | | | | – | | | | – | | | | 105,722,158 | (e) |
| 1 to 29 Feb | | | – | | | | – | | | | – | | | | – | | | | – | | | | 105,722,158 | (e) |
| 1 to 31 Mar | | | 160,179 | | | | 31.78 | | | | – | | | | 160,179 | | | | – | | | | 105,722,158 | (e) |
| 1 to 30 Apr | | | 1,351,356 | | | | 27.65 | | | | 1,223,894 | | | | 127,462 | | | | – | | | | 137,431,729 | (f) |
| 1 to 31 May | | | – | | | | – | | | | – | | | | – | | | | – | | | | 137,431,729 | (f) |
| 1 to 30 Jun | | | 32,545 | | | | 30.94 | | | | – | | | | 32,545 | | | | – | | | | 137,431,729 | (f) |
| 1 to 31 Jul | | | – | | | | – | | | | – | | | | – | | | | – | | | | 137,431,729 | (f) |
| 1 to 31 Aug | | | – | | | | – | | | | – | | | | – | | | | – | | | | 137,431,729 | (f) |
| 1 to 30 Sep | | | 424,570 | | | | 32.59 | | | | 372,381 | | | | 52,189 | | | | – | | | | 137,431,729 | (f) |
| 1 to 31 Oct | | | 751,475 | | | | 32.83 | | | | – | | | | 751,475 | | | | – | | | | 137,431,729 | (f) |
| 1 to 30 Nov | | | – | | | | – | | | | – | | | | – | | | | – | | | | 137,431,729 | (f) |
| 1 to 31 Dec | | | 108,011 | | | | 37.96 | | | | – | | | | 108,011 | | | | – | | | | 137,431,729 | (f) |
| Total | | | 2,828,136 | (d) | | | 30.43 | | | | 1,596,275 | | | | 1,231,861 | | | | – | | | | 137,431,729 | (f) |
| 2017 | | | | | | | | | | | | | | | | | | | | | | | | |
| 1 to 31 Jan | | | – | | | | – | | | | – | | | | – | | | | – | | | | 137,431,729 | (f) |
| 1 to 17 Feb | | | – | | | | – | | | | – | | | | – | | | | – | | | | 137,431,729 | (f) |
| | | | |
| 46 | | riotinto.com | | 2016 Annual report |
Rio Tinto Limited shares
| | | | | | | | | | | | | | | | | | | | | | | | |
| | | Total number (a)
of shares
purchased | | | Average price (b)
paid per
share US$ | | | Total number
of shares
purchased to
satisfy company
dividend
reinvestment
plans | | | Total number
of shares
purchased to
satisfy employee
share plans | | | Total number (c)
of shares
purchased as
part of publicly
announced plans
or programmes | | | Maximum
number of
shares that may
be purchased
under plans
or programmes | |
| 2016 | | | | | | | | | | | | | | | | | | | | | | | | |
| 1 to 31 Jan | | | – | | | | – | | | | – | | | | – | | | | – | | | | 43,500,00 | (h) |
| 1 to 29 Feb | | | – | | | | – | | | | – | | | | – | | | | – | | | | 43,500,00 | (h) |
| 1 to 31 Mar | | | 126,604 | | | | 33.57 | | | | – | | | | 126,604 | | | | – | | | | 43,500,00 | (h) |
| 1 to 30 Apr | | | 1,290,466 | | | | 33.06 | | | | 1,226,063 | | | | 64,403 | | | | – | | | | 43,500,00 | (h) |
| 1 to 31 May | | | – | | | | – | | | | – | | | | – | | | | – | | | | 42,400,00 | (i) |
| 1 to 30 Jun | | | 61,008 | | | | 32.36 | | | | – | | | | 61,008 | | | | – | | | | 42,400,00 | (i) |
| 1 to 31 Jul | | | – | | | | – | | | | – | | | | – | | | | – | | | | 42,400,00 | (i) |
| 1 to 31 Aug | | | – | | | | – | | | | – | | | | – | | | | – | | | | 42,400,00 | (i) |
| 1 to 30 Sep | | | 383,734 | | | | 37.63 | | | | 356,346 | | | | 27,388 | | | | – | | | | 42,400,00 | (i) |
| 1 to 31 Oct | | | 837,595 | | | | 40.18 | | | | – | | | | 837,595 | | | | – | | | | 42,400,00 | (i) |
| 1 to 30 Nov | | | – | | | | – | | | | – | | | | – | | | | – | | | | 42,400,00 | (i) |
| 1 to 31 Dec | | | 127,490 | | | | 43.08 | | | | – | | | | 127,490 | | | | – | | | | 42,400,00 | (i) |
| Total | | | 2,826,897 | | | | 36.25 | | | | 1,582,409 | | | | 1,244,488 | | | | – | | | | 42,400,00 | (i) |
| 2017 | | | | | | | | | | | | | | | | | | | | | | | | |
| 1 to 31 Jan | | | – | | | | – | | | | – | | | | – | | | | – | | | | 42,400,00 | (i) |
| 1 to 17 Feb | | | – | | | | – | | | | – | | | | – | | | | – | | | | 42,400,00 | (i) |
| (a) | Monthly totals of purchases are based on settlement date. |
| (b) | The shares were purchased in the currency of the stock exchange on which the purchases took place and the sale price has been converted into US dollars at the exchange rate on the day of settlement. |
| (c) | Shares purchased in connection with the dividend reinvestment plans and employee share plans are not deemed to form part of any publicly announced plan or programme. |
| (d) | This figure represents 0.2 per cent of Rio Tinto plc issued share capital at 31 December 2016. |
| (e) | At the Rio Tinto plc annual general meeting held in 2015, shareholders authorised theon-market purchase by Rio Tinto plc, Rio Tinto Limited, and its subsidiaries of up to 141,381,390 Rio Tinto plc shares. This authorisation expired on 16 April 2016. |
| (f) | At the Rio Tinto plc annual general meeting held in 2016, shareholders authorised theon-market purchase by Rio Tinto plc, Rio Tinto Limited, and its subsidiaries of up to 137,431,729 Rio Tinto plc shares. This authorisation will expire on the later of 14 April 2017 or the date of the 2017 annual general meeting. |
| (g) | The average price of shares purchasedon-market by the trustee of Rio Tinto Limited’s employee share trusts during 2016 was US$38.99. |
| (h) | At the Rio Tinto Limited annual general meeting held in 2015 shareholders authorised theoff-market oron-marketbuy-back of up to 43.5 million Rio Tinto Limited shares. |
| (i) | At the Rio Tinto Limited annual general meeting held in 2016 shareholders authorised theoff-market and/oron-marketbuy-back of up to 42.4 million Rio Tinto Limited shares. |
| (j) | On 8 February 2017 Rio Tinto announced a US$500 million sharebuy-back programme of Rio Tinto plc shares. The programme is expected to be completed over the period from 1 March 2017 to 31 December 2017. |
Substantial shareholders
Details of substantial shareholders can be found on page 246.
Dividends
Details of dividends paid and the Company’s dividend policy can be found on page 248.
Directors
The names of the directors who served during the year, together with their biographical details and other information, are shown on pages 50 to 52.
All directors, save for Robert Brown and Anne Lauvergeon, will stand forre-election or in the case of new directors, election, at the 2017 annual general meetings.
A table of directors’ attendance at board and committee meetings during 2016 is on page 57.
Secretaries
Steve Allen is the Group company secretary, having been appointed on 9 January 2017. He is company secretary of Rio Tinto plc and joint company secretary, together with Tim Paine, of Rio Tinto Limited. Steve’s and Tim’s
qualifications and experience are set out on page 52.
Eleanor Evans, LLB, Solicitor, was Group company secretary of Rio Tinto plc and joint company secretary of Rio Tinto Limited until 19 August 2016. Victoria Hames, FCIS, was acting company secretary of Rio Tinto plc and joint acting company secretary of Rio Tinto Limited from 19 August 2016 to 9 January 2017. Eleanor is a qualified solicitor and Victoria a qualified company secretary. Both have extensive experience at large listed companies.
Corporate governance
A full report on corporate governance can be found on pages 55 to 66 and forms part of this Directors’ report.
Indemnities and insurance
The Articles of Association and Constitution of the Companies provide for them to indemnify, to the extent permitted by law, directors and officers of the Companies, including officers of certain subsidiaries, against liabilities arising from the conduct of the Group’s business. The directors of the Companies, the Group company secretary and the joint company secretary of Rio Tinto Limited, and certain
employees serving as directors of certain eligible subsidiaries at the Group’s request have also received direct indemnities consistent with these provisions. The indemnities are qualifying third-party indemnity provisions for the purposes of the
UK Companies Act 2006 and each of these qualifying third-party indemnities was in force during the course of the financial year ended 31 December 2016 and as at the date of this Directors’ report. No amount has been paid under any of these indemnities during the year.
Qualifying pension scheme indemnity provisions (as defined by section 235 of the UK Companies Act 2006) were in force during the course of the financial year ended 31 December 2016 and as at the date of this Directors Report, for the benefit of trustees of the Rio Tinto Group pension and superannuation funds across various jurisdictions. No amount has been paid under any of these indemnities during the year.
The Group has purchased directors’ and officers’ insurance during the year. In broad terms, the insurance cover indemnifies individual directors and officers against certain personal legal liability and legal defence costs for claims arising out of actions taken in connection with Group business.
| | | | |
| 2016 Annual report | | riotinto.com | | 47 |
| | | | | | | | | | | | | | | | |
| | | | | | | | | |
| STRATEGIC REPORT | | | | DIRECTORS’ REPORT DIRECTORS’ REPORT | | | | FINANCIAL STATEMENTS | | | | PRODUCTION, RESERVES AND OPERATIONS | | | | ADDITIONAL INFORMATION |
Directors’ report
continued
Employment policies and communication
Information about the Group’s employment policies and our employees is available on page 27.
Political donations
No donations were made during 2016 for political purposes in the EU, Australia or elsewhere, as defined by the UK Companies Act 2006.
Government regulations
Our operations in around 35 countries are subject to extensive laws and regulations imposed by local, state, provincial and federal governments. These regulations govern many aspects of our operations – how we explore, mine and process ore, conditions of land tenure and use, health, safety and environmental requirements, how we operate as a company including laws regarding securities, taxation, intellectual property, competition and foreign investment, provisions to protect data privacy, conditions of trade and export and infrastructure access. In addition to these laws, several operations are also governed by the provisions of specific agreements which have been made with governments. Some of these agreements are enshrined in legislation.
The geographic and product diversity of our operations reduces the likelihood of any single law or government regulation having a material effect on the Group’s business as a whole.
In India, the National Mineral Exploration Policy (NMEP) was passed in 2016. It provides for private participation in exploration only through the process of auction of identified exploration blocks on a revenue sharing basis for a successful exploration and/or a reimbursement on normative cost basis for no discovery. The NMEP affects the progress of exploration activities as the regulatory path is inconsistent with accepted principles of risk and reward and progress of tenure from exploration to mining.
Environmental regulations
Rio Tinto is subject to various environmental laws and regulations in the countries where it has operations. Rio Tinto measures its performance against environmental regulation by tracking and rating incidents according to their actual environmental and compliance impacts using five severity categories (minor, medium, serious, major, or catastrophic). Incidents with a consequence rating of major or catastrophic are of a severity that require notification to the relevant product group chief executive and the Rio Tinto chief executive immediately after the incident occurring.
In 2016, we recorded no incidents with catastrophic consequence at managed operations and one incident with a major consequence. The New South Wales Environment Protection Authority has alleged a breach of Warkworth Mining Limited’s Environmental Protection Licence conditions in relation to the partial failure of a sediment dam at the Mount Thorley Warkworth Mine. The incident did not result in any environmental harm, with the allegation relating to a breach of a condition that requires the carrying out of licensed activities in a competent manner.
During 2016, five operations incurred fines amounting to US$57,618 (2015: US$130,371). Details of these fines are reported in the performance section of the sustainable development report at:riotinto.com/sd2016.
Australian corporations that exceed specific greenhouse gas emissions or energy use thresholds have obligations under the Australian National Greenhouse and Energy Reporting Act 2007 (NGER). All Rio Tinto entities covered under this Act have submitted their annual NGER reports by the required 31 October 2016 deadline.
Further information on the Group’s environmental performance is included in the sustainable development section of this Annual report, on pages 24 to 30, and on the website.
Greenhouse gas emissions
Greenhouse gas emissions
(in million tCO2-e)(a)(b)
| | | | | | | | |
| | | 2016 | | | 2015 (g) | |
| Scope 1 (c) | | | 21.1 | | | | 20.2 | |
| Scope 2 (d) | | | 11.3 | | | | 11.9 | |
| Total emissions (e) | | | 32.0 | | | | 31.7 | |
| Ratios | | | | | | | | |
| GH intensity index (f) | | | 74.1 | | | | 79.7 | |
| GH intensity | | | | | | | | |
| (tCO2-e/t of product) | | | 0.069 | | | | 0.071 | |
| (a) | Rio Tinto’s greenhouse gas emissions for managed operations are reported in accordance with the requirements under Part 7 of The UK Companies Act 2006 (Strategic Report and Directors’ Report) Regulations 2013. Our approach and methodology used for the determination of these emissions are available at:riotinto.com/sd2016/environment andriotinto.com/ sd2016/glossary. |
| (b) | Rio Tinto’s greenhouse gas emission inventory is based on definitions provided by The World Resource Institute/ World Business Council for Sustainable Development Greenhouse Gas Protocol: A Carbon Reporting and Accounting Standard, March 2004. |
| (c) | Scope 1 emissions include “emissions from combustion of fuel and operation of managed facilities”. It includes emissions from land management and livestock management at those facilities. |
| (d) | Scope 2 emissions include “emissions from the purchase of electricity, heat, steam or cooling”. |
| (e) | Total emissions is the sum of scope 1 and scope 2 emissions minus emissions that are associated with the generation of electricity, heat, steam or cooling supplied to others. These emissions exclude indirect emissions |
| | associated with transportation and use of our products reported on page 28. |
| (f) | Rio Tinto greenhouse gas intensity index is the weighted emissions intensity for each of Rio Tinto’s main commodities relative to the commodity intensities in the 2008 base year (set to 100). This index incorporates approximately 98 per cent of Rio Tinto’s emissions from managed operations. |
| (g) | All the numbers are restated to ensure comparability over time. Amendment due to changes in measurement and calculation methodologies including adoption of updated global warming potentials from IPCC fourth assessment report or immaterial updates to data. |
Exploration, research and development
The Group carries out exploration as well as research and development in support of its activities as described more fully under Growth & Innovation on pages 40 and 41. Amounts charged for the year, net of any gains on disposal, generated a net loss before tax for exploration and evaluation of US$453 million (2015: US$568 million). Research and development costs were US$60 million (2015: US$104 million).
Auditors
PricewaterhouseCoopers LLP and PricewaterhouseCoopers (together, PwC) are the auditors of Rio Tinto plc and Rio Tinto Limited respectively. PricewaterhouseCoopers LLP have indicated their willingness to continue in office as auditors of Rio Tinto plc and a resolution to reappoint them as auditors of Rio Tinto plc will be proposed at the 2017 annual general meetings. A separate resolution will seek authority for the Audit Committee to determine the remuneration of PwC. PricewaterhouseCoopers will continue in office as auditors of Rio Tinto Limited.
A copy of the declaration given by PricewaterhouseCoopers, as the Group’s external auditors, to the directors in relation to the auditors’ compliance with the independence requirements of the Australian Corporations Act 2001 and the professional code of conduct for external auditors is set out on page 206 in the financial statements.
No person who was an officer of Rio Tinto during 2016 was a director or partner of PwC at a time when they conducted an audit of the Group.
Each person who held the office of director at the date the board resolved to approve this report makes the following statements:
| – | | so far as the directors are aware, there is no relevant audit information of which the auditors are unaware; and |
| – | | each director has taken all steps that he or she ought to have taken as a director to make him or herself aware of any relevant audit information and to establish that the auditors are aware of that information. |
| | | | |
| 48 | | riotinto.com | | 2016 Annual report |
Fees for audit andnon-audit services
The amounts payable to the Group’s auditors, PwC, were:
| | | | | | | | |
| | | 2016
US$m | | | 2015
US$m | |
| Audit fees (a) | | | 13.5 | | | | 14.4 | |
| Assurance services (b) | | | 1.5 | | | | 1.8 | |
| Taxation services | | | 0.6 | | | | 0.9 | |
| All other fees (c) | | | 1.8 | | | | 1.3 | |
| | | | 17.4 | | | | 18.5 | |
| (a) | Audit fees relating to statutory audits. |
| (b) | Assurance services in 2016 were mainly related to half year review procedures, sustainability assurance and other project-related assurance services. |
| (c) | All other fees include services in connection with other corporate projects. |
Further information on audit and non-audit fees is set out in note 39 to the financial statements.
During the year, the Audit Committee reviewed the effectiveness of PwC for Group audit and
local, statutory audit work. The evaluation took the form of a survey comprising a range of questions covering objectivity, quality and efficiency and was completed by individual Rio Tinto business units. The results of this survey and review were presented to the Audit Committee which concluded that PwC continued to provide a high-quality audit and an effective and independent challenge to management. The Audit Committee was satisfied with the external audit process and the independence of the external auditors.
PwC have been the external auditors since before the formation of the dual listed companies structure in 1995. For the reasons noted on page 60 the Audit Committee does not consider it necessary at the present time to undertake a tender process for the Group’s external audit. Since 2002, PwC have followed the requirements of the Sarbanes-Oxley Act 2002 and APB Ethical Standards and rotated both the lead UK and Australian audit partners at least every five years. In the UK, the audit
engagement partner was appointed in 2016 and will continue until the audit is tendered. In Australia the audit engagement partner was appointed in 2012, and will rotate off after the 2016year-end audit process. This continued refreshing of the team brings new perspectives to the audit and promotes constructive debate between auditors on the one hand and management and the Audit Committee on the other.
Based on advice provided by the Audit Committee as set out in the report of the Audit Committee on pages 58 to 60, the directors are satisfied that the provision ofnon-audit services by PwC is compatible with the general standard of independence for auditors and the standards imposed by Australian, UK and US legislation.
Financial instruments
Details of the Group’s financial risk management objectives and policies and exposure to risk are described in note 30 to the 2016 financial statements.
| | | | |
| 2016 Annual report | | riotinto.com | | 49 |
| | | | | | | | | | | | | | | | |
| | | | | | | | | |
| STRATEGIC REPORT | | | | DIRECTORS’ REPORT DIRECTORS’ REPORT | | | | FINANCIAL STATEMENTS | | | | PRODUCTION, RESERVES AND OPERATIONS | | | | ADDITIONAL INFORMATION |
Board of directors
Key for committee memberships:
| (R) | Remuneration Committee |
| (S) | Sustainability Committee |
Jan du Plessis (R, N and C)
Chairman, BCom, LLB, CA (SA), age 63
Appointment: September 2008 (board), April 2009 (chairman). Chairman of the Nominations Committee.
Skills and experience: Jan, a South African and British citizen, has significant experience on the boards of major UK public companies, having served as chairman andnon-executive director of various FTSE100 companies across a range of sectors. His breadth of experience and leadership skills enable him to fulfil his role as chairman effectively. Jan was group finance director of Compagnie Financière Richemont, the Swiss luxury goods group, from 1988 to 2004. He was appointed anon-executive director of British American Tobacco plc in 1999, prior to holding the chairmanship from 2004 to 2009. He was anon-executive director of Lloyds TSB from 2005 to 2009.
External appointments (current and recent):
Non-executive director and chairman of SABMiller plc from September 2014 and July 2015 respectively, until October 2016.Non-executive director and senior independent director of Marks and Spencer Group plc from 2008 and 2012 respectively until March 2015.
Jean-Sébastien Jacques (C)
Chief executive, MSc, age 45
Appointment: March 2016 (board), July 2016 (chief executive).
Skills and experience: Jean-Sébastien, a British citizen, has strong executive leadership skills and expertise in leading significant growth projects. He is also highly respected for his thought leadership across a wide range of geopolitical and economic issues within the mining industry and more broadly.Jean-Sébastien was appointed chief executive officer of Rio Tinto’s Copper group in 2013 and chief executive of the Copper & Coal group in February 2015. He led the transformation of this group, delivering a step-change in both safety and cash performance whilst reshaping the portfolio to focus on a core of thehighest-quality assets. He also had responsibility for two growth projects, Oyu Tolgoi in Mongolia and Resolution in the US, both of which saw significant progress during his tenure. Prior to joining Rio Tinto,Jean-Sébastien spent more than 15 years working in various roles across Europe, South East Asia, India and the US. He covered a wide range of operational and functional positions for the aluminium, bauxite and steel industries and more notably served as group director, Strategy for Tata Steel Group from 2007 to 2011.
External appointments (current and recent):
Chairman of the International Copper Association since late 2014.
Chris Lynch (C)
Chief financial officer, BCom, MBA, age 63
Appointment: September 2011 (board), April 2013 (chief financial officer).
Skills and experience:Chris, an Australian citizen, has significant experience in the mining and metals industry, having spent over 30 years working in these fields globally. Chris also has extensive listed company experience at board level across a variety of leadership roles, providing the board with significant operational and financial expertise. He was chief executive officer of the Transurban Group, an international toll road developer and manager with interests in Australia and North America, until 2012. His career has included seven years at BHP Billiton, where he was chief financial officer and then executive director and group president – Carbon Steel Materials. Prior to this, Chris spent 20 years with Alcoa Inc. where he was vice president and chief information officer based in Pittsburgh, and chief financial officer of Alcoa Europe in Switzerland. He was also managing director of KAAL Australia Limited, a joint venture company formed by Alcoa and Kobe Steel.
External appointments (current and recent):
Chief executive officer of the Transurban Group Limited from 2008 until 2012. Commissioner of the Australian Football League from 2008 until 2014.
Robert Brown (A, N and I)
Non-executive director, BSc, age 72
Appointment: April 2010.
Skills and experience: Bob, a Canadian citizen, contributes his considerable experience in large, high-profile Canadian companies. With a background in a wide range of sectors, Bob brings a broad perspective to the board. He is chairman of Aimia Inc., a customer loyalty management provider, and serves on the board of BCE Inc. (Bell Canada Enterprises), Canada’s largest communications company. He was previously president and chief executive officer of CAE Inc., a world leader in flight simulation and training. Before that he spent 16 years at Bombardier Inc., the aerospace and transportation company, where he was firstly head of the Aerospace Group and then president and chief executive officer. He has also served as chairman of Air Canada and of the Aerospace Industries Association of Canada. Bob was inducted to the Order of Canada as well as l’Ordre National du Québec. He has been awarded honorary doctorates from five Canadian universities.
External appointments (current and recent):
Non-executive director of BCE Inc. and Bell Canada since 2009,non-executive director and chairman of Aimia Inc. since 2005 and 2008 respectively,non-executive director of Fier CPVC-Montreal L.P. from 2005 until 2014.
Megan Clark AC (S, N, R and I)
Non-executive director, BSc, PhD, age 58
Appointment:November 2014. Chairman of the Sustainability Committee.
Skills and experience: Megan, an Australian citizen, has had an extensive career in both the private and public sector, combining expertise in the metals and mining business withhigh-level experience in science, research and technology. Her core industry experience and knowledge brings valuable insight and effective contributions to the board. Megan was chief executive of the Commonwealth Scientific and Industrial Research Organisation (CSIRO) from 2009 until 2014. Prior to CSIRO, Megan held various roles with Western Mining Corporation, was a director at N M Rothschild and Sons (Australia) and was vice president, Technology and subsequently vice president, Health, Safety, Environment, Community and Sustainability with BHP Billiton. She holds a PhD in economic geology from Queen’s University, Canada and is a Fellow of the Australian Academy of Technological Sciences and Engineering, the Australian Institute of Mining and Metallurgy and the Australian Institute of Company Directors. In 2014 she was appointed a Companion of the Order of Australia.
External appointments (current and recent):
Non-executive director of CSL Limited since February 2016,non-executive director of CARE Australia since 2016, member of the Prime Minister’s Science, Industry and Engineering Council from 2009 to 2014.
David Constable (N and I)
Non-executive director, B.Sc. Engineering, age 55
Appointment: February 2017.
Skills and experience: David, a Canadian citizen, is an experienced executive with strong credentials in the engineering, construction, energy and chemical sectors. He brings an international perspective to the board, having worked in Canada, the US, Chile, Argentina, the Netherlands, China and South Africa. David was the chief executive officer of SASOL Limited from 2011 to 2016 where he drove a comprehensive group wide change programme which culminated in the roll out of the organisation’s new operating model and its related structures, systems and processes. Prior to this, David held various roles with Fluor Corporation from 1982 to 2011, most recently as Group President, Operations. He also served as Group President for Fluor’s Power Business, heading up the company’s activities in the global coal, gas, nuclear and renewable power generation industries. Prior to this, David was Group President, Operations and Maintenance, focusing on Fluor’s operational asset productivity improvement business across a wide range of industries.
External Appointments (current and recent):
Non-executive director of Anadarko Petroleum Corporation since 2016 and ABB Ltd since 2015, member of the US Business Council and
| | | | |
| 50 | | riotinto.com | | 2016 Annual report |
the International Business Council, member of SASOL Limited’s Risk and Safety, Health and Environmental Committee and Capital Investment Committee until June 2016 and was also Chairman of the Sasol Global Foundation.
Ann Godbehere (A, N and I)
Non-executive director, FCPA, FCGA, age 61
Appointment: February 2010. Chairman of the Audit Committee.
Skills and experience: Ann, a Canadian and British citizen, has more than 25 years’ experience in the financial services industry. She spent ten years at Swiss Re, a global reinsurer, latterly as chief financial officer from 2003 until 2007. She was interim chief financial officer and executive director of Northern Rock bank after its nationalisation. Ann is a qualified accountant and was made a fellow of the Institute of Chartered Professional Accountants in 2014. Ann’s strong financial background and expertise enable her to effectively fulfil the role of Audit Committee chairman.
External appointments (current and recent):
Non-executive director of UBS Group AG since 2014 andnon-executive director of UBS AG since 2009,non-executive director of British American Tobacco plc since 2011,non-executive director and chairman of the audit committee of Prudential Public Limited Company since 2007 and 2009 respectively,non-executive director of Atrium Underwriting Group Limited from 2007 until 2014,non-executive director of Arden Holdings Ltd from 2007 until 2014.
Sam Laidlaw (N and I)
Non-executive director, MA, MBA, age 61
Appointment: February 2017.
Skills and experience: Sam, a British citizen, has had a long and distinguished career in the energy industry, both in the UK and internationally. Sam brings to the board deep experience of long-cycle, high-capex and safety critical industries from his involvement in the upstream oil and gas industry for over 30 years. Sam was chief executive officer of Centrica plc from 2006 to 2014. His other previous roles include Executive Vice President of Chevron Corporation;non-executive director of Hanson PLC; chief executive officer of Enterprise Oil plc; and President and chief operating officer of Amerada Hess Corporation. He was also a member of the UK Prime Minister’s Business Advisory Group and was senior director of the UK Department of Transport. Sam is a qualified solicitor and has a Master’s degree in Business Administration from INSEAD.
External Appointments (current and recent):
Non-executive director of HSBC Holdings plc since 2008 and chairman of the Remuneration Committee and the Nomination Committee, director of Neptune Oil & Gas Limited, chairman of the National Centre of Universities & Business, a board member of the Oxford Saïd Business School and a council member of Radley College.
Anne Lauvergeon (S, N and I)
Non-executive director, PhD, age 57
Appointment: March 2014.
Skills and experience: Anne, a French citizen, has strong board, strategic and general management experience across a range of sectors including energy, communications and financial services. Her breadth of experience complements the balance of skills on the board. Anne started her professional career in 1983 in the steel industry and in 1990 was named adviser for Economic International Affairs at the French Presidency and deputy chief of its staff in 1991. In 1995 she became a partner of Lazard Frères & Cie, subsequently joining Alcatel Telecom as senior executive vice president in 1997, where she was responsible for international activities and the group’s industrial shareholdings in the energy and securities sectors. Anne was CEO & Chairman of COGEMA from 1999 until 2011. Following a merger in 2001, COGEMA became AREVA where Anne remained in position until 2011.
External appointments (current and recent):
Chairman and chief executive officer of A.L.P since 2011, chairman of SIGFOX since 2014, chairman of BoostHEAT since 2015,non-executive director of American Express Company since 2013,non-executive director of KOC since April 2016,non-executive director of Suez since 2015,non-executive director of Airbus Group NV from 2013 to 2016,non-executive director of Total SA from 2000 until May 2015,non-executive director of GDF SUEZ from 2001 until 2012, andnon-executive director of Vodafone plc from 2005 until 2014.
Michael L’Estrange AO (N, S and I)
Non-executive director, BA (Sydney), MA (Oxon), age 64
Appointment: September 2014.
Skills and experience: Michael, an Australian citizen, has had long and distinguished public service experience in Australia and brings to the board valuable, global expertise in foreign policy, international relations and trade. Michael joined the Australian Government’s Department of Prime Minister and Cabinet in 1981. From 1989 to 1994, he worked in a range of policy advisory positions before he was appointed the inaugural executive director of the Menzies Research Centre in Canberra in 1995. In 1996, he was appointed by the Prime Minister as secretary to cabinet and head of the Cabinet Policy Unit. He served in that role until 2000 when he became Australia’s high commissioner to the United Kingdom. He returned to Australia as secretary of the Department of Foreign Affairs and Trade from 2005 to 2009. In 2007, he was appointed as an Officer of the Order of Australia.
External Appointments (current and recent): Director of the University of Notre Dame, Australia since 2014, and head of college of the National Security College at the Australian National University in Canberra from 2009 until 2014, continuing as a professor until 2015.Non-executive director of Qantas Airways Limited.
Hon. Paul Tellier (A, R, N and I)
Non-executive director, LLL, BLitt (Oxon), LL.D, C.C. age 77
Appointment: October 2007.
Skills and experience: Paul, a Canadian citizen, has extensive experience in both the corporate sector and the civil service, broadening the board’s diversity and enabling Paul to contribute effectively as a member of the Audit Committee and Remuneration Committee. He entered the civil service in the 1970s and was clerk of the Privy Council Office and secretary to the Cabinet of the Government of Canada from 1985 to 1992. He became president and chief executive officer of the Canadian National Railway Company from 1992 to 2002. From 2002 to 2004, he was president and chief executive officer of Bombardier Inc., the aerospace and transportation company.
External appointments (current and recent):
Director of Groupe Harnois since January 2017, chairman of Global Container Terminals Inc. from 2007 to January 2016, member of the advisory board of General Motors of Canada since 2005, trustee of the International Accounting Standards Foundation from 2007 until 2012,co-chair of the Prime Minister of Canada’s Advisory Committee on the Renewal of the Public Service from 2006 until 2014, strategic adviser to Société Générale (Canada) from 2005 until 2013, director of BCE Inc. (Bell Canada Enterprises) from 1999 until 2010, director of Bell Canada from 1996 until 2010, director of McCain Foods Limited from 1996 until 2014.
Simon Thompson (S, R, N and I)
Non-executive director, MA (Oxon), age 57
Appointment: April 2014.
Skills and experience: Simon, a British citizen, has a wealth of global experience in the metals and mining industry, having held numerous executive andnon-executive positions in this sector. This enables Simon to provide valuable insight as anon-executive director and member of the Sustainability Committee and Remuneration Committee. Simon was an executive director of Anglo American plc, chairman and chief executive of the Base Metals Division, chairman of the Exploration Division and chairman of Tarmac. Prior to his career with Anglo American he held investment banking positions at S. G. Warburg and N M Rothschild.
External appointments (current and recent):
Chairman of 3i Group plc since 2015,non-executive director and chairman of Tullow Oil plc since 2011 and 2012 respectively,non-executive director and senior independent director of AMEC Foster Wheeler plc from 2009 and 2014 respectively until 2015,non-executive director of Sandvik AB from 2008 until May 2015, andnon-executive director of Newmont Mining Corporation from 2008 until 2014.
| | | | |
| 2016 Annual report | | riotinto.com | | 51 |
| | | | | | | | | | | | | | | | |
| | | | | | | | | |
| STRATEGIC REPORT | | | | DIRECTORS’ REPORT BOARD OF DIRECTORS | | | | FINANCIAL STATEMENTS | | | | METALS AND MINERALS PRODUCTION | | | | ADDITIONAL INFORMATION |
Board of directors
continued
John Varley (A, R, N and I)
Non-executive director, BA, MA (Oxon), age 60
Appointment: September 2011 (board), May 2012 (senior independent director). Chairman of the Remuneration Committee.
Skills and experience: John, a British citizen, has significant banking experience having spent 28 years with Barclays PLC, most notably as chief executive of the Group from 2004 until 2010. John’s extensive board-level experience makes him an effective senior independent director and his financial services experience complements the balance of skills on the board. During his career with Barclays, he held several senior positions, including chairman of the Asset Management division, group finance director and deputy chief executive. Prior to joining Barclays, John worked as a solicitor.
External appointments (current and recent):
Director of Barclays PLC and Barclays Bank PLC from 1998 until 2010,non-executive director ofBlackRock Inc. since 2009,non-executive director and senior independent director of AstraZeneca plc from 2006 and 2012 respectively until April 2015, chairman of Marie Curie since 2011, chairman of Employment for Excluded Groups since 2006 and trustee of the Prince of Wales Charitable Foundation since 2011.
New director appointment to take effect after the AGMs
Simon Henry (N and I)
Non-executive director, MA, FCMA, age 55
Appointment:July 2017.
Skills and experience: Simon, a British citizen, has significant global experience in the oil and gas industry, having spent over 30 years at Royal Dutch Shell plc, most notably as chief financial officer, a position that he has held since 2009. He was chief financial officer and executive vice president, Finance, Exploration & Production from 2004 to 2009, and prior to this he was head of Group Investor Relations from 2001 to 2004. Simon brings extensive financial expertise to the board and is a fellow of the Chartered Institute of Management Accountants (CIMA) and has a BA in Mathematics and an MA from the University of Cambridge.
External appointments (current and recent):
Non-executive director of Lloyds Banking Group plc since June 2014 and a member of the Audit Committee and the Risk Committee, member of the Advisory Board of the Centre for European Reform and the Advisory Panel of CIMA, chaired the European Round Table CFO Taskforce from 2011 to 2017, member of the Main Committee of the 100 Group of UK FTSE CFOs from 2009 to 2017.
Directors who left the board
Sam Walsh AO (C)
Chief executive, BCom (Melbourne), age 67
Appointment: June 2009 (board), January 2013 (chief executive) to July 2016.
Skills and experience: Sam, an Australian citizen, joined Rio Tinto in 1991, following 20 years in the automotive industry at General Motors and Nissan Australia. He held a number of management positions during his career at Rio Tinto, including chief executive of the Aluminium group from 2001 to 2004, chief executive of the Iron Ore group from 2004 to 2009 and chief executive, Iron Ore and Australia from 2009 to 2013. Sam is a Fellow of the Australian Institute of Management, the Australasian Institute of Mining and Metallurgy, the Chartered Institute of Purchasing and Supply Management, the Australian Institute of Company Directors and the Australian Academy of Technical Science and Engineering. In 2010, he was appointed an Officer in the General Division of the Order of Australia.
External appointments (current and recent):
Trustee of the Royal Opera House from 2014 to 2016, member of the Council of the International Council on Mining & Metals and a director of The International Council on Mining and Metals (UK) Limited from 2013 to July 2016.
Richard Goodmanson (R, S, N and I)
Non-executive director, B. Econ, BCom, MBA, MCE, age 69
Appointment:December 2004 to May 2016.
Skills and experience: Richard, a US citizen, was executive vice president and chief operating officer of DuPont until 2009. Prior to this he was president and chief executive officer of America West Airlines and senior vice president of operations forFrito-Lay, Inc., a subsidiary of PepsiCo. Richard has worked at senior levels for McKinsey & Co, where he led client service teams on major programmes of strategy development. He spent ten years in heavy civil engineering project management, principally in South East Asia, including the construction of the Hong Kong Subway System.
External appointments (current and recent):
Non-executive director of Qantas Airways Limited since 2008.
Company secretaries
Steve Allen
BA (Modern Languages and European Studies), Solicitor (England and Wales), age 45
Appointment:January 2017.
Skills and experience: Steve joined the Group as company secretary of Rio Tinto plc and joint company secretary of Rio Tinto Limited in January 2017. Prior to joining Rio Tinto, Steve was Deputy General Counsel at BG Group plc. He served as company secretary of BG Group from 2011 to 2016, having previously been Chief Counsel, Corporate from 2008 to 2011. Before joining BG Group in 2005, Steve was a corporate lawyer for Herbert Smith LLP in London.
External appointments (current and recent):member of the GC100 Executive Committee.
Tim Paine
BEc, LLB, FGIA, FCIS, age 53
Appointment:January 2013.
Skills and experience:Tim joined the Group in 2012 and became joint company secretary of Rio Tinto Limited in 2013. He has over 25 years’ experience in corporate counsel and company secretary roles, including as general counsel and company secretary at Mayne Group, Symbion Health and Skilled Group. Prior to that Tim spent twelve years at ANZ Bank, including a period as acting general counsel and company secretary. Tim commenced his career as a solicitor in private practice and has also managed his own consulting company.
External appointments (current and recent):
Company secretary for the Foundation for Australia-Japan Studies and a member of the Governance Institute of Australia’s Legislation Review Committee.
| | | | |
| 52 | | riotinto.com | | 2016 Annual report |
Executive Committee
Bold Baatar
MBA (Business Administration), age 43
Bold was appointed chief executive, Energy & Minerals in November 2016. Bold was previously a member of the Rio Tinto Iron Ore executive committee, as managing director, Iron Ore Sales and Marketing and head of Rio Tinto’s Marine business. He joined Rio Tinto in May 2013 as president of Copper International Operations. Prior to joining the Group, Bold held executive positions with a diversified investment management business and a local gold mining company in Mongolia. Until 2009, Bold spent 11 years as an investment banker with JPMorgan in New York and London.
He was the chairman of the Mongolian Stock Exchange from 2010 to 2012, chairman of the Mongolian Mining Association from 2012 to 2014 and served as anon-executive director on the board of Southgobi Resources Ltd from 2013 to 2014.
Alfredo Barrios
PhD (Energy Economics), BSc (Physics), MSc (Management), age 51
Alfredo was appointed chief executive, Aluminium in 2014. He joined Rio Tinto after a wide-ranging career in leadership positions with BP plc. His most recent role was executive director and executive vice president Downstream atTNK-BP, based in Moscow, where he was directly responsible for the refining, trading, supply, logistics, and marketing businesses.
Alfredo has held board positions in a number of companies, including CLH (Spain) from 2007 to 2011 where he was chairman of the Audit Committee, and OAO NGK Slavneft (Russia) from 2012 until 2013. He was president of the Spanish National Oil Industry Association (AOP) from 2009 until 2011.
Joanne Farrell
BSc (Psychology and Economics), Graduate Diploma (Management), age 59
Joanne Farrell was appointed Group executive, Health, Safety & Environment in July 2016. Joanne, who has more than 35 years’ experience in the mining sector, is also responsible for leading Rio Tinto’s interaction with key stakeholders in Australia as managing director, Australia. Joanne has been with Rio Tinto for 29 years and brings a wealth of experience from roles across Organisational Resources, Government Affairs and Communities. Joanne worked for BHP before joining Rio Tinto and prior to that she was an economist in regional development with the Government of Western Australia.
Joanne is a director and Chair of the Rio Tinto Staff Superannuation Fund, a director of the Perth Institute of Contemporary Art, a member of the Business Council and its Economics and Competition and its Citizenship and Governance Committee, a specialist advisor to the Male Champions of Change and a member of Chief Executive Women.
Vera Kirikova
MA (Inter-cultural Communications), MBA, age 43
Vera was appointed Human Resources Group executive in January 2017. Vera joined Rio Tinto in 2015 as vice president, Human Resources for the then Diamonds & Minerals product group and was appointed head of Human Resources for the Group in July 2016. She has accountability for the Group’s Human Resources function, including strategy and execution. Prior to joining Rio Tinto, Vera was employed by Schlumberger, where she worked for over 20 years in human resources, operations, marketing and M&A positions in the US, Canada, UK, Russia and France.
Stephen McIntosh
MSc (Geology), age 53
Stephen was appointed Group executive, Growth & Innovation in July 2016. Stephen has close to 30 years of service with the Group after joining the business as an exploration geologist. Stephen has deep experience across a wide range of commodities and geographies, having worked on projects in more than 45 countries. In his previous role as Rio Tinto’s global head of Exploration, Stephen led teams operating in 20 countries and drove a step-change in safety improvement whilst delivering industry-leading discovery performance. Stephen has been actively involved in the management, exploration, evaluation or discovery of a number of the Group’s exploration discoveries.
Stephen is a fellow of the Australian Institute of Mining and Metallurgy, a fellow of the Society of Economic Geology, a member of the Australian Society of Exploration Geophysics and a graduate of the Australian Institute of Company Directors.
Simone Niven
BA (Comms), age 46
Simone was appointed Corporate Relations Group executive in January 2017. Simone joined Rio Tinto in 2008 and has accountability for the Group’s reputation and corporate relations areas – external affairs, communities, media, reputation and employee communications. She also has responsibility for the leadership of the country and regional office teams including Africa, Australia, Canada, China, the European Union, India, Japan, UK and the US. Prior to joining Rio Tinto she spent over 15 years working in senior roles at some of the world’s largest companies across many continents, including Vodafone, the United Technologies group, Smiths Group plc and Smith & Nephew plc in a range of corporate relations fields.
Chris Salisbury
BEng (Metallurgical), FAICD, age 50
Chris was appointed chief executive of Rio Tinto’s Iron Ore group in July 2016. He became acting chief executive of the Copper & Coal group in March 2016, overseeing its operations and projects globally. Chris was previously chief operating officer, Coal with accountability for strategy, project development, operations and logistics for Rio Tinto’s coal mines in New South Wales, Queensland and South Africa. Chris joined Rio Tinto in 1988, with experience spanning bauxite, alumina refining, aluminium smelting, coal, port logistics and uranium.
He has served as executive andnon-executive director of Energy Resources of Australia Ltd, chairman of Queensland Alumina Limited, president of the Namibian Uranium Stewardship Committee, external chair for both the Northern Territory Minerals Council and the Australian Uranium Association.
Arnaud Soirat
PhD (Theoretical Physical Chemistry), age 52
Arnaud Soirat was appointed chief executive, Copper & Diamonds in July 2016. Arnaud has almost 25 years’ experience in the metals and mining industry and a wealth of operational and commercial experience gained in various roles, working across five continents.
Arnaud was previously Aluminium Primary Metal president and chief executive officer, responsible for managing and improving operations and businesses globally, with a particular focus on lean manufacturing and operational excellence. He joined Rio Tinto in 2010 as chief operating officer, Primary Metal, Europe, Middle-East & Africa. Before joining Rio Tinto, Arnaud spent 18 years in various technical and operational positions with Alcoa and Pechiney in both Australia and Europe.
Executive director members
Jean-Sébastien Jacques and Chris Lynch were also members of the Executive Committee in 2016 through their positions as chief executive and chief financial officer respectively. Their biographies are shown on page 50.
| | | | |
| 2016 Annual report | | riotinto.com | | 53 |
| | | | | | | | | | | | | | | | |
| | | | | | | | | |
| STRATEGIC REPORT | | | | DIRECTORS’ REPORT BOARD OF DIRECTORS | | | | FINANCIAL STATEMENTS | | | | METALS AND MINERALS PRODUCTION | | | | ADDITIONAL INFORMATION |
Executive Committee
continued
Executive Committee members who left the Group
Hugo Bague
MA (Linguistics), age 56
Hugo Bague was appointed Group executive, Organisational Resources in 2013 after joining Rio Tinto as global head of Human Resources in 2007. Previously he worked forHewlett-Packard where he was the global vice president, Human Resources for the Technology Solutions Group, based in the US. Prior to this he worked for Compaq Computers, Nortel Networks and Abbott Laboratories based in Switzerland, France and Germany. Hugo will leave the Group on 31 March 2017.
He has been anon-executive director and member of the nominating and governance and compensation committees of Jones Lang LaSalle Incorporated, a global real estate services firm, since 2011.
Alan Davies
BBus (Acctcy) LLB, LLM, FCA, age 46
Alan was appointed chief executive, Energy & Minerals in July 2016, having previously held the position of chief executive, Diamonds & Minerals since 2012. He joined the Group in 1997 and has held management positions in Australia, London and the US for the Iron Ore and Energy businesses. Previously, Alan was president, International Operations for Rio Tinto’s Iron Ore business with global accountability for operations and projects in Canada, India and Guinea, and was also previously chief financial officer of the Iron Ore business. Alan assumed responsibility for the Uranium business in February 2015. Alan is a Fellow of the Institute of Chartered Accountants in Australia. Alan left Rio Tinto in November 2016, following the announcement made on 17 November 2016.
Andrew Harding
BEng (Mining Engineering), MBA, age 50
Andrew Harding was appointed chief executive, Iron Ore in 2013. Prior to his current role, Andrew spent three years as chief executive, Copper, where he was responsible for a range of mines and projects including the development of the world-class Oyu Tolgoi copper-gold mine in Mongolia. Andrew joined Rio Tinto in 1992 and spent seven years in Iron Ore. He has also held a range of positions in Technology & Innovation, Energy and Aluminium and was president and chief executive officer of Kennecott Utah Copper. Andrew left the Group in July 2016.
He was a director of Turquoise Hill Resources Ltd between 2009 and 2010 and between 2011 and 2013.
Greg Lilleyman
BEng (Construction), age 50
Greg was appointed Group executive, Technology & Innovation in January 2014. He joined the Group in 1990 and held a number of operational roles across the Pilbara, Hunter Valley and Canada with both the Iron Ore and Energy businesses. In 2011 Greg was appointed president, Pilbara Operations for Rio Tinto Iron Ore and in 2013 assumed the role of head of Productivity Improvement with Technology & Innovation. Greg left Rio Tinto in May 2016 after 25 years of service.
Greg was a board member of the Australian Institute of Management of Western Australia from 2012 until 2013, a board member of the Energy & Minerals Institute from 2011 until 2013, and a director of the Chamber of Minerals and Energy of Western Australia from 2008 until 2013, holding the position of president from 2011 until 2013, and a board member of the Curtin University Foundation from 2012 until 2015.
Debra Valentine
BA (History), JD, age 63
Debra was appointed Group executive, Legal & Regulatory Affairs in 2009 having joined Rio Tinto as global head of Legal in 2008. She previously worked at United Technologies Corporation in the US where she was vice president, deputy general counsel and corporate secretary. Before then, she was a partner with the law firm O’Melveny & Myers, in Washington DC. Debra served as general counsel at the US Federal Trade Commission from 1997 to 2001. Debra was appointed anon-executive director of Lamprell plc in 2015. Debra left Rio Tinto in November 2016, following the announcement made on 17 November 2016.
| | | | |
| 54 | | riotinto.com | | 2016 Annual report |
Corporate governance
Rio Tinto takes a unified approach to corporate governance to comply with the regulatory obligations associated with its three principal stock exchange listings in the UK, Australia and the US.
Statement of compliance with governance codes and standards in 2016
In compiling this report, the directors have referred to the April 2016 edition of the UK Corporate Governance Code (the Code), the Australian Securities Exchange Corporate Governance Council’s Corporate Governance Principles and Recommendations (3rd edition) (the ASX Principles), and the New York Stock Exchange (NYSE) Corporate Governance Standards (the NYSE Standards).
Throughout 2016, and at the date of this report, the Group applied the principles of, and was compliant with the provisions of, the Code and the ASX Principles.
Rio Tinto plc, as a foreign issuer with American Depositary Receipts (ADRs) listed on the NYSE, is obliged by the NYSE Standards to disclose any significant ways in which its practices of corporate governance differ from the NYSE Standards.
The Company has reviewed the NYSE Standards and believes that its practices are broadly consistent with them, with the following exceptions where the literal requirements of the NYSE Standards are not met due to differences in corporate governance between the US, UK and Australia.
The NYSE Standards state that companies must have a nominating/corporate governance committee composed entirely of independent directors which, in addition to identifying individuals qualified to become board members, develops and recommends to the board a set of corporate governance principles applicable to the company. Rio Tinto has a Nominations Committee comprising the chairman and independentnon-executive directors, information about which is set out on page 61. This committee does not develop corporate governance principles for the board’s approval. The board itself develops such principles.
Under US securities law and the NYSE Standards, the Company is required to have an audit committee that is directly responsible for the appointment, compensation, retention and oversight of the work of external auditors. While the Rio Tinto Audit Committee makes recommendations to the board on these matters, and is subject to legal and regulatory requirements on oversight of audit tenders, the ultimate responsibility for the compensation of the external auditors and the appointment of the external auditors of Rio Tinto plc rests with the shareholders.
Further information about the corporate governance framework is available in the “Corporate governance” section of Rio Tinto’s website.
The board and management
Rio Tinto plc and Rio Tinto Limited have a common board of directors. The directors are responsible for the success of the Group and, through the independent oversight of management, are accountable to shareholders for the performance of the business.
Role and responsibilities
The principal role of the board is to set the Group’s strategy and to review regularly its strategic direction. In doing this, the board also has responsibility for corporate governance.
A formal schedule of matters reserved for the board has been established by the directors. This covers areas such as setting of the Group’s strategy (and monitoring the Group’s performance in the delivery of such strategy), major investments, acquisitions and divestments, oversight of risk and the Group’s risk appetite, and reviewing the Group’s governance framework. Matters reserved for the board also include approval of the Group’s Annual Plan, and any other matters that have significant financial, reputational, social and/or environmental implications. A copy of such schedule of matters is available on the website.
Responsibility forday-to-day management of the business is delegated to the chief executive and other members of the Executive Committee under a Group delegation of authorities. A number of management committees support the chief executive and the Executive Committee in the performance of their duties. The structure of these committees is set out at page 57.
As part of the annual financial planning process, the board sets annual performance targets, which include personal and business performance measures, under the Group’s short-term incentive plan (detailed on page 79) for the chief executive. These performance targets are determined by the Remuneration Committee on behalf of the board. The chief executive establishes targets for the Executive Committee. Those objectives are cascaded throughout management teams.
Details of the terms of appointment of the directors and members of the Executive Committee are discussed in the Remuneration Policy section of the Remuneration Report on pages 70 and 77. Details of the performance of the executive directors and other members of the Executive Committee are discussed in the Implementation Report section of the Remuneration Report from page 70.
Board balance and independence
Board composition
The names, skills and experience of each director, together with their terms in office, are shown in the biographical details on pages 50 to 52. Details of changes to the board during 2016 and in the year to date are set out in the Directors’ report on page 52.
Director independence
The tests of independence of anon-executive director vary between the jurisdictions where Rio Tinto has listings. The Nominations
Committee assesses the independence of thenon-executive directors against an independence framework which takes into account the requirements of the Code, the ASX Principles and the NYSE Standards. This framework is reviewed and approved annually by the Nominations Committee.
Among the key criteria of the independence framework are independence from management and the absence of any business relationship which could interfere with the director’s independence of judgement and his or her ability to provide a strong, valuable contribution to the board’s deliberations, or which could interfere with the director’s ability to act in the best interests of the Group.
The chairman was considered independent upon his appointment under the Code and, in the board’s view, he continues to satisfy the tests for independence under the ASX Principles and the NYSE Standards.
Having reviewed the framework and used it to assess the independence of thenon-executive directors, the board is satisfied that all of itsnon-executive directors are, and remain, independent.
Non-executive directors serving more than six years are subject to a particularly rigorous independence review by the Nominations Committee. Consequently, the Committee closely reviewed the continuing independence of Ann Godbehere (who has served on the board for six years) and Paul Tellier (who will have served on the board for more than nine years by the end of 2017). In the case of Ann Godbehere, the Committee took into account her significant contribution to the board as Chair of the Audit Committee, as well as the combination of her strong financial and accounting expertise, her extensive sector experience and her detailed understanding of the Rio Tinto business. In the case of Paul Tellier, the Committee concluded that, in addition to relevant sector experience, the board would continue to place significant reliance on his perspectives and advice on Canadian matters. His length of service would also provide valuable continuity during a period of refreshment of the composition of the board. As a result of this review, the Nominations Committee is confident that both Ann and Paul continue to be independent members of the board and therefore has recommended to the board that they be allowed to stand forre-election at the forthcoming annual general meetings.
Directors’ other directorships
Executive directors may be invited to becomenon-executive directors of other companies. The Nominations Committee, on behalf of the board, operates a procedure under which approval may be given to accept such invitations, recognising the benefit to be derived to the individual and to Rio Tinto from such appointments. Specific consideration is also given to any actual or perceived conflicts of interest arising from external appointments of Rio Tintonon-executive directors, including any situational conflicts for the purposes of the UK Companies Act, and whether such
| | | | |
| 2016 Annual report | | riotinto.com | | 55 |
| | | | | | | | | | | | | | | | |
| | | | | | | | | |
| STRATEGIC REPORT | | | | DIRECTORS’ REPORT CORPORATE GOVERNANCE | | | | FINANCIAL STATEMENTS | | | | METALS AND MINERALS PRODUCTION | | | | ADDITIONAL INFORMATION |
Corporate governance
continued
appointments materially and adversely affect the ability of the directors to dedicate sufficient time to their responsibilities to Rio Tinto.
The board considers that, in compliance with the requirements of the Code, each of the directors is able to allocate sufficient time to Rio Tinto in order to discharge their responsibilities effectively.
The chief executive and the chief financial officer do not hold anynon-executive director positions at other companies.
Election andre-election
The directors may appoint additional members to join the board during the year. Directors appointed in this way will be subject to election by shareholders at the first annual general meetings after their appointment. In subsequent years, the directors are expected to submit themselves for annualre-election at the annual general meetings.
On 10 February 2017, the board announced the appointment of three newnon-executive directors who will stand for election at the 2017 annual general meetings: David Constable, Sam Laidlaw and Simon Henry. The appointments of David and Sam took immediate effect, while Simon’s appointment as anon-executive director will, subject to election at the annual general meetings, take effect on 1 July 2017. Biographies of the newnon-executive directors can be found on pages 50 to 52.
Robert Brown, who was first elected by shareholders as anon-executive director at the 2010 annual general meetings, and Anne Lauvergeon, who was first elected at the 2014 annual general meetings, are not standing forre-election in 2017 and will each step down from the board at the end of the annual general meeting of Rio Tinto Limited in May 2017.
All directors apart from Robert and Anne will offer themselves for election orre-election at the annual general meetings in 2017 and further details about each of them are set out on pages 50 and 51 of the Annual report and in the notices of the annual general meetings.
Governance processes
In 2016, there were nine scheduled board meetings. Details of the directors’ attendance at all of the board and committee meetings held in 2016 are set out on the following page.
The board has regular discussions with senior management on the Group’s strategy. These discussions typically include presentations given by senior management during the year. The board attends an annualtwo-day strategy meeting with the Executive Committee, which includes a broader, detailed review of the Group’s strategic direction. The outputs from this event help underpin the board’s annual financial planning exercise and provide strategic direction and focus to the Executive Committee.
Directors receive timely, regular and appropriate information to enable them to fulfil their duties. They also have direct access to the advice and services of the Group company secretary, who is accountable to the board and advises the chairman and, through the chairman, the board on all governance matters. The directors are also able to obtain, through the Group company secretary, independent professional advice at the Group’s expense.
The chairman andnon-executive directors meet, typically at the start of each board meeting, without the executive directors present, to create an opportunity fornon-executive directors to raise any issues in private session.
In addition, the directors are in regular communication with members of the Executive Committee and other members of senior management. This helps to foster an open and regular exchange of knowledge and experience.
All newnon-executive directors undertake a full, formal and tailored induction on joining the board. The board is provided with training and development opportunities during the year. The directors regularly attend site visits to the Group’s operations around the world and meet with employees and, from time to time, shareholders and other key stakeholders. In 2016, the board visited the Oyu Tolgoi copper and gold mining project in Mongolia, and reviewed the progress being made on the development of underground mining operations at the site. These visits are designed to ensure directors have appropriate knowledge of the Company and access to its operations and staff. The board’s decision to visit Oyu Tolgoi reflects the importance of this asset to the Group. The site contains reserves and resources that make it one of the world’s largest known copper and gold deposits. In addition, with a significant capital investment having been recently approved into the development of the underground mine, Oyu Tolgoi was considered of prime importance for a board visit.
Performance evaluation
The Nominations Committee is responsible for developing and recommending to the board processes for the evaluation of the board’s performance, as well as that of its committees and individual directors.
In accordance with the board approved process, the effectiveness of the performance of the board, all board committees and individual directors is assessed internally on an annual basis.
In addition, performance evaluations are carried out by external consultants every three years. The board engaged Lintstock Limited, a specialist corporate governance consultancy with no other connections to Rio Tinto, to undertake an external, independent evaluation of the board and its committees during 2016.
The first stage of the evaluation process involved agreeing questions with the chairman and the committee chairmen for discussion with directors and the Group company secretary in interviews which were conducted by Lintstock during the first half of 2016.
The findings from these questionnaires and interviews formed the basis of evaluation reports for the board and its committees and formed the basis of certain recommendations made by Lintstock in July 2016.
The board and board committee performance evaluation results and recommendations were then discussed at a meeting of the board in August 2016. A full review of the outcome of the committee effectiveness evaluation was tabled for discussion with each committee in October 2016. Outcomes from the performance evaluation process were considered and reviewed by the board at subsequent meetings. A series of recommended actions has been considered and approved by the board for implementation in 2017 aimed at enhancing the overall effectiveness of the board and its committees. The action plan, and progress and outcomes against the plan, will also form the basis of future internal and external reviews. The action plan includes items regarding regular reporting and discussion of investor feedback and the outcomes of post-investment reviews; and enhanced reporting to the board on changes to the legal, fiscal and regulatory landscapes in which Rio Tinto operates.
The board will continue to monitor progress against these actions in 2017 and will report on progress in next year’s annual report.
Thenon-executive directors, led by the senior independent director, are responsible for the performance evaluation of the chairman. Lintstock facilitated this review through a questionnaire and interviews, and provided a report to the senior independent director. In addition, directors met with the senior independent director to give their view on the performance of the chairman. The senior independent director provided feedback to the chairman on his performance at the conclusion of this process, factoring in the inputs received from the external consultants, and from other directors.
The chairman continues to be responsible for the assessment of each individualnon-executive director’s performance and contribution. The chairman met with each of thenon-executive directors in September 2016 to review their performance and training needs. Key outcomes from such evaluation process will be factored into subsequent development plans for eachnon-executive director, and progress towards such development goals will be monitored in future evaluation processes.
| | | | |
| 56 | | riotinto.com | | 2016 Annual report |
Directors’ attendance at board and committee meetings during 2016
| | | | | | | | | | | | | | | | | | | | | | | | | | | | |
| | | Board (a) | | | Audit
Committee (a) | | | Remuneration
Committee (a) | | | Sustainability
Committee (a) | | | Nominations
Committee (a) | | | Chairman’s
Committee (a) | | | Annual
general
meetings | |
| Jan du Plessis | | | 9/9 | | | | – | | | | 9/9 | | | | – | | | | 8/8 | | | | 14/14 | | | | 2/2 | |
| Sam Walsh(b) | | | 9/9 | | | | – | | | | – | | | | – | | | | – | | | | 4/5 | | | | 2/2 | |
| Jean-Sébastien Jacques (c) | | | 7/7 | | | | – | | | | – | | | | – | | | | – | | | | 11/11 | | | | – | |
| Chris Lynch | | | 9/9 | | | | – | | | | – | | | | – | | | | – | | | | 14/14 | | | | 2/2 | |
| Robert Brown | | | 9/9 | | | | 6/6 | | | | – | | | | – | | | | 8/8 | | | | – | | | | 1/2 | |
| Megan Clark | | | 9/9 | | | | – | | | | 5/5 | (d) | | | 5/5 | | | | 8/8 | | | | – | | | | 2/2 | |
| Ann Godbehere | | | 9/9 | | | | 6/6 | | | | – | | | | – | | | | 8/8 | | | | – | | | | 2/2 | |
| Richard Goodmanson(e) | | | 4/4 | | | | – | | | | 5/5 | | | | 3/3 | | | | 4/4 | | | | – | | | | 2/2 | |
| Anne Lauvergeon | | | 9/9 | (f) | | | – | | | | – | | | | 5/5 | | | | 6/8 | | | | – | | | | 1/2 | |
| Michael L’Estrange | | | 9/9 | | | | – | | | | – | | | | 5/5 | | | | 8/8 | | | | – | | | | 2/2 | |
| Paul Tellier | | | 9/9 | | | | 6/6 | | | | 9/9 | | | | – | | | | 8/8 | | | | – | | | | 2/2 | |
| Simon Thompson | | | 9/9 | | | | – | | | | – | | | | 5/5 | | | | 8/8 | | | | – | | | | 2/2 | |
| John Varley | | | 9/9 | | | | 6/6 | | | | 9/9 | | | | – | | | | 8/8 | | | | – | | | | 2/2 | |
| (a) | The number of meetings attended/maximum number the director could have attended. A number of additional ad hoc meetings of the board and board committees were held in 2016, including in relation to (i) the ongoing investigations relating to contractual payments made to a consultant who had provided advisory services on the Simandou project; and (ii) the investigation by relevant authorities, including the SEC, relating to the impairment that was included in the Company’s 2012 accounts in respect of Rio Tinto Coal Mozambique. |
| (b) | Stood down from the board on 1 July 2016. |
| (c) | Appointed to the board on 17 March 2016. |
| (d) | Appointed to the Remuneration Committee on 1 May 2016. |
| (e) | Stood down from the board on 5 May 2016. |
| (f) | At the board meeting on3-4 May 2016, Anne attended 4 May only. |
Governance structure
The board has established committees which are responsible for audit, remuneration, sustainability and nominations issues. In addition, a Chairman’s Committee operates under delegated authority between scheduled board meetings. These committees support the board in ensuring that high standards of corporate governance are maintained across the Group.
The committees are governed by terms of reference, set and approved by the board, which are reviewed annually. The terms of reference of the Audit, Nominations, Remuneration and Sustainability Committees
may be viewed in the “Corporate governance” section of the website.
Thenon-executive directors, excluding the chairman, who are members of each of the committees are all considered to be independent in accordance with the independence framework that has been approved by the Nominations Committee. The chief executive is assisted by various management committees in monitoring the Group’s performance and delivering Rio Tinto’s strategy.
The board determined that additional consideration was required of the allegations arising in respect of the contractual payments
made to a consultant who had provided advisory services on the Simandou project in Guinea and the investigations by relevant authorities, including the SEC, relating to impairment included in the Company’s 2012 accounts in respect of Rio Tinto Coal Mozambique. Accordingly, a dedicatedsub-committee of the board was established, chaired by the chairman of the board, to consider the ongoing issues regarding the investigations. It consists of members of the Chairman’s Committee, plus the chairman of the Audit Committee, the senior independent director and Simon Thompson.
The diagram below provides an overview of the organisation of the key board and management committees.
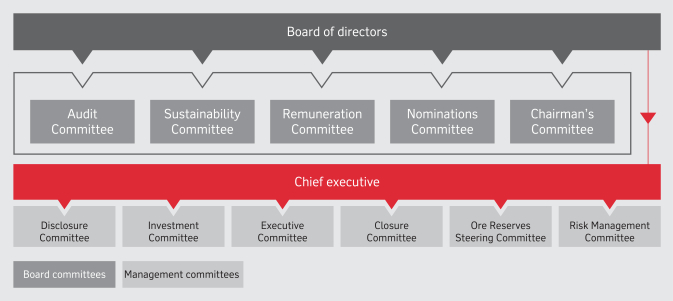
| | | | |
| 2016 Annual report | | riotinto.com | | 57 |
| | | | | | | | | | | | | | | | |
| | | | | | | | | |
| STRATEGIC REPORT | | | | DIRECTORS’ REPORT CORPORATE GOVERNANCE | | | | FINANCIAL STATEMENTS | | | | METALS AND MINERALS PRODUCTION | | | | ADDITIONAL INFORMATION |
Corporate governance
continued
Board committees
Audit Committee report
Chairman’s introduction
Dear shareholders
The Audit Committee fulfils an important oversight role on behalf of the Rio Tinto board and is focused on the quality of the Group’s financial reporting and the effectiveness both of the Group’s systems of internal control and its risk management processes. In 2016, our activities included:
| – | | Reviewing asset carrying values, cash generating units, pension valuations and other material accounting matters. |
| – | | Reviewing Group Internal Audit findings and approving the Internal Audit Plan and budget and the associated resources. |
| – | | Reviewing internal controls over financial reporting (SOx) testing results. |
| – | | Monitoring the effectiveness of the Group’s internal controls systems. |
| – | | Reviewing reports from the head of Group Ethics and Integrity. |
| – | | Monitoring the effectiveness of the Group’s risk management systems. |
| – | | Monitoring legal and tax matters and reviewing associated accounting provisions. |
| – | | Considering the requirement for the Annual report and accounts, taken as a whole, to be fair, balanced and understandable. |
| – | | Reviewing reports from the Ore Reserves Steering Committee and Closure Steering Committee. |
| – | | Assessing management’s projections under different scenarios to allow the board to make its assessment of the longer-term viability of the company. |
We have also focused on ensuring the independence and effectiveness of the external auditors, PwC:
| – | | A new UK audit engagement partner, Paul Barkus, was appointed in 2016 in compliance with the five year rotation requirement for individuals fulfilling this role. The Committee has also agreed to the replacement of the PwC Australian audit engagement partner at the end of the 2016year-end audit process. |
| – | | The Committee has conducted ongoing monitoring of allnon-audit activities performed by the Group’s external auditors and approved their audit engagement contracts and compensation. |
| – | | The Committee has reviewed management’s evaluation of the effectiveness of PwC for Group audit and local statutory audit work, as well as the outcomes of the Audit Quality Review of PwC by the Financial Reporting Council in the UK and the Quality Assurance Department of the Institute of Chartered Accountants in England and Wales. |
The Committee’s additional work during 2016 included undertaking training and development on relevant accounting topics, considering the findings from the 2015 evaluation of the Committee’s performance, and reviewing the impact of the EU Statutory Audit Amending Directive both on the regulatory environment in which the Group operates and on the way that the Committee will discharge its terms of reference in 2017.
In early 2017, the Committee considered, at the request of the board, the draft 2016 Annual report and accounts, to assess whether it is, taken as a whole, fair, balanced and understandable.
During the remainder of 2017, the Committee will follow our annual schedule of meetings and topics for discussion and approval and we will report on the same in 2018. Continued focus in 2017 will be given by the Committee to the Group’s controls enhancement programme, which is designed to refresh accountabilities with respect to financial and non-financial controls assurance and testing.
| | | | | | |

| | | | | | |
| Ann Godbehere | | | | | | |
| Audit Committee chairman | | | | | | |
| | | |
| 1 March 2017 | | | | | | |
| | | | |
| 58 | | riotinto.com | | 2016 Annual report |
Membership
Members of the Committee are Ann Godbehere (chairman), Robert Brown, Paul Tellier and John Varley.
Key responsibilities
The objective of the Committee is to assist the board in monitoring decisions and processes designed to ensure the integrity of financial reporting and sound systems of internal control and risk management.
The Committee’s terms of reference set out its main responsibilities, and are available to view on the website. The Committee is responsible for:
| – | | internal control, including internal control over financial reporting; |
| – | | internal audit and assurance; |
| – | | the external auditors (appointment and relationship); |
| – | | the effectiveness of the risk management framework; and |
| – | | the integrity and compliance programme including the Group’sSpeak-OUT whistleblowing programme. |
In carrying out its responsibilities, the Committee has full authority to investigate all matters that fall within its terms of reference. Accordingly, the Committee may:
| – | | obtain, through the Group company secretary, independent professional advice in the satisfaction of its duties at the cost of the Group; and |
| – | | have direct access to the resources of the Group as it may reasonably require including the internal auditors, and have direct access to the external auditors. |
Significant issues relating to the financial statements
The significant issues considered by the Committee in relation to the financial statements are set out in the table below, together with a summary of how the issue was addressed by the Committee. In addition, the Committee and the external auditors have discussed the significant issues addressed by the Committee during the year and the areas of particular audit focus, as described in the Independent auditors’ report on pages 207 to 214.
| | |
Significant issues considered by the Committee
in relation to the financial statements | | How the issue was addressed by the Committee |
Review of carrying value of cash-generating units and impairment charges | | The Committee assessed management’s determination of cash-generating units, review of impairment triggers and consideration of potential impairment charges and reversals over the course of the year. For cash-generating units dependent upon major capital spend (Oyu Tolgoi) and those where impairment indicators were identified (Argyle Diamond Mine), the Committee considered the key judgments made by management in relation to discount rates, forecasted commodity prices and updates to resource estimates. The Committee reviewed disclosures related to Oyu Tolgoi in note 6 on page 133 and the impairment charge of US$0.2 billion recorded in 2016 at the Argyle Diamond Mine. |
| Estimate of provision for closure, restoration and environmental obligations | | The Committee reviewed the significant changes in the estimated provision for closure, restoration and environmental obligations by product group and legacy management. At 31 December 2016, the Group’s balance sheet included provision for close-down, restoration and environmental obligations of US$8.7 billion as described in note 26 on page 146. |
Policy for items excluded from underlying earnings | | The Committee approved the Group’s policy for exclusion of certain items from underlying earnings and confirmed consistent application of this policy year on year. The Committee reviewed action taken by management in late 2016 to reduce the foreign currency retranslation volatility arising from currency exchange gains and losses on US dollar intragroup balances by converting US dollar debt to local currency in Canada. The items excluded from underlying earnings amounted to US$0.5 billion and are described in note 2 on page 130. |
| The Group’s tax exposures | | The Committee considered management’s assessment of the Group’s tax exposures, including the recoverability of deferred tax assets and the appropriateness of provisions for uncertain tax positions. The Committee reviewed key judgments made by management in respect of ongoing discussions with the Australian Tax Office relating to the transfer pricing of certain transactions with the Group’s commercial centre in Singapore. At 31 December 2016, the Group’s balance sheet included a net tax payable of US$902 million. |
Defined benefit pension plan surpluses and deficits | | During 2016, the Committee received a comprehensive update on the status of funding, investment performance and governance of pensions and other retirement benefit obligations provided to current and former employees of the Group. |
| Going concern basis for the preparation of the financial statements | | The Committee critically assessed the projections of future cash flows under different scenarios and compared these with cash balances and committed facilities available to the Group. The Committee satisfied itself that it was appropriate to recommend to the board the adoption by the Group of the going concern basis of preparation. |
| Contingent liabilities | | The Committee assessed certain matters in respect of which contingent liabilities exist. In particular the Committee reviewed and recommended that contingent liabilities be disclosed in the financial statements in respect of the following matters: – contractual payments totalling US$10.5 million made to a consultant who had provided advisory services on the Simandou project, in respect of which the authorities in the US, the UK and Australia have been notified; and – investigation by relevant authorities, including the SEC, into an impairment included in the Company’s 2012 accounts in respect of Rio Tinto Coal Mozambique. |
| | | | |
| 2016 Annual report | | riotinto.com | | 59 |
| | | | | | | | | | | | | | | | |
| | | | | | | | | |
| STRATEGIC REPORT | | | | DIRECTORS’ REPORT CORPORATE GOVERNANCE | | | | FINANCIAL STATEMENTS | | | | METALS AND MINERALS PRODUCTION | | | | ADDITIONAL INFORMATION |
Corporate governance
continued
During the year, the Company received a letter from the FRC’s Corporate Reporting Review team in relation to the 2015 financial statements. The Committee reviewed the response from management and discussed the matter with the external auditors. The FRC Review team was satisfied with the response from the Company and had no further questions.
The Committee continues to review the Group’s systems for risk management and internal controls on a regular basis to ensure that the company has the relevant processes and policies in place and that they operate effectively. For the period 1 January 2016 to the date of this report, with respect to the Internal Control: Guidance to Directors (formerly the Turnbull Guidance), the Committee has concluded that executive management has taken or is taking appropriate actions to remedy any failings or weaknesses identified through the operation of the Group’s framework of controls. Continued focus in 2017 will be given by the Committee to the Group’s controls enhancement programme, which is designed to refresh accountabilities with respect to financial andnon-financial controls assurance and testing. During 2017, the board and Committee will focus on the scope and frequency of risk management and internal control reporting (and associated assurance) in accordance with the Financial Reporting Council’s: Guidance on Risk Management, Internal Control and Related Financial and Business Reporting (September 2014). It is also intended that a review of the Group’s risk management and internal controls systems and processes, and procurement and compliance programmes, be conducted in 2017 by an independent, external third party, with the findings to be considered by the Committee.
Governance processes
The Committee met six times in 2016. The chairman of the board, chief financial officer, other senior management and external and internal auditors regularly attended the Committee’s meetings. The Committee carries out its business following an agreed annual cycle of meetings and topics for consideration.
The members of the Committee are independent and free of any relationship that would affect their impartiality in carrying out their responsibilities. The members meet the independence requirements of the Code, the ASX Principles and the NYSE Standards. The Committee meets the composition, operation and responsibility requirements of the ASX Principles.
The Committee is also bound by SEC requirements for audit committees’ financial experts and the requirements of the Code and ASX Principles that at least one committee member should have recent and relevant financial qualifications and experience. Ann Godbehere, chairman of the Committee, is considered by the board to have recent and relevant financial experience, and financial qualifications, and has been designated the Committee’s financial expert. All other members of the Committee are, in the opinion of the board, deemed to be financially literate by virtue of their business experience.
The Code requires that the Committee as a whole shall have competence relevant to the sector in which the company operates. The members of the Committee have gained and illustrated relevant experience in the mining sector by virtue of their experience on the board of the Company and on the Committee over an extended period of time. Further sectoral expertise has been obtained by the members of the Committee as a result of multiple site visits that they have undertaken on a regular basis, and through relevant training and development activities that the Group has provided.
The Committee considered reports from management in order to assess the quality and effectiveness of the Group’s internal control systems, including the effectiveness of the Group’s internal controls over financial reporting and the Group’s disclosure controls and procedures in accordance with sections 404 and 302 of the Sarbanes-Oxley Act 2002. The Committee separately received objective reports from Group Internal Audit and PwC on the activities undertaken in reviewing and auditing the control environment.
The Committee meets privately with the heads of Group Internal Audit and Ethics and Integrity from time to time without management present and the chairman of the Committee has regular discussions with them.
The Committee maintains a clearly defined policy for thepre-approval of permitted services provided by the Group’s external auditors, PwC. Fornon-audit services, because of their knowledge, experience and/or for reasons of confidentiality, it may be more efficient or necessary to engage the external auditor rather than another party. At half-year andyear-end, the chief financial officer and the external auditors submit to the Committee a schedule of the services that were performed by PwC during the period. The Committee has imposed a financial limit on the total value of thenon-audit services that can be provided. Anynon-audit service provided by the external auditors, where the expected fee exceeds apre-determined level, must be subject to the Group’s normal tender procedures.
In exceptional circumstances, the chief financial officer is authorised to engage the external auditors to provide such services without going to tender, but if the fees are expected to exceed certainpre-determined limits the chairman of the Committee must give prior approval of the engagement. All of the engagements for services provided by PwC were either within thepre-approval policies or separately approved by the Committee. The Committee members are satisfied that the provision ofnon-audit services by PwC in accordance with this procedure is compatible with the general standard of independence for auditors imposed by relevant regulations. A breakdown of the categories of permittednon-audit services and the fees paid to PwC for such services is shown in note 39 on page 166.
The external auditors attended all six Committee meetings during the year. In advance of the Committee meetings, the audit partners brief the chairman of the Committee on key matters. Private discussion sessions were held between PwC and the Committee without management present to discuss the
status of the audit and the nature of interactions with management.
During the year, the Committee reviewed the effectiveness of PwC for Group audit and local statutory audit work. The evaluation, managed by the Group’s financial controllers, took the form of a survey comprising a range of questions covering objectivity, quality and efficiency, and was completed by individual Rio Tinto business units. The results of this survey and review were assessed by the Committee which concluded that PwC continued to provide an effective and independent audit.
PwC have been the external auditors since before the formation of the DLC structure in 1995, and their reappointment has not been subject to a tender during that time. In the UK, the audit engagement partner Paul Barkus was appointed in 2016. In Australia, the audit engagement partner Paul Bendall was appointed in 2012 and will transition off the account at the end of the 2016year-end audit process. Debbie Smith will assume the role of audit engagement partner in Australia.
The Committee considers its recommendations to the board on the appointment and reappointment of external auditors annually, and specifically has responsibility for establishing formal and transparent arrangements with PwC. The Committee has reviewed the timetable for tendering the external audit, taking into account all relevant regulation and guidance. In light of this, the Committee has requested management to commence preparations for an audit tender to enable an orderly transition to new auditors no later than the 2020 financial year.
The Committee continues to believe that the requirements of good governance and the needs of Rio Tinto are best served by tendering in the above timeframe for the following reasons:
| – | | The Group continues to undergo significant business process change. A measured rotation timetable maintains stability in the independent oversight provided by the external auditors while the business fully implements the changes to maximise efficiency and effectiveness. |
| – | | Rio Tinto draws on expertise from other accounting firms and therefore a rotation of external audit services will require careful planning of transition periods to ensure that all services are effectively contracted throughout the rotation process without unnecessary disruption. |
Rio Tinto ensures independence through other means, including detailed review, challenge and reporting of all work performed by accounting firms. A summary is presented annually to the Committee of the fees incurred and nature of work performed. Further information on fees paid to PwC in 2016 for audit andnon-audit services are set out on page 49 of the Directors’ report.
The Committee does however keep the external audit arrangements under regular review and, if it deems it appropriate, the Committee would accelerate the planned appointment of new auditors at any time.
The Company confirms that it complied with the provisions of the UK Competition and Markets Authority’s Order for the financial year under review.
| | | | |
| 60 | | riotinto.com | | 2016 Annual report |
Sustainability Committee report
Members of the Committee are Megan Clark (chairman), Anne Lauvergeon, Michael L’Estrange and Simon Thompson. Richard Goodmanson (former chairman of the Committee) stood down from the Committee on 5 May 2016 on his retirement from the board, and Megan Clark assumed chairmanship of the Committee.
Key responsibilities
The Committee assists the board with overseeing strategies designed to manage social and environmental risks, overseeing management processes and standards, and achieving compliance with health, safety, environment and communities (HSEC) responsibilities and commitments. It is responsible for reviewing, at least annually, periodic reports from management that identify the Group’s material business risks within the Committee’s scope and the risk management strategies and controls applied to prevent and mitigate these risks. The Committee’s terms of reference set out its main responsibilities, and are available to view on the website.
Governance processes
In 2016, the Committee met five times. The chairman of the board, chief executive, Group executive, Health, Safety and Environment and other senior management regularly attend its meetings.
2016 activities
In 2016, the Committee:
| – | | Reviewed key HSSEC risks associated with safety, process safety and communities and social performance, and management’s plans for managing them, including risks and controls associated with natural disaster, underground safety, geotechnical activity, tailings, water management, transportation and the risk management approach fornon-managed operations. |
| – | | Reviewed work programmes formulated for HSSEC matters, and associated assurance over selected areas within the Committee’s terms of reference. |
| – | | Received updates on findings following the fatalities at the Paraburdoo operations and also at thenon-managed Grasberg operation. |
| – | | Assessed 2015 safety metrics and recommended 2016 safety metrics in relation to fatalities and all injury frequency rates, and the impact this should have on short-term incentive plans. |
| – | | Reviewed the 2015 Sustainable development online report and the Sustainable development sections of the 2015 Annual report. |
| – | | Evaluated the Committee’s performance and agreed actions. |
We draw to your attention the Sustainable development report on pages 24 to 30.
Chairman’s Committee report
The members of the Chairman’s Committee are the chairman (Jan du Plessis), the chief executive (Jean-Sébastien Jacques, who attended the Committee from March 2016 to July 2016 in his role as deputy chief executive)
and the chief financial officer (Chris Lynch). Sam Walsh was also a member of the Committee until July 2016 in his role as chief executive at such time.
Key responsibilities
The Committee acts on behalf of the board between scheduled board meetings either in accordance with specific authority delegated by the board or as specifically set out within its terms of reference. It supports the functioning of the board and ensures that the business of the board and its committees is properly planned and aligned with management. When mandated by the board, the Chairman’s Committee will consider urgent matters between board meetings. Other than for the chairman of the board whose remuneration is set by the Remuneration Committee, the Committee performs the annual review ofnon-executive directors’ fees and makes a recommendation to the board.
This year the Committee reviewed thenon-executive directors’ fees and recommended an increase – the first increase since 2014. As a result, the total amount of thenon-executive directors’ fees for the 2016 financial year were £2,264,865. For more details regardingnon-executive directors’ fees, please refer to the Remuneration Report on page 88.
Nominations Committee report
Members of the Committee comprise Jan du Plessis (chairman) and allnon-executive directors.
Key responsibilities
The Committee is responsible, on behalf of the board, for regularly assessing the balance of executive andnon-executive directors and the composition of the board in terms of the skills, experience, diversity and capacity required to oversee the delivery of Rio Tinto’s strategy.
The Committee develops and agrees in advance the desired profiles of potential candidates for board membership. It oversees the recruitment process and engages external search consultants to manage searches on its behalf, including constructing shortlists comprising candidates from diverse backgrounds and conducting appropriate background and reference checks on shortlisted candidates. Following a final review of shortlisted candidates, the Committee makes recommendations for new board members to the board for approval.
In 2016, the Committee oversaw the process in respect of the appointment of a new chief executive for the Group. In early 2016, the board received notification that Sam Walsh intended to retire in mid-2016. The Nominations Committee conducted a detailed review of a number of internal and external candidates, and considered the findings of a review of the candidates conducted by recruitment consultant, Egon Zehnder. After careful consideration, the Committee determined that an internal appointment was preferable. Having considered the relative attributes of the respective candidates, the Nominations Committee recommended to the board that Jean-Sébastien Jacques, previously the head of Rio Tinto’s copper and coal businesses, be chosen to succeed Sam Walsh
as the chief executive of the Group. In recommending this appointment, the Committee considered Jean-Sébastien to be a highly regarded leader, who has considerable operational experience, a proven track record of successful business delivery and an excellent blend of strategic and operational expertise. Jean-Sébastien was appointed deputy chief executive in March 2016 and assumed the role of chief executive in July 2016 upon Sam Walsh’s retirement from the business.
In addition to the chief executive succession process, the Committee engages Egon Zehnder as an external recruitment consultant from time to time. Egon Zehnder conducts searches and executive evaluations for a number of Rio Tinto positions, not only at board and Executive Committee level, and has no other connection with the Company.
In 2016, the Committee also engaged Egon Zehnder to conduct a search for newnon-executive directors. The recruitment process commenced in June 2016 with an initial longlist of candidates which was reviewed by the chairman and Egon Zehnder. Following initial contact with potential suitable individuals, a short list of candidates was drawn up. Interviews were conducted with theshort-listed candidates by members of the Committee, following which the Committee decided to recommend the appointments of Sam Laidlaw, Simon Henry and David Constable asnon-executive directors.
The board, supported by the Nominations Committee, continues to value diversity in its broadest sense when consideringnon-executive director appointments and, in addition to considering gender and ethnicity, will seek to achieve within the boardroom the appropriate balance of skills, experience, independence and knowledge of Rio Tinto and the industry as a whole. This is the context for the recent appointments of Sam, Simon and David.
The Nominations Committee, on behalf of the board, recognises that gender diversity is a key foundation for introducing different perspectives into Board debate. It will remain focused on diversity issues in 2017 and, specifically, when considering the nextnon-executive director appointments to the board.
On behalf of the board, the Committee also reviews proposals for appointments to the Executive Committee and monitors executive succession planning. Following the appointment of Jean-Sébastien Jacques as chief executive, a review was conducted of the members of the Executive Committee, and the chief executive recommended that certain strategic changes be made to themake-up of the Executive Committee in order to support a new phase of development for the Group. The Committee considered and reviewed the proposed appointment process and approved the succession planning changes that the chief executive was seeking to implement, including the restructuring of Rio Tinto’s product groups.
The Committee’s terms of reference set out its main responsibilities, and are available to view on the website.
| | | | |
| 2016 Annual report | | riotinto.com | | 61 |
| | | | | | | | | | | | | | | | |
| | | | | | | | | |
| STRATEGIC REPORT | | | | DIRECTORS’ REPORT CORPORATE GOVERNANCE | | | | FINANCIAL STATEMENTS | | | | METALS AND MINERALS PRODUCTION | | | | ADDITIONAL INFORMATION |
Corporate governance
continued
Governance processes
The Committee meets as required and, in 2016, met eight times.
Remuneration Committee
The report of the Remuneration Committee is set out on pages 67 to 107. The report was recommended by the Committee for approval by the board, and was approved by the board on 1 March 2017. On page 78 we have included sections dealing with the responsibilities of the Committee and how it spent its time in 2016.
Members of the Committee are John Varley (chairman), Jan du Plessis, Megan Clark, Paul Tellier and Simon Thompson. Richard Goodmanson stood down from the Committee when he retired from the board on 5 May 2016. Megan Clark joined the Committee with effect
from 1 May 2016 and Simon Thompson with effect from 23 November 2016.
Key responsibilities
The Committee assists the board with fulfilling its oversight responsibility to shareholders. In particular, the Committee seeks to spend compensation resource fairly and responsibly to ensure that remuneration policy and practices are properly linked to corporate and individual performance and to the delivery of the Group’s strategy on behalf of our owners. The Committee’s terms of reference set out its main responsibilities, and are available to view on the Group’s website.
The Committee met nine times in 2016.
Board skills, experience and diversity
More information about the board’s process for the selection, appointment and election of directors is available in the “Corporate governance” section of the Group’s website.
In leading a large global mining and metals company, the board aims to evolve its composition by seekingnon-executive directors with diverse and complementary skills and experience. The board recognises that the evolution of the mix of skills and diversity (gender and nationality) is along-term process and it weighs the various factors relevant to board balance and diversity when vacancies arise. The key attributes relevant for our board are set out below.
| | |
Capital projects | | Experience working in an industry with projects involving large-scale capital outlays and long-term investment horizons. |
| Executive leadership | | Sustainable success in business at a senior executive level. |
| Financial | | Proficiency in financial accounting and reporting, corporate finance and internal financial controls, corporate funding, and the associated risks. |
| Global | | Experience in multiple global locations, exposed to a range of political, cultural, regulatory and business environments. |
| Governance | | Commitment to the highest standard of governance, including experience with a major organisation that demonstrates rigorous governance standards. |
| Government relations/geopolitical | | Interaction with government and regulators and involvement in public policy decisions. |
| Health, safety, security, environment and communities | | Familiarity with issues associated with workplace health and safety, security, environment and social responsibility and communities. |
| Marketing | | Senior executive experience in marketing, and development of product and/or customer management strategies. |
| Extractive industries | | Senior executive and operational experience in a large mining (or other extractive industry) organisation involved in the discovery, acquisition, development and marketing of natural resources. |
| Remuneration | | Understanding of the link between strategy, performance, desired behaviours, long-term shareholder value creation and remuneration outcomes, as well as broader remuneration regulations and guidelines published by relevant shareholder and / or investor bodies in the UK and Australia. |
| Risk management and internal control | | Experience in developing an asset or business portfolio over the long term that remains resilient to strategic, business and financial risks, and establishing risk management and internal control frameworks, setting risk appetite and overseeing organisational risk culture. |
| Strategy | | Proven ability in developing and implementing successful strategies, including appropriately probing and challenging management on the delivery of agreed strategic objectives. |
| Technology | | A strong understanding of technology and innovation, and the development and implementation of initiatives to enhance production. |
| | | | |
| 62 | | riotinto.com | | 2016 Annual report |
Inclusion and diversity
Our commitment to inclusion and diversity
We are a global company and, wherever we operate and across every part of our business, we strive to create an inclusive culture in which diversity is recognised and valued. By bringing together men and women from diverse backgrounds and giving each person the opportunity to contribute their skills, experience and perspectives, we believe that we are able to develop the best solutions to challenges and deliver value for Rio Tinto and its stakeholders. This approach is reflected and put into effect through the Company’s Diversity and inclusion policy, a copy of which is available on the website.
What inclusion and diversity mean for Rio Tinto
| – | | Embracing workforce diversity – age, gender, race, national or ethnic origin, religion, language, political beliefs, sexual orientation and physical ability. |
| – | | Valuing diversity of perspective – leveraging the diverse thinking, skills, experience and working styles of our employees and other stakeholders. |
| – | | Building a flexible organisation – providing opportunities for work arrangements that accommodate the diverse needs of individuals at different career and life stages. |
| – | | Respecting stakeholder diversity – developing strong and sustainable relationships with diverse shareholders, communities, employees, governments, customers and suppliers. |
Our current focus
Our goal is to have a workforce that is representative of the countries and communities in which we operate. Currently, our focus is to improve the representation of women and of people from nationalities representative of our current and future footprint, and to continue to build an inclusive culture in which all talent can thrive.
Some of the activities and initiatives relating to diversity during 2016 are:
| – | | Our inclusion and diversity steering committee continued to guide the inclusion and diversity agenda for the Group. |
| – | | The reinforcement of accountability amongst leaders of the product groups and functions for inclusion and diversity, with progress linked to incentive plans and focusing on four key levers: leadership, inclusion, integration and business rationale. An example is active involvement with Women in Mining groups, professional women’s associations and other targeted recruiting efforts to raise awareness about Rio Tinto and to increase the attraction, development and retention of talented women wherever we operate. |
| – | | Significant time was invested in integrating inclusion and diversity into the core practices and competencies of the business of the product groups to ensure we achieve |
| – | | irreversible change. An example is the |
| | |
expansion of training programmes aimed at countering unconscious bias. These have targeted senior leaders, hiring managers and recruiters to help minimise the impact of bias in recruitment and development practices, as well as to improve the cross-cultural interactions and relationship-building needed to globalise our business. – The continuation of a three-year commitment by the chairman to mentoring high-potential female board candidates through the FTSE 100 Cross-company Mentoring Programme. Proportion of women employees and board members In 2016, the proportion of women on the board was 27 per cent (ie three directors out of 11, excluding the chairman). Following the appointment of three new malenon-executive directors in February 2017, and the forthcoming retirement of Anne Lauvergeon from the board, this percentage will reduce to 17 per cent (ie two directors out of 12, excluding the chairman). The board remains committed to diversity and to seeking to ensure better gender balance in future appointments to the board. The proportion of women on the Executive Committee in 2016 was ten per cent. The proportion of women in senior management in 2016 was 19.2 per cent and in the overall workforce 18.2 per cent. For these purposes, “senior management” includes the business unit or functional unit leaders who are direct reports of Executive Committee members, and those at general manager, Group adviser and chief adviser levels. Subsidiary board diversity Women represented 11.0 per cent of the directors of our principal controlled subsidiary undertakings during 2016 (14 female; 113 male). The way we work Policies and standards Rio Tinto’s commitment to integrity and compliance is set out inThe way we work, our global code of conduct, which is available on our website. It sets out the behaviours the company expects of its people, consistent with Rio Tinto’s values: safety, teamwork, respect, integrity and excellence. | | It is supported by a number of Group policies and standards. These are adopted after wide consultation and, once adopted, are communicated globally, to all of the Company’s business units, together with related procedures, guidelines and resources to support implementation. Management is required to adhere to these policies and standards and any mandated procedures and to monitor their effectiveness. Rio Tinto policies and standards address a variety of important topics which apply to all our managed businesses. Where the Group does not have operating responsibility for a business, Rio Tinto’s policies and standards are communicated to our business partners. The company makes every effort to ensure that the standards it espouses are respected at all times and to encouragenon-managed businesses to adopt similar policies and standards of their own. Rio Tinto employees are required to undertake training on the requirements ofThe way we work and various policies and standards. “Whistleblowing” programme Speak-OUT is the Group’s confidential and independently operated whistleblowing programme. It offers an avenue through which employees, contractors, suppliers and customers of Rio Tinto managed sites can report concerns, anonymously if they so choose, subject to local law. This can include any significant concerns about the business, or the behaviour of individuals, including suspicion of violations of financial reporting, safety or environmental procedures or business integrity issues in general. The programme features telephone and web submissions, a case management tool, and a reporting tool to allow for improved analysis of case statistics and reporting. Rio Tinto continuously considers ways to promote positive awareness ofSpeak-OUT. The Audit Committee receives a report twice annually onSpeak-OUT activity, with the Sustainability Committee receiving an annual report onSpeak-OUT relating to sustainable development issues. |
Measurable objectives and progress
Progress continues to be made in meeting our measurable objectives for workforce diversity, which were first put in place at the start of 2011:
| | |
| Position during 2015 | | Progress during 2016 |
| Women represented 18.1 per cent of our senior management in 2015. | | Women represented 19.2 per cent of our senior management in 2016. |
| Women represented 43.0 per cent of our 2015 graduate intake. | | Women represented 46.4 per cent of our 2016 graduate intake. |
| 33.3 per cent of our 2015 graduate intake were nationals from regions where we are growing new businesses. | | 36.2 per cent of our 2016 graduate intake were nationals from regions where we are growing new businesses. |
| | | | |
| 2016 Annual report | | riotinto.com | | 63 |
| | | | | | | | | | | | | | | | |
| | | | | | | | | |
| STRATEGIC REPORT | | | | DIRECTORS’ REPORT CORPORATE GOVERNANCE | | | | FINANCIAL STATEMENTS | | | | METALS AND MINERALS PRODUCTION | | | | ADDITIONAL INFORMATION |
Corporate governance
continued
Dealing in Rio Tinto securities
Rio Tinto operates rules which restrict the dealing in Rio Tinto securities by directors and employees with regular access to “inside information”. These rules require those people to seek clearance before any proposed dealing and place restrictions on when some people can deal.
These rules also prohibit such persons from engaging in hedging or other arrangements which limit the economic risk in connection with Rio Tinto securities issued, or otherwise allocated, as remuneration that are either unvested, or that have vested, but remain subject to a holding period. There are also restrictions applying to a broader group of employees requiring them to seek clearance before engaging in similar arrangements over any Rio Tinto securities.
Communication with stakeholders
Rio Tinto recognises the importance of effective and timely communication with shareholders and the wider investment community.
To ensure that trading in its securities takes place in an informed marketplace, Rio Tinto has adopted procedures to ensure Rio Tinto’s compliance with its continuous disclosure obligations.
It is Rio Tinto’s policy to ensure that all public reports and other documents filed, disclosed or released by the Group shall be accurate, complete and timely, and comply with the relevant regulatory requirements, and all continuous and other disclosure obligations under applicable listing rules and other relevant legislation.
The Group’s Disclosure Committee is responsible for determining whether information relating to Rio Tinto may require disclosure to the markets under the continuous disclosure requirements in the jurisdictions in which Rio Tinto is listed. In accordance with its terms of reference, the specific focus of the Disclosure Committee is to consider and determine on a timely basis whether information would, to the extent that the information is not public and relates directly or indirectly to Rio Tinto, be likely to have a significant effect on the price of Rio Tinto securities if that information was generally available.
The members of the Committee are the chief executive, chief financial officer, Group company secretary, the acting chief legal officer, the head of Investor Relations and the Group Corporate Relations director.
Rio Tinto makes immediate disclosure (unless an exemption applies allowing a delay) to the relevant listing authorities in accordance with their rules of any information that a reasonable
person would expect to have a material effect on its share price. All information released to the markets is posted on the Media section of our website.
In addition to statutory documents, Rio Tinto’s website features information on corporate governance, and general investor information. Annual and half year results, as well as any major presentations, are webcast and the materials are available on our website. Presentation material from investor seminars is also made available on our website.
Annual general meetings
The annual general meetings present an opportunity to provide a summary business presentation to inform shareholders of recent developments and to give them the opportunity to ask questions. Generally, the chairs of all board committees will be available to answer questions raised by shareholders and all directors are expected to attend, where possible. In 2016, all of the directors attended the annual general meetings, save for Anne Lauvergeon and Robert Brown who were unable to attend the Rio Tinto Limited annual general meeting. Rio Tinto’s external auditors, PwC, attend the annual general meetings and are available to answer questions about the conduct of the external audit and the preparation and content of the Independent auditors’ report. Any such questions received and answers provided ahead of the annual general meetings are made available to shareholders, who also have the opportunity to meet informally with directors after the meetings.
Transcripts of speeches made at the annual general meetings are available on the website, along with a summary of the proceedings at such meetings, and the results of voting on resolutions.
Investor engagement
Rio Tinto provides shareholders with the option to receive communications from, and send communications to, the Company and the share registrars electronically. The contact details for the registrars are available on page 252 and on our website.
The main channels of communication with the investment community are through the chairman, chief executive and chief financial officer, who have regular meetings with the Company’s major shareholders. The senior independent director has a specific responsibility to be available to shareholders who have concerns, and where contact with the chairman, chief executive or chief financial officer has failed to resolve their concerns, or when such contact is inappropriate.
In his capacity as Remuneration Committee chairman, the senior independent director also meets shareholders to discuss remuneration
issues. The senior independent director met major investors in November 2016 to discuss and obtain feedback on the Group’s remuneration policy. Feedback from such meetings has been collated, and will be taken into consideration ahead of the renewal of this policy in 2018.
During 2016, meetings with the investment community focused on the issues of strategy, board succession, corporate governance, executive remuneration, and the operational and financial performance of the Group. Regular investor seminars provide atwo-way communication opportunity with investors and analysts. Surveys of major shareholders’ opinions are presented to the board by the Group’s investor relations advisers on a regular basis.
Risk management and internal control
A description of the principal risks and uncertainties that could affect Rio Tinto and the Group’s governance framework for risk management and internal control may be found under the Risk management, Principal risks and uncertainties and Sustainable development headings within the Strategic report on pages 24 to 30. On an annual basis, the board conducts a robust assessment of those principal risks, with the support of management.
The board, on the advice of the Audit Committee, has completed the annual review of the Group’s risk management and internal control system for the period 1 January 2016 to the date of this report, and concluded that executive management has taken or is taking appropriate actions to remedy any failings or weaknesses identified through the operation of our framework of controls. This review included consideration of material financial, operational and compliance controls.
Two of the Group’s management committees, the Executive Committee and the Disclosure Committee, regularly review reports related to the Group’s control framework in order to satisfy the internal control requirements of the Code, the ASX Principles, the NYSE Standards and section 404 of the Sarbanes-Oxley Act 2002. The Group Internal Audit function performs reviews of the integrity and effectiveness of control activities and provides regular reports to the Audit Committee, Sustainability Committee and other management committees.
Each year, the leaders of the Group’s businesses and functions complete a representation letter confirming that adequate internal controls are in place, are operating effectively and are designed to capture and evaluate failings and weaknesses, if any exist, and that action is taken promptly, as appropriate.
| | | | |
| 64 | | riotinto.com | | 2016 Annual report |
Internal control framework
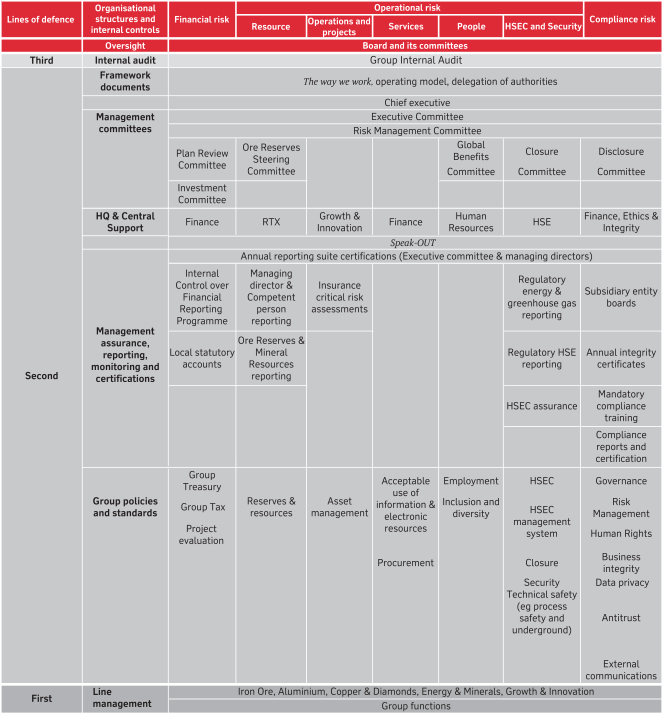
| | | | |
| 2016 Annual report | | riotinto.com | | 65 |
| | | | | | | | | | | | | | | | |
| | | | | | | | | |
| STRATEGIC REPORT | | | | DIRECTORS’ REPORT CORPORATE GOVERNANCE | | | | FINANCIAL STATEMENTS | | | | METALS AND MINERALS PRODUCTION | | | | ADDITIONAL INFORMATION |
Corporate governance
continued
Internal audit
Group Internal Audit
Group Internal Audit is an internal function which provides independent and objective assurance on the adequacy and effectiveness of the Group’s systems for risk management and internal control, together with recommendations to improve the effectiveness of the relevant systems and processes. The function has an internal audit methodology which is aligned with international auditing standards set by the Institute of Internal Auditors (IIA).
The function operates independently of management, under a mandate approved by the Audit Committee, and has full access to all functions, records, property and personnel of the Group. The head of Group Internal Audit administratively reports to the chief executive and has direct communication lines with the chairs of both the Audit Committee and Sustainability Committee and regularly attends their meetings.
A risk-based approach is used to focus assurance activities on high-risk areas and audit plans are presented annually to the Audit Committee and Sustainability Committee for approval.
In support of its internal audit function, Rio Tinto utilises the services of external service providers. The function has a policy which addresses conflicts of interest in relation to engagements of the service provider that are requested by management. The policy complies with the IIA’s standards on independence. Certain services arepre-approved under the policy as they are not in conflict with the internal auditor’s role. There is a list of prohibited services which may not be undertaken without approval of the head of Group Internal Audit, and guidance on the consideration of services which may give rise to a conflict of interest.
Financial reporting
Financial statements
The directors are required to prepare financial statements for each financial period which give a true and fair view of the state of affairs of the Group as at the end of the financial period, and the profit or loss and cash flows for that period. This includes preparing financial statements in accordance with UK company law which give a true and fair view of the state of the Company’s affairs, and preparing a Remuneration report which includes the information required by Regulation 11, Schedule 8 of the Large and Medium Sized Companies and Groups (Accounts and Reports) Regulations 2008 as amended and the Australian Corporations Act 2001.
In addition, the Code requires that the board provides a fair, balanced and understandable assessment of the Company’s position and prospects in its external reporting.
Management conducts extensive review and challenge in support of the board’s obligations in this regard, seeking to ensure balance between positive and negative statement and good linkages throughout the Annual report. The directors were responsible for the preparation and approval of the Annual report for the year ended 31 December 2016.
They consider the Annual report, taken as a whole, to be fair, balanced and understandable, and that it provides the information necessary for shareholders to assess the Company’s position and performance, business model and strategy.
The directors are responsible for maintaining proper accounting records, in accordance with UK and Australian legislation. They have a general responsibility for taking such steps as are reasonably open to them to safeguard the assets of the Group, and to prevent and detect fraud and other irregularities. The directors are also responsible for ensuring that appropriate systems are in place to maintain and preserve the integrity of the Group’s website. Legislation in the UK governing the preparation and dissemination of financial statements may differ from current and future legislation in other jurisdictions. The work carried out by the external auditors does not involve consideration of such developments and, accordingly, the external auditors accept no responsibility for any changes, should any be made, to the financial statements after they are made available on the Group’s website.
The directors, senior executives, senior financial managers and other members of staff who are required to exercise judgment in the course of the preparation of the financial statements are required to conduct themselves with integrity and honesty and in accordance with the ethical standards of their profession and the business, as are all other Group employees.
The directors consider that the 2016 Annual report presents a true and fair view and has been prepared in accordance with applicable accounting standards, using the most appropriate accounting policies for Rio Tinto’s business, and supported by reasonable judgments and estimates. The accounting policies have been consistently applied. The directors have received a written statement from the chief executive and the chief financial officer to this effect. In accordance with the internal control requirements of the Code and the ASX Principles, this written statement confirms that the declarations in the statement are founded on a sound system of risk management and internal controls, and that the system is operating effectively in all material respects in relation to financial reporting risks.
Disclosure controls and procedures
The Group maintains disclosure controls and procedures as this term is defined in US Exchange Act Rule13a-15(e). Management, with the participation of the chief executive and chief financial officer, has evaluated the effectiveness of the design and operation of the Group’s disclosure controls and procedures pursuant to Exchange Act Rule13a-15(b) as of the end of the period covered by this report and has concluded that these disclosure controls and procedures were effective at a reasonable assurance level.
Management’s report on internal control over financial reporting
Management is responsible for establishing and maintaining adequate internal control over financial reporting. The Companies’ internal control over financial reporting is a process designed under the supervision of the chief executive and chief financial officer to provide reasonable assurance regarding the reliability of financial reporting and the preparation and fair presentation of the Group’s published financial statements for external reporting purposes in accordance with International Financial Reporting Standards as adopted by the European Union (IFRS).
The Group’s internal control over financial reporting includes policies and procedures that pertain to the maintenance of records that, in reasonable detail:
| – | | accurately and fairly reflect transactions and dispositions of assets; |
| – | | provide reasonable assurances that transactions are recorded as necessary to permit preparation of financial statements in accordance with IFRS, and that receipts and expenditures are being made only in accordance with authorisations of management and directors of each of the Companies; and |
| – | | provide reasonable assurance regarding prevention or timely detection of unauthorised acquisition, use or disposition of the Group’s assets that could have a material effect on its financial statements. |
Due to inherent limitations, internal control over financial reporting cannot provide absolute assurance, and may not prevent or detect all misstatements whether caused by error or fraud, if any, within each of Rio Tinto plc and Rio Tinto Limited.
There were no changes in the internal controls over financial reporting that occurred during the period that have materially affected, or are reasonably likely to materially affect, the internal controls over financial reporting of each of Rio Tinto plc and Rio Tinto Limited.
| | | | |
| 66 | | riotinto.com | | 2016 Annual report |
Remuneration Report: Annual statement by the Remuneration Committee chairman
Dear shareholders
On behalf of the board, I am pleased to introduce our 2016 directors’ remuneration report (the Remuneration Report), for which we seek your support at our annual general meetings (AGMs), in London in April, and in Sydney in May.
The Remuneration Report is designed to demonstrate the link between the Group’s strategy, its performance, and the remuneration outcomes for our executives, particularly the executive directors.
Rio Tinto takes a long-term approach to its activities. This means that we concentrate on developing long-life,low-cost, expandable operations, that are capable of providing attractive returns to our shareholders throughout the cycle. Our executives’ performance objectives are set accordingly.
The Remuneration Report has been prepared in accordance with applicable legislation and corporate governance guidance in the UK and Australia. Australian legislation requires disclosures in respect of “key management personnel”, being those persons having authority and responsibility for planning, directing and controlling the activities of the Group. The key management personnel are, in addition to the directors, thenon-director members of the Executive Committee. The Executive Committee comprises the executive directors, product group chief executives and Group executives. Throughout this Remuneration Report, the members of the Executive Committee are collectively referred to as “executives”. They are listed on pages 53 and 54, with details of the positions held during the year and dates of appointment to those roles.
Shareholders will be aware that we have to comply with UK and Australian legislation in the remuneration arena and that the rules differ. We have structured the voting arrangements such that all shareholders vote on both the resolutions that we are putting to our AGMs.
This Remuneration Report is divided into two parts: the statement of remuneration policy, which summarises our policies and practices (the Remuneration Policy); and the annual report on remuneration, which shows how the Remuneration Policy has been applied (the Implementation Report).
The Remuneration Policy was subject to a binding vote for UK law purposes in 2015 and became effective in respect of payments to directors from 7 May 2015. Minor changes were made to the Remuneration Policy included in the 2015 Annual report; these did not require shareholder approval. A version of the Remuneration Policy which highlights these changes can be found on our website. There will be no vote this year for UK law purposes on the Remuneration Policy. It is our intention that the Remuneration Policy will next be put before shareholders for a vote, for UK law purposes, at our AGMs in 2018.
The Implementation Report (including this statement) is subject to an advisory vote for UK law purposes. The Remuneration Report as a whole is subject to an advisory vote for Australian law purposes. Both resolutions are to be voted on at the AGMs as Joint Decision Matters by Rio Tinto plc and Rio Tinto Limited shareholders.
Although, as a matter of UK law, the Remuneration Policy only applies to the remuneration of our directors, it is the intention of the Remuneration Committee (“the Committee”) that its broad policy principles will continue to inform the way in which ournon-director key management personnel on the Executive Committee are remunerated.
The Remuneration Policy describes, among other things: our executive remuneration structure; the details of the discretions available to the Committee; our approach to remuneration on recruitment; the details of executives’ service contracts; and how we treat leavers.
Remuneration for executives comprises fixed compensation in the form of base salary; participation in a pension plan, superannuation fund and/or a cash allowance to contribute to a pension fund; the receipt of certain benefits; and performance-related remuneration. Each element is described in the Remuneration Policy. The majority of the remuneration
of executives will normally be performance related, which is provided in the form of variable short and long-term incentives, weighted towards the long-term and delivered in Rio Tinto shares.
In relation to the short-term incentive plan (STIP), the Committee each year sets performance criteria relative to three benchmarks: “threshold”, “target” and “outstanding”. “Target” performance is intended to be stretching, and is typically equivalent to the business plan for the year.
Our approach to the disclosure of measures, weightings and targets remains unchanged. In relation to the long-term incentive plan (LTIP), these will all be disclosed in advance, at the beginning of each five-year performance period. In relation to the STIP, we will, when it comes to disclosure, distinguish between safety goals and financial and individual goals. In the area of safety goals, we will continue to disclose the measures, weightings and targets at the beginning of each year. In the area of financial and individual goals, we will continue to disclose, at the beginning of each year, the measures and weightings only, because we regard the targets as commercially sensitive. However, as we said in the Remuneration Report last year, we intended to disclose, and have in the Implementation Report disclosed, the targets and outcomes for 2016 retrospectively. In the rare instances where this may not be prudent on grounds of commercial sensitivity, I will seek to explain why, and give an indication of when they would be disclosed.
The chart on page 92 demonstrates the usual timeframe for the delivery of the components of remuneration, using 2016 as an example. This emphasises the long-term nature of our remuneration arrangements.
You will see several mechanisms in the Remuneration Report that are intended to create alignment of interest between shareholders and executives. We have, for our executives, a mandatory conversion of 50 per cent of any annual short-term bonus payment into shares, with vesting deferred for three years. The performance measures under our long-term remuneration plans are structured to support and incentivise the creation of long-term shareholder value. In addition, should circumstances warrant, we have reserved to the Committee such discretions as enable it to safeguard against the return experience of shareholders being materially misaligned with the reward experience of executives. Because we want their remuneration outcomes properly to reflect the Group’s overall performance. We also have meaningful share ownership requirements for our executives which are described in the Implementation Report.
There are many examples in the Remuneration Policy and practice of how our dialogue with shareholders has influenced the Committee’s decisions. In 2013, we added a new performance measure to our Performance Share Plan (PSP), namely the relative EBIT margin improvement measure. We did this because many of our owners had expressed a wish that our PSP should incorporate some diversification beyond total shareholder return (TSR). We extended the performance period of the PSP from four to five years and we materially reduced thepay-out for “threshold” performance. We ceased new awards under our Share Option Plan. We have adjusted the safety measures in our STIP targets to reflect lost time injuries and all injury frequency rates. In addition, from and including 2016, we included performance metrics relating to a key programme to support our goal of fatality elimination, called critical risk management (CRM), which is described in more detail on page 26.
Our meetings with shareholders in 2016 were well attended and provided an opportunity for me to discuss remuneration related topics with our owners. I look forward to continuing that dialogue during 2017 as we prepare to present our refreshed Remuneration Policy to shareholders at the 2018 AGM.
2017 decisions
In his letter, the chairman of the board has provided context to the issues arising from the Simandou project. The board has determined that it would be inappropriate, while investigations are ongoing, to make any determination about Sam Walsh, our former chief executive, or about his outstanding remuneration. The company has therefore reached an
| | | | |
| 2016 Annual report | | riotinto.com | | 67 |
| | | | | | | | | | | | | | | | |
| | | | | | | | | |
| STRATEGIC REPORT | | | | DIRECTORS’ REPORT REMUNERATION REPORT: LETTER FROM CHAIRMAN | | | | FINANCIAL STATEMENTS | | | | PRODUCTION, RESERVES AND OPERATIONS | | | | ADDITIONAL INFORMATION |
Remuneration Report: Annual statement by the Remuneration Committee chairman
continued
agreement with Sam to defer the payment of his 2016 STIP award and all remaining unvested LTIP awards (including BDP and PSP awards) for a minimum of two years. Further details of these arrangements are described in the Implementation Report.
There will be no annual salary increases for the chief executive or for the newly appointed members of the Executive Committee. Consistent with the prior practice, annual salary increases for other executives are in line with the base salary budgets applying to the broader employee population.
For 2017, the STIP measures and opportunities for executives remain weighted 50 per cent for financial, 30 per cent for individual and 20 per cent for safety measures. The Group financial targets relate to earnings and free cash flow. The individual targets cover objectives directly relating to the five strategic priorities, described on page 9. These include safety, cash, license to operate, people and growth, together with an assessment of broader leadership capability and contribution. The 2017 safety measures, weightings and targets are fully disclosed on page 91. The financial measures and weightings are also described on page 89. We expect to describe the 2017 financial and individual targets retrospectively in the 2017 Implementation Report.
The level of LTIP awards to be granted to executives in March 2017, as a percentage of base salary, will be broadly equivalent to those made in 2016. Consistent with our practice since 1998, the awards made under the LTIP are calculated using the average share price over the previous calendar year. As such, the awards granted in 2017 will be calculated using the 2016 average share prices of £23.352 and A$48.533 respectively. These prices are below the current share price as at the end of February 2017. When we made the awards last year, the reverse was true. The level of the average price compared to the current price has an impact on the number of shares contained within an LTIP award. Our decision to use average prices over the year, rather than spot prices, is intended to subdue the reward consequences of share price volatility.
The performance conditions for the 2017 PSP awards are outlined in the Implementation Report. The 2017 comparator group for the EBIT margin measure remains unchanged from 2016 although Alcoa’s membership will be subject to future review following its recent demerger.
2016 performance and remuneration
On pages 80 and 82 of this Report, we retrospectively disclose the financial and individual targets for our Short Term Incentive Plan (STIP), set by the board for 2016. I won’t repeat here the details of performance against targets, save to say that, in the main, targets were exceeded, especially when looking at the financial targets on an “unflexed” basis. I talk later in this statement about 2016 remuneration outcomes, and I describe our “flexing” policy in relation to the STIP. This is designed to subdue the reward consequences of significant foreign exchange and commodity price volatility.
I know that shareholders expect to see strong alignment between the value of their own shareholdings and the wealth of executives. The remuneration outcomes shown in the single total figure of remuneration testify clearly to this alignment. Fifty per cent of the annual STIP awards are deferred into shares (through the Bonus Deferral Plan (BDP)) for three years, specifically to ensure that a material proportion of short-term pay is exposed over the medium term to fluctuations in our share price.
The single total figure of remuneration is of understandable interest to shareholders, so let me comment on it. The picture is somewhat complicated in this year’s report because of the retirement of our previous chief executive, Sam Walsh, at the beginning of July, and his succession byJean-Sébastien Jacques.Jean-Sébastien’s base pay and variable pay arrangements are at a similar level to his predecessor’s, using three-year average exchange rates. However, our new chief executive does not receive the expatriate benefits provided to his predecessor. If we compare the chief executive’s total single figure of remuneration for 2016 with the equivalent figure for last year, it is lower,
becauseJean-Sébastien was paid as a deputy chief executive and product group chief executive for the first half of 2016. If we compare Jean-Sébastien’s single figure for 2016 compared to 2015, it is higher because his base pay and variable pay increased upon his appointment as chief executive.
The single total figure of remuneration for the chief financial officer, Chris Lynch, is higher in 2016 due mainly to the LTIP awards vesting in 2016, this being the first vesting of such awards following his appointment to the Executive Committee in April 2013.
Short Term Incentive Plan (STIP)
The 2016 STIP awards for both executive directors are higher than last year (although in the case of Jean-Sébastien, this comparison is distorted by what I described above), reflecting performance against stretching safety, financial and individual targets. I will talk in a moment about the aggregate STIP financial result, but before that I will talk about the 2016 safety performance.
STIP – Safety
Our safety performance continues to improve year on year, but the challenge to do better remains. In June 2016, a colleague died at Paraburdoo, our iron ore operation in Western Australia. Our Critical Risk Management (CRM) programme is designed to prevent fatalities in the future – this is our most important safety goal. Encouragingly, we saw some solid learnings and improvements in 2016, starting the rollout of CRM at every site, with leaders recording more than 1.3 million verifications, and we introduced new procedures to make our rail networks safer.
Looking at achievement against our 2016 safety STIP targets, the Group’s all injury frequency rate remained unchanged at 0.44 for 2016 which was the Group’s “threshold” target (set at the 2015 AIFR outcome). There were 206 lost time injuries in 2016 compared with 220 in 2015. This was above the level set for “threshold” performance for the Group, and just below the level set for “target”, of 202 lost time injuries. Performance against the CRM measures was between “target” and “outstanding”. This has led to a total safety outcome for the Group of 106 per cent (out of 200 per cent).
However, reductions were applied to the safety performance component of the STIP where a fatality occurred. For example, the safety result for the chief executive was reduced from 106 per cent to 85 per cent due to the impact of the Paraburdoo fatality. This was driven by a 25 percent reduction for the period from the chief executive’s appointment as deputy chief executive effective 17 March 2016, leading to an overall reduction of 20 percent for the year. Such adjustments reflect the level of oversight which the chief executive and other executives had for safety leadership during the year. There were also safety related downward adjustments to the remuneration of the chief financial officer and of certain other executives.
STIP – Financial
To remind you, in considering financial performance against the annual plan, we measure half against the original plan; the other half is “flexed” to exclude the impact of fluctuations in exchange rates, and quoted metal and other prices during the year, which are outside management’s control. We have used this approach consistently since 2005 for measuring our earnings performance, and have flexed the cash flow outcomes since the introduction of this measure in the STIP in 2009. When commodity prices rise, or there are favourable exchange rate variations, we protect shareholders by ensuring that 50 per cent of the STIP opportunity (as it relates to financial performance) is denied the benefit of that rise. When the reverse happens, and commodity prices fall or there are negative exchange rate variations, that STIP opportunity is safeguarded (as to 50 per cent) against the fall. Our view is that this approach maintains appropriate incentive for executives, even in times of significant earnings volatility.
In terms of achievement against our 2016 financial STIP targets, the Committee determined that the “outstanding” level for underlying “unflexed” earnings and free cash flow set by the board was exceeded.
| | | | |
| 68 | | riotinto.com | | 2016 Annual report |
The “flexed” earnings free cash flow targets were also exceeded. It is worth noting that the targets were set in early 2016 when there was a subdued outlook for commodity prices. For example, iron ore prices started 2016 at US$43 per tonne and ended the year around US$80 per tonne. Shareholders too benefited from the unexpected increase in commodity prices, particularly in the second half of the year, because this created higher profits for the year than were signaled by consensus estimates in January 2016, with the commensurate strengthening in share price and the level of dividend payments. A significant contribution to the achievement of the “flexed” targets was driven by meeting and exceeding challenging cost savings and productivity targets.
Taking all these points into consideration, the Committee determined that the STIP financial result for 2016 should be 166 per cent out of a maximum of 200 per cent. This was after certain minor adjustments to the targets in 2016 to take account of events outside management’s control and to ensure alike-for-like comparison. The financial result before adjustments made by the Committee was 167 per cent.
Long Term Incentive Plan
Turning to the LTIP, the PSP awards granted in 2013 have three performance metrics – TSR relative to the Euromoney Global Mining Index, TSR relative to the MSCI World Index and improvement in EBIT margin relative to global mining comparators (weighted one third each). Once again, I believe that the award outcome clearly demonstrates that our decision some years ago to have the two TSR indices operate alongside each other has protected shareholders against windfall gains for executives. For while our TSR against the Mining Index demonstrated outperformance, we underperformed against the MSCI. The outcome against the TSR measures, which is explained in the Implementation Report, was an award of 24.67 per cent out of a potential 66.67 per cent. The Committee gave consideration to the Group’s overall performance during the four-year performance period and concluded that the vesting of awards, based upon the achievement of the TSR measures, was justified and, by consequence, this portion of the award vested on 20 February 2017.
The estimated performance against the EBIT margin measure is that Rio Tinto ranked no.2 against the comparator group of eleven, which
would result in a vesting of 100 percent for this measure (33.33 per cent of the total award). We can only provide an estimate at this time as we do not have the reported data for all the comparator companies. The overall estimated vesting for the award when the TSR and EBIT margin portions are combined is therefore 58.0 per cent. The Committee will make a definitive assessment against the improvement in EBIT margin measure when the details of the margin performance of the comparator group companies become available in May 2017 and if applicable, this portion of the award would vest on 31 May 2017.
There were a number of changes to the Group’s Executive Committee during 2016, all of which have previously been announced. The details of the retirement of the former chief executive are included on page 87. The appointment and departure terms for other executives are included in the relevant sections of the Implementation Report. These include the severance terms for Alan Davies and Debra Valentine. The terms in all cases are compliant with our Remuneration Policy and with precedent.
The Company continues to monitor gender pay and is satisfied that awards made between male and female employees demonstrate equality.
Governance and owners’ views
It continues to be our intention to be alert to evolving best practice as well as to the views and guidance given to us in the conversations we have with our owners. The Committee reaffirms its commitment to keep under review the level of vesting for “threshold” performance under the PSP. We are committed to a continuing dialogue, including listening to views about this report, which are most welcome.
Yours sincerely,

John Varley
Remuneration Committee chairman
| | | | |
| 2016 Annual report | | riotinto.com | | 69 |
| | | | | | | | | | | | | | | | |
| | | | | | | | | |
| STRATEGIC REPORT | | | | DIRECTORS’ REPORT REMUNERATION REPORT: LETTER FROM CHAIRMAN | | | | FINANCIAL STATEMENTS | | | | PRODUCTION, RESERVES AND OPERATIONS | | | | ADDITIONAL INFORMATION |
Remuneration Report: Remuneration Policy
Remuneration Policy introduction
This Remuneration Policy applies to our executive andnon-executive directors and to the chairman. It also sets out, in conformance with Australian law, the broad policy principles which generally apply to thenon-director members of the Executive Committee. The policy applying to our chairman andnon- executive directors is set out at the end of the Remuneration Policy.
Shareholders should note that this Remuneration Policy is binding only in so far as it relates to directors.
Our remuneration policies, principles and practices
Our first objective is to spend remuneration resource wisely in pursuit of the implementation of the Group’s strategy. We want our pay policies to be regarded as fair by shareholders and employees alike. Although we have remuneration structures which are fit for purpose, the Committee retains appropriate discretions, enabling it to override inappropriate mechanistic outcomes, if it thinks fit, but always within the confines of the Remuneration Policy.
Rio Tinto operates in global and local markets where it competes for a limited pool of talented executives. High-quality people, who are capable of achieving stretching performance targets, are essential to generating superior returns for the Group. Our compensation strategies aim to provide this support by enabling the Group to attract and retain people whose contribution will increase shareholder value over time.
We aim to engage our people over the long term by fostering diversity, providing challenging work and development opportunities, and encouraging strong delivery by good performance. This people strategy is underpinned by our values of respect, integrity, teamwork and accountability and by our commitment to provide sustainable growth and development for both Rio Tinto and its employees.
Our policy is based on the principle of aligning remuneration outcomes with the successful delivery of strategy. The remuneration strategy and the policies which support it, together with a description of how we believe they will help Rio Tinto achieve its vision, are set out below and under the heading “Executive remuneration structure – policy table”. Complementary remuneration structures are designed for other employees, drawing on these strategies and policies.
Competitive, performance-related remuneration
We aim to provide competitive rewards that attract, retain and motivate executives of the high calibre required to lead the Group, while ensuring that rewards remain appropriate and proportionate when compared both to market practice and to remuneration arrangements for other employees in the Group.
| – | | The majority of remuneration is linked to demanding performance targets over both the short and long term to ensure that executive rewards are directed at delivering good performance for shareholders. |
| – | | For the purposes of assessing the appropriate level of executive remuneration, the Committee refers to the FTSE30 (excluding financial services companies) as the initial comparator group. The FTSE30 is considered the most relevant comparator group as it largely comprises organisations broadly comparable to the Group in terms of global reach, revenue, market capitalisation and complexity. References are also made to other relevant supplementary comparator groups, including a cross-section of comparable international industrial organisations and other international mining companies. |
| – | | Typically we aim to position base salaries at the median of these comparator groups, while our incentive plans are designed with the potential to deliver total remuneration outcomes across the full market range according to business and individual performance. |
| – | | Benchmarking is undertaken periodically, but not annually, and our intention is to apply judgment in evaluating market data. We will take salary increases in the broader employee population into account in determining any change to the base pay of executives. We normally use three-year average exchange rates, in order to mitigate the impact of exchange rate volatility, to help determine the appropriate positioning of executive remuneration against internal and external comparators. |
| – | | We regularly consult with shareholders on the design of our policies and programmes, most recently on the subjects of the safety measure component of the STIP, the ceasing of the use of share options as a mechanism for long-term reward, and the performance conditions and the performance period for the Performance Share Plan (PSP). |
| – | | Employee share plans provide the opportunity for employees to participate in the voting on executive remuneration. Employees who are shareholders – approximately 25 per cent of the workforce at the time the Remuneration Policy was approved – are able to vote on the Remuneration Report. Employees have not been consulted on the Remuneration Policy but are free to ask any questions they wish and to offer any opinions they have through our normal employee communications channels. |
Safety
We have a strong focus on safety in the STIP targets.
| – | | As an organisation, we strive for superior long-term shareholder value creation in a |
| | | healthy, safe and environmentally appropriate way. These are important elements of our licence to operate. |
| – | | Safety key performance indicators determine a significant portion of the STIP for executives. |
| – | | Any fatality will have a material impact on the STIP score for the relevant executives. Further details on the approach to fatalities are provided in the Implementation Report. |
Long-term focus
Consistent with our strategy of investing in and operating long-life,low-cost, expandable operations in the most attractive industry sectors, we seek to provide incentive plans that focus on longer-term performance.
| – | | Our incentive plans are designed to promote and reward decision-making with a positive long-term impact while avoiding excessive risk. |
| – | | Fifty per cent of the STIP for executives is deferred into shares which vest after three years, through the Bonus Deferral Plan (BDP). |
| – | | The performance-based options and shares awarded prior to 2013 have a three and four-year performance period, respectively. The performance period for performance shares awarded under the PSP from 2013 is five years. However, as a transitional measure, awards granted in 2013 will potentially vest 50 per cent after four years and 50 per cent after five years. |
| – | | Options are no longer granted, but existing options may be exercised (subject to their vesting conditions) up to ten years after their grant. |
| – | | The Committee intends to keep the Group’s long-term incentive arrangements under review. |
Shareholder alignment
Our share ownership policy requires executives to build up and maintain a meaningful shareholding as described in the Implementation Report under the heading “Share ownership policy for executives”.
We reward executives for delivering shareholder value by using relative TSR as one of the measures for our LTIP.
| – | | For awards granted from 2013 under the PSP, a relative EBIT margin improvement measure has complemented the existing relative TSR measures, and incentivises executives to deliver long-term shareholder value while maximising operational performance in the medium term. This comprisesone-third of the total value opportunity under the PSP awards. |
| – | | The reward opportunity under the remaining portion of the PSP awards is delivered based on relative TSR performance against both the Euromoney Global Mining Index (formerly the HSBC Global Mining Index) and the broader market of large global companies as measured through the Morgan Stanley Capital World Index (MSCI). |
| | | | |
| 70 | | riotinto.com | | 2016 Annual report |
| – | | The choice of both the Euromoney Global Mining Index and MSCI reflects the fact that Rio Tinto competes in a global market for investors as well as within the mining sector. It is consistent with rewarding executives for providing stable returns over the long term relative to the broader market and the mining sector. |
Risk management – malus and claw-back
The Committee has authority under the “malus” provisions of the PSP to reduce or cancel awards made from 2013 in the event of gross misconduct which may have a material effect on the value or reputation of the Group, a materially adverse error in the Group’s or a product group’s financial statements, exceptional events that have a materially detrimental impact on the value of any Group company, or for any other reason that the Committee decides in a particular case.
The Committee also has authority under the “claw-back” provisions of the PSP to recover the value of any vested awards made from 2013 in the event of deliberate misconduct by a participant that may have a material impact on
the value or reputation of a Rio Tinto Group company or for any other reason that the Committee decides in a particular case.
“Malus” and “claw-back” can be applied by the Committee in relation to the STIP and its deferral into BDP. The Committee evaluates the outcomes of the STIP for fairness with the original targets and with shareholder experience, and may make discretionary adjustments for executives using “malus” principles as necessary. Any such adjustments are disclosed in the Implementation Report for the relevant financial period.
The Committee retains discretion with respect to the vesting of BDP awards made from 2013 onwards prior to their vesting dates, such that if an executive resigns or is dismissed for misconduct, or for any other reason that the Committee decides in the event of an executive terminating their employment, BDP awards may be “clawed back” and consequently lapse.
The Committee reserves rights to exercise discretions more generally as described under the heading “Discretions”.
Executive remuneration structure – policy table
The Committee seeks to achieve a remuneration mix which best reflects the long-term nature of the business. The total remuneration package is therefore designed to provide an appropriate balance between fixed and variable components, with an emphasis on long-term variable pay. The remuneration structure for executives, including the relationship between each element of remuneration and Group performance, is summarised below. Further details on the key performance indicators used to assess Group performance are provided in the Strategic report under the heading “Key performance indicators”. Shareholders should note that the following remuneration structure is binding only insofar as it relates to directors.
Any commitment made before this Remuneration Policy takes effect or before an executive became or becomes a director will be honoured even if it is not consistent with this Remuneration Policy or any subsequent policy.
| | | | | | | | |
| Remuneration arrangements – Fixed | | Link to Group performance and strategy |
| Base salary | | – | | Base salary provides the main fixed element of the remuneration package. | | – | | We pay competitive salaries to hire, motivate and retain highly competent people. |
| | – | | Base salaries are reviewed annually, with a maximum increase of nine per cent, or inflation if higher, per annum. An increase may be higher than this for executives who are not directors in the circumstances described below. | | |
| | – | | Any increase is generally aligned with the average base salary increases applying to the broader employee population unless there were significant changes to an individual’s role and/or responsibilities during the year. Any increases are determined with reference to underlying Group and individual performance, global economic conditions, role responsibilities, an assessment against relevant comparator groups and internal relativities. | | | | |
| | – | | An increase above the maximum noted above for executives who are not directors may be made in the event of internal promotion or increase in responsibility or where the executive’s salary is significantly below market positioning. | | | | |
| | | – | | Benchmarking is undertaken periodically but not annually, and our intention is to apply judgment in evaluating market data. | | | | |
| Pension or super- annuation | | – | | Employment benefits typically include participation in a pension plan, superannuation fund, or a cash allowance to contribute to a personal pension or superannuation fund. | | – | | We provide locally competitive post-employment benefits in a cost-efficient manner in order to hire and retain. |
| | – | | The maximum level of Company contribution to an individual executive director’s schemes annually is 35 per cent of base salary. | | |
| Other benefits | | – | | Other benefits include private healthcare cover for the executive and their dependants, company car or allowance, car parking, life insurance, accident insurance, provision of Company-provided transport/chauffeur, professional advice, participation in local flexible benefit programmes and certain other minor benefits (including modest retirement gifts in applicable circumstances, occasional spouse travel in support of the business and any Rio Tinto business expenses which are deemed to be taxable where the Company has paid the tax on their behalf). | | – | | We provide competitive other benefits in a cost-efficient manner to hire and retain. |
| | – | | Secondment, relocation and localisation benefits (for example, housing, tax equalisation, cost of living allowance, the payment of school fees, periodic visits home for the executive and their family and where relevant, localisation payments) may also be made to and on behalf of executives living outside their home country. Examples of these types of payments are set out in the Implementation Report. | | | | |
| | | – | | Other benefits are paid at cost and, given the nature and variety of the items, there is no formal maximum level of Company contribution. | | | | |
| | | | |
| 2016 Annual report | | riotinto.com | | 71 |
| | | | | | | | | | | | | | | | |
| | | | | | | | | |
| STRATEGIC REPORT | | | | DIRECTORS’ REPORT REMUNERATION REPORT: REMUNERATION POLICY | | | | FINANCIAL STATEMENTS | | | | METALS AND MINERALS PRODUCTION | | | | ADDITIONAL INFORMATION |
Remuneration Report: Remuneration Policy
continued
| | | | |
| Remuneration arrangements – Performance-related (At risk) | | Link to Group performance and strategy |
| Short Term Incentive Plan (STIP) | | – If target performance is achieved under the STIP, the bonus opportunity is up to 120 per cent of base salary for executive directors and up to 100 per cent of base salary for other executives. The award for achieving threshold performance is 50 per cent of the target bonus opportunity and the maximum bonus award for outstanding performance is 200 per cent of base salary. These percentages, with the exception of the maximum percentage, are subject to the exercise of discretion by the Committee. | | – STIP focuses participants on achieving demanding annual performance goals, which are based on the Group’s KPIs, in pursuit of the creation of sustainable shareholder value. – We demand that sustainable business practices are adhered to, particularly in the context of safety. – When reviewing the outcome of the awards under the STIP the Committee will, when evaluating overall safety, financial, Group and individual performance, consider the overall fairness against original expectations and shareholder experience. – Any discretionary adjustments for directors will be disclosed in the Implementation Report for the financial period. |
| | – A scorecard of key performance indicators (KPIs) is established for each executive at the commencement of the financial year. The measures and the relative weightings are selected by the Committee in order to drive business performance for the current year, including the achievement of financial, safety and other individual business outcomes that are priorities for the financial year in question. | |
| | – The measures, weightings and targets are reviewed annually and are included either prospectively or retrospectively each year in the Implementation Report. The Committee retains flexibility to determine the measures, weightings and targets as appropriate, based on the outcomes of its annual review. | |
| | – We expect to disclose the measures, weightings and targets for safety goals at the beginning of each year. In the area of financial and individual goals, we will, at the beginning of each year, disclose the measures and weightings only, because we regard the targets as commercially sensitive. However, we intend to disclose these targets and outcomes retrospectively. In the rare instances where this may not be prudent on grounds of commercial sensitivity, we will seek to explain why, and give an indication of when they will be disclosed. | |
| | – Threshold, target and outstanding performance levels are established for all STIP measures to help drive high levels of business and individual performance. | | |
| | – The central case or “base” plan delivers what the board considers to be target performance. Target performance is intended to be stretching. Probability factors are then applied, based upon a range of potential operating and cost scenarios, to establish the threshold and outstanding performance levels. These threshold (below target), target, and outstanding (above target) levels are determined by the Committee at the beginning of each performance year. | | |
| | – The Committee seeks to ensure, in making itsyear-end determination of STIP awards, that actual performance is directly comparable to the targets set at the beginning of the year. This sometimes results in adjustments to the targets being made by the Committee (in particular to take account of events outside management’s control), to ensure alike-for-like comparison. Both upward and downward adjustments can be made, with reference to principles agreed by the Committee, to ensure the outcomes are fair. | | |
| | | – Safety KPIs comprise a significant portion of the STIP for executives, and any fatality will have a material impact on the STIP score for the relevant executives. | | |
| Bonus Deferral Plan (BDP) | | – Fifty per cent of the STIP is delivered in deferred shares under the BDP, with the remainder delivered in cash. | | – The BDP ensures ongoing alignment between executives and shareholders through deferral of 50 per cent of STIP awards into Rio Tinto shares. |
| | – The BDP vests in the December of the third year after the end of performance year to which it relates. | |
| | – The number of BDP shares awarded is increased by reference to the dividends paid in the deferral period before vesting. | |
| | | – BDP shares vest on a change of control. | | |
| | | | |
| 72 | | riotinto.com | | 2016 Annual report |
| | | | |
| Remuneration arrangements – Performance-related (At risk) | | Link to Group performance and strategy |
| Performance Share Plan (PSP) | | – A new plan was approved by shareholders at the 2013 AGMs. – Awards under the new PSP have a maximum face value of 438 per cent of base salary (ignoring dividend equivalents as described below). | | – The PSP incorporates a simple structure to align executive reward with shareholder returns and business strategy, to help drive performance over a long-term horizon. – Award levels are set to incentivise executives to meet the long-term strategic goals of the Group, to provide retention for the executive team and to contribute towards the competitiveness of the overall remuneration package. – TSR rewards the delivery of superior returns to shareholders over the long term. – EBIT margin improvement rewards sustained operational performance of our business and the cost- competitive operation of our mining assets, a core part of our strategy. – How performance is generated is as important as what level of performance is delivered. Before vesting, the Committee must satisfy itself that relative TSR and EBIT margin performances are an appropriate reflection of the underlying performance of the business, and can adjust vesting accordingly. – Awards will normally have a five-year performance period to provide long-term alignment with the interests of shareholders. – As a transitional measure, awards granted in 2013 will vest 50 per cent after four years and 50 per cent after five years. |
| | – The awards have been calculated independently by our consultants (Willis Towers Watson since 1 August 2013 and Deloitte LLP previously) to have an expected value of approximately 50 per cent of face value. Expected value is face value adjusted for the probability of the performance target being met. | |
| | – Threshold performance, as explained in the Implementation Report, would result in the vesting of 22.5 per cent of the face value of an award. | |
| | – The maximum expected value that can be awarded under the PSP is 219 per cent of base salary (ie 438 per cent x 50 per cent). The threshold value is a maximum of 98.6 per cent of base salary (ie 438 per cent x 22.5 per cent). | |
| | – Actual award levels may vary for each executive and are included in the Implementation Report. | |
| | – Conditional share awards vest subject to the achievement of stretching performance conditions, comparing Rio Tinto’s performance against: | |
| | – One-third: TSR relative to the Euromoney Global Mining Index; | |
| | – One-third: TSR relative to the Morgan Stanley Capital World Index (MSCI); and | |
| | – One-third: improvement in EBIT margin relative to the global mining comparators which will be listed in the Implementation Report each year. | |
| | – Each component of the award will be assessed independently. Details of the TSR and EBIT margin measures (targets and vesting schedules) will be set out in the Implementation Report each year. With respect to the EBIT margin measure, in order to ensure that outcomes are fair and that business performance has been appropriately taken into account, the Committee will consider, on a discretionary basis, any specific, significant, unusual, “below the line” items (eg impairments) reported by Rio Tinto or its peers during the performance period to ensure genuine comparability when determining any level of vesting indicated by third-party data (currently S&P Capital IQ). The application of any such discretion will be disclosed. | |
| | – The outperformance required for maximum vesting under all components of the award is considered by the Committee to be very stretching. | |
| | – If, but only if, vesting is achieved, participants in the PSP shall be entitled to receive a number of additional shares whose market value reflects the aggregate cash amount of dividends that would have been received had the shares which have vested at the end of the performance period been held throughout the performance period. | |
| | – Awards and performance conditions can be adjusted to take account of variations of capital and other transactions. Subject to this policy, performance conditions may be amended in other circumstances if the Committee considers that a changed performance condition would be a fairer measure of performance. | |
| | – If there is a change of control, awards will vest to the extent performance conditions are then satisfied. If the change of control happens during the first 36 months from the date of grant of the award, the number of shares that can vest will be reduced pro rata over that 36 months period. The Committee may, alternatively, with agreement of an acquiring company, replace awards with equivalent new awards over shares in the acquiring company. | | |
| | – The Committee retains the discretion, where circumstances warrant, to amend or waive performance conditions under the Plan rules. | | |
| | | – As described under the malus and claw-back provisions set out earlier in this Policy Report, the Committee retains the discretion to reduce or cancel awards before they vest (“malus”) or to recover the value of awards after vesting (“claw-back”). – The Committee will seek to ensure that outcomes are fair and that they take account of the overall performance of the Company during the performance period. | | |
The long-term incentive awards made prior to 2013, and under which payments are still intended to be made should the relevant performance conditions be satisfied, can be paid out under this policy. The details of the awards granted prior to 2013 which have yet to vest, including the details of the performance conditions, are provided in the Implementation Report.
| | | | |
| 2016 Annual report | | riotinto.com | | 73 |
| | | | | | | | | | | | | | | | |
| | | | | | | | | |
| STRATEGIC REPORT | | | | DIRECTORS’ REPORT REMUNERATION REPORT: REMUNERATION POLICY | | | | FINANCIAL STATEMENTS | | | | METALS AND MINERALS PRODUCTION | | | | ADDITIONAL INFORMATION |
Remuneration Report: Remuneration Policy
continued
Total remuneration opportunity
The following charts provide an indication, based on 2016 remuneration and the 2016 PSP awards for the chief executive and 2015 remuneration and the 2015 PSP awards for the chief financial officer, of what can be achieved under the Remuneration Policy for the
executive directors at below threshold (A), threshold (B), target (C) and outstanding (D) performance levels, together with the proportion of the package delivered through fixed and variable remuneration. The PSP, STIP deferred shares (BDP) and STIP cash are all performance-related remuneration. UK
legislation requires that these charts are given in relation to the first year in which the Remuneration Policy applies (ie 2015). The charts have been updated in 2016 to include the details forJean-Sébastien Jacques who was appointed chief executive effective 2 July 2016.
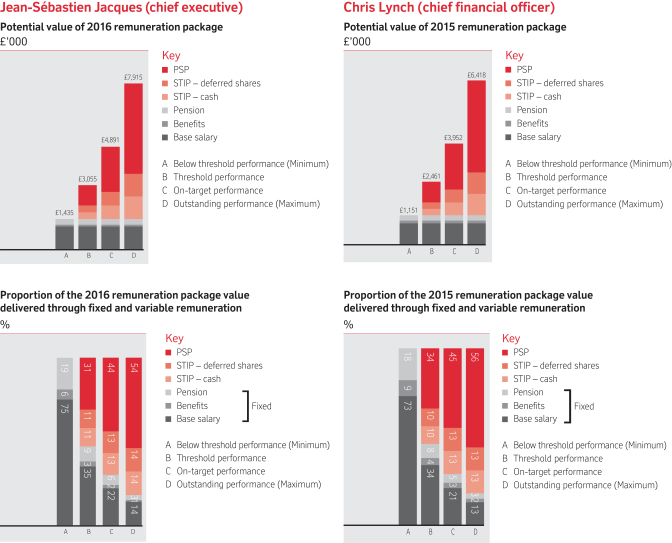
The following table provides the basis for the values included in the charts above:
| | | | | | | | | | | | | | | | |
Fixed (stated in ’000) – shown as column A above | | Base
Salary (a) | | | Pension (b) | | | Benefits (c) | | | Total
fixed | |
| Jean-Sébastien Jacques | | | £1,080 | | | | £270 | | | | £85 | | | | £1,435 | |
| Chris Lynch | | | £836 | | | | £208 | | | | £107 | | | | £1,151 | |
| (a) | Base salary is the salary effective at the time the Remuneration Policy was approved, or in the case ofJean-Sébastien Jacques, the base salary on appointment as chief executive. |
| (b) | The value of pension used for the chief executive is an estimate based on his new base salary as chief executive for a full year. |
| (c) | The value of benefits for the chief executive is an estimate based on a full year as chief executive. The value of benefits for the chief financial officer is as per the benefits figure in the single figure of remuneration tables for 2014, as set out in the Implementation Report. |
| | | | |
| 74 | | riotinto.com | | 2016 Annual report |
| | | | |
| Performance-related (At risk) | | | | |
| Threshold STIP and LTIP (a) performance – shown as column B above | | – | | A STIP award of 50% of the target STIP opportunity, ie 60% of base salary |
| | | – | | Threshold vesting of the PSP award at 22.5% of face value, calculated as 90% of face value for the chief executive (2016 award) and 96.8% of base salary for the chief financial officer (2015 award) |
| Target STIP and LTIP performance – shown as column C above | | – | | A STIP award of 100% of the target STIP opportunity, ie 120% of base salary |
| | | – | | Expected value of the PSP award of 50% of face value, calculated as 200% of base salary for the chief executive (2016 award) and 215% of base salary for the chief financial officer (2015 award) |
| Outstanding STIP and LTIP performance | | – | | A maximum STIP award of 200% of base salary |
| (Maximum) – shown as column D above | | – | | Full vesting of the PSP award, calculated as 400% of base salary for the chief executive (2016 award) and 430% of base salary for the chief financial officer (2015 award) |
| (a) | Long-term incentives consist of share awards only, measured at 2016 face value for the chief executive and 2015 face value for the chief financial officer. This does not constitute an estimate of the value of awards that may potentially vest with respect to year end 31 December 2016 for the chief executive or 31 December 2015 for the chief financial officer. No assumption has been made for changes in share price or payment of dividends. |
Context for outstanding performance
Demanding performance targets are designed to ensure that the level of remuneration is aligned with performance delivered for shareholders.
Outstanding business and individual performance is required to achieve the maximum level of remuneration. This comprises:
| – | | outstanding performance against all financial, health and safety, and individual STIP measures; |
| – | | TSR outperformance against both the Euromoney Global Mining and MSCI indices by six per cent per annum over five years; and |
| – | | EBIT margin improvement equal to or greater than the second ranked company in the comparator group over five years. |
The intention of the Committee is that if these levels of reward are achieved by our executives then shareholders will benefit over time from superior share price performance.
Discretions
The Committee recognises the importance of ensuring that the outcomes of the Group’s executive pay arrangements described in this Remuneration Policy properly reflect the Group’s overall performance and the experience of its shareholders and other stakeholders over the performance period.
The Committee undertakes to owners that it will exercise discretion diligently and in a manner that is aligned with our strategy to create long-term shareholder value.
Accordingly, when reviewing the operation of short and long-term incentive plans and the outcome of awards made under these plans, the Committee will, when evaluating safety, financial, Group and individual performance,
consider the overall shareholder experience during the performance period in question.
It is the Committee’s intention that the mechanistic outcome of performance conditions relating to awards made under such plans will routinely be subject to review to avoid outcomes which could be seen as contrary to shareholders’ expectations. To the extent provided for in the terms of any performance condition or in accordance with any relevant amendment power under the plan rules, the Committee may adjust and/or set different performance measures if events occur (such as a change in strategy, a material acquisition or divestment, a change in control or unexpected event) which cause the Committee to determine that the measures are no longer appropriate or in the best interests of shareholders, and that the amendment is required so that the measures achieve their original purpose. Committee discretion should not operate as an automatic override, and it must be exercised judiciously.
To the extent that discretion is applied in any year, the Committee undertakes that this will be clearly explained and disclosed to shareholders in the Implementation Report.
Recruitment remuneration
Our approach to recruitment remuneration for executives (both external and internal) is set out below. Shareholders are reminded that the following principles are binding only in so far as they relate to the recruitment of directors.
We aim to position base salary at an appropriate level, taking into consideration a range of factors including an executive’s current remuneration, experience, internal relativities, an assessment against relevant comparator groups and cost.
Other elements of remuneration will be established in line with the Remuneration Policy set out earlier in this Policy Report in the executive remuneration structure table. As such, annual variable remuneration for new appointees will comprise a maximum award of
200 per cent of base salary under the STIP and a maximum award of 438 per cent of base salary under the PSP.
In the event that an internal appointment is made, existing commitments will be honoured.
If the Committee concludes that it is necessary and appropriate to secure an appointment, relocation-related support and international mobility benefits may also be provided depending on the circumstances.
Any relocation arrangements will be set out in the Implementation Report.
Any compensation provided to an executive recruited from outside the Group for the forfeiture of any award under variable remuneration arrangements entered into with a previous employer is considered separately to the establishment of forward looking annual remuneration arrangements. Our policy with respect to such“buy-outs” is to determine a reasonable level of award, on alike-for-like basis, of primarily equity-based, but also potentially cash or restricted stock, taking into consideration the quantum of forfeited awards, their performance conditions and vesting schedules. The Committee will obtain an independent external assessment of the value of awards proposed to be bought out and retains discretion, subject to the above, to make such compensation as it deems necessary and appropriate to secure the relevant executive’s employment. The Committee’s intention is thatbuy-out compensation should include, where appropriate, performance-tested equity.
No form of “golden hello” will be provided upon recruitment.
Executives’ service contracts and termination
The Committee will seek to honour any commitments made in respect of termination of employment in the executive directors’ service contracts predating this Remuneration Policy which are described in this section. This section also sets out Rio Tinto’s policy on termination payments and notice periods. Shareholders are reminded that such policy is binding only in so far as it relates to directors.
For new appointments where the Company terminates by making a payment in lieu of notice, the Committee will for executive directors (to the extent permitted by relevant law) have regard to the executive director’s ability to mitigate his loss in assessing the payment to be made.
The executive directors may have or may be offered service contracts which can be terminated by either party with up to 12 months’ notice in writing, or immediately by paying the base salary only in lieu of any unexpired notice. An initial notice period of up to 24 months during the first two years of employment, reducing to up to 12 months thereafter, may sometimes be necessary to secure an external appointment. In some
| | | | |
| 2016 Annual report | | riotinto.com | | 75 |
| | | | | | | | | | | | | | | | |
| | | | | | | | | |
| STRATEGIC REPORT | | | | DIRECTORS’ REPORT CORPORATE GOVERNANCE | | | | FINANCIAL STATEMENTS | | | | METALS AND MINERALS PRODUCTION | | | | ADDITIONAL INFORMATION |
Remuneration Report: Remuneration Policy
continued
circumstances, it may also be appropriate to use fixed-term contracts for executive directors.
Other executives can be offered service contracts which can be terminated by the Company with up to 12 months’ notice in writing, and by the employee with six months’ notice in writing, or immediately by the Company by paying the base salary only in lieu of any unexpired notice.
The current contract terms of both directors and the other executives are included in the Implementation Report.
Executives may be required to undertake garden leave during all or part of their notice period and may receive their contractual salary, STIP and benefits during the notice period (or the cash equivalent). Where applicable, tax equalisation and other expatriate benefits will continue in accordance with the executive’s prevailing terms and conditions.
In the case of dismissal for cause, the Company can terminate employment without notice and without payment of any salary or compensation in lieu of notice. Deferred bonus shares and outstanding awards under the LTIP may be forfeited in these circumstances.
Accrued but untaken annual leave and any long service leave will be paid out on termination, in accordance with the relevant country legislation and applicable practice applying to all employees. For eligible leavers (as defined below), in Australia the value of the leave is calculated on the basis of base salary, target STIP and car allowance. No STIP is included where the executive is not an eligible leaver.
If termination is a result of redundancy, the terms of the relevant local policy may apply in the same way as for other local employees.
On termination, the Company will pay relocation or expatriation benefits as agreed on the original expatriation and/or in accordance with its applicable policies on travel and relocation. For example, Sam Walsh is provided with expatriation benefits and allowances and on termination of his employment by the Company repatriation expenses would be paid.
On termination other than for cause, the Company may make a payment in consideration for entry by the departing executive director into appropriate restrictive covenants to protect Rio Tinto and its shareholders. The amount of such payment will be determined by the Committee based on the content and duration of the covenant.
Following termination, executive directors may be eligible to exercise long- term incentives awards under the conditions described in the sections following. They and their dependants may also be eligible for post-retirement benefits such as medical and life insurance. The Company may also agree to continue certain other benefits for a period following termination where the arrangements are provided under term contracts or in accordance
with the terms of the service contract, for example, payment for financial advice, tax advice and preparation of tax returns for a tax year. In some cases, they may receive a modest retirement gift.
The Company may pay such amount as it determines is reasonable to settle any claims which in the Committee’s view are legitimate which the executive director may have in connection with the termination of his employment. The Company may also pay reasonable legal and other professional fees (including outplacement support) to or in respect of a director in connection with the termination of his employment. These may include legal fees incurred by him in negotiating a settlement agreement with Rio Tinto. In assessing what is reasonable, the Company will take account of prevailing rates for such advice and support and determine appropriate level of contribution based on the complexity of the issues.
Treatment of STIP and LTIP on termination
The STIP and share plan rules govern the entitlements that executive participants may have under those plans upon termination of employment.
The concept of an “eligible leaver” is defined in the relevant Plan rules. In general terms, an eligible leaver is an executive who leaves the Group by reason ofill-health, injury, disability (as determined by the executive’s employer); retirement; redundancy; transfer of the undertaking in which the executive works; change of control of the executive’s employing company; or death; and usually there is a discretion for the Remuneration Committee to treat an executive as an eligible leaver.
Short Term Incentive Plan (STIP)
If an eligible leaver leaves the Group during a performance year, the Committee may determine in its absolute discretion to award a pro rata portion of the STIP based on the amount of the year served and based on actual assessment of performance against targets. Any cash payment will be made at the normal STIP payment date and no portion of the award will be deferred into shares.
If an executive provides the Company notice of their resignation during the performance year, but does not leave the Group until after the end of the performance year, the Committee may determine in its absolute discretion to make an award under the STIP. In these circumstances, the executive will only be eligible to receive the cash portion of the award and will forfeit the deferred shares portion. Any cash payment will be made at the normal STIP payment date.
No STIP award will be made where an executive who is not an eligible leaver leaves the Group, resigns or is terminated for cause prior to the end of the performance year.
Bonus Deferral Plan (BDP) (2013 onwards)
For grants made to executives from and including 2013, awards will normally be retained and vest at the scheduled vesting date, save where the Committee determines otherwise. There will be no pro rata reduction of awards and any dividend equivalent shares will be calculated on the vested shares.
If the executive resigns or is dismissed for misconduct, or for any other reason that the Committee decides, the awards will lapse.
BDP(pre-2013)(a)
For grants made to eligible leavers before 2013, awards will normally vest at the scheduled vesting date save where the Committee determines otherwise. There will be no pro rata reduction of awards and any dividend equivalent shares will be calculated on the vested shares.
If an executive leaves the Group for any other reason, awards will lapse.
For any BDP award, where required by law or regulation, and where the Remuneration Committee so decides, cash may be provided in lieu of shares.
PSP (2013 onwards)
For grants made to executives from and including 2013, awards will normally be retained, and vest at the scheduled vesting date. Unvested awards remain subject to the satisfaction of the performance conditions. Any dividend equivalent shares will be calculated on the vested shares at vesting.
If the executive leaves the Group during the first 36 months from the date of grant of the award, the number of shares that can vest will be reduced pro rata over that36-month period.
Awards will vest immediately on death, but if an executive dies during the first 36 months from the date of grant of the award, the number of shares that can vest will be reduced pro rata over that36-month period.
If the executive resigns or is dismissed for misconduct, or for any other reason that the Committee decides, the awards will lapse.
PSP(pre-2013)(a)
For grants made to eligible leavers before 2013, awards will normally be retained and vest at the scheduled vesting date, although the Committee may determine that awards should vest early. Unvested awards remain subject to the satisfaction of the performance conditions.
Awards vest immediately on death. The number of shares vesting is determined on the assumption that performance conditions are met at median level or at the level to which they are actually satisfied at the date of death, if higher. If an executive leaves the Group for any other reason, awards will lapse.
For any PSP award, where permitted by the Plan Rules, and where the Remuneration Committee so decides, awards may be made in cash in lieu of shares.
| | | | |
| 76 | | riotinto.com | | 2016 Annual report |
Share Option Plan (SOP)(pre-2013)(a)
For grants made to eligible leavers before 2013, awards will normally be retained. If the executive is an eligible leaver, vested awards will lapse one year from the date the executive leaves the Group and unvested awards will lapse one year from the vesting date or such longer period as permitted by the Committee. At the date of this report there are no awards under the SOP which remain subject to the satisfaction of performance conditions.
Awards vest in full on death.
If an executive leaves the Group for any other reason, unvested awards and vested awards that have not been exercised will lapse.
Management Share Plan (MSP)(a)
Awards under the MSP are only made to executives prior to their appointment as an Executive Committee member. All retained awards will be reduced pro rata to reflect the proportion of the period between the date of grant of the award and the normal vesting date which has not elapsed at the time employment ceased. Any dividend equivalent shares or cash equivalent will be calculated on the vested shares. Awards vest on death, subject to the pro rata reduction described above.
For grants made to executives from and including 2013, awards will normally be retained, and vest, at the Committee’s discretion, at the scheduled vesting date (although awards of US taxpayers may vest on leaving).
If the executive resigns or is dismissed for misconduct, or for any other reason that the Committee decides, the awards will lapse.
Chairman andnon-executive directors’ remuneration
Chairman
It is Rio Tinto’s policy that the chairman should be remunerated on a competitive basis and at a level which reflects his contribution to the Group, as assessed by the board.
The Committee determines the terms of service, including remuneration, of the chairman. The chairman’s fees are set by the Committee. The chairman has no part in the setting of his fees and is not present at any discussion at the Committee about his fees.
The chairman receives a fixed annual fee and does not receive any additional fee or allowance either for committee membership or chairmanship, or for travel. The chairman does not participate in the Group’s incentive plans.
The chairman is provided with a car and driver. Any use for transport between home and the office and other personal travel is a taxable benefit to the chairman, and the Company
| (a) | All awards granted underpre-2013 plans or in the case of the MSP, awards granted prior to 2014, have now vested. |
pays any tax arising on the chairman’s behalf. The chairman pays a fixed annual fee to the Company for the personal travel element.
Other benefits provided include private healthcare cover, accident insurance (note this is neither contractual nor a taxable benefit), other minor benefits (including modest retirement gifts in applicable circumstances), occasional spouse travel in support of the business and any Rio Tinto business expenses which are deemed to be taxable where the Company has paid the tax on his behalf. Rio Tinto does not pay retirement or post-employment benefits to the chairman.
Non-executive directors
Fees paid tonon-executive directors reflect their respective duties and responsibilities and the time required to be spent by them so as to make a meaningful and effective contribution to the affairs of Rio Tinto.
Thenon-executive directors’ fees and other terms are set by the board upon the recommendation of the Chairman’s Committee (which comprises the chairman, chief executive and chief financial officer).
Non-executive directors receive a fixed annual fee comprising a base fee, committee membership or committee chairmanship fee or senior independent director fee, as applicable, and allowances for attending meetings which involve medium or long-distance air travel. They do not participate in any of the Group’s incentive plans.
Where the payment of statutory minimum superannuation contributions for Australiannon-executive directors is required by Australian superannuation law, these contributions are deducted from the director’s overall fee entitlements.
Non-executive directors may on occasion receive reimbursement for costs incurred in relation to the provision of professional advice. These payments, if made, are taxable benefits to thenon-executive directors and the tax arising is paid by the Company on the director’s behalf.
Other benefits provided include accident insurance (note this is neither contractual nor a taxable benefit), other minor benefits (including modest retirement gifts in applicable circumstances), occasional spouse travel in support of the business and any Rio Tinto business expenses which are deemed to be taxable where the Company has paid the tax on their behalf. Rio Tinto does not pay retirement or post-employment benefits tonon-executive directors.
Appointment
The appointment ofnon-executive directors (including the chairman) is handled through the Nominations Committee and board processes. The current fee levels are set out in the Implementation Report.
Details of each element of remuneration paid to the chairman andnon-executive directors are set out in the Implementation Report in table 1b.
The chairman’s letter of appointment from the Company stipulates his duties as chairman of the Group. His appointment may be terminated without liability on the part of Rio Tinto in accordance with the Group’s constitutional documents dealing with retirement, disqualification from office or other vacation from office. Otherwise, his appointment may be terminated by giving 12 months’ notice. There are no provisions for compensation payable on termination of his appointment, other than if his appointment as chairman is terminated by reason of his removal as a director pursuant to a resolution of shareholders in general meeting in which case the Company shall be liable to pay any fees accrued to the date of any such removal.
Thenon-executive directors’ letters of appointment from the Company stipulate their duties and responsibilities as directors. Eachnon-executive director is appointed subject to their election and annualre-election by shareholders.Non-executive directors’ appointments may be terminated by giving three months’ notice. There are no provisions for compensation payable on termination of their appointment. The letters of appointment are available for inspection at Rio Tinto plc’s registered office, and at its annual general meeting.
In accordance with the provisions of the Group’s constitutional documents, the maximum aggregate fees payable to thenon-executive directors (including the chairman) in respect of any year, including fees received by thenon- executive directors for serving on any committee of the boards, and any travel allowances received by thenon-executive directors for attending meetings, will not exceed £3,000,000.Non-monetary benefits are not included in this limit.
| | | | |
| 2016 Annual report | | riotinto.com | | 77 |
| | | | | | | | | | | | | | | | |
| | | | | | | | | |
| STRATEGIC REPORT | | | | DIRECTORS’ REPORT REMUNERATION REPORT: REMUNERATION POLICY | | | | FINANCIAL STATEMENTS | | | | METALS AND MINERALS PRODUCTION | | | | ADDITIONAL INFORMATION |
Remuneration Report: Implementation Report
Implementation Report introduction
This Implementation Report is presented to shareholders for approval at the AGMs. It outlines how our Remuneration Policy was implemented in 2016 and how we intend to operate it in 2017.
Remuneration for executives, set out in the single total figure of remuneration tables on pages 81, 84, 86, 92 and 93, is shown gross of tax and in the relevant currency of award or payment. The information reported for executives in table 1a on page 98 is reported in accordance with Australian statutory disclosure requirements and is shown gross of tax and in US dollars. Where applicable, amounts have been converted using the relevant average exchange rates included in the notes to table 1a on page 98(a).
In addition to executive remuneration, this report covers, in table 1b on page 100, the remuneration of the chairman and thenon-executive directors. All figures are shown gross of tax and in US dollars.
Remuneration Committee responsibilities
The Committee’s responsibilities are set out in its terms of reference which are available in the corporate governance section of the Rio Tinto website. The Committed reviews its responsibilities and terms of reference annually. These currently include:
| – | | determining the Group’s remuneration structure and policies, and assessing their cost, including pension and superannuation arrangements for executives; |
| – | | determining the mix and use of short and long-term incentive plans for executives; |
| – | | overseeing the operation of the Group’s short and long-term incentive plans as they relate to executives, including the approval of awards, the setting of performance criteria, where applicable, and the determination of any vesting; |
| – | | determining contractual notice periods and termination commitments and setting any retention and termination arrangements for executives; |
| – | | determining awards under the Group’sall-employee share plan; |
| – | | monitoring gender pay; and |
| – | | determining the terms of service upon appointment and any subsequent changes for the chairman and executives. |
The Committee takes account of the level of pay and conditions throughout the Group when determining executive remuneration.
The membership of the Committee and meeting attendances are detailed in the Corporate Governance section on page 62.
The Committee is supported by executives and members of senior management who attend meetings to provide information as requested by the Committee. These included Sam Walsh (chief executive until 1 July 2016),Jean-Sébastien Jacques (chief executive from 2 July 2016), Hugo Bague (group executive, Organisational Resources until 31 December 2016), Vera Kirikova (group executive, Human Resources from 1 January 2017), John Beadle (head of Performance & Reward), Eleanor Evans (company secretary until 19 August 2016), Victoria Hames (acting company secretary from 20 August 2016 until 9 January 2017) and Steve Allen (company secretary from 9 January 2017). None of the attendees mentioned above was present when matters associated with their own remuneration were considered by the Committee. The Committee will normally hold private sessions at committee meetings where no executives or managers are present.
Independent advisers
The independent advisers engaged by the Committee during 2016 were Willis Towers Watson. Willis Towers Watson reports to the Committee and not to management.
To ensure that “remuneration recommendations” (being advice relating to the elements of remuneration for key management personnel, as defined under the Australian Corporations Act) were made free from undue influence by key management personnel to whom they may relate, the Committee established a protocol for the engagement of and interaction with remuneration consultants and has monitored compliance with its requirements throughout 2016. Declarations were given by Willis Towers Watson to the effect that its remuneration recommendations were made free from undue influence by key management personnel to whom they related. The board has received assurance from the Committee and is satisfied that the remuneration recommendations received from Willis Towers Watson were made free from undue influence.
Willis Towers Watson is a member of the Remuneration Consultants’ Group and, as such, voluntarily operates under its Code of Conduct (the Code) in relation to executive remuneration consulting in the UK. The Code is based upon principles of transparency, integrity, objectivity, competence, due care and confidentiality. Willis Towers Watson has confirmed that it adhered to the Code throughout 2016 for all remuneration services provided to Rio Tinto. The Code is available online at remunerationconsultantsgroup.com.
Willis Towers Watson is the only remuneration consultant which provided remuneration recommendations to the Committee during 2016. The Committee is content that Willis Towers Watson, in providing remuneration advice to the Committee, did not have any connections with Rio Tinto that impaired its independence.
During 2016, as part of its engagement, Willis Towers Watson provided remuneration recommendations to the Committee. Its services included Committee meeting attendance and advice in relation to management proposals. Willis Towers Watson was paid US$234,967 (2015: US$179,223) for these services.
Willis Towers Watson provided general and technical executive remuneration services. These services included the giving of advice about remuneration of employees other than key management personnel across the Group, and advice in relation to preparation of the 2016 Remuneration Report. Other services and publications relating to remuneration data were received from a range of sources.
How the Committee spent its time in 2016
During 2016, the Committee met nine times. It fulfilled its responsibilities as set out in its terms of reference.
In particular, its work in 2016 and in the early part of 2017 has included:
| – | | reviewing and determining any base salary adjustments for executives; |
| – | | reviewing and determining “threshold”, “target” and “outstanding” targets for the safety and financial components of the 2016 STIP; |
| – | | reviewing actual performance against the targets for the 2016 STIP and assessing applicable adjustments; |
| – | | reviewing and determining the TSR outcome and the estimated EBIT margin outcome for LTIP awards with a performance period ending 31 December 2016; |
| – | | reviewing and determining LTIP grants for the executives in 2017; |
| – | | reviewing the PSP EBIT margin comparator group; |
| – | | determining the terms of retirement for the outgoing chief executive (Sam Walsh); the severance terms for the former chief executive, Energy & Minerals (Alan Davies) and the Group executive, Legal & Regulatory Affairs (Debra Valentine); and the departure terms for the former chief executive, Iron Ore (Andrew Harding); the Group, executive Technology & Innovation (Greg Lilleyman) and the Group executive, Organisational Resources (Hugo Bague); |
| (a) | UK and Australian remuneration figures are generally not comparable due to the different methodologies required to calculate various parts of the remuneration packages, most notably LTIP arrangements and the value of pension or superannuation. |
| | | | |
| 78 | | riotinto.com | | 2016 Annual report |
| – | | determining the terms of appointment for the new chief executive(Jean-Sébastien Jacques); the new chief executive, Energy & Minerals (Bold Baatar); the Group executive, Health, Safety & Environment (Joanne Farrell); the Group executive, Human Resources (Vera Kirikova); the Group executive, Growth & Innovation (Stephen McIntosh); the Group executive, Corporate Relations (Simone Niven); the new chief executive, Iron Ore (Chris Salisbury) and the chief executive, Copper & Diamonds (Arnaud Soirat); |
| – | | reviewing the strategy and annual reports on the Group’s global benefit plans; |
| – | | reviewing progress towards compliance with the Group’s share ownership requirements; |
| – | | determining the 2017 STIP targets; and |
| – | | preparing the Remuneration Report (including this Implementation Report). |
The performance targets under the LTIP and the Company’s approach to establishing the performance targets under the STIP are detailed in the executive remuneration structure table on pages 71 to 73. The Committee’s approach to the commercial sensitivity of certain targets is discussed below.
Performance review process for executives
Rio Tinto conducts an annual performance review process for all of its executives. In the case of members of the Executive Committee, the chief executive conducts the review. In the case of the chief executive, his performance is assessed by the chairman of the board.
The key objectives of the performance review process are to:
| – | | improve organisational effectiveness by creating alignment between the executive’s objectives and Rio Tinto’s strategy; and |
| – | | provide a consistent, transparent and balanced approach to measure, recognise and reward executive performance. |
All such reviews took place in 2016 or early 2017.
Share ownership policy for executives
The Group recognises the importance of aligning executives’ interests with those of shareholders and they are therefore expected to build up and maintain a meaningful shareholding. The Committee intends that executives should aim to reach a share ownership (defined below) in Rio Tinto shares equivalent in value to:
| | |
| | | Share ownership requirement |
| Chief executive | | 4 x base salary |
| Other executives | | 3 x base salary |
The Committee expects that this shareholding will be built up over afive-year period by holding shares that vest under the LTIPs. For new hires, longer periods may be accepted, given the five-year vesting periods for the PSP.
Shares will be treated as “owned” if they are not subject to restriction, and as such include shares directly held by the executive and any shares where there is a beneficial interest. A beneficial interest includes any shares where the executive receives the benefit of ownership (such as a right to receive dividends) without directly owning the shares. A value for vested, but unexercised, share options is included, with a 50 per cent discount for the likely effects of taxation, on the basis that executives with unexercised vested options have a strong financial alignment with the share price and therefore with shareholder interests.
Shareholding requirements also exist for senior management below the Executive Committee.
Details of executives’ beneficial interests in Rio Tinto shares are set out in table 2 on page 101 and the details of awards of shares and options under long-term incentive plans are set out in table 3 on pages 102 to 107.
Executives’ external and other appointments
Executives may be invited to becomenon-executive directors of other companies. It is Rio Tinto’s policy that such appointments can broaden the experience and knowledge of executives, to the benefit of the Group. This policy limits each executive’s external appointment to one FTSE100 company directorship or equivalent. Consequently, where there is no likelihood that such an appointment will give rise to a conflict of interest, the board will normally provide consent to the appointment. The executive is typically permitted to retain any fees earned.
Details of all executives’ external appointments can be found on pages 50 and 53. Note that neither of the executive directors currently has an external directorship.
Performance and impact on 2016 STIP
Group financial and safety measures are included in the STIP for executive directors and Group executives. The STIP measures for the product group chief executive officers (PGCEOs) include product group financial and safety measures in addition to the Group financial measures.
Safety measures for all executives in 2016 were split between all injury frequency rate (AIFR) (30 per cent), lost time injuries (LTIs) (30 per cent) and measures relating to the implementation of critical risk management (CRM) (40 per cent). Our goal is zero harm, including, above all, the elimination of workplace fatalities.
The Committee selected the current financial measures of underlying earnings and free cash flow because they are KPIs used in managing the business.
Underlying earnings is a key financial performance indicator used across the Group, and underpins our shareholder return policy. It gives insight into cost management, production growth and performance efficiency from each of our assets.
Operating free cash flow is also a key measure to the business, demonstrating how we convert underlying earnings to cash. It provides additional insight into how we are managing costs, increasing efficiency and productivity across the business.
In measuring financial performance against the annual plan, half is measured against the original plan, and half is “flexed” to exclude the impact of fluctuations in exchange rates, quoted metal and other prices during the year, which are outside management’s control. These financial targets have been higher than the “unflexed” targets set by the board when commodity prices have risen as in the case of 2016, and lower when commodity prices fall. Earnings and free cash flow results are compared against equally weighted “flexed” and “unflexed” targets.
Safety performance
One person lost their life while working at Rio Tinto managed operations in 2016, which meant we did not achieve our goal of zero fatalities.
The Remuneration Committee sought guidance from the Sustainability Committee on safety performance for 2016, as per our normal procedures. The Group’s AIFR remained unchanged at 0.44 for 2016 which was the Group’s “threshold” target (set at the 2015 AIFR outcome).
There were 206 lost time injuries in 2016 compared to 220 in 2015. This “threshold” performance was just below the level set for “target” performance for the Group of 202 lost time injuries.
Good progress was made on CRM during 2016. The assessment criteria to determine the level of implementation have proven to be robust and effective. All units have completed theon-boarding phase and leadership participation, with leaders recording more than 1.3 million verifications, was well above target. Performance against the CRM measures was assessed by the Sustainability Committee to be between “target” and “outstanding”. See page 61 of the Report from the Sustainability Committee.
| | | | |
| 2016 Annual report | | riotinto.com | | 79 |
| | | | | | | | | | | | | | | | |
| | | | | | | | | |
| STRATEGIC REPORT | | | | DIRECTORS’ REPORT REMUNERATION REPORT: IMPLEMENTATION REPORT | | | | FINANCIAL STATEMENTS | | | | METALS AND MINERALS PRODUCTION | | | | ADDITIONAL INFORMATION |
Remuneration Report: Implementation Report
continued
The combined performance against our AIFR, LTI and CRM targets meant that the Group achieved a STIP safety result of close to “target”, with two of the four product groups also achieving above “target” STIP safety results and two product groups achieving below “target” STIP safety results. The total STIP safety result for the Group was 106 per cent (out of a maximum of 200 per cent).
However reductions were applied as required for executives where a fatality has occurred. Thus the safety results for the chief executive and the chief financial officer were reduced from 106 per cent to 85 per cent and 90 per cent respectively for the impact of the fatality in 2016. These adjustments reflect the level of oversight they had for safety leadership during the year. Similarly there were downward adjustments made for certain other executives, particularly those with the portfolio where the fatality occurred.
Group financial performance
Highlights of our 2016 performance can be found on page 1 of this Annual report.
The table below provides details of performance against our “unflexed” and “flexed” underlying earnings and free cash flow financial targets for 2016.
| | | | | | | | | | | | |
| Group measures | | Unflexed
target | | | Flexed
target | | | Actual
result | |
| Underlying earnings | | | | | | | | | | | | |
| Threshold | | US$ | 0.6b | | | US$ | 3.3b | | | | | |
| Target | | US$ | 1.5b | | | US$ | 4.4b | | | US$ | 5.1b | |
| Outstanding | | US$ | 2.8b | | | US$ | 6.2b | | | | | |
| | | |
| Free cash flow | | | | | | | | | | | | |
| Threshold | | US$ | 0.8b | | | US$ | 3.3b | | | | | |
| Target | | US$ | 2.0b | | | US$ | 5.1b | | | US$ | 5.9b | |
| Outstanding | | US$ | 3.7b | | | US$ | 7.7b | | | | | |
It is worth noting that the “unflexed” targets determined in early 2016 were set in the context of a subdued outlook for commodity prices at that time, reflected both in consensus pricing and the ‘voice of market’ commodity prices. For example, iron ore prices started 2016 at US$43 per tonne and ended the year around US$80 per tonne, while hard coking coal prices almost quadrupled to US$310 per tonne from January to November 2016. Copper prices dipped below US$2 per pound in early 2016 before rising 25 per cent byyear-end. Aluminium prices started 2016 below US$1,500 per tonne and ended the year 15 per cent higher and the alumina price rallied from less than US$200 per tonne to US$350 per tonne. These factors, as well as strong performance in the areas of productivity and cost management, lie behind the actual achievement against targets, as shown in the above table.
The underlying “unflexed” earnings and cash flow results for the Group exceeded the targets set by the board and were “outstanding”. The “flexed” earnings result was between “target” and “outstanding” and the “flexed” free cash result was above “target”. These outcomes are reflected in the financial component of the STIP awards, both at the Group and product group level.
These outcomes (adjusted as described below) translate into a Group performance against the financial targets of 166 per cent (out of a maximum of 200 per cent).
The Committee seeks to ensure, in making its year end determination of STIP awards, that actual performance is directly comparable to the targets set at the beginning of the year. This resulted in the Committee making certain minor adjustments to the targets in 2016 to take account of events outside management’s control and to ensure alike-for-like comparison. Both upward and downward adjustments were made to the targets by reference to principles agreed by the Committee, which have been consistently applied over several years, to ensure the outcomes are fair.
This process reduced the Group’s result against the financial targets from 167 per cent to 166 per cent out of a maximum of 200 per cent (2015: from 132 per cent to 131 per cent).
Aggregate Results
The aggregate results for Group safety and financial measures are set out in the table below. The outcomes for the executive directors, with commentary on key highlights on performance against individual objectives, are provided on pages 82 and 84. Additional details for other executives are provided on page 89.
| | | | | | | | | | | | |
| Group measures | | Weight (%) | | | Result (out of 200%) | | | Weighted result | |
| Group safety(a) | | | 20.0 | | | | 106 | | | | 21.2 | |
| Underlying earnings | | | 12.5 | | | | 200 | | | | 25.0 | |
| Underlying earnings – flexed | | | 12.5 | | | | 147 | | | | 18.2 | |
| Free cash flow | | | 12.5 | | | | 200 | | | | 25.0 | |
| Free cash flow – flexed | | | 12.5 | | | | 119 | | | | 14.8 | |
| Group financial | | | 50.0 | | | | 166 | | | | 83.0 | |
| Safety and financial measures(b) | | | 70.0 | | | | 149 | | | | 104.2 | |
| Individual measures(c) | | | 30.0 | | | | – | | | | – | |
| Total(c) | | | 100.0 | | | | – | | | | – | |
| (a) | This excludes the impact of adjustments for the fatality in 2016 which vary by executive. |
| (b) | The weighted result represents the total Group safety and financial measures result (out of a maximum of 200 per cent) weighted based on the total STIP opportunity of 70 per cent allocated to the safety and financial measures. This excludes the impact of adjustments for the fatality in 2016 which vary by executive. |
| (c) | The outcomes against individual measures and the total result for executives (assessed out of 200 per cent) are included in the following pages. |
STIP individual measures for 2016
The individual measures which were set by the chairman for the chief executive and by the chief executive for other executives were based on our five priorities.
Details of the outcomes against the individual measures are provided in the following pages.
Performance and impact on LTIP vesting outcome for the period ended 31 December 2016
As part of the transition from a four-year to a five-year performance period under the PSP approved by shareholders in 2013, half of the award granted on 27 May 2013 has a performance period ending after four years on 31 December 2016. The other half of the award has a performance period of five years ending on 31 December 2017. The conditional share awards vest subject to the achievement of performance conditions, comparing Rio Tinto’s performance against:
| – | | One-third – TSR relative to the Euromoney Global Mining Index; |
| – | | One-third – TSR relative to the Morgan Stanley Capital World Index (MSCI); and |
| – | | One-third – improvement in EBIT margin relative to global mining comparators. |
Performance against the TSR measures has been calculated by Willis Towers Watson. Rio Tinto outperformed the Euromoney Global Mining Index by 16.9 per cent for the four-year performance period starting 1 January 2013 and ending on 31 December 2016. This equated to an outperformance of 4.0 per cent per annum positioning performance between “target” and “outstanding”. The level of outperformance required for maximum vesting against this index was 6 per cent per annum. The vesting outcome against this index was therefore 74.0 per cent (24.67 per cent of the total award). The level of vesting against the MSCI is nil as Rio Tinto underperformed this index.
The Committee considered the Group’s overall performance in the context of the PSP awards with a performance period ending on 31 December 2016 and concluded that the vesting of awards, based
| | | | |
| 80 | | riotinto.com | | 2016 Annual report |
upon performance against the achievement of the TSR measures was justified and, as a consequence, this portion of the award vested on 20 February 2017.
Performance against the improvement in EBIT margin measure cannot be finalised until May 2017 due to the reporting timeframes for companies in the EBIT margin comparator group and the time taken for the external source (currently S&P Capital IQ) to report the relevant data. The estimated performance against the EBIT margin measure is that Rio Tinto ranked no.2 against the comparator group of eleven, which would result in a vesting of 100 per cent for this measure (or 33.33 per cent of the total award). The figures used are adjusted compared to the headline figures disclosed by Rio Tinto and the comparators to remove the impact of impairments. S&P Capital IQ provides figures with these adjustments already made and the Committee has not made any additional adjustments. Accordingly, there is no benefit afforded to Rio Tinto’s margin performance from the impairments reported for the 2012 baseline year.
The estimated overall vesting of the 2013 PSP award is therefore 58.0 per cent of face value. The vesting of the EBIT margin portion of the award will be determined after the EBIT margin assessment has been completed and any EBIT margin portion of the award will therefore vest on 31 May 2017.
The value of LTIP awards vesting included in the 2016 single total figure of remuneration tables is therefore an estimate based on:
| – | | the TSR portion of the award (with estimated associated dividend equivalent shares) which vested on 20 February 2017 based on the four year performance period to 31 December 2016; |
| – | | an estimate of the vesting of the EBIT margin portion of the award (with estimated associated dividend equivalent shares) based on the latest available EBIT margin ranking as at the date of this report; and |
| – | | the average share prices for Rio Tinto plc and Rio Tinto Limited over the last quarter of 2016 of £29.30 and A$56.51 respectively, as the market price of shares at the date on which all shares vest is not ascertainable by the date on which the remuneration report was approved by the directors. |
The actual LTIP values will be recalculated following the vesting of the EBIT margin portion of the award at the end of May 2017 based on the actual share prices on the date of vesting. The estimated LTIP values will be restated, if applicable, on our website and in the 2017 Annual report.
Further details of the LTIP outcomes for the period ended 31 December 2016 and in prior years, including a chart on TSR performance against both the Euromoney Global Mining Index and the MSCI, are provided on page 95.
Jean-Sébastien Jacques (chief executive)
Single total figure of remuneration
The table below provides a summary of actual remuneration in respect of 2016 and prior years in accordance with UK legislation, stated in pounds sterling, the currency ofJean-Sébastien’s arrangements. This table is provided in addition to the Australian statutory disclosure requirements set out in US dollars in table 1a on pages 98 to 99. The remuneration details set out in table 1a include theoretical accounting values relating to various parts of the remuneration package, most notably LTIP awards, and require a different methodology for calculating the pension value. Accordingly, the figures opposite are not directly comparable with those in table 1a.
| | | | | | | | | | | | |
| (stated in £‘000) | | 2016 | | | 2015 | | | 2014 | |
| Base salary paid | | | 887 | | | | 546 | | | | 500 | |
| STIP payment – cash | | | 732 | | | | 465 | | | | 394 | |
| STIP payment – deferred shares(b) | | | 732 | | | | 465 | | | | 395 | |
| Total short-term pay | | | 2,351 | | | | 1,476 | | | | 1,289 | |
| Value of LTIP awards vesting(c) | | | 501 | | | | 58 | | | | 350 | |
| Pension(d) | | | 225 | | | | 130 | | | | 117 | |
| Other benefits(e) | | | 43 | | | | 31 | | | | 31 | |
| Single total figure of remuneration | | | 3,120 | | | | 1,695 | | | | 1,787 | |
| Percentage change in total remuneration (2016 versus 2015; 2015 versus 2014) | | | 84.1% | | | | (5.1%) | | | | | |
| Percentage of total remuneration provided as performance-related pay (STIP and LTIP) | | | 63.0% | | | | 58.3% | | | | 63.7% | |
Percentage of total remuneration provided asnon-performance-related pay (base salary, pension and other benefits) | | | 37.0% | | | | 41.7% | | | | 36.3% | |
| Percentage of maximum STIP awarded(f) | | | 82.4% | | | | 84.0% | | | | 77.0% | |
| Percentage of maximum STIP forfeited | | | 17.6% | | | | 16.0% | | | | 23.0% | |
| Percentage of target STIP awarded | | | 139.9% | | | | 168.1% | | | | 154.0% | |
| Percentage of PSP award vesting(g) | | | 58.0% | | | | 65.4% | | | | – | |
| Percentage SOP award vesting(g) | | | – | | | | – | | | | – | |
The increase in the single total figure of remuneration is due mainly to the higher base salary paid and the higher STIP award in 2016 compared with 2015 due toJean-Sébastien’s appointment as chief executive. The value of LTIP awards vesting was also significantly higher in 2016 due to the higher number of PSP awards granted in 2013 compared with 2012 as a result ofJean-Sébastien’s appointment to the Executive Committee in 2013, combined with the higher share price used to calculate the value of LTIP awards vesting with respect to 2016.
| (a) | Salary paid in the financial year to 31 December. Salaries are generally reviewed with effect from 1 March. However, in 2016Jean-Sébastien’s base salary was increased from £553,300 to £800,000 on appointment as deputy chief executive with effect from 17 March 2016 and increased to £1,080,000 on appointment as chief executive with effect from 2 July 2016. The salary and single figure of remuneration for 2015 and 2014 relate to his positions as chief executive, Copper & Coal for the period 1 March 2015 to 31 December 2015 and as chief executive, Copper for the period 1 January 2014 to 28 February 2015. |
| (b) | Value of STIP deferred under the BDP, the vesting of which is subject to the Plan rules. |
| (c) | Based on the estimated value of the LTIP awards, including dividend shares where applicable, which vested on 20 February 2017 (TSR portion) and which are anticipated to vest at the end of May 2017 (EBIT margin portion) for the performance period that ended 31 December 2016 and the LTIP awards which vested for the performance periods that ended 31 December 2015 and 31 December 2014. The Rio Tinto plc share price used to calculate the estimated value of the award vesting with respect to 2016 is the average share price over the last quarter of 2016 of £29.30. The performance conditions for awards vesting for the period ending 31 December 2016 are detailed in the notes to table 3 on page 107. |
| (d) | Pension reflects the value of the pension contribution and payment in lieu of pension paid during the year. |
| (e) | Includes healthcare, allowance for professional tax services and car allowance. |
| (f) | The maximum potential STIP award is 200 per cent of base salary. |
| (g) | Jean-Sébastien had no PSP awards vest in respect of the performance period that ended 31 December 2014 as his first PSP award was granted in 2012 and vested in respect of the performance period that ended 31 December 2015. He has received no awards under the SOP. |
| | | | |
| 2016 Annual report | | riotinto.com | | 81 |
| | | | | | | | | | | | | | | | |
| | | | | | | | | |
| STRATEGIC REPORT | | | | DIRECTORS’ REPORT REMUNERATION REPORT: IMPLEMENTATION REPORT | | | | FINANCIAL STATEMENTS | | | | METALS AND MINERALS PRODUCTION | | | | ADDITIONAL INFORMATION |
Remuneration Report: Implementation Report
continued
Base salary
Jean-Sébastien’s base salary will remain unchanged in 2017.
| | | | | | | | | | | | |
| | | 2017 | | | 2016(a) | | | % change | |
| Base salary (stated in £’000) | | | 1,080 | | | | 1,080 | | | | – | |
| (a) | Base salary on appointment as chief executive, effective 2 July 2016. |
STIP individual objectives for 2016
Jean-Sébastien’s performance against his individual objectives is summarised below:
| | | | |
| Category | | Performance |
| Safety | | – | | Embedded the CRM process across all operations, ready for full operation in 2017. |
| | | – | | Progressed the implementation of the Process safety standard. |
| People | | – | | Articulated a clear long term strategy and vision for the future. |
| | – | | Strengthened the Group’s diversity platform. |
| | – | | Strengthened engagement activities across the Group with regular and directface-to-face discussions with leaders and employees globally. |
| | – | | Provided ongoing mentorship and support to the Executive Committee with a primary focus on recently appointed Executive Committee members. |
| | | – | | Strengthened cash and performance culture across the Group. |
| Cash | | – | | Generated strong operating cash flow of US$8.5 billion. |
| | – | | Achieved US$1.6 billion ofpre-tax sustainable operating cash cost improvements. |
| | – | | Continued the optimisation of the portfolio via disposals. |
| | – | | Strengthened the balance sheet with further net debt reductions. |
| | | – | | Defined and embedded optimum working capital. |
| Partnership | | – | | Promoted and upheld‘The way we work’ principles. |
| | – | | Developed afit-for-purpose and sustainable licence to operate. |
| | – | | Strengthened relationships with governments, international organisations and society. |
| | | – | | Developed Rio Tinto’s credibility with shareholders. |
| Growth | | – | | Developed a clear strategic pathway for the Group. |
| | – | | Progressed the 2015 board strategy outcomes. |
| | – | | Progressed the Oyu Tolgoi underground project in a value creating way. |
| | – | | Scheduled the Amrun project to optimise 2016 cash flow. |
| | | – | | Refined and strengthened the growth pipeline to focus only on “Tier 1” potential projects. |
The Committee, with input from the chairman of the board, assessedJean-Sébastien’s performance against his individual objectives as 140 per cent (out of 200 per cent) for his individual contribution to the business during the year.
STIP outcomes for 2016
The following table summarises the STIP outcomes for 2016.
| | | | | | | | | | | | |
| Measures | | Weight (%) | | | Result (out of 200%) | | | Weighted Result | |
| Group safety(a)(b) | | | 15.8 | | | | 79.0 | | | | 12.5 | |
| Group financial(a)(b) | | | 43.8 | | | | 166.0 | | | | 72.7 | |
| Copper & Coal safety(b) | | | 4.2 | | | | 106.0 | | | | 4.4 | |
| Copper & Coal financial(b) | | | 6.2 | | | | 133.0 | | | | 8.3 | |
| Safety and financial | | | 70.0 | | | | 139.9 | | | | 97.9 | |
| Individual | | | 30.0 | | | | 140.0 | | | | 42.0 | |
| Total (% of target out of 200%) | | | 100.0 | | | | – | | | | 139.9 | |
| (a) | Refer to pages 79 and 80 for further details of Group safety and financial performance. The Group safety result of 106 per cent has been reduced by 25 per cent to 79 per cent for the impact of the fatality in 2016. |
| (b) | The 2016 STIP measures have beenpro-rated for the periods as chief executive, Copper & Coal (1 January 2016 to 16 March 2016) and as deputy chief executive and chief executive (17 March 2016 to 31 December 2016). |
As a result,Jean-Sébastien received a STIP award of £1,464,146 (2015: £929,821), which is 139.9 per cent of target (2015: 168.1 per cent), and equivalent to 164.7 per cent of hispro-rated base salary (2015: 168.1 per cent), half to be delivered in cash in March 2017, and the remainder to be delivered in deferred shares, vesting in December 2019.Jean-Sébastien’s 2016 target STIP opportunity and base salary have beenpro-rated for the periods as chief executive, Copper & Coal (1 January 2016 to 16 March 2016 with a target STIP opportunity of 100 per cent of his base salary of £553,300); deputy chief executive (17 March 2016 to 1 July 2016 with a target STIP opportunity of 120 per cent of his base salary of £800,000) and chief executive (2 July 2016 to 31 December 2016 with a target STIP opportunity of 120 per cent of his base salary of £1,080,000). Thepro-rated based salary for 2016 was therefore £888,773 and thepro-rated STIP opportunity for 2016 was 115.8 per cent.
STIP measures for 2017
The 2017 STIP measures and weightings are described on page 91 of this Report.
LTIP outcome for the period ended 31 December 2016
Jean-Sébastien will receive an estimated 17,090 shares (2015: 3,134 shares) in Rio Tinto plc in 2017 from the vesting of the PSP awarded in 2013. The TSR portion of the award vested on 20 February 2017 and the EBIT margin portion is anticipated to vest on 31 May 2017. The average share price over the last quarter of 2016 of £29.30 has been used to calculate the value of LTIP awards vesting with respect to 2016. The share price used to calculate the value of the 2012 PSP on 15 February 2016 was £18.51. The shares vesting is inclusive of an estimated 2,195 shares which is equal to the aggregate net dividends that would have been paid on the shares that vest had he owned them during that four-year period. No dividends shares will be granted in respect of the share awards that lapse. The total estimated value of the LTIP awards vesting for the performance period ending 31 December 2016, inclusive of the estimated dividend shares on the 2013 PSP, was therefore £501,000 (2015: £58,000).
Further details of the LTIP outcomes for the period ended 31 December 2016 and the awards vesting in prior years are provided on page 95 and in table 3 on pages 102 to 107.
| | | | |
| 82 | | riotinto.com | | 2016 Annual report |
LTIP award granted in 2016
The details ofJean-Sébastien’s 2016 LTIP award which were included in the announcement relating to his appointment are summarised in the following table.
| | | | | | | | | | | | | | | | | | | | |
Type of
award | | Grant dates | | | Face value
of award
(% of base
salary) | | | Face value
of award
(£’000)(a) | | | % vesting at
threshold
performance | | | End of the
performance
period over which
the performance
conditions have
to be fulfilled(b)(c) | |
| PSP | |
| 11 March 2016 /
12 September
2016 |
| | | 400% | | | | 4,320 | | | | 22.5% | | |
| 31 Dec
2020 |
|
| (a) | The face value represents the maximum value of the award of 400 per cent ofJean-Sébastien’s base salary of £1,080,000 on his appointment as chief executive and resulted in a total award of 163,971 conditional shares based on the average share price over 2015 of £26.346. An award of 84,005 conditional shares was granted on 11 March 2016 and an additional award of 79,966 conditional shares was granted on 12 September 2016. The expected value of the award is 50 per cent of the face value or £2,160,000. |
| (b) | The 2016 PSP award may vest after five years in 2021. |
| (c) | The full performance conditions for the award are set out in detail in table 3 on pages 101 to 107. |
LTIP award for 2017
Jean-Sébastien’s PSP award in 2017 will have a face value of 400 per cent of base salary and an expected value of 200 per cent of base salary. The award may vest after five years in 2022, subject to the Group’s relative TSR and the relative EBIT margin performance. The performance conditions for the award are unchanged from 2016 and the full performance conditions are set out in detail on page 89.
The number of conditional shares awarded under the LTIP is calculated using the average share price over the previous calendar year and, as such, the awards granted in 2017 will be calculated using the 2016 average share price of £23.352.
Shareholding
Jean-Sébastien’s shareholding for the purposes of the share ownership policy, calculated using the market price of Rio Tinto shares on the latest practicable date each year before the date of publication of this report was:
| | | | | | | | | | | | |
| | | 31 December
2016 | | | 31 December
2015 | | | Increase in
shareholding | |
| Holding of ordinary shares | | | 21,087 | | | | 13,563 | | | | 55.5% | |
| Multiple of base salary | | | 0.7 | | | | 0.5 | | | | 0.2 | |
Jean-Sébastien holds no options over Rio Tinto shares. He has until 2021 to build up his ownership in shares to four times his salary as chief executive.
Pension
Jean-Sébastien is employed in the UK and is provided with pension benefits on a defined contribution basis on terms equivalent to other UK employees as follows:
| – | | A pension contribution to a funded UK company pension arrangement on salary of £135,000, being the current maximum salary on which pension contributions are based under that arrangement. For the period to 1 July 2016 the contribution rate was 20 per cent and from 2 July 2016 it was 25 per cent. The total pension contribution for 2016 was £30,375 (2015: £27,000). |
| – | | A cash supplement on base salary in excess of £135,000, less any applicable withholdings. For the period to 1 July 2016 the cash supplement rate was 20 per cent and from 2 July 2016 it was 25 per cent. A cash supplement of 20 per cent was also paid in respect of the 2015 STIP award (paid in March 2016); this element of the cash |
| | | supplement was restricted to 4 per cent of base salary. Following appointment as chief executive, the cash supplement is paid on base salary only; no cash supplement will be paid on the 2016 STIP award or on any future annual STIP award. The total gross cash supplement for 2016 was £194,144 (2015: £103,000). |
Fees from external appointments
Jean-Sébastien received no fees from external appointments in 2016 or 2015.
Service contract
| | |
| Positions held and date of appointment to position |
| Positions held during 2016 | | Date of appointment to position |
| Chief executive | | 2 July 2016 |
| Deputy chief executive | | 17 March 2016 |
| Chief executive, Copper & Coal | | 1 March 2015 |
Jean-Sébastien’s contract can be terminated by either party with 12 months’ notice in writing, or immediately by paying the base salary only in lieu of any unexpired notice.
Other
As a UK contracted employee,Jean-Sébastien is not eligible for tax equalisation on his remuneration, cost of living or any other ongoing assignment benefits such as a housing allowance.
Chief executive’s pay and employee pay
The table below compares the changes from 2015 to 2016, in salary, benefits and annual incentives paid for the chief executive and the Australian workforce. We have chosen a comparison to the Australian workforce because we employ more people in Australia than in any other country (approximately 40 per cent of the total workforce). This comparator group has been selected due to the availability of comparative data and to remove the impacts ofyear-on-year exchange rate fluctuations. The underlying elements of the chief executive’s pay are based on the values reported in the single total figure of remuneration table.
There was no annual salary increase effective 1 March 2016 for the chief executive or for other employees (other than those protected by legislation or prior industrial agreements).Jean-Sébastien received a salary increase from £553,300 to £800,000 upon his appointment as deputy chief executive effective 17 March 2016 and an increase from £800,000 to £1,080,000 upon his appointment as chief executive effective 2 July 2016.
| | | | | | | | | | | | |
| | | Percentage
change in
salary paid | | | Percentage
change in
other
benefits paid | | | Percentage
change in annual
incentive paid(c)(d) | |
| Chief executive | | | 62.5% | | | | 38.7% | | | | 18.0% | |
| Australian workforce | | | 0.9% | | | | 1.1% | | | | 19.1% | |
| (a) | The percentage change in each element of remuneration for the workforce is calculated on a per capita basis using average employee numbers. |
| (b) | The percentage change in annual incentive compares amounts paid in 2016 with respect to the 2015 performance year, to amounts paid in 2015 with respect to the 2014 performance year. Annual incentives for the workforce comprise a number of different short-term incentive arrangements. |
| (c) | The increase in annual incentive paid to the chief executive was primarily due to a higher safety outcome for the Copper & Coal product group in 2015 compared with 2014 andJean-Sébastien’s higher base salary in 2015 due to his broadened portfolio, partly offset by lower financial outcomes in 2015 compared with 2014. |
| (d) | The higher average annual incentive paid to the Australian workforce was due mainly to higher average financial and safety performance outcomes in 2015 compared to 2014, particularly for the Iron Ore Product Group which represents a significant portion of the Australian workforce. |
| | | | |
| 2016 Annual report | | riotinto.com | | 83 |
| | | | | | | | | | | | | | | | |
| | | | | | | | | |
| STRATEGIC REPORT | | | | DIRECTORS’ REPORT REMUNERATION REPORT: IMPLEMENTATION REPORT | | | | FINANCIAL STATEMENTS | | | | PRODUCTION, RESERVES AND OPERATIONS | | | | ADDITIONAL INFORMATION |
Remuneration Report: Implementation Report
continued
Chris Lynch (chief financial officer)
Single total figure of remuneration
The table below provides a summary of actual remuneration in respect of 2016 and prior years in accordance with UK legislation, stated in pounds sterling, the currency of Chris’s arrangements. This table is provided is in addition to the Australian statutory disclosure requirements set out in US dollars in table 1a on pages 98 and 99. The remuneration details set out in table 1a include theoretical accounting values relating to various parts of the remuneration package, most notably LTIP awards, and require a different methodology for calculating the pension value. Accordingly, the figures below are not directly comparable with those in table 1a.
| | | | | | | | | | | | |
| (stated in £‘000) | | 2016 | | | 2015 | | | 2014 | |
| Base salary paid(a) | | | 836 | | | | 834 | | | | 817 | |
| STIP payment – cash | | | 717 | | | | 690 | | | | 746 | |
| STIP payment – deferred shares(b) | | | 718 | | | | 690 | | | | 746 | |
| Total short-term pay | | | 2,271 | | | | 2,214 | | | | 2,309 | |
| Value of LTIP awards vesting(c) | | | 1,016 | | | | 0 | | | | 0 | |
| Pension(d) | | | 209 | | | | 208 | | | | 204 | |
| Other benefits(e) | | | 144 | | | | 151 | | | | 107 | |
| Single total figure of remuneration | | | 3,640 | | | | 2,573 | | | | 2,620 | |
| Percentage change in total remuneration (2016 versus 2015; 2015 versus 2014) | | | 41.5% | | | | (1.8% | ) | | | | |
| Percentage of total remuneration provided as performance-related pay (STIP and LTIP) | | | 67.3% | | | | 53.6% | | | | 56.9% | |
Percentage of total remuneration provided asnon-performance-related pay (base salary, pension and other benefits) | | | 32.7% | | | | 46.4% | | | | 43.1% | |
| Percentage of maximum STIP awarded(f) | | | 85.8% | | | | 82.5% | | | | 91.0% | |
| Percentage of maximum STIP forfeited | | | 14.2% | | | | 17.5% | | | | 9.0% | |
| Percentage of target STIP awarded | | | 143.0% | | | | 137.5% | | | | 151.7% | |
| Percentage of PSP award vesting(g) | | | 58.0% | | | | – | | | | – | |
| Percentage SOP award vesting(g) | | | – | | | | – | | | | – | |
The increase in the single total figure of remuneration is due mainly to 2016 including the first vesting of LTIP awards for Chris following his appointment as chief financial officer in April 2013.
| (a) | Salary paid in the financial year to 31 December. Salaries are generally reviewed with effect from 1 March. Chris did not receive a salary increase effective 1 March 2016. |
| (b) | Value of STIP deferred under the BDP, the vesting of which is subject to the Plan rules. |
| (c) | Based on the estimated value of the LTIP awards, including dividend shares, which vested on 20 February 2017 (TSR portion) and which are anticipated to vest at 31 May 2017 (EBIT margin portion) for the performance period that ended 31 December 2016 and the LTIP awards which vested for the performance periods that ended 31 December 2015 and 31 December 2014. The Rio Tinto plc share price used to calculate the estimated value of the award vesting with respect to 2016 is the average share price over the last quarter of 2016 of £29.30. The performance conditions for awards vesting for the period ending 31 December 2016 are detailed in the notes to table 3 on page 107. |
| (d) | Pension reflects the value of the pension contribution and payment in lieu of pension paid during the year. |
| (e) | Includes healthcare, allowance for professional tax services and car allowance. |
| (f) | The maximum potential STIP award is 200 per cent of base salary. |
| (g) | Chris had no LTIP awards vest in respect of the performance periods that ended prior to 31 December 2016 as he received no LTIP awards prior to the award made in 2013. |
Base salary
The Committee increased Chris’s base salary by 2.4 per cent with effect from 1 March 2017, consistent with the salary budget for other UK contracted employees in the Group.
| | | | | | | | | | | | |
| | | 2017 | | | 2016 | | | % change | |
| Base salary (stated in £’000) | | | 856 | | | | 836 | | | | 2.4 | |
STIP individual objectives for 2016
Chris’s performance against his individual objectives is summarised below:
| | | | |
| Category | | Performance |
| Safety | | – | | Embedded the CRM process across all operations, ready for full operation in 2017. |
| | | – | | Demonstrated visible safety leadership through visits to multiple sites. |
| People | | – | | Partially met diversity targets with gender representation above target and nationality representation below target. |
| | | | Provided sponsorship at the annual senior leadership conference. |
| | – | | Established our Treasury hub in Singapore. |
| | | – | | Strengthened cash and performance culture across the Group. |
| Cash | | – | | Generated strong operating cash flow of US$8.5 billion which was in excess of target. |
| | – | | Achieved US$1.6 billion ofpre-tax sustainable operating cash cost improvements.
Continued the optimisation of the portfolio. |
| | – | | Strengthened the balance sheet further with further net debt reduction. |
| | | – | | Defined and embedded optimum working capital. |
| Partnership | | – | | Promoted and upheld‘The way we work’ principles. |
| | – | | Introduced new shareholder return policy. |
| | | – | | Strengthened relationships with investors and government. |
| Growth | | – | | Helped develop a clear strategic pathway for the Group. |
| | – | | Progressed the 2015 board strategy |
| | – | | Progressed the Oyu Tolgoi underground project in a value creating way. |
| | – | | Scheduled the Amrun project to optimise 2016 cash flow. |
| | | | | Refined and strengthened the growth pipeline to focus only on “Tier 1” potential projects. |
The Committee, with input from the chief executive, assessed Chris’s performance against his individual objectives as 140 per cent (out of 200 per cent) for his individual contribution to the business during the year.
STIP outcomes for 2016
The following table summarises the STIP outcomes for 2016.
| | | | | | | | | | | | |
| Measures | | Weight (%) | | | Result (out of 200%) | | | Weighted Result | |
| Safety(a) | | | 20 | | | | 90.0 | | | | 18.0 | |
| Group financial(a) | | | 50 | | | | 166.0 | | | | 83.0 | |
| Safety and financial | | | 70 | | | | 144.3 | | | | 101.0 | |
| Individual | | | 30 | | | | 140.0 | | | | 42.0 | |
| Total (% of target out of 200%) | | | 100 | | | | – | | | | 143.0 | |
| (a) | Refer to pages 79 and 80 for further details of Group safety and financial performance. The Group safety result of 106 per cent has been reduced by 15 per cent to 90 per cent for the impact of the fatality in 2016. |
| | | | |
| 84 | | riotinto.com | | 2016 Annual report |
As a result, Chris received a STIP award of £1,435,262 (2015: £1,380,060), which is 143.0 per cent of target (2015: 137.5 per cent), and equivalent to 171.6 per cent of base salary (2015: 165.0 per cent), half to be delivered in cash in March 2017, and the remainder to be delivered in deferred shares, vesting in December 2019.
STIP measures for 2017
The 2017 STIP measures and weightings are described on page 91 of this Report.
LTIP outcome for the period ended 31 December 2016
Chris will receive an estimated 34,660 shares (2015: nil shares) in Rio Tinto plc in 2017 from the vesting of the PSP awarded in 2013. The TSR portion of the award vested on 20 February 2017 and the EBIT margin portion is anticipated to vest on 31 May 2017. The average share price over the last quarter of 2016 of £29.30 has been used to calculate the value of LTIP awards vesting with respect to 2016. The shares vesting is inclusive of an estimated 4,452 shares which is equal to the aggregate net dividends that would have been paid on the shares that vest had he owned them during that four-year period. No dividends shares will be granted in respect of the share awards that lapse. The total estimated value of the LTIP awards vesting for the performance period ending 31 December 2016, inclusive of the estimated dividend shares on the 2013 PSP, was therefore £1,016,000 (2015: nil).
Further details of the LTIP outcomes for the period ended 31 December 2016 and the awards vesting in prior years are provided on page 95 and in table 3 on pages 102 to 107.
LTIP award granted in 2016
The details of Chris’s 2016 LTIP award, which were previewed in the 2015 Remuneration Report, are summarised in the following table.
| | | | | | | | | | | | | | | | | | | | |
| Type of award | | Grant date | | | Face value of award (% of base salary) | | | Face value of award (£’000)(a) | | | % vesting at threshold performance | | | End of the performance period over which the performance
conditions have
to be fulfilled(b)(c) | |
| PSP | |
| 11 March
2016 |
| | | 400% | | | | 3,346 | | | | 22.5% | | | | 31 Dec 2020 | |
| (a) | The face value represents the maximum value of the award and resulted in an award of 126,987 conditional shares based on the average share price over 2015 of £26.346. The expected value of the award is 50 per cent of the face value or £1,672,800. |
| (b) | The 2016 PSP award may vest after five years in 2021. |
| (c) | The full performance conditions for the award are set out in detail in table 3 on pages 102 to 107. |
LTIP award for 2017
Chris’s PSP award in 2017 will have a face value of 400 per cent of base salary and an expected value of 200 per cent of base salary. The award may vest after five years in 2022, subject to the Group’s relative TSR and the relative EBIT margin performance. The performance conditions for the award are unchanged from 2016 and the full performance conditions are set out in detail on page 89.
The number of conditional shares awarded under the LTIP is calculated using the average share price over the previous calendar year, and as such, the awards granted in 2017 will be calculated using the 2016 average share price of £23.352.
Shareholding
Chris’s shareholding for the purposes of the share ownership policy, calculated using the market price of Rio Tinto shares on the latest practicable date each year before the date of publication of this report was:
| | | | | | | | | | | | |
| | | 31 December 2016 | | | 31 December 2015 | | | Increase in
shareholding | |
| Holding of ordinary shares | | | 17,620 | | | | 9,182 | | | | 91.9% | |
| Multiple of base salary | | | 0.8 | | | | 0.2 | | | | 0.6 | |
Chris holds no options over Rio Tinto shares. He has until 2018 to build up his ownership in shares to three times his salary as chief financial officer.
Pension
Chris is employed in the UK and is provided with pension benefits on a defined contribution basis on terms equivalent to other UK employees as follows:
| – | | A pension contribution to a funded UK company pension arrangement of 25 per cent of £135,000, being the current maximum salary on which pension contributions are based under that arrangement. The pension contribution for 2016 was £33,750 (2015: £33,750). |
| – | | A cash supplement equal to 25 per cent of the amount by which his base salary exceeded £135,000, less any applicable withholdings. The gross cash supplement for 2016 was £175,350 (2015: £174,667). |
Fees from external appointments
Chris received no fees from external appointments in 2016 or 2015.
Service contract
| | |
| Positions held and date of appointment to position |
| Position held during 2016 | | Date of appointment to position |
| Chief financial officer | | 18 April 2013 |
Chris’s contract can be terminated by either party with 12 months’ notice in writing, or immediately by paying the base salary only in lieu of any unexpired notice.
Other
As a UK contracted employee, Chris is not eligible for tax equalisation on his remuneration, cost of living or any other ongoing assignment benefits such as a housing allowance. He is eligible for repatriation support to Australia at the end of his employment as per his service contact.
Sam Walsh (former chief executive)
Single total figure of remuneration
The table below provides a summary of actual remuneration in respect of 2016 and prior years in accordance with UK legislation. It is stated in Australian dollars, the currency of Sam Walsh’s remuneration arrangements. Remuneration details for 2016 reflect remuneration received for the period 1 January 2016 to 1 July 2016. Details of remuneration received following Sam’s retirement are provided under the heading “Payments on retirement”.
| | | | |
| 2016 Annual report | | riotinto.com | | 85 |
| | | | | | | | | | | | | | | | |
| | | | | | | | | |
| STRATEGIC REPORT | | | | DIRECTORS’ REPORT REMUNERATION REPORT: IMPLEMENTATION REPORT | | | | FINANCIAL STATEMENTS | | | | PRODUCTION, RESERVES AND OPERATIONS | | | | ADDITIONAL INFORMATION |
Remuneration Report: Implementation Report
continued
This table is provided is in addition to the Australian statutory disclosure requirements set out in US dollars in table 1a on pages 98 and 99. The remuneration details set out in table 1a include theoretical accounting values relating to various parts of the remuneration package, most notably LTIP awards, and require a different methodology for calculating the superannuation value. Accordingly, the figures below are not directly comparable with those in table 1a.
| | | | | | | | | | | | |
| (stated in A$’000) | | 2016 | | | 2015 | | | 2014 | |
| Base salary paid(a) | | | 1,004 | | | | 1,985 | | | | 1,940 | |
| STIP payment – cash | | | – | | | | 1,631 | | | | 1,721 | |
| STIP payment – deferred shares(b)(c) | | | – | | | | 1,632 | | | | 1,721 | |
| Total short-term pay | | | 1,004 | | | | 5,248 | | | | 5,382 | |
| Value of LTIP awards vesting (d) | | | – | | | | 2,076 | | | | 3,161 | |
| Superannuation(e) | | | 232 | | | | 600 | | | | 903 | |
| Other benefits(f) | | | 421 | | | | 1,217 | | | | 1,030 | |
| Single total figure of remuneration | | | 1,657 | | | | 9,141 | | | | 10,476 | |
| Percentage change in total remuneration (2016 versus 2015; 2015 versus 2014) | | | (81.9% | ) | | | (12.7% | ) | | | | |
| Percentage of total remuneration provided as performance-related pay (STIP and LTIP) | | | 0.0% | | | | 58.4% | | | | 63.0% | |
| Percentage of total remuneration provided asnon-performance-related pay (base salary, pension and other benefits) | | | 100.0% | | | | 41.6% | | | | 37.0% | |
| Percentage of maximum STIP awarded(c)(g) | | | – | | | | 81.9% | | | | 88.4% | |
| Percentage of maximum STIP forfeited(c) | | | – | | | | 18.1% | | | | 11.6% | |
| Percentage of target STIP awarded(c) | | | – | | | | 136.5% | | | | 147.3% | |
| Percentage of PSP award vesting(d) | | | – | | | | 65.4% | | | | 73.5% | |
| Percentage SOP award vesting | | | – | | | | – | | | | – | |
The decrease in the single total figure of remuneration is due mainly to Sam’s 2016 remuneration reflecting remuneration for a part-year from 1 January 2016 to 1 July 2016, rather than for the full year in 2015, and to the actions described below in the section headed “deferral agreement”, relating to the 2016 STIP award and the 2013 PSP award.
| (a) | Salary paid in the financial year to 31 December. Salaries are generally reviewed with effect from 1 March. Sam did not receive a salary increase effective 1 March 2016. |
| (b) | Value of STIP deferred under the BDP, the vesting of which is subject to the Plan rules. |
| (c) | The 2016 STIP award is subject to the deferral agreement explained below. |
| (d) | The LTIP awards vesting with respect to the performance period ending 31 December 2016 is subject to the deferral agreement explained below. The value of the LTIP awards vesting with respect to the performance periods ending 31 December 2015 and 31 December 2014 includes the cash payment for dividends on the awards that vested. The performance conditions for awards vesting for the period ending 31 December 2016 are detailed in the notes to table 3 on page 107. |
| (e) | Superannuation reflects the value of the superannuation accrued during the year assuming that it was to come into payment immediately. This differs from the value reported in table 1a which is calculated using an IAS19 methodology and assumptions on rates of investment return, inflation and salary increases. |
| (f) | Other benefits include international assignment benefits of A$293,000 for 2016 (2015: A$1,001,000), medical cover, allowance for professional tax compliance services, car allowance, Company provided transport and other contractual payments or benefits. Other benefits were lower in 2016 due primarily to the proportion of the year worked. |
| (g) | The maximum potential STIP award is 200 per cent of base salary. |
Deferral agreement
As referenced in the Annual statement by the Remuneration Committee chairman, a deed of deferral has been entered into between Sam and the Company. The parties have agreed to the deferral of Sam’s entitlements in good faith as the investigations concerning the Simandou project are at an early stage. The principal provision of this deed is that the payment of the 2016 STIP award and of any outstanding LTIP awards (including BDP and PSP awards) which would have vested up to 2021 will be subject to a staged deferral.
Under this agreement, on 31 December 2018, Sam will receive 50 per cent of the 2016 STIP award and 50 per cent of the LTIP awards which would otherwise have vested on or before 31 December 2018. On 31 December 2020, Sam will receive the remaining 50 per cent of the 2016 STIP award and the remaining 50 per cent of the LTIP awards which would have otherwise vested by 31 December 2018, and any other LTIP awards which would have vested by 31 December 2020. The payment of any of these awards is contingent on there being no information in connection with the Simandou matter which would justify the Remuneration Committee making a determination to cancel, defer or reduce these awards.
Base salary
As reported last year, Sam’s base salary of A$1,992,300 was not increased effective 1 March 2016 and his base salary remained at this level until he retired from the Group on 1 July 2016.
STIP individual objectives for 2016
Sam’s individual objectives were consistent with those outlined forJean-Sébastien Jacques on page 82 and his primary individual objective in 2016 was to successfully support the transition of the new chief executive.
The Committee, with input from the chairman of the board, assessed Sam’s performance against his individual objectives as 125 per cent (out of 200 per cent) for his individual contribution to the business during the year.
STIP outcomes for 2016
The following table summarises the STIP outcomes for 2016.
| | | | | | | | | | | | |
| Measures | | Weight (%) | | | Result
(out of 200%) | | | Weighted
result | |
| Safety(a) | | | 20 | | | | 79.0 | | | | 15.8 | |
| Group financial(a) | | | 50 | | | | 166.0 | | | | 83.0 | |
| Safety and financial | | | 70 | | | | 141.1 | | | | 98.8 | |
| Individual | | | 30 | | | | 125.0 | | | | 37.5 | |
| Total (% of target out of 200%) | | | 100 | | | | – | | | | 136.3 | |
| (a) | Refer to pages 79 and 80 for further details of Group safety and financial performance. The Group safety result of 106 per cent has been reduced by 25 per cent to 79 per cent for the impact of the fatality in 2016. |
As a result, subject to the deferral agreement described above, Sam will receive a STIP award of $ A$1,629,303 (2015: $3,263,387). This is equivalent to 163.6 per cent of base salary (2015: 163.8 per cent),pro-rated for the period of employment up to 1 July 2016.
LTIP outcome for the period ended 31 December 2016
Subject to the deferral agreement described above, Sam will receive the cash value of an estimated 44,285 shares (2015: 41,555 shares) in Rio Tinto Limited from the vesting of the PSP awarded in 2013. This is inclusive of an estimated 5,642 shares which is equal to the aggregate net dividends that would have been paid on the shares that vest had he owned them during that four-year period.
Further details of the LTIP outcomes for the period ended 31 December 2016 and the awards vesting in prior years are provided on page 93 and in table 3 on pages 102 to 107.
| | | | |
| 86 | | riotinto.com | | 2016 Annual report |
LTIP award granted in 2016
The details of Sam’s 2016 LTIP award are summarised in the following table. Note that, in accordance with the LTIP rules, the number of conditional shares granted in 2016 has been reduced from 147,076 to 15,164 conditional shares, based on the time employed between the grant of the award and Sam’s retirement as a proportion of the first 36 months from the date of grant.
| | | | | | | | | | | | | | | | | | | | |
| Type of award | | Grant date | | | Face value
of award
(% of base
salary) | | | Face value
of award
(A$’000) (a) | | | % vesting at
threshold
performance | | | End of the
performance
period over which
the performance
conditions have
to be fulfilled (b)(c) | |
| PSP | |
| 11 March
2016 |
| | | 400% | | | | 7,969 | | | | 22.5% | | | | 31 Dec 2020 | |
| (a) | The face value represents the maximum value of the award and resulted in an award of 147,076 conditional shares based on the average share price over 2015 of A$54.184. The expected value of the award is 50 per cent of the face value or A$3,984,600. In accordance with the LTIP rules the number of conditional shares been reduced to 15,164 conditional shares based on the time employed between the grant of the award on 11 March 2016 and Sam’s retirement as a proportion of the first 36 months from the date of grant. |
| (b) | The 2016 PSP award may vest after five years in 2021. |
| (c) | The full performance conditions for the award are set out in detail in table 3 on pages 102 to 107. |
Superannuation
Sam was provided with superannuation through an employer-funded plan as provided to Australian-based employees.
In line with Australian-based employees with defined benefit provision who remain in service beyond age 62, Sam’s benefit was calculated as the greater of:
| | | | |
(a) | | 20 per cent of base salary, averaged over three years, for each year of service and proportionate month with the Company to 1 July 2016. The accrued lump sum benefit as at 1 July 2016 calculated on this basis was A$9,476,931 (31 December 2015: A$9,144,489); or |
| (b) | | (i) | | his accrued benefit at age 62 of 4.05 times final base salary; plus |
| | (ii) | | Company contributions required under Australian legislation sufficient to meet the maximum contribution base as detailed within the Superannuation Guarantee legislation, being at the rate of 9.5 per cent for the period 1 January to 1 July 2016, less tax; plus |
| | (iii) | | investment earnings at the rate the trustee of the superannuation fund may determine from time to time for the period from age 62 to the date of retirement. |
| | The accrued lump sum benefit as at 1 July 2016 calculated on this basis was A$10,769,896 (31 December 2015: A$10,460,855). |
Additionally, and in line with typical market practice in Australia, Sam received an additional Company contribution on a defined contribution basis of 20 per cent of the lesser of:
| (a) | 50 per cent of the annual STIP award; or |
| (b) | 20 per cent of base salary. |
The additional Company contribution on a defined contribution basis for 2016 was A$79,692 (2015: A$77,900). Sam elected to take the defined contribution element as a cash amount less any applicable withholdings.
The total benefit can be taken without employer or trustee consent and without actuarial reduction on cessation of employment on or after age 62.
The superannuation value included in the single total figure of remuneration for 2016 of A$231,820 is the sum of the accrued defined benefit lump sum at 1 July 2016 (A$10,769,896), less the accrued defined benefit lump sum at 31 December 2015 (A$10,460,855), plus the additional Company contribution on a defined contribution basis for 2016 (A$79,692), less inflation on the accrued defined benefit lump sum at 31 December 2015 (A$156,913).
When Sam’s benefits were calculated at 1 July 2016, it was discovered that an incorrect interest rate had been previously used to calculate his
benefit. A correction to the interest rate used to calculate the benefit set out in (b) above was therefore applied from 2012 as per Australian-based employees with defined benefit provision who had remained in service beyond age 62. This correction resulted in a restatement of his superannuation values as follows:
| | | | | | | | | | | | | | | | |
| (stated in A$’000) | | Superannuation
value in single total
figure of
remuneration
table
disclosed
previously | | | Restated
superannuation
value for single total
figure of
remuneration
table | | | Accrued
lump sum
at year end
disclosed
previously | | | Restated
accrued
lump sum
at year
end | |
| 31 December 2012 | | | 745 | | | | 838 | | | | 7,145 | | | | 7,306 | |
| 31 December 2013 | | | 1,322 | | | | 1,245 | | | | 8,544 | | | | 8,697 | |
| 31 December 2014 | | | 841 | | | | 903 | | | | 9,496 | | | | 9,716 | |
| 31 December 2015 | | | 584 | | | | 600 | | | | 10,221 | | | | 10,461 | |
Fees received from external appointments
Sam received no fees from external appointments up to the time he left the Group in 2016 or for 2015.
Service contract
| | |
| Positions held and date of appointment to position |
| Position held during 2016 | | Date of appointment to position |
| Chief executive | | 17 January 2013 |
Other
Sam received a housing allowance and other assignment benefits during his secondment to London. His remuneration was not subject to tax equalisation or cost of living adjustments, both of which are standard provisions for other international assignees in the Group. The amounts are included in note (e) under the single total figure of remuneration table on page 86.
Payments on retirement
Sam retired on 1 July 2016 after providing the Company notice of his intention to retire on 16 March 2016. Until that date, he received his contractual remuneration including base salary, benefits and superannuation contributions. He received a payment of A$1,408,000, being his base salary for the remainder of his contractual notice period which was just less than nine months and a payment for the outstanding balance of his accrued and unused long-service leave and annual leave of A$1,843,000 and A$1,008,000 respectively, in accordance with his contract, Australian legislation and applicable practice applying to all employees in Australia. He also received net repatriation benefits of US$91,000 in line with contractual entitlements.
Sam’s 2016 STIP award of A$1,629,303, which is subject to the deferral agreement described above, has been calculated on a pro rata basis for the period of employment up to 1 July 2016. Further details of the STIP calculation are provided on page 86. Final details of the 2013 PSP award, the payment of which is also subject to the deferral agreement described above, will be calculated based on the assessment against the EBIT margin measure in May 2017. The details of the awards which vest will be disclosed in accordance with the timing set out in the deferral agreement.
Past-director payments
As explained in the 2015 Annual report, during 2015, the UK tax authorities completed a review of their interpretation of the UK/USA Double Tax Treaty. In this context, they reviewed the UK tax returns of a number of Rio Tinto employees, including the former chief executive, Tom Albanese, in connection with foreign tax credits. The periods under review related to Tom’s service when he was on a tax equalised assignment to the UK, which was prior to his appointment as chief executive.
The outcome of this review resulted in an assessment of additional UK tax for the 2004/05, 2005/06 and 2006/07 tax years. It is noted that all tax returns were prepared and submitted in good faith, in line with best practice at the time and that neither the Company nor Tom has failed in meeting their compliance obligations.
| | | | |
| 2016 Annual report | | riotinto.com | | 87 |
| | | | | | | | | | | | | | | | |
| | | | | | | | | |
| STRATEGIC REPORT | | | | DIRECTORS’ REPORT REMUNERATION REPORT: IMPLEMENTATION REPORT | | | | FINANCIAL STATEMENTS | | | | PRODUCTION, RESERVES AND OPERATIONS | | | | ADDITIONAL INFORMATION |
Remuneration Report: Implementation Report
continued
The final settlement for the additional UK tax and related professional fees (to date) for this matter, the payment of which on behalf of Tom is in accordance with our policies, was £221,377. The Company continues to work with its external advisers to seek a partial credit from the US Tax Authorities in respect of the additional UK taxes paid. Further professional fees may be incurred.
What we paid our chairman andnon-executive directors
Positions held
Details of thenon-executive directors who held office during 2016 are set out below. EachNon-executive director held office for the whole of 2016 unless otherwise indicated. Years of appointment for eachNon-executive director are included in the section headed Board of directors on page 51.
| | |
| Name | | Title |
| Jan du Plessis | | Chairman |
| Robert Brown | | Non-executive director |
| Megan Clark | | Non-executive director |
| Ann Godbehere | | Non-executive director |
| Richard Goodmanson | | Non-executive director to 5 May 2016 |
| Anne Lauvergeon | | Non-executive director |
| Michael L’Estrange | | Non-executive director |
| Paul Tellier | | Non-executive director |
| Simon Thompson | | Non-executive director |
| John Varley | | Non-executive director |
Annual fees payable
The table below sets out the annual fees paid in 2016 and payable in 2017 to the chairman and thenon-executive directors.
| | | | | | | | | | | | |
| | | 2017 | | | 2016 | | | 2015 | |
| Director fees | | | | | | | | | | | | |
| Chairman’s fee | | £ | 730,000 | | | £ | 730,000 | | | £ | 730,000 | |
| Non-executive director base fee | | £ | 95,000 | | | £ | 90,000 | | | £ | 90,000 | |
| Non-executive director base fee for Australian residents | | £ | 105,000 | | | £ | 90,000 | | | £ | 90,000 | |
| Senior independent director | | £ | 40,000 | | | £ | 40,000 | | | £ | 40,000 | |
| Committee fees | | | | | | | | | | | | |
| Audit Committee chairman | | £ | 40,000 | | | £ | 35,000 | | | £ | 35,000 | |
| Audit Committee member | | £ | 20,000 | | | £ | 20,000 | | | £ | 20,000 | |
| Remuneration Committee chairman | | £ | 35,000 | | | £ | 30,000 | | | £ | 30,000 | |
| Remuneration Committee member | | £ | 15,000 | | | £ | 15,000 | | | £ | 15,000 | |
| Sustainability Committee chairman | | £ | 35,000 | | | £ | 30,000 | | | £ | 30,000 | |
| Sustainability Committee member | | £ | 15,000 | | | £ | 15,000 | | | £ | 15,000 | |
| Nominations Committee member | | £ | 7,500 | | | £ | 7,500 | | | £ | 7,500 | |
| Meeting allowances | | | | | | | | | | | | |
Long distance (flights over 10 hours per journey) | | £ | 10,000 | | | £ | 10,000 | | | £ | 10,000 | |
Medium distance (flights of5-10 hours per journey) | | £ | 5,000 | | | £ | 5,000 | | | £ | 5,000 | |
The Chairman’s fee is determined by the Remuneration Committee. This fee remains unchanged, having last been increased on 1 July 2013. All other fees are subject to review by the board on the recommendation of the Chairman’s Committee. A review ofnon-executive fees was conducted in October 2016, the previous review having been conducted in January 2014. Following this review, it was determined that the base fee fornon-executive directors and the Committee fee for Committee chairmen should be increased with effect from 1 January 2017, as set out in the table above.
The additional £10,000 allowance for Australian directors is to compensate them for the additional payments they are required to make
regarding UK national insurance contributions which, unlike directors based in other jurisdictions, they are not able to offset against their local tax payments.
There have been no changes to other fees or allowances since 1 January 2012, save that the travel allowances have, since 2013, been based on the length of flight rather than whether the travel is overseas.
Details of each element of remuneration and the single total figure of remuneration paid to the chairman andnon-executive directors during 2016 and 2015 are set out in US dollars in table 1b on page 100. No post-employment, termination payments or share-based payments were made. Where the payment of statutory minimum superannuation contributions fornon-executive directors is required by Australian superannuation law, these contributions are deducted from the director’s overall fee entitlements.
The total fee and allowances payments made to the chairman andnon-executive directors in 2016 are within the maximum aggregate annual amount of £3 million set out in the Group’s constitutional documents approved by shareholders at the 2009 annual general meetings.
Share ownership policy fornon-executive directors
The board, in 2006, adopted a policy wherebynon-executive directors are encouraged to build up a shareholding within three years of their appointment equal in value to one year’s base fee. Details ofnon-executive directors’ share interests in the Group, including total holdings, are set out in table 2 on page 101.
Non-executive directors’ share ownership
Thenon-executive directors’ shareholdings, calculated using the market price of Rio Tinto shares on the latest practicable date before the date of publication of this report were:
| | | | | | | | |
| Director | | Share ownership level
at 31 December 2016
as a multiple of base fee | | | Share ownership level
at 31 December 2015
as a multiple of base fee | |
| Jan du Plessis | | | 1.5 | | | | 0.8 | |
| Robert Brown | | | 1.7 | | | | 0.9 | |
| Megan Clark | | | 1.4 | | | | 0.6 | |
| Ann Godbehere | | | 1.3 | | | | 0.6 | |
| Anne Lauvergeon | | | 1.4 | | | | 0.7 | |
| Michael L’Estrange | | | 0.9 | | | | 0.2 | |
| Paul Tellier | | | 10.3 | | | | 5.0 | |
| Simon Thompson | | | 3.0 | | | | 1.5 | |
| John Varley | | | 3.9 | | | | 2.0 | |
The value of the shares and the multiple of base fee as at 31 December 2016 is higher than the multiple reported as at 31 December 2015 due mainly to the higher share price.
What we paid our other Executive Committee members and why
Base salary
The base salaries for the newly appointed Executive Committee members will remain unchanged in 2017. For the other members of the Executive Committee, the Committee has reviewed the base salary levels and has made adjustments in line with the base salary budgets applying to the broader employee population.
| | | | | | | | | | | | |
| Stated in ’000 | | 2017 | | | 2016 | | | % change | |
| Bold Baatar | | | £510 | | | | £510 | (a) | | | 0.0 | |
| Hugo Bague | | | £494 | | | | £494 | | | | 0.0 | |
| Alfredo Barrios | | | C$986 | | | | C$964 | | | | 2.3 | |
| Joanne Farrell | | | A$825 | | | | A$825 | (a) | | | 0.0 | |
| Vera Kirikova | | | £400 | (b) | | | – | | | | – | |
| Stephen McIntosh | | | A$985 | | | | A$985 | (a) | | | 0.0 | |
| Simone Niven | | | £400 | (b) | | | – | | | | – | |
| Chris Salisbury | | | A$985 | | | | A$985 | (a) | | | 0.0 | |
| Arnaud Soirat | | | £510 | | | | £510 | (a) | | | 0.0 | |
| (a) | Base salary on appointment to the Executive Committee during 2016. |
| (b) | Base salary on appointment to the Executive Committee, effective 1 January 2017. |
| | | | |
| 88 | | riotinto.com | | 2016 Annual report |
STIP objectives and outcomes for 2016
Overview of STIP weightings and measures for 2016
The following table provides an overview of the measures and weightings used to determine STIP awards for members of the Executive Committee in 2016:
| | | | | | | | |
| | | Weighting for
executive
directors and
Group
executives | | | Weighting for
PGCEOs | |
| Safety – split between AIFR, LTIs and CRM implementation adjusted for fatalities | | | 20% | | | | 20% | |
| Financial measures split equally between underlying earnings and free cash flow for the Group | | | 50% | | | | 20% | |
| Financial measures split equally between underlying earnings and free cash flow for the relevant product group | | | 0% | | | | 30% | |
| Individual measures based on key strategic initiatives of each role and contribution to overall company performance | | | 30% | | | | 30% | |
The Group safety result of 106 per cent (out of 200 per cent) exceeded “target”, and the average performance against safety goals for individual Executive Committee members, excluding the impact of adjustments for the fatality in 2016, was also above “target”.
Average performance against the individual product group financial goals was above “target”.
The individual performance of Executive Committee members who are not executive directors was reviewed by the Committee against these measures and, on average, was considered above “target”. This reflected, among other things, achievement of the cost reduction targets set for 2016 and the progress against our asset portfolio, growth and people agenda’s.
The 2016 STIP awards are detailed in the table below.
| | | | | | | | |
| | | 2016 STIP award
(% of Salary) (a) | | | 2016 STIP
award (000’s) | |
| Bold Baatar(b) | | | 138.1% | | | | £60 | |
| Hugo Bague | | | 137.5% | | | | £679 | |
| Alfredo Barrios | | | 160.2% | | | | C$1,544 | |
| Joanne Farrell(b) | | | 136.3% | | | | A$562 | |
| Andrew Harding(c) | | | 112.3% | | | | £321 | |
| Stephen McIntosh(b) | | | 129.8% | | | | A$716 | |
| Chris Salisbury(b) | | | 127.5% | | | | A$848 | |
| Arnaud Soirat(b) | | | 111.1% | | | | £283 | |
| (a) | Results out of 200% have been rounded to one decimal place in the above table and STIP awards have been rounded to the nearest thousand units. As the actual STIP awards do not use rounding conventions, small rounding variances may occur. |
| (b) | The 2016 STIP award is based on the portion of the 2016 year served as an executive. |
| (c) | STIP award for the period 1 January 2016 to 1 July 2016. |
| (d) | No 2016 STIP awards were made to Alan Davies, Greg Lilleyman and Debra Valentine. |
Detailed commentary on the performance of each product group is provided in the Annual report on pages 32 to 39. The average overall performance of Executive Committee members who are not executive directors was adjudged by the Committee to be above target.
LTIP outcomes for the period ended 31 December 2016
Executives will receive shares in Rio Tinto plc or Rio Tinto Limited as applicable in 2017 from the vesting of the PSP awarded in 2013. The TSR portion of the award vested on 20 February 2017 and the EBIT margin portion is anticipated to vest on 31 May 2017. The average Rio Tinto plc and Rio Tinto Limited share prices over the last quarter of 2016 of £29.30 and A$56.51 respectively have been used to calculate the value of LTIP awards vesting with respect to 2016. All executives who were granted
the 2013 PSP awards will also receive additional shares equal to the aggregate net dividends that would have been paid on the 2013 PSP shares that vested had they owned them during the four-year performance period. No dividends will be paid in respect of the share awards that lapse.
An estimate of the total value of LTIP awards which will vest is included in the single total figure of remuneration. The actual LTIP values will be recalculated following the vesting of the EBIT margin portion of the award at the end of May 2017 based on the actual share prices on the date of vesting (31 May 2017). The estimated LTIP values will be restated, if applicable, on our website and in the 2017 Annual report.
Further details of the LTIP outcomes for the period ended 31 December 2016 are provided on page 93 and pages 102 to 107.
LTIP awards granted in 2016
The maximum potential value of PSP awards granted in 2016 was 438 per cent of base salary. The Committee decided that the PSP awards in 2016 would have a face value of awards as shown in the table below. The eventual value of the award will depend on the Group’s relative TSR and relative EBIT margin performance during the years 2016-2020. The 2016 PSP award may vest after five years in 2021. The performance conditions for the awards granted in 2016 are consistent with the performance conditions for awards to be granted in 2017 as set out below.
LTIP awards for 2017
The Committee has determined that the PSP awards in 2017 will have a face value as shown in the table below. The award levels have been set to incentivise executives to meet the long-term strategic goals of the Group, to provide retention and to contribute towards the competitiveness of the overall remuneration package.
Consistent with our practice since 1998, the awards made under the LTIP are calculated using the average share price over the previous calendar year, in order to mitigate the impact of short-term volatility in the share price. As such, the awards granted in 2017 will be calculated using the 2016 average share prices for Rio Tinto plc and Rio Tinto Limited of £23.352 and A$48.533 respectively.
The average face value of awards to be made to Executive Committee members in 2017, excluding the executive directors, is 390 per cent of base salary (2016: 384 per cent of salary).
| | | | | | | | |
Maximum value (Percentage of 1 March base salary) | | 2017 | | | 2016 | |
| Bold Baatar | | | 390 | | | | – | |
| Alfredo Barrios | | | 390 | | | | 390 | |
| Joanne Farrell | | | 390 | | | | – | |
| Vera Kirikova | | | 390 | | | | – | |
| Stephen McIntosh | | | 390 | | | | – | |
| Simone Niven | | | 390 | | | | – | |
| Chris Salisbury | | | 390 | | | | – | |
| Arnaud Soirat | | | 390 | | | | – | |
| Average | | | 390 | | | | 390 | (a) |
| (a) | Average of Executive Committee members shown above. |
The performance conditions for the PSP awards made from 2013 are the same. The expected value of the awards made from 2013 is equal to 50 per cent of the face value. The percentage vesting at “threshold” performance is 22.5 per cent. The 2017 award will vest after five years in 2022, subject to the Group’s performance against the relative TSR and relative EBIT margin measures.
| | | | |
| 2016 Annual report | | riotinto.com | | 89 |
| | | | | | | | | | | | | | | | |
| | | | | | | | | |
| STRATEGIC REPORT | | | | DIRECTORS’ REPORT REMUNERATION REPORT: IMPLEMENTATION REPORT | | | | FINANCIAL STATEMENTS | | | | PRODUCTION, RESERVES AND OPERATIONS | | | | ADDITIONAL INFORMATION |
Remuneration Report: Implementation Report
continued
For the TSR component (constitutingtwo-thirds of the award), where TSR performance is measured against both the Euromoney Global Mining Index and the broader market of large global companies as measured through the MSCI, the award will vest as follows:
| | |
Outperformance of the index by 6 per cent per annum | | 1.0 x award vests |
Performance between equal to the index and 6 per cent outperformance | | Proportionate vesting between 0.225 x and 1.0 x vesting |
| Performance equal to the index | | 0.225 x award vests |
| Performance less than the index | | Nil vesting |
For the EBIT margin measure, change in the EBIT margin of Rio Tinto and each of the comparator companies (measured on a“point-to-point” basis using the last financial year in the performance period and the financial year prior to the start of the performance period) will be calculated using independent third-party data. Vesting will be subject to Rio Tinto’s interpolated ranking position using the following schedule:
| | |
Equal to or greater than 2nd ranked company | | 1.0 x award vests |
Between the 5th and 2nd ranked companies | | Proportionate vesting between 0.225 x and 1.0 x vesting |
| Above the 6th ranked company | | 0.225 x award vests |
Equal to the 6th ranked company or below | | Nil vesting |
The 2017 comparator group (unchanged from 2016) for the EBIT margin measure is: Alcoa*, Antofagasta, Anglo American, Barrick Gold, BHP Billiton, Freeport McMoRan, Fortescue, Glencore, Teck Resources and Vale.
| * | Alcoa’s membership is subject to future review following their recent demerger. |
Share ownership
The following table illustrates the executive share ownership level for current members of the Executive Committee in office at 31 December 2016 as a multiple of salary as at the same date.
| | | | |
| | | Share Ownership
level at 31 December 2016
as a multiple of base pay | |
| Bold Baatar | | | 0.2 | |
| Hugo Bague | | | 6.6 | |
| Alfredo Barrios | | | 0.2 | |
| Joanne Farrell | | | 2.6 | |
| Stephen McIntosh | | | 0.9 | |
| Chris Salisbury | | | 1.2 | |
| Arnaud Soirat | | | 0.5 | |
The share ownership level is calculated using the market price of Rio Tinto shares on the latest practicable date each year before the date of publication of this report. The value of any vested but unexercised options is calculated based on the share price as at the relevant date in February less the exercise price and with a 50 per cent discount for the effects of taxation. The recent vesting of the 2013 PSP has increased the multiples noted above for several executives.
All executives have increased their holding of ordinary shares during 2016, and are making progress towards their ownership requirements. The value of the shares, and options if applicable, has also increased due to the higher share prices.
Post-employment benefits
Executives may participate in pension, superannuation and post-employment medical and life insurance benefits, which are typically offered to the broader employee population in similar locations.
Service contracts
All other executives have service contracts which can be terminated by the Company with 12 months’ notice in writing, and by the employee
with six months’ notice in writing, or immediately by the Company by paying the base salary only in lieu of any unexpired notice.
Positions held and date of appointment to position
| | | | |
| Name | | Position(s) held during 2016 | | Date of appointment to position |
| Other executives | | | | |
| Bold Baatar | | Chief executive, Energy & Minerals | | 1 December 2016 |
| Hugo Bague(a) | | Group executive, Organisational Resources | | 1 March 2013 |
| Alfredo Barrios | | Chief executive, Aluminium | | 1 June 2014 |
| Alan Davies(a) | | Chief executive, Energy & Minerals | | 2 July 2016 |
| | | Chief executive, Diamonds & Minerals | | 1 September 2012 |
| Joanne Farrell | | Group executive, Health, Safety & Environment | | 2 July 2016 |
| Andrew Harding(a) | | Chief executive, Iron Ore | | 14 February 2013 |
| Greg Lilleyman(a) | | Group executive, Technology & Innovation | | 1 January 2014 |
| Stephen McIntosh | | Group executive, Growth & Innovation | | 2 July 2016 |
| | | Acting Group executive, Technology & Innovation | | 24 May 2016 |
| Chris Salisbury | | Chief executive, Iron Ore | | 2 July 2016 |
| | | Acting Chief executive, Copper & Coal | | 17 March 2016 |
| Arnaud Soirat | | Chief executive, Copper & Diamonds | | 2 July 2016 |
| Debra Valentine(a) | | Group executive, Legal & Regulatory Affairs | | 15 January 2008 |
| (a) | Alan Davies and Debra Valentine left the Executive Committee on 8 November 2016. Andrew Harding left the Executive Committee on 20 June 2016. Greg Lilleyman left the Executive Committee on 24 May 2016. Hugo Bague left the Executive Committee on 31 December 2016. |
Departures from the Executive Committee
Greg Lilleyman left the Executive Committee on 24 May 2016 and left the Group on 1 July 2016. He received his normal base salary and other contractual benefits until 1 July 2016, excluding eligibility for STIP. With the exception of there being no 2015 and 2016 PSP awards, outstanding LTIP awards were treated, where required, in accordance with eligible leaver provisions of each plan with pro rating, where applicable, up to 1 July 2016.
Greg received a payment of A$697,000 as payment in lieu of notice equal to approximately 11 months’ base salary based on his 12 months’ contractual notice period and a payment of A$69,000 in relation to rental allowance for the unworked notice period. Unused and accrued annual leave and long-service leave amounting to A$514,000 was also paid as at the termination date in line with Australian legislation and policy. He is eligible for executive outplacement support.
Andrew Harding left the Executive Committee on 20 June 2016 and left the Group on 1 July 2016. He received his normal base salary and contractual benefits until 1 July 2016. As such, he remained eligible to receive a pro rata STIP award for the period 1 January 2016 to 1 July 2016, which has been calculated based on actual business and individual performance and will be paid fully in cash in March 2017. Outstanding LTIP awards were also treated, where required, in accordance with eligible leaver provisions of each plan with pro rating, where applicable, up to 1 July 2016.
| | | | |
| 90 | | riotinto.com | | 2016 Annual report |
Andrew received a payment of £549,000 as payment in lieu of notice equal to slightly less than 12 months’ base salary based on his 12 months’ contractual notice period. Unused and accrued vacation amounting to £31,000 was also paid as at the termination date in line with UK policy. He is eligible for executive outplacement support and he received standard benefits related to his repatriation from Australia to the UK which includes tax preparation assistance to recognise a prior period of tax equalisation.
Alan Davies was suspended on 8 November 2016 and his employment was terminated on 16 November 2016. He received his normal base salary and contractual benefits until 16 November 2016. He will not receive a STIP award for 2016 and all outstanding but unvested LTIP and BDP awards earned in previous years have lapsed and have been forfeited. Unused and accrued vacation amounting to £33,000 was paid as at the termination date in line with UK policy. An amount of £32,110 (gross), representing a portion of the lump sum amount paid to Alan in 2015 in connection with his localisation to the UK and as disclosed last year, was clawed back. The claw-back was achieved by offsetting this amount against unused and accrued vacation which would have otherwise been paid to Alan on termination.
Debra Valentine was suspended on 8 November 2016 and her employment was terminated on 16 November 2016. Debra received her normal base salary and contractual benefits until 16 November 2016. She will not receive a STIP award for 2016 and all outstanding but unvested LTIP and BDP awards earned in previous years have lapsed and have been forfeited. Unused and accrued vacation amounting to US$16,000 was paid as at the termination date in line with US policy. Repatriation benefits have been forfeited although Debra will receive tax preparation assistance primarily to enable the Company to benefit from expected tax refunds due in the US. Company provided household goods storage in the US continued until 31 December 2016.
As part of the restructure of the Executive Committee, the role of Group executive, Organisational Resources was made redundant effective 31 December 2016. As a result, Hugo Bague left the Executive Committee on 31 December 2016 and will leave the Group on 31 March 2017. Hugo will assist with the handover of his responsibilities, provide advisory services to the chief executive and assist with such other matters as the Company may reasonably require until 31 March 2017. Hugo will receive his normal base salary and contractual benefits until 31 March 2017. As such, he remains eligible to receive a pro rata STIP award for the period 1 January 2017 to 31 March 2017, which will be calculated based on actual business and individual performance and will be paid fully in cash in March 2018. Outstanding LTIP awards will be treated, where required, in accordance with eligible leaver provisions of each plan with pro rating, where applicable, up to 31 March 2017.
Consistent with severance practice in the UK, Hugo will receive a payment of £370,500 equal to nine months’ base salary based on his 12 months’ contractual notice period and a severance payment of £398,000 in line with UK practice. The total severance payment is therefore equal to £768,500. Unused and accrued vacation estimated at £23,000 will also be paid as at the termination date in line with UK policy. Hugo is eligible for executive outplacement support and tax preparation services to ensure accurate reporting of trailing Rio Tinto income.
STIP measures, weightings and targets for 2017
As in 2016, the STIP measures and weightings for executive directors and executives will be 50 per cent for financial, 30 per cent for individual and 20 per cent for safety measures. The individual targets include objectives relating to safety, people, cash, partnership and growth.
The financial and individual targets which have been set for 2017 are regarded by the board to be commercially sensitive. As such, the specific targets for these measures, and the performance against them, are expected to be described retrospectively in the 2017 Implementation Report. The Group financial targets relate to earnings and free cash flow.
The safety measures, weightings and targets for 2017 are outlined below.
2017 safety measures, weightings and targets
For 2017, the safety measures for all executives will continue to be split between AIFR (30 per cent), LTIs (30 per cent) and measures relating to the implementation of CRM (40 per cent). The 2017 safety element of the STIP seeks to balance the focus between injury reduction and fatality elimination.
For the AIFR and LTI measures, “target” performance for the Group has been set at a 9 per cent and 8 per cent improvement respectively compared with the actual outcome for 2016 which is the “threshold” number for calculation purposes. “Outstanding” performance for both measures has been set at twice the “target” improvement. Due to the potential for variation in planned versus actual hours worked related to the Oyu Tolgoi Underground and Amrun projects, along with any changes in the Group’s portfolio, the LTI targets will be reviewed at the end of June 2017 to ensure they remain appropriate. Should the targets be revised, the basis for any change will be explained in the 2017 Remuneration Report.
The Group-wide deployment of CRM will be completed in 2017 and the metrics for CRM will focus on implementation maturity and leadership participation, with equal weighting to each. Implementation maturity will be assessed using the same approach as in 2016. Each site will be assessed using an evaluation tool which contains 15 individual elements, over three categories: systems, people and processes. The criteria for the elements use a combination of quantitative and qualitative dimensions. A core element of the success of CRM is for all leaders on an ongoing basis to verify that controls are correct, in place and effective.
The 2016 metrics have driven a strong focus on this through setting targets for the number of critical control verifications being conducted. For 2017, we will continue with the leadership participation metric as a base, and, change the focus from quantity of verification to quality, using identification ofnon-compliances as the metric.
The safety STIP result will continue to be adjusted for fatalities. The adjustment for fatalities for 2017 in the event a fatality occurs remains unchanged from 2016 and will be:
| – | | For the product group chief executives and the Group executive, Growth & Innovation, the STIP safety result is reduced by 50 per cent if a fatality occurs within their respective product groups or function. |
| – | | For the chief executive and the Group executive, Health, Safety & Environment, the STIP safety result is reduced by 25 per cent if a fatality occurs in the Group. |
| – | | For other Executive Committee members, the STIP safety result is reduced by 15 per cent if a fatality occurs in the Group. |
| – | | The fatality adjustment for a multiple fatality incident, or multiple incidents resulting in fatalities, will remain at the discretion of the board in respect of Executive Committee members and at the discretion of the chief executive in respect of other employees. |
| | | | |
| 2016 Annual report | | riotinto.com | | 91 |
| | | | | | | | | | | | | | | | |
| | | | | | | | | |
| STRATEGIC REPORT | | | | DIRECTORS’ REPORT REMUNERATION REPORT: IMPLEMENTATION REPORT | | | | FINANCIAL STATEMENTS | | | | PRODUCTION, RESERVES AND OPERATIONS | | | | ADDITIONAL INFORMATION |
Remuneration Report: Implementation Report
continued
When remuneration is delivered
The following chart provides a timeline of when total remuneration is delivered, using 2016 as an example.
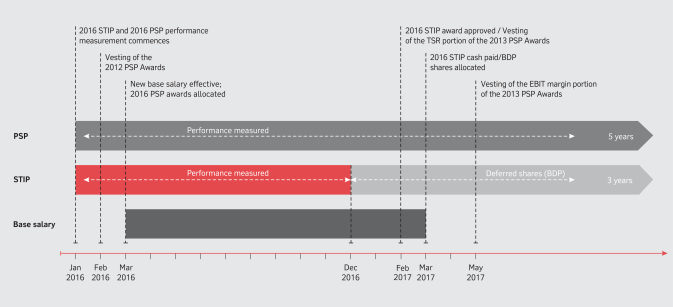
Single total figure of remuneration
The table below provides a summary of actual remuneration in respect of 2016 and 2015, stated in the currency of payment. While not required under UK or Australian legislation, the information is presented for consistency with the disclosures for executive directors on pages 81 and 84. This table is provided in addition to the Australian statutory disclosure requirements set out in US dollars in table 1a on pages 98 and 99. The remuneration details set out in table 1a include theoretical accounting values relating to various parts of the remuneration packages, most notably LTIP awards, and require a different methodology for calculating the pension and superannuation values. Accordingly, the figures below are not directly comparable with those in table 1a.
| | | | | | | | | | | | | | | | | | | | | | | | |
| | | Bold Baatar(g) | | | Hugo Bague | | | Alfredo Barrios | |
| (stated in ’000) | | 2016 | | | 2015 | | | 2016 | | | 2015 | | | 2016 | | | 2015 | |
| Base salary paid(a) | | | £43 | | | | – | | | | £494 | | | | £492 | | | | C$964 | | | | C$961 | |
| STIP payment – cash | | | £30 | | | | – | | | | £339 | | | | £333 | | | | C$772 | | | | C$667 | |
| STIP payment – deferred shares(b) | | | £30 | | | | – | | | | £340 | | | | £334 | | | | C$772 | | | | C$668 | |
| Total short-term pay | | | £103 | | | | – | | | | £1,173 | | | | £1,159 | | | | C$2,508 | | | | C$2,296 | |
| Value of LTIP awards vesting(c) | | | £3 | | | | – | | | | £571 | | | | £329 | | | | C$0 | | | | C$0 | |
| Pension or superannuation(d) | | | £8 | | | | – | | | | £119 | | | | £118 | | | | C$326 | | | | C$275 | |
| Other benefits(e) | | | £382 | | | | – | | | | £53 | | | | £46 | | | | C$138 | | | | C$125 | |
| Single total figure of remuneration | | | £496 | | | | – | | | | £1,916 | | | | £1,652 | | | | C$2,972 | | | | C$2,696 | |
| Percentage change in total remuneration (2016 versus 2015) | | | – | | | | – | | | | 16.0% | | | | | | | | 10.2% | | | | | |
| Percentage of total remuneration provided as performance-related pay (STIP and LTIP) | | | 12.7% | | | | – | | | | 47.5% | | | | 60.3% | | | | 52.0% | | | | 49.5% | |
| Percentage of total remuneration provided asnon-performance- related pay (base salary, pension and other benefits) | | | 87.3% | | | | – | | | | 52.5% | | | | 39.7% | | | | 48.0% | | | | 50.5% | |
| Percentage of maximum STIP awarded(f) | | | 69.1% | | | | – | | | | 68.8% | | | | 67.5% | | | | 80.1% | | | | 69.2% | |
| Percentage of maximum STIP forfeited | | | 30.9% | | | | – | | | | 31.2% | | | | 32.5% | | | | 19.9% | | | | 30.8% | |
| Percentage of target STIP awarded | | | 138.1% | | | | – | | | | 137.5% | | | | 135.0% | | | | 160.2% | | | | 138.5% | |
| | | | |
| 92 | | riotinto.com | | 2016 Annual report |
| | | | | | | | | | | | | | | | | | | | | | | | |
| | | Alan Davies(h) | | | Joanne Farrell(i) | | | Andrew Harding(j) | |
| (stated in ‘000) | | 2016 | | | 2015 | | | 2016 | | | 2015 | | | 2016 | | | 2015 | |
| Base salary paid(a) | | | £474 | | | | £515 | | | | A$411 | | | | – | | | | £288 | | | | £569 | |
| STIP payment – cash | | | £0 | | | | £306 | | | | A$281 | | | | – | | | | £321 | | | | £405 | |
| STIP payment – deferred shares(b) | | | £0 | | | | £307 | | | | A$281 | | | | – | | | | £0 | | | | £405 | |
| Total short-term pay | | | £474 | | | | £1,128 | | | | A$973 | | | | – | | | | £609 | | | | £1,379 | |
| Value of LTIP awards vesting(c) | | | £0 | | | | £91 | | | | A$47 | | | | – | | | | £347 | | | | £334 | |
| Pension or superannuation(d) | | | £116 | | | | £119 | | | | A$1,626 | | | | – | | | | £86 | | | | £147 | |
| Other benefits(e) | | | £56 | | | | £765 | | | | A$59 | | | | – | | | | £213 | | | | £403 | |
| Single total figure of remuneration | | | £646 | | | | £2,103 | | | | A$2,705 | | | | – | | | | £1,255 | | | | £2,263 | |
| Percentage change in total remuneration (2016 versus 2015) | | | (69.3% | ) | | | | | | | – | | | | – | | | | (44.5% | ) | | | | |
Percentage of total remuneration provided asperformance-
related
pay (STIP and LTIP) | | | 0.0% | | | | 33.5% | | | | 22.5% | | | | – | | | | 53.2% | | | | 50.6% | |
Percentage of total remuneration provided asnon-performance-
related pay (base salary, pension and other benefits) | | | 100.0% | | | | 66.5% | | | | 77.5% | | | | – | | | | 46.8% | | | | 49.4% | |
| Percentage of maximum STIP awarded(f) | | | 0.0% | | | | 56.8% | | | | 68.2% | | | | – | | | | 56.2% | | | | 70.9% | |
| Percentage of maximum STIP forfeited | | | 100.0% | | | | 43.2% | | | | 31.8% | | | | – | | | | 43.8% | | | | 29.1% | |
| Percentage of target STIP awarded | | | 0.0% | | | | 113.5% | | | | 136.3% | | | | – | | | | 112.3% | | | | 141.9% | |
| | | |
| | | Greg Lilleyman(k) | | | Stephen McIntosh(l) | | | Chris Salisbury(m) | |
| (stated in ‘000) | | 2016 | | | 2015 | | | 2016 | | | 2015 | | | 2016 | | | 2015 | |
| Base salary paid(a) | | | A$392 | | | | A$775 | | | | A$549 | | | | – | | | | A$662 | | | | – | |
| STIP payment – cash | | | A$0 | | | | A$521 | | | | A$358 | | | | – | | | | A$424 | | | | – | |
| STIP payment – deferred shares(b) | | | A$0 | | | | A$521 | | | | A$358 | | | | – | | | | A$424 | | | | – | |
| Total short-term pay | | | A$392 | | | | A$1,817 | | | | A$1,265 | | | | – | | | | A$1,510 | | | | – | |
| Value of LTIP awards vesting(c) | | | A$367 | | | | A$154 | | | | A$128 | | | | – | | | | A$116 | | | | – | |
| Pension or superannuation(d) | | | A$39 | | | | A$170 | | | | A$119 | | | | – | | | | A$135 | | | | – | |
| Other benefits(e) | | | A$136 | | | | A$79 | | | | A$438 | | | | – | | | | A$501 | | | | – | |
| Single total figure of remuneration | | | A$934 | | | | A$2,220 | | | | A$1,950 | | | | – | | | | A$2,262 | | | | – | |
| Percentage change in total remuneration (2016 versus 2015) | | | (57.9% | ) | | | | | | | – | | | | – | | | | – | | | | – | |
Percentage of total remuneration provided asperformance-
related pay (STIP and LTIP) | | | 39.3% | | | | 53.9% | | | | 43.3% | | | | – | | | | 42.6% | | | | – | |
Percentage of total remuneration provided asnon-performance-
related pay (base salary, pension and other benefits) | | | 60.7% | | | | 46.1% | | | | 56.7% | | | | – | | | | 57.4% | | | | – | |
| Percentage of maximum STIP awarded(f) | | | 0.0% | | | | 67.0% | | | | 67.1% | | | | – | | | | 69.1% | | | | – | |
| Percentage of maximum STIP forfeited | | | 100.0% | | | | 33.0% | | | | 32.9% | | | | – | | | | 30.9% | | | | – | |
| Percentage of target STIP awarded | | | 0.0% | | | | 134.0% | | | | 134.5% | | | | – | | | | 137.2% | | | | – | |
| | | | | | | | | | | | | | | | |
| | | Arnaud Soirat(n) | | | Debra Valentine | |
| (stated in ‘000) | | 2016 | | | 2015 | | | 2016 | | | 2015 | |
| Base salary paid(a) | | | £253 | | | | – | | | | US$612 | | | | US$694 | |
| STIP payment – cash | | | £141 | | | | – | | | | US$0 | | | | US$475 | |
| STIP payment – deferred shares(b) | | | £142 | | | | – | | | | US$0 | | | | US$476 | |
| Total short-term pay | | | £536 | | | | – | | | | US$612 | | | | US$1,645 | |
| Value of LTIP awards vesting(c) | | | £37 | | | | – | | | | US$0 | | | | US$485 | |
| Pension or superannuation(d) | | | £45 | | | | – | | | | US$216 | | | | US$236 | |
| Other benefits(e) | | | £341 | | | | – | | | | US$411 | | | | US$557 | |
| Single total figure of remuneration | | | £959 | | | | – | | | | US$1,239 | | | | US$2,923 | |
| Percentage change in total remuneration (2016 versus 2015) | | | – | | | | – | | | | (57.6% | ) | | | | |
Percentage of total remuneration provided as performance-related
pay (STIP and LTIP) | | | 33.4% | | | | – | | | | 0.0% | | | | 49.1% | |
Percentage of total remuneration provided asnon-performance-
related pay (base salary, pension and other benefits) | | | 66.6% | | | | – | | | | 100.0% | | | | 50.9% | |
| Percentage of maximum STIP awarded(f) | | | 55.6% | | | | – | | | | 0.0% | | | | 68.3% | |
| Percentage of maximum STIP forfeited | | | 44.4% | | | | – | | | | 100.0% | | | | 31.7% | |
| Percentage of target STIP awarded | | | 111.1% | | | | – | | | | 0.0% | | | | 136.6% | |
| (a) | Salary paid in the financial year to 31 December. Salaries are generally reviewed with effect from 1 March. There were no salary increases effective 1 March 2016. |
| (b) | Value of STIP deferred under the BDP, the vesting of which is subject to the Plan rules. |
| | | | |
| 2016 Annual report | | riotinto.com | | 93 |
| | | | | | | | | | | | | | | | |
| | | | | | | | | |
| STRATEGIC REPORT | | | | DIRECTORS’ REPORT REMUNERATION REPORT: IMPLEMENTATION REPORT | | | | FINANCIAL STATEMENTS | | | | PRODUCTION, RESERVES AND OPERATIONS | | | | ADDITIONAL INFORMATION |
Remuneration Report: Implementation Report
continued
| (c) | Based on the estimated value of the LTIP awards which vested on 20 February 2017 (TSR portion) and which are anticipated to vest at 31 May 2017 (EBIT margin portion) for the performance period that ended 31 December 2016, for the 2016 disclosure, and the LTIP awards which vested for the performance period that ended 31 December 2015, for the 2015 disclosure. The Rio Tinto Limited and Rio Tinto plc share prices used to calculate the estimated value of the awards vesting are the average share prices over the last quarter of 2016 which were A$56.51 and £29.30 respectively. All executives who were granted the 2013 PSP awards will also receive additional shares equal to the aggregate net dividends that would have been paid on the 2013 PSP shares that vest had they owned them during the four-year performance period. No dividend payments will be made in respect of the shares that lapse. |
| (d) | For defined benefit plans, pension or superannuation reflects the value of the pension or superannuation accrued during the year assuming that it was to come into payment immediately. For defined contribution plans and cash paid in lieu of pension contributions it is the amount contributed in the year by the Company. This differs from the value reported in table 1a which is calculated using an IAS19 methodology and assumptions on rates of investment return, inflation and salary increases. |
| (e) | Includes healthcare, other post-employment benefits, allowance for professional tax compliance services and car and fuel allowances or car benefit value. Includes active or legacyexpatriate-related benefits, as relevant and for 2016, includesone-time grosslump-sum payments for certain executives in lieu of ongoing relocation related benefits in accordance with the Rio Tinto Permanent International Transfer Standard. |
| (f) | The maximum potential STIP award is 200 per cent of base salary. |
| (g) | Remuneration details for 2016 reflect remuneration received for the period 1 December 2016 to 31 December 2016. Bold Baatar received aone-time international transfer allowance of £343,000 (gross) related to his relocation from Singapore to London. Thislump-sum payment, included in the section “Other benefits”, is offered as compensation for all costs, losses or other disadvantages that may be sustained as a result of the International Transfer. |
| (h) | Alan Davies’s employment was localised to the UK with effect from 1 March 2015. To comply with Australian legislation, the Company made a payment to Alan in 2015 for his accruedlong-service leave, which was valued at £240,000. In addition, Alan received a part payment of his accrued annual leave of £167,000 and a lump sum payment of £225,000 (gross) in lieu of contractual commitments already made in relation to his future, multi-year entitlements to a housing allowance, education assistance, home leave and a resettlement allowance. Remuneration details for 2016 reflect remuneration received for the period 1 January 2016 to 16 November 2016 and excludes pay in lieu of untaken annual leave of £33,000. An amount of £32,000 (gross), representing a portion of the lump sum amount paid to Alan in 2015 in connection with his localisation to the UK and as disclosed last year, was clawed back. The claw-back was processed by offsetting this amount against unused and accrued vacation which would have otherwise been paid to Alan on termination. |
| (i) | Remuneration details for 2016 reflect remuneration received for the period 2 July 2016 to 31 December 2016. Joanne Farrell is on a defined benefit arrangement and the pension or superannuation value for 2016 reflects the increase in benefit due to her base salary increase on appointment to the Executive Committee. |
| (j) | Remuneration details for 2016 reflect remuneration received for the period 1 January 2016 to 1 July 2016 and excludes termination related payments and benefits. The full value of the estimated LTIP award vesting with respect to 2016 was £693,000, of which £347,000 corresponds to Andrew Harding’s employment period and £346,000 relates to the post termination period. Andrew received a payment of £549,000 as payment in lieu of notice which was equal to slightly less than 12 months’ base salary based on his 12 months’ contractual notice period. Unused and accrued vacation amounting to £31,000 was also paid as at the termination date in line with UK policy. Further details are provided under the heading “Departures from the Executive Committee”. |
| (k) | Remuneration details for 2016 reflect remuneration received for the period 1 January 2016 to 1 July 2016 and excludes termination related benefits. The full value of the estimated LTIP award vesting with respect to 2016 was A$496,000 of which A$367,000 corresponds to Greg’s employment period and A$129,000 relates to the post termination period. Greg received a payment of A$697,000 as payment in lieu of notice which was equal to approximately 11 months’ base salary based on his 12 months’ contractual notice period and a payment of A$69,000 in relation to rental allowance for the unworked notice period. Unused and accrued annual leave and long-service leave amounting to A$514,000 was also paid as at the termination date in line with Australian legislation and policy. Further details are provided under the heading “Departures from the Executive Committee”. |
| (l) | Remuneration details for 2016 reflect remuneration received for the period 24 May 2016 to 31 December 2016. Stephen McIntosh received aone-time domestic transfer allowance of A$335,000 (gross) related to his relocation from Melbourne to Brisbane. Thislump-sum payment, included in the section “Other benefits”, is in lieu of any ongoing relocation related costs and benefits. |
| (m) | Remuneration details for 2016 reflect remuneration received for the period 17 March 2016 to 31 December 2016. Chris Salisbury received aone-time domestic transfer allowance of A$335,000 (gross) related to his relocation from Brisbane to Perth. Thislump-sum payment, included in the section “Other benefits”, is in lieu of any ongoing relocation related costs and benefits. |
| (n) | Remuneration details for 2016 reflect remuneration received for the period 2 July 2016 to 31 December 2016. Arnaud Soirat received aone-time international transfer allowance of £280,000 (gross) related to his relocation from Montreal to London. Thislump-sum payment, included in the section “Other benefits”, is offered as compensation for all costs, losses or other disadvantages that may be sustained as a result of the International Transfer. |
Context to outcomes for the Executive Committee
The single total figure of remuneration was significantly lower for those executives who left the Group during 2016 due to their 2016 remuneration reflecting only part year remuneration, combined with, in some cases, the forfeiture of STIP and LTIP awards. The single total figure of remuneration for Hugo Bague was higher in 2016 due mainly to the higher value of LTIP awards vesting with respect to 2016 compared with the value of LTIP awards vesting with respect to 2015. This was due mainly to the higher share price used to calculate the estimated value of the 2013 PSP awards compared with the share price at the date the 2012 PSP awards vested on 15 February 2016. The single total figure of remuneration for Alfredo Barrios was higher in 2016 due mainly to the higher value of the 2016 STIP award compared with the 2015 STIP award due to higher safety and business performance. A comparison is not possible for the new members of the Executive Committee as their remuneration is only reported from the date of their appointments.
| | | | |
| 94 | | riotinto.com | | 2016 Annual report |
Long-term incentives – vesting outcomes for the period ended 31 December 2016
As part of the transition from a four- to a five-year performance period under the PSP approved by shareholders in 2013, half of the PSP awards granted on 27 May 2013 had a performance period which ended after four years on 31 December 2016. The other half of the award has a performance period of five years ending on 31 December 2017.
The TSR performance, measured equally against the Euromoney Global Mining Index and the MSCI World Index, was determined in early January 2017 and this portion of the award vested on 20 February 2017. Performance against the improvement in EBIT margin measure cannot be finalised until early May 2017. This is due to the reporting timeframes for companies in the EBIT margin comparator group, and the time taken for S&P Capital IQ to report the relevant data. Accordingly, this portion of the award is anticipated to vest, subject to satisfaction of the EBIT margin performance conditions, on 31 May 2017.
Whilst the current performance conditions remain in place, the TSR portion of the PSP awards will vest in February and the EBIT margin portion will vest at 31 May in the year following the end of the respective performance period.
The table below summarises the outcomes for the PSP awards granted on 27 May 2013 which had a four year performance period which ended on 31 December 2016.
2013 PSP awards
| | | | | | | | |
Performance period (4 years) Rio Tinto TSR | |
| 1 January 2013 – 31 December 2016
(28.6%) |
|
| | |
| Comparator index | | Euromoney Global
Mining | | | MSCI | |
| Index TSR | | | (45.5% | ) | | | 45.1% | |
| Outperformance per annum | | | 4.0% | | | | (28.4% | ) |
| Vesting against index | | | 74.0% | | | | 0% | |
| Contribution to overall vesting | | | 24.67% | | | | 0% | |
| Vesting date for TSR portion of award: 20 February 2017 | | | | | | | | |
| | |
| EBIT margin | | | | | | |
| Rank against the comparator group (estimate) | | | | | | | 2nd | |
| Vesting against EBIT Margin measure (estimate) | | | | | | | 100% | |
| Contribution to overall vesting (estimate) | | | | | | | 33.33% | |
| Anticipated vesting date for EBIT margin portion of award: 31 May 2017 | | | | | | | | |
| | |
| Overall vesting | | | | | | |
| % of shares vesting (estimate) | | | | | | | 58.0% | |
| % of shares forfeited (estimate) | | | | | | | 42.0% | |
The EBIT Margin data provided by S&P Capital IQ is based on full year 2015 comparator company performance as at August 2016. S&P Capital IQ applies a consistent approach across all companies, including the treatment of determining unusual transactions, which can lead to a variation between the S&P Capital IQ data when compared to published results for Rio Tinto and comparator companies.
As a result, 24.67 per cent of the 2013 PSP award granted on 27 May 2013 with a four-year performance period which ended 31 December 2016, vested on 20 February 2017 and it is estimated that 33.33 per cent of the award will vest on 31 May 2017. The associated dividend equivalent shares vest in line with the vesting of the underlying awards.
The performance conditions for the PSP awards are included in the notes to table 3 on pages 102 to 107.
The graph below shows Rio Tinto’s TSR performance under the 2013 PSP performance condition. The methodology used for this graph is consistent with the methodology used to calculate the vesting for the 2013 PSP award.
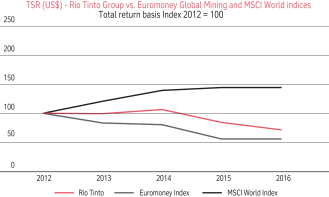
The methodology used to calculate the starting share prices for TSR comparison purposes, for Rio Tinto and the index, was the12-month average prior to the commencement of the performance period.
The period used in the methodology to calculate the ending share prices for TSR comparison purposes, for Rio Tinto and the index, was the last 12 months of the performance period. The usual conventions were also applied to set the number of shares awarded, based upon the prior-year average share price.
The table below summarises the average vesting of performance shares for executive directors since 2013. The overall vesting level for the 2013-2016 performance period is an estimate.
| | | | | | | | | | | | |
| Performance period | | Vesting year | | | % of shares
vested | | | % of
maximum
shares vested | |
| 2009-2012 | | | 2013 | | | | 92.5 | | | | 61.7 | |
| 2010-2013 | | | 2014 | | | | 75.0 | | | | 50.0 | |
| 2011-2014 | | | 2015 | | | | 73.5 | | | | 49.0 | |
| 2012-2015 | | | 2016 | | | | 65.4 | | | | 43.6 | |
| 2013-2016 | | | 2017 | | | | 58.0 | | | | 58.0 | |
| Average vesting | | | – | | | | 72.9 | | | | 52.5 | |
The SOP ceased operation for new awards from 2013. No awards of share options have been made since 2012.
MSP awards
Executives are not eligible to receive awards under the MSP after their appointment as executives. Greg Lilleyman’s final MSP award granted prior to his appointment as an executive vested on 15 February 2016.
TSR
Relative TSR against the Euromoney Global Mining Index and the MSCI World Index representstwo-thirds of the performance measures used to determine the vesting of awards made under the PSP. The remaining third is based on the improvement in EBIT margin relative to the comparator group. Rio Tinto’s TSR relative to the relevant index over the performance period has a direct impact on the levels of LTIP vesting.
| | | | |
| 2016 Annual report | | riotinto.com | | 95 |
| | | | | | | | | | | | | | | | |
| | | | | | | | | |
| STRATEGIC REPORT | | | | DIRECTORS’ REPORT REMUNERATION REPORT: IMPLEMENTATION REPORT | | | | FINANCIAL STATEMENTS | | | | PRODUCTION, RESERVES AND OPERATIONS | | | | ADDITIONAL INFORMATION |
Remuneration Report: Implementation Report
continued
The effect of this performance on the value of shareholdings, as measured by TSR delivered over the past five years, based on the sum of dividend paid and share price movements during each calendar year, is detailed in the table.
| | | | | | | | | | | | | | | | | | | | | | | | |
| | | Dividends
paid
during the
year | | | Share price – Rio Tinto plc pence | | | Share price – Rio Tinto Limited
A$ | | | Total
shareholder
return
(TSR) | |
| Year | | US cents
per share | | | 1 Jan | | | 31 Dec | | | 1 Jan | | | 31 Dec | | | Group% | |
| 2016 | | | 152.5 | | | | 1,980 | | | | 3,159 | | | | 44.71 | | | | 59.90 | | | | 41.3 | |
| 2015 | | | 226.5 | | | | 3,000 | | | | 1,980 | | | | 58.00 | | | | 44.71 | | | | (32.6 | ) |
| 2014 | | | 204.5 | | | | 3,409 | | | | 3,000 | | | | 68.18 | | | | 58.00 | | | | (15.6 | ) |
| 2013 | | | 178.0 | | | | 3,512 | | | | 3,409 | | | | 66.01 | | | | 68.18 | | | | (0.8 | ) |
| 2012 | | | 163.5 | | | | 3,125 | | | | 3,512 | | | | 60.30 | | | | 66.01 | | | | 18.8 | |
The data presented in this table accounts for the dual corporate structure of Rio Tinto. In 2016, the approach used to weight the two Rio Tinto listings, and produce a Group TSR figure, was adjusted. This approach is consistent with the methodology used for the PSP. The figures in this table are in some cases slightly different to equivalent tables presented in prior years’ reports.
The graph below illustrates the TSR performance of the Group against the Euromoney Global Mining Index and the MSCI over the past eight years to the end of 2016. These two indices are used to assess Rio Tinto’s relative TSR performance for awards made under the PSP in 2013.
The graph has been prepared in accordance with the requirements of Schedule 8 of the UK Large andMedium-sized Companies and Groups (Accounts and Reports) Regulations 2008 (as amended) and is not an indication of the likely vesting of awards granted under the PSP.
Five years of TSR performance were presented when this report was first prepared in accordance with Schedule 8 and this will progressively increase to ten years of TSR performance in the fifth year of this report being prepared in accordance with Schedule 8.
The executive remuneration structure policy table on pages 71 to 73 provides further details of the performance conditions for the current PSP. The performance conditions for the previous PSP are provided in the notes to table 3 on pages 102 to 107.
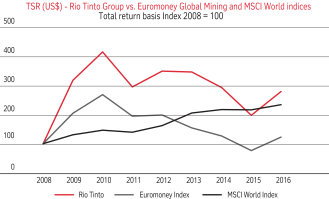
Chief executive’s remuneration summary
| | | | | | | | | | | | | | | | | | |
| Year | | Chief
executive (a) | | Single total
figure of
remuneration
(’000) | | | Annual
STIP award
against
maximum
opportunity | | | Long-term
incentive
vesting
against
maximum
opportunity
(SOP) (b)(c) | | | Long-term
incentive
vesting
against
maximum opportunity
(PSP) (c) | |
| 2009 | | Tom Albanese | | | £3,516 | | | | 54.1% | | | | 0.0% | | | | 26.4% | |
| 2010 | | Tom Albanese | | | £4,512 | | | | 87.8% | | | | 0.0% | | | | 24.3% | |
| 2011 | | Tom Albanese | | | £4,256 | | | | 0.0% | | | | 100.0% | | | | 0.0% | |
| 2012 | | Tom Albanese | | | £4,040 | | | | 0.0% | | | | 100.0% | | | | 61.7% | |
| 2013 | | Tom Albanese | | | £53 | | | | 0.0% | | | | – | | | | – | |
| | Sam Walsh(d) | | | A$9,993 | | | | 72.1% | | | | – | | | | 50.0% | |
| 2014 | | Sam Walsh(d) | | | A$10,476 | | | | 88.4% | | | | – | | | | 49.0% | |
| 2015 | | Sam Walsh(d) | | | A$9,141 | | | | 81.9% | | | | – | | | | 43.6% | |
| 2016 | | Sam Walsh | | | A$1,657 | | | | – | | | | – | | | | – | |
| | | Jean-Sébastien Jacques | | | £3,120 | | | | 82.4% | | | | – | | | | 58.0% | |
| (a) | Tom Albanese held the role of chief executive until 17 January 2013, and left the Group on 16 July 2013. The single total figure of remuneration for Tom Albanese for 2013 is for the period up until 17 January 2013. Sam Walsh took over as chief executive from 17 January 2013, having previously been the chief executive, Iron Ore and Australia. The single total figure of remuneration for Sam Walsh for 2016 is for the period up until 1 July 2016.Jean-Sébastien Jacques took over as chief executive on 2 July 2016, having previously been the chief executive, Copper & Coal. |
| (b) | In 2011 and 2012, Sam Walsh elected to receive his full LTIP awards under the PSP and as a result he has no options under the SOP that were granted in 2011 or 2012 and which had performance periods that ended on 31 December 2013 and 31 December 2014 respectively. The SOP ceased operation from 2013 and LTIP awards from 2013 have been made under the PSP. |
| (c) | All outstanding but unvested LTIP awards earned in previous years lapsed and were forfeited when Tom Albanese left the Group. |
| (d) | As explained in the superannuation section for Sam Walsh, a correction was made to the superannuation values included in the single total figure of remuneration from 2012 and the single total figure of remuneration values have been restated accordingly in this summary. The previous single total figure of remuneration values were: 2013: A$10,070; 2014: A$10,414 and 2015: A$9,125. |
Employee share plans
Management Share Plan (MSP)
The primary focus of the MSP is to support the Group’s ability to attract and retain key staff below executive level in an increasingly tight and competitive labour market. Executives are not eligible to participate in the MSP.
Retention of key individuals is also important given the long-term nature of the delivery of the business strategy. MSP awards are conditional awards not subject to a performance condition as they vest subject to continued employment, at the end of three years, and thus act as an effective retention tool. Shares to satisfy the awards are purchased in the market and no new shares are issued.
All employee share plans
Executives may participate in broad-based share and share option plans which are available to Group employees generally and for which performance conditions do not apply. These plans form part of standard remuneration practice whereby employees are offered participation in plans to encourage alignment with the long-term performance of the Group.
Global employee share plan
The Committee believes that all employees should be given the opportunity to become shareholders in our business. A global employee share purchase plan is normally offered to all eligible employees across the world save for any local jurisdictional restrictions and excluding contractors. Under the plan, employees may acquire shares up to the value of US$5,000 (or equivalent in other currencies) per year, capped at ten per cent of base salary. Each share purchased will be matched by the Company providing the participant holds the shares, and remains employed, at the end of the three-year vesting period. The Committee believes this plan will serve to engage, retain and motivate employees over the long-term.
Over 15,000 (approximately 37 per cent) of our employees are shareholders as a result of participating in this Plan.
| | | | |
| 96 | | riotinto.com | | 2016 Annual report |
Dilution
Awards under the SOP, PSP and all employee plans (other than the MSP) may be satisfied by, in the case of Rio Tinto plc, treasury shares or the issue of new shares or the purchase of shares in the market and in the case of Rio Tinto Limited by the issue of new shares or the purchase of shares in the market.
In the UK, the Investment Association has issued corporate governance guidelines in relation to the amount of new shares which may be issued having regard to the total issued share capital. These guidelines provide that the rules of a scheme must provide that commitments to issue new shares orre-issue treasury shares, when aggregated with awards under all of a company’s other schemes, must not exceed ten per cent of the issued ordinary share capital (adjusted for share issuance and cancellation) in any rollingten-year period. Furthermore, commitments to issue new shares orre-issue treasury shares under executive (discretionary) schemes should not exceed five per cent of the issued ordinary share capital of a company (adjusted for share issuance and cancellation) in any rollingten-year period. This may be exceeded where vesting is dependent on the achievement of significantly more stretching performance criteria. Rio Tinto plc is in compliance with these guidelines. As at 31 December 2016 these limits had not been exceeded.
In Australia, as a condition of relief from prospectus requirements, the Australian Securities and Investments Commission has imposed a cap on the issue of shares to employees of five per cent of issued capital during a three year period. As Rio Tinto Limited satisfies awards by market purchase, this cap does not currently apply. However, Rio Tinto would be in compliance with this guideline.
All other share awards are satisfied by the use of shares which are purchased in the market. Further information in respect of the share plan arrangements and outstanding balances under each plan can be found in note 44 to the financial statements.
Shareholder voting
The table below sets out the results of the remuneration-related resolutions approved at the Group’s 2016 AGMs. Our meetings with shareholders in 2016 were well attended and provided an opportunity for the Remuneration Committee chairman to discuss remuneration related topics with shareholders. This dialogue will continue during 2017 as we prepare to present our refreshed Remuneration Policy to shareholders in 2018.
| | | | | | | | | | | | | | | | |
| Resolution | | Total votes
cast | | | Votes for | | | Votes
against | | | Votes withheld (a) | |
| Approval of the Directors’ Report on Remuneration and Remuneration Committee chairman’s letter | | | 1,203,535,603 | | | | 1,051,946,426 | | | | 151,589,177 | | | | 32,895,563 | |
| | | | | | | | 87.4% | | | | 12.6% | | | | | |
| Approval of the Remuneration Report | | | 1,202,997,534 | | | | 1,045,352,178 | | | | 157,645,356 | | | | 33,426,458 | |
| | | | | | | | 86.9% | | | | 13.1% | | | | | |
| (a) | A vote “withheld” is not a vote in law, and is not counted in the calculation of the proportion of votes for and against the resolution. |
Relative spend on remuneration
The table below sets out the details of total remuneration paid; distributions to shareholders; purchase of property, plant and equipment and intangible assets, and tax paid during the financial year. The items in addition to Remuneration paid were chosen by the directors as they represent other significant disbursements of the Company’s funds.
| | | | | | | | | | | | |
| Stated in US$m | | 2016 | | | 2015 | | | Difference in
spend | |
| Remuneration paid(a) | | | 4,881 | | | | 5,446 | | | | (565 | ) |
| Distributions to shareholders(b) | | | 2,725 | | | | 6,104 | | | | (3,379 | ) |
| Purchase of property, plant and equipment and intangible assets(c) | | | 3,012 | | | | 4,685 | | | | (1,673 | ) |
| Corporate income tax paid(c) | | | 1,521 | | | | 1,792 | | | | (271 | ) |
| (a) | Total employment costs for the financial year as per note 5 to the financial statements. |
| (b) | Distributions to shareholders include equity dividends paid to owners of Rio Tinto and own shares purchased from owners of Rio Tinto as per the Group cash flow statement. |
| (c) | Purchase of property, plant and equipment and intangible assets, and corporate income tax paid during the financial year are as per the Group cash flow statement and are calculated as per note 1 to the financial statements. |
| | | | |
| 2016 Annual report | | riotinto.com | | 97 |
| | | | | | | | | | | | | | | | |
| | | | | | | | | |
| STRATEGIC REPORT | | | | DIRECTORS’ REPORT REMUNERATION REPORT: IMPLEMENTATION REPORT | | | | FINANCIAL STATEMENTS | | | | PRODUCTION, RESERVES AND OPERATIONS | | | | ADDITIONAL INFORMATION |
Remuneration Report: Implementation Report
continued
Table 1a – Executives’ remuneration
| | | | | | | | | | | | | | | | | | | | | | | | | | | | |
| | | | | | Short term benefits | | | | | | | |
| Stated in US$‘000 (a) | | | | | Base salary | | | Cash bonus (b) | | | Other cash
based
benefits (c) | | | Non- monetary
benefits (d)(e) | | | Total short
term benefits | | | Other
long term
benefits | |
Executive directors | |
| Sam Walsh (k) | | | 2016 | | | | 747 | | | | – | | | | 93 | | | | 280 | | | | 1,120 | | | | | |
| | | | 2015 | | | | 1,494 | | | | 1,188 | | | | 127 | | | | 805 | | | | 3,614 | | | | – | |
| Jean-Sébastien Jacques | | | 2016 | | | | 1,203 | | | | 896 | | | | 283 | | | | 38 | | | | 2,420 | | | | – | |
| | | | 2015 | | | | 835 | | | | 689 | | | | 177 | | | | 13 | | | | 1,714 | | | | – | |
| Chris Lynch | | | 2016 | | | | 1,134 | | | | 878 | | | | 259 | | | | 175 | | | | 2,446 | | | | | |
| | | 2015 | | | | 1,274 | | | | 1,023 | | | | 290 | | | | 191 | | | | 2,778 | | | | | |
Other key management personnel | |
| Hugo Bague | | | 2016 | | | | 670 | | | | 415 | | | | 147 | | | | 48 | | | | 1,280 | | | | | |
| | | | 2015 | | | | 753 | | | | 495 | | | | 159 | | | | 40 | | | | 1,447 | | | | | |
| Alfredo Barrios | | | 2016 | | | | 728 | | | | 572 | | | | 227 | | | | 106 | | | | 1,633 | | | | | |
| | | | 2015 | | | | 753 | | | | 480 | | | | 196 | | | | 95 | | | | 1,524 | | | | | |
| Bold Baatar | | | 2016 | | | | 58 | | | | 36 | | | | 473 | | | | 52 | | | | 619 | | | | | |
| Alan Davies (l) | | | 2016 | | | | 643 | | | | – | | | | 139 | | | | 59 | | | | 841 | | | | | |
| | | | 2015 | | | | 787 | | | | 453 | | | | 161 | | | | 1,099 | | | | 2,500 | | | | – | |
| Joanne Farrell | | | 2016 | | | | 306 | | | | 203 | | | | 13 | | | | 30 | | | | 552 | | | | – | |
| Andrew Harding (m) | | | 2016 | | | | 390 | | | | 392 | | | | 104 | | | | 269 | | | | 1,155 | | | | | |
| | | | 2015 | | | | 870 | | | | 600 | | | | 214 | | | | 553 | | | | 2,237 | | | | – | |
| Greg Lilleyman (n) | | | 2016 | | | | 292 | | | | – | | | | 36 | | | | 88 | | | | 416 | | | | – | |
| | | | 2015 | | | | 583 | | | | 379 | | | | 27 | | | | 33 | | | | 1,022 | | | | – | |
| Stephen McIntosh | | | 2016 | | | | 409 | | | | 259 | | | | 272 | | | | 56 | | | | 996 | | | | | |
| Chris Salisbury | | | 2016 | | | | 493 | | | | 306 | | | | 352 | | | | 92 | | | | 1,243 | | | | – | |
| Arnaud Soirat | | | 2016 | | | | 343 | | | | 173 | | | | 440 | | | | 74 | | | | 1,030 | | | | | |
| Debra Valentine (o) | | | 2016 | | | | 612 | | | | – | | | | 23 | | | | 388 | | | | 1,023 | | | | | |
| | | | 2015 | | | | 694 | | | | 475 | | | | 26 | | | | 515 | | | | 1,710 | | | | | |
Notes to Table 1a – Executives’ remuneration
| (a) | ‘Table 1a – Executives’ remuneration’ is reported in US$ using A$1 = 0.74406 US$; £1 = 1.35616 US$; C$1 = 0.75530 US$ year to date average rates, except for cash bonuses which use A$1 = 0.72187 US$; £1 = 1.22339 US$; C$1 = 0.74123 US$year-end rates. |
| (b) | ‘Cash bonus’ relates to the cash portion of the 2016 STIP award to be paid in March 2017. |
| (c) | ‘Other cash based benefits’ typically include cash in lieu of a car and fuel and, where applicable cash in lieu of Company pension or superannuation contributions. For 2016, this includesone-time grosslump-sum payments to Bold Baatar (£343,000 : US$465,000); Arnaud Soirat (£280,000 : US$380,000); Stephen McIntosh (A$335,000 : US$249,000) and Chris Salisbury (A$335,000 : US$249,000) related to their respective relocations on appointment to the Executive Committee in 2016. These payments were made as compensation for all costs, losses or other disadvantages that may be sustained as a result of the permanent international transfer or domestic relocation. |
| (d) | ‘Non-monetary benefits’ for executives include healthcare coverage, provision of a car, professional tax compliance services/advice and flexible perquisites. For executive directors, it also includes the value of company provided transport. For Alan Davies, the amount for 2015 included the annual leave balance and long service leave paid on localisation to the United Kingdom. |
| (e) | ‘Non-monetary benefits’ for executives living outside their home country include international assignment benefits comprising, where applicable, housing, education, relocation expenses, tax equalisation and related compliance services, assignee and family home leave trips and international assignment payments made to and on their behalf. |
| (f) | The value of share based awards has been determined in accordance with the recognition and measurement requirements of IFRS2 “Share-based Payment”. The fair value of awards granted under the Share Option Plan (SOP), the Management Share Plan (MSP), the Bonus Deferral Plan (BDP), the Performance Share Plan (PSP) and the Share Savings Plan (SSP) have been calculated at their dates of grant using valuation models provided by external consultants, Lane Clark and Peacock LLP, including an independent lattice-based option valuation model and a Monte Carlo valuation model which take into account the constraints on vesting and exercise attached to these awards. Further details of the valuation methods and assumptions used for these awards are included in note 44 (Share Based Payments) in the financial statements. The fair value of other share-based awards is measured at the purchase cost of the shares from the market. Thenon-executive directors do not participate in the long-term incentive share schemes. The recognition of fair value for awards for “eligible leavers” (Sam Walsh, Andrew Harding and Greg Lilleyman in 2016) under the Plan rules is accelerated so that the accumulated IFRS2 compensation at the end of the period is based on 100 per cent of the fair value of each outstanding award. This accelerated fair value is recognised in their IFRS2 compensation over the period to the date of termination. The values for Sam Walsh have not been adjusted for the deferral agreement detailed in the Implementation Report. |
| | | | |
| 98 | | riotinto.com | | 2016 Annual report |
Table 1a – Executives’ remuneration (continued)
| | | | | | | | | | | | | | | | | | | | | | | | | | | | | | | | | | | | | | | | | | | | |
| | | | | | Long term benefits Value of share-based awards(f) | | | Post employment benefits (i) | | | | | | | | | | |
| Stated in US$‘000 (a) | | | | | BDP (g) | | | PSP | | | MSP | | | SOP | | | Others (h) | | | Pension and
superannuation | | | Other post
employment
benefits | | | Termination
benefits | | | Total
remuneration (j) | | | Currency
of actual
payment | |
Executive directors | |
| Sam Walsh (k) | | | 2016 | | | | 1,845 | | | | 4,928 | | | | – | | | | – | | | | – | | | | 172 | | | | 2,122 | | | | 1,231 | | | | 11,418 | | | | A$ | |
| | | | 2015 | | | | 1,072 | | | | 3,014 | | | | – | | | | – | | | | 2 | | | | 364 | | | | – | | | | – | | | | 8,066 | | | | A$ | |
| Jean-Sébastien Jacques | | | 2016 | | | | 612 | | | | 1,316 | | | | – | | | | – | | | | 9 | | | | 41 | | | | | | | | | | | | 4,398 | | | | £ | |
| | | | 2015 | | | | 446 | | | | 1,170 | | | | – | | | | – | | | | 9 | | | | 41 | | | | | | | | | | | | 3,380 | | | | £ | |
| Chris Lynch | | | 2016 | | | | 874 | | | | 2,013 | | | | – | | | | – | | | | 5 | | | | 46 | | | | – | | | | | | | | 5,384 | | | | £ | |
| | | 2015 | | | | 716 | | | | 1,881 | | | | – | | | | – | | | | 5 | | | | 52 | | | | | | | | | | | | 5,432 | | | | £ | |
Other key management personnel | |
| Hugo Bague | | | 2016 | | | | 447 | | | | 1,195 | | | | – | | | | – | | | | 5 | | | | 37 | | | | – | | | | – | | | | 2,964 | | | | £ | |
| | | | 2015 | | | | 455 | | | | 1,372 | | | | – | | | | 43 | | | | 4 | | | | 41 | | | | | | | | | | | | 3,362 | | | | £ | |
| Alfredo Barrios | | | 2016 | | | | 340 | | | | 736 | | | | – | | | | – | | | | 2 | | | | 20 | | | | | | | | | | | | 2,731 | | | | C$ | |
| | | | 2015 | | | | 221 | | | | 563 | | | | – | | | | – | | | | 1 | | | | 20 | | | | – | | | | – | | | | 2,329 | | | | C$ | |
| Bold Baatar | | | 2016 | | | | 13 | | | | 14 | | | | 12 | | | | – | | | | – | | | | 3 | | | | – | | | | – | | | | 661 | | | | £ | |
| Alan Davies (l) | | | 2016 | | | | (557 | ) | | | (1,679 | ) | | | – | | | | – | | | | 2 | | | | 34 | | | | 45 | | | | – | | | | (1,314 | ) | | | £ | |
| | | | 2015 | | | | 398 | | | | 1,047 | | | | – | | | | – | | | | 3 | | | | 40 | | | | – | | | | – | | | | 3,988 | | | | £ | |
| Joanne Farrell | | | 2016 | | | | 84 | | | | 70 | | | | 79 | | | | – | | | | 2 | | | | 73 | | | | | | | | – | | | | 860 | | | | A$ | |
| Andrew Harding (m) | | | 2016 | | | | 772 | | | | 2,511 | | | | – | | | | – | | | | 5 | | | | 26 | | | | 42 | | | | 859 | | | | 5,370 | | | | £ | |
| | | | 2015 | | | | 515 | | | | 1,597 | | | | – | | | | 44 | | | | 7 | | | | 57 | | | | | | | | | | | | 4,457 | | | | £ | |
| Greg Lilleyman (n) | | | 2016 | | | | 536 | | | | 630 | | | | 10 | | | | – | | | | (4 | ) | | | 65 | | | | 383 | | | | 574 | | | | 2,610 | | | | A$ | |
| | | | 2015 | | | | 249 | | | | 654 | | | | 76 | | | | – | | | | 3 | | | | 174 | | | | – | | | | – | | | | 2,178 | | | | A$ | |
| Stephen McIntosh | | | 2016 | | | | 107 | | | | 131 | | | | 99 | | | | – | | | | 3 | | | | 88 | | | | | | | | – | | | | 1,424 | | | | A$ | |
| Chris Salisbury | | | 2016 | | | | 132 | | | | 176 | | | | 134 | | | | – | | | | – | | | | 19 | | | | – | | | | – | | | | 1,704 | | | | A$ | |
| Arnaud Soirat | | | 2016 | | | | 90 | | | | 146 | | | | 91 | | | | – | | | | – | | | | 9 | | | | | | | | – | | | | 1,366 | | | | £ | |
| Debra Valentine (o) | | | 2016 | | | | (590 | ) | | | (1,537 | ) | | | – | | | | – | | | | (3 | ) | | | 216 | | | | 20 | | | | 18 | | | | (853 | ) | | | US$ | |
| | | | 2015 | | | | 429 | | | | 1,223 | | | | – | | | | 42 | | | | 4 | | | | 236 | | | | 4 | | | | – | | | | 3,648 | | | | US$ | |
| (g) | ‘BDP’ represents the portion of the 2013 – 2016 STIP awards deferred into Rio Tinto Shares under the Bonus Deferral Plan. |
| (h) | ‘Others’ includes the Global Employee Share Plan (myShare), Share Savings Plan, Share Ownership Plan and Global Employee Share Plan as described in the Implementation Report. |
| (i) | The costs shown for defined benefit pension plans and post-retirement medical benefits are the service costs attributable to the individual, calculated in accordance with IAS19. The cost for defined contribution plans is the amount contributed in the year by the Company. Amounts included as ‘Other post-employment benefits’ include the value of accrued annual leave and long service leave, where applicable, paid out on termination. |
| (j) | ‘Total remuneration’ represents the disclosure of total emoluments and compensation required under the Australian Corporations Act 2001 and applicable accounting standards. |
| (k) | Sam Walsh received a payment of A$1,408,000 (US$1,048,000) as payment in lieu of notice which was equal to approximately 11 months’ base salary based on his 12 months’ contractual notice period. He also received repatriation benefits of US$91,000 (net) in accordance with contractual entitlements. These amounts are included as ‘Termination benefits’. Unused and accrued annual leave and long-service leave amounting to A$2,852,000 (US$2,122,000) was also paid as at the termination date in line with Australian legislation and policy. This amount is included in ‘Other post-employment benefits’. The other amounts reported in Table 1a relate to the period when he was an executive. Further details are provided in the Implementation Report under the heading “Payments on retirement”. |
| (l) | Alan Davies received a payment for unused and accrued annual leave amounting to £33,000 (US$45,000) in line with UK policy. This amount is included in ‘Other post-employment benefits’. The other amounts reported in Table 1a relate to the period when he was an executive. Further details are provided in the Implementation Report under the heading “Departures from the Executive Committee”. |
| (m) | Andrew Harding received a payment of £549,000 (US$744,000) as payment in lieu of notice which was equal to slightly less than 12 months’ base salary based on his 12 months’ contractual notice period and benefits related to the end of his assignment in Australia and his repatriation to the UK. These amounts are included as ‘Termination benefits’. Unused and accrued vacation amounting to £31,000 (US$42,000) was also paid as at the termination date in line with UK policy. This amount is included in ‘Other post-employment benefits’. The other amounts reported in Table 1a relate to the period when he was an executive. Further details are provided in the Implementation Report under the heading “Departures from the Executive Committee”. |
| (n) | Greg Lilleyman received a payment of A$697,000 (US$518,000) as payment in lieu of notice which was equal to approximately 11 months’ base salary based on his 12 months’ contractual notice period and a payment of A$69,000 (US$52,000) in relation to rental allowance for the unworked notice period. These amounts are included as ‘Termination benefits’. Unused and accrued annual leave and long-service leave amounting to A$514,000 (US$383,000) was also paid as at the termination date in line with Australian legislation and policy. This amount is included in ‘Other post-employment benefits’. The other amounts reported in Table 1a relate to the period when he was an executive. Further details are provided in the Implementation report under the heading “Departures from the Executive Committee”. |
| (o) | Unused and accrued annual leave amounting to US$16,000 was paid on termination to Debra Valentine in line with US legislation. This amount is included in ‘Other post-employment benefits’. |
| | | | |
| 2016 Annual report | | riotinto.com | | 99 |
| | | | | | | | | | | | | | | | |
| | | | | | | | | |
| STRATEGIC REPORT | | | | DIRECTORS’ REPORT REMUNERATION REPORT: IMPLEMENTATION REPORT | | | | FINANCIAL STATEMENTS | | | | PRODUCTION, RESERVES AND OPERATIONS | | | | ADDITIONAL INFORMATION |
Remuneration Report: Implementation Report
continued
Table 1b –Non-executive directors’ remuneration
| | | | | | | | | | | | | | | | | | | | |
| Stated in US$’000 (a) | | | | | Fees and
allowances (b) | | | Non-monetary
benefits (c)(d) | | | Single total
figure of
remuneration (e) | | | Currency of
actual payment | |
| Chairman | | | | | |
| Jan du Plessis | | | 2016 | | | | 990 | | | | 88 | | | | 1,078 | | | | £ | |
| | | 2015 | | | | 1,116 | | | | 134 | | | | 1,250 | | | | £ | |
| Non-executive directors | | | | | | | | | | | | | | | | | | | | |
| Robert Brown | | | 2016 | | | | 186 | | | | 46 | | | | 232 | | | | £ | |
| | | | 2015 | | | | 310 | | | | 59 | | | | 369 | | | | £ | |
| Megan Clark | | | 2016 | | | | 286 | | | | 28 | | | | 314 | | | | A$ | |
| | | | 2015 | | | | 268 | | | | 0 | | | | 268 | | | | A$ | |
| Michael L’Estrange | | | 2016 | | | | 237 | | | | 25 | | | | 262 | | | | A$ | |
| | | | 2015 | | | | 275 | | | | 0 | | | | 275 | | | | A$ | |
| Ann Godbehere | | | 2016 | | | | 221 | | | | 9 | | | | 230 | | | | £ | |
| | | | 2015 | | | | 249 | | | | 20 | | | | 269 | | | | £ | |
| Richard Goodmanson(f) | | | 2016 | | | | 122 | | | | 10 | | | | 132 | | | | £ | |
| | | | 2015 | | | | 340 | | | | 25 | | | | 365 | | | | £ | |
| Anne Lauvergeon | | | 2016 | | | | 173 | | | | 13 | | | | 186 | | | | £ | |
| | | | 2015 | | | | 218 | | | | 23 | | | | 241 | | | | £ | |
| Paul Tellier | | | 2016 | | | | 207 | | | | 52 | | | | 259 | | | | £ | |
| | | | 2015 | | | | 325 | | | | 72 | | | | 397 | | | | £ | |
| Simon Thompson | | | 2016 | | | | 196 | | | | 8 | | | | 204 | | | | £ | |
| | | | 2015 | | | | 218 | | | | 9 | | | | 227 | | | | £ | |
| John Varley | | | 2016 | | | | 295 | | | | 5 | | | | 300 | | | | £ | |
| | | | 2015 | | | | 333 | | | | 13 | | | | 346 | | | | £ | |
Notes to Table 1b –Non-executive directors’ remuneration
| (a) | The remuneration is reported in US dollars. The amounts have been converted using the relevant 2016 average exchange rates of £1 = 1.35616 US$ and A$1 = 0.74406 US$ (1 January to 31 December 2016 average). |
| (b) | ‘Fees and allowances’ comprise the total fees for the chairman and allnon-executive directors and travel allowances for thenon-executive directors (other than the chairman). The payment of statutory minimum superannuation contributions for Australiannon-executive directors is required by Australian superannuation law. These contributions are included in the Fees and Allowances amount disclosed for Australiannon-executive directors. While the fees and allowances contractual values defined in British Pounds have not chanaged, the US Dollar values reflected in Table 1b are a primarily a consequence of the weakening of the British Pound relative to the US Dollar in 2016 (note that the rate for 2015 was £1 = 1.52868 US$). Travel allowances were overpaid in 2015 due to an administrative error to Robert Brown and Paul Tellier and were refunded. The amounts stated in ‘Fees and allowances’ do not reflect the refunds. |
| (c) | ‘Non-monetary benefits’ include, as in previous year, amounts which are deemed by the UK tax authorities to be benefits in kind relating largely to the costs ofnon-executive directors’ expenses in attending Board meetings held at the Company’s UK registered office (including associated hotel and subsistence expenses). Given these expenses are incurred by directors in the fulfilment of their duties, the Company pays the tax on them. |
| (d) | In 2016, the following additional amounts are included as noted for the relevant director. For Jan du Plessis the value of company provided transport and medical insurance premiums. Mr du Plessis is provided with a car and driver in his capacity as chairman of Rio Tinto. For the year ended 31 December 2016, the amount was £30,353. |
| (e) | Represents disclosure of the single total figure of remuneration under Schedule 8 of the Large andMedium-sized Companies and Groups (Accounts and Reports) Regulations 2008 (as amended) and total remuneration under the Australian Corporations Act 2001 and applicable accounting standards. |
| (f) | The amounts reported for Richard Goodmanson reflect the period when he was an active member of the Board from 1 Jan to 5 May 2016. |
| | | | |
| 100 | | riotinto.com | | 2016 Annual report |
Table 2 – Directors’ and executives’ beneficial interests in Rio Tinto shares
| | | | | | | | | | | | | | | | | | | | | | | | | | | | | | | | | | | | |
| | | Rio Tinto plc(a) | | | Rio Tinto Limited | | | Movements | |
| | | 01 Jan
2016 (b) | | | 31 Dec
2016 (c) | | | 17 Feb
2017 | | | 01 Jan
2016 (b) | | | 31 Dec
2016 (c) | | | 17 Feb
2017 | | | Exercise of
options (d) | | | Compensation (e) | | | Other (f) | |
| Directors | | | | | | | | | | | | | | | | | | | | | | | | | | | | | | | | | | | | |
| Robert Brown | | | 4,200 | | | | 4,200 | | | | 8,700 | | | | – | | | | – | | | | – | | | | – | | | | – | | | | 4,500 | |
| Megan Clark | | | – | | | | – | | | | – | | | | 2,715 | | | | 3,215 | | | | 3,215 | | | | – | | | | – | | | | 500 | |
| David Constable(g) | | | – | | | | – | | | | – | | | | – | | | | – | | | | – | | | | – | | | | – | | | | – | |
| Jan du Plessis | | | 30,000 | | | | 30,000 | | | | 30,000 | | | | – | | | | – | | | | – | | | | – | | | | – | | | | – | |
| Ann Godbehere | | | 3,100 | | | | 3,100 | | | | 3,100 | | | | – | | | | – | | | | – | | | | – | | | | – | | | | – | |
| Richard Goodmanson (g) | | | 5,512 | | | | 5,512 | | | | – | | | | – | | | | – | | | | – | | | | – | | | | – | | | | – | |
| Jean-Sébastien Jacques | | | 13,563 | | | | 21,087 | | | | 21,127 | | | | – | | | | – | | | | – | | | | – | | | | 12,677 | | | | (5,113 | ) |
| Sam Laidlaw (g) | | | – | | | | – | | | | – | | | | – | | | | – | | | | – | | | | – | | | | – | | | | – | |
| Anne Lauvergeon | | | 3,539 | | | | 3,539 | | | | 3,539 | | | | – | | | | – | | | | – | | | | – | | | | – | | | | – | |
| Michael L’Estrange | | | – | | | | – | | | | – | | | | 1,003 | | | | 2,003 | | | | 2,003 | | | | – | | | | – | | | | 1,000 | |
| Chris Lynch | | | 2,292 | | | | 10,730 | | | | 10,730 | | | | 6,890 | | | | 6,890 | | | | 6,890 | | | | – | | | | 16,097 | | | | (7,659 | ) |
| Paul Tellier | | | 24,248 | | | | 25,371 | | | | 25,371 | | | | – | | | | – | | | | – | | | | – | | | | – | | | | 1,123 | |
| Simon Thompson | | | 7,458 | | | | 7,458 | | | | 7,458 | | | | – | | | | – | | | | – | | | | – | | | | – | | | | – | |
| John Varley | | | 9,685 | | | | 9,685 | | | | 9,685 | | | | – | | | | – | | | | – | | | | – | | | | – | | | | – | |
| Sam Walsh (g) | | | – | | | | – | | | | – | | | | 194,780 | | | | 221,279 | | | | – | | | | – | | | | 41,584 | | | | (15,085 | ) |
| Executives | | | | | | | | | | | | | | | | | | | | | | | | | | | | | | | | | | | | |
| Bold Baatar (g) | | | 1,898 | | | | 2,746 | | | | 2,756 | | | | – | | | | – | | | | – | | | | – | | | | 955 | | | | (97 | ) |
| Hugo Bague (g) | | | 67,354 | | | | 88,324 | | | | – | | | | – | | | | – | | | | – | | | | – | | | | 25,228 | | | | (4,258 | ) |
| Alfredo Barrios | | | 2,835 | | | | 3,110 | | | | 3,133 | | | | – | | | | – | | | | – | | | | – | | | | 119 | | | | 178 | |
| Alan Davies(g) | | | 72 | | | | 420 | | | | – | | | | 31,704 | | | | 34,359 | | | | – | | | | – | | | | 4,773 | | | | (1,771 | ) |
| Joanne Farrell(g) | | | 2,802 | | | | 2,839 | | | | 2,839 | | | | 27,552 | | | | 29,220 | | | | 29,265 | | | | – | | | | 2,857 | | | | (1,107 | ) |
| Andrew Harding(g) | | | 22,303 | | | | 30,542 | | | | – | | | | 36,605 | | | | 36,605 | | | | – | | | | – | | | | 14,799 | | | | (6,559 | ) |
| Vera Kirikova(g)(h) | | | – | | | | – | | | | 791 | | | | – | | | | – | | | | – | | | | – | | | | 17 | | | | – | |
| Greg Lilleyman (g) | | | – | | | | – | | | | – | | | | 26,258 | | | | 30,017 | | | | – | | | | – | | | | 9,025 | | | | (5,267 | ) |
Stephen
McIntosh (g) | | | 7,528 | | | | 7,538 | | | | 7,538 | | | | 4,124 | | | | 5,626 | | | | 5,660 | | | | – | | | | 2,764 | | | | (1,218 | ) |
| Simone Niven(g) | | | – | | | | – | | | | 1,711 | | | | – | | | | – | | | | – | | | | – | | | | 0 | | | | – | |
| Chris Salisbury(g) | | | – | | | | – | | | | – | | | | 15,178 | | | | 16,387 | | | | 16,387 | | | | – | | | | 2,370 | | | | (1,161 | ) |
| Arnaud Soirat(g) | | | – | | | | | | | | – | | | | 5,009 | | | | 6,383 | | | | 6,383 | | | | – | | | | 2,583 | | | | (1,208 | ) |
| Debra Valentine(g) | | | 65,490 | | | | 76,451 | | | | – | | | | – | | | | – | | | | – | | | | – | | | | 14,169 | | | | (3,208 | ) |
| (a) | Rio Tinto plc ordinary shares or American Depositary Shares. |
| (b) | Or date of appointment, if later. |
| (c) | Or date of retirement / date stepped down from the Executive Committee, if earlier. |
| (d) | Shares obtained through the exercise of options under the Rio Tinto Share Savings Plan or the Share Option Plan. The number of shares retained may differ from the number of options exercised. |
| (e) | Shares obtained through the Rio Tinto Share Ownership Plan and/or vesting of awards under PSP, MSP and BDP. |
| (f) | Share movements due to the sale or purchase of shares, shares received under dividend reinvestment plans, shares purchased /sold through thenon-executive directors’ Share Purchase Plan |
| (g) | Richard Goodmanson and Sam Walsh retired as directors on 5 May 2016 and 1 July 2016 respectively. David Constable and Sam Laidlaw were appointed as directors with effect from 10 February 2017. Hugo Bague, Alan Davies, Andrew Harding, Greg Lilleyman, and Debra Valentine stepped down from the Executive Committee on 31 December 2016, 8 November 2016, 20 June 2016, 24 May 2016 and 8 November 2016 respectively. Bold Baatar, Joanne Farrell, Vera Kirikova, Stephen McIntosh, Simone Niven, Chris Salisbury and Arnaud Soirat joined the Executive Committee on 1 December 2016, 2 July 2016, 1 January 2017, 24 May 2016, 1 January 2017, 17 March 2016 and 2 July 2016 respectively. |
| (h) | Vera Kirikova acquired 17 Rio Tinto plc ordinary shares on 17 January 2017. |
| Interests | in outstanding awards under LTIPs and option plans are set out in table 3. |
| | | | |
| 2016 Annual report | | riotinto.com | | 101 |
| | | | | | | | | | | | | | | | |
| | | | | | | | | |
| STRATEGIC REPORT | | | | DIRECTORS’ REPORT REMUNERATION REPORT: IMPLEMENTATION REPORT | | | | FINANCIAL STATEMENTS | | | | PRODUCTION, RESERVES AND OPERATIONS | | | | ADDITIONAL INFORMATION |
Remuneration Report: Implementation Report
continued
Table 3 – Plan interests (awards of shares and options under long-term incentive plans)
| | | | | | | | | | | | | | | | | | | | | | | | | | | | | | | | | | | | | | | | | | | | | | | | | | | | |
| Name | | Conditional
Award
Granted | | | Market
Price At
Award (a),(b) | | | 01 January
2016 | | | Awarded | | | Lapsed/
Cancelled | | | Dividend
Units | | | Vested | | | 31 December
2016 | | | 15 February
2017 | | | Performance
Period
Concludes (c) | | | Date of
Election | | | Market
Price at
Election | | | Monetary
Value of
Award at
Election
US$ (d) | |
| Bonus Deferral Plan | | | | | | | | | | | | | | | | | | | | | | | | | | | | | | | | | | | | | | | | | | | | | | | | | | | | |
| Bold Baatar | | | 17-Mar-2014 | | | | £31.54 | | | | 859 | | | | – | | | | – | | | | 86 | | | | 945 | | | | – | | | | – | | | | 01-Dec-2016 | | | | 08-Dec-2016 | | | | £32.73 | | | | 41,947 | |
| | | 23-Mar-2015 | | | | £29.43 | | | | 2,136 | | | | – | | | | – | | | | – | | | | – | | | | 2,136 | | | | 2,136 | | | | 01-Dec-2017 | | | | – | | | | – | | | | – | |
| | | | 11-Mar-2016 | | | | £20.00 | | | | – | | | | 3,165 | | | | – | | | | – | | | | – | | | | 3,165 | | | | 3,165 | | | | 01-Dec-2018 | | | | – | | | | – | | | | – | |
| Hugo Bague | | | 17-Mar-2014 | | | | £31.54 | | | | 9,669 | | | | – | | | | – | | | | 976 | | | | 10,645 | | | | – | | | | – | | | | 01-Dec-2016 | | | | 13-Dec-2016 | | | | £32.13 | | | | 463,767 | |
| | | 23-Mar-2015 | | | | £29.43 | | | | 12,354 | | | | – | | | | – | | | | – | | | | – | | | | 12,354 | | | | 12,354 | | | | 01-Dec-2017 | | | | – | | | | – | | | | – | |
| | | | 11-Mar-2016 | | | | £20.00 | | | | – | | | | 16,062 | | | | – | | | | – | | | | – | | | | 16,062 | | | | 16,062 | | | | 01-Dec-2018 | | | | – | | | | – | | | | – | |
| Alfredo Barrios | | | 23-Mar-2015 | | | | £29.43 | | | | 8,931 | | | | – | | | | – | | | | – | | | | – | | | | 8,931 | | | | 8,931 | | | | 01-Dec-2017 | | | | – | | | | – | | | | – | |
| | | | 11-Mar-2016 | | | | £20.00 | | | | – | | | | 16,957 | | | | – | | | | – | | | | – | | | | 16,957 | | | | 16,957 | | | | 01-Dec-2018 | | | | – | | | | – | | | | – | |
| Alan Davies (e) | | | 17-Mar-2014 | | | | A$61.67 | | | | 6,709 | | | | – | | | | -6,709 | | | | – | | | | – | | | | – | | | | – | | | | 18-Nov-2016 | | | | – | | | | – | | | | – | |
| | | 23-Mar-2015 | | | | £29.43 | | | | 12,493 | | | | – | | | | -12,493 | | | | – | | | | – | | | | – | | | | – | | | | 18-Nov-2016 | | | | – | | | | – | | | | – | |
| | | | 11-Mar-2016 | | | | £20.00 | | | | – | | | | 14,766 | | | | -14,766 | | | | – | | | | – | | | | – | | | | – | | | | 18-Nov-2016 | | | | – | | | | – | | | | – | |
| Joanne Farrell | | | 17-Mar-2014 | | | | A$61.67 | | | | 2,340 | | | | – | | | | – | | | | 237 | | | | 2,577 | | | | – | | | | – | | | | 01-Dec-2016 | | | | 08-Dec-2016 | | | | A$62.59 | | | | 120,016 | |
| | | 23-Mar-2015 | | | | A$58.21 | | | | 1,946 | | | | – | | | | – | | | | – | | | | – | | | | 1,946 | | | | 1,946 | | | | 01-Dec-2017 | | | | – | | | | – | | | | – | |
| | | | 11-Mar-2016 | | | | A$44.57 | | | | – | | | | 2,583 | | | | – | | | | – | | | | – | | | | 2,583 | | | | 2,583 | | | | 01-Dec-2018 | | | | – | | | | – | | | | – | |
| Andrew Harding (e) | | | 17-Mar-2014 | | | | £31.54 | | | | 11,776 | | | | – | | | | – | | | | N/A | | | | N/A | | | | N/A | | | | N/A | | | | 01-Dec-2016 | | | | N/A | | | | N/A | | | | N/A | |
| | | 23-Mar-2015 | | | | £29.43 | | | | 12,093 | | | | – | | | | – | | | | – | | | | – | | | | N/A | | | | N/A | | | | 01-Dec-2017 | | | | N/A | | | | N/A | | | | N/A | |
| | | | 11-Mar-2016 | | | | £20.00 | | | | – | | | | 19,497 | | | | – | | | | – | | | | – | | | | N/A | | | | N/A | | | | 01-Dec-2018 | | | | N/A | | | | N/A | | | | N/A | |
| Jean-Sébastien Jacques | | | 17-Mar-2014 | | | | £31.54 | | | | 8,259 | | | | – | | | | – | | | | 834 | | | | 9,093 | | | | – | | | | – | | | | 01-Dec-2016 | | | | 05-Dec-2016 | | | | £30.36 | | | | 374,386 | |
| | | 23-Mar-2015 | | | | £29.43 | | | | 13,781 | | | | – | | | | – | | | | – | | | | – | | | | 13,781 | | | | 13,781 | | | | 01-Dec-2017 | | | | – | | | | – | | | | – | |
| | | | 11-Mar-2016 | | | | £20.00 | | | | – | | | | 22,394 | | | | – | | | | – | | | | – | | | | 22,394 | | | | 22,394 | | | | 01-Dec-2018 | | | | – | | | | – | | | | – | |
| Greg Lilleyman (e) | | | 17-Mar-2014 | | | | A$61.67 | | | | 2,754 | | | | – | | | | – | | | | N/A | | | | N/A | | | | N/A | | | | N/A | | | | 01-Dec-2016 | | | | N/A | | | | N/A | | | | N/A | |
| | | 23-Mar-2015 | | | | A$58.21 | | | | 9,321 | | | | – | | | | – | | | | – | | | | – | | | | N/A | | | | N/A | | | | 01-Dec-2017 | | | | N/A | | | | N/A | | | | N/A | |
| | | | 11-Mar-2016 | | | | A$44.57 | | | | – | | | | 11,542 | | | | – | | | | – | | | | – | | | | N/A | | | | N/A | | | | 01-Dec-2018 | | | | N/A | | | | N/A | | | | N/A | |
| Chris Lynch | | | 17-Mar-2014 | | | | £31.54 | | | | 14,479 | | | | – | | | | – | | | | 1,462 | | | | 15,941 | | | | – | | | | – | | | | 01-Dec-2016 | | | | 07-Dec-2016 | | | | £32.34 | | | | 699,144 | |
| | | 23-Mar-2015 | | | | £29.43 | | | | 26,066 | | | | – | | | | – | | | | – | | | | – | | | | 26,066 | | | | 26,066 | | | | 01-Dec-2017 | | | | – | | | | – | | | | – | |
| | | | 11-Mar-2016 | | | | £20.00 | | | | – | | | | 33,238 | | | | – | | | | – | | | | – | | | | 33,238 | | | | 33,238 | | | | 01-Dec-2018 | | | | – | | | | – | | | | – | |
| Stephen McIntosh | | | 17-Mar-2014 | | | | A$61.67 | | | | 2,369 | | | | – | | | | – | | | | 240 | | | | 2,609 | | | | – | | | | – | | | | 01-Dec-2016 | | | | 12-Dec-2016 | | | | A$62.88 | | | | 122,067 | |
| | | 23-Mar-2015 | | | | A$58.21 | | | | 2,017 | | | | – | | | | – | | | | – | | | | – | | | | 2,017 | | | | 2,017 | | | | 01-Dec-2017 | | | | – | | | | – | | | | – | |
| | | | 11-Mar-2016 | | | | A$44.57 | | | | – | | | | 2,965 | | | | – | | | | – | | | | – | | | | 2,965 | | | | 2,965 | | | | 01-Dec-2018 | | | | – | | | | – | | | | – | |
| Chris Salisbury | | | 17-Mar-2014 | | | | A$61.67 | | | | 2,152 | | | | – | | | | – | | | | 218 | | | | 2,370 | | | | – | | | | – | | | | 01-Dec-2016 | | | | 07-Dec-2016 | | | | A$59.82 | | | | 105,488 | |
| | | 23-Mar-2015 | | | | A$58.21 | | | | 1,705 | | | | – | | | | – | | | | – | | | | – | | | | 1,705 | | | | 1,705 | | | | 01-Dec-2017 | | | | – | | | | – | | | | – | |
| | | | 11-Mar-2016 | | | | A$44.57 | | | | – | | | | 3,542 | | | | – | | | | – | | | | – | | | | 3,542 | | | | 3,542 | | | | 01-Dec-2018 | | | | – | | | | – | | | | – | |
| Arnaud Soirat | | | 17-Mar-2014 | | | | A$61.67 | | | | 2,345 | | | | – | | | | – | | | | 238 | | | | 2,583 | | | | – | | | | – | | | | 01-Dec-2016 | | | | 06-Dec-2016 | | | | A$59.77 | | | | 114,868 | |
| | | 23-Mar-2015 | | | | A$58.21 | | | | 3,292 | | | | – | | | | – | | | | – | | | | – | | | | 3,292 | | | | 3,292 | | | | 01-Dec-2017 | | | | – | | | | – | | | | – | |
| | | | 11-Mar-2016 | | | | A$44.57 | | | | – | | | | 3,050 | | | | – | | | | – | | | | – | | | | 3,050 | | | | 3,050 | | | | 01-Dec-2018 | | | | – | | | | – | | | | – | |
| Debra Valentine (e) | | | 17-Mar-2014 | | | | £31.54 | | | | 8,153 | | | | – | | | | -8,153 | | | | – | | | | – | | | | – | | | | – | | | | 18-Nov-2016 | | | | – | | | | – | | | | – | |
| | | 23-Mar-2015 | | | | £29.43 | | | | 12,227 | | | | – | | | | -12,227 | | | | – | | | | – | | | | – | | | | – | | | | 18-Nov-2016 | | | | – | | | | – | | | | – | |
| | | | 11-Mar-2016 | | | | £20.00 | | | | – | | | | 16,111 | | | | -16,111 | | | | – | | | | – | | | | – | | | | – | | | | 18-Nov-2016 | | | | – | | | | – | | | | – | |
| Sam Walsh (e) (f) | | | 17-Mar-2014 | | | | A$61.67 | | | | 22,226 | | | | – | | | | – | | | | N/A | | | | N/A | | | | N/A | | | | N/A | | | | 01-Dec-2016 | | | | N/A | | | | N/A | | | | N/A | |
| | | 23-Mar-2015 | | | | A$58.21 | | | | 29,609 | | | | – | | | | – | | | | – | | | | – | | | | N/A | | | | N/A | | |
| 31-Dec-2018 /
31-Dec-2020 |
| | | N/A | | | | N/A | | | | N/A | |
| | | | 11-Mar-2016 | | | | A$44.57 | | | | – | | | | 36,153 | | | | – | | | | – | | | | – | | | | N/A | | | | N/A | | |
| 31-Dec-2018 /
31-Dec-2020 |
| | | N/A | | | | N/A | | | | N/A | |
| Management Share Plan | | | | | | | | | | | | | | | | | | | | | | | | | | | | | | | | | | | | | | | | | | | | | | | | | |
| Bold Baatar | | | 16-Sep-2013 | | | | £31.83 | | | | 1,750 | | | | – | | | | – | | | | 264 | | | | 2,014 | | | | – | | | | – | | | | 15-Feb-2016 | | | | 29-Feb-2016 | | | | £18.18 | | | | 49,655 | |
| | | 17-Mar-2014 | | | | £31.54 | | | | 3,882 | | | | – | | | | – | | | | – | | | | – | | | | 3,882 | | | | 3,882 | | | | 20-Feb-2017 | | | | – | | | | – | | | | – | |
| | | 23-Mar-2015 | | | | £29.43 | | | | 3,738 | | | | – | | | | – | | | | – | | | | – | | | | 3,738 | | | | 3,738 | | | | 19-Feb-2018 | | | | – | | | | – | | | | – | |
| | | | 11-Mar-2016 | | | | £20.00 | | | | – | | | | 4,317 | | | | – | | | | – | | | | – | | | | 4,317 | | | | 4,317 | | | | 18-Feb-2019 | | | | – | | | | – | | | | – | |
| Joanne Farrell | | | 27-May-2013 | | | | A$53.11 | | | | 2,477 | | | | – | | | | – | | | | 366 | | | | 2,843 | | | | – | | | | – | | | | 15-Feb-2016 | | | | 18-Feb-2016 | | | | A$42.99 | | | | 90,939 | |
| | | 17-Mar-2014 | | | | A$61.67 | | | | 3,724 | | | | – | | | | – | | | | – | | | | – | | | | 3,724 | | | | 3,724 | | | | 20-Feb-2017 | | | | – | | | | – | | | | – | |
| | | 23-Mar-2015 | | | | A$58.21 | | | | 3,769 | | | | – | | | | – | | | | – | | | | – | | | | 3,769 | | | | 3,769 | | | | 19-Feb-2018 | | | | – | | | | – | | | | – | |
| | | | 11-Mar-2016 | | | | A$44.57 | | | | – | | | | 4,318 | | | | – | | | | – | | | | – | | | | 4,318 | | | | 4,318 | | | | 18-Feb-2019 | | | | – | | | | – | | | | – | |
| Greg Lilleyman (e) | | | 27-May-2013 | | | | A$53.11 | | | | 4,598 | | | | – | | | | – | | | | 680 | | | | 5,278 | | | | – | | | | – | | | | 15-Feb-2016 | | | | 04-Mar-2016 | | | | A$44.84 | | | | 176,085 | |
| | | | |
| 102 | | riotinto.com | | 2016 Annual report |
Table 3 – Plan interests (awards of shares and options under long-term incentive plans) (continued)
| | | | | | | | | | | | | | | | | | | | | | | | | | | | | | | | | | | | | | | | | | | | | | | | | | | | |
| Name | | Conditional
Award
Granted | | | Market
Price At
Award (a),(b) | | | 01 January
2016 | | | Awarded | | | Lapsed/
Cancelled | | | Dividend
Units | | | Vested | | | 31 December
2016 | | | 15 February
2017 | | | Performance
Period
Concludes (c) | | | Date of
Election | | | Market
Price at
Election | | | Monetary
Value of
Award at
Election
US$ (d) | |
| Management Share Plan continued | | | | | | | | | | | | | | | | | | | | | | | | | | | | | | | | | | | | | | | | | | | | | | | | | |
| Stephen McIntosh | | | 27-May-2013 | | | | A$53.11 | | | | 3,755 | | | | – | | | | – | | | | 555 | | | | 4,310 | | | | – | | | | – | | | | 15-Feb-2016 | | | | 16-Feb-2016 | | | | A$43.01 | | | | 137,933 | |
| | | 17-Mar-2014 | | | | A$61.67 | | | | 3,789 | | | | – | | | | – | | | | – | | | | – | | | | 3,789 | | | | 3,789 | | | | 20-Feb-2017 | | | | – | | | | – | | | | – | |
| | | 23-Mar-2015 | | | | A$58.21 | | | | 3,809 | | | | – | | | | – | | | | – | | | | – | | | | 3,809 | | | | 3,809 | | | | 19-Feb-2018 | | | | – | | | | – | | | | – | |
| | | | 11-Mar-2016 | | | | A$44.57 | | | | – | | | | 4,364 | | | | – | | | | – | | | | – | | | | 4,364 | | | | 4,364 | | | | 18-Feb-2019 | | | | – | | | | – | | | | – | |
| Chris Salisbury | | | 27-May-2013 | | | | A$53.11 | | | | 2,604 | | | | – | | | | – | | | | 385 | | | | 2,989 | | | | – | | | | – | | | | 15-Feb-2016 | | | | 16-Feb-2016 | | | | A$43.20 | | | | 96,077 | |
| | | 17-Mar-2014 | | | | A$61.67 | | | | 3,997 | | | | – | | | | – | | | | – | | | | – | | | | 3,997 | | | | 3,997 | | | | 20-Feb-2017 | | | | – | | | | – | | | | – | |
| | | 23-Mar-2015 | | | | A$58.21 | | | | 4,043 | | | | – | | | | – | | | | – | | | | – | | | | 4,043 | | | | 4,043 | | | | 19-Feb-2018 | | | | – | | | | – | | | | – | |
| | | | 11-Mar-2016 | | | | A$44.57 | | | | – | | | | 4,632 | | | | – | | | | – | | | | – | | | | 4,632 | | | | 4,632 | | | | 18-Feb-2019 | | | | – | | | | – | | | | – | |
| Arnaud Soirat | | | 27-May-2013 | | | | A$53.11 | | | | 3,601 | | | | – | | | | – | | | | 532 | | | | 4,133 | | | | – | | | | – | | | | 15-Feb-2016 | | | | 16-Feb-2016 | | | | A$42.85 | | | | 131,772 | |
| | | 17-Mar-2014 | | | | A$61.67 | | | | 4,081 | | | | – | | | | – | | | | – | | | | – | | | | 4,081 | | | | 4,081 | | | | 20-Feb-2017 | | | | – | | | | – | | | | – | |
| | | 23-Mar-2015 | | | | A$58.21 | | | | 4,414 | | | | – | | | | – | | | | – | | | | – | | | | 4,414 | | | | 4,414 | | | | 19-Feb-2018 | | | | – | | | | – | | | | – | |
| | | | 11-Mar-2016 | | | | A$44.57 | | | | – | | | | 5,057 | | | | – | | | | – | | | | – | | | | 5,057 | | | | 5,057 | | | | 18-Feb-2019 | | | | – | | | | – | | | | – | |
| Performance Share Plan(g) | | | | | | | | | | | | | | | | | | | | | | | | | | | | | | | | | | | | | | | | | | | | | |
| Bold Baatar | | | 16-Sep-2013 | | | | £31.83 | | | | 1,750 | | | | – | | | | – | | | | – | | | | – | | | | 1,750 | | | | 1,750 | | | | 31-Dec-2016 | | | | – | | | | – | | | | – | |
| | | 16-Sep-2013 | | | | £31.83 | | | | 1,751 | | | | – | | | | – | | | | – | | | | – | | | | 1,751 | | | | 1,751 | | | | 31-Dec-2017 | | | | – | | | | – | | | | – | |
| | | 17-Mar-2014 | | | | £31.54 | | | | 7,765 | | | | – | | | | – | | | | – | | | | – | | | | 7,765 | | | | 7,765 | | | | 31-Dec-2018 | | | | – | | | | – | | | | – | |
| | | 23-Mar-2015 | | | | £29.43 | | | | 14,954 | | | | – | | | | – | | | | – | | | | – | | | | 14,954 | | | | 14,954 | | | | 31-Dec-2019 | | | | – | | | | – | | | | – | |
| | | | 11-Mar-2016 | | | | £20.00 | | | | – | | | | 17,270 | | | | – | | | | – | | | | – | | | | 17,270 | | | | 17,270 | | | | 31-Dec-2020 | | | | – | | | | – | | | | – | |
| Hugo Bague | | | 19-Mar-2012 | | | | £36.15 | | | | 22,056 | | | | – | | | | -7,632 | | | | – | | | | 14,424 | | | | – | | | | – | | | | 31-Dec-2015 | | | | 16-Feb-2016 | | | | £19.10 | | | | 373,620 | |
| | | 27-May-2013 | | | | £28.67 | | | | 29,294 | | | | – | | | | – | | | | – | | | | – | | | | 29,294 | | | | 29,294 | | | | 31-Dec-2016 | | | | – | | | | – | | | | – | |
| | | 27-May-2013 | | | | £28.67 | | | | 29,295 | | | | – | | | | – | | | | – | | | | – | | | | 29,295 | | | | 29,295 | | | | 31-Dec-2017 | | | | – | | | | – | | | | – | |
| | | 17-Mar-2014 | | | | £31.54 | | | | 61,607 | | | | – | | | | – | | | | – | | | | – | | | | 61,607 | | | | 61,607 | | | | 31-Dec-2018 | | | | – | | | | – | | | | – | |
| | | 23-Mar-2015 | | | | £29.43 | | | | 66,516 | | | | – | | | | – | | | | – | | | | – | | | | 66,516 | | | | 66,516 | | | | 31-Dec-2019 | | | | – | | | | – | | | | – | |
| | | | 11-Mar-2016 | | | | £20.00 | | | | – | | | | 75,001 | | | | – | | | | – | | | | – | | | | 75,001 | | | | 75,001 | | | | 31-Dec-2020 | | | | – | | | | – | | | | – | |
| Alfredo Barrios | | | 15-Sep-2014 | | | | £31.44 | | | | 43,568 | | | | – | | | | – | | | | – | | | | – | | | | 43,568 | | | | 43,568 | | | | 31-Dec-2018 | | | | – | | | | – | | | | – | |
| | | 23-Mar-2015 | | | | £29.43 | | | | 66,390 | | | | – | | | | – | | | | – | | | | – | | | | 66,390 | | | | 66,390 | | | | 31-Dec-2019 | | | | – | | | | – | | | | – | |
| | | | 11-Mar-2016 | | | | £20.00 | | | | – | | | | 73,140 | | | | – | | | | – | | | | – | | | | 73,140 | | | | 73,140 | | | | 31-Dec-2020 | | | | – | | | | – | | | | – | |
| Alan Davies (e) | | | 19-Mar-2012 | | | | A$65.85 | | | | 6,663 | | | | – | | | | -2,306 | | | | – | | | | 4,357 | | | | – | | | | – | | | | 31-Dec-2015 | | | | 18-Feb-2016 | | | | A$43.16 | | | | 139,919 | |
| | | 27-May-2013 | | | | A$53.11 | | | | 27,047 | | | | – | | | | -27,047 | | | | – | | | | – | | | | – | | | | – | | | | 18-Nov-2016 | | | | – | | | | – | | | | – | |
| | | 27-May-2013 | | | | A$53.11 | | | | 27,047 | | | | – | | | | -27,047 | | | | – | | | | – | | | | – | | | | – | | | | 18-Nov-2016 | | | | – | | | | – | | | | – | |
| | | 17-Mar-2014 | | | | A$61.67 | | | | 51,817 | | | | – | | | | -51,817 | | | | – | | | | – | | | | – | | | | – | | | | 18-Nov-2016 | | | | – | | | | – | | | | – | |
| | | 23-Mar-2015 | | | | £29.43 | | | | 71,019 | | | | – | | | | -71,019 | | | | – | | | | – | | | | – | | | | – | | | | 18-Nov-2016 | | | | – | | | | – | | | | – | |
| | | | 11-Mar-2016 | | | | £20.00 | | | | – | | | | 79,936 | | | | -79,936 | | | | – | | | | – | | | | – | | | | – | | | | 18-Nov-2016 | | | | – | | | | – | | | | – | |
| Joanne Farrell | | | 19-Mar-2012 | | | | A$65.85 | | | | 2,903 | | | | – | | | | -1,005 | | | | – | | | | 1,898 | | | | – | | | | – | | | | 31-Dec-2015 | | | | 18-Feb-2016 | | | | A$43.01 | | | | 60,737 | |
| | | 27-May-2013 | | | | A$53.11 | | | | 2,477 | | | | – | | | | – | | | | – | | | | – | | | | 2,477 | | | | 2,477 | | | | 31-Dec-2016 | | | | – | | | | – | | | | – | |
| | | 27-May-2013 | | | | A$53.11 | | | | 2,477 | | | | – | | | | – | | | | – | | | | – | | | | 2,477 | | | | 2,477 | | | | 31-Dec-2017 | | | | – | | | | – | | | | – | |
| | | 17-Mar-2014 | | | | A$61.67 | | | | 7,448 | | | | – | | | | – | | | | – | | | | – | | | | 7,448 | | | | 7,448 | | | | 31-Dec-2018 | | | | – | | | | – | | | | – | |
| | | 23-Mar-2015 | | | | A$58.21 | | | | 7,539 | | | | – | | | | – | | | | – | | | | – | | | | 7,539 | | | | 7,539 | | | | 31-Dec-2019 | | | | – | | | | – | | | | – | |
| | | | 11-Mar-2016 | | | | A$44.57 | | | | – | | | | 8,637 | | | | – | | | | – | | | | – | | | | 8,637 | | | | 8,637 | | | | 31-Dec-2020 | | | | – | | | | – | | | | – | |
| Andrew Harding(e) | | | 19-Mar-2012 | | | | £36.15 | | | | 22,390 | | | | – | | | | -7,747 | | | | – | | | | 14,643 | | | | – | | | | – | | | | 31-Dec-2015 | | | | 25-Feb-2016 | | | | £18.17 | | | | 360,824 | |
| | | 27-May-2013 | | | | £28.67 | | | | 35,547 | | | | – | | | | – | | | | – | | | | – | | | | N/A | | | | N/A | | | | 31-Dec-2016 | | | | N/A | | | | N/A | | | | N/A | |
| | | 27-May-2013 | | | | £28.67 | | | | 35,548 | | | | – | | | | – | | | | – | | | | – | | | | N/A | | | | N/A | | | | 31-Dec-2017 | | | | N/A | | | | N/A | | | | N/A | |
| | | 17-Mar-2014 | | | | £31.54 | | | | 76,539 | | | | – | | | | -18,017 | | | | – | | | | – | | | | N/A | | | | N/A | | | | 31-Dec-2018 | | | | N/A | | | | N/A | | | | N/A | |
| | | 23-Mar-2015 | | | | £29.43 | | | | 75,083 | | | | – | | | | -43,090 | | | | – | | | | – | | | | N/A | | | | N/A | | | | 31-Dec-2019 | | | | N/A | | | | N/A | | | | N/A | |
| | | | 11-Mar-2016 | | | | £20.00 | | | | – | | | | 84,510 | | | | -75,788 | | | | – | | | | – | | | | N/A | | | | N/A | | | | 31-Dec-2020 | | | | N/A | | | | N/A | | | | N/A | |
| Jean-Sébastien Jacques | | | 19-Mar-2012 | | | | £36.15 | | | | 4,793 | | | | – | | | | -1,659 | | | | – | | | | 3,134 | | | | – | | | | – | | | | 31-Dec-2015 | | | | 15-Feb-2016 | | | | £18.52 | | | | 78,714 | |
| | | 27-May-2013 | | | | £28.67 | | | | 25,682 | | | | – | | | | – | | | | – | | | | – | | | | 25,682 | | | | 25,682 | | | | 31-Dec-2016 | | | | – | | | | – | | | | – | |
| | | 27-May-2013 | | | | £28.67 | | | | 25,683 | | | | – | | | | – | | | | – | | | | – | | | | 25,683 | | | | 25,683 | | | | 31-Dec-2017 | | | | – | | | | – | | | | – | |
| | | 17-Mar-2014 | | | | £31.54 | | | | 70,057 | | | | – | | | | – | | | | – | | | | – | | | | 70,057 | | | | 70,057 | | | | 31-Dec-2018 | | | | – | | | | – | | | | – | |
| | | 23-Mar-2015 | | | | £29.43 | | | | 72,768 | | | | – | | | | – | | | | – | | | | – | | | | 72,768 | | | | 72,768 | | | | 31-Dec-2019 | | | | – | | | | – | | | | – | |
| | | 11-Mar-2016 | | | | £20.00 | | | | – | | | | 84,005 | | | | – | | | | – | | | | – | | | | 84,005 | | | | 84,005 | | | | 31-Dec-2020 | | | | – | | | | – | | | | – | |
| | | | 12-Sep-2016 | | | | £22.95 | | | | – | | | | 79,966 | | | | – | | | | – | | | | – | | | | 79,966 | | | | 79,966 | | | | 31-Dec-2020 | | | | – | | | | – | | | | – | |
| Greg Lilleyman (e) | | | 19-Mar-2012 | | | | A$65.85 | | | | 5,585 | | | | – | | | | -1,933 | | | | – | | | | 3,652 | | | | – | | | | – | | | | 31-Dec-2015 | | | | 04-Mar-2016 | | | | A$44.90 | | | | 122,007 | |
| | | 27-May-2013 | | | | A$53.11 | | | | 6,898 | | | | – | | | | – | | | | – | | | | – | | | | N/A | | | | N/A | | | | 31-Dec-2016 | | | | N/A | | | | N/A | | | | N/A | |
| | | 27-May-2013 | | | | A$53.11 | | | | 6,898 | | | | – | | | | – | | | | – | | | | – | | | | N/A | | | | N/A | | | | 31-Dec-2017 | | | | N/A | | | | N/A | | | | N/A | |
| | | 17-Mar-2014 | | | | A$61.67 | | | | 47,321 | | | | – | | | | -11,139 | | | | – | | | | – | | | | N/A | | | | N/A | | | | 31-Dec-2018 | | | | N/A | | | | N/A | | | | N/A | |
| | | 23-Mar-2015 | | | | A$58.21 | | | | 50,101 | | | | – | | | | -50,101 | | | | – | | | | – | | | | – | | | | – | | | | 01-Jul-2016 | | | | – | | | | – | | | | – | |
| | | | 11-Mar-2016 | | | | A$44.57 | | | | – | | | | 48,787 | | | | -48,787 | | | | – | | | | – | | | | – | | | | – | | | | 01-Jul-2016 | | | | – | | | | – | | | | – | |
| | | | |
| 2016 Annual report | | riotinto.com | | 103 |
| | | | | | | | | | | | | | | | |
| | | | | | | | | |
| STRATEGIC REPORT | | | | DIRECTORS’ REPORT REMUNERATION REPORT: IMPLEMENTATION REPORT | | | | FINANCIAL STATEMENTS | | | | PRODUCTION, RESERVES AND OPERATIONS | | | | ADDITIONAL INFORMATION |
Remuneration Report: Implementation Report
continued
Table 3 – Plan interests (awards of shares and options under long-term incentive plans) (continued)
| | | | | | | | | | | | | | | | | | | | | | | | | | | | | | | | | | | | | | | | | | | | | | | | | | | | |
| Name | | Conditional
Award
Granted | | | Market
Price At
Award (a),(b) | | | 01 January
2016 | | | Awarded | | | Lapsed/
Cancelled | | | Dividend
Units | | | Vested | | | 31 December
2016 | | | 15 February
2017 | | | Performance
Period
Concludes (c) | | | Date of
Election | | | Market
Price at
Election | | | Monetary
Value of
Award at
Election
US$ (d) | |
| Performance Share Plan continued(g) | | | | | | | | | | | | | | | | | | | | | | | | | | | | | | | | | | | | | | | | | | | | | |
| Chris Lynch | | | 27-May-2013 | | | | £28.67 | | | | 52,084 | | | | – | | | | – | | | | – | | | | – | | | | 52,084 | | | | 52,084 | | | | 31-Dec-2016 | | | | – | | | | – | | | | – | |
| | | 27-May-2013 | | | | £28.67 | | | | 52,085 | | | | – | | | | – | | | | – | | | | – | | | | 52,085 | | | | 52,085 | | | | 31-Dec-2017 | | | | – | | | | – | | | | – | |
| | | 17-Mar-2014 | | | | £31.54 | | | | 104,312 | | | | – | | | | – | | | | – | | | | – | | | | 104,312 | | | | 104,312 | | | | 31-Dec-2018 | | | | – | | | | – | | | | – | |
| | | 23-Mar-2015 | | | | £29.43 | | | | 112,620 | | | | – | | | | – | | | | – | | | | – | | | | 112,620 | | | | 112,620 | | | | 31-Dec-2019 | | | | – | | | | – | | | | – | |
| | | | 11-Mar-2016 | | | | £20.00 | | | | – | | | | 126,987 | | | | – | | | | – | | | | – | | | | 126,987 | | | | 126,987 | | | | 31-Dec-2020 | | | | – | | | | – | | | | – | |
| Stephen McIntosh | | | 19-Mar-2012 | | | | A$65.85 | | | | 4,791 | | | | – | | | | -1,658 | | | | – | | | | 3,133 | | | | – | | | | – | | | | 31-Dec-2015 | | | | 17-Feb-2016 | | | | A$42.92 | | | | 100,053 | |
| | | 27-May-2013 | | | | A$53.11 | | | | 5,632 | | | | – | | | | – | | | | – | | | | – | | | | 5,632 | | | | 5,632 | | | | 31-Dec-2016 | | | | – | | | | – | | | | – | |
| | | 27-May-2013 | | | | A$53.11 | | | | 5,633 | | | | – | | | | – | | | | – | | | | – | | | | 5,633 | | | | 5,633 | | | | 31-Dec-2017 | | | | – | | | | – | | | | – | |
| | | 17-Mar-2014 | | | | A$61.67 | | | | 7,578 | | | | – | | | | – | | | | – | | | | – | | | | 7,578 | | | | 7,578 | | | | 31-Dec-2018 | | | | – | | | | – | | | | – | |
| | | 23-Mar-2015 | | | | A$58.21 | | | | 11,429 | | | | – | | | | – | | | | – | | | | – | | | | 11,429 | | | | 11,429 | | | | 31-Dec-2019 | | | | – | | | | – | | | | – | |
| | | | 11-Mar-2016 | | | | A$44.57 | | | | – | | | | 13,093 | | | | – | | | | – | | | | – | | | | 13,093 | | | | 13,093 | | | | 31-Dec-2020 | | | | – | | | | – | | | | – | |
| Chris Salisbury | | | 19-Mar-2012 | | | | A$65.85 | | | | 4,698 | | | | – | | | | -1,626 | | | | – | | | | 3,072 | | | | – | | | | – | | | | 31-Dec-2015 | | | | 16-Feb-2016 | | | | A$43.20 | | | | 98,745 | |
| | | 27-May-2013 | | | | A$53.11 | | | | 3,907 | | | | – | | | | – | | | | – | | | | – | | | | 3,907 | | | | 3,907 | | | | 31-Dec-2016 | | | | – | | | | – | | | | – | |
| | | 27-May-2013 | | | | A$53.11 | | | | 3,907 | | | | – | | | | – | | | | – | | | | – | | | | 3,907 | | | | 3,907 | | | | 31-Dec-2017 | | | | – | | | | – | | | | – | |
| | | 17-Mar-2014 | | | | A$61.67 | | | | 7,994 | | | | – | | | | – | | | | – | | | | – | | | | 7,994 | | | | 7,994 | | | | 31-Dec-2018 | | | | – | | | | – | | | | – | |
| | | 23-Mar-2015 | | | | A$58.21 | | | | 16,175 | | | | – | | | | – | | | | – | | | | – | | | | 16,175 | | | | 16,175 | | | | 31-Dec-2019 | | | | – | | | | – | | | | – | |
| | | | 11-Mar-2016 | | | | A$44.57 | | | | – | | | | 13,898 | | | | – | | | | – | | | | – | | | | 13,898 | | | | 13,898 | | | | 31-Dec-2020 | | | | – | | | | – | | | | – | |
| Arnaud Soirat | | | 19-Mar-2012 | | | | A$65.85 | | | | 5,724 | | | | – | | | | -1,981 | | | | – | | | | 3,743 | | | | – | | | | – | | | | 31-Dec-2015 | | | | 16-Feb-2016 | | | | A$42.86 | | | | 119,366 | |
| | | 27-May-2013 | | | | A$53.11 | | | | 3,601 | | | | – | | | | – | | | | – | | | | – | | | | 3,601 | | | | 3,601 | | | | 31-Dec-2016 | | | | – | | | | – | | | | – | |
| | | 27-May-2013 | | | | A$53.11 | | | | 3,601 | | | | – | | | | – | | | | – | | | | – | | | | 3,601 | | | | 3,601 | | | | 31-Dec-2017 | | | | – | | | | – | | | | – | |
| | | 17-Mar-2014 | | | | A$61.67 | | | | 16,326 | | | | – | | | | – | | | | – | | | | – | | | | 16,326 | | | | 16,326 | | | | 31-Dec-2018 | | | | – | | | | – | | | | – | |
| | | 23-Mar-2015 | | | | A$58.21 | | | | 17,658 | | | | – | | | | – | | | | – | | | | – | | | | 17,658 | | | | 17,658 | | | | 31-Dec-2019 | | | | – | | | | – | | | | – | |
| | | | 11-Mar-2016 | | | | A$44.57 | | | | – | | | | 20,230 | | | | – | | | | – | | | | – | | | | 20,230 | | | | 20,230 | | | | 31-Dec-2020 | | | | – | | | | – | | | | – | |
| Debra Valentine (e) | | | 19-Mar-2012 | | | | £36.15 | | | | 21,257 | | | | – | | | | -7,355 | | | | – | | | | 13,902 | | | | – | | | | – | | | | 31-Dec-2015 | | | | 29-Feb-2016 | | | | £18.25 | | | | 344,013 | |
| | | 27-May-2013 | | | | £28.67 | | | | 26,274 | | | | – | | | | -26,274 | | | | – | | | | – | | | | – | | | | – | | | | 18-Nov-2016 | | | | – | | | | – | | | | – | |
| | | 27-May-2013 | | | | £28.67 | | | | 26,275 | | | | – | | | | -26,275 | | | | – | | | | – | | | | – | | | | – | | | | 18-Nov-2016 | | | | – | | | | – | | | | – | |
| | | 17-Mar-2014 | | | | £31.54 | | | | 55,522 | | | | – | | | | -55,522 | | | | – | | | | – | | | | – | | | | – | | | | 18-Nov-2016 | | | | – | | | | – | | | | – | |
| | | 23-Mar-2015 | | | | £29.43 | | | | 52,942 | | | | – | | | | -52,942 | | | | – | | | | – | | | | – | | | | – | | | | 18-Nov-2016 | | | | – | | | | – | | | | – | |
| | | | 11-Mar-2016 | | | | £20.00 | | | | – | | | | 65,693 | | | | -65,693 | | | | – | | | | – | | | | – | | | | – | | | | 18-Nov-2016 | | | | – | | | | – | | | | – | |
| Sam Walsh (e)(f) | | | 19-Mar-2012 | | | | A$65.85 | | | | 63,540 | | | | – | | | | -21,985 | | | | – | | | | 41,555 | | | | – | | | | – | | | | 31-Dec-2015 | | | | 19-Feb-2016 | | | | A$43.09 | | | | 1,332,318 | |
| | | 27-May-2013 | | | | A$53.11 | | | | 66,627 | | | | – | | | | – | | | | – | | | | – | | | | N/A | | | | N/A | | |
| 31-Dec-2018 /
31-Dec-2020 |
| | | N/A | | | | N/A | | | | N/A | |
| | | 27-May-2013 | | | | A$53.11 | | | | 66,628 | | | | – | | | | – | | | | – | | | | – | | | | N/A | | | | N/A | | |
| 31-Dec-2018 /
31-Dec-2020 |
| | | N/A | | | | N/A | | | | N/A | |
| | | 17-Mar-2014 | | | | A$61.67 | | | | 134,026 | | | | – | | | | -31,549 | | | | – | | | | – | | | | N/A | | | | N/A | | | | 31-Dec-2020 | | | | N/A | | | | N/A | | | | N/A | |
| | | 23-Mar-2015 | | | | A$58.21 | | | | 138,010 | | | | – | | | | -79,204 | | | | – | | | | – | | | | N/A | | | | N/A | | | | 31-Dec-2020 | | | | N/A | | | | N/A | | | | N/A | |
| | | | 11-Mar-2016 | | | | A$44.57 | | | | – | | | | 147,076 | | | | -131,912 | | | | – | | | | – | | | | N/A | | | | N/A | | | | 31-May-2021 | | | | N/A | | | | N/A | | | | N/A | |
| | | | |
| 104 | | riotinto.com | | 2016 Annual report |
[THIS PAGE IS INTENTIONALLY LEFT BLANK]
| | | | |
| 2016 Annual report | | riotinto.com | | 105 |
| | | | | | | | | | | | | | | | |
| | | | | | | | | |
| STRATEGIC REPORT | | | | DIRECTORS’ REPORT REMUNERATION REPORT: IMPLEMENTATION REPORT | | | | FINANCIAL STATEMENTS | | | | PRODUCTION, RESERVES AND OPERATIONS | | | | ADDITIONAL INFORMATION |
Remuneration Report: Implementation Report
continued
Table 3 – Plan interests (awards of shares and options under long-term incentive plans) (continued)
| | | | | | | | | | | | | | | | | | | | | | | | | | |
| Name | | Date Of Grant | | | 01 January
2016(a) | | | Vested
During 2016 | | | Exercised | | | Lapsed/
Cancelled | | | Vested And
Exercisable
On 31 Dec
2016(b) | | | |
| Share Savings Plan(h) | | | |
| Hugo Bague | | | 04-Oct-2011 | | | | 425 | | | | – | | | | – | | | | – | | | | 425 | | | |
| Andrew Harding (e) | | | 05-Oct-2010 | | | | 555 | | | | – | | | | – | | | | -555 | | | | – | | | |
| Greg Lilleyman (e) | | | 05-Oct-2010 | | | | 555 | | | | – | | | | – | | | | -555 | | | | – | | | |
| Share Option Plan (h) | | | | | | | | | | | | | | | | | | | | | | | | | | |
| Hugo Bague | | | 22-Mar-2010 | | | | 47,297 | | | | – | | | | | | | | – | | | | 47,297 | | | |
| | | 06-May-2011 | | | | 34,415 | | | | – | | | | – | | | | – | | | | 34,415 | | | |
| | | | 19-Mar-2012 | | | | 33,085 | | | | – | | | | – | | | | – | | | | 33,085 | | | |
| Joanne Farrell | | | 07-Mar-2006 | | | | 3,666 | | | | – | | | | – | | | | -3,666 | | | | – | | | |
| Andrew Harding (e) | | | 17-Mar-2009 | | | | 6,268 | | | | – | | | | – | | | | – | | | | N/A | | | |
| | | 22-Mar-2010 | | | | 46,597 | | | | – | | | | – | | | | – | | | | N/A | | | |
| | | 06-May-2011 | | | | 34,829 | | | | – | | | | – | | | | – | | | | N/A | | | |
| | | | 19-Mar-2012 | | | | 33,585 | | | | – | | | | – | | | | – | | | | N/A | | | |
| Stephen McIntosh | | | 07-Mar-2006 | | | | 1,553 | | | | – | | | | – | | | | -1,553 | | | | – | | | |
| | | | 17-Mar-2009 | | | | 2,951 | | | | – | | | | – | | | | – | | | | 2,951 | | | |
| Chris Salisbury | | | 17-Mar-2009 | | | | 3,335 | | | | – | | | | – | | | | – | | | | 3,335 | | | |
| Debra Valentine (e) | | | 17-Mar-2009 | | | | 13,558 | | | | – | | | | – | | | | -13,558 | | | | – | | | |
| | | 22-Mar-2010 | | | | 47,831 | | | | – | | | | – | | | | -47,831 | | | | – | | | |
| | | 06-May-2011 | | | | 33,830 | | | | – | | | | – | | | | -33,830 | | | | – | | | |
| | | | 19-Mar-2012 | | | | 31,886 | | | | – | | | | – | | | | -31,886 | | | | – | | | |
| Sam Walsh(e) | | | 07-Mar-2006 | | | | 48,079 | | | | – | | | | – | | | | -48,079 | | | | – | | | |
| | | 17-Mar-2009 | | | | 40,005 | | | | – | | | | N/A | | | | – | | | | N/A | | | |
| | | | 22-Mar-2010 | | | | 83,763 | | | | – | | | | – | | | | – | | | | N/A | | | |
| | (a) | Awards and options denominated in pounds sterling were for Rio Tinto plc ordinary shares of 10 pence each and awards denominated in Australian dollars were for Rio Tinto Limited shares. All options are granted over ordinary shares. Each option is granted over one share at no cost to participants. Where an exercise price is stated, it represents the amount payable per share on the exercise of each option by participants. | |
| | (b) | The weighted fair value per share of conditional awards granted in 2016 under the BDP was £19.54 for Rio Tinto plc and A$44.56 for Rio Tinto Limited and for PSP was £12.92 for Rio Tinto plc and A$28.66 for Rio Tinto Limited. Conditional awards are awarded at no cost to the recipient and no amount remains unpaid on any shares awarded. | |
| | (c) | Details of performance conditions for the PSP are provided below. | |
For 2012 awards, the awards had a four-year performance period and from 2014, awards have a five-year performance period commencing on 1 January of the year of grant. For 2013 awards only, 50 per cent of the award granted will be measured against the performance conditions after four years (at the end of 2016) and 50 per cent of the awards granted will be measured against the performance conditions after five years (at the end of 2017).
For 2012 awards, subject to the “mix” chosen, awards had a maximum face value of 292 per cent of base salary with the potential for 1.5 times of this value, ie 438 per cent of base salary, for outstanding performance. The expected value of the 2012 awards was 190 per cent of base salary. For awards granted from 2013, awards have a maximum face value of 438 per cent of base salary and a maximum expected value of 219 per cent of base salary. The actual award levels granted from 2013 vary by executive.
For 2012 awards, conditional share awards vested in 2016 subject to the achievement of a stretching TSR performance condition, comparing Rio Tinto’s TSR performance against:
– 50 per cent: the Euromoney Global Mining Index
– 50 per cent: the Morgan Stanley Capital World Index (MSCI)
Vesting of awards made in 2012 was as follows:
| | |
| Out-performance of the index by 8 per cent per annum | | 1.5x award vests |
| Performance between index and 8 per cent out-performance | | Proportionate vesting for performance between index and 8 per cent out-performance of the index |
| Out-performance of the index by approximately 5 per cent per annum | | 1.0x award vests |
| Performance equal to index | | 0.35x award vests |
| Performance less than index | | Nil vesting |
For awards granted from 2013, for the TSR component (constituting two-thirds of the award), where TSR performance is measured against both the Euromoney Global Mining Index and the Morgan Stanley Capital World Index, the award will vest as follows:
| | |
| Out-performance of the index by 6 per cent per annum | | 1.0x award vests |
| Performance between equal to the index and 6 per cent out-performance | | Proportionate vesting between 0.225x and 1.0x vesting |
| Performance equal to index | | 0.225x award vests |
| Performance less than index | | Nil vesting |
For the EBIT margin measure (constituting one-third of the award), change in the EBIT margin of Rio Tinto and each of the comparator companies (measured on a “point-to-point” basis using the last financial year in the performance period and the financial year prior to the start of the performance period) will be calculated using independent third-party data. Vesting will be subject to Rio Tinto’s interpolated ranking position using the following schedule.
| | |
| Equal to or greater than 2nd ranked company | | 1.0x award vests |
| Between the 5th and 2nd ranked companies | | Proportionate vesting between 0.225x and 1.0x vesting |
| Above the 6th ranked company | | 0.225x award vests |
| Equal to the 6th ranked company or below | | Nil vesting |
For awards granted in 2012, a cash payment was paid equal to the dividends that would have been received had the number of shares which vested at the end of the performance period been held throughout the performance period. For awards granted from 2013, if vesting is achieved, participants will be entitled to receive a number of additional shares whose market value reflects the aggregate cash amount of dividends that would have been received had the number of shares which have vested at the end of the performance period been held throughout the period.
| | | | |
| 106 | | riotinto.com | | 2016 Annual report |
Table 3 – Plan interests (awards of shares and options under long-term incentive plans) (continued)
| | | | | | | | | | | | | | | | | | | | | | | | | | | | | | | | | | |
| | | Name | | 31 December
2016 | | | Vested And
Exercisable On
15 February
2017 | | | 15 February
2017 | | | Exercise
Price | | | Value Of Options
Exercised
During 2016 | | | Market Price
On Date Of
Exercise | | | Date From
Which First
Exercisable | | | Expiry Date | |
| | | Share Savings Plan(h) | |
| | | Hugo Bague | | | 425 | | | | – | | | | – | | | £ | 28.630 | | | | – | | | | – | | | | 01-Jan-2017 | | | | 01-Jul-2017 | |
| | | Andrew Harding (e) | | | – | | | | – | | | | – | | | £ | 27.810 | | | | – | | | | – | | | | 01-Jan-2016 | | | | 01-Jul-2016 | |
| | | Greg Lilleyman (e) | | | – | | | | – | | | | – | | | A$ | 59.260 | | | | – | | | | – | | | | 01-Jan-2016 | | | | 01-Jul-2016 | |
| | | Share Option Plan (h) | | | | | | | | | | | | | | | | | | | | | | | | | | | | | | | | |
| | Hugo Bague | | | 47,297 | | | | 47,297 | | | | 47,297 | | | £ | 37.050 | | | | – | | | | – | | | | 22-Mar-2013 | | | | 22-Mar-2020 | |
| | | | | 34,415 | | | | 34,415 | | | | 34,415 | | | £ | 42.450 | | | | – | | | | – | | | | 06-May-2014 | | | | 06-May-2021 | |
| | | | | | 33,085 | | | | 33,085 | | | | 33,085 | | | £ | 35.179 | | | | – | | | | – | | | | 19-Mar-2015 | | | | 19-Mar-2022 | |
| | | Joanne Farrell | | | – | | | | – | | | | – | | | A$ | 54.951 | | | | – | | | | – | | | | 07-Mar-2009 | | | | 07-Mar-2016 | |
| | Andrew Harding (e) | | | N/A | | | | N/A | | | | N/A | | | A$ | 33.451 | | | | N/A | | | | N/A | | | | 17-Mar-2012 | | | | 02-Jul-2017 | |
| | | | | N/A | | | | N/A | | | | N/A | | | A$ | 76.150 | | | | N/A | | | | N/A | | | | 22-Mar-2013 | | | | 02-Jul-2017 | |
| | | | | N/A | | | | N/A | | | | N/A | | | £ | 42.450 | | | | N/A | | | | N/A | | | | 06-May-2014 | | | | 02-Jul-2017 | |
| | | | | | N/A | | | | N/A | | | | N/A | | | £ | 35.179 | | | | N/A | | | | N/A | | | | 19-Mar-2015 | | | | 02-Jul-2017 | |
| | Stephen McIntosh | | | – | | | | – | | | | – | | | £ | 22.397 | | | | – | | | | – | | | | 07-Mar-2009 | | | | 07-Mar-2016 | |
| | | | | | 2,951 | | | | 2,951 | | | | 2,951 | | | £ | 16.530 | | | | – | | | | – | | | | 17-Mar-2012 | | | | 17-Mar-2019 | |
| | | Chris Salisbury | | | 3,335 | | | | 3,335 | | | | 3,335 | | | A$ | 33.451 | | | | – | | | | – | | | | 17-Mar-2012 | | | | 17-Mar-2019 | |
| | Debra Valentine (e) | | | – | | | | – | | | | – | | | £ | 16.530 | | | | – | | | | – | | | | 17-Mar-2012 | | | | 18-Nov-2016 | |
| | | | | – | | | | – | | | | – | | | £ | 37.050 | | | | – | | | | – | | | | 22-Mar-2013 | | | | 18-Nov-2016 | |
| | | | | – | | | | – | | | | – | | | £ | 42.450 | | | | – | | | | – | | | | 06-May-2014 | | | | 18-Nov-2016 | |
| | | | | | – | | | | – | | | | – | | | £ | 35.179 | | | | – | | | | – | | | | 19-Mar-2015 | | | | 18-Nov-2016 | |
| | Sam Walsh(e) | | | – | | | | – | | | | – | | | A$ | 54.951 | | | | – | | | | – | | | | 07-Mar-2009 | | | | 07-Mar-2016 | |
| | | | | N/A | | | | N/A | | | | N/A | | | A$ | 33.451 | | | | N/A | | | | N/A | | | | 17-Mar-2012 | | | | 02-Jul-2017 | |
| | | | | | N/A | | | | N/A | | | | N/A | | | A$ | 76.150 | | | | N/A | | | | N/A | | | | 22-Mar-2013 | | | | 02-Jul-2017 | |
| | (d) | The amount in US dollars has been converted at the rate of US$1.35616=£1 and US$0.74406= A$1, being the average exchange rates for 2016. |
| | (e) | Hugo Bague stepped down from the Executive Committee on 31 December 2016; Alan Davies stepped down from the Executive Committee on 18 November 2016; Andrew Harding stepped down from the Executive Committee on 01 July 2016; Greg Lilleyman stepped down from the Executive Committee on 01 July 2016; Deborah Valentine stepped down from the Executive Committee on 18 November 2016; Sam Walsh stepped down from the Board and the Executive Committee on 01 July 2016. |
| | (f) | Details of the Deferral agreement for Sam Walsh are included in the Implementation report |
| | (g) | For the 2013 PSP awards granted on 27 May 2013 with a performance period that concluded on 31 December 2016, 24.67 per cent of the award vested in relation to the TSR portion of the award. The remaining performance condition of relative EBIT margin will be assesed later in 2017. |
| | (h) | No options have been granted to executives since 19 March 2012. |
The closing price at 31 December 2016 was £31.585 for Rio Tinto Plc ordinary shares and was A$59.90 for Rio Tinto Limited ordinary shares. The high and low prices during 2016 of Rio Tinto plc and Rio Tinto Limited shares were £33.405 and £15.57 and A$63.44 and A$36.53 respectively.
As of 15 February 2017, members of the Executive Committee held 1,711,908 shares awarded and not vested under long-term incentive plans and 121,083 options to acquire Rio Tinto plc and Rio Tinto Limited shares.
| | | | |
| 2016 Annual report | | riotinto.com | | 107 |
| | | | | | | | | | | | | | | | |
| | | | | | | | | |
| STRATEGIC REPORT | | | | DIRECTORS’ REPORT REMUNERATION REPORT: IMPLEMENTATION REPORT | | | | FINANCIAL STATEMENTS | | | | PRODUCTION, RESERVES AND OPERATIONS | | | | ADDITIONAL INFORMATION |
Audited information
Under Schedule 8 of the Large and Medium-sized Companies and Groups (Accounts and Reports) Regulations 2008 (as amended), the information included in respect of: the single total figure of remuneration for each director as set out on pages 81 and 84 and Table 1b on page 100; details of the directors’ total pension entitlements as set out on pages 83 and 85; details of scheme interests awarded to the directors during the financial year as set out on pages 82 and 85 and Table 3 on pages 102 to 104; details of payments to past directors as set out on pages 85 and 86; and the statement of the directors’ shareholdings and share interests, as set out in Tables 2 and 3 on pages 101 to 107 of the Implementation Report are all auditable. The Australian Securities and Investments Commission issued an order dated 14 December 2015 under which the Remuneration Report must be prepared and audited in accordance with the requirements of the Corporations Act 2001 applied on the basis of certain modifications set out in the order (as detailed on page 205). The information provided in the Remuneration Report has been audited as required by section 308 (3C) of the Corporations Act.
Going concern
The directors, having made appropriate enquiries, have satisfied themselves that it is appropriate to adopt the going concern basis of accounting in preparing the financial statements. Additionally the directors have considered longer-term viability and their statement in this regard may be found on page 15.
Annual general meetings
The 2017 annual general meetings will be held on 12 April in London and 4 May in Sydney. Separate notices of the 2017 annual general meetings are produced for the shareholders of each Company.
Directors’ approval statement
The Directors’ report is delivered in accordance with a resolution of the board.
|
|
Jan du Plessis Chairman |
|
| 1 March 2017 |
| | | | |
| 108 | | riotinto.com | | 2016 Annual report |
2016 financial statements
| | | | |
| 2016 Annual report | | riotinto.com | | 109 |
| | | | | | | | | | | | | | | | |
| | | | | | | | | |
| STRATEGIC REPORT | | | | DIRECTORS’ REPORT | | | | FINANCIAL STATEMENTS | | | | METALS AND MINERALS PRODUCTION | | | | ADDITIONAL INFORMATION |
Group income statement
Years ended 31 December
| | | | | | | | | | | | | | | | |
| | | Note | | | 2016
US$m | | | 2015
US$m | | | 2014
US$m | |
| Consolidated operations | | | | | | | | | | | | | | | | |
| Consolidated sales revenue | | | 2,3 | | | | 33,781 | | | | 34,829 | | | | 47,664 | |
| Net operating costs (excluding items shown separately) | | | 4 | | | | (26,799 | ) | | | (27,919 | ) | | | (33,910 | ) |
| Impairment charges net of reversals | | | 6 | | | | (249 | ) | | | (2,791 | ) | | | (1,062 | ) |
| Net gains/(losses) on disposal of interests in businesses | | | 2,37 | | | | 515 | | | | 64 | | | | (563 | ) |
| Exploration and evaluation costs | | | 13 | | | | (497 | ) | | | (576 | ) | | | (747 | ) |
| Profit/(loss) relating to interests in undeveloped projects | | | 13 | | | | 44 | | | | 8 | | | | (36 | ) |
| Operating profit | | | | | | | 6,795 | | | | 3,615 | | | | 11,346 | |
| Share of profit after tax of equity accounted units | | | 7 | | | | 321 | | | | 361 | | | | 625 | |
| Impairment reversals of investments in equity accounted units after tax | | | 6 | | | | – | | | | – | | | | 589 | |
| Profit before finance items and taxation | | | | | | | 7,116 | | | | 3,976 | | | | 12,560 | |
| Finance items | | | | | | | | | | | | | | | | |
| Net exchange gains/(losses) on external debt and intragroup balances | | | 24 | | | | 611 | | | | (3,538 | ) | | | (1,995 | ) |
| Net losses on derivatives not qualifying for hedge accounting | | | | | | | (24 | ) | | | (88 | ) | | | (46 | ) |
| Finance income | | | 8 | | | | 89 | | | | 52 | | | | 64 | |
| Finance costs | | | 8 | | | | (1,111 | ) | | | (750 | ) | | | (649 | ) |
| Amortisation of discount | | | | | | | (338 | ) | | | (378 | ) | | | (382 | ) |
| | | | | | | | (773 | ) | | | (4,702 | ) | | | (3,008 | ) |
| Profit/(loss) before taxation | | | | | | | 6,343 | | | | (726 | ) | | | 9,552 | |
| Taxation | | | 9 | | | | (1,567 | ) | | | (993 | ) | | | (3,053 | ) |
| Profit/(loss) after tax for the year | | | | | | | 4,776 | | | | (1,719 | ) | | | 6,499 | |
| – attributable to owners of Rio Tinto (net earnings/(loss)) | | | | | | | 4,617 | | | | (866 | ) | | | 6,527 | |
| – attributable tonon-controlling interests (net earnings/(loss)) | | | | | | | 159 | | | | (853 | ) | | | (28 | ) |
| | | | |
| Basic earnings/(loss) per share | | | 10 | | | | 256.9c | | | | (47.5 | )c | | | 353.1c | |
| Diluted earnings/(loss) per share | | | 10 | | | | 255.3c | | | | (47.5 | )c | | | 351.2c | |
The notes on pages 116 to 194 are an integral part of these consolidated financial statements.
| | | | |
| 110 | | riotinto.com | | 2016 Annual report |
Group statement of comprehensive income
Years ended 31 December
| | | | | | | | | | | | | | | | |
| | | Note | | | 2016
US$m | | | 2015
US$m | | | 2014
US$m | |
| Profit/(loss) after tax for the year | | | | | | | 4,776 | | | | (1,719 | ) | | | 6,499 | |
| | | | |
| Other comprehensive (loss)/income: | | | | | | | | | | | | | | | | |
| Items that will not be reclassified to profit or loss: | | | | | | | | | | | | | | | | |
| Actuarial (losses)/gains on post retirement benefit plans | | | 45 | | | | (90 | ) | | | 619 | | | | (735 | ) |
| Tax relating to these components of other comprehensive (loss)/income | | | 9 | | | | 29 | | | | (175 | ) | | | 215 | |
| | | | | | | | (61 | ) | | | 444 | | | | (520 | ) |
| | | | |
| Items that have been/may be subsequently reclassified to profit or loss: | | | | | | | | | | | | | | | | |
| Currency translation adjustment(a) | | | | | | | (157 | ) | | | (2,395 | ) | | | (2,004 | ) |
| Currency translation on companies disposed of, transferred to the income statement | | | | | | | 99 | | | | (2 | ) | | | 53 | |
| Fair value movements: | | | | | | | | | | | | | | | | |
| – Cash flow hedge losses | | | | | | | (88 | ) | | | (41 | ) | | | (48 | ) |
| – Cash flow hedge losses transferred to the income statement | | | | | | | 116 | | | | 32 | | | | 55 | |
| – Gains/(losses) on revaluation of available for sale securities | | | | | | | 13 | | | | (19 | ) | | | (36 | ) |
| – Losses on revaluation of available for sale securities transferred to the income statement | | | | | | | – | | | | 11 | | | | 6 | |
| Tax relating to these components of other comprehensive (loss)/income | | | 9 | | | | 4 | | | | (3 | ) | | | (9 | ) |
| Share of other comprehensive income/(loss) of equity accounted units, net of tax | | | | | | | 11 | | | | (57 | ) | | | (44 | ) |
| Other comprehensive loss for the year, net of tax | | | | | | | (63 | ) | | | (2,030 | ) | | | (2,547 | ) |
| Total comprehensive income/(loss) for the year | | | | | | | 4,713 | | | | (3,749 | ) | | | 3,952 | |
| – attributable to owners of Rio Tinto | | | | | | | 4,504 | | | | (2,443 | ) | | | 4,322 | |
| – attributable tonon-controlling interests | | | | | | | 209 | | | | (1,306 | ) | | | (370 | ) |
| (a) | Excludes a currency translation charge of US$35 million (2015: US$503 million; 2014: US$376 million) arising on Rio Tinto Limited’s share capital for the year ended 31 December 2016, which is recognised in the Group statement of changes in equity. Refer to Group statement of changes in equity on page 114. |
The notes on pages 116 to 194 are an integral part of these consolidated financial statements.
| | | | |
| 2016 Annual report | | riotinto.com | | 111 |
| | | | | | | | | | | | | | | | |
| | | | | | | | | |
| STRATEGIC REPORT | | | | DIRECTORS’ REPORT | | | | FINANCIAL STATEMENTS | | | | METALS AND MINERALS PRODUCTION | | | | ADDITIONAL INFORMATION |
Group cash flow statement
Years ended 31 December
| | | | | | | | | | | | | | | | |
| | | Note | | | 2016
US$m | | | 2015
US$m | | | 2014
US$m | |
| Cash flows from consolidated operations (a) | | | | | | | 11,368 | | | | 12,102 | | | | 18,896 | |
| Dividends from equity accounted units | | | | | | | 253 | | | | 210 | | | | 298 | |
| Cash flows from operations | | | | | | | 11,621 | | | | 12,312 | | | | 19,194 | |
| | | | |
| Net interest paid | | | | | | | (1,294 | ) | | | (827 | ) | | | (981 | ) |
| Dividends paid to holders ofnon-controlling interests in subsidiaries | | | | | | | (341 | ) | | | (310 | ) | | | (309 | ) |
| Tax paid | | | | | | | (1,521 | ) | | | (1,792 | ) | | | (3,618 | ) |
| Net cash generated from operating activities | | | | | | | 8,465 | | | | 9,383 | | | | 14,286 | |
| | | | |
| Cash flows from investing activities | | | | | | | | | | | | | | | | |
| Purchases of property, plant and equipment and intangible assets | | | 2 | | | | (3,012 | ) | | | (4,685 | ) | | | (8,162 | ) |
| Disposals of subsidiaries, joint ventures and associates | | | 37 | | | | 761 | | | | (38 | ) | | | 887 | |
| Purchases of financial assets | | | | | | | (789 | ) | | | (49 | ) | | | (24 | ) |
| Sales of financial assets | | | | | | | 582 | | | | 65 | | | | 172 | |
| Sales of property, plant and equipment and intangible assets | | | | | | | 354 | | | | 97 | | | | 744 | |
| Net funding of equity accounted units | | | | | | | (12 | ) | | | 11 | | | | (117 | ) |
| Acquisitions of subsidiaries, joint ventures and associates | | | 37 | | | | – | | | | (3 | ) | | | – | |
| Other investing cash flows | | | | | | | 12 | | | | 2 | | | | (3 | ) |
| Net cash used in investing activities | | | | | | | (2,104 | ) | | | (4,600 | ) | | | (6,503 | ) |
| | | | |
| Cash flows before financing activities | | | | | | | 6,361 | | | | 4,783 | | | | 7,783 | |
| | | | |
| Cash flows from financing activities | | | | | | | | | | | | | | | | |
| Equity dividends paid to owners of Rio Tinto | | | 11 | | | | (2,725 | ) | | | (4,076 | ) | | | (3,710 | ) |
| Proceeds from additional borrowings | | | | | | | 4,413 | | | | 1,837 | | | | 442 | |
| Repayment of borrowings | | | | | | | (9,361 | ) | | | (3,518 | ) | | | (3,476 | ) |
| Proceeds from issue of equity tonon-controlling interests | | | | | | | 101 | | | | 103 | | | | 1,291 | |
| Own shares purchased from owners of Rio Tinto | | | | | | | – | | | | (2,028 | ) | | | – | |
| Purchase ofnon-controlling interests | | | 37 | | | | (23 | ) | | | – | | | | – | |
| Other financing cash flows | | | | | | | 104 | | | | 12 | | | | 17 | |
| Net cash flows used in financing activities | | | | | | | (7,491 | ) | | | (7,670 | ) | | | (5,436 | ) |
| Effects of exchange rates on cash and cash equivalents | | | | | | | (35 | ) | | | (159 | ) | | | (156 | ) |
| Net (decrease)/increase in cash and cash equivalents | | | | | | | (1,165 | ) | | | (3,046 | ) | | | 2,191 | |
| Opening cash and cash equivalents less overdrafts | | | | | | | 9,354 | | | | 12,400 | | | | 10,209 | |
| Closing cash and cash equivalents less overdrafts | | | 21 | | | | 8,189 | | | | 9,354 | | | | 12,400 | |
| | | | |
| (a) Cash flows from consolidated operations | | | | | | | | | | | | | | | | |
| Profit/(loss) after tax for the year | | | | | | | 4,776 | | | | (1,719 | ) | | | 6,499 | |
| Adjustments for: | | | | | | | | | | | | | | | | |
| – Taxation | | | | | | | 1,567 | | | | 993 | | | | 3,053 | |
| – Finance items | | | | | | | 773 | | | | 4,702 | | | | 3,008 | |
| – Share of profit after tax of equity accounted units | | | | | | | (321 | ) | | | (361 | ) | | | (625 | ) |
| – Impairment charges net of reversals of investments in equity accounted units after tax | | | 6 | | | | – | | | | – | | | | (589 | ) |
| – Net (gains)/losses on disposal of interests in businesses | | | 37 | | | | (515 | ) | | | (64 | ) | | | 563 | |
| – Impairment charges net of reversals | | | 6 | | | | 249 | | | | 2,791 | | | | 1,062 | |
| – Depreciation and amortisation | | | | | | | 4,794 | | | | 4,645 | | | | 4,860 | |
| – Provisions (including exchange differences on provisions) | | | 26 | | | | 1,417 | | | | 726 | | | | 712 | |
| Utilisation of provisions | | | 26 | | | | (627 | ) | | | (585 | ) | | | (973 | ) |
| Utilisation of provision for post-retirement benefits | | | 26 | | | | (370 | ) | | | (230 | ) | | | (296 | ) |
| Change in inventories | | | | | | | 292 | | | | 526 | | | | 937 | |
| Change in trade and other receivables | | | | | | | (794 | ) | | | 1,404 | | | | 962 | |
| Change in trade and other payables | | | | | | | 229 | | | | (431 | ) | | | (380 | ) |
| Other items(b) | | | | | | | (102 | ) | | | (295 | ) | | | 103 | |
| | | | | | | | 11,368 | | | | 12,102 | | | | 18,896 | |
| (b) | Includes a cash outflow of US$29 million (2015: outflow of US$227 million; 2014: inflow of US$66 million) mainly relating to derivative contracts transacted for operational purposes and not designated in a hedge relationship. |
The notes on pages 116 to 194 are an integral part of these consolidated financial statements.
| | | | |
| 112 | | riotinto.com | | 2016 Annual report |
Group balance sheet
At 31 December
| | | | | | | | | | | | |
| | | Note | | | 2016
US$m | | | 2015
US$m | |
| Non-current assets | | | | | | | | | | | | |
| Goodwill | | | 12 | | | | 951 | | | | 892 | |
| Intangible assets | | | 13 | | | | 3,279 | | | | 3,336 | |
| Property, plant and equipment | | | 14 | | | | 58,855 | | | | 61,057 | |
| Investments in equity accounted units | | | 15 | | | | 5,019 | | | | 4,941 | |
| Inventories | | | 16 | | | | 143 | | | | 253 | |
| Deferred tax assets | | | 17 | | | | 3,728 | | | | 3,309 | |
| Trade and other receivables | | | 18 | | | | 1,342 | | | | 1,356 | |
| Tax recoverable | | | | | | | 38 | | | | 78 | |
| Other financial assets (including loans to equity accounted units) | | | 20 | | | | 822 | | | | 788 | |
| | | | | | | 74,177 | | | | 76,010 | |
| | | |
| Current assets | | | | | | | | | | | | |
| Inventories | | | 16 | | | | 2,937 | | | | 3,168 | |
| Trade and other receivables | | | 18 | | | | 3,460 | | | | 2,386 | |
| Tax recoverable | | | | | | | 98 | | | | 118 | |
| Other financial assets (including loans to equity accounted units) | | | 20 | | | | 359 | | | | 223 | |
| Cash and cash equivalents | | | 21 | | | | 8,201 | | | | 9,366 | |
| | | | | | | 15,055 | | | | 15,261 | |
| Assets of disposal groups held for sale | | | 19 | | | | 31 | | | | 293 | |
| Total assets | | | | | | | 89,263 | | | | 91,564 | |
| | | |
| Current liabilities | | | | | | | | | | | | |
| Borrowings and other financial liabilities | | | 22 | | | | (922 | ) | | | (2,484 | ) |
| Trade and other payables | | | 25 | | | | (6,361 | ) | | | (6,237 | ) |
| Tax payable | | | | | | | (764 | ) | | | (135 | ) |
| Provisions including post-retirement benefits | | | 26 | | | | (1,315 | ) | | | (1,190 | ) |
| | | | | | | (9,362 | ) | | | (10,046 | ) |
| | | |
| Non-current liabilities | | | | | | | | | | | | |
| Borrowings and other financial liabilities | | | 22 | | | | (17,470 | ) | | | (21,140 | ) |
| Trade and other payables | | | 25 | | | | (789 | ) | | | (682 | ) |
| Tax payable | | | | | | | (274 | ) | | | (295 | ) |
| Deferred tax liabilities | | | 17 | | | | (3,121 | ) | | | (3,286 | ) |
| Provisions including post-retirement benefits | | | 26 | | | | (12,479 | ) | | | (11,876 | ) |
| | | | | | | (34,133 | ) | | | (37,279 | ) |
| Liabilities of disposal groups held for sale | | | 19 | | | | (38 | ) | | | (111 | ) |
| Total liabilities | | | | | | | (43,533 | ) | | | (47,436 | ) |
| Net assets | | | | | | | 45,730 | | | | 44,128 | |
| | | |
| Capital and reserves | | | | | | | | | | | | |
| Share capital | | | | | | | | | | | | |
| – Rio Tinto plc | | | 27 | | | | 224 | | | | 224 | |
| – Rio Tinto Limited | | | 28 | | | | 3,915 | | | | 3,950 | |
| Share premium account | | | | | | | 4,304 | | | | 4,300 | |
| Other reserves | | | 29 | | | | 9,216 | | | | 9,139 | |
| Retained earnings | | | 29 | | | | 21,631 | | | | 19,736 | |
| Equity attributable to owners of Rio Tinto | | | | | | | 39,290 | | | | 37,349 | |
| Attributable tonon-controlling interests | | | | | | | 6,440 | | | | 6,779 | |
| Total equity | | | | | | | 45,730 | | | | 44,128 | |
The notes on pages 116 to 194 are an integral part of these consolidated financial statements.
The financial statements on pages 109 to 194 were approved by the directors on 1 March 2017 and signed on their behalf by
| | | | | | | | | | |
| Jan du Plessis | | | | | | Jean-Sébastien Jacques | | | | Chris Lynch |
| Chairman | | | | | | Chief executive | | | | Chief financial officer |
| | | | |
| 2016 Annual report | | riotinto.com | | 113 |
| | | | | | | | | | | | | | | | |
| | | | | | | | | |
| STRATEGIC REPORT | | | | DIRECTORS’ REPORT | | | | FINANCIAL STATEMENTS | | | | METALS AND MINERALS PRODUCTION | | | | ADDITIONAL INFORMATION |
Group statement of changes in equity
| | | | | | | | | | | | | | | | | | | | | | | | | | | | |
| | | Attributable to owners of Rio Tinto | | | | | | | |
| Year ended 31 December 2016 | | Share
capital
(notes 27 and 28)
US$m | | | Share
premium
US$m | | | Other
reserves
(note 29)
US$m | | | Retained
earnings
(note 29)
US$m | | | Total
US$m | | | Non-
controlling
interests
US$m | | | Total
equity
US$m | |
| Opening balance | | | 4,174 | | | | 4,300 | | | | 9,139 | | | | 19,736 | | | | 37,349 | | | | 6,779 | | | | 44,128 | |
| Total comprehensive income for the year (a) | | | – | | | | – | | | | (49 | ) | | | 4,553 | | | | 4,504 | | | | 209 | | | | 4,713 | |
| Currency translation arising on Rio Tinto Limited’s share capital(b) | | | (35 | ) | | | – | | | | – | | | | – | | | | (35 | ) | | | – | | | | (35 | ) |
| Dividends | | | – | | | | – | | | | – | | | | (2,725 | ) | | | (2,725 | ) | | | (352 | ) | | | (3,077 | ) |
| Companies no longer consolidated | | | – | | | | – | | | | – | | | | – | | | | – | | | | 8 | | | | 8 | |
| Own shares purchased from Rio Tinto shareholders to satisfy share options | | | – | | | | – | | | | (43 | ) | | | (37 | ) | | | (80 | ) | | | – | | | | (80 | ) |
| Change in equity interest held by Rio Tinto (c) | | | – | | | | – | | | | 108 | | | | 40 | | | | 148 | | | | (313 | ) | | | (165 | ) |
| Treasury shares reissued and other movements | | | – | | | | 4 | | | | – | | | | – | | | | 4 | | | | – | | | | 4 | |
| Equity issued to holders ofnon-controlling interests | | | – | | | | – | | | | – | | | | – | | | | – | | | | 109 | | | | 109 | |
| Employee share options and other IFRS 2charges to the income statement | | | – | | | | – | | | | 61 | | | | 64 | | | | 125 | | | | – | | | | 125 | |
| Closing balance | | | 4,139 | | | | 4,304 | | | | 9,216 | | | | 21,631 | | | | 39,290 | | | | 6,440 | | | | 45,730 | |
| | | | | | | | | | | | | | | | | | | | | | | | | | | | |
| | | Attributable to owners of Rio Tinto | | | | | | | |
| Year ended 31 December 2015 | | Share
capital
(notes 27 and 28)
US$m | | | Share
premium
US$m | | | Other
reserves
(note 29)
US$m | | | Retained
earnings
(note 29)
US$m | | | Total
US$m | | | Non-
controlling
interests
US$m | | | Total
equity
US$m | |
| Opening balance | | | 4,765 | | | | 4,288 | | | | 11,122 | | | | 26,110 | | | | 46,285 | | | | 8,309 | | | | 54,594 | |
| Total comprehensive income for the year (a) | | | – | | | | – | | | | (2,020 | ) | | | (423 | ) | | | (2,443 | ) | | | (1,306 | ) | | | (3,749 | ) |
| Currency translation arising on Rio Tinto Limited’s share capital(b) | | | (503 | ) | | | – | | | | – | | | | – | | | | (503 | ) | | | – | | | | (503 | ) |
| Dividends | | | – | | | | – | | | | – | | | | (4,076 | ) | | | (4,076 | ) | | | (315 | ) | | | (4,391 | ) |
| Sharebuy-back | | | (88 | ) | | | – | | | | 6 | | | | (1,946 | ) | | | (2,028 | ) | | | – | | | | (2,028 | ) |
| Companies no longer consolidated | | | – | | | | – | | | | – | | | | – | | | | – | | | | 5 | | | | 5 | |
| Own shares purchased from Rio Tinto shareholders to satisfy share options | | | – | | | | – | | | | (25 | ) | | | (28 | ) | | | (53 | ) | | | – | | | | (53 | ) |
| Change in equity interest held by Rio Tinto | | | – | | | | – | | | | – | | | | 20 | | | | 20 | | | | (17 | ) | | | 3 | |
| Treasury shares reissued and other movements | | | – | | | | 12 | | | | – | | | | 1 | | | | 13 | | | | – | | | | 13 | |
| Equity issued to holders ofnon-controlling interests | | | – | | | | – | | | | – | | | | – | | | | – | | | | 103 | | | | 103 | |
| Employee share options and other IFRS 2 charges to the income statement | | | – | | | | – | | | | 56 | | | | 78 | | | | 134 | | | | – | | | | 134 | |
| Closing balance | | | 4,174 | | | | 4,300 | | | | 9,139 | | | | 19,736 | | | | 37,349 | | | | 6,779 | | | | 44,128 | |
| | | | | | | | | | | | | | | | | | | | | | | | | | | | |
| | | Attributable to owners of Rio Tinto | | | | | | | |
| Year ended 31 December 2014 | | Share
capital
(notes 27 and 28)
US$m | | | Share
premium
US$m | | | Other
reserves
(note 29)
US$m | | | Retained
earnings
(note 29)
US$m | | | Total
US$m | | | Non-
controlling
interests
US$m | | | Total
equity
US$m | |
| Opening balance | | | 5,141 | | | | 4,269 | | | | 12,871 | | | | 23,605 | | | | 45,886 | | | | 7,616 | | | | 53,502 | |
| Total comprehensive income for the year (a) | | | – | | | | – | | | | (1,689 | ) | | | 6,011 | | | | 4,322 | | | | (370 | ) | | | 3,952 | |
| Currency translation arising on Rio Tinto Limited’s share capital(b) | | | (376 | ) | | | – | | | | – | | | | – | | | | (376 | ) | | | – | | | | (376 | ) |
| Dividends | | | – | | | | – | | | | – | | | | (3,710 | ) | | | (3,710 | ) | | | (304 | ) | | | (4,014 | ) |
| Own shares purchased from Rio Tinto shareholders to satisfy share options | | | – | | | | – | | | | (129 | ) | | | (31 | ) | | | (160 | ) | | | – | | | | (160 | ) |
| Treasury shares reissued and other movements | | | – | | | | 19 | | | | – | | | | 3 | | | | 22 | | | | – | | | | 22 | |
| Newly consolidated operations | | | – | | | | – | | | | – | | | | – | | | | – | | | | 6 | | | | 6 | |
| Change in equity interest held by Rio Tinto | | | – | | | | – | | | | – | | | | 36 | | | | 36 | | | | (29 | ) | | | 7 | |
| Equity issued to holders ofnon-controlling interests(d) | | | – | | | | – | | | | – | | | | – | | | | – | | | | 1,291 | | | | 1,291 | |
| Companies no longer consolidated | | | – | | | | – | | | | – | | | | – | | | | – | | | | (18 | ) | | | (18 | ) |
| Employee share options and other IFRS 2 charges to the income statement | | | – | | | | – | | | | 69 | | | | 196 | | | | 265 | | | | 117 | | | | 382 | |
| Closing balance | | | 4,765 | | | | 4,288 | | | | 11,122 | | | | 26,110 | | | | 46,285 | | | | 8,309 | | | | 54,594 | |
| (a) | Refer to Group statement of comprehensive income. |
| (c) | The restructure of Coal & Allied Industries Limited completed on 3 February 2016. The restructure involved the exchange of a 32.4 per cent interest in Hunter Valley Operations mine for an additional 20 per cent shareholding in Coal & Allied Industries Limited, increasing Rio Tinto’s shareholding of Coal & Allied Industries Limited from 80 per cent to 100 per cent. |
| (d) | Equity issued to holders ofnon-controlling interests in 2014 included US$1,158 million of proceeds from a rights issue by Turquoise Hill Resources Ltd in January 2014. |
| | | | |
| 114 | | riotinto.com | | 2016 Annual report |
Reconciliation with Australian Accounting Standards
The Group’s financial statements have been prepared in accordance with IFRS, as defined in note 1, which differs in certain respects from the version of International Financial Reporting Standards that is applicable in Australia, referred to as Australian Accounting Standards (AAS).
Prior to 1 January 2004, the Group’s financial statements were prepared in accordance with UK GAAP. Under IFRS, as defined in note 1, goodwill on acquisitions prior to 1998, which was eliminated directly against equity in the Group’s UK GAAP financial statements, has not been reinstated. This was permitted under the rules governing the transition to IFRS set out in IFRS 1. The equivalent Australian Standard, AASB 1, does not provide for the netting of goodwill against equity. As a consequence, shareholders’ funds under AAS include the residue of such goodwill, which amounted to US$561 million at 31 December 2016 (2015: US$560 million).
Save for the exception described above, the Group’s financial statements drawn up in accordance with IFRS are consistent with the requirements of AAS.
Outline of dual listed companies structure and basis of financial statements
The Rio Tinto Group
These are the financial statements of the Group formed through the merger of economic interests of Rio Tinto plc and Rio Tinto Limited (“Merger”), and presented by both Rio Tinto plc and Rio Tinto Limited as their consolidated accounts in accordance with both UK and Australian legislation and regulations.
Merger terms
On 21 December 1995, Rio Tinto plc and Rio Tinto Limited, entered into a dual listed companies (DLC) merger. Rio Tinto plc is incorporated in the UK and listed on the London and New York Stock Exchanges and Rio Tinto Limited is incorporated in Australia and listed on the Australian Stock Exchange. The merger was effected by contractual arrangements between the companies and amendments to Rio Tinto plc’s Memorandum and Articles of Association and Rio Tinto Limited’s Constitution.
As a result, Rio Tinto plc and Rio Tinto Limited and their respective groups operate together as a single economic enterprise, with neither assuming a dominant role. In particular, the arrangements:
| – | | confer upon the shareholders of Rio Tinto plc and Rio Tinto Limited a common economic interest in both groups; |
| – | | provide for common boards of directors and a unified management structure; |
| – | | provide for equalised dividends and capital distributions; and |
| – | | provide for the shareholders of Rio Tinto plc and Rio Tinto Limited to take key decisions, including the election of directors, through an electoral procedure in which the public shareholders of the two companies in effect vote on a joint basis. |
The merger involved no change in the legal ownership of any assets of Rio Tinto plc or Rio Tinto Limited, nor any change in the ownership of any existing shares or securities of Rio Tinto plc or Rio Tinto Limited, nor the issue of any shares, securities or payment by way of consideration, save for the issue by each company of one special voting share to a trustee company which facilitates the joint electoral procedure for public shareholders. During 2002, each of the parent companies issued a DLC Dividend Share to facilitate the efficient management of funds within the DLC structure.
Accounting standards
The financial statements have been drawn up in accordance with IFRS as defined in note 1. The Merger was accounted for as a merger under UK GAAP. As permitted under the rules governing the transition to IFRS, which are set out in IFRS 1, the Group did not restate business combinations that occurred before the transition date of 1 January 2004. As a result, the DLC Merger of economic interests described above continues to be accounted for as a merger under IFRS as defined in note 1.
The main consequence of adopting merger rather than acquisition accounting is that the balance sheet of the merged Group includes the assets and liabilities of Rio Tinto plc and Rio Tinto Limited at their carrying values prior to the merger, subject to adjustments to achieve uniformity of accounting policies, rather than at their fair values at the date of the merger. For accounting purposes Rio Tinto plc and Rio Tinto Limited are viewed as a single public parent company (with their respective public shareholders being the shareholders in that single company). As a result, the amounts attributable to both Rio Tinto plc and Rio Tinto Limited public shareholders are included in the amounts attributed to owners of Rio Tinto on the balance sheet, income statement and statement of comprehensive income.
Australian Corporations Act
The financial statements are drawn up in accordance with an order, under section 340 of the Australian Corporations Act 2001, issued by the Australian Securities and Investments Commission (ASIC) on 14 December 2015. The main effect of the order is that the financial statements are prepared on the basis that Rio Tinto Limited, Rio Tinto plc and their respective controlled entities are treated as a single economic entity, and in accordance with the principles and requirements of International Financial Reporting Standards as adopted by the European Union (EU IFRS) and include a reconciliation from EU IFRS to the Australian equivalents of IFRS (see above).
For further details of the ASIC Class Order relief see page 204.
| | | | |
| 2016 Annual report | | riotinto.com | | 115 |
| | | | | | | | | | | | | | | | |
| | | | | | | | | |
| STRATEGIC REPORT | | | | DIRECTORS’ REPORT | | | | FINANCIAL STATEMENTS | | | | METALS AND MINERALS PRODUCTION | | | | ADDITIONAL INFORMATION |
Notes to the 2016 financial statements
1 Principal accounting policies
Corporate information
Rio Tinto’s business is finding, mining and processing mineral resources. Major products are aluminium, copper, diamonds, gold, industrial minerals (borates, titanium dioxide and salt), iron ore, thermal and metallurgical coal and uranium. Activities span the world and are strongly represented in Australia and North America, with significant businesses in Asia, Europe, Africa and South America.
Rio Tinto plc is incorporated in the UK and listed on the London and New York Stock Exchanges and Rio Tinto Limited is incorporated in Australia and listed on the Australian Stock Exchange. Rio Tinto plc’s registered office is at 6 St James’s Square, London SW1Y 4AD, UK. Rio Tinto Limited’s registered office is at 120 Collins Street, Melbourne, Australia, 3000.
These financial statements consolidate the accounts of Rio Tinto plc and Rio Tinto Limited (together “the Companies”) and their respective subsidiaries (together “the Group”) and include the Group’s share of joint arrangements and associates as explained in note 1(b) below. The Group’s financial statements for the year ended 31 December 2016 were authorised for issue in accordance with a directors’ resolution on 1 March 2017.
Notes 33 to 36 provide more information on the Group’s subsidiaries, joint arrangements and associates and note 40 provides information on the Group’s transactions with other related parties.
Basis of preparation of the financial statements
The basis of preparation and the accounting policies used in preparing the Group’s 2016 financial statements are set out below.
The financial statements have been prepared on a going concern basis in accordance with the Companies Act 2006 applicable to companies reporting under International Financial Reporting Standards and in accordance with applicable UK law, applicable Australian law as amended by the Australian Securities and Investments Commission Order dated 14 December 2015, Article 4 of the European Union IAS regulation and also with:
| – | | International Financial Reporting Standards as issued by the International Accounting Standards Board (IASB) and interpretations issued from time to time by the IFRS Interpretations Committee (IFRS IC) both as adopted by the European Union (EU) and which are mandatory for EU reporting as at 31 December 2016; and |
| – | | International Financial Reporting Standards as issued by the IASB and interpretations issued from time to time by the IFRS IC which are mandatory as at 31 December 2016. |
The above accounting standards and interpretations are collectively referred to as “IFRS” in this report. The Group has not early adopted any amendments, standards or interpretations that have been issued but are not yet mandatory.
The Group’s financial statements have been prepared on the basis of accounting policies consistent with those applied in the financial statements for the year ended 31 December 2015 except for the implementation of a number of minor amendments issued by the IASB and endorsed by the EU which have been applied for the first time in 2016. These new pronouncements do not have a significant impact on the Group’s financial statements and therefore prior-period financial statements have not been restated for these pronouncements.
Mandatory for 2017 – not yet endorsed by the EU
Amendments to IAS 12: Recognition of Deferred Tax Assets for Unrealised Losses. These amendments on the recognition of deferred tax assets for unrealised losses clarify how to account for deferred tax assets related to debt instruments measured at fair value.
IAS 7 – Statement of cash flows, Narrow-scope amendments. The amendments introduce an additional disclosure that will enable users of financial statements to evaluate changes in liabilities arising from financing activities. The Group will be required to provide information on
movements in gross liabilities arising from financing activities in addition to the net debt reconciliation currently provided.
The Group does not expect these pronouncements to have a significant impact on the Group’s financial statements.
Mandatory beyond 2017
IFRS 9 “Financial Instruments”, IFRS 15 “Revenue from Contracts with Customers” and IFRIC 22 “Foreign Currency Transactions and Advance Consideration” are mandatory in 2018 and IFRS 16 “Leases” is mandatory in 2019.
The Group’s process of implementation of new pronouncements is in four stages:
| – | | Diagnostic – the high-level identification of accounting issues in the new pronouncement that will impact the Group. |
| – | | Confirmation of understanding – the detailed review of contracts or other relevant data and training for finance, commercial, procurement and other teams. |
| – | | Solution development – identifying and progressing system and data changes. |
The Group is currently evaluating the impact of these pronouncements. This work is ongoing and additional impacts may be identified later in the implementation process.
IFRS 9 “Financial Instruments” – endorsed by the EU
The standard includes a single approach for the classification and measurement of financial assets, based on cash flow characteristics and the business model used for the management of the financial instruments. It introduces the expected credit loss model for impairment of financial assets which replaces the incurred loss model used in IAS 39. Lastly, the standard amends the rules on hedge accounting to align the accounting treatment with the risk management practices of the business.
Work to date has primarily focused on the Group’s Treasury operations, which hold the majority of the Group’s financial instruments, with a high level review of the rest of the Group. In 2017, a more detailed review will be completed including analysis at a business unit level. Potential differences identified to date relate to the alternative under IFRS 9 to amortise the cost of hedging over the life of the hedging instrument (this is currently taken directly to the income statement under IAS 39), and changes to the calculation of impairment losses as well as the possibility of increased application of hedge accounting. The Group does not currently expect the impact of these changes to be material.
IFRS 15 “Revenue from Contracts with Customers” – endorsed by the EU
The core principle of IFRS 15 is that an entity recognises revenue related to the transfer of promised goods or services when control of the goods or services passes to customers. The amount of revenue recognised should reflect the consideration to which the entity expects to be entitled in exchange for those goods or services.
Work to date has focused primarily on the Iron Ore and Aluminium product groups, as these together account for over 70 per cent of the Group’s sales revenue, with a limited review of contracts at other product groups. In 2017, further review of contracts will be undertaken at all businesses. To date, no material measurement differences have been identified between IAS 18, the current revenue recognition standard, and IFRS 15.
The Group sells a significant proportion of its products on CFR or CIF Incoterms. This means that the Group is responsible for providing shipping services after the date at which control of the goods passes to the customer at the loading port. Under IAS 18, the Group recognises such shipping and other freight revenue and accrues the associated costs in full on loading. The impact of treating freight, where applicable, as a separate performance obligation and therefore recognising revenue over time would not have materially impacted revenue, costs or earnings as at 31 December 2016.
| | | | |
| 116 | | riotinto.com | | 2016 Annual report |
IFRS 15 as well as IFRS 9 requires certain additional disclosures, in particular in relation to the impact of provisional pricing and, where applicable, changes to systems are being made to capture this data.
The Group expects to adopt the modified transitional approach to implementation where any transitional adjustment is recognised in retained earnings at the date of implementation of the standard without adjustment of comparatives. The new standard will only be applied to contracts that remain in force at the transition date.
IFRIC 22 “Foreign Currency Transactions and Advance Consideration” – not yet endorsed by the EU
The Interpretation, which was issued on 8 December 2016, addresses how to determine the date of a transaction for the purpose of determining the exchange rate to use on initial recognition of an asset, expense or income (or part of it) when a relatednon-monetary asset ornon-monetary liability arising from the payment or receipt of advance consideration in a foreign currency is derecognised.
The Group is currently evaluating the impact of this pronouncement.
IFRS 16 “Leases” – not yet endorsed by the EU
Under the new standard, a lessee is in essence required to:
| (a) | recognise all right of use assets and lease liabilities, with the exception of short term (under 12 months) and low value leases, on the balance sheet. The liability is initially measured at the present value of future lease payments for the lease term. This includes variable lease payments that depend on an index or rate but excludes other variable lease payments. The right of use asset reflects the lease liability, initial direct costs, any lease payments made before the commencement date of the lease, less any lease incentives and, where applicable, provision for dismantling and restoration. |
| (b) | recognise depreciation of right of use assets and interest on lease liabilities in the income statement over the lease term. |
| (c) | separate the total amount of cash paid into a principal portion (presented within financing activities) and interest portion (which the Group presents in operating activities) in the cash flow statement. |
This standard will have an impact on the Group’s earnings and shareholders’ funds at transition and in future years. It must be implemented retrospectively, either with the restatement of comparatives or with the cumulative impact of application recognised as at 1 January 2019 under the modified retrospective approach.
IFRS 16 contains a number of practical expedients, one of which permits the classification of existing contracts as leases under current accounting standards to be carried over to IFRS 16.
Under the modified retrospective approach, on alease-by-lease basis, the right of use of an asset may be deemed to be equivalent to the liability at transition or calculated retrospectively as at inception of the lease.
Under IFRS 16 the present value of the Group’s operating lease commitments as defined under the new standard, excluding low value leases and short term leases, will be shown as right of use assets and as lease liabilities on the balance sheet. Information on the undiscounted amount of the Group’s operating lease commitments under IAS 17, the current leasing standard, is disclosed in note 31. The Group is considering the available options for transition.
To date, work has focused on the identification of the provisions of the standard which will most impact the Group. In 2017, work on these issues and their resolution will continue and work on the detailed review of contracts and financial reporting impacts will commence as well as assessment of likely changes to systems.
Judgments in applying accounting policies and key sources of estimation uncertainty
The preparation of the financial statements requires management to make assumptions, judgments and estimates and to use judgment in applying accounting policies and in making critical accounting estimates.
These assumptions, judgments and estimates are based on management’s best knowledge of the relevant facts and circumstances, having regard to previous experience, but actual results may differ materially from the amounts included in the financial statements. Key areas of judgment and estimation uncertainty are highlighted below and further information is contained in the accounting policies and/or the notes to the financial statements.
Areas of judgment that have the most significant effect on the amounts recognised in the financial statements are:
| – | | Dual listed companies reporting (see Dual listed companies structure on page 115); |
| – | | Determination of Cash Generating Units (CGUs), review of asset carrying values, impairment charges and reversals and the recoverability of goodwill – note 1(e) and (i), note 6, note 12 and note 13; |
| – | | Estimation of asset lives – note 1(e) and (i); |
| – | | Determination of ore reserve and mineral resource estimates – note 1(j); |
| – | | Provision for onerous contracts – note 1(i); |
| – | | Close-down, restoration and environmental obligations – note 1(k); |
| – | | Deferral of stripping costs – note 1(h); |
| – | | Recognition of deferred tax on mining rights recognised in acquisitions – note 1(m); |
| – | | Uncertain tax positions – note 1(m), note 9 and note 31; |
| – | | Recoverability of potential deferred tax assets – note 17(c), (e) and (f); |
| – | | Capitalisation of exploration and evaluation costs and development costs prior to the decision to mine/construct – note 1(f); |
| – | | Identification of functional currencies – note 1(d); |
| – | | Estimation of obligations for post-employment costs– note 1(n) and note 45; |
| – | | Basis of consolidation – note 1(b) and note 42; |
| – | | Contingencies – note 31. |
Key sources of estimation uncertainty that have a significant risk of causing a material adjustment to the carrying amounts of assets and liabilities within the next financial year are:
| – | | Review of asset carrying values, impairment charges and reversals and the recoverability of goodwill – note1(e) and (i), note 6, note 12 and note 13; |
| – | | Estimation of asset lives – note 1(e) and (i); |
| – | | Determination of ore reserve and mineral resource estimates – note 1(j); |
| – | | Provision for onerous contracts – note 1(i); |
| – | | Estimation of close-down, restoration and environmental costs and the timing of expenditure – note 1(k) and note 26; |
| – | | Uncertain tax positions – note 1(m), note 9 and note 31; |
| – | | Recoverability of potential deferred tax assets – note 17 (c), (e) and (f); |
| – | | Capitalisation of exploration and evaluation costs and development costs prior to the decision to mine/construct – note 1(f); |
| – | | Estimation of obligations for post-employment costs – note 1(n) and note 45; |
| – | | Contingencies – note 31. |
These areas of judgment and estimation are discussed further in critical accounting policies and estimates on pages 125 to 127.
(a) Accounting convention
The financial information included in the financial statements for the year ended 31 December 2016, and for the related comparative periods, has been prepared under the historical cost convention, as modified by the revaluation of certain derivative contracts and financial assets, the impact of fair value hedge accounting on the hedged item and the accounting for post-employment assets and obligations. The Group’s policy in respect of these items is set out in the notes below.
| | | | |
| 2016 Annual report | | riotinto.com | | 117 |
| | | | | | | | | | | | | | | | |
| | | | | | | | | |
| STRATEGIC REPORT | | | | DIRECTORS’ REPORT | | | | FINANCIAL STATEMENTS | | | | METALS AND MINERALS PRODUCTION | | | | ADDITIONAL INFORMATION |
Notes to the 2016 financial statements
continued
1 Principal accounting policiescontinued
The Group’s financial statements are presented in US dollars and all values are rounded to the nearest million (US$m) unless otherwise stated.
Where applicable, comparatives have been adjusted to measure or present them on the same basis as current period figures.
(b) Basis of consolidation (notes 33 to 36)
All intragroup transactions and balances have been eliminated on consolidation.
Where necessary, adjustments are made to the locally reported assets, liabilities, and results of subsidiaries, joint arrangements and associates to bring their accounting policies into line with those used by the Group.
Subsidiaries: Subsidiaries are entities controlled by either of the Companies. Control exists where either of the Companies has: power over the entities, that is, existing rights that give it the current ability to direct the relevant activities of the entities (those that significantly affect the Companies’ returns); exposure, or rights, to variable returns from its involvement with the entities; and the ability to use its power to affect those returns. Subsidiaries are fully consolidated from the date on which control is transferred to the Group. They are deconsolidated from the date that control ceases.
Unincorporated arrangements:In some cases, the Group participates in unincorporated arrangements and has rights to its share of the assets and obligations for its share of the liabilities of the arrangement rather than a right to a net return, but does not share joint control. In such cases, the Group recognises: its share of assets and liabilities; revenue from the sale of its share of the output and its share of any revenue generated from the sale of the output by the unincorporated arrangement; and its share of expenses. All such amounts are measured in accordance with the terms of the arrangement, which is usually in proportion to the Group’s interest in the arrangement. These amounts are recorded in the Group’s financial statements on the appropriate lines.
Joint arrangements: A joint arrangement is an arrangement in which two or more parties have joint control. Joint control is the contractually agreed sharing of control such that decisions about the relevant activities of the arrangement (those that significantly affect the Companies’ returns) require the unanimous consent of the parties sharing control. The Group has two types of joint arrangements:
Joint operations (JO): A JO is a joint arrangement in which the parties that share joint control have rights to the assets, and obligations for the liabilities, relating to the arrangement. This includes situations where the parties benefit from the joint activity through a share of the output, rather than by receiving a share of the results of trading. In relation to its interest in a JO, the Group recognises: its share of assets and liabilities; revenue from the sale of its share of the output and its share of any revenue generated from the sale of the output by the JO; and its share of expenses. All such amounts are measured in accordance with the terms of the arrangement, which is usually in proportion to the Group’s interest in the JO. These amounts are recorded in the Group’s financial statements on the appropriate lines.
Joint ventures (JV): A JV is a joint arrangement in which the parties that share joint control have rights to the net assets of the arrangement. JVs are accounted for using the equity accounting method.
Associates: An associate is an entity, that is neither a subsidiary nor a joint arrangement, over which the Group has significant influence. Significant influence is presumed to exist where there is neither control nor joint control and the Group has over 20 per cent of the voting rights, unless it can be clearly demonstrated that this is not the case. Significant influence can arise where the Group holds less than 20 per cent of the voting rights if it has the power to participate in the financial and operating policy decisions affecting the entity. Investments in associates are accounted for using the equity accounting method.
The Group uses the term “equity accounted units” (EAUs) to refer to associates and JVs collectively. Under the equity accounting method the investment is recorded initially at cost to the Group, including any goodwill on acquisition. In subsequent periods the carrying amount of the investment is adjusted to reflect the Group’s share of the EAUs’ retained post-acquisition profit or loss and other comprehensive income. Long term loans to EAUs that in substance form part of the Group’s net investment (quasi equity loans) are financial assets but are included in the line “Investments in equity accounted units” on the face of the balance sheet. When the Group’s share of losses in an EAU equals or exceeds its interest in the EAU, including such long term loans and any other unsecured receivables, the Group does not recognise further losses, unless it has incurred legal or constructive obligations to continue to make payments on behalf of the EAU.
Acquisitions (note 37)
Under the “acquisition” method of accounting for business combinations, the purchase consideration is allocated to the identifiable assets acquired and liabilities and contingent liabilities assumed (the identifiable net assets) on the basis of their fair value at the date of acquisition, which is the date on which control is obtained.
The consideration transferred for the acquisition of a subsidiary comprises the fair values of the assets transferred, the liabilities incurred to the former owners of the acquiree, the fair value of any asset or liability resulting from a contingent consideration arrangement and any equity interests issued by the Group. Costs related to the acquisition of a subsidiary are expensed as incurred.
The excess of the consideration transferred, the amount of anynon-controlling interest in the acquiree and the acquisition-date fair value of any previous equity interest in the acquiree over the fair value of the identifiable net assets acquired is recorded as goodwill. Any shortfall is immediately recognised in the income statement.
Provisional fair values allocated at a reporting date are finalised within 12 months of the acquisition date.
Non-controlling interests in the acquiree, that are present ownership interests and entitle their holders to a proportionate share of the entity’s net assets in the event of liquidation, are recognised by the Group in one of two ways with the choice being available on anacquisition-by- acquisition basis. They can be measured at either thenon-controlling interest’s proportionate share of the acquiree’s identifiable net assets or at fair value. In some cases,non-controlling interests may be treated as equity options and valued on that basis. Goodwill (see note (e)) and amounts attributable tonon-controlling interests will differ depending on the basis used.
Where the Group has a previously heldnon-controlling interest in the acquiree, this is remeasured to fair value at the date control is gained with any gain or loss recognised in the income statement. The cash cost of the share purchase that gives rise to control is included within “Investing activities” in the cash flow statement.
Where the Group increases its ownership interest in a subsidiary, the difference between the purchase price and the carrying value of the share of net assets acquired is recorded in equity. The cash cost of such purchases is included within “Financing activities” in the cash flow statement.
The results of businesses acquired during the year are included in the consolidated financial statements from the date on which control, joint control or significant influence commences.
Disposals (note 37)
Individualnon-current assets or “disposal groups” (that is, groups of assets and liabilities) to be disposed of by sale or otherwise in a single transaction are classified as “held for sale” if the following criteria are met at the period end:
| – | | the carrying amount will be recovered principally through a sale transaction rather than through continuing use; and |
| | | | |
| 118 | | riotinto.com | | 2016 Annual report |
| – | | the disposal group is available for immediate sale in its present condition subject only to terms that are usual and customary for such sales; and |
| – | | the sale is highly probable. |
Disposal groups held for sale are carried at the lower of their carrying amount and fair value less costs to sell. The comparative balance sheet is not restated. Disposal groups acquired with a view to resale are held at the fair value determined at the acquisition date. For these assets acquired for resale no profits or losses are recognised between the acquisition date and the disposal date, unless there is a subsequent impairment.
On classification as held for sale, the assets are no longer depreciated and, if applicable, equity accounting ceases.
If control is lost, any interest in the entity retained by the Group is remeasured to its fair value and the change in carrying amount is recognised in the income statement. The retained interest may be subsequently accounted for as a joint venture, joint operation, associate or financial asset depending on the facts. Certain amounts previously recognised in other comprehensive income in respect of the entity disposed of, or for which control, joint control or significant influence has ceased, may be recycled to the income statement. The cash proceeds of disposals are included within “Investing activities” in the cash flow statement.
Changes in the Group’s interest in a subsidiary that do not result in a loss of control are accounted for in equity. The cash proceeds of such disposals are included within “Financing activities” in the cash flow statement.
(c) Sales revenue
Sales revenue comprises sales to third parties. All shipping and handling costs incurred by the Group are recognised as operating costs. Amounts billed to customers in respect of shipping and handling are classified as sales revenue where the Group is responsible for freight. If the Group is acting solely as an agent, amounts billed to customers are offset against the relevant costs. Revenue from other services is recognised as those services are rendered to and accepted by the customer.
Sales revenue excludes any applicable sales taxes. Mining royalties payable are presented as an operating cost or, where they are in substance a profit-based tax, within taxation.
Revenues from the sale of significantby-products, such as gold, are included in sales revenue. Sundry revenue, incidental to the main revenue-generating activities of the operations, is treated as a credit to operating costs.
Third-party commodity swap arrangements for delivery and receipt of smelter grade alumina are offset within operating costs.
Sales of copper concentrate are stated at their invoiced amount which is net of treatment and refining charges.
Sales revenue is only recognised on individual sales when all of the following criteria are met:
| – | | the significant risks and rewards of ownership of the product have been transferred to the buyer; |
| – | | neither continuing managerial involvement to the degree usually associated with ownership, nor effective control over the goods sold, has been retained; |
| – | | the amount of revenue can be measured reliably; |
| – | | it is probable that the economic benefits associated with the sale will flow to the Group; and |
| – | | the costs incurred or to be incurred in respect of the sale can be measured reliably. |
In most instances, sales revenue is recognised when the product is delivered to the destination specified by the customer, which is typically the vessel on which it will be shipped, the destination port or the customer’s premises.
The Group’s products are sold to customers under contracts which vary in tenure and pricing mechanisms, including some volumes sold in the spot market. Sales revenue is commonly subject to adjustment based on an inspection of the product by the customer.
Pricing for iron ore is on a range of terms, the majority being either monthly or quarterly average pricing mechanisms, with a smaller proportion of iron ore volumes being sold on the spot market.
Certain of the Group’s products are provisionally priced at the date revenue is recognised, however, with the exception of copper, prices are generally finalised within the quarter of the month of shipment. The final selling price is based on the price for the quotational period stipulated in the contract. Substantially all iron ore sales are reflected at final prices in the results for the period. Final prices for copper concentrate are normally determined between 30 to 180 days after delivery to the customer. Revenue for provisionally priced copper sales is recognised at the period end based on estimates of the fair value of the consideration receivable based on relevant forward market prices. The change in fair value attributable to prices is included in sales revenue.
Information on provisionally priced sales contracts is included in note 30.
(d) Currency translation
The functional currency for each entity in the Group, and for joint arrangements and associates, is the currency of the primary economic environment in which that entity operates. For many entities, this is the currency of the country in which they are located. Transactions denominated in other currencies are converted to the functional currency at the exchange rate ruling at the date of the transaction. Monetary assets and liabilities denominated in foreign currencies are retranslated atperiod-end exchange rates.
The Group’s financial statements are presented in US dollars, as that presentation currency most reliably reflects the global business performance of the Group as a whole. On consolidation, income statement items for each entity are translated from the functional currency into US dollars at average rates of exchange, except for materialone-off transactions, which are translated at the rate prevailing on the transaction date. Balance sheet items are translated into US dollars atperiod-end exchange rates.
Exchange differences arising on the translation of the net assets of entities with functional currencies other than the US dollar are recognised directly in the currency translation reserve. These translation differences are shown in the statement of comprehensive income, with the exception of translation adjustments relating to Rio Tinto Limited’s share capital which are shown in the statement of changes in equity.
Where an intragroup balance is, in substance, part of the Group’s net investment in an entity, exchange gains and losses on that balance are taken to the currency translation reserve.
Except as noted above, or in relation to derivative contracts designated as cash flow hedges, all other exchange differences are charged or credited to the income statement in the year in which they arise.
(e) Goodwill and intangible assets (excluding exploration and evaluation expenditure) (notes 12 and 13)
Goodwill is not amortised; it is tested annually for impairment or more frequently if events or changes in circumstances indicate a potential impairment. Investments in EAUs, including any goodwill, are tested for impairment as a single asset when a trigger for impairment has been identified. The Group’s impairment policy is explained in note 1(i).
Purchased intangible assets are initially recorded at cost. Finite-life intangible assets are amortised over their useful economic lives on a straight-line or units of production basis, as appropriate. Intangible assets that are deemed to have indefinite lives and intangible assets that are not yet ready for use are not amortised; they are reviewed annually for impairment or more frequently if events or changes in circumstances indicate a potential impairment in accordance with accounting policy note 1(i).
| | | | |
| 2016 Annual report | | riotinto.com | | 119 |
| | | | | | | | | | | | | | | | |
| | | | | | | | | |
| STRATEGIC REPORT | | | | DIRECTORS’ REPORT | | | | FINANCIAL STATEMENTS | | | | METALS AND MINERALS PRODUCTION | | | | ADDITIONAL INFORMATION |
Notes to the 2016 financial statements
continued
1 Principal accounting policiescontinued
The Group considers that intangible assets have indefinite lives when, based on an analysis of all of the relevant factors, there is no foreseeable limit to the period over which the asset is expected to generate cash flows for the Group. The factors considered in making this judgment include the existence of contractual rights for unlimited terms or evidence that renewal of the contractual rights without significant incremental cost can be expected for indefinite future periods in view of the Group’s investment intentions. The life cycles of the products and processes that depend on the asset are also considered.
(f) Exploration and evaluation (note 13)
Exploration and evaluation expenditure comprises costs that are directly attributable to:
| – | | researching and analysing existing exploration data; |
| – | | conducting geological studies, exploratory drilling and sampling; |
| – | | examining and testing extraction and treatment methods; and/or |
| – | | compilingpre-feasibility and feasibility studies. |
Exploration expenditure relates to the initial search for deposits with economic potential. Expenditure on exploration activity undertaken by the Group is not capitalised.
Evaluation expenditure relates to a detailed assessment of deposits or other projects that have been identified as having economic potential. Capitalisation of evaluation expenditure commences when there is a high degree of confidence that the Group will determine that a project is commercially viable, that is the project will provide a satisfactory return relative to its perceived risks, and therefore it is considered probable that future economic benefits will flow to the Group.
The carrying values of capitalised evaluation expenditure for undeveloped mining projects (projects for which the decision to mine has not yet been approved at the appropriate authorisation level within the Group) are reviewed at each reporting date for indicators of impairment in accordance with IFRS 6 and when indicators are identified, are tested in accordance with IAS 36. Evaluation expenditure fornon-mining projects is reviewed and tested under IAS 36.
In the case of undeveloped mining projects which have arisen through acquisition, the allocation of the purchase price consideration may result in undeveloped properties being recognised at an earlier stage of project evaluation compared with projects arising from the Group’s exploration and evaluation programme. The impairment review is based on a status report summarising the Group’s intentions to recover value through development, sale or other partnering arrangements. Subsequent expenditure on acquired undeveloped projects is only capitalised if it meets the high degree of confidence threshold discussed above.
In some cases, undeveloped projects are regarded as successors to orebodies, smelters or refineries currently in production. Where this is the case, it is intended that these will be developed and go into production when the current source of ore is exhausted or to replace the output when existing smelters or refineries are closed.
(g) Property, plant and equipment (note 14)
Once an undeveloped mining project has been determined as commercially viable and approval to mine has been given, expenditure other than that on land, buildings, plant, equipment and capital work in progress is capitalised under “Mining properties and leases” together with any amount transferred from “Exploration and evaluation”. Ore reserves may be declared for an undeveloped mining project before its commercial viability has been fully determined. Evaluation costs may continue to be capitalised during the period between declaration of ore reserves and approval to mine as further work is undertaken in order to refine the development case to maximise the project’s returns.
Costs of evaluation of a smelter or refinery prior to approval to develop are capitalised under “Capital works in progress”, provided that there is a high degree of confidence that the project will be deemed to be commercially viable.
Costs which are necessarily incurred whilst commissioning new assets, in the period before they are capable of operating in the manner intended by management, are capitalised. Development costs incurred after the commencement of production are capitalised to the extent they are expected to give rise to a future economic benefit. Interest on borrowings related to construction or development projects is capitalised, at the rate payable on project-specific debt if applicable or at the Group or subsidiary’s cost of borrowing if not, until the point when substantially all the activities that are necessary to make the asset ready for its intended use are complete. It may be appropriate to use a subsidiary’s cost of borrowing when the debt was negotiated based on the financing requirements of that subsidiary.
Property, plant and equipment is stated at cost, as defined in IAS 16, less accumulated depreciation and accumulated impairment losses. The cost of property, plant and equipment includes, where applicable, the estimated close-down and restoration costs associated with the asset.
(h) Deferred stripping (note 14)
In open pit mining operations, overburden and other waste materials must be removed to access ore from which minerals can be extracted economically. The process of removing overburden and waste materials is referred to as stripping. During the development of a mine (or pit), before production commences, stripping costs related to a component of an orebody are capitalised as part of the cost of construction of the mine (or pit) and are subsequently amortised over the life of the mine (or pit) on a units of production basis.
In order for production phase stripping costs to qualify for capitalisation as a stripping activity asset, three criteria must be met:
| – | | it must be probable that there will be an economic benefit in a future accounting period because the stripping activity has improved access to the orebody; |
| – | | it must be possible to identify the “component” of the orebody for which access has been improved; and |
| – | | it must be possible to reliably measure the costs that relate to the stripping activity. |
A “component” is a specific section of the orebody that is made more accessible by the stripping activity. It will typically be a subset of the larger orebody that is distinguished by a separate useful economic life (for example, a pushback).
Production phase stripping can give rise to two benefits: the extraction of ore in the current period and improved access to ore which will be extracted in future periods. When the cost of stripping which has a future benefit is not distinguishable from the cost of producing current inventories, the stripping cost is allocated to each of these activities based on a relevant production measure using alife-of-component strip ratio. The ratio divides the tonnage of waste mined for the component for the period either by the quantity of ore mined for the component or by the quantity of minerals contained in the ore mined for the component. In some operations, the quantity of ore is a more appropriate basis for allocating costs, particularly where there are significantby-products. Stripping costs for the component are deferred to the extent that the current period ratio exceeds the life of component ratio. The stripping activity asset is depreciated on a “units of production” basis based on expected production of either ore or contained minerals over the life of the component unless another method is more appropriate.
Thelife-of-component ratios are based on the ore reserves of the mine (and for some mines, other mineral resources) and the annual mine plan; they are a function of the mine design and therefore, changes to that design will generally result in changes to the ratios. Changes in other technical or economic parameters that impact the ore reserves (and for some mines, other mineral resources) may also have an impact on thelife-of-component ratios even if they do not affect the mine design. Changes to the ratios are accounted for prospectively.
| | | | |
| 120 | | riotinto.com | | 2016 Annual report |
It may be the case that subsequent phases of stripping will access additional ore and that these subsequent phases are only possible after the first phase has taken place. Where applicable, the Group considers this on amine-by-mine basis. Generally, the only ore attributed to the stripping activity asset for the purposes of calculating alife-of- component ratio, and for the purposes of amortisation, is the ore to be extracted from the originally identified component.
Where a mine operates several open pits that are regarded as separate operations for the purpose of mine planning, initial stripping costs are accounted for separately by reference to the ore from each separate pit. If, however, the pits are highly integrated for the purpose of mine planning, the second and subsequent pits are regarded as extensions of the first pit in accounting for stripping costs. In such cases, the initial stripping (i.e. overburden and other waste removal) of the second and subsequent pits is considered to be production phase stripping.
The Group’s judgment as to whether multiple pit mines are considered separate or integrated operations depends on each mine’s specific circumstances.
The following factors would point towards the initial stripping costs for the individual pits being accounted for separately:
| – | | If mining of the second and subsequent pits is conducted consecutively with that of the first pit, rather than concurrently. |
| – | | If separate investment decisions are made to develop each pit, rather than a single investment decision being made at the outset. |
| – | | If the pits are operated as separate units in terms of mine planning and the sequencing of overburden removal and ore mining, rather than as an integrated unit. |
| – | | If expenditures for additional infrastructure to support the second and subsequent pits are relatively large. |
| – | | If the pits extract ore from separate and distinct orebodies, rather than from a single orebody. |
If the designs of the second and subsequent pits are significantly influenced by opportunities to optimise output from the several pits combined, including theco-treatment or blending of the output from the pits, then this would point to treatment as an integrated operation for the purposes of accounting for initial stripping costs.
The relative importance of each of the above factors is considered in each case.
Deferred stripping costs are included in “Mining properties and leases” within “Property, plant and equipment” or within “Investments in equity accounted units”, as appropriate. Amortisation of deferred stripping costs is included in “Depreciation of property, plant and equipment” within “Net operating costs” or in “Share of profit after tax of equity accounted units”, as appropriate.
(i) Depreciation and impairment (notes 13 and 14)
Depreciation ofnon-current assets
Property, plant and equipment is depreciated over its useful life, or over the remaining life of the mine or smelter or refinery if that is shorter and there is no reasonable alternative use for the asset by the Group.
The useful lives of the major assets of a cash-generating unit are often dependent on the life of the orebody to which they relate. Where this is the case, the lives of mining properties, and their associated refineries, concentrators and other long-lived processing equipment are generally based on the expected life of the orebody. The life of the orebody, in turn, is estimated on the basis of thelife-of-mine plan. Where the major assets of a cash-generating unit are not dependent on the life of a related orebody, management applies judgment in estimating the remaining service potential of long-lived assets. Factors affecting the remaining service potential of smelters include, for example, smelter technology and electricity purchase contracts when power is not sourced from the company’s, or in some cases a local government’s, renewably sourced electricity generating capacity.
The useful lives and residual values for material assets and categories of assets are reviewed annually and changes are reflected prospectively.
Depreciation commences when an asset is available for use. The major categories of property, plant and equipment are depreciated on a units of production and/or straight-line basis as follows:
Units of production basis
For mining properties and leases and certain mining equipment, consumption of the economic benefits of the asset is linked to production. Except as noted below, these assets are depreciated on a units of production basis.
In applying the units of production method, depreciation is normally calculated based on production in the period as a percentage of total expected production in current and future periods based on ore reserves and, for some mines, other mineral resources. Other mineral resources may be included in depreciation calculations in limited circumstances and where there is a high degree of confidence that they can be extracted economically. This would be the case when the other mineral resources do not yet have the status of ore reserves merely because the necessary detailed evaluation work has not yet been performed and the responsible technical personnel agree that inclusion of a proportion of measured and indicated resources is appropriate based on historical reserve conversion rates.
Other mineral resources would usually only be included in unit of production calculations where there are very large areas of contiguous mineralisation, for which the economic viability is not sensitive to likely variations in grade, as may be the case for certain iron ore, bauxite and industrial minerals deposits. The required level of confidence is unlikely to exist for minerals that are typically found inlow-grade ore (as compared with the above), such as copper or gold. In these cases, specific areas of mineralisation have to be evaluated in considerable detail before their economic status can be predicted with confidence.
Where measured and indicated resources are used in the calculation of depreciation for infrastructure, primarily rail and port, which will benefit current and future mines, then the measured and indicated resources may relate to mines which are currently in production or to mines where there is a high degree of confidence that they will be brought into production in the future. The quantum of mineral resources is determined taking into account future capital costs as required by the Joint Ore Reserves Committee (JORC) code. The depreciation calculation, however, does not take into account future development costs for mines which are not yet in production. Measured and indicated resources are currently incorporated into depreciation calculations in the Group’s Australian iron ore business.
Straight-line basis
Assets within operations for which production is not expected to fluctuate significantly from one year to another or which have a physical life shorter than the related mine are depreciated on a straight-line basis.
Impairment charges/reversals ofnon-current assets
Impairment charges and reversals are assessed at the level of cash-generating units which, in accordance with IAS 36 “Impairment of Assets”, are identified as the smallest identifiable asset or group of assets that generate cash inflows, which are largely independent of the cash inflows from other assets. Separate cash-generating units are identified where an active market exists for intermediate products, even if the majority of those products are further processed internally. Impairment of financial assets is evaluated in accordance with IAS 39.
In some cases, individual business units consist of several operations with independent cash-generating streams which constitute separate cash-generating units.
Goodwill acquired through business combinations is allocated to the cash-generating unit or groups of cash-generating units if that is the lowest level within the Group at which goodwill is monitored for internal management purposes, that are expected to benefit from the related business combination. All goodwill, intangible assets that have an indefinite life and intangible assets that are not ready for use are tested annually for impairment as at 30 September, regardless of whether there has been an impairment trigger or more frequently if events or changes in circumstances indicate a potential impairment.
| | | | |
| 2016 Annual report | | riotinto.com | | 121 |
| | | | | | | | | | | | | | | | |
| | | | | | | | | |
| STRATEGIC REPORT | | | | DIRECTORS’ REPORT | | | | FINANCIAL STATEMENTS | | | | METALS AND MINERALS PRODUCTION | | | | ADDITIONAL INFORMATION |
Notes to the 2016 financial statements
continued
1 Principal accounting policiescontinued
Property, plant and equipment and intangible assets with finite lives are reviewed for impairment if there is an indication that the carrying amount may not be recoverable. The Group conducts an internal review of the asset values annually as at 30 September which is used as a source of information to assess for indications of impairment or reversal of previously recognised impairment losses. External factors, such as changes in forecasted commodity prices, costs and other market factors as well as internal factors such as cancellation of a project or reduced project scope, are also monitored to assess for indications of impairment or reversal of previously recognised impairment losses. If any such indication exists then an impairment review is undertaken; the recoverable amount is assessed by reference to the higher of value in use (being the net present value of expected future cash flows of the relevant cash-generating unit in its current condition) and fair value less costs of disposal (FVLCD).
When the recoverable amount of the cash-generating unit is measured by reference to FVLCD, this amount is further classified in accordance with the fair value hierarchy for observable market data that is consistent with the unit of account for the cash-generating unit being tested. The Group considers that the best evidence of FVLCD is the value obtained from an active market or binding sale agreement and, in this case, the recoverable amount is classified in the fair value hierarchy as level 1. When FVLCD is based on quoted prices for equity instruments but adjusted to reflect factors such as a lack of liquidity in the market, the recoverable amount is classified as level 2 in the fair value hierarchy. No cash-generating units are currently assessed for impairment by reference to a recoverable amount based on FVLCD classified as level 1 or level 2.
Where unobservable inputs are material to the measurement of the recoverable amount, FVLCD is based on the best information available to reflect the amount the Group could receive for the cash-generating unit in an orderly transaction between market participants at the measurement date. This is often estimated using discounted cash flow techniques and is classified as level 3 in the fair value hierarchy.
Where the recoverable amount is assessed using FVLCD based on discounted cash flow techniques, the resulting estimates are based on detailedlife-of-mine and/or long-term production plans. The latter may include brownfield expansions which have not yet been approved at the appropriate authorisation level in the Group.
The cash flow forecasts for FVLCD purposes are based on management’s best estimates of expected future revenues and costs, including the future cash costs of production, capital expenditure, closure, restoration and environmental costs. For the purposes of determining FVLCD from a market participant’s perspective, the cash flows incorporate management’s price and cost assumptions in the short and medium term. In the longer term, operating margins are assumed to remain constant where appropriate, as it is considered unlikely that a market participant would prepare detailed forecasts over a longer term. The cash flow forecasts may include net cash flows expected to be realised from the extraction, processing and sale of material that does not currently qualify for inclusion in ore reserves. Suchnon-reserve material is only included when there is a high degree of confidence in its economic extraction. This expectation is usually based on preliminary drilling and sampling of areas of mineralisation that are contiguous with existing ore reserves. Typically, the additional evaluation required to achieve reserves status for such material has not yet been done because this would involve incurring evaluation costs earlier than is required for the efficient planning and operation of the mine.
As noted above, cost levels incorporated in the cash flow forecasts for FVLCD purposes are based on the currentlife-of-mine plan or long-term production plan for the cash-generating unit. This differs from value in use which requires future cash flows to be estimated for the asset in its current condition and therefore does not include future cash flows associated with improving or enhancing an asset’s performance.
Anticipated enhancements to assets may be included in FVLCD calculations and therefore, generally result in a higher value.
Where the recoverable amount of a cash-generating unit is dependent on the life of its associated orebody, expected future cash flows reflect the current life of mine and/or long-term production plans, which are based on detailed research, analysis and iterative modelling to optimise the level of return from investment, output and sequence of extraction. The mine plan takes account of all relevant characteristics of the orebody, includingwaste-to-ore ratios, ore grades, haul distances, chemical and metallurgical properties of the ore impacting process recoveries and capacities of processing equipment that can be used. Thelife-of-mine plan and/or long term production plans are, therefore, the basis for forecasting production output and production costs in each future year.
Forecast cash flows for ore reserve estimation for JORC purposes are generally based on Rio Tinto’s commodity price forecasts, which assume short-term market prices will revert to the Group’s assessment of the long-term price, generally over a period of three to five years. For most commodities, these forecast commodity prices are derived from a combination of analyses of the marginal costs of the producers and of the incentive price of these commodities. These assessments often differ from current price levels and are updated periodically. The Group does not believe that published medium and long-term forward prices necessarily provide a good indication of future levels because they tend to be strongly influenced by spot prices. The price forecasts used for ore reserve estimation are generally consistent with those used for impairment testing unless management deems that in certain economic environments, a market participant would not assign Rio Tinto’s view on prices, in which case management estimates the assumptions that a market participant would be expected to use.
Forecast future cash flows of a cash-generating unit take into account the sales prices under existing sales contracts.
The discount rates applied to the future cash flow forecasts represent an estimate of the rate the market would apply having regard to the time value of money and the risks specific to the asset for which the future cash flow estimates have not been adjusted. The Group’s weighted average cost of capital is generally used as a starting point for determining the discount rates, with appropriate adjustments for the risk profile of the countries in which the individual cash-generating units operate. For final feasibility studies and ore reserve estimation, internal hurdle rates, which are generally higher than the Group’s weighted average cost of capital, are used. For developments funded with project finance, the debt component of the weighted average cost of capital may be calculated by reference to the specific interest rate of the project finance and anticipated leverage of the project.
For operations with a functional currency other than the US dollar, the impairment review is undertaken in the relevant functional currency. In estimating FVLCD, internal forecasts of exchange rates take into account spot exchange rates, historical data and external forecasts, and are kept constant in real terms after five years. The great majority of the Group’s sales are based on prices denominated in US dollars. To the extent that the currencies of countries in which the Group produces commodities strengthen against the US dollar without commodity price offset, cash flows and, therefore, net present values are reduced. Management considers that over the long term, there is a tendency for movements in commodity prices to compensate to some extent for movements in the value of the US dollar, particularly against the Australian dollar and Canadian dollar, and vice versa. However, such compensating changes are not synchronised and do not fully offset each other. In estimating value in use, the present value of future cash flows in foreign currencies is translated at the spot exchange rate on the testing date.
Non-current assets (excluding goodwill) that have suffered impairment are reviewed using the same basis for valuation of such assets as explained above whenever events or changes in circumstances indicate that the impairment loss may no longer exist, or may have decreased. If appropriate an impairment reversal will be recognised. The carrying
| | | | |
| 122 | | riotinto.com | | 2016 Annual report |
amount of the cash-generating unit after reversal must be the lower of (a) the recoverable amount, as calculated above, and (b) the carrying amount that would have been determined (net of amortisation or depreciation) had no impairment loss been recognised for the cash-generating unit in prior periods.
An onerous contract is defined under IAS 37 “Provisions, Contingent Liabilities and Contingent Assets” as a contract under which the unavoidable costs of meeting the obligations under the contract exceed the economic benefits expected to be received under it. However, no provision is required unless the related assets, which may be the wider cash-generating unit of which the business unit forms part, are fully impaired or the contract becomes stranded as a result of a business decision.
(j) Determination of ore reserve and mineral resource estimates
The Group estimates its ore reserves and mineral resources based on information compiled by Competent Persons as defined in accordance with the Australasian Code for Reporting of Exploration Results, Mineral Resources and Ore Reserves of December 2012 (the “JORC code”, which is produced by the Australasian Joint Ore Reserves Committee).
Ore reserves and, for certain mines, other mineral resources, determined in this way are used in the calculation of depreciation, amortisation and impairment charges and for forecasting the timing of the payment of close-down and restoration costs and the recovery of deferred tax assets. The depreciation and impairment policy above notes instances in which mineral resources are taken into account for accounting purposes. In addition, value may be attributed to mineral resources in purchase price allocations undertaken for the purposes of business combination accounting.
For the purposes of disclosure only with this combined Annual report on Form 20-F estimates of ore reserves have been computed in accordance with the SEC’s Industry Guide 7, rather than in accordance with the JORC code, and are shown on pages 223 to 232. Ore reserves presented in accordance with SEC Industry Guide 7 do not exceed the quantities that, it is estimated, could be extracted economically if future prices were to be in line with the average of historical prices for the three years to 30 June 2016, or contracted prices where applicable. For this purpose, contracted prices are applied only to future sales volumes for which the price is predetermined by an existing contract; and the average of historical prices is applied to expected sales volumes in excess of such amounts. Moreover, reported ore reserve estimates have not been increased above the levels expected to be economic based on Rio Tinto’s own long term price assumptions. Therefore, a reduction in commodity prices from the three year average historical price levels would not necessarily give rise to a reduction in reported ore reserves.
(k) Close-down, restoration and environmental obligations (note 26)
The Group has provisions for close-down and restoration costs which include the dismantling and demolition of infrastructure, the removal of residual materials and the remediation of disturbed areas for mines and certain refineries and smelters. These provisions are based on all regulatory requirements and any other commitments made to stakeholders. Closure provisions are not made for those operations that have no known restrictions on their lives as the closure dates cannot be reliably estimated. This applies primarily to certain North American smelters which have indefinite-lived water rights or power agreements for renewably sourced power with local governments.
Close-down and restoration costs are a normal consequence of mining or production, and the majority of close-down and restoration expenditure is incurred in the years following closure of the mine, refinery or smelter. Although the ultimate cost to be incurred is uncertain, the Group’s businesses estimate their costs using current restoration standards and techniques.
Close-down and restoration costs are provided for in the accounting period when the obligation arising from the related disturbance occurs, based on the net present value of the estimated future costs of restoration to be incurred during the life of the operation and post closure. Where appropriate, the provision is estimated using probability weighting of the different remediation and closure scenarios. The obligation may occur during development or during the production phase of a facility.
Provisions for close-down and restoration costs do not include any additional obligations which are expected to arise from future disturbance. The costs are estimated on the basis of a closure plan, and are reviewed at each reporting period during the life of the operation to reflect known developments. The estimates are also subject to formal review, with appropriate external support, at regular intervals.
The initial close-down and restoration provision is capitalised within “Property, plant and equipment”. Subsequent movements in the close-down and restoration provisions for ongoing operations, including those resulting from new disturbance related to expansions or other activities qualifying for capitalisation, updated cost estimates, changes to the estimated lives of operations, changes to the timing of closure activities
and revisions to discount rates are also capitalised within “Property, plant and equipment”. These costs are then depreciated over the lives of the assets to which they relate. Changes in closure provisions relating to closed operations are charged/credited to “Net operating costs” in the income statement.
Where rehabilitation is conducted systematically over the life of the operation, rather than at the time of closure, provision is made for the estimated outstanding continuous rehabilitation work at each balance sheet date and the cost is charged to the income statement.
The amortisation or “unwinding” of the discount applied in establishing the provisions is charged to the income statement in each accounting period. The amortisation of the discount is shown within “Finance items” in the income statement.
Environmental costs result from environmental damage that was not a necessary consequence of operations, and may include remediation, compensation and penalties. Provision is made for the estimated present value of such costs at the balance sheet date. These costs are charged to “Net operating costs”, except for the unwinding of the discount which is shown within “Finance items”.
Remediation procedures may commence soon after the time the disturbance, remediation process and estimated remediation costs become known, but can continue for many years depending on the nature of the disturbance and the remediation techniques used.
(l) Inventories (note 16)
Inventories are valued at the lower of cost and net realisable value, primarily on a weighted average cost basis. Average costs are calculated by reference to the cost levels experienced in the relevant month together with those in opening inventory. The cost of raw materials and consumable stores is the purchase price. The cost of partly-processed and saleable products is generally the cost of production, including:
| – | | labour costs, materials and contractor expenses which are directly attributable to the extraction and processing of ore or the production of alumina and aluminium; |
| – | | the depreciation of mining properties and leases and of property, plant and equipment used in the extraction and processing of ore or the production of alumina and aluminium; and |
Work in progress includes ore stockpiles and other partly processed material. Stockpiles represent ore that has been extracted and is available for further processing. If there is significant uncertainty as to if and when the stockpiled ore will be processed, the ore is expensed as mined. If the ore will not be processed within 12 months after the balance sheet date, it is included withinnon-current assets and net realisable value is calculated on a discounted cash flow basis. Quantities of stockpiled ore are assessed primarily through surveys and assays. Certain estimates, including expected metal recoveries, are calculated using available industry, engineering and scientific data, and are periodically reassessed taking into account technical analysis and historical performance.
(m) Taxation (note 9 and note 17)
Current tax is the tax expected to be payable on the taxable income for the year calculated using rates that have been enacted or substantively enacted at the balance sheet date. It includes adjustments for tax expected to be payable or recoverable in respect of previous periods. Where the amount of tax payable or recoverable is uncertain, Rio Tinto establishes provisions based on the Group’s judgment of the most likely amount of the liability, or recovery.
Deferred tax is calculated in accordance with IAS 12. The Group provides for deferred tax in respect of fair value adjustments on acquisitions. These adjustments may relate to assets such as mining rights that, in general, are not eligible for income tax allowances. Provision for deferred tax is based on the difference between the carrying value of the asset and its income tax base (which may be nil). Even when there is no income tax base, the existence of a tax base for capital gains tax
| | | | |
| 2016 Annual report | | riotinto.com | | 123 |
| | | | | | | | | | | | | | | | |
| | | | | | | | | |
| STRATEGIC REPORT | | | | DIRECTORS’ REPORT | | | | FINANCIAL STATEMENTS | | | | METALS AND MINERALS PRODUCTION | | | | ADDITIONAL INFORMATION |
Notes to the 2016 financial statements
continued
1 Principal accounting policiescontinued
purposes is not usually taken into account in determining the deferred tax provision for the assets, unless they are classified as held for sale, because it is expected that the carrying amount will be recovered primarily through use of the assets and not from disposal.
(n) Post-employment benefits (note 45)
The Group operates a number of defined benefit plans which provide lump sums, pensions, medical benefits and life insurance to retirees. In accordance with IAS 19, for post-employment defined benefit plans, the difference between the fair value of any plan assets and the present value of the plan obligations is recognised as an asset or liability in the balance sheet.
Where appropriate, the recognition of assets may be restricted to the present value of any amounts the Group expects to recover by way of refunds from the plan or reductions in future contributions. In determining the extent to which a refund will be available the Group has considered whether any third party, such as a trustee or pension committee, has the power to enhance benefits or to wind up a pension plan without the Group’s consent.
The most significant assumptions used in accounting for pension plans are the discount rate, the inflation rate and the mortality rate. The discount rate is used to determine the net present value of the obligations, the interest cost on the obligations and the interest income on plan assets. The discount rate used is the yield on high-quality corporate bonds with maturities and terms that match those of the post-employment obligations as closely as possible. Where there is no developed corporate bond market in a currency, the rate on government bonds is used. The inflation rate is used to project increases in future benefit payments for those plans that have benefits linked to inflation. The mortality rates are used to project the period over which benefits will be paid, which is then discounted to arrive at the net present value of the obligations.
The current service cost, any past service cost and the effect of any curtailment or settlements are recognised in the income statement. The interest cost less interest income on assets held in the plans is also charged to the income statement. All amounts charged to the income statement in respect of these plans are included within “Net operating costs” or in “Share of profit after tax of equity accounted units”, as appropriate.
The Group’s contributions to defined contribution plans are charged to the income statement in the period to which the contributions relate.
(o) Cash and cash equivalents (note 21)
For the purpose of the balance sheet, cash and cash equivalents comprise: cash on hand, deposits held on call with banks, and short-term, highly liquid investments that are readily convertible into known amounts of cash and which are subject to insignificant risk of changes in value. Bank overdrafts are shown as current liabilities in the balance sheet.
For the purposes of the cash flow statement, cash and cash equivalents are net of bank overdrafts that are repayable on demand.
(p) Financial instruments (note 30)
(i) Financial assets
Classification
The Group classifies its financial assets in the following categories: at fair value through profit or loss; loans and receivables;held-to-maturity; andavailable-for-sale investments. The classification depends on the purpose for which the financial assets were acquired. The Group’s policy with regard to financial risk management is set out in note 30. Generally, the Group does not acquire financial assets for the purpose of selling in the short term. When the Group enters into derivative contracts, these transactions are designed to reduce exposures related to assets and liabilities, firm commitments or anticipated transactions.
Management determines the classification of financial assets at initial recognition.
(a) Financial assets at fair value through profit or loss
Assets in this category are classified as current assets if expected to be settled within 12 months, otherwise they are classified asnon-current. Derivatives, including embedded derivatives separated from the host contracts, are included within financial assets/financial liabilities at fair value through profit or loss unless they are designated as hedging instruments.
(b) Loans and receivables
Loans and receivables comprisenon-derivative financial assets with fixed or determinable payments that are not quoted in an active market. Trade receivables are included within this category; however, trade receivables subject to provisional pricing are valued as explained in note 1(c) Sales revenue.
(c)Held-to-maturity
Held-to-maturity investments arenon-derivative financial assets with fixed or determinable payments and fixed maturity that the Group has the intention and ability to hold to maturity and which do not qualify as loans and receivables. Assets in this category are classified as “Other investments” and are classified as current assets ornon-current assets based on their maturity.
(d)Available-for-sale
Available-for-sale financial assets arenon-derivative financial assets that are either designated asavailable-for-sale or not classified in any of the other categories. Assets in this category are included innon-current assets unless the Group intends to dispose of the assets within 12 months of the balance sheet date or the asset matures within 12 months.
Recognition and measurement
All derivatives,available-for-sale financial assets and financial assets at fair value through profit or loss are initially recognised at fair value, with transaction costs expensed in the income statement, and are subsequently carried at fair value. Loans and receivables andheld-to- maturity financial assets are initially recognised at fair value plus transactions costs and are subsequently carried at amortised cost using the effective interest method.
The fair values of the various derivative instruments used for hedging purposes are disclosed in note 30. Movements on the hedging reserve are disclosed in note 29.
(ii) Financial liabilities
Borrowings and other financial liabilities (including trade payables but excluding derivative liabilities) are recognised initially at fair value, net of transaction costs incurred, and are subsequently stated at amortised cost.
The Group participates in supply chain finance arrangements whereby vendors may elect to receive early payment of their invoice from a bank by factoring their receivable from Rio Tinto. These arrangements do not modify the terms of the original liability and therefore, financial liabilities subject to supply chain finance continue to be classified as trade payables.
(q) Share-based payments (note 44)
The fair value of the Group’s share plans is recognised as an expense over the expected vesting period with a corresponding entry to retained earnings for Rio Tinto plc plans and to other reserves for Rio Tinto Limited plans.
The Group uses fair values provided by independent actuaries calculated using either a lattice-based option valuation model or a Monte Carlo simulation model.
The terms of each plan are considered at the balance sheet date to determine whether the plan should be accounted for as equity or cash-settled. The Group does not operate any plans as cash-settled. However, the Performance Share Plan can, at the discretion of the directors, offer employees an equivalent amount in cash. This is not standard practice. In some jurisdictions, employees are granted cash-settled awards where
| | | | |
| 124 | | riotinto.com | | 2016 Annual report |
equity-settled awards are prohibited by local laws and regulations. The value of these awards is immaterial.
The Group’s equity-settled share plans are settled either by: the issuance of shares by the relevant parent company, the purchase of shares on market, or the use of shares held in treasury which were previously acquired as part of a sharebuy-back. If the cost of shares acquired to satisfy the plans differs from the expense charged, the difference is taken to retained earnings or other reserves, as appropriate.
(r) Share capital (notes 27 and 28)
Ordinary shares are classified as equity. Incremental costs directly attributable to the issuance of new shares are shown in equity as a deduction, net of tax, from the proceeds.
Where any Group company purchases the Group’s equity share capital (treasury shares), the consideration paid, including any directly attributable incremental costs (net of income taxes) is deducted from equity attributable to owners of Rio Tinto. Where such shares are subsequently reissued, any consideration received, net of any directly-attributable incremental costs and the related income tax effects, is included in equity attributable to owners of Rio Tinto.
(s) Segment reporting (notes 2 and 3)
Operating segments are reported in a manner consistent with the internal reporting provided to the chief operating decision maker (CODM). The Group considers that Rio Tinto’s chief executive is the CODM, who is responsible for allocating resources and assessing performance of the operating segments.
Critical accounting policies and estimates
(i) Dual listed companies reporting
As described in the “Outline of dual listed companies structure and basis of financial statements” on page 115, for the purposes of preparing the IFRS compliant consolidated financial statements of the Rio Tinto Group, both the DLC companies, Rio Tinto plc and Rio Tinto Limited, are viewed as a single company, and the interests of shareholders of both companies are presented as the equity interests of shareholders in the reporting entity.
The 2016 Annual report satisfies the obligations of Rio Tinto Limited to prepare consolidated accounts under Australian company law, as amended by an order issued by the Australian Securities and Investments Commission on 14 December 2015. The 2016 financial statements disclose the effect of the adjustments to the Group’s consolidated profit/(loss), consolidated total comprehensive income/(loss) and consolidated shareholders’ funds as prepared under IFRS as defined on page 116 that would be required under the version of International Financial Reporting Standards that is applicable in Australia, referred to as Australian Accounting Standards (AAS).
The US dollar is the presentation currency used in these financial statements, as it most reliably reflects the Group’s global business performance.
(ii) Determination of CGUs, review of asset carrying values, impairment charges and reversals and the recoverability of goodwill (notes 6, 12 and 13)
Events or changes in circumstances can give rise to significant impairment charges or reversals of impairment. Identification of the appropriate composition of cash-generating units requires judgment and, together with estimates in respect of the timing of project expansions and the cost to complete asset construction, is critical to determining the recoverable amounts for cash-generating units.
Where the recoverable amounts of the Group’s cash-generating units are assessed using analyses of discounted cash flows, the resulting valuations are also sensitive to changes in estimates of long-term commodity prices, production timing and recovery rates, exchange rates, operating costs, reserve estimates, closure costs and discount rates and, in some instances, the renewal of mining licences. Some of these factors are unique to each individual cash-generating unit.
Note 6 outlines the significant judgments, sensitivities and assumptions made in measuring the impairments recorded and notes 12 and 13
outline judgments in relation to the testing of cash-generating units containing goodwill and indefinite-life intangible assets respectively.
(iii) Estimation of asset lives and determination of ore reserve and mineral resource estimates
Intangible assets are considered to have indefinite lives when, based on an analysis of all of the relevant factors, there is no foreseeable limit to the period over which the asset is expected to generate cash flows for the Group. The factors considered in making this judgment include the existence of contractual rights for unlimited terms; or evidence that renewal of the contractual rights without significant incremental cost can be expected for indefinite periods into the future in view of the Group’s investment intentions.
Rio Tinto estimates its ore reserves and mineral resources based on information compiled by Competent Persons as defined in accordance with the JORC code (see note 1(j)). The amounts presented under IFRS and AAS are based on the ore reserves, and in some cases mineral resources, determined under the JORC code.
For the purposes of disclosure only with this combined Annual report on Form 20-F estimates of ore reserves have been computed in accordance with the SEC’s Industry Guide 7, rather than in accordance with the JORC code, and are shown on pages 223 to 232. Ore reserves presented in accordance with SEC Industry Guide 7 do not exceed the quantities that, it is estimated, could be extracted economically if future prices were to be in line with the average of historical prices for the three years to 30 June 2016, or contracted prices where applicable. For this purpose, contracted prices are applied only to future sales volumes for which the price is predetermined by an existing contract; and the average of historical prices is applied to expected sales volumes in excess of such amounts. Moreover, reported ore reserve estimates have not been increased above the levels expected to be economic based on Rio Tinto’s own long term price assumptions. Therefore, a reduction in commodity prices from the three year average historical price levels would not necessarily give rise to a reduction in reported ore reserves.
The estimation of ore reserves and mineral resources requires judgment to interpret available geological data and then to select an appropriate mining method and establish an extraction schedule. It also requires assumptions about future commodity prices and demand, exchange rates, production costs, transport costs, recovery rates and discount rates and, in some instances, the renewal of mining licences. There are many uncertainties in the estimation process and assumptions that are valid at the time of estimation may change significantly when new information becomes available.
New geological data, as well as changes in assumptions and unforeseen operational issues, may change ore reserve and mineral resource estimates and may ultimately result in their restatement. Changes in ore reserves and, in some cases, mineral resources, could have an impact on: depreciation and amortisation rates; the carrying values of intangible assets and property, plant and equipment; deferred stripping calculations; provisions for close-down and restoration costs; and the recovery of deferred tax assets.
(iv) Provision for onerous contracts
Provision for an onerous contract is made only when the related assets, which may be part of the wider cash-generating unit of which the business unit forms part, are fully impaired or the contract becomes stranded as a result of a business decision. Judgment is required as to when it is appropriate to look to the wider cash-generating unit.
In some cases, product to be supplied under a sales contract can become onerous when the cost of production exceeds the revenues or it is purchased externally and sold at a loss. The decision on sourcing will be dependent on the Group’s future marketing plans and changes in those plans may impact the amount of any provision.
(v) Close-down, restoration and environmental obligations (note 26)
Provision is made for close-down, restoration and environmental costs when the obligation occurs, based on the net present value of estimated future costs with, where appropriate, probability weighting of the different remediation and closure scenarios. The ultimate cost of close-down and restoration is uncertain, and management uses its judgment and experience to determine the potential scope of rehabilitation work required and to provide for the costs associated with that work. Adjustments are made to provisions when the range of possible outcomes becomes sufficiently narrow to permit reliable estimation.
Cost estimates can vary in response to many factors including: changes to the relevant legal or local/national government ownership requirements and any other commitments made to stakeholders; review of remediation and relinquishment options; the emergence of new restoration techniques and the effects of inflation. Experience gained at other mine or production sites is also a significant consideration, although elements of the restoration and rehabilitation of each site are relatively unique to the site and, in some cases, there may be relatively limited restoration and rehabilitation activity and historical precedent against which to benchmark cost estimates. External experts support the cost estimation process where appropriate.
| | | | |
| 2016 Annual report | | riotinto.com | | 125 |
| | | | | | | | | | | | | | | | |
| | | | | | | | | |
| STRATEGIC REPORT | | | | DIRECTORS’ REPORT | | | | FINANCIAL STATEMENTS | | | | METALS AND MINERALS PRODUCTION | | | | ADDITIONAL INFORMATION |
Notes to the 2016 financial statements
continued
1 Principal accounting policiescontinued
Cost estimates are updated throughout the life of the operation and generally must comply with the Group’s Capital Project Framework once the operation is ten years from expected closure. The expected timing of expenditure included in cost estimates can also change, for example in response to changes to expectations relating to ore reserves and mineral resources, production rates, operating licences or economic conditions. Expenditure may occur before and after closure and can continue for an extended period of time depending on the specific site requirements. Some expenditure can continue into perpetuity. In such cases, the provision for these ongoing costs may be restricted to a period for which the costs can be reliably estimated.
As noted in note (k) above, changes in closure and restoration provisions for ongoing operations are capitalised and therefore have no impact on equity at the time the change is made. Subsequently, such changes will impact depreciation and the unwind of discount.
The main risk of changes to equity within the next year therefore relate to changes to closure estimates for closed operations and any changes to environmental estimates including any arising from new incidents.
Cash flows must be discounted if this has a material effect. The selection of appropriate sources on which to base the calculation of the risk-free discount rate used for such close-down, restoration and environmental obligations requires judgment.
As a result of all of the above factors, there could be significant adjustments to the provision for close-down, restoration and environmental costs which would affect future financial results.
(vi) Deferral of stripping costs (note 14)
Stripping of waste materials takes place throughout the production phase of a surface mine or pit. The identification of components within a mine and of life of component strip ratios requires judgment and is dependent on an individual mine’s design and the estimates inherent within that. Changes to that design may introduce new components and/or change the life of component strip ratios. Changes in other technical or economic parameters that impact ore reserves may also have an impact on the life of component strip ratios, even if they do not affect the mine’s design. Changes to the life of component strip ratios are accounted for prospectively.
The Group’s judgment as to whether multiple pit mines are considered separate or integrated operations determines whether initial stripping of a pit is deemed to bepre-production or production phase stripping and, therefore, the amortisation base for those costs. The analysis depends on each mine’s specific circumstances and requires judgment: another mining company could make a different judgment even where the fact pattern appears to be similar.
(vii) Recognition of deferred tax liabilities on mining rights recognised in acquisitions
Deferred tax is provided in respect of fair value adjustments on acquisitions. These adjustments may relate to assets such as mining rights that, in general, are not eligible for income tax allowances. Provision for deferred tax is based on the difference between the carrying value of the asset and its income tax base (which may be nil). Even where there is no income tax base, the existence of a tax base for capital gains tax purposes is not usually taken into account in determining the deferred tax liability for the assets, unless they are classified as held for sale, because it is expected that the carrying amount will be recovered primarily through use of the assets and not from disposal. For acquisitions after 1 January 2004, such a deferred tax liability on acquisition results in a consequential increase in the amounts attributed to goodwill. For acquisitions prior to 1 January 2004, such deferred tax was recognised in equity on transition to IFRS.
(viii) Uncertain tax positions
The Group operates across a large number of jurisdictions and is subject to periodic challenges by local tax authorities on a range of tax matters during the normal course of business, including transfer pricing, indirect taxes and transaction related issues. Where the amount of tax payable or recoverable is uncertain, the Group establishes provisions based on the Group’s judgment of the most likely amount of the liability, or recovery. Further information is given in note 9.
(ix) Recoverability of potential deferred tax assets (note 17)
The Group has tax losses, and other deductible temporary differences, mainly in Australian, Canadian, French, US and Mongolian taxable entities, that have the potential to reduce tax payments in future years. Deferred tax assets have been recognised to the extent that their recovery is probable, having regard to the availability of sufficient taxable temporary differences relating to the same taxation authority and the same taxable entity, the estimates of projected future taxable income of these taxable entities and after taking account of specific risk factors that are expected to affect the recovery of these assets including risk of expiry of losses.
(x) Capitalisation of exploration and evaluation costs and development costs prior to the decision to mine/construct (note 13)
Under the Group’s accounting policy, exploration expenditure on exploration activity undertaken by the Group is not capitalised. Evaluation expenditure is capitalised when there is a high degree of confidence that the Group will determine that a project is commercially viable and it is therefore considered probable that future economic benefits will flow to the Group.
A project’s commercial viability is determined based on whether it will provide a satisfactory return relative to its perceived risks. Once commercial viability has been established, the Group will decide, at the appropriate authorisation level (that is, the Rio Tinto Investment Committee, and the board where appropriate) whether the project should proceed. In determining whether to approve a mining project, the Investment Committee reviews the ore reserves estimate together with analyses of the net present value of the project and sensitivity analyses for the key assumptions.
There are occasions when the Group concludes that the asset recognition criteria are met at an earlier stage than the granting of approval to proceed. In these cases, evaluation expenditure is capitalised if there is a high degree of confidence that the Group will determine the project is commercially viable. The Group’s view is that a high degree of confidence is greater than “more likely than not” (that is, greater than 50 per cent certainty) and less than “virtually certain” (that is, less than 90 per cent certainty). Determining whether there is a high degree of confidence that the Group will ultimately determine that an evaluation project is commercially viable requires a significant degree of judgment and assessment of all relevant factors such as the nature and objective of the project; the project’s current stage; project timeline; current estimates of the project’s net present value, including sensitivity analyses for the key assumptions; and the main risks of the project. Development expenditure incurred prior to the decision to proceed is subject to the same criteria for capitalisation, being a high degree of confidence that the Group will ultimately determine that a project is commercially viable.
In accordance with IFRS 6 “Exploration for and Evaluation of Mineral Resources”, the criteria for the capitalisation of evaluation costs are applied consistently from period to period.
Subsequent recovery of the carrying value for evaluation costs depends on successful development, sale or other partnering arrangements of the undeveloped project. If a project does not prove viable, all irrecoverable costs associated with the project net of any related impairment provisions are charged to the income statement.
| | | | |
| 126 | | riotinto.com | | 2016 Annual report |
(xi) Identification of functional currencies
The functional currency for each subsidiary, unincorporated arrangement, joint operation and equity accounted unit, is the currency of the primary economic environment in which it operates. Determination of functional currency involves significant judgment and other companies may make different judgments based on similar facts. For many of Rio Tinto’s businesses, their functional currency is the currency of the country in which they operate. The Group reconsiders the functional currency of its businesses if there is a change in the underlying transactions, events or conditions which determine their primary economic environment.
The determination of functional currency affects the carrying value ofnon-current assets included in the balance sheet and, as a consequence, the amortisation of those assets included in the income statement. It also impacts exchange gains and losses included in the income statement and in equity.
(xii) Estimation of obligations for post-employment costs (note 45)
The value of the Group’s obligations for post-employment benefits is dependent on the amount of benefits to be paid out and is discounted to the balance sheet date. This amount will vary depending on the assumptions made about the future pay increases received by members of final pay plans, the level of inflation (for those benefits that are subject to some form of inflation protection), the number of individuals and how long individuals live in retirement. Most of the Group’s defined benefit pension plans are closed to new entrants and the majority of the obligations relate to former employees. As a consequence, the carrying value of the Group’s post-employment obligations is less sensitive to assumptions about future salary increases than it is to assumptions regarding future inflation. The assumption regarding future inflation is based on market yields on inflation-linked instruments where possible, combined with consensus views on future inflation, and is derived using the same process at each reporting date. Changes to the assumption, therefore, reflect changes to the market and consensus views of future inflation.
The Group reviews the actual mortality rates of retirees in its major pension plans on a regular basis and uses these rates to set its current mortality assumptions. It also uses its judgment with respect to allowances for future improvements in mortality having regard to standard improvement scales in each relevant country and after taking external actuarial advice.
The discount rate used to value post-employment obligations is based upon the yields on high quality corporate bonds in the relevant currency which have durations consistent with the nature of the obligations. The discount rate will vary from one period to another in line with movements in corporate bond yields, but at any given measurement date there is relatively little estimation uncertainty. This rate is also used to calculate the interest cost on obligations and interest income on plan assets.
Details of the key assumptions, how they have moved since the previous balance sheet date and the sensitivity of the carrying value to changes in the assumptions are set out in note 45.
(xiii) Basis of consolidation (notes 33 to 36)
Judgment is sometimes required to determine whether after considering all relevant factors, the Group has control, joint control or significant influence over an entity. Significant influence includes situations of collective control (see note 36a).
(xiv) Contingencies (note 31)
Disclosure is made of material contingent liabilities unless the possibility of any loss arising is considered remote based on the Group’s views and legal advice.
| | | | |
| 2016 Annual report | | riotinto.com | | 127 |
| | | | | | | | | | | | | | | | |
| | | | | | | | | |
| STRATEGIC REPORT | | | | DIRECTORS’ REPORT | | | | FINANCIAL STATEMENTS | | | | METALS AND MINERALS PRODUCTION | | | | ADDITIONAL INFORMATION |
Notes to the 2016 financial statements
continued
2 Operating segments
Rio Tinto’s management structure is based on the principal product groups in the tables below together with the global functions that support the business, which include Growth & Innovation. The chief executive of each product group reports to the chief executive of Rio Tinto. The chief executive of Rio Tinto monitors the performance of each product group based on a number of measures, including EBITDA, capital expenditure and operating cash flows, with underlying earnings and free cash flow being the key financial performance indicators. Finance costs and net debt are managed on a Group basis.
The operating segment data has been adjusted in accordance with the organisational restructure announced on 21 June 2016. The main impacts are as follows: Iron Ore Company of Canada has moved from the Iron Ore product group to the Energy & Minerals product group; Coal businesses have moved from the previous Copper & Coal product group
to the Energy & Minerals product group; and, Diamonds businesses have moved from the previous Diamonds & Minerals product group to the Copper & Diamonds product group.
Generally, business units are allocated to product groups based on their primary product. The Energy & Minerals product group includes businesses with products such as uranium, borates, salt and titanium dioxide feedstock together with coal operations and the Simandou iron ore project, which is the responsibility of the Energy & Minerals product group chief executive. The Copper & Diamonds product group includes certain gold operations in addition to copper and diamonds.
The financial information by business unit provided on pages 199 to 203 of these financial statements provides additional voluntary disclosure which the Group considers useful to the users of the financial statements.
| | | | | | | | | | | | |
| Gross sales revenue | | 2016
US$m | | | 2015
US$m | | | 2014
US$m | |
| Iron Ore | | | 14,605 | | | | 13,952 | | | | 21,585 | |
| Aluminium | | | 9,458 | | | | 10,117 | | | | 12,123 | |
| Copper & Diamonds | | | 4,524 | | | | 5,592 | | | | 7,183 | |
| Energy & Minerals | | | 6,734 | | | | 7,140 | | | | 9,253 | |
| Other Operations | | | – | | | | 13 | | | | 241 | |
| Reportable segments total | | | 35,321 | | | | 36,814 | | | | 50,385 | |
| Inter-segment transactions | | | (3 | ) | | | (29 | ) | | | (344 | ) |
| Product group total | | | 35,318 | | | | 36,785 | | | | 50,041 | |
| Items excluded from underlying earnings | | | 18 | | | | (1 | ) | | | – | |
| Gross sales revenue | | | 35,336 | | | | 36,784 | | | | 50,041 | |
| Share of equity accounted units and adjustments for inter-subsidiary/equity accounted units sales | | | (1,555 | ) | | | (1,955 | ) | | | (2,377 | ) |
| Consolidated sales revenue per income statement | | | 33,781 | | | | 34,829 | | | | 47,664 | |
Gross sales revenue includes the Group’s proportionate share of sales revenue of equity accounted units (after adjusting for sales to subsidiaries) of US$1,585 million (2015: US$1,987 million; 2014: US$2,533 million) which are not included in consolidated sales revenue. Consolidated sales revenue includes subsidiary sales of US$30 million (2015: US$32 million; 2014: US$156 million) to equity accounted units which are not included in gross sales revenue.
| | | | | | | | | | | | |
| Capital expenditure | | 2016
US$m | | | 2015
US$m | | | 2014
US$m | |
| Iron Ore | | | 868 | | | | 1,608 | | | | 4,038 | |
| Aluminium | | | 916 | | | | 1,682 | | | | 2,021 | |
| Copper & Diamonds | | | 1,441 | | | | 1,576 | | | | 2,097 | |
| Energy & Minerals | | | 141 | | | | 552 | | | | 757 | |
| Other Operations | | | (11 | ) | | | (36 | ) | | | (56 | ) |
| Reportable segments total | | | 3,355 | | | | 5,382 | | | | 8,857 | |
| Other items | | | (46 | ) | | | 65 | | | | (407 | ) |
| Less: capital expenditure of equity accounted units | | | (651 | ) | | | (859 | ) | | | (1,032 | ) |
| Capital expenditure per financial information by business units | | | 2,658 | | | | 4,588 | | | | 7,418 | |
| Add: Proceeds from disposal of property, plant and equipment | | | 354 | | | | 97 | | | | 744 | |
| Capital expenditure per cash flow statement | | | 3,012 | | | | 4,685 | | | | 8,162 | |
Capital expenditure for reportable segments comprises the net cash outflow on purchases less disposals of property, plant and equipment, capitalised evaluation costs and purchases less disposals of other intangible assets. The details provided include 100 per cent of subsidiaries’ capital expenditure and Rio Tinto’s share of the capital expenditure of joint operations and equity accounted units.
| | | | |
| 128 | | riotinto.com | | 2016 Annual report |
| | | | | | | | | | | | |
| Depreciation and amortisation | | 2016
US$m | | | 2015
US$m | | | 2014
US$m | |
| Iron Ore | | | 1,645 | | | | 1,744 | | | | 1,789 | |
| Aluminium | | | 1,250 | | | | 1,172 | | | | 1,180 | |
| Copper & Diamonds | | | 1,601 | | | | 1,261 | | | | 1,219 | |
| Energy & Minerals | | | 739 | | | | 830 | | | | 1,028 | |
| Other Operations | | | 34 | | | | 32 | | | | 34 | |
| Reportable segments total | | | 5,269 | | | | 5,039 | | | | 5,250 | |
| Other items | | | 51 | | | | 68 | | | | 82 | |
| Less: depreciation and amortisation of equity accounted units | | | (526 | ) | | | (462 | ) | | | (472 | ) |
| Depreciation and amortisation per note 4 | | | 4,794 | | | | 4,645 | | | | 4,860 | |
Product group depreciation and amortisation for reportable segments totals include 100 per cent of subsidiaries’ depreciation and amortisation and Rio Tinto’s share of the depreciation and amortisation of equity accounted units. Rio Tinto’s share of the depreciation and amortisation charge of equity accounted units is deducted to arrive at depreciation and amortisation, excluding equity accounted units, as shown in note 4. These figures exclude impairment charges and reversals, which are excluded from underlying earnings.
| | | | | | | | | | | | |
| Tax charge | | 2016
US$m | | | 2015
US$m | | | 2014
US$m | |
| Iron Ore | | | 2,005 | | | | 1,747 | | | | 3,595 | |
| Aluminium | | | 171 | | | | 303 | | | | 303 | |
| Copper & Diamonds | | | (320 | ) | | | (77 | ) | | | 196 | |
| Energy & Minerals | | | 331 | | | | 122 | | | | 140 | |
| Other Operations | | | (73 | ) | | | (73 | ) | | | (135 | ) |
| Reportable segments total | | | 2,114 | | | | 2,022 | | | | 4,099 | |
| Other items | | | (191 | ) | | | (192 | ) | | | (193 | ) |
| Exploration and evaluation not attributed to product groups | | | (27 | ) | | | (25 | ) | | | (34 | ) |
| Net finance costs | | | (484 | ) | | | (245 | ) | | | (396 | ) |
| | | 1,412 | | | | 1,560 | | | | 3,476 | |
| Tax charge/(credit) excluded from underlying earnings | | | 155 | | | | (567 | ) | | | (423 | ) |
| Tax charge per income statement | | | 1,567 | | | | 993 | | | | 3,053 | |
Further information on the tax charge/(credit) excluded from underlying earnings is provided below in the section “Underlying earnings”.
| | | | | | | | | | | | |
| Underlying earnings (a) | | 2016
US$m | | | 2015
US$m | | | 2014
US$m | |
| Iron Ore | | | 4,611 | | | | 3,940 | | | | 7,963 | |
| Aluminium | | | 947 | | | | 1,118 | | | | 1,248 | |
| Copper & Diamonds | | | (18 | ) | | | 370 | | | | 1,118 | |
| Energy & Minerals | | | 610 | | | | 175 | | | | 232 | |
| Other Operations | | | (86 | ) | | | (88 | ) | | | (240 | ) |
| Reportable segments total | | | 6,064 | | | | 5,515 | | | | 10,321 | |
| Other items | | | (241 | ) | | | (375 | ) | | | (593 | ) |
| Exploration and evaluation not attributed to product groups | | | (147 | ) | | | (211 | ) | | | (262 | ) |
| Net finance costs | | | (576 | ) | | | (389 | ) | | | (161 | ) |
| Underlying earnings | | | 5,100 | | | | 4,540 | | | | 9,305 | |
| Items excluded from underlying earnings (a) | | | (483 | ) | | | (5,406 | ) | | | (2,778 | ) |
| Net earnings/(loss) attributable to owners of Rio Tinto per income statement | | | 4,617 | | | | (866 | ) | | | 6,527 | |
Underlying earnings is reported by Rio Tinto to provide greater understanding of the underlying business performance of its operations and to enhance comparability of reporting periods.
The measure of underlying earnings, in conjunction with net cash generated from operating activities and capital expenditure (net of proceeds on disposals), together with free cash flow, is used by the chief executive of Rio Tinto to assess the performance of the product groups. Underlying earnings and net earnings/(loss) both represent amounts net of tax attributable to owners of Rio Tinto. The following items are
excluded from net earnings/(loss) in arriving at underlying earnings in each period irrespective of materiality:
| – | | Net gains/(losses) on disposal of interests in businesses. |
| – | | Impairment charges and reversals. |
| – | | Profit/(loss) after tax from discontinued operations. |
| – | | Exchange and derivative gains and losses. This exclusion includes exchange gains/(losses) on US dollar net debt and intragroup balances, gains/(losses) on currency and interest rate derivatives not qualifying for hedge accounting and gains/(losses) on commodity derivatives not qualifying for hedge accounting. |
| | | | |
| 2016 Annual report | | riotinto.com | | 129 |
| | | | | | | | | | | | | | | | |
| | | | | | | | | |
| STRATEGIC REPORT | | | | DIRECTORS’ REPORT | | | | FINANCIAL STATEMENTS | | | | METALS AND MINERALS PRODUCTION | | | | ADDITIONAL INFORMATION |
Notes to the 2016 financial statements
continued
2 Operating segmentscontinued
In addition, there is a final judgmental category which includes, where applicable, other credits and charges that, individually or in aggregate if of a similar type, are of a nature or size to require exclusion in order to provide additional insight into underlying business performance.
Product group earnings include earnings of subsidiaries and equity accounted units stated before finance items but after the amortisation of discount on provisions.
Rio Tinto’s share of the underlying profits of equity accounted units amounted to US$309 million in 2016 (2015: US$390 million; 2014:
US$626 million). This amount is attributable as follows: US$272 million profit to the Copper & Diamonds product group and US$37 million profit to other product groups (2015: US$307 million profit to the Copper & Diamonds product group and US$83 million profit to other product groups; 2014: US$551 million profit attributable to the Copper & Diamonds product group and US$75 million profit to other product groups). These amounts are included in underlying earnings of the relevant product groups and include the underlying earnings of the Group’s tolling entities which process alumina. Tolling entities recharge the majority of their costs and generally have minimal earnings.
(a) Reconciliation of net earnings/(losses) to underlying earnings
| | | | | | | | | | | | | | | | | | | | | | | | |
| Exclusions from underlying earnings | | Pre-tax (k) 2016
US$m | | | Taxation
2016
US$m | | | Non-
controlling
interests
2016
US$m | | | Net
amount
2016
US$m | | | Net
amount
2015
US$m | | | Net
amount
2014
US$m | |
| Impairment charges net of reversals (note 6) | | | (249 | ) | | | 66 | | | | – | | | | (183 | ) | | | (1,802 | ) | | | (138 | ) |
| Net gains/(losses) ondisposal of interests in businesses (b) | | | 515 | | | | (133 | ) | | | – | | | | 382 | | | | 48 | | | | (349 | ) |
| Exchange and derivative gains/(losses): | | | | | | | | | | | | | | | | | | | | | | | | |
| – Exchange gains/(losses) on US dollar net debt andintragroup balances (c) | | | 603 | | | | (88 | ) | | | 1 | | | | 516 | | | | (3,282 | ) | | | (1,858 | ) |
| – Losses on currency and interest ratederivatives not qualifying for hedge accounting (d) | | | (22 | ) | | | 6 | | | | 4 | | | | (12 | ) | | | (88 | ) | | | (22 | ) |
| – Gains on commodity derivatives notqualifying for hedge accounting (e) | | | 41 | | | | (9 | ) | | | – | | | | 32 | | | | 88 | | | | 30 | |
| Onerous port and rail contracts (f) | | | (469 | ) | | | 140 | | | | – | | | | (329 | ) | | | – | | | | – | |
| Restructuring costs and global headcount reductions (g) | | | (265 | ) | | | 71 | | | | 17 | | | | (177 | ) | | | (258 | ) | | | (82 | ) |
| Increased closure provision fornon-operating and legacy operations (h) | | | (402 | ) | | | 120 | | | | – | | | | (282 | ) | | | (233 | ) | | | – | |
| Tax provision (i) | | | – | | | | (380 | ) | | | – | | | | (380 | ) | | | – | | | | – | |
| Recognition of deferred tax assets relating to planned divestments | | | – | | | | – | | | | – | | | | – | | | | 234 | | | | – | |
| Write off of deferred tax asset following the MRRT repeal | | | – | | | | – | | | | – | | | | – | | | | – | | | | (362 | ) |
| Gain on disposal of the Group’s St James’s Square properties | | | – | | | | – | | | | – | | | | – | | | | – | | | | 356 | |
| Other exclusions (j) | | | (102 | ) | | | 52 | | | | – | | | | (50 | ) | | | (113 | ) | | | (353 | ) |
| Total excluded from underlying earnings | | | (350 | ) | | | (155 | ) | | | 22 | | | | (483 | ) | | | (5,406 | ) | | | (2,778 | ) |
| Net earnings/(loss) | | | 6,343 | | | | (1,567 | ) | | | (159 | ) | | | 4,617 | | | | (866 | ) | | | 6,527 | |
| Underlying earnings | | | 6,693 | | | | (1,412 | ) | | | (181 | ) | | | 5,100 | | | | 4,540 | | | | 9,305 | |
| (b) | Net gains on disposal of interests in businesses in 2016 related mainly to the sale of Rio Tinto’s 40 per cent interest in the Bengalla Joint Venture on 1 March 2016 and the sale of the Lochaber assets in Scotland on 23 November 2016. This was partially offset by a loss on disposal of the 100 per cent interest in Carbone Savoie on 31 March 2016. |
| | In 2015, the balance related mainly to the reduction in shareholding of SouthGobi Resources Ltd, the sale of the Group’s interest in Murowa Diamonds and Sengwa Colliery on 17 June 2015 and the Aluminium product group divestments of ECL on 9 July 2015 and Alesa on 24 November 2015. |
| (c) | Net exchange gains in 2016 comprisepost-tax foreign exchange gains of US$123 million principally on external US dollar denominated net debt innon-US dollar functional currency companies (on borrowings of approximately US$17.6 billion), and US$393 million gains on intragroup balances mainly as the Canadian dollar strengthened against the US dollar. The Group took further steps during 2016 to reduce the income statement exposure on retranslation of intragroup balances. |
| | Net exchange losses in 2015 comprisepost-tax foreign exchange losses of US$1,197 million on external US dollar denominated net debt innon-US dollar functional currency companies (on borrowings of approximately US$23.1 billion), and US$2,085 million losses on intragroup balances, as the Australian dollar, Canadian dollar and the Euro all weakened against the US dollar. |
| (d) | Valuation changes on currency and interest rate derivatives, which are ineligible for hedge accounting, other than those embedded in commercial contracts, and the currency revaluation of embedded US dollar derivatives contained in contracts held by entities whose functional currency is not the US dollar. |
| (e) | Valuation changes on commodity derivatives, including those embedded in commercial contracts, that are ineligible for hedge accounting, but for which there will be an offsetting change in future Group earnings. |
| (f) | A review of the infrastructure capacity requirements in Queensland, Australia, has confirmed that it is no longer likely that Rio Tinto will utilise the Abbot Point Coal Terminal and associated rail infrastructure capacity contracted under take or pay arrangements. On 31 October 2016, agreement was reached with Adani, the owner of the port, to relinquish that capacity. Accordingly, an onerous contract provision has been recognised based on the net present value of expected future cash flows for the port and rail capacity discounted at apost-tax real rate of 2 per cent, resulting in apost-tax onerous contract charge of US$329 million. During the second half of the year, as a result of the agreement to relinquish port capacity, there was a decrease of US$240 million before tax in the estimated onerous contract provision. |
| (g) | The Group has specific criteria in place to determine whether restructuring costs should be excluded from underlying earnings. Only restructuring costs which are material to a business unit are excluded. |
| (h) | The increase in closure provision(non-operating sites) relates to the Gove alumina refinery in Northern Territory, Australia where operations have been curtailed since May 2014. The provision has been updated based on the current cost estimates from the studies which are expected to be finalisedmid-2017. |
| | Future revisions to the closure cost estimate during the study periods (including the next stage of feasibility study) are expected to be excluded from underlying earnings as the site operating assets have been fully impaired. |
| (i) | Tax provision includes amounts provided for specific tax matters for which the timing of resolution and potential economic outflow are uncertain. |
| | In particular, the Group is currently in discussions with the Australian Taxation Office (ATO) in relation to the transfer pricing of certain transactions between Rio Tinto entities based in Australia and the Group’s commercial centre in Singapore for the period since 2009. These matters were raised by Rio Tinto with the ATO through advance ruling requests or are under discussions pursuant to ourco-operative compliance agreement. |
| (j) | Other credits and charges that, individually, or in aggregate, if of similar type, are of a nature or size to require exclusion in order to provide additional insight into underlying business performance. In 2016, other exclusions included costs related to multiple transformation projects and recuperation of capital losses against capital gains on divestment. In 2015, other exclusions included a provision relating to the incomplete divestment of Carbone Savoie within the Rio Tinto Aluminium product group, divestment costs and an increase in provision relating to the Gove refinery. In 2014, other exclusions included US$116 million (afternon-controlling interests and tax) IFRS 2 “Share-based Payment” charge. This reflected the discount to an estimated fair value at which shares were transferred to the Government of Guinea under the Simandou project Investment Framework ratified on 26 May 2014. |
| (k) | Exclusions from underlying earnings relating to equity accounted units are stated after tax and are included in the column“Pre-tax”. |
| | | | |
| 130 | | riotinto.com | | 2016 Annual report |
3 Operating segments – additional information
| | | | | | | | | | | | | | | | | | | | | | | | |
| Consolidated sales revenue by destination (a) | | 2016 % | | | Adjusted (b) 2015 % | | | Adjusted (b) 2014 % | | | 2016
US$m | | | Adjusted (b) 2015 US$m | | | Adjusted (b) 2014 US$m | |
| China | | | 42.6 | | | | 41.8 | | | | 38.3 | | | | 14,405 | | | | 14,566 | | | | 18,257 | |
| Asia (excluding China and Japan) | | | 14.8 | | | | 13.7 | | | | 13.2 | | | | 5,011 | | | | 4,762 | | | | 6,313 | |
| United States of America | | | 14.4 | | | | 15.5 | | | | 14.8 | | | | 4,862 | | | | 5,400 | | | | 7,032 | |
| Japan | | | 10.9 | | | | 11.2 | | | | 15.6 | | | | 3,681 | | | | 3,907 | | | | 7,449 | |
| Europe (excluding UK) | | | 7.8 | | | | 8.5 | | | | 9.0 | | | | 2,621 | | | | 2,970 | | | | 4,308 | |
| Canada | | | 3.3 | | | | 3.4 | | | | 2.9 | | | | 1,099 | | | | 1,167 | | | | 1,397 | |
| Australia | | | 2.1 | | | | 2.5 | | | | 2.1 | | | | 715 | | | | 866 | | | | 978 | |
| UK | | | 1.0 | | | | 1.0 | | | | 1.0 | | | | 352 | | | | 339 | | | | 475 | |
| Other countries | | | 3.1 | | | | 2.4 | | | | 3.1 | | | | 1,035 | | | | 852 | | | | 1,455 | |
| Consolidated sales revenue | | | 100.0 | | | | 100.0 | | | | 100.0 | | | | 33,781 | | | | 34,829 | | | | 47,664 | |
| (a) | Consolidated sales revenue by geographical destination is based on the ultimate country of destination of the product, if known. If the eventual destination of the product sold through traders is not known then revenue is allocated to the location of the product at the time when the risks and rewards of ownership are transferred. Rio Tinto is domiciled in both the UK and Australia. |
| (b) | The 2015 and 2014 comparatives above have been amended to correct the allocation of revenues by region. The impact is to decrease the amount allocated to Canada by US$321 million and US$318 million for 2015 and 2014 respectively and to increase other regions in aggregate by the same amount. |
Consolidated sales revenue by product
Consolidated sales revenues of the Group are derived from the following products sold to external customers:
| | | | | | | | | | | | |
| | | 2016
US$m | | | 2015(a) US$m | | | 2014 (a) US$m | |
| Iron ore | | | 15,855 | | | | 15,239 | | | | 23,178 | |
| Aluminium | | | 9,342 | | | | 9,904 | | | | 11,667 | |
| Copper | | | 1,609 | | | | 1,577 | | | | 2,590 | |
| Coal | | | 2,567 | | | | 2,703 | | | | 3,590 | |
| Industrial minerals | | | 1,954 | | | | 2,155 | | | | 3,238 | |
| Gold | | | 608 | | | | 1,063 | | | | 976 | |
| Diamonds | | | 613 | | | | 698 | | | | 901 | |
| Other | | | 1,233 | | | | 1,490 | | | | 1,524 | |
| Consolidated sales revenue | | | 33,781 | | | | 34,829 | | | | 47,664 | |
| (a) | 2015 and 2014 comparative figures have been adjusted to conform with the 2016 presentation of consolidated sales revenue, where previously gross sales revenue was presented. |
Non-current assets other than excluded items
The total ofnon-current assets other than items excluded is shown by location below. This is allocated based on the location of the business units holding the assets.
| | | | | | | | |
| Non-current assets other than excluded items(a) | | 2016
US$m | | | 2015(a) US$m | |
| | |
| Australia | | | 30,602 | | | | 32,615 | |
| Canada | | | 14,362 | | | | 14,396 | |
| Mongolia | | | 7,743 | | | | 7,712 | |
| United States of America | | | 4,958 | | | | 5,372 | |
| Africa | | | 3,882 | | | | 3,682 | |
| South America | | | 3,785 | | | | 3,639 | |
| Indonesia | | | 1,482 | | | | 1,385 | |
| Europe (excluding France and the UK) | | | 429 | | | | 451 | |
| UK | | | 66 | | | | 274 | |
| France | | | 251 | | | | 267 | |
| Other countries | | | 891 | | | | 895 | |
| | | | 68,451 | | | | 70,688 | |
| | |
| Non-current assets excluded from analysis above: | | | | | | | | |
| Deferred tax assets | | | 3,728 | | | | 3,309 | |
| Other financial assets (including loans to equity accounted units) | | | 822 | | | | 788 | |
| Quasi equity loans to equity accounted units (b) | | | 163 | | | | 183 | |
| Tax recoverable | | | 38 | | | | 78 | |
| Accounts receivable | | | 975 | | | | 964 | |
| Totalnon-current assets per balance sheet | | | 74,177 | | | | 76,010 | |
| (a) | Allocation ofnon-current assets by country is based on the location of the business units holding the assets. It includes investments in equity accounted units totalling US$4,856 million (2015: US$4,758 million) which represents the Group’s share of net assets excluding quasi equity loans shown separately within “Loans to equity accounted units” above. |
| (b) | Loans to equity accounted units comprise quasi equity loans of US$163 million (2015: US$183 million) included in “Investments in equity accounted units” on the face of the balance sheet andnon-currentnon-quasi equity loans of US$39 million (2015: US$nil) shown within “Other financial assets”. |
| | | | |
| 2016 Annual report | | riotinto.com | | 131 |
| | | | | | | | | | | | | | | | |
| | | | | | | | | |
| STRATEGIC REPORT | | | | DIRECTORS’ REPORT | | | | FINANCIAL STATEMENTS | | | | METALS AND MINERALS PRODUCTION | | | | ADDITIONAL INFORMATION |
Notes to the 2016 financial statements
continued
4 Net operating costs (excluding items shown separately)
| | | | | | | | | | | | | | | | |
| | | Note | | | 2016
US$m | | | Adjusted (a) 2015
US$m | | | 2014
US$m | |
| Raw materials, consumables, repairs and maintenance (a) | | | | | | | 8,456 | | | | 8,823 | | | | 11,044 | |
| Amortisation of intangible assets | | | 13 | | | | 227 | | | | 207 | | | | 237 | |
| Depreciation of property, plant and equipment | | | 14 | | | | 4,567 | | | | 4,438 | | | | 4,623 | |
| Employment costs | | | 5 | | | | 4,881 | | | | 5,446 | | | | 6,659 | |
| Shipping and other freight costs | | | | | | | 1,454 | | | | 2,165 | | | | 3,370 | |
| Decrease in finished goods and work in progress | | | | | | | 391 | | | | 701 | | | | 1,284 | |
| Royalties | | | | | | | 1,889 | | | | 1,863 | | | | 2,516 | |
| Amounts charged by equity accounted units (a) (b) | | | | | | | 1,184 | | | | 1,246 | | | | 1,554 | |
| Net foreign exchange gains/(losses) | | | | | | | 38 | | | | (263 | ) | | | (34 | ) |
| Other external costs | | | | | | | 3,472 | | | | 4,181 | | | | 3,074 | |
| Provisions (including exchange differences on provisions) | | | 26 | | | | 1,404 | | | | 731 | | | | 1,138 | |
| Research and development | | | | | | | 60 | | | | 104 | | | | 112 | |
| Costs included above qualifying for capitalisation | | | | | | | (521 | ) | | | (661 | ) | | | (738 | ) |
| Other operating income | | | | | | | (703 | ) | | | (1,062 | ) | | | (929 | ) |
| Net operating costs (excluding items shown separately) (c) | | | | | | | 26,799 | | | | 27,919 | | | | 33,910 | |
| (a) | The 2015 comparative has been amended to correctly present the purchases fromnon-tolling equity accounted units as “Amounts charged by equity accounted units”. The impact is to decrease the amount allocated to “Raw materials, consumables, repairs and maintenance” by US$787 million and to increase “Amounts charged by equity accounted units” by the same amount. |
| (b) | Amounts charged by equity accounted units relate to toll processing and also include purchases from equity accounted units of bauxite and aluminium which are then processed by the product group or sold to third parties. Generally, purchases are in proportion to the Group’s share of the equity accounted unit but in 2016, US$383 million (2015: US$378 million; 2014: US$463 million) related to purchases of the other investors’ share of production. |
| (c) | Net operating costs includes operating lease expense of US$573 million (2015: US$644 million). Costs for leases of dry bulk vessels (which include costs for crewing services) are included within “Shipping and other freight costs” and other lease costs are included within “Other external costs”. |
5 Employment costs
| | | | | | | | | | | | | | | | |
| | | Note | | | 2016
US$m | | | 2015
US$m | | | 2014
US$m | |
| Total employment costs | | | | | | | | | | | | | | | | |
| – Wages and salaries | | | | | | | 4,235 | | | | 4,670 | | | | 5,878 | |
| – Social security costs | | | | | | | 429 | | | | 430 | | | | 467 | |
| – Net post-retirement charge | | | 45 | | | | 522 | | | | 439 | | | | 590 | |
| – Share option charge | | | 44 | | | | 116 | | | | 128 | | | | 152 | |
| | | | | | | 5,302 | | | | 5,667 | | | | 7,087 | |
| Less: charged within provisions | | | | | | | (421 | ) | | | (221 | ) | | | (428 | ) |
| Employment costs | | | 4 | | | | 4,881 | | | | 5,446 | | | | 6,659 | |
| | | | |
| 132 | | riotinto.com | | 2016 Annual report |
6 Impairment charges and reversals
| | | | | | | | | | | | | | | | | | | | | | | | | | | | |
| | | Note | | | Pre-tax
2016
US$m | | | Taxation
2016
US$m | | | Non-
controlling
interests
2016
US$m | | | Net
amount
2016
US$m | | | Pre-tax
amount
2015
US$m | | | Pre-tax
amount
2014
US$m | |
| Copper & Diamonds – Argyle | | | | | | | (241 | ) | | | 64 | | | | – | | | | (177 | ) | | | – | | | | – | |
| Copper & Diamonds – Molybdenum Autoclave Process | | | | | | | – | | | | – | | | | – | | | | – | | | | (17 | ) | | | (559 | ) |
| Energy & Minerals – Simandou | | | | | | | – | | | | – | | | | – | | | | – | | | | (2,039 | ) | | | – | |
| Energy & Minerals – Energy Resources of Australia | | | | | | | – | | | | – | | | | – | | | | – | | | | (260 | ) | | | – | |
| Energy & Minerals – Roughrider | | | | | | | – | | | | – | | | | – | | | | – | | | | (229 | ) | | | – | |
| Aluminium – Other | | | | | | | – | | | | – | | | | – | | | | – | | | | (179 | ) | | | (46 | ) |
| Aluminium – Kitimat | | | | | | | – | | | | – | | | | – | | | | – | | | | – | | | | (1,092 | ) |
| Aluminium – Pacific Aluminium smelters | | | | | | | – | | | | – | | | | – | | | | – | | | | – | | | | 1,224 | |
| Other | | | | | | | (8 | ) | | | 2 | | | | – | | | | (6 | ) | | | (67 | ) | | | – | |
| Total impairment charge net of reversals | | | | | | | (249 | ) | | | 66 | | | | – | | | | (183 | ) | | | (2,791 | ) | | | (473 | ) |
| | | | | | | |
| Allocated as: | | | | | | | | | | | | | | | | | | | | | | | | | | | | |
| Goodwill | | | 12 | | | | – | | | | | | | | | | | | | | | | (116 | ) | | | – | |
| Intangible assets | | | 13 | | | | (1 | ) | | | | | | | | | | | | | | | (1,833 | ) | | | – | |
| Property, plant and equipment | | | 14 | | | | (248 | ) | | | | | | | | | | | | | | | (652 | ) | | | (1,034 | ) |
| Investment in equity accounted units | | | | | | | – | | | | | | | | | | | | | | | | – | | | | 589 | |
| Other assets and liabilities | | | | | | | – | | | | | | | | | | | | | | | | (190 | ) | | | (28 | ) |
| Total impairment charge net of reversals | | | | | | | (249 | ) | | | | | | | | | | | | | | | (2,791 | ) | | | (473 | ) |
| Comprising: | | | | | | | | | | | | | | | | | | | | | | | | | | | | |
| Impairment charges net of reversals of consolidated balances | | | | | | | | | | | | | | | | | | | (249 | ) | | | (2,791 | ) | | | (1,062 | ) |
| Impairment reversals of investments in equity accounted units(pre-tax) | | | | | | | | | | | | | | | | | | | – | | | | – | | | | 841 | |
| Total impairment charge net of reversals in the financial | | | | | | | | | | | | | | | | | | | | | | | | | | | | |
| information by business unit (page 200) | | | | | | | | | | | | | | | | | | | (249 | ) | | | (2,791 | ) | | | (221 | ) |
| Taxation (including related to EAUs) | | | | | | | | | | | | | | | | | | | 66 | | | | (57 | ) | | | 83 | |
| Non-controlling interests | | | | | | | | | | | | | | | | | | | – | | | | 1,046 | | | | – | |
| Total impairment in the income statement | | | | | | | | | | | | | | | | | | | (183 | ) | | | (1,802 | ) | | | (138 | ) |
Copper & Diamonds
Argyle Diamond Mine, Australia
An impairment trigger assessment at the Argyle cash-generating unit resulted in the identification of impairment indicators as a result of lower production volumes compared with forecast and lower prices achieved for bulk diamonds. The recoverable amount for Argyle has been determined to be US$191 million assessed by reference to a value in use (VIU) model in line with the accounting policy set out in note 1(i). The reduction in the recoverable amount resulted in apre-tax impairment charge of US$240 million to property, plant and equipment and US$1 million to intangible assets. In arriving at VIU,post-tax cash flows expressed in real terms have been estimated and discounted using apost-tax discount rate of 7.0 per cent, giving consideration to the specific amount and timing of future tax cash flows.
Oyu Tolgoi, Mongolia
The restart of the Oyu Tolgoi Underground Mine Development was approved in May 2016 by all shareholders of the project. Subsequently, all necessary permits were granted, the project finance was drawn down and the main contractor for engineering, procurement and construction management was appointed. Underground work is underway and progressing as planned.
As part of the annual impairment review at 30 September 2016, the project was reviewed for indicators that would require reassessment of its carrying value. The review concluded that there were no indicators of impairment or impairment reversal. Management continues to optimise production planning and sequencing of development and to implement cost reductions that are intended to improve the overall value of the project and the headroom from further impairment. The scale and complexity of the underground development means that reversal of previous impairments is not appropriate at this stage of the construction.
Molybdenum Autoclave Process, US
In 2015, previously estimated net disposal proceeds for the Molybdenum Autoclave Process project were reduced resulting in apre-tax impairment of US$17 million recorded against property, plant and equipment. In 2014, following a review of the investment case and subsequent decision to terminate the project, apre-tax impairment charge of US$559 million was recorded against property, plant and equipment.
Energy & Minerals
Simandou, Guinea
In 2015, apre-tax impairment charge of US$1,655 million to exploration and evaluation intangible assets and apre-tax impairment charge of US$194 million to property, plant and equipment were recognised to fully write-down the long-term assets of the Simandou project. In addition apre-tax charge of US$7 million was recognised in relation to inventories and apre-tax charge of US$183 million was also recognised as a financial liability for contractual arrangements.
Energy Resources of Australia (ERA), Australia
In 2015, apre-tax write down to property, plant and equipment and intangible assets of US$260 million to fully write off these long-term assets was recognised. Deferred tax assets of US$123 million were also fully written off.
Roughrider, Canada
In 2015, apre-tax impairment charge of US$116 million to fully write off goodwill and apre-tax impairment charge of US$113 million to exploration and evaluation intangible assets were recognised. The recoverable amount for Roughrider has been determined by reference to a fair value less cost of disposal (FVLCD) model in line with the accounting policy set out in note 1(i).
| | | | |
| 2016 Annual report | | riotinto.com | | 133 |
| | | | | | | | | | | | | | | | |
| | | | | | | | | |
| STRATEGIC REPORT | | | | DIRECTORS’ REPORT | | | | FINANCIAL STATEMENTS | | | | METALS AND MINERALS PRODUCTION | | | | ADDITIONAL INFORMATION |
Notes to the 2016 financial statements
continued
6 Impairment charges and reversalscontinued
Aluminium
Other
In 2015, apre-tax impairment loss of US$147 million was recorded in relation to the Carbone Savoie cash-generating unit and US$32 million was recorded in relation to other aluminium businesses which were subsequently disposed of in the second half of 2015.
In 2014, apre-tax impairment loss of US$46 million was recorded in relation to other aluminium businesses.
Kitimat, Canada
In 2014, revisions to forecast capital required to complete the modernisation project resulted in apre-tax impairment charge of
US$1,092 million to the property, plant and equipment of the cash-generating unit. The recoverable amount was determined by reference to a FVLCD model, in line with the accounting policy set out in note 1(i).
Pacific Aluminium, Australia and New Zealand
Impairment reversal was recorded in 2014 in relation to the Tomago, Bell Bay and Boyne smelters, and the Gladstone Power Station, within the Pacific Aluminium cash-generating unit as evidence emerged that previously recognised impairment losses from 2011 and 2012 had reversed.
7 Share of profit after tax of equity accounted units
| | | | | | | | | | | | |
| | | 2016
US$m | | | 2015
US$m | | | 2014
US$m | |
| Sales revenue: Rio Tinto share(a) | | | 1,727 | | | | 2,149 | | | | 2,852 | |
| Operating costs | | | (1,237 | ) | | | (1,609 | ) | | | (1,804 | ) |
| Profit before finance items and taxation | | | 490 | | | | 540 | | | | 1,048 | |
| Finance items | | | (33 | ) | | | (37 | ) | | | (49 | ) |
| Share of profit after tax of equity accounted units | | | 20 | | | | 35 | | | | 30 | |
| Profit before taxation | | | 477 | | | | 538 | | | | 1,029 | |
| Taxation | | | (156 | ) | | | (177 | ) | | | (404 | ) |
| Profit for the year (Rio Tinto share) | | | 321 | | | | 361 | | | | 625 | |
| (a) | Sales revenue of equity accounted units excludes sales by equity accounted units to Group subsidiaries. |
Further information relating to the Group’s interests in joint ventures and associates is given in notes 35 and 36.
8 Finance income and finance costs
| | | | | | | | | | | | | | | | |
| | | Note | | | 2016
US$m | | | 2015
US$m | | | 2014
US$m | |
| Finance income from equity accounted units (Rio Tinto share) | | | | | | | 6 | | | | 8 | | | | 10 | |
| Other finance income (including bank deposits and other financial assets) | | | | | | | 83 | | | | 44 | | | | 54 | |
| Total finance income | | | | | | | 89 | | | | 52 | | | | 64 | |
| | | | |
| Interest payable and similar charges(a) | | | | | | | (898 | ) | | | (1,004 | ) | | | (1,119 | ) |
| Loss on early redemption of bonds(b) | | | | | | | (324 | ) | | | – | | | | – | |
| Amounts capitalised | | | 14 | | | | 111 | | | | 254 | | | | 470 | |
| Total finance costs | | | | | | | (1,111 | ) | | | (750 | ) | | | (649 | ) |
| (a) | Interest payable and similar charges relate to interest on bank loans and other borrowings. This includes a fair value loss on interest rate swaps designated as fair value hedges of US$89 million (2015: US$11 million loss; 2014: US$199 million gain) and a fair value gain on bonds and notes attributable to interest rate risk of US$89 million (2015: US$17 million loss; 2014: US$200 million loss). |
| (b) | Loss on early redemption of bonds includes a premium charge of US$441 million; unamortised debt issuance costs and fees of US$42 million partially offset by the write off of the fair value hedge adjustment of US$159 million (refer to note 30). |
| | | | |
| 134 | | riotinto.com | | 2016 Annual report |
9 Taxation
| | | | | | | | | | | | | | | | |
| | | Note | | | 2016 US$m | | | 2015 US$m | | | 2014 US$m | |
| Taxation charge | | | | | | | | | | | | | | | | |
| – Current | | | | | | | 2,115 | | | | 1,132 | | | | 3,402 | |
| – Deferred | | | 17 | | | | (548 | ) | | | (139 | ) | | | (349 | ) |
| | | | | | | | 1,567 | | | | 993 | | | | 3,053 | |
| | | | | | | | | | | | | | | | |
| Prima facie tax reconciliation | | | | | 2016 US$m | | | 2015 US$m | | | 2014 US$m | |
| Profit/(loss) before taxation | | | | | | | 6,343 | | | | (726 | ) | | | 9,552 | |
| Deduct: share of profit after tax of equity accounted units | | | | | | | (321 | ) | | | (361 | ) | | | (625 | ) |
| Deduct: impairment reversal after tax of investments in equity accounted units(a) | | | | | | | – | | | | – | | | | (589 | ) |
| Parent companies’ and subsidiaries’ profit/(loss) before tax | | | | | | | 6,022 | | | | (1,087 | ) | | | 8,338 | |
| | | | |
| Prima facie tax payable/(receivable) at UK rate of 20 per cent (2015: 20 per cent; 2014: 21 per cent) | | | | | | | 1,204 | | | | (217 | ) | | | 1,751 | |
| Higher rate of taxation on Australian underlying earnings | | | | | | | 604 | | | | 506 | | | | 1,038 | |
| Impact of items excluded in arriving at underlying earnings(b): | | | | | | | | | | | | | | | | |
Impairment charges net of reversals | | | | | | | (16 | ) | | | 615 | | | | (112 | ) |
Gains and losses on disposal of businesses | | | | | | | 30 | | | | (11 | ) | | | (85 | ) |
Foreign exchange on excluded finance items | | | | | | | (33 | ) | | | 481 | | | | 231 | |
Onerous port and rail contracts | | | | | | | (46 | ) | | | – | | | | – | |
Closure provision for legacy operations | | | | | | | (40 | ) | | | – | | | | – | |
Tax provision (c) | | | | | | | 380 | | | | – | | | | – | |
Recognition of deferred tax assets relating to planned divestments | | | | | | | – | | | | (250 | ) | | | – | |
Impact of tax law changes on recognition of deferred tax assets (d) | | | | | | | – | | | | – | | | | 401 | |
Other exclusions | | | | | | | (48 | ) | | | (17 | ) | | | (35 | ) |
| Impact of changes in tax rates and laws | | | | | | | (9 | ) | | | (3 | ) | | | (11 | ) |
| Other tax rates applicable outside the UK and Australia on underlying earnings | | | | | | | (283 | ) | | | (68 | ) | | | 5 | |
| Resource depletion and other depreciation allowances | | | | | | | (15 | ) | | | (15 | ) | | | (121 | ) |
| Research, development and other investment allowances | | | | | | | (15 | ) | | | (21 | ) | | | (34 | ) |
| Recognition of previously unrecognised deferred tax assets | | | | | | | (154 | ) | | | (40 | ) | | | (106 | ) |
| Unrecognised current year operating losses | | | | | | | 25 | | | | 45 | | | | 73 | |
| Other items | | | | | | | (17 | ) | | | (12 | ) | | | 58 | |
| Total taxation charge(e) | | | | | | | 1,567 | | | | 993 | | | | 3,053 | |
| (a) | For the year ended 31 December 2014, the impairment reversal in investments in equity accounted units is net of a tax charge of US$252 million. |
| (b) | The impact for each item includes the effect of tax rates applicable outside the UK. |
| (c) | The tax provision includes amounts provided for tax matters for which the timing of resolution and potential economic outflow are uncertain. |
| | Specifically, the Group has recognised a charge of US$380m in the year to 31 December 2016 for matters currently under discussion with the Australian Taxation Office (ATO) in relation to the pricing of certain transactions between Rio Tinto entities based in Australia and the Group’s commercial centre in Singapore for the period since 2009. These matters were raised by Rio Tinto with the ATO through advance ruling requests or are under discussions pursuant to ourco-operative compliance agreement. |
| | The pricing adopted by the Group in determining the amounts paid to the Singapore commercial centre is based on supporting analysis and applies established principles. All transactions with the Singapore commercial centre are undertaken on an arm’s length basis and priced in accordance with OECD guidelines and local tax requirements and where applicable, the Group has used previous settlements reached with the ATO for prior periods as the basis to determine the commission rates. While the Group is satisfied that these transactions align with tax requirements, differences of interpretation with tax authorities can occur. This includes whether an arm’s length transfer price should be based on revised commission rates or some other basis, for example based on the direct costs of the relevant function. |
| | The ATO is reviewing the transactions and its position in relation to arm’s length transfer pricing. In the light of ongoing discussions with the ATO about the transfer prices charged between Singapore and Australia, management has reassessed the tax provision in accordance with its accounting policy as described in note 1(m). |
| | The Group has not received amended tax assessments from the ATO in respect of these matters, but it is possible that assessments may be issued in the near future. It is possible that the final amount of any payment to the ATO may vary from the amount currently provided. The Group does however consider that any difference between the maximum amount of the possible economic outflow in the next financial year and the amount of the tax provision is not material. |
| (d) | For the year ended 31 December 2014, the remaining Minerals Resource Rent Tax (MRRT) starting base deferred tax asset was derecognised on repeal of the tax in Australia. |
| (e) | This tax reconciliation relates to the Group’s parent companies, subsidiaries and joint operations. The Group’s share of profit of equity accounted units is net of tax charges of US$156 million (31 December 2015: US$177 million; 31 December 2014: US$404 million). |
| | | | |
| 2016 Annual report | | riotinto.com | | 135 |
| | | | | | | | | | | | | | | | |
| | | | | | | | | |
| STRATEGIC REPORT | | | | DIRECTORS’ REPORT | | | | FINANCIAL STATEMENTS | | | | METALS AND MINERALS PRODUCTION | | | | ADDITIONAL INFORMATION |
Notes to the 2016 financial statements
continued
9 Taxationcontinued
| | | | | | | | | | | | |
| | | 2016
Total
US$m | | | 2015
Total
US$m | | | 2014
Total
US$m | |
| Tax on exchange adjustments | | | – | | | | – | | | | (3 | ) |
| Tax on fair value movements: | | | | | | | | | | | | |
– Cash flow hedge fair value (gains)/losses | | | – | | | | (3 | ) | | | 2 | |
– Cash flow hedge gains transferred to the income statement | | | 4 | | | | – | | | | – | |
– Losses on revaluation of available for sale securities | | | – | | | | – | | | | 1 | |
– (Losses)/gains on revaluation of available for sale securities transferred to the income statement | | | – | | | | – | | | | (1 | ) |
| Tax credit/(charge) on actuarial losses/(gains) on post-retirement benefit plans | | | 29 | | | | (175 | ) | | | 215 | |
| Other | | | – | | | | – | | | | (8 | ) |
| Tax relating to components of other comprehensive income/(loss) for the year(a) | | | 33 | | | | (178 | ) | | | 206 | |
| (a) | This comprises deferred tax credit of US$33 million (2015: charge of US$174 million; 2014: credit of US$205 million) and current tax charge of US$nil (2015: charge of US$4 million; 2014: credit of US$1 million), plus share of tax on other comprehensive income of equity accounted units shown separately (see note 17). |
10 Earnings/(loss) per ordinary share
| | | | | | | | | | | | | | | | | | | | | | | | |
| | | 2016
Earnings
US$m | | | 2016
Weighted
average
number of
shares
(millions) | | | 2016
Per share
amount
(cents) | | | 2015
Loss
US$m | | | 2015
Weighted
average
number of
shares
(millions) | | | 2015
Per share
amount
(cents) | |
| Basic earnings/(loss) per share attributable to ordinaryshareholders of Rio Tinto (a) | | | 4,617 | | | | 1,797.3 | | | | 256.9 | | | | (866 | ) | | | 1,824.7 | | | | (47.5 | ) |
| Diluted earnings/(loss) per share attributable to ordinary shareholders of Rio Tinto(b) | | | 4,617 | | | | 1,808.6 | | | | 255.3 | | | | (866 | ) | | | 1,824.7 | | | | (47.5 | ) |
| | | | | | | | | | | | | | | | | | | | | | | | |
| | | | | | | | | | | | 2014
Earnings
US$m | | | 2014
Weighted
average
number of
shares
(millions) | | | 2014
Per share
amount
(cents) | |
| Basic earnings per share attributable to ordinaryshareholders of Rio Tinto(a) | | | | | | | | | | | | | | | 6,527 | | | | 1,848.4 | | | | 353.1 | |
| Diluted earnings per share attributable to ordinary shareholders of Rio Tinto (b) | | | | | | | | | | | | | | | 6,527 | | | | 1,858.7 | | | | 351.2 | |
| (a) | The weighted average number of shares is calculated as the average number of Rio Tinto plc shares outstanding not held as treasury shares of 1,373.7 million (2015: 1,398.1 million; 2014: 1,413.0 million) plus the average number of Rio Tinto Limited shares outstanding of 423.6 million (2015: 426.6 million; 2014: 435.4 million) over the relevant period. No Rio Tinto Limited ordinary shares were held by Rio Tinto plc in any of the periods presented. |
| (b) | For the purposes of calculating diluted earnings per share, the effect of dilutive securities of 11.3 million shares in 2016 and 10.3 million shares in 2014 is added to the weighted average number of shares described in (a) above. This effect is calculated under the treasury stock method. In accordance with IAS 33 “Earnings per share”, for the purposes of calculating diluted loss per share, the effect of potentially dilutive securities has not been taken into account for the year ended 31 December 2015. The Group’s only potential dilutive ordinary shares are share options for which terms and conditions are described in note 44. |
11 Dividends
| | | | | | | | | | | | |
| | | 2016
US$m | | | 2015
US$m | | | 2014
US$m | |
| Rio Tinto plc previous year final dividend paid | | | 1,443 | | | | 1,642 | | | | 1,533 | |
| Rio Tinto plc interim dividend paid | | | 604 | | | | 1,476 | | | | 1,299 | |
| Rio Tinto Limited previous year final dividend paid | | | 473 | | | | 520 | | | | 473 | |
| Rio Tinto Limited interim dividend paid | | | 205 | | | | 438 | | | | 405 | |
| Dividends paid during the year | | | 2,725 | | | | 4,076 | | | | 3,710 | |
| | | |
| Dividends per share: paid during the year | | | 152.5c | | | | 226.5c | | | | 204.5c | |
| Dividends per share: proposed in the announcement of the results for the year | | | 125.0c | | | | 107.5c | | | | 119.0c | |
| | | | | | | | | | | | |
| | | Dividends
per
share
2016 | | | Dividends
per share
2015 | | | Dividends
per share
2014 | |
| Rio Tinto plc previous year final (pence) | | | 74.21p | | | | 77.98p | | | | 65.82p | |
| Rio Tinto plc interim (pence) | | | 33.80p | | | | 68.92p | | | | 56.90p | |
| Rio Tinto Limited previous year final – fully franked at 30% (Australian cents) | | | 151.89c | | | | 152.98c | | | | 120.14c | |
| Rio Tinto Limited interim – fully franked at 30% (Australian cents) | | | 59.13c | | | | 144.91c | | | | 103.09c | |
| | | | |
| 136 | | riotinto.com | | 2016 Annual report |
| | | | | | | | | | | | |
| | | Number
of
shares
2016
(millions) | | | Number
of shares
2015
(millions) | | | Number
of shares
2014
(millions) | |
| Rio Tinto plc previous year final | | | 1,373.9 | | | | 1,412.7 | | | | 1,413.2 | |
| Rio Tinto plc interim | | | 1,374.4 | | | | 1,395.2 | | | | 1,413.8 | |
| Rio Tinto Limited previous year final | | | 423.5 | | | | 435.0 | | | | 435.6 | |
| Rio Tinto Limited interim | | | 424.0 | | | | 423.7 | | | | 435.7 | |
The dividends paid in 2016 are based on the following US cents per share amounts: 2015 final – 107.5 cents, 2016 interim – 45.0 cents (2015 dividends paid: 2014 final – 119.0 cents, 2015 interim – 107.5 cents; 2014 dividends paid: 2013 final – 108.5 cents, 2014 interim – 96.0 cents).
The number of shares on which Rio Tinto plc dividends are based excludes those held as treasury shares and those held by employee share trusts which waived the right to dividends. Employee share trusts waived dividends on 428,529 Rio Tinto plc ordinary shares and 13,881 American Depository Receipts (ADRs) for the 2015 final dividend and on 217,661 Rio Tinto plc ordinary shares and 31,604 ADRs for the 2016 interim dividend (2015: 342,902 Rio Tinto plc ordinary shares and 24,582 ADRs for the 2014 final dividend and on 237,266 Rio Tinto plc ordinary shares and 27,050 ADRs for the 2015 interim dividend; 2014: 207,766 Rio Tinto plc ordinary shares and 3,353 ADRs for the 2013 final dividend and on 90,304 Rio Tinto plc ordinary shares and 1,912 ADRs for the 2014 interim dividend). In 2016, 2015 and 2014, no Rio Tinto Limited shares were held by Rio Tinto plc.
The number of shares on which Rio Tinto Limited dividends are based excludes those held by shareholders who have waived the rights to
dividends. Employee share trusts waived dividends on Rio Tinto Limited shares of 681,818 for the 2015 final dividend and on 152,834 shares for the 2016 interim dividend (2015: 727,676 for the 2014 final dividend and on 474,665 for the 2015 interim dividend; 2014: 183,981 shares for the 2013 final dividend and 24,046 for the 2014 interim dividend).
In addition, the directors of Rio Tinto announced a final dividend of 125.0 cents per share on 8 February 2017. This is expected to result in payments of US$2,249 million (Rio Tinto plc: US$1,719 million, Rio Tinto Limited US$530 million). The dividends will be paid on 6 April 2017 to Rio Tinto plc and Rio Tinto Limited shareholders on the register at the close of business on 24 February 2017.
The proposed Rio Tinto Limited dividends will be franked out of existing franking credits or out of franking credits arising from the payment of income tax during 2017.
The approximate amount of the Rio Tinto Limited consolidated tax group’s retained profits and reserves that could be distributed as dividends and franked out of available credits that arose from net payments of income tax in respect of periods up to 31 December 2016 (after deducting franking credits expected to be utilised on the 2016 final dividend declared) is US$11,577 million.
12 Goodwill
| | | | | | | | |
| | | 2016
US$m | | | 2015
US$m | |
| Net book value | | | | | | | | |
| At 1 January | | | 892 | | | | 1,228 | |
| Adjustment on currency translation | | | 59 | | | | (220 | ) |
| Impairment charges (a) | | | – | | | | (116 | ) |
| At 31 December | | | 951 | | | | 892 | |
| – cost | | | 17,144 | | | | 17,120 | |
| – accumulated impairment | | | (16,193 | ) | | | (16,228 | ) |
| | | | | | | | |
| At 1 January | | | | | | | | |
| – cost | | | 17,120 | | | | 20,122 | |
| – accumulated impairment | | | (16,228 | ) | | | (18,894 | ) |
At 31 December, goodwill has been allocated as follows: | | | | | | | | |
| | | 2016
US$m | | | 2015
US$m | |
| Net book value | | | | | | | | |
| Richards Bay Minerals | | | 502 | | | | 439 | |
| Pilbara | | | 360 | | | | 363 | |
| Dampier Salt | | | 89 | | | | 90 | |
| | | | 951 | | | | 892 | |
| (a) | The 2015 impairment charge of US$116 million represents the full impairment of goodwill arising from the Hathor Exploration Limited acquisition, which includes the Roughrider project. Refer to note 6 for further details. |
| | | | |
| 2016 Annual report | | riotinto.com | | 137 |
| | | | | | | | | | | | | | | | |
| | | | | | | | | |
| STRATEGIC REPORT | | | | DIRECTORS’ REPORT | | | | FINANCIAL STATEMENTS | | | | METALS AND MINERALS PRODUCTION | | | | ADDITIONAL INFORMATION |
Notes to the 2016 financial statements
continued
12 Goodwillcontinued
Impairment tests for goodwill
Richards Bay Minerals
Richards Bay Minerals’ annual impairment review resulted in no impairment charge for 2016 (2015: no impairment charge). The recoverable amount has been assessed by reference to FVLCD, in line with the policy set out in note 1(i) and classified as level 3 under the fair value hierarchy. FVLCD was determined by estimating cash flows until the end of thelife-of-mine plan including anticipated expansions. In arriving at FVLCD, apost-tax discount rate of 9.0 per cent (2015: 9.3 per cent) has been applied to thepost-tax cash flows expressed in real terms.
The key assumptions to which the calculation of FVLCD for Richards Bay Minerals is most sensitive and the corresponding decrease in FVLCD are set out below:
| | | | |
| | | US$ million | |
| 5% decrease in the titanium slag price | | | 198 | |
| 1% increase in the discount rate applied topost-tax cash flows | | | 326 | |
| 10% strengthening of the South African rand | | | 658 | |
Other assumptions include the long-term pig iron and zircon prices and operating costs. Future selling prices and operating costs have been estimated in line with the policy set out in note 1(i). The recoverable amount of the cash-generating unit exceeds the carrying value for each of these sensitivities applied in isolation.
Pilbara
The recoverability of goodwill arising at Robe River is monitored at the Pilbara cash-generating unit level and has been assessed by reference to FVLCD using discounted cash flows, which is in line with the policy set out in note 1(i) and is classified as level 3 under the fair value hierarchy. In arriving at FVLCD, apost-tax discount rate of 7.0 per cent (2015: 7.3 per cent) has been applied to thepost-tax cash flows expressed in real terms. The recoverable amounts were determined to be significantly in excess of carrying value, and there are not considered to be any reasonably possible changes in key assumptions that would cause the remaining goodwill to be impaired.
13 Intangible assets
| | | | | | | | | | | | | | | | | | | | |
| Year ended 31 December 2016 | | Exploration
and
evaluation (a) US$m | | | Trademarks,
patented and
non-patented
technology
US$m | | | Contract
based
intangible
assets (b) US$m | | | Other
intangible
assets
US$m | | | Total
US$m | |
| Net book value | | | | | | | | | | | | | | | | | | | | |
| At 1 January 2016 | | | 706 | | | | 94 | | | | 2,138 | | | | 398 | | | | 3,336 | |
| Adjustment on currency translation | | | 14 | | | | (3 | ) | | | 47 | | | | – | | | | 58 | |
| Expenditure during the year | | | 8 | | | | – | | | | – | | | | 23 | | | | 31 | |
| Amortisation for the year (c) | | | – | | | | (13 | ) | | | (87 | ) | | | (127 | ) | | | (227 | ) |
| Impairment charges (d) | | | – | | | | – | | | | – | | | | (1 | ) | | | (1 | ) |
| Disposals, transfers and other movements (e) | | | (17 | ) | | | – | | | | 5 | | | | 94 | | | | 82 | |
| At 31 December 2016 | | | 711 | | | | 78 | | | | 2,103 | | | | 387 | | | | 3,279 | |
| – cost | | | 2,588 | | | | 199 | | | | 3,897 | | | | 1,329 | | | | 8,013 | |
| – accumulated amortisation and impairment | | | (1,877 | ) | | | (121 | ) | | | (1,794 | ) | | | (942 | ) | | | (4,734 | ) |
| | | | | | | | | | | | | | | | | | | | |
| Year ended 31 December 2015 | | Exploration
and
evaluation (a) US$m | | | Trademarks,
patented and
non patented
technology
US$m | | | Contract
based
intangible
assets (b) US$m | | | Other
intangible
assets
US$m | | | Total
US$m | |
| Net book value | | | | | | | | | | | | | | | | | | | | |
| At 1 January 2015 | | | 2,596 | | | | 156 | | | | 2,454 | | | | 674 | | | | 5,880 | |
| Adjustment on currency translation | | | (134 | ) | | | (15 | ) | | | (393 | ) | | | (58 | ) | | | (600 | ) |
| Expenditure during the year | | | 152 | | | | – | | | | – | | | | 64 | | | | 216 | |
| Amortisation for the year (c) | | | – | | | | (15 | ) | | | (90 | ) | | | (102 | ) | | | (207 | ) |
| Impairment charges (d) | | | (1,773 | ) | | | (28 | ) | | | (30 | ) | | | (2 | ) | | | (1,833 | ) |
| Disposals, transfers and other movements (e) | | | (135 | ) | | | (4 | ) | | | 197 | | | | (178 | ) | | | (120 | ) |
| At 31 December 2015 | | | 706 | | | | 94 | | | | 2,138 | | | | 398 | | | | 3,336 | |
| – cost | | | 2,585 | | | | 208 | | | | 3,829 | | | | 1,252 | | | | 7,874 | |
| – accumulated amortisation and impairment | | | (1,879 | ) | | | (114 | ) | | | (1,691 | ) | | | (854 | ) | | | (4,538 | ) |
| (a) | Exploration and evaluation assets’ useful lives are not determined until transferred to property, plant and equipment. This balance includes the Roughrider project in Canada which had an exploration and evaluation asset at 31 December 2016 of US$353 million (31 December 2015: US$343 million). The impairment charge in the year ended 31 December 2015 of US$1,773 million primarily relates to exploration and evaluation assets within the Simandou and Roughrider projects in the Energy & Minerals product group (see note 6). |
| (b) | The Group benefits from certain intangible assets acquired with Alcan, including power supply contracts and water rights. The water rights are expected to contribute to the efficiency and cost effectiveness of operations for the foreseeable future: accordingly, these rights are considered to have indefinite lives and are not subject to amortisation but are tested annually for impairment. These water rights constitute the majority of the amounts in “Contract based intangible assets”. |
| | The remaining carrying value of the water rights (US$1,702 million) as at 31 December 2016 relates wholly to the Quebec smelters cash-generating unit. The Quebec smelters cash-generating unit was tested for impairment by reference to FVLCD using discounted cash flows, which is in line with the policy set out in note 1(i). The recoverable amount of the Quebec smelters is classified as level 3 under the fair value hierarchy. In arriving at FVLCD,post-tax cash flows expressed in real terms have been estimated over the expected useful economic lives of the underlying smelting assets and discounted using a realpost-tax discount rate of 7.0 per cent (2015: 7.3 per cent). |
| | The recoverable amounts were determined to be significantly in excess of carrying value, and there are no reasonably possible changes in key assumptions that would cause the remaining water rights to be impaired. |
| | | | |
| 138 | | riotinto.com | | 2016 Annual report |
| (c) | Finite life intangible assets are amortised over their useful economic lives on a straight-line or units of production basis, as appropriate. Where amortisation is calculated on a straight-line basis, the following useful lives have been determined: |
| | Trademarks, patented andnon-patented technology |
| | Trademarks: 14 to 20 years |
| | Patented andnon-patented technology: ten to 20 years |
| | Contract based intangible assets |
| | Power contracts/water rights: two to 45 years |
| | Other purchase and customer contracts: five to 15 years |
| | Internally generated intangible assets and computer software: two to five years |
| | Other intangible assets: two to 20 years |
| (d) | Impairment charges in 2016 relate to the full write off of the intangible assets of the Argyle cash-generating unit (see note 6). Impairment charges in 2015, excluding charges against exploration and evaluation, primarily related to the full write off of the intangible assets of the Carbone Savoie cash-generating unit. |
| (e) | Disposals, transfers and other movements for exploration and evaluation in 2016 includes the disposal of the Mount Pleasant thermal coal project in New South Wales, Australia. The sale to MACH Energy Australia Pty Ltd completed on 5 August 2016. Disposals, transfers and other movements for exploration and evaluation in 2015 included US$164 million transferred to Mining property in relation to the Amrun project in Australia. |
Exploration and evaluation expenditure
The charge for the year and the net amount of intangible assets capitalised during the year are as follows:
| | | | | | | | | | | | |
| | | 2016
US$m | | | 2015
US$m | | | 2014
US$m | |
| Net expenditure in the year (net of proceeds of US$208 million (2015: US$nil; 2014: US$11 million) ondisposal of undeveloped projects) | | | (284 | ) | | | (705 | ) | | | (872 | ) |
| Non-cash movements andnon-cash proceeds on disposal of undeveloped projects | | | (177 | ) | | | (15 | ) | | | (53 | ) |
| Amount capitalised during the year | | | 8 | | | | 152 | | | | 142 | |
| Net charge for the year | | | (453 | ) | | | (568 | ) | | | (783 | ) |
| Reconciliation to income statement | | | | | | | | | | | | |
| Exploration and evaluation costs | | | (497 | ) | | | (576 | ) | | | (747 | ) |
| Profit/(loss) relating to interests in undeveloped projects | | | 44 | | | | 8 | | | | (36 | ) |
| Net charge for the year | | | (453 | ) | | | (568 | ) | | | (783 | ) |
At 31 December 2016, a total of US$726 million had been capitalised related to projects which had not yet been approved to proceed. This comprised evaluation costs of US$711 million included above and US$15 million of early works expenditure within property, plant and equipment (31 December 2015: a total of US$766 million had been capitalised comprising: evaluation costs of US$706 million included above and US$60 million of early works expenditure within property, plant and equipment).
14 Property, plant and equipment
| | | | | | | | | | | | | | | | | | | | | | | | |
| Year ended 31 December 2016 | | Note | | | Mining
properties
and leases (a) US$m | | | Land
and
buildings (b) US$m | | | Plant
and
equipment
US$m | | | Capital
works in
progress
US$m | | | Total
US$m | |
| Net book value | | | | | | | | | | | | | | | | | | | | | | | | |
| At 1 January 2016 | | | | | | | 11,146 | | | | 7,571 | | | | 37,900 | | | | 4,440 | | | | 61,057 | |
| Adjustment on currency translation | | | | | | | 137 | | | | 62 | | | | 138 | | | | 16 | | | | 353 | |
| Adjustments to capitalised closure costs | | | 26 | | | | (123 | ) | | | – | | | | – | | | | – | | | | (123 | ) |
| Interest capitalised(c) | | | 8 | | | | – | | | | – | | | | – | | | | 111 | | | | 111 | |
| Additions | | | | | | | 237 | | | | 47 | | | | 537 | | | | 2,307 | | | | 3,128 | |
| Depreciation for the year (a) (d) | | | | | | | (760 | ) | | | (429 | ) | | | (3,378 | ) | | | – | | | | (4,567 | ) |
| Impairment charges, net of reversals (e) | | | | | | | (130 | ) | | | – | | | | (112 | ) | | | (6 | ) | | | (248 | ) |
| Disposals | | | | | | | (3 | ) | | | (169 | ) | | | (86 | ) | | | – | | | | (258 | ) |
| Subsidiaries no longer consolidated | | | | | | | (40 | ) | | | (88 | ) | | | (217 | ) | | | (14 | ) | | | (359 | ) |
| Transfers and other movements (f) | | | | | | | 384 | | | | 322 | | | | 924 | | | | (1,869 | ) | | | (239 | ) |
| At 31 December 2016 | | | | | | | 10,848 | | | | 7,316 | | | | 35,706 | | | | 4,985 | | | | 58,855 | |
| – cost | | | | | | | 22,989 | | | | 11,444 | | | | 68,030 | | | | 5,374 | | | | 107,837 | |
| – accumulated depreciation and impairment | | | | | | | (12,141 | ) | | | (4,128 | ) | | | (32,324 | ) | | | (389 | ) | | | (48,982 | ) |
| | | | | | |
| Non-current assets held under finance leases (g) | | | | | | | – | | | | – | | | | 38 | | | | – | | | | 38 | |
| Non-current assets pledged as security (h) | | | | | | | 3,310 | | | | 423 | | | | 5,332 | | | | 2,104 | | | | 11,169 | |
| | | | |
| 2016 Annual report | | riotinto.com | | 139 |
| | | | | | | | | | | | | | | | |
| | | | | | | | | |
| STRATEGIC REPORT | | | | DIRECTORS’ REPORT | | | | FINANCIAL STATEMENTS | | | | METALS AND MINERALS PRODUCTION | | | | ADDITIONAL INFORMATION |
Notes to the 2016 financial statements
continued
14 Property, plant and equipmentcontinued
| | | | | | | | | | | | | | | | | | | | |
| Year ended 31 December 2015 | | Mining
properties
and leases (a) US$m | | | Land and
buildings (b) US$m | | | Plant and
equipment
US$m | | | Capital
works in
progress
US$m | | | Total
US$m | |
| Net book value | | | | | | | | | | | | | | | | | | | | |
| At 1 January 2015 | | | 11,913 | | | | 7,085 | | | | 39,810 | | | | 9,885 | | | | 68,693 | |
| Adjustment on currency translation | | | (1,049 | ) | | | (890 | ) | | | (4,268 | ) | | | (754 | ) | | | (6,961 | ) |
| Adjustments to capitalised closure costs (note 26) | | | 147 | | | | – | | | | – | | | | – | | | | 147 | |
| Interest capitalised (c) (note 8) | | | – | | | | – | | | | – | | | | 254 | | | | 254 | |
| Additions | | | 400 | | | | 374 | | | | 715 | | | | 2,767 | | | | 4,256 | |
| Depreciation for the year(a) (d) | | | (725 | ) | | | (419 | ) | | | (3,294 | ) | | | – | | | | (4,438 | ) |
| Impairment charges, net of reversals (e) | | | (69 | ) | | | (51 | ) | | | (308 | ) | | | (224 | ) | | | (652 | ) |
| Disposals | | | (4 | ) | | | (15 | ) | | | (77 | ) | | | – | | | | (96 | ) |
| Subsidiaries no longer consolidated | | | – | | | | (7 | ) | | | (17 | ) | | | – | | | | (24 | ) |
| Transfers and other movements (f) | | | 533 | | | | 1,494 | | | | 5,339 | | | | (7,488 | ) | | | (122 | ) |
| At 31 December 2015 | | | 11,146 | | | | 7,571 | | | | 37,900 | | | | 4,440 | | | | 61,057 | |
| – cost | | | 22,474 | | | | 11,405 | | | | 67,690 | | | | 5,000 | | | | 106,569 | |
| – accumulated depreciation and impairment | | | (11,328 | ) | | | (3,834 | ) | | | (29,790 | ) | | | (560 | ) | | | (45,512 | ) |
| | | | | |
| Non-current assets held under finance leases(g) | | | – | | | | 37 | | | | 6 | | | | – | | | | 43 | |
| Non-current assets pledged as security (h) | | | 911 | | | | 294 | | | | 6,293 | | | | 2,402 | | | | 9,900 | |
| (a) | At 31 December 2016, the net book value of capitalised production phase stripping costs totalled US$1,967 million, with US$1,511 million within Property, plant and equipment and a further US$456 million within Investments in equity accounted units (2015 total of US$1,923 million with US$1,464 million in Property, plant and equipment and a further US$459 million within Investments in equity accounted units). During the year capitalisation of US$319 million was partly offset by depreciation of US$298 million. Depreciation of deferred stripping costs of US$203 million (2015: US$173 million; 2014: US$84 million) is included within “Depreciation for the year”. |
| (b) | At 31 December 2016, the net book value amount for land and buildings includes freehold US$7,276 million (2015: US$7,435 million) and long leasehold US$40 million (2015: US$136 million). |
| (c) | Interest is capitalised at a rate based on the Group or relevant subsidiary’s cost of borrowing or at the rate on project specific debt, where applicable. The Group’s average borrowing rate used for capitalisation of interest is 4.2 per cent (2015: 3.7 per cent). |
| (d) | Assets within operations for which production is not expected to fluctuate significantly from one year to another or which have a physical life shorter than the related mine are depreciated on a straight-line basis as follows: |
| | Buildings: five to 50 years |
| | Other plant and equipment: three to 50 years |
| | Power assets: 25 to 50 years |
| | Capital work in progress: not depreciated |
| (e) | During 2016 impairment charges primarily related to the Copper & Diamonds businesses (see note 6). During 2015 impairment charges primarily related to the Energy & Minerals and Aluminium businesses. |
| (f) | “Transfers and other movements” includes reclassifications and adjustments between categories, including the transfer to assets of disposal groups held for sale. |
| (g) | The finance leases under which these assets are held are disclosed in note 23. |
| (h) | Excludes assets held under finance leases.Non-current assets pledged as security represent amounts pledged as collateral against US$4,783 million (2015: US$701 million) of loans, which are included in note 22. |
15 Investments in equity accounted units
| | | | | | | | |
| Summary balance sheet (Rio Tinto share) | | 2016
US$m | | | 2015
US$m | |
| Rio Tinto’s share of assets | | | | | | | | |
| –Non-current assets | | | 6,686 | | | | 6,780 | |
| – Current assets | | | 832 | | | | 429 | |
| | | | 7,518 | | | | 7,209 | |
| Rio Tinto’s share of liabilities | | | | | | | | |
| – Current liabilities | | | (612 | ) | | | (941 | ) |
| –Non-current liabilities | | | (1,887 | ) | | | (1,327 | ) |
| | | | (2,499 | ) | | | (2,268 | ) |
| Rio Tinto’s share of net assets | | | 5,019 | | | | 4,941 | |
Further details of investments in equity accounted units are set out in notes 35 and 36.
At 31 December 2016 and 2015 the Group had no investments in equity accounted units with shares listed on recognised stock exchanges.
At 31 December 2016, net debt of equity accounted units, excluding amounts due to Rio Tinto, was US$1,338 million (2015: US$1,224 million).
| | | | |
| 140 | | riotinto.com | | 2016 Annual report |
16 Inventories
| | | | | | | | |
| | | 2016
US$m | | | 2015
US$m | |
| Raw materials and purchased components | | | 470 | | | | 528 | |
| Consumable stores | | | 840 | | | | 1,030 | |
| Work in progress | | | 970 | | | | 1,142 | |
| Finished goods and goods for resale | | | 800 | | | | 721 | |
| | | | 3,080 | | | | 3,421 | |
| Comprising: | | | | | | | | |
| Expected to be used within one year | | | 2,937 | | | | 3,168 | |
| Expected to be used after more than one year | | | 143 | | | | 253 | |
| | | | 3,080 | | | | 3,421 | |
Inventory write-downs, net of reversals, amounting to US$51 million (2015: US$192 million; 2014: US$94 million) were recognised during the year.
At 31 December 2016, US$564 million (2015: US$587 million) of inventories were pledged as security for liabilities.
17 Deferred taxation
| | | | | | | | |
| | | 2016
US$m | | | 2015
US$m | |
| At 1 January | | | (23 | ) | | | 34 | |
| Adjustment on currency translation | | | 58 | | | | (149 | ) |
| Credited to the income statement | | | (548 | ) | | | (139 | ) |
| (Credited)/charged to statement of comprehensive income (a) | | | (33 | ) | | | 174 | |
| Disposals | | | (8 | ) | | | (1 | ) |
| Other movements (b) | | | (53 | ) | | | 58 | |
| At 31 December | | | (607 | ) | | | (23 | ) |
| | |
| Comprising: | | | | | | | | |
| – deferred tax liabilities(c) (d) | | | 3,121 | | | | 3,286 | |
| – deferred tax assets (c) (e) (f) | | | (3,728 | ) | | | (3,309 | ) |
Deferred tax balances for which there is a right of offset within the same tax jurisdiction are presented net on the face of the balance sheet as permitted by IAS 12. The closing deferred tax liabilities and assets, prior to this offsetting of balances, are shown below.
| | | | | | | | |
| | | Total
2016
US$m | | | Total
2015
US$m | |
| Deferred tax liabilities arising from: | | | | | | | | |
| Capital allowances | | | 4,937 | | | | 5,311 | |
| Unremitted earnings (d) | | | 659 | | | | 664 | |
| Capitalised interest | | | 403 | | | | 432 | |
| Unrealised exchange gains | | | 40 | | | | 68 | |
| Other temporary differences | | | 301 | | | | 451 | |
| | | | 6,340 | | | | 6,926 | |
| | |
| Deferred tax assets arising from: | | | | | | | | |
| Tax losses(e) | | | (2,246 | ) | | | (2,170 | ) |
| Provisions | | | (2,040 | ) | | | (1,745 | ) |
| Capital allowances | | | (883 | ) | | | (794 | ) |
| Post-retirement benefits | | | (888 | ) | | | (829 | ) |
| Unrealised exchange losses | | | (342 | ) | | | (522 | ) |
| Other temporary differences | | | (548 | ) | | | (889 | ) |
| | | | (6,947 | ) | | | (6,949 | ) |
| | |
| Charged/(credited) to the income statement | | | | | | | | |
| Unrealised exchange losses | | | 156 | | | | (108 | ) |
| Tax losses | | | (122 | ) | | | (335 | ) |
| Provisions | | | (279 | ) | | | 40 | |
| Capital allowances | | | (441 | ) | | | 251 | |
| Tax on unremitted earnings | | | (6 | ) | | | (16 | ) |
| Post-retirement benefits | | | (6 | ) | | | 47 | |
| Other temporary differences | | | 150 | | | | (18 | ) |
| | | | (548 | ) | | | (139 | ) |
| | | | |
| 2016 Annual report | | riotinto.com | | 141 |
| | | | | | | | | | | | | | | | |
| | | | | | | | | |
| STRATEGIC REPORT | | | | DIRECTORS’ REPORT | | | | FINANCIAL STATEMENTS | | | | METALS AND MINERALS PRODUCTION | | | | ADDITIONAL INFORMATION |
Notes to the 2016 financial statements
continued
17 Deferred taxationcontinued
| (a) | The amounts credited directly to the Statement of comprehensive income include provisions for tax on exchange differences on intragroup loans qualifying for reporting as part of the net investment in subsidiaries, on cash flow hedges and on actuarial gains and losses on pension schemes and on post-retirement healthcare plans. |
| (b) | “Other movements” include deferred tax relating to tax payable recognised by subsidiary holding companies on the profits of the equity accounted units to which it relates and amounts credited directly to the statement of changes in equity relating to the restructure of Coal & Allied Industries Limited. |
| (c) | The deferred tax liability of US$3,121 million (2015: US$3,286 million) includes US$3,109 million (2015: US$3,275 million) due in more than one year. The deferred tax asset of US$3,728 million (2015: US$3,309 million) includes US$3,721 million (2015: US$3,091 million) receivable in more than one year. All amounts are shown asnon-current on the face of the balance sheet as required by IAS 12. |
| (d) | Deferred tax is not recognised on the unremitted earnings of subsidiaries and joint ventures totalling US$2,523 million (2015: US$2,763 million) where the Group is able to control the timing of the remittance and it is probable that there will be no remittance in the foreseeable future. If these earnings were remitted, tax of US$125 million (2015: US$136 million) would be payable. |
| (e) | There is a limited time period, the shortest of which is four years, for the recovery of US$1,309 million (2015: US$1,482 million) of tax losses and other tax assets which have been recognised as deferred tax assets in the financial statements. |
| (f) | Recognised and unrecognised deferred tax assets are shown in the table below and totalled US$7,170 million at 31 December 2016 (2015: US$6,966 million). Of this total, US$3,728 million has been recognised as deferred tax assets (2015: US$3,309 million), leaving US$3,442 million (2015: US$3,657 million) unrecognised, as recovery is not considered probable. |
The recognised amounts do not include deferred tax assets that have been netted off against deferred tax liabilities.
| | | | | | | | | | | | | | | | |
| | | Recognised | | | Unrecognised | |
| At 31 December | | 2016
US$m | | | 2015 US$m | | | 2016
US$m | | | 2015
US$m | |
| France(a) | | | 330 | | | | 331 | | | | 1,077 | | | | 1,112 | |
| Canada | | | 470 | | | | 420 | | | | 707 | | | | 645 | |
| US | | | 1,239 | | | | 928 | | | | 6 | | | | 5 | |
| Australia | | | 1,072 | | | | 1,242 | | | | 446 | | | | 323 | |
| Mongolia | | | 441 | | | | 214 | | | | – | | | | 317 | |
| Other | | | 176 | | | | 174 | | | | 1,206 | | | | 1,255 | |
| Total(b) | | | 3,728 | | | | 3,309 | | | | 3,442 | | | | 3,657 | |
| (a) | US$1,077 million (2015: US$1,112 million) of the unrecognised assets relate to trading losses in France, which were acquired as part of the Alcan acquisition. The amount recognised takes account of legislation which restricts the recovery of losses. |
| (b) | US$964 million (2015: US$784 million) of the unrecognised assets relate to realised or unrealised capital losses, the recovery of which depends on the existence of capital gains in future years. There is a time limit, the shortest of which is one year, for the recovery of US$105 million of the unrecognised assets (2015: US$433 million). |
18 Trade and other receivables
| | | | | | | | | | | | | | | | | | | | | | | | |
| | | Non-current
2016
US$m | | | Current
2016
US$m | | | Total
2016
US$m | | | Non-current
2015
US$m | | | Current
2015
US$m | | | Total
2015
US$m | |
| Trade receivables (a) | | | – | | | | 2,283 | | | | 2,283 | | | | 5 | | | | 1,365 | | | | 1,370 | |
| Other receivables | | | 347 | | | | 880 | | | | 1,227 | | | | 370 | | | | 752 | | | | 1,122 | |
| Prepayment of tolling charges to jointly controlled entities (b) | | | 267 | | | | – | | | | 267 | | | | 288 | | | | – | | | | 288 | |
| Pension surpluses (note 45) | | | 625 | | | | – | | | | 625 | | | | 592 | | | | – | | | | 592 | |
| Amounts due from equity accounted units | | | – | | | | 31 | | | | 31 | | | | – | | | | 27 | | | | 27 | |
| Other prepayments | | | 103 | | | | 266 | | | | 369 | | | | 101 | | | | 242 | | | | 343 | |
| | | | 1,342 | | | | 3,460 | | | | 4,802 | | | | 1,356 | | | | 2,386 | | | | 3,742 | |
| (a) | At 31 December 2016, trade and other receivables are stated net of provisions for doubtful debts of US$66 million (2015: US$77 million). Amounts of US$89 million (2015: US$37 million) were impaired; the majority of these receivables were more than 90 days overdue. |
| (b) | Rio Tinto Aluminium has made certain prepayments to equity accounted units for toll processing of alumina. These prepayments will be charged to Group operating costs as processing takes place. |
There is no material element of trade and other receivables that is interest bearing.
The fair value of current trade and other receivables and the majority of amounts classified asnon-current assets approximates their carrying value.
As of 31 December 2016, trade receivables of US$230 million (2015: US$123 million) were past due but not impaired. The ageing of these receivables is as follows:
| | | | | | | | |
| | | 2016
US$m | | | 2015
US$m | |
| less than 30 days overdue | | | 196 | | | | 71 | |
| between 30 and 60 days overdue | | | 4 | | | | 7 | |
| between 60 and 90 days overdue | | | 7 | | | | 23 | |
| more than 90 days overdue | | | 23 | | | | 22 | |
| | | | 230 | | | | 123 | |
These relate to a number of customers for whom there is no recent history of default.
With respect to trade and other receivables that are neither impaired nor past due, there are no indications as of the reporting date that the debtors will not meet their payment obligations.
| | | | |
| 142 | | riotinto.com | | 2016 Annual report |
19 Assets and liabilities held for sale
Following the termination of the previous sales agreement for Blair Athol, a binding agreement was signed in September 2016 to divest Rio Tinto’s 71.2 per cent interest to Terracom subject to certain conditions precedent. At 31 December 2016, assets held for sale also included certain cancelled projects at Rio Tinto Kennecott.
At 31 December 2015, assets and liabilities held for sale primarily related to the Group’s 40 per cent interest in the Bengalla coal Joint venture and its interest in Blair Athol.
20 Other financial assets (includingnon-quasi equity loans to equity accounted units)
| | | | | | | | | | | | | | | | | | | | | | | | |
| | | Non-current
2016
US$m | | | Current
2016
US$m | | | Total
2016
US$m | | | Non-current
2015
US$m | | | Current
2015
US$m | | | Total
2015
US$m | |
| Derivative financial instruments | | | 508 | | | | 24 | | | | 532 | | | | 529 | | | | 77 | | | | 606 | |
| Equity shares and quoted funds | | | 73 | | | | 83 | | | | 156 | | | | 76 | | | | 81 | | | | 157 | |
| Other investments, including loans(a) | | | 202 | | | | 252 | | | | 454 | | | | 183 | | | | 23 | | | | 206 | |
| Loans to equity accounted units | | | 39 | | | | – | | | | 39 | | | | – | | | | 42 | | | | 42 | |
| | | | 822 | | | | 359 | | | | 1,181 | | | | 788 | | | | 223 | | | | 1,011 | |
| (a) | Current “other investments, including loans” includes US$250 million (2015: US$nil) of highly liquid financial assets held in managed investment funds classified as held for trading. |
Detailed information relating to other financial assets is given in note 30.
21 Cash and cash equivalents
| | | | | | | | | | | | |
| | | Note | | | 2016
US$m | | | 2015
US$m | |
| Cash at bank and in hand | | | | | | | 956 | | | | 843 | |
| Money market funds and other cash equivalents | | | | | | | 7,245 | | | | 8,523 | |
| Balance per Group balance sheet | | | | | | | 8,201 | | | | 9,366 | |
| Bank overdrafts repayable on demand (unsecured) | | | 22 | | | | (12 | ) | | | (12 | ) |
| Balance per Group cash flow statement | | | | | | | 8,189 | | | | 9,354 | |
Cash and cash equivalents of US$358 million (2015: US$426 million) are held in countries where there are restrictions on remittances. Of this balance US$252 million (2015: US$311 million) could be used to repay subsidiaries’ third-party borrowings.
There are also restrictions on a further US$1,051 million (2015: US$802 million) of cash and cash equivalents, the majority of which is
held by partially owned subsidiaries and is not available for use in the wider Group due to the legal and contractual restrictions currently in place. Of this balance US$766 million (2015: US$53 million) could be used to repay subsidiaries’ third-party borrowings.
| | | | |
| 2016 Annual report | | riotinto.com | | 143 |
| | | | | | | | | | | | | | | | |
| | | | | | | | | |
| STRATEGIC REPORT | | | | DIRECTORS’ REPORT | | | | FINANCIAL STATEMENTS | | | | METALS AND MINERALS PRODUCTION | | | | ADDITIONAL INFORMATION |
Notes to the 2016 financial statements
continued
22 Borrowings and other financial liabilities
| | | | | | | | | | | | | | | | | | | | | | | | | | | | |
| Borrowings at 31 December | | Note | | | Non-current
2016
US$m | | | Current
2016
US$m | | | Total
2016
US$m | | | Non-current
2015
US$m | | | Current
2015
US$m | | | Total 2015
US$m | |
| Rio Tinto Finance (USA) plc Bonds 1.375% 2016 | | | | | | | – | | | | – | | | | – | | | | – | | | | 998 | | | | 998 | |
| Rio Tinto Finance (USA) plc Bonds LIBOR plus 0.84% 2016 | | | | | | | – | | | | – | | | | – | | | | – | | | | 500 | | | | 500 | |
| Rio Tinto Finance (USA) plc Bonds 2.0% 2017 | | | | | | | – | | | | – | | | | – | | | | 500 | | | | – | | | | 500 | |
| Rio Tinto Finance (USA) plc Bonds 1.625% 2017 | | | | | | | – | | | | – | | | | – | | | | 1,247 | | | | – | | | | 1,247 | |
| Rio Tinto Finance (USA) Limited Bonds 6.5% 2018 (a) | | | | | | | – | | | | – | | | | – | | | | 1,894 | | | | – | | | | 1,894 | |
| Rio Tinto Finance (USA) plc Bonds 2.250% 2018 | | | | | | | – | | | | – | | | | – | | | | 1,242 | | | | – | | | | 1,242 | |
| Rio Tinto Finance (USA) Limited Bonds 9.0% 2019 (a) | | | | | | | 1,235 | | | | – | | | | 1,235 | | | | 1,481 | | | | – | | | | 1,481 | |
| Rio Tinto Finance (USA) Limited Bonds 3.5% 2020 | | | | | | | 464 | | | | – | | | | 464 | | | | 997 | | | | – | | | | 997 | |
| Rio Tinto Finance plc Euro Bonds 2.0% due 2020 (a) (b) | | | | | | | 817 | | | | – | | | | 817 | | | | 848 | | | | – | | | | 848 | |
| Rio Tinto Finance (USA) Limited Bonds 4.125% 2021 (a) | | | | | | | 573 | | | | – | | | | 573 | | | | 989 | | | | – | | | | 989 | |
| Rio Tinto Finance (USA) Limited Bonds 3.750% 2021 (a) | | | | | | | 621 | | | | – | | | | 621 | | | | 1,142 | | | | – | | | | 1,142 | |
| Rio Tinto Finance (USA) plc Bonds 3.5% 2022 (a) | | | | | | | 459 | | | | – | | | | 459 | | | | 1,004 | | | | – | | | | 1,004 | |
| Rio Tinto Finance (USA) plc Bonds 2.875% 2022 (a) | | | | | | | 509 | | | | – | | | | 509 | | | | 994 | | | | – | | | | 994 | |
| Rio Tinto Finance plc Euro Bonds 2.875% due 2024 (a) (b) | | | | | | | 577 | | | | – | | | | 577 | | | | 584 | | | | – | | | | 584 | |
| Rio Tinto Finance (USA) Limited Bonds 3.75% 2025 (a) | | | | | | | 1,195 | | | | – | | | | 1,195 | | | | 1,202 | | | | – | | | | 1,202 | |
| Rio Tinto Finance (USA) Limited Bonds 7.125% 2028 (a) | | | | | | | 980 | | | | – | | | | 980 | | | | 1,000 | | | | – | | | | 1,000 | |
| Alcan Inc. Debentures 7.25% due 2028 | | | | | | | 105 | | | | – | | | | 105 | | | | 106 | | | | – | | | | 106 | |
| Rio Tinto Finance plc Sterling Bonds 4.0% due 2029(a) (b) | | | | | | | 609 | | | | – | | | | 609 | | | | 738 | | | | – | | | | 738 | |
| Alcan Inc. Debentures 7.25% due 2031 | | | | | | | 425 | | | | – | | | | 425 | | | | 427 | | | | – | | | | 427 | |
| Alcan Inc. Global Notes 6.125% due 2033 | | | | | | | 741 | | | | – | | | | 741 | | | | 741 | | | | – | | | | 741 | |
| Alcan Inc. Global Notes 5.75% due 2035 | | | | | | | 287 | | | | – | | | | 287 | | | | 286 | | | | – | | | | 286 | |
| Rio Tinto Finance (USA) Limited Bonds 5.2% 2040 (a) | | | | | | | 1,103 | | | | – | | | | 1,103 | | | | 1,147 | | | | – | | | | 1,147 | |
| Rio Tinto Finance (USA) plc Bonds 4.75% 2042 (a) | | | | | | | 466 | | | | – | | | | 466 | | | | 490 | | | | – | | | | 490 | |
| Rio Tinto Finance (USA) plc Bonds 4.125% 2042 (a) | | | | | | | 690 | | | | – | | | | 690 | | | | 727 | | | | – | | | | 727 | |
| Oyu Tolgoi LLC Secured Loan due 2027 (c) | | | | | | | 2,259 | | | | – | | | | 2,259 | | | | – | | | | – | | | | – | |
| Oyu Tolgoi LLC Secured Loan due 2028 (c) | | | | | | | 247 | | | | – | | | | 247 | | | | – | | | | – | | | | – | |
| Oyu Tolgoi LLC Secured Loan due 2029 (c) | | | | | | | 866 | | | | – | | | | 866 | | | | – | | | | – | | | | – | |
| Oyu Tolgoi LLC Secured Loan due 2030 (c) | | | | | | | 754 | | | | – | | | | 754 | | | | – | | | | – | | | | – | |
| Loans from equity accounting units | | | | | | | – | | | | 49 | | | | 49 | | | | – | | | | 37 | | | | 37 | |
| Other secured loans | | | | | | | 530 | | | | 127 | | | | 657 | | | | 597 | | | | 104 | | | | 701 | |
| Other unsecured loans | | | | | | | 377 | | | | 508 | | | | 885 | | | | 382 | | | | 595 | | | | 977 | |
| Finance leases | | | 23 | | | | 24 | | | | 21 | | | | 45 | | | | 45 | | | | 7 | | | | 52 | |
| Bank overdrafts | | | 21 | | | | – | | | | 12 | | | | 12 | | | | – | | | | 12 | | | | 12 | |
| Total borrowings including overdrafts (d) | | | | | | | 16,913 | | | | 717 | | | | 17,630 | | | | 20,810 | | | | 2,253 | | | | 23,063 | |
| (a) | These borrowings are subject to the hedging arrangements summarised below. Fair value hedge accounting has been applied except for the Rio Tinto Finance plc Sterling Bonds 4.0% due 2029 which has cash flow hedge accounting applied. |
| (b) | Rio Tinto has a US$10 billion (2015: US$10 billion) European Debt Issuance Programme against which the cumulative amount utilised was US$1.9 billion equivalent at 31 December 2016 (2015: US$2.1 billion). The carrying value of these bonds after hedge accounting adjustments amounted to US$2.0 billion (2015: US$ 2.2 billion) in aggregate. |
| (c) | These borrowings relate to Oyu Tolgoi LLC project finance facility. The project finance facility provides for interest-only payments for the first five years followed by minimum repayments according to a stepped amortisation schedule for the remaining life of the facility. The due dates stated represent the final repayment date. Further details are provided in note 30. |
| (d) | The Group’s borrowings of US$17.6 billion (2015: US$23.1 billion) include US$2.8 billion (2015: US$2.9 billion) which relate to subsidiary entity borrowings that are without recourse to the Group and US$4.8 billion (2015: US$0.7 billion) which is subject to various financial and general covenants with which the respective borrowers were in compliance as at 31 December 2016. |
| | | | | | | | | | | | | | | | | | | | | | | | | | |
| Other financial liabilities | | | | Non-current
2016
US$m | | | Current
2016
US$m | | | Total
2016
US$m | | | Non-current
2015
US$m | | | Current
2015
US$m | | | Total 2015
US$m | |
| Derivative financial instruments | | | | | 517 | | | | 6 | | | | 523 | | | | 283 | | | | 41 | | | | 324 | |
| Other financial liabilities | | | | | 40 | | | | 199 | | | | 239 | | | | 47 | | | | 190 | | | | 237 | |
| Total other financial liabilities | | | | | 557 | | | | 205 | | | | 762 | | | | 330 | | | | 231 | | | | 561 | |
| Total borrowings including overdrafts (as above) | | | | | 16,913 | | | | 717 | | | | 17,630 | | | | 20,810 | | | | 2,253 | | | | 23,063 | |
| Total borrowings and other financial liabilities | | | | | 17,470 | | | | 922 | | | | 18,392 | | | | 21,140 | | | | 2,484 | | | | 23,624 | |
Swap arrangements
At 31 December 2016, US$7.7 billion (2015: US$7.0 billion) US dollar notional of the fixed rate US dollar borrowings were swapped to floating US dollar rates and US$1.3 billion (2015: US$1.4 billion) US dollar notional equivalent of euro borrowings were fully swapped to floating US dollar rates.
Hedge accounting has been applied to the full notional of items marked (a) in the above table except for: US$75 million (2015: US$75 million) of the Rio Tinto Finance (USA) Limited Bonds 7.125% due 2028 and US$nil million (2015: US$750 million) of the Rio Tinto Finance (USA) Limited Bonds 6.5% due 2018. These portions are held at amortised cost.
| | | | |
| 144 | | riotinto.com | | 2016 Annual report |
The Rio Tinto Finance plc Sterling Bond 4.0% due 2029 at US$0.6 billion (2015: US$0.7 billion) US dollar notional equivalent of sterling was fully swapped to US dollar notional and fixed US dollar rates. Cash flow hedging was applied to the annual interest coupons and principal of this bond. The hedge was fully effective in 2016 and 2015 financial years.
The fair value of interest rate and cross currency interest rate swaps at 31 December 2016 was US$108 million (2015: US$189 million) asset
and US$516 million (2015: US$275 million) liability, respectively. These are included within “Other financial assets” and “Other financial liabilities” in the balance sheet.
Details of the major interest rate and cross currency interest rate swaps are shown in note 30.
23 Capitalised finance leases
| | | | | | | | | | | | |
| | | Note | | | 2016
US$m | | | 2015
US$m | |
| Present value of minimum lease payments | | | | | | | | | | | | |
| Total minimum lease payments | | | | | | | 45 | | | | 53 | |
| Effect of discounting | | | | | | | – | | | | (1 | ) |
| | | | 14 | | | | 45 | | | | 52 | |
| | | |
| Payments under capitalised finance leases | | | | | | | | | | | | |
| Due within 1 year | | | | | | | 21 | | | | 7 | |
| Between 1 and 3 years | | | | | | | 8 | | | | 28 | |
| Between 3 and 5 years | | | | | | | 6 | | | | 5 | |
| More than 5 years | | | | | | | 10 | | | | 12 | |
| | | | 14 | | | | 45 | | | | 52 | |
24 Consolidated net debt
| | | | | | | | | | | | |
| | | Note | | | 2016
US$m | | | 2015
US$m | |
| Analysis of changes in consolidated net debt | | | | | | | | | | | | |
| Opening balance | | | | | | | (13,783 | ) | | | (12,495 | ) |
| Adjustment on currency translation | | | | | | | (103 | ) | | | 1,586 | |
| Exchange gains/(losses) charged/(credit) to the income statement(a) | | | | | | | 193 | | | | (1,630 | ) |
| Cash movements excluding exchange movements | | | | | | | 3,915 | | | | (1,109 | ) |
| Other movements | | | | | | | 191 | | | | (135 | ) |
| Closing balance | | | | | | | (9,587 | ) | | | (13,783 | ) |
| | | |
| Total borrowings in balance sheet | | | 22 | | | | (17,630 | ) | | | (23,063 | ) |
| Derivatives related to net debt (included in “Other financial assets/liabilities”) | | | 30 | | | | (408 | ) | | | (86 | ) |
| Adjusted total borrowings | | | | | | | (18,038 | ) | | | (23,149 | ) |
| Cash and cash equivalents | | | 21 | | | | 8,201 | | | | 9,366 | |
| Other investments(b) | | | 20 | | | | 250 | | | | – | |
| Consolidated net debt | | | | | | | (9,587 | ) | | | (13,783 | ) |
| | | | | | | | | | | | |
| | | 2016
US$m | | | 2015
US$m | | | 2014
US$m | |
| Exchange gains/(losses) on US dollar net debt and intragroup balances excluded from underlying earnings | | | | | | | | | | | | |
| Exchange gains/(losses) on US dollar net debt | | | 160 | | | | (1,578 | ) | | | (1,056 | ) |
| Exchange gains/(losses) on intragroup balances | | | 449 | | | | (1,961 | ) | | | (940 | ) |
| Exchange gains on loans from equity accounted units | | | – | | | | – | | | | 1 | |
| Exchange gains on settlement of dividends | | | 2 | | | | 1 | | | | – | |
| Credited/(charged) to income statement | | | 611 | | | | (3,538 | ) | | | (1,995 | ) |
| (a) | Exchange gains and losses taken to the income statement include amounts excluded from underlying earnings. |
| (b) | Other investments include US$250 million of highly liquid financial assets held in managed investment funds classified as held for trading. |
Further information relating to the currency and interest rate exposures arising from net debt and related derivatives is given in note 30.
| | | | |
| 2016 Annual report | | riotinto.com | | 145 |
| | | | | | | | | | | | | | | | |
| | | | | | | | | |
| STRATEGIC REPORT | | | | DIRECTORS’ REPORT | | | | FINANCIAL STATEMENTS | | | | METALS AND MINERALS PRODUCTION | | | | ADDITIONAL INFORMATION |
Notes to the 2016 financial statements
continued
25 Trade and other payables
| | | | | | | | | | | | | | | | | | | | | | | | |
| | | Non-current
2016
US$m | | | Current
2016
US$m | | | Total
2016
US$m | | | Non-current
2015
US$m | | | Current
2015
US$m | | | Total
2015
US$m | |
| Trade payables | | | – | | | | 2,787 | | | | 2,787 | | | | 9 | | | | 2,567 | | | | 2,576 | |
| Deferred income | | | 234 | | | | 197 | | | | 431 | | | | 176 | | | | 175 | | | | 351 | |
| Accruals | | | 1 | | | | 973 | | | | 974 | | | | 3 | | | | 1,225 | | | | 1,228 | |
| Other payables | | | 309 | | | | 1,072 | | | | 1,381 | | | | 263 | | | | 1,075 | | | | 1,338 | |
| Employee entitlements | | | – | | | | 720 | | | | 720 | | | | – | | | | 747 | | | | 747 | |
| Royalties and mining taxes | | | 3 | | | | 516 | | | | 519 | | | | 2 | | | | 345 | | | | 347 | |
| Amounts owed to equity accounted units | | | 151 | | | | 92 | | | | 243 | | | | 131 | | | | 100 | | | | 231 | |
| Government grants deferred | | | 91 | | | | 4 | | | | 95 | | | | 98 | | | | 3 | | | | 101 | |
| | | | 789 | | | | 6,361 | | | | 7,150 | | | | 682 | | | | 6,237 | | | | 6,919 | |
Due to their short term maturities, the fair value of trade and other payables approximates their carrying value.
26 Provisions (including post-retirement benefits)
| | | | | | | | | | | | | | | | | | | | | | | | | | | | |
| | | Note | | | Pensions
and post
retirement
healthcare (a)
US$m | | | Other
employee
entitlements (b)
US$m | | | Close down
and
restoration/
environmental (c)
US$m | | | Other
US$m | | | Total
2016
US$m | | | Total
2015
US$m | |
| At 1 January | | | | | | | 3,122 | | | | 458 | | | | 8,426 | | | | 1,060 | | | | 13,066 | | | | 14,602 | |
| Adjustment on currency translation | | | | | | | 3 | | | | (3 | ) | | | (29 | ) | | | (27 | ) | | | (56 | ) | | | (1,344 | ) |
| Adjustments to mining properties | | | 14 | | | | | | | | | | | | | | | | | | | | | | | | | |
– changes in estimate | | | | | | | – | | | | – | | | | (123 | ) | | | – | | | | (123 | ) | | | 147 | |
| Charged/(credited) to profit: | | | | | | | | | | | | | | | | | | | | | | | | | | | | |
– increases to existing and new provisions | | | | | | | 260 | | | | 255 | | | | 537 | | | | 578 | | | | 1,630 | | | | 898 | |
– unused amounts reversed | | | | | | | – | | | | (95 | ) | | | (111 | ) | | | (33 | ) | | | (239 | ) | | | (258 | ) |
– exchange losses on provisions | | | | | | | – | | | | – | | | | 10 | | | | 3 | | | | 13 | | | | 91 | |
– amortisation of discount | | | | | | | – | | | | 1 | | | | 296 | | | | 41 | | | | 338 | | | | 378 | |
| Utilised in year | | | | | | | (370 | ) | | | (178 | ) | | | (257 | ) | | | (192 | ) | | | (997 | ) | | | (824 | ) |
| Actuarial losses/(gains) recognised in equity | | | | | | | 152 | | | | – | | | | – | | | | – | | | | 152 | | | | (442 | ) |
| Subsidiaries no longer consolidated | | | | | | | – | | | | – | | | | (38 | ) | | | (25 | ) | | | (63 | ) | | | (19 | ) |
| Transfers to assets held for sale | | | | | | | – | | | | – | | | | (4 | ) | | | – | | | | (4 | ) | | | (57 | ) |
| Transfers and other movements | | | | | | | – | | | | 12 | | | | 15 | | | | 50 | | | | 77 | | | | (106 | ) |
| At 31 December | | | | | | | 3,167 | | | | 450 | | | | 8,722 | | | | 1,455 | | | | 13,794 | | | | 13,066 | |
| Balance sheet analysis: | | | | | | | | | | | | | | | | | | | | | | | | | | | | |
| Current | | | | | | | 104 | | | | 305 | | | | 439 | | | | 467 | | | | 1,315 | | | | 1,190 | |
| Non-current | | | | | | | 3,063 | | | | 145 | | | | 8,283 | | | | 988 | | | | 12,479 | | | | 11,876 | |
| Total | | | | | | | 3,167 | | | | 450 | | | | 8,722 | | | | 1,455 | | | | 13,794 | | | | 13,066 | |
| (a) | The main assumptions used to determine the provision for pensions and post-retirement healthcare, and other information, including the expected level of future funding payments in respect of those arrangements, are given in note 45. |
| (b) | The provision for other employee entitlements includes a provision for long service leave of US$317 million (2015: US$322 million), based on the relevant entitlements in certain Group operations and includes US$59 million (2015: US$52 million) of provision for redundancy and severance payments. |
| (c) | The Group’s policy on close-down and restoration costs is described in note 1(k) and in paragraph (v) under “Critical accounting policies and estimates” on pages 123 and 125. Close-down and restoration costs are a normal consequence of mining, and the majority of close-down and restoration expenditure is incurred in the years following closure of the mine, refinery or smelter. Remaining lives of operations and infrastructure range from one to over 50 years with an average for all sites, weighted by present closure obligation, of around 16 years (2015: 17 years). Although the ultimate cost to be incurred is uncertain, the Group’s businesses estimate their respective costs based on current restoration standards and techniques. Provisions of US$8,722 million (2015: US$8,426 million) for close-down and restoration costs and environmentalclean-up obligations are based on risk adjusted cash flows. These estimates have been discounted to their present value at a real risk free rate of 2 per cent per annum, based on an estimate of the long-term, risk free,pre-tax cost of borrowing. |
| | Non-current provisions for close down and restoration/environmental expenditure include amounts relating to environmentalclean-up of US$366 million (2015: US$286 million) expected to take place between one and five years from the balance sheet date, and US$727 million (2015: US$867 million) expected to take place later than five years after the balance sheet date. |
| | Close-down and restoration/environmental liabilities at 31 December 2016 have not been adjusted for amounts of US$110 million (2015: US$97 million) relating to insurance recoveries and other financial assets held for the purposes of meeting these obligations. |
| | | | |
| 146 | | riotinto.com | | 2016 Annual report |
27 Share capital – Rio Tinto plc
| | | | | | | | | | | | | | | | | | | | | | | | |
| | | 2016
Number
(million) | | | 2015
Number
(million) | | | 2014
Number
(million) | | | 2016
US$m | | | 2015
US$m | | | 2014
US$m | |
| Issued and fully paid up share capital of 10p each | | | | | | | | | | | | | | | | | | | | | | | | |
| At 1 January | | | 1,384.487 | | | | 1,425.378 | | | | 1,425.377 | | | | 224 | | | | 230 | | | | 230 | |
| Ordinary shares issued (a) (c) | | | 0.033 | | | | 0.022 | | | | 0.001 | | | | – | | | | – | | | | – | |
| Shares purchased and cancelled(b) | | | – | | | | (40.913 | ) | | | – | | | | – | | | | (6 | ) | | | – | |
| At 31 December | | | 1,384.520 | | | | 1,384.487 | | | | 1,425.378 | | | | 224 | | | | 224 | | | | 230 | |
| | | | | | |
| Shares held by public | | | | | | | | | | | | | | | | | | | | | | | | |
| At 1 January | | | 1,374.046 | | | | 1,414.147 | | | | 1,412.695 | | | | | | | | | | | | | |
| Shares reissued from treasury (a) | | | 0.743 | | | | 0.790 | | | | 1.451 | | | | | | | | | | | | | |
| Shares purchased and cancelled(b) | | | – | | | | (40.913 | ) | | | – | | | | | | | | | | | | | |
| Ordinary shares issued (a) (c) | | | 0.033 | | | | 0.022 | | | | 0.001 | | | | | | | | | | | | | |
| At 31 December | | | 1,374.822 | | | | 1,374.046 | | | | 1,414.147 | | | | | | | | | | | | | |
| | | | | | |
| Shares held in treasury | | | 9.698 | | | | 10.441 | | | | 11.231 | | | | | | | | | | | | | |
| Shares held by public | | | 1,374.822 | | | | 1,374.046 | | | | 1,414.147 | | | | | | | | | | | | | |
| Total share capital | | | 1,384.520 | | | | 1,384.487 | | | | 1,425.378 | | | | | | | | | | | | | |
| | | | | | |
| Other share classes | | | | | | | | | | | | | | | | | | | | | | | | |
| Special Voting Share of 10p each(d) | | | 1 only | | | | 1 only | | | | 1 only | | | | | | | | | | | | | |
| DLC Dividend Share of 10p each (d) | | | 1 only | | | | 1 only | | | | 1 only | | | | | | | | | | | | | |
| Equalisation Share of 10p each(d) | | | 1 only | | | | 1 only | | | | 1 only | | | | | | | | | | | | | |
| (a) | 33,210 ordinary shares were issued in 2016 under the Global Employee Share Plan (GESP). 743,380 ordinary shares were reissued from treasury during the year resulting from the vesting of awards and the exercise of options under Rio Tinto plc employee share-based payment plans, with exercise prices and market values between £16.53 and £32.235 per share (2015: 21,709 ordinary shares were issued under the GESP, and 789,887 ordinary shares reissued from treasury with exercise prices and market values between £15.086 and £32.375 per share; 2014: 971 ordinary shares were issued under the GESP, and 1,450,659 ordinary shares reissued from treasury with exercise prices and market values between £10.979 and £36.275 per share). |
| (b) | The authority for the Company to buy back its ordinary shares was renewed at the 2016 annual general meeting. No shares were bought back in 2016. 40,912,881 shares were bought back and cancelled in 2015 under theon-marketbuy-back programme. No shares were bought back in 2014. |
| (c) | The aggregate consideration for new shares issued under the GESP was US$0.9 million (2015: US$0.9 million; 2014: US$0.05 million). The difference between the nominal value and the issue price of the shares issued was credited to the share premium account. The aggregate consideration received for treasury shares reissued was US$4 million (2015: US$13 million; 2014: US$22 million). No new shares were issued as a result of the exercise of options under Rio Tinto plc employee share-based payment plans in 2016, 2015 and 2014. |
| (d) | The “Special Voting Share” was issued to facilitate the joint voting by shareholders of Rio Tinto plc and Rio Tinto Limited on Joint Decisions, following the DLC Merger. The “DLC Dividend Share” was issued to facilitate the efficient management of funds within the DLC structure. Directors have the ability to issue an Equalisation Share if that is required under the terms of the DLC Merger Sharing Agreement. |
During 2016, US$40.1 million of shares and ADRs (2015: US$34.1 million; 2014: US$49.5 million) were purchased by employee share ownership trusts on behalf of Rio Tinto plc to satisfy future share options and awards as they vest. At 31 December 2016, 892,938 shares and 33,417 ADRs were held in the employee share ownership trusts on behalf of Rio Tinto plc.
Information relating to share options and other share-based incentive schemes is given in note 44.
28 Share capital – Rio Tinto Limited
| | | | | | | | | | | | | | | | | | | | | | | | |
| | | 2016
Number
(million) | | | 2015
Number
(million) | | | 2014
Number
(million) | | | 2016
US$m | | | 2015
US$m | | | 2014
US$m | |
| Issued and fully paid up share capital | | | | | | | | | | | | | | | | | | | | | | | | |
| At 1 January | | | 424.19 | | | | 435.76 | | | | 435.76 | | | | 3,950 | | | | 4,535 | | | | 4,911 | |
| Adjustment on currency translation | | | – | | | | – | | | | – | | | | (35 | ) | | | (503 | ) | | | (376 | ) |
| Ordinary shares purchased and cancelled(a) | | | – | | | | (11.57 | ) | | | – | | | | – | | | | (82 | ) | | | – | |
| At 31 December | | | 424.19 | | | | 424.19 | | | | 435.76 | | | | 3,915 | | | | 3,950 | | | | 4,535 | |
| – Special Voting Share (b) | | | 1 only | | | | 1 only | | | | 1 only | | | | | | | | | | | | | |
| – DLC Dividend Share(b) | | | 1 only | | | | 1 only | | | | 1 only | | | | | | | | | | | | | |
| Total share capital | | | 424.19 | | | | 424.19 | | | | 435.76 | | | | | | | | | | | | | |
| (a) | In April 2015, 11,566,308 Rio Tinto Limited ordinary shares were purchased at A$48.44 per share and cancelled under anoff-market sharebuy-back programme carried out pursuant to the shareholder approval granted at Rio Tinto Limited’s 2015 annual general meeting foroff-market andon-marketbuy-backs of up to 43.5 million Rio Tinto Limited ordinary shares. |
| (b) | The “Special Voting Share” was issued to facilitate the joint voting by shareholders of Rio Tinto Limited and Rio Tinto plc on Joint Decisions following the DLC Merger. The “DLC Dividend Share” was issued to facilitate the efficient management of funds within the DLC structure. Directors have the ability to issue an Equalisation Share if that is required under the terms of the DLC Merger Sharing Agreement. |
Share options exercised during the year to 31 December 2016 under various Rio Tinto Limited employee share option schemes were satisfied by theon-market purchase of Rio Tinto Limited shares by a third party on the Group’s behalf.
Information relating to share options and other share-based incentive schemes is given in note 44.
| | | | |
| 2016 Annual report | | riotinto.com | | 147 |
| | | | | | | | | | | | | | | | |
| | | | | | | | | |
| STRATEGIC REPORT | | | | DIRECTORS’ REPORT | | | | FINANCIAL STATEMENTS | | | | METALS AND MINERALS PRODUCTION | | | | ADDITIONAL INFORMATION |
Notes to the 2016 financial statements
continued
29 Other reserves and retained earnings
| | | | | | | | | | | | |
| | | 2016
US$m | | | 2015
US$m | | | 2014
US$m | |
| Capital redemption reserve(a) | | | | | | | | | | | | |
| At 1 January | | | 34 | | | | 28 | | | | 28 | |
| Own shares purchased and cancelled | | | – | | | | 6 | | | | – | |
| At 31 December | | | 34 | | | | 34 | | | | 28 | |
| Hedging reserves | | | | | | | | | | | | |
| At 1 January | | | – | | | | 12 | | | | 3 | |
| Parent and subsidiaries’ net cash flow hedge fair value losses | | | (88 | ) | | | (41 | ) | | | (48 | ) |
| Parent and subsidiaries’ net cash flow hedge losses transferred to the income statement | | | 116 | | | | 32 | | | | 55 | |
| Tax on the above | | | 4 | | | | (3 | ) | | | 2 | |
| At 31 December | | | 32 | | | | – | | | | 12 | |
| Available for sale revaluation reserves | | | | | | | | | | | | |
| At 1 January | | | (139 | ) | | | (130 | ) | | | (117 | ) |
| Gains/(losses) on available for sale securities | | | 13 | | | | (16 | ) | | | (19 | ) |
| Losses on available for sale securities transferred to the income statement | | | – | | | | 7 | | | | 6 | |
| At 31 December | | | (126 | ) | | | (139 | ) | | | (130 | ) |
| Other reserves(b) | | | | | | | | | | | | |
| At 1 January | | | 11,735 | | | | 11,704 | | | | 11,766 | |
| Change in equity interest held by Rio Tinto | | | 108 | | | | – | | | | – | |
| Own shares purchased from Rio Tinto Limited shareholders to satisfy share options | | | (43 | ) | | | (25 | ) | | | (129 | ) |
| Employee share options: value of services | | | 58 | | | | 58 | | | | 69 | |
| Deferred tax on share options | | | 3 | | | | (2 | ) | | | (2 | ) |
| At 31 December | | | 11,861 | | | | 11,735 | | | | 11,704 | |
| | | |
| Foreign currency translation reserve(c) | | | | | | | | | | | | |
| At 1 January | | | (2,491 | ) | | | (492 | ) | | | 1,191 | |
| Parent and subsidiaries currency translation and exchange adjustments | | | (204 | ) | | | (1,940 | ) | | | (1,690 | ) |
| Equity accounted units currency translation adjustments | | | 11 | | | | (57 | ) | | | (43 | ) |
| Currency translation reclassified on disposal | | | 99 | | | | (2 | ) | | | 53 | |
| Tax on the above | | | – | | | | – | | | | (3 | ) |
| At 31 December | | | (2,585 | ) | | | (2,491 | ) | | | (492 | ) |
| | | |
| Total other reserves per balance sheet | | | 9,216 | | | | 9,139 | | | | 11,122 | |
| | | | | | | | | | | | |
| | | 2016
US$m | | | 2015
US$m | | | 2014
US$m | |
| Retained earnings(d) | | | | | | | | | | | | |
| At 1 January | | | 19,736 | | | | 26,110 | | | | 23,605 | |
| Parent and subsidiaries’ profit/(loss) for the year | | | 4,298 | | | | (1,218 | ) | | | 5,243 | |
| Equity accounted units’ profit after tax for the year | | | 319 | | | | 352 | | | | 1,284 | |
| Actuarial (losses)/gains(e) | | | (94 | ) | | | 616 | | | | (720 | ) |
| Tax relating to components of other comprehensive income | | | 30 | | | | (173 | ) | | | 204 | |
| Total comprehensive income/(loss) for the year | | | 4,553 | | | | (423 | ) | | | 6,011 | |
| Sharebuy-back scheme | | | – | | | | (1,946 | ) | | | – | |
| Dividends paid | | | (2,725 | ) | | | (4,076 | ) | | | (3,710 | ) |
| Change in equity interest held by Rio Tinto | | | 40 | | | | 20 | | | | 36 | |
| Own shares purchased/treasury shares reissued for share options and other movements | | | (37 | ) | | | (27 | ) | | | (28 | ) |
| Employee share options and other IFRS 2 charges taken to the income statement | | | 64 | | | | 78 | | | | 196 | |
| At 31 December | | | 21,631 | | | | 19,736 | | | | 26,110 | |
| (a) | The capital redemption reserve was set up to comply with section 733 of the UK Companies Act 2006 (previously section 170 of the UK Companies Act 1985) when shares of a company are redeemed or purchased wholly out of the company’s profits. Balances reflect the amount by which the Company’s issued share capital is diminished in accordance with this section. |
| (b) | Other reserves includes US$11,936 million which represents the difference between the nominal value and issue price of the shares issued arising from Rio Tinto plc’s rights issue completed in July 2009. No share premium was recorded in the Rio Tinto plc financial statements through the operation of the merger relief provisions of the UK Companies Act 1985. |
| | Other reserves also include the cumulative amount recognised under IFRS 2 in respect of options granted but not exercised to acquire shares in Rio Tinto Limited, less, where applicable, the cost of shares purchased to satisfy share options exercised. The cumulative amount recognised under IFRS 2 in respect of options granted but not exercised to acquire shares in Rio Tinto plc is recorded in retained earnings. |
| (c) | Exchange differences arising on the translation of the Group’s net investment in foreign controlled companies are taken to the foreign currency translation reserve, as described in note 1(d). The cumulative differences relating to an investment are transferred to the income statement when the investment is disposed of. |
| (d) | Retained earnings and movements in reserves of subsidiaries include those arising from the Group’s share of joint operations. |
| (e) | There were no actuarial losses relating to equity accounted units in 2016, 2015 or 2014. |
| | | | |
| 148 | | riotinto.com | | 2016 Annual report |
30 Financial instruments and risk management
Except where stated, the information given below relates to the financial instruments of the parent companies and their subsidiaries and joint operations, and excludes those of equity accounted units. The information is grouped in the following sections:
A – Financial assets and liabilities by categories
B – Derivative financial instruments
C – Fair values
A (a) Financial assets and liabilities by categories
| | | | | | | | | | | | | | | | | | | | | | | | |
| At 31 December 2016 | | Note | | | Total
US$m | | | Loans and
receivables
US$m | | | Available
for sale
securities
US$m | | | Held at
fair value
US$m | | | Held to maturity
assets/other
financial
liabilities
US$m | |
| Financial assets | | | | | | | | | | | | | | | | | | | | | | | | |
| Cash and cash equivalents | | | 21 | | | | 8,201 | | | | 8,201 | | | | – | | | | – | | | | – | |
| Trade and other receivables(a) | | | | | | | 3,432 | | | | 3,289 | | | | – | | | | 143 | | | | – | |
| Equity shares and quoted funds | | | 20 | | | | 156 | | | | – | | | | 156 | | | | – | | | | – | |
| Other investments, including loans(b) | | | 20 | | | | 454 | | | | 14 | | | | – | | | | 431 | | | | 9 | |
| Currency and commodity derivatives: designated as hedges(c) | | | 20 | | | | 1 | | | | – | | | | – | | | | 1 | | | | – | |
| Derivatives and embedded derivatives not related to net debt: | | | | | | | | | | | | | | | | | | | | | | | | |
| not designated as hedges(c) | | | 20 | | | | 423 | | | | – | | | | – | | | | 423 | | | | – | |
| Derivatives related to net debt(c) | | | 20,22,24 | | | | 108 | | | | – | | | | – | | | | 108 | | | | – | |
| Loans to equity accounted units including quasi equity loans | | | | | | | 202 | | | | 202 | | | | – | | | | – | | | | – | |
| Total financial assets | | | | | | | 12,977 | | | | 11,706 | | | | 156 | | | | 1,106 | | | | 9 | |
| | | | | | |
| Financial liabilities | | | | | | | | | | | | | | | | | | | | | | | | |
| Trade and other payables(d) | | | | | | | (5,386 | ) | | | | | | | | | | | (5 | ) | | | (5,381 | ) |
| Short term borrowings and bank overdrafts | | | 22 | | | | (717 | ) | | | | | | | | | | | – | | | | (717 | ) |
| Medium and long term borrowings | | | 22 | | | | (16,913 | ) | | | | | | | | | | | – | | | | (16,913 | ) |
| Derivatives related to net debt(c) | | | 22,24 | | | | (516 | ) | | | | | | | | | | | (516 | ) | | | – | |
| Other derivatives and embedded derivatives: not designated | | | | | | | | | | | | | | | | | | | | | | | | |
| as hedges(c) | | | 22 | | | | (7 | ) | | | | | | | | | | | (7 | ) | | | – | |
| Other financial liabilities | | | 22 | | | | (239 | ) | | | | | | | | | | | – | | | | (239 | ) |
| Total financial liabilities | | | | | | | (23,778 | ) | | | | | | | | | | | (528 | ) | | | (23,250 | ) |
| | | | | | | | | | | | | | | | | | | | | | | | |
| At 31 December 2015 | | Note | | | Total
US$m | | | Loans and
receivables
US$m | | | Available
for sale
securities
US$m | | | Held at
fair value
US$m | | | Held to maturity
assets/other
financial
liabilities
US$m | |
| Financial assets | | | | | | | | | | | | | | | | | | | | | | | | |
| Cash and cash equivalents | | | 21 | | | | 9,366 | | | | 9,366 | | | | – | | | | – | | | | – | |
| Trade and other receivables(a) | | | | | | | 2,468 | | | | 2,456 | | | | – | | | | 12 | | | | – | |
| Equity shares and quoted funds | | | 20 | | | | 157 | | | | – | | | | 157 | | | | – | | | | – | |
| Other investments, including loans | | | 20 | | | | 206 | | | | 32 | | | | – | | | | 170 | | | | 4 | |
| Currency and commodity derivatives: designated as hedges(c) | | | 20 | | | | 5 | | | | – | | | | – | | | | 5 | | | | – | |
| Derivatives and embedded derivatives not related to net debt: | | | | | | | | | | | | | | | | | | | | | | | | |
| not designated as hedges(c) | | | 20 | | | | 412 | | | | – | | | | – | | | | 412 | | | | – | |
| Derivatives related to net debt(c) | | | 20,22,24 | | | | 189 | | | | – | | | | – | | | | 189 | | | | – | |
| Loans to equity accounted units including quasi equity loans | | | | | | | 225 | | | | 225 | | | | – | | | | – | | | | – | |
| Total financial assets | | | | | | | 13,028 | | | | 12,079 | | | | 157 | | | | 788 | | | | 4 | |
| | | | | | |
| Financial liabilities | | | | | | | | | | | | | | | | | | | | | | | | |
| Trade and other payables(d) | | | | | | | (5,373 | ) | | | | | | | | | | | (24 | ) | | | (5,349 | ) |
| Short term borrowings and bank overdrafts | | | 22 | | | | (2,253 | ) | | | | | | | | | | | – | | | | (2,253 | ) |
| Medium and long term borrowings | | | 22 | | | | (20,810 | ) | | | | | | | | | | | – | | | | (20,810 | ) |
| Derivatives related to net debt(c) | | | 22,24 | | | | (275 | ) | | | | | | | | | | | (275 | ) | | | – | |
| Other derivatives and embedded derivatives not designated | | | | | | | | | | | | | | | | | | | | | | | | |
| as hedges(c) | | | 22 | | | | (49 | ) | | | | | | | | | | | (49 | ) | | | – | |
| Other financial liabilities | | | 22 | | | | (237 | ) | | | | | | | | | | | – | | | | (237 | ) |
| Total financial liabilities | | | | | | | (28,997 | ) | | | | | | | | | | | (348 | ) | | | (28,649 | ) |
| (a) | This excludes pension surpluses, prepayment of tolling charges to joint operations and other prepayments and other non-financial instrument items within other receivables and will therefore differ from note 18. |
| (b) | “Other investments, including loans” includes US$250 million of highly liquid financial assets held in managed investment funds classified as held for trading. |
| (c) | These financial assets and liabilities in aggregate agree to total derivative financial instruments disclosed in notes 20 and 22. |
| (d) | Trade and other payables excludes deferred income, Government grants, royalties, mining taxes and employee entitlements and will therefore differ from note 25. |
| | | | |
| 2016 Annual report | | riotinto.com | | 149 |
| | | | | | | | | | | | | | | | |
| | | | | | | | | |
| STRATEGIC REPORT | | | | DIRECTORS’ REPORT | | | | FINANCIAL STATEMENTS | | | | METALS AND MINERALS PRODUCTION | | | | ADDITIONAL INFORMATION |
Notes to the 2016 financial statements
continued
30 Financial instruments and risk managementcontinued
A (b) Financial risk management
Funding and exposure management
The Group is exposed to a number of financial risks which are considered within the overall Group Risk management framework described on pages 14 to 15. The key financial risks are foreign exchange risk, interest rate risk, commodity price risk, credit risk, liquidity risk and capital management risk which are discussed in detail below.
The Group’s policies on financial risk management are clearly defined and consistently applied. The policies look to ensure that the Group has an appropriate capital structure which enables it to manage the risks faced by the organisation through the commodities cycle. The general approach to financial risks is to ensure that the business is robust enough to enable exposures to float with the market. However the Group may choose to fix some financial exposures when it is deemed appropriate to do so.
The Group has a diverse portfolio of commodities and operates in a number of markets, which have varying responses to the economic cycle. This diversity also provides some naturally offsetting long-term positions, for example Australian and Canadian currencies tend to strengthen when commodity prices are high and vice versa.
Treasury operations
Treasury is a centralised support and service function that acts as the custodian of the Group’s cash and balance sheet and its key financial risks. It performs its activities in a strong control environment, within board approved limits. It is not a profit centre. It is responsible for managing liquidity through funding and investments as well as financial risks such as foreign exchange, interest, financial counterparty credit, commodity, insurance and pension risk. It is also responsible for managing banking relationships across the Group.
Treasury policy
Rio Tinto does not acquire or issue derivative financial instruments for trading or speculative purposes; nor does it believe that it has material exposure to such trading or speculative holdings through its investments in joint arrangements and associates. However, derivatives are used as and when required in order to manage the Group’s exposure in accordance with its underlying financial risk management principles. Cash management and investment activities are managed andco-ordinated centrally by Treasury using only approved counterparties and within allocated credit limits which are reviewed and approved by the board at least annually.
(i) Foreign exchange risk
Management policy
The Group’s shareholders’ equity, earnings and cash flows are influenced by a wide variety of currencies due to the geographic diversity of the Group’s sales and the countries in which it operates. The US dollar, however, is the currency in which the majority of the Group’s sales are denominated. Operating costs are influenced by the currencies of those countries where the Group’s mines and processing plants are located and also by those currencies in which the costs of imported equipment and services are determined. The Australian and Canadian dollars are the most important currencies (apart from the US dollar) influencing costs. In any particular year, currency fluctuations may have a significant impact on Rio Tinto’s financial results. A strengthening of the US dollar against the currencies in which the Group’s costs are partly determined has a positive effect on Rio Tinto’s Underlying earnings. However, a strengthening of the US dollar does reduce the value of non US dollar denominated net assets and therefore total equity.
Given the dominant role of the US currency in the Group’s affairs, the US dollar is the currency in which financial results are presented both internally and externally. It is also the most appropriate currency for financing the Group’s operations. Borrowings and cash are predominantly denominated in US dollars, either directly or through the use of derivatives.
Certain financial assets and liabilities, including intragroup balances, are held in currencies other than the functional currency of the relevant subsidiary. This results in an accounting exposure to exchange gains and losses as the financial assets and liabilities are translated into the functional currency of the subsidiary that holds those assets and liabilities. These exchange gains and losses are recorded in the Group’s income statement except to the extent that they can be taken to equity under the Group’s accounting policy which is explained in note 1(d). Exchange gains and losses on US dollar net debt held in subsidiaries with a non-US dollar functional currency and on all intragroup balances are excluded from underlying earnings. Other exchange gains and losses are included in underlying earnings.
See section B for the details of cross currency interest rate swaps relating to borrowings.
After taking into account relevant swap instruments, almost all of the Group’s net debt is denominated in US dollars. The table below summarises, by currency, the Group’s net debt, after taking into account relevant cross currency interest rate swaps and foreign exchange contracts:
| | | | | | | | | | | | | | | | | | | | | | | | |
| Net funds/(debt) by currency | | Cash and
cash
equivalents
US$m | | | Other
investments
US$m | | | Total borrowings
in note 22 US$m | | | Derivatives
related to
net debt
US$m | | | Net funds/
(debt)
2016
US$m | | | Net funds/
(debt)
2015
US$m | |
| US dollar | | | 7,631 | | | | 250 | | | | (16,791 | ) | | | (408 | ) | | | (9,294 | ) | | | (13,517 | ) |
| Australian dollar | | | 253 | | | | – | | | | (566 | ) | | | – | | | | (313 | ) | | | (277 | ) |
| Euro | | | 40 | | | | – | | | | (102 | ) | | | – | | | | (62 | ) | | | (88 | ) |
| South African rand | | | 104 | | | | – | | | | (1 | ) | | | – | | | | 103 | | | | 29 | |
| Canadian dollar | | | 15 | | | | – | | | | (170 | ) | | | – | | | | (155 | ) | | | (121 | ) |
| Other | | | 158 | | | | – | | | | – | | | | – | | | | 134 | | | | 191 | |
| Total | | | 8,201 | | | | 250 | | | | (17,630 | ) | | | (408 | ) | | | (9,587 | ) | | | (13,783 | ) |
Hedging strategy
Under normal market conditions, the Group does not generally believe that active currency hedging of transactions would provide long-term benefits to shareholders. The Group reviews its exposure on a regular basis and reserves the right to enter into hedges to maintain financial stability. Currency protection measures may be deemed appropriate in
specific commercial circumstances, typically hedging of capital expenditures and other significant financial items such as acquisitions, disposals, tax and dividends, and are subject to strict limits laid down by the board. Refer to section B for the details of cross currency interest rate, currency forward and option contracts used to manage the currency risk exposures of the Group at 31 December 2016.
| | | | |
| 150 | | riotinto.com | | 2016 Annual report |
Sensitivities
The table below gives the estimated retranslation effect on financial assets and financial liabilities of a ten per cent strengthening in the closing exchange rate of the US dollar against significant currencies. The sensitivity associated with a ten per cent weakening of a particular currency would be broadly equal and opposite to the figures presented. The impact is expressed in terms of the effect on net earnings and
underlying earnings, assuming that each exchange rate moves in isolation. The sensitivities are based on financial assets and financial liabilities held at 31 December 2016, where balances are not denominated in the functional currency of the subsidiary or joint operation, and exclude financial assets and liabilities held by equity accounted units. These balances will not remain constant throughout 2017, and therefore the following information should be used with care.
At 31 December 2016
Gains/(losses) associated with ten per cent strengthening of the US dollar
| | | | | | | | | | | | |
| Currency exposure | | Closing
exchange
rate
US cents | | | Effect on
net
earnings
US$m | | | Of which
amount
impacting
underlying
earnings
US$m | |
| Australian dollar | | | 72 | | | | 369 | | | | 37 | |
| Canadian dollar | | | 74 | | | | (159 | ) | | | 15 | |
| Euro | | | 105 | | | | 172 | | | | – | |
At 31 December 2015
Gains/(losses) associated with ten per cent strengthening of the US dollar
| | | | | | | | | | | | |
| Currency exposure | | Closing
exchange
rate
US cents | | | Effect on
net
earnings
US$m | | | Of which
amount
impacting
underlying
earnings
US$m | |
| Australian dollar | | | 73 | | | | (182 | ) | | | 58 | |
| Canadian dollar | | | 72 | | | | (771 | ) | | | 2 | |
| Euro | | | 109 | | | | 60 | | | | (25 | ) |
Ten per cent is the annual exchange rate movement that management deems to be reasonably probable (on an annual basis over the long run) for one of the Group’s significant currencies and as such provides an appropriate representation.
(ii) Interest rate risk
Management policy
Interest rate risk refers to the risk that the value of a financial instrument or cash flows associated with the instrument will fluctuate due to changes in market interest rates. The Group’s interest rate management policy is generally to borrow and invest at floating interest rates. This approach is based on a historical correlation between interest rates and commodity prices. However, in certain circumstances the Group may elect to maintain a higher proportion of fixed rate funding.
Hedging strategy
As noted above, the Group hedges its interest rate risk by entering into interest rate derivatives to achieve its policies. The Group reviews the positions on a regular basis and may act to monetisein-the-money instruments either to take advantage of favourable market conditions, manage counterparty credit risk or as part of its debt management programme. During 2016 in conjunction with its liability management programme, the Group closed out interest rate swaps with a notional principal amount of US$3 billion, giving rise to a net cash inflow of US$113 million, including accrued interest of US$25 million. The interest rate swaps were in fair value hedge relationships prior to close out. See section B for details of currency and interest rate swaps relating to borrowings.
At the end of 2016, US$14.7 billion (2015: US$10.8 billion) of the Group’s adjusted total borrowings was at floating rates after taking into account interest and currency interest rate swaps, resulting in a floating to fixed debt ratio of 81 per cent floating to 19 per cent fixed (2015: 47 per cent floating to 53 per cent fixed). On a net debt basis, the floating to fixed debt ratio was 65 per cent floating to 35 per cent fixed (2015: 11 per cent floating to 89 per cent fixed). These ratios were principally impacted by the repayment of fixed rate bonds during the year and the draw down of predominantly floating rate debt in relation to Oyu Tolgoi project financing (See Note 30A(v)). The weighted average interest rate on total adjusted borrowings as at 31 December 2016 was
approximately 4.0 per cent (2015: approximately 3.5 per cent) and the weighted average maturity was approximately ten years (2015: eight years). The weighted average maturity and weighted average interest rate are based on current interest rates and the carrying value of total adjusted borrowings at the year end.
See note 22 for the details of debt outstanding at 31 December 2016.
Sensitivities
Based on the Group’s net debt (refer to note 24) and other floating rate financial instruments outstanding as at 31 December 2016, the effect on net earnings of a 100 basis point increase in US dollar LIBOR interest rates, with all other variables held constant, would be a charge of US$44 million (2015: US$8 million). The Group has an exposure to interest rate volatility within shareholders’ equity arising from fair value movements on derivatives in the cash flow reserve. These derivatives have an underlying exposure to sterling and US dollar rates. With all factors remaining constant and based on the composition of derivatives impacting the cash flow reserve at 31 December 2016, the sensitivity of a 100 basis point increase in interest rates in each of the currencies in isolation would impact equity, before tax, by US$84 million charge (2015: US$100 million charge) for sterling and US$95 million credit (2015: US$103 million credit) for US dollar. A 100 basis point decrease would have broadly the same impact in the opposite direction. These balances will not remain constant throughout 2017, and therefore this information should be used with care.
(iii) Commodity price risk
Management policy
The Group’s normal policy is to sell its products at prevailing market prices. Exceptions to this rule are subject to strict limits laid down by the board and to rigid internal controls.
Metals such as copper and aluminium are generally sold under contracts which vary in tenure and pricing mechanisms, with some volumes sold in the spot market. The prices are determined by reference to prevailing market prices on terminal markets, such as the London Metal Exchange (LME) and the Commodities Exchange (COMEX) in New York. Prices fluctuate widely in response to changing levels of supply and demand but, in the long run, prices are related to the marginal cost of supply. Gold is also priced in an active market in which prices respond to daily
| | | | |
| 2016 Annual report | | riotinto.com | | 151 |
| | | | | | | | | | | | | | | | |
| | | | | | | | | |
| STRATEGIC REPORT | | | | DIRECTORS’ REPORT | | | | FINANCIAL STATEMENTS | | | | METALS AND MINERALS PRODUCTION | | | | ADDITIONAL INFORMATION |
Notes to the 2016 financial statements
continued
30 Financial instruments and risk managementcontinued
changes in quantities offered and sought. Newly mined gold is only one source of supply; investment and disinvestment can be important elements of supply and demand. Contract prices for many other natural resource products including coal are generally agreed quarterly or for longer periods with customers, although volume commitments vary by product.
Certain products, predominantly copper concentrate, are provisionally priced, that is the selling price is determined normally 30 to 180 days after delivery to the customer, based on the market price at the relevant quotation point stipulated in the contract. Revenue is recognised on provisionally priced sales based on estimates of fair value of the consideration receivable which is based on forward market prices. At each reporting date provisionally priced metal sales are marked to market based on the forward selling price for the period stipulated in the contract. For this purpose the expected selling price can be measured reliably at each period end date for those products such as copper concentrate for which the price is directly related to the price of copper for which an active and freely traded commodity market exists, such as the LME, and the value of product sold by the Group is directly linked to the form in which it is traded on that market.
The marking to market of provisionally priced sales contracts is recorded as an adjustment to sales revenue.
During 2016, the Group had 235 million pounds of unsettled copper sales (2015: 252 million pounds) that were provisionally priced at US 250 cents per pound (2015: US 217 cents per pound). The final price of these sales will be determined during the first half of 2017. A ten per cent change in the price of copper realised on the provisionally priced sales, all other factors held constant, would increase or reduce net earnings by US$36 million (2015: US$36 million).
Hedging strategy
Rio Tinto’s exposure to commodity prices is diversified by virtue of its broad commodity base and the Group does not generally believe commodity price hedging would provide a long-term benefit to shareholders. The Group may hedge certain commitments with some of its customers or suppliers. Details of commodity derivatives held at 31 December 2016 are set out in section B.
Sensitivities
The Group’s commodity derivatives are impacted by changes in market prices and include those aluminium forward and option contracts embedded in electricity purchase contracts outstanding at 31 December 2016. A ten per cent increase in aluminium market prices would reduce net earnings by US$144 million (2015: US$70 million), and a ten per cent decrease in prices would increase net earnings by US$139 million (2015: US$58 million). A ten per cent change in prices would have nil impact on equity, before tax (2015: nil).
The Group’s “own use contracts” are excluded from the sensitivity analysis as they are outside the scope of IAS 39. Such contracts to buy or
sellnon-financial items can be net settled but were entered into and continue to be held for the purpose of the receipt or delivery of thenon-financial item in accordance with the business unit’s expected purchase, sale or usage requirements.
(iv) Credit risk
Treasury management policy
Credit risk is the risk that a counterparty will not meet its obligations under a financial instrument or customer contract, leading to a financial loss. The Group is exposed to credit risk from its operating activities (primarily from customer receivables) and from its financing activities, including investments in government securities, deposits with banks and financial institutions, other short-term investments, interest rate and currency derivative contracts and other financial instruments.
Credit risks related to receivables
Customer credit risk is managed by each business unit subject to the Group’s established policy, procedures and controls relating to customer credit risk management. Credit limits are established for all customers based on internal or external rating criteria. Where customers are rated by an independent credit rating agency, these ratings are used to set credit limits. In circumstances where no independent credit rating exists, the credit quality of the customer is assessed based on an extensive credit rating scorecard. Outstanding customer receivables are regularly monitored and any credit concerns highlighted to senior management. High-risk shipments to major customers are generally covered by letters of credit or other forms of credit insurance.
At 31 December 2016, the Group had approximately 92 customers (2015: 74 customers) that owed the Group more than US$5 million each and these balances accounted for approximately 74 per cent (2015: 75 per cent) of all receivables owing. There were 24 customers (2015: 13 customers) with balances greater than US$20 million accounting for just over 42 per cent (2015: 37 per cent) of total amounts receivable. Details of trade and other receivables past due but not impaired are provided in note 18.
The maximum exposure to credit risk at the reporting date is the carrying value of each class of financial assets (refer to table of financial assets and liabilities reported on page 149.).
Credit risk related to financial instruments and cash deposits
Credit risk from investments in government securities (primarily US Government), corporate and asset backed or money market funds and balances with banks and financial institutions is managed by Group Treasury in accordance with a board approved policy. Investments of surplus funds are made only with approved counterparties who have been assigned specific credit limits beforehand based on specific assessment criteria. The counterparty credit framework and limits are reviewed by the board at least annually. The limits are set to minimise the concentration of credit risk and therefore mitigate the potential for financial loss through counterparty failure.
The maximum credit risk exposure of the Group’s financial assets at the balance sheet date is as follows:
| | | | | | | | | | | | |
| | | Note | | | 2016
US$m | | | 2015
US$m | |
| Cash and cash equivalents | | | 21 | | | | 8,201 | | | | 9,366 | |
| Trade and other receivables | | | | | | | 3,432 | | | | 2,468 | |
| Investments | | | 20 | | | | 454 | | | | 206 | |
| Derivative assets | | | 20 | | | | 532 | | | | 606 | |
| Total | | | | | | | 12,619 | | | | 12,646 | |
(v) Liquidity and capital risk management
Management policy
The Group’s overriding objective when managing capital is to safeguard the business as a going concern whilst maximising returns for shareholders. In a cyclical and capital intensive industry such as the mining industry, maintaining a strong balance sheet and a sound
financial risk management framework are desirable to preserve financial flexibility and generate shareholder value through the cycle. In practice, this involves regular reviews by the board and senior management. These reviews take into account the Group’s strategic priorities, economic and business conditions and opportunities that are identified to invest across all points of the commodities cycle and focus on the dividend policy and other forms of shareholder return whilst also striving
| | | | |
| 152 | | riotinto.com | | 2016 Annual report |
to maintain a strong balance sheet. In February 2016, the Group announced a change in its dividend policy, moving from a progressive dividend policy to a dividend determined by, taking into account the results for the financial year, the outlook for the Group’s major commodities, the board’s view of the long-term growth prospects of the business and the Group’s objective of maintaining a strong balance sheet. The board expects total cash returns to shareholders over the longer term to be in a range of 40 – 60 per cent of underlying earnings in aggregate throughout the cycle. Acknowledging the cyclical nature of the industry in periods of strong earnings and cash generation it is the
board’s intention to supplement the ordinary dividends with additional returns to shareholders. The resulting capital structure provides the Group with a high degree of financial flexibility at a low cost of capital.
To maintain a strong balance sheet, the Group considers various financial metrics including a net gearing ratio of 20 to 30 per cent, the overall level of borrowings and their maturity profile, liquidity levels, total capital, cash flow, EBITDA and interest cover ratios either on a statutory reported basis or as expected to be adjusted by the credit rating agencies.
| | | | | | | | | | | | |
| Total capital | | Note | | | 2016
US$m | | | 2015
US$m | |
| Equity attributable to owners of Rio Tinto (see Group balance sheet) | | | | | | | 39,290 | | | | 37,349 | |
| Equity attributable to non-controlling interests (see Group balance sheet) | | | | | | | 6,440 | | | | 6,779 | |
| Net debt | | | 24 | | | | 9,587 | | | | 13,783 | |
| Total capital | | | | | | | 55,317 | | | | 57,911 | |
Net debt is a measure used by management and the board to manage the Group’s capital structure and liquidity risks. Net debt is disclosed in note 24. Net debt decreased from US$13.8 billion at 31 December 2015 to US$9.6 billion at 31 December 2016 as operating cash inflows and divestment proceeds were partly offset by capital expenditure and cash returns to shareholders. At 31 December 2016 net debt to total capital was 17 per cent (2015: 24 per cent) and interest cover (which includes
the loss on early redemption of bonds) was seven times (2015: seven times).
The unified credit status of the Group is maintained through cross guarantees whereby contractual obligations of Rio Tinto plc and Rio Tinto Limited are automatically guaranteed by the other. The table below summarises the credit ratings attributed to the Group by Standard and Poor’s and Moody’s investor services as at 31 December.
| | | | | | | | |
| | | 2016 | | | 2015 | |
| Long term rating | | | A-/Baa1 | (a) | | | A-/A3 | |
| Short term rating | | | A-1/P-2 | | | | A-2/P-2 | |
| Outlook | |
| Stable/
Stable |
(a) | |
| Negative/
Stable |
|
| (a) | On 27 February 2017, the Group was upgraded to A3 with a stable outlook. |
The Group has access to various forms of financing including its US Shelf Programme, European Debt Issuance Programme, Commercial Paper and credit facilities. The Group did not issue any listed debt in 2016 under these programmes.
During 2016, the Group redeemed US$7,500 million, in aggregate, principal value of the bonds issued by Rio Tinto Finance (USA) plc and Rio Tinto Finance (USA) Limited as part of a liability management programme. As a result, US$500 million of the 2% 2017 bond, US$1,250 million of the 1.625% 2017 bond, US$1,750 million of the 6.5% 2018 bond, US$1,250 million of the 2.25% 2018 bond, US$246 million of the 9% 2019 bond, US$535 million of the 3.5% 2020 bond, US$420 million of the 4.125% 2021 bond, US$523 million of the 3.75% 2021 bond, US$540 million of the 3.5% 2022 bond and US$486 million of the 2.875% 2022 bond were redeemed early resulting in an aggregate cash outflow of US$7,941 million before fees.
In June 2015, under its US Shelf Programme, the Group issued a Rio Tinto Finance (USA) Limited US$1,200 million 3.75% bond due 2025. The proceeds were used to repurchase the Rio Tinto Finance (USA) Limited US$700 million 2.5% bond due 2016 and the Rio Tinto Finance (USA) Limited US$500 million 2.25% bond due 2016.
During 2016, Oyu Tolgoi LLC drew down US$4,323 million under the project finance facility signed in December 2015. The project finance facility provides for interest-only payments for the first five years followed by minimum repayments according to a stepped amortisation schedule for the remaining life of the facility. The due dates stated below represent the final repayment date.
The facility is provided and funded by international financial institutions and export credit agencies representing the governments of the United States, Canada and Australia, along with 15 commercial banks.
Drawdown comprised, in aggregate, US$699 million MIGA Insured Loan due 2027 (LIBOR plus 2.65%pre-completion, LIBOR plus 3.65% post
completion); US$1,591 million commercial banks “B Loan” due 2027 (LIBOR plus 3.4%pre-completion, LIBOR plus 4.4% post completion); US$283 million Export Credit Agencies Loan due 2028 (fixed at 2.3%); US$900 million Export Credit Agencies Loan due 2029 (LIBOR plus 3.65%pre-completion, LIBOR plus 4.65% post completion); and US$850 million International Financial Institutions “A Loan” due 2030 (LIBOR plus 3.78%pre-completion, LIBOR plus 4.78% post completion).
The project finance lenders have agreed a debt cap of US$6,000 million. In addition to the funding drawn down to date (US$4,323 million) there is an additional US$84 million available under the facilities to draw down, subject to certain conditions and the potential for an additional US$1,593 million of Supplemental Debt in future.
In November 2015, Rio Tinto Finance plc and Rio Tinto Finance Limited amended and extended its, in aggregate, US$7.5 billion multi-currency revolving credit facilities, originally signed in 2013, with a syndicate of banks. The facilities had twoone-year extension options, the first of which was utilised in November 2016. A US$1,875 million facility currently matures in November 2019 and a US$5,625 million facility (including a US$ denominated same day access swing-line facility) matures in November 2021. The remaining extension option could be utilised in 2017, subject to the agreement by the banks, extending the maturities to November 2020 and November 2022 respectively. The funds made available under the facility agreements may be used for the general corporate purposes of the Group.
Advances under the revolving facilities bear an interest rate per annum based on LIBOR (or EURIBOR, CDOR or BBSW in relation to any euro, Canadian dollar or Australian dollar loans respectively) plus a margin (which is dependent on the Group’s long-term credit rating as determined by Moody’s and Standard & Poor’s and the level of drawdown). The facility agreements contain no financial covenants. At 31 December 2016 the facilities were undrawn.
| | | | |
| 2016 Annual report | | riotinto.com | | 153 |
| | | | | | | | | | | | | | | | |
| | | | | | | | | |
| STRATEGIC REPORT | | | | DIRECTORS’ REPORT | | | | FINANCIAL STATEMENTS | | | | METALS AND MINERALS PRODUCTION | | | | ADDITIONAL INFORMATION |
Notes to the 2016 financial statements
continued
30 Financial instruments and risk managementcontinued
A (c) Financial liability analysis
The table below analyses the Group’s financial liabilities by relevant maturity groupings based on the remaining period from the balance
sheet date to the contractual maturity date. As the amounts disclosed in the table are the contractual undiscounted cash flows, these balances will not necessarily agree with the amounts disclosed in the balance sheet.
At 31 December 2016
| | | | | | | | | | | | | | | | | | | | | | | | | | | | |
| (Outflows)/inflows | | Within 1 year or on
demand
US$m | | | Between
1 and 2 years
US$m | | | Between
2 and 3 years
US$m | | | Between
3 and 4 years
US$m | | | Between
4 and 5 years
US$m | | | After
5 years
US$m | | | Total
US$m | |
| Non-derivative financial liabilities | | | | | | | | | | | | | | | | | | | | | | | | | | | | |
| Trade and other payables | | | (4,925 | ) | | | (461 | ) | | | – | | | | – | | | | – | | | | – | | | | (5,386 | ) |
| Borrowings before swaps | | | (704 | ) | | | (191 | ) | | | (1,330 | ) | | | (1,347 | ) | | | (1,317 | ) | | | (12,806 | ) | | | (17,695 | ) |
| Expected future interest payments(a) | | | (783 | ) | | | (779 | ) | | | (722 | ) | | | (667 | ) | | | (620 | ) | | | (5,056 | ) | | | (8,627 | ) |
| Other financial liabilities | | | (199 | ) | | | (41 | ) | | | – | | | | – | | | | – | | | | – | | | | (240 | ) |
| Derivative financial liabilities(b) | | | | | | | | | | | | | | | | | | | | | | | | | | | | |
| Derivatives related to net debt – net settled | | | 29 | | | | 29 | | | | 27 | | | | 25 | | | | 23 | | | | 25 | | | | 158 | |
Derivatives related to net debt – gross settled(a): | | | | | | | | | | | | | | | | | | | | | | | | | | | | |
| – gross inflows | | | 55 | | | | 55 | | | | 55 | | | | 842 | | | | 40 | | | | 1,377 | | | | 2,424 | |
| – gross outflows | | | (73 | ) | | | (73 | ) | | | (73 | ) | | | (1,045 | ) | | | (51 | ) | | | (1,785 | ) | | | (3,100 | ) |
| Derivatives not related to net debt – net settled | | | (2 | ) | | | – | | | | – | | | | – | | | | – | | | | – | | | | (2 | ) |
Derivatives not related to net debt – gross settled: | | | | | | | | | | | | | | | | | | | | | | | | | | | | |
| – gross inflows | | | 29 | | | | – | | | | – | | | | – | | | | – | | | | – | | | | 29 | |
| – gross outflows | | | (29 | ) | | | – | | | | – | | | | – | | | | – | | | | – | | | | (29 | ) |
| Total | | | (6,602 | ) | | | (1,461 | ) | | | (2,043 | ) | | | (2,192 | ) | | | (1,925 | ) | | | (18,245 | ) | | | (32,468 | ) |
At 31 December 2015
| | | | | | | | | | | | | | | | | | | | | | | | | | | | |
| (Outflows) / inflows | | Within 1 year or on
demand
US$m | | | Between
1 and 2 years
US$m | | | Between
2 and 3 years
US$m | | | Between
3 and 4 years
US$m | | | Between
4 and 5 years
US$m | | | After
5 years
US$m | | | Total
US$m | |
| Non-derivative financial liabilities | | | | | | | | | | | | | | | | | | | | | | | | | | | | |
| Trade and other payables | | | (4,967 | ) | | | (406 | ) | | | – | | | | – | | | | – | | | | – | | | | (5,373 | ) |
| Borrowings before swaps | | | (2,266 | ) | | | (1,889 | ) | | | (3,462 | ) | | | (1,538 | ) | | | (1,945 | ) | | | (12,318 | ) | | | (23,418 | ) |
| Expected future interest payments(a) | | | (884 | ) | | | (867 | ) | | | (837 | ) | | | (628 | ) | | | (561 | ) | | | (4,789 | ) | | | (8,566 | ) |
| Other financial liabilities | | | (190 | ) | | | (5 | ) | | | – | | | | – | | | | – | | | | – | | | | (195 | ) |
| Derivative financial liabilities(b) | | | | | | | | | | | | | | | | | | | | | | | | | | | | |
| Derivatives related to net debt – net settled | | | 30 | | | | 30 | | | | 30 | | | | 30 | | | | 29 | | | | 28 | | | | 177 | |
Derivatives related to net debt – gross settled(a): | | | | | | | | | | | | | | | | | | | | | | | | | | | | |
| – gross inflows | | | 62 | | | | 62 | | | | 62 | | | | 62 | | | | 872 | | | | 1,617 | | | | 2,737 | |
| – gross outflows | | | (65 | ) | | | (65 | ) | | | (65 | ) | | | (65 | ) | | | (1,039 | ) | | | (1,824 | ) | | | (3,123 | ) |
| Derivatives not related to net debt – net settled | | | (29 | ) | | | (6 | ) | | | – | | | | – | | | | – | | | | (2 | ) | | | (37 | ) |
Derivatives not related to net debt – gross settled: | | | | | | | | | | | | | | | | | | | | | | | | | | | | |
| – gross inflows | | | 22 | | | | – | | | | – | | | | – | | | | – | | | | – | | | | 22 | |
| – gross outflows | | | (22 | ) | | | – | | | | – | | | | – | | | | – | | | | – | | | | (22 | ) |
| Total | | | (8,309 | ) | | | (3,146 | ) | | | (4,272 | ) | | | (2,139 | ) | | | (2,644 | ) | | | (17,288 | ) | | | (37,798 | ) |
| (a) | Interest payments have been projected using interest rates applicable at the end of the applicable financial year. Where debt is subject to variable interest rates, future interest payments are subject to change in line with market rates. |
| (b) | The maturity grouping is based on the earliest payment date. |
The maximum carrying value of borrowings repayable, after the impact of swaps, maturing in any financial year is US$1.7 billion (2015: US$3.3 billion).
Offsetting and enforceable master netting agreements
Financial assets and liabilities are offset and the net amount reported in the consolidated balance sheet when there is a legally enforceable right to offset the recognised amounts and there is an intention to settle on a
net basis or realise the asset and settle the liability simultaneously. There were no material amounts offset in the balance sheet and no material balances associated with enforceable master netting agreements were identified.
| | | | |
| 154 | | riotinto.com | | 2016 Annual report |
B (a) Derivative financial instruments
The Group’s derivatives, including embedded derivatives, as at 31 December 2016, are summarised below:
| | | | | | | | | | | | | | | | |
| | | Total fair value | |
| | | 2016 | | | 2015 | |
| Derivatives designated as hedges | | Asset
US$m | | | Liability
US$m | | | Asset
US$m | | | Liability
US$m | |
| Aluminium forward contracts embedded in electricity purchase contracts(a) | | | – | | | | – | | | | 5 | | | | – | |
| Interest rate swaps(b) | | | 108 | | | | (134 | ) | | | 189 | | | | (16 | ) |
| Cross currency interest rate swaps(c) | | | – | | | | (382 | ) | | | – | | | | (259 | ) |
| Currency forward contracts, options and swaps | | | 1 | | | | – | | | | – | | | | – | |
| Total derivatives designated as hedges | | | 109 | | | | (516 | ) | | | 194 | | | | (275 | ) |
| | | | |
| Derivatives not designated as hedges | | | | | | | | | | | | | | | | |
| Currency forward contracts, options and swaps | | | 1 | | | | – | | | | 13 | | | | – | |
| Aluminium forward contracts(d) | | | 6 | | | | (2 | ) | | | 5 | | | | (22 | ) |
| Aluminium forward contracts/options embedded in electricity purchase contracts(a) | | | 411 | | | | (3 | ) | | | 373 | | | | (3 | ) |
| Other embedded derivatives | | | 5 | | | | – | | | | 21 | | | | – | |
| Other commodity contracts | | | – | | | | (2 | ) | | | – | | | | (24 | ) |
| Total derivatives not designated as hedges | | | 423 | | | | (7 | ) | | | 412 | | | | (49 | ) |
| Total derivative instruments | | | 532 | | | | (523 | ) | | | 606 | | | | (324 | ) |
| | | | |
| Analysed by maturity: | | | | | | | | | | | | | | | | |
| Less than 1 year | | | 24 | | | | (6 | ) | | | 78 | | | | (41 | ) |
| Between 1 and 5 years | | | 110 | | | | (194 | ) | | | 121 | | | | (144 | ) |
| More than 5 years | | | 398 | | | | (323 | ) | | | 407 | | | | (139 | ) |
| Total | | | 532 | | | | (523 | ) | | | 606 | | | | (324 | ) |
| Total net derivative instruments | | | 9 | | | | | | | | 282 | | | | | |
| | | | | | | | | | | | | | | | | | | | |
| Reconciliation to balance sheet | | Note | | | 2016
US$m | | | | | | 2015
US$m | | | | |
| –non-current assets | | | 20 | | | | 508 | | | | | | | | 529 | | | | | |
| – current assets | | | 20 | | | | 24 | | | | | | | | 77 | | | | | |
| – current liabilities | | | 22 | | | | (6 | ) | | | | | | | (41 | ) | | | | |
| –non-current liabilities | | | 22 | | | | (517 | ) | | | | | | | (283 | ) | | | | |
| Total net derivatives instruments, detailed above | | | | | | | 9 | | | | | | | | 282 | | | | | |
| (a) | Aluminium embedded derivatives (forward contracts and options) are contained within certain aluminium smelter electricity purchase contracts. These contracts reduce the Group’s margin exposure to movements in the aluminium price. |
| (b) | The interest rate swaps are used to convert certain fixed rate borrowings to a floating rate. For further details, see note 22. |
| (c) | The cross currency interest rate swaps are used to convert non US dollar denominated borrowings to either fixed or floating US dollar borrowings. For further details see note 22. |
| (d) | The aluminium forward contracts are entered into to convert aluminium sales made at a fixed price to LME cash. In 2016 the aluminium forward contracts which were taken out to convert aluminium sales made at a fixed price to LME cash were not designated as hedges as they are largely offset. In 2015, the US$(6) million ineffective portion arising from cash flow hedges was recognised in the income statement. |
C (a) Fair values
The carrying amounts and fair values of all of the Group’s financial instruments which are not carried at an amount which approximates their fair value at 31 December 2016 and 31 December 2015 are shown in the following table. The fair values of the Group’s cash equivalents and loans to equity accounted units approximate their carrying values as a result of their short maturity or because they carry floating rates of interest.
| | | | | | | | | | | | | | | | | | | | |
| | | | | | 31 December 2016 | | | 31 December 2015 | |
| | | Note | | | Carrying
value
US$m | | | Fair
value
US$m | | | Carrying
value
US$m | | | Fair
value
US$m | |
| Short term borrowings | | | 22 | | | | (717 | ) | | | (706 | ) | | | (2,253 | ) | | | (2,255 | ) |
| Medium and long term borrowings | | | 22 | | | | (16,913 | ) | | | (18,437 | ) | | | (20,810 | ) | | | (20,302 | ) |
Borrowings with a carrying value of US$11.9 billion (2015: US$21.3 billion) relate to listed bonds with a fair value of US$12.9 billion (2015: US$20.8 billion) and are categorised as level 1 in the fair value hierarchy. Borrowings with a carrying value of US$4.1 billion (2015: nil) relates to project finance draw down with a fair value of US$4.6 billion
(2015: nil) and are categorised as level 3 in the fair value hierarchy. The remaining borrowings have a fair value measured by discounting estimated cash flows with an applicable market quoted yield and are categorised as level 2 in the fair value hierarchy.
| | | | |
| 2016 Annual report | | riotinto.com | | 155 |
| | | | | | | | | | | | | | | | |
| | | | | | | | | |
| STRATEGIC REPORT | | | | DIRECTORS’ REPORT | | | | FINANCIAL STATEMENTS | | | | METALS AND MINERALS PRODUCTION | | | | ADDITIONAL INFORMATION |
Notes to the 2016 financial statements
continued
30 Financial instruments and risk managementcontinued
C (b) Valuation hierarchy
The table below shows the financial instruments carried at fair value by valuation method at 31 December 2016:
| | | | | | | | | | | | | | | | | | | | | | | | |
| | | Note | | | Total
US$m | | | Level 1 (a)
US$m | | | Level 2 (b)
US$m | | | Level 3 (c)
US$m | | | Not held
at fair value
US$m | |
| Assets | | | | | | | | | | | | | | | | | | | | | | | | |
| Equity shares and quoted funds | | | 20 | | | | 156 | | | | 94 | | | | – | | | | 3 | | | | 59 | |
| Other investments, including loans(d) | | | 20 | | | | 454 | | | | 363 | | | | – | | | | 68 | | | | 23 | |
| Trade receivables(e) | | | | | | | 2,283 | | | | – | | | | 143 | | | | – | | | | 2,140 | |
| | | | | | | 2,893 | | | | 457 | | | | 143 | | | | 71 | | | | 2,222 | |
| | | | | | |
| Derivatives | | | | | | | | | | | | | | | | | | | | | | | | |
| Forward contracts: designated as hedges (Section B) | | | | | | | 1 | | | | – | | | | 1 | | | | – | | | | – | |
| Forward contracts and option contracts, not designated as hedges (Section B)(f) | | | | | | | 416 | | | | – | | | | 8 | | | | 408 | | | | – | |
| Derivatives related to net debt (Section B)(g) | | | | | | | (408 | ) | | | – | | | | (408 | ) | | | – | | | | – | |
| | | | | | | | 2,902 | | | | 457 | | | | (256 | ) | | | 479 | | | | 2,222 | |
| | | | | | | | | | | | | | | | | | | | | | | | |
The table below shows the financial instruments carried at fair value by valuation method at 31 December 2015: | |
| | | Note | | | Total
US$m | | | Level 1 (a)
US$m | | | Level 2 (b)
US$m | | | Level 3(c)
US$m | | | Not held
at fair value
US$m | |
| Assets | | | | | | | | | | | | | | | | | | | | | | | | |
| Equity shares and quoted funds | | | 20 | | | | 157 | | | | 87 | | | | 7 | | | | 10 | | | | 53 | |
| Other investments, including loans(d) | | | 20 | | | | 206 | | | | 99 | | | | – | | | | 71 | | | | 36 | |
| Trade receivables(e) | | | | | | | 1,370 | | | | – | | | | 12 | | | | – | | | | 1,358 | |
| | | | | | | 1,733 | | | | 186 | | | | 19 | | | | 81 | | | | 1,447 | |
| | | | | | |
| Derivatives | | | | | | | | | | | | | | | | | | | | | | | | |
| Forward contracts: designated as hedges (Section B)(f) | | | | | | | 5 | | | | – | | | | – | | | | 5 | | | | – | |
| Forward contracts and option contracts, not designated as hedges (Section B)(f) | | | | | | | 363 | | | | – | | | | (7 | ) | | | 370 | | | | – | |
| Derivatives related to net debt (Section B)(g) | | | | | | | (86 | ) | | | – | | | | (86 | ) | | | – | | | | – | |
| | | | | | | | 2,015 | | | | 186 | | | | (74 | ) | | | 456 | | | | 1,447 | |
| (a) | Valuation is based on unadjusted quoted prices in active markets for identical financial instruments. This category includes listed equity shares and other quoted funds. |
| (b) | Valuation is based on inputs that are observable for the financial instruments which include quoted prices for similar instruments or identical instruments in markets which are not considered to be active, or inputs, either directly or indirectly based on observable market data. |
| (c) | Valuation is based on inputs for the asset or liability that are not based on observable market data (unobservable inputs). |
| (d) | Other investments, including loans, mainly comprise of: cash deposits in rehabilitation funds, government bonds, managed investment funds and royalty amounts receivable. The royalty receivables are valued based on an estimate of forward sales subject to the royalty agreement. |
| (e) | Trade receivables includes provisionally priced receivables relating to sales contracts where selling price is determined after delivery to the customer, based on the market price at the relevant quotation point stipulated in the contract. Revenue is recognised on provisionally priced sales based on the forward selling price for the period stipulated in the contract. At the end of December 2016, US$143 million (2015 US$12 million) of provisionally priced receivables were recognised. |
| (f) | Level 3 derivatives consist of derivatives embedded in electricity purchase contracts linked to the LME with terms expiring between 2017 and 2030 (2015: 2016 and 2030). The embedded derivatives are measured using discounted cash flows and option model valuation techniques. Long-term embedded derivatives with a fair value of US$408 million at 31 December 2016 (2015: US$370 million) are valued using significant unobservable inputs as the term of the derivative extends beyond the forward curve for aluminium. |
| | Aluminium prices are flatlined beyond the market forward curve and increased by projected inflation up to the date of expiry of the contract. The range of market prices are US$2,136 per metric tonne in 2027 to US$2,300 in 2030 (2015: US$2,044 per metric tonne in 2026 to US$2,242 in 2030). |
| | At 31 December 2015 US$5 million were categorised as level 3 as the market premium assumptions used represent unobservable inputs. |
| (g) | Interest rate and currency interest rate swaps are valued using applicable market quoted swap yield curves adjusted for relevant basis and credit default spreads. Currency interest rate swap valuations also use market quoted foreign exchange rates. A discounted cash flow approach is applied to the cash flows derived from the inputs to determine fair value. |
There were no transfers between Level 1 and Level 2, or between Level 2 and Level 3 in the year ended 31 December 2016 or the year ended 31 December 2015.
| | | | |
| 156 | | riotinto.com | | 2016 Annual report |
C (c) Level 3 financial assets and financial liabilities
The table below shows the summary of changes in the fair value of the Group’s Level 3 financial assets and financial liabilities.
| | | | | | | | |
| | | 31 December 2016
Level 3 financial assets
and financial liabilities US$m | | | 31 December 2015
Level 3 financial assets
and financial liabilities US$m | |
| Opening balance | | | 456 | | | | 282 | |
| Currency translation adjustments | | | (2 | ) | | | (43 | ) |
| Total realised gains/(losses) included in: | | | | | | | | |
| – Consolidated sales revenue | | | 1 | | | | – | |
| – Net operating costs | | | (28 | ) | | | 6 | |
| Total unrealised gains included in: | | | | | | | | |
| – Net operating costs | | | 11 | | | | 196 | |
| Total unrealised gains transferred into other comprehensive income | | | – | | | | 15 | |
| Additions | | | 43 | | | | – | |
| Impairment | | | (2 | ) | | | – | |
| Closing balance | | | 479 | | | | 456 | |
| Total gains/(losses) for the year included in the income statement for assets andliabilities held at year end | | | 11 | | | | (15 | ) |
Sensitivity analysis in respect of Level 3 derivatives
Forward contracts and options whose carrying value are valued using unobservable inputs are calculated using appropriate discounted cashflow and option model valuation techniques. The most significant of these assumptions relate to long-term pricing wherein internal pricing assumptions are used after the ten year LME curve. A ten per cent
increase in long-term metal pricing assumptions would result in a US$38 million (31 December 2015: US$38 million) decrease in carrying value. A ten per cent decrease in long-term metal pricing assumptions would result in a US$64 million (31 December 2015: US$39 million) increase in carrying value.
31 Contingencies and commitments
| | | | | | | | |
| | | 2016
US$m | | | 2015
US$m | |
| Capital commitments excluding the Group’s share of Joint Venture Capital Commitments | | | | | | | | |
| Within 1 year | | | 1,588 | | | | 710 | |
| Between 1 and 3 years | | | 433 | | | | 98 | |
| Between 3 and 5 years | | | 194 | | | | 2 | |
| After 5 years | | | 15 | | | | 24 | |
| Total | | | 2,230 | | | | 834 | |
| | |
| Group’s share of Joint Venture Capital Commitments | | | | | | | | |
| Within 1 year | | | 113 | | | | 300 | |
| Between 1 and 3 years | | | – | | | | 57 | |
| Total | | | 113 | | | | 357 | |
Capital commitments include open purchase orders for managed operations and expenditure on major projects authorised to date by the Rio Tinto Investment Committee fornon-managed operations. On a legally enforceable basis capital commitments would be some US$1.6bn less as many of the contracts relating to the Group’s projects have various cancellation clauses.
Unrecognised commitments to contribute funding or resources to joint ventures
The Group has a commitment to purchase and market a portion (in excess of the Group’s ownership interest) of the output of Sohar
Aluminium Company L.L.C., an aluminium smelter in which the Group is a joint venturer. The Group immediately sells the purchased products to third parties.
The Group, along with the other joint venturers, has made various commitments to provide shareholder funding as required for Sohar Aluminium Company L.L.C., subject to approved thresholds.
At 31 December 2016, Minera Escondida Limitada held an undrawn shareholder line of credit for US$225 million (Rio Tinto share). This has a three year duration. The previous line of credit matured during 2015.
| | | | |
| 2016 Annual report | | riotinto.com | | 157 |
| | | | | | | | | | | | | | | | |
| | | | | | | | | |
| STRATEGIC REPORT | | | | DIRECTORS’ REPORT | | | | FINANCIAL STATEMENTS | | | | METALS AND MINERALS PRODUCTION | | | | ADDITIONAL INFORMATION |
Notes to the 2016 financial statements
continued
31 Contingencies and commitmentscontinued
Operating leases
The aggregate amount of minimum lease payments undernon-cancellable operating leases are as follows:
| | | | | | | | |
| | | 2016
US$m | | | 2015
US$m | |
| Within 1 year | | | 353 | | | | 400 | |
| Between 1 and 3 years | | | 495 | | | | 590 | |
| Between 3 and 5 years | | | 385 | | | | 443 | |
| After 5 years | | | 612 | | | | 745 | |
| | | | 1,845 | | | | 2,178 | |
Operating leases include leases of dry bulk vessels and offices as well as other property, plant and equipment. The terms of lease payments vary with a significant proportion being fixed rate and including renewal options. Leases for dry bulk vessels include costs for crewing services.
Purchase obligations
The aggregate amount of future payment commitments under purchase obligations outstanding at 31 December was:
| | | | | | | | |
| | | 2016
US$m | | | Adjusted (a)
2015
US$m | |
| Within 1 year | | | 2,631 | | | | 2,677 | |
| Between 1 and 2 years | | | 1,624 | | | | 2,269 | |
| Between 2 and 3 years | | | 1,327 | | | | 1,856 | |
| Between 3 and 4 years | | | 1,125 | | | | 1,519 | |
| Between 4 and 5 years | | | 1,040 | | | | 1,346 | |
| After 5 years(a) | | | 11,334 | | | | 13,595 | |
| | | | 19,081 | | | | 23,262 | |
| (a) | The 2015 comparative has been amended to correctly present purchase obligations which are due later than five years. The impact is to increase total 2015 purchase obligations by US$650 million, all of which is due after five years. |
Purchase obligations as disclosed above are agreements to purchase goods or services that are enforceable and legally binding and specify all significant terms, including: fixed or minimum quantities to be purchased or consumed; fixed, minimum or variable price provisions; and the approximate timing of the transactions.
Purchase obligations for goods primarily relate to purchases of raw materials and consumables and purchase obligations for services primarily relate to charges for use of infrastructure, commitments to purchase power and freight contracts. These goods and services are expected to be used in the business. To the extent that this changes a provision for onerous obligations may be made as described in note 1(i).
Purchases from joint arrangements or associates are included to the extent that the quantity purchased is in excess of Rio Tinto’s ownership interest in the entity. However, purchase obligations exclude contracted purchases of bauxite, alumina and aluminium from joint arrangements and associates and contracted purchases of alumina from third parties as the purchases are made for commercial reasons and the Group is, overall, a net seller of these commodities.
In addition, as explained above, the Group has a commitment to purchase and market a portion (in excess of the Group’s ownership interest) of the output of Sohar Aluminium Company L.L.C.
| | | | | | | | |
| | | 2016
US$m | | | 2015
US$m | |
| Contingent liabilities (subsidiaries and joint operations) | | | | | | | | |
| Indemnities and other performance guarantees (a) (b) | | | 473 | | | | 226 | |
| (a) | Indemnities and other performance guarantees represent the potential outflow of funds from the Group for the satisfaction of obligations including those under contractual arrangements (for example undertakings related to supplier agreements) not provided for in the balance sheet, where the likelihood of the guarantees or indemnities being called is assessed as possible rather than probable or remote. |
| (b) | There were no material contingent liabilities arising in relation to the Group’s joint ventures and associates. |
Contingent liabilities
On 9 November 2016, Rio Tinto announced that, following an investigation led by external counsel, it had notified or was in the course of notifying the relevant authorities in the United States, United Kingdom and Australia of information concerning contractual payments totalling US$10.5 million made to a consultant who had provided advisory services on the Simandou project in Guinea. Rio Tinto is cooperating fully with each of the relevant authorities. On 12 December 2016, a class action was also filed in the United States District Court for the Southern District of New York against Rio Tinto plc and certain of its current and former directors in connection with the Simandou payments.
On 1 December 2016, Rio Tinto confirmed that it was cooperating with relevant authorities (including the U.S. Securities and Exchange Commission) in connection with an investigation into the impairment included in the Company’s 2012 accounts in respect of Rio Tinto Coal Mozambique.
The likely outcome on the Group of these regulatory investigations, and any associated litigation, is subject to a number of significant uncertainties at the present time. They could ultimately expose the Group to material financial cost. The Board has established a dedicated Committee chaired by the chairman of the board to keep these matters under review as they progress.
Guarantees by parent companies
Rio Tinto plc and Rio Tinto Limited have, jointly and severally, fully and unconditionally guaranteed the following securities issued by the following 100 per cent owned finance subsidiaries: US$8.3 billion (31 December 2015: US$17.3 billion) Rio Tinto Finance (USA) Limited and Rio Tinto Finance (USA) plc bonds with maturity dates up to 2042; and US$1.9 billion (31 December 2015: US$2.1 billion) on the European Debt Issuance Programme. In addition, Rio Tinto Finance plc and Rio
| | | | |
| 158 | | riotinto.com | | 2016 Annual report |
Tinto Finance Limited have entered into facility arrangements for an aggregate amount of US$7.5 billion (31 December 2015: US$7.5 billion). The facilities are guaranteed by Rio Tinto plc and Rio Tinto Limited.
Rio Tinto plc has provided a guarantee, known as the completion support undertaking (CSU), in favour of the Oyu Tolgoi LLC project finance lenders. At 31 December 2016 US$4,323 million of project finance debt was outstanding under this facility (31 December 2015: US$ nil). Oyu Tolgoi LLC is jointly owned by Erdenes Oyu Tolgoi LLC (34 per cent), which is controlled by the Government of Mongolia, and Turquoise Hill Resources Ltd (66 per cent, of which Rio Tinto owns 51 per cent). The project finance has been raised for development of the underground mine and the CSU will terminate on the completion of the underground mine according to a set of completion tests set out in the project finance facility.
The Rio Tinto guarantee applies to the extent that Turquoise Hill Resources Ltd cannot satisfy Oyu Tolgoi LLC’s project finance debt servicing obligations under its own guarantee to the lenders, called the sponsor debt service undertaking (DSU). Both the CSU and DSU contain acarve-out for certain political risk events.
Contingent assets
The Group has, from time to time, various insurance claims outstanding with reinsurers. At 31 December 2016 and 2015 this included a claim relating to the Manefay slide at Rio Tinto Kennecott in April 2013. Interim progress payments were received on this claim in 2013 and 2015; the final payment was received in January 2017.
32 Average number of employees
| | | | | | | | | | | | | | | | | | | | | | | | | | | | | | | | | | | | |
| | | Subsidiaries and joint operations | | | Equity accounted units (Rio Tinto share) | | | Group total | |
| | | 2016 | | | 2015 | | | 2014 | | | 2016 | | | 2015 | | | 2014 | | | 2016 | | | 2015 | | | 2014 | |
| The principal locations of employment were: | | | | | | | | | | | | | | | | | | | | | | | | | | | | | | | | | | | | |
| Australia and New Zealand | | | 20,489 | | | | 22,125 | | | | 23,447 | | | | 849 | | | | 863 | | | | 711 | | | | 21,338 | | | | 22,988 | | | | 24,158 | |
| Canada | | | 10,239 | | | | 11,113 | | | | 12,187 | | | | – | | | | – | | | | – | | | | 10,239 | | | | 11,113 | | | | 12,187 | |
| UK | | | 487 | | | | 542 | | | | 649 | | | | – | | | | – | | | | – | | | | 487 | | | | 542 | | | | 649 | |
| Europe | | | 1,722 | | | | 2,312 | | | | 2,850 | | | | – | | | | – | | | | 88 | | | | 1,722 | | | | 2,312 | | | | 2,938 | |
| Africa | | | 4,875 | | | | 5,651 | | | | 5,699 | | | | 1,270 | | | | 1,271 | | | | 1,560 | | | | 6,145 | | | | 6,922 | | | | 7,259 | |
| US | | | 3,196 | | | | 3,439 | | | | 3,503 | | | | – | | | | – | | | | – | | | | 3,196 | | | | 3,439 | | | | 3,503 | |
| Mongolia | | | 2,737 | | | | 2,647 | | | | 3,212 | | | | – | | | | – | | | | – | | | | 2,737 | | | | 2,647 | | | | 3,212 | |
| Indonesia | | | 2,862 | | | | 2,871 | | | | 2,959 | | | | – | | | | – | | | | – | | | | 2,862 | | | | 2,871 | | | | 2,959 | |
| South America | | | 166 | | | | 192 | | | | 356 | | | | 1,388 | | | | 1,317 | | | | 1,509 | | | | 1,554 | | | | 1,509 | | | | 1,865 | |
| Other countries(a) | | | 749 | | | | 595 | | | | 1,045 | | | | – | | | | – | | | | – | | | | 749 | | | | 595 | | | | 1,045 | |
| | | | 47,522 | | | | 51,487 | | | | 55,907 | | | | 3,507 | | | | 3,451 | | | | 3,868 | | | | 51,029 | | | | 54,938 | | | | 59,775 | |
| (a) | “Other countries” primarily includes employees in the Middle East (excluding Oman which is included in Africa), India, Singapore and other countries in Asia which are not shown separately in the table above. For the year ended 31 December 2016, the average number of employees in Singapore was 262 (2015: 212) and the average number of employees in India was 280 (2015: 232). |
Employee numbers, which represent the average for the year, include 100 per cent of employees of subsidiary companies. Employee numbers for joint operations and equity accounted units are proportional to the Group’s interest under contractual agreements. Average employee numbers include a part-year effect for companies acquired or disposed of during the year.
Part-time employees are included on a full-time-equivalent basis. Temporary employees are included in employee numbers.
People employed by contractors are not included.
| | | | |
| 2016 Annual report | | riotinto.com | | 159 |
| | | | | | | | | | | | | | | | |
| | | | | | | | | |
| STRATEGIC REPORT | | | | DIRECTORS’ REPORT | | | | FINANCIAL STATEMENTS | | | | METALS AND MINERALS PRODUCTION | | | | ADDITIONAL INFORMATION |
Notes to the 2016 financial statements
continued
33 Principal subsidiaries
| | | | | | | | | | | | | | | | | | | | | | | | |
At 31 December 2016 | |
Company and country of incorporation/ operation | | Principal activities | | Class of shares held | | Proportion
of class
held (%) | | | | | | Group
interest
(%) | | | | | | Non-controlling
interest (%) | |
| Australia | | | | | | | | | | | | | | | | | | | | | | | | |
| Argyle Diamonds Limited | | Mining and processing of diamonds | | Ordinary | | | 100 | | | | | | | | 100 | | | | | | | | – | |
| Coal & Allied Industries Limited(a) | | Coal mining | | Ordinary | | | 100 | | | | | | | | 100 | | | | | | | | – | |
| Dampier Salt Limited | | Salt production | | Ordinary | | | 68.36 | | | | | | | | 68.36 | | | | | | | | 31.64 | |
| Energy Resources of Australia Limited | | Uranium mining | | Ordinary | | | 68.39 | | | | | | | | 68.39 | | | | | | | | 31.61 | |
| Hamersley Iron Pty Limited | | Iron ore mining | | Ordinary | | | 100 | | | | | | | | 100 | | | | | | | | – | |
| North Mining Limited(c) | | Iron ore mining | | Ordinary | | | 100 | | | | | | | | 100 | | | | | | | | – | |
| Queensland Coal Pty Limited(b) | | Coal mining | | Ordinary | | | 100 | | | | | | | | 100 | | | | | | | | – | |
| Rio Tinto Aluminium (Holdings) Limited | | Bauxite mining; alumina production; primary aluminium smelting | | Ordinary | | | 100 | | | | | | | | 100 | | | | | | | | – | |
| Robe River Mining Co Pty Ltd(c) | | Iron ore mining | | Class A | | | 40 | | | | ] | | | | 60 | | | | | | | | 40 | |
| | | Class B | | | 73.61 | | | | | | | | |
| Brazil | | | | | | | | | | | | | | | | | | | | | | | | |
| Alcan Alumina Ltda.(d) | | Alumina production and bauxite mining | | Quota | | | 100 | | | | | | | | 100 | | | | | | | | – | |
| Canada | | | | | | | | | | | | | | | | | | | | | | | | |
| Rio Tinto Canada Uranium Corporation | | Uranium projects | | Common | | | 100 | | | | | | | | 100 | | | | | | | | – | |
| Iron Ore Company of Canada (e) | | Iron ore mining; iron ore pellets | | Common | | | 58.72 | | | | | | | | 58.72 | | | | | | | | 41.28 | |
| Rio Tinto Fer et Titane Inc. | | Titanium dioxide feedstock; high purity iron and steel | | Common | | | 100 | | | | | | | | 100 | | | | | | | | – | |
| | | Class B preference | | | 100 | | | | | | | | 100 | | | | | | | | – | |
| | | CAD 0.01 preferred | | | 100 | | | | | | | | 100 | | | | | | | | – | |
| Rio Tinto Alcan Inc. | | Bauxite mining; alumina refining; aluminium smelting | | Common | | | 100 | | | | | | | | 100 | | | | | | | | – | |
| Diavik Diamond Mines (2012) Inc.(f) | | Diamond mining and processing | | Common | | | 100 | | | | | | | | 100 | | | | | | | | – | |
| Guinea | | | | | | | | | | | | | | | | | | | | | | | | |
| Simfer Jersey Limited(g) | | Iron ore project | | Ordinary | | | 53 | | | | | | | | 53 | | | | | | | | 47 | |
| Madagascar | | | | | | | | | | | | | | | | | | | | | | | | |
| QIT Madagascar Minerals SA(h) | | Ilmenite mining | | Common | | | 80 | | | | | | | | 80 | | | | ] | | | | 15 | |
| | | | Investment certificates | | | 100 | | | | | | | | 100 | | | |
| | | | | Voting certificates | | | 80 | | | | | | | | 80 | | | | | | | | 20 | |
| Mongolia | | | | | | | | | | | | | | | | | | | | | | | | |
| Turquoise Hill Resources Ltd (including Oyu Tolgoi LLC)(i) | | Copper and gold mining | | Common | | | 50.79 | | | | | | | | 50.79 | | | | | | | | 49.21 | |
| Namibia | | | | | | | | | | | | | | | | | | | | | | | | |
| Rössing Uranium Limited(j) | | Uranium mining | | B N$1 | | | 71.22 | | | | | | | | 68.62 | | | | | | | | 31.38 | |
| | | C N10c | | | 70.59 | | | | | | | | | | | |
| South Africa | | | | | | | | | | | | | | | | | | | | | | | | |
| Richards Bay Titanium (Proprietary) Limited(k) | | Titanium dioxide/high purity iron production | | B Ordinary B preference | |
| 100
100 |
| | | ] | | | | 74 | | | | | | | | 26 | |
| | | | Parent Preference | | | 100 | | | | | | | | |
| Richards Bay Mining (Proprietary) Limited(k) | | Ilmenite, rutile and zircon
mining | | B Ordinary | | | 100 | | | | ] | | | | 74 | | | | | | | | 26 | |
| | | | B preference | | | 100 | | | | | |
| | | | | Parent Preference | | | 100 | | | | | |
| United States of America | | | | | | | | | | | | | | | | | | | | | | | | |
| Kennecott Holdings Corporation (including Kennecott Utah Copper, Kennecott Land and Kennecott Exploration) | | Copper and gold mining, smelting and refining, land development and exploration activities | | Common US$0.01 | | | 100 | | | | | | | | 100 | | | | | | | | – | |
| U.S. Borax Inc. | | Mining, refining and marketing of borates | | Common US$0.10 | | | 100 | | | | | | | | 100 | | | | | | | | – | |
This list includes only those companies that have a more significant impact on the profit or assets of the Group. Refer to note 47 for a list of related undertakings.
The Group’s principal subsidiaries are mostly held by intermediate holding companies and not directly by Rio Tinto plc or Rio Tinto Limited.
| | | | |
| 160 | | riotinto.com | | 2016 Annual report |
| (a) | In February 2016, after a restructuring of the Coal and Allied group, Rio Tinto obtained a 100 per cent shareholding in Coal & Allied Industries Limited and its wholly-owned subsidiaries. Mitsubishi became a joint venture participant in the Hunter Valley Operations Joint Venture. |
| (b) | Queensland Coal Pty Limited is the main legal entity that holds the Group’s interests in Hail Creek (82 per cent), Blair Athol (71.2 per cent) and Kestrel (80 per cent). These are unincorporated arrangements that are not entities; the Group recognises its share of assets, liabilities, revenues and expenses relating to these arrangements. Queensland Coal forms part of the Rio Tinto Coal Australia business unit. In September 2016 the Blair Athol Coal Joint Venture signed a conditional sale and purchase agreement to transfer its interests in the Blair Athol mine to TerraCom Limited. The transaction has not completed and is subject to certain conditions precedent being met, including approval from the Queensland Government. |
| (c) | Robe River Mining Co Pty Ltd (which is 60 per cent owned by the Group) holds a 30 per cent interest in Robe River Iron Associates (Robe River). North Mining Limited (which is wholly owned by the Group) holds a 35 per cent interest in Robe River. Through these companies the Group recognises a 65 per cent share of the assets, liabilities, revenues and expenses of Robe River, with a 12 per centnon-controlling interest. The Group therefore has a 53 per cent beneficial interest in Robe River. |
| (d) | Alcan Alumina Ltda holds the Group’s 10 per cent interest in Consórcio De Alumínio Do Maranhão, a joint operation in which the Group participates but is not a joint operator. The Group recognises its share of assets, liabilities, revenues and expenses relating to this arrangement. |
| (e) | Iron Ore Company of Canada is incorporated in the United States of America, but operates in Canada. |
| (f) | Diavik Diamond Mines (2012) Inc. is the legal entity that owns the Group’s 60 per cent interest in the Diavik Joint Venture, an unincorporated arrangement that is not an entity. The Group recognises its share of assets, liabilities, revenue and expenses relating to this arrangement. |
| (g) | Simfer Jersey Limited, a company incorporated in Jersey in which the Group has a 53 per cent interest, has an 80.75 per cent interest in Simfer S.A. the company that operates the Simandou mining project in Guinea. The Group therefore has a 42.80 per cent indirect interest in Simfer S.A. These entities are consolidated as subsidiaries and together referred to as the Simandou iron ore project. |
| (h) | The Group’s shareholding in QIT Madagascar Minerals SA carries an 80 per cent economic interest and 80 per cent of the total voting rights; a further 5 per cent economic interest is held throughnon-voting investment certificates to give an economic interest of 85 per cent. Thenon-controlling interests have a 15 per cent economic interest and 20 per cent of the total voting rights. |
| (i) | The Group has a 50.79 per cent interest in Turquoise Hill, which holds a 66 per cent interest in Oyu Tolgoi LLC (OT) which is subsidiary of Turquoise Hill. The Group therefore has a 33.5 per cent indirect interest in OT. Turquoise Hill is incorporated in Canada but operates principally in Mongolia. |
| (j) | The Group’s shareholding in Rössing Uranium Limited (Rössing) holds 35.57 per cent of the total voting rights; thenon-controlling interests hold 64.43 per cent of the total voting rights. Rössing is consolidated by virtue of the Group’s board control. The Government of Namibia has the ability to veto matters that are considered not to be in the interest of Namibia; this is considered to be a protective right. Rio Tinto therefore has control of Rössing and consolidates it as a subsidiary. |
| (k) | Additional classes of shares issued by Richards Bay Titanium (Proprietary) Limited and Richards Bay Mining (Proprietary) Limited representingnon-controlling interests are not shown. The Group’s total legal and beneficial interest in Richards Bay Titanium (Proprietary) Limited and Richards Bay Mining (Proprietary) Limited is 74 per cent. |
Summary financial information for subsidiaries that havenon-controlling interests that are material to the Group
This summarised financial information is shown on a 100 per cent basis. It represents the amounts shown in the subsidiaries’ financial statements prepared in accordance with IFRS under Group accounting policies, including fair value adjustments, and before intercompany eliminations.
| | | | | | | | | | | | | | | | | | | | | | | | | | | | | | | | |
| | | Iron Ore
Company of
Canada
2016
US$m | | | Iron Ore
Company of
Canada
2015 US$m | | | Energy
Resources of
Australia
2016 US$m | | | Energy
Resources of
Australia
2015 US$m | | | Simandou (a)
2016 US$m | | | Simandou (a) (c)
2015 US$m | | | Turquoise
Hill (b)
2016
US$m | | | Turquoise
Hill (b) 2015 US$m | |
| Revenue | | | 1,324 | | | | 1,353 | | | | 193 | | | | 245 | | | | – | | | | – | | | | 1,203 | | | | 1,636 | |
| Profit/(loss) after tax | | | 108 | | | | (12 | ) | | | 7 | | | | (412 | ) | | | (323 | ) | | | (1,955 | ) | | | 140 | | | | 215 | |
| – attributable tonon-controlling interests | | | 44 | | | | (4 | ) | | | 2 | | | | (132 | ) | | | (160 | ) | | | (974 | ) | | | 37 | | | | 76 | |
| – attributable to Rio Tinto | | | 64 | | | | (8 | ) | | | 5 | | | | (280 | ) | | | (163 | ) | | | (981 | ) | | | 103 | | | | 139 | |
| Other comprehensive income/(loss) | | | 56 | | | | (341 | ) | | | – | | | | (21 | ) | | | – | | | | – | | | | 2 | | | | 7 | |
| Total comprehensive income/(loss) | | | 164 | | | | (353 | ) | | | 7 | | | | (433 | ) | | | (323 | ) | | | (1,955 | ) | | | 142 | | | | 222 | |
| Non-current assets | | | 2,315 | | | | 2,325 | | | | 58 | | | | 89 | | | | – | | | | – | | | | 7,969 | | | | 7,712 | |
| Current assets | | | 627 | | | | 412 | | | | 383 | | | | 363 | | | | 18 | | | | 18 | | | | 5,702 | | | | 1,728 | |
| Current liabilities | | | (348 | ) | | | (261 | ) | | | (96 | ) | | | (94 | ) | | | (243 | ) | | | (78 | ) | | | (316 | ) | | | (322 | ) |
| Non-current liabilities | | | (755 | ) | | | (724 | ) | | | (336 | ) | | | (355 | ) | | | (19 | ) | | | (19 | ) | | | (4,257 | ) | | | (167 | ) |
| Net assets/(liabilities) | | | 1,839 | | | | 1,752 | | | | 9 | | | | 3 | | | | (244 | ) | | | (79 | ) | | | 9,098 | | | | 8,951 | |
| – attributable tonon-controlling interests | | | 759 | | | | 724 | | | | 2 | | | | 1 | | | | (125 | ) | | | (44 | ) | | | 4,073 | | | | 4,075 | |
| – attributable to Rio Tinto | | | 1,080 | | | | 1,028 | | | | 7 | | | | 2 | | | | (119 | ) | | | (35 | ) | | | 5,025 | | | | 4,876 | |
| Cash flow from operations | | | 302 | | | | 206 | | | | 18 | | | | 56 | | | | (157 | ) | | | (59 | ) | | | 387 | | | | 658 | |
| Dividends paid tonon-controlling interests | | | (31 | ) | | | – | | | | – | | | | – | | | | – | | | | – | | | | – | | | | – | |
| (a) | These figures represent the consolidated position of both Simfer Jersey Limited and Simfer S.A. which together form the Simandou Iron Ore project. In 2016, a post-tax charge of US$194 million (Rio Tinto share US$103 million) has been recognised in Simfer Jersey Limited as a financial liability following the decision by International Finance Corporation (IFC) to exercise a put option in respect of its 4.25% investment in Simfer SA. |
| (b) | Turquoise Hill Resources Ltd holds controlling interests in Oyu Tolgoi. The main driver of the increase innon-current liabilities and current assets, compared with 2015, was the draw-down of Oyu Tolgoi Project financing and the subsequent placing of net proceeds with 9539549 Canada Inc., a wholly owned subsidiary of Rio Tinto. Net proceeds placed with 9539549 Canada Inc. are returned to Turquoise Hill as required for the purposes of Oyu Tolgoi underground mine development and financing. |
| (c) | These amounts include impairment adjustments recognised by Rio Tinto. Refer to note 6 on page 133 for further information. |
| | | | |
| 2016 Annual report | | riotinto.com | | 161 |
| | | | | | | | | | | | | | | | |
| | | | | | | | | |
| STRATEGIC REPORT | | | | DIRECTORS’ REPORT | | | | FINANCIAL STATEMENTS | | | | METALS AND MINERALS PRODUCTION | | | | ADDITIONAL INFORMATION |
Notes to the 2016 financial statements
continued
33 Principal subsidiariescontinued
| | | | | | | | | | | | | | | | | | | | | | | | |
| | | Robe River
Mining Co
Pty Ltd
2016
US$m | | | Robe River
Mining Co
Pty Ltd
2015
US$m | | | Other
companies
and
eliminations (a)
2016
US$m | | | Other
companies
and
eliminations (a)
2015 US$m | | | Robe River
2016
US$m | | | Robe River
2015 US$m | |
| Revenue | | | 982 | | | | 976 | | | | 1,139 | | | | 1,133 | | | | 2,121 | | | | 2,109 | |
| Profit/(loss) after tax | | | 482 | | | | 615 | | | | 517 | | | | 203 | | | | 999 | | | | 818 | |
| – attributable tonon-controlling interests | | | 193 | | | | 176 | | | | – | | | | – | | | | 193 | | | | 176 | |
| – attributable to Rio Tinto | | | 289 | | | | 439 | | | | 517 | | | | 203 | | | | 806 | | | | 642 | |
| Other comprehensive loss | | | (23 | ) | | | (107 | ) | | | (20 | ) | | | (578 | ) | | | (43 | ) | | | (685 | ) |
| Total comprehensive income/(loss) | | | 459 | | | | 508 | | | | 497 | | | | (375 | ) | | | 956 | | | | 133 | |
| Non-current assets | | | 2,797 | | | | 2,935 | | | | 3,976 | | | | 4,154 | | | | 6,773 | | | | 7,089 | |
| Current assets | | | 1,122 | | | | 602 | | | | (401 | ) | | | (10 | ) | | | 721 | | | | 592 | |
| Current liabilities | | | (92 | ) | | | (105 | ) | | | (148 | ) | | | (247 | ) | | | (240 | ) | | | (352 | ) |
| Non-current liabilities | | | (666 | ) | | | (60 | ) | | | (1,546 | ) | | | (2,120 | ) | | | (2,212 | ) | | | (2,180 | ) |
| Net assets | | | 3,161 | | | | 3,372 | | | | 1,881 | | | | 1,777 | | | | 5,042 | | | | 5,149 | |
| – attributable tono- controlling interests | | | 1,263 | | | | 1,347 | | | | – | | | | – | | | | 1,263 | | | | 1,347 | |
| – attributable to Rio Tinto | | | 1,898 | | | | 2,025 | | | | 1,881 | | | | 1,777 | | | | 3,779 | | | | 3,802 | |
| Cashflow from operations | | | 145 | | | | 798 | | | | 1,496 | | | | 733 | | | | 1,641 | | | | 1,531 | |
| Dividends paid tonon-controlling interests | | | (268 | ) | | | (271 | ) | | | – | | | | – | | | | (268 | ) | | | (271 | ) |
| (a) | “Other companies and eliminations” includes North Mining Limited, a wholly owned subsidiary of the Group which accounts for its interest in Robe River and goodwill of US$360 million (2015: US$363 million) that arose on acquisition of the Group’s interest in Robe River. |
34 Principal joint operations
| | | | | | |
| Company and country of incorporation/operation | | Principal activities | | Group interest (%) | |
| Australia | | | | | | |
| Tomago Aluminium Joint Venture | | Aluminium smelting | | | 51.6 | |
| Kestrel(a) | | Coal mining | | | 80 | |
| Gladstone Power Station | | Power generation | | | 42.1 | |
| Hope Downs Joint Venture | | Iron ore mining | | | 50 | |
| Queensland Alumina Limited(b) (c) | | Alumina production | | | 80 | |
| New Zealand | | | | | | |
| New Zealand Aluminium Smelters Limited(b) (c) | | Aluminium smelting | | | 79.4 | |
| Canada | | | | | | |
| Aluminerie Alouette Inc. | | Aluminium production | | | 40 | |
| Indonesia | | | | | | |
| Grasberg expansion(d) | | Copper and gold mining | | | 40 | |
| United States of America | | | | | | |
| Pechiney Reynolds Quebec Inc(c) (e) | | Aluminium smelting | | | 50.3 | |
This list includes only those joint operations that have a more significant impact on the profit or operating assets of the Group. Refer to note 47 for a list of related undertakings.
The Group’s joint operations are held by intermediate holding companies and not directly by Rio Tinto plc or Rio Tinto Limited.
| (a) | Although the Group has an 80 per cent interest share in the Kestrel Joint Venture, decisions about activities that significantly affect the returns that are generated require agreement of both parties to the Joint Venture Agreement, giving rise to joint control. |
| (b) | Although the Group has a 79.4 per cent interest in New Zealand Aluminium Smelters Limited and an 80 per cent interest in Queensland Alumina Limited, decisions about activities that significantly affect the returns that are generated require agreement of both parties to the arrangements, giving rise to joint control. |
| (c) | Queensland Alumina Limited, New Zealand Aluminium Smelters Limited and Pechiney Reynolds Quebec Inc. are joint arrangements that are primarily designed for the provision of output to the parties sharing joint control; this indicates that the parties have rights to substantially all the economic benefits of the assets. The liabilities of the arrangements are in substance satisfied by cash flows received from the parties; this dependence indicates that the parties in effect have obligations for the liabilities. It is these facts and circumstances that give rise to the classification of these entities as joint operations. |
| (d) | Under the terms of a contractual agreement, Rio Tinto is entitled to 40 per cent of production above specified levels until the end of 2021 and 40 per cent of all production thereafter under the Participation Agreement. This date is subject to extension under certain conditions. |
| (e) | Pechiney Reynolds Quebec Inc. has a 50.1 per cent interest in the Aluminerie de Bécancour, Inc. aluminium smelter, which is located in Canada. |
| | | | |
| 162 | | riotinto.com | | 2016 Annual report |
35 Principal joint ventures
| | | | | | | | | | | | | | | | | | |
At 31 December 2016 | |
| Company and country of incorporation/operation | | Principal activities | | Number of
shares held | | | Class of
shares
held | | | Proportion
of class
held (%) | | | Group
interest
(%) | |
| Chile | | | | | | | | | | | | | | | | | | |
| Minera Escondida Limitada(a) | | Copper mining and refining | | | – | | | | – | | | | 30 | | | | 30 | |
| Oman | | | | | | | | | | | | | | | | | | |
| Sohar Aluminium Co. L.L.C. (b) | | Aluminium smelting/power generation | | | 37,500 | | | | Ordinary | | | | 20 | | | | 20 | |
This list includes only those joint ventures that have a more significant impact on the profit or operating assets of the Group. Refer to note 47 for a list of related undertakings.
The Group’s principal joint ventures are held by intermediate holding companies and not directly by Rio Tinto plc or Rio Tinto Limited.
| (a) | Although the Group has a 30 per cent interest in Minera Escondida Limitada, participant and management agreements provide for an Owners’ Council whereby significant commercial and operational decisions about the relevant activities that significantly affect the returns that are generated in effect require the joint approval of both Rio Tinto and BHP Billiton (holders of a 57.5 per cent interest). It is therefore determined that Rio Tinto has joint control. |
| | Theyear-end of Minera Escondida Limitada is 30 June. The amounts included in the consolidated financial statements of Rio Tinto are, however, based on accounts of Minera Escondida Limitada that are coterminous with those of the Group. |
| (b) | Although the Group holds a 20 per cent interest in Sohar Aluminium Co. L.L.C., decisions about relevant activities that significantly affect the returns that are generated require agreement of all parties to the arrangement. It is therefore determined that Rio Tinto has joint control. |
Summary information for joint ventures that are material to the Group
This summarised financial information is shown on a 100 per cent basis. It represents the amounts shown in the joint ventures’ financial statements prepared in accordance with IFRS under Group accounting policies, including fair value adjustments and amounts due to and from Rio Tinto.
| | | | | | | | | | | | | | | | |
| | | Minera
Escondida
Limitada (a)
2016
US$m | | | Minera
Escondida
Limitada (a)
2015 US$m | | | Sohar
Aluminium
Company LLC (a)
2016 US$m | | | Sohar
Aluminium
Company LLC (a)
2015 US$m | |
| Revenue | | | 4,883 | | | | 6,184 | | | | 610 | | | | 665 | |
| | | | |
| Depreciation and amortisation | | | (1,213 | ) | | | (977 | ) | | | (130 | ) | | | (135 | ) |
| Other operating costs | | | (2,199 | ) | | | (3,777 | ) | | | (425 | ) | | | (445 | ) |
| Operating profit | | | 1,471 | | | | 1,430 | | | | 55 | | | | 85 | |
| | | | |
| Finance expense | | | (47 | ) | | | (20 | ) | | | (25 | ) | | | (20 | ) |
| Income tax | | | (517 | ) | | | (533 | ) | | | – | | | | 5 | |
| Profit after tax | | | 907 | | | | 877 | | | | 30 | | | | 70 | |
| Total comprehensive income | | | 907 | | | | 877 | | | | 30 | | | | 70 | |
| | | | |
| Non-current assets | | | 14,947 | | | | 13,761 | | | | 3,275 | | | | 3,400 | |
| Current assets | | | 2,257 | | | | 2,177 | | | | 255 | | | | 255 | |
| Current liabilities | | | (1,403 | ) | | | (2,303 | ) | | | (45 | ) | | | (240 | ) |
| Non-current liabilities | | | (4,112 | ) | | | (2,223 | ) | | | (1,505 | ) | | | (1,480 | ) |
| Net assets | | | 11,689 | | | | 11,412 | | | | 1,980 | | | | 1,935 | |
| | | | |
| Assets and liabilities above include: | | | | | | | | | | | | | | | | |
| Cash and cash equivalents | | | 443 | | | | 197 | | | | 20 | | | | 10 | |
| Current financial liabilities | | | (467 | ) | | | (1,223 | ) | | | 20 | | | | (170 | ) |
| Non-current financial liabilities | | | (2,643 | ) | | | (1,200 | ) | | | (1,350 | ) | | | (1,320 | ) |
| | | | |
| Dividends received from joint venture (Rio Tinto share) | | | 401 | | | | 401 | | | | – | | | | – | |
Reconciliation of the above amounts to the carrying value of the Group’s interest
| | | | | | | | | | | | | | | | |
| Group interest | | 30% | | | 30% | | | 20% | | | 20% | |
| Net assets | | | 11,689 | | | | 11,412 | | | | 1,980 | | | | 1,935 | |
| Group’s ownership interest | | | 3,507 | | | | 3,424 | | | | 396 | | | | 387 | |
| Other adjustments | | | (3 | ) | | | (11 | ) | | | (2 | ) | | | – | |
| | | | |
| Carrying value of Group’s interest | | | 3,504 | | | | 3,413 | | | | 394 | | | | 387 | |
| (a) | In addition to its “Investment in equity accounted units”, the Group recognises deferred tax liabilities of US$579 million (2015: US$582 million) relating to tax on unremitted earnings of equity accounted units. |
| | | | |
| 2016 Annual report | | riotinto.com | | 163 |
| | | | | | | | | | | | | | | | |
| | | | | | | | | |
| STRATEGIC REPORT | | | | DIRECTORS’ REPORT | | | | FINANCIAL STATEMENTS | | | | METALS AND MINERALS PRODUCTION | | | | ADDITIONAL INFORMATION |
Notes to the 2016 financial statements
continued
36 Principal associates
| | | | | | | | | | | | | | | | | | |
At 31 December 2016 | |
| Company and country of incorporation/operation | | Principal activities | | Number of
shares held | | | Class of
shares
held | | | Proportion
of class
held (%) | | | Group
interest
(%) | |
| Australia | | | | | | | | | | | | | | | | | | |
| Boyne Smelters Limited(a) | | Aluminium smelting | | | 153,679,560 | | | | Ordinary | | | | 59.4 | | | | 59.4 | |
| Brasil | | | | | | | | | | | | | | | | | | |
| Mineração Rio do Norte S.A.(b) | | Bauxite mining | | | 25,000,000 | | | | Ordinary | | | | 12.5 | | | | 12 | |
| | | | 47,000,000 | | | | Preferred | | | | 11.8 | | |
| United States of America | | | | | | | | | | | | | | | | | | |
| Halco (Mining) Inc | | (c) | | | 4,500 | | | | Common | | | | 45 | | | | 45 | |
This list includes only those associates that have a more significant impact on the profit or operating assets of the Group. Refer to note 47 for a list of related undertakings.
The Group’s principal associates are held by intermediate holding companies and not directly by Rio Tinto plc or Rio Tinto Limited.
| (a) | The parties that collectively control Boyne Smelters Limited do so through decisions that are determined on an aggregate voting interest that can be achieved by several combinations of the parties. Although each combination requires Rio Tinto’s approval, this is not joint control as defined under IFRS 11. Rio Tinto is therefore determined to have significant influence over this company. |
| (b) | Although the Group holds only 12 per cent of Mineração Rio do Norte S.A., it has representation on its board of directors and a consequent ability to participate in the financial and operating policy decisions. It is therefore determined that Rio Tinto has significant influence. |
| (c) | Halco (Mining) Inc has a 51 per cent indirect interest in Compagnie des Bauxites de Guinée, a bauxite mine, the core assets of which are located in Guinea. |
Summary information for associates that are material to the Group
This summarised financial information is shown on a 100 per cent basis. It represents the amounts shown in the associate’s financial statements prepared in accordance with IFRS under Group accounting policies, including amounts due to and from Rio Tinto.
| | | | | | | | |
| | | Boyne
Smelters
Limited (a)
2016
US$m | | | Boyne
Smelters
Limited (a)
2015
US$m | |
| Revenue | | | – | | | | – | |
| | |
| Profit after tax | | | 12 | | | | 40 | |
| | |
| Other comprehensive loss (b) | | | (4 | ) | | | (91 | ) |
| Total comprehensive income/(loss) | | | 8 | | | | (51 | ) |
| | |
| Non-current assets | | | 1,465 | | | | 1,525 | |
| Current assets | | | 66 | | | | 64 | |
| Current liabilities | | | (121 | ) | | | (106 | ) |
| Non-current liabilities | | | (987 | ) | | | (1,069 | ) |
| Net assets | | | 423 | | | | 414 | |
| (a) | Boyne Smelters Limited is a tolling operation which under Group accounting policies requires the net presentation of income and expenses for product processed on behalf of the participating shareholders. Rio Tinto Aluminium has made certain prepayments to Boyne for toll processing of alumina. These are charged to Group operating costs as processing takes place. |
| (b) | “Other comprehensive loss” is net of amounts recognised by subsidiaries in relation to quasi equity loans. |
| | | | | | | | |
| Group interest | | | 59.4% | | | | 59.4% | |
| Net assets | | | 423 | | | | 414 | |
| Group’s ownership interest | | | 251 | | | | 246 | |
| Loans to equity accounted units | | | 163 | | | | 183 | |
| Carrying value of Group’s interest | | | 414 | | | | 429 | |
Summary information for joint ventures and associates that are not individually material to the Group
| | | | | | | | | | | | | | | | |
| | | Joint
ventures
2016
US$m | | | Joint
ventures
2015
US$m | | | Associates
2016
US$m | | | Associates
2015
US$m | |
| Carrying value of Group’s interest | | | – | | | | 10 | | | | 707 | | | | 702 | |
| | | | |
| Profit after tax | | | – | | | | – | | | | 36 | | | | 60 | |
| | | | |
| Other comprehensive income/(loss) | | | – | | | | 15 | | | | 13 | | | | (43 | ) |
| Total comprehensive income | | | – | | | | 15 | | | | 49 | | | | 17 | |
| | | | |
| 164 | | riotinto.com | | 2016 Annual report |
37 Purchases and sales of subsidiaries, joint ventures, associates and other interests in businesses
Acquisitions
There were no material acquisitions during the years ended 31 December 2016, 2015 and 2014.
2016 disposals
On 1 March 2016, Rio Tinto disposed of its 40 per cent interest in the Bengalla Joint Venture to New Hope Corporation Limited for US$599 million (net of working capital adjustments, transaction costs and cash disposed of in the Joint Venture).
On 31 March 2016, Rio Tinto disposed of its 100 per cent interest in Carbone Savoie to Alandia Industries.
On 20 July 2016, a tranche of 7.5 per centnon-contributory shares in Simfer S.A.was transferred free of charge to the Government of Guinea as per the terms of the Simandou project agreement signed in 2014, further diluting the ownership percentage of Rio Tinto and its partners in the project. Under the agreement, a second tranche comprising 10 per cent Ordinary Contributory Shares may be acquired at any time for a pro rata share of historical mining cost. The remaining two tranches of 5 per cent ordinary contributing shares may be acquired by the Government of Guinea at market value at any time after 22 April 2026 and 22 April 2031 respectively.
On 2 September 2016, Rio Tinto disposed of its interest in Zululand Anthracite Colliery.
On 23 November 2016, Rio Tinto disposed of its 100 per cent interest in Lochaber to SIMEC for US$410 million (before finalisation of closing adjustments and transaction costs) of which US$224 million was received in December 2016 and US$186 million is due to be received by 31 March 2017.
2015 disposals
On 23 April 2015, Turquoise Hill Resources Ltd completed the block sale of 48.7 million common shares in SouthGobi Resources Ltd and with further divestments has reduced its interest to below 20 per cent. As at 31 December 2015 Turquoise Hill Resources Ltd’s interest in SouthGobi
Resources Ltd was no longer consolidated as a subsidiary and had been classified as an available for sale investment.
On 17 June 2015, Rio Tinto disposed of its 77.8 per cent interest in Murowa Diamonds and 50 per cent interest in Sengwa Colliery Ltd (Sengwa) to RZ Murowa Holdings Limited.
Rio Tinto completed the sale of ECL to Fives on 9 July 2015 and the sale of Alesa to Groupe Reel on 24 November 2015.
2014 disposals
On 29 May 2014, Rio Tinto completed the sale of its 50.1 per cent interest in the Clermont Joint Venture to GS Coal for US$1,015 million (before finalisation of net debt and working capital adjustments).
On 7 October 2014, Rio Tinto completed the sale of Rio Tinto Coal Mozambique, which comprises the Benga coal mine and other projects in the Tete province of Mozambique, to International Coal Ventures Private Limited for US$50 million (before net debt and working capital adjustments).
Rio Tinto completed the sale of its 50 per cent share in SØRAL to Norsk Hydro Aluminium ASA on 31 October 2014 and the sale of its 46.67 per cent share in Alucam to the Government of Cameroon on 31 December 2014.
On 26 May 2014, Rio Tinto and its Simandou project partners signed an Investment Framework with the Government of Guinea and agreed to transfer an equity interest in Simfer S.A., to the state. The arrangement allows the Government of Guinea to acquire equity interests of up to 25 per cent of Simfer S.A. at a discount to fair value, and a further 10 per cent at full fair value. Arrangements to transfer an interest in a subsidiary undertaking at a discount to fair value are considered to be a share-based payment. The discount provided or value given on the 25 per cent interest in Simfer S.A. was calculated in accordance with IFRS 2 “Share based payment” as US$230 million.
The first tranche of shares comprising 7.5 per centnon-contributory shares was transferred free of charge to the Government of Guinea on 26 May 2014.
38 Directors’ and key management remuneration
Aggregate remuneration, calculated in accordance with the UK Companies Act 2006, of the directors of the parent companies was as follows:
| | | | | | | | | | | | |
| | | 2016 US$’000 | | | 2015 US$’000 | | | 2014 US$’000 | |
| Emoluments(a) | | | 9,186 | | | | 10,590 | | | | 11,090 | |
| Long-term incentive plans | | | 3,071 | | | | 2,118 | | | | 3,444 | |
| | | | 12,257 | | | | 12,708 | | | | 14,534 | |
| Pension contributions: defined contribution plans | | | 69 | | | | 52 | | | | 55 | |
| Gains made on exercise of share options | | | – | | | | 1 | | | | – | |
| (a) | The aggregate figures in the table above include the full year remuneration for Jean-Sébastien Jacques. Jean-Sébastien was appointed to an executive director position on 17 March 2016. |
The Group defines key management personnel as the directors and members of the Executive Committee. The Executive Committee comprises the executive directors, product group chief executive officers and Group executives.
The aggregate remuneration incurred by Rio Tinto plc in respect of its directors was US$10,648,000 (2015: US$6,385,000; 2014: US$6,653,000). The aggregate pension contribution to defined contribution plans was US$69,000 (2015: US$52,000; 2014: US$55,000). The aggregate remuneration, including pension contributions and other retirement benefits, incurred by Rio Tinto Limited in respect of its directors was US$1,696,000 (2015: US$6,375,000; 2014: US$9,796,000). The aggregate pension contribution to defined contribution plans was US$nil (2015: US$nil; 2014: US$nil).
During 2016, one director (2015: one; 2014: one) accrued retirement benefits under defined benefit arrangements, and two directors (2015: one; 2014: one) accrued retirement benefits under defined contribution arrangements.
Emoluments included in the table above have been translated from local currency at the average exchange rate for the year with the exception of bonus payments which, together with amounts payable under long-term incentive plans, have been translated at theyear-end rate.
Detailed information concerning directors’ remuneration, shareholdings and options is shown in the Remuneration Report, including tables 1 to 3, on pages 70 to 107.
| | | | |
| 2016 Annual report | | riotinto.com | | 165 |
| | | | | | | | | | | | | | | | |
| | | | | | | | | |
| STRATEGIC REPORT | | | | DIRECTORS’ REPORT | | | | FINANCIAL STATEMENTS | | | | METALS AND MINERALS PRODUCTION | | | | ADDITIONAL INFORMATION |
Notes to the 2016 financial statements
continued
38 Directors’ and key management remunerationcontinued
Aggregate compensation, representing the expense recognised under IFRS, as defined in note 1, of the Group’s key management, including directors, was as follows:
| | | | | | | | | | | | |
| | | 2016 US$’000 | | | 2015 US$’000 | | | 2014 US$’000 | |
| Short-term employee benefits and costs | | | 22,269 | | | | 25,616 | | | | 30,137 | |
| Post-employment benefits | | | 3,461 | | | | 1,049 | | | | 1,449 | |
| Employment termination benefits | | | 2,682 | | | | – | | | | – | |
| Share-based payments | | | 15,806 | | | | 17,566 | | | | 19,676 | |
| | | | 44,218 | | | | 44,231 | | | | 51,262 | |
The figures shown above include employment costs which comprise social security and accident premiums in Canada, the UK and US and payroll taxes in Australia paid by the employer as a direct additional cost of hire. In total, they amount to US$2,295,000 (2015: US$2,320,000; 2014: US$2,870,000) and although disclosed here, are not included in table 1 of the Remuneration Report.
More detailed information concerning the remuneration of key management is shown in the Remuneration report, including tables 1 to 3 on pages 70 to 107.
39 Auditors’ remuneration
| | | | | | | | | | | | |
| | | 2016 US$m | | | 2015 US$m | | | 2014 US$m | |
| Group Auditors’ remuneration(a) | | | | | | | | | | | | |
| | | |
| Audit of the company | | | 4.5 | | | | 4.3 | | | | 4.0 | |
| Audit of subsidiaries | | | 9.0 | | | | 10.1 | | | | 10.7 | |
| Total audit | | | 13.5 | | | | 14.4 | | | | 14.7 | |
| | | |
| Audit related assurance service | | | 0.9 | | | | 0.9 | | | | 1.1 | |
| Other assurance services(b) | | | 0.6 | | | | 0.9 | | | | 1.0 | |
| Total assurance services | | | 1.5 | | | | 1.8 | | | | 2.1 | |
| | | |
| Tax compliance(c) | | | 0.5 | | | | 0.5 | | | | 0.4 | |
| Tax advisory services(c) | | | 0.1 | | | | 0.4 | | | | 0.5 | |
| Services related to corporate finance transactions not covered above | | | | | | | | | | | | |
– services in connection with bond issues/capital raising | | | – | | | | 0.2 | | | | 0.1 | |
| Othernon-audit services not covered above | | | 1.8 | | | | 1.1 | | | | 0.3 | |
| Totalnon-audit services | | | 3.9 | | | | 2.2 | | | | 1.3 | |
| | | | 17.4 | | | | 18.4 | | | | 18.1 | |
| | | |
| Audit fees payable to other accounting firms | | | | | | | | | | | | |
| | | |
| Audit of the financial statements of the Group’s subsidiaries | | | 2.1 | | | | 1.9 | | | | 2.7 | |
| Fees in respect of pension scheme audits | | | 0.1 | | | | 0.2 | | | | 0.4 | |
| | | | 2.2 | | | | 2.1 | | | | 3.1 | |
| (a) | The remuneration payable to PwC, the Group Auditors, is approved by the Audit Committee. The Committee sets the policy for the award ofnon-audit work to the auditors and approves the nature and extent of such work, and the amount of the related fees, to ensure that independence is maintained. The fees disclosed above consolidate all payments made to member firms of PwC by the Companies and their subsidiaries, together with the Group’s share of the payments made by joint operations.Non-audit services arise largely from assurance and/or regulation related work. |
| (b) | Other assurance services are mainly related tocarve-out financial statements and sustainability assurance. |
| (c) | “Taxation services” includes tax compliance and advisory services. Tax compliance involves the review of returns for corporation, income, sales and excise taxes. Tax advisory services include advice onnon-recurring acquisitions and disposals, advice on transfer pricing and advice on employee global mobility. |
| | | | |
| 166 | | riotinto.com | | 2016 Annual report |
40 Related-party transactions
Information about material related-party transactions of the Rio Tinto Group is set out below:
Subsidiary companies and joint operations
Details of investments in principal subsidiary companies are disclosed in note 33. Information relating to joint operations can be found in note 34.
Equity accounted units
Transactions and balances with equity accounted units are summarised below. Purchases, trade and other receivables, and trade and other payables relate largely to amounts charged by equity accounted units for toll processing of alumina and purchasing of bauxite and aluminium. Sales relate largely to sales of alumina to equity accounted units for smelting into aluminium.
| | | | | | | | | | | | |
| Income statement items | | 2016
US$m | | | 2015
US$m | | | 2014
US$m | |
| Purchases from equity accounted units | | | (1,216 | ) | | | (1,249 | ) | | | (1,835 | ) |
| Sales to equity accounted units | | | 248 | | | | 307 | | | | 625 | |
| | | |
| Cash flow statement items | | US$m | | | US$m | | | US$m | |
| Dividends from equity accounted units | | | 253 | | | | 210 | | | | 298 | |
| Net funding of equity accounted units | | | (12 | ) | | | 11 | | | | (117 | ) |
| | | |
| Balance sheet items | | US$m | | | US$m | | | US$m | |
| Investments in equity accounted units (note 15) (a) | | | 5,019 | | | | 4,941 | | | | 4,868 | |
| Loans to equity accounted units (note 20) | | | 39 | | | | 42 | | | | 71 | |
| | | |
| Loans from equity accounted units (note 22) | | | (49 | ) | | | (37 | ) | | | (52 | ) |
| Trade and other receivables: amounts due from equity accounted units (b) (note 18) | | | 298 | | | | 315 | | | | 423 | |
| Trade and other payables: amounts due to equity accounted units (note 25) | | | (243 | ) | | | (231 | ) | | | (225 | ) |
| (a) | Investments in equity accounted units include quasi equity loans. Further information about investments in equity accounted units is set out in notes 35 and 36. |
| (b) | This includes prepayments of tolling charges. |
Pension funds
Information relating to pension fund arrangements is set out in note 45.
Directors and key management
Details of directors’ and key management remuneration are set out in note 38 and in the Remuneration report on pages 70 to 107.
41 Exchange rates in US$
The principal exchange rates used in the preparation of the 2016 financial statements were:
| | | | | | | | | | | | | | | | | | | | | | | | |
| | | Full-year average | | | Year-end | |
| | | 2016 | | | 2015 | | | 2014 | | | 2016 | | | 2015 | | | 2014 | |
| Sterling | | | 1.36 | | | | 1.53 | | | | 1.65 | | | | 1.22 | | | | 1.48 | | | | 1.56 | |
| Australian dollar | | | 0.74 | | | | 0.75 | | | | 0.90 | | | | 0.72 | | | | 0.73 | | | | 0.82 | |
| Canadian dollar | | | 0.76 | | | | 0.78 | | | | 0.91 | | | | 0.74 | | | | 0.72 | | | | 0.86 | |
| Euro | | | 1.11 | | | | 1.11 | | | | 1.33 | | | | 1.05 | | | | 1.09 | | | | 1.22 | |
| South African rand | | | 0.068 | | | | 0.079 | | | | 0.092 | | | | 0.073 | | | | 0.064 | | | | 0.086 | |
42 Bougainville Copper Limited (BCL)
Rio Tinto transferred its 53.83 per cent shareholding in BCL to Equity Trustees Limited (independent trustee) on 30 June 2016 for nil consideration. Equity Trustees Limited subsequently distributed the shares in accordance with the trust deed to nominees of each of the Autonomous Bougainville Government (36.4 per cent) and the Independent State of Papua New Guinea (17.4 per cent) such that each party controlled an equal share of BCL (36.4 per cent). The Group did not previously consolidate BCL as it was determined that in accordance with IFRS, as defined in note 1, the Group did not control the relevant activities, being the mining of copper at the Panguna mine, which was brought to a halt by unrest in 1989. The carrying value has previously been fully impaired and therefore the transfer resulted in no financial impact for the year ended 31 December 2016.
43 Events after the balance sheet date
On 24 January 2017, the Group announced it had reached a binding agreement for the sale of its wholly-owned Australian subsidiary Coal & Allied Industries Limited to Yancoal Australia Limited for up to US$2.45 billion comprising an initial US$1.95 billion cash payment, payable at completion; and US$500 million in aggregate deferred cash payments, payable as annual instalments of US$100 million over five years following completion.
Yancoal Australia is entitled to elect for an alternative purchase price structure of a single cash payment at completion of US$2.35 billion. Rio Tinto will use the consideration received for general corporate purposes.
On 8 February 2017, the Group announced anon-market sharebuy-back of US$0.5 billion Rio Tinto plc shares.
Except as disclosed above, no significant events were identified after the balance sheet date.
| | | | |
| 2016 Annual report | | riotinto.com | | 167 |
| | | | | | | | | | | | | | | | |
| | | | | | | | | |
| STRATEGIC REPORT | | | | DIRECTORS’ REPORT | | | | FINANCIAL STATEMENTS | | | | METALS AND MINERALS PRODUCTION | | | | ADDITIONAL INFORMATION |
Notes to the 2016 financial statements
continued
44 Share-based payments
Rio Tinto plc and Rio Tinto Limited have a number of share-based incentive plans, which are described in detail in the Remuneration Report. These plans have been accounted for in accordance with the fair value recognition provisions of IFRS 2 “Share-based Payment”.
The charge that has been recognised in the income statement for Rio Tinto’s share-based incentive plans, and the related liability (for cash-settled plans), is set out in the table below.
| | | | | | | | | | | | | | | | | | | | |
| | | Charge recognised for the year | | | Liability at the end of the year | |
| | | 2016
US$m | | | 2015
US$m | | | 2014
US$m | | | 2016
US$m | | | 2015
US$m | |
| Equity-settled plans | | | 116 | | | | 128 | | | | 152 | | | | – | | | | – | |
| Cash-settled plans | | | – | | | | – | | | | – | | | | 1 | | | | 1 | |
| Total | | | 116 | | | | 128 | | | | 152 | | | | 1 | | | | 1 | |
The main Rio Tinto plc and Rio Tinto Limited plans are as follows:
Share Savings Plans
Awards under these plans are settled in equity and accounted for accordingly. The fair value of each award on the day of grant was estimated using a lattice-based option valuation model, including allowance for the exercise price being at a discount to market price.
Awards are no longer granted under the Share Savings Plans as these plans were replaced by the Global Employee Share Plans in 2012. Charges will continue to be incurred until prior period awards have vested.
Share Option Plans
Awards are no longer granted under the Share Option Plans as the long term incentive plan arrangements have been simplified and awards are now only made under the Performance Share Plans. All charges have been incurred as the remaining unvested awards vested during 2015. There remain vested options outstanding under this plan.
UK Share Plan (formerly the Share Ownership Plan)
The fair values of Matching and Free Shares made by Rio Tinto plc are taken to be the market value of the shares on the date of purchase. These awards are settled in equity.
Performance Share Plans
Participants are generally assigned shares in settlement of their awards on vesting and therefore the awards are accounted for in accordance with the requirements applying to equity-settled share-based payment transactions.
For the awards or parts of awards with Total Shareholder Return (TSR) performance conditions, the fair value of the awards was calculated using a Monte Carlo simulation model taking into account the TSR performance conditions.One-third of the awards granted since 2013 are subject to an earnings performance target relative to ten global mining comparators. As this is anon-market related performance condition, under IFRS 2, the fair value recognised is reviewed at each accounting date based on the directors’ expectations for the proportion vesting. As at 31 December 2016 it was assumed 100 per cent of awards subject to the earnings condition would vest. Forfeitures prior to vesting are assumed at five per cent per annum of outstanding awards (2015: three per cent per annum).
Management Share Plans
The Management Share Plans were introduced in 2007 to provide conditional share-based awards to management. The vesting of these awards is dependent on service conditions being met. In general, the awards will be settled in equity, including the dividends accumulated from date of award to vesting. The awards are accounted for in accordance with the requirements applying to equity-settled share-based payment transactions.
The fair value of each award on the day of grant is equal to the share price on the day of grant less a small adjustment for the timing of dividends. Forfeitures prior to vesting are assumed at seven per cent per annum of outstanding awards (2015: seven per cent per annum).
Bonus Deferral Plans
The Bonus Deferral Plans were originally introduced in 2009 for the mandatory deferral of the 2008 bonuses for executive directors, product group executives and for other executives. Additional Bonus Deferral Awards have been made each year since 2011 (made in respect of the 2010 bonus) for the mandatory deferral of 50 per cent of the bonuses for executive directors and product group executives and 25 per cent of the bonuses for other executives.
The vesting of these awards is dependent only on service conditions being met. In general, the awards will be settled in equity including the dividends accumulated from date of award to vesting. The awards are accounted for in accordance with the requirements applying to equity-settled share-based payment transactions. The fair value of each award on the day of grant is equal to the share price on the day of grant less a small adjustment for the timing of dividends. Forfeitures prior to vesting are assumed at three per cent per annum of outstanding awards (2015: three per cent per annum).
Global Employee Share Plans
The Global Employee Share Plans were introduced in 2012. The Companies provide matching shares for each share purchased. The vesting of these matching awards is dependent on service conditions being met. These awards are settled in equity. The fair value of each matching share on the day of grant is equal to the share price on the date of purchase. Forfeitures prior to vesting are assumed at five per cent per annum of outstanding awards (2015: five per cent per annum).
Summary of options outstanding
A summary of the status of the Companies’ equity-settled share option plans (Share Savings Plans and Share Option Plans) at 31 December 2016 is presented below.
| | | | | | | | | | | | | | | | |
| Options outstanding at 31 December 2016 | | Number | | | Weighted
average
exercise
price per
option £/A$ | | | Weighted
average
remaining
contractual
life Years | | | Aggregate
intrinsic
value
2016 US$m | |
| Rio Tinto plc Share Savings Plan (exercise price £29) | | | 23,979 | | | £ | 28.63 | | | | 0.5 | | | | – | |
| Rio Tinto Limited Share Savings Plan (exercise price A$56) | | | 64,344 | | | A$ | 55.62 | | | | 0.5 | | | | – | |
| Rio Tinto plc Share Option Plan (exercise price £16 – £43) | | | 277,498 | | | £ | 30.98 | | | | 3.0 | | | | 2 | |
| Rio Tinto Limited Share Option Plan (exercise price A$33 – A$77) | | | 201,777 | | | A$ | 61.04 | | | | 3.0 | | | | 1 | |
| | | | 567,598 | | | | | | | | | | | | 3 | |
| | | | |
| 168 | | riotinto.com | | 2016 Annual report |
As at 31 December 2015 there were 1,322,786 options outstanding with an aggregate intrinsic value of US$2 million.
| | | | | | | | | | | | | | | | |
| | |
| Options exercisable at 31 December 2016 | | Number | | | Weighted
average
exercise
price per
option £/A$ | | | Weighted
average
remaining
contractual
life Years | | | Aggregate
intrinsic
value
2016 US$m | |
| Rio Tinto plc Share Option Plan (exercise price £16 – £43) | | | 277,498 | | | £ | 30.98 | | | | 3.0 | | | | 2 | |
| Rio Tinto Limited Share Option Plan (exercise price A$33 – A$77) | | | 201,777 | | | A$ | 61.04 | | | | 3.0 | | | | 1 | |
| | | | 479,275 | | | | | | | | | | | | 3 | |
As at 31 December 2016 there were no options exercisable under either the Rio Tinto plc or the Rio Tinto Limited Share Savings Plans.
The Management Share Plans, Performance Share Plans, Bonus Deferral Plans, Global Employee Share Plans and UK Share Plan together represent 100 per cent (2015: 99 per cent) of the total IFRS 2 charge for Rio Tinto plc and Rio Tinto Limited plans in 2016.
Performance Share Plans
| | | | | | | | | | | | | | | | | | | | | | | | | | | | | | | | |
| | | Rio Tinto plc awards | | | Rio Tinto Limited awards | |
| | | 2016
Number | | | Weighted
average
fair
value at
grant
date 2016 £ | | | 2015
Number | | | Weighted
average
fair value
at grant
date 2015 £ | | | 2016
Number | | | Weighted
average
fair
value at
grant
date 2016 A$ | | | 2015
Number | | | Weighted
average
fair value
at grant
date 2015 A$ | |
| Non-vested shares at 1 January | | | 2,988,454 | | | | 21.29 | | | | 2,928,001 | | | | 24.05 | | | | 2,048,823 | | | | 41.13 | | | | 2,024,876 | | | | 45.87 | |
| Awarded | | | 1,085,974 | | | | 12.81 | | | | 912,883 | | | | 19.59 | | | | 535,418 | | | | 28.66 | | | | 523,259 | | | | 39.28 | |
| Forfeited | | | (603,871 | ) | | | 17.22 | | | | (171,310 | ) | | | 20.04 | | | | (526,212 | ) | | | 36.18 | | | | (80,207 | ) | | | 39.44 | |
| Failed performance conditions | | | (203,491 | ) | | | 24.61 | | | | (175,554 | ) | | | 31.17 | | | | (161,937 | ) | | | 44.71 | | | | (109,808 | ) | | | 62.04 | |
| Vested | | | (384,013 | ) | | | 24.61 | | | | (505,566 | ) | | | 31.19 | | | | (305,135 | ) | | | 44.71 | | | | (309,297 | ) | | | 62.03 | |
| Non-vested shares at 31 December | | | 2,883,053 | | | | 18.27 | | | | 2,988,454 | | | | 21.29 | | | | 1,590,957 | | | | 37.52 | | | | 2,048,823 | | | | 41.13 | |
| | | | | | | | | | | | | | | | | | | | | | | | | | | | | | | | |
| | | 2016
Number | | | Weighted
average
share
price 2016
£ | | | 2015
Number | | | Weighted
average
share
price 2015
£ | | | 2016
Number | | | Weighted
average
share
price 2016
A$ | | | 2015
Number | | | Weighted
average
share
price 2015
A$ | |
| Vested awards settled in shares during the year | | | 368,623 | | | | 19.08 | | | | 481,360 | | | | 29.44 | | | | 284,507 | | | | 42.99 | | | | 288,803 | | | | 58.59 | |
| Vested awards settled in cash during the year | | | 486 | | | | 19.00 | | | | 24,206 | | | | 29.44 | | | | 847 | | | | 43.47 | | | | 20,494 | | | | 58.59 | |
In addition to the equity-settled awards shown above, there were 22,010 Rio Tinto plc cash-settled awards outstanding at 31 December 2016 (2015: 4,053 Rio Tinto plc cash-settled awards outstanding). The total liability for these awards at 31 December 2016 was less than US$1 million (2015: less than US$1 million).
| | | | |
| 2016 Annual report | | riotinto.com | | 169 |
| | | | | | | | | | | | | | | | |
| | | | | | | | | |
| STRATEGIC REPORT | | | | DIRECTORS’ REPORT | | | | FINANCIAL STATEMENTS | | | | METALS AND MINERALS PRODUCTION | | | | ADDITIONAL INFORMATION |
Notes to the 2016 financial statements
continued
44 Share-based paymentscontinued
Management Share Plans, Bonus Deferral Plans, Global Employee Share Plans and UK Share Plan (combined)
| | | | | | | | | | | | | | | | | | | | | | | | | | | | | | | | |
| | | Rio Tinto plc awards (a) | | | Rio Tinto Limited awards | |
| | | 2016
Number | | | Weighted
average
fair value
at grant
date 2016
£ | | | 2015
Number | | | Weighted
average
fair value
at grant
date 2015
£ | | | 2016
Number | | | Weighted
average
fair value
at grant
date 2016
A$ | | | 2015
Number | | | Weighted
average
fair value
at grant
date 2015
A$ | |
| Non-vested awards at 1 January | | | 3,211,727 | | | | 29.70 | | | | 2,747,346 | | | | 31.31 | | | | 2,993,396 | | | | 58.09 | | | | 2,579,081 | | | | 59.83 | |
| Awarded | | | 1,673,017 | | | | 20.62 | | | | 1,452,429 | | | | 28.15 | | | | 1,405,348 | | | | 45.27 | | | | 1,352,526 | | | | 56.37 | |
| Forfeited | | | (246,806 | ) | | | 23.02 | | | | (239,018 | ) | | | 29.41 | | | | (164,020 | ) | | | 54.48 | | | | (200,278 | ) | | | 57.48 | |
| Vested | | | (1,331,972 | ) | | | 28.72 | | | | (749,030 | ) | | | 32.51 | | | | (1,248,644 | ) | | | 55.54 | | | | (737,933 | ) | | | 61.19 | |
| Non-vested shares at 31 December | | | 3,305,966 | | | | 26.00 | | | | 3,211,727 | | | | 29.70 | | | | 2,986,080 | | | | 53.32 | | | | 2,993,396 | | | | 58.09 | |
| Comprising of: | | | | | | | | | | | | | | | | | | | | | | | | | | | | | | | | |
| | | | | | | | |
| – Management Share Plan | | | 1,668,590 | | | | 25.79 | | | | 1,778,043 | | | | 29.62 | | | | 1,530,814 | | | | 53.88 | | | | 1,629,390 | | | | 58.09 | |
| – Bonus Deferral Plan | | | 312,767 | | | | 23.24 | | | | 274,965 | | | | 29.99 | | | | 148,158 | | | | 50.25 | | | | 211,341 | | | | 59.78 | |
| – Global Employee Share Plan | | | 1,223,144 | | | | 26.90 | | | | 1,078,327 | | | | 29.72 | | | | 1,307,108 | | | | 53.03 | | | | 1,152,665 | | | | 57.79 | |
| – UK Share Plan | | | 101,465 | | | | 27.00 | | | | 80,392 | | | | 30.17 | | | | | | | | | | | | | | | | | |
| | | | | | | | | | | | | | | | | | | | | | | | | | | | | | | | |
| | | 2016
Number | | | Weighted
average
fair
value at
grant
date 2016
£ | | | 2015
Number | | | Weighted
average
fair value
at grant
date 2015
£ | | | 2016
Number | | | Weighted
average
fair
value at
grant
date 2016
A$ | | | 2015
Number | | | Weighted
average
fair value
at grant
date 2015
A$ | |
| Vested awards settled in shares during the year (including dividend shares applied on vesting) | | | | | | | | | | | | | | | | | | | | | | | | | | | | | | | | |
| | | | | | | | |
| – Management Share Plan | | | 758,776 | | | | 20.07 | | | | 633,690 | | | | 27.14 | | | | 701,965 | | | | 43.93 | | | | 564,679 | | | | 53.44 | |
| – Bonus Deferral Plan | | | 112,623 | | | | 30.36 | | | | 126,997 | | | | 22.57 | | | | 113,407 | | | | 56.78 | | | | 121,205 | | | | 45.21 | |
| – Global Employee Share Plan | | | 344,072 | | | | 24.33 | | | | 68,422 | | | | 24.91 | | | | 332,010 | | | | 48.69 | | | | 76,446 | | | | 52.93 | |
| – UK Share Plan | | | 21,082 | | | | 21.92 | | | | 4,687 | | | | 25.25 | | | | | | | | | | | | | | | | | |
| (a) | Awards of Rio Tinto American Depository Receipts (ADRs) under the Global Employee Share Plan are included within the totals for Rio Tinto plc awards for the purpose of these tables. |
In addition to the equity-settled awards shown above, there were 34,517 Rio Tinto plc and 15,239 Rio Tinto Limited cash-settled awards outstanding at 31 December 2016 (2015: 26,576 Rio Tinto plc and 7,684 Rio Tinto Limited cash-settled awards outstanding). The total liability for these awards at 31 December 2016 was less than US$1 million (2015: less than US$1 million).
45 Post-retirement benefits
Description of plans
The Group operates a number of pension and post-retirement healthcare plans around the world. Some of these plans are defined contribution and some are defined benefit, with assets held in separate trusts, foundations and similar entities.
Defined benefit pension and post-retirement healthcare plans expose the Group to a number of risks:
| | |
| | | |
| Uncertainty in benefit payments | | The value of the Group’s liabilities for post-retirement benefits will ultimately depend on the amount of benefits paid out. This in turn will depend on the level of future pay increases, the level of inflation (for those benefits that are subject to some form of inflation protection) and how long individuals live. |
| Volatility in asset values | | The Group is exposed to future movements in the values of assets held in pension plans to meet future benefit payments. |
| Uncertainty in cash funding | | Movements in the values of the obligations or assets may result in the Group being required to provide higher levels of cash funding, although changes in the level of cash required can often be spread over a number of years. In some countries control over the rate of cash funding or over the investment policy for pension assets might rest to some extent with a trustee body or other body that is not under the Group’s direct control. In addition the Group is also exposed to adverse changes in pension regulation. |
For these reasons the Group has a policy of moving away from defined benefit pension provision and towards defined contribution arrangements instead. The defined benefit pension plans for salaried employees are closed to new entrants in almost all countries. For unionised employees, some plans remain open.
The Group does not usually participate in multi-employer plans in which the risks are shared with other companies using those plans. The Group’s participation in such plans is immaterial and consequently no detailed disclosures are provided in this note.
| | | | |
| 170 | | riotinto.com | | 2016 Annual report |
Pension plans
The majority of the Group’s defined benefit pension obligations are in Canada, the UK, the US, Switzerland and the Eurozone.
In Canada the benefits for salaried staff are generally linked to final average pay and are closed to new entrants. Benefits for bargaining employees are reviewed in negotiation with unions and are typically either linked to final average pay or to a flat monetary amount per year of service. Some of these plans have been closed to new entrants but some remain open at present. During 2015 agreement was reached with the unions to close the largest plan to new entrants. New employees now join an arrangement which is defined contribution from the Group’s perspective, with any required additional funding being provided by employees. The plans are subject to the regulatory requirements that apply to Canadian pension plans in the relevant provinces and territories (predominantly Quebec). Pension Committees are responsible for ensuring that the plans operate in a manner that is compliant with the relevant regulations. The Pension Committees generally have a number of members appointed by the sponsor and a number appointed by the plan participants. In some cases there is also an independent Committee member.
The defined benefit sections of the UK arrangements are linked to final pay and are closed to new members. New employees are admitted to defined contribution sections. The plans are subject to the regulatory requirements that apply to UK pension plans. Trustees are responsible for ensuring that the plans operate in a manner that is compliant with UK regulations. The Trustee board governing the main UK plans has a number of directors appointed by the sponsor, a number appointed by the plan participants and an independent trustee director.
A number of defined benefit pension plans are sponsored by the US entities. Benefits for salaried staff are generally linked to final average pay and closed to new entrants, while benefits for bargaining employees are reviewed in negotiation with unions and are typically a flat monetary amount per year of service. A Benefits Governance Committee is responsible for ensuring that the plans are compliant with US regulations. Members of that Committee are appointed by the sponsor.
In Europe, there are defined benefit plans in Switzerland, the Netherlands, Germany and France. The largest single plan is in
Switzerland and provides benefits linked to final average pay. The Swiss plan is overseen by a Foundation Board which is responsible for ensuring that the plan complies with Swiss regulations. Foundation Board members are appointed by the plan sponsor, by employees and by retirees.
In Australia, the main arrangements are principally defined contribution in nature but there are sections providing defined benefits linked to final pay, typically paid in lump sum form. The defined benefit sections are closed to new entrants.
The Group also operates a number of unfunded defined benefit plans, which are included in the figures below.
Post-retirement healthcare plans
Certain subsidiaries of the Group, mainly in the US and Canada, provide health and life insurance benefits to retired employees and in some cases to their beneficiaries and covered dependants. Eligibility for cover is dependent upon certain age and service criteria. These arrangements are generally unfunded, and are included in the figures below.
Plan assets
The assets of the pension plans are invested predominantly in a diversified range of equities, bonds and property. Consequently, the funding level of the pension plans is affected by movements in the level of equity markets and also by movements in interest rates. The Group monitors its exposure to changes in interest rates and equity markets and also measures its balance sheet pension risk using a value at risk approach. These measures are considered when deciding whether significant changes in investment strategy are required. Asset-liability studies are conducted on a periodic basis for the main pension plans to determine the optimal investment mix bearing in mind the Group’s tolerance for risk, the risk tolerance of the local sponsor companies and the views of the pension committees and trustee boards who are legally responsible for the investments of the plans. In Canada, the UK and Switzerland the Group works with the trustees to ensure that the investment policy adopted is consistent with the Group’s tolerance for risk. In the US the Group has direct control over the investment policy, subject to local investment regulations.
The proportions of the total fair value of assets in the pension plans for each asset class at the balance sheet date were:
| | | | | | | | | | | | | | | | |
| | | 2016 | | | 2015 | |
| Equities | | | 36.8% | | | | | | | | 37.7% | | | | | |
| – Quoted | | | | | | | 32.5% | | | | | | | | 33.3% | |
| – Private | | | | | | | 4.3% | | | | | | | | 4.4% | |
| Bonds | | | 47.9% | | | | | | | | 48.0% | | | | | |
| – Government fixed income | | | | | | | 11.3% | | | | | | | | 13.5% | |
| – Government inflation-linked | | | | | | | 12.0% | | | | | | | | 12.8% | |
| – Corporate and other publicly quoted | | | | | | | 22.3% | | | | | | | | 20.8% | |
| – Private | | | | | | | 2.3% | | | | | | | | 0.9% | |
| Property | | | 11.0% | | | | | | | | 10.8% | | | | | |
| – Quoted property funds | | | | | | | 5.8% | | | | | | | | 6.5% | |
| – Unquoted property funds | | | | | | | 5.2% | | | | | | | | 4.3% | |
| Qualifying insurance policies | | | 0.6% | | | | | | | | 0.6% | | | | | |
| Cash & other | | | 3.7% | | | | | | | | 2.9% | | | | | |
| | | | 100.0% | | | | | | | | 100.0% | | | | | |
The assets of the plans are managed on aday-to-day basis by external specialist fund managers. These managers may invest in the Group’s securities subject to limits imposed by the relevant fiduciary committees and local legislation. The approximate total holding of Group securities within the plans is US$16 million (2015: US$23 million).
The holdings of quoted equities are invested either in pooled funds or segregated accounts held in the name of the relevant pension funds.
These equity portfolios are well diversified in terms of the geographic distribution and market sectors.
The holdings of government bonds are generally invested in the debt of the country in which a pension plan is situated. Corporate and other quoted bonds are usually of investment grade. Private debt is mainly in North America.
| | | | |
| 2016 Annual report | | riotinto.com | | 171 |
| | | | | | | | | | | | | | | | |
| | | | | | | | | |
| STRATEGIC REPORT | | | | DIRECTORS’ REPORT | | | | FINANCIAL STATEMENTS | | | | METALS AND MINERALS PRODUCTION | | | | ADDITIONAL INFORMATION |
Notes to the 2016 financial statements
continued
45 Post-retirement benefitscontinued
The quoted property funds are invested in a diversified range of properties.
The holdings of cash & other are predominantly cash and short-term money market instruments.
Investments in private equity, private debt, and property are less liquid than the other investment classes listed above and therefore the Group’s
investment in those asset classes is restricted to a level that does not endanger the liquidity of the pension plans.
The Group does not currently utilise derivatives to manage risk in its pension plans. However, fund managers may use derivatives to hedge currency movements within their portfolios and, in the case of bond managers, to take positions that could be taken using direct holdings of bonds but more efficiently.
Maturity of defined benefit obligations
An approximate analysis of the maturity of the obligations is given in the table below:
| | | | | | | | | | | | | | | | | | | | |
| | | Pension
benefits | | | Other
benefits | | | 2016 Total % | | | 2015 Total % | | | 2014 Total % | |
| Proportion relating to current employees | | | 22% | | | | 18% | | | | 21% | | | | 22% | | | | 25% | |
| Proportion relating to former employees not yet retired | | | 12% | | | | 2% | | | | 12% | | | | 11% | | | | 11% | |
| Proportion relating to retirees | | | 66% | | | | 80% | | | | 67% | | | | 67% | | | | 64% | |
| Total | | | 100% | | | | 100% | | | | 100% | | | | 100% | | | | 100% | |
| Average duration of obligations (years) | | | 14.4 | | | | 13.2 | | | | 14.3 | | | | 13.4 | | | | 13.9 | |
Geographical distribution of defined benefit obligations
An approximate analysis of the geographic distribution of the obligations is given in the table below:
| | | | | | | | | | | | | | | | | | | | |
| | | Pension
benefits | | | Other
benefits | | | 2016 Total % | | | 2015 Total % | | | 2014 Total % | |
| Canada | | | 47% | | | | 42% | | | | 46% | | | | 44% | | | | 46% | |
| UK | | | 28% | | | | 2% | | | | 27% | | | | 29% | | | | 27% | |
| US | | | 13% | | | | 54% | | | | 16% | | | | 15% | | | | 15% | |
| Switzerland | | | 6% | | | | 0% | | | | 5% | | | | 6% | | | | 5% | |
| Eurozone | | | 4% | | | | 0% | | | | 4% | | | | 4% | | | | 4% | |
| Other | | | 2% | | | | 2% | | | | 2% | | | | 2% | | | | 3% | |
| Total | | | 100% | | | | 100% | | | | 100% | | | | 100% | | | | 100% | |
Total expense recognised in the income statement
| | | | | | | | | | | | | | | | | | | | |
| | | Pension
benefits | | | Other
benefits | | | 2016 Total US$m | | | 2015 Total US$m | | | 2014 Total US$m | |
| Current employer service cost for defined benefit plans | | | (148 | ) | | | (10 | ) | | | (158 | ) | | | (184 | ) | | | (196 | ) |
| Past service income | | | – | | | | – | | | | – | | | | 144 | | | | 66 | |
| Curtailment gains/(losses) | | | 1 | | | | 4 | | | | 5 | | | | 13 | | | | (1 | ) |
| Settlement gains | | | – | | | | – | | | | – | | | | 11 | | | | 22 | |
| Net interest on net defined benefit liability | | | (55 | ) | | | (35 | ) | | | (90 | ) | | | (113 | ) | | | (133 | ) |
| Non-investment expenses paid from the plans | | | (22 | ) | | | – | | | | (22 | ) | | | (21 | ) | | | (19 | ) |
| Total defined benefit expense | | | (224 | ) | | | (41 | ) | | | (265 | ) | | | (150 | ) | | | (261 | ) |
| Current employer service cost for defined contribution and industry-wide plans | | | (255 | ) | | | (2 | ) | | | (257 | ) | | | (289 | ) | | | (329 | ) |
| Total expense recognised in the income statement | | | (479 | ) | | | (43 | ) | | | (522 | ) | | | (439 | ) | | | (590 | ) |
The above expense amounts are included as an employee cost within net operating costs. In 2016, US$nil(pre-tax) of curtailment and settlement gains have been excluded from underlying earnings (2015: US$nil; 2014: US$2 million relating to divestments).
The curtailments shown in the table above relate primarily to headcount reductions at various operations. The settlement gains in 2015 and 2014
relate mainly to an exercise in the US in which deferred vested participants were offered aone-time lump sum payment in place of their future pension payments. The past service income in 2015 relates to design changes in Canada and to changes to post-retirement medical plans in the US. The past service income during 2014 relates to design changes to post-retirement medical plans in the US.
Total amount recognised in other comprehensive income before tax
| | | | | | | | | | | | |
| | | 2016 US$m | | | 2015 US$m | | | 2014 US$m | |
| Actuarial (losses)/gains | | | (1,120 | ) | | | 548 | | | | (1,853 | ) |
| Return on assets (net of interest on assets) | | | 1,031 | | | | 79 | | | | 1,127 | |
| Loss on application of asset ceiling | | | (1 | ) | | | (8 | ) | | | (9 | ) |
| Total (loss)/gain recognised in other comprehensive income | | | (90 | ) | | | 619 | | | | (735 | ) |
| | | | |
| 172 | | riotinto.com | | 2016 Annual report |
Amounts recognised in the balance sheet
The following amounts were measured in accordance with IAS 19 at 31 December:
| | | | | | | | | | | | | | | | |
| | | Pension
benefits | | | Other
benefits | | | 2016 Total US$m | | | 2015 Total US$m | |
| Total fair value of plan assets | | | 13,749 | | | | – | | | | 13,749 | | | | 13,642 | |
| Present value of obligations – funded | | | (14,504 | ) | | | – | | | | (14,504 | ) | | | (14,443 | ) |
| Present value of obligations – unfunded | | | (798 | ) | | | (926 | ) | | | (1,724 | ) | | | (1,680 | ) |
| Present value of obligations – total | | | (15,302 | ) | | | (926 | ) | | | (16,228 | ) | | | (16,123 | ) |
| Effect of asset ceiling | | | (63 | ) | | | – | | | | (63 | ) | | | (49 | ) |
| Net deficit to be shown in the balance sheet | | | (1,616 | ) | | | (926 | ) | | | (2,542 | ) | | | (2,530 | ) |
| Comprising: | | | | | | | | | | | | | | | | |
| – Deficits | | | (2,241 | ) | | | (926 | ) | | | (3,167 | ) | | | (3,122 | ) |
| – Surpluses | | | 625 | | | | – | | | | 625 | | | | 592 | |
| Net deficits on pension plans | | | (1,616 | ) | | | – | | | | (1,616 | ) | | | (1,668 | ) |
| Unfunded post-retirement healthcare obligation | | | – | | | | (926 | ) | | | (926 | ) | | | (862 | ) |
The surplus amounts shown above are included in the balance sheet as Trade and other receivables. See note 18.
Deficits are shown in the balance sheet within Provisions (including post-retirement benefits). See note 26.
Funding policy and contributions to plans
The Group reviews the funding position of its major pension plans on a regular basis and considers whether to provide funding above the minimum level required in each country. In Canada and the US the minimum level is prescribed by legislation. In the UK and Switzerland the
minimum is negotiated with the local trustee or foundation in accordance with the funding guidance issued by the local regulators. In deciding whether to provide funding above the minimum level the Group takes into account other possible uses of cash within the Group, the tax situation of the local sponsoring entity and any strategic advantage that the Group might obtain by accelerating contributions. The Group does not generallypre-fund post-retirement healthcare arrangements.
| | | | | | | | | | | | | | | | | | | | |
| | | Pension
benefits | | | Other
benefits | | | 2016 Total US$m | | | 2015 Total US$m | | | 2014 Total US$m | |
| Contributions to defined benefit plans | | | 408 | | | | 56 | | | | 464 | | | | 328 | | | | 353 | |
| Contributions to defined contribution plans | | | 238 | | | | 2 | | | | 240 | | | | 272 | | | | 310 | |
| Contributions to industry-wide plans | | | 17 | | | | – | | | | 17 | | | | 17 | | | | 19 | |
| Total | | | 663 | | | | 58 | | | | 721 | | | | 617 | | | | 682 | |
Contributions to defined benefit pension plans are kept under regular review and actual contributions will be determined in line with the Group’s wider financing strategy, taking into account relevant minimum funding requirements. As contributions to many plans are reviewed on at least an annual basis, the contributions for 2017 and subsequent years cannot be determined precisely in advance. Most of the Group’s largest pension funds are fully funded on their local funding basis and do not require long term funding commitments at present. Contributions to defined benefit plans for 2017 are estimated to be around US$480 million but may be higher or lower than this depending on the evolution of financial markets and voluntary funding decisions taken by the Group. Contributions for subsequent years are expected to be at similar levels. Healthcare plans are generally unfunded and contributions for future years will be equal to benefit payments net of participant contributions. The Group’s contributions are expected to be similar to the amounts paid in 2016.
Movements in the net defined benefit liability
A summary of the movement in the net defined benefit liability is shown in the first table below. The subsequent tables provide a more detailed analysis of the movements in the present value of the obligations, the fair value of assets and the effect of the asset ceiling.
The amounts shown below include, where appropriate, 100 per cent of the costs, contributions, gains and losses in respect of employees who participate in the plans and who are employed in associates and joint arrangements. Consequently, the costs, contributions, gains and losses may not correspond directly to the amounts disclosed above in respect of the Group. Defined contribution plans and industry-wide plans are excluded from the movements below.
| | | | | | | | | | | | | | | | |
| | | Pension
benefits | | | Other
benefits | | | 2016 Total US$m | | | 2015 Total US$m | |
| Change in the net defined benefit liability | | | | | | | | | | | | | | | | |
| Net defined benefit liability at the start of the year | | | (1,668 | ) | | | (862 | ) | | | (2,530 | ) | | | (3,733 | ) |
| Amounts recognised in Income | | | (224 | ) | | | (41 | ) | | | (265 | ) | | | (150 | ) |
| Amounts recognised in Other comprehensive income | | | (21 | ) | | | (69 | ) | | | (90 | ) | | | 619 | |
| Employer contributions | | | 408 | | | | 56 | | | | 464 | | | | 328 | |
| Arrangements divested | | | (8 | ) | | | – | | | | (8 | ) | | | 25 | |
| Currency exchange rate (loss)/gain | | | (103 | ) | | | (10 | ) | | | (113 | ) | | | 381 | |
| Net defined benefit liability at the end of the year | | | (1,616 | ) | | | (926 | ) | | | (2,542 | ) | | | (2,530 | ) |
| | | | |
| 2016 Annual report | | riotinto.com | | 173 |
| | | | | | | | | | | | | | | | |
| | | | | | | | | |
| STRATEGIC REPORT | | | | DIRECTORS’ REPORT | | | | FINANCIAL STATEMENTS | | | | METALS AND MINERALS PRODUCTION | | | | ADDITIONAL INFORMATION |
Notes to the 2016 financial statements
continued
45 Post-retirement benefitscontinued
| | | | | | | | | | | | | | | | |
| | | Pension
benefits | | | Other
benefits | | | 2016 Total US$m | | | 2015 Total US$m | |
| Change in present value of obligation | | | | | | | | | | | | | | | | |
| Present value of obligation at the start of the year | | | (15,261 | ) | | | (862 | ) | | | (16,123 | ) | | | (18,899 | ) |
| Current employer service costs | | | (148 | ) | | | (10 | ) | | | (158 | ) | | | (184 | ) |
| Past service income | | | – | | | | – | | | | – | | | | 144 | |
| Curtailments | | | 1 | | | | 4 | | | | 5 | | | | 13 | |
| Settlements | | | – | | | | – | | | | – | | | | 52 | |
| Interest on obligation | | | (542 | ) | | | (35 | ) | | | (577 | ) | | | (615 | ) |
| Contributions by plan participants | | | (23 | ) | | | – | | | | (23 | ) | | | (28 | ) |
| Benefits paid | | | 911 | | | | 56 | | | | 967 | | | | 995 | |
| Experience gain/(loss) | | | 165 | | | | (26 | ) | | | 139 | | | | 107 | |
| Changes in financial assumptions (loss)/gain | | | (1,153 | ) | | | (34 | ) | | | (1,187 | ) | | | 446 | |
| Changes in demographic assumptions loss | | | (63 | ) | | | (9 | ) | | | (72 | ) | | | (5 | ) |
| Arrangements divested | | | 86 | | | | – | | | | 86 | | | | 46 | |
| Currency exchange rate gain/(loss) | | | 725 | | | | (10 | ) | | | 715 | | | | 1,805 | |
| Present value of obligation at the end of the year | | | (15,302 | ) | | | (926 | ) | | | (16,228 | ) | | | (16,123 | ) |
| | | | | | | | | | | | | | | | |
| | | Pension
benefits | | | Other
benefits | | | 2016 Total US$m | | | 2015 Total US$m | |
| Change in plan assets | | | | | | | | | | | | | | | | |
| Fair value of plan assets at the start of the year | | | 13,642 | | | | – | | | | 13,642 | | | | 15,219 | |
| Settlements | | | – | | | | – | | | | – | | | | (41 | ) |
| Interest on assets | | | 492 | | | | – | | | | 492 | | | | 506 | |
| Contributions by plan participants | | | 23 | | | | – | | | | 23 | | | | 28 | |
| Contributions by employer | | | 408 | | | | 56 | | | | 464 | | | | 328 | |
| Benefits paid | | | (911 | ) | | | (56 | ) | | | (967 | ) | | | (995 | ) |
| Non-investment expenses | | | (22 | ) | | | – | | | | (22 | ) | | | (21 | ) |
| Return on plan assets (net of interest on assets) | | | 1,031 | | | | – | | | | 1,031 | | | | 79 | |
| Arrangements divested | | | (94 | ) | | | – | | | | (94 | ) | | | (21 | ) |
| Currency exchange rate loss | | | (820 | ) | | | – | | | | (820 | ) | | | (1,440 | ) |
| Fair value of plan assets at the end of the year | | | 13,749 | | | | – | | | | 13,749 | | | | 13,642 | |
| | | | | | | | | | | | | | | | |
| | | Pension
benefits | | | Other
benefits | | | 2016 Total US$m | | | 2015 Total US$m | |
| Change in the effect of the asset ceiling | | | | | | | | | | | | | | | | |
| Effect of the asset ceiling at the start of the year | | | (49 | ) | | | – | | | | (49 | ) | | | (53 | ) |
| Interest on the effect of the asset ceiling | | | (5 | ) | | | – | | | | (5 | ) | | | (4 | ) |
| Movement in the effect of the asset ceiling | | | (1 | ) | | | – | | | | (1 | ) | | | (8 | ) |
| Currency exchange rate (loss)/gain | | | (8 | ) | | | – | | | | (8 | ) | | | 16 | |
| Effect of the asset ceiling at the end of the year | | | (63 | ) | | | – | | | | (63 | ) | | | (49 | ) |
In determining the extent to which the asset ceiling has an effect, the Group considers the funding legislation in each country and the rules specific to each pension plan. The calculation takes into account any minimum funding requirements that may be applicable to the plan, whether any reduction in future Group contributions is available, and whether a refund of surplus may be available. In considering whether any refund of surplus is available the Group considers the powers of trustee
boards and similar bodies to augment benefits or wind up a plan. Where such powers are unilateral, the Group does not consider a refund to be available at the end of the life of a plan. Where the plan rules and legislation both permit the employer to take a refund of surplus, the asset ceiling may have no effect, although it may be the case that a refund will only be available many years in the future.
| | | | |
| 174 | | riotinto.com | | 2016 Annual report |
Main assumptions (rates per annum)
The main assumptions for the valuations of the plans under IAS 19 are set out below.
| | | | | | | | | | | | | | | | | | | | |
| | | Canada | | | UK | | | US | | | Switzerland | | | Eurozone | |
| At 31 December 2016 | | | | | | | | | | | | | | | | | | | | |
| Discount rate | | | 3.8% | | | | 2.6% | | | | 3.9% | | | | 0.6% | | | | 1.4% | |
| Inflation(a) | | | 1.9% | | | | 3.3% | | | | 2.1% | | | | 1.0% | | | | 1.6% | |
| Rate of increase in pensions | | | 0.4% | | | | 2.9% | | | | 0.0% | | | | 0.0% | | | | 1.4% | |
| Rate of increase in salaries | | | 3.2% | | | | 3.7% | | | | 3.6% | | | | 2.0% | | | | 2.4% | |
| | | | | |
| At 31 December 2015 | | | | | | | | | | | | | | | | | | | | |
| Discount rate | | | 3.9% | | | | 3.7% | | | | 4.2% | | | | 0.8% | | | | 2.1% | |
| Inflation(a) | | | 1.7% | | | | 3.0% | | | | 2.1% | | | | 1.1% | | | | 1.7% | |
| Rate of increase in pensions | | | 0.4% | | | | 2.6% | | | | 0.0% | | | | 0.0% | | | | 1.6% | |
| Rate of increase in salaries | | | 3.0% | | | | 3.7% | | | | 3.6% | | | | 2.1% | | | | 2.3% | |
| (a) | The inflation assumption shown for the UK is for the Retail Price Index. The assumption for the Consumer Price Index at 31 December 2016 was 2.2 per cent (2015: 2.0 per cent). |
The main financial assumptions used for the healthcare plans, which are predominantly in the US and Canada, were: discount rate: 3.9 per cent (2015: 4.1 per cent); medical trend rate: 9.1 per cent reducing to 5.1 per cent by the year 2025 broadly on a straight-line basis (2015: 8.4 per cent, reducing to 5.1 per cent by the year 2023); claims costs based on individual company experience.
For both the pension and healthcare arrangements the post-retirement mortality assumptions allow for future improvements in longevity. The mortality tables used imply that a man aged 60 at the balance sheet date has a weighted average expected future lifetime of 26 years (2015: 26 years) and that a man aged 60 in 2036 would have a weighted average expected future lifetime of 28 years (2015: 28 years).
Sensitivity
The values reported for the defined benefit obligations are sensitive to the actuarial assumptions used for projecting future benefit payments and discounting those payments. In order to estimate the sensitivity of the obligations to changes in assumptions, we calculate what the obligations would be if we were to make small changes to each of the key assumptions in isolation. The difference between this figure and the figure calculated using our stated assumptions is an indication of the sensitivity to changes in each assumption. The results of this sensitivity analysis are summarised in the table below. Note that this approach is valid for small changes in the assumptions but will be less accurate for larger changes in the assumptions. The sensitivity to inflation includes the impact on pension increases, which are generally linked to inflation where they are granted.
| | | | | | | | | | | | | | | | | | |
| | | | | 2016 | | | 2015 | |
| | | | | Approximate (increase)/decrease in obligations | | | Approximate (increase)/decrease in obligations | |
| Assumption | | Change in assumption | | Pensions
US$m | | | Other
US$m | | | Pensions
US$m | | | Other
US$m | |
| Discount rate | | Increase of 0.5 percentage points | | | 1,031 | | | | 57 | | | | 960 | | | | 50 | |
| | Decrease of 0.5 percentage points | | | (1,107 | ) | | | (61 | ) | | | (1,025 | ) | | | (54 | ) |
| | | | | |
| Inflation | | Increase of 0.5 percentage points | | | (536 | ) | | | (19 | ) | | | (505 | ) | | | (17 | ) |
| | Decrease of 0.5 percentage points | | | 507 | | | | 17 | | | | 481 | | | | 14 | |
| | | | | |
| Salary increases | | Increase of 0.5 percentage points | | | (77 | ) | | | (3 | ) | | | (77 | ) | | | (2 | ) |
| | Decrease of 0.5 percentage points | | | 75 | | | | 2 | | | | 75 | | | | 2 | |
| | | | | |
| Demographic – allowance for future improvements in longevity | | Participants assumed to have the mortality rates of individuals who are one year older | | | 481 | | | | 20 | | | | 435 | | | | 15 | |
| | Participants assumed to have the mortality rates of individuals who are one year younger | | | (481 | ) | | | (20 | ) | | | (435 | ) | | | (15 | ) |
| | | | | |
| Medical costs trend rates | | Increase of 1.0 percentage points | | | – | | | | (37 | ) | | | – | | | | (31 | ) |
| | | Decrease of 1.0 percentage points | | | – | | | | 31 | | | | – | | | | 26 | |
| | | | |
| 2016 Annual report | | riotinto.com | | 175 |
| | | | | | | | | | | | | | | | |
| | | | | | | | | |
| STRATEGIC REPORT | | | | DIRECTORS’ REPORT | | | | FINANCIAL STATEMENTS | | | | METALS AND MINERALS PRODUCTION | | | | ADDITIONAL INFORMATION |
Notes to the 2016 financial statements
continued
46 Rio Tinto Limited parent company disclosures
| | | | | | | | |
| As at 31 December | | 2016 A$m | | | 2015 A$m | |
| Assets | | | | | | | | |
| Current assets | | | 8,041 | | | | 6,034 | |
| Non-current assets | | | 10,758 | | | | 11,525 | |
| Total assets | | | 18,799 | | | | 17,559 | |
| | |
| Liabilities | | | | | | | | |
| Current liabilities | | | (1,268 | ) | | | (616 | ) |
| Non-current liabilities | | | (4,814 | ) | | | (4,833 | ) |
| Total liabilities | | | (6,082 | ) | | | (5,449 | ) |
| Net assets | | | 12,717 | | | | 12,110 | |
| | |
| Shareholders’ equity | | | | | | | | |
| Share capital | | | 4,004 | | | | 4,004 | |
| Other reserves | | | 413 | | | | 373 | |
| Retained earnings | | | 8,300 | | | | 7,733 | |
| Total equity | | | 12,717 | | | | 12,110 | |
| Profit of the parent company | | | 4,452 | | | | 6,532 | |
| Total comprehensive income of the parent company | | | 4,452 | | | | 6,532 | |
Prepared under Australian Accounting Standards (AAS). In relation to Rio Tinto Limited there are no significant measurement differences between AAS and IFRS as defined in note 1.
Rio Tinto Limited guarantees
Rio Tinto Limited provides a number of guarantees in respect of Group companies.
Rio Tinto plc and Rio Tinto Limited have jointly guaranteed the Group’s external listed debt under the US Shelf Programme, European Debt Issuance Programme and Commercial Paper Programme which totalled A$14.1 billion at 31 December 2016 (31 December 2015: A$26.6 billion); in addition these entities also jointly guarantee the Group’s undrawn credit facility which was A$10.4 billion at 31 December 2016 (31 December 2015: A$10.3 billion).
Rio Tinto Limited has guaranteed other external debt held by Rio Tinto Group entities which totalled A$0.1 billion at 31 December 2016 (31 December 2015: A$0.1 billion) and provided guarantees in respect of certain derivative contracts which were in a liability position of A$1 million at 31 December 2016 (31 December 2015: A$18 million).
In addition, Rio Tinto Limited has provided a guarantee of certain obligations, including contingent obligations, of Rio Tinto Finance Limited, a wholly owned subsidiary.
Pursuant to the DLC Merger, both Rio Tinto plc and Rio Tinto Limited issued deed poll guarantees by which each company guaranteed contractual obligations incurred by the other or guaranteed by the other.
| | | | |
| 176 | | riotinto.com | | 2016 Annual report |
47 Related undertakings
The following tables outline the Group’s subsidaries, associated undertakings and joint ventures as defined in Regulation 7 of the UK Companies Act 2006. All subsidaries are included in the Group Consolidation.
| | | | | | | | |
| Name of undertaking and country of incorporation | | Share class | | % of share
class held
by Group
companies | | Registered office address |
| 10029734 Canada Inc.; Canada | | CAD$1.00 Common shares | | 100 | | 400-1190 Avenue des Canadiens-de-Montréal, Montreal Québec H3B 0E3, Canada |
| 1043802 Ontario Ltd; Canada | | CAD Ordinary shares | | 100 | | 66 Wellington Street West, Suite 4700, Toronto Dominion Bank Tower, Toronto ON M5K 1E6, Canada |
| 46106 YUKON INC.; Canada | | CAD Ordinary shares | | 100 | | 200-204 Lambert Street, Whitehorse YT Y1A 3T2, Canada |
| 46117 YUKON INC.; Canada | | CAD Ordinary shares
CAD Preferred shares | | 100
100 | | 200-204 Lambert Street, Whitehorse YT Y1A 3T2, Canada |
| 535630 YUKON INC.; Canada | | CAD Common shares
CAD Preferred shares | | 100
100 | | c/o Macdonald & Company, 200-204 Lambert Street, Whitehorse YT Y1A 3T2, Canada |
| 7999674 CANADA INC.; Canada | | CAD Common shares | | 100 | | 400-1190 Avenue des Canadiens-de-Montréal, Montreal Québec H3B 0E3, Canada |
| 9230556 CANADA INC.; Canada | | CAD Common shares
CAD Preferred shares | | 100
100 | | 400-1190 Avenue des Canadiens-de-Montréal, Montreal Québec H3B 0E3, Canada |
| 9539549 CANADA INC.; Canada | | USD Common shares | | 100 | | 400-1190 Avenue des Canadiens-de-Montréal, Montreal Québec H3B 0E3, Canada |
| AGM Holding Company Pte Ltd; Singapore | | USD Ordinary shares | | 100 | | 77 Robinson Road, #13-00, Robinson 77, 068896, Singapore |
| Alcan Alumina Ltda.; Brazil | | BRL1.00 Quota shares | | 100 | | Avenida Engenheiro Emiliano Macieira, 1—km 18, Pedrinhas, Sao Luis, MA, 65095-603, Brazil |
| Alcan Asia Limited; Hong Kong | | HKD Ordinary shares | | 100 | | Suite 2802, 28/F, Lippo Centre Tower 2, 89 Queensway, Admiralty, Hong Kong |
| Alcan Betriebs- und Verwaltungsgesellschaft GmbH; Germany | | €51.13 Ordinary shares | | 100 | | Alusingenplatz 1, D-78221, Singen, Germany |
| Alcan Chemicals Limited; United Kingdom | | £1.00 Ordinary shares | | 100 | | 6 St James’s Square, London, SW1Y 4AD, United Kingdom |
| Alcan Composites Brasil Ltda; Brazil | | BRL0.01 Ordinary shares | | 100 | | Avenida das Nações Unidas, 10.989, 14th floor, Suite 141, São Paulo, 04578-000, Brazil |
| Alcan Corporation; United States | | US$0.01 Ordinary shares | | 100 | | Corporation Service Company, 211 East 7th Street, Suite 620, Austin TX 78701-3218, United States |
| Alcan Farms Limited; United Kingdom | | £1.00 Ordinary shares | | 100 | | 6 St James’s Square, London, SW1Y 4AD, United Kingdom |
| Alcan Finances USA LLC; United States | | US$1,000.00 Ordinary
shares | | 100 | | CSC, 2711 Centerville Road, Suite 400, Wilmington
DE 19808 |
| Alcan Gove Development Pty Limited; Australia | | AUD Ordinary shares | | 100 | | 123 Albert Street, Brisbane QLD 4000, Australia |
| Alcan Gove Pty Limited; Australia | | AUD Class A shares | | 100 | | 123 Albert Street, Brisbane QLD 4000, Australia |
| | AUD Class B shares | | 100 | | |
| Alcan Gove Superannuation Pty Limited; Australia | | AUD Ordinary shares | | 100 | | 123 Albert Street, Brisbane QLD 4000, Australia |
| Alcan Holdings Australia Pty Limited; Australia | | AUD Class A shares | | 100 | | 123 Albert Street, Brisbane QLD 4000, Australia |
| | AUD Ordinary shares | | 100 | | |
| Alcan Holdings Europe B.V.; Netherlands | | €455.00 Ordinary shares | | 100 | | Aluminiumstraat 1, 4823 AL Breda P.O. Box 3408, 4800 DK Breda, The Netherlands |
| Alcan Holdings Nederland B.V.; Netherlands | | €4,555.00 Ordinary shares | | 100 | | Aluminiumstraat 1, 4823 AL Breda P.O. Box 3408, 4800 DK Breda, The Netherlands |
| Alcan Holdings Switzerland AG (SA/Ltd.); Switzerland | | CHF0.01 Registered shares | | 100 | | Max Hoegger-Strasse 6, P.O. Box 1954, CH-8048 Zürich, Switzerland |
| Alcan International Network U.S.A. Inc.; United States | | USD Ordinary shares | | 100 | | CSC, 80 State Street, Albany NY 12207-2543, United States |
| Alcan Lebensmittelverpackungen GmbH; Germany | | €51.13 Ordinary shares | | 100 | | Alusingenplatz 1, D-78221, Singen, Germany |
| Alcan Management Services (Shanghai) Co., Ltd.; China | | US$1.00 Ordinary shares | | 100 | | Unit E, 40F Wheelock Square, No. 1717 West Nanjing Road, Jing’an District, Shanghai, 200040, China |
| Alcan Management Services Canada Limited/Societe de Services de Gestion Alcan Canada Limitee; Canada | | CAD Ordinary shares | | 100 | | 400-1190 Avenue des Canadiens-de-Montréal, Montreal Québec H3B 0E3, Canada |
| Alcan Northern Territory Alumina Pty Limited; Australia | | AUD Ordinary shares | | 100 | | 123 Albert Street, Brisbane QLD 4000, Australia |
| Alcan Packaging Canada Limited; Canada | | CAD Ordinary shares | | 100 | | McCarthy Tetrault LLP, c/o Joanne Pierucci, Suite 5300 Toronto Dominion Bank Tower, Toronto ON M5K 1E6, Canada |
| | | | |
| 2016 Annual report | | riotinto.com | | 177 |
| | | | | | | | | | | | | | | | |
| | | | | | | | | |
| STRATEGIC REPORT | | | | DIRECTORS’ REPORT | | | | FINANCIAL STATEMENTS | | | | METALS AND MINERALS PRODUCTION | | | | ADDITIONAL INFORMATION |
Notes to the 2016 financial statements
continued
47 Related undertakingscontinued
| | | | | | | | |
| Name of undertaking and country of incorporation | | Share class | | % of share
class held
by Group
companies | | Registered office address |
| Alcan Packaging Mühltal Gmbh & Co. KG; Germany | | €51.13 Ordinary shares | | 100 | | Alusingenplatz 1, D-78221, Singen, Germany |
| Alcan Primary Metal Australia Pty Ltd; Australia | | AUD Ordinary shares | | 100 | | 123 Albert Street, Brisbane QLD 4000, Australia |
| Alcan Primary Products Company LLC; United States | | USD Units shares | | 100 | | CSC, 2711 Centerville Road, Suite 400, Wilmington DE 19808 |
| Alcan Primary Products Corporation; United States | | US$0.01 Ordinary shares | | 100 | | CSC, 211 East 7th Street, Suite 620, Austin TX 78701-3218, United States |
| Alcan Realty Limited/Societe Immobiliere Alcan Limitee; Canada | | CAD Ordinary shares | | 100 | | 400-1190 Avenue des Canadiens-de-Montréal, Montreal Québec H3B 0E3, Canada |
| Alcan South Pacific Pty Ltd; Australia | | AUD Ordinary shares | | 100 | | 123 Albert Street, Brisbane QLD 4000, Australia |
| Alcan Trading AG (SA/Ltd.); Switzerland | | CHF1000 Registered shares | | 100 | | Max Hoegger-Strasse 6, P.O. Box 1852, CH-8048 Zürich, Switzerland |
| Aluminium Dunkerque; France | | €16.00 Ordinary shares | | 100 | | 17 Place des Reflets, La Defense 2, 92400, Courbevoie, France |
| Aluminium Pechiney; France | | €16.00 Ordinary shares | | 100 | | 725 rue Aristide Bergès, 38341 Voreppe Cedex,
France |
| Aluminum Company of Canada Limited/Aluminium du Canada Limitee; Canada | | CAD Ordinary shares | | 100 | | 400-1190 Avenue des Canadiens-de-Montréal, Montreal Québec H3B 0E3, Canada |
| AML Exploration Pty Limited; Australia(g) | | AUD Ordinary shares | | 100 | | 37 Belmont Avenue, Belmont WA 6104, Australia |
| AML Properties Pty Ltd; Australia | | AUD Ordinary shares | | 100 | | Level 22 Central Park, 152-158 St. Georges Terrace, Perth WA 6000, Australia |
| Anglesey Aluminium Limited; United Kingdom | | £1.00 Ordinary shares | | 100 | | 6 St James’s Square, London, SW1Y 4AD, United Kingdom |
| Anglesey Aluminium Metal Limited; United Kingdom | | £1.00 Ordinary shares | | 100 | | 6 St James’s Square, London, SW1Y 4AD, United Kingdom |
| AP Service; France | | €15.00 Ordinary shares | | 100 | | 725 rue Aristide Bergès, 38341 Voreppe Cedex, France |
| Argyle Diamond Mines Pty Limited; Australia | | AUD Ordinary shares | | 100 | | Level 22 Central Park, 152-158 St. Georges Terrace, Perth WA 6000, Australia |
| Argyle Diamonds (2013) Ltd; Australia | | AUD Ordinary shares | | 100 | | Level 22 Central Park, 152-158 St. Georges Terrace, Perth WA 6000, Australia |
| Argyle Diamonds Limited; Australia | | AUD Class A shares
AUD Class B shares | | 100
100 | | Level 22 Central Park, 152-158 St. Georges Terrace, Perth WA 6000, Australia |
| Ashton Canada Pty Limited; Australia | | AUD Ordinary shares | | 100 | | 37 Belmont Avenue, Belmont WA 6104, Australia |
| Ashton Mining Pty Ltd; Australia | | AUD Ordinary shares | | 100 | | Level 22 Central Park, 152-158 St. Georges Terrace, Perth WA 6000, Australia |
| Ashton Nominees Pty Limited; Australia | | AUD Ordinary shares | | 100 | | Level 22 Central Park, 152-158 St. Georges Terrace, Perth WA 6000, Australia |
| Asia Gold Mongolia LLC; Mongolia | | MNT1,250.00 Common shares | | 100 | | Suite 201, Seoul Business ctr, Zaluuchuud Av.26, 1s khoroo, Bayanzurkh district, Ulaanbaatar, 13380, Mongolia |
| Asia Naran Bulag LLC; Mongolia | | MNT1,000.00 Common shares | | 100 | | suite 201, Seoul Business ctr. Zaluuchuud Av.26, 1s khoroo, Bayanzurkh district, Ulaanbaatar, 13380, Mongolia |
| Australian Coal Holdings Pty. Limited; Australia(a) | | AUD A shares | | 100 | | 123 Albert Street, Brisbane QLD 4000, Australia |
| | AUD Ordinary shares | | 100 | | |
| Australian Coal Resources Limited; Australia | | AUD Ordinary shares | | 100 | | 123 Albert Street, Brisbane QLD 4000, Australia |
| Australian Mining & Smelting Pty Ltd; Australia(a) | | AUD Ordinary shares | | 100 | | Level 33, 120 Collins Street, Melbourne VIC 3000, Australia |
| Balkhash Saryshagan LLP; Kazakhstan(c) | | – | | 100 | | Dostyk 310/G, Almaty, 050020, Kazakhstan |
| Baume Pty. Limited; Australia(a)(g) | | AUD Ordinary shares | | 100 | | Level 27, Central Park, 152-158 St. Georges Terrace, Perth WA 6000, Australia |
| Beasley River Management Pty Limited; Australia | | AUD Ordinary shares | | 100 | | Level 22 Central Park, 152-158 St. Georges Terrace, Perth WA 6000, Australia |
| Beasley River Mining Pty Limited; Australia | | AUD Ordinary shares | | 100 | | Level 22 Central Park, 152-158 St. Georges Terrace, Perth WA 6000, Australia |
| Bektau B.V.; Netherlands | | €200.00 Ordinary shares | | 75 | | Aluminiumstraat 1, 4823 AL Breda P.O. Box 3408,
4800 DK Breda, The Netherlands, the Netherlands |
| Black Hill Land Pty Ltd; Australia | | AUD Ordinary shares | | 100 | | 123 Albert Street, Brisbane QLD 4000, Australia |
| Borax España, S.A.; Spain | | €150.00 Ordinary shares | | 100 | | CN 340, Km 954, 12520 NULES, Castellon, Spain |
| Borax Europe Limited; United Kingdom | | £0.25 Ordinary shares | | 100 | | 6 St James’s Square, London, SW1Y 4AD, United Kingdom |
| | | | |
| 178 | | riotinto.com | | 2016 Annual report |
| | | | | | |
| Name of undertaking and country of incorporation | | Share class | | % of share
class held
by Group
companies | | Registered office address |
| Borax Francais; France | | €2.75 Ordinary shares | | 100 | | 89 Route de Bourbourg, 59210,Coudekerque-Branche, France |
| Borax Malaysia Sdn Bhd; Malaysia | | MYR1.00 Ordinary shares | | 100 | | Level 7, Menara Milenium, Jalan Damanlela, Pusat Bandar Damansara, Damansara Heights 50490 Kuala Lumpur, Malaysia |
| Borax Rotterdam N.V.; Netherlands | | €453.78 Ordinary shares | | 100 | | Welplaatweg 104, 3197KS, ROTTERDAM – BOTLEK, Netherlands |
| British Alcan Aluminium Plc; United Kingdom | | £1.00 Ordinary shares | | 100 | | 6 St James’s Square, London, SW1Y 4AD, United Kingdom |
| Canning Resources Pty Limited; Australia(a) | | AUD Ordinary shares | | 100 | | Level 33, 120 Collins Street, Melbourne VIC 3000, Australia |
| Capricorn Diamonds Investments Pty Limited; Australia | | AUD Ordinary shares | | 100 | | Level 22 Central Park, 152-158 St. Georges Terrace, Perth WA 6000, Australia |
| Carol Lake Company Ltd.; Canada | | CAD$100.00 Ordinary shares | | 100 | | 400-1190 Avenue des Canadiens-de-Montréal, Montreal Québec H3B 0E3, Canada |
| Catherine Hill Bay Land Pty Ltd; Australia | | AUD Ordinary shares | | 100 | | 123 Albert Street, Brisbane QLD 4000, Australia |
| Cathjoh Holdings Pty Limited; Australia | | AUD Ordinary shares | | 100 | | Pacific Aluminium, Level 3, 500 Queen Street, Brisbane QLD 4000, Australia |
| Champlain Reinsurance Company Ltd.; Switzerland | | CHF1.23 Registered shares | | 100 | | Max Hoegger-Strasse 6, P.O. Box 1852, CH-8048 Zürich, Switzerland |
| Channar Finance Limited; Australia(g) | | AUD Class B shares | | 100 | | Level 22 Central Park, 152-158 St. Georges Terrace, Perth WA 6000, Australia |
| Channar Financial Services Pty Ltd; Australia(g) | | AUD Ordinary shares | | 100 | | Level 22 Central Park, 152-158 St. Georges Terrace, Perth WA 6000, Australia |
| Channar Investment Nominee Pty Limited; Australia(g) | | AUD Ordinary shares | | 100 | | Level 22 Central Park, 152-158 St. Georges Terrace, Perth WA 6000, Australia |
| Channar Management Services Pty Limited; Australia | | AUD Ordinary shares | | 100 | | Level 22 Central Park, 152-158 St. Georges Terrace, Perth WA 6000, Australia |
| Channar Mining Pty Ltd; Australia | | AUD Ordinary shares | | 100 | | Level 22 Central Park, 152-158 St. Georges Terrace, Perth WA 6000, Australia |
| Channar Security Pty Limited; Australia(g) | | AUD Ordinary shares | | 100 | | Level 22 Central Park, 152-158 St. Georges Terrace, Perth WA 6000, Australia |
| Chlor Alkali Unit Pte Ltd; Singapore | | SGD$1.00 Ordinary
(SGD) shares | | 100 | | 12 Marina Boulevard, #20-01 Marina Bay Financial
Centre Tower 3, Singapore, 018982, Singapore |
| | US$1.00 Ordinary (USD) shares | | 68.4 | | |
| CIA. Inmobiliaria e Inversiones Cosmos S.A.C.; Peru | | PEN1,000.00 Ordinary shares | | 100 | | Av. Santa Maria No. 110 Urb. Miraflores – MIRAFLORES – LIMA, Peru |
| CNA Bengalla Investments Pty Limited; Australia | | AUD Ordinary shares | | 100 | | 123 Albert Street, Brisbane QLD 4000, Australia |
| CNA Investments (UK) Pty Limited; Australia | | AUD Ordinary shares | | 100 | | 123 Albert Street, Brisbane QLD 4000, Australia |
| CNA Resources Holdings Pty Limited; Australia | | AUD Ordinary shares | | 100 | | 123 Albert Street, Brisbane QLD 4000, Australia |
| CNA Resources Limited; Australia | | AUD “A” Ordinary shares | | 100 | | 123 Albert Street, Brisbane QLD 4000, Australia |
| | AUD “B” Ordinary shares | | 100 | | |
| CNA Sub Holdings Pty Limited; Australia | | AUD Ordinary shares | | 100 | | 123 Albert Street, Brisbane QLD 4000, Australia |
| CNA UK Limited; United Kingdom(g) | | US$0.01 Ordinary bearer shares | | 100 | | 6 St James’s Square, London, SW1Y 4AD,
United Kingdom |
| CNA Warkworth Australasia Pty Limited; Australia | | AUD Ordinary shares | | 100 | | 123 Albert Street, Brisbane QLD 4000, Australia |
| CNA Warkworth Pty Ltd; Australia | | AUD Ordinary shares | | 100 | | 123 Albert Street, Brisbane QLD 4000, Australia |
| Coal & Allied Industries Limited; Australia | | AUD Ordinary shares | | 100 | | 123 Albert Street, Brisbane QLD 4000, Australia |
| Coal & Allied Mining Services Pty Limited; Australia | | AUD Ordinary shares | | 100 | | 123 Albert Street, Brisbane QLD 4000, Australia |
| Coal & Allied Operations Pty Ltd; Australia | | AUD Ordinary shares | | 100 | | 123 Albert Street, Brisbane QLD 4000, Australia |
| Compagnie Générale D’électrolyse Du Palais; France | | €0.94 Ordinary shares | | 100 | | 17 Place des Reflets, La Defense 2, 92400, Courbevoie, France |
| Compania de Transmision Sierraoriente S.A.C.; Peru | | PEN1,000.00 Ordinary shares | | 100 | | Av. Santa Maria No. 110 Urb. Miraflores – MIRAFLORES – LIMA, Peru |
| Corporation De Pêche Ste-Marguerite Inc.; Canada | | CAD$10.00 Ordinary shares | | 96.8 | | 400-1190 Avenue des Canadiens-de-Montréal, Montreal Québec H3B 0E3, Canada |
| CRA Exploration (India) Private Limited; India | | INR10.00 Ordinary shares | | 99.9 | | Apartment No.100 A/5, Ground Floor, The Capital Court, Olof Palme Marg, Munirka, NEW DELHI 110067, India |
| CRA Investments Pty. Limited; Australia | | AUD Ordinary shares | | 100 | | Level 33, 120 Collins Street, Melbourne VIC 3000, Australia |
| CRA Pty Ltd; Australia(a) | | AUD Ordinary shares | | 100 | | Level 33, 120 Collins Street, Melbourne VIC 3000,
Australia |
| | | | |
| 2016 Annual report | | riotinto.com | | 179 |
| | | | | | | | | | | | | | | | |
| | | | | | | | | |
| STRATEGIC REPORT | | | | DIRECTORS’ REPORT | | | | FINANCIAL STATEMENTS | | | | METALS AND MINERALS PRODUCTION | | | | ADDITIONAL INFORMATION |
Notes to the 2016 financial statements
continued
47 Related undertakingscontinued
| | | | | | | | |
| Name of undertaking and country of incorporation | | Share class | | % of share
class held
by Group
companies | | Registered office address |
| Dampier Salt Limited; Australia | | AUD Ordinary ($1.00257) shares | | 68.4 | | Level 22 Central Park, 152-158 St. Georges Terrace, Perth WA 6000, Australia |
| | AUD Ordinary ($1.88 on 31/01/2013) shares | | 68.4 | | |
| Darex Capital, Inc.; Panama(g) | | US$0.01 Par value one cent shares | | 100 | | Plaza Bancomer Building, 50th Street Apartedo 6307, Panama 5, Panama |
| Daybreak Development LLC; United States | | US$0.01 Common shares | | 100 | | CSC, 2711 Centerville Road, Suite 400, Wilmington DE 19808 |
| Daybreak Property Holdings LLC; United States(c) | | – | | – | | CSC, 15 West South Temple, Suite 1701, Salt Lake City UT 84101, United States |
| Daybreak Secondary Water Distribution Company; United States | | US$0.01 Common shares | | 100 | | CSC, 2711 Centerville Road, Suite 400, Wilmington DE 19808 |
| Daybreak Water Holding LLC; United States | | US$0.01 Common shares | | 100 | | CSC, 2711 Centerville Road, Suite 400, Wilmington DE 19808 |
| DB Medical I LLC; United States | | USD Units shares | | 100 | | CSC, 15 West South Temple, Suite 1701, Salt Lake City UT 84101, United States |
| DBVC1 LLC; United States(c) | | – | | – | | CSC, 15 West South Temple, Suite 1701, Salt Lake City UT 84101, United States |
| Diavik Diamond Mines (2012) Inc.; Canada | | CAD Common shares | | 100 | | 300-5201 50th Avenue, PO Box 2498, Yellowknife NT X1A 2P8, Canada |
| Dolphin Properties Pty. Ltd.; Australia | | AUD Ordinary shares | | 100 | | 123 Albert Street, Brisbane QLD 4000, Australia |
| East Kalimantan Coal Pte. Ltd; Singapore(a) | | SGD1.00 Ordinary shares
US$1.00 Ordinary shares | | 100
100 | | 12 Marina Boulevard, #20-01 Marina Bay Financial Centre Tower 3, Singapore, 018982, Singapore |
| Eastland Management Inc.; United States | | US$1.00 Common shares | | 100 | | CSC, 2711 Centerville Road, Suite 400, Wilmington DE 19808 |
| Electric Power Generation Limited; New Zealand(a) | | NZD1 Ordinary shares | | 100 | | Level 6, 109 Featherston Street, Wellington, 6011, New Zealand |
| Emirates Energy Limited; United Kingdom(g) | | US$1.00 Ordinary shares | | 100 | | 6 St James’s Square, London, SW1Y 4AD, United Kingdom |
| Energy Resources of Australia Ltd; Australia | | AUD A Class ordinary shares | | 68.4 | | C/- Mallesons Stephen Jacques, 60 Marcus Clarke Street, Canberra ACT, Australia |
| Falcon Insurance Ltd; Malta(a) | | US$1.00 Class “A” ordinary shares | | 100 | | No 7, 4th Floor, Block C, Skyway Offices, 179 Marina Street, Pieta , PTA 9042, Malta |
| | US$1.00 Class “B” shares | | 100 | | |
| Flambeau Mining Company; United States | | US$0.01 Common shares | | 100 | | CSC, 2711 Centerville Road, Suite 400, Wilmington DE 19808 |
| Fundsprops Pty. Limited; Australia(a) | | AUD A Class ordinary shares | | 100 | | Level 33, 120 Collins Street, Melbourne VIC 3000, Australia |
| Gladstone Infrastructure Pty Ltd; Australia | | AUD Class G Redeemable Preference shares | | 100 | | 123 Albert Street, Brisbane QLD 4000, Australia |
| | AUD A Class ordinary shares | | 100 | | |
| Gove Aluminium Ltd; Australia | | AUD A Non redeemable
preference shares | | 100 | | 123 Albert Street, Brisbane QLD 4000, Australia |
| | AUD A Redeemable preference shares | | 100 | | 123 Albert Street, Brisbane QLD 4000, Australia |
| | AUD A Class ordinary shares | | 100 | | 123 Albert Street, Brisbane QLD 4000, Australia |
| GPS Energy Pty Limited; Australia | | AUD A Class ordinary shares | | 100 | | Pacific Aluminium, Level 3, 500 Queen Street, Brisbane QLD 4000, Australia |
| GPS Nominee Pty Limited; Australia | | AUD A Class ordinary shares | | 100 | | Pacific Aluminium, Level 3, 500 Queen Street, Brisbane QLD 4000, Australia |
| GPS Power Pty. Limited; Australia | | AUD A Class ordinary shares | | 100 | | Pacific Aluminium, Level 3, 500 Queen Street, Brisbane QLD 4000, Australia |
| Gulf Power Company/La Compagnie Gulf Power; Canada | | CAD$100.00 Ordinary shares | | 100 | | 400-1190 Avenue des Canadiens-de-Montréal, Montreal Québec H3B 0E3, Canada |
| Gumala Advisory Company Pty Ltd; Australia(g) | | AUD A Class ordinary shares | | 51 | | Level 22 Central Park, 152-158 St. Georges Terrace, Perth WA 6000, Australia |
| Gwandalan Land Pty Ltd; Australia | | AUD A Class ordinary shares | | 100 | | 123 Albert Street, Brisbane QLD 4000, Australia |
| Hail Creek Coal Pty Ltd; Australia | | AUD A Class ordinary shares | | 100 | | 123 Albert Street, Brisbane QLD 4000, Australia |
| Hail Creek Marketing Pty Ltd; Australia | | AUD A Class ordinary shares | | 82 | | 123 Albert Street, Brisbane QLD 4000, Australia |
| Hamersley Associated Investments Pty Limited; Australia(g) | | AUD A Class ordinary shares | | 100 | | Level 22 Central Park, 152-158 St. Georges Terrace, Perth WA 6000, Australia |
| Hamersley Exploration Pty Limited; Australia | | AUD A Class ordinary shares | | 100 | | Level 22 Central Park, 152-158 St. Georges Terrace, Perth WA 6000, Australia |
| | | | |
| 180 | | riotinto.com | | 2016 Annual report |
| | | | | | | | |
| Name of undertaking and country of incorporation | | Share class | | % of share
class held
by Group
companies | | Registered office address |
| Hamersley HMS Pty Ltd; Australia | | AUD A Class ordinary shares
| | 100 | | Level 22 Central Park, 152-158 St. Georges Terrace, Perth WA 6000, Australia |
| Hamersley Holdings Limited; Australia(a) | | AUD A Class ordinary shares | | 100 | | Level 22 Central Park, 152-158 St. Georges Terrace, Perth WA 6000, Australia |
| Hamersley Iron – Yandi Pty Limited; Australia(a) | | AUD Class B shares
AUD Class C shares
AUD Ordinary shares | | 100
100
100 | | Level 22 Central Park, 152-158 St. Georges Terrace, Perth WA 6000, Australia |
| Hamersley Iron Pty Limited; Australia | | AUD Ordinary shares | | 100 | | Level 22 Central Park, 152-158 St. Georges Terrace, Perth WA 6000, Australia |
| Hamersley Resources Limited; Australia | | AUD Ordinary shares
AUD Z Class ordinary shares | | 100 | | Level 22 Central Park, 152-158 St. Georges Terrace, Perth WA 6000, Australia |
| Hamersley WA Pty Ltd; Australia | | AUD Ordinary shares | | 100 | | Level 22 Central Park, 152-158 St. Georges Terrace, Perth WA 6000, Australia |
| Henlopen Manufacturing Co., Inc.; United States | | US$100.00 Ordinary shares | | 100 | | CSC, 80 State Street, Albany NY 12207-2543, United States |
| Heruga Exploration LLC; Mongolia | | MNT12,500.00 Common shares | | 100 | | suite 201, Seoul Business ctr, Zaluuchuud av.26,1st khoroo, Ulaanbaatar, Bayanzurkh district, 13380, Mongolia |
| High Purity Iron Inc.; United States | | US$1.00 Common shares | | 100 | | CSC, 2711 Centerville Road, Suite 400, Wilmington
DE 19808 |
| HImet Corporation Pty Limited; Australia(a)(g) | | AUD Ordinary shares | | 100 | | Level 22 Central Park, 152-158 St. Georges Terrace, Perth WA 6000, Australia |
| HIsmelt (Operations) Pty Ltd; Australia(g) | | AUD Ordinary shares | | 100 | | Level 22 Central Park, 152-158 St. Georges Terrace, Perth WA 6000, Australia |
| HIsmelt Corporation Pty Limited; Australia | | AUD A Class shares | | 100 | | Level 22 Central Park, 152-158 St. Georges Terrace, Perth WA 6000, Australia |
| Hope Downs Marketing Company Pty Ltd; Australia | | AUD A Class shares | | 100 | | Level 22 Central Park, 152-158 St. Georges Terrace, Perth WA 6000, Australia |
| Howmet Insurance Company, Inc.; United States | | US$1.00 Ordinary shares | | 100 | | CSC, 159 State Street, Montpelier VT 05602 |
| Hunter Valley Resources Pty Ltd; Australia | | AUD A Class shares | | 100 | | 123 Albert Street, Brisbane QLD 4000, Australia |
| | AUD B Class shares | | 100 | | |
| HV Operations Pty Ltd; Australia | | AUD Ordinary shares | | 100 | | 123 Albert Street, Brisbane QLD 4000, Australia |
| HVO Coal Sales Pty Ltd; Australia | | AUD Ordinary shares | | 100 | | 123 Albert Street, Brisbane QLD 4000, Australia |
| IAL Holdings Singapore Pte Ltd; Singapore | | USD Ordinary shares | | 100 | | 77 Robinson Road, #13-00, Robinson 77, 068896, Singapore |
| IEA Coal Research Limited; United Kingdom | | £1.00 Ordinary shares | | 100 | | Park House, 14 Northfields, London, SW18 1DD, United Kingdom |
| IEA Environmental Projects Limited; United Kingdom | | £1.00 Ordinary shares | | 100 | | Park House, 14 Northfields, London, SW18 1DD, United Kingdom |
| IGP Holding Company Ltd; Virgin Islands, British | | USD Ordinary shares | | 100 | | Midocean Chambers, Road Town, Tortola, Virgin Islands, British |
| Industrias Metalicas Castello S.A.; Spain | | €6.01 Ordinary shares | | 100 | | Calle Tuset 10, 08006, Barcelona, Catalogna, Spain |
| Integrity Land and Cattle LLC; United States | | USD Units shares | | 100 | | CSC, 2338 W. Royal Palm Road, Suite J, Phoenix AZ 85021 |
| Iron Ore Company of Canada; United States | | US$1,000.00 Series A shares | | 91.4 | | 2711 Centerville Road, Suite 400, Wilmington Delaware 19808 |
| | US$1,000.00 Series E shares | | 100 | | |
| | US$1,000.00 Series F shares | | 100 | | |
| Itallumina Srl; Italy(g) | | €1.00 Quotas shares | | 100 | | Viale Castro Pretorio 122, 00185, Roma, Italy |
| Johcath Holdings Pty Limited; Australia | | AUD Ordinary shares | | 100 | | Pacific Aluminium, Level 3, 500 Queen Street, Brisbane QLD 4000, Australia |
| Juna Station Pty Ltd; Australia | | AUD Ordinary shares | | 100 | | Level 22 Central Park, 152-158 St. Georges Terrace, Perth WA 6000, Australia |
| Kalamah Pty Ltd; Australia | | AUD Ordinary shares | | 100 | | 123 Albert Street, Brisbane QLD 4000, Australia |
| Kalimantan Gold Pty Limited; Australia | | AUD Ordinary shares | | 100 | | Level 33, 120 Collins Street, Melbourne VIC 3000, Australia |
| | | | |
| 2016 Annual report | | riotinto.com | | 181 |
| | | | | | | | | | | | | | | | |
| | | | | | | | | |
| STRATEGIC REPORT | | | | DIRECTORS’ REPORT | | | | FINANCIAL STATEMENTS | | | | METALS AND MINERALS PRODUCTION | | | | ADDITIONAL INFORMATION |
Notes to the 2016 financial statements
continued
47 Related undertakingscontinued
| | | | | | | | |
| Name of undertaking and country of incorporation | | Share class | | % of share
class held
by Group
companies | | Registered office address |
| Kalteng Pty. Ltd; Australia(a) | | AUD A Class ordinary shares | | 100 | | 37 Belmont Avenue, Belmont WA 6104, Australia |
| | AUD1.00 Class B (Fully paid $1.00 13/01/2003) | | 100 | | |
| | AUD1.00 Class B (Paid to $0.12 02/09/2005) | | 100 | | |
| | AUD Ordinary shares | | 100 | | |
| Kelian Investment Limited; Virgin Islands, British(c) | | – | | – | | Woodbourne Hall, Road Town, Tortola, British Virgin Islands |
| Kelian Pty. Limited; Australia | | AUD Ordinary shares | | 100 | | Level 33, 120 Collins Street, Melbourne VIC 3000, Australia |
| Kembla Coal & Coke Pty. Limited; Australia | | AUD Ordinary shares | | 100 | | 123 Albert Street, Brisbane QLD 4000, Australia |
| Kennecott Barneys Canyon Mining Company; United States | | US$0.01 Common shares | | 100 | | CSC, 2711 Centerville Road, Suite 400, Wilmington DE 19808 |
| Kennecott Exploration Company; United States | | US$0.01 Common shares | | 100 | | CSC, 2711 Centerville Road, Suite 400, Wilmington DE 19808 |
| Kennecott Exploration Mexico, S.A. de C.V.; Mexico | | MXN1,000.00 Ordinary shares | | 100 | | Felix Berenguer 125 – 4, Col. Lomas Virreyes, Distrito Federal, 11000, Mexico |
| Kennecott Holdings Corporation; United States | | US$0.01 Common shares | | 100 | | CSC, 2711 Centerville Road, Suite 400, Wilmington DE 19808 |
| Kennecott Land Company; United States | | US$0.01 Common shares | | 100 | | CSC, 2711 Centerville Road, Suite 400, Wilmington DE 19808 |
| Kennecott Land Investment Company LLC; United States(c) | | – | | – | | CSC, 2711 Centerville Road, Suite 400, Wilmington DE 19808 |
| Kennecott Molybdenum Company; United States | | US$0.01 Common shares | | 100 | | CSC, 2711 Centerville Road, Suite 400, Wilmington DE 19808 |
| Kennecott Nevada Copper Company; United States | | US$0.01 Common shares | | 100 | | CSC, 2711 Centerville Road, Suite 400, Wilmington DE 19808 |
| Kennecott Ridgeway Mining Company; United States | | US$0.01 Common shares | | 100 | | CSC, 2711 Centerville Road, Suite 400, Wilmington DE 19808 |
| Kennecott Royalty Company; United States | | US$100.00 Common shares | | 100 | | CSC, 2711 Centerville Road, Suite 400, Wilmington DE 19808 |
| Kennecott Services Company; United States | | US$0.01 Common shares | | 100 | | CSC, 2711 Centerville Road, Suite 400, Wilmington DE 19808 |
| Kennecott Uranium Company; United States | | US$0.01 Common shares | | 100 | | CSC, 2711 Centerville Road, Suite 400, Wilmington DE 19808 |
| Kennecott Utah Copper LLC; United States | | USD Units shares | | 100 | | CSC, 15 West South Temple, Suite 1701, Salt Lake City UT 84101, United States |
| Kennecott Water Distribution LLC; United States | | USD Ordinary shares | | 100 | | CSC, 2711 Centerville Road, Suite 400, Wilmington DE 19808 |
| Kestrel Coal Pty Limited; Australia | | AUD Ordinary shares | | 100 | | 123 Albert Street, Brisbane QLD 4000, Australia |
| Kestrel Coal Sales Pty Limited; Australia | | AUD Ordinary shares | | 100 | | 123 Albert Street, Brisbane QLD 4000, Australia |
| Kirganik LLC; Russian Federation(c) | | – | | – | | 2, 23 Liniya, Vasilievsky Ostrov, 199106, St. Petersburg, Russian Federation |
| Korgantas LLP; Kazakhstan(c) | | – | | – | | Dostyk 310/G, Almaty, 050020, Kazakhstan |
| Kutaibar Holdings Pty Ltd; Australia(a) | | AUD Ordinary shares | | 100 | | Level 33, 120 Collins Street, Melbourne VIC 3000, Australia |
| Lao Sanxai Minerals Company Limited; Lao People’s Democratic Republic | | US$1.00 Ordinary shares | | 70 | | 5th Floor, ANZ Bank Building, 33 Lane Xang Avenue, Hatsady Village, Chanthaboury District, Vientiane Capital, Lao People’s Democratic Republic |
| Lawson Mardon Flexible Limited; United Kingdom | | £1.00 Ordinary shares | | 100 | | 6 St James’s Square, London, SW1Y 4AD,
United Kingdom |
| Lawson Mardon Smith Brothers Ltd.; United Kingdom | | £1.00 Ordinary shares | | 100 | | 6 St James’s Square, London, SW1Y 4AD,
United Kingdom |
| Lazurnoe LLC; Russian Federation(c) | | – | | – | | 2, 23 Liniya, Vasilievsky Ostrov, 199106, St. Petersburg, Russian Federation |
| Lower Hunter Land Holdings Pty Ltd; Australia | | AUD Ordinary shares | | 100 | | 123 Albert Street, Brisbane QLD 4000, Australia |
| Magma Arizona Railroad Company; United States | | US$100.00 Common shares | | 99.9 | | CSC, 2338 W. Royal Palm Road, Suite J, Phoenix AZ 85021 |
| Malmikaivos Oy; Finland(g) | | €168.19 Ordinary shares | | 100 | | Raivantie 31 , Perttula, 01860 , Finland |
| Metallwerke Refonda AG; Switzerland | | CHF125 Bearer shares | | 100 | | Am Bahnhof, CH-8172, Niederglatt, Switzerland |
| Metals & Minerals Insurance Pte. Limited; Singapore | | SGD Redeemable preference shares
| | 100 | | 2 Shenton Way, #2601, SGX Centre 1,
Singapore 068804, Singapore |
| | SGD Ordinary shares | | 100 | | |
| Miller Pohang Coal Co Pty Ltd; Australia | | AUD Ordinary shares | | 100 | | 123 Albert Street, Brisbane QLD 4000, Australia |
| | | | |
| 182 | | riotinto.com | | 2016 Annual report |
| | | | | | | | |
| Name of undertaking and country of incorporation | | Share class | | % of share
class held
by Group
companies | | Registered office address |
| Minera Kennecott, S.A. de C.V.; Mexico | | MXN1 Series “B” shares | | 100 | | Florencia 57, Piso 3, Col. Juarez, Delegacion Cuauhtemoc, Mexico, D.F., 06600, Mexico |
| Minmi Land Pty Ltd; Australia | | AUD Ordinary shares | | 100 | | 123 Albert Street, Brisbane QLD 4000, Australia |
| Mitchell Plateau Bauxite Co. Pty. Limited; Australia | | AUD Ordinary shares | | 100 | | 123 Albert Street, Brisbane QLD 4000, Australia |
| Mount Bruce Mining Pty Limited; Australia | | AUD Ordinary shares | | 100 | | Level 22 Central Park, 152-158 St. Georges Terrace, Perth WA 6000, Australia |
| Mount Pleasant Pty Ltd; Australia | | AUD Ordinary shares | | 100 | | 123 Albert Street, Brisbane QLD 4000, Australia |
| Mount Thorley Coal Loading Ltd; Australia | | AUD Ordinary shares | | 58.3 | | 123 Albert Street, Brisbane QLD 4000, Australia |
| Mount Thorley Operations Pty Limited; Australia | | AUD Ordinary shares | | 100 | | 123 Albert Street, Brisbane QLD 4000, Australia |
| Movele; Luxembourg | | USD Ordinary shares | | 100 | | 22 rue Jean-Pierre Brasseur, L-1258, Luxembourg |
| | USD Preference shares | | 100 | | |
| Mutamba Mineral Sands S.A.; Mozambique | | MZN100.00 Ordinary shares | | 100 | | Avenida 24 de Julho, no. 3412, Bairro da Polana Cimento, Maputo City, Mozambique |
| Namoi Valley Coal Pty. Limited; Australia | | AUD Class B shares | | 100 | | 123 Albert Street, Brisbane QLD 4000, Australia |
| | AUD Ordinary shares | | 100 | | |
| NBH Pty Ltd; Australia | | AUD Ordinary shares | | 100 | | Level 22 Central Park, 152-158 St. Georges Terrace, Perth WA 6000, Australia |
| Nhulunbuy Corporation Limited; Australia(c) | | – | | – | | Endeavour Square, Nhulunbuy, Northern Territory 0880, Australia |
| Nords Wharf Land Pty Ltd; Australia | | AUD Ordinary shares | | 100 | | 123 Albert Street, Brisbane QLD 4000, Australia |
| Norgold Pty Limited; Australia | | AUD Ordinary shares | | 100 | | Level 22 Central Park, 152-158 St. Georges Terrace, Perth WA 6000, Australia |
| North Gold (W.A.) Pty Ltd; Australia | | AUD Ordinary shares
AUD Redeemable preference shares | | 100
100 | | Level 22 Central Park, 152-158 St. Georges Terrace, Perth WA 6000, Australia |
| North Insurances Pty. Ltd.; Australia | | AUD Ordinary shares | | 100 | | Level 33, 120 Collins Street, Melbourne VIC 3000, Australia |
| North IOC (Bermuda) Holdings Limited; Bermuda | | US$1.00 Ordinary shares | | 100 | | Clarendon House, 2 Church Street, Hamilton, HM 11, Bermuda |
| North IOC (Bermuda) Limited; Bermuda | | US$143.64 Class A ordinary shares (US$143.64126903) | | 100 | | Clarendon House, 2 Church Street, Hamilton, HM 11, Bermuda |
| | US$1.00 Ordinary shares | | 100 | | |
| | US$100,000.00 Preferred shares | | 100 | | |
| North IOC Holdings Pty Ltd; Australia | | AUD Ordinary shares | | 100 | | Level 27, Central Park, 152-158 St. Georges Terrace, Perth WA 6000, Australia |
| North Limited; Australia | | AUD Ordinary shares | | 100 | | Level 22 Central Park, 152-158 St. Georges Terrace, Perth WA 6000, Australia |
| North Mining Limited; Australia | | AUD Ordinary shares
AUD Redeemable preference shares | | 100
100 | | Level 22 Central Park, 152-158 St. Georges Terrace, Perth WA 6000, Australia |
| Northern (Rhondda) Collieries Pty Ltd; Australia | | AUD Ordinary shares | | 100 | | 123 Albert Street, Brisbane QLD 4000, Australia |
| Novacoal Australia Pty. Limited; Australia | | AUD Ordinary shares | | 100 | | 123 Albert Street, Brisbane QLD 4000, Australia |
| Nozalela Mineral Sands (Pty) Ltd; South Africa | | ZAR 1.00 Ordinary shares | | 100 | | The Farm RBM, Number 16317, KwaZulu-Natal, South Africa |
| Oaklands Coal Pty. Limited; Australia | | AUD Ordinary shares | | 100 | | 123 Albert Street, Brisbane QLD 4000, Australia |
| Olkhovoe LLC; Russian Federation(c) | | – | | – | | 2, 23 Liniya, Vasilievsky Ostrov, 199106, St. Petersburg, Russian Federation |
| Orian Holding Corp; Virgin Islands, British | | USD Common shares | | 100 | | Midocean Cambers-Management and Trust Services (BVI) Limited, PO Box 805, Pelican Drive, Road Town, Tortola, VG 110, Virgin Islands, British |
| Oyu Tolgoi LLC; Mongolia | | MNT10,000.00 Common shares | | 66 | | Level 12 Monnis Tower, Chinggis Avenue-15, 1st khoroo, Sukhbaatar District, Ulaanbaatar, 14240, Mongolia |
| Oyu Tolgoi Netherlands BV; Netherlands | | €100.00 Ordinary shares | | 100 | | Prins Bernhardplein 200 , Amsterdam, 1097 JB, The Netherlands |
| Pacific Aluminium (New Zealand) Limited; New Zealand | | NZD1 Ordinary shares | | 100 | | Level 6, 109 Featherston Street, Wellington, 6011, New Zealand |
| Pacific Aluminium Bell Bay Sales Pty Limited; Australia | | AUD Ordinary shares | | 100 | | Pacific Aluminium, Level 3, 500 Queen Street, Brisbane QLD 4000, Australia |
| Pacific Aluminium Pty. Limited; Australia(a) | | AUD Ordinary shares | | 100 | | Level 33, 120 Collins Street, Melbourne VIC 3000, Australia |
| Pacific Aluminium Services Pty Limited; Australia | | AUD Ordinary shares | | 100 | | Pacific Aluminium, Level 3, 500 Queen Street, Brisbane QLD 4000, Australia |
| | | | |
| 2016 Annual report | | riotinto.com | | 183 |
| | | | | | | | | | | | | | | | |
| | | | | | | | | |
| STRATEGIC REPORT | | | | DIRECTORS’ REPORT | | | | FINANCIAL STATEMENTS | | | | METALS AND MINERALS PRODUCTION | | | | ADDITIONAL INFORMATION |
Notes to the 2016 financial statements
continued
47 Related undertakingscontinued
| | | | | | | | |
| Name of undertaking and country of incorporation | | Share class | | % of share
class held
by Group
companies | | Registered office address |
| Pacific Coast Mines, Inc.; United States | | US$1.00 Common shares | | 100 | | CSC, 2711 Centerville Road, Suite 400, Wilmington DE 19808 |
| Pechiney Aviatube Limited; United Kingdom | | £1.00 Ordinary shares | | 100 | | 6 St James’s Square, London, SW1Y 4AD,
United Kingdom |
| Pechiney Bâtiment; France | | €15.00 Ordinary shares | | 100 | | 725 rue Aristide Bergès, 38341 Voreppe Cedex, France |
| Pechiney Bécancour, Inc.; United States | | US$1.00 Ordinary shares | | 100 | | CSC, 2711 Centerville Road, Suite 400, Wilmington DE 19808 |
| Pechiney Cast Plate, Inc.; United States | | US$1.00 Ordinary shares | | 100 | | CSC, 2711 Centerville Road, Suite 400, Wilmington DE 19808 |
| Pechiney Consolidated Australia Pty Limited; Australia | | US$1.00 Ordinary shares | | 100 | | 123 Albert Street, Brisbane QLD 4000, Australia |
| Pechiney Dis Ticaret Limited Sirketi; Turkey(g) | | TRY25.00 Ordinary shares | | 100 | | Karakoy Haci Mimi Mah. Vekil Harc Sok. 10 Kat 4, Beyoglu, Istanbul, Turkey |
| Pechiney Holdings, Inc.; United States | | US$1.00 Ordinary shares | | 100 | | CSC, 2711 Centerville Road, Suite 400, Wilmington DE 19808 |
| Pechiney Metals LLC ; United States(c) | | – | | – | | CSC, 2711 Centerville Road, Suite 400, Wilmington DE 19808 |
| Pechiney Philippines Inc.; Philippines | | PHP10.00 Ordinary shares | | 99.9 | | Room 306, ITC Building, 337 Sen Gil Puyat Avenue, Markati, Metro Manila, Philippines |
| Pechiney Plastic Packaging, Inc.; United States | | USD Ordinary shares | | 100 | | CSC, 2711 Centerville Road, Suite 400, Wilmington
DE 19808 |
| Pechiney Sales Corporation; United States | | US$1.00 Ordinary shares | | 100 | | CSC, 2711 Centerville Road, Suite 400, Wilmington DE 19808 |
| Pechiney Vénézuela, S.A.; Venezuela, Bolivarian Republic of(g) | | VEB1,000.00 A shares
VEB10,000.00 B shares | | 100
100 | | Avenida Libertador , Multicentro Empresarial del Estede, Edificio Miranda, Nucleo A, Piso 14, Oficina 146A, Caracas, Venezuela |
| Peko Exploration Pty Ltd.; Australia | | AUD Ordinary shares | | 100 | | 37 Belmont Avenue, Belmont WA 6104, Australia |
| Peko-Wallsend Pty Ltd; Australia | | AUD Ordinary shares | | 100 | | Level 22, Central Park, 152-158 St. Georges Terrace, Perth WA 6000, Australia |
| Pilbara Iron Company (Services) Pty Ltd ; Australia | | AUD Ordinary shares | | 100 | | Level 22, Central Park, 152-158 St. Georges Terrace, Perth WA 6000, Australia |
| Pilbara Iron Pty Ltd; Australia | | AUD Ordinary shares | | 100 | | Level 22, Central Park, 152-158 St. Georges Terrace, Perth WA 6000, Australia |
| Port d’Ehoala S.A.; Madagascar | | US$100.00 Ordinary shares | | 100 | | Immeuble ASSIST, Ivandry , Lot N°35, 5ème étage, 101 Antananarivo , Antananarivo, Madagascar |
| Project Generation Group Pty Ltd; Australia(a) | | AUD Ordinary shares | | 100 | | Level 33, 120 Collins Street, Melbourne VIC 3000, Australia |
| PSZ Pty Limited; Australia | | AUD Ordinary shares | | 100 | | Level 27, Central Park, 152-158 St. Georges Terrace, Perth WA 6000, Australia |
| PT Alcan Packaging Flexipack; Indonesia | | IDR1,000,000.00 Ordinary shares | | 100 | | 31st Floor, Menara BTPN, Jl. Dr. Ide Anak Agung Gde Agung Lot 5.5-5.6, Mega Kuningan, Jakarta, 12950, Indonesia |
| PT Hutan Lindung Kelian Lestari; Indonesia | | IDR9,803.00 Ordinary shares | | 99 | | Kelian Mine Site, West Kutai, East Kalimantan, Indonesia |
| PT Kelian Equatorial Mining; Indonesia | | IDR1,080.00 Ordinary shares | | 90 | | 31st Floor, Menara BTPN, Jl. Dr. Ide Anak Agung Gde Agung Lot 5.5-5.6, Mega Kuningan, Jakarta, 12950, Indonesia |
| PT Mitra Sumbawa Minerals; Indonesia | | US$1.00 Ordinary shares | | 90 | | 15th Floor, Menara Anugrah, Kantor Taman E3.3, Jalan DR. Ide Anak Agung Gde Agung Lot 8.6-8.7, Jakarta, 12950, Indonesia |
| PT Rikit Alas Minerals; Indonesia | | US$1.00 Ordinary shares | | 90 | | 15th Floor, Menara Anugrah, Kantor Taman E3.3,
Jalan DR. Ide Anak Agung Gde Agung Lot 8.6-8.7,
Jakarta, 12950, Indonesia |
| PT Rio Tinto Consultants; Indonesia(g) | | US$1.00 Ordinary shares | | 100 | | 31st Floor, Menara BTPN, Jl. Dr. Ide Anak Agung Gde Agung Lot 5.5-5.6, Mega Kuningan, Jakarta, 12950, Indonesia |
| PT Rio Tinto Exploration; Indonesia(g) | | US$1.00 Ordinary shares | | 100 | | 15th Floor, Menara Anugrah, Kantor Taman E3.3, Jalan DR. Ide Anak Agung Gde Agung Lot 8.6-8.7, Jakarta, 12950, Indonesia |
| PT Rio Tinto Indonesia; Indonesia | | US$1.00 Ordinary shares | | 100
| | 31st Floor, Menara BTPN, Jl. Dr. Ide Anak Agung Gde Agung Lot 5.5-5.6, Mega Kuningan, Jakarta, 12950, Indonesia |
| | | | |
| 184 | | riotinto.com | | 2016 Annual report |
| | | | | | | | |
| Name of undertaking and country of incorporation | | Share class | | % of share
class held
by Group
companies | | Registered office address |
| PT Rio Tinto Irja; Indonesia(g) | | US$1.00 Ordinay shares | | 100 | | 31st Floor, Menara BTPN, Jl. Dr. Ide Anak Agung Gde Agung Lot 5.5-5.6, Mega Kuningan, Jakarta, 12950, Indonesia |
| QIT Madagascar Minerals Ltd; Bermuda | | US$1.00 Ordinay shares | | 100 | | Canon’s Court, 22 Victoria Street, Hamilton, HM 12, Bermuda |
| QIT Madagascar Minerals SA; Madagascar | | US$10.00 Certicats d’investissemant
| | 100 | | Immeuble ASSIST, Ivandry , Lot N°35, 5ème étage, 101 Antananarivo , Antananarivo, Madagascar |
| | US$10.00 Common shares | | 80 | | |
| Quebec North Shore and Labrador Railway Company/ Compagnie de Chemin de Fer du Littoral Nord de Quebec et du Labrador Inc. | | CAD$27.59 Ordinary shares | | 100 | | 400-1190 Avenue des Canadiesn-de-Montréal, Montreal Québec H3B 0E3, Canada
Canada |
Queensland Coal Pty. Limited; Australia | | AUD Ordinary shares | | 100 | | 123 Albert Street, Brisbane QLD 4000, Australia |
Química e Metalúrgica Mequital Ltda.; Brazil(g) | | BRL Ordinary shares | | 100 | | Av. das Nacoes Unida, 12551 19o, andar, CJ 1911, 04578-000, Sao Paulo, SP, Brazil |
| R.W. Miller (Holdings) Limited; Australia | | AUD Ordinary shares | | 100 | | 123 Albert Street, Brisbane QLD 4000, Australia |
| Ranges Management Company Pty Ltd; Australia | | AUD Ordinary shares | | 100 | | Level 22 Central Park, 152-158 St. Georges Terrace, Perth WA 6000, Australia |
Ranges Mining Pty Ltd; Australia | | AUD Ordinary shares | | 100 | | Level 22 Central Park, 152-158 St. Georges Terrace, Perth WA 6000, Australia |
Resolution Copper Company; United States | | US$0.01 Common shares | | 100 | | CSC, 2711 Centerville Road, Suite 400, Wilmington DE 19808 |
Resolution Copper Mining LLC; United States(c) | | – | | – | | CSC, 2711 Centerville Road, Suite 400, Wilmington DE 19808 |
Richards Bay Mining (Proprietary) Limited; South Africa | | ZAR0.01 B Ordinary shares
ZAR1 A Ordinary shares | | 99.9
100 | | The Farm RBM, Number 16317, KwaZulu-Natal, South Africa |
Richards Bay Mining Holdings (Proprietary) Limited; South Africa | | ZAR1.00 A Ordinary shares
ZAR1.00 B Ordinary shares | | 100
100 | | The Farm RBM, Number 16317, KwaZulu-Natal, South Africa |
| Richards Bay Prefco (Pty) Ltd; South Africa | | ZAR0.01 Preference shares | | 100 | | The Farm RBM, Number 16317, KwaZulu-Natal, South Africa |
Richards Bay Mining (Proprietary) Limited; South Africa | | ZAR0.01 Prefence shares shares | | 100 | | The Farm RBM, Number 16317, KwaZulu-Natal, South Africa |
Richards Bay Titanium (Proprietary) Limited;
South Africa | | ZAR0.01 B Preference
shares | | 100 | | The Farm RBM, Number 16317, KwaZulu-Natal,
South Africa |
| | ZAR0.01 BHP Billiton Preference shares | | 100 | | |
| | ZAR0.01 B Ordinary shares | | 100 | | |
| Richards Bay Titanium Holdings (Proprietary) Limited; South Africa | | ZAR1.00 A Ordinary shares
ZAR1.00 B Ordinary shares | | 100
100 | | The Farm RBM, Number 16317, KwaZulu-Natal, South Africa |
| Rio de Contas Desenvolvimentos Minerais Ltda; Brazil | | BRL Quota shares | | 100 | | Rua Coronel Durval Matos, S/N. Centro, Municipio de Jaguaquara, Estado da Bahia, CEP45345-000, Brazil |
| Rio Sava Exploration DOO; Serbia(c) | | – | | – | | Takovska 45, Belgrade, 11000, Serbia, Republic of |
| Rio Tinto (Commercial Paper) Limited; Australia(a) | | AUD Ordinary shares | | 100 | | Level 33, 120 Collins Street, Melbourne VIC 3000, Australia |
| Rio Tinto (Hong Kong) Ltd; Hong Kong | | HKD Ordinary shares | | 100 | | Suite 2802, 28/F, Lippo Centre Tower 2, 89 Queensway, Admiralty, Hong Kong |
| Rio Tinto (Mauritius) Pty Limited; Mauritius(g) | | US$1.00 Ordinary shares | | 100 | | 6th Floor, Tower A, 1 Cybercity, Ebene, Mauritius |
| Rio Tinto Advisory Services Pty Limited; Australia | | AUD Ordinary shares | | 100 | | Level 33, 120 Collins Street, Melbourne VIC 3000, Australia |
| Rio Tinto Alcan Fund Inc.; Canada | | CAD Ordinary shares | | 100 | | 400-1190 Avenue des Canadiens-de-Montréal, Montreal Québec H3B 0E3, Canada |
| Rio Tinto Alcan Inc.; Canada | | CAD Common shares | | 100 | | 400-1190 Avenue des Canadiens-de-Montréal, Montreal Québec H3B 0E3, Canada |
| Rio Tinto Alcan International Ltd. / Rio Tinto Alcan International Ltee; Canada | | CAD Common shares | | 100 | | 400-1190 Avenue des Canadiens-de-Montréal, Montreal Québec H3B 0E3, Canada |
| Rio Tinto Alcan Middle East DMCC; United Arab Emirates | | AED1,000 Ordinary shares | | 100 | | Gold Tower, Jlt Cluster I, 8th Floor, Unit E, Dubai, PO BOX 340801, United Arab Emirates |
| Rio Tinto Alcan Technology Pty Ltd; Australia | | AUD Ordinary shares | | 100 | | 123 Albert Street, Brisbane QLD 4000, Australia |
| Rio Tinto Almazpoisk LLC; Russian Federation(c) | | – | | – | | 3, Aleksandra Lukyanova, 105066, Moscow, Russian Federation |
| Rio Tinto Aluminium (Bell Bay) Limited; Australia | | AUD 7.5% Cumulative preference shares | | 100 | | Pacific Aluminium, Level 3, 500 Queen Street, Brisbane QLD 4000, Australia |
| | AUD Ordinary shares | | 100 | | |
| Rio Tinto Aluminium (Holdings) Limited; Australia | | AUD Ordinary shares | | 100 | | 123 Albert Street, Brisbane QLD 4000, Australia |
| | | | |
| 2016 Annual report | | riotinto.com | | 185 |
| | | | | | | | | | | | | | | | |
| | | | | | | | | |
| STRATEGIC REPORT | | | | DIRECTORS’ REPORT | | | | FINANCIAL STATEMENTS | | | | METALS AND MINERALS PRODUCTION | | | | ADDITIONAL INFORMATION |
Notes to the 2016 financial statements
continued
47 Related undertakingscontinued
| | | | | | | | |
| Name of undertaking and country of incorporation | | Share class | | % of share
class held
by Group
companies | | Registered office address |
| Rio Tinto Aluminium Limited; Australia | | AUD Ordinary shares | | 100 | | 123 Albert Street, Brisbane QLD 4000, Australia |
| Rio Tinto America Holdings Inc.; United States | | US$0.01 Class A common shares | | 100 | | CSC, 2711 Centerville Road, Suite 400, Wilmington DE 19808 |
| | US$100.00 Series A preferred stock | | 100 | | |
| Rio Tinto America Inc.; United States | | US$100.00 Common shares | | 100 | | CSC, 2711 Centerville Road, Suite 400, Wilmington
DE 19808 |
| Rio Tinto Asia Ltd; Hong Kong | | HKD Ordinary shares | | 100 | | Suite 2802, 28/F, Lippo Centre Tower 2, 89 Queensway, Admiralty, Hong Kong |
| Rio Tinto Asia Pty. Limited.; Australia(a) | | AUD Class A shares
AUD Ordinary shares | | 100
100 | | Level 33, 120 Collins Street, Melbourne VIC 3000, Australia |
| Rio Tinto AuM Company; United States | | US$0.01 Common shares | | 100 | | CSC, 2711 Centerville Road, Suite 400, Wilmington DE 19808 |
| Rio Tinto Australian Holdings Limited; United Kingdom | | £1.00 Ordinary shares
US$1.00 Ordinary shares | | 100
100 | | 6 St James’s Square, London, SW1Y 4AD, United Kingdom |
| Rio Tinto Bahia Holdings Limited; United Kingdom | | US$1.00 Ordinary shares | | 100 | | 6 St James’s Square, London, SW1Y 4AD, United Kingdom |
| Rio Tinto Base Metals Pty. Limited; Australia(a) | | AUD Ordinary shares | | 100 | | Level 33, 120 Collins Street, Melbourne VIC 3000, Australia |
| Rio Tinto Brazilian Holdings Limited; United Kingdom | | £1.00 Ordinary shares
US$1.00 Ordinary shares | | 100
100 | | 6 St James’s Square, London, SW1Y 4AD, United Kingdom |
| Rio Tinto Brazilian Investments Limited; United Kingdom | | £1.00 Ordinary shares
£1.00 Ordinary shares | | 100
100 | | 6 St James’s Square, London, SW1Y 4AD, United Kingdom |
| Rio Tinto Canada Diamond Operation Management Inc.; Canada | | CAD Common shares | | 100 | | 300-5201 50th Avenue, PO Box 2498, Yellowknife NT X1A 2P8, Canada |
| Rio Tinto Canada Inc; Canada | | CAD Class B shares
CAD Class C shares
CAD Class D shares
CAD Class J Shares
Class K Shares | | 100
100
100
100
100 | | 400-1190 Avenue des Canadiens-de-Montréal, Montreal Québec H3B 0E3, Canada |
| Rio Tinto Canada Management Inc./ Rio Tinto Gestion Canada Inc. ; Canada | | CAD Common shares
CAD Preferred shares | | 100
100 | | 400-1190 Avenue des Canadiens-de-Montréal, Montreal Québec H3B 0E3, Canada |
| Rio Tinto Canada Uranium Corporation; Canada | | CAD Common shares | | 100 | | 400-1190 Avenue des Canadiens-de-Montréal, Montreal Québec H3B 0E3, Canada |
| Rio Tinto Coal (Clermont) Pty Ltd; Australia | | AUD Ordinary shares | | 100 | | 123 Albert Street, Brisbane QLD 4000, Australia |
| Rio Tinto Coal (NSW) Pty Limited; Australia | | AUD Ordinary shares | | 100 | | 123 Albert Street, Brisbane QLD 4000, Australia |
| Rio Tinto Coal Australia Pty Limited; Australia | | AUD Ordinary shares | | 100 | | 123 Albert Street, Brisbane QLD 4000, Australia |
| Rio Tinto Coal Investments Pty Limited; Australia | | AUD Ordinary shares | | 100 | | 123 Albert Street, Brisbane QLD 4000, Australia |
| Rio Tinto Coal NSW Holdings Limited; Australia(a) | | AUD Ordinary shares | | 100 | | 123 Albert Street, Brisbane QLD 4000, Australia |
| Rio Tinto Desenvolvimentos Minerais LTDA.; Brazil | | BRL Quotas shares | | 100 | | SIG Quadra 04, Lote 175, Torre A, Salas 106 a 109,
Edificio Capital Financial Center, Brasilia, CEP
70610-440, Brazil |
| Rio Tinto Diamonds and Minerals Canada Holding Inc.; Canada | | CAD Class A (dividend rights) | | 100 | | 300-5201 50th Avenue, PO Box 2498, Yellowknife NT X1A 2P8, Canada |
| | CAD Class B shares | | 100 | | |
| | CAD Class C (voting rights) shares | | 100 | | |
| | CAD Class P1 preferred shares | | 100 | | |
| Rio Tinto Diamonds Limited; United Kingdom | | US$1.00 Ordinary shares | | 100 | | 6 St James’s Square, London, SW1Y 4AD, United Kingdom |
| Rio Tinto Diamonds Netherlands B.V.; Netherlands | | €500.00 Ordinary shares | | 100 | | Aluminiumstraat 1, 4823AL Breda, Postbus 3408, 4800DK, Breda, Netherlands |
| Rio Tinto Diamonds NV; Belgium | | EUR Ordinary shares | | 100 | | Hoveniersstraat 53, 2018 Antwerp, Belgium |
| Rio Tinto Eastern Investments B.V.; Netherlands | | €453.78 Ordinary shares | | 100 | | 6 St James’s Square, London, SW1Y 4AD, United Kingdom |
| Rio Tinto Energy America Inc.; United States | | US$0.01 Common shares | | 100 | | CSC, 2711 Centerville Road, Suite 400, Wilmington DE 19808 |
| Rio Tinto Energy Limited; United Kingdom | | US$1.00 Ordinary shares | | 100 | | 6 St James’s Square, London, SW1Y 4AD, United Kingdom |
| Rio Tinto Escondida Limited; Bermuda | | US$1.00 Ordinary shares | | 100 | | 22 Canon’s Court, Victoria Street, Hamilton, HM 12, Bermuda |
| Rio Tinto European Holdings Limited; United Kingdom(b) | | £1.00 Ordinary shares | | 100 | | 6 St James’s Square, London, SW1Y 4AD,
United Kingdom |
| | | | |
| 186 | | riotinto.com | | 2016 Annual report |
| | | | | | | | |
| Name of undertaking and country of incorporation | | Share class | | % of share
class held
by Group
companies | | Registered office address |
| Rio Tinto Exploration (Asia) Holdings Pte. Ltd.; Singapore | | US$1.00 Ordinary shares | | 100 | | 12 Marina Boulevard, #20-01 Marina Bay Financial Centre Tower 3, Singapore, 018982, Singapore |
| Rio Tinto Exploration (PNG) Limited; Papua New Guinea(a) | | PGK1.00 Ordinary shares | | 100 | | c/o BDO Accountants, Section 15, Lot 15, Bernal Street, National Capital District, Papua New Guinea |
| Rio Tinto Exploration and Mining (India) Private Limited; India | | INR10.00 Ordinary shares | | 100 | | 21st Floor, DLF Building No.5, Tower A, DLF Cyber City, Phase –III, Gurgaon, Haryana, 122002, India |
| Rio Tinto Exploration Canada Inc.; Canada | | CAD Class A shares CAD Class B shares CAD Class C shares CAD Class D shares CAD Class E preferred shares | | 100
100 100 100 100 | | 400-1190 Avenue des Canadiens-de-Montréal, Montreal Québec H3B 0E3, Canada |
| | | | |
| | | | |
| | | | |
| | | | |
| Rio Tinto Exploration Gabon SA; Gabon(g) | | XAF10,000 Ordinary shares | | 100 | | C/O NEW ACE Baker Tilly, Quartier Louis – Quaben, Libreville, B.P : 3981 , Gabon |
| Rio Tinto Exploration India Private Limited; India | | INR10.00 Ordinary shares | | 100 | | Apartment No.100 A/5, Ground Floor, The Capital
Court, Olof Palme Marg, Munirka, NEW DELHI
110067, India |
| Rio Tinto Exploration Kazakhstan LLP; Kazakhstan(c) | | – | | – | | Dostyk 310/G, Almaty, Kazakhstan, 050020, Kazakhstan |
| Rio Tinto Exploration Pty Limited; Australia(a) | | AUD Class B shares | | 100 | | 37 Belmont Avenue, Belmont WA 6104, Australia |
| | AUD Class C shares | | 100 | | |
| | AUD Ordinary shares | | 100 | | |
| Rio Tinto Exploration Zambia Limited; Zambia | | ZMW1.00 Ordinary shares | | 100 | | Plot 3827, Parliament Road, Olympia, Lusaka, Zambia |
| Rio Tinto Fer et Titane inc.; Canada | | CAD Class B preference shares | | 100 | | 1625 Route Marie-Victorin, Sorel-Tracy QC J3R 1M6, Canada |
| | CAD Common shares | | 100 | | |
| | CAD$0.01 Preferred shares | | 100 | | |
| Rio Tinto FH Limited; United Kingdom | | £1.00 Ordinary shares | | 100 | | 6 St James’s Square, London, SW1Y 4AD, United Kingdom |
| Rio Tinto Finance (USA) Limited; Australia(a) | | AUD Ordinary shares | | 100 | | Level 33, 120 Collins Street, Melbourne VIC 3000, Australia |
| Rio Tinto Finance (USA) plc; United Kingdom | | £1.00 Ordinary shares | | 100 | | 6 St James’s Square, London, SW1Y 4AD, United Kingdom |
| Rio Tinto Finance Canada Inc./Finances Rio Tinto Canada Inc.; Canada | | CAD Ordinary shares | | 100 | | 400-1190 Avenue des Canadiens-de-Montréal, Montreal Québec H3B 0E3, Canada |
| Rio Tinto Finance Limited; Australia(a) | | AUD Ordinary shares | | 100 | | Level 33, 120 Collins Street, Melbourne VIC 3000, Australia |
| Rio Tinto Finance plc; United Kingdom | | £1.00 Ordinary shares
US$1.00 Ordinary shares | | 100
100 | | 6 St James’s Square, London, SW1Y 4AD, United Kingdom |
| Rio Tinto France S.A.S.; France | | €15.25 Ordinary shares | | 100 | | 17 Place des Reflets, La Defense 2, 92400,
Courbevoie, France |
| Rio Tinto Global Employment Company Pte. Ltd.; Singapore | | US$1.00 Ordinary shares | | 100 | | 12 Marina Boulevard, #20-01 Marina Bay Financial Centre Tower 3, Singapore, 018982, Singapore |
| Rio Tinto Guinée S.A.; Guinea | | GNF100,000.00 Ordinary shares | | 100 | | Route de la Corniche Nord, Cité Ministérielle—Rue DI 256 Quartier Landréah, Commune de Dixinn—BP 99, Conakry, Guinea |
| Rio Tinto Holdings LLC; Mongolia | | MNT20,000.00 Ordinary shares | | 100 | | Suite No 201, Seoul Business Centre, Zaluuchuud Avenue 26, BZD-1, Ulaanbaatar, 13380, Mongolia |
| Rio Tinto Hydrogen Energy Australia Pty Limited; Australia(a) | | AUD Ordinary shares | | 100 | | Level 33, 120 Collins Street, Melbourne VIC 3000, Australia |
| Rio Tinto Hydrogen Energy LLC; United States(c) | | – | | – | | CSC, 2711 Centerville Road, Suite 400, Wilmington DE 19808 |
| Rio Tinto Iceland Ltd.; Iceland | | ISK1.00 Registered shares | | 100 | | P.O. Box 244, IS-222, Hafnarfjördur, Iceland |
| Rio Tinto India Private Limited; India | | INR10.00 Ordinary shares | | 100 | | Apartment No.100 A/5, Ground Floor, The Capital Court, Olof Palme Marg, Munirka, NEW DELHI 110067, India |
| Rio Tinto Indonesian Holdings Limited; United Kingdom | | £1.00 Ordinary shares
US$1.00 Ordinary shares | | 100
100 | | 6 St James’s Square, London, SW1Y 4AD, United Kingdom |
| Rio Tinto International Holdings Limited; United Kingdom(b) | | £1.00 Ordinary shares | | 100 | | 6 St James’s Square, London, SW1Y 4AD, United Kingdom |
| Rio Tinto International Trading (Shanghai) Co Ltd; China(g) | | US$1.00 Ordinary shares | | 100 | | Room 1615-3, No. 1 Jilong Road, China (Shanghai) Pilot Free Trade Zone, Shanghai, 200031, China |
| | | | |
| 2016 Annual report | | riotinto.com | | 187 |
| | | | | | | | | | | | | | | | |
| | | | | | | | | |
| STRATEGIC REPORT | | | | DIRECTORS’ REPORT | | | | FINANCIAL STATEMENTS | | | | METALS AND MINERALS PRODUCTION | | | | ADDITIONAL INFORMATION |
Notes to the 2016 financial statements
continued
47 Related undertakingscontinued
| | | | | | | | |
| Name of undertaking and country of incorporation | | Share class | | % of share
class held
by Group
companies | | Registered office address |
| Rio Tinto Investments One Pty Limited; Australia | | AUD Ordinary shares | | 100 | | Level 22 Central Park, 152-158 St. Georges Terrace, Perth WA 6000, Australia |
| Rio Tinto Investments Two Pty Limited; Australia | | AUD Ordinary shares | | 100 | | Level 22 Central Park, 152-158 St. Georges Terrace, Perth WA 6000, Australia |
| Rio Tinto Iron & Titanium (Suzhou) Co., Ltd; China | | US$1.00 Ordinary shares | | 100 | | 418 Nanshi Street, Suzhou Industrial Park, Suzhou, 215021, China |
| Rio Tinto Iron & Titanium GmbH; Germany(c) | | – | | – | | Mergenthalerallee 77, D-65760, Eschborn, (Frankfurt am Main), Germany |
| Rio Tinto Iron & Titanium Holdings GmbH; Germany(c) | | – | | – | | Mergenthalerallee 77, D-65760, Eschborn, (Frankfurt am Main), Germany |
| Rio Tinto Iron & Titanium Limited; United Kingdom | | £1.00 Ordinary shares | | 100 | | 6 St James’s Square, London, SW1Y 4AD, United Kingdom |
| Rio Tinto Iron and Titanium Canada Inc./Rio Tinto Fer et Titane Canada Inc.; Canada | | CAD Common shares | | 100 | | 1625 Route Marie-Victorin, Sorel-Tracy QC J3R 1M6, Canada |
| Rio Tinto Iron Ore Asia Pte Ltd; Singapore | | US$1.00 Ordinary shares | | 100 | | 12 Marina Boulevard, #20-01 Marina Bay Financial Centre Tower 3, Singapore, 018982, Singapore |
| Rio Tinto Iron Ore Atlantic Limited; United Kingdom | | US$1.00 Ordinary shares | | 100 | | 6 St James’s Square, London, SW1Y 4AD, United
Kingdom |
| Rio Tinto Iron Ore Europe S.A.S.; France | | €100.00 Ordinary shares | | 100 | | 17 Place des Reflets, La Defense 2, 92400, Courbevoie, France |
| Rio Tinto Iron Ore Trading China Limited; United Kingdom | | US$1.00 Ordinary shares | | 100 | | 6 St James’s Square, London, SW1Y 4AD, United Kingdom |
| Rio Tinto Japan Ltd; Japan | | JPY500 Ordinary shares | | 100 | | 8th Floor, Kojimachi Diamond Building, 1 Kojimachi 4-chome, Chiyoda-ku, Tokyo 102-0083, Japan |
| Rio Tinto Jersey Holdings 2010 Limited; Jersey | | USD Ordinary shares | | 100 | | 22 Grenville Street, St Helier, JE4 8PX, Jersey |
| Rio Tinto Korea Ltd; Korea, Republic of | | KRW10,000.00 Ordinary shares | | 100 | | 2nd Floor, JS Tower, 6 Teheran-ro 79-gil, Gangnam-Gu, Seoul, 135-877, Korea, Republic of |
| Rio Tinto Logistic Services Pty Ltd; Australia(a) | | AUD Ordinary shares | | 100 | | Level 33, 120 Collins Street, Melbourne VIC 3000, Australia |
| Rio Tinto London Limited; United Kingdom | | £1.00 Ordinary shares | | 100 | | 6 St James’s Square, London, SW1Y 4AD, United Kingdom |
| Rio Tinto Management Services South Africa (Proprietary) Ltd; South Africa | | ZAR2.00 Ordinary shares | | | | 1 Harries Road, Illovo, Sandton, 2196, Sandton, South Africa, 2196, South Africa |
| Rio Tinto Marketing Pte. Ltd.; Singapore | | SGD$1.00 Ordinary shares
US$1.00 Ordinary shares | | 100
100 | | 12 Marina Boulevard, #20-01 Marina Bay Financial Centre Tower 3, Singapore, 018982, Singapore |
| Rio Tinto Marketing Services Limited; United Kingdom | | £1.00 Ordinary shares | | 100 | | 6 St James’s Square, London, SW1Y 4AD, United Kingdom |
| Rio Tinto Medical Plan Trustees Limited; United Kingdom | | £1.00 Ordinary shares | | 100 | | 6 St James’s Square, London, SW1Y 4AD, United Kingdom |
| Rio Tinto Metals Limited; United Kingdom | | £1.00 Ordinary shares
US$1.00 Ordinary shares | | 100 | | 6 St James’s Square, London, SW1Y 4AD, United Kingdom |
| Rio Tinto Minera Peru Limitada SAC; Peru | | PEN100.00 Ordinary shares | | 100 | | Av. La Paz 1049, Oficina 501, Lima 18, Peru |
| Rio Tinto Mineracao do Brasil Ltda; Brazil | | BRL1 Quotas shares | | 100 | | SIG Quadra 04, Lote 175, Torre A, Salas 106 a 109, Edificio Capital Financial Center, , Brasilia, Brasilia, CEP 70610-440, Brazil |
| Rio Tinto Minerals Asia Pte Ltd; Singapore | | SGD$1.00 Ordinary shares
US$1.00 Ordinary shares | | 100
100 | | 12 Marina Boulevard, #20-01 Marina Bay Financial Centre Tower 3, Singapore, 018982, Singapore |
Rio Tinto Minerals Development Limited; United
Kingdom | | £0.25 Ordinary shares | | 100 | | 6 St James’s Square, London, SW1Y 4AD, United
Kingdom |
| Rio Tinto Minerals Inc.; United States | | US$0.01 Common shares | | 100 | | CSC, 15 West South Temple, Suite 1701, Salt Lake City UT 84101, United States |
| Rio Tinto Mining and Exploration Inc.; United States | | US$1.00 Common shares | | 100 | | CSC, 2711 Centerville Road, Suite 400, Wilmington DE 19808 |
| Rio Tinto Mining and Exploration Limited; United Kingdom | | £1.00 Ordinary shares
US$1.00 Ordinary shares | | 100
100 | | 6 St James’s Square, London, SW1Y 4AD, United Kingdom |
| Rio Tinto Mining and Exploration S.A.C.; Peru | | PEN0.5 Ordinary shares | | 100 | | Calle General Borgono N 1034, Miraflores, Lima 18, Peru |
| Rio Tinto Namibian Holdings Limited; United Kingdom | | £1.00 Ordinary shares | | 100 | | 6 St James’s Square, London, SW1Y 4AD, United Kingdom |
| Rio Tinto Nickel Company; United States | | US$0.01 Common shares | | 100 | | CSC, 2711 Centerville Road, Suite 400, Wilmington DE 19808 |
| Rio Tinto Nominees Limited; United Kingdom | | £1.00 Ordinary shares | | 100 | | 6 St James’s Square, London, SW1Y 4AD, United Kingdom |
| Rio Tinto Orissa Mining Private Ltd; India | | INR100.00 Ordinary shares | | 51 | | N-3 / 356, IRC Village, Nayapalli, Bhubaneswar , Orissa, 751015, India |
| | | | |
| 188 | | riotinto.com | | 2016 Annual report |
| | | | | | | | |
| Name of undertaking and country of incorporation | | Share class | | % of share
class held
by Group
companies | | Registered office address |
| Rio Tinto OT Management Limited; United Kingdom | | US$1.00 Ordinary shares | | 100 | | 6 St James’s Square, London, SW1Y 4AD, United Kingdom |
| Rio Tinto Overseas Holdings Limited; United Kingdom | | £1.00 Ordinary shares
US$1.00 Ordinary shares | | 100
100 | | 6 St James’s Square, London, SW1Y 4AD, United Kingdom |
| Rio Tinto Pension Investments Limited; United Kingdom(b) | | £1.00 Ordinary shares | | 100 | | 6 St James’s Square, London, SW1Y 4AD, United Kingdom |
| Rio Tinto Peru Limited; United Kingdom | | US$1.00 Ordinary shares | | 100 | | 6 St James’s Square, London, SW1Y 4AD, United Kingdom |
| Rio Tinto Potash Management Inc./Rio Tinto Potasse Management Inc.; Canada | | CAD Common shares | | 100 | | 400-1190 Avenue des Canadiens-de-Montréal, Montreal Québec H3B 0E3, Canada |
| Rio Tinto Procurement (Singapore) Pte Ltd; Singapore | | US$1.00 Ordinary shares | | 100 | | 12 Marina Boulevard, #20-01 Marina Bay Financial Centre Tower 3, Singapore, 018982, Singapore |
| Rio Tinto Pte Ltd; Singapore | | SGD$1.00 Ordinary shares
SGD$1.00 Preference shares | | 100
100 | | 12 Marina Boulevard, #20-01 Marina Bay Financial Centre Tower 3, Singapore, 018982, Singapore |
| Rio Tinto Saskatchewan Management Inc.; Canada | | CAD Common shares | | 100 | | 400-1190 Avenue des Canadiens-de-Montréal, Montreal Québec H3B 0E3, Canada |
Rio Tinto Saskatchewan Potash Holdings General
Partner Inc.; Canada | | CAD Common shares | | 100 | | McCarthy Tetrault LLP, Suite 5300, TD Bank Tower
66 Wellington Street West, Toronto ON M5K 1E6,
Canada |
| Rio Tinto Saskatchewan Potash Holdings Limited Partnership; Canada(c) | | – | | – | | McCarthy Tetrault LLP, Suite 5300, TD Bank Tower 66 Wellington Street West, Toronto ON M5K 1E6, Canada |
| Rio Tinto Services Inc.; United States | | US$0.01 Common shares | | 100 | | CSC, 2711 Centerville Road, Suite 400, Wilmington DE 19808 |
| Rio Tinto Services Limited; Australia(a) | | AUD Class Z shares
AUD Ordinary shares | | 100
100 | | Level 33, 120 Collins Street, Melbourne VIC 3000, Australia |
| Rio Tinto Shared Services Pty Limited; Australia | | AUD Ordinary shares | | 100 | | Level 33, 120 Collins Street, Melbourne VIC 3000, Australia |
| Rio Tinto Shipping (Asia) Pte. Ltd.; Singapore | | US$1.00 Ordinary shares | | 100 | | 12 Marina Boulevard, #20-01 Marina Bay Financial Centre Tower 3, Singapore, 018982, Singapore |
| Rio Tinto Shipping Pty. Limited.; Australia(a) | | AUD Ordinary shares | | 100 | | Level 33, 120 Collins Street, Melbourne VIC 3000, Australia |
| Rio Tinto Simfer UK Limited; United Kingdom | | US$1.00 Ordinary shares | | 100 | | 6 St James’s Square, London, SW1Y 4AD, United Kingdom |
| Rio Tinto Singapore Holdings Pte Ltd; Singapore | | SGD$1.00 Ordinary shares
USD Ordinary shares | | 100
100 | | 12 Marina Boulevard, #20-01 Marina Bay Financial Centre Tower 3, Singapore, 018982, Singapore |
| Rio Tinto Sohar Logistics LLC; Oman | | OMR1.00 Ordinary shares | | 70 | | P.O. Box 686, Ruwi, 112, Oman |
| Rio Tinto South East Asia Limited; United Kingdom | | £1.00 Ordinary shares
US$1.00 Ordinary shares | | 100
100 | | 6 St James’s Square, London, SW1Y 4AD, United Kingdom |
| Rio Tinto Staff Fund Pty Limited; Australia(a) | | AUD Ordinary shares | | 100 | | Level 33, 120 Collins Street, Melbourne VIC 3000, Australia |
| Rio Tinto Sulawesi Holdings Limited; United Kingdom | | US$1.00 Ordinary shares | | 100 | | 6 St James’s Square, London, SW1Y 4AD, United Kingdom |
| Rio Tinto Technological Resources Inc.; United States | | US$0.01 Common shares | | 100 | | CSC, 2711 Centerville Road, Suite 400, Wilmington DE 19808 |
| Rio Tinto Technological Resources UK Limited; United Kingdom | | US$1.00 Ordinary shares | | 100 | | 6 St James’s Square, London, SW1Y 4AD, United Kingdom |
| Rio Tinto Trading (Shanghai) Co., Ltd.; China | | US$1.00 Ordinary shares | | 100 | | 41/F Wheelock Square, No. 1717 West Nanjing Road, Jing’ an District, Shanghai, 200040, China |
| Rio Tinto Uranium Limited; United Kingdom | | US$1.00 Ordinary shares | | 100 | | 6 St James’s Square, London, SW1Y 4AD, United Kingdom |
| Rio Tinto Uranium Services Limited; United Kingdom | | US$1.00 Ordinary shares | | 100 | | 6 St James’s Square, London, SW1Y 4AD, United Kingdom |
| Rio Tinto Vostok Limited; United Kingdom | | US$1.00 Ordinary shares | | 100 | | 6 St James’s Square, London, SW1Y 4AD, United Kingdom |
| Rio Tinto Western Holdings Limited; United Kingdom | | £1.00 Ordinary shares
US$1.00 Ordinary shares | | 100
100 | | 6 St James’s Square, London, SW1Y 4AD, United Kingdom |
| Riversdale Anthracite Colliery (Proprietary) Ltd; South Africa | | ZAR2.00 Ordinary shares | | 74 | | Ground Floor – Cypress Place North, Woodmead Business Park, 140-142 Western Service Road, Woodmead, 2151, South Africa |
| Riversdale Connections (Proprietary) Ltd; South Africa | | ZAR1.00 Ordinary shares | | 100 | | Ground Floor – Cypress Place North, Woodmead Business Park140/142 Western Service Road, Woodmead, 2191, South Africa |
| | | | |
| 2016 Annual report | | riotinto.com | | 189 |
| | | | | | | | | | | | | | | | |
| | | | | | | | | |
| STRATEGIC REPORT | | | | DIRECTORS’ REPORT | | | | FINANCIAL STATEMENTS | | | | METALS AND MINERALS PRODUCTION | | | | ADDITIONAL INFORMATION |
Notes to the 2016 financial statements
continued
47 Related undertakingscontinued
| | | | | | | | |
| Name of undertaking and country of incorporation | | Share class | | % of share
class held
by Group
companies | | Registered office address |
| Robe River Limited; Australia | | AUD Ordinary shares | | 100 | | Level 27, Central Park, 152-158 St. Georges Terrace, Perth WA 6000, Australia |
| Robe River Mining Co. Pty. Ltd.; Australia | | AUD Class A shares
AUD Class B shares | | 40
76.4 | | Level 27, Central Park, 152-158 St. Georges Terrace, Perth WA 6000, Australia |
| Rocklea Station Pty Ltd; Australia | | AUD Ordinary shares | | 100 | | Level 22 Central Park, 152-158 St. Georges Terrace, Perth WA 6000, Australia |
| Rössing Uranium Limited; Namibia | | NAD1 “B” Shares shares
NAD0.1 “C” Shares | | 71.2
70.6 | | 360 Sam Nujoma Drive, Klein Windhoek, Windhoek, Namibia |
| RTA AAL Australia Limited; Australia | | AUD Ordinary shares | | 100 | | 123 Albert Street, Brisbane QLD 4000, Australia |
| RTA Boyne Limited; Australia | | AUD Ordinary shares | | 100 | | Pacific Aluminium, Level 3, 500 Queen Street, Brisbane QLD 4000, Australia |
| RTA Holdco 1 Limited; United Kingdom | | USD Ordinary shares | | 100 | | 6 St James’s Square, London, SW1Y 4AD, United Kingdom |
| RTA Holdco 4 Limited; United Kingdom | | US$1.00 Ordinary shares
US$0.73 Ordinary shares | | 100
100 | | 6 St James’s Square, London, SW1Y 4AD, United Kingdom |
| RTA Holdco 7 Limited; United Kingdom | | US$1.00 Ordinary shares
USD Class A preference shares | | 100
100 | | 6 St James’s Square, London, SW1Y 4AD, United Kingdom |
| RTA Holdco 8 Limited; United Kingdom | | US$1.00 Ordinary shares
USD Class A preference shares | | 100
100 | | 6 St James’s Square, London, SW1Y 4AD, United Kingdom |
| RTA Holdco Australia 1 Pty Ltd; Australia | | AUD Ordinary shares | | 100 | | 123 Albert Street, Brisbane QLD 4000, Australia |
| RTA Holdco Australia 3 Pty Ltd; Australia | | AUD Ordinary shares | | 100 | | 123 Albert Street, Brisbane QLD 4000, Australia |
| RTA Holdco Australia 5 Pty Ltd; Australia | | AUD Ordinary shares | | 100 | | 123 Albert Street, Brisbane QLD 4000, Australia |
| RTA Holdco Australia 6 Pty Ltd; Australia | | AUD Ordinary shares | | 100 | | 123 Albert Street, Brisbane QLD 4000, Australia |
| RTA Pacific Pty Limited; Australia | | AUD Ordinary shares | | 100 | | 123 Albert Street, Brisbane QLD 4000, Australia |
| RTA Sales Pty Ltd; Australia | | AUD Class A shares
AUD Class B shares | | 100
100 | | 123 Albert Street, Brisbane QLD 4000, Australia |
| RTA Smelter Development Pty Limited; Australia | | AUD Ordinary shares | | 100 | | 123 Albert Street, Brisbane QLD 4000, Australia |
| RTA Weipa Pty Ltd; Australia | | AUD Ordinary shares | | 100 | | 123 Albert Street, Brisbane QLD 4000, Australia |
| RTA Yarwun Pty Ltd; Australia | | AUD Ordinary shares | | 100 | | 123 Albert Street, Brisbane QLD 4000, Australia |
| RTAlcan 1 LLC; United States | | USD Common shares
USD Class A preferred shares | | 100
100 | | CSC, 2711 Centerville Road, Suite 400, Wilmington DE 19808 |
| RTAlcan 2 LLC; United States | | USD Common shares | | 100 | | CSC, 2711 Centerville Road, Suite 400, Wilmington DE 19808 |
| RTAlcan 3 LLC; United States | | USD Common shares | | 100 | | CSC, 2711 Centerville Road, Suite 400, Wilmington DE 19808 |
| RTLDS Aus Pty. Ltd; Australia(a) | | AUD Ordinary shares | | 100 | | Level 33, 120 Collins Street, Melbourne VIC 3000, Australia |
| RTLDS UK Limited; United Kingdom | | £1.00 Ordinary shares | | 100 | | 6 St James’s Square, London, SW1Y 4AD, United Kingdom |
| RTMDC LLC; Mongolia | | MNT1,240.00 Common shares | | 100 | | 7 floor, Seoul Business Centre, Zaluuchuud avenue – 26, 1st khoroo, Bayanzurkh district, Ulaanbaatar, 13381, Mongolia |
| RTPDS Aus Pty Ltd; Australia | | AUD Ordinary shares | | 100 | | Level 33, 120 Collins Street, Melbourne VIC 3000, Australia |
| Saryarka B.V.; Netherlands | | €200.00 Ordinary shares | | 75 | | Aluminiumstraat 1, 4823AL Breda, Postbus 3408, 4800DK, Breda, Netherlands |
| Savoie Services Y.K.; Japan | | JPY50,000 Ordinary shares | | 100 | | Harumi, 3 Nagahama-cho, Ozu-city, Ehime-ken, 799-3412, Japan |
| Scheuch Unterstuetzungskasse GmbH; Germany | | €51.13 Ordinary shares | | 100 | | Alusingenplatz 1, D-78221, Singen, Germany |
| SGLS LLC; Mongolia | | MNT10,000 Common shares | | 100 | | Suite 201, Seoul Business ctr.,Zaluuchuud ave.-26,1st khoroo, Bayanzurch District, Ulaanbaatar, 13380, Mongolia |
| Simfer Jersey Finance 1 Ltd; Jersey | | USD Ordinary shares | | 100 | | 22 Grenville Street, St Helier, JE4 8PX, Jersey |
| Simfer Jersey Finance 2 Ltd; Jersey | | USD Ordinary shares | | 53 | | 22 Grenville Street, St Helier, JE4 8PX, Jersey |
| Simfer Jersey Limited; Jersey | | USD Ordinary shares | | 53 | | 22 Grenville Street, St Helier, JE4 8PX, Jersey |
| Simfer Jersey Nominee Limited; United Kingdom | | £1.00 Ordinary shares | | 100 | | 6 St James’s Square, London, SW1Y 4AD, United
Kingdom |
| SIMFER S.A.; Guinea | | GNF100,000 Ordinary shares | | 80.7 | | Résidence Dolphine 1 – Coleah Corniche Sud, Commune de Matam, BP 848, Conakry, BP 848, Guinea |
| | | | |
| 190 | | riotinto.com | | 2016 Annual report |
| | | | | | | | |
| Name of undertaking and country of incorporation | | Share class | | % of share
class held
by Group
companies | | Registered office address |
| Singapore Metals Pte. Ltd.; Singapore | | USD Ordinary shares | | 100 | | 77 Robinson Road, #13-00, Robinson 77, 068896, Singapore |
| Skeleton Coast Diamonds Limited; Namibia | | NAD2.00 Ordinary shares | | 100 | | 360 Sam Nujoma Drive, Klein Windhoek, Windhoek, Namibia |
| Skymont Corporation; United States | | USD Common shares | | 100 | | CSC, 2711 Centerville Road, Suite 400, Wilmington DE 19808 |
| Société De Financement Des Risques Industriels; Luxembourg | | EUR Ordinary shares | | 100 | | 534, rue de Neudorf, B.P. 593, Luxembourg,L-2015, Luxembourg |
| Société D’entreprises, Carrières Et Mines De L’Esterel; France | | €9.33 Ordinary shares | | 100 | | 17 Place des Reflets, La Defense 2, 92400, Courbevoie, France |
| Société Générale de Recherches et d’exploitations Minières; France | | €0.22 Ordinary shares | | 100 | | 17 Place des Reflets, La Defense 2, 92400, Courbevoie, France |
| Société Immobilière Alpes Provence; France | | €15.00 Ordinary shares | | 100 | | 17 Place des Reflets, La Defense 2, 92400, Courbevoie, France |
| Société Minière Et De Participations Guinée-Alusuisse; Guinea(c) | | – | | – | | Tougue, Guinea |
| Sohio Western Mining Company; United States | | US$100.00 Common shares | | 100 | | CSC, 2711 Centerville Road, Suite 400, Wilmington DE 19808 |
| Southern Copper Pty. Limited; Australia | | AUD A shares
AUD B shares | | 100
100 | | Level 33, 120 Collins Street, Melbourne VIC 3000, Australia |
| | AUD$0.01 Non cumulative redeemable preference shares | | 100 | | |
| | AUD Ordinary shares | | 100 | | |
| Straitmaile Holdings Limited; Cyprus | | US$10.00 Class ‘A’ ordinary shares | | 100 | | Lampousas, 1, 1095 Nicosia, Cyprus |
| Swift Current Land & Cattle LLC; United States(c) | | - | | – | | CSC, 2338 W. Royal Palm Road, Suite J, Phoenix AZ 85021 |
| Swiss Aluminium Australia Limited; Australia | | AUD Ordinary shares | | 100 | | 123 Albert Street, Brisbane QLD 4000, Australia |
| | AUD$1,000.00 Stock unit shares A | | 100 | | |
| | AUD$999.00 Stock unit shares B | | 100 | | |
| | | AUD$997.00 Stock unit shares C | | 100 | | |
| TBAC Limited; United Kingdom | | £1.00 Ordinary shares | | 100 | | 6 St James’s Square, London, SW1Y 4AD, United
Kingdom |
| Technological Resources Pty. Limited; Australia(a) | | AUD A Ordinary shares
AUD B Ordinary shares | | 100
100 | | Level 33, 120 Collins Street, Melbourne VIC 3000, Australia |
| The Barrier Corporation (Vic.) Pty. Limited; Australia(a) | | AUD Ordinary shares | | 100 | | Level 33, 120 Collins Street, Melbourne VIC 3000, Australia |
| The Kelian Community and Forest Protection Trust; Singapore(c) | | – | | – | | 10 Collyer Quay, #10-01 Ocean Financial Centre, 049315, Singapore |
| The Pyrites Company, Inc.; United States | | US$1.00 Common shares | | 100 | | CSC, 2711 Centerville Road, Suite 400, Wilmington DE 19808 |
| The Roberval and Saguenay Railway Company/La Compagnie du Chemin de Fer Roberval Saguenay; Canada | | CAD$100.00 Ordinary shares
CAD$100.00 Preference shares 6% non-cumulative | | 100
100 | | 400-1190 Avenue des Canadiens-de-Montréal, Montreal Québec H3B 0E3, Canada |
| The Zinc Corporation Pty Ltd; Australia | | AUD Ordinary shares
AUD Z Class ordinary shares | | 100
100 | | Level 33, 120 Collins Street, Melbourne VIC 3000, Australia |
| Thos. W. Ward Limited; United Kingdom | | £0.25 Ordinary shares | | 100 | | 6 St James’s Square, London, SW1Y 4AD, United Kingdom |
| THR Aruba Holdings LLC A.V.V.; Aruba | | US$1.00 Common shares | | 100 | | IMC International Management Trust Company N.V., L.G. Smith Blvd. 62, Miramar Building, Oranjestad, Aruba |
| THR Delaware Holdings, LLC; United States(c) | | – | | – | | National Corporate Research, Ltd., 850 New Burton Road, Suite 201, Dover DE 19904, United States |
| THR Kharmagtai Pte Ltd.; Singapore | | USD Ordinary shares | | 100 | | 77 Robinson Road, #13-00, Robinson 77, 068896, Singapore |
| | | | |
| 2016 Annual report | | riotinto.com | | 191 |
| | | | | | | | | | | | | | | | |
| | | | | | | | | |
| STRATEGIC REPORT | | | | DIRECTORS’ REPORT | | | | FINANCIAL STATEMENTS | | | | METALS AND MINERALS PRODUCTION | | | | ADDITIONAL INFORMATION |
Notes to the 2016 financial statements
continued
47 Related undertakingscontinued
| | | | | | |
| Name of undertaking and country of incorporation | | Share class | | % of share
class held
by Group
companies | | Registered office address |
| THR MINES (BC) LTD.; Canada | | CAD Common shares
USD Common shares | | 100
100 | | 354-200 Granville Street, Vancouver BC V6C 1S4, Canada |
| THR Mines Services Co. Ltd.; Canada | | CAD Common shares | | 100 | | Lackowicz Shier & Hoffman Barristers & Solicitors, 300-204 Black Street, Whitehorse YT Y1A 2M9, Canada |
| THR Mongolia Development Inc.; Virgin Islands, British(g) | | US$1.00 Common shares | | 100 | | Midocean Chambers, Road Town, Tortola, Virgin Islands, British |
| THR OYU TOLGOI LTD.; Virgin Islands, British | | US$1.00 Common shares | | 100 | | Midocean Chambers, Road Town, Tortola, Virgin Islands, British |
| THR Ulaan Pte. Ltd.; Singapore | | USD Ordinary shares | | 100 | | 77 Robinson Road, #13-00, Robinson 77, 068896, Singapore |
| Three Crowns Insurance Company Limited; Bermuda | | £1.00 Ordinary shares | | 100 | | Canon’s Court, 22 Victoria Street, Hamilton, HM 12, Bermuda |
| Tinto Holdings Australia Pty. Limited; Australia | | AUD A Ordinary shares
AUD Ordinary shares | | 100
100 | | Level 33, 120 Collins Street, Melbourne VIC 3000, Australia |
| Tisand (Proprietary) Limited; South Africa | | ZAR1.00 A Ordinary shares
ZAR1.00 B Ordinary shares
ZAR1,000.00 Cumulative preference shares shares | | 100
100
100 | | Administration Block, The Farm, RBM No. 16317, ADMIN DISTR. OF KWAZULU-NATAL, POB 401 Richards Bay, 3900, South Africa |
| Trans Territory Pipeline Pty Limited; Australia | | AUD Ordinary shares | | 100 | | 123 Albert Street, Brisbane QLD 4000, Australia |
| Turquoise Hill Netherlands Cooperatief U.A.; Netherlands | | USD COOP shares | | 100 | | Prins Bernhardplein 200, 1097 JB Amsterdam, The Netherlands |
| Turquoise Hill Resources Limited Luxembourg Branch; Luxembourg(c) | | – | | – | | 11-13, boulevard Grand-Duchesse, Charlotte,L-1331, Luxembourg |
| Turquoise Hill Resources Ltd.; Canada | | CAD Common shares | | 50.8 | | 300-204 Black Street, Whitehorse Yukon Territories Y1A 2M9, Canada |
| Turquoise Hill Resources Philippines Inc.; Philippines(g) | | PHP100.00 Common shares | | 99.9 | | Romulo Mabanta Buenaventura Sayoc & De Los Angeles, 21st Floor, Philamlife Tower, 8767 Paswo de Roxas, Makati City, 1226, Philippines |
| Turquoise Hill Resources Singapore Pte Ltd.; Singapore | | SGD1.00 Common shares | | 100 | | 1A International Business Park, 609933, Singapore |
| U.S. Borax Inc.; United States | | US$0.10 Common shares | | 100 | | CSC, 2711 Centerville Road, Suite 400, Wilmington DE 19808 |
| Union Générale Industrielle Africaine; Morocco | | MAD100.00 Ordinary shares | | 100 | | 52 bld Zerktouni – 1er étage – Appartement N° 3 – , Espace Erreda—Casablanca – Maroc, Maroc, Morocco |
| Victoria Technology Inc.; United States(a) | | US$1.00 Ordinary shares | | 100 | | CSC, 2711 Centerville Road, Suite 400, Wilmington DE 19808 |
| Vostin Pty. Limited; Australia(a)(g) | | AUD Ordinary shares | | 100 | | Level 27, Central Park, 152-158 St. Georges Terrace, Perth WA 6000, Australia |
| Warkworth Coal Sales Ltd; Australia | | AUD Ordinary shares | | 55.5 | | 123 Albert Street, Brisbane QLD 4000, Australia |
| Warkworth Mining Limited; Australia | | AUD Ordinary shares | | 55.5 | | 123 Albert Street, Brisbane QLD 4000, Australia |
| Warkworth Pastoral Co Pty Ltd; Australia | | AUD Ordinary shares | | 55.5 | | 123 Albert Street, Brisbane QLD 4000, Australia |
| Warkworth Tailings Treatment Pty Ltd; Australia | | AUD Ordinary shares | | 55.5 | | 123 Albert Street, Brisbane QLD 4000, Australia |
| Waste Solutions and Recycling LLC; United States | | USD Units shares | | 100 | | CSC, 2711 Centerville Road, Suite 400, Wilmington DE 19808 |
| West Kutai Foundation Limited; Singapore(c) | | – | | – | | 10 Collyer Quay, #10-01 Ocean Financial Centre, 049315, Singapore |
| Wimmera Industrial Minerals Pty. Limited; Australia(a) | | AUD Ordinary shares | | 100 | | Level 33, 120 Collins Street, Melbourne VIC 3000,
Australia |
| Winchester South Development Company Proprietary Limited; Australia | | AUD Ordinary shares | | 100 | | 123 Albert Street, Brisbane QLD 4000, Australia |
| Wyoming Coal Resources Company; United States | | US$0.01 Common shares | | 100 | | CSC, 2711 Centerville Road, Suite 400, Wilmington DE 19808 |
| Zululand Titanium (Pty) Ltd; South Africa | | ZAR1.00 Ordinary shares | | 100 | | The Farm RBM, Number 16317, KwaZulu-Natal, South Africa |
| | | | |
| 192 | | riotinto.com | | 2016 Annual report |
| | | | | | |
Associated undertakings (equity accounted) Name of undertaking and country of incorporation | | Share class | | % of share
class held
by Group
companies | | Registered office address |
| Alufluor AB; Sweden | | SEK1,000.00 Ordinary shares | | 50 | | Industrigatan 70, Box 902, S-25109, Helsingborg, Sweden |
| Blair Athol Coal Pty. Ltd.; Australia | | AUD Ordinary shares | | 71.2 | | 123 Albert Street, Brisbane, QLD 4000, Australia |
| Boyne Smelters Limited; Australia | | AUD A1 Class shares
AUD A2 Class shares
AUD B1 Class shares | | 100
100
100 | | 500 Queen Street, Brisbane QLD 4000, Australia |
| CanPacific Potash Inc.; Canada(e) | | – | | – | | c/o McKercher LLP, 374 Third Avenue South, Saskatoon SK S7K1M5, Canada |
| Chinalco Rio Tinto Exploration Co. Ltd; China(g) | | CNY1.00 Capital Contribution (Ordinary shares) | | 49 | | Unit 402, China Resources Building, No.8 Jianguomenbei Avenue, Dong Cheng District, Beijing, 100005 P.R., China |
| Empresa de Mineracao Finesa Ltda.; Brazil | | BRL Quotas shares | | 49 | | SIA, Trecho 2, Lotes 710/720, Brasilia DF, Brazil |
| Enarotali Gold Project Limited; Jersey | | £0.001 Ordinary shares | | 25 | | 13 Castle Street, St Helier, Jersey JE4 5UT, JERSEY, Jersey |
| Fabrica De Plasticos Mycsa, S.A. ; Venezuela, Bolivarian Republic of(g) | | VEF1.00 Common shares | | 49 | | Urbanización Industrial San Ignacio, parcela 2-A, vía San Pedro, Los Teques, Estado Miranda”, Venezuela |
| Global Hubco BV ; Netherlands | | €1.00 Ordinary shares | | 33.3 | | c/o TMF Netherlands B.V., Luna Arena, Herikerbergweg 238, 1101, CM Amsterdam Zuidoost, Netherlands |
| Halco (Mining) Inc.; United States | | US$100.00 Ordinary shares | | 45 | | The Prentice-Hall Corporation System, Inc., 2711 Centerville Road, Suite 400, Willmington DE 19808, United States |
| Hydrogen Energy International LLC; United States(e) | | – | | – | | 1209 Orange Street, Wilmington, New Castle, Delaware, U.S.A. |
| Leichhardt Coal Pty Limited; Australia | | AUD Ordinary shares | | 44.7 | | 123 Albert Street, Brisbane QLD 4000, Australia |
| Minera Escondida Ltda; Chile(e) | | – | | – | | Av. Cerro Plomo, Piso 18, Las Condes, Santiago, 7580154, Chile |
| Mineracao Tabuleiro Ltda; Brazil | | BRL Quotas shares | | 48 | | SIA, Trecho 2, Lotes 690/720, Brasilia DF, Brazil |
| Northern Land Company Ltd; Canada | | CAD1.00 Ordinary shares | | 50 | | 235 Water Street, Ste 1000 Scotia Ctr, St-John’s Newfoundland A1C 1B6 |
| Port Waratah Coal Services Ltd; Australia | | AUD Ordinary shares | | 30 | | Curlew Street, KOORAGANG NSW 2304, Australia |
| Procivis Savoie; France | | €19.00 Ordinary shares | | 22.1 | | 116 Quai Charles Roissard, 73000, Chambéry, France |
| Rightship Pty Ltd; Australia | | AUD Ordinary shares | | 33.3 | | Level 20, 500 Collins Street, Melbourne VIC 3000, Australia |
| Sohar Aluminium Co. L.L.C.; Oman | | OMR1.00 Ordinary shares | | 20 | | Sohar Industrial Estate, P.O. Box 80, PC 327, Sohar, Sultanate of Oman |
| Twin Falls Power Corporation Ltd; Canada | | CAD Class B shares | | 74.4 | | Hydro Place, P.O. Box 12500, St-John’s Newfoundand, Labrador A1B 3T5 |
| Yalleen Pastoral Co Pty Ltd; Australia | | AUD Ordinary shares | | 53 | | Level 27, Central Park, 152-158 St. Georges Terrace, Perth WA 6000, Australia |
| | | | |
| 2016 Annual report | | riotinto.com | | 193 |
| | | | | | | | | | | | | | | | |
| | | | | | | | | |
| STRATEGIC REPORT | | | | DIRECTORS’ REPORT | | | | FINANCIAL STATEMENTS | | | | METALS AND MINERALS PRODUCTION | | | | ADDITIONAL INFORMATION |
Notes to the 2016 financial statements
continued
| | | | | | |
Joint ventures (proportionately consolidated) Name of undertaking and country of incorporation | | Address of principal place of business | | Capital % owned
by Group |
| Aluminerie Alouette Inc.; Canada | | 400, Chemin de la Pointe-Noire, C.P. 1650, Sept-Îles Québec G4R 5M9, Canada | | 40 |
| Aluminerie De Bécancour, Inc.; Canada | | 5555 Pierre Thibault Street, PO 30, Becancour, Quebec G0X 1B, Canada | | 25.2 |
| Aluminium & Chemie Rotterdam B.V.; Netherlands | | Oude Maasweg 80, NL-3197 KJ, Botlek, Rotterdam, The Netherlands | | 65.8 |
| Bao-HI Ranges Joint Venture; Australia | | Level 22 Central Park, 152-158 St. Georges Terrace, Perth WA 6000, Australia | | 54 |
| Beasley River Marketing Pty Ltd; Australia | | Level 22 Central Park, 152-158 St. Georges Terrace, Perth WA 6000, Australia | | 53 |
Blair Athol Joint Venture | | 123 Albert Street, Brisbane QLD 4000, Australia | | 71.2 |
| Cape Bougainville Joint Venture; Australia | | 123 Albert Street, Brisbane QLD 4000, Australia | | 67.5 |
| Channar Mining Joint Venture; Australia | | Level 22 Central Park, 152-158 St. Georges Terrace, Perth WA 6000, Australia | | 60 |
| Consórcio de Alumínio do Maranhão; Brazil | | Av. Engenheiro Emiliano Macieira 01, KM18, Pedrinhas, 65095-604, Sao Luis, Maranhao, Brazil | | 10 |
| Diavik Joint Venture; Canada | | 300-5201 50th Avenue, Yellowknife NT X1A 2P9, Canada | | 60 |
| Gladstone Power Station Joint Venture; Australia | | NRG Gladstone Operating Service, Gladstone Power Station, Gladstone QLD 4680, Australia | | 42.1 |
| Grasberg joint operation; Indonesia | | JI Mandala Raya Selatan, No.1 Kuala Kencana, Timika, Irian Jaya, 98663, Indonesia | | 40 |
| Hail Creek Joint Venture; Australia | | 123 Albert Street, Brisbane QLD 4000, Australia | | 82 |
| Hope Downs Joint Venture; Australia | | Level 22 Central Park, 152-158 St. Georges Terrace, Perth WA 6000, Australia | | 50 |
| Hunter Valley Operations Joint Venture; Australia | | 123 Albert Street, Brisbane QLD 4000, Australia | | 67.6 |
| Kestrel Joint Venture; Australia | | 123 Albert Street, Brisbane QLD 4000, Australia | | 80 |
| Mitchell Plateau Joint Venture; Australia | | 123 Albert Street, Brisbane QLD 4000, Australia | | 65.6 |
| Mount Thorley Co Venture; Australia | | 123 Albert Street, Brisbane QLD 4000, Australia | | 80 |
| New Zealand Aluminium Smelters Ltd; New Zealand | | Level 6, 109 Featherston Street, Wellington, 6011, New Zealand | | 79.4 |
| Pechiney Reynolds Quebec, Inc.; United States | | CSC, 233 South 13th Street, Suite 1900, Lincoln NE 68508, United States | | 50.2 |
| Queensland Alumina Limited; Australia | | Plant Operations Building, Parsons Point, Gladstone QLD 4680, Australia | | 80 |
| Robe River Iron Associates Joint Venture; Australia | | Level 27, Central Park, 152-158 St. Georges Terrace, Perth WA 6000, Australia | | 53 |
| Robe River Ore Sales Pty. Ltd.; Australia | | Level 27, Central Park, 152-158 St. Georges Terrace, Perth WA 6000, Australia | | 53 |
| Tomago Aluminium Company Pty Limited; Australia | | 638 Tomago Road, NSW 2322, Tomago, Australia | | 51.6 |
| Tomago Aluminium Joint Venture; Australia | | 638 Tomago Road, NSW 2322, Tomago, Australia | | 51.6 |
| Warkworth Joint Venture; Australia | | 123 Albert Street, Brisbane QLD 4000, Australia | | 55.6 |
| Winchester South Joint Venture; Australia | | 123 Albert Street, Brisbane QLD 4000, Australia | | 75 |
| Winter Road Joint Venture; Canada | | 300-5201 50th Avenue, Yellowknife NT X1A 2P9, Canada | | 33.3 |
| (a) | Directly held by Rio Tinto Limited. |
| (b) | Directly held by Rio Tinto plc. |
| (c) | Group ownership is held through an interest in capital. The entity has no classes of shares. |
| (d) | Company limited by guarantee. |
| (e) | Group ownership in the associate is held through an interest in capital. The entity has no classes of shares. |
| (f) | All joint ventures are governed by a joint venture agreement. |
| (g) | In liquidation or application for dissolution filed. The filing for Darex Capital Inc. was submitted in January 2017. |
| | | | |
| 194 | | riotinto.com | | 2016 Annual report |
Rio Tinto plc
Company balance sheet
| | | | | | | | | | | | |
| As at 31 December | | Note | | | 2016 US$m | | | 2015 US$m | |
| Non-current assets | | | | | | | | | | | | |
| Investments | | | B | | | | 36,050 | | | | 36,180 | |
| Trade and other receivables | | | | | | | 392 | | | | – | |
| | | | | | | 36,442 | | | | 36,180 | |
| | | |
| Current assets | | | | | | | | | | | | |
| Trade and other receivables | | | C | | | | 6,070 | | | | 883 | |
| Cash at bank and in hand | | | | | | | 4 | | | | 4 | |
| | | | | | | | 6,074 | | | | 887 | |
| Total assets | | | | | | | 42,516 | | | | 37,067 | |
| | | |
| Current liabilities | | | | | | | | | | | | |
| Trade and other payables | | | D | | | | (12,223 | ) | | | (12,079 | ) |
| Dividends payable | | | | | | | (16 | ) | | | (18 | ) |
| Other financial liabilities | | | G | | | | (23 | ) | | | – | |
| | | | | | | | (12,262 | ) | | | (12,097 | ) |
| Non-current liabilities | | | | | | | | | | | | |
| Other financial liabilities | | | G | | | | (392 | ) | | | – | |
| | | | | | | | | | | | | |
| Total liabilities | | | | | | | (12,654 | ) | | | (12,097 | ) |
| | | |
| Net assets | | | | | | | 29,862 | | | | 24,970 | |
| | | |
| Capital and reserves | | | | | | | | | | | | |
| Share capital | | | E | | | | 224 | | | | 224 | |
| Share premium account | | | | | | | 4,304 | | | | 4,300 | |
| Other reserves | | | F | | | | 11,988 | | | | 11,988 | |
| Retained earnings | | | | | | | 13,346 | | | | 8,458 | |
| Total equity | | | | | | | 29,862 | | | | 24,970 | |
The Rio Tinto plc company balance sheet has been prepared in accordance with Financial Reporting Standard 101 “Reduced Disclosure Framework” (FRS 101). Note A explains the principal accounting policies.
Profit after tax and total comprehensive income for the year amounted to US$6,875 million (2015: US$2,863 million). As permitted by section 408 of the UK Companies Act 2006, no statement of comprehensive income for the Rio Tinto plc parent company is shown.
The Rio Tinto plc company balance sheet, statement of comprehensive income and the related notes on pages 195 to 198 were approved by the directors on 1 March 2017 and the balance sheet is signed on their behalf by
| | | | | | | | | | |
| Jan du Plessis | | | | | | Jean-Sébastien Jacques | | | | Chris Lynch |
| Chairman | | | | | | Chief executive | | | | Chief financial officer |
Rio Tinto plc
Registered number: 719885
Rio Tinto plc (the “Company”) is incorporated in the United Kingdom, registered in England and Wales, and domiciled in the United Kingdom
| | | | |
| 2016 Annual report | | riotinto.com | | 195 |
| | | | | | | | | | | | | | | | |
| | | | | | | | | |
| STRATEGIC REPORT | | | | DIRECTORS’ REPORT | | | | FINANCIAL STATEMENTS | | | | METALS AND MINERALS PRODUCTION | | | | ADDITIONAL INFORMATION |
Rio Tinto plc
continued
Company statement of changes in equity
| | | | | | | | | | | | | | | | | | | | |
| Year ended 31 December 2016 | | Share
capital US$m | | | Share
premium
account US$m | | | Other
reserves US$m | | | Retained
earnings US$m | | | Total
equity US$m | |
| Opening balance | | | 224 | | | | 4,300 | | | | 11,988 | | | | 8,458 | | | | 24,970 | |
| Profit for the financial year (comprehensive income) | | | – | | | | – | | | | – | | | | 6,875 | | | | 6,875 | |
| Dividends | | | – | | | | – | | | | – | | | | (2,046 | ) | | | (2,046 | ) |
| Proceeds from issue of shares | | | – | | | | 4 | | | | – | | | | 1 | | | | 5 | |
| Share based payments | | | – | | | | – | | | | – | | | | 58 | | | | 58 | |
| Total | | | 224 | | | | 4,304 | | | | 11,988 | | | | 13,346 | | | | 29,862 | |
| | | | | | | | | | | | | | | | | | | | |
| Year ended 31 December 2015 | | Share
capital US$m | | | Share
premium
account US$m | | | Other
reserves US$m | | | Retained
earnings US$m | | | Total
equity US$m | |
| Opening balance | | | 230 | | | | 4,288 | | | | 11,982 | | | | 8,643 | | | | 25,143 | |
| Profit for the financial year (comprehensive income) | | | – | | | | – | | | | – | | | | 2,863 | | | | 2,863 | |
| Dividends | | | – | | | | – | | | | – | | | | (3,119 | ) | | | (3,119 | ) |
| Proceeds from issue of shares | | | – | | | | 12 | | | | – | | | | 1 | | | | 13 | |
| Sharebuy-back | | | (6 | ) | | | – | | | | 6 | | | | – | | | | – | |
| Share based payments | | | – | | | | – | | | | – | | | | 70 | | | | 70 | |
| Total | | | 224 | | | | 4,300 | | | | 11,988 | | | | 8,458 | | | | 24,970 | |
| | | | |
| 196 | | riotinto.com | | 2016 Annual report |
A Principal accounting policies
a. Basis of preparation
The Rio Tinto plc company financial statements have been prepared using the historical cost convention, as modified by the revaluation of certain financial liabilities and in accordance with the UK Companies Act 2006 and FRS 101. The financial statements have been prepared on a going concern basis.
As a result of the amendments to FRS 101 issued in July 2015 and effective for reporting periods beginning 1 January 2016, the balance sheet is now presented in accordance with IAS 1 “Presentation of financial statements”.
The accounting policies set out below have been applied consistently to all periods presented in these financial statements. The following exemptions available under FRS 101 have been applied:
| – | | Paragraphs 45(b) and 46 to 52 of IFRS 2, “Share-based payment” (details of the number and weighted average exercise prices of share options and how the fair value of goods and services received was determined). |
| – | | Paragraphs91-99 of IFRS 13 “Fair value measurement” (disclosure of valuation techniques and inputs used for fair value measurement of assets and liabilities). |
| – | | IFRS 7 “Financial Instruments: Disclosures”. |
| – | | Paragraph 38 of IAS 1 “Presentation of financial statements”, comparative information requirements in respect of Paragraph 79(a)(iv) of IAS 1. |
| – | | The following paragraphs of IAS 1 “Presentation of financial statements”: |
| | – | | 10 (d) (statement of cash flows); |
| | – | | 16 (statement of compliance with all IFRS); |
| | – | | 38A (requirement for minimum of two primary statements, including cash flow statements); |
| | – | | 38B-D (additional comparative information); |
| | – | | 111 (cash flow statement information); and |
| | – | | 134-136 (capital management disclosures). |
| – | | IAS 7 “Statement of cash flows”. |
| – | | Paragraph 30 and 31 of IAS 8 “Accounting policies, changes in accounting estimates and errors” (requirement for the disclosure of information when an entity has not applied a new IFRS that has been issued and is not yet effective). |
| – | | Paragraph 17 of IAS 24 “Related party disclosures” (key management compensation). |
| – | | The requirements of IAS 24, “Related party disclosures” to disclose related-party transactions entered into between two or more members of a group. |
b. Judgments in applying accounting policies and key sources of estimation uncertainty
The preparation of the financial statements requires management to make assumptions, judgments and estimates and to use judgment in applying accounting policies and making critical accounting estimates. These judgments, estimates and assumptions are based on management’s best knowledge of the relevant facts and circumstances, having regard to previous experience, but actual results may differ materially from the amounts included in the financial statements.
The key area of judgment that has the most significant effect on the amounts recognised in the financial statements is the review for impairment of investment carrying values.
c. Currency translation
Items included in the financial statements are measured using the currency of the primary economic environment in which the Company operates (the functional currency). The financial statements are presented in US dollars, which is the Company’s functional and presentation currency. Transactions denominated in other currencies, including the issue of shares, are translated into the functional currency using the exchange rates prevailing at the date of the transaction.
Foreign exchange gains and losses resulting from the settlement of such transactions, and from the translation atyear-end exchange rates of monetary assets and liabilities denominated in foreign currencies, are recognised in the profit and loss account.
Exchange rates used are consistent with the rates used by the Group as disclosed in the consolidated financial statements (note 41).
d. Investments
Investments in Group companies are valued at cost less accumulated impairment losses. Investments are reviewed for impairment if events or changes in circumstances indicate that the carrying amount may not be recoverable.
e. Financial guarantees
Financial guarantees are recognised initially at fair value. Subsequently, the liability is measured at the higher of the best estimate of the expenditure required to settle the present obligation and the amount initially recognised less cumulative amortisation.
f. Share-based payments
The Company operates a number of share-based payment plans for Group employees, the details of which are included in the consolidated financial statements (note 44). The fair value of the Company’s share plans is recognised as an addition to the cost of the investment in the subsidiary in which the relevant employees work over the expected vesting period, with a corresponding entry to the profit and loss account reserve. Payments received from the Company’s subsidiaries in respect of these share-based payments are recognised as a reduction in the cost of the investment. The Company uses fair values provided by independent actuaries calculated using either a lattice-based option valuation model or a Monte Carlo simulation model. The fair value of the share plans is determined at the date of grant, taking into account any market-based vesting conditions attached to the award.
Non-market based vesting conditions (eg earnings per share targets) are taken into account in estimating the number of awards likely to vest. The estimate of the number of awards likely to vest is reviewed at each balance sheet date up to the vesting date, at which point the estimate is adjusted to reflect the actual awards issued. No adjustment is made after the vesting date even if the awards are forfeited or not exercised.
g. Dividend income
Dividend income is recognised when the right to receive payment is established.
h. Treasury shares
The consideration paid for shares repurchased by the Company and held as treasury shares is recognised as a reduction in shareholders’ funds through the profit and loss account.
B Investments
| | | | | | | | |
| | | 2016 US$m | | | 2015 US$m | |
| Investments in Group companies: | | | | | | | | |
| At 1 January | | | 36,180 | | | | 36,139 | |
| Additions | | | 58 | | | | 70 | |
| Disposals | | | (160 | ) | | | – | |
| Other adjustments | | | (28 | ) | | | (29 | ) |
| At 31 December | | | 36,050 | | | | 36,180 | |
| | | | |
| 2016 Annual report | | riotinto.com | | 197 |
| | | | | | | | | | | | | | | | |
| | | | | | | | | |
| STRATEGIC REPORT | | | | DIRECTORS’ REPORT | | | | FINANCIAL STATEMENTS | | | | METALS AND MINERALS PRODUCTION | | | | ADDITIONAL INFORMATION |
Rio Tinto plc
continued
At 31 December 2016 the Company had the following principal subsidiaries:
| | | | | | | | |
| Company | | Principal activity | | Country of
incorporation | | Percentage
shareholding | |
| Rio Tinto International Holdings Limited | | Holding company | | UK | | | 100 | |
| Rio Tinto European Holdings Limited | | Holding company | | UK | | | 100 | |
In accordance with Section 409 of the UK Companies Act 2006, a full list of related undertakings is disclosed in the consolidated financial statements (note 47).
C Trade and other receivables
Trade and other receivables includes US$6,007 million (31 December 2015: US$833 million), which is subject to interest based on LIBOR, is unsecured and repayable on demand.
D Trade and other payables
Trade and other payables include US$12,079 million (31 December 2015: US$11,970 million) which is subject to interest rates based on LIBOR, is unsecured and repayable on demand.
E Share capital
| | | | | | | | |
| | | 2016 US$m | | | 2015 US$m | |
| Issued and fully paid up share capital of 10p each(a) | | | | | | | | |
| At 1 January | | | 224 | | | | 230 | |
| Ordinary shares purchased and cancelled(b) | | | – | | | | (6 | ) |
| At 31 December | | | 224 | | | | 224 | |
| (a) | 33,210 new shares (2015: 21,709 new shares) were issued during the year and 743,380 shares (2015: 789,887 shares) were reissued from treasury pursuant to share plans. |
| (b) | During the year nil shares (2015: 40,912,881 shares) were purchased from Rio Tinto Limited and immediately cancelled. |
F Other reserves
Other reserves include US$11,936 million which represents the difference between the nominal value and issue price of the shares issued arising from Rio Tinto plc’s rights issue completed in July 2009.
G Rio Tinto plc guarantees
Rio Tinto plc provides a number of guarantees in respect of Group companies.
Rio Tinto plc and Rio Tinto Limited have jointly guaranteed the Group’s external listed debt under the US Shelf Programme, European Debt Issuance Programme and Commercial Paper Programme which totalled US$10.2 billion at 31 December 2016 (31 December 2015: US$19.4 billion). In addition, these entities also jointly guarantee the Group’s undrawn credit facility which was US$7.5 billion at 31 December 2016 (31 December 2015: US$7.5 billion). Rio Tinto plc has provided guarantees in respect of certain derivative contracts that are in a liability position of US$458 million at 31 December 2016 (31 December 2015: US$275 million).
Rio Tinto plc has provided a guarantee, known as the completion support undertaking (CSU), in favour of the Oyu Tolgoi LLC project finance lenders. At 31 December 2016 US$4,323 million of project finance debt was outstanding under this facility (31 December 2015: US$ nil). Oyu Tolgoi LLC is owned by Erdenes Oyu Tolgoi LLC (34 per cent), which is controlled by the Government of Mongolia, and Turquoise Hill Resources Ltd (66 per cent, of which Rio Tinto owns 51 per cent). The project finance has been raised for development of the underground mine and the CSU will terminate on the completion of the underground mine according to a set of completion tests set out in the project finance facility.
The Rio Tinto guarantee applies to the extent that Turquoise Hill Resources Ltd cannot satisfy Oyu Tolgoi LLC’s project finance debt servicing obligations under its own guarantee to the lenders, called the sponsor debt service undertaking (DSU). Both the CSU and DSU contain acarve-out for certain political risk events.
During 2016, fees of US$13 million (2015: US$nil) were received from Oyu Tolgoi LLC and Turquoise Hill Resources Ltd as consideration for provision of the CSU with an additional balance of US$13 million (31 December 2015: US$nil) due and included within Current Assets – Trade and other receivables.
Rio Tinto plc has provided a number of guarantees in relation to various pension funds. Subject to certain conditions, Rio Tinto plc would pay any contributions due from Group companies participating in these funds in the event that the companies fail to meet their contribution requirements. The guarantees were not called upon in 2016. The aggregate of company contributions to these plans in 2016 was US$94 million (2015: US$107 million).
Other guarantees issued by Rio Tinto plc in relation to Rio Tinto Group entities as at 31 December 2016 amount to US$337 million (31 December 2015: US$328 million). Included within this balance is US$60 million (31 December 2015: US$59 million) in relation tonon-wholly owned subsidiaries.
Pursuant to the DLC Merger, both Rio Tinto plc and Rio Tinto Limited issued deed poll guarantees by which each company guaranteed contractual obligations incurred by the other or guaranteed by the other.
The liability recognised for financial guarantees is US$415 million (31 December 2015: US$nil).
H Events after the balance sheet date
On 8 February 2017, the Group announced anon-market sharebuy-back of US$0.5 billion Rio Tinto plc shares.
| | | | |
| 198 | | riotinto.com | | 2016 Annual report |
Rio Tinto financial information by business unit
| | | | | | | | | | | | | | | | | | | | | | | | | | | | | | | | | | | | | | | | |
| | | | | | Gross revenue (a) for the year ended 31 December | | | EBITDA (b) for the year ended 31 December | | | Net earnings (c) for the year ended 31 December | |
| | | Rio Tinto
interest
% | | | 2016
US$m | | | 2015
US$m | | | 2014
US$m | | | 2016
US$m | | | 2015
US$m | | | 2014
US$m | | | 2016
US$m | | | 2015
US$m | | | 2014
US$m | |
| Iron Ore | | | | | | | | | | | | | | | | | | | | | | | | | | | | | | | | | | | | | | | | |
| Pilbara | | | (d | ) | | | 14,530 | | | | 13,886 | | | | 21,482 | | | | 8,558 | | | | 7,730 | | | | 13,701 | | | | 4,662 | | | | 4,013 | | | | 7,956 | |
| Evaluation projects/other | | | | | | | 75 | | | | 66 | | | | 103 | | | | (32 | ) | | | (55 | ) | | | 27 | | | | (51 | ) | | | (73 | ) | | | 7 | |
| Total Iron Ore | | | | | | | 14,605 | | | | 13,952 | | | | 21,585 | | | | 8,526 | | | | 7,675 | | | | 13,728 | | | | 4,611 | | | | 3,940 | | | | 7,963 | |
| | | | | | | | | | |
| Aluminium | | | (e | ) | | | | | | | | | | | | | | | | | | | | | | | | | | | | | | | | | | | | |
| Bauxite | | | | | | | 1,913 | | | | 2,057 | | | | 1,956 | | | | 848 | | | | 937 | | | | 752 | | | | 493 | | | | 542 | | | | 429 | |
| Alumina | | | | | | | 2,118 | | | | 2,145 | | | | 2,158 | | | | 27 | | | | (47 | ) | | | (54 | ) | | | (121 | ) | | | (187 | ) | | | (209 | ) |
| Intrasegment | | | | | | | (786 | ) | | | (849 | ) | | | (834 | ) | | | – | | | | – | | | | – | | | | – | | | | – | | | | – | |
| Bauxite & Alumina | | | | | | | 3,245 | | | | 3,353 | | | | 3,280 | | | | 875 | | | | 890 | | | | 698 | | | | 372 | | | | 355 | | | | 220 | |
| Primary Metal | | | | | | | 4,913 | | | | 4,931 | | | | 5,867 | | | | 1,258 | | | | 1,245 | | | | 1,604 | | | | 402 | | | | 446 | | | | 629 | |
| Pacific Aluminium | | | | | | | 1,971 | | | | 2,254 | | | | 2,483 | | | | 264 | | | | 408 | | | | 524 | | | | 62 | | | | 147 | | | | 291 | |
| Intersegment & Other | | | | | | | (1,822 | ) | | | (1,876 | ) | | | (2,087 | ) | | | (50 | ) | | | 132 | | | | (43 | ) | | | (13 | ) | | | 92 | | | | (6 | ) |
| Integrated Operations | | | | | | | 8,307 | | | | 8,662 | | | | 9,543 | | | | 2,347 | | | | 2,675 | | | | 2,783 | | | | 823 | | | | 1,040 | | | | 1,134 | |
| Other Product Group Items | | | | | | | 1,075 | | | | 1,374 | | | | 2,373 | | | | (42 | ) | | | (76 | ) | | | 36 | | | | (30 | ) | | | (50 | ) | | | 26 | |
| Product group operations | | | | | | | 9,382 | | | | 10,036 | | | | 11,916 | | | | 2,305 | | | | 2,599 | | | | 2,819 | | | | 793 | | | | 990 | | | | 1,160 | |
| Evaluation projects/other | | | | | | | 76 | | | | 81 | | | | 207 | | | | 167 | | | | 143 | | | | 111 | | | | 154 | | | | 128 | | | | 88 | |
| Total Aluminium | | | | | | | 9,458 | | | | 10,117 | | | | 12,123 | | | | 2,472 | | | | 2,742 | | | | 2,930 | | | | 947 | | | | 1,118 | | | | 1,248 | |
| | | | | | | | | | |
| Copper & Diamonds | | | | | | | | | | | | | | | | | | | | | | | | | | | | | | | | | | | | | | | | |
| Rio Tinto Kennecott | | | 100.0 | | | | 1,243 | | | | 1,403 | | | | 2,186 | | | | 126 | | | | 437 | | | | 958 | | | | (228 | ) | | | 44 | | | | 523 | |
| Escondida | | | 30.0 | | | | 1,465 | | | | 1,855 | | | | 2,282 | | | | 793 | | | | 760 | | | | 1,292 | | | | 270 | | | | 281 | | | | 612 | |
| Grasberg | | | (f | ) | | | – | | | | – | | | | 49 | | | | (17 | ) | | | (17 | ) | | | 6 | | | | (64 | ) | | | (34 | ) | | | (17 | ) |
| Oyu Tolgoi & Turquoise Hill | | | (g | ) | | | 1,203 | | | | 1,636 | | | | 1,765 | | | | 436 | | | | 501 | | | | 366 | | | | 52 | | | | 57 | | | | (20 | ) |
| Diamonds | | | (h | ) | | | 613 | | | | 698 | | | | 901 | | | | 239 | | | | 293 | | | | 315 | | | | 47 | | | | 79 | | | | 104 | |
| Product group operations | | | | | | | 4,524 | | | | 5,592 | | | | 7,183 | | | | 1,577 | | | | 1,974 | | | | 2,937 | | | | 77 | | | | 427 | | | | 1,202 | |
| Evaluation projects/other | | | | | | | – | | | | – | | | | – | | | | (190 | ) | | | (141 | ) | | | (184 | ) | | | (95 | ) | | | (57 | ) | | | (84 | ) |
| Total Copper & Diamonds | | | | | | | 4,524 | | | | 5,592 | | | | 7,183 | | | | 1,387 | | | | 1,833 | | | | 2,753 | | | | (18 | ) | | | 370 | | | | 1,118 | |
| | | | | | | | | | |
| Energy & Minerals | | | | | | | | | | | | | | | | | | | | | | | | | | | | | | | | | | | | | | | | |
| Rio Tinto Coal Australia | | | (i | ) | | | 2,634 | | | | 2,757 | | | | 3,560 | | | | 893 | | | | 497 | | | | 450 | | | | 382 | | | | 48 | | | | 21 | |
| Rio Tinto Coal Mozambique | | | (j | ) | | | – | | | | – | | | | 59 | | | | – | | | | – | | | | (96 | ) | | | – | | | | – | | | | (93 | ) |
| Iron Ore Company of Canada | | | 58.7 | | | | 1,324 | | | | 1,353 | | | | 1,696 | | | | 335 | | | | 197 | | | | 516 | | | | 64 | | | | 12 | | | | 144 | |
| Rio Tinto Iron & Titanium | | | (k | ) | | | 1,419 | | | | 1,571 | | | | 2,168 | | | | 370 | | | | 435 | | | | 689 | | | | 86 | | | | 116 | | | | 248 | |
| Rio Tinto Borates | | | 100.0 | | | | 620 | | | | 624 | | | | 675 | | | | 213 | | | | 178 | | | | 212 | | | | 117 | | | | 103 | | | | 121 | |
| Dampier Salt | | | 68.4 | | | | 259 | | | | 306 | | | | 398 | | | | 74 | | | | 71 | | | | 67 | | | | 25 | | | | 24 | | | | 18 | |
| Uranium | | | (l | ) | | | 456 | | | | 474 | | | | 633 | | | | 54 | | | | 1 | | | | (77 | ) | | | 10 | | | | (42 | ) | | | (117 | ) |
| Product group operations | | | | | | | 6,712 | | | | 7,085 | | | | 9,189 | | | | 1,939 | | | | 1,379 | | | | 1,761 | | | | 684 | | | | 261 | | | | 342 | |
| Simandou iron ore project | | | (m | ) | | | – | | | | – | | | | – | | | | (102 | ) | | | (87 | ) | | | (97 | ) | | | (47 | ) | | | (41 | ) | | | (55 | ) |
| Evaluation projects/other | | | (n | ) | | | 22 | | | | 55 | | | | 64 | | | | (34 | ) | | | (57 | ) | | | (68 | ) | | | (27 | ) | | | (45 | ) | | | (55 | ) |
| Total Energy & Minerals | | | | | | | 6,734 | | | | 7,140 | | | | 9,253 | | | | 1,803 | | | | 1,235 | | | | 1,596 | | | | 610 | | | | 175 | | | | 232 | |
| | | | | | | | | | |
| Other Operations | | | (o | ) | | | – | | | | 13 | | | | 241 | | | | (92 | ) | | | (81 | ) | | | (287 | ) | | | (86 | ) | | | (88 | ) | | | (240 | ) |
| | | | | | | | | | |
| Intersegment transactions | | | | | | | (3 | ) | | | (29 | ) | | | (344 | ) | | | – | | | | – | | | | – | | | | – | | | | – | | | | – | |
| Product Group Total | | | | | | | 35,318 | | | | 36,785 | | | | 50,041 | | | | 14,096 | | | | 13,404 | | | | 20,720 | | | | 6,064 | | | | 5,515 | | | | 10,321 | |
| | | | |
| 2016 Annual report | | riotinto.com | | 199 |
| | | | | | | | | | | | | | | | |
| | | | | | | | | |
| STRATEGIC REPORT | | | | DIRECTORS’ REPORT | | | | FINANCIAL STATEMENTS | | | | METALS AND MINERALS PRODUCTION | | | | ADDITIONAL INFORMATION |
Rio Tinto financial information by business unit
continued
| | | | | | | | | | | | | | | | | | | | | | | | | | | | | | | | | | | | | | | | |
| | | | | | Gross revenue (a) for the year ended 31 December | | | EBITDA (b) for the year ended 31 December | | | Net earnings (c) for the year ended 31 December | |
| | | Rio Tinto
interest
% | | | 2016
US$m | | | 2015
US$m | | | 2014
US$m | | | 2016
US$m | | | 2015
US$m | | | 2014
US$m | | | 2016
US$m | | | 2015
US$m | | | 2014
US$m | |
| Product Group Total | | | | | | | 35,318 | | | | 36,785 | | | | 50,041 | | | | 14,096 | | | | 13,404 | | | | 20,720 | | | | 6,064 | | | | 5,517 | | | | 10,321 | |
| Other items | | | | | | | | | | | | | | | | | | | (411 | ) | | | (546 | ) | | | (755 | ) | | | (241 | ) | | | (375 | ) | | | (593 | ) |
| Exploration and evaluation | | | | | | | | | | | | | | | | | | | (175 | ) | | | (237 | ) | | | (300 | ) | | | (147 | ) | | | (211 | ) | | | (262 | ) |
| Net interest | | | | | | | | | | | | | | | | | | | | | | | | | | | | | | | (576 | ) | | | (389 | ) | | | (161 | ) |
| Underlying EBITDA/earnings | | | | | | | | | | | | | | | | | | | 13,510 | | | | 12,621 | | | | 19,665 | | | | 5,100 | | | | 4,540 | | | | 9,305 | |
| Items excluded from underlying EBITDA/earnings | | | | | | | 18 | | | | (1 | ) | | | – | | | | (687 | ) | | | (563 | ) | | | (825 | ) | | | (483 | ) | | | (5,406 | ) | | | (2,778 | ) |
| EBITDA/net earnings | | | | | | | | | | | | | | | | | | | 12,823 | | | | 12,058 | | | | 18,840 | | | | 4,617 | | | | (866 | ) | | | 6,527 | |
| Reconciliation to Group income statement | | | | | | | | | | | | | | | | | | | | | | | | | | | | | | | | | | | | | | | | |
| Share of equity accounted unit sales and intra-subsidiary/equity accounted units sales | | | | | | | (1,555 | ) | | | (1,955 | ) | | | (2,377 | ) | | | | | | | | | | | | | | | | | | | | | | | | |
| Depreciation & amortisation in subsidiaries excluding capitalised depreciation | | | | | | | | | | | | | | | | | | | (4,691 | ) | | | (4,553 | ) | | | (4,828 | ) | | | | | | | | | | | | |
| Impairment charges, net of reversals | | | | | | | | | | | | | | | | | | | (249 | ) | | | (2,791 | ) | | | (221 | ) | | | | | | | | | | | | |
| Depreciation & amortisation in equity accounted units | | | | | | | | | | | | | | | | | | | (526 | ) | | | (462 | ) | | | (472 | ) | | | | | | | | | | | | |
| Taxation and finance items in equity accounted units | | | | | | | | | | | | | | | | | | | (241 | ) | | | (276 | ) | | | (759 | ) | | | | | | | | | | | | |
| Consolidated sales revenue/profit on ordinary activities before finance items and tax | | | | | | | 33,781 | | | | 34,829 | | | | 47,664 | | | | 7,116 | | | | 3,976 | | | | 12,560 | | | | | | | | | | | | | |
| | | | |
| 200 | | riotinto.com | | 2016 Annual report |
| | | | | | | | | | | | | | | | | | | | | | | | | | | | | | | | | | | | | | | | | | | | | | | | | | | | |
| | | | | | Capital expenditure (p) for the year
ended 31 December | | | Depreciation &
amortisation for the year
ended 31 December | | | Operating assets (q) as at | | | Employees for the year
ended 31 December | |
| | | Rio Tinto
interest
% | | | 2016
US$m | | | 2015
US$m | | | 2014
US$m | | | 2016
US$m | | | 2015
US$m | | | 2014
US$m | | | 2016
US$m | | | 2015
US$m | | | 2014
US$m | | | 2016
Number | | | 2015
Number | | | 2014
Number | |
| Iron Ore | | | | | | | | | | | | | | | | | | | | | | | | | | | | | | | | | | | | | | | | | | | | | | | | | | | | |
| Pilbara | | | (d | ) | | | 868 | | | | 1,608 | | | | 4,038 | | | | 1,645 | | | | 1,744 | | | | 1,789 | | | | 16,337 | | | | 16,848 | | | | 19,524 | | | | 10,424 | | | | 11,097 | | | | 12,032 | |
| Evaluation projects/other | | | | | | | – | | | | – | | | | – | | | | – | | | | – | | | | – | | | | 2 | | | | 2 | | | | 3 | | | | – | | | | – | | | | – | |
| Total Iron Ore | | | | | | | 868 | | | | 1,608 | | | | 4,038 | | | | 1,645 | | | | 1,744 | | | | 1,789 | | | | 16,339 | | | | 16,850 | | | | 19,527 | | | | 10,424 | | | | 11,097 | | | | 12,032 | |
| | | | | | | | | | | | | |
| Aluminium | | | (e | ) | | | | | | | | | | | | | | | | | | | | | | | | | | | | | | | | | | | | | | | | | | | | | | | | |
| Bauxite | | | | | | | 343 | | | | 159 | | | | 122 | | | | 110 | | | | 112 | | | | 126 | | | | 1,278 | | | | 1,050 | | | | 1,366 | | | | 2,592 | | | | 2,603 | | | | 2,613 | |
| Alumina | | | | | | | 87 | | | | 158 | | | | 166 | | | | 206 | | | | 207 | | | | 212 | | | | 2,588 | | | | 2,698 | | | | 3,166 | | | | 2,139 | | | | 2,287 | | | | 2,228 | |
| Bauxite & Alumina | | | | | | | 430 | | | | 317 | | | | 288 | | | | 316 | | | | 319 | | | | 338 | | | | 3,866 | | | | 3,748 | | | | 4,532 | | | | 4,731 | | | | 4,890 | | | | 4,841 | |
| Primary Metal | | | | | | | 394 | | | | 1,249 | | | | 1,781 | | | | 716 | | | | 629 | | | | 692 | | | | 10,701 | | | | 10,326 | | | | 11,455 | | | | 6,799 | | | | 7,980 | | | | 9,270 | |
| Pacific Aluminium | | | | | | | 91 | | | | 126 | | | | 129 | | | | 193 | | | | 212 | | | | 135 | | | | 1,044 | | | | 1,198 | | | | 1,421 | | | | 2,276 | | | | 2,339 | | | | 2,395 | |
| Intersegment and Other | | | | | | | 1 | | | | (10 | ) | | | (177 | ) | | | 25 | | | | 12 | | | | 15 | | | | 171 | | | | 677 | | | | 889 | | | | 231 | | | | 210 | | | | 311 | |
| Total Aluminium | | | | | | | 916 | | | | 1,682 | | | | 2,021 | | | | 1,250 | | | | 1,172 | | | | 1,180 | | | | 15,782 | | | | 15,949 | | | | 18,297 | | | | 14,037 | | | | 15,419 | | | | 16,817 | |
| | | | | | | | | | | | | |
| Copper & Diamonds | | | | | | | | | | | | | | | | | | | | | | | | | | | | | | | | | | | | | | | | | | | | | | | | | | | | |
| Rio Tinto Kennecott | | | 100.0 | | | | 333 | | | | 408 | | | | 642 | | | | 530 | | | | 344 | | | | 324 | | | | 2,190 | | | | 2,442 | | | | 2,603 | | | | 1,638 | | | | 1,793 | | | | 1,976 | |
| Escondida | | | 30.0 | | | | 517 | | | | 770 | | | | 947 | | | | 364 | | | | 293 | | | | 308 | | | | 3,565 | | | | 3,485 | | | | 2,999 | | | | 1,230 | | | | 1,159 | | | | 1,344 | |
| Grasberg | | | (f | ) | | | 174 | | | | 179 | | | | 193 | | | | 89 | | | | 43 | | | | 36 | | | | 1,151 | | | | 1,016 | | | | 878 | | | | 2,859 | | | | 2,868 | | | | 2,955 | |
| Oyu Tolgoi & Turquoise Hill | | | (g | ) | | | 322 | | | | 92 | | | | 166 | | | | 450 | | | | 416 | | | | 379 | | | | 3,804 | | | | 3,597 | | | | 3,933 | | | | 2,728 | | | | 2,798 | | | | 3,255 | |
| Diamonds | | | (h | ) | | | 97 | | | | 124 | | | | 148 | | | | 164 | | | | 159 | | | | 168 | | | | 655 | | | | 857 | | | | 1,124 | | | | 907 | | | | 1,118 | | | | 1,268 | |
| Product group operations | | | | | | | 1,443 | | | | 1,573 | | | | 2,096 | | | | 1,597 | | | | 1,255 | | | | 1,215 | | | | 11,365 | | | | 11,397 | | | | 11,537 | | | | 9,362 | | | | 9,736 | | | | 10,798 | |
| Evaluation projects/other | | | | | | | (2 | ) | | | 3 | | | | 1 | | | | 4 | | | | 6 | | | | 4 | | | | 166 | | | | 155 | | | | 152 | | | | 127 | | | | 160 | | | | 153 | |
| Total Copper & Diamonds | | | | | | | 1,441 | | | | 1,576 | | | | 2,097 | | | | 1,601 | | | | 1,261 | | | | 1,219 | | | | 11,531 | | | | 11,552 | | | | 11,689 | | | | 9,489 | | | | 9,896 | | | | 10,951 | |
| | | | | | | | | | | | | |
| Energy & Minerals | | | | | | | | | | | | | | | | | | | | | | | | | | | | | | | | | | | | | | | | | | | | | | | | | | | | |
| Rio Tinto Coal Australia | | | (i)/(r | ) | | | (107 | ) | | | 108 | | | | 165 | | | | 297 | | | | 336 | | | | 406 | | | | 1,807 | | | | 2,137 | | | | 3,099 | | | | 3,049 | | | | 3,157 | | | | 3,187 | |
| Rio Tinto Coal Mozambique | | | (j | ) | | | – | | | | – | | | | 2 | | | | – | | | | – | | | | – | | | | – | | | | – | | | | 7 | | | | – | | | | – | | | | 183 | |
| Iron Ore Company of Canada | | | 58.7 | | | | 75 | | | | 118 | | | | 173 | | | | 151 | | | | 162 | | | | 164 | | | | 1,018 | | | | 1,155 | | | | 1,460 | | | | 2,308 | | | | 2,316 | | | | 2,580 | |
| Rio Tinto Iron & Titanium | | | (k | ) | | | 97 | | | | 150 | | | | 185 | | | | 189 | | | | 194 | | | | 233 | | | | 3,662 | | | | 3,554 | | | | 4,424 | | | | 4,094 | | | | 4,507 | | | | 4,787 | |
| Rio Tinto Borates | | | 100.0 | | | | 31 | | | | 28 | | | | 69 | | | | 53 | | | | 45 | | | | 41 | | | | 508 | | | | 585 | | | | 650 | | | | 984 | | | | 987 | | | | 1,024 | |
| Dampier Salt | | | 68.4 | | | | 11 | | | | 14 | | | | 21 | | | | 23 | | | | 22 | | | | 28 | | | | 146 | | | | 140 | | | | 193 | | | | 317 | | | | 394 | | | | 479 | |
| Uranium | | | (l | ) | | | 30 | | | | 39 | | | | 54 | | | | 25 | | | | 65 | | | | 135 | | | | (143 | ) | | | (216 | ) | | | 151 | | | | 1,303 | | | | 1,329 | | | | 1,243 | |
| Product group operations | | | | | | | 137 | | | | 457 | | | | 669 | | | | 738 | | | | 824 | | | | 1,007 | | | | 6,998 | | | | 7,355 | | | | 9,984 | | | | 12,055 | | | | 12,690 | | | | 13,483 | |
| Simandou iron ore project | | | (m | ) | | | – | | | | 91 | | | | 85 | | | | – | | | | 1 | | | | 14 | | | | 13 | | | | (10 | ) | | | 864 | | | | 635 | | | | 912 | | | | 958 | |
| Evaluation projects/other | | | (n | ) | | | 4 | | | | 4 | | | | 3 | | | | 1 | | | | 5 | | | | 7 | | | | 272 | | | | 276 | | | | 583 | | | | 769 | | | | 865 | | | | 749 | |
| Total Energy & Minerals | | | | | | | 141 | | | | 552 | | | | 757 | | | | 739 | | | | 830 | | | | 1,028 | | | | 7,283 | | | | 7,621 | | | | 11,431 | | | | 13,459 | | | | 14,467 | | | | 15,190 | |
| | | | | | | | | | | | | |
| Other Operations | | | (o | ) | | | (11 | ) | | | (36 | ) | | | (56 | ) | | | 34 | | | | 32 | | | | 34 | | | | 227 | | | | (14 | ) | | | 418 | | | | 246 | | | | 296 | | | | 845 | |
| Product Group Total | | | | | | | 3,355 | | | | 5,382 | | | | 8,857 | | | | 5,269 | | | | 5,039 | | | | 5,250 | | | | 51,162 | | | | 51,958 | | | | 61,362 | | | | 47,655 | | | | 51,175 | | | | 55,835 | |
| Intersegment transactions | | | | | | | | | | | | | | | | | | | | | | | | | | | | | | | 142 | | | | 242 | | | | 238 | | | | | | | | | | | | | |
| Net assets/(liabilities) of disposal groups held for sale | | | (s | ) | | | | | | | | | | | | | | | | | | | | | | | | | | | (7 | ) | | | 182 | | | | (48 | ) | | | | | | | | | | | | |
| Other items | | | | | | | (46 | ) | | | 65 | | | | (407 | ) | | | 51 | | | | 68 | | | | 82 | | | | (2,420 | ) | | | (1,250 | ) | | | (2,761 | ) | | | 3,363 | | | | 3,763 | | | | 3,940 | |
| Less: equity accounted units | | | | | | | (651 | ) | | | (859 | ) | | | (1,032 | ) | | | (526 | ) | | | (462 | ) | | | (472 | ) | | | | | | | | | | | | | | | | | | | | | | | | |
| Total | | | | | | | 2,658 | | | | 4,588 | | | | 7,418 | | | | 4,794 | | | | 4,645 | | | | 4,860 | | | | 48,877 | | | | 51,132 | | | | 58,791 | | | | 51,018 | | | | 54,938 | | | | 59,775 | |
| Add back: Proceeds from disposal of property, plant and equipment | | | | | | | 354 | | | | 97 | | | | 744 | | | | | | | | | | | | | | | | | | | | | | | | | | | | | | | | | | | | | |
| Total capital expenditure per cash flow statement | | | | | | | 3,012 | | | | 4,685 | | | | 8,162 | | | | | | | | | | | | | | | | | | | | | | | | | | | | | | | | | | | | | |
| Less: Net debt | | | | | | | | | | | | | | | | | | | | | | | | | | | | | | | (9,587 | ) | | | (13,783 | ) | | | (12,495 | ) | | | | | | | | | | | | |
| Less: EAU funded balances excluded from net debt | | | | | | | | | | | | | | | | | | | | | | | | | | | | | | | – | | | | – | | | | (11 | ) | | | | | | | | | | | | |
| Equity attributable to owners of Rio Tinto | | | | | | | | | | | | | | | | | | | | | | | | | | | | | | | 39,290 | | | | 37,349 | | | | 46,285 | | | | | | | | | | | | | |
| | | | |
| 2016 Annual report | | riotinto.com | | 201 |
| | | | | | | | | | | | | | | | |
| | | | | | | | | |
| STRATEGIC REPORT | | | | DIRECTORS’ REPORT | | | | FINANCIAL STATEMENTS | | | | METALS AND MINERALS PRODUCTION | | | | ADDITIONAL INFORMATION |
Notes to financial information by business unit
Business units are classified according to the Group’s management structure. The financial information by business unit has been recast in accordance with the organisational restructure announced on 21 June 2016. The main impacts are as follows: Iron Ore Company of Canada has moved from the Iron Ore product group to the Energy & Minerals product group; Coal businesses have moved from the previous Copper & Coal product group to the Energy & Minerals product group; and, Diamonds businesses have moved from the previous Diamonds & Minerals product group to the Copper & Diamonds product group.
| a) | Gross sales revenue includes the sales revenue of equity accounted units on a proportionately consolidated basis (after adjusting for sales to subsidiaries) in addition to consolidated sales. Consolidated sales revenue includes subsidiary sales to equity accounted units which are not included in gross sales revenue. |
| b) | EBITDA of subsidiaries and the Group’s share of EBITDA relating to equity accounted units represents profit before: tax, net finance items, depreciation and amortisation charged to the income statement in the period. Underlying EBITDA excludes the same items that are excluded from underlying earnings. |
| c) | Represents profit after tax for the period attributable to the owners of the Rio Tinto Group. Business unit earnings are stated before finance items but after the amortisation of discount related to provisions. Earnings attributed to business units do not include amounts that are excluded in arriving at underlying earnings. |
| d) | Pilbara represents the Group’s 100 per cent holding in Hamersley, 50 per cent holding of Hope Downs Joint Venture and 65 per cent holding of Robe River Iron Associates. The Group’s net beneficial interest in Robe River Iron Associates is 53 per cent as 30 per cent is held through a 60 per cent owned subsidiary and 35 per cent is held through a 100 per cent owned subsidiary. |
| e) | Presented on an integrated operations basis splitting activities between Bauxite & Alumina, Primary Metal, Pacific Aluminium and Other integrated operations (which in total reflect the results of the integrated production of aluminium) and Other product group items which relate to other commercial activities. |
| f) | Through a joint venture agreement with Freeport-McMoRan Inc. (Freeport), Rio Tinto is entitled to 40 per cent of material mined above an agreed threshold as a consequence of expansions and developments of the Grasberg facilities since 1998. |
| g) | Rio Tinto’s interest in Oyu Tolgoi is held indirectly through its 50.8 per cent investment in Turquoise Hill Resources Ltd (TRQ), where TRQ’s principal asset is its 66 per cent investment in Oyu Tolgoi LLC, which owns the Oyu Tolgoi copper-gold mine. |
| h) | Includes Rio Tinto’s interests in Argyle (100 per cent) and Diavik (60 per cent). Murowa (77.8 per cent) was included until its disposal to RZ Murowa Holdings Limited on 17 June 2015. |
| i) | As at 31 December 2016, includes Rio Tinto’s 100 per cent shareholding in Coal & Allied Industries Limited and its wholly-owned subsidiaries. Rio Tinto as a 100 per cent owner of Coal & Allied holds a 67.6 per cent, 80 per cent and 55.6 per cent respectively, with management rights, in Hunter Valley Operations, Mount Thorley and Warkworth. |
| | As at 31 December 2015, this represented Rio Tinto’s 80 per cent interest in Coal & Allied, through which Rio Tinto held its beneficial interests in Bengalla Joint Venture, Mount Thorley and Warkworth of 32 per cent, 64 per cent and 44.5 per cent respectively. |
| | Mitsubishi has moved from holding a 20 per cent stake in Coal & Allied (as at 31 December 2015) to holding a direct 32.4 per cent stake in the Hunter Valley Operations. |
| | On 1 March 2016, Coal & Allied disposed of its 40 per cent interest in Bengalla Joint Venture and on 5 August 2016, Coal & Allied disposed of its 100 per cent interest in the Mount Pleasant project. Both were included up until their respective disposal dates. |
| | On 24 January 2017, Rio Tinto announced it had reached a binding agreement for the sale of its 100 per cent shareholding in Coal & Allied Industries Limited to Yancoal Australia Limited. |
| | The transaction is subject to certain conditions precedent being satisfied, including approvals from the Australian Government, Chinese regulatory agencies and the New South Wales Government. |
| | As a result of the shareholding levels of various Chinese state-owned entities in each of Yankuang, Yanzhou and Chinalco (Aluminium Corporation of China), and Chinalco being a 10.1 per cent shareholder in the Rio Tinto Group, Yancoal Australia is considered to be a related party of Rio Tinto for the purposes of the UK Listing Rules and the ASX Listing Rules. Accordingly, approval is also required from a majority of independent Rio Tinto shareholders (that is, not including Chinalco and any other entities considered to be associates of Chinalco under the UK Listing Rules). |
| | Subject to all approvals and other conditions precedent being satisfied, it is expected that the transaction will complete in the second half of 2017. |
| j) | On 7 October 2014, Rio Tinto disposed of its interest in Rio Tinto Coal Mozambique (RTCM), including its interests in the Benga project, a 65:35 joint venture with Tata Steel Limited. Zululand Anthracite Colliery (ZAC), which was retained, is reported within Coal Evaluation projects/other. On 2 September 2016, Rio Tinto disposed of its interest in ZAC. |
| k) | Includes Rio Tinto’s interests in Rio Tinto Fer et Titane Inc (100 per cent), QIT Madagascar Minerals SA (QMM, 80 per cent) and Richards Bay Minerals (attributable interest of 74 per cent). |
| l) | Includes Rio Tinto’s interests in Energy Resources of Australia (68.4 per cent) and Rössing Uranium Limited (68.6 per cent). |
| m) | Simfer Jersey Limited, a company incorporated in Jersey in which the Group has a 53 per cent interest, has an 80.75 per cent interest in Simfer S.A. the company that operates the Simandou mining project in Guinea. The Group therefore has a 42.8 per cent indirect interest in Simfer S.A. These entities are consolidated as subsidiaries and together referred to as the Simandou iron ore project. |
| n) | On 2 September 2016, Rio Tinto disposed of its interest in Zululand Anthracite Colliery (ZAC), which was previously reported within Coal Evaluation projects/other. |
| o) | Other Operations include Rio Tinto’s 100 per cent interest in the Gove alumina refinery and Rio Tinto Marine. |
| p) | Capital expenditure comprises the net cash outflow on purchases less disposals of property, plant and equipment, capitalised evaluation costs and purchases less disposals of other intangible assets. The details provided include 100 per cent of subsidiaries’ capital expenditure and Rio Tinto’s share of the capital expenditure of joint operations and equity accounted units. |
| q) | Operating assets of subsidiaries comprise net assets excluding post-retirement assets and liabilities, net of tax, and are before deducting net debt. Operating assets are stated after deduction ofnon-controlling interests, which are calculated by reference to the net assets of the relevant companies (ie inclusive of such companies’ debt and amounts due to or from Rio Tinto Group companies). |
| | | | |
| 202 | | riotinto.com | | 2016 Annual report |
| r) | Capital expenditure in 2016 for RTCA includes net proceeds of US$192 million for the disposal of 100 per cent interest in the Mount Pleasant thermal coal project to MACH Energy Australia Pty Ltd on 5 August 2016. |
| s) | Following the termination of the previous sales agreement for Blair Athol, a binding agreement was signed in September 2016 to divest Rio Tinto’s 71.2 per cent interest to Terracom subject to certain conditions precedent. At 31 December 2016, assets held for sale also included certain cancelled projects at Rio Tinto Kennecott. |
| | At 31 December 2015, assets and liabilities held for sale primarily related to the Group’s 40 per cent interest in the Bengalla coal Joint venture and its interest in Blair Athol. |
| | Assets and liabilities held for sale as at 31 December 2014 comprised Rio Tinto’s interests in the Blair Athol coal project and SouthGobi Resources Ltd. |
| | | | |
| 2016 Annual report | | riotinto.com | | 203 |
| | | | | | | | | | | | | | | | |
| | | | | | | | | |
| STRATEGIC REPORT | | | | DIRECTORS’ REPORT | | | | FINANCIAL STATEMENTS | | | | METALS AND MINERALS PRODUCTION | | | | ADDITIONAL INFORMATION |
Australian Corporations Act – summary of ASIC relief
Pursuant to section 340 of the Corporations Act 2001 (Corporations Act), the Australian Securities and Investments Commission issued an order dated 14 December 2015 that granted relief to Rio Tinto Limited from certain requirements of the Corporations Act in relation to the Company’s financial statements and associated reports. The order essentially continues the relief that has applied to Rio Tinto Limited since the formation of the Group’s dual listed companies (DLC) structure in 1995. The order applies to Rio Tinto Limited’s financial reporting obligations for the financial years and half-years ending between 31 December 2015 and 30 June 2020 inclusive.
In essence, instead of being required under the Corporations Act to prepare consolidated financial statements covering only itself and its controlled entities, the order allows Rio Tinto Limited to prepare consolidated financial statements in which it, Rio Tinto plc and their respective controlled entities are treated as a single economic entity. In addition, those consolidated financial statements are to be prepared:
| – | | in accordance with the principles and requirements of International Financial Reporting Standards as adopted by the European Union (EU IFRS) rather than the Australian Accounting Standards (AAS) (except for one limited instance in the case of any concise report), and in accordance with UK financial reporting obligations generally; |
| – | | on the basis that the transitional provisions of International Financial Reporting Standard 1, First-time Adoption of International Financial Reporting Standards, should be applied using the combined financial statements previously prepared for Rio Tinto Limited, Rio Tinto plc and their respective controlled entities under Generally Accepted Accounting Principles in the United Kingdom, under which the DLC Merger between Rio Tinto Limited and Rio Tinto plc was accounted for using “merger”, rather than “acquisition”, accounting (reflecting that neither Rio Tinto Limited nor Rio Tinto plc was acquired by, or is controlled by, the other; and meaning that the existing carrying amounts, rather than fair values, of assets and liabilities at the time of the DLC Merger were used to measure those assets and liabilities at formation); |
| – | | on the basis that Rio Tinto Limited and Rio Tinto plc are a single company (with their respective shareholders being the shareholders in that single company); and |
| – | | with a reconciliation, from EU IFRS to AAS, of the following amounts: consolidated loss/profit for the financial year, total consolidated comprehensive loss/income for the financial year and total consolidated equity at the end of the financial year (see page 115). |
Those consolidated financial statements must also be audited in relation to their compliance with relevant Australian and UK requirements. Rio Tinto Limited must also prepare a Directors’ report which satisfies the content requirements of the Corporations Act (applied on the basis that for these purposes the consolidated entity is the Group, and the consolidated financial statements cover the Group). This includes a Remuneration Report (see pages 70 to 107) prepared in accordance with the requirements of the Corporations Act.
Rio Tinto Limited is also required to comply generally with the lodgement and distribution requirements of the Corporations Act (including timing requirements) in relation to those consolidated financial statements (including any concise financial statements), the Auditor’s report and the Directors’ report. The Corporations Act also requires that anon-binding resolution to adopt the Remuneration Report be voted on by shareholders at the Company’s annual general meeting.
Rio Tinto Limited is not required to prepare separate consolidated financial statements solely for it and its controlled entities. Rio Tinto Limited is also not required to prepare and lodge parent entity financial statements for itself in respect of each relevant financial year.
Rio Tinto Limited must, however, in accordance with the Corporations Act include in the consolidated financial statements for the Group, as a note, various parent entity information regarding Rio Tinto Limited (including in relation to assets, liabilities, shareholders’ equity, profit and loss, income, guarantees, contingent liabilities, and contractual commitments) prepared in accordance with AAS (see page 176).
| | | | |
| 204 | | riotinto.com | | 2016 Annual report |
Directors’ declaration
Directors’ statement of responsibilities in relation to the Group financial statements, Rio Tinto plc financial statements and Rio Tinto Limited financial statements
The directors are responsible for preparing the Annual report, the Remuneration Report and the financial statements in accordance with applicable law and regulations.
UK and Australian company law requires the directors to prepare financial statements for each financial year. Under UK law the directors have elected to prepare the Group financial statements in accordance with International Financial Reporting Standards (IFRSs) as adopted by the European Union and the Rio Tinto plc financial statements in accordance with United Kingdom Generally Accepted Accounting Practice (United Kingdom Accounting Standards and applicable law), including FRS 101 “Reduced disclosure framework”.
Under Australian law, the directors are also required to prepare certain Rio Tinto Limited parent company financial statements in accordance with Australian Accounting Standards (AAS). In preparing the Group financial statements, the directors have also elected to comply with IFRSs, issued by the International Accounting Standards Board (IASB).
Under UK and Australian company law the directors must not approve the financial statements unless they are satisfied that they give a true and fair view of the state of affairs of the Group and the companies as at the end of the financial year, and of the profit or loss of the companies and Group for the period (as applicable).
In preparing these financial statements, the directors are required to:
| – | | select suitable accounting policies and apply them consistently; |
| – | | make judgments and estimates that are reasonable and prudent; |
| – | | state whether IFRSs as adopted by the European Union, applicable UK Accounting Standards and AAS have been followed, subject to any material departures disclosed and explained in the Group and parent company financial statements respectively; and |
| – | | prepare the financial statements on the going concern basis unless it is inappropriate to presume that the Group and the companies will continue in business. |
The directors are responsible for keeping adequate accounting records that are sufficient to show and explain the transactions of the companies and the Group and disclose with reasonable accuracy at any time the financial position of the companies and the Group and enable them to ensure that:
| – | | the Group financial statements comply with the UK Companies Act 2006, the Australian Corporations Act 2001 as amended by the Australian Securities and Investments Commission Order dated 14 December 2015 and Article 4 of the IAS Regulation; |
| – | | the Rio Tinto plc financial statements comply with the UK Companies Act 2006; |
| – | | the Rio Tinto Limited parent company disclosures comply with the Corporations Act as amended by the Australian Securities and Investments Commission Order dated 14 December 2015; and |
| – | | the Remuneration Report complies with the UK Companies Act 2006 and the Corporations Act 2001 as amended by the Australian Securities and Investments Commission Order dated 14 December 2015. |
The directors are also responsible for safeguarding the assets of the Companies and the Group and hence for taking reasonable steps for the prevention and detection of fraud and other irregularities.
The directors are responsible for the maintenance and integrity of the Group’s website. Legislation governing the preparation and dissemination of financial statements may differ between jurisdictions in which the Group reports.
Each of the current directors, whose names and function are listed on pages 50 to 52 in the Governance section, confirm that, to the best of their knowledge:
| – | | the Rio Tinto Group financial statements and notes, which have been prepared in accordance with IFRS as adopted by the EU, the Corporations Act 2001 as amended by the Australian Securities and Investments Commission Order dated 14 December 2015, the UK Companies Act 2006 and Article 4 of the IAS Regulation, give a true and fair view of the assets, liabilities, financial position and profit of the Group; |
| – | | the Rio Tinto plc financial statements and notes, which have been prepared in accordance with United Kingdom Generally Accepted Accounting Practice give a true and fair view of the assets, liabilities, financial position and profit of the company; |
| – | | the Rio Tinto Limited parent company disclosures, which have been prepared in accordance with Australian Accounting Standards (AAS) and Corporations Act 2001 as amended by the Australian Securities and Investments Commission Order dated 14 December 2015 give a true and fair view of the assets, liabilities, financial position and profit of the company; |
| – | | the Strategic report section of the Annual report includes a fair review of the development and performance of the business and the position of the Group, together with a description of the principal risks and uncertainties that it faces; and |
| – | | there are reasonable grounds to believe that each of the Rio Tinto Group, Rio Tinto plc and Rio Tinto Limited will be able to pay its debts as and when they become due and payable. |
The directors have been given the declarations by the chief executive and chief financial officer required by section 295A of the Corporations Act 2001 as amended by the Australian Securities and Investments Commission Order dated 14 December 2015.
Disclosure of information to auditors
The directors in office at the date of this report have each confirmed that:
| – | | so far as he or she is aware, there is no relevant audit information of which the Group’s auditors are unaware; and |
| – | | he or she has taken all the steps that he or she ought to have taken as a director to make himself or herself aware of any relevant audit information and to establish that the Group’s auditors are aware of that information. |
This declaration is made in accordance with a resolution of the board.
| | | | | | | | |

| | | |
| | | | 
|
| Jan du Plessis | | | | Jean-Sébastien Jacques | | | | Chris Lynch |
| Chairman | | | | Chief executive | | | | Chief financial officer |
1 March 2017 | | | | 1 March 2017 | | | | 1 March 2017 |
| | | | |
| 2016 Annual report | | riotinto.com | | 205 |
| | | | | | | | | | | | | | | | |
| | | | | | | | | |
| STRATEGIC REPORT | | | | DIRECTORS’ REPORT | | | | FINANCIAL STATEMENTS | | | | METALS AND MINERALS PRODUCTION | | | | ADDITIONAL INFORMATION |
Auditor’s independence declaration
As lead auditor for the audit of Rio Tinto Limited for the year ended 31 December 2016, I declare that to the best of my knowledge and belief, there have been:
| (a) | no contraventions of the auditor independence requirements of theCorporations Act 2001 in relation to the audit; and |
| (b) | no contraventions of any applicable code of professional conduct in relation to the audit. |
This declaration is in respect of Rio Tinto Limited and the entities it controlled during the period.
Paul Bendall
Partner
PricewaterhouseCoopers
Melbourne
1 March 2017
Liability limited by a scheme approved under Professional Standards Legislation
| | | | |
| 206 | | riotinto.com | | 2016 Annual report |
Independent auditors’ report of PricewaterhouseCoopers LLP to the members of Rio Tinto plc and PricewaterhouseCoopers to the members of Rio Tinto Limited
For the purpose of this report, the terms “we” and “our” denote PricewaterhouseCoopers LLP in relation to UK legal, professional and regulatory responsibilities and reporting obligations to the members of Rio Tinto plc and PricewaterhouseCoopers in relation to Australian legal, professional and regulatory responsibilities and reporting obligations to the members of Rio Tinto Limited. For the purposes of the table on pages 208 to 210 that sets out the areas of focus / key audit matters and how our audit addressed the area of focus / key audit matter, the terms “we” and “our” refer to PricewaterhouseCoopers LLP and/or PricewaterhouseCoopers and/or our component teams. The Group financial statements, as defined below, consolidate the accounts of Rio Tinto plc and Rio Tinto Limited and their respective subsidiaries (“the Group”) and include the Group’s share of joint arrangements and associates.
The relevant legislation governing the companies is the United Kingdom Companies Act 2006 (“Companies Act 2006”) for Rio Tinto plc and the Australian Corporations Act 2001 (“Corporations Act 2001”) as amended by the ASIC order dated 14 December 2015 (the “ASIC Order”) for Rio Tinto Limited.
Report on the financial statements and the financial report
Opinion of PricewaterhouseCoopers LLP on the financial statements to the members of Rio Tinto plc
In our opinion:
| – | | the financial statements, defined below, give a true and fair view of the state of the Group’s and of Rio Tinto plc’s affairs as at 31 December 2016 and of the Group’s profit and cash flows for the year then ended; |
| – | | the Group financial statements have been properly prepared in accordance with International Financial Reporting Standards (“IFRSs”) as adopted by the European Union; |
| – | | the Rio Tinto plc company financial statements have been properly prepared in accordance with United Kingdom Generally Accepted Accounting Practice; and |
| – | | the financial statements have been prepared in accordance with the requirements of the Companies Act 2006 and, as regards the Group financial statements, Article 4 of the IAS Regulation. |
Separate opinion of PricewaterhouseCoopers LLP in relation to financial statements prepared in accordance with IFRSs as issued by the International Accounting Standards Board (“IASB”)
As explained in note 1 to the financial statements, the Group, in addition to applying IFRSs as adopted by the European Union, has also applied IFRSs as issued by the IASB.
In our opinion, the Group financial statements comply with IFRSs as issued by the IASB.
Opinion of PricewaterhouseCoopers on the financial report to the members of Rio Tinto Limited
In our opinion:
The accompanying financial report, defined below, is in accordance with the Corporations Act 2001 as amended by the ASIC Order, including:
| – | | giving a true and fair view of the Group’s financial position as at 31 December 2016 and of its performance for the year then ended; and |
| – | | complying with Australian Accounting Standards and the Corporations Regulations 2001. |
Basis for opinion:
We conducted our audit in accordance with Australian Auditing Standards. Our responsibilities under those standards are further
described in theResponsibilities for the financial statements, the financial report and the auditsection of our report.
We believe that the audit evidence we have obtained is sufficient and appropriate to provide a basis for our opinion.
Independence:
We are independent of the Group in accordance with the auditor independence requirements of the Corporations Act 2001 and the ethical requirements of the Accounting Professional and Ethical Standards Board’s APES 110 Code of Ethics for Professional Accountants (“APES 110”) that are relevant to our audit of the financial report in Australia. We have also fulfilled our other ethical responsibilities in accordance with APES 110.
What we have audited
The Group financial statements, included within the Annual report and Accounts (the “Annual report”), comprise:
| – | | the Group balance sheet as at 31 December 2016; |
| – | | the Group income statement and Group statement of comprehensive income for the year then ended; |
| – | | the Group cash flow statement for the year then ended; |
| – | | the Group statement of changes in equity for the year then ended; |
| – | | notes 1 – 45 and 47 to the Group financial statements, which include a summary of significant accounting policies and other explanatory information; |
| – | | the outline of dual listed companies structure and basis of financial statements; and |
| – | | the Rio Tinto financial information by business unit. |
The Rio Tinto plc company financial statements, included within the Annual report, comprise:
| – | | the Rio Tinto plc company balance sheet as at 31 December 2016; |
| – | | the Rio Tinto plc company statement of changes in equity for the year then ended; and |
| – | | notesA-H to the Rio Tinto plc company financial statements, which include a summary of significant accounting policies and other explanatory information. |
The Group financial statements and the Rio Tinto plc company financial statements are referred to in this report as the “financial statements”. The Group financial statements, note 46 “Rio Tinto Limited parent company disclosures” and the Directors’ declaration on page 205 are referred to in this report as the “financial report”.
PricewaterhouseCoopers LLP has audited the financial statements for the year ended 31 December 2016.
PricewaterhouseCoopers has audited the Reconciliation with Australian Accounting Standards, the Directors’ Remuneration Report included in the Directors’ report and the financial report for the year ended 31 December 2016.
Certain required disclosures have been presented elsewhere in the Annual report rather than in the notes to the financial statements and the financial report. These are cross-referenced from the financial statements and the financial report and are identified as audited.
The financial reporting framework that has been applied in the preparation of the Group financial statements is applicable law in the United Kingdom, applicable law in Australia as amended by the ASIC Order (described in the Annual report under the heading “Australian Corporations Act – Summary of ASIC relief”) and IFRSs as adopted by the European Union and as issued by the IASB.
| | | | |
| 2016 Annual report | | riotinto.com | | 207 |
| | | | | | | | | | | | | | | | |
| | | | | | | | | |
| STRATEGIC REPORT | | | | DIRECTORS’ REPORT | | | | FINANCIAL STATEMENTS | | | | METALS AND MINERALS PRODUCTION | | | | ADDITIONAL INFORMATION |
Independent auditors’ report of PricewaterhouseCoopers LLP to the members of Rio Tinto plc and PricewaterhouseCoopers to the members of Rio Tinto Limited
continued
The financial reporting framework that has been applied in the preparation of the Rio Tinto plc company financial statements is United Kingdom Accounting Standards, comprising FRS 101, “Reduced Disclosure Framework” and applicable law (United Kingdom Generally Accepted Accounting Practice).
All currency references are to the United States Dollar, unless otherwise stated.
Our audit approach
The Group’s principal activities are minerals and metals exploration, development, production and processing. The Group operates through four product groups which are supported by the Growth & Innovation group and other centralised functions. Together these comprise 49 business units containing multiple reporting units.
Overview
| | |
Materiality | | Overall Group materiality: $275 million (2015: $300 million). |
| Scope | | We identified the Pilbara business unit as a significant component which required an audit of its complete financial information due to its financial significance to the Group. Aside from the Pilbara, we obtained full scope reporting from a further 21 reporting units (2015: one). Specific audit procedures on certain balances and transactions were performed at a further 12 reporting units (2015: 17), which comprised seven (2015: 12) operating reporting units and five (2015: five) central reporting units, such as treasury entities. |
Areas of focus /
key audit matters | | We assessed the risks of material misstatement in the financial statements and the financial report and determined the following areas of focus / key audit matters for 2016: – impairment assessments (including indicators of impairment and impairment reversal), with a particular focus on property, plant and equipment (at Oyu Tolgoi and Argyle) and indefinite-lived intangible assets in Rio Tinto Aluminium; – provisions for uncertain tax positions, with a particular focus on transfer pricing of certain transactions with the Group’s commercial centre in Singapore; – provisions for close-down, restoration and environmental obligations; and – defined benefit pension plan surpluses and deficits. |
The scope of our audit and our areas of focus / key audit matters
We conducted our audit in accordance with International Standards on Auditing (UK and Ireland) (“ISAs (UK & Ireland)”) and Australian Auditing Standards (“ASAs”).
We designed our audit by determining materiality and assessing the risks of material misstatement in the financial statements and the financial report. In particular, we looked at where the directors made subjective judgements, for example in respect of significant accounting estimates that involved making assumptions and considering future events that are inherently uncertain. As in all of our audits, we also addressed the risk of management override of internal controls, including evaluating whether there was evidence of bias by the directors that represented a risk of material misstatement due to fraud.
The risks of material misstatement that were of most significance and had the greatest effect on our audit, including the allocation of our resources and effort in the current year, are identified as “areas of focus / key audit matters” in the table below. We have also set out how we tailored our audit to address these specific areas in order to provide an opinion on the financial statements and financial report as a whole, and any comments we make on the results of our procedures should be read in this context. This is not a complete list of all risks identified by our audit.
| | |
| Area of focus / key audit matter | | How our audit addressed the area of focus / key audit matter |
Impairment/reversal of impairment assessment The Group has goodwill of $951 million, indefinite-lived intangible assets of $1,702 million, finite-lived intangible assets of $1,577 million, (including exploration and evaluation assets of $711 million) and property, plant and equipment of $58,855 million as at 31 December 2016. Impairment charges to each of these asset categories have been recognised in previous years. All cash generating units (CGUs) containing goodwill and indefinite-lived intangible assets must be tested for impairment annually. Management must also determine the recoverable amount for other assets including finite-lived intangible assets, property, plant and equipment and evaluation and exploration assets when impairment indicators are identified. The determination of recoverable amount, being the higher ofvalue-in-use and fair value less costs of disposal, requires judgement on the part of management in identifying and then estimating the recoverable amount for the relevant CGUs. Recoverable amounts are based on management’s view of key internal value driver inputs and external market conditions such as future commodity prices, the timing and approval of future capital and operating expenditure, and the most appropriate discount rate. As well as considering indicators of impairment, management must determine whether any indicators of reversal of previous impairments are apparent for assets other than goodwill. Due to continued uncertainty over long-term commodity prices, impairment reversals were only considered in a limited number of cases. No impairment reversals were recognised. | | For material goodwill balances, other intangible assets, including indefinite-lived water rights in Rio Tinto Aluminium, property, plant and equipment, and exploration and evaluation assets we undertook the following: – satisfied ourselves as to the appropriateness of management’s identification of the Group’s CGUs and the continued satisfactory operation of the Group’s controls over the impairment assessment process; – evaluated management’s assessment of impairment indicators, as well as indicators of impairment reversal, including the conclusions reached; – with the support of our valuation experts, benchmarked key market related assumptions in management’s valuation models used to determine recoverable amount against external data, including assumptions of future commodity prices, foreign exchange rates and discount rates; and – checked the mathematical accuracy of management’s valuation models and agreed relevant data, including assumptions on timing and future capital and operating expenditure, to the latest Life of Mine/production plans and budgets. |
| | | | |
| 208 | | riotinto.com | | 2016 Annual report |
| | |
| Area of focus / key audit matter | | How our audit addressed the area of focus / key audit matter |
In relation to specific reporting units we noted the following: Argyle – as a result of the lower production volumes compared with forecast and lower prices achieved for bulk diamonds, an impairment trigger was identified for the Argyle CGU. Management determined the recoverable amount for Argyle was $191 million assessed by reference to a value in use (“VIU”) model in line with the accounting policy set out in note 1(i). The reduction in the recoverable amount resulted in apre-tax impairment charge of $240 million related to property, plant & equipment and $1 million to intangible assets. Oyu Tolgoi – this project has progressed during 2016, including formal notice to proceed with the underground mine development and approval of the 2016 Oyu Tolgoi feasibility study by both the Government of Mongolia and Turquoise Hill Resources. The operating assets of the Oyu Tolgoi CGU as at 31 December 2016 were $7.9 billion. Refer to note 6 for management’s conclusions and the Audit Committee’s views set out on page 59. | | In addition to our overall response to impairment risk described above, we performed additional procedures on certain projects or reporting units as follows: |
| | – Argyle – assessed the reliability of management’s diamond price forecasts based on recent sales prices achieved as well as performing sensitivity analysis over the key assumptions in the VIU model such as changes in diamond prices, operating expenses, the discount rate and exchange rates; and – Oyu Tolgoi – read the formal notice to proceed issued by the Group and the Government of Mongolia and the 2016 Oyu Tolgoi feasibility study. We understood key changes in the 2016 Oyu Tolgoi feasibility study compared with the 2015 feasibility study and the impact of the latest study on Life of Mine assumptions and assessed management’s competence and objectivity in preparing the study. Given the positive developments in 2016, we satisfied ourselves that no impairment trigger arose in the year. However, due to the length of time remaining to complete the underground mine, and the associated complexity of doing so, we also satisfied ourselves that developments in 2016 did not give rise to an impairment reversal trigger for the Oyu Tolgoi CGU. We considered the appropriateness of the related disclosures in note 6 to the financial statements. |
Close-down, restoration and environmental obligations The Group has provisions for close-down, restoration and environmental obligations of $8,722 million as at 31 December 2016. The calculation of these provisions requires management judgement in estimating the quantum and timing of future costs, particularly given the unique nature of each site, the long timescales involved and the potential associated obligations. These calculations also require management to determine an appropriate rate to discount future costs to their net present value. The judgement required to estimate such costs is compounded by the fact that there has been limited restoration and rehabilitation activity and historical precedent against which to benchmark estimates of future costs. Management reviews the close-down, restoration and environmental obligations on a semi-annual basis, using experts to provide support in its assessment where appropriate. This review incorporates the effects of any changes in local regulations and management’s anticipated approach to restoration and rehabilitation. In relation to specific assets, we focussed on the change in provision at the Gove alumina refinery. An updated closure study in 2016 at the Gove refinery resulted in a change in the estimate and an increase in the closure provision by $402 million. Refer to notes 2 and 26, and the Audit Committee’s views set out on page 59. | | We assessed management’s process for the review of closure provisions, and performed detailed testing for 10 reporting units that had a material movement in their closure provision in the year or a material closure provision as at 31 December 2016 (2015: 5 reporting units). As part of our detailed testing of the cost estimates prepared by management for the 10 reporting units selected, we established the existence of legal and/or constructive obligations with respect to the closure provision and considered the intended method of restoration and rehabilitation and associated cost estimate. We also considered the competence and objectivity of management’s experts, whether internal or external to the Group, who produced the cost estimates. We checked the mathematical accuracy of management’s calculations and assessed the appropriateness of the discount rate using our valuations experts. In addition to our overall response to the risk described above, we performed additional procedures in respect of the Gove alumina refinery provision as follows: – read the latest available technical studies and assessed the appropriateness of the scope of work performed by management and the various third party experts; and – engaged our expert in the field of restoration and rehabilitation to evaluate technical data related to the project. For the remaining reporting units which did not have a material closure provision or material movement in the year, including legacy operations, we considered whether the provision relating toclose-down, restoration and environmental obligations was consistent with our understanding of the obligations associated with the operation and the remediation plans. We considered the appropriateness of the related disclosures in notes 2 and 26 to the financial statements. |
| | | | |
| 2016 Annual report | | riotinto.com | | 209 |
| | | | | | | | | | | | | | | | |
| | | | | | | | | |
| STRATEGIC REPORT | | | | DIRECTORS’ REPORT | | | | FINANCIAL STATEMENTS | | | | METALS AND MINERALS PRODUCTION | | | | ADDITIONAL INFORMATION |
Independent auditors’ report of PricewaterhouseCoopers LLP to the members of Rio Tinto plc and PricewaterhouseCoopers to the members of Rio Tinto Limited
continued
| | |
| Area of focus / key audit matter | | How our audit addressed the area of focus / key audit matter |
Provisions for uncertain tax positions The Group operates across a large number of jurisdictions and is subject to periodic challenges by local tax authorities on a range of tax matters during the normal course of business, including transfer pricing, indirect taxes and transaction related tax matters. As at 31 December 2016, the Group has current andnon-current taxes payable of $1,038 million. Where the amount of tax payable is uncertain, the Group establishes provisions based on management’s best estimate of the most likely outcome. In relation to specific uncertain tax positions, we focussed on matters relating to the transfer pricing of certain transactions between the Group’s entities based in Australia and the Group’s commercial centre in Singapore. The Group has been in discussion with the Australian Taxation Office (“ATO”) on these matters through advance ruling requests or pursuant to the Group’sco-operative compliance agreement. The Group has recognised an increase in the tax provision of $380 million in the year. The Group has not yet received amended tax assessments from the ATO in respect of these matters, but it is possible that assessments may be issued in the near future. Refer to notes 2 and 9, and the Audit Committee’s views set out on page 59. | | We assessed management’s process for identifying uncertain tax positions and the related accounting policy of providing for tax exposures. We used our tax specialists to gain an understanding of the current status of tax assessments and investigations and to monitor developments in ongoing disputes. We read recent rulings and correspondence with local tax authorities, as well as external advice received by the Group where relevant, to satisfy ourselves that the tax provisions had been appropriately recorded or adjusted to reflect the latest external developments. In addition to our overall response to the risk described above, we performed additional procedures in respect of the Group’s Singapore commercial centre as follows: – read the latest available position paper and expert reports to assess the appropriateness of the provision recognised by management; – checked the mathematical accuracy of management’s models and agreed relevant input data to supporting records; and – engaged our experts in the field of transfer pricing to evaluate the basis on which the provision has been recognised. We considered the appropriateness of the related disclosures in notes 2 and 9 to the financial statements. |
Defined benefit pension plan surpluses and deficits The Group has approximately 55 defined benefit pension plans. The total fair value of plan assets is $13,749 million, and the total present value of pension obligations is $15,302 million, which are both significant in the context of the overall balance sheet of the Group. The valuation of the pension liabilities requires judgement in determining appropriate assumptions such as salary increases, mortality rates, discount rates, inflation levels and the impact of any changes in individual pension plans. Movements in these assumptions can have a material impact on the determination of the liability. Management uses external actuaries to assist in assessing these assumptions. Judgement is also involved in the measurement of the fair value of certain pension assets. Refer to note 45 and the Audit Committee’s views set out on page 59. | | We used our actuarial experts to satisfy ourselves that the assumptions used in calculating the pension plan liabilities, including salary increases and mortality rate assumptions, were consistent with the specifics of eachin-scope plan and, where applicable, with relevant national and industry benchmarks. We also checked that the discount and inflation rates used in the valuation of the pension liabilities were consistent with our internally developed benchmarks and in line with other companies’ recent external reporting. For pension plan assets, we obtained third party confirmations of ownership and third party valuations of individual pension assets. Were-performed a sample of the valuations independently, for example testing the valuation of marketable securities to index prices as at 31 December 2016, recalculating valuations based on observable inputs and using our experts to help us assess other individual asset values whose value is not determined based on observable market inputs, such as property. We considered the appropriateness of the related disclosures in note 45 to the financial statements. |
How we tailored the audit scope
As the Group engagement team, we tailored the scope of our audit to ensure that we performed enough work to be able to give an opinion on the financial statements and the financial report as a whole, taking into account the geographical structure of the Group, the accounting processes and controls, and the industry in which the Group operates.
Following the reorganisation of the Group’s product group structure in June 2016, the Group is organised into four product groups – Aluminium, Copper & Diamonds, Energy & Minerals and Iron Ore, all of which are supported by the Growth & Innovation group and other centralised functions. Each product group is made up of a number of operating businesses which represent separate business units. Each business unit is comprised of individual reporting units which align to discrete operations. The Group financial statements are a consolidation of reporting units, comprising the Group’s operating businesses and centralised functions. We determined the appropriate reporting units to perform work on based on factors such as the size of the balances, the
areas of focus / key audit matters as noted above and known accounting matters, and to include unpredictability in our audit procedures.
In establishing the overall approach to the Group audit, we determined the type of work that needed to be performed at reporting units by us, as the Group engagement team, or component auditors from either other PwC network firms ornon-PwC firms operating under our instruction. In 2016, were-evaluated our audit approach in respect of the Aluminium product group, and received reporting directly from Aluminium reporting units that previously reported to, and were aggregated at, the product group level, before being reported to the Group team at that aggregated product group level. With this change in our audit scoping we also extended certain procedures atin-scope reporting units when compared with those undertaken last year to simplify our Group audit approach.
We identified the Pilbara reporting unit as a significant component (as defined within ISAs (UK & Ireland) and ASAs) which, in our view, required an audit of its complete financial information, due to its financial
| | | | |
| 210 | | riotinto.com | | 2016 Annual report |
significance to the Group. Outside of the Pilbara reporting unit, we obtained full scope reporting from a further 21 reporting units (2015: one), the increase largely reflecting our revised approach to the Aluminium product group, as well as at other key reporting units in which we previously performed specific audit procedures. Specific audit procedures on certain balances and transactions were performed at a further 12 reporting units (2015: 17), which comprised seven (2015: 12) operating reporting units and five (2015: five) central reporting units, such as treasury entities, primarily to ensure appropriate audit coverage.
As we seek to vary our audit procedures each year to ensure an element of unpredictability, two smaller reporting units (2015: two) were included in our Group audit scope for 2016. We also performed work centrally on IT general controls, journals, taxation and pensions.
Where work was performed by component auditors, we determined the level of involvement we needed to have in the audit work at those reporting units to be able to conclude whether sufficient appropriate audit evidence had been obtained as a basis for our opinion on the Group financial statements as a whole.
We issued formal written instructions to all component auditors setting out the audit work to be performed by each of them and maintained regular communication with the component auditors throughout the audit cycle. These interactions included attending certain component clearance meetings and holding regular conference calls, as well as reviewing and assessing any matters reported. The Group engagement team also reviewed selected audit working papers for certainin-scope component teams.
In addition, senior members of the Group engagement team visited component teams across all four product groups in Canada, Australia, Chile, Mongolia and Singapore. These visits included meetings with local management and with the component auditors, and typically operating site tours.
Materiality
The scope of our audit was influenced by our application of materiality. We set certain quantitative thresholds for materiality. These, together with qualitative considerations, helped us to determine the scope of our audit and the nature, timing and extent of our audit procedures on the individual financial statement line items and disclosures and to evaluate the effect of misstatements, both individually and on the financial statements and the financial report as a whole.
Based on our professional judgement, we determined materiality for the financial statements and the financial report as a whole as follows:
| | |
| Overall Group materiality | | $275 million (2015: $300 million). |
| How we determined it | | We used an average of underlying earnings before tax (as defined in note 2 to the financial statements) of the current and previous three years (2015: 5% of single year underlying earnings before tax). |
| Rationale for benchmark applied | | We chose to use an adjusted underlying earnings measure as the benchmark because an adjusted measure removes the impact of material items which do not recur from year to year or otherwise significantly affect the underlying trend of performance from continuing operations. This is the metric against which the performance of the Group is most commonly assessed by management and reported to shareholders. For 2016 we amended our approach to calculate materiality based on a four year average of profit before tax adjusted for items excluded from underlying earnings. Adoption of a multi-year average benchmark for materiality will respond to longer-term trends in commodity markets and reduce volatility in the measureyear-on-year. Using our professional judgement, we determined materiality for this year at $275 million, which equates to approximately 4.1% of the current year’s underlying earnings before tax. |
| Component materiality | | For each reporting unit (“component”) in our audit scope, we allocated a materiality that was less than our overall Group materiality. The materiality allocated to each component was between $19 million and $250 million. |
We agreed with the Audit Committee that we would report to them misstatements identified during our audit above $25 million (2015: $30 million) as well as misstatements below that amount that, in our view, warranted reporting for qualitative reasons.
Going concern
Under the Listing Rules we are required to review the Directors’ statement, set out on page 108, in relation to going concern. We have nothing to report having performed our review.
Under ISAs (UK & Ireland) we are also required to report to you if we have anything material to add or to draw attention to in relation to the Directors’ statement about whether they considered it appropriate to adopt the going concern basis in preparing the financial statements. We have nothing material to add or to draw attention to.
Under ASAs we are required to conclude on the appropriateness of the directors’ use of the going concern basis of accounting and, based on the audit evidence obtained, whether a material uncertainty exists related to events or conditions that may cast significant doubt on the Group’s ability to continue as a going concern. If we conclude that a material uncertainty exists, we are required to draw attention in our auditor’s report to the related disclosures in the financial report or, if such disclosures are inadequate, to modify our opinion. Our conclusions are based on the audit evidence obtained up to the date of our auditor’s report.
As noted in the Directors’ statement, the directors have concluded that it is appropriate to adopt the going concern basis in preparing the financial statements. The going concern basis presumes that the Group and the parent companies, defined as Rio Tinto plc and Rio Tinto Limited (the “Parent Companies”), have adequate resources to remain in operation, and that the directors intend them to do so, for at least one year from the date the financial statements were signed.
As part of our audit we have concluded that the directors’ use of the going concern basis is appropriate. However, because not all future events or conditions can be predicted, these statements are not a guarantee as to the Group’s and Parent Companies’ ability to continue as a going concern.
Other required reporting – PricewaterhouseCoopers LLP
Consistency of other information
Companies Act 2006 opinion
In our opinion, based on the work undertaken in the course of the audit:
| – | | the information given in the Strategic report and the Directors’ report for the financial year for which the financial statements are prepared is consistent with the financial statements; and |
| – | | the Strategic report and the Directors’ report have been prepared in accordance with applicable legal requirements. |
| | | | |
| 2016 Annual report | | riotinto.com | | 211 |
| | | | | | | | | | | | | | | | |
| | | | | | | | | |
| STRATEGIC REPORT | | | | DIRECTORS’ REPORT | | | | FINANCIAL STATEMENTS | | | | METALS AND MINERALS PRODUCTION | | | | ADDITIONAL INFORMATION |
Independent auditors’ report of PricewaterhouseCoopers LLP to the members of Rio Tinto plc and PricewaterhouseCoopers to the members of Rio Tinto Limited
continued
In addition, in light of the knowledge and understanding of the Group and Parent Companies and their environment obtained in the course of the audit, we are required to report if we have identified any material
misstatements in the Strategic report and the Directors’ report. We have nothing to report in this respect.
ISAs (UK & Ireland) reporting
| | |
| Under ISAs (UK & Ireland) we are required to report to you if, in our opinion: |
Information in the Annual report is: – materially inconsistent with the information in the audited financial statements; – apparently materially incorrect based on, or materially inconsistent with, our knowledge of the Group and Rio Tinto plc acquired in the course of performing our audit; or – otherwise misleading. | | We have no exceptions to report arising from this responsibility. |
| The statement given by the directors on page 66, in accordance with provision C.1.1 of the UK Corporate Governance Code (“the Code”), that they consider the Annual report taken as a whole to be fair, balanced and understandable and provides the information necessary for members to assess the Group’s and Rio Tinto plc’s position and performance, business model and strategy is materially inconsistent with our knowledge of the Group and Rio Tinto plc acquired in the course of performing our audit. | | We have no exceptions to report arising from this responsibility. |
| The section of the Annual report on page 59, as required by provision C.3.8 of the Code, describing the work of the Audit Committee does not appropriately address matters communicated by us to the Audit Committee. | | We have no exceptions to report arising from this responsibility. |
The directors’ assessment of the prospects of the Group and of the principal risks that would threaten the solvency or liquidity of the Group
| | |
| Under ISAs (UK & Ireland) we are required to report to you if we have anything material to add or to draw attention to in relation to: |
– the directors’ confirmation on page 15 of the Annual report, in accordance with provision C.2.1 of the Code, that they have carried out a robust assessment of the principal risks facing the Group, including those that would threaten its business model, future performance, solvency or liquidity. | | We have nothing material to add or to draw attention to. |
– the disclosures in the Annual report that describe those risks and explain how they are being managed or mitigated. | | We have nothing material to add or to draw attention to. |
– the directors’ explanation on page 15 of the Annual report, in accordance with provision C.2.2 of the Code, as to how they have assessed the prospects of the Group, over what period they have done so and why they consider that period to be appropriate, and their statement as to whether they have a reasonable expectation that the Group will be able to continue in operation and meet its liabilities as they fall due over the period of their assessment, including any related disclosures drawing attention to any necessary qualifications or assumptions. | | We have nothing material to add or to draw attention to. |
| Under the Listing Rules we are required to review the Directors’ statement that they have carried out a robust assessment of the principal risks facing the Group and the Directors’ statement in relation to the longer-term viability of the Group, set out on page 15. Our review was substantially less in scope than an audit and only consisted of making enquiries and considering the directors’ process supporting their statements; checking that the statements are in alignment with the relevant provisions of the Code; and considering whether the statements are consistent with the knowledge acquired by us in the course of performing our audit. We have nothing to report having performed our review. |
Adequacy of accounting records and information and explanations received
Under the Companies Act 2006 we are required to report to you if, in our opinion:
| – | | we have not received all the information and explanations we require for our audit; |
| – | | adequate accounting records have not been kept by Rio Tinto plc, or returns adequate for our audit have not been received from branches not visited by us; or |
| – | | the Rio Tinto plc financial statements and the part of the Directors’ Remuneration Report to be audited are not in agreement with the accounting records and returns. |
We have no exceptions to report arising from this responsibility.
Directors’ remuneration
Directors’ Remuneration Report – Companies Act 2006 opinion
In our opinion, the part of the Directors’ Remuneration Report to be audited has been properly prepared in accordance with the Companies Act 2006.
Other Companies Act 2006 reporting
Under the Companies Act 2006 we are required to report to you if, in our opinion, certain disclosures of directors’ remuneration specified by law are not made. We have no exceptions to report arising from this responsibility.
Corporate governance statement
Under the Listing Rules we are required to review the part of the Corporate Governance Statement relating to ten further provisions of the Code. We have nothing to report having performed our review.
Other required reporting – PricewaterhouseCoopers
Other information
The directors are responsible for the other information. The other information comprises the information included in the Annual report other than the financial report and our auditor’s report thereon.
Our opinion on the financial report does not cover the other information and accordingly we do not express any form of assurance conclusion thereon.
In connection with our audit of the financial report, our responsibility is to read the other information identified above and, in doing so, consider whether the other information is materially inconsistent with the financial report or our knowledge obtained in the audit, or otherwise appears to be materially misstated.
If, based on the work we have performed, we conclude that there is a material misstatement of this other information, we are required to report that fact. We have nothing to report in this regard.
| | | | |
| 212 | | riotinto.com | | 2016 Annual report |
Directors’ remuneration
Directors’ Remuneration Report – Corporations Act 2001 opinion
Under the Corporations Act 2001 (in respect of Rio Tinto Limited) we are required to express an opinion on the Directors’ Remuneration Report based on our audit conducted in accordance with ASAs.
Opinion on the Remuneration Report
We have audited the Remuneration Report included on pages 67 to 107 of the Directors’ report for the year ended 31 December 2016.
In our opinion, the Remuneration Report of Rio Tinto Limited complies with the requirements of section 300A of the Corporations Act 2001 as amended by the ASIC Order.
Responsibilities
The directors of Rio Tinto Limited are responsible for the preparation and presentation of the Remuneration Report in accordance with section 300A of the Corporations Act 2001 as amended by the ASIC Order.
Our responsibility is to express an opinion on the Remuneration Report, based on our audit conducted in accordance with ASAs.
Responsibilities for the financial statements, the financial report and the audit
Responsibilities of the directors
As explained more fully in the Directors’ statement of responsibilities set out on page 205, the directors are responsible for the preparation of the financial statements and the financial report and for being satisfied that they give a true and fair view in accordance with the applicable financial reporting frameworks. The directors are also responsible for such internal control as the directors determine is necessary to enable the preparation of the financial report that is free from material misstatement, whether due to fraud or error.
Auditor’s responsibilities for the audit of the financial statements and financial report
Our responsibility is to audit and express an opinion on the financial statements and financial report in accordance with applicable law and ISAs (UK & Ireland) and ASAs respectively. Those standards require us to comply with the Auditing Practices Board’s Ethical Standards for Auditors and relevant ethical requirements relating to audit engagements in Australia.
This report, including the opinions, has been prepared for and only for the members of Rio Tinto plc and Rio Tinto Limited as a body in accordance with Chapter 3 of Part 16 of the Companies Act 2006 (in respect of Rio Tinto plc) and the Corporations Act 2001 as amended by the ASIC Order (in respect of Rio Tinto Limited) and for no other purpose. We do not, in giving these opinions, accept or assume responsibility for any other purpose or to any other person to whom this report is shown or into whose hands it may come save where expressly agreed by our prior consent in writing.
An audit involves obtaining evidence about the amounts and disclosures in the financial statements and the financial report to obtain reasonable assurance about whether the financial statements and financial report as a whole are free from material misstatement, whether due to fraud or error, and to issue an auditor’s report that includes our opinion. Reasonable assurance is a high level of assurance, but is not a guarantee that an audit conducted in accordance with the ISAs (UK & Ireland) and ASAs will always detect a material misstatement when it exists. Misstatements can arise from fraud or error and are considered material if, individually or in the aggregate, they could reasonably be expected to influence the economic decisions of users taken on the basis of these financial statements or financial report.
As part of an audit in accordance with the ISAs (UK & Ireland) and ASAs, we exercise professional judgement and maintain professional scepticism throughout the audit. We also:
| – | | identify and assess the risks of material misstatement of the financial statements and financial report, whether due to fraud or error, design and perform audit procedures responsive to those risks, and obtain audit evidence that is sufficient and appropriate to provide a basis for our opinion. The risk of not detecting a material misstatement resulting from fraud is higher than for one resulting from error, as fraud may involve collusion, forgery, intentional omissions, misrepresentations, or the override of internal control; |
| – | | obtain an understanding of internal control relevant to the audit in order to design audit procedures that are appropriate in the circumstances, but not for the purpose of expressing an opinion on the effectiveness of the Group’s and the Parent Companies’ internal control; |
| – | | assess whether the accounting policies are appropriate to the Group’s and the Parent Companies’ circumstances and have been consistently applied and adequately disclosed; |
| – | | evaluate the reasonableness of significant accounting estimates and related disclosures made by the directors; |
| – | | assess the overall presentation of the financial statements and the financial report, including the disclosures, and whether the financial statements and the financial report represents the underlying transactions and events in a manner that achieves fair presentation; and |
| – | | obtain sufficient appropriate audit evidence regarding the financial information of the entities or business activities within the Group to express an opinion on the financial statements and the financial report. We are responsible for the direction, supervision and performance of the group audit. We remain solely responsible for our audit opinion. |
We primarily focus our work in the areas outlined above by assessing the directors’ judgements against available evidence, forming our own judgements, and evaluating the disclosures in the financial statements and the financial report.
We test and examine information, using sampling and other auditing techniques, to the extent we consider necessary to provide a reasonable basis for us to draw conclusions. We obtain audit evidence through testing the effectiveness of controls, substantive procedures or a combination of both.
We communicate with the directors regarding, among other matters, the planned scope and timing of the audit and significant audit findings, including any significant deficiencies in internal control that we identify during our audit.
We also provide the directors with a statement that we have complied with relevant ethical requirements regarding independence, and communicate with them all relationships and other matters that may reasonably be thought to bear on our independence, and where applicable, related safeguards.
From the matters communicated with the directors, we determine those matters that were of most significance in the audit of the financial statements and the financial report for the current period and had the greatest effect on our audit and are therefore the areas of focus / key audit matters. We describe these matters in our auditors’ report unless law or regulation precludes public disclosure about the matter or when, in extremely rare circumstances, we determine that a matter should not be communicated in our report because the adverse consequences of doing so would reasonably be expected to outweigh the public interest benefits of such communication.
| | | | |
| 2016 Annual report | | riotinto.com | | 213 |
| | | | | | | | | | | | | | | | |
| | | | | | | | | |
| STRATEGIC REPORT | | | | DIRECTORS’ REPORT | | | | FINANCIAL STATEMENTS | | | | METALS AND MINERALS PRODUCTION | | | | ADDITIONAL INFORMATION |
Independent auditors’ report of PricewaterhouseCoopers LLP to the members of Rio Tinto plc and PricewaterhouseCoopers to the members of Rio Tinto Limited
continued
In addition, we read all the financial andnon-financial information in the Annual report to identify material inconsistencies with the audited financial statements and the audited financial report and to identify any information that is apparently materially incorrect based on, or materially inconsistent with, the knowledge acquired by us in the course
of performing the audit. If we become aware of any apparent material misstatements or inconsistencies we consider the implications for our report. With respect to the Strategic report and Directors’ report, we consider whether those reports include the disclosures required by applicable legal requirements.
| | | | |
Paul Barkus (Senior Statutory Auditor) for and on behalf of PricewaterhouseCoopers LLP Chartered Accountants and Statutory Auditors London, United Kingdom 1 March 2017 | | | | Paul Bendall Partner for and on behalf of PricewaterhouseCoopers Melbourne, Australia 1 March 2017 |
| (a) | The maintenance and integrity of the Rio Tinto Group website is the responsibility of the directors; the work carried out by the auditors does not involve consideration of these matters and, accordingly, the auditors accept no responsibility for any changes that may have occurred to the financial statements since they were initially presented on the website. |
| (b) | Legislation in the United Kingdom and Australia governing the preparation and dissemination of financial statements may differ from legislation in other jurisdictions. |
| | | | |
| 214 | | riotinto.com | | 2016 Annual report |
Financial summary2007-2016
| | | | | | | | | | | | | | | | | | | | | | | | | | | | | | | | | | | | | | | | |
| US$m | | 2007 | | | 2008 | | | 2009 | | | 2010 | | | 2011 | | | 2012 | | | 2013 | | | 2014 | | | 2015 | | | 2016 | |
| Gross sales revenue (a) | | | 33,518 | | | | 56,905 | | | | 42,734 | | | | 59,008 | | | | 65,298 | | | | 55,597 | | | | 54,575 | | | | 50,041 | | | | 36,784 | | | | 35,318 | |
| Share of equity accounted units’ sales revenue and items excluded from underlying earnings | | | (3,818 | ) | | | (4,044 | ) | | | (2,472 | ) | | | (3,837 | ) | | | (4,769 | ) | | | (4,655 | ) | | | (3,404 | ) | | | (2,377 | ) | | | (1,955 | ) | | | (1,537 | ) |
| Consolidated sales revenue | | | 29,700 | | | | 52,861 | | | | 40,262 | | | | 55,171 | | | | 60,529 | | | | 50,942 | | | | 51,171 | | | | 47,664 | | | | 34,829 | | | | 33,781 | |
| Underlying profit before interest and tax (PBIT) | | | 10,517 | | | | 17,683 | | | | 9,843 | | | | 21,128 | | | | 23,662 | | | | 13,467 | | | | 16,039 | | | | 13,851 | | | | 7,310 | | | | 8,053 | |
| Finance costs (b) | | | (570 | ) | | | (1,706 | ) | | | (1,058 | ) | | | (909 | ) | | | (759 | ) | | | (616 | ) | | | (794 | ) | | | (967 | ) | | | (1,076 | ) | | | (1,360 | ) |
| Exchange differences and derivatives (c) | | | 253 | | | | (322 | ) | | | 528 | | | | 529 | | | | 2 | | | | 695 | | | | (3,362 | ) | | | (2,021 | ) | | | (3,458 | ) | | | 622 | |
| Other exclusions from underlying earnings | | | (364 | ) | | | (6,477 | ) | | | (1,453 | ) | | | (257 | ) | | | (9,633 | ) | | | (15,977 | ) | | | (8,378 | ) | | | (1,311 | ) | | | (3,502 | ) | | | (972 | ) |
| Profit/(loss) before tax (PBT) | | | 9,836 | | | | 9,178 | | | | 7,860 | | | | 20,491 | | | | 13,272 | | | | (2,431 | ) | | | 3,505 | | | | 9,552 | | | | (726 | ) | | | 6,343 | |
| Tax on exclusions | | | 60 | | | | 988 | | | | (91 | ) | | | 42 | | | | 135 | | | | 2,896 | | | | 2,642 | | | | 423 | | | | 567 | | | | (155 | ) |
| Tax on underlying PBT | | | (2,150 | ) | | | (4,730 | ) | | | (1,985 | ) | | | (5,338 | ) | | | (6,607 | ) | | | (3,485 | ) | | | (5,068 | ) | | | (3,476 | ) | | | (1,560 | ) | | | (1,412 | ) |
| Loss after tax from discontinued operations | | | – | | | | (827 | ) | | | (449 | ) | | | (97 | ) | | | (10 | ) | | | (7 | ) | | | – | | | | – | | | | – | | | | – | |
| Attributable tonon-controlling interests | | | (434 | ) | | | (933 | ) | | | (463 | ) | | | (860 | ) | | | (955 | ) | | | (1 | ) | | | 2,586 | | | | 28 | | | | 853 | | | | (159 | ) |
| Net earnings/(loss) (d) | | | 7,312 | | | | 3,676 | | | | 4,872 | | | | 14,238 | | | | 5,835 | | | | (3,028 | ) | | | 3,665 | | | | 6,527 | | | | (866 | ) | | | 4,617 | |
| Underlying earnings | | | 7,443 | | | | 10,303 | | | | 6,298 | | | | 13,987 | | | | 15,572 | | | | 9,269 | | | | 10,217 | | | | 9,305 | | | | 4,540 | | | | 5,100 | |
| Earnings/(loss) per share (basic) – continuing operations (e) | | | 464.9c | | | | 286.8c | | | | 301.7c | | | | 731.0c | | | | 303.9c | | | | (163.4)c | | | | 198.4c | | | | 353.1c | | | | (47.5)c | | | | 256.9c | |
| Underlying earnings per share (basic) – continuing operations (e) | | | 473.2c | | | | 656.2c | | | | 357.1c | | | | 713.3c | | | | 809.7c | | | | 501.3c | | | | 553.1c | | | | 503.4c | | | | 248.8 | c | | | 283.8c | |
| Dividends per share: declared for year (f) | | | | | | | | | | | | | | | | | | | | | | | | | | | | | | | | | | | | | | | | |
| Rio Tinto shareholders (US cents) | | | 111.23c | | | | 111.22c | | | | 45.00c | | | | 108.00c | | | | 145.00c | | | | 167.00c | | | | 192.00c | | | | 215.00c | | | | 215.00c | | | | 170.00c | |
| Rio Tinto plc (pence) | | | 56.20p | | | | 67.49p | | | | 28.84p | | | | 67.35p | | | | 90.47p | | | | 106.77p | | | | 120.10p | | | | 134.88p | | | | 143.13p | | | | 134.36p | |
| Rio Tinto Limited (Aus. cents) | | | 125.72c | | | | 146.22c | | | | 51.56c | | | | 111.21c | | | | 134.01c | | | | 160.18c | | | | 213.14c | | | | 256.07c | | | | 296.80c | | | | 222.75c | |
| Net assets | | | | | | | | | | | | | | | | | | | | | | | | | | | | | | | | | | | | | | | | |
| Fixed assets (g) | | | 75,888 | | | | 67,651 | | | | 72,706 | | | | 83,895 | | | | 91,529 | | | | 90,580 | | | | 81,554 | | | | 80,669 | | | | 70,226 | | | | 68,104 | |
| Other assets less liabilities | | | 11,609 | | | | 8,469 | | | | 10,078 | | | | 4,394 | | | | 1,632 | | | | 8,478 | | | | 8,224 | | | | 4,596 | | | | 4,037 | | | | 4,128 | |
| Provisions (including deferred tax) | | | (16,013 | ) | | | (14,987 | ) | | | (17,998 | ) | | | (19,706 | ) | | | (25,935 | ) | | | (22,126 | ) | | | (18,221 | ) | | | (18,176 | ) | | | (16,352 | ) | | | (16,915 | ) |
| Net debt | | | (45,191 | ) | | | (38,672 | ) | | | (18,861 | ) | | | (4,071 | ) | | | (8,342 | ) | | | (19,192 | ) | | | (18,055 | ) | | | (12,495 | ) | | | (13,783 | ) | | | (9,587 | ) |
| Non-controlling interests | | | (1,521 | ) | | | (1,823 | ) | | | (2,094 | ) | | | (6,265 | ) | | | (6,685 | ) | | | (11,187 | ) | | | (7,616 | ) | | | (8,309 | ) | | | (6,779 | ) | | | (6,440 | ) |
| Equity attributable to owners of Rio Tinto | | | 24,772 | | | | 20,638 | | | | 43,831 | | | | 58,247 | | | | 52,199 | | | | 46,553 | | | | 45,886 | | | | 46,285 | | | | 37,349 | | | | 39,290 | |
| | | | | | | | | | |
| Capital expenditure (h) | | | (5,000 | ) | | | (8,574 | ) | | | (5,388 | ) | | | (4,591 | ) | | | (12,573 | ) | | | (17,615 | ) | | | (13,001 | ) | | | (8,162 | ) | | | (4,685 | ) | | | (3,012 | ) |
| Acquisitions | | | (37,539 | ) | | | (9 | ) | | | (396 | ) | | | (907 | ) | | | (4,156 | ) | | | (1,335 | ) | | | 4 | | | | – | | | | (3 | ) | | | – | |
| Disposals | | | 13 | | | | 2,572 | | | | 2,424 | | | | 3,800 | | | | 386 | | | | 251 | | | | 1,896 | | | | 887 | | | | (38 | ) | | | 761 | |
| Net cash generated from operating activities (i) | | | 8,491 | | | | 14,883 | | | | 9,212 | | | | 18,277 | | | | 20,235 | | | | 9,430 | | | | 15,078 | | | | 14,286 | | | | 9,383 | | | | 8,465 | |
| Cash flows before financing activities (j) | | | (34,251 | ) | | | 8,702 | | | | 5,855 | | | | 16,566 | | | | 3,245 | | | | (8,813 | ) | | | 4,132 | | | | 7,783 | | | | 4,783 | | | | 6,361 | |
| Ratios | | | | | | | | | | | | | | | | | | | | | | | | | | | | | | | | | | | | | | | | |
| Operating margin (k) | | | 34% | | | | 32% | | | | 24% | | | | 37% | | | | 37% | | | | 25% | | | | 30% | | | | 28% | | | | 20% | | | | 23% | |
| Net debt to total capital (l) | | | 63% | | | | 63% | | | | 29% | | | | 6% | | | | 12% | | | | 25% | | | | 25% | | | | 19% | | | | 24% | | | | 17% | |
| Underlying earnings: owners’ equity (m) | | | 35% | | | | 45% | | | | 20% | | | | 27% | | | | 28% | | | | 19% | | | | 22% | | | | 20% | | | | 11% | | | | 13% | |
| Interest cover(n) | | | 20 | | | | 10 | | | | 9 | | | | 27 | | | | 27 | | | | 13 | | | | 13 | | | | 13 | | | | 7 | | | | 7 | |
| (a) | Gross sales revenue includes 100 per cent of subsidiaries’ sales revenue and the Group’s share of the sales revenue of equity accounted units (after adjusting for sales to subsidiaries). |
| | | | |
| 2016 Annual report | | riotinto.com | | 215 |
| | | | | | | | | | | | | | | | |
| | | | | | | | | |
| STRATEGIC REPORT | | | | DIRECTORS’ REPORT | | | | FINANCIAL STATEMENTS | | | | METALS AND MINERALS PRODUCTION | | | | ADDITIONAL INFORMATION |
Financial summary2007-2016
continued
| (b) | Finance costs include net interest and amortisation of discount. |
| (c) | Under IFRS, as defined in note 1, certain gains and losses on currency exchange and on revaluation of derivatives are included in the Group’s net earnings/(loss). These items are excluded from underlying earnings. |
| (d) | Underlying earnings is an additional measure of earnings, which is reported by Rio Tinto with its IFRS (as defined in note 1) results to provide greater understanding of the underlying business performance of its operations. It is defined in note 2 to the financial statements. Underlying profit before interest and tax (PBIT) is similar to underlying earnings except that it is stated before tax and interest. |
| (e) | 2009 earnings per share from continuing operations and underlying earnings per share have been calculated using a number of shares which reflects the discounted price of the July 2009 rights issues (the bonus factor). 2007 and 2008 comparatives have been restated accordingly. |
| (f) | Dividends per share are the amounts declared in respect of each financial year. These usually include an interim dividend paid in the year, and a final dividend paid after the end of the year. 2007 and 2008 ordinary dividends per share have been restated using a number of shares which reflects the discounted price of the July 2009 rights issues (the bonus factor). |
| (g) | Fixed assets include property, plant and equipment, intangible assets, goodwill, and investments in, and long-term loans to, equity accounted units. |
| (h) | Capital expenditure is presented gross, before taking into account any disposals of property, plant and equipment or intangible assets. |
| (i) | Net cash generated from operating activities represents the cash generated by the Group’s consolidated operations, after payment of interest, taxes, and dividends tonon-controlling interests in subsidiaries. |
| (j) | Cash flow before financing activities is stated before deducting dividends payable to owners of Rio Tinto. |
| (k) | Operating margin is the percentage of underlying PBIT, after excluding tax on equity accounted units, to gross sales revenue. |
| (l) | Total capital comprises equity attributable to owners of Rio Tinto plus net debt andnon-controlling interests. |
| (m) | Underlying earnings: owners’ equity represents underlying earnings expressed as a percentage of the mean of opening and closing equity attributable to owners of Rio Tinto. |
| (n) | Interest cover represents the number of times interest payable less receivable (excluding the amortisation of discount but including capitalised interest) is covered by underlying operating profit, less amortisation of discount, plus dividends from equity accounted units. Underlying operating profit is similar to underlying earnings but is stated before tax, interest and share of profit after tax of equity accounted units. |
| | | | |
| 216 | | riotinto.com | | 2016 Annual report |
Summary financial data in Australian dollars, sterling and US dollars
| | | | | | | | | | | | | | | | | | | | | | | | |
2016 A$m | | | 2015 A$m | | | 2016 £m | | | 2015 £m | | | | | 2016
US$m | | | 2015
US$m | |
| | 47,467 | | | | 48,878 | | | | 26,043 | | | | 24,063 | | | Gross sales revenue | | | 35,318 | | | | 36,784 | |
| | 45,401 | | | | 46,281 | | | | 24,909 | | | | 22,784 | | | Consolidated sales revenue | | | 33,781 | | | | 34,829 | |
| | 8,525 | | | | (965 | ) | | | 4,677 | | | | (475 | ) | | Profit/(loss) before tax from continuing operations | | | 6,343 | | | | (726 | ) |
| | 6,419 | | | | (2,284 | ) | | | 3,522 | | | | (1,124 | ) | | Profit/(loss) for the year from continuing operations | | | 4,776 | | | | (1,719 | ) |
| | 6,205 | | | | (1,151 | ) | | | 3,404 | | | | (567 | ) | | Net earnings/(loss) attributable to Rio Tinto shareholders | | | 4,617 | | | | (866 | ) |
| | 6,854 | | | | 6,033 | | | | 3,761 | | | | 2,970 | | | Underlying earnings(a) | | | 5,100 | | | | 4,540 | |
| | 345.2 | c | | | (63.1) | c | | | 189.4 | p | | | (31.0) | p | | Basic earnings/(loss) per ordinary share (b) | | | 256.9 | c | | | (47.5) | c |
| | 381.4 | c | | | 330.6 | c | | | 209.2 | p | | | 162.8 | p | | Basic underlying earnings per ordinary share (a)(b) | | | 283.8 | c | | | 248.8 | c |
| | | | | | | | | | | | | | | | Dividends per share to Rio Tinto shareholders(c) | | | | | | | | |
| | 211.02 | c | | | 297.89 | c | | | 108.01 | p | | | 146.90 | p | | – paid | | | 152.5 | c | | | 226.5 | c |
| | 163.62 | c | | | 151.89 | c | | | 100.56 | p | | | 74.21 | p | | – proposed | | | 125.0 | c | | | 107.5 | c |
| | 8,549 | | | | 6,356 | | | | 4,690 | | | | 3,129 | | | Cash flow before financing activities | | | 6,361 | | | | 4,783 | |
| | (13,281 | ) | | | (18,924 | ) | | | (7,836 | ) | | | (9,294 | ) | | Net debt | | | (9,587 | ) | | | (13,783 | ) |
| | 54,428 | | | | 51,280 | | | | 32,116 | | | | 25,184 | | | Equity attributable to Rio Tinto shareholders | | | 39,290 | | | | 37,349 | |
| (a) | Underlying earnings exclude net impairment and other charges of US$483 million (2015: charges of US$5,406 million), which are analysed on page 130. |
| (b) | Basic earnings/(loss) per ordinary share and basic underlying earnings per ordinary share do not recognise the dilution resulting from share options on issue. |
| (c) | The Australian dollar and sterling amounts are based on the US dollar amounts, retranslated at average or closing rates as appropriate, except for the dividends which are the actual amounts. |
The financial data above has been extracted from the financial information set out on pages 110 to 179.
| | | | |
| 2016 Annual report | | riotinto.com | | 217 |
| | | | | | | | | | | | | | | | |
| | | | | | | | | |
| STRATEGIC REPORT | | | | DIRECTORS’ REPORT | | | | FINANCIAL STATEMENTS | | | | METALS AND MINERALS PRODUCTION | | | | ADDITIONAL INFORMATION |
Contents
Production, reserves and operations
| | | | |
| 218 | | riotinto.com | | 2016 Annual report |
Metals and minerals production
| | | | | | | | | | | | | | | | | | | | | | | | | | | | |
| | | | | | 2016 Production | | | 2015 Production | | | 2014 Production | |
| | | Rio Tinto
% share (a) | | | Total | | | Rio Tinto
share | | | Total | | | Rio Tinto
share | | | Total | | | Rio Tinto
share | |
Alumina(’000 tonnes) | | | | | | | | | | | | | | | | | | | | | | | | | | | | |
| Jonquière (Vaudreuil) (Canada) (b) | | | 100.0 | | | | 1,452 | | | | 1,452 | | | | 1,449 | | | | 1,449 | | | | 1,444 | | | | 1,444 | |
| Jonquière (Vaudreuil) specialty plant (Canada) | | | 100.0 | | | | 115 | | | | 115 | | | | 110 | | | | 110 | | | | 108 | | | | 108 | |
| Queensland Alumina (Australia) | | | 80.0 | | | | 3,848 | | | | 3,078 | | | | 3,747 | | | | 2,997 | | | | 3,568 | | | | 2,854 | |
| São Luis (Alumar) (Brazil) | | | 10.0 | | | | 3,707 | | | | 371 | | | | 3,667 | | | | 367 | | | | 3,639 | | | | 364 | |
| Yarwun (Australia) | | | 100.0 | | | | 3,176 | | | | 3,176 | | | | 2,864 | | | | 2,864 | | | | 2,688 | | | | 2,688 | |
| | | | | | | | | | | 8,192 | | | | | | | | 7,788 | | | | | | | | 7,458 | |
| Other Aluminium | | | | | | | | | | | | | | | | | | | | | | | | | | | | |
| Gove Refinery (Australia) (c) | | | 100.0 | | | | – | | | | – | | | | – | | | | – | | | | 676 | | | | 676 | |
| | | | | | | | | | | | | | | | | | | | | | | | | | | | 676 | |
| Rio Tinto total | | | | | | | | | | | 8,192 | | | | | | | | 7,788 | | | | | | | | 8,134 | |
Aluminium(’000 tonnes) | | | | | | | | | | | | | | | | | | | | | | | | | | | | |
| Alma (Canada) | | | 100.0 | | | | 467 | | | | 467 | | | | 466 | | | | 466 | | | | 455 | | | | 455 | |
| Alouette (Sept-Îles) (Canada) | | | 40.0 | | | | 609 | | | | 244 | | | | 606 | | | | 242 | | | | 583 | | | | 233 | |
| Alucam (Edéa) (Cameroon) (d) | | | – | | | | – | | | | – | | | | – | | | | – | | | | 93 | | | | 43 | |
| Arvida (Canada) | | | 100.0 | | | | 172 | | | | 172 | | | | 173 | | | | 173 | | | | 173 | | | | 173 | |
| Arvida AP60 (Canada) | | | 100.0 | | | | 60 | | | | 60 | | | | 59 | | | | 59 | | | | 59 | | | | 59 | |
| Bécancour (Canada) | | | 25.1 | | | | 445 | | | | 111 | | | | 437 | | | | 109 | | | | 446 | | | | 112 | |
| Bell Bay (Australia) | | | 100.0 | | | | 182 | | | | 182 | | | | 191 | | | | 191 | | | | 188 | | | | 188 | |
| Boyne Island (Australia) | | | 59.4 | | | | 583 | | | | 346 | | | | 579 | | | | 344 | | | | 553 | | | | 328 | |
| Dunkerque (France) | | | 100.0 | | | | 280 | | | | 280 | | | | 275 | | | | 275 | | | | 270 | | | | 270 | |
| Grande-Baie (Canada) | | | 100.0 | | | | 227 | | | | 227 | | | | 221 | | | | 221 | | | | 222 | | | | 222 | |
| ISAL (Reykjavik) (Iceland) | | | 100.0 | | | | 205 | | | | 205 | | | | 201 | | | | 201 | | | | 206 | | | | 206 | |
| Kitimat (Canada) | | | 100.0 | | | | 408 | | | | 408 | | | | 110 | | | | 110 | | | | 125 | | | | 125 | |
| Laterrière (Canada) | | | 100.0 | | | | 247 | | | | 247 | | | | 244 | | | | 244 | | | | 244 | | | | 244 | |
| Lochaber (UK) (e) | | | – | | | | 46 | | | | 46 | | | | 47 | | | | 47 | | | | 42 | | | | 42 | |
| Sohar (Oman) | | | 20.0 | | | | 386 | | | | 77 | | | | 377 | | | | 75 | | | | 364 | | | | 73 | |
| SØRAL (Husnes) (Norway) (f) | | | – | | | | – | | | | – | | | | – | | | | – | | | | 76 | | | | 38 | |
| Tiwai Point (New Zealand) | | | 79.4 | | | | 339 | | | | 269 | | | | 333 | | | | 265 | | | | 327 | | | | 260 | |
| Tomago (Australia) | | | 51.6 | | | | 589 | | | | 304 | | | | 579 | | | | 299 | | | | 561 | | | | 289 | |
| | | | | | | | | | | | 3,646 | | | | | | | | 3,322 | | | | | | | | 3,361 | |
| Rio Tinto total | | | | | | | | | | | 3,646 | | | | | | | | 3,322 | | | | | | | | 3,361 | |
| | | | | | | | | | | | | | | | | | | | | | | | |
See notes222
| | | | |
| 2016 Annual report | | riotinto.com | | 219 |
| | | | | | | | | | | | | | | | |
| | | | | | | | | |
| STRATEGIC REPORT | | | | DIRECTORS’ REPORT | | | | FINANCIAL STATEMENTS | | | | PRODUCTION, RESERVES AND OPERATIONS METALS AND MINERALS PRODUCTION | | | | ADDITIONAL INFORMATION |
Metals and minerals production
continued
| | | | | | | | | | | | | | | | | | | | | | | | | | | | |
| | | | | | 2016 Production | | | 2015 Production | | | 2014 Production | |
| | | Rio Tinto
% share (a) | | | Total | | | Rio Tinto
share | | | Total | | | Rio Tinto
share | | | Total | | | Rio Tinto
share | |
Bauxite (’000 tonnes) | | | | | | | | | | | | | | | | | | | | | | | | | | | | |
| Gove (Australia) | | | 100.0 | | | | 9,091 | | | | 9,091 | | | | 7,497 | | | | 7,497 | | | | 6,528 | | | | 6,528 | |
| Porto Trombetas (MRN) (Brazil) | | | 12.0 | | | | 16,462 | | | | 1,975 | | | | 16,162 | | | | 1,939 | | | | 16,376 | | | | 1,965 | |
| Sangaredi (Guinea) | | | 23.0 (g) | | | | 16,023 | | | | 7,210 | | | | 14,615 | | | | 6,577 | | | | 15,803 | | | | 7,111 | |
| Weipa (Australia) | | | 100.0 | | | | 29,427 | | | | 29,427 | | | | 27,663 | | | | 27,663 | | | | 26,266 | | | | 26,266 | |
| Rio Tinto total | | | | | | | | | | | 47,703 | | | | | | | | 43,677 | | | | | | | | 41,871 | |
Borates (’000 tonnes) (h) | | | | | | | | | | | | | | | | | | | | | | | | | | | | |
| Rio Tinto Borates – Boron (US) | | | 100.0 | | | | 503 | | | | 503 | | | | 476 | | | | 476 | | | | 508 | | | | 508 | |
| Rio Tinto total | | | | | | | | | | | 503 | | | | | | | | 476 | | | | | | | | 508 | |
Coal (hard coking) (’000 tonnes) | | | | | | | | | | | | | | | | | | | | | | | | | | | | |
| Rio Tinto Coal Australia | | | | | | | | | | | | | | | | | | | | | | | | | | | | |
| Hail Creek Coal (Australia) (i) | | | 82.0 | | | | 5,950 | | | | 4,879 | | | | 6,218 | | | | 5,099 | | | | 6,492 | | | | 5,324 | |
| Kestrel Coal (Australia) (i) | | | 80.0 | | | | 4,077 | | | | 3,262 | | | | 3,450 | | | | 2,760 | | | | 2,163 | | | | 1,730 | |
| Total Australian hard coking coal | | | | | | | | | | | 8,141 | | | | | | | | 7,859 | | | | | | | | 7,054 | |
| Rio Tinto Coal Mozambique | | | | | | | | | | | | | | | | | | | | | | | | | | | | |
| Benga (j) | | | – | | | | – | | | | – | | | | – | | | | – | | | | 641 | | | | 416 | |
| Rio Tinto total hard coking coal | | | | | | | | | | | 8,141 | | | | | | | | 7,859 | | | | | | | | 7,471 | |
Coal (semi-soft coking) (’000 tonnes) | | | | | | | | | | | | | | | | | | | | | | | | | | | | |
| Rio Tinto Coal Australia | | | | | | | | | | | | | | | | | | | | | | | | | | | | |
| Hunter Valley (Australia) (k) | | | 67.6 | | | | 3,720 | | | | 2,540 | | | | 2,966 | | | | 2,373 | | | | 1,935 | | | | 1,548 | |
| Mount Thorley (Australia) (k) | | | 80.0 | | | | 1,420 | | | | 1,127 | | | | 1,398 | | | | 895 | | | | 1,952 | | | | 1,250 | |
| Warkworth (Australia) (k) | | | 55.6 | | | | 809 | | | | 436 | | | | 853 | | | | 380 | | | | 933 | | | | 415 | |
| Rio Tinto total semi-soft coking coal | | | | | | | | | | | 4,102 | | | | | | | | 3,647 | | | | | | | | 3,213 | |
Coal (thermal) (’000 tonnes) | | | | | | | | | | | | | | | | | | | | | | | | | | | | |
| Rio Tinto Coal Australia | | | | | | | | | | | | | | | | | | | | | | | | | | | | |
| Bengalla (Australia) (l) | | | – | | | | 1,476 | | | | 527 | | | | 8,319 | | | | 2,662 | | | | 8,558 | | | | 2,739 | |
| Clermont (Australia) (m) | | | – | | | | – | | | | – | | | | – | | | | – | | | | 4,832 | | | | 2,421 | |
| Hail Creek Coal (Australia) (i) | | | 82.0 | | | | 3,767 | | | | 3,089 | | | | 3,245 | | | | 2,661 | | | | 2,304 | | | | 1,890 | |
| Hunter Valley (Australia) (k) | | | 67.6 | | | | 9,925 | | | | 6,782 | | | | 10,048 | | | | 8,039 | | | | 11,924 | | | | 9,539 | |
| Kestrel Coal (Australia) (i) | | | 80.0 | | | | 846 | | | | 676 | | | | 637 | | | | 509 | | | | 564 | | | | 451 | |
| Mount Thorley (Australia) (k) | | | 80.0 | | | | 2,850 | | | | 2,235 | | | | 2,815 | | | | 1,802 | | | | 2,241 | | | | 1,434 | |
| Warkworth (Australia) (k) | | | 55.6 | | | | 7,225 | | | | 3,945 | | | | 6,663 | | | | 2,965 | | | | 6,803 | | | | 3,027 | |
| Total Australian thermal coal | | | | | | | | | | | 17,254 | | | | | | | | 18,638 | | | | | | | | 21,501 | |
| Rio Tinto Coal Mozambique | | | | | | | | | | | | | | | | | | | | | | | | | | | | |
| Benga (j) | | | – | | | | – | | | | – | | | | – | | | | – | | | | 593 | | | | 385 | |
| Rio Tinto total thermal coal | | | | | | | | | | | 17,254 | | | | | | | | 18,638 | | | | | | | | 21,886 | |
| | | | | | | | | | | | | | | | | | | | | | | | | | | | |
See notes222
| | | | |
| 220 | | riotinto.com | | 2016 Annual report |
| | | | | | | | | | | | | | | | | | | | | | | | | | | | |
| | | | | | 2016 Production | | | 2015 Production | | | 2014 Production | |
| | | Rio Tinto
% share (a) | | | Total | | | Rio Tinto
share | | | Total | | | Rio Tinto
share | | | Total | | | Rio Tinto
share | |
Copper(mined) (’000 tonnes) | | | | | | | | | | | | | | | | | | | | | | | | | | | | |
| Bingham Canyon (US) | | | 100.0 | | | | 152.7 | | | | 152.7 | | | | 92.0 | | | | 92.0 | | | | 204.3 | | | | 204.3 | |
| Escondida (Chile) | | | 30.0 | | | | 1,010.7 | | | | 303.1 | | | | 1,148.8 | | | | 344.7 | | | | 1,137.6 | | | | 341.3 | |
| Grasberg – Joint Venture (Indonesia) (n) | | | 40.0 | | | | 0.0 | | | | 0.0 | | | | 0.0 | | | | 0.0 | | | | 19.2 | | | | 7.7 | |
| Oyu Tolgoi (Mongolia) (o) | | | 33.5 | | | | 201.3 | | | | 67.5 | | | | 202.2 | | | | 67.8 | | | | 148.4 | | | | 49.8 | |
| Rio Tinto total | | | | | | | | | | | 523.3 | | | | | | | | 504.4 | | | | | | | | 603.1 | |
Copper(refined) (’000 tonnes) | | | | | | | | | | | | | | | | | | | | | | | | | | | | |
| Escondida (Chile) | | | 30.0 | | | | 312.1 | | | | 93.6 | | | | 326.3 | | | | 97.9 | | | | 301.5 | | | | 90.5 | |
| Rio Tinto Kennecott (US) | | | 100.0 | | | | 156.5 | | | | 156.5 | | | | 115.2 | | | | 115.2 | | | | 204.1 | | | | 204.1 | |
| Rio Tinto total | | | | | | | | | | | 250.1 | | | | | | | | 213.0 | | | | | | | | 294.6 | |
Diamonds(’000 carats) | | | | | | | | | | | | | | | | | | | | | | | | | | | | |
| Argyle (Australia) | | | 100.0 | | | | 13,958 | | | | 13,958 | | | | 13,472 | | | | 13,472 | | | | 9,188 | | | | 9,188 | |
| Diavik (Canada) | | | 60.0 | | | | 6,658 | | | | 3,995 | | | | 6,406 | | | | 3,843 | | | | 7,233 | | | | 4,340 | |
| Murowa (Zimbabwe) (p) | | | – | | | | – | | | | – | | | | 99 | | | | 77 | | | | 442 | | | | 344 | |
| Rio Tinto total | | | | | | | | | | | 17,953 | | | | | | | | 17,392 | | | | | | | | 13,872 | |
Gold(mined) (’000 ounces) | | | | | | | | | | | | | | | | | | | | | | | | | | | | |
| Barneys Canyon (US) | | | 100.0 | | | | 0.0 | | | | 0.0 | | | | 0.0 | | | | 0.0 | | | | 0.4 | | | | 0.4 | |
| Bingham Canyon (US) | | | 100.0 | | | | 153.2 | | | | 153.2 | | | | 130.8 | | | | 130.8 | | | | 259.8 | | | | 259.8 | |
| Escondida (Chile) | | | 30.0 | | | | 132.6 | | | | 39.8 | | | | 88.5 | | | | 26.6 | | | | 90.1 | | | | 27.0 | |
| Grasberg – Joint Venture (Indonesia) (n) | | | 40.0 | | | | 0.0 | | | | 0.0 | | | | 0.0 | | | | 0.0 | | | | 5.6 | | | | 2.3 | |
| Oyu Tolgoi (Mongolia) (o) | | | 33.5 | | | | 300.0 | | | | 100.5 | | | | 653.4 | | | | 219.0 | | | | 588.7 | | | | 197.3 | |
| Rio Tinto total | | | | | | | | | | | 293.5 | | | | | | | | 376.4 | | | | | | | | 486.8 | |
Gold(refined) (’000 ounces) | | | | | | | | | | | | | | | | | | | | | | | | | | | | |
| Rio Tinto Kennecott (US) | | | 100.0 | | | | 135.4 | | | | 135.4 | | | | 179.0 | | | | 179.0 | | | | 252.2 | | | | 252.2 | |
Iron ore(’000 tonnes) | | | | | | | | | | | | | | | | | | | | | | | | | | | | |
| Hamersley mines (Australia) | | | (q) | | | | 205,902 | | | | 205,902 | | | | 189,421 | | | | 189,421 | | | | 163,163 | | | | 163,163 | |
| Hamersley – Channar (Australia) | | | 60.0 | | | | 9,731 | | | | 5,839 | | | | 10,561 | | | | 6,337 | | | | 10,913 | | | | 6,548 | |
| Hope Downs (Australia) | | | 50.0 | | | | 47,010 | | | | 23,505 | | | | 44,745 | | | | 22,373 | | | | 42,715 | | | | 21,358 | |
| Iron Ore Company of Canada (Canada) | | | 58.7 | | | | 18,155 | | | | 10,661 | | | | 17,691 | | | | 10,388 | | | | 14,775 | | | | 8,676 | |
| Robe River – Robe Valley (Australia) (r) | | | 53.0 | | | | 32,776 | | | | 17,371 | | | | 32,482 | | | | 17,216 | | | | 34,535 | | | | 18,304 | |
| Robe River – West Angelas (Australia) | | | 53.0 | | | | 34,044 | | | | 18,044 | | | | 32,665 | | | | 17,313 | | | | 29,264 | | | | 15,510 | |
| Rio Tinto total | | | | | | | | | | | 281,321 | | | | | | | | 263,048 | | | | | | | | 233,557 | |
Molybdenum(’000 tonnes) | | | | | | | | | | | | | | | | | | | | | | | | | | | | |
| Bingham Canyon (US) | | | 100.0 | | | | 2.8 | | | | 2.8 | | | | 7.6 | | | | 7.6 | | | | 11.5 | | | | 11.5 | |
| | | | | | | | | | | | | | | | | | | | | | | | | | | | |
See notes222
| | | | |
| 2016 Annual report | | riotinto.com | | 221 |
| | | | | | | | | | | | | | | | |
| | | | | | | | | |
| STRATEGIC REPORT | | | | DIRECTORS’ REPORT | | | | FINANCIAL STATEMENTS | | | | PRODUCTION, RESERVES AND OPERATIONS METALS AND MINERALS PRODUCTION | | | | ADDITIONAL INFORMATION |
Metals and minerals production
continued
| | | | | | | | | | | | | | | | | | | | | | | | | | | | |
| | | | | | 2016 Production | | | 2015 Production | | | 2014 Production | |
| | | Rio Tinto
% share (a) | | | Total | | | Rio Tinto
share | | | Total | | | Rio Tinto
share | | | Total | | | Rio Tinto
share | |
Salt(’000 tonnes) | | | | | | | | | | | | | | | | | | | | | | | | | | | | |
| Dampier Salt (Australia) | | | 68.4 | | | | 7,578 | | | | 5,180 | | | | 8,103 | | | | 5,539 | | | | 9,938 | | | | 6,793 | |
Silver(mined) (’000 ounces) | | | | | | | | | | | | | | | | | | | | | | | | | | | | |
| Bingham Canyon (US) | | | 100.0 | | | | 1,943 | | | | 1,943 | | | | 1,458 | | | | 1,458 | | | | 2,935 | | | | 2,935 | |
| Escondida (Chile) | | | 30.0 | | | | 5,971 | | | | 1,791 | | | | 4,812 | | | | 1,443 | | | | 4,883 | | | | 1,465 | |
| Grasberg – Joint Venture (Indonesia) (n) | | | 40.0 | | | | 0 | | | | 0 | | | | 0 | | | | 0 | | | | 0 | | | | 0 | |
| Oyu Tolgoi (Mongolia) (o) | | | 33.5 | | | | 1,420 | | | | 476 | | | | 1,223 | | | | 410 | | | | 893 | | | | 299 | |
| Rio Tinto total | | | | | | | | | | | 4,210 | | | | | | | | 3,311 | | | | | | | | 4,699 | |
Silver(refined) (’000 ounces) | | | | | | | | | | | | | | | | | | | | | | | | | | | | |
| Rio Tinto Kennecott (US) | | | 100.0 | | | | 1,815 | | | | 1,815 | | | | 1,843 | | | | 1,843 | | | | 2,811 | | | | 2,811 | |
Titanium dioxide slag(’000 tonnes) | | | | | | | | | | | | | | | | | | | | | | | | | | | | |
| Rio Tinto Iron & Titanium | | | | | | | | | | | | | | | | | | | | | | | | | | | | |
| (Canada/South Africa) (s) | | | 100.0 | | | | 1,048 | | | | 1,048 | | | | 1,089 | | | | 1,089 | | | | 1,443 | | | | 1,443 | |
Uranium(’000 lbs U3O8) | | | | | | | | | | | | | | | | | | | | | | | | | | | | |
| Energy Resources of Australia (Australia) (t) | | | 68.4 | | | | 5,182 | | | | 3,544 | | | | 4,421 | | | | 3,023 | | | | 2,569 | | | | 1,757 | |
| Rössing (Namibia) (t) | | | 68.6 | | | | 4,078 | | | | 2,798 | | | | 2,747 | | | | 1,884 | | | | 3,401 | | | | 2,333 | |
| Rio Tinto total | | | | | | | | | | | 6,342 | | | | | | | | 4,907 | | | | | | | | 4,089 | |
| | | | | | | | | | | | | | | | | | | | | | | | | | | | |
Notes:
Mine production figures for metals refer to the total quantity of metal produced in concentrates, leach liquor or doré bullion irrespective of whether these products are then refined onsite, except for the data for bauxite and iron ore which can represent production of marketable quantities of ore plus concentrates and pellets. Production figures are sometimes more precise than the rounded numbers shown, hence small differences may result from calculation of Rio Tinto share of production.
| (a) | Rio Tinto percentage share, shown above, is as at the end of 2016. The footnotes below include all ownership changes over the three years. |
| (b) | Jonquiére’s (Vaudreuil’s) production shows smelter grade alumina only and excludes hydrate produced and used for specialty alumina. |
| (c) | The curtailment of production at the Gove refinery was completed on 28 May 2014. |
| (d) | Rio Tinto sold its 46.7 per cent interest in the Alucam (Edéa) smelter with an effective date of 31 December 2014. Production data are shown up to that date. |
| (e) | Rio Tinto sold its 100 per cent interest in the Lochaber aluminium smelter with an effective date of 16 December 2016. Production data are shown up to that date. |
| (f) | Rio Tinto sold its 50 per cent interest in the SØRAL (Husnes) smelter with an effective date of 31 October 2014. Production data are shown up to that date. |
| (g) | Rio Tinto has a 22.95 per cent shareholding in the Sangaredi mine but benefits from 45.0 per cent of production. |
| (h) | Borate quantities are expressed as B2O3. |
| (i) | Kestrel and Hail Creek produce hard coking coal and thermal coal through their mining operations. Both mines may blend coal types at ports. |
| (j) | Rio Tinto completed the sale of Rio Tinto Coal Mozambique and its 65 per cent interest in the Benga mine with an effective date of 7 October 2014. Production data are shown up to that date. |
| (k) | On 24 January 2017, Rio Tinto announced a binding agreement to sell Coal & Allied, a wholly owned subsidiary of Rio Tinto Coal Australia (RTCA). This includes Coal & Allied’s 67.6 per cent interest in the Hunter Valley Operations mine, 80 per cent interest in the Mount Thorley mine and 55.6 per cent interest in the Warkworth mine. In an earlier restructuring of the Coal & Allied group completed on 3 February 2016, Rio Tinto had obtained 100 per cent of Coal & Allied and retained a 67.6 per cent interest in the newly created Hunter Valley Operations joint venture. Prior to restructuring, Rio Tinto’s interest in the Hunter Valley Operations, Mount Thorley and Warkworth mines was 80 per cent, 64 per cent and 44.46 per cent respectively. |
| (l) | Rio Tinto sold its interest in the Bengalla Joint Venture with an effective date of 1 March 2016. |
| (m) | Rio Tinto sold its 50.1 per cent interest in the Clermont mine with an effective date of 29 May 2014. Production data are shown up to that date. |
| (n) | Through a joint venture agreement with Freeport-McMoRan (FCX), Rio Tinto is entitled to 40 per cent of additional material mined as a consequence of expansions and developments of the Grasberg facilities since 1998. Total production reflects the quantities attributable to the joint venture. The 2016 production from Grasberg did not exceed the metal attributable to PT Freeport Indonesia per the joint venture agreement for the year. Accordingly, Rio Tinto’s share of joint venture production for the year 2016 was zero. |
| (o) | Rio Tinto owns a 33.52 per cent indirect interest in Oyu Tolgoi through its 50.79 per cent interest in Turquoise Hill Resources Ltd. |
| (p) | Rio Tinto sold its 77.8 per cent interest in Murowa Diamonds with an effective date of 17 June 2015. Production data are shown up to that date. |
| (q) | Includes 100 per cent of production from Paraburdoo, Mt Tom Price, Marandoo, Yandicoogina, Brockman, Nammuldi and the Eastern Range mines. Whilst Rio Tinto owns 54 per cent of the Eastern Range mine, under the terms of the joint venture agreement, Hamersley Iron manages the operation and is obliged to purchase all mine production from the joint venture and therefore all of the production is included in Rio Tinto’s share of production. |
| (r) | Robe River – Robe Valley (Australia) was previously reported as Robe River – Pannawonica (Australia) |
| (s) | Quantities comprise 100 per cent of Rio Tinto Fer et Titane and Rio Tinto’s share of Richards Bay Minerals’ production. Ilmenite mined in Madagascar is being processed in Canada. |
| (t) | ERA and Rössing report drummed U3O8. |
| | | | |
| 222 | | riotinto.com | | 2016 Annual report |
Ore reserves (under industry guide 7)
For the purposes of this combined Annual report on Form20-F estimates of Ore Reserves have been prepared in accordance with the SEC’s Industry Guide 7 under the United States Securities Act of 1933 and the following definitions:
| — | An ‘Ore Reserve’ means that part of a mineral deposit that can be economically and legally extracted or produced at the time of the reserves determination. To establish this, studies appropriate to the type of mineral deposit involved have been carried out to estimate the quantity, grade and value of the ore mineral(s) present. In addition, technical studies have been completed to determine realistic assumptions for the extraction of the minerals including estimates of mining, processing, economic, marketing, legal, environmental, social and governmental factors. The degree of these studies is sufficient to demonstrate the technical and economic feasibility of the project and depends on whether or not the project is an extension of an existing project or operation. The estimates of minerals to be produced include allowances for ore losses and the treatment of unmineralised materials which may occur as part of the mining and processing activities. Ore Reserves aresub-divided in order of increasing confidence into Probable Ore Reserves and Proven Ore Reserves as defined below. Stockpile tonnages that are over one per cent of total Ore Reserves are reported separately. |
| — | The term “economically”, as used in the definition of reserves, implies that profitable extraction or production under defined investment assumptions has been established through the creation of a mining plan, processing plan and cash flow model. The assumptions made must be reasonable, including costs and operating conditions that will prevail during the life of the project. |
| — | Ore Reserves presented in accordance with SEC Industry Guide 7 do not exceed the quantities that, it is estimated, could be extracted economically if future prices were to be in line with the average of historical prices for the three years to 30 June 2016, or contracted prices where applicable. For this purpose, contracted prices are applied only to future sales volumes for which the price is predetermined by an existing contract; and the average of historical prices is applied to expected sales volumes in excess of such amounts. Moreover, reported Ore Reserve estimates have not been increased above the levels expected to be economic based on Rio Tinto’s own long term price assumptions. |
| — | The term “legally”, as used in the definition of Ore Reserves, does not imply that all permits needed for mining and processing have been obtained or that other legal issues have been completely resolved. However, for Ore Reserves to exist, there is reasonable assurance of the issuance of these permits or resolution of legal issues. Reasonable assurance means that, based on applicable laws and regulations, the issuance of permits or resolution of legal issues necessary for mining and processing at a particular deposit will be accomplished in the ordinary course and in a timeframe consistent with the Company’s current mine plans. |
| — | The term “Proven Ore Reserves” means reserves for which (1) quantity is computed from dimensions revealed in outcrops, trenches, workings or drill holes; grade and/or quality are computed from the results of detailed sampling; and (2) the sites for inspection, sampling and measurement are spaced so closely and the geologic character is so well defined that size, shape, depth and mineral content of reserves are well established. Proven Ore Reserves represent that part of an orebody for which there exists the highest level of confidence in data regarding its geology, physical characteristics, chemical composition and probable processing requirements. |
| — | The term “Probable Ore Reserves” means reserves for which quantity and grade and/or quality are computed from information similar to that used for Proven Ore Reserves, but the sites for inspection, sampling and measurement are farther apart or are otherwise less adequately spaced. The degree of assurance, although lower than that for Proven Ore Reserves, is high enough to assume continuity between points of observation. This means that Probable Ore Reserves generally have a wider drill hole spacing than for Proven Ore Reserves. |
| — | The amount of Proven and Probable Ore Reserves shown below does not necessarily represent the amount of material currently scheduled for extraction, because the amount scheduled for extraction may be derived from a life of mine plan predicated on prices and other assumptions which are different to those used in the life of mine plan prepared in accordance with Industry Guide 7. |
The estimated Ore Reserve figures in the following tables are as of 31 December 2016. Metric units are used throughout. The figures used to calculate Rio Tinto’s share of Ore Reserves are often more precise than the rounded numbers shown in the tables, hence small differences might result if the calculations are repeated using the tabulated figures. Commodity price information is given in footnote (a).
Where operations are not managed by Rio Tinto, the reserves are published as received from the managing company.
| | | | |
| 2016 Annual report | | riotinto.com | | 223 |
| | | | | | | | | | | | | | | | |
| | | | | | | | | |
| STRATEGIC REPORT | | | | DIRECTORS’ REPORT | | | | FINANCIAL STATEMENTS | | | | PRODUCTION, RESERVES AND OPERATIONS ORE RESERVES | | | | ADDITIONAL INFORMATION |
Ore reserves (under industry guide 7)
continued
| | | | | | | | | | | | | | | | | | | | | | | | | | | | |
| | | | | | | | | Total ore reserves at end 2016 | | | | | | | | | Rio Tinto share | |
| | | Type of
mine (b) | | | | | | Tonnage | | | Grade | | | | | | Interest % | | | Recoverable mineral | |
Bauxite(c) | | | | | | | | | | | | | | | | | | | | | | | | | | | | |
| | | | | | | | | millions of tonnes | | | % Al2O3 | | | | | | | | | millions of tonnes | |
| Reserves at operating mines | | | | | | | | | | | | | | | | | | | | | | | | | | | | |
| Gove (Australia) (d) | | | O/P | | | | | | | | 147 | | | | 49.2 | | | | | | | | 100.0 | | | | 147 | |
| Porto Trombetas (MRN) (Brazil) (e) | | | O/P | | | | | | | | 61 | | | | 49.8 | | | | | | | | 12.0 | | | | 7 | |
| Sangaredi (Guinea) (f) | | | O/P | | | | | | | | 346 | | | | 48.9 | | | | | | | | 23.0 | | | | 79 | |
| Weipa (Australia) (g) | | | | | | | | | | | | | | | | | | | | | | | | | | | | |
| – East Weipa and Andoom (h) | | | O/P | | | | | | | | 209 | | | | 50.6 | | | | | | | | 100.0 | | | | 209 | |
| Total | | | | | | | | | | | | | | | | | | | | | | | | | | | 443 | |
| Undeveloped reserves (i) | | | | | | | | | | | | | | | | | | | | | | | | | | | | |
| Weipa (Australia) (g) | | | | | | | | | | | | | | | | | | | | | | | | | | | | |
| – South of Embley (j) | | | O/P | | | | | | | | 1,409 | | | | 52.4 | | | | | | | | 100.0 | | | | 1,409 | |
| | | | | | | | | | | | | | | | | | | | | Marketable product | |
Borates(k) | | | | | | | | | | | | | | | | | | | | | | | | | | | | |
| | | | | | | | | millions of tonnes | | | | | | | | | | | | millions of tonnes | |
| Reserves at operating mine | | | | | | | | | | | | | | | | | | | | | | | | | | | | |
| Rio Tinto Borates – Boron (US) | | | | | | | | | | | | | | | | | | | | | | | | | | | | |
| – mine | | | O/P | | | | | | | | 20 | | | | | | | | | | | | 100.0 | | | | 20 | |
| – stockpiles | | | | | | | | | | | 3 | | | | | | | | | | | | 100.0 | | | | 3 | |
| Total | | | | | | | | | | | | | | | | | | | | | | | | | | | 22 | |
| | | | | | Coal type (m) | | | Marketable reserves | | | Marketable coal quality | | | | | | | | | | |
| | | | | | | | | | | | Calorific value (n) | | | Sulphur content (n) | | | | | | Marketable reserves | |
Coal(l) | | | | | | | | | | | | | | | | | | | | | | | | | | | | |
| | | | | | | | | millions of tonnes | | | MJ/kg | | | % | | | | | | millions of tonnes | |
| Reserves at operating mines | | | | | | | | | | | | | | | | | | | | | | | | | | | | |
| Rio Tinto Coal Australia | | | | | | | | | | | | | | | | | | | | | | | | | | | | |
| – Hail Creek (o) | | | O/C | | | | SC + MC | | | | 55 | | | | 25.74 | | | | 0.35 | | | | 82.0 | | | | 45 | |
| – Hunter Valley Operations (p) | | | O/C | | | | SC + MC | | | | 616 | | | | 27.50 | | | | 0.54 | | | | 67.6 | | | | 416 | |
| – Kestrel Coal (q) | | | U/G | | | | SC + MC | | | | 94 | | | | 32.03 | | | | 0.57 | | | | 80.0 | | | | 75 | |
| – Mouth Thorley Operations (p) | | | O/C | | | | SC + MC | | | | 12 | | | | 29.09 | | | | 0.44 | | | | 80.0 | | | | 9 | |
| – Warkworth (p) | | | O/C | | | | SC + MC | | | | 206 | | | | 28.98 | | | | 0.41 | | | | 55.6 | | | | 114 | |
| Total | | | | | | | | | | | | | | | | | | | | | | | | | | | 660 | |
| | | | | | | | | | | | | | | | | | | | | | | | |
| | | | |
| 224 | | riotinto.com | | 2016 Annual report |
Ore reserves (under industry guide 7)
continued
| | | | | | | | | | | | | | | | | | | | | | | | |
| | | | | | Total ore reserves at end 2016 | | | Average
mill
recovery
% | | | | | | Rio Tinto share | |
| | | Type of
mine (b) | | | Tonnage | | | Grade | | | | Interest
% | | | Recoverable
metal | |
| | | | | | | | | | | | | | | | | |
Copper | | | | | | | | | | | | | | | | | | | | | | | | |
| | | | | | millions
of tonnes | | | % Cu | | | | | | | | | millions of tonnes | |
Reserves at operating mines | | | | | | | | | | | | | | | | | | | | | | | | |
Bingham Canyon (US) | | | O/P | | | | 668 | | | | 0.43 | | | | 87 | | | | 100.0 | | | | 2.505 | |
Escondida (Chile) | | | | | | | | | | | | | | | | | | | | | | | | |
– sulphide mine | | | O/P | | | | 5,638 | | | | 0.67 | | | | 83 | | | | 30.0 | | | | 9.376 | |
– sulphide leach mine | | | O/P | | | | 2,458 | | | | 0.42 | | | | 28 | | | | 30.0 | | | | 0.890 | |
– oxide mine (r) | | | O/P | | | | 277 | | | | 0.65 | | | | 65 | | | | 30.0 | | | | 0.348 | |
– sulphide leach stockpiles (s) | | | | | | | 21 | | | | 0.51 | | | | 30 | | | | 30.0 | | | | 0.010 | |
– oxide stockpiles (t) | | | | | | | 24 | | | | 0.85 | | | | 65 | | | | 30.0 | | | | 0.040 | |
Grasberg (Indonesia) | | | O/P + U/G | | | | 2,059 | | | | 1.06 | | | | 89 | | | | (u) | | | | 6.660 | |
Oyu Tolgoi (Mongolia) | | | | | | | | | | | | | | | | | | | | | | | | |
– Oyut mine | | | O/P | | | | 912 | | | | 0.44 | | | | 79 | | | | 33.5 | | | | 1.061 | |
– Oyut stockpiles (v) | | | | | | | 39 | | | | 0.46 | | | | 77 | | | | 33.5 | | | | 0.046 | |
| Total | | | | | | | | | | | | | | | | | | | | | | | 20.936 | |
Undeveloped reserves (i) | | | | | | | | | | | | | | | | | | | | | | | | |
Oyu Tolgoi (Mongolia) | | | | | | | | | | | | | | | | | | | | | | | | |
– Hugo Dummett North | | | U/G | | | | 464 | | | | 1.66 | | | | 92 | | | | 33.5 | | | | 2.371 | |
– Hugo Dummett North Extension (w) | | | U/G | | | | 35 | | | | 1.59 | | | | 92 | | | | 29.9 | | | | 0.152 | |
| Total | | | | | | | | | | | | | | | | | | | | | | | 2.523 | |
| | | | | | | | | | | | | | | | | | Recoverable
diamonds | |
Diamonds(c) | | | | | | | | | | | | | | | | | | | | | | | | |
| | | | | | millions
of tonnes | | | carats
per tonne | | | | | | | | | millions
of carats | |
Reserves at operating mines | | | | | | | | | | | | | | | | | | | | | | | | |
Argyle (Australia) (x) | | | U/G | | | | 29 | | | | 2.3 | | | | | | | | 100.0 | | | | 67.4 | |
Diavik (Canada) (y) | | | O/P + U/G | | | | 16 | | | | 2.8 | | | | | | | | 60.0 | | | | 27.6 | |
| Total | | | | | | | | | | | | | | | | | | | | | | | 95.0 | |
| | | | | | | | | | | | | | | | | | Recoverable
metal | |
Gold | | | | | | | | | | | | | | | | | | | | | | | | |
| | | | | | millions
of tonnes | | | grammes
per tonne | | | | | | | | | millions
of ounces | |
Reserves at operating mines | | | | | | | | | | | | | | | | | | | | | | | | |
Bingham Canyon (US) | | | O/P | | | | 668 | | | | 0.17 | | | | 67 | | | | 100.0 | | | | 2.495 | |
Grasberg (Indonesia) | | | O/P + U/G | | | | 2,059 | | | | 0.86 | | | | 67 | | | | (u) | | | | 11.815 | |
Oyu Tolgoi (Mongolia) | | | | | | | | | | | | | | | | | | | | | | | | |
– Oyut mine | | | O/P | | | | 912 | | | | 0.28 | | | | 73 | | | | 33.5 | | | | 1.967 | |
– Oyut stockpiles (v) | | | | | | | 39 | | | | 0.21 | | | | 68 | | | | 33.5 | | | | 0.058 | |
| Total | | | | | | | | | | | | | | | | | | | | | | | 16.335 | |
Undeveloped reserves (i) | | | | | | | | | | | | | | | | | | | | | | | | |
Oyu Tolgoi (Mongolia) | | | | | | | | | | | | | | | | | | | | | | | | |
– Hugo Dummett North | | | U/G | | | | 464 | | | | 0.34 | | | | 83 | | | | 33.5 | | | | 1.407 | |
– Hugo Dummett North Extension (w) | | | U/G | | | | 35 | | | | 0.55 | | | | 84 | | | | 29.9 | | | | 0.155 | |
| Total | | | | | | | | | | | | | | | | | | | | | | | 1.563 | |
| | | | | | | | | | | | | | | | | | | | |
| | | | |
| 2016 Annual report | | riotinto.com | | 225 |
| | | | | | | | | | | | | | | | |
| | | | | | | | | |
| STRATEGIC REPORT | | | | DIRECTORS’ REPORT | | | | FINANCIAL STATEMENTS | | | | PRODUCTION, RESERVES AND OPERATIONS ORE RESERVES | | | | ADDITIONAL INFORMATION |
Ore reserves (under industry guide 7)
continued
| | | | | | | | | | | | | | | | | | | | | | | | |
| | | | | | Total ore reserves at end 2016 | | | Average
mill
recovery
% | | | Rio Tinto
share | |
| | Type of
mine (b) | | | Tonnage | | | Grade | | | | Interest
% | | | Marketable
product | |
| | | | | | | | | | | | | | | | | |
Iron ore (c) (z) | | | | | | | | | | | | | | | | | | | | | | | | |
| | | | | | millions of tonnes | | | % Fe | | | | | | | | | millions of tonnes | |
| Reserves at operating mines | | | | | | | | | | | | | | | | | | | | | | | | |
| Hamersley Iron (Australia) | | | | | | | | | | | | | | | | | | | | | | | | |
| – Brockman 2 (Brockman ore) | | | | | | | | | | | | | | | | | | | | | | | | |
– mine (aa) | | | O/P | | | | 66 | | | | 62.5 | | | | | | | | 100.0 | | | | 66 | |
– stockpiles | | | | | | | 3 | | | | 60.8 | | | | | | | | 100.0 | | | | 3 | |
| – Brockman 4 (Brockman ore) | | | | | | | | | | | | | | | | | | | | | | | | |
– mine | | | O/P | | | | 434 | | | | 61.9 | | | | | | | | 100.0 | | | | 434 | |
– stockpiles (bb) | | | | | | | 12 | | | | 58.7 | | | | | | | | 100.0 | | | | 12 | |
| – Marandoo (Marra Mamba ore) (cc) | | | O/P | | | | 161 | | | | 63.5 | | | | | | | | 100.0 | | | | 161 | |
| – Mt Tom Price (Brockman and Marra Mamba ore) | | | | | | | | | | | | | | | | | | | | | | | | |
– mine (dd) | | | O/P | | | | 43 | | | | 63.8 | | | | | | | | 100.0 | | | | 43 | |
– stockpiles | | | | | | | 2 | | | | 60.9 | | | | | | | | 100.0 | | | | 2 | |
| – Nammuldi (Marra Mamba ore) (ee) | | | O/P | | | | 136 | | | | 62.3 | | | | | | | | 100.0 | | | | 136 | |
| – Paraburdoo (Brockman ore) | | | O/P | | | | 16 | | | | 62.9 | | | | | | | | 100.0 | | | | 16 | |
| – Silvergrass (Marra Mamba ore) | | | | | | | | | | | | | | | | | | | | | | | | |
– mine (ff) | | | O/P | | | | 175 | | | | 61.4 | | | | | | | | 100.0 | | | | 175 | |
– stockpiles | | | | | | | 3 | | | | 57.5 | | | | | | | | 100.0 | | | | 3 | |
| – Western Turner Syncline (Brockman and Marra Mamba ore) (gg) | | | | | | | | | | | | | | | | | | | | | | | | |
– mine | | | O/P | | | | 279 | | | | 62.1 | | | | | | | | 100.0 | | | | 279 | |
– stockpiles | | | | | | | 10 | | | | 60.7 | | | | | | | | 100.0 | | | | 10 | |
| – Yandicoogina (Pisolite ore) | | | O/P | | | | 642 | | | | 58.5 | | | | | | | | 100.0 | | | | 642 | |
| Channar JV (Australia) | | | | | | | | | | | | | | | | | | | | | | | | |
| – Channar (Brockman ore) (hh) | | | O/P | | | | 37 | | | | 62.0 | | | | | | | | 60.0 | | | | 22 | |
| Eastern Range JV (Australia) | | | | | | | | | | | | | | | | | | | | | | | | |
| – Eastern Range (Brockman ore) | | | O/P | | | | 52 | | | | 61.7 | | | | | | | | 54.0 | | | | 28 | |
| Hope Downs JV (Australia) | | | | | | | | | | | | | | | | | | | | | | | | |
| – Hope Downs 1 (Marra Mamba ore) (ii) | | | O/P | | | | 238 | | | | 61.5 | | | | | | | | 50.0 | | | | 119 | |
| – Hope Downs 4 (Brockman ore) | | | O/P | | | | 162 | | | | 63.0 | | | | | | | | 50.0 | | | | 81 | |
| Robe River JV (Australia) | | | | | | | | | | | | | | | | | | | | | | | | |
| – Robe Valley (Pisolite ore) (jj) | | | O/P | | | | 190 | | | | 56.5 | | | | | | | | 53.0 | | | | 101 | |
| – West Angelas (Marra Mamba ore) (kk) | | | O/P | | | | 182 | | | | 61.6 | | | | | | | | 53.0 | | | | 97 | |
| Iron Ore Company of Canada (Canada) (ll) | | | O/P | | | | 529 | | | | 65.0 | | | | | | | | 58.7 | | | | 310 | |
| Total | | | | | | | | | | | | | | | | | | | | | | | 2,740 | |
| Undeveloped reserves (i) | | | | | | | | | | | | | | | | | | | | | | | | |
| Hamersley Iron (Australia) | | | | | | | | | | | | | | | | | | | | | | | | |
| – Koodaideri (Brockman ore) (mm) | | | O/P | | | | 594 | | | | 61.9 | | | | | | | | 100.0 | | | | 594 | |
| – Turee Central (Brockman ore) | | | O/P | | | | 78 | | | | 61.9 | | | | | | | | 100.0 | | | | 78 | |
| Simandou (Guinea) (nn) | | | O/P | | | | 1,844 | | | | 65.5 | | | | | | | | 42.8 | | | | 789 | |
| Total | | | | | | | | | | | | | | | | | | | | | | | 1,461 | |
| | | | | | | | | | | | | | | | | | | | | | | | |
| | | | |
| 226 | | riotinto.com | | 2016 Annual report |
Ore reserves (under industry guide 7)
continued
| | | | | | | | | | | | | | | | | | | | | | | | |
| | | | | | Total ore reserves at end 2016 | | | Average
mill
recovery
% | | | Rio Tinto
share | |
| | | Type of mine (b) | | | Tonnage | | | Grade | | | | Interest % | | | Recoverable metal | |
Molybdenum | | | | | | | | | | | | | | | | | | | | | | | | |
| | | | | | millions
of tonnes | | | % Mo | | | | | | | | | millions of tonnes | |
| Reserves at operating mine | | | | | | | | | | | | | | | | | | | | | | | | |
| Bingham Canyon (US) (oo) | | | O/P | | | | 668 | | | | 0.033 | | | | 65 | | | | 100.0 | | | | 0.143 | |
| Total | | | | | | | | | | | | | | | | | | | | | | | 0.143 | |
Silver | | | | | | | | | | | | | | | | | | | | | | | | |
| | | | | | millions of tonnes | | | grammes
per tonne | | | | | | | | | millions
of ounces | |
| Reserves at operating mines | | | | | | | | | | | | | | | | | | | | | |
| Bingham Canyon (US) | | | O/P | | | | 668 | | | | 2.06 | | | | 67 | | | | 100.0 | | | | 29.637 | |
| Grasberg (Indonesia) | | | O/P + U/G | | | | 2,059 | | | | 4.48 | | | | 70 | | | | (u) | | | | 75.211 | |
| Oyu Tolgoi (Mongolia) | | | | | | | | | | | | | | | | | | | | | | | | |
| – Oyut mine | | | O/P | | | | 912 | | | | 1.20 | | | | 76 | | | | 33.5 | | | | 8.931 | |
| – Oyut stockpiles (v) | | | | | | | 39 | | | | 0.82 | | | | 75 | | | | 33.5 | | | | 0.256 | |
| Total | | | | | | | | | | | | | | | | | | | | | | | 114.035 | |
| Undeveloped reserves (i) | | | | | | | | | | | | | | | | | | | | | |
| Oyu Tolgoi (Mongolia) | | | | | | | | | | | | | | | | | | | | | | | | |
| – Hugo Dummett North | | | U/G | | | | 464 | | | | 3.37 | | | | 86 | | | | 33.5 | | | | 14.574 | |
| – Hugo Dummett North Extension (w) | | | U/G | | | | 35 | | | | 3.72 | | | | 86 | | | | 29.9 | | | | 1.074 | |
| Total | | | | | | | | | | | | | | | | | | | | | | | 15.648 | |
| | | | | | | | | | | | | | | | | | Marketable product | |
Titanium dioxide feedstock (pp) | | | | | | | | | | | | | | | | | | | | | | | | |
| | | | | | millions
of tonnes | | | % Ti Minerals | | | | | | | | | millions of tonnes | |
| Reserves at operating mines | | | | | | | | | | | | | | | | | | | | | |
| QMM (Madagascar) (qq) | | | D/O | | | | 449 | | | | 3.5 | | | | | | | | 80.0 | | | | 5.7 | |
| RBM (South Africa) | | | | | | | | | | | | | | | | | | | | | | | | |
| – mine | | | D/O + O/P | | | | 1,765 | | | | 2.2 | | | | | | | | 74.0 | | | | 12.6 | |
| – stockpiles (rr) | | | | | | | 36 | | | | 1.7 | | | | | | | | 74.0 | | | | 0.2 | |
| RTFT (Canada) (ss) | | | O/P | | | | 128 | | | | 83.1 | | | | | | | | 100.0 | | | | 42.2 | |
| Total | | | | | | | | | | | | | | | | | | | | | | | 60.6 | |
| | | | | | | | | | | | | | | | | | Recoverable metal | |
Uranium | | | | | | | | | | | | | | | | | | | | | | | | |
| | | | | | millions
of tonnes | | | %U3O8 | | | | | | | | | millions of tonnes | |
| Reserves at operating mines | | | | | | | | | | | | | | | | | | | | | |
| Energy Resources of Australia (Australia) | | | | | | | | | | | | | | | | | | | | | | | | |
| – Ranger #3 stockpiles (tt) | | | | | | | 3.4 | | | | 0.106 | | | | 84 | | | | 68.4 | | | | 0.002 | |
| Rössing SJ (Namibia) | | | | | | | | | | | | | | | | | | | | | | | | |
| – mine | | | O/P | | | | 101 | | | | 0.036 | | | | 83 | | | | 68.6 | | | | 0.021 | |
| – stockpiles (uu) | | | | | | | 5.4 | | | | 0.018 | | | | 78 | | | | 68.6 | | | | 0.001 | |
| Total | | | | | | | | | | | | | | | | | | | | | | | 0.023 | |
| | | | | | | | | | | | | | | | | | Marketable
product | |
Zircon (vv) | | | | | | | | | | | | | | | | | | | | | | | | |
| | | | | | millions
of tonnes | | | % Zircon | | | | | | | | | millions of tonnes | |
| Reserves at operating mines | | | | | | | | | | | | | | | | | | | | | |
| QMM (Madagascar) (qq) | | | D/O | | | | 449 | | | | 0.2 | | | | | | | | 80.0 | | | | 0.4 | |
| RBM (South Africa) | | | | | | | | | | | | | | | | | | | | | | | | |
| – mine | | | D/O + O/P | | | | 1,765 | | | | 0.3 | | | | | | | | 74.0 | | | | 3.5 | |
| – stockpiles (rr) | | | | | | | 36 | | | | 0.1 | | | | | | | | 74.0 | | | | 0.02 | |
| Total | | | | | | | | | | | | | | | | | | | | | | | 3.9 | |
| | | | | | | | | | | | | | | | | | | | | | | | |
| | | | |
| 2016 Annual report | | riotinto.com | | 227 |
| | | | | | | | | | | | | | | | |
| | | | | | | | | |
| STRATEGIC REPORT | | | | DIRECTORS’ REPORT | | | | FINANCIAL STATEMENTS | | | | PRODUCTION, RESERVES AND OPERATIONS ORE RESERVES | | | | ADDITIONAL INFORMATION |
Ore reserves (under industry guide 7)
continued
| | | | | | | | | | | | | | | | | | | | | | | | | | | | |
| | | | | | Proven ore reserves at end 2016 | | | Probable ore reserves at end 2016 | |
| | | Type of
mine (b) | | | Tonnage | | | Grade | | | Drill hole
spacing
(ww) | | | Tonnage | | | Grade | | | Drill hole
spacing
(ww) | |
Bauxite(c) | | | | | | | | | | | | | | | | | | | | | | | | | | | | |
| | | | | | millions
of tonnes | | | % Al2O3 | | | | | | millions
of tonnes | | | % Al2O3 | | | | |
| Reserves at operating mines | | | | | | | | | | | | | | | | | | | | | | | | | | | | |
| Gove (Australia) (d) | | | O/P | | | | 142 | | | | 49.2 | | | | 50-100m x 50-100m | | | | 5 | | | | 49.4 | | | | 200-400m x 200-400m | |
| Porto Trombetas (MRN) (Brazil) (e) | | | O/P | | | | 43 | | | | 49.6 | | | | 200m x 200m | | | | 17 | | | | 50.1 | | | | 400m x 400m | |
| Sangaredi (Guinea) (f) | | | O/P | | | | 183 | | | | 48.5 | | | | 38m x 38m | | | | 163 | | | | 49.3 | | | | 75m x 75m | |
| Weipa (Australia) (g) | | | | | | | | | | | | | | | | | | | | | | | | | | | | |
| – East Weipa and Andoom (h) | | | O/P | | | | 194 | | | | 50.6 | | | | 150m x 150m | | | | 16 | | | | 50.3 | | | | 300m x 300m | |
| Undeveloped reserves (i) | | | | | | | | | | | | | | | | | | | | | | | | | | | | |
| Weipa (Australia) (g) | | | | | | | | | | | | | | | | | | | | | | | | | | | | |
| – South of Embley (j) | | | O/P | | | | 315 | | | | 52.3 | | | | 200m x 100m | | | | 1,094 | | | | 52.4 | | | | 400m x 200m | |
Borates (k) | | | | | | | | | | | | | | | | | | | | | | | | | | | | |
| | | | | | millions
of tonnes | | | | | | | | | millions
of tonnes | | | | | | | |
| Reserves at operating mine | | | | | | | | | | | | | | | | | | | | | | | | | | | | |
| Rio Tinto Borates –Boron (US) | | | | | | | | | | | | | | | | | | | | | | | | | | | | |
| – mine | | | O/P | | | | 11 | | | | | | | | 0-130m x0-130m | | | | 9 | | | | | | | | 130-488m x 130-488m | |
| – stockpiles | | | | | | | | | | | | | | | | | | | 3 | | | | | | | | | |
| | | | | | | | | | | | Marketable Reserves | |
| | | | | | Recoverable
reserves total | | | % Yield to give
Marketable
reserves | | | Proven
at end 2016 | | | Drill hole
spacing
(vv) | | | Probable
at end
2016 | | | Drill hole
spacing
(vv) | |
Coal(l) | | | | | | | | | | | | | | | | | | | | | | | | | | | | |
| | | | | | millions
of tonnes | | | | | | | | | millions
of tonnes | | | | | | | |
| Reserves at operating mines | | | | | | | | | | | | | | | | | | | | | | | | | | | | |
| Rio Tinto Coal Australia | | | | | | | | | | | | | | | | | | | | | | | | | | | | |
| Hail Creek (o) | | | O/C | | | | 74 | | | | 74 | | | | 43 | | | | 100-500m x 100-500m | | | | 12 | | | | 200-1000m x 200-1000m | |
| Hunter Valley Operations (p) | | | O/C | | | | 871 | | | | 71 | | | | 471 | | | | 125-500m x125-500m | | | | 144 | | | | 400-1000m x400-1000m | |
| Kestrel Coal (q) | | | U/G | | | | 123 | | | | 73 | | | | 20 | | | | 500m x 500m | | | | 74 | | | | 1000m x 1000m | |
| Mount Thorley Operations (p) | | | O/C | | | | 19 | | | | 63 | | | | 4 | | | | 125-500m x125-500m | | | | 7.4 | | | | 400-1000m x400-1000m | |
| Warkworth (p) | | | O/C | | | | 308 | | | | 67 | | | | 124 | | | | 125-500m x125-500m | | | | 82 | | | | 400-1000m x400-1000m | |
| | | | |
| 228 | | riotinto.com | | 2016 Annual report |
Ore reserves (under industry guide 7)
continued
| | | | | | | | | | | | | | | | | | | | | | | | | | | | |
| | | | | | Proven ore reserves at end 2016 | | | Probable ore reserves at end 2016 | |
| | | Type of mine (b) | | | Tonnage | | | Grade | | | Drill hole
spacing (ww) | | | Tonnage | | | Grade | | | Drill hole spacing (ww) | |
Copper | | | | | | | | | | | | | | | | | | | | | | | | | | | | |
| | | | | | millions
of tonnes | | | % Cu | | | | | | millions
of tonnes | | | % Cu | | | | |
| Reserves at operating mines | | | | | | | | | | | | | | | | | | | | | | | | | | | | |
| Bingham Canyon (US) | | | O/P | | | | 418 | | | | 0.46 | | | | 85m x 85m | | | | 250 | | | | 0.38 | | | | 131m x 131m | |
| Escondida (Chile) | | | | | | | | | | | | | | | | | | | | | | | | | | | | |
| – sulphide mine | | | O/P | | | | 3,563 | | | | 0.73 | | | | 50m x 50m | | | | 2,075 | | | | 0.56 | | | | 90m x 90m | |
| – sulphide leach mine | | | O/P | | | | 1,782 | | | | 0.44 | | | | 60m x 60m | | | | 676 | | | | 0.38 | | | | 115m x 115m | |
| – oxide mine (r) | | | O/P | | | | 83 | | | | 0.74 | | | | 30m x 30m | | | | 194 | | | | 0.60 | | | | 45m x 45m | |
| – sulphide leach stockpiles (s) | | | | | | | 21 | | | | 0.51 | | | | | | | | | | | | | | | | | |
| – oxide stockpiles (t) | | | | | | | 24 | | | | 0.85 | | | | | | | | | | | | | | | | | |
| Grasberg (Indonesia) | | | O/P + U/G | | | | 700 | | | | 1.17 | | | | 1-60m x 1-60m | | | | 1,359 | | | | 1.00 | | | | 3-240m x 3-240m | |
| Oyu Tolgoi (Mongolia) | | | | | | | | | | | | | | | | | | | | | | | | | | | | |
| – Oyut mine | | | O/P | | | | 333 | | | | 0.53 | | | | 30m x 50m | | | | 579 | | | | 0.39 | | | | 70m x 70m | |
| – Oyut stockpiles (v) | | | | | | | 39 | | | | 0.46 | | | | | | | | | | | | | | | | | |
| Undeveloped reserves (i) | | | | | | | | | | | | | | | | | | | | | | | | | | | | |
| Oyu Tolgoi (Mongolia) | | | | | | | | | | | | | | | | | | | | | | | | | | | | |
| – Hugo Dummett North | | | U/G | | | | | | | | | | | | | | | | 464 | | | | 1.66 | | | | 50-70m x 100-125m | |
| – Hugo Dummett North Extension (w) | | | U/G | | | | | | | | | | | | | | | | 35 | | | | 1.59 | | | | 50-70m x100-125m | |
Diamonds(c) | | | | | | | | | | | | | | | | | | | | | | | | | | | | |
| | | | | | millions
of tonnes | | | carats
per tonne | | | | | | millions
of tonnes | | | carats
per tonne | | | | |
| Reserves at operating mines | | | | | | | | | | | | | | | | | | | | | | | | | | | | |
| Argyle (Australia) (x) | | | U/G | | | | | | | | | | | | | | | | 29 | | | | 2.3 | | | | 25-50m x25-50m | |
| Diavik (Canada) (y) | | | O/P + U/G | | | | 9.1 | | | | 2.9 | | | | 2-39m x2-62m | | | | 7.3 | | | | 2.7 | | | | 7-53m x5-43m | |
Gold | | | | | | | | | | | | | | | | | | | | | | | | | | | | |
| | | | | | millions
of tonnes | | | grammes
per tonne | | | | | | millions
of tonnes | | | grammes
per tonne | | | | |
| Reserves at operating mines | | | | | | | | | | | | | | | | | | | | | | | | | | | | |
| Bingham Canyon (US) | | | O/P | | | | 418 | | | | 0.18 | | | | 85m x 85m | | | | 250 | | | | 0.16 | | | | 131m x 131m | |
| Grasberg (Indonesia) | | | O/P + U/G | | | | 700 | | | | 0.99 | | | | 1-60m x1-60m | | | | 1,359 | | | | 0.80 | | | | 3-240m x3-240m | |
| Oyu Tolgoi (Mongolia) | | | | | | | | | | | | | | | | | | | | | | | | | | | | |
| – Oyut mine | | | O/P | | | | 333 | | | | 0.35 | | | | 30m x 50m | | | | 579 | | | | 0.23 | | | | 70m x 70m | |
| – Oyut stockpiles (v) | | | | | | | 39 | | | | 0.21 | | | | | | | | | | | | | | | | | |
| Undeveloped reserves (i) | | | | | | | | | | | | | | | | | | | | | | | | | | | | |
| Oyu Tolgoi (Mongolia) | | | | | | | | | | | | | | | | | | | | | | | | | | | | |
| – Hugo Dummett North | | | U/G | | | | | | | | | | | | | | | | 464 | | | | 0.34 | | | | 50-70m x 100-125m | |
| – Hugo Dummett North Extension (w) | | | U/G | | | | | | | | | | | | | | | | 35 | | | | 0.55 | | | | 50-70m x100-125m | |
| | | | |
| 2016 Annual report | | riotinto.com | | 229 |
| | | | | | | | | | | | | | | | |
| | | | | | | | | |
| STRATEGIC REPORT | | | | DIRECTORS’ REPORT | | | | FINANCIAL STATEMENTS | | | | PRODUCTION, RESERVES AND OPERATIONS ORE RESERVES | | | | ADDITIONAL INFORMATION |
Ore reserves (under industry guide 7)
continued
| | | | | | | | | | | | | | | | | | | | | | | | | | | | |
| | | Type of mine (b) | | | Proven ore reserves at end 2016 | | | | | | Probable ore reserves at end 2016 | |
| | | | Tonnage | | | Grade | | | Drill hole spacing (ww) | | | Tonnage | | | Grade | | | Drill hole spacing (ww) | |
Iron ore(c) (z) | | | | | | | | | | | | | | | | | | | | | | | | | | | | |
| | | | | | millions of tonnes | | | % Fe | | | | | | millions of tonnes | | | % Fe | | | | |
Reserves at operating mines | | | | | | | | | | | | | | | | | | | | | | | | | | | | |
Hamersley Iron (Australia) | | | | | | | | | | | | | | | | | | | | | | | | | | | | |
– Brockman 2 (Brockman ore) | | | | | | | | | | | | | | | | | | | | | | | | | | | | |
– mine (aa) | | | O/P | | | | 53 | | | | 62.7 | | | | 50m x 50m | | | | 14 | | | | 61.9 | | | | 50m x 50m | |
– stockpiles | | | | | | | | | | | | | | | | | | | 3 | | | | 60.8 | | | | | |
– Brockman 4 (Brockman ore) | | | | | | | | | | | | | | | | | | | | | | | | | | | | |
– mine | | | O/P | | | | 307 | | | | 62.3 | | | | 50m x 50m | | | | 127 | | | | 61.0 | | | | 50-100m x 50m | |
– stockpiles (bb) | | | | | | | | | | | | | | | | | | | 12 | | | | 58.7 | | | | | |
– Marandoo (Marra Mamba ore) (cc) | | | O/P | | | | 151 | | | | 63.6 | | | | 75m x 75m | | | | 11 | | | | 62.0 | | | | 75m x 75m | |
– Mt Tom Price (Brockman and Marra Mamba ore) | | | | | | | | | | | | | | | | | | | | | | | | | | | | |
– mine (dd) | | | O/P | | | | 15 | | | | 62.4 | | | | 30-60m x 30-60m | | | | 28 | | | | 64.5 | | | | 30-60m x 30-60m | |
– stockpiles | | | | | | | | | | | | | | | | | | | 2 | | | | 60.9 | | | | | |
– Nammuldi (Marra Mamba ore) (ee) | | | O/P | | | | 69 | | | | 62.5 | | | | 25-50m x25-50m | | | | 67 | | | | 62.0 | | | | 25-50m x 25-50m | |
– Paraburdoo (Brockman ore) | | | O/P | | | | 7 | | | | 61.7 | | | | 30-60m x30-60m | | | | 9 | | | | 63.8 | | | | 30-60m x 30-60m | |
– Silvergrass (Marra Mamba ore) | | | | | | | | | | | | | | | | | | | | | | | | | | | | |
– mine (ff) | | | O/P | | | | 126 | | | | 62.4 | | | | 50m x 50m | | | | 49 | | | | 58.7 | | | | 50m x 50m | |
– stockpiles | | | | | | | | | | | | | | | | | | | 3 | | | | 57.5 | | | | | |
| – Western Turner Syncline (Brockman and Marra Mamba ore) (gg) | | | | | | | | | | | | | | | | | | | | | | | | | | | | |
– mine | | | O/P | | | | 238 | | | | 62.2 | | | | 60m x 60m | | | | 41 | | | | 61.1 | | | | 60m x 60m | |
– stockpiles | | | | | | | | | | | | | | | | | | | 10 | | | | 60.7 | | | | | |
– Yandicoogina (Pisolite ore) | | | O/P | | | | 642 | | | | 58.5 | | | | 100m x 50m | | | | | | | | | | | | | |
Channar JV (Australia) | | | | | | | | | | | | | | | | | | | | | | | | | | | | |
– Brockman ore (hh) | | | O/P | | | | 6 | | | | 61.6 | | | | 30-60m x30-60m | | | | 31 | | | | 62.1 | | | | 30-120m x 30-120m | |
Eastern Range JV (Australia) | | | | | | | | | | | | | | | | | | | | | | | | | | | | |
– Brockman ore | | | O/P | | | | 41 | | | | 62.1 | | | | 30-60m x30-60m | | | | 10 | | | | 60.3 | | | | 30-60m x 30-60m | |
Hope Downs JV (Australia) | | | | | | | | | | | | | | | | | | | | | | | | | | | | |
– Hope Downs 1 (Marra Mamba ore) (ii) | | | O/P | | | | 115 | | | | 62.4 | | | | 25-50m x 50m | | | | 123 | | | | 60.6 | | | | 25-50m x 50m | |
– Hope Downs 4 (Brockman ore) | | | O/P | | | | 82 | | | | 63.2 | | | | 63m x 50m | | | | 81 | | | | 62.8 | | | | 63m x 50m | |
| Robe River JV (Australia) | | | | | | | | | | | | | | | | | | | | | | | | | | | | |
– Robe Valley (Pisolite ore) (jj) | | | O/P | | | | 115 | | | | 56.9 | | | | 50-70m x50-70m | | | | 75 | | | | 56.0 | | | | 50-70m x 50-70m | |
– West Angelas (Marra Mamba ore) (kk) | | | O/P | | | | 145 | | | | 62.0 | | | | 25-50m x25-50m | | | | 37 | | | | 60.1 | | | | 25-50m x 25-50m | |
Iron Ore Company of Canada (Canada) (ll) | | | O/P | | | | 247 | | | | 65.0 | | | | 30-60m x 30-120m | | | | 282 | | | | 65.0 | | | | 60-120m x 60-120m | |
Undeveloped reserves (i) | | | | | | | | | | | | | | | | | | | | | | | | | | | | |
Hamersley Iron (Australia) | | | | | | | | | | | | | | | | | | | | | | | | | | | | |
– Koodaideri (Brockman ore) (mm) | | | O/P | | | | 263 | | | | 62.2 | | | | 50-100m x 50m | | | | 331 | | | | 61.6 | | | | 50-100m x 50m | |
– Turee Central (Brockman ore) | | | O/P | | | | 72 | | | | 62.0 | | | | 60-120m x 60-120m | | | | 6 | | | | 61.4 | | | | 60-120m x 60-120m | |
Simandou (Guinea) (nn) | | | O/P | | | | | | | | | | | | | | | | 1,844 | | | | 65.5 | | | | 30-125m x 30-125m | |
| | | | |
| 230 | | riotinto.com | | 2016 Annual report |
Ore reserves (under industry guide 7)
continued
| | | | | | | | | | | | | | | | | | | | | | | | | | | | |
| | | | | | Proven ore reserves at end 2016 | | | Probable ore reserves at end 2016 | |
| | | Type of mine (b) | | | Tonnage | | | Grade | | | Drill hole spacing (ww) | | | Tonnage | | | Grade | | | Drill hole spacing (ww) | |
Molybdenum | | | | | | | | | | | | | | | | | | | | | | | | | | | | |
| | | | | | millions of tonnes | | | % Mo | | | | | | millions of tonnes | | | % Mo | | | | |
| Reserves at operating mine | | | | | | | | | | | | | | | | | | | | | | | | | |
| Bingham Canyon (US) (oo) | | | O/P | | | | 418 | | | | 0.040 | | | | 85m x 85m | | | | 250 | | | | 0.022 | | | | 131m x 131m | |
Silver | | | | | | | | | | | | | | | | | | | | | | | | | |
| | | | | | millions of tonnes | | | grammes per tonne | | | | | | millions of tonnes | | | grammes per tonne | | | | |
| Reserves at operating mines | | | | | | | | | | | | | | | | | | | | | | | | | |
| Bingham Canyon (US) | | | O/P | | | | 418 | | | | 2.06 | | | | 85m x 85m | | | | 250 | | | | 2.06 | | | | 131m x 131m | |
| Grasberg (Indonesia) | | | O/P + U/G | | | | 700 | | | | 4.93 | | | | 1-60m x 1-60m | | | | 1,359 | | | | 4.25 | | | | 3-240m x 3-240m | |
| Oyu Tolgoi (Mongolia) | | | | | | | | | | | | | | | | | | | | | | | | | | | | |
| – Oyut mine | | | O/P | | | | 333 | | | | 1.38 | | | | 30m x 50m | | | | 579 | | | | 1.10 | | | | 70m x 70m | |
| – Oyut stockpiles (v) | | | | | | | 39 | | | | 0.82 | | | | | | | | | | | | | | | | | |
| Undeveloped reserves (i) | | | | | | | | | | | | | | | | | | | | | | | | | |
| Oyu Tolgoi (Mongolia) | | | | | | | | | | | | | | | | | | | | | | | | | | | | |
| – Hugo Dummett North | | | U/G | | | | | | | | | | | | | | | | 464 | | | | 3.37 | | | | 50-70m x 100-125m | |
| – Hugo Dummett North Extension (w) | | | U/G | | | | | | | | | | | | | | | | 35 | | | | 3.72 | | | | 50-70m x 100-125m | |
Titanium Dioxide Feedstock(pp) | | | | | | | | | | | | | | | | | | | | | | | | | |
| | | | | | millions of tonnes | | | % Ti Minerals | | | | | | millions of tonnes | | | % Ti Minerals | | | | |
| Reserves at operating mines | | | | | | | | | | | | | | | | | | | | | | | | | |
| QMM (Madagascar) (qq) | | | D/O | | | | 436 | | | | 3.5 | | | | 100-200m x 100m | | | | 13 | | | | 3.6 | | | | 200-400m x 100m | |
| RBM (South Africa) | | | | | | | | | | | | | | | | | | | | | | | | | | | | |
| – mine | | | D/O + O/P | | | | 1,139 | | | | 2.1 | | | | 0-100m x 0-200m | | | | 625 | | | | 2.4 | | | | 100-200m x 200-400m | |
| – stockpiles (rr) | | | | | | | 36 | | | | 1.7 | | | | | | | | | | | | | | | | | |
| RTFT (Canada) (ss) | | | O/P | | | | | | | | | | | | | | | | 128 | | | | 83.1 | | | | 60-100m x 60-100m | |
Uranium | | | | | | | | | | | | | | | | | | | | | | | | | | | | |
| | | | | | millions of tonnes | | | % U308 | | | | | | millions of tonnes | | | % U308 | | | | |
| Reserves at operating mines | | | | | | | | | | | | | | | | | | | | | | | | | |
| Energy Resources of Australia (Australia) | | | | | | | | | | | | | | | | | | | | | | | | | | | | |
| – Ranger #3 stockpiles (tt) | | | | | | | | | | | | | | | | | | | 3.4 | | | | 0.106 | | | | | |
| Rössing SJ (Namibia) | | | | | | | | | | | | | | | | | | | | | | | | | | | | |
| – mine | | | O/P | | | | 7.4 | | | | 0.031 | | | | 4-7m x 4-9m | | | | 94 | | | | 0.036 | | | | 20-120m x 20-120m | |
| – stockpiles (uu) | | | | | | | 1.5 | | | | 0.025 | | | | | | | | 3.9 | | | | 0.016 | | | | | |
Zircon(vv) | | | | | | | | | | | | | | | | | | | | | | | | | | | | |
| | | | | | millions of tonnes | | | % Zircon | | | | | | millions of tonnes | | | % Zircon | | | | |
| Reserves at operating mines | | | | | | | | | | | | | | | | | | | | | | | | | |
| QMM (Madagascar) (qq) | | | D/O | | | | 436 | | | | 0.2 | | | | 100-200m x 100m | | | | 13 | | | | 0.2 | | | | 200-400m x 100m | |
| RBM (South Africa) | | | | | | | | | | | | | | | | | | | | | | | | | | | | |
| – mine | | | D/O + O/P | | | | 1,139 | | | | 0.3 | | | | 0-100m x 0-200m | | | | 625 | | | | 0.3 | | | | 100-200m x 200-400m | |
| – stockpiles (rr) | | | | | | | 36 | | | | 0.1 | | | | | | | | | | | | | | | | | |
| | | | |
| 2016 Annual report | | riotinto.com | | 231 |
| | | | | | | | | | | | | | | | |
| | | | | | | | | |
| STRATEGIC REPORT | | | | DIRECTORS’ REPORT | | | | FINANCIAL STATEMENTS | | | | PRODUCTION, RESERVES AND OPERATIONS ORE RESERVES | | | | ADDITIONAL INFORMATION |
Ore reserves (under industry guide 7)
continued
Notes
| (a) | Commodity prices (based on a three year average historical price to 30 June, 2016) used to test whether the reported Ore Reserve estimates could be economically extracted, include the following benchmark prices: Aluminium – 0.78 US$/lb, Copper – 2.77 US$/lb, Gold – 1,228 US$/oz, Iron ore fines 62% Fe, FOB Western Australia – 74.6 US$/dry metric tonne, Molybdenum – 8.5 US$/lb, Silver – 17.8 US$/oz. |
| (b) | Type of mine: O/P = open pit, O/C = open cut, U/G = underground, D/O = dredging operation. |
| (c) | Reserves of bauxite, diamonds and iron ore are shown as recoverable Reserves of marketable product after accounting for all mining and processing losses. Mill recoveries are therefore not shown. |
| (d) | Gove Reserves are stated as dry tonnes and total alumina grade. |
| (e) | The reduction in Porto Trombetas (MRN) Reserve tonnes follow mining depletion. Reserves are stated as dry tonnes and available alumina grade. |
| (f) | Sangaredi Reserves tonnes are reported on a three per cent moisture basis and alumina grades are reported as total alumina. |
| (g) | Previously reported as a combined figure, Weipa’s Reserves are now reported based on separate geographical areas. |
| (h) | East Weipa and Andoom Reserves are stated as dry tonnes and total alumina grade. |
| (i) | The term “undeveloped reserves” is used here to describe material that is economically viable on the basis of technical and economic studies but for which mining and processing permits may have yet to be requested or obtained. There is a reasonable, but not absolute, certainty that the necessary permits will be issued and that mining can proceed when required. |
| (j) | The South of Embley region encompasses a number of bauxite deposits with Amrun being the first development, having commenced construction in 2016. The Reserves are stated as dry tonnes and total alumina grade. |
| (k) | Reserves of borates are expressed in terms of marketable product (B2O3) after all mining and processing losses. |
| (l) | For coal, the yield factors shown reflect the impact of further processing, where necessary, to provide marketable coal. |
| (m) | Coal type: SC: steam/thermal coal, MC: metallurgical/coking coal. |
| (n) | Coals have been analysed on an “air dried” moisture basis in accordance with Australian Standards and gross calorific value and sulphur content are reported here on that basis. Marketable Reserves tonnages are reported on a product moisture basis. |
| (o) | Hail Creek Reserves tonnes reduced following an updated economic evaluation and production depletion. |
| (p) | As a result of a restructure of the Coal & Allied group, which completed on 3 February 2016, Rio Tinto obtained 100 per cent ownership of Coal & Allied and retained a 67.6 per cent interest in the newly created Hunter Valley Operations joint venture, which owns the Hunter Valley Operations mine. The ownership shown above reflects these changes. On 24 January 2017, Rio Tinto announced that it had reached a binding agreement for the sale of its wholly-owned Australian subsidiary Coal & Allied Industries Limited. This includes its 67.6 per cent interest in the Hunter Valley Operations mine, 80 per cent interest in the Mount Thorley mine and 55.6 per cent interest in the Warkworth mine. |
| (q) | The change in the Kestrel Coal Reserves tonnes follows mining depletion and updated yields to reflect calibrated plant performance. |
| (r) | Escondida – oxide Reserves tonnes increased and grade decreased following an updated model based on improved performance in the oxide heap leach process. |
| (s) | The variation in Escondida – sulphide leach stockpile Reserves tonnes and grade follows mine production. |
| (t) | The variation in Escondida – oxide stockpile Reserves tonnes and grade follows mine production. |
| (u) | Under the terms of a joint venture agreement between Rio Tinto and FCX, Rio Tinto is entitled to a direct 40 per cent share in Reserves discovered after 31 December 1994 and it is this entitlement that is shown. |
| (v) | The increase in Oyut stockpile Reserves tonnes and grade follows mine production. |
| (w) | Rio Tinto’s interest in Hugo Dummett North Extension decreased from 30.0 per cent to 29.9 per cent during 2016. |
| (x) | The change in Argyle Reserves tonnes follows mining depletion and an updated life of mine plan. Argyle Reserves are based on a nominal 0.8 millimetre lowercut-off size and a finalre-crushing size of 8 millimetres. |
| (y) | The changes in the Diavik Reserves tonnes follows mining depletion. Diavik Reserves are based on a nominal 1 millimetre lowercut-off size and a finalre-crushing size of 5 millimetres. |
| (z) | Australian and Guinean iron ore Reserves tonnes are reported on a dry weight basis. |
| (aa) | Brockman 2 (Brockman ore) Reserves tonnes decreased due to production depletion and updated geological and metallurgical models. |
| (bb) | The increase in Brockman 4 stockpile Reserves tonnes follows mine production. |
| (cc) | Marandoo (Marra Mamba ore) Reserves tonnes decreased due to production depletion and an updated metallurgical model. |
| (dd) | Mt Tom Price (Brockman and Marra Mamba ore) Reserves have been combined for reporting purposes and the Reserves tonnes decreased following production depletion. |
| (ee) | Nammuldi (Marra Mamba ore) Reserve tonnes decreased due to production depletion and changes to the pit designs,cut-off grades and the metallurgical model. |
| (ff) | Silvergrass (Marra Mamba ore) Reserves tonnes have increased due to an updated geological model. Silvergrass was previously reported as Silvergrass East. |
| (gg) | Western Turner Syncline (Brockman and Marra Mamba ore) Reserves are combined for reporting purposes. |
| (hh) | Channar (Brockman ore) Reserves tonnes have decreased due to production depletion, an updated geological model and changes to the pit designs. |
| (ii) | Hope Downs 1 (Marra Mamba ore) Reserves tonnes have increased due to the inclusion of an additional mining area. |
| (jj) | Robe Valley (Pisolite ore) was previously reported as Pannawonica (Pisolite ore). |
| (kk) | West Angelas (Marra Mamba ore) Reserves tonnes have decreased due to production depletion, updated geological models and changes incut-off grade. |
| (ll) | Reserves at Iron Ore Company of Canada are reported as marketable product (59 per cent pellets and 41 per cent concentrate for sale) at a natural moisture content of two per cent. The marketable product is derived from mined material comprising 629 million dry tonnes at 38.2 per cent iron (Proven) and 720 million dry tonnes at 38.0 per cent iron (Probable) using process recovery factors derived from current IOC concentrating and pellet operations. |
| (mm) | Koodaideri (Brockman ore) Reserves tonnes have increased due to the reporting of a new mining area for the first time. |
| (nn) | On 28 October 2016, Rio Tinto and Chinalco signed anon-binding agreement to sell Rio Tinto’s entire stake in the Simandou project in Guinea to Chinalco. The Heads of Agreement sets out the proposed principal terms of the sale with the aim of signing a binding agreement within six months. Rio Tinto’s interest in Simandou decreased from 46.6 per cent to 42.8 per cent during 2016. |
| (oo) | Bingham Canyon Reserves molybdenum grades interpolated from exploration drilling assays have been factored based on a long reconciliation history to blast hole and mill samples |
| (pp) | The marketable product (TiO2 slag) is shown after all mining and processing losses. The Reserves are expressed as in situ tonnes. |
| (qq) | The estimates of QMM contained products were modified to include all metallurgical process factors to align with RBM and RTFT. |
| (rr) | The variation in RBM stockpile Reserves tonnes follows mine production and an increase in processing feed stock as a result of increased zircon production relative to slag production. |
| (ss) | At RTFT a new geological model and life of mine design resulted in an increase in Reserves. Development of RTFT Reserves beyond 2026 requires permitting and commissioning of a new waste dump by 2023. The waste dump permitting process is scheduled for completion in 2017. The facility is projected to support full extraction of reserves to 2062, including all associated water management infrastructure. |
| (tt) | The decrease in Ranger #3 stockpile Reserves tonnes follows processing depletion. |
| (uu) | The decrease in Rössing SJ stockpile Reserves tonnes and grade follows processing depletion. |
| (vv) | The marketable product (zircon at RBM and zirsil at QMM) is shown after all mining and processing losses. The Reserves are expressed as in situ tonnes. |
| (ww) | Drill hole spacings are either average distances, a specified grid distance (a regular pattern of drill holes – the distance between the drill holes along the two axes of the grid will be aligned to test the size, shape and continuity of the mineral deposit; as such there may be different distances between the drill holes along the two axes of a grid) or the maximum drill hole spacing that is sufficient to determine the Reserve category for a particular deposit. As the continuity of mineralisation varies from deposit to deposit, the drill hole spacing required to categorise a Reserve varies between and within deposit types. |
| | | | |
| 232 | | riotinto.com | | 2016 Annual report |
Mines and production facilities
Group mines as at 31 December 2016
(Rio Tinto’s interest 100 per cent unless otherwise shown)
| | | | | | | | |
| Mine | | Location | | Access | | Title/lease | | |
| Iron Ore | | | | | | | | |
Hamersley Iron Brockman 2 Brockman 4 Marandoo Mount Tom Price Nammuldi Paraburdoo Silvergrass Western Turner Syncline Yandicoogina Channar (60%) Eastern Range (54%) | | Hamersley Ranges, Western Australia | | Railway and port (owned by Hamersley Iron and operated by Pilbara Iron) | | Agreements for life of mine with Government of Western Australia. | | |
Hope Downs 1 (50% mine, 100% infrastructure) | | Pilbara region, Western Australia | | Railway and port (owned by Hamersley Iron and Robe Valley and operated by Pilbara Iron) | | Agreements for life of mine with Government of Western Australia. | | |
Hope Downs 4 (50% mine, 100% infrastructure) | | Pilbara region, Western Australia | | Railway and port (owned by Hamersley Iron and Robe Valley and operated by Pilbara Iron) | | Agreements for life of mine with Government of Western Australia. | | |
Robe River Iron Associates (53%) Robe Valley West Angelas | | Pilbara region, Western Australia | | Railway and port (owned by Robe River and operated by Pilbara Iron) | | Agreements for life of mine with Government of Western Australia. | | |
| Aluminium | | | | | | | | |
| Bauxite | | | | | | | | |
| CBG Sangaredi (22.95%) | | Sangaredi, Guinea | | Road, air and port | | Mining concession expires in 2040. | | |
| Gove | | Gove, Northern Territory, Australia | | Road, air and port | | All leases were renewed in 2011 for a further period of 42 years. The residue disposal area is leased from the Arnhem Land Aboriginal Land Trust. The Northern Territory government is the lessor of the balance of the leases; however, on expiry of the42-year renewed term, the land subject of the balances of the leases will all vest to the Arnhem Land Aboriginal Land Trust. | | |
| MRN Porto Trombetas (12%) | | Porto Trombetas, Para, Brazil | | Air or port | | Mining concession granted under the Brazilian mining code with no expiration date. | | |
| Weipa/Ely | | Weipa, Queensland, Australia | | Road, air and port | | The Queensland Government Comalco (ML7024) lease expires in 2042 with an option of a21-year extension, then two years’ notice of termination; the Queensland Government Alcan lease (ML7031) expires in 2048 with a21-year right of renewal with atwo-year notice period. | | |
| | | | |
| 236 | | riotinto.com | | 2016 Annual report |
| | | | | | |
| | | History | | Type of mine | | Power source |
| | | | | | |
| | | Mount Tom Price began operations in 1966, followed by Paraburdoo in 1974. In the 1990s, Channar, Brockman 2, Marandoo and Yandicoogina achieved first ore. Annual capacity increased to 68 million tonnes during the 1990s and has more than doubled in the past 25 years. Since 2000, Eastern Ranges, Nammuldi, Brockman 4 and Western Turner Syncline have joined the network of Hamersley Iron mines. The brownfield mine expansion at such sites as Paraburdoo, Brockman 2, Nammuldi and Yandicoogina will enable production to meet expanded port and rail capacity in the coming years. | | Open pit | | Supplied through the integrated Hamersley and Robe power network operated by Pilbara Iron |
| | | Joint venture between Rio Tinto and Hancock Prospecting. Construction of Stage 1 to 22 million tonnes per annum commenced 2006 and first production occurred 2007. Stage 2 to 30 million tonnes per annum completed 2009. | | Open pit | | Supplied through the integrated Hamersley and Robe power network operated by Pilbara Iron |
| | | Joint venture between Rio Tinto and Hancock Prospecting. Construction of wet plant processing to 15 million tonnes per annum commenced 2011 and first production occurred 2013. | | Open pit | | Supplied through the integrated Hamersley and Robe power network operated by Pilbara Iron |
| | First shipment in 1972 from Robe Valley. Interest acquired in 2000 through North. First ore was shipped from West Angelas in 2002. In 2014, total production of the Robe River Iron Associates joint venture was 64 million tonnes. | | Open pit | | Supplied through the integrated Hamersley and Robe power network operated by Pilbara Iron |
| | | | | | |
| | | | | | | |
| | | Bauxite mining commenced in 1973. Shareholders are 51% Halco and 49% Government of Guinea. Rio Tinto holds a 45 per cent interest in Halco. Rated production capacity is 13.5 million tonnes per annum and actual annual production in 2016 was 16.0 million tonnes on a dry basis. Rio Tinto currently benefits from approximately 45 per cent of the mine’s production. In 2013, CBG signed a contract with Abu Dhabi state-owned investment fund Mubadala to supply up to 4.9 million tonnes of bauxite per annum from December 2017. Expansion of the CBG bauxite mine, processing plant and associated infrastructure is under way, increasing production capacity from 13.5 to 18.5 million tonnes per annum by 2018. CBG is currently studying other expansion options beyond 18.5 million tonnes per annum. | | Open cut | | On-site generation (fuel oil) |
| | | Bauxite mining commenced in 1970, feeding both the Gove refinery and export market, capped at two million tonnes per annum. Bauxite export ceased in 2006 with feed intended for the expanded Gove refinery. Bauxite exports recommenced in 2008 and will increase in the coming years following the curtailment of the refinery production in 2014. Current annual production capacity is 9 million tonnes on a dry basis. | | Open cut | | On-site diesel fired power station |
| | | Mineral extraction commenced in 1979. Initial production capacity 3.4 million tonnes annually. From 2003, production capacity up to 16.3 million tonnes per year on a dry basis. Capital structure currently: Vale (40%), BHP Billiton (14.8%), Rio Tinto (12%), CBA (10%), Alcoa/Abalco (18.2%), and Norsk Hydro (5%). | | Open cut | | On-site generation (diesel) |
| | | Bauxite mining commenced in 1961 at Weipa. Major upgrade completed in 1998. Rio Tinto interest increased from 72.4% to 100% in 2000. In 1997, Ely Bauxite Mining Project Agreement signed with local Aboriginal land owners. Bauxite Mining and Exchange Agreement signed in 1998 with Comalco to allow for extraction of ore at Ely. The Western Cape CommunitiesCo-Existence Agreement, an Indigenous Land Use Agreement, was signed in 2001. The annual production of the Weipa mine has now reached 29.5 million tonnes following the execution of a series of projects since 2004. Approval for the Amrun project was granted in 2015 and it is in construction. Construction will take approximately three years. Amrun is expected to extend the Weipa mine life by approximately 40 years. | | Open cut | | On-site generation (diesel) supplemented by a solar generation facility |
| | | | |
| 2016 Annual report | | riotinto.com | | 237 |
| | | | | | | | | | | | | | | | |
| | | | | | | | | |
| STRATEGIC REPORT | | | | DIRECTORS’ REPORT | | | | FINANCIAL STATEMENTS | | | | PRODUCTION, RESERVES AND OPERATIONS MINES AND PRODUCTION FACILITIES | | | | ADDITIONAL INFORMATION |
Mines and production facilities
continued
Group mines as at 31 December 2016continued
(Rio Tinto’s interest 100 per cent unless otherwise shown)
| | | | | | | | |
| Mine | | Location | | Access | | Title/lease | | |
| Copper & Diamonds | | | | | | | | |
| Copper | | | | | | | | |
| Escondida (30%) | | Atacama Desert, Chile | | Pipeline and road to deep sea port at Coloso; road and rail | | Rights conferred by Government under Chilean Mining Code. | | |
| Grasberg joint venture (40% share of production above specified levels) | | Papua, Indonesia | | Pipeline, road and port | | Indonesian Government Contracts of Work expire in 2021 with option of twoten-year extensions. | | |
| Rio Tinto Kennecott Bingham Canyon | | Near Salt Lake City, Utah, US | | Pipeline, road and rail | | Owned. | | |
| Oyu Tolgoi (51% of Turquoise Hill Resources Ltd. which owns 66% of Oyu Tolgoi LLC) | | Gobi Desert, Mongolia | | Air and road | | Three mining licences are held by Oyu Tolgoi LLC and two further licences are held in joint venture with Entrée Gold LLC. The licence term under the Minerals Law of Mongolia is 30 years with two20-year extensions. First renewals are due in 2033 and 2039 for the Oyu Tolgoi and Entrée Gold licences respectively. | | |
| Diamonds | | | | | | | | |
| Argyle Diamonds | | Kimberley Ranges, Western Australia | | Road and air | | Mining tenement held under Diamond (Argyle Diamond Mines Joint Venture) Agreement Act 1981; lease extended for 21 years from 2004 with option to renew. | | |
| Diavik (60%) | | Northwest Territories (NWT), Canada | | Air, ice road in winter | | Mining leases from NWT Government, expiring in 2017 and 2018 with options to renew. | | |
| Energy & Minerals | | | | | | | | |
| Coal | | | | | | | | |
Rio Tinto Coal Australia Hail Creek (82%)
Hunter Valley Operations (67.6%)
Kestrel (80%)
Mount Thorley Operations (80%)
Warkworth (55.57%) | | New South Wales and Queensland, Australia | | Road, rail, conveyor
and port | | Leases granted by respective state governments. Please refer to page 38 for an update on the ownership changes since 31 December 2016. | | |
| Industrial minerals | | | | | | | | |
| Dampier Salt (68.4%) | | Dampier, Lake MacLeod and Port Hedland, Western Australia | | Road and port | | State agreements (mining leases) expiring in 2034 at Dampier, 2018 at Port Hedland and 2021 at Lake MacLeod, with options to renew at the latter two sites. | | |
| Rio Tinto Borates – Boron | | California, US | | Road and rail | | Owned. | | |
| Rio Tinto Fer et Titane Lac Tio | | Havre-Saint-Pierre, Quebec, Canada | | Rail and port
(St Lawrence River) | | Mining covered by two concessions granted by Quebec State in 1949 and 1951 which, subject to certain Mining Act restrictions, confer rights and obligations of an owner. | | |
| QIT Madagascar Minerals (80%) | | Fort-Dauphin, Madagascar | | Road and port | | Mining lease granted by central government. | | |
| Richards Bay Minerals (74%) | | Richards Bay, KwaZulu- Natal, South Africa | | Rail, road and port | | Mineral rights for Reserve 4 and Reserve 10 issued by South African State and converted to new order mining rights from 9 May 2012. Mining rights run until 8 May 2041 for both lease areas. | | |
| Iron ore | | | | | | | | |
| Iron Ore Company of Canada (IOC) (58.7%) | | Labrador City, Province of Labrador and Newfoundland | | Railway and port facilities in Sept-Îles, Quebec (owned and operated by IOC) | | Sublease with the Labrador Iron Ore Royalty Corporation which has lease agreements with the Government of Newfoundland and Labrador that are due to be renewed in 2020, 2022, 2025 and 2031. | | |
| Uranium | | | | | | | | |
Energy Resources of Australia (68.4%) Ranger | | Northern Territory, Australia | | Road, rail and port | | Mining tenure granted by Federal Government. | | |
| Rössing Uranium (68.6%) | | Erongo Region, Namibia | | Rail, road and port | | Mining licence granted by Namibian State. | | |
| | | | |
| 238 | | riotinto.com | | 2016 Annual report |
| | | | | | |
| | | History | | Type of mine | | Power source |
| | | | | | |
| | | | | | | |
| | | Production started in 1990 and since then capacity has been expanded numerous times. In 1998 first cathode was produced from the oxide leach plant, and during 2006 the sulphide leach plant was inaugurated, a year after the start of Escondida Norte pit production. During 2016 the third concentrator plant was commissioned. | | Open pit | | Supplied from SING grid under various contracts with local generating companies |
| | | Joint venture interest acquired 1995. Capacity expanded to over 200,000 tonnes of ore per day in 1998. Addition of underground production of more than 35,000 tonnes per day in 2003. Expansion to 50,000 tonnes per day inmid-2007 and to 80,000 tonnes in 2010. | | Open pit and underground | | Long-term contract withUS-Indonesian consortium operated purpose-built coal-fired generating station |
| | | Interest acquired in 1989. In 2012, the pushback of the south wall commenced, extending the mine life from 2018 to 2030. | | Open pit | | On-site generation supplemented by long-term contracts with Rocky Mountain Power |
| | | Oyu Tolgoi was first discovered in 1996. Construction began in late 2009 after signing of an Investment Agreement with the Government of Mongolia, and first concentrate was produced in 2012. First sales of concentrate were made to Chinese customers in 2013. | | Open pit and underground | | Grid power from China and supplementary diesel power generation site |
| | | | | | | |
| | | Interest increased from 59.7% following purchase of Ashton Mining in 2000. Underground mine project approved in 2005 to extend mine life to 2020. | | Underground
(previously open pit) | | Long-term contract with Ord Hydro Consortium andon-site generation |
| | | Deposits discovered 1994-1995. Construction approved 2000. Diamond production started 2003. Second dike closed off in 2005 for mining of additional orebody. The underground mine started production in 2010, ramping up to full production in 2013. | | Underground (previously open pit) | | On-site diesel generators; installed capacity 44MW and 9.2MW of wind capacity |
| | | | | | |
| | | | | | | |
| | | Kestrel Mine in Queensland, Rio Tinto Coal Australia’s sole underground mine, was acquired and recommissioned in 1999, and Hail Creek Mine in Queensland was officially opened in 2003. Blair Athol Mine ceased operations in 2012. Rio Tinto completed the privatisation of Coal & Allied during 2011, which was owned 80/20 with Mitsubishi Development until 3 February 2016, when Rio Tinto assumed 100 per cent ownership of Coal & Allied. This followed the completion of a change to the ownership structure which saw Mitsubishi Development move from a 20 per cent interest in Coal & Allied to a direct 32 per cent holding in the Hunter Valley Operations mine. | | Open cut and underground | | State-owned grid |
| | | | | | | |
| | | Construction of the Dampier field started in 1969; first shipment in 1972. Lake MacLeod was acquired in 1978 as an operating field. Port Hedland was acquired in 2001 as an operating field. | | Solar evaporation of seawater (Dampier and Port Hedland) and underground brine (Lake MacLeod); extraction of gypsum from surface of Lake MacLeod | | Dampier supply from Hamersley Iron Pty Ltd; Lake MacLeod from Horizon Power andon-site generation units; Port Hedland from Horizon Power |
| | | Deposit discovered in 1925 and acquired by Rio Tinto in 1967. | | Open pit | | On-siteco-generation units and local power grid |
| | | Production started 1950; interest acquired in 1989. | | Open pit | | Provincial power grid at regulated tariff |
| | | Exploration project started in 1986; construction approved 2005. Ilmenite and zirsil production started 2008. QMM intends to extract ilmenite and zirsil from heavy mineral sands over an area of about 6,000 hectares along the coast over the next 40 years. | | Mineral sand dredging | | On-site heavy fuel oil generators |
| | | Production started 1977; initial interest acquired 1989. Fifth mining plant commissioned in 2000. One mining plant decommissioned in 2008. In September 2012, Rio Tinto doubled its holding in Richards Bay Minerals to 74 per cent following the acquisition of BHP Billiton’s entire interests. | | Dune sand dredging | | Contract with ESKOM |
| | | | | | | |
| | | Interest acquired in 2000 through North. Current operation began in 1962 and has processed over one billion tonnes of crude ore since. Annual capacity 23.3 million tonnes of concentrate of which 12.5 million tonnes can be pelletised. | | Open pit | | Supplied by Newfoundland Hydro |
| | | | | | | |
| | | Mining commenced 1981. Interest acquired through acquisition of North 2000. Open pit mining ended 2012, since when ERA has been processing ore stockpiles. | | Stockpile | | On-site diesel generation |
| | | Production began in 1976. | | Open pit | | Supplied by NamPower via grid network |
| | | | |
| 2016 Annual report | | riotinto.com | | 239 |
| | | | | | | | | | | | | | | | |
| | | | | | | | | |
| STRATEGIC REPORT | | | | DIRECTORS’ REPORT | | | | FINANCIAL STATEMENTS | | | | PRODUCTION, RESERVES AND OPERATIONS MINES AND PRODUCTION FACILITIES | | | �� | ADDITIONAL INFORMATION |
Mines and production facilities
continued
Group smelters and refineries
(Rio Tinto’s interest 100 per cent unless otherwise shown)
| | | | | | | | |
| Smelter/refinery | | Location | | Title/lease | | Plant type/product | | Capacity as of
31 December 2016
(based on 100%
ownership) |
Aluminium | | | | | | | | |
Alma | | Alma, Quebec, Canada | | 100% freehold | | Aluminium smelter producing aluminium rod,t-foundry, molten metal, high purity, remelt | | 471,000 tonnes per year aluminium |
Alouette (40%) | | Sept-Îles, Quebec, Canada | | 100% freehold | | Aluminium smelter producing aluminium high purity, remelt | | 611,000 tonnes per year aluminium |
Arvida | | Saguenay, Quebec,
Canada | | 100% freehold | | Aluminium smelter producing aluminium billet, molten metal, remelt | | 176,000 tonnes per year aluminium |
Arvida AP60 | | Saguenay, Quebec,
Canada | | 100% freehold | | Aluminium smelter producing aluminium high purity, remelt | | 60,000 tonnes per year aluminium |
Bécancour (25.1%) | | Bécancour, Quebec,
Canada | | 100% freehold | | Aluminium smelter producing aluminium slab, billet,t-foundry, remelt, molten metal | | 446,000 tonnes per year aluminium |
Bell Bay | | Bell Bay, Northern Tasmania, Australia | | 100% freehold | | Aluminium smelter producing aluminium slab, molten metal, small form andt-foundry, remelt | | 195,000 tonnes per year aluminium |
Boyne Smelters (59.4%) | | Boyne Island, Queensland, Australia | | 100% freehold | | Aluminium smelter producing aluminium billet, EC grade, small form andt-foundry, remelt | | 584,000 tonnes per year aluminium |
Dunkerque | | Dunkerque, France | | 100% freehold | | Aluminium smelter producing aluminium slab, small form foundry, remelt | | 282,000 tonnes per year aluminium |
Grande-Baie | | Saguenay, Quebec,
Canada | | 100% freehold | | Aluminium smelter producing aluminium slab, molten metal, high purity, remelt | | 227,000 tonnes per year aluminium |
ISAL | | Reykjavik, Iceland | | 100% freehold | | Aluminium smelter producing aluminium remelt, billet | | 205,000 tonnes per year aluminium |
Jonquière (Vaudreuil) | | Jonquière, Quebec,
Canada | | 100% freehold | | Refinery producing specialty alumina and smelter grade alumina | | 1,566,000 tonnes per year alumina |
Kitimat (a) | | Kitimat, British Columbia,
Canada | | 100% freehold | | Aluminium smelter producing aluminium slab, remelt, high purity | | 420,000 tonnes per year aluminium |
Laterrière | | Saguenay, Quebec,
Canada | | 100% freehold | | Aluminium smelter producing aluminium slab, remelt, molten metal | | 247,000 tonnes per year aluminium |
Queensland Alumina (80%) | | Gladstone, Queensland,
Australia | | 73.3% freehold; 26.7% leasehold (of which more than 80% expires in 2026 and after) | | Refinery producing alumina | | 3,950,000 tonnes per year alumina |
São Luis (Alumar) (10%) | | São Luis, Maranhão, Brazil | | 100% freehold | | Refinery producing alumina | | 3,706,000 tonnes per year alumina |
Sohar (20%) | | Sohar, Oman | | 100% leasehold (expiring 2039) | | Aluminium smelter producing aluminium, high purity, remelt | | 387,000 tonnes per year aluminium |
Tiwai Point (New Zealand Aluminium Smelters) (79.4%) | | Invercargill, Southland, New Zealand | | 19.6% freehold; 80.4% leasehold (expiring in 2029 and use of certain Crown land) | | Aluminium smelter producing aluminium billet, slab, small form foundry, high purity, remelt | | 365,000 tonnes per year aluminium |
Tomago (51.6%) | | Tomago, New South Wales, Australia | | 100% freehold | | Aluminium smelter producing aluminium billet, slab, remelt | | 595,000 tonnes per year aluminium |
Yarwun | | Gladstone, Queensland,
Australia | | 97% freehold; 3% leasehold (expiring 2101 and after) | | Refinery producing alumina | | 3,200,000 tonnes per year alumina |
| | | | |
| 240 | | riotinto.com | | 2016 Annual report |
| | | | | | | | |
| Smelter/refinery | | Location | | Title/lease | | Plant type/product | | Capacity as of
31 December 2016
(based on 100%
ownership) |
Other aluminium | | | | | | | | |
Gove | | Gove, Northern Territory, Australia | | 100% leasehold. All leases were renewed in 2011 for a further period of 42 years. The residue disposal area is leased from the Arnhem Land Aboriginal Land Trust. The Northern Territory government is the lessor of the balance of the leases; however, on expiry of the42-year renewed term, the land subject of the balances of the leases will all vest to the Arnhem Land Aboriginal Land Trust. | | Refinery producing alumina | | 2,650,000 tonnes per year alumina. The Group curtailed production at Gove as of May 2014 |
Copper & Diamonds | | | | | | | | |
Kennecott Utah Copper | | Magna, Salt Lake City,
Utah, US | | 100% freehold | | Flash smelting furnace/Flash convertor furnace copper refinery | | 335,000 tonnes per year refined copper |
Energy & Minerals | | | | | | | | |
Boron | | California, US | | 100% freehold | | Borates refinery | | 576,000 tonnes per year boric oxide |
IOC Pellet Plant (58.7%) | | Labrador City, Newfoundland and Labrador, Canada | | 100% freehold (asset), 100% leasehold (land) under sublease with Labrador Iron Ore Royalty Corporation for life of mine. | | Pellet induration furnaces producing multiple iron ore pellet types | | 12.5 million tonnes per year pellet |
Rio Tinto Fer et Titane Sorel Plant | | Sorel-Tracy, Quebec, Canada | | 100% freehold | | Ilmenite smelter | | 1,300,000 tonnes per year titanium dioxide slag, 1,000,000 tonnes per year iron |
Richards Bay Minerals (74%) | | Richards Bay, South Africa | | 100% freehold | | Ilmenite smelter | | 1,050,000 tonnes per year titanium dioxide slag, 565,000 tonnes per year iron |
Note:
| (a) | Kitimat ramped up to nameplate capacity of 420,000 tonnes (a more than 48 per cent increase over previous nameplate capacity), on 29 March 2016. |
| | | | |
| 2016 Annual report | | riotinto.com | | 241 |
| | | | | | | | | | | | | | | | |
| | | | | | | | | |
| STRATEGIC REPORT | | | | DIRECTORS’ REPORT | | | | FINANCIAL STATEMENTS | | | | PRODUCTION, RESERVES AND OPERATIONS MINES AND PRODUCTION FACILITIES | | | | ADDITIONAL INFORMATION |
Mines and production facilities
continued
Information on Group power plants
(Rio Tinto’s interest 100 per cent unless otherwise shown)
| | | | | | | | |
| Power plant | | Location | | Title/lease | | Plant type/product | | Capacity as of
31 December
2016 (based on
100% ownership) |
Iron Ore | | | | | | | | |
Paraburdoo power station | | Paraburdoo, Western Australia, Australia | | Lease | | Three LM6000PCgas-fired turbines One Frame5 dual-fuel turbine | | 138MW |
Yurralyi Maya power station (Rio Tinto: 84.2%) | | Dampier, Western Australia, Australia | | Miscellaneous licence | | Four LM6000PDgas-fired turbines One LM6000PFgas-fired turbine (dual-fuel potential) | | 200MW |
West Angelas power station (Rio Tinto: 67%) | | West Angelas, Western Australia, Australia | | Miscellaneous licence | | Two LM6000PF dual-fuel turbines | | 80MW |
Aluminium | | | | | | | | |
Gladstone power station (42%) | | Gladstone, Queensland, Australia | | 100% freehold | | Thermal power station | | 1,680MW |
Gove power station | | Nhulunbuy, Northern Territory, Australia | | 100% leasehold | | Diesel generation | | 24MW |
Kemano power station | | Kemano, British Columbia, Canada | | 100% freehold | | Hydroelectric power | | 872.5MW |
Quebec power stations | | Saguenay, Quebec, Canada (Chute-à-Caron,Chute-à-la- Savane,Chute-des-Passes,Chute-du-Diable, Isle-Maligne, Shipshaw) | | 100% freehold
(certain facilities leased from Quebec Government until 2058 pursuant to Peribonka Lease) | | Hydroelectric power | | 3,147MW |
Yarwun alumina refineryco-generation plant | | Gladstone, Queensland, Australia | | 100% freehold | | Gas turbine and heat recovery steam generator | | 160MW |
Weipa power stations and solar generation facility | | Lorim Point, Andoom, and Weipa | | 100% leasehold | | Diesel generation supplemented by solar generation facility | | 38MW |
| | | | |
| 242 | | riotinto.com | | 2016 Annual report |
| | | | | | | | |
| Power plant | | Location | | Title/lease | | Plant type/product | | Capacity as of
31 December 2016
(based on 100%
ownership) |
Copper & Diamonds | | | | | | | | |
Kennecott Utah Copper Power Stations | | Salt Lake City, Utah, US | | 100% freehold | | Thermal power station Steam turbine running off waste heat boilers at the copper smelter | | 175MW 31.8MW |
| | | | | | Combined heat and power plant supplying steam to the copper refinery | | 6.2MW |
Energy & Minerals | | | | | | | | |
Boronco-generation plant | | Boron, California, US | | 100% freehold | | Co-generation uses natural gas to generate steam and electricity, used to run Boron’s refining operations | | 48MW |
Energy Resources of Australia (Rio Tinto: 68.4%) | | Ranger Mine, Jabiru, Northern Territory, Australia | | Lease | | Five diesel generator sets rated at 5.1MW; one diesel generator set rated at 1.9MW; four diesel generator sets rated at 2MW | | 35.4MW |
IOC power station | | Sept Îles, Quebec, Canada | | Statutory grant | | Hydroelectric power | | 22MW |
| | | | |
| 2016 Annual report | | riotinto.com | | 243 |
| | | | | | | | | | | | | | | | |
| | | | | | | | | |
| STRATEGIC REPORT | | | | DIRECTORS’ REPORT | | | | FINANCIAL STATEMENTS | | | | PRODUCTION, RESERVES AND OPERATIONS MINES AND PRODUCTION FACILITIES | | | | ADDITIONAL INFORMATION |
Shareholder information
Organisational structure
The Rio Tinto Group consists of Rio Tinto plc, which is registered in England and Wales under company number 719885 under the UK Companies Act 2006, and is listed on the London Stock Exchange, and Rio Tinto Limited, which is registered in Australia under ABN 96 004 458 404 under the Australian Corporations Act 2001, and is listed on the Australian Securities Exchange.
Rio Tinto is headquartered in London and has a corporate office in Melbourne.
Rio Tinto plc has a sponsored ADR facility and the underlying shares are registered with the US Securities and Exchange Commission and are listed on the New York Stock Exchange.
Nomenclature and financial data
Rio Tinto plc and Rio Tinto Limited operate together and are referred to in this report as Rio Tinto, the Rio Tinto Group or, more simply, the Group. These collective expressions are used for convenience only, since both Companies, and the individual companies in which they directly or indirectly own investments, are separate and distinct legal entities. “Limited”, “plc”, “Pty”, “Inc.”, “Limitada”, “L.L.C.”, “A.S.” or “SA” have generally been omitted from Group company names, except to distinguish between Rio Tinto plc and Rio Tinto Limited. Financial data in US dollars (US$) is derived from, and should be read in conjunction with, the 2016 financial statements. In general, financial data in pounds sterling (£) and Australian dollars (A$) have been translated from the consolidated financial statements and have been provided solely for convenience; exceptions arise where data can be extracted directly from source records. Certain key information has been provided in all three currencies in the 2016 financial statements.
History
Rio Tinto plc was incorporated on 30 March 1962 (then called The Rio Tinto-Zinc Corporation Limited (RTZ)) and was formed by the merger of The Rio Tinto Company Limited and The Consolidated Zinc Corporation Limited. The Rio Tinto Company was incorporated in 1873 to reopen ancient copper workings in Spain. The Consolidated Zinc Corporation Limited’s origins trace back to the Australian mining industry in the early twentieth century. Operating out of Broken Hill in New South Wales, it came to prominence with the mining of silver, lead and zinc deposits and later expanded into lead and zinc smelting.
Rio Tinto Limited was incorporated on 17 December 1959 (then called The Rio Tinto Mining Company of Australia Limited) and in 1962 the Australian interests of The Consolidated Zinc Corporation Limited and The Rio Tinto Company Limited were merged to form Conzinc Riotinto of Australia Limited as a limited liability company under the laws of the State of Victoria, Australia. In 1980, Conzinc
Riotinto of Australia Limited changed its name to CRA Limited.
Between 1962 and 1995, both RTZ and CRA discovered important mineral deposits, developed major mining projects and also grew through acquisition.
RTZ and CRA began operating in 1995 through a dual listed companies structure. In 1997, RTZ became Rio Tinto plc and CRA became Rio Tinto Limited.
Dual listed companies structure
In 1995, Rio Tinto shareholders approved the terms of the dual listed companies merger (the DLC structure) which was designed to place the shareholders of both Companies in substantially the same position as if they held shares in a single entity owning all of the assets of both Companies.
Following the approval of the DLC structure, both Companies entered into a DLC Merger Sharing Agreement (the Sharing Agreement) through which each Company agreed to ensure that the businesses of Rio Tinto plc and Rio Tinto Limited are managed on a unified basis, to ensure that the boards of directors of each Company are the same, and to give effect to certain arrangements designed to provide shareholders of each Company with a common economic interest in the DLC structure.
In order to achieve this third objective, the Sharing Agreement provided for the ratio of dividend, voting and capital distribution rights attached to each Rio Tinto plc share and to each Rio Tinto Limited share to be fixed in an Equalisation Ratio which has remained unchanged at 1:1. The Sharing Agreement has provided for this ratio to be revised in special circumstances where, for example, certain modifications are made to the share capital of one Company, such as rights issues, bonus issues, share splits and share consolidations, but not to the share capital of the other. Outside these specified circumstances, the Equalisation Ratio can only be altered with the approval of shareholders under the Class Rights Action approval procedure described under Voting rights below. In addition, any adjustments are required to be confirmed by the Group’s external auditors.
Consistent with the creation of the DLC structure, directors of each Company seek to act in the best interests of Rio Tinto as a whole. The Class Rights Action approval procedure is intended to deal with instances where there may be a conflict of interest between the shareholders of each Company.
To ensure that the boards of both Companies are identical, resolutions to appoint or remove directors must be put to shareholders of both Companies as a joint electorate (as Joint Decisions as described under Voting rights). It is a requirement of the constitution of each Company that a person can only be a director of one Company if that person is also a director of the other Company. So, for example, if a
person was removed as a director of Rio Tinto plc, he or she would also cease to be a director of Rio Tinto Limited.
One consequence of the DLC merger is that Rio Tinto is subject to a wide range of laws, rules and regulatory review across multiple jurisdictions. Where these rules differ, Rio Tinto will comply at a minimum with the requirements in each jurisdiction.
Dividend arrangements
The Sharing Agreement provides for dividends paid on Rio Tinto plc and Rio Tinto Limited shares to be equalised on a net cash basis, that is without taking into account any associated tax credits. Dividends are determined in US dollars and are then, except for ADR holders, translated and paid in sterling and Australian dollars. The Companies are also required to announce and pay their dividends and other distributions as close in time to each other as possible.
In the unlikely event that one Company did not have sufficient distributable reserves to pay the equalised dividend or the equalised capital distribution, it would be entitled to receive atop-up payment from the other relevant Company. Thetop-up payment could be made as a dividend on the DLC Dividend Share, or by way of a contractual payment.
If the payment of an equalised dividend would contravene the law applicable to one of the Companies they may depart from the Equalisation Ratio. However, should such a departure occur, the relevant Company will put aside reserves to be held for payment on the relevant shares at a later date.
Rio Tinto shareholders have no direct rights to enforce the dividend equalisation provisions of the Sharing Agreement.
The DLC Dividend Shares can also be utilised to provide the Group with flexibility for internal funds management by allowing dividends to be paid between the Companies and their subsidiaries.
Voting arrangements
In principle, the Sharing Agreement provides for the shareholders of Rio Tinto plc and Rio Tinto Limited to vote as a joint electorate on all matters which affect shareholders of both Companies in similar ways. These are referred to as Joint Decisions. Such Joint Decisions include the creation of new classes of share capital, the appointment or removal of directors and auditors and the receiving of the annual financial statements. All shareholder resolutions including Joint Decisions are voted on a poll.
The Sharing Agreement also provides for the protection of shareholders of each Company by requiring their separate approval for decisions that do not affect the shareholders of both Companies equally. Matters requiring this approval procedure are referred to as Class Rights Actions and are voted on a poll. For example, fundamental elements of the DLC
| | | | |
| 244 | | riotinto.com | | 2016 Annual report |
structure cannot be changed unless approved separately by shareholders of both Companies under the Class Rights Action approval procedure.
Exceptions to these principles can arise in situations such as where legislation requires the separate approval of a decision by the appropriate majority of shareholders in one Company, and approval of the matter by shareholders of the other Company is not required.
Where a matter has been expressly categorised as either a Joint Decision or a Class Rights Action, the directors do not have the power to change that categorisation. If a matter falls within both categories, it is treated as a Class Rights Action. In addition, the directors can determine that matters not expressly listed in either category should be put to shareholders for their approval under either procedure.
To facilitate the joint voting arrangements, each Company has entered into shareholder voting agreements. Each Company has issued a Special Voting Share to a special purpose company held in trust for shareholders by a common Trustee.
Rio Tinto plc has issued its Special Voting Share (RTP Special Voting Share) to RTL Shareholder SVC and Rio Tinto Limited has issued its Special Voting Share (RTL Special Voting Share) to RTP Shareholder SVC. The total number of votes cast on Joint Decisions by the shareholders of one Company are voted at the parallel meeting of the other Company. The role of these special purpose companies in achieving this is described below.
In exceptional circumstances, certain shareholders of the Companies can be excluded from voting at the respective Company’s general meetings because they have acquired shares in one Company in excess of a given threshold without making an offer for all the shares in the other Company. If this should occur, the votes cast by these excluded shareholders will be disregarded.
Following the Companies’ general meetings the overall results of the voting are announced to the stock exchanges, to the media and published on the Rio Tinto website.
At a Rio Tinto plc shareholders’ meeting at which a Joint Decision is considered, each Rio Tinto plc share carries one vote and the holder of its Special Voting Share has one vote for each vote cast by the public shareholders of Rio Tinto Limited in their parallel meeting. The holder of the Special Voting Share is required to vote strictly, and only, in accordance with the votes cast by public shareholders for and against the equivalent resolution at the parallel Rio Tinto Limited shareholders’ meeting.
The holders of Rio Tinto Limited ordinary shares do not actually hold any voting shares in Rio Tinto plc by virtue of their holding in
Rio Tinto Limited and cannot enforce the voting arrangements relating to the Special Voting Share.
At a Rio Tinto Limited shareholders’ meeting at which a Joint Decision is considered, each Rio Tinto Limited share carries one vote and the holder of its Special Voting Share will have one vote for each vote cast by the public shareholders of Rio Tinto plc in their parallel meeting. The holder of the Special Voting Share is required to vote strictly, and only, in accordance with the votes cast for and against the equivalent resolution at the parallel Rio Tinto plc shareholders’ meeting.
The holders of Rio Tinto plc ordinary shares do not actually hold any voting shares in Rio Tinto Limited by virtue of their holding in Rio Tinto plc and cannot enforce the voting arrangements relating to the Special Voting Share.
Capital distribution arrangements
If either of the Companies goes into liquidation, the Sharing Agreement provides for a valuation to be made of the surplus assets of both Companies. If the surplus assets available for distribution by one Company on each of the shares held by its shareholders exceed the surplus assets available for distribution by the other Company on each of the shares held by its shareholders, then an equalising payment between the two Companies shall be made, to the extent permitted by applicable law, such that the amount available for distribution on each share held by shareholders of each Company conforms to the Equalisation Ratio. The objective is to ensure that the shareholders of both Companies have equivalent entitlements to the assets of the combined Group on a per share basis, taking account of the Equalisation Ratio.
The Sharing Agreement does not grant any enforceable rights to the shareholders of either Company upon liquidation of a Company.
Limitations on ownership of shares and merger obligations
The laws and regulations of the UK and Australia impose restrictions and obligations on persons who control interests in publicly listed companies in excess of defined thresholds that, under certain circumstances, include obligations to make a public offer for all of the outstanding issued shares of the relevant company. The threshold applicable to Rio Tinto plc under UK law and regulations is 30 per cent and to Rio Tinto Limited under Australian law and regulations is 20 per cent (on a standalone basis or, taking into account only Rio Tinto plc interests, on a Joint Decision basis).
As part of the DLC merger, the Articles of Association of Rio Tinto plc and the Constitution of Rio Tinto Limited were amended with the intention of extending these laws and regulations to the combined enterprise and, in particular, to ensure that a
person cannot exercise control over one Company without having made offers to the public shareholders of both Companies.
It is consistent with the creation of the single economic enterprise, and the equal treatment of the two sets of shareholders, that these laws and regulations should operate in this way. The Articles of Association of Rio Tinto plc and the Constitution of Rio Tinto Limited impose restrictions on any person who controls, directly or indirectly, 20 per cent or more of the votes on a Joint Decision. If, however, such a person only has an interest in either Rio Tinto Limited or Rio Tinto plc, the restrictions will only apply if they control, directly or indirectly, 30 per cent or more of the votes at that Company’s general meetings.
If one of the thresholds specified above is breached, subject to certain limited exceptions and notification by the relevant Company, such persons may not attend or vote at general meetings of the relevant Company, may not receive dividends or other distributions from the relevant Company and may be divested of their interest by the directors of the relevant Company. These restrictions continue to apply until such persons have either made a public offer for all of the publicly held shares of the other Company, or have reduced their controlling interest below the thresholds specified, or have acquired through a permitted means at least 50 per cent of the publicly held shares of each Company.
These provisions are designed to ensure that offers for the publicly held shares of both Companies would be required in order to avoid the restrictions set out above, even if the interests which breach the thresholds are only held in one of the Companies. The directors do not have the discretion to exempt a person from the operation of these rules.
Under the Sharing Agreement, the Companies agree toco-operate to enforce the above restrictions contained in their Articles of Association and Constitution.
Guarantees
In 1995 each Company entered into a Deed Poll Guarantee in favour of creditors of the other Company. Pursuant to the Deed Poll Guarantees, each Company guaranteed the contractual obligations of the other Company and the obligations of other persons which are guaranteed by the other Company, subject to certain limited exceptions. Beneficiaries under the Deed Poll Guarantees may make demands upon the guarantor thereunder without first having recourse to the Company or persons whose obligations are being guaranteed. The obligations of the guarantor under each Deed Poll Guarantee expire upon termination of the Sharing Agreement and under other limited circumstances, but only in respect of obligations arising after such termination and, in the case of other limited circumstances, the publication and expiry of due notice. The shareholders of the Companies cannot enforce
| | | | |
| 2016 Annual report | | riotinto.com | | 245 |
| | | | | | | | | | | | | | | | |
| | | | | | | | | |
| STRATEGIC REPORT | | | | DIRECTORS’ REPORT | | | | FINANCIAL STATEMENTS | | | | PRODUCTION, RESERVES AND OPERATIONS | | | | ADDITIONAL INFORMATION SHAREHOLDER INFORMATION |
Shareholder information
continued
the provisions of the Deed Poll Guarantees in relation to their interest in the shares of the other Company.
Markets
Rio Tinto plc
The principal market for Rio Tinto plc shares is the London Stock Exchange with the shares trading through the Stock Exchange Electronic Trading Service (SETS) system.
Rio Tinto plc American depositary receipts are listed on the New York Stock Exchange. Further details relating to Rio Tinto plc American depositary receipts are available in Rio Tinto’s Annual report on Form20-F.
Rio Tinto Limited
Rio Tinto Limited shares are listed on the Australian Securities Exchange (ASX).
The ASX is the principal trading market for Rio Tinto Limited shares. The ASX is a national stock exchange with an automated trading system.
Share ownership
Substantial shareholders
Under the UK Disclosure and Transparency Rules and the Australian Corporations Act, any shareholder of Rio Tinto plc with voting rights of three per cent or more, or any person with voting power of five per cent or more in Rio Tinto Limited, is required to provide the relevant companies with notice.
The shareholders who have provided such, or an equivalent, notice as of 17 February 2017 are:
| | | | | | | | | | | | |
| Rio Tinto plc | | Date of notice | | | Number of shares | | | Percentage of
issued share
capital | |
| BlackRock, Inc. | | | 4 Dec 2009 | | | | 127,744,871 | | | | 8.38 | |
| The Capital Group Companies, Inc. | | | 21 Jan 2014 | | | | 57,950,440 | | | | 4.10 | |
| The Capital Group Companies, Inc. | | | 3 Apr 2014 | | | | 55,307,243 | | | | 3.91 | |
| The Capital Group Companies, Inc. | | | 24 Feb 2015 | | | | 56,647,518 | | | | 4.01 | |
| The Capital Group Companies, Inc. | | | 17 Sep 2015 | | | | 54,763,331 | | | | 3.93 | |
| The Capital Group Companies, Inc. | | | 9 Oct 2015 | | | | 55,867,795 | | | | 4.02 | |
| Shining Prospect Pte. Ltd | | | 26 Jan 2016 | | | | 182,550,329 | | | | 13.10 | |
| Rio Tinto Limited | | | | | | | | | | | | |
| Shining Prospect Pte. Ltd | | | 10 Jun 2009 | | | | See footnote (a) | | | | See footnote (a) | |
| BlackRock, Inc. | | | 24 Mar 2015 | | | | 22,161,984 | | | | 5.13 | |
| BlackRock, Inc. | | | 13 Apr 2015 | | | | See footnote (b) | | | | See footnote (b) | |
| BlackRock, Inc. | | | 30 Oct 2015 | | | | See footnote (c) | | | | See footnote (c) | |
| BlackRock, Inc. | | | 14 Apr 2016 | | | | 21,479,771 | | | | 5.06 | |
| BlackRock, Inc. | | | 11 Oct 2016 | | | | 26,656,003 | | | | 6.28 | |
| (a) | In its substantial holding notice filed on 10 June 2009 Shining Prospect Pte. Ltd, a Singapore-based entity owned by Chinalco (Aluminium Corporation of China) disclosed a holding of 182,550,329 Rio Tinto plc shares which, at that time, through the operation of the Australian Corporations Act as modified, gave these entities and their associates voting power of 9.3 per cent in the Rio Tinto Group on a Joint Decision matter, making them substantial shareholders of Rio Tinto Limited, as well as of Rio Tinto plc. Rio Tinto plc has subsequently, by notice dated 26 January 2016, disclosed that Shining Prospect Pte. Ltd’s holding of 182,550,329 Rio Tinto plc shares gave these entities and their associates voting power of 13.1 per cent in Rio Tinto plc, which in turn would give these entities and their associates voting power of 10.1 per cent in the Rio Tinto Group on a Joint Decision Matter. |
| (b) | In its substantial holding notice filed on 13 April 2015, BlackRock, Inc. and its associates disclosed a holding of 120,174,604 shares in Rio Tinto plc and 22,330,443 shares in Rio Tinto Limited. Through the operation of the Australian Corporations Act as modified, these interests gave BlackRock, Inc. and its associates voting power of 7.7 per cent in the Rio Tinto Group on a Joint Decision matter, making them substantial shareholders of Rio Tinto Limited, as well as of Rio Tinto plc. |
| (c) | By subsequent notice dated 30 October 2015, BlackRock, Inc. and its associates disclosed that they no longer held a relevant interest in five per cent or more of Rio Tinto Limited’s issued capital. |
As far as is known, Rio Tinto plc and Rio Tinto Limited are not directly or indirectly owned or controlled by another corporation or by any government or natural person. Rio Tinto is not aware of any arrangement which may result in a change in control of Rio Tinto plc or Rio Tinto Limited. No shareholder possesses voting rights that differ from those attaching to Rio Tinto plc’s and Rio Tinto Limited’s securities.
As of 17 February 2017, the total amount of the Group’s voting securities owned by the directors and executives in Rio Tinto plc was 138,478 ordinary shares of 10p each or ADRs and in Rio Tinto Limited was 69,803 ordinary shares, in aggregate representing less than one per cent of the Group’s total number of ordinary shares in issue.
| | | | |
| 246 | | riotinto.com | | 2016 Annual report |
Analysis of ordinary shareholders
| | | | | | | | | | | | | | | | | | | | | | | | | | | | | | | | |
| | | | | | | | | Rio Tinto plc | | | | | | | | | Rio Tinto Limited | |
| As at 17 February 2017 | | No. of
accounts | | | % | | | Shares | | | % | | | No. of
accounts | | | % | | | Shares | | | % | |
| 1 to 1,000 shares | | | 26,624 | | | | 75.85 | | | | 8,381,754 | | | | 0.61 | | | | 142,306 | | | | 83.50 | | | | 41,780,964 | | | | 9.85 | |
| 1,001 to 5,000 shares | | | 6,428 | | | | 18.31 | | | | 12,719,441 | | | | 0.92 | | | | 25,145 | | | | 14.75 | | | | 50,213,627 | | | | 11.84 | |
| 5,001 to 10,000 shares | | | 613 | | | | 1.75 | | | | 4,225,447 | | | | 0.31 | | | | 1,985 | | | | 1.16 | | | | 13,725,250 | | | | 3.24 | |
| 10,001 to 25,000 shares | | | 385 | | | | 1.10 | | | | 6,115,005 | | | | 0.44 | | | | 775 | | | | 0.45 | | | | 11,326,081 | | | | 2.67 | |
| 25,001 to 125,000 shares | | | 472 | | | | 1.35 | | | | 28,838,811 | | | | 2.08 | | | | 161 | | | | 0.09 | | | | 7,251,727 | | | | 1.71 | |
| 125,001 to 250,000 shares | | | 172 | | | | 0.49 | | | | 30,472,643 | | | | 2.20 | | | | 18 | | | | 0.01 | | | | 3,285,940 | | | | 0.77 | |
| 250,001 to 1,250,000 shares | | | 273 | | | | 0.78 | | | | 159,118,553 | | | | 11.49 | | | | 30 | | | | 0.02 | | | | 13,987,010 | | | | 3.30 | |
| 1,250,001 to 2,500,000 shares | | | 60 | | | | 0.17 | | | | 108,287,834 | | | | 7.82 | | | | 2 | | | | 0.00 | | | | 4,460,496 | | | | 1.05 | |
| 2,500,001 shares and over(a) | | | 75 | | | | 0.21 | | | | 1,026,366,048 | (b) | | | 74.13 | | | | 11 | | | | 0.01 | | | | 278,161,317 | | | | 65.57 | |
| | | | | | | | | | | | 1,384,525,536 | (c) | | | 100.00 | | | | | | | | | | | | 424,192,412 | (d) | | | 100.00 | |
| | | | | | | | | | | | | | | | | | | | | | | | | | | | | | | | | |
| Number of holdings less than marketable parcel of A$500 | | | | | | | | | | | | | | | | | | | 3,830 | | | | | | | | | | | | | |
| (a) | Excludes shares held in Treasury. |
| (b) | This includes 117,122,918 shares held in the name of a nominee on the share register. The shares are listed on the NYSE in the form of American Depositary Receipts (ADRs). |
| (c) | The total issued share capital is made up of 1,384,525,536 publicly held shares; of which 9,607,891 shares are held in Treasury. |
| (d) | Publicly held shares in Rio Tinto Limited. |
Twenty largest registered shareholders
In accordance with the ASX Listing Rules, below are the names of the 20 largest registered holders of Rio Tinto Limited shares and the number of shares and the percentage of issued capital each holds as of 17 February 2017:
| | | | | | | | |
| Rio Tinto Limited | | Number of
shares | | | Percentage of
issued share
capital | |
| HSBC Custody Nominees (Australia) Limited | | | 121,820,095 | | | | 28.72 | |
| J. P. Morgan Nominees Australia Limited | | | 71,864,782 | | | | 16.94 | |
| Citicorp Nominees Pty Ltd | | | 24,176,758 | | | | 5.70 | |
| National Nominees Limited | | | 21,941,431 | | | | 5.17 | |
| BNP Paribas Noms Pty Ltd (Agency Lending DRP A/C) | | | 14,204,180 | | | | 3.35 | |
| Citicorp Nominees Pty Limited (Colonial First State Inv A/C) | | | 7,505,389 | | | | 1.77 | |
| BNP Paribas Noms Pty Ltd (DRP) | | | 6,446,083 | | | | 1.52 | |
| Australian Foundation Investment Company Limited | | | 4,031,753 | | | | 0.95 | |
| Australian Mutual Provident Society | | | 3,493,185 | | | | 0.82 | |
| HSBC Custody Nominees (Australia) Limited(NT-Comnwlth Super Corp A/C) | | | 3,061,456 | | | | 0.72 | |
| Argo Investments Limited | | | 2,445,739 | | | | 0.58 | |
| RBC Global Services Australia Nominees Pty Ltd | | | 2,353,866 | | | | 0.55 | |
| Computershare Trustees Jey Ltd (RE 3000086 A/C) | | | 2,014,757 | | | | 0.47 | |
| UBS Nominees Pty Ltd | | | 948,027 | | | | 0.22 | |
| HKBA Nominees Limited | | | 709,213 | | | | 0.17 | |
| BNP Paribas Noms (NZ) Ltd (DRP) | | | 676,457 | | | | 0.16 | |
| Computershare Trustees Jey Ltd (RE 3000091 A/C) | | | 659,764 | | | | 0.16 | |
| Navigator Australia Ltd (MLC Investment Sett A/C) | | | 623,970 | | | | 0.15 | |
| CGU Insurance | | | 590,308 | | | | 0.14 | |
| The Senior Master of the Supreme Court (Common Fund No.3 A/C) | | | 586,563 | | | | 0.14 | |
| | | | |
| 2016 Annual report | | riotinto.com | | 247 |
| | | | | | | | | | | | | | | | |
| | | | | | | | | |
| STRATEGIC REPORT | | | | DIRECTORS’ REPORT | | | | FINANCIAL STATEMENTS | | | | PRODUCTION, RESERVES AND OPERATIONS | | | | ADDITIONAL INFORMATION SHAREHOLDER INFORMATION |
Shareholder information
continued
Dividends
Both Companies have paid dividends on their ordinary shares every year since incorporation in 1962. The process by which Rio Tinto shareholders receive dividends is explained under the description of the DLC structure on page 244.
Dividend policy
The dividend policy adopted by the Board in February 2016 provides that at the end of each financial period, the board will determine an appropriate total level of ordinary dividend per share, taking into account the results for the financial year, the outlook for our major commodities, the board’s view of the long-term growth prospects of the business and the Company’s objective of maintaining a strong balance sheet. The intention is that the balance between the interim and final dividend is weighted to the final dividend.
The board expects total cash returns to shareholders over the longer term to be in a range of 40 to 60 per cent of underlying earnings in aggregate through the cycle.
The board is committed to maintaining an appropriate balance between cash returns to shareholders and investment in the business, with the intention of maximising shareholder value.
Acknowledging the cyclical nature of the industry, in periods of strong earnings and cash generation, it is the board’s intention to supplement the ordinary dividends with additional returns to shareholders.
Dividend determination
The majority of our sales are transacted in US dollars, making this the most appropriate measure for our global business performance. It is our main reporting currency and, consequently, the natural currency for dividend determination. Dividends determined in US dollars are translated at exchange rates prevailing two days prior to the declaration and payable in sterling by Rio Tinto plc and in Australian dollars by Rio Tinto Limited.
On request, shareholders of Rio Tinto plc can elect to receive dividends in Australian dollars and Rio Tinto Limited shareholders can elect to receive dividends in pounds sterling. If such an election is made, the dividend amounts received will be calculated by converting the declared dividend using the exchange rates applicable to sterling and Australian dollars – five days prior to the dividend payment date.
Shareholders who wish to receive their dividends in any other currencies should contact the Companies’ share registrars, who offer payment services in other currencies, subject to a fee.
2016 dividends
The 2016 interim and final dividends were determined at 45 US cents and at 125 US cents per share respectively and the applicable conversion rates for the interim and final dividend were US$1.33135 and US$1.2365 to the pound sterling and US$0.76105 and
US$0.7611 to the Australian dollar respectively. For those Rio Tinto plc shareholders who elected to receive their interim dividend in Australian dollars the applicable conversion rate was A$1.75850 to the pound sterling and for Rio Tinto Limited shareholders who elected to receive their dividend in sterling the applicable conversion rate was £0.56867 to the Australian dollar.
Final dividends of 100.56 pence or 163.62 Australian cents per share will be paid on 6 April 2017. For those Rio Tinto plc shareholders requesting the 2016 final dividend be paid in Australian dollars, those holders of Rio Tinto plc ADRs (each representing one share) and those Rio Tinto Limited shareholders requesting the 2016 final dividend be paid in pounds sterling, the applicable conversion rates will be determined on 30 March 2017.
Dividend reinvestment plan (DRP)
Rio Tinto offers a DRP to registered shareholders, which provides the opportunity to use cash dividends to purchase Rio Tinto shares in the market.
Material contracts
Articles of Association and Constitution, and DLC Sharing Agreement
As explained on pages 244 to 245. under the terms of the DLC structure the shareholders of Rio Tinto plc and of Rio Tinto Limited entered into certain contractual arrangements which are designed to place the shareholders of both Companies in substantially the same position as if they held shares in a single entity which owned all of the assets of both Companies. Generally, and as far as is permitted by the UK Companies Act and the Australian Corporations Act and ASX Listing Rules, this principle is reflected in the Articles of Association of Rio Tinto plc and in the Constitution of Rio Tinto Limited. The summaries below include descriptions of material rights of the shareholders of both Rio Tinto plc and Rio Tinto Limited.
Objects
At the 2009 annual general meetings, shareholders of Rio Tinto plc and Rio Tinto Limited approved amendments to the constitutional documents whereby the object clauses were removed to allow the Companies to have the widest possible scope of activities.
Directors
Under Rio Tinto plc’s Articles of Association, a director may not vote in respect of any proposal in which he or she, or any other person connected with him or her, has any interest, other than by virtue of his or her interests in shares or debentures or other securities of, or otherwise in or through, the Company, except in certain prescribed circumstances, including in respect of resolutions:
| – | | indemnifying him or her or a third party in respect of obligations incurred by the |
| | director on behalf of, or for the benefit of, the Company, or in respect of obligations of the Company, for which the director has assumed responsibility under an indemnity, security or guarantee; |
| – | | relating to an offer of securities in which he or she may be interested as a holder of securities or as an underwriter; |
| – | | concerning another body corporate in which the director is beneficially interested in less than one per cent of the issued shares of any class of shares of such a body corporate; |
| – | | relating to an employee benefit in which the director will share equally with other employees; |
| – | | relating to liability insurance that the Company is empowered to purchase for the benefit of directors of the Company in respect of actions undertaken as directors (or officers) of the Company; and |
| – | | concerning the giving of indemnities in favour of directors or the funding of expenditure by directors to defend criminal, civil or regulatory proceedings or actions against a director. |
Under Rio Tinto Limited’s Constitution, except where a director is constrained by Australian law, a director may be present at a meeting of the board while a matter in which the director has a material personal interest is being considered and may vote in respect of that matter.
The directors are empowered to exercise all the powers of the Companies to borrow money, to charge any property or business of the Companies or all, or any, of their uncalled capital and to issue debentures or give any other security for a debt, liability or obligation of the Companies or of any other person. The directors shall restrict the borrowings of Rio Tinto plc to the limitation that the aggregate amount of all moneys borrowed by the Company and its subsidiaries shall not exceed an amount equal to one and one half times the Companies’ share capital plus aggregate reserves unless sanctioned by an ordinary resolution of the Company.
Directors are not required to hold any shares of either Company by way of qualification. The Remuneration Report on pages 67 to 107 provides information on shareholding policies relating to executive andnon-executive directors. Please refer to the Corporate governance section on pages 55 to 56 for information on the appointment of directors.
Rights attaching to shares
Under English law, dividends on shares may only be paid out of profits available for distribution, as determined in accordance with generally accepted accounting principles and by the relevant law. Shareholders are entitled to receive such dividends as may be declared by the directors. The directors may also pay shareholders such interim dividends as appear to them to be justified by the financial position of the Group.
| | | | |
| 248 | | riotinto.com | | 2016 Annual report |
Under the Australian Corporations Act, dividends on shares may only be paid if the company’s assets exceed its liabilities immediately before the dividend is declared and the excess is sufficient for the payment of the dividend, the payment of the dividend is fair and reasonable to the Company’s shareholders as a whole, and the payment of the dividend does not materially prejudice the Company’s ability to pay its creditors. Any Rio Tinto plc dividend unclaimed after 12 years from the date the dividend was declared, or became due for payment, will be forfeited and returned to the Company. Any Rio Tinto Limited dividend unclaimed may be invested or otherwise used by the board for the benefit of the Company until claimed or otherwise disposed of according to Australian law. Rio Tinto Limited is governed by Victorian unclaimed monies legislation, which requires the Company to pay to the State Revenue Office any unclaimed dividend payments of A$20 or more that at 1 March each year have remained unclaimed for over 12 months.
Voting
Voting at any general meeting of shareholders on a resolution on which the holder of the Special Voting Share is entitled to vote shall be decided by a poll, and any other resolution shall be decided by a show of hands unless a poll has been duly demanded. On a show of hands, every shareholder who is present in person or by proxy or other duly authorised representative and is entitled to vote has one vote regardless of the number of shares held. The holder of the Special Voting Share is not entitled to vote on a show of hands. On a poll, every shareholder who is present in person or by proxy or other duly authorised representative and is entitled to vote has one vote for every ordinary share for which he or she is the holder and, in the case of Joint Decisions, the holder of the Special Voting Share has one vote for each vote cast in respect of the publicly held shares of the other Company.
A poll may be demanded by any of the following:
| – | | the chairman of the meeting; |
| – | | at least five shareholders entitled to vote on the resolution; |
| – | | any shareholder or shareholders representing in the aggregate not less than one tenth (Rio Tinto plc) or one 20th (Rio Tinto Limited) of the total voting rights of all shareholders entitled to vote on the resolution; |
| – | | any shareholder or shareholders holding Rio Tinto plc shares conferring a right to vote at the meeting on which there have beenpaid-up sums in the aggregate equal to not less than one tenth of the total sum paid up on all the shares conferring that right; or |
| – | | the holder of the Special Voting Share of either Company. |
A proxy form will be treated as giving the proxy the authority to demand a poll, or to join others in demanding one.
The necessary quorum for a Rio Tinto plc general meeting is three members present (in person or by proxy or other duly authorised representative) and entitled to vote, and for a Rio Tinto Limited general meeting is two members present (in person or by proxy or other duly authorised representative).
Matters are transacted at general meetings by the proposing and passing of resolutions as:
| – | | ordinary resolutions, which require the affirmative vote of a majority of the votes of those persons voting at a meeting at which there is a quorum, for example the election of directors; and |
| – | | special resolutions, which require the affirmative vote of not less thanthree-fourths of the persons voting at a meeting at which there is a quorum, for example amending the Articles of Association of Rio Tinto plc or the Constitution of Rio Tinto Limited. |
The Sharing Agreement further classifies resolutions as “Joint Decisions” and “Class Rights Actions” as explained under Voting arrangements on pages 244 and 245.
Annual general meetings must be convened with 21 days’ written notice for Rio Tinto plc and with 28 days’ notice for Rio Tinto Limited. In accordance with the authority granted by shareholders at the Rio Tinto plc annual general meeting in 2016, other meetings of Rio Tinto plc may be convened with 14 days’ written notice for the passing of a special resolution and with 14 days’ notice for any other resolution, depending on the nature of the business to be transacted. All meetings of Rio Tinto Limited require 28 days’ notice. In calculating the period of notice the days of delivery or receipt of the notice and the date of the meeting are not included. Among other things, the notice must specify the nature of the business to be transacted.
Variation of rights
If, at any time, the share capital is divided into different classes of shares, the rights attached to any class may be varied, subject to the provisions of the relevant legislation, with the consent in writing of holders of three-fourths in value of the shares of that class or upon the adoption of an extraordinary resolution passed at a separate meeting of the holders of the shares of that class. At every such separate meeting, all of the provisions of the Articles of Association and Constitution relating to proceedings at a general meeting apply, except that the quorum for Rio Tinto plc should be two or more persons who hold or represent by proxy not less thanone-third in nominal value of the issued shares of the class.
Rights upon awinding-up
Except as the shareholders have agreed or may otherwise agree, upon awinding-up, the balance of assets available for distribution:
| – | | after the payment of all creditors including certain preferential creditors, whether statutorily preferred creditors or normal creditors; and |
| – | | subject to any special rights attaching to any class of shares, |
is to be distributed among the holders of ordinary shares according to the amountspaid-up on the shares held by them. This distribution is generally to be made in cash. A liquidator may, however, upon the adoption of a special resolution of the shareholders, divide among the shareholders the whole or any part of the assets in specie or kind.
The Sharing Agreement further sets out further arrangements relating to the distribution of assets of each of the Companies in the event of a liquidation as explained on page 245.
Facility agreement
Details of the Group’s US$7.5 billionmulti-currency committed revolving credit facilities are set out in note 30 to the 2016 financial statements.
Exchange controls and foreign investment
Rio Tinto plc
There are no UK foreign exchange controls or other UK restrictions on the import or export of capital or on the payment of dividends tonon-resident holders of Rio Tinto plc shares or that materially affect the conduct of Rio Tinto plc’s operations. It should be noted, however, that various sanctions, laws, regulations or conventions may restrict the import or export of capital by, or the payment of dividends to,non-resident holders of Rio Tinto plc shares. There are no restrictions under Rio Tinto plc’s Articles of Association or under UK law that limit the right ofnon-resident owners to hold or vote Rio Tinto plc shares. However, certain of the provisions of the Australian Foreign Acquisitions and Takeovers Act 1975 described below also apply to the acquisition bynon-Australian persons of interests in securities of Rio Tinto plc.
Rio Tinto Limited
Under current Australian legislation, Australia does not impose general exchange or foreign currency controls. Subject to some specific requirements and restrictions, Australian and foreign currency may be freely brought into and sent out of Australia. There are requirements to report cash transfers in or out of Australia of A$10,000 or more. There is a prohibition on, or in some cases the specific prior approval of the Department of Foreign Affairs and Trade or Minister for Foreign Affairs
| | | | |
| 2016 Annual report | | riotinto.com | | 249 |
| | | | | | | | | | | | | | | | |
| | | | | | | | | |
| STRATEGIC REPORT | | | | DIRECTORS’ REPORT | | | | FINANCIAL STATEMENTS | | | | PRODUCTION, RESERVES AND OPERATIONS | | | | ADDITIONAL INFORMATION SHAREHOLDER INFORMATION |
Shareholder information
continued
must be obtained for, certain payments or other dealings connected with countries or parties identified with terrorism, or to whom United Nations or autonomous Australian sanctions apply. Sanction, anti-money laundering and counterterrorism laws may restrict or prohibit payments, transactions and dealings or require reporting of certain transactions.
Rio Tinto Limited may be required to deduct withholding tax from foreign remittances of dividends, to the extent that they are unfranked, and from payments of interest.
Acquisitions of interests in shares, and certain other equity instruments in Australian companies bynon-Australian (“foreign”) persons are subject to review and approval by the Treasurer of the Commonwealth of Australia under the Foreign Acquisitions and
Takeovers Act 1975 (the Takeovers Act). In broad terms, the Takeovers Act applies to acquisitions of interests in securities in an Australian entity by a foreign person where, as a result, a single foreign person (and any associate) would control 20 per cent or more of the voting power or potential voting power in the entity, or several foreign persons (and any associates) would control 40 per cent or more of the voting power or the potential voting power in the entity. The potential voting power in an entity is determined having regard to the voting shares in the entity that would be on issue if all rights (whether or not presently exercisable) to be issued voting shares in the entity were exercised. The Takeovers Act also applies to direct investments by foreign government investors, in certain circumstances regardless of the size of the investment. Persons who are proposing relevant
acquisitions or transactions may be required to provide notice to the Treasurer before proceeding with the acquisition or transaction. The Treasurer has the power to order divestment in cases where relevant acquisitions or transactions have already occurred, including where prior notice to the Treasurer was not required. The Takeovers Act does not affect the rights of owners whose interests are held in compliance with the legislation.
Limitations on voting and shareholding
Except for the provisions of the Takeovers Act, there are no limitations imposed by law, Rio Tinto plc’s Articles of Association or Rio Tinto Limited’s Constitution, on the rights ofnon-residents or foreigners to hold or vote the Group’s ordinary shares or ADRs that would not apply generally to all shareholders.
UK Listing Rules cross reference table
The following table contains cross references identifying the location of information required to be disclosed in the Annual report by the UK Listing Authority’s Listing Rule 9.8.4 R.
| | | | |
| Listing rule | | Description of Listing Rule | | Reference in Report |
| 9.8.4 (1) | | A statement of any interest capitalised by the Group during the year | | Note 8 Finance income and finance costs and note 17 Deferred taxation |
| 9.8.4 (2) | | Any information required by Listing Rule 9.2.18 R | | N/A |
| 9.8.4 (4) | | Details of any long-term incentive scheme as required by LR 9.4.3R | | N/A |
| 9.8.4 (5) | | Details of any arrangement under which a director has waived any emoluments | | N/A |
| 9.8.4 (6) | | Details of any arrangement under which a director has agreed to waive future emoluments | | N/A |
| 9.8.4 (7) | | Details of any allotments of shares by the company for cash not previously authorised by shareholders | | N/A |
| 9.8.4 (8) | | Details of any allotments of shares for cash by a major subsidiary of the company | | N/A |
| 9.8.4 (9) | | Details of the participation by the company in any placing made by its parent company | | N/A |
| 9.8.4 (10) | | Details of any contract of significance with the company in which a director has a material interest;
or a contract between the company and a controlling shareholder | | N/A |
| 9.8.4 (11) | | Details of any contract for the provision of services to the company by a controlling shareholder | | N/A |
| 9.8.4 (12) | | Details of any arrangement under which a shareholder has waived or agreed to waive any dividends | | Note 11 Dividends |
| 9.8.4 (13) | | Details of where a shareholder has agreed to waive future dividends | | N/A |
| 9.8.4 (14) | | Information required by LR 9.2.2AR (2)(a) | | N/A |
| | | | |
| 250 | | riotinto.com | | 2016 Annual report |
Financial calendar
| | | | |
| 2017 | | | | |
| 16 | | January | | Fourth quarter 2016 operations review (Sydney 17 January) |
| 8 | | February | | Announcement of unaudited results for 2016 |
| 22 | | February | | Rio Tinto Limited shares and Rio Tinto plc ADRs quoted“ex-dividend” for 2016 final dividend |
| 23 | | February | | Rio Tinto plc shares quoted“ex-dividend” for 2016 final dividend |
| 24 | | February | | Record date for 2016 final dividend for Rio Tinto plc and Rio Tinto Limited shares and Rio Tinto plc ADRs |
| 2 | | March | | Publication of 2016 Annual report,20-F and Notices of annual general meetings |
| 16 | | March | | Plan notice date for election under the dividend reinvestment plans and date for electing dividends paid in alternate currency for the 2016 final dividend |
| 30 | | March | | Dividend currency conversion date (Rio Tinto plc holders electing to receive Australian dollars and Rio Tinto Limited holders electing to receive pounds sterling) |
| 6 | | April | | Payment date for 2016 final dividend to holders of ordinary shares and ADRs |
| 12 | | April | | Annual general meeting for Rio Tinto plc, London |
| 19 | | April | | First quarter 2017 operations review (Sydney 20 April) |
| 4 | | May | | Annual general meeting for Rio Tinto Limited, Sydney |
| 17 | | July | | Second quarter 2017 operations review (Sydney 18 July) |
| 2 | | August | | Announcement of half year results for 2017 |
| 9 | | August | | Rio Tinto plc ADRs quoted“ex-dividend” for 2017 interim dividend |
| 10 | | August | | Rio Tinto plc shares and Rio Tinto Limited shares quoted“ex-dividend” for 2017 interim dividend |
| 11 | | August | | Record date for 2017 interim dividend for Rio Tinto plc and Rio Tinto Limited shares and Rio Tinto plc ADRs |
| 31 | | August | | Plan notice date for election under the dividend reinvestment plans and date for electing dividends paid in alternate currency for the 2017 interim dividend for Rio Tinto plc and Rio Tinto Limited |
| 14 | | September | | Dividend currency conversion date (Rio Tinto plc holders electing to receive Australian dollars and Rio Tinto Limited holders electing to receive pounds sterling) |
| 21 | | September | | Payment date for 2017 interim dividend to holders of ordinary shares and ADRs |
| 16 | | October | | Third quarter 2017 operations review (Sydney 17 October) |
| | | | |
| 2018 | | | | |
| January | | | | Fourth quarter 2017 operations review |
| February | | | | Announcement of unaudited results for 2017 |
| April | | | | Annual general meeting for Rio Tinto plc, London |
| April | | | | First quarter 2018 operations review |
| May | | | | Annual general meeting for Rio Tinto Limited, Melbourne |
| July | | | | Second quarter 2018 operations review |
| August | | | | Announcement of half year results for 2018 |
| October | | | | Third quarter 2018 operations review |
| | | | |
| 2016 Annual report | | riotinto.com | | 251 |
| | | | | | | | | | | | | | | | |
| | | | | | | | | |
| STRATEGIC REPORT | | | | DIRECTORS’ REPORT | | | | FINANCIAL STATEMENTS | | | | PRODUCTION, RESERVES AND OPERATIONS | | | | ADDITIONAL INFORMATION FINANCIAL CALENDAR |
Contact details
Registered offices
Rio Tinto plc
6 St James’s Square
London
SW1Y 4AD
Registered in England No. 719885
Telephone: +44 (0) 20 7781 2000
Website: riotinto.com
Rio Tinto Limited
Level 33
120 Collins Street
Melbourne
Victoria 3000
ABN 96 004 458 404
Telephone: +61 (0) 3 9283 3333
Fax: +61 (0) 3 9283 3707
Website: riotinto.com
Rio Tinto’s agent in the US is Cheree Finan, who may be contacted at
Rio Tinto Services Inc.
80 State Street
Albany, NY 12207-2543
Shareholders
Please refer to the Investor Centre of the respective registrar if you have any queries about your shareholding.
Rio Tinto plc
Computershare Investor Services PLC
The Pavilions
Bridgwater Road
Bristol
BS99 6ZZ
Telephone: +44 (0) 370 703 6364
Fax: +44 (0) 370 703 6119
UK residents only,
Freephone: 0800 435021
Website: computershare.com
Holders of Rio Tinto American Depositary Receipts (ADRs)
Please contact the ADR administrator if you have any queries about your ADRs.
ADR administrator
JPMorgan Chase & Co
PO Box 64504
St. Paul, MN 55164-0854
Telephone: +1 (651) 453 2128
US residents only, toll free general:
(800) 990 1135
US residents only, toll free Global invest direct: (800) 428 4267
Website: adr.com
Email: jpmorgan.adr@wellsfargo.com
Rio Tinto Limited
Computershare Investor Services
Pty Limited
GPO Box 2975
Melbourne
Victoria 3000
Telephone: +61 (0) 3 9415 5000
Fax: +61 (0) 3 9473 2500
Australian residents only, toll free:
1800 813 292
New Zealand residents only, toll free:
0800 450 740
Website: computershare.com
Former Alcan Inc. shareholders
Computershare Investor Services Inc.
8th Floor
100 University Avenue
Toronto, ON M5J 2Y1
Ontario
Telephone: +1 416 263 9200
North American residents only,
toll free: +1 (866)624-1341
Website: computershare.com
Investor Centre
Investor Centre is Computershare’s free, secure, self service website, where shareholders can manage their holdings online. The website enables shareholders to:
| – | | View payment and tax information |
| – | | Update payment instructions |
In addition, shareholders who register their email address on Investor Centre can be notified electronically of events such as annual general meetings, and can receive shareholder communications such as the Annual report or Notice of meeting electronically online.
Rio Tinto plc shareholders
Website: investorcentre.co.uk/riotinto
Rio Tinto Limited shareholders
Website: investorcentre.com/rio
| | | | |
| 252 | | riotinto.com | | 2016 Annual report |

Printed by Park Communications on FSC® certified paper. Park is an EMAS-certified company and its Environmental Management System is certified to ISO 14001. 100% of the inks used are vegetable oil based, 95% of press chemicals are recycled for further use and, on average 99% of any waste associated with this production will be recycled. This document is printed on Edixion Offset, a paper containing 100% Environmental Chlorine Free (ECF) virgin fibre sourced from well-managed, responsible, FSC® certified forests. Designed and produced by SampsonMay sampsonmay.com Typesetting and formatting by Donnelley Financial Solutions dfsco.com

RioTinto
Get more information online
Find out more about our business and performance:
riotinto.com
View our 2016 Annual report:
riotinto.com/ar2016
View our 2016 Sustainable development online report:
riotinto.com/sd2016