UNITED STATES
SECURITIES AND EXCHANGE COMMISSION
Washington, D.C. 20549
FORM N-CSR
CERTIFIED SHAREHOLDER REPORT OF REGISTERED
MANAGEMENT INVESTMENT COMPANIES
Investment Company Act file number: 811-06110
Western Asset Funds, Inc.
Name of Fund
| | |
| 385 East Colorado Boulevard Pasadena, CA | | 91101 |
| |
| (Address of principal executive offices) | | (Zip code) |
Richard M. Wachterman, Esq.
Legg Mason Wood Walker, Incorporated
100 Light Street
Baltimore, MD 21202.
(Name and address of agent for service)
Registrant’s telephone number, including area code: (410) 539-0000
Date of fiscal year end: March 31, 2004
Date of reporting period: March 31, 2004
Item 1 – Report to Shareholders

Portfolio Manager Commentary
and Annual Report to
Shareholders
March 31, 2004
Western Asset Funds, Inc.
Institutional and Financial Intermediary Classes
Western Asset Limited Duration Bond Portfolio
Western Asset Intermediate Bond Portfolio
Western Asset Core Bond Portfolio
Western Asset Core Plus Bond Portfolio
Western Asset Inflation Indexed Plus Bond Portfolio
Western Asset High Yield Portfolio
Western Asset Non-U.S. Opportunity Bond Portfolio
Contents
For more information, visit us on the web
at www.westernassetfunds.com.
Western Asset Funds, Inc.
Western Asset Limited Duration Bond Portfolio
Western Asset Intermediate Bond Portfolio
Western Asset Core Bond Portfolio
Western Asset Core Plus Bond Portfolio
Western Asset Inflation Indexed Plus Bond Portfolio
Western Asset High Yield Portfolio
Western Asset Non-U.S. Opportunity Bond Portfolio
Annual Report to Shareholders
March 31, 2004
Annual Report to Shareholders
MANAGEMENT’S DISCUSSION OF FUND PERFORMANCE
Western Asset Limited Duration Bond Portfolio
| | | | |
| | | Total Return |
| | |
| |
| | | First
Quarter 2004 | | Since
InceptionA |
|
Western Asset Limited Duration Bond Portfolio
Institutional Class | | +1.43% | | +1.69% |
|
Merrill Lynch 1-3 Year Treasury IndexB | | +1.00% | | +1.15% |
|
The impact of market conditions on the Fund’s performance was mixed for the 6-month period which began with its inception October 1, 2003, and ended March 31, 2004, since Treasury yields were mixed but on balance unchanged. With strategies producing generally positive results, the Fund’s total return of 1.69% (net of expenses) exceeded that of its benchmark, the Merrill Lynch 1-3 Year Treasury Index, which recorded a total return of 1.15%. The biggest positive for performance came from heavily underweighting the government sector in order to overweight the higher-yielding corporate, mortgage-backed securities, and asset-backed sectors during an environment in which spreads were generally unchanged to tighter. A moderate exposure to longer-maturity Treasury Inflation-Protected Securities (“TIPS”) also made a substantial contribution to returns as real yields declined. Duration and yield curve exposure had little impact on returns.
Western Asset Intermediate Bond Portfolio
| | | | | | | | | | |
| | | | | Average Annual Total Return |
| | | | |
| |
| | | First
Quarter 2004 | | One Year | | Three Years | | Five Years | | Since
InceptionC |
|
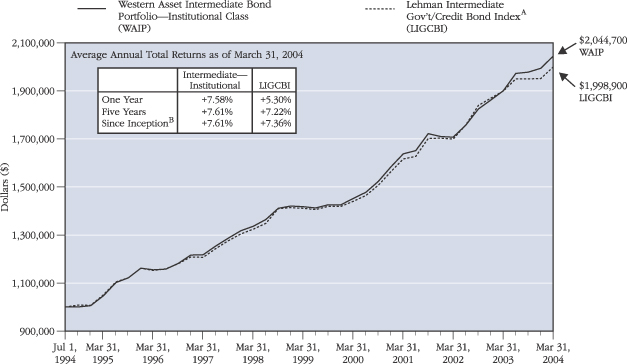
Western Asset Intermediate Bond Portfolio
Institutional Class | | +2.55% | | +7.58% | | +7.68% | | +7.61% | | +7.61% |
|
Lehman Intermediate Government/Credit Bond IndexD | | +2.47% | | +5.30% | | +7.36% | | +7.22% | | +7.36% |
|
The impact of market conditions on the Fund’s performance was mixed but generally positive for the year ended March 31, 2004. Short-term interest rates fell, but long-term rates rose modestly, while spreads on non-Treasury issues declined. With strategies producing generally positive results, the Fund’s total return of 7.58% (net of expenses) exceeded that of its benchmark, the Lehman Intermediate Government/Credit Bond Index, which recorded a total return of 5.30%. The biggest positive for performance came from a moderate overweighting to the corporate sector, with an emphasis on longer maturity, BBB rated securities. A moderate exposure to long-maturity Treasury Inflation-Protected Securities (“TIPS”) also made a substantial contribution to returns as real yields declined. A moderate exposure to the mortgage sector also added to performance as spreads tightened. The Fund’s barbelled exposure to maturities detracted from performance, suffering as the yield curve steepened.
| A | The Fund’s Institutional Class inception date is October 1, 2003. Index returns are for periods beginning September 30, 2003. |
| B | A subset of the Merrill Lynch Treasury Master Index, consisting of bonds with an outstanding par that is greater than or equal to $25 million and fixed rate coupons greater than 4.25%. The maturity range on these securities is from 1 to 3 years. It is not possible to invest in an index. |
| C | The Fund’s Institutional Class inception date is July 1, 1994. Index returns are for periods beginning June 30, 1994. |
| D | An index based on all publicly issued intermediate government and corporate debt securities with an average maturity of 4 to 5 years. It is not possible to invest in an index. |
1
Annual Report to Shareholders
Western Asset Core Bond Portfolio
| | | | | | | | | | |
| | | | | Average Annual Total Return |
| | | | |
| |
| | | First
Quarter 2004 | | One
Year | | Five
Years | | Ten
Years | | Since
InceptionE |
|
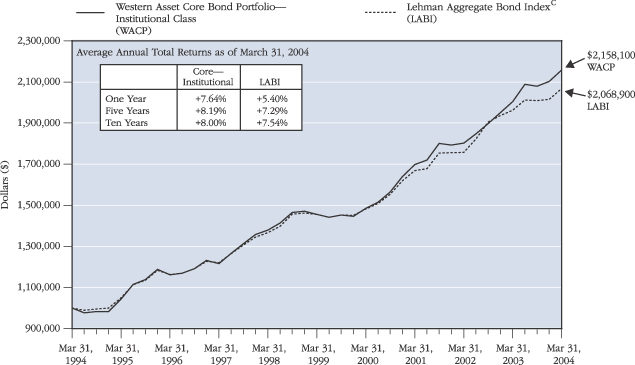
Western Asset Core Bond Portfolio
Institutional Class | | +2.60% | | +7.64% | | +8.19% | | +8.00% | | +8.99% |
|
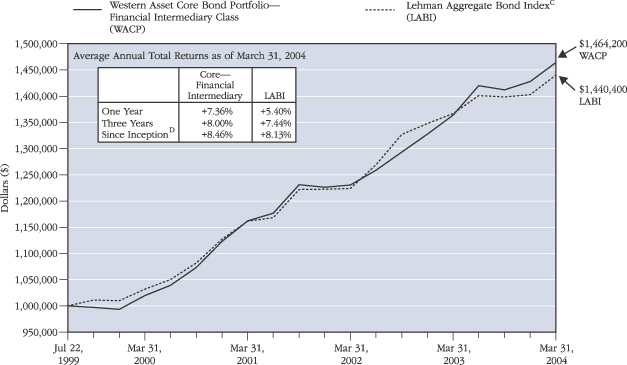
Financial Intermediary Class | | +2.53% | | +7.36% | | N/A | | N/A | | +8.46% |
|
Lehman Aggregate Bond IndexF | | +2.66% | | +5.40% | | +7.29% | | +7.54% | | +8.18% |
|
The impact of market conditions on the Fund’s performance was mixed but generally positive for the year ended March 31, 2004. Short-term interest rates fell, but long-term rates rose modestly, while spreads on non-Treasury issues declined. With strategies producing generally positive results, the Fund’s Institutional Class total return of 7.64% (net of expenses) exceeded that of its benchmark, the Lehman Aggregate Bond Index, which recorded a total return of 5.40%. The biggest positive for performance came from a moderate overweighting to the corporate sector, with an emphasis on longer maturity, BBB rated securities. A moderate exposure to long-maturity Treasury Inflation-Protected Securities (“TIPS”) also made a substantial contribution to returns as real yields declined. A moderate overweighting to the mortgage sector in the first part of the period also added to performance as spreads tightened. The Fund’s barbelled exposure to maturities detracted from performance, suffering as the yield curve steepened.
Western Asset Core Plus Bond Portfolio
| | | | | | | | | | |
| | | | | Average Annual Total Return |
| | | | |
| |
| | | First
Quarter 2004 | | One Year | | Three
Years | | Five Years | | Since
InceptionG |
|
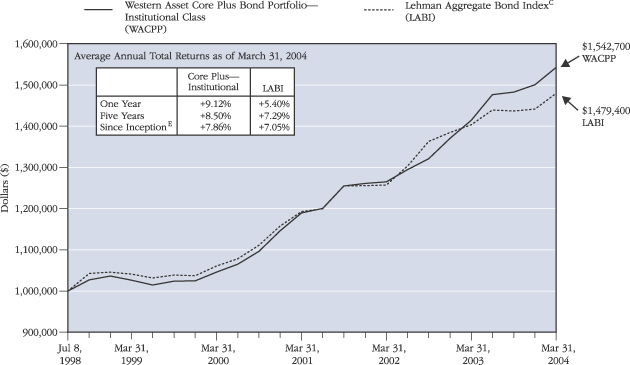
Western Asset Core Plus Bond Portfolio
Institutional Class | | +2.82% | | +9.12% | | +9.06% | | +8.50% | | +7.86% |
|
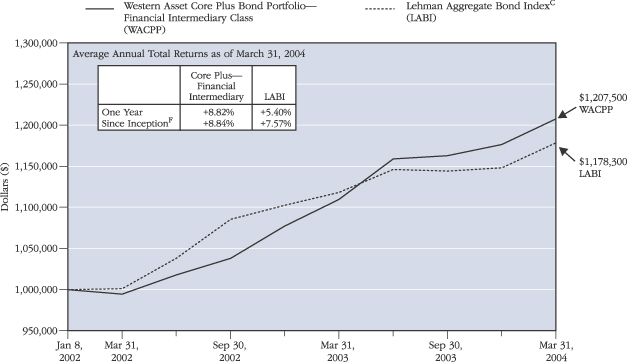
Financial Intermediary Class | | +2.67% | | +8.82% | | N/A | | N/A | | +8.84% |
|
Lehman Aggregate Bond IndexF | | +2.66% | | +5.40% | | +7.29% | | +7.54% | | +7.05% |
|
The impact of market conditions on the Fund’s performance was mixed but generally positive for the year ended March 31, 2004. Short-term interest rates fell, but long-term rates rose modestly, while spreads on non-Treasury issues declined. With strategies producing generally positive results, the Fund’s Institutional Class total return of 9.12% (net of expenses) exceeded that of its benchmark, the Lehman Aggregate Bond Index, which recorded a total return of 5.40%. The biggest positive for performance came from a moderate overweighting to the corporate sector, with an emphasis on longer maturity, BBB rated securities. Exposure to high-yield and emerging market debt securities also contributed substantially to performance thanks to generous and tighter spreads in both sectors. A moderate exposure to long-maturity Treasury Inflation-Protected Securities (“TIPS”) also made a substantial positive contribution to returns as real yields declined. A moderate overweighting to the mortgage sector in the first part of the period also added to performance as spreads tightened. Non-dollar bond exposure also contributed to returns, primarily due to a decision to leave some currency exposure unhedged as the dollar weakened. The Fund’s barbelled exposure to maturities detracted from performance, suffering as the yield curve steepened.
| E | The Fund’s Institutional Class inception date is September 4, 1990. The Financial Intermediary Class inception date is July 22, 1999. Index returns are for periods beginning August 31, 1990. |
| F | A market value-weighted index that tracks the daily price, coupon, pay-downs, and total return performance of fixed rate, publicly placed, dollar-denominated, and nonconvertible investment grade debt issues with at least $100 million par amount outstanding and with at least one year to final maturity. It is not possible to invest in an index. |
| G | The Fund’s Institutional Class inception date is July 8, 1998. The Financial Intermediary Class inception date is January 8, 2002. Index returns are for periods beginning June 30, 1998. |
2
Western Asset Inflation Indexed Plus Bond Portfolio
| | | | | | | | |
| | | | | Average Annual Total Return |
| | | | |
| |
| | | First
Quarter 2004 | | One Year | | Three
Years | | Since
InceptionH |
|
Western Asset Inflation Indexed Plus Bond Portfolio
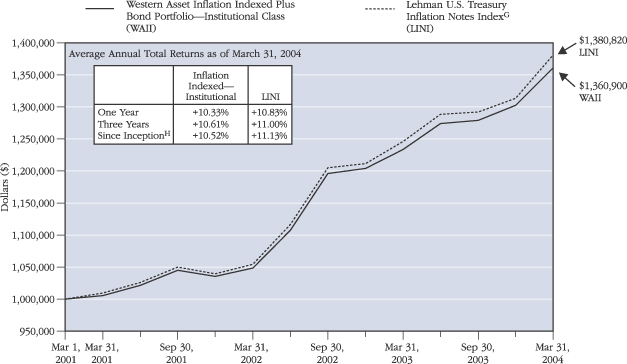
Institutional Class | | +4.48% | | +10.33% | | +10.61% | | +10.52% |
|
Lehman U.S. Treasury Inflation Notes IndexI | | +5.14% | | +10.83% | | +11.00% | | +11.13% |
|
The impact of market conditions on the Fund’s performance was generally positive for the year ended March 31, 2004, since real yields fell. The inflation adjustment on indexed bonds was only modest, however, at 1.7%. With strategies experiencing mixed results, the Fund’s total return of 10.33% (net of expenses) trailed that of its benchmark, the Lehman U.S. Treasury Inflation Notes Index, which recorded a total return of 10.83%. Although the Fund’s neutral to moderately long duration posture benefited somewhat from declining real yields, this was more than offset by the negative impact of a steeper real yield curve, which worked against the portfolio’s emphasis on longer maturities.
Western Asset High Yield Portfolio
| | | | | | |
| | | | | Average Annual
Total Return |
| | | | |
| |
| | | First
Quarter 2004 | | One Year | | Since
InceptionJ |
|
Western Asset High Yield Portfolio
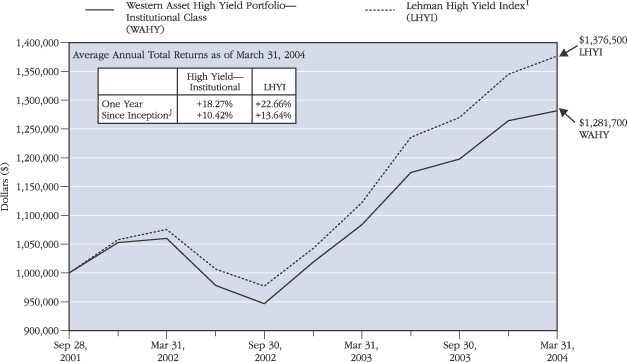
Institutional Class | | +1.38% | | +18.27% | | +10.42% |
|
Lehman High Yield IndexK | | +2.34% | | +22.66% | | +13.64% |
|
For the year ended March 31, 2004, the Fund underperformed its benchmark, returning 18.27% versus 22.66% for the Lehman High Yield Index. The primary reason for the relative underperformance to the benchmark was due to the Fund’s underweighting, for most of the year, to the riskiest part of the high yield market, CCC rated and distressed securities. For the past 12 months, CCC issues have returned 34.80% and distressed over the same period have returned 77.07%. The Western Asset management team believes that over the long run, the primary way to generate returns in the asset class is to generate coupon income. Therefore, a primary strategy of the portfolio managers is to avoid those issues which present a higher than acceptable probability of default. The Western Asset management team believes that these issuers are typically found in the CCC and distressed categories. During the period, the Fund experienced a default rate of less than 1.50% versus a market rate of 4.2%.
| H | The Fund’s Institutional Class inception date is March 1, 2001. Index returns are for periods beginning February 28, 2001. |
| I | An unmanaged index that measures the performance of intermediate (1 to 10 year) U.S. Treasury inflation-protected securities. It is not possible to invest in an index. |
| J | The Fund’s Institutional Class inception date is September 28, 2001. Index returns are for periods beginning September 30, 2001. |
| K | A market value-weighted index that tracks the daily price-only, coupon, and total return performance of non-investment grade, fixed rate, publicly placed, dollar-denominated, and non-convertible debt registered with the U.S. Securities and Exchange Commission. It is not possible to invest in an index. |
3
Annual Report to Shareholders
Western Asset Non-U.S. Opportunity Bond Portfolio
| | | | | | | | | | |
| | | | | Average Annual Total Return |
| | | | |
| |
| | | First
Quarter 2004 | | One
Year | | Three
Years | | Five
Years | | Since
InceptionL |
|
Western Asset Non-U.S. Opportunity Bond Portfolio
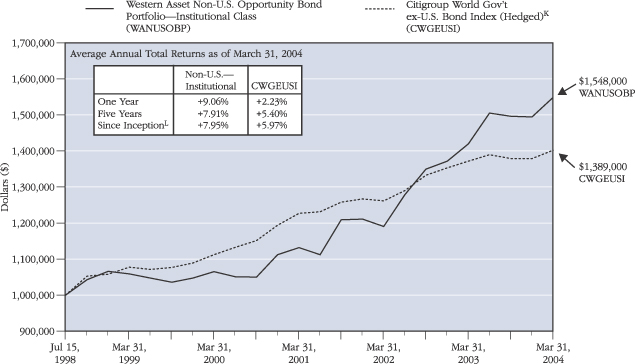
Institutional Class | | +3.64% | | +9.06% | | +11.02% | | +7.91% | | +7.95% |
|
Citigroup World Government
ex-U.S. Bond Index (Hedged)M | | +1.67% | | +2.23% | | +4.56% | | +5.40% | | +5.97% |
|
The impact of market conditions on the Fund’s performance was mixed to somewhat positive in the year ended March 31, 2004; European bond yields moved modestly lower, but Japanese bond yields rose significantly. With strategies producing uniformly positive results, the Fund’s total return of 9.06% (net of expenses) exceeded that of its benchmark, the Citigroup World Government ex-U.S. Bond Index (Hedged), which recorded a total return of 2.23%. Having no exposure to the Japanese bond market made a significant contribution to returns. The Fund’s heavy emphasis on long-maturity Eurozone and euro-peripheral government bonds benefited handsomely from higher-than-benchmark yields and stable to lower interest rates. A bulleted yield curve exposure benefited from lower short-term interest rates, as most European yield curves steepened. Finally, the Fund’s moderate unhedged exposure to the euro and dollar-bloc currencies benefited significantly as the dollar declined.
Western Asset Management Company
April 27, 2004
The performance data quoted represents past performance and does not guarantee future results. The performance stated may have been due to extraordinary market conditions, which may not be duplicated in the future. Current performance may be lower or higher than the performance data quoted. To obtain the most recent month-end performance information please visit www.westernassetfunds.com. The investment return and principal value of the Funds will fluctuate so that an investor’s shares, when redeemed, may be worth more or less than the original cost. Calculations assume reinvestment of dividends and capital gain distributions. Performance would have been lower if fees had not been waived in various periods.
| L | The Fund’s Institutional Class inception date is July 15, 1998. Index returns are for periods beginning July 31, 1998. |
| M | An index encompassing an all-inclusive universe of institutionally traded bonds, including all fixed rate bonds with remaining maturities of one year or longer and with amounts outstanding of at least the equivalent of $25 million. This Index excludes the U.S. and is currency-hedged as a means of achieving low-risk interest rate diversification. It is not possible to invest in an index. |
4
PERFORMANCE INFORMATION
The following graphs and tables compare each Fund’s total returns against that of an appropriate broad-based securities market index. The lines illustrate the cumulative total return of an initial $1,000,000 investment for the periods indicated. The line for each Fund represents the total return after deducting all Fund investment management and other administrative expenses and the transaction costs of buying and selling securities. The line representing the securities market index does not include any transaction costs associated with buying and selling securities in the index or other investment management or administrative expenses.
Due to the limited operating history of the Western Asset Limited Duration Bond Portfolio, performance graphs are not presented. The Fund, which began operations on October 1, 2003, had a total return of +1.69% for the period ended March 31, 2004.
Total return measures investment performance in terms of appreciation or depreciation in net asset value per share, plus dividends and any capital gain distributions. It assumes that dividends and distributions were reinvested at the time they were paid. Returns do not reflect the deduction of taxes that a shareholder would pay on Fund distributions or the redemption of Fund shares. Average annual returns tend to smooth out variations in a fund’s return, so that they differ from actual year-to-year results.
The performance data quoted represents past performance and does not guarantee future results. The performance stated may have been due to extraordinary market conditions, which may not be duplicated in the future. Current performance may be lower or higher than the performance data quoted. To obtain the most recent month-end performance information, please visit www.westernassetfunds.com. The investment return and principal value of the Funds will fluctuate so that an investor’s shares, when redeemed, may be worth more or less than the original cost. Calculations assume reinvestment of dividends and capital gain distributions. Performance would have been lower if fees had not been waived in various periods.
5
Annual Report to Shareholders
PERFORMANCE INFORMATION—Continued
Western Asset Intermediate Bond Portfolio
The graph and table do not reflect the deduction of taxes that a shareholder
would pay on Fund distributions or the redemption of Fund shares.
Past performance does not predict future performance.
| A | An index based on all publicly issued intermediate government and corporate debt securities with an average maturity of 4 to 5 years. It is not possible to invest in an index. |
| B | The Fund’s Institutional Class inception date is July 1, 1994. Index returns are for periods beginning June 30, 1994. |
6
Western Asset Core Bond Portfolio
The graph and table do not reflect the deduction of taxes that a shareholder
would pay on Fund distributions or the redemption of Fund shares.
Past performance does not predict future performance.
| C | A market value-weighted index that tracks the daily price, coupon, pay-downs, and total return performance of fixed rate, publicly placed, dollar-denominated, and nonconvertible investment grade debt issues with at least $100 million par amount outstanding and with at least one year to final maturity. It is not possible to invest in an index. |
7
Annual Report to Shareholders
PERFORMANCE INFORMATION—Continued
Western Asset Core Bond Portfolio—Continued
The graph and table do not reflect the deduction of taxes that a shareholder
would pay on Fund distributions or the redemption of Fund shares.
Past performance does not predict future performance.
| D | The Fund’s Financial Intermediary Class inception date is July 22, 1999. Index returns are for periods beginning July 31, 1999. |
8
Western Asset Core Plus Bond Portfolio
The graph and table do not reflect the deduction of taxes that a shareholder
would pay on Fund distributions or the redemption of Fund shares.
Past performance does not predict future performance.
| E | The Fund’s Institutional Class inception date is July 8, 1998. Index returns are for periods beginning June 30, 1998. |
9
Annual Report to Shareholders
PERFORMANCE INFORMATION—Continued
Western Asset Core Plus Bond Portfolio—Continued
The graph and table do not reflect the deduction of taxes that a shareholder
would pay on Fund distributions or the redemption of Fund shares.
Past performance does not predict future performance.
| F | The Fund’s Financial Intermediary Class inception date is January 8, 2002. Index returns are for periods beginning December 31, 2001. |
10
Western Asset Inflation Indexed Plus Bond Portfolio
The graph and table do not reflect the deduction of taxes that a shareholder
would pay on Fund distributions or the redemption of Fund shares.
Past performance does not predict future performance.
| G | An unmanaged index that measures the performance of intermediate (1 to 10 year) U.S. Treasury inflation-protected securities. It is not possible to invest in an index. |
| H | The Fund’s Institutional Class inception date is March 1, 2001. Index returns are for periods beginning February 28, 2001. |
11
Annual Report to Shareholders
PERFORMANCE INFORMATION—Continued
Western Asset High Yield Portfolio
The graph and table do not reflect the deduction of taxes that a shareholder
would pay on Fund distributions or the redemption of Fund shares.
Past performance does not predict future performance.
| I | A market value-weighted index that tracks the daily price-only, coupon, and total return performance of non-investment grade, fixed rate, publicly placed, dollar-denominated, and non-convertible debt registered with the U.S. Securities and Exchange Commission. It is not possible to invest in an index. |
| J | The Fund’s Institutional Class inception date is September 28, 2001. Index returns are for periods beginning September 30, 2001. |
12
Western Asset Non-U.S. Opportunity Bond Portfolio
The graph and table do not reflect the deduction of taxes that a shareholder
would pay on Fund distributions or the redemption of Fund shares.
Past performance does not predict future performance.
| K | An index encompassing an all-inclusive universe of institutionally traded bonds, including all fixed rate bonds with remaining maturities of one year or longer and with amounts outstanding of at least the equivalent of $25 million USD. This Index excludes the U.S. and is currency-hedged as a means of achieving low-risk interest rate diversification. It is not possible to invest in an index. |
| L | The Fund’s Institutional Class inception date is July 15, 1998. Index returns are for periods beginning July 31, 1998. |
13
Annual Report to Shareholders
STATEMENT OF NET ASSETS
March 31, 2004
(Amounts in Thousands)
Western Asset Limited Duration Bond Portfolio
| | | | | | | | | | | | | |
| | | % OF
NET ASSETS | | RATE | | MATURITY
DATE | | PAR/
SHARES | | VALUE | |
| | |
| |
Long-Term Securities | | 92.9% | | | | | | | | | | | |
| | | | | |
Corporate Bonds and Notes | | 29.8% | | | | | | | | | | | |
| | | | | |
Aerospace/Defense | | 0.4% | | | | | | | | | | | |
Raytheon Company | | | | 1.580% | | 6/10/05 | | $ | 100 | | $ | 100 | A |
| | | | | | | | | | | |
|
|
|
| | | | | |
Banking and Finance | | 3.5% | | | | | | | | | | | |
Ford Motor Credit Company | | | | 7.600% | | 8/1/05 | | | 100 | | | 106 | |
Ford Motor Credit Company | | | | 7.375% | | 10/28/09 | | | 150 | | | 165 | |
General Motors Acceptance Corporation | | | | 7.000% | | 10/25/04 | | | 30 | | | 31 | |
General Motors Acceptance Corporation | | | | 4.150% | | 2/7/05 | | | 60 | | | 61 | |
General Motors Acceptance Corporation | | | | 5.250% | | 5/16/05 | | | 70 | | | 72 | |
General Motors Acceptance Corporation | | | | 7.500% | | 7/15/05 | | | 110 | | | 117 | |
Household Finance Corporation | | | | 6.500% | | 1/24/06 | | | 120 | | | 130 | |
John Deere Capital Corporation | | | | 3.900% | | 1/15/08 | | | 120 | | | 125 | |
Toyota Motor Credit Corporation | | | | 1.160% | | 2/15/05 | | | 125 | | | 125 | A |
| | | | | | | | | | | |
|
|
|
| | | | | | | | | | | | | 932 | |
| | | | | | | | | | | |
|
|
|
Banks | | 1.9% | | | | | | | | | | | |
Bank of America Corporation | | | | 1.400% | | 10/22/04 | | | 70 | | | 70 | A |
Bank One Corporation | | | | 6.500% | | 2/1/06 | | | 130 | | | 141 | |
FleetBoston Financial Corporation | | | | 4.875% | | 12/1/06 | | | 140 | | | 149 | |
Wachovia Corporation | | | | 6.800% | | 6/1/05 | | | 120 | | | 127 | |
| | | | | | | | | | | |
|
|
|
| | | | | | | | | | | | | 487 | |
| | | | | | | | | | | |
|
|
|
Cable | | 0.8% | | | | | | | | | | | |
Tele-Communications, Inc. | | | | 7.250% | | 8/1/05 | | | 200 | | | 214 | |
| | | | | | | | | | | |
|
|
|
| | | | | |
Chemicals | | 0.6% | | | | | | | | | | | |
The Dow Chemical Company | | | | 7.000% | | 8/15/05 | | | 140 | | | 150 | |
| | | | | | | | | | | |
|
|
|
| | | | | |
Computer Services and Systems | | 0.2% | | | | | | | | | | | |
Electronic Data Systems Corporation | | | | 7.125% | | 10/15/09 | | | 50 | | | 53 | |
| | | | | | | | | | | |
|
|
|
| | | | | |
Consumer Products | | 0.5% | | | | | | | | | | | |
The Procter & Gamble Company | | | | 4.750% | | 6/15/07 | | | 120 | | | 129 | |
| | | | | | | | | | | |
|
|
|
| | | | | |
Containers and Packaging | | 0.6% | | | | | | | | | | | |
MeadWestvaco Corporation | | | | 8.400% | | 6/1/07 | | | 130 | | | 152 | |
| | | | | | | | | | | |
|
|
|
| | | | | |
Diversified Financial Services | | 1.3% | | | | | | | | | | | |
Citigroup Inc. | | | | 3.625% | | 2/9/09 | | | 115 | | | 117 | |
14
| | | | | | | | | | | | | |
| | | % OF
NET ASSETS | | RATE | | MATURITY
DATE | | PAR/
SHARES | | VALUE | |
| | |
| |
Corporate Bonds and Notes—Continued | | | | | | | | | | | | | |
| | | | | |
Diversified Financial Services—Continued | | | | | | | | | | | | | |
U.S. Bancorp | | | | 3.125% | | 3/15/08 | | $ | 130 | | $ | 131 | |
Wells Fargo & Company | | | | 1.220% | | 3/3/06 | | | 100 | | | 100 | A |
| | | | | | | | | | | |
|
|
|
| | | | | | | | | | | | | 348 | |
| | | | | | | | | | | |
|
|
|
| | | | | |
Drug and Grocery Store Chains | | 0.1% | | | | | | | | | | | |
Safeway Inc. | | | | 1.601% | | 11/1/05 | | | 30 | | | 30 | A |
| | | | | | | | | | | |
|
|
|
| | | | | |
Electric | | 3.1% | | | | | | | | | | | |
American Electric Power Company, Inc. | | | | 6.125% | | 5/15/06 | | | 160 | | | 173 | |
FirstEnergy Corp. | | | | 5.500% | | 11/15/06 | | | 400 | | | 425 | |
Southern California Edison Company | | | | 1.420% | | 1/13/06 | | | 60 | | | 60 | A |
Virginia Electric and Power Company | | | | 5.750% | | 3/31/06 | | | 150 | | | 161 | |
| | | | | | | | | | | |
|
|
|
| | | | | | | | | | | | | 819 | |
| | | | | | | | | | | |
|
|
|
Energy | | 1.1% | | | | | | | | | | | |
DTE Energy Company | | | | 6.000% | | 6/1/04 | | | 40 | | | 40 | |
Pacific Gas and Electric Company | | | | 3.600% | | 3/1/09 | | | 80 | | | 80 | |
Progress Energy, Inc. | | | | 6.750% | | 3/1/06 | | | 150 | | | 163 | |
| | | | | | | | | | | |
|
|
|
| | | | | | | | | | | | | 283 | |
| | | | | | | | | | | |
|
|
|
Environmental Services | | 0.7% | | | | | | | | | | | |
Waste Management, Inc. | | | | 7.000% | | 10/15/06 | | | 175 | | | 194 | |
| | | | | | | | | | | |
|
|
|
| | | | | |
Food, Beverage and Tobacco | | 1.7% | | | | | | | | | | | |
Altria Group, Inc. | | | | 7.000% | | 7/15/05 | | | 140 | | | 148 | |
Kellogg Company | | | | 6.000% | | 4/1/06 | | | 130 | | | 140 | |
Sara Lee Corporation | | | | 1.950% | | 6/15/06 | | | 160 | | | 160 | |
| | | | | | | | | | | |
|
|
|
| | | | | | | | | | | | | 448 | |
| | | | | | | | | | | |
|
|
|
Investment Banking/Brokerage | | 2.7% | | | | | | | | | | | |
J.P. Morgan Chase & Co., Inc. | | | | 1.390% | | 5/20/05 | | | 100 | | | 100 | A |
Lehman Brothers Holdings Inc. | | | | 1.551% | | 4/3/06 | | | 80 | | | 80 | A |
Lehman Brothers Holdings Inc. | | | | 1.390% | | 5/15/06 | | | 100 | | | 100 | A |
Merrill Lynch & Co., Inc. | | | | 7.375% | | 5/15/06 | | | 140 | | | 156 | |
The Bear Stearns Companies Inc. | | | | 1.360% | | 6/19/06 | | | 150 | | | 151 | A |
The Goldman Sachs Group, Inc. | | | | 1.470% | | 2/25/05 | | | 110 | | | 110 | A |
| | | | | | | | | | | |
|
|
|
| | | | | | | | | | | | | 697 | |
| | | | | | | | | | | |
|
|
|
Media | | 2.8% | | | | | | | | | | | |
America Online Inc. | | | | 0.000% | | 12/6/19 | | | 295 | | | 187 | B,C |
Clear Channel Communications, Inc. | | | | 3.125% | | 2/1/07 | | | 80 | | | 81 | |
15
Annual Report to Shareholders
STATEMENT OF NET ASSETS—Continued
Western Asset Limited Duration Bond Portfolio—Continued
| | | | | | | | | | | | | |
| | | % OF
NET ASSETS | | RATE | | MATURITY
DATE | | PAR/
SHARES | | VALUE | |
| | |
| |
Corporate Bonds and Notes—Continued | | | | | | | | | | | | | |
| | | | | |
Media—Continued | | | | | | | | | | | | | |
Liberty Media Corporation | | | | 2.610% | | 9/17/06 | | $ | 70 | | $ | 71 | A |
News America Incorporated | | | | 6.625% | | 1/9/08 | | | 140 | | | 157 | |
Viacom Inc. | | | | 5.625% | | 5/1/07 | | | 220 | | | 240 | |
| | | | | | | | | | | |
|
|
|
| | | | | | | | | | | | | 736 | |
| | | | | | | | | | | |
|
|
|
Oil and Gas | | 2.4% | | | | | | | | | | | |
Anadarko Petroleum Corporation | | | | 5.375% | | 3/1/07 | | | 165 | | | 178 | |
Apache Corporation | | | | 6.250% | | 4/15/12 | | | 90 | | | 103 | |
Devon Energy Corporation | | | | 2.750% | | 8/1/06 | | | 150 | | | 151 | |
Pemex Project Funding Master Trust | | | | 8.500% | | 2/15/08 | | | 50 | | | 58 | |
Tosco Corporation | | | | 7.625% | | 5/15/06 | | | 115 | | | 128 | |
| | | | | | | | | | | |
|
|
|
| | | | | | | | | | | | | 618 | |
| | | | | | | | | | | |
|
|
|
Paper and Forest Products | | 0.6% | | | | | | | | | | | |
Weyerhaeuser Company | | | | 5.500% | | 3/15/05 | | | 150 | | | 156 | |
| | | | | | | | | | | |
|
|
|
| | | | | |
Pharmaceuticals | | 0.5% | | | | | | | | | | | |
Bristol-Myers Squibb Company | | | | 4.750% | | 10/1/06 | | | 120 | | | 127 | |
| | | | | | | | | | | |
|
|
|
| | | | | |
Retail | | 0.6% | | | | | | | | | | | |
Target Corporation | | | | 5.400% | | 10/1/08 | | | 150 | | | 164 | |
| | | | | | | | | | | |
|
|
|
| | | | | |
Special Purpose | | 2.3% | | | | | | | | | | | |
American Honda Finance Corporation | | | | 3.850% | | 11/6/08 | | | 34 | | | 35 | D |
ChevronTexaco Capital Company | | | | 3.500% | | 9/17/07 | | | 120 | | | 124 | |
DaimlerChrysler NA Holding Corporation | | | | 2.130% | | 8/8/06 | | | 150 | | | 152 | A |
Sprint Capital Corporation | | | | 7.900% | | 3/15/05 | | | 240 | | | 253 | |
Verizon Wireless Capital LLC | | | | 1.190% | | 5/23/05 | | | 50 | | | 50 | A,D |
| | | | | | | | | | | |
|
|
|
| | | | | | | | | | | | | 614 | |
| | | | | | | | | | | |
|
|
|
Telecommunications (Cellular/Wireless) | | 0.7% | | | | | | | | | | | |
AT&T Wireless Services Inc. | | | | 7.350% | | 3/1/06 | | | 160 | | | 175 | |
| | | | | | | | | | | |
|
|
|
Telecommunications Equipment | | 0.7% | | | | | | | | | | | |
New York Telephone | | | | 6.000% | | 4/15/08 | | | 160 | | | 175 | |
| | | | | | | | | | | |
|
|
|
Total Corporate Bonds and Notes
(Identified Cost—$7,713) | | | | | | | | | | | | 7,801 | |
| |
16
| | | | | | | | | | | | | |
| | | % OF
NET ASSETS | | RATE | | MATURITY
DATE | | PAR/
SHARES | | VALUE | |
| | |
| |
Asset-Backed Securities | | 23.9% | | | | | | | | | | | |
| | | | | |
Fixed Rate Securities | | 5.8% | | | | | | | | | | | |
ACE Security Corp. 2003-MH1 | | | | 2.200% | | 8/15/30 | | $ | 262 | | $ | 261 | D |
Aesop Funding II LLC 1998-1 | | | | 6.140% | | 5/20/06 | | | 250 | | | 261 | D |
Capital One Auto Finance Trust 2002-B | | | | 2.710% | | 10/16/06 | | | 250 | | | 253 | |
Drivetime Auto Owner Trust 2002-C | | | | 2.200% | | 12/17/07 | | | 49 | | | 49 | D |
Fingerhut Master Trust 2003-1 | | | | 2.720% | | 9/15/10 | | | 71 | | | 70 | D |
Hyundai Auto Receivables Trust 2002-A | | | | 2.800% | | 2/15/07 | | | 250 | | | 253 | D |
Onyx Acceptance Owner Trust 2002-D | | | | 3.100% | | 7/15/09 | | | 138 | | | 141 | |
UCFC Home Equity Loan 1998-D | | | | 6.905% | | 4/15/30 | | | 140 | | | 148 | |
Vanderbilt Mortgage Finance 2001-C | | | | 4.235% | | 8/7/14 | | | 71 | | | 72 | |
| | | | | | | | | | | |
|
|
|
| | | | | | | | | | | | | 1,508 | |
| | | | | | | | | | | |
|
|
|
Indexed SecuritiesA | | 18.1% | | | | | | | | | | | |
ABSC Long Beach Home Equity Loan Trust
2001-LB1 | | | | 1.350% | | 8/21/30 | | | 3 | | | 3 | |
AmeriCredit Automobile Loan Trust 2003-BX | | | | 1.480% | | 1/6/10 | | | 30 | | | 30 | |
AmeriCredit Automobile Receivables Trust 2003-AM | | | | 1.370% | | 10/6/06 | | | 144 | | | 144 | |
AQ Finance Nim Trust 2003-N13 | | | | 1.320% | | 12/25/08 | | | 207 | | | 207 | D |
ARG Funding Corp. 1999-3A | | | | 1.340% | | 8/20/05 | | | 333 | | | 334 | D |
Capital Auto Receivables Asset Trust 2003-1 | | | | 1.140% | | 6/15/05 | | | 511 | | | 511 | |
Centex Home Equity 2002-D | | | | 1.530% | | 12/25/32 | | | 191 | | | 191 | |
Chase Credit Card Master Trust 2001-3 | | | | 1.940% | | 9/15/06 | | | 80 | | | 80 | |
Chase Credit Card Master Trust 2002-2 | | | | 1.990% | | 7/16/07 | | | 100 | | | 100 | |
Chase Funding Mortgage Loan Asset-Backed Certificates 2002-4 | | | | 1.460% | | 10/25/32 | | | 183 | | | 184 | |
Chase USA Master Trust 2000-1 | | | | 1.570% | | 8/17/09 | | | 200 | | | 199 | |
Chesapeake Funding LLC 2003-1 | | | | 1.350% | | 8/7/08 | | | 300 | | | 301 | |
Citibank Credit Card Issuance Trust 2000-C2 | | | | 1.770% | | 10/15/07 | | | 90 | | | 90 | |
Citibank Credit Card Issuance Trust 2002-C3 | | | | 2.250% | | 12/15/09 | | | 160 | | | 163 | |
Countrywide Asset-Backed Certificates 2000-4 | | | | 1.330% | | 12/25/31 | | | 240 | | | 240 | |
Countrywide Asset-Backed Certificates 2001-4 | | | | 1.430% | | 4/25/32 | | | 109 | | | 109 | |
Countrywide Asset-Backed Certificates 2002-3 | | | | 1.460% | | 5/25/32 | | | 180 | | | 180 | |
Countrywide Asset-Backed Certificates 2002-C | | | | 1.330% | | 5/15/28 | | | 124 | | | 125 | |
EQCC Trust 2002 | | | | 1.390% | | 11/25/31 | | | 164 | | | 165 | |
First North American National Bank 2003-A | | | | 1.570% | | 5/16/11 | | | 220 | | | 221 | |
Irwin Home Equity Trust 2003-A | | | | 1.590% | | 10/25/27 | | | 172 | | | 174 | |
Metris Master Trust 2001-4A | | | | 1.440% | | 8/20/08 | | | 60 | | | 60 | |
Navistar Financial 2003-B Owner Trust | | | | 1.290% | | 4/15/08 | | | 200 | | | 200 | |
New Century Home Equity Loan Trust 2001-NC1 | | | | 1.380% | | 6/20/31 | | | 138 | | | 138 | |
Residential Asset Mortgage Products, Inc. 2002-RS6 | | | | 1.540% | | 11/25/32 | | | 220 | | | 221 | |
17
Annual Report to Shareholders
STATEMENT OF NET ASSETS—Continued
Western Asset Limited Duration Bond Portfolio—Continued
| | | | | | | | | | | | | |
| | | % OF
NET ASSETS | | RATE | | MATURITY
DATE | | PAR/
SHARES | | VALUE | |
| | |
| |
Asset-Backed Securities—Continued | | | | | | | | | | | | | |
| | | | | |
Indexed Securities—Continued | | | | | | | | | | | | | |
Residential Asset Securities Corporation 1999-KS1 | | | | 1.365% | | 3/25/29 | | $ | 192 | | $ | 192 | |
Structured Asset Securities Corporation 2002-BC1 | | | | 1.590% | | 8/25/32 | | | 186 | | | 187 | |
| | | | | | | | | | | |
|
|
|
| | | | | | | | | | | | | 4,749 | |
| | | | | | | | | | | |
|
|
|
Total Asset-Backed Securities (Identified Cost—$6,252) | | | | | | | | | | | | 6,257 | |
| |
Mortgage-Backed Securities | | 14.1% | | | | | | | | | | | |
| | | | | |
Fixed Rate Securities | | 1.4% | | | | | | | | | | | |
Asset Securitization Corporation 1996-D2 | | | | 6.920% | | 2/14/29 | | | 138 | | | 147 | |
Countrywide Alternative Loan Trust 2004-J1 | | | | 6.000% | | 2/25/34 | | | 202 | | | 207 | |
| | | | | | | | | | | |
|
|
|
| | | | | | | | | | | | | 354 | |
| | | | | | | | | | | |
|
|
|
Indexed SecuritiesA | | 12.7% | | | | | | | | | | | |
Bank of America Mortgage Securities 2003-D | | | | 4.569% | | 5/25/33 | | | 425 | | | 427 | |
Crusade Global Trust 2003-2 | | | | 1.300% | | 9/18/34 | | | 197 | | | 197 | E |
Granite Mortgages PLC 2003-1 | | | | 1.310% | | 1/20/20 | | | 400 | | | 400 | |
Holmes Financing plc Series 6 | | | | 1.290% | | 4/15/08 | | | 300 | | | 300 | |
Impac CMB Trust 2002-8 | | | | 1.550% | | 3/25/33 | | | 172 | | | 172 | |
J.P. Morgan Chase Commercial Mortgage
Securities Corp. 2003-FL2A | | | | 1.340% | | 11/15/16 | | | 216 | | | 216 | D |
Lehman Brothers Floating Rate Commercial Mortgage
Trust 2001-LLFA | | | | 1.330% | | 8/16/13 | | | 63 | | | 63 | D |
Mall America Capital Company LLC 2000-1 | | | | 1.390% | | 3/12/10 | | | 250 | | | 250 | D |
Medallion Trust 2000-2G | | | | 1.310% | | 12/18/31 | | | 191 | | | 191 | |
Medallion Trust 2003-1G | | | | 1.300% | | 12/21/33 | | | 173 | | | 173 | |
MLCC Mortgage Investors, Inc. 2003-H | | | | 2.894% | | 1/25/29 | | | 158 | | | 159 | |
Morgan Stanley Dean Witter Capital I Trust 2001-XLF | | | | 1.650% | | 10/7/13 | | | 164 | | | 164 | D |
Strategic Hotel Capital Incorporated 2003-1 | | | | 1.640% | | 2/15/13 | | | 400 | | | 398 | D |
Torrens Trust 2000-1GA | | | | 1.350% | | 7/15/31 | | | 91 | | | 91 | D |
Wachovia Bank Commercial Mortgage Trust
2002-WHL1 | | | | 1.390% | | 3/15/15 | | | 133 | | | 133 | D |
| | | | | | | | | | | |
|
|
|
| | | | | | | | | | | | | 3,334 | |
| | | | | | | | | | | |
|
|
|
Total Mortgage-Backed Securities
(Identified Cost—$3,700) | | | | | | | | | | | | 3,688 | |
| |
U.S. Government and Agency Obligations | | 14.9% | | | | | | | | | | | |
| | | | | |
Fixed Rate Securities | | 2.8% | | | | | | | | | | | |
Fannie Mae | | | | 2.800% | | 3/1/19 | | | 260 | | | 262 | F |
Freddie Mac | | | | 3.875% | | 1/12/09 | | | 375 | | | 382 | |
United States Treasury Notes | | | | 1.875% | | 11/30/05 | | | 105 | | | 106 | |
| | | | | | | | | | | |
|
|
|
| | | | | | | | | | | | | 750 | |
| | | | | | | | | | | |
|
|
|
18
| | | | | | | | | | | | | |
| | | % OF
NET ASSETS | | RATE | | MATURITY
DATE | | PAR/
SHARES | | VALUE | |
| | |
| |
U.S. Government and Agency
Obligations—Continued | | | | | | | | | | | | | |
Indexed SecuritiesG | | 12.1% | | | | | | | | | | | |
United States Treasury Inflation-Protected Security | | | | 3.625% | | 1/15/08 | | $ | 1,146 | | $ | 1,298 | |
United States Treasury Inflation-Protected Security | | | | 3.000% | | 7/15/12 | | | 1,030 | | | 1,172 | |
United States Treasury Inflation-Protected Security | | | | 3.375% | | 4/15/32 | | | 522 | | | 692 | |
| | | | | | | | | | | |
|
|
|
| | | | | | | | | | | | | 3,162 | |
| | | | | | | | | | | |
|
|
|
Total U.S. Government and Agency Obligations
(Identified Cost—$3,749) | | | | | | | | | | | | 3,912 | |
| |
U.S. Government Agency Mortgage-Backed Securities | | 4.8% | | | | | | | | | | | |
| | | | | |
Fixed Rate Securities | | 4.8% | | | | | | | | | | | |
Government National Mortgage Association | | | | 5.000% | | 2/1/33 | | | 1,250 | | | 1,259 | H |
| | | | | | | | | | | |
|
|
|
Total U.S. Government Agency Mortgage-Backed Securities (Identified Cost—$1,264) | | | | | | | | | | | | 1,259 | |
| |
Yankee BondsE | | 5.4% | | | | | | | | | | | |
| | | | | |
Foreign Governments | | 0.5% | | | | | | | | | | | |
Republic of Chile | | | | 1.520% | | 1/28/08 | | | 120 | | | 120 | A |
| | | | | | | | | | | |
|
|
|
| | | | | |
Manufacturing (Diversified) | | 1.1% | | | | | | | | | | | |
Tyco International Group SA | | | | 6.375% | | 6/15/05 | | | 275 | | | 288 | |
| | | | | | | | | | | |
|
|
|
| | | | | |
Retail | | 0.6% | | | | | | | | | | | |
Wal-Mart Stores Canada, Inc. | | | | 5.580% | | 5/1/06 | | | 140 | | | 150 | D |
| | | | | | | | | | | |
|
|
|
| | | | | |
Special Purpose | | 1.7% | | | | | | | | | | | |
BP Capital Markets Plc | | | | 2.750% | | 12/29/06 | | | 140 | | | 143 | |
Deutsche Telekom International Finance BV | | | | 8.250% | | 6/15/05 | | | 200 | | | 215 | |
Diageo Capital Plc | | | | 3.375% | | 3/20/08 | | | 100 | | | 102 | |
| | | | | | | | | | | |
|
|
|
| | | | | | | | | | | | | 460 | |
| | | | | | | | | | | |
|
|
|
Telecommunications | | 1.5% | | | | | | | | | | | |
British Telecommunications plc | | | | 7.875% | | 12/15/05 | | | 110 | | | 121 | |
Telefonos de Mexico SA de CV (Telmex) | | | | 8.250% | | 1/26/06 | | | 250 | | | 274 | |
| | | | | | | | | | | |
|
|
|
| | | | | | | | | | | | | 395 | |
| | | | | | | | | | | |
|
|
|
Total Yankee Bonds (Identified Cost—$1,402) | | | | | | | | | | | | 1,413 | |
| | | | | | | | | | | |
|
|
|
Total Long-Term Securities (Identified Cost—$24,080) | | | | | | | | | | | | 24,330 | |
| |
19
Annual Report to Shareholders
STATEMENT OF NET ASSETS—Continued
Western Asset Limited Duration Bond Portfolio—Continued
| | | | | | | | | | | | | | |
| | | % OF
NET ASSETS | | RATE | | MATURITY
DATE | | PAR/ SHARES | | | VALUE | |
| | |
| |
Short-Term Securities | | 11.1% | | | | | | | | | | | | |
| | | | | |
Corporate Bonds and Notes | | 0.4% | | | | | | | | | | | | |
Altria Group, Inc. | | | | 7.500% | | 4/1/04 | | $ | 100 | | | $ | 100 | |
| | | | | | | | | | | | |
|
|
|
| | | | | |
U.S. Government and Agency Obligations | | 1.9% | | | | | | | | | | | | |
Federal Farm Credit Bank | | | | 0.000% | | 4/5/04 | | | 20 | | | | 20 | B |
Freddie Mac | | | | 0.000% | | 4/5/04 | | | 100 | | | | 100 | B |
Freddie Mac | | | | 0.000% | | 4/5/04 | | | 220 | | | | 220 | B |
Freddie Mac | | | | 0.000% | | 4/6/04 | | | 170 | | | | 170 | B |
| | | | | | | | | | | | |
|
|
|
| | | | | | | | | | | | | | 510 | |
| | | | | | | | | | | | |
|
|
|
| | | | | |
Repurchase Agreements | | 8.8% | | | | | | | | | | | | |
Credit Suisse First Boston USA
1.04%, dated 3/31/04, to be repurchased at $2,300 on 4/1/04 (Collateral: $2,305 Freddie Mac medium-term notes, 3.75%, due 4/15/04, value $2,388) | | | | | | | | | 2,300 | | | | 2,300 | |
| | | | | | | | | | | | |
|
|
|
Total Short-Term Securities
(Identified Cost—$2,910) | | | | | | | | | | | | | 2,910 | |
| |
Total Investments (Identified Cost—$26,990) | | 104.0% | | | | | | | | | | | 27,240 | |
Other Assets Less Liabilities | | (4.0)% | | | | | | | | | | | (1,058 | ) |
| | | | | | | | | | | | |
|
|
|
Net assets consist of: | | | | | | | | | | | | | | |
Accumulated paid-in capital applicable to
2,595 Institutional Class shares outstanding | | | | | | | | $ | 25,938 | | | | | |
Accumulated net realized gain/(loss) on investments | | | | | | | | | (6 | ) | | | | |
Unrealized appreciation/(depreciation) of investments | | | | | | | | | 250 | | | | | |
| | | | | | | | |
|
|
| | | | |
| | | | | |
Net assets | | 100.0% | | | | | | | | | | $ | 26,182 | |
| | | | | | | | | | | | |
|
|
|
| | | | | |
Net asset value per share: | | | | | | | | | | | | | | |
Institutional Class | | | | | | | | | | | | $
| 10.09
|
|
| | | | | | | | | | | | | | | |
| |
| A | Indexed security – The rates of interest earned on these securities are tied to the London Interbank Offered Rate (“LIBOR”), the Consumer Price Index (“CPI”), or the one-year Treasury Bill rate. The coupon rates are the rates as of March 31, 2004. |
| B | Zero coupon bond – A bond with no periodic interest payments which is sold at such a discount as to produce a current yield to maturity. |
| C | Convertible security – Security may be converted into the issuer’s common stock. |
| D | Rule 144a Security – A security purchased pursuant to Rule 144a under the Securities Act of 1933 which may not be resold subject to that rule except to qualified institutional buyers. These securities represent 11.4% of net assets. |
| E | Yankee Bond – A dollar-denominated bond issued in the U.S. by foreign entities. |
| F | Stepped coupon security – A security with a predetermined schedule of interest or dividend rate changes, at which time it begins to accrue interest or pay dividends. |
| G | Treasury Inflation-Protected Security – Security whose principal value is adjusted daily or monthly in accordance with changes to the Consumer Price Index for All Urban Consumers. Interest is calculated on the basis of the current adjusted principal value. |
| H | When-issued security – Security purchased on a delayed delivery basis. Final settlement amount and maturity date have not been announced. |
See notes to financial statements.
20
STATEMENT OF NET ASSETS
March 31, 2004
(Amounts in Thousands)
Western Asset Intermediate Bond Portfolio
| | | | | | | | | | | | | |
| | | % OF
NET ASSETS | | RATE | | MATURITY
DATE | | PAR/
SHARES | | VALUE | |
| | |
| |
Long-Term Securities | | 92.5% | | | | | | | | | | | |
| | | | | |
Corporate Bonds and Notes | | 33.3% | | | | | | | | | | | |
| | | | | |
Aerospace/Defense | | 0.6% | | | | | | | | | | | |
Raytheon Company | | | | 6.000% | | 12/15/10 | | $ | 130 | | $ | 146 | |
Systems 2001 Asset Trust | | | | 6.664% | | 9/15/13 | | | 1,813 | | | 2,036 | A |
United Technologies Corporation | | | | 6.350% | | 3/1/11 | | | 1,280 | | | 1,470 | |
| | | | | | | | | | | |
|
|
|
| | | | | | | | | | | | | 3,652 | |
| | | | | | | | | | | |
|
|
|
Automotive | | 0.3% | | | | | | | | | | | |
General Motors Corporation | | | | 7.125% | | 7/15/13 | | | 1,730 | | | 1,890 | B |
| | | | | | | | | | | |
|
|
|
| | | | | |
Banking and Finance | | 3.8% | | | | | | | | | | | |
Boeing Capital Corporation | | | | 6.350% | | 11/15/07 | | | 1,530 | | | 1,712 | |
Countrywide Home Loans, Inc. | | | | 2.875% | | 2/15/07 | | | 1,250 | | | 1,260 | |
Ford Motor Credit Company | | | | 1.560% | | 7/18/05 | | | 640 | | | 636 | C |
Ford Motor Credit Company | | | | 6.875% | | 2/1/06 | | | 1,025 | | | 1,090 | |
Ford Motor Credit Company | | | | 7.375% | | 10/28/09 | | | 4,390 | | | 4,819 | |
General Motors Acceptance Corporation | | | | 1.995% | | 5/18/06 | | | 1,500 | | | 1,495 | C |
General Motors Acceptance Corporation | | | | 6.125% | | 9/15/06 | | | 735 | | | 786 | |
General Motors Acceptance Corporation | | | | 2.020% | | 1/16/07 | | | 2,920 | | | 2,897 | C |
General Motors Acceptance Corporation | | | | 6.125% | | 8/28/07 | | | 805 | | | 867 | |
General Motors Acceptance Corporation | | | | 7.750% | | 1/19/10 | | | 1,500 | | | 1,700 | |
Household Finance Corporation | | | | 6.375% | | 10/15/11 | | | 3,120 | | | 3,538 | |
Household Finance Corporation | | | | 7.000% | | 5/15/12 | | | 1,170 | | | 1,373 | |
| | | | | | | | | | | |
|
|
|
| | | | | | | | | | | | | 22,173 | |
| | | | | | | | | | | |
|
|
|
Banks | | 2.9% | | | | | | | | | | | |
Bank of America Corporation | | | | 5.250% | | 2/1/07 | | | 1,100 | | | 1,187 | |
Bank of America Corporation | | | | 7.400% | | 1/15/11 | | | 2,720 | | | 3,265 | |
Bank One Corporation | | | | 6.000% | | 8/1/08 | | | 2,370 | | | 2,648 | |
BankBoston NA | | | | 6.375% | | 3/25/08 | | | 1,270 | | | 1,430 | B |
HBOS Treasury Services plc | | | | 3.750% | | 9/30/08 | | | 1,350 | | | 1,379 | A |
The Chase Manhattan Corporation | | | | 1.670% | | 3/1/27 | | | 2,000 | | | 1,907 | C |
The Korea Development Bank | | | | 5.750% | | 9/10/13 | | | 2,770 | | | 2,987 | |
Wachovia Corporation | | | | 3.625% | | 2/17/09 | | | 1,900 | | | 1,931 | B |
| | | | | | | | | | | |
|
|
|
| | | | | | | | | | | | | 16,734 | |
| | | | | | | | | | | |
|
|
|
21
Annual Report to Shareholders
STATEMENT OF NET ASSETS—Continued
Western Asset Intermediate Bond Portfolio—Continued
| | | | | | | | | | | | | |
| | | % OF
NET ASSETS | | RATE | | MATURITY
DATE | | PAR/
SHARES | | VALUE | |
| | |
| |
Corporate Bonds and Notes—Continued | | | | | | | | | | | | | |
| | | | | |
Cable | | 0.3% | | | | | | | | | | | |
Comcast Corporation | | | | 6.500% | | 1/15/15 | | $ | 530 | | $ | 587 | |
Cox Communications, Inc. | | | | 5.500% | | 10/1/15 | | | 690 | | | 707 | |
TCI Communications, Inc. | | | | 8.000% | | 8/1/05 | | | 220 | | | 237 | |
| | | | | | | | | | | |
|
|
|
| | | | | | | | | | | | | 1,531 | |
| | | | | | | | | | | |
|
|
|
Computer Services and Systems | | 0.3% | | | | | | | | | | | |
Electronic Data Systems Corporation | | | | 7.125% | | 10/15/09 | | | 1,740 | | | 1,858 | B |
| | | | | | | | | | | |
|
|
|
| | | | | |
Diversified Financial Services | | 1.3% | | | | | | | | | | | |
CIT Group Inc. | | | | 1.360% | | 11/4/05 | | | 180 | | | 181 | C |
CIT Group Inc. | | | | 4.000% | | 5/8/08 | | | 1,410 | | | 1,454 | B |
CIT Group Inc. | | | | 3.375% | | 4/1/09 | | | 150 | | | 149 | |
Citigroup Inc. | | | | 5.625% | | 8/27/12 | | | 2,470 | | | 2,702 | |
U.S. Bancorp | | | | 3.125% | | 3/15/08 | | | 1,500 | | | 1,512 | B |
Wells Fargo & Company | | | | 5.000% | | 11/15/14 | | | 1,770 | | | 1,827 | |
| | | | | | | | | | | |
|
|
|
| | | | | | | | | | | | | 7,825 | |
| | | | | | | | | | | |
|
|
|
Drug and Grocery Store Chains | | 0.3% | | | | | | | | | | | |
Safeway Inc. | | | | 1.601% | | 11/1/05 | | | 740 | | | 741 | C |
The Kroger Co. | | | | 6.200% | | 6/15/12 | | | 1,090 | | | 1,206 | |
| | | | | | | | | | | |
|
|
|
| | | | | | | | | | | | | 1,947 | |
| | | | | | | | | | | |
|
|
|
Electric | | 3.2% | | | | | | | | | | | |
American Electric Power Company, Inc. | | | | 6.125% | | 5/15/06 | | | 1,830 | | | 1,977 | |
Dominion Resources, Inc. | | | | 5.700% | | 9/17/12 | | | 2,220 | | | 2,391 | |
FirstEnergy Corp. | | | | 6.450% | | 11/15/11 | | | 4,530 | | | 4,960 | |
General Electric Company | | | | 5.000% | | 2/1/13 | | | 6,600 | | | 6,911 | |
Niagara Mohawk Power Corporation | | | | 7.750% | | 10/1/08 | | | 2,150 | | | 2,521 | |
| | | | | | | | | | | |
|
|
|
| | | | | | | | | | | | | 18,760 | |
| | | | | | | | | | | |
|
|
|
Energy | | 1.9% | | | | | | | | | | | |
DTE Energy Company | | | | 6.000% | | 6/1/04 | | | 990 | | | 997 | |
Duke Energy Corporation | | | | 6.250% | | 1/15/12 | | | 1,330 | | | 1,464 | B |
Exelon Corporation | | | | 6.750% | | 5/1/11 | | | 2,200 | | | 2,516 | B |
MidAmerican Energy Holdings Company | | | | 5.875% | | 10/1/12 | | | 1,020 | | | 1,102 | B |
Pacific Gas and Electric Company | | | | 3.600% | | 3/1/09 | | | 1,630 | | | 1,637 | |
PECO Energy Company | | | | 5.950% | | 11/1/11 | | | 325 | | | 358 | |
Progress Energy, Inc. | | | | 5.850% | | 10/30/08 | | | 1,250 | | | 1,366 | B |
Progress Energy, Inc. | | | | 7.100% | | 3/1/11 | | | 1,650 | | | 1,908 | |
| | | | | | | | | | | |
|
|
|
| | | | | | | | | | | | | 11,348 | |
| | | | | | | | | | | |
|
|
|
22
| | | | | | | | | | | | | |
| | | % OF
NET ASSETS | | RATE | | MATURITY
DATE | | PAR/
SHARES | | VALUE | |
| | |
| |
Corporate Bonds and Notes—Continued | | | | | | | | | | | | | |
| | | | | |
Environmental Services | | 0.5% | | | | | | | | | | | |
Waste Management, Inc. | | | | 7.000% | | 10/15/06 | | $ | 2,700 | | $ | 2,996 | B |
Waste Management, Inc. | | | | 6.375% | | 11/15/12 | | | 200 | | | 224 | |
| | | | | | | | | | | |
|
|
|
| | | | | | | | | | | | | 3,220 | |
| | | | | | | | | | | |
|
|
|
Food, Beverage and Tobacco | | 2.2% | | | | | | | | | | | |
Altria Group, Inc. | | | | 7.000% | | 7/15/05 | | | 2,000 | | | 2,108 | B |
Altria Group, Inc. | | | | 6.375% | | 2/1/06 | | | 460 | | | 489 | |
Nabisco Incorporated | | | | 7.050% | | 7/15/07 | | | 3,500 | | | 3,959 | |
Pepsi Bottling Holdings Inc. | | | | 5.625% | | 2/17/09 | | | 2,441 | | | 2,709 | A |
Philip Morris Companies, Inc. | | | | 6.950% | | 6/1/06 | | | 1,390 | | | 1,500 | |
Sara Lee Corporation | | | | 2.750% | | 6/15/08 | | | 2,050 | | | 2,028 | |
| | | | | | | | | | | |
|
|
|
| | | | | | | | | | | | | 12,793 | |
| | | | | | | | | | | |
|
|
|
Gas and Pipeline Utilities | | 0.4% | | | | | | | | | | | |
The Williams Companies, Inc. | | | | 8.125% | | 3/15/12 | | | 1,900 | | | 2,097 | B |
| | | | | | | | | | | |
|
|
|
| | | | | |
Health Care | | 0.4% | | | | | | | | | | | |
HCA Inc. | | | | 5.750% | | 3/15/14 | | | 2,080 | | | 2,078 | |
| | | | | | | | | | | |
|
|
|
| | | | | |
Insurance | | 0.7% | | | | | | | | | | | |
ACE INA Holdings Inc. | | | | 8.200% | | 8/15/04 | | | 1,090 | | | 1,116 | |
ACE INA Holdings Inc. | | | | 8.300% | | 8/15/06 | | | 1,610 | | | 1,822 | |
Loews Corporation | | | | 3.125% | | 9/15/07 | | | 1,240 | | | 1,225 | D |
| | | | | | | | | | | |
|
|
|
| | | | | | | | | | | | | 4,163 | |
| | | | | | | | | | | |
|
|
|
Investment Banking/Brokerage | | 2.9% | | | | | | | | | | | |
Credit Suisse First Boston USA | | | | 6.125% | | 11/15/11 | | | 2,220 | | | 2,480 | |
J.P. Morgan & Co. Incorporated | | | | 4.443% | | 2/15/12 | | | 2,190 | | | 2,376 | C |
Lehman Brothers Holdings Inc. | | | | 8.250% | | 6/15/07 | | | 1,500 | | | 1,755 | |
Lehman Brothers Holdings Inc. | | | | 7.000% | | 2/1/08 | | | 495 | | | 567 | |
Merrill Lynch & Co., Inc. | | | | 4.125% | | 1/15/09 | | | 3,130 | | | 3,228 | B |
Morgan Stanley | | | | 3.625% | | 4/1/08 | | | 250 | | | 256 | |
Morgan Stanley | | | | 5.300% | | 3/1/13 | | | 410 | | | 430 | |
Salomon Smith Barney Holdings Inc. | | | | 6.250% | | 1/15/05 | | | 2,150 | | | 2,235 | B |
The Bear Stearns Companies Inc. | | | | 2.875% | | 7/2/08 | | | 1,380 | | | 1,363 | |
The Bear Stearns Companies Inc. | | | | 5.700% | | 11/15/14 | | | 500 | | | 539 | |
The Goldman Sachs Group, Inc. | | | | 4.750% | | 7/15/13 | | | 1,270 | | | 1,270 | |
The Goldman Sachs Group, Inc. | | | | 5.250% | | 10/15/13 | | | 300 | | | 310 | |
| | | | | | | | | | | |
|
|
|
| | | | | | | | | | | | | 16,809 | |
| | | | | | | | | | | |
|
|
|
23
Annual Report to Shareholders
STATEMENT OF NET ASSETS—Continued
Western Asset Intermediate Bond Portfolio—Continued
| | | | | | | | | | | | | |
| | | % OF
NET ASSETS | | RATE | | MATURITY
DATE | | PAR/ SHARES | | VALUE | |
| | |
| |
Corporate Bonds and Notes—Continued | | | | | | | | | | | | | |
| | | | | |
Investment Management | | 0.5% | | | | | | | | | | | |
Dryden Investor Trust | | | | 7.157% | | 7/23/08 | | $ | 2,826 | | $ | 3,072 | |
| | | | | | | | | | | |
|
|
|
| | | | | |
Media | | 1.7% | | | | | | | | | | | |
America Online Inc. | | | | 0.000% | | 12/6/19 | | | 2,240 | | | 1,417 | D,E |
AOL Time Warner Inc. | | | | 6.875% | | 5/1/12 | | | 830 | | | 950 | |
Cox Enterprises, Inc. | | | | 8.000% | | 2/15/07 | | | 1,150 | | | 1,316 | A |
Liberty Media Corporation | | | | 2.610% | | 9/17/06 | | | 1,805 | | | 1,826 | C |
Turner Broadcasting System, Inc. | | | | 8.375% | | 7/1/13 | | | 2,740 | | | 3,413 | |
Viacom Inc. | | | | 5.625% | | 8/15/12 | | | 730 | | | 792 | |
| | | | | | | | | | | |
|
|
|
| | | | | | | | | | | | | 9,714 | |
| | | | | | | | | | | |
|
|
|
Oil and Gas | | 2.7% | | | | | | | | | | | |
Apache Corporation | | | | 6.250% | | 4/15/12 | | | 2,280 | | | 2,619 | |
ConocoPhillips | | | | 4.750% | | 10/15/12 | | | 1,620 | | | 1,670 | |
Occidental Petroleum Corporation | | | | 5.875% | | 1/15/07 | | | 1,920 | | | 2,097 | B |
Panhandle Eastern Pipe Line Company | | | | 4.800% | | 8/15/08 | | | 315 | | | 331 | |
Pemex Project Funding Master Trust | | | | 2.650% | | 1/7/05 | | | 1,500 | | | 1,506 | A,C |
Pemex Project Funding Master Trust | | | | 8.500% | | 2/15/08 | | | 2,570 | | | 2,997 | |
Sonat Inc. | | | | 7.625% | | 7/15/11 | | | 4,880 | | | 4,234 | |
XTO Energy, Inc. | | | | 7.500% | | 4/15/12 | | | 560 | | | 666 | |
| | | | | | | | | | | |
|
|
|
| | | | | | | | | | | | | 16,120 | |
| | | | | | | | | | | |
|
|
|
Paper and Forest Products | | 0.8% | | | | | | | | | | | |
MeadWestvaco Corporation | | | | 6.850% | | 4/1/12 | | | 2,063 | | | 2,316 | B |
Willamette Industries, Inc. | | | | 7.125% | | 7/22/13 | | | 2,270 | | | 2,633 | |
| | | | | | | | | | | |
|
|
|
| | | | | | | | | | | | | 4,949 | |
| | | | | | | | | | | |
|
|
|
Pharmaceuticals | | 0.2% | | | | | | | | | | | |
Bristol-Myers Squibb Company | | | | 5.750% | | 10/1/11 | | | 1,200 | | | 1,319 | |
| | | | | | | | | | | |
|
|
|
| | | | | |
Photo Equipment and Supplies | | N.M. | | | | | | | | | | | |
Eastman Kodak Company | | | | 7.250% | | 11/15/13 | | | 200 | | | 217 | |
| | | | | | | | | | | |
|
|
|
| | | | | |
Retail | | 0.5% | | | | | | | | | | | |
Target Corporation | | | | 5.875% | | 3/1/12 | | | 1,320 | | | 1,465 | |
Wal-Mart Stores, Inc. | | | | 3.375% | | 10/1/08 | | | 600 | | | 607 | |
Wal-Mart Stores, Inc. | | | | 4.125% | | 2/15/11 | | | 850 | | | 863 | |
| | | | | | | | | | | |
|
|
|
| | | | | | | | | | | | | 2,935 | |
| | | | | | | | | | | |
|
|
|
24
| | | | | | | | | | | | | |
| | | % OF
NET ASSETS | | RATE | | MATURITY
DATE | | PAR/ SHARES | | VALUE | |
| | |
| |
Corporate Bonds and Notes—Continued | | | | | | | | | | | | | |
| | | | | |
Special Purpose | | 2.3% | | | | | | | | | | | |
BAE Systems Holdings Inc. | | | | 6.400% | | 12/15/11 | | $ | 1,450 | | $ | 1,609 | A |
DaimlerChrysler NA Holding Corporation | | | | 2.130% | | 8/8/06 | | | 2,000 | | | 2,023 | C |
DaimlerChrysler NA Holding Corporation | | | | 7.300% | | 1/15/12 | | | 2,170 | | | 2,502 | |
Devon Financing Corporation ULC | | | | 6.875% | | 9/30/11 | | | 500 | | | 579 | B |
Sprint Capital Corporation | | | | 8.375% | | 3/15/12 | | | 3,212 | | | 3,911 | |
Verizon Global Funding Corp. | | | | 6.875% | | 6/15/12 | | | 2,500 | | | 2,888 | |
| | | | | | | | | | | |
|
|
|
| | | | | | | | | | | | | 13,512 | |
| | | | | | | | | | | |
|
|
|
Telecommunications | | 0.3% | | | | | | | | | | | |
Pacific Bell | | | | 6.125% | | 2/15/08 | | | 1,800 | | | 1,994 | |
| | | | | | | | | | | |
|
|
|
| | | | | |
Telecommunications (Cellular/Wireless) | | 0.8% | | | | | | | | | | | |
AT&T Wireless Services Inc. | | | | 7.350% | | 3/1/06 | | | 500 | | | 548 | |
AT&T Wireless Services Inc. | | | | 8.125% | | 5/1/12 | | | 3,232 | | | 3,937 | |
| | | | | | | | | | | |
|
|
|
| | | | | | | | | | | | | 4,485 | |
| | | | | | | | | | | |
|
|
|
Transportation | | 1.5% | | | | | | | | | | | |
Delta Air Lines, Inc. | | | | 6.619% | | 3/18/11 | | | 1,710 | | | 1,690 | |
Delta Air Lines, Inc. | | | | 6.718% | | 7/2/23 | | | 2,556 | | | 2,754 | |
The Hertz Corporation | | | | 1.660% | | 8/13/04 | | | 2,500 | | | 2,499 | C |
U.S. Airways | | | | 6.850% | | 1/30/18 | | | 1,392 | | | 1,315 | |
Union Pacific Corporation | | | | 7.250% | | 11/1/08 | | | 250 | | | 289 | |
| | | | | | | | | | | |
|
|
|
| | | | | | | | | | | | | 8,547 | |
| | | | | | | | | | | |
|
|
|
Total Corporate Bonds and Notes
(Identified Cost—$187,643) | | | | | | | | | | | | 195,742 | |
| |
Asset-Backed Securities | | 13.3% | | | | | | | | | | | |
| | | | | |
Fixed Rate Securities | | 4.0% | | | | | | | | | | | |
ABFS Mortgage Loan Trust 2002-3 | | | | 4.263% | | 9/15/33 | | | 4,861 | | | 4,948 | F |
ARG Funding Corp. 1999-1A | | | | 6.020% | | 5/20/05 | | | 1,253 | | | 1,256 | A |
Asset Backed Funding Certificates 2002-WF2 | | | | 2.858% | | 5/25/32 | | | 1,253 | | | 1,271 | |
Chevy Chase 1997-A | | | | 7.650% | | 12/20/07 | | | 84 | | | 86 | |
Chevy Chase Home Loan Trust 1996-1 | | | | 7.150% | | 5/15/15 | | | 80 | | | 81 | |
Conseco Finance Securitizations Corp. 2000-4 | | | | 8.310% | | 5/1/32 | | | 800 | | | 690 | |
Ford Credit Auto Owner Trust 2002-B | | | | 4.140% | | 12/15/05 | | | 3,069 | | | 3,104 | |
Green Tree Financial Corporation 1994-6 | | | | 8.900% | | 1/15/20 | | | 3,800 | | | 4,215 | |
Green Tree Recreational, Equipment and Consumer Trust 1998-C | | | | 6.700% | | 2/15/14 | | | 2,812 | | | 2,841 | |
Guaranteed Export Certificates 1995-B | | | | 6.130% | | 6/15/04 | | | 118 | | | 119 | |
Mego Mortgage Home Loan Trust 1996-2 | | | | 7.275% | | 9/25/16 | | | 77 | | | 77 | |
25
Annual Report to Shareholders
STATEMENT OF NET ASSETS—Continued
Western Asset Intermediate Bond Portfolio—Continued
| | | | | | | | | | | | | |
| | | % OF
NET ASSETS | | RATE | | MATURITY
DATE | | PAR/
SHARES | | VALUE | |
| | |
| |
Asset-Backed Securities—Continued | | | | | | | | | | | | | |
| | | | | |
Fixed Rate Securities—Continued | | | | | | | | | | | | | |
UCFC Home Equity Loan 1998-D | | | | 6.905% | | 4/15/30 | | $ | 790 | | $ | 834 | |
WFS Financial Owner Trust 2002-2 | | | | 3.810% | | 2/20/07 | | | 4,132 | | | 4,180 | |
| | | | | | | | | | | |
|
|
|
| | | | | | | | | | | | | 23,702 | |
| | | | | | | | | | | |
|
|
|
Indexed SecuritiesB | | 9.0% | | | | | | | | | | | |
AFC Home Equity Loan Trust 2003-3 | | | | 1.440% | | 10/25/30 | | | 3,610 | | | 3,603 | A |
AmeriCredit Automobile Receivables Trust
2003-BX | | | | 1.290% | | 11/6/06 | | | 3,318 | | | 3,320 | |
Amresco Residential Securities Mortgage Loan Trust 1998-2 | | | | 1.640% | | 6/25/28 | | | 651 | | | 650 | |
Asset Backed Securities Corporation Home Equity Loan Trust 2002-HE2 | | | | 1.390% | | 8/15/32 | | | 3,753 | | | 3,760 | |
Capital One Auto Finance Trust 2003-A | | | | 1.250% | | 10/15/07 | | | 5,500 | | | 5,511 | |
CNH Equipment Trust 2003-A | | | | 1.270% | | 7/16/07 | | | 5,500 | | | 5,502 | |
Countrywide Asset-Backed Certificates 2002-BC1 | | | | 1.420% | | 4/25/32 | | | 3,522 | | | 3,528 | |
Household Home Equity Loan Trust 2002-3 | | | | 1.540% | | 7/20/32 | | | 3,917 | | | 3,928 | |
IndyMac Home Equity Loan Asset-Backed
Trust 2001-A | | | | 1.350% | | 3/25/31 | | | 2,271 | | | 2,268 | |
Mesa 2002-1 Global Issuance Company Home Loan Asset Backed Notes | | | | 1.440% | | 2/18/33 | | | 755 | | | 755 | A |
Metris Master Trust 2001-4A | | | | 1.440% | | 8/20/08 | | | 1,370 | | | 1,366 | B |
MMCA Automobile Trust 2002-1 | | | | 1.370% | | 1/15/10 | | | 1,434 | | | 1,432 | |
MSDWCC HELOC Trust 2003-1 | | | | 1.360% | | 11/25/15 | | | 4,697 | | | 4,706 | |
Residential Asset Securities Corporation 2003-KS1 | | | | 1.460% | | 1/25/33 | | | 5,499 | | | 5,515 | |
Saxon Asset Securities Trust 2003-3 | | | | 1.230% | | 12/25/33 | | | 1,320 | | | 1,321 | |
Sovereign Dealer Floor Plan Master LLC 2000-1A | | | | 1.340% | | 10/15/07 | | | 5,500 | | | 5,510 | A |
| | | | | | | | | | | |
|
|
|
| | | | | | | | | | | | | 52,675 | |
| | | | | | | | | | | |
|
|
|
Stripped Securities | | 0.3% | | | | | | | | | | | |
ACA CDS 2002-1, Ltd. | | | | 5.484% | | 7/15/08 | | | 7,600 | | | 812 | G1 |
Oakwood Mortgage Investors Inc. 2001-C | | | | 6.000% | | 5/15/08 | | | 5,700 | | | 918 | G1 |
| | | | | | | | | | | |
|
|
|
| | | | | | | | | | | | | 1,730 | |
| | | | | | | | | | | |
|
|
|
Total Asset-Backed Securities
(Identified Cost—$77,905) | | | | | | | | | | | | 78,107 | |
| |
Mortgage-Backed Securities | | 6.0% | | | | | | | | | | | |
| | | | | |
Fixed Rate Securities | | 1.9% | | | | | | | | | | | |
Asset Securitization Corporation 1996-D2 | | | | 6.920% | | 2/14/29 | | | 861 | | | 918 | |
26
| | | | | | | | | | | | | |
| | | % OF
NET ASSETS | | RATE | | MATURITY
DATE | | PAR/
SHARES | | VALUE | |
| | |
| |
Mortgage-Backed Securities—Continued | | | | | | | | | | | | | |
| | | | | |
Fixed Rate Securities—Continued | | | | | | | | | | | | | |
GMAC Commercial Mortgage Securities Inc.
1998-C1 | | | | 6.700% | | 5/15/30 | | $ | 1,000 | | $ | 1,132 | |
GMAC Commercial Mortgage Securities Inc.
1998-C2 | | | | 6.150% | | 11/15/07 | | | 1,597 | | | 1,655 | |
Merrill Lynch Mortgage Investors, Inc. 1998-C1 | | | | 6.310% | | 11/15/26 | | | 732 | | | 765 | |
Morgan Stanley Capital I 1995-GAL1 | | | | 7.950% | | 8/15/27 | | | 2,650 | | | 2,836 | A |
Nomura Asset Securities Corporation 1996-MD5 | | | | 7.120% | | 4/13/36 | | | 1,500 | | | 1,633 | |
Ocwen Residential MBS Corporation 1998-R1 | | | | 7.000% | | 10/25/40 | | | 877 | | | 913 | A,F |
Wells Fargo Mortgage Backed Securities Trust
2002-18 | | | | 5.500% | | 12/25/32 | | | 1,379 | | | 1,396 | |
| | | | | | | | | | | |
|
|
|
| | | | | | | | | | | | | 11,248 | |
| | | | | | | | | | | |
|
|
|
Indexed SecuritiesC | | 4.1% | | | | | | | | | | | |
Commercial Mortgage Pass-Through Certificates 2002-F17 | | | | 1.440% | | 11/15/14 | | | 5,000 | | | 4,999 | A |
Countrywide Home Loans 2003-49 | | | | 3.696% | | 10/25/33 | | | 1,000 | | | 1,000 | |
Credit Suisse First Boston Mortgage Securities Corp.
2003-TFLA1 | | | | 1.360% | | 4/15/13 | | | 5,420 | | | 5,420 | A |
G-Wing Limited 2001-WH1A | | | | 3.750% | | 11/6/11 | | | 1,393 | | | 1,389 | A |
Impac CMB Trust 2001-3 | | | | 1.460% | | 11/25/31 | | | 2,544 | | | 2,549 | |
Impac CMB Trust 2002-5 | | | | 1.460% | | 7/25/32 | | | 3,055 | | | 3,063 | |
Impac CMB Trust 2003-12 | | | | 1.470% | | 12/25/33 | | | 5,659 | | | 5,675 | |
Paragon Hotel Finance Company 2003-CTF | | | | 2.590% | | 11/15/13 | | | 100 | | | 101 | A |
| | | | | | | | | | | |
|
|
|
| | | | | | | | | | | | | 24,196 | |
| | | | | | | | | | | |
|
|
|
Stripped Securities | | N.M. | | | | | | | | | | | |
FFCA Secured Lending Corporation 1997-1 | | | | 0.611% | | 2/18/15 | | | 4,412 | | | 59 | A,G1 |
| | | | | | | | | | | |
|
|
|
| | | | | |
Variable Rate SecuritiesH | | N.M. | | | | | | | | | | | |
Housing Securities Inc. 1995-RP1 | | | | 1.640% | | 11/25/26 | | | 82 | | | 81 | |
Securitized Asset Sales, Inc. 1994-4 | | | | 3.909% | | 8/25/33 | | | 2 | | | 2 | |
| | | | | | | | | | | |
|
|
|
| | | | | | | | | | | | | 83 | |
| | | | | | | | | | | |
|
|
|
Total Mortgage-Backed Securities
(Identified Cost—$35,799) | | | | | | | | | | | | 35,586 | |
| |
U.S. Government and Agency Obligations | | 30.8% | | | | | | | | | | | |
| | | | | |
Fixed Rate Securities | | 24.7% | | | | | | | | | | | |
Fannie Mae | | | | 5.500% | | 5/2/06 | | | 3,900 | | | 4,191 | B |
Fannie Mae | | | | 6.000% | | 1/18/12 | | | 9,420 | | | 9,766 | B |
Fannie Mae | | | | 6.125% | | 3/15/12 | | | 3,160 | | | 3,621 | B |
Fannie Mae | | | | 4.375% | | 3/15/13 | | | 3,540 | | | 3,606 | B |
Freddie Mac | | | | 6.250% | | 8/13/04 | | | 250 | | | 255 | |
27
Annual Report to Shareholders
STATEMENT OF NET ASSETS—Continued
Western Asset Intermediate Bond Portfolio—Continued
| | | | | | | | | | | | | |
| | | % OF
NET ASSETS | | RATE | | MATURITY
DATE | | PAR/
SHARES | | VALUE | |
| | |
| |
U.S. Government and Agency
Obligations—Continued | | | | | | | | | | | | | |
| | | | | |
Fixed Rate Securities—Continued | | | | | | | | | | | | | |
Freddie Mac | | | | 5.800% | | 3/30/09 | | $ | 600 | | $ | 675 | |
Freddie Mac | | | | 3.000% | | 4/15/09 | | | 4,410 | | | 4,376 | B |
Freddie Mac | | | | 4.750% | | 10/11/12 | | | 11,030 | | | 11,165 | B |
Freddie Mac | | | | 5.250% | | 11/5/12 | | | 7,660 | | | 7,941 | B |
Freddie Mac | | | | 4.500% | | 1/15/13 | | | 2,450 | | | 2,517 | B |
Overseas Private Investment Corporation | | | | 7.740% | | 8/15/07 | | | 3,000 | | | 3,036 | |
Tennessee Valley Authority | | | | 5.375% | | 11/13/08 | | | 6,320 | | | 6,955 | |
United States Treasury Notes | | | | 1.875% | | 12/31/05 | | | 9,770 | | | 9,838 | B |
United States Treasury Notes | | | | 1.500% | | 3/31/06 | | | 10,000 | | | 9,984 | |
United States Treasury Notes | | | | 2.250% | | 2/15/07 | | | 4,390 | | | 4,427 | B |
United States Treasury Notes | | | | 4.375% | | 5/15/07 | | | 980 | | | 1,048 | B |
United States Treasury Notes | | | | 6.625% | | 5/15/07 | | | 2,290 | | | 2,606 | |
United States Treasury Notes | | | | 3.000% | | 2/15/08 | | | 680 | | | 696 | B |
United States Treasury Notes | | | | 2.625% | | 5/15/08 | | | 26,610 | | | 26,772 | B |
United States Treasury Notes | | | | 3.250% | | 8/15/08 | | | 2,750 | | | 2,828 | B |
United States Treasury Notes | | | | 3.375% | | 11/15/08 | | | 1,490 | | | 1,535 | B |
United States Treasury Notes | | | | 3.375% | | 12/15/08 | | | 2,690 | | | 2,769 | B |
United States Treasury Notes | | | | 2.625% | | 3/15/09 | | | 440 | | | 437 | |
United States Treasury Notes | | | | 4.000% | | 11/15/12 | | | 1,205 | | | 1,236 | B |
United States Treasury Notes | | | | 4.250% | | 8/15/13 | | | 455 | | | 472 | B |
United States Treasury Notes | | | | 4.000% | | 2/15/14 | | | 15,280 | | | 15,481 | B |
United States Treasury Notes | | | | 6.500% | | 11/15/26 | | | 5,105 | | | 6,280 | B |
| | | | | | | | | | | |
|
|
|
| | | | | | | | | | | | | 144,513 | |
| | | | | | | | | | | |
|
|
|
Indexed SecuritiesI | | 5.5% | | | | | | | | | | | |
United States Treasury Inflation-Protected Security | | | | 3.000% | | 7/15/12 | | | 23,563 | | | 26,821 | B |
United States Treasury Inflation-Protected Security | | | | 1.875% | | 7/15/13 | | | 706 | | | 735 | B |
United States Treasury Inflation-Protected Security | | | | 3.625% | | 4/15/28 | | | 3,698 | | | 4,873 | B |
| | | | | | | | | | | |
|
|
|
| | | | | | | | | | | | | 32,429 | |
| | | | | | | | | | | |
|
|
|
Stripped Securities | | 0.6% | | | | | | | | | | | |
United States Treasury Notes | | | | 0.000% | | 5/15/30 | | | 14,100 | | | 3,698 | G2 |
| | | | | | | | | | | |
|
|
|
Total U.S. Government and Agency Obligations
(Identified Cost—$176,676) | | | | | | | | | | | | 180,640 | |
| |
28
| | | | | | | | | | | | | |
| | | % OF
NET ASSETS | | RATE | | MATURITY
DATE | | PAR/
SHARES | | VALUE | |
| | |
| |
U.S. Government Agency Mortgage-Backed Securities | | 4.5% | | | | | | | | | | | |
| | | | | |
Fixed Rate Securities | | 4.5% | | | | | | | | | | | |
Fannie Mae | | | | 7.000% | | 4/1/08 to 7/1/28 | | $ | 4,131 | | $ | 4,395 | |
Fannie Mae | | | | 7.250% | | 1/15/10 | | | 200 | | | 240 | B |
Fannie Mae | | | | 4.750% | | 2/21/13 | | | 3,350 | | | 3,391 | B |
Fannie Mae | | | | 6.000% | | 7/1/13 to 6/1/28 | | | 314 | | | 328 | |
Fannie Mae | | | | 5.125% | | 1/2/14 | | | 1,300 | | | 1,355 | |
Fannie Mae | | | | 6.500% | | 6/1/14 to 8/1/29 | | | 1,207 | | | 1,273 | |
Fannie Mae | | | | 8.000% | | 9/1/15 | | | 175 | | | 188 | |
Fannie Mae | | | | 9.500% | | 4/1/21 | | | 109 | | | 122 | |
Fannie Mae | | | | 5.000% | | 7/1/33 to 8/1/33 | | | 8,570 | | | 8,616 | |
Freddie Mac | | | | 8.500% | | 7/1/06 | | | 3 | | | 3 | |
Freddie Mac | | | | 6.500% | | 6/1/13 to 11/1/15 | | | 167 | | | 177 | |
Freddie Mac | | | | 7.500% | | 4/1/17 | | | 24 | | | 26 | |
Freddie Mac | | | | 9.300% | | 4/15/19 | | | 156 | | | 156 | |
Freddie Mac | | | | 6.000% | | 12/15/28 | | | 1,640 | | | 1,668 | |
Government National Mortgage Association | | | | 9.500% | | 9/15/05 | | | 21 | | | 22 | |
Government National Mortgage Association | | | | 9.000% | | 6/15/06 | | | 49 | | | 52 | |
Government National Mortgage Association | | | | 7.000% | | 10/1/27 | | | 4,000 | | | 4,260 | J |
Government National Mortgage Association | | | | 7.000% | | 2/15/28 to 12/15/28 | | | 120 | | | 128 | |
| | | | | | | | | | | |
|
|
|
| | | | | | | | | | | | | 26,400 | |
| | | | | | | | | | | |
|
|
|
| | | | | |
Stripped Securities | | N.M. | | | | | | | | | | | |
Fannie Mae | | | | 0.000% | | 5/25/22 | | | 29 | | | 27 | G2 |
Freddie Mac | | | | 10.000% | | 3/1/21 | | | 23 | | | 5 | G1 |
| | | | | | | | | | | |
|
|
|
| | | | | | | | | | | | | 32 | |
| | | | | | | | | | | |
|
|
|
Variable Rate SecuritiesH | | N.M. | | | | | | | | | | | |
Fannie Mae | | | | 3.390% | | 3/1/18 | | | 56 | | | 58 | |
Freddie Mac | | | | 3.763% | | 1/1/19 | | | 24 | | | 24 | |
| | | | | | | | | | | |
|
|
|
| | | | | | | | | | | | | 82 | |
| | | | | | | | | | | |
|
|
|
Total U.S. Government Agency Mortgage-Backed
Securities (Identified Cost—$25,924) | | | | | | | | | | | | 26,514 | |
| |
29
Annual Report to Shareholders
STATEMENT OF NET ASSETS—Continued
Western Asset Intermediate Bond Portfolio—Continued
| | | | | | | | | | | | | |
| | | % OF
NET ASSETS | | RATE | | MATURITY
DATE | | PAR/
SHARES | | VALUE | |
| | |
| |
Yankee BondsK | | 4.4% | | | | | | | | | | | |
| | | | | |
Banks | | N.M. | | | | | | | | | | | |
The Korea Development Bank | | | | 4.250% | | 11/13/07 | | $ | 60 | | $ | 62 | |
| | | | | | | | | | | |
|
|
|
| | | | | |
Diversified Financial Services | | 0.5% | | | | | | | | | | | |
Pemex Finance LTD. | | | | 7.800% | | 2/15/13 | | | 2,400 | | | 2,913 | |
| | | | | | | | | | | |
|
|
|
| | | | | |
Electric | | 0.4% | | | | | | | | | | | |
SP PowerAssets Limited | | | | 5.000% | | 10/22/13 | | | 1,965 | | | 2,023 | A |
| | | | | | | | | | | |
|
|
|
| | | | | |
Foreign Governments | | 0.6% | | | | | | | | | | | |
Republic of Chile | | | | 1.520% | | 1/28/08 | | | 2,410 | | | 2,413 | C |
United Mexican States | | | | 8.375% | | 1/14/11 | | | 1,120 | | | 1,361 | |
| | | | | | | | | | | |
|
|
|
| | | | | | | | | | | | | 3,774 | |
| | | | | | | | | | | |
|
|
|
Insurance | | 0.1% | | | | | | | | | | | |
XL Capital plc | | | | 6.500% | | 1/15/12 | | | 700 | | | 799 | B |
| | | | | | | | | | | |
|
|
|
| | | | | |
Manufacturing (Diversified) | | 1.1% | | | | | | | | | | | |
Tyco International Group SA | | | | 5.875% | | 11/1/04 | | | 1,000 | | | 1,023 | |
Tyco International Group SA | | | | 5.800% | | 8/1/06 | | | 3,030 | | | 3,219 | |
Tyco International Group SA | | | | 6.000% | | 11/15/13 | | | 1,700 | | | 1,792 | A |
Tyco International Group SA | | | | 7.000% | | 6/15/28 | | | 60 | | | 64 | |
Tyco International Group SA | | | | 6.875% | | 1/15/29 | | | 120 | | | 126 | |
| | | | | | | | | | | |
|
|
|
| | | | | | | | | | | | | 6,224 | |
| | | | | | | | | | | |
|
|
|
Oil and Gas | | 0.2% | | | | | | | | | | | |
Anderson Exploration Ltd. | | | | 6.750% | | 3/15/11 | | | 1,250 | | | 1,415 | |
| | | | | | | | | | | |
|
|
|
| | | | | |
Special Purpose | | 0.8% | | | | | | | | | | | |
Deutsche Telekom International Finance BV | | | | 8.500% | | 6/15/10 | | | 1,300 | | | 1,596 | |
Diageo Capital Plc | | | | 3.375% | | 3/20/08 | | | 2,090 | | | 2,122 | |
Petrozuata Finance, Inc. | | | | 8.220% | | 4/1/17 | | | 1,090 | | | 992 | A |
| | | | | | | | | | | |
|
|
|
| | | | | | | | | | | | | 4,710 | |
| | | | | | | | | | | |
|
|
|
Telecommunications | | 0.7% | | | | | | | | | | | |
Koninklijke KPN NV | | | | 8.000% | | 10/1/10 | | | 1,600 | | | 1,949 | |
Telecom Italia S.p.A. | | | | 4.000% | | 11/15/08 | | | 1,800 | | | 1,840 | A |
| | | | | | | | | | | |
|
|
|
| | | | | | | | | | | | | 3,789 | |
| | | | | | | | | | | |
|
|
|
Total Yankee Bonds
(Identified Cost—$24,094) | | | | | | | | | | | | 25,709 | |
| |
30
| | | | | | | | | | | | | | |
| | | % OF
NET ASSETS | | RATE | | MATURITY
DATE | | PAR/
SHARES | | | VALUE | |
| | |
| |
Preferred Stocks | | 0.2% | | | | | | | | | | | | |
Home Ownership Funding Corporation | | | | 13.331% | | | | | 6 | shs | | $ | 286 | A,F |
Home Ownership Funding Corporation II | | | | 13.338% | | | | | 18 | | | | 858 | A,F |
| | | | | | | | | | | | |
|
|
|
Total Preferred Stocks (Identified Cost—$1,942) | | | | | | | | | | | | | 1,144 | |
| | | | | | | | | | | | |
|
|
|
Total Long-Term Securities
(Identified Cost—$529,983) | | | | | | | | | | | | | 543,442 | |
| |
Investment of Proceeds From Securities Lending | | 25.4% | | | | | | | | | | | | |
State Street Navigator Securities Lending Prime Portfolio | | | | | | | | | 149,628 | | | | 149,628 | |
| | | | | | | | | | | | |
|
|
|
Total Investment of Proceeds From Securities Lending (Identified Cost—$149,628) | | | | | | | | | | | | | 149,628 | |
| |
Short-Term Securities | | 7.5% | | | | | | | | | | | | |
| | | | | |
U.S. Government and Agency Obligations | | 2.3% | | | | | | | | | | | | |
Fannie Mae | | | | 0.000% | | 9/8/04 | | $ | 3,250 | | | | 3,235 | E,L |
Federal Farm Credit Bank | | | | 0.000% | | 4/6/04 | | | 380 | | | | 380 | E |
Freddie Mac | | | | 0.000% | | 4/5/04 | | | 2,200 | | | | 2,200 | E |
Freddie Mac | | | | 0.000% | | 4/5/04 | | | 3,410 | | | | 3,409 | E |
Freddie Mac | | | | 0.000% | | 4/6/04 | | | 1,100 | | | | 1,100 | E |
Freddie Mac | | | | 0.000% | | 4/6/04 | | | 2,560 | | | | 2,560 | E |
Freddie Mac | | | | 0.000% | | 4/7/04 | | | 400 | | | | 400 | E |
| | | | | | | | | | | | |
|
|
|
| | | | | | | | | | | | | | 13,284 | |
| | | | | | | | | | | | |
|
|
|
| | | | | |
Corporate Bonds and Notes | | 0.4% | | | | | | | | | | | | |
Eastman Kodak Company | | | | 2.149% | | 9/15/04 | | | 2,136 | | | | 2,135 | |
| | | | | | | | | | | | |
|
|
|
| | | | | |
Options PurchasedM | | N.M. | | | | | | | | | | | | |
U.S. Treasury Note Futures Call, September 2004, Strike Price $119 | | | | | | | | | 119 | N | | | 75 | |
| | | | | | | | | | | | |
|
|
|
31
Annual Report to Shareholders
STATEMENT OF NET ASSETS—Continued
Western Asset Intermediate Bond Portfolio—Continued
| | | | | | | | | |
| | | % OF
NET ASSETS | | PAR/
SHARES | | VALUE | |
| | |
| |
Short-Term Securities—Continued | | | | | | | | | |
| | | |
Repurchase Agreements | | 4.8% | | | | | | | |
Credit Suisse First Boston USA
1.04%, dated 3/31/04, to be repurchased at $12,405 on 4/1/04 (Collateral: $12,420 Freddie Mac notes, 3.75%, due 4/15/04, value $12,868) | | | | $ | 12,405 | | $ | 12,405 | |
Deutsche Bank AG
1.04%, dated 3/31/04, to be repurchased at $16,000 on 4/1/04 (Collateral: $15,152 Fannie Mae notes, 4.375%, due 10/15/06, value $16,629) | | | | | 16,000 | | | 16,000 | |
| | | | | | | |
|
|
|
| | | | | | | | | 28,405 | |
| | | | | | | |
|
|
|
| | | | | | | | | | |
Total Short-Term Securities (Identified Cost—$43,910) | | | | | | | | 43,899 | |
| |
Total Investments (Identified Cost—$723,521) | | 125.5% | | | | | | 736,969 | |
Obligation to Return Collateral for Securities Loaned | | (25.5)% | | | | | | (149,628 | ) |
Other Assets Less Liabilities | | N.M. | | | | | | (112 | ) |
| | | | | | | |
|
|
|
| | | |
Net assets consist of: | | | | | | | | | |
Accumulated paid-in capital applicable to
53,331 Institutional Class shares outstanding | | | | $ | 558,509 | | | | |
Under/(Over) distributed net investment income | | | | | 82 | | | | |
Accumulated net realized gain/(loss) on investments, options, futures and swaps | | | | | 15,038 | | | | |
Unrealized appreciation/(depreciation) of investments, options, futures and swaps | | | | | 13,600 | | | | |
| | | | |
|
| | | | |
| | | |
Net assets | | 100.0% | | | | | $ | 587,229 | |
| | | | | | | |
|
|
|
| | | |
Net asset value per share: | | | | | | | | | |
Institutional Class | | | | | | |
| $11.01
|
|
32
| | | | | | | | |
| | | |
| | | EXPIRATION | | ACTUAL
CONTRACTS | | APPRECIATION/
(DEPRECIATION) | |
| | |
| |
Futures Contracts PurchasedM | | | | | | | | |
Eurodollar Futures | | December 2004 | | 144 | | $ | 446 | |
U.S. Treasury Note Futures | | June 2004 | | 240 | | | 297 | |
| | | | | | |
|
|
|
| | | | | | | | $ 743 | |
| | | | | | |
|
|
|
Futures Contracts WrittenM | | | | | | | | |
U.S. Treasury Note Futures | | June 2004 | | 75 | | $ | 1 | |
U.S. Treasury Note Futures | | June 2004 | | 73 | | | 60 | |
| | | | | | |
|
|
|
| | | | | | | | $ 61 | |
| | | | | | |
|
|
|
Options WrittenM | | | | | | | | |
Deutsche Bank, Swaption Put, Strike Price $100.00 | | September 2004 | | 13,400,000 | | $ | 136 | |
Eurodollar Futures Call, Strike Price $98.00 | | December 2004 | | 102 | | | (73 | ) |
U.S. Treasury Note Futures Call, Strike Price $112.00 | | June 2004 | | 397 | | | (811 | ) |
U.S. Treasury Note Futures Call, Strike Price $116.00 | | September 2004 | | 253 | | | (163 | ) |
U.S. Treasury Note Futures Put, Strike Price $110.00 | | June 2004 | | 293 | | | 301 | |
U.S. Treasury Note Futures Put, Strike Price $108.00 | | September 2004 | | 145 | | | 58 | |
U.S. Treasury Note Futures Put, Strike Price $109.00 | | September 2004 | | 119 | | | (15 | ) |
| | | | | | |
|
|
|
| | | | | | | $ | (567 | ) |
| | | | | | |
|
|
|
| | | | | | | | | |
| |
| A | Rule 144a Security – A security purchased pursuant to Rule 144a under the Securities Act of 1933 which may not be resold subject to that rule except to qualified institutional buyers. These securities represent 7.7% of net assets. |
| B | All or a portion of this security is on loan. See Note 4 to the financial statements. |
| C | Indexed security – The rates of interest earned on these securities are tied to the London Interbank Offered Rate (“LIBOR”), the Consumer Price Index (“CPI”), or the one-year Treasury Bill rate. The coupon rates are the rates as of March 31, 2004. |
| D | Convertible security – Security may be converted into the issuer’s common stock. |
| E | Zero coupon bond – A bond with no periodic interest payments which is sold at such a discount as to produce a current yield to maturity. |
| F | Stepped coupon security – A security with a predetermined schedule of interest or dividend rate changes, at which time it begins to accrue interest or pay dividends. |
| G | Stripped security – Security with interest-only or principal-only payment streams, denoted by a 1 or 2, respectively. For interest-only securities, the amount shown as principal is the notional balance used to calculate the amount of interest due. |
| H | The coupon rates shown on variable rate securities are the rates at March 31, 2004. These rates vary with the weighted average coupon of the underlying loans. |
| I | Inflation-Protected Security – Security whose principal value is adjusted daily or monthly in accordance with changes to the Consumer Price Index for All Urban Consumers. Interest is calculated on the basis of the current adjusted principal value. |
| J | When-issued security – Security purchased on a delayed delivery basis. Final settlement amount and maturity date have not yet been announced. |
| K | Yankee Bond – A dollar-denominated bond issued in the U.S. by foreign entities. |
| L | Collateral to cover futures and option contracts. |
| M | Options and futures are described in more detail in the notes to financial statements. |
| N | Represents actual number of contracts. |
See notes to financial statements.
33
Annual Report to Shareholders
STATEMENT OF NET ASSETS
March 31, 2004
(Amounts in Thousands)
Western Asset Core Bond Portfolio
| | | | | | | | | | | | | |
| | | % OF
NET ASSETS | | RATE | | MATURITY
DATE | | PAR/
SHARES | | VALUE | |
| | |
| |
| | | | | |
Long-Term Securities | | 107.3% | | | | | | | | | | | |
| | | | | |
Corporate Bonds and Notes | | 21.3% | | | | | | | | | | | |
| | | | | |
Aerospace/Defense | | 0.2% | | | | | | | | | | | |
Lockheed Martin Corporation | | | | 7.650% | | 5/1/16 | | $ | 225 | | $ | 280 | |
Raytheon Company | | | | 6.000% | | 12/15/10 | | | 125 | | | 140 | |
Raytheon Company | | | | 5.500% | | 11/15/12 | | | 65 | | | 69 | |
Raytheon Company | | | | 5.375% | | 4/1/13 | | | 705 | | | 738 | A |
Systems 2001 Asset Trust | | | | 6.664% | | 9/15/13 | | | 3,189 | | | 3,582 | B |
| | | | | | | | | | | |
|
|
|
| | | | | | | | | | | | | 4,809 | |
| | | | | | | | | | | |
|
|
|
Automotive | | N.M. | | | | | | | | | | | |
General Motors Corporation | | | | 7.125% | | 7/15/13 | | | 100 | | | 109 | A |
| | | | | | | | | | | |
|
|
|
| | | | | |
Banking and Finance | | 3.8% | | | | | | | | | | | |
Beneficial Corporation | | | | 6.750% | | 7/20/04 | | | 200 | | | 203 | |
Boeing Capital Corporation | | | | 7.375% | | 9/27/10 | | | 3,240 | | | 3,845 | |
Ford Motor Credit Company | | | | 6.875% | | 2/1/06 | | | 11,410 | | | 12,136 | |
Ford Motor Credit Company | | | | 6.500% | | 1/25/07 | | | 5,000 | | | 5,341 | |
Ford Motor Credit Company | | | | 5.800% | | 1/12/09 | | | 11,110 | | | 11,454 | A |
Ford Motor Credit Company | | | | 7.375% | | 10/28/09 | | | 4,580 | | | 5,027 | |
Ford Motor Credit Company | | | | 7.875% | | 6/15/10 | | | 7,450 | | | 8,336 | |
Ford Motor Credit Company | | | | 7.375% | | 2/1/11 | | | 1,825 | | | 1,991 | |
Ford Motor Credit Company | | | | 7.250% | | 10/25/11 | | | 360 | | | 390 | |
General Motors Acceptance Corporation | | | | 7.625% | | 6/15/04 | | | 100 | | | 101 | |
General Motors Acceptance Corporation | | | | 6.125% | | 9/15/06 | | | 8,090 | | | 8,650 | |
General Motors Acceptance Corporation | | | | 6.125% | | 2/1/07 | | | 4,800 | | | 5,158 | |
General Motors Acceptance Corporation | | | | 7.250% | | 3/2/11 | | | 2,220 | | | 2,464 | |
General Motors Acceptance Corporation | | | | 0.000% | | 6/15/15 | | | 13,910 | | | 6,887 | C |
Household Finance Corporation | | | | 7.875% | | 3/1/07 | | | 2,800 | | | 3,213 | A |
Household Finance Corporation | | | | 8.000% | | 7/15/10 | | | 690 | | | 845 | |
Household Finance Corporation | | | | 7.000% | | 5/15/12 | | | 700 | | | 822 | |
Household Finance Corporation | | | | 6.375% | | 11/27/12 | | | 440 | | | 498 | |
SB Treasury Company LLC | | | | 9.400% | | 12/29/49 | | | 2,930 | | | 3,428 | B |
SLM Corporation | | | | 3.050% | | 4/1/09 | | | 7,620 | | | 7,667 | D |
| | | | | | | | | | | |
|
|
|
| | | | | | | | | | | | | 88,456 | |
| | | | | | | | | | | |
|
|
|
Banks | | 0.6% | | | | | | | | | | | |
Bank of America Corporation | | | | 5.250% | | 2/1/07 | | | 3,200 | | | 3,453 | |
Bank of America Corporation | | | | 7.400% | | 1/15/11 | | | 1,500 | | | 1,801 | A |
Bank One Corporation | | | | 7.875% | | 8/1/10 | | | 4,500 | | | 5,503 | |
34
| | | | | | | | | | | | | |
| | | % OF
NET ASSETS | | RATE | | MATURITY
DATE | | PAR/
SHARES | | VALUE | |
| | |
| |
Corporate Bonds and Notes—Continued | | | | | | | | | | | | | |
| | | | | |
Banks—Continued | | | | | | | | | | | | | |
Bank One Corporation | | | | 5.900% | | 11/15/11 | | $ | 2,000 | | $ | 2,234 | |
Firstar Bank NA | | | | 7.125% | | 12/1/09 | | | 450 | | | 531 | |
Wells Fargo Bank NA, San Francisco | | | | 6.450% | | 2/1/11 | | | 510 | | | 586 | |
| | | | | | | | | | | |
|
|
|
| | | | | | | | | | | | | 14,108 | |
| | | | | | | | | | | |
|
|
|
Cable | | 0.6% | | | | | | | | | | | |
Comcast Cable Communications, Inc. | | | | 6.375% | | 1/30/06 | | | 2,790 | | | 2,994 | |
Comcast Corporation | | | | 6.500% | | 1/15/15 | | | 1,800 | | | 1,991 | |
Comcast Corporation | | | | 7.050% | | 3/15/33 | | | 3,130 | | | 3,478 | |
Continental Cablevision, Inc. | | | | 9.000% | | 9/1/08 | | | 2,200 | | | 2,674 | |
Cox Communications, Inc. | | | | 7.875% | | 8/15/09 | | | 640 | | | 760 | |
Cox Communications, Inc. | | | | 7.125% | | 10/1/12 | | | 460 | | | 532 | |
Cox Communications, Inc. | | | | 4.625% | | 6/1/13 | | | 50 | | | 49 | A |
Cox Communications, Inc. | | | | 5.500% | | 10/1/15 | | | 230 | | | 236 | |
| | | | | | | | | | | |
|
|
|
| | | | | | | | | | | | | 12,714 | |
| | | | | | | | | | | |
|
|
|
Computer Services and Systems | | 0.1% | | | | | | | | | | | |
Electronic Data Systems Corporation | | | | 7.125% | | 10/15/09 | | | 1,940 | | | 2,071 | A |
Electronic Data Systems Corporation | | | | 6.000% | | 8/1/13 | | | 320 | | | 311 | |
Electronic Data Systems Corporation | | | | 7.450% | | 10/15/29 | | | 160 | | | 157 | |
| | | | | | | | | | | |
|
|
|
| | | | | | | | | | | | | 2,539 | |
| | | | | | | | | | | |
|
|
|
Diversified Financial Services | | 0.2% | | | | | | | | | | | |
CIT Group Inc. | | | | 5.750% | | 9/25/07 | | | 2,390 | | | 2,620 | |
U.S. Bancorp | | | | 3.125% | | 3/15/08 | | | 1,300 | | | 1,310 | A |
Wells Fargo & Company | | | | 5.000% | | 11/15/14 | | | 180 | | | 186 | A |
| | | | | | | | | | | |
|
|
|
| | | | | | | | | | | | | 4,116 | |
| | | | | | | | | | | |
|
|
|
Electric | | 0.9% | | | | | | | | | | | |
Dominion Resources, Inc. | | | | 4.125% | | 2/15/08 | | | 950 | | | 985 | A |
Dominion Resources, Inc. | | | | 5.125% | | 12/15/09 | | | 50 | | | 53 | |
Dominion Resources, Inc. | | | | 5.700% | | 9/17/12 | | | 2,350 | | | 2,531 | A |
FirstEnergy Corp. | | | | 5.500% | | 11/15/06 | | | 6,290 | | | 6,688 | A |
FirstEnergy Corp. | | | | 6.450% | | 11/15/11 | | | 620 | | | 679 | A |
FirstEnergy Corp. | | | | 7.375% | | 11/15/31 | | | 5,000 | | | 5,573 | |
Northern States Power Company | | | | 6.875% | | 8/1/09 | | | 250 | | | 290 | |
System Energy Resources, Inc. | | | | 7.430% | | 1/15/11 | | | 1,961 | | | 2,033 | |
The Detroit Edison Company | | | | 6.125% | | 10/1/10 | | | 920 | | | 1,031 | |
| | | | | | | | | | | |
|
|
|
| | | | | | | | | | | | | 19,863 | |
| | | | | | | | | | | |
|
|
|
35
Annual Report to Shareholders
STATEMENT OF NET ASSETS—Continued
Western Asset Core Bond Portfolio—Continued
| | | | | | | | | | | | | |
| | | % OF
NET ASSETS | | RATE | | MATURITY
DATE | | PAR/
SHARES | | VALUE | |
| | |
| |
Corporate Bonds and Notes—Continued | | | | | | | | | | | | | |
| | | | | |
Energy | | 0.9% | | | | | | | | | | | |
Duke Energy Corporation | | | | 5.625% | | 11/30/12 | | $ | 1,880 | | $ | 1,997 | A |
Pacific Gas and Electric Company | | | | 1.810% | | 4/3/06 | | | 2,100 | | | 2,101 | D |
Pacific Gas and Electric Company | | | | 6.050% | | 3/1/34 | | | 3,090 | | | 3,125 | |
Progress Energy, Inc. | | | | 7.100% | | 3/1/11 | | | 3,170 | | | 3,667 | |
TXU Corp. | | | | 6.375% | | 6/15/06 | | | 8,380 | | | 9,040 | |
| | | | | | | | | | | |
|
|
|
| | | | | | | | | | | | | 19,930 | |
| | | | | | | | | | | |
|
|
|
Environmental Services | | 0.7% | | | | | | | | | | | |
Waste Management, Inc. | | | | 7.000% | | 10/1/04 | | | 290 | | | 297 | |
Waste Management, Inc. | | | | 7.125% | | 10/1/07 | | | 1,330 | | | 1,514 | |
Waste Management, Inc. | | | | 6.875% | | 5/15/09 | | | 2,000 | | | 2,285 | |
Waste Management, Inc. | | | | 6.375% | | 11/15/12 | | | 2,530 | | | 2,827 | |
Waste Management, Inc. | | | | 7.125% | | 12/15/17 | | | 6,000 | | | 6,935 | |
Waste Management, Inc. | | | | 7.375% | | 5/15/29 | | | 1,220 | | | 1,414 | |
| | | | | | | | | | | |
|
|
|
| | | | | | | | | | | | | 15,272 | |
| | | | | | | | | | | |
|
|
|
Food, Beverage and Tobacco | | 0.5% | | | | | | | | | | | |
Altria Group, Inc. | | | | 7.000% | | 11/4/13 | | | 1,755 | | | 1,934 | A |
Altria Group, Inc. | | | | 7.750% | | 1/15/27 | | | 2,160 | | | 2,407 | |
Nabisco Incorporated | | | | 6.375% | | 2/1/05 | | | 4,250 | | | 4,398 | |
R.J. Reynolds Tobacco Holdings, Inc. | | | | 7.875% | | 5/15/09 | | | 3,240 | | | 3,483 | |
Sara Lee Corporation | | | | 5.950% | | 1/20/05 | | | 200 | | | 207 | |
| | | | | | | | | | | |
|
|
|
| | | | | | | | | | | | | 12,429 | |
| | | | | | | | | | | |
|
|
|
Gas and Pipeline Utilities | | 1.4% | | | | | | | | | | | |
Dynegy Holdings Inc. | | | | 8.750% | | 2/15/12 | | | 11,260 | | | 10,641 | A |
Southern Natural Gas Company | | | | 8.000% | | 3/1/32 | | | 7,390 | | | 7,593 | |
Tennessee Gas Pipeline Company | | | | 8.375% | | 6/15/32 | | | 1,110 | | | 1,166 | |
The Williams Companies, Inc. | | | | 8.125% | | 3/15/12 | | | 3,730 | | | 4,117 | |
The Williams Companies, Inc. | | | | 7.500% | | 1/15/31 | | | 5,000 | | | 4,825 | A |
The Williams Companies, Inc. | | | | 8.750% | | 3/15/32 | | | 3,240 | | | 3,434 | |
| | | | | | | | | | | |
|
|
|
| | | | | | | | | | | | | 31,776 | |
| | | | | | | | | | | |
|
|
|
Health Care | | 1.4% | | | | | | | | | | | |
HCA Inc. | | | | 5.750% | | 3/15/14 | | | 21,360 | | | 21,343 | |
Tenet Healthcare Corporation | | | | 6.375% | | 12/1/11 | | | 2,500 | | | 2,163 | A |
Tenet Healthcare Corporation | | | | 7.375% | | 2/1/13 | | | 9,462 | | | 8,539 | A |
| | | | | | | | | | | |
|
|
|
| | | | | | | | | | | | | 32,045 | |
| | | | | | | | | | | |
|
|
|
36
| | | | | | | | | | | | | |
| | | % OF
NET ASSETS | | RATE | | MATURITY
DATE | | PAR/
SHARES | | VALUE | |
| | |
| |
Corporate Bonds and Notes—Continued | | | | | | | | | | | | | |
| | | | | |
Insurance | | 0.4% | | | | | | | | | | | |
Loews Corporation | | | | 7.625% | | 6/1/23 | | $ | 5,459 | | $ | 5,669 | |
Loews Corporation | | | | 7.000% | | 10/15/23 | | | 3,000 | | | 3,037 | |
| | | | | | | | | | | |
|
|
|
| | | | | | | | | | | | | 8,706 | |
| | | | | | | | | | | |
|
|
|
Investment Banking/Brokerage | | 1.0% | | | | | | | | | | | |
Credit Suisse First Boston USA | | | | 4.625% | | 1/15/08 | | | 1,650 | | | 1,748 | |
J.P. Morgan Chase & Co., Inc. | | | | 4.443% | | 2/15/12 | | | 2,000 | | | 2,170 | D |
J.P. Morgan Chase & Co., Inc. | | | | 5.750% | | 1/2/13 | | | 3,270 | | | 3,554 | |
Lehman Brothers Holdings Inc. | | | | 1.390% | | 5/15/06 | | | 5,490 | | | 5,498 | D |
Merrill Lynch & Co., Inc. | | | | 3.375% | | 9/14/07 | | | 2,120 | | | 2,176 | |
Morgan Stanley | | | | 5.300% | | 3/1/13 | | | 3,380 | | | 3,548 | |
The Goldman Sachs Group, Inc. | | | | 4.750% | | 7/15/13 | | | 4,370 | | | 4,369 | |
| | | | | | | | | | | |
|
|
|
| | | | | | | | | | | | | 23,063 | |
| | | | | | | | | | | |
|
|
|
Investment Management | | 0.6% | | | | | | | | | | | |
Dryden Investor Trust | | | | 7.157% | | 7/23/08 | | | 11,701 | | | 12,719 | |
| | | | | | | | | | | |
|
|
|
| | | | | |
Media | | 2.4% | | | | | | | | | | | |
AOL Time Warner Inc. | | | | 6.875% | | 5/1/12 | | | 8,270 | | | 9,461 | A |
AOL Time Warner Inc. | | | | 7.625% | | 4/15/31 | | | 1,350 | | | 1,579 | |
AOL Time Warner Inc. | | | | 7.700% | | 5/1/32 | | | 11,960 | | | 14,139 | |
Liberty Media Corporation | | | | 2.610% | | 9/17/06 | | | 2,640 | | | 2,671 | A,D |
Liberty Media Corporation | | | | 3.500% | | 9/25/06 | | | 21,380 | | | 21,772 | |
Liberty Media Corporation | | | | 3.750% | | 2/15/30 | | | 290 | | | 202 | E |
Time Warner Inc. | | | | 6.850% | | 1/15/26 | | | 2,000 | | | 2,118 | |
Time Warner Inc. | | | | 6.950% | | 1/15/28 | | | 2,500 | | | 2,709 | |
Viacom Inc. | | | | 5.625% | | 8/15/12 | | | 1,750 | | | 1,900 | A |
| | | | | | | | | | | |
|
|
|
| | | | | | | | | | | | | 56,551 | |
| | | | | | | | | | | |
|
|
|
Oil and Gas | | 1.3% | | | | | | | | | | | |
Apache Corporation | | | | 6.250% | | 4/15/12 | | | 1,320 | | | 1,516 | |
Conoco Inc. | | | | 6.950% | | 4/15/29 | | | 8,040 | | | 9,371 | |
ConocoPhillips | | | | 4.750% | | 10/15/12 | | | 800 | | | 825 | |
ConocoPhillips | | | | 7.000% | | 3/30/29 | | | 280 | | | 327 | A |
Devon Energy Corporation | | | | 7.950% | | 4/15/32 | | | 3,605 | | | 4,467 | |
El Paso Corporation | | | | 0.000% | | 2/28/21 | | | 4,950 | | | 2,302 | C,E |
El Paso Corporation | | | | 7.800% | | 8/1/31 | | | 140 | | | 112 | A |
El Paso Natural Gas Company | | | | 8.375% | | 6/15/32 | | | 3,610 | | | 3,682 | |
Sonat Inc. | | | | 7.625% | | 7/15/11 | | | 5,000 | | | 4,338 | |
XTO Energy, Inc. | | | | 7.500% | | 4/15/12 | | | 2,090 | | | 2,485 | |
| | | | | | | | | | | |
|
|
|
| | | | | | | | | | | | | 29,425 | |
| | | | | | | | | | | |
|
|
|
37
Annual Report to Shareholders
STATEMENT OF NET ASSETS—Continued
Western Asset Core Bond Portfolio—Continued
| | | | | | | | | | | | | |
| | | % OF
NET ASSETS | | RATE | | MATURITY
DATE | | PAR/
SHARES | | VALUE | |
| | |
| |
Corporate Bonds and Notes—Continued | | | | | | | | | | | | | |
| | | | | |
Paper and Forest Products | | N.M. | | | | | | | | | | | |
International Paper Company | | | | 5.500% | | 1/15/14 | | $ | 675 | | $ | 700 | |
| | | | | | | | | | | |
|
|
|
| | | | | |
Pharmaceuticals | | 0.2% | | | | | | | | | | | |
Abbott Laboratories | | | | 5.125% | | 7/1/04 | | | 200 | | | 202 | |
Bristol-Myers Squibb Company | | | | 5.750% | | 10/1/11 | | | 3,790 | | | 4,166 | |
Merck & Co., Inc. | | | | 6.750% | | 9/19/05 | | | 1,000 | | | 1,073 | |
| | | | | | | | | | | |
|
|
|
| | | | | | | | | | | | | 5,441 | |
| | | | | | | | | | | |
|
|
|
Photo Equipment and Supplies | | 0.6% | | | | | | | | | | | |
Eastman Kodak Company | | | | 3.625% | | 5/15/08 | | | 13,000 | | | 12,587 | A |
Eastman Kodak Company | | | | 7.250% | | 11/15/13 | | | 710 | | | 769 | A |
| | | | | | | | | | | |
|
|
|
| | | | | | | | | | | | | 13,356 | |
| | | | | | | | | | | |
|
|
|
Real Estate | | N.M. | | | | | | | | | | | |
Socgen Real Estate Co. LLC | | | | 7.640% | | 12/29/49 | | | 260 | | | 299 | B |
| | | | | | | | | | | |
|
|
|
| | | | | |
Retail | | 0.3% | | | | | | | | | | | |
Target Corporation | | | | 4.000% | | 6/15/13 | | | 4,445 | | | 4,315 | A |
Wal-Mart Stores, Inc. | | | | 5.450% | | 8/1/06 | | | 150 | | | 161 | A |
Wal-Mart Stores, Inc. | | | | 4.125% | | 2/15/11 | | | 2,210 | | | 2,244 | |
| | | | | | | | | | | |
|
|
|
| | | | | | | | | | | | | 6,720 | |
| | | | | | | | | | | |
|
|
|
Special Purpose | | 2.4% | | | | | | | | | | | |
Anadarko Finance Company | | | | 6.750% | | 5/1/11 | | | 1,590 | | | 1,855 | A |
Conoco Funding Company | | | | 6.350% | | 10/15/11 | | | 1,370 | | | 1,573 | |
Conoco Funding Company | | | | 7.250% | | 10/15/31 | | | 350 | | | 425 | |
DaimlerChrysler NA Holding Corporation | | | | 4.050% | | 6/4/08 | | | 3,490 | | | 3,527 | A |
Devon Financing Corporation ULC | | | | 6.875% | | 9/30/11 | | | 400 | | | 463 | A |
Patrons’ Legacy 2003 IV | | | | 5.775% | | 11/23/17 | | | 5,100 | | | 5,230 | B |
Sprint Capital Corporation | | | | 6.000% | | 1/15/07 | | | 22,760 | | | 24,728 | A |
Sprint Capital Corporation | | | | 8.375% | | 3/15/12 | | | 5,445 | | | 6,630 | |
Texaco Capital Inc. | | | | 5.500% | | 1/15/09 | | | 1,000 | | | 1,112 | |
Unilever Capital Corporation | | | | 7.125% | | 11/1/10 | | | 1,730 | | | 2,062 | |
Verizon Global Funding Corp. | | | | 7.250% | | 12/1/10 | | | 1,720 | | | 2,027 | |
Verizon Global Funding Corp. | | | | 6.875% | | 6/15/12 | | | 1,290 | | | 1,490 | |
Verizon Global Funding Corp. | | | | 7.375% | | 9/1/12 | | | 2,480 | | | 2,959 | A |
Verizon Global Funding Corp. | | | | 4.375% | | 6/1/13 | | | 1,880 | | | 1,832 | A |
| | | | | | | | | | | |
|
|
|
| | | | | | | | | | | | | 55,913 | |
| | | | | | | | | | | |
|
|
|
38
| | | | | | | | | | | | | |
| | | % OF
NET ASSETS | | RATE | | MATURITY
DATE | | PAR/
SHARES | | VALUE | |
| | |
| |
Corporate Bonds and Notes—Continued | | | | | | | | | | | | | |
| | | | | |
Telecommunications | | N.M. | | | | | | | | | | | |
GTE Hawaiian Telephone Company, Inc. | | | | 7.375% | | 9/1/06 | | $ | 700 | | $ | 780 | A |
| | | | | | | | | | | |
|
|
|
| | | | | |
Telecommunications (Cellular/Wireless) | | N.M. | | | | | | | | | | | |
AT&T Wireless Services Inc. | | | | 8.125% | | 5/1/12 | | | 825 | | | 1,005 | |
| | | | | | | | | | | |
|
|
|
| | | | | |
Transportation | | 0.8% | | | | | | | | | | | |
Continental Airlines, Inc. | | | | 6.545% | | 2/2/19 | | | 844 | | | 832 | |
Delta Air Lines, Inc. | | | | 6.619% | | 3/18/11 | | | 684 | | | 676 | |
Delta Air Lines, Inc. | | | | 7.111% | | 9/18/11 | | | 500 | | | 498 | A |
Delta Air Lines, Inc. | | | | 6.718% | | 7/2/24 | | | 4,526 | | | 4,877 | |
Southwest Airlines Co. | | | | 5.496% | | 11/1/06 | | | 9,000 | | | 9,660 | |
United Airlines, Inc. | | | | 7.783% | | 1/1/14 | | | 2,539 | | | 2,283 | |
| | | | | | | | | | | |
|
|
|
| | | | | | | | | | | | | 18,826 | |
| | | | | | | | | | | |
|
|
|
Total Corporate Bonds and Notes
(Identified Cost—$465,949) | | | | | | | | | | | | 491,670 | |
| |
Asset-Backed Securities | | 6.0% | | | | | | | | | | | |
| | | | | |
Fixed Rate Securities | | 1.1% | | | | | | | | | | | |
Advanta Mortgage Loan Trust 1999-3 | | | | 7.590% | | 6/25/14 | | | 460 | | | 501 | |
Chevy Chase 1997-A | | | | 7.650% | | 12/20/07 | | | 252 | | | 259 | |
Conseco Finance Securitizations Corp. 2000-5 | | | | 7.960% | | 2/1/32 | | | 4,700 | | | 4,084 | |
Equity One ABS, Inc. 2003-3 | | | | 4.995% | | 12/25/33 | | | 8,200 | | | 8,333 | |
Green Tree Financial Corporation 1996-5 | | | | 8.100% | | 7/15/27 | | | 1,072 | | | 372 | |
Green Tree Home Improvement Loan Trust 1997-D | | | | 7.450% | | 9/15/28 | | | 1,700 | | | 1,703 | |
Irwin Home Equity Loan Trust 2001-1 | | | | 7.100% | | 9/25/31 | | | 9,407 | | | 9,842 | F |
| | | | | | | | | | | |
|
|
|
| | | | | | | | | | | | | 25,094 | |
| | | | | | | | | | | |
|
|
|
Indexed SecuritiesD | | 4.8% | | | | | | | | | | | |
ACE Securities Corp. 2001-AQ1 | | | | 1.350% | | 4/25/31 | | | 198 | | | 198 | |
Aesop Funding II LLC 2001-1A | | | | 1.290% | | 4/20/05 | | | 2,567 | | | 2,567 | B |
Aesop Funding II LLC 2003-4A | | | | 1.320% | | 8/20/07 | | | 13,900 | | | 13,906 | B |
Amortizing Residential Collateral Trust 2002-BC1M | | | | 1.370% | | 1/1/32 | | | 1,204 | | | 1,204 | |
Argent NIM Trust 2003-N1 | | | | 1.360% | | 8/25/08 | | | 4,028 | | | 4,028 | B |
Asset Backed Funding Certificates 2002-SB1 | | | | 1.520% | | 4/25/18 | | | 4,479 | | | 4,496 | |
Bayview Financial Acquisition Trust 2001-DA | | | | 1.470% | | 11/25/31 | | | 2,937 | | | 2,939 | B |
Bayview Financial Acquisition Trust 2002-CA | | | | 1.420% | | 5/25/32 | | | 3,606 | | | 3,606 | B |
CDC Mortgage Capital Trust 2002-HE1 | | | | 1.400% | | 1/25/33 | | | 4,453 | | | 4,461 | |
Centex Home Equity 2000-C | | | | 1.330% | | 10/25/30 | | | 289 | | | 289 | |
39
Annual Report to Shareholders
STATEMENT OF NET ASSETS—Continued
Western Asset Core Bond Portfolio—Continued
| | | | | | | | | | | | | |
| | | % OF
NET ASSETS | | RATE | | MATURITY
DATE | | PAR/
SHARES | | VALUE | |
| | |
| |
Asset-Backed Securities—Continued | | | | | | | | | | | | | |
| | | | | |
Indexed Securities—Continued | | | | | | | | | | | | | |
Centex Home Equity 2002-D | | | | 1.530% | | 12/25/32 | | $ | 4,854 | | $ | 4,868 | |
Chase Funding Mortgage Loan Asset-Backed Certificates 2000-2 | | | | 1.370% | | 5/25/30 | | | 83 | | | 83 | |
CIT Group Home Equity Loan Trust 2002-1 | | | | 1.380% | | 3/25/33 | | | 3,615 | | | 3,621 | |
Countrywide Asset-Backed Certificates 2001-BC2 | | | | 1.340% | | 7/25/31 | | | 382 | | | 382 | |
Countrywide Asset-Backed Certificates 2003-3 | | | | 1.230% | | 2/25/22 | | | 1,832 | | | 1,832 | |
Countrywide Asset-Backed Certificates 2003-BC3 | | | | 1.400% | | 9/25/33 | | | 14,000 | | | 14,029 | |
Fannie Mae Grantor Trust 2003-T4 | | | | 1.160% | | 12/26/21 | | | 7,045 | | | 7,045 | |
Fleet Home Equity Loan Trust 2003-1 | | | | 1.340% | | 1/20/33 | | | 10,534 | | | 10,543 | |
Household Home Equity Loan Trust 2002-4A | | | | 1.640% | | 10/20/32 | | | 1,230 | | | 1,234 | |
Long Beach Mortgage Loan Trust 2000-1 | | | | 1.350% | | 1/21/31 | | | 1,379 | | | 1,381 | |
New Century Home Equity Loan Trust 2001-NC1 | | | | 1.380% | | 6/20/31 | | | 4,306 | | | 4,312 | |
Option One Mortgage Securities Corp. NIM Trust 2003-1 | | | | 1.480% | | 1/26/10 | | | 1,636 | | | 1,638 | B |
Provident Bank Home Equity Loan Trust 1999-3 | | | | 1.480% | | 1/25/31 | | | 3,106 | | | 3,110 | |
Residential Asset Mortgage Products, Inc. 2000-RS3 | | | | 1.380% | | 9/25/30 | | | 96 | | | 96 | |
Residential Asset Mortgage Products, Inc. 2003-RS2 | | | | 1.430% | | 3/25/33 | | | 2,223 | | | 2,229 | |
Residential Asset Securities Corporation 2001-KS2 | | | | 1.320% | | 6/25/31 | | | 2,621 | | | 2,627 | |
Residential Asset Securities Corporation 2001-KS3 | | | | 1.320% | | 9/25/31 | | | 1,135 | | | 1,136 | |
Structured Asset Investment Loan Trust 2003-BC5 | | | | 1.210% | | 6/25/33 | | | 4,975 | | | 4,975 | |
William Street Funding Corporation 2003-1 | | | | 1.420% | | 4/23/06 | | | 7,400 | | | 7,411 | B |
| | | | | | | | | | | |
|
|
|
| | | | | | | | | | | | | 110,246 | |
| | | | | | | | | | | |
|
|
|
Stripped Securities | | 0.1% | | | | | | | | | | | |
Bayview Financial Acquisition Trust 2002-A | | | | 5.100% | | 7/25/04 | | | 1,779 | | | 28 | B,G1 |
Bayview Financial Acquisition Trust 2002-FA | | | | 7.000% | | 6/25/05 | | | 320 | | | 13 | B,G1 |
Diversified REIT Trust 1999-1A | | | | 0.538% | | 3/18/11 | | | 98,304 | | | 1,951 | B,G1 |
| | | | | | | | | | | |
|
|
|
| | | | | | | | | | | | | 1,992 | |
| | | | | | | | | | | |
|
|
|
Total Asset-Backed Securities
(Identified Cost—$137,010) | | | | | | | | | | | | 137,332 | |
| |
Mortgage-Backed Securities | | 9.0% | | | | | | | | | | | |
| | | | | |
Fixed Rate Securities | | 5.9% | | | | | | | | | | | |
Asset Securitization Corporation 1996-D2 | | | | 6.920% | | 2/14/29 | | | 5,583 | | | 5,954 | |
Criimi Mae Commercial Mortgage Trust 1998-C1 | | | | 7.000% | | 6/2/33 | | | 7,838 | | | 8,605 | B |
Deutsche Mortgage and Asset Receiving Corporation 1998-C1 | | | | 6.538% | | 6/15/31 | | | 12,990 | | | 14,374 | |
Merrill Lynch Mortgage Investors, Inc. 1996-C2 | | | | 6.960% | | 11/21/28 | | | 949 | | | 1,035 | |
Nomura Asset Securities Corporation 1996-MD5 | | | | 7.120% | | 4/13/39 | | | 5,444 | | | 5,927 | |
Nomura Asset Securities Corporation 1996-MD5A | | | | 7.070% | | 4/13/39 | | | 1,359 | | | 1,422 | |
40
| | | | | | | | | | | | | |
| | | % OF
NET ASSETS | | RATE | | MATURITY
DATE | | PAR/
SHARES | | VALUE | |
| | |
| |
Mortgage-Backed Securities—Continued | | | | | | | | | | | | | |
| | | | | |
Fixed Rate Securities—Continued | | | | | | | | | | | | | |
Residential Asset Securitization Trust 2003-A14 | | | | 4.750% | | 2/25/19 | | $ | 93,599 | | $ | 94,653 | |
Washington Mutual 2002-S8 | | | | 5.750% | | 1/25/33 | | | 3,863 | | | 3,892 | |
| | | | | | | | | | | |
|
|
|
| | | | | | | | | | | | | 135,862 | |
| | | | | | | | | | | |
|
|
|
Indexed SecuritiesD | | 3.1% | | | | | | | | | | | |
Chevy Chase Mortgage Funding Corporation
2003-2A | | | | 1.470% | | 5/25/34 | | | 13,960 | | | 13,950 | B |
Credit Suisse First Boston Mortgage 2003-NP6 | | | | 1.990% | | 8/25/32 | | | 2,208 | | | 2,205 | B |
Credit-Based Asset Servicing and Securitization
2001-CB2 | | | | 1.380% | | 8/25/33 | | | 2,888 | | | 2,893 | |
Granite Mortgages PLC 2003-1 | | | | 1.310% | | 1/20/20 | | | 8,900 | | | 8,905 | |
Impac CMB Trust 2001-1 | | | | 1.370% | | 7/25/31 | | | 1,559 | | | 1,559 | |
Impac Mortgage Trust 2003-7 A | | | | 1.410% | | 8/25/33 | | | 9,688 | | | 9,715 | |
Medallion Trust 2000-1G | | | | 1.370% | | 7/12/31 | | | 352 | | | 352 | |
Medallion Trust 2000-2G | | | | 1.310% | | 12/18/31 | | | 2,481 | | | 2,484 | |
Medallion Trust 2003-1G | | | | 1.300% | | 12/21/33 | | | 5,519 | | | 5,520 | |
MLCC Mortgage Investors, Inc. 2003-B | | | | 1.430% | | 4/25/28 | | | 13,857 | | | 13,908 | |
Morgan Stanley Capital I 2003 XLF A-1 | | | | 1.270% | | 7/15/17 | | | 9,573 | | | 9,572 | B |
| | | | | | | | | | | |
|
|
|
| | | | | | | | | | | | | 71,063 | |
| | | | | | | | | | | |
|
|
|
Stripped Securities | | N.M. | | | | | | | | | | | |
FFCA Secured Lending Corporation 1999-1A | | | | 1.710% | | 9/18/25 | | | 12,682 | | | 590 | B,G1 |
LB-UBS Commercial Mortgage Trust 2001-C3 | | | | 0.984% | | 6/15/36 | | | 19,525 | | | 1,067 | B,G1 |
Structured Mortgage Asset Residential Trust 1991-3 | | | | 2,500.000% | | 8/25/22 | | | 0.011 | | | 0.001 | G1 |
Structured Mortgage Asset Residential Trust 1991-8 | | | | 0.070% | | 1/25/23 | | | 1,003 | | | 1 | G1 |
| | | | | | | | | | | |
|
|
|
| | | | | | | | | | | | | 1,658 | |
| | | | | | | | | | | |
|
|
|
Total Mortgage-Backed Securities
(Identified Cost—$206,127) | | | | | | | | | | | | 208,583 | |
| |
U.S. Government and Agency Obligations | | 30.0% | | | | | | | | | | | |
| | | | | |
Fixed Rate Securities | | 16.9% | | | | | | | | | | | |
Fannie Mae | | | | 2.375% | | 2/15/07 | | | 2,280 | | | 2,291 | A |
Fannie Mae | | | | 10.350% | | 12/10/15 | | | 770 | | | 1,190 | |
Freddie Mac | | | | 1.875% | | 6/15/06 | | | 3,580 | | | 3,581 | A |
Freddie Mac | | | | 7.250% | | 2/15/07 | | | 100 | | | 114 | |
Tennessee Valley Authority | | | | 6.750% | | 11/1/25 | | | 2,560 | | | 3,087 | A |
Tennessee Valley Authority | | | | 7.125% | | 5/1/30 | | | 2,450 | | | 3,099 | A |
41
Annual Report to Shareholders
STATEMENT OF NET ASSETS—Continued
Western Asset Core Bond Portfolio—Continued
| | | | | | | | | | | | | |
| | | % OF
NET ASSETS | | RATE | | MATURITY
DATE | | PAR/
SHARES | | VALUE | |
| | |
| |
U.S. Government and Agency
Obligations—Continued | | | | | | | | | | | | | |
| | | | | |
Fixed Rate Securities—Continued | | | | | | | | | | | | | |
United States Treasury Bonds | | | | 7.500% | | 11/15/16 | | $ | 1,490 | | $ | 1,964 | A |
United States Treasury Bonds | | | | 8.000% | | 11/15/21 | | | 13,860 | | | 19,458 | A |
United States Treasury Bonds | | | | 7.250% | | 8/15/22 | | | 13,010 | | | 17,092 | |
United States Treasury Bonds | | | | 5.250% | | 11/15/28 | | | 6,000 | | | 6,335 | A |
United States Treasury Bonds | | | | 5.250% | | 2/15/29 | | | 8,000 | | | 8,457 | A |
United States Treasury Bonds | | | | 6.250% | | 5/15/30 | | | 32,800 | | | 39,600 | A |
United States Treasury Notes | | | | 1.250% | | 5/31/05 | | | 480 | | | 480 | A |
United States Treasury Notes | | | | 1.625% | | 2/28/06 | | | 36,350 | | | 36,407 | A |
United States Treasury Notes | | | | 2.625% | | 11/15/06 | | | 28,650 | | | 29,214 | A |
United States Treasury Notes | | | | 2.250% | | 2/15/07 | | | 14,310 | | | 14,432 | A |
United States Treasury Notes | | | | 3.125% | | 9/15/08 | | | 1,940 | | | 1,982 | A |
United States Treasury Notes | | | | 3.125% | | 10/15/08 | | | 12,680 | | | 12,940 | A |
United States Treasury Notes | | | | 3.375% | | 11/15/08 | | | 15,330 | | | 15,796 | A |
United States Treasury Notes | | | | 3.375% | | 12/15/08 | | | 100,000 | | | 102,941 | A |
United States Treasury Notes | | | | 3.000% | | 2/15/09 | | | 7,070 | | | 7,147 | A |
United States Treasury Notes | | | | 2.625% | | 3/15/09 | | | 30,270 | | | 30,052 | |
United States Treasury Notes | | | | 4.250% | | 11/15/13 | | | 20,000 | | | 20,688 | A |
United States Treasury Notes | | | | 4.000% | | 2/15/14 | | | 12,325 | | | 12,487 | A |
| | | | | | | | | | | |
|
|
|
| | | | | | | | | | | | | 390,834 | |
| | | | | | | | | | | |
|
|
|
Indexed SecuritiesH | | 13.1% | | | | | | | | | | | |
United States Treasury Inflation-Protected Security | | | | 3.875% | | 1/15/09 | | | 67,860 | | | 78,831 | A |
United States Treasury Inflation-Protected Security | | | | 4.250% | | 1/15/10 | | | 83,348 | | | 99,920 | A |
United States Treasury Inflation-Protected Security | | | | 1.875% | | 7/15/13 | | | 13,943 | | | 14,527 | A |
United States Treasury Inflation-Protected Security | | | | 2.000% | | 1/15/14 | | | 11,084 | | | 11,630 | A |
United States Treasury Inflation-Protected Security | | | | 3.625% | | 4/15/28 | | | 13,590 | | | 17,908 | A |
United States Treasury Inflation-Protected Security | | | | 3.875% | | 4/15/29 | | | 57,040 | | | 78,698 | A |
United States Treasury Inflation-Protected Security | | | | 3.375% | | 4/15/32 | | | 313 | | | 415 | A |
| | | | | | | | | | | |
|
|
|
| | | | | | | | | | | | | 301,929 | |
| | | | | | | | | | | |
|
|
|
Stripped Securities | | N.M. | | | | | | | | | | | |
United States Treasury Bonds | | | | 0.000% | | 8/15/27 | | | 1,630 | | | 486 | A,G1 |
| | | | | | | | | | | |
|
|
|
Total U.S. Government and Agency Obligations
(Identified Cost—$671,891) | | | | | | | | | | | | 693,249 | |
| |
42
| | | | | | | | | | | | | |
| | | % OF
NET ASSETS | | RATE | | MATURITY
DATE | | PAR/
SHARES | | VALUE | |
| | |
| |
U.S. Government Agency Mortgage-Backed Securities | | 36.1% | | | | | | | | | | | |
| | | | | |
Fixed Rate Securities | | 36.1% | | | | | | | | | | | |
Fannie Mae | | | | 7.000% | | 9/1/07 to 2/1/33 | | $ | 25,615 | | $ | 27,193 | |
Fannie Mae | | | | 8.000% | | 5/1/15 | | | 81 | | | 87 | |
Fannie Mae | | | | 5.500% | | 11/1/16 | | | 50,000 | | | 52,078I | |
Fannie Mae | | | | 6.000% | | 11/1/16 to 2/1/32 | | | 5,381 | | | 5,651 | |
Fannie Mae | | | | 5.500% | | 4/1/18 | | | 3,078 | | | 3,210 | |
Fannie Mae | | | | 4.500% | | 5/1/18 | | | 30,000 | | | 30,366 | I |
Fannie Mae | | | | 4.500% | | 7/1/18 | | | 6,506 | | | 6,595 | |
Fannie Mae | | | | 7.500% | | 6/1/25 to 7/1/29 | | | 1,935 | | | 2,078 | |
Fannie Mae | | | | 6.500% | | 7/1/28 to 5/1/32 | | | 13,763 | | | 14,468 | |
Freddie Mac | | | | 7.500% | | 4/1/06 | | | 3 | | | 4 | |
Freddie Mac | | | | 9.750% | | 7/1/08 | | | 45 | | | 49 | |
Freddie Mac | | | | 5.500% | | 12/1/13 to 6/1/33 | | | 15,223 | | | 15,636 | |
Freddie Mac | | | | 6.000% | | 11/1/14 | | | 1,700 | | | 1,790 | I |
Freddie Mac | | | | 4.500% | | 2/1/18 | | | 133,900 | | | 135,197 | I |
Freddie Mac | | | | 9.300% | | 4/15/19 | | | 301 | | | 301 | |
Freddie Mac | | | | 7.000% | | 4/1/24 to 5/1/32 | | | 10,378 | | | 11,009 | |
Freddie Mac | | | | 6.000% | | 2/1/29 to 5/1/29 | | | 451 | | | 468 | |
Freddie Mac | | | | 6.500% | | 6/1/32 | | | 266 | | | 280 | |
Freddie Mac | | | | 5.500% | | 1/1/33 | | | 13,000 | | | 13,321 | I |
Freddie Mac | | | | 5.000% | | 6/1/33 to 8/1/33 | | | 58,342 | | | 58,678 | |
Government National Mortgage Association | | | | 10.000% | | 11/15/09 | | | 1 | | | 1 | |
Government National Mortgage Association | | | | 8.000% | | 10/15/16 to 7/15/17 | | | 446 | | | 492 | |
Government National Mortgage Association | | | | 7.500% | | 10/15/22 to 8/15/32 | | | 1,393 | | | 1,499 | |
Government National Mortgage Association | | | | 7.000% | | 6/15/23 to 5/15/32 | | | 1,263 | | | 1,350 | |
Government National Mortgage Association | | | | 6.500% | | 10/15/23 to 3/15/33 | | | 72,129 | | | 76,176 | |
Government National Mortgage Association | | | | 6.000% | | 11/15/28 to 5/15/33 | | | 30,423 | | | 31,784 | |
Government National Mortgage Association | | | | 6.000% | | 8/1/31 | | | 113,890 | | | 118,908 | I |
Government National Mortgage Association | | | | 5.500% | | 12/1/32 | | | 108,800 | | | 111,894 | I |
Government National Mortgage Association | | | | 5.500% | | 1/15/33 | | | 520 | | | 535 | |
43
Annual Report to Shareholders
STATEMENT OF NET ASSETS—Continued
Western Asset Core Bond Portfolio—Continued
| | | | | | | | | | | | | |
| | | % OF
NET ASSETS | | RATE | | MATURITY
DATE | | PAR/
SHARES | | VALUE | |
| | |
| |
U.S. Government Agency Mortgage-Backed Securities—Continued | | | | | | | | | | | | | |
Fixed Rate Securities—Continued | | | | | | | | | | | | | |
Government National Mortgage Association | | | | 5.000% | | 2/1/33 | | $ | 111,565 | | $ | 112,332 | I |
| | | | | | | | | | | |
|
|
|
| | | | | | | | | | | | | 833,430 | |
| | | | | | | | | | | |
|
|
|
Stripped Securities | | N.M. | | | | | | | | | | | |
Fannie Mae | | | | 9.500% | | 2/1/17 | | | 32 | | | 7 | G1 |
Fannie Mae | | | | 1,009.250% | | 2/25/20 | | | 0.02 | | | 1 | G1 |
Fannie Mae | | | | 1,009.250% | | 8/25/21 | | | 1 | | | 22 | G1 |
Fannie Mae | | | | 0.000% | | 5/25/22 | | | 345 | | | 321 | G2 |
Financing Corporation | | | | 0.000% | | 4/5/19 | | | 1,150 | | | 529 | G2 |
Freddie Mac | | | | 10.000% | | 3/1/21 | | | 250 | | | 54 | G1 |
Freddie Mac | | | | 0.000% | | 7/15/22 | | | 38 | | | 38 | G2 |
| | | | | | | | | | | |
|
|
|
| | | | | | | | | | | | | 972 | |
| | | | | | | | | | | |
|
|
|
Total U.S. Government Agency Mortgage-Backed
Securities (Identified Cost—$832,182) | | | | | | | | 834,402 | |
| |
Yankee BondsJ | | 4.7% | | | | | | | | | | | |
| | | | | |
Banking and Finance | | 0.1% | | | | | | | | | | | |
The Export-Import Bank of Korea | | | | 7.100% | | 3/15/07 | | | 1,050 | | | 1,175 | |
| | | | | | | | | | | |
|
|
|
| | | | | |
Banks | | 0.1% | | | | | | | | | | | |
Royal Bank of Scotland Group plc | | | | 8.817% | | 3/31/49 | | | 870 | | | 929 | |
The Korea Development Bank | | | | 4.250% | | 11/13/07 | | | 1,545 | | | 1,604 | |
| | | | | | | | | | | |
|
|
|
| | | | | | | | | | | | | 2,533 | |
| | | | | | | | | | | |
|
|
|
Electric | | N.M. | | | | | | | | | | | |
Hydro-Quebec | | | | 6.300% | | 5/11/11 | | | 800 | | | 924 | |
| | | | | | | | | | | |
|
|
|
| | | | | |
Energy | | 0.1% | | | | | | | | | | | |
Korea Electric Power Corporation | | | | 8.250% | | 3/15/05 | | | 1,050 | | | 1,111 | |
| | | | | | | | | | | |
|
|
|
| | | | | |
Foreign Governments | | 1.2% | | | | | | | | | | | |
Quebec Province | | | | 5.500% | | 4/11/06 | | | 200 | | | 215 | |
United Mexican States | | | | 8.375% | | 1/14/11 | | | 1,720 | | | 2,090 | A |
United Mexican States | | | | 11.500% | | 5/15/26 | | | 17,070 | | | 26,288 | |
| | | | | | | | | | | |
|
|
|
| | | | | | | | | | | | | 28,593 | |
| | | | | | | | | | | |
|
|
|
44
| | | | | | | | | | | | | | |
| | | % OF
NET ASSETS | | RATE | | MATURITY
DATE | | PAR/
SHARES | | | VALUE | |
| | |
| |
Yankee Bonds—Continued | | | | | | | | | | | | | | |
| | | | | |
Insurance | | 0.1% | | | | | | | | | | | | |
Atlas Reinsurance PLC | | | | 3.525% | | 1/7/05 | | $ | 250 | | | $ | 252 | B,D |
Korea Deposit Insurance Corp. | | | | 2.500% | | 12/11/05 | | | 2,400 | | | | 2,724 | B,E |
| | | | | | | | | | | | |
|
|
|
| | | | | | | | | | | | | | 2,976 | |
| | | | | | | | | | | | |
|
|
|
Manufacturing (Diversified) | | 2.3% | | | | | | | | | | | | |
Tyco International Group SA | | | | 5.875% | | 11/1/04 | | | 900 | | | | 921 | |
Tyco International Group SA | | | | 6.375% | | 2/15/06 | | | 16,600 | | | | 17,674 | |
Tyco International Group SA | | | | 5.800% | | 8/1/06 | | | 10,250 | | | | 10,890 | |
Tyco International Group SA | | | | 6.125% | | 1/15/09 | | | 200 | | | | 218 | |
Tyco International Group SA | | | | 6.750% | | 2/15/11 | | | 230 | | | | 256 | |
Tyco International Group SA | | | | 6.375% | | 10/15/11 | | | 1,230 | | | | 1,345 | |
Tyco International Group SA | | | | 7.000% | | 6/15/28 | | | 3,070 | | | | 3,267 | |
Tyco International Group SA | | | | 6.875% | | 1/15/29 | | | 17,000 | | | | 17,842 | |
| | | | | | | | | | | | |
|
|
|
| | | | | | | | | | | | | | 52,413 | |
| | | | | | | | | | | | |
|
|
|
Oil and Gas | | 0.2% | | | | | | | | | | | | |
Anderson Exploration Ltd. | | | | 6.750% | | 3/15/11 | | | 930 | | | | 1,052 | |
YPF Sociedad Anonima | | | | 7.750% | | 8/27/07 | | | 3,250 | | | | 3,559 | |
| | | | | | | | | | | | |
|
|
|
| | | | | | | | | | | | | | 4,611 | |
| | | | | | | | | | | | |
|
|
|
Special Purpose | | 0.4% | | | | | | | | | | | | |
CVRD Finance LTD. | | | | 1.770% | | 10/15/07 | | | 2,587 | | | | 2,574 | B,D |
HSBC Capital Funding LP | | | | 4.610% | | 12/29/49 | | | 1,630 | | | | 1,580 | A,B |
Petronas Capital Ltd. | | | | 7.875% | | 5/22/22 | | | 1,340 | | | | 1,605 | B |
Petrozuata Finance, Inc. | | | | 8.220% | | 4/1/17 | | | 3,950 | | | | 3,595 | B |
| | | | | | | | | | | | |
|
|
|
| | | | | | | | | | | | | | 9,354 | |
| | | | | | | | | | | | |
|
|
|
Telecommunications | | 0.2% | | | | | | | | | | | | |
British Telecommunications plc | | | | 8.375% | | 12/15/10 | | | 1,755 | | | | 2,169 | A |
Telecom Italia S.p.A. | | | | 5.250% | | 11/15/13 | | | 2,005 | | | | 2,067 | B |
| | | | | | | | | | | | |
|
|
|
| | | | | | | | | | | | | | 4,236 | |
| | | | | | | | | | | | |
|
|
|
Total Yankee Bonds (Identified Cost—$99,800) | | | | | | | | | | | | | 107,926 | |
| |
Preferred Stocks | | 0.2% | | | | | | | | | | | | |
Home Ownership Funding Corporation | | | | 13.331% | | | | | 6 | shs | | | 2,657 | B,F |
Home Ownership Funding Corporation II | | | | 13.338% | | | | | 5 | | | | 2,384 | B,F |
| | | | | | | | | | | | |
|
|
|
Total Preferred Stocks (Identified Cost—$9,045) | | | | | | | | | | | | | 5,041 | |
| | | | | | | | | | | | |
|
|
|
Total Long-Term Securities
(Identified Cost—$2,422,004) | | | | | | | | | | | | | 2,478,203 | |
| |
45
Annual Report to Shareholders
STATEMENT OF NET ASSETS—Continued
Western Asset Core Bond Portfolio—Continued
| | | | | | | | | | | | | | |
| | | % OF
NET ASSETS | | RATE | | MATURITY
DATE | | PAR/
SHARES | | | VALUE | |
| | |
| |
Investment of Proceeds From Securities Lending | | 25.7% | | | | | | | | | | | | |
State Street Navigator Securities Lending Prime Portfolio | | | | | | | | | 593,633 | shs | | $ | 593,633 | |
| | | | | | | | | | | | |
|
|
|
Total Investment of Proceeds From Securities Lending (Identified Cost—$593,633) | | | | | | | | | | | 593,633 | |
| |
Short-Term Securities | | 17.3% | | | | | | | | | | | | |
| | | | | |
Corporate Bonds and Notes | | 0.5% | | | | | | | | | | | | |
Altria Group, Inc. | | | | 1.870% | | 10/22/04 | | $ | 6,600 | | | | 6,599 | D |
Ford Motor Credit Company | | | | 1.970% | | 8/17/04 | | | 5,060 | | | | 5,060 | |
| | | | | | | | | | | | |
|
|
|
| | | | | | | | | | | | | | 11,659 | |
| | | | | | | | | | | | |
|
|
|
| | | | | |
U.S. Government and Agency Obligations | | 4.7% | | | | | | | | | | | | |
Fannie Mae | | | | 0.000% | | 9/8/04 | | | 12,890 | | | | 12,831 | C,K |
Federal Farm Credit Bank | | | | 0.000% | | 4/6/04 | | | 2,840 | | | | 2,840 | C |
Federal Farm Credit Bank | | | | 0.000% | | 9/17/04 | | | 20,000 | | | | 19,903 | C |
Freddie Mac | | | | 0.000% | | 4/5/04 | | | 17,000 | | | | 16,998 | C |
Freddie Mac | | | | 0.000% | | 4/5/04 | | | 25,530 | | | | 25,527 | C |
Freddie Mac | | | | 0.000% | | 4/6/04 | | | 8,800 | | | | 8,799 | C |
Freddie Mac | | | | 0.000% | | 4/6/04 | | | 19,140 | | | | 19,137 | C |
Freddie Mac | | | | 0.000% | | 4/7/04 | | | 3,200 | | | | 3,200 | C |
| | | | | | | | | | | | |
|
|
|
| | | | | | | | | | | | | | 109,235 | |
| | | | | | | | | | | | |
|
|
|
| | | | | |
Repurchase Agreements | | 12.1% | | | | | | | | | | | | |
Deutsche Bank AG
1.04%, dated 3/31/04, to be repurchased at $122,600 on 4/1/04 (Collateral: $125,295 Fannie Mae zero coupon notes, due 6/1/04, value $125,080) | | | | | | | | | 122,597 | | | | 122,597 | |
The Goldman Sachs Group, Inc.
1.05%, dated 3/31/04, to be repurchased at $155,914 on 4/1/04 (Collateral: $159,435 Fannie Mae zero coupon notes, due 6/23/04, value $159,064) | | | | | | | | | 155,910 | | | | 155,910 | |
| | | | | | | | | | | | |
|
|
|
| | | | | | | | | | | | | | 278,507 | |
| | | | | | | | | | | | |
|
|
|
Total Short-Term Securities (Identified Cost—$399,401) | | | | | | | | | | | 399,401 | |
| |
46
| | | | | | | | | | |
| | | % OF
NET ASSETS | | | | | VALUE | |
| | |
| |
Total Investments (Identified Cost—$3,415,038) | | 150.3% | | | | | | $ | 3,471,237 | |
Payable for Securities Purchased | | (33.4)% | | | | | | | (770,640 | ) |
Obligation to Return Collateral for Securities Loaned | | (25.7)% | | | | | | | (593,633 | ) |
Receivable for Securities Sold | | 8.4% | | | | | | | 192,896 | |
Other Assets Less Liabilities | | 0.4% | | | | | | | 8,966 | |
| | | | | | | | |
|
|
|
| | | |
Net assets consist of: | | | | | | | | | | |
Accumulated paid-in capital applicable to: | | | | | | | | | | |
185,276 Institutional Class shares outstanding | | | | | $ | 2,091,620 | | | | |
10,299 Financial Intermediary Class shares outstanding | | | | | | 117,831 | | | | |
Under/(Over) distributed net investment income | | | | | | (567) | | | | |
Accumulated net realized gain/(loss) on investments, options, futures and swaps | | | | | | 48,271 | | | | |
Unrealized appreciation/(depreciation) of investments, options, futures and swaps | | | | | | 51,671 | | | | |
| | | | | |
|
| | | | |
| | | |
Net assets | | 100.0 | % | | | | | $ | 2,308,826 | |
| | | | | | | | |
|
|
|
| | | |
Net asset value per share: | | | | | | | | | | |
Institutional Class | | | | | | | |
| $11.81
|
|
Financial Intermediary Class | | | | | | | |
| $11.81
|
|
47
Annual Report to Shareholders
STATEMENT OF NET ASSETS—Continued
Western Asset Core Bond Portfolio—Continued
| | | | | | | | |
| | | EXPIRATION | | ACTUAL
CONTRACTS | | APPRECIATION/
(DEPRECIATION) | |
| | |
| |
Futures Contracts PurchasedL | | | | | | | | |
U.S. Treasury Note Futures | | June 2004 | | 826 | | $ | 42 | |
U.S. Treasury Note Futures | | September 2004 | | 4 | | | 9 | |
| | | | | | |
|
|
|
| | | | | | | $ | 51 | |
| | | | | | |
|
|
|
Futures Contracts WrittenL | | | | | | | | |
U.S. Treasury Bond Futures | | June 2004 | | 383 | | $ | 350 | |
U.S. Treasury Note Futures | | June 2004 | | 718 | | | 300 | |
| | | | | | |
|
|
|
| | | | | | | $ | 650 | |
| | | | | | |
|
|
|
Options WrittenL | | | | | | | | |
Deutsche Bank, Swaption Put, Strike Price $100.00 | | September 2004 | | 92,700,000 | | $ | 942 | |
Goldman Sachs Swaption Call, Strike Price $4.935 | | December 2005 | | 30,300,000 | | | 97 | |
U.S. Treasury Bond Futures Put, Strike Price $104.00 | | June 2004 | | 759 | | | 747 | |
U.S. Treasury Bond Futures Put, Strike Price $108.00 | | June 2004 | | 670 | | | 421 | |
U.S. Treasury Bond Futures Put, Strike Price $112.00 | | June 2004 | | 1,701 | | | (370 | ) |
U.S. Treasury Note Futures Call, Strike Price $114.00 | | June 2004 | | 1,249 | | | (1,155 | ) |
U.S. Treasury Note Futures Call, Strike Price $116.00 | | June 2004 | | 549 | | | (208 | ) |
U.S. Treasury Note Futures Call, Strike Price $117.00 | | September 2004 | | 400 | | | — | |
U.S. Treasury Note Futures Call, Strike Price $120.00 | | June 2004 | | 500 | | | 91 | |
U.S. Treasury Note Futures Call, Strike Price $115.00 | | September 2004 | | 122 | | | (104 | ) |
U.S. Treasury Note Futures Put, Strike Price $112.00 | | June 2004 | | 500 | | | 294 | |
U.S. Treasury Note Futures Put, Strike Price $108.00 | | June 2004 | | 734 | | | 520 | |
U.S. Treasury Note Futures Put, Strike Price $110.00 | | June 2004 | | 614 | | | 207 | |
U.S. Treasury Note Futures Put, Strike Price $112.00 | | June 2004 | | 1,283 | | | 320 | |
U.S. Treasury Note Futures Put, Strike Price $112.00 | | June 2004 | | 565 | | | 8 | |
| | | | | | |
|
|
|
| | | | | | | $ | 1,810 | |
| | | | | | |
|
|
|
| A | All or a portion of this security is on loan. See Note 4 to the financial statements. |
| B | Rule 144a Security – A security purchased pursuant to Rule 144a under the Securities Act of 1933 which may not be resold subject to that rule except to qualified institutional buyers. These securities represent 4.5% of net assets. |
| C | Zero coupon bond – A bond with no periodic interest payments which is sold at such a discount as to produce a current yield to maturity. |
| D | Indexed security – The rates of interest earned on these securities are tied to the London Interbank Offered Rate (“LIBOR”), the Consumer Price Index (“CPI”), or the one-year Treasury Bill rate. The coupon rates are the rates as of March 31, 2004. |
| E | Convertible bond – Bond may be converted into the issuer’s common stock. |
| F | Stepped coupon security – A security with a predetermined schedule of interest or dividend rate changes, at which time it begins to accrue interest or pay dividends. |
| G | Stripped security – Security with interest-only or principal-only payment streams, denoted by a 1 or 2, respectively. For interest-only securities, the amount shown as principal is the notional balance used to calculate the amount of interest due. |
| H | Inflation-Protected Security – Security whose principal value is adjusted daily or monthly in accordance with changes to the Consumer Price Index for All Urban Consumers. Interest is calculated on the basis of the current adjusted principal value. |
| I | When-issued security – Security purchased on a delayed delivery basis. Final settlement amount and maturity date have not yet been announced. |
| J | Yankee Bond – A dollar-denominated bond issued in the U.S. by foreign entities. |
| K | Collateral to cover futures and options contracts. |
| L | Options and futures are described in more detail in the notes to financial statements. |
See notes to financial statements.
48
STATEMENT OF NET ASSETS
March 31, 2004
(Amounts in Thousands)
Western Asset Core Plus Bond Portfolio
| | | | | | | | | | | | | |
| | | % OF
NET ASSETS | | RATE | | MATURITY
DATE | | PAR/
SHARES | | VALUE | |
| | |
| |
Long-Term Securities | | 95.9% | | | | | | | | | | | |
| | | | | |
Corporate Bonds and Notes | | 17.7% | | | | | | | | | | | |
| | | | | |
Aerospace/Defense | | 0.2% | | | | | | | | | | | |
L-3 Communications Corp. | | | | 7.625% | | 6/15/12 | | $ | 912 | | $ | 1,003 | |
Lockheed Martin Corporation | | | | 7.650% | | 5/1/16 | | | 1,575 | | | 1,957 | |
Lockheed Martin Corporation | | | | 8.500% | | 12/1/29 | | | 20 | | | 27 | |
Raytheon Company | | | | 6.750% | | 8/15/07 | | | 25 | | | 28 | |
Raytheon Company | | | | 6.000% | | 12/15/10 | | | 160 | | | 180 | |
Raytheon Company | | | | 5.500% | | 11/15/12 | | | 75 | | | 79 | |
Raytheon Company | | | | 5.375% | | 4/1/13 | | | 875 | | | 916 | |
Systems 2001 Asset Trust | | | | 6.664% | | 9/15/13 | | | 3,219 | | | 3,616 | A |
| | | | | | | | | | | |
|
|
|
| | | | | | | | | | | | | 7,806 | |
| | | | | | | | | | | |
|
|
|
Auto and Automotive Parts | | N.M. | | | | | | | | | | | |
Cummins Inc. | | | | 7.125% | | 3/1/28 | | | 545 | | | 540 | |
| | | | | | | | | | | |
|
|
|
| | | | | |
Automotive | | N.M. | | | | | | | | | | | |
General Motors Corporation | | | | 7.125% | | 7/15/13 | | | 870 | | | 950 | B |
| | | | | | | | | | | |
|
|
|
| | | | | |
Banking and Finance | | 2.3% | | | | | | | | | | | |
Boeing Capital Corporation | | | | 5.800% | | 1/15/13 | | | 2,030 | | | 2,195 | B |
Ford Motor Credit Company | | | | 6.875% | | 2/1/06 | | | 800 | | | 851 | |
Ford Motor Credit Company | | | | 6.500% | | 1/25/07 | | | 5,000 | | | 5,341 | |
Ford Motor Credit Company | | | | 5.800% | | 1/12/09 | | | 21,150 | | | 21,805 | |
Ford Motor Credit Company | | | | 7.375% | | 10/28/09 | | | 390 | | | 428 | |
Ford Motor Credit Company | | | | 7.875% | | 6/15/10 | | | 4,200 | | | 4,700 | |
Ford Motor Credit Company | | | | 7.375% | | 2/1/11 | | | 7,985 | | | 8,708 | |
Ford Motor Credit Company | | | | 7.250% | | 10/25/11 | | | 5,760 | | | 6,238 | |
Ford Motor Credit Company | | | | 7.000% | | 10/1/13 | | | 70 | | | 74 | B |
General Motors Acceptance Corporation | | | | 6.750% | | 1/15/06 | | | 3,730 | | | 3,987 | |
General Motors Acceptance Corporation | | | | 6.125% | | 9/15/06 | | | 10 | | | 11 | |
General Motors Acceptance Corporation | | | | 4.375% | | 12/10/07 | | | 20 | | | 20 | B |
General Motors Acceptance Corporation | | | | 7.750% | | 1/19/10 | | | 110 | | | 125 | |
General Motors Acceptance Corporation | | | | 7.250% | | 3/2/11 | | | 1,400 | | | 1,554 | B |
General Motors Acceptance Corporation | | | | 7.000% | | 2/1/12 | | | 110 | | | 119 | |
General Motors Acceptance Corporation | | | | 0.000% | | 12/1/12 | | | 2,090 | | | 1,231 | C |
Household Finance Corporation | | | | 7.200% | | 7/15/06 | | | 3,750 | | | 4,163 | |
Household Finance Corporation | | | | 6.400% | | 6/17/08 | | | 20 | | | 23 | |
Household Finance Corporation | | | | 6.500% | | 11/15/08 | | | 40 | | | 45 | |
Household Finance Corporation | | | | 8.000% | | 7/15/10 | | | 70 | | | 86 | |
Household Finance Corporation | | | | 6.375% | | 8/1/10 | | | 1,000 | | | 1,130 | |
49
Annual Report to Shareholders
STATEMENT OF NET ASSETS—Continued
Western Asset Core Plus Bond Portfolio—Continued
| | | | | | | | | | | | | |
| | | % OF
NET ASSETS | | RATE | | MATURITY
DATE | | PAR/
SHARES | | VALUE | |
| | |
| |
Corporate Bonds and Notes—Continued | | | | | | | | | | | | | |
| | | | | |
Banking and Finance—Continued | | | | | | | | | | | | | |
Household Finance Corporation | | | | 7.000% | | 5/15/12 | | $ | 160 | | $ | 188 | |
Household Finance Corporation | | | | 6.375% | | 11/27/12 | | | 520 | | | 588 | |
SB Treasury Company LLC | | | | 9.400% | | 12/29/49 | | | 360 | | | 421 | A |
SLM Corporation | | | | 3.050% | | 4/1/09 | | | 10,680 | | | 10,747 | D |
Toyota Motor Credit Corporation | | | | 2.800% | | 1/18/06 | | | 150 | | | 154 | |
| | | | | | | | | | | |
|
|
|
| | | | | | | | | | | | | 74,932 | |
| | | | | | | | | | | |
|
|
|
Banks | | 0.4% | | | | | | | | | | | |
Bank of America Corporation | | | | 5.250% | | 2/1/07 | | | 400 | | | 432 | |
Bank of America Corporation | | | | 7.400% | | 1/15/11 | | | 3,090 | | | 3,709 | |
Bank One Corporation | | | | 4.125% | | 9/1/07 | | | 2,780 | | | 2,910 | B |
Bank One Corporation | | | | 6.000% | | 8/1/08 | | | 150 | | | 168 | |
Bank One Corporation | | | | 5.900% | | 11/15/11 | | | 2,000 | | | 2,233 | |
Firstar Bank NA | | | | 7.125% | | 12/1/09 | | | 350 | | | 413 | |
KeyCorp | | | | 2.750% | | 2/27/07 | | | 240 | | | 243 | |
Wells Fargo Bank NA, San Francisco | | | | 6.450% | | 2/1/11 | | | 1,600 | | | 1,840 | |
| | | | | | | | | | | |
|
|
|
| | | | | | | | | | | | | 11,948 | |
| | | | | | | | | | | |
|
|
|
Cable | | 0.6% | | | | | | | | | | | |
Comcast Cable Communications, Inc. | | | | 6.375% | | 1/30/06 | | | 3,550 | | | 3,810 | |
Comcast Cable Communications, Inc. | | | | 6.750% | | 1/30/11 | | | 680 | | | 772 | B |
Comcast Corporation | | | | 6.500% | | 1/15/15 | | | 1,970 | | | 2,179 | |
Comcast Corporation | | | | 7.050% | | 3/15/33 | | | 6,530 | | | 7,256 | B |
Continental Cablevision, Inc. | | | | 9.000% | | 9/1/08 | | | 1,060 | | | 1,289 | |
Cox Communications, Inc. | | | | 7.125% | | 10/1/12 | | | 3,120 | | | 3,609 | |
Cox Communications, Inc. | | | | 4.625% | | 6/1/13 | | | 1,190 | | | 1,162 | |
CSC Holdings Inc. | | | | 7.625% | | 4/1/11 | | | 80 | | | 84 | |
CSC Holdings Inc. | | | | 6.750% | | 4/15/12 | | | 500 | | | 500 | A |
CSC Holdings Inc. | | | | 7.875% | | 2/15/18 | | | 260 | | | 279 | B |
| | | | | | | | | | | |
|
|
|
| | | | | | | | | | | | | 20,940 | |
| | | | | | | | | | | |
|
|
|
Casino Resorts | | 0.1% | | | | | | | | | | | |
Harrah’s Operating Company, Inc. | | | | 7.875% | | 12/15/05 | | | 852 | | | 922 | |
MGM MIRAGE | | | | 9.750% | | 6/1/07 | | | 795 | | | 918 | B |
MGM MIRAGE | | | | 8.500% | | 9/15/10 | | | 20 | | | 24 | |
MGM MIRAGE | | | | 8.375% | | 2/1/11 | | | 162 | | | 187 | B |
Park Place Entertainment Corporation | | | | 7.875% | | 12/15/05 | | | 724 | | | 771 | B |
Park Place Entertainment Corporation | | | | 8.125% | | 5/15/11 | | | 100 | | | 114 | |
Station Casinos, Inc. | | | | 6.000% | | 4/1/12 | | | 1,420 | | | 1,470 | A |
| | | | | | | | | | | |
|
|
|
| | | | | | | | | | | | | 4,406 | |
| | | | | | | | | | | |
|
|
|
50
| | | | | | | | | | | | | |
| | | % OF
NET ASSETS | | RATE | | MATURITY
DATE | | PAR/
SHARES | | VALUE | |
| | |
| |
Corporate Bonds and Notes—Continued | | | | | | | | | | | | | |
| | | | | |
Chemicals | | 0.2% | | | | | | | | | | | |
FMC Corporation | | | | 10.250% | | 11/1/09 | | $ | 295 | | $ | 346 | |
IMC Global Inc. | | | | 10.875% | | 6/1/08 | | | 615 | | | 741 | |
IMC Global Inc. | | | | 11.250% | | 6/1/11 | | | 132 | | | 157 | |
IMC Global Inc. | | | | 10.875% | | 8/1/13 | | | 460 | | | 576 | |
MacDermid, Incorporated | | | | 9.125% | | 7/15/11 | | | 1,067 | | | 1,203 | |
Millennium America Inc. | | | | 7.000% | | 11/15/06 | | | 880 | | | 895 | B |
The Dow Chemical Company | | | | 5.250% | | 5/14/04 | | | 2,100 | | | 2,109 | |
Westlake Chemical Corporation | | | | 8.750% | | 7/15/11 | | | 150 | | | 166 | |
| | | | | | | | | | | |
|
|
|
| | | | | | | | | | | | | 6,193 | |
| | | | | | | | | | | |
|
|
|
Coal | | N.M. | | | | | | | | | | | |
Peabody Energy Corporation | | | | 6.875% | | 3/15/13 | | | 860 | | | 929 | |
| | | | | | | | | | | |
|
|
|
| | | | | |
Computer Services and Systems | | 0.1% | | | | | | | | | | | |
Electronic Data Systems Corporation | | | | 7.125% | | 10/15/09 | | | 2,580 | | | 2,755 | B |
Electronic Data Systems Corporation | | | | 6.000% | | 8/1/13 | | | 460 | | | 446 | |
Electronic Data Systems Corporation | | | | 7.450% | | 10/15/29 | | | 250 | | | 245 | |
International Business Machines Corporation | | | | 4.750% | | 11/29/12 | | | 40 | | | 41 | |
Unisys Corporation | | | | 6.875% | | 3/15/10 | | | 86 | | | 95 | |
| | | | | | | | | | | |
|
|
|
| | | | | | | | | | | | | 3,582 | |
| | | | | | | | | | | |
|
|
|
Containers and Packaging | | N.M. | | | | | | | | | | | |
Ball Corporation | | | | 6.875% | | 12/15/12 | | | 1,109 | | | 1,199 | |
| | | | | | | | | | | |
|
|
|
| | | | | |
Diversified Financial Services | | 0.8% | | | | | | | | | | | |
CIT Group Inc. | | | | 6.500% | | 2/7/06 | | | 40 | | | 44 | |
CIT Group Inc. | | | | 5.750% | | 9/25/07 | | | 2,840 | | | 3,113 | |
Citigroup Inc. | | | | 5.000% | | 3/6/07 | | | 500 | | | 536 | B |
Citigroup Inc. | | | | 3.625% | | 2/9/09 | | | 2,936 | | | 2,990 | B |
Citigroup Inc. | | | | 7.250% | | 10/1/10 | | | 150 | | | 179 | |
General Electric Capital Corporation | | | | 6.125% | | 2/22/11 | | | 70 | | | 79 | B |
General Electric Capital Corporation | | | | 5.450% | | 1/15/13 | | | 11,845 | | | 12,755 | B |
IBJ Preferred Capital Corp. LLC | | | | 8.790% | | 12/29/49 | | | 3,380 | | | 3,819 | A |
Philip Morris Capital Corporation | | | | 7.500% | | 7/16/09 | | | 190 | | | 212 | |
U.S. Bancorp | | | | 3.125% | | 3/15/08 | | | 1,610 | | | 1,623 | |
Wells Fargo & Company | | | | 1.200% | | 6/12/06 | | | 50 | | | 50 | D |
Wells Fargo & Company | | | | 5.000% | | 11/15/14 | | | 1,150 | | | 1,187 | |
Wells Fargo Financial, Inc. | | | | 5.875% | | 8/15/08 | | | 150 | | | 167 | |
| | | | | | | | | | | |
|
|
|
| | | | | | | | | | | | | 26,754 | |
| | | | | | | | | | | |
|
|
|
51
Annual Report to Shareholders
STATEMENT OF NET ASSETS—Continued
Western Asset Core Plus Bond Portfolio—Continued
| | | | | | | | | | | | | |
| | | % OF
NET ASSETS | | RATE | | MATURITY
DATE | | PAR/
SHARES | | VALUE | |
| | |
| |
Corporate Bonds and Notes—Continued | | | | | | | | | | | | | |
| | | | | |
Diversified Services | | N.M. | | | | | | | | | | | |
SPX Corporation | | | | 7.500% | | 1/1/13 | | $ | 579 | | $ | 625 | B |
| | | | | | | | | | | |
|
|
|
| | | | | |
Electric | | 1.6% | | | | | | | | | | | |
Dominion Resources, Inc. | | | | 4.125% | | 2/15/08 | | | 460 | | | 477 | B |
Dominion Resources, Inc. | | | | 5.125% | | 12/15/09 | | | 1,260 | | | 1,343 | |
Dominion Resources, Inc. | | | | 5.700% | | 9/17/12 | | | 3,810 | | | 4,103 | B |
FirstEnergy Corp. | | | | 5.500% | | 11/15/06 | | | 6,840 | | | 7,273 | |
FirstEnergy Corp. | | | | 6.450% | | 11/15/11 | | | 3,135 | | | 3,432 | B |
FirstEnergy Corp. | | | | 7.375% | | 11/15/31 | | | 9,120 | | | 10,166 | |
General Electric Company | | | | 5.000% | | 2/1/13 | | | 920 | | | 963 | B |
Niagara Mohawk Power Corporation | | | | 7.750% | | 10/1/08 | | | 500 | | | 586 | |
Oncor Electric Delivery Company | | | | 6.375% | | 1/15/15 | | | 685 | | | 768 | B |
Orion Power Holdings, Inc. | | | | 12.000% | | 5/1/10 | | | 1,047 | | | 1,296 | |
System Energy Resources, Inc. | | | | 7.430% | | 1/15/11 | | | 87 | | | 90 | |
The AES Corporation | | | | 10.000% | | 7/15/05 | | | 486 | | | 498 | A |
The AES Corporation | | | | 9.500% | | 6/1/09 | | | 2,736 | | | 2,969 | B |
The AES Corporation | | | | 9.375% | | 9/15/10 | | | 2,494 | | | 2,718 | B |
The AES Corporation | | | | 8.750% | | 5/15/13 | | | 13,098 | | | 14,408 | A |
The Detroit Edison Company | | | | 5.200% | | 10/15/12 | | | 10 | | | 11 | |
| | | | | | | | | | | |
|
|
|
| | | | | | | | | | | | | 51,101 | |
| | | | | | | | | | | |
|
|
|
Energy | | 1.0% | | | | | | | | | | | |
Calpine Corporation | | | | 8.250% | | 8/15/05 | | | 470 | | | 449 | B |
Calpine Corporation | | | | 7.750% | | 4/15/09 | | | 38 | | | 27 | B |
Calpine Corporation | | | | 8.625% | | 8/15/10 | | | 180 | | | 132 | B |
Calpine Corporation | | | | 8.500% | | 2/15/11 | | | 9,708 | | | 7,135 | B |
Calpine Corporation | | | | 8.750% | | 7/15/13 | | | 3,430 | | | 3,139 | A,B |
Duke Energy Corporation | | | | 5.625% | | 11/30/12 | | | 2,010 | | | 2,135 | B |
MidAmerican Energy Holdings Company | | | | 5.875% | | 10/1/12 | | | 30 | | | 32 | |
Pacific Gas and Electric Company | | | | 1.810% | | 4/3/06 | | | 2,980 | | | 2,982 | D |
Pacific Gas and Electric Company | | | | 7.250% | | 8/1/26 | | | 1,000 | | | 1,035 | |
Pacific Gas and Electric Company | | | | 6.050% | | 3/1/34 | | | 4,300 | | | 4,349 | |
Peabody Energy Corporation | | | | 5.875% | | 4/15/16 | | | 880 | | | 887 | |
Progress Energy, Inc. | | | | 7.100% | | 3/1/11 | | | 110 | | | 127 | |
TXU Corp. | | | | 6.375% | | 6/15/06 | | | 9,795 | | | 10,566 | |
TXU Energy Co. | | | | 7.000% | | 3/15/13 | | | 10 | | | 12 | |
| | | | | | | | | | | |
|
|
|
| | | | | | | | | | | | | 33,007 | |
| | | | | | | | | | | |
|
|
|
52
| | | | | | | | | | | | | |
| | | % OF
NET ASSETS | | RATE | | MATURITY
DATE | | PAR/
SHARES | | VALUE | |
| | |
| |
Corporate Bonds and Notes—Continued | | | | | | | | | | | | | |
| | | | | |
Environmental Services | | 0.8% | | | | | | | | | | | |
Allied Waste North America Incorporated | | | | 8.875% | | 4/1/08 | | $ | 882 | | $ | 990 | |
Allied Waste North America Incorporated | | | | 8.500% | | 12/1/08 | | | 375 | | | 420 | B |
Safety-Kleen Corp. | | | | 9.250% | | 5/15/09 | | | 85 | | | 8 | E |
Waste Management, Inc. | | | | 7.000% | | 10/1/04 | | | 120 | | | 123 | |
Waste Management, Inc. | | | | 7.000% | | 10/15/06 | | | 2,545 | | | 2,824 | |
Waste Management, Inc. | | | | 7.125% | | 10/1/07 | | | 1,060 | | | 1,207 | |
Waste Management, Inc. | | | | 6.875% | | 5/15/09 | | | 8,000 | | | 9,140 | |
Waste Management, Inc. | | | | 7.375% | | 8/1/10 | | | 6,055 | | | 7,134 | |
Waste Management, Inc. | | | | 7.125% | | 12/15/17 | | | 500 | | | 578 | |
Waste Management, Inc. | | | | 7.000% | | 7/15/28 | | | 3,010 | | | 3,346 | |
Waste Management, Inc. | | | | 7.375% | | 5/15/29 | | | 80 | | | 93 | |
Waste Management, Inc. | | | | 7.750% | | 5/15/32 | | | 750 | | | 914 | |
| | | | | | | | | | | |
|
|
|
| | | | | | | | | | | | | 26,777 | |
| | | | | | | | | | | |
|
|
|
Food, Beverage and Tobacco | | 0.5% | | | | | | | | | | | |
Altria Group, Inc. | | | | 7.000% | | 11/4/13 | | | 1,755 | | | 1,934 | B |
Altria Group, Inc. | | | | 7.750% | | 1/15/27 | | | 4,530 | | | 5,049 | |
Constellation Brands, Inc. | | | | 8.000% | | 2/15/08 | | | 782 | | | 882 | |
Nabisco Incorporated | | | | 7.550% | | 6/15/15 | | | 3,570 | | | 4,409 | |
R.J. Reynolds Tobacco Holdings, Inc. | | | | 7.750% | | 5/15/06 | | | 1,080 | | | 1,147 | |
R.J. Reynolds Tobacco Holdings, Inc. | | | | 6.500% | | 6/1/07 | | | 590 | | | 611 | |
R.J. Reynolds Tobacco Holdings, Inc. | | | | 7.875% | | 5/15/09 | | | 730 | | | 785 | B |
Sara Lee Corporation | | | | 6.250% | | 9/15/11 | | | 50 | | | 57 | |
Smithfield Foods, Inc. | | | | 8.000% | | 10/15/09 | | | 471 | | | 526 | |
| | | | | | | | | | | |
|
|
|
| | | | | | | | | | | | | 15,400 | |
| | | | | | | | | | | |
|
|
|
Gaming | | N.M. | | | | | | | | | | | |
Mohegan Tribal Gaming Authority | | | | 8.125% | | 1/1/06 | | | 100 | | | 108 | |
Mohegan Tribal Gaming Authority | | | | 6.375% | | 7/15/09 | | | 749 | | | 786 | |
Mohegan Tribal Gaming Authority | | | | 8.375% | | 7/1/11 | | | 380 | | | 420 | |
| | | | | | | | | | | |
|
|
|
| | | | | | | | | | | | | 1,314 | |
| | | | | | | | | | | |
|
|
|
Gas and Pipeline Utilities | | 1.1% | | | | | | | | | | | |
Dynegy Holdings Inc. | | | | 8.750% | | 2/15/12 | | | 5,890 | | | 5,566 | B |
Southern Natural Gas Company | | | | 8.875% | | 3/15/10 | | | 1,220 | | | 1,354 | |
Southern Natural Gas Company | | | | 8.000% | | 3/1/32 | | | 11,940 | | | 12,269 | |
The Williams Companies, Inc. | | | | 7.500% | | 1/15/31 | | | 4,113 | | | 3,969 | |
The Williams Companies, Inc. | | | | 7.750% | | 6/15/31 | | | 530 | | | 522 | |
The Williams Companies, Inc. | | | | 8.750% | | 3/15/32 | | | 11,630 | | | 12,328 | |
| | | | | | | | | | | |
|
|
|
| | | | | | | | | | | | | 36,008 | |
| | | | | | | | | | | |
|
|
|
53
Annual Report to Shareholders
STATEMENT OF NET ASSETS—Continued
Western Asset Core Plus Bond Portfolio—Continued
| | | | | | | | | | | | | |
| | | % OF
NET ASSETS | | RATE | | MATURITY
DATE | | PAR/
SHARES | | VALUE | |
| | |
| |
Corporate Bonds and Notes—Continued | | �� | | | | | | | | | | | |
| | | | | |
Health Care | | 0.9% | | | | | | | | | | | |
Tenet Healthcare Corporation | | | | 5.375% | | 11/15/06 | | $ | 10,260 | | $ | 9,644 | B |
Tenet Healthcare Corporation | | | | 5.000% | | 7/1/07 | | | 6,460 | | | 5,895 | B |
Tenet Healthcare Corporation | | | | 6.375% | | 12/1/11 | | | 2,500 | | | 2,163 | |
Tenet Healthcare Corporation | | | | 7.375% | | 2/1/13 | | | 13,939 | | | 12,580 | B |
| | | | | | | | | | | |
|
|
|
| | | | | | | | | | | | | 30,282 | |
| | | | | | | | | | | |
|
|
|
Homebuilding | | N.M. | | | | | | | | | | | |
Lennar Corporation | | | | 9.950% | | 5/1/10 | | | 286 | | | 326 | |
The Ryland Group, Inc. | | | | 8.000% | | 8/15/06 | | | 104 | | | 116 | |
| | | | | | | | | | | |
|
|
|
| | | | | | | | | | | | | 442 | |
| | | | | | | | | | | |
|
|
|
Insurance | | 0.5% | | | | | | | | | | | |
Loews Corporation | | | | 3.125% | | 9/15/07 | | | 12,000 | | | 11,850 | F |
Loews Corporation | | | | 8.875% | | 4/15/11 | | | 90 | | | 110 | |
Loews Corporation | | | | 7.625% | | 6/1/23 | | | 1,500 | | | 1,558 | |
Loews Corporation | | | | 7.000% | | 10/15/23 | | | 3,300 | | | 3,341 | |
Oil Insurance Ltd. | | | | 5.150% | | 8/15/33 | | | 35 | | | 36 | A |
| | | | | | | | | | | |
|
|
|
| | | | | | | | | | | | | 16,895 | |
| | | | | | | | | | | |
|
|
|
Investment Banking/Brokerage | | 0.7% | | | | | | | | | | | |
Credit Suisse First Boston USA | | | | 4.625% | | 1/15/08 | | | 2,730 | | | 2,892 | |
Credit Suisse First Boston USA | | | | 7.125% | | 7/15/32 | | | 60 | | | 72 | B |
J.P. Morgan Capital Trust II | | | | 7.950% | | 2/1/27 | | | 20 | | | 23 | |
J.P. Morgan Chase & Co., Inc. | | | | 4.500% | | 11/15/10 | | | 140 | | | 144 | |
J.P. Morgan Chase & Co., Inc. | | | | 5.250% | | 5/30/07 | | | 30 | | | 32 | B |
J.P. Morgan Chase & Co., Inc. | | | | 5.750% | | 1/2/13 | | | 4,430 | | | 4,815 | |
J.P. Morgan Chase & Co., Inc. | | | | 6.000% | | 2/15/09 | | | 10 | | | 11 | |
Lehman Brothers Holdings Inc. | | | | 6.625% | | 4/1/04 | | | 470 | | | 470 | |
Lehman Brothers Holdings Inc. | | | | 4.000% | | 1/22/08 | | | 1,740 | | | 1,806 | |
Lehman Brothers Holdings Inc. | | | | 7.000% | | 2/1/08 | | | 160 | | | 183 | |
Merrill Lynch & Co., Inc. | | | | 3.375% | | 9/14/07 | | | 3,130 | | | 3,213 | |
Morgan Stanley | | | | 3.625% | | 4/1/08 | | | 90 | | | 92 | B |
Morgan Stanley | | | | 5.300% | | 3/1/13 | | | 4,090 | | | 4,293 | |
The Goldman Sachs Group, Inc. | | | | 6.600% | | 1/15/12 | | | 2,810 | | | 3,220 | |
The Goldman Sachs Group, Inc. | | | | 4.750% | | 7/15/13 | | | 1,420 | | | 1,420 | |
| | | | | | | | | | | |
|
|
|
| | | | | | | | | | | | | 22,686 | |
| | | | | | | | | | | |
|
|
|
Investment Management | | 0.1% | | | | | | | | | | | |
Dryden Investor Trust | | | | 7.157% | | 7/23/08 | | | 1,563 | | | 1,699 | |
| | | | | | | | | | | |
|
|
|
54
| | | | | | | | | | | | | |
| | | % OF
NET ASSETS | | RATE | | MATURITY
DATE | | PAR/
SHARES | | VALUE | |
| | |
| |
Corporate Bonds and Notes—Continued | | | | | | | | | | | | | |
| | | | | |
Lodging/Hotels | | 0.1% | | | | | | | | | | | |
Hilton Hotels Corporation | | | | 7.625% | | 5/15/08 | | $ | 917 | | $ | 1,029 | |
Host Marriott Corporation | | | | 7.875% | | 8/1/08 | | | 737 | | | 766 | |
ITT Corporation | | | | 6.750% | | 11/15/05 | | | 80 | | | 84 | |
Starwood Hotels & Resorts Worldwide, Inc. | | | | 7.375% | | 5/1/07 | | | 850 | | | 925 | |
| | | | | | | | | | | |
|
|
|
| | | | | | | | | | | | | 2,804 | |
| | | | | | | | | | | |
|
|
|
Machinery | | N.M. | | | | | | | | | | | |
AGCO Corporation | | | | 9.500% | | 5/1/08 | | | 179 | | | 197 | |
Deere & Company | | | | 6.950% | | 4/25/14 | | | 80 | | | 95 | |
Grant Prideco, Inc. | | | | 9.000% | | 12/15/09 | | | 147 | | | 166 | |
Terex Corporation | | | | 10.375% | | 4/1/11 | | | 185 | | | 211 | B |
| | | | | | | | | | | |
|
|
|
| | | | | | | | | | | | | 669 | |
| | | | | | | | | | | |
|
|
|
Manufacturing (Diversified) | | N.M. | | | | | | | | | | | |
Procter & Gamble Company | | | | 8.500% | | 8/10/09 | | | 90 | | | 113 | B |
The Gillette Company | | | | 2.500% | | 6/1/08 | | | 160 | | | 157 | |
| | | | | | | | | | | |
|
|
|
| | | | | | | | | | | | | 270 | |
| | | | | | | | | | | |
|
|
|
| | | | | |
Media | | 1.3% | | | | | | | | | | | |
AOL Time Warner Inc. | | | | 6.875% | | 5/1/12 | | | 5,850 | | | 6,692 | B |
AOL Time Warner Inc. | | | | 7.625% | | 4/15/31 | | | 440 | | | 515 | |
AOL Time Warner Inc. | | | | 7.700% | | 5/1/32 | | | 15,480 | | | 18,300 | |
Lamar Media Corporation | | | | 7.250% | | 1/1/13 | | | 989 | | | 1,073 | B |
Liberty Media Corporation | | | | 2.610% | | 9/17/06 | | | 12,170 | | | 12,314 | D |
Liberty Media Corporation | | | | 3.500% | | 9/25/06 | | | 90 | | | 92 | |
Liberty Media Corporation | | | | 5.700% | | 5/15/13 | | | 565 | | | 590 | B |
Liberty Media Corporation | | | | 3.750% | | 2/15/30 | | | 170 | | | 119 | F |
News America Incorporated | | | | 6.750% | | 1/9/38 | | | 200 | | | 232 | |
Viacom Inc. | | | | 5.625% | | 8/15/12 | | | 2,080 | | | 2,258 | B |
Vivendi Universal S.A. | | | | 6.250% | | 7/15/08 | | | 860 | | | 929 | |
| | | | | | | | | | | |
|
|
|
| | | | | | | | | | | | | 43,114 | |
| | | | | | | | | | | |
|
|
|
Medical Care Facilities | | 0.3% | | | | | | | | | | | |
HCA Inc. | | | | 6.910% | | 6/15/05 | | | 353 | | | 369 | |
HCA Inc. | | | | 7.125% | | 6/1/06 | | | 540 | | | 584 | |
HCA Inc. | | | | 7.250% | | 5/20/08 | | | 314 | | | 347 | |
HCA Inc. | | | | 8.750% | | 9/1/10 | | | 256 | | | 307 | |
HCA Inc. | | | | 6.300% | | 10/1/12 | | | 3 | | | 3 | |
HCA Inc. | | | | 5.750% | | 3/15/14 | | | 5,880 | | | 5,875 | |
Health Care REIT, Inc. | | | | 8.000% | | 9/12/12 | | | 128 | | | 151 | |
55
Annual Report to Shareholders
STATEMENT OF NET ASSETS—Continued
Western Asset Core Plus Bond Portfolio—Continued
| | | | | | | | | | | | | |
| | | % OF
NET ASSETS | | RATE | | MATURITY
DATE | | PAR/
SHARES | | VALUE | |
| | |
| |
Corporate Bonds and Notes—Continued | | | | | | | | | | | | | |
| | | | | |
Medical Care Facilities—Continued | | | | | | | | | | | | | |
Manor Care, Inc. | | | | 7.500% | | 6/15/06 | | $ | 867 | | $ | 949 | |
Manor Care, Inc. | | | | 8.000% | | 3/1/08 | | | 87 | | | 100 | |
| | | | | | | | | | | |
|
|
|
| | | | | | | | | | | | | 8,685 | |
| | | | | | | | | | | |
|
|
|
Medical Products | | 0.1% | | | | | | | | | | | |
Fresenius Medical Care Capital Trust II | | | | 7.875% | | 2/1/08 | | | 719 | | | 784 | G |
Fresenius Medical Care Capital Trust IV | | | | 7.875% | | 6/15/11 | | | 681 | | | 752 | B |
| | | | | | | | | | | |
|
|
|
| | | | | | | | | | | | | 1,536 | |
| | | | | | | | | | | |
|
|
|
Oil and Gas | | 1.0% | | | | | | | | | | | |
Apache Corporation | | | | 6.250% | | 4/15/12 | | | 1,430 | | | 1,643 | B |
Chesapeake Energy Corporation | | | | 9.000% | | 8/15/12 | | | 182 | | | 210 | |
Conoco Inc. | | | | 6.950% | | 4/15/29 | | | 7,925 | | | 9,237 | |
ConocoPhillips | | | | 8.750% | | 5/25/10 | | | 3,100 | | | 3,943 | |
ConocoPhillips | | | | 4.750% | | 10/15/12 | | | 1,170 | | | 1,207 | B |
ConocoPhillips | | | | 7.000% | | 3/30/29 | | | 640 | | | 747 | |
ConocoPhillips | | | | 5.900% | | 10/15/32 | | | 10 | | | 10 | |
Devon Energy Corporation | | | | 7.950% | | 4/15/32 | | | 4,085 | | | 5,062 | B |
El Paso Corporation | | | | 0.000% | | 2/28/21 | | | 3,150 | | | 1,465 | C,F |
El Paso Natural Gas Company | | | | 8.375% | | 6/15/32 | | | 1,310 | | | 1,336 | |
Parker & Parsley Petroleum Company | | | | 8.875% | | 4/15/05 | | | 232 | | | 246 | |
Parker & Parsley Petroleum Company | | | | 8.250% | | 8/15/07 | | | 330 | | | 385 | |
Pioneer Natural Resources Company | | | | 9.625% | | 4/1/10 | | | 270 | | | 346 | |
Seariver Maritime Inc. | | | | 0.000% | | 9/1/12 | | | 70 | | | 49 | C |
Sonat Inc. | | | | 7.625% | | 7/15/11 | | | 3,000 | | | 2,602 | |
Vintage Petroleum, Inc. | | | | 7.875% | | 5/15/11 | | | 340 | | | 366 | B |
Vintage Petroleum, Inc. | | | | 8.250% | | 5/1/12 | | | 441 | | | 496 | |
Westport Resources Corporation | | | | 8.250% | | 11/1/11 | | | 221 | | | 246 | |
XTO Energy, Inc. | | | | 7.500% | | 4/15/12 | | | 1,061 | | | 1,262 | |
XTO Energy, Inc. | | | | 6.250% | | 4/15/13 | | | 1,787 | | | 1,979 | |
| | | | | | | | | | | |
|
|
|
| | | | | | | | | | | | | 32,837 | |
| | | | | | | | | | | |
|
|
|
Paper and Forest Products | | 0.2% | | | | | | | | | | | |
Georgia-Pacific Corp. | | | | 7.500% | | 5/15/06 | | | 200 | | | 215 | |
Georgia-Pacific Corp. | | | | 8.875% | | 2/1/10 | | | 245 | | | 286 | |
Georgia-Pacific Corp. | | | | 8.125% | | 5/15/11 | | | 9 | | | 10 | B |
Georgia-Pacific Corp. | | | | 9.500% | | 12/1/11 | | | 588 | | | 709 | B |
Georgia-Pacific Corp. | | | | 9.375% | | 2/1/13 | | | 12 | | | 14 | |
Georgia-Pacific Corp. | | | | 7.700% | | 6/15/15 | | | 176 | | | 193 | |
56
| | | | | | | | | | | | | |
| | | % OF
NET ASSETS | | RATE | | MATURITY
DATE | | PAR/
SHARES | | VALUE | |
| | |
| |
| | | | | |
Corporate Bonds and Notes—Continued | | | | | | | | | | | | | |
| | | | | |
Paper and Forest Products—Continued | | | | | | | | | | | | | |
International Paper Company | | | | 5.500% | | 1/15/14 | | $ | 1,205 | | $ | 1,250 | |
MeadWestvaco Corporation | | | | 6.850% | | 4/1/12 | | | 2,235 | | | 2,509 | B |
| | | | | | | | | | | |
|
|
|
| | | | | | | | | | | | | 5,186 | |
| | | | | | | | | | | |
|
|
|
Pharmaceuticals | | 0.3% | | | | | | | | | | | |
AmerisourceBergen Corporation | | | | 8.125% | | 9/1/08 | | | 756 | | | 843 | |
Bristol-Myers Squibb Company | | | | 5.750% | | 10/1/11 | | | 4,380 | | | 4,815 | |
Bristol-Myers Squibb Company | | | | 5.250% | | 8/15/13 | | | 4,460 | | | 4,703 | A |
Omnicare, Inc. | | | | 8.125% | | 3/15/11 | | | 709 | | | 790 | |
| | | | | | | | | | | |
|
|
|
| | | | | | | | | | | | | 11,151 | |
| | | | | | | | | | | |
|
|
|
Photo Equipment and Supplies | | N.M. | | | | | | | | | | | |
Eastman Kodak Company | | | | 7.250% | | 11/15/13 | | | 755 | | | 818 | B |
| | | | | | | | | | | |
|
|
|
| | | | | |
Publishing | | N.M. | | | | | | | | | | | |
Dex Media West LLC | | | | 8.500% | | 8/15/10 | | | 710 | | | 783 | A,B |
| | | | | | | | | | | |
|
|
|
| | | | | |
Real Estate | | N.M. | | | | | | | | | | | |
Ventas Realty, Limited Partnership | | | | 8.750% | | 5/1/09 | | | 560 | | | 634 | |
Ventas Realty, Limited Partnership | | | | 9.000% | | 5/1/12 | | | 90 | | | 104 | |
| | | | | | | | | | | |
|
|
|
| | | | | | | | | | | | | 738 | |
| | | | | | | | | | | |
|
|
|
Restaurants | | N.M. | | | | | | | | | | | |
Yum! Brands, Inc. | | | | 8.500% | | 4/15/06 | | | 171 | | | 190 | |
| | | | | | | | | | | |
|
|
|
| | | | | |
Retail | | 0.3% | | | | | | | | | | | |
Target Corporation | | | | 5.875% | | 3/1/12 | | | 80 | | | 89 | |
Target Corporation | | | | 4.000% | | 6/15/13 | | | 5,340 | | | 5,183 | B |
Wal-Mart Stores, Inc. | | | | 4.125% | | 2/15/11 | | | 3,160 | | | 3,209 | B |
| | | | | | | | | | | |
|
|
|
| | | | | | | | | | | | | 8,481 | |
| | | | | | | | | | | |
|
|
|
Special Purpose | | 1.6% | | | | | | | | | | | |
Air 2 US Series A | | | | 8.027% | | 10/1/19 | | | 207 | | | 188 | A |
Anadarko Finance Company | | | | 6.750% | | 5/1/11 | | | 240 | | | 280 | |
ChevronTexaco Capital Company | | | | 3.500% | | 9/17/07 | | | 20 | | | 21 | |
Conoco Funding Company | | | | 6.350% | | 10/15/11 | | | 2,010 | | | 2,307 | |
Conoco Funding Company | | | | 7.250% | | 10/15/31 | | | 810 | | | 985 | |
DaimlerChrysler NA Holding Corporation | | | | 7.400% | | 1/20/05 | | | 190 | | | 199 | B |
DaimlerChrysler NA Holding Corporation | | | | 4.050% | | 6/4/08 | | | 1,750 | | | 1,769 | B |
DaimlerChrysler NA Holding Corporation | | | | 7.300% | | 1/15/12 | | | 3,315 | | | 3,822 | |
DaimlerChrysler NA Holding Corporation | | | | 6.500% | | 11/15/13 | | | 1,290 | | | 1,395 | |
57
Annual Report to Shareholders
STATEMENT OF NET ASSETS—Continued
Western Asset Core Plus Bond Portfolio—Continued
| | | | | | | | | | | | | |
| | | % OF
NET ASSETS | | RATE | | MATURITY
DATE | | PAR/
SHARES | | VALUE | |
| | |
| |
Corporate Bonds and Notes—Continued | | | | | | | | | | | | | |
| | | | | |
Special Purpose—Continued | | | | | | | | | | | | | |
Devon Financing Corporation ULC | | | | 6.875% | | 9/30/11 | | $ | 1,600 | | $ | 1,851 | B |
Entercom Capital Inc. | | | | 7.625% | | 3/1/14 | | | 390 | | | 422 | |
Patrons’ Legacy 2003 IV | | | | 5.775% | | 12/23/63 | | | 6,600 | | | 6,768 | A |
Sprint Capital Corporation | | | | 6.000% | | 1/15/07 | | | 9,220 | | | 10,017 | |
Sprint Capital Corporation | | | | 6.125% | | 11/15/08 | | | 130 | | | 144 | |
Sprint Capital Corporation | | | | 8.375% | | 3/15/12 | | | 3,295 | | | 4,012 | |
TCI Communications Financing III | | | | 9.650% | | 3/31/27 | | | 1,480 | | | 1,792 | |
Texaco Capital Inc. | | | | 5.500% | | 1/15/09 | | | 1,600 | | | 1,778 | |
Unilever Capital Corporation | | | | 7.125% | | 11/1/10 | | | 1,450 | | | 1,728 | |
Verizon Global Funding Corp. | | | | 6.875% | | 6/15/12 | | | 2,130 | | | 2,461 | B |
Verizon Global Funding Corp. | | | | 7.375% | | 9/1/12 | | | 5,350 | | | 6,384 | B |
Verizon Global Funding Corp. | | | | 4.375% | | 6/1/13 | | | 3,220 | | | 3,138 | B |
| | | | | | | | | | | |
|
|
|
| | | | | | | | | | | | | 51,461 | |
| | | | | | | | | | | |
|
|
|
Telecommunications | | 0.3% | | | | | | | | | | | |
Cincinnati Bell Inc. | | | | 7.250% | | 7/15/13 | | | 1,450 | | | 1,464 | B |
EchoStar DBS Corporation | | | | 4.405% | | 10/1/08 | | | 833 | | | 866 | A,D |
EchoStar DBS Corporation | | | | 9.125% | | 1/15/09 | | | 380 | | | 430 | |
PanAmSat Corporation | | | | 6.375% | | 1/15/08 | | | 346 | | | 359 | |
PanAmSat Corporation | | | | 8.500% | | 2/1/12 | | | 344 | | | 360 | |
Qwest Communications International Inc. | | | | 4.630% | | 2/15/09 | | | 1,745 | | | 1,631 | A,D |
Qwest Corporation | | | | 7.200% | | 11/1/04 | | | 750 | | | 769 | |
Qwest Corporation | | | | 5.625% | | 11/15/08 | | | 2,400 | | | 2,394 | |
| | | | | | | | | | | |
|
|
|
| | | | | | | | | | | | | 8,273 | |
| | | | | | | | | | | |
|
|
|
Telecommunications (Cellular/Wireless) | | 0.1% | | | | | | | | | | | |
AT&T Wireless Services Inc. | | | | 7.350% | | 3/1/06 | | | 3,000 | | | 3,290 | |
AT&T Wireless Services Inc. | | | | 8.125% | | 5/1/12 | | | 50 | | | 61 | B |
Nextel Communications, Inc. | | | | 7.375% | | 8/1/15 | | | 440 | | | 476 | |
| | | | | | | | | | | |
|
|
|
| | | | | | | | | | | | | 3,827 | |
| | | | | | | | | | | |
|
|
|
Transportation | | 0.2% | | | | | | | | | | | |
CSX Corporation | | | | 6.250% | | 10/15/08 | | | 570 | | | 637 | |
Delta Air Lines, Inc. | | | | 6.619% | | 3/18/11 | | | 3,147 | | | 3,110 | |
Delta Air Lines, Inc. | | | | 6.417% | | 7/2/12 | | | 40 | | | 43 | |
Delta Air Lines, Inc. | | | | 6.718% | | 1/2/23 | | | 2,583 | | | 2,783 | |
Kansas City Southern Railway | | | | 9.500% | | 10/1/08 | | | 558 | | | 619 | |
Norfolk Southern Corporation | | | | 6.200% | | 4/15/09 | | | 20 | | | 23 | |
| | | | | | | | | | | |
|
|
|
| | | | | | | | | | | | | 7,215 | |
| | | | | | | | | | | |
|
|
|
Total Corporate Bonds and Notes
(Identified Cost—$550,864) | | | | | | | | | | | | 584,453 | |
| |
58
| | | | | | | | | | | | | |
| | | % OF
NET ASSETS | | RATE | | MATURITY
DATE | | PAR/
SHARES | | VALUE | |
| | |
| |
Asset-Backed Securities | | 6.0% | | | | | | | | | | | |
| | | | | |
Fixed Rate Securities | | 0.7% | | | | | | | | | | | |
Bay View Auto Trust 2003-LJ1 | | | | 3.440% | | 4/25/12 | | $ | 300 | | $ | 306 | |
Chevy Chase Home Loan Trust 1996-1 | | | | 7.150% | | 5/15/15 | | | 12 | | | 12 | |
Conseco Finance Securitizations Corp. 2000-4 | | | | 8.310% | | 5/1/32 | | | 2,200 | | | 1,898 | |
Conseco Finance Securitizations Corp. 2000-6 | | | | 6.770% | | 9/1/32 | | | 2,380 | | | 2,461 | |
Contimortgage Home Equity Loan Trust 1997-4 | | | | 7.330% | | 10/15/28 | | | 1,434 | | | 789 | |
Green Tree Financial Corporation 1992-2 | | | | 9.150% | | 1/15/18 | | | 547 | | | 507 | |
Green Tree Financial Corporation 1993-2 | | | | 8.000% | | 7/15/18 | | | 1,300 | | | 1,287 | |
Green Tree Financial Corporation 1996-5 | | | | 8.100% | | 7/15/27 | | | 6,135 | | | 2,132 | |
Green Tree Home Improvement Loan Trust 1996-A | | | | 7.400% | | 2/15/26 | | | 1,289 | | | 709 | |
Green Tree Home Improvement Loan Trust 1997-D | | | | 7.450% | | 9/15/28 | | | 1,500 | | | 1,503 | |
Lehman ABS Manufactured Housing Contract 2001-B A3 | | | | 4.350% | | 5/15/14 | | | 4,781 | | | 4,865 | |
Lehman ABS Manufactured Housing Contract 2001-B A6 | | | | 6.467% | | 8/15/28 | | | 4,687 | | | 5,104 | |
Pegasus Aviation Lease Securitization 2000-1 | | | | 8.370% | | 3/25/30 | | | 2,500 | | | 1,625 | A |
UCFC Home Equity Loan Trust 1998-C | | | | 5.935% | | 1/15/30 | | | 72 | | | 75 | |
Vanderbilt Mortgage Finance 1996-A | | | | 8.150% | | 4/7/26 | | | 477 | | | 473 | |
Vanderbilt Mortgage Finance 1997-B | | | | 8.155% | | 10/7/26 | | | 250 | | | 249 | |
Vanderbilt Mortgage Finance 1997-C | | | | 7.830% | | 8/7/27 | | | 500 | | | 519 | |
| | | | | | | | | | | |
|
|
|
| | | | | | | | | | | | | 24,514 | |
| | | | | | | | | | | |
|
|
|
Indexed SecuritiesD | | 5.2% | | | | | | | | | | | |
ABSC Long Beach Home Equity Loan Trust
2001-LB1 | | | | 1.350% | | 8/21/30 | | | 4 | | | 4 | |
Advanta Revolving Home Equity Loan Trust 2000-A | | | | 1.340% | | 8/25/24 | | | 1,546 | | | 1,547 | |
Aesop Funding II LLC 2001-1A | | | | 1.290% | | 4/20/05 | | | 1,983 | | | 1,983 | A |
AFC Home Equity Loan Trust 2002-2 | | | | 1.390% | | 6/25/30 | | | 2,165 | | | 2,168 | |
AmeriCredit Automobile Receivables Trust 2003-BX | | | | 1.290% | | 11/6/06 | | | 130 | | | 130 | |
Argent NIM Trust 2003-N1 | | | | 1.360% | | 8/25/08 | | | 9,306 | | | 9,306 | A |
Asset Backed Funding Certificates 2002-WF1 | | | | 1.380% | | 12/25/32 | | | 1,592 | | | 1,594 | |
Asset Backed Securities Corporation Home Equity Loan Trust 2001 HE3 | | | | 1.360% | | 11/15/31 | | | 2,184 | | | 2,187 | |
Bayview Financial Acquisition Trust 2001-DA | | | | 1.470% | | 11/25/31 | | | 430 | | | 430 | A |
Capital Auto Receivables Asset Trust 2003-1 | | | | 1.140% | | 6/15/05 | | | 145 | | | 145 | |
CDC Mortgage Capital Trust 2002-HE1 | | | | 1.400% | | 8/25/32 | | | 4,246 | | | 4,253 | |
CDC Mortgage Capital Trust 2003-HE1 | | | | 1.420% | | 7/25/33 | | | 1,944 | | | 1,948 | |
Centex Home Equity 2000-C | | | | 1.330% | | 10/25/30 | | | 622 | | | 622 | |
Centex Home Equity 2002-D | | | | 1.530% | | 12/25/32 | | | 5,007 | | | 5,020 | |
59
Annual Report to Shareholders
STATEMENT OF NET ASSETS—Continued
Western Asset Core Plus Bond Portfolio—Continued
| | | | | | | | | | | | | |
| | | % OF
NET ASSETS | | RATE | | MATURITY
DATE | | PAR/
SHARES | | VALUE | |
| | |
| |
Asset-Backed Securities—Continued | | | | | | | | | | | | | |
| | | | | |
Indexed Securities—Continued | | | | | | | | | | | | | |
Chase Funding Loan Acquisition Trust 2003-C1 | | | | 1.240% | | 5/25/24 | | $ | 9,653 | | $ | 9,655 | |
Chase Funding Mortgage Loan Asset-Backed Certificates 2000-2 | | | | 1.370% | | 5/25/30 | | | 8 | | | 8 | |
Chase USA Master Trust 2000-2 | | | | 1.260% | | 4/15/09 | | | 110 | | | 110 | |
Citibank Credit Card Issuance Trust 2002-C1 | | | | 2.120% | | 2/9/09 | | | 2,040 | | | 2,068 | |
Conseco Finance 2000-C | | | | 1.460% | | 10/15/31 | | | 145 | | | 145 | |
Countrywide Asset-Backed Certificates 2001-BC2 | | | | 1.340% | | 7/25/31 | | | 367 | | | 367 | |
Countrywide Asset-Backed Certificates 2003-1 | | | | 1.430% | | 6/25/33 | | | 7,784 | | | 7,806 | |
Countrywide Asset-Backed Certificates 2003-3 | | | | 1.230% | | 2/25/22 | | | 10,515 | | | 10,517 | |
Countrywide Asset-Backed Certificates 2003-BC3 | | | | 1.400% | | 9/25/33 | | | 19,090 | | | 19,130 | |
Countrywide Home Equity Loan Trust 2002-F | | | | 1.440% | | 11/15/28 | | | 4,637 | | | 4,685 | |
DaimlerChrysler Master Owner Trust 2002-A | | | | 1.150% | | 5/15/07 | | | 60 | | | 60 | |
Fannie Mae Grantor Trust 2002-T15 | | | | 1.290% | | 11/26/32 | | | 7,128 | | | 7,100 | |
Fannie Mae Grantor Trust 2003-T4 | | | | 1.160% | | 12/26/21 | | | 6,309 | | | 6,309 | |
Fleet Home Equity Loan Trust 2003-1 | | | | 1.340% | | 1/20/33 | | | 13,554 | | | 13,565 | |
Ford Credit Auto Owner Trust 2003-A | | | | 1.140% | | 8/15/05 | | | 79 | | | 79 | |
Household Home Equity Loan Trust 2001-1 | | | | 1.380% | | 1/20/31 | | | 48 | | | 48 | |
Household Home Equity Loan Trust 2002-1 | | | | 1.460% | | 3/14/32 | | | 1,900 | | | 1,905 | |
Household Home Equity Loan Trust 2002-3 | | | | 1.540% | | 8/20/12 | | | 678 | | | 680 | |
Irwin Home Equity Loan Trust 2003-1 | | | | 1.590% | | 2/25/28 | | | 105 | | | 105 | |
Korea Asset Funding Ltd. 2000-1A | | | | 3.220% | | 2/10/09 | | | 460 | | | 460 | A |
Option One Mortgage Loan Trust 2000-2 | | | | 1.380% | | 6/25/30 | | | 313 | | | 313 | |
Option One Mortgage Loan Trust 2003-1 | | | | 1.510% | | 2/25/33 | | | 147 | | | 148 | |
Option One Mortgage Securities Corp. NIM Trust
2003-1 | | | | 1.480% | | 1/26/10 | | | 67 | | | 67 | A |
Pass-Through Amortizing Credit Card Trust
2002-1A | | | | 1.840% | | 6/18/12 | | | 77 | | | 77 | A |
Provident Bank Home Equity Loan Trust 2000-2 | | | | 1.360% | | 8/25/31 | | | 1,322 | | | 1,324 | |
Providian Gateway Master Trust 2002-B | | | | 1.790% | | 6/15/09 | | | 14,970 | | | 15,016 | A |
Residential Asset Mortgage Products, Inc. 2003-RS4 | | | | 1.420% | | 5/25/33 | | | 12,890 | | | 12,920 | |
Residential Funding Mortgage Securities II 2003-HS3 | | | | 1.380% | | 8/25/33 | | | 224 | | | 225 | |
Salomon Brothers Mortgage Securities VII
1999-AQ1 | | | | 1.410% | | 4/25/29 | | | 7 | | | 7 | |
Salomon Brothers Mortgage Securities VII
2002-CIT1 | | | | 1.390% | | 3/25/32 | | | 5,106 | | | 5,115 | |
Southern Pacific Secured Assets Corporation 1998-2 | | | | 1.260% | | 7/25/29 | | | 91 | | | 91 | |
Vanderbilt Mortgage Finance 1999-D | | | | 4.350% | | 1/7/30 | | | 4,100 | | | 3,666 | |
Wachovia Asset Securitization, Inc. 2002-HE1 | | | | 1.460% | | 9/27/32 | | | 4,457 | | | 4,492 | |
60
| | | | | | | | | | | | | |
| | | % OF
NET ASSETS | | RATE | | MATURITY
DATE | | PAR/
SHARES | | VALUE | |
| | |
| |
Asset-Backed Securities—Continued | | | | | | | | | | | | | |
| | | | | |
Indexed Securities—Continued | | | | | | | | | | | | | |
Wachovia Asset Securitization, Inc. 2002-HE2 | | | | 1.520% | | 12/25/32 | | $ | 426 | | $ | 428 | |
Wachovia Asset Securitization, Inc. 2003-HE1 | | | | 1.380% | | 3/25/33 | | | 157 | | | 158 | |
William Street Funding Corporation 2003-1 | | | | 1.420% | | 4/23/06 | | | 9,600 | | | 9,614 | A |
| | | | | | | | | | | |
|
|
|
| | | | | | | | | | | | | 169,800 | |
| | | | | | | | | | | |
|
|
|
Stripped Securities | | 0.1% | | | | | | | | | | | |
Diversified REIT Trust 2001-1 | | | | 0.772% | | 3/8/10 | | | 16,000 | | | 462 | A,H1 |
Oakwood Mortgage Investors Inc. 2001-E | | | | 6.000% | | 11/15/09 | | | 6,972 | | | 1,332 | H1 |
| | | | | | | | | | | |
|
|
|
| | | | | | | | | | | | | 1,794 | |
| | | | | | | | | | | |
|
|
|
Total Asset-Backed Securities
(Identified Cost—$195,397) | | | | | | | | | | | | 196,108 | |
| |
Mortgage-Backed Securities | | 3.6% | | | | | | | | | | | |
| | | | | |
Fixed Rate Securities | | 1.5% | | | | | | | | | | | |
Asset Securitization Corporation 1996-D2 | | | | 6.920% | | 2/14/29 | | | 7,437 | | | 7,932 | |
Banc of America Funding Corporation 2003-1 | | | | 6.000% | | 5/20/33 | | | 2,253 | | | 2,305 | |
Blackrock Capital Finance L.P. 1997-R3 | | | | 7.220% | | 11/25/28 | | | 196 | | | 199 | A |
Commercial Capital Access One, Inc. 2 | | | | 12.000% | | 11/15/27 | | | 3,538 | | | 1,573 | |
Commercial Mortgage Asset Trust 1999-C2 | | | | 7.546% | | 11/17/09 | | | 330 | | | 391 | |
Criimi Mae Commercial Mortgage Trust 1998-C1 | | | | 7.000% | | 3/2/11 | | | 680 | | | 747 | A |
Enterprise Mortgage Acceptance Company 1998-1 | | | | 6.110% | | 1/15/25 | | | 1,023 | | | 1,018 | A |
FFCA Secured Lending Corporation 1999-1A | | | | 6.370% | | 10/18/08 | | | 165 | | | 169 | A |
GMAC Commercial Mortgage Securities Inc.
1998-C1 | | | | 6.700% | | 5/15/30 | | | 10,800 | | | 12,221 | |
GMAC Commercial Mortgage Securities Inc.
1999-C2 | | | | 6.945% | | 9/15/33 | | | 340 | | | 392 | |
GS Mortgage Securities Corporation II 1998-C1 | | | | 6.620% | | 10/18/30 | | | 5,500 | | | 6,180 | |
J.P. Morgan Commercial Mortgage Finance Corporation 1999-C8 | | | | 7.400% | | 7/15/31 | | | 2,000 | | | 2,329 | |
Nomura Asset Securities Corporation 1996-MD5 | | | | 7.120% | | 4/13/36 | | | 2,000 | | | 2,178 | |
Residential Asset Securitization Trust 2003-A14 | | | | 4.750% | | 2/25/19 | | | 5,414 | | | 5,475 | |
Structured Asset Securities Corporation 1996-CFL | | | | 7.750% | | 2/25/28 | | | 5,000 | | | 5,612 | |
| | | | | | | | | | | |
|
|
|
| | | | | | | | | | | | | 48,721 | |
| | | | | | | | | | | |
|
|
|
Indexed SecuritiesD | | 2.1% | | | | | | | | | | | |
Chase Commercial Mortgage Securities Corporation 2000-FL1A | | | | 1.370% | | 12/12/13 | | | 298 | | | 298 | A |
COMM 2001-FL4A | | | | 1.330% | | 4/15/13 | | | 978 | | | 978 | A |
Credit Suisse First Boston Mortgage Securities Corp. 2003-TFLA1 | | | | 1.360% | | 4/15/13 | | | 200 | | | 200 | A |
61
Annual Report to Shareholders
STATEMENT OF NET ASSETS—Continued
Western Asset Core Plus Bond Portfolio—Continued
| | | | | | | | | | | | | |
| | | % OF
NET ASSETS | | RATE | | MATURITY
DATE | | PAR/
SHARES | | VALUE | |
| | |
| |
Mortgage-Backed Securities—Continued | | | | | | | | | | | | | |
| | | | | |
Indexed Securities—Continued | | | | | | | | | | | | | |
Impac CMB Trust 2002-1 | | | | 1.410% | | 3/25/31 | | $ | 3,719 | | $ | 3,726 | |
Impac Mortgage Trust 2003-7 A | | | | 1.410% | | 8/25/33 | | | 9,914 | | | 9,942 | |
J.P. Morgan Chase Commercial Mortgage Security 2003-FL1A | | | | 1.360% | | 2/17/15 | | | 123 | | | 123 | A |
Lehman Brothers Floating Rate Commercial Mortgage Trust 2001-LLFA | | | | 1.330% | | 8/16/13 | | | 1,319 | | | 1,318 | A |
Medallion Trust 2000-2G | | | | 1.310% | | 12/18/31 | | | 859 | | | 860 | |
MLCC Mortgage Investors, Inc. 2003-B | | | | 1.430% | | 4/25/28 | | | 19,220 | | | 19,291 | |
Morgan Stanley Capital I 2003 XLF A-1 | | | | 1.270% | | 7/15/17 | | | 9,834 | | | 9,833 | A |
Sequoia Mortgage Trust 4 | | | | 1.450% | | 4/22/25 | | | 44 | | | 43 | |
Wachovia Bank Commercial Mortgage Trust
2002-WHL | | | | 1.390% | | 3/15/15 | | | 199 | | | 199 | A |
Wachovia Bank Commercial Mortgage Trust
2003-WHL2 | | | | 1.280% | | 6/15/13 | | | 22,200 | | | 22,196 | A |
Westpac Securitisation Trust 1999-1G | | | | 1.320% | | 5/19/30 | | | 178 | | | 177 | |
| | | | | | | | | | | |
|
|
|
| | | | | | | | | | | | | 69,184 | |
| | | | | | | | | | | |
|
|
|
Stripped Securities | | N.M. | | | | | | | | | | | |
FFCA Secured Lending Corporation 1999-1A | | | | 1.710% | | 3/18/16 | | | 773 | | | 36 | A,H1,I |
GMAC Commercial Mortgage Security Inc.
1999-CTL1 | | | | 0.908% | | 12/15/16 | | | 2,076 | | | 36 | A,H1,I |
LB-UBS Commercial Mortgage Trust 2001-C3 | | | | 0.984% | | 6/15/36 | | | 5,467 | | | 299 | A,H1,I |
| | | | | | | | | | | |
|
|
|
| | | | | | | | | | | | | 371 | |
| | | | | | | | | | | |
|
|
|
Variable Rate SecuritiesI | | N.M. | | | | | | | | | | | |
Securitized Asset Sales, Inc. 1994-4 | | | | 3.909% | | 8/25/33 | | | 25 | | | 25 | |
| | | | | | | | | | | |
|
|
|
Total Mortgage-Backed Securities
(Identified Cost—$116,749) | | | | | | | | | | | | 118,301 | |
| |
U.S. Government and Agency Obligations | | 20.3% | | | | | | | | | | | |
| | | | | |
Fixed Rate Securities | | 11.3% | | | | | | | | | | | |
Fannie Mae | | | | 2.875% | | 9/15/06 | | | 535 | | | 546 | |
Fannie Mae | | | | 2.375% | | 2/15/07 | | | 3,080 | | | 3,094 | B |
Fannie Mae | | | | 6.375% | | 6/15/09 | | | 1,374 | | | 1,583 | B |
Fannie Mae | | | | 6.625% | | 11/15/10 | | | 2,860 | | | 3,363 | B |
Fannie Mae | | | | 10.350% | | 12/10/15 | | | 1,030 | | | 1,592 | |
Freddie Mac | | | | 1.875% | | 6/15/06 | | | 4,720 | | | 4,722 | B |
Freddie Mac | | | | 4.875% | | 11/15/06 | | | 100 | | | 107 | |
Freddie Mac | | | | 3.500% | | 11/15/07 | | | 100 | | | 103 | |
62
| | | | | | | | | | | | | |
| | | % OF
NET ASSETS | | RATE | | MATURITY
DATE | | PAR/
SHARES | | VALUE | |
| | |
| |
U.S. Government and Agency
Obligations—Continued | | | | | | | | | | | | | |
| | | | | |
Fixed Rate Securities—Continued | | | | | | | | | | | | | |
Freddie Mac | | | | 5.875% | | 11/15/07 | | $ | 750 | | $ | 835 | |
Freddie Mac | | | | 3.375% | | 4/15/09 | | | 40 | | | 40 | |
Freddie Mac | | | | 4.500% | | 9/16/13 | | | 160 | | | 164 | |
Tennessee Valley Authority | | | | 6.250% | | 12/15/17 | | | 40 | | | 46 | |
Tennessee Valley Authority | | | | 6.750% | | 11/1/25 | | | 1,670 | | | 2,014 | B |
Tennessee Valley Authority | | | | 7.125% | | 5/1/30 | | | 840 | | | 1,063 | B |
United States Treasury Bonds | | | | 8.000% | | 11/15/21 | | | 27,920 | | | 39,196 | B |
United States Treasury Bonds | | | | 6.750% | | 8/15/26 | | | 1,600 | | | 2,023 | B |
United States Treasury Bonds | | | | 5.250% | | 11/15/28 | | | 8,790 | | | 9,280 | B |
United States Treasury Bonds | | | | 6.250% | | 5/15/30 | | | 31,050 | | | 37,487 | B |
United States Treasury Bonds | | | | 5.375% | | 2/15/31 | | | 5,150 | | | 5,614 | B |
United States Treasury Notes | | | | 1.625% | | 1/31/05 | | | 360 | | | 362 | B |
United States Treasury Notes | | | | 1.625% | | 2/28/06 | | | 47,700 | | | 47,774 | B |
United States Treasury Notes | | | | 2.625% | | 11/15/06 | | | 45,680 | | | 46,579 | B |
United States Treasury Notes | | | | 2.250% | | 2/15/07 | | | 19,150 | | | 19,313 | B |
United States Treasury Notes | | | | 6.125% | | 8/15/07 | | | 60 | | | 68 | B |
United States Treasury Notes | | | | 3.000% | | 11/15/07 | | | 60 | | | 62 | B |
United States Treasury Notes | | | | 3.250% | | 8/15/08 | | | 1,310 | | | 1,347 | B |
United States Treasury Notes | | | | 3.125% | | 9/15/08 | | | 2,800 | | | 2,860 | B |
United States Treasury Notes | | | | 3.125% | | 10/15/08 | | | 70,460 | | | 71,902 | B |
United States Treasury Notes | | | | 3.375% | | 11/15/08 | | | 19,640 | | | 20,237 | B |
United States Treasury Notes | | | | 3.000% | | 2/15/09 | | | 28,970 | | | 29,285 | B |
United States Treasury Notes | | | | 2.625% | | 3/15/09 | | | 20,000 | | | 19,856 | |
United States Treasury Notes | | | | 4.250% | | 8/15/13 | | | 140 | | | 145 | B |
| | | | | | | | | | | |
|
|
|
| | | | | | | | | | | | | 372,662 | |
| | | | | | | | | | | |
|
|
|
| | | | | |
Indexed SecuritiesJ | | 8.4% | | | | | | | | | | | |
United States Treasury Inflation-Protected Security | | | | 3.875% | | 1/15/09 | | | 54,288 | | | 63,066 | B |
United States Treasury Inflation-Protected Security | | | | 4.250% | | 1/15/10 | | | 23,685 | | | 28,394 | B |
United States Treasury Inflation-Protected Security | | | | 1.875% | | 7/15/13 | | | 19,519 | | | 20,335 | B |
United States Treasury Inflation-Protected Security | | | | 2.000% | | 1/15/14 | | | 12,948 | | | 13,586 | B |
United States Treasury Inflation-Protected Security | | | | 3.625% | | 4/15/28 | | | 25,336 | | | 33,386 | B |
United States Treasury Inflation-Protected Security | | | | 3.875% | | 4/15/29 | | | 80,999 | | | 111,753 | B |
United States Treasury Inflation-Protected Security | | | | 3.375% | | 4/15/32 | | | 3,370 | | | 4,469 | B |
| | | | | | | | | | | |
|
|
|
| | | | | | | | | | | | | 274,989 | |
| | | | | | | | | | | |
|
|
|
63
Annual Report to Shareholders
STATEMENT OF NET ASSETS—Continued
Western Asset Core Plus Bond Portfolio—Continued
| | | | | | | | | | | | | |
| | | % OF
NET ASSETS | | RATE | | MATURITY
DATE | | PAR/
SHARES | | VALUE | |
| | |
| |
U.S. Government and Agency
Obligations—Continued | | | | | | | | | | | | | |
| | | | | |
Stripped Securities | | 0.6% | | | | | | | | | | | |
United States Treasury Notes | | | | 0.000% | | 5/15/30 | | $ | 1,000 | | $ | 262 | H2 |
United States Treasury Bonds | | | | 0.000% | | 11/15/21 | | | 45,460 | | | 18,684 | B,H2 |
United States Treasury Bonds | | | | 0.000% | | 8/15/27 | | | 1,520 | | | 454 | B,H2 |
United States Treasury Bonds | | | | 0.000% | | 11/15/27 | | | 500 | | | 147 | B,H2 |
| | | | | | | | | | | |
|
|
|
| | | | | | | | | | | | | 19,547 | |
| | | | | | | | | | | |
|
|
|
Total U.S. Government and Agency Obligations
(Identified Cost—$638,173) | | | | | | | | | | | | 667,198 | |
| |
U.S. Government Agency Mortgage-Backed Securities | | 36.1% | | | | | | | | | | | |
| | | | | |
Fixed Rate Securities | | 36.1% | | | | | | | | | | | |
Fannie Mae | | | | 6.500% | | 5/1/14 to 6/1/32 | | | 11,511 | | | 12,143 | |
Fannie Mae | | | | 6.000% | | 5/1/16 to 7/1/32 | | | 7,548 | | | 7,899 | |
Fannie Mae | | | | 5.500% | | 1/1/17 to 4/1/18 | | | 14,592 | | | 15,217 | |
Fannie Mae | | | | 5.000% | | 1/1/18 | | | 68,440 | | | 70,343 | K |
Fannie Mae | | | | 9.500% | | 11/1/21 | | | 4 | | | 4 | |
Fannie Mae | | | | 7.000% | | 1/1/29 | | | 500 | | | 531 | K |
Fannie Mae | | | | 7.000% | | 8/1/29 to 7/1/32 | | | 15,850 | | | 16,824 | |
Fannie Mae | | | | 7.500% | | 11/1/29 | | | 77 | | | 83 | |
Fannie Mae | | | | 6.000% | | 1/1/32 | | | 28,500 | | | 29,658 | K |
Freddie Mac | | | | 5.500% | | 12/1/13 | | | 208 | | | 217 | |
Freddie Mac | | | | 6.000% | | 11/1/14 | | | 12,200 | | | 12,845 | K |
Freddie Mac | | | | 7.000% | | 10/1/16 to 4/1/32 | | | 5,539 | | | 5,873 | |
Freddie Mac | | | | 4.500% | | 2/1/18 | | | 226,800 | | | 228,997 | K |
Freddie Mac | | | | 6.500% | | 7/1/29 | | | 1,189 | | | 1,251 | |
Freddie Mac | | | | 5.500% | | 1/1/33 | | | 35,000 | | | 35,864 | K |
Government National Mortgage Association | | | | 9.500% | | 1/15/06 | | | 32 | | | 34 | |
Government National Mortgage Association | | | | 7.500% | | 3/15/23 to 9/15/31 | | | 838 | | | 903 | |
Government National Mortgage Association | | | | 7.000% | | 7/15/23 to 7/15/31 | | | 2,852 | | | 3,046 | |
Government National Mortgage Association | | | | 6.500% | | 4/15/28 to 4/15/33 | | | 68,945 | | | 72,802 | |
Government National Mortgage Association | | | | 6.000% | | 1/15/29 to 7/15/33 | | | 77,876 | | | 81,365 | |
Government National Mortgage Association | | | | 6.500% | | 8/1/29 | | | 14,850 | | | 15,671 | K |
Government National Mortgage Association | | | | 8.000% | | 12/15/30 to 1/15/31 | | | 124 | | | 135 | |
Government National Mortgage Association | | | | 6.000% | | 8/1/31 | | | 208,890 | | | 218,094 | K |
Government National Mortgage Association | | | | 5.500% | | 12/1/32 | | | 88,200 | | | 90,708 | K |
Government National Mortgage Association | | | | 5.000% | | 2/1/33 | | | 252,200 | | | 253,934 | K |
Government National Mortgage Association | | | | 5.500% | | 7/15/33 | | | 13,918 | | | 14,329 | |
| | | | | | | | | | | |
|
|
|
| | | | | | | | | | | | | 1,188,770 | |
| | | | | | | | | | | |
|
|
|
64
| | | | | | | | | | | | | |
| | | % OF
NET ASSETS | | RATE | | MATURITY
DATE | | PAR/
SHARES | | VALUE | |
| | |
| |
U.S. Government Agency Mortgage-Backed Securities—Continued | | | | | | | | | | | | | |
| | | | | |
IndexedD | | N.M. | | | | | | | | | | | |
Government National Mortgage Association | | | | 1.490% | | 8/20/31 | | $ | 14 | | $ | 14 | |
| | | | | | | | | | | |
|
|
|
| | | | | |
Stripped Securities | | N.M. | | | | | | | | | | | |
Financing Corporation | | | | 0.000% | | 11/30/17 | | | 1,250 | | | 631 | H2 |
Financing Corporation | | | | 0.000% | | 4/5/19 | | | 320 | | | 147 | H2 |
| | | | | | | | | | | |
|
|
|
| | | | | | | | | | | | | 778 | |
| | | | | | | | | | | |
|
|
|
Total U.S. Government Agency Mortgage-Backed
Securities (Identified Cost—$1,188,978) | | | | | | | | | | | | 1,189,562 | |
| |
Yankee BondsL | | 7.7% | | | | | | | | | | | |
| | | | | |
Banks | | N.M. | | | | | | | | | | | |
KFW Kreditanstalt fuer Wiederaufbau | | | | 2.375% | | 9/25/06 | | | 240 | | | 243 | B |
KFW Kreditanstalt fuer Wiederaufbau | | | | 3.375% | | 1/23/08 | | | 100 | | | 103 | |
Royal Bank of Scotland Group plc | | | | 8.817% | | 3/31/05 | | | 230 | | | 246 | |
The Korea Development Bank | | | | 4.250% | | 11/13/07 | | | 200 | | | 207 | |
The Korea Development Bank | | | | 5.500% | | 11/13/12 | | | 60 | | | 64 | B |
| | | | | | | | | | | |
|
|
|
| | | | | | | | | | | | | 863 | |
| | | | | | | | | | | |
|
|
|
Cable | | 0.1% | | | | | | | | | | | |
Rogers Cable Inc. | | | | 7.875% | | 5/1/12 | | | 687 | | | 780 | |
Shaw Communications Inc. | | | | 7.250% | | 4/6/11 | | | 630 | | | 705 | |
| | | | | | | | | | | |
|
|
|
| | | | | | | | | | | | | 1,485 | |
| | | | | | | | | | | |
|
|
|
Containers and Packaging | | 0.1% | | | | | | | | | | | |
Cascades Inc. | | | | 7.250% | | 2/15/13 | | | 1,416 | | | 1,491 | |
Norampac Inc. | | | | 6.750% | | 6/1/13 | | | 572 | | | 606 | |
| | | | | | | | | | | |
|
|
|
| | | | | | | | | | | | | 2,097 | |
| | | | | | | | | | | |
|
|
|
Diversified Financial Services | | N.M. | | | | | | | | | | | |
Pemex Finance Ltd. | | | | 8.500% | | 2/15/08 | | | 110 | | | 116 | |
Pemex Finance Ltd. | | | | 9.030% | | 2/15/11 | | | 10 | | | 12 | |
| | | | | | | | | | | |
|
|
|
| | | | | | | | | | | | | 128 | |
| | | | | | | | | | | |
|
|
|
Electric | | 0.1% | | | | | | | | | | | |
Hydro-Quebec | | | | 6.300% | | 5/11/11 | | | 2,380 | | | 2,750 | |
| | | | | | | | | | | |
|
|
|
Foreign Governments | | 4.4% | | | | | | | | | | | |
Federative Republic of Brazil | | | | 2.062% | | 4/15/09 | | | 1,139 | | | 1,068 | D |
Federative Republic of Brazil | | | | 14.500% | | 10/15/09 | | | 13,910 | | | 17,742 | |
Federative Republic of Brazil | | | | 12.000% | | 4/15/10 | | | 3,240 | | | 3,767 | |
Federative Republic of Brazil | | | | 2.062% | | 4/15/12 | | | 6,180 | | | 5,408 | D |
Federative Republic of Brazil | | | | 8.000% | | 4/15/14 | | | 6,760 | | | 6,591 | B |
65
Annual Report to Shareholders
STATEMENT OF NET ASSETS—Continued
Western Asset Core Plus Bond Portfolio—Continued
| | | | | | | | | | | | | |
| | | % OF
NET ASSETS | | RATE | | MATURITY
DATE | | PAR/
SHARES | | VALUE | |
| | |
| |
Yankee Bonds—Continued | | | | | | | | | | | | | |
| | | | | |
Foreign Governments—Continued | | | | | | | | | | | | | |
Federative Republic of Brazil | | | | 11.000% | | 8/17/40 | | $ | 4,036 | | $ | 4,310 | |
Province of British Columbia | | | | 4.300% | | 5/30/13 | | | 180 | | | 184 | |
Province of Ontario | | | | 3.500% | | 9/17/07 | | | 110 | | | 113 | |
Republic of Bulgaria | | | | 8.250% | | 1/15/15 | | | 6,820 | | | 8,312 | A |
Republic of Colombia | | | | 10.500% | | 7/9/10 | | | 2,230 | | | 2,676 | B |
Republic of Colombia | | | | 11.750% | | 2/25/20 | | | 3,185 | | | 4,077 | |
Republic of Panama | | | | 9.625% | | 2/8/11 | | | 2,733 | | | 3,252 | |
Republic of Panama | | | | 9.375% | | 7/23/12 | | | 1,030 | | | 1,218 | |
Republic of Panama | | | | 10.750% | | 5/15/20 | | | 1,967 | | | 2,483 | |
Republic of Peru | | | | 9.125% | | 2/21/12 | | | 440 | | | 498 | |
Republic of Peru | | | | 5.000% | | 3/7/17 | | | 6,006 | | | 5,556 | A |
Republic of Peru | | | | 5.000% | | 3/7/17 | | | 46 | | | 42 | A |
Republic of Peru | | | | 8.750% | | 11/21/33 | | | 1,170 | | | 1,177 | B |
Republic of the Philippines | | | | 9.875% | | 1/15/19 | | | 2,740 | | | 2,836 | B |
Russian Federation | | | | 8.250% | | 3/31/10 | | | 510 | | | 579 | |
Russian Federation | | | | 5.000% | | 3/31/30 | | | 21,270 | | | 21,302 | M |
United Mexican States | | | | 8.375% | | 1/14/11 | | | 8,050 | | | 9,785 | B |
United Mexican States | | | | 11.500% | | 5/15/26 | | | 28,020 | | | 43,151 | |
| | | | | | | | | | | |
|
|
|
| | | | | | | | | | | | | 146,127 | |
| | | | | | | | | | | |
|
|
|
Insurance | | 0.1% | | | | | | | | | | | |
Atlas Reinsurance PLC | | | | 3.525% | | 1/7/05 | | | 250 | | | 252 | A,D |
Korea Deposit Insurance Corp. | | | | 2.500% | | 12/11/05 | | | 2,500 | | | 2,838 | A,F |
Residential Reinsurance LTD | | | | 6.073% | | 6/1/05 | | | 850 | | | 850 | A,D |
| | | | | | | | | | | |
|
|
|
| | | | | | | | | | | | | 3,940 | |
| | | | | | | | | | | |
|
|
|
Manufacturing (Diversified) | | 1.9% | | | | | | | | | | | |
Tyco International Group SA | | | | 6.375% | | 2/15/06 | | | 10,250 | | | 10,913 | |
Tyco International Group SA | | | | 5.800% | | 8/1/06 | | | 10,250 | | | 10,890 | |
Tyco International Group SA | | | | 6.125% | | 11/1/08 | | | 100 | | | 109 | |
Tyco International Group SA | | | | 6.125% | | 1/15/09 | | | 220 | | | 239 | |
Tyco International Group SA | | | | 6.750% | | 2/15/11 | | | 240 | | | 267 | |
Tyco International Group SA | | | | 6.375% | | 10/15/11 | | | 5,580 | | | 6,103 | |
Tyco International Group SA | | | | 7.000% | | 6/15/28 | | | 145 | | | 154 | |
Tyco International Group SA | | | | 6.875% | | 1/15/29 | | | 32,830 | | | 34,457 | B |
| | | | | | | | | | | |
|
|
|
| | | | | | | | | | | | | 63,132 | |
| | | | | | | | | | | |
|
|
|
Media | | N.M. | | | | | | | | | | | |
Shaw Communications Inc. | | | | 8.250% | | 4/11/10 | | | 27 | | | 32 | |
Shaw Communications Inc. | | | | 7.200% | | 12/15/11 | | | 395 | | | 442 | |
| | | | | | | | | | | |
|
|
|
| | | | | | | | | | | | | 474 | |
| | | | | | | | | | | |
|
|
|
66
| | | | | | | | | | | | | |
| | | % OF
NET ASSETS | | RATE | | MATURITY
DATE | | PAR/
SHARES | | VALUE | |
| | |
| |
Yankee Bonds—Continued | | | | | | | | | | | | | |
| | | | | |
Oil and Gas | | 0.1% | | | | | | | | | | | |
Anderson Exploration Ltd. | | | | 6.750% | | 3/15/11 | | $ | 620 | | $ | 702 | |
Western Oil Sands Inc. | | | | 8.375% | | 5/1/12 | | | 708 | | | 844 | |
YPF Sociedad Anonima | | | | 7.750% | | 8/27/07 | | | 1,000 | | | 1,095 | |
| | | | | | | | | | | |
|
|
|
| | | | | | | | | | | | | 2,641 | |
| | | | | | | | | | | |
|
|
|
Paper and Forest Products | | N.M. | | | | | | | | | | | |
Abitibi-Consolidated Inc. | | | | 8.550% | | 8/1/10 | | | 614 | | | 671 | |
Abitibi-Consolidated Inc. | | | | 8.500% | | 8/1/29 | | | 79 | | | 78 | |
| | | | | | | | | | | |
|
|
|
| | | | | | | | | | | | | 749 | |
| | | | | | | | | | | |
|
|
|
Services | | N.M. | | | | | | | | | | | |
Compagnie Generale de Geophysique SA | | | | 10.625% | | 11/15/07 | | | 136 | | | 147 | |
| | | | | | | | | | | |
|
|
|
| | | | | |
Special Purpose | | 0.7% | | | | | | | | | | | |
Arcel Finance | | | | 5.940% | | 2/1/09 | | | 9,938 | | | 10,734 | A |
Diageo Capital Plc | | | | 6.625% | | 6/24/04 | | | 1,400 | | | 1,417 | B |
Eircom Funding | | | | 8.250% | | 8/15/13 | | | 900 | | | 1,003 | B |
General Motors Nova Scotia Finance Company | | | | 6.850% | | 10/15/08 | | | 1,550 | | | 1,692 | |
HSBC Capital Funding LP | | | | 4.610% | | 12/29/49 | | | 2,090 | | | 2,026 | A,B |
Petrozuata Finance, Inc. | | | | 8.220% | | 4/1/17 | | | 5,220 | | | 4,750 | A |
| | | | | | | | | | | |
|
|
|
| | | | | | | | | | | | | 21,622 | |
| | | | | | | | | | | |
|
|
|
Telecommunications | | 0.1% | | | | | | | | | | | |
British Telecommunications plc | | | | 8.375% | | 12/15/10 | | | 1,145 | | | 1,415 | B |
Telecom Italia S.p.A. | | | | 5.250% | | 11/15/13 | | | 2,510 | | | 2,588 | A |
| | | | | | | | | | | |
|
|
|
| | | | | | | | | | | | | 4,003 | |
| | | | | | | | | | | |
|
|
|
Telecommunications (Cellular/Wireless) | | N.M. | | | | | | | | | | | |
Rogers Wireless Communications Inc. | | | | 6.375% | | 3/1/14 | | | 900 | | | 915 | A |
| | | | | | | | | | | |
|
|
|
| | | | | |
Transportation | | 0.1% | | | | | | | | | | | |
Teekay Shipping Corporation | | | | 8.875% | | 7/15/11 | | | 1,219 | | | 1,416 | |
| | | | | | | | | | | |
|
|
|
Total Yankee Bonds
(Identified Cost—$224,825) | | | | | | | | | | | | 252,489 | |
| |
67
Annual Report to Shareholders
STATEMENT OF NET ASSETS—Continued
Western Asset Core Plus Bond Portfolio—Continued
| | | | | | | | | | | | | | |
| | | % OF
NET ASSETS | | RATE | | MATURITY
DATE | | PAR/
SHARES | | | VALUE | |
| | |
| |
Foreign Government Obligations | | 4.5% | | | | | | | | | | | | |
| | | | | |
Fixed Rate Securities | | 4.5% | | | | | | | | | | | | |
Federal Republic of Germany | | | | 3.750% | | 1/4/09 | | | 57,340 | N | | $ | 72,705 | |
Federal Republic of Germany | | | | 5.000% | | 1/4/12 | | | 17,775 | N | | | 23,738 | |
Federal Republic of Germany | | | | 5.500% | | 1/4/31 | | | 11,240 | N | | | 15,352 | |
Government of Canada | | | | 5.250% | | 6/1/12 | | | 45,000 | O | | | 36,791 | |
Statens Bostadsfinansier | | | | 5.500% | | 3/15/06 | | | 8,500 | P | | | 1,183 | |
| | | | | | | | | | | | |
|
|
|
Total Foreign Government Obligations
(Identified Cost—$130,113) | | | | | | | | | | | | | 149,769 | |
| |
Preferred Stocks | | N.M. | | | | | | | | | | | | |
Home Ownership Funding Corporation | | | | 13.331% | | | | | 13 | shs | | | 620 | A,M |
Home Ownership Funding Corporation II | | | | 13.338% | | | | | 9 | | | | 429 | A,M |
| | | | | | | | | | | | |
|
|
|
Total Preferred Stocks
(Identified Cost—$1,518) | | | | | | | | | | | | | 1,049 | |
| |
Options PurchasedQ | | N.M. | | | | | | | | | | | | |
BellSouth Telecommunications Inc.
Call, July 2006, Strike Price $97.72 | | | | | | | | | 500 | R | | | 13 | |
International Business Machines Corporation
Call, July 2006, Strike Price $99.90 | | | | | | | | | 500 | R | | | 27 | |
| | | | | | | | | | | | |
|
|
|
Total Options Purchased (Identified Cost—$18) | | | | | | | | | | | | | 40 | |
| | | | | | | | | | | | |
|
|
|
Total Long-Term Securities
(Identified Cost—$3,046,635) | | | | | | | | | | | | | 3,158,969 | |
| |
Investment of Proceeds From Securities Lending | | 22.6% | | | | | | | | | | | | |
State Street Navigator Securities Lending Prime Portfolio | | | | | | | | | 744,654 | shs | | | 744,654 | |
| | | | | | | | | | | | |
|
|
|
Total Investment of Proceeds From Securities Lending (Indentified Cost—$744,654) | | | | | | | | | | | 744,654 | |
| |
| | | | | |
Short-Term Securities | | 27.7% | | | | | | | | | | | | |
| | | | | |
Corporate Bonds and Notes | | 0.4% | | | | | | | | | | | | |
Altria Group, Inc. | | | | 1.780% | | 10/22/04 | | $ | 7,780 | | | | 7,779 | D |
Ford Motor Credit Company | | | | 1.970% | | 8/17/04 | | | 6,850 | | | | 6,850 | |
| | | | | | | | | | | | |
|
|
|
| | | | | | | | | | | | | | 14,629 | |
| | | | | | | | | | | | |
|
|
|
| | | | | |
U.S. Government and Agency Obligations | | 6.9% | | | | | | | | | | | | |
Fannie Mae | | | | 0.000% | | 9/8/04 | | | 20,410 | | | | 20,317 | C,S |
Federal Farm Credit Bank | | | | 0.000% | | 4/6/04 | | | 6,900 | | | | 6,899 | C |
Freddie Mac | | | | 0.000% | | 4/5/04 | | | 41,400 | | | | 41,396 | C |
Freddie Mac | | | | 0.000% | | 4/5/04 | | | 62,100 | | | | 62,093 | C |
68
| | | | | | | | | | | | | | |
| | | % OF
NET ASSETS | | RATE | | MATURITY
DATE | | PAR/
SHARES | | | VALUE | |
| | |
| |
Short-Term Securities—Continued | | | | | | | | | | | | | | |
| | | | | |
U.S. Government and Agency Obligations—Continued | | | | | | | | | | | | | | |
Freddie Mac | | | | 0.000% | | 4/6/04 | | $ | 21,500 | | | $ | 21,497 | C |
Freddie Mac | | | | 0.000% | | 4/6/04 | | | 46,550 | | | | 46,544 | C |
Freddie Mac | | | | 0.000% | | 4/7/04 | | | 7,800 | | | | 7,798 | C |
Freddie Mac | | | | 0.000% | | 5/12/04 | | | 20,000 | | | | 19,977 | C |
| | | | | | | | | | | | |
|
|
|
| | | | | | | | | | | | | | 226,521 | |
| | | | | | | | | | | | |
|
|
|
| | | | | |
Options PurchasedQ | | 0.2% | | | | | | | | | | | | |
JPY Call / USD Put, June 2004, Strike Price $115 | | | | | | | | | 320,000 | R | | | 3,507 | |
Sterling Futures Call, September 2004, Strike Price
GBP 94 | | | | | | | | | 770 | R | | | 1,807 | |
| | | | | | | | | | | | |
|
|
|
| | | | | | | | | | | | | | 5,314 | |
| | | | | | | | | | | | |
|
|
|
Repurchase Agreements | | 20.2% | | | | | | | | | | | | |
The Goldman Sachs Group, Inc.
1.05%, dated 3/31/04, to be repurchased at $399,011 on 4/1/04 (Collateral: $197,025 Freddie Mac notes, 4.50% to 5.50%, due 8/15/04 to 7/15/06, value $209,209; $50,000 Freddie Mac zero coupon notes, due 4/13/04, value $49,982; $150,000 Fannie Mae zero coupon discount notes, due 6/23/04 to 9/22/04, value $149,497) | | | | | | | | | 399,000 | | | | 399,000 | |
Merrill Lynch Government Securities, Inc.
1.05%, dated 3/31/04, to be repurchased at $267,484 on 4/1/04 (Collateral: $176,625 Resolution Funding Corp. principal-only securities, due 7/15/20 to 4/15/30, value $55,596; $489,390 Resolution Funding Corp. interest-only securities, due 7/15/12 to 10/15/29, value $217,224) | | | | | | | | | 267,476 | | | | 267,476 | |
| | | | | | | | | | | | |
|
|
|
| | | | | | | | | | | | | | 666,476 | |
| | | | | | | | | | | | |
|
|
|
Total Short-Term Securities (Identified Cost—$911,141) | | | | | | | | | | | 912,940 | |
| |
Total Investments (Identified Cost—$4,702,430) | | 146.2% | | | | | | | | | | | 4,816,563 | |
Receivable for Securities Sold | | 13.0% | | | | | | | | | | | 428,265 | |
Payable for Securities Purchased | | (40.9)% | | | | | | | | | | | (1,346,821 | ) |
Obligation to Return Collateral for Securities Loaned | | (22.6)% | | | | | | | | | | | (744,654 | ) |
Other Assets Less Liabilities | | 4.3% | | | | | | | | | | | 140,332 | |
| | | | | | | | | | | | |
|
|
|
Net Assets | | 100.0% | | | | | | | | | | $ | 3,293,690 | |
| | | | | | | | | | | | |
|
|
|
69
Annual Report to Shareholders
STATEMENT OF NET ASSETS—Continued
Western Asset Core Plus Bond Portfolio—Continued
| | | | | | |
| | |
Net assets consist of: | | | | | | |
Accumulated paid-in capital applicable to: | | | | | | |
306,968 Institutional Class shares outstanding | | | | $ | 3,144,909 | |
657 Financial Intermediary Class shares outstanding | | | | | 6,944 | |
Under/(Over) distributed net investment income | | | | | (15,993 | ) |
Accumulated net realized gain/(loss) on investments, options, futures, swaps and foreign currency transactions | | | | | 37,875 | |
Unrealized appreciation/(depreciation) of investments, options, futures, swaps and foreign currency translations | | | | | 119,955 | |
| | |
| |
|
|
|
| | |
Net assets | | | | $ | 3,293,690 | |
| | |
| |
|
|
|
| | | | | | | |
| | |
Net asset value per share: | | | | | | |
Institutional Class | | | |
| $10.71
|
|
Financial Intermediary Class | | | |
| $10.71
|
|
| | | | | | | | |
| | | EXPIRATION | | ACTUAL
CONTRACTS | | APPRECIATION/
(DEPRECIATION) | |
| | |
| |
Futures Contracts PurchasedQ | | | | | | | | |
Canadian Dollar Futures | | June 2004 | | 400 | | $ | 482 | |
Euribor Futures | | June 2004 | | 250 | | | 467 | |
Euribor Futures | | June 2005 | | 888 | | | 2,609 | |
Euribor Futures | | September 2005 | | 218 | | | 444 | |
Euribor Futures | | June 2004 | | 512 | | | 1,431 | |
Euribor Futures | | September 2004 | | 400 | | | 404 | |
Eurodollar Futures | | June 2004 | | 276 | | | 362 | |
German Government Bond Futures | | June 2004 | | 577 | | | 666 | |
German Government Bond Futures | | June 2004 | | 3,249 | | | 1,648 | |
LIBOR Futures | | June 2004 | | 616 | | | (809 | ) |
U.S. Treasury Bond Futures | | June 2004 | | 32 | | | 4 | |
U.S. Treasury Note Futures | | September 2004 | | 9 | | | 20 | |
| | | | | | |
|
|
|
| | | | | | | $ | 7,728 | |
| | | | | | |
|
|
|
Futures Contracts WrittenQ | | | | | | | | |
U.S. Treasury Note Futures | | June 2004 | | 100 | | $ | 1 | |
U.S. Treasury Note Futures | | June 2004 | | 4,021 | | | 2,251 | |
| | | | | | |
|
|
|
| | | | | | | $ | 2,252 | |
| | | | | | |
|
|
|
70
| | | | | | | | |
| | | EXPIRATION | | ACTUAL
CONTRACTS | | APPRECIATION/
(DEPRECIATION) | |
| | |
| |
Options WrittenQ | | | | | | | | |
Goldman Sachs Swaption Call, Strike Price $98.00 | | January 2004 | | 39,300,000 | | $ | 126 | |
Deutsche Bank Swaption Put, Strike Price $100.00 | | September 2004 | | 129,700,000 | | | 1,318 | |
U.S. Treasury Bond Futures Put, Strike Price $104 | | June 2004 | | 1,013 | | | 996 | |
U.S. Treasury Bond Futures Put, Strike Price $108 | | June 2004 | | 909 | | | 573 | |
U.S. Treasury Bond Futures Put, Strike Price $112 | | June 2004 | | 278 | | | (47 | ) |
U.S. Treasury Note Futures Call, Strike Price $114 | | June 2004 | | 1,543 | | | (1,445 | ) |
U.S. Treasury Note Futures Call, Strike Price $116 | | June 2004 | | 732 | | | (276 | ) |
U.S. Treasury Note Futures Call, Strike Price $117 | | September 2004 | | 500 | | | (3 | ) |
U.S. Treasury Note Futures Call, Strike Price $120 | | June 2004 | | 500 | | | 91 | |
U.S. Treasury Note Futures Call, Strike Price $115 | | September 2004 | | 259 | | | (221 | ) |
U.S. Treasury Note Futures Put, Strike Price $108 | | June 2004 | | 913 | | | 646 | |
U.S. Treasury Note Futures Put, Strike Price $110 | | June 2004 | | 658 | | | 222 | |
U.S. Treasury Note Futures Put, Strike Price $112 | | June 2004 | | 500 | | | 295 | |
U.S. Treasury Note Futures Put, Strike Price $112 | | June 2004 | | 790 | | | 11 | |
| | | | | | |
|
|
|
| | | | | | | $ | 2,286 | |
| | | | | | |
|
|
|
| A | Rule 144a Security – A security purchased pursuant to Rule 144a under the Securities Act of 1933 which may not be resold subject to that rule except to qualified institutional buyers. These securities represent 4.6% of net assets. |
| B | All or a portion of this security is on loan. See Note 4 to the financial statements. |
| C | Zero coupon bond – A bond with no periodic interest payments which is sold at such a discount as to produce a current yield to maturity. |
| D | Indexed security – The rates of interest earned on these securities are tied to the London Interbank Offered Rate (“LIBOR”), the Consumer Price Index (“CPI”), or the one-year Treasury Bill rate. The coupon rates are the rates as of March 31, 2004. |
| E | Bond is in default at March 31, 2004. |
| FConvertible | security –Security may be converted into the issuer’s common stock. |
| G | Unit – A security which consists of a bond and warrants to purchase the stock of the issuer. |
| H | Stripped security – Security with interest-only or principal-only payment streams, denoted by a 1 or 2, respectively. For interest-only securities, the amount shown as principal is the notional balance used to calculate the amount of interest due. |
| I | The coupon rates shown on variable rate securities are the rates at March 31, 2004. These rates vary with the weighted average coupon of the underlying loans. |
| J | Inflation-Protected Security – Security whose principal value is adjusted daily or monthly in accordance with changes to the Consumer Price Index for All Urban Consumers. Interest is calculated on the basis of the current adjusted principal value. |
| K | When-issued security – Security purchased on a delayed delivery basis. Final settlement amount and maturity date have not yet been announced. |
| L | Yankee Bond – A dollar-denominated bond issued in the U.S. by foreign entities. |
| M | Stepped coupon security – A security with a predetermined schedule of interest or dividend rate changes, at which time it begins to accrue interest or pay dividends. |
| N | Denominated in euro currency. |
| O | Denominated in Canadian dollars. |
| P | Denominated in Swedish krona. |
| Q | Options and futures are described in more detail in the notes to financial statements. |
| R | Represents actual number of contracts. |
| S | Collateral to cover futures and options contracts. |
See notes to financial statements.
71
Annual Report to Shareholders
STATEMENT OF NET ASSETS
March 31, 2004
(Amounts in Thousands)
Western Asset Inflation Indexed Plus Bond Portfolio
| | | | | | | | | | | | | |
| | | % OF
NET ASSETS | | RATE | | MATURITY
DATE | | PAR/
SHARES | | VALUE | |
| | |
| |
Long-Term Securities | | 108.4% | | | | | | | | | | | |
| | | | | |
Corporate Bonds and Notes | | 0.8% | | | | | | | | | | | |
| | | | | |
Investment Banking/Brokerage | | 0.8% | | | | | | | | | | | |
J.P. Morgan Chase & Co., Inc. | | | | 4.443% | | 2/15/12 | | $ | 2,690 | | $ | 2,918 | A |
| | | | | | | | | | | |
|
|
|
Total Corporate Bonds and Notes
(Identified Cost—$2,624) | | | | | | | | | | | | 2,918 | |
| |
Asset-Backed Securities | | 9.2% | | | | | | | | | | | |
| | | | | |
Indexed SecuritiesA | | 9.2% | | | | | | | | | | | |
ACE Securities Corp. Home Equity Loan Trust
2003-HS1 | | | | 1.460% | | 6/25/33 | | | 2,700 | | | 2,710 | |
AmeriCredit Automobile Receivables Trust
2000-B | | | | 1.300% | | 4/5/07 | | | 273 | | | 273 | |
Ameriquest Mortgage Securities, Inc. 2002-5 | | | | 1.560% | | 2/25/33 | | | 2,328 | | | 2,334 | |
Ameriquest Mortgage Securities, Inc. 2002-AR3 | | | | 1.460% | | 10/25/33 | | | 985 | | | 988 | |
AQ Finance NIM Trust 2003-N10A | | | | 1.350% | | 8/25/08 | | | 2,085 | | | 2,088 | B |
ARG Funding Corp. 1999-3A | | | | 1.340% | | 8/22/05 | | | 2,667 | | | 2,668 | B |
ARG Funding Corp. 2001-2A | | | | 1.330% | | 3/20/06 | | | 1,100 | | | 1,101 | B |
Bear Stearns Asset Backed Securities, Inc.
2003-ABF1 | | | | 1.460% | | 2/25/34 | | | 2,726 | | | 2,735 | |
Chase Funding Mortgage Loan Asset-Backed Certificates 2002-4 | | | | 1.460% | | 10/25/32 | | | 1,643 | | | 1,651 | |
Chevy Chase Funding LLC 2004-1 A1 | | | | 1.390% | | 1/25/35 | | | 3,300 | | | 3,300 | |
Countrywide Asset-Backed Certificates 2002-1 | | | | 1.370% | | 8/25/32 | | | 328 | | | 328 | |
EMC Mortgage Loan Trust ABS Security 2002-B | | | | 1.640% | | 11/25/41 | | | 3,033 | | | 3,040 | B |
EQCC Trust 2002 | | | | 1.390% | | 11/25/31 | | | 998 | | | 1,001 | |
Home Equity Mortgage Trust 2003-5 | | | | 1.510% | | 1/15/34 | | | 2,527 | | | 2,538 | |
IndyMac Home Equity Loan Asset-Backed
Trust 2003-A | | | | 1.250% | | 9/25/19 | | | 675 | | | 675 | |
Residential Asset Mortgage Products, Inc.
2003-RS2 | | | | 1.430% | | 3/25/33 | | | 789 | | | 791 | |
Structured Asset Investment Loan Trust 2003-BC7 | | | | 1.220% | | 7/25/33 | | | 880 | | | 880 | |
Structured Asset Investment Loan Trust 2003-BC8 | | | | 1.230% | | 8/25/10 | | | 2,722 | | | 2,721 | |
| | | | | | | | | | | |
|
|
|
Total Asset-Backed Securities
(Identified Cost—$31,770) | | | | | | | | | | | | 31,822 | |
| |
72
| | | | | | | | | | | | | |
| | | % OF
NET ASSETS | | RATE | | MATURITY
DATE | | PAR/
SHARES | | VALUE | |
| | |
| |
Mortgage-Backed Securities | | 2.8% | | | | | | | | | | | |
| | | | | |
Indexed SecuritiesA | | 2.8% | | | | | | | | | | | |
Credit Suisse First Boston Mortgage Securities Corp.
2001-28 | | | | 1.740% | | 11/25/31 | | $ | 2,323 | | $ | 2,331 | |
Credit Suisse First Boston Mortgage Securities Corp.
2003-TFLA1 | | | | 1.360% | | 4/15/13 | | | 500 | | | 500 | B |
Credit Suisse RPM Mortgage Loan Trust Series 2003-2 | | | | 1.790% | | 6/25/33 | | | 2,796 | | | 2,808 | |
Crusade Global Trust 2003-2 | | | | 1.300% | | 9/18/34 | | | 2,707 | | | 2,710 | C |
Merrill Lynch Mortgage Investors, Inc. 2003-F | | | | 2.902% | | 10/25/33 | | | 1,548 | | | 1,494 | |
| | | | | | | | | | | |
|
|
|
Total Mortgage-Backed Securities
(Identified Cost—$9,925) | | | | | | | | | | | | 9,843 | |
| |
U.S. Government and Agency Obligations | | 92.2% | | | | | | | | | | | |
| | | | | |
Fixed Rate Securities | | 2.4% | | | | | | | | | | | |
Tennessee Valley Authority | | | | 3.375% | | 1/15/07 | | | 7,480 | | | 8,179 | D |
| | | | | | | | | | | |
|
|
|
| | | | | |
Indexed SecuritiesE | | 89.8% | | | | | | | | | | | |
United States Treasury Inflation-Protected Security | | | | 3.375% | | 1/15/07 | | | 725 | | | 799 | D |
United States Treasury Inflation-Protected Security | | | | 3.625% | | 1/15/08 | | | 20,369 | | | 23,054 | D |
United States Treasury Inflation-Protected Security | | | | 3.875% | | 1/15/09 | | | 36,832 | | | 42,788 | D |
United States Treasury Inflation-Protected Security | | | | 4.250% | | 1/15/10 | | | 25,765 | | | 30,888 | D |
United States Treasury Inflation-Protected Security | | | | 3.500% | | 1/15/11 | | | 30,919 | | | 36,059 | D |
United States Treasury Inflation-Protected Security | | | | 3.375% | | 1/15/12 | | | 5,058 | | | 5,898 | D |
United States Treasury Inflation-Protected Security | | | | 3.000% | | 7/15/12 | | | 25,160 | | | 28,638 | D |
United States Treasury Inflation-Protected Security | | | | 1.875% | | 7/15/13 | | | 23,914 | | | 24,914 | D |
United States Treasury Inflation-Protected Security | | | | 2.000% | | 1/15/14 | | | 28,152 | | | 29,540 | D |
United States Treasury Inflation-Protected Security | | | | 3.625% | | 4/15/28 | | | 32,503 | | | 42,830 | D |
United States Treasury Inflation-Protected Security | | | | 3.875% | | 4/15/29 | | | 24,060 | | | 33,195 | D |
United States Treasury Inflation-Protected Security | | | | 3.375% | | 4/15/32 | | | 9,347 | | | 12,397 | D |
| | | | | | | | | | | |
|
|
|
| | | | | | | | | | | | | 311,000 | |
| | | | | | | | | | | |
|
|
|
Total U.S. Government and Agency Obligations (Identified Cost—$303,274) | | | | | | | | | | | | 319,179 | |
| |
73
Annual Report to Shareholders
STATEMENT OF NET ASSETS—Continued
Western Asset Inflation Indexed Plus Bond Portfolio—Continued
| | | | | | | | | | | | | | |
| | | % OF
NET ASSETS | | RATE | | MATURITY
DATE | | PAR/
SHARES | | | VALUE | |
| | |
| |
Foreign Government Obligations | | 3.4% | | | | | | | | | | | | |
| | | | | |
Fixed Rate Securities | | 1.9% | | | | | | | | | | | | |
French Republic | | | | 2.500% | | 7/25/13 | | | 5,100 | G | | $ | 6,690 | |
| | | | | | | | | | | | |
|
|
|
Indexed SecuritiesA | | 1.5% | | | | | | | | | | | | |
Canadian Real Return Bond | | | | 3.000% | | 12/1/36 | | | 3,960 | F | | | 3,434 | E |
Kingdom of Sweden Inflation-Protected Notes | | | | 3.798% | | 12/1/28 | | | 9,100 | H | | | 1,577 | E |
| | | | | | | | | | | | |
|
|
|
| | | | | | | | | | | | | | 5,011 | |
| | | | | | | | | | | | |
|
|
|
Total Foreign Government Obligations
(Identified Cost—$11,193) | | | | | | | | | | | | | 11,701 | |
| | | | | | | | | | | | |
|
|
|
Total Long-Term Securities
(Identified Cost—$358,786) | | | | | | | | | | | | | 375,463 | |
| |
Investment of Proceeds From Securities Lending | | 25.2% | | | | | | | | | | | | |
State Street Navigator Securities Lending Prime Portfolio | | | | | | | | | 87,384 | shs | | | 87,384 | |
| | | | | | | | | | | | |
|
|
|
Total Investment of Proceeds From Securities
Lending (Identified Cost—$87,384) | | | | | | | | | | | 87,384 | |
| |
Short-Term Securities | | 3.9% | | | | | | | | | | | | |
| | | | | |
U.S. Government and Agency Obligations | | 0.8% | | | | | | | | | | | | |
Fannie Mae | | | | 0.000% | | 9/8/04 | | $ | 1,750 | | | | 1,742 | I,J |
Federal Farm Credit Bank | | | | 0.000% | | 4/6/04 | | | 50 | | | | 50 | I,J |
Freddie Mac | | | | 0.000% | | 4/5/04 | | | 300 | | | | 300 | I,J |
Freddie Mac | | | | 0.000% | | 4/5/04 | | | 470 | | | | 470 | I,J |
Freddie Mac | | | | 0.000% | | 4/6/04 | | | 100 | | | | 100 | I,J |
Freddie Mac | | | | 0.000% | | 4/6/04 | | | 350 | | | | 350 | I,J |
| | | | | | | | | | | | |
|
|
|
| | | | | | | | | | | | | | 3,012 | |
| | | | | | | | | | | | |
|
|
|
| | | | | |
Options PurchasedK | | N.M. | | | | | | | | | | | | |
Eurodollar Futures Put, September 2004, Strike
Price $98 | | | | | | | | | 335 | L | | | 14 | |
| | | | | | | | | | | | |
|
|
|
74
| | | | | | | | | |
| | | % OF
NET ASSETS | | PAR/
SHARES | | VALUE | |
| | |
| |
Short-Term Securities—Continued | | | | | | | | | |
Repurchase Agreements | | 3.1% | | | | | | | |
Credit Suisse First Boston USA
1.04%, dated 3/31/04, to be repurchased at $4,635 on 4/1/04
(Collateral: $4,640 Freddie Mac notes, 3.75%, due 4/15/04,
value $4,807) | | | | $ | 4,635 | | $ | 4,635 | |
Deutsche Bank AG
1.04%, dated 3/31/04, to be repurchased at $6,000 on 4/1/04
(Collateral: $5,703 Freddie Mac notes, 5.25%, due 1/15/06,
value $6,184) | | | | | 6,000 | | | 6,000 | |
| | | | | | | |
|
|
|
| | | | | | | | | 10,635 | |
| | | | | | | |
|
|
|
Total Short-Term Securities (Identified Cost—$13,812) | | | | | | | | 13,661 | |
| |
Total Investments (Identified Cost—$459,982) | | 137.5% | | | | | | 476,508 | |
Obligation to Return Collateral for Securities Loaned | | (25.2)% | | | | | | (87,384 | ) |
Payable for Securities Purchased | | (14.6)% | | | | | | (50,580 | ) |
Other Assets Less Liabilities | | 2.3% | | | | | | 7,835 | |
| | | | | | | |
|
|
|
| | | |
Net assets consist of: | | | | | | | | | |
Accumulated paid-in capital applicable to
30,810 Institutional Class shares outstanding | | | | $ | 317,811 | | | | |
Undistributed Net Investment Income | | | | | 64 | | | | |
Accumulated net realized gain/(loss) on investments, options, futures, swaps and foreign currency transactions | | | | | 11,636 | | | | |
Unrealized appreciation/(depreciation) of investments, options, futures, swaps and foreign currency translations | | | | | 16,868 | | | | |
| | | | |
|
| | | | |
| | | |
Net assets | | 100.0% | | | | | $ | 346,379 | |
| | | | | | | |
|
|
|
| | | |
Net asset value per share: | | | | | | | | | |
Institutional Class | | | | | | |
| $11.24
|
|
75
Annual Report to Shareholders
STATEMENT OF NET ASSETS—Continued
Western Asset Inflation Indexed Plus Bond Portfolio—Continued
| | | | | | | | |
| | | EXPIRATION | | ACTUAL
CONTRACTS | | APPRECIATION/
(DEPRECIATION) | |
| | |
| |
Options WrittenK | | | | | | | | |
Goldman Sachs Swaption Call, Strike Price $4.935 | | January 2005 | | 4,600,000 | | $ | 15 | |
J.P. Morgan Chase & Co., Inc. Swaption Put, Strike Price $100.00 | | September 2004 | | 25,600,000 | | | 258 | |
U.S. Treasury Bond Futures Call, Strike Price $117 | | June 2004 | | 185 | | | 129 | |
U.S. Treasury Bond Futures Put, Strike Price $111 | | June 2004 | | 277 | | | (10 | ) |
U.S. Treasury Note Futures Put, Strike Price $113 | | June 2004 | | 110 | | | (20 | ) |
U.S. Treasury Note Futures Call, Strike Price $116 | | June 2004 | | 98 | | | (33 | ) |
| | | | | | |
|
|
|
| | | | | | | $ | 339 | |
| | | | | | |
|
|
|
| A | Indexed security – The rates of interest earned on these securities are tied to the London Interbank Offered Rate (“LIBOR”), the Consumer Price Index (“CPI”), or the one-year Treasury Bill rate. The coupon rates are the rates as of March 31, 2004. |
| B | Rule 144a Security – A security purchased pursuant to Rule 144a under the Securities Act of 1933 which may not be resold subject to that rule except to qualified institutional buyers. These securities represent 2.7% of net assets. |
| C | Yankee Bond – A dollar-denominated bond issued in the U.S. by foreign entities. |
| D | All or a portion of this security is on loan. See Note 4 to the financial statements. |
| E | Inflation-Protected Securities – Security whose principal value is adjusted daily or monthly in accordance with changes to the Consumer Price Index for All Urban Consumers. Interest is calculated on the basis of the current adjusted principal value. |
| F | Denominated in Canadian dollar. |
| G | Denominated in euro currency. |
| H | Denominated in Swedish krona. |
| I | Zero coupon bond – A bond with no periodic interest payments which is sold at such a discount as to produce a current yield to maturity. |
| J | Collateral to cover futures and options contracts. |
| K | Options and futures are described in more detail in the notes to financial statements. |
| L | Represents actual number of contracts. |
See notes to financial statements.
76
STATEMENT OF NET ASSETS
March 31, 2004
(Amounts in Thousands)
Western Asset High Yield Portfolio
| | | | | | | | | | | | | |
| | | % OF
NET ASSETS | | RATE | | MATURITY
DATE | | PAR/
SHARES | | VALUE | |
| | |
| |
Long-Term Securities | | 88.0% | | | | | | | | | | | |
| | | | | |
Corporate Bonds and Notes | | 79.7% | | | | | | | | | | | |
| | | | | |
Advertising | | 0.6% | | | | | | | | | | | |
Vertis Inc. | | | | 10.875% | | 6/15/09 | | $ | 1,112 | | $ | 1,120 | |
| | | | | | | | | | | |
|
|
|
| | | | | |
Aerospace/Defense | | 1.5% | | | | | | | | | | | |
Armor Holdings, Inc. | | | | 8.250% | | 8/15/13 | | | 790 | | | 875 | |
Esterline Technologies Corporation | | | | 7.750% | | 6/15/13 | | | 855 | | | 911 | |
Hexcel Corporation | | | | 9.875% | | 10/1/08 | | | 736 | | | 819 | |
Hexcel Corporation | | | | 9.750% | | 1/15/09 | | | 290 | | | 301 | |
| | | | | | | | | | | |
|
|
|
| | | | | | | | | | | | | 2,906 | |
| | | | | | | | | | | |
|
|
|
Animal Hospitals | | 0.3% | | | | | | | | | | | |
Vicar Operating, Inc. | | | | 9.875% | | 12/1/09 | | | 580 | | | 650 | |
| | | | | | | | | | | |
|
|
|
| | | | | |
Apparel | | 1.3% | | | | | | | | | | | |
Oxford Industries, Inc. | | | | 8.875% | | 6/1/11 | | | 734 | | | 789 | A |
Russell Corporation | | | | 9.250% | | 5/1/10 | | | 916 | | | 973 | |
The William Carter Company | | | | 10.875% | | 8/15/11 | | | 585 | | | 680 | |
| | | | | | | | | | | |
|
|
|
| | | | | | | | | | | | | 2,442 | |
| | | | | | | | | | | |
|
|
|
Auto and Automotive Parts | | 1.7% | | | | | | | | | | | |
Cummins Inc. | | | | 10.250% | | 12/1/10 | | | 1,001 | | | 1,179 | A |
Keystone Automotive Operations Inc. | | | | 9.750% | | 11/1/13 | | | 800 | | | 876 | A |
TRW Automotive | | | | 9.375% | | 2/15/13 | | | 649 | | | 746 | |
TRW Automotive | | | | 11.000% | | 2/15/13 | | | 417 | | | 498 | |
| | | | | | | | | | | |
|
|
|
| | | | | | | | | | | | | 3,299 | |
| | | | | | | | | | | |
|
|
|
Automotive Retailer | | 0.8% | | | | | | | | | | | |
Asbury Automotive Group Inc. | | | | 9.000% | | 6/15/12 | | | 1,437 | | | 1,538 | |
| | | | | | | | | | | |
|
|
|
| | | | | |
Building Materials | | 3.9% | | | | | | | | | | | |
American Standard, Inc. | | | | 7.375% | | 2/1/08 | | | 31 | | | 34 | |
Associated Materials Incorporated | | | | 0.000% | | 3/1/14 | | | 1,420 | | | 863 | A,B |
Atrium Companies, Inc. | | | | 10.500% | | 5/1/09 | | | 1,348 | | | 1,419 | |
Atrium Companies, Inc. | | | | 10.500% | | 5/1/09 | | | 360 | | | 379 | A |
Interface, Inc. | | | | 7.300% | | 4/1/08 | | | 411 | | | 407 | |
Interface, Inc. | | | | 10.375% | | 2/1/10 | | | 907 | | | 1,025 | |
Koppers Inc. | | | | 9.875% | | 10/15/13 | | | 1,170 | | | 1,287 | A |
Nortek Holdings, Inc. | | | | 0.000% | | 5/15/11 | | | 650 | | | 494 | A,B |
Nortek Holdings, Inc. | | | | 9.875% | | 6/15/11 | | | 1,309 | | | 1,472 | |
| | | | | | | | | | | |
|
|
|
| | | | | | | | | | | | | 7,380 | |
| | | | | | | | | | | |
|
|
|
77
Annual Report to Shareholders
STATEMENT OF NET ASSETS—Continued
Western Asset High Yield Portfolio—Continued
| | | | | | | | | | | | | |
| | | % OF
NET ASSETS | | RATE | | MATURITY
DATE | | PAR/
SHARES | | VALUE | |
| | |
| |
Corporate Bonds and Notes—Continued | | | | | | | | | | | | | |
| | | | | |
Cable | | 2.8% | | | | | | | | | | | |
Charter Communications Holdings, LLC | | | | 9.625% | | 11/15/09 | | $ | 1,150 | | $ | 972 | |
Charter Communications, Inc. | | | | 10.250% | | 9/15/10 | | | 2,036 | | | 2,097 | A |
CSC Holdings Inc. | | | | 6.750% | | 4/15/12 | | | 600 | | | 600 | A |
CSC Holdings Inc. | | | | 7.625% | | 7/15/18 | | | 718 | | | 757 | |
LodgeNet Entertainment Corporation | | | | 9.500% | | 6/15/13 | | | 717 | | | 796 | |
| | | | | | | | | | | |
|
|
|
| | | | | | | | | | | | | 5,222 | |
| | | | | | | | | | | |
|
|
|
Casino Resorts | | 3.2% | | | | | | | | | | | |
Inn of the Mountain Gods | | | | 12.000% | | 11/15/10 | | | 720 | | | 779 | A |
Mandalay Resort Group | | | | 9.375% | | 2/15/10 | | | 200 | | | 238 | |
MGM MIRAGE | | | | 8.500% | | 9/15/10 | | | 662 | | | 773 | |
MGM MIRAGE | | | | 8.375% | | 2/1/11 | | | 190 | | | 219 | |
Mirage Resorts, Incorporated | | | | 7.250% | | 10/15/06 | | | 328 | | | 354 | |
Park Place Entertainment Corporation | | | | 7.875% | | 12/15/05 | | | 75 | | | 80 | |
Park Place Entertainment Corporation | | | | 8.500% | | 11/15/06 | | | 370 | | | 412 | |
Park Place Entertainment Corporation | | | | 9.375% | | 2/15/07 | | | 124 | | | 140 | |
Park Place Entertainment Corporation | | | | 8.875% | | 9/15/08 | | | 502 | | | 573 | |
Premier Entertainment Biloxi LLC | | | | 10.750% | | 2/1/12 | | | 544 | | | 588 | A |
Station Casinos, Inc. | | | | 6.000% | | 4/1/12 | | | 770 | | | 797 | A |
Station Casinos, Inc. | | | | 6.875% | | 3/1/16 | | | 360 | | | 370 | A |
Wynn Las Vegas LLC | | | | 12.000% | | 11/1/10 | | | 614 | | | 740 | |
| | | | | | | | | | | |
|
|
|
| | | | | | | | | | | | | 6,063 | |
| | | | | | | | | | | |
|
|
|
Chemicals | | 5.3% | | | | | | | | | | | |
Airgas, Inc. | | | | 6.250% | | 7/15/14 | | | 460 | | | 474 | A |
Equistar Chemical LP | | | | 10.125% | | 9/1/08 | | | 322 | | | 346 | |
Equistar Chemical LP | | | | 10.625% | | 5/1/11 | | | 505 | | | 544 | |
FMC Corporation | | | | 10.250% | | 11/1/09 | | | 466 | | | 548 | |
Georgia Gulf Corporation | | | | 7.625% | | 11/15/05 | | | 17 | | | 18 | |
Georgia Gulf Corporation | | | | 7.125% | | 12/15/13 | | | 360 | | | 382 | A |
Hercules Incorporated | | | | 11.125% | | 11/15/07 | | | 380 | | | 456 | |
Huntsman International Holdings LLC | | | | 0.000% | | 12/31/09 | | | 1,170 | | | 538 | C |
Huntsman International LLC | | | | 9.875% | | 3/1/09 | | | 533 | | | 586 | |
Huntsman International LLC | | | | 10.125% | | 7/1/09 | | | 772 | | | 786 | |
IMC Global Inc. | | | | 10.875% | | 6/1/08 | | | 400 | | | 482 | |
IMC Global Inc. | | | | 10.875% | | 8/1/13 | | | 7 | | | 9 | |
Lyondell Chemical Company | | | | 9.875% | | 5/1/07 | | | 720 | | | 747 | |
MacDermid, Incorporated | | | | 9.125% | | 7/15/11 | | | 1,341 | | | 1,512 | |
Millennium America Inc. | | | | 7.000% | | 11/15/06 | | | 121 | | | 123 | |
Millennium America Inc. | | | | 9.250% | | 6/15/08 | | | 528 | | | 564 | |
78
| | | | | | | | | | | | | |
| | | % OF
NET ASSETS | | RATE | | MATURITY
DATE | | PAR/ SHARES | | VALUE | |
| | |
| |
Corporate Bonds and Notes—Continued | | | | | | | | | | | | | |
| | | | | |
Chemicals—Continued | | | | | | | | | | | | | |
Nalco Company | | | | 7.750% | | 11/15/11 | | $ | 310 | | $ | 324 | A |
Nalco Company | | | | 8.875% | | 11/15/13 | | | 470 | | | 490 | A |
Westlake Chemical Corporation | | | | 8.750% | | 7/15/11 | | | 1,000 | | | 1,105 | |
| | | | | | | | | | | |
|
|
|
| | | | | | | | | | | | | 10,034 | |
| | | | | | | | | | | |
|
|
|
Containers and Packaging | | 0.4% | | | | | | | | | | | |
Graphic Packaging International Corp. | | | | 9.500% | | 8/15/13 | | | 710 | | | 802 | |
| | | | | | | | | | | |
|
|
|
| | | | | |
Diversified Services | | 0.3% | | | | | | | | | | | |
SPX Corporation | | | | 7.500% | | 1/1/13 | | | 595 | | | 643 | |
| | | | | | | | | | | |
|
|
|
| | | | | |
Electric | | 3.0% | | | | | | | | | | | |
FirstEnergy Corp. | | | | 5.500% | | 11/15/06 | | | 1,008 | | | 1,072 | |
Orion Power Holdings, Inc. | | | | 12.000% | | 5/1/10 | | | 1,633 | | | 2,021 | |
The AES Corporation | | | | 10.000% | | 7/15/05 | | | 335 | | | 343 | A |
The AES Corporation | | | | 8.500% | | 11/1/07 | | | 627 | | | 639 | |
The AES Corporation | | | | 8.750% | | 5/15/13 | | | 150 | | | 165 | A |
The AES Corporation | | | | 9.000% | | 5/15/15 | | | 1,345 | | | 1,485 | A |
| | | | | | | | | | | |
|
|
|
| | | | | | | | | | | | | 5,725 | |
| | | | | | | | | | | |
|
|
|
Electronics | | 2.1% | | | | | | | | | | | |
Amkor Technology, Inc. | | | | 9.250% | | 2/15/08 | | | 630 | | | 694 | |
BRL Universal Equipment 2001 A., L.P. | | | | 8.875% | | 2/15/08 | | | 670 | | | 724 | |
Fairchild Semiconductor International, Inc. | | | | 10.500% | | 2/1/09 | | | 790 | | | 872 | |
Rayovac Corporation | | | | 8.500% | | 10/1/13 | | | 640 | | | 690 | |
Viasystems Inc. | | | | 10.500% | | 1/15/11 | | | 840 | | | 939 | A |
| | | | | | | | | | | |
|
|
|
| | | | | | | | | | | | | 3,919 | |
| | | | | | | | | | | |
|
|
|
Energy | | 3.5% | | | | | | | | | | | |
Calpine Corporation | | | | 7.625% | | 4/15/06 | | | 470 | | | 414 | |
Calpine Corporation | | | | 8.625% | | 8/15/10 | | | 592 | | | 435 | |
Calpine Corporation | | | | 8.500% | | 2/15/11 | | | 1,169 | | | 859 | |
Calpine Corporation | | | | 9.875% | | 12/1/11 | | | 452 | | | 435 | A |
Calpine Corporation | | | | 8.750% | | 7/15/13 | | | 940 | | | 860 | A |
Calpine Generating Co. LLC | | | | 11.500% | | 4/1/11 | | | 460 | | | 428 | A |
NRG Energy, Inc. | | | | 8.000% | | 12/15/13 | | | 802 | | | 828 | A |
Peabody Energy Corporation | | | | 5.875% | | 4/15/16 | | | 370 | | | 373 | |
PG&E Corporation | | | | 6.875% | | 7/15/08 | | | 1,250 | | | 1,364 | A |
TECO Energy, Inc. | | | | 10.500% | | 12/1/07 | | | 600 | | | 699 | |
| | | | | | | | | | | |
|
|
|
| | | | | | | | | | | | | 6,695 | |
| | | | | | | | | | | |
|
|
|
79
Annual Report to Shareholders
STATEMENT OF NET ASSETS—Continued
Western Asset High Yield Portfolio—Continued
| | | | | | | | | | | | | |
| | | % OF
NET ASSETS | | RATE | | MATURITY
DATE | | PAR/
SHARES | | VALUE | |
| | |
| |
Corporate Bonds and Notes—Continued | | | | | | | | | | | | | |
| | | | | |
Entertainment | | 0.3% | | | | | | | | | | | |
AMF Bowling Worldwide, Inc. | | | | 10.000% | | 3/1/10 | | $ | 600 | | $ | 621 | A |
| | | | | | | | | | | |
|
|
|
| | | | | |
Environmental Services | | 0.7% | | | | | | | | | | | |
Allied Waste North America Incorporated | | | | 8.500% | | 12/1/08 | | | 1,125 | | | 1,260 | |
Safety-Kleen Corp. | | | | 9.250% | | 5/15/09 | | | 1,418 | | | 128 | D |
| | | | | | | | | | | |
|
|
|
| | | | | | | | | | | | | 1,388 | |
| | | | | | | | | | | |
|
|
|
Food, Beverage and Tobacco | | 2.1% | | | | | | | | | | | |
Cott Beverages Incorporated | | | | 8.000% | | 12/15/11 | | | 796 | | | 876 | |
DIMON Incorporated | | | | 9.625% | | 10/15/11 | | | 949 | | | 1,025 | |
Domino’s, Inc. | | | | 8.250% | | 7/1/11 | | | 1,129 | | | 1,217 | |
Smithfield Foods, Inc. | | | | 8.000% | | 10/15/09 | | | 770 | | | 860 | |
| | | | | | | | | | | |
|
|
|
| | | | | | | | | | | | | 3,978 | |
| | | | | | | | | | | |
|
|
|
Funeral Parlors and Cemetery | | 0.2% | | | | | | | | | | | |
Alderwoods Group, Inc. | | | | 12.250% | | 1/2/09 | | | 350 | | | 392 | |
| | | | | | | | | | | |
|
|
|
| | | | | |
Gaming | | 2.3% | | | | | | | | | | | |
Argosy Gaming Company | | | | 9.000% | | 9/1/11 | | | 1,083 | | | 1,218 | |
Herbst Gaming, Inc. | | | | 10.750% | | 9/1/08 | | | 717 | | | 808 | |
Isle of Capri Casinos, Inc. | | | | 7.000% | | 3/1/14 | | | 330 | | | 332 | A |
Mohegan Tribal Gaming Authority | | | | 8.125% | | 1/1/06 | | | 70 | | | 76 | |
Mohegan Tribal Gaming Authority | | | | 6.375% | | 7/15/09 | | | 700 | | | 735 | |
Pinnacle Entertainment, Inc. | | | | 9.250% | | 2/15/07 | | | 1,097 | | | 1,123 | |
| | | | | | | | | | | |
|
|
|
| | | | | | | | | | | | | 4,292 | |
| | | | | | | | | | | |
|
|
|
Gas and Pipeline Utilities | | 5.1% | | | | | | | | | | | |
ANR Pipeline, Inc. | | | | 8.875% | | 3/15/10 | | | 243 | | | 270 | |
ANR Pipeline, Inc. | | | | 9.625% | | 11/1/21 | | | 354 | | | 413 | |
Colorado Interstate Gas Company | | | | 10.000% | | 6/15/05 | | | 400 | | | 424 | |
Dynegy Holdings Inc. | | | | 10.125% | | 7/15/13 | | | 710 | | | 779 | A |
Encore Acquisition Company | | | | 6.250% | | 4/15/14 | | | 430 | | | 436 | A |
GulfTerra Energy Partners, L.P. | | | | 10.625% | | 12/1/12 | | | 331 | | | 415 | |
KCS Energy, Inc. | | | | 7.125% | | 4/1/12 | | | 710 | | | 713 | A |
Northwest Pipelines Corporation | | | | 8.125% | | 3/1/10 | | | 210 | | | 232 | |
Sonat Inc. | | | | 6.875% | | 6/1/05 | | | 190 | | | 188 | |
Southern Natural Gas Company | | | | 8.875% | | 3/15/10 | | | 525 | | | 583 | |
Southern Natural Gas Company | | | | 8.000% | | 3/1/32 | | | 1,048 | | | 1,077 | |
The Williams Companies, Inc. | | | | 6.750% | | 1/15/06 | | | 1,110 | | | 1,157 | |
The Williams Companies, Inc. | | | | 8.625% | | 6/1/10 | | | 500 | | | 550 | |
80
| | | | | | | | | | | | | |
| | | % OF
NET ASSETS | | RATE | | MATURITY
DATE | | PAR/
SHARES | | VALUE | |
| | |
| |
Corporate Bonds and Notes—Continued | | | | | | | | | | | | | |
| | | | | |
Gas and Pipeline Utilities—Continued | | | | | | | | | | | | | |
The Williams Companies, Inc. | | | | 8.125% | | 3/15/12 | | $ | 178 | | $ | 196 | |
The Williams Companies, Inc. | | | | 7.500% | | 1/15/31 | | | 284 | | | 274 | |
The Williams Companies, Inc. | | | | 8.750% | | 3/15/32 | | | 758 | | | 804 | |
Transcontinental Gas Pipeline Corporation | | | | 7.000% | | 8/15/11 | | | 272 | | | 294 | |
Transcontinental Gas Pipeline Corporation | | | | 8.875% | | 7/15/12 | | | 698 | | | 827 | |
| | | | | | | | | | | |
|
|
|
| | | | | | | | | | | | | 9,632 | |
| | | | | | | | | | | |
|
|
|
Health Care | | 2.1% | | | | | | | | | | | |
Ardent Health Services | | | | 10.000% | | 8/15/13 | | | 810 | | | 899 | |
Equinox Holdings Inc. | | | | 9.000% | | 12/15/09 | | | 590 | | | 621 | A |
Genesis HealthCare Corporation | | | | 8.000% | | 10/15/13 | | | 380 | | | 405 | A |
Tenet Healthcare Corporation | | | | 5.375% | | 11/15/06 | | | 356 | | | 334 | |
Tenet Healthcare Corporation | | | | 5.000% | | 7/1/07 | | | 459 | | | 419 | |
Tenet Healthcare Corporation | | | | 6.375% | | 12/1/11 | | | 136 | | | 118 | |
Tenet Healthcare Corporation | | | | 7.375% | | 2/1/13 | | | 1,253 | | | 1,131 | |
| | | | | | | | | | | |
|
|
|
| | | | | | | | | | | | | 3,927 | |
| | | | | | | | | | | |
|
|
|
Homebuilding | | 1.0% | | | | | | | | | | | |
Beazer Homes USA, Inc. | | | | 8.625% | | 5/15/11 | | | 500 | | | 559 | |
Schuler Homes, Inc. | | | | 9.375% | | 7/15/09 | | | 307 | | | 344 | |
Schuler Homes, Inc. | | | | 10.500% | | 7/15/11 | | | 430 | | | 507 | |
The Ryland Group, Inc. | | | | 9.750% | | 9/1/10 | | | 473 | | | 539 | |
| | | | | | | | | | | |
|
|
|
| | | | | | | | | | | | | 1,949 | |
| | | | | | | | | | | |
|
|
|
Lodging/Hotels | | 1.5% | | | | | | | | | | | |
Extended Stay America, Inc. | | | | 9.150% | | 3/15/08 | | | 547 | | | 563 | |
Extended Stay America, Inc. | | | | 9.875% | | 6/15/11 | | | 538 | | | 632 | |
Felcor Lodging LP | | | | 1.000% | | 9/15/08 | | | 798 | | | 850 | |
Hilton Hotels Corporation | | | | 7.950% | | 4/15/07 | | | 109 | | | 121 | |
Host Marriott Corporation | | | | 9.250% | | 10/1/07 | | | 135 | | | 151 | |
La Quinta Inns, Inc. | | | | 7.400% | | 9/15/05 | | | 100 | | | 105 | |
Meristar Hospitality Operating Partnership, L.P. | | | | 10.500% | | 6/15/09 | | | 370 | | | 398 | |
| | | | | | | | | | | |
|
|
|
| | | | | | | | | | | | | 2,820 | |
| | | | | | | | | | | |
|
|
|
Machinery | | 3.7% | | | | | | | | | | | |
AGCO Corporation | | | | 9.500% | | 5/1/08 | | | 755 | | | 829 | |
Case New Holland Incorporated | | | | 9.250% | | 8/1/11 | | | 1,090 | | | 1,232 | A |
Case New Holland Incorporated | | | | 9.250% | | 8/1/11 | | | 30 | | | 34 | A |
Grant Prideco, Inc. | | | | 9.000% | | 12/15/09 | | | 692 | | | 780 | |
Hanover Compressor Company | | | | 8.625% | | 12/15/10 | | | 862 | | | 927 | |
Joy Global Inc. | | | | 8.750% | | 3/15/12 | | | 817 | | | 919 | |
81
Annual Report to Shareholders
STATEMENT OF NET ASSETS—Continued
Western Asset High Yield Portfolio—Continued
| | | | | | | | | | | | | |
| | | % OF
NET ASSETS | | RATE | | MATURITY
DATE | | PAR/ SHARES | | VALUE | |
| | |
| |
Corporate Bonds and Notes—Continued | | | | | | | | | | | | | |
| | | | | |
Machinery—Continued | | | | | | | | | | | | | |
NMHG Holdings Co. | | | | 10.000% | | 5/15/09 | | $ | 954 | | $ | 1,049 | |
Terex Corporation | | | | 10.375% | | 4/1/11 | | | 424 | | | 483 | |
Terex Corporation | | | | 9.250% | | 7/15/11 | | | 750 | | | 840 | |
| | | | | | | | | | | |
|
|
|
| | | | | | | | | | | | | 7,093 | |
| | | | | | | | | | | |
|
|
|
Manufacturing (Diversified) | | 0.7% | | | | | | | | | | | |
Jacuzzi Brands Incorporated | | | | 9.625% | | 7/1/10 | | | 1,146 | | | 1,266 | |
| | | | | | | | | | | |
|
|
|
| | | | | |
Media | | 1.0% | | | | | | | | | | | |
Lamar Media Corporation | | | | 7.250% | | 1/1/13 | | | 460 | | | 499 | |
Paxson Communications Corporation | | | | 10.750% | | 7/15/08 | | | 320 | | | 335 | |
Paxson Communications Corporation | | | | 0.000% | | 1/15/09 | | | 237 | | | 202 | B |
Sinclair Broadcast Group, Inc. | | | | 8.750% | | 12/15/11 | | | 730 | | | 808 | |
| | | | | | | | | | | |
|
|
|
| | | | | | | | | | | | | 1,844 | |
| | | | | | | | | | | |
|
|
|
Medical Care Facilities | | 1.7% | | | | | | | | | | | |
Extendicare Health Services, Inc. | | | | 9.350% | | 12/15/07 | | | 442 | | | 456 | |
Extendicare Health Services, Inc. | | | | 9.500% | | 7/1/10 | | | 231 | | | 258 | |
HCA Inc. | | | | 6.910% | | 6/15/05 | | | 150 | | | 157 | |
HCA Inc. | | | | 7.875% | | 2/1/11 | | | 546 | | | 629 | |
HCA Inc. | | | | 6.300% | | 10/1/12 | | | 367 | | | 385 | |
HCA Inc. | | | | 9.000% | | 12/15/14 | | | 120 | | | 148 | |
Triad Hospitals, Inc. | | | | 8.750% | | 5/1/09 | | | 1,010 | | | 1,101 | |
| | | | | | | | | | | |
|
|
|
| | | | | | | | | | | | | 3,134 | |
| | | | | | | | | | | |
|
|
|
Medical Products | | 0.5% | | | | | | | | | | | |
Fresenius Medical Care Capital Trust II | | | | 7.875% | | 2/1/08 | | | 917 | | | 1,000 | E |
| | | | | | | | | | | |
|
|
|
| | | | | |
Medical Supplies and Services | | 0.3% | | | | | | | | | | | |
AmeriPath Inc. | | | | 10.500% | | 4/1/13 | | | 608 | | | 620 | |
| | | | | | | | | | | |
|
|
|
| | | | | |
Metals | | 0.3% | | | | | | | | | | | |
California Steel Industries Inc. | | | | 6.125% | | 3/15/14 | | | 420 | | | 423 | A |
Kaiser Aluminum & Chemical | | | | 12.750% | | 2/1/49 | | | 1,780 | | | 214 | D |
| | | | | | | | | | | |
|
|
|
| | | | | | | | | | | | | 637 | |
| | | | | | | | | | | |
|
|
|
Oil and Gas | | 4.7% | | | | | | | | | | | |
Amerada Hess Corporation | | | | 7.875% | | 10/1/29 | | | 310 | | | 351 | |
Amerigas Partners LP | | | | 8.875% | | 5/20/11 | | | 602 | | | 667 | |
Chesapeake Energy Corporation | | | | 8.375% | | 11/1/08 | | | 64 | | | 71 | |
82
| | | | | | | | | | | | | |
| | | % OF
NET ASSETS | | RATE | | MATURITY
DATE | | PAR/ SHARES | | VALUE | |
| | |
| |
Corporate Bonds and Notes—Continued | | | | | | | | | | | | | |
| | | | | |
Oil and Gas—Continued | | | | | | | | | | | | | |
Chesapeake Energy Corporation | | | | 9.000% | | 8/15/12 | | $ | 846 | | $ | 978 | |
El Paso CGP Co. | | | | 6.500% | | 6/1/08 | | | 340 | | | 291 | |
El Paso CGP Co. | | | | 7.750% | | 6/15/10 | | | 1,758 | | | 1,520 | |
El Paso Corporation | | | | 6.950% | | 12/15/07 | | | 395 | | | 359 | |
El Paso Corporation | | | | 7.750% | | 1/15/32 | | | 225 | | | 181 | |
El Paso Energy Partners | | | | 8.500% | | 6/1/11 | | | 143 | | | 162 | |
Evergreen Resources, Inc. | | | | 5.875% | | 3/15/12 | | | 780 | | | 788 | A |
Nuevo Energy Company | | | | 9.375% | | 10/1/10 | | | 902 | | | 1,003 | |
Parker Drilling Company | | | | 10.125% | | 11/15/09 | | | 470 | | | 508 | |
Suburban Propane Partners LP | | | | 6.875% | | 12/15/13 | | | 600 | | | 624 | A |
Vintage Petroleum, Inc. | | | | 7.875% | | 5/15/11 | | | 522 | | | 561 | |
Vintage Petroleum, Inc. | | | | 8.250% | | 5/1/12 | | | 110 | | | 124 | |
Westport Resources Corporation | | | | 8.250% | | 11/1/11 | | | 584 | | | 650 | |
| | | | | | | | | | | |
|
|
|
| | | | | | | | | | | | | 8,838 | |
| | | | | | | | | | | |
|
|
|
Paper and Forest Products | | 1.4% | | | | | | | | | | | |
Georgia-Pacific Corp. | | | | 8.875% | | 2/1/10 | | | 133 | | | 155 | |
Georgia-Pacific Corp. | | | | 9.500% | | 12/1/11 | | | 698 | | | 841 | |
Georgia-Pacific Corp. | | | | 9.375% | | 2/1/13 | | | 579 | | | 682 | |
Georgia-Pacific Corp. | | | | 7.700% | | 6/15/15 | | | 46 | | | 50 | |
Georgia-Pacific Corp. | | | | 8.250% | | 3/1/23 | | | 169 | | | 174 | |
Georgia-Pacific Corp. | | | | 7.750% | | 11/15/29 | | | 67 | | | 68 | |
Georgia-Pacific Corp. | | | | 8.875% | | 5/15/31 | | | 540 | | | 605 | |
| | | | | | | | | | | |
|
|
|
| | | | | | | | | | | | | 2,575 | |
| | | | | | | | | | | |
|
|
|
Publishing | | 1.5% | | | | | | | | | | | |
Dex Media East LLC | | | | 9.875% | | 11/15/09 | | | 365 | | | 411 | |
Dex Media East LLC | | | | 12.125% | | 11/15/12 | | | 795 | | | 928 | |
Hollinger International Publishing | | | | 9.000% | | 12/15/10 | | | 931 | | | 1,024 | |
The Reader’s Digest Association, Inc. | | | | 6.500% | | 3/1/11 | | | 620 | | | 639 | A |
| | | | | | | | | | | |
|
|
|
| | | | | | | | | | | | | 3,002 | |
| | | | | | | | | | | |
|
|
|
| | | | | |
Real Estate | | 0.5% | | | | | | | | | | | |
Forest City Enterprises, Inc. | | | | 7.625% | | 6/1/15 | | | 90 | | | 97 | |
Ventas Realty, Limited Partnership | | | | 8.750% | | 5/1/09 | | | 516 | | | 584 | |
Ventas Realty, Limited Partnership | | | | 9.000% | | 5/1/12 | | | 192 | | | 222 | |
| | | | | | | | | | | |
|
|
|
| | | | | | | | | | | | | 903 | |
| | | | | | | | | | | |
|
|
|
83
Annual Report to Shareholders
STATEMENT OF NET ASSETS—Continued
Western Asset High Yield Portfolio—Continued
| | | | | | | | | | | | | |
| | | % OF
NET ASSETS | | RATE | | MATURITY
DATE | | PAR/ SHARES | | VALUE | |
| | |
| |
Corporate Bonds and Notes—Continued | | | | | | | | | | | | | |
| | | | | |
Rental and Lease Services (Commercial) | | 0.5% | | | | | | | | | | | |
NationsRent, Inc. | | | | 9.500% | | 10/15/10 | | $ | 430 | | $ | 465 | A |
United Rentals North America Inc. | | | | 7.000% | | 2/15/14 | | | 465 | | | 437 | A |
| | | | | | | | | | | |
|
|
|
| | | | | | | | | | | | | 902 | |
| | | | | | | | | | | |
|
|
|
Retail | | 2.0% | | | | | | | | | | | |
American Achievement Corp. | | | | 8.250% | | 4/1/12 | | | 580 | | | 596 | A |
Cinemark, Inc. | | | | 9.750% | | 3/15/14 | | | 960 | | | 595 | A,B |
Hollywood Entertainment Corporation | | | | 9.625% | | 3/15/11 | | | 349 | | | 405 | |
J.C. Penney Company, Inc. | | | | 8.000% | | 3/1/10 | | | 20 | | | 23 | |
J.C. Penney Company, Inc. | | | | 9.750% | | 6/15/21 | | | 139 | | | 144 | |
J.C. Penney Company, Inc. | | | | 7.125% | | 11/15/23 | | | 820 | | | 927 | |
J.C. Penney Company, Inc. | | | | 7.400% | | 4/1/37 | | | 17 | | | 19 | |
Norcraft Companies | | | | 9.000% | | 11/1/11 | | | 1,080 | | | 1,150 | A |
| | | | | | | | | | | |
|
|
|
| | | | | | | | | | | | | 3,859 | |
| | | | | | | | | | | |
|
|
|
Special Purpose | | 5.5% | | | | | | | | | | | |
Alamosa Incorporated | | | | 11.000% | | 7/31/10 | | | 923 | | | 985 | |
Arch Western Finance LLC | | | | 6.750% | | 7/1/13 | | | 437 | | | 465 | A |
Couche Tard United States L.P. | | | | 7.500% | | 12/15/13 | | | 550 | | | 589 | A |
H & E Equipment Services LLC | | | | 11.125% | | 6/15/12 | | | 1,160 | | | 1,206 | |
Midland Funding II | | | | 11.750% | | 7/23/05 | | | 1,127 | | | 1,192 | |
Qwest Capital Funding, Inc. | | | | 7.000% | | 8/3/09 | | | 936 | | | 821 | |
River Rock Entertainment | | | | 9.750% | | 11/1/11 | | | 750 | | | 810 | A |
Sensus Metering Systems Incorporated | | | | 8.625% | | 12/15/13 | | | 759 | | | 752 | A |
Toll Corp. | | | | 8.000% | | 5/1/09 | | | 360 | | | 375 | |
Transdigm Funding Corp. | | | | 8.375% | | 7/15/11 | | | 980 | | | 1,039 | |
UCAR Finance Inc. | | | | 10.250% | | 2/15/12 | | | 1,251 | | | 1,458 | |
WII Components Inc. | | | | 10.000% | | 2/15/12 | | | 740 | | | 762 | A |
| | | | | | | | | | | |
|
|
|
| | | | | | | | | | | | | 10,454 | |
| | | | | | | | | | | |
|
|
|
Storage Facilities | | 0.5% | | | | | | | | | | | |
Mobile Mini, Inc. | | | | 9.500% | | 7/1/13 | | | 837 | | | 912 | |
| | | | | | | | | | | |
|
|
|
| | | | | |
Telecommunications | | 4.4% | | | | | | | | | | | |
Cincinnati Bell Inc. | | | | 7.250% | | 7/15/13 | | | 667 | | | 674 | |
Crown Castle International Corp. | | | | 10.750% | | 8/1/11 | | | 370 | | | 414 | |
EchoStar DBS Corporation | | | | 4.405% | | 10/1/08 | | | 790 | | | 821 | A,F |
EchoStar DBS Corporation | | | | 9.125% | | 1/15/09 | | | 229 | | | 259 | |
Insight Communications | | | | 10.500% | | 11/1/10 | | | 790 | | | 849 | A |
MCI Communications Corporation | | | | 6.500% | | 4/15/10 | | | 990 | | | 787 | D |
84
| | | | | | | | | | | | | |
| | | % OF
NET ASSETS | | RATE | | MATURITY
DATE | | PAR/ SHARES | | VALUE | |
| | |
| |
Corporate Bonds and Notes—Continued | | | | | | | | | | | | | |
| | | | | |
Telecommunications—Continued | | | | | | | | | | | | | |
PanAmSat Corporation | | | | 6.375% | | 1/15/08 | | $ | 317 | | $ | 330 | |
PanAmSat Corporation | | | | 8.500% | | 2/1/12 | | | 894 | | | 934 | |
Qwest Corporation | | | | 9.125% | | 3/15/12 | | | 1,060 | | | 1,203 | A |
Qwest Services Corporation | | | | 13.500% | | 12/15/10 | | | 1,740 | | | 2,023 | A |
| | | | | | | | | | | |
|
|
|
| | | | | | | | | | | | | 8,294 | |
| | | | | | | | | | | |
|
|
|
Telecommunications (Cellular/Wireless) | | 2.2% | | | | | | | | | | | |
Centennial Communications Corporation | | | | 8.125% | | 2/1/14 | | | 1,140 | | | 1,052 | A |
Nextel Communications, Inc. | | | | 5.250% | | 1/15/10 | | | 843 | | | 847 | G |
Nextel Communications, Inc. | | | | 7.375% | | 8/1/15 | | | 765 | | | 828 | |
Rural Cellular Corporation | | | | 8.250% | | 3/15/12 | | | 580 | | | 593 | A |
SBA Communications Corporation | | | | 0.000% | | 12/15/11 | | | 1,210 | | | 850 | A,B |
| | | | | | | | | | | |
|
|
|
| | | | | | | | | | | | | 4,170 | |
| | | | | | | | | | | |
|
|
|
Telecommunications Equipment | | 0.4% | | | | | | | | | | | |
Avaya Inc. | | | | 11.125% | | 4/1/09 | | | 665 | | | 793 | |
| | | | | | | | | | | |
|
|
|
| | | | | |
Transportation | | 1.5% | | | | | | | | | | | |
Continental Airlines, Inc. | | | | 7.373% | | 12/15/15 | | | 896 | | | 787 | |
Delta Air Lines, Inc. | | | | 7.900% | | 12/15/09 | | | 880 | | | 581 | |
Kansas City Southern Railway | | | | 9.500% | | 10/1/08 | | | 1,339 | | | 1,486 | |
| | | | | | | | | | | |
|
|
|
| | | | | | | | | | | | | 2,854 | |
| | | | | | | | | | | |
|
|
|
Water Utilities | | 0.4% | | | | | | | | | | | |
National Waterworks, Inc. | | | | 10.500% | | 12/1/12 | | | 615 | | | 695 | |
| | | | | | | | | | | |
|
|
|
Total Corporate Bonds and Notes
(Identified Cost—$144,922) | | | | | | | | | | | | 151,282 | |
| |
Yankee BondsH | | 7.4% | | | | | | | | | | | |
| | | | | |
Building Materials | | 0.5% | | | | | | | | | | | |
North American Energy Partners | | | | 8.750% | | 12/1/11 | | | 890 | | | 890 | A |
| | | | | | | | | | | |
|
|
|
| | | | | |
Chemicals | | 0.8% | | | | | | | | | | | |
Rhodia SA | | | | 7.625% | | 6/1/10 | | | 440 | | | 405 | A |
Rhodia SA | | | | 8.875% | | 6/1/11 | | | 1,243 | | | 1,038 | A |
| | | | | | | | | | | |
|
|
|
| | | | | | | | | | | | | 1,443 | |
| | | | | | | | | | | |
|
|
|
Foreign Governments | | 0.5% | | | | | | | | | | | |
Federative Republic of Brazil | | | | 14.500% | | 10/15/09 | | | 800 | | | 1,020 | |
| | | | | | | | | | | |
|
|
|
85
Annual Report to Shareholders
STATEMENT OF NET ASSETS—Continued
Western Asset High Yield Portfolio—Continued
| | | | | | | | | | | | | |
| | | % OF
NET ASSETS | | RATE | | MATURITY
DATE | | PAR/ SHARES | | VALUE | |
| | |
| |
Yankee Bonds—Continued | | | | | | | | | | | | | |
| | | | | |
Forestry | | 0.3% | | | | | | | | | | | |
Tembec Industries, Inc. | | | | 8.500% | | 2/1/11 | | $ | 580 | | $ | 580 | |
| | | | | | | | | | | |
|
|
|
| | | | | |
Manufacturing (Diversified) | | 0.6% | | | | | | | | | | | |
Tyco International Group SA | | | | 6.375% | | 10/15/11 | | | 225 | | | 246 | |
Tyco International Group SA | | | | 7.000% | | 6/15/28 | | | 316 | | | 337 | |
Tyco International Group SA | | | | 6.875% | | 1/15/29 | | | 587 | | | 616 | |
| | | | | | | | | | | |
|
|
|
| | | | | | | | | | | | | 1,199 | |
| | | | | | | | | | | |
|
|
|
Media | | 0.7% | | | | | | | | | | | |
Alliance Atlantis Communications Inc. | | | | 13.000% | | 12/15/09 | | | 353 | | | 396 | |
Vivendi Universal S.A. | | | | 9.250% | | 4/15/10 | | | 812 | | | 970 | |
| | | | | | | | | | | |
|
|
|
| | | | | | | | | | | | | 1,366 | |
| | | | | | | | | | | |
|
|
|
Paper and Forest Products | | 0.4% | | | | | | | | | | | |
Abitibi-Consolidated Inc. | | | | 8.500% | | 8/1/29 | | | 553 | | | 543 | |
Abitibi-Consolidated Inc. | | | | 8.850% | | 8/1/30 | | | 142 | | | 144 | |
| | | | | | | | | | | |
|
|
|
| | | | | | | | | | | | | 687 | |
| | | | | | | | | | | |
|
|
|
Publishing | | 0.3% | | | | | | | | | | | |
Sun Media Corporation | | | | 7.625% | | 2/15/13 | | | 452 | | | 492 | |
| | | | | | | | | | | |
|
|
|
| | | | | |
Services | | 0.4% | | | | | | | | | | | |
Compagnie Generale de Geophysique SA | | | | 10.625% | | 11/15/07 | | | 704 | | | 760 | |
| | | | | | | | | | | |
|
|
|
| | | | | |
Special Purpose | | 1.7% | | | | | | | | | | | |
Calpine Canada Energy Finance | | | | 8.500% | | 5/1/08 | | | 569 | | | 421 | |
Eircom Funding | | | | 8.250% | | 8/15/13 | | | 750 | | | 836 | |
Gemstone Investors Limited | | | | 7.710% | | 10/31/04 | | | 750 | | | 748 | A |
MDP Acquisitions PLC | | | | 9.625% | | 10/1/12 | | | 628 | | | 710 | |
Yell Finance BV | | | | 10.750% | | 8/1/11 | | | 371 | | | 434 | |
| | | | | | | | | | | |
|
|
|
| | | | | | | | | | | | | 3,149 | |
| | | | | | | | | | | |
|
|
|
Telecommunications (Cellular/Wireless) | | 0.3% | | | | | | | | | | | |
Rogers Wireless Communications Inc. | | | | 9.625% | | 5/1/11 | | | 516 | | | 631 | |
| | | | | | | | | | | |
|
|
|
| | | | | |
Transportation | | 0.9% | | | | | | | | | | | |
OMI Corporation | | | | 7.625% | | 12/1/13 | | | 310 | | | 322 | |
Teekay Shipping Corporation | | | | 8.875% | | 7/15/11 | | | 1,195 | | | 1,388 | |
| | | | | | | | | | | |
|
|
|
| | | | | | | | | | | | | 1,710 | |
| | | | | | | | | | | |
|
|
|
Total Yankee Bonds
(Identified Cost—$13,182) | | | | | | | | | | | | 13,927 | |
| |
86
| | | | | | | | | | | | | | |
| | | % OF
NET ASSETS | | RATE | | MATURITY
DATE | | PAR/ SHARES | | | VALUE | |
| | |
| |
Common Stocks | | 0.1% | | | | | | | | | | | | |
| | | | | |
Engineering and Construction | | 0.1% | | | | | | | | | | | | |
Washington Group International, Inc. | | | | | | | | | 5 | shs | | $ | 191 | I |
| | | | | | | | | | | | |
|
|
|
Total Common Stocks
(Identified Cost—$51) | | | | | | | | | | | | | 191 | |
| |
Preferred Stocks | | 0.7% | | | | | | | | | | | | |
| | | | | |
Cable | | 0.1% | | | | | | | | | | | | |
Cablevision Systems New York Group | | | | | | | | | 1 | | | | 87 | |
| | | | | | | | | | | | |
|
|
|
| | | | | |
Industrial Conglomerates | | N.M. | | | | | | | | | | | | |
High Voltage Engineering Corporation | | | | | | | | | 0.2 | | | | 3 | J |
| | | | | | | | | | | | |
|
|
|
| | | | | |
Media | | 0.4% | | | | | | | | | | | | |
Paxson Communications Corporation | | | | | | | | | 0.1 | | | | 867 | J |
| | | | | | | | | | | | |
|
|
|
| | | | | |
Telecommunications (Cellular/Wireless) | | 0.2% | | | | | | | | | | | | |
Rural Cellular Corporation | | | | | | | | | 3 | | | | 286 | F,J |
| | | | | | | | | | | | |
|
|
|
Total Preferred Stocks
(Identified Cost—$1,340) | | | | | | | | | | | | | 1,243 | |
| |
Warrants | | 0.1% | | | | | | | | | | | | |
American Tower Corporation | | | | | | | | | 1 | wts | | | 105 | A,I |
Horizon PCS, Inc. | | | | | | | | | 1 | | | | 0 | A,I |
Next Generation Network, Inc. | | | | | | | | | 3 | | | | 0 | I |
Washington Group International, Series A | | | | | | | | | 3 | | | | 31 | I |
Washington Group International, Series B | | | | | | | | | 4 | | | | 27 | I |
Washington Group International, Series C | | | | | | | | | 2 | | | | 15 | I |
| | | | | | | | | | | | |
|
|
|
Total Warrants (Identified Cost—$75) | | | | | | | | | | | | | 178 | |
| | | | | | | | | | | | |
|
|
|
Total Long-Term Securities
(Identified Cost—$159,570) | | | | | | | | | | | | | 166,821 | |
| |
Short-Term Securities | | 0.9% | | | | | | | | | | | | |
| | | | | |
U.S. Government and Agency Obligations | | 0.1% | | | | | | | | | | | | |
Federal Farm Credit Bank | | | | 0.000% | | 4/5/04 | | $ | 10 | | | | 10 | C |
Freddie Mac | | | | 0.000% | | 4/6/04 | | | 110 | | | | 110 | C |
Freddie Mac | | | | 0.000% | | 4/6/04 | | | 90 | | | | 90 | C |
| | | | | | | | | | | | |
|
|
|
| | | | | | | | | | | | | | 210 | |
| | | | | | | | | | | | |
|
|
|
87
Annual Report to Shareholders
STATEMENT OF NET ASSETS—Continued
Western Asset High Yield Portfolio—Continued
| | | | | | | | | |
| | | % OF
NET ASSETS | | PAR/ SHARES | | | VALUE |
| | |
|
Short-Term Securities—Continued | | | | | | | | | |
| | | |
Repurchase Agreements | | 0.8% | | | | | | | |
Deutsche Bank AG
1.04%, dated 3/31/04, to be repurchased at $1,423 on 4/1/04
(Collateral: $1,348 Fannie Mae notes, 4.375%, due 10/15/06,
value $1,479) | | | | $ | 1,423 | | | $ | 1,423 |
| | | | | | | | |
|
|
Total Short-Term Securities (Identified Cost—$1,633) | | | | | | | | | 1,633 |
|
Total Investments (Identified Cost—$161,203) | | 88.9% | | | | | | | 168,454 |
Other Assets Less Liabilities | | 11.1% | | | | | | | 21,004 |
| | | | | | | | |
|
|
| | | |
Net assets consist of: | | | | | | | | | |
Accumulated paid-in capital applicable to
18,424 Institutional Class shares outstanding | | | | $ | 183,783 | | | | |
Under/(Over) distributed net investment income | | | | | 2,608 | | | | |
Accumulated net realized gain/(loss) on investments | | | | | (4,184 | ) | | | |
Unrealized appreciation/(depreciation) of investments | | | | | 7,251 | | | | |
| | | | |
|
|
| | | |
Net assets | | 100.0% | | | | | | $ | 189,458 |
| | | | | | | | |
|
|
| | | |
Net asset value per share: | | | | | | | | | |
Institutional Class | | | | | | | |
| $10.28
|
| A | Rule 144a Security – A security purchased pursuant to Rule 144a under the Securities Act of 1933 which may not be resold subject to that rule except to qualified institutional buyers. These securities represent 25.1% of net assets. |
| B | Stepped coupon security – A security with a predetermined schedule of interest or dividend rate changes, at which time it begins to accrue interest or pay dividends. |
| C | Zero coupon bond – A bond with no periodic interest payments which is sold at such a discount as to produce a current yield to maturity. |
| D | Bond is in default at March 31, 2004. |
| E | Unit – A security which consists of a bond and warrants to purchase the stock of the issuer. |
| F | Indexed security – The rates of interest earned on these securities are tied to the London Interbank Offered Rate (“LIBOR”). The coupon rates are the rates as of March 31, 2004. |
| G | Convertible security – Security may be converted into the issuer’s common stock. |
| H | Yankee Bond – A dollar-denominated bond issued in the U.S. by foreign entities. |
| J | Pay-in-Kind (“PIK”) security – A security in which interest or dividends during the initial few years is paid in additional PIK securities rather than in cash. |
See notes to financial statements.
88
STATEMENT OF NET ASSETS
March 31, 2004
(Amounts in Thousands)
Western Asset Non-U.S. Opportunity Bond Portfolio
| | | | | | | | | | | |
| | | % OF
NET ASSETS | | RATE | | MATURITY
DATE | | PAR/
SHARESA | | VALUE |
| | |
|
Long-Term Securities | | 85.3% | | | | | | | | | |
| | | | | |
British Sterling | | 2.4% | | | | | | | | | |
| | | | | |
Corporate Bonds and Notes | | 0.8% | | | | | | | | | |
Halifax plc | | | | 6.375% | | 4/3/08 | | 200 | | $ | 384 |
Landesbank Hessen-Thueringen Girozentrale | | | | 5.375% | | 3/7/12 | | 200 | | | 372 |
| | | | | | | | | | |
|
|
| | | | | | | | | | | | 756 |
| | | | | | | | | | |
|
|
| | | | | |
Government Obligations | | 1.6% | | | | | | | | | |
United Kingdom Treasury Stock | | | | 5.000% | | 3/7/12 | | 840 | | | 1,575 |
| | | | | | | | | | |
|
|
Total British Sterling | | | | | | | | | | | 2,331 |
|
Danish Krone | | 5.2% | | | | | | | | | |
| | | | | |
Corporate Bonds and Notes | | 0.5% | | | | | | | | | |
Realkredit Danmark A/S | | | | 5.000% | | 10/1/35 | | 2,870 | | | 469 |
| | | | | |
Government Obligations | | 4.7% | | | | | | | | | |
Kingdom of Denmark | | | | 5.000% | | 11/15/13 | | 26,000 | | | 4,592 |
| | | | | | | | | | |
|
|
Total Danish Krone | | | | | | | | | | | 5,061 |
|
Euro | | 68.1% | | | | | | | | | |
| | | | | |
Corporate Bonds and Notes | | 9.3% | | | | | | | | | |
Bank Nederlandse Gemeenten NV | | | | 5.625% | | 10/25/10 | | 1,850 | | | 2,548 |
Bank of Scotland | | | | 5.125% | | 12/5/13 | | 545 | | | 718 |
Caisse de Refinancement l’ Habitat | | | | 4.200% | | 4/25/11 | | 2,000 | | | 2,529 |
CAM International | | | | 5.750% | | 4/3/12 | | 400 | | | 530 |
KFW Group | | | | 5.250% | | 1/4/10 | | 1,800 | | | 2,432 |
ING Verzekeringen NV | | | | 6.250% | | 6/21/21 | | 190 | | | 260 |
| | | | | | | | | | |
|
|
| | | | | | | | | | | | 9,017 |
| | | | | | | | | | |
|
|
89
Annual Report to Shareholders
STATEMENT OF NET ASSETS—Continued
Western Asset Non-U.S. Opportunity Bond Portfolio—Continued
| | | | | | | | | | | |
| | | % OF
NET ASSETS | | RATE | | MATURITY
DATE | | PAR/
SHARESA | | VALUE |
| | |
|
| | | | | |
Euro—Continued | | | | | | | | | | | |
| | | | | |
U.S. Government and Agency Obligations | | 1.3% | | | | | | | | | |
Freddie Mac | | | | 5.750% | | 9/15/10 | | 900 | | $ | 1,240 |
| | | | | | | | | | |
|
|
| | | | | |
Government Obligations | | 57.5% | | | | | | | | | |
Federal Republic of Germany | | | | 5.000% | | 2/17/06 | | 9,500 | | | 12,281 |
Federal Republic of Germany | | | | 4.250% | | 1/4/14 | | 4,400 | | | 5,538 |
Federal Republic of Germany | | | | 5.500% | | 1/4/31 | | 3,350 | | | 4,575 |
Finland Republic | | | | 5.375% | | 7/4/13 | | 3,250 | | | 4,445 |
French Republic | | | | 5.750% | | 10/25/32 | | 2,600 | | | 3,674 |
Hellenic Republic | | | | 6.500% | | 10/22/19 | | 2,600 | | | 3,877 |
Kingdom of Spain | | | | 5.750% | | 7/30/32 | | 2,600 | | | 3,673 |
Kingdom of the Netherlands | | | | 5.500% | | 1/15/28 | | 2,950 | | | 4,024 |
Republic of Austria | | | | 3.800% | | 10/20/13 | | 3,650 | | | 4,432 |
Republic of Italy | | | | 2.750% | | 2/1/06 | | 7,510 | | | 9,319 |
| | | | | | | | | | |
|
|
| | | | | | | | | | | | 55,838 |
| | | | | | | | | | |
|
|
Total Euro | | | | | | | | | | | 66,095 |
|
Swedish Krona | | 9.6% | | | | | | | | | |
| | | | | |
Corporate Bonds and Notes | | 2.6% | | | | | | | | | |
AB Spintab | | | | 5.750% | | 6/15/05 | | 18,000 | | | 2,479 |
| | | | | | | | | | |
|
|
| | | | | |
Government Obligations | | 7.0% | | | | | | | | | |
Kingdom of Sweden | | | | 5.500% | | 10/8/12 | | 25,000 | | | 3,640 |
Statens Bostadsfinansier | | | | 5.500% | | 3/15/06 | | 22,900 | | | 3,187 |
| | | | | | | | | | |
|
|
| | | | | | | | | | | | 6,827 |
| | | | | | | | | | |
|
|
Total Swedish Krona | | | | | | | | | | | 9,306 |
| | | | | | | | | | |
|
|
Total Long-Term Securities
(Identified Cost—$70,712) | | | | | | | | | | | 82,793 |
|
90
| | | | | | | | | | | | | |
| | | % OF
NET ASSETS | | RATE | | MATURITY
DATE | | PAR/
SHARESA | | | VALUE |
| | |
|
Short-Term Securities | | 7.9% | | | | | | | | | | | |
| | | | | |
Options PurchasedB | | 1.0% | | | | | | | | | | | |
Euribor Futures Call, June 2004, Strike Price EUR 96.00 | | | | | | | | | 140 | C | | $ | 914 |
| | | | | | | | | | | | |
|
|
| | | | | |
Repurchase Agreements | | 6.9% | | | | | | | | | | | |
Deutsche Bank AG
1.04%, dated 3/31/04, to be repurchased at $3,700 on 4/1/04 (Collateral: $3,517 Freddie Mac notes, 5.25%, due 1/15/06, value $3,814) | | | | | | | | $ | 3,700 | | | | 3,700 |
Lehman Brothers, Inc.
1.03%, dated 3/31/04, to be repurchased at $3,013 on 4/1/04 (Collateral: $2,960 Federal Home Loan Bank bonds, 6.10%, due 12/3/18, value $3,132) | | | | | | | | | 3,013 | | | | 3,013 |
| | | | | | | | | | | | |
|
|
| | | | | | | | | | | | | | 6,713 |
| | | | | | | | | | | | |
|
|
Total Short-Term Securities (Identified Cost—$7,212) | | | | | | | | | | | | | 7,627 |
|
Total Investments (Identified Cost—$77,924) | | 93.2% | | | | | | | | | | | 90,420 |
Other Assets Less Liabilities | | 6.8% | | | | | | | | | | | 6,607 |
| | | | | | | | | | | | |
|
|
| | | | | |
Net assets consist of: | | | | | | | | | | | | | |
Accumulated paid-in capital applicable to
9,225 Institutional Class shares outstanding | | | | | | | | $ | 93,990 | | | | |
Under/(Over) distributed net investment income | | | | | | | | | (10,604 | ) | | | |
Accumulated net realized gain/(loss) on investments, options, futures and currency transactions | | | | | | | | | 137 | | | | |
Unrealized appreciation/(depreciation) of investments, options, futures and currency translations | | | | | | | | | 13,504 | | | | |
| | | | | | | | |
|
|
| | | |
| | | | | |
Net assets | | 100.0% | | | | | | | | | | $ | 97,027 |
| | | | | | | | | | | | |
|
|
| | | | | |
Net asset value per share: | | | | | | | | | | | | | |
Institutional Class | | | | | | | | | | | |
| $10.52
|
| | | | | | | | | | | | | | |
|
| A | Securities are grouped by the currencies in which they were issued, and the par amounts are also in the issuance currency of the security. |
| B | Options are described in more detail in the notes to financial statements. |
| C | Represents actual number of contracts. |
See notes to financial statements.
91
Annual Report to Shareholders
STATEMENTS OF OPERATIONS
(Amounts in Thousands)
| | | | | | | | | | | | | | | | | | | | | | | | | | | | |
| | | YEAR ENDED MARCH 31, 2004
| |
| | | WESTERN
ASSET
LIMITED
DURATION
BOND
PORTFOLIOA | | | WESTERN
ASSET
INTERMEDIATE
BOND
PORTFOLIO | | | WESTERN
ASSET
CORE
BOND
PORTFOLIO | | | WESTERN
ASSET
CORE
PLUS BOND
PORTFOLIO | | | WESTERN
ASSET
INFLATION
INDEXED
PLUS BOND
PORTFOLIO | | | WESTERN
ASSET
HIGH YIELD
PORTFOLIO | | | WESTERN ASSET NON-U.S. OPPORTUNITY BOND PORTFOLIO | |
| |
Investment Income: | | | | | | | | | | | | | | | | | | | | | | | | | | | | |
Interest | | $ | 258 | | | $ | 24,671 | | | $ | 73,039 | | | $ | 98,011 | | | $ | 12,350 | | | $ | 13,418 | | | $ | 2,842 | |
Dividends | | | — | | | | 399 | | | | 1,760 | | | | 300 | | | | — | | | | 237 | | | | — | |
| | |
|
|
| |
|
|
| |
|
|
| |
|
|
| |
|
|
| |
|
|
| |
|
|
|
Total income | | | 258 | | | | 25,070 | | | | 74,799 | | | | 98,311 | | | | 12,350 | | | | 13,655 | | | | 2,842 | |
| | |
|
|
| |
|
|
| |
|
|
| |
|
|
| |
|
|
| |
|
|
| |
|
|
|
Expenses: | | | | | | | | | | | | | | | | | | | | | | | | | | | | |
Advisory fee | | | 46 | | | | 2,240 | | | | 7,804 | | | | 10,218 | | | | 685 | | | | 883 | | | | 281 | |
Distribution and service fees: | | | | | | | | | | | | | | | | | | | | | | | | | | | | |
Financial Intermediary Class | | | N/A | | | | N/A | | | | 245 | | | | 7 | | | | N/A | | | | N/A | | | | N/A | |
Audit and legal fees | | | 7 | | | | 66 | | | | 142 | | | | 180 | | | | 39 | | | | 36 | | | | 32 | |
Custodian fees | | | 24 | | | | 216 | | | | 657 | | | | 970 | | | | 111 | | | | 120 | | | | 141 | |
Directors’ fees and expenses | | | 1 | | | | 30 | | | | 117 | | | | 97 | | | | 20 | | | | 8 | | | | 3 | |
Registration fees | | | 3 | | | | 24 | | | | 197 | | | | 227 | | | | 13 | | | | 5 | | | | 23 | |
Reports to shareholders | | | 1 | | | | 16 | | | | 45 | | | | 52 | | | | 5 | | | | 5 | | | | 3 | |
Transfer agent and shareholder servicing expense: | | | | | | | | | | | | | | | | | | | | | | | | | | | | |
Institutional Class | | | 5 | | | | 46 | | | | 87 | | | | 94 | | | | 24 | | | | 19 | | | | 14 | |
Financial Intermediary Class | | | N/A | | | | N/A | | | | 19 | | | | — | | | | N/A | | | | N/A | | | | N/A | |
Other expenses | | | 1 | | | | 15 | | | | 61 | | | | 90 | | | | 33 | | | | 5 | | | | 4 | |
| | |
|
|
| |
|
|
| |
|
|
| |
|
|
| |
|
|
| |
|
|
| |
|
|
|
| | | | 88 | | | | 2,653 | | | | 9,374 | | | | 11,935 | | | | 930 | | | | 1,081 | | | | 501 | |
Less fees waived | | | (36 | ) | | | (133 | ) | | | (7 | ) | | | (854 | ) | | | (74 | ) | | | (156 | ) | | | (157 | ) |
| | |
|
|
| |
|
|
| |
|
|
| |
|
|
| |
|
|
| |
|
|
| |
|
|
|
Total expenses, net of waivers | | | 52 | | | | 2,520 | | | | 9,367 | | | | 11,081 | | | | 856 | | | | 925 | | | | 344 | |
| | |
|
|
| |
|
|
| |
|
|
| |
|
|
| |
|
|
| |
|
|
| |
|
|
|
Net Investment Income | | | 206 | | | | 22,550 | | | | 65,432 | | | | 87,230 | | | | 11,494 | | | | 12,730 | | | | 2,498 | |
| | |
|
|
| |
|
|
| |
|
|
| |
|
|
| |
|
|
| |
|
|
| |
|
|
|
| | | | | |
Net Realized and Unrealized Gain/(Loss) on Investments: | | | | | | | | | | | | | | | | | | | | | |
Realized gain/(loss) on: | | | | | | | | | | | | | | | | | | | | | | | | | | | | |
Investments | | | (6 | ) | | | 14,552 | | | | 36,582 | | | | 54,846 | | | | 23,617 | | | | 6,041 | | | | 1,398 | |
Options | | | — | | | | 1,941 | | | | 11,025 | | | | 10,926 | | | | 189 | | | | — | | | | (792 | ) |
Futures | | | — | | | | 281 | | | | 9,958 | | | | 7,793 | | | | (743 | ) | | | — | | | | 1,003 | |
Foreign currency transactions | | | N/A | | | | N/A | | | | N/A | | | | (10,025 | ) | | | 64 | | | | — | | | | (4,162 | ) |
Swaps | | | — | | | | 163 | | | | (1,799 | ) | | | (1,964 | ) | | | — | | | | — | | | | — | |
| | |
|
|
| |
|
|
| |
|
|
| |
|
|
| |
|
|
| |
|
|
| |
|
|
|
| | | | (6 | ) | | | 16,937 | | | | 55,766 | | | | 61,576 | | | | 23,127 | | | | 6,041 | | | | (2,553 | ) |
| | |
|
|
| |
|
|
| |
|
|
| |
|
|
| |
|
|
| |
|
|
| |
|
|
|
Change in unrealized gain/(loss) on: | | | | | | | | | | | | | | | | | | | | | | | | | | | | |
Investments | | | 250 | | | | 2,068 | | | | 18,124 | | | | 64,580 | | | | (2,557 | ) | | | 7,912 | | | | 5,459 | |
Assets and liabilities denominated in foreign currency | | | N/A | | | | N/A | | | | N/A | | | | 2,537 | | | | 1 | | | | — | | | | (31 | ) |
| | |
|
|
| |
|
|
| |
|
|
| |
|
|
| |
|
|
| |
|
|
| |
|
|
|
| | | | 250 | | | | 2,068 | | | | 18,124 | | | | 67,117 | | | | (2,556 | ) | | | 7,912 | | | | 5,428 | |
| | |
|
|
| |
|
|
| |
|
|
| |
|
|
| |
|
|
| |
|
|
| |
|
|
|
Net Realized and Unrealized Gain/(Loss) on Investments | | | 244 | | | | 19,005 | | | | 73,890 | | | | 128,693 | | | | 20,571 | | | | 13,953 | | | | 2,875 | |
| | |
|
|
| |
|
|
| |
|
|
| |
|
|
| |
|
|
| |
|
|
| |
|
|
|
Change in Net Assets Resulting From Operations | | $ | 450 | | | $ | 41,555 | | | $ | 139,322 | | | $ | 215,923 | | | $ | 32,065 | | | $ | 26,683 | | | $ | 5,373 | |
| | |
|
|
| |
|
|
| |
|
|
| |
|
|
| |
|
|
| |
|
|
| |
|
|
|
| | | | | | | | | | | | | | | | | | | | | | | | | | | | | |
| |
| A | For the period October 1, 2003 (commencement of operations) to March 31, 2004. |
See notes to financial statements.
92
[This Page Intentionally Left Blank]
93
Annual Report to Shareholders
STATEMENT OF CHANGES IN NET ASSETS
(Amounts in Thousands)
| | | | | | | | | | | | |
| | | WESTERN ASSET
LIMITED DURATION
BOND PORTFOLIO
| | | WESTERN ASSET
INTERMEDIATE BOND
PORTFOLIO
| |
| | | PERIOD ENDED
| | | YEARS ENDED
| |
| | | 3/31/04A | | | 3/31/04 | | | 3/31/03 | |
| |
| Change in Net Assets: | | | | | | | | | |
Net investment income | | $ | 206 | | | $ | 22,550 | | | $ | 29,740 | |
| | | |
Net realized gain/(loss) on investments, options, futures, swaps and foreign currency transactions | | | (6 | ) | | | 16,937 | | | | 20,637 | |
| | | |
Change in unrealized appreciation/(depreciation) of investments, options, futures, swaps and assets and liabilities denominated in foreign currencies | | | 250 | | | | 2,068 | | | | 15,410 | |
| | |
|
|
| |
|
|
| |
|
|
|
Change in net assets resulting from operations | | | 450 | | | | 41,555 | | | | 65,787 | |
| | | |
Distributions to Shareholders: | | | | | | | | | | | | |
From net investment income: | | | | | | | | | | | | |
Institutional Class | | | (206 | ) | | | (22,411 | ) | | | (29,740 | ) |
Financial Intermediary Class | | | N/A | | | | N/A | | | | N/A | |
| | | |
From net realized gain on investments: | | | | | | | | | | | | |
Institutional Class | | | — | | | | (13,489 | ) | | | (5,142 | ) |
Financial Intermediary Class | | | N/A | | | | N/A | | | | N/A | |
| | | |
Change in net assets from | | | | | | | | | | | | |
Fund share transactions: | | | | | | | | | | | | |
Institutional Class | | | 25,938 | | | | 41,700 | | | | (119,227 | ) |
Financial Intermediary Class | | | N/A | | | | N/A | | | | N/A | |
| | |
|
|
| |
|
|
| |
|
|
|
Change in net assets | | | 26,182 | | | | 47,355 | | | | (88,322 | ) |
| | | |
Net Assets: | | | | | | | | | | | | |
Beginning of year | | | — | | | | 539,874 | | | | 628,196 | |
| | |
|
|
| |
|
|
| |
|
|
|
| | | |
End of year | | $ | 26,182 | | | $ | 587,229 | | | $ | 539,874 | |
| | |
|
|
| |
|
|
| |
|
|
|
| | | |
Under/(over) distributed net investment income | | $ | — | | | $ | 82 | | | $ | (34 | ) |
| | |
|
|
| |
|
|
| |
|
|
|
| | | | | | | | | | | | | |
| |
A For the period October 1, 2003 (commencement of operations) to March 31, 2004.
N/A—Not applicable.
See notes to financial statements.
94
| | | | | | | | | | | | | | | | | | | | | | | | | | | | | | | | | | | | | | |
WESTERN ASSET
CORE BOND
PORTFOLIO
| | | WESTERN ASSET
CORE PLUS BOND
PORTFOLIO
| | | WESTERN ASSET
INFLATION INDEXED PLUS BOND PORTFOLIO
| | | WESTERN ASSET
HIGH YIELD
PORTFOLIO
| | | WESTERN ASSET
NON-U.S. OPPORTUNITY
BOND PORTFOLIO
| |
YEARS ENDED
| | | YEARS ENDED
| | | YEARS ENDED
| | | YEARS ENDED
| | | YEARS ENDED
| |
| 3/31/04 | | | 3/31/03 | | | 3/31/04 | | | 3/31/03 | | | 3/31/04 | | | 3/31/03 | | | 3/31/04 | | | 3/31/03 | | | 3/31/04 | | | 3/31/03 | |
| |
| | | | | | | | | | | | | | | | | | | | | | | | | | | | | |
| $ | 65,432 | | | $ | 58,408 | | | $ | 87,230 | | | $ | 68,200 | | | $ | 11,494 | | | $ | 11,989 | | | $ | 12,730 | | | $ | 14,773 | | | $ | 2,498 | | | $ | 2,518 | |
| | | | | | | | | |
| | 55,766 | | | | 22,203 | | | | 61,576 | | | | 19,480 | | | | 23,127 | | | | 5,240 | | | | 6,041 | | | | (9,702 | ) | | | (2,553 | ) | | | (3,008 | ) |
| | | | | | | | | |
| | 18,124 | | | | 45,929 | | | | 67,117 | | | | 65,746 | | | | (2,556 | ) | | | 21,652 | | | | 7,912 | | | | (2,170 | ) | | | 5,428 | | | | 9,840 | |
|
|
| |
|
|
| |
|
|
| |
|
|
| |
|
|
| |
|
|
| |
|
|
| |
|
|
| |
|
|
| |
|
|
|
| | 139,322 | | | | 126,540 | | | | 215,923 | | | | 153,426 | | | | 32,065 | | | | 38,881 | | | | 26,683 | | | | 2,901 | | | | 5,373 | | | | 9,350 | |
| | | | | | | | | |
| | | | | | | | | | | | | | | | | | | | | | | | | | | | | | | | | | | | | | | |
| | | | | | | | | | | | | | | | | | | | | | | | | | | | | | | | | | | | | | | |
| | (65,545 | ) | | | (57,541 | ) | | | (95,872 | ) | | | (68,241 | ) | | | (11,494 | ) | | | (11,989 | ) | | | (15,028 | ) | | | (14,132 | ) | | | (5,476 | ) | | | (636 | ) |
| | (3,395 | ) | | | (866 | ) | | | (107 | ) | | | (15 | ) | | | N/A | | | | N/A | | | | N/A | | | | N/A | | | | N/A | | | | N/A | |
| | | | | | | | | |
| | | | | | | | | | | | | | | | | | | | | | | | | | | | | | | | | | | | | | | |
| | (23,668 | ) | | | (8,232 | ) | | | (43,348 | ) | | | (12,750 | ) | | | (12,824 | ) | | | (3,799 | ) | | | — | | | | — | | | | (1,794 | ) | | | — | |
| | (1,371 | ) | | | (30 | ) | | | (45 | ) | | | (3 | ) | | | N/A | | | | N/A | | | | N/A | | | | N/A | | | | N/A | | | | N/A | |
| | | | | | | | | |
| | | | | | | | | | | | | | | | | | | | | | | | | | | | | | | | | | | | | | | |
| | | | | | | | | | | | | | | | | | | | | | | | | | | | | | | | | | | | | | | |
| | 743,572 | | | | 370,610 | | | | 1,343,566 | | | | 802,545 | | | | 48,326 | | | | 56,578 | | | | 27,866 | | | | 8,439 | | | | 39,898 | | | | 2,825 | |
| | 40,360 | | | | 75,641 | | | | 6,585 | | | | 118 | | | | N/A | | | | N/A | | | | N/A | | | | N/A | | | | N/A | | | | N/A | |
|
|
| |
|
|
| |
|
|
| |
|
|
| |
|
|
| |
|
|
| |
|
|
| |
|
|
| |
|
|
| |
|
|
|
| | 829,275 | | | | 506,122 | | | | 1,426,702 | | | | 875,080 | | | | 56,073 | | | | 79,671 | | | | 39,521 | | | | (2,792 | ) | | | 38,001 | | | | 11,539 | |
| | | | | | | | | |
| | | | | | | | | | | | | | | | | | | | | | | | | | | | | | | | | | | | | | | |
| | 1,479,551 | | | | 973,429 | | | | 1,866,988 | | | | 991,908 | | | | 290,306 | | | | 210,635 | | | | 149,937 | | | | 152,729 | | | | 59,026 | | | | 47,487 | |
|
|
| |
|
|
| |
|
|
| |
|
|
| |
|
|
| |
|
|
| |
|
|
| |
|
|
| |
|
|
| |
|
|
|
| | | | | | | | | |
| $ | 2,308,826 | | | $ | 1,479,551 | | | $ | 3,293,690 | | | $ | 1,866,988 | | | $ | 346,379 | | | $ | 290,306 | | | $ | 189,458 | | | $ | 149,937 | | | $ | 97,027 | | | $ | 59,026 | |
|
|
| |
|
|
| |
|
|
| |
|
|
| |
|
|
| |
|
|
| |
|
|
| |
|
|
| |
|
|
| |
|
|
|
| | | | | | | | | |
| $ | (566 | ) | | $ | 755 | | | $ | (15,992 | ) | | $ | (5,860 | ) | | $ | 64 | | | $ | — | | | $ | 2,608 | | | $ | 4,906 | | | $ | (10,604 | ) | | $ | (3,673 | ) |
|
|
| |
|
|
| |
|
|
| |
|
|
| |
|
|
| |
|
|
| |
|
|
| |
|
|
| |
|
|
| |
|
|
|
| | | | | | | | | | | | | | | | | | | | | | | | | | | | | | | | | | | | | | | |
| |
95
Annual Report to Shareholders
FINANCIAL HIGHLIGHTS
Contained below is per share operating performance data for a share of common stock outstanding throughout each period shown, total investment return, ratios to average net assets and other supplemental data. This information has been derived from information in the financial statements.
| | | | | | | | | | | | | | |
| | | | | INVESTMENT OPERATIONS
| |
| | | NET ASSET
VALUE,
BEGINNING
OF YEAR | | NET
INVESTMENT
INCOME | | NET REALIZED
AND UNREALIZED
GAIN/(LOSS) ON
INVESTMENTS,
OPTIONS, FUTURES,
SWAPS, AND
FOREIGN CURRENCY
TRANSACTIONS | | | TOTAL
FROM
INVESTMENT
OPERATIONS | |
| |
| Western Asset Limited Duration Bond Portfolio | | | | | | | | | | |
—Institutional Class | | | | | | | | | | | | | | |
Period Ended March 31, 2004A | | $ | 10.00 | | $ | .08B | | $ | .09 | | | $ | .17 | |
| | | | |
Western Asset Intermediate Bond Portfolio | | | | | | | | | | | | | | |
—Institutional Class | | | | | | | | | | | | | | |
Years Ended March 31, | | | | | | | | | | | | | | |
2004 | | $ | 10.92 | | $ | .44E | | $ | .36 | | | $ | .80 | |
2003 | | | 10.39 | | | .53 | | | .62 | | | | 1.15 | |
2002 | | | 10.65 | | | .57E | | | (.13 | ) | | | .44 | |
2001 | | | 10.09 | | | .68E | | | .56 | | | | 1.24 | |
2000 | | | 10.62 | | | .63E | | | (.38 | ) | | | .25 | |
—Financial Intermediary Class | | | | | | | | | | | | | | |
Period Ended November 30, 1999F | | $ | 10.61 | | $ | .41G | | $ | (.33 | ) | | $ | .08 | |
| | | | |
Western Asset Core Bond Portfolio | | | | | | | | | | | | | | |
—Institutional Class | | | | | | | | | | | | | | |
Years Ended March 31, | | | | | | | | | | | | | | |
2004 | | $ | 11.57 | | $ | .41 | | $ | .45 | | | $ | .86 | |
2003 | | | 11.01 | | | .55 | | | .65 | | | | 1.20 | |
2002 | | | 11.09 | | | .62H | | | .05 | | | | .67 | |
2001 | | | 10.39 | | | .73H | | | .70 | | | | 1.43 | |
2000 | | | 11.01 | | | .67H | | | (.46 | ) | | | .21 | |
—Financial Intermediary Class | | | | | | | | | | | | | | |
Years Ended March 31, | | | | | | | | | | | | | | |
2004 | | $ | 11.57 | | $ | .40I | | $ | .43 | | | $ | .83 | |
2003 | | | 11.02 | | | .53 | | | .63 | | | | 1.16 | |
2002 | | | 11.10 | | | .59I | | | .06 | | | | .65 | |
2001 | | | 10.40 | | | .70I | | | .70 | | | | 1.40 | |
2000J | | | 10.69 | | | .45I | | | (.25 | ) | | | .20 | |
| | | | |
Western Asset Core Plus Bond Portfolio | | | | | | | | | | | | | | |
—Institutional Class | | | | | | | | | | | | | | |
Years Ended March 31, | | | | | | | | | | | | | | |
2004 | | $ | 10.40 | | $ | .37K | | $ | .55 | | | $ | .92 | |
2003 | | | 9.88 | | | .51K | | | .62 | | | | 1.13 | |
2002 | | | 10.07 | | | .56K,L | | | .06L | | | | .62 | |
2001 | | | 9.48 | | | .66K | | | .59 | | | | 1.25 | |
2000 | | | 9.97 | | | .55K | | | (.37 | ) | | | .18 | |
—Financial Intermediary Class | | | | | | | | | | | | | | |
Years Ended March 31, | | | | | | | | | | | | | | |
2004 | | $ | 10.40 | | $ | .36M | | $ | .54 | | | $ | .90 | |
2003 | | | 9.87 | | | .48M | | | .63 | | | | 1.11 | |
2002N | | | 10.04 | | | .11L,M | | | (.17 | )L | | | (.06 | ) |
| | | | | | | | | | | | | | | |
| |
96
| | | | | | | | | | | | | | | | | | | | | | | | | | | | |
DISTRIBUTIONS
| | | | | RATIOS/SUPPLEMENTAL DATA
|
FROM NET
INVESTMENT
INCOME | | | FROM NET
REALIZED
GAIN ON
INVESTMENTS | | | TOTAL
DISTRIBUTIONS | | | NET ASSET
VALUE,
END OF
YEAR | | TOTAL
RETURN | | | EXPENSES
TO
AVERAGE
NET
ASSETS | | | NET
INVESTMENT
INCOME TO AVERAGE
NET ASSETS | | | PORTFOLIO
TURNOVER
RATE | | | NET ASSETS, END OF
YEAR (IN
THOUSANDS) |
|
| | | | | | | | | | | | | | | | | | | | | | | | | | | | | |
| | | | | | | | | | | | | | | | | | | | | | | | | | | | | |
| $ | (.08 | ) | | $ | — | | | $ | (.08 | ) | | $ | 10.09 | | 1.69 | %C | | .40 | %B,D | | 1.6 | %B,D | | 125.5 | %C | | $ | 26,182 |
| | | | | | | | |
| | | | | | | | | | | | | | | | | | | | | | | | | | | | | |
| | | | | | | | | | | | | | | | | | | | | | | | | | | | | |
| | | | | | | | | | | | | | | | | | | | | | | | | | | | | |
| $ | (.44 | ) | | $ | (.27 | ) | | $ | (.71 | ) | | $ | 11.01 | | 7.58 | % | | .45 | %E | | 4.0 | %E | | 255.1 | % | | $ | 587,229 |
| | (.53 | ) | | | (.09 | ) | | | (.62 | ) | | | 10.92 | | 11.37 | % | | .45 | % | | 5.0 | % | | 238.5 | % | | | 539,874 |
| | (.57 | ) | | | (.13 | ) | | | (.70 | ) | | | 10.39 | | 4.20 | % | | .45 | %E | | 5.3 | %E | | 274.8 | % | | | 628,196 |
| | (.68 | ) | | | — | | | | (.68 | ) | | | 10.65 | | 12.79 | % | | .45 | %E | | 6.6 | %E | | 328.4 | % | | | 457,822 |
| | (.78 | ) | | | — | | | | (.78 | ) | | | 10.09 | | 2.49 | % | | .45 | %E | | 6.3 | %E | | 440.8 | % | | | 376,056 |
| | | | | | | | | | | | | | | | | | | | | | | | | | | | | |
| $ | (.43 | ) | | $ | — | | | $ | (.43 | ) | | $ | 10.26 | | .81 | %C | | .70 | %D,G | | 5.9 | %D,G | | 440.8 | % | | $ | — |
| | | | | | | | |
| | | | | | | | | | | | | | | | | | | | | | | | |
| | | | | | | | | | | | | | | | | | | | | | | | | | | | | |
| | | | | | | | | | | | | | | | | | | | | | | | | | | | | |
| $ | (.44 | ) | | $ | (.18 | ) | | $ | (.62 | ) | | $ | 11.81 | | 7.64 | % | | .49 | % | | 3.5 | % | | 464.6 | % | | $ | 2,187,219 |
| | (.55 | ) | | | (.09 | ) | | | (.64 | ) | | | 11.57 | | 11.19 | % | | .49 | % | | 4.9 | % | | 438.6 | % | | | 1,400,431 |
| | (.62 | ) | | | (.13 | ) | | | (.75 | ) | | | 11.01 | | 6.14 | % | | .50 | %H | | 5.6 | %H | | 595.2 | % | | | 971,544 |
| | (.73 | ) | | | — | | | | (.73 | ) | | | 11.09 | | 14.37 | % | | .50 | %H | | 6.8 | %H | | 387.2 | % | | | 826,459 |
| | (.80 | ) | | | (.03 | ) | | | (.83 | ) | | | 10.39 | | 1.99 | % | | .50 | %H | | 6.3 | %H | | 260.4 | % | | | 649,038 |
| | | | | | | | | | | | | | | | | | | | | | | | | | | | | |
| | | | | | | | | | | | | | | | | | | | | | | | | | | | | |
| $ | (.41 | ) | | $ | (.18 | ) | | $ | (.59 | ) | | $ | 11.81 | | 7.36 | % | | .75 | %I | | 3.3 | %I | | 464.6 | % | | $ | 121,607 |
| | (.52 | ) | | | (.09 | ) | | | (.61 | ) | | | 11.57 | | 10.80 | % | | .75 | % | | 4.1 | % | | 438.6 | % | | | 79,120 |
| | (.60 | ) | | | (.13 | ) | | | (.73 | ) | | | 11.02 | | 5.88 | % | | .75 | %I | | 5.3 | %I | | 595.2 | % | | | 1,885 |
| | (.70 | ) | | | — | | | | (.70 | ) | | | 11.10 | | 13.96 | % | | .75 | %I | | 6.6 | %I | | 387.2 | % | | | 1,883 |
| | (.49 | ) | | | — | | | | (.49 | ) | | | 10.40 | | 1.97 | %C | | .75 | %D,I | | 6.2 | %D,I | | 260.4 | % | | | 1,456 |
| | | | | | | | |
| | | | | | | | | | | | | | | | | | | | | | | | | | | | | |
| | | | | | | | | | | | | | | | | | | | | | | | | | | | | |
| | | | | | | | | | | | | | | | | | | | | | | | | | | | | |
| $ | (.41 | ) | | $ | (.20 | ) | | $ | (.61 | ) | | $ | 10.71 | | 9.12 | % | | .45 | %K | | 3.6 | %K | | 463.8 | % | | $ | 3,286,650 |
| | (.51 | ) | | | (.10 | ) | | | (.61 | ) | | | 10.40 | | 11.78 | % | | .45 | %K | | 5.0 | %K | | 422.6 | % | | | 1,866,619 |
| | (.54 | ) | | | (.27 | ) | | | (.81 | ) | | | 9.88 | | 6.34 | % | | .45 | %K | | 5.3 | %K | | 590.7 | % | | | 991,673 |
| | (.66 | ) | | | — | | | | (.66 | ) | | | 10.07 | | 13.73 | % | | .46 | %K | | 6.8 | %K | | 432.8 | % | | | 444,451 |
| | (.67 | ) | | | — | | | | (.67 | ) | | | 9.48 | | 1.95 | % | | .50 | %K | | 6.2 | %K | | 315.9 | % | | | 215,184 |
| | | | | | | | | | | | | | | | | | | | | | | | | | | | | |
| | | | | | | | | | | | | | | | | | | | | | | | | | | | | |
| $ | (.39 | ) | | $ | (.20 | ) | | $ | (.59 | ) | | $ | 10.71 | | 8.82 | % | | .70 | %M | | 3.2 | %M | | 463.8 | % | | $ | 7,040 |
| | (.48 | ) | | | (.10 | ) | | | (.58 | ) | | | 10.40 | | 11.57 | % | | .70 | %M | | 4.8 | %M | | 422.6 | % | | | 369 |
| | (.11 | ) | | | — | | | | (.11 | ) | | | 9.87 | | (.57 | )%C | | .70 | %D,M | | 5.3 | %D,M | | 590.7 | % | | | 235 |
| | | | | | | | | | | | | | | | | | | | | | | | | | | | | |
|
97
Annual Report to Shareholders
FINANCIAL HIGHLIGHTS—Continued
| | | | | | | | | | | | | |
| | | | | INVESTMENT OPERATIONS
|
| | | NET ASSET
VALUE,
BEGINNING
OF YEAR | | NET
INVESTMENT
INCOME | | NET REALIZED
AND UNREALIZED
GAIN/(LOSS) ON
INVESTMENTS,
OPTIONS, FUTURES,
SWAPS, AND
FOREIGN CURRENCY
TRANSACTIONS | | | TOTAL FROM
INVESTMENT
OPERATIONS |
|
Western Asset Inflation Indexed Plus Bond Portfolio | | | | | | | | | | | | | |
—Institutional Class | | | | | | | | | | | | | |
Years Ended March 31, | | | | | | | | | | | | | |
2004 | | $ | 10.96 | | $ | .37O | | $ | .71 | | | $ | 1.08 |
2003 | | | 9.92 | | | .51O | | | 1.19 | | | | 1.70 |
2002 | | | 9.98 | | | .41O | | | .01 | | | | .42 |
2001P | | | 10.00 | | | .08O | | | (.02 | ) | | | .06 |
| | | | |
Western Asset High Yield Portfolio | | | | | | | | | | | | | |
—Institutional Class | | | | | | | | | | | | | |
Years Ended March 31, | | | | | | | | | | | | | |
2004 | | $ | 9.56 | | $ | .78Q | | $ | .89 | | | $ | 1.67 |
2003 | | | 10.36 | | | .96Q | | | (.82 | ) | | | .14 |
2002R | | | 10.00 | | | .53Q | | | .07 | | | | .60 |
| | | | |
Western Asset Non-U.S. Opportunity Bond Portfolio | | | | | | | | | | | | | |
—Institutional Class | | | | | | | | | | | | | |
Years Ended March 31, | | | | | | | | | | | | | |
2004 | | $ | 10.91 | | $ | .97S | | $ | (.01 | ) | | $ | .96 |
2003 | | | 9.25 | | | .25S | | | 1.52 | | | | 1.77 |
2002 | | | 9.25 | | | —L,S | | | .46L | | | | .46 |
2001 | | | 9.59 | | | .59S | | | (.05 | ) | | | .54 |
2000 | | | 10.21 | | | .49S | | | (.47 | ) | | | .02 |
| | | | | | | | | | | | | | |
|
| A | For the period October 1, 2003 (commencement of operations) to March 31, 2004. |
| B | Net of advisory fees waived by the adviser pursuant to a voluntary expense limitation of 0.40%. If no fees had been waived by the adviser, the annualized ratio of expenses to average net assets would have been as follows: for the period October 1, 2003 (commencement of operations) to March 31, 2004, 0.68%. |
| E | Net of advisory fees waived by the adviser pursuant to a voluntary expense limitation of 0.45%. If no fees had been waived by the adviser, the ratio of expenses to average net assets would have been: for the years ended March 31, 2004, 0.47%; 2002, 0.47%; 2001, 0.47%; and 2000, 0.48%. |
| F | Liquidation of Financial Intermediary Class shares. |
| G | Net of advisory fees waived by the adviser pursuant to a voluntary expense limitation of 0.70%. If no fees had been waived by the adviser, the annualized ratio of expenses to average net assets would have been as follows: for the period ending November 30, 1999 (liquidation of Financial Intermediary Class shares), 0.74%. |
| H | Net of advisory fees waived by the adviser pursuant to a voluntary expense limitation of 0.50%. If no fees had been waived by the adviser, the ratio of expenses to average net assets would have been as follows: for the years ended March 31, 2002, 0.52%; 2001, 0.53%; and 2000, 0.51%. |
| I | Net of advisory fees waived by the adviser pursuant to a voluntary expense limitation of 0.75%. If no fees had been waived by the adviser, the ratio of expenses to average net assets would have been as follows: for the years ended March 31, 2004, 0.76% ; 2002, 0.77%; and 2001, 0.78%. For the period July 22, 1999 (commencement of operations) to March 31, 2000, the annualized ratio of expenses to average net assets would have been 0.76%. |
| J | For the period July 22, 1999 (commencement of operations) to March 31, 2000. |
| K | Net of advisory fees waived by the adviser pursuant to a voluntary expense limitation of 0.50% to June 30, 2000, and 0.45% thereafter. If no fees had been waived by the adviser, the ratio of expenses to average net assets would have been as follows: for the years ended March 31, 2004, 0.48%; 2003, 0.50%; 2002, 0.54%; 2001, 0.57%; and 2000, 0.65%. |
| L | The amount presented is calculated pursuant to a methodology prescribed by the Securities and Exchange Commission for a share outstanding throughout the period. This amount is inconsistent with the Fund’s aggregate gains and losses because of the timing of sales and redemptions of Fund shares in relation to fluctuating market values for the investment portfolio. |
98
| | | | | | | | | | | | | | | | | | | | | | | | | | | | |
DISTRIBUTIONS
| | | | | RATIOS/SUPPLEMENTAL DATA
|
FROM NET
INVESTMENT
INCOME | | | FROM NET
REALIZED
GAIN ON
INVESTMENTS | | | TOTAL
DISTRIBUTIONS | | | NET ASSET
VALUE,
END OF
YEAR | | TOTAL
RETURN | | | EXPENSES
TO
AVERAGE
NET
ASSETS | | | NET
INVESTMENT
INCOME TO AVERAGE
NET ASSETS | | | PORTFOLIO
TURNOVER
RATE | | | NET ASSETS, END OF
YEAR (IN
THOUSANDS) |
|
| | | | | | | | | | | | | | | | | | | | | | | | | | | | | |
| | | | | | | | | | | | | | | | | | | | | | | | | | | | | |
| | | | | | | | | | | | | | | | | | | | | | | | | | | | | |
| $ | (.37 | ) | | $ | (.43 | ) | | $ | (.80 | ) | | $ | 11.24 | | 10.33 | % | | .25 | %O | | 3.4 | %O | | 281.8 | % | | $ | 346,379 |
| | (.51 | ) | | | (.15 | ) | | | (.66 | ) | | | 10.96 | | 17.62 | % | | .25 | %O | | 4.8 | %O | | 75.4 | % | | | 290,306 |
| | (.41 | ) | | | (.07 | ) | | | (.48 | ) | | | 9.92 | | 4.28 | % | | .25 | %O | | 5.0 | %O | | 79.5 | % | | | 210,635 |
| | (.08 | ) | | | — | | | | (.08 | ) | | | 9.98 | | .55 | %C | | .25 | %D,O | | 8.9 | %D,O | | — | | | | 11,978 |
| | | | | | | | |
| | | | | | | | | | | | | | | | | | | | | | | | | | | | | |
| | | | | | | | | | | | | | | | | | | | | | | | | | | | | |
| | | | | | | | | | | | | | | | | | | | | | | | | | | | | |
| $ | (.95 | ) | | $ | — | | | $ | (.95 | ) | | $ | 10.28 | | 18.27 | % | | .58 | %Q | | 7.9 | %Q | | 116.0 | % | | $ | 189,458 |
| | (.94 | ) | | | — | | | | (.94 | ) | | | 9.56 | | 2.22 | % | | .55 | %Q | | 10.2 | %Q | | 110.1 | % | | | 149,937 |
| | (.24 | ) | | | — | | | | (.24 | ) | | | 10.36 | | 6.02 | %C | | .55 | %D,Q | | 10.4 | %D,Q | | 51.8 | %C | | | 152,729 |
| | | | | | | | |
| | | | | | | | | | | | | | | | | | | | | | | | | | | | | |
| | | | | | | | | | | | | | | | | | | | | | | | | | | | | |
| | | | | | | | | | | | | | | | | | | | | | | | | | | | | |
| $ | (1.01 | ) | | $ | (.34 | ) | | $ | (1.35 | ) | | $ | 10.52 | | 9.06 | % | | .55 | %S | | 4.0 | %S | | 42.8 | % | | $ | 97,027 |
| | (.11 | ) | | | — | | | | (.11 | ) | | | 10.91 | | 19.26 | % | | .55 | %S | | 4.4 | %S | | 187.5 | % | | | 59,026 |
| | (.46 | ) | | | — | | | | (.46 | ) | | | 9.25 | | 5.21 | % | | .55 | %S | | 4.5 | %S | | 307.6 | % | | | 47,487 |
| | (.88 | ) | | | — | | | | (.88 | ) | | | 9.25 | | 6.31 | % | | .55 | %S | | 5.6 | %S | | 263.4 | % | | | 93,385 |
| | (.50 | ) | | | (.14 | ) | | | (.64 | ) | | | 9.59 | | .57 | % | | .55 | %S | | 4.9 | %S | | 347.1 | % | | | 62,526 |
| | | | | | | | | | | | | | | | | | | | | | | | | | | | | |
|
| M | Net of advisory fees waived by the adviser pursuant to a voluntary expense limitation of 0.70%. If no fees had been waived by the adviser, the ratio of expenses to average net assets would have been as follows: for the years ended March 31, 2004, 0.73% and 2003, 0.75%. For the period January 8, 2002 (commencement of operations) to March 31, 2002, the annualized ratio of expenses to average net assets would have been 0.75%. |
| N | For the period January 8, 2002 (commencement of operations) to March 31, 2002. |
| O | Net of advisory fees waived by the adviser pursuant to a voluntary expense limitation of 0.25%. If no fees had been waived by the adviser, the ratio of expenses to average net assets would have been as follows: for the years ended March 31, 2004, 0.27%; 2003, 0.27%; and 2002, 0.67%. For the period March 1, 2001 (commencement of operations) to March 31, 2001, the annualized ratio of expenses to average net assets would have been 2.03%. |
| P | For the period March 1, 2001 (commencement of operations) to March 31, 2001. |
| Q | Net of advisory fees waived by the adviser pursuant to a voluntary expense limitation of 0.55% to December 31, 2003, and 0.65% thereafter. If no fees had been waived by the adviser, the ratio of expenses to average net assets would have been as follows: for the years ended March 31, 2004, 0.67% and 2003, 0.67%. For the period September 28, 2001 (commencement of operations) to March 31, 2002, the annualized ratio of expenses to average net assets would have been 0.75%. |
| R | For the period September 28, 2001 (commencement of operations) to March 31, 2002. |
| S | Net of advisory fees waived by the adviser pursuant to a voluntary expense limitation of 0.55%. If no fees had been waived by the adviser, the ratio of expenses to average net assets would have been as follows: for the years ended March 31, 2004, 0.80%; 2003, 0.82%; 2002, 0.82%; 2001, 0.85; and 2000, 0.83%. |
See notes to financial statements.
99
Annual Report to Shareholders
NOTES TO FINANCIAL STATEMENTS
(Amounts in Thousands)
1. Significant Accounting Policies:
Western Asset Funds, Inc. (“Corporation”), consisting of Western Asset Limited Duration Bond Portfolio (“Limited Duration”), Western Asset Intermediate Bond Portfolio (“Intermediate”), Western Asset Core Bond Portfolio (“Core”), Western Asset Core Plus Bond Portfolio (“Core Plus”), Western Asset Inflation Indexed Plus Bond Portfolio (“Inflation Indexed”), Western Asset High Yield Portfolio (“High Yield”), and Western Asset Non-U.S. Opportunity Bond Portfolio (“Non-U.S.”) (individually a “Fund,” collectively the “Funds”), is registered under the Investment Company Act of 1940 (“1940 Act”), as amended, as a diversified, open-end management investment company with the exception of Non-U.S., which is non-diversified.
Each Fund offers two classes of shares: Institutional Class and Financial Intermediary Class. Shares in the Financial Intermediary Class bear a distribution fee. The Financial Intermediary Class shares of Limited Duration, Inflation Indexed, High Yield, and Non-U.S. are not active. All outstanding Financial Intermediary Class shares of Intermediate were redeemed on November 30, 1999. The income and expenses of each of the Funds are allocated proportionately to the two classes of shares based on daily net assets, except for Rule 12b-1 distribution fees, which are charged only on the Financial Intermediary Class shares, and transfer agent and shareholder servicing expenses, which are determined separately for each class.
Preparation of the financial statements in accordance with accounting principles generally accepted in the United States of America requires management to make estimates and assumptions that affect the reported amounts and disclosures in the financial statements. Actual results could differ from these estimates. The following is a summary of significant accounting policies followed by the funds in the preparation of their financial statements:
Security Valuation
Securities owned by the Funds for which market quotations are readily available are valued at current market value. Securities for which market quotations are not readily available are fair valued by the Board of Directors or the Funds’ Valuation Committee pursuant to procedures adopted by the Board. In determining fair value, the Board of Directors or the Funds’ Valuation Committee consider all relevant qualitative and quantitative factors available. These factors are subject to change over time and are reviewed periodically. The values assigned to fair value investments are based on available information and do not necessarily represent amounts that might ultimately be realized, since such amounts depend on future developments inherent in long-term investments. Further, because of the inherent uncertainty of valuation, those estimated values may differ significantly from the values that would have been used had a ready market of the investments existed, and the differences could be material.
With respect to Core Plus, Inflation Indexed, High Yield and Non-U.S., where a security is traded on more than one market, which may include foreign markets, the securities are generally valued on the market considered by the Funds’ adviser to be the primary market. The Funds will value their foreign securities in U.S. dollars on the basis of the then-prevailing exchange rates.
Security Transactions
Security transactions are recorded on the trade date. Realized gains and losses from security transactions are reported on an identified cost basis for both financial reporting and federal income tax purposes. At March 31, 2004, receivables for securities sold and payables for securities purchased for each Fund were:
| | | | | | |
| | | Receivable for Securities Sold
| | Payable for Securities Purchased
|
Limited Duration | | $ | — | | $ | 1,264 |
Intermediate | | | 3,137 | | | 8,016 |
Core | | | 192,896 | | | 770,640 |
Core Plus | | | 428,265 | | | 1,346,821 |
Inflation Indexed | | | 5,260 | | | 50,580 |
High Yield | | | 3,394 | | | 3,337 |
Non-U.S. | | | 155 | | | 722 |
100
For the year ended March 31, 2004, investment transactions (excluding short-term investments) were:
| | | | | | | | | | | | |
| | | Purchases
| | Proceeds From Sales
|
| | | U.S. Gov’t
Securities
| | Other
| | U.S. Gov’t Securities
| | Other
|
Limited Duration | | $ | 33,051 | | $ | 22,346 | | $ | 27,919 | | $ | 2,998 |
Intermediate | | | 1,123,998 | | | 298,197 | | | 1,082,187 | | | 241,644 |
Core | | | 8,974,239 | | | 696,348 | | | 8,159,608 | | | 401,555 |
Core Plus | | | 11,102,457 | | | 1,608,314 | | | 10,079,170 | | | 1,361,228 |
Inflation Indexed | | | 897,465 | | | 70,611 | | | 989,624 | | | 19,319 |
High Yield | | | — | | | 196,431 | | | — | | | 180,355 |
Non-U.S. | | | — | | | 49,247 | | | — | | | 23,610 |
Foreign Currency Translation
Assets and liabilities initially expressed in non-U.S. currencies are translated into U.S. dollars at the current rate of exchange. Purchases and sales of securities and income and expenses are translated into U.S. dollars at the prevailing market rates on the dates of such transactions. The effects of changes in non-U.S. currency exchange rates on investment securities and other assets and liabilities are included with the net realized and unrealized gain or loss on investment securities.
Repurchase Agreements
The Funds may engage in repurchase agreement transactions. Under the terms of a typical repurchase agreement, a fund takes possession of an underlying debt obligation subject to an obligation of the seller to repurchase, and a fund to resell, the obligation at an agreed-upon price and time, thereby determining the yield during a fund’s holding period. This arrangement results in a fixed rate of return that is not subject to market fluctuations during the fund’s holding period. The value of the collateral is at all times at least equal to the total amount of the repurchase obligation, including interest. In the event of counterparty default, a fund has the right to use the collateral to satisfy the terms of the repurchase agreement. However, there could be potential loss to the fund in the event the fund is delayed or prevented from exercising its right to dispose of the collateral securities, including the risk of a possible decline in the value of the collateral securities during the period in which the fund seeks to assert its rights. The Funds’ investment advisers review the value of the collateral and the creditworthiness of those banks and dealers with which the Funds enter into repurchase agreements to evaluate potential risks.
Options, Futures and Swap Agreements
The current market value of a traded option is the last sale price or, in the absence of a sale, the mean between the closing bid and asked price. Futures contracts are valued daily at the settlement price established by the board of trade or exchange on which they are traded. Futures contracts are marked-to-market on a daily basis. As a contract’s value fluctuates, payments known as variation margin are made or received by a Fund each day, depending on the daily fluctuation in the value of the contract. The daily changes in contract value are recorded as unrealized gains or losses, and the Fund recognizes a gain or loss when the contract is closed. Swap agreements are priced daily based upon quotations from brokers and the change, if any, is recorded as unrealized appreciation or depreciation.
Investment Income and Distributions to Shareholders
Dividend income and distributions to shareholders are allocated at the class level and are recorded on the ex-dividend date. Dividends from net investment income are declared daily and paid monthly for each Fund except High Yield and Non-U.S., which declare and pay dividends quarterly. Net capital gains distributions, which are calculated at the Fund level, are declared and paid annually in June. An additional distribution may be made in December to the extent necessary. Distributions are determined in accordance with federal income tax regulations, which may differ from those determined in accordance with accounting principles generally accepted in the United States of America; accordingly, periodic reclassifications are made within the Funds’ capital accounts to reflect income and gains available for distribution under federal income tax regulations. At March 31, 2004, accrued dividends payable were as follows: Limited Duration, $0; Intermediate, $58; Core, $364; Core Plus, $1,289; Inflation Indexed, $62; High Yield, $0; and Non-U.S., $0. Interest income and expenses are recorded on the accrual basis. Bond discounts and premiums are amortized and included in interest income for financial reporting and federal income tax purposes.
101
Annual Report to Shareholders
NOTES TO FINANCIAL STATEMENTS—Continued
2. Federal Income Taxes:
No provision for federal income or excise taxes is required since each Fund intends to continue to qualify as a regulated investment company and distribute substantially all of its taxable income and capital gains to its shareholders. Because federal income tax regulations differ from accounting principles generally accepted in the United States of America, income and capital gains distributions determined in accordance with tax regulations may differ from net investment income and realized gains recognized for financial reporting purposes. Accordingly, the character of the distributions and composition of net assets for tax purposes differ from those reflected in the accompanying financial statements.
Distributions during the years ended March 31, 2003 and 2004, were characterized as follows for tax purposes:
| | | | | | | | | | | | | | | | | |
| | | Limited Duration
| | Intermediate
| | Core
| | |
| | | 2004
| | 2004
| | 2003
| | 2004
| | 2003
| | |
Ordinary income | | $ | 206 | | $ | 29,826 | | $ | 31,385 | | $ | 89,254 | | $ | 60,987 | | |
Long-term capital gains | | | — | | | 6,074 | | | 3,497 | | | 4,725 | | | 5,682 | | |
| | |
|
| |
|
| |
|
| |
|
| |
|
| |
|
Total distributions | | $ | 206 | | $ | 35,900 | | $ | 34,882 | | $ | 93,979 | | $ | 66,669 | | |
| | |
|
| |
|
| |
|
| |
|
| |
|
| |
|
| | | | | | | | | | | | | | | | | | |
| | | Core Plus
| | Inflation Indexed
| | High Yield
|
| | | 2004
| | 2003
| | 2004
| | 2003
| | 2004
| | 2003
|
Ordinary income | | $ | 117,629 | | $ | 74,122 | | $ | 15,526 | | $ | 15,685 | | $ | 15,028 | | $ | 14,132 |
Long-term capital gains | | | 21,743 | | | 6,887 | | | 8,792 | | | 103 | | | — | | | — |
| | |
|
| |
|
| |
|
| |
|
| |
|
| |
|
|
Total distributions | | $ | 139,372 | | $ | 81,009 | | $ | 24,318 | | $ | 15,788 | | $ | 15,028 | | $ | 14,132 |
| | |
|
| |
|
| |
|
| |
|
| |
|
| |
|
|
| | | | | | | | |
| | | Non-U.S.
| | |
| | | 2004
| | 2003
| | |
Ordinary income | | $ | 5,862 | | $ | 636 | | |
Long-term capital gains | | | 1,408 | | | — | | |
| | |
|
| |
|
| |
|
Total distributions | | $ | 7,270 | | $ | 636 | | |
| | |
|
| |
|
| |
|
Pursuant to federal income tax regulations applicable to investment companies, each Fund has elected to treat net capital losses realized between November 1 and March 31 of each year (“post-October loss”) as occurring on the first day of the following tax year. For the year ended March 31, 2004, realized capital losses reflected in the accompanying financial statements, as shown in the accompanying table below, will not be recognized for federal income tax purposes until the fiscal year ending March 31, 2005.
The tax basis components of net assets at March 31, 2004, were:
| | | | | | | | | | | | | | | | | | | | | | | | | | | | |
| | | Limited
Duration
| | | Intermediate
| | | Core
| | | Core Plus
| | | Inflation
Indexed
| | | High Yield
| | | Non-U.S.
| |
Unrealized appreciation | | $ | 275 | | | $ | 17,198 | | | $ | 68,653 | | | $ | 125,190 | | | $ | 17,411 | | | $ | 10,451 | | | $ | 7,513 | |
Unrealized depreciation | | | (25 | ) | | | (3,881 | ) | | | (20,679 | ) | | | (28,098 | ) | | | (1,626 | ) | | | (3,015 | ) | | | (1,103 | ) |
| | |
|
|
| |
|
|
| |
|
|
| |
|
|
| |
|
|
| |
|
|
| |
|
|
|
Net unrealized appreciation/ (depreciation) | | | 250 | | | | 13,317 | | | | 47,974 | | | | 97,092 | | | | 15,785 | | | | 7,436 | | | | 6,410 | |
Undistributed net investment income | | | — | | | | 9,166 | | | | 27,733 | | | | 41,010 | | | | 6,296 | | | | 2,317 | | | | 2,029 | |
Undistributed long-term capital gains | | | — | | | | 6,295 | | | | 24,032 | | | | 6,156 | | | | 6,549 | | | | — | | | | — | |
Capital loss carryforwards | | | (6 | ) | | | — | | | | — | | | | — | | | | — | | | | (4,078 | ) | | | — | |
Post-October loss push and other loss deferrals | | | — | | | | — | | | | — | | | | (1,132 | ) | | | — | | | | — | | | | (5,402 | ) |
Paid-in capital | | | 25,938 | | | | 558,451 | | | | 2,209,087 | | | | 3,150,564 | | | | 317,749 | | | | 183,783 | | | | 93,990 | |
| | |
|
|
| |
|
|
| |
|
|
| |
|
|
| |
|
|
| |
|
|
| |
|
|
|
Net assets | | $ | 26,182 | | | $ | 587,229 | | | $ | 2,308,826 | | | $ | 3,293,690 | | | $ | 346,379 | | | $ | 189,458 | | | $ | 97,027 | |
| | |
|
|
| |
|
|
| |
|
|
| |
|
|
| |
|
|
| |
|
|
| |
|
|
|
The Funds intend to retain realized capital gains that may be offset against available capital loss carryforwards for federal income tax purposes. As of March 31, 2004, Limited Duration and High Yield had capital loss carryforwards of $6 (expiring in 2012) and $4,078 (expiring in 2011), respectively. There were no capital loss carryforwards for any of the other Funds.
102
For financial reporting purposes, capital accounts and distributions to shareholders may be adjusted to reflect the tax character of permanent book/tax differences. For the year ended March 31, 2004, the Funds recorded the following permanent reclassifications, which relate primarily to reclassifications of gains/losses on paydown securities, swap transactions, and/or currency transactions. Results of operations and net assets were not affected by these reclassifications.
| | | | | | | | | | | | | | | | | | | | |
| | | Intermediate
| | | Core
| | | Core
Plus
| | | Inflation
Indexed
| | | Non-U.S.
| |
Undistributed net investment income | | $ | (23 | ) | | $ | 2,186 | | | $ | (1,384 | ) | | $ | 64 | | | $ | (3,953 | ) |
Accumulated realized gain/(loss) | | | 23 | | | | (2,310 | ) | | | 1,616 | | | | (64 | ) | | | 3,953 | |
Paid-in capital | | | — | | | | 124 | | | | (232 | ) | | | — | | | | — | |
At March 31, 2004, the cost of investments for federal income tax purposes was as follows:
| | | | | |
Limited Duration | | $ | 26,990 | | |
Intermediate | | | 723,804 | | |
Core | | | 3,418,735 | | |
Core Plus | | | 4,710,829 | | |
Inflation Indexed | | | 461,065 | | |
High Yield | | | 161,018 | | |
Non-U.S. | | | 78,967 | | |
3. Financial Instruments:
Forward Currency Exchange Contracts
As part of their investment programs, Limited Duration, Core Plus, Inflation Indexed High Yield, and Non-U.S. may utilize forward currency exchange contracts. The nature and risks of these financial instruments and the reasons for using them are set forth more fully in the Corporation’s prospectus and statement of additional information.
Forward foreign currency contracts are marked-to-market daily using forward foreign currency exchange rates supplied by an independent pricing service. The change in a contract’s market value is recorded by the Funds as an unrealized gain or loss. When the contract is closed or delivery is taken, the Funds record a realized gain or loss equal to the difference between the value of the contract at the time it was opened and the value at the time it was closed.
The use of forward foreign currency exchange contracts does not eliminate fluctuations in the underlying prices of the Funds’ securities, but it does establish a rate of exchange that can be achieved in the future. These forward foreign currency contracts involve market risk in excess of amounts reflected in the financial statements. Although forward foreign currency contracts used for hedging purposes limit the risk of loss due to a decline in the value of the hedged currency, they also limit any potential gain that might result should the value of the currency increase. In addition, the Funds could be exposed to risks if the counterparties to the contracts are unable to meet the terms of their contracts.
At March 31, 2004, open forward currency exchange contracts were as follows:
Core Plus
| | | | | | | | | | | |
Settlement Date
| | Contract to
| | Unrealized Gain/(Loss)
|
| | ReceiveA
| | DeliverA
| |
| 05/11/2004 | | CAD | | 270 | | USD | | 206 | | $ | — |
| 05/11/2004 | | USD | | 39,272 | | CAD | | 51,481 | | | 28 |
| 05/11/2004 | | USD | | 97,755 | | EUR | | 77,679 | | | 2,373 |
| 05/11/2004 | | USD | | 2,232 | | SEK | | 16,203 | | | 88 |
| | | | | | | | | | |
|
|
| | | | | | | | | | | $ | 2,489 |
| | | | | | | | | | |
|
|
103
Annual Report to Shareholders
NOTES TO FINANCIAL STATEMENTS—Continued
Non-U.S.
| | | | | | | | | | | | |
Settlement Date
| | Contract to
| | Unrealized Gain/(Loss)
| |
| | ReceiveA
| | DeliverA
| |
| 05/11/2004 | | CAD | | 10,545 | | USD | | 8,031 | | $ | 8 | |
| 05/11/2004 | | DKK | | 46 | | USD | | 8 | | | — | |
| 05/11/2004 | | USD | | 1,621 | | DKK | | 9,740 | | | 15 | |
| 05/11/2004 | | EUR | | 2,846 | �� | NOK | | 24,541 | | | (80 | ) |
| 05/11/2004 | | EUR | | 4,964 | | USD | | 6,211 | | | (116 | ) |
| 05/11/2004 | | NOK | | 20,438 | | EUR | | 2,372 | | | 65 | |
| 05/11/2004 | | USD | | 67,293 | | EUR | | 54,135 | | | 821 | |
| 05/11/2004 | | NOK | | 14,792 | | USD | | 2,160 | | | (6 | ) |
| 05/11/2004 | | USD | | 1,901 | | NOK | | 13,030 | | | 4 | |
| 05/11/2004 | | GBP | | 550 | | USD | | 998 | | | 10 | |
| 05/11/2004 | | USD | | 3,507 | | GBP | | 1,933 | | | (37 | ) |
| 05/11/2004 | | USD | | 9,469 | | SEK | | 68,733 | | | 374 | |
| | | | | | | | | | |
|
|
|
| | | | | | | | | | | $ | 1,058 | |
| | | | | | | | | | |
|
|
|
Options and Futures
As part of their investment programs, the Funds may utilize options and futures. Options may be written (sold) or purchased by the Funds. When a Fund purchases a put or call option, the premium paid is recorded as an investment and its value is marked-to-market daily. When a Fund writes a put or call option, an amount equal to the premium received by the Fund is recorded as a liability and its value is marked-to-market daily.
When options, whether written or purchased, expire, are exercised or are closed (by entering into a closing purchase or sale transaction), the Fund realizes a gain or loss as described in the chart below:
| | |
| Purchased option: | | Impact on the Fund: |
| The option expires | | Realize a loss in the amount of the cost of the option. |
|
| The option is closed through a closing sale transaction | | Realize a gain or loss depending on whether the proceeds from the closing sale transaction are greater or less than the cost of the option. |
|
| A | Definitions of currency abbreviations: |
CAD—Canadian dollar
DKK—Danish krona
EUR—Euro
GBP—British pound
NOK—Norwegian krone
SEK—Swedish krona
USD—United States dollar
104
| | |
| Written option: | | Impact on the Fund: |
| The Fund exercises a call option | | The cost of the security purchased through the exercise of the option will be increased by the premium originally paid to purchase the option. |
|
| The Fund exercises a put option | | Realize a gain or loss from the sale of the underlying security. The proceeds of that sale will be reduced by the premium originally paid to purchase the put option. |
|
| The option expires | | Realize a gain equal to the amount of the premium received. |
|
| The option is closed through a closing purchase transaction | | Realize a gain or loss without regard to any unrealized gain or loss on the underlying security and eliminate the option liability. The Fund will realize a loss in this transaction if the cost of the closing purchase exceeds the premium received when the option was written. |
|
| A written call option is exercised by the option purchaser | | Realize a gain or loss from the sale of the underlying security. The proceeds of that sale will be increased by the premium originally received when the option was written. |
|
| A written put option is exercised by the option purchaser | | The amount of the premium originally received will reduce the cost of the security that the Fund purchased when the option was exercised. |
|
The risk associated with purchasing options is limited to the premium originally paid. Options written by a Fund involve, to varying degrees, risk of loss in excess of the option value reflected in the statement of net assets. The risk in writing a covered call option is that a Fund may forgo the opportunity of profit if the market price of the underlying security increases and the option is exercised. The risk in writing a put option is that a Fund may incur a loss if the market price of the underlying security decreases and the option is exercised. In addition, there is the risk a Fund may not be able to enter into a closing transaction because of an illiquid secondary market or, for over-the-counter options, because of the counterparty’s inability or unwillingness to perform. The nature and risks of these financial instruments and the reasons for using them are set forth more fully in the Corporation’s prospectus and statement of additional information.
Activity in written call and put options during the year ended March 31, 2004, was as follows:
| | | | | | | | | | | | | | |
| | | Calls
| | | Puts
| |
| Intermediate | | Actual
Contracts
| | | Premiums
| | | Actual
Contracts
| | | Premiums
| |
Options outstanding at March 31, 2003 | | — | | | $ | — | | | — | | | $ | — | |
Options written | | 3,270 | | | | 2,888 | | | 17,503,329 | | | | 2,903 | |
Options closed | | (2,435 | ) | | | (1,860 | ) | | (4,102,772 | ) | | | (2,167 | ) |
Options expired | | — | | | | — | | | — | | | | — | |
Options exercised | | (83 | ) | | | (37 | ) | | — | | | | — | |
| | |
|
| |
|
|
| |
|
| |
|
|
|
Options outstanding at March 31, 2004 | | 752 | | | $ | 991 | | | 13,400,557 | | | $ | 736 | |
| | |
|
| |
|
|
| |
|
| |
|
|
|
| | |
| | | Calls
| | | Puts
| |
| Core | | Actual
Contracts
| | | Premiums
| | | Actual
Contracts
| | | Premiums
| |
Options outstanding at March 31, 2003 | | 31,583,587 | | | $ | 2,821 | | | 2,795 | | | $ | 2,265 | |
Options written | | 30,327,640 | | | | 21,307 | | | 105,227,116 | | | | 20,919 | |
Options closed | | (17,487 | ) | | | (13,707 | ) | | (12,510,371 | ) | | | (10,000 | ) |
Options expired | | (6,540 | ) | | | (4,508 | ) | | (10,594 | ) | | | (5,755 | ) |
Options exercised | | (31,584,380 | ) | | | (2,951 | ) | | (2,120 | ) | | | (959 | ) |
| | |
|
| |
|
|
| |
|
| |
|
|
|
Options outstanding at March 31, 2004 | | 30,302,820 | | | $ | 2,962 | | | 92,706,826 | | | $ | 6,470 | |
| | |
|
| |
|
|
| |
|
| |
|
|
|
105
Annual Report to Shareholders
NOTES TO FINANCIAL STATEMENTS—Continued
| | | | | | | | | | | | | | |
| | | Calls
| | | Puts
| |
| Core Plus | | Actual
Contracts
| | | Premiums
| | | Actual
Contracts
| | | Premiums
| |
Options outstanding at March 31, 2003 | | 39,124,247 | | | $ | 3,365 | | | 3,426 | | | $ | 2,822 | |
Options written | | 39,335,672 | | | | 27,829 | | | 146,528,486 | | | | 23,683 | |
Options closed | | (23,385 | ) | | | (18,238 | ) | | (16,817,722 | ) | | | (15,657 | ) |
Options expired | | (39,126,270 | ) | | | (4,475 | ) | | (7,466 | ) | | | (4,481 | ) |
Options exercised | | (6,730 | ) | | | (4,678 | ) | | (1,663 | ) | | | (850 | ) |
| | |
|
| |
|
|
| |
|
| |
|
|
|
Options outstanding at March 31, 2004 | | 39,303,534 | | | $ | 3,803 | | | 129,705,061 | | | $ | 5,517 | |
| | |
|
| |
|
|
| |
|
| |
|
|
|
| | | | | | | | | | | | | | |
| | | Calls
| | | Puts
| |
| Inflation Indexed | | Actual
Contracts
| | | Premiums
| | | Actual
Contracts
| | | Premiums
| |
Options outstanding at March 31, 2003 | | 86 | | | $ | 89 | | | 40 | | | $ | 21 | |
Options written | | 4,602,449 | | | | 1,766 | | | 25,601,615 | | | | 1,162 | |
Options closed | | (1,587 | ) | | | (1,126 | ) | | (1,264 | ) | | | (778 | ) |
Options expired | | (139 | ) | | | (80 | ) | | — | | | | — | |
Options exercised | | (526 | ) | | | (344 | ) | | (4 | ) | | | (2 | ) |
| | |
|
| |
|
|
| |
|
| |
|
|
|
Options outstanding at March 31, 2004 | | 4,600,283 | | | $ | 305 | | | 25,600,387 | | | $ | 403 | |
| | |
|
| |
|
|
| |
|
| |
|
|
|
| | | | | | | | | | | | |
| | | Calls
| | Puts
| |
| Non-U.S. | | Actual
Contracts
| | Premiums
| | Actual
Contracts
| | | Premiums
| |
Options outstanding at March 31, 2003 | | — | | $ | — | | — | | | $ | — | |
Options written | | — | | | — | | 333 | | | | 280 | |
Options closed | | — | | | — | | — | | | | — | |
Options expired | | — | | | — | | (333 | ) | | | (280 | ) |
Options exercised | | — | | | — | | — | | | | — | |
| | |
| |
|
| |
|
| |
|
|
|
Options outstanding at March 31, 2004 | | — | | $ | — | | — | | | $ | — | |
| | |
| |
|
| |
|
| |
|
|
|
Upon entering into a futures contract, the Funds are required to deposit with the broker cash or cash equivalents in an amount equal to a certain percentage of the contract amount. This is known as the “initial margin.” Subsequent payments (“variation margin”) are made or received by the Fund each day, depending on the daily fluctuation in the value of the contract. For Non-U.S. and foreign denominated futures held in Core Plus and Inflation Indexed, payment is not sent daily, but is recorded as a net payable or receivable by the Fund to or from the futures broker, which holds cash collateral from the Fund. The daily changes in contract value are recorded as unrealized gains or losses, and each Fund recognizes a realized gain or loss when the contract is closed. Futures contracts are valued daily at the settlement price established by the board of trade or exchange on which they are traded.
The Funds enter into futures contracts for various reasons, including in connection with their interest rate management strategy. Futures contracts involve, to varying degrees, risk of loss in excess of the amounts reflected in the financial statements. The change in value of the futures contracts primarily corresponds with the value of the underlying instruments, which may not correlate with changes in interest rates, if applicable. In addition, there is a risk that a Fund may not be able to enter into a closing transaction because of an illiquid secondary market. The nature and risks of these financial instruments and other reasons for using them are set forth more fully in the Corporation’s prospectus and statement of additional information.
The open futures positions and related appreciation or depreciation at March 31, 2004 are listed at the end of each Fund’s statement of net assets.
Swap Agreements
The use of swaps involves risks that are different from those associated with ordinary portfolio securities transactions. Swap agreements may be considered to be illiquid. Although a Fund will not enter into any swap agreement unless the adviser believes
106
that the other party to the transaction is creditworthy, a Fund does bear the risk of loss of the amount expected to be received under a swap agreement in the event of the default or bankruptcy of the agreement counterparty. The nature and risks of these financial instruments and the reasons for using them are set forth more fully in the Corporation’s prospectus and statement of additional information.
The Funds may invest in different types of swap agreements. Currently, the Funds hold credit default, interest rate, and total return swap contracts (denoted in the table below by a superscript 1, 2 or 3 respectively). Credit default swap contracts represent the exchange of commitments to provide a level of credit protection for a commitment to receive interest at a fixed rate based on the potential risk of default of the relevant underlying issuer. The relevant underlying issuer for credit default swap contracts is listed in a parenthetical reference following the agreement counterparty. Interest rate swap contracts involve the exchange of commitments to pay and receive interest based on a notional principal amount. Total Return swap contracts involve the exchange of commitments to pay and receive interest based on the total return of an index over a specified period.
The following is a summary of open swap contracts outstanding at March 31, 2004.
| | | | | | | | | | | | |
Intermediate: | | | | | | | | | | | | |
Agreement With:
| | Termination Date
| | The Fund
Agrees to Pay
| | The Fund
Will Receive
| | Contract Notional Amount
| | Unrealized Appreciation/ (Depreciation)
|
Lehman Brothers Holdings Inc. (Dynegy Holdings,
8.75%, due 2/15/12)1 | | April 23, 2007 | | Specified amount
upon credit
event noticeA | | 3.00%
Quarterly | | $ | 2,200 | | $ | (128) |
| | | | | |
J.P. Morgan Chase & Co. (Telecom Italia SPA,
6.25%, due 2/1/12)1 | | March 20, 2009 | | Specified amount
upon credit
event noticeA | | 1.00%
Quarterly | | | 3,010 | | | 43 |
| | | | | | | | | | | |
|
|
| | | | | | | | | | | | $ | (85) |
| | | | | | | | | | | |
|
|
| | | | | |
Core: | | | | | | | | | | | | |
Agreement With:
| | Termination Date
| | The Fund
Agrees to Pay
| | The Fund
Will Receive
| | Contract Notional Amount
| | Unrealized Appreciation/ (Depreciation)
|
Deutsche Bank AG (Target Corporation,
5.875%, due 3/1/12)1 | | July 20, 2004 | | Specified amount
upon credit
event noticeB | | 0.15%
Quarterly | | $ | 7,280 | | $ | (4) |
| | | | | |
Deutsche Bank AG (Dynegy Holdings,
8.75%, due 2/15/12)1 | | May 1, 2007 | | Specified amount
upon credit
event noticeA | | 5.25%
Quarterly | | | 3,340 | | | (129) |
| | | | | |
Deutsche Bank AG (iBoxx Hi-Vol)1 | | March 20, 2009 | | Specified amount
upon credit
event noticeB | | 1.25%
Quarterly | | | 9,740 | | | 40 |
| | | | | |
Deutsche Bank AG
(iBoxx Hi-Vol)1 | | March 20, 2009 | | 1.25%
Quarterly | | Specified amount
upon credit
event noticeC | | | 3,970 | | | (17) |
| | | | | |
Deutsche Bank AG
(iBoxx Hi-Vol)1 | | March 20, 2009 | | 1.25%
Quarterly | | Specified amount
upon credit
event noticeC | | | 3,810 | | | (16) |
| | | | | |
Deutsche Bank AG
(iBoxx 30 Hi-Vol)1 | | March 20, 2009 | | 1.25%
Quarterly | | Specified amount
upon credit
event noticeC | | | 7,400 | | | (31) |
107
Annual Report to Shareholders
NOTES TO FINANCIAL STATEMENTS—Continued
| | | | | | | | | | | | |
Agreement With:
| | Termination Date
| | The Fund
Agrees to Pay
| | The Fund
Will Receive
| | Contract Notional Amount
| | Unrealized Appreciation/ (Depreciation)
|
| | | | | |
Deutsche Bank AG
(iBoxx IG Hi-Vol)1 | | March 20, 2009 | | 1.25%
Quarterly | | Specified amount
upon credit
event noticeC | | $ | 12,500 | | $ | (52) |
| | | | | |
Deutsche Bank AG
(iBoxx IG TMT)1 | | March 20, 2009 | | 0.60%
Quarterly | | Specified amount
upon credit
event noticeC | | | 7,400 | | | 97 |
| | | | | |
Deutsche Bank AG (iBoxx IG Hi-Vol)1 | | March 20, 2009 | | 1.25%
Quarterly | | Specified amount
upon credit
event noticeC | | | 3,850 | | | (16) |
| | | | | |
Deutsche Bank AG (iBoxx IG Hi-Vol 2)1 | | September 20, 2009 | | Specified
amount upon
credit event
noticeB | | 1.15%
Quarterly | | | 25,000 | | | 46 |
| | | | | |
Credit Suisse First Boston USA
(iBoxx IG Hi-Vol 2)1 | | September 20, 2009 | | 1.15%
Quarterly | | Specified amount
upon credit
event noticeC | | | 25,000 | | | (46) |
| | | | | |
Deutsche Bank AG
(iBoxx Hi-Vol)1 | | September 20, 2009 | | Specified
amount upon
credit event
noticeB | | 1.15%
Quarterly | | | 25,000 | | | 46 |
| | | | | |
The Goldman Sachs Group, Inc.2 | | December 8, 2013 | | 4.78714%
Quarterly | | 3-month
LIBORD | | | 33,400 | | | (1,659) |
| | | | | |
Lehman Brothers Holdings Inc.2 | | December 8, 2013 | | 4.7935%
Semi-annually | | 3-month
LIBORD | | | 38,800 | | | (1,927) |
| | | | | |
Deutsche Bank AG
(iBoxx IG Hi-Vol)1 | | March 20, 2014 | | 1.35%
Quarterly | | Specified amount
upon credit
event noticeC | | | 12,500 | | | (2) |
| | | | | |
Deutsche Bank AG
(iBoxx IG 2)1 | | September 20, 2014 | | 0.80%
Quarterly | | Specified amount
upon credit
event noticeC | | | 7,400 | | | (12) |
| | | | | |
Deutsche Bank AG2 | | November 18, 2033 | | 5.38413%
Semi-annually | | 3-month
LIBORD | | | 24,000 | | | (1,095) |
| | | | | |
J.P. Morgan Chase & Co.2 | | November 26, 2033 | | 5.34252%
Semi-annually | | 3-month
LIBORD | | | 26,500 | | | (1,036) |
| | | | | |
Deutsche Bank AG2 | | December 8, 2033 | | 5.4765%
Semi-annually | | 3-month
LIBORD | | | 23,300 | | | (1,401) |
| | | | | |
J.P. Morgan Chase & Co.2 | | January 15, 2034 | | 5.29678%
Semi-annually | | 3-month
LIBORD | | | 15,300 | | | (489) |
| | | | | | | | | | | |
|
|
| | | | | | | | | | | | $ | (7,703) |
| | | | | | | | | | | |
|
|
108
| | | | | | | | | | | | |
| | | | | |
Core Plus: | | | | | | | | | | | | |
Agreement With:
| | Termination Date
| | The Fund
Agrees to Pay
| | The Fund
Will Receive
| | Contract Notional Amount
| | Unrealized Appreciation/ (Depreciation)
|
Merrill Lynch & Co., Inc. (Verizon Global
Funding Corp.,
0%, due 5/15/21)1 | | June 15, 2004 | | Specified amount
upon credit
event noticeB | | 0.75%
Quarterly | | $ | 2,500 | | $ | 2 |
| | | | | |
Deutsche Bank AG (Target Corporation,
5.875%, due 3/1/12)1 | | July 20, 2004 | | Specified amount
upon credit
event noticeB | | 0.15%
Quarterly | | | 9,230 | | | (6) |
| | | | | |
Lehman Brothers Holdings Inc.
(iBoxx IG Hi-Vol)3 | | August 2, 2004 | | Monthly total
return of the
Lehman U.S.
High Yield
Index, Monthly | | 3-month LIBORD
minus 30 basis
pointsE Monthly | | | 9,800 | | | — |
| | | | | |
Deutsche Bank AG (Dynegy Holdings,
8.75%, due 2/15/12)1 | | April 23, 2007 | | Specified amount
upon credit
event noticeA | | 2.95%
Quarterly | | | 2,250 | | | (205) |
| | | | | |
Deutsche Bank AG (Dynegy Holdings,
8.75%, due 2/15/12)1 | | May 1, 2007 | | Specified amount
upon credit
event noticeA | | 5.25%
Quarterly | | | 3,460 | | | (134) |
| | | | | |
Deutsche Bank AG
(iBoxx Hi-Vol)1 | | March 20, 2009 | | Specified amount
upon credit
event noticeB | | 1.25%
Quarterly | | | 13,760 | | | 57 |
| | | | | |
Deutsche Bank AG
(iBoxx IG Hi-Vol)1 | | March 20, 2009 | | 1.25%
Quarterly | | Specified amount
upon credit
event noticeC | | | 10,800 | | | (45) |
| | | | | |
Deutsche Bank AG
(iBoxx IG Hi-Vol)1 | | March 20, 2009 | | 1.25%
Quarterly | | Specified amount
upon credit
event noticeC | | | 12,500 | | | (52) |
| | | | | |
Deutsche Bank AG (iBoxx Hi-Vol)1 | | March 20, 2009 | | 1.25%
Quarterly | | Specified amount
upon credit
event noticeC | | | 5,450 | | | (22) |
| | | | | |
Deutsche Bank AG (iBoxx Hi-Vol)1 | | March 20, 2009 | | 1.25%
Quarterly | | Specified amount
upon credit
event noticeC | | | 5,070 | | | (21) |
| | | | | |
Credit Suisse First Boston USA (iBoxx IG Hi-Vol)1 | | March 20, 2009 | | Specified amount
upon credit
event noticeB | | 1.25%
Quarterly | | | 50,000 | | | 208 |
| | | | | |
Deutsche Bank AG (iBoxx IG Hi-Vol)1 | | March 20, 2009 | | 1.25%
Quarterly | | Specified amount
upon credit
event noticeC | | | 4,890 | | | (20) |
109
Annual Report to Shareholders
NOTES TO FINANCIAL STATEMENTS—Continued
| | | | | | | | | | | | |
Agreement With:
| | Termination Date
| | The Fund
Agrees to Pay
| | The Fund
Will Receive
| | Contract Notional Amount
| | Unrealized Appreciation/ (Depreciation)
|
Deutsche Bank AG (iBoxx IG Hi-Vol 2)1 | | March 20, 2009 | | Specified amount
upon credit
event noticeB | | 5.00%
Quarterly | | $ | 10,000 | | $ | (9) |
| | | | | |
Deutsche Bank AG
(iBoxx 100 HY)1 | | March 20, 2009 | | Specified amount
upon credit
event noticeB | | 4.25%
Quarterly | | | 10,000 | | | (56) |
| | | | | |
Deutsche Bank AG (iBoxx 100 IG)1 | | March 20, 2009 | | 4.25%
Quarterly | | Specified amount
upon credit
event noticeC | | | 3,710 | | | 21 |
| | | | | |
Deutsche Bank AG (iBoxx 30 Hi-Vol)1 | | March 20, 2009 | | 1.25%
Quarterly | | Specified amount
upon credit
event noticeC | | | 9,500 | | | (39) |
| | | | | |
Deutsche Bank AG
(iBoxx HY B)1 | | March 20, 2009 | | Specified amount
upon credit
event noticeB | | 5.00%
Quarterly | | | 5,000 | | | (5) |
| | | | | |
Deutsche Bank AG (iBoxx 30 IG Hi-Vol)1 | | March 20, 2009 | | 1.25%
Quarterly | | Specified amount
upon credit
event noticeC | | | 14,880 | | | (62) |
| | | | | |
Deutsche Bank AG
(iBoxx 100 HY)1 | | March 20, 2009 | | 4.25%
Quarterly | | Specified amount
upon credit
event noticeC | | | 1,900 | | | 11 |
| | | | | |
Deutsche Bank AG
(iBoxx IG TMT)1 | | March 20, 2009 | | 0.60%
Quarterly | | Specified amount
upon credit
event noticeC | | | 6,450 | | | 84 |
| | | | | |
Deutsche Bank AG (iBoxx IG TMT)1 | | March 20, 2009 | | 1.25%
Quarterly | | Specified amount
upon credit
event noticeC | | | 13,860 | | | (58) |
| | | | | |
Deutsche Bank AG
(iBoxx IG TMT)1 | | March 20, 2009 | | 0.60%
Quarterly | | Specified amount
upon credit
event noticeC | | | 9,500 | | | 124 |
| | | | | |
Lehman Brothers Holdings Inc. (iBoxx IG TMT)1 | | March 20, 2009 | | 0.60%
Quarterly | | Specified amount
upon credit
event noticeC | | | 9,000 | | | 118 |
| | | | | |
Deutsche Bank AG (iBoxx IG Hi-Vol 2)1 | | September 20, 2009 | | 1.15%
Quarterly | | Specified amount
upon credit
event noticeC | | | 25,000 | | | (46) |
| | | | | |
Deutsche Bank AG
(iBoxx IG Hi-Vol 2)1 | | September 20, 2009 | | Specified amount
upon credit
event noticeB | | 1.15%
Quarterly | | | 25,000 | | | 47 |
| | | | | |
Deutsche Bank AG (iBoxx IG Hi-Vol 2)1 | | September 20, 2009 | | Specified amount
upon credit
event noticeB | | 1.15%
Quarterly | | | 25,000 | | | 46 |
110
| | | | | | | | | | | | |
Agreement With:
| | Termination Date
| | The Fund
Agrees to Pay
| | The Fund
Will Receive
| | Contract Notional Amount
| | Unrealized Appreciation/ (Depreciation)
|
Credit Suisse First Boston USA (iBoxx IG HY 2B)1 | | November 1, 2012 | | Specified amount
upon credit
event noticeB | | 4.30%
Quarterly | | $ | 10,000 | | $ | (10) |
| | | | | |
The Goldman Sachs Group, Inc.2 | | December 8, 2013 | | 4.78714%
Semi-annually | | 3-month
LIBORD | | | 43,700 | | | (2,171) |
| | | | | |
Lehman Brothers Holdings Inc.2 | | December 8, 2013 | | 4.7935%
Semi-annually | | 3-month
LIBORD | | | 50,800 | | | (2,523) |
| | | | | |
Deutsche Bank AG
(iBoxx IG Hi-Vol)1 | | March 20, 2014 | | 1.35%
Quarterly | | Specified amount
upon credit
event noticeC | | | 12,500 | | | (2) |
| | | | | |
Deutsche Bank AG
(iBoxx 30 IG Hi-Vol)1 | | March 20, 2014 | | 1.35%
Quarterly | | Specified amount
upon credit
event noticeC | | | 8,530 | | | (2) |
| | | | | |
Deutsche Bank AG (iBoxx IG 2)1 | | September 20, 2014 | | 0.80%
Quarterly | | Specified amount
upon credit
event noticeC | | | 24,500 | | | (41) |
| | | | | |
Deutsche Bank AG2 | | November 18, 2033 | | 5.38413%
Semi-annually | | 3-month
LIBORD | | | 29,000 | | | (1,324) |
| | | | | |
J.P. Morgan Chase & Co.2 | | November 26, 2033 | | 5.34252%
Semi-annually | | 3-month
LIBORD | | | 34,200 | | | (1,337) |
| | | | | |
Deutsche Bank AG2 | | December 8, 2033 | | 5.4765%
Semi-annually | | 3-month
LIBORD | | | 30,600 | | | (1,840) |
| | | | | |
J.P. Morgan Chase & Co.2 | | January 15, 2034 | | 5.29678%
Semi-annually | | 3-month
LIBORD | | | 20,400 | | | (652) |
| | | | | | | | | | | |
|
|
| | | | | | | | | | | | $ | (9,964) |
| | | | | | | | | | | |
|
|
Inflation Indexed: | | | | | | | | | | | | |
Agreement With:
| | Termination Date
| | The Fund
Agrees to Pay
| | The Fund
Will Receive
| | Contract Notional Amount
| | Unrealized Appreciation/ (Depreciation)
|
Merrill Lynch & Co., Inc.
(Verizon Global
Funding Corp.,
0%, due 5/15/21)1 | | June 15, 2004 | | Specified amount
upon credit
event noticeB | | 0.75%
Quarterly | | $ | 2,500 | | $
| 3
|
| A | Upon bankruptcy or failure to make a scheduled interest payment, the Fund will pay $1,000; upon default, the Fund will pay $10,000. |
| B | Upon bankruptcy or failure to make a scheduled interest payment, the Fund will pay $1,000. |
| C | Upon bankruptcy or failure to make a scheduled interest payment, the Fund will receive $1,000. |
| D | London Interbank Offered Rate. |
111
Annual Report to Shareholders
NOTES TO FINANCIAL STATEMENTS—Continued
4. Securities Loaned:
Each Fund may lend its securities to approved brokers to earn additional income and will receive cash and U.S. government securities as collateral against the loans. Cash collateral received is invested in a money market pooled account by each Fund’s lending agent. Collateral is maintained over the life of the loan in an amount not less than 100% of the value of the loaned securities.
At March 31, 2004, the market value of securities on loan to broker-dealers was $146,623 for Intermediate, $581,767 for Core, $729,765 for Core Plus, and $85,650 for Inflation Indexed. Cash collateral received was $149,628 for Intermediate, $593,633 for Core, $744,654 for Core Plus, and $87,384 for Inflation Indexed.
5. Transactions With Affiliates:
Each Fund has a management agreement with Legg Mason Fund Adviser, Inc. (“LMFA”). Western Asset Management Company (“Western Asset”) is the investment adviser to Limited Duration, Intermediate, Core, Core Plus, Inflation Indexed, and High Yield. Western Asset Management Company Limited (“WAML”) is the investment adviser to Non-U.S. and shares advisory responsibilities with Western Asset for Core Plus and Inflation Indexed. Pursuant to their respective agreements, LMFA provides the Funds with management and administrative services for which each Fund pays a fee, computed daily and payable monthly, at annual rates of each Fund’s average daily net assets. LMFA, Western Asset and WAML have voluntarily agreed to waive their fees and reimburse the Funds to the extent each Fund’s expenses (exclusive of taxes, interest, brokerage and extraordinary expenses) exceed during any month certain annual rates of each Fund’s average daily net assets. Western Asset and WAML have also agreed to waive their advisory fees (which are paid by LMFA, and not the Funds) in corresponding amounts. The following chart shows annual rates of management fees, expense limits, management fees waived, and management fees payable for each Fund:
| | | | | | | | | | | | | | |
Fund
| | Asset
Breakpoint
| | Management Fee
| | | Expense Limitation
| | | Management Fees Waived
| | Management Fees Payable
|
Limited Duration | | All asset levels | | 0.350 | % | | 0.40 | % | | $ | 36 | | $ | — |
| | | | | |
Intermediate | | All asset levels | | 0.400 | % | | 0.45 | % | | | 133 | | | 190 |
| | | | | |
Core | | | | | | | | | | | | | | |
Institutional Class | | Up to $500 million | | 0.450 | % | | 0.50 | % | | | — | | | 764 |
| | | Next $500 million | | 0.425 | % | | | | | | | | | |
| | | In excess of $1 billion | | 0.400 | % | | | | | | | | | |
| | | | | |
Financial Intermediary Class | | Up to $500 million | | 0.450 | % | | 0.75 | % | | | 7 | | | 42 |
| | | Next $500 million | | 0.425 | % | | | | | | | | | |
| | | In excess of $1 billion | | 0.400 | % | | | | | | | | | |
| | | | | |
Core Plus | | | | | | | | | | | | | | |
Institutional Class | | Up to $500 million | | 0.450 | % | | 0.45 | % | | | 853 | | | 988 |
| | | Next $500 million | | 0.425 | % | | | | | | | | | |
| | | In excess of $1 billion | | 0.400 | % | | | | | | | | | |
| | | | | |
Financial Intermediary Class | | Up to $500 million | | 0.450 | % | | 0.70 | % | | | 1 | | | 2 |
| | | Next $500 million | | 0.425 | % | | | | | | | | | |
| | | In excess of $1 billion | | 0.400 | % | | | | | | | | | |
| | | | | |
Inflation Indexed | | All asset levels | | 0.200 | % | | 0.25 | % | | | 74 | | | 46 |
| | | | | |
High Yield | | All asset levels | | 0.550 | % | | 0.65 | % | | | 156 | | | 78 |
| | | | | |
Non-U.S. | | All asset levels | | 0.450 | % | | 0.55 | % | | | 157 | | | 7 |
Legg Mason Wood Walker, Incorporated (“LMWW”), a member of the New York Stock Exchange, serves as distributor of the Funds’ shares. LMWW receives from each Fund an annual distribution fee of 0.25% of the average daily net assets of the Financial Intermediary Class of each Fund, computed daily and payable monthly. At March 31, 2004, $25 was due to LMWW from Core and $1 from Core Plus.
LMFA, Western Asset, WAML and LMWW are wholly owned subsidiaries of Legg Mason, Inc.
112
6. Fund Share Transactions:
At March 31, 2004, there were 13.1 billion shares of common stock of the Corporation authorized at $.001 par value. Transactions in Fund shares were as follows:
| | | | | | | | | | | | | | | | | | | | | | | | |
| | | Sold
| | Reinvested
| | Repurchased
| | | Net Change
| |
| | | Shares
| | Amount
| | Shares
| | Amount
| | Shares
| | | Amount
| | | Shares
| | | Amount
| |
Limited Duration | | | | | | | | | | | | | | | | | | | | | | | | |
—Institutional Class | | | | | | | | | | | | | | | | | | | | | | | | |
Year Ended Mar. 31, 2004* | | 3,108 | | $ | 31,078 | | 17 | | $ | 171 | | (530 | ) | | $ | (5,311 | ) | | 2,595 | | | $ | 25,938 | |
| | | | | | | | |
Intermediate | | | | | | | | | | | | | | | | | | | | | | | | |
—Institutional Class | | | | | | | | | | | | | | | | | | | | | | | | |
Year Ended Mar. 31, 2004 | | 15,529 | | $ | 168,930 | | 3,173 | | $ | 34,520 | | (14,808 | ) | | $ | (161,750 | ) | | 3,894 | | | $ | 41,700 | |
Year Ended Mar. 31, 2003 | | 16,609 | | | 178,235 | | 3,004 | | | 32,131 | | (30,621 | ) | | | (329,593 | ) | | (11,008 | ) | | | (119,227 | ) |
| | | | | | | | |
Core | | | | | | | | | | | | | | | | | | | | | | | | |
—Institutional Class | | | | | | | | | | | | | | | | | | | | | | | | |
Year Ended Mar. 31, 2004 | | 102,574 | | $ | 1,186,661 | | 7,133 | | $ | 82,880 | | (45,456 | ) | | $ | (525,969 | ) | | 64,251 | | | $ | 743,572 | |
Year Ended Mar. 31, 2003 | | 63,347 | | | 715,929 | | 5,789 | | | 64,840 | | (36,378 | ) | | | (410,159 | ) | | 32,758 | | | | 370,610 | |
| | | | | | | | |
—Financial Intermediary Class | | | | | | | | | | | | | | | | | | | | | | | | |
Year Ended Mar. 31, 2004 | | 6,137 | | $ | 71,299 | | 410 | | $ | 4,766 | | (3,084 | ) | | $ | (35,705 | ) | | 3,463 | | | $ | 40,360 | |
Year Ended Mar. 31, 2003 | | 7,268 | | | 82,500 | | 79 | | | 903 | | (682 | ) | | | (7,762 | ) | | 6,665 | | | | 75,641 | |
| | | | | | | | |
Core Plus | | | | | | | | | | | | | | | | | | | | | | | | |
—Institutional Class | | | | | | | | | | | | | | | | | | | | | | | | |
Year Ended Mar. 31, 2004 | | 149,832 | | $ | 1,577,617 | | 11,320 | | $ | 118,968 | | (33,656 | ) | | $ | (353,019 | ) | | 127,496 | | | $ | 1,343,566 | |
Year Ended Mar. 31, 2003 | | 95,998 | | | 972,861 | | 6,485 | | | 65,336 | | (23,407 | ) | | | (235,652 | ) | | 79,076 | | | | 802,545 | |
| | | | | | | | |
—Financial Intermediary Class | | | | | | | | | | | | | | | | | | | | | | | | |
Year Ended Mar. 31, 2004 | | 669 | | $ | 7,091 | | 14 | | $ | 153 | | (62 | ) | | $ | (659 | ) | | 621 | | | $ | 6,585 | |
Year Ended Mar. 31, 2003 | | 11 | | | 110 | | 2 | | | 17 | | (1 | ) | | | (9 | ) | | 12 | | | | 118 | |
| | | | | | | | |
Inflation Indexed | | | | | | | | | | | | | | | | | | | | | | | | |
—Institutional Class | | | | | | | | | | | | | | | | | | | | | | | | |
Year Ended Mar. 31, 2004 | | 8,298 | | $ | 91,034 | | 2,059 | | $ | 22,404 | | (6,028 | ) | | $ | (65,112 | ) | | 4,329 | | | $ | 48,326 | |
Year Ended Mar. 31, 2003 | | 5,334 | | | 57,156 | | 1,405 | | | 14,773 | | (1,490 | ) | | | (15,351 | ) | | 5,249 | | | | 56,578 | |
| | | | | | | | |
High Yield | | | | | | | | | | | | | | | | | | | | | | | | |
—Institutional Class | | | | | | | | | | | | | | | | | | | | | | | | |
Year Ended Mar. 31, 2004 | | 17,347 | | $ | 178,219 | | 1,518 | | $ | 15,029 | | (16,128 | ) | | $ | (165,382 | ) | | 2,737 | | | $ | 27,866 | |
Year Ended Mar. 31, 2003 | | 1,438 | | | 12,957 | | 1,564 | | | 14,132 | | (2,054 | ) | | | (18,650 | ) | | 948 | | | | 8,439 | |
| | | | | | | | |
Non-U.S. | | | | | | | | | | | | | | | | | | | | | | | | |
—Institutional Class | | | | | | | | | | | | | | | | | | | | | | | | |
Year Ended Mar. 31, 2004 | | 3,740 | | $ | 39,475 | | 704 | | $ | 7,271 | | (630 | ) | | $ | (6,848 | ) | | 3,814 | | | $ | 39,898 | |
Year Ended Mar. 31, 2003 | | 3,383 | | | 34,089 | | 64 | | | 636 | | (3,171 | ) | | | (31,900 | ) | | 276 | | | | 2,825 | |
| | | | | | | | | | | | | | | | | | | | | | | | | |
| |
| * | For the period from October 1, 2003 (commencement of operations) to March 31, 2004. |
113
REPORT OF INDEPENDENT REGISTERED PUBLIC ACCOUNTING FIRM
To the Board of Directors of Western Asset Funds, Inc. and Shareholders of Western Asset Limited Duration Bond Portfolio, Western Asset Intermediate Bond Portfolio, Western Asset Core Bond Portfolio, Western Asset Core Plus Bond Portfolio, Western Asset Inflation Indexed Plus Bond Portfolio, Western Asset High Yield Portfolio, and Western Asset Non-U.S. Opportunity Bond Portfolio:
In our opinion, the accompanying statements of net assets and the related statements of operations and of changes in net assets and the financial highlights present fairly, in all material respects, the financial position of Western Asset Limited Duration Bond Portfolio, Western Asset Intermediate Bond Portfolio, Western Asset Core Bond Portfolio, Western Asset Core Plus Bond Portfolio, Western Asset Inflation Indexed Plus Bond Portfolio, Western Asset High Yield Portfolio and Western Asset Non-U.S. Opportunity Bond Portfolio (comprising Western Asset Funds, Inc., hereafter referred to as the “Funds”) at March 31, 2004, the results of each of their operations, the changes in each of their net assets and the financial highlights for each of the fiscal periods presented, in conformity with accounting principles generally accepted in the United States of America. These financial statements and financial highlights (hereafter referred to as “financial statements”) are the responsibility of the Funds’ management; our responsibility is to express an opinion on these financial statements based on our audits. We conducted our audits of these financial statements in accordance with the standards of the Public Company Accounting Oversight Board (United States), which require that we plan and perform the audit to obtain reasonable assurance about whether the financial statements are free of material misstatement. An audit includes examining, on a test basis, evidence supporting the amounts and disclosures in the financial statements, assessing the accounting principles used and significant estimates made by management, and evaluating the overall financial statement presentation. We believe that our audits, which included confirmation of securities at March 31, 2004, by correspondence with the custodian and brokers, provide a reasonable basis for our opinion.
PricewaterhouseCoopers LLP
Baltimore, Maryland
May 21, 2004
114
Annual Report to Shareholders
DIRECTORS AND OFFICERS
The table below provides information about each of the Corporation’s directors and officers, including biographical information about their business experience and information about their relationships with Western Asset Management Company and its affiliates. The mailing address of each director and officer is 385 East Colorado Boulevard, Pasadena, California 91101.
| | | | | | | | | | |
| Name and Age | | Position(s)
Held With
Company | | Term of Office
and Length of
Time ServedA | | Number of
Portfolios Overseen
in the Fund
ComplexB | | Other Directorships Held | | Principal Occupation(s) During the Past Five Years |
|
| Independent Directors: |
|
William G. McGagh Age 74 | | Chairman and Director | | Since 1990 | | 14 | | None | | Consultant, McGagh Associates (corporate financial consulting), since 1989; Chairman of the Board of the John Tracy Clinic; Chairman of the Board of the Los Angeles Orthopedic Hospital. Formerly: Senior Vice President, Chief Financial Officer and Director of Northrup Grumman Corp. (defense, aerospace and cyberspace products). |
|
Ronald J. Arnault Age 60 | | Director | | Since 1997 | | 14 | | None | | Retired (1996) Executive Vice President, Chief Financial Officer and Director of Atlantic Richfield Company. |
|
John E. Bryson Age 60 | | Director | | Since 1998 | | 14 | | The Boeing Company and the Walt Disney Company. | | Chairman and CEO, Edison International (electric power generator, distributor and structured finance provider), since 1990; Chairman of Southern California Edison Company (1990-1999 and 2003-present); Chief Executive Officer of Southern California Edison Company (1990-1999). |
|
Anita L. DeFrantz Age 51 | | Director | | Since 1998 | | 14 | | OBN Holdings Inc. | | President, since 1987, and Director, since 1990, Amateur Athletic Foundation of Los Angeles; President and Director, Kids in Sports, since 1994; Vice President and Director, International Rowing Federation, since 1997. Member, International Olympic Committee (“IOC”), since 1986; Member, IOC Executive Board, 1992-2001; Member, U.S. Olympic Committee (“USOC”), since 1976; Member, USOC Executive Board, since 1977. |
|
William E.B. Siart Age 57 | | Director | | Since 1997 | | 14 | | Sybron Dental Specialties, Inc. | | Chairman, Walt Disney Concert Hall, Inc., since 1998; Chairman, since 2000, President and Chief Executive Officer (1998-2000), Excellent Education Development. Formerly: Chairman and Chief Executive Officer, First Interstate Bancorp. |
|
Louis A. Simpson Age 67 | | Director | | Since 1994 | | 14 | | ResMed Inc. | | President and CEO, Capital Operations of GEICO Corporation, since 1993. Formerly: President and Chief Executive Officer, Western Asset Management Company (1977-1979). |
|
115
| | | | | | | | | | |
| Name and Age | | Position(s)
Held With
Company | | Term of Office
and Length of
Time ServedA | | Number of
Portfolios Overseen
in the Fund
ComplexB | | Other Directorships Held | | Principal Occupation(s) During the Past Five Years |
|
| Interested Directors: |
|
Edward A. Taber III Age 59 100 Light Street Baltimore, MD 21203 | | Director | | Since 1998 | | 12 | | None | | Senior Executive Vice President, Legg Mason, Inc.; Senior Executive Vice President of LMWW; Director of the manager, Legg Mason Capital Management, Inc., Western Asset, WAML, and Batterymarch Financial Management, Inc. Formerly: Director and Head of Taxable Fixed Income Division, T. Rowe Price Associates (1973-1992). |
|
| Executive Officers:D |
|
James W. Hirschmann III Age 43 | | President | | Since 1990 | | N/A | | N/A | | Director, President, and CEO, Western Asset, March 1999 to present; Director, WAML, 1999 to present; Member, Board of Directors of Medical Simulation Corporation; Member, Board of Trustees of Widener College; President, Pacific American Income Shares, Inc. and Western Asset Premier Bond Fund. Formerly: Director of Marketing, Western Asset, April 1989 to 1998; Vice President of the Corporation (1990 to 1999); Vice President and Director of Marketing, Financial Trust Corporation (bank holding company), 1988 to 1989; Vice President of Marketing, Atalanta/ Sosnoff Capital (investment management company), 1986 to 1988. |
|
Scott F. Grannis Age 54 | | Vice President | | Since 1990 | | N/A | | N/A | | Chief Economist, Western Asset, 1989 to present; Vice President, Pacific American Income Shares, Inc. Formerly: Vice President, Leland O’Brien Rubinstein (investment advisory firm), 1986 to 1989; Senior Economist, Claremont Economics Institute, 1980 to 1986. |
|
Ilene S. Harker Age 49 | | Vice President | | Since 1990 | | N/A | | N/A | | Head of Enterprise Risk, Western Asset, 2003 to present; Vice President, Pacific American Income Shares, Inc., 1996 to present, and Western Asset Premier Bond Fund, 2001 to present. Formerly: Secretary of the Corporation and Secretary of Pacific American Income Shares, Inc., 1993 to 1996; Director of Compliance and Controls, Western Asset, 1978 to 2003. |
|
Gavin L. James Age 41 | | Vice President | | Since 2001 | | N/A | | N/A | | Director, Global Client Service and Marketing, Western Asset, 1998 to present. Formerly: Senior Portfolio Manager, J.P. Morgan Investment Management, 1990 to 1998. |
|
116
| | | | | | | | | | |
| Name and Age | | Position(s)
Held With
Company | | Term of Office
and Length of
Time ServedA | | Number of
Portfolios Overseen
in the Fund
ComplexB | | Other Directorships Held | | Principal Occupation(s) During the Past Five Years |
|
S. Kenneth Leech Age 49 | | Vice President | | Since 1990 | | N/A | | N/A | | Chief Investment Officer, Western Asset, 1998 to present; Vice President, Pacific American Income Shares, Inc. and Western Asset Premier Bond Fund. Formerly: Director of Portfolio Management, Western Asset, 1990 to 1998; Senior Trader, Greenwich Capital, 1988 to 1990; Fixed Income Manager of The First Boston Corporation (holding company; stock and bond dealers), 1980 to 1987; Portfolio Manager of National Bank of Detroit, 1977 to 1980. |
|
Detlev S. Schlichter Age 38 155 Bishopsgate London, England EC2N3TY | | Vice President | | Since 2001 | | N/A | | N/A | | Portfolio Manager, WAML, 2001 to present. Formerly: Director of European Bond Team, Merrill Lynch Investment Managers (1998 to 2001); Vice President, J.P. Morgan & Co. (1990 to 1998). |
|
Stephen A. Walsh Age 45 | | Vice President | | Since 1994 | | N/A | | N/A | | Deputy Chief Investment Officer, Western Asset, 2000 to present. Formerly: Director of Portfolio Management, Western Asset, 1998 to 2000; Senior Portfolio Manager, Western Asset, 1991 to 2000; Portfolio Manager and Trader, Security Pacific Investment Managers, Inc. (investment management company), 1989 to 1991; Portfolio Manager of Atlantic Richfield Company, 1981 to 1988. |
|
Susanne D. Wilson Age 41 100 Light Street Baltimore, MD 21203 | | Vice President | | Since 1998 | | N/A | | N/A | | Vice President, LMWW, 1998 to present. Formerly: Manager of Legg Mason mutual fund operations, 1989 to 1998; Retirement Specialist, T. Rowe Price Associates, 1983 to 1989. |
|
Marie K. Karpinski Age 55 100 Light Street Baltimore, MD 21203 | | Vice President and Treasurer | | Since 1990 | | N/A | | N/A | | Vice President, LMWW, 1992 to present; Vice President and Treasurer of all Legg Mason retail funds (open-end investment companies), 1986 to present; Vice President and Treasurer of Legg Mason Charles Street Trust, Inc. (open-end investment company); Treasurer and Principal Financial and Accounting Officer of Pacific American Income Shares, Inc. and Western Asset Premier Bond Fund, 2001 to present, Western Asset/Claymore U.S. Treasury Inflation Protected Securities Fund, 2003 to present, and Western Asset/Claymore U.S. Treasury Inflation Protected Securities Fund 2, 2004 to present. Formerly: Assistant Treasurer of Pacific American Income Shares, Inc., 1988 to 2001; Assistant Vice President, LMWW, 1989 to 1992. |
|
117
| | | | | | | | | | |
| Name and Age | | Position(s)
Held With
Company | | Term of Office
and Length of
Time ServedA | | Number of
Portfolios Overseen
in the Fund
ComplexB | | Other Directorships Held | | Principal Occupation(s) During the Past Five Years |
|
Lisa G. Mrozek Age 41 | | Secretary | | Since 1999 | | N/A | | N/A | | Senior Compliance Officer, Western Asset; Secretary of Pacific American Income Shares, Inc. and Western Asset Premier Bond Fund; President of the Board of Directors of Dollars for Scholars; Member of the Board of Trustees of Scholarship America. Formerly: Assistant Vice President, Fund Business Management, Capital Research and Management Company (an investment management firm), 1990 to 1999. |
|
Morris, Erin K. Age 37 100 Light Street Baltimore, MD 21203 | | Assistant Treasurer | | Since 2001 | | N/A | | N/A | | Assistant Vice President of LMWW, 2002 to present; Assistant Treasurer (2001 to present) of: Legg Mason Income Trust, Inc., Legg Mason Cash Reserve Trust, Legg Mason Tax Exempt Trust, Inc., Legg Mason Tax-Free Income Fund, Pacific American Income Shares, Inc., Western Asset Premier Bond Fund, Western Asset/Claymore U.S. Treasury Inflation Protected Securities Fund (2003 to present) and Western Asset/Claymore U.S. Treasury Inflation Protected Securities Fund 2 (2004 to present); Manager, Funds Accounting, Legg Mason Wood Walker, Inc., 2000 to present. Formerly: Assistant Manager, Funds Accounting, LMWW, 1993 to 2000. |
|
ADDITIONAL INFORMATION ABOUT THE CORPORATION’S DIRECTORS
AND OFFICERS IS CONTAINED IN THE STATEMENT OF ADDITIONAL
INFORMATION, AVAILABLE WITHOUT CHARGE UPON REQUEST BY CALLING
1-888-425-6432, OR ON THE SECURITIES AND EXCHANGE
COMMISSION WEBSITE (http://www.sec.gov).
| A | Each of the Directors of the Corporation shall hold office until his successor shall have been duly elected and shall qualify, until he shall resign or shall have been removed or until required by applicable law. Each officer shall hold office until his successor shall have been duly chosen and shall qualify or until his resignation or removal. |
| B | Each Director, other than Mr. Taber, also serves as a Trustee for Western Asset Premier Bond Fund (closed-end investment company) and a Director of Pacific American Income Shares, Inc. (closed-end investment company), which are considered part of the same Fund Complex as the Corporation. |
| C | Mr. Taber is considered to be an interested person, as defined above, of the Corporation on the basis of his employment with affiliated entities of the Corporation’s investment adviser (including the Corporation’s principal underwriter). |
| D | Officers of the Funds are interested persons (as defined in the Act). |
118
Western Asset Funds, Inc.
Investment Manager
Legg Mason Fund Adviser, Inc.
P.O. Box 17635
Baltimore, Maryland 21297-1635
Investment Advisers
Western Asset Management Company
385 East Colorado Boulevard
Pasadena, California 91101
Western Asset Management Company Limited
155 Bishopgate
London, England EC2M3XG
Transfer and Shareholder Servicing Agent
Boston Financial Data Services
66 Brooks Drive
Braintree, Massachusetts 02184
Custodian
State Street Bank & Trust Company
P.O Box 1031
Boston, Massachusetts 02103
Counsel
Ropes & Gray LLP
45 Rockefeller Plaza
New York, New York 10111
Independent Accountants
PricewaterhouseCoopers LLP
250 West Pratt Street
Baltimore, Maryland 21201
Information about the policies and procedures that the Funds use to determine how to vote proxies relating to each Fund’s portfolio securities is available in the Statement of Additional Information, available without charge upon request by calling 1-888-425-6423 or on the Securities Exchange Commission’s website (http://www.sec.gov).
Monthly portfolio holdings are available upon request
by calling 1-888-425-6432.
This report is not to be distributed unless preceded or accompanied by a prospectus.
Legg Mason Wood Walker, Inc., Distributor
Item 2 – Code of Ethics
| | (a) | Western Asset Funds, Inc. (“Registrant”) has adopted a Code of Ethics, as defined in the instructions to Form N-CSR that applies to the Registrant’s Principal Executive, Financial and Accounting Officers a copy of which is attached as an exhibit to this Form N-CSR. |
Item 3 – Audit Committee Financial Expert
The Audit Committee of the Registrant’s Board of Directors is comprised solely of Directors who are “independent” (as such term has been defined by the Securities and Exchange Commission (“SEC”) in regulations implementing Section 407 of the Sarbanes-Oxley Act of 2002 (the “Regulations”)). In addition, the Board of Directors of the Registrant has determined that Mr. Ronald J. Arnault qualifies as an “audit committee financial expert” (as such term has been defined by the Regulations) based on its review of his pertinent experience, knowledge and education. The SEC has stated that the designation or identification of a person as an audit committee financial expert pursuant to this Item 3 of Form N-CSR does not impose on such person any duties, obligations or liability that are greater than the duties, obligations and liability imposed on such person as a member of the Audit Committee and the Board of Directors in absence of such designation or identification.
Item 4 – Principal Accountant Fees and Services
Fiscal Year Ended March 31, 2003 – $93,200
Fiscal Year Ended March 31, 2004 – $124,700
Fiscal Year Ended March 31, 2003 – $12,600
Fiscal Year Ended March 31, 2004 – $15,000
Services include interim audit security pricing.
PricewaterhouseCoopers LLP did not bill fees for non-audit services that required pre-approval by the Audit Committee pursuant to paragraph (c)(7)(ii) of Rule 2-01 of Regulation S-X during the Registrant’s last two fiscal years.
Fiscal Year Ended March 31, 2003 – $4,800
Fiscal Year Ended March 31, 2004 – $6,090
Services include preparation of federal and state income tax returns and preparation of excise tax returns.
PricewaterhouseCoopers LLP did not bill fees for tax services that required pre-approval by the Audit Committee pursuant to paragraph (c)(7)(ii) of Rule 2-01 of Regulation S-X during the Registrant’s last two fiscal years.
There were no fees billed to the Registrant during each of the last two fiscal years by PricewaterhouseCoopers LLP that were not disclosed in Items 4(a), (b) or (c) above.
PricewaterhouseCoopers LLP did not bill fees for services not included in Items 4(a), (b) or (c) above that required pre-approval by the Audit Committee pursuant to paragraph (c)(7)(ii) of Rule 2-01 of Regulation S-X during the Registrant’s last two fiscal years.
| | (e) | (1) The Audit Committee has determined that all work performed for the Registrant by PricewaterhouseCoopers LLP will be pre-approved by the full Audit Committee and, therefore, has not adopted pre-approval procedures. |
PricewaterhouseCoopers LLP did not bill fees for services where pre-approval by the Audit Committee pursuant to paragraph (c)(7)(ii) of Rule 2-01 of Regulation S-X was waived pursuant to paragraph (c)(7)(i)(C) of Rule 2-01 of Regulation S-X during the Registrant’s last two fiscal years.
Fiscal Year Ended March 31, 2003 – $477,017
Fiscal Year Ended March 31, 2004 – $474,477
PricewaterhouseCoopers LLP did not bill fees for non-audit services that required pre-approval by the Audit Committee pursuant to paragraph (c)(7)(ii) of Rule 2-01 of Regulation S-X during the Registrant’s last two fiscal years.
| | (h) | The Audit Committee of the Registrant has considered whether the non-audit services that were rendered by the Registrant’s principal accountant to the Registrant’s investment adviser (not including any subadviser whose role is primarily portfolio management and is subcontracted with or overseen by another investment adviser) and any entity controlling, controlled by, or under common control with the investment adviser and that were not pre-approved by the Audit Committee are compatible with maintaining the principal accountant’s independence. |
Item 5 – Audit Committee of Listed Registrants
Not applicable.
Item 6 – Schedule of Investments
Not applicable.
Item 7 – Disclosure of Proxy Voting Policies and Procedures
Not applicable.
Item 8 – Purchases of Equity Securities by Closed-End Management Investment Companies and Affiliated Purchasers
Not applicable.
Item 9 – Submission of Matters to a Vote of Security Holders
The Governance and Nominating Committee will accept recommendations for nominees to the Registrant’s Board of Directors from shareholders. Shareholders may forward recommendations the Registrant’s Secretary at 385 East Colorado Boulevard, Pasadena, California 91101, Attn: Secretary. The Governance and Nominating Committee has approved the following procedures for shareholders to submit nominees to the Registrants Board of Directors:
Procedures for Shareholders to Submit Nominee Candidates
(As of February 10, 2004)
| | | A Fund shareholder must follow the following procedures in order to properly submit a nominee recommendation for the Committee’s consideration. |
| | 1. | The shareholder must submit any such recommendation (a “Shareholder Recommendation”) in writing to the Fund, to the attention of the Secretary, at the address of the principal executive offices of the Fund. |
| | 2. | The Shareholder Recommendation must be delivered to or mailed and received at the principal executive offices of the Fund not less than one hundred and twenty (120) calendar days nor more than one hundred and thirty-five (135) calendar days prior to the date of the Board or shareholder meeting at which the nominee would be elected. |
| | 3. | The Shareholder Recommendation must include: (i) a statement in writing setting forth (A) the name, age, date of birth, business address, residence address and nationality of the person recommended by the shareholder (the “candidate”); (B) the class or series and number of all shares of the Fund owned of record or beneficially by the candidate, as reported to such shareholder by the candidate; (C) any other information regarding the candidate called for with respect to director/trustee nominees by paragraphs (a), (d), (e) and (f) of Item 401 of Regulation S-K or paragraph (b) of Item 22 of Rule 14a-101 (Schedule 14A) under the Securities Exchange Act of 1934, as amended (the “Exchange Act”), adopted by the Securities and Exchange Commission (or the corresponding provisions of any regulation or rule subsequently adopted by the Securities and Exchange Commission or any successor agency applicable to the Fund); (D) any other information regarding the candidate that would be required to be disclosed if the candidate were a nominee in a proxy statement or other filing required to be made in connection with solicitation of proxies for election of trustees or directors pursuant to Section 14 of the Exchange Act and the rules and regulations promulgated thereunder; and (E) whether the recommending shareholder believes that the candidate is or |
| | | will be an “interested person” of the Fund (as defined in the Investment Company Act of 1940, as amended) and, if not an “interested person,” information regarding the candidate that will be sufficient for the Fund to make such determination; (ii) the written and signed consent of the candidate to be named as a nominee and to serve as a director/trustee if elected; (iii) the recommending shareholder’s name as it appears on the Fund’s books; (iv) the class or series and number of all shares of the Fund owned beneficially and of record by the recommending shareholder; and (v) a description of all arrangements or understandings between the recommending shareholder and the candidate and any other person or persons (including their names) pursuant to which the recommendation is being made by the recommending shareholder. In addition, the Committee may require the candidate to furnish such other information as it may reasonably require or deem necessary to determine the eligibility of such candidate to serve on the Board. |
Item 10 – Controls and Procedures
| | (a) | The registrant’s principal executive and principal financial officers have concluded, based on their evaluation of the Registrant’s disclosure controls and procedures as of a date within 90 days of the filing date of this report, that the Registrant’s disclosure controls and procedures are reasonably designed to ensure that information required to be disclosed by the Registrant on Form N-CSR is recorded, processed, summarized and reported within the required time periods and that information required to be disclosed by the Registrant in the reports that it files or submits on Form N-CSR is accumulated and communicated to the Registrant’s management, including its principal executive and principal financial officers, as appropriate to allow timely decisions regarding required disclosure. |
| | (b) | There were no changes in the registrant’s internal control over financial reporting during the registrant’s last half-year that have materially affected, or are reasonably likely to materially affect, the internal control over financial reporting. |
Item 11 – Exhibits
(a) File the exhibits listed below as part of this Form.
(a)(1) The Registrant’s code of ethics is attached hereto.
(a)(2) Certifications pursuant to Rule 30a-2(a) under the Investment Company Act of 1940 is attached hereto.
(b) Certifications pursuant to Rule 30a-2(b) under the Investment Company Act of 1940 is attached hereto.
SIGNATURES
Pursuant to the requirements of the Securities Exchange Act of 1934 and the Investment Company Act of 1940, the registrant has duly caused this report to be signed on its behalf by the undersigned, thereunto duly authorized.
| | |
Western Asset Funds, Inc. |
| |
| By: | | /s/ James W. Hirschmann |
| | |
|
| | | James W. Hirschmann President Western Asset Funds, Inc. |
Date: 5/21/04
Pursuant to the requirements of the Securities Exchange Act of 1934 and the Investment Company Act of 1940, this report has been signed below by the following persons on behalf of the registrant and in the capacities and on the dates indicated.
| | |
| |
| By: | | /s/ James W. Hirschmann |
| | |
|
| | | James W. Hirschmann President Western Asset Funds, Inc. |
Date: 5/21/04
| | |
| |
| By: | | /s/ Marie K. Karpinski |
| | |
|
| | | Marie K. Karpinski Vice President, Treasurer and Principal Financial and Accounting Officer Western Asset Funds, Inc. |
Date: 5/21/04