UNITED STATES
SECURITIES AND EXCHANGE COMMISSION
Washington, D.C. 20549
FORM N-CSR
CERTIFIED SHAREHOLDER REPORT OF REGISTERED
MANAGEMENT INVESTMENT COMPANIES
| | |
| Investment Company Act file number: | | 811-06110 |
Western Asset Funds, Inc.
| | |
| 385 East Colorado Boulevard Pasadena, CA | | 91101 |
| Address of Principal Executive Offices: | | |
Richard M. Wachterman, Esq.
Legg Mason & Co., LLC
100 Light Street
Baltimore, MD 21202
|
| Name and address of agent for service: |
Registrant’s telephone number, including area code: (410) 539-0000
Date of fiscal year end: December 31, 2008
Date of reporting period: December 31, 2008
Item 1 – Report to Shareholders
Page 1 of 6
Western Asset Funds, Inc.
Western Asset Absolute Return Portfolio
Western Asset High Yield Portfolio
Western Asset Inflation Indexed Plus Bond Portfolio
Western Asset Intermediate Bond Portfolio
Western Asset Intermediate Plus Bond Portfolio
Western Asset Limited Duration Bond Portfolio
Western Asset Non-U.S. Opportunity Bond Portfolio
Annual Report to Shareholders
December 31, 2008
Annual Report to Shareholders
Management’s Discussion of Fund Performance
Western Asset Absolute Return Portfolio
Total returns for the Fund for various periods ended December 31, 2008 are presented below, along with those of comparative indices:
| | | | | | | | |
| | | Three
Months | | Nine
Months | | One
Year | | Since
InceptionA |
Western Asset Absolute Return Portfolio: | | | | | | | | |
Institutional Class | | -8.30% | | -14.20% | | -14.84% | | -3.01% |
Financial Intermediary Class | | -8.39% | | -14.31% | | -15.00% | | -4.44% |
Institutional Select Class | | -8.33% | | N/A | | N/A | | -11.69% |
Barclays Capital U.S. Aggregate IndexB | | +4.58% | | +3.01% | | +5.24% | | +6.96% |
Merrill Lynch Constant Maturity 3-Month LIBOR IndexC | | +1.35% | | +2.46% | | +3.82% | | +4.90% |
Lipper Flexible Income Funds Category AverageD | | -4.07% | | -15.32% | | -15.31% | | -5.55% |
The performance data quoted represent past performance and do not guarantee future results. Current performance may be lower or higher than the performance data quoted. To obtain the most recent month-end performance information, please visit www.westernassetfunds.com. The investment return and principal value of the Fund will fluctuate so that an investor’s shares, when redeemed, may be worth more or less than the original cost. Calculations assume reinvestment of dividends and capital gain distributions. Performance would have been lower if fees had not been waived in various periods. Performance figures for periods shorter than one year represent cumulative figures and are not annualized.
The expense ratio for both the Institutional and Institutional Select Classes was 0.80%. The gross expense ratio for the Financial Intermediary Class was 1.36% and does not reflect fee waivers or reimbursements. The net expense ratio for the Financial Intermediary Class was 1.05% and reflects contractual fee waivers and/or reimbursements. As a result of a contractual expense limitation, the ratio of expenses, other than taxes, interest, deferred organizational expenses, brokerage and extraordinary expenses, to average net assets will not exceed 1.05% for Financial Intermediary Class shares until July 31, 2009.
All expenses shown include management fees, 12b-1 distribution fees and other expenses as indicated in the Fund’s most current prospectus dated August 1, 2008.
For the period from April 1, 2008 through December 31, 2008, Institutional Class shares of Western Asset Absolute Return Portfolio returned -14.20%. The Fund’s unmanaged benchmarks, the Barclays Capital U.S. Aggregate Index and the Merrill Lynch Constant Maturity 3-Month LIBOR Index, returned 3.01% and 2.46%, respectively, over the same time frame. The Lipper Flexible Income Funds Category Average returned -15.32% for the same period.
A | | The inception date of the Institutional Class is July 6, 2006. The inception date of the Financial Intermediary Class is September 6, 2006. The inception date of the Institutional Select Class is August 4, 2008. Index returns are for periods beginning June 30, 2006. Although it is not possible to invest directly in an index, it is possible to purchase investment vehicles designed to track the performance of certain indices. |
B | | The Barclays Capital (formerly Lehman Brothers) U.S. Aggregate Index is a broad-based bond index comprised of government, corporate, mortgage- and asset-backed issues, rated investment grade or higher, and having at least one year to maturity. |
C | | The Merrill Lynch Constant Maturity 3-Month LIBOR Index is based on the assumed purchase of a synthetic instrument having 3 months to maturity and with a coupon equal to the closing quote for 3-month LIBOR. That issue is sold the following day (priced at a yield equal to the current day closing 3-month LIBOR rate) and is rolled into a new 3-month instrument. The Index therefore will always have a constant maturity equal to exactly 3 months. |
D | | Lipper, Inc., a wholly-owned subsidiary of Reuters, provides independent insight on global collective investments. The Lipper Flexible Income Funds Category Average is comprised of the Fund’s peer group of mutual funds. |
1
Annual Report to Shareholders
Management’s Discussion of Fund Performance—Continued
The impact of market conditions on the Fund’s performance was negative for the nine-month period ended December 31, 2008, with strategies also producing significantly negative results. A large allocation to the mortgage-backed sector detracted from returns as volatility remained high and negative housing news continued to damage market sentiment. We had diversified into a number of non-agency issues that were particularly impacted and further detracted from performance due to a lack of liquidity and uncertainty in that marketplace. An emphasis on lower-quality credits and select Financials issues was also a large negative as spreads soared in the wake of the subprime lending crisis, deteriorating liquidity conditions and slowing economic growth. Spreads narrowed in April and May, but these gains were given back later in the period on deteriorating investor sentiment and poor earnings. The high-yield sector performed poorly along with a declining stock market. During the period, a flight to safety occurred in both the U.S. and abroad. However, international treasuries did not do as well as U.S. Treasuries on a currency hedged basis; hence, relative to the benchmark, the Fund’s modest exposure to international treasuries had a negative impact on results. A modest exposure to U.S. Treasury Inflation-Protected Securities (“TIPS”)E also had a negative impact as oil plunged to $40 per barrel and inflation fears switched to deflation fears. On a positive note, added durationF at the front part of the yield curveG contributed modestly to returns as the Federal Reserve Board (“Fed”)H reduced rates toward zero.
Western Asset Management Company
January 20, 2009
Investment Risks: Bonds are subject to a variety of risks, including interest rate, credit and inflation risk. As interest rates rise, bond prices fall, reducing the value of the Fund’s share price. Foreign securities are subject to certain risks of overseas investing, including currency fluctuations and changes in political and economic conditions. These risks are magnified in emerging markets. The Fund may invest in high-yield bonds, which are rated below investment grade and carry more risk than higher-rated securities. Mortgage-backed securities involve more risk, including prepayment and extension risks, than other investments in fixed-income securities. The Fund may use derivatives, such as options and futures, which can be illiquid, may disproportionately increase losses, and have a potentially large impact on Fund performance.
E | | U.S. Treasury Inflation-Protected Securities (“TIPS”) are inflation-indexed securities issued by the U.S. Treasury in 5-year, 10-year and 20-year maturities. The principal is adjusted to the Consumer Price Index, the commonly used measure of inflation. The coupon rate is constant, but generates a different amount of interest when multiplied by the inflation-adjusted principal. |
F | | Duration is the measure of the price sensitivity of a fixed-income security to an interest rate change of 100 basis points. Calculation is based on the weighted average of the present values for all cash flows. |
G | | The yield curve is the graphical depiction of the relationship between the yield on bonds of the same credit quality but different maturities. |
H | | The Federal Reserve Board (“Fed”) is responsible for the formulation of policies designed to promote economic growth, full employment, stable prices and a sustainable pattern of international trade and payments. |
N/A—Not applicable.
2
Annual Report to Shareholders
Expense Example
Western Asset Absolute Return Portfolio
As a shareholder of the Fund, you incur ongoing costs, including management fees, distribution (12b-1) fees on Financial Intermediary Class shares, and other Fund expenses. These examples are intended to help you understand your ongoing costs (in dollars) of investing in the Fund and to compare these costs with the ongoing costs of investing in other mutual funds.
Actual Expense
The first line for each class in the table below provides information about actual account values and actual expenses for each class. You may use the information in this line, together with the amount you invested, to estimate the expenses that you paid over the period. Simply divide your account value by $1,000 (for example, an $8,600 account value divided by $1,000 = 8.6), then multiply the result by the number in the first line under the heading entitled “Expenses Paid During the Period” to estimate the expenses you paid on your account if your shares were held through the entire period. For the Institutional and Financial Intermediary Classes, the example is based on an investment of $1,000 invested on July 1, 2008 and held through December 31, 2008; for Institutional Select Class, the example is based on an investment of $1,000 invested on August 4, 2008 (commencement of operations) and held through December 31, 2008.
Hypothetical Examples for Comparison Purposes
The second line for each class in the table below provides information about hypothetical account values and hypothetical expenses based on the relevant class’s actual expense ratio and an assumed rate of return of 5% per year before expenses, which is not the class’s actual return. The hypothetical account values and expenses may not be used to estimate the actual ending account balance or expenses you paid for the period. You may use this information to compare the ongoing costs of investing in the Fund and other funds. To do so, compare these 5% hypothetical examples with the 5% hypothetical examples for the relevant classes that appear in the shareholder reports of other funds. Because each example is intended to be comparable to the examples provided by other funds, it is based on a hypothetical investment of $1,000 invested on July 1, 2008 and held through December 31, 2008 for each class, even though the Institutional Select Class did not begin operations until August 4, 2008.
| | | | | | | | | | | |
| | | Beginning
Account Value 7/1/08 | | | Ending
Account Value
12/31/08 | | Expenses PaidA
During the Period
7/1/08 to 12/31/08 | |
Institutional Class: | | | | | | | | | | | |
Actual | | $ | 1,000.00 | | | $ | 864.20 | | $ | 3.76 | |
Hypothetical (5% return before expenses) | | | 1,000.00 | | | | 1,029.42 | | | 4.09 | |
Institutional Select Class: | | | | | | | | | | | |
Actual | | $ | 1,000.00 | B | | $ | 883.10 | | $ | 3.10 | C |
Hypothetical (5% return before expenses) | | | 1,000.00 | | | | 1,029.42 | | | 4.09 | |
Financial Intermediary Class: | | | | | | | | | | | |
Actual | | $ | 1,000.00 | | | $ | 864.50 | | $ | 4.93 | |
Hypothetical (5% return before expenses) | | | 1,000.00 | | | | 1,028.16 | | | 5.37 | |
A | | These calculations are based on expenses incurred from July 1, 2008 to December 31, 2008. The dollar amounts shown as “Expenses Paid” are equal to the annualized expense ratios of 0.80% and 1.05% for the Institutional Class and the Financial Intermediary Class respectively, multiplied by the average values over the period, multiplied by the number of days in the most recent fiscal period (184), and divided by 365. |
B | | Beginning account value is as of August 4, 2008 (commencement of operations). |
C | | This calculation is based on expenses incurred from August 4, 2008 (commencement of operations) to December 31, 2008. The dollar amount shown as “Expenses Paid” is equal to the annualized expense ratio of 0.80% for the Institutional Select Class, multiplied by the average values over the period, multiplied by the number of days in the period (150) and divided by 365. |
3
Annual Report to Shareholders
Performance Information
Western Asset Absolute Return Portfolio
The graphs compare the Fund’s total returns to that of two broad-based securities market indexes. The graphs illustrate the cumulative total return of an initial $1,000,000 investment in each of the Institutional Class and Financial Intermediary Class of the Fund, for the periods indicated. The lines for the Fund represent the total return after deducting all Fund investment management and other administrative expenses and the transaction costs of buying and selling securities. The lines representing the securities market indexes do not include any transaction costs associated with buying and selling securities in the indexes or other investment management or administrative expenses.
Due to the limited operating history of the Institutional Select Class, a performance graph is not presented. Institutional Select Class shares, which began operations on August 4, 2008, had a total return of -11.69% for the period ended December 31, 2008.
Total return measures investment performance in terms of appreciation or depreciation in the Fund’s net asset value per share, plus dividends and any capital gain distributions. It assumes that dividends and distributions were reinvested at the time they were paid. Returns (and the graphs and tables found below) do not reflect the deduction of taxes that a shareholder would pay on Fund distributions or the redemption of Fund shares. Average annual returns tend to smooth out variations in a fund’s return, so that they differ from actual year-to-year results.
Bonds are subject to a variety of risks, including interest rate, credit and inflation risk. Non-U.S. investments are subject to currency fluctuations, social, economic and political risk.
Growth of a $1,000,000 Investment—Institutional Class
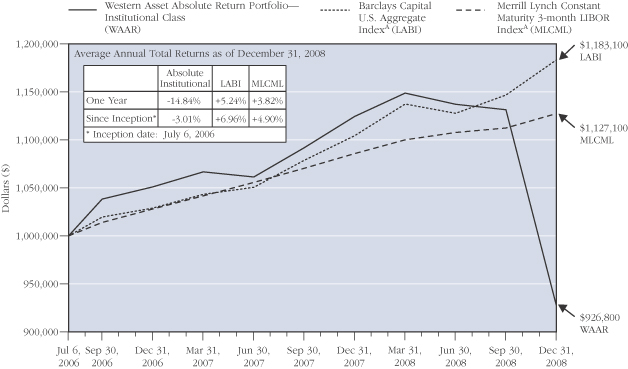
The performance data quoted represent past performance and do not guarantee future results. The performance stated may have been due to extraordinary market conditions, which may not be duplicated in the future. Current performance may be lower or higher than the performance data quoted. To obtain the most recent month-end performance information, please visit www.westernassetfunds.com. The investment return and principal value of the Fund will fluctuate so that an investor’s shares, when redeemed, may be worth more or less than the original cost. Calculations assume reinvestment of dividends and capital gain distributions. Performance would have been lower if fees had not been waived in various periods.
A | | Index returns are for periods beginning June 30, 2006. Formerly: Lehman Aggregate Bond Index. The name change is a result of Barclays’ purchase of Lehman Brothers in September 2008. |
4
Annual Report to Shareholders
Growth of a $1,000,000 Investment—Financial Intermediary Class

The performance data quoted represent past performance and do not guarantee future results. The performance stated may have been due to extraordinary market conditions, which may not be duplicated in the future. Current performance may be lower or higher than the performance data quoted. To obtain the most recent month-end performance information, please visit www.westernassetfunds.com. The investment return and principal value of the Fund will fluctuate so that an investor’s shares, when redeemed, may be worth more or less than the original cost. Calculations assume reinvestment of dividends and capital gain distributions. Performance would have been lower if fees had not been waived in various periods.
B | | Index returns are for periods beginning August 31, 2006. Formerly: Lehman Aggregate Bond Index. The name change is a result of Barclay’s purchase of Lehman Brothers in September 2008. |
5
Annual Report to Shareholders
Performance Information—Continued
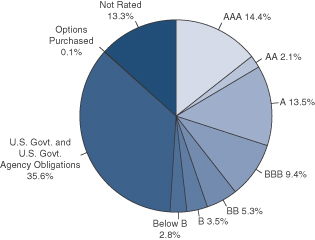
Portfolio Composition (as of December 31, 2008)C
Standard & Poor’s Debt RatingsD
(as a percentage of the portfolio)
Maturity Schedule
(as a percentage of the portfolio)
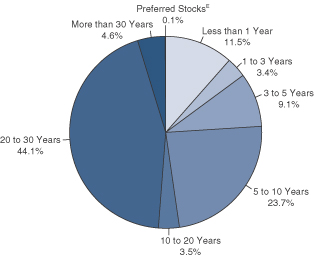
C | | The pie charts above represent the composition of the Fund’s portfolio as of December 31, 2008 and do not include derivatives such as Futures Contracts, Options Written, and Swaps. The Fund is actively managed. As a result, the composition of the portfolio holdings and sectors are subject to change at any time. |
D | | Standard & Poor’s Ratings Service provides capital markets with credit ratings for the evaluation and assessment of credit risk. These ratings are the opinions of S&P and not absolute measures of quality or guarantees of performance. |
E | | Preferred Stocks do not have defined maturity dates. |
6
Annual Report to Shareholders
Spread Duration
Western Asset Absolute Return Portfolio
December 31, 2008
Economic Exposure

Spread duration is defined as the change in value for a 100 basis point change in the spread relative to Treasuries. The spread over Treasuries is the annual risk-premium demanded by investors to hold non-Treasury securities. This chart highlights the market sector exposure of the Fund’s portfolio and the exposure relative to the selected benchmarks as of the end of the reporting period.
ABS—Asset Backed Securities
LABI—Barclays Capital U.S. Aggregate Index
MLCML—Merrill Lynch Constant Maturity 3-month LIBOR Index
CMBS—Commercial Mortgage Backed Securities
HY—High Yield
IG Credit—Investment Grade Credit
MBS—Mortgage Backed Securities
| * | | The Merrill Lynch 3-month Libor, has 0.25 year spread duration. This is included in the derivatives bucket. |
7
Annual Report to Shareholders
Effective Duration
Western Asset Absolute Return Portfolio
December 31, 2008
Interest Rate Exposure
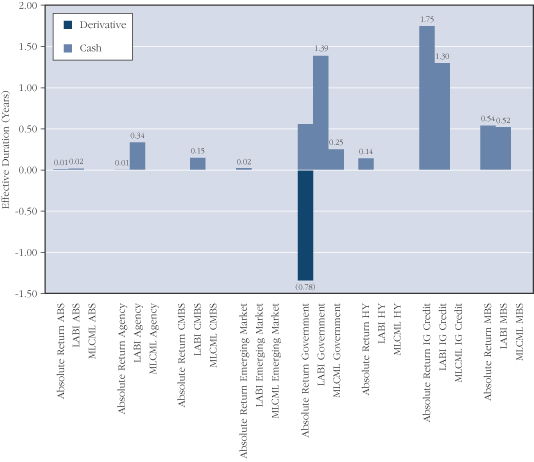
Effective duration is defined as the change in value for a 100 basis point change in Treasury yields. This chart highlights the interest rate exposure of the Fund’s portfolio relative to the selected benchmarks as of the end of the reporting period.
ABS—Asset Backed Securities
LABI—Barclays Capital U.S. Aggregate Index
MLCML—Merrill Lynch Constant Maturity 3-month LIBOR Index
CMBS—Commercial Mortgage Backed Securities
HY—High Yield
IG Credit—Investment Grade Credit
MBS—Mortgage Backed Securities
8
Annual Report to Shareholders
Portfolio of Investments
Western Asset Absolute Return Portfolio
December 31, 2008
| | | | | | | | | | | | | |
| | | % OF
NET ASSETS | | RATE | | MATURITY
DATE | | PAR/
SHARES† | | VALUE | |
| | | | | | | | | | | | | |
| | | | | | | | | | | | | |
Long-Term Securities | | 113.9% | | | | | | | | | | | |
| | | | | |
Corporate Bonds and Notes | | 38.1% | | | | | | | | | | | |
| | | | | |
Airlines | | 0.2% | | | | | | | | | | | |
Continental Airlines Inc. | | | | 6.820% | | 5/1/18 | | $ | 60,915 | | $ | 44,564 | |
Continental Airlines Inc. | | | | 6.703% | | 6/15/21 | | | 58,567 | | | 43,925 | |
United Air Lines Inc. | | | | 7.032% | | 10/1/10 | | | 96,582 | | | 88,855 | |
United Air Lines Inc. | | | | 7.186% | | 10/1/12 | | | 364,958 | | | 343,061 | |
US Airways Pass-Through Trust | | | | 6.850% | | 1/30/18 | | | 314,007 | | | 219,805 | |
| | | | | | | | | | | | | |
| | | | | | | | | | | | 740,210 | |
| | | | | | | | | | | | | |
Auto Components | | 0.1% | | | | | | | | | | | |
Visteon Corp. | | | | 8.250% | | 8/1/10 | | | 179,000 | | | 55,490 | |
Visteon Corp. | | | | 12.250% | | 12/31/16 | | | 462,000 | | | 110,880 | A |
| | | | | | | | | | | | | |
| | | | | | | | | | | | 166,370 | |
| | | | | | | | | | | | | |
Automobiles | | N.M. | | | | | | | | | | | |
Ford Motor Co. | | | | 4.250% | | 12/15/36 | | | 80,000 | | | 20,600 | B |
| | | | | | | | | | | | | |
| | | | | |
Beverages | | 0.1% | | | | | | | | | | | |
Dr. Pepper Snapple Group Inc. Senior Notes | | | | 6.820% | | 5/1/18 | | | 460,000 | | | 453,722 | A |
| | | | | | | | | | | | | |
| | | | | |
Building Products | | 0.1% | | | | | | | | | | | |
Associated Materials Inc. | | | | 9.750% | | 4/15/12 | | | 365,000 | | | 287,437 | |
Associated Materials Inc. | | | | 0.000% | | 3/1/14 | | | 155,000 | | | 86,025 | C |
Masco Corp. | | | | 7.125% | | 8/15/13 | | | 50,000 | | | 40,235 | |
| | | | | | | | | | | | | |
| | | | | | | | | | | | 413,697 | |
| | | | | | | | | | | | | |
Capital Markets | | 4.1% | | | | | | | | | | | |
Goldman Sachs Capital II | | | | 5.793% | | 12/29/49 | | | 60,000 | | | 23,065 | C |
Lehman Brothers Holdings Capital Trust VII | | | | 5.857% | | 11/29/49 | | | 100,000 | | | 10 | C,D,P |
Lehman Brothers Holdings Inc. | | | | 5.625% | | 1/24/13 | | | 1,000,000 | | | 95,000 | D,P |
Lehman Brothers Holdings Inc. | | | | 6.200% | | 9/26/14 | | | 320,000 | | | 30,400 | D,P |
Lehman Brothers Holdings Inc. | | | | 6.750% | | 12/28/17 | | | 2,350,000 | | | 235 | D,P |
Merrill Lynch and Co. Inc. | | | | 5.450% | | 2/5/13 | | | 3,490,000 | | | 3,354,749 | |
Merrill Lynch and Co. Inc. | | | | 6.050% | | 5/16/16 | | | 1,980,000 | | | 1,852,235 | |
Morgan Stanley | | | | 6.625% | | 4/1/18 | | | 2,160,000 | | | 1,894,946 | |
The Bear Stearns Cos. Inc. | | | | 7.250% | | 2/1/18 | | | 3,560,000 | | | 3,901,247 | |
The Goldman Sachs Group Inc. | | | | 6.150% | | 4/1/18 | | | 1,800,000 | | | 1,729,730 | |
| | | | | | | | | | | | | |
| | | | | | | | | | | | 12,881,617 | |
| | | | | | | | | | | | | |
9
Annual Report to Shareholders
Portfolio of Investments—Continued
Western Asset Absolute Return Portfolio—Continued
| | | | | | | | | | | | | |
| | | % OF
NET ASSETS | | RATE | | MATURITY
DATE | | PAR/
SHARES† | | VALUE | |
| | | | | | | | | | | | | |
Corporate Bonds and Notes—Continued | | | | | | | | | | | | | |
| | | | | |
Commercial Banks | | 2.4% | | | | | | | | | | | |
HSBK Europe BV | | | | 9.250% | | 10/16/13 | | $ | 1,220,000 | | $ | 890,600 | A |
Wachovia Corp. | | | | 5.625% | | 10/15/16 | | | 730,000 | | | 666,853 | |
Wachovia Corp. | | | | 5.750% | | 2/1/18 | | | 6,120,000 | | | 6,132,179 | |
| | | | | | | | | | | | | |
| | | | | | | | | | | | 7,689,632 | |
| | | | | | | | | | | | | |
Communications Equipment | | 0.1% | | | | | | | | | | | |
EchoStar DBS Corp. | | | | 7.750% | | 5/31/15 | | | 245,000 | | | 208,250 | |
| | | | | | | | | | | | | |
| | | | | |
Consumer Finance | | 5.0% | | | | | | | | | | | |
American Express Co. | | | | 6.800% | | 9/1/66 | | | 40,000 | | | 20,706 | C |
American General Finance Corp. | | | | 6.900% | | 12/15/17 | | | 1,000,000 | | | 432,773 | |
Caterpillar Financial Services Corp. | | | | 5.450% | | 4/15/18 | | | 500,000 | | | 468,142 | |
Ford Motor Credit Co. | | | | 5.700% | | 1/15/10 | | | 270,000 | | | 229,454 | |
Ford Motor Credit Co. | | | | 9.750% | | 9/15/10 | | | 2,000,000 | | | 1,599,988 | |
Ford Motor Credit Co. | | | | 7.000% | | 10/1/13 | | | 7,800,000 | | | 5,389,231 | |
Ford Motor Credit Co. | | | | 12.000% | | 5/15/15 | | | 1,610,000 | | | 1,202,282 | |
GMAC LLC | | | | 5.850% | | 1/14/09 | | | 1,320,000 | | | 1,311,398 | |
GMAC LLC | | | | 6.000% | | 5/15/11 | | | 949,000 | | | 739,100 | A |
GMAC LLC | | | | 6.875% | | 9/15/11 | | | 1,709,667 | | | 1,400,662 | A |
GMAC LLC | | | | 6.000% | | 12/15/11 | | | 1,013,000 | | | 819,456 | A |
GMAC LLC | | | | 7.500% | | 12/31/13 | | | 273,000 | | | 199,290 | A |
GMAC LLC | | | | 8.000% | | 12/31/18 | | | 185,000 | | | 92,500 | A |
GMAC LLC | | | | 8.000% | | 11/1/31 | | | 1,799,000 | | | 1,069,308 | A |
John Deere Capital Corp. | | | | 5.350% | | 4/3/18 | | | 800,000 | | | 749,532 | |
| | | | | | | | | | | | | |
| | | | | | | | | | | | 15,723,822 | |
| | | | | | | | | | | | | |
Containers and Packaging | | N.M. | | | | | | | | | | | |
Graphic Packaging International Corp. | | | | 9.500% | | 8/15/13 | | | 130,000 | | | 89,700 | |
| | | | | | | | | | | | | |
| | | | | |
Diversified Financial Services | | 3.7% | | | | | | | | | | | |
Air 2 US | | | | 8.027% | | 10/1/19 | | | 754,171 | | | 565,628 | A |
BAC Capital Trust XIV | | | | 5.630% | | 12/31/49 | | | 40,000 | | | 16,026 | C |
Citigroup Inc. | | | | 5.500% | | 2/15/17 | | | 5,570,000 | | | 5,067,581 | |
Citigroup Inc. | | | | 6.875% | | 3/5/38 | | | 1,380,000 | | | 1,570,284 | |
East Lane Re Ltd. | | | | 9.193% | | 5/6/11 | | | 300,000 | | | 287,250 | A,E |
El Paso Performance-Linked | | | | 7.750% | | 7/15/11 | | | 340,000 | | | 294,355 | A |
General Electric Capital Corp. | | | | 5.625% | | 5/1/18 | | | 2,800,000 | | | 2,820,297 | |
General Electric Capital Corp. | | | | 6.375% | | 11/15/67 | | | 60,000 | | | 37,714 | C |
Glen Meadow Pass-Through Certificates | | | | 6.505% | | 2/12/67 | | | 100,000 | | | 44,709 | A,C |
Leucadia National Corp. | | | | 8.125% | | 9/15/15 | | | 250,000 | | | 200,625 | |
10
Annual Report to Shareholders
| | | | | | | | | | | | | |
| | | % OF
NET ASSETS | | RATE | | MATURITY
DATE | | PAR/
SHARES† | | VALUE | |
| | | | | | | | | | | | | |
Corporate Bonds and Notes—Continued | | | | | | | | | | | | | |
| | | | | |
Diversified Financial Services—Continued | | | | | | | | | | | | | |
PHH Corp. | | | | 7.125% | | 3/1/13 | | $ | 110,000 | | $ | 62,323 | |
TNK-BP Finance SA | | | | 7.875% | | 3/13/18 | | | 370,000 | | | 185,000 | A |
Vanguard Health Holding Co. II LLC | | | | 9.000% | | 10/1/14 | | | 330,000 | | | 275,550 | |
ZFS Finance USA Trust II | | | | 6.450% | | 12/15/65 | | | 500,000 | | | 233,525 | A,C |
| | | | | | | | | | | | | |
| | | | | | | | | | | | 11,660,867 | |
| | | | | | | | | | | | | |
Diversified Telecommunication Services | | 1.7% | | | | | | | | | | | |
AT&T Inc. | | | | 5.500% | | 2/1/18 | | | 2,930,000 | | | 2,961,131 | |
Citizens Communications Co. | | | | 7.875% | | 1/15/27 | | | 490,000 | | | 284,200 | |
Level 3 Financing Inc. | | | | 9.250% | | 11/1/14 | | | 500,000 | | | 290,000 | |
Qwest Corp. | | | | 7.500% | | 10/1/14 | | | 190,000 | | | 157,700 | |
Verizon Communications Inc. | | | | 6.100% | | 4/15/18 | | | 1,150,000 | | | 1,145,850 | |
Windstream Corp. | | | | 8.625% | | 8/1/16 | | | 480,000 | | | 424,800 | |
| | | | | | | | | | | | | |
| | | | | | | | | | | | 5,263,681 | |
| | | | | | | | | | | | | |
Electric Utilities | | 1.3% | | | | | | | | | | | |
Energy Future Holdings Corp. | | | | 10.875% | | 11/1/17 | | | 20,000 | | | 14,200 | A |
Energy Future Holdings Corp. | | | | 11.250% | | 11/1/17 | | | 4,810,000 | | | 2,332,850 | A,F |
FirstEnergy Corp. | | | | 6.450% | | 11/15/11 | | | 1,870,000 | | | 1,767,629 | |
FirstEnergy Corp. | | | | 7.375% | | 11/15/31 | | | 100,000 | | | 94,601 | |
| | | | | | | | | | | | | |
| | | | | | | | | | | | 4,209,280 | |
| | | | | | | | | | | | | |
Food and Staples Retailing | | 1.8% | | | | | | | | | | | |
CVS Corp. | | | | 9.350% | | 1/10/23 | | | 500,000 | | | 150,000 | A |
CVS Corp. | | | | 5.298% | | 1/11/27 | | | 32,089 | | | 24,632 | A |
CVS Lease Pass-Through Trust | | | | 5.880% | | 1/10/28 | | | 43,719 | | | 33,864 | A |
CVS Lease Pass-Through Trust | | | | 6.036% | | 12/10/28 | | | 117,305 | | | 71,348 | A |
Safeway Inc. | | | | 7.250% | | 2/1/31 | | | 1,360,000 | | | 1,509,344 | |
The Kroger Co. | | | | 5.000% | | 4/15/13 | | | 1,620,000 | | | 1,559,555 | |
The Kroger Co. | | | | 6.150% | | 1/15/20 | | | 1,100,000 | | | 1,085,286 | |
Wal-Mart Stores Inc. | | | | 4.250% | | 4/15/13 | | | 1,060,000 | | | 1,091,036 | |
| | | | | | | | | | | | | |
| | | | | | | | | | | | 5,525,065 | |
| | | | | | | | | | | | | |
Food Products | | N.M. | | | | | | | | | | | |
Sara Lee Corp. | | | | 6.250% | | 9/15/11 | | | 150,000 | | | 148,491 | |
| | | | | | | | | | | | | |
| | | | | |
Gas Utilities | | 0.2% | | | | | | | | | | | |
Suburban Propane Partners LP | | | | 6.875% | | 12/15/13 | | | 600,000 | | | 492,000 | |
| | | | | | | | | | | | | |
| | | | | |
Health Care Equipment and Supplies | | N.M. | | | | | | | | | | | |
Advanced Medical Optics Inc. | | | | 7.500% | | 5/1/17 | | | 250,000 | | | 127,500 | |
| | | | | | | | | | | | | |
11
Annual Report to Shareholders
Portfolio of Investments—Continued
Western Asset Absolute Return Portfolio—Continued
| | | | | | | | | | | | | |
| | | % OF
NET ASSETS | | RATE | | MATURITY
DATE | | PAR/
SHARES† | | VALUE | |
| | | | | | | | | | | | | |
Corporate Bonds and Notes—Continued | | | | | | | | | | | | | |
| | | | | |
Health Care Providers and Services | | 4.1% | | | | | | | | | | | |
AmerisourceBergen Corp. | | | | 5.875% | | 9/15/15 | | $ | 50,000 | | $ | 43,699 | |
Cardinal Health Inc. | | | | 5.800% | | 10/15/16 | | | 60,000 | | | 54,281 | |
DaVita Inc. | | | | 6.625% | | 3/15/13 | | | 500,000 | | | 475,000 | |
HCA Inc. | | | | 6.300% | | 10/1/12 | | | 274,000 | | | 193,170 | |
HCA Inc. | | | | 9.125% | | 11/15/14 | | | 10,000 | | | 9,275 | |
HCA Inc. | | | | 6.500% | | 2/15/16 | | | 619,000 | | | 380,685 | |
HCA Inc. | | | | 9.250% | | 11/15/16 | | | 910,000 | | | 834,925 | |
HCA Inc. | | | | 9.625% | | 11/15/16 | | | 599,000 | | | 467,220 | F |
Tenet Healthcare Corp. | | | | 6.375% | | 12/1/11 | | | 670,000 | | | 517,575 | |
Tenet Healthcare Corp. | | | | 6.500% | | 6/1/12 | | | 380,000 | | | 288,800 | |
Tenet Healthcare Corp. | | | | 9.875% | | 7/1/14 | | | 29,000 | | | 23,345 | |
U.S. Oncology Holdings Inc. | | | | 8.334% | | 3/15/12 | | | 353,000 | | | 222,390 | E,F |
UnitedHealth Group Inc. | | | | 4.875% | | 2/15/13 | | | 6,360,000 | | | 5,937,849 | |
UnitedHealth Group Inc. | | | | 4.875% | | 4/1/13 | | | 940,000 | | | 875,898 | |
UnitedHealth Group Inc. | | | | 6.000% | | 2/15/18 | | | 1,210,000 | | | 1,116,386 | |
WellPoint Inc. | | | | 5.875% | | 6/15/17 | | | 1,470,000 | | | 1,337,898 | |
| | | | | | | | | | | | | |
| | | | | | | | | | | | 12,778,396 | |
| | | | | | | | | | | | | |
Hotels, Restaurants and Leisure | | 0.6% | | | | | | | | | | | |
Inn of the Mountain Gods Resort and Casino | | | | 12.000% | | 11/15/10 | | | 250,000 | | | 82,500 | |
McDonald’s Corp. | | | | 5.350% | | 3/1/18 | | | 1,590,000 | | | 1,651,668 | |
MGM MIRAGE | | | | 6.625% | | 7/15/15 | | | 140,000 | | | 85,400 | |
River Rock Entertainment Authority | | | | 9.750% | | 11/1/11 | | | 220,000 | | | 182,600 | |
Starwood Hotels and Resorts Worldwide Inc. | | | | 7.875% | | 5/1/12 | | | 50,000 | | | 37,250 | |
| | | | | | | | | | | | | |
| | | | | | | | | | | | 2,039,418 | |
| | | | | | | | | | | | | |
Household Durables | | 0.1% | | | | | | | | | | | |
Norcraft Cos. | | | | 9.000% | | 11/1/11 | | | 480,000 | | | 408,000 | |
| | | | | | | | | | | | | |
| | | | | |
Independent Power Producers and Energy Traders | | 1.5% | | | | | | | | | | | |
Dynegy Holdings Inc. | | | | 7.750% | | 6/1/19 | | | 30,000 | | | 20,700 | |
Edison Mission Energy | | | | 7.000% | | 5/15/17 | | | 190,000 | | | 165,300 | |
Edison Mission Energy | | | | 7.200% | | 5/15/19 | | | 250,000 | | | 205,000 | |
Edison Mission Energy | | | | 7.625% | | 5/15/27 | | | 90,000 | | | 69,750 | |
Mirant Mid Atlantic LLC | | | | 9.125% | | 6/30/17 | | | 849,801 | | | 764,821 | |
NRG Energy Inc. | | | | 7.375% | | 2/1/16 | | | 250,000 | | | 232,500 | |
The AES Corp. | | | | 7.750% | | 3/1/14 | | | 1,800,000 | | | 1,584,000 | |
12
Annual Report to Shareholders
| | | | | | | | | | | | | |
| | | % OF
NET ASSETS | | RATE | | MATURITY
DATE | | PAR/
SHARES† | | VALUE | |
| | | | | | | | | | | | | |
Corporate Bonds and Notes—Continued | | | | | | | | | | | | | |
| | | | | |
Independent Power Producers and Energy Traders—Continued | | | | | | | | | | | | | |
The AES Corp. | | | | 7.750% | | 10/15/15 | | $ | 300,000 | | $ | 252,000 | |
The AES Corp. | | | | 8.000% | | 10/15/17 | | | 1,630,000 | | | 1,336,600 | |
| | | | | | | | | | | | | |
| | | | | | | | | | | | 4,630,671 | |
| | | | | | | | | | | | | |
Insurance | | 2.1% | | | | | | | | | | | |
Allstate Life Global Funding Trust | | | | 5.375% | | 4/30/13 | | | 440,000 | | | 433,135 | |
American International Group Inc. | | | | 5.850% | | 1/16/18 | | | 4,420,000 | | | 2,962,660 | |
ASIF Global Financing XIX | | | | 4.900% | | 1/17/13 | | | 1,400,000 | | | 1,123,839 | A |
MetLife Inc. | | | | 6.400% | | 12/15/36 | | | 50,000 | | | 30,000 | |
Metropolitan Life Global Funding I | | | | 5.125% | | 4/10/13 | | | 1,130,000 | | | 1,052,888 | A |
Pacific Life Global Funding | | | | 5.150% | | 4/15/13 | | | 1,040,000 | | | 977,140 | A |
The Travelers Cos. Inc. | | | | 6.250% | | 3/15/37 | | | 120,000 | | | 78,604 | C |
| | | | | | | | | | | | | |
| | | | | | | | | | | | 6,658,266 | |
| | | | | | | | | | | | | |
IT Services | | 0.1% | | | | | | | | | | | |
SunGard Data Systems Inc. | | | | 10.250% | | 8/15/15 | | | 250,000 | | | 165,000 | |
| | | | | | | | | | | | | |
| | | | | |
Media | | 1.1% | | | | | | | | | | | |
Affinion Group Inc. | | | | 11.500% | | 10/15/15 | | | 430,000 | | | 258,537 | |
Charter Communications Operating LLC | | | | 10.875% | | 9/15/14 | | | 160,000 | | | 128,000 | A |
Comcast Corp. | | | | 6.500% | | 1/15/17 | | | 70,000 | | | 69,140 | |
Comcast Corp. | | | | 5.700% | | 5/15/18 | | | 2,350,000 | | | 2,203,849 | |
Dex Media West LLC | | | | 8.500% | | 8/15/10 | | | 425,000 | | | 257,125 | |
EchoStar DBS Corp. | | | | 7.125% | | 2/1/16 | | | 300,000 | | | 250,500 | |
Gannett Co. Inc. | | | | 6.375% | | 4/1/12 | | | 40,000 | | | 27,988 | |
Idearc Inc. | | | | 8.000% | | 11/15/16 | | | 250,000 | | | 18,750 | |
News America Inc. | | | | 6.650% | | 11/15/37 | | | 50,000 | | | 49,488 | |
Viacom Inc. | | | | 5.750% | | 4/30/11 | | | 100,000 | | | 90,819 | |
| | | | | | | | | | | | | |
| | | | | | | | | | | | 3,354,196 | |
| | | | | | | | | | | | | |
Metals and Mining | | 1.3% | | | | | | | | | | | |
Freeport-McMoRan Copper & Gold Inc. | | | | 8.375% | | 4/1/17 | | | 1,910,000 | | | 1,566,200 | |
GTL Trade Finance Inc. | | | | 7.250% | | 10/20/17 | | | 2,550,000 | | | 2,139,093 | A |
Steel Dynamics Inc. | | | | 7.750% | | 4/15/16 | | | 410,000 | | | 283,925 | A |
| | | | | | | | | | | | | |
| | | | | | | | | | | | 3,989,218 | |
| | | | | | | | | | | | | |
Multi-Utilities | | 0.7% | | | | | | | | | | | |
Dominion Resources Inc. | | | | 5.700% | | 9/17/12 | | | 2,170,000 | | | 2,148,691 | |
| | | | | | | | | | | | | |
13
Annual Report to Shareholders
Portfolio of Investments—Continued
Western Asset Absolute Return Portfolio—Continued
| | | | | | | | | | | | | |
| | | % OF
NET ASSETS | | RATE | | MATURITY
DATE | | PAR/
SHARES† | | VALUE | |
| | | | | | | | | | | | | |
Corporate Bonds and Notes—Continued | | | | | | | | | | | | | |
| | | | | |
Multiline Retail | | 0.1% | | | | | | | | | | | |
The Neiman-Marcus Group Inc. | | | | 9.000% | | 10/15/15 | | $ | 240,000 | | $ | 105,600 | F |
The Neiman-Marcus Group Inc. | | | | 10.375% | | 10/15/15 | | | 230,000 | | | 98,900 | |
| | | | | | | | | | | | | |
| | | | | | | | | | | | 204,500 | |
| | | | | | | | | | | | | |
Oil, Gas and Consumable Fuels | | 5.3% | | | | | | | | | | | |
Anadarko Petroleum Corp. | | | | 3.219% | | 9/15/09 | | | 170,000 | | | 162,660 | E |
Anadarko Petroleum Corp. | | | | 5.950% | | 9/15/16 | | | 540,000 | | | 476,987 | |
Belden and Blake Corp. | | | | 8.750% | | 7/15/12 | | | 1,060,000 | | | 726,100 | |
Chesapeake Energy Corp. | | | | 6.375% | | 6/15/15 | | | 400,000 | | | 316,000 | |
Chesapeake Energy Corp. | | | | 6.500% | | 8/15/17 | | | 100,000 | | | 76,500 | |
Chesapeake Energy Corp. | | | | 7.250% | | 12/15/18 | | | 45,000 | | | 35,100 | |
Dynegy Roseton/Danskammer Pass Through Trust | | | | 7.670% | | 11/8/16 | | | 420,000 | | | 298,462 | |
El Paso Corp. | | | | 7.000% | | 6/15/17 | | | 2,260,000 | | | 1,768,687 | |
Energy Transfer Partners LP | | | | 6.700% | | 7/1/18 | | | 3,800,000 | | | 3,202,990 | |
Exco Resources Inc. | | | | 7.250% | | 1/15/11 | | | 300,000 | | | 234,000 | |
KazMunaiGaz Exploration Production—GDR | | | | 8.375% | | 7/2/13 | | | 1,290,000 | | | 1,006,200 | A |
Kinder Morgan Energy Partners LP | | | | 6.000% | | 2/1/17 | | | 1,000,000 | | | 868,175 | |
Kinder Morgan Energy Partners LP | | | | 5.950% | | 2/15/18 | | | 4,570,000 | | | 3,900,335 | |
Parker Drilling Co. | | | | 9.625% | | 10/1/13 | | | 180,000 | | | 139,500 | |
Petrohawk Energy Corp. | | | | 9.125% | | 7/15/13 | | | 250,000 | | | 202,500 | |
SandRidge Energy Inc. | | | | 8.625% | | 4/1/15 | | | 1,000,000 | | | 525,000 | F |
SemGroup LP | | | | 8.750% | | 11/15/15 | | | 335,000 | | | 11,725 | A,D,H,P |
VeraSun Energy Corp. | | | | 9.375% | | 6/1/17 | | | 250,000 | | | 30,000 | D,G,P |
Whiting Petroleum Corp. | | | | 7.250% | | 5/1/12 | | | 160,000 | | | 119,200 | |
XTO Energy Inc. | | | | 5.500% | | 6/15/18 | | | 2,688,000 | | | 2,433,385 | |
| | | | | | | | | | | | | |
| | | | | | | | | | | | 16,533,506 | |
| | | | | | | | | | | | | |
Pharmaceuticals | | N.M. | | | | | | | | | | | |
Leiner Health Products Inc. | | | | 11.000% | | 6/1/12 | | | 250,000 | | | 12,500 | D,H,P |
| | | | | | | | | | | | | |
| | | | | |
Real Estate Investment Trusts (REITs) | | 0.1% | | | | | | | | | | | |
Health Care Property Investors Inc. | | | | 6.450% | | 6/25/12 | | | 60,000 | | | 49,611 | |
iStar Financial Inc. | | | | 5.850% | | 3/15/17 | | | 770,000 | | | 231,000 | |
| | | | | | | | | | | | | |
| | | | | | | | | | | | 280,611 | |
| | | | | | | | | | | | | |
Real Estate Management and Development | | N.M. | | | | | | | | | | | |
Realogy Corp. | | | | 12.375% | | 4/15/15 | | | 755,000 | | | 101,925 | |
| | | | | | | | | | | | | |
| | | | | |
Road and Rail | | 0.1% | | | | | | | | | | | |
Hertz Corp. | | | | 8.875% | | 1/1/14 | | | 200,000 | | | 123,000 | |
14
Annual Report to Shareholders
| | | | | | | | | | | | | |
| | | % OF
NET ASSETS | | RATE | | MATURITY
DATE | | PAR/
SHARES† | | VALUE | |
| | | | | | | | | | | | | |
Corporate Bonds and Notes—Continued | | | | | | | | | | | | | |
| | | | | |
Road and Rail—Continued | | | | | | | | | | | | | |
Hertz Corp. | | | | 10.500% | | 1/1/16 | | $ | 530,000 | | $ | 241,812 | |
Swift Transportation Co. | | | | 12.500% | | 5/15/17 | | | 120,000 | | | 10,950 | A |
| | | | | | | | | | | | | |
| | | | | | | | | | | | 375,762 | |
| | | | | | | | | | | | | |
Textiles, Apparel and Luxury Goods | | N.M. | | | | | | | | | | | |
Oxford Industries Inc. | | | | 8.875% | | 6/1/11 | | | 200,000 | | | 151,000 | |
| | | | | | | | | | | | | |
| | | | | |
Trading Companies and Distributors | | N.M. | | | | | | | | | | | |
Ashtead Capital Inc. | | | | 9.000% | | 8/15/16 | | | 200,000 | | | 103,000 | A |
| | | | | | | | | | | | | |
| | | | | |
Transportation Infrastructure | | 0.1% | | | | | | | | | | | |
Hawker Beechcraft Acquisition Co. | | | | 8.875% | | 4/1/15 | | | 480,000 | | | 163,200 | F |
| | | | | | | | | | | | | |
Total Corporate Bonds and Notes
(Cost—$143,771,246) | | | | | | | | | | | | 119,912,364 | |
Asset-Backed Securities | | 6.1% | | | | | | | | | | | |
| | | | | |
Fixed Rate Securities | | 0.6% | | | | | | | | | | | |
ABSC Manufactured Housing Contract 2004-CN1 | | | | 8.400% | | 12/2/30 | | | 170,000 | | | 86,700 | A |
Bombardier Capital Mortgage Securitization Corp. 2000-A A3 | | | | 7.830% | | 6/15/30 | | | 1,698,989 | | | 784,091 | |
Centex Home Equity 2003-B AF4 | | | | 3.735% | | 2/25/32 | | | 142,664 | | | 118,637 | |
Lehman XS Trust 2007-1 WF1 | | | | 7.000% | | 1/25/37 | | | 1,529,688 | | | 802,609 | |
Oakwood Mortgage Investors Inc. 1999-D A1 | | | | 7.840% | | 11/15/29 | | | 293,930 | | | 170,145 | |
Pegasus Aviation Lease Securitization 2000-1 A2 | | | | 8.370% | | 3/25/30 | | | 390,000 | | | 109,193 | A |
| | | | | | | | | | | | | |
| | | | | | | | | | | | 2,071,375 | |
| | | | | | | | | | | | | |
Indexed SecuritiesE | | 5.3% | | | | | | | | | | | |
ACE Securities Corp. 2006-GP1 A | | | | 1.525% | | 2/25/31 | | | 564,619 | | | 407,871 | |
Amortizing Residential Collateral Trust 2005-BC5 M1 | | | | 2.430% | | 7/25/32 | | | 694,578 | | | 483,177 | |
Bear Stearns Asset-Backed Securities Trust 2006-SD2 | | | | 1.595% | | 6/25/36 | | | 690,395 | | | 588,518 | |
Carrington Mortgage Loan Trust 2006-NC4 A2 | | | | 1.495% | | 10/25/36 | | | 1,450,000 | | | 1,230,344 | |
Citigroup Mortgage Loan Trust Inc.
2006-SHL1 A1 | | | | 1.595% | | 11/25/45 | | | 191,982 | | | 139,495 | A |
Citigroup Mortgage Loan Trust Inc.
2007-SHL1 A | | | | 1.795% | | 11/25/46 | | | 513,676 | | | 192,166 | A |
15
Annual Report to Shareholders
Portfolio of Investments—Continued
Western Asset Absolute Return Portfolio—Continued
| | | | | | | | | | | | | |
| | | % OF
NET ASSETS | | RATE | | MATURITY
DATE | | PAR/
SHARES† | | VALUE | |
| | | | | | | | | | | | | |
Asset-Backed Securities—Continued | | | | | | | | | | | | | |
| | | | | |
Indexed Securities—Continued | | | | | | | | | | | | | |
Countrywide Home Equity Loan Trust
2006-B 2A | | | | 1.593% | | 5/15/36 | | $ | 430,840 | | $ | 170,789 | |
Fremont Home Loan Trust 2006-B 2A2 | | | | 1.495% | | 8/25/36 | | | 2,188,743 | | | 1,760,133 | |
GMAC Mortgage Corp. Loan Trust
2006-HE4 A1 | | | | 3.329% | | 12/25/36 | | | 2,261,005 | | | 785,051 | |
GSAA Home Equity Trust 2007-6 A4 | | | | 1.695% | | 5/25/47 | | | 2,090,000 | | | 422,160 | |
GSAMP Trust 2006-SEA1 A | | | | 1.695% | | 5/25/36 | | | 405,712 | | | 255,598 | A |
GSRPM Mortgage Loan Trust 2006-2 A2 | | | | 1.695% | | 9/25/36 | | | 587,135 | | | 375,767 | A |
HIS Asset Securitization Corp. Trust 2007-NC1 A3 | | | | 1.575% | | 4/25/37 | | | 2,740,000 | | | 933,888 | |
IndyMac Seconds Asset Backed Trust A-A | | | | 1.525% | | 6/25/36 | | | 1,355,764 | | | 229,862 | |
IXIS Real Estate Capital Trust 2005-HE4 A3 | | | | 1.735% | | 2/25/36 | | | 1,300,000 | | | 1,054,417 | |
Lehman XS Trust 2006-16N A4B | | | | 1.635% | | 11/25/46 | | | 751,341 | | | 161,733 | |
Lehman XS Trust 2006-2N 1A1 | | | | 1.655% | | 2/25/46 | | | 474,883 | | | 193,319 | |
Lehman XS Trust 2006-GP3 2A2 | | | | 1.615% | | 6/25/46 | | | 770,194 | | | 236,591 | |
Lehman XS Trust 2007-2N 3A1 | | | | 1.485% | | 2/25/37 | | | 2,672,273 | | | 1,556,498 | |
MASTR Asset Backed Securities Trust
2006-FRE1 A2 | | | | 1.515% | | 12/25/35 | | | 282,620 | | | 278,357 | |
MASTR Second Lien Trust 2005-1 A | | | | 1.665% | | 9/25/35 | | | 409,463 | | | 297,478 | |
MASTR Specialized Loan Trust 2006-3 A | | | | 1.655% | | 6/25/46 | | | 489,698 | | | 336,109 | A |
MASTR Specialized Loan Trust 2007-1 A | | | | 1.765% | | 1/25/37 | | | 394,618 | | | 205,502 | A |
Morgan Stanley Home Equity Loans 2007-1 A3 | | | | 1.535% | | 12/25/36 | | | 2,720,000 | | | 1,365,814 | |
Morgan Stanley Mortgage Loan Trust 2006-12XS | | | | 1.515% | | 10/25/36 | | | 332,657 | | | 284,701 | |
Nelnet Student Loan Trust 2008-4 A4 | | | | 5.015% | | 4/25/24 | | | 860,000 | | | 696,715 | |
Option One Mortgage Loan Trust 2005-1 A4 | | | | 1.795% | | 2/25/35 | | | 803,209 | | | 625,994 | |
RAAC 2006-RP4 A | | | | 1.685% | | 1/25/46 | | | 710,182 | | | 483,978 | A |
Structured Asset Securities Corp. 2007-BC4 A3 | | | | 1.645% | | 11/25/37 | | | 1,177,876 | | | 854,195 | |
| | | | | | | | | | | | | |
| | | | | | | | | | | | 16,606,220 | |
| | | | | | | | | | | | | |
Stripped Securities | | 0.2% | | | | | | | | | | | |
First Franklin Mortgage Loan Asset-Backed Certificates 2006-FF5 2A5 | | | | 0.000% | | 4/25/36 | | | 1,050,000 | | | 537,040 | I2 |
| | | | | | | | | | | | | |
| | | | | |
Variable Rate SecuritiesJ | | N.M. | | | | | | | | | | | |
GSAMP Trust 2006-S3 A1 | | | | 6.085% | | 5/25/36 | | | 364,040 | | | 44,941 | C |
| | | | | | | | | | | | | |
Total Asset-Backed Securities
(Cost—$32,412,626) | | | | | | | | | | | | 19,259,576 | |
16
Annual Report to Shareholders
| | | | | | | | | | | | | |
| | | % OF
NET ASSETS | | RATE | | MATURITY
DATE | | PAR/
SHARES† | | VALUE | |
| | | | | | | | | | | | | |
Mortgage-Backed Securities | | 11.8% | | | | | | | | | | | |
| | | | | |
Fixed Rate Securities | | 0.3% | | | | | | | | | | | |
Banc of America Funding Corp. 2006-8T2 A2 | | | | 5.791% | | 10/25/36 | | $ | 433,292 | | $ | 362,365 | |
BlackRock Capital Finance LP 1997-R1 | | | | 7.750% | | 3/25/37 | | | 170,909 | | | 30,763 | A |
IndyMac Manufactured Housing Contract A2-2 | | | | 6.170% | | 12/25/11 | | | 555,892 | | | 452,158 | |
| | | | | | | | | | | | | |
| | | | | | | | | | | | 845,286 | |
| | | | | | | | | | | | | |
Indexed SecuritiesE | | 7.5% | | | | | | | | | | | |
American Home Mortgage Assets 2006-6 A1A | | | | 1.585% | | 12/25/46 | | | 327,732 | | | 135,688 | |
American Home Mortgage Investment Trust 2005-4 5A | | | | 5.350% | | 11/25/45 | | | 868,004 | | | 427,227 | |
Banc of America Mortgage Securities 2003-F 1A1 | | | | 5.137% | | 7/25/33 | | | 33,531 | | | 18,880 | |
Banc of America Mortgage Securities 2004-A 1A1 | | | | 6.740% | | 2/25/34 | | | 65,319 | | | 55,985 | |
Bear Stearns Adjustable Rate Mortgage Trust 2005-12 23A1 | | | | 5.733% | | 2/25/36 | | | 3,003,190 | | | 1,603,378 | |
Bear Stearns Alt-A Trust 2004-10 1A1 | | | | 1.735% | | 9/25/34 | | | 217,103 | | | 119,579 | |
Bear Stearns Alt-A Trust 2004-11 1A2 | | | | 2.235% | | 11/25/34 | | | 144,313 | | | 30,959 | |
Bear Stearns Alt-A Trust 2005-2 1A1 | | | | 1.645% | | 3/25/35 | | | 63,577 | | | 28,740 | |
Bear Stearns Mortgage Funding Trust
2006-AR5 1A1 | | | | 1.555% | | 12/25/46 | | | 1,135,271 | | | 489,364 | |
Citigroup Mortgage Loan Trust Inc. 2005-9 1A1 | | | | 1.655% | | 11/25/35 | | | 588,717 | | | 268,784 | |
Countrywide Alternative Loan Trust 2005-24 4A1 | | | | 1.683% | | 7/20/35 | | | 765,408 | | | 377,659 | |
Countrywide Alternative Loan Trust 2005-51 2A1 | | | | 1.753% | | 11/20/35 | | | 469,298 | | | 217,792 | |
Countrywide Alternative Loan Trust 2005-59 1A1 | | | | 4.505% | | 11/20/35 | | | 644,530 | | | 322,188 | |
Countrywide Alternative Loan Trust 2005-76 3A1 | | | | 1.655% | | 1/25/46 | | | 489,788 | | | 244,764 | |
Countrywide Alternative Loan Trust 2005-J12 | | | | 1.665% | | 8/25/35 | | | 315,045 | | | 151,938 | |
Countrywide Alternative Loan Trust
2006-OA10 4A3 | | | | 1.665% | | 8/25/46 | | | 2,174,041 | | | 354,629 | |
Countrywide Alternative Loan Trust
2006-OA8 1A2 | | | | 1.625% | | 7/25/46 | | | 716,724 | | | 141,422 | |
Countrywide Alternative Loan Trust
2006-OA9 1A1 | | | | 1.653% | | 7/20/46 | | | 1,262,865 | | | 438,023 | |
Countrywide Home Loans 2001-HYB1 1A1 | | | | 4.928% | | 6/19/31 | | | 31,872 | | | 31,857 | |
Countrywide Home Loans 2003-60 1A1 | | | | 4.734% | | 2/25/34 | | | 621,502 | | | 433,898 | |
Countrywide Home Loans 2003-HYB1 1A1 | | | | 6.644% | | 5/19/33 | | | 37,438 | | | 32,300 | |
17
Annual Report to Shareholders
Portfolio of Investments—Continued
Western Asset Absolute Return Portfolio—Continued
| | | | | | | | | | | | | |
| | | % OF
NET ASSETS | | RATE | | MATURITY
DATE | | PAR/
SHARES† | | VALUE | |
| | | | | | | | | | | | | |
Mortgage-Backed Securities—Continued | | | | | | | | | | | | | |
| | | | | |
Indexed Securities—Continued | | | | | | | | | | | | | |
Countrywide Home Loans 2006-3 1A2 | | | | 1.725% | | 3/25/36 | | $ | 558,862 | | $ | 143,867 | |
Deutsche Mortgage Securities Inc. 2004-4 7AR2 | | | | 1.845% | | 6/25/34 | | | 405,837 | | | 312,208 | |
First Horizon Alternative Mortgage Securities 2005-AA12 1A1 | | | | 5.648% | | 2/25/36 | | | 541,324 | | | 260,994 | |
Greenpoint Mortgage Funding Trust
2006-AR2 1A2 | | | | 1.645% | | 4/25/36 | | | 3,838,164 | | | 1,177,536 | |
Greenpoint Mortgage Funding Trust
2006-AR3 3A1 | | | | 1.625% | | 4/25/36 | | | 781,880 | | | 321,169 | |
GSR Mortgage Loan Trust 2006-0A1 2A2 | | | | 3.519% | | 8/25/46 | | | 709,035 | | | 178,356 | |
Harborview Mortgage Loan Trust 2006-13 A | | | | 1.654% | | 11/19/46 | | | 594,248 | | | 236,276 | |
Harborview Mortgage Loan Trust 2006-14 2A1A | | | | 1.624% | | 1/25/47 | | | 1,265,479 | | | 502,499 | |
Harborview Mortgage Loan Trust 2007-7 2A1A | | | | 2.395% | | 11/25/47 | | | 1,625,690 | | | 625,345 | |
Impac CMB Trust 2004-5 1A1 | | | | 1.755% | | 10/25/34 | | | 288,939 | | | 165,947 | |
Impac CMB Trust 2004-6 1A2 | | | | 2.175% | | 10/25/34 | | | 416,462 | | | 210,354 | |
Impac CMB Trust 2005-7 A1 | | | | 1.655% | | 11/25/35 | | | 555,204 | | | 261,857 | |
Impac Secured Assets Corp. 2004-3 1A4 | | | | 1.795% | | 11/25/34 | | | 20,276 | | | 10,062 | |
Impac Secured Assets Corp. 2005-2 | | | | 1.715% | | 3/25/36 | | | 434,434 | | | 201,550 | |
Lehman XS Trust 2006-GP2 1A1A | | | | 1.465% | | 6/25/46 | | | 262,932 | | | 210,214 | |
Merit Securities Corp. 11PA B2 | | | | 2.931% | | 9/28/32 | | | 42,696 | | | 29,821 | A |
Merrill Lynch Mortgage Investors Trust 2004-A3 4A3 | | | | 5.029% | | 5/25/34 | | | 1,326,248 | | | 962,241 | |
Residential Accredit Loans Inc. 2007-Q01 A1 | | | | 1.545% | | 2/25/47 | | | 3,435,647 | | | 1,305,541 | |
Structured Adjustable Rate Mortgage Loan Trust 2004-7 A1 | | | | 1.800% | | 6/25/34 | | | 24,232 | | | 13,150 | |
Structured Adjustable Rate Mortgage Loan Trust 2005-19XS | | | | 1.715% | | 10/25/35 | | | 1,724,025 | | | 776,332 | |
Structured Asset Mortgage Investments Inc. 2003-AR2 A1 | | | | 1.844% | | 12/19/33 | | | 118,760 | | | 80,343 | |
Structured Asset Mortgage Investments Inc. 2006-AR6 | | | | 1.585% | | 7/25/46 | | | 2,095,989 | | | 722,906 | |
Structured Asset Mortgage Investments Inc. 2007-AR4 A1 | | | | 1.595% | | 9/25/47 | | | 1,699,212 | | | 1,397,931 | |
Structured Asset Securities Corp. 2002-08A 7A1 | | | | 5.118% | | 5/25/32 | | | 108,885 | | | 99,188 | |
Structured Asset Securities Corp. 2002-11A 1A1 | | | | 5.267% | | 6/25/32 | | | 26,494 | | | 21,865 | |
Structured Asset Securities Corp. 2002-16A 1A1 | | | | 6.222% | | 8/25/32 | | | 249,906 | | | 248,740 | |
18
Annual Report to Shareholders
| | | | | | | | | | | | | |
| | | % OF
NET ASSETS | | RATE | | MATURITY
DATE | | PAR/
SHARES† | | VALUE | |
| | | | | | | | | | | | | |
Mortgage-Backed Securities—Continued | | | | | | | | | | | | | |
| | | | | |
Indexed Securities—Continued | | | | | | | | | | | | | |
Structured Asset Securities Corp. 2002-18A 1A1 | | | | 6.157% | | 9/25/32 | | $ | 20,247 | | $ | 20,071 | |
Structured Asset Securities Corp. 2004-NP1 A | | | | 1.795% | | 9/25/33 | | | 271,094 | | | 219,884 | A |
Thornburg Mortgage Securities Trust 2004-1 I2A | | | | 1.845% | | 3/25/44 | | | 39,485 | | | 35,308 | |
Thornburg Mortgage Securities Trust 2006-1 | | | | 1.565% | | 1/25/46 | | | 688,924 | | | 686,296 | |
WaMu Mortgage Pass- Through Certificates 2006-AR11 3A1A | | | | 3.399% | | 9/25/46 | | | 2,886,863 | | | 1,010,402 | |
WaMu Mortgage Pass-Through Certificates 2006-AR2 A1A | | | | 3.419% | | 4/25/46 | | | 4,704,466 | | | 1,952,353 | |
WaMu Mortgage Pass-Through Certificates 2006-AR3 A1A | | | | 3.449% | | 5/25/46 | | | 3,786,663 | | | 1,476,798 | |
WaMu Mortgage Pass-Through Certificates 2006-AR4 DA | | | | 3.449% | | 6/25/46 | | | 2,041,440 | | | 653,261 | |
WaMu Mortgage Pass-Through Certificates 2006-AR6 2A | | | | 3.439% | | 8/25/46 | | | 2,776,887 | | | 1,055,217 | |
| | | | | | | | | | | | | |
| | | | | | | | | | | | 23,510,936 | |
| | | | | | | | | | | | | |
Variable Rate SecuritiesJ | | 4.0% | | | | | | | | | | | |
Adjustable Rate Mortgage Trust 2004-1 4A1 | | | | 5.550% | | 1/25/35 | | | 4,669,177 | | | 3,175,041 | |
Banc of America Funding Corp. 2006-D 6A1 | | | | 5.990% | | 5/20/36 | | | 1,405,346 | | | 684,097 | |
Bear Stearns Adjustable Rate Mortgage Trust 2004-12 1A1 | | | | 6.455% | | 2/25/35 | | | 160,095 | | | 104,362 | |
Bear Stearns Alt-A Trust 2003-5 2A1 | | | | 5.056% | | 12/25/33 | | | 699,991 | | | 457,086 | |
Bear Stearns Alt-A Trust 2005 -10 21A1 | | | | 5.547% | | 1/25/36 | | | 511,160 | | | 244,369 | |
BlackRock Capital Finance LP 1996-R1 | | | | 9.584% | | 9/25/26 | | | 392,549 | | | 117,765 | |
MASTR Adjustable Rate Mortgages Trust 2003-3 3A4 | | | | 4.570% | | 9/25/33 | | | 2,178,577 | | | 1,471,084 | |
Morgan Stanley Mortgage Loan Trust 2004-6AR | | | | 4.886% | | 8/25/34 | | | 121,696 | | | 56,752 | |
Morgan Stanley Mortgage Loan Trust 2006-3AR 2A3 | | | | 5.774% | | 3/25/36 | | | 660,226 | | | 301,413 | |
Nomura Asset Acceptance Corp. 2006-AF2 4A | | | | 6.681% | | 8/25/36 | | | 700,084 | | | 304,452 | |
Sequoia Mortgage Trust 2007-4 4A1 | | | | 6.030% | | 7/20/47 | | | 1,584,471 | | | 1,014,061 | |
Structured Adjustable Rate Mortgage Loan Trust 2004-17 A1 | | | | 4.158% | | 11/25/34 | | | 66,342 | | | 38,236 | |
Structured Adjustable Rate Mortgage Loan Trust 2004-4 3A2 | | | | 4.590% | | 4/25/34 | | | 1,119,493 | | | 656,005 | |
Structured Adjustable Rate Mortgage Loan Trust 2005-20 4A1 | | | | 5.946% | | 10/25/35 | | | 2,330,569 | | | 1,182,434 | |
19
Annual Report to Shareholders
Portfolio of Investments—Continued
Western Asset Absolute Return Portfolio—Continued
| | | | | | | | | | | | |
| | | % OF
NET ASSETS | | RATE | | MATURITY
DATE | | PAR/
SHARES† | | VALUE |
| | | | | | | | | | | | |
Mortgage-Backed
Securities—Continued | | | | | | | | | | | | |
| | | | | |
Variable Rate Securities—Continued | | | | | | | | | | | | |
Thornburg Mortgage Securities Trust 2007-4 2A1 | | | | 6.216% | | 9/25/37 | | $ | 1,617,641 | | $ | 1,145,641 |
Thornburg Mortgage Securities Trust 2007-4 3A1 | | | | 6.203% | | 9/25/37 | | | 1,545,708 | | | 1,185,891 |
Wells Fargo Mortgage-Backed Securities Trust 2005-AR9 4A1 | | | | 4.304% | | 5/25/35 | | | 671,282 | | | 595,829 |
| | | | | | | | | | | | |
| | | | | | | | | | | | 12,734,518 |
| | | | | | | | | | | | |
Total Mortgage-Backed Securities
(Cost—$71,953,334) | | | | | | | | | | | | 37,090,740 |
Loan Participations and AssignmentsE | | 11.2% | | | | | | | | | | |
| | | | | |
Aerospace and Defense | | 0.3% | | | | | | | | | | |
Dubai Aerospace Enterprise, Term Loan, Tranche B1 | | | | 5.800% to 7.170% | | 1/30/09 | | | 287,234 | | | 143,617 |
Dubai Aerospace Enterprise, Term Loan, Tranche B2 | | | | 7.170% | | 1/30/09 | | | 283,871 | | | 141,936 |
TransDigm Inc., Term Loan, Tranche B | | | | 3.498% | | 3/23/09 | | | 1,000,000 | | | 790,000 |
| | | | | | | | | | | | |
| | | | | | | | | | | | 1,075,553 |
| | | | | | | | | | | | |
Airlines | | 0.2% | | | | | | | | | | |
Delta Air Lines Inc., Term Loan | | | | 3.899% to 4.700% | | 1/30/09 | | | 990,000 | | | 625,680 |
| | | | | | | | | | | | |
| | | | | |
Auto Components | | 0.2% | | | | | | | | | | |
Allison Transmission Inc., Term Loan, Tranche B | | | | 4.190% to 5.000% | | 3/31/09 | | | 973,871 | | | 538,411 |
| | | | | | | | | | | | |
| | | | | |
Automobiles | | 0.2% | | | | | | | | | | |
Chrysler Financial Services NA LLC, First Lien Term Loan | | | | 6.000% | | 3/16/09 | | | 987,500 | | | 497,276 |
| | | | | | | | | | | | |
| | | | | |
Commercial Services and Supplies | | 0.6% | | | | | | | | | | |
Aramark Corp., Letter of Credit | | | | 5.637% | | 1/7/09 | | | 131,683 | | | 107,980 |
Aramark Corp., Term Loan, Tranche B | | | | 3.334% | | 3/31/09 | | | 2,072,776 | | | 1,699,676 |
| | | | | | | | | | | | |
| | | | | | | | | | | | 1,807,656 |
| | | | | | | | | | | | |
20
Annual Report to Shareholders
| | | | | | | | | | | | |
| | | % OF
NET ASSETS | | RATE | | MATURITY
DATE | | PAR/
SHARES† | | VALUE |
| | | | | | | | | | | | |
Loan Participations and Assignments—Continued | | | | | | | | | | | | |
| | | | | |
Computers and Peripherals | | 0.4% | | | | | | | | | | |
CCG, Term Loan, Tranche B | | | | 3.811%��to 5.428% | | 6/30/09 | | $ | 830,000 | | $ | 655,700 |
SunGard Data Systems Inc., Term Loan, Tranche B | | | | 3.575% to 4.138% | | 2/9/09 | | | 977,538 | | | 665,703 |
| | | | | | | | | | | | |
| | | | | | | | | | | | 1,321,403 |
| | | | | | | | | | | | |
Containers and Packaging | | 0.4% | | | | | | | | | | |
Amscan Holdings Inc., Term Loan, Tranche B | | | | 3.716% to 4.423% | | 3/26/09 | | | 985,000 | | | 615,625 |
Graham Packaging Co. LP, Term Loan, Tranche B | | | | 2.750% to 6.313% | | 4/3/09 | | | 982,500 | | | 704,944 |
| | | | | | | | | | | | |
| | | | | | | | | | | | 1,320,569 |
| | | | | | | | | | | | |
Distributors | | 0.1% | | | | | | | | | | |
Keystone Automotive Industries Inc., Term Loan, Tranche B | | | | 5.325% to 5.750% | | 3/31/09 | | | 953,328 | | | 357,498 |
| | | | | | | | | | | | |
| | | | | |
Diversified Consumer Services | | 0.2% | | | | | | | | | | |
Thomson Medical Education, Term Loan, Tranche B | | | | 2.960% | | 1/30/09 | | | 990,000 | | | 639,650 |
| | | | | | | | | | | | |
| | | | | |
Electric Utilities | | 0.3% | | | | | | | | | | |
TXU, Term Loan, Tranche B2 | | | | 3.949% to 5.888% | | 2/9/09 | | | 1,237,500 | | | 855,422 |
| | | | | | | | | | | | |
| | | | | |
Energy Equipment and Services | | 0.2% | | | | | | | | | | |
Brand Energy, Term Loan, Tranche B | | | | 4.750% to 5.188% | | 3/31/09 | | | 990,000 | | | 504,900 |
| | | | | | | | | | | | |
| | | | | |
Health Care Providers and Services | | 1.5% | | | | | | | | | | |
Community Health Systems Inc., Term Loan, Tranche B | | | | 4.439% to 4.446% | | 2/27/09 | | | 2,267,560 | | | 1,757,926 |
Community Health, Delayed Draw Term Loan | | | | 3.404% | | 2/27/09 | | | 116,009 | | | 89,936 |
Davita Inc., Term Loan, Tranche B1 | | | | 1.970% to 6.320% | | 3/31/09 | | | 1,000,000 | | | 869,286 |
HCA Inc., Term Loan, Tranche B | | | | 3.709% | | 3/31/09 | | | 980,000 | | | 766,238 |
IASIS Healthcare Corp., Delayed Draw Term Loan | | | | 2.461% | | 1/30/09 | | | 238,293 | | | 169,039 |
IASIS Healthcare Corp., Letter of Credit | | | | 2.474% | | 1/7/09 | | | 63,704 | | | 45,190 |
21
Annual Report to Shareholders
Portfolio of Investments—Continued
Western Asset Absolute Return Portfolio—Continued
| | | | | | | | | | | | |
| | | % OF
NET ASSETS | | RATE | | MATURITY
DATE | | PAR/
SHARES† | | VALUE |
| | | | | | | | | | | | |
Loan Participations and Assignments—Continued | | | | | | | | | | | | |
| | | | | |
Health Care Providers and Services—Continued | | | | | | | | | | | | |
IASIS Healthcare Corp., Term Loan | | | | 2.461% | | 1/30/09 | | $ | 688,666 | | $ | 488,522 |
Sheridan Healthcare Inc., Term Loan, Tranche B | | | | 3.959% to 7.135% | | 3/31/09 | | | 987,500 | | | 553,000 |
| | | | | | | | | | | | |
| | | | | | | | | | | | 4,739,137 |
| | | | | | | | | | | | |
Hotels, Restaurants and Leisure | | 0.6% | | | | | | | | | | |
Harrah’s Entertainment Inc., Term Loan B | | | | 4.459% to 6.535% | | 3/31/09 | | | 995,000 | | | 575,166 |
Las Vegas Sands LLC, Delayed Term Loan | | | | 2.220% | | 1/30/09 | | | 199,500 | | | 89,553 |
Las Vegas Sands LLC, Term Loan, Tranche B | | | | 2.220% | | 1/30/09 | | | 790,000 | | | 354,622 |
Quiznos LLC, First Lien Term Loan | | | | 3.750% | | 3/31/09 | | | 982,412 | | | 510,854 |
Wimar Opco LLC, Term Loan, Tranche B | | | | 6.500% | | 3/31/09 | | | 947,645 | | | 216,379 |
| | | | | | | | | | | | |
| | | | | | | | | | | | 1,746,574 |
| | | | | | | | | | | | |
Independent Power Producers and Energy Traders | | 0.3% | | | | | | | | | | |
NRG Energy Inc., Term Loan | | | | 1.961% | | 3/31/09 | | | 1,267,532 | | | 1,094,831 |
| | | | | | | | | | | | |
| | | | | |
IT Services | | 0.7% | | | | | | | | | | |
First Data Corp., Term Loan B2 | | | | 3.211% | | 1/30/09 | | | 3,336,300 | | | 2,136,423 |
| | | | | | | | | | | | |
| | | | | |
Machinery | | 0.3% | | | | | | | | | | |
Nacco Materials Handling Group, Term Loan | | | | 2.461% to 4.595% | | 5/15/09 | | | 982,412 | | | 510,854 |
Oshkosh Truck Corp., Term Loan, Tranche B | | | | 1.970% to 3.700% | | 3/6/09 | | | 880,385 | | | 509,890 |
| | | | | | | | | | | | |
| | | | | | | | | | | | 1,020,744 |
| | | | | | | | | | | | |
Media | | 2.0% | | | | | | | | | | |
Cedar Fair LP, Term Loan, Tranche B | | | | 2.461% | | 1/30/09 | | | 977,500 | | | 610,937 |
Charter Communications Operating LLC, Term Loan | | | | 4.160% to 5.470% | | 2/12/09 | | | 990,000 | | | 722,700 |
Citadel Communication Group, Term Loan, Tranche B | | | | 2.220% to 3.650% | | 1/30/09 | | | 1,000,000 | | | 400,000 |
22
Annual Report to Shareholders
| | | | | | | | | | | | |
| | | % OF
NET ASSETS | | RATE | | MATURITY
DATE | | PAR/
SHARES† | | VALUE |
| | | | | | | | | | | | |
Loan Participations and Assignments—Continued | | | | | | | | | | | | |
| | | | | |
Media—Continued | | | | | | | | | | | | |
CSC Holdings Inc., Incremental Term Loan | | | | 2.945% | | 1/15/09 | | $ | 977,444 | | $ | 830,419 |
Idearc Inc., Term Loan, Tranche B | | | | 2.470% to 3.460% | | 3/31/09 | | | 982,500 | | | 299,663 |
Insight Midwest Holdings LLC, Term Loan, Tranche B | | | | 3.910% | | 1/2/09 | | | 675,000 | | | 497,813 |
Lodgenet Entertainment Corp., Term Loan, Tranche B | | | | 3.460% | | 3/31/09 | | | 971,500 | | | 354,598 |
Nielsen Finance LLC, Term Loan, Tranche B | | | | 3.825% to 4.388% | | 2/9/09 | | | 980,007 | | | 659,667 |
Tribune Co., Tranche B | | | | 5.250% | | 3/31/09 | | | 987,500 | | | 272,974 |
Univision Communications, Term Loan, Tranche B | | | | 2.711% | | 1/30/09 | | | 1,000,000 | | | 398,333 |
UPC Broadband Holding, Term Loan, Tranche N1 | | | | 3.181% | | 1/2/09 | | | 2,000,000 | | | 1,328,000 |
| | | | | | | | | | | | |
| | | | | | | | | | | | 6,375,104 |
| | | | | | | | | | | | |
Metals and Mining | | 0.2% | | | | | | | | | | |
Noranda Aluminum Acquisition Corp., Term Loan | | | | 4.239% | | 2/19/09 | | | 925,765 | | | 536,944 |
| | | | | | | | | | | | |
| | | | | |
Multiline Retail | | 0.4% | | | | | | | | | | |
Dollar General Corp., Term Loan, Tranche B | | | | 3.250% to 6.170% | | 7/7/14 | | | 1,000,000 | | | 768,750 |
Neiman Marcus Group Inc., Term Loan | | | | 4.193% | | 3/6/09 | | | 1,000,000 | | | 631,818 |
| | | | | | | | | | | | |
| | | | | | | | | | | | 1,400,568 |
| | | | | | | | | | | | |
Oil, Gas and Consumable Fuels | | 0.4% | | | | | | | | | | |
Alpha Natural Resources, Term Loan B | | | | 2.000% | | 3/30/09 | | | 941,919 | | | 798,277 |
Ashmore Energy, Term Loan | | | | 4.456% | | 1/30/09 | | | 864,936 | | | 484,364 |
Ashmore Energy, Term Loan | | | | 3.461% | | 3/31/09 | | | 95,952 | | | 55,652 |
| | | | | | | | | | | | |
| | | | | | | | | | | | 1,338,293 |
| | | | | | | | | | | | |
Paper and Forest Products | | 0.2% | | | | | | | | | | |
Georgia-Pacific Corp., First Lien Term Loan | | | | 2.581% to 4.189% | | 3/31/09 | | | 872,257 | | | 708,345 |
| | | | | | | | | | | | |
23
Annual Report to Shareholders
Portfolio of Investments—Continued
Western Asset Absolute Return Portfolio—Continued
| | | | | | | | | | | | | |
| | | % OF
NET ASSETS | | RATE | | MATURITY
DATE | | PAR/
SHARES† | | VALUE | |
| | | | | | | | | | | | | |
Loan Participations and
Assignments—Continued | | | | | | | | | | | | | |
| | | | | |
Personal Products | | 0.4% | | | | | | | | | | | |
Bausch and Lomb Inc., Term Loan, Tranche B | | | | 4.709% | | 3/31/09 | | $ | 1,587,181 | | $ | 1,072,480 | |
Bausch and Lomb Inc., Term Loan, Tranche B | | | | 4.709% | | 3/31/09 | | | 400,803 | | | 270,829 | |
| | | | | | | | | | | | | |
| | | | | | | | | | | | 1,343,309 | |
| | | | | | | | | | | | | |
Road and Rail | | 0.1% | | | | | | | | | | | |
Swift Transportation, Term Loan | | | | 4.688% to 6.500% | | 2/2/09 | | | 883,721 | | | 313,721 | |
| | | | | | | | | | | | | |
| | | | | |
Semiconductors and Semiconductor Equipment | | 0.3% | | | | | | | | | | | |
Freescale Semiconductor, Term Loan, Tranche B | | | | 3.931% | | 3/2/09 | | | 980,000 | | | 561,322 | |
Sensata Technologies, Term Loan, Tranche B | | | | 5.258% | | 1/29/09 | | | 977,500 | | | 488,750 | |
| | | | | | | | | | | | | |
| | | | | | | | | | | | 1,050,072 | |
| | | | | | | | | | | | | |
Specialty Retail | | 0.2% | | | | | | | | | | | |
Michaels Stores Inc., Term Loan B | | | | 2.750% to 4.500% | | 1/30/09 | | | 984,925 | | | 506,497 | |
| | | | | | | | | | | | | |
| | | | | |
Wireless Telecommunication Services | | 0.5% | | | | | | | | | | | |
ALLTEL Corp., Term Loan B2 | | | | 4.371% | | 3/17/09 | | | 1,488,725 | | | 1,459,323 | |
| | | | | | | | | | | | | |
Total Loan Participations and Assignments (Cost—$54,980,203) | | | | | | | | | | | | 35,313,903 | |
U.S. Government and Agency Obligations | | 3.2% | | | | | | | | | | | |
| | | | | |
Fixed Rate Securities | | 0.2% | | | | | | | | | | | |
Fannie Mae | | | | 5.250% | | 8/1/12 | | | 620,000 | | | 653,492 | G |
| | | | | | | | | | | | | |
| | | | | |
Treasury Inflation-Protected SecuritiesK | | 3.0% | | | | | | | | | | | |
United States Treasury Inflation-Protected Security | | | | 2.500% | | 7/15/16 | | | 2,091,863 | | | 2,075,356 | L |
United States Treasury Inflation-Protected Security | | | | 2.375% | | 1/15/17 | | | 4,490,490 | | | 4,455,056 | L |
24
Annual Report to Shareholders
| | | | | | | | | | | | | |
| | | % OF
NET ASSETS | | RATE | | MATURITY
DATE | | PAR/
SHARES† | | VALUE | |
| | | | | | | | | | | | | |
U.S. Government and Agency Obligations—Continued | | | | | | | | | | | | | |
| | | | | |
Treasury Inflation-Protected Securities—Continued | | | | | | | | | | | | | |
United States Treasury Inflation-Protected Security | | | | 2.000% | | 1/15/26 | | $ | 109,153 | | $ | 102,817 | L |
United States Treasury Inflation-Protected Security | | | | 2.375% | | 1/15/27 | | | 2,674,957 | | | 2,687,286 | L |
| | | | | | | | | | | | | |
| | | | | | | | | | | | 9,320,515 | |
| | | | | | | | | | | | | |
Total U.S. Government and Agency Obligations (Cost—$9,730,036) | | | | | | | | | | | | 9,974,007 | |
U.S. Government Agency Mortgage-Backed Securities | | 36.4% | | | | | | | | | | | |
| | | | | |
Fixed Rate Securities | | 36.4% | | | | | | | | | | | |
Fannie Mae | | | | 5.500% | | 6/1/33 to 8/1/38 | | | 14,210,659 | | | 14,602,021 | G |
Fannie Mae | | | | 5.000% | | 4/1/35 to 4/1/38 | | | 7,265,728 | | | 7,432,818 | G |
Fannie Mae | | | | 5.000% | | 12/1/38 | | | 18,700,000 | | | 19,091,541 | G,M |
Fannie Mae | | | | 5.500% | | 12/1/38 | | | 31,200,000 | | | 31,980,000 | G,M |
Fannie Mae | | | | 6.000% | | 12/1/38 | | | 4,900,000 | | | 5,043,938 | G,M |
Freddie Mac | | | | 5.500% | | 12/1/37 | | | 22,698,989 | | | 23,259,331 | G |
Freddie Mac | | | | 6.000% | | 12/1/37 | | | 2,468,590 | | | 2,545,700 | G |
Freddie Mac | | | | 5.500% | | 12/1/38 | | | 1,300,000 | | | 1,330,469 | G,M |
Freddie Mac | | | | 6.000% | | 12/1/38 | | | 8,800,000 | | | 9,064,000 | G,M |
| | | | | | | | | | | | | |
Total U.S. Government Agency Mortgage-Backed Securities
(Cost—$112,452,872) | | | | | | | | | | | | 114,349,818 | |
Yankee BondsN | | 3.8% | | | | | | | | | | | |
| | | | | |
Commercial Banks | | 1.3% | | | | | | | | | | | |
Glitnir Banki Hf | | | | 6.375% | | 9/25/12 | | | 680,000 | | | 32,300 | A,D,P |
Glitnir Banki Hf | | | | 6.693% | | 6/15/16 | | | 1,810,000 | | | 271 | A,C,D,P |
Glitnir Banki Hf | | | | 7.451% | | 9/14/49 | | | 100,000 | | | 15 | A,C,D,P |
HBOS Capital Funding LP | | | | 6.071% | | 6/30/49 | | | 230,000 | | | 85,066 | A,C |
HSBK Europe BV | | | | 7.250% | | 5/3/17 | | | 1,480,000 | | | 799,200 | A |
ICICI Bank Ltd. | | | | 6.375% | | 4/30/22 | | | 1,422,000 | | | 746,709 | A,C |
ICICI Bank Ltd. | | | | 6.375% | | 4/30/22 | | | 590,000 | | | 311,001 | A,C |
Kaupthing Bank Hf | | | | 7.625% | | 2/28/15 | | | 3,130,000 | | | 187,800 | A,D,P,H |
Kaupthing Bank Hf | | | | 7.125% | | 5/19/16 | | | 240,000 | | | 1,800 | A,D,P |
Landsbanki Islands Hf | | | | 6.100% | | 8/25/11 | | | 2,190,000 | | | 38,325 | A,D,P |
Natixis | | | | 10.000% | | 4/29/49 | | | 1,300,000 | | | 603,083 | A,C |
Shinsei Finance Cayman Ltd. | | | | 6.418% | | 1/29/49 | | | 300,000 | | | 62,746 | A,C |
25
Annual Report to Shareholders
Portfolio of Investments—Continued
Western Asset Absolute Return Portfolio—Continued
| | | | | | | | | | | | | |
| | | % OF
NET ASSETS | | RATE | | MATURITY
DATE | | PAR/
SHARES† | | VALUE | |
| | | | | | | | | | | | | |
Yankee Bonds—Continued | | | | | | | | | | | | | |
| | | | | |
Commercial Banks—Continued | | | | | | | | | | | | | |
TuranAlem Finance BV | | | | 8.250% | | 1/22/37 | | $ | 1,330,000 | | $ | 571,900 | A |
TuranAlem Finance BV | | | | 8.250% | | 1/22/37 | | | 1,390,000 | | | 597,700 | A |
| | | | | | | | | | | | | |
| | | | | | | | | | | | 4,037,916 | |
| | | | | | | | | | | | | |
Diversified Financial Services | | 0.3% | | | | | | | | | | | |
TNK-BP Finance SA | | | | 7.500% | | 7/18/16 | | | 550,000 | | | 286,000 | A |
TNK-BP Finance SA | | | | 7.500% | | 7/18/16 | | | 781,000 | | | 406,120 | A |
TNK-BP Finance SA | | | | 6.625% | | 3/20/17 | | | 200,000 | | | 96,000 | A |
TNK-BP Finance SA | | | | 6.625% | | 3/20/17 | | | 342,000 | | | 164,160 | A |
| | | | | | | | | | | | | |
| | | | | | | | | | | | 952,280 | |
| | | | | | | | | | | | | |
Diversified Telecommunication Services | | 0.4% | | | | | | | | | | | |
NTL Cable PLC | | | | 9.125% | | 8/15/16 | | | 340,000 | | | 251,600 | |
VIP Finance Ireland Ltd | | | | 8.375% | | 4/30/13 | | | 940,000 | | | 601,600 | A |
Wind Acquisition Finance SA | | | | 10.750% | | 12/1/15 | | | 300,000 | | | 258,000 | A |
| | | | | | | | | | | | | |
| | | | | | | | | | | | 1,111,200 | |
| | | | | | | | | | | | | |
Energy Equipment and Services | | N.M. | | | | | | | | | | | |
Compagnie Generale de Geophysique-Veritas | | | | 7.750% | | 5/15/17 | | | 250,000 | | | 145,000 | |
| | | | | | | | | | | | | |
| | | | | |
Food and Staples Retailing | | 0.9% | | | | | | | | | | | |
Delhaize Group | | | | 6.500% | | 6/15/17 | | | 3,014,000 | | | 2,736,694 | |
| | | | | | | | | | | | | |
| | | | | |
Metals and Mining | | 0.8% | | | | | | | | | | | |
Evraz Group SA | | | | 8.875% | | 4/24/13 | | | 1,170,000 | | | 596,700 | A |
Novelis Inc. | | | | 7.250% | | 2/15/15 | | | 440,000 | | | 255,200 | |
Vale Overseas Ltd. | | | | 6.875% | | 11/21/36 | | | 1,356,000 | | | 1,230,841 | |
Vedanta Resources PLC | | | | 8.750% | | 1/15/14 | | | 630,000 | | | 378,000 | A |
| | | | | | | | | | | | | |
| | | | | | | | | | | | 2,460,741 | |
| | | | | | | | | | | | | |
Oil, Gas and Consumable Fuels | | N.M. | | | | | | | | | | | |
Teekay Shipping Corp. | | | | 8.875% | | 7/15/11 | | | 140,000 | | | 118,300 | |
| | | | | | | | | | | | | |
| | | | | |
Paper and Forest Products | | 0.1% | | | | | | | | | | | |
Abitibi-Consolidated Co. of Canada | | | | 15.500% | | 7/15/10 | | | 137,000 | | | 39,730 | A |
Abitibi-Consolidated Co. of Canada | | | | 13.750% | | 4/1/11 | | | 500,000 | | | 320,000 | A |
| | | | | | | | | | | | | |
| | | | | | | | | | | | 359,730 | |
| | | | | | | | | | | | | |
Total Yankee Bonds (Cost—$26,677,265) | | | | | | | | | | | | 11,921,861 | |
26
Annual Report to Shareholders
| | | | | | | | | | | | | | |
| | | % OF
NET ASSETS | | RATE | | MATURITY
DATE | | PAR/
SHARES† | | | VALUE | |
| | | | | | | | | | | | | | |
Foreign Government Obligations | | 3.2% | | | | | | | | | | | | |
Brazil Notas do Tesouro Nacional Series F | | | | 10.000% | | 1/1/12 | | | 1,683,000 | BRL | | $ | 711,532 | |
Commonwealth of Australia | | | | 4.000% | | 8/20/20 | | | 1,730,000 | AUD | | | 1,926,098 | O |
Federative Republic of Brazil | | | | 10.000% | | 1/1/10 | | | 1 | BRL | | | 422 | |
Federative Republic of Brazil | | | | 10.000% | | 7/1/10 | | | 4,452 | BRL | | | 1,854,994 | |
Federative Republic of Brazil | | | | 6.000% | | 5/15/15 | | | 591 | BRL | | | 401,946 | O |
Government of Indonesia | | | | 10.250% | | 7/15/27 | | | 10,665,000,000 | IDR | | | 752,737 | |
Kingdom of Sweden Inflation-Protected Notes | | | | 3.500% | | 12/1/28 | | | 15,000,000 | SEK | | | 2,939,726 | O |
Thailand Government Bond | | | | 4.250% | | 3/13/13 | | | 22,000,000 | THB | | | 687,107 | |
United Kingdom Treasury Gilt | | | | 1.250% | | 11/22/55 | | | 390,813 | GBP | | | 742,775 | O |
| | | | | | | | | | | | | | |
Total Foreign Government Obligations
(Cost—$11,405,764) | | | | | | | | | | | | | 10,017,337 | |
Preferred Stocks | | 0.1% | | | | | | | | | | | | |
Fannie Mae | | | | 7.000% | | | | | 1,900 | shs | | | 1,425 | E,G |
Preferred Blocker Inc. | | | | 9.000% | | | | | 1,226 | | | | 306,500 | A |
| | | | | | | | | | | | | | |
Total Preferred Stocks (Cost—$402,439) | | | | | | | | | | | | | 307,925 | |
| | | | | | | | | | | | | | |
Total Long-Term Securities
(Cost—$463,785,785) | | | | | | | | | | | | | 358,147,531 | |
Short-Term Securities | | 2.0% | | | | | | | | | | | | |
| | | | | |
U.S. Government and Agency Obligations | | 1.8% | | | | | | | | | | | | |
Federal Home Loan Bank | | | | 0.000% | | 3/26/09 | | $ | 5,500,000 | | | | 5,499,115 | Q |
| | | | | | | | | | | | | | |
| | | | | |
Foreign Government Obligations | | 0.1% | | | | | | | | | | | | |
Bank Negara Malaysia Monetary Notes | | | | 0.000% | | 2/17/09 | | | 600,000 | MYR | | | 172,642 | Q |
| | | | | | | | | | | | | | |
| | | | | |
Options PurchasedR | | 0.1% | | | | | | | | | | | | |
Barclays Swaption Put, January 2009, Strike Price $4.93 | | | | | | | | | 8,050,000 | S | | | 39 | |
UBS Warburg LLC Swaption Call, March 2009, Strike Price $3.62 | | | | | | | | | 3,600,000 | S | | | 342,746 | |
| | | | | | | | | | | | | | |
| | | | | | | | | | | | | 342,785 | |
| | | | | | | | | | | | | | |
Total Short-Term Securities
(Cost—$5,898,013) | | | | | | | | | | | | | 6,014,542 | |
Total Investments (Cost—$469,683,798)T | | 115.9% | | | | | | | | | | | 364,162,073 | |
Other Assets Less Liabilities | | (15.9)% | | | | | | | | | | | (49,906,006 | ) |
| | | | | | | | | | | | | | |
Net Assets | | 100.0% | | | | | | | | | | $ | 314,256,067 | |
| | | | | | | | | | | | | | |
27
Annual Report to Shareholders
Portfolio of Investments—Continued
Western Asset Absolute Return Portfolio—Continued
| | | | | | | | |
| | | EXPIRATION | | ACTUAL
CONTRACTS/
NOTIONAL PAR | | APPRECIATION/ (DEPRECIATION) | |
Futures Contracts PurchasedR | | | | | | | | |
Eurodollar Futures | | March 2009 | | 442 | | $ | 1,881,090 | |
Eurodollar Futures | | June 2009 | | 291 | | | 1,158,232 | |
Eurodollar Futures | | September 2009 | | 91 | | | 354,882 | |
German Euro Bobl Futures | | March 2009 | | 74 | | | 92,960 | |
German Euro Bund Futures | | March 2009 | | 45 | | | 27,377 | |
LIBOR Futures | | March 2009 | | 86 | | | 683,350 | |
U.S. Treasury Bond Futures | | March 2009 | | 101 | | | 1,601,597 | |
U.S. Treasury Note Futures | | March 2009 | | 7 | | | 21,637 | |
| | | | | | | | |
| | | | | | $ | 5,821,125 | |
| | | | | | | | |
Futures Contracts WrittenR | | | | | | | | |
U.S. Treasury Note Futures | | March 2009 | | 573 | | $ | (5,093,912 | ) |
U.S. Treasury Note Futures | | March 2009 | | 26 | | | (96,317 | ) |
| | | | | | | | |
| | | | | | $ | (5,190,229 | ) |
| | | | | | | | |
Options WrittenR | | | | | | | | |
Barclays Swaption Call, Strike Price $4.86 | | October 2013 | | 4,770,000 | | $ | (433,805 | ) |
Barclays Swaption Call, Strike Price $4.95 | | October 2013 | | 4,770,000 | | | (466,402 | ) |
Barclays Swaption Put, Strike Price $4.00 | | January 2009 | | 32,200,000 | | | 235,057 | |
Barclays Swaption Put, Strike Price $4.86 | | October 2013 | | 4,770,000 | | | 165,594 | |
Barclays Swaption Put, Strike Price $4.95 | | October 2013 | | 4,770,000 | | | 165,957 | |
Eurodollar Futures Call, Strike Price $97.50 | | March 2009 | | 286 | | | (873,080 | ) |
Eurodollar Futures Call, Strike Price $97.63 | | March 2009 | | 254 | | | (685,482 | ) |
Eurodollar Futures Call, Strike Price $97.75 | | March 2009 | | 42 | | | (78,435 | ) |
Eurodollar Futures Call, Strike Price $98.00 | | March 2009 | | 45 | | | (70,537 | ) |
Eurodollar Futures Put, Strike Price $96.75 | | March 2009 | | 244 | | | 111,630 | |
Eurodollar Futures Put, Strike Price $97.50 | | March 2009 | | 288 | | | 103,960 | |
Eurodollar Futures Put, Strike Price $97.63 | | March 2009 | | 254 | | | 97,155 | |
U.S. Treasury Bond Futures Put, Strike Price $122.00 | | February 2009 | | 53 | | | 114,844 | |
U.S. Treasury Note Futures Put, Strike Price $113.50 | | February 2009 | | 59 | | | 54,096 | |
U.S. Treasury Note Futures Put, Strike Price $114.00 | | February 2009 | | 116 | | | 173,420 | |
U.S. Treasury Note Futures Put, Strike Price $124.00 | | February 2009 | | 120 | | | (38,100 | ) |
| | | | | | | | |
| | | | | | $ | (1,424,128 | ) |
| | | | | | | | |
| | | | | | | | | |
N.M.—Not Meaningful.
A | | Rule 144a Security – A security purchased pursuant to Rule 144a under the Securities Act of 1933 which may not be resold subject to that rule except to qualified institutional buyers. These securities, which the Fund’s investment adviser has determined to be liquid, represent 8.53% of net assets. |
B | | Convertible Security – Security may be converted into the issuer’s common stock. |
C | | Stepped Coupon Security – A security with a predetermined schedule of interest or dividend rate changes at which time it begins to accrue interest or pay dividends according to the predetermined schedule. |
D | | Bond is currently in default. |
28
Annual Report to Shareholders
E | | Indexed Security – The rates of interest earned on these securities are tied to the London Interbank Offered Rate (“LIBOR”), the Euro Interbank Offered Rate (“EURIBOR”) Index, the Consumer Price Index (“CPI”), the one-year Treasury Bill Rate or the ten-year Japanese Government Bond Rate. The coupon rates are the rates as of December 31, 2008. |
F | | Pay-in-Kind (“PIK”) security – A security in which interest or dividends during the initial few years is paid in additional PIK securities rather than in cash. |
G | | On September 7, 2008, the Federal Housing Finance Agency placed Fannie Mae and Freddie Mac into Conservatorship. |
H | | Illiquid security valued at fair value under the procedures approved by the Board of Directors. |
I | | Stripped Security – Security with interest-only or principal-only payment streams, denoted by a 1 or 2, respectively. For interest-only securities, the amount shown as principal is the notional balance used to calculate the amount of interest due. |
J | | The coupon rates shown on variable rate securities are the rates at December 31, 2008. These rates vary with the weighted average coupon of the underlying loans. |
K | | Treasury Inflation-Protected Security – Treasury security whose principal value is adjusted daily in accordance with changes to the Consumer Price Index for All Urban Consumers. Interest is calculated on the basis of the current adjusted principal value. |
L | | All or a portion of this security is collateral to cover futures and options contracts written. |
M | | When-issued Security – Security purchased on a delayed delivery basis. Final settlement amount and maturity date have not yet been announced. |
N | | Yankee Bond – A dollar-denominated bond issued in the U.S. by foreign entities. |
O | | Inflation-Protected Security – Security whose principal value is adjusted daily or monthly in accordance with changes to the relevant country’s Consumer Price Index or its equivalent used as an inflation proxy. Interest is calculated on the basis of the current adjusted principal value. |
Q | | Zero coupon bond – A bond with no periodic interest payments which is sold at such a discount as to produce a current yield to maturity. |
R | | Options and futures are described in more detail in the notes to financial statements. |
S | | Par represents actual number of contracts. |
T | | At December 31, 2008, the aggregate gross unrealized appreciation and depreciation of investments for federal income tax purposes were substantially as follows: |
| | | | |
| Gross unrealized appreciation | | $ | 4,466,412 | |
| Gross unrealized depreciation | | | (109,992,733 | ) |
| | | | |
| Net unrealized depreciation | | $ | (105,526,321 | ) |
| | | | |
† | | Securities are denominated in U.S. Dollars, unless otherwise noted. |
AUD—Australian Dollar
BRL—Brazilian Real
EUR—Euro
GBP—British Pound
IDR—Indonesian Rupiah
MYR—Malaysian Ringgit
SEK—Swedish Krona
THB—Thailand Baht
See notes to financial statements.
29
Annual Report to Shareholders
Statement of Assets and Liabilities
Western Asset Absolute Return Portfolio
December 31, 2008
| | | | | | | |
Assets: | | | | | | | |
Investment securities at value (Cost—$463,785,785) | | | | | $ | 358,147,531 | |
Short-term securities at value (Cost—$5,898,013) | | | | | | 6,014,542 | |
Cash | | | | | | 9,357,643 | |
Foreign currency at value (Cost—$577,955) | | | | | | 571,953 | |
Receivable for securities sold | | | | | | 46,141,168 | |
Restricted cash pledged for swaps | | | | | | 11,100,000 | |
Interest receivable | | | | | | 4,146,121 | |
Unrealized appreciation of forward foreign currency contracts | | | | | | 3,070,611 | |
Unrealized appreciation on swaps | | | | | | 503,188 | |
Premiums paid for open swaps | | | | | | 175,464 | |
Futures variation margin receivable | | | | | | 1,306,102 | |
Deposits with brokers for open futures contracts | | | | | | 946,513 | |
Receivable for fund shares sold | | | | | | 66,876 | |
Amount receivable for open swaps | | | | | | 44,996 | |
| | | | | | | |
Total assets | | | | | | 441,592,708 | |
| | | | | | | |
| | |
Liabilities: | | | | | | | |
Payable for securities purchased | | $ | 110,483,591 | | | | |
Unrealized depreciation on swaps | | | 9,532,469 | | | | |
Options written (Proceeds—$2,682,008) | | | 4,106,136 | | | | |
Unrealized depreciation of forward foreign currency contracts | | | 1,508,331 | | | | |
Income distribution payable | | | 365,313 | | | | |
Payable for fund shares repurchased | | | 266,808 | | | | |
Premium received for open swaps | | | 676,315 | | | | |
Accrued management fee | | | 237,614 | | | | |
Amount payable for open swaps | | | 44,937 | | | | |
Payable for Lehman settlement | | | 6,828 | | | | |
Accrued distribution fees | | | 247 | | | | |
Accrued expenses and other liabilities | | | 108,052 | | | | |
| | | | | | | |
Total liabilities | | | | | | 127,336,641 | |
| | | | | | | |
| | |
Net Assets | | | | | $ | 314,256,067 | |
| | | | | | | |
| | |
Net assets consist of: | | | | | | | |
Accumulated paid-in-capital | | | | | $ | 433,158,058 | |
Undistributed net investment income | | | | | | 521,558 | |
Accumulated net realized loss on investments, options, futures, swaps and foreign currency transactions | | | | | | (5,585,133 | ) |
Net unrealized depreciation of investments, options, futures, swaps and foreign currency translations | | | | | | (113,838,416 | ) |
| | | | | | | |
| | |
Net Assets | | | | | $ | 314,256,067 | |
| | | | | | | |
| | |
Net Asset Value Per Share: | | | | | | | |
Institutional Class (19,494,973 shares outstanding) | | | | | | $7.81 | |
Institutional Select Class (20,600,426 shares outstanding) | | | | | | $7.82 | |
Financial Intermediary Class (103,861 shares outstanding) | | | | | | $7.82 | |
| | | | | | | | |
See notes to financial statements.
30
Annual Report to Shareholders
Statement of Operations
Western Asset Absolute Return Portfolio
| | | | | | | | | | | | | | | | |
| | | FOR THE
PERIOD ENDED
DECEMBER 31, 2008A | | | FOR THE
YEAR ENDED
MARCH 31, 2008 | |
Investment Income: | | | | | | | | | | | | | | | | |
Interest | | $ | 22,135,513 | | | | | | | $ | 28,055,991 | | | | | |
Dividends | | | 3,325 | | | | | | | | — | | | | | |
Less: Foreign taxes withheld | | | (5,918 | ) | | | | | | | — | | | | | |
| | | | | | | | | | | | | | | | |
Total income | | | | | | $ | 22,132,920 | | | | | | | $ | 28,055,991 | |
Expenses: | | | | | | | | | | | | | | | | |
Management fees | | | 2,620,299 | | | | | | | | 3,666,577 | | | | | |
Distribution fees: | | | | | | | | | | | | | | | | |
Financial Intermediary Class | | | 1,274 | | | | | | | | 260 | | | | | |
Audit and legal fees | | | 96,318 | | | | | | | | 43,801 | | | | | |
Custodian fees | | | 99,296 | | | | | | | | 103,678 | | | | | |
Directors’ fees and expenses | | | 14,398 | | | | | | | | 5,814 | | | | | |
Registration fees | | | 42,345 | | | | | | | | 32,978 | | | | | |
Report to shareholdersB | | | — | | | | | | | | 6,262 | | | | | |
Reports to shareholders: | | | | | | | | | | | | | | | | |
Institutional Class | | | 2,986 | | | | | | | | — | | | | | |
Institutional Select Class | | | 2,059 | | | | | | | | N/A | | | | | |
Financial Intermediary Class | | | 103 | | | | | | | | — | | | | | |
Transfer agent and shareholder servicing expense: | | | | | | | | | | | | | | | | |
Institutional Class | | | 14,344 | | | | | | | | 17,925 | | | | | |
Institutional Select Class | | | 615 | | | | | | | | N/A | | | | | |
Financial Intermediary Class | | | 313 | | | | | | | | 260 | | | | | |
Fees recaptured | | | — | | | | | | | | 189,329 | | | | | |
Other expenses | | | 28,438 | | | | | | | | 47,463 | | | | | |
| | | | | | | | | | | | | | | | |
| | | 2,922,788 | | | | | | | | 4,114,347 | | | | | |
Less: Fees waived | | | (126,860 | ) | | | | | | | — | | | | | |
Compensating balance credits | | | (234 | ) | | | | | | | (47,077 | ) | | | | |
| | | | | | | | | | | | | | | | |
Net expenses | | | | | | | 2,795,694 | | | | | | | | 4,067,270 | |
| | | | | | | | | | | | | | | | |
Net Investment Income | | | | | | | 19,337,226 | | | | | | | | 23,988,721 | |
Net Realized and Unrealized Gain/(Loss) on Investments: | | | | | | | | | | | | | | | | |
Net realized gain/(loss) on: | | | | | | | | | | | | | | | | |
Investments | | | (7,284,345 | ) | | | | | | | 5,277,954 | | | | | |
Options | | | 2,441,085 | | | | | | | | 80,340 | | | | | |
Futures | | | (2,682,196 | ) | | | | | | | 8,349,372 | | | | | |
Swaps | | | 1,241,721 | | | | | | | | 991,523 | | | | | |
Foreign currency transactions | | | 2,044,958 | | | | | | | | 407,708 | | | | | |
| | | | | | | | | | | | | | | | |
| | | | | | | (4,238,777 | ) | | | | | | | 15,106,897 | |
Change in unrealized appreciation/(depreciation) of: | | | | | | | | | | | | | | | | |
Investments, options, futures, swaps and foreign currency translations | | | (83,866,253 | ) | | | | | | | (31,146,146 | ) | | | | |
Assets and liabilities denominated in foreign currency | | | 74,913 | �� | | | | | | | (119,683 | ) | | | | |
| | | | | | | | | | | | | | | | |
| | | | | | | (83,791,340 | ) | | | | | | | (31,265,829 | ) |
| | | | | | | | | | | | | | | | |
Net Realized and Unrealized Loss on Investments | | | | | | | (88,030,117 | ) | | | | | | | (16,158,932 | ) |
| | | | | | | | | | | | | | | | | |
Change in Net Assets Resulting From Operations | | | | | | $ | (68,692,891 | ) | | | | | | $ | 7,829,789 | |
| | | | | | | | | | | | | | | | | |
A | | For the period April 1, 2008 to December 31, 2008. |
B | | Computed on a composite level for year ended March 31, 2008. |
See notes to financial statements.
31
Annual Report to Shareholders
Statement of Changes in Net Assets
Western Asset Absolute Return Portfolio
| | | | | | | | | | | | |
| | | FOR THE
PERIOD ENDED
DECEMBER 31, 2008A | | | FOR THE
YEARS ENDED MARCH 31, | |
| | | | 2008 | | | 2007 | |
| Change in Net Assets: | | | | | | | | | |
Net investment income | | $ | 19,337,226 | | | $ | 23,988,721 | | | $ | 5,736,559 | |
| | | |
Net realized gain/(loss) | | | (4,238,777 | ) | | | 15,106,897 | | | | 2,150,512 | |
| | | |
Change in unrealized appreciation/(depreciation) | | | (83,791,340 | ) | | | (31,265,829 | ) | | | 1,218,753 | |
| | | | | | | | | | | | |
Change in net assets resulting from operations | | | (68,692,891 | ) | | | 7,829,789 | | | | 9,105,824 | |
| | | |
Distributions to shareholders from: | | | | | | | | | | | | |
Net investment income: | | | | | | | | | | | | |
Institutional Class | | | (16,087,470 | ) | | | (23,789,518 | ) | | | (5,733,712 | ) |
Institutional Select Class | | | (5,703,469 | ) | | | N/A | | | | N/A | |
Financial Intermediary Class | | | (36,322 | ) | | | (4,728 | ) | | | (446 | ) |
| | | |
Net realized gain on investments: | | | | | | | | | | | | |
Institutional Class | | | (12,841,701 | ) | | | (2,180,665 | ) | | | (782,602 | ) |
Financial Intermediary Class | | | (9,321 | ) | | | (163 | ) | | | (125 | ) |
| | | |
Change in net assets from fund share transactions: | | | | | | | | | | | | |
Institutional Class | | | (334,535,983 | ) | | | 207,117,247 | | | | 368,649,391 | |
Institutional Select Class | | | 190,945,457 | | | | N/A | | | | N/A | |
Financial Intermediary Class | | | 593,184 | | | | 396,921 | | | | 17,370 | |
| | | | | | | | | | | | |
Change in net assets | | | (246,368,516 | ) | | | 189,368,883 | | | | 371,255,700 | |
| | | |
Net Assets: | | | | | | | | | | | | |
Beginning of period | | | 560,624,583 | | | | 371,255,700 | | | | — | |
| | | | | | | | | | | | |
| | | |
End of period | | $ | 314,256,067 | | | $ | 560,624,583 | | | $ | 371,255,700 | |
| | | | | | | | | | | | |
| | | |
Undistributed net investment income | | $ | 521,558 | | | $ | 1,582,356 | | | $ | 79,358 | |
| | | | | | | | | | | | |
| | | | | | | | | | | | | |
A | | For the period April 1, 2008 to December 31, 2008. |
N/A—Not applicable.
See notes to financial statements.
32
Annual Report to Shareholders
Financial Highlights
Western Asset Absolute Return Portfolio
For a share of each class of capital stock outstanding:
Institutional Class:
| | | | | | | | | | | | |
| | | PERIOD
ENDED
DECEMBER 31,
2008A | | | YEARS ENDED
MARCH 31, | |
| | | | 2008 | | | 2007B | |
Net asset value, beginning of period | | $ | 9.82 | | | $ | 10.23 | | | $ | 10.00 | |
| | | | | | | | | | | | |
Investment operations: | | | | | | | | | | | | |
Net investment income | | | .38 | C | | | .49 | C | | | .36 | C |
Net realized and unrealized gain/(loss) | | | (1.71 | ) | | | (.36 | ) | | | .29 | |
| | | | | | | | | | | | |
Total from investment operations | | | (1.33 | ) | | | .13 | | | | .65 | |
| | | | | | | | | | | | |
Distributions from: | | | | | | | | | | | | |
Net investment income | | | (.44 | ) | | | (.49 | ) | | | (.35 | ) |
Net realized gain on investments | | | (.24 | ) | | | (.05 | ) | | | (.07 | ) |
| | | | | | | | | | | | |
Total distributions | | | (.68 | ) | | | (.54 | ) | | | (.42 | ) |
| | | | | | | | | | | | |
Net asset value, end of period | | $ | 7.81 | | | $ | 9.82 | | | $ | 10.23 | |
| | | | | | | | | | | | |
Total return | | | (14.20 | )%D | | | 1.31 | % | | | 6.63 | %D |
| | | |
Ratios to Average Net Assets:E | | | | | | | | | | | | |
Total expenses | | | .83 | %F | | | .84 | % | | | 1.09 | %F |
Expenses net of waivers, if any | | | .80 | %F | | | .84 | % | | | .93 | %F |
Expenses net of all reductions | | | .80 | %F | | | .83 | % | | | .89 | %F |
Net investment income | | | 5.5 | %F | | | 4.9 | % | | | 4.9 | %F |
| | | |
Supplemental Data: | | | | | | | | | | | | |
Portfolio turnover rate | | | 229.6 | %D | | | 386.9 | % | | | 182.2 | %D |
Net assets, end of period (in thousands) | | $ | 152,349 | | | $ | 560,219 | | | $ | 371,239 | |
| | | | | | | | | | | | | |
A | | For the period April 1, 2008 to December 31, 2008. |
B | | For the period July 6, 2006 (commencement of operations) to March 31, 2007. |
C | | Computed using average daily shares outstanding. |
E | | Total expenses reflects operating expenses prior to any contractual expense waivers and/or compensating balance credits. Expenses net of waivers reflects total expenses before compensating balance credits but net of any contractual expense waivers. Expenses net of all reductions reflects expenses less any compensating balance credits and/or contractual expense waivers. |
See notes to financial statements.
33
Annual Report to Shareholders
Financial Highlights—Continued
Western Asset Absolute Return Portfolio
For a share of each class of capital stock outstanding:
Institutional Select Class:
| | | | |
| | | PERIOD
ENDED
DECEMBER 31,
2008G | |
Net asset value, beginning of period | | $ | 9.15 | |
| | | | |
Investment operations: | | | | |
Net investment income | | | .20 | C |
Net realized and unrealized loss | | | (1.26 | ) |
| | | | |
Total from investment operations | | | (1.06 | ) |
| | | | |
Distributions from: | | | | |
Net investment income | | | (.27 | ) |
| | | | |
Total distributions | | | (.27 | ) |
| | | | |
Net asset value, end of period | | $ | 7.82 | |
| | | | |
Total return | | | (11.69 | )%D |
| |
Ratios to Average Net Assets:E | | | | |
Total expenses | | | .85 | %F |
Expenses net of waivers, if any | | | .80 | %F |
Expenses net of all reductions | | | .80 | %F |
Net investment income | | | 5.8 | %F |
| |
Supplemental Data: | | | | |
Portfolio turnover rate | | | 229.6 | %D |
Net assets, end of period (in thousands) | | $ | 161,094 | |
| | | | | |
G | | For the period August 4, 2008 (commencement of operations) to December 31, 2008. |
See notes to financial statements.
34
Annual Report to Shareholders
Financial Intermediary Class:
| | | | | | | | | | | | |
| | | PERIOD ENDED
DECEMBER 31,
2008A | | | YEARS ENDED
MARCH 31, | |
| | | | 2008 | | | 2007H | |
Net asset value, beginning of period | | $ | 9.82 | | | $ | 10.23 | | | $ | 10.17 | |
| | | | | | | | | | | | |
Investment operations: | | | | | | | | | | | | |
Net investment income | | | .35 | C | | | .47 | C | | | .27 | C |
Net realized and unrealized gain/(loss) | | | (1.69 | ) | | | (.37 | ) | | | .13 | |
| | | | | | | | | | | | |
Total from investment operations | | | (1.34 | ) | | | .10 | | | | .40 | |
| | | | | | | | | | | | |
Distributions from: | | | | | | | | | | | | |
Net investment income | | | (.42 | ) | | | (.46 | ) | | | (.27 | ) |
Net realized gain on investments | | | (.24 | ) | | | (.05 | ) | | | (.07 | ) |
| | | | | | | | | | | | |
Total distributions | | | (.66 | ) | | | (.51 | ) | | | (.34 | ) |
| | | | | | | | | | | | |
Net asset value, end of period | | $ | 7.82 | | | $ | 9.82 | | | $ | 10.23 | |
| | | | | | | | | | | | |
Total return | | | (14.31 | )%D | | | 1.03 | % | | | 3.99 | %D |
| | | |
Ratios to Average Net Assets:E | | | | | | | | | | | | |
Total expenses | | | 1.38 | %F | | | 1.31 | % | | | 85.97 | %F |
Expenses net of waivers, if any | | | 1.05 | %F | | | 1.06 | % | | | 1.18 | %F |
Expenses net of all reductions | | | 1.05 | %F | | | 1.03 | % | | | 1.16 | %F |
Net investment income | | | 5.5 | %F | | | 4.7 | % | | | 4.6 | %F |
| | | |
Supplemental Data: | | | | | | | | | | | | |
Portfolio turnover rate | | | 229.6 | %D | | | 386.9 | % | | | 182.2 | %D |
Net assets, end of period (in thousands) | | $ | 813 | | | $ | 406 | | | $ | 17 | |
| | | | | | | | | | | | | |
H | | For the period September 6, 2006 (commencement of operations) to March 31, 2007. |
See notes to financial statements.
35
Annual Report to Shareholders
Management’s Discussion of Fund Performance
Western Asset High Yield Portfolio
Total returns for the Fund for various periods ended December 31, 2008 are presented below, along with those of comparative indices:
| | | | | | | | | | | | |
| | | | | | | | | Average Annual Total Returns |
| | | Three
Months | | Nine
Months | | One
Year | | Three
Years | | Five
Years | | Since
InceptionA |
Western Asset High Yield Portfolio: | | | | | | | | | | | | |
Institutional Class | | -21.83% | | -27.19% | | -30.12% | | -7.47% | | -2.06% | | +1.81% |
Institutional Select Class | | -21.87% | | N/A | | N/A | | N/A | | N/A | | -27.16% |
Barclays Capital U.S. Corporate High Yield 2% Issuer Cap IndexB | | -18.06% | | -23.61% | | -25.88% | | -5.66% | | -0.84% | | +3.71% |
Lipper High Current Yield Funds Category AverageC | | -18.35% | | -23.34% | | -25.92% | | -6.16% | | -1.52% | | +2.55% |
The performance data quoted represent past performance and do not guarantee future results. Current performance may be lower or higher than the performance data quoted. To obtain the most recent month-end performance information, please visit www.westernassetfunds.com. The investment return and principal value of the Fund will fluctuate so that an investor’s shares, when redeemed, may be worth more or less than the original cost. Calculations assume reinvestment of dividends and capital gain distributions. Performance would have been lower if fees had not been waived in various periods. Performance figures for periods shorter than one year represent cumulative figures and are not annualized.
The expense ratio for both the Institutional and Institutional Select Classes was 0.58% and are the Fund’s operating expenses for each share class as indicated in the Fund’s most current prospectus dated August 1, 2008.
For the period from April 1, 2008 through December 31, 2008, Institutional Class shares of Western Asset High Yield Portfolio returned -27.19%. The Fund’s unmanaged benchmark, the Barclays Capital U.S. Corporate High Yield 2% Issuer Cap Index (the “Index”), returned -23.61% over the same time frame. The Lipper High Current Yield Funds Category Average returned -23.34% for the same period.
The impact of market conditions on the Fund’s performance was negative for the nine-month period ended December 31, 2008, with strategies also producing significantly negative results. The best performing sub-sectors within the Index for the nine-month period were Consumer Noncyclicals and Financials, which returned -13.63% and -14.70%, respectively. Consumer Noncyclicals benefited from the defensive nature of the sub-sector and, in particular, the Health Care industry. Health Care returned -10.80% for the period. The worst performing sub-sectors within the Index included Technology and Basic Industry. Technology returned -31.61% for the nine-month period. Technology companies were some of the largest leveraged buyouts (“LBOs”) completed in the LBO frenzy period of 2006-early 2007. Specifically, Freescale (LBO’d in September 2006) and First Data (LBO’d in April 2007) returned -41.18% and -23.74%, respectively, for the period. Basic Industry, which returned - -31.72% for the period, is a good indicator of broad economic activity as it includes the Chemical industry whose returns have historically been highly correlated to economic activity. The Chemical industry returned -35.95% for the period.
A | | The inception date of the Institutional Class is September 28, 2001. The inception date of the Institutional Select Class is August 4, 2008. Index returns are for periods beginning September 30, 2001. Although it is not possible to invest directly in an index, it is possible to purchase investment vehicles designed to track the performance of certain indices. |
B | | The Barclays Capital (formerly Lehman Brothers) U.S. Corporate High Yield 2% Issuer Cap Index is an index of the 2% Issuer Cap component of the Barclays Capital U.S. Corporate High Yield Index, which covers the U.S. dollar-denominated, non-investment grade, fixed-rate, taxable corporate bond market. |
C | | Lipper, Inc., a wholly-owned subsidiary of Reuters, provides independent insight on global collective investments. The Lipper High Current Yield Funds Category Average is comprised of the Fund’s peer group of mutual funds. |
N/A—Not applicable.
36
Annual Report to Shareholders
While our rating profile tends to be somewhat aggressive, our industry positioning is defensive and provides a bit of a hedge in our portfolios. Electric Utilities are our single largest sector bet, as we continued to feel the current market afforded us a great opportunity to buy a historically defensive sector at very attractive valuations. We also remained overweight Aerospace & Defense based on the sub-sector’s strong balance sheets, free cash flow generation and focus on operations and maintenance as opposed to weapons programs. While overweight to the Automobile sub-sector, this was largely based on our position in Ford Motor Credit (our second largest position behind Texas Utilities). In addition, we continued to increase our Wireless exposure due to the defensive nature of the business, as well as strong underlying asset values. Our key underweights have not changed over the period. The most notable of these were Retail, Media—Non-Cable and Technology.
Western Asset Management Company
January 20, 2009
Investment Risks: Bonds are subject to a variety of risks, including interest rate, credit and inflation risk. As interest rates rise, bond prices fall, reducing the value of the Fund’s share price. Foreign securities are subject to certain risks of overseas investing, including currency fluctuations and changes in political and economic conditions. These risks are magnified in emerging markets. The Fund may invest in high-yield bonds, which are rated below investment grade and carry more risk than higher-rated securities. The Fund may use derivatives, such as options and futures, which can be illiquid, may disproportionately increase losses, and have a potentially large impact on Fund performance.
37
Annual Report to Shareholders
Expense Example
Western Asset High Yield Portfolio
As a shareholder of the Fund, you incur ongoing costs, including management fees and other Fund expenses. These examples are intended to help you understand your ongoing costs (in dollars) of investing in the Fund and to compare these costs with the ongoing costs of investing in other mutual funds.
Actual Expenses
The first line for each class in the table below provides information about actual account values and actual expenses for the Fund. You may use the information in this line, together with the amount you invested, to estimate the expenses that you paid over the period. Simply divide your account value by $1,000 (for example, an $8,600 account value divided by $1,000 = 8.6), then multiply the result by the number in the first line under the heading entitled “Expenses Paid During the Period” to estimate the expenses you paid on your account if your shares were held through the entire period. For Institutional Class, the example is based on an investment of $1,000 invested on July 1, 2008 and held through December 31, 2008; for Institutional Select Class, the example is based on an investment of $1,000 invested on August 4, 2008 (commencement of operations) and held through December 31, 2008.
Hypothetical Example for Comparison Purposes
The second line for each class in the table below provides information about hypothetical account values and hypothetical expenses based on the Fund’s actual expense ratio and an assumed rate of return of 5% per year before expenses, which is not the Class’s actual return. The hypothetical account values and expenses may not be used to estimate the actual ending account balance or expenses you paid for the period. You may use this information to compare the ongoing costs of investing in the Fund and other funds. To do so, compare these 5% hypothetical examples with the 5% hypothetical examples that appear in the shareholder reports of other funds. Because each example is intended to be comparable to the examples provided by other funds, it is based on a hypothetical investment of $1,000 invested on July 1, 2008 and held through December 31, 2008 for each class, even though the Institutional Select Class did not begin operations until August 4, 2008.
| | | | | | | | | | | |
| | | Beginning
Account Value
7/1/08 | | | Ending
Account Value
12/31/08 | | Expenses PaidA
During the Period
7/1/08 to 12/31/08 | |
Institutional Class: | | | | | | | | | | | |
Actual | | $ | 1,000.00 | | | $ | 708.20 | | $ | 2.58 | |
Hypothetical (5% return before expenses) | | | 1,000.00 | | | | 1,030.43 | | | 3.07 | |
Institutional Select Class: | | | | | | | | | | | |
Actual | | $ | 1,000.00 | B | | $ | 728.40 | | $ | 2.13 | C |
Hypothetical (5% return before expenses) | | | 1,000.00 | | | | 1,030.43 | | | 3.07 | |
A | | These calculations are based on expenses incurred from July 1, 2008 to December 31, 2008. The dollar amounts shown as “Expenses Paid” are equal to the annualized expense ratio of 0.60% for the Institutional Class, multiplied by the average value over the period, multiplied by the number of days in the most recent half-year (184), and divided by 365. |
B | | Beginning account value is as of August 4, 2008 (commencement of operations). |
C | | This calculation is based on expenses incurred from August 4, 2008 (commencement of operations) to December 31, 2008. The dollar amount shown as “Expenses Paid” is equal to the annualized expense ratio of 0.60% for the Institutional Select Class, multiplied by the average values over the period, multiplied by the number of days in the period (150) and divided by 365. |
38
Annual Report to Shareholders
Performance Information
Western Asset High Yield Portfolio
The graph compares the Fund’s total returns to that of two appropriate broad-based securities market indexes. The lines illustrate the cumulative total return of an initial $1,000,000 investment for the periods indicated. The line for the Fund represents the total return after deducting all Fund investment management and other administrative expenses and the transaction costs of buying and selling securities. The lines representing the securities market indexes do not include any transaction costs associated with buying and selling securities in the indexes or other investment management or administrative expenses.
Due to the limited operating history of the Institutional Select Class, a performance graph is not presented. Institutional Select Class shares, which began operations on August 4, 2008, had a total return of -27.16% for the period ended December 31, 2008.
Total return measures investment performance in terms of appreciation or depreciation in the Fund’s net asset value per share, plus dividends and any capital gain distributions. It assumes that dividends and distributions were reinvested at the time they were paid. Returns (and the graph and table found below) do not reflect the deduction of taxes that a shareholder would pay on Fund distributions or the redemption of Fund shares. Average annual returns tend to smooth out variations in a fund’s return, so that they differ from actual year-to-year results.
Bonds are subject to a variety of risks, including interest rate, credit and inflation risks. Non-U.S. investments are subject to currency fluctuations, social, economic, and political risk.
Growth of a $1,000,000 Investment—Institutional Class
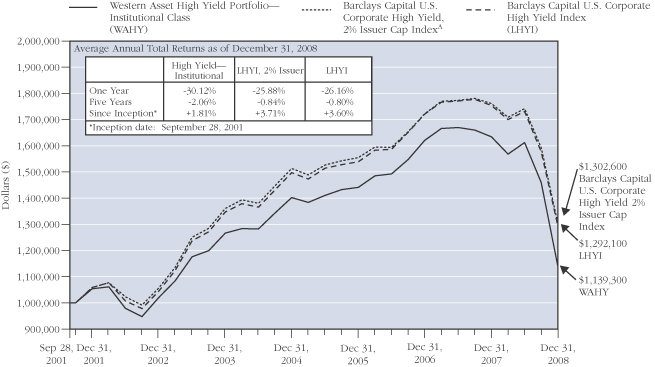
The performance data quoted represent past performance and do not guarantee future results. The performance stated may have been due to extraordinary market conditions, which may not be duplicated in the future. Current performance may be lower or higher than the performance data quoted. To obtain the most recent month-end performance information, please visit www.westernassetfunds.com. The investment return and principal value of the Fund will fluctuate so that an investor’s shares, when redeemed, may be worth more or less than the original cost. Calculations assume reinvestment of dividends and capital gain distributions. Performance would have been lower if fees had not been waived in various periods.
A | | Index returns are for periods beginning September 30, 2001. Formerly: Lehman High Yield Bond Index. The name change is a result of Barclays’ purchase of Lehman Brothers in September 2008. |
39
Annual Report to Shareholders
Performance Information—Continued
Western Asset High Yield Portfolio
Portfolio Composition (as of December 31, 2008)B
Standard & Poor’s Debt RatingsC (as a percentage of the portfolio)

Maturity Schedule (as a percentage of the portfolio)
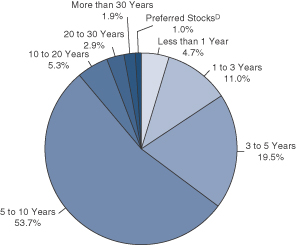
B | | The pie charts above represent the composition of the Fund’s portfolio as of December 31, 2008 and do not include derivatives such as Futures Contracts, Options Written, and Swaps. The Fund is actively managed. As a result, the composition of the portfolio holdings and sectors are subject to change at any time. |
C | | Standard & Poor’s Ratings Service provides capital markets with credit ratings for the evaluation and assessment of credit risk. These ratings are the opinions of S&P and not absolute measures of quality or guarantees of performance. |
D | | Preferred stocks do not have defined maturity dates. |
40
Annual Report to Shareholders
Spread Duration
Western Asset High Yield Portfolio
December 31, 2008
Economic Exposure

Spread duration is defined as the change in value for a 100 basis point change in the spread relative to Treasuries. The spread over Treasuries is the annual risk-premium demanded by investors to hold non-Treasury securities. This chart highlights the market sector exposure of the Fund’s portfolio and the exposure relative to the selected benchmark as of the end of the reporting period.
EM—Emerging Market
LHYI 2%—Barclays Capital U.S. Corporate High Yield, 2% Issuer Cap Index
HY—High Yield
IG Credit—Investment Grade Credit
41
Annual Report to Shareholders
Effective Duration
Western Asset High Yield Portfolio
December 31, 2008
Interest Rate Exposure
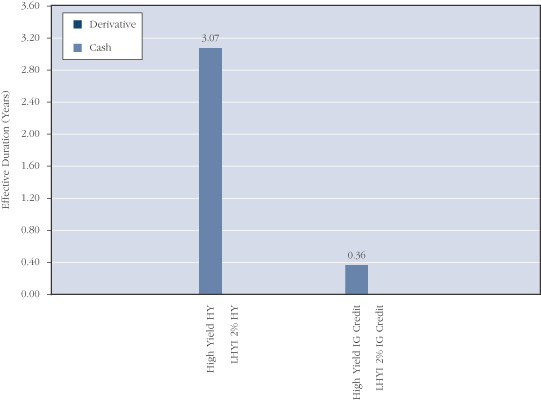
Effective duration is defined as the change in value for a 100 basis point change in Treasury yields. This chart highlights the interest rate exposure of the Fund’s portfolio relative to the selected benchmark as of the end of the reporting period.
HY—High Yield
LHYI 2%—Barclays Capital U.S. Corporate High Yield, 2% Issuer Cap Index
IG Credit—Investment Grade Credit
42
Annual Report to Shareholders
Portfolio of Investments
Western Asset High Yield Portfolio
December 31, 2008
| | | | | | | | | | | | | |
| | | % OF
NET ASSETS | | RATE | | MATURITY
DATE | | PAR/
SHARES | | VALUE | |
| | | | | | | | | | | | | |
Long-Term Securities | | 94.0% | | | | | | | | | | | |
| | | | | |
Corporate Bonds and Notes | | 79.5% | | | | | | | | | | | |
| | | | | |
Aerospace and Defense | | 1.6% | | | | | | | | | | | |
BE Aerospace Inc. | | | | 8.500% | | 7/1/18 | | $ | 1,860,000 | | $ | 1,674,000 | |
DRS Technologies Inc. | | | | 6.625% | | 2/1/16 | | | 1,355,000 | | | 1,355,000 | |
DRS Technologies Inc. | | | | 7.625% | | 2/1/18 | | | 1,500,000 | | | 1,500,000 | |
DynCorp International Inc. | | | | 9.500% | | 2/15/13 | | | 3,140,000 | | | 2,743,575 | A |
Sequa Corp. | | | | 11.750% | | 12/1/15 | | | 1,420,000 | | | 539,600 | A |
Sequa Corp. | | | | 13.500% | | 12/1/15 | | | 1,517,467 | | | 485,589 | A,B |
| | | | | | | | | | | | | |
| | | | | | | | | | | | 8,297,764 | |
| | | | | | | | | | | | | |
Airlines | | 1.3% | | | | | | | | | | | |
Continental Airlines Inc. | | | | 7.339% | | 4/19/14 | | | 1,455,000 | | | 843,900 | |
Continental Airlines Inc. | | | | 8.388% | | 11/1/20 | | | 672,972 | | | 397,053 | |
DAE Aviation Holdings Inc. | | | | 11.250% | | 8/1/15 | | | 6,150,000 | | | 2,521,500 | A |
Delta Air Lines Inc. | | | | 8.954% | | 8/10/14 | | | 1,994,220 | | | 1,036,995 | |
United Air Lines Inc. | | | | 7.032% | | 10/1/10 | | | 498,898 | | | 458,987 | |
United Air Lines Inc. | | | | 7.186% | | 10/1/12 | | | 1,432,366 | | | 1,346,424 | |
| | | | | | | | | | | | | |
| | | | | | | | | | | | 6,604,859 | |
| | | | | | | | | | | | | |
Auto Components | | 0.6% | | | | | | | | | | | |
Allison Transmission | | | | 11.000% | | 11/1/15 | | | 90,000 | | | 44,100 | A |
Allison Transmission | | | | 12.000% | | 11/1/15 | | | 2,670,000 | | | 1,054,650 | A,B |
Visteon Corp. | | | | 8.250% | | 8/1/10 | | | 3,542,000 | | | 1,098,020 | |
Visteon Corp. | | | | 12.250% | | 12/31/16 | | | 4,546,000 | | | 1,091,040 | A |
| | | | | | | | | | | | | |
| | | | | | | | | | | | 3,287,810 | |
| | | | | | | | | | | | | |
Automobiles | | 0.9% | | | | | | | | | | | |
Ford Motor Co. | | | | 7.450% | | 7/16/31 | | | 3,400,000 | | | 952,000 | |
General Motors Corp. | | | | 7.200% | | 1/15/11 | | | 6,900,000 | | | 1,449,000 | |
General Motors Corp. | | | | 8.250% | | 7/15/23 | | | 1,475,000 | | | 243,375 | |
General Motors Corp. | | | | 8.375% | | 7/15/33 | | | 10,565,000 | | | 1,848,875 | |
| | | | | | | | | | | | | |
| | | | | | | | | | | | 4,493,250 | |
| | | | | | | | | | | | | |
Beverages | | 0.2% | | | | | | | | | | | |
Constellation Brands Inc. | | | | 7.250% | | 9/1/16 | | | 1,100,000 | | | 1,039,500 | |
| | | | | | | | | | | | | |
| | | | | |
Building Products | | 1.7% | | | | | | | | | | | |
Associated Materials Inc. | | | | 9.750% | | 4/15/12 | | | 2,400,000 | | | 1,890,000 | |
Associated Materials Inc. | | | | 0.000% | | 3/1/14 | | | 7,295,000 | | | 4,048,725 | C |
Nortek Inc. | | | | 10.000% | | 12/1/13 | | | 2,890,000 | | | 1,965,200 | |
43
Annual Report to Shareholders
Portfolio of Investments—Continued
Western Asset High Yield Portfolio—Continued
| | | | | | | | | | | | | |
| | | % OF
NET ASSETS | | RATE | | MATURITY
DATE | | PAR/
SHARES | | VALUE | |
| | | | | | | | | | | | | |
Corporate Bonds and Notes—Continued | | | | | | | | | | | | | |
| | | | | |
Building Products—Continued | | | | | | | | | | | | | |
NTK Holdings Inc. | | | | 0.000% | | 3/1/14 | | $ | 4,965,000 | | $ | 1,067,475 | C |
| | | | | | | | | | | | | |
| | | | | | | | | | | | 8,971,400 | |
| | | | | | | | | | | | | |
Chemicals | | 0.4% | | | | | | | | | | | |
ARCO Chemical Co. | | | | 9.800% | | 2/1/20 | | | 80,000 | | | 8,800 | |
Georgia Gulf Corp. | | | | 10.750% | | 10/15/16 | | | 6,125,000 | | | 1,470,000 | |
Huntsman International LLC | | | | 7.875% | | 11/15/14 | | | 725,000 | | | 387,875 | |
Westlake Chemical Corp. | | | | 6.625% | | 1/15/16 | | | 547,000 | | | 317,260 | |
| | | | | | | | | | | | | |
| | | | | | | | | | | | 2,183,935 | |
| | | | | | | | | | | | | |
Commercial Banks | | 0.1% | | | | | | | | | | | |
Wells Fargo Capital XV | | | | 9.750% | | 12/29/49 | | | 700,000 | | | 707,000 | C |
| | | | | | | | | | | | | |
| | | | | |
Commercial Services and Supplies | | 1.7% | | | | | | | | | | | |
Interface Inc. | | | | 10.375% | | 2/1/10 | | | 3,454,000 | | | 3,419,460 | |
Rental Service Corp. | | | | 9.500% | | 12/1/14 | | | 4,570,000 | | | 2,513,500 | |
US Investigations Services Inc. | | | | 10.500% | | 11/1/15 | | | 360,000 | | | 262,800 | A |
US Investigations Services Inc. | | | | 11.750% | | 5/1/16 | | | 4,130,000 | | | 2,601,900 | A |
| | | | | | | | | | | | | |
| | | | | | | | | | | | 8,797,660 | |
| | | | | | | | | | | | | |
Communications Equipment | | 0.2% | | | | | | | | | | | |
EchoStar DBS Corp. | | | | 7.750% | | 5/31/15 | | | 1,305,000 | | | 1,109,250 | |
| | | | | | | | | | | | | |
| | | | | |
Consumer Finance | | 5.8% | | | | | | | | | | | |
Ford Motor Credit Co. | | | | 9.203% | | 4/15/09 | | | 2,605,000 | | | 2,513,825 | D |
Ford Motor Credit Co. | | | | 8.625% | | 11/1/10 | | | 1,310,000 | | | 991,707 | |
Ford Motor Credit Co. | | | | 12.000% | | 5/15/15 | | | 20,835,000 | | | 15,558,724 | |
GMAC LLC | | | | 7.500% | | 12/31/13 | | | 1,909,000 | | | 1,393,570 | A |
GMAC LLC | | | | 8.000% | | 12/31/18 | | | 449,000 | | | 224,500 | A |
GMAC LLC | | | | 8.000% | | 11/1/31 | | | 7,398,000 | | | 4,397,297 | A |
SLM Corp. | | | | 3.695% | | 7/26/10 | | | 5,360,000 | | | 4,574,658 | D |
SLM Corp. | | | | 3.765% | | 10/25/11 | | | 435,000 | | | 333,370 | D |
| | | | | | | | | | | | | |
| | | | | | | | | | | | 29,987,651 | |
| | | | | | | | | | | | | |
Containers and Packaging | | 1.0% | | | | | | | | | | | |
Berry Plastics Holding Corp. | | | | 10.250% | | 3/1/16 | | | 840,000 | | | 298,200 | |
Greif Inc. | | | | 6.750% | | 2/1/17 | | | 1,690,000 | | | 1,495,650 | |
Plastipak Holdings Inc. | | | | 8.500% | | 12/15/15 | | | 845,000 | | | 566,150 | A |
Rock-Tenn Co. | | | | 9.250% | | 3/15/16 | | | 1,470,000 | | | 1,367,100 | A |
Solo Cup Co. | | | | 8.500% | | 2/15/14 | | | 1,955,000 | | | 1,251,200 | |
| | | | | | | | | | | | | |
| | | | | | | | | | | | 4,978,300 | |
| | | | | | | | | | | | | |
44
Annual Report to Shareholders
| | | | | | | | | | | | | |
| | | % OF
NET ASSETS | | RATE | | MATURITY
DATE | | PAR/
SHARES | | VALUE | |
| | | | | | | | | | | | | |
Corporate Bonds and Notes—Continued | | | | | | | | | | | | | |
| | | | | |
Distributors | | 0.2% | | | | | | | | | | | |
Keystone Automotive Operations Inc. | | | | 9.750% | | 11/1/13 | | $ | 2,380,000 | | $ | 904,400 | |
| | | | | | | | | | | | | |
| | | | | |
Diversified Consumer Services | | 0.8% | | | | | | | | | | | |
Education Management LLC | | | | 8.750% | | 6/1/14 | | | 710,000 | | | 539,600 | |
Education Management LLC | | | | 10.250% | | 6/1/16 | | | 3,405,000 | | | 2,468,625 | |
Service Corp. International | | | | 7.625% | | 10/1/18 | | | 575,000 | | | 425,500 | |
Service Corp. International | | | | 7.500% | | 4/1/27 | | | 1,487,000 | | | 951,680 | |
| | | | | | | | | | | | | |
| | | | | | | | | | | | 4,385,405 | |
| | | | | | | | | | | | | |
Diversified Financial Services | | 4.6% | | | | | | | | | | | |
AAC Group Holding Corp. | | | | 10.250% | | 10/1/12 | | | 5,510,000 | | | 3,636,600 | A |
Capmark Financial Group Inc. | | | | 5.875% | | 5/10/12 | | | 1,710,000 | | | 583,095 | E |
CCM Merger Inc. | | | | 8.000% | | 8/1/13 | | | 3,400,000 | | | 1,751,000 | A |
Citigroup Inc. | | | | 8.400% | | 4/29/49 | | | 3,270,000 | | | 2,159,148 | C |
DI Finance LLC | | | | 9.500% | | 2/15/13 | | | 5,680,000 | | | 4,948,700 | |
El Paso Performance-Linked | | | | 7.750% | | 7/15/11 | | | 155,000 | | | 134,191 | A |
Hexion US Finance Corp/Hexion Nova Scotia Finance ULC | | | | 6.649% | | 11/15/14 | | | 1,110,000 | | | 299,700 | D |
JPMorgan Chase and Co. | | | | 7.900% | | 4/29/49 | | | 3,305,000 | | | 2,749,198 | C |
Leucadia National Corp. | | | | 8.125% | | 9/15/15 | | | 2,340,000 | | | 1,877,850 | |
Leucadia National Corp. | | | | 7.125% | | 3/15/17 | | | 550,000 | | | 408,375 | |
TNK-BP Finance SA | | | | 7.875% | | 3/13/18 | | | 910,000 | | | 455,000 | A |
Vanguard Health Holding Co. I LLC | | | | 0.000% | | 10/1/15 | | | 730,000 | | | 573,050 | C |
Vanguard Health Holding Co. II LLC | | | | 9.000% | | 10/1/14 | | | 4,904,000 | | | 4,094,840 | |
| | | | | | | | | | | | | |
| | | | | | | | | | | | 23,670,747 | |
| | | | | | | | | | | | | |
Diversified Telecommunication Services | | 3.9% | | | | | | | | | | | |
Cincinnati Bell Inc. | | | | 6.300% | | 12/1/28 | | | 3,160,000 | | | 1,990,800 | |
Citizens Communications Co. | | | | 7.875% | | 1/15/27 | | | 1,435,000 | | | 832,300 | |
Citizens Communications Co. | | | | 7.050% | | 10/1/46 | | | 380,000 | | | 165,300 | |
Hawaiian Telcom Communications Inc. | | | | 12.500% | | 5/1/15 | | | 1,460,000 | | | 7,300 | F,K |
Intelsat Corp. | | | | 9.250% | | 8/15/14 | | | 4,500,000 | | | 4,185,000 | A |
Level 3 Financing Inc. | | | | 12.250% | | 3/15/13 | | | 1,010,000 | | | 611,050 | |
Level 3 Financing Inc. | | | | 9.250% | | 11/1/14 | | | 4,225,000 | | | 2,450,500 | |
Level 3 Financing Inc. | | | | 6.845% | | 2/15/15 | | | 1,605,000 | | | 698,175 | D |
MetroPCS Wireless Inc. | | | | 9.250% | | 11/1/14 | | | 1,315,000 | | | 1,176,925 | |
Qwest Communications International Inc. | | | | 5.649% | | 2/15/09 | | | 240,000 | | | 238,800 | D |
Qwest Communications International Inc. | | | | 7.250% | | 2/15/11 | | | 2,652,000 | | | 2,307,240 | |
Qwest Communications International Inc. | | | | 7.500% | | 2/15/14 | | | 3,262,000 | | | 2,332,330 | |
Windstream Corp. | | | | 8.625% | | 8/1/16 | | | 3,740,000 | | | 3,309,900 | |
| | | | | | | | | | | | | |
| | | | | | | | | | | | 20,305,620 | |
| | | | | | | | | | | | | |
45
Annual Report to Shareholders
Portfolio of Investments—Continued
Western Asset High Yield Portfolio—Continued
| | | | | | | | | | | | | |
| | | % OF
NET ASSETS | | RATE | | MATURITY
DATE | | PAR/
SHARES | | VALUE | |
| | | | | | | | | | | | | |
Corporate Bonds and Notes—Continued | | | | | | | | | | | | | |
| | | | | |
Electric Utilities | | 3.5% | | | | | | | | | | | |
Elwood Energy LLC | | | | 8.159% | | 7/5/26 | | $ | 2,442,610 | | $ | 1,655,997 | |
Energy Future Holdings Corp. | | | | 11.250% | | 11/1/17 | | | 29,630,000 | | | 14,370,550 | A,B |
IPALCO Enterprises Inc. | | | | 8.625% | | 11/14/11 | | | 240,000 | | | 224,400 | E |
Texas Competitive Electrics Holdings Co. LLC | | | | 10.500% | | 11/1/16 | | | 3,470,000 | | | 1,735,000 | A,B |
| | | | | | | | | | | | | |
| | | | | | | | | | | | 17,985,947 | |
| | | | | | | | | | | | | |
Energy Equipment and Services | | 1.2% | | | | | | | | | | | |
Atlas Pipeline Partners LP | | | | 8.750% | | 6/15/18 | | | 2,930,000 | | | 1,919,150 | A |
Complete Production Services Inc. | | | | 8.000% | | 12/15/16 | | | 1,940,000 | | | 1,222,200 | |
Key Energy Services Inc. | | | | 8.375% | | 12/1/14 | | | 2,260,000 | | | 1,491,600 | |
Pride International Inc. | | | | 7.375% | | 7/15/14 | | | 1,610,000 | | | 1,497,300 | |
| | | | | | | | | | | | | |
| | | | | | | | | | | | 6,130,250 | |
| | | | | | | | | | | | | |
Food and Staples Retailing | | 0.1% | | | | | | | | | | | |
Stater Brothers Holding Inc. | | | | 7.750% | | 4/15/15 | | | 560,000 | | | 470,400 | |
| | | | | | | | | | | | | |
| | | | | |
Food Products | | 0.7% | | | | | | | | | | | |
Dole Food Co. Inc. | | | | 8.625% | | 5/1/09 | | | 360,000 | | | 325,800 | |
Dole Food Co. Inc. | | | | 7.250% | | 6/15/10 | | | 4,350,000 | | | 3,034,125 | |
Dole Food Co. Inc. | | | | 8.875% | | 3/15/11 | | | 165,000 | | | 103,125 | |
| | | | | | | | | | | | | |
| | | | | | | | | | | | 3,463,050 | |
| | | | | | | | | | | | | |
Gas Utilities | | 0.9% | | | | | | | | | | | |
Suburban Propane Partners LP | | | | 6.875% | | 12/15/13 | | | 5,685,000 | | | 4,661,700 | |
| | | | | | | | | | | | | |
| | | | | |
Health Care Equipment and Supplies | | 0.8% | | | | | | | | | | | |
Advanced Medical Optics Inc. | | | | 7.500% | | 5/1/17 | | | 2,320,000 | | | 1,183,200 | |
Biomet Inc. | | | | 10.375% | | 10/15/17 | | | 2,955,000 | | | 2,334,450 | B |
Biomet Inc. | | | | 11.625% | | 10/15/17 | | | 500,000 | | | 427,500 | |
Fresenius Medical Care Capital Trust IV | | | | 7.875% | | 6/15/11 | | | 150,000 | | | 142,500 | |
| | | | | | | | | | | | | |
| | | | | | | | | | | | 4,087,650 | |
| | | | | | | | | | | | | |
Health Care Providers and Services | | 5.6% | | | | | | | | | | | |
CRC Health Corp. | | | | 10.750% | | 2/1/16 | | | 4,940,000 | | | 2,976,350 | |
DaVita Inc. | | | | 6.625% | | 3/15/13 | | | 1,700,000 | | | 1,615,000 | |
DaVita Inc. | | | | 7.250% | | 3/15/15 | | | 2,345,000 | | | 2,227,750 | |
HCA Inc. | | | | 9.000% | | 12/15/14 | | | 56,000 | | | 35,887 | |
HCA Inc. | | | | 6.375% | | 1/15/15 | | | 1,995,000 | | | 1,216,950 | |
HCA Inc. | | | | 9.250% | | 11/15/16 | | | 1,370,000 | | | 1,256,975 | |
HCA Inc. | | | | 9.625% | | 11/15/16 | | | 7,095,000 | | | 5,534,100 | B |
46
Annual Report to Shareholders
| | | | | | | | | | | | | |
| | | % OF
NET ASSETS | | RATE | | MATURITY
DATE | | PAR/
SHARES | | VALUE | |
| | | | | | | | | | | | | |
Corporate Bonds and Notes—Continued | | | | | | | | | | | | | |
| | | | | |
Health Care Providers and Services—Continued | | | | | | | | | | | | | |
HCA Inc. | | | | 7.500% | | 12/15/23 | | $ | 170,000 | | $ | 79,841 | |
HCA Inc. | | | | 7.690% | | 6/15/25 | | | 1,870,000 | | | 877,875 | |
IASIS Healthcare LLC | | | | 8.750% | | 6/15/14 | | | 450,000 | | | 348,750 | |
Tenet Healthcare Corp. | | | | 6.375% | | 12/1/11 | | | 2,455,000 | | | 1,896,487 | |
Tenet Healthcare Corp. | | | | 6.500% | | 6/1/12 | | | 2,030,000 | | | 1,542,800 | |
Tenet Healthcare Corp. | | | | 7.375% | | 2/1/13 | | | 1,365,000 | | | 972,563 | |
Tenet Healthcare Corp. | | | | 9.875% | | 7/1/14 | | | 4,565,000 | | | 3,674,825 | |
U.S. Oncology Holdings Inc. | | | | 8.334% | | 3/15/12 | | | 5,309,000 | | | 3,344,670 | B,D |
Universal Hospital Services Inc. | | | | 5.943% | | 6/1/15 | | | 940,000 | | | 573,400 | D |
Universal Hospital Services Inc. | | | | 8.500% | | 6/1/15 | | | 1,135,000 | | | 805,850 | B |
| | | | | | | | | | | | | |
| | | | | | | | | | | | 28,980,073 | |
| | | | | | | | | | | | | |
Hotels, Restaurants and Leisure | | 3.6% | | | | | | | | | | | |
Boyd Gaming Corp. | | | | 6.750% | | 4/15/14 | | | 690,000 | | | 434,700 | |
Boyd Gaming Corp. | | | | 7.125% | | 2/1/16 | | | 430,000 | | | 253,700 | |
Buffets Inc. | | | | 12.500% | | 11/1/14 | | | 4,105,000 | | | 7,697 | F,K,H |
Caesars Entertainment Inc. | | | | 8.125% | | 5/15/11 | | | 2,675,000 | | | 1,310,750 | |
Carrols Corp. | | | | 9.000% | | 1/15/13 | | | 450,000 | | | 303,750 | |
Denny’s Holdings Inc. | | | | 10.000% | | 10/1/12 | | | 1,710,000 | | | 1,184,175 | |
El Pollo Loco Inc. | | | | 11.750% | | 11/15/13 | | | 2,521,000 | | | 1,865,540 | |
Fontainebleau Las Vegas Holdings LLC/Fontainebleau Las Vegas Capital Corp. | | | | 10.250% | | 6/15/15 | | | 1,625,000 | | | 158,437 | A |
Harrah’s Operating Co. Inc. | | | | 10.750% | | 2/1/16 | | | 1,130,000 | | | 322,050 | A |
Harrah’s Operating Co. Inc. | | | | 10.000% | | 12/15/18 | | | 259,000 | | | 94,535 | A |
Indianapolis Downs LLC and Capital Corp. | | | | 11.000% | | 11/1/12 | | | 2,520,000 | | | 1,373,400 | A |
Indianapolis Downs LLC and Capital Corp. | | | | 15.500% | | 11/1/13 | | | 3,484,409 | | | 1,358,920 | A,B |
Inn of the Mountain Gods Resort and Casino | | | | 12.000% | | 11/15/10 | | | 5,810,000 | | | 1,917,300 | |
Mandalay Resort Group | | | | 9.375% | | 2/15/10 | | | 58,000 | | | 42,340 | |
MGM MIRAGE | | | | 8.500% | | 9/15/10 | | | 85,000 | | | 71,400 | |
MGM MIRAGE | | | | 8.375% | | 2/1/11 | | | 1,750,000 | | | 1,041,250 | |
MGM MIRAGE | | | | 6.750% | | 9/1/12 | | | 125,000 | | | 87,500 | |
MGM MIRAGE | | | | 13.000% | | 11/15/13 | | | 240,000 | | | 228,600 | A |
Quapaw Downstream Development | | | | 12.000% | | 10/15/15 | | | 2,165,000 | | | 1,190,750 | A |
Sbarro Inc. | | | | 10.375% | | 2/1/15 | | | 2,675,000 | | | 1,404,375 | |
Snoqualmie Entertainment Authority | | | | 6.875% | | 2/1/14 | | | 3,075,000 | | | 1,783,500 | A,D |
Station Casinos Inc. | | | | 6.000% | | 4/1/12 | | | 2,470,000 | | | 494,000 | |
Station Casinos Inc. | | | | 7.750% | | 8/15/16 | | | 2,930,000 | | | 556,700 | |
Station Casinos Inc. | | | | 6.625% | | 3/15/18 | | | 995,000 | | | 57,212 | |
47
Annual Report to Shareholders
Portfolio of Investments—Continued
Western Asset High Yield Portfolio—Continued
| | | | | | | | | | | | | |
| | | % OF
NET ASSETS | | RATE | | MATURITY
DATE | | PAR/
SHARES | | VALUE | |
| | | | | | | | | | | | | |
Corporate Bonds and Notes—Continued | | | | | | | | | | | | | |
| | | | | |
Hotels, Restaurants and Leisure—Continued | | | | | | | | | | | | | |
The Choctaw Resort Development Enterprise | | | | 7.250% | | 11/15/19 | | $ | 320,000 | | $ | 166,400 | A |
Turning Stone Casino Resort Enterprise | | | | 9.125% | | 9/15/14 | | | 995,000 | | | 756,200 | A |
| | | | | | | | | | | | | |
| | | | | | | | | | | | 18,465,181 | |
| | | | | | | | | | | | | |
Household Durables | | 1.9% | | | | | | | | | | | |
American Greetings Corp. | | | | 7.375% | | 6/1/16 | | | 260,000 | | | 174,200 | |
K Hovnanian Enterprises Inc. | | | | 11.500% | | 5/1/13 | | | 4,700,000 | | | 3,572,000 | |
Norcraft Cos. | | | | 9.000% | | 11/1/11 | | | 6,100,000 | | | 5,185,000 | |
Norcraft Holdings LP | | | | 9.750% | | 9/1/12 | | | 1,270,000 | | | 946,150 | |
| | | | | | | | | | | | | |
| | | | | | | | | | | | 9,877,350 | |
| | | | | | | | | | | | | |
Household Products | | 0.2% | | | | | | | | | | | |
Visant Holding Corp. | | | | 8.750% | | 12/1/13 | | | 1,395,000 | | | 1,032,300 | |
| | | | | | | | | | | | | |
| | | | | |
Independent Power Producers and Energy Traders | | 5.6% | | | | | | | | | | | |
Dynegy Holdings Inc. | | | | 7.750% | | 6/1/19 | | | 5,040,000 | | | 3,477,600 | |
Edison Mission Energy | | | | 7.750% | | 6/15/16 | | | 2,190,000 | | | 1,949,100 | |
Edison Mission Energy | | | | 7.200% | | 5/15/19 | | | 1,410,000 | | | 1,156,200 | |
Edison Mission Energy | | | | 7.625% | | 5/15/27 | | | 2,595,000 | | | 2,011,125 | |
Mirant Mid Atlantic LLC | | | | 10.060% | | 12/30/28 | | | 2,654,952 | | | 2,442,556 | |
Mirant North America LLC | | | | 7.375% | | 12/31/13 | | | 1,240,000 | | | 1,190,400 | |
NRG Energy Inc. | | | | 7.250% | | 2/1/14 | | | 860,000 | | | 804,100 | |
NRG Energy Inc. | | | | 7.375% | | 2/1/16 | | | 6,010,000 | | | 5,589,300 | |
NRG Energy Inc. | | | | 7.375% | | 1/15/17 | | | 3,045,000 | | | 2,801,400 | |
The AES Corp. | | | | 9.375% | | 9/15/10 | | | 200,000 | | | 190,000 | |
The AES Corp. | | | | 8.750% | | 5/15/13 | | | 1,452,000 | | | 1,393,920 | A |
The AES Corp. | | | | 8.000% | | 10/15/17 | | | 4,820,000 | | | 3,952,400 | |
The AES Corp. | | | | 8.000% | | 6/1/20 | | | 2,630,000 | | | 2,038,250 | A |
| | | | | | | | | | | | | |
| | | | | | | | | | | | 28,996,351 | |
| | | | | | | | | | | | | |
Insurance | | 0.4% | | | | | | | | | | | |
American International Group Inc. | | | | 8.175% | | 5/15/58 | | | 4,680,000 | | | 1,820,637 | A,C |
| | | | | | | | | | | | | |
| | | | | |
Internet and Catalog Retail | | 0.2% | | | | | | | | | | | |
Expedia Inc. | | | | 8.500% | | 7/1/16 | | | 255,000 | | | 189,975 | A |
Ticketmaster | | | | 10.750% | | 8/1/16 | | | 1,700,000 | | | 918,000 | A |
| | | | | | | | | | | | | |
| | | | | | | | | | | | 1,107,975 | |
| | | | | | | | | | | | | |
48
Annual Report to Shareholders
| | | | | | | | | | | | | |
| | | % OF
NET ASSETS | | RATE | | MATURITY
DATE | | PAR/
SHARES | | VALUE | |
| | | | | | | | | | | | | |
Corporate Bonds and Notes—Continued | | | | | | | | | | | | | |
| | | | | |
IT Services | | 0.9% | | | | | | | | | | | |
Ceridian Corp. | | | | 11.250% | | 11/15/15 | | $ | 370,000 | | $ | 196,563 | A |
Ceridian Corp. | | | | 12.250% | | 11/15/15 | | | 2,325,000 | | | 1,142,156 | A,B |
First Data Corp. | | | | 9.875% | | 9/24/15 | | | 2,570,000 | | | 1,554,850 | A |
SunGard Data Systems Inc. | | | | 10.250% | | 8/15/15 | | | 2,500,000 | | | 1,650,000 | |
| | | | | | | | | | | | | |
| | | | | | | | | | | | 4,543,569 | |
| | | | | | | | | | | | | |
Machinery | | 0.2% | | | | | | | | | | | |
American Railcar Industries Inc. | | | | 7.500% | | 3/1/14 | | | 1,250,000 | | | 825,000 | |
| | | | | | | | | | | | | |
| | | | | |
Marine | | 0.1% | | | | | | | | | | | |
Horizon Lines Inc. | | | | 4.250% | | 8/15/12 | | | 1,000,000 | | | 512,500 | G |
| | | | | | | | | | | | | |
| | | | | |
Media | | 4.7% | | | | | | | | | | | |
Affinion Group Inc. | | | | 10.125% | | 10/15/13 | | | 670,000 | | | 489,100 | |
Affinion Group Inc. | | | | 11.500% | | 10/15/15 | | | 6,755,000 | | | 4,061,444 | |
Cablevision Systems Corp. | | | | 8.000% | | 4/15/12 | | | 1,100,000 | | | 979,000 | |
CCH I Holdings LLC | | | | 11.000% | | 10/1/15 | | | 12,674,000 | | | 2,217,950 | |
CCH I Holdings LLC | | | | 11.000% | | 10/1/15 | | | 1,690,000 | | | 261,950 | |
CCH II Holdings LLC | | | | 10.250% | | 10/1/13 | | | 1,070,000 | | | 385,200 | |
Charter Communications Holdings LLC | | | | 11.750% | | 5/15/11 | | | 1,120,000 | | | 134,400 | |
Charter Communications Holdings LLC | | | | 12.125% | | 1/15/12 | | | 1,345,000 | | | 134,500 | |
Charter Communications Operating LLC | | | | 10.875% | | 9/15/14 | | | 5,420,000 | | | 4,336,000 | A |
CMP Susquehanna Corp. | | | | 9.875% | | 5/15/14 | | | 2,145,000 | | | 85,800 | |
CSC Holdings Inc. | | | | 8.125% | | 7/15/09 | | | 325,000 | | | 323,375 | |
CSC Holdings Inc. | | | | 6.750% | | 4/15/12 | | | 2,180,000 | | | 1,994,700 | |
CSC Holdings Inc. | | | | 8.500% | | 6/15/15 | | | 1,460,000 | | | 1,284,800 | A |
Dex Media Inc. | | | | 9.000% | | 11/15/13 | | | 275,000 | | | 50,875 | |
Dex Media Inc. | | | | 9.000% | | 11/15/13 | | | 145,000 | | | 26,825 | |
Dex Media West LLC | | | | 9.875% | | 8/15/13 | | | 6,017,000 | | | 1,429,037 | |
DirecTV Holdings LLC | | | | 8.375% | | 3/15/13 | | | 1,110,000 | | | 1,104,450 | |
EchoStar DBS Corp. | | | | 6.625% | | 10/1/14 | | | 1,630,000 | | | 1,361,050 | |
Idearc Inc. | | | | 8.000% | | 11/15/16 | | | 3,850,000 | | | 288,750 | |
R.H. Donnelley Corp. | | | | 6.875% | | 1/15/13 | | | 765,000 | | | 103,275 | |
R.H. Donnelley Corp. | | | | 11.750% | | 5/15/15 | | | 960,000 | | | 235,200 | A |
TL Acquisitions Inc. | | | | 10.500% | | 1/15/15 | | | 3,065,000 | | | 1,256,650 | A |
TL Acquisitions Inc. | | | | 0.000% | | 7/15/15 | | | 3,145,000 | | | 912,050 | A,C |
Virgin Media Inc. | | | | 6.500% | | 11/15/16 | | | 2,075,000 | | | 897,438 | A,G |
| | | | | | | | | | | | | |
| | | | | | | | | | | | 24,353,819 | |
| | | | | | | | | | | | | |
49
Annual Report to Shareholders
Portfolio of Investments—Continued
Western Asset High Yield Portfolio—Continued
| | | | | | | | | | | | | |
| | | % OF
NET ASSETS | | RATE | | MATURITY
DATE | | PAR/
SHARES | | VALUE | |
| | | | | | | | | | | | | |
Corporate Bonds and Notes—Continued | | | | | | | | | | | | | |
| | | | | |
Metals and Mining | | 2.1% | | | | | | | | | | | |
Freeport-McMoRan Copper & Gold Inc. | | | | 8.375% | | 4/1/17 | | $ | 3,460,000 | | $ | 2,837,200 | |
Metals USA Holdings Corp. | | | | 10.883% | | 7/1/12 | | | 615,000 | | | 172,200 | B,D |
Metals USA Inc. | | | | 11.125% | | 12/1/15 | | | 3,880,000 | | | 2,289,200 | |
Noranda Aluminium Holding Corp. | | | | 8.345% | | 11/15/14 | | | 7,810,000 | | | 1,249,600 | B,D |
Ryerson Inc. | | | | 12.250% | | 11/1/15 | | | 7,395,000 | | | 4,566,413 | A |
| | | | | | | | | | | | | |
| | | | | | | | | | | | 11,114,613 | |
| | | | | | | | | | | | | |
Multiline Retail | | 1.4% | | | | | | | | | | | |
Dollar General Corp. | | | | 11.875% | | 7/15/17 | | | 4,150,000 | | | 3,548,250 | B |
The Neiman-Marcus Group Inc. | | | | 9.000% | | 10/15/15 | | | 6,720,000 | | | 2,956,800 | B |
The Neiman-Marcus Group Inc. | | | | 7.125% | | 6/1/28 | | | 2,010,000 | | | 944,700 | |
| | | | | | | | | | | | | |
| | | | | | | | | | | | 7,449,750 | |
| | | | | | | | | | | | | |
Oil, Gas and Consumable Fuels | | 9.7% | | | | | | | | | | | |
ANR Pipeline Inc. | | | | 9.625% | | 11/1/21 | | | 1,364,000 | | | 1,494,461 | |
Belden and Blake Corp. | | | | 8.750% | | 7/15/12 | | | 9,340,000 | | | 6,397,900 | |
Chesapeake Energy Corp. | | | | 6.375% | | 6/15/15 | | | 2,065,000 | | | 1,631,350 | |
Chesapeake Energy Corp. | | | | 6.500% | | 8/15/17 | | | 1,485,000 | | | 1,136,025 | |
Chesapeake Energy Corp. | | | | 6.250% | | 1/15/18 | | | 2,515,000 | | | 1,861,100 | |
Chesapeake Energy Corp. | | | | 7.250% | | 12/15/18 | | | 2,985,000 | | | 2,328,300 | |
El Paso Corp. | | | | 7.750% | | 6/15/10 | | | 1,568,000 | | | 1,453,490 | |
El Paso Corp. | | | | 7.875% | | 6/15/12 | | | 350,000 | | | 314,291 | |
El Paso Corp. | | | | 7.800% | | 8/1/31 | | | 3,290,000 | | | 2,143,445 | |
El Paso Natural Gas Co. | | | | 8.375% | | 6/15/32 | | | 1,600,000 | | | 1,380,626 | |
Enterprise Products Operating LP | | | | 8.375% | | 8/1/66 | | | 3,165,000 | | | 1,740,750 | C |
Exco Resources Inc. | | | | 7.250% | | 1/15/11 | | | 4,048,000 | | | 3,157,440 | |
Inergy LP | | | | 8.250% | | 3/1/16 | | | 760,000 | | | 592,800 | |
International Coal Group Inc. | | | | 10.250% | | 7/15/14 | | | 4,260,000 | | | 3,195,000 | |
Mariner Energy Inc. | | | | 7.500% | | 4/15/13 | | | 1,210,000 | | | 774,400 | |
Mariner Energy Inc. | | | | 8.000% | | 5/15/17 | | | 1,405,000 | | | 730,600 | |
MarkWest Energy Partners LP | | | | 8.750% | | 4/15/18 | | | 1,750,000 | | | 1,085,000 | |
Parallel Petroleum Corp. | | | | 10.250% | | 8/1/14 | | | 2,345,000 | | | 1,489,075 | |
Parker Drilling Co. | | | | 9.625% | | 10/1/13 | | | 936,000 | | | 725,400 | |
Petrohawk Energy Corp. | | | | 9.125% | | 7/15/13 | | | 2,520,000 | | | 2,041,200 | |
Quicksilver Resources Inc. | | | | 8.250% | | 8/1/15 | | | 2,020,000 | | | 1,282,700 | |
SandRidge Energy Inc. | | | | 8.000% | | 6/1/18 | | | 7,460,000 | | | 4,140,300 | A |
SemGroup LP | | | | 8.750% | | 11/15/15 | | | 5,875,000 | | | 205,625 | A,F,H,K |
Sonat Inc. | | | | 7.625% | | 7/15/11 | | | 95,000 | | | 86,615 | |
Southwestern Energy Co. | | | | 7.500% | | 2/1/18 | | | 2,310,000 | | | 2,021,250 | A |
Stone Energy Corp. | | | | 8.250% | | 12/15/11 | | | 310,000 | | | 192,200 | |
50
Annual Report to Shareholders
| | | | | | | | | | | | | |
| | | % OF
NET ASSETS | | RATE | | MATURITY
DATE | | PAR/
SHARES | | VALUE | |
| | | | | | | | | | | | | |
Corporate Bonds and Notes—Continued | | | | | | | | | | | | | |
| | | | | |
Oil, Gas and Consumable Fuels—Continued | | | | | | | | | | | | | |
Stone Energy Corp. | | | | 6.750% | | 12/15/14 | | $ | 1,635,000 | | $ | 801,150 | |
Targa Resources Partners LP | | | | 8.250% | | 7/1/16 | | | 590,000 | | | 365,800 | A |
The Williams Cos. Inc. | | | | 7.500% | | 1/15/31 | | | 970,000 | | | 649,900 | |
Transcontinental Gas Pipe Line Corp. | | | | 8.875% | | 7/15/12 | | | 1,060,000 | | | 1,034,447 | |
VeraSun Energy Corp. | | | | 9.375% | | 6/1/17 | | | 3,755,000 | | | 450,600 | F,K |
W&T Offshore Inc. | | | | 8.250% | | 6/15/14 | | | 2,380,000 | | | 1,285,200 | A |
Whiting Petroleum Corp. | | | | 7.250% | | 5/1/12 | | | 195,000 | | | 145,275 | |
Whiting Petroleum Corp. | | | | 7.000% | | 2/1/14 | | | 2,350,000 | | | 1,656,750 | |
| | | | | | | | | | | | | |
| | | | | | | | | | | | 49,990,465 | |
| | | | | | | | | | | | | |
Paper and Forest Products | | 1.2% | | | | | | | | | | | |
Appleton Papers Inc. | | | | 8.125% | | 6/15/11 | | | 650,000 | | | 448,500 | |
Appleton Papers Inc. | | | | 9.750% | | 6/15/14 | | | 4,025,000 | | | 2,354,625 | |
NewPage Corp. | | | | 9.443% | | 5/1/12 | | | 5,715,000 | | | 2,185,988 | D |
NewPage Corp. | | | | 12.000% | | 5/1/13 | | | 480,000 | | | 136,800 | |
Newpage Holding Corp. | | | | 10.265% | | 11/1/13 | | | 1,826,692 | | | 675,876 | B,D |
Verso Paper Holdings LLC | | | | 11.375% | | 8/1/16 | | | 1,710,000 | | | 513,000 | |
| | | | | | | | | | | | | |
| | | | | | | | | | | | 6,314,789 | |
| | | | | | | | | | | | | |
Pharmaceuticals | | 0.1% | | | | | | | | | | | |
Leiner Health Products Inc. | | | | 11.000% | | 6/1/12 | | | 9,460,000 | | | 473,000 | F,H,K |
| | | | | | | | | | | | | |
| | | | | |
Real Estate Investment Trusts (REITs) | | 0.1% | | | | | | | | | | | |
Ventas Inc. | | | | 9.000% | | 5/1/12 | | | 762,000 | | | 678,180 | |
| | | | | | | | | | | | | |
| | | | | |
Real Estate Management and Development | | 0.3% | | | | | | | | | | | |
Ashton Woods USA LLC | | | | 9.500% | | 10/1/15 | | | 2,160,000 | | | 432,000 | F,K |
Forest City Enterprises Inc. | | | | 7.625% | | 6/1/15 | | | 465,000 | | | 162,750 | |
Realogy Corp. | | | | 10.500% | | 4/15/14 | | | 3,830,000 | | | 660,675 | |
Realogy Corp. | | | | 11.000% | | 4/15/14 | | | 306,800 | | | 35,282 | B |
Realogy Corp. | | | | 12.375% | | 4/15/15 | | | 3,325,000 | | | 448,875 | |
| | | | | | | | | | | | | |
| | | | | | | | | | | | 1,739,582 | |
| | | | | | | | | | | | | |
Road and Rail | | 1.2% | | | | | | | | | | | |
Hertz Corp. | | | | 10.500% | | 1/1/16 | | | 8,355,000 | | | 3,811,969 | |
Kansas City Southern Railway | | | | 7.500% | | 6/15/09 | | | 1,365,000 | | | 1,368,412 | |
Kansas City Southern Railway | | | | 13.000% | | 12/15/13 | | | 635,000 | | | 636,587 | |
Swift Transportation Co. | | | | 9.899% | | 5/15/15 | | | 3,460,000 | | | 281,125 | A,D |
Swift Transportation Co. | | | | 12.500% | | 5/15/17 | | | 2,550,000 | | | 232,688 | A |
| | | | | | | | | | | | | |
| | | | | | | | | | | | 6,330,781 | |
| | | | | | | | | | | | | |
51
Annual Report to Shareholders
Portfolio of Investments—Continued
Western Asset High Yield Portfolio—Continued
| | | | | | | | | | | | | |
| | | % OF
NET ASSETS | | RATE | | MATURITY
DATE | | PAR/
SHARES | | VALUE | |
| | | | | | | | | | | | | |
Corporate Bonds and Notes—Continued | | | | | | | | | | | | | |
| | | | | |
Semiconductors and Semiconductor Equipment | | 0.1% | | | | | | | | | | | |
Freescale Semiconductor Inc. | | | | 8.875% | | 12/15/14 | | $ | 300,000 | | $ | 132,000 | |
Freescale Semiconductor Inc. | | | | 9.125% | | 12/15/14 | | | 600,000 | | | 138,000 | B |
| | | | | | | | | | | | | |
| | | | | | | | | | | | 270,000 | |
| | | | | | | | | | | | | |
Software | | 0.3% | | | | | | | | | | | |
Activant Solutions Inc. | | | | 9.500% | | 5/1/16 | | | 3,130,000 | | | 1,455,450 | |
| | | | | | | | | | | | | |
| | | | | |
Specialty Retail | | 0.8% | | | | | | | | | | | |
ACE Hardware Corp. | | | | 9.125% | | 6/1/16 | | | 555,000 | | | 366,300 | A |
AutoNation Inc. | | | | 6.753% | | 4/15/13 | | | 980,000 | | | 671,300 | D |
Blockbuster Inc. | | | | 9.000% | | 9/1/12 | | | 2,970,000 | | | 1,440,450 | |
Eye Care Centers of America Inc. | | | | 10.750% | | 2/15/15 | | | 1,000,000 | | | 950,000 | |
Michaels Stores Inc. | | | | 10.000% | | 11/1/14 | | | 2,030,000 | | | 923,650 | |
| | | | | | | | | | | | | |
| | | | | | | | | | | | 4,351,700 | |
| | | | | | | | | | | | | |
Textiles, Apparel and Luxury Goods | | 0.2% | | | | | | | | | | | |
Oxford Industries Inc. | | | | 8.875% | | 6/1/11 | | | 1,577,000 | | | 1,190,635 | |
| | | | | | | | | | | | | |
| | | | | |
Tobacco | | 1.4% | | | | | | | | | | | |
Alliance One International Inc. | | | | 8.500% | | 5/15/12 | | | 2,190,000 | | | 1,609,650 | |
Alliance One International Inc. | | | | 11.000% | | 5/15/12 | | | 2,950,000 | | | 2,448,500 | |
Altria Group Inc. | | | | 9.700% | | 11/10/18 | | | 1,750,000 | | | 1,891,452 | E |
Reynolds American Inc. | | | | 6.500% | | 7/15/10 | | | 1,330,000 | | | 1,321,568 | |
| | | | | | | | | | | | | |
| | | | | | | | | | | | 7,271,170 | |
| | | | | | | | | | | | | |
Trading Companies and Distributors | | 1.4% | | | | | | | | | | | |
Ashtead Capital Inc. | | | | 9.000% | | 8/15/16 | | | 3,451,000 | | | 1,777,265 | A |
H&E Equipment Services Inc. | | | | 8.375% | | 7/15/16 | | | 4,540,000 | | | 2,406,200 | |
Penhall International Corp. | | | | 12.000% | | 8/1/14 | | | 7,515,000 | | | 2,855,700 | A |
| | | | | | | | | | | | | |
| | | | | | | | | | | | 7,039,165 | |
| | | | | | | | | | | | | |
Transportation Infrastructure | | 0.5% | | | | | | | | | | | |
Hawker Beechcraft Acquisition Co. | | | | 8.875% | | 4/1/15 | | | 7,500,000 | | | 2,550,000 | B |
| | | | | | | | | | | | | |
| | | | | |
Wireless Telecommunication Services | | 3.1% | | | | | | | | | | | |
ALLTEL Communications Inc. | | | | 10.375% | | 12/1/17 | | | 2,570,000 | | | 2,878,400 | A,B |
iPCS Inc. | | | | 5.318% | | 5/1/13 | | | 1,175,000 | | | 834,250 | D |
Sprint Capital Corp. | | | | 7.625% | | 1/30/11 | | | 5,745,000 | | | 4,797,075 | |
Sprint Capital Corp. | | | | 8.375% | | 3/15/12 | | | 4,330,000 | | | 3,464,000 | |
52
Annual Report to Shareholders
| | | | | | | | | | | | | |
| | | % OF
NET ASSETS | | RATE | | MATURITY
DATE | | PAR/
SHARES | | VALUE | |
| | | | | | | | | | | | | |
Corporate Bonds and Notes—Continued | | | | | | | | | | | | | |
| | | | | |
Wireless Telecommunication Services—Continued | | | | | | | | | | | | | |
Sprint Capital Corp. | | | | 6.875% | | 11/15/28 | | $ | 6,135,000 | | $ | 3,650,325 | |
Sprint Capital Corp. | | | | 8.750% | | 3/15/32 | | | 790,000 | | | 533,250 | |
| | | | | | | | | | | | | |
| | | | | | | | | | | | 16,157,300 | |
| | | | | | | | | | | | | |
Total Corporate Bonds and Notes
(Cost—$665,537,302) | | | | | | | | | | | | 411,414,883 | |
Mortgage-Backed Securities | | N.M. | | | | | | | | | | | |
| | | | | |
Variable Rate SecuritiesI | | N.M. | | | | | | | | | | | |
BlackRock Capital Finance LP 1996-R1 | | | | 9.586% | | 9/25/26 | | | 629,337 | | | 188,801 | |
| | | | | | | | | | | | | |
Total Mortgage-Backed Securities
(Cost—$564,605) | | | | | | | | | | | | 188,801 | |
Yankee BondsJ | | 10.6% | | | | | | | | | | | |
| | | | | |
Biotechnology | | N.M. | | | | | | | | | | | |
FMC Finance III SA | | | | 6.875% | | 7/15/17 | | | 10,000 | | | 9,350 | |
| | | | | | | | | | | | | |
| | | | | |
Chemicals | | 0.5% | | | | | | | | | | | |
Methanex Corp. | | | | 8.750% | | 8/15/12 | | | 2,507,000 | | | 2,265,793 | |
Montell Finance Co. BV | | | | 8.100% | | 3/15/27 | | | 4,995,000 | | | 99,900 | A |
Sensata Technologies BV | | | | 8.000% | | 5/1/14 | | | 1,010,000 | | | 454,500 | |
| | | | | | | | | | | | | |
| | | | | | | | | | | | 2,820,193 | |
| | | | | | | | | | | | | |
Commercial Banks | | 0.4% | | | | | | | | | | | |
ATF Capital BV | | | | 9.250% | | 2/21/14 | | | 1,105,000 | | | 718,250 | A |
TuranAlem Finance BV | | | | 8.250% | | 1/22/37 | | | 1,720,000 | | | 739,600 | A |
TuranAlem Finance BV | | | | 8.250% | | 1/22/37 | | | 1,585,000 | | | 681,550 | A |
| | | | | | | | | | | | | |
| | | | | | | | | | | | 2,139,400 | |
| | | | | | | | | | | | | |
Containers and Packaging | | 0.3% | | | | | | | | | | | |
Smurfit Capital Funding PLC | | | | 7.500% | | 11/20/25 | | | 2,225,000 | | | 1,312,750 | |
| | | | | | | | | | | | | |
| | | | | |
Diversified Financial Services | | 0.6% | | | | | | | | | | | |
Petroplus Finance Ltd. | | | | 6.750% | | 5/1/14 | | | 1,110,000 | | | 704,850 | A |
Petroplus Finance Ltd. | | | | 7.000% | | 5/1/17 | | | 1,175,000 | | | 716,750 | A |
TNK-BP Finance SA | | | | 7.500% | | 7/18/16 | | | 710,000 | | | 369,200 | A |
TNK-BP Finance SA | | | | 7.500% | | 7/18/16 | | | 280,000 | | | 145,600 | A |
TNK-BP Finance SA | | | | 7.875% | | 3/13/18 | | | 1,904,000 | | | 952,000 | A |
| | | | | | | | | | | | | |
| | | | | | | | | | | | 2,888,400 | |
| | | | | | | | | | | | | |
53
Annual Report to Shareholders
Portfolio of Investments—Continued
Western Asset High Yield Portfolio—Continued
| | | | | | | | | | | | | |
| | | % OF
NET ASSETS | | RATE | | MATURITY
DATE | | PAR/
SHARES | | VALUE | |
| | | | | | | | | | | | | |
Yankee Bonds —Continued | | | | | | | | | | | | | |
| | | | | |
Diversified Telecommunication Services | | 3.3% | | | | | | | | | | | |
Intelsat Bermuda Ltd. | | | | 9.500% | | 6/15/16 | | $ | 2,805,000 | | $ | 2,580,600 | A |
Intelsat Bermuda Ltd. | | | | 11.250% | | 6/15/16 | | | 900,000 | | | 819,000 | |
Intelsat Jackson Holdings Ltd. | | | | 11.500% | | 6/15/16 | | | 6,425,000 | | | 5,589,750 | A |
Nordic Telephone Co. Holdings ApS | | | | 8.875% | | 5/1/16 | | | 4,305,000 | | | 3,013,500 | A |
NTL Cable PLC | | | | 9.125% | | 8/15/16 | | | 5,580,000 | | | 4,129,200 | |
Wind Acquisition Finance SA | | | | 10.750% | | 12/1/15 | | | 1,100,000 | | | 946,000 | A |
| | | | | | | | | | | | | |
| | | | | | | | | | | | 17,078,050 | |
| | | | | | | | | | | | | |
Energy Equipment and Services | | 0.2% | | | | | | | | | | | |
Compagnie Generale de Geophysique-Veritas | | | | 7.500% | | 5/15/15 | | | 1,950,000 | | | 1,209,000 | |
| | | | | | | | | | | | | |
| | | | | |
Foreign Government | | 0.1% | | | | | | | | | | | |
Russian Federation | | | | 7.500% | | 3/31/30 | | | 860,714 | | | 750,681 | A |
| | | | | | | | | | | | | |
| | | | | |
Media | | 0.6% | | | | | | | | | | | |
Sun Media Corp. | | | | 7.625% | | 2/15/13 | | | 3,880,000 | | | 3,123,400 | |
| | | | | | | | | | | | | |
| | | | | |
Metals and Mining | | 0.6% | | | | | | | | | | | |
Novelis Inc. | | | | 7.250% | | 2/15/15 | | | 5,125,000 | | | 2,972,500 | |
| | | | | | | | | | | | | |
| | | | | |
Oil, Gas and Consumable Fuels | | 1.3% | | | | | | | | | | | |
Corral Finans AB | | | | 9.753% | | 4/15/10 | | | 5,027,286 | | | 2,714,734 | A,B,D |
OPTI Canada Inc. | | | | 7.875% | | 12/15/14 | | | 935,000 | | | 476,850 | |
OPTI Canada Inc. | | | | 8.250% | | 12/15/14 | | | 525,000 | | | 283,500 | |
Teekay Shipping Corp. | | | | 8.875% | | 7/15/11 | | | 3,652,000 | | | 3,085,940 | |
| | | | | | | | | | | | | |
| | | | | | | | | | | | 6,561,024 | |
| | | | | | | | | | | | | |
Paper and Forest Products | | 1.0% | | | | | | | | | | | |
Abitibi-Consolidated Co. of Canada | | | | 15.500% | | 7/15/10 | | | 5,757,000 | | | 1,669,530 | A |
Abitibi-Consolidated Co. of Canada | | | | 13.750% | | 4/1/11 | | | 5,860,000 | | | 3,750,400 | A |
| | | | | | | | | | | | | |
| | | | | | | | | | | | 5,419,930 | |
| | | | | | | | | | | | | |
Road and Rail | | 1.1% | | | | | | | | | | | |
Grupo Transportacion Ferroviaria Mexicana SA de CV | | | | 9.375% | | 5/1/12 | | | 3,175,000 | | | 2,905,125 | |
Grupo Transportacion Ferroviaria Mexicana SA de CV | | | | 7.625% | | 12/1/13 | | | 1,915,000 | | | 1,570,300 | |
Kansas City Southern de Mexico SA de CV | | | | 7.375% | | 6/1/14 | | | 1,380,000 | | | 1,129,116 | |
| | | | | | | | | | | | | |
| | | | | | | | | | | | 5,604,541 | |
| | | | | | | | | | | | | |
54
Annual Report to Shareholders
| | | | | | | | | | | | | | |
| | | % OF
NET ASSETS | | RATE | | MATURITY
DATE | | PAR/
SHARES | | | VALUE | |
| | | | | | | | | | | | | | |
Yankee Bonds —Continued | | | | | | | | | | | | | | |
| | | | | |
Semiconductors and Semiconductor Equipment | | 0.1% | | | | | | | | | | | | |
NXP BV/NXP Funding LLC | | | | 7.503% | | 10/15/13 | | $ | 970,000 | | | $ | 322,525 | D |
NXP BV/NXP Funding LLC | | | | 7.875% | | 10/15/14 | | | 485,000 | | | | 189,150 | |
| | | | | | | | | | | | | | |
| | | | | | | | | | | | | 511,675 | |
| | | | | | | | | | | | | | |
Wireless Telecommunication Services | | 0.5% | | | | | | | | | | | | |
True Move Co. Ltd. | | | | 10.750% | | 12/16/13 | | | 5,505,000 | | | | 2,036,850 | A |
True Move Co. Ltd. | | | | 10.750% | | 12/16/13 | | | 865,000 | | | | 349,764 | A |
| | | | | | | | | | | | | | |
| | | | | | | | | | | | | 2,386,614 | |
| | | | | | | | | | | | | | |
Total Yankee Bonds
(Cost—$84,899,527) | | | | | | | | | | | | | 54,787,508 | |
Preferred Stocks | | 1.0% | | | | | | | | | | | | |
Bank of America Corp. | | | | 7.250% | | | | | 5,400 | shs | | | 3,510,000 | |
Citigroup Inc. | | | | 6.500% | | | | | 41,400 | | | | 1,158,786 | |
ION Media Networks Inc. | | | | 12.000% | | | | | 7 | | | | — | K |
Preferred Blocker Inc. | | | | 9.000% | | | | | 1,849 | | | | 462,250 | A |
| | | | | | | | | | | | | | |
Total Preferred Stocks
(Cost— $8,132,967) | | | | | | | | | | | | | 5,131,036 | |
Loan Participations and AssignmentsD | | 2.9% | | | | | | | | | | | | |
| | | | | |
Auto Components | | 0.5% | | | | | | | | | | | | |
Allison Transmission Inc., Term Loan, Tranche B | | | | 4.190% to 5.000% | | 3/31/09 | | $ | 4,838,952 | | | | 2,675,248 | |
| | | | | | | | | | | | | | |
| | | | | |
Containers and Packaging | | 0.2% | | | | | | | | | | | | |
Berry Plastics Holding Corp., Term Loan | | | | 11.334% | | 1/7/09 | | | 5,035,859 | | | | 1,007,172 | |
| | | | | | | | | | | | | | |
| | | | | |
Diversified Telecommunication Services | | 0.5% | | | | | | | | | | | | |
Wind Acquisition Holdings Finance SA, PIK Loan | | | | 11.753% | | 1/20/09 | | | 4,313,512 | | | | 2,588,107 | |
| | | | | | | | | | | | | | |
| | | | | |
Independent Power Producers and Energy Traders | | 0.3% | | | | | | | | | | | | |
Dynegy Holdings Inc., Letter of Credit | | | | 1.970% | | 1/30/09 | | | 1,203,515 | | | | 899,628 | |
Dynegy Holdings Inc., Term Loan | | | | 1.970% | | 1/30/09 | | | 786,529 | | | | 587,930 | |
| | | | | | | | | | | | | | |
| | | | | | | | | | | | | 1,487,558 | |
| | | | | | | | | | | | | | |
55
Annual Report to Shareholders
Portfolio of Investments—Continued
Western Asset High Yield Portfolio—Continued
| | | | | | | | | | | | | |
| | | % OF
NET ASSETS | | RATE | | MATURITY
DATE | | PAR/
SHARES | | VALUE | |
| | | | | | | | | | | | | |
Loan Participations and Assignments—Continued | | | | | | | | | | | | | |
| | | | | |
Media | | 0.4% | | | | | | | | | | | |
Idearc Inc., Term Loan, Tranche B | | | | 0.000% | | 11/12/14 | | $ | 1,680,000 | | $ | 512,400 | |
Newsday LLC, Term Loan | | | | 9.750% | | 1/15/09 | | | 2,000,000 | | | 1,600,000 | |
| | | | | | | | | | | | | |
| | | | | | | | | | | | 2,112,400 | |
| | | | | | | | | | | | | |
Oil, Gas and Consumable Fuels | | 0.7% | | | | | | | | | | | |
Turbo Bet Ltd., Term Loan | | | | 14.500% | | 5/13/09 | | | 4,304,678 | | | 3,400,696 | H |
| | | | | | | | | | | | | |
| | | | | |
Paper and Forest Products | | 0.3% | | | | | | | | | | | |
Georgia-Pacific Corp., First Lien Term Loan | | | | 2.581% to 4.189% | | 3/31/09 | | | 1,392,134 | | | 1,130,528 | |
Verso Paper Holdings LLC, Term Loan | | | | 10.012% | | 1/2/09 | | | 672,000 | | | 268,800 | |
| | | | | | | | | | | | | |
| | | | | | | | | | | | 1,399,328 | |
| | | | | | | | | | | | | |
Total Loan Participations and Assignments (Cost—$23,741,077) | | | | | | | | | | | | 14,670,509 | |
| | | | | | | | | | | | | |
Total Long-Term Securities
(Cost—$782,875,478) | | | | | | | | | | | | 486,192,737 | |
Short-Term Securities | | 0.8% | | | | | | | | | | | |
| | | | | |
U.S. Government and Agency Obligations | | 0.8% | | | | | | | | | | | |
Federal Home Loan Bank | | | | 0.000% | | 3/26/09 | | | 4,200,000 | | | 4,198,530 | L,M |
| | | | | | | | | | | | | |
Total Short-Term Securities
(Cost—$4,198,530) | | | | | | | | | | | | 4,198,530 | |
Total Investments
(Cost—$787,074,008)N | | 94.8% | | | | | | | | | | 490,391,267 | |
Other Assets Less Liabilities | | 5.2% | | | | | | | | | | 26,849,710 | |
| | | | | | | | | | | | | |
| | | | | |
Net Assets | | 100.0% | | | | | | | | | $ | 517,240,977 | |
| | | | | | | | | | | | | |
| | | | | | | | | | | | | | |
N.M.—Not Meaningful.
A | | Rule 144a Security – A security purchased pursuant to Rule 144a under the Securities Act of 1933 which may not be resold subject to that rule except to qualified institutional buyers. These securities, which the Fund’s investment adviser has determined to be liquid, represent 23.81% of net assets. |
B | | Pay-in-Kind (“PIK”) security – A security in which interest or dividends during the initial few years is paid in additional PIK securities rather than in cash. |
C | | Stepped Coupon Security – A security with a predetermined schedule of interest or dividend rate changes at which time it begins to accrue interest or pay dividends according to the predetermined schedule. |
D | | Indexed Security – The rates of interest earned on these securities are tied to the London Interbank Offered Rate (“LIBOR”), the Euro Interbank Offered Rate (“EURIBOR”) Index, the Consumer Price Index (“CPI”), the one-year Treasury Bill Rate or the ten-year Japanese Government Bond Rate. The coupon rates are the rates as of December 31, 2008. |
56
Annual Report to Shareholders
E | | Credit Linked Security – The rates of interest earned on these securities are tied to the credit rating assigned by Standard & Poor’s Rating Service and/or Moody’s Investors Services. |
F | | Bond is currently in default. |
G | | Convertible Security – Security may be converted into the issuer’s common stock. |
H | | Illiquid security valued at fair value under the procedures approved by the Board of Directors. |
I | | The coupon rates shown on variable rate securities are the rates at December 31, 2008. These rates vary with the weighted average coupon of the underlying loans. |
J | | Yankee Bond – A dollar-denominated bond issued in the U.S. by foreign entities. |
L | | Zero coupon bond – A bond with no periodic interest payments which is sold at such a discount as to produce a current yield to maturity. |
M | | On September 7, 2008, the Federal Housing Finance Agency placed Fannie Mae and Freddie Mac into Conservatorship. |
N | | At December 31, 2008, the aggregate gross unrealized appreciation and depreciation of investments for federal income tax purposes were substantially as follows: |
| | | | |
| Gross unrealized appreciation | | $ | 785,884 | |
| Gross unrealized depreciation | | | (298,998,777 | ) |
| | | | |
| Net unrealized depreciation | | $ | (298,212,893 | ) |
| | | | |
See notes to financial statements.
57
Annual Report to Shareholders
Statement of Assets and Liabilities
Western Asset High Yield Portfolio
December 31, 2008
| | | | | | | |
Assets: | | | | | | | |
Investment securities at value (Cost—$782,875,478) | | | | | $ | 486,192,737 | |
Short-term securities at value (Cost—$4,198,530) | | | | | | 4,198,530 | |
Cash | | | | | | 6,630,558 | |
Foreign currency at value (Cost—$196) | | | | | | 196 | |
Interest receivable | | | | | | 18,022,850 | |
Receivable for securities sold | | | | | | 9,818,799 | |
Restricted cash pledged as collateral for swaps | | | | | | 1,100,000 | |
Receivable for fund shares sold | | | | | | 180,875 | |
Amount receivable for open swaps | | | | | | 2,222 | |
| | | | | | | |
Total assets | | | | | | 526,146,767 | |
| | | | | | | |
| | |
Liabilities: | | | | | | | |
Payable for securities purchased | | $ | 7,470,390 | | | | |
Unrealized depreciation on swaps | | | 535,349 | | | | |
Premium received on open swaps | | | 300,000 | | | | |
Payable for fund shares repurchased | | | 271,591 | | | | |
Accrued management fee | | | 226,383 | | | | |
Accrued expenses | | | 102,077 | | | | |
| | | | | | | |
Total liabilities | | | | | | 8,905,790 | |
| | | | | | | |
| | |
Net Assets | | | | | $ | 517,240,977 | |
| | | | | | | |
| | |
Net assets consist of: | | | | | | | |
Accumulated paid-in-capital | | | | | $ | 886,707,349 | |
Overdistributed net investment income | | | | | | (301,203 | ) |
Accumulated net realized loss on investments, options, swaps and foreign currency transactions | | | | | | (71,947,079 | ) |
Net unrealized depreciation on investments and swaps | | | | | | (297,218,090 | ) |
| | | | | | | |
| | |
Net Assets | | | | | $ | 517,240,977 | |
| | | | | | | |
| | |
Net Asset Value Per Share: | | | | | | | |
Institutional Class (73,334,570 shares outstanding) | | | | | | $5.99 | |
Institutional Select Class (12,831,096 shares outstanding) | | | | | | $6.06 | |
| | | | | | | | |
See notes to financial statements.
58
Annual Report to Shareholders
Statement of Operations
Western Asset High Yield Portfolio
| | | | | | | | | | | | | | | | |
| | | FOR THE
PERIOD ENDED
DECEMBER 31, 2008A | | | FOR THE
YEAR ENDED
MARCH 31, 2008 | |
Investment Income: | | | | | | | | | | | | | | | | |
Interest | | $ | 58,130,112 | | | | | | | $ | 81,239,280 | | | | | |
Dividends | | | 429,637 | | | | | | | | — | | | | | |
| | | | | | | | | | | | | | | | |
Total income | | | | | | $ | 58,559,749 | | | | | | | $ | 81,239,280 | |
Expenses: | | | | | | | | | | | | | | | | |
Management fees | | | 2,882,854 | | | | | | | | 5,035,782 | | | | | |
Audit and legal fees | | | 87,666 | | | | | | | | 89,716 | | | | | |
Custodian fees | | | 86,015 | | | | | | | | 110,697 | | | | | |
Directors’ fees and expenses | | | 18,290 | | | | | | | | 24,190 | | | | | |
Registration fees | | | 20,356 | | | | | | | | 27,687 | | | | | |
Reports to shareholders: | | | | | | | | | | | | | | | | |
Institutional Class | | | 7,200 | | | | | | | | 9,437 | | | | | |
Institutional Select Class | | | 23 | | | | | | | | N/A | | | | | |
Transfer agent and shareholder servicing expense: | | | | | | | | | | | | | | | | |
Institutional Class | | | 12,864 | | | | | | | | 15,237 | | | | | |
Institutional Select Class | | | 495 | | | | | | | | N/A | | | | | |
Other expenses | | | 30,197 | | | | | | | | 50,412 | | | | | |
| | | | | | | | | | | | | | | | |
| | | 3,145,960 | | | | | | | | 5,363,158 | | | | | |
Less: Fees waived | | | — | | | | | | | | — | | | | | |
Compensating balance credits | | | (607 | ) | | | | | | | (60,278 | ) | | | | |
| | | | | | | | | | | | | | | | |
Net expenses | | | | | | | 3,145,353 | | | | | | | | 5,302,880 | |
| | | | | | | | | | | | | | | | |
Net Investment Income | | | | | | | 55,414,396 | | | | | | | | 75,936,400 | |
Net Realized and Unrealized Gain/(Loss) on Investments: | | | | | | | | | | | | | | | | |
Net realized gain/(loss) on: | | | | | | | | | | | | | | | | |
Investments | | | (52,601,218 | ) | | | | | | | (17,778,987 | ) | | | | |
Options | | | 137,750 | | | | | | | | — | | | | | |
Swaps | | | 300,554 | | | | | | | | 345,171 | | | | | |
Foreign currency transactions | | | (8,921 | ) | | | | | | | — | | | | | |
| | | | | | | | | | | | | | | | |
| | | | | | | (52,171,835 | ) | | | | | | | (17,433,816 | ) |
Change in unrealized appreciation/(depreciation) of: | | | | | | | | | | | | | | | | |
Investments and swaps | | | | | | | (203,191,273 | ) | | | (113,737,089 | ) | | | | |
Net Realized and Unrealized Loss on Investments | | | | | | | (255,363,108 | ) | | | | | | | (131,170,905 | ) |
| | | | | | | | | | | | | | | | | |
Change in Net Assets Resulting From Operations | | | | | | $ | (199,948,712 | ) | | | | | | $ | (55,234,505 | ) |
| | | | | | | | | | | | | | | | | |
A | | For the period April 1, 2008 to December 31, 2008. |
N/A—Not applicable.
See notes to financial statements.
59
Annual Report to Shareholders
Statement of Changes in Net Assets
Western Asset High Yield Portfolio
| | | | | | | | | | | | |
| | | FOR THE
PERIOD ENDED
DECEMBER 31, 2008A | | | FOR THE
YEARS ENDED MARCH 31, | |
| | | | 2008 | | | 2007 | |
| Change in Net Assets: | | | | | | | | | |
Net investment income | | $ | 55,414,396 | | | $ | 75,936,400 | | | $ | 53,017,362 | |
| | | |
Net realized gain/(loss) | | | (52,171,835 | ) | | | (17,433,816 | ) | | | 4,211,652 | |
| | | |
Change in unrealized appreciation/(depreciation) | | | (203,191,273 | ) | | | (113,737,089 | ) | | | 21,006,214 | |
| | | | | | | | | | | | |
Change in net assets resulting from operations | | | (199,948,712 | ) | | | (55,234,505 | ) | | | 78,235,228 | |
| | | |
Distributions to shareholders from: | | | | | | | | | | | | |
Net investment income: | | | | | | | | | | | | |
Institutional Class | | | (70,179,099 | ) | | | (73,407,062 | ) | | | (48,140,250 | ) |
Institutional Select Class | | | (4,937,498 | ) | | | N/A | | | | N/A | |
| | | |
Net realized gain on investments: | | | | | | | | | | | | |
Institutional Class | | | — | | | | (5,888,441 | ) | | | (130,587 | ) |
| | | |
Change in net assets from fund share transactions: | | | | | | | | | | | | |
Institutional Class | | | (121,890,768 | ) | | | 55,309,962 | | | | 252,440,140 | |
Institutional Select Class | | | 114,094,156 | | | | N/A | | | | N/A | |
| | | | | | | | | | | | |
Change in net assets | | | (282,861,921 | ) | | | (79,220,046 | ) | | | 282,404,531 | |
| | | |
Net Assets: | | | | | | | | | | | | |
Beginning of period | | | 800,102,898 | | | | 879,322,944 | | | | 596,918,413 | |
| | | | | | | | | | | | |
| | | |
End of period | | $ | 517,240,977 | | | $ | 800,102,898 | | | $ | 879,322,944 | |
| | | | | | | | | | | | |
| | | |
(Overdistributed)/Undistributed net investment income | | $ | (301,203 | ) | | $ | 19,427,792 | | | $ | 16,590,204 | |
| | | | | | | | | | | | |
| | | | | | | | | | | | | |
A | | For the period April 1, 2008 to December 31, 2008. |
N/A—Not applicable.
See notes to financial statements.
60
Annual Report to Shareholders
Financial Highlights
Western Asset High Yield Portfolio
For a share of each class of capital stock outstanding:
Institutional Class:
| | | | | | | | | | | | | | | | | | | | | | | | |
| | | PERIOD
ENDED
DECEMBER 31,
2008A | | | YEARS ENDED MARCH 31, | |
| | | 2008 | | | 2007 | | | 2006 | | | 2005 | | | 2004 | |
Net asset value, beginning of period | | $ | 9.30 | | | $ | 10.75 | | | $ | 10.34 | | | $ | 10.49 | | | $ | 10.28 | | | $ | 9.56 | |
| | | | | | | | | | | | | | | | | | | | | | | | |
Investment operations: | | | | | | | | | | | | | | | | | | | | | | | | |
Net investment income | | | .66 | B | | | .83 | B | | | .80 | B | | | .76 | C | | | .61 | C | | | .78 | C |
Net realized and unrealized gain/(loss) | | | (3.05 | ) | | | (1.41 | ) | | | .39 | | | | (.05 | ) | | | .17 | | | | .89 | |
| | | | | | | | | | | | | | | | | | | | | | | | |
Total from investment operations | | | (2.39 | ) | | | (.58 | ) | | | 1.19 | | | | .71 | | | | .78 | | | | 1.67 | |
| | | | | | | | | | | | | | | | | | | | | | | | |
Distributions from: | | | | | | | | | | | | | | | | | | | | | | | | |
Net investment income | | | (.92 | ) | | | (.80 | ) | | | (.78 | ) | | | (.73 | ) | | | (.57 | ) | | | (.95 | ) |
Net realized gain on investments | | | — | | | | (.07 | ) | | | — | D | | | (.13 | ) | | | — | | | | — | |
| | | | | | | | | | | | | | | | | | | | | | | | |
Total distributions | | | (.92 | ) | | | (.87 | ) | | | (.78 | ) | | | (.86 | ) | | | (.57 | ) | | | (.95 | ) |
| | | | | | | | | | | | | | | | | | | | | | | | |
Net asset value, end of period | | $ | 5.99 | | | $ | 9.30 | | | $ | 10.75 | | | $ | 10.34 | | | $ | 10.49 | | | $ | 10.28 | |
| | | | | | | | | | | | | | | | | | | | | | | | |
Total return | | | (27.19 | )%E | | | (5.88 | )% | | | 12.14 | % | | | 7.30 | % | | | 7.81 | % | | | 18.27 | % |
| | | | | | |
Ratios to Average Net Assets:F | | | | | | | | | | | | | | | | | | | | | | | | |
Total expenses | | | .60 | %G | | | .59 | % | | | .61 | % | | | .62 | % | | | .62 | % | | | .67 | % |
Expenses net of waivers, if any | | | .60 | %G | | | .59 | % | | | .61 | % | | | .62 | % | | | .62 | % | | | .58 | % |
Expenses net of all reductions | | | .60 | %G | | | .58 | % | | | .61 | % | | | .62 | % | | | .62 | % | | | .58 | % |
Net investment income | | | 10.4 | %G | | | 8.3 | % | | | 7.8 | % | | | 7.8 | % | | | 7.0 | % | | | 7.9 | % |
| | | | | | |
Supplemental Data: | | | | | | | | | | | | | | | | | | | | | | | | |
Portfolio turnover rate | | | 40.9 | %E | | | 59.1 | % | | | 63.6 | % | | | 147.2 | % | | | 121.0 | % | | | 116.0 | % |
Net assets, end of period (in thousands) | | $ | 439,446 | | | $ | 800,103 | | | $ | 879,323 | | | $ | 596,918 | | | $ | 414,417 | | | $ | 189,458 | |
| | | | | | | | | | | | | | | | | | | | | | | | | |
A | | For the period April 1, 2008 to December 31, 2008. |
B | | Computed using average daily shares outstanding. |
C | | Computed using SEC method. |
D | | Amount less than $.01 per share. |
F | | Total expenses reflects operating expenses prior to any contractual expense waivers and/or compensating balance credits. Expenses net of waivers reflects total expenses before compensating balance credits but net of any contractual expense waivers. Expenses net of all reductions reflects expenses less any compensating balance credits and/or voluntary expense waivers. As of the most current prospectus, the Institutional Class has no limit on expenses. |
See notes to financial statements.
61
Annual Report to Shareholders
Financial Highlights—Continued
Western Asset High Yield Portfolio
For a share of each class of capital stock outstanding:
Institutional Select Class:
| | | | |
| | | PERIOD
ENDED
DECEMBER 31,
2008H | |
| | |
| | |
Net asset value, beginning of period | | $ | 8.86 | |
| | | | |
Investment operations: | | | | |
Net investment income | | | .37 | B |
Net realized and unrealized loss | | | (2.77 | ) |
| | | | |
Total from investment operations | | | (2.40 | ) |
| | | | |
Distributions from: | | | | |
Net investment income | | | (.40 | ) |
| | | | |
Total distributions | | | (.40 | ) |
| | | | |
Net asset value, end of period | | $ | 6.06 | |
| | | | |
Total return | | | (27.16 | )%E |
| |
Ratios to Average Net Assets:F | | | | |
Total expenses | | | .60 | %G |
Expenses net of waivers, if any | | | .60 | %G |
Expenses net of all reductions | | | .60 | %G |
Net investment income | | | 12.4 | %G |
| |
Supplemental Data: | | | | |
Portfolio turnover rate | | | 40.9 | %E |
Net assets, end of period (in thousands) | | $ | 77,795 | |
| | | | | |
H | | For the period August 4, 2008 (commencement of operations) to December 31, 2008. |
See notes to financial statements.
62
Annual Report to Shareholders
Management’s Discussion of Fund Performance
Western Asset Inflation Indexed Plus Bond Portfolio
Total returns for the Fund for various periods ended December 31, 2008 are presented below, along with those of comparative indices:
| | | | | | | | | | | | |
| | | | | | | | | Average Annual Total Returns |
| | | Three
Months | | Nine
Months | | One
Year | | Three
Years | | Five
Years | | Since
InceptionA |
Western Asset Inflation Indexed Plus Bond Portfolio: | | | | | | | | | | | | |
Institutional Class | | -2.23% | | -8.32% | | -4.04% | | +2.46% | | +3.68% | | +5.85% |
Financial Intermediary Class | | -2.24% | | -8.47% | | -4.32% | | N/A | | N/A | | +3.03% |
Institutional Select Class | | N/A | | N/A | | N/A | | N/A | | N/A | | -1.04% |
Barclays Capital U.S. Treasury Inflation Notes IndexB | | -3.48% | | -7.16% | | -2.35% | | +3.06% | | +4.07% | | +6.21% |
Lipper Treasury Inflation Protected Funds Category AverageC | | -3.75% | | -8.40% | | -3.98% | | +1.84% | | +3.27% | | +5.07% |
The performance data quoted represent past performance and do not guarantee future results. Current performance may be lower or higher than the performance data quoted. To obtain the most recent month-end performance information, please visit www.westernassetfunds.com. The investment return and principal value of the Fund will fluctuate so that an investor’s shares, when redeemed, may be worth more or less than the original cost. Calculations assume reinvestment of dividends and capital gain distributions. Performance would have been lower if fees had not been waived in various periods. Performance figures for periods shorter than one year represent cumulative figures and are not annualized.
The gross expense ratios for the Institutional, Financial Intermediary and Institutional Select Classes were 0.42%, 0.84% and 0.27%, respectively and do not reflect fee waivers or reimbursements. The net expense ratio for the Institutional, Financial Intermediary and Institutional Select Classes were 0.40%, 0.75% and 0.25%, respectively, and reflect contractual fee waivers and/or reimbursements. As a result of a contractual expense limitation, total annual operating expenses for the Institutional Class will be waived or reimbursed at a rate of 0.02% of the Fund’s average daily net assets attributable to the Institutional Class until July 31, 2009. As a result of a contractual expense limitation, the ratio of expenses, other than taxes, interest, deferred organizational expenses, brokerage and extraordinary expenses, to average net assets will not exceed 0.75% for the Financial Intermediary Class and 0.25% for the Institutional Select Class until July 31, 2009.
All expenses shown include management fees, 12b-1 distribution fees and other expenses as indicated in the Fund’s most current prospectus dated August 1, 2008.
For the period from April 1, 2008 through December 31, 2008, Institutional Class shares of Western Asset Inflation Indexed Plus Bond Portfolio returned -8.32%. The Fund’s unmanaged benchmark, the Barclays Capital U.S. Treasury Inflation Notes Index, returned -7.16% over the same time frame. The Lipper Treasury Inflation Protected Funds Category Average returned -8.40% for the same period.
A | | The inception date of the Institutional Class is March 1, 2001. The inception date of the Financial Intermediary Class is June 28, 2007. The inception date of the Institutional Select Class is December 18, 2008. Index returns are for periods beginning February 28, 2001. Although it is not possible to invest directly in an index, it is possible to purchase investment vehicles designed to track the performance of certain indices. |
B | | The Barclays Capital (formerly Lehman Brothers) U.S. Treasury Inflation Notes Index consists of all inflation-protected securities issued by the U.S. Treasury. |
C | | Lipper, Inc., a wholly-owned subsidiary of Reuters, provides independent insight on global collective investments. The Lipper Treasury Inflation Protected Funds Category Average is comprised of the Fund’s peer group of mutual funds. |
63
Annual Report to Shareholders
Management’s Discussion of Fund Performance—Continued
The impact of market conditions on the Fund’s performance was negative for the nine-month period ended December 31, 2008, with strategies also producing negative results. U.S. Treasury Inflation-Protected Securities (“TIPS”)D suffered tremendously after the summer when oil prices plunged, and a diversification away from inflation-linked, toward nominal bonds had a large positive impact on performance as the market become concerned with deflation. The selection of nominal corporates, however, had an overwhelming negative impact. Spreads on corporate debt and mortgage-backed securities widened dramatically as rising tensions in the Financials sector and an evaporation of liquidity exerted downward pressure on the economy.
Western Asset Management Company
January 20, 2009
Investment Risks: Bonds are subject to a variety of risks, including interest rate, credit and inflation risk. As interest rates rise, bond prices fall, reducing the value of the Fund’s share price. The Fund is subject to the additional risks associated with Inflation-Indexed Securities, including liquidity risk, prepayment risk, extension risk and deflation risk. Foreign securities are subject to certain risks of overseas investing, including currency fluctuations and changes in political and economic conditions. These risks are magnified in emerging markets. The Fund may invest in high-yield bonds, which are rated below investment grade and carry more risk than higher-rated securities. Mortgage-backed securities involve more risk, including prepayment and extension risks, than other investments in fixed-income securities. The Fund may use derivatives, such as options and futures, which can be illiquid, may disproportionately increase losses, and have a potentially large impact on Fund performance.
D | | U.S. Treasury Inflation-Protected Securities (“TIPS”) are inflation-indexed securities issued by the U.S. Treasury in 5-year, 10-year and 20-year maturities. The principal is adjusted to the Consumer Price Index, the commonly used measure of inflation. The coupon rate is constant, but generates a different amount of interest when multiplied by the inflation-adjusted principal. |
N/A—Not applicable.
64
Annual Report to Shareholders
Expense Example
Western Asset Inflation Indexed Plus Bond Portfolio
As a shareholder of the Fund, you incur ongoing costs, including management fees, distribution (12b-1) fees on Financial Intermediary Class shares, and other Fund expenses. These examples are intended to help you understand your ongoing costs (in dollars) of investing in the Fund and to compare these costs with the ongoing costs of investing in other mutual funds.
Actual Expenses
The first line for each class in the table below provides information about actual account values and actual expenses for the Fund. You may use the information in this line, together with the amount you invested, to estimate the expenses that you paid over the period. Simply divide your account value by $1,000 (for example, an $8,600 account value divided by $1,000 = 8.6), then multiply the result by the number in the first line under the heading entitled “Expenses Paid During the Period” to estimate the expenses you paid on your account if your shares were held through the entire period. For the Institutional and Financial Intermediary Classes, the example is based on an investment of $1,000 invested on July 1, 2008 and held through December 31, 2008; for Institutional Select Class, the example is based on an investment of $1,000 invested on December 18, 2008 (commencement of operations) and held through December 31, 2008.
Hypothetical Example for Comparison Purposes
The second line for each class in the table below provides information about hypothetical account values and hypothetical expenses based on the Fund’s actual expense ratio and an assumed rate of return of 5% per year before expenses, which is not the Class’s actual return. The hypothetical account values and expenses may not be used to estimate the actual ending account balance or expenses you paid for the period. You may use this information to compare the ongoing costs of investing in the Fund and other funds. To do so, compare these 5% hypothetical examples with the 5% hypothetical examples that appear in the shareholder reports of other funds. Because each example is intended to be comparable to the examples provided by other funds, it is based on a hypothetical investment of $1,000 invested on July 1, 2008 and held through December 31, 2008 for each class, even though the Institutional Select Class did not begin operations until December 18, 2008.
| | | | | | | | | | | |
| | | Beginning
Account Value
7/1/08 | | | Ending
Account Value
12/31/08 | | Expenses PaidA
During the Period
7/1/08 to 12/31/08 | |
Institutional Class: | | | | | | | | | | | |
Actual | | $ | 1,000.00 | | | $ | 925.20 | | $ | 1.21 | |
Hypothetical (5% return before expenses) | | | 1,000.00 | | | | 1,023.95 | | | 1.28 | |
Institutional Select Class: | | | | | | | | | | | |
Actual | | $ | 1,000.00 | B | | $ | 989.60 | | $ | 0.09 | C |
Hypothetical (5% return before expenses) | | | 1,000.00 | | | | 1,024.00 | | | 1.22 | |
Financial Intermediary Class: | | | | | | | | | | | |
Actual | | $ | 1,000.00 | | | $ | 924.20 | | $ | 2.52 | |
Hypothetical (5% return before expenses) | | | 1,000.00 | | | | 1,022.58 | | | 2.65 | |
A | | These calculations are based on expenses incurred from July 1, 2008 to December 31, 2008. The dollar amounts shown as “Expenses Paid” are equal to the annualized expense ratios of 0.25% and 0.52% for the Institutional and Financial Intermediary Class, respectively, multiplied by the average value over the period, multiplied by the number of days in the most recent fiscal half-year (184), and divided by 365. |
B | | Beginning account value is as of December 18, 2008 (commencement of operations). |
C | | This calculation is based on expenses incurred from December 18, 2008 (commencement of operations) to December 31, 2008. The dollar amount shown as “Expenses Paid” is equal to the annualized expense ratio of 0.24% for the Institutional Select Class, multiplied by the average values over the period, multiplied by the number of days in the period (14) and divided by 365. |
65
Annual Report to Shareholders
Performance Information
Western Asset Inflation Indexed Plus Bond Portfolio
The graphs compare the Fund’s total returns to that of an appropriate broad-based securities market index. The graphs illustrates the cumulative total return of an initial $1,000,000 investment in each of the Institutional Class and Financial Intermediary Class of the Fund, for the periods indicated. The lines for the Fund represent the total return after deducting all Fund investment management and other administrative expenses and the transaction costs of buying and selling securities. The lines representing the securities market index does not include any transaction costs associated with buying and selling securities in the index or other investment management or administrative expenses.
Due to the limited operating history of the Institutional Select Class, a performance graph is not presented. Institutional Select Class shares, which began operations on December 18, 2008, had a total return of -1.04% for the period ended December 31, 2008.
Total return measures investment performance in terms of appreciation or depreciation in the Fund’s net asset value per share, plus dividends and any capital gain distributions. It assumes that dividends and distributions were reinvested at the time they were paid. Returns (and the graph and table found below) do not reflect the deduction of taxes that a shareholder would pay on Fund distributions or the redemption of Fund shares. Average annual returns tend to smooth out variations in a fund’s return, so that they differ from actual year-to-year results.
Bonds are subject to a variety of risks, including interest rate, credit and inflation risk.
Growth of a $1,000,000 Investment—Institutional Class
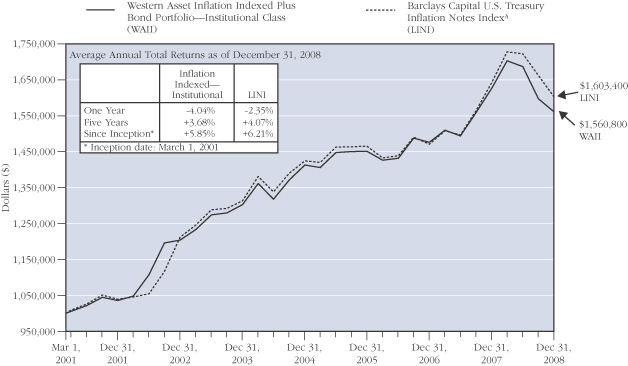
The performance data quoted represent past performance and do not guarantee future results. The performance stated may have been due to extraordinary market conditions, which may not be duplicated in the future. Current performance may be lower or higher than the performance data quoted. To obtain the most recent month-end performance information, please visit www.westernassetfunds.com. The investment return and principal value of the Fund will fluctuate so that an investor’s shares, when redeemed, may be worth more or less than the original cost. Calculations assume reinvestment of dividends and capital gain distributions. Performance would have been lower if fees had not been waived in various periods.
A | | Since-inception index returns are for periods beginning February 28, 2001. Formerly: Lehman U.S. Treasury Inflation Notes Index. The name change is a result of Barclays’ purchase of Lehman Brothers in September 2008. |
66
Annual Report to Shareholders
Growth of a $1,000,000 Investment—Financial Intermediary Class
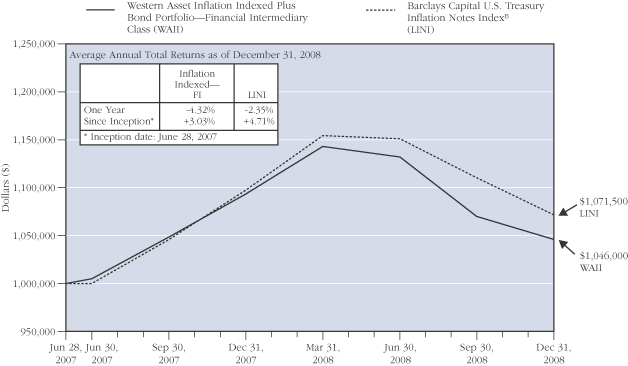
The performance data quoted represent past performance and do not guarantee future results. The performance stated may have been due to extraordinary market conditions, which may not be duplicated in the future. Current performance may be lower or higher than the performance data quoted. To obtain the most recent month-end performance information, please visit www.westernassetfunds.com. The investment return and principal value of the Fund will fluctuate so that an investor’s shares, when redeemed, may be worth more or less than the original cost. Calculations assume reinvestment of dividends and capital gain distributions. Performance would have been lower if fees had not been waived in various periods.
B | | Since-inception index returns are for periods beginning June 30, 2007. Formerly: Lehman U.S. Treasury Inflation Notes Index. The name change is a result of Barclays’ purchase of Lehman Brothers in September 2008. |
67
Annual Report to Shareholders
Performance Information—Continued
Portfolio Composition (as of December 31, 2008)C
Standard & Poor’s Debt RatingsD
(as a percentage of the portfolio)
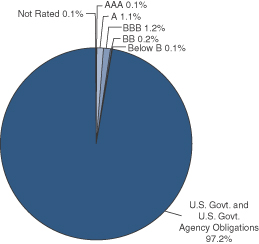
Maturity Schedule (as a percentage of the portfolio)
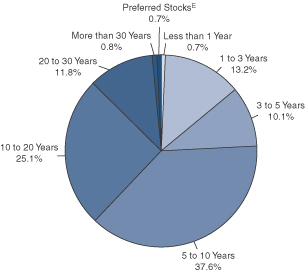
C | | The pie charts above represent the composition of the Fund’s portfolio as of December 31, 2008 and do not include derivatives such as Futures Contracts, Options Written, and Swaps. The Fund is actively managed. As a result, the composition of the portfolio holdings and sectors are subject to change at any time. |
D | | Standard & Poor’s Rating Service provides capital markets with credit ratings for the evaluation and assessment of credit risk. These ratings are the opinions of S&P and not absolute measures of quality or guarantees of performance. |
E | | Preferred stocks do not have defined maturity dates. |
68
Annual Report to Shareholders
Spread Duration
Western Asset Inflation Indexed Plus Portfolio
December 31, 2008
Economic Exposure
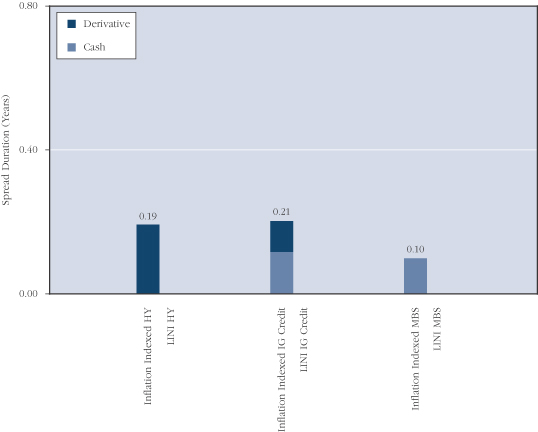
Spread duration is defined as the change in value for a 100 basis point change in the spread relative to Treasuries. The spread over Treasuries is the annual risk-premium demanded by investors to hold non-Treasury securities. This chart highlights the market sector exposure of the Fund’s portfolio and the exposure relative to the selected benchmark as of the end of the reporting period.
HY—High Yield
LINI—Barclays Capital U.S. Treasury Inflation Notes Index
IG Credit—Investment Grade Credit
MBS—Mortgage Backed Securities
69
Annual Report to Shareholders
Effective Duration
Western Asset Inflation Indexed Plus Portfolio
December 31, 2008
Interest Rate Exposure
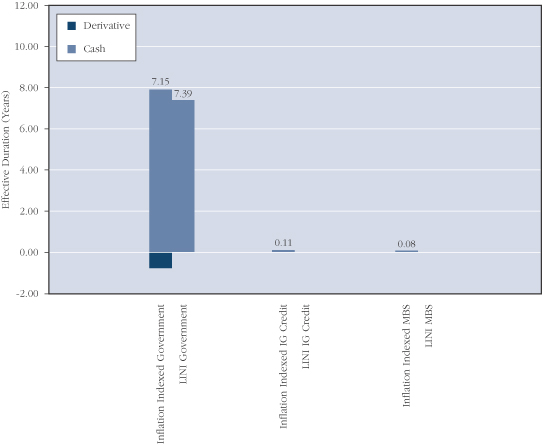
Effective duration is defined as the change in value for a 100 basis point change in Treasury yields. This chart highlights the interest rate exposure of the Fund’s portfolio relative to the selected benchmark as of the end of the reporting period.
LINI—Barclays Capital U.S. Treasury Inflation Notes Index
IG Credit—Investment Grade Credit
MBS—Mortgage Backed Securities
70
Annual Report to Shareholders
Portfolio of Investments
Western Asset Inflation Indexed Plus Bond Portfolio
December 31, 2008
| | | | | | | | | | | | | |
| | | % OF
NET ASSETS | | RATE | | MATURITY
DATE | | PAR/
SHARES | | VALUE | |
| | | | | | | | | | | | | |
Long-Term Securities | | 100.4% | | | | | | | | | | | |
| | | | | |
Corporate Bonds and Notes | | 1.8% | | | | | | | | | | | |
| | | | | |
Consumer Finance | | 0.5% | | | | | | | | | | | |
SLM Corp. | | | | 6.220% | | 2/1/10 | | $ | 1,020,000 | | $ | 798,956 | A |
SLM Corp. | | | | 5.375% | | 1/15/13 | | | 1,775,000 | | | 1,301,297 | |
SLM Corp. | | | | 5.375% | | 5/15/14 | | | 1,010,000 | | | 681,622 | |
| | | | | | | | | | | | | |
| | | | | | | | | | | | 2,781,875 | |
| | | | | | | | | | | | | |
Diversified Financial Services | | 1.1% | | | | | | | | | | | |
Bank of America Corp. | | | | 8.000% | | 12/29/49 | | | 2,270,000 | | | 1,632,784 | B |
J.P. Morgan and Co. Inc. | | | | 5.886% | | 2/15/12 | | | 1,720,000 | | | 1,453,366 | A |
JPMorgan Chase and Co. | | | | 7.900% | | 12/31/49 | | | 2,650,000 | | | 2,204,349 | B |
| | | | | | | | | | | | | |
| | | | | | | | | | | | 5,290,499 | |
| | | | | | | | | | | | | |
Oil, Gas and Consumable Fuels | | 0.2% | | | | | | | | | | | |
The Williams Cos. Inc. | | | | 8.750% | | 3/15/32 | | | 1,220,000 | | | 908,900 | |
| | | | | | | | | | | | | |
Total Corporate Bonds and Notes
(Cost—$11,582,276) | | | | | | | | | | | | 8,981,274 | |
Asset-Backed Securities | | 0.1% | | | | | | | | | | | |
| | | | | |
Indexed SecuritiesA | | 0.1% | | | | | | | | | | | |
Bear Stearns Asset Backed Securities Inc. 2003-ABF1 | | | | 1.765% | | 2/25/34 | | | 181,278 | | | 130,556 | |
Chase Funding Mortgage Loan Asset-Backed Certificates 2002-4 | | | | 2.135% | | 10/25/32 | | | 119,897 | | | 102,858 | |
Countrywide Asset-Backed Certificates 2002-1 | | | | 1.955% | | 8/25/32 | | | 36,302 | | | 14,734 | |
EMC Mortgage Loan Trust 2003-B | | | | 1.945% | | 11/25/41 | | | 383,558 | | | 346,377 | C |
Residential Asset Mortgage Products Inc. 2003-RS2 | | | | 2.075% | | 3/25/33 | | | 39,185 | | | 16,930 | |
| | | | | | | | | | | | | |
Total Asset-Backed Securities (Cost—$760,426) | | | | | | | | | | | | 611,455 | |
Mortgage-Backed Securities | | 0.1% | | | | | | | | | | | |
| | | | | |
Indexed SecuritiesA | | 0.1% | | | | | | | | | | | |
Credit Suisse First Boston Mortgage Securities Corp. 2001-28 | | | | 2.045% | | 11/25/31 | | | 579,787 | | | 480,663 | |
Crusade Global Trust 2003-2 | | | | 3.066% | | 9/18/34 | | | 1 | | | 1 | D |
Sequoia Mortgage Trust 2004-4 A | | | | 4.439% | | 5/20/34 | | | 104,301 | | | 72,533 | |
| | | | | | | | | | | | | |
Total Mortgage-Backed Securities
(Cost—$657,120) | | | | | | | | | | | | 553,197 | |
71
Annual Report to Shareholders
Portfolio of Investments—Continued
Western Asset Inflation Indexed Plus Bond Portfolio—Continued
| | | | | | | | | | | | | |
| | | % OF
NET ASSETS | | RATE | | MATURITY
DATE | | PAR/
SHARES | | VALUE | |
| | | | | | | | | | | | | |
U.S. Government and Agency Obligations | | 93.8% | | | | | | | | | | | |
| | | | | |
Treasury Inflation-Protected SecuritiesE | | 93.8% | | | | | | | | | | | |
United States Treasury Inflation-Protected Security | | | | 0.875% | | 4/15/10 | | $ | 29,241,085 | | $ | 27,482,058 | F |
United States Treasury Inflation-Protected Security | | | | 3.500% | | 1/15/11 | | | 26,718,773 | | | 26,224,049 | |
United States Treasury Inflation-Protected Security | | | | 2.375% | | 4/15/11 | | | 11,340,477 | | | 11,075,575 | |
United States Treasury Inflation-Protected Security | | | | 3.000% | | 7/15/12 | | | 25,532,255 | | | 25,023,601 | |
United States Treasury Inflation-Protected Security | | | | 1.875% | | 7/15/13 | | | 23,780,131 | | | 22,388,613 | |
United States Treasury Inflation-Protected Security | | | | 2.000% | | 1/15/14 | | | 21,163,264 | | | 20,052,193 | |
United States Treasury Inflation-Protected Security | | | | 1.625% | | 1/15/15 | | | 53,087,466 | | | 49,230,343 | |
United States Treasury Inflation-Protected Security | | | | 1.875% | | 7/15/15 | | | 37,443,728 | | | 35,369,683 | |
United States Treasury Inflation-Protected Security | | | | 2.000% | | 1/15/16 | | | 38,902,129 | | | 37,254,857 | |
United States Treasury Inflation-Protected Security | | | | 1.625% | | 1/15/18 | | | 25,408,328 | | | 24,116,086 | |
United States Treasury Inflation-Protected Security | | | | 1.375% | | 7/15/18 | | | 22,243,172 | | | 20,802,571 | |
United States Treasury Inflation-Protected Security | | | | 2.000% | | 1/15/26 | | | 63,024,942 | | | 59,366,533 | |
United States Treasury Inflation-Protected Security | | | | 1.750% | | 1/15/28 | | | 37,704,015 | | | 34,834,966 | |
United States Treasury Inflation-Protected Security | | | | 3.625% | | 4/15/28 | | | 25,690,709 | | | 30,606,061 | F |
United States Treasury Inflation-Protected Security | | | | 3.875% | | 4/15/29 | | | 30,811,099 | | | 38,054,111 | F |
| | | | | | | | | | | | | |
Total U.S. Government and Agency Obligations (Cost—$491,867,602) | | | | | | | | | | | | 461,881,300 | |
U.S. Government Agency Mortgage-Backed Securities | | 3.9% | | | | | | | | | | | |
| | | | | |
Fixed Rate Securities | | 3.9% | | | | | | | | | | | |
Fannie Mae | | | | 5.000% | | 12/1/38 | | | 18,800,000 | | | 19,193,634 | G,H |
| | | | | | | | | | | | | |
Total U.S. Government Agency Mortgage-Backed Securities (Cost—$18,984,238) | | | | | | | | | | | | 19,193,634 | |
72
Annual Report to Shareholders
| | | | | | | | | | | | | | |
| | | % OF
NET ASSETS | | RATE | | MATURITY
DATE | | PAR/
SHARES | | | VALUE | |
Yankee BondsD | | N.M. | | | | | | | | | | | | |
| | | | | |
Commercial Banks | | N.M. | | | | | | | | | | | | |
Glitnir Banki Hf | | | | 6.693% | | 6/15/16 | | $ | 1,760,000 | | | $ | 264 | B,C,I,M |
Kaupthing Bank Hf | | | | 7.125% | | 5/19/16 | | | 2,940,000 | | | | 22,050 | C,I,M |
| | | | | | | | | | | | | | |
Total Yankee Bonds (Cost—$4,691,475) | | | | | | | | | | | | | 22,314 | |
Preferred Stocks | | 0.7% | | | | | | | | | | | | |
Citigroup Inc. | | | | 8.125% | | | | | 189,000 | shs | | | 3,014,550 | |
Fannie Mae | | | | 8.250% | | | | | 346,900 | | | | 287,927 | H |
Freddie Mac | | | | 8.375% | | | | | 418,300 | | | | 163,138 | B,H |
| | | | | | | | | | | | | | |
Total Preferred Stocks (Cost—$24,040,105) | | | | | | | | | | | | | 3,465,615 | |
| | | | | | | | | | | | | | |
Total Long-Term Securities (Cost—$552,583,242) | | | | | | | | | | | | | 494,708,789 | |
Short-Term Securities | | 0.7% | | | | | | | | | | | | |
| | | | | |
U.S. Government and Agency Obligations | | 0.7% | | | | | | | | | | | | |
Federal Home Loan Bank | | | | 0.000% | | 3/26/09 | | $ | 3,400,000 | | | | 3,399,453 | J |
| | | | | | | | | | | | | | |
Total Short-Term Securities
(Cost—$3,398,810) | | | | | | | | | | | | | 3,399,453 | |
Total Investments
(Cost—$555,982,052)K | | 101.1% | | | | | | | | | | | 498,108,242 | |
Other Assets Less Liabilities | | (1.1)% | | | | | | | | | | | (5,414,138 | ) |
| | | | | | | | | | | | | | |
| | | | | |
Net Assets | | 100.0% | | | | | | | | | | $ | 492,694,104 | |
| | | | | | | | | | | | | | |
| | | | | | | |
| | | EXPIRATION | | ACTUAL
CONTRACTS | | APPRECIATION/
(DEPRECIATION) | |
Futures Contracts WrittenL | | | | | | | |
U.S. Treasury Bond Futures | | March 2009 | | 191 | | (2,936,242 | ) |
U.S. Treasury Note Futures | | March 2009 | | 96 | | (705,135 | ) |
| | | | | | | |
| | | | | | $(3,641,377) | |
| | | | | | | |
| | | | | | | | |
N.M.—Not Meaningful.
A | | Indexed Security – The rates of interest earned on these securities are tied to the London Interbank Offered Rate (“LIBOR”), the Euro Interbank Offered Rate (“EURIBOR”) Index, the Consumer Price Index (“CPI”), the one-year Treasury Bill Rate or the ten-year Japanese Government Bond Rate. The coupon rates are the rates as of December 31, 2008. |
B | | Stepped Coupon Security – A security with a predetermined schedule of interest or dividend rate changes at which time it begins to accrue interest or pay dividends according to the predetermined schedule. |
C | | Rule 144a Security – A security purchased pursuant to Rule 144a under the Securities Act of 1933 which may not be resold subject to that rule except to qualified institutional buyers. These securities, which the Fund’s investment adviser has determined to be liquid, represent 0.07% of net assets. |
D | | Yankee Bond – A dollar-denominated bond issued in the U.S. by foreign entities. |
73
Annual Report to Shareholders
Portfolio of Investments—Continued
Western Asset Inflation Indexed Plus Bond Portfolio—Continued
E | | Treasury Inflation-Protected Security – Treasury security whose principal value is adjusted daily in accordance with changes to the Consumer Price Index for All Urban Consumers. Interest is calculated on the basis of the current adjusted principal value. |
F | | All or a portion of this security is collateral to cover futures and options contracts written. |
G | | When-issued Security – Security purchased on a delayed delivery basis. Final settlement amount and maturity date have not yet been announced. |
H | | On September 7, 2008, the Federal Housing Finance Agency placed Fannie Mae and Freddie Mac into Conservatorship. |
I | | Bond is currently in default. |
J | | Zero coupon bond – A bond with no periodic interest payments which is sold at such a discount as to produce a current yield to maturity. |
K | | At December 31, 2008, the aggregate gross unrealized appreciation and depreciation of investments for federal income tax purposes were substantially as follows: |
| | | | |
| Gross unrealized appreciation | | $ | 1,989,476 | |
| Gross unrealized depreciation | | | (59,946,606 | ) |
| | | | |
| Net unrealized depreciation | | $ | (57,957,130 | ) |
| | | | |
L | | Futures are described in more detail in the notes to financial statements. |
See notes to financial statements.
74
Annual Report to Shareholders
Statement of Assets and Liabilities
Western Asset Inflation Indexed Plus Bond Portfolio
December 31, 2008
| | | | | | | |
Assets: | |
Investment securities at market value (Cost—$552,583,242) | | | | | $ | 494,708,789 | |
Short-term securities at value (Cost—$3,398,810) | | | | | | 3,399,453 | |
Cash | | | | | | 5,128,403 | |
Foreign currency at value (Cost—$698,907) | | | | | | 683,552 | |
Restricted cash pledged for swaps | | | | | | 9,500,000 | |
Receivable for securities sold | | | | | | 7,152,969 | |
Unrealized appreciation of forward foreign currency contracts | | | | | | 6,185,104 | |
Interest receivable | | | | | | 4,294,849 | |
Futures variation margin receivable | | | | | | 793,125 | |
Receivable for fund shares sold | | | | | | 441,288 | |
Amounts receivable for open swaps | | | | | | 63,065 | |
Deposits with brokers for open futures contracts | | | | | | 802 | |
| | | | | | | |
Total assets | | | | | | 532,351,399 | |
| | | | | | | |
| | |
Liabilities: | | | | | | | |
Payable for securities purchased | | $ | 25,849,707 | | | | |
Unrealized depreciation of swaps | | | 6,654,022 | | | | |
Unrealized depreciation of forward foreign currency contracts | | | 5,980,204 | | | | |
Premium received on open swap | | | 708,535 | | | | |
Payable for fund shares repurchased | | | 264,670 | | | | |
Accrued management fee | | | 76,087 | | | | |
Accrued distribution fees | | | 34 | | | | |
Accrued expenses | | | 124,036 | | | | |
| | | | | | | |
Total liabilities | | | | | | 39,657,295 | |
| | | | | | | |
| | |
Net Assets | | | | | $ | 492,694,104 | |
| | | | | | | |
| | |
Net assets consist of: | | | | | | | |
Accumulated paid-in-capital | | | | | $ | 567,031,028 | |
Undistributed net investment income | | | | | | 2,305,323 | |
Accumulated net realized loss on investments, options, futures, swaps and foreign currency transactions | | | | | | (8,662,583 | ) |
Net unrealized depreciation on investments, futures, swaps and foreign currency translations | | | | | | (67,979,664 | ) |
| | | | | | | |
| | |
Net Assets | | | | | $ | 492,694,104 | |
| | | | | | | |
| | |
Net Asset Value Per Share: | | | | | | | |
Institutional Class (49,320,994 shares outstanding) | | | | | | $9.53 | |
Institutional Select Class (2,369,153 shares outstanding) | | | | | | $9.53 | |
Financial Intermediary Class (17,082 shares outstanding) | | | | | | $9.51 | |
| | | | | | | | |
See notes to financial statements.
75
Annual Report to Shareholders
Statement of Operations
Western Asset Inflation Indexed Plus Bond Portfolio
| | | | | | | | | | | | | | | |
| | | FOR THE
PERIOD ENDED
DECEMBER 31, 2008A | | | FOR THE
YEAR ENDED
MARCH 31, 2008 |
Investment Income: | | | | | | | | | | | | | | | |
Interest | | $ | 33,486,057 | | | | | | | $ | 43,671,224 | | | | |
Dividends | | | 976,326 | | | | | | | | 501,643 | | | | |
Income from securities loaned | | | 844,223 | | | | | | | | — | | | | |
| | | | | | | | | | | | | | | |
Total income | | | | | | $ | 35,306,606 | | | | | | | $ | 44,172,867 |
Expenses: | | | | | | | | | | | | | | | |
Management fees | | | 1,178,419 | | | | | | | | 1,450,226 | | | | |
Distribution and service fees: | | | | | | | | | | | | | | | |
Financial Intermediary Class | | | 193 | | | | | | | | 66 | | | | |
Audit and legal fees | | | 67,258 | | | | | | | | 77,726 | | | | |
Custodian fees | | | 78,435 | | | | | | | | 96,352 | | | | |
Directors’ fees and expenses | | | 15,970 | | | | | | | | 22,446 | | | | |
Registration fees | | | 31,726 | | | | | | | | 38,318 | | | | |
Reports to shareholdersB | | | — | | | | | | | | 67,244 | | | | |
Reports to shareholders: | | | | | | | | | | | | | | | |
Institutional Class | | | 9,081 | | | | | | | | — | | | | |
Financial Intermediary Class | | | 1 | | | | | | | | — | | | | |
Transfer agent and shareholder servicing expense: | | | | | | | | | | | | | | | |
Institutional Class | | | 159,100 | | | | | | | | 164,859 | | | | |
Financial Intermediary Class | | | 20 | | | | | | | | 57 | | | | |
Other expenses | | | 30,316 | | | | | | | | 52,512 | | | | |
| | | | | | | | | | | | | | | |
| | | 1,570,519 | | | | | | | | 1,969,806 | | | | |
Less: Fees waived | | | (89,008 | ) | | | | | | | (151,075 | ) | | | |
Compensating balance credits | | | (94 | ) | | | | | | | (5,888 | ) | | | |
| | | | | | | | | | | | | | | |
Net expenses | | | | | | | 1,481,417 | | | | | | | | 1,812,843 |
| | | | | | | | | | | | | | | |
Net Investment Income | | | | | | | 33,825,189 | | | | | | | | 42,360,024 |
Net Realized and Unrealized Gain/(Loss) on Investments: | | | | | | | | | | | | | | | |
Net realized gain/(loss) on: | | | | | | | | | | | | | | | |
Investments | | | (31,736,409 | ) | | | | | | | 16,272,903 | | | | |
Options | | | 990,515 | | | | | | | | 1,124,634 | | | | |
Futures | | | (1,308,249 | ) | | | | | | | (1,271,970 | ) | | | |
Swaps | | | 1,546,228 | | | | | | | | 1,762,039 | | | | |
Foreign currency transactions | | | 3,957,225 | | | | | | | | 1,400,522 | | | | |
| | | | | | | | | | | | | | | |
| | | | | | | (26,550,690 | ) | | | | | | | 19,288,128 |
Change in unrealized appreciation/(depreciation) of: | | | | | | | | | | | | | | | |
Investments, futures, swaps and foreign currency translations | | | (102,368,968 | ) | | | | | | | 29,233,266 | | | | |
Assets and liabilities denominated in foreign currency | | | (18,360 | ) | | | | | | | 18,321 | | | | |
| | | | | | | | | | | | | | | |
| | | | | | | (102,387,328 | ) | | | | | | | 29,251,587 |
| | | | | | | | | | | | | | | |
Net Realized and Unrealized Gain/(Loss) on Investments | | | | | | | (128,938,018 | ) | | | | | | | 48,539,715 |
| | | | | | | | | | | | | | | | |
Change in Net Assets Resulting From Operations | | | | | | $ | (95,112,829 | ) | | | | | | $ | 90,899,739 |
| | | | | | | | | | | | | | | | |
A | | For the period April 1, 2008 to December 31, 2008. |
B | | Computed on a composite level for year ended March 31, 2008. |
See notes to financial statements.
76
Annual Report to Shareholders
Statement of Changes in Net Assets
Western Asset Inflation Indexed Plus Bond Portfolio
| | | | | | | | | | | | |
| | | FOR THE
PERIOD ENDED
DECEMBER 31, 2008A | | | FOR THE
YEARS ENDED MARCH 31, | |
| | | | 2008 | | | 2007 | |
| Change in Net Assets: | | | | | | | | | |
Net investment income | | $ | 33,825,189 | | | $ | 42,360,024 | | | $ | 22,204,411 | |
| | | |
Net realized gain/(loss) | | | (26,550,690 | ) | | | 19,288,128 | | | | (1,653,441 | ) |
| | | |
Change in unrealized appreciation/(depreciation) | | | (102,387,328 | ) | | | 29,251,587 | | | | 13,103,572 | |
| | | | | | | | | | | | |
Change in net assets resulting from operations | | | (95,112,829 | ) | | | 90,899,739 | | | | 33,654,542 | |
| | | |
Distributions to shareholders from: | | | | | | | | | | | | |
Net investment income: | | | | | | | | | | | | |
Institutional Class | | | (39,535,523 | ) | | | (42,554,324 | ) | | | (22,374,973 | ) |
Institutional Select Class | | | — | | | | N/A | | | | N/A | |
Financial Intermediary Class | | | (3,568 | ) | | | (1,115 | ) | | | — | |
| | | |
Net realized gain on investments: | | | | | | | | | | | | |
Institutional Class | | | (15,894,795 | ) | | | — | | | | — | |
Financial Intermediary Class | | | (667 | ) | | | — | | | | — | |
| | | |
Change in net assets from fund share transactions: | | | | | | | | | | | | |
Institutional Class | | | (226,348,181 | ) | | | 154,011,663 | | | | 90,425,095 | |
Institutional Select Class | | | 22,814,947 | | | | N/A | | | | N/A | |
Financial Intermediary Class | | | 144,350 | | | | 37,906 | | | | — | |
| | | | | | | | | | | | |
Change in net assets | | | (353,936,266 | ) | | | 202,393,869 | | | | 101,704,664 | |
| | | |
Net Assets: | | | | | | | | | | | | |
Beginning of period | | | 846,630,370 | | | | 644,236,501 | | | | 542,531,837 | |
| | | | | | | | | | | | |
| | | |
End of period | | $ | 492,694,104 | | | $ | 846,630,370 | | | $ | 644,236,501 | |
| | | | | | | | | | | | |
| | | |
Undistributed net investment income | | $ | 2,305,323 | | | $ | 3,777,864 | | | $ | 1,055,171 | |
| | | | | | | | | | | | |
| | | | | | | | | | | | | |
A | | For the period April 1, 2008 to December 31, 2008. |
See notes to financial statements.
77
Annual Report to Shareholders
Financial Highlights
Western Asset Inflation Indexed Plus Bond Portfolio
For a share of each class of capital stock outstanding:
Institutional Class:
| | | | | | | | | | | | | | | | | | | | | | | | |
| | | PERIOD
ENDED
DECEMBER 31,
2008A | | | YEARS ENDED MARCH 31, | |
| | | | 2008 | | | 2007 | | | 2006 | | | 2005 | | | 2004 | |
Net asset value, beginning of period | | $ | 11.08 | | | $ | 10.43 | | | $ | 10.25 | | | $ | 10.74 | | | $ | 11.24 | | | $ | 10.96 | |
| | | | | | | | | | | | | | | | | | | | | | | | |
Investment operations: | | | | | | | | | | | | | | | | | | | | | | | | |
Net investment income | | | .44 | B | | | .61 | B | | | .39 | B | | | .54 | C | | | .42 | C | | | .37 | C |
Net realized and unrealized gain/(loss) | | | (1.32 | ) | | | .67 | | | | .20 | | | | (.38 | ) | | | (.10 | ) | | | .71 | |
| | | | | | | | | | | | | | | | | | | | | | | | |
Total from investment operations | | | (.88 | ) | | | 1.28 | | | | .59 | | | | .16 | | | | .32 | | | | 1.08 | |
| | | | | | | | | | | | | | | | | | | | | | | | |
Distributions from: | | | | | | | | | | | | | | | | | | | | | | | | |
Net investment income | | | (.47 | ) | | | (.63 | ) | | | (.41 | ) | | | (.56 | ) | | | (.42 | ) | | | (.37 | ) |
Net realized gain on investments | | | (.20 | ) | | | — | | | | — | | | | (.09 | ) | | | (.40 | ) | | | (.43 | ) |
| | | | | | | | | | | | | | | | | | | | | | | | |
Total distributions | | | (.67 | ) | | | (.63 | ) | | | (.41 | ) | | | (.65 | ) | | | (.82 | ) | | | (.80 | ) |
| | | | | | | | | | | | | | | | | | | | | | | | |
Net asset value, end of period | | $ | 9.53 | | | $ | 11.08 | | | $ | 10.43 | | | $ | 10.25 | | | $ | 10.74 | | | $ | 11.24 | |
| | | | | | | | | | | | | | | | | | | | | | | | |
Total return | | | (8.32 | )%D | | | 12.77 | % | | | 5.89 | % | | | 1.44 | % | | | 3.27 | % | | | 10.33 | % |
| | | | | | |
Ratios to Average Net Assets:E | | | | | | | | | | | | | | | | | | | | | | | | |
Total expenses | | | .27 | %F | | | .27 | % | | | .29 | % | | | .27 | % | | | .27 | % | | | .27 | % |
Expenses net of waivers, if any | | | .25 | %F | | | .25 | % | | | .25 | % | | | .25 | % | | | .25 | % | | | .25 | % |
Expenses net of all reductions | | | .25 | %F | | | .25 | % | | | .25 | % | | | .25 | % | | | .25 | % | | | .25 | % |
Net investment income | | | 5.8 | %F | | | 5.8 | % | | | 3.8 | % | | | 5.0 | % | | | 3.8 | % | | | 3.4 | % |
| | | | | | |
Supplemental Data: | | | | | | | | | | | | | | | | | | | | | | | | |
Portfolio turnover rate | | | 74.4 | %D | | | 141.7 | % | | | 96.4 | % | | | 177.1 | % | | | 255.5 | % | | | 281.8 | % |
Net assets, end of period (in thousands) | | $ | 469,959 | | | $ | 846,594 | | | $ | 644,236 | | | $ | 542,532 | | | $ | 461,746 | | | $ | 346,379 | |
| | | | | | | | | | | | | | | | | | | | | | | | | |
A | | For the period April 1, 2008 to December 31, 2008 |
B | | Computed using average daily shares outstanding. |
C | | Computed using SEC method. |
E | | Total expenses reflects operating expenses prior to any contractual expense waivers and/or compensating balance credits. Expenses net of waivers reflects total expenses before compensating balance credits but net of any contractual expense waivers. Expenses net of all reductions reflects expenses less any compensating balance credits and/or contractual expense waivers. As of the most current prospectus, the Institutional Class has no limit on expenses. |
See notes to financial statements.
78
Annual Report to Shareholders
Institutional Select Class:
| | | | |
| | | PERIOD
ENDED
DECEMBER 31, 2008G | |
Net asset value, beginning of period | | $ | 9.63 | |
| | | | |
Investment operations: | | | | |
Net investment loss | | | (.03 | )B |
Net realized and unrealized loss | | | (.07 | ) |
| | | | |
Total from investment operations | | | (.10 | ) |
| | | | |
Net asset value, end of period | | $ | 9.53 | |
| | | | |
Total return | | | (1.04 | )%D |
| |
Ratios to Average Net Assets:E | | | | |
Total expenses | | | .24 | %F |
Expenses net of waivers, if any | | | .24 | %F |
Expenses net of all reductions | | | .24 | %F |
Net investment loss | | | (10.0 | )%F |
| |
Supplemental Data: | | | | |
Portfolio turnover rate | | | 74.4 | %D |
Net assets, end of period (in thousands) | | $ | 22,573 | |
| | | | | |
G | | For the period December 18, 2008 (commencement of operations) to December 31, 2008 |
See notes to financial statements.
79
Annual Report to Shareholders
Financial Highlights—Continued
Western Asset Inflation Indexed Plus Bond Portfolio
For a share of each class of capital stock outstanding:
Financial Intermediary Class:
| | | | | | | | |
| | | PERIOD
ENDED
DECEMBER 31,
2008A | | | PERIOD
ENDED
MARCH 31,
2008I | |
Net asset value, beginning of period | | $ | 11.06 | | | $ | 10.02 | |
| | | | | | | | |
Investment operations: | | | | | | | | |
Net investment income | | | .17 | B | | | .35 | B |
Net realized and unrealized gain/(loss) | | | (1.06 | ) | | | 1.06 | |
| | | | | | | | |
Total from investment operations | | | (.89 | ) | | | 1.41 | |
| | | | | | | | |
Distributions from: | | | | | | | | |
Net investment income | | | (.46 | ) | | | (.37 | ) |
Net realized gain on investments | | | (.20 | ) | | | — | |
| | | | | | | | |
Total distributions | | | (.66 | ) | | | (.37 | ) |
| | | | | | | | |
Net asset value, end of period | | $ | 9.51 | | | $ | 11.06 | |
| | | | | | | | |
Total return | | | (8.47 | )%D | | | 14.29 | %D |
| | |
Ratios to Average Net Assets:H | | | | | | | | |
Total expenses | | | .77 | %F | | | .71 | %F |
Expenses net of waivers, if any | | | .52 | %F | | | .48 | %F |
Expenses net of all reductions | | | .52 | %F | | | .48 | %F |
Net investment income | | | 2.4 | %F | | | 4.1 | %F |
| | |
Supplemental Data: | | | | | | | | |
Portfolio turnover rate | | | 74.4 | %D | | | 141.7 | %D |
Net assets, end of period (in thousands) | | $ | 162 | | | $ | 36 | |
| | | | | | | | | |
I | | For the period June 28, 2007 (commencement of operations) to March 31, 2008. |
See notes to financial statements.
80
Annual Report to Shareholders
Management’s Discussion of Fund Performance
Western Asset Intermediate Bond Portfolio
Total returns for the Fund for various periods ended December 31, 2008 are presented below, along with those of comparative indices:
| | | | | | | | | | | | |
| | | | | | | | | Average Annual Total Returns |
| | | Three
Months | | Nine
Months | | One
Year | | Five
Years | | Ten
Years | | Since
InceptionA |
Western Asset Intermediate Bond Portfolio: | | | | | | | | | | | | |
Institutional Class | | -0.26% | | -4.72% | | -4.62% | | +2.49% | | +4.73% | | +5.77% |
Institutional Select Class | | N/A | | N/A | | N/A | | N/A | | N/A | | -0.41% |
Barclays Capital Intermediate U.S. Government/Credit IndexB | | +4.84% | | +2.02% | | +5.08% | | +4.21% | | +5.43% | | +6.22% |
Lipper Short-Intermediate Investment Grade Debt Funds Category AverageC | | -0.33% | | -3.50% | | -2.82% | | +1.80% | | +3.78% | | +4.75% |
The performance data quoted represent past performance and do not guarantee future results. Current performance may be lower or higher than the performance data quoted. To obtain the most recent month-end performance information, please visit www.westernassetfunds.com. The investment return and principal value of the Fund will fluctuate so that an investor’s shares, when redeemed, may be worth more or less than the original cost. Calculations assume reinvestment of dividends and capital gain distributions. Performance would have been lower if fees had not been waived in various periods. Performance figures for periods shorter than one year represent cumulative figures and are not annualized.
The expense ratios for the Institutional and Institutional Select Classes were 0.47% and 0.45%, respectively, and are the Fund’s operating expenses for each share class as indicated in the Fund’s most current prospectus dated August 1, 2008.
For the period from April 1, 2008 through December 31, 2008, Institutional Class shares of Western Asset Intermediate Bond Portfolio returned -4.72%. The Fund’s unmanaged benchmark, the Barclays Capital Intermediate U.S. Government/Credit Index, returned 2.02% over the same time frame. The Lipper Short-Intermediate Investment Grade Debt Funds Category Average returned -3.50% for the same period.
The impact of market conditions on the Fund’s performance was negative for the period ended December 31, 2008, with strategies also producing negative results. An emphasis on lower-quality credits and select Financials issues was a large detractor from performance as spreads soared in the wake of the subprime lending crisis, deteriorating liquidity conditions and slowing economic growth. Spreads narrowed in April and May, but these gains were given back later in the period on deteriorating investor sentiment and poor earnings. A large exposure to the mortgage-backed sector detracted from returns as volatility remained high and negative housing news continued to damage market sentiment. We had diversified into a number of non-agency issues that were particularly impacted and further detracted from performance due to a lack of liquidity and uncertainty in that marketplace. A modest U.S. Treasury Inflation-Protected Securities (“TIPS”)D exposure also had a negative impact as oil plunged to $40 per barrel and inflation fears switched to deflation fears. A tactically-driven durationE posture contributed modestly
A | | The inception date of the Institutional Class is July 1, 1994. The inception date of the Institutional Select Class is October 3, 2008. Index returns are for periods beginning June 30, 1994. Although it is not possible to invest directly in an index, it is possible to purchase investment vehicles designed to track the performance of certain indices. |
B | | The Barclays Capital (formerly Lehman Brothers) Intermediate U.S. Government/Credit Index is a market value weighted performance benchmark for government and corporate fixed-rate debt issues (rated Baa/BBB or higher) with maturities between one and ten years. |
C | | Lipper, Inc., a wholly-owned subsidiary of Reuters, provides independent insight on global collective investments. The Lipper Short-Intermediate Investment Grade Debt Funds Category Average is comprised of the Fund’s peer group of mutual funds. |
81
Annual Report to Shareholders
Management’s Discussion of Fund Performance—Continued
to returns as bond yields rallied over the period. The portfolio’s yield curveF positioning detracted from performance as the spread between two- and ten-year yields widened.
Western Asset Management Company
January 20, 2009
Investment Risks: Bonds are subject to a variety of risks, including interest rate, credit and inflation risk. As interest rates rise, bond prices fall, reducing the value of the Fund’s share price. Mortgage-backed securities involve more risk, including prepayment and extension risks, than other investments in fixed-income securities. The Fund may use derivatives, such as options and futures, which can be illiquid, may disproportionately increase losses, and have a potentially large impact on Fund performance.
D | | U.S. Treasury Inflation-Protected Securities (“TIPS”) are inflation-indexed securities issued by the U.S. Treasury in 5-year, 10-year and 20-year maturities. The principal is adjusted to the Consumer Price Index, the commonly used measure of inflation. The coupon rate is constant, but generates a different amount of interest when multiplied by the inflation-adjusted principal. |
E | | Duration is the measure of the price sensitivity of a fixed-income security to an interest rate change of 100 basis points. Calculation is based on the weighted average of the present values for all cash flows. |
F | | The yield curve is the graphical depiction of the relationship between the yield on bonds of the same credit quality but different maturities. |
N/A—Not applicable.
82
Annual Report to Shareholders
Expense Example
Western Asset Intermediate Bond Portfolio
As a shareholder of the Fund, you incur ongoing costs, including management fees, and other Fund expenses. These examples are intended to help you understand your ongoing costs (in dollars) of investing in the Fund and to compare these costs with the ongoing costs of investing in other mutual funds.
Actual Expenses
The first line in the table below provides information about actual account values and actual expenses for the Fund. You may use the information in this line, together with the amount you invested, to estimate the expenses that you paid over the period. Simply divide your account value by $1,000 (for example, an $8,600 account value divided by $1,000 = 8.6), then multiply the result by the number in the first line under the heading entitled “Expenses Paid During the Period” to estimate the expenses you paid on your account if your shares were held through the entire period. For the Institutional Class, the example is based on an investment of $1,000 invested on July 1, 2008 and held through December 31, 2008; for Institutional Select Class, the example is based on an investment of $1,000 invested on October 3, 2008 (commencement of operations) and held through December 31, 2008.
Hypothetical Example for Comparison Purposes
The second line in the table below provides information about hypothetical account values and hypothetical expenses based on the Fund’s actual expense ratio and an assumed rate of return of 5% per year before expenses, which is not the Fund’s actual return. The hypothetical account values and expenses may not be used to estimate the actual ending account balance or expenses you paid for the period. You may use this information to compare the ongoing costs of investing in the Fund and other funds. To do so, compare this 5% hypothetical example with the 5% hypothetical examples that appear in the shareholder reports of other funds. Because each example is intended to be comparable to the examples provided by other funds, it is based on a hypothetical investment of $1,000 invested on July 1, 2008 and held through December 31, 2008 for each class, even though the Institutional Select Class did not begin operations until October 3, 2008.
| | | | | | | | | | | |
| | | Beginning
Account Value
7/1/08 | | | Ending
Account Value
12/31/08 | | Expenses PaidA
During the Period
7/1/08 to 12/31/08 | |
Institutional Class: | | | | | | | | | | | |
Actual | | $ | 1,000.00 | | | $ | 956.70 | | $ | 2.27 | |
Hypothetical (5% return before expenses) | | | 1,000.00 | | | | 1,022.89 | | | 2.35 | |
Institutional Select Class: | | | | | | | | | | | |
Actual | | $ | 1,000.00 | B | | $ | 995.90 | | $ | 1.11 | C |
Hypothetical (5% return before expenses) | | | 1,000.00 | | | | 1,022.94 | | | 2.29 | |
A | | These calculations are based on expenses incurred from July 1, 2008 to December 31, 2008. The dollar amounts shown as “Expenses Paid” are equal to the annualized expense ratio of 0.46% multiplied by the average value over the period, multiplied by the number of days in the most recent fiscal half-year (184), and divided by 365. |
B | | Beginning account value is as of October 3, 2008. |
C | | This calculation is based on expenses incurred from October 3, 2008 (commencement of operations) to December 31, 2008. The dollar amount shown as “Expenses Paid” is equal to the annualized expense ratio of 0.45% for the Institutional Select Class, multiplied by the number of days in the period (90) and divided by 365. |
83
Annual Report to Shareholders
Performance Information
Western Asset Intermediate Bond Portfolio
The graph compares the Fund’s total returns to that of an appropriate broad-based securities market index. The line illustrates the cumulative total return of an initial $1,000,000 investment for the periods indicated. The line for the Fund represents the total return after deducting all Fund investment management and other administrative expenses and the transaction costs of buying and selling securities. The line representing the securities market index does not include any transaction costs associated with buying and selling securities in the index or other investment management or administrative expenses.
Due to the limited operating history of the Institutional Select Class, a performance graph is not presented. Institutional Select Class shares, which began operations on October 3, 2008, had a total return of -0.41% for the period ended December 31, 2008.
Total return measures investment performance in terms of appreciation or depreciation in the Fund’s net asset value per share, plus dividends and any capital gain distributions. It assumes that dividends and distributions were reinvested at the time they were paid. Returns (and the graph and table found below) do not reflect the deduction of taxes that a shareholder would pay on Fund distributions or the redemption of Fund shares. Average annual returns tend to smooth out variations in a fund’s return, so that they differ from actual year-to-year results.
Bonds are subject to a variety of risks, including interest rate, credit, and inflation risk.
Growth of a $1,000,000 Investment—Institutional Class
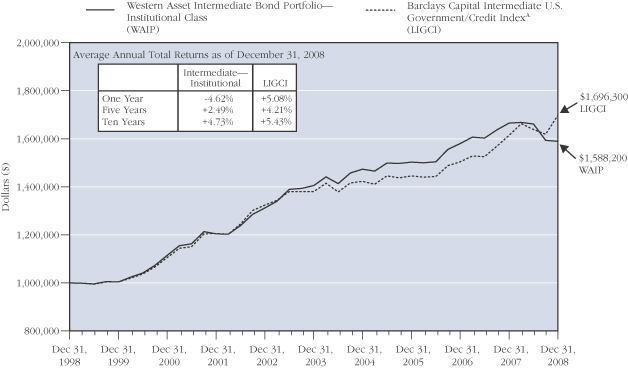
The performance data quoted represent past performance and do not guarantee future results. The performance stated may have been due to extraordinary market conditions, which may not be duplicated in the future. Current performance may be lower or higher than the performance data quoted. To obtain the most recent month-end performance information, please visit www.westernassetfunds.com. The investment return and principal value of the Fund will fluctuate so that an investor’s shares, when redeemed, may be worth more or less than the original cost. Calculations assume reinvestment of dividends and capital gain distributions. Performance would have been lower if fees had not been waived in various periods.
A | | Formerly: Lehman Brothers Intermediate U.S. Government/Credit Index. The name change is a result of Barclays’ purchase of Lehman Brothers in September 2008. |
84
Annual Report to Shareholders
Portfolio Composition (as of December 31, 2008)B
Standard & Poor’s Debt RatingsC (as a percentage of the portfolio)
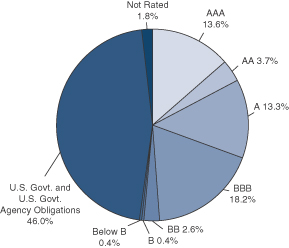
Maturity Schedule (as a percentage of the portfolio)

B | | The pie charts above represent the composition of the Fund’s portfolio as of December 31, 2008 and do not include derivatives such as Futures Contracts, Options Written, and Swaps. The Fund is actively managed. As a result, the composition of the portfolio holdings and sectors are subject to change at any time. |
C | | Standard & Poor’s Ratings Service provides capital markets with credit ratings for the evaluation and assessment of credit risks. These ratings are the opinions of S&P and not absolute measures of quality or guarantees of performance. |
D | | Preferred stocks do not have defined maturity dates. |
85
Annual Report to Shareholders
Spread Duration
Western Asset Intermediate Bond Portfolio
December 31, 2008
Economic Exposure
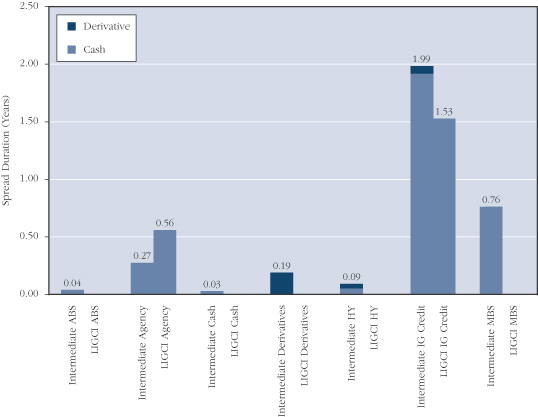
Spread duration is defined as the change in value for a 100 basis point change in the spread relative to Treasuries. The spread over Treasuries is the annual risk-premium demanded by investors to hold non-Treasury securities. This chart highlights the market sector exposure of the Fund’s portfolio and the exposure relative to the selected benchmark as of the end of the reporting period.
ABS—Asset Backed Security
LIGCI—Barclays Capital Intermediate U.S. Government/Credit Index
HY—High Yield
IG Credit—Investment Grade Credit
MBS—Mortgage Backed Securities
86
Annual Report to Shareholders
Effective Duration
Western Asset Intermediate Bond Portfolio
December 31, 2008
Interest Rate Exposure
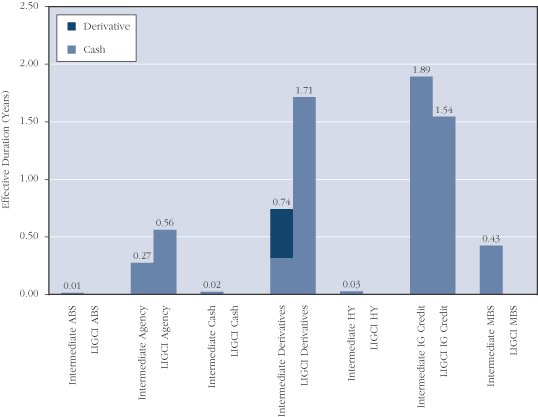
Effective duration is defined as the change in value for a 100 basis point change in Treasury yields. This chart highlights the interest rate exposure of the Fund’s portfolio relative to the selected benchmark as of the end of the reporting period.
ABS—Asset Backed Security
LIGCI—Barclays Capital Intermediate U.S. Government/Credit Index
HY—High Yield
IG Credit—Investment Grade Credit
MBS—Mortgage Backed Securities
87
Annual Report to Shareholders
Portfolio of Investments
Western Asset Intermediate Bond Portfolio
December 31, 2008
| | | | | | | | | | | | | |
| | | % OF
NET ASSETS | | RATE | | MATURITY
DATE | | PAR/
SHARES | | VALUE | |
| | | | | | | | | | | | | |
Long-Term Securities | | 87.9% | | | | | | | | | | | |
| | | | | |
Corporate Bonds and Notes | | 38.6% | | | | | | | | | | | |
| | | | | |
Aerospace and Defense | | 0.2% | | | | | | | | | | | |
United Technologies Corp. | | | | 6.350% | | 3/1/11 | | $ | 1,037,000 | | $ | 1,096,470 | |
| | | | | | | | | | | | | |
| | | | | |
Airlines | | 0.5% | | | | | | | | | | | |
Continental Airlines Inc. | | | | 6.545% | | 2/2/19 | | | 965,547 | | | 772,438 | |
Delta Air Lines Inc. | | | | 6.619% | | 9/18/12 | | | 1,165,229 | | | 1,013,749 | |
US Airways Pass-Through Trust | | | | 6.850% | | 1/30/18 | | | 1,422,298 | | | 995,608 | |
| | | | | | | | | | | | | |
| | | | | | | | | | | | 2,781,795 | |
| | | | | | | | | | | | | |
Automobiles | | 0.5% | | | | | | | | | | | |
DaimlerChrysler NA Holding Corp. | | | | 6.500% | | 11/15/13 | | | 2,390,000 | | | 1,864,231 | |
Ford Motor Co. | | | | 7.450% | | 7/16/31 | | | 1,159,000 | | | 324,520 | |
General Motors Corp. | | | | 8.375% | | 7/15/33 | | | 1,198,000 | | | 209,650 | |
| | | | | | | | | | | | | |
| | | | | | | | | | | | 2,398,401 | |
| | | | | | | | | | | | | |
Beverages | | 0.3% | | | | | | | | | | | |
Bottling Group LLC | | | | 6.950% | | 3/15/14 | | | 1,310,000 | | | 1,422,405 | |
| | | | | | | | | | | | | |
| | | | | |
Capital Markets | | 4.3% | | | | | | | | | | | |
Goldman Sachs Capital II | | | | 5.793% | | 12/29/49 | | | 6,510,000 | | | 2,502,594 | A |
Goldman Sachs Capital III | | | | 2.973% | | 9/29/49 | | | 2,590,000 | | | 777,000 | B |
Lehman Brothers Holdings Capital Trust VII | | | | 5.857% | | 12/31/49 | | | 6,200,000 | | | 620 | A,C,O |
Lehman Brothers Holdings E-Capital Trust I | | | | 3.850% | | 8/19/65 | | | 360,000 | | | 36 | B,C,O |
Lehman Brothers Holdings Inc. | | | | 5.625% | | 1/24/13 | | | 600,000 | | | 57,000 | C,O |
Lehman Brothers Holdings Inc. | | | | 6.500% | | 7/19/17 | | | 30,000 | | | 3 | C,O |
Merrill Lynch and Co. Inc. | | | | 3.079% | | 2/5/10 | | | 480,000 | | | 455,466 | B |
Merrill Lynch and Co. Inc. | | | | 5.700% | | 5/2/17 | | | 2,500,000 | | | 2,214,890 | |
Merrill Lynch and Co. Inc. | | | | 6.875% | | 4/25/18 | | | 1,420,000 | | | 1,485,357 | |
Morgan Stanley | | | | 5.550% | | 4/27/17 | | | 2,340,000 | | | 1,932,337 | |
The Bear Stearns Cos. Inc. | | | | 6.400% | | 10/2/17 | | | 3,590,000 | | | 3,730,649 | |
The Bear Stearns Cos. Inc. | | | | 7.250% | | 2/1/18 | | | 1,840,000 | | | 2,016,375 | |
The Goldman Sachs Group Inc. | | | | 3.250% | | 6/15/12 | | | 6,890,000 | | | 7,188,481 | |
| | | | | | | | | | | | | |
| | | | | | | | | | | | 22,360,808 | |
| | | | | | | | | | | | | |
Chemicals | | 1.0% | | | | | | | | | | | |
The Dow Chemical Co. | | | | 6.000% | | 10/1/12 | | | 4,850,000 | | | 4,685,299 | |
The Dow Chemical Co. | | | | 5.700% | | 5/15/18 | | | 540,000 | | | 479,740 | |
| | | | | | | | | | | | | |
| | | | | | | | | | | | 5,165,039 | |
| | | | | | | | | | | | | |
88
Annual Report to Shareholders
| | | | | | | | | | | | | |
| | | % OF
NET ASSETS | | RATE | | MATURITY
DATE | | PAR/
SHARES | | VALUE | |
| | | | | | | | | | | | | |
| | | | | |
Corporate Bonds and Notes—Continued | | | | | | | | | | | | | |
| | | | | |
Commercial Banks | | 1.8% | | | | | | | | | | | |
Comerica Capital Trust II | | | | 6.576% | | 2/20/37 | | $ | 960,000 | | $ | 385,393 | A |
SunTrust Capital VIII | | | | 6.100% | | 12/15/36 | | | 550,000 | | | 387,205 | A |
Wachovia Capital Trust III | | | | 5.800% | | 3/15/42 | | | 8,668,000 | | | 5,114,120 | A |
Wells Fargo Capital X | | | | 5.950% | | 12/15/36 | | | 4,310,000 | | | 3,693,877 | |
| | | | | | | | | | | | | |
| | | | | | | | | | | | 9,580,595 | |
| | | | | | | | | | | | | |
Consumer Finance | | 3.0% | | | | | | | | | | | |
American Express Co. | | | | 6.800% | | 9/1/66 | | | 6,590,000 | | | 3,411,320 | A |
GMAC LLC | | | | 7.500% | | 12/31/13 | | | 390,000 | | | 284,700 | D |
GMAC LLC | | | | 6.750% | | 12/1/14 | | | 955,000 | | | 656,104 | D |
GMAC LLC | | | | 8.000% | | 12/31/18 | | | 325,000 | | | 162,500 | D |
John Deere Capital Corp. | | | | 2.875% | | 6/19/12 | | | 7,280,000 | | | 7,487,415 | |
Nelnet Inc. | | | | 7.400% | | 9/29/36 | | | 1,850,000 | | | 554,711 | A |
SLM Corp. | | | | 8.450% | | 6/15/18 | | | 3,700,000 | | | 2,925,298 | |
| | | | | | | | | | | | | |
| | | | | | | | | | | | 15,482,048 | |
| | | | | | | | | | | | | |
Diversified Financial Services | | 6.7% | | | | | | | | | | | |
AGFC Capital Trust I | | | | 6.000% | | 1/15/67 | | | 4,380,000 | | | 1,046,150 | A,D |
BAC Capital Trust XIV | | | | 5.630% | | 12/31/49 | | | 50,000 | | | 20,033 | A |
Bank of America Corp. | | | | 3.125% | | 6/15/12 | | | 3,160,000 | | | 3,283,815 | |
Bank of America Corp. | | | | 8.000% | | 12/29/49 | | | 1,420,000 | | | 1,021,389 | A |
Capmark Financial Group Inc. | | | | 5.875% | | 5/10/12 | | | 2,500,000 | | | 852,478 | E |
General Electric Capital Corp. | | | | 3.000% | | 12/9/11 | | | 8,850,000 | | | 9,149,572 | |
General Electric Capital Corp. | | | | 5.625% | | 5/1/18 | | | 2,000,000 | | | 2,014,498 | |
General Electric Capital Corp. | | | | 6.375% | | 11/15/67 | | | 2,855,000 | | | 1,794,564 | A |
Glen Meadow Pass-Through Certificates | | | | 6.505% | | 2/12/67 | | | 3,260,000 | | | 1,457,523 | A,D |
ILFC E-Capital Trust I | | | | 5.900% | | 12/21/65 | | | 250,000 | | | 80,128 | A,D |
JPMorgan Chase and Co. | | | | 2.125% | | 6/22/12 | | | 8,690,000 | | | 8,726,194 | |
JPMorgan Chase Capital XXII | | | | 6.450% | | 2/2/37 | | | 2,600,000 | | | 2,130,679 | A |
Private Export Funding Corp. | | | | 3.550% | | 4/15/13 | | | 1,640,000 | | | 1,708,660 | |
TNK-BP Finance SA | | | | 6.125% | | 3/20/12 | | | 210,000 | | | 134,400 | D |
TNK-BP Finance SA | | | | 7.500% | | 3/13/13 | | | 720,000 | | | 446,400 | D |
ZFS Finance USA Trust II | | | | 6.450% | | 12/15/65 | | | 2,060,000 | | | 962,121 | A,D |
ZFS Finance USA Trust III | | | | 3.146% | | 12/15/65 | | | 1,570,000 | | | 474,925 | B,D |
| | | | | | | | | | | | | |
| | | | | | | | | | | | 35,303,529 | |
| | | | | | | | | | | | | |
Diversified Telecommunication Services | | 2.2% | | | | | | | | | | | |
AT&T Inc. | | | | 5.600% | | 5/15/18 | | | 400,000 | | | 407,258 | |
Embarq Corp. | | | | 7.082% | | 6/1/16 | | | 1,880,000 | | | 1,447,600 | |
Qwest Corp. | | | | 8.875% | | 3/15/12 | | | 1,510,000 | | | 1,396,750 | |
89
Annual Report to Shareholders
Portfolio of Investments—Continued
Western Asset Intermediate Bond Portfolio—Continued
| | | | | | | | | | | | |
| | | % OF
NET ASSETS | | RATE | | MATURITY
DATE | | PAR/
SHARES | | VALUE |
| | | | | | | | | | | | |
| | | | | |
Corporate Bonds and Notes—Continued | | | | | | | | | | | | |
| | | | | |
Diversified Telecommunication Services—Continued | | | | | | | | | | | | |
Verizon Communications Inc. | | | | 5.500% | | 2/15/18 | | $ | 220,000 | | $ | 211,606 |
Verizon Communications Inc. | | | | 8.750% | | 11/1/18 | | | 3,350,000 | | | 3,930,294 |
Verizon Global Funding Corp. | | | | 7.250% | | 12/1/10 | | | 4,051,000 | | | 4,246,910 |
| | | | | | | | | | | | |
| | | | | | | | | | | | 11,640,418 |
| | | | | | | | | | | | |
Electric Utilities | | 0.8% | | | | | | | | | | |
Duke Energy Corp. | | | | 6.250% | | 1/15/12 | | | 1,078,000 | | | 1,116,999 |
Duke Energy Corp. | | | | 5.625% | | 11/30/12 | | | 729,000 | | | 742,418 |
Exelon Corp. | | | | 6.750% | | 5/1/11 | | | 2,269,000 | | | 2,214,469 |
FirstEnergy Corp. | | | | 7.375% | | 11/15/31 | | | 140,000 | | | 132,442 |
Pacific Gas and Electric Co. | | | | 4.800% | | 3/1/14 | | | 70,000 | | | 68,744 |
| | | | | | | | | | | | |
| | | | | | | | | | | | 4,275,072 |
| | | | | | | | | | | | |
Energy Equipment and Services | | 0.4% | | | | | | | | | | |
Baker Hughes Inc. | | | | 7.500% | | 11/15/18 | | | 1,890,000 | | | 2,095,364 |
| | | | | | | | | | | | |
| | | | | |
Food and Staples Retailing | | 0.6% | | | | | | | | | | |
Safeway Inc. | | | | 6.500% | | 3/1/11 | | | 760,000 | | | 762,238 |
The Kroger Co. | | | | 6.200% | | 6/15/12 | | | 883,000 | | | 898,578 |
Wal-Mart Stores Inc. | | | | 4.250% | | 4/15/13 | | | 930,000 | | | 957,230 |
Wal-Mart Stores Inc. | | | | 5.800% | | 2/15/18 | | | 360,000 | | | 398,358 |
| | | | | | | | | | | | |
| | | | | | | | | | | | 3,016,404 |
| | | | | | | | | | | | |
Health Care Equipment and Supplies | | 0.4% | | | | | | | | | | |
Baxter International Inc. | | | | 5.900% | | 9/1/16 | | | 500,000 | | | 540,786 |
Hospira Inc. | | | | 5.550% | | 3/30/12 | | | 1,700,000 | | | 1,610,696 |
| | | | | | | | | | | | |
| | | | | | | | | | | | 2,151,482 |
| | | | | | | | | | | | |
Health Care Providers and Services | | 0.9% | | | | | | | | | | |
HCA Inc. | | | | 8.750% | | 9/1/10 | | | 822,000 | | | 789,120 |
Quest Diagnostics Inc. | | | | 7.500% | | 7/12/11 | | | 2,220,000 | | | 2,396,415 |
Universal Health Services Inc. | | | | 6.750% | | 11/15/11 | | | 1,720,000 | | | 1,659,716 |
WellPoint Inc. | | | | 5.875% | | 6/15/17 | | | 100,000 | | | 91,013 |
| | | | | | | | | | | | |
| | | | | | | | | | | | 4,936,264 |
| | | | | | | | | | | | |
Independent Power Producers and Energy Traders | | 0.2% | | | | | | | | | | |
TXU Corp. | | | | 5.550% | | 11/15/14 | | | 2,480,000 | | | 1,158,725 |
| | | | | | | | | | | | |
90
Annual Report to Shareholders
| | | | | | | | | | | | | |
| | | % OF
NET ASSETS | | RATE | | MATURITY
DATE | | PAR/
SHARES | | VALUE | |
| | | | | | | | | | | | | |
| | | | | |
Corporate Bonds and Notes—Continued | | | | | | | | | | | | | |
| | | | | |
Insurance | | 1.6% | | | | | | | | | | | |
Allstate Life Global Funding Trust | | | | 5.375% | | 4/30/13 | | $ | 1,900,000 | | $ | 1,870,356 | |
American International Group Inc. | | | | 5.850% | | 1/16/18 | | | 250,000 | | | 167,571 | |
American International Group Inc. | | | | 8.250% | | 8/15/18 | | | 500,000 | | | 365,960 | D |
Genworth Life Insurance Co. | | | | 5.875% | | 5/3/13 | | | 1,520,000 | | | 1,136,740 | D |
MetLife Capital Trust IVA | | | | 7.875% | | 12/15/37 | | | 3,100,000 | | | 1,944,822 | D |
MetLife Inc. | | | | 6.400% | | 12/15/36 | | | 70,000 | | | 42,000 | A |
Metropolitan Life Global Funding I | | | | 5.125% | | 4/10/13 | | | 1,190,000 | | | 1,108,793 | D |
The Travelers Cos. Inc. | | | | 6.250% | | 3/15/37 | | | 2,370,000 | | | 1,552,438 | A |
| | | | | | | | | | | | | |
| | | | | | | | | | | | 8,188,680 | |
| | | | | | | | | | | | | |
Media | | 1.6% | | | | | | | | | | | |
Comcast Corp. | | | | 6.500% | | 1/15/17 | | | 3,400,000 | | | 3,358,228 | |
News America Inc. | | | | 6.650% | | 11/15/37 | | | 70,000 | | | 69,283 | |
Time Warner Cable Inc. | | | | 8.250% | | 2/14/14 | | | 2,010,000 | | | 2,039,077 | |
Time Warner Inc. | | | | 5.500% | | 11/15/11 | | | 70,000 | | | 65,773 | |
Time Warner Inc. | | | | 6.875% | | 5/1/12 | | | 1,288,000 | | | 1,237,376 | |
Turner Broadcasting System Inc. | | | | 8.375% | | 7/1/13 | | | 1,483,000 | | | 1,446,345 | |
Viacom Inc. | | | | 5.750% | | 4/30/11 | | | 410,000 | | | 372,357 | |
| | | | | | | | | | | | | |
| | | | | | | | | | | | 8,588,439 | |
| | | | | | | | | | | | | |
Metals and Mining | | 0.2% | | | | | | | | | | | |
Alcoa Inc. | | | | 6.000% | | 7/15/13 | | | 1,230,000 | | | 1,112,145 | |
| | | | | | | | | | | | | |
| | | | | |
Multi-Utilities | | 0.7% | | | | | | | | | | | |
Dominion Resources Inc. | | | | 4.750% | | 12/15/10 | | | 50,000 | | | 49,439 | |
Dominion Resources Inc. | | | | 5.700% | | 9/17/12 | | | 1,596,000 | | | 1,580,327 | |
Dominion Resources Inc. | | | | 8.875% | | 1/15/19 | | | 1,160,000 | | | 1,250,931 | |
MidAmerican Energy Holdings Co. | | | | 5.875% | | 10/1/12 | | | 827,000 | | | 824,943 | |
| | | | | | | | | | | | | |
| | | | | | | | | | | | 3,705,640 | |
| | | | | | | | | | | | | |
Multiline Retail | | 0.4% | | | | | | | | | | | |
Federated Retail Holdings Inc. | | | | 5.350% | | 3/15/12 | | | 1,050,000 | | | 779,912 | |
JC Penney Corp. Inc. | | | | 5.750% | | 2/15/18 | | | 610,000 | | | 404,920 | |
May Department Stores Co. | | | | 5.750% | | 7/15/14 | | | 1,470,000 | | | 932,659 | |
| | | | | | | | | | | | | |
| | | | | | | | | | | | 2,117,491 | |
| | | | | | | | | | | | | |
Office Electronics | �� | 0.4% | | | | | | | | | | | |
Xerox Corp. | | | | 5.500% | | 5/15/12 | | | 2,240,000 | | | 1,877,232 | |
| | | | | | | | | | | | | |
91
Annual Report to Shareholders
Portfolio of Investments—Continued
Western Asset Intermediate Bond Portfolio—Continued
| | | | | | | | | | | | | |
| | | % OF
NET ASSETS | | RATE | | MATURITY
DATE | | PAR/
SHARES | | VALUE | |
| | | | | | | | | | | | | |
| | | | | |
Corporate Bonds and Notes—Continued | | | | | | | | | | | | | |
| | | | | |
Oil, Gas and Consumable Fuels | | 5.9% | | | | | | | | | | | |
Anadarko Petroleum Corp. | | | | 5.950% | | 9/15/16 | | $ | 3,200,000 | | $ | 2,826,589 | |
ConocoPhillips | | | | 5.200% | | 5/15/18 | | | 2,830,000 | | | 2,754,227 | |
Enbridge Energy Partners LP | | | | 9.875% | | 3/1/19 | | | 590,000 | | | 593,785 | |
Energy Transfer Partners LP | | | | 9.700% | | 3/15/19 | | | 800,000 | | | 824,329 | |
Hess Corp. | | | | 6.650% | | 8/15/11 | | | 5,468,000 | | | 5,465,835 | |
KazMunaiGaz Exploration Production—GDR | | | | 8.375% | | 7/2/13 | | | 1,720,000 | | | 1,341,600 | D |
Kinder Morgan Energy Partners LP | | | | 6.000% | | 2/1/17 | | | 3,700,000 | | | 3,212,247 | |
Occidental Petroleum Corp. | | | | 6.750% | | 1/15/12 | | | 1,310,000 | | | 1,364,582 | |
Pemex Project Funding Master Trust | | | | 5.750% | | 3/1/18 | | | 190,000 | | | 167,675 | D |
Sonat Inc. | | | | 7.625% | | 7/15/11 | | | 3,954,000 | | | 3,605,012 | |
The Williams Cos. Inc. | | | | 7.125% | | 9/1/11 | | | 600,000 | | | 552,000 | |
The Williams Cos. Inc. | | | | 8.125% | | 3/15/12 | | | 1,540,000 | | | 1,418,725 | |
The Williams Cos. Inc. | | | | 7.875% | | 9/1/21 | | | 720,000 | | | 550,800 | |
The Williams Cos. Inc. | | | | 7.500% | | 1/15/31 | | | 310,000 | | | 207,700 | |
The Williams Cos. Inc. | | | | 7.750% | | 6/15/31 | | | 750,000 | | | 513,750 | |
The Williams Cos. Inc. | | | | 8.750% | | 3/15/32 | | | 2,040,000 | | | 1,519,800 | |
XTO Energy Inc. | | | | 7.500% | | 4/15/12 | | | 859,000 | | | 849,000 | |
XTO Energy Inc. | | | | 6.250% | | 4/15/13 | | | 1,645,000 | | | 1,604,591 | |
XTO Energy Inc. | | | | 5.750% | | 12/15/13 | | | 200,000 | | | 194,146 | |
XTO Energy Inc. | | | | 5.650% | | 4/1/16 | | | 1,682,000 | | | 1,543,181 | |
| | | | | | | | | | | | | |
| | | | | | | | | | | | 31,109,574 | |
| | | | | | | | | | | | | |
Paper and Forest Products | | 0.4% | | | | | | | | | | | |
Willamette Industries Inc. | | | | 7.125% | | 7/22/13 | | | 1,839,000 | | | 1,811,658 | |
| | | | | | | | | | | | | |
| | | | | |
Pharmaceuticals | | 0.3% | | | | | | | | | | | |
GlaxoSmithKline Capital Inc. | | | | 5.650% | | 5/15/18 | | | 1,690,000 | | | 1,775,054 | |
| | | | | | | | | | | | | |
| | | | | |
Real Estate Investment Trusts (REITs) | | 0.3% | | | | | | | | | | | |
iStar Financial Inc. | | | | 5.500% | | 6/15/12 | | | 3,980,000 | | | 1,253,700 | |
iStar Financial Inc. | | | | 5.950% | | 10/15/13 | | | 1,400,000 | | | 441,000 | |
| | | | | | | | | | | | | |
| | | | | | | | | | | | 1,694,700 | |
| | | | | | | | | | | | | |
Thrifts and Mortgage Finance | | 1.0% | | | | | | | | | | | |
Countrywide Financial Corp. | | | | 1.686% | | 3/24/09 | | | 1,170,000 | | | 1,160,481 | B |
Countrywide Financial Corp. | | | | 5.800% | | 6/7/12 | | | 4,400,000 | | | 4,288,473 | |
| | | | | | | | | | | | | |
| | | | | | | | | | | | 5,448,954 | |
| | | | | | | | | | | | | |
92
Annual Report to Shareholders
| | | | | | | | | | | | | |
| | | % OF
NET ASSETS | | RATE | | MATURITY
DATE | | PAR/
SHARES | | VALUE | |
| | | | | | | | | | | | | |
| | | | | |
Corporate Bonds and Notes—Continued | | | | | | | | | | | | | |
| | | | | |
Tobacco | | 1.0% | | | | | | | | | | | |
Altria Group Inc. | | | | 9.700% | | 11/10/18 | | $ | 1,940,000 | | $ | 2,096,810 | E |
Philip Morris International Inc. | | | | 5.650% | | 5/16/18 | | | 3,300,000 | | | 3,271,399 | |
| | | | | | | | | | | | | |
| | | | | | | | | | | | 5,368,209 | |
| | | | | | | | | | | | | |
Wireless Telecommunication Services | | 1.0% | | | | | | | | | | | |
New Cingular Wireless Services Inc. | | | | 8.125% | | 5/1/12 | | | 3,000,000 | | | 3,217,107 | |
Sprint Capital Corp. | | | | 8.375% | | 3/15/12 | | | 2,669,000 | | | 2,135,200 | |
Vodafone Group PLC | | | | 5.350% | | 2/27/12 | | | 70,000 | | | 69,107 | |
| | | | | | | | | | | | | |
| | | | | | | | | | | | 5,421,414 | |
| | | | | | | | | | | | | |
Total Corporate Bonds and Notes
(Cost—$250,677,067) | | | | | | | | | | | | 203,084,009 | |
Asset-Backed Securities | | 2.5% | | | | | | | | | | | |
| | | | | |
Fixed Rate Securities | | 0.2% | | | | | | | | | | | |
ABFS Mortgage Loan Trust 2002-3 | | | | 4.263% | | 9/15/33 | | | 37,060 | | | 36,842 | |
Conseco Finance Securitizations Corp. 2000-4 | | | | 8.310% | | 5/1/32 | | | 568,143 | | | 296,454 | |
Green Tree Financial Corp. 1994-6 | | | | 8.900% | | 1/15/20 | | | 98,665 | | | 98,340 | |
UCFC Home Equity Loan 1998-D | | | | 6.905% | | 4/15/30 | | | 618,201 | | | 610,472 | |
| | | | | | | | | | | | | |
| | | | | | | | | | | | 1,042,108 | |
| | | | | | | | | | | | | |
Indexed SecuritiesB | | 1.9% | | | | | | | | | | | |
AFC Home Equity Loan Trust 2003-3 | | | | 0.821% | | 10/25/30 | | | 690,937 | | | 258,548 | D |
Bear Stearns Asset Backed Securities Trust 2007-HE6 1A1 | | | | 1.721% | | 6/25/37 | | | 2,338,602 | | | 1,984,523 | |
Countrywide Asset-Backed Certificates 2002-BC1 | | | | 1.131% | | 4/25/32 | | | 330,228 | | | 229,768 | |
Countrywide Asset-Backed Certificates 2005-6 M1 | | | | 0.961% | | 12/25/35 | | | 1,950,000 | | | 1,466,796 | |
IndyMac Home Equity Loan Asset-Backed Trust 2001-A | | | | 0.731% | | 3/25/31 | | | 213,298 | | | 179,348 | |
Long Beach Mortgage Loan Trust 2005-WL3 2A2A | | | | 0.611% | | 11/25/35 | | | 171,649 | | | 168,836 | |
MSDWCC Heloc Trust 2003-1 | | | | 0.741% | | 11/25/15 | | | 499,776 | | | 355,159 | |
Nelnet Student Loan Trust 2008-4 A4 | | | | 5.015% | | 4/25/24 | | | 1,140,000 | | | 923,553 | |
Washington Mutual Master Note Trust 2006-A3A A3 | | | | 1.225% | | 9/16/13 | | | 5,180,000 | | | 4,534,450 | D |
| | | | | | | | | | | | | |
| | | | | | | | | | | | 10,100,981 | |
| | | | | | | | | | | | | |
93
Annual Report to Shareholders
Portfolio of Investments—Continued
Western Asset Intermediate Bond Portfolio—Continued
| | | | | | | | | | | | | |
| | | % OF
NET ASSETS | | RATE | | MATURITY
DATE | | PAR/
SHARES | | VALUE | |
| | | | | | | | | | | | | |
Asset-Backed Securities—Continued | | | | | | | | | | | | | |
| | | | | |
Variable Rate SecuritiesG | | 0.4% | | | | | | | | | | | |
Green Tree 2008-MH1 A2 | | | | 8.960% | | 4/25/38 | | $ | 2,170,000 | | $ | 1,729,489 | D |
| | | | | | | | | | | | | |
Total Asset-Backed Securities
(Cost—$14,622,180) | | | | | | | | | | | | 12,872,578 | |
Mortgage-Backed Securities | | 7.5% | | | | | | | | | | | |
| | | | | |
Fixed Rate Securities | | 2.2% | | | | | | | | | | | |
CS First Boston Mortgage Securities Corp. 2005-9 3A1 | | | | 6.000% | | 10/25/35 | | | 1,780,501 | | | 1,120,603 | |
Fannie Mae Grantor Trust 2002-T3 | | | | 5.763% | | 12/25/11 | | | 3,663,449 | | | 3,966,494 | |
Prime Mortgage Trust 2006-DR1 2A2 | | | | 6.000% | | 11/25/36 | | | 1,780,769 | | | 1,151,100 | D |
Residential Asset Securitization Trust 2003-A14 | | | | 4.750% | | 2/25/19 | | | 2,507,465 | | | 1,918,128 | |
Virginia Housing Development Mortgage Bonds Pass-Through Certificates 2006 | | | | 6.000% | | 6/25/34 | | | 3,798,870 | | | 3,704,961 | |
| | | | | | | | | | | | | |
| | | | | | | | | | | | 11,861,286 | |
| | | | | | | | | | | | | |
Indexed SecuritiesB | | 3.3% | | | | | | | | | | | |
Bayview Commercial Asset Trust 2005-1A A2 | | | | 0.821% | | 4/25/35 | | | 1,332,488 | | | 930,615 | D |
Bear Stearns Structured Products Inc. 2007-R11 A1A | | | | 1.071% | | 9/27/37 | | | 1,805,666 | | | 1,755,979 | D |
Citigroup Mortgage Loan Trust Inc. 2005-11 A3 | | | | 4.900% | | 12/25/35 | | | 2,502,824 | | | 1,805,458 | |
Countrywide Home Loans 2003-49 | | | | 3.697% | | 10/25/33 | | | 427,666 | | | 408,319 | |
First Horizon Mortgage Pass-Through Trust 2003-AR2 2A1 | | | | 4.429% | | 7/25/33 | | | 1,184,200 | | | 1,148,369 | |
GMAC Mortgage Corp. Loan Trust 2005-AR5 3A1 | | | | 5.068% | | 9/19/35 | | | 1,255,136 | | | 1,031,659 | |
IndyMac Inda Mortgage Loan Trust 2007-AR7 1A1 | | | | 6.217% | | 11/25/37 | | | 2,860,414 | | | 1,763,417 | |
MASTR Adjustable Rate Mortgages Trust 2004-13 | | | | 3.788% | | 11/21/34 | | | 6,815,190 | | | 4,361,863 | |
Structured Asset Mortgage Investments Inc. 2004-AR8 A1 | | | | 0.921% | | 5/19/35 | | | 1,633,613 | | | 837,590 | |
Wells Fargo Mortgage-Backed Securities Trust 2004-S | | | | 3.732% | | 9/25/34 | | | 3,525,000 | | | 3,456,805 | |
| | | | | | | | | | | | | |
| | | | | | | | | | | | 17,500,074 | |
| | | | | | | | | | | | | |
Variable Rate SecuritiesG | | 2.0% | | | | | | | | | | | |
Banc of America Funding Corp. 2005-B | | | | 5.092% | | 4/20/35 | | | 1,751,264 | | | 1,017,018 | |
Bear Stearns Alt-A Trust 2005-2 | | | | 4.687% | | 4/25/35 | | | 1,329,096 | | | 734,113 | |
94
Annual Report to Shareholders
| | | | | | | | | | | | | |
| | | % OF
NET ASSETS | | RATE | | MATURITY
DATE | | PAR/
SHARES | | VALUE | |
| | | | | | | | | | | | | |
Mortgage-Backed Securities—Continued | | | | | | | | | | | | | |
| | | | | |
Variable Rate Securities—Continued | | | | | | | | | | | | | |
Citigroup Mortgage Loan Trust Inc. 2005-8 1A1A | | | | 5.298% | | 10/25/35 | | $ | 1,531,864 | | $ | 1,034,994 | |
Countrywide Home Loans 2004-20 | | | | 5.054% | | 9/25/34 | | | 465,187 | | | 276,741 | |
JP Morgan Mortgage Trust 2004-A3 SF3 | | | | 4.587% | | 6/25/34 | | | 1,775,209 | | | 1,368,597 | |
Merrill Lynch Mortgage Investors Inc. 2005-A2 | | | | 4.487% | | 2/25/35 | | | 1,357,495 | | | 825,180 | |
Merrill Lynch Mortgage Investors Trust 2004-A1 2A1 | | | | 4.851% | | 2/25/34 | | | 1,744,662 | | | 1,422,049 | |
MLCC Mortgage Investors Inc. 2005-1 2A1 | | | | 4.952% | | 4/25/35 | | | 617,922 | | | 391,916 | |
MLCC Mortgage Investors Inc. 2005-1 2A2 | | | | 4.952% | | 4/25/35 | | | 1,922,935 | | | 1,298,022 | |
SACO I Trust 2007-VA1 A | | | | 8.964% | | 6/25/21 | | | 1,717,553 | | | 1,746,545 | D |
WaMu Mortgage Pass-Through Certificates 2004-AR11 | | | | 4.537% | | 10/25/34 | | | 293,106 | | | 197,157 | |
| | | | | | | | | | | | | |
| | | | | | | | | | | | 10,312,332 | |
| | | | | | | | | | | | | |
Total Mortgage-Backed Securities
(Cost—$49,907,467) | | | | | | | | | | | | 39,673,692 | |
U.S. Government and Agency Obligations | | 9.5% | | | | | | | | | | | |
| | | | | |
Fixed Rate Securities | | 6.0% | | | | | | | | | | | |
Fannie Mae | | | | 7.250% | | 1/15/10 | | | 162,000 | | | 172,977 | H |
Farmer Mac | | | | 4.875% | | 4/4/12 | | | 2,561,000 | | | 2,808,364 | |
Farmer Mac | | | | 5.125% | | 4/19/17 | | | 2,800,000 | | | 3,160,108 | D |
Federal Home Loan Bank | | | | 3.625% | | 9/16/11 | | | 5,630,000 | | | 5,957,148 | |
Federal Home Loan Bank | | | | 5.500% | | 7/15/36 | | | 130,000 | | | 166,599 | |
Freddie Mac | | | | 3.750% | | 6/28/13 | | | 10,290,000 | | | 10,957,831 | H |
Freddie Mac | | | | 5.250% | | 4/18/16 | | | 4,210,000 | | | 4,793,948 | H |
Tennessee Valley Authority | | | | 5.625% | | 1/18/11 | | | 373,000 | | | 398,388 | |
Tennessee Valley Authority | | | | 6.790% | | 5/23/12 | | | 2,747,000 | | | 3,153,496 | |
Tennessee Valley Authority | | | | 5.980% | | 4/1/36 | | | 70,000 | | | 90,860 | |
United States Treasury Bonds | | | | 8.875% | | 8/15/17 | | | 10,000 | | | 14,887 | |
| | | | | | | | | | | | | |
| | | | | | | | | | | | 31,674,606 | |
| | | | | | | | | | | | | |
Treasury Inflation-Protected SecuritiesI | | 3.5% | | | | | | | | | | | |
United States Treasury Inflation-Protected Security | | | | 2.000% | | 1/15/14 | | | 1,048,197 | | | 993,167 | |
United States Treasury Inflation-Protected Security | | | | 1.875% | | 7/15/15 | | | 1,373,315 | | | 1,297,246 | |
United States Treasury Inflation-Protected Security | | | | 2.000% | | 1/15/16 | | | 1,534,691 | | | 1,469,706 | |
United States Treasury Inflation-Protected Security | | | | 2.500% | | 7/15/16 | | | 3,915,538 | | | 3,884,640 | J |
95
Annual Report to Shareholders
Portfolio of Investments—Continued
Western Asset Intermediate Bond Portfolio—Continued
| | | | | | | | | | | | | |
| | | % OF
NET ASSETS | | RATE | | MATURITY DATE | | PAR/
SHARES | | VALUE | |
| | | | | | | | | | | | | |
U.S. Government and Agency Obligations—Continued | | | | | | | | | | | | | |
| | | | | |
Treasury Inflation-Protected Securities—Continued | | | | | | | | | | | | | |
United States Treasury Inflation-Protected Security | | | | 2.625% | | 7/15/17 | | $ | 1,797,916 | | $ | 1,842,443 | J |
United States Treasury Inflation-Protected Security | | | | 1.375% | | 7/15/18 | | | 904,194 | | | 845,633 | J |
United States Treasury Inflation-Protected Security | | | | 2.375% | | 1/15/25 | | | 1,579,179 | | | 1,552,036 | J |
United States Treasury Inflation-Protected Security | | | | 2.000% | | 1/15/26 | | | 1,005,299 | | | 946,945 | J |
United States Treasury Inflation-Protected Security | | | | 2.375% | | 1/15/27 | | | 64,457 | | | 64,754 | J |
United States Treasury Inflation-Protected Security | | | | 1.750% | | 1/15/28 | | | 5,708,342 | | | 5,273,972 | J |
| | | | | | | | | | | | | |
| | | | | | | | | | | | 18,170,542 | |
| | | | | | | | | | | | | |
Total U.S. Government and Agency
Obligations (Cost—$47,115,945) | | | | | | | | | | | | 49,845,148 | |
U.S. Government Agency Mortgage-
Backed Securities | | 21.1% | | | | | | | | | | | |
| | | | | |
Fixed Rate Securities | | 18.2% | | | | | | | | | | | |
Fannie Mae | | | | 6.500% | | 6/1/14 to 9/1/37 | | | 1,490,136 | | | 1,550,127 | H |
Fannie Mae | | | | 8.000% | | 9/1/15 | | | 28,890 | | | 30,067 | H |
Fannie Mae | | | | 9.500% | | 4/15/21 | | | 27,346 | | | 29,664 | H |
Fannie Mae | | | | 5.000% | | 6/1/35 to 2/1/36 | | | 11,991,175 | | | 12,262,407 | H |
Fannie Mae | | | | 6.000% | | 10/1/36 to 10/1/37 | | | 18,109,897 | | | 18,664,951 | H |
Fannie Mae | | | | 5.500% | | 7/1/38 | | | 3,858,720 | | | 3,959,573 | H |
Fannie Mae | | | | 5.000% | | 12/1/38 | | | 22,670,000 | | | 23,144,664 | H,K |
Freddie Mac | | | | 6.500% | | 6/1/13 to 11/1/15 | | | 37,210 | | | 39,068 | H |
Freddie Mac | | | | 7.500% | | 4/1/17 | | | 977 | | | 1,008 | H |
Freddie Mac | | | | 9.300% | | 4/15/19 | | | 36,220 | | | 38,979 | H |
Freddie Mac | | | | 5.000% | | 11/1/35 | | | 422,937 | | | 432,801 | H |
Freddie Mac | | | | 5.500% | | 4/1/38 | | | 24,662,186 | | | 25,270,698 | H |
Freddie Mac | | | | 5.000% | | 12/1/38 | | | 491,000 | | | 501,741 | H,K |
Freddie Mac | | | | 5.500% | | 12/1/38 | | | 900,000 | | | 921,094 | H,K |
Freddie Mac | | | | 6.000% | | 12/1/38 | | | 100,000 | | | 103,000 | H,K |
Government National Mortgage Association | | | | 5.000% | | 12/1/38 | | | 8,100,000 | | | 8,302,500 | K |
Government National Mortgage Association | | | | 6.000% | | 12/1/38 | | | 100,000 | | | 103,156 | K |
| | | | | | | | | | | | | |
| | | | | | | | | | | | 95,355,498 | |
| | | | | | | | | | | | | |
96
Annual Report to Shareholders
| | | | | | | | | | | | | |
| | | % OF
NET ASSETS | | RATE | | MATURITY
DATE | | PAR/
SHARES | | VALUE | |
| | | | | | | | | | | | | |
U.S. Government Agency Mortgage-
Backed Securities—Continued | | | | | | | | | | | | | |
| | | | | |
Indexed SecuritiesB | | 2.9% | | | | | | | | | | | |
Fannie Mae | | | | 4.516% | | 3/1/18 | | $ | 16,836 | | $ | 16,712 | H |
Fannie Mae | | | | 4.341% | | 11/1/34 | | | 422,817 | | | 424,276 | H |
Fannie Mae | | | | 4.223% | | 12/1/34 | | | 612,355 | | | 609,654 | H |
Fannie Mae | | | | 4.851% | | 1/1/35 | | | 2,883,100 | | | 2,933,323 | H |
Fannie Mae | | | | 3.787% | | 3/1/35 | | | 799,345 | | | 799,124 | H |
Fannie Mae | | | | 4.764% | | 4/1/35 | | | 735,225 | | | 737,991 | H |
Fannie Mae | | | | 5.740% | | 9/1/37 | | | 5,120,204 | | | 5,241,140 | H |
Freddie Mac | | | | 4.855% | | 1/1/19 | | | 7,163 | | | 7,162 | H |
Freddie Mac | | | | 4.360% | | 12/1/34 | | | 231,767 | | | 231,129 | H |
Freddie Mac | | | | 4.470% | | 12/1/34 | | | 1,144,306 | | | 1,154,412 | H |
Freddie Mac | | | | 4.101% | | 1/1/35 | | | 210,478 | | | 207,089 | H |
Freddie Mac | | | | 4.141% | | 1/1/35 | | | 378,010 | | | 377,199 | H |
Freddie Mac | | | | 4.679% | | 7/1/35 | | | 2,626,417 | | | 2,636,363 | H |
| | | | | | | | | | | | | |
| | | | | | | | | | | | 15,375,574 | |
| | | | | | | | | | | | | |
Stripped Securities | | N.M. | | | | | | | | | | | |
Fannie Mae | | | | 0.000% | | 5/25/22 | | | 4,060 | | | 3,784 | F,H,L,M1 |
Freddie Mac | | | | 10.000% | | 3/1/21 | | | 3,535 | | | 611 | F,H,M2 |
| | | | | | | | | | | | | |
| | | | | | | | | | | | 4,395 | |
| | | | | | | | | | | | | |
Total U.S. Government Agency Mortgage-Backed Securities (Cost—$108,006,480) | | | | | | | | | | | | 110,735,467 | |
Yankee BondsN | | 8.6% | | | | | | | | | | | |
| | | | | |
Aerospace and Defense | | 0.2% | | | | | | | | | | | |
Systems 2001 Asset Trust | | | | 6.664% | | 9/15/13 | | | 938,643 | | | 901,754 | D |
| | | | | | | | | | | | | |
| | | | | |
Beverages | | 0.5% | | | | | | | | | | | |
Diageo Capital PLC | | | | 7.375% | | 1/15/14 | | | 2,620,000 | | | 2,790,958 | |
| | | | | | | | | | | | | |
| | | | | |
Commercial Banks | | 2.2% | | | | | | | | | | | |
Barclays Bank PLC | | | | 7.434% | | 9/29/49 | | | 390,000 | | | 197,176 | A,D |
Barclays Bank PLC | | | | 7.700% | | 12/31/49 | | | 900,000 | | | 595,134 | A,D |
Glitnir Banki Hf | | | | 5.815% | | 1/21/11 | | | 4,430,000 | | | 210,425 | B,C,D,O |
Glitnir Banki Hf | | | | 6.329% | | 7/28/11 | | | 120,000 | | | 5,700 | B,C,D,O |
Glitnir Banki Hf | | | | 5.678% | | 1/18/12 | | | 100,000 | | | 4,750 | B,C,D,O |
Glitnir Banki Hf | | | | 6.375% | | 9/25/12 | | | 1,980,000 | | | 94,050 | C,D,O |
Glitnir Banki Hf | | | | 6.693% | | 6/15/16 | | | 910,000 | | | 137 | A,C,D,O |
HBOS Treasury Services PLC | | | | 4.000% | | 9/15/09 | | | 1,240,000 | | | 1,213,161 | D |
97
Annual Report to Shareholders
Portfolio of Investments—Continued
Western Asset Intermediate Bond Portfolio—Continued
| | | | | | | | | | | | | |
| | | % OF
NET ASSETS | | RATE | | MATURITY
DATE | | PAR/
SHARES | | VALUE | |
| | | | | | | | | | | | | |
Yankee Bonds—Continued | | | | | | | | | | | | | |
| | | | | |
Commercial Banks—Continued | | | | | | | | | | | | | |
Kaupthing Bank Hf | | | | 5.750% | | 10/4/11 | | $ | 4,090,000 | | $ | 245,400 | C,D,O |
Kaupthing Bank Hf | | | | 7.625% | | 2/28/15 | | | 1,590,000 | | | 95,400 | C,D,F,O |
Landsbanki Islands Hf | | | | 6.100% | | 8/25/11 | | | 2,330,000 | | | 40,775 | C,D,O |
Landsbanki Islands Hf | | | | 7.431% | | 12/31/49 | | | 1,830,000 | | | 275 | A,C,D,O |
Resona Preferred Global Securities | | | | 7.191% | | 12/29/49 | | | 4,640,000 | | | 2,209,048 | A,D |
Royal Bank of Scotland Group PLC | | | | 9.118% | | 3/31/49 | | | 2,431,000 | | | 2,075,432 | |
RSHB Capital SA | | | | 6.299% | | 5/15/17 | | | 270,000 | | | 153,900 | D |
Santander Issuances | | | | 5.805% | | 6/20/16 | | | 1,030,000 | | | 926,642 | A,D |
Shinsei Finance Cayman Ltd. | | | | 6.418% | | 1/29/49 | | | 4,565,000 | | | 954,779 | A,D |
TuranAlem Finance BV | | | | 5.434% | | 1/22/09 | | | 970,000 | | | 911,800 | B,D |
VTB Capital SA for Vneshtorgbank | | | | 4.559% | | 11/2/09 | | | 1,850,000 | | | 1,619,693 | B,D |
| | | | | | | | | | | | | |
| | | | | | | | | | | | 11,553,677 | |
| | | | | | | | | | | | | |
Diversified Financial Services | | 1.2% | | | | | | | | | | | |
Aiful Corp. | | | | 5.000% | | 8/10/10 | | | 3,491,000 | | | 1,919,348 | D |
MUFG Capital Finance 1 Ltd. | | | | 6.346% | | 7/29/49 | | | 3,402,000 | | | 2,370,252 | A |
TNK-BP Finance SA | | | | 6.875% | | 7/18/11 | | | 2,783,000 | | | 2,031,590 | D |
| | | | | | | | | | | | | |
| | | | | | | | | | | | 6,321,190 | |
| | | | | | | | | | | | | |
Diversified Telecommunication Services | | 2.1% | | | | | | | | | | | |
Deutsche Telekom International Finance BV | | | | 8.500% | | 6/15/10 | | | 70,000 | | | 72,105 | E |
Deutsche Telekom International Finance BV | | | | 5.750% | | 3/23/16 | | | 1,800,000 | | | 1,723,028 | |
France Telecom SA | | | | 7.750% | | 3/1/11 | | | 2,428,000 | | | 2,554,994 | |
Telecom Italia Capital SpA | | | | 5.250% | | 10/1/15 | | | 1,400,000 | | | 1,065,750 | |
Telecom Italia Capital SpA | | | | 6.999% | | 6/4/18 | | | 2,000,000 | | | 1,622,500 | |
Telefonica Emisiones S.A.U. | | | | 3.356% | | 2/4/13 | | | 5,230,000 | | | 4,195,475 | B |
| | | | | | | | | | | | | |
| | | | | | | | | | | | 11,233,852 | |
| | | | | | | | | | | | | |
Energy Equipment and Services | | 0.3% | | | | | | | | | | | |
Transocean Inc. | | | | 5.250% | | 3/15/13 | | | 1,670,000 | | | 1,551,089 | |
| | | | | | | | | | | | | |
| | | | | |
Foreign Government | | N.M. | | | | | | | | | | | |
Russian Federation | | | | 7.500% | | 3/31/30 | | | 17,369 | | | 15,148 | D |
| | | | | | | | | | | | | |
| | | | | |
Industrial Conglomerates | | 0.4% | | | | | | | | | | | |
Tyco International Group SA | | | | 6.000% | | 11/15/13 | | | 2,358,000 | | | 2,212,547 | |
| | | | | | | | | | | | | |
| | | | | |
Insurance | | 0.2% | | | | | | | | | | | |
Merna Reinsurance Ltd. | | | | 3.209% | | 6/30/12 | | | 1,300,000 | | | 1,173,770 | B,D |
| | | | | | | | | | | | | |
98
Annual Report to Shareholders
| | | | | | | | | | | | | | |
| | | % OF
NET ASSETS | | RATE | | MATURITY
DATE | | PAR/
SHARES | | | VALUE | |
| | | | | | | | | | | | | | |
Yankee Bonds—Continued | | | | | | | | | | | | | | |
| | | | | |
Metals and Mining | | 0.7% | | | | | | | | | | | | |
Vale Overseas Ltd. | | | | 6.250% | | 1/23/17 | | $ | 3,560,000 | | | $ | 3,356,368 | |
| | | | | | | | | | | | | | |
| | | | | |
Oil, Gas and Consumable Fuels | | 0.7% | | | | | | | | | | | | |
Anadarko Finance Co. | | | | 6.750% | | 5/1/11 | | | 720,000 | | | | 720,258 | |
BP Capital Markets PLC | | | | 5.250% | | 11/7/13 | | | 1,250,000 | | | | 1,304,920 | |
Gazprom | | | | 6.212% | | 11/22/16 | | | 1,710,000 | | | | 1,128,600 | D |
Gazprom | | | | 6.510% | | 3/7/22 | | | 940,000 | | | | 559,300 | D |
| | | | | | | | | | | | | | |
| | | | | | | | | | | | | 3,713,078 | |
| | | | | | | | | | | | | | |
Wireless Telecommunication Services | | 0.1% | | | | | | | | | | | | |
America Movil SA de CV | | | | 5.625% | | 11/15/17 | | | 680,000 | | | | 604,540 | |
| | | | | | | | | | | | | | |
Total Yankee Bonds (Cost—$75,801,110) | | | | | | | | | | | | | 45,427,971 | |
Preferred Stocks | | 0.1% | | | | | | | | | | | | |
Fannie Mae | | | | 8.250% | | | | | 61,925 | shs | | | 51,398 | H |
Freddie Mac | | | | 8.375% | | | | | 84,900 | | | | 33,111 | H |
Home Ownership Funding Corp. | | | | 1.000% | | | | | 600 | | | | 59,130 | D,F |
Home Ownership Funding Corp. II | | | | 1.000% | | | | | 1,800 | | | | 177,390 | D,F |
Preferred Blocker Inc. | | | | 9.000% | | | | | 238 | | | | 59,500 | D |
| | | | | | | | | | | | | | |
Total Preferred Stocks (Cost—$5,672,235) | | | | | | | | | | | | | 380,529 | |
| | | | | | | | | | | | | | |
Total Long-Term Securities
(Cost—$551,802,484) | | | | | | | | | | | | | 462,019,394 | |
Short-Term Securities | | 18.3% | | | | | | | | | | | | |
| | | | | |
U.S. Government and Agency Obligations | | 18.3% | | | | | | | | | | | | |
Fannie Mae | | | | 0.000% | | 5/5/09 | | $ | 38,600,000 | | | | 38,567,036 | H,L |
Federal Home Loan Bank | | | | 0.000% | | 1/2/09 | | | 20,700,000 | | | | 20,698,401 | L |
Federal Home Loan Bank | | | | 0.000% | | 1/15/09 | | | 37,100,000 | | | | 37,066,816 | L |
| | | | | | | | | | | | | | |
Total Short-Term Securities (Cost—$96,199,023) | | | | | | | | | | | | | 96,332,253 | |
Total Investments (Cost—$648,001,507)P | | 106.2% | | | | | | | | | | | 558,351,647 | |
Other Assets Less Liabilities | | (6.2)% | | | | | | | | | | | (32,460,155 | ) |
| | | | | | | | | | | | | | |
| | | | | |
Net Assets | | 100.0% | | | | | | | | | | $ | 525,891,492 | |
| | | | | | | | | | | | | | |
99
Annual Report to Shareholders
Portfolio of Investments—Continued
Western Asset Intermediate Bond Portfolio—Continued
| | | | | | | | |
| | | EXPIRATION | | ACTUAL
CONTRACTS | | APPRECIATION/
(DEPRECIATION) | |
Futures Contracts PurchasedQ | | | | | | | | |
Eurodollar Futures | | March 2009 | | 531 | | $ | 3,133,357 | |
Eurodollar Futures | | June 2009 | | 117 | | | 446,028 | |
Eurodollar Futures | | September 2009 | | 16 | | | 110,945 | |
U.S. Treasury Note Futures | | March 2009 | | 437 | | | 2,653,784 | |
U.S. Treasury Note Futures | | March 2009 | | 248 | | | 156,932 | |
U.S. Treasury Note Futures | | March 2009 | | 151 | | | 381,573 | |
| | | | | | | | |
| | | | | | $ | 6,882,619 | |
| | | | | | | | |
Options WrittenQ | | | | | | | | |
Eurodollar Futures Call, Strike Price $97.63 | | September 2009 | | 16 | | $ | (34,780 | ) |
Eurodollar Futures Call, Strike Price $98.25 | | March 2009 | | 556 | | | (639,930 | ) |
U.S. Treasury Note Futures Call, Strike Price $117.00 | | February 2009 | | 188 | | | (290,284 | ) |
U.S. Treasury Note Futures Call, Strike Price $118.00 | | February 2009 | | 305 | | | (2,215,790 | ) |
U.S. Treasury Note Futures Call, Strike Price $120.00 | | February 2009 | | 181 | | | (979,436 | ) |
U.S. Treasury Note Futures Put, Strike Price $110.00 | | February 2009 | | 289 | | | 355,289 | |
U.S. Treasury Note Futures Put, Strike Price $114.00 | | February 2009 | | 181 | | | 44,344 | |
| | | | | | | | |
| | | | | | $ | (3,760,587 | ) |
| | | | | | | | |
| | | | | | | | | |
N.M.—Not Meaningful.
A | | Stepped Coupon Security – A security with a predetermined schedule of interest or dividend rate changes at which time it begins to accrue interest or pay dividends according to the predetermined schedule. |
B | | Indexed Security – The rates of interest earned on these securities are tied to the London Interbank Offered Rate (“LIBOR”), the Euro Interbank Offered Rate (“EURIBOR”) Index, the Consumer Price Index (“CPI”), the one-year Treasury Bill Rate or the ten-year Japanese Government Bond Rate. The coupon rates are the rates as of December 31, 2008. |
C | | Bond is currently in default. |
D | | Rule 144a Security – A security purchased pursuant to Rule 144a under the Securities Act of 1933 which may not be resold subject to that rule except to qualified institutional buyers. These securities, which the Fund’s investment adviser has determined to be liquid, represent 8.47% of net assets. |
E | | Credit Linked Security – The rates of interest earned on these securities are tied to the credit rating assigned by Standard & Poor’s Rating Service and/or Moody’s Investors Services. |
F | | Illiquid security valued at fair value under the procedures approved by the Board of Directors. |
G | | The coupon rates shown on variable rate securities are the rates at December 31, 2008. These rates vary with the weighted average coupon of the underlying loans. |
H | | On September 7, 2008, the Federal Housing Finance Agency placed Fannie Mae and Freddie Mac into Conservatorship. |
I | | Treasury Inflation-Protected Security – Treasury security whose principal value is adjusted daily in accordance with changes to the Consumer Price Index for All Urban Consumers. Interest is calculated on the basis of the current adjusted principal value. |
J | | All or a portion of this security is collateral to cover futures and options contracts written. |
K | | When-issued Security – Security purchased on a delayed delivery basis. Final settlement amount and maturity date have not yet been announced. |
L | | Zero coupon bond – A bond with no periodic interest payments which is sold at such a discount as to produce a current yield to maturity. |
M | | Stripped Security – Security with interest-only or principal-only payment streams, denoted by a 1 or 2, respectively. For interest-only securities, the amount shown as principal is the notional balance used to calculate the amount of interest due. |
N | | Yankee Bond – A dollar-denominated bond issued in the U.S. by foreign entities. |
100
Annual Report to Shareholders
P | | At December 31, 2008, the aggregate gross unrealized appreciation and depreciation of investments for federal income tax purposes were substantially as follows: |
| | | | |
| Gross unrealized appreciation | | $ | 9,707,448 | |
| Gross unrealized depreciation | | | (99,572,040 | ) |
| | | | |
| Net unrealized depreciation | | $ | (89,864,592 | ) |
| | | | |
Q | | Options and futures are described in more detail in the notes to financial statements. |
See notes to financial statements.
101
Annual Report to Shareholders
Statement of Assets and Liabilities
Western Asset Intermediate Bond Portfolio
December 31, 2008
| | | | | | | |
Assets: | | | | | | | |
Investment securities at market value (Cost—$551,802,484) | | | | | $ | 462,019,394 | |
Short-term securities at value (Cost—$96,199,023) | | | | | | 96,332,253 | |
Restricted cash pledged for swaps | | | | | | 6,550,000 | |
Interest receivable | | | | | | 5,323,078 | |
Unrealized appreciation on swaps | | | | | | 2,619,417 | |
Receivable for securities sold | | | | | | 1,417,633 | |
Receivable for fund shares sold | | | | | | 480,236 | |
Premium paid on open swaps | | | | | | 235,330 | |
Amount receivable for open swaps | | | | | | 150,807 | |
| | | | | | | |
Total assets | | | | | | 575,128,148 | |
| | | | | | | |
| | |
Liabilities: | | | | | | | |
Payable for securities purchased | | $ | 33,083,105 | | | | |
Options written (Proceeds—$1,532,092) | | | 5,292,679 | | | | |
Unrealized depreciation on swaps | | | 3,912,677 | | | | |
Premium received on open swaps | | | 1,960,128 | | | | |
Payable for Lehman settlement | | | 1,774,545 | | | | |
Payable for fund shares repurchased | | | 918,967 | | | | |
Futures variation margin payable | | | 839,167 | | | | |
Income distribution payable | | | 645,800 | | | | |
Due to Custodian | | | 456,022 | | | | |
Accrued management fee | | | 180,310 | | | | |
Amount payable for open swaps | | | 46,040 | | | | |
Accrued expenses and other liabilities | | | 127,216 | | | | |
| | | | | | | |
Total liabilities | | | | | | 49,236,656 | |
| | | | | | | |
| | |
Net Assets | | | | | $ | 525,891,492 | |
| | | | | | | |
| | |
Net assets consist of: | | | | | | | |
Accumulated paid-in-capital | | | | | $ | 608,593,724 | |
Undistributed net investment income | | | | | | 543,818 | |
Accumulated net realized gain on investments, options, futures and swaps | | | | | | 4,575,038 | |
Net unrealized depreciation on investments, options, futures and swaps | | | | | | (87,821,088 | ) |
| | | | | | | |
| | |
Net Assets | | | | | $ | 525,891,492 | |
| | | | | | | |
| | |
Net Asset Value Per Share: | | | | | | | |
Institutional Class (51,063,763 shares outstanding) | | | | | | $9.32 | |
Institutional Select Class (5,390,108 shares outstanding) | | | | | | $9.31 | |
| | | | | | | | |
See notes to financial statements.
102
Annual Report to Shareholders
Statement of Operations
Western Asset Intermediate Bond Portfolio
| | | | | | | | | | | | | | | | |
| | | FOR THE
PERIOD ENDED
DECEMBER 31, 2008A | | | FOR THE
YEAR ENDED
MARCH 31, 2008 | |
Investment Income: | | | | | | | | | | | | | | | | |
Interest | | $ | 23,814,247 | | | | | | | $ | 37,979,550 | | | | | |
Dividends | | | 120,299 | | | | | | | | — | | | | | |
Income from securities loaned | | | 721,753 | | | | | | | | 494,752 | | | | | |
| | | | | | | | | | | | | | | | |
Total income | | | | | | $ | 24,656,299 | | | | | | | $ | 38,474,302 | |
Expenses: | | | | | | | | | | | | | | | | |
Management fees | | | 1,961,709 | | | | | | | | 2,835,468 | | | | | |
Audit and legal fees | | | 85,919 | | | | | | | | 91,840 | | | | | |
Custodian fees | | | 62,101 | | | | | | | | 89,963 | | | | | |
Directors’ fees and expenses | | | 16,300 | | | | | | | | 19,256 | | | | | |
Registration fees | | | 43,424 | | | | | | | | 34,618 | | | | | |
Reports to shareholders: | | | | | | | | | | | | | | | | |
Institutional Class | | | 14,714 | | | | | | | | 2,405 | | | | | |
Institutional Select Class | | | 1,553 | | | | | | | | N/A | | | | | |
Transfer agent and shareholder servicing expense: | | | | | | | | | | | | | | | | |
Institutional Class | | | 33,507 | | | | | | | | 34,592 | | | | | |
Institutional Select Class | | | 132 | | | | | | | | N/A | | | | | |
Fees recaptured | | | — | | | | | | | | 28,475 | | | | | |
Other expenses | | | 28,383 | | | | | | | | 54,914 | | | | | |
| | | | | | | | | | | | | | | | |
| | | 2,247,742 | | | | | | | | 3,191,531 | | | | | |
Less: Fees waived | | | (1,131 | ) | | | | | | | — | | | | | |
Compensating balance credits | | | (148 | ) | | | | | | | (1,630 | ) | | | | |
| | | | | | | | | | | | | | | | |
Net expenses | | | | | | | 2,246,463 | | | | | | | | 3,189,901 | |
| | | | | | | | | | | | | | | | |
Net Investment Income | | | | | | | 22,409,836 | | | | | | | | 35,284,401 | |
Net Realized and Unrealized Gain/(Loss) on Investments: | | | | | | | | | | | | | | | | |
Net realized gain/(loss) on: | | | | | | | | | | | | | | | | |
Investments | | | 2,624,691 | | | | | | | | 2,718,068 | | | | | |
Options | | | 2,052,451 | | | | | | | | 1,242,323 | | | | | |
Futures | | | 7,414,558 | | | | | | | | 7,693,513 | | | | | |
Swaps | | | (2,062,371 | ) | | | | | | | 71,775 | | | | | |
| | | | | | | | | | | | | | | | |
| | | | | | | 10,029,329 | | | | | | | | 11,725,679 | |
Change in unrealized appreciation/(depreciation) of investments, options, futures and swaps | | | | | | | (67,968,240 | ) | | | | | | | (19,855,767 | ) |
| | | | | | | | | | | | | | | | |
Net Realized and Unrealized Loss on Investments | | | | | | | (57,938,911 | ) | | | | | | | (8,130,088 | ) |
| | | | | | | | | | | | | | | | | |
Change in Net Assets Resulting From Operations | | | | | | $ | (35,529,075 | ) | | | | | | $ | 27,154,313 | |
| | | | | | | | | | | | | | | | | |
A | | For the period April 1, 2008 to December 31, 2008. |
See notes to financial statements.
103
Annual Report to Shareholders
Statement of Changes in Net Assets
Western Asset Intermediate Bond Portfolio
| | | | | | | | | | | | |
| | | FOR THE
PERIOD ENDED
DECEMBER 31, 2008A | | | FOR THE
YEARS ENDED MARCH 31, | |
| | | | 2008 | | | 2007 | |
| Change in Net Assets: | | | | | | | | | |
Net investment income | | $ | 22,409,836 | | | $ | 35,284,401 | | | $ | 30,716,282 | |
| | | |
Net realized gain/(loss) | | | 10,029,329 | | | | 11,725,679 | | | | (1,664,912 | ) |
| | | |
Change in unrealized appreciation/(depreciation) | | | (67,968,240 | ) | | | (19,855,767 | ) | | | 15,152,515 | |
| | | | | | | | | | | | |
Change in net assets resulting from operations | | | (35,529,075 | ) | | | 27,154,313 | | | | 44,203,885 | |
| | | |
Distributions to shareholders from: | | | | | | | | | | | | |
Net investment income: | | | | | | | | | | | | |
Institutional Class | | | (23,850,535 | ) | | | (35,155,441 | ) | | | (30,869,536 | ) |
Institutional Select Class | | | (511,463 | ) | | | N/A | | | | N/A | |
| | | |
Net realized gain on investments: | | | | | | | | | | | | |
Institutional Class | | | (9,280,041 | ) | | | — | | | | — | |
| | | |
Change in net assets from fund share transactions: | | | | | | | | | | | | |
Institutional Class | | | (160,875,180 | ) | | | 75,139,298 | | | | (113,092,171 | ) |
Institutional Select Class | | | 49,065,033 | | | | N/A | | | | N/A | |
| | | | | | | | | | | | |
Change in net assets | | | (180,981,261 | ) | | | 67,138,170 | | | | (99,757,822 | ) |
| | | |
Net Assets: | | | | | | | | | | | | |
Beginning of period | | | 706,872,753 | | | | 639,734,583 | | | | 739,492,405 | |
| | | | | | | | | | | | |
| | | |
End of period | | $ | 525,891,492 | | | $ | 706,872,753 | | | $ | 639,734,583 | |
| | | | | | | | | | | | |
| | | |
Undistributed net investment income | | $ | 543,818 | | | $ | 1,507,535 | | | $ | 409,387 | |
| | | | | | | | | | | | |
| | | | | | | | | | | | | |
A | | For the period April 1, 2008 to December 31, 2008. |
See notes to financial statements.
104
Annual Report to Shareholders
Financial Highlights
Western Asset Intermediate Bond Portfolio
For a share of each class of capital stock outstanding:
Institutional Class:
| | | | | | | | | | | | | | | | | | | | | | | | |
| | | PERIOD
ENDED
DECEMBER 31,
2008A | | | YEARS ENDED MARCH 31, | |
| | | | 2008 | | | 2007 | | | 2006 | | | 2005 | | | 2004 | |
Net asset value, beginning of period | | $ | 10.30 | | | $ | 10.43 | | | $ | 10.21 | | | $ | 10.51 | | | $ | 11.01 | | | $ | 10.92 | |
| | | | | | | | | | | | | | | | | | | | | | | | |
Investment operations: | | | | | | | | | | | | | | | | | | | | | | | | |
Net investment income | | | .34 | B | | | .52 | B | | | .49 | B | | | .44 | C | | | .38 | C | | | .44 | C |
Net realized and unrealized gain/(loss) | | | (.82 | ) | | | (.14 | ) | | | .22 | | | | (.20 | ) | | | (.22 | ) | | | .36 | |
| | | | | | | | | | | | | | | | | | | | | | | | |
Total from investment operations | | | (.48 | ) | | | .38 | | | | .71 | | | | .24 | | | | .16 | | | | .80 | |
| | | | | | | | | | | | | | | | | | | | | | | | |
Distributions from: | | | | | | | | | | | | | | | | | | | | | | | | |
Net investment income | | | (.37 | ) | | | (.51 | ) | | | (.49 | ) | | | (.44 | ) | | | (.38 | ) | | | (.44 | ) |
Net realized gain on investments | | | (.13 | ) | | | — | | | | — | | | | (.10 | ) | | | (.28 | ) | | | (.27 | ) |
| | | | | | | | | | | | | | | | | | | | | | | | |
Total distributions | | | (.50 | ) | | | (.51 | ) | | | (.49 | ) | | | (.54 | ) | | | (.66 | ) | | | (.71 | ) |
| | | | | | | | | | | | | | | | | | | | | | | | |
Net asset value, end of period | | $ | 9.32 | | | $ | 10.30 | | | $ | 10.43 | | | $ | 10.21 | | | $ | 10.51 | | | $ | 11.01 | |
| | | | | | | | | | | | | | | | | | | | | | | | |
Total return | | | (4.72 | )%D | | | 3.77 | % | | | 7.17 | % | | | 2.37 | % | | | 1.66 | % | | | 7.58 | % |
| | | | | | |
Ratios to Average Net Assets:E | | | | | | | | | | | | | | | | | | | | | | | | |
Total expenses | | | .46 | %F | | | .45 | % | | | .46 | % | | | .47 | % | | | .46 | % | | | .47 | % |
Expenses net of waivers, if any | | | .46 | %F | | | .45 | % | | | .45 | % | | | .45 | % | | | .45 | % | | | .45 | % |
Expenses net of all reductions | | | .46 | %F | | | .45 | % | | | .45 | % | | | .45 | % | | | .45 | % | | | .45 | % |
Net investment income | | | 4.6 | %F | | | 5.0 | % | | | 4.8 | % | | | 4.3 | % | | | 3.6 | % | | | 4.0 | % |
| | | | | | |
Supplemental Data: | | | | | | | | | | | | | | | | | | | | | | | | |
Portfolio turnover rate | | | 164.7 | %D | | | 239.0 | % | | | 244.1 | % | | | 266.1 | % | | | 215.7 | % | | | 255.1 | % |
Net assets, end of period (in thousands) | | $ | 475,695 | | | $ | 706,873 | | | $ | 639,735 | | | $ | 739,492 | | | $ | 660,480 | | | $ | 587,229 | |
| | | | | | | | | | | | | | | | | | | | | | | | | |
A | | For the period April 1, 2008 to December 31, 2008. |
B | | Computed using average daily shares outstanding. |
C | | Computed using SEC method. |
E | | Total expenses reflects operating expenses prior to any contractual expense waivers and/or compensating balance credits. Expenses net of waivers reflects total expenses before compensating balance credits but net of any contractual expense waivers. Expenses net of all reductions reflects expenses less any compensating balance credits and/or contractual expense waivers. As of the most current prospectus, the Institutional Class has no limit on expenses. |
See notes to financial statements.
105
Annual Report to Shareholders
Financial Highlights—Continued
Western Asset Intermediate Bond Portfolio
For a share of each class of capital stock outstanding:
Institutional Select Class:
| | | | |
| | | PERIOD
ENDED
DECEMBER 31,
2008G | |
Net asset value, beginning of period | | $ | 9.49 | |
| | | | |
Investment operations: | | | | |
Net investment income | | | .09 | B |
Net realized and unrealized loss | | | (.13 | ) |
| | | | |
Total from investment operations | | | (.04 | ) |
| | | | |
Distributions from: | | | | |
Net investment income | | | (.14 | ) |
| | | | |
Total distributions | | | (.14 | ) |
| | | | |
Net asset value, end of period | | $ | 9.31 | |
| | | | |
Total return | | | (.41 | )%D |
| |
Ratios to Average Net Assets:E | | | | |
Total expenses | | | .46 | %F |
Expenses net of waivers, if any | | | .45 | %F |
Expenses net of all reductions | | | .45 | %F |
Net investment income | | | 4.5 | %F |
| |
Supplemental Data: | | | | |
Portfolio turnover rate | | | 164.7 | %D |
Net assets, end of period (in thousands) | | $ | 50,196 | |
| | | | | |
G | | For the period October 3, 2008 (commencement of operations) to December 31, 2008. |
See notes to financial statements.
106
Annual Report to Shareholders
Management’s Discussion of Fund Performance
Western Asset Intermediate Plus Bond Portfolio
Total returns for the Fund for various periods ended December 31, 2008 are presented below, along with those of comparative indices:
| | | | | | | | | | |
| | | | | | | Average Annual Total Returns |
| | | Three
Months | | Nine
Months | | One
Year | | Three
Years | | Since
InceptionA |
Western Asset Intermediate Plus Bond Portfolio: | | | | | | | | | | |
Institutional Class | | +0.10% | | -5.37% | | -5.59% | | +1.16% | | +1.76% |
Institutional Select Class | | N/A | | N/A | | N/A | | N/A | | +4.32% |
Barclays Capital Intermediate U.S. Government/Credit IndexB | | +4.84% | | +2.02% | | +5.08% | | +5.51% | | +3.90% |
Lipper Short-Intermediate Investment Grade Debt Funds Category AverageC | | -0.33% | | -3.50% | | -2.82% | | +1.84% | | +1.51% |
The performance data quoted represent past performance and do not guarantee future results. Current performance may be lower or higher than the performance data quoted. To obtain the most recent month-end performance information, please visit www.westernassetfunds.com. The investment return and principal value of the Fund will fluctuate so that an investor’s shares, when redeemed, may be worth more or less than the original cost. Calculations assume reinvestment of dividends and capital gain distributions. Performance would have been lower if fees had not been waived in various periods. Performance figures for periods shorter than one year represent cumulative figures and are not annualized.
The gross expense ratio for both the Institutional and Institutional Select Classes was 0.58% and does not reflect fee waivers or reimbursements. The net expense ratio for both the Institutional and Institutional Select Classes was 0.45% and reflects fee waivers and/or reimbursements. As a result of a contractual expense limitation, total annual operating expenses for the Institutional Class will be waived or reimbursed at a rate of 0.13% of the Fund’s average daily net assets attributable to the Institutional Class until July 31, 2009. As a result of a contractual expense limitation, the ratio of expenses, other than taxes, interest, deferred organizational expenses, brokerage and extraordinary expenses, to average net assets will not exceed 0.45% for the Institutional Select Class until July 31, 2009.
All expenses shown include management fees and other expenses as indicated in the Fund’s most current prospectus dated August 1, 2008.
For the period from April 1, 2008 through December 31, 2008, Institutional Class shares of Western Asset Intermediate Plus Bond Portfolio returned -5.37%. The Fund’s unmanaged benchmark, the Barclays Capital Intermediate U.S. Government/Credit Index, returned 2.02% over the same time frame. The Lipper Short-Intermediate Investment Grade Debt Funds Category Average returned -3.50% for the same period.
A | | The inception date of the Institutional Class is April 1, 2004. The inception date of the Institutional Select Class is November 10, 2008. Index returns are for periods beginning March 31, 2004. Although it is not possible to invest directly in an index, it is possible to purchase investment vehicles designed to track the performance of certain indices. |
B | | The Barclays Capital (formerly Lehman Brothers) Intermediate U.S. Government/Credit Index is a market value weighted performance benchmark for government and corporate fixed-rate debt issues (rated Baa/BBB or higher) with maturities between one and ten years. |
C | | Lipper, Inc., a wholly-owned subsidiary of Reuters, provides independent insight on global collective investments. The Lipper Short-Intermediate Investment Grade Debt Funds Category Average is comprised of the Fund’s peer group of mutual funds. |
107
Annual Report to Shareholders
Management’s Discussion of Fund Performance—Continued
The impact of market conditions on the Fund’s performance was negative for the period ended December 31, 2008, with strategies also producing negative results. An emphasis on lower-quality credits and select Financials issues was a large detractor from performance as spreads soared in the wake of the subprime lending crisis, deteriorating liquidity conditions and slowing economic growth. Spreads narrowed in April and May, but these gains were given back later in the period on deteriorating investor sentiment and poor earnings. A large exposure to the mortgage-backed sector detracted from returns as volatility remained high and negative housing news continued to damage market sentiment. We had diversified into a number of non-agency issues that were particularly impacted and further detracted from performance due to a lack of liquidity and uncertainty in that marketplace. During the period, a flight to safety occurred in both the U.S. and abroad. However, international treasuries did not do as well as U.S. Treasuries on a currency hedged basis; hence, relative to the benchmark, the Fund’s modest exposure to international treasuries had a negative impact on results. A modest U.S. Treasury Inflation-Protected Securities (“TIPS”)D exposure also had a negative impact as oil plunged to $40/barrel and inflation fears switched to deflation fears. A tactically-driven durationE posture contributed modestly to returns as bond yields rallied over the period. The portfolio’s yield curveF positioning detracted from performance as the spread between the two- and ten-year yields widened.
Western Asset Management Company
January 20, 2009
Investment Risks: Bonds are subject to a variety of risks, including interest rate, credit and inflation risk. As interest rates rise, bond prices fall, reducing the value of the Fund’s share price. Foreign securities are subject to certain risks of overseas investing, including currency fluctuations and changes in political and economic conditions. These risks are magnified in emerging markets. The Fund may invest in high-yield bonds, which are rated below investment grade and carry more risk than higher-rated securities. Mortgage-backed securities involve more risk, including prepayment and extension risks, than other investments in fixed-income securities. The Fund may use derivatives, such as options and futures, which can be illiquid, may disproportionately increase losses, and have a potentially large impact on Fund performance.
D | | U.S. Treasury Inflation-Protected Securities (“TIPS”) are inflation-indexed securities issued by the U.S. Treasury in 5-year, 10-year and 20-year maturities. The principal is adjusted to the Consumer Price Index, the commonly used measure of inflation. The coupon rate is constant, but generates a different amount of interest when multiplied by the inflation-adjusted principal. |
E | | Duration is the measure of the price sensitivity of a fixed-income security to an interest rate change of 100 basis points. Calculation is based on the weighted average of the present values for all cash flows. |
F | | The yield curve is the graphical depiction of the relationship between the yield on bonds of the same credit quality but different maturities. |
N/A—Not applicable.
108
Annual Report to Shareholders
Expense Example
Western Asset Intermediate Plus Bond Portfolio
As a shareholder of the Fund, you incur ongoing costs, including management fees, and other Fund expenses. These examples are intended to help you understand your ongoing costs (in dollars) of investing in the Fund and to compare these costs with the ongoing costs of investing in other mutual funds.
Actual Expenses
The first line in the table below provides information about actual account values and actual expenses for the Fund. You may use the information in this line, together with the amount you invested, to estimate the expenses that you paid over the period. Simply divide your account value by $1,000 (for example, an $8,600 account value divided by $1,000 = 8.6), then multiply the result by the number in the first line under the heading entitled “Expenses Paid During the Period” to estimate the expenses you paid on your account if your shares were held through the entire period. For the Institutional Class, the example is based on an investment of $1,000 invested on July 1, 2008 and held through December 31, 2008; for Institutional Select Class, the example is based on an investment of $1,000 invested on November 10, 2008 (commencement of operations) and held through December 31, 2008.
Hypothetical Example for Comparison Purposes
The second line in the table below provides information about hypothetical account values and hypothetical expenses based on the Fund’s actual expense ratio and an assumed rate of return of 5% per year before expenses, which is not the Fund’s actual return. The hypothetical account values and expenses may not be used to estimate the actual ending account balance or expenses you paid for the period. You may use this information to compare the ongoing costs of investing in the Fund and other funds. To do so, compare this 5% hypothetical example with the 5% hypothetical examples that appear in the shareholder reports of other funds. Because each example is intended to be comparable to the examples provided by other funds, it is based on a hypothetical investment of $1,000 invested on July 1, 2008 and held through December 31, 2008 for each class, even though the Institutional Select Class did not begin operations until November 10, 2008.
| | | | | | | | | | | |
| | | Beginning
Account Value
7/1/08 | | | Ending
Account Value
12/31/08 | | Expenses PaidA
During the Period
7/1/08 to 12/31/08 | |
Institutional Class: | | | | | | | | | | | |
Actual | | $ | 1,000.00 | | | $ | 953.90 | | $ | 2.41 | |
Hypothetical (5% return before expenses) | | | 1,000.00 | | | | 1,022.74 | | | 2.50 | |
Institutional Select Class: | | | | | | | | | | | |
Actual | | $ | 1,000.00 | B | | $ | 1,043.20 | | $ | 0.65 | C |
Hypothetical (5% return before expenses) | | | 1,000.00 | | | | 1,022.94 | | | 2.29 | |
A | | These calculations are based on expenses incurred from July 1, 2008 to December 31, 2008. The dollar amounts shown as “Expenses Paid” are equal to the annualized expense ratio of 0.49% multiplied by the average value over the period, multiplied by the number of days in the most recent fiscal half-year (184), and divided by 365. |
B | | Beginning account value is as of November 10, 2008. |
C | | This calculation is based on expenses incurred from November 10, 2008 (commencement of operations) to December 31, 2008. The dollar amount shown as “Expenses Paid” is equal to the annualized expense ratio of 0.45% for the Institutional Select Class, multiplied by the number of days in the period (52) and divided by 365. |
109
Annual Report to Shareholders
Performance Information
Western Asset Intermediate Plus Bond Portfolio
The graph compares the Fund’s total returns to that of an appropriate broad-based securities market index. The line illustrates the cumulative total return of an initial $1,000,000 investment for the periods indicated. The line for the Fund represents the total return after deducting all Fund investment management and other administrative expenses and the transaction costs of buying and selling securities. The line representing the securities market index does not include any transaction costs associated with buying and selling securities in the index or other investment management or administrative expenses.
Due to the limited operating history of the Institutional Select Class, a performance graph is not presented. Institutional Select Class shares, which began operations on November 10, 2008, had a total return of 4.32% for the period ended December 31, 2008.
Total return measures investment performance in terms of appreciation or depreciation in the Fund’s net asset value per share, plus dividends and any capital gain distributions. It assumes that dividends and distributions were reinvested at the time they were paid. Returns (and the graph and table found below) do not reflect the deduction of taxes that a shareholder would pay on Fund distributions or the redemption of Fund shares. Average annual returns tend to smooth out variations in a fund’s return, so that they differ from actual year-to-year results.
Bonds are subject to a variety of risks, including interest rate, credit, and inflation risk. Non-U.S. investments are subject to currency fluctuations, social, economic and political risk.
Growth of a $1,000,000 Investment—Institutional Class
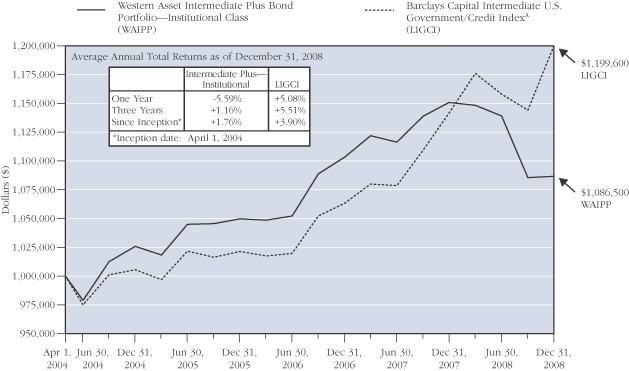
The performance data quoted represent past performance and do not guarantee future results. The performance stated may have been due to extraordinary market conditions, which may not be duplicated in the future. Current performance may be lower or higher than the performance data quoted. To obtain the most recent month-end performance information, please visit www.westernassetfunds.com. The investment return and principal value of the Fund will fluctuate so that an investor’s shares, when redeemed, may be worth more or less than the original cost. Calculations assume reinvestment of dividends and capital gain distributions. Performance would have been lower if fees had not been waived in various periods.
A | | Index returns are for periods beginning March 31, 2004. Formerly: Lehman Brothers Intermediate Government/Credit Bond Index. The name change is a result of Barclays’ purchase of Lehman Brothers in September 2008. |
110
Annual Report to Shareholders
Portfolio Composition (as of December 31, 2008)B
Standard & Poor’s Debt RatingsC (as a percentage of the portfolio)
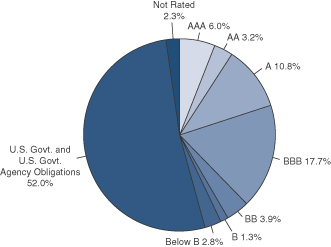
Maturity Schedule (as a percentage of the portfolio)
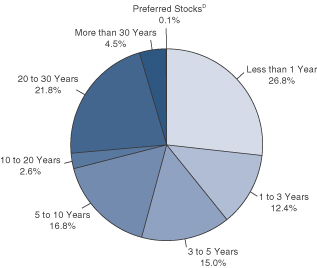
B | | The pie charts above represent the composition of the Fund’s Portfolio as of December 31, 2008 and do not include derivatives such as Futures Contracts, Options Written, and Swaps. The Fund is actively managed. As a result, the composition of the portfolio holdings and sectors are subject to change at any time. |
C | | Standard & Poor’s Rating Service provides capital markets with credit ratings for the evaluation and assessment of credit risk. These ratings are the opinions of S&P and not absolute measures of quality or guarantees of performance. |
D | | Preferred stocks do not have defined maturity dates. |
111
Annual Report to Shareholders
Spread Duration
Western Asset Intermediate Plus Bond Portfolio
December 31, 2008
Economic Exposure
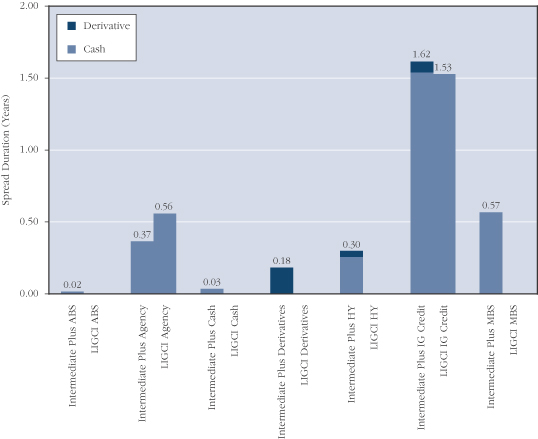
Spread duration is defined as the change in value for a 100 basis point change in the spread relative to Treasuries. The spread over Treasuries is the annual risk-premium demanded by investors to hold non-Treasury securities. This chart highlights the market sector exposure of the Fund’s portfolio and the exposure relative to the selected benchmark as of the end of the reporting period.
ABS—Asset Backed Security
LIGCI—Barclays Capital Intermediate U.S. Government/Credit Index
HY—High Yield
IG Credit—Investment Grade Credit
MBS—Mortgage Backed Securities
112
Annual Report to Shareholders
Effective Duration
Western Asset Intermediate Plus Bond Portfolio
December 31, 2008
Interest Rate Exposure
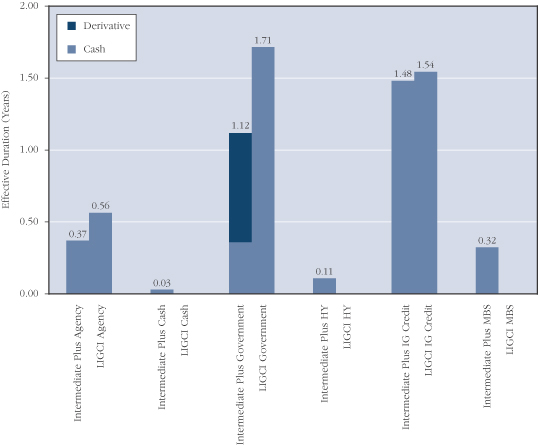
Effective duration is defined as the change in value for a 100 basis point change in Treasury yields. This chart highlights the interest rate exposure of the Fund’s portfolio relative to the selected benchmark as of the end of the reporting period.
LIGCI—Barclays Capital Intermediate U.S. Government/Credit Index
HY—High Yield
IG Credit—Investment Grade Credit
MBS—Mortgage Backed Securities
113
Annual Report to Shareholders
Portfolio of Investments
Western Asset Intermediate Plus Bond Portfolio
December 31, 2008
| | | | | | | | | | | | | | |
| | | % OF
NET ASSETS | | RATE | | MATURITY
DATE | | PAR/
SHARES† | | | VALUE | |
| | | | | | | | | | | | | | |
Long-Term Securities | | 85.1% | | | | | | | | | | | | |
| | | | | |
Corporate Bonds and Notes | | 37.4% | | | | | | | | | | | | |
| | | | | |
Airlines | | 0.2% | | | | | | | | | | | | |
Delta Air Lines Inc. | | | | 7.570% | | 11/18/10 | | $ | 200,000 | | | $ | 168,000 | |
| | | | | | | | | | | | | | |
| | | | | |
Automobiles | | 0.5% | | | | | | | | | | | | |
DaimlerChrysler NA Holding Corp. | | | | 6.500% | | 11/15/13 | | | 380,000 | | | | 296,405 | |
Ford Motor Co. | | | | 7.450% | | 7/16/31 | | | 110,000 | | | | 30,800 | |
General Motors Corp. | | | | 8.375% | | 7/5/33 | | | 50,000 | EUR | | | 11,120 | |
General Motors Corp. | | | | 8.375% | | 7/15/33 | | | 120,000 | | | | 21,000 | |
| | | | | | | | | | | | | | |
| | | | | | | | | | | | | 359,325 | |
| | | | | | | | | | | | | | |
Beverages | | 0.3% | | | | | | | | | | | | |
Bottling Group LLC | | | | 6.950% | | 3/15/14 | | | 190,000 | | | | 206,303 | |
| | | | | | | | | | | | | | |
| | | | | |
Capital Markets | | 2.3% | | | | | | | | | | | | |
Goldman Sachs Capital II | | | | 5.793% | | 12/29/49 | | | 1,320,000 | | | | 507,438 | A |
Lehman Brothers Holdings Capital Trust VII | | | | 5.857% | | 12/31/49 | | | 920,000 | | | | 92 | A,B,N |
Lehman Brothers Holdings Capital Trust VIII | | | | 3.915% | | 5/29/49 | | | 20,000 | | | | 2 | B,C,N |
Lehman Brothers Holdings Inc. | | | | 4.500% | | 7/26/10 | | | 140,000 | | | | 13,300 | B,N |
Merrill Lynch and Co. Inc. | | | | 5.700% | | 5/2/17 | | | 420,000 | | | | 372,102 | |
Merrill Lynch and Co. Inc. | | | | 6.875% | | 4/25/18 | | | 220,000 | | | | 230,126 | |
Morgan Stanley | | | | 5.550% | | 4/27/17 | | | 310,000 | | | | 255,993 | |
The Bear Stearns Cos. Inc. | | | | 7.250% | | 2/1/18 | | | 330,000 | | | | 361,632 | |
| | | | | | | | | | | | | | |
| | | | | | | | | | | | | 1,740,685 | |
| | | | | | | | | | | | | | |
Chemicals | | 0.1% | | | | | | | | | | | | |
The Dow Chemical Co. | | | | 5.700% | | 5/15/18 | | | 70,000 | | | | 62,189 | |
| | | | | | | | | | | | | | |
| | | | | |
Commercial Banks | | 2.6% | | | | | | | | | | | | |
Comerica Capital Trust II | | | | 6.576% | | 2/20/37 | | | 130,000 | | | | 52,189 | A |
KeyBank NA | | | | 3.200% | | 6/15/12 | | | 300,000 | | | | 311,689 | |
SunTrust Capital VIII | | | | 6.100% | | 12/15/36 | | | 80,000 | | | | 56,321 | A |
Wachovia Capital Trust III | | | | 5.800% | | 8/29/49 | | | 1,350,000 | | | | 796,500 | A |
Wells Fargo and Co. | | | | 5.250% | | 10/23/12 | | | 270,000 | | | | 275,004 | |
Wells Fargo Capital X | | | | 5.950% | | 12/15/36 | | | 640,000 | | | | 548,511 | |
| | | | | | | | | | | | | | |
| | | | | | | | | | | | | 2,040,214 | |
| | | | | | | | | | | | | | |
Commercial Services and Supplies | | 0.6% | | | | | | | | | | | | |
Waste Management Inc. | | | | 7.375% | | 8/1/10 | | | 460,000 | | | | 466,158 | |
| | | | | | | | | | | | | | |
114
Annual Report to Shareholders
| | | | | | | | | | | | | |
| | | % OF
NET ASSETS | | RATE | | MATURITY
DATE | | PAR/
SHARES† | | VALUE | |
| | | | | | | | | | | | | |
Corporate Bonds and Notes—Continued | | | | | | | | | | | | | |
| | | | | |
Consumer Finance | | 5.2% | | | | | | | | | | | |
American Express Co. | | | | 6.800% | | 9/1/66 | | $ | 710,000 | | $ | 367,532 | A |
Ford Motor Credit Co. | | | | 9.203% | | 4/15/09 | | | 1,200,000 | | | 1,158,000 | C |
Ford Motor Credit Co. | | | | 7.569% | | 1/13/12 | | | 1,160,000 | | | 754,000 | C |
GMAC LLC | | | | 6.875% | | 9/15/11 | | | 443,247 | | | 363,135 | D |
GMAC LLC | | | | 6.000% | | 12/15/11 | | | 747,000 | | | 604,278 | D |
GMAC LLC | | | | 7.500% | | 12/31/13 | | | 108,000 | | | 78,840 | D |
GMAC LLC | | | | 6.750% | | 12/1/14 | | | 24,000 | | | 16,488 | D |
GMAC LLC | | | | 8.000% | | 12/31/18 | | | 90,000 | | | 45,000 | D |
John Deere Capital Corp. | | | | 5.100% | | 1/15/13 | | | 100,000 | | | 98,386 | |
Nelnet Inc. | | | | 7.400% | | 9/29/36 | | | 250,000 | | | 74,961 | A |
SLM Corp. | | | | 3.835% | | 1/27/14 | | | 700,000 | | | 472,406 | C |
| | | | | | | | | | | | | |
| | | | | | | | | | | | 4,033,026 | |
| | | | | | | | | | | | | |
Diversified Financial Services | | 5.8% | | | | | | | | | | | |
AGFC Capital Trust I | | | | 6.000% | | 1/15/67 | | | 520,000 | | | 124,200 | A,D |
BAC Capital Trust XIII | | | | 2.396% | | 3/15/43 | | | 120,000 | | | 37,311 | C |
BAC Capital Trust XIV | | | | 5.630% | | 12/31/49 | | | 10,000 | | | 4,007 | A |
Bank of America Corp. | | | | 3.125% | | 6/15/12 | | | 480,000 | | | 498,807 | |
Bank of America Corp. | | | | 8.000% | | 12/29/49 | | | 300,000 | | | 215,786 | A |
Beaver Valley II Funding | | | | 9.000% | | 6/1/17 | | | 203,000 | | | 190,310 | |
Capmark Financial Group Inc. | | | | 5.875% | | 5/10/12 | | | 350,000 | | | 119,347 | E |
General Electric Capital Corp. | | | | 3.000% | | 12/9/11 | | | 470,000 | | | 485,910 | |
General Electric Capital Corp. | | | | 6.375% | | 11/15/67 | | | 380,000 | | | 238,856 | A |
Glen Meadow Pass-Through Certificates | | | | 6.505% | | 2/12/67 | | | 450,000 | | | 201,192 | A,D |
ILFC E-Capital Trust I | | | | 5.900% | | 12/21/65 | | | 170,000 | | | 54,487 | A,D |
JPMorgan Chase and Co. | | | | 2.125% | | 6/22/12 | | | 1,370,000 | | | 1,375,706 | |
JPMorgan Chase Capital XXII | | | | 6.450% | | 2/2/37 | | | 380,000 | | | 311,407 | A |
The Williams Cos. Inc. Credit Linked Certificate Trust | | | | 6.750% | | 4/15/09 | | | 170,000 | | | 168,513 | D |
The Williams Cos. Inc. Credit Linked Certificate Trust | | | | 6.443% | | 5/1/09 | | | 255,000 | | | 254,274 | C,D |
TNK-BP Finance SA | | | | 7.500% | | 3/13/13 | | | 100,000 | | | 62,000 | D |
ZFS Finance USA Trust II | | | | 6.450% | | 12/15/65 | | | 240,000 | | | 112,092 | A,D |
| | | | | | | | | | | | | |
| | | | | | | | | | | | 4,454,205 | |
| | | | | | | | | | | | | |
Diversified Telecommunication Services | | 0.7% | | | | | | | | | | | |
Citizens Communications Co. | | | | 7.875% | | 1/15/27 | | | 40,000 | | | 23,200 | |
Embarq Corp. | | | | 6.738% | | 6/1/13 | | | 110,000 | | | 92,950 | |
Embarq Corp. | | | | 7.082% | | 6/1/16 | | | 250,000 | | | 192,500 | |
Qwest Communications International Inc. | | | | 5.649% | | 2/15/09 | | | 67,000 | | | 66,665 | C |
115
Annual Report to Shareholders
Portfolio of Investments—Continued
Western Asset Intermediate Plus Bond Portfolio—Continued
| | | | | | | | | | | | | |
| | | % OF
NET ASSETS | | RATE | | MATURITY
DATE | | PAR/
SHARES† | | VALUE | |
| | | | | | | | | | | | | |
Corporate Bonds and Notes—Continued | | | | | | | | | | | | | |
| | | | | |
Diversified Telecommunication Services—Continued | | | | | | | | | | | | | |
Qwest Communications International Inc. | | | | 7.500% | | 2/15/14 | | $ | 90,000 | | $ | 64,350 | |
Qwest Corp. | | | | 5.246% | | 6/15/13 | | | 70,000 | | | 52,150 | C |
Windstream Corp. | | | | 8.625% | | 8/1/16 | | | 30,000 | | | 26,550 | |
| | | | | | | | | | | | | |
| | | | | | | | | | | | 518,365 | |
| | | | | | | | | | | | | |
Electric Utilities | | 1.2% | | | | | | | | | | | |
Duke Energy Corp. | | | | 6.250% | | 1/15/12 | | | 200,000 | | | 207,235 | |
Duke Energy Corp. | | | | 5.625% | | 11/30/12 | | | 160,000 | | | 162,945 | |
Energy Future Holdings Corp. | | | | 11.250% | | 11/1/17 | | | 250,000 | | | 121,250 | D,G |
Exelon Corp. | | | | 6.750% | | 5/1/11 | | | 300,000 | | | 292,790 | |
IPALCO Enterprises Inc. | | | | 7.250% | | 4/1/16 | | | 190,000 | | | 155,800 | D |
| | | | | | | | | | | | | |
| | | | | | | | | | | | 940,020 | |
| | | | | | | | | | | | | |
Energy Equipment and Services | | 0.1% | | | | | | | | | | | |
Key Energy Services Inc. | | | | 8.375% | | 12/1/14 | | | 70,000 | | | 46,200 | |
| | | | | | | | | | | | | |
| | | | | |
Food and Staples Retailing | | 0.8% | | | | | | | | | | | |
Safeway Inc. | | | | 6.500% | | 3/1/11 | | | 220,000 | | | 220,648 | |
Wal-Mart Stores Inc. | | | | 4.250% | | 4/15/13 | | | 370,000 | | | 380,833 | |
| | | | | | | | | | | | | |
| | | | | | | | | | | | 601,481 | |
| | | | | | | | | | | | | |
Health Care Equipment and Supplies | | 0.2% | | | | | | | | | | | |
Hospira Inc. | | | | 5.550% | | 3/30/12 | | | 200,000 | | | 189,494 | |
| | | | | | | | | | | | | |
| | | | | |
Health Care Providers and Services | | 1.8% | | | | | | | | | | | |
DaVita Inc. | | | | 7.250% | | 3/15/15 | | | 30,000 | | | 28,500 | |
HCA Inc. | | | | 8.750% | | 9/1/10 | | | 50,000 | | | 48,000 | |
HCA Inc. | | | | 6.250% | | 2/15/13 | | | 30,000 | | | 18,750 | |
HCA Inc. | | | | 6.750% | | 7/15/13 | | | 70,000 | | | 44,100 | |
HCA Inc. | | | | 9.125% | | 11/15/14 | | | 10,000 | | | 9,275 | |
HCA Inc. | | | | 9.250% | | 11/15/16 | | | 90,000 | | | 82,575 | |
HCA Inc. | | | | 9.625% | | 11/15/16 | | | 60,000 | | | 46,800 | G |
Quest Diagnostics Inc. | | | | 7.500% | | 7/12/11 | | | 320,000 | | | 345,429 | |
Tenet Healthcare Corp. | | | | 9.875% | | 7/1/14 | | | 170,000 | | | 136,850 | |
UnitedHealth Group Inc. | | | | 6.000% | | 11/15/17 | | | 440,000 | | | 393,331 | |
Universal Health Services Inc. | | | | 6.750% | | 11/15/11 | | | 240,000 | | | 231,588 | |
WellPoint Inc. | | | | 5.875% | | 6/15/17 | | | 10,000 | | | 9,102 | |
| | | | | | | | | | | | | |
| | | | | | | | | | | | 1,394,300 | |
| | | | | | | | | | | | | |
116
Annual Report to Shareholders
| | | | | | | | | | | | | |
| | | % OF
NET ASSETS | | RATE | | MATURITY
DATE | | PAR/
SHARES† | | VALUE | |
| | | | | | | | | | | | | |
Corporate Bonds and Notes—Continued | | | | | | | | | | | | | |
| | | | | |
Independent Power Producers and Energy Traders | | 0.8% | | | | | | | | | | | |
Dynegy Holdings Inc. | | | | 7.750% | | 6/1/19 | | $ | 70,000 | | $ | 48,300 | |
Edison Mission Energy | | | | 7.625% | | 5/15/27 | | | 70,000 | | | 54,250 | |
Mirant Mid Atlantic LLC | | | | 9.125% | | 6/30/17 | | | 89,453 | | | 80,508 | |
NRG Energy Inc. | | | | 7.375% | | 2/1/16 | | | 60,000 | | | 55,800 | |
The AES Corp. | | | | 7.750% | | 10/15/15 | | | 50,000 | | | 42,000 | |
The AES Corp. | | | | 8.000% | | 6/1/20 | | | 160,000 | | | 124,000 | D |
TXU Corp. | | | | 5.550% | | 11/15/14 | | | 480,000 | | | 224,269 | |
| | | | | | | | | | | | | |
| | | | | | | | | | | | 629,127 | |
| | | | | | | | | | | | | |
Insurance | | 1.3% | | | | | | | | | | | |
Allstate Life Global Funding Trust | | | | 5.375% | | 4/30/13 | | | 300,000 | | | 295,319 | |
American International Group Inc. | | | | 5.850% | | 1/16/18 | | | 40,000 | | | 26,811 | |
American International Group Inc. | | | | 8.250% | | 8/15/18 | | | 100,000 | | | 73,192 | D |
Genworth Life Insurance Co. | | | | 5.875% | | 5/3/13 | | | 190,000 | | | 142,093 | D |
MetLife Capital Trust IV | | | | 7.875% | | 12/15/37 | | | 450,000 | | | 282,313 | A,D |
MetLife Inc. | | | | 6.400% | | 12/15/36 | | | 10,000 | | | 6,000 | A |
Metropolitan Life Global Funding I | | | | 5.125% | | 4/10/13 | | | 190,000 | | | 177,034 | D |
The Travelers Cos. Inc. | | | | 6.250% | | 3/15/37 | | | 30,000 | | | 19,651 | A |
| | | | | | | | | | | | | |
| | | | | | | | | | | | 1,022,413 | |
| | | | | | | | | | | | | |
IT Services | | N.M. | | | | | | | | | | | |
SunGard Data Systems Inc. | | | | 10.250% | | 8/15/15 | | | 30,000 | | | 19,800 | |
| | | | | | | | | | | | | |
| | | | | |
Machinery | | N.M. | | | | | | | | | | | |
Terex Corp. | | | | 7.375% | | 1/15/14 | | | 20,000 | | | 17,400 | |
| | | | | | | | | | | | | |
| | | | | |
Media | | 1.4% | | | | | | | | | | | |
CSC Holdings Inc. | | | | 7.625% | | 4/1/11 | | | 60,000 | | | 56,550 | |
EchoStar DBS Corp. | | | | 7.125% | | 2/1/16 | | | 130,000 | | | 108,550 | |
Idearc Inc. | | | | 8.000% | | 11/15/16 | | | 90,000 | | | 6,750 | |
News America Inc. | | | | 5.300% | | 12/15/14 | | | 220,000 | | | 202,618 | |
News America Inc. | | | | 6.650% | | 11/15/37 | | | 10,000 | | | 9,898 | |
Time Warner Cable Inc. | | | | 8.250% | | 2/14/14 | | | 300,000 | | | 304,340 | |
Time Warner Inc. | | | | 6.875% | | 5/1/12 | | | 200,000 | | | 192,139 | |
Turner Broadcasting System Inc. | | | | 8.375% | | 7/1/13 | | | 130,000 | | | 126,787 | |
Viacom Inc. | | | | 5.750% | | 4/30/11 | | | 60,000 | | | 54,491 | |
| | | | | | | | | | | | | |
| | | | | | | | | | | | 1,062,123 | |
| | | | | | | | | | | | | |
117
Annual Report to Shareholders
Portfolio of Investments—Continued
Western Asset Intermediate Plus Bond Portfolio—Continued
| | | | | | | | | | | | | |
| | | % OF
NET ASSETS | | RATE | | MATURITY
DATE | | PAR/
SHARES† | | VALUE | |
| | | | | | | | | | | | | |
Corporate Bonds and Notes—Continued | | | | | | | | | | | | | |
| | | | | |
Metals and Mining | | 0.7% | | | | | | | | | | | |
Alcoa Inc. | | | | 6.000% | | 7/15/13 | | $ | 190,000 | | $ | 171,795 | |
Freeport-McMoRan Copper & Gold Inc. | | | | 8.375% | | 4/1/17 | | | 410,000 | | | 336,200 | |
Steel Dynamics Inc. | | | | 7.750% | | 4/15/16 | | | 50,000 | | | 34,625 | D |
| | | | | | | | | | | | | |
| | | | | | | | | | | | 542,620 | |
| | | | | | | | | | | | | |
Multi-Utilities | | 0.6% | | | | | | | | | | | |
Dominion Resources Inc. | | | | 5.700% | | 9/17/12 | | | 280,000 | | | 277,250 | |
Dominion Resources Inc. | | | | 8.875% | | 1/15/19 | | | 140,000 | | | 150,975 | |
| | | | | | | | | | | | | |
| | | | | | | | | | | | 428,225 | |
| | | | | | | | | | | | | |
Multiline Retail | | 0.4% | | | | | | | | | | | |
Federated Retail Holdings Inc. | | | | 5.350% | | 3/15/12 | | | 140,000 | | | 103,988 | |
JC Penney Corp. Inc. | | | | 5.750% | | 2/15/18 | | | 80,000 | | | 53,104 | |
May Department Stores Co. | | | | 5.750% | | 7/15/14 | | | 210,000 | | | 133,237 | |
| | | | | | | | | | | | | |
| | | | | | | | | | | | 290,329 | |
| | | | | | | | | | | | | |
Office Electronics | | 0.3% | | | | | | | | | | | |
Xerox Corp. | | | | 5.500% | | 5/15/12 | | | 300,000 | | | 251,415 | |
| | | | | | | | | | | | | |
| | | | | |
Oil, Gas and Consumable Fuels | | 5.2% | | | | | | | | | | | |
Anadarko Petroleum Corp. | | | | 5.950% | | 9/15/16 | | | 220,000 | | | 194,328 | |
Chesapeake Energy Corp. | | | | 7.250% | | 12/15/18 | | | 55,000 | | | 42,900 | |
El Paso Corp. | | | | 7.000% | | 5/15/11 | | | 80,000 | | | 72,783 | |
El Paso Corp. | | | | 6.875% | | 6/15/14 | | | 540,000 | | | 435,950 | |
El Paso Corp. | | | | 7.000% | | 6/15/17 | | | 200,000 | | | 156,521 | |
Enbridge Energy Partners LP | | | | 9.875% | | 3/1/19 | | | 100,000 | | | 100,642 | |
Energy Transfer Partners LP | | | | 9.700% | | 3/15/19 | | | 130,000 | | | 133,953 | |
KazMunaiGaz Exploration Production—GDR | | | | 8.375% | | 7/2/13 | | | 250,000 | | | 195,000 | D |
Kerr-McGee Corp. | | | | 6.875% | | 9/15/11 | | | 650,000 | | | 643,260 | |
Kinder Morgan Energy Partners LP | | | | 6.000% | | 2/1/17 | | | 470,000 | | | 408,042 | |
Occidental Petroleum Corp. | | | | 6.750% | | 1/15/12 | | | 200,000 | | | 208,333 | |
Pemex Project Funding Master Trust | | | | 5.750% | | 3/1/18 | | | 250,000 | | | 220,625 | D |
SemGroup LP | | | | 8.750% | | 11/15/15 | | | 20,000 | | | 700 | B,D,F,N |
The Williams Cos. Inc. | | | | 5.883% | | 10/1/10 | | | 280,000 | | | 246,946 | C,D |
The Williams Cos. Inc. | | | | 6.375% | | 10/1/10 | | | 60,000 | | | 55,934 | D |
The Williams Cos. Inc. | | | | 7.875% | | 9/1/21 | | | 110,000 | | | 84,150 | |
The Williams Cos. Inc. | | | | 7.500% | | 1/15/31 | | | 40,000 | | | 26,800 | |
The Williams Cos. Inc. | | | | 7.750% | | 6/15/31 | | | 110,000 | | | 75,350 | |
The Williams Cos. Inc. | | | | 8.750% | | 3/15/32 | | | 10,000 | | | 7,450 | |
XTO Energy Inc. | | | | 7.500% | | 4/15/12 | | | 100,000 | | | 98,836 | |
XTO Energy Inc. | | | | 6.250% | | 4/15/13 | | | 190,000 | | | 185,333 | |
118
Annual Report to Shareholders
| | | | | | | | | | | | | |
| | | % OF
NET ASSETS | | RATE | | MATURITY
DATE | | PAR/
SHARES† | | VALUE | |
| | | | | | | | | | | | | |
Corporate Bonds and Notes—Continued | | | | | | | | | | | | | |
| | | | | |
Oil, Gas and Consumable Fuels—Continued | | | | | | | | | | | | | |
XTO Energy Inc. | | | | 5.650% | | 4/1/16 | | $ | 460,000 | | $ | 422,035 | |
| | | | | | | | | | | | | |
| | | | | | | | | | | | 4,015,871 | |
| | | | | | | | | | | | | |
Paper and Forest Products | | 0.2% | | | | | | | | | | | |
Weyerhaeuser Co. | | | | 6.750% | | 3/15/12 | | | 180,000 | | | 161,127 | |
| | | | | | | | | | | | | |
| | | | | |
Pharmaceuticals | | 0.3% | | | | | | | | | | | |
GlaxoSmithKline Capital Inc. | | | | 5.650% | | 5/15/18 | | | 250,000 | | | 262,582 | |
| | | | | | | | | | | | | |
| | | | | |
Real Estate Investment Trusts (REITs) | | 0.4% | | | | | | | | | | | |
iStar Financial Inc. | | | | 5.500% | | 6/15/12 | | | 470,000 | | | 148,050 | |
iStar Financial Inc. | | | | 5.950% | | 10/15/13 | | | 310,000 | | | 97,650 | |
Ventas Inc. | | | | 9.000% | | 5/1/12 | | | 30,000 | | | 26,700 | |
| | | | | | | | | | | | | |
| | | | | | | | | | | | 272,400 | |
| | | | | | | | | | | | | |
Real Estate Management and Development | | N.M. | | | | | | | | | | | |
Realogy Corp. | | | | 12.375% | | 4/15/15 | | | 150,000 | | | 20,250 | |
| | | | | | | | | | | | | |
| | | | | |
Road and Rail | | N.M. | | | | | | | | | | | |
Hertz Corp. | | | | 10.500% | | 1/1/16 | | | 50,000 | | | 22,813 | |
| | | | | | | | | | | | | |
| | | | | |
Semiconductors and Semiconductor Equipment | | 0.1% | | | | | | | | | | | |
Freescale Semiconductor Inc. | | | | 8.875% | | 12/15/14 | | | 90,000 | | | 39,600 | |
| | | | | | | | | | | | | |
| | | | | |
Thrifts and Mortgage Finance | | 0.8% | | | | | | | | | | | |
Countrywide Financial Corp. | | | | 5.800% | | 6/7/12 | | | 600,000 | | | 584,792 | |
| | | | | | | | | | | | | |
| | | | | |
Tobacco | | 0.9% | | | | | | | | | | | |
Altria Group Inc. | | | | 9.700% | | 11/10/18 | | | 290,000 | | | 313,441 | E |
Philip Morris International Inc. | | | | 5.650% | | 5/16/18 | | | 400,000 | | | 396,533 | |
| | | | | | | | | | | | | |
| | | | | | | | | | | | 709,974 | |
| | | | | | | | | | | | | |
Wireless Telecommunication Services | | 1.6% | | | | | | | | | | | |
New Cingular Wireless Services Inc. | | | | 8.125% | | 5/1/12 | | | 400,000 | | | 428,948 | |
Sprint Capital Corp. | | | | 8.375% | | 3/15/12 | | | 590,000 | | | 472,000 | |
Vodafone Group PLC | | | | 5.350% | | 2/27/12 | | | 330,000 | | | 325,792 | |
| | | | | | | | | | | | | |
| | | | | | | | | | | | 1,226,740 | |
| | | | | | | | | | | | | |
Total Corporate Bonds and Notes
(Cost—$37,017,973) | | | | | | | | | | | | 28,799,566 | |
119
Annual Report to Shareholders
Portfolio of Investments—Continued
Western Asset Intermediate Plus Bond Portfolio—Continued
| | | | | | | | | | | | | |
| | | % OF
NET ASSETS | | RATE | | MATURITY
DATE | | PAR/
SHARES† | | VALUE | |
| | | | | | | | | | | | | |
Asset-Backed Securities | | 1.4% | | | | | | | | | | | |
| | | | | |
Indexed SecuritiesC | | 1.4% | | | | | | | | | | | |
Countrywide Asset-Backed Certificates 2005-6 M1 | | | | 0.961% | | 12/25/35 | | $ | 320,000 | | $ | 240,705 | |
GSAA Home Equity Trust 2007-7 A4 | | | | 0.741% | | 7/25/37 | | | 410,000 | | | 94,567 | |
Long Beach Mortgage Loan Trust 2005-WL3 2A2A | | | | 0.611% | | 11/25/35 | | | 24,416 | | | 24,016 | |
Nelnet Student Loan Trust 2008-4 A4 | | | | 5.015% | | 4/25/24 | | | 170,000 | | | 137,723 | |
Washington Mutual Master Note Trust 2006-A3A A3 | | | | 1.225% | | 9/15/13 | | | 700,000 | | | 612,763 | D |
| | | | | | | | | | | | | |
Total Asset-Backed Securities
(Cost—$1,419,167) | | | | | | | | | | | | 1,109,774 | |
Mortgage-Backed Securities | | 3.4% | | | | | | | | | | | |
| | | | | |
Fixed Rate Securities | | 0.5% | | | | | | | | | | | |
CS First Boston Mortgage Securities Corp. 2005-9 3A1 | | | | 6.000% | | 10/25/35 | | | 292,449 | | | 184,060 | |
Residential Accredit Loans Inc. 2006-QS8 A2 | | | | 6.000% | | 8/25/36 | | | 400,000 | | | 204,000 | |
Washington Mutual MSC Mortgage Pass-Through Certificates Series 2004-RA1 | | | | 7.000% | | 3/25/34 | | | 15,665 | | | 14,016 | |
| | | | | | | | | | | | | |
| | | | | | | | | | | | 402,076 | |
| | | | | | | | | | | | | |
Indexed SecuritiesC | | 1.1% | | | | | | | | | | | |
GMAC Mortgage Corp. Loan Trust 2005-AR5 3A1 | | | | 5.068% | | 9/19/35 | | | 126,809 | | | 104,231 | |
IndyMac Inda Mortgage Loan Trust 2007-AR7 1A1 | | | | 6.176% | | 11/25/37 | | | 391,838 | | | 241,564 | |
MASTR Adjustable Rate Mortgages Trust 2004-13 | | | | 3.788% | | 11/21/34 | | | 550,000 | | | 352,011 | |
MLCC Mortgage Investors Inc. 2004-B | | | | 4.727% | | 5/25/29 | | | 10,993 | | | 7,527 | |
Residential Accredit Loans Inc. 2007-QS1 2A2 | | | | 0.831% | | 1/25/37 | | | 656,961 | | | 153,025 | |
| | | | | | | | | | | | | |
| | | | | | | | | | | | 858,358 | |
| | | | | | | | | | | | | |
Variable Rate SecuritiesH | | 1.8% | | | | | | | | | | | |
Banc of America Funding Corp. 2005-B | | | | 5.092% | | 4/20/35 | | | 142,675 | | | 82,856 | |
Bear Stearns Alt-A Trust 2005-2 | | | | 4.636% | | 4/25/35 | | | 100,424 | | | 55,468 | |
Countrywide Home Loans 2004-20 | | | | 4.828% | | 9/25/34 | | | 11,133 | | | 6,623 | |
JP Morgan Mortgage Trust 2004-A3 | | | | 4.301% | | 7/25/34 | | | 364,368 | | | 279,721 | |
MASTR Adjustable Rate Mortgages Trust 2007-R5 A1 | | | | 5.652% | | 11/25/35 | | | 296,129 | | | 159,005 | D |
Merrill Lynch Mortgage Investors Trust 2004-A1 2A1 | | | | 4.852% | | 2/25/34 | | | 241,090 | | | 196,509 | |
MLCC Mortgage Investors Inc. 2005-1 2A1 | | | | 4.957% | | 4/25/35 | | | 45,527 | | | 28,876 | |
MLCC Mortgage Investors Inc. 2005-1 2A2 | | | | 4.957% | | 4/25/35 | | | 147,964 | | | 99,879 | |
Structured Adjustable Rate Mortgage Loan Trust 2004-6 3A2 | | | | 4.715% | | 6/25/34 | | | 140,878 | | | 85,032 | |
Washington Mutual Inc. 2005-AR12 | | | | 4.834% | | 10/25/35 | | | 359,452 | | | 269,217 | |
120
Annual Report to Shareholders
| | | | | | | | | | | | | |
| | | % OF
NET ASSETS | | RATE | | MATURITY
DATE | | PAR/
SHARES† | | VALUE | |
| | | | | | | | | | | | | |
Mortgage-Backed Securities—Continued | | | | | | | | | | | | | |
| | | | | |
Variable Rate Securities—Continued | | | | | | | | | | | | | |
Washington Mutual Inc. 2005-AR4 | | | | 4.668% | | 4/25/35 | | $ | 300,000 | | $ | 142,470 | |
| | | | | | | | | | | | | |
| | | | | | | | | | | | 1,405,656 | |
| | | | | | | | | | | | | |
Total Mortgage-Backed Securities
(Cost—$4,176,625) | | | | | | | | | | | | 2,666,090 | |
U.S. Government and Agency Obligations | | 16.9% | | | | | | | | | | | |
| | | | | |
Fixed Rate Securities | | 13.3% | | | | | | | | | | | |
Farmer Mac | | | | 5.125% | | 4/19/17 | | | 400,000 | | | 451,444 | D |
Federal Home Loan Bank | | | | 4.500% | | 10/9/09 | | | 3,300,000 | | | 3,399,320 | |
Federal Home Loan Bank | | | | 3.625% | | 9/16/11 | | | 3,760,000 | | | 3,978,486 | |
Federal Home Loan Bank | | | | 5.000% | | 12/21/15 | | | 540,000 | | | 604,813 | |
Federal Home Loan Bank | | | | 5.500% | | 7/15/36 | | | 10,000 | | | 12,815 | |
Freddie Mac | | | | 5.250% | | 4/18/16 | | | 1,080,000 | | | 1,229,802 | I |
Tennessee Valley Authority | | | | 5.625% | | 1/18/11 | | | 10,000 | | | 10,681 | |
Tennessee Valley Authority | | | | 6.790% | | 5/23/12 | | | 210,000 | | | 241,075 | |
Tennessee Valley Authority | | | | 5.980% | | 4/1/36 | | | 10,000 | | | 12,980 | |
United States Treasury Bonds | | | | 8.875% | | 8/15/17 | | | 30,000 | | | 44,660 | |
United States Treasury Notes | | | | 1.500% | | 12/31/13 | | | 300,000 | | | 299,320 | |
| | | | | | | | | | | | | |
| | | | | | | | | | | | 10,285,396 | |
| | | | | | | | | | | | | |
Treasury Inflation-Protected SecuritiesJ | | 3.6% | | | | | | | | | | | |
United States Treasury Inflation-Protected Security | | | | 2.000% | | 1/15/14 | | | 211,046 | | | 199,966 | K |
United States Treasury Inflation-Protected Security | | | | 1.875% | | 7/15/15 | | | 144,794 | | | 136,774 | K |
United States Treasury Inflation-Protected Security | | | | 2.000% | | 1/15/16 | | | 196,475 | | | 188,156 | K |
United States Treasury Inflation-Protected Security | | | | 2.500% | | 7/15/16 | | | 590,013 | | | 585,357 | K |
United States Treasury Inflation-Protected Security | | | | 2.625% | | 7/15/17 | | | 250,872 | | | 257,085 | K |
United States Treasury Inflation-Protected Security | | | | 1.375% | | 7/15/18 | | | 130,606 | | | 122,147 | K |
United States Treasury Inflation-Protected Security | | | | 2.375% | | 1/15/25 | | | 80,453 | | | 79,070 | K |
United States Treasury Inflation-Protected Security | | | | 2.000% | | 1/15/26 | | | 109,153 | | | 102,817 | K |
United States Treasury Inflation-Protected Security | | | | 2.375% | | 1/15/27 | | | 5,371 | | | 5,396 | K |
United States Treasury Inflation-Protected Security | | | | 1.750% | | 1/15/28 | | | 1,147,873 | | | 1,060,527 | K |
| | | | | | | | | | | | | |
| | | | | | | | | | | | 2,737,295 | |
| | | | | | | | | | | | | |
Total U.S. Government and Agency Obligations
(Cost—$12,464,581) | | | | | | | | | | | | 13,022,691 | |
121
Annual Report to Shareholders
Portfolio of Investments—Continued
Western Asset Intermediate Plus Bond Portfolio—Continued
| | | | | | | | | | | | | |
| | | % OF
NET ASSETS | | RATE | | MATURITY
DATE | | PAR/
SHARES† | | VALUE | |
| | | | | | | | | | | | | |
U.S. Government Agency Mortgage-Backed Securities | | 17.2% | | | | | | | | | | | |
| | | | | |
Fixed Rate Securities | | 15.0% | | | | | | | | | | | |
Fannie Mae | | | | 5.000% | | 6/1/35 to 2/1/36 | | $ | 1,754,623 | | $ | 1,794,332 | I |
Fannie Mae | | | | 5.500% | | 7/1/38 | | | 673,026 | | | 690,616 | I |
Fannie Mae | | | | 5.000% | | 12/1/38 | | | 3,220,000 | | | 3,287,420 | I,L |
Fannie Mae | | | | 5.500% | | 12/1/38 | | | 400,000 | | | 410,000 | I,L |
Freddie Mac | | | | 5.500% | | 4/1/38 | | | 3,831,973 | | | 3,926,523 | I |
Freddie Mac | | | | 5.000% | | 12/1/38 | | | 100,000 | | | 102,187 | I,L |
Freddie Mac | | | | 5.500% | | 12/1/38 | | | 100,000 | | | 102,344 | I,L |
Government National Mortgage Association | | | | 5.000% | | 12/1/38 | | | 1,200,000 | | | 1,230,000 | L |
| | | | | | | | | | | | | |
| | | | | | | | | | | | 11,543,422 | |
| | | | | | | | | | | | | |
Indexed SecuritiesC | | 2.2% | | | | | | | | | | | |
Fannie Mae | | | | 4.348% | | 12/1/34 | | | 412,534 | | | 412,180 | I |
Fannie Mae | | | | 4.519% | | 9/1/35 | | | 196,790 | | | 198,839 | I |
Fannie Mae | | | | 5.856% | | 8/1/37 | | | 366,155 | | | 380,404 | I |
Freddie Mac | | | | 4.101% | | 1/1/35 | | | 16,056 | | | 15,797 | I |
Freddie Mac | | | | 4.141% | | 1/1/35 | | | 27,868 | | | 27,808 | I |
Freddie Mac | | | | 6.091% | | 9/1/37 | | | 683,084 | | | 699,151 | I |
| | | | | | | | | | | | | |
| | | | | | | | | | | | 1,734,179 | |
| | | | | | | | | | | | | |
Total U.S. Government Agency Mortgage-Backed Securities (Cost—$12,961,528) | | | | | | | | | | | | 13,277,601 | |
Yankee BondsM | | 8.7% | | | | | | | | | | | |
| | | | | |
Beverages | | 0.2% | | | | | | | | | | | |
Diageo Capital PLC | | | | 7.375% | | 1/15/14 | | | 140,000 | | | 149,135 | |
| | | | | | | | | | | | | |
| | | | | |
Commercial Banks | | 1.9% | | | | | | | | | | | |
Banco Santiago SA | | | | 2.536% | | 12/9/09 | | | 200,000 | | | 195,974 | C,D |
Barclays Bank PLC | | | | 7.700% | | 12/31/49 | | | 100,000 | | | 66,126 | A,D |
Glitnir Banki Hf | | | | 5.815% | | 1/21/11 | | | 640,000 | | | 30,400 | B,C,D,N |
Glitnir Banki Hf | | | | 5.678% | | 1/18/12 | | | 100,000 | | | 4,750 | B,C,D,N |
Glitnir Banki Hf | | | | 6.375% | | 9/25/12 | | | 260,000 | | | 12,350 | B,D,N |
Glitnir Banki Hf | | | | 6.693% | | 6/15/16 | | | 100,000 | | | 15 | A,B,D,N |
Kaupthing Bank Hf | | | | 5.750% | | 10/4/11 | | | 580,000 | | | 34,800 | B,D,N |
Kaupthing Bank Hf | | | | 7.625% | | 2/28/15 | | | 360,000 | | | 21,600 | B,D,F,N |
Landsbanki Islands Hf | | | | 6.100% | | 8/25/11 | | | 330,000 | | | 5,775 | B,D,N |
Landsbanki Islands Hf | | | | 7.431% | | 10/19/17 | | | 250,000 | | | 38 | A,B,D,N |
Resona Preferred Global Securities | | | | 7.191% | | 12/29/49 | | | 680,000 | | | 323,740 | A,D |
Royal Bank of Scotland Group PLC | | | | 9.118% | | 3/31/49 | | | 180,000 | | | 153,672 | |
Santander Issuances | | | | 5.805% | | 6/20/16 | | | 140,000 | | | 125,951 | A,D |
122
Annual Report to Shareholders
| | | | | | | | | | | | | |
| | | % OF
NET ASSETS | | RATE | | MATURITY
DATE | | PAR/
SHARES† | | VALUE | |
| | | | | | | | | | | | | |
Yankee Bonds—Continued | | | | | | | | | | | | | |
| | | | | |
Commercial Banks—Continued | | | | | | | | | | | | | |
Shinsei Finance Cayman Ltd. | | | | 6.418% | | 1/29/49 | | $ | 650,000 | | $ | 135,949 | A,D |
TuranAlem Finance BV | | | | 5.434% | | 1/22/09 | | | 130,000 | | | 122,200 | C,D |
VTB Capital SA for Vneshtorgbank | | | | 4.559% | | 11/2/09 | | | 280,000 | | | 245,143 | C,D |
| | | | | | | | | | | | | |
| | | | | | | | | | | | 1,478,483 | |
| | | | | | | | | | | | | |
Diversified Financial Services | | 1.0% | | | | | | | | | | | |
Aiful Corp. | | | | 5.000% | | 8/10/10 | | | 390,000 | | | 214,422 | D |
MUFG Capital Finance 1 Ltd. | | | | 6.346% | | 7/29/49 | | | 450,000 | | | 313,525 | A |
TNK-BP Finance SA | | | | 6.875% | | 7/18/11 | | | 380,000 | | | 277,400 | D |
| | | | | | | | | | | | | |
| | | | | | | | | | | | 805,347 | |
| | | | | | | | | | | | | |
Diversified Telecommunication Services | | 3.7% | | | | | | | | | | | |
British Telecommunications PLC | | | | 8.625% | | 12/15/10 | | | 350,000 | | | 360,045 | E |
Deutsche Telekom International Finance BV | | | | 5.750% | | 3/23/16 | | | 500,000 | | | 478,619 | |
France Telecom SA | | | | 7.750% | | 3/1/11 | | | 400,000 | | | 420,922 | |
Intelsat Bermuda Ltd. | | | | 11.250% | | 6/15/16 | | | 30,000 | | | 27,300 | |
Koninklijke (Royal) KPN NV | | | | 8.000% | | 10/1/10 | | | 450,000 | | | 454,141 | |
Telecom Italia Capital SpA | | | | 5.250% | | 10/1/15 | | | 420,000 | | | 319,725 | |
Telecom Italia Capital SpA | | | | 6.999% | | 6/4/18 | | | 110,000 | | | 89,237 | |
Telefonica Emisiones S.A.U. | | | | 3.356% | | 2/4/13 | | | 680,000 | | | 545,492 | C |
VIP Finance Ireland Ltd | | | | 8.375% | | 4/30/13 | | | 260,000 | | | 166,400 | D |
| | | | | | | | | | | | | |
| | | | | | | | | | | | 2,861,881 | |
| | | | | | | | | | | | | |
Energy Equipment and Services | | 0.3% | | | | | | | | | | | |
Transocean Inc. | | | | 5.250% | | 3/15/13 | | | 220,000 | | | 204,335 | |
| | | | | | | | | | | | | |
| | | | | |
Foreign Government | | N.M. | | | | | | | | | | | |
United Mexican States | | | | 6.750% | | 9/27/34 | | | 9,000 | | | 9,495 | |
| | | | | | | | | | | | | |
| | | | | |
Industrial Conglomerates | | 0.6% | | | | | | | | | | | |
Tyco International Group SA | | | | 6.000% | | 11/15/13 | | | 460,000 | | | 431,625 | |
| | | | | | | | | | | | | |
| | | | | |
Metals and Mining | | 0.7% | | | | | | | | | | | |
Evraz Group SA | | | | 8.875% | | 4/24/13 | | | 220,000 | | | 112,200 | D |
Vale Overseas Ltd. | | | | 6.250% | | 1/23/17 | | | 370,000 | | | 348,836 | |
Vedanta Resources PLC | | | | 8.750% | | 1/15/14 | | | 130,000 | | | 78,000 | D |
| | | | | | | | | | | | | |
| | | | | | | | | | | | 539,036 | |
| | | | | | | | | | | | | |
Oil, Gas and Consumable Fuels | | 0.2% | | | | | | | | | | | |
Gazprom | | | | 6.212% | | 11/22/16 | | | 40,000 | | | 26,400 | D |
Gazprom | | | | 6.510% | | 3/7/22 | | | 110,000 | | | 65,450 | D |
123
Annual Report to Shareholders
Portfolio of Investments—Continued
Western Asset Intermediate Plus Bond Portfolio—Continued
| | | | | | | | | | | | | | |
| | | % OF
NET ASSETS | | RATE | | MATURITY
DATE | | PAR/
SHARES† | | | VALUE | |
| | | | | | | | | | | | | | |
Yankee Bonds—Continued | | | | | | | | | | | | | | |
| | | | | |
Oil, Gas and Consumable Fuels—Continued | | | | | | | | | | | | | | |
OPTI Canada Inc. | | | | 8.250% | | 12/15/14 | | $ | 100,000 | | | $ | 54,000 | |
| | | | | | | | | | | | | | |
| | | | | | | | | | | | | 145,850 | |
| | | | | | | | | | | | | | |
Wireless Telecommunication Services | | 0.1% | | | | | | | | | | | | |
America Movil SA de CV | | | | 5.625% | | 11/15/17 | | | 100,000 | | | | 88,903 | |
| | | | | | | | | | | | | | |
Total Yankee Bonds (Cost—$11,294,819) | | | | | | | | | | | | | 6,714,090 | |
Preferred Stocks | | 0.1% | | | | | | | | | | | | |
Fannie Mae | | | | 8.250% | | | | | 8,850 | shs | | | 7,346 | I |
Freddie Mac | | | | 8.375% | | | | | 12,075 | | | | 4,709 | I |
Preferred Block Inc. | | | | 9.000% | | | | | 258 | | | | 64,500 | D |
| | | | | | | | | | | | | | |
| | | | | |
Total Preferred Stocks (Cost—$583,049) | | | | | | | | | | | | | 76,555 | |
| | | | | | | | | | | | | | |
Total Long-Term Securities (Cost—$79,917,742) | | | | | | | | | | | | | 65,666,367 | |
Short-Term Securities | | 21.2% | | | | | | | | | | | | |
| | | | | |
U.S. Government and Agency Obligations | | 21.2% | | | | | | | | | | | | |
Fannie Mae | | | | 0.000% | | 5/5/09 | | $ | 6,500,000 | | | | 6,494,449 | I,O |
Fannie Mae | | | | 0.000% | | 5/18/09 | | | 443,000 | | | | 442,582 | I,K,O |
Federal Home Loan Bank | | | | 0.000% | | 1/2/09 | | | 2,900,000 | | | | 2,899,776 | O |
Federal Home Loan Bank | | | | 0.000% | | 1/15/09 | | | 6,500,000 | | | | 6,494,186 | O |
| | | | | | | | | | | | | | |
Total Short-Term Securities (Cost—$16,308,386) | | | | | | | | | | | | | 16,330,993 | |
Total Investments (Cost—$96,226,128)P | | 106.3% | | | | | | | | | | | 81,997,360 | |
Other Assets Less Liabilities | | (6.3)% | | | | | | | | | | | (4,847,812 | ) |
| | | | | | | | | | | | | | |
| | | | | |
Net Assets | | 100.0% | | | | | | | | | | $ | 77,149,548 | |
| | | | | | | | | | | | | | |
| | | | | | | |
| | | EXPIRATION | | ACTUAL
CONTRACTS | | APPRECIATION/
(DEPRECIATION) |
Futures Contracts Purchased Q | | | | | | | |
Eurodollar Futures | | March 2009 | | 78 | | $ | 436,885 |
Eurodollar Futures | | June 2009 | | 17 | | | 63,102 |
Eurodollar Futures | | September 2009 | | 3 | | | 20,785 |
German Euro Bund Futures | | March 2009 | | 13 | | | 2,273 |
U.S. Treasury Note Futures | | March 2009 | | 45 | | | 255,705 |
U.S. Treasury Note Futures | | March 2009 | | 81 | | | 187,790 |
U.S. Treasury Note Futures | | March 2009 | | 24 | | | 60,930 |
| | | | | | | |
| | | | | | $ | 1,027,470 |
| | | | | | | |
124
Annual Report to Shareholders
| | | | | | | | |
| | | Expiration | | Actual
Contracts | | Appreciation/
(Depreciation) | |
Options WrittenQ | | | | | | | | |
Eurodollar Futures Call, Strike Price $97.63 | | September 2009 | | 3 | | $ | (6,246 | ) |
Eurodollar Futures Call, Strike Price $98.25 | | March 2009 | | 79 | | | (91,208 | ) |
U.S. Treasury Note Futures Call, Strike Price $117.00 | | February 2009 | | 18 | | | (27,793 | ) |
U.S. Treasury Note Futures Call, Strike Price $118.00 | | February 2009 | | 45 | | | (326,959 | ) |
U.S. Treasury Note Futures Call, Strike Price $120.00 | | February 2009 | | 27 | | | (146,104 | ) |
U.S. Treasury Note Futures Put, Strike Price $110.00 | | February 2009 | | 43 | | | 52,863 | |
U.S. Treasury Note Futures Put, Strike Price $114.00 | | February 2009 | | 27 | | | 6,615 | |
| | | | | | | | |
| | | | | | $ | (538,832 | ) |
| | | | | | | | |
| | | | | | | | | |
N.M.—Not Meaningful.
A | | Stepped Coupon Security – A security with a predetermined schedule of interest or dividend rate changes at which time it begins to accrue interest or pay dividends according to the predetermined schedule. |
B | | Bond is currently in default. |
C | | Indexed Security – The rates of interest earned on these securities are tied to the London Interbank Offered Rate (“LIBOR”), the Euro Interbank Offered Rate (“EURIBOR”) Index, the Consumer Price Index (“CPI”), the one-year Treasury Bill Rate or the ten-year Japanese Government Bond Rate. The coupon rates are the rates as of December 31, 2008. |
D | | Rule 144a Security – A security purchased pursuant to Rule 144a under the Securities Act of 1933 which may not be resold subject to that rule except to qualified institutional buyers. These securities, which the Fund’s investment adviser has determined to be liquid, represent 9.68% of net assets. |
E | | Credit Linked Security – The rates of interest earned on these securities are tied to the credit rating assigned by Standard & Poor’s Rating Service and/or Moody’s Investors Services. |
F | | Illiquid security valued at fair value under the procedures approved by the Board of Directors. |
G | | Pay-in-Kind (“PIK”) security – A security in which interest or dividends during the initial few years is paid in additional PIK securities rather than in cash. |
H | | The coupon rates shown on variable rate securities are the rates at December 31, 2008. These rates vary with the weighted average coupon of the underlying loans. |
I | | On September 7, 2008, the Federal Housing Finance Agency placed Fannie Mae and Freddie Mac into Conservatorship. |
J | | Treasury Inflation-Protected Security –Treasury security whose principal value is adjusted daily in accordance with changes to the Consumer Price Index for All Urban Consumers. Interest is calculated on the basis of the current adjusted principal value. |
K | | All or a portion of this security is collateral to cover futures and options contracts written. |
L | | When-issued Security – Security purchased on a delayed delivery basis. Final settlement amount and maturity date have not yet been announced. |
M | | Yankee Bond – A dollar-denominated bond issued in the U.S. by foreign entities. |
O | | Zero coupon bond – A bond with no periodic interest payments which is sold at such a discount as to produce a current yield to maturity. |
P | | At December 31, 2008, the aggregate gross unrealized appreciation and depreciation of investments for federal income tax purposes were substantially as follows: |
| | | | |
| Gross unrealized appreciation | | $ | 1,170,503 | |
| Gross unrealized depreciation | | | (15,796,640 | ) |
| | | | |
| Net unrealized depreciation | | $ | (14,626,137 | ) |
| | | | |
QOptions | | and futures are described in more detail in the notes to financial statements. |
† | | Securities are denominated in U.S. Dollars, unless otherwise noted. |
EUR—Euro
See notes to financial statements.
125
Annual Report to Shareholders
Statement of Assets and Liabilities
Western Asset Intermediate Plus Bond Portfolio
December 31, 2008
| | | | | | | |
Assets: | | | | | | | |
Investment securities at market value (Cost—$79,917,742) | | | | | $ | 65,666,367 | |
Short-term securities at value (Cost—$16,308,386) | | | | | | 16,330,993 | |
Cash | | | | | | 144,003 | |
Foreign currency at value (Cost—$5) | | | | | | 5 | |
Receivable for securities sold | | | | | | 1,608,071 | |
Interest receivable | | | | | | 837,017 | |
Restricted cash pledged for swaps | | | | | | 600,000 | |
Unrealized appreciation on swaps | | | | | | 346,881 | |
Unrealized appreciation of forward foreign currency contracts | | | | | | 257,268 | |
Premium paid on open swaps | | | | | | 35,213 | |
Amounts receivable for open swaps | | | | | | 21,294 | |
Deposits with brokers for open futures contracts | | | | | | 16,345 | |
| | | | | | | |
Total assets | | | | | | 85,863,457 | |
| | | | | | | |
| | |
Liabilities: | | | | | | | |
Payable for securities purchased | | $ | 6,369,182 | | | | |
Options written (Proceeds—$214,812) | | | 753,644 | | | | |
Unrealized depreciation on swaps | | | 428,977 | | | | |
Premium received on open swaps | | | 402,381 | | | | |
Payable for Lehman settlement | | | 273,007 | | | | |
Unrealized depreciation of forward foreign currency contracts | | | 194,231 | | | | |
Futures variation margin payable | | | 110,078 | | | | |
Income distribution payable | | | 84,736 | | | | |
Amounts payable for open swaps | | | 19,041 | | | | |
Accrued management fee | | | 15,580 | | | | |
Accrued expenses and other liabilities | | | 63,052 | | | | |
| | | | | | | |
Total liabilities | | | | | | 8,713,909 | |
| | | | | | | |
| | |
Net Assets | | | | | $ | 77,149,548 | |
| | | | | | | |
| | |
Net assets consist of: | | | | | | | |
Accumulated paid-in-capital | | | | | $ | 91,924,637 | |
Overdistributed net investment income | | | | | | (185,602 | ) |
Accumulated net realized loss on investments, options, futures, swaps and foreign currency transactions | | | | | | (830,924 | ) |
Net unrealized depreciation on investments, options, futures and swaps | | | | | | (13,758,563 | ) |
| | | | | | | |
| | |
Net Assets | | | | | $ | 77,149,548 | |
| | | | | | | |
| | |
Net Asset Value Per Share: | | | | | | | |
Institutional Class (8,203,657 shares outstanding) | | | | | | $8.54 | |
Institutional Select Class (826,840 shares outstanding) | | | | | | $8.53 | |
| | | | | | | | |
See notes to financial statements.
126
Annual Report to Shareholders
Statement of Operations
Western Asset Intermediate Plus Bond Portfolio
| | | | | | | | | | | | | | | | |
| | | FOR THE
PERIOD ENDED
DECEMBER 31, 2008A | | | FOR THE
YEAR ENDED
MARCH 31, 2008 | |
Investment Income: | | | | | | | | | | | | | | | | |
Interest | | $ | 3,686,105 | | | | | | | $ | 5,527,905 | | | | | |
Dividends | | | 15,447 | | | | | | | | — | | | | | |
| | | | | | | | | | | | | | | | |
Total income | | | | | | $ | 3,701,552 | | | | | | | $ | 5,527,905 | |
| | | | |
Expenses: | | | | | | | | | | | | | | | | |
Management fees | | | 287,933 | | | | | | | | 404,576 | | | | | |
Audit and legal fees | | | 76,548 | | | | | | | | 79,762 | | | | | |
Custodian fees | | | 25,549 | | | | | | | | 37,719 | | | | | |
Directors’ fees and expenses | | | 2,687 | | | | | | | | 3,572 | | | | | |
Registration fees | | | 34,275 | | | | | | | | 6,395 | | | | | |
Reports to shareholders: | | | | | | | | | | | | | | | | |
Institutional Class | | | 363 | | | | | | | | 11,975 | | | | | |
Institutional Select Class | | | — | | | | | | | | N/A | | | | | |
Transfer agent and shareholder servicing expense: | | | | | | | | | | | | | | | | |
Institutional Class | | | 10,892 | | | | | | | | 14,104 | | | | | |
Institutional Select Class | | | 93 | | | | | | | | N/A | | | | | |
Other expenses | | | 22,260 | | | | | | | | 24,241 | | | | | |
| | | | | | | | | | | | | | | | |
| | | 460,600 | | | | | | | | 582,344 | | | | | |
Less: Fees waived | | | (106,270 | ) | | | | | | | (124,716 | ) | | | | |
Compensating balance credits | | | (132 | ) | | | | | | | (2,481 | ) | | | | |
| | | | | | | | | | | | | | | | |
Net expenses | | | | | | | 354,198 | | | | | | | | 455,147 | |
| | | | | | | | | | | | | | | | |
Net Investment Income | | | | | | | 3,347,354 | | | | | | | | 5,072,758 | |
Net Realized and Unrealized Gain/(Loss) on Investments: | | | | | | | | | | | | | | | | |
Net realized gain/(loss) on: | | | | | | | | | | | | | | | | |
Investments | | | (915,845 | ) | | | | | | | 573,728 | | | | | |
Options | | | 495,802 | | | | | | | | 175,472 | | | | | |
Futures | | | 1,310,141 | | | | | | | | 935,985 | | | | | |
Swaps | | | (309,083 | ) | | | | | | | 1,405 | | | | | |
Foreign currency transactions | | | 132,537 | | | | | | | | (220 | ) | | | | |
| | | | | | | | | | | | | | | | |
| | | | | | | 713,552 | | | | | | | | 1,686,370 | |
Change in unrealized appreciation/(depreciation) of: | | | | | | | | | | | | | | | | |
Investments, options, futures and swaps | | | (9,625,845 | ) | | | | | | | (4,385,681 | ) | | | | |
Assets and liabilities denominated in foreign currency | | | 2,117 | | | | | | | | (1,414 | ) | | | | |
| | | | | | | | | | | | | | | | |
| | | | | | | (9,623,728 | ) | | | | | | | (4,387,095 | ) |
| | | | | | | | | | | | | | | | |
Net Realized and Unrealized Loss on Investments | | | | | | | (8,910,176 | ) | | | | | | | (2,700,725 | ) |
| | | | | | | | | | | | | | | | | |
Change in Net Assets Resulting From Operations | | | | | | $ | (5,562,822 | ) | | | | | | $ | 2,372,033 | |
| | | | | | | | | | | | | | | | | |
A | | For the period April 1, 2008 to December 31, 2008. |
N/A—Not applicable.
See notes to financial statements.
127
Annual Report to Shareholders
Statement of Changes in Net Assets
Western Asset Intermediate Plus Bond Portfolio
| | | | | | | | | | | | |
| | | FOR THE
PERIOD ENDED
DECEMBER 31, 2008A | | | FOR THE
YEARS ENDED MARCH 31, | |
| | | | 2008 | | | 2007 | |
| Change in Net Assets: | | | | | | | | | |
Net investment income | | $ | 3,347,354 | | | $ | 5,072,758 | | | $ | 3,918,725 | |
| | | |
Net realized gain | | | 713,552 | | | | 1,686,370 | | | | 225,039 | |
| | | |
Change in unrealized appreciation/(depreciation) | | | (9,623,728 | ) | | | (4,387,095 | ) | | | 1,511,215 | |
| | | | | | | | | | | | |
Change in net assets resulting from operations | | | (5,562,822 | ) | | | 2,372,033 | | | | 5,654,979 | |
| | | |
Distributions to shareholders from: | | | | | | | | | | | | |
Net investment income: | | | | | | | | | | | | |
Institutional Class | | | (3,930,720 | ) | | | (4,962,617 | ) | | | (3,920,425 | ) |
Institutional Select Class | | | (114,207 | ) | | | N/A | | | | N/A | |
| | | |
Net realized gain on investments: | | | | | | | | | | | | |
Institutional Class | | | (2,548,887 | ) | | | (254,925 | ) | | | — | |
| | | |
Change in net assets from fund share transactions: | | | | | | | | | | | | |
Institutional Class | | | (28,378,624 | ) | | | 26,837,152 | | | | 15,179,431 | |
Institutional Select Class | | | 6,871,040 | | | | N/A | | | | N/A | |
| | | | | | | | | | | | |
Change in net assets | | | (33,664,220 | ) | | | 23,991,643 | | | | 16,913,985 | |
| | | |
Net Assets: | | | | | | | | | | | | |
Beginning of period | | | 110,813,768 | | | | 86,822,125 | | | | 69,908,140 | |
| | | | | | | | | | | | |
| | | |
End of period | | $ | 77,149,548 | | | $ | 110,813,768 | | | $ | 86,822,125 | |
| | | | | | | | | | | | |
| | | |
(Overdistributed)/Undistributed net investment income | | $ | (185,602 | ) | | $ | 34,069 | | | $ | (32,207 | ) |
| | | | | | | | | | | | |
| | | | | | | | | | | | | |
A | | For the period April 1, 2008 to December 31, 2008. |
N/A—Not applicable.
See notes to financial statements.
128
Annual Report to Shareholders
Financial Highlights
Western Asset Intermediate Plus Bond Portfolio
For a share of each class of capital stock outstanding:
Institutional Class:
| | | | | | | | | | | | | | | | | | | | |
| | | PERIOD
ENDED
DECEMBER 31,
2008A | | | YEARS ENDED MARCH 31, | |
| | | | 2008 | | | 2007 | | | 2006 | | | 2005 | |
Net asset value, beginning of period | | $ | 9.67 | | | $ | 9.95 | | | $ | 9.74 | | | $ | 9.86 | | | $ | 10.00 | |
| | | | | | | | | | | | | | | | | | | | |
Investment operations: | | | | | | | | | | | | | | | | | | | | |
Net investment income | | | .32 | B | | | .49 | B | | | .45 | B | | | .40 | C | | | .32 | C |
Net realized and unrealized gain/(loss) | | | (.81 | ) | | | (.26 | ) | | | .21 | | | | (.11 | ) | | | (.14 | ) |
| | | | | | | | | | | | | | | | | | | | |
Total from investment operations | | | (.49 | ) | | | .23 | | | | .66 | | | | .29 | | | | .18 | |
| | | | | | | | | | | | | | | | | | | | |
Distributions from: | | | | | | | | | | | | | | | | | | | | |
Net investment income | | | (.40 | ) | | | (.49 | ) | | | (.45 | ) | | | (.41 | ) | | | (.32 | ) |
Net realized gain on investments | | | (.24 | ) | | | (.02 | ) | | | — | | | | — | | | | — | |
| | | | | | | | | | | | | | | | | | | | |
Total distributions | | | (.64 | ) | | | (.51 | ) | | | (.45 | ) | | | (.41 | ) | | | (.32 | ) |
| | | | | | | | | | | | | | | | | | | | |
Net asset value, end of period | | $ | 8.54 | | | $ | 9.67 | | | $ | 9.95 | | | $ | 9.74 | | | $ | 9.86 | |
| | | | | | | | | | | | | | | | | | | | |
Total return | | | (5.37 | )%D | | | 2.35 | % | | | 6.98 | % | | | 2.99 | % | | | 1.81 | % |
| | | | | |
Ratios to Average Net Assets:E | | | | | | | | | | | | | | | | | | | | |
Total expenses | | | .64 | %F | | | .58 | % | | | .63 | % | | | .76 | % | | | 1.22 | % |
Expenses net of waivers, if any | | | .49 | %F | | | .45 | % | | | .45 | % | | | .45 | % | | | .45 | % |
Expenses net of all reductions | | | .49 | %F | | | .45 | % | | | .45 | % | | | .45 | % | | | .45 | % |
Net investment income | | | 4.7 | %F | | | 5.0 | % | | | 4.6 | % | | | 4.1 | % | | | 3.1 | % |
| | | | | |
Supplemental Data: | | | | | | | | | | | | | | | | | | | | |
Portfolio turnover rate | | | 181.5 | %D | | | 300.0 | % | | | 312.2 | % | | | 368.6 | % | | | 463.5 | % |
Net assets, end of period (in thousands) | | $ | 70,093 | | | $ | 110,814 | | | $ | 86,822 | | | $ | 69,908 | | | $ | 40,637 | |
| | | | | | | | | | | | | | | | | | | | | |
A | | For the period April 1, 2008 to December 31, 2008. |
B | | Computed using average daily shares outstanding. |
C | | Computed using SEC method. |
E | | Total expenses reflects operating expenses prior to any contractual expense waivers and/or compensating balance credits. Expenses net of waivers reflects total expenses before compensating balance credits but net of any contractual expense waivers. Expenses net of all reductions reflects expenses less any compensating balance credits and/or contractual expense waivers. As of the most current prospectus, the Institutional Class has no limit on expenses. |
See notes to financial statements.
129
Annual Report to Shareholders
Financial Highlights—Continued
Western Asset Intermediate Plus Bond Portfolio
For a share of each class of capital stock outstanding:
Institutional Select Class:
| | | | |
| | | PERIOD
ENDED
DECEMBER 31,
2008G | |
Net asset value, beginning of period | | $ | 8.31 | |
| | | | |
Investment operations: | | | | |
Net investment income | | | .05 | B |
Net realized and unrealized gain | | | .31 | |
| | | | |
Total from investment operations | | | .36 | |
| | | | |
Distributions from: | | | | |
Net investment income | | | (.14 | ) |
| | | | |
Total distributions | | | (.14 | ) |
| | | | |
Net asset value, end of period | | $ | 8.53 | |
| | | | |
Total return | | | 4.32 | %D |
| |
Ratios to Average Net Assets:E | | | | |
Total expenses | | | .63 | %F |
Expenses net of waivers, if any | | | .45 | %F |
Expenses net of all reductions | | | .45 | %F |
Net investment income | | | 4.6 | %F |
| |
Supplemental Data: | | | | |
Portfolio turnover rate | | | 181.5 | %D |
Net assets, end of period (in thousands) | | $ | 7,057 | |
| | | | | |
G | | For the period November 10, 2008 (commencement of operations) to December 31, 2008. |
See notes to financial statements.
130
Annual Report to Shareholders
Management’s Discussion of Fund Performance
Western Asset Limited Duration Bond Portfolio
Total returns for the Fund for various periods ended December 31, 2008 are presented below, along with those of comparative indices:
| | | | | | | | | | | | |
| | | | | | | | | Average Annual Total Returns |
| | | Three
Months | | Nine
Months | | One
Year | | Three
Years | | Five
Years | | Since
InceptionA |
Western Asset Limited Duration Bond Portfolio: | | | | | | | | | | | | |
Institutional Class | | -4.06% | | -9.23% | | -13.16% | | -2.67% | | -0.77% | | -0.69% |
Institutional Select Class | | N/A | | N/A | | N/A | | N/A | | N/A | | -0.96% |
Merrill Lynch 1-3 Year Treasury IndexB | | +2.69% | | +3.52% | | +6.61% | | +5.96% | | +4.06% | | +3.89% |
Lipper Short-Intermediate Investment Grade Debt Funds Category AverageC | | -0.33% | | -3.50% | | -2.82% | | +1.84% | | +1.80% | | +1.76% |
The performance data quoted represent past performance and do not guarantee future results. Current performance may be lower or higher than the performance data quoted. To obtain the most recent month-end performance information, please visit www.westernassetfunds.com. The investment return and principal value of the Fund will fluctuate so that an investor’s shares, when redeemed, may be worth more or less than the original cost. Calculations assume reinvestment of dividends and capital gain distributions. Performance would have been lower if fees had not been waived in various periods. Performance figures for periods shorter than one year represent cumulative figures and are not annualized.
The gross expense ratios for the Institutional and Institutional Select Classes were 0.51% and 0.50%, respectively, and do not reflect fee waivers or reimbursements. The net expense ratio for the Institutional and Institutional Select Classes were 0.41% and 0.40%, respectively, and reflect contractual fee waivers and/or reimbursements. As a result of a contractual expense limitation, total annual operating expenses for the Institutional Class will be waived or reimbursed at a rate of 0.10% of the Fund’s average daily net assets attributable to the Institutional Class until July 31, 2009. As a result of a contractual expense limitation, the ratio of expenses, other than taxes, interest, deferred organizational expenses, brokerage and extraordinary expenses, to average net assets will not exceed 0.40% for the Institutional Select Class until July 31, 2009.
All expenses shown include management fees and other expenses as indicated in the Fund’s most current prospectus dated August 1, 2008.
For the period from April 1, 2008 through December 31, 2008, Institutional Class shares of Western Asset Limited Duration Bond Portfolio returned -9.23%. The Fund’s unmanaged benchmark, the Merrill Lynch 1-3 Year Treasury Index, returned 3.52% over the same time frame. The Lipper Short-Intermediate Investment Grade Debt Funds Category Average returned -3.50% for the same period.
A | | The inception date of the Institutional Class is October 1, 2003. The inception date of the Institutional Select Class is October 29, 2008. Index returns are for periods beginning September 30, 2003. Although it is not possible to invest directly in an index, it is possible to purchase investment vehicles designed to track the performance of certain indices. |
B | | The Merrill Lynch 1-3 Year Treasury Index is a market capitalization-weighted index including all U.S. Treasury notes and bonds with maturities greater than or equal to one year and less than three years. |
C | | Lipper, Inc., a wholly-owned subsidiary of Reuters, provides independent insight on global collective investments. The Lipper Short-Intermediate Investment Grade Debt Funds Category Average is comprised of the Fund’s peer group of mutual funds. |
131
Annual Report to Shareholders
Management’s Discussion of Fund Performance—Continued
The impact of market conditions on the Fund’s performance was negative for the period ended December 31, 2008, with strategies also producing negative results. An emphasis on lower-quality credits and select Financials issues was also a large detractor from performance as spreads soared in the wake of the subprime lending crisis, deteriorating liquidity conditions and slowing economic growth. Spreads narrowed in April and May, but these gains were given back later in the period on deteriorating investor sentiment and poor earnings. A large exposure to the mortgage-backed sector detracted from returns as volatility remained high and negative housing news continued to damage market sentiment. We had diversified into a number of non-agency issues that were particularly impacted and further detracted from performance due to a lack of liquidity and uncertainty in that marketplace. A modest U.S. Treasury Inflation-Protected Securities (“TIPS”)D exposure also had a negative impact as oil plunged to $40/barrel and inflation fears switched to deflation fears. A tactically-driven durationE and yield curveF posture contributed modestly to returns as overall bond yields rallied and the spread between two- and ten-year yields widened over the period.
Western Asset Management Company
January 20, 2009
Investment Risks: Bonds are subject to a variety of risks, including interest rate, credit and inflation risk. As interest rates rise, bond prices fall, reducing the value of the Fund’s share price. Mortgage-backed securities involve more risk, including prepayment and extension risks, than other investments in fixed-income securities. The Fund may use derivatives, such as options and futures, which can be illiquid, may disproportionately increase losses and have a potentially large impact on Fund performance.
D | | U.S. Treasury Inflation-Protected Securities (“TIPS”) are inflation-indexed securities issued by the U.S. Treasury in 5-year, 10-year and 20-year maturities. The principal is adjusted to the Consumer Price Index, the commonly used measure of inflation. The coupon rate is constant, but generates a different amount of interest when multiplied by the inflation-adjusted principal. |
E | | Duration is the measure of the price sensitivity of a fixed-income security to an interest rate change of 100 basis points. Calculation is based on the weighted average of the present values for all cash flows. |
F | | The yield curve is the graphical depiction of the relationship between the yield on bonds of the same credit quality but different maturities. |
N/A—Not applicable.
132
Annual Report to Shareholders
Expense Example
Western Asset Limited Duration Bond Portfolio
As a shareholder of the Fund, you incur ongoing costs, including management fees and other Fund expenses. These examples are intended to help you understand your ongoing costs (in dollars) of investing in the Fund and to compare these costs with the ongoing costs of investing in other mutual funds.
Actual Expenses
The first line for each class in the table below provides information about actual account values and actual expenses for the Fund. You may use the information in this line, together with the amount you invested, to estimate the expenses that you paid over the period. Simply divide your account value by $1,000 (for example, an $8,600 account value divided by $1,000 = 8.6), then multiply the result by the number in the first line under the heading entitled “Expenses Paid During the Period” to estimate the expenses you paid on your account if your shares were held through the entire period. For the Institutional Class, the example is based on an investment of $1,000 invested on July 1, 2008 and held through December 31, 2008; for Institutional Select Class, the example is based on an investment of $1,000 invested on October 29, 2008 (commencement of operations) and held through December 31, 2008.
Hypothetical Example for Comparison Purposes
The second line for each class in the table below provides information about hypothetical account values and hypothetical expenses based on the Fund’s actual expense ratio and an assumed rate of return of 5% per year before expenses, which is not the Fund’s actual return. The hypothetical account values and expenses may not be used to estimate the actual ending account balance or expenses you paid for the period. You may use this information to compare the ongoing costs of investing in the Fund and other funds. To do so, compare this 5% hypothetical example with the 5% hypothetical examples that appear in the shareholder reports of other funds. Because each example is intended to be comparable to the examples provided by other funds, it is based on a hypothetical investment of $1,000 invested on July 1, 2008 and held through December 31, 2008 for each class, even though the Institutional Select Class did not begin operations until October 29, 2008.
| | | | | | | | | | | |
| | | Beginning
Account Value
7/1/08 | | | Ending
Account Value
12/31/08 | | Expenses PaidA
During the Period
7/1/08 to 12/31/08 | |
Institutional Class: | | | | | | | | | | | |
Actual | | $ | 1,000.00 | | | $ | 912.60 | | $ | 2.22 | |
Hypothetical (5% return before expenses) | | | 1,000.00 | | | | 1,022.84 | | | 2.35 | |
Institutional Select Class: | | | | | | | | | | | |
Actual | | $ | 1,000.00 | B | | $ | 990.40 | | $ | 0.70 | C |
Hypothetical (5% return before expenses) | | | 1,000.00 | | | | 1,023.19 | | | 2.04 | |
A | | These calculations are based on expenses incurred from July 1, 2008 to December 31, 2008. The dollar amounts shown as “Expenses Paid” are equal to the annualized expense ratio of 0.46% for the Institutional Class, multiplied by the average value over the period, multiplied by the number of days in the most recent half-year (184), and divided by 365. |
B | | Beginning account value is as of October 29, 2008 (commencement of operations). |
C | | This calculation is based on expenses incurred from October 29, 2008 (commencement of operations) to December 31, 2008. The dollar amount shown as “Expense Paid” is equal to the annualized expense ratio of 0.40% for the Institutional Select Class, multiplied by the average values over the period, multiplied by the number of days in the period (64) and divided by 365. |
133
Annual Report to Shareholders
Performance Information
Western Asset Limited Duration Bond Portfolio
The graph compares the Fund’s total returns to that of an appropriate broad-based securities market index. The line illustrates the cumulative total return of an initial $1,000,000 investment for the periods indicated. The line for the Fund represents the total return after deducting all Fund investment management and other administrative expenses and the transaction costs of buying and selling securities. The line representing the securities market index does not include any transaction costs associated with buying and selling securities in the index or other investment management or administrative expenses.
Due to the limited operating history of the Institutional Select Class, a performance graph is not presented. Institutional Select Class shares, which began operations on October 29, 2008, had a total return of -0.96% for the period ended December 31, 2008.
Total return measures investment performance in terms of appreciation or depreciation in the Fund’s net asset value per share, plus dividends and any capital gain distributions. It assumes that dividends and distributions were reinvested at the time they were paid. Returns (and the graph and table found below) do not reflect the deduction of taxes that a shareholder would pay on Fund distributions or the redemption of Fund shares. Average annual returns tend to smooth out variations in a fund’s return, so that they differ from actual year-to-year results.
Bonds are subject to a variety of risks, including interest rate, credit and inflation risk. Non-U.S. investments are subject to currency fluctuations, social, economical and political risk.
Growth of a $1,000,000 Investment—Institutional Class

The performance data quoted represent past performance and do not guarantee future results. The performance stated may have been due to extraordinary market conditions, which may not be duplicated in the future. Current performance may be lower or higher than the performance data quoted. To obtain the most recent month-end performance information, please visit www.westernassetfunds.com. The investment return and principal value of the Fund will fluctuate so that an investor’s shares, when redeemed, may be worth more or less than the original cost. Calculations assume reinvestment of dividends and capital gain distributions. Performance would have been lower if fees had not been waived in various periods.
A | | Index returns are for periods beginning September 30, 2003. |
134
Annual Report to Shareholders
Portfolio Composition (as of December 31, 2008)B
Standard & Poor’s Debt RatingsC (as a percentage of the portfolio)
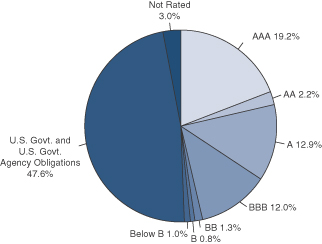
Maturity Schedule (as a percentage of the portfolio)
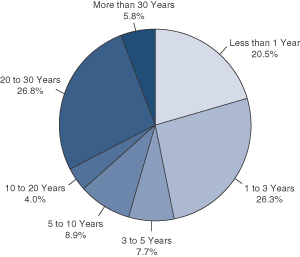
B | | The pie charts above represent the composition of the Fund’s portfolio as of December 31, 2008 and do not include derivatives such as Futures Contracts, Options Written, and Swaps. The Fund is actively managed. As a result, the composition of the portfolio holdings and sectors are subject to change at any time. |
C | | Standard & Poor’s Ratings Service provides capital markets with credit ratings for the evaluation and assessment of credit risk. These ratings are the opinions of S&P and not absolute measures of quality or guarantees of performance. |
135
Annual Report to Shareholders
Spread Duration
Western Asset Limited Duration Bond Portfolio
December 31, 2008
Economic Exposure
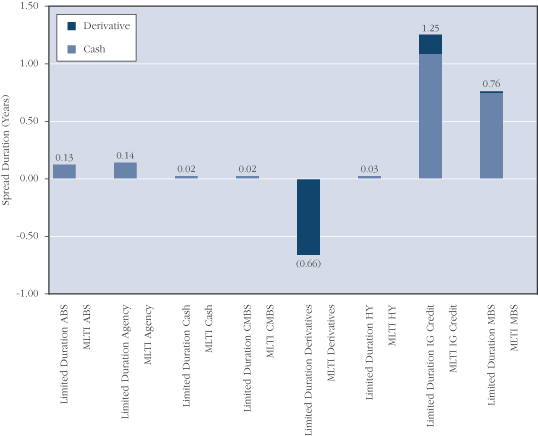
Spread duration is defined as the change in value for a 100 basis point change in the spread relative to Treasuries. The spread over Treasuries is the annual risk-premium demanded by investors to hold non-Treasury securities. This chart highlights the market sector exposure of the Fund’s portfolio and the exposure relative to the selected benchmark as of the end of the reporting period.
136
ABS—Asset Backed Security
MLTI—Merrill Lynch 1-3 Year Treasury Index
CMBS—Commercial Mortgage Backed Securities
HY—High Yield
IG Credit—Investment Grade Credit
MBS—Mortgage Backed Securities
Annual Report to Shareholders
Effective Duration
Western Asset Limited Duration Bond Portfolio
December 31, 2008
Interest Rate Exposure
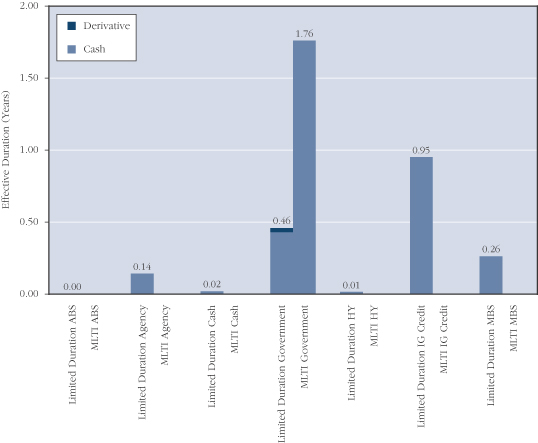
Effective duration is defined as the change in value for a 100 basis point change in Treasury yields. This chart highlights the interest rate exposure of the Fund’s portfolio relative to the selected benchmark as of the end of the reporting period.
ABS—Asset Backed Security
MLTI—Merrill Lynch 1-3 Year Treasury Index
HY—High Yield
IG Credit—Investment Grade Credit
MBS—Mortgage Backed Securities
137
Annual Report to Shareholders
Portfolio of Investments
Western Asset Limited Duration Bond Portfolio
December 31, 2008
| | | | | | | | | | | | | |
| | | % OF
NET ASSETS | | RATE | | MATURITY
DATE | | PAR/
SHARES | | VALUE | |
| | | | | | | | | | | | | |
Long-Term Securities | | 94.6% | | | | | | | | | | | |
| | | | | |
Corporate Bonds and Notes | | 28.6% | | | | | | | | | | | |
| | | | | |
Aerospace and Defense | | 0.3% | | | | | | | | | | | |
United Technologies Corp. | | | | 5.375% | | 12/15/17 | | $ | 240,000 | | $ | 242,615 | |
| | | | | | | | | | | | | |
| | | | | |
Air Freight and Logistics | | 0.3% | | | | | | | | | | | |
United Parcel Service Inc. | | | | 4.500% | | 1/15/13 | | | 200,000 | | | 206,308 | |
| | | | | | | | | | | | | |
| | | | | |
Airlines | | 1.2% | | | | | | | | | | | |
Continental Airlines Inc. | | | | 7.056% | | 9/15/09 | | | 50,000 | | | 48,000 | |
Continental Airlines Inc. | | | | 6.900% | | 1/2/18 | | | 305,169 | | | 244,135 | |
Continental Airlines Inc. | | | | 6.545% | | 8/2/20 | | | 275,658 | | | 220,526 | |
Continental Airlines Inc. | | | | 6.703% | | 6/15/21 | | | 199,128 | | | 149,346 | |
Northwest Airlines Inc. | | | | 2.968% | | 5/20/14 | | | 439,302 | | | 307,511 | A |
| | | | | | | | | | | | | |
| | | | | | | | | | | | 969,518 | |
| | | | | | | | | | | | | |
Capital Markets | | 2.6% | | | | | | | | | | | |
Goldman Sachs Capital II | | | | 5.793% | | 12/29/49 | | | 1,440,000 | | | 553,569 | B |
Lehman Brothers Holdings Capital Trust VII | | | | 5.857% | | 11/29/49 | | | 570,000 | | | 57 | B,C,Q |
Lehman Brothers Holdings Inc. | | | | 6.500% | | 7/19/17 | | | 200,000 | | | 20 | C,Q |
Merrill Lynch and Co. Inc. | | | | 6.050% | | 8/15/12 | | | 400,000 | | | 394,632 | |
Merrill Lynch and Co. Inc. | | | | 6.150% | | 4/25/13 | | | 450,000 | | | 445,900 | |
Morgan Stanley | | | | 6.600% | | 4/1/12 | | | 200,000 | | | 193,358 | |
The Bear Stearns Cos. Inc. | | | | 6.400% | | 10/2/17 | | | 230,000 | | | 239,011 | |
The Goldman Sachs Group Inc. | | | | 6.600% | | 1/15/12 | | | 210,000 | | | 207,200 | |
| | | | | | | | | | | | | |
| | | | | | | | | | | | 2,033,747 | |
| | | | | | | | | | | | | |
Chemicals | | 0.1% | | | | | | | | | | | |
The Dow Chemical Co. | | | | 5.700% | | 5/15/18 | | | 60,000 | | | 53,304 | |
| | | | | | | | | | | | | |
| | | | | |
Commercial Banks | | 3.5% | | | | | | | | | | | |
HSBC Bank PLC | | | | 7.333% | | 7/20/12 | | | 500,000 | | | 252,500 | A,D |
HSBC Bank PLC | | | | 7.468% | | 8/20/12 | | | 40,000 | | | 21,468 | A |
Keycorp | | | | 2.646% | | 12/15/10 | | | 1,300,000 | | | 1,304,772 | A |
SunTrust Capital VIII | | | | 6.100% | | 12/15/36 | | | 60,000 | | | 42,241 | B |
Wachovia Capital Trust III | | | | 5.800% | | 3/15/42 | | | 1,270,000 | | | 749,300 | B |
Wells Fargo Capital X | | | | 5.950% | | 12/15/36 | | | 150,000 | | | 128,557 | B |
Wells Fargo Capital XIII | | | | 7.700% | | 12/29/49 | | | 290,000 | | | 239,340 | B |
| | | | | | | | | | | | | |
| | | | | | | | | | | | 2,738,178 | |
| | | | | | | | | | | | | |
138
Annual Report to Shareholders
| | | | | | | | | | | | | |
| | | % OF
NET ASSETS | | RATE | | MATURITY
DATE | | PAR/
SHARES | | VALUE | |
| | | | | | | | | | | | | |
Corporate Bonds and Notes—Continued | | | | | | | | | | | | | |
| | | | | |
Consumer Finance | | 2.6% | | | | | | | | | | | |
American Express Bank FSB | | | | 3.150% | | 12/9/11 | | $ | 1,300,000 | | $ | 1,310,349 | |
American Express Co. | | | | 6.800% | | 9/1/66 | | | 300,000 | | | 155,295 | B |
GMAC LLC | | | | 7.500% | | 12/31/13 | | | 153,000 | | | 111,690 | D |
GMAC LLC | | | | 8.000% | | 12/31/18 | | | 127,500 | | | 63,750 | D |
Nelnet Inc. | | | | 7.400% | | 9/29/36 | | | 280,000 | | | 83,957 | B |
SLM Corp. | | | | 8.450% | | 6/15/18 | | | 420,000 | | | 332,061 | |
| | | | | | | | | | | | | |
| | | | | | | | | | | | 2,057,102 | |
| | | | | | | | | | | | | |
Diversified Financial Services | | 7.2% | | | | | | | | | | | |
AGFC Capital Trust I | | | | 6.000% | | 1/15/67 | | | 630,000 | | | 150,474 | B,D |
Bank of America Corp. | | | | 8.000% | | 12/29/49 | | | 300,000 | | | 215,786 | B |
Capmark Financial Group Inc. | | | | 5.875% | | 5/10/12 | | | 300,000 | | | 102,297 | E |
Citigroup Inc. | | | | 5.000% | | 9/15/14 | | | 500,000 | | | 439,791 | |
General Electric Capital Corp. | | | | 5.000% | | 12/1/10 | | | 270,000 | | | 274,403 | |
General Electric Capital Corp. | | | | 3.000% | | 12/9/11 | | | 1,500,000 | | | 1,550,775 | |
General Electric Capital Corp. | | | | 3.116% | | 12/9/11 | | | 1,200,000 | | | 1,220,376 | A |
General Electric Capital Corp. | | | | 6.375% | | 11/15/67 | | | 450,000 | | | 282,856 | B |
IBM International Group Capital LLC | | | | 5.050% | | 10/22/12 | | | 540,000 | | | 563,454 | |
JPMorgan Chase Bank NA | | | | 5.085% | | 2/11/11 | | | 805,000 | | | 673,008 | A |
TNK-BP Finance SA | | | | 7.500% | | 3/13/13 | | | 110,000 | | | 68,200 | D |
ZFS Finance USA Trust III | | | | 3.146% | | 12/15/65 | | | 540,000 | | | 163,350 | A,D |
| | | | | | | | | | | | | |
| | | | | | | | | | | | 5,704,770 | |
| | | | | | | | | | | | | |
Diversified Telecommunication Services | | 0.3% | | | | | | | | | | | |
Qwest Corp. | | | | 8.875% | | 3/15/12 | | | 130,000 | | | 120,250 | |
Verizon Communications Inc. | | | | 8.750% | | 11/1/18 | | | 120,000 | | | 140,787 | |
| | | | | | | | | | | | | |
| | | | | | | | | | | | 261,037 | |
| | | | | | | | | | | | | |
Electric Utilities | | 0.7% | | | | | | | | | | | |
FirstEnergy Corp. | | | | 6.450% | | 11/15/11 | | | 110,000 | | | 103,978 | |
Ohio Edison Co. Credit Linked Certificate Trust | | | | 5.647% | | 6/15/09 | | | 20,000 | | | 19,573 | D,E |
Pacific Gas and Electric Co. | | | | 4.800% | | 3/1/14 | | | 400,000 | | | 392,822 | |
| | | | | | | | | | | | | |
| | | | | | | | | | | | 516,373 | |
| | | | | | | | | | | | | |
Health Care Equipment and Supplies | | 0.2% | | | | | | | | | | | |
Hospira Inc. | | | | 5.550% | | 3/30/12 | | | 200,000 | | | 189,494 | |
| | | | | | | | | | | | | |
| | | | | |
Health Care Providers and Services | | 0.3% | | | | | | | | | | | |
Quest Diagnostics Inc. | | | | 5.125% | | 11/1/10 | | | 180,000 | | | 174,722 | |
UnitedHealth Group Inc. | | | | 4.875% | | 2/15/13 | | | 110,000 | | | 102,699 | |
| | | | | | | | | | | | | |
| | | | | | | | | | | | 277,421 | |
| | | | | | | | | | | | | |
139
Annual Report to Shareholders
Portfolio of Investments—Continued
Western Asset Limited Duration Bond Portfolio—Continued
| | | | | | | | | | | | | |
| | | % OF
NET ASSETS | | RATE | | MATURITY
DATE | | PAR/
SHARES | | VALUE | |
| | | | | | | | | | | | | |
Corporate Bonds and Notes—Continued | | | | | | | | | | | | | |
IT Services | | 0.9% | | | | | | | | | | | |
Electronic Data Systems Corp. | | | | 7.125% | | 10/15/09 | | $ | 690,000 | | $ | 701,471 | |
| | | | | | | | | | | | | |
| | | | | |
Leisure Equipment and Products | | N.M. | | | | | | | | | | | |
Eastman Kodak Co. | | | | 7.250% | | 11/15/13 | | | 10,000 | | | 6,450 | |
| | | | | | | | | | | | | |
| | | | | |
Media | | 2.4% | | | | | | | | | | | |
Clear Channel Communications Inc. | | | | 4.250% | | 5/15/09 | | | 760,000 | | | 668,800 | |
Comcast Cable Communications Inc. | | | | 6.875% | | 6/15/09 | | | 300,000 | | | 301,406 | |
Comcast Cable Communications Inc. | | | | 6.750% | | 1/30/11 | | | 200,000 | | | 200,760 | |
The Walt Disney Co. | | | | 4.700% | | 12/1/12 | | | 160,000 | | | 164,669 | |
Time Warner Cable Inc. | | | | 8.250% | | 2/14/14 | | | 140,000 | | | 142,025 | |
Time Warner Inc. | | | | 5.500% | | 11/15/11 | | | 400,000 | | | 375,846 | |
| | | | | | | | | | | | | |
| | | | | | | | | | | | 1,853,506 | |
| | | | | | | | | | | | | |
Multi-Utilities | | 0.5% | | | | | | | | | | | |
Dominion Resources Inc. | | | | 4.750% | | 12/15/10 | | | 400,000 | | | 395,515 | |
| | | | | | | | | | | | | |
| | | | | |
Multiline Retail | | 0.1% | | | | | | | | | | | |
Federated Retail Holdings Inc. | | | | 5.350% | | 3/15/12 | | | 150,000 | | | 111,416 | |
| | | | | | | | | | | | | |
| | | | | |
Office Electronics | | 0.2% | | | | | | | | | | | |
Xerox Corp. | | | | 5.500% | | 5/15/12 | | | 170,000 | | | 142,468 | |
| | | | | | | | | | | | | |
| | | | | |
Oil, Gas and Consumable Fuels | | 3.1% | | | | | | | | | | | |
Devon Financing Corp. ULC | | | | 6.875% | | 9/30/11 | | | 260,000 | | | 262,382 | |
El Paso Natural Gas Co. | | | | 5.950% | | 4/15/17 | | | 370,000 | | | 294,010 | |
Energy Transfer Partners LP | | | | 9.700% | | 3/15/19 | | | 90,000 | | | 92,737 | |
Hess Corp. | | | | 6.650% | | 8/15/11 | | | 420,000 | | | 419,833 | |
Kinder Morgan Energy Partners LP | | | | 6.750% | | 3/15/11 | | | 310,000 | | | 301,519 | |
Occidental Petroleum Corp. | | | | 7.000% | | 11/1/13 | | | 540,000 | | | 589,380 | |
Pemex Project Funding Master Trust | | | | 2.820% | | 12/3/12 | | | 220,000 | | | 183,700 | A,D |
XTO Energy Inc. | | | | 5.650% | | 4/1/16 | | | 290,000 | | | 266,066 | |
| | | | | | | | | | | | | |
| | | | | | | | | | | | 2,409,627 | |
| | | | | | | | | | | | | |
| | | | | |
Real Estate Investment Trusts (REITs) | | 0.4% | | | | | | | | | | | |
iStar Financial Inc. | | | | 2.336% | | 9/15/09 | | | 300,000 | | | 171,000 | A |
iStar Financial Inc. | | | | 5.650% | | 9/15/11 | | | 500,000 | | | 160,000 | |
| | | | | | | | | | | | | |
| | | | | | | | | | | | 331,000 | |
| | | | | | | | | | | | | |
140
Annual Report to Shareholders
| | | | | | | | | | | | | |
| | | % OF
NET ASSETS | | RATE | | MATURITY
DATE | | PAR/
SHARES | | VALUE | |
| | | | | | | | | | | | | |
Corporate Bonds and Notes—Continued | | | | | | | | | | | | | |
Thrifts and Mortgage Finance | | 0.8% | | | | | | | | | | | |
Countrywide Financial Corp. | | | | 1.686% | | 3/24/09 | | $ | 570,000 | | $ | 565,363 | A |
Countrywide Financial Corp. | | | | 5.800% | | 6/7/12 | | | 60,000 | | | 58,479 | |
| | | | | | | | | | | | | |
| | | | | | | | | | | | 623,842 | |
| | | | | | | | | | | | | |
Tobacco | | 0.4% | | | | | | | | | | | |
Philip Morris International Inc. | | | | 4.875% | | 5/16/13 | | | 300,000 | | | 300,859 | |
| | | | | | | | | | | | | |
| | | | | |
Wireless Telecommunication Services | | 0.5% | | | | | | | | | | | |
Vodafone Group PLC | | | | 5.350% | | 2/27/12 | | | 400,000 | | | 394,900 | |
| | | | | | | | | | | | | |
Total Corporate Bonds and Notes
(Cost—$27,664,764) | | | | | | | | | | | | 22,520,921 | |
Asset-Backed Securities | | 9.3% | | | | | | | | | | | |
| | | | | |
Fixed Rate Securities | | 1.7% | | | | | | | | | | | |
Countryplace Manufactured Housing Contract Trust 2007-1 A1 | | | | 5.484% | | 7/15/37 | | | 28,281 | | | 27,870 | D |
Countryplace Manufactured Housing Contract Trust 2007-1 A2 | | | | 5.232% | | 7/15/37 | | | 500,000 | | | 439,928 | D |
Drive Auto Receivables Trust 2006-1 A4 | | | | 5.540% | | 12/16/13 | | | 600,000 | | | 552,209 | D |
Prestige Auto Receivables Trust 2005-1A | | | | 4.370% | | 6/16/12 | | | 67,437 | | | 61,771 | D |
UCFC Home Equity Loan 1998-D | | | | 6.905% | | 4/15/30 | | | 33,160 | | | 32,746 | |
Wells Fargo Financial Auto Owner Trust 2005-A A4 | | | | 4.280% | | 5/15/12 | | | 262,502 | | | 255,520 | |
| | | | | | | | | | | | | |
| | | | | | | | | | | | 1,370,044 | |
| | | | | | | | | | | | | |
Indexed SecuritiesA | | 6.9% | | | | | | | | | | | |
AESOP Funding II LLC 2004-2A | | | | 0.728% | | 4/20/10 | | | 333,337 | | | 316,906 | D |
Ameriquest Mortgage Securities Inc. 2005-R11 A2D | | | | 0.801% | | 1/25/36 | | | 240,000 | | | 143,112 | |
Asset Backed Funding Certificates 2004-OPT2 M1 | | | | 1.021% | | 8/25/33 | | | 180,000 | | | 108,841 | |
Asset Backed Securities Corp. Home Equity Loan Trust 2005-HE5 A1 | | | | 0.631% | | 6/25/35 | | | 140,757 | | | 136,105 | |
Bayview Financial Acquisition Trust 2004-C | | | | 1.101% | | 5/28/44 | | | 69,540 | | | 53,168 | |
Bayview Financial Acquisition Trust 2006-D 2A4 | | | | 0.751% | | 12/28/36 | | | 529,789 | | | 308,390 | |
Bear Stearns Asset-Backed Securities Inc. 2005-AQ2 | | | | 0.741% | | 9/25/35 | | | 64,454 | | | 63,156 | |
Bear Stearns Asset-Backed Securities Inc. 2007-SD2 2A1 | | | | 0.871% | | 9/25/46 | | | 339,679 | | | 231,989 | |
Bear Stearns Asset-Backed Securities Trust 2006-SD2 | | | | 0.671% | | 6/25/36 | | | 287,665 | | | 245,216 | |
141
Annual Report to Shareholders
Portfolio of Investments—Continued
Western Asset Limited Duration Bond Portfolio—Continued
| | | | | | | | | | | | | |
| | | % OF
NET ASSETS | | RATE | | MATURITY
DATE | | PAR/
SHARES | | VALUE | |
| | | | | | | | | | | | | |
Asset-Backed Securities—Continued | | | | | | | | | | | | | |
| | | | | |
Indexed Securities—Continued | | | | | | | | | | | | | |
Countrywide Asset-Backed Certificates 2007-SE1 1A1 | | | | 1.021% | | 5/25/47 | | $ | 847,652 | | $ | 504,244 | D |
Countrywide Home Equity Loan Trust 2004-O | | | | 1.475% | | 2/15/34 | | | 54,149 | | | 15,853 | |
Ellington Loan Acquisition Trust 2007-1 A2A1 | | | | 1.471% | | 5/26/37 | | | 258,951 | | | 225,299 | D |
MASTR Specialized Loan Trust 2006-3 A | | | | 0.731% | | 6/25/46 | | | 489,698 | | | 336,109 | D |
Morgan Stanley Mortgage Loan Trust 2006-12XS | | | | 0.591% | | 10/25/36 | | | 213,851 | | | 183,022 | |
Nelnet Student Loan Trust 2008-4 A4 | | | | 5.015% | | 4/25/24 | | | 1,090,000 | | | 883,046 | |
Origen Manufactured Housing 2006-A | | | | 1.345% | | 11/15/18 | | | 443,028 | | | 368,902 | |
Residential Asset Securities Corp. 2006-KS1 A4 | | | | 0.771% | | 2/25/36 | | | 310,000 | | | 189,375 | |
SACO I Trust 2006-3 A3 | | | | 0.701% | | 4/25/36 | | | 739,170 | | | 127,501 | |
SLM Student Loan Trust 2007-6 A1 | | | | 3.705% | | 4/27/15 | | | 431,066 | | | 421,692 | |
Specialty Underwriting & Residential Finance Trust 2001-BC4 M1 | | | | 1.071% | | 11/25/34 | | | 240,000 | | | 147,404 | |
Superior Wholesale Inventory Financing Trust 2004-A10 | | | | 1.295% | | 9/15/11 | | | 500,000 | | | 412,938 | |
| | | | | | | | | | | | | |
| | | | | | | | | | | | 5,422,268 | |
| | | | | | | | | | | | | |
Variable Rate SecuritiesG | | 0.7% | | | | | | | | | | | |
Green Tree 2008-MH1 A1 | | | | 7.000% | | 4/25/38 | | | 580,389 | | | 507,840 | D |
| | | | | | | | | | | | | |
Total Asset-Backed Securities (Cost—$9,692,399) | | | | | | | | | | | | 7,300,152 | |
Mortgage-Backed Securities | | 8.2% | | | | | | | | | | | |
| | | | | |
Fixed Rate Securities | | 0.6% | | | | | | | | | | | |
Residential Asset Mortgage Products Inc. 2004-SL1 | | | | 7.000% | | 11/25/31 | | | 97,977 | | | 98,433 | |
Residential Asset Mortgage Products Inc. 2004-SL2 | | | | 8.500% | | 10/25/31 | | | 23,496 | | | 23,977 | |
Residential Asset Mortgage Products Inc. 2005-SL1 | | | | 8.000% | | 5/25/32 | | | 462,857 | | | 325,592 | |
| | | | | | | | | | | | | |
| | | | | | | | | | | | 448,002 | |
| | | | | | | | | | | | | |
Indexed SecuritiesA | | 5.5% | | | | | | | | | | | |
American Home Mortgage Investment Trust 2005-SD1 | | | | 0.921% | | 9/25/35 | | | 401,268 | | | 167,202 | D |
Banc of America Mortgage Securities 2003-D | | | | 4.569% | | 5/25/33 | | | 128,556 | | | 90,586 | |
Bayview Commercial Asset Trust 2005-2A A2 | | | | 0.821% | | 8/25/35 | | | 320,013 | | | 251,158 | D |
Bear Stearns ARM Trust 2004-10 | | | | 5.042% | | 1/25/35 | | | 223,864 | | | 164,386 | |
Bear Stearns Second Lien Trust 2007-SV1A A1 | | | | 0.691% | | 12/25/36 | | | 290,837 | | | 182,046 | D |
CBA Commercial Small Balance Commercial Trust 2005-1A | | | | 0.791% | | 7/25/35 | | | 318,877 | | | 159,438 | D |
Citigroup Mortgage Loan Trust Inc. 2005-5 | | | | 5.441% | | 8/25/35 | | | 236,250 | | | 125,593 | |
Countrywide Alternative Loan Trust 2005-51 2A1 | | | | 0.808% | | 11/20/35 | | | 273,690 | | | 127,014 | |
Countrywide Asset-Backed Certificates 2005-IM1 | | | | 0.751% | | 11/25/35 | | | 261,692 | | | 221,068 | |
142
Annual Report to Shareholders
| | | | | | | | | | | | | |
| | | % OF
NET ASSETS | | RATE | | MATURITY
DATE | | PAR/
SHARES | | VALUE | |
| | | | | | | | | | | | | |
Mortgage-Backed Securities—Continued | | | | | | | | | | | | | |
| | | | | |
Indexed Securities—Continued | | | | | | | | | | | | | |
Countrywide Home Loans 2005-R3 | | | | 0.871% | | 9/25/35 | | $ | 468,799 | | $ | 359,617 | D |
Crusade Global Trust 2003-2 | | | | 2.038% | | 9/18/34 | | | 38,492 | | | 37,244 | H |
CS First Boston Mortgage Securities Corp. 2004-AR5 7A2 | | | | 4.604% | | 6/25/34 | | | 281,508 | | | 206,474 | |
CS First Boston Mortgage Securities Corp. 2004-AR6 1A1 | | | | 4.338% | | 10/25/34 | | | 167,426 | | | 124,292 | |
First Horizon Alternative Mortgage Securities 2004-AA4 A1 | | | | 5.386% | | 10/25/34 | | | 212,646 | | | 97,147 | |
Greenpoint Mortgage Funding Trust 2006-AR7 1A1B | | | | 0.591% | | 12/25/46 | | | 339,206 | | | 186,475 | |
GSMPS Mortgage Loan Trust 2005-RP3 | | | | 0.821% | | 9/25/35 | | | 374,809 | | | 294,408 | D |
Luminent Mortgage Trust 2006-7 2A2 | | | | 0.691% | | 12/25/36 | | | 1,061,134 | | | 240,316 | |
MASTR Specialized Loan Trust 2006-2 | | | | 0.731% | | 2/25/36 | | | 292,409 | | | 218,795 | D |
Medallion Trust 2003-1G | | | | 1.715% | | 12/21/33 | | | 43,266 | | | 33,898 | H |
MLCC Mortgage Investors Inc. 2003-H | | | | 4.401% | | 1/25/29 | | | 15,924 | | | 9,807 | |
Sequoia Mortgage Trust 2003-2 A2 | | | | 4.859% | | 6/20/33 | | | 24,350 | | | 18,854 | |
Wachovia Mortgage Loan Trust LLC 2005-A | | | | 5.405% | | 8/20/35 | | | 152,165 | | | 62,720 | |
WaMu Mortgage Pass Through Certificates 2003-AR8 A | | | | 4.282% | | 8/25/33 | | | 220,437 | | | 164,426 | |
WaMu Mortgage Pass-Through Certificates 2005-AR19 | | | | 0.881% | | 12/25/45 | | | 484,772 | | | 152,670 | |
WaMu Mortgage Pass-Through Certificates 2006-AR4 DA | | | | 3.449% | | 6/25/46 | | | 460,567 | | | 147,382 | |
WaMu Mortgage Pass-Through Certificates 2007-HY7 1A1 | | | | 5.642% | | 7/25/37 | | | 370,244 | | | 203,632 | |
Zuni Mortgage Loan Trust 2006-OA1 | | | | 0.601% | | 8/25/36 | | | 294,975 | | | 279,619 | |
| | | | | | | | | | | | | |
| | | | | | | | | | | | 4,326,267 | |
| | | | | | | | | | | | | |
Variable Rate SecuritiesG | | 2.1% | | | | | | | | | | | |
Banc of America Funding Corp. 2004-B | | | | 5.258% | | 12/20/34 | | | 81,308 | | | 49,339 | |
Citigroup Mortgage Loan Trust Inc. 2007-AR8 1A1A | | | | 5.727% | | 8/25/47 | | | 537,389 | | | 282,393 | |
IndyMac INDX Mortgage Loan Trust 2004-AR15 | | | | 6.476% | | 2/25/35 | | | 184,330 | | | 78,056 | |
Merrill Lynch Mortgage Investors Trust 2004-A1 2A1 | | | | 4.851% | | 2/25/34 | | | 264,421 | | | 215,526 | |
Prime Mortgage Trust 2005-2 | | | | 7.399% | | 10/25/32 | | | 109,985 | | | 76,474 | |
Small Business Administration Series 2004-2 | | | | 4.830% | | 9/25/18 | | | 304,705 | | | 313,957 | |
Structured Adjustable Rate Mortgage Loan Trust 2005-12 3A1 | | | | 5.677% | | 6/25/35 | | | 320,809 | | | 219,627 | |
143
Annual Report to Shareholders
Portfolio of Investments—Continued
Western Asset Limited Duration Bond Portfolio—Continued
| | | | | | | | | | | | | |
| | | % OF
NET ASSETS | | RATE | | MATURITY
DATE | | PAR/
SHARES | | VALUE | |
| | | | | | | | | | | | | |
Mortgage-Backed Securities—Continued | | | | | | | | | | | | | |
| | | | | |
Variable Rate Securities—Continued | | | | | | | | | | | | | |
Structured Asset Securities Corp. 2003-22A 3A | | | | 4.689% | | 6/25/33 | | $ | 573,874 | | $ | 402,810 | |
Structured Asset Securities Corp. 2004-SC1 | | | | 9.240% | | 12/25/29 | | | 73,371 | | | 59,713 | D |
| | | | | | | | | | | | | |
| | | | | | | | | | | | 1,697,895 | |
| | | | | | | | | | | | | |
Total Mortgage-Backed Securities
(Cost—$10,780,618) | | | | | | | | | | | | 6,472,164 | |
U.S. Government and Agency Obligations | | 21.2% | | | | | | | | | | | |
| | | | | |
Fixed Rate Securities | | 14.5% | | | | | | | | | | | |
Fannie Mae | | | | 4.750% | | 3/12/10 | | | 4,750,000 | | | 4,948,312 | I |
Federal Home Loan Bank | | | | 5.000% | | 2/20/09 | | | 320,000 | | | 321,998 | |
Federal Home Loan Bank | | | | 2.450% | | 5/4/09 | | | 1,600,000 | | | 1,611,584 | |
Federal Home Loan Bank | | | | 4.500% | | 10/9/09 | | | 3,000,000 | | | 3,090,291 | |
Federal Home Loan Bank | | | | 3.500% | | 12/10/10 | | | 770,000 | | | 802,682 | |
Freddie Mac | | | | 5.125% | | 8/23/10 | | | 260,000 | | | 276,888 | I |
Freddie Mac | | | | 5.000% | | 10/18/10 | | | 300,000 | | | 319,382 | I |
| | | | | | | | | | | | | |
| | | | | | | | | | | | 11,371,137 | |
| | | | | | | | | | | | | |
Treasury Inflation-Protected SecuritiesJ | | 6.7% | | | | | | | | | | | |
United States Treasury Inflation-Protected Security | | | | 0.875% | | 4/15/10 | | | 1,841,148 | | | 1,730,392 | |
United States Treasury Inflation-Protected Security | | | | 1.875% | | 7/15/15 | | | 111,380 | | | 105,211 | |
United States Treasury Inflation-Protected Security | | | | 2.500% | | 7/15/16 | | | 750,925 | | | 744,999 | K |
United States Treasury Inflation-Protected Security | | | | 2.375% | | 1/15/17 | | | 1,160,222 | | | 1,151,067 | K |
United States Treasury Inflation-Protected Security | | | | 2.375% | | 1/15/25 | | | 1,091,864 | | | 1,073,096 | K |
United States Treasury Inflation-Protected Security | | | | 3.875% | | 4/15/29 | | | 395,352 | | | 488,291 | K |
| | | | | | | | | | | | | |
| | | | | | | | | | | | 5,293,056 | |
| | | | | | | | | | | | | |
Total U.S. Government and Agency Obligations (Cost—$16,562,482) | | | | | | | | | | | | 16,664,193 | |
U.S. Government Agency Mortgage-Backed Securities | | 18.0% | | | | | | | | | | | |
| | | | | |
Fixed Rate Securities | | 9.3% | | | | | | | | | | | |
Fannie Mae | | | | 5.000% | | 12/1/23 | | | 300,000 | | | 307,875 | I,L |
Fannie Mae | | | | 5.500% | | 12/1/23 | | | 600,000 | | | 617,813 | I,L |
144
Annual Report to Shareholders
| | | | | | | | | | | | | |
| | | % OF
NET ASSETS | | RATE | | MATURITY
DATE | | PAR/
SHARES | | VALUE | |
| | | | | | | | | | | | | |
U.S. Government Agency Mortgage-Backed Securities—Continued | | | | | | | | | | | | | |
| | | | | |
Fixed Rate Securities—Continued | | | | | | | | | | | | | |
Fannie Mae | | | | 5.000% | | 6/1/35 to 2/1/38 | | $ | 1,076,172 | | $ | 1,100,693 | I |
Fannie Mae | | | | 6.000% | | 7/1/38 | | | 1,456,225 | | | 1,500,656 | I |
Fannie Mae | | | | 6.000% | | 12/1/38 | | | 3,200,000 | | | 3,294,000 | I,L |
Freddie Mac | | | | 5.000% | | 12/1/38 | | | 100,000 | | | 102,187 | I,L |
Freddie Mac | | | | 6.000% | | 12/1/38 | | | 300,000 | | | 309,000 | I,L |
Government National Mortgage Association | | | | 5.000% | | 8/15/33 | | | 58,449 | | | 60,181 | |
| | | | | | | | | | | | | |
| | | | | | | | | | | | 7,292,405 | |
| | | | | | | | | | | | | |
Indexed SecuritiesA | | 8.7% | | | | | | | | | | | |
Fannie Mae | | | | 4.211% | | 12/1/34 | | | 104,230 | | | 104,035 | I |
Fannie Mae | | | | 4.231% | | 12/1/34 | | | 93,990 | | | 93,731 | I |
Fannie Mae | | | | 4.329% | | 1/1/35 | | | 125,331 | | | 121,233 | I |
Fannie Mae | | | | 4.851% | | 1/1/35 | | | 205,627 | | | 209,209 | I |
Fannie Mae | | | | 4.795% | | 2/1/35 | | | 467,434 | | | 472,978 | I |
Fannie Mae | | | | 4.542% | | 3/1/35 | | | 209,829 | | | 209,953 | I |
Fannie Mae | | | | 5.040% | | 3/1/35 | | | 370,008 | | | 375,267 | I |
Fannie Mae | | | | 5.502% | | 7/1/37 | | | 2,416,622 | | | 2,465,744 | I |
Freddie Mac | | | | 4.101% | | 1/1/35 | | | 30,748 | | | 30,253 | I |
Freddie Mac | | | | 4.509% | | 1/1/35 | | | 156,858 | | | 157,200 | I |
Freddie Mac | | | | 6.213% | | 12/1/36 | | | 2,536,844 | | | 2,601,514 | I |
| | | | | | | | | | | | | |
| | | | | | | | | | | | 6,841,117 | |
| | | | | | | | | | | | | |
Total U.S. Government Agency Mortgage-Backed Securities (Cost—$13,930,521) | | | | | | | | | | | | 14,133,522 | |
Yankee BondsH | | 9.3% | | | | | | | | | | | |
| | | | | |
Beverages | | 0.3% | | | | | | | | | | | |
Diageo Capital PLC | | | | 5.200% | | 1/30/13 | | | 210,000 | | | 206,644 | |
| | | | | | | | | | | | | |
| | | | | |
Capital Markets | | 0.7% | | | | | | | | | | | |
Deutsche Bank AG | | | | 6.000% | | 9/1/17 | | | 500,000 | | | 530,527 | |
| | | | | | | | | | | | | |
| | | | | |
Commercial Banks | | 1.9% | | | | | | | | | | | |
Glitnir Banki Hf | | | | 5.815% | | 1/21/11 | | | 720,000 | | | 34,200 | A,C,D,Q |
HSBC Bank PLC | | | | 7.718% | | 8/20/12 | | | 40,000 | | | 21,660 | A |
Kaupthing Bank Hf | | | | 5.750% | | 10/4/11 | | | 290,000 | | | 17,400 | C,D,Q |
Kaupthing Bank Hf | | | | 7.625% | | 2/28/15 | | | 700,000 | | | 42,000 | C,D,F,Q |
Landsbanki Islands Hf | | | | 6.100% | | 8/25/11 | | | 410,000 | | | 7,175 | C,D,Q |
Landsbanki Islands Hf | | | | 7.431% | | 10/19/17 | | | 140,000 | | | 21 | B,C,D,Q |
Resona Preferred Global Securities | | | | 7.191% | | 12/29/49 | | | 360,000 | | | 171,392 | B,D |
145
Annual Report to Shareholders
Portfolio of Investments—Continued
Western Asset Limited Duration Bond Portfolio—Continued
| | | | | | | | | | | | | |
| | | % OF
NET ASSETS | | RATE | | MATURITY
DATE | | PAR/
SHARES | | VALUE | |
| | | | | | | | | | | | | |
Yankee Bonds—Continued | | | | | | | | | | | | | |
| | | | | |
Commercial Banks—Continued | | | | | | | | | | | | | |
Royal Bank of Scotland PLC | | | | 3.000% | | 12/9/11 | | $ | 710,000 | | $ | 725,775 | D |
Shinsei Finance Cayman Ltd. | | | | 6.418% | | 1/29/49 | | | 410,000 | | | 85,752 | B,D |
TuranAlem Finance BV | | | | 5.434% | | 1/22/09 | | | 130,000 | | | 122,200 | A,D |
VTB Capital SA for Vneshtorgbank | | | | 4.559% | | 11/2/09 | | | 280,000 | | | 245,143 | A,D |
| | | | | | | | | | | | | |
| | | | | | | | | | | | 1,472,718 | |
| | | | | | | | | | | | | |
Diversified Financial Services | | 0.9% | | | | | | | | | | | |
Aiful Corp. | | | | 5.000% | | 8/10/10 | | | 500,000 | | | 274,899 | D |
MUFG Capital Finance 1 Ltd. | | | | 6.346% | | 7/29/49 | | | 240,000 | | | 167,214 | B |
TNK-BP Finance SA | | | | 6.875% | | 7/18/11 | | | 370,000 | | | 270,100 | D |
| | | | | | | | | | | | | |
| | | | | | | | | | | | 712,213 | |
| | | | | | | | | | | | | |
Diversified Telecommunication Services | | 3.0% | | | | | | | | | | | |
British Telecommunications PLC | | | | 8.625% | | 12/15/10 | | | 400,000 | | | 411,480 | E |
Deutsche Telekom International Finance BV | | | | 8.500% | | 6/15/10 | | | 400,000 | | | 412,030 | E |
France Telecom SA | | | | 7.750% | | 3/1/11 | | | 400,000 | | | 420,921 | E |
Koninklijke (Royal) KPN NV | | | | 8.000% | | 10/1/10 | | | 400,000 | | | 403,681 | |
Telefonica Emisiones S.A.U. | | | | 1.825% | | 6/19/09 | | | 410,000 | | | 396,925 | A |
Telefonica Emisiones S.A.U. | | | | 3.356% | | 2/4/13 | | | 400,000 | | | 320,878 | A |
| | | | | | | | | | | | | |
| | | | | | | | | | | | 2,365,915 | |
| | | | | | | | | | | | | |
Foreign Governments | | 0.2% | | | | | | | | | | | |
Russian Federation | | | | 8.250% | | 3/31/10 | | | 13,335 | | | 13,626 | D |
Russian Federation | | | | 8.250% | | 3/31/10 | | | 123,347 | | | 127,664 | D |
| | | | | | | | | | | | | |
| | | | | | | | | | | | 141,290 | |
| | | | | | | | | | | | | |
Health Care Equipment and Supplies | | 0.3% | | | | | | | | | | | |
Baxter Finco BV | | | | 4.750% | | 10/15/10 | | | 260,000 | | | 259,265 | |
| | | | | | | | | | | | | |
| | | | | |
Industrial Conglomerates | | 0.4% | | | | | | | | | | | |
Tyco International Group SA | | | | 6.375% | | 10/15/11 | | | 300,000 | | | 294,883 | |
| | | | | | | | | | | | | |
| | | | | |
Metals and Mining | | 0.7% | | | | | | | | | | | |
Vale Overseas Ltd. | | | | 6.250% | | 1/23/17 | | | 620,000 | | | 584,536 | |
| | | | | | | | | | | | | |
| | | | | |
Oil, Gas and Consumable Fuels | | 0.9% | | | | | | | | | | | |
Anadarko Finance Co. | | | | 6.750% | | 5/1/11 | | | 700,000 | | | 700,251 | |
| | | | | | | | | | | | | |
Total Yankee Bonds (Cost—$10,397,958) | | | | | | | | | | | | 7,268,242 | |
146
Annual Report to Shareholders
| | | | | | | | | | | | | | |
| | | % OF
NET ASSETS | | RATE | | MATURITY
DATE | | PAR/
SHARES | | | VALUE | |
| | | | | | | | | | | | | | |
Preferred Stocks | | N.M. | | | | | | | | | | | | |
Fannie Mae | | | | 8.250% | | | | | 8,850 | shs | | $ | 7,345 | B,I |
Freddie Mac | | | | 8.375% | | | | | 12,125 | | | | 4,729 | B,I |
| | | | | | | | | | | | | | |
Total Preferred Stocks (Cost—$524,375) | | | | | | | | | | | | | 12,074 | |
| | | | | | | | | | | | | | |
Total Long-Term Securities (Cost—$89,553,117) | | | | | | | | | | | | | 74,371,268 | |
Short-Term Securities | | 11.2% | | | | | | | | | | | | |
| | | | | |
U.S. Government and Agency Obligations | | 11.2% | | | | | | | | | | | | |
Fannie Mae | | | | 0.000% | | 5/5/09 | | $ | 5,200,000 | | | | 5,195,559 | I,M |
Federal Home Loan Bank | | | | 0.000% | | 1/2/09 | | | 3,200,000 | | | | 3,199,753 | M |
Federal Home Loan Bank | | | | 0.000% | | 3/26/09 | | | 400,000 | | | | 399,936 | M |
| | | | | | | | | | | | | | |
| | | | | | | | | | | | | 8,795,248 | |
| | | | | | | | | | | | | | |
Options PurchasedN | | N.M. | | | | | | | | | | | | |
U.S. Treasury Note Futures Put, February 2009, Strike Price $85.00 | | | | | | | | | 93 | O | | | 1,453 | |
| | | | | | | | | | | | | | |
Total Short-Term Securities (Cost—$8,780,596) | | | | | | | | | | | | | 8,796,701 | |
Total Investments (Cost—$98,333,713)P | | 105.8% | | | | | | | | | | | 83,167,969 | |
Other Assets Less Liabilities | | (5.8)% | | | | | | | | | | | (4,557,074 | ) |
| | | | | | | | | | | | | | |
| | | | | |
Net Assets | | 100.0% | | | | | | | | | | $ | 78,610,895 | |
| | | | | | | | | | | | | | |
| | | | | | | | |
| | | EXPIRATION | | ACTUAL
CONTRACTS | | APPRECIATION/
(DEPRECIATION) | |
Futures Contracts PurchasedN | | | | | | | | |
Eurodollar Futures | | March 2009 | | 141 | | $ | 706,145 | |
Eurodollar Futures | | June 2009 | | 92 | | | 529,215 | |
Eurodollar Futures | | September 2009 | | 40 | | | 255,637 | |
Eurodollar Futures | | September 2010 | | 17 | | | (4,585 | ) |
U.S. Treasury Note Futures | | March 2009 | | 113 | | | 351,853 | |
U.S. Treasury Note Futures | | March 2009 | | 286 | | | 723,820 | |
| | | | | | | | |
| | | | | | $ | 2,562,085 | |
| | | | | | | | |
Futures Contracts WrittenN | | | | | | | | |
U.S. Treasury Note Futures | | March 2009 | | 58 | | $ | (554,462 | ) |
| | | | | | | | |
147
Annual Report to Shareholders
Portfolio of Investments—Continued
Western Asset Limited Duration Bond Portfolio—Continued
| | | | | | | | |
| | | EXPIRATION | | ACTUAL
CONTRACTS | | APPRECIATION/
(DEPRECIATION) | |
Options WrittenN | | | | | | | | |
Eurodollar Futures Call, Strike Price $97.63 | | September 2009 | | 40 | | $ | (86,950 | ) |
Eurodollar Futures Call, Strike Price $98.25 | | March 2009 | | 93 | | | (117,727 | ) |
U.S. Treasury Note Futures Call, Strike Price $117.00 | | February 2009 | | 24 | | | (37,057 | ) |
U.S. Treasury Note Futures Call, Strike Price $118.00 | | February 2009 | | 53 | | | (387,406 | ) |
U.S. Treasury Note Futures Put, Strike Price $110.00 | | February 2009 | | 53 | | | 64,469 | |
| | | | | | | | |
| | | | | | $ | (564,671 | ) |
| | | | | | | | |
| | | | | | | | | |
N.M.—Not Meaningful.
A | | Indexed Security – The rates of interest earned on these securities are tied to the London Interbank Offered Rate (“LIBOR”), the Euro Interbank Offered Rate (“EURIBOR”) Index, the Consumer Price Index (“CPI”), the one-year Treasury Bill Rate or the ten-year Japanese Government Bond Rate. The coupon rates are the rates as of December 31, 2008. |
B | | Stepped Coupon Security – A security with a predetermined schedule of interest or dividend rate changes at which time it begins to accrue interest or pay dividends according to the predetermined schedule. |
C | | Bond is currently in default. |
D | | Rule 144a Security – A security purchased pursuant to Rule 144a under the Securities Act of 1933 which may not be resold subject to that rule except to qualified institutional buyers. These securities, which the Fund’s investment adviser has determined to be liquid, represent 9.94% of net assets. |
E | | Credit Linked Security – The rates of interest earned on these securities are tied to the credit rating assigned by Standard & Poor’s Rating Service and/or Moody’s Investors Services. |
F | | Illiquid security valued at fair value under the procedures approved by the Board of Directors. |
G | | The coupon rates shown on variable rate securities are the rates at December 31, 2008. These rates vary with the weighted average coupon of the underlying loans. |
H | | Yankee Bond – A dollar-denominated bond issued in the U.S. by foreign entities. |
I | | On September 7, 2008, the Federal Housing Finance Agency placed Fannie Mae and Freddie Mac into Conservatorship. |
J | | Treasury Inflation-Protected Security – Treasury security whose principal value is adjusted daily in accordance with changes to the Consumer Price Index for All Urban Consumers. Interest is calculated on the basis of the current adjusted principal value. |
K | | All or a portion of this security is collateral to cover futures and options contracts written. |
L | | When-issued Security – Security purchased on a delayed delivery basis. Final settlement amount and maturity date have not yet been announced. |
M | | Zero coupon bond – A bond with no periodic interest payments which is sold at such a discount as to produce a current yield to maturity. |
N | | Options and futures are described in more detail in the notes to financial statements. |
O | | Par represents actual number of contracts. |
P | | At December 31, 2008, the aggregate gross unrealized appreciation and depreciation of investments for federal income tax purposes were substantially as follows: |
| | | | |
| Gross unrealized appreciation | | $ | 731,486 | |
| Gross unrealized depreciation | | | (15,899,746 | ) |
| | | | |
| Net unrealized depreciation | | $ | (15,168,260 | ) |
| | | | |
See notes to financial statements.
148
Annual Report to Shareholders
Statement of Assets and Liabilities
Western Asset Limited Duration Bond Portfolio
December 31, 2008
| | | | | | | |
Assets: | | | | | | | |
Investment securities at value (Cost—$89,553,117) | | | | | $ | 74,371,268 | |
Short-term securities at value (Cost—$8,780,596) | | | | | | 8,796,701 | |
Cash | | | | | | 862,711 | |
Receivable for securities sold | | | | | | 3,796,205 | |
Restricted cash pledged as collateral for swaps | | | | | | 1,500,000 | |
Interest receivable | | | | | | 679,897 | |
Unrealized appreciation on swaps | | | | | | 274,143 | |
Premium paid on open swaps | | | | | | 35,287 | |
Amounts receivable for open swaps | | | | | | 11,848 | |
Futures variation margin receivable | | | | | | 163 | |
Receivable for fund shares sold | | | | | | 31 | |
| | | | | | | |
Total assets | | | | | | 90,328,254 | |
| | | | | | | |
| | |
Liabilities: | | | | | | | |
Payable for securities purchased | | $ | 8,341,317 | | | | |
Unrealized depreciation on swaps | | | 2,290,806 | | | | |
Options written (Proceeds—$226,219) | | | 790,890 | | | | |
Premium received on open swaps | | | 181,136 | | | | |
Income distribution payable | | | 42,486 | | | | |
Accrued management fee | | | 12,091 | | | | |
Amounts payable for open swaps | | | 5,710 | | | | |
Payable for fund shares repurchased | | | 501 | | | | |
Accrued expenses | | | 52,422 | | | | |
| | | | | | | |
Total liabilities | | | | | | 11,717,359 | |
| | | | | | | |
| | |
Net Assets | | | | | $ | 78,610,895 | |
| | | | | | | |
| | |
Net assets consist of: | | | | | | | |
Accumulated paid-in-capital | | | | | $ | 102,269,796 | |
Overdistributed net investment income | | | | | | (20,309 | ) |
Accumulated net realized loss on investments, options, futures and swaps | | | | | | (7,899,138 | ) |
Net unrealized depreciation on investments, options, futures and swaps | | | | | | (15,739,454 | ) |
| | | | | | | |
| | |
Net Assets | | | | | $ | 78,610,895 | |
| | | | | | | |
| | |
Net Asset Value Per Share: | | | | | | | |
Institutional Class (8,306,729 shares outstanding) | | | | | | $7.87 | |
Institutional Select Class (1,687,523 shares outstanding) | | | | | | $7.87 | |
| | | | | | | | |
See notes to financial statements.
149
Annual Report to Shareholders
Statement of Operations
Western Asset Limited Duration Bond Portfolio
| | | | | | | | | | | | | | | | |
| | | FOR THE
PERIOD ENDED
DECEMBER 31, 2008A | | | FOR THE
YEAR ENDED
MARCH 31, 2008 | |
Investment Income: | | | | | | | | | | | | | | | | |
Interest | | $ | 3,479,007 | | | | | | | $ | 5,940,539 | | | | | |
Dividends | | | 15,473 | | | | | | | | — | | | | | |
| | | | | | | | | | | | | | | | |
Total income | | | | | | $ | 3,494,480 | | | | | | | $ | 5,940,539 | |
Expenses: | | | | | | | | | | | | | | | | |
Management fees | | | 261,435 | | | | | | | | 372,082 | | | | | |
Audit and legal fees | | | 79,576 | | | | | | | | 58,536 | | | | | |
Custodian fees | | | 27,814 | | | | | | | | 36,991 | | | | | |
Directors’ fees and expenses | | | 4,175 | | | | | | | | 2,717 | | | | | |
Registration fees | | | 19,262 | | | | | | | | 22,491 | | | | | |
Reports to shareholders: | | | | | | | | | | | | | | | | |
Institutional Class | | | 5,550 | | | | | | | | 1,252 | | | | | |
Institutional Select Class | | | 16 | | | | | | | | N/A | | | | | |
Transfer agent and shareholder servicing expense: | | | | | | | | | | | | | | | | |
Institutional Class | | | 11,262 | | | | | | | | 15,932 | | | | | |
Institutional Select Class | | | 91 | | | | | | | | N/A | | | | | |
Other expenses | | | 26,296 | | | | | | | | 22,424 | | | | | |
| | | | | | | | | | | | | | | | |
| | | 435,477 | | | | | | | | 532,425 | | | | | |
Less: Fees waived | | | (92,358 | ) | | | | | | | (101,940 | ) | | | | |
Compensating balance credits | | | (1,256 | ) | | | | | | | (5,249 | ) | | | | |
| | | | | | | | | | | | | | | | |
Net expenses | | | | | | | 341,863 | | | | | | | | 425,236 | |
| | | | | | | | | | | | | | | | |
Net Investment Income | | | | | | | 3,152,617 | | | | | | | | 5,515,303 | |
Net Realized and Unrealized Gain/(Loss) on Investments: | | | | | | | | | | | | | | | | |
Net realized gain/(loss) on: | | | | | | | | | | | | | | | | |
Investments | | | (7,775,984 | ) | | | | | | | 509,158 | | | | | |
Options | | | 168,052 | | | | | | | | 47,875 | | | | | |
Futures | | | 918,589 | | | | | | | | (941,651 | ) | | | | |
Swaps | | | (29,702 | ) | | | | | | | (877,443 | ) | | | | |
| | | | | | | | | | | | | | | | |
| | | | | | | (6,719,045 | ) | | | | | | | (1,262,061 | ) |
Change in unrealized appreciation/(depreciation) of investments, options, futures and swaps | | | | | | | (6,251,969 | ) | | | | | | | (9,569,232 | ) |
| | | | | | | | | | | | | | | | |
Net Realized and Unrealized Loss on Investments | | | | | | | (12,971,014 | ) | | | | | | | (10,831,293 | ) |
| | | | | | | | | | | | | | | | | |
Change in Net Assets Resulting From Operations | | | | | | $ | (9,818,397 | ) | | | | | | $ | (5,315,990 | ) |
| | | | | | | | | | | | | | | | | |
A | | For the period April 1, 2008 to December 31, 2008. |
N/A—Not applicable
See notes to financial statements.
150
Annual Report to Shareholders
Statement of Changes in Net Assets
Western Asset Limited Duration Bond Portfolio
| | | | | | | | | | | | |
| | | FOR THE
PERIOD ENDED
DECEMBER 31, 2008A | | | FOR THE
YEARS ENDED MARCH 31, | |
| | | | 2008 | | | 2007 | |
| Change in Net Assets: | | | | | | | | | |
Net investment income | | $ | 3,152,617 | | | $ | 5,515,303 | | | $ | 3,946,150 | |
| | | |
Net realized loss | | | (6,719,045 | ) | | | (1,262,061 | ) | | | (158,541 | ) |
| | | |
Change in unrealized appreciation/(depreciation) | | | (6,251,969 | ) | | | (9,569,232 | ) | | | 841,224 | |
| | | | | | | | | | | | |
Change in net assets resulting from operations | | | (9,818,397 | ) | | | (5,315,990 | ) | | | 4,628,833 | |
| | | |
Distributions to shareholders from: | | | | | | | | | | | | |
Net investment income: | | | | | | | | | | | | |
Institutional Class | | | (3,140,101 | ) | | | (4,689,218 | ) | | | (3,944,005 | ) |
Institutional Select Class | | | (104,712 | ) | | | N/A | | | | N/A | |
| | | |
Return of capital: | | | | | | | | | | | | |
Institutional Class | | | — | | | | (547,710 | ) | | | — | |
| | | |
Change in net assets from fund share transactions: | | | | | | | | | | | | |
Institutional Class | | | (25,328,029 | ) | | | 21,640,200 | | | | 17,571,827 | |
Institutional Select Class | | | 13,514,889 | | | | N/A | | | | N/A | |
| | | | | | | | | | | | |
Change in net assets | | | (24,876,350 | ) | | | 11,087,282 | | | | 18,256,655 | |
| | | |
Net Assets: | | | | | | | | | | | | |
Beginning of period | | | 103,487,245 | | | | 92,399,963 | | | | 74,143,308 | |
| | | | | | | | | | | | |
| | | |
End of period | | $ | 78,610,895 | | | $ | 103,487,245 | | | $ | 92,399,963 | |
| | | | | | | | | | | | |
| | | |
(Overdistributed)/Undistributed net investment income | | $ | (20,309 | ) | | $ | (8,842 | ) | | $ | 34,081 | |
| | | | | | | | | | | | |
| | | | | | | | | | | | | |
A | | For the period April 1, 2008 to December 31, 2008. |
N/A—Not applicable
See notes to financial statements.
151
Annual Report to Shareholders
Financial Highlights
Western Asset Limited Duration Bond Portfolio
For a share of each class of capital stock outstanding:
Institutional Class:
| | | | | | | | | | | | | | | | | | | | | | | | |
| | | PERIOD
ENDED
DECEMBER 31,
2008A | | | YEARS ENDED MARCH 31, | |
| | | | 2008 | | | 2007 | | | 2006 | | | 2005 | | | 2004B | |
Net asset value, beginning of period | | $ | 8.96 | | | $ | 9.88 | | | $ | 9.80 | | | $ | 9.89 | | | $ | 10.09 | | | $ | 10.00 | |
| | | | | | | | | | | | | | | | | | | | | | | | |
Investment operations: | | | | | | | | | | | | | | | | | | | | | | | | |
Net investment income | | | .27 | C | | | .50 | C | | | .47 | C | | | .38 | D | | | .24 | D | | | .08 | D |
Net realized and unrealized gain/(loss) | | | (1.08 | ) | | | (.94 | ) | | | .08 | | | | (.09 | ) | | | (.17 | ) | | | .09 | |
| | | | | | | | | | | | | | | | | | | | | | | | |
Total from investment operations | | | (.81 | ) | | | (.44 | ) | | | .55 | | | | .29 | | | | .07 | | | | .17 | |
| | | | | | | | | | | | | | | | | | | | | | | | |
Distributions from: | | | | | | | | | | | | | | | | | | | | | | | | |
Net investment income | | | (.28 | ) | | | (.43 | ) | | | (.47 | ) | | | (.38 | ) | | | (.25 | ) | | | (.08 | ) |
Net realized gain on investments | | | — | | | | — | | | | — | | | | — | | | | (.02 | ) | | | — | |
Return of capital | | | — | | | | (.05 | ) | | | — | | | | — | | | | — | | | | — | |
| | | | | | | | | | | | | | | | | | | | | | | | |
Total distributions | | | (.28 | ) | | | (.48 | ) | | | (.47 | ) | | | (.38 | ) | | | (.27 | ) | | | (.08 | ) |
| | | | | | | | | | | | | | | | | | | | | | | | |
Net asset value, end of period | | $ | 7.87 | | | $ | 8.96 | | | $ | 9.88 | | | $ | 9.80 | | | $ | 9.89 | | | $ | 10.09 | |
| | | | | | | | | | | | | | | | | | | | | | | | |
Total return | | | (9.23 | )%E | | | (4.72 | )% | | | 5.73 | % | | | 3.01 | % | | | .69 | % | | | 1.69 | %E |
| | | | | | |
Ratios to Average Net Assets:F | | | | | | | | | | | | | | | | | | | | | | | | |
Total expenses | | | .58 | %G | | | .50 | % | | | .58 | % | | | .68 | % | | | .73 | % | | | .68 | %G |
Expenses net of waivers, if any | | | .46 | %G | | | .40 | % | | | .40 | % | | | .40 | % | | | .40 | % | | | .40 | %G |
Expenses net of all reductions | | | .46 | %G | | | .40 | % | | | .40 | % | | | .40 | % | | | .40 | % | | | .40 | %G |
Net investment income | | | 4.2 | %G | | | 5.2 | % | | | 4.8 | % | | | 3.9 | % | | | 2.4 | % | | | 1.6 | %G |
| | | | | | |
Supplemental Data: | | | | | | | | | | | | | | | | | | | | | | | | |
Portfolio turnover rate | | | 261.3 | %E | | | 312.1 | % | | | 270.5 | % | | | 244.7 | % | | | 231.5 | % | | | 125.5 | %E |
Net assets, end of period (in thousands) | | $ | 65,337 | | | $ | 103,487 | | | $ | 92,400 | | | $ | 74,143 | | | $ | 37,426 | | | $ | 26,182 | |
| | | | | | | | | | | | | | | | | | | | | | | | | |
A | | For the period April 1, 2008 to December 31, 2008. |
B | | For the period October 1, 2003 (commencement of operations) to March 31, 2004. |
C | | Computed using average daily shares outstanding. |
D | | Computed using SEC method. |
F | | Total expenses reflects operating expenses prior to any contractual expense waivers and/or compensating balance credits. Expenses net of waivers reflects total expenses before compensating balance credits but net of any contractual expense waivers. Expenses net of all reductions reflects expenses less any compensating balance credits and/or contractual expense waivers. As of the most current prospectus, the Institutional Class has no limit on expenses. |
See notes to financial statements.
152
Annual Report to Shareholders
Institutional Select Class:
| | | | |
| | | PERIOD
ENDED
DECEMBER 31,
2008H | |
Net asset value, beginning of period | | $ | 8.01 | |
| | | | |
Investment operations: | | | | |
Net investment income | | | .05 | C |
Net realized and unrealized loss | | | (.13 | ) |
| | | | |
Total from investment operations | | | (.08 | ) |
| | | | |
Distributions from: | | | | |
Net investment income | | | (.06 | ) |
| | | | |
Total distributions | | | (.06 | ) |
| | | | |
Net asset value, end of period | | $ | 7.87 | |
| | | | |
Total return | | | (.96 | )%E |
| |
Ratios to Average Net Assets:F | | | | |
Total expenses | | | .58 | %G |
Expenses net of waivers, if any | | | .41 | %G |
Expenses net of all reductions | | | .40 | %G |
Net investment income | | | 3.7 | %G |
| |
Supplemental Data: | | | | |
Portfolio turnover rate | | | 261.3 | %E |
Net assets, end of period (in thousands) | | $ | 13,274 | |
| | | | | |
H | | For the period October 29, 2008 (commencement of operations) to December 31, 2008. |
See notes to financial statements.
153
Annual Report to Shareholders
Management’s Discussion of Fund Performance
Western Asset Non-U.S. Opportunity Bond Portfolio
Total returns for the Fund for various periods ended December 31, 2008 are presented below, along with those of comparative indices:
| | | | | | | | | | | | |
| | | | | | | | | Average Annual Total Returns |
| | | Three
Months | | Nine
Months | | One
Year | | Five
Years | | Ten
Years | | Since
InceptionA |
Western Asset Non-U.S. Opportunity Bond Portfolio: | | | | | | | | | | | | |
Institutional Class | | +6.64% | | +4.49% | | +4.60% | | +5.40% | | +6.25% | | +6.61% |
Citigroup World Government Ex-U.S. Index (Hedged)B | | +5.51% | | +5.74% | | +8.01% | | +5.36% | | +5.40% | | +5.65% |
Lipper International Income Funds Category AverageC | | +3.65% | | -5.58% | | +2.00% | | +3.93% | | +4.99% | | +5.40% |
The performance data quoted represent past performance and do not guarantee future results. Current performance may be lower or higher than the performance data quoted. To obtain the most recent month-end performance information, please visit www.westernassetfunds.com. The investment return and principal value of the Fund will fluctuate so that an investor’s shares, when redeemed, may be worth more or less than the original cost. Calculations assume reinvestment of dividends and capital gain distributions. Performance would have been lower if fees had not been waived in various periods. Performance figures for periods shorter than one year represent cumulative figures and are not annualized.
The gross expense ratio for the Institutional Class was 0.61% and does not reflect fee waivers or reimbursements. The net expense ratio for the Institutional Class was 0.57% and reflects fee waivers and/or reimbursements. As a result of a contractual expense limitation, total annual operating expenses for the Institutional Class will be waived or reimbursed at a rate of 0.04% of the Fund’s average daily net assets attributable to the Institutional Class until July 31, 2009.
All expenses shown include management fees and other expenses as indicated in the Fund’s most current prospectus dated August 1, 2008.
For the period from April 1, 2008 through December 31, 2008, Institutional Class shares of Western Asset Non-U.S. Opportunity Bond Portfolio returned 4.49%. The Fund’s unmanaged benchmark, the Citigroup World Government Ex-U.S. Index (Hedged), returned 5.74% over the same time frame. The Lipper International Income Funds Category Average returned -5.58% for the same period.
The impact of market conditions on the Fund’s performance was negative for the nine-month period ended December 31, 2008, with strategies also producing negative results. Central bankers and fiscal authorities were driven to bold action as the financial crisis evolved into the first ever run on the global banking system, triggering panic-driven selling and fears of a debt-deflationary vicious cycle. Policy rates were slashed to the lowest level ever in many cases, and discussions mounted over the size of massive government spending measures. By late-November, market indicators had turned and improvements continued to gain momentum through the end of the year. The portfolio maintained an emphasis on the European corporate sector, with particular
A | | The inception date of the Institutional Class is July 15, 1998. Index returns are for periods beginning July 31, 1998. Although it is not possible to invest directly in an index, it is possible to purchase investment vehicles designed to track the performance of certain indices. |
B | | The Citigroup World Government Ex-U.S. Index (Hedged) encompasses an all-inclusive universe of institutionally traded bonds, including all fixed-rate bonds with remaining maturities of one year or longer with amounts outstanding of at least the equivalent of $25 million USD. This Index excludes the U.S. and is currency-hedged as a means of achieving low-risk interest rate diversification. |
C | | Lipper, Inc., a wholly-owned subsidiary of Reuters, provides independent insight on global collective investments. The Lipper International Income Funds Category Average is comprised of the Fund’s peer group of mutual funds. |
154
Annual Report to Shareholders
focus on European and UK Financials issues. This had a significant negative impact on performance as spreads widened dramatically. Partial nationalization moves increased confusion over the relative risk along the capital structure and subordinated debt underperformed. DurationD management had a small positive impact, though this impact was overwhelmed by movements in the credit markets. Currency strategies had a positive impact, though these were reduced to minimal levels by the end of the period. The euro and pound sterling depreciated, and the decision to hedge exposure to these currencies into the U.S. dollar benefited performance. The decision to maintain a modest long position to the Japanese yen also contributed to performance as volatility soared and the yen gained as carry trades unwound.
Western Asset Management Company
January 20, 2009
Investment Risks: Bonds are subject to a variety of risks, including interest rate, credit and inflation risk. As interest rates rise, bond prices fall, reducing the value of the Fund’s share price. Foreign securities are subject to certain risks of overseas investing, including currency fluctuations and changes in political and economic conditions. These risks are magnified in emerging markets. Asset-backed and mortgage-backed securities involve more risk, including prepayment and extension risks, than other investments in fixed income securities. The Fund is subject to the additional risks associated with inflation-indexed securities, including liquidity risk, prepayment risk, extension risk and deflation risk. The Fund is not diversified, which means that it is permitted to invest a higher percentage of its assets in any one issuer than a diversified fund. This may magnify the Fund’s losses from events affecting a particular issuer. The Fund may use derivatives, such as options and futures, which can be illiquid, may disproportionately increase losses, and have a potentially large impact on Fund performance.
D | | Duration is the measure of the price sensitivity of a fixed-income security to an interest rate change of 100 basis points. Calculation is based on the weighted average of the present values for all cash flows. |
155
Annual Report to Shareholders
Expense Example
Western Asset Non-U.S. Opportunity Bond Portfolio
As a shareholder of the Fund, you incur ongoing costs, including management fees and other Fund expenses. These examples are intended to help you understand your ongoing costs (in dollars) of investing in the Fund and to compare these costs with the ongoing costs of investing in other mutual funds. The example is based on an investment of $1,000 invested on July 1, 2008, and held through December 31, 2008.
Actual Expenses
The first line in the table below provides information about actual account values and actual expenses for the Fund. You may use the information in this line, together with the amount you invested, to estimate the expenses that you paid over the period. Simply divide your account value by $1,000 (for example, an $8,600 account value divided by $1,000 = 8.6), then multiply the result by the number in the first line under the heading entitled “Expenses Paid During the Period” to estimate the expenses you paid on your account if your shares were held through the entire period.
Hypothetical Example for Comparison Purposes
The second line in the table below provides information about hypothetical account values and hypothetical expenses based on the Fund’s actual expense ratio and an assumed rate of return of 5% per year before expenses, which is not the Fund’s actual return. The hypothetical account values and expenses may not be used to estimate the actual ending account balance or expenses you paid for the period. You may use this information to compare the ongoing costs of investing in the Fund and other funds. To do so, compare this 5% hypothetical example with the 5% hypothetical examples that appear in the shareholder reports of other funds.
| | | | | | | | | |
| | | Beginning
Account Value
7/1/08 | | Ending
Account Value
12/31/08 | | Expenses PaidA
During the Period
7/1/08 to 12/31/08 |
Institutional Class: | | | | | | | | | |
Actual | | $ | 1,000.00 | | $ | 1,064.20 | | $ | 3.02 |
Hypothetical (5% return before expenses) | | | 1,000.00 | | | 1,022.28 | | | 2.96 |
A | | These calculations are based on expenses incurred in the most recent fiscal half-year. The dollar amounts shown as “Expenses Paid” are equal to the annualized expense ratio of 0.58% multiplied by the average value over the period, multiplied by the number of days in the most recent fiscal half-year (184), and divided by 365. |
156
Annual Report to Shareholders
Performance Information
Western Asset Non-U.S. Opportunity Bond Portfolio
The graph compares the Fund’s total returns against that of an appropriate broad-based securities market index. The line illustrates the cumulative total return of an initial $1,000,000 investment for the periods indicated. The line for the Fund represents the total return after deducting all Fund investment management and other administrative expenses and the transaction costs of buying and selling securities. The line representing the securities market index does not include any transaction costs associated with buying and selling securities in the index or other investment management or administrative expenses.
Total return measures investment performance in terms of appreciation or depreciation in the Fund’s net asset value per share, plus dividends and any capital gain distributions. It assumes that dividends and distributions were reinvested at the time they were paid. Returns (and the graph and table found below) do not reflect the deduction of taxes that a shareholder would pay on Fund distributions or the redemption of Fund shares. Average annual returns tend to smooth out variations in a fund’s return, so that they differ from actual year-to-year results.
Bonds are subject to a variety of risks, including interest rate, credit and inflation risk. Non U.S. investments are subject to currency fluctuations, social, economic, and political risk.
Growth of a $1,000,000 Investment—Institutional Class

The performance data quoted represent past performance and do not guarantee future results. The performance stated may have been due to extraordinary market conditions, which may not be duplicated in the future. Current performance may be lower or higher than the performance data quoted. To obtain the most recent month-end performance information, please visit www.westernassetfunds.com. The investment return and principal value of the Fund will fluctuate so that an investor’s shares, when redeemed, may be worth more or less than the original cost. Calculations assume reinvestment of dividends and capital gain distributions. Performance would have been lower if fees had not been waived in various periods.
157
Annual Report to Shareholders
Performance Information—Continued
Portfolio Composition (as of December 31, 2008)A
Standard & Poor’s Debt RatingsB (as a percentage of the portfolio)
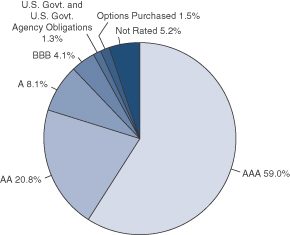
Maturity Schedule (as a percentage of the portfolio)
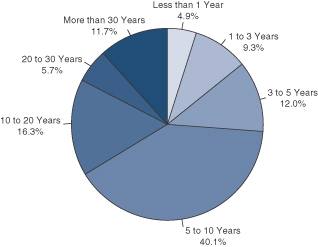
A | | The pie charts above represent the composition of the Fund’s portfolio as of December 31, 2008 and do not include derivatives such as Futures Contracts, Options Written, and Swaps. The Fund is actively managed. As a result, the composition of the portfolio holdings and sectors are subject to change at any time. |
B | | Standard & Poor’s Ratings Service provides capital markets with credit ratings for the evaluation and assessment of credit risk. These ratings are the opinions of S&P and not absolute measures of quality or guarantees of performance. |
158
Annual Report to Shareholders
Spread Duration
Western Asset Non-U.S. Opportunity Bond Portfolio
December 31, 2008
Economic Exposure
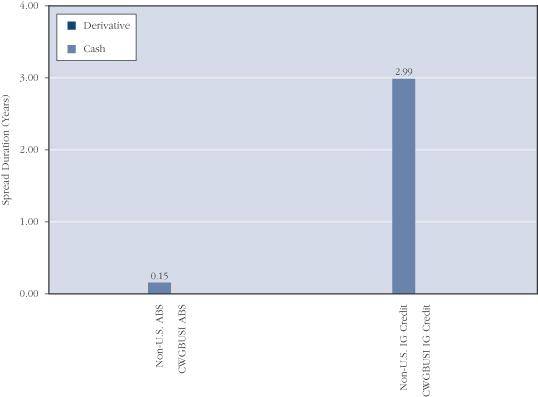
Spread duration is defined as the change in value for a 100 basis point change in the spread relative to Treasuries. The spread over Treasuries is the annual risk-premium demanded by investors to hold non-Treasury securities. This chart highlights the market sector exposure of the Fund’s portfolio and the exposure relative to the selected benchmark as of the end of the reporting period.
159
ABS—Asset Backed Security
CWGBUSI—Citigroup World Gov’t ex-U.S. Bond Index (Hedged)
IG Credit—Investment Grade Credit
Annual Report to Shareholders
Effective Duration
Western Asset Non-U.S. Opportunity Bond Portfolio
December 31, 2008
Interest Rate Exposure
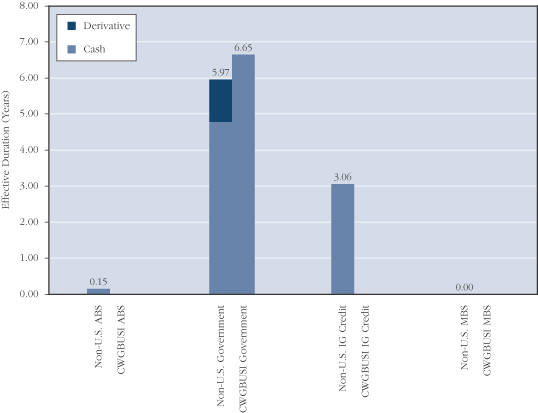
Effective duration is defined as the change in value for a 100 basis point change in Treasury yields. This chart highlights the interest rate exposure of the Fund’s portfolio relative to the selected benchmark as of the end of the reporting period.
ABS—Asset Backed Security
CWGBUSI—Citigroup World Gov’t ex-U.S. Bond Index (Hedged)
IG—Credit Investment Grade Credit
MBS—Mortgage Backed Securities
160
Annual Report to Shareholders
Portfolio of Investments
Western Asset Non-U.S. Opportunity Bond Portfolio
December 31, 2008
| | | | | | | | | | | | | |
| | | % OF
NET ASSETS | | RATE | | MATURITY
DATE | | PAR† | | | VALUE | |
| | | | | | | | | | | | | |
Long-Term Securities | | 93.9% | | | | | | | | | | | |
| | | | | |
Corporate Bonds and Notes | | 34.9% | | | | | | | | | | | |
| | | | | |
Capital Markets | | 0.8% | | | | | | | | | | | |
Lehman Brothers Holdings Inc. | | | | 4.625% | | 3/14/19 | | 1,300,000 | EUR | | $ | 2,141 | A,B,K |
Merrill Lynch and Co. Inc. | | | | 6.750% | | 5/21/13 | | 100,000 | EUR | | | 126,792 | |
The Goldman Sachs Group Inc. | | | | 6.375% | | 5/2/18 | | 573,000 | EUR | | | 690,162 | |
| | | | | | | | | | | | | |
| | | | | | | | | | | | 819,095 | |
| | | | | | | | | | | | | |
Commercial Banks | | 13.2% | | | | | | | | | | | |
Alliance and Leicester PLC | | | | 5.000% | | 10/4/10 | | 1,200,000 | EUR | | | 1,652,625 | |
Banco Popolare di Verona e Novara Scrl | | | | 6.156% | | 6/29/49 | | 500,000 | EUR | | | 298,861 | B |
Barclays Bank PLC | | | | 4.250% | | 10/27/11 | | 1,000,000 | EUR | | | 1,429,589 | |
Bayerische Landesbank | | | | 5.750% | | 10/23/17 | | 250,000 | EUR | | | 300,034 | |
BES Finance Ltd. | | | | 4.500% | | 12/29/49 | | 50,000 | EUR | | | 36,746 | B |
Deutsche Postbank IV | | | | 5.983% | | 6/29/49 | | 600,000 | EUR | | | 266,889 | B |
Dexia Municipal Agency | | | | 1.550% | | 10/31/13 | | 282,000,000 | JPY | | | 3,016,106 | |
ESFG International Ltd. | | | | 5.753% | | 6/29/49 | | 700,000 | EUR | | | 291,910 | B |
European Investment Bank | | | | 4.250% | | 12/7/10 | | 1,740,000 | GBP | | | 2,613,066 | |
European Investment Bank | | | | 1.900% | | 1/26/26 | | 236,000,000 | JPY | | | 2,436,465 | C |
HSH Nordbank Luxembourg | | | | 7.408% | | 6/29/49 | | 1,100,000 | EUR | | | 321,101 | B |
HT1 Funding GmbH | | | | 6.352% | | 7/29/49 | | 287,000 | EUR | | | 119,683 | B |
Intesa Sanpaolo SpA | | | | 5.750% | | 5/28/18 | | 600,000 | EUR | | | 800,235 | B |
Shinsei Bank Ltd. | | | | 3.750% | | 2/23/16 | | 100,000 | EUR | | | 50,570 | B,C |
Swedbank AB | | | | 5.570% | | 9/27/17 | | 100,000 | EUR | | | 116,094 | B |
| | | | | | | | | | | | | |
| | | | | | | | | | | | 13,749,974 | |
| | | | | | | | | | | | | |
Diversified Financial Services | | 16.5% | | | | | | | | | | | |
Banca Italease SpA | | | | 4.033% | | 3/2/09 | | 50,000 | EUR | | | 67,205 | D |
Banca Italease SpA | | | | 5.568% | | 10/15/09 | | 50,000 | EUR | | | 59,117 | D |
Banca Italease SpA | | | | 4.994% | | 2/2/10 | | 250,000 | EUR | | | 286,614 | D |
Banca Italease SpA | | | | 4.326% | | 11/23/10 | | 200,000 | EUR | | | 199,530 | D |
Banca Italease SpA | | | | 4.892% | | 2/8/12 | | 50,000 | EUR | | | 44,439 | D |
Banca Italease SpA | | | | 3.579% | | 3/14/12 | | 50,000 | EUR | | | 43,787 | D |
Caisse Refinancement de l’Habitat | | | | 4.200% | | 4/25/11 | | 900,000 | EUR | | | 1,264,812 | |
Eksportfinans ASA | | | | 1.600% | | 3/20/14 | | 365,000,000 | JPY | | | 3,981,339 | |
Eurohypo Capital Funding Trust 1 | | | | 6.445% | | 5/29/49 | | 61,000 | EUR | | | 19,502 | B |
European Investment Bank | | | | 1.400% | | 6/20/17 | | 442,000,000 | JPY | | | 4,752,687 | |
Kreditanstalt fuer Wiederaufbau | | | | 2.050% | | 2/16/26 | | 188,000,000 | JPY | | | 1,897,863 | |
Kreditanstalt fuer Wiederaufbau | | | | 2.600% | | 6/20/37 | | 42,000,000 | JPY | | | 473,872 | |
Landesbank Hessen-Thueringen Girozentrale | | | | 5.375% | | 3/7/12 | | 200,000 | GBP | | | 297,499 | |
Network Rail MTN Finance PLC | | | | 4.875% | | 3/6/09 | | 2,270,000 | GBP | | | 3,284,199 | |
161
Annual Report to Shareholders
Portfolio of Investments—Continued
Western Asset Non-U.S. Opportunity Bond Portfolio—Continued
| | | | | | | | | | | | | |
| | | % OF
NET ASSETS | | RATE | | MATURITY
DATE | | PAR† | | | VALUE | |
| | | | | | | | | | | | | |
Corporate Bonds and Notes—Continued | | 34.9% | | | | | | | | | | | |
| | | | | |
Diversified Financial Services—Continued | | | | | | | | | | | | | |
Nykredit Realkredit A/S | | | | 6.000% | | 10/1/41 | | 5,745 | DKK | | $ | 1,063 | |
Resona Bank Ltd. | | | | 4.125% | | 9/29/49 | | 200,000 | EUR | | | 148,318 | B,C |
SNS Reaal | | | | 6.258% | | 7/17/17 | | 650,000 | EUR | | | 374,966 | B |
| | | | | | | | | | | | | |
| | | | | | | | | | | | 17,196,812 | |
| | | | | | | | | | | | | |
Diversified Telecommunication Services | | 1.3% | | | | | | | | | | | |
British Telecommunications PLC | | | | 5.250% | | 1/22/13 | | 230,000 | EUR | | | 296,702 | |
British Telecommunications PLC | | | | 5.250% | | 6/23/14 | | 274,000 | EUR | | | 347,692 | |
Deutsche Telekom International Finance BV | | | | 7.125% | | 7/11/11 | | 108,000 | EUR | | | 155,707 | E |
Koninklijke (Royal) KPN N.V. | | | | 5.000% | | 11/13/12 | | 250,000 | EUR | | | 344,732 | |
Telecom Italia SpA | | | | 5.250% | | 3/17/55 | | 200,000 | EUR | | | 165,469 | |
| | | | | | | | | | | | | |
| | | | | | | | | | | | 1,310,302 | |
| | | | | | | | | | | | | |
Insurance | | 1.3% | | | | | | | | | | | |
American International Group Inc. | | | | 8.000% | | 5/22/38 | | 150,000 | EUR | | | 62,552 | B,C |
Aviva PLC | | | | 5.250% | | 10/2/23 | | 320,000 | EUR | | | 286,685 | B |
AXA SA | | | | 6.211% | | 10/29/49 | | 200,000 | EUR | | | 139,005 | B |
Groupama | | | | 6.298% | | 10/29/49 | | 550,000 | EUR | | | 379,497 | B |
Mapfre SA | | | | 5.921% | | 7/24/37 | | 400,000 | EUR | | | 224,062 | B |
Muenchener Rueckversicherungs-Gesellschaft AG (MunichRe) | | | | 5.767% | | 6/29/49 | | 350,000 | EUR | | | 314,485 | B |
| | | | | | | | | | | | | |
| | | | | | | | | | | | 1,406,286 | |
| | | | | | | | | | | | | |
Oil, Gas and Consumable Fuels | | 0.3% | | | | | | | | | | | |
BP Capital Markets PLC | | | | 5.750% | | 2/26/10 | | 250,000 | GBP | | | 369,094 | |
| | | | | | | | | | | | | |
| | | | | |
Pharmaceuticals | | 0.3% | | | | | | | | | | | |
AstraZeneca PLC | | | | 5.125% | | 1/15/15 | | 209,000 | EUR | | | 292,141 | |
| | | | | | | | | | | | | |
| | | | | |
Thrifts and Mortgage Finance | | N.M. | | | | | | | | | | | |
Hypo Real Estate International Trust I | | | | 5.864% | | 6/14/17 | | 350,000 | EUR | | | 24,521 | B |
| | | | | | | | | | | | | |
| | | | | |
Tobacco | | 0.9% | | | | | | | | | | | |
BAT International Finance PLC | | | | 5.375% | | 6/29/17 | | 500,000 | EUR | | | 604,204 | |
Imperial Tobacco Group PLC | | | | 7.250% | | 9/15/14 | | 310,000 | EUR | | | 392,459 | |
| | | | | | | | | | | | | |
| | | | | | | | | | | | 996,663 | |
| | | | | | | | | | | | | |
Water Utilities | | 0.3% | | | | | | | | | | | |
Anglian Water Services Ltd | | | | 6.250% | | 6/27/16 | | 230,000 | EUR | | | 320,351 | |
| | | | | | | | | | | | | |
Total Corporate Bonds and Notes
(Cost—$42,344,484) | | | | | | | | | | | | 36,485,239 | |
162
Annual Report to Shareholders
| | | | | | | | | | | | | |
| | | % OF
NET ASSETS | | RATE | | MATURITY
DATE | | PAR† | | | VALUE | |
| | | | | | | | | | | | | |
U.S. Government and Agency Obligations | | 1.3% | | | | | | | | | | | |
| | | | | |
Fixed Rate Securities | | 1.3% | | | | | | | | | | | |
Freddie Mac | | | | 5.750% | | 9/15/10 | | 900,000 | EUR | | $ | 1,304,264 | F |
| | | | | | | | | | | | | |
Total U.S. Government and Agency Obligations (Cost—$858,638) | | | | | | | | | | | | 1,304,264 | |
Foreign Government Obligations | | 57.7% | | | | | | | | | | | |
Bundesrepublik Deutschland | | | | 3.250% | | 7/4/15 | | 6,210,000 | EUR | | | 8,944,691 | |
Canadian Real Return Bond | | | | 4.000% | | 12/1/31 | | 200,544 | CAD | | | 215,338 | G |
Development Bank of Japan | | | | 1.750% | | 3/17/17 | | 440,000,000 | JPY | | | 5,147,903 | |
Federal Republic of Germany | | | | 3.500% | | 4/8/11 | | 2,000 | EUR | | | 2,881 | |
France Government Bond OAT | | | | 4.000% | | 4/25/55 | | 6,070,000 | EUR | | | 9,091,555 | G |
Government of Canada | | | | 4.000% | | 6/1/16 | | 5,820,000 | CAD | | | 5,240,546 | |
Government of Japan | | | | 1.300% | | 9/10/17 | | 36,864,000 | JPY | | | 355,749 | G |
Government of Japan | | | | 1.500% | | 9/20/18 | | 306,000,000 | JPY | | | 3,490,483 | |
Government of Poland | | | | 5.000% | | 10/24/13 | | 1,400,000 | PLN | | | 468,103 | |
Government of Poland | | | | 5.750% | | 9/23/22 | | 8,800,000 | PLN | | | 3,065,400 | |
Hungary Government Bond | | | | 6.000% | | 10/24/12 | | 75,430,000 | HUF | | | 351,836 | |
Japan Development Bank | | | | 2.300% | | 3/19/26 | | 560,000,000 | JPY | | | 6,361,828 | |
Kingdom of Denmark | | | | 5.000% | | 11/15/13 | | 17,460,000 | DKK | | | 3,539,124 | |
Kingdom of Norway | | | | 6.500% | | 5/15/13 | | 5,640,000 | NOK | | | 912,676 | |
Kingdom of Norway | | | | 5.000% | | 5/15/15 | | 17,360,000 | NOK | | | 2,683,529 | |
Kingdom of Norway | | | | 4.250% | | 5/19/17 | | 6,630,000 | NOK | | | 982,344 | |
Kingdom of Spain | | | | 5.750% | | 7/30/32 | | 1,970,000 | EUR | | | 3,316,664 | |
Kingdom of the Netherlands | | | | 5.500% | | 1/15/28 | | 1,270,000 | EUR | | | 2,134,516 | |
Republic of France | | | | 4.750% | | 4/25/35 | | 880,000 | EUR | | | 1,409,717 | G |
United Kingdom Treasury Stock | | | | 5.000% | | 3/7/12 | | 1,590,000 | GBP | | | 2,476,311 | |
| | | | | | | | | | | | | |
Total Foreign Government Obligations
(Cost—$54,394,498) | | | | | | | | | | | | 60,191,194 | |
| | | | | | | | | | | | | |
Total Long-Term Securities
(Cost—$97,597,620) | | | | | | | | | | | | 97,980,697 | |
Short-Term Securities | | 1.4% | | | | | | | | | | | |
| | | | | |
Options PurchasedH | | 1.4% | | | | | | | | | | | |
German Federal Republic Bond Futures Call, February 2009, Strike Price $115.50 | | | | | | | | 235 | I | | | 519,392 | |
U.S. Treasury Note Futures Call, February 2009, Strike Price $116.00 | | | | | | | | 284 | I | | | 982,906 | |
| | | | | | | | | | | | | |
Total Short-Term Securities (Cost—$869,110) | | | | | | | | | | | | 1,502,298 | |
Total Investments (Cost—$98,466,730)J | | 95.3% | | | | | | | | | | 99,482,995 | |
Other Assets Less Liabilities | | 4.7% | | | | | | | | | | 4,879,184 | |
| | | | | | | | | | | | | |
| | | | | |
Net Assets | | 100.0% | | | | | | | | | $ | 104,362,179 | |
| | | | | | | | | | | | | |
163
Annual Report to Shareholders
Portfolio of Investments—Continued
Western Asset Non-U.S. Opportunity Bond Portfolio—Continued
| | | | | | | | |
| | | EXPIRATION | | ACTUAL
CONTRACTS | | APPRECIATION/
(DEPRECIATION) | |
Futures Contracts PurchasedH | | | | | | | | |
Australia Bond Futures | | March 2009 | | 80 | | $ | 147,699 | |
German Euro Bobl Futures | | March 2009 | | 54 | | | 54,452 | |
United Kingdom Treasury Gilt Futures | | March 2009 | | 2 | | | 21,257 | |
| | | | | | | | |
| | | | | | $ | 223,408 | |
| | | | | | | | |
Futures Contracts WrittenH | | | | | | | | |
German Euro Bund Futures | | March 2009 | | 104 | | $ | (364,143 | ) |
U.S. Treasury Note Futures | | March 2009 | | 39 | | | (224,097 | ) |
U.S. Treasury Note Futures | | March 2009 | | 46 | | | 34,293 | |
| | | | | | | | |
| | | | | | $ | (553,947 | ) |
| | | | | | | | |
Options WrittenH | | | | | | | | |
German Federal Republic Bond Futures Put, Strike Price $112.50 | | February 2009 | | 235 | | $ | 160,066 | |
| | | | | | | | |
| | | | | | | | | |
N.M.—Not Meaningful.
A | | Bond is currently in default. |
B | | Stepped Coupon Security – A security with a predetermined schedule of interest or dividend rate changes at which time it begins to accrue interest or pay dividends according to the predetermined schedule. |
C | | Rule 144a Security – A security purchased pursuant to Rule 144a under the Securities Act of 1933 which may not be resold subject to that rule except to qualified institutional buyers. These securities, which the Fund’s investment adviser has determined to be liquid, represent 2.58% of net assets. |
D | | Indexed Security – The rates of interest earned on these securities are tied to the London Interbank Offered Rate (“LIBOR”), the Euro Interbank Offered Rate (“EURIBOR”) Index, the Consumer Price Index (“CPI”), the one-year Treasury Bill Rate or the ten-year Japanese Government Bond Rate. The coupon rates are the rates as of December 31, 2008. |
E | | Credit Linked Security – The rates of interest earned on these securities are tied to the credit rating assigned by Standard & Poor’s Rating Service and/or Moody’s Investors Services. |
F | | On September 7, 2008, the Federal Housing Finance Agency placed Fannie Mae and Freddie Mac into Conservatorship. |
G | | Inflation-Protected Security – Security whose principal value is adjusted daily or monthly in accordance with changes to the relevant country’s Consumer Price Index or its equivalent used as an inflation proxy. Interest is calculated on the basis of the current adjusted principal value. |
H | | Options and futures are described in more detail in the notes to financial statements. |
I | | Par represents actual number of contracts. |
J | | At December 31, 2008, the aggregate gross unrealized appreciation and depreciation of investments for federal income tax purposes were substantially as follows: |
| | | | |
| Gross unrealized appreciation | | $ | 12,461,343 | |
| Gross unrealized depreciation | | | (11,445,078 | ) |
| | | | |
| Net unrealized appreciation | | $ | 1,016,265 | |
| | | | |
164
Annual Report to Shareholders
† | | Securities are denominated in U.S. Dollars, unless otherwise noted. |
CAD—Canadian Dollar
DKK—Danish Krone
EUR—Euro
GBP—British Pound
HUF—Hungarian Forint
JPY—Japanese Yen
NOK—Norwegian Krone
PLN—Polish Zloty
See notes to financial statements.
165
Annual Report to Shareholders
Statement of Assets and Liabilities
Western Asset Non-U.S. Opportunity Bond Portfolio
December 31, 2008
| | | | | | | |
Assets: | | | | | | | |
Investment securities at value (Cost—$97,597,620) | | | | | $ | 97,980,697 | |
Short-term securities at value (Cost—$869,110) | | | | | | 1,502,298 | |
Cash | | | | | | 2,046,009 | |
Foreign currency at value (Cost—$1,678,506) | | | | | | 1,600,943 | |
Unrealized appreciation of forward foreign currency contracts | | | | | | 9,427,323 | |
Interest receivable | | | | | | 1,706,958 | |
Deposits with brokers for open futures contracts | | | | | | 1,444,914 | |
Receivable from Custodian | | | | | | 232,693 | |
Receivable for fund shares sold | | | | | | 8,487 | |
| | | | | | | |
Total assets | | | | | | 115,950,322 | |
| | | | | | | |
| | |
Liabilities: | | | | | | | |
Unrealized depreciation of forward foreign currency contracts | | $ | 10,961,364 | | | | |
Futures variation margin payable | | | 330,542 | | | | |
Payable for fund shares repurchased | | | 136,499 | | | | |
Accrued management fee | | | 38,928 | | | | |
Options written (Proceeds—$197,632) | | | 37,566 | | | | |
Accrued expenses | | | 83,244 | | | | |
| | | | | | | |
Total liabilities | | | | | | 11,588,143 | |
| | | | | | | |
| | |
Net Assets | | | | | $ | 104,362,179 | |
| | | | | | | |
| | |
Net assets consist of: | | | | | | | |
Accumulated paid-in-capital | | | | | $ | 108,697,026 | |
Overdistributed net investment income | | | | | | (3,950,890 | ) |
Accumulated net realized gain on investments, options, futures, swaps and foreign currency transactions | | | | | | 386,349 | |
Net unrealized depreciation on investments, options, futures and foreign currency translations | | | | | | (770,306 | ) |
| | | | | | | |
| | |
Net Assets | | | | | $ | 104,362,179 | |
| | | | | | | |
| | |
Net Asset Value Per Share: | | | | | | | |
Institutional Class (11,905,609 shares outstanding) | | | | | | $8.77 | |
| | | | | | | | |
See notes to financial statements.
166
Annual Report to Shareholders
Statement of Operations
Western Asset Non-U.S. Opportunity Bond Portfolio
| | | | | | | | | | | | | | | | |
| | | FOR THE
PERIOD ENDED
DECEMBER 31, 2008A | | | FOR THE
YEAR ENDED
MARCH 31, 2008 | |
Investment Income: | | | | | | | | | | | | | | | | |
Interest | | | | | | $ | 4,971,631 | | | | | | | $ | 7,674,533 | |
Expenses: | | | | | | | | | | | | | | | | |
Management fees | | $ | 595,948 | | | | | | | $ | 805,725 | | | | | |
Audit and legal fees | | | 67,137 | | | | | | | | 67,468 | | | | | |
Custodian fees | | | 65,327 | | | | | | | | 84,308 | | | | | |
Directors’ fees and expenses | | | 5,080 | | | | | | | | 5,127 | | | | | |
Registration fees | | | 28,593 | | | | | | | | 22,846 | | | | | |
Reports to shareholders: | | | | | | | | | | | | | | | | |
Institutional Class | | | 12,246 | | | | | | | | 9,589 | | | | | |
Transfer agent and shareholder servicing expense: | | | | | | | | | | | | | | | | |
Institutional Class | | | 18,323 | | | | | | | | 20,122 | | | | | |
Other expenses | | | 23,375 | | | | | | | | 37,475 | | | | | |
| | | | | | | | | | | | | | | | |
| | | 816,029 | | | | | | | | 1,052,660 | | | | | |
Less: Fees waived | | | (48,260 | ) | | | | | | | (63,146 | ) | | | | |
Compensating balance credits | | | (1,618 | ) | | | | | | | (4,739 | ) | | | | |
| | | | | | | | | | | | | | | | |
Net expenses | | | | | | | 766,151 | | | | | | | | 984,775 | |
| | | | | | | | | | | | | | | | |
Net Investment Income | | | | | | | 4,205,480 | | | | | | | | 6,689,758 | |
Net Realized and Unrealized Gain/(Loss) on Investments: | | | | | | | | | | | | | | | | |
Net realized gain/(loss) on: | | | | | | | | | | | | | | | | |
Investments | | | (3,469,206 | ) | | | | | | | 7,374,812 | | | | | |
Options | | | 2,271,529 | | | | | | | | 23,360 | | | | | |
Futures | | | (1,434,709 | ) | | | | | | | (1,322,796 | ) | | | | |
Swaps | | | 374,506 | | | | | | | | — | | | | | |
Foreign currency transactions | | | 15,026,418 | | | | | | | | (16,611,006 | ) | | | | |
| | | | | | | | | | | | | | | | |
| | | | | | | 12,768,538 | | | | | | | | (10,535,630 | ) |
Change in unrealized appreciation/(depreciation) of: | | | | | | | | | | | | | | | | |
Investments, options, futures and foreign currency translations | | | (12,519,999 | ) | | | | | | | 7,285,124 | | | | | |
Assets and liabilities denominated in foreign currency | | | (309,477 | ) | | | | | | | 116,207 | | | | | |
| | | | | | | | | | | | | | | | |
| | | | | | | (12,829,475 | ) | | | | | | | 7,401,331 | |
| | | | | | | | | | | | | | | | |
Net Realized and Unrealized Gain/(Loss) on Investments | | | | | | | (60,937 | ) | | | | | | | (3,134,299 | ) |
| | | | | | | | | | | | | | | | | |
Change in Net Assets Resulting From Operations | | | | | | $ | 4,144,543 | | | | | | | $ | 3,555,459 | |
| | | | | | | | | | | | | | | | | |
A | | For the period April 1, 2008 to December 31, 2008. |
See notes to financial statements.
167
Annual Report to Shareholders
Statement of Changes in Net Assets
Western Asset Non-U.S. Opportunity Bond Portfolio
| | | | | | | | | | | | |
| | | FOR THE
PERIOD ENDED
DECEMBER 31, 2008A | | | FOR THE
YEARS ENDED MARCH 31, | |
| | | | 2008 | | | 2007 | |
| Change in Net Assets: | | | | | | | | | |
Net investment income | | $ | 4,205,480 | | | $ | 6,689,758 | | | $ | 4,930,292 | |
| | | |
Net realized gain/(loss) | | | 12,768,538 | | | | (10,535,630 | ) | | | (979,032 | ) |
| | | |
Change in unrealized appreciation/(depreciation) | | | (12,829,475 | ) | | | 7,401,331 | | | | 1,219,671 | |
| | | | | | | | | | | | |
Change in net assets resulting from operations | | | 4,144,543 | | | | 3,555,459 | | | | 5,170,931 | |
| | | |
Distributions to shareholders from: | | | | | | | | | | | | |
Net investment income: | | | | | | | | | | | | |
Institutional Class | | | (17,500,005 | ) | | | — | | | | (2,138,065 | ) |
| | | |
Net realized gain on investments: | | | | | | | | | | | | |
Institutional Class | | | — | | | | (461,385 | ) | | | — | |
| | | |
Change in net assets from fund share transactions: | | | | | | | | | | | | |
Institutional Class | | | (87,936,589 | ) | | | 25,251,687 | | | | 83,854,409 | |
| | | | | | | | | | | | |
Change in net assets | | | (101,292,051 | ) | | | 28,345,761 | | | | 86,887,275 | |
| | | |
Net Assets: | | | | | | | | | | | | |
Beginning of period | | | 205,654,230 | | | | 177,308,469 | | | | 90,421,194 | |
| | | | | | | | | | | | |
| | | |
End of period | | $ | 104,362,179 | | | $ | 205,654,230 | | | $ | 177,308,469 | |
| | | | | | | | | | | | |
| | | |
(Overdistributed)/Undistributed net investment income | | $ | (3,950,890 | ) | | $ | (2,442,558 | ) | | $ | 1,195,373 | |
| | | | | | | | | | | | |
| | | | | | | | | | | | | |
A | | For the period April 1, 2008 to December 31, 2008. |
See notes to financial statements.
168
Annual Report to Shareholders
Financial Highlights
Western Asset Non-U.S. Opportunity Bond Portfolio
For a share of each class of capital stock outstanding:
Institutional Class:
| | | | | | | | | | | | | | | | | | | | | | | | |
| | | PERIOD
ENDED
DECEMBER 31,
2008A | | | YEARS ENDED MARCH 31, | |
| | | | 2008 | | | 2007 | | | 2006 | | | 2005 | | | 2004 | |
Net asset value, beginning of period | | $ | 9.93 | | | $ | 9.75 | | | $ | 9.59 | | | $ | 10.98 | | | $ | 10.52 | | | $ | 10.91 | |
| | | | | | | | | | | | | | | | | | | | | | | | |
Investment operations: | | | | | | | | | | | | | | | | | | | | | | | | |
Net investment income | | | .24 | B | | | .37 | B | | | .36 | B | | | .64 | C | | | .19 | C | | | .97 | C |
Net realized and unrealized gain/(loss) | | | .21 | | | | (.16 | ) | | | — | D | | | (.07 | ) | | | .57 | | | | (.01 | ) |
| | | | | | | | | | | | | | | | | | | | | | | | |
Total from investment operations | | | .45 | | | | .21 | | | | .36 | | | | .57 | | | | .76 | | | | .96 | |
| | | | | | | | | | | | | | | | | | | | | | | | |
Distributions from: | | | | | | | | | | | | | | | | | | | | | | | | |
Net investment income | | | (1.61 | ) | | | — | | | | (.20 | ) | | | (1.16 | ) | | | (.29 | ) | | | (1.01 | ) |
Net realized gain on investments | | | — | | | | (.03 | ) | | | — | | | | (.80 | ) | | | (.01 | ) | | | (.34 | ) |
| | | | | | | | | | | | | | | | | | | | | | | | |
Total distributions | | | (1.61 | ) | | | (.03 | ) | | | (.20 | ) | | | (1.96 | ) | | | (.30 | ) | | | (1.35 | ) |
| | | | | | | | | | | | | | | | | | | | | | | | |
Net asset value, end of period | | $ | 8.77 | | | $ | 9.93 | | | $ | 9.75 | | | $ | 9.59 | | | $ | 10.98 | | | $ | 10.52 | |
| | | | | | | | | | | | | | | | | | | | | | | | |
Total return | | | 4.49 | %E | | | 2.11 | % | | | 3.89 | % | | | 5.33 | % | | | 7.60 | % | | | 9.06 | % |
| | | | | | |
Ratios to Average Net Assets:F | | | | | | | | | | | | | | | | | | | | | | | | |
Total expenses | | | .62 | %G | | | .59 | % | | | .64 | % | | | .74 | % | | | .68 | % | | | .80 | % |
Expenses net of waivers, if any | | | .58 | %G | | | .55 | % | | | .55 | % | | | .55 | % | | | .55 | % | | | .55 | % |
Expenses net of all reductions | | | .58 | %G | | | .55 | % | | | .55 | % | | | .55 | % | | | .55 | % | | | .55 | % |
Net investment income | | | 3.2 | %G | | | 3.7 | % | | | 3.7 | % | | | 3.3 | % | | | 3.2 | % | | | 4.0 | % |
| | | | | | |
Supplemental Data: | | | | | | | | | | | | | | | | | | | | | | | | |
Portfolio turnover rate | | | 52.2 | %E | | | 68.4 | % | | | 117.9 | % | | | 140.1 | % | | | 40.8 | % | | | 42.8 | % |
Net assets, end of period (in thousands) | | $ | 104,362 | | | $ | 205,654 | | | $ | 177,308 | | | $ | 90,421 | | | $ | 89,170 | | | $ | 97,027 | |
| | | | | | | | | | | | | | | | | | | | | | | | | |
A | | For the period April 1, 2008 to December 31, 2008. |
B | | Computed using average daily shares outstanding. |
C | | Computed using SEC method. |
D | | Amount less than $.01 per share. |
F | | Total expenses reflects operating expenses prior to any contractual expense waivers and/or compensating balance credits. Expenses net of waivers reflects total expenses before compensating balance credits but net of any contractual expense waivers. Expenses net of all reductions reflects expenses less any compensating balance credits and/or contractual expense waivers. As of the most current prospectus, the Institutional Class has no limit on expenses. |
See notes to financial statements.
169
Annual Report to Shareholders
Notes to Financial Statements
1. Significant Accounting Policies:
Western Asset Funds, Inc. (“Corporation”), consisting of Western Asset Absolute Return Portfolio (“Absolute Return”), Western Asset Core Bond Portfolio (“Core”), Western Asset Core Plus Bond Portfolio (“Core Plus”), Western Asset High Yield Portfolio (“High Yield”), Western Asset Inflation Indexed Plus Bond Portfolio (“Inflation Indexed”), Western Asset Intermediate Bond Portfolio (“Intermediate”), Western Asset Intermediate Plus Bond Portfolio (“Intermediate Plus”), Western Asset Limited Duration Bond Portfolio (“Limited Duration”) and Western Asset Non-U.S. Opportunity Bond Portfolio (“Non-U.S.”) (individually a “Fund,” collectively the “Funds”), is registered under the Investment Company Act of 1940, as amended (“1940 Act”), as a diversified, open-end management investment company with the exception of Non-U.S., which is non-diversified. Financial Statements for Core and Core Plus are contained in a separate Report to Shareholders.
Each Fund offers three classes of shares: Institutional Class, Institutional Select Class and Financial Intermediary Class. Shares in the Financial Intermediary Class bear a distribution fee. The Institutional Select Class shares of Non-U.S. have not commenced operations. The Financial Intermediary Class shares of Limited Duration, Intermediate, Intermediate Plus, High Yield, and Non-U.S. have not commenced operations. The income and expenses of each of the Funds are allocated proportionately to the three classes of shares based on daily net assets, except for Rule 12b-1 distribution fees, which are charged only on the Financial Intermediary Class shares, and transfer agent and shareholder servicing expenses, and certain other expenses, which are determined separately for each class.
Preparation of the financial statements in accordance with accounting principles generally accepted in the United States of America requires management to make estimates and assumptions that affect the reported amounts and disclosures in the financial statements. Actual results could differ from those estimates. The following is a summary of significant accounting policies followed by each Fund in the preparation of its financial statements:
Investment Valuation
The Funds’ securities are valued under policies approved by and under the general oversight of the Board of Directors. Effective April 1, 2008, the Fund adopted Statement of Financial Accounting Standards No. 157 (“FAS 157”). FAS 157 establishes a single definition of fair value, creates a three-tier hierarchy as a framework for measuring fair value based on inputs used to value the Fund’s investments, and requires additional disclosure about fair value. The hierarchy of inputs is summarized below.
| | • | | Level 1—quoted prices in active markets for identical investments |
| | • | | Level 2—other significant observable inputs (including quoted prices for similar investments, interest rates, prepayment speeds, credit risk, etc.) |
| | • | | Level 3—significant unobservable inputs (including the Fund’s own assumptions in determining the fair value of investments) |
Debt securities are valued at the last quoted bid prices provided by an independent pricing service that are based on transactions in debt obligations, quotations from bond dealers, market transactions in comparable securities and various other relationships between securities. Publicly traded foreign government debt securities are typically traded internationally in the over-the-counter market and are valued at the bid price as of the close of business of that market. Equity securities for which market quotations are available are valued at the last sale price or official closing price on the primary market or exchange on which they trade. When prices are not readily available, or are determined not to reflect fair value, such as when the value of a security has been significantly affected by events after the close of the exchange or market on which the security is principally traded, but before the Fund calculates its net asset value, the Fund may value these securities at fair value as determined in accordance with the procedures approved by the Fund’s Board of Directors.
170
Annual Report to Shareholders
The inputs or methodology used for valuing securities are not necessarily an indication of the risk associated with investing in those securities.
The following is a summary of the inputs used in valuing the Fund’s assets carried at fair value:
Absolute Return
| | | | | | | | | | | | | | | |
| | | December 31,
2008 | | | Quoted Prices
(Level 1) | | | Other Significant
Observable
Inputs
(Level 2) | | | Significant
Unobservable
Inputs
(Level 3) |
Investments in Securities | | $ | 364,162,073 | | | $ | 1,425 | | | $ | 362,020,495 | | | $ | 2,140,153 |
Other Financial Instruments* | | | (8,260,233 | ) | | | (459,634 | ) | | | (7,800,599 | ) | | | — |
| | | | | | | | | | | | | | | |
Total | | $ | 355,901,840 | | | $ | (458,209 | ) | | $ | 354,219,896 | | | $ | 2,140,153 |
| | | | | | | | | | | | | | | |
| * | | Other financial instruments include written options, futures, swaps and forward contracts. |
Following is a reconciliation of investments in which significant unobservable inputs (Level 3) were used in determining fair value:
| | | |
| | | Investments
in Securities |
Balance as of 3/31/08 | | $ | — |
Accrued Premiums/Discounts | | | — |
Realized Gain (Loss) | | | — |
Change in unrealized appreciation (depreciation) | | | — |
Net purchases (sales) | | | — |
Transfers in and/or out of Level 3 | | | 2,140,153 |
| | | |
Balance as of 12/31/08 | | $ | 2,140,153 |
| | | |
High Yield
| | | | | | | | | | | | | | |
| | | December 31,
2008 | | | Quoted Prices
(Level 1) | | Other Significant
Observable
Inputs
(Level 2) | | | Significant
Unobservable
Inputs
(Level 3) |
Investments in Securities | | $ | 490,391,267 | | | $ | 4,668,786 | | $ | 485,722,481 | | | $ | — |
Other Financial Instruments* | | | (535,349 | ) | | | — | | | (535,349 | ) | | | — |
| | | | | | | | | | | | | | |
Total | | $ | 489,855,918 | | | $ | 4,668,786 | | $ | 485,187,132 | | | $ | — |
| | | | | | | | | | | | | | |
| * | | Other financial instruments include swaps. |
Following is a reconciliation of investments in which significant unobservable inputs (Level 3) were used in determining fair value:
| | | | |
| | | Investments
in Securities | |
Balance as of 3/31/08 | | $ | 5,758 | |
Accrued Premiums/Discounts | | | (2,640 | ) |
Realized Gain (Loss) | | | (51,372 | ) |
Change in unrealized appreciation (depreciation) | | | 48,601 | |
Net purchases (sales) | | | (347 | ) |
Transfers in and/or out of Level 3 | | | — | |
| | | | |
Balance as of 12/31/08 | | $ | — | |
| | | | |
171
Annual Report to Shareholders
Notes to Financial Statements—Continued
Inflation Indexed
| | | | | | | | | | | | | | | |
| | | December 31,
2008 | | | Quoted Prices
(Level 1) | | | Other Significant
Observable
Inputs
(Level 2) | | | Significant
Unobservable
Inputs
(Level 3) |
Investments in Securities | | $ | 498,108,242 | | | $ | 3,465,615 | | | $ | 494,642,627 | | | $ | — |
Other Financial Instruments* | | | (10,090,499 | ) | | | (3,641,377 | ) | | | (6,449,122 | ) | | | — |
| | | | | | | | | | | | | | | |
Total | | $ | 488,017,743 | | | $ | (175,762 | ) | | $ | 488,193,505 | | | $ | — |
| | | | | | | | | | | | | | | |
| * | | Other financial instruments include futures, swaps and forward contracts. |
Intermediate
| | | | | | | | | | | | | |
| | | December 31,
2008 | | Quoted Prices
(Level 1) | | Other Significant
Observable
Inputs
(Level 2) | | | Significant
Unobservable
Inputs
(Level 3) |
Investments in Securities | | $ | 558,351,647 | | $ | 84,509 | | $ | 557,935,218 | | | $ | 331,920 |
Other Financial Instruments* | | | 1,828,772 | | | 3,122,032 | | | (1,293,260 | ) | | | — |
| | | | | | | | | | | | | |
Total | | $ | 560,180,419 | | $ | 3,206,541 | | $ | 556,641,958 | | | $ | 331,920 |
| | | | | | | | | | | | | |
| * | | Other financial instruments include written options, futures, and swaps. |
Following is a reconciliation of investments in which significant unobservable inputs (Level 3) were used in determining fair value:
| | | |
| | | Investments
in Securities |
Balance as of 3/31/08 | | $ | — |
Accrued Premiums/Discounts | | | — |
Realized Gain (Loss) | | | — |
Change in unrealized appreciation (depreciation) | | | — |
Net purchases (sales) | | | — |
Transfers in and/or out of Level 3 | | | 331,920 |
| | | |
Balance as of 12/31/08 | | $ | 331,920 |
| | | |
Intermediate Plus
| | | | | | | | | | | | | |
| | | December 31,
2008 | | Quoted Prices
(Level 1) | | Other Significant
Observable
Inputs
(Level 2) | | | Significant
Unobservable
Inputs
(Level 3) |
Investments in Securities | | $ | 81,997,360 | | $ | 12,055 | | $ | 81,963,705 | | | $ | 21,600 |
Other Financial Instruments* | | | 469,579 | | | 488,638 | | | (19,059 | ) | | | — |
| | | | | | | | | | | | | |
Total | | $ | 82,466,939 | | $ | 500,693 | | $ | 81,944,646 | | | $ | 21,600 |
| | | | | | | | | | | | | |
| * | | Other financial instruments include written options, futures, swaps and forward contracts. |
172
Annual Report to Shareholders
Following is a reconciliation of investments in which significant unobservable inputs (Level 3) were used in determining fair value:
| | | |
| | | Investments
in Securities |
Balance as of 3/31/08 | | $ | — |
Accrued Premiums/Discounts | | | — |
Realized Gain (Loss) | | | — |
Change in unrealized appreciation (depreciation) | | | — |
Net purchases (sales) | | | — |
Transfers in and/or out of Level 3 | | | 21,600 |
| | | |
Balance as of 12/31/08 | | $ | 21,600 |
| | | |
Limited Duration
| | | | | | | | | | | | | | |
| | | December 31,
2008 | | | Quoted Prices
(Level 1) | | Other Significant
Observable
Inputs
(Level 2) | | | Significant
Unobservable
Inputs
(Level 3) |
Investments in Securities | | $ | 83,167,969 | | | $ | 13,527 | | $ | 83,112,442 | | | $ | 42,000 |
Other Financial Instruments* | | | (573,711 | ) | | | 1,442,952 | | | (2,016,663 | ) | | | — |
| | | | | | | | | | | | | | |
Total | | $ | 82,594,258 | | | $ | 1,456,479 | | $ | 81,095,779 | | | $ | 42,000 |
| | | | | | | | | | | | | | |
| * | | Other financial instruments include written options, futures and swaps. |
Following is a reconciliation of investments in which significant unobservable inputs (Level 3) were used in determining fair value:
| | | |
| | | Investments
in Securities |
Balance as of 3/31/08 | | $ | — |
Accrued Premiums/Discounts | | | — |
Realized Gain (Loss) | | | — |
Change in unrealized appreciation (depreciation) | | | — |
Net purchases (sales) | | | — |
Transfers in and/or out of Level 3 | | | 42,000 |
| | | |
Balance as of 12/31/08 | | $ | 42,000 |
| | | |
Non-U.S.
| | | | | | | | | | | | | | | |
| | | December 31,
2008 | | | Quoted Prices
(Level 1) | | | Other Significant
Observable
Inputs
(Level 2) | | | Significant
Unobservable
Inputs
(Level 3) |
Investments in Securities | | $ | 99,482,995 | | | $ | 1,502,298 | | | $ | 97,980,697 | | | $ | — |
Other Financial Instruments* | | | (1,704,514 | ) | | | (170,473 | ) | | | (1,534,041 | ) | | | — |
| | | | | | | | | | | | | | | |
Total | | $ | 97,778,481 | | | $ | 1,331,825 | | | $ | 96,446,656 | | | $ | — |
| | | | | | | | | | | | | | | |
| * | | Other financial instruments include written options, futures and forward contracts. |
Security Transactions
Security transactions are accounted for as of the trade date. Realized gains and losses from security transactions are reported on an identified cost basis for both financial reporting and federal income tax purposes.
173
Annual Report to Shareholders
Notes to Financial Statements—Continued
For the period ended December 31, 2008, security transactions (excluding short-term investments) were as follows:
| | | | | | | | | | | | |
| | | Purchases | | Proceeds From Sales |
| | | U.S. Gov’t.
Securities | | Other | | U.S. Gov’t.
Securities | | Other |
Absolute Return | | $ | 1,092,408,492 | | $ | 65,292,268 | | $ | 1,230,633,242 | | $ | 40,425,518 |
High Yield | | | — | | | 269,163,221 | | | — | | | 272,806,061 |
Inflation Indexed | | | 582,173,833 | | | 23,483,005 | | | 535,737,922 | | | 32,148,814 |
Intermediate | | | 765,451,506 | | | 108,262,579 | | | 865,850,958 | | | 30,098,442 |
Intermediate Plus | | | 124,032,012 | | | 13,000,778 | | | 132,101,313 | | | 8,545,818 |
Limited Duration | | | 237,420,230 | | | 13,484,727 | | | 247,515,523 | | | 25,847,345 |
Non-U.S. | | | — | | | 74,269,811 | | | — | | | 108,836,829 |
Forward Commitments
The Funds may enter into commitments to purchase securities on a “forward commitment” basis, including purchases on a “when-issued” basis or a “to be announced” basis. When such transactions are negotiated, certain terms may be fixed at the time the commitment is made, but delivery and payment for the securities takes place at a later date. During the period between a commitment and settlement, no payment is made by the purchaser for the securities purchased and, thus, no interest accrues to the purchaser from the transaction. In a “to be announced” transaction, a Fund commits to purchase securities for which all specific information is not yet known at the time of the trade, particularly the exact face amount in forward commitment mortgage backed securities transactions. Depending on market conditions, a Fund’s forward commitment purchases could cause its net asset value to be more volatile.
A Fund may sell the securities subject to a forward commitment purchase, which may result in a gain or loss. When a Fund purchases securities on a forward commitment basis, it assumes the risks of ownership, including the risk of price fluctuation, at the time of purchase, not at the time of receipt. Purchases of forward commitment securities also involve a risk of loss if the seller fails to deliver after the value of the securities has risen.
Each Fund may also enter into a forward commitment to sell securities it owns and will generally do so only with the intention of actually delivering the securities. In a forward sale, a Fund does not participate in gains or losses on the security occurring after the commitment date. Forward commitments to sell securities also involve a risk of loss if the seller fails to take delivery after the value of the securities has declined.
Foreign Currency Translation
Assets and liabilities initially expressed in non-U.S. currencies are translated into U.S. dollars using currency exchange rates determined prior to the close of trading on the New York Stock Exchange, usually at 2:00 p.m. Eastern time. Purchases and sales of securities and income and expenses are translated into U.S. dollars at the prevailing market rates on the dates of such transactions. The effects of changes in non-U.S. currency exchange rates on investment securities and other assets and liabilities are included with the net realized and unrealized gain or loss on investment securities.
Repurchase Agreements
Each Fund may enter into repurchase agreements with institutions that its investment adviser has determined are creditworthy. Each repurchase agreement is recorded at cost. Under the terms of a typical repurchase agreement, a fund takes possession of an underlying debt obligation subject to an obligation of the seller to repurchase, and of the fund to resell, the obligation at an agreed-upon price and time, thereby determining the yield during a fund’s holding period. When entering into repurchase agreements, it is the Fund’s policy that its custodian acting on the fund’s behalf, or a third party custodian take possession of the underlying collateral securities, the market value of which, at all times, at least equals the principal amount of the repurchase transaction, including accrued interest. To the extent that any repurchase transaction exceeds one business day, the value of the collateral is marked to market to ensure the adequacy of the collateral. If the counterparty defaults, the affected Fund generally has the right to use the collateral to satisfy the terms of the repurchase transaction. However, if the market value of the collateral declines during the period in which the Fund seeks to assert its rights or if bankruptcy proceedings are commenced with respect to the seller of the security, realization of the collateral by the Fund may be delayed or limited.
174
Annual Report to Shareholders
Options, Futures and Swap Agreements
The current market value of an exchange traded option is the last sale price or, in the absence of a sale, the price obtained by reference to broker-dealer quotations. Futures contracts are valued daily at the settlement price established by the board of trade or exchange on which they are traded. Futures contracts are marked-to-market on a daily basis. As the contract’s value fluctuates, payments known as variation margin are made or received by the Fund each day, depending on the daily fluctuation in the value of the contract. The daily changes in contract value are recorded as unrealized gains or losses, and the Fund recognizes a gain or loss when the contract is closed. Swap agreements are priced daily by vendors or advisor models and the change, if any, is recorded as unrealized appreciation or depreciation.
Investment Income and Distributions to Shareholders
Investment income and distributions to shareholders are allocated at the class level and are recorded on the ex-dividend date. Dividends from net investment income are declared daily and paid monthly for each Fund except High Yield and Non-U.S., which declare and pay dividends quarterly. Net capital gain distributions, which are calculated at the Fund level, are declared and paid annually. An additional distribution may be made in December to the extent necessary in order to comply with federal excise tax requirements. Distributions are determined in accordance with federal income tax regulations, which may differ from those determined in accordance with accounting principles generally accepted in the United States of America; accordingly, periodic reclassifications are made within the Funds’ capital accounts to reflect income and gains available for distribution under federal income tax regulations. Interest income and expenses are recorded on the accrual basis. Bond discounts and premiums are amortized and included in interest income for financial reporting and federal income tax purposes.
Compensating Balance Credits
The Funds have an arrangement with their custodian bank, whereby a portion of the custodian’s fee is paid indirectly by credits earned on each Fund’s cash on deposit with the bank. This deposit arrangement is an alternative to purchasing overnight investments.
Redemption-In-Kind
In consideration of the best interests of non-redeeming shareholders, the Corporation reserves the right to pay any redemption price in whole or in part by a distribution in-kind of readily marketable securities held by a Fund in lieu of cash. For financial reporting purposes, the Fund recognizes a gain on in-kind redemptions to the extent the value of the distributed securities on the date of redemption exceeds the cost of those securities; the Fund recognizes a loss if cost exceeds value. Gains and losses realized on redemption-in-kind transactions are not recognized for tax purposes, and are reclassified from undistributed realized gain/(loss) to paid-in-capital. During the year ended December 31, 2008, Western Asset Inflation Indexed Plus Bond Portfolio realized $24,386,948 of net loss on $269,387,186 redemption-in-kind transactions.
Credit and Market Risk
Investments in structured securities collateralized by residential real estate mortgages are subject to certain credit and liquidity risks. When market conditions result in an increase in default rates of the underlying mortgages and the foreclosure values of underlying real estate properties are materially below the outstanding amount of these underlying mortgages, collection of accrued interest and principal on these investments may be doubtful. Such market conditions may significantly impair the value of these investments resulting in a lack of correlation between their credit ratings and values.
Other
In the normal course of business, each Fund enters into contracts that provide general indemnifications. Each Fund’s maximum exposure under these arrangements is dependent upon claims that may be made against the Fund in the future and, therefore, cannot be estimated; however, based on experience, the risk of material loss from such claims is considered remote.
2. Federal Income Taxes:
It is each Fund’s policy to continue to comply with the federal income and excise tax requirements of the Internal Revenue Code of 1986, as amended, applicable to regulated investment companies. Accordingly, the Funds intend to distribute substantially all of their income and net realized gains on investments, if any, to shareholders each year. Therefore, no federal income tax provision is required in the Funds’ financial statements. Under the applicable foreign tax laws, a withholding tax may be imposed on interest, dividends and capital gains at various rates.
175
Annual Report to Shareholders
Notes to Financial Statements—Continued
Management has analyzed the each Fund’s tax positions taken on federal income tax returns for all open tax years and has concluded that as of December 31, 2008, no provision for income tax would be required in the Funds’ financial statements. The Funds’ federal and state income and federal excise tax returns for tax years for which the applicable statutes of limitations have not expired are subject to examination by the Internal Revenue Service and state departments of revenue.
Reclassifications:
Generally Accepted Accounting Principles require that certain components of net assets be adjusted to reflect permanent differences between financial and tax reporting. These reclassifications have no effect on net assets or net asset values per share. During the current year, the following reclassifications have been made:
| | | | | | | | | | | | | |
Fund | | | | (Over)/Undistributed
Net Investment Income | | | Accumulated Net
Realized Gain/(Loss) | | | Paid-in Capital | |
| | | | |
Absolute Return | �� | (a) | | $(100,000 | ) | | $ | — | | | $ | 100,000 | |
| | (b) | | 1,529,237 | | | | (1,529,237 | ) | | | — | |
High Yield | | (c) | | (26,794 | ) | | | 26,794 | | | | — | |
Inflation Indexed | | (d) | | — | | | | 25,121,094 | | | | (25,121,094 | ) |
| | (b) | | 4,241,361 | | | | (4,241,361 | ) | | | — | |
Intermediate | | (e) | | 988,445 | | | | (988,445 | ) | | | — | |
Intermediate Plus | | (f) | | 1,501 | | | | — | | | | (1,501 | ) |
| | (b) | | 476,401 | | | | (476,401 | ) | | | — | |
Limited Duration | | (e) | | 80,729 | | | | (80,729 | ) | | | — | |
Non-U.S. | | (g) | | 11,786,193 | | | | (11,786,193 | ) | | | — | |
(a) | | Reclassifications are primarily due to prior year distributions paid in connection with redemption of fund shares. |
(b) | | Reclassifications are primarily due to foreign currency transactions treated as ordinary income for tax purposes, losses from mortgage-backed securities treated as capital losses for tax purposes, book/tax differences in the treatment of distributions and book/tax differences in the treatment of swap contracts. |
(c) | | Reclassifications are primarily due to foreign currency transactions treated as ordinary income for tax purposes, losses from mortgage-backed securities treated as capital losses for tax purposes and book/tax differences in the treatment of swap contracts. |
(d) | | Reclassifications are primarily due to book/tax differences in the treatment of an in-kind distribution of securities and tax adjustments associated with securities involved in an in-kind distribution. |
(e) | | Reclassifications are primarily due to losses from mortgage-backed securities treated as capital losses for tax purposes and book/tax differences in the treatment of swap contracts. |
(f) | | Reclassifications are primarily due to a non-deductible excise tax paid by the Fund. |
(g) | | Reclassifications are primarily due to foreign currency transactions treated as ordinary income for tax purposes and book/tax differences in the treatment of swap contracts. |
176
Annual Report to Shareholders
Distributions to Shareholders:
Subsequent to the fiscal year end, the Funds have made the following distributions:
| | | | | | | | | |
| | | Absolute Return |
Record Date
Payable Date | | Institutional
Class | | Financial
Intermediary
Class | | Institutional Select
Class |
Daily
1/30/2009 | | $ | 0.032907 | | $ | 0.028807 | | $ | 0.030464 |
| | |
| | | Intermediate | | |
Record Date
Payable Date | | Institutional
Class | | Institutional Select
Class | | |
Daily
1/30/2009 | | $ | 0.031433 | | $ | 0.031930 | | | |
| | |
| | | Intermediate Plus | | |
Record Date
Payable Date | | Institutional
Class | | Institutional Select
Class | | |
Daily
1/30/2009 | | $ | 0.027839 | | $ | 0.028152 | | | |
| | |
| | | Limited Duration | | |
Record Date
Payable Date | | Institutional
Class | | Institutional Select
Class | | |
Daily
1/30/2009 | | $ | 0.014929 | | $ | 0.015462 | | | |
The tax character of distributions paid during the period ended December 31, 2008 were as follows:
| | | | | | | | | |
| Distributions paid from: | | Absolute Return | | High Yield | | Inflation Indexed |
Ordinary Income | | $ | 29,928,294 | | $ | 75,116,597 | | $ | 49,148,590 |
Net Long-term Capital Gains | | | 4,749,989 | | | — | | | 6,285,963 |
| | | | | | | | | |
Total Distributions Paid | | $ | 34,678,283 | | $ | 75,116,597 | | $ | 55,434,553 |
| | | | | | | | | |
| | | |
| Distributions paid from: | | Intermediate | | Intermediate Plus | | Limited Duration |
Ordinary Income | | $ | 26,859,226 | | $ | 5,237,065 | | $ | 3,244,813 |
Net Long-term Capital Gains | | | 6,782,813 | | | 1,356,749 | | | — |
| | | | | | | | | |
Total Distributions Paid | | $ | 33,642,039 | | $ | 6,593,814 | | $ | 3,244,813 |
| | | | | | | | | |
| | | |
| Distributions paid from: | | Non-U.S. | | | | |
Ordinary Income | | $ | 17,500,005 | | | | | | |
| | | | | | | | | |
The tax character of distributions paid during the fiscal year ended March 31, 2008 were as follows:
| | | | | | | | | |
| Distributions paid from: | | Absolute Return | | High Yield | | Inflation Indexed |
Ordinary Income | | $ | 25,150,309 | | $ | 74,729,646 | | $ | 42,555,439 |
Net Long-term Capital Gains | | | 824,765 | | | 4,565,857 | | | — |
| | | | | | | | | |
Total Distributions Paid | | $ | 25,975,074 | | $ | 79,295,503 | | $ | 42,555,439 |
| | | | | | | | | |
177
Annual Report to Shareholders
Notes to Financial Statements—Continued
| | | | | | | | | |
| | | |
| Distributions paid from: | | Intermediate | | Intermediate Plus | | Limited Duration |
Ordinary Income | | $ | 35,155,441 | | $ | 5,126,363 | | $ | 4,689,218 |
Net Long-term Capital Gains | | | — | | | 91,179 | | | — |
| | | | | | | | | |
Total Taxable Distributions | | $ | 35,155,441 | | $ | 5,217,542 | | $ | 4,689,218 |
Tax Return of Capital | | | — | | | — | | | 547,710 |
| | | | | | | | | |
Total Distributions Paid | | $ | 35,155,441 | | $ | 5,217,542 | | $ | 5,236,928 |
| | | | | | | | | |
| | | |
| Distributions paid from: | | Non-U.S. | | | | |
Ordinary Income | | $ | 736 | | | | | | |
Net Long-term Capital Gains | | | 460,649 | | | | | | |
| | | | | | | | | |
Total Distributions Paid | | $ | 461,385 | | | | | | |
| | | | | | | | | |
Accumulated Earnings on a Tax Basis:
As of the period ended December 31, 2008, the components of accumulated earnings on a tax basis were as follows:
| | | | | | | | | | | | |
| | | Absolute Return | | | High Yield | | | Inflation Indexed | |
Undistributed ordinary income—net | | $ | 2,294,333 | | | $ | 794,280 | | | $ | 2,961,928 | |
Capital loss carryforward(*) | | | (1,073,088 | ) | | | (49,747,397 | ) | | | (6,600,414 | ) |
Other book/tax temporary differences | | | (6,280,224 | )(a) | | | (21,765,013 | )(c) | | | (2,635,455 | )(a) |
Unrealized appreciation/(depreciation) | | | (113,843,012 | )(b) | | | (298,748,242 | )(b) | | | (68,062,983 | )(b) |
| | | | | | | | | | | | |
Total accumulated earnings/(losses)—net | | $ | (118,901,991 | ) | | $ | (369,466,372 | ) | | $ | (74,336,924 | ) |
| | | | | | | | | | | | |
| | | |
| | | Intermediate | | | Intermediate Plus | | | Limited Duration | |
Undistributed ordinary income—net | | $ | 8,714,944 | | | $ | 71,871 | | | $ | 23,211 | |
Capital loss carryforward(*) | | | — | | | | — | | | | (6,431,230 | ) |
Other book/tax temporary differences | | | (3,381,356 | )(d) | | | (691,028 | )(a) | | | (1,508,912 | )(d) |
Unrealized appreciation/(depreciation) | | | (88,035,820 | )(b) | | | (14,155,932 | )(b) | | | (15,741,970 | )(b) |
| | | | | | | | | | | | |
Total accumulated earnings/(losses)—net | | $ | (82,702,232 | ) | | $ | (14,775,089 | ) | | $ | (23,658,901 | ) |
| | | | | | | | | | | | |
| | | |
| | | Non-U.S. | | | | | | | |
Undistributed long-term capital gains—net | | $ | 597,737 | | | | | | | | | |
Capital loss carryforward(*) | | | — | | | | | | | | | |
Other book/tax temporary differences | | | (4,162,277 | )(a) | | | | | | | | |
Unrealized appreciation/(depreciation) | | | (770,308 | ) | | | | | | | | |
| | | | | | | | | | | | |
Total accumulated earnings/(losses)—net | | $ | (4,334,848 | ) | | | | | | | | |
| | | | | | | | | | | | |
178
Annual Report to Shareholders
As of the period ended December 31, 2008, the following capital loss carryforwards are available:
| | | | | | |
Year of Expiration | | Absolute Return | | High Yield | | Inflation Indexed |
12/31/2016 | | $(1,073,088) | | $(49,747,397) | | $(6,600,414) |
| | | |
Year of Expiration | | Limited Duration | | | | |
12/31/2013 | | $ (234,847) | | | | |
12/31/2014 | | (394,050) | | | | |
12/31/2015 | | (34,113) | | | | |
12/31/2016 | | (5,768,220) | | | | |
| | | | | | |
| | $(6,431,230) | | | | |
| | | | | | |
(*) These amounts will be available to offset any future taxable capital gains.
(a) | | Other book/tax temporary differences are attributable primarily to the tax deferral of losses on straddles, the realization for tax purposes of unrealized gains / (losses) on certain futures and/or foreign currency contracts, the deferral of post-October losses for tax purposes, differences between book/tax accrual of interest income on certain securities and book/tax differences in the timing of the deductibility of various expenses. |
(b) | | The difference between book-basis and tax-basis unrealized appreciation / (depreciation) is attributable primarily to the tax deferral of losses on wash sales. |
(c) | | Other book/tax temporary differences are attributable primarily to the tax deferral of post-October losses for tax purposes, differences between book/tax accrual of interest income on certain securities and book/tax differences in the timing of the deductibility of various expenses. |
(d) | | Other book/tax temporary differences are attributable primarily to the tax deferral of losses on straddles, the realization for tax purposes of unrealized gains on certain futures contracts, differences between book/tax accrual of interest income on certain securities and book/tax differences in the timing of the deductibility of various expenses. |
Tax Cost of Investments:
As of December 31, 2008, the aggregate cost of investments for federal tax purposes were as follows:
| | | |
Absolute Return | | $ | 469,688,394 |
High Yield | | | 788,604,160 |
Inflation Indexed | | | 556,065,371 |
Intermediate | | | 648,216,239 |
Intermediate Plus | | | 96,623,497 |
Limited Duration | | | 98,336,229 |
Non-U.S. | | | 98,466,730 |
3. Financial Instruments:
Forward Currency Exchange Contracts
As part of their investment program, the Funds may utilize forward currency exchange contracts. The nature and risks of these financial instruments and the reasons for using them are set forth more fully in the Corporation’s prospectus and statement of additional information.
Forward foreign currency contracts are marked-to-market daily using forward foreign currency exchange rates supplied by an independent pricing service. The change in a contract’s market value is recorded by a Fund as an unrealized gain or loss. When the contract is closed or delivery is taken, the Fund records a realized gain or loss equal to the difference between the value of the contract at the time it was opened and the value at the time it was closed.
The use of forward foreign currency contracts does not eliminate fluctuations in the underlying prices of the Funds’ securities, but it does establish a rate of exchange that can be achieved in the future. These forward foreign currency contracts involve market risk in excess of amounts reflected in the financial statements. Although forward foreign currency contracts used for hedging purposes limit the risk of loss due to a decline in the value of the hedged currency, they also limit any potential gain that might result should the value of the currency increase. In addition, the Fund could be exposed to risks if the counterparties to the contracts are unable to meet the terms of their contracts.
179
Annual Report to Shareholders
Notes to Financial Statements—Continued
At December 31, 2008, open forward currency exchange contracts (expressed in the contractual currency) were:
Absolute Return
| | | | | | | | | | | | | | |
Broker | | Settlement
Date | | Contract to | | Unrealized
Gain/(Loss) | |
| | | Receive | | Deliver | |
Citibank NA | | 2/3/09 | | EUR | | 6,656,945 | | USD | | 8,529,743 | | $ | 710,071 | |
Citibank NA | | 2/3/09 | | GBP | | 5,697,950 | | USD | | 8,973,017 | | | (788,389 | ) |
Citibank NA | | 2/3/09 | | JPY | | 173,092,800 | | USD | | 1,719,305 | | | 191,473 | |
Credit Suisse First Boston (London) | | 2/3/09 | | JPY | | 380,220,380 | | USD | | 3,794,312 | | | 402,955 | |
Citibank NA | | 2/3/09 | | USD | | 965,124 | | CAD | | 1,150,138 | | | 33,902 | |
Citibank NA | | 2/3/09 | | USD | | 8,835,629 | | EUR | | 6,656,945 | | | (404,184 | ) |
Citibank NA | | 2/3/09 | | USD | | 549,101 | | EUR | | 435,000 | | | (54,678 | ) |
Citibank NA | | 2/3/09 | | USD | | 9,708,622 | | GBP | | 5,697,950 | | | 1,523,994 | |
Credit Suisse First Boston (London) | | 2/3/09 | | USD | | 1,297,837 | | GBP | | 767,515 | | | 195,365 | |
Credit Suisse First Boston (London) | | 2/3/09 | | USD | | 5,758,065 | | JPY | | 545,260,000 | | | (261,080 | ) |
HSBC Bank USA | | 3/18/09 | | CNY | | 10,045,500 | | USD | | 1,441,248 | | | 12,851 | |
| | | | | | | | | | | | | | |
| | | | | | | | | | | | $ | 1,562,280 | |
| | | | | | | | | | | | | | |
Inflation Indexed
| | | | | | | | | | | | | | |
Broker | | Settlement
Date | | Contract to | | Unrealized
Gain/(Loss) | |
| | | Receive | | Deliver | |
UBS AG London | | 2/3/09 | | CAD | | 12,862,436 | | USD | | 10,768,050 | | $ | (353,839 | ) |
Morgan Stanley London FX | | 2/3/09 | | EUR | | 2,834,218 | | USD | | 3,753,639 | | | 180,245 | |
Credit Suisse First Boston (London) | | 2/3/09 | | GBP | | 13,406,133 | | USD | | 22,501,315 | | | (3,244,526 | ) |
Deutsche Bank AG London | | 2/3/09 | | JPY | | 640,263,600 | | USD | | 6,368,564 | | | 699,330 | |
UBS AG London | | 2/3/09 | | JPY | | 1,182,190,000 | | USD | | 11,767,768 | | | 1,282,471 | |
Deutsche Bank AG London | | 2/3/09 | | SEK | | 21,712,930 | | USD | | 2,951,530 | | | (207,556 | ) |
Citibank NA | | 2/3/09 | | USD | | 1,752,348 | | EUR | | 1,320,255 | | | (80,161 | ) |
Credit Suisse First Boston (London) | | 2/3/09 | | USD | | 4,187,379 | | CAD | | 5,031,136 | | | 113,865 | |
Credit Suisse First Boston (London) | | 2/3/09 | | USD | | 3,249,514 | | EUR | | 2,458,308 | | | (162,607 | ) |
Credit Suisse First Boston (London) | | 2/3/09 | | USD | | 18,187,538 | | JPY | | 1,822,536,810 | | | (1,931,515 | ) |
Deutsche Bank AG London | | 2/3/09 | | USD | | 5,799,326 | | CAD | | 6,931,239 | | | 187,374 | |
Deutsche Bank AG London | | 2/3/09 | | USD | | 1,708,481 | | SEK | | 12,850,000 | | | 84,561 | |
UBS AG London | | 2/3/09 | | USD | | 23,071,376 | | GBP | | 13,569,801 | | | 3,579,491 | |
UBS AG London | | 2/3/09 | | USD | | 1,177,054 | | SEK | | 8,856,860 | | | 57,767 | |
| | | | | | | | | | | | | | |
| | | | | | | | | | | | $ | 204,900 | |
| | | | | | | | | | | | | | |
Intermediate Plus
| | | | | | | | | | | | | | |
Broker | | Settlement
Date | | Contract to | | Unrealized
Gain/(Loss) | |
| | | Receive | | Deliver | |
Credit Suisse First Boston (London) | | 2/3/09 | | AUD | | 289,277 | | USD | | 196,853 | | $ | 4,080 | |
Credit Suisse First Boston (London) | | 2/3/09 | | EUR | | 760,670 | | USD | | 973,363 | | | 82,443 | |
Citibank NA | | 2/3/09 | | GBP | | 330,000 | | USD | | 485,562 | | | (11,544 | ) |
Credit Suisse First Boston (London) | | 2/3/09 | | JPY | | 104,501,670 | | USD | | 1,066,344 | | | 87,254 | |
Citibank NA | | 2/3/09 | | USD | | 1,240,103 | | EUR | | 934,319 | | | (56,728 | ) |
Credit Suisse First Boston (London) | | 2/3/09 | | USD | | 194,494 | | EUR | | 147,137 | | | (9,733 | ) |
Credit Suisse First Boston (London) | | 2/3/09 | | USD | | 554,635 | | GBP | | 328,000 | | | 83,491 | |
Credit Suisse First Boston (London) | | 2/3/09 | | USD | | 1,061,592 | | JPY | | 106,380,000 | | | (112,742 | ) |
UBS AG London | | 2/3/09 | | USD | | 185,259 | | AUD | | 271,728 | | | (3,484 | ) |
| | | | | | | | | | | | | | |
| | | | | | | | | | | | $ | 63,037 | |
| | | | | | | | | | | | | | |
180
Annual Report to Shareholders
Non-U.S.
| | | | | | | | | | | | | | |
Broker | | Settlement
Date | | Contract to | | Unrealized
Gain/(Loss) | |
| | | Receive | | Deliver | |
Citibank NA | | 2/3/09 | | AUD | | 2,120,565 | | USD | | 1,442,719 | | $ | 30,232 | |
UBS AG London | | 2/3/09 | | AUD | | 5,300,000 | | USD | | 3,590,100 | | | 91,298 | |
Citibank NA | | 2/3/09 | | CAD | | 260,000 | | USD | | 202,248 | | | 8,264 | |
Deutsche Bank AG London | | 2/3/09 | | CAD | | 3,000,000 | | USD | | 2,590,785 | | | (161,803 | ) |
JPMorgan Chase Bank | | 2/3/09 | | CAD | | 1,750,000 | | USD | | 1,385,261 | | | 31,646 | |
JPMorgan Chase Bank | | 2/3/09 | | DKK | | 2,900,000 | | USD | | 482,529 | | | 57,612 | |
UBS AG London | | 2/3/09 | | DKK | | 4,436,174 | | USD | | 784,678 | | | 41,585 | |
Citibank NA | | 2/3/09 | | EUR | | 2,157,823 | | USD | | 2,788,787 | | | 206,263 | |
Goldman Sachs International | | 2/3/09 | | EUR | | 4,980,000 | | USD | | 6,646,347 | | | 265,874 | |
JPMorgan Chase Bank | | 2/3/09 | | EUR | | 5,882,167 | | USD | | 7,500,710 | | | 663,716 | |
UBS AG London | | 2/3/09 | | EUR | | 13,467,342 | | USD | | 17,247,844 | | | 1,444,774 | |
Citibank NA | | 2/3/09 | | GBP | | 2,481,887 | | USD | | 4,159,516 | | | (594,493 | ) |
Deutsche Bank AG London | | 2/3/09 | | GBP | | 800,200 | | EUR | | 1,000,000 | | | (238,576 | ) |
Deutsche Bank AG London | | 2/3/09 | | GBP | | 937,617 | | USD | | 1,500,000 | | | (153,191 | ) |
JPMorgan Chase Bank | | 2/3/09 | | GBP | | 2,500,000 | | USD | | 3,957,750 | | | (366,709 | ) |
UBS AG London | | 2/3/09 | | GBP | | 4,800,000 | | USD | | 7,468,196 | | | (573,397 | ) |
Deutsche Bank AG London | | 2/3/09 | | JPY | | 412,560,000 | | USD | | 4,103,646 | | | 450,620 | |
Goldman Sachs International | | 2/3/09 | | JPY | | 498,740,000 | | USD | | 5,182,973 | | | 322,637 | |
Morgan Stanley London FX | | 2/3/09 | | JPY | | 41,140,000 | | USD | | 410,047 | | | 44,099 | |
Citibank NA | | 2/3/09 | | NOK | | 2,500,000 | | USD | | 349,528 | | | 6,613 | |
UBS AG London | | 2/3/09 | | NOK | | 2,237,866 | | USD | | 331,880 | | | (13,082 | ) |
Citibank NA | | 2/3/09 | | PLN | | 1,000,000 | | USD | | 328,319 | | | 7,751 | |
UBS AG London | | 2/3/09 | | PLN | | 7,000,000 | | USD | | 2,558,293 | | | (205,806 | ) |
Credit Suisse First Boston (London) | | 2/3/09 | | SEK | | 12,241,600 | | USD | | 1,613,284 | | | (66,251 | ) |
Citibank NA | | 2/3/09 | | USD | | 2,798,105 | | AUD | | 4,096,066 | | | (47,037 | ) |
Citibank NA | | 2/3/09 | | USD | | 1,510,716 | | CAD | | 1,800,320 | | | 53,067 | |
Citibank NA | | 2/3/09 | | USD | | 1,603,339 | | DKK | | 9,055,016 | | | (83,208 | ) |
Citibank NA | | 2/3/09 | | USD | | 18,778,165 | | JPY | | 1,890,510,547 | | | (2,091,251 | ) |
Citibank NA | | 2/3/09 | | USD | | 1,570,759 | | NOK | | 10,538,854 | | | 69,435 | |
Citibank NA | | 2/3/09 | | USD | | 6,481,351 | | PLN | | 17,662,977 | | | 545,363 | |
Credit Suisse First Boston (London) | | 2/3/09 | | USD | | 4,791,475 | | CAD | | 5,756,957 | | | 130,292 | |
Credit Suisse First Boston (London) | | 2/3/09 | | USD | | 9,649,505 | | EUR | | 7,300,000 | | | (482,867 | ) |
Credit Suisse First Boston (London) | | 2/3/09 | | USD | | 4,298,991 | | GBP | | 2,542,337 | | | 647,136 | |
Deutsche Bank AG London | | 2/3/09 | | USD | | 1,770,453 | | EUR | | 1,337,857 | | | (86,487 | ) |
Deutsche Bank AG London | | 2/3/09 | | USD | | 20,236,578 | | GBP | | 11,933,000 | | | 3,095,821 | |
Deutsche Bank AG London | | 2/3/09 | | USD | | 469,711 | | NOK | | 3,159,981 | | | 19,552 | |
Goldman Sachs International | | 2/3/09 | | USD | | 2,930,470 | | AUD | | 4,236,008 | | | (11,875 | ) |
Goldman Sachs International | | 2/3/09 | | USD | | 1,175,471 | | CAD | | 1,391,052 | | | 49,190 | |
Goldman Sachs International | | 2/3/09 | | USD | | 12,279,881 | | EUR | | 9,290,000 | | | (614,603 | ) |
Goldman Sachs International | | 2/3/09 | | USD | | 432,200 | | GBP | | 250,000 | | | 73,096 | |
Goldman Sachs International | | 2/3/09 | | USD | | 12,975,795 | | JPY | | 1,276,900,000 | | | (1,119,952 | ) |
JPMorgan Chase Bank | | 2/3/09 | | USD | | 2,244,167 | | CAD | | 2,693,001 | | | 63,750 | |
JPMorgan Chase Bank | | 2/3/09 | | USD | | 3,298,561 | | DKK | | 18,691,295 | | | (182,797 | ) |
JPMorgan Chase Bank | | 2/3/09 | | USD | | 11,227,463 | | EUR | | 8,481,238 | | | (544,463 | ) |
JPMorgan Chase Bank | | 2/3/09 | | USD | | 4,170,000 | | GBP | | 2,469,609 | | | 622,613 | |
Morgan Stanley London FX | | 2/3/09 | | USD | | 20,403,083 | | EUR | | 15,405,530 | | | (979,732 | ) |
UBS AG London | | 2/3/09 | | USD | | 17,308,800 | | EUR | | 13,688,493 | | | (1,690,775 | ) |
UBS AG London | | 2/3/09 | | USD | | 1,877,733 | | GBP | | 1,104,419 | | | 291,328 | |
181
Annual Report to Shareholders
Notes to Financial Statements—Continued
Non-U.S.—Continued
| | | | | | | | | | | | | | |
Broker | | Settlement
Date | | Contract to | | Unrealized
Gain/(Loss) | |
| | | Receive | | Deliver | |
UBS AG London | | 2/3/09 | | USD | | 5,991,920 | | JPY | | 601,948,235 | | $ | (653,009 | ) |
UBS AG London | | 2/3/09 | | USD | | 2,720,465 | | NOK | | 19,000,000 | | | 13,798 | |
UBS AG London | | 2/3/09 | | USD | | 1,627,994 | | SEK | | 12,250,000 | | | 79,898 | |
| | | | | | | | | | | | | | |
| | | | | | | | | | | | $ | (1,534,041 | ) |
| | | | | | | | | | | | | | |
AUD—Australian dollar
CAD—Canadian Dollar
DKK—Danish krona
EUR—Euro
GBP—British Pound
JPY—Japanese yen
NOK—Norwegian krone
SEK—Swedish krona
CNY—Chinese yuan renminbi
PLN—Polish zloty
USD—United States dollar
Loan Participations and Assignments
The Funds may invest in loans arranged through private negotiation between one or more financial institutions. The Funds’ investment in any such loan may be in the form of a participation in or an assignment of the loan. In connection with purchasing participations, the Funds generally will have no right to enforce compliance by the borrower with the terms of the loan agreement relating to the loan, nor any rights of set-off against the borrower and the Funds may not benefit directly from any collateral supporting the loan in which it has purchased the participation.
The Funds will assume the credit risk of both the borrower and the lender that is selling the participation. In the event of the insolvency of the lender selling the participation, the Funds may be treated as a general creditor of the lender and may not benefit from any set-off between the lender and the borrower.
Options and Futures
As part of their investment programs, the Funds may utilize options and futures. Options may be written (sold) or purchased by the Funds. When a Fund purchases a put or call option, the premium paid is recorded as an investment and its value is marked-to-market daily. When a Fund writes a put or call option, an amount equal to the premium received by the Fund is recorded as a liability and its value is marked-to-market daily.
When options, whether written or purchased, expire, are exercised or are closed (by entering into a closing purchase or sale transaction), the Fund realizes a gain or loss as described in the chart below:
| | |
| Purchased option: | | Impact on the Fund: |
| The option expires | | Realize a loss in the amount of the cost of the option. |
| The option is closed through a closing sale transaction | | Realize a gain or loss depending on whether the proceeds from the closing sale transaction are greater or less than the cost of the option. |
| The Fund exercises a call option | | The cost of the security purchased through the exercise of the option will be increased by the premium originally paid to purchase the option. |
| The Fund exercises a put option | | Realize a gain or loss from the sale of the underlying security. The proceeds of that sale will be reduced by the premium originally paid to purchase the put option. |
182
Annual Report to Shareholders
| | |
| |
| Written option: | | Impact on the Fund: |
| The option expires | | Realize a gain equal to the amount of the premium received. |
| The option is closed through a closing purchase transaction | | Realize a gain or loss without regard to any unrealized gain or loss on the underlying security and eliminate the option liability. The Fund will realize a loss in this transaction if the cost of the closing purchase exceeds the premium received when the option was written. |
| A written call option is exercised by the option purchaser | | Realize a gain or loss from the sale of the underlying security. The proceeds of that sale will be increased by the premium originally received when the option was written. |
| A written put option is exercised by the option purchaser | | The amount of the premium originally received will reduce the cost of the security that the Fund purchased when the option was exercised. |
The risk associated with purchasing options is limited to the premium originally paid. Options written by a Fund involve, to varying degrees, risk of loss in excess of the option value reflected in the statement of assets and liabilities. The risk in writing a covered call option is that a Fund may forgo the opportunity of profit if the market price of the underlying security increases and the option is exercised. The risk in writing a put option is that a Fund may incur a loss if the market price of the underlying security decreases and the option is exercised. In addition, there is the risk a Fund may not be able to enter into a closing transaction because of an illiquid secondary market or, for over-the-counter options, because of the counterparty’s inability or unwillingness to perform.
Activity in written call and put options during the period ended December 31, 2008, was as follows:
| | | | | | | |
| Absolute Return | | Actual
Contracts/
Notional Par | | | Premiums | |
Options outstanding at March 31, 2008 | | 1,293 | | | $ | 1,081,079 | |
Options written | | 137,285,918 | | | | 5,231,018 | |
Options closed | | (22,002,276 | ) | | | (1,204,450 | ) |
Options expired | | (34,652,349 | ) | | | (1,729,324 | ) |
Options exercised | | (29,350,825 | ) | | | (696,315 | ) |
| | | | | | | |
Options outstanding at December 31, 2008 | | 51,281,761 | | | $ | 2,682,008 | |
| | | | | | | |
| | |
| High Yield | | Actual
Contracts/
Notional Par | | | Premiums | |
Options outstanding at March 31, 2008 | | — | | | $ | — | |
Options written | | 11,600,000 | | | | 275,500 | |
Options closed | | — | | | | — | |
Options expired | | (11,600,000 | ) | | | (275,500 | ) |
Options exercised | | — | | | | — | |
| | | | | | | |
Options outstanding at December 31, 2008 | | — | | | $ | — | |
| | | | | | | |
183
Annual Report to Shareholders
Notes to Financial Statements—Continued
| | | | | | | |
| | |
| Inflation Indexed | | Actual
Contracts | | | Premiums | |
Options outstanding at March 31, 2008 | | — | | | $ | — | |
Options written | | 2,004 | | | | 1,067,254 | |
Options closed | | — | | | | — | |
Options expired | | (1,569 | ) | | | (772,639 | ) |
Options exercised | | (435 | ) | | | (294,615 | ) |
| | | | | | | |
Options outstanding at December 31, 2008 | | — | | | $ | — | |
| | | | | | | |
| | |
| Intermediate | | Actual
Contracts/
Notional Par | | | Premiums | |
Options outstanding at March 31, 2008 | | 34,880,408 | | | $ | 457,539 | |
Options written | | 93,706,889 | | | | 4,763,744 | |
Options closed | | (41,004,162 | ) | | | (2,758,357 | ) |
Options expired | | (43,900,728 | ) | | | (424,475 | ) |
Options exercised | | (43,680,691 | ) | | | (506,359 | ) |
| | | | | | | |
Options outstanding at December 31, 2008 | | 1,716 | | | $ | 1,532,092 | |
| | | | | | | |
| | |
| Intermediate Plus | | Actual
Contracts/
Notional Par | | | Premiums | |
Options outstanding at March 31, 2008 | | 5,150,062 | | | $ | 70,376 | |
Options written | | 14,701,287 | | | | 856,419 | |
Options closed | | (7,000,906 | ) | | | (555,886 | ) |
Options expired | | (6,900,103 | ) | | | (75,479 | ) |
Options exercised | | (5,950,098 | ) | | | (80,618 | ) |
| | | | | | | |
Options outstanding at December 31, 2008 | | 242 | | | $ | 214,812 | |
| | | | | | | |
| | |
| Limited Duration | | Actual
Contracts/
Notional Par | | | Premiums | |
Options outstanding at March 31, 2008 | | 46 | | | $ | 31,395 | |
Options written | | 14,100,656 | | | | 510,287 | |
Options closed | | (4,200,374 | ) | | | (222,318 | ) |
Options expired | | (6,700,022 | ) | | | (48,212 | ) |
Options exercised | | (3,200,043 | ) | | | (44,933 | ) |
| | | | | | | |
Options outstanding at December 31, 2008 | | 263 | | | $ | 226,219 | |
| | | | | | | |
| | |
| Non-U.S. | | Actual
Contracts | | | Premiums | |
Options outstanding at March 31, 2008 | | 661 | | | $ | 653,738 | |
Options written | | 1,659 | | | | 854,471 | |
Options closed | | (1,374 | ) | | | (969,149 | ) |
Options expired | | (616 | ) | | | (244,126 | ) |
Options exercised | | (95 | ) | | | (97,302 | ) |
| | | | | | | |
Options outstanding at December 31, 2008 | | 235 | | | $ | 197,632 | |
| | | | | | | |
184
Annual Report to Shareholders
Upon entering into a futures contract, the Funds are required to deposit with the broker cash or cash equivalents in an amount equal to a certain percentage of the contract amount. This is known as the “initial margin.” Subsequent payments (“variation margin”) are made or received by the Fund each day, depending on the daily fluctuation in the value of the contract. For non-U.S. and foreign denominated futures held in Absolute Return, Inflation Indexed, Intermediate Plus, and Non-U.S., payment is not sent daily, but is recorded as a net payable or receivable by the Fund to or from the futures broker, which holds cash collateral from the Fund. The daily changes in contract value are recorded as unrealized gains or losses and each Fund recognizes a realized gain or loss when the contract is closed. Futures contracts are valued daily at the settlement price established by the board of trade or exchange on which they are traded.
The Funds enter into futures contracts for various reasons, including in connection with their interest rate management strategy. Futures contracts involve, to varying degrees, risk of loss in excess of the amounts reflected in the financial statements. The change in the value of futures contracts primarily corresponds with the value of the underlying instruments, which may not correlate with changes in interest rates, if applicable. In addition, there is a risk that a Fund may not be able to enter into a closing transaction because of an illiquid secondary market. The nature and risks of these financial instruments and other reasons for using them are set forth more fully in the Corporation’s prospectus and statement of additional information.
The open futures positions and related appreciation or depreciation at December 31, 2008 are listed at the end of each Fund’s portfolio of investments.
Swap Agreements
The Funds may invest in swaps for the purpose of managing their exposure to interest rate, credit or market risk, or for other purposes. The use of swaps involves risks that are different from those associated with ordinary portfolio transactions.
Each Fund may enter into credit default swap (“CDS”) contracts for investment purposes, to manage its credit risk or to add leverage. CDS agreements involve one party making a stream of payments to another party in exchange for the right to receive a specified return in the event of a default by a third party, typically corporate issuers or sovereign issuers of an emerging country, on a specified obligation or in the event of a write-down, principal shortfall, interest shortfall or default of all or part of the referenced entities comprising a credit index. A Fund may use a CDS to provide a measure of protection against defaults of the issuers (i.e., to reduce risk where a Fund has exposure to the sovereign issuer) or to take an active long or short position with respect to the likelihood of a particular issuer’s default. As a seller of protection, the Fund generally receives an upfront payment or a stream of payments throughout the term of the swap provided that there is no credit event. If the Fund is a seller of protection and a credit event occurs, as defined under the terms of that particular swap agreement, the maximum potential amount of future payments (undiscounted) that the Fund could be required to make under a credit default swap agreement, would be an amount equal to the notional amount of the agreement. These amounts of potential payments will be partially offset by any recovery of value from the respective referenced obligations. As a seller of protection, a Fund effectively adds leverage to its portfolio because, in addition to its total net assets, the Fund would be subject to investment exposure on the notional amount of the swap. As a buyer of protection, the Fund generally receives an amount up to the notional value of the swap if a credit event occurs.
Implied spreads are the theoretical price a lender receives for credit default protection. When spreads rise, market perceived credit risk rises and when spreads fall, market perceived credit risk falls. The implied credit spread of a particular referenced entity reflects the cost of buying/selling protection and may include upfront payments required to enter into the agreement. Wider credit spreads and decreasing market values, when compared to the notional amount of the swap, represent a deterioration of the referenced entity’s credit soundness and a greater likelihood or risk of default or other credit event occurring as defined under the terms of the agreement. Credit spreads utilized in determining the period end market value of credit default swap agreements on corporate issues or sovereign issues of an emerging country are disclosed in the Notes to Financial Statements and serve as an indicator of the current status of the payment/performance risk and represent the likelihood or risk of default for credit derivatives. For credit default swap agreements on asset-backed securities and credit indices, the quoted market prices and resulting values particularly in relation to the notional amount of the contract, as well as the annual payment rate serve as an indication of the current status of the payment/performance risk.
185
Annual Report to Shareholders
Notes to Financial Statements—Continued
Payments received or made at the beginning of the measurement period are reflected as a premium or deposit, respectively, on the Statement of Assets and Liabilities. These upfront payments are amortized over the life of the swap and are recognized as realized gain or loss on the Statement of Operations. A liquidation payment received or made at the termination of the swap is recognized as realized gain or loss on the Statement of Operations. Net periodic payments received or paid by the Fund are recognized as realized gain or loss at the time of receipt or payment on the Statement of Operations.
Entering into a CDS agreement involves, to varying degrees, elements of credit, market and documentation risk in excess of the related amounts recognized on the Statement of Assets and Liabilities. Such risks involve the possibility that there will be no liquid market for these agreements, that the counterparty to the agreement may default on its obligation to perform or disagree as to the meaning of the contractual terms in the agreement, and that there will be unfavorable changes in net interest rates.
Interest rate swap contracts involve the exchange of commitments to pay and receive interest based on a notional principal amount.
Commodity swaps are agreements to exchange cash flows at specified intervals to gain investment exposure to the relevant spread of commodity reference prices. Total return swaps are agreements to exchange the return generated by one instrument for the return generated by another instrument, for example, the agreement to pay interest in exchange for a market-linked return based on a notional amount. To the extent the total return of the index exceeds the offsetting interest obligation, the Funds will receive a payment from the counterparty. To the extent it is less, the Fund will make a payment to the counterparty. Periodic payments received or made by the Funds are recorded in the accompanying statements of operations as realized gains or losses, respectively.
Swaps are marked-to-market daily and changes in value are recorded as unrealized appreciation/(depreciation). Gains or losses are realized upon termination of the swap agreement. Net periodic payments received or made by a Fund are recorded in the accompanying Statements of Operations as realized gains or losses; at the time of receipt or payment on the Statement of Operation. Collateral, in the form of restricted cash or securities, may be required to be held in segregated accounts with the Fund’s custodian in compliance with the terms of the swap contracts. Risks may exceed amounts recognized on the Statements of Assets and Liabilities. These risks include changes in the returns of the underlying instruments, failure of the counterparties to perform under the contracts’ terms, and the possible lack of liquidity with respect to the swap agreements.
As of December 31, 2008, the one-and three-month London Interbank Offered Rates were .44% and 1.43%, respectively. The six month Euribor Rate was 2.97%.
The following is a summary of open swap contracts outstanding as of December 31, 2008.
| | | | | | | | | | | | | | | | |
| Western Asset Absolute Return Bond Portfolio | |
Swap Counterparty
(Reference Entity) | | Termination Date | | Periodic
Payments Made
by the Fund‡ | | Periodic Payments
Received by the
Fund‡ | | Contract
Notional
Amount | | Upfront
Premiums
Paid/Received | | Unrealized
Appreciation/
(Depreciation) | |
| | | | | | | | | | | | | | | | |
Interest Rate Swaps: | | | | | | | | | | | | | | |
Banc of America Securities LLC | | March 1, 2013 | | 5.104%
Semi-Annually | | 3-month
LIBOR | | $ | 100,000 | | $ | — | | $ | (12,394 | ) |
| | | | | | |
Barclays Capital Inc. | | May 31, 2012 | | 3-month LIBOR | | 4.4%
Semi-Annually | | | 2,641,000 | | | 10,935 | | | 209,683 | |
| | | | | | |
Barclays Capital Inc. | | June 25, 2012 | | 5.06%
Semi-Annually | | 3-month
LIBOR | | | 60,000 | | | — | | | (6,487 | ) |
| | | | | | |
Barclays Capital Inc. | | October 20, 2016 | | 5.326%
Semi-Annually | | 3-month
LIBOR | | | 60,000 | | | — | | | (12,367 | ) |
186
Annual Report to Shareholders
| | | | | | | | | | | | | | | | | |
| Western Asset Absolute Return Bond Portfolio—Continued | |
| | | | | | |
Swap Counterparty
(Reference Entity) | | Termination Date | | Periodic
Payments Made
by the Fund‡ | | Periodic Payments
Received by the
Fund‡ | | Contract
Notional
Amount | | Upfront
Premiums
Paid/Received | | | Unrealized
Appreciation/
(Depreciation) | |
Interest Rate Swaps—Continued | | | | | | | | | | | | | | | |
Barclays Capital Inc. | | February 15, 2025 | | 4.3%
Semi-Annually | | 3-month LIBOR | | $ | 14,000,000 | | $ | 74,667 | | | $ | (2,802,899 | ) |
| | | | | | |
Bear Stearns, Inc. | | April 30, 2011 | | 5.05%
Semi-Annually | | 3-month
LIBOR | | | 100,000 | | | — | | | | (7,814 | ) |
| | | | | | |
Citigroup Global Markets | | September 15, 2011 | | 3.34%
Semi-Annually | | 3-month
LIBOR | | | 150,000 | | | — | | | | (6,462 | ) |
| | | | | | |
Credit Suisse First Boston USA | | May 1, 2012 | | 5.085%
Semi-Annually | | 3-month LIBOR | | | 50,000 | | | — | | | | (5,196 | ) |
| | | | | | |
Credit Suisse First Boston USA | | August 15, 2013 | | 5.023%
Semi-Annually | | 3-month
LIBOR | | | 50,000 | | | — | | | | (6,493 | ) |
| | | | | | |
Credit Suisse First Boston USA | | September 15, 2015 | | 5.16%
Semi-Annually | | 3-month
LIBOR | | | 50,000 | | | — | | | | (8,775 | ) |
| | | | | | |
RBS Greenwich | | April 1, 2012 | | 5.011%
Semi-Annually | | 3-month
LIBOR | | | 40,000 | | | — | | | | (4,044 | ) |
| | | | | | |
The Goldman Sachs Group, Inc. | | May 15, 2016 | | 4.25%
Semi-Annually | | 3-month
LIBOR | | | 7,950,000 | | | (28,620 | ) | | | (979,237 | ) |
| | | | | | |
UBS Warburg LLC | | December 16, 2018 | | 4.16%
Semi-Annually | | 3-month
LIBOR | | | 7,200,000 | | | (100,530 | ) | | | (911,836 | ) |
| | | | | | | | | | | | | | | | | |
| | | | Net unrealized depreciation on interest rate swaps | | | $ | (4,554,321 | ) |
| | | | | | | | | | | | | | | | | |
| | | | | | | | | | | | | | | | | | | | |
|
| Credit Default Swap on Corporate Issues—Sell Protection1 | |
| | | | | | | |
Swap Counterparty
(Reference Entity) | | Termination Date | | Implied Credit
Spread At
December 31,
20082 | | Periodic
Payments
Received by the
Fund‡ | | Contract
Notional
Amount3 | | Market Value | | | Upfront
Premiums
Paid/(Received) | | Unrealized
Appreciation/
(Depreciation) | |
| | | | | | | | | | | | | | | | | | | | |
Barclays Capital Inc.
(General Motors Corp.
7.125%, due 7/15/13) | | March 20, 2012 | | 87.92% | | 3.45%
Quarterly | | $ | 1,600,000 | | $ | (1,238,103 | ) | | $ | — | | $ | (1,238,103 | ) |
| | | | | | | |
Barclays Capital Inc.
(MBIA Insurance Corporation, 5.37563%, due 10/6/10) | | December 20, 2012 | | 33.97% | | 3.1%
Quarterly | | | 150,000 | | | (76,363 | ) | | | — | | | (76,363 | ) |
187
Annual Report to Shareholders
Notes to Financial Statements—Continued
| | | | | | | | | | | | |
| Western Asset Absolute Return Bond Portfolio—Continued |
|
| Credit Default Swap on Corporate Issues—Sell Protection—Continued |
| | | | | | | | | | | | | | | | | | | | |
| | | | | | | |
Swap Counterparty
(Reference Entity) | | Termination Date | | Implied Credit
Spread At
December 31,
20082 | | Periodic
Payments
Received by the
Fund‡ | | Contract
Notional
Amount3 | | Market Value | | | Upfront
Premiums
Paid/(Received) | | Unrealized
Appreciation/
(Depreciation) | |
| | | | | | | |
Barclays Capital Inc.
(MBIA Insurance Corporation,
5.37563%, due 10/6/10) | | December 20, 2012 | | 33.97% | | 3.05%
Quarterly | | $ | 100,000 | | $ | (50,991 | ) | | $ | — | | $ | (50,991 | ) |
| | | | | | | |
Barclays Capital Inc.
(SLM Corp., 5.125%, due 8/27/12) | | September 20, 2012 | | 8.92% | | 2.35%
Quarterly | | | 2,350,000 | | | (420,497 | ) | | | — | | | (420,497 | ) |
| | | | | | | |
Barclays Capital Inc.
(The AES Corp.,
7.75%, due 3/1/14) | | September 20, 2012 | | 7.75% | | 3.15%
Quarterly | | | 3,000,000 | | | (402,501 | ) | | | — | | | (402,501 | ) |
| | | | | | | |
Barclays Capital Inc.
(The AES Corp.,
7.75%, due 3/1/14) | | September 20, 2012 | | 7.75% | | 3.65%
Quarterly | | | 3,000,000 | | | (358,706 | ) | | | — | | | (358,706 | ) |
| | | | | | | |
Barclays Capital Inc.
(TXU Corp.,
5.55%, due 11/15/14) | | September 20, 2012 | | 14.11% | | 2.97%
Quarterly | | | 2,000,000 | | | (548,203 | ) | | | — | | | (548,203 | ) |
| | | | | | | | | | | | | | | | | | | | |
Net unrealized depreciation on sales of credit default swaps on corporate issues | | $ | (3,095,364 | ) |
| | | | | | | | | | | | | | | | | | | | |
| | | | | | | | | | | | | | | |
|
| Credit Default Swaps on Corporate Issues—Buy Protection4 |
| | | | | | |
Swap Counterparty
(Reference Entity) | | Termination Date | | Periodic
Payments Made
by the Fund‡ | | Contract
Notional
Amount3 | | Market Value | | Upfront
Premiums
Paid/(Received) | | Unrealized
Appreciation/
Depreciation |
| | | | | | | | | | | | | | | |
Barclays Capital Inc.
(Health Care Property Investments Inc.,
6.45%, due 06/25/12) | | June 20, 2012 | | 0.63%
Quarterly | | $ 60,000 | | $ | 18,215 | | $ | — | | $ | 18,215 |
| | | | | | |
Barclays Capital Inc.
(Juneau Investments LLC,
5.9%, due 2/22/21) | | December 20, 2012 | | 3.6%
Quarterly | | 120,000 | | | 47,997 | | | — | | | 47,997 |
| | | | | | |
Barclays Capital Inc.
(Juneau Investments LLC,
5.9%, due 2/22/21) | | December 20, 2012 | | 3.6%
Quarterly | | 80,000 | | | 31,998 | | | — | | | 31,998 |
188
Annual Report to Shareholders
| | | | | | | | | | | | |
| Western Asset Absolute Return Bond Portfolio—Continued |
|
| Credit Default Swaps on Corporate Issues—Buy Protection—Continued |
| | | | | | | | | | | | | | | |
| | | | | | |
Swap Counterparty
(Reference Entity) | | Termination Date | | Periodic
Payments Made
by the Fund‡ | | Contract
Notional
Amount3 | | Market Value | | Upfront
Premiums
Paid/(Received) | | Unrealized
Appreciation/
Depreciation |
| | | | | | |
Barclays Capital Inc.
(Cardinal Health Inc.
5.85%, due 12/15/17) | | September 20, 2016 | | 0.49%
Quarterly | | $ 60,000 | | $ | 1,200 | | $ | — | | $ | 1,200 |
| | | | | | |
Banc of America Securities LLC
(PHH Corporate Note,
7.125%, due 3/1/13) | | March 20, 2013 | | 1.05%
Monthly | | 110,000 | | | 63,555 | | | — | | | 63,555 |
| | | | | | |
Bear Stearns, Inc. (Viacom Inc.,
6.25%, due 4/30/16) | | March 20, 2011 | | 0.59%
Quarterly | | 100,000 | | | 6,460 | | | — | | | 6,460 |
| | | | | | |
Credit Suisse First Boston USA
(Starwood Hotels Resorts,
7.875%, due 8/25/34) | | December 20, 2011 | | 1.37%
Quarterly | | 50,000 | | | 7,452 | | | — | | | 7,452 |
| | | | | | |
Credit Suisse First Boston USA
(Masco Corp.,
5.875%, due 7/15/12) | | September 20, 2013 | | 0.75%
Quarterly | | 50,000 | | | 7,483 | | | — | | | 7,483 |
| | | | | | |
Credit Suisse First Boston USA
(Amerisource Bergen Corp.,
8.125%, due 9/1/08) | | September 20, 2015 | | 0.9%
Quarterly | | 50,000 | | | 100 | | | — | | | 100 |
| | | | | | |
Morgan Stanley & Co., Inc.
(Sara Lee Corp.
6.125% due 11/01/32) | | September 20, 2011 | | 0.62%
Quarterly | | 150,000 | | | 378 | | | — | | | 378 |
| | | | | | |
Morgan Stanley & Co.,
Inc. (Gannett Co.,
6.375%, due 4/01/12) | | March 20, 2012 | | 0.46%
Quarterly | | 40,000 | | | 9,063 | | | — | | | 9,063 |
| | | | | | | | | | | | | | | |
Net unrealized appreciation on buys of credit default swaps on corporate issues | | $ | 193,901 |
| | | | | | | | | | | | | | | |
| | | | | | | | | | | | | | | | | | |
| | |
| Credit Default Swap on Credit Indices—Sell Protection1 | | | | | | | |
| | | | | | |
Swap Counterparty
(Reference Entity) | | Termination Date | | Periodic
Payment
Received by the
Fund‡ | | Contract
Notional
Amount3 | | Market
Value5 | | | Upfront
Premiums
Paid/(Received) | | | Unrealized
Appreciation/
(Depreciation) | |
| | | | | | | | | | | | | | | | | | |
Barclays Capital Inc.
(CDX IG 10) | | June 20, 2013 | | 1.55%
Quarterly | | $1,756,800 | | $ | (40,310 | ) | | $ | (15,230 | ) | | $ | (25,080 | ) |
| | | | | | |
Barclays Capital Inc.
(CDX IG 10) | | June 20, 2013 | | 1.55%
Quarterly | | 2,147,200 | | | (49,267 | ) | | | (31,247 | ) | | | (18,020 | ) |
189
Annual Report to Shareholders
Notes to Financial Statements—Continued
| | | | | | | | | | | | |
| Western Asset Absolute Return Bond Portfolio—Continued |
|
| Credit Default Swap on Credit Indices—Sell Protection—Continued |
| | | | | | | | | | | | | | | | | | |
| | | | | | |
Swap Counterparty
(Reference Entity) | | Termination Date | | Periodic
Payments
Received by the
Fund‡ | | Contract
Notional
Amount3 | | Market Value5 | | | Upfront
Premiums
Paid/(Received) | | | Unrealized
Appreciation/
(Depreciation) | |
| | | | | | |
Barclays Capital Inc.
(CDX IG 10) | | June 20, 2013 | | 1.55%
Quarterly | | $ 5,856,000 | | $ | (134,365 | ) | | $ | (34,357 | ) | | $ | (100,008 | ) |
| | | | | | |
Barclays Capital Inc.
(CDX IG 10) | | June 20, 2013 | | 1.55%
Quarterly | | 1,756,800 | | | (40,310 | ) | | | (18,838 | ) | | | (21,472 | ) |
| | | | | | |
Barclays Capital Inc.
(CDX IG 10) | | June 20, 2013 | | 1.55%
Quarterly | | 1,561,600 | | | (35,831 | ) | | | (17,388 | ) | | | (18,443 | ) |
| | | | | | |
Barclays Capital Inc.
(CDX IG 11) | | December 20, 2013 | | 1.5%
Quarterly | | 1,590,000 | | | (31,755 | ) | | | (57,998 | ) | | | 26,243 | |
| | | | | | |
Barclays Capital Inc.
(CDX IG HVOL 8) | | June 20, 2012 | | 0.75%
Quarterly | | 800,000 | | | (93,986 | ) | | | (7,366 | ) | | | (86,620 | ) |
| | | | | | |
Barclays Capital Inc.
(CDX IG HVOL 8) | | June 20, 2012 | | 0.75%
Quarterly | | 10,000,000 | | | (1,174,826 | ) | | | (163,425 | ) | | | (1,011,401 | ) |
| | | | | | |
Credit Suisse First Boston USA
(CDX HY 10) | | June 20, 2013 | | 5%
Quarterly | | 245,000 | | | (38,791 | ) | | | (28,665 | ) | | | (10,126 | ) |
| | | | | | |
Credit Suisse First Boston USA
(CDX HY 10) | | June 20, 2013 | | 5%
Quarterly | | 490,000 | | | (77,582 | ) | | | (58,457 | ) | | | (19,125 | ) |
| | | | | | |
Deutsche Bank AG
(ABX. HE-AAA 06-2) | | May 25, 2046 | | 0.11%
Monthly | | 700,000 | | | (350,000 | ) | | | (32,119 | ) | | | (317,881 | ) |
| | | | | | |
JP Morgan Chase & Co.
(CDX HY 10) | | June 20, 2013 | | 5%
Quarterly | | 245,000 | | | (38,791 | ) | | | (28,175 | ) | | | (10,616 | ) |
| | | | | | |
JP Morgan Chase & Co.
(CDX HY 10) | | June 20, 2013 | | 5%
Quarterly | | 490,000 | | | (77,582 | ) | | | (53,900 | ) | | | (23,682 | ) |
| | | | | | | | | | | | | | | | | | |
Net unrealized depreciation on sales of credit default swaps on credit indices | | | $ | (1,636,231 | ) |
| | | | | | | | | | | | | | | | | | |
| | | |
| Credit Default Swap on Credit Indices—Buy Protection4 | | | | | | | | | |
| | | | | | |
Swap Counterparty
(Reference Entity) | | Termination Date | | Periodic
Payments Made
by the Fund‡ | | Contract
Notional
Amount3 | | Market Value5 | | | Upfront
Premiums
Paid/(Received) | | | Unrealized
Appreciation/
(Depreciation) | |
Barclays Capital Inc.
(CDX IG 11) | | December 20, 2013 | | 1.5%
Quarterly | | $ 240,000 | | | $ 4,793 | | | | $ 7,512 | | | | $ (2,719 | ) |
| | | | | | |
Barclays Capital Inc.
(CDX IG 10 6/13) | | June 20, 2013 | | 1.55%
Quarterly | | 780,800 | | | 17,915 | | | | 15,171 | | | | 2,744 | |
| | | | | | |
Barclays Capital Inc.
(CDX IG 10) | | June 20, 2013 | | 1.55%
Quarterly | | 878,400 | | | 20,155 | | | | 2,517 | | | | 17,638 | |
190
Annual Report to Shareholders
Western Asset Absolute Return Bond Portfolio—Continued
Credit Default Swap on Credit Indices—Buy Protection—Continued
| | | | | | | | | | | | | | | | |
| | | | | | |
Swap Counterparty
(Reference Entity) | | Termination Date | | Periodic
Payments Made
by the Fund‡ | | Contract
Notional
Amount3 | | Market Value5 | | Upfront
Premiums
Paid/(Received) | | Unrealized
Appreciation/
(Depreciation) | |
| | | | | | |
Barclays Capital Inc.
(CDX IG 10) | | June 20, 2013 | | 1.55%
Quarterly | | $3,123,200 | | $ | 71,662 | | $ | 18,683 | | $ | 52,979 | |
| | | | | | |
The Goldman Sachs Group, Inc.
(CDX IG 10 6/13) | | June 20, 2013 | | 1.55%
Quarterly | | 1,659,200 | | | 38,071 | | | 45,979 | | | (7,908 | ) |
| | | | | | | | | | | | | | | | |
Net unrealized appreciation on buys of credit default swaps on credit indices | | $ | 62,734 | |
| | | | | | | | | | | | | | | | |
| | | | | | | | | | | | | | | | | | | | | |
| | |
| Western Asset High Yield Portfolio | | | | | | | |
| | | | |
| Credit Default Swap on Corporate Issues—Sell Protection1 | | | | | | | | | | | |
| | | | | | | |
Swap Counterparty
(Reference Entity) | | Termination
Date | | Implied Credit
Spread At
December 31,
20082 | | Periodic
Payments
Received
by the Fund‡ | | Contract
Notional
Amount3 | | Market Value | | | Upfront
Premiums
Paid/(Received) | | | Unrealized
Appreciation/
(Depreciation) | |
| | | | | | | | | | | | | | | | | | | | | |
| | | | | | | | | | | | | | | | | | | | | |
Deutsche Bank AG
(Visteon Corp.,
7%, due 3/10/14) | | June 20, 2010 | | 64.7% | | 5%
Quarterly | | $ | 800,000 | | $ | (417,675 | ) | | $ | (132,000 | ) | | $ | (285,675 | ) |
| | | | | | | |
Deutsche Bank AG
(Visteon Corp.,
7%, due 3/10/14) | | June 20, 2010 | | 64.7% | | 5%
Quarterly | | | 800,000 | | | (417,674 | ) | | | (168,000 | ) | | | (249,674 | ) |
| | | | | | | | | | | | | | | | | | | | | |
Net unrealized depreciation on sales of credit default swaps on corporate issues | | | $ | (535,349 | ) |
| | | | | | | | | | | | | | | | | | | | | |
| | | | | | | | | | | | | | | | | | |
| Western Asset Inflation Indexed Plus Bond Portfolio | | | | | |
|
| Credit Default Swap on Corporate Issues—Sell Protection1 |
| | | | | | | |
Swap Counterparty
(Reference Entity) | | Termination Date | | Implied Credit
Spread At
December 31,
20082 | | Periodic
Payments
Received
by the Fund‡ | | Contract
Notional
Amount3 | | Market Value | | | Upfront
Premiums
Paid/(Received) | | Unrealized
Appreciation/
(Depreciation) |
| | | | | | | | | | | | | | | | | | |
J.P. Morgan Chase & Co.
(Ford Motor Credit Company,
7%, due 8/15/12) | | June 20, 2010 | | 13.65% | | 2.9%
Quarterly | | $ | 5,000,000 | | $ | (690,694 | ) | | $ | — | | $ (690,694) |
191
Annual Report to Shareholders
Notes to Financial Statements—Continued
| | | | | | | | | | | | | | | | | | | | |
| Western Asset Inflation Indexed Plus Bond Portfolio—Continued | | | | | | |
|
| Credit Default Swap on Corporate Issues—Sell Protection—Continued | |
| | | | | | | |
Swap Counterparty
(Reference Entity) | | Termination Date | | Implied Credit
Spread At
December 31,
20082 | | Periodic
Payments
Received
by the Fund‡ | | Contract
Notional
Amount3 | | Market Value | | | Upfront
Premiums
Paid/(Received) | | Unrealized
Appreciation/
(Depreciation) | |
Merrill Lynch & Co., Inc.
(El Paso Corporation,
7%, due 5/15/11) | | June 20, 2010 | | 9.28% | | 3.625%
Quarterly | | $ | 2,500,000 | | $ | (185,682 | ) | | $ | — | | $ | (185,682 | ) |
| | | | | | | |
Merrill Lynch & Co., Inc.
(Ford Motor Credit Company,
7.375%, due 10/28/09) | | June 20, 2010 | | 13.65% | | 5.5%
Quarterly | | | 2,500,000 | | | (261,540 | ) | | | — | | | (261,540 | ) |
| | | | | | | |
Merrill Lynch & Co., Inc.
(General Motors Acceptance Corporation,
7.75%, due 1/19/10) | | March 20, 2010 | | 9.38% | | 3.55%
Quarterly | | | 5,000,000 | | | (331,549 | ) | | | — | | | (331,549 | ) |
| | | | | | | |
The Goldman Sachs Group, Inc.
(General Motors Acceptance Corporation,
6.875%, due 8/28/12) | | June 20, 2010 | | 9.07% | | 4.5%
Quarterly | | | 7,500,000 | | | (462,890 | ) | | | — | | | (462,890 | ) |
| | | | | | | | | | | | | | | | | | | | |
Net unrealized depreciation on sales of credit default swaps on corporate issues | | $ | (1,932,355 | ) |
| | | | | | | | | | | | | | | | | | | | |
| | | | | | | | | | | | | | | | | | |
| | |
| Credit Default Swap on Credit Indices—Sell Protection1 | | | | | | | |
| | | | | | |
Swap Counterparty
(Reference Entity) | | Termination Date | | Periodic
Payments
Received
by the Fund‡ | | Contract
Notional
Amount3 | | Market Value5 | | | Upfront
Premiums
Paid/(Received) | | | Unrealized
Appreciation/
(Depreciation) | |
| | | | | | | | | | | | | | | | | | |
Barclays Capital Inc.
(CDX HY 8) | | June 20, 2012 | | 2.75%
Quarterly | | $ 7,056,000 | | $ | (1,197,989 | ) | | $ | (369,231 | ) | | $ | (828,758 | ) |
| | | | | | |
Bear Stearns, Inc.
(CDX HY 8) | | June 20, 2012 | | 2.75%
Quarterly | | 13,132,000 | | | (2,229,591 | ) | | | (226,780 | ) | | | (2,002,811 | ) |
192
Annual Report to Shareholders
Western Asset Inflation Indexed Plus Bond Portfolio—Continued
| | | | | | | | | | | | | | | | | | |
| | |
| Credit Default Swap on Credit Indices—Sell Protection—Continued | | | | | | | |
| | | | | | |
Swap Counterparty
(Reference Entity) | | Termination Date | | Periodic
Payments
Received
by the Fund‡ | | Contract
Notional
Amount3 | | Market Value5 | | | Upfront
Premiums
Paid/(Received) | | | Unrealized
Appreciation/
(Depreciation) | |
| | | | | | |
Deutsche Bank AG (CDX HY 4) | | June 20, 2010 | | 3.6%
Quarterly | | $9,400,000 | | $ | (275,628 | ) | | $ | (31,939 | ) | | $ | (243,689 | ) |
| | | | | | | | | | | | | | | | | | |
Deutsche Bank AG (CDX IG HVOL 8) | | June 20, 2012 | | 0.75%
Quarterly | | 4,700,000 | | | (1,726,994 | ) | | | (80,585 | ) | | | (1,646,409 | ) |
| | | | | | | | | | | | | | | | | | |
Net unrealized depreciation on sales of credit default swaps on credit indices | | | $ | (4,721,667 | ) |
| | | | | | | | | | | | | | | | | | |
| | | | | | | | | | | | | | | |
| Western Asset Intermediate Bond Portfolio |
Swap Counterparty
(Reference Entity) | | Termination Date | | Periodic
Payments Made
by the Fund‡ | | Periodic
Payment
Received
by the Fund‡ | | Contract
Notional
Amount | | Upfront
Premiums
Paid/Received | | Unrealized
Appreciation/
(Depreciation) |
| | | | | | | | | | | | | | | |
Interest Rate Swaps: | | | | | | | | | | | | | |
Deutsche Bank AG | | November 28, 2012 | | 3-month LIBOR | | 5.27%
Semi-Annually | | $ | 14,900,000 | | $ | 106,898 | | $ | 1,749,800 |
| | | | | | | | | | | | | | | |
Net unrealized appreciation on interest rate swaps | | $ | 1,749,800 |
| | | | | | | | | | | | | | | |
| | | | | | | | | | | | | | | | | | | | |
| | |
| Credit Default Swap on Corporate Issues—Sell Protection1 | | | | | | |
| | | | | | | |
Swap Counterparty
(Reference Entity) | | Termination Date | | Implied Credit
Spread At
December 31,
20082 | | Periodic
Payments
Received
by the Fund‡ | | Contract
Notional
Amount3 | | Market Value | | | Upfront
Premiums
Paid/(Received) | | Unrealized
Appreciation/
(Depreciation) | |
| | | | | | | | | | | | | | | | | | | | |
Morgan Stanley & Co., Inc. (SLM Corp., 5.125%, due 8/27/12) | | September 20, 2012 | | 9.1% | | 2.6% Quarterly | | $ | 800,000 | | $ | (134,691 | ) | | $ | — | | $ | (134,691 | ) |
| | | | | | | | | | | | | | | | | | | | |
Net unrealized depreciation on sales of credit default swaps on corporate issues | | $ | (134,691 | ) |
| | | | | | | | | | | | | | | | | | | | |
| | | | | | | | | | | | | | | | | | |
| Credit Default Swap on Credit Indices—Sell Protection1 | | | | |
| | | | | | |
Swap Counterparty
(Reference Entity) | | Termination Date | | Periodic
Payments
Received
by the Fund‡ | | Contract
Notional
Amount3 | | Market Value5 | | | Upfront
Premiums
Paid/(Received) | | | Unrealized
Appreciation/
(Depreciation) | |
JP Morgan Chase & Co.
(CDX IG HVOL 8) | | June 20, 2012 | | 0.75% Quarterly | | $ 3,240,000 | | $ | (380,644 | ) | | $ | (106,385 | ) | | $ | (274,259 | ) |
| | | | | | |
The Goldman Sachs Group, Inc.
(CDX IG 8) | | June 20, 2012 | | 0.35% Quarterly | | 25,083,200 | | | (1,520,350 | ) | | | (143,874 | ) | | | (1,376,476 | ) |
193
Annual Report to Shareholders
Notes to Financial Statements—Continued
Western Asset Intermediate Bond Portfolio—Continued
| | | | | | | | | | | | | | | | | | |
| Credit Default Swap on Credit Indices—Sell Protection—Continued | | | | |
| | | | | | |
Swap Counterparty
(Reference Entity) | | Termination Date | | Periodic
Payments
Received
by the Fund‡ | | Contract
Notional
Amount3 | | Market Value5 | | | Upfront
Premiums
Paid/(Received) | | | Unrealized
Appreciation/
(Depreciation) | |
| | | | | | |
The Goldman Sachs Group, Inc.
(CDX IG HVOL 8) | | June 20, 2012 | | 0.75% Quarterly | | $1,410,000 | | $ | (165,650 | ) | | $ | (7,843 | ) | | $ | (157,807 | ) |
| | | | | | |
The Goldman Sachs Group, Inc.
(CDX IG HVOL 9) | | December 20, 2012 | | 1.4%
Quarterly | | 15,080,052 | | | (2,405,268 | ) | | | (1,650,380 | ) | | | (754,888 | ) |
| | | | | | |
The Goldman Sachs Group, Inc. (iBoxx IG HiVol4) | | June 20, 2012 | | 1%
Quarterly | | 7,811,292 | | | (1,266,202 | ) | | | (51,646 | ) | | | (1,214,556 | ) |
| | | | | | | | | | | | | | | | | | |
Net unrealized depreciation on sales of credit default swaps on credit indices | | | $ | (3,777,986 | ) |
| | | | | | | | | | | | | | | | | | |
| | | | | | | | | | | | | | | |
| Credit Default Swap on Credit Indices—Buy Protection4 | | |
| | | | | | |
Swap Counterparty
(Reference Entity) | | Termination Date | | Periodic
Payments Made
by the Fund‡ | | Contract
Notional
Amount3 | | Market
Value5 | | Upfront
Premiums
Paid/(Received) | | Unrealized
Appreciation/
(Depreciation) |
The Goldman Sachs Group, Inc. (CDX IG 8) | | June 20, 2017 | | 0.6%
Quarterly | | $15,049,920 | | $ | 998,049 | | $ | 128,432 | | $ | 869,617 |
| | | | | | | | | | | | | | | |
Net unrealized appreciation on buys of credit default swaps on credit indices | | $ | 869,617 |
| | | | | | | | | | | | | | | |
| | | | | | | | | | | | | | | |
| Western Asset Intermediate Plus Bond Portfolio | | | | |
Swap Counterparty
(Reference Entity) | | Termination Date | | Periodic
Payments Made
by the Fund‡ | | Periodic
Payments
Received by the
Fund‡ | | Contract
Notional
Amount | | Upfront
Premiums
Paid/Received | | Unrealized
Appreciation/
(Depreciation) |
| | | | | | | | | | | | | | | |
Interest Rate Swaps: | | | | | | | | | | | |
Deutsche Bank AG | | November 28, 2012 | | 3-month LIBOR | | 5.27%
Semi-Annually | | $ | 1,900,000 | | $ | 14,986 | | $ | 221,774 |
| | | | | | | | | | | | | | | |
Net unrealized appreciation on interest rate swaps | | $ | 221,774 |
| | | | | | | | | | | | | | | |
| | | | | | | | | | | | | | | | | | | | |
| |
| Credit Default Swap on Corporate Issues—Sell Protection1 | | | |
| | | | | | | |
Swap Counterparty
(Reference Entity) | | Termination Date | | Implied Credit
Spread At
December 31,
20082 | | Periodic
Payments
Received
by the Fund‡ | | Contract
Notional
Amount3 | | Market
Value | | | Upfront
Premiums
Paid/(Received) | | Unrealized
Appreciation/
(Depreciation) | |
| | | | | | | | | | | | | | | | | | | | |
Morgan Stanley & Co., Inc.
(SLM Corp.,
5.125%, due 8/27/12) | | September 20, 2012 | | 9.10% | | 2.6%
Quarterly | | $ | 100,000 | | $ | (16,836 | ) | | $ | — | | $ | (16,836 | ) |
| | | | | | | | | | | | | | | | | | | | |
Net unrealized depreciation on sales of credit default swaps on corporate issues | | $ | (16,836 | ) |
| | | | | | | | | | | | | | | | | | | | |
194
Annual Report to Shareholders
Western Asset Intermediate Plus Bond Portfolio—Continued
| | | | | | | | | | | | | | | | | |
| |
| Credit Default Swap on Credit Indices—Sell Protection1 | | | | |
| | | | | | |
Swap Counterparty
(Reference Entity) | | Termination Date | | Periodic
Payments
Received
by the Fund‡ | | Contract
Notional
Amount3 | | Market
Value5 | | | Upfront
Premiums
Paid/(Received) | | | Unrealized
Appreciation/
(Depreciation) | |
| | | | | | | | | | | | | | | | | |
Barclays Capital Inc.
(CDX IG HVOL 9) | | December 20, 2012 | | 1.4%
Quarterly | | $2,320,008 | | $ | (370,041 | ) | | $(271,847) | | | $ | (98,194 | ) |
| | | | | | |
JP Morgan Chase & Co.
(CDX HY 10) | | June 20, 2013 | | 5%
Quarterly | | 800,000 | | | (126,664 | ) | | (90,315) | | | | (36,349 | ) |
| | | | | | |
JP Morgan Chase & Co.
(CDX IG HVOL 8) | | June 20, 2012 | | 0.75%
Quarterly | | 560,000 | | | (65,790 | ) | | (15,863 | ) | | | (49,927 | ) |
| | | | | | |
Merrill Lynch & Co., Inc.
(iBoxx HY3) | | December 20, 2009 | | 3.75%
Quarterly | | 380,000 | | | (6,131 | ) | | 1,191 | | | | (7,322 | ) |
| | | | | | |
The Goldman Sachs Group, Inc.
(CDX IG 8) | | June 20, 2012 | | 0.35%
Quarterly | | 3,552,640 | | | (215,334 | ) | | (20,483 | ) | | | (194,851 | ) |
| | | | | | |
The Goldman Sachs Group, Inc.
(CDX IG HVOL 8) | | June 20, 2012 | | 0.75%
Quarterly | | 250,000 | | | (29,371 | ) | | (3,873 | ) | | | (25,498 | ) |
| | | | | | |
The Goldman Sachs Group, Inc.
(iBoxx HY2) | | September 20, 2009 | | 4.3%
Quarterly | | 235,000 | | | 2,397 | | | 822 | | | | 1,575 | |
| | | | | | | | | | | | | | | | | |
Net depreciation on sales of credit default swaps on credit indices | | | $ | (410,566 | ) |
| | | | | | | | | | | | | | | | | |
| | | | | | | | | | | | | | | |
| |
| Credit Default Swap on Credit Indices—Buy Protection4 | | |
| | | | | | |
Swap Counterparty
(Reference Entity) | | Termination Date | | Periodic
Payments Made
by the Fund‡ | | Contract
Notional
Amount3 | | Market Value5 | | Upfront
Premiums
Paid/(Received) | | Unrealized
Appreciation/
(Depreciation) |
| | | | | | | | | | | | | | | |
The Goldman Sachs Group, Inc.
(CDX IG 8) | | June 20, 2017 | | 0.6%
Quarterly | | $2,137,440 | | $ | 141,746 | | $ | 18,214 | | $ | 123,532 |
| | | | | | | | | | | | | | | |
Net unrealized appreciation on buys of credit default swaps on credit indices | | $ | 123,532 |
| | | | | | | | | | | | | | | |
| | | | | | | | | | | | | | | | |
| Western Asset Limited Duration Bond Portfolio | | | | | |
Swap Counterparty
(Reference Entity) | | Termination Date | | Periodic
Payments Made
by the Fund‡ | | Periodic
Payments
Received by
the Fund‡ | | Contract
Notional
Amount | | Upfront
Premiums
Paid/Received | | Unrealized
Appreciation/
(Depreciation) | |
| | | | | | | | | | | | | | | | |
Interest Rate Swaps: | | | | | | | | | | | | |
Deutsche Bank AG | | November 28, 2012 | | 3-month
LIBOR | | 5.27%
Semi-Annually | | $ | 2,200,000 | | $ | — | | $ | 274,143 | |
| | | | | | |
Deutsche Bank AG | | March 18, 2019 | | 4.25%
Semi-Annually | | 3-month
LIBOR | | | 2,740,000 | | | 35,287 | | | (433,878 | ) |
195
Annual Report to Shareholders
Notes to Financial Statements—Continued
| | | | | | | | | | | | | | | | | |
| Western Asset Limited Duration Bond Portfolio—Continued | | | | | | |
| | | | | | |
Swap Counterparty
(Reference Entity) | | Termination Date | | Periodic
Payments Made
by the Fund‡ | | Periodic
Payments
Received by
the Fund‡ | | Contract
Notional
Amount | | Upfront
Premiums
Paid/Received | | | Unrealized
Appreciation/
(Depreciation) | |
Interest Rate Swaps—Continued | | | | | | | | | | | | | | | |
| | | | | | |
Deutsche Bank AG | | March 18, 2016 | | 4.4%
Semi-Annually | | 3-month
LIBOR | | $ | 5,830,000 | | $ | (47,655 | ) | | $ | (692,075 | ) |
| | | | | | |
Morgan Stanley & Co., Inc. | | March 18, 2016 | | 4.4%
Semi-Annually | | 3-month
LIBOR | | | 5,160,000 | | | (58,908 | ) | | | (617,023 | ) |
| | | | | | | | | | | | | | | | | |
Net unrealized depreciation on interest rate swaps | | | $ | (1,468,833 | ) |
| | | | | | | | | | | | | | | | | |
| | | | | | | | | | | | | | | | | |
| |
| Credit Default Swap on Credit Indices—Sell Protection1 | | | | |
| | | | | | |
Swap Counterparty
(Reference Entity) | | Termination Date | | Periodic
Payments
Received by the
Fund‡ | | Contract Notional
Amount3 | | Market Value5 | | | Upfront
Premiums
Paid/(Received) | | | Unrealized
Appreciation/
(Depreciation) | |
| | | | | | | | | | | | | | | | | |
Barclays Capital Inc.
(CDX HVOL 8) | | June 20, 2012 | | 0.75%
Quarterly | | $1,380,000 | | $ | (162,126 | ) | | $(10,405) | | | $ | (151,721 | ) |
| | | | | | |
Barclays Capital Inc.
(CDX IG HVOL 8) | | June 20, 2012 | | 0.75%
Quarterly | | 200,000 | | | (23,497 | ) | | (1,806 | ) | | | (21,691 | ) |
| | | | | | |
Credit Suisse First Boston USA
(ABX.HE-AAA 06-1) | | July 25, 2045 | | 0.18%
Monthly | | 433,406 | | | (86,681 | ) | | (27,464 | ) | | | (59,217 | ) |
| | | | | | |
Deutsche Bank AG
(CDX HVOL 8) | | June 20, 2012 | | 0.75%
Quarterly | | 240,000 | | | (28,196 | ) | | (7,652 | ) | | | (20,544 | ) |
| | | | | | |
Deutsche Bank AG
(CDX HVOL 8) | | June 20, 2012 | | 0.75%
Quarterly | | 240,000 | | | (28,196 | ) | | (7,954 | ) | | | (20,242 | ) |
| | | | | | |
JP Morgan Chase & Co.
(CDX IG HVOL 8) | | June 20, 2012 | | 0.75%
Quarterly | | 400,000 | | | (46,993 | ) | | (3,614 | ) | | | (43,379 | ) |
| | | | | | |
Morgan Stanley & Co. Inc.
(CDX HVOL 8) | | June 20, 2012 | | 0.75%
Quarterly | | 100,000 | | | (11,748 | ) | | (604 | ) | | | (11,144 | ) |
| | | | | | |
Morgan Stanley & Co. Inc.
(CDX HVOL 8) | | June 20, 2012 | | 0.75%
Quarterly | | 200,000 | | | (23,497 | ) | | (1,244 | ) | | | (22,253 | ) |
| | | | | | |
Morgan Stanley & Co. Inc.
(CDX HVOL 8) | | June 20, 2012 | | 0.75%
Quarterly | | 200,000 | | | (23,496 | ) | | (1,420 | ) | | | (22,076 | ) |
| | | | | | |
Morgan Stanley & Co. Inc.
(CDX HVOL 8) | | June 20, 2012 | | 0.75%
Quarterly | | 200,000 | | | (23,497 | ) | | (1,539 | ) | | | (21,958 | ) |
| | | | | | |
The Goldman Sachs Group, Inc.
(CDX IG HVOL 8) | | June 20, 2012 | | 0.75%
Quarterly | | 1,100,000 | | | (129,231 | ) | | (6,195 | ) | | | (123,036 | ) |
| | | | | | |
The Goldman Sachs Group, Inc.
(CDX IG HVOL 8) | | June 20, 2012 | | 0.75%
Quarterly | | 300,000 | | | (35,245 | ) | | (4,676 | ) | | | (30,569 | ) |
| | | | | | | | | | | | | | | | | |
Net unrealized depreciation on sales of credit default swaps on credit indices | | | $ | (547,830 | ) |
| | | | | | | | | | | | | | | | | |
1 | | If the Fund is a seller of protection and a credit event occurs, as defined under the terms of that particular swap agreement, the Fund will either (i) pay to the buyer of protection an amount equal to the notional amount of the swap and take delivery of the referenced obligation or underlying securities comprising the referenced index or (ii) pay a net settlement amount in the form of cash or securities equal to the notional amount of the swap less the recovery value of the referenced obligation or underlying securities comprising the referenced index. |
196
Annual Report to Shareholders
2 | | Implied credit spreads, utilized in determining the market value of credit default swap agreements on corporate issues or sovereign issues of an emerging country as of period end serve as an indicator of the current status of the payment/performance risk and represent the likelihood or risk of default for the credit derivative. The implied credit spread of a particular referenced entity reflects the cost of buying/selling protection and may include upfront payments required to be made to enter into the agreement. Wider credit spreads represent a deterioration of the referenced entity’s credit soundness and a greater likelihood or risk of default or other credit event occurring as defined under the terms of the agreement. A credit spread identified as “Defaulted” indicates a credit event has occurred for the referenced entity or obligation. |
3 | | The maximum potential amount the Fund could be required to make as a seller of credit protection or receive as a buyer of credit protection if a credit event occurs as defined under the terms of that particular swap agreement. |
4 | | If the Fund is a buyer of protection and a credit event occurs, as defined under the terms of that particular swap agreement, the Fund will either (i) receive from the seller of protection an amount equal to the notional amount of the swap and deliver the underlying securities comprising the referenced index or (ii) receive a net settlement amount in the form of cash or securities equal to the notional amount of the swap less the recovery value of the underlying securities comprising the referenced index. |
5 | | The quoted market prices and resulting values for credit default swap agreements on asset-backed securities and credit indices serve as an indicator of the current status of the payment/performance risk and represent the likelihood of an expected liability (or profit) for the credit derivative should the notional amount of the swap agreement have been closed/sold as of the period end. Decreasing market values when compared to the notional amount of the swap, represent a deterioration of the referenced entity’s credit soundness and a greater likelihood or risk of default or other credit event occurring as defined under the terms of the agreement. |
‡ | | Percentage shown is an annual percentage rate. |
4. Securities Lending
Each Fund may lend its securities to approved brokers to earn additional income, and will receive cash and U.S. government securities as collateral against the loans. Cash collateral received is invested in a money market pooled amount by the Fund’s lending agent. Collateral is maintained over the life of the loan in an amount not less than 100% of the value of the loaned securities. As of December 31, 2008, there were no securities on loan.
5. Transactions With Affiliates:
Each Fund has an investment management agreement with Legg Mason Fund Adviser, Inc. (“LMFA”). Western Asset Management Company (“Western Asset”) is the investment adviser to Absolute Return, High Yield, Inflation Indexed, Intermediate, Intermediate Plus, and Limited Duration. Western Asset Management Company Limited (“WAML”) is the investment adviser to Non-U.S. and shares advisory responsibilities with Western Asset for Absolute Return, Inflation Indexed, and Intermediate Plus. WAML, Western Asset Management Company Pte Ltd. (“Western Singapore”) and Western Asset Management Company Limited (“Western Japan”) share advisory responsibilities with Non-U.S., Absolute Return and Inflation Indexed.
Pursuant to their respective agreements, LMFA provides the Funds with management and administrative services for which each Fund pays a fee, computed daily and payable monthly, at annual rates of each Fund’s average daily net assets. In order to limit the annualized operating expense ratios of the classes offered by each Fund to specified amounts, from August 1, 2007 until July 31, 2008, LMFA was contractually obligated with respect to each Fund to waive its compensation (and, to the extent necessary, bear other expenses of each Fund) when the annualized operating expense ratio of a class of the Fund, as a percentage of average daily net assets of such Fund attributable to such class, exceeded a specified amount (“Fee Cap”). From August 1, 2008 through July 31, 2009, the Manager is contractually obligated to follow the Fee Cap for the Institutional Select and Financial Intermediary Classes of each Fund offering those classes. The Fee Cap ceased to apply to the Institutional Class of each Fund (except Absolute Return) beginning August 1, 2008. From August 1, 2008 through July 31, 2009, the Manager is contractually obligated to waive its compensation (and, to the extent necessary, bear other expenses of the Fund) with respect to the Institutional Class of certain Funds in amounts equal to specified annual rates of each such Fund’s average daily net assets attributable to such share class (“Flat Waiver”). Western Asset and WAML also agreed to waive their advisory fees (which are paid by LMFA, and not the Funds) in corresponding amounts under both the Fee Cap and the Flat Waiver.
Any amounts waived or reimbursed in a particular fiscal year under the Fee Cap will be subject to repayment by a Fund on behalf of the applicable class to LMFA to the extent that from time to time during the next three fiscal years the repayment will not cause a Fund’s expenses for such class to exceed a limit agreed between the Fund and LMFA. The following chart shows annual rates of management fees, expense limits or waivers (as applicable), management fees waived and potential fees which may be recaptured for the Funds’ share classes.
197
Annual Report to Shareholders
Notes to Financial Statements—Continued
| | | | | | | | | | | | | | | | | | | |
Fund | | Asset
Breakpoint for
Management
Fee | | Management
Fee | | | Expense
Limitation
8/1/08-7/31/09 | | | Waiver | | | Management
Fees (Waived)/
Recaptured | | | Maximum
Amount
Subject to
Recapture | |
Absolute Return | | | | | | | | | | | | | | | | | | | |
Institutional Class | | All asset levels | | 0.750 | % | | 0.80 | % | | — | | | $ | (91,193 | ) | | $ | (91,193 | ) |
Institutional Select Class | | All asset levels | | 0.750 | % | | 0.80 | % | | — | | | | (33,985 | ) | | | (33,985 | ) |
Financial Intermediary Class | | All asset levels | | 0.750 | % | | 1.05 | % | | — | | | | (408 | ) | | | (408 | ) |
| | | | | | |
High Yield | | | | | | | | | | | | | | | | | | | |
Institutional Class | | All asset levels | | 0.550 | % | | — | * | | — | | | $ | — | | | $ | — | |
Institutional Select Class | | All asset levels | | 0.550 | % | | 0.65 | % | | — | | | | — | | | | — | |
| | | | | | |
Inflation Indexed | | | | | | | | | | | | | | | | | | | |
Institutional Class | | All asset levels | | 0.200 | % | | — | * | | 0.02 | % | | $ | (88,813 | ) | | $ | (454,031 | ) |
Institutional Select Class | | All asset levels | | 0.200 | % | | 0.25 | % | | — | | | | — | | | | — | |
Financial Intermediary Class | | All asset levels | | 0.200 | % | | 0.75 | %* | | — | | | | (2 | ) | | | (8 | ) |
| | | | | | |
Intermediate | | | | | | | | | | | | | | | | | | | |
Institutional Class | | All asset levels | | 0.400 | % | | — | * | | — | | | $ | (312 | ) | | $ | (91,085 | ) |
Institutional Select Class | | All asset levels | | 0.400 | % | | 0.45 | % | | — | | | | (819 | ) | | | (819 | ) |
| | | | | | |
Intermediate Plus | | | | | | | | | | | | | | | | | | | |
Institutional Class | | All asset levels | | 0.400 | % | | — | * | | 0.13 | % | | $ | (97,069 | ) | | $ | (375,316 | ) |
Institutional Select Class | | All asset levels | | 0.400 | % | | 0.45 | % | | — | | | | (1,690 | ) | | | (1,690 | ) |
| | | | | | |
Limited Duration | | | | | | | | | | | | | | | | | | | |
Institutional Class | | All asset levels | | 0.350 | % | | — | * | | 0.10 | % | | $ | (83,725 | ) | | $ | (343,675 | ) |
Institutional Select Class | | All asset levels | | 0.350 | % | | 0.40 | % | | — | | | | (3,637 | ) | | | (3,637 | ) |
| | | | | | |
Non-U.S. | | All asset levels | | 0.450 | % | | — | * | | 0.04 | % | | $ | (48,260 | ) | | $ | (235,986 | ) |
| * | | From August 1, 2007 until July 31, 2008, the following limits on annualized expense ratios were in place under the Fee Cap Approach: |
| | |
Fund | | Expense
Limitation |
High Yield | | |
Institutional Class | | 0.65% |
Inflation Indexed | | |
Institutional Class | | 0.25% |
Financial Intermediary Class | | 0.50% |
Intermediate | | 0.45% |
Intermediate Plus | | 0.45% |
Limited Duration | | 0.40% |
Non-U.S. | | 0.55% |
Legg Mason Investor Services, LLC (“LMIS”) serves as distributor of the Funds’ shares. LMIS receives from each Fund an annual distribution fee of 0.25% of the average daily net assets of the Financial Intermediary Class of each Fund, computed daily and payable monthly.
LMFA, Western Asset, WAML Western Singapore, Western Japan and LMIS are wholly owned subsidiaries of Legg Mason, Inc.
198
Annual Report to Shareholders
6. Fund Share Transactions:
At December 31, 2008, there were 21.050 billion of common stock of the Corporation authorized at $.001 par value. Transactions in the Funds’ shares were as follows:
| | | | | | | | | | | | | | | | | | | | | |
| | | Period Ended
December 31, 2008A | | | Year Ended
March 31, 2008 | | | Year Ended
March 31, 2007 | |
| | | Shares | | | Amount | | | Shares | | | Amount | | | Shares | | | Amount | |
Absolute Return | | | | | | | | | | | | | | | | | | | | | |
Institutional Class | | | | | | | | | | | | | | | | | | | | | |
Shares sold | | 6,412,606 | | | $ | 58,970,805 | | | 25,040,517 | | | $ | 250,612,343 | | | 36,584,554 | | | $ | 371,514,164 | |
Shares issued on reinvestment | | 2,838,025 | | | | 26,290,859 | | | 2,465,367 | | | | 24,781,815 | | | 631,102 | | | | 6,441,688 | |
Shares repurchased | | (46,775,614 | ) | | | (419,797,647 | ) | | (6,792,146 | ) | | | (68,276,911 | ) | | (909,438 | ) | | | (9,306,461 | ) |
| | | | | | | | | | | | | | | | | | | | | |
Net Increase (Decrease) | | (37,524,983 | ) | | $ | (334,535,983 | ) | | 20,713,738 | | | $ | 207,117,247 | | | 36,306,218 | | | $ | 368,649,391 | |
| | | | | | | | | | | | | | | | | | | | | |
Institutional Select ClassB | | | | | | | | | | | | | | | | | | | | | |
Shares sold | | 24,180,661 | | | $ | 220,281,667 | | | — | | | $ | — | | | — | | | $ | — | |
Shares issued on reinvestment | | 702,878 | | | | 5,730,893 | | | — | | | | — | | | — | | | | — | |
Shares repurchased | | (4,283,113 | ) | | | (35,067,103 | ) | | — | | | | — | | | — | | | | — | |
| | | | | | | | | | | | | | | | | | | | | |
Net Increase | | 20,600,426 | | | $ | 190,945,457 | | | — | | | $ | — | | | — | | | $ | — | |
| | | | | | | | | | | | | | | | | | | | | |
Financial Intermediary Class | | | | | | | | | | | | | | | | | | | | | |
Shares sold | | 111,254 | | | $ | 973,495 | | | 39,400 | | | $ | 395,029 | | | 1,652 | | | $ | 16,800 | |
Shares issued on reinvestment | | 2,805 | | | | 24,845 | | | 488 | | | | 4,892 | | | 56 | | | | 570 | |
Shares repurchased | | (51,496 | ) | | | (405,156 | ) | | (298 | ) | | | (3,000 | ) | | — | | | | — | |
| | | | | | | | | | | | | | | | | | | | | |
Net Increase | | 62,563 | | | $ | 593,184 | | | 39,590 | | | $ | 396,921 | | | 1,708 | | | $ | 17,370 | |
| | | | | | | | | | | | | | | | | | | | | |
| | | | | | |
High Yield | | | | | | | | | | | | | | | | | | | | | |
Institutional Class | | | | | | | | | | | | | | | | | | | | | |
Shares sold | | 4,570,280 | | | $ | 40,466,782 | | | 23,467,385 | | | $ | 240,438,693 | | | 21,423,737 | | | $ | 225,257,662 | |
Shares issued on reinvestment | | 9,329,465 | | | | 70,111,837 | | | 7,766,638 | | | | 79,240,754 | | | 4,732,934 | | | | 48,268,332 | |
Shares repurchased | | (26,564,923 | ) | | | (232,469,387 | ) | | (27,068,309 | ) | | | (264,369,485 | ) | | (2,033,622 | ) | | | (21,085,854 | ) |
| | | | | | | | | | | | | | | | | | | | | |
Net Increase (Decrease) | | (12,665,178 | ) | | $ | (121,890,768 | ) | | 4,165,714 | | | $ | 55,309,962 | | | 24,123,049 | | | $ | 252,440,140 | |
| | | | | | | | | | | | | | | | | | | | | |
Institutional Select ClassB | | | | | | | | | | | | | | | | | | | | | |
Shares sold | | 13,646,907 | | | $ | 120,053,238 | | | — | | | $ | — | | | — | | | $ | — | |
Shares issued on reinvestment | | 797,924 | | | | 4,937,498 | | | — | | | | — | | | — | | | | — | |
Shares repurchased | | (1,613,735 | ) | | | (10,896,580 | ) | | — | | | | — | | | — | | | | — | |
| | | | | | | | | | | | | | | | | | | | | |
Net Increase | | 12,831,096 | | | $ | 114,094,156 | | | — | | | $ | — | | | — | | | $ | — | |
| | | | | | | | | | | | | | | | | | | | | |
| | | | | | |
Inflation Indexed | | | | | | | | | | | | | | | | | | | | | |
Institutional Class | | | | | | | | | | | | | | | | | | | | | |
Shares sold | | 16,828,142 | | | $ | 174,272,074 | | | 19,972,862 | | | $ | 211,161,547 | | | 9,069,158 | | | $ | 93,117,187 | |
Shares issued on reinvestment | | 5,004,860 | | | | 52,182,331 | | | 3,763,953 | | | | 39,571,513 | | | 2,048,497 | | | | 20,971,112 | |
Shares repurchased | | (48,896,241 | ) | | | (452,802,586 | ) | | (9,104,549 | ) | | | (96,721,397 | ) | | (2,315,019 | ) | | | (23,663,204 | ) |
| | | | | | | | | | | | | | | | | | | | | |
Net Increase (Decrease) | | (27,063,239 | ) | | $ | (226,348,181 | ) | | 14,632,266 | | | $ | 154,011,663 | | | 8,802,636 | | | $ | 90,425,095 | |
| | | | | | | | | | | | | | | | | | | | | |
Institutional Select ClassC | | | | | | | | | | | | | | | | | | | | | |
Shares sold | | 2,369,153 | | | $ | 22,814,947 | | | — | | | $ | — | | | — | | | $ | — | |
| | | | | | | | | | | | | | | | | | | | | |
Net Increase | | 2,369,153 | | | $ | 22,814,947 | | | — | | | $ | — | | | — | | | $ | — | |
| | | | | | | | | | | | | | | | | | | | | |
Financial Intermediary Class | | | | | | | | | | | | | | | | | | | | | |
Shares sold | | 16,934 | | | $ | 172,659 | | | 21,815 | | | $ | 238,876 | | | — | | | $ | — | |
Shares issued on reinvestment | | 415 | | | | 4,253 | | | 108 | | | | 1,186 | | | — | | | | — | |
Shares repurchased | | (3,518 | ) | | | (32,562 | ) | | (18,672 | ) | | | (202,156 | ) | | — | | | | — | |
| | | | | | | | | | | | | | | | | | | | | |
Net Increase | | 13,831 | | | $ | 144,350 | | | 3,251 | | | $ | 37,906 | | | — | | | $ | — | |
| | | | | | | | | | | | | | | | | | | | | |
199
Annual Report to Shareholders
Notes to Financial Statements—Continued
| | | | | | | | | | | | | | | | | | | | | |
| | | Period Ended
December 31, 2008A | | | Year Ended
March 31, 2008 | | | Year Ended
March 31, 2007 | |
| | | Shares | | | Amount | | | Shares | | | Amount | | | Shares | | | Amount | |
Intermediate | | | | | | | | | | | | | | | | | | | | | |
Institutional Class | | | | | | | | | | | | | | | | | | | | | |
Shares sold | | 5,956,977 | | | $ | 59,086,946 | | | 32,296,580 | | | $ | 334,375,744 | | | 20,543,609 | | | $ | 211,659,756 | |
Shares issued on reinvestment | | 2,751,284 | | | | 26,924,151 | | | 2,690,562 | | | | 27,904,316 | | | 2,588,997 | | | | 26,658,928 | |
Shares repurchased | | (26,268,220 | ) | | | (246,886,277 | ) | | (27,670,873 | ) | | | (287,140,762 | ) | | (34,281,270 | ) | | | (351,410,855 | ) |
| | | | | | | | | | | | | | | | | | | | | |
Net Increase (Decrease) | | (17,559,959 | ) | | $ | (160,875,180 | ) | | 7,316,269 | | | $ | 75,139,298 | | | (11,148,664 | ) | | $ | (113,092,171 | ) |
| | | | | | | | | | | | | | | | | | | | | |
Institutional Select ClassD | | | | | | | | | | | | | | | | | | | | | |
Shares sold | | 5,462,341 | | | $ | 49,716,313 | | | — | | | $ | — | | | — | | | $ | — | |
Shares issued on reinvestment | | 55,831 | | | | 515,387 | | | — | | | | — | | | — | | | | — | |
Shares repurchased | | (128,064 | ) | | | (1,166,667 | ) | | — | | | | — | | | — | | | | — | |
| | | | | | | | | | | | | | | | | | | | | |
Net Increase | | 5,390,108 | | | $ | 49,065,033 | | | — | | | $ | — | | | — | | | $ | — | |
| | | | | | | | | | | | | | | | | | | | | |
| | | | | | |
Intermediate Plus | | | | | | | | | | | | | | | | | | | | | |
Institutional Class | | | | | | | | | | | | | | | | | | | | | |
Shares sold | | 174,919 | | | $ | 1,596,448 | | | 2,821,735 | | | $ | 27,713,562 | | | 2,077,405 | | | $ | 20,297,794 | |
Shares issued on reinvestment | | 686,190 | | | | 6,232,310 | | | 491,208 | | | | 4,818,988 | | | 349,598 | | | | 3,439,890 | |
Shares repurchased | | (4,119,709 | ) | | | (36,207,382 | ) | | (580,831 | ) | | | (5,695,398 | ) | | (873,959 | ) | | | (8,558,253 | ) |
| | | | | | | | | | | | | | | | | | | | | |
Net Increase (Decrease) | | (3,258,600 | ) | | $ | (28,378,624 | ) | | 2,732,112 | | | $ | 26,837,152 | | | 1,553,044 | | | $ | 15,179,431 | |
| | | | | | | | | | | | | | | | | | | | | |
Institutional Select ClassE | | | | | | | | | | | | | | | | | | | | | |
Shares sold | | 826,840 | | | $ | 6,871,040 | | | — | | | $ | — | | | — | | | $ | — | |
| | | | | | | | | | | | | | | | | | | | | |
Net Increase | | 826,840 | | | $ | 6,871,040 | | | — | | | $ | — | | | — | | | $ | — | |
| | | | | | | | | | | | | | | | | | | | | |
| | | | | | |
Limited Duration | | | | | | | | | | | | | | | | | | | | | |
Institutional Class | | | | | | | | | | | | | | | | | | | | | |
Shares sold | | 1,956,595 | | | $ | 16,372,393 | | | 4,509,320 | | | $ | 43,936,448 | | | 6,140,043 | | | $ | 60,429,477 | |
Shares issued on reinvestment | | 328,775 | | | | 2,799,456 | | | 541,671 | | | | 5,205,159 | | | 390,874 | | | | 3,843,630 | |
Shares repurchased | | (5,530,590 | ) | | | (44,499,878 | ) | | (2,848,957 | ) | | | (27,501,407 | ) | | (4,747,155 | ) | | | (46,701,280 | ) |
| | | | | | | | | | | | | | | | | | | | | |
Net Increase (Decrease) | | (3,245,220 | ) | | $ | (25,328,029 | ) | | 2,202,034 | | | $ | 21,640,200 | | | 1,783,762 | | | $ | 17,571,827 | |
| | | | | | | | | | | | | | | | | | | | | |
Institutional Select ClassF | | | | | | | | | | | | | | | | | | | | | |
Shares sold | | 1,674,034 | | | $ | 13,409,011 | | | — | | | $ | — | | | — | | | $ | — | |
Shares issued on reinvestment | | 13,489 | | | | 105,878 | | | — | | | | — | | | — | | | | — | |
| | | | | | | | | | | | | | | | | | | | | |
Net Increase | | 1,687,523 | | | $ | 13,514,889 | | | — | | | $ | — | | | — | | | $ | — | |
| | | | | | | | | | | | | | | | | | | | | |
| | | | | | |
Non-U.S. | | | | | | | | | | | | | | | | | | | | | |
Institutional Class | | | | | | | | | | | | | | | | | | | | | |
Shares sold | | 4,393,007 | | | $ | 43,328,054 | | | 7,776,592 | | | $ | 76,569,432 | | | 10,430,916 | | | $ | 100,110,270 | |
Shares issued on reinvestment | | 1,324,270 | | | | 11,640,333 | | | 39,858 | | | | 394,372 | | | 192,711 | | | | 1,792,208 | |
Shares repurchased | | (14,513,511 | ) | | | (142,904,976 | ) | | (5,293,702 | ) | | | (51,712,115 | ) | | (1,871,748 | ) | | | (18,048,069 | ) |
| | | | | | | | | | | | | | | | | | | | | |
Net Increase (Decrease) | | (8,796,234 | ) | | $ | (87,936,589 | ) | | 2,522,748 | | | $ | 25,251,689 | | | 8,751,879 | | | $ | 83,854,409 | |
| | | | | | | | | | | | | | | | | | | | | |
| | | | | | | | | | | | | | | | | | | | | | |
A | | For the period April 1, 2008 to December 31, 2008. |
B | | Institutional Select Class commenced operations August 4, 2008. |
C | | Institutional Select Class commenced operations December 18, 2008. |
D | | Institutional Select Class commenced operations October 3, 2008. |
E | | Institutional Select Class commenced operations November 10, 2008. |
F | | Institutional Select Class commenced operations October 29, 2008. |
200
Annual Report to Shareholders
7. Recent Accounting Pronouncement
In March 2008, the FASB issued the Statement of Financial Accounting Standards No. 161, “Disclosures about Derivative Instruments and Hedging Activities” (“FAS 161”). FAS 161 is effective for fiscal years and interim periods beginning after November 15, 2008. FAS 161 requires enhanced disclosures about the Funds’ derivative and hedging activities, including how such activities are accounted for and their effect on the Fund’s financial position, performance and cash flows. Management is currently evaluating the impact the adoption of FAS 161 will have on the Fund’s financial statements and related disclosures.
201
Annual Report to Shareholders
Report of Independent Registered Public Accounting Firm
To the Board of Directors of Western Asset Funds, Inc. and to the Shareholders of Western Asset Absolute Return Portfolio, Western Asset High Yield Portfolio, Western Asset Inflation Indexed Plus Bond Portfolio, Western Asset Intermediate Bond Portfolio, Western Asset Intermediate Plus Bond Portfolio, Western Asset Limited Duration Bond Portfolio, and Western Asset Non-U.S. Opportunity Bond Portfolio:
In our opinion, the accompanying statements of assets and liabilities, including the schedules of investments, and the related statements of operations and of changes in net assets and the financial highlights present fairly, in all material respects, the financial position of Western Asset Absolute Return Portfolio, Western Asset High Yield Portfolio, Western Asset Inflation Indexed Plus Bond Portfolio, Western Asset Intermediate Bond Portfolio, Western Asset Intermediate Plus Bond Portfolio, Western Asset Limited Duration Bond Portfolio, and Western Asset Non-U.S. Opportunity Bond Portfolio (seven of the Portfolios comprising Western Asset Funds, Inc., the “Funds”) at December 31, 2008, the results of their operations, the changes in their net assets, and the financial highlights for each of the periods presented, in conformity with accounting principles generally accepted in the United States of America. These financial statements and financial highlights (hereafter referred to as “financial statements”) are the responsibility of the Funds’ management; our responsibility is to express an opinion on these financial statements based on our audits. We conducted our audits of these financial statements in accordance with the standards of the Public Company Accounting Oversight Board (United States). Those standards require that we plan and perform the audit to obtain reasonable assurance about whether the financial statements are free of material misstatement. An audit includes examining, on a test basis, evidence supporting the amounts and disclosures in the financial statements, assessing the accounting principles used and significant estimates made by management, and evaluating the overall financial statement presentation. We believe that our audits, which included confirmation of securities at December 31, 2008 by correspondence with the custodian and brokers, provide a reasonable basis for our opinion.
PricewaterhouseCoopers LLP
Baltimore, Maryland
February 27, 2009
202
Annual Report to Shareholders
Important Tax Information (Unaudited)
The following information is provided with respect to the distributions paid during the period ended December 31, 2008:
| | | | | | | | | | |
| | | | | Absolute Return | | |
Record Date: | | | | | 5/27/2008 | | | Daily | | |
Payable Date: | | | | | 5/29/2008 | |
| April 2008–
December 2008 | | |
| | | | | | | | | | |
Interest from Federal Obligations | | | | | 2.82% | | | 2.21% | | |
| | | | | | | | | | |
Long-Term Capital Gain Dividend | | | | $ | 0.088400 | | | — | | |
| | | | | | | | | | |
| |
| | | High Yield |
Record Date: | | 5/27/2008 | | | 7/23/2008 | | | 10/14/2008 | | 12/26/2008 |
Payable Date: | | 5/28/2008 | | | 7/24/2008 | | | 10/15/2008 | | 12/29/2008 |
| | | | | | | | | | |
Ordinary Income: | | | | | | | | | | |
Qualified Dividend Income for Individuals | | 0.40% | | | 0.78% | | | 0.78% | | 0.78% |
| | | | | | | | | | |
Dividends Qualifying for the Dividends | | | | | | | | | | |
Received Deduction for Corporations | | 0.40% | | | 0.78% | | | 0.78% | | 0.78% |
| | | | | | | | | | |
| | | |
| | | | | Inflation Indexed | | |
Record Date: | | | | | Daily | | | 5/27/2008 | | |
Payable Date: | | | |
| May 2008–
October 2008 | | | 5/29/2008 | | |
| | | | | | | | | | |
Ordinary Income: | | | | | | | | | | |
Qualified Dividend Income for Individuals | | | | | 0.96% | | | — | | |
| | | | | | | | | | |
Dividends Qualifying for the Dividends | | | | | | | | | | |
Received Deduction for Corporations | | | | | 0.96% | | | — | | |
| | | | | | | | | | |
Interest from Federal Obligations* | | | | | 69.77% | | | 69.77% | | |
| | | | | | | | | | |
Long-Term Capital Gain Dividend | | | | | — | | $ | 0.078820 | | |
| | | | | | | | | | |
* This Fund has met the quarterly asset requirements for California, Connecticut and New York resident shareholders. |
| | | |
| | | | | Intermediate | | |
Record Date: | | | | | Daily | | | 5/27/2008 | | |
Payable Date: | | | |
| April 2008–
December 2008 | | | 5/29/2008 | | |
| | | | | | | | | | |
Ordinary Income: | | | | | | | | | | |
Qualified Dividend Income for Individuals | | | | | 0.01% | | | — | | |
| | | | | | | | | | |
Dividends Qualifying for the Dividends | | | | | | | | | | |
Received Deduction for Corporations | | | | | 0.01% | | | — | | |
| | | | | | | | | | |
Interest from Federal Obligations | | | | | 11.50% | | | 0.01% | | |
| | | | | | | | | | |
Long-Term Capital Gain Dividend | | | | | — | | $ | 0.098200 | | |
| | | | | | | | | | |
203
Annual Report to Shareholders
Important Tax Information (Unaudited)—Continued
| | | | | | | |
| | | Intermediate Plus |
Record Date: | | | | | 5/27/2008 | | Daily |
Payable Date: | | | | | 5/29/2008 | | April 2008–
December 2008 |
| | | | | | | |
Ordinary Income: | | | | | | | |
Qualified Dividend Income for Individuals | | | | | 0.53% | | 0.38% |
| | | | | | | |
Dividends Qualifying for the Dividends | | | | | | | |
Received Deduction for Corporations | | | | | 0.53% | | 0.38% |
| | | | | | | |
Interest from Federal Obligations | | | | | 7.43% | | 9.78% |
| | | | | | | |
Long-Term Capital Gain Dividend | | | | $ | 0.125400 | | — |
| | | | | | | |
| | |
| | | Limited Duration | | |
Record Date: | | | | | Daily | | |
Payable Date: | | | |
| April 2008–
December 2008 | | |
| | | | | | | |
Ordinary Income: | | | | | | | |
Qualified Dividend Income for Individuals | | | | | 0.48% | | |
| | | | | | | |
Dividends Qualifying for the Dividends | | | | | | | |
Received Deduction for Corporations | | | | | 2.48% | | |
| | | | | | | |
Interest from Federal Obligations | | | | | 7.56% | | |
| | | | | | | |
The law varies in each state as to whether and what percentage of dividend income attributable to Federal obligations is exempt from state income tax. We recommend that you consult with your tax adviser to determine if any portion of the dividends you received is exempt from state income taxes.
The following information is provided for shareholders who are not residents of the United States:
| | |
| | | Intermediate |
Record Date: | | Daily |
Payable Date: | | April 2008–
December 2008 |
| | |
Qualified Interest Income | | 84.61% |
| | |
Additionally, the Fund paid $0.0361 per share to shareholders of record on May 27, 2008, all of which is qualified short-term capital gains not subject to U.S. withholding tax for nonresident alien shareholders.
Please retain this information for your records.
204
Annual Report to Shareholders
Directors and Officers
The Directors and officers of the Funds, their age (as of December 31, 2008) and a description of their principal occupations during the past five years are listed below. Except as shown, each Director’s and officer’s principal occupation and business experience for the last five years has been with the employer(s) indicated, although in some cases the Director or officer may have held different positions with such employer(s). Unless otherwise indicated, the business address of the persons listed below is c/o Western Asset Management Company, 385 East Colorado Blvd., Pasadena, California 91101.
| | | | | | | | | | |
Name and Year Born | | Position(s)
Held With
Corporation | | Term of Office
and Length of
Time ServedA | | Principal Occupations
During the Past 5 Years | | Number of
Portfolios In
Fund Complex
OverseenB | | Other
Directorships Held |
| Independent Directors | | | | | | | | | | |
Ronald J. Arnault 65 | | Director | | Served
since 1997 | | Retired. | | 13 | | None |
Anita L. DeFrantz 56 | | Director | | Served
since 1998 | | President (1987-present) and Director (1990-present) of LA84 (formerly Amateur Athletic Foundation of Los Angeles); President and Director of Kids in Sports (1994-present); Vice President, International Rowing Federation (1986-present); Member of the International Olympic Committee (1986-present). | | 13 | | OBN Holdings, Inc. |
Avedick B. Poladian 57 | | Director | | Served
since 2007 | | Executive Vice President and Chief Operating Officer of Lowe Enterprises, Inc. (real estate and hospitality firm) (2002-present); Formerly. Partner, Arthur Andersen, LLP. | | 13 | | Occidental Petroleum Corporation |
William E. B. Siart 62 | | Director and Chairman | | Served
since 1997 | | Vice Chairman of The Getty Trust (2005–present); Chairman of Walt Disney Concert Hall, Inc. (1998-2006); Chairman of Excellent Education Development (2000-present). | | 13 | | None |
Jaynie Miller Studenmund 54 | | Director | | Served
since 2004 | | Chief Operating Officer of Overture Services, Inc. (online marketing firm) (2001-2004); President and Chief Operating Officer of Paymybills.com (2000-2001). | | 13 | | eHarmony.com, Inc. Forest Lawn Orbitz Worldwide |
| Interested Directors | | | | | | | | | | |
R. Jay Gerken 57 | | Director and President | | Served as a Director since 2006 and as President since 2007C | | Managing Director of Legg Mason & Co., LLC, Chairman, President and Chief Executive Officer of certain mutual funds associated with Legg Mason & Co., LLC or its affiliates (2005-present); President of Legg Mason Partners Fund Advisor, LLC (“LMPFA”) (2006-present); Chairman of Smith Barney Fund Management LLC and Citi Fund Management Inc. (2002-2005); Chairman, President and Chief Executive Officer of Travelers Investment Adviser, Inc. (2002-2005). | | 159 | | Trustee or Director of certain funds associated with Legg Mason & Co., LLC or its affiliates (consisting of funds with 159 portfolios). |
Ronald L. Olson 67 | | Director | | Served
since 2005D | | Senior Partner of Munger, Tolles & Olson LLP (a law partnership) (1968-present). | | 13 | | Edison International, City National Corporation (financial services company), The Washington Post Company, and Berkshire Hathaway, Inc. |
205
Annual Report to Shareholders
Directors and Officers—Continued
| | | | | | | | | | |
Name and Year Born | | Position(s)
Held With
Corporation | | Term of Office
and Length of
Time ServedA | | Principal Occupations
During the Past 5 Years | | Number of
Portfolios In
Fund Complex
OverseenB | | Other
Directorships Held |
| OfficersD | | | | | | | | | | |
D. Daniel Fleet 51 | | Vice President | | Served
since 2006 | | President of Western Asset (2006-present); Vice President of Western Asset Income Fund and Western Asset Premier Bond Fund (2006-present); Director, Western Asset Management Company Limited (2006-present); Director of Risk Management of Western Asset (2002-2006). | | N/A | | N/A |
Gavin L. James 48 | | Vice President | | Served
since 2001 | | Director of Global Client Services and Marketing of Western Asset (1998-present). | | N/A | | N/A |
S. Kenneth Leech 54 | | Vice President | | Served
since 1990 | | Chief Investment Officer, Emeritus of Western Asset (2008-present); Chief Investment Officer of Western Asset (1998-2008); Vice President of Western Asset Income Fund (1998-present) and Western Asset Premier Bond Fund (2001-present). | | N/A | | N/A |
Stephen A. Walsh 50 | | Vice President | | Served
since 1994 | | Chief Investment Officer Western Asset (2008-present) Deputy Chief Investment Officer of Western Asset (2000-2008); Vice President of Western Asset Income Fund (1999-present) and Western Asset Premier Bond Fund (2001-present). | | N/A | | N/A |
Susanne D. Wilson 47 100 Light Street Baltimore, MD 21202 | | Vice President | | Served
since 1998 | | Vice President of Legg Mason & Co., LLC (2005-present); Vice President of Legg Mason Wood Walker, Incorporated (1998-2005). | | N/A | | N/A |
Marie K. Karpinski 59 100 Light Street Baltimore, MD 21202 | | Principal Financial and Accounting Officer | | Served
since 1990 | | Vice President, Legg Mason & Co., LLC (2005-present); Legg Mason Wood Walker, Incorporated (1992-2005); Vice President (1986-present), Chief Financial Officer (2006-present) and Treasurer (1986-2006) of all Legg Mason retail, open-end investment companies; Treasurer and Principal Financial and Accounting Officer, Western Asset/Claymore Inflation-Linked Securities & Income Fund (2003-present) and Western Asset/Claymore Inflation-Linked Opportunities & Income Fund (2004-present); Principal Financial and Accounting Officer of Western Asset Income Fund (2001–present) and Western Asset Premier Bond Fund (2001-present); Treasurer of the Corporation (1990–2006), Western Asset Income Fund (2001–2006) and Western Asset Premier Bond Fund (2001-2006). | | N/A | | N/A |
206
Annual Report to Shareholders
| | | | | | | | | | |
Name and Year Born | | Position(s)
Held With
Corporation | | Term of Office
and Length of
Time ServedA | | Principal Occupations
During the Past 5 Years | | Number of
Portfolios In
Fund Complex
OverseenB | | Other
Directorships Held |
Erin K. Morris 42 100 Light Street Baltimore, MD 21202 | | Treasurer | | Served
since 2006 | | Vice President and Manager, Global Funds Administration, Legg Mason & Co., LLC (2005-present); Assistant Vice President of Legg Mason Wood Walker, Incorporated (2002-2005); Treasurer of Legg Mason Income Trust, Inc., Legg Mason Tax-Free Income Fund, Western Asset Income Fund and Western Asset Premier Bond Fund (2006-present); Assistant Treasurer, Legg Mason Partners Fund fixed income complex (2007-present), Western Asset/Claymore Inflation-Linked Securities & Income Fund (2003-present), Western Asset/Claymore Inflation-Linked Opportunities & Income Fund (2004-present); Assistant Treasurer, the Corporation, Western Asset Income Fund, Western Asset Premier Bond Fund, Legg Mason Income Trust, Inc. and Legg Mason Tax-Free Income Fund (2001-2006); Manager, Funds Accounting, Legg Mason Wood Walker, Incorporated (2000-2005). | | N/A | | N/A |
Susan C. Curry 42 55 Water St. New York, NY 10041 | | Assistant Treasurer | | Served
since 2007 | | Director of Tax – Mutual Funds, Legg Mason & Co., LLC (2005-present); Director of Tax – Mutual Funds, Citigroup (2004-2005); Assistant Treasurer, Western Asset Income Fund, Western Asset Premier Bond Fund, Western Asset/Claymore Inflation-Linked Securities & Income Fund and Western Asset/Claymore Inflation-Linked Opportunities & Income Fund (2007-present); Partner, Deloitte & Touche (1990-2004). | | N/A | | N/A |
Todd F. Kuehl 39 100 Light Street Baltimore, MD 21202 | | Chief Compliance Officer | | Served
since 2007 | | Director, Legg Mason & Co., LLC (2006-present); Chief Compliance Officer of Legg Mason Private Portfolio Group (2009-present) Chief Compliance Officer of Western Asset/Claymore Inflation-Linked Securities & Income Fund, Western Asset/Claymore Inflation-Linked Opportunities & Income Fund, Western Asset Income Fund, Western Asset Premier Bond Fund (2007-present) and Barrett Growth Fund and Barrett Opportunity Fund (2006-2008); Branch Chief, Division of Investment Management, U.S. Securities and Exchange Commission (2002-2006). | | N/A | | N/A |
207
Annual Report to Shareholders
Directors and Officers—Continued
| | | | | | | | | | |
Name and Year Born | | Position(s)
Held With
Corporation | | Term of Office
and Length of
Time ServedA | | Principal Occupations
During the Past 5 Years | | Number of
Portfolios In
Fund Complex
OverseenB | | Other
Directorships Held |
Richard M. Wachterman 61 100 Light Street Baltimore, MD 21202 | | Secretary | | Served
since 2008 | | Associate General Counsel, Legg Mason & Co. (2004-present); Managing Director, Victory Capital Management (1981-2003); Secretary, Legg Mason Funds (2004-present); Secretary, Western Funds (2008-present); Vice President, Legg Mason Fund Adviser, Inc. (2007-present). | | N/A | | N/A |
Peter J. Ciliberti 34 100 Light Street Baltimore, MD 21202 | | Assistant Secretary | | Served
since 2008 | | Associate General Counsel, Legg Mason & Co. (2007-present); Assistant Secretary, Legg Mason Funds (2006-present); Asset Management Compliance Officer, Legg Mason & Co. (2005-2007); Asset Management Compliance Officer, Legg Mason Wood Walker, Inc. (2005); and Broker-Dealer Compliance Officer, Legg Mason Wood Walker, Inc. (2001-2005). | | N/A | | N/A |
A | | Each officer holds office until his or her respective successor is chosen and qualified, or in each case until he or she sooner dies, resigns, is removed with or without cause or becomes disqualified. Each of the Directors of the Corporation holds office until his or her successor shall have been duly elected and shall qualify, subject to prior death, resignation, retirement, disqualification or removal from office and applicable law and the rules of the New York Stock Exchange. |
B | | In addition to overseeing the thirteen portfolios of the Corporation, each Director also serves as a Director of Western Asset Income Fund and a Trustee of Western Asset Premier Bond Fund (closed-end investment companies), which are considered part of the same Fund Complex as the Corporation. In addition, Mr. Gerken serves as Director/Trustee to 159 other portfolios associated with Legg Mason & Co., LLC or its affiliates. Legg Mason & Co., LLC is an affiliate of LMFA and Western Asset. |
C | | Mr. Gerken is an “interested person” (as defined in section 2(a)(19) of the Investment Company Act of 1940, as amended (the “1940 Act”)) of each Fund because of his positions with subsidiaries of, and ownership of shares of common stock of, Legg Mason, Inc., the parent company of Western Asset. |
D | | Mr. Olson is an “interested person” (as defined above) of each Fund because his law firm has provided legal services to Western Asset. |
E | | Each officer of the Corporation is an “interested person” (as defined above) of the Corporation. |
ADDITIONAL INFORMATION ABOUT THE CORPORATION’S
DIRECTORS AND OFFICERS IS CONTAINED IN THE
CORPORATION’S STATEMENT OF ADDITIONAL INFORMATION,
AVAILABLE WITHOUT CHARGE UPON REQUEST BY CALLING
1-888-425-6432, OR ON THE SECURITIES AND EXCHANGE
COMMISSION’S WEBSITE (http://www.sec.gov).
208
Annual Report to Shareholders
Board Consideration of the Management and Advisory Agreements
The Executive and Contracts Committee of the Board of Directors considered the Investment Management Agreements between the Corporation and LMFA, the Investment Advisory Agreements between LMFA and Western Asset and the Investment Advisory Agreements between LMFA and WAML (collectively, the “Agreements”) with respect to each Fund at meetings held on September 9, 2008, October 17, 2008 and October 30, 2008. At a meeting held on November 18, 2008, the Executive and Contracts Committee reported to the full Board of Directors their considerations with respect to the Agreements, and the Board of Directors, including a majority of the Independent Directors, considered and approved renewal of the Agreements.
In arriving at their decision to renew the Agreements, the Directors met with representatives of Western Asset and WAML (together, the “Advisers”), including relevant investment advisory personnel as well as representatives of LMFA; reviewed a variety of information prepared by LMFA and the Advisers and materials provided by Lipper Inc. (“Lipper”) and counsel to the Independent Directors; and reviewed performance and expense information for peer groups of comparable funds selected and prepared by Lipper and for certain other comparable products available from Western Asset. These reviews were in addition to information obtained by the Directors at their regular quarterly meetings with respect to the Funds’ performance and other relevant matters, and related discussions with the Advisers’ personnel.
As part of their review, the Directors examined LMFA’s ability to provide high quality oversight and administrative and shareholder support services to the Funds, and Western Asset’s and WAML’s ability to provide high quality investment management services to the Funds. The Directors considered the experience of LMFA’s personnel in providing the types of services that LMFA is responsible for providing to the Funds; the ability of LMFA to attract and retain capable personnel; the capability and integrity of LMFA’s senior management and staff; and the level of skill required to provide such services to the Funds. The Directors considered the investment philosophy and research and decision-making processes of each Adviser; the experience of its key advisory personnel responsible for management of the Funds; the ability of the Advisers to attract and retain capable research and advisory personnel; the capability and integrity of the Advisers’ senior management and staff; and the level of skill required to manage each Fund. In addition, the Directors reviewed the quality of LMFA and the Advisers’ services with respect to regulatory compliance and compliance with the investment policies of the Funds and conditions that might affect LMFA or an Adviser’s ability to provide high quality services to the Funds in the future under the Agreements, including LMFA and each Adviser’s business reputation, financial condition and operational stability. Based on the foregoing, the Directors concluded that the Advisers’ investment process, research capabilities and philosophy were well suited to the Funds given their respective investment objectives and policies, and that LMFA and each of the Advisers would be able to meet any reasonably foreseeable obligations under the Agreements.
In reviewing the quality of the services provided to the Funds, the Directors also reviewed comparisons of the performance of the Funds to the performance of certain comparable funds in their respective peer groups and to their respective investment benchmarks over one-, three-, five- and ten-year and since inception periods ended August 31, 2008 (as applicable). In that connection, the Directors noted that the performance of most of the Funds for the one-year and three-year periods was below, and near or below, their peer averages, respectively. They also noted, however, that the performance of the Funds in existence for at least five years was generally near or above their peer averages for the five-year period ended August 31, 2008 and the performance of each of the two Funds in existence for at least ten years exceeded their peer averages for the ten-year period ended on that date. With respect to each of the Funds, the Directors considered the factors involved in its performance relative to the performance of its investment benchmark and peer groups.
The Directors also considered the management fees payable by the Funds to LMFA, the total expenses payable by the Funds and the fact that LMFA pays to the Advisers the entire management fee it receives from each Fund. They reviewed information concerning fees paid to investment advisers of similarly-managed funds, as well as fees paid by the Advisers’ other clients, including separate accounts managed by the Advisers. The Directors observed that the management fees paid to LMFA by the Funds were lower than their peer groups, except the fees with respect to the Absolute Return Fund which were higher than the applicable average and a few Funds that were near the applicable averages. The Directors also observed that total expenses for each Fund except the Absolute Return Fund were lower than the average of the funds in its respective peer group. The Directors noted that the management fees paid by the Funds were generally higher than the fees paid by other clients of the Advisers for accounts with similar investment strategies, but that the administrative and operational responsibilities for the Advisers with respect
209
Annual Report to Shareholders
Board Consideration of the Management and Advisory Agreements—Continued
to the Funds were also relatively higher. In light of these differences, the Directors concluded that the differences in management fees from those paid by the Advisers’ other clients were reasonable.
The Directors further evaluated the benefits of the advisory relationship to LMFA and the Advisers, including, among others, the profitability of the relationship to LMFA and the Advisers; the direct and indirect benefits that LMFA and each Adviser may receive from its relationship with the Funds, including any “fallout benefits”, such as reputational value derived from serving as investment manager or adviser; and the affiliations between LMFA, the Advisers and certain service providers for the Portfolios. In that connection, the Directors concluded that LMFA and each Adviser’s profitability was consistent with levels of profitability that had been determined by courts not to be excessive.
Finally, the Directors considered, in light of the profitability information provided by the Advisers, the extent to which economies of scale would be realized by the Advisers as the assets of the Funds grow. They further concluded that, where a Fund’s assets were currently at a level at which the Advisers potentially may realize economies of scale from any future growth in the Fund, fee breakpoints had been implemented to capture a portion of any economies of scale for the benefit of the Fund’s shareholders.
In their deliberations with respect to these matters, the Independent Directors were advised by their independent counsel, who are independent of LMFA and the Advisers within the meaning of the Securities and Exchange Commission rules regarding the independence of counsel. The Independent Directors weighed the foregoing matters in light of the advice given to them by their independent counsel as to the law applicable to the review of investment advisory contracts. In arriving at a decision, the Directors, including the Independent Directors, did not identify any single matter as all-important or controlling, and the foregoing summary does not detail all the matters considered. The Directors judged the terms and conditions of the Agreements, including the investment advisory fees, in light of all of the surrounding circumstances.
Based upon their review, the Directors, including all of the Independent Directors, determined, in the exercise of their business judgment, that they were generally satisfied with the quality of investment advisory services being provided by each Adviser, but would continue to closely monitor the Advisers’ performance in light of the Funds’ recent relative underperformance; that the fees to be paid to the Advisers and LMFA under the relevant Agreements were fair and reasonable, given the scope and quality of the services rendered by the Advisers and LMFA; and that approval of the Agreements was in the best interest of the Corporation and its shareholders.
Approval of Additional Subadvisers
At their September 9, 2008 meeting, the Directors, including the Independent Directors, approved the addition of the following two non-U.S. affiliates of Western Asset as additional investment subadvisers of Western Asset Absolute Return Portfolio, Western Asset Inflation Indexed Plus Bond Portfolio and Western Asset Non-U.S. Opportunity Bond Portfolio (the “Selected Funds”): Western Asset Management Company Pte. Ltd. in Singapore (“Western Asset Singapore”) and Western Asset Management Company Ltd in Japan (“Western Asset Japan” and together with Western Asset Singapore, the “New Subadvisers”). In approving the addition of the New Subadvisers, the Directors drew on their knowledge of and experience with Western Asset, its personnel, the quality of the services it has provided to the Selected Funds and its investment philosophy and performance, as well as additional information relating to the New Subadvisers. The Directors noted that the Selected Funds are permitted to invest in non-U.S. dollar denominated securities and related foreign currency instruments and that the addition of the New Subadvisers will provide the Selected Funds with greater global investment management and trading resources. The Directors also noted that although the New Subadvisers are separate legal entities from Western Asset, senior investment personnel at Western Asset have supervisory oversight responsibility over the investment decisions made by the New Subadvisers. Finally, the Directors noted that the management fees paid by the Selected Funds would not change as a result of the addition of the New Subadvisers since the Selected Funds would not be paying the fees of the New Subadvisers.
210
Annual Report to Shareholders
Privacy Policy
The Fund is committed to keeping nonpublic personal information secure and confidential. This notice is intended to help a shareholder understand how the Fund fulfills this commitment.
From time to time, the Fund, through its service providers, may collect a variety of personal information, including:
| | • | | Information received on applications and forms, via the telephone, and through websites; |
| | • | | Information about transactions with the Fund, affiliates, or others (such as purchases, sales, or account balances); and |
| | • | | Information about shareholders received from consumer reporting agencies. |
The Fund does not disclose shareholder nonpublic personal information, except as permitted by applicable law or regulation. For example, the Fund may share this information with others in order to process transactions. Any information provided to companies that perform services on behalf of the Fund, such as printing and mailing, or to other financial institutions with which the Fund has joint marketing agreements are required to protect the confidentiality of shareholders information and to use it only to perform the services for which the companies are hired.
The Fund, through its service providers, maintains physical, electronic, and procedural safeguards to protect shareholder nonpublic personal information. Access to this information is restricted.
If a shareholder decides at some point either to close his/her account(s) or become an inactive customer, the Fund will continue to adhere to these privacy policies and practices with respect to shareholder nonpublic personal information.
This notice is being provided on behalf of:
Western Asset Funds, Inc.
Western Asset Funds, Inc.
The Board of Directors
William E. B. Siart, Chairman
Ronald J. Arnault
Anita L. DeFrantz
R. Jay Gerken
Ronald L. Olson
Avedick B. Poladian
Jaynie Miller Studenmund
Officers
R. Jay Gerken, President
D. Daniel Fleet, Vice President
Gavin L. James, Vice President
S. Kenneth Leech, Vice President
Stephen A. Walsh, Vice President
Susanne D. Wilson, Vice President
Marie K. Karpinski, Principal Financial and Accounting Officer
Erin K. Morris, Treasurer
Susan C. Curry, Assistant Treasurer
Todd F. Kuehl, Chief Compliance Officer
Richard M. Wachterman, Secretary
Peter J. Ciliberti, Assistant Secretary
Investment Manager
Legg Mason Fund Adviser, Inc.
P.O. Box 17635
Baltimore, Maryland 21297-1635
Investment Advisers
Western Asset Management Company
385 East Colorado Boulevard
Pasadena, California 91101
Western Asset Management Company Limited
10 Exchange Square
London, England EC2A2EN
Western Asset Management Company Pte. Ltd.
1 George Street #23-01
Singapore 049145
Western Asset Management Company Ltd
36F Shin-Marunouchi Building
5-1 Marunouchi 1-Chrome Chiyoda-Ku
Tokyo 100-6536
Transfer and Shareholder Servicing Agent
Boston Financial Data Services
66 Brooks Drive
Braintree, Massachusetts 02184
Custodian
State Street Bank & Trust Company
P.O Box 1031
Boston, Massachusetts 02103
Counsel
Ropes & Gray LLP
1211 Avenue of the Americas
New York, New York 10036
Independent Registered Public Accounting Firm
PricewaterhouseCoopers LLP
100 East Pratt Street
Baltimore, Maryland 21201
Information about the policies and procedures that each Fund uses to determine how to vote proxies relating to each Fund’s portfolio securities is contained in the Statement of Additional Information, available upon request without charge by calling 1-888-425-6432 or on the Securities and Exchange Commission’s (“SEC”) website (http://www.sec.gov). Information regarding how the Funds voted proxies relating to portfolio securities during the most recent twelve-month period ended June 30 is also available on the SEC’s website or without charge through www.westernassetfunds.com.
Each Fund files a complete schedule of portfolio holdings with the SEC for the first and third quarters of each fiscal year on Form N-Q. Each Fund’s Form N-Q is available on the Securities and Exchange Commission’s (“SEC”) website (http://www.sec.gov) and may be viewed and copied at the SEC’s Public Reference Room in Washington, D.C. Information about the operation of the Public Reference Room may be obtained by calling 1-800-SEC-0330. Quarterly portfolio holdings are also available upon request by calling 1-888-425-6432 or at www.lminstitutionalfunds.com/fund_information/fund_literature/gbl_literature/proxy_report.asp.
This report must be preceded or accompanied by a free prospectus. Investors should consider the Fund’s investment objectives, risks, charges and expenses carefully before investing. The prospectus contains this and other important information about the Fund. Please read the prospectus carefully before investing.
Western Asset Management Company
Legg Mason Investor Services, LLC, Distributor
Legg Mason, Inc. Subsidiaries
| | |
| WAF-A-(02/09) TN09-4346 | | WASX011417 |
Western Asset Funds, Inc.
Western Asset Core Bond Portfolio
Western Asset Core Plus Bond Portfolio
Annual Report to Shareholders
December 31, 2008
Annual Report to Shareholders
Management’s Discussion of Fund Performance
Western Asset Core Bond Portfolio
Total returns for the Fund for various periods ended December 31, 2008 are presented below, along with those of comparative indices:
| | | | | | | | | | | | |
| | | | | Average Annual Total Returns |
| | | Three Months
Ended
12/31/08 | | Nine
Months | | One
Year | | Five
Years | | Ten
Years | | Since
InceptionA |
Western Asset Core Bond Portfolio: | | | | | | | | | | | | |
Institutional Class | | -3.35% | | -8.88% | | -10.81% | | +0.68% | | +3.99% | | +6.63% |
Financial Intermediary Class | | -3.42% | | -9.06% | | -11.13% | | +0.42% | | N/A | | +4.07% |
Institutional Select Class | | -3.29% | | N/A | | N/A | | N/A | | N/A | | -7.08% |
Barclays Capital U.S. Aggregate IndexB | | +4.58% | | +3.01% | | +5.24% | | +4.65% | | +5.63% | | +7.17% |
Lipper Intermediate Investment Grade Debt Funds Category AverageC | | -0.21% | | -4.95% | | -4.39% | | +1.75% | | +4.06% | | +6.32% |
The performance data quoted represent past performance and do not guarantee future results. Current performance may be lower or higher than the performance data quoted. To obtain the most recent month-end performance information for the Institutional, Financial Intermediary and Institutional Select Classes, please visit www.westernassetfunds.com. The investment return and principal value of the Fund will fluctuate so that an investor’s shares, when redeemed, may be worth more or less than the original cost. Calculations assume reinvestment of dividends and capital gain distributions. Performance would have been lower if fees had not been waived in various periods. Performance figures for periods shorter than one year represent cumulative figures and are not annualized.
The expense ratios for the Institutional, Financial Intermediary and Institutional Select Classes were 0.46%, 0.74% and 0.44%, respectively, as indicated in the Fund’s most current prospectus dated August 1, 2008.
For the period from April 1, 2008 through December 31, 2008, Institutional Class shares of Western Asset Core Bond Portfolio returned -8.88%. The Fund’s unmanaged benchmark, the Barclays Capital U.S. Aggregate Index, returned 3.01% over the same time frame. The Lipper Intermediate Investment Grade Debt Funds Category Average returned -4.95% for the same period.
The impact of market conditions on the Fund’s performance was negative for the nine-month period ended December 31, 2008, with strategies also producing significantly negative results. A large overweight exposure to the mortgage-backed sector detracted from returns as volatility remained high and negative housing news continued to damage market sentiment. We had diversified into a number of non-agency issues that were particularly impacted and further detracted from performance due to a lack of liquidity and uncertainty in that marketplace. An emphasis on lower-quality credits and select Financials issues was also a
A | | The inception of the Institutional Class is September 4, 1990. The inception date of the Financial Intermediary Class is July 22, 1999. The inception date of the Institutional Select Class is August 29, 2008. Index returns are for periods beginning August 31, 1990. Although it is not possible to invest directly in an index, it is possible to purchase investment vehicles designed to track the performance of certain indices. |
B | | The Barclays Capital (formerly Lehman Brothers) U.S. Aggregate Index is a broad-based bond index comprised of government, corporate, mortgage- and asset-backed issues, rated investment grade or higher, and having at least one year to maturity. |
C | | Lipper, Inc., a wholly-owned subsidiary of Reuters, provides independent insight on global collective investments. The Lipper Intermediate Investment Grade Debt Funds Category Average is comprised of the Fund’s peer group of mutual funds. |
1
Annual Report to Shareholders
Management’s Discussion of Fund Performance—Continued
Western Asset Core Bond Portfolio—Continued
large detractor from performance as spreads soared in the wake of the subprime lending crisis, deteriorating liquidity conditions and slowing economic growth. Spreads narrowed in April and May, but these gains were given back later in the period on deteriorating investor sentiment and poor earnings. A modest U.S. Treasury Inflation-Protected Securities (“TIPS”)D exposure also had a negative impact as oil plunged to $40 per barrel and inflation fears switched to deflation fears. On a positive note, a tactically-driven durationE posture contributed modestly to returns as bond yields rallied over the year. A yield curveF-steepening strategy also had a positive impact on performance as the spread between two- and 10-year yields widened.
Western Asset Management Company
January 20, 2009
Investment Risks: Bonds are subject to a variety of risks, including interest rate, credit and inflation risk. As interest rates rise, bond prices fall, reducing the value of the Fund’s share price. The Fund may invest in high-yield bonds, which are rated below investment grade and carry more risk than higher-rated securities. Mortgage-backed securities involve more risk, including prepayment and extension risks, than other investments in fixed-income securities. The Fund may use derivatives, such as options and futures which can be illiquid, may disproportionately increase losses, and have a potentially large impact on Fund performance.
D | | U.S. Treasury Inflation-Protected Securities (“TIPS”) are inflation-indexed securities issued by the U.S. Treasury in 5-year, 10-year and 20-year maturities. The principal is adjusted to the Consumer Price Index, the commonly used measure of inflation. The coupon rate is constant, but generates a different amount of interest when multiplied by the inflation-adjusted principal. |
E | | Duration is the measure of the price sensitivity of a fixed-income security to an interest rate change of 100 basis points. Calculation is based on the weighted average of the present values for all cash flows. |
F | | The yield curve is the graphical depiction of the relationship between the yield on bonds of the same credit quality but different maturities. |
2
Annual Report to Shareholders
Expense Example
Western Asset Core Bond Portfolio
As a shareholder of the Fund, you incur ongoing costs, including management fees, distribution (12b-1) fees on Financial Intermediary Class shares, and other Fund expenses. These examples are intended to help you understand your ongoing costs (in dollars) of investing in the Fund and to compare these costs with the ongoing costs of investing in other mutual funds.
Actual Expenses
The first line for each class in the table below provides information about actual account values and actual expenses for each Class. You may use the information in this line, together with the amount you invested, to estimate the expenses that you paid over the period. Simply divide your account value by $1,000 (for example, an $8,600 account value divided by $1,000 = 8.6), then multiply the result by the number in the first line under the heading entitled “Expenses Paid During the Period” to estimate the expenses you paid on your account if your shares were held for the entire period. For Institutional Class and Financial Intermediary Class, the example is based on an investment of $1,000 invested on July 1, 2008 and held through December 31, 2008; for Institutional Select Class, the example is based on an investment of $1,000 invested on August 29, 2008 (commencement of operations) and held through December 31, 2008. The ending values assume dividends were reinvested at the time they were paid.
Hypothetical Examples for Comparison Purposes
The second line for each class in the table below provides information about hypothetical account values and hypothetical expenses based on the relevant class’s actual expense ratio and an assumed rate of return of 5% per year before expenses, which is not the class’s actual return. The hypothetical account values and expenses may not be used to estimate the actual ending account balance or expenses you paid for the period. You may use this information to compare the ongoing costs of investing in the Fund and other funds. To do so, compare this 5% hypothetical example with the 5% hypothetical examples for the relevant classes that appear in the shareholder reports of other funds. Because the example is intended to be comparable to the examples provided by other funds, it is based on a hypothetical investment of $1,000 invested on July 1, 2008 and held through December 31, 2008 for each class, even though the Institutional Select Class did not begin operations until August 29, 2008. The ending values assume dividends were reinvested at the time they were paid.
| | | | | | | | | | | |
| | | Beginning
Account Value
7/1/08 | | | Ending
Account Value
12/31/08 | | Expenses PaidA
During the Period
7/1/08 to 12/31/08 | |
Institutional Class: | | | | | | | | | | | |
Actual | | $ | 1,000.00 | | | $ | 914.20 | | $ | 2.27 | |
Hypothetical (5% return before expenses) | | | 1,000.00 | | | | 1,022.84 | | | 2.40 | |
Institutional Select Class: | | | | | | | | | | | |
Actual | | $ | 1,000.00 | B | | $ | 929.20 | | $ | 1.49 | C |
Hypothetical (5% return before expenses) | | | 1,000.00 | | | | 1,022.94 | | | 2.29 | |
Financial Intermediary Class: | | | | | | | | | | | |
Actual | | $ | 1,000.00 | | | $ | 912.90 | | $ | 3.47 | |
Hypothetical (5% return before expenses) | | | 1,000.00 | | | | 1,021.58 | | | 3.67 | |
A | | These calculations are based on expenses incurred from July 1, 2008 to December 31, 2008. The dollar amounts shown as “Expenses Paid” are equal to the annualized expense ratios of 0.47% and 0.72% for the Institutional Class and Financial Intermediary Class, respectively, multiplied by the average values over the period, multiplied by the number of days in the most recent fiscal period (184), and divided by 365. |
B | | Beginning account value is as of August 29, 2008. |
C | | This calculation is based on expenses incurred from August 29, 2008 (commencement of operations) to December 31, 2008. The dollar amount shown as “Expenses Paid” is equal to the annualized expense ratio of 0.45% for the Institutional Select Class, multiplied by the average values over the period, multiplied by the number of days in the fiscal period (125) and divided by 365. |
3
Annual Report to Shareholders
Performance Information
Western Asset Core Bond Portfolio
The graphs compare the Fund’s total returns to that of an appropriate broad-based securities market index. The graphs illustrate the cumulative total return of an initial $1,000,000 investment in the Institutional Class and Financial Intermediary Class of the Fund, for the periods indicated. The line for the Fund represents the total return after deducting all Fund investment management and other administrative expenses and the transaction costs of buying and selling securities. The line representing the securities market index does not include any transaction costs associated with buying and selling securities in the index or other investment management or administrative expenses.
Due to the limited operating history of the Institutional Select Class, a performance graph is not presented. Institutional Select shares, which began operations on August 29, 2008 had a total return of -7.08% for the period ended December 31, 2008.
Total return measures investment performance in terms of appreciation or depreciation in the Fund’s net asset value per share, plus dividends and any capital gain distributions. It assumes that dividends and distributions were reinvested at the time they were paid. Returns (and the graphs and tables found below) do not reflect the deduction of taxes that a shareholder would pay on Fund distributions or the redemption of Fund shares. Average annual returns tend to smooth out variations in a fund’s return, so that they differ from actual year-to-year results.
Bonds are subject to a variety of risks, including interest rate, credit and inflation risk. Non-U.S. investments are subject to currency fluctuations, social, economical and political risk.
Growth of a $1,000,000 Investment—Institutional Class
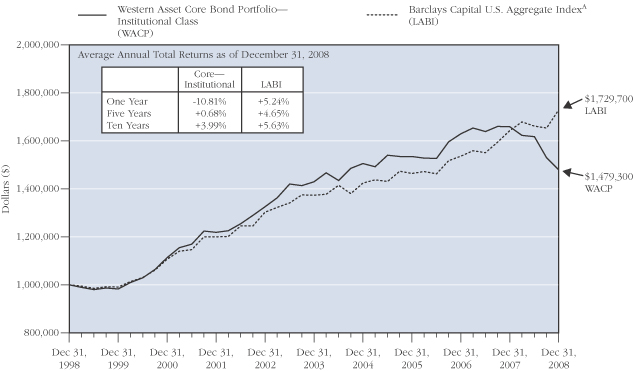
The performance data quoted represent past performance and do not guarantee future results. The performance stated may have been due to extraordinary market conditions, which may not be duplicated in the future. Current performance may be lower or higher than the performance data quoted. To obtain the most recent month-end performance information, please visit www.westernassetfunds.com. The investment return and principal value of the Fund will fluctuate so that an investor’s shares, when redeemed, may be worth more or less than the original cost. Calculations assume reinvestment of dividends and capital gain distributions. Performance would have been lower if fees had not been waived in various periods.
A | | Formerly: Lehman Aggregate Bond Index. The name change is a result of Barclays’ purchase of Lehman Brothers in September 2008. |
4
Annual Report to Shareholders
Growth of a $1,000,000 Investment—Financial Intermediary Class
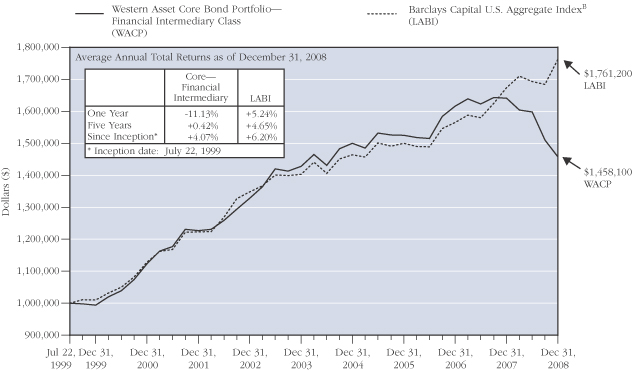
The performance data quoted represent past performance and do not guarantee future results. The performance stated may have been due to extraordinary market conditions, which may not be duplicated in the future. Current performance may be lower or higher than the performance data quoted. To obtain the most recent month-end performance information, please visit www.westernassetfunds.com. The investment return and principal value of the Fund will fluctuate so that an investor’s shares, when redeemed, may be worth more or less than the original cost. Calculations assume reinvestment of dividends and capital gain distributions. Performance would have been lower if fees had not been waived in various periods.
B | | Index returns are for periods beginning July 31, 1999. Formerly: Lehman Aggregate Bond Index. The name change is a result of Barclays’ purchase of Lehman Brothers in September 2008. |
5
Annual Report to Shareholders
Performance Information—Continued
Portfolio Composition (as of December 31, 2008)C
Standard & Poor’s Debt RatingsD (as a percentage of the portfolio)
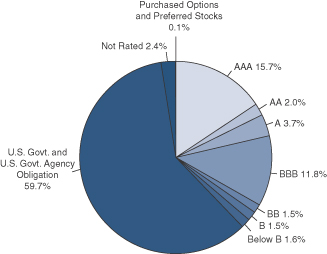
Maturity Schedule (as a percentage of the portfolio)
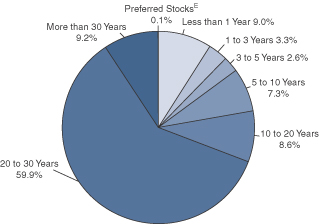
C | | The pie charts above represent the composition of the Fund’s portfolio as of December 31, 2008 and do not include derivatives such as Futures Contracts, Options Written, and Swaps. The Fund is actively managed. As a result, the composition of the portfolio holdings and sectors are subject to change at any time. |
D | | Source: Standard & Poor's. These ratings are the opinions of S&P and not absolute measures of quality or guarantees of performance. |
E | | Preferred stocks do not have defined maturity dates. |
6
Annual Report to Shareholders
Spread Duration
Western Asset Core Bond Portfolio
December 31, 2008
Economic Exposure
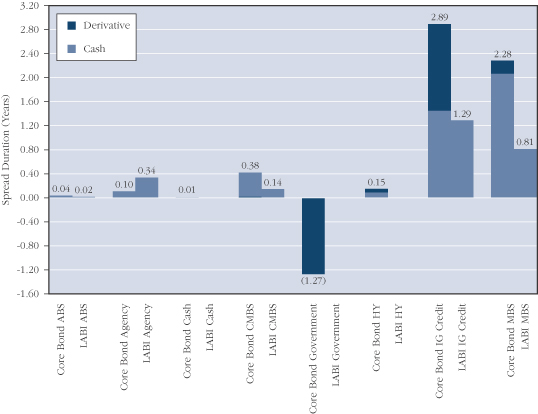
Spread duration is defined as the change in value for a 100 basis point change in the spread relative to Treasuries. The spread over Treasuries is the annual risk-premium demanded by investors to hold non-Treasury securities. This chart highlights the market sector exposure of the Fund’s portfolio and the exposure relative to the selected benchmark as of the end of the reporting period.
ABS—Asset Backed Securities
LABI—Barclays Capital U.S. Aggregate Index
CMBS—Commercial Mortgage Backed Securities
HY—High Yield
IG Credit—Investment Grade Credit
MBS—Mortgage Backed Securities
7
Annual Report to Shareholders
Effective Duration
Western Asset Core Bond Portfolio
December 31, 2008
Interest Rate Exposure
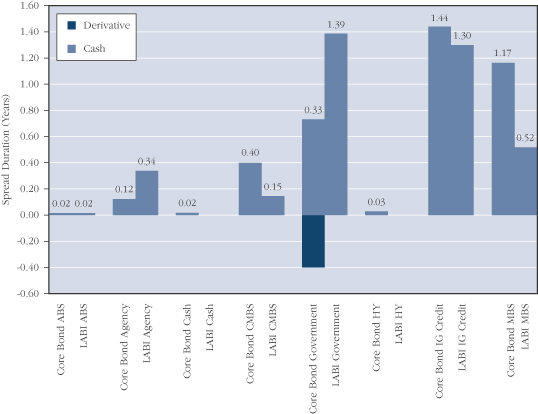
Effective duration is defined as the change in value for a 100 basis point change in Treasury yields. This chart highlights the interest rate exposure of the Fund’s portfolio relative to the selected benchmark as of the end of the reporting period.
ABS—Asset Backed Securities
LABI—Barclays Capital U.S. Aggregate Index
CMBS—Commercial Mortgage Backed Securities
HY—High Yield
IG Credit—Investment Grade Credit
MBS—Mortgage Backed Securities
8
Annual Report to Shareholders
Portfolio of Investments
Western Asset Core Bond Portfolio
December 31, 2008
| | | | | | | | | | | | | |
| | | % OF
NET ASSETS | | RATE | | MATURITY
DATE | | PAR/
SHARES | | VALUE | |
| | | | | | | | | | | | | |
Long-Term Securities | | 121.0% | | | | | | | | | | | |
| | | | | |
Corporate Bonds and Notes | | 21.8% | | | | | | | | | | | |
| | | | | |
Aerospace and Defense | | N.M. | | | | | | | | | | | |
United Technologies Corp. | | | | 5.400% | | 5/1/35 | | $ | 1,460,000 | | $ | 1,375,914 | |
| | | | | | | | | | | | | |
| | | | | |
Airlines | | 1.2% | | | | | | | | | | | |
Continental Airlines Inc. | | | | 6.900% | | 1/2/18 | | | 2,472,490 | | | 1,977,992 | |
Continental Airlines Inc. | | | | 6.820% | | 5/1/18 | | | 548,237 | | | 405,695 | |
Continental Airlines Inc. | | | | 6.545% | | 2/2/19 | | | 4,306,222 | | | 3,444,978 | |
Delta Air Lines Inc. | | | | 7.379% | | 5/18/10 | | | 2,651,821 | | | 2,439,675 | |
Delta Air Lines Inc. | | | | 7.570% | | 11/18/10 | | | 12,026,000 | | | 10,101,840 | |
Delta Air Lines Inc. | | | | 7.111% | | 9/18/11 | | | 15,600,000 | | | 12,480,000 | |
Delta Air Lines Inc. | | | | 6.821% | | 8/10/22 | | | 6,825,032 | | | 4,043,831 | |
Northwest Airlines Corp. | | | | 7.575% | | 3/1/19 | | | 5,745,286 | | | 3,906,794 | |
Northwest Airlines Inc. | | | | 2.968% | | 5/20/14 | | | 2,793,171 | | | 1,955,220 | A |
Southwest Airlines Co. | | | | 5.125% | | 3/1/17 | | | 2,640,000 | | | 1,908,871 | |
US Airways Pass-Through Trust | | | | 6.850% | | 1/30/18 | | | 10,063,668 | | | 7,044,568 | |
| | | | | | | | | | | | | |
| | | | | | | | | | | | 49,709,464 | |
| | | | | | | | | | | | | |
Automobiles | | 0.1% | | | | | | | | | | | |
DaimlerChrysler NA Holding Corp. | | | | 5.875% | | 3/15/11 | | | 700,000 | | | 610,401 | |
Ford Motor Co. | | | | 7.450% | | 7/16/31 | | | 13,410,000 | | | 3,754,800 | |
| | | | | | | | | | | | | |
| | | | | | | | | | | | 4,365,201 | |
| | | | | | | | | | | | | |
Building Products | | 0.1% | | | | | | | | | | | |
Masco Corp. | | | | 7.125% | | 8/15/13 | | | 3,320,000 | | | 2,671,604 | |
Masco Corp. | | | | 6.125% | | 10/3/16 | | | 4,120,000 | | | 2,827,766 | |
| | | | | | | | | | | | | |
| | | | | | | | | | | | 5,499,370 | |
| | | | | | | | | | | | | |
Capital Markets | | 0.9% | | | | | | | | | | | |
Goldman Sachs Capital II | | | | 5.793% | | 12/29/49 | | | 770,000 | | | 296,006 | B |
Lehman Brothers Holdings Capital Trust VII | | | | 5.857% | | 11/29/49 | | | 1,300,000 | | | 130 | B,C,S |
Lehman Brothers Holdings Inc. | | | | 6.200% | | 9/26/14 | | | 4,370,000 | | | 415,150 | C,S |
Lehman Brothers Holdings Inc. | | | | 6.500% | | 7/19/17 | | | 11,920,000 | | | 1,192 | C,S |
Lehman Brothers Holdings Inc. | | | | 6.750% | | 12/28/17 | | | 29,990,000 | | | 2,999 | C,S |
Merrill Lynch and Co. Inc. | | | | 6.110% | | 1/29/37 | | | 3,510,000 | | | 3,155,227 | |
Morgan Stanley | | | | 4.750% | | 4/1/14 | | | 3,070,000 | | | 2,338,999 | |
Morgan Stanley | | | | 4.953% | | 10/18/16 | | | 4,040,000 | | | 2,779,738 | A |
The Bear Stearns Cos. Inc. | | | | 6.400% | | 10/2/17 | | | 17,120,000 | | | 17,790,727 | |
The Goldman Sachs Group Inc. | | | | 5.625% | | 1/15/17 | | | 9,935,000 | | | 8,534,930 | |
| | | | | | | | | | | | | |
| | | | | | | | | | | | 35,315,098 | |
| | | | | | | | | | | | | |
9
Annual Report to Shareholders
Portfolio of Investments—Continued
Western Asset Core Bond Portfolio—Continued
| | | | | | | | | | | | | |
| | | % OF
NET ASSETS | | RATE | | MATURITY
DATE | | PAR/
SHARES | | VALUE | |
| | | | | | | | | | | | | |
Corporate Bonds and Notes—Continued | | | | | | | | | | | | | |
| | | | | |
Commercial Banks | | 1.1% | | | | | | | | | | | |
Bank One Corp. | | | | 7.875% | | 8/1/10 | | $ | 4,500,000 | | $ | 4,716,675 | |
Bank One Corp. | | | | 5.900% | | 11/15/11 | | | 2,000,000 | | | 2,006,424 | |
HBOS Treasury Services PLC | | | | 5.250% | | 2/21/17 | | | 2,500,000 | | | 2,432,455 | D |
Rabobank Capital Funding Trust II | | | | 5.260% | | 12/31/49 | | | 470,000 | | | 248,644 | B,D |
Rabobank Capital Funding Trust III | | | | 5.254% | | 12/31/49 | | | 3,030,000 | | | 1,661,267 | B,D |
SunTrust Capital VIII | | | | 6.100% | | 12/15/36 | | | 14,970,000 | | | 10,539,030 | B |
Wachovia Capital Trust III | | | | 5.800% | | 3/15/49 | | | 6,130,000 | | | 3,616,700 | B |
Wachovia Corp. | | | | 5.750% | | 6/15/17 | | | 16,100,000 | | | 16,024,990 | |
Wells Fargo Capital X | | | | 5.950% | | 12/15/36 | | | 1,890,000 | | | 1,619,821 | |
| | | | | | | | | | | | | |
| | | | | | | | | | | | 42,866,006 | |
| | | | | | | | | | | | | |
Commercial Services and Supplies | | 0.3% | | | | | | | | | | | |
Waste Management Inc. | | | | 6.875% | | 5/15/09 | | | 2,000,000 | | | 1,990,714 | |
Waste Management Inc. | | | | 6.375% | | 11/15/12 | | | 2,530,000 | | | 2,359,296 | |
Waste Management Inc. | | | | 5.000% | | 3/15/14 | | | 3,440,000 | | | 2,951,630 | |
Waste Management Inc. | | | | 7.125% | | 12/15/17 | | | 6,000,000 | | | 5,589,216 | |
| | | | | | | | | | | | | |
| | | | | | | | | | | | 12,890,856 | |
| | | | | | | | | | | | | |
Communications Equipment | | 0.1% | | | | | | | | | | | |
Motorola Inc. | | | | 8.000% | | 11/1/11 | | | 5,600,000 | | | 4,673,043 | |
| | | | | | | | | | | | | |
| | | | | |
Consumer Finance | | 2.7% | | | | | | | | | | | |
American Express Co. | | | | 6.800% | | 9/1/66 | | | 4,460,000 | | | 2,308,724 | B |
American General Finance Corp. | | | | 6.900% | | 12/15/17 | | | 4,070,000 | | | 1,761,386 | |
Capital One Financial Corp. | | | | 6.150% | | 9/1/16 | | | 3,170,000 | | | 2,230,720 | |
Ford Motor Credit Co. | | | | 7.375% | | 10/28/09 | | | 50,175,000 | | | 44,064,739 | |
Ford Motor Credit Co. | | | | 7.875% | | 6/15/10 | | | 6,310,000 | | | 5,049,136 | |
Ford Motor Credit Co. | | | | 7.375% | | 2/1/11 | | | 6,435,000 | | | 4,893,573 | |
Ford Motor Credit Co. | | | | 7.250% | | 10/25/11 | | | 5,910,000 | | | 4,317,308 | |
GMAC LLC | | | | 5.625% | | 5/15/09 | | | 9,550,000 | | | 9,177,225 | |
GMAC LLC | | | | 7.750% | | 1/19/10 | | | 3,493,000 | | | 3,142,338 | D |
GMAC LLC | | | | 7.250% | | 3/2/11 | | | 519,000 | | | 446,023 | D |
GMAC LLC | | | | 7.500% | | 12/31/13 | | | 1,449,000 | | | 1,057,770 | D |
GMAC LLC | | | | 0.000% | | 6/15/15 | | | 220,000 | | | 37,140 | E |
GMAC LLC | | | | 8.000% | | 12/31/18 | | | 1,207,500 | | | 603,750 | D |
SLM Corp. | | | | 5.375% | | 5/15/14 | | | 3,000,000 | | | 2,024,622 | |
SLM Corp. | | | | 5.625% | | 8/1/33 | | | 42,895,000 | | | 26,022,080 | |
| | | | | | | | | | | | | |
| | | | | | | | | | | | 107,136,534 | |
| | | | | | | | | | | | | |
10
Annual Report to Shareholders
| | | | | | | | | | | | | |
| | | % OF
NET ASSETS | | RATE | | MATURITY
DATE | | PAR/
SHARES | | VALUE | |
| | | | | | | | | | | | | |
Corporate Bonds and Notes—Continued | | | | | | | | | | | | | |
| | | | | |
Diversified Financial Services | | 2.3% | | | | | | | | | | | |
Air 2 US | | | | 8.027% | | 10/1/19 | | $ | 9,347,745 | | $ | 7,010,809 | D |
BAC Capital Trust XIV | | | | 5.630% | | 12/31/49 | | | 500,000 | | | 200,328 | B |
Citigroup Inc. | | | | 6.125% | | 8/25/36 | | | 2,000,000 | | | 1,791,590 | |
Citigroup Inc. | | | | 5.875% | | 5/29/37 | | | 17,000,000 | | | 16,987,148 | |
Citigroup Inc. | | | | 6.875% | | 3/5/38 | | | 17,330,000 | | | 19,719,582 | |
General Electric Capital Corp. | | | | 6.375% | | 11/15/67 | | | 22,960,000 | | | 14,431,944 | B |
Glen Meadow Pass-Through Certificates | | | | 6.505% | | 2/12/67 | | | 12,080,000 | | | 5,400,884 | B,D |
HSBC Finance Corp. | | | | 8.000% | | 7/15/10 | | | 690,000 | | | 701,475 | |
HSBC Finance Corp. | | | | 7.000% | | 5/15/12 | | | 700,000 | | | 701,063 | |
HSBC Finance Corp. | | | | 6.375% | | 11/27/12 | | | 440,000 | | | 430,487 | |
ILFC E-Capital Trust II | | | | 6.250% | | 12/21/65 | | | 4,160,000 | | | 1,737,270 | B,D |
J.P. Morgan and Co. Inc. | | | | 3.574% | | 2/15/12 | | | 2,000,000 | | | 1,689,960 | A |
JPMorgan Chase and Co. | | | | 5.750% | | 1/2/13 | | | 3,770,000 | | | 3,824,838 | |
JPMorgan Chase and Co. | | | | 6.125% | | 6/27/17 | | | 7,855,000 | | | 7,730,278 | |
Liberty Media LLC | | | | 3.750% | | 2/15/30 | | | 290,000 | | | 76,850 | F |
PHH Corp. | | | | 7.125% | | 3/1/13 | | | 5,010,000 | | | 2,838,541 | |
TNK-BP Finance SA | | | | 7.875% | | 3/13/18 | | | 6,420,000 | | | 3,210,000 | D |
Unilever Capital Corp. | | | | 7.125% | | 11/1/10 | | | 1,730,000 | | | 1,850,124 | |
| | | | | | | | | | | | | |
| | | | | | | | | | | | 90,333,171 | |
| | | | | | | | | | | | | |
Diversified Telecommunication Services | | 0.4% | | | | | | | | | | | |
AT&T Inc. | | | | 5.100% | | 9/15/14 | | | 4,960,000 | | | 4,875,616 | |
BellSouth Corp. | | | | 4.750% | | 11/15/12 | | | 440,000 | | | 431,672 | |
BellSouth Corp. | | | | 5.200% | | 9/15/14 | | | 4,270,000 | | | 4,156,990 | |
CenturyTel Inc. | | | | 6.000% | | 4/1/17 | | | 4,120,000 | | | 2,966,400 | |
Verizon Global Funding Corp. | | | | 7.250% | | 12/1/10 | | | 2,220,000 | | | 2,327,361 | |
Verizon Global Funding Corp. | | | | 7.375% | | 9/1/12 | | | 5,000 | | | 5,231 | |
| | | | | | | | | | | | | |
| | | | | | | | | | | | 14,763,270 | |
| | | | | | | | | | | | | |
Electric Utilities | | 0.6% | | | | | | | | | | | |
Exelon Corp. | | | | 5.625% | | 6/15/35 | | | 345,000 | | | 217,785 | |
FirstEnergy Corp. | | | | 6.450% | | 11/15/11 | | | 290,000 | | | 274,124 | |
FirstEnergy Corp. | | | | 7.375% | | 11/15/31 | | | 10,610,000 | | | 10,037,230 | |
Pacific Gas and Electric Co. | | | | 6.050% | | 3/1/34 | | | 940,000 | | | 998,336 | |
Pacific Gas and Electric Co. | | | | 5.800% | | 3/1/37 | | | 7,330,000 | | | 7,602,727 | |
Progress Energy Inc. | | | | 7.100% | | 3/1/11 | | | 1,488,000 | | | 1,474,800 | |
The Cleveland Electric Illuminating Co. | | | | 5.700% | | 4/1/17 | | | 630,000 | | | 510,775 | |
The Detroit Edison Co. | | | | 6.125% | | 10/1/10 | | | 920,000 | | | 925,313 | |
| | | | | | | | | | | | | |
| | | | | | | | | | | | 22,041,090 | |
| | | | | | | | | | | | | |
11
Annual Report to Shareholders
Portfolio of Investments—Continued
Western Asset Core Bond Portfolio—Continued
| | | | | | | | | | | | | |
| | | % OF
NET ASSETS | | RATE | | MATURITY
DATE | | PAR/
SHARES | | VALUE | |
| | | | | | | | | | | | | |
Corporate Bonds and Notes—Continued | | | | | | | | | | | | | |
| | | | | |
Food and Staples Retailing | | 1.0% | | | | | | | | | | | |
CVS Lease Pass-Through Trust | | | | 6.117% | | 1/10/13 | | $ | 2,631,943 | | $ | 2,517,578 | D |
CVS Lease Pass-Through Trust | | | | 6.036% | | 12/10/28 | | | 34,925,328 | | | 21,242,632 | D |
The Kroger Co. | | | | 6.400% | | 8/15/17 | | | 580,000 | | | 584,909 | |
The Kroger Co. | | | | 6.150% | | 1/15/20 | | | 850,000 | | | 838,630 | |
Wal-Mart Stores Inc. | | | | 5.800% | | 2/15/18 | | | 9,150,000 | | | 10,124,932 | |
Wal-Mart Stores Inc. | | | | 6.200% | | 4/15/38 | | | 5,410,000 | | | 6,191,502 | |
| | | | | | | | | | | | | |
| | | | | | | | | | | | 41,500,183 | |
| | | | | | | | | | | | | |
Food Products | | 0.2% | | | | | | | | | | | |
General Mills Inc. | | | | 5.700% | | 2/15/17 | | | 3,580,000 | | | 3,598,208 | |
Sara Lee Corp. | | | | 6.250% | | 9/15/11 | | | 5,500,000 | | | 5,444,675 | |
| | | | | | | | | | | | | |
| | | | | | | | | | | | 9,042,883 | |
| | | | | | | | | | | | | |
Gas Utilities | | 0.1% | | | | | | | | | | | |
Southern Natural Gas Co. | | | | 8.000% | | 3/1/32 | | | 7,390,000 | | | 6,157,843 | |
| | | | | | | | | | | | | |
| | | | | |
Health Care Providers and Services | | 1.2% | | | | | | | | | | | |
AmerisourceBergen Corp. | | | | 5.625% | | 9/15/12 | | | 3,520,000 | | | 3,295,818 | |
AmerisourceBergen Corp. | | | | 5.875% | | 9/15/15 | | | 3,050,000 | | | 2,665,651 | |
Cardinal Health Inc. | | | | 5.800% | | 10/15/16 | | | 3,530,000 | | | 3,193,513 | |
Cardinal Health Inc. | | | | 5.850% | | 12/15/17 | | | 12,985,000 | | | 11,708,302 | |
HCA Inc. | | | | 5.750% | | 3/15/14 | | | 35,430,000 | | | 21,435,150 | |
Tenet Healthcare Corp. | | | | 6.375% | | 12/1/11 | | | 2,500,000 | | | 1,931,250 | |
Tenet Healthcare Corp. | | | | 7.375% | | 2/1/13 | | | 6,584,000 | | | 4,691,100 | |
WellPoint Inc. | | | | 5.875% | | 6/15/17 | | | 900,000 | | | 819,122 | |
| | | | | | | | | | | | | |
| | | | | | | | | | | | 49,739,906 | |
| | | | | | | | | | | | | |
Hotels, Restaurants and Leisure | | 0.1% | | | | | | | | | | | |
Marriott International Inc. | | | | 5.810% | | 11/10/15 | | | 4,400,000 | | | 3,081,685 | |
Starwood Hotels and Resorts Worldwide Inc. | | | | 7.875% | | 5/1/12 | | | 3,050,000 | | | 2,272,250 | |
| | | | | | | | | | | | | |
| | | | | | | | | | | | 5,353,935 | |
| | | | | | | | | | | | | |
Household Durables | | 0.1% | | | | | | | | | | | |
Pulte Homes Inc. | | | | 8.125% | | 3/1/11 | | | 3,480,000 | | | 3,027,600 | |
| | | | | | | | | | | | | |
| | | | | |
Independent Power Producers and Energy Traders | | 0.1% | | | | | | | | | | | |
TXU Corp. | | | | 6.500% | | 11/15/24 | | | 1,090,000 | | | 385,629 | |
TXU Corp. | | | | 6.550% | | 11/15/34 | | | 9,930,000 | | | 3,352,289 | |
| | | | | | | | | | | | | |
| | | | | | | | | | | | 3,737,918 | |
| | | | | | | | | | | | | |
12
Annual Report to Shareholders
| | | | | | | | | | | | | |
| | | % OF
NET ASSETS | | RATE | | MATURITY
DATE | | PAR/
SHARES | | VALUE | |
| | | | | | | | | | | | | |
Corporate Bonds and Notes—Continued | | | | | | | | | | | | | |
| | | | | |
Industrial Conglomerates | | 0.5% | | | | | | | | | | | |
Tyco International Ltd./Tyco International Finance SA | | | | 7.000% | | 12/15/19 | | $ | 3,380,000 | | $ | 2,776,569 | |
Tyco International Ltd./Tyco International Finance SA | | | | 6.875% | | 1/15/21 | | | 22,895,000 | | | 17,704,085 | |
| | | | | | | | | | | | | |
| | | | | | | | | | | | 20,480,654 | |
| | | | | | | | | | | | | |
Insurance | | 1.6% | | | | | | | | | | | |
American International Group Inc. | | | | 5.850% | | 1/16/18 | | | 2,370,000 | | | 1,588,575 | |
American International Group Inc. | | | | 6.250% | | 3/15/37 | | | 12,690,000 | | | 4,743,167 | |
ASIF Global Financing XIX | | | | 4.900% | | 1/17/13 | | | 1,210,000 | | | 971,318 | D |
Marsh and McLennan Cos. Inc. | | | | 5.150% | | 9/15/10 | | | 3,070,000 | | | 2,988,424 | |
MetLife Inc. | | | | 6.400% | | 12/15/36 | | | 46,870,000 | | | 28,122,000 | |
The Travelers Cos. Inc. | | | | 6.250% | | 3/15/37 | | | 37,460,000 | | | 24,537,686 | B |
| | | | | | | | | | | | | |
| | | | | | | | | | | | 62,951,170 | |
| | | | | | | | | | | | | |
IT Services | | 0.2% | | | | | | | | | | | |
Electronic Data Systems Corp. | | | | 7.125% | | 10/15/09 | | | 7,685,000 | | | 7,812,763 | |
| | | | | | | | | | | | | |
| | | | | |
Leisure Equipment and Products | | 0.6% | | | | | | | | | | | |
Eastman Kodak Co. | | | | 7.250% | | 11/15/13 | | | 34,680,000 | | | 22,368,600 | |
| | | | | | | | | | | | | |
| | | | | |
Media | | 1.1% | | | | | | | | | | | |
CBS Corp. | | | | 7.625% | | 1/15/16 | | | 2,750,000 | | | 2,246,648 | |
Clear Channel Communications Inc. | | | | 4.250% | | 5/15/09 | | | 2,130,000 | | | 1,874,400 | |
Clear Channel Communications Inc. | | | | 6.250% | | 3/15/11 | | | 5,580,000 | | | 1,674,000 | |
Clear Channel Communications Inc. | | | | 5.500% | | 9/15/14 | | | 790,000 | | | 94,800 | |
Comcast Corp. | | | | 6.500% | | 1/15/15 | | | 1,200,000 | | | 1,179,517 | |
Comcast Corp. | | | | 6.500% | | 1/15/17 | | | 1,500,000 | | | 1,481,571 | |
Comcast Corp. | | | | 6.950% | | 8/15/37 | | | 3,130,000 | | | 3,296,053 | |
Cox Communications Inc. | | | | 7.875% | | 8/15/09 | | | 9,640,000 | | | 9,476,014 | |
News America Inc. | | | | 6.200% | | 12/15/34 | | | 105,000 | | | 95,817 | |
News America Inc. | | | | 6.650% | | 11/15/37 | | | 700,000 | | | 692,833 | |
Time Warner Inc. | | | | 6.875% | | 5/1/12 | | | 8,270,000 | | | 7,944,956 | |
Time Warner Inc. | | | | 6.950% | | 1/15/28 | | | 2,000,000 | | | 1,844,496 | |
Time Warner Inc. | | | | 7.625% | | 4/15/31 | | | 350,000 | | | 343,984 | |
Viacom Inc. | | | | 5.750% | | 4/30/11 | | | 8,580,000 | | | 7,792,253 | |
Viacom Inc. | | | | 6.250% | | 4/30/16 | | | 3,400,000 | | | 2,818,236 | |
| | | | | | | | | | | | | |
| | | | | | | | | | | | 42,855,578 | |
| | | | | | | | | | | | | |
13
Annual Report to Shareholders
Portfolio of Investments—Continued
Western Asset Core Bond Portfolio—Continued
| | | | | | | | | | | | | |
| | | % OF
NET ASSETS | | RATE | | MATURITY
DATE | | PAR/
SHARES | | VALUE | |
| | | | | | | | | | | | | |
Corporate Bonds and Notes—Continued | | | | | | | | | | | | | |
| | | | | |
Multi-Utilities | | 0.1% | | | | | | | | | | | |
Dominion Resources Inc. | | | | 5.125% | | 12/15/09 | | $ | 50,000 | | $ | 49,890 | |
Dominion Resources Inc. | | | | 4.750% | | 12/15/10 | | | 570,000 | | | 563,609 | |
Dominion Resources Inc. | | | | 5.700% | | 9/17/12 | | | 2,050,000 | | | 2,029,869 | |
| | | | | | | | | | | | | |
| | | | | | | | | | | | 2,643,368 | |
| | | | | | | | | | | | | |
Multiline Retail | | 0.1% | | | | | | | | | | | |
Target Corp. | | | | 4.000% | | 6/15/13 | | | 4,445,000 | | | 4,146,145 | |
| | | | | | | | | | | | | |
| | | | | |
Oil, Gas and Consumable Fuels | | 3.2% | | | | | | | | | | | |
Anadarko Petroleum Corp. | | | | 3.219% | | 9/15/09 | | | 12,340,000 | | | 11,807,196 | A |
Anadarko Petroleum Corp. | | | | 5.950% | | 9/15/16 | | | 16,943,000 | | | 14,965,904 | |
Anadarko Petroleum Corp. | | | | 6.450% | | 9/15/36 | | | 1,325,000 | | | 1,045,205 | |
Conoco Inc. | | | | 6.950% | | 4/15/29 | | | 2,780,000 | | | 2,991,561 | |
El Paso Natural Gas Co. | | | | 8.375% | | 6/15/32 | | | 3,610,000 | | | 3,115,037 | |
Hess Corp. | | | | 7.875% | | 10/1/29 | | | 3,840,000 | | | 3,686,331 | |
Hess Corp. | | | | 7.300% | | 8/15/31 | | | 8,695,000 | | | 7,911,198 | |
KazMunaiGaz Exploration Production—GDR | | | | 8.375% | | 7/2/13 | | | 15,560,000 | | | 12,136,800 | D |
Kerr-McGee Corp. | | | | 6.875% | | 9/15/11 | | | 17,000,000 | | | 16,823,727 | |
Kerr-McGee Corp. | | | | 6.950% | | 7/1/24 | | | 650,000 | | | 569,951 | |
Kinder Morgan Energy Partners LP | | | | 7.125% | | 3/15/12 | | | 4,650,000 | | | 4,490,979 | |
Kinder Morgan Energy Partners LP | | | | 5.000% | | 12/15/13 | | | 3,180,000 | | | 2,773,103 | |
Kinder Morgan Energy Partners LP | | | | 6.000% | | 2/1/17 | | | 990,000 | | | 859,493 | |
Kinder Morgan Energy Partners LP | | | | 6.950% | | 1/15/38 | | | 410,000 | | | 331,586 | |
Pemex Project Funding Master Trust | | | | 6.625% | | 6/15/35 | | | 17,313,000 | | | 14,655,455 | |
Pemex Project Funding Master Trust | | | | 6.625% | | 6/15/35 | | | 410,000 | | | 347,065 | D |
Sonat Inc. | | | | 7.625% | | 7/15/11 | | | 5,000,000 | | | 4,558,690 | |
Tennessee Gas Pipeline Co. | | | | 8.375% | | 6/15/32 | | | 1,110,000 | | | 957,809 | |
Texaco Capital Inc. | | | | 5.500% | | 1/15/09 | | | 1,000,000 | | | 1,001,031 | |
The Williams Cos. Inc. | | | | 8.125% | | 3/15/12 | | | 3,240,000 | | | 2,984,850 | |
The Williams Cos. Inc. | | | | 7.500% | | 1/15/31 | | | 7,262,000 | | | 4,865,540 | |
The Williams Cos. Inc. | | | | 8.750% | | 3/15/32 | | | 3,240,000 | | | 2,413,800 | |
XTO Energy Inc. | | | | 7.500% | | 4/15/12 | | | 10,379,000 | | | 10,258,168 | |
XTO Energy Inc. | | | | 6.750% | | 8/1/37 | | | 320,000 | | | 299,700 | |
| | | | | | | | | | | | | |
| | | | | | | | | | | | 125,850,179 | |
| | | | | | | | | | | | | |
Paper and Forest Products | | 0.1% | | | | | | | | | | | |
Weyerhaeuser Co. | | | | 6.750% | | 3/15/12 | | | 2,775,000 | | | 2,484,041 | |
| | | | | | | | | | | | | |
14
Annual Report to Shareholders
| | | | | | | | | | | | | |
| | | % OF
NET ASSETS | | RATE | | MATURITY
DATE | | PAR/
SHARES | | VALUE | |
| | | | | | | | | | | | | |
Corporate Bonds and Notes—Continued | | | | | | | | | | | | | |
| | | | | |
Pharmaceuticals | | 0.3% | | | | | | | | | | | |
Wyeth | | | | 5.950% | | 4/1/37 | | $ | 9,750,000 | | $ | 10,825,298 | |
| | | | | | | | | | | | | |
| | | | | |
Real Estate Investment Trusts (REITs) | | 0.1% | | | | | | | | | | | |
Health Care Property Investors Inc. | | | | 6.450% | | 6/25/12 | | | 3,550,000 | | | 2,935,300 | |
| | | | | | | | | | | | | |
| | | | | |
Specialty Retail | | 0.5% | | | | | | | | | | | |
Autozone Inc. | | | | 6.950% | | 6/15/16 | | | 5,620,000 | | | 4,970,862 | |
Home Depot Inc. | | | | 4.625% | | 8/15/10 | | | 1,380,000 | | | 1,366,531 | |
Home Depot Inc. | | | | 5.250% | | 12/16/13 | | | 2,740,000 | | | 2,558,604 | |
Home Depot Inc. | | | | 5.400% | | 3/1/16 | | | 4,250,000 | | | 3,803,410 | |
Limited Brands Inc. | | | | 6.125% | | 12/1/12 | | | 9,420,000 | | | 6,795,145 | |
| | | | | | | | | | | | | |
| | | | | | | | | | | | 19,494,552 | |
| | | | | | | | | | | | | |
Thrifts and Mortgage Finance | | 0.5% | | | | | | | | | | | |
Countrywide Financial Corp. | | | | 3.418% | | 3/24/09 | | | 3,000,000 | | | 2,975,592 | A |
Countrywide Financial Corp. | | | | 6.250% | | 5/15/16 | | | 18,400,000 | | | 17,470,947 | |
| | | | | | | | | | | | | |
| | | | | | | | | | | | 20,446,539 | |
| | | | | | | | | | | | | |
Tobacco | | 0.1% | | | | | | | | | | | |
Reynolds American Inc. | | | | 7.875% | | 5/15/09 | | | 3,240,000 | | | 3,208,206 | |
| | | | | | | | | | | | | |
| | | | | |
Wireless Telecommunication Services | | 0.2% | | | | | | | | | | | |
Sprint Capital Corp. | | | | 8.375% | | 3/15/12 | | | 7,935,000 | | | 6,348,000 | |
Sprint Capital Corp. | | | | 6.900% | | 5/1/19 | | | 230,000 | | | 163,300 | |
Sprint Capital Corp. | | | | 8.750% | | 3/15/32 | | | 1,050,000 | | | 708,750 | |
| | | | | | | | | | | | | |
| | | | | | | | | | | | 7,220,050 | |
| | | | | | | | | | | | | |
Total Corporate Bonds and Notes
(Cost—$1,134,129,807) | | | | | | | | | | | | 865,251,728 | |
Asset-Backed Securities | | 4.8% | | | | | | | | | | | |
| | | | | |
Fixed Rate Securities | | 0.8% | | | | | | | | | | | |
Conseco Finance Securitizations Corp. 2000-5 | | | | 7.960% | | 2/1/32 | | | 3,901,466 | | | 2,148,483 | |
Drive Auto Receivables Trust 2006-2 A3 | | | | 5.330% | | 4/15/14 | | | 25,360,000 | | | 22,316,754 | D |
E-Trade RV and Marine Trust A3-1 | | | | 3.620% | | 10/8/18 | | | 184,381 | | | 172,860 | |
Equity One ABS Inc. 2003-3 | | | | 4.995% | | 12/25/33 | | | 4,068,582 | | | 3,789,291 | |
Green Tree Financial Corp. 1996-5 | | | | 8.100% | | 7/15/26 | | | 450,781 | | | 82,129 | |
Patrons’ Legacy 2003-IV | | | | 5.775% | | 12/23/63 | | | 5,800,000 | | | 3,668,493 | D |
| | | | | | | | | | | | | |
| | | | | | | | | | | | 32,178,010 | |
| | | | | | | | | | | | | |
15
Annual Report to Shareholders
Portfolio of Investments—Continued
Western Asset Core Bond Portfolio—Continued
| | | | | | | | | | | | | |
| | | % OF
NET ASSETS | | RATE | | MATURITY
DATE | | PAR/
SHARES | | VALUE | |
| | | | | | | | | | | | | |
Asset-Backed Securities—Continued | | | | | | | | | | | | | |
| | | | | |
Indexed SecuritiesA | | 4.0% | | | | | | | | | | | |
Amortizing Residential Collateral Trust 2005-BC5 M1 | | | | 2.430% | | 7/25/32 | | $ | 2,572,512 | | $ | 1,789,544 | |
Asset-Backed Funding Certificates 2002-SB1 | | | | 1.825% | | 12/25/30 | | | 1,245,745 | | | 1,143,708 | |
Bear Stearns Asset Backed Securities Trust 2007-HE6 1A1 | | | | 2.645% | | 8/25/37 | | | 10,140,661 | | | 8,605,302 | |
Brazos Higher Education Authority Inc. 2005-1 | | | | 3.241% | | 9/26/16 | | | 5,152,000 | | | 4,898,419 | |
CDC Mortgage Capital Trust 2002-HE1 | | | | 2.015% | | 1/25/33 | | | 512,543 | | | 326,604 | |
CIT Group Home Equity Loan Trust 2002-1 | | | | 1.685% | | 3/25/33 | | | 302,228 | | | 278,147 | |
Citigroup Mortgage Loan Trust Inc. 2007-SHL1 A | | | | 1.795% | | 11/25/46 | | | 4,821,218 | | | 1,803,618 | D |
Countrywide Asset-Backed Certificates 2003-BC3 | | | | 1.705% | | 9/25/33 | | | 467,213 | | | 275,665 | |
Fleet Home Equity Loan Trust 2003-1 | | | | 1.703% | | 1/20/33 | | | 1,898,126 | | | 1,120,712 | |
GMAC Mortgage Corp. Loan Trust 2004-VF1 A1 | | | | 2.145% | | 2/25/31 | | | 49,269,804 | | | 39,046,319 | D |
GMAC Mortgage Corp. Loan Trust 2005-HE3 A1VN | | | | 3.519% | | 2/25/36 | | | 21,706,631 | | | 5,521,624 | |
GSAMP Trust 2006-S4 | | | | 1.485% | | 5/25/36 | | | 1,928,063 | | | 728,284 | |
Lehman XS Trust 2005-5N | | | | 1.695% | | 11/25/35 | | | 7,918,168 | | | 3,560,554 | |
Lehman XS Trust 2006-2N 1A1 | | | | 1.655% | | 2/25/46 | | | 14,958,811 | | | 6,089,540 | |
Lehman XS Trust 2006-GP4 | | | | 1.465% | | 8/25/46 | | | 2,214,352 | | | 1,701,027 | |
Long Beach Mortgage Loan Trust 2000-1 | | | | 1.934% | | 1/21/31 | | | 201,769 | | | 173,303 | |
Long Beach Mortgage Loan Trust 2006-9 2A3 | | | | 1.555% | | 10/25/36 | | | 3,200,000 | | | 1,018,009 | |
Merrill Lynch Mortgage Investors Trust 2007-SD1 A1 | | | | 1.845% | | 2/25/47 | | | 46,336,463 | | | 33,751,378 | |
MSDWCC Heloc Trust 2005-1 | | | | 1.585% | | 7/25/17 | | | 1,450,276 | | | 972,849 | |
Provident Bank Home Equity Loan Trust 1999-3 | | | | 2.175% | | 1/25/31 | | | 633,850 | | | 317,846 | |
RAAC 2007-SP3 A1 | | | | 2.595% | | 9/25/37 | | | 940,405 | | | 812,370 | |
Residential Asset Mortgage Products Inc. 2003-RS2 | | | | 2.075% | | 3/25/33 | | | 158,520 | | | 68,492 | |
Residential Asset Securities Corp. 2001-KS2 | | | | 1.855% | | 6/25/31 | | | 259,202 | | | 196,939 | |
Residential Asset Securities Corp. 2001-KS3 AII | | | | 1.855% | | 9/25/31 | | | 97,896 | | | 56,932 | |
SACO I Trust 2005-10 1A | | | | 1.655% | | 6/25/36 | | | 4,615,429 | | | 2,248,811 | |
SACO I Trust 2005-8 A1 | | | | 1.675% | | 11/25/20 | | | 1,222,554 | | | 696,644 | |
SACO I Trust 2006-1 A | | | | 1.565% | | 9/25/35 | | | 1,823,640 | | | 521,979 | |
16
Annual Report to Shareholders
| | | | | | | | | | | | | |
| | | % OF
NET ASSETS | | RATE | | MATURITY
DATE | | PAR/
SHARES | | VALUE | |
| | | | | | | | | | | | | |
Asset-Backed Securities—Continued | | | | | | | | | | | | | |
| | | | | |
Indexed Securities—Continued | | | | | | | | | | | | | |
Securitized Asset Backed Receivables LLC Trust 2007-BR2 A2 | | | | 1.625% | | 2/25/37 | | $ | 47,781,452 | | $ | 22,150,072 | |
SLM Student Loan Trust 2006-5 | | | | 3.525% | | 7/25/17 | | | 17,165,072 | | | 16,647,217 | |
| | | | | | | | | | | | | |
| | | | | | | | | | | | 156,521,908 | |
| | | | | | | | | | | | | |
Total Asset-Backed Securities
(Cost—$284,516,317) | | | | | | | | | | | | 188,699,918 | |
Mortgage-Backed Securities | | 19.7% | | | | | | | | | | | |
| | | | | |
Fixed Rate Securities | | 7.6% | | | | | | | | | | | |
Banc of America Commercial Mortgage Inc. 2006-3 A4 | | | | 5.889% | | 7/10/44 | | | 25,420,000 | | | 20,716,026 | |
Banc of America Commercial Mortgage Inc. 2007-5 A3 | | | | 5.620% | | 2/10/51 | | | 3,710,000 | | | 2,384,104 | |
Citicorp Mortgage Securities Inc. 2003-7 A1 | | | | 4.750% | | 8/25/18 | | | 6,618,767 | | | 6,135,379 | |
Commercial Mortgage Asset Trust 1999-C1 A3 | | | | 6.640% | | 1/17/32 | | | 1,054,175 | | | 1,050,335 | |
Countrywide Alternative Loan Trust 2003-20CB 1A1 | | | | 5.500% | | 10/25/33 | | | 9,597,322 | | | 7,917,791 | |
Credit Suisse Mortgage Capital Certificates 2006-C5 A3 | | | | 5.311% | | 12/15/39 | | | 14,800,000 | | | 11,483,683 | |
GE Capital Commercial Mortgage Corp. 2007-C1 A4 | | | | 5.543% | | 12/10/49 | | | 1,330,000 | | | 991,313 | |
GMAC Commercial Mortgage Securities Inc 2006-C1 A4 | | | | 5.238% | | 11/10/45 | | | 3,800,000 | | | 3,028,132 | |
GS Mortgage Securities Corp. II 2005-GG4 | | | | 4.680% | | 7/10/39 | | | 12,900,000 | | | 11,421,602 | |
GSR Mortgage Loan Trust 2005-4F 1A1 | | | | 4.500% | | 4/25/20 | | | 6,635,946 | | | 6,250,232 | |
JP Morgan Chase Commercial Mortgage Pass-Through Certificates 2005-CIBC12 | | | | 4.895% | | 9/12/37 | | | 1,610,000 | | | 1,272,584 | |
JP Morgan Chase Commercial Mortgage Securities Corp. 2007-LDPX A3 | | | | 5.420% | | 5/15/49 | | | 52,420,000 | | | 37,059,226 | |
JP Morgan Commercial Mortgage Finance Corp. 1999-C8 A2 | | | | 7.400% | | 7/15/31 | | | 1,345,300 | | | 1,341,335 | |
LB-UBS Commercial Mortgage Trust 2005-C3 A5 | | | | 4.739% | | 7/15/30 | | | 13,356,000 | | | 10,794,079 | |
LB-UBS Commercial Mortgage Trust 2005-C3 AAB | | | | 4.664% | | 7/15/30 | | | 15,000,000 | | | 12,067,986 | |
LB-UBS Commercial Mortgage Trust 2005-C5 | | | | 4.954% | | 9/15/30 | | | 17,880,000 | | | 14,595,476 | |
MASTR Reperforming Loan Trust 2005-1 | | | | 6.500% | | 8/25/34 | | | 972,038 | | | 1,006,255 | D |
17
Annual Report to Shareholders
Portfolio of Investments—Continued
Western Asset Core Bond Portfolio—Continued
| | | | | | | | | | | | | |
| | | % OF
NET ASSETS | | RATE | | MATURITY
DATE | | PAR/
SHARES | | VALUE | |
| | | | | | | | | | | | | |
Mortgage-Backed Securities—Continued | | | | | | | | | | | | | |
| | | | | |
Fixed Rate Securities—Continued | | | | | | | | | | | | | |
MASTR Reperforming Loan Trust 2005-1 1A3 | | | | 7.000% | | 8/25/34 | | $ | 7,914,900 | | $ | 8,314,200 | D |
Merrill Lynch/Countrywide Commercial Mortgage 2007-6 A4 | | | | 5.485% | | 3/12/51 | | | 18,740,000 | | | 12,902,155 | |
Merrill Lynch/Countrywide Commercial Mortgage Trust 2007-5 A4 | | | | 5.378% | | 8/12/48 | | | 1,030,000 | | | 761,404 | |
Morgan Stanley Capital I 2005-HQ6 | | | | 4.989% | | 8/13/42 | | | 13,450,000 | | | 10,988,323 | |
Morgan Stanley Capital I 2006-IQ12 A4 | | | | 5.332% | | 12/15/43 | | | 8,700,000 | | | 6,545,031 | |
Prime Mortgage Trust 2006-DR1 1A1 | | | | 5.500% | | 5/25/35 | | | 24,166,269 | | | 18,661,193 | D |
Prime Mortgage Trust 2006-DR1 1A2 | | | | 6.000% | | 5/25/35 | | | 11,034,336 | | | 8,602,368 | D |
Prime Mortgage Trust 2006-DR1 2A2 | | | | 6.000% | | 5/25/35 | | | 43,305,053 | | | 27,992,659 | D |
Residential Asset Mortgage Products Inc. 2005-SL2 | | | | 7.500% | | 2/25/32 | | | 3,293,907 | | | 2,058,434 | |
Residential Asset Securitization Trust 2003-A14 | | | | 4.750% | | 2/25/19 | | | 38,860,043 | | | 29,726,650 | |
Structured Asset Securities Corp. 2003-29 1A1 | | | | 4.750% | | 9/25/18 | | | 23,436,289 | | | 22,528,133 | |
WaMu Mortgage Pass-Through Certificates 2003-S7 A1 | | | | 4.500% | | 8/25/18 | | | 4,190,802 | | | 4,072,936 | |
| | | | | | | | | | | | | |
| | | | | | | | | | | | 302,669,024 | |
| | | | | | | | | | | | | |
Indexed SecuritiesA | | 7.3% | | | | | | | | | | | |
American Home Mortgage Assets 2006-4 | | | | 1.605% | | 10/25/46 | | | 924,184 | | | 321,932 | |
American Home Mortgage Investment Trust 2006-2 1A1 | | | | 1.475% | | 6/25/46 | | | 1,810,178 | | | 1,447,460 | |
Amortizing Residential Collateral Trust 2002-BC1M | | | | 1.675% | | 1/1/32 | | | 1,817,795 | | | 908,898 | |
Banc of America Funding Corp. 2005-E | | | | 4.123% | | 6/20/35 | | | 11,217,785 | | | 4,892,081 | |
Bear Stearns Adjustable Rate Mortgage Trust 2004-9 24A1 | | | | 5.467% | | 11/25/34 | | | 16,645,515 | | | 11,813,733 | |
Bear Stearns Mortgage Funding Trust 2007-AR5 1A1A | | | | 1.565% | | 6/25/47 | | | 7,471,301 | | | 2,682,356 | |
Bear Stearns Structured Products Inc. 2007-R11 A1A | | | | 3.859% | | 9/27/37 | | | 14 | | | 14 | D |
Citigroup Mortgage Loan Trust Inc. 2005-HE2 | | | | 1.795% | | 5/25/35 | | | 2,487,682 | | | 1,691,265 | D |
Countrywide Alternative Loan Trust 2005-14 | | | | 1.605% | | 5/25/35 | | | 6,726,795 | | | 3,082,056 | |
Countrywide Alternative Loan Trust 2005-17 1A1 | | | | 1.655% | | 7/25/35 | | | 8,420,439 | | | 3,852,060 | |
18
Annual Report to Shareholders
| | | | | | | | | | | | | |
| | | % OF
NET ASSETS | | RATE | | MATURITY
DATE | | PAR/
SHARES | | VALUE | |
| | | | | | | | | | | | | |
Mortgage-Backed Securities—Continued | | | | | | | | | | | | | |
| | | | | |
Indexed Securities—Continued | | | | | | | | | | | | | |
Countrywide Alternative Loan Trust 2005-17 2A1 | | | | 1.635% | | 7/25/35 | | $ | 18,073,343 | | $ | 8,236,491 | |
Countrywide Alternative Loan Trust 2005-38 A3 | | | | 1.745% | | 9/25/35 | | | 5,534,586 | | | 2,495,894 | |
Countrywide Alternative Loan Trust 2005-56 3A1 | | | | 1.685% | | 11/25/35 | | | 774,039 | | | 350,855 | |
Countrywide Alternative Loan Trust 2005-59 1A1 | | | | 4.505% | | 11/20/35 | | | 2,363,276 | | | 1,181,355 | |
Countrywide Alternative Loan Trust 2005-85CB 2A5 | | | | 2.495% | | 2/25/36 | | | 7,996,885 | | | 2,644,828 | |
Countrywide Alternative Loan Trust 2006-0A7 | | | | 1.605% | | 6/25/46 | | | 10,725,611 | | | 4,384,924 | |
Countrywide Home Loans 2005-03 1A2 | | | | 1.685% | | 4/25/35 | | | 9,243,470 | | | 4,528,380 | |
Countrywide Home Loans 2005-09 1A1 | | | | 1.695% | | 5/25/35 | | | 9,255,461 | | | 4,305,676 | |
Countrywide Home Loans 2005-09 2A1 | | | | 1.615% | | 5/25/35 | | | 4,900,508 | | | 1,928,353 | |
Deutsche Mortgage Securities Inc. 2004-4 7AR2 | | | | 1.845% | | 6/25/34 | | | 2,435,023 | | | 1,873,246 | |
Downey Savings and Loan Association Mortgage Loan Trust 2005-AR6 | | | | 1.764% | | 10/19/45 | | | 3,875,334 | | | 1,972,789 | |
First Horizon Alternative Mortgage Securities 2006-FA8 1A8 | | | | 1.765% | | 2/25/37 | | | 4,351,974 | | | 1,302,487 | |
GMAC Mortgage Corp. Loan Trust 2004-AR2 3A | | | | 4.371% | | 8/19/34 | | | 33,496,122 | | | 24,658,023 | |
Greenpoint Mortgage Funding Trust 2005-AR1 | | | | 1.615% | | 6/25/45 | | | 6,981,556 | | | 3,149,065 | |
Greenpoint Mortgage Funding Trust 2005-AR4 | | | | 1.655% | | 10/25/45 | | | 1,449,246 | | | 651,779 | |
Greenpoint Mortgage Funding Trust 2006-AR4 | | | | 1.495% | | 9/25/46 | | | 25,943,937 | | | 19,513,263 | |
Greenpoint Mortgage Funding Trust 2006-AR5 | | | | 1.475% | | 10/25/46 | | | 30,266,447 | | | 15,469,907 | |
GSMPS Mortgage Loan Trust 2005-RP2 | | | | 1.745% | | 3/25/35 | | | 14,683,965 | | | 11,219,034 | D |
Harborview Mortgage Loan Trust 2005-7 | | | | 4.543% | | 6/19/45 | | | 13,622,218 | | | 4,767,776 | |
Harborview Mortgage Loan Trust 2006-14 2A1A | | | | 1.624% | | 3/19/38 | | | 759,287 | | | 301,499 | |
Harborview Mortgage Loan Trust 2006-9 2A1A | | | | 1.684% | | 11/19/36 | | | 896,648 | | | 385,635 | |
Harborview Mortgage Loan Trust 2007-7 2A1A | | | | 2.395% | | 11/25/47 | | | 55,602,191 | | | 21,388,184 | |
19
Annual Report to Shareholders
Portfolio of Investments—Continued
Western Asset Core Bond Portfolio—Continued
| | | | | | | | | | | | | |
| | | % OF
NET ASSETS | | RATE | | MATURITY
DATE | | PAR/
SHARES | | VALUE | |
| | | | | | | | | | | | | |
Mortgage-Backed Securities—Continued | | | | | | | | | | | | | |
| | | | | |
Indexed Securities—Continued | | | | | | | | | | | | | |
Impac Secured Assets Corp. 2005-2 | | | | 1.715% | | 3/25/36 | | $ | 1,303,303 | | $ | 604,652 | |
Impac Secured Assets Corp. 2006-2 2A1 | | | | 1.745% | | 8/25/36 | | | 2,636,704 | | | 1,395,331 | |
IndyMac Inda Mortgage Loan Trust 2007-AR7 1A1 | | | | 6.217% | | 11/25/37 | | | 7,335,198 | | | 4,522,078 | |
MASTR Adjustable Rate Mortgages Trust 2007-3 22A2 | | | | 1.605% | | 5/25/47 | | | 34,908,000 | | | 8,987,173 | |
Medallion Trust 2003-1G | | | | 3.394% | | 12/21/33 | | | 1,519,491 | | | 1,190,475 | |
Merrill Lynch Mortgage Investors Inc. 2005-A3 A1 | | | | 1.665% | | 4/25/35 | | | 681,165 | | | 266,797 | |
MLCC Mortgage Investors Inc. 2003-B | | | | 1.735% | | 4/25/28 | | | 1,803,615 | | | 1,213,795 | |
MLCC Mortgage Investors Inc. 2006-1 1A | | | | 5.247% | | 2/25/36 | | | 687,700 | | | 445,508 | |
Structured Adjustable Rate Mortgage Loan Trust 2005-18 5A1 | | | | 5.521% | | 9/25/35 | | | 4,688,033 | | | 2,388,280 | |
Structured Adjustable Rate Mortgage Loan Trust 2005-19XS | | | | 1.715% | | 10/25/35 | | | 1,456,504 | | | 655,867 | |
Structured Asset Mortgage Investments Inc. 2006-AR6 | | | | 1.585% | | 7/25/46 | | | 16,049,284 | | | 5,535,398 | |
Structured Asset Mortgage Investments Inc. 2006-AR7 A1A | | | | 1.605% | | 8/25/36 | | | 35,045,827 | | | 13,923,174 | |
Thornburg Mortgage Securities Trust 2006-3 | | | | 1.500% | | 5/25/46 | | | 3,446,830 | | | 3,131,666 | |
WaMu Alternative Mortgage Pass-Through Certificates 2007-OA4 A1A | | | | 3.239% | | 4/25/47 | | | 23,556,293 | | | 9,422,517 | |
WaMu Mortgage Pass-Through Certificates, 2005-AR06 2A1A | | | | 1.625% | | 4/25/45 | | | 8,522,277 | | | 4,023,239 | |
WaMu Mortgage Pass-Through Certificates, 2005-AR08 1A1A | | | | 1.665% | | 7/25/45 | | | 9,300,985 | | | 3,718,211 | |
WaMu Mortgage Pass-Through Certificates, 2005-AR11 | | | | 1.715% | | 8/25/45 | | | 23,482,372 | | | 12,697,787 | |
WaMu Mortgage Pass-Through Certificates, 2005-AR13 A1A1 | | | | 1.685% | | 10/25/45 | | | 14,230,464 | | | 7,772,341 | |
WaMu Mortgage Pass-Through Certificates, 2005-AR13 B10 | | | | 2.595% | | 10/25/45 | | | 3,733,702 | | | 224,022 | D |
WaMu Mortgage Pass-Through Certificates, 2005-AR17 A1A2 | | | | 1.685% | | 12/25/45 | | | 8,784,155 | | | 4,069,302 | |
WaMu Mortgage Pass-Through Certificates, 2005-AR19 A1A1 | | | | 1.665% | | 12/25/45 | | | 17,787,596 | | | 8,122,425 | |
WaMu Mortgage Pass-Through Certificates, 2005-AR19 A1A2 | | | | 1.685% | | 12/25/45 | | | 17,259,579 | | | 7,962,717 | |
20
Annual Report to Shareholders
| | | | | | | | | | | | | |
| | | % OF
NET ASSETS | | RATE | | MATURITY
DATE | | PAR/
SHARES | | VALUE | |
| | | | | | | | | | | | | |
Mortgage-Backed Securities—Continued | | | | | | | | | | | | | |
| | | | | |
Indexed Securities—Continued | | | | | | | | | | | | | |
Zuni Mortgage Loan Trust 2006-OA1 | | | | 1.525% | | 8/25/36 | | $ | 18,362,212 | | $ | 17,406,299 | |
| | | | | | | | | | | | | |
| | | | | | | | | | | | 287,080,352 | |
| | | | | | | | | | | | | |
Stripped Securities | | N.M. | | | | | | | | | | | |
Diversified REIT Trust 1999-1A | | | | 0.913% | | 3/18/11 | | | 42,397,355 | | | 170,437 | D,G,H1 |
FFCA Secured Lending Corp. 1999-1A | | | | 1.345% | | 9/18/25 | | | 3,433,985 | | | 99,584 | D,G,H1 |
LB-UBS Commercial Mortgage Trust 2001-C3 X | | | | 1.148% | | 6/15/36 | | | 15,455,697 | | | 259,418 | D,G,H1 |
Structured Mortgage Asset Residential Trust 1991-8 | | | | 0.014% | | 1/25/23 | | | 56,751 | | | 64 | G,H1 |
| | | | | | | | | | | | | |
| | | | | | | | | | | | 529,503 | |
| | | | | | | | | | | | | |
Variable Rate SecuritiesI | | 4.8% | | | | | | | | | | | |
Banc of America Commercial Mortgage Inc. 2005-5 A4 | | | | 5.115% | | 10/10/45 | | | 10,400,000 | | | 8,476,090 | |
Citigroup Mortgage Loan Trust Inc. 2005-5 3A2A | | | | 5.628% | | 10/25/35 | | | 4,503,692 | | | 2,571,745 | |
Credit Suisse Mortgage Capital Certificates 2006-C1 A4 | | | | 5.609% | | 2/15/39 | | | 5,080,000 | | | 4,124,662 | |
Credit Suisse Mortgage Capital Certificates A3-C2 | | | | 5.847% | | 3/15/39 | | | 53,500,000 | | | 43,554,618 | |
Deutsche Mortgage Securities Inc. 2005-WF1 1A3 | | | | 5.094% | | 6/26/35 | | | 11,730,000 | | | 8,478,035 | D |
GE Capital Commercial Mortgage Corp. 2005-C4 | | | | 5.334% | | 11/10/45 | | | 7,110,000 | | | 5,890,117 | |
Greenwich Capital Commercial Funding Corp. 2006-GG7 | | | | 6.112% | | 7/10/38 | | | 22,870,000 | | | 17,849,102 | |
IndyMac INDX Mortgage Loan Trust 2005-AR15 | | | | 5.099% | | 9/25/35 | | | 6,578,088 | | | 3,158,353 | |
JP Morgan Chase Commercial Mortgage Securities Corp. 2005-CB13 | | | | 5.458% | | 1/12/43 | | | 7,600,000 | | | 6,104,619 | |
JP Morgan Chase Commercial Mortgage Securities Corp. 2007-CB20 A4 | | | | 5.794% | | 2/12/51 | | | 40,800,000 | | | 29,647,895 | |
MASTR Adjustable Rate Mortgages Trust 2004-15 | | | | 5.737% | | 12/25/34 | | | 168,106 | | | 89,142 | |
Merrill Lynch Mortgage Investors Inc. 1998-C1 A3 | | | | 6.720% | | 11/15/26 | | | 2,787,497 | | | 2,664,067 | |
Merrill Lynch Mortgage Trust 2005-CIP1 A4 | | | | 5.047% | | 7/12/38 | | | 1,450,000 | | | 1,181,977 | |
Merrill Lynch Mortgage Trust 2005-CKI1 | | | | 5.415% | | 11/12/37 | | | 23,750,000 | | | 19,602,794 | |
21
Annual Report to Shareholders
Portfolio of Investments—Continued
Western Asset Core Bond Portfolio—Continued
| | | | | | | | | | | | | |
| | | % OF
NET ASSETS | | RATE | | MATURITY
DATE | | PAR/
SHARES | | VALUE | |
| | | | | | | | | | | | | |
Mortgage-Backed Securities—Continued | | | | | | | | | | | | | |
| | | | | |
Variable Rate Securities—Continued | | | | | | | | | | | | | |
Morgan Stanley Mortgage Loan Trust 2005-3AR | | | | 5.063% | | 7/25/35 | | $ | 3,235,685 | | $ | 1,754,977 | |
Thornburg Mortgage Securities Trust 2007-4 2A1 | | | | 6.216% | | 9/25/37 | | | 22,289,224 | | | 15,785,616 | |
Thornburg Mortgage Securities Trust 2007-4 3A1 | | | | 6.220% | | 9/25/37 | | | 22,136,160 | | | 16,983,205 | |
Wachovia Bank Commercial Mortgage Trust 2005-C20 | | | | 5.118% | | 7/15/42 | | | 4,000,000 | | | 3,274,712 | |
| | | | | | | | | | | | | |
| | | | | | | | | | | | 191,191,726 | |
| | | | | | | | | | | | | |
Total Mortgage-Backed Securities
(Cost—$1,203,808,435) | | | | | | | | | | | | 781,470,605 | |
U.S. Government and Agency Obligations | | 7.7% | | | | | | | | | | | |
| | | | | |
Fixed Rate Securities | | 1.9% | | | | | | | | | | | |
Fannie Mae | | | | 6.250% | | 2/1/11 | | | 3,260,000 | | | 3,454,436 | J |
Fannie Mae | | | | 5.250% | | 8/1/12 | | | 2,610,000 | | | 2,750,992 | J |
Freddie Mac | | | | 5.300% | | 5/12/20 | | | 53,095,000 | | | 52,055,400 | J,T |
Freddie Mac | | | | 5.625% | | 11/23/35 | | | 12,290,000 | | | 12,791,555 | J,T |
Tennessee Valley Authority | | | | 7.125% | | 5/1/30 | | | 2,450,000 | | | 3,472,728 | |
United States Treasury Bonds | | | | 5.375% | | 2/15/31 | | | 50,000 | | | 68,703 | |
United States Treasury Bonds | | | | 4.375% | | 2/15/38 | | | 550,000 | | | 736,656 | |
| | | | | | | | | | | | | |
| | | | | | | | | | | | 75,330,470 | |
| | | | | | | | | | | | | |
Treasury Inflation-Protected SecuritiesK | | 5.8% | | | | | | | | | | | |
United States Treasury Inflation-Protected Security | | | | 2.375% | | 1/15/17 | | | 6,499,394 | | | 6,448,107 | T |
United States Treasury Inflation-Protected Security | | | | 2.625% | | 7/15/17 | | | 2,393,737 | | | 2,453,020 | T |
United States Treasury Inflation-Protected Security | | | | 1.625% | | 1/15/18 | | | 20,682 | | | 19,631 | |
United States Treasury Inflation-Protected Security | | | | 2.375% | | 1/15/25 | | | 41,559,773 | | | 40,845,444 | L,T |
United States Treasury Inflation-Protected Security | | | | 2.000% | | 1/15/26 | | | 73,711,021 | | | 69,432,317 | L,T |
United States Treasury Inflation-Protected Security | | | | 2.375% | | 1/15/27 | | | 54,498,224 | | | 54,749,407 | L,T |
United States Treasury Inflation-Protected Security | | | | 1.750% | | 1/15/28 | | | 13,908,914 | | | 12,850,529 | L,T |
United States Treasury Inflation-Protected Security | | | | 3.625% | | 4/15/28 | | | 13,474,968 | | | 16,053,106 | L |
22
Annual Report to Shareholders
| | | | | | | | | | | | | |
| | | % OF
NET ASSETS | | RATE | | MATURITY
DATE | | PAR/
SHARES | | VALUE | |
| | | | | | | | | | | | | |
U.S. Government and Agency Obligations—Continued | | | | | | | | | | | | | |
| | | | | |
Treasury Inflation-Protected Securities—Continued | | | | | | | | | | | | | |
United States Treasury Inflation-Protected Security | | | | 3.875% | | 4/15/29 | | $ | 16,894,709 | | $ | 20,866,283 | L |
United States Treasury Inflation-Protected Security | | | | 3.375% | | 4/15/32 | | | 6,127,061 | | | 7,554,954 | L |
| | | | | | | | | | | | | |
| | | | | | | | | | | | 231,272,798 | |
| | | | | | | | | | | | | |
Total U.S. Government and Agency Obligations (Cost—$300,458,044) | | | | | | | | | | | | 306,603,268 | |
U.S. Government Agency Mortgage-Backed Securities | | 60.8% | | | | | | | | | | | |
| | | | | |
Fixed Rate Securities | | 56.5% | | | | | | | | | | | |
Fannie Mae | | | | 7.000% | | 5/1/09 to 2/1/33 | | | 7,361,993 | | | 7,784,836 | J |
Fannie Mae | | | | 8.000% | | 5/1/15 | | | 6,590 | | | 6,961 | J |
Fannie Mae | | | | 5.500% | | 4/1/18 to 7/1/38 | | | 131,657,790 | | | 134,894,779 | J |
Fannie Mae | | | | 4.500% | | 7/1/18 to 9/1/38 | | | 35,266,024 | | | 35,840,809 | J |
Fannie Mae | | | | 4.000% | | 8/1/20 to 9/1/20 | | | 4,514,058 | | | 4,573,909 | J |
Fannie Mae | | | | 5.000% | | 8/1/20 to 9/1/36 | | | 661,798,471 | | | 677,601,788 | J |
Fannie Mae | | | | 6.000% | | 12/1/23 to 12/1/38 | | | 58,970,000 | | | 60,765,019 | J,M |
Fannie Mae | | | | 7.500% | | 6/1/25 to 5/1/28 | | | 459,263 | | | 487,143 | J |
Fannie Mae | | | | 6.000% | | 1/1/26 to 8/1/37 | | | 44,168,544 | | | 45,547,449 | J |
Fannie Mae | | | | 6.500% | | 7/1/28 to 10/1/37 | | | 28,159,323 | | | 29,305,463 | J |
Fannie Mae | | | | 4.000% | | 12/1/38 | | | 15,000,000 | | | 14,974,200 | J,M |
Fannie Mae | | | | 4.500% | | 12/1/38 | | | 163,000,000 | | | 165,190,394 | J,M |
Fannie Mae | | | | 5.000% | | 12/1/38 | | | 81,400,000 | | | 83,104,353 | J,M |
Fannie Mae | | | | 5.500% | | 12/1/38 | | | 312,450,000 | | | 320,261,250 | J,M |
Fannie Mae | | | | 6.500% | | 12/1/38 | | | 6,900,000 | | | 7,165,222 | J,M |
Freddie Mac | | | | 6.000% | | 3/1/09 to 12/1/37 | | | 790,338 | | | 818,906 | J |
Freddie Mac | | | | 5.500% | | 12/1/13 to 8/1/35 | | | 29,194,114 | | | 29,932,603 | J |
Freddie Mac | | | | 9.300% | | 4/15/19 | | | 86,046 | | | 92,600 | J |
Freddie Mac | | | | 5.000% | | 9/1/20 to 4/1/38 | | | 387,439,948 | | | 396,592,109 | J |
Freddie Mac | | | | 7.000% | | 4/1/24 to 5/1/32 | | | 2,365,837 | | | 2,484,691 | J |
Freddie Mac | | | | 6.500% | | 6/1/32 | | | 38,533 | | | 40,207 | J |
Freddie Mac | | | | 5.000% | | 12/1/38 | | | 35,500,000 | | | 36,276,563 | J,M |
Freddie Mac | | | | 5.500% | | 12/1/38 | | | 32,200,000 | | | 32,954,704 | J,M |
Government National Mortgage Association | | | | 10.000% | | 11/15/09 | | | 73 | | | 76 | |
23
Annual Report to Shareholders
Portfolio of Investments—Continued
Western Asset Core Bond Portfolio—Continued
| | | | | | | | | | | | | |
| | | % OF
NET ASSETS | | RATE | | MATURITY
DATE | | PAR/
SHARES | | VALUE | |
| | | | | | | | | | | | | |
U.S. Government Agency Mortgage-Backed
Securities—Continued | | | | | | | | | | | | | |
| | | | | |
Fixed Rate Securities—Continued | | | | | | | | | | | | | |
Government National Mortgage Association | | | | 8.000% | | 10/15/16 to 7/15/17 | | $ | 108,311 | | $ | 115,859 | |
Government National Mortgage Association | | | | 7.500% | | 10/15/22 to 8/15/32 | | | 181,594 | | | 192,474 | |
Government National Mortgage Association | | | | 7.000% | | 6/15/23 to 5/15/32 | | | 265,803 | | | 281,558 | |
Government National Mortgage Association | | | | 6.500% | | 10/15/23 to 3/15/33 | | | 13,165,540 | | | 13,839,693 | |
Government National Mortgage Association | | | | 6.000% | | 3/15/26 to 8/15/35 | | | 25,001,171 | | | 25,868,861 | |
Government National Mortgage Association | | | | 5.500% | | 1/15/33 | | | 214,479 | | | 221,667 | |
Government National Mortgage Association | | | | 5.000% | | 6/15/35 to 9/15/35 | | | 54,590,646 | | | 56,140,053 | |
Government National Mortgage Association | | | | 5.000% | | 12/1/38 | | | 56,300,000 | | | 57,637,180 | M |
| | | | | | | | | | | | | |
| | | | | | | | | | | | 2,240,993,379 | |
| | | | | | | | | | | | | |
| | | | | |
Indexed SecuritiesA | | 4.3% | | | | | | | | | | | |
Fannie Mae | | | | 4.878% | | 6/1/35 | | | 7,673,440 | | | 7,710,680 | J |
Fannie Mae | | | | 4.547% | | 7/1/35 | | | 4,086,854 | | | 4,098,404 | J |
Fannie Mae | | | | 5.131% | | 8/1/35 | | | 873,869 | | | 880,600 | J |
Fannie Mae | | | | 5.020% | | 9/1/35 | | | 1,985,640 | | | 1,994,842 | J |
Fannie Mae | | | | 5.135% | | 9/1/35 | | | 4,844,504 | | | 4,868,376 | J |
Fannie Mae | | | | 4.442% | | 10/1/35 | | | 14,950,658 | | | 15,085,301 | J |
Fannie Mae | | | | 4.902% | | 10/1/35 | | | 1,728,971 | | | 1,734,760 | J |
Fannie Mae | | | | 4.963% | | 10/1/35 | | | 1,854,409 | | | 1,860,183 | J |
Fannie Mae | | | | 5.015% | | 10/1/35 | | | 2,145,180 | | | 2,154,282 | J |
Fannie Mae | | | | 5.673% | | 10/1/35 | | | 1,547,016 | | | 1,555,753 | J |
Fannie Mae | | | | 0.410% | | 11/1/35 | | | 6,120,711 | | | 6,175,397 | J |
Fannie Mae | | | | 2.728% | | 11/1/35 | | | 5,978,990 | | | 6,032,552 | J |
Fannie Mae | | | | 4.427% | | 11/1/35 | | | 6,616,662 | | | 6,675,937 | J |
Fannie Mae | | | | 4.429% | | 11/1/35 | | | 6,622,115 | | | 6,681,438 | J |
Fannie Mae | | | | 4.441% | | 11/1/35 | | | 6,399,795 | | | 6,457,431 | J |
Fannie Mae | | | | 5.505% | | 2/1/37 | | | 53,610,101 | | | 56,320,733 | J,T |
Fannie Mae | | | | 5.626% | | 4/1/37 | | | 12,922,485 | | | 13,667,123 | J |
Freddie Mac | | | | 4.999% | | 10/1/35 | | | 2,229,185 | | | 2,237,034 | J |
24
Annual Report to Shareholders
| | | | | | | | | | | | | |
| | | % OF
NET ASSETS | | RATE | | MATURITY
DATE | | PAR/
SHARES | | VALUE | |
| | | | | | | | | | | | | |
U.S. Government Agency Mortgage-
Backed Securities—Continued | | | | | | | | | | | | | |
| | | | | |
Indexed Securities—Continued | | | | | | | | | | | | | |
Freddie Mac | | | | 5.823% | | 8/1/37 | | $ | 20,446,532 | | $ | 20,987,168 | J |
Freddie Mac | | | | 6.062% | | 10/1/37 | | | 5,660,183 | | | 5,780,854 | J |
| | | | | | | | | | | | | |
| | | | | | | | | | | | 172,958,848 | |
| | | | | | | | | | | | | |
| | | | | |
Stripped Securities | | N.M. | | | | | | | | | | | |
Fannie Mae | | | | 9.500% | | 2/1/17 | | | 549 | | | 86 | G,H1,J |
Fannie Mae | | | | 1,009.250% | | 8/25/21 | | | 301 | | | 6,087 | G,H1,J |
Fannie Mae | | | | 0.000% | | 5/25/22 | | | 60,124 | | | 56,041 | G,H2,J |
Financing Corp. | | | | 0.000% | | 4/5/19 | | | 1,150,000 | | | 807,230 | G,H2 |
Freddie Mac | | | | 10.000% | | 3/1/21 | | | 56,492 | | | 9,761 | G,H1,J |
Freddie Mac | | | | 0.000% | | 7/15/22 | | | 10,101 | | | 8,833 | G,H2,J |
| | | | | | | | | | | | | |
| | | | | | | | | | | | 888,038 | |
| | | | | | | | | | | | | |
Total U.S. Government Agency Mortgage-Backed Securities
(Cost—$2,342,285,348) | | | | | | | | | | | | 2,414,840,265 | |
Yankee BondsN | | 6.1% | | | | | | | | | | | |
| | | | | |
Aerospace and Defense | | 0.2% | | | | | | | | | | | |
Systems 2001 Asset Trust | | | | 6.664% | | 9/15/13 | | | 9,304,708 | | | 8,939,033 | D |
| | | | | | | | | | | | | |
| | | | | |
Commercial Banks | | 0.9% | | | | | | | | | | | |
Eksportfinans ASA | | | | 5.500% | | 5/25/16 | | | 10,700,000 | | | 11,660,036 | |
Glitnir Banki Hf | | | | 6.330% | | 7/28/11 | | | 6,080,000 | | | 288,800 | C,D,S |
Glitnir Banki Hf | | | | 6.375% | | 9/25/12 | | | 8,920,000 | | | 423,700 | C,D,S |
Glitnir Banki Hf | | | | 6.693% | | 6/15/16 | | | 11,830,000 | | | 1,775 | B,C,D,S |
Glitnir Banki Hf | | | | 7.451% | | 9/14/49 | | | 1,600,000 | | | 240 | B,C,D,S |
HBOS Capital Funding LP | | | | 6.071% | | 6/30/49 | | | 3,105,000 | | | 1,148,387 | B,D |
HSBC Capital Funding LP | | | | 4.610% | | 6/27/49 | | | 1,630,000 | | | 883,279 | B,D |
Kaupthing Bank Hf | | | | 5.750% | | 10/4/11 | | | 2,960,000 | | | 177,600 | C,D,S |
Kaupthing Bank Hf | | | | 7.625% | | 2/28/15 | | | 20,280,000 | | | 1,216,800 | C,D,G,S |
Kaupthing Bank Hf | | | | 7.125% | | 5/19/16 | | | 30,520,000 | | | 228,900 | C,D,S |
Landsbanki Islands Hf | | | | 6.100% | | 8/25/11 | | | 17,170,000 | | | 300,475 | C,D,S |
Resona Preferred Global Securities | | | | 7.191% | | 12/29/49 | | | 13,670,000 | | | 6,508,123 | B,D |
Royal Bank of Scotland Group PLC | | | | 7.640% | | 3/31/49 | | | 3,700,000 | | | 1,473,651 | B |
Royal Bank of Scotland Group PLC | | | | 6.990% | | 10/29/49 | | | 5,720,000 | | | 2,674,306 | B,D |
RSHB Capital SA | | | | 6.299% | | 5/15/17 | | | 15,740,000 | | | 8,971,800 | D |
25
Annual Report to Shareholders
Portfolio of Investments—Continued
Western Asset Core Bond Portfolio—Continued
| | | | | | | | | | | | | |
| | | % OF
NET ASSETS | | RATE | | MATURITY
DATE | | PAR/
SHARES | | VALUE | |
| | | | | | | | | | | | | |
Yankee Bonds—Continued | | | | | | | | | | | | | |
| | | | | |
Commercial Banks—Continued | | | | | | | | | | | | | |
Shinsei Finance Cayman Ltd. | | | | 6.418% | | 1/29/49 | | $ | 11,080,000 | | $ | 2,317,404 | B,D |
| | | | | | | | | | | | | |
| | | | | | | | | | | | 38,275,276 | |
| | | | | | | | | | | | | |
Diversified Financial Services | | 0.6% | | | | | | | | | | | |
Aiful Corp. | | | | 5.000% | | 8/10/10 | | | 4,030,000 | | | 2,215,690 | D |
MUFG Capital Finance 1 Ltd. | | | | 6.346% | | 7/29/49 | | | 4,660,000 | | | 3,246,729 | B |
SMFG Preferred Capital | | | | 6.078% | | 1/29/49 | | | 13,800,000 | | | 9,309,894 | B,D |
TNK-BP Finance SA | | | | 7.500% | | 7/18/16 | | | 726,000 | | | 377,520 | D |
TNK-BP Finance SA | | | | 7.500% | | 7/18/16 | | | 9,940,000 | | | 5,168,800 | D |
TNK-BP Finance SA | | | | 6.625% | | 3/20/17 | | | 4,830,000 | | | 2,318,400 | D |
TNK-BP Finance SA | | | | 6.625% | | 3/20/17 | | | 318,000 | | | 152,640 | D |
| | | | | | | | | | | | | |
| | | | | | | | | | | | 22,789,673 | |
| | | | | | | | | | | | | |
Diversified Telecommunication Services | | 0.5% | | | | | | | | | | | |
British Telecommunications PLC | | | | 8.625% | | 12/15/10 | | | 1,755,000 | | | 1,805,367 | O |
Deutsche Telekom International Finance BV | | | | 5.750% | | 3/23/16 | | | 5,370,000 | | | 5,140,368 | |
Koninklijke (Royal) KPN NV | | | | 8.000% | | 10/1/10 | | | 8,240,000 | | | 8,315,833 | |
Telecom Italia Capital SpA | | | | 5.250% | | 11/15/13 | | | 965,000 | | | 735,813 | |
Telecom Italia Capital SpA | | | | 4.950% | | 9/30/14 | | | 2,570,000 | | | 1,956,412 | |
Telecom Italia Capital SpA | | | | 5.250% | | 10/1/15 | | | 2,060,000 | | | 1,568,175 | |
| | | | | | | | | | | | | |
| | | | | | | | | | | | 19,521,968 | |
| | | | | | | | | | | | | |
| | | | | |
Electric Utilities | | N.M. | | | | | | | | | | | |
Hydro-Quebec | | | | 6.300% | | 5/11/11 | | | 570,000 | | | 605,275 | |
| | | | | | | | | | | | | |
| | | | | |
Foreign Governments | | 1.1% | | | | | | | | | | | |
Russian Federation | | | | 7.500% | | 3/31/30 | | | 18,336,780 | | | 15,992,606 | D |
United Mexican States | | | | 5.625% | | 1/15/17 | | | 160,000 | | | 160,000 | |
United Mexican States | | | | 7.500% | | 4/8/33 | | | 302,000 | | | 345,035 | |
United Mexican States | | | | 6.750% | | 9/27/34 | | | 25,404,000 | | | 26,801,220 | |
| | | | | | | | | | | | | |
| | | | | | | | | | | | 43,298,861 | |
| | | | | | | | | | | | | |
Gas Utilities | | 0.2% | | | | | | | | | | | |
Intergas Finance BV | | | | 6.375% | | 5/14/17 | | | 13,221,000 | | | 7,668,180 | D |
Intergas Finance BV | | | | 6.375% | | 5/14/17 | | | 1,220,000 | | | 701,500 | D |
| | | | | | | | | | | | | |
| | | | | | | | | | | | 8,369,680 | |
| | | | | | | | | | | | | |
| | | | | |
Industrial Conglomerates | | 0.9% | | | | | | | | | | | |
Tyco International Group SA | | | | 6.125% | | 1/15/09 | | | 330,000 | | | 329,566 | |
Tyco International Group SA | | | | 6.750% | | 2/15/11 | | | 26,549,000 | | | 26,389,255 | |
26
Annual Report to Shareholders
| | | | | | | | | | | | | | |
| | | % OF
NET ASSETS | | RATE | | MATURITY
DATE | | PAR/
SHARES | | | VALUE | |
| | | | | | | | | | | | | | |
Yankee Bonds—Continued | | | | | | | | | | | | | | |
| | | | | |
Industrial Conglomerates—Continued | | | | | | | | | | | | | | |
Tyco International Group SA | | | | 6.375% | | 10/15/11 | | $ | 6,560,000 | | | $ | 6,448,112 | |
Tyco International Group SA | | | | 6.000% | | 11/15/13 | | | 2,950,000 | | | | 2,768,029 | |
| | | | | | | | | | | | | | |
| | | | | | | | | | | | | 35,934,962 | |
| | | | | | | | | | | | | | |
Insurance | | 0.3% | | | | | | | | | | | | |
Merna Reinsurance Ltd. | | | | 5.512% | | 7/7/10 | | | 13,500,000 | | | | 12,189,150 | A,D |
| | | | | | | | | | | | | | |
Metals and Mining | | 0.5% | | | | | | | | | | | | |
Corporacion Nacional del Cobre—Codelco | | | | 4.750% | | 10/15/14 | | | 1,750,000 | | | | 1,643,588 | D |
Vale Overseas Ltd. | | | | 8.250% | | 1/17/34 | | | 330,000 | | | | 350,691 | |
Vale Overseas Ltd. | | | | 6.875% | | 11/21/36 | | | 20,252,000 | | | | 18,382,740 | |
| | | | | | | | | | | | | | |
| | | | | | | | | | | | | 20,377,019 | |
| | | | | | | | | | | | | | |
Oil, Gas and Consumable Fuels | | 0.7% | | | | | | | | | | | | |
Anadarko Finance Co. | | | | 7.500% | | 5/1/31 | | | 710,000 | | | | 627,837 | |
Conoco Funding Co. | | | | 6.350% | | 10/15/11 | | | 400,000 | | | | 420,813 | |
Conoco Funding Co. | | | | 7.250% | | 10/15/31 | | | 350,000 | | | | 376,563 | |
Gazprom | | | | 6.212% | | 11/22/16 | | | 15,410,000 | | | | 10,170,600 | D |
Gazprom | | | | 6.510% | | 3/7/22 | | | 12,230,000 | | | | 7,276,850 | D |
Petrobras International Finance Co. | | | | 6.125% | | 10/6/16 | | | 10,020,000 | | | | 9,769,500 | |
| | | | | | | | | | | | | | |
| | | | | | | | | | | | | 28,642,163 | |
| | | | | | | | | | | | | | |
Wireless Telecommunication Services | | 0.2% | | | | | | | | | | | | |
America Movil SA de CV | | | | 5.625% | | 11/15/17 | | | 6,820,000 | | | | 6,063,177 | |
| | | | | | | | | | | | | | |
Total Yankee Bonds
(Cost—$411,810,035) | | | | | | | | | | | | | 245,006,237 | |
Preferred Stocks | | 0.1% | | | | | | | | | | | | |
Fannie Mae | | | | 5.375% | | | | | 44 | shs | | | 55,000 | F,J |
Fannie Mae | | | | 7.000% | | | | | 26,600 | | | | 19,950 | A,J |
Fannie Mae | | | | 8.250% | | | | | 578,475 | | | | 480,134 | B,J |
Freddie Mac | | | | 8.375% | | | | | 844,875 | | | | 329,501 | B,J |
General Motors Corp. | | | | 5.250% | | | | | 292,725 | | | | 1,006,974 | F |
Home Ownership Funding Corp. | | | | 1.000% | | | | | 5,575 | | | | 549,417 | D,G |
Home Ownership Funding Corp. II | | | | 1.000% | | | | | 5,000 | | | | 492,750 | D,G |
Preferred Blocker Inc. | | | | 9.000% | | | | | 726 | | | | 181,500 | D |
| | | | | | | | | | | | | | |
Total Preferred Stocks (Cost—$55,701,537) | | | | | | | | | | | | | 3,115,226 | |
| | | | | | | | | | | | | | |
Total Long-Term Securities
(Cost—$5,732,709,523) | | | | | | | | | | | | | 4,804,987,247 | |
27
Annual Report to Shareholders
Portfolio of Investments—Continued
Western Asset Core Bond Portfolio—Continued
| | | | | | | | | | | | | | |
| | | % OF
NET ASSETS | | RATE | | MATURITY
DATE | | PAR/
SHARES | | | VALUE | |
| | | | | | | | | | | | | | |
Short-Term Securities | | 9.5% | | | | | | | | | | | | |
| | | | | |
U.S. Government and Agency Obligations | | 9.4% | | | | | | | | | | | | |
Fannie Mae | | | | 0.000% | | 1/20/09 | | $ | 5,000,000 | | | $ | 4,995,830 | E,J,T |
Federal Home Loan Bank | | | | 0.000% | | 3/26/09 | | | 32,200,000 | | | | 32,194,816 | E |
Freddie Mac | | | | 0.000% | | 2/24/09 | | | 161,945,000 | | | | 161,379,998 | E,J,T |
Freddie Mac | | | | 0.000% | | 1/5/09 | | | 6,335,000 | | | | 6,333,557 | E,J,T |
Freddie Mac | | | | 0.000% | | 1/12/09 | | | 12,735,000 | | | | 12,728,206 | E,J |
Freddie Mac | | | | 0.000% | | 1/20/09 | | | 2,785,000 | | | | 2,782,575 | E,J |
United States Treasury Bill | | | | 0.000% | | 6/4/09 | | | 101,120,000 | | | | 101,075,305 | E,T |
United States Treasury Bill | | | | 0.000% | | 7/2/09 | | | 29,000,000 | | | | 28,961,372 | E |
United States Treasury Notes | | | | 0.000% | | 1/2/09 | | | 21,000,000 | | | | 20,998,892 | E,T |
| | | | | | | | | | | | | | |
| | | | | | | | | | | | | 371,450,551 | |
| | | | | | | | | | | | | | |
Options PurchasedP | | 0.1% | | | | | | | | | | | | |
Barclays Swaption Put, January 2009, Strike Price $4.93 | | | | | | | | | 46,775,000 | Q | | | 229 | |
Greenwich Swaption Put, January 2009, Strike Price $4.93 | | | | | | | | | 48,325,000 | Q | | | 237 | |
U.S. Treasury Note Futures Put, February 2009, Strike Price $112.00 | | | | | | | | | 1,400 | Q | | | 164,063 | |
UBS Warburg LLC Swaption Call, March 2009, Strike Price $3.62 | | | | | | | | | 43,000,000 | Q | | | 4,093,905 | |
| | | | | | | | | | | | | | |
| | | | | | | | | | | | | 4,258,434 | |
| | | | | | | | | | | | | | |
Total Short-Term Securities
(Cost—$374,144,116) | | | | | | | | | | | | | 375,708,985 | |
Total Investments (Cost—$6,106,853,639)R | | 130.5% | | | | | | | | | | | 5,180,696,232 | |
Other Assets Less Liabilities | | (30.5)% | | | | | | | | | | | (1,212,244,599 | ) |
| | | | | | | | | | | | | | |
| | | | | |
Net Assets | | 100.0% | | | | | | | | | | $ | 3,968,451,633 | |
| | | | | | | | | | | | | | |
| | | | | | | |
| | | EXPIRATION | | ACTUAL
CONTRACTS | | APPRECIATION/
(DEPRECIATION) |
Futures Contracts PurchasedP | | | | | | | |
Eurodollar Futures | | March 2009 | | 3,319 | | $ | 17,865,717 |
Eurodollar Futures | | June 2009 | | 1,850 | | | 6,991,613 |
Eurodollar Futures | | September 2009 | | 1,097 | | | 2,972,627 |
U.S. Treasury Bond Futures | | March 2009 | | 3,408 | | | 55,550,467 |
U.S. Treasury Note Futures | | March 2009 | | 1,445 | | | 3,895,424 |
| | | | | | | |
| | | | | | $ | 87,275,848 |
| | | | | | | |
28
Annual Report to Shareholders
| | | | | | | | |
| | | EXPIRATION | | ACTUAL
CONTRACTS/
NOTIONAL PAR | | APPRECIATION/
(DEPRECIATION) | |
Futures Contracts WrittenP | | | | | | | | |
U.S. Treasury Note Futures | | March 2009 | | 3,490 | | $ | (30,300,410 | ) |
| | | | | | | | |
Options WrittenP | | | | | | | | |
Barclays Swaption Call, Strike Price $4.86 | | October 2013 | | 31,920,000 | | $ | (2,902,945 | ) |
Barclays Swaption Put, Strike Price $4.00 | | January 2009 | | 187,100,000 | | | 1,365,811 | |
Barclays Swaption Put, Strike Price $4.86 | | October 2013 | | 31,920,000 | | | 1,108,128 | |
Eurodollar Futures Call, Strike Price $97.50 | | March 2009 | | 518 | | | (1,709,803 | ) |
Eurodollar Futures Call, Strike Price $97.75 | | March 2009 | | 343 | | | (640,553 | ) |
Eurodollar Futures Call, Strike Price $98.00 | | March 2009 | | 371 | | | (581,505 | ) |
Eurodollar Futures Put, Strike Price $96.00 | | March 2009 | | 750 | | | 704,063 | |
Eurodollar Futures Put, Strike Price $96.75 | | June 2009 | | 785 | | | 635,138 | |
Eurodollar Futures Put, Strike Price $97.25 | | June 2009 | | 391 | | | 271,733 | |
Eurodollar Futures Put, Strike Price $98.00 | | March 2009 | | 202 | | | 86,103 | |
Greenwich Swaption Call, Strike Price $4.35 | | January 2009 | | 19,000,000 | | | (2,507,751 | ) |
Greenwich Swaption Call, Strike Price $4.97 | | October 2013 | | 57,220,000 | | | (5,649,107 | ) |
Greenwich Swaption Put, Strike Price $4.00 | | January 2009 | | 193,300,000 | | | 1,391,741 | |
Greenwich Swaption Put, Strike Price $4.35 | | January 2009 | | 19,000,000 | | | 492,096 | |
Greenwich Swaption Put, Strike Price $4.97 | | October 2013 | | 57,220,000 | | | 2,002,803 | |
JP Morgan Swaption Call, Strike Price $4.86 | | October 2013 | | 25,300,000 | | | (2,308,483 | ) |
JP Morgan Swaption Put, Strike Price $4.86 | | October 2013 | | 25,300,000 | | | 885,900 | |
U.S. Treasury Bond Futures Put, Strike Price $122.00 | | February 2009 | | 176 | | | 425,370 | |
U.S. Treasury Bond Futures Put, Strike Price $124.00 | | February 2009 | | 500 | | | 903,750 | |
U.S. Treasury Bond Futures Put, Strike Price $126.00 | | February 2009 | | 801 | | | 1,229,026 | |
U.S. Treasury Bond Futures Put, Strike Price $134.00 | | February 2009 | | 641 | | | (322,580 | ) |
U.S. Treasury Note Futures Call, Strike Price $116.00 | | February 2009 | | 122 | | | (1,077,048 | ) |
U.S. Treasury Note Futures Call, Strike Price $118.00 | | February 2009 | | 315 | | | (2,300,091 | ) |
U.S. Treasury Note Futures Call, Strike Price $120.00 | | February 2009 | | 399 | | | (2,233,761 | ) |
U.S. Treasury Note Futures Put, Strike Price $118.00 | | February 2009 | | 1,380 | | | 1,359,475 | |
U.S. Treasury Note Futures Put, Strike Price $119.00 | | February 2009 | | 1,031 | | | 1,166,814 | |
U.S. Treasury Note Futures Put, Strike Price $122.00 | | February 2009 | | 300 | | | 293,781 | |
U.S. Treasury Note Futures Put, Strike Price $124.00 | | February 2009 | | 235 | | | (111,128 | ) |
U.S. Treasury Note Futures Put, Strike Price $126.00 | | February 2009 | | 163 | | | (69,581 | ) |
U.S. Treasury Note Futures Put, Strike Price $126.50 | | February 2009 | | 1,000 | | | (1,153,484 | ) |
| | | | | | | | |
| | | | | | $ | (9,246,088 | ) |
| | | | | | | | |
| | | | | | | | | |
N.M. Not Meaningful.
A | | Indexed Security – The rates of interest earned on these securities are tied to the London Interbank Offered Rate (“LIBOR”), the Euro Interbank Offered Rate (“EURIBOR”) Index, the Consumer Price Index (“CPI”), the one-year Treasury Bill Rate or the ten-year Japanese Government Bond Rate. The coupon rates are the rates as of December 31, 2008. |
B | | Stepped Coupon Security – A security with a predetermined schedule of interest or dividend rate changes at which time it begins to accrue interest or pay dividends according to the predetermined schedule. |
29
Annual Report to Shareholders
Portfolio of Investments—Continued
Western Asset Core Bond Portfolio—Continued
C | | Bond is currently in default. |
D | | Rule 144a Security – A security purchased pursuant to Rule 144a under the Securities Act of 1933 which may not be resold subject to that rule except to qualified institutional buyers. These securities, which the Fund’s investment adviser has determined to be liquid, represent 8.27% of net assets. |
E | | Zero coupon bond – A bond with no periodic interest payments which is sold at such a discount as to produce a current yield to maturity. |
F | | Convertible Security – Security may be converted into the issuer’s common stock. |
G | | Illiquid security valued at fair value under the procedures approved by the Board of Directors. |
H | | Stripped Security – Security with interest-only or principal-only payment streams, denoted by a 1 or 2, respectively. For interest-only securities, the amount shown as principal is the notional balance used to calculate the amount of interest due. |
I | | The coupon rates shown on variable rate securities are the rates at December 31, 2008. These rates vary with the weighted average coupon of the underlying loans. |
J | | On September 7, 2008, the Federal Housing Finance Agency placed Fannie Mae and Freddie Mac into Conservatorship. |
K | | Treasury Inflation-Protected Security –Treasury security whose principal value is adjusted daily in accordance with changes to the Consumer Price Index for All Urban Consumers. Interest is calculated on the basis of the current adjusted principal value. |
L | | All or a portion of this security is collateral to cover futures and options contracts written. |
M | | When-issued Security – Security purchased on a delayed delivery basis. Final settlement amount and maturity date have not yet been announced. |
N | | Yankee Bond – A dollar-denominated bond issued in the U.S. by foreign entities. |
O | | Credit Linked Security – The rates of interest earned on these securities are tied to the credit rating assigned by Standard & Poor’s Rating Service and/or Moody’s Investors Services. |
P | | Options and futures are described in more detail in the notes to financial statements. |
Q | | Par represents actual number of contracts. |
R | | At December 31, 2008, the aggregate gross unrealized appreciation and depreciation of investments for federal income tax purposes were as follows: |
| | | | |
Gross unrealized appreciation | | $ | 96,162,977 | |
Gross unrealized depreciation | | | (1,023,550,780 | ) |
| | | | |
Net unrealized depreciation | | $ | (927,387,803 | ) |
| | | | |
T | | All or a portion of this security is collateral to cover swap contracts. |
See notes to financial statements.
30
Annual Report to Shareholders
Statement of Assets and Liabilities
Western Asset Core Bond Portfolio
December 31, 2008
| | | | | | | |
Assets: | | | | | | | |
Investment securities at market value (Cost—$5,732,709,523) | | | | | $ | 4,804,987,247 | |
Short-term securities at value (Cost—$374,144,116) | | | | | | 375,708,985 | |
Cash | | | | | | 12,529,226 | |
Unrealized appreciation on swaps | | | | | | 145,504,927 | |
Receivable for securities sold | | | | | | 49,956,307 | |
Interest and dividends receivable | | | | | | 36,201,562 | |
Premiums paid on open swaps | | | | | | 11,453,290 | |
Amount receivable for open swaps | | | | | | 13,876,829 | |
Receivable for fund shares sold | | | | | | 4,055,870 | |
Other assets | | | | | | 1,487 | |
| | | | | | | |
Total assets | | | | | | 5,454,275,730 | |
| | | | | | | |
| | |
Liabilities: | | | | | | | |
Payable for securities purchased | | $ | 818,911,830 | | | | |
Unrealized depreciation on swaps | | | 477,135,988 | | | | |
Premiums received on open swaps | | | 79,261,058 | | | | |
Options written (Proceeds—$32,385,640) | | | 41,631,728 | | | | |
Payable for Lehman settlement | | | 31,596,429 | | | | |
Payable for fund shares repurchased | | | 15,067,384 | | | | |
Amount payable for open swaps | | | 7,319,574 | | | | |
Futures variation margin payable | | | 7,308,587 | | | | |
Income distribution payable | | | 4,161,689 | | | | |
Accrued management fee | | | 1,370,941 | | | | |
Accrued distribution fees | | | 230,250 | | | | |
Accrued expenses and other liabilities | | | 1,828,639 | | | | |
| | | | | | | |
Total liabilities | | | | | | 1,485,824,097 | |
| | | | | | | |
| | |
Net Assets | | | | | $ | 3,968,451,633 | |
| | | | | | | |
| | |
Net assets consist of: | | | | | | | |
Accumulated paid-in-capital | | | | | $ | 5,330,927,957 | |
Undistributed net investment income | | | | | | 22,102,922 | |
Accumulated net realized loss on investments, options, futures and swaps | | | | | | (174,520,131 | ) |
Net unrealized depreciation of investments, options, futures and swaps | | | | | | (1,210,059,115 | ) |
| | | | | | | |
| | |
Net Assets | | | | | $ | 3,968,451,633 | |
| | | | | | | |
| | |
Net Asset Value Per Share: | | | | | | | |
Institutional Class (281,742,813 shares outstanding) | | | | | | $9.08 | |
Institutional Select Class (26,483,756 shares outstanding) | | | | | | $9.09 | |
Financial Intermediary Class (128,726,927 shares outstanding) | | | | | | $9.08 | |
| | | | | | | | |
See notes to financial statements.
31
Annual Report to Shareholders
Statement of Operations
Western Asset Core Bond Portfolio
| | | | | | | | | | | | | | | | |
| | | FOR THE
PERIOD ENDED
DECEMBER 31, 2008A | | | FOR THE
YEAR ENDED
MARCH 31, 2008 | |
| | | | |
Investment Income: | | | | | | | | | | | | | | | | |
Interest | | $ | 260,034,011 | | | | | | | $ | 393,569,154 | | | | | |
Dividends | | | 1,422,129 | | | | | | | | — | | | | | |
Income from securities loaned | | | 1,790,431 | | | | | | | | 2,103,127 | | | | | |
| | | | | | | | | | | | | | | | |
Total income | | | | | | $ | 263,246,571 | | | | | | | $ | 395,672,281 | |
Expenses: | | | | | | | | | | | | | | | | |
Management fees | | | 17,693,084 | | | | | | | | 27,807,910 | | | | | |
Distribution and service fees: | | | | | | | | | | | | | | | | |
Financial Intermediary Class | | | 2,730,037 | | | | | | | | 3,882,741 | | | | | |
Audit and legal fees | | | 211,986 | | | | | | | | 188,874 | | | | | |
Custodian fees | | | 413,434 | | | | | | | | 621,548 | | | | | |
Directors’ fees and expenses | | | 160,878 | | | | | | | | 188,556 | | | | | |
Registration fees | | | 61,870 | | | | | | | | 100,282 | | | | | |
Reports to shareholdersB | | | — | | | | | | | | 1,336,970 | | | | | |
Reports to shareholders: | | | | | | | | | | | | | | | | |
Institutional Class | | | 858,187 | | | | | | | | — | | | | | |
Institutional Select Class | | | 45 | | | | | | | | N/A | | | | | |
Financial Intermediary Class | | �� | 367,816 | | | | | | | | — | | | | | |
Transfer agent and shareholder servicing expense: | | | | | | | | | | | | | | | | |
Institutional Class | | | 723,668 | | | | | | | | 52,088 | | | | | |
Institutional Select Class | | | 67,844 | | | | | | | | N/A | | | | | |
Financial Intermediary Class | | | 339,219 | | | | | | | | 26,803 | | | | | |
Other expenses | | | 87,120 | | | | | | | | 112,296 | | | | | |
| | | | | | | | | | | | | | | | |
| | | 23,715,188 | | | | | | | | 34,318,068 | | | | | |
Less: Fees waived | | | (479,256 | ) | | | | | | | — | | | | | |
Compensating balance credits | | | (166 | ) | | | | | | | — | | | | | |
| | | | | | | | | | | | | | | | |
Net expenses | | | | | | | 23,235,766 | | | | | | | | 34,318,068 | |
| | | | | | | | | | | | | | | | |
Net Investment Income | | | | | | | 240,010,805 | | | | | | | | 361,354,213 | |
Net Realized and Unrealized Gain/(Loss) on Investments: | | | | | | | | | | | | | | | | |
Net realized gain/(loss) on: | | | | | | | | | | | | | | | | |
Investments | | | (32,357,233 | ) | | | | | | | 39,732,323 | | | | | |
Options | | | 50,165,935 | | | | | | | | 35,482,732 | | | | | |
Futures | | | 6,474,871 | | | | | | | | (236,297,498 | ) | | | | |
Swaps | | | (49,764,534 | ) | | | | | | | 83,401,448 | | | | | |
| | | | | | | | | | | | | | | | |
| | | | | | | (25,480,961 | ) | | | | | | | (77,680,995 | ) |
Change in unrealized appreciation/(depreciation) of investments, options, futures and swaps | | | | | | | (803,419,816 | ) | | | | | | | (418,890,141 | ) |
| | | | | | | | | | | | | | | | |
Net Realized and Unrealized Loss on Investments | | | | | | | (828,900,777 | ) | | | | | | | (496,571,136 | ) |
Change in Net Assets Resulting From Operations | | | | | | $ | (588,889,972 | ) | | | | | | $ | (135,216,923 | ) |
| | | | | | | | | | | | | | | | | |
A | | For the period April 1, 2008 to December 31, 2008. |
B | | Computed on a composite level for year ended March 31, 2008. |
N/A—Not applicable.
See notes to financial statements.
32
Annual Report to Shareholders
Statement of Changes in Net Assets
Western Asset Core Bond Portfolio
| | | | | | | | | | | | |
| | | FOR THE
PERIOD ENDED
DECEMBER 31,
2008A | | | FOR THE
YEARS ENDED
MARCH 31, | |
| | | | 2008 | | | 2007 | |
| Change in Net Assets: | | | | | | | | | |
Net investment income | | $ | 240,010,805 | | | $ | 361,354,213 | | | $ | 259,135,907 | |
| | | |
Net realized gain/(loss) | | | (25,480,961 | ) | | | (77,680,995 | ) | | | 69,502,656 | |
| | | |
Change in unrealized appreciation/(depreciation) | | | (803,419,816 | ) | | | (418,890,141 | ) | | | 95,353,218 | |
| | | | | | | | | | | | |
Change in net assets resulting from operations | | | (588,889,972 | ) | | | (135,216,923 | ) | | | 423,991,781 | |
| | | |
Distributions to shareholders from: | | | | | | | | | | | | |
Net investment income: | | | | | | | | | | | | |
Institutional Class | | | (212,870,311 | ) | | | (279,146,241 | ) | | | (224,496,328 | ) |
Institutional Select Class | | | (4,754,933 | ) | | | N/A | | | | N/A | |
Financial Intermediary Class | | | (73,545,140 | ) | | | (77,801,855 | ) | | | (45,594,813 | ) |
| | | |
Net realized gain on investments: | | | | | | | | | | | | |
Institutional Class | | | — | | | | (22,347,640 | ) | | | — | |
Financial Intermediary Class | | | — | | | | (6,284,549 | ) | | | — | |
| | | |
Change in net assets from fund share transactions: | | | | | | | | | | | | |
Institutional Class | | | (1,908,390,929 | ) | | | 567,219,859 | | | | 611,643,176 | |
Institutional Select Class | | | 230,873,479 | | | | N/A | | | | N/A | |
Financial Intermediary Class | | | (241,647,090 | ) | | | 343,480,947 | | | | 1,008,162,458 | |
| | | | | | | | | | | | |
Change in net assets | | | (2,799,224,896 | ) | | | 389,903,598 | | | | 1,773,706,274 | |
| | | |
Net Assets: | | | | | | | | | | | | |
Beginning of period | | | 6,767,676,529 | | | | 6,377,772,931 | | | | 4,604,066,657 | |
| | | | | | | | | | | | |
| | | |
End of period | | $ | 3,968,451,633 | | | $ | 6,767,676,529 | | | $ | 6,377,772,931 | |
| | | | | | | | | | | | |
| | | |
Undistributed net investment income | | $ | 22,102,922 | | | $ | 16,291,168 | | | $ | 3,789,043 | |
| | | | | | | | | | | | |
| | | | | | | | | | | | | |
A | | For the period April 1, 2008 to December 31, 2008. |
N/A—Not applicable.
See notes to financial statements.
33
Annual Report to Shareholders
Financial Highlights
Western Asset Core Bond Portfolio
For a share of each class of capital stock outstanding:
Institutional Class:
| | | | | | | | | | | | | | | | | | |
| | | PERIOD ENDED
DECEMBER 31,
2008A | | YEARS ENDED MARCH 31, |
| | | | 2008 | | 2007 | | 2006 | | 2005 | | 2004 |
Net asset value, beginning of period | | | $10.54 | | | $11.37 | | | $11.05 | | | $11.29 | | | $11.81 | | | $11.57 |
| | | | | | | | | | | | | | | | | | |
Investment operations: | | | | | | | | | | | | | | | | | | |
Net investment income | | | .42B | | | .58B | | | .55B | | | .49C | | | .39C | | | .41C |
Net realized and unrealized gain/(loss) | | | (1.34) | | | (.78) | | | .34 | | | (.22) | | | (.21) | | | .45 |
| | | | | | | | | | | | | | | | | | |
Total from investment operations | | | (.92) | | | (.20) | | | .89 | | | .27 | | | .18 | | | .86 |
| | | | | | | | | | | | | | | | | | |
Distributions from: | | | | | | | | | | | | | | | | | | |
Net investment income | | | (.54) | | | (.58) | | | (.57) | | | (.51) | | | (.39) | | | (.44) |
Net realized gain on investments | | | — | | | (.05) | | | — | | | —D | | | (.31) | | | (.18) |
| | | | | | | | | | | | | | | | | | |
Total distributions | | | (.54) | | | (.63) | | | (.57) | | | (.51) | | | (.70) | | | (.62) |
| | | | | | | | | | | | | | | | | | |
Net asset value, end of period | | | $9.08 | | | $10.54 | | | $11.37 | | | $11.05 | | | $11.29 | | | $11.81 |
| | | | | | | | | | | | | | | | | | |
Total return | | | (8.88)%E | | | (1.88)% | | | 8.23% | | | 2.46% | | | 1.68% | | | 7.64% |
| | | | | | |
Ratios to Average Net Assets:F | | | | | | | | | | | | | | | | | | |
Total expenses | | | .47%G | | | .44% | | | .47% | | | .45% | | | .46% | | | .49% |
Expenses net of waivers, if any | | | .47%G | | | .44% | | | .47% | | | .45% | | | .46% | | | .49% |
Expenses net of all reductions | | | .47%G | | | .44% | | | .47% | | | .45% | | | .46% | | | .49% |
Net investment income | | | 5.6%G | | | 5.3% | | | 4.9% | | | 4.3% | | | 3.4% | | | 3.5% |
| | | | | | |
Supplemental Data: | | | | | | | | | | | | | | | | | | |
Portfolio turnover rate | | | 140.8%E | | | 455.0% | | | 431.7% | | | 540.4% | | | 407.2% | | | 464.6% |
Net assets, end of period
(in thousands) | | $ | 2,558,597 | | $ | 5,140,277 | | $ | 4,975,052 | | $ | 4,243,248 | | $ | 3,277,782 | | $ | 2,187,219 |
| | | | | | | | | | | | | | | | | | | |
A | | For the period April 1, 2008 to December 31, 2008. |
B | | Computed using average daily shares outstanding. |
C | | Computed using SEC method. |
D | | Amount less than $.01 per share. |
F | | Total expenses reflects operating expenses prior to any voluntary expense waivers and/or compensating balance credits. Expenses net of waivers reflects total expenses before compensating balance credits but net of any voluntary expense waivers. Expenses net of all reductions reflects expenses less any compensating balance credits and/or voluntary expense waivers. As of the most current prospectus, the Institutional Class has no limit on expenses. |
See notes to financial statements.
34
Annual Report to Shareholders
Institutional Select Class:
| | | |
| | | PERIOD ENDED
DECEMBER 31,
2008H |
Net asset value, beginning of period | | | $10.11 |
| | | |
Investment operations: | | | |
Net investment income | | | .15B |
Net realized and unrealized loss | | | (.87) |
| | | |
Total from investment operations | | | (.72) |
| | | |
Distributions from: | | | |
Net investment income | | | (.30) |
| | | |
Total distributions | | | (.30) |
| | | |
Net asset value, end of period | | | $9.09 |
| | | |
Total return | | | (7.08)%E |
| |
Ratios to Average Net Assets:F | | | |
Total expenses | | | .45%G |
Expenses net of waivers, if any | | | .45%G |
Expenses net of all reductions | | | .45%G |
Net investment income | | | 5.2%G |
| |
Supplemental Data: | | | |
Portfolio turnover rate | | | 140.8%E |
Net assets, end of period (in thousands) | | $ | 240,681 |
| | | | |
H | | For the period August 29, 2008 (commencement of operations) to December 31, 2008. |
See notes to financial statements.
35
Annual Report to Shareholders
Financial Highlights—Continued
Western Asset Core Bond Portfolio
For a share of each class of capital stock outstanding:
Financial Intermediary Class:
| | | | | | | | | | | | | | | | | | |
| | | PERIOD
ENDED
DECEMBER 31,
2008A | | YEARS ENDED MARCH 31, |
| | | | 2008 | | 2007 | | 2006 | | 2005 | | 2004 |
Net asset value, beginning of period | | | $10.54 | | | $11.37 | | | $11.05 | | | $11.29 | | | $11.81 | | | $11.57 |
| | | | | | | | | | | | | | | | | | |
Investment operations: | | | | | | | | | | | | | | | | | | |
Net investment income | | | .40B | | | .56B | | | .51B | | | .47C | | | .38C | | | .40C |
Net realized and unrealized gain/(loss) | | | (1.34) | | | (.79) | | | .35 | | | (.22) | | | (.23) | | | .43 |
| | | | | | | | | | | | | | | | | | |
Total from investment operations | | | (.94) | | | (.23) | | | .86 | | | .25 | | | .15 | | | .83 |
| | | | | | | | | | | | | | | | | | |
Distributions from: | | | | | | | | | | | | | | | | | | |
Net investment income | | | (.52) | | | (.55) | | | (.54) | | | (.49) | | | (.36) | | | (.41) |
Net realized gain on investments | | | — | | | (.05) | | | — | | | —D | | | (.31) | | | (.18) |
| | | | | | | | | | | | | | | | | | |
Total distributions | | | (.52) | | | (.60) | | | (.54) | | | (.49) | | | (.67) | | | (.59) |
| | | | | | | | | | | | | | | | | | |
Net asset value, end of period | | | $9.08 | | | $10.54 | | | $11.37 | | | $11.05 | | | $11.29 | | | $11.81 |
| | | | | | | | | | | | | | | | | | |
Total return | | | (9.06)%E | | | (2.12)% | | | 7.95% | | | 2.19% | | | 1.42% | | | 7.36% |
| | | | | | |
Ratios to Average Net Assets:F | | | | | | | | | | | | | | | | | | |
Total expenses | | | .77%G | | | .69% | | | .72% | | | .70% | | | .72% | | | .76% |
Expenses net of waivers, if any | | | .72%G | | | .69% | | | .72% | | | .70% | | | .72% | | | .75% |
Expenses net of all reductions | | | .72%G | | | .69% | | | .72% | | | .70% | | | .72% | | | .75% |
Net investment income | | | 5.3%G | | | 5.1% | | | 4.6% | | | 4.1% | | | 4.2% | | | 3.3% |
| | | | | | |
Supplemental Data: | | | | | | | | | | | | | | | | | | |
Portfolio turnover rate | | | 140.8%E | | | 455.0% | | | 431.7% | | | 540.4% | | | 407.2% | | | 464.6% |
Net assets, end of period (in thousands) | | $ | 1,169,174 | | $ | 1,627,400 | | $ | 1,402,721 | | $ | 360,819 | | $ | 265,518 | | $ | 121,607 |
| | | | | | | | | | | | | | | | | | | |
See notes to financial statements.
36
Annual Report to Shareholders
Management’s Discussion of Fund Performance
Western Asset Core Plus Bond Portfolio
Total returns for the Fund for various periods ended December 31, 2008 are presented below, along with those of comparative indices:
| | | | | | | | | | | | |
| | | | | Average Annual Total Returns |
| | | Three Months
Ended
12/31/08 | | Nine
Months | | One
Year | | Five
Years | | Ten
Years | | Since
InceptionA |
Western Asset Core Plus Bond Portfolio: | | | | | | | | | | | | |
Institutional Class | | -3.73% | | -8.01% | | -9.78% | | +1.68% | | +4.64% | | +4.77% |
Financial Intermediary Class | | -3.80% | | -8.28% | | -9.99% | | +1.41% | | N/A | | +3.38% |
Institutional Select Class | | -3.72% | | N/A | | N/A | | N/A | | N/A | | -4.54% |
Barclays Capital U.S. Aggregate IndexB | | +4.58% | | +3.01% | | +5.24% | | +4.65% | | +5.63% | | +5.81% |
Lipper Intermediate Investment Grade Debt Funds Category AverageC | | -0.21% | | -4.95% | | -4.39% | | +1.75% | | +4.06% | | +4.22% |
The performance data quoted represent past performance and do not guarantee future results. Current performance may be lower or higher than the performance data quoted. To obtain the most recent month-end performance information for the Institutional, Financial Intermediate and Institutional Select Classes, please visit www.westernassetfunds.com. The investment return and principal value of the Fund will fluctuate so that an investor’s shares, when redeemed, may be worth more or less than the original cost. Calculations assume reinvestment of dividends and capital gain distributions. Performance would have been lower if fees had not been waived in various periods. Performance figures for periods shorter than one year represent cumulative figures and are not annualized.
The expense ratios for the Institutional and Institutional Select Classes were 0.46% and 0.43%, respectively. The gross expense ratio for the Financial Intermediary Class was 0.79% and does not reflect fee waivers or reimbursements. The net expense ratio for the Financial Intermediary Class was 0.70% and reflects contractual fee waivers and/or reimbursements. As a result of a contractual expense limitation, the ratio of expenses, other than taxes, interest, deferred organizational expenses, brokerage and extraordinary expenses, to average net assets will not exceed 0.70% for Financial Intermediary Class shares until July 31, 2009.
All expenses shown include management fees, 12b-1 distribution fees and other expenses, as indicated in the Fund’s most current prospectus dated August 1, 2008.
A | | The inception of the Institutional Class is July 8, 1998. The inception date of the Financial Intermediary Class is January 8, 2002. The inception date of the Institutional Select Class is August 4, 2008. Index returns are for periods beginning June 30, 1998. Although it is not possible to invest directly in an index, it is possible to purchase investment vehicles designed to track the performance of certain indices. |
B | | The Barclays Capital (formerly Lehman Brothers) U.S. Aggregate Index is a broad-based bond index comprised of government, corporate, mortgage- and asset-backed issues, rated investment grade or higher, and having at least one year to maturity. |
C | | Lipper, Inc., a wholly-owned subsidiary of Reuters, provides independent insight on global collective investments. The Lipper Intermediate Investment Grade Debt Funds Category Average is comprised of the Fund’s peer group of mutual funds. |
37
Annual Report to Shareholders
Management’s Discussion of Fund Performance—Continued
Western Asset Core Plus Bond Portfolio—Continued
For the period from April 1, 2008 through December 31, 2008, Institutional Class shares of Western Asset Core Plus Bond Portfolio returned -8.01%. The Fund’s unmanaged benchmark, the Barclays Capital U.S. Aggregate Index, returned 3.01% over the same time frame. The Lipper Intermediate Investment Grade Debt Funds Category Average returned -4.95% for the same period.
The impact of market conditions on the Fund’s performance was negative for the nine-month period ended December 31, 2008, with strategies also producing significantly negative results. A large overweight exposure to the mortgage-backed sector detracted from returns as volatility remained high and negative housing news continued to damage market sentiment. We had diversified into a number of non-agency issues that were particularly impacted and further detracted from performance due to a lack of liquidity and uncertainty in that marketplace. An emphasis on lower-quality credits and select Financials issues was also a large detractor from performance as spreads soared in the wake of the subprime lending crisis, deteriorating liquidity conditions and slowing economic growth. Spreads narrowed in April and May, but these gains were given back later in the period on deteriorating investor sentiment and poor earnings. The high-yield sector performed poorly along with a declining stock market. During the period, a flight to safety occurred in both the U.S. and abroad. However, international treasuries did not do as well as U.S. Treasuries on a currency hedged basis; hence, relative to the benchmark, the Fund’s modest exposure to international treasuries had a negative impact on results. A modest U.S. Treasury Inflation-Protected Securities (“TIPS”)D exposure also had a negative impact as oil plunged to $40 per barrel and inflation fears switched to deflation fears. On a positive note, a tactically-driven durationE posture contributed modestly to returns as bond yields rallied over the year. A yield curveF-steepening strategy had a positive impact on performance as the spread between two- and 10-year yields widened.
Western Asset Management Company
January 20, 2009
Investment Risks: Bonds are subject to a variety of risks, including interest rate, credit and inflation risk. As interest rates rise, bond prices fall, reducing the value of the Fund’s share price. The Fund may invest in high-yield bonds, which are rated below investment grade and carry more risk than higher-rated securities. Mortgage-backed securities involve more risk, including prepayment and extension risks, than other investments in fixed-income securities. The Fund may use derivatives, such as options and futures, which can be illiquid, may disproportionately increase losses, and have a potentially large impact on Fund performance.
D | | U.S. Treasury Inflation-Protected Securities (“TIPS”) are inflation-indexed securities issued by the U.S. Treasury in 5-year, 10-year and 20-year maturities. The principal is adjusted to the Consumer Price Index, the commonly used measure of inflation. The coupon rate is constant, but generates a different amount of interest when multiplied by the inflation-adjusted principal. |
E | | Duration is the measure of the price sensitivity of a fixed-income security to an interest rate change of 100 basis points. Calculation is based on the weighted average of the present values for all cash flows. |
F | | The yield curve is the graphical depiction of the relationship between the yield on bonds of the same credit quality but different maturities. |
38
Annual Report to Shareholders
Expense Example
Western Asset Core Plus Bond Portfolio
As a shareholder of the Fund, you incur ongoing costs, including management fees, distribution (12b-1) fees on Financial Intermediary Class shares, and other Fund expenses. These examples are intended to help you understand your ongoing costs (in dollars) of investing in the Fund and to compare these costs with the ongoing costs of investing in other mutual funds.
Actual Expenses
The first line for each class in the table below provides information about actual account values and actual expenses for each class. You may use the information in this line, together with the amount you invested, to estimate the expenses that you paid over the period. Simply divide your account value by $1,000 (for example, an $8,600 account value divided by $1,000 = 8.6), then multiply the result by the number in the first line under the heading entitled “Expenses Paid During the Period” to estimate the expenses you paid on your account if your shares were held for the period. For Institutional Class and Financial Intermediary Class, the example is based on an investment of $1,000 invested on July 1, 2008 and held through December 31, 2008; for Institutional Select Class, the example is based on an investment of $1,000 invested on August 4, 2008 (commencement of operations) and held through December 31, 2008. The ending values assume dividends were reinvested at the time they were paid.
Hypothetical Example for Comparison Purposes
The second line for each class in the table below provides information about hypothetical account values and hypothetical expenses based on the relevant class’s actual expense ratio and an assumed rate of return of 5% per year before expenses, which is not the class’s actual return. The hypothetical account values and expenses may not be used to estimate the actual ending account balance or expenses you paid for the period. You may use this information to compare the ongoing costs of investing in the Fund and other funds. To do so, compare this 5% hypothetical example with the 5% hypothetical examples that appear in the shareholder reports of other funds. Because the example is intended to be comparable to the examples provided by other funds, it is based on a hypothetical investment of $1,000 invested on July 1, 2008 and held through December 31, 2008 for each class, even though the Institutional Select Class did not begin operations until August 4, 2008. The ending values assume dividends were reinvested at the time they were paid.
| | | | | | | | | | | |
| | | Beginning
Account Value
7/1/08 | | | Ending
Account Value
12/31/08 | | Expenses PaidA
During the Period
7/1/08 to 12/31/08 | |
Institutional Class: | | | | | | | | | | | |
Actual | | $ | 1,000.00 | | | $ | 937.50 | | $ | 2.25 | |
Hypothetical (5% return before expenses) | | | 1,000.00 | | | | 1,022.94 | | | 2.35 | |
Institutional Select Class: | | | | | | | | | | | |
Actual | | $ | 1,000.00 | B | | $ | 954.60 | | $ | 1.77 | C |
Hypothetical (5% return before expenses) | | | 1,000.00 | | | | 1,022.99 | | | 2.24 | |
Financial Intermediary Class: | | | | | | | | | | | |
Actual | | $ | 1,000.00 | | | $ | 936.30 | | $ | 3.42 | |
Hypothetical (5% return before expenses) | | | 1,000.00 | | | | 1,021.68 | | | 3.57 | |
A | | These calculations are based on expenses incurred from July 1, 2008 to December 31, 2008. The dollar amounts shown as “Expenses Paid” are equal to the annualized expense ratios of 0.46% and 0.70% for the Institutional Class and Financial Intermediary Class, respectively, multiplied by the average values over the period, multiplied by the number of days in the most recent fiscal period (184), and divided by 365. |
B | | Beginning account value is as of August 4, 2008. |
C | | This calculation is based on expenses incurred from August 4, 2008 (commencement of operations) to December 31, 2008. The dollar amount shown as “Expenses Paid” is equal to the annualized expense ratio of 0.44% for the Institutional Select Class, multiplied by the average values over the period, multiplied by the number of days in the fiscal period (150) and divided by 365. |
39
Annual Report to Shareholders
Performance Information
Western Asset Core Plus Bond Portfolio
The graphs compare the Fund’s total returns to that of an appropriate broad-based securities market index. The graphs illustrate the cumulative total return of an initial $1,000,000 investment in the Institutional Class and Financial Intermediary Class of the Fund, for the periods indicated. The lines for the Fund represent the total return after deducting all Fund investment management and other administrative expenses and the transaction costs of buying and selling securities. The line representing the securities market index does not include any transaction costs associated with buying and selling securities in the index or other investment management or administrative expenses.
Due to the limited operating history of the Institutional Select Class, a performance graph is not presented. Institutional Select shares, which began operations on August 4, 2008 had a total return of -4.54% for the period ended December 31, 2008.
Total return measures investment performance in terms of appreciation or depreciation in the Fund’s net asset value per share, plus dividends and any capital gain distributions. It assumes that dividends and distributions were reinvested at the time they were paid. Returns (and the graphs and tables found below) do not reflect the deduction of taxes that a shareholder would pay on Fund distributions or the redemption of Fund shares. Average annual returns tend to smooth out variations in a fund’s return, so that they differ from actual year-to-year results.
Bonds are subject to a variety of risks, including interest rate, credit and inflation risk. Non-U.S. investment are subject to currency fluctuations, social, economical and political risk.
Growth of a $1,000,000 Investment—Institutional Class
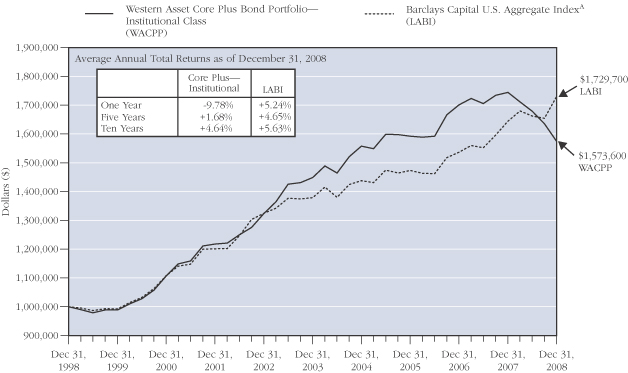
The performance data quoted represent past performance and do not guarantee future results. The performance stated may have been due to extraordinary market conditions, which may not be duplicated in the future. Current performance may be lower or higher than the performance data quoted. To obtain the most recent month-end performance information, please visit www.westernassetfunds.com. The investment return and principal value of the Fund will fluctuate so that an investor’s shares, when redeemed, may be worth more or less than the original cost. Calculations assume reinvestment of dividends and capital gain distributions. Performance would have been lower if fees had not been waived in various periods.
A | | Formerly: Lehman Aggregate Bond Index. The name change is a result of Barclays’ purchase of Lehman Brothers in September 2008. |
40
Annual Report to Shareholders
Growth of a $1,000,000 Investment—Financial Intermediary Class
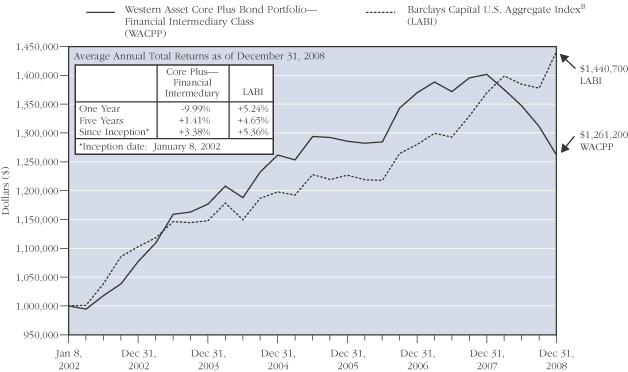
The performance data quoted represent past performance and do not guarantee future results. The performance stated may have been due to extraordinary market conditions, which may not be duplicated in the future. Current performance may be lower or higher than the performance data quoted. To obtain the most recent month-end performance information, please visit www.westernassetfunds.com. The investment return and principal value of the Fund will fluctuate so that an investor’s shares, when redeemed, may be worth more or less than the original cost. Calculations assume reinvestment of dividends and capital gain distributions. Performance would have been lower if fees had not been waived in various periods.
B | | Since-inception index returns are for periods beginning December 31, 2001. Formerly: Lehman Aggregate Bond Index. The name change is a result of Barclays’ purchase of Lehman Brothers in September 2008. |
41
Annual Report to Shareholders
Performance Information—Continued
Portfolio Composition (as of December 31, 2008)C
Standard & Poor’s Debt RatingsD (as a percentage of the portfolio)
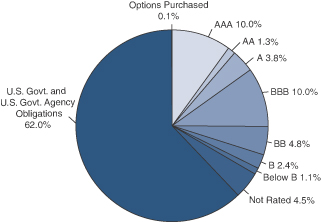
Maturity Schedule (as a percentage of the portfolio)
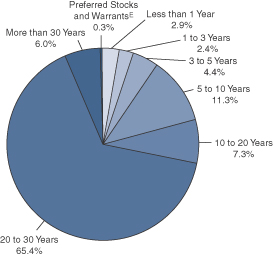
C | | The pie charts above represent the composition of the Fund’s Portfolio as of December 31, 2008 and do not include derivatives such as Futures Contracts, Options Written, and Swaps. The Fund is actively managed. As a result, the composition of the portfolio holdings and sectors are subject to change at any time. |
D | | Source: Standard & Poor's. These ratings are the opinions of S&P and not absolute measures of quality or guarantees of performance. |
E | | Preferred stocks and warrants do not have a defined maturity date. |
42
Annual Report to Shareholders
Spread Duration
Western Asset Core Plus Bond Portfolio
December 31, 2008
Economic Exposure
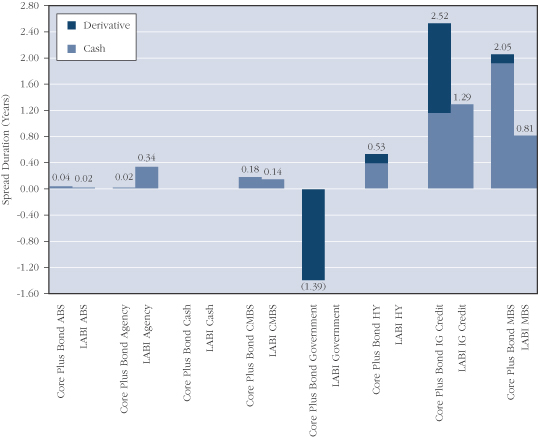
Spread duration is defined as the change in value for a 100 basis point change in the spread relative to Treasuries. The spread over Treasuries is the annual risk-premium demanded by investors to hold non-Treasury securities. This chart highlights the market sector exposure of the Fund’s portfolio and the exposure relative to the selected benchmark as of the end of the reporting period.
ABS—Asset Backed Securities
LABI—Barclays Capital U.S. Aggregate Index
CMBS—Commercial Mortgage Backed Securities
HY—High Yield
IG Credit—Investment Grade Credit
MBS—Mortgage Backed Securities
43
Annual Report to Shareholders
Effective Duration
Western Asset Core Plus Bond Portfolio
December 31, 2008
Interest Rate Exposure
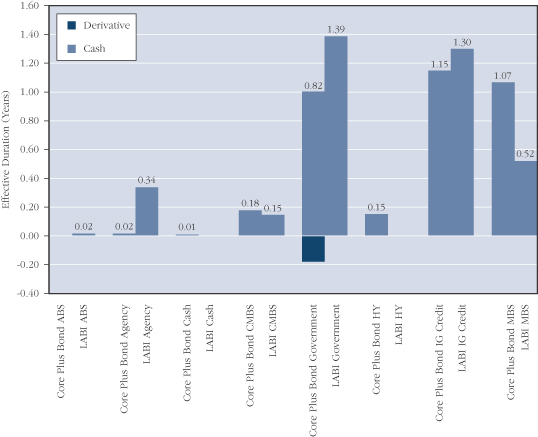
Effective duration is defined as the change in value for a 100 basis point change in Treasury yields. This chart highlights the interest rate exposure of the Fund’s portfolio relative to the selected benchmark as of the end of the reporting period.
ABS—Asset Backed Securities
LABI—Barclays Capital U.S. Aggregate Index
CMBS—Commercial Mortgage Backed Securities
HY—High Yield
IG Credit—Investment Grade Credit
MBS—Mortgage Backed Securities
44
Annual Report to Shareholders
Portfolio of Investments
Western Asset Core Plus Bond Portfolio
December 31, 2008
| | | | | | | | | | | | | |
| | | % OF
NET ASSET | | RATE | | MATURITY
DATE | | PAR/
SHARES† | | VALUE | |
| | | | | | | | | | | | | |
Long-Term Securities | | 112.0% | | | | | | | | | | | |
| | | | | |
Corporate Bonds and Notes | | 19.9% | | | | | | | | | | | |
| | | | | |
Aerospace and Defense | | N.M. | | | | | | | | | | | |
DRS Technologies Inc. | | | | 6.625% | | 2/1/16 | | $ | 10,000 | | $ | 10,000 | |
L-3 Communications Corp. | | | | 7.625% | | 6/15/12 | | | 852,000 | | | 832,830 | |
| | | | | | | | | | | | | |
| | | | | | | | | | | | 842,830 | |
| | | | | | | | | | | | | |
Air Freight and Logistics | | N.M. | | | | | | | | | | | |
United Parcel Service Inc. | | | | 4.500% | | 1/15/13 | | | 310,000 | | | 319,778 | |
| | | | | | | | | | | | | |
| | | | | |
Airlines | | 0.7% | | | | | | | | | | | |
Continental Airlines Inc. | | | | 6.503% | | 12/15/12 | | | 1,015,000 | | | 786,625 | |
Continental Airlines Inc. | | | | 6.545% | | 8/2/20 | | | 11,474,815 | | | 9,179,852 | |
Continental Airlines Inc. | | | | 5.983% | | 4/19/22 | | | 8,410,000 | | | 5,634,700 | |
Continental Airlines Inc. | | | | 6.703% | | 12/15/22 | | | 181,557 | | | 136,168 | |
DAE Aviation Holdings Inc. | | | | 11.250% | | 8/1/15 | | | 1,950,000 | | | 799,500 | A |
Delta Air Lines Inc. | | | | 6.619% | | 3/18/11 | | | 2,978,463 | | | 2,591,263 | |
Delta Air Lines Inc. | | | | 7.570% | | 5/18/12 | | | 11,575,000 | | | 9,723,000 | |
Delta Air Lines Inc. | | | | 6.821% | | 8/10/22 | | | 14,180,172 | | | 8,401,752 | |
Northwest Airlines Corp. | | | | 7.575% | | 3/1/19 | | | 11,530,749 | | | 7,840,909 | |
Northwest Airlines Inc. | | | | 3.186% | | 8/6/13 | | | 1,142,855 | | | 731,427 | B |
Northwest Airlines Inc. | | | | 2.968% | | 5/20/14 | | | 983,511 | | | 688,458 | B |
Southwest Airlines Co. | | | | 5.125% | | 3/1/17 | | | 5,320,000 | | | 3,846,663 | |
United Air Lines Inc. | | | | 7.032% | | 4/1/12 | | | 2,717,835 | | | 2,500,408 | |
United Air Lines Inc. | | | | 7.186% | | 10/1/12 | | | 13,138,487 | | | 12,350,178 | |
United Air Lines Inc. | | | | 6.602% | | 3/1/15 | | | 2,007,097 | | | 1,886,672 | |
| | | | | | | | | | | | | |
| | | | | | | | | | | | 67,097,575 | |
| | | | | | | | | | | | | |
Auto Components | | N.M. | | | | | | | | | | | |
Visteon Corp. | | | | 8.250% | | 8/1/10 | | | 386,000 | | | 119,660 | |
Visteon Corp. | | | | 12.250% | | 12/31/16 | | | 997,000 | | | 239,280 | A |
| | | | | | | | | | | | | |
| | | | | | | | | | | | 358,940 | |
| | | | | | | | | | | | | |
Automobiles | | 0.3% | | | | | | | | | | | |
DaimlerChrysler NA Holding Corp. | | | | 5.750% | | 5/18/09 | | | 90,000 | | | 87,344 | |
DaimlerChrysler NA Holding Corp. | | | | 5.875% | | 3/15/11 | | | 500,000 | | | 436,000 | |
DaimlerChrysler NA Holding Corp. | | | | 7.300% | | 1/15/12 | | | 3,315,000 | | | 2,865,420 | |
DaimlerChrysler NA Holding Corp. | | | | 6.500% | | 11/15/13 | | | 1,390,000 | | | 1,084,218 | |
Ford Motor Co. | | | | 7.450% | | 7/16/31 | | | 30,335,000 | | | 8,493,800 | |
Ford Motor Co. | | | | 4.250% | | 12/15/36 | | | 175,000 | | | 45,062 | C |
General Motors Corp. | | | | 8.250% | | 7/15/23 | | | 33,240,000 | | | 5,484,600 | |
45
Annual Report to Shareholders
Portfolio of Investments—Continued
Western Asset Core Plus Bond Portfolio—Continued
| | | | | | | | | | | | | | |
| | | % OF
NET ASSET | | RATE | | MATURITY
DATE | | PAR/
SHARES† | | | VALUE | |
| | | | | | | | | | | | | | |
Corporate Bonds and Notes—Continued | | | | | | | | | | | | | | |
| | | | | |
Automobiles—Continued | | | | | | | | | | | | | | |
General Motors Corp. | | | | 8.375% | | 7/5/33 | | | 9,520,000 | EUR | | $ | 2,117,323 | |
General Motors Corp. | | | | 8.375% | | 7/15/33 | | $ | 21,230,000 | | | | 3,715,250 | |
| | | | | | | | | | | | | | |
| | | | | | | | | | | | | 24,329,017 | |
| | | | | | | | | | | | | | |
Beverages | | 0.1% | | | | | | | | | | | | |
Dr. Pepper Snapple Group Inc.
Senior Notes | | | | 6.820% | | 5/1/18 | | | 6,000,000 | | | | 5,918,112 | A,D |
PepsiCo Inc | | | | 7.900% | | 11/1/18 | | | 210,000 | | | | 257,386 | |
| | | | | | | | | | | | | | |
| | | | | | | | | | | | | 6,175,498 | |
| | | | | | | | | | | | | | |
Building Products | | 0.1% | | | | | | | | | | | | |
Masco Corp. | | | | 7.125% | | 8/15/13 | | | 5,830,000 | | | | 4,691,401 | |
Masco Corp. | | | | 6.125% | | 10/3/16 | | | 8,270,000 | | | | 5,676,123 | |
| | | | | | | | | | | | | | |
| | | | | | | | | | | | | 10,367,524 | |
| | | | | | | | | | | | | | |
Capital Markets | | 0.8% | | | | | | | | | | | | |
Goldman Sachs Capital II | | | | 5.793% | | 12/29/49 | | | 1,810,000 | | | | 695,806 | E |
Goldman Sachs Group LP | | | | 4.500% | | 6/15/10 | | | 1,760,000 | | | | 1,734,285 | |
Lehman Brothers Holdings Capital
Trust VII | | | | 5.857% | | 11/29/49 | | | 5,530,000 | | | | 553 | E,F,S |
Lehman Brothers Holdings Inc. | | | | 5.250% | | 2/6/12 | | | 1,690,000 | | | | 160,550 | F,S |
Lehman Brothers Holdings Inc. | | | | 6.200% | | 9/26/14 | | | 8,690,000 | | | | 825,550 | F,S |
Lehman Brothers Holdings Inc. | | | | 6.500% | | 7/19/17 | | | 5,280,000 | | | | 528 | F,S |
Merrill Lynch and Co. Inc. | | | | 6.050% | | 5/16/16 | | | 390,000 | | | | 364,834 | |
Morgan Stanley | | | | 5.625% | | 1/9/12 | | | 470,000 | | | | 445,704 | |
Morgan Stanley | | | | 4.750% | | 4/1/14 | | | 8,460,000 | | | | 6,445,581 | |
Morgan Stanley | | | | 4.953% | | 10/18/16 | | | 7,380,000 | | | | 5,077,838 | B |
The Bear Stearns Cos. Inc. | | | | 6.400% | | 10/2/17 | | | 12,620,000 | | | | 13,114,426 | |
The Bear Stearns Cos. Inc. | | | | 7.250% | | 2/1/18 | | | 39,620,000 | | | | 43,417,815 | |
The Goldman Sachs Group Inc. | | | | 6.600% | | 1/15/12 | | | 2,810,000 | | | | 2,772,529 | |
The Goldman Sachs Group Inc. | | | | 5.625% | | 1/15/17 | | | 1,420,000 | | | | 1,219,889 | |
| | | | | | | | | | | | | | |
| | | | | | | | | | | | | 76,275,888 | |
| | | | | | | | | | | | | | |
Chemicals | | N.M. | | | | | | | | | | | | |
Georgia Gulf Corp. | | | | 9.500% | | 10/15/14 | | | 3,750,000 | | | | 1,125,000 | |
Westlake Chemical Corp. | | | | 6.625% | | 1/15/16 | | | 1,265,000 | | | | 733,700 | |
| | | | | | | | | | | | | | |
| | | | | | | | | | | | | 1,858,700 | |
| | | | | | | | | | | | | | |
Commercial Banks | | 0.3% | | | | | | | | | | | | |
Bank One Corp. | | | | 7.875% | | 8/1/10 | | | 150,000 | | | | 157,222 | |
Bank One Corp. | | | | 5.900% | | 11/15/11 | | | 2,000,000 | | | | 2,006,424 | |
46
Annual Report to Shareholders
| | | | | | | | | | | | | |
| | | % OF
NET ASSET | | RATE | | MATURITY
DATE | | PAR/
SHARES† | | VALUE | |
| | | | | | | | | | | | | |
Corporate Bonds and Notes—Continued | | | | | | | | | | | | | |
| | | | | |
Commercial Banks—Continued | | | | | | | | | | | | | |
HBOS Treasury Services PLC | | | | 5.250% | | 2/21/17 | | $ | 4,570,000 | | $ | 4,446,528 | A |
Rabobank Capital Funding Trust II | | | | 5.260% | | 12/31/49 | | | 590,000 | | | 312,128 | A,E |
Rabobank Capital Funding Trust III | | | | 5.254% | | 12/31/49 | | | 4,140,000 | | | 2,269,850 | A,E |
SunTrust Capital VIII | | | | 6.100% | | 12/15/36 | | | 3,140,000 | | | 2,210,591 | E |
Wachovia Capital Trust III | | | | 5.800% | | 3/15/42 | | | 9,480,000 | | | 5,593,200 | E |
Wachovia Corp. | | | | 5.250% | | 8/1/14 | | | 720,000 | | | 670,690 | |
Wells Fargo and Co. | | | | 5.300% | | 8/26/11 | | | 75,000 | | | 76,057 | |
Wells Fargo and Co. | | | | 5.000% | | 11/15/14 | | | 130,000 | | | 130,142 | |
Wells Fargo Capital X | | | | 5.950% | | 12/15/36 | | | 6,995,000 | | | 5,995,051 | E |
| | | | | | | | | | | | | |
| | | | | | | | | | | | 23,867,883 | |
| | | | | | | | | | | | | |
Commercial Services and Supplies | | 0.3% | | | | | | | | | | | |
Rental Service Corp. | | | | 9.500% | | 12/1/14 | | | 1,900,000 | | | 1,045,000 | |
Waste Management Inc. | | | | 6.875% | | 5/15/09 | | | 8,000,000 | | | 7,962,856 | |
Waste Management Inc. | | | | 7.375% | | 8/1/10 | | | 6,055,000 | | | 6,136,064 | |
Waste Management Inc. | | | | 6.375% | | 11/15/12 | | | 2,110,000 | | | 1,967,634 | |
Waste Management Inc. | | | | 5.000% | | 3/15/14 | | | 6,938,000 | | | 5,953,026 | |
Waste Management Inc. | | | | 7.125% | | 12/15/17 | | | 500,000 | | | 465,768 | |
Waste Management Inc. | | | | 7.750% | | 5/15/32 | | | 90,000 | | | 80,521 | |
| | | | | | | | | | | | | |
| | | | | | | | | | | | 23,610,869 | |
| | | | | | | | | | | | | |
Communications Equipment | | 0.1% | | | | | | | | | | | |
EchoStar DBS Corp. | | | | 7.750% | | 5/31/15 | | | 2,725,000 | | | 2,316,250 | |
Motorola Inc. | | | | 8.000% | | 11/1/11 | | | 10,850,000 | | | 9,054,021 | |
| | | | | | | | | | | | | |
| | | | | | | | | | | | 11,370,271 | |
| | | | | | | | | | | | | |
Computers and Peripherals | | N.M. | | | | | | | | | | | |
International Business Machines Corp. | | | | 4.750% | | 11/29/12 | | | 40,000 | | | 41,312 | |
| | | | | | | | | | | | | |
| | | | | |
Consumer Finance | | 1.7% | | | | | | | | | | | |
American Express Co. | | | | 6.800% | | 9/1/66 | | | 10,485,000 | | | 5,427,571 | E |
American General Finance Corp. | | | | 6.900% | | 12/15/17 | | | 8,600,000 | | | 3,721,848 | |
Caterpillar Financial Services Corp. | | | | 6.200% | | 9/30/13 | | | 290,000 | | | 298,966 | |
Ford Motor Credit Co. | | | | 5.800% | | 1/12/09 | | | 4,180,000 | | | 4,168,158 | |
Ford Motor Credit Co. | | | | 7.875% | | 6/15/10 | | | 3,560,000 | | | 2,848,641 | |
Ford Motor Credit Co. | | | | 7.246% | | 6/15/11 | | | 5,724,000 | | | 3,777,840 | B |
Ford Motor Credit Co. | | | | 7.250% | | 10/25/11 | | | 2,525,000 | | | 1,844,535 | |
Ford Motor Credit Co. | | | | 7.800% | | 6/1/12 | | | 19,090,000 | | | 13,393,048 | |
Ford Motor Credit Co. | | | | 7.000% | | 10/1/13 | | | 22,000,000 | | | 15,200,394 | |
GMAC LLC | | | | 6.625% | | 5/15/12 | | | 177,000 | | | 137,756 | A |
47
Annual Report to Shareholders
Portfolio of Investments—Continued
Western Asset Core Plus Bond Portfolio—Continued
| | | | | | | | | | | | | | |
| | | % OF
NET ASSET | | RATE | | MATURITY
DATE | | PAR/
SHARES† | | | VALUE | |
| | | | | | | | | | | | | | |
Corporate Bonds and Notes—Continued | | | | | | | | | | | | | | |
| | | | | |
Consumer Finance—Continued | | | | | | | | | | | | | | |
GMAC LLC | | | | 7.500% | | 12/31/13 | | $ | 2,946,000 | | | $ | 2,150,580 | A |
GMAC LLC | | | | 8.000% | | 12/31/18 | | | 2,455,000 | | | | 1,227,500 | A |
GMAC LLC | | | | 8.000% | | 11/1/31 | | | 101,534,000 | | | | 60,350,794 | A |
SLM Corp. | | | | 5.000% | | 10/1/13 | | | 17,665,000 | | | | 12,639,661 | |
SLM Corp. | | | | 5.375% | | 5/15/14 | | | 25,005,000 | | | | 16,875,224 | |
SLM Corp. | | | | 5.050% | | 11/14/14 | | | 4,690,000 | | | | 3,121,143 | |
SLM Corp. | | | | 5.000% | | 4/15/15 | | | 740,000 | | | | 469,463 | |
SLM Corp. | | | | 5.625% | | 8/1/33 | | | 4,160,000 | | | | 2,523,647 | |
| | | | | | | | | | | | | | |
| | | | | | | | | | | | | 150,176,769 | |
| | | | | | | | | | | | | | |
Diversified Consumer Services | | 0.1% | | | | | | | | | | | | |
Service Corp. International | | | | 6.750% | | 4/1/16 | | | 1,530,000 | | | | 1,162,800 | |
Service Corp. International | | | | 7.625% | | 10/1/18 | | | 400,000 | | | | 296,000 | |
Service Corp. International | | | | 7.500% | | 4/1/27 | | | 5,385,000 | | | | 3,446,400 | |
| | | | | | | | | | | | | | |
| | | | | | | | | | | | | 4,905,200 | |
| | | | | | | | | | | | | | |
Diversified Financial Services | | 2.1% | | | | | | | | | | | | |
AAC Group Holding Corp. | | | | 10.250% | | 10/1/12 | | | 770,000 | | | | 508,200 | A |
Air 2 US | | | | 8.027% | | 10/1/19 | | | 12,683,958 | | | | 9,512,968 | A |
BAC Capital Trust XIV | | | | 5.630% | | 12/31/49 | | | 2,240,000 | | | | 897,469 | E |
Banca Italease SpA | | | | 4.994% | | 2/2/10 | | | 57,800,000 | EUR | | | 66,265,213 | B |
Bank of America Corp. | | | | 5.420% | | 3/15/17 | | | 2,030,000 | | | | 1,804,412 | |
Bank of America Corp. | | | | 5.750% | | 12/1/17 | | | 480,000 | | | | 479,252 | |
Citigroup Inc. | | | | 4.125% | | 2/22/10 | | | 860,000 | | | | 847,466 | |
Citigroup Inc. | | | | 6.500% | | 8/19/13 | | | 110,000 | | | | 110,999 | |
Citigroup Inc. | | | | 5.000% | | 9/15/14 | | | 270,000 | | | | 237,487 | |
Citigroup Inc. | | | | 6.125% | | 8/25/36 | | | 1,560,000 | | | | 1,397,440 | |
Citigroup Inc. | | | | 5.875% | | 5/29/37 | | | 6,040,000 | | | | 6,035,434 | |
Citigroup Inc. | | | | 6.875% | | 3/5/38 | | | 36,010,000 | | | | 40,975,311 | |
DI Finance LLC | | | | 9.500% | | 2/15/13 | | | 1,004,000 | | | | 874,735 | |
General Electric Capital Corp. | | | | 5.450% | | 1/15/13 | | | 1,155,000 | | | | 1,163,271 | |
General Electric Capital Corp. | | | | 5.625% | | 5/1/18 | | | 530,000 | | | | 533,842 | |
General Electric Capital Corp. | | | | 6.375% | | 11/15/67 | | | 47,395,000 | | | | 29,791,028 | E |
Glen Meadow Pass-Through Certificates | | | | 6.505% | | 2/12/67 | | | 100,000 | | | | 44,709 | A,E |
HSBC Finance Corp. | | | | 8.000% | | 7/15/10 | | | 70,000 | | | | 71,164 | |
HSBC Finance Corp. | | | | 6.375% | | 8/1/10 | | | 1,000,000 | | | | 993,404 | |
HSBC Finance Corp. | | | | 7.000% | | 5/15/12 | | | 160,000 | | | | 160,243 | |
HSBC Finance Corp. | | | | 6.375% | | 11/27/12 | | | 520,000 | | | | 508,758 | |
ILFC E-Capital Trust II | | | | 6.250% | | 12/21/65 | | | 7,220,000 | | | | 3,015,166 | A,E |
JPMorgan Chase and Co. | | | | 2.125% | | 6/22/12 | | | 160,000 | | | | 160,666 | |
48
Annual Report to Shareholders
| | | | | | | | | | | | | |
| | | % OF
NET ASSET | | RATE | | MATURITY
DATE | | PAR/
SHARES† | | VALUE | |
| | | | | | | | | | | | | |
Corporate Bonds and Notes—Continued | | | | | | | | | | | | | |
| | | | | |
Diversified Financial Services—Continued | | | | | | | | | | | | | |
JPMorgan Chase and Co. | | | | 5.750% | | 1/2/13 | | $ | 4,430,000 | | $ | 4,494,439 | |
JPMorgan Chase and Co. | | | | 5.125% | | 9/15/14 | | | 920,000 | | | 891,552 | |
JPMorgan Chase and Co. | | | | 5.150% | | 10/1/15 | | | 490,000 | | | 462,686 | |
JPMorgan Chase and Co. | | | | 6.125% | | 6/27/17 | | | 60,000 | | | 59,047 | |
Liberty Media LLC | | | | 5.700% | | 5/15/13 | | | 535,000 | | | 350,734 | |
Liberty Media LLC | | | | 3.750% | | 2/15/30 | | | 170,000 | | | 45,050 | C |
PHH Corp. | | | | 7.125% | | 3/1/13 | | | 8,640,000 | | | 4,895,208 | |
TNK-BP Finance SA | | | | 7.875% | | 3/13/18 | | | 13,200,000 | | | 6,600,000 | A |
Unilever Capital Corp. | | | | 7.125% | | 11/1/10 | | | 1,450,000 | | | 1,550,682 | |
| | | | | | | | | | | | | |
| | | | | | | | | | | | 185,738,035 | |
| | | | | | | | | | | | | |
Diversified Telecommunication Services | | 1.2% | | | | | | | | | | | |
AT&T Inc. | | | | 5.100% | | 9/15/14 | | | 8,640,000 | | | 8,493,008 | |
AT&T Inc. | | | | 5.600% | | 5/15/18 | | | 25,000,000 | | | 25,453,600 | |
AT&T Inc. | | | | 6.300% | | 1/15/38 | | | 130,000 | | | 137,424 | |
AT&T Inc. | | | | 6.400% | | 5/15/38 | | | 10,377,000 | | | 11,115,645 | |
BellSouth Corp. | | | | 4.750% | | 11/15/12 | | | 640,000 | | | 627,887 | |
BellSouth Corp. | | | | 5.200% | | 9/15/14 | | | 8,250,000 | | | 8,031,656 | |
CenturyTel Inc. | | | | 6.000% | | 4/1/17 | | | 8,270,000 | | | 5,954,400 | |
Citizens Communications Co. | | | | 9.250% | | 5/15/11 | | | 530,000 | | | 503,500 | |
Citizens Communications Co. | | | | 7.875% | | 1/15/27 | | | 5,290,000 | | | 3,068,200 | |
Level 3 Financing Inc. | | | | 9.250% | | 11/1/14 | | | 4,695,000 | | | 2,723,100 | |
Qwest Communications International Inc. | | | | 5.649% | | 2/15/09 | | | 10,000 | | | 9,950 | B |
Qwest Communications International Inc. | | | | 7.500% | | 2/15/14 | | | 6,774,000 | | | 4,843,410 | |
Qwest Corp. | | | | 7.500% | | 10/1/14 | | | 2,680,000 | | | 2,224,400 | |
Qwest Corp. | | | | 6.875% | | 9/15/33 | | | 5,600,000 | | | 3,332,000 | |
Verizon Communications Inc. | | | | 6.400% | | 2/15/38 | | | 700,000 | | | 744,591 | |
Verizon Communications Inc. | | | | 8.950% | | 3/1/39 | | | 14,400,000 | | | 18,600,336 | |
Verizon Global Funding Corp. | | | | 7.375% | | 9/1/12 | | | 155,000 | | | 162,154 | |
Verizon New York Inc. | | | | 6.875% | | 4/1/12 | | | 3,942,000 | | | 3,922,097 | |
Windstream Corp. | | | | 8.625% | | 8/1/16 | | | 10,100,000 | | | 8,938,500 | |
| | | | | | | | | | | | | |
| | | | | | | | | | | | 108,885,858 | |
| | | | | | | | | | | | | |
Electric Utilities | | 1.3% | | | | | | | | | | | |
Duke Energy Corp. | | | | 5.625% | | 11/30/12 | | | 1,010,000 | | | 1,028,590 | |
Energy Future Holdings Corp. | | | | 10.875% | | 11/1/17 | | | 1,051,000 | | | 746,210 | A |
Energy Future Holdings Corp. | | | | 11.250% | | 11/1/17 | | | 146,179,000 | | | 70,896,815 | A,G |
Exelon Corp. | | | | 5.625% | | 6/15/35 | | | 455,000 | | | 287,224 | |
49
Annual Report to Shareholders
Portfolio of Investments—Continued
Western Asset Core Plus Bond Portfolio—Continued
| | | | | | | | | | | | | |
| | | % OF
NET ASSET | | RATE | | MATURITY
DATE | | PAR/
SHARES† | | VALUE | |
| | | | | | | | | | | | | |
Corporate Bonds and Notes—Continued | | | | | | | | | | | | | |
| | | | | |
Electric Utilities—Continued | | | | | | | | | | | | | |
FirstEnergy Corp. | | | | 6.450% | | 11/15/11 | | $ | 3,190,000 | | $ | 3,015,367 | |
FirstEnergy Corp. | | | | 7.375% | | 11/15/31 | | | 20,615,000 | | | 19,502,120 | |
Pacific Gas and Electric Co. | | | | 8.250% | | 10/15/18 | | | 40,000 | | | 48,058 | |
Pacific Gas and Electric Co. | | | | 6.050% | | 3/1/34 | | | 5,180,000 | | | 5,501,466 | |
Pacific Gas and Electric Co. | | | | 5.800% | | 3/1/37 | | | 11,790,000 | | | 12,228,670 | |
Progress Energy Inc. | | | | 7.100% | | 3/1/11 | | | 52,000 | | | 51,539 | |
The Cleveland Electric Illuminating Co. | | | | 5.700% | | 4/1/17 | | | 1,080,000 | | | 875,613 | |
The Detroit Edison Co. | | | | 5.200% | | 10/15/12 | | | 10,000 | | | 9,866 | |
| | | | | | | | | | | | | |
| | | | | | | | | | | | 114,191,538 | |
| | | | | | | | | | | | | |
Energy Equipment and Services | | 0.1% | | | | | | | | | | | |
Baker Hughes Inc. | | | | 7.500% | | 11/15/18 | | | 280,000 | | | 310,424 | |
Complete Production Services Inc. | | | | 8.000% | | 12/15/16 | | | 5,355,000 | | | 3,373,650 | |
Pacific Energy Partners | | | | 7.125% | | 6/15/14 | | | 630,000 | | | 550,265 | |
Pride International Inc. | | | | 7.375% | | 7/15/14 | | | 1,440,000 | | | 1,339,200 | |
| | | | | | | | | | | | | |
| | | | | | | | | | | | 5,573,539 | |
| | | | | | | | | | | | | |
Food and Staples Retailing | | 0.3% | | | | | | | | | | | |
CVS Caremark Corp. | | | | 6.943% | | 1/10/30 | | | 3,211,495 | | | 2,019,292 | A |
CVS Corp. | | | | 5.789% | | 1/10/26 | | | 112,885 | | | 85,926 | A |
CVS Corp. | | | | 5.298% | | 1/11/27 | | | 569,572 | | | 437,213 | A |
CVS Lease Pass-Through Trust | | | | 5.880% | | 1/10/28 | | | 5,674,155 | | | 4,395,165 | A |
CVS Lease Pass-Through Trust | | | | 6.036% | | 12/10/28 | | | 20,065,779 | | | 12,204,609 | A |
Safeway Inc. | | | | 6.350% | | 8/15/17 | | | 310,000 | | | 306,494 | |
The Kroger Co. | | | | 6.400% | | 8/15/17 | | | 1,270,000 | | | 1,280,748 | |
The Kroger Co. | | | | 6.150% | | 1/15/20 | | | 1,830,000 | | | 1,805,522 | |
Wal-Mart Stores Inc. | | | | 5.800% | | 2/15/18 | | | 180,000 | | | 199,179 | |
Wal-Mart Stores Inc. | | | | 6.200% | | 4/15/38 | | | 2,260,000 | | | 2,586,468 | |
| | | | | | | | | | | | | |
| | | | | | | | | | | | 25,320,616 | |
| | | | | | | | | | | | | |
Food Products | | 0.2% | | | | | | | | | | | |
General Mills Inc. | | | | 5.700% | | 2/15/17 | | | 7,210,000 | | | 7,246,670 | |
Sara Lee Corp. | | | | 6.250% | | 9/15/11 | | | 9,750,000 | | | 9,651,925 | |
| | | | | | | | | | | | | |
| | | | | | | | | | | | 16,898,595 | |
| | | | | | | | | | | | | |
Gas Utilities | | 0.1% | | | | | | | | | | | |
Southern Natural Gas Co. | | | | 5.900% | | 4/1/17 | | | 50,000 | | | 39,623 | A |
Southern Natural Gas Co. | | | | 8.000% | | 3/1/32 | | | 9,410,000 | | | 7,841,042 | |
Suburban Propane Partners LP | | | | 6.875% | | 12/15/13 | | | 2,000,000 | | | 1,640,000 | |
| | | | | | | | | | | | | |
| | | | | | | | | | | | 9,520,665 | |
| | | | | | | | | | | | | |
50
Annual Report to Shareholders
| | | | | | | | | | | | | |
| | | % OF
NET ASSET | | RATE | | MATURITY
DATE | | PAR/
SHARES† | | VALUE | |
| | | | | | | | | | | | | |
Corporate Bonds and Notes—Continued | | | | | | | | | | | | | |
| | | | | |
Health Care Equipment and Supplies | | N.M. | | | | | | | | | | | |
Biomet Inc. | | | | 10.375% | | 10/15/17 | | $ | 1,800,000 | | $ | 1,422,000 | G |
Fresenius Medical Care Capital Trust IV | | | | 7.875% | | 6/15/11 | | | 681,000 | | | 646,950 | |
| | | | | | | | | | | | | |
| | | | | | | | | | | | 2,068,950 | |
| | | | | | | | | | | | | |
Health Care Providers and Services | | 1.1% | | | | | | | | | | | |
AmerisourceBergen Corp. | | | | 5.625% | | 9/15/12 | | | 6,330,000 | | | 5,926,855 | |
AmerisourceBergen Corp. | | | | 5.875% | | 9/15/15 | | | 7,070,000 | | | 6,179,067 | |
Cardinal Health Inc. | | | | 5.800% | | 10/15/16 | | | 6,260,000 | | | 5,663,284 | |
Cardinal Health Inc. | | | | 5.850% | | 12/15/17 | | | 270,000 | | | 243,453 | |
Community Health Systems Inc. | | | | 8.875% | | 7/15/15 | | | 6,910,000 | | | 6,357,200 | |
DaVita Inc. | | | | 6.625% | | 3/15/13 | | | 4,435,000 | | | 4,213,250 | |
HCA Inc. | | | | 8.750% | | 9/1/10 | | | 256,000 | | | 245,760 | |
HCA Inc. | | | | 7.875% | | 2/1/11 | | | 1,000,000 | | | 880,000 | |
HCA Inc. | | | | 6.300% | | 10/1/12 | | | 299,000 | | | 210,795 | |
HCA Inc. | | | | 6.250% | | 2/15/13 | | | 1,243,000 | | | 776,875 | |
HCA Inc. | | | | 5.750% | | 3/15/14 | | | 221,000 | | | 133,705 | |
HCA Inc. | | | | 9.125% | | 11/15/14 | | | 1,280,000 | | | 1,187,200 | |
HCA Inc. | | | | 9.250% | | 11/15/16 | | | 10,500,000 | | | 9,633,750 | |
HCA Inc. | | | | 9.625% | | 11/15/16 | | | 9,809,000 | | | 7,651,020 | G |
HCA Inc. | | | | 7.690% | | 6/15/25 | | | 723,000 | | | 339,414 | |
HCA Inc. | | | | 7.500% | | 11/6/33 | | | 1,925,000 | | | 895,125 | |
HCA Inc. | | | | 7.500% | | 11/15/95 | | | 15,410,000 | | | 6,529,525 | |
Tenet Healthcare Corp. | | | | 6.375% | | 12/1/11 | | | 2,500,000 | | | 1,931,250 | |
Tenet Healthcare Corp. | | | | 7.375% | | 2/1/13 | | | 6,222,000 | | | 4,433,175 | |
Tenet Healthcare Corp. | | | | 9.875% | | 7/1/14 | | | 2,668,000 | | | 2,147,740 | |
Tenet Healthcare Corp. | | | | 9.250% | | 2/1/15 | | | 12,430,000 | | | 10,006,150 | |
UnitedHealth Group Inc. | | | | 4.875% | | 2/15/13 | | | 180,000 | | | 168,052 | |
UnitedHealth Group Inc. | | | | 4.875% | | 4/1/13 | | | 18,130,000 | | | 16,893,643 | |
WellPoint Inc. | | | | 5.875% | | 6/15/17 | | | 3,040,000 | | | 2,766,811 | |
| | | | | | | | | | | | | |
| | | | | | | | | | | | 95,413,099 | |
| | | | | | | | | | | | | |
Hotels, Restaurants and Leisure | | 0.2% | | | | | | | | | | | |
Boyd Gaming Corp. | | | | 6.750% | | 4/15/14 | | | 10,000 | | | 6,300 | |
Boyd Gaming Corp. | | | | 7.125% | | 2/1/16 | | | 20,000 | | | 11,800 | |
Inn of the Mountain Gods Resort and Casino | | | | 12.000% | | 11/15/10 | | | 1,070,000 | | | 353,100 | |
Marriott International Inc. | | | | 5.810% | | 11/10/15 | | | 7,950,000 | | | 5,568,045 | |
McDonald’s Corp. | | | | 5.350% | | 3/1/18 | | | 310,000 | | | 322,023 | |
MGM MIRAGE | | | | 6.750% | | 9/1/12 | | | 435,000 | | | 304,500 | |
MGM MIRAGE | | | | 6.625% | | 7/15/15 | | | 380,000 | | | 231,800 | |
51
Annual Report to Shareholders
Portfolio of Investments—Continued
Western Asset Core Plus Bond Portfolio—Continued
| | | | | | | | | | | | | |
| | | % OF
NET ASSET | | RATE | | MATURITY
DATE | | PAR/
SHARES† | | VALUE | |
| | | | | | | | | | | | | |
Corporate Bonds and Notes—Continued | | | | | | | | | | | | | |
| | | | |
Hotels, Restaurants and Leisure—Continued | | | | | | | | | | | |
MGM MIRAGE | | | | 7.625% | | 1/15/17 | | $ | 3,690,000 | | $ | 2,380,050 | |
Mohegan Tribal Gaming Authority | | | | 8.000% | | 4/1/12 | | | 245,000 | | | 149,450 | |
River Rock Entertainment Authority | | | | 9.750% | | 11/1/11 | | | 220,000 | | | 182,600 | |
Starwood Hotels and Resorts Worldwide Inc. | | | | 7.875% | | 5/1/12 | | | 5,350,000 | | | 3,985,750 | |
Station Casinos Inc. | | | | 7.750% | | 8/15/16 | | | 9,760,000 | | | 1,854,400 | |
| | | | | | | | | | | | | |
| | | | | | | | | | | | 15,349,818 | |
| | | | | | | | | | | | | |
Household Durables | | 0.1% | | | | | | | | | | | |
Pulte Homes Inc. | | | | 8.125% | | 3/1/11 | | | 6,890,000 | | | 5,994,300 | |
| | | | | | | | | | | | | |
| | | | | |
Household Products | | N.M. | | | | | | | | | | | |
American Achievement Corp. | | | | 8.250% | | 4/1/12 | | | 250,000 | | | 192,500 | A |
Procter and Gamble Co. | | | | 8.500% | | 8/10/09 | | | 90,000 | | | 93,201 | |
| | | | | | | | | | | | | |
| | | | | | | | | | | | 285,701 | |
| | | | | | | | | | | | | |
Independent Power Producers and Energy Traders | | 1.4% | | | | | | | | | | | |
Dynegy Holdings Inc. | | | | 7.750% | | 6/1/19 | | | 9,730,000 | | | 6,713,700 | |
NRG Energy Inc. | | | | 7.250% | | 2/1/14 | | | 3,130,000 | | | 2,926,550 | |
NRG Energy Inc. | | | | 7.375% | | 2/1/16 | | | 6,791,000 | | | 6,315,630 | |
NRG Energy Inc. | | | | 7.375% | | 1/15/17 | | | 595,000 | | | 547,400 | |
The AES Corp. | | | | 8.750% | | 5/15/13 | | | 11,741,000 | | | 11,271,360 | A |
The AES Corp. | | | | 7.750% | | 3/1/14 | | | 32,158,000 | | | 28,299,040 | |
The AES Corp. | | | | 7.750% | | 10/15/15 | | | 8,070,000 | | | 6,778,800 | |
The AES Corp. | | | | 8.000% | | 10/15/17 | | | 52,640,000 | | | 43,164,800 | |
The AES Corp. | | | | 8.000% | | 6/1/20 | | | 14,470,000 | | | 11,214,250 | A |
TXU Corp. | | | | 5.550% | | 11/15/14 | | | 1,560,000 | | | 728,875 | |
TXU Corp. | | | | 6.500% | | 11/15/24 | | | 2,850,000 | | | 1,008,296 | |
TXU Corp. | | | | 6.550% | | 11/15/34 | | | 28,635,000 | | | 9,666,947 | |
| | | | | | | | | | | | | |
| | | | | | | | | | | | 128,635,648 | |
| | | | | | | | | | | | | |
Industrial Conglomerates | | 0.4% | | | | | | | | | | | |
General Electric Co. | | | | 5.000% | | 2/1/13 | | | 7,055,000 | | | 7,134,658 | |
Tyco International Ltd./Tyco International Finance SA | | | | 7.000% | | 12/15/19 | | | 945,000 | | | 776,289 | |
Tyco International Ltd./Tyco International Finance SA | | | | 6.875% | | 1/15/21 | | | 31,995,000 | | | 24,740,870 | |
| | | | | | | | | | | | | |
| | | | | | | | | | | | 32,651,817 | |
| | | | | | | | | | | | | |
52
Annual Report to Shareholders
| | | | | | | | | | | | | |
| | | % OF
NET ASSET | | RATE | | MATURITY
DATE | | PAR/
SHARES† | | VALUE | |
| | | | | | | | | | | | | |
Corporate Bonds and Notes—Continued | | | | | | | | | | | | | |
| | | | | |
Insurance | | 0.2% | | | | | | | | | | | |
American International Group Inc. | | | | 5.850% | | 1/16/18 | | $ | 5,390,000 | | $ | 3,612,836 | |
American International Group Inc. | | | | 6.250% | | 3/15/37 | | | 360,000 | | | 134,558 | E |
ASIF Global Financing XIX | | | | 4.900% | | 1/17/13 | | | 2,180,000 | | | 1,749,978 | A |
Marsh and McLennan Cos. Inc. | | | | 5.150% | | 9/15/10 | | | 5,990,000 | | | 5,830,834 | |
MetLife Capital Trust IV | | | | 7.875% | | 12/15/37 | | | 13,000,000 | | | 8,155,706 | A,E |
MetLife Inc. | | | | 6.400% | | 12/15/66 | | | 2,835,000 | | | 1,701,000 | E |
The Travelers Cos. Inc. | | | | 6.250% | | 3/15/67 | | | 2,760,000 | | | 1,807,902 | E |
| | | | | | | | | | | | | |
| | | | | | | | | | | | 22,992,814 | |
| | | | | | | | | | | | | |
IT Services | | 0.2% | | | | | | | | | | | |
Electronic Data Systems Corp. | | | | 7.125% | | 10/15/09 | | | 21,645,000 | | | 22,004,848 | |
Electronic Data Systems Corp. | | | | 6.000% | | 8/1/13 | | | 775,000 | | | 803,078 | D |
| | | | | | | | | | | | | |
| | | | | | | | | | | | 22,807,926 | |
| | | | | | | | | | | | | |
Leisure Equipment and Products | | 0.3% | | | | | | | | | | | |
Eastman Kodak Co. | | | | 7.250% | | 11/15/13 | | | 21,264,000 | | | 13,715,280 | |
Eastman Kodak Co. | | | | 3.375% | | 10/15/33 | | | 13,820,000 | | | 11,142,375 | C |
| | | | | | | | | | | | | |
| | | | | | | | | | | | 24,857,655 | |
| | | | | | | | | | | | | |
Machinery | | N.M. | | | | | | | | | | | |
Terex Corp. | | | | 7.375% | | 1/15/14 | | | 2,680,000 | | | 2,331,600 | |
| | | | | | | | | | | | | |
| | | | | |
Media | | 1.2% | | | | | | | | | | | |
CBS Corp. | | | | 7.625% | | 1/15/16 | | | 5,500,000 | | | 4,493,297 | |
Charter Communications Operating LLC | | | | 10.875% | | 9/15/14 | | | 3,640,000 | | | 2,912,000 | A |
Clear Channel Communications Inc. | | | | 4.250% | | 5/15/09 | | | 2,760,000 | | | 2,428,800 | |
Clear Channel Communications Inc. | | | | 6.250% | | 3/15/11 | | | 6,600,000 | | | 1,980,000 | |
Clear Channel Communications Inc. | | | | 5.500% | | 9/15/14 | | | 8,120,000 | | | 974,400 | |
Comcast Cable Communications Inc. | | | | 6.750% | | 1/30/11 | | | 210,000 | | | 210,798 | |
Comcast Cable Communications Inc. | | | | 8.875% | | 5/1/17 | | | 40,000 | | | 42,714 | |
Comcast Corp. | | | | 6.500% | | 1/15/15 | | | 3,760,000 | | | 3,695,821 | |
Comcast Corp. | | | | 6.500% | | 1/15/17 | | | 3,660,000 | | | 3,615,033 | |
Comcast Corp. | | | | 5.875% | | 2/15/18 | | | 10,000 | | | 9,476 | |
Comcast Corp. | | | | 6.450% | | 3/15/37 | | | 14,000,000 | | | 13,931,638 | |
Comcast Corp. | | | | 6.950% | | 8/15/37 | | | 7,470,000 | | | 7,866,298 | |
Cox Communications Inc. | | | | 7.875% | | 8/15/09 | | | 7,680,000 | | | 7,549,356 | |
CSC Holdings Inc. | | | | 6.750% | | 4/15/12 | | | 500,000 | | | 457,500 | |
DirecTV Holdings LLC | | | | 8.375% | | 3/15/13 | | | 2,531,000 | | | 2,518,345 | |
EchoStar DBS Corp. | | | | 7.000% | | 10/1/13 | | | 6,340,000 | | | 5,499,950 | |
EchoStar DBS Corp. | | | | 6.625% | | 10/1/14 | | | 1,185,000 | | | 989,475 | |
53
Annual Report to Shareholders
Portfolio of Investments—Continued
Western Asset Core Plus Bond Portfolio—Continued
| | | | | | | | | | | | | |
| | | % OF
NET ASSET | | RATE | | MATURITY
DATE | | PAR/
SHARES† | | VALUE | |
| | | | | | | | | | | | | |
Corporate Bonds and Notes—Continued | | | | | | | | | | | | | |
| | | | | |
Media—Continued | | | | | | | | | | | | | |
EchoStar DBS Corp. | | | | 7.125% | | 2/1/16 | | $ | 20,000 | | $ | 16,700 | |
Gannett Co. Inc. | | | | 6.375% | | 4/1/12 | | | 4,560,000 | | | 3,190,632 | |
Idearc Inc. | | | | 8.000% | | 11/15/16 | | | 8,250,000 | | | 618,750 | |
Lamar Media Corp. | | | | 6.625% | | 8/15/15 | | | 2,010,000 | | | 1,452,225 | |
News America Inc. | | | | 6.200% | | 12/15/34 | | | 260,000 | | | 237,262 | |
News America Inc. | | | | 6.650% | | 11/15/37 | | | 1,330,000 | | | 1,316,382 | |
News America Inc. | | | | 6.750% | | 1/9/38 | | | 200,000 | | | 197,844 | |
R.H. Donnelley Corp. | | | | 11.750% | | 5/15/15 | | | 1,300,000 | | | 318,500 | A |
Time Warner Cable Inc. | | | | 8.750% | | 2/14/19 | | | 14,150,000 | | | 15,385,790 | |
Time Warner Entertainment Co. LP | | | | 8.375% | | 7/15/33 | | | 20,000 | | | 20,183 | |
Time Warner Inc. | | | | 6.875% | | 5/1/12 | | | 6,230,000 | | | 5,985,136 | |
Time Warner Inc. | | | | 7.625% | | 4/15/31 | | | 440,000 | | | 432,436 | |
Time Warner Inc. | | | | 7.700% | | 5/1/32 | | | 5,634,000 | | | 5,640,947 | |
Viacom Inc. | | | | 5.750% | | 4/30/11 | | | 14,870,000 | | | 13,504,756 | |
Viacom Inc. | | | | 6.250% | | 4/30/16 | | | 6,600,000 | | | 5,470,694 | |
| | | | | | | | | | | | | |
| | | | | | | | | | | | 112,963,138 | |
| | | | | | | | | | | | | |
Metals and Mining | | 0.2% | | | | | | | | | | | |
Freeport-McMoRan Copper & Gold Inc. | | | | 8.375% | | 4/1/17 | | | 14,090,000 | | | 11,553,800 | |
Steel Dynamics Inc. | | | | 6.750% | | 4/1/15 | | | 5,890,000 | | | 4,064,100 | |
Steel Dynamics Inc. | | | | 7.750% | | 4/15/16 | | | 1,980,000 | | | 1,371,150 | A |
| | | | | | | | | | | | | |
| | | | | | | | | | | | 16,989,050 | |
| | | | | | | | | | | | | |
Multi-Utilities | | 0.1% | | | | | | | | | | | |
Dominion Resources Inc. | | | | 5.125% | | 12/15/09 | | | 1,260,000 | | | 1,257,227 | |
Dominion Resources Inc. | | | | 4.750% | | 12/15/10 | | | 1,010,000 | | | 998,675 | |
Dominion Resources Inc. | | | | 5.700% | | 9/17/12 | | | 5,495,000 | | | 5,441,039 | |
Dominion Resources Inc. | | | | 8.875% | | 1/15/19 | | | 90,000 | | | 97,055 | |
| | | | | | | | | | | | | |
| | | | | | | | | | | | 7,793,996 | |
| | | | | | | | | | | | | |
Multiline Retail | | 0.1% | | | | | | | | | | | |
J.C. Penney Co. Inc. | | | | 7.400% | | 4/1/37 | | | 690,000 | | | 454,288 | |
Target Corp. | | | | 4.000% | | 6/15/13 | | | 5,340,000 | | | 4,980,970 | |
The Neiman-Marcus Group Inc. | | | | 9.000% | | 10/15/15 | | | 3,790,000 | | | 1,667,600 | G |
The Neiman-Marcus Group Inc. | | | | 10.375% | | 10/15/15 | | | 3,030,000 | | | 1,302,900 | |
| | | | | | | | | | | | | |
| | | | | | | | | | | | 8,405,758 | |
| | | | | | | | | | | | | |
Office Electronics | | N.M. | | | | | | | | | | | |
Xerox Corp. | | | | 6.750% | | 2/1/17 | | | 1,180,000 | | | 856,248 | |
| | | | | | | | | | | | | |
54
Annual Report to Shareholders
| | | | | | | | | | | | | |
| | | % OF
NET ASSET | | RATE | | MATURITY
DATE | | PAR/
SHARES† | | VALUE | |
| | | | | | | | | | | | | |
Corporate Bonds and Notes—Continued | | | | | | | | | | | | | |
| | | | | |
Oil, Gas and Consumable Fuels | | 2.7% | | | | | | | | | | | |
Anadarko Petroleum Corp. | | | | 2.396% | | 9/15/09 | | $ | 21,780,000 | | $ | 20,839,605 | B |
Anadarko Petroleum Corp. | | | | 5.950% | | 9/15/16 | | | 2,340,000 | | | 2,066,943 | |
Anadarko Petroleum Corp. | | | | 6.450% | | 9/15/36 | | | 30,075,000 | | | 23,724,183 | |
Apache Corp. | | | | 6.000% | | 1/15/37 | | | 240,000 | | | 232,722 | |
Chesapeake Energy Corp. | | | | 6.375% | | 6/15/15 | | | 1,205,000 | | | 951,950 | |
Chesapeake Energy Corp. | | | | 6.250% | | 1/15/18 | | | 1,970,000 | | | 1,457,800 | |
Chesapeake Energy Corp. | | | | 7.250% | | 12/15/18 | | | 7,105,000 | | | 5,541,900 | |
Conoco Inc. | | | | 6.950% | | 4/15/29 | | | 638,000 | | | 686,552 | |
ConocoPhillips | | | | 8.750% | | 5/25/10 | | | 3,100,000 | | | 3,267,195 | |
ConocoPhillips | | | | 5.900% | | 10/15/32 | | | 10,000 | | | 9,836 | |
Devon Energy Corp. | | | | 7.950% | | 4/15/32 | | | 210,000 | | | 231,943 | |
El Paso Corp. | | | | 7.000% | | 6/15/17 | | | 68,790,000 | | | 53,835,398 | |
El Paso Corp. | | | | 7.800% | | 8/1/31 | | | 4,277,000 | | | 2,786,478 | |
El Paso Corp. | | | | 7.750% | | 1/15/32 | | | 8,074,000 | | | 5,241,003 | |
El Paso Natural Gas Co. | | | | 8.375% | | 6/15/32 | | | 2,520,000 | | | 2,174,485 | |
Energy Transfer Partners LP | | | | 6.125% | | 2/15/17 | | | 5,305,000 | | | 4,381,012 | |
Energy Transfer Partners LP | | | | 6.700% | | 7/1/18 | | | 320,000 | | | 269,725 | |
Energy Transfer Partners LP | | | | 9.700% | | 3/15/19 | | | 15,000,000 | | | 15,456,165 | |
Enterprise Products Operating LLP | | | | 6.300% | | 9/15/17 | | | 4,300,000 | | | 3,639,382 | |
Hess Corp. | | | | 7.875% | | 10/1/29 | | | 5,290,000 | | | 5,078,305 | |
Hess Corp. | | | | 7.300% | | 8/15/31 | | | 13,235,000 | | | 12,041,944 | |
KazMunaiGaz Exploration Production—GDR | | | | 8.375% | | 7/2/13 | | | 33,910,000 | | | 26,449,800 | A |
Kerr-McGee Corp. | | | | 6.875% | | 9/15/11 | | | 800,000 | | | 791,705 | |
Kerr-McGee Corp. | | | | 6.950% | | 7/1/24 | | | 2,780,000 | | | 2,437,637 | |
Kerr-McGee Corp. | | | | 7.875% | | 9/15/31 | | | 10,555,000 | | | 9,716,374 | |
Kinder Morgan Energy Partners LP | | | | 6.300% | | 2/1/09 | | | 10,000 | | | 9,990 | |
Kinder Morgan Energy Partners LP | | | | 6.750% | | 3/15/11 | | | 40,000 | | | 38,906 | |
Kinder Morgan Energy Partners LP | | | | 7.125% | | 3/15/12 | | | 7,670,000 | | | 7,407,701 | |
Kinder Morgan Energy Partners LP | | | | 5.850% | | 9/15/12 | | | 20,000 | | | 18,316 | |
Kinder Morgan Energy Partners LP | | | | 5.000% | | 12/15/13 | | | 1,879,000 | | | 1,638,573 | |
Kinder Morgan Energy Partners LP | | | | 6.000% | | 2/1/17 | | | 5,190,000 | | | 4,505,828 | |
Kinder Morgan Energy Partners LP | | | | 6.950% | | 1/15/38 | | | 1,697,000 | | | 1,372,444 | |
Occidental Petroleum Corp. | | | | 7.000% | | 11/1/13 | | | 360,000 | | | 392,920 | |
Peabody Energy Corp. | | | | 6.875% | | 3/15/13 | | | 1,085,000 | | | 1,028,038 | |
Peabody Energy Corp. | | | | 5.875% | | 4/15/16 | | | 880,000 | | | 748,000 | |
Pemex Project Funding Master Trust | | | | 2.820% | | 12/3/12 | | | 104,000 | | | 86,840 | A,B |
Pemex Project Funding Master Trust | | | | 6.625% | | 6/15/35 | | | 20,773,000 | | | 17,584,345 | |
Pemex Project Funding Master Trust | | | | 6.625% | | 6/15/35 | | | 850,000 | | | 719,525 | A |
55
Annual Report to Shareholders
Portfolio of Investments—Continued
Western Asset Core Plus Bond Portfolio—Continued
| | | | | | | | | | | | | |
| | | % OF
NET ASSET | | RATE | | MATURITY
DATE | | PAR/
SHARES† | | VALUE | |
| | | | | | | | | | | | | |
Corporate Bonds and Notes—Continued | | | | | | | | | | | | | |
| | | | | |
Oil, Gas and Consumable
Fuels—Continued | | | | | | | | | | | | | |
Seariver Maritime Inc. | | | | 0.000% | | 9/1/12 | | $ | 70,000 | | $ | 59,953 | H |
Texaco Capital Inc. | | | | 5.500% | | 1/15/09 | | | 1,600,000 | | | 1,601,650 | |
The Williams Cos. Inc. | | | | 7.500% | | 1/15/31 | | | 990,000 | | | 663,300 | |
The Williams Cos. Inc. | | | | 7.750% | | 6/15/31 | | | 530,000 | | | 363,050 | |
XTO Energy Inc. | | | | 7.500% | | 4/15/12 | | | 971,000 | | | 959,696 | |
XTO Energy Inc. | | | | 6.750% | | 8/1/37 | | | 2,570,000 | | | 2,406,969 | |
| | | | | | | | | | | | | |
| | | | | | | | | | | | 244,916,086 | |
| | | | | | | | | | | | | |
Paper and Forest Products | | 0.1% | | | | | | | | | | | |
Georgia-Pacific Corp. | | | | 8.125% | | 5/15/11 | | | 9,000 | | | 8,460 | |
Weyerhaeuser Co. | | | | 6.750% | | 3/15/12 | | | 7,340,000 | | | 6,570,401 | |
| | | | | | | | | | | | | |
| | | | | | | | | | | | 6,578,861 | |
| | | | | | | | | | | | | |
Pharmaceuticals | | 0.2% | | | | | | | | | | | |
Schering-Plough Corp. | | | | 6.000% | | 9/15/17 | | | 340,000 | | | 336,569 | |
Wyeth | | | | 5.950% | | 4/1/37 | | | 19,955,000 | | | 22,155,777 | |
| | | | | | | | | | | | | |
| | | | | | | | | | | | 22,492,346 | |
| | | | | | | | | | | | | |
Real Estate Investment Trusts (REITs) | | 0.1% | | | | | | | | | | | |
Health Care Property Investors Inc. | | | | 6.450% | | 6/25/12 | | | 6,240,000 | | | 5,159,513 | |
Host Marriott LP | | | | 6.750% | | 6/1/16 | | | 2,065,000 | | | 1,507,450 | |
Ventas Inc. | | | | 8.750% | | 5/1/09 | | | 420,000 | | | 413,700 | |
Ventas Inc. | | | | 9.000% | | 5/1/12 | | | 1,240,000 | | | 1,103,600 | |
Ventas Inc. | | | | 6.750% | | 4/1/17 | | | 850,000 | | | 646,000 | |
| | | | | | | | | | | | | |
| | | | | | | | | | | | 8,830,263 | |
| | | | | | | | | | | | | |
Real Estate Management and Development | | N.M. | | | | | | | | | | | |
Forest City Enterprises Inc. | | | | 7.625% | | 6/1/15 | | | 360,000 | | | 126,000 | |
Forest City Enterprises Inc. | | | | 6.500% | | 2/1/17 | | | 597,000 | | | 208,950 | |
| | | | | | | | | | | | | |
| | | | | | | | | | | | 334,950 | |
| | | | | | | | | | | | | |
Road and Rail | | N.M. | | | | | | | | | | | |
Hertz Corp. | | | | 8.875% | | 1/1/14 | | | 1,320,000 | | | 811,800 | |
Hertz Corp. | | | | 10.500% | | 1/1/16 | | | 3,745,000 | | | 1,708,656 | |
Norfolk Southern Corp. | | | | 6.200% | | 4/15/09 | | | 20,000 | | | 20,026 | |
| | | | | | | | | | | | | |
| | | | | | | | | | | | 2,540,482 | |
| | | | | | | | | | | | | |
Semiconductors and Semiconductor Equipment | | N.M. | | | | | | | | | | | |
Freescale Semiconductor Inc. | | | | 8.875% | | 12/15/14 | | | 10,000 | | | 4,400 | |
| | | | | | | | | | | | | |
56
Annual Report to Shareholders
| | | | | | | | | | | | | |
| | | % OF
NET ASSET | | RATE | | MATURITY
DATE | | PAR/
SHARES† | | VALUE | |
| | | | | | | | | | | | | |
Corporate Bonds and Notes—Continued | | | | | | | | | | | | | |
| | | | | |
Specialty Retail | | 0.4% | | | | | | | | | | | |
Autozone Inc. | | | | 6.950% | | 6/15/16 | | $ | 10,890,000 | | $ | 9,632,150 | |
Home Depot Inc. | | | | 4.625% | | 8/15/10 | | | 2,720,000 | | | 2,693,453 | |
Home Depot Inc. | | | | 5.250% | | 12/16/13 | | | 5,510,000 | | | 5,145,221 | |
Home Depot Inc. | | | | 5.400% | | 3/1/16 | | | 8,230,000 | | | 7,365,192 | |
Limited Brands Inc. | | | | 6.125% | | 12/1/12 | | | 16,900,000 | | | 12,190,866 | |
| | | | | | | | | | | | | |
| | | | | | | | | | | | 37,026,882 | |
| | | | | | | | | | | | | |
Textiles, Apparel and Luxury Goods | | N.M. | | | | | | | | | | | |
Oxford Industries Inc. | | | | 8.875% | | 6/1/11 | | | 800,000 | | | 604,000 | |
| | | | | | | | | | | | | |
| | | | | |
Thrifts and Mortgage Finance | | N.M. | | | | | | | | | | | |
Countrywide Financial Corp. | | | | 4.348% | | 1/5/09 | | | 30,000 | | | 30,000 | B |
Countrywide Financial Corp. | | | | 5.800% | | 6/7/12 | | | 350,000 | | | 341,129 | |
Countrywide Financial Corp. | | | | 6.250% | | 5/15/16 | | | 290,000 | | | 275,357 | |
Countrywide Home Loans Inc. | | | | 4.125% | | 9/15/09 | | | 160,000 | | | 158,125 | |
| | | | | | | | | | | | | |
| | | | | | | | | | | | 804,611 | |
| | | | | | | | | | | | | |
Tobacco | | 0.4% | | | | | | | | | | | |
Altria Group Inc. | | | | 9.700% | | 11/10/18 | | | 25,420,000 | | | 27,474,699 | D |
Philip Morris Capital Corp. | | | | 7.500% | | 7/16/09 | | | 190,000 | | | 191,290 | |
Reynolds American Inc. | | | | 7.875% | | 5/15/09 | | | 730,000 | | | 722,836 | |
Reynolds American Inc. | | | | 7.625% | | 6/1/16 | | | 100,000 | | | 83,281 | |
Reynolds American Inc. | | | | 6.750% | | 6/15/17 | | | 8,430,000 | | | 6,691,616 | |
| | | | | | | | | | | | | |
| | | | | | | | | | | | 35,163,722 | |
| | | | | | | | | | | | | |
Wireless Telecommunication Services | | 0.7% | | | | | | | | | | | |
Cellco Partnership | | | | 8.500% | | 11/15/18 | | | 36,200,000 | | | 42,414,707 | A |
Nextel Communications Inc. | | | | 6.875% | | 10/31/13 | | | 60,000 | | | 25,500 | |
Nextel Communications Inc. | | | | 5.950% | | 3/15/14 | | | 493,000 | | | 207,060 | |
Nextel Communications Inc. | | | | 7.375% | | 8/1/15 | | | 1,980,000 | | | 831,600 | |
Sprint Capital Corp. | | | | 8.375% | | 3/15/12 | | | 17,545,000 | | | 14,036,000 | |
Sprint Capital Corp. | | | | 6.900% | | 5/1/19 | | | 720,000 | | | 511,200 | |
Sprint Capital Corp. | | | | 8.750% | | 3/15/32 | | | 3,395,000 | | | 2,291,625 | |
| | | | | | | | | | | | | |
| | | | | | | | | | | | 60,317,692 | |
| | | | | | | | | | | | | |
Total Corporate Bonds and Notes
(Cost—$2,273,267,401) | | | | | | | | | | | | 1,787,738,713 | |
Asset-Backed Securities | | 3.9% | | | | | | | | | | | |
| | | | | |
Fixed Rate Securities | | 0.3% | | | | | | | | | | | |
Conseco Finance Securitizations Corp. 2000-4 | | | | 8.310% | | 5/1/32 | | | 1,928,880 | | | 1,006,482 | |
57
Annual Report to Shareholders
Portfolio of Investments—Continued
Western Asset Core Plus Bond Portfolio—Continued
| | | | | | | | | | | | | |
| | | % OF
NET ASSET | | RATE | | MATURITY
DATE | | PAR/
SHARES† | | VALUE | |
| | | | | | | | | | | | | |
Asset-Backed Securities—Continued | | | | | | | | | | | | | |
| | | | | |
Fixed Rate Securities—Continued | | | | | | | | | | | | | |
Contimortgage Home Equity Trust 1997-4 B1F | | | | 7.330% | | 10/15/28 | | $ | 1,058,415 | | $ | 877,003 | |
Credit-Based Asset Servicing and Securitization LLC 2006-MH1 AF2 | | | | 5.650% | | 10/25/36 | | | 860,852 | | | 752,893 | A,E |
Green Tree Financial Corp. 1992-2 B | | | | 9.150% | | 1/15/18 | | | 137,291 | | | 95,547 | |
Green Tree Financial Corp. 1993-2 | | | | 8.000% | | 7/15/18 | | | 400,626 | | | 411,321 | |
Green Tree Financial Corp. 1996-5 | | | | 8.100% | | 7/15/27 | | | 2,581,021 | | | 470,245 | |
Green Tree Home Improvement Loan Trust 1996-A | | | | 7.400% | | 2/15/26 | | | 240,438 | | | 158,027 | |
Lehman ABS Manufactured Housing Contract 2001-B A3 | | | | 4.350% | | 5/15/14 | | | 3,109,035 | | | 1,985,086 | |
Lehman ABS Manufactured Housing Contract 2001-B A6 | | | | 6.467% | | 8/15/28 | | | 2,114,990 | | | 1,473,816 | |
Merrill Lynch Mortgage Investors Inc. 2005-SD1 A2 | | | | 5.666% | | 5/25/46 | | | 1,008,709 | | | 902,502 | |
Origen Manufactured Housing Contract Trust 2005-B | | | | 5.910% | | 1/15/37 | | | 4,797,000 | | | 3,320,529 | |
Origen Manufactured Housing Contract Trust 2005-B | | | | 5.990% | | 1/15/37 | | | 1,500,000 | | | 999,430 | |
Origen Manufactured Housing Contract Trust 2005-B | | | | 6.480% | | 1/15/37 | | | 2,100,000 | | | 1,339,536 | |
Patrons’ Legacy 2003-IV | | | | 5.775% | | 12/23/63 | | | 8,900,000 | | | 5,629,239 | A |
Pegasus Aviation Lease Securitization 2000-1 A2 | | | | 8.370% | | 3/25/30 | | | 4,475,000 | | | 1,252,914 | A |
Terwin Mortgage Trust 2006-10SL A1 | | | | 4.750% | | 10/25/37 | | | 26,471,912 | | | 5,950,094 | |
UCFC Home Equity Loan 1998-C | | | | 5.935% | | 1/15/30 | | | 5,318 | | | 4,595 | |
Vanderbilt Mortgage Finance 1997-B 1B2 | | | | 8.155% | | 10/7/26 | | | 180,510 | | | 128,040 | |
Vanderbilt Mortgage Finance 1997-C | | | | 7.830% | | 8/8/27 | | | 432,127 | | | 334,988 | |
WEF Issuer LLC 2006-A | | | | 5.190% | | 12/15/14 | | | 400,018 | | | 383,045 | A |
| | | | | | | | | | | | | |
| | | | | | | | | | | | 27,475,332 | |
| | | | | | | | | | | | | |
Indexed SecuritiesB | | 3.5% | | | | | | | | | | | |
ACE Securities Corp. 2006-GP1 A | | | | 0.601% | | 2/25/31 | | | 564,619 | | | 407,871 | |
Ace Securities Corp. Home Equity Loan Trust 2006-SL3 | | | | 0.571% | | 6/25/36 | | | 1,019,912 | | | 181,086 | |
AFC Home Equity Loan Trust 2002-2 | | | | 0.771% | | 6/25/30 | | | 416,345 | | | 212,944 | |
Asset Backed Securities Corp. Home Equity Loan Trust 2001-HE3 | | | | 1.735% | | 11/15/31 | | | 235,795 | | | 185,451 | |
Bear Stearns Asset Backed Securities Inc. 2005-CL1 | | | | 0.971% | | 9/25/34 | | | 8,873,186 | | | 5,873,940 | |
58
Annual Report to Shareholders
| | | | | | | | | | | | | |
| | | % OF
NET ASSET | | RATE | | MATURITY
DATE | | PAR/
SHARES† | | VALUE | |
| | | | | | | | | | | | | |
Asset-Backed Securities—Continued | | | | | | | | | | | | | |
| | | | | |
Indexed Securities—Continued | | | | | | | | | | | | | |
Bear Stearns Asset Backed Securities Inc. 2006-1 A | | | | 0.751% | | 2/25/36 | | $ | 1,770,928 | | $ | 1,498,597 | |
Bear Stearns Second Lien Trust 2007-SV1A A3 | | | | 0.721% | | 12/25/36 | | | 2,379,932 | | | 1,367,747 | A |
CDC Mortgage Capital Trust 2002-HE1 | | | | 1.091% | | 1/25/33 | | | 488,725 | | | 311,426 | |
Countrywide Asset-Backed Certificates 2002-BC1 | | | | 1.131% | | 4/25/32 | | | 141,405 | | | 98,388 | |
Countrywide Asset-Backed Certificates 2003-1 | | | | 0.811% | | 6/25/33 | | | 294,215 | | | 238,951 | |
Countrywide Asset-Backed Certificates 2003-BC3 | | | | 0.781% | | 9/25/33 | | | 637,078 | | | 375,889 | |
Countrywide Asset-Backed Certificates 2004-2 M1 | | | | 0.971% | | 5/25/34 | | | 390,000 | | | 205,847 | |
Countrywide Asset-Backed Certificates 2006-SD4 A1 | | | | 0.811% | | 12/25/36 | | | 223,465 | | | 130,794 | A |
Countrywide Home Equity Loan Trust 2002-F | | | | 1.545% | | 11/15/28 | | | 413,720 | | | 290,295 | |
Countrywide Home Equity Loan Trust 2004-I A | | | | 1.485% | | 2/15/34 | | | 399,607 | | | 219,843 | |
Countrywide Home Equity Loan Trust 2006-E 2A | | | | 1.335% | | 7/15/36 | | | 467,610 | | | 187,948 | |
Countrywide Home Equity Loan Trust 2006-RES | | | | 1.455% | | 6/15/29 | | | 544,940 | | | 98,089 | A |
Credit-Based Asset Servicing and Securitization 2007-RP1 A | | | | 0.781% | | 5/25/46 | | | 35,718,814 | | | 17,615,978 | A |
EMC Mortgage Loan Trust 2002-B A1 | | | | 1.121% | | 2/25/41 | | | 527,562 | | | 416,247 | A |
Fairbanks Capital Mortgage Loan Trust 1999-1 A | | | | 1.671% | | 5/25/28 | | | 842,094 | | | 818,594 | A |
Fleet Home Equity Loan Trust 2003-1 | | | | 1.703% | | 1/20/33 | | | 3,171,391 | | | 1,872,487 | |
GMAC Mortgage Corp. Loan Trust 2004-HE3 A2VN | | | | 0.711% | | 10/25/34 | | | 56,205,657 | | | 24,972,173 | |
GMAC Mortgage Corp. Loan Trust 2004-VF1 A1 | | | | 1.221% | | 2/25/31 | | | 5,270,065 | | | 4,176,527 | A |
GMAC Mortgage Corp. Loan Trust 2005-HE3 A1VN | | | | 1.655% | | 2/25/36 | | | 42,071,786 | | | 10,702,011 | |
GMAC Mortgage Corp. Loan Trust 2006-HE1 A | | | | 0.681% | | 11/25/36 | | | 2,085,421 | | | 1,177,168 | |
Greenpoint Mortgage Funding Trust 2005-HE1 | | | | 0.871% | | 9/25/34 | | | 3,972,312 | | | 1,927,547 | |
59
Annual Report to Shareholders
Portfolio of Investments—Continued
Western Asset Core Plus Bond Portfolio—Continued
| | | | | | | | | | | | | |
| | | % OF
NET ASSET | | RATE | | MATURITY
DATE | | PAR/
SHARES† | | VALUE | |
| | | | | | | | | | | | | |
Asset-Backed Securities—Continued | | | | | | | | | | | | | |
| | | | | |
Indexed Securities—Continued | | | | | | | | | | | | | |
GSAMP Trust 2006-S4 | | | | 0.561% | | 5/25/36 | | $ | 186,041 | | $ | 70,273 | |
GSRPM Mortgage Loan Trust 2004-1 A1 | | | | 0.951% | | 9/25/42 | | | 1,477,220 | | | 1,458,776 | A |
IndyMac Home Equity Loan Asset-Backed Trust 2001-A | | | | 0.731% | | 3/25/31 | | | 89,499 | | | 75,254 | |
IndyMac Seconds Asset Backed Trust A-A | | | | 0.601% | | 6/25/36 | | | 552,348 | | | 93,648 | |
Lehman XS Trust 2005-5N | | | | 0.771% | | 11/25/35 | | | 19,465,497 | | | 8,753,029 | |
Lehman XS Trust 2005-5N 3A1A | | | | 0.771% | | 11/25/35 | | | 5,224,474 | | | 2,431,629 | |
Lehman XS Trust 2006-2N 1A1 | | | | 0.731% | | 2/25/46 | | | 253,271 | | | 103,103 | |
Lehman XS Trust 2006-4N A2A | | | | 0.691% | | 4/25/46 | | | 6,744,277 | | | 2,651,353 | |
Lehman XS Trust 2007-8H A1 | | | | 0.601% | | 6/25/37 | | | 80,872,505 | | | 58,582,336 | |
Lehman XS Trust 2007-9 1A1 | | | | 0.591% | | 6/25/37 | | | 789,676 | | | 574,148 | |
Long Beach Mortgage Loan Trust 2006-8 2A4 | | | | 0.711% | | 9/25/36 | | | 7,500,000 | | | 661,963 | |
Long Beach Mortgage Loan Trust 2006-9 2A3 | | | | 0.631% | | 10/25/36 | | | 6,200,000 | | | 1,972,392 | |
Merrill Lynch Mortgage Investors Trust 2007-SD1 A1 | | | | 0.921% | | 2/25/37 | | | 89,348,338 | | | 65,081,133 | |
Morgan Stanley Mortgage Loan Trust 2006-4SL A1 | | | | 0.621% | | 3/25/36 | | | 322,003 | | | 75,733 | |
MSDWCC Heloc Trust 2005-1 | | | | 0.661% | | 7/25/17 | | | 1,687,905 | | | 1,132,252 | |
Nelnet Student Loan Trust 2008-4 A4 | | | | 5.015% | | 4/25/24 | | | 200,000 | | | 162,027 | |
Option One Mortgage Loan Trust 2003-1 | | | | 1.311% | | 2/25/33 | | | 15,038 | | | 10,243 | |
Provident Bank Home Equity Loan Trust 2000-2 | | | | 1.011% | | 8/25/31 | | | 261,525 | | | 101,572 | |
RAAC 2006-RP2 A | | | | 0.721% | | 2/25/37 | | | 421,230 | | | 261,183 | A |
RAAC 2006-RP3 A | | | | 0.741% | | 5/25/36 | | | 42,319 | | | 31,717 | A |
RAAC 2006-RP4 A | | | | 0.761% | | 1/25/46 | | | 28,204,367 | | | 19,220,830 | A |
RAAC 2007-RP2 M1 | | | | 1.121% | | 2/25/46 | | | 600,000 | | | 16,920 | A |
RAAC 2007-SP3 A1 | | | | 1.671% | | 9/25/37 | | | 940,405 | | | 812,370 | |
Renaissance Home Equity Loan Trust 2003-4 A3 | | | | 1.091% | | 3/25/34 | | | 17,210,120 | | | 12,509,134 | |
Renaissance Home Equity Loan Trust 2005-1 | | | | 0.801% | | 5/25/35 | | | 2,975,156 | | | 1,853,145 | |
Residential Asset Mortgage Products Inc. 2003-RS4 | | | | 1.131% | | 5/25/33 | | | 817,879 | | | 471,088 | |
Residential Funding Mortgage Securities II 2003-HS3 | | | | 0.761% | | 8/25/33 | | | 227,644 | | | 143,926 | |
Residential Funding Securities Corp. 2002-RP2 A1 | | | | 1.221% | | 10/25/32 | | | 4,710,785 | | | 3,063,568 | A |
60
Annual Report to Shareholders
| | | | | | | | | | | | | |
| | | % OF
NET ASSET | | RATE | | MATURITY
DATE | | PAR/
SHARES† | | VALUE | |
| | | | | | | | | | | | | |
Asset-Backed Securities—Continued | | | | | | | | | | | | | |
| | | | | |
Indexed Securities—Continued | | | | | | | | | | | | | |
SACO I Trust 2006-3 A3 | | | | 0.701% | | 4/25/36 | | $ | 3,658,891 | | $ | 631,131 | |
SACO I Trust 2006-5 1A | | | | 0.621% | | 4/25/36 | | | 346,267 | | | 67,633 | |
SACO I Trust 2006-6 A | | | | 0.601% | | 6/25/36 | | | 1,009,029 | | | 167,782 | |
Salomon Brothers Mortgage Securities VII 2002-CIT1 | | | | 0.771% | | 3/25/32 | | | 309,685 | | | 282,964 | |
Securitized Asset Backed Receivables LLC 2007-BR3 A2B | | | | 0.691% | | 4/25/37 | | | 51,787,000 | | | 19,422,631 | |
Securitized Asset Backed Receivables LLC Trust 2007-BR2 A2 | | | | 0.701% | | 2/25/37 | | | 36,033,861 | | | 16,704,235 | |
SLM Student Loan Trust 2006-10 A2 | | | | 3.545% | | 10/25/17 | | | 201,063 | | | 200,352 | |
SLM Student Loan Trust 2006-5 | | | | 3.525% | | 7/25/17 | | | 352,268 | | | 341,641 | |
Southern Pacific Secured Asset Corp. 1998-2 | | | | 0.811% | | 7/25/29 | | | 19,826 | | | 13,062 | |
Structured Asset Securities Corp. 2006-ARS1 A1 | | | | 0.581% | | 2/25/36 | | | 834,651 | | | 109,063 | A |
Truman Capital Mortgage Loan Trust 2006-1 | | | | 0.731% | | 3/25/36 | | | 20,792,855 | | | 11,436,070 | A |
Vanderbilt Mortgage Finance 1999-D | | | | 5.126% | | 1/7/30 | | | 4,100,000 | | | 2,615,949 | |
Wachovia Asset Securitization Inc. 2002-HE1 | | | | 0.841% | | 9/27/32 | | | 638,677 | | | 461,878 | |
Wachovia Asset Securitization Inc. 2002-HE2 | | | | 0.901% | | 12/25/32 | | | 68,047 | | | 53,047 | |
Wachovia Asset Securitization Inc. 2003-HE1 | | | | 0.761% | | 3/25/33 | | | 14,958 | | | 9,679 | |
| | | | | | | | | | | | | |
| | | | | | | | | | | | 310,455,700 | |
| | | | | | | | | | | | | |
Stripped Securities | | N.M. | | | | | | | | | | | |
Oakwood Mortgage Investors Inc. 2001-E | | | | 6.000% | | 11/15/09 | | | 3,897,909 | | | 164,944 | P,I1 |
| | | | | | | | | | | | | |
| | | | | |
Variable Rate SecuritiesJ | | 0.1% | | | | | | | | | | | |
Countrywide Asset-Backed Certificates 2004-15 | | | | 4.614% | | 12/25/32 | | | 10,824,449 | | | 10,426,354 | |
Structured Asset Securities Corp. 2005-SC1 1A2 | | | | 9.556% | | 5/25/31 | | | 664,021 | | | 512,588 | A |
| | | | | | | | | | | | | |
| | | | | | | | | | | | 10,938,942 | |
| | | | | | | | | | | | | |
Total Asset-Backed Securities
(Cost—$618,833,175) | | | | | | | | | | | | 349,034,918 | |
61
Annual Report to Shareholders
Portfolio of Investments—Continued
Western Asset Core Plus Bond Portfolio—Continued
| | | | | | | | | | | | | |
| | | % OF
NET ASSET | | RATE | | MATURITY
DATE | | PAR/
SHARES† | | VALUE | |
| | | | | | | | | | | | | |
Mortgage-Backed Securities | | 10.8% | | | | | | | | | | | |
| | | | | |
Fixed Rate Securities | | 3.1% | | | | | | | | | | | |
Banc of America Commercial Mortgage Inc. 2006-1 A4 | | | | 5.372% | | 9/10/45 | | $ | 310,000 | | $ | 248,083 | |
Banc of America Commercial Mortgage Inc. 2006-3 A4 | | | | 5.889% | | 7/10/44 | | | 400,000 | | | 325,980 | |
Banc of America Commercial Mortgage Inc. 2007-5 A3 | | | | 5.620% | | 2/10/51 | | | 2,430,000 | | | 1,561,556 | |
Banc of America Funding Corp. 2003-1 | | | | 6.000% | | 5/20/33 | | | 463,147 | | | 453,595 | |
Banc of America Funding Corp. 2006-8T2 A2 | | | | 5.791% | | 10/25/36 | | | 117,608 | | | 98,356 | |
Bear Stearns Commercial Mortgage Securities 2007-PW17 A3 | | | | 5.736% | | 6/11/50 | | | 6,250,000 | | | 4,228,868 | |
Commercial Capital Access One Inc. 2I | | | | 12.000% | | 11/15/27 | | | 1,833,693 | | | 623,456 | |
Commercial Mortgage Pass-Through Certificates 2001-J1A A2 | | | | 6.457% | | 2/14/34 | | | 347,156 | | | 340,747 | A |
Countrywide Alternative Loan Trust 2003-20CB 1A1 | | | | 5.500% | | 10/25/33 | | | 21,243,084 | | | 17,525,544 | |
Credit Suisse Mortgage Capital Certificates 2006-C4 A3 | | | | 5.467% | | 9/15/39 | | | 1,800,000 | | | 1,324,375 | |
GE Capital Commercial Mortgage Corp. 2007-C1 A4 | | | | 5.543% | | 12/10/49 | | | 24,050,000 | | | 17,925,622 | |
GMAC Commercial Mortgage Securities Inc. 1999-C2 | | | | 6.945% | | 9/15/33 | | | 195,566 | | | 194,795 | |
GS Mortgage Securities Corp. II 2005-GG4 | | | | 4.680% | | 7/10/39 | | | 18,650,000 | | | 16,512,626 | |
JP Morgan Chase Commercial Mortgage Pass-Through Certificates
2005-CIBC12 | | | | 4.895% | | 9/12/37 | | | 3,000,000 | | | 2,371,275 | |
JP Morgan Chase Commercial Mortgage Securities Corp. 2006-CB15 | | | | 5.814% | | 6/12/43 | | | 2,370,000 | | | 1,823,436 | |
JP Morgan Chase Commercial Mortgage Securities Corp. 2006-CB17 A4 | | | | 5.429% | | 12/12/43 | | | 1,240,000 | | | 941,178 | |
JP Morgan Chase Commercial Mortgage Securities Corp. 2006-LDP9 A3 | | | | 5.336% | | 5/15/47 | | | 75,000,000 | | | 56,263,237 | |
JP Morgan Chase Commercial Mortgage Securities Corp. 2007-LDPX A3 | | | | 5.420% | | 5/15/49 | | | 34,910,000 | | | 24,680,228 | |
JP Morgan Commercial Mortgage Finance Corp. 1999-C8 A2 | | | | 7.400% | | 7/15/31 | | | 538,120 | | | 536,534 | |
LB-UBS Commercial Mortgage Trust 2000-C3 A2 | | | | 7.950% | | 5/15/25 | | | 95,740 | | | 96,154 | |
62
Annual Report to Shareholders
| | | | | | | | | | | | | |
| | | % OF
NET ASSET | | RATE | | MATURITY
DATE | | PAR/
SHARES† | | VALUE | |
| | | | | | | | | | | | | |
Mortgage-Backed Securities—Continued | | | | | | | | | | | | | |
| | | | | |
Fixed Rate Securities—Continued | | | | | | | | | | | | | |
LB-UBS Commercial Mortgage Trust 2005-C3 A5 | | | | 4.739% | | 7/15/30 | | $ | 8,640,000 | | $ | 6,982,692 | |
LB-UBS Commercial Mortgage Trust 2005-C3 AAB | | | | 4.664% | | 7/15/30 | | | 4,100,000 | | | 3,298,583 | |
LB-UBS Commercial Mortgage Trust 2005-C5 | | | | 4.954% | | 9/15/30 | | | 1,570,000 | | | 1,281,594 | |
MASTR Reperforming Loan Trust
2005-1 1A1 | | | | 6.000% | | 8/25/34 | | | 4,814,749 | | | 4,914,999 | A |
MASTR Reperforming Loan Trust
2005-1 1A3 | | | | 7.000% | | 8/25/34 | | | 6,975,225 | | | 7,327,120 | A |
Merrill Lynch/Countrywide Commercial Mortgage 2007-6 A4 | | | | 5.485% | | 3/12/51 | | | 22,470,000 | | | 15,470,193 | |
Morgan Stanley Capital I 2005-HQ6 | | | | 4.989% | | 8/13/42 | | | 21,070,000 | | | 17,213,678 | |
Morgan Stanley Capital I 2006-IQ12 A4 | | | | 5.332% | | 12/15/43 | | | 300,000 | | | 225,691 | |
Morgan Stanley Capital I 2007-IQ14 A4 | | | | 5.692% | | 4/15/49 | | | 20,290,000 | | | 15,226,687 | |
Morgan Stanley Mortgage Loan Trust 2006-2 5A2 | | | | 5.500% | | 2/25/36 | | | 310,631 | | | 275,559 | |
Prime Mortgage Trust 2006-DR1 2A2 | | | | 6.000% | | 11/25/36 | | | 73,713,295 | | | 47,648,739 | A |
Residential Asset Mortgage Products Inc. 2004-SL2 | | | | 8.500% | | 10/25/31 | | | 211,462 | | | 215,798 | |
Residential Asset Mortgage Products Inc. 2004-SL4 | | | | 7.500% | | 7/25/32 | | | 2,050,954 | | | 1,836,245 | |
Residential Asset Mortgage Products Inc. 2005-SL2 | | | | 7.500% | | 3/25/32 | | | 10,293,459 | | | 6,432,608 | |
Residential Asset Securitization Trust 2003-A14 | | | | 4.750% | | 2/25/19 | | | 2,247,821 | | | 1,719,509 | |
| | | | | | | | | | | | | |
| | | | | | | | | | | | 278,145,340 | |
| | | | | | | | | | | | | |
Indexed SecuritiesB | | 4.7% | | | | | | | | | | | |
American Home Mortgage Assets Trust 2006-3 | | | | 0.661% | | 7/25/46 | | | 17,837,793 | | | 7,204,897 | |
American Home Mortgage Investment Trust 2005-4 | | | | 0.761% | | 11/25/45 | | | 15,584,223 | | | 7,463,362 | |
Bayview Commercial Asset Trust 2006-2A A1 | | | | 0.701% | | 7/25/36 | | | 1,725,526 | | | 1,251,352 | A |
Bayview Commercial Asset Trust 2006-SP1 A1 | | | | 0.741% | | 4/25/36 | | | 1,735,257 | | | 1,268,906 | A |
Bear Stearns Second Lien Trust
2007-SV1A A1 | | | | 0.691% | | 12/25/36 | | | 6,785,583 | | | 4,247,351 | A |
63
Annual Report to Shareholders
Portfolio of Investments—Continued
Western Asset Core Plus Bond Portfolio—Continued
| | | | | | | | | | | | | |
| | | % OF
NET ASSET | | RATE | | MATURITY
DATE | | PAR/
SHARES† | | VALUE | |
| | | | | | | | | | | | | |
Mortgage-Backed Securities—Continued | | | | | | | | | | | | | |
| | | | | |
Indexed Securities—Continued | | | | | | | | | | | | | |
Chevy Chase Mortgage Funding Corp. 2005-4A A1 | | | | 0.671% | | 10/25/36 | | $ | 1,385,924 | | $ | 613,889 | A |
Citigroup Mortgage Loan Trust Inc. 2005-5 | | | | 5.441% | | 8/25/35 | | | 236,250 | | | 125,593 | |
Citigroup Mortgage Loan Trust Inc. 2005-HE2 | | | | 0.871% | | 7/25/35 | | | 8,959,677 | | | 6,091,290 | A |
Countrywide Alternative Loan Trust 2004-J9 3A4 | | | | 0.861% | | 10/25/34 | | | 118,936 | | | 59,161 | |
Countrywide Alternative Loan Trust 2005-38 A3 | | | | 0.821% | | 9/25/35 | | | 16,763,047 | | | 7,559,516 | |
Countrywide Alternative Loan Trust 2005-44 1A1 | | | | 0.801% | | 10/25/35 | | | 20,496,417 | | | 9,466,088 | |
Countrywide Alternative Loan Trust 2005-44 2A1 | | | | 0.781% | | 10/25/35 | | | 10,358,369 | | | 4,694,984 | |
Countrywide Alternative Loan Trust 2005-56 3A1 | | | | 0.761% | | 11/25/35 | | | 12,972,887 | | | 5,880,336 | |
Countrywide Alternative Loan Trust 2005-56 4A1 | | | | 0.781% | | 11/25/35 | | | 6,543,914 | | | 3,021,460 | |
Countrywide Alternative Loan Trust 2005-59 1A1 | | | | 0.801% | | 11/20/35 | | | 6,337,526 | | | 3,168,004 | |
Countrywide Alternative Loan Trust 2005-72 A1 | | | | 0.741% | | 1/25/36 | | | 4,733,258 | | | 2,224,874 | |
Countrywide Alternative Loan Trust 2005-J12 | | | | 0.741% | | 8/25/35 | | | 865,622 | | | 417,468 | |
Countrywide Alternative Loan Trust 2006-0A10 4A1 | | | | 0.661% | | 8/25/46 | | | 683,270 | | | 266,409 | |
Countrywide Alternative Loan Trust 2006-0A11 A4 | | | | 0.661% | | 9/25/46 | | | 746,604 | | | 182,938 | |
Countrywide Alternative Loan Trust 2006-0A2 A5 | | | | 0.738% | | 5/20/46 | | | 7,527,318 | | | 2,734,860 | |
Countrywide Alternative Loan Trust 2006-0A9 2A1B | | | | 0.708% | | 7/20/46 | | | 754,699 | | | 245,871 | |
Countrywide Alternative Loan Trust 2006-OA1 2A1 | | | | 0.718% | | 3/20/46 | | | 159,523 | | | 65,644 | |
Countrywide Alternative Loan Trust 2006-OA17 | | | | 0.703% | | 12/20/46 | | | 42,140,768 | | | 18,278,111 | |
Countrywide Alternative Loan Trust 2006-OA18 A2 | | | | 0.711% | | 12/25/36 | | | 318,569 | | | 68,344 | |
Countrywide Alternative Loan Trust 2006-OA9 1A1 | | | | 0.708% | | 7/20/46 | | | 731,132 | | | 253,592 | |
64
Annual Report to Shareholders
| | | | | | | | | | | | | |
| | | % OF
NET ASSET | | RATE | | MATURITY
DATE | | PAR/
SHARES† | | VALUE | |
| | | | | | | | | | | | | |
Mortgage-Backed Securities—Continued | | | | | | | | | | | | | |
| | | | | |
Indexed Securities—Continued | | | | | | | | | | | | | |
Countrywide Alternative Loan Trust 2006-OC2 2A3 | | | | 0.761% | | 2/25/36 | | $ | 10,000,000 | | $ | 1,786,036 | |
Countrywide Home Loans 2005-09 1A1 | | | | 0.771% | | 5/25/35 | | | 7,795,635 | | | 3,626,559 | |
Countrywide Home Loans 2005-R3 | | | | 0.871% | | 9/25/35 | | | 6,042,294 | | | 4,635,067 | A |
Countrywide Home Loans 2006-OA5 1A1 | | | | 0.671% | | 4/25/46 | | | 4,738,341 | | | 1,999,908 | |
DSLA Mortgage Loan Trust 2006-AR1 1A1A | | | | 3.176% | | 3/19/46 | | | 1,965,610 | | | 589,683 | |
DSLA Mortgage Loan Trust 2006-AR1 1A1B | | | | 3.176% | | 3/19/47 | | | 1,519,422 | | | 346,618 | |
First Horizon Alternative Mortgage Securities 2006-FA8 1A8 | | | | 0.841% | | 2/25/37 | | | 725,329 | | | 217,081 | |
GMAC Mortgage Corp. Loan Trust 2005-AR6 2A1 | | | | 5.207% | | 11/19/35 | | | 279,057 | | | 187,710 | |
Greenpoint Mortgage Funding Trust 2005-AR5 2A2 | | | | 0.741% | | 11/25/46 | | | 5,464,375 | | | 1,676,668 | |
Greenpoint Mortgage Funding Trust 2006-AR3 3A1 | | | | 0.701% | | 4/25/36 | | | 6,050,261 | | | 2,485,238 | |
Greenpoint Mortgage Funding Trust 2007-AR2 1A1 | | | | 0.601% | | 4/25/47 | | | 70,030,052 | | | 42,143,252 | |
GSMPS Mortgage Loan Trust 2005-RP2 | | | | 0.821% | | 3/25/35 | | | 19,561,506 | | | 14,945,636 | A |
GSMPS Mortgage Loan Trust 2005-RP3 | | | | 0.821% | | 9/25/35 | | | 30,359,547 | | | 23,847,063 | A |
Harborview Mortgage Loan Trust 2005-3 | | | | 0.821% | | 6/19/35 | | | 15,706,823 | | | 7,224,856 | |
Harborview Mortgage Loan Trust 2005-7 | | | | 4.619% | | 6/19/45 | | | 6,602,606 | | | 2,310,912 | |
Harborview Mortgage Loan Trust 2006-13 A | | | | 0.761% | | 11/19/46 | | | 777,925 | | | 309,307 | |
Harborview Mortgage Loan Trust 2006-7 | | | | 0.781% | | 10/19/37 | | | 3,675,799 | | | 1,497,272 | |
Harborview Mortgage Loan Trust
2007-4 2A1 | | | | 0.801% | | 7/19/47 | | | 33,987,842 | | | 14,266,733 | |
Impac CMB Trust 2003-4 1A1 | | | | 1.111% | | 10/25/33 | | | 131,299 | | | 76,272 | |
Impac Secured Assets Corp. 2005-2 | | | | 0.791% | | 3/25/36 | | | 477,878 | | | 221,706 | |
Impac Secured Assets Corp. 2006-2 2A1 | | | | 0.821% | | 8/25/36 | | | 4,394,507 | | | 2,325,552 | |
IndyMac Inda Mortgage Loan Trust 2007-AR7 1A1 | | | | 6.176% | | 11/25/37 | | | 14,389,489 | | | 8,870,979 | |
IndyMac Index Mortgage Loan Trust 2004-AR2 2A1 | | | | 1.091% | | 6/25/34 | | | 44,388 | | | 26,423 | |
IndyMac Index Mortgage Loan Trust 2006-AR15 A1 | | | | 0.591% | | 7/25/36 | | | 285,122 | | | 106,213 | |
IndyMac Index Mortgage Loan Trust 2006-AR6 2A1A | | | | 0.671% | | 6/25/47 | | | 700,418 | | | 305,954 | |
65
Annual Report to Shareholders
Portfolio of Investments—Continued
Western Asset Core Plus Bond Portfolio—Continued
| | | | | | | | | | | | | |
| | | % OF
NET ASSET | | RATE | | MATURITY
DATE | | PAR/
SHARES† | | VALUE | |
| | | | | | | | | | | | | |
Mortgage-Backed Securities—Continued | | | | | | | | | | | | | |
| | | | | |
Indexed Securities—Continued | | | | | | | | | | | | | |
La Hipotecaria SA 2007-1GA A | | | | 5.500% | | 12/23/36 | | $ | 344,460 | | $ | 258,347 | A |
Lehman XS Trust 2006-GP2 1A1A | | | | 0.541% | | 6/25/46 | | | 613,509 | | | 490,498 | |
Luminent Mortgage Trust 2006-4 A1A | | | | 0.661% | | 5/25/46 | | | 589,380 | | | 261,169 | |
Luminent Mortgage Trust 2006-7 2A1 | | | | 0.641% | | 12/25/36 | | | 5,060,795 | | | 2,219,569 | |
MASTR Adjustable Rate Mortgages Trust 2004-13 | | | | 3.788% | | 11/21/34 | | | 1,830,000 | | | 1,171,238 | |
MASTR Adjustable Rate Mortgages Trust 2006-0A1 1A1 | | | | 0.681% | | 4/25/46 | | | 560,379 | | | 219,357 | |
MASTR Adjustable Rate Mortgages Trust 2007-3 12A1 | | | | 0.671% | | 5/25/47 | | | 999,721 | | | 385,451 | |
MASTR Reperforming Loan Trust 2005-2 1A1F | | | | 0.821% | | 5/25/35 | | | 5,707,029 | | | 3,799,199 | A |
MLCC Mortgage Investors Inc. 2003-B | | | | 0.811% | | 4/25/28 | | | 2,501,732 | | | 1,683,613 | |
MLCC Mortgage Investors Inc. 2006-1 1A | | | | 5.382% | | 2/25/36 | | | 916,933 | | | 594,010 | |
Novastar Mortgage-Backed Notes 2006-MTA1 2A1A | | | | 0.661% | | 9/25/46 | | | 566,976 | | | 235,216 | |
RBSGC Mortgage Pass Through Certificates 2007-B 1A4 | | | | 0.921% | | 1/25/37 | | | 42,230,230 | | | 21,374,476 | |
Residential Accredit Loans Inc. 2005-QO3 A1 | | | | 0.871% | | 10/24/45 | | | 2,484,282 | | | 1,142,004 | |
Residential Accredit Loans Inc. 2006-QO10 A1 | | | | 0.631% | | 1/25/37 | | | 329,567 | | | 122,208 | |
Residential Accredit Loans Inc. 2006-QO8 1A1A | | | | 0.561% | | 10/25/46 | | | 2,235,878 | | | 1,580,654 | |
Residential Accredit Loans Inc. 2007-QO4 A1A | | | | 0.661% | | 5/25/47 | | | 14,063,269 | | | 5,097,964 | |
Sequoia Mortgage Trust A4 | | | | 0.868% | | 11/25/24 | | | 10,532 | | | 7,883 | |
Structured Adjustable Rate Mortgage Loan Trust 2004-20 2A1 | | | | 5.193% | | 1/25/35 | | | 363,309 | | | 212,109 | |
Structured Adjustable Rate Mortgage Loan Trust 2005-19XS | | | | 0.771% | | 10/25/35 | | | 444,861 | | | 202,024 | |
Structured Asset Mortgage Investments Inc. 2006-AR3 11A1 | | | | 0.681% | | 4/25/36 | | | 5,625,449 | | | 2,287,801 | |
Structured Asset Mortgage Investments Inc. 2006-AR6 1A1 | | | | 0.651% | | 7/25/46 | | | 658,739 | | | 263,239 | |
Structured Asset Mortgage Investments Inc. 2006-AR7 A1A | | | | 0.681% | | 8/25/36 | | | 40,868,231 | | | 16,236,327 | |
Structured Asset Mortgage Investments Inc. 2007-AR4 GA4B | | | | 0.651% | | 9/25/47 | | | 1,084,328 | | | 334,287 | |
66
Annual Report to Shareholders
| | | | | | | | | | | | | |
| | | % OF
NET ASSET | | RATE | | MATURITY
DATE | | PAR/
SHARES† | | VALUE | |
| | | | | | | | | | | | | |
Mortgage-Backed Securitie—Continued | | | | | | | | | | | | | |
| | | | | |
Indexed Securities—Continued | | | | | | | | | | | | | |
Terwin Mortgage Trust 2006-9HGA A1 | | | | 0.551% | | 10/25/37 | | $ | 482,256 | | $ | 439,358 | A |
Thornburg Mortgage Securities Trust 2006-1 | | | | 1.565% | | 1/25/36 | | | 752,273 | | | 749,404 | |
Thornburg Mortgage Securities Trust 2006-1 A2 | | | | 0.621% | | 1/25/36 | | | 6,493,443 | | | 6,475,193 | |
WaMu Mortgage Pass-Through Certificates 2005-AR17 A1A1 | | | | 0.741% | | 12/25/45 | | | 424,497 | | | 199,389 | |
WaMu Mortgage Pass-Through Certificates, 2005-AR06 2A1A | | | | 0.701% | | 4/25/45 | | | 10,861,865 | | | 5,127,723 | |
WaMu Mortgage Pass-Through Certificates, 2005-AR08 1A1A | | | | 0.741% | | 7/25/45 | | | 10,657,659 | | | 4,260,562 | |
WaMu Mortgage Pass-Through Certificates, 2005-AR1 A1A | | | | 0.791% | | 1/25/45 | | | 2,508,615 | | | 1,262,377 | |
WaMu Mortgage Pass-Through Certificates, 2005-AR11 | | | | 0.791% | | 8/25/45 | | | 33,935,193 | | | 18,350,015 | |
WaMu Mortgage Pass-Through Certificates, 2005-AR13 A1A1 | | | | 0.761% | | 10/25/45 | | | 19,584,368 | | | 10,696,516 | |
WaMu Mortgage Pass-Through Certificates, 2005-AR13 B10 | | | | 1.671% | | 10/25/45 | | | 5,849,380 | | | 350,963 | A |
WaMu Mortgage Pass-Through Certificates, 2005-AR15 A1A1 | | | | 0.731% | | 11/25/45 | | | 17,850,900 | | | 8,757,559 | |
WaMu Mortgage Pass-Through Certificates, 2005-AR15 A1A2 | | | | 0.751% | | 11/25/45 | | | 28,075,759 | | | 13,789,606 | |
WaMu Mortgage Pass-Through Certificates, 2005-AR17 A1A2 | | | | 0.761% | | 12/25/45 | | | 17,601,933 | | | 8,154,180 | |
WaMu Mortgage Pass-Through Certificates, 2005-AR19 A1A1 | | | | 0.741% | | 12/25/45 | | | 25,711,162 | | | 11,740,596 | |
WaMu Mortgage Pass-Through Certificates, 2005-AR19 A1A2 | | | | 0.761% | | 12/25/45 | | | 28,050,940 | | | 12,941,318 | |
Wells Fargo Alternative Loan Trust 2007-PA2 2A1 | | | | 0.901% | | 6/25/37 | | | 50,364,897 | | | 19,041,960 | |
Zuni Mortgage Loan Trust 2006-OA1 | | | | 0.601% | | 8/25/36 | | | 24,530,883 | | | 23,253,837 | |
| | | | | | | | | | | | | |
| | | | | | | | | | | | 428,652,197 | |
| | | | | | | | | | | | | |
Stripped Securities | | N.M. | | | | | | | | | | | |
Diversified REIT Trust 2001-1A | | | | 1.197% | | 3/8/10 | | | 5,797,667 | | | 88,646 | A,I1,P |
FFCA Secured Lending Corp. 1999-1A | | | | 1.343% | | 9/18/25 | | | 206,982 | | | 6,002 | A,I1,P |
GMAC Commercial Mortgage Securities Inc. 1999-CTL1 | | | | 0.171% | | 12/15/16 | | | 118,434 | | | 25 | A,I1,P |
67
Annual Report to Shareholders
Portfolio of Investments—Continued
Western Asset Core Plus Bond Portfolio—Continued
| | | | | | | | | | | | | |
| | | % OF
NET ASSET | | RATE | | MATURITY
DATE | | PAR/
SHARES† | | VALUE | |
| | | | | | | | | | | | | |
Mortgage-Backed Securities—Continued | | | | | | | | | | | | | |
| | | | | |
Stripped Securities—Continued | | | | | | | | | | | | | |
LB-UBS Commercial Mortgage Trust 2001-C3 X | | | | 0.926% | | 6/15/36 | | $ | 8,179,382 | | $ | 137,288 | A,I1,P |
| | | | | | | | | | | | | |
| | | | | | | | | | | | 231,961 | |
| | | | | | | | | | | | | |
Variable Rate SecuritiesJ | | 3.0% | | | | | | | | | | | |
Banc of America Commercial Mortgage Inc. 2005-5 A4 | | | | 5.115% | | 10/10/45 | | | 8,600,000 | | | 7,009,075 | |
Banc of America Commercial Mortgage Inc. 2006-2 A4 | | | | 5.739% | | 5/10/45 | | | 28,805,000 | | | 23,526,069 | |
Banc of America Funding Corp. 2005-F 2A1 | | | | 4.958% | | 9/20/35 | | | 19,105,652 | | | 9,519,047 | |
Bear Stearns Adjustable Rate Mortgage Trust 2005-12 11A1 | | | | 5.268% | | 2/25/36 | | | 596,359 | | | 301,206 | |
Bear Stearns Commercial Mortgage Securities 2005-PW10 A4 | | | | 5.405% | | 12/11/40 | | | 400,000 | | | 340,164 | |
Citigroup Mortgage Loan Trust Inc. 2005-10 1A1A | | | | 5.528% | | 12/25/35 | | | 372,389 | | | 181,725 | |
Commercial Mortgage Asset Trust 1999-C2 | | | | 7.546% | | 11/17/32 | | | 232,589 | | | 232,572 | |
Countrywide Alternative Loan Trust 2004-33 2A1 | | | | 5.395% | | 12/25/34 | | | 42,234 | | | 19,753 | |
Countrywide Home Loan Mortgage Pass Through Trust 2006-HYB1 2A1 | | | | 5.327% | | 3/20/36 | | | 225,305 | | | 118,741 | |
Countrywide Home Loan Mortgage Pass Through Trust 2006-HYB3 2A1A | | | | 5.702% | | 5/20/36 | | | 5,207 | | | 2,756 | |
Credit Suisse Mortgage Capital Certificates 2006-C1 A4 | | | | 5.552% | | 2/15/39 | | | 2,130,000 | | | 1,729,435 | |
Credit Suisse Mortgage Capital Certificates 2007-C4 A3 | | | | 5.811% | | 9/15/39 | | | 7,700,000 | | | 4,596,940 | |
Credit Suisse Mortgage Capital Certificates 2007-C4 A4 | | | | 5.811% | | 9/15/39 | | | 2,040,000 | | | 1,261,378 | |
Credit Suisse Mortgage Capital Certificates 2007-C5 A3 | | | | 5.694% | | 9/15/40 | | | 2,740,000 | | | 1,627,721 | |
Credit Suisse Mortgage Capital Certificates A3-C2 | | | | 5.658% | | 3/15/39 | | | 8,200,000 | | | 6,675,661 | |
Deutsche Mortgage Securities Inc. 2005-WF1 1A3 | | | | 5.098% | | 6/26/35 | | | 28,770,000 | | | 20,793,952 | A |
GE Capital Commercial Mortgage Corp. 2005-C4 | | | | 5.334% | | 11/10/45 | | | 15,020,000 | | | 12,442,975 | |
68
Annual Report to Shareholders
| | | | | | | | | | | | | |
| | | % OF
NET ASSET | | RATE | | MATURITY
DATE | | PAR/
SHARES† | | VALUE | |
| | | | | | | | | | | | | |
Mortgage-Backed Securities—Continued | | | | | | | | | | | | | |
| | | | | |
Variable Rate Securities—Continued | | | | | | | | | | | | | |
Greenwich Capital Commercial Funding Corp. 2008-GG5 A5 | | | | 5.224% | | 4/10/37 | | $ | 3,660,000 | | $ | 3,007,799 | |
GS Mortgage Securities Corp. II 2007-GG10 A4 | | | | 5.799% | | 8/10/45 | | | 2,510,000 | | | 1,821,398 | |
GSR Mortgage Loan Trust 2005-AR7 1A1 | | | | 5.423% | | 11/25/35 | | | 2,740,917 | | | 1,778,694 | |
Harborview Mortgage Loan Trust 2006-2 | | | | 5.571% | | 2/25/36 | | | 5,773,391 | | | 2,193,889 | |
IndyMac INDX Mortgage Loan Trust 2004-AR15 | | | | 6.095% | | 2/25/35 | | | 430,104 | | | 182,131 | |
IndyMac INDX Mortgage Loan Trust 2005-AR1 1A1 | | | | 5.707% | | 3/25/35 | | | 341,356 | | | 153,610 | |
IndyMac INDX Mortgage Loan Trust 2005-AR13 | | | | 4.666% | | 8/25/35 | | | 693,644 | | | 364,539 | |
IndyMac INDX Mortgage Loan Trust 2005-AR15 | | | | 5.099% | | 9/25/35 | | | 9,713,432 | | | 4,663,733 | |
IndyMac INDX Mortgage Loan Trust 2005-AR9 1A1 | | | | 4.939% | | 7/25/35 | | | 146,165 | | | 75,611 | |
JP Morgan Chase Commercial Mortgage Securities Corp. 2005-CB13 | | | | 5.280% | | 1/12/43 | | | 11,800,000 | | | 9,478,225 | |
JP Morgan Chase Commercial Mortgage Securities Corp. 2006-LDP9 HS | | | | 5.748% | | 5/15/47 | | | 5,000,000 | | | 374,592 | A |
JP Morgan Mortgage Trust 2004-A3 SF3 | | | | 4.588% | | 6/25/34 | | | 337,908 | | | 260,510 | |
MASTR Adjustable Rate Mortgages Trust 2004-15 | | | | 5.737% | | 12/25/34 | | | 34,504 | | | 18,296 | |
MASTR Adjustable Rate Mortgages Trust 2004-4 3A1 | | | | 4.175% | | 5/25/34 | | | 2,401,911 | | | 2,345,159 | |
MASTR Adjustable Rate Mortgages Trust 2005-1 7A1 | | | | 4.819% | | 2/25/35 | | | 675,627 | | | 350,288 | |
MASTR Adjustable Rate Mortgages Trust 2006-2 3A1 | | | | 4.845% | | 1/25/36 | | | 3,256,412 | | | 2,597,434 | |
MASTR Adjustable Rate Mortgages Trust 2007-R5 A1 | | | | 5.652% | | 11/25/35 | | | 7,812,586 | | | 4,194,930 | A |
Merrill Lynch Mortgage Investors Trust 2005-A2 A4 | | | | 4.487% | | 2/25/35 | | | 249,890 | | | 185,758 | |
Merrill Lynch Mortgage Investors Trust 2006-A1 1A1 | | | | 5.838% | | 3/25/36 | | | 34,717,946 | | | 16,283,418 | |
Merrill Lynch Mortgage Trust 2005-CKI1 | | | | 5.242% | | 11/12/37 | | | 18,940,000 | | | 15,632,712 | |
Merrill Lynch Mortgage Trust 2005-MCP1 | | | | 4.747% | | 6/12/43 | | | 15,240,000 | | | 12,313,041 | |
Merrill Lynch Mortgage Trust 2006-C1 A4 | | | | 5.657% | | 5/12/39 | | | 510,000 | | | 415,343 | |
69
Annual Report to Shareholders
Portfolio of Investments—Continued
Western Asset Core Plus Bond Portfolio—Continued
| | | | | | | | | | | | |
| | | % OF
NET ASSET | | RATE | | MATURITY
DATE | | PAR/
SHARES† | | VALUE |
| | | | | | | | | | | | |
Mortgage-Backed Securities—Continued | | | | | | | | | | | | |
| | | | | |
Variable Rate Securities—Continued | | | | | | | | | | | | |
Merrill Lynch/Countrywide Commercial Mortgage Trust 2007-7 A4 | | | | 5.749% | | 6/12/50 | | $ | 5,150,000 | | $ | 3,656,149 |
Merrill Lynch/Countrywide Commercial Mortgage Trust 2007-8 A3 | | | | 5.957% | | 8/12/49 | | | 2,800,000 | | | 2,141,679 |
Morgan Stanley Capital I 2007-HQ11 A4 | | | | 5.447% | | 2/12/44 | | | 1,670,000 | | | 1,238,649 |
Morgan Stanley Mortgage Loan Trust 2004-10AR 4A | | | | 5.467% | | 11/25/34 | | | 4,940,097 | | | 2,986,485 |
Morgan Stanley Mortgage Loan Trust 2004-8AR 4A1 | | | | 5.365% | | 10/25/34 | | | 10,639 | | | 5,411 |
Morgan Stanley Mortgage Loan Trust 2005-3AR | | | | 5.150% | | 7/25/35 | | | 7,071,805 | | | 3,835,620 |
Prime Mortgage Trust 2005-2 | | | | 7.404% | | 10/25/32 | | | 1,106,513 | | | 769,373 |
Structured Adjustable Rate Mortgage Loan Trust 2004-16 5A2 | | | | 5.070% | | 11/25/34 | | | 38,150,401 | | | 20,995,424 |
Thornburg Mortgage Securities Trust 2004-1 | | | | 5.204% | | 3/25/44 | | | 86,826 | | | 60,465 |
Thornburg Mortgage Securities Trust 2007-4 2A1 | | | | 6.208% | | 9/25/37 | | | 44,328,060 | | | 31,393,903 |
Thornburg Mortgage Securities Trust 2007-4 3A1 | | | | 6.201% | | 9/25/37 | | | 42,208,970 | | | 32,383,376 |
WaMu Mortgage Pass-Through Certificates 2005-AR14 1A1 | | | | 5.048% | | 12/25/35 | | | 648,857 | | | 522,476 |
WaMu Mortgage Pass-Through Certificates 2006-AR10 1A1 | | | | 5.929% | | 9/25/36 | | | 454,817 | | | 262,981 |
WaMu Mortgage Pass-Through Certificates 2007-HY4 4A1 | | | | 5.506% | | 9/25/36 | | | 132,965 | | | 93,051 |
Wells Fargo Mortgage Backed Securities Trust 2006-AR8 2A3 | | | | 5.240% | | 4/25/36 | | | 286,135 | | | 207,233 |
| | | | | | | | | | | | |
| | | | | | | | | | | | 269,622,555 |
| | | | | | | | | | | | |
Total Mortgage-Backed Securities
(Cost—$1,557,900,612) | | | | | | | | | | | | 976,652,053 |
70
Annual Report to Shareholders
| | | | | | | | | | | | |
| | | % OF
NET ASSET | | RATE | | MATURITY
DATE | | PAR/
SHARES† | | VALUE |
| | | | | | | | | | | | |
Loan Participations and AssignmentsB | | 0.5% | | | | | | | | | | |
| | | | | |
Auto Components | | N.M. | | | | | | | | | | |
Allison Transmission Inc., Term Loan, Tranche B | | | | 4.190% to 5.000% | | 3/31/09 | | $ | 973,871 | | $ | 538,411 |
| | | | | | | | | | | | |
| | | | | |
Communications Equipment | | N.M. | | | | | | | | | | |
Panamsat Corp., Term Loan, Tranche A | | | | 6.650% | | 1/5/09 | | | 1,550,000 | | | 1,333,000 |
| | | | | | | | | | | | |
| | | | | |
Computers and Peripherals | | N.M. | | | | | | | | | | |
SunGard Data Systems Inc., Term Loan, Tranche B | | | | 3.575% to 4.138% | | 2/9/09 | | | 1,955,076 | | | 1,331,407 |
| | | | | | | | | | | | |
| | | | | |
Containers and Packaging | | N.M. | | | | | | | | | | |
Amscan Holdings Inc., Term Loan, Tranche B | | | | 3.716% to 4.423% | | 3/26/09 | | | 985,000 | | | 615,625 |
| | | | | | | | | | | | |
| | | | | |
Diversified Consumer Services | | N.M. | | | | | | | | | | |
Thomson Medical Education, First Lien Term Loan | | | | 2.960% | | 1/30/09 | | | 990,000 | | | 639,650 |
| | | | | | | | | | | | |
| | | | | |
Diversified Financial Services | | N.M. | | | | | | | | | | |
CCM Merger Inc., Term Loan, Tranche B | | | | 3.459% to 4.193% | | 3/31/09 | | | 941,323 | | | 423,595 |
| | | | | | | | | | | | |
| | | | | |
Electric Utilities | | N.M. | | | | | | | | | | |
TXU, Term Loan, Tranche B2 | | | | 3.949% to 5.888% | | 2/9/09 | | | 1,237,500 | | | 855,422 |
| | | | | | | | | | | | |
| | | | | |
Health Care Providers and Services | | 0.1% | | | | | | | | | | |
Davita Inc., Term Loan, Tranche B1 | | | | 1.970% to 6.320% | | 3/31/09 | | | 2,000,000 | | | 1,738,572 |
Sheridan Healthcare Inc., Term Loan, Tranche B | | | | 3.959% to 7.135% | | 3/31/09 | | | 982,468 | | | 550,182 |
Vanguard Health Holding Co. II, Replacement Term Loan | | | | 2.721% to 3.709% | | 3/30/09 | | | 1,950,559 | | | 1,584,829 |
| | | | | | | | | | | | |
| | | | | | | | | | | | 3,873,583 |
| | | | | | | | | | | | |
71
Annual Report to Shareholders
Portfolio of Investments—Continued
Western Asset Core Plus Bond Portfolio—Continued
| | | | | | | | | | | | |
| | | % OF
NET ASSET | | RATE | | MATURITY
DATE | | PAR/
SHARES† | | VALUE |
| | | | | | | | | | | | |
Loan Participations and Assignments—Continued | | | | | | | | | | | | |
| | | | | |
Hotels, Restaurants and Leisure | | N.M. | | | | | | | | | | |
Metro-Goldwyn-Mayer Studios Inc., Term Loan, Tranche B | | | | 3.711% to 4.709% | | 3/31/09 | | $ | 1,466,165 | | $ | 601,128 |
| | | | | | | | | | | | |
| | | | | |
IT Services | | 0.3% | | | | | | | | | | |
First Data Corp., Term Loan, Tranche B1 | | | | 3.211% | | 1/30/09 | | | 39,411,900 | | | 25,237,686 |
| | | | | | | | | | | | |
| | | | | |
Media | | 0.1% | | | | | | | | | | |
Carmike Cinemas Inc., Delayed Draw Term Loan | | | | 5.330% | | 1/12/09 | | | 662,794 | | | 465,613 |
Cedar Fair LP, Term Loan, Tranche B | | | | 2.461% | | 1/30/09 | | | 975,000 | | | 609,375 |
Charter Communications Operating LLC, Term Loan | | | | 4.160% to 5.470% | | 2/12/09 | | | 1,980,000 | | | 1,445,400 |
Citadel Communication Group, Term Loan,
Tranche B | | | | 2.220% to 3.650% | | 1/30/09 | | | 1,000,000 | | | 400,000 |
CSC Holdings Inc., Incremental Term Loan | | | | 2.945% | | 1/15/09 | | | 977,444 | | | 830,419 |
Idearc Inc., Term Loan, Tranche B | | | | 2.470% to 3.460% | | 3/31/09 | | | 982,500 | | | 299,662 |
Nielsen Finance LLC, Term Loan, Tranche B | | | | 3.825% to 4.388% | | 2/9/09 | | | 1,960,015 | | | 1,319,335 |
Tribune Co., Tranche B | | | | 5.250% | | 3/31/09 | | | 987,500 | | | 272,974 |
Univision Communications, Term Loan, Tranche B | | | | 2.711% | | 1/30/09 | | | 1,000,000 | | | 398,333 |
UPC Broadband Holding, Term Loan, Tranche N1 | | | | 3.181% | | 1/2/09 | | | 1,000,000 | | | 664,000 |
| | | | | | | | | | | | |
| | | | | | | | | | | | 6,705,111 |
| | | | | | | | | | | | |
Multiline Retail | | N.M. | | | | | | | | | | |
Dollar General Corp., Term Loan, Tranche B | | | | 3.211% to 6.170% | | 3/31/09 | | | 1,000,000 | | | 768,750 |
| | | | | | | | | | | | |
| | | | | |
Paper and Forest Products | | N.M. | | | | | | | | | | |
Georgia-Pacific Corp., First Lien Term Loan | | | | 2.581% to 4.189% | | 3/31/09 | | | 872,257 | | | 708,345 |
| | | | | | | | | | | | |
72
Annual Report to Shareholders
| | | | | | | | | | | | | |
| | | % OF
NET ASSET | | RATE | | MATURITY
DATE | | PAR/
SHARES† | | VALUE | |
| | | | | | | | | | | | | |
Loan Participations and Assignments—Continued | | | | | | | | | | | | | |
| | | | | |
Road and Rail | | N.M. | | | | | | | | | | | |
Swift Transportation, Term Loan | | | | 4.688% to 6.500% | | 2/2/09 | | $ | 883,721 | | $ | 313,721 | |
| | | | | | | | | | | | | |
| | | | | |
Semiconductors and Semiconductor Equipment | | N.M. | | | | | | | | | | | |
Sensata Technologies, Term Loan, Tranche B | | | | 5.258% | | 1/29/09 | | | 1,466,250 | | | 733,125 | |
| | | | | | | | | | | | | |
Total Loan Participations and Assignments
(Cost—$68,803,069) | | | | | | | | | | | | 44,678,559 | |
U.S. Government and Agency Obligations | | 9.0% | | | | | | | | | | | |
| | | | | |
Fixed Rate Securities | | 2.8% | | | | | | | | | | | |
Fannie Mae | | | | 6.250% | | 2/1/11 | | | 6,960,000 | | | 7,375,115 | K |
Fannie Mae | | | | 5.250% | | 8/1/12 | | | 6,050,000 | | | 6,376,821 | K |
Farmer Mac | | | | 5.125% | | 8/25/16 | | | 410,000 | | | 469,160 | |
Federal Home Loan Bank | | | | 5.500% | | 7/15/36 | | | 3,040,000 | | | 3,895,854 | |
Freddie Mac | | | | 4.750% | | 3/5/12 | | | 200,000 | | | 217,021 | K |
Freddie Mac | | | | 4.750% | | 1/19/16 | | | 1,610,000 | | | 1,805,129 | K |
Tennessee Valley Authority | | | | 7.125% | | 5/1/30 | | | 840,000 | | | 1,190,650 | |
Tennessee Valley Authority | | | | 5.980% | | 4/1/36 | | | 120,000 | | | 155,760 | |
United States Treasury Bonds | | | | 8.750% | | 5/15/17 | | | 10,000 | | | 14,716 | |
United States Treasury Bonds | | | | 8.875% | | 8/15/17 | | | 10,000 | | | 14,887 | |
United States Treasury Bonds | | | | 5.375% | | 2/15/31 | | | 1,050,000 | | | 1,442,765 | |
United States Treasury Bonds | | | | 4.375% | | 2/15/38 | | | 60,000 | | | 80,362 | |
United States Treasury Notes | | | | 3.750% | | 11/15/18 | | | 200,000,000 | | | 226,406,000 | |
| | | | | | | | | | | | | |
| | | | | | | | | | | | 249,444,240 | |
| | | | | | | | | | | | | |
Stripped Securities | | N.M. | | | | | | | | | | | |
United States Treasury Bonds | | | | 0.000% | | 11/15/24 | | | 510,000 | | | 332,153 | I2 |
| | | | | | | | | | | | | |
| | | | | |
Treasury Inflation-Protected SecuritiesL | | 6.2% | | | | | | | | | | | |
United States Treasury Inflation-Protected Security | | | | 0.875% | | 4/15/10 | | | 1,543,820 | | | 1,450,949 | |
United States Treasury Inflation-Protected Security | | | | 2.000% | | 1/15/16 | | | 40,299,288 | | | 38,592,855 | |
73
Annual Report to Shareholders
Portfolio of Investments—Continued
Western Asset Core Plus Bond Portfolio—Continued
| | | | | | | | | | | | | |
| | | % OF
NET ASSET | | RATE | | MATURITY
DATE | | PAR/
SHARES† | | VALUE | |
| | | | | | | | | | | | | |
U.S. Government and Agency Obligations—Continued | | | | | | | | | | | | | |
| | | | | |
Treasury Inflation-Protected Securities—Continued | | | | | | | | | | | | | |
United States Treasury Inflation-Protected Security | | | | 2.500% | | 7/15/16 | | $ | 8,528,363 | | $ | 8,461,065 | |
United States Treasury Inflation-Protected Security | | | | 2.375% | | 1/15/17 | | | 13,192,158 | | | 13,088,059 | |
United States Treasury Inflation-Protected Security | | | | 2.625% | | 7/15/17 | | | 5,005,311 | | | 5,129,272 | |
United States Treasury Inflation-Protected Security | | | | 1.625% | | 1/15/18 | | | 134,391 | | | 127,556 | |
United States Treasury Inflation-Protected Security | | | | 1.375% | | 7/15/18 | | | 723,118 | | | 676,284 | |
United States Treasury Inflation-Protected Security | | | | 2.375% | | 1/15/25 | | | 74,430,611 | | | 73,151,297 | |
United States Treasury Inflation-Protected Security | | | | 2.000% | | 1/15/26 | | | 147,673,094 | | | 139,101,114 | M |
United States Treasury Inflation-Protected Security | | | | 2.375% | | 1/15/27 | | | 165,632,490 | | | 166,395,891 | M |
United States Treasury Inflation-Protected Security | | | | 1.750% | | 1/15/28 | | | 14,984,399 | | | 13,844,176 | M |
United States Treasury Inflation-Protected Security | | | | 3.625% | | 4/15/28 | | | 25,141,664 | | | 29,951,969 | M |
United States Treasury Inflation-Protected Security | | | | 3.875% | | 4/15/29 | | | 41,498,782 | | | 51,254,232 | M |
United States Treasury Inflation-Protected Security | | | | 3.375% | | 4/15/32 | | | 16,208,638 | | | 19,986,013 | M |
| | | | | | | | | | | | | |
| | | | | | | | | | | | 561,210,732 | |
| | | | | | | | | | | | | |
Total U.S. Government and Agency Obligations
(Cost—$792,194,775) | | | | | | | | | | | | 810,987,125 | |
U.S. Government Agency Mortgage-Backed Securities | | 59.9% | | | | | | | | | | | |
| | | | | |
Fixed Rate Securities | | 56.4% | | | | | | | | | | | |
Fannie Mae | | | | 6.500% | | 5/1/14 to 12/1/37 | | | 118,113,008 | | | 122,830,197 | K |
Fannie Mae | | | | 5.500% | | 1/1/17 to 7/1/38 | | | 447,830,972 | | | 459,704,232 | K |
Fannie Mae | | | | 9.500% | | 11/1/21 | | | 1,152 | | | 1,263 | K |
Fannie Mae | | | | 5.000% | | 12/1/23 to 12/1/38 | | | 332,200,000 | | | 339,819,604 | K,N |
Fannie Mae | | | | 6.000% | | 12/1/23 to 12/1/38 | | | 74,430,000 | | | 76,680,356 | K,N |
74
Annual Report to Shareholders
| | | | | | | | | | | | | |
| | | % OF
NET ASSET | | RATE | | MATURITY
DATE | | PAR/
SHARES† | | VALUE | |
| | | | | | | | | | | | | |
U.S. Government Agency Mortgage-Backed
Securities—Continued | | | | | | | | | | | | | |
| | | | |
Fixed Rate Securities—Continued | | | | | | | | | | | |
Fannie Mae | | | | 6.000% | | 4/1/24 to 8/1/37 | | $ | 94,219,715 | | $ | 97,113,167 | K |
Fannie Mae | | | | 7.000% | | 8/1/29 to 6/1/32 | | | 3,533,557 | | | 3,738,468 | K |
Fannie Mae | | | | 7.500% | | 11/1/29 | | | 17,791 | | | 18,844 | K |
Fannie Mae | | | | 5.000% | | 7/1/33 to 11/1/36 | | | 2,176,492,113 | | | 2,229,236,030 | K |
Fannie Mae | | | | 4.500% | | 12/1/34 to 6/1/38 | | | 66,319,913 | | | 67,320,021 | K |
Fannie Mae | | | | 4.000% | | 12/1/38 | | | 85,000,000 | | | 84,853,800 | K,N |
Fannie Mae | | | | 5.500% | | 12/1/38 | | | 78,500,000 | | | 80,462,500 | K,N |
Fannie Mae | | | | 6.500% | | 12/1/38 | | | 315,000,000 | | | 327,107,970 | K,N |
Freddie Mac | | | | 6.000% | | 10/1/09 to 7/1/37 | | | 8,351,231 | | | 8,638,333 | K |
Freddie Mac | | | | 5.500% | | 12/1/13 to 4/1/38 | | | 32,925,862 | | | 33,746,858 | K |
Freddie Mac | | | | 7.000% | | 10/1/16 to 4/1/32 | | | 1,165,622 | | | 1,224,973 | K |
Freddie Mac | | | | 6.500% | | 7/1/29 | | | 289,064 | | | 302,524 | K |
Freddie Mac | | | | 5.000% | | 12/1/34 to 4/1/38 | | | 392,019,200 | | | 401,163,700 | K |
Freddie Mac | | | | 5.000% | | 12/1/38 | | | 224,900,000 | | | 229,819,687 | K,N |
Freddie Mac | | | | 5.500% | | 12/1/38 | | | 161,800,000 | | | 165,592,268 | K,N |
Government National Mortgage Association | | | | 7.500% | | 3/15/23 to 9/15/31 | | | 209,247 | | | 221,844 | |
Government National Mortgage Association | | | | 7.000% | | 7/15/23 to 7/15/31 | | | 616,095 | | | 652,607 | |
Government National Mortgage Association | | | | 6.500% | | 4/15/28 to 4/15/33 | | | 13,366,795 | | | 14,046,713 | |
Government National Mortgage Association | | | | 6.000% | | 1/15/29 to 11/15/35 | | | 65,850,102 | | | 68,116,055 | |
Government National Mortgage Association | | | | 8.000% | | 12/15/30 to 1/15/31 | | | 23,837 | | | 25,476 | |
Government National Mortgage Association | | | | 5.000% | | 7/15/33 to 11/15/35 | | | 65,315,925 | | | 67,162,355 | |
Government National Mortgage Association | | | | 5.500% | | 7/15/33 to 6/15/35 | | | 18,458,274 | | | 19,073,624 | |
Government National Mortgage Association | | | | 5.000% | | 12/1/38 | | | 175,900,000 | | | 180,058,412 | N |
| | | | | | | | | | | | | |
| | | | | | | | | | | | 5,078,731,881 | |
| | | | | | | | | | | | | |
Indexed SecuritiesB | | 3.5% | | | | | | | | | | | |
Fannie Mae | | | | 4.598% | | 5/1/35 | | | 4,441,933 | | | 4,462,709 | K |
Fannie Mae | | | | 4.877% | | 6/1/35 | | | 11,258,783 | | | 11,313,423 | K |
Fannie Mae | | | | 5.343% | | 6/1/35 | | | 2,746,956 | | | 2,785,172 | K |
Fannie Mae | | | | 5.131% | | 8/1/35 to 9/1/35 | | | 8,694,156 | | | 8,740,655 | K |
75
Annual Report to Shareholders
Portfolio of Investments—Continued
Western Asset Core Plus Bond Portfolio—Continued
| | | | | | | | | | | | | |
| | | % OF
NET ASSET | | RATE | | MATURITY
DATE | | PAR/
SHARES† | | VALUE | |
| | | | | | | | | | | | | |
U.S. Government Agency
Mortgage-Backed
Securities—Continued | | | | | | | | | | | | | |
| | | | | |
Indexed Securities—Continued | | | | | | | | | | | | | |
Fannie Mae | | | | 5.014% | | 9/1/35 | | $ | 2,992,277 | | $ | 3,006,143 | K |
Fannie Mae | | | | 4.902% | | 10/1/35 | | | 2,590,532 | | | 2,599,206 | K |
Fannie Mae | | | | 4.915% | | 10/1/35 | | | 2,761,455 | | | 2,770,053 | K |
Fannie Mae | | | | 5.015% | | 10/1/35 | | | 3,219,700 | | | 3,233,362 | K |
Fannie Mae | | | | 5.673% | | 10/1/35 | | | 2,325,023 | | | 2,338,154 | K |
Fannie Mae | | | | 4.415% | | 11/1/35 | | | 343,217 | | | 346,284 | K |
Fannie Mae | | | | 4.421% | | 11/1/35 | | | 290,061 | | | 292,659 | K |
Fannie Mae | | | | 4.427% | | 11/1/35 | | | 292,773 | | | 295,395 | K |
Fannie Mae | | | | 4.429% | | 11/1/35 | | | 293,014 | | | 295,639 | K |
Fannie Mae | | | | 4.441% | | 11/1/35 | | | 285,705 | | | 288,278 | K |
Fannie Mae | | | | 5.289% | | 12/1/35 | | | 4,598,299 | | | 4,678,046 | K |
Fannie Mae | | | | 5.500% | | 2/1/36 | | | 725,423 | | | 739,412 | K |
Fannie Mae | | | | 6.415% | | 1/1/37 | | | 19,380,191 | | | 19,820,566 | K |
Fannie Mae | | | | 5.505% | | 2/1/37 | | | 33,259,874 | | | 34,941,559 | K |
Fannie Mae | | | | 5.690% | | 4/1/37 | | | 24,614,396 | | | 25,419,196 | K |
Fannie Mae | | | | 5.844% | | 4/1/37 | | | 14,577,251 | | | 15,105,272 | K |
Fannie Mae | | | | 6.328% | | 7/1/37 | | | 704,593 | | | 731,216 | K |
Fannie Mae | | | | 5.745% | | 8/1/37 | | | 1,130,438 | | | 1,172,959 | K |
Fannie Mae | | | | 6.118% | | 8/1/37 | | | 25,764,544 | | | 26,559,342 | K |
Fannie Mae | | | | 5.539% | | 11/1/37 | | | 408,753 | | | 417,462 | K |
Freddie Mac | | | | 4.683% | | 8/1/35 | | | 14,134,782 | | | 14,191,184 | K |
Freddie Mac | | | | 4.769% | | 9/1/35 | | | 5,544,542 | | | 5,547,955 | K |
Freddie Mac | | | | 5.138% | | 9/1/35 | | | 1,966,188 | | | 1,986,499 | K |
Freddie Mac | | | | 4.999% | | 10/1/35 | | | 3,301,347 | | | 3,312,972 | K |
Freddie Mac | | | | 5.110% | | 12/1/35 | | | 6,253,823 | | | 6,306,801 | K |
Freddie Mac | | | | 5.170% | | 12/1/35 | | | 428,012 | | | 434,667 | K |
Freddie Mac | | | | 5.776% | | 2/1/37 | | | 59,571 | | | 60,925 | K |
Freddie Mac | | | | 6.056% | | 3/1/37 | | | 31,992,149 | | | 32,852,460 | K |
Freddie Mac | | | | 5.794% | | 5/1/37 | | | 5,233,806 | | | 5,348,368 | K |
Freddie Mac | | | | 5.853% | | 5/1/37 | | | 14,046,609 | | | 14,380,900 | K |
Freddie Mac | | | | 5.887% | | 5/1/37 | | | 110,132 | | | 112,787 | K |
Freddie Mac | | | | 5.932% | | 5/1/37 | | | 611,217 | | | 626,092 | K |
Freddie Mac | | | | 5.387% | | 6/1/37 | | | 1,046,873 | | | 1,063,430 | K |
Freddie Mac | | | | 5.800% | | 6/1/37 | | | 2,794,010 | | | 2,857,773 | K |
Freddie Mac | | | | 5.890% | | 7/1/37 | | | 38,051,296 | | | 38,928,056 | K |
Freddie Mac | | | | 5.891% | | 8/1/37 | | | 12,922,501 | | | 13,292,130 | K |
Freddie Mac | | | | 6.091% | | 9/1/37 | | | 253,007 | | | 258,958 | K |
76
Annual Report to Shareholders
| | | | | | | | | | | | | |
| | | % OF
NET ASSET | | RATE | | MATURITY
DATE | | PAR/
SHARES† | | VALUE | |
| | | | | | | | | | | | | |
U.S. Government Agency Mortgage-Backed
Securities—Continued | | | | | | | | | | | | | |
| | | | | |
Indexed Securities—Continued | | | | | | | | | | | | | |
Government National Mortgage Association | | | | 0.908% | | 8/20/31 | | $ | 2,299 | | $ | 2,236 | |
| | | | | | | | | | | | | |
| | | | | | | | | | | | 313,916,355 | |
| | | | | | | | | | | | | |
| | | | | |
Stripped Securities | | N.M. | | | | | | | | | | | |
Financing Corp. | | | | 0.000% | | 11/30/17 to 4/5/19 | | | 1,570,000 | | | 1,167,876 | I2,P |
| | | | | | | | | | | | | |
Total U.S. Government Agency Mortgage-Backed Securities
(Cost—$5,244,120,843) | | | | | | | | | | | | 5,393,816,112 | |
Yankee BondsO | | 6.6% | | | | | | | | | | | |
| | | | | |
Aerospace and Defense | | 0.1% | | | | | | | | | | | |
Systems 2001 Asset Trust | | | | 6.664% | | 9/15/13 | | | 6,154,883 | | | 5,912,996 | A |
| | | | | | | | | | | | | |
Commercial Banks | | 0.9% | | | | | | | | | | | |
Eksportfinans ASA | | | | 5.500% | | 5/25/16 | | | 260,000 | | | 283,328 | |
Glitnir Banki Hf | | | | 6.330% | | 7/28/11 | | | 10,670,000 | | | 506,825 | A,F,S |
Glitnir Banki Hf | | | | 6.375% | | 9/25/12 | | | 18,040,000 | | | 856,900 | A,F,S |
HBOS Capital Funding LP | | | | 6.071% | | 6/30/49 | | | 60,000 | | | 22,191 | A,E |
HSBC Capital Funding LP | | | | 4.610% | | 6/27/49 | | | 2,090,000 | | | 1,132,548 | A,E |
Hypothekenbank in Essen AG | | | | 5.000% | | 1/20/12 | | | 1,380,000 | | | 1,491,828 | A |
ICICI Bank Ltd. | | | | 6.375% | | 4/30/22 | | | 14,709,000 | | | 7,723,873 | A,E |
ICICI Bank Ltd. | | | | 6.375% | | 4/30/22 | | | 15,561,000 | | | 8,202,514 | A,E |
Kaupthing Bank Hf | | | | 5.750% | | 10/4/11 | | | 5,550,000 | | | 333,000 | A,F,S |
Kaupthing Bank Hf | | | | 7.625% | | 2/28/15 | | | 80,340,000 | | | 4,820,400 | A,F,P,S |
Korea Development Bank | | | | 5.500% | | 11/13/12 | | | 60,000 | | | 55,276 | |
Landsbanki Islands Hf | | | | 6.100% | | 8/25/11 | | | 28,520,000 | | | 499,100 | A,F,S |
Resona Preferred Global Securities | | | | 7.191% | | 12/29/49 | | | 11,950,000 | | | 5,689,252 | A,E |
Royal Bank of Scotland Group PLC | | | | 7.640% | | 3/31/49 | | | 7,500,000 | | | 2,987,130 | E |
Royal Bank of Scotland Group PLC | | | | 6.990% | | 10/29/49 | | | 12,030,000 | | | 5,624,458 | A,E |
RSHB Capital SA | | | | 6.299% | | 5/15/17 | | | 30,690,000 | | | 17,493,300 | A |
Shinsei Finance Cayman Ltd. | | | | 6.418% | | 1/29/49 | | | 26,025,000 | | | 5,443,181 | A,E |
TuranAlem Finance BV | | | | 8.250% | | 1/22/37 | | | 29,590,000 | | | 12,723,700 | A |
TuranAlem Finance BV | | | | 8.250% | | 1/22/37 | | | 30,793,000 | | | 13,240,990 | A |
| | | | | | | | | | | | | |
| | | | | | | | | | | | 89,129,794 | |
| | | | | | | | | | | | | |
77
Annual Report to Shareholders
Portfolio of Investments—Continued
Western Asset Core Plus Bond Portfolio—Continued
| | | | | | | | | | | | | |
| | | % OF
NET ASSET | | RATE | | MATURITY
DATE | | PAR/
SHARES† | | VALUE | |
| | | | | | | | | | | | | |
Yankee Bonds—Continued | | | | | | | | | | | | | |
| | | | | |
Diversified Financial Services | | 0.3% | | | | | | | | | | | |
Aiful Corp. | | | | 5.000% | | 8/10/10 | | $ | 12,610,000 | | $ | 6,932,965 | A |
Credit Suisse Guernsey Ltd. | | | | 5.860% | | 5/29/49 | | | 150,000 | | | 70,010 | E |
European Investment Bank | | | | 4.000% | | 3/3/10 | | | 100,000 | | | 102,784 | |
European Investment Bank | | | | 4.625% | | 3/21/12 | | | 50,000 | | | 53,435 | |
MUFG Capital Finance 1 Ltd. | | | | 6.346% | | 7/29/49 | | | 7,400,000 | | | 5,155,750 | E |
Pemex Finance Ltd. | | | | 9.030% | | 2/15/11 | | | 4,500 | | | 4,590 | |
SMFG Preferred Capital | | | | 6.078% | | 1/29/49 | | | 350,000 | | | 236,121 | A,E |
TNK-BP Finance SA | | | | 7.500% | | 7/18/16 | | | 17,520,000 | | | 9,110,400 | A |
TNK-BP Finance SA | | | | 7.500% | | 7/18/16 | | | 1,650,000 | | | 858,000 | A |
TNK-BP Finance SA | | | | 6.625% | | 3/20/17 | | | 11,350,000 | | | 5,448,000 | A |
TNK-BP Finance SA | | | | 6.625% | | 3/20/17 | | | 724,000 | | | 347,520 | A |
| | | | | | | | | | | | | |
| | | | | | | | | | | | 28,319,575 | |
| | | | | | | | | | | | | |
Diversified Telecommunication Services | | 0.7% | | | | | | | | | | | |
British Telecommunications PLC | | | | 8.625% | | 12/15/10 | | | 2,315,000 | | | 2,381,438 | D |
British Telecommunications PLC | | | | 9.125% | | 12/15/30 | | | 11,160,000 | | | 11,862,433 | D |
Deutsche Telekom International Finance BV | | | | 5.750% | | 3/23/16 | | | 20,180,000 | | | 19,317,063 | |
Koninklijke (Royal) KPN NV | | | | 8.000% | | 10/1/10 | | | 14,800,000 | | | 14,936,204 | |
Telecom Italia Capital SpA | | | | 5.250% | | 11/15/13 | | | 1,260,000 | | | 960,750 | |
Telecom Italia Capital SpA | | | | 4.950% | | 9/30/14 | | | 3,730,000 | | | 2,839,463 | |
Telecom Italia Capital SpA | | | | 5.250% | | 10/1/15 | | | 6,280,000 | | | 4,780,650 | |
Wind Acquisition Finance SA | | | | 10.750% | | 12/1/15 | | | 4,800,000 | | | 4,128,000 | A |
| | | | | | | | | | | | | |
| | | | | | | | | | | | 61,206,001 | |
| | | | | | | | | | | | | |
Electric Utilities | | N.M. | | | | | | | | | | | |
Hydro-Quebec | | | | 6.300% | | 5/11/11 | | | 1,720,000 | | | 1,826,444 | |
| | | | | | | | | | | | | |
| | | | | |
| | | | | | | | | | | | | |
Energy Equipment and Services | | 0.1% | | | | | | | | | | | |
Compagnie Generale de Geophysique-Veritas | | | | 7.500% | | 5/15/15 | | | 1,970,000 | | | 1,221,400 | |
Compagnie Generale de Geophysique-Veritas | | | | 7.750% | | 5/15/17 | | | 8,594,000 | | | 4,984,520 | |
Transocean Inc. | | | | 5.250% | | 3/15/13 | | | 290,000 | | | 269,351 | |
Transocean Ltd. | | | | 6.000% | | 3/15/18 | | | 6,000,000 | | | 5,464,806 | |
| | | | | | | | | | | | | |
| | | | | | | | | | | | 11,940,077 | |
| | | | | | | | | | | | | |
Food and Staples Retailing | | N.M. | | | | | | | | | | | |
Delhaize Group | | | | 6.500% | | 6/15/17 | | | 120,000 | | | 108,959 | |
| | | | | | | | | | | | | |
78
Annual Report to Shareholders
| | | | | | | | | | | | | |
| | | % OF
NET ASSET | | RATE | | MATURITY
DATE | | PAR/
SHARES† | | VALUE | |
| | | | | | | | | | | | | |
Yankee Bonds—Continued | | | | | | | | | | | | | |
| | | | | |
Foreign Governments | | 1.3% | | | | | | | | | | | |
Province of British Columbia | | | | 4.300% | | 5/30/13 | | $ | 180,000 | | $ | 191,507 | |
Russian Federation | | | | 7.500% | | 3/31/30 | | | 65,034,760 | | | 56,720,716 | A |
United Mexican States | | | | 5.625% | | 1/15/17 | | | 374,000 | | | 374,000 | |
United Mexican States | | | | 6.750% | | 9/27/34 | | | 54,000,000 | | | 56,970,000 | |
| | | | | | | | | | | | | |
| | | | | | | | | | | | 114,256,223 | |
| | | | | | | | | | | | | |
Gas Utilities | | 0.2% | | | | | | | | | | | |
Intergas Finance BV | | | | 6.375% | | 5/14/17 | | | 27,909,000 | | | 16,187,220 | A |
Intergas Finance BV | | | | 6.375% | | 5/14/17 | | | 2,220,000 | | | 1,276,500 | A |
| | | | | | | | | | | | | |
| | | | | | | | | | | | 17,463,720 | |
| | | | | | | | | | | | | |
Industrial Conglomerates | | 0.6% | | | | | | | | | | | |
Tyco International Group SA | | | | 6.125% | | 1/15/09 | | | 644,000 | | | 643,153 | |
Tyco International Group SA | | | | 6.750% | | 2/15/11 | | | 35,798,000 | | | 35,582,603 | |
Tyco International Group SA | | | | 6.375% | | 10/15/11 | | | 15,948,000 | | | 15,675,991 | |
Tyco International Group SA | | | | 6.000% | | 11/15/13 | | | 5,398,000 | | | 5,065,024 | |
| | | | | | | | | | | | | |
| | | | | | | | | | | | 56,966,771 | |
| | | | | | | | | | | | | |
Insurance | | 0.3% | | | | | | | | | | | |
Merna Reinsurance Ltd. | | | | 3.209% | | 6/30/12 | | | 26,450,000 | | | 23,881,705 | A,B |
| | | | | | | | | | | | | |
Media | | N.M. | | | | | | | | | | | |
Rogers Cable Inc. | | | | 7.875% | | 5/1/12 | | | 687,000 | | | 685,657 | |
Rogers Cable Inc. | | | | 6.750% | | 3/15/15 | | | 130,000 | | | 126,596 | |
Shaw Communications Inc. | | | | 7.250% | | 4/6/11 | | | 630,000 | | | 595,350 | |
Sun Media Corp. | | | | 7.625% | | 2/15/13 | | | 1,125,000 | | | 905,625 | |
| | | | | | | | | | | | | |
| | | | | | | | | | | | 2,313,228 | |
| | | | | | | | | | | | | |
Metals and Mining | | 0.6% | | | | | | | | | | | |
Corporacion Nacional del Cobre—Codelco | | | | 4.750% | | 10/15/14 | | | 2,590,000 | | | 2,432,510 | A |
Evraz Group SA | | | | 8.875% | | 4/24/13 | | | 27,310,000 | | | 13,928,100 | A |
Evraz Group SA Series 2008 | | | | 8.875% | | 4/24/13 | | | 2,150,000 | | | 1,118,000 | A |
Vale Overseas Ltd. | | | | 8.250% | | 1/17/34 | | | 770,000 | | | 818,279 | |
Vale Overseas Ltd. | | | | 6.875% | | 11/21/36 | | | 40,970,000 | | | 37,188,469 | |
| | | | | | | | | | | | | |
| | | | | | | | | | | | 55,485,358 | |
| | | | | | | | | | | | | |
Oil, Gas and Consumable Fuels | | 1.3% | | | | | | | | | | | |
Anadarko Finance Co. | | | | 7.500% | | 5/1/31 | | | 16,297,000 | | | 14,411,062 | |
BP Capital Markets PLC | | | | 5.250% | | 11/7/13 | | | 25,550,000 | | | 26,672,565 | |
Conoco Funding Co. | | | | 6.350% | | 10/15/11 | | | 590,000 | | | 620,700 | |
Conoco Funding Co. | | | | 7.250% | | 10/15/31 | | | 810,000 | | | 871,475 | |
Gazprom | | | | 6.212% | | 11/22/16 | | | 29,470,000 | | | 19,450,200 | A |
79
Annual Report to Shareholders
Portfolio of Investments—Continued
Western Asset Core Plus Bond Portfolio—Continued
| | | | | | | | | | | | | | |
| | | % OF
NET ASSET | | RATE | | MATURITY
DATE | | PAR/
SHARES† | | | VALUE | |
| | | | | | | | | | | | | | |
Yankee Bonds—Continued | | | | | | | | | | | | | | |
Oil, Gas and Consumable
Fuels—Continued | | | | | | | | | | | | | | |
Gazprom | | | | 6.510% | | 3/7/22 | | $ | 23,180,000 | | | $ | 13,792,100 | A |
OPTI Canada Inc. | | | | 8.250% | | 12/15/14 | | | 2,405,000 | | | | 1,298,700 | |
Petrobras International Finance Co. | | | | 6.125% | | 10/6/16 | | | 19,100,000 | | | | 18,622,500 | |
Shell International Finance BV | | | | 6.375% | | 12/15/38 | | | 18,125,000 | | | | 20,390,426 | |
Teekay Shipping Corp. | | | | 8.875% | | 7/15/11 | | | 1,729,000 | | | | 1,461,005 | |
| | | | | | | | | | | | | | |
| | | | | | | | | | | | | 117,590,733 | |
| | | | | | | | | | | | | | |
Paper and Forest Products | | N.M. | | | | | | | | | | | | |
Abitibi-Consolidated Co. of Canada | | | | 15.500% | | 7/15/10 | | | 1,375,000 | | | | 398,750 | A |
| | | | | | | | | | | | | | |
| | | | | |
| | | | | | | | | | | | | | |
Semiconductors and Semiconductor Equipment | | N.M. | | | | | | | | | | | | |
NXP BV/NXP Funding LLC | | | | 7.875% | | 10/15/14 | | | 3,935,000 | | | | 1,534,650 | |
NXP BV/NXP Funding LLC | | | | 9.500% | | 10/15/15 | | | 1,510,000 | | | | 286,900 | |
| | | | | | | | | | | | | | |
| | | | | | | | | | | | | 1,821,550 | |
| | | | | | | | | | | | | | |
Thrifts and Mortgage Finance | | N.M. | | | | | | | | | | | | |
Willow Re Ltd. | | | | 8.545% | | 6/16/10 | | | 250,000 | | | | 156,180 | A,B,Q |
| | | | | | | | | | | | | | |
| | | | | |
| | | | | | | | | | | | | | |
Wireless Telecommunication Services | | 0.2% | | | | | | | | | | | | |
America Movil SA de CV | | | | 5.625% | | 11/15/17 | | | 14,040,000 | | | | 12,481,967 | |
Rogers Wireless Inc. | | | | 6.375% | | 3/1/14 | | | 1,850,000 | | | | 1,758,604 | |
| | | | | | | | | | | | | | |
| | | | | | | | | | | | | 14,240,571 | |
| | | | | | | | | | | | | | |
Total Yankee Bonds
(Cost—$937,176,459) | | | | | | | | | | | | | 603,018,635 | |
Foreign Government Obligations | | 1.1% | | | | | | | | | | | | |
Brazil Notas do Tesouro Nacional Series F | | | | 10.000% | | 1/1/12 | | | 181,800,000 | BRL | | | 76,860,627 | |
Canadian Real Return Bond | | | | 4.000% | | 12/1/31 | | | 7,131,846 | CAD | | | 7,657,968 | R |
Federative Republic of Brazil | | | | 10.000% | | 1/1/10 | | | 1 | BRL | | | 422 | |
Federative Republic of Brazil | | | | 6.000% | | 5/15/15 | | | 18,938 | BRL | | | 12,879,962 | |
| | | | | | | | | | | | | | |
Total Foreign Government Obligations
(Cost—$91,014,192) | | | | | | | | | | | | | 97,398,979 | |
80
Annual Report to Shareholders
| | | | | | | | | | | | | | |
| | | % OF
NET ASSET | | RATE | | MATURITY
DATE | | PAR/
SHARES† | | | VALUE | |
| | | | | | | | | | | | | | |
Preferred Stocks | | 0.3% | | | | | | | | | | | | |
AES Trust III | | | | 6.750% | | | | | 71,200 | shs | | $ | 2,694,208 | C |
Fannie Mae | | | | 5.375% | | | | | 29 | | | | 36,250 | C,K |
Fannie Mae | | | | 7.000% | | | | | 53,100 | | | | 39,825 | B,K |
Fannie Mae | | | | 8.250% | | | | | 1,193,775 | | | | 990,833 | E,K |
Ford Motor Co. | | | | 7.500% | | | | | 16,300 | | | | 107,254 | |
Freddie Mac | | | | 8.375% | | | | | 1,737,615 | | | | 677,670 | E,K |
General Motors Corp. | | | | 1.500% | | | | | 399,400 | | | | 3,295,050 | C |
General Motors Corp. | | | | 5.250% | | | | | 207,050 | | | | 712,252 | C |
General Motors Corp. | | | | 6.250% | | | | | 2,749,475 | | | | 8,798,320 | |
General Motors Corp. | | | | 7.250% | | | | | 127,900 | | | | 429,744 | |
General Motors Corp. | | | | 7.250% | | | | | 56,300 | | | | 179,034 | |
General Motors Corp. | | | | 7.250% | | | | | 45,400 | | | | 148,458 | |
General Motors Corp. | | | | 7.375% | | | | | 327,800 | | | | 1,016,180 | |
General Motors Corp. | | | | 7.500% | | | | | 259,700 | | | | 818,055 | |
Home Ownership Funding Corp. | | | | 1.000% | | | | | 1,500 | | | | 147,825 | A,P |
Home Ownership Funding Corp. II | | | | 1.000% | | | | | 1,300 | | | | 128,115 | A,P |
Preferred Blocker Inc. | | | | 9.000% | | | | | 25,421 | | | | 6,355,250 | A |
Total Preferred Stocks
(Cost—$183,550,615) | | | | | | | | | | | | | 26,574,323 | |
Warrants | | N.M. | | | | | | | | | | | | |
Bear Stearns Trust Certficates 2001-2, Strike Price $97.72 | | | | | | | | | 10,000 | wts | | | 134,631 | S |
| | | | | | | | | | | | | | |
Total Warrants (Cost—$55,800) | | | | | | | | | | | | | 134,631 | |
| | | | | | | | | | | | | | |
Total Long-Term Securities
(Cost—$11,766,916,941) | | | | | | | | | | | | | 10,090,034,048 | |
Short-Term Securities | | 2.0% | | | | | | | | | | | | |
| | | | | |
U.S. Government and Agency Obligations | | 1.9% | | | | | | | | | | | | |
United States Treasury Bill | | | | 0.000% | | 7/2/09 | | $ | 169,000,000 | | | | 168,774,892 | H |
| | | | | | | | | | | | | | |
Foreign Government Obligations | | N.M. | | | | | | | | | | | | |
Bank Negara Malaysia Monetary Notes | | | | 0.000% | | 2/17/09 | | | 12,800,000 | MYR | | | 3,683,035 | H |
| | | | | | | | | | | | | | |
Options PurchasedT | | 0.1% | | | | | | | | | | | | |
Barclays Swaption Put, January 2009, Strike Price $4.93 | | | | | | | | | 101,400,000 | U | | | 497 | |
Greenwich Swaption Put, January 2009, Strike Price $4.93 | | | | | | | | | 104,775,000 | U | | | 513 | |
U.S. Treasury Note Futures Put, February 2009, Strike Price $112.00 | | | | | | | | | 600 | U | | | 70,313 | |
U.S. Treasury Note Futures Put, January 2009, Strike Price $117.00 | | | | | | | | | 3,900 | U | | | 1,096,875 | |
81
Annual Report to Shareholders
Portfolio of Investments—Continued
Western Asset Core Plus Bond Portfolio—Continued
| | | | | | | | | | | | | |
| | | % OF
NET ASSET | | RATE | | MATURITY
DATE | | PAR/
SHARES† | | | VALUE | |
| | | | | | | | | | | | | |
Short-Term Securities—Continued | | | | | | | | | | | | | |
| | | | | |
Options Purchased—Continued | | | | | | | | | | | | | |
UBS Warburg LLC Swaption Call, March 2009, Strike Price $3.62 | | | | | | | | 93,650,000 | U | | $ | 8,916,145 | |
| | | | | | | | | | | | | |
| | | | | | | | | | | | 10,084,343 | |
| | | | | | | | | | | | | |
Total Short-Term Securities
(Cost—$179,070,282) | | | | | | | | | | | | 182,542,270 | |
Total Investments (Cost—$11,945,987,223)V | | 114.0% | | | | | | | | | | 10,272,576,318 | |
Other Assets Less Liabilities | | (14.0)% | | | | | | | | | | (1,265,101,432 | ) |
| | | | | | | | | | | | | |
| | | | | |
Net Assets | | 100.0% | | | | | | | | | $ | 9,007,474,886 | |
| | | | | | | | | | | | | |
| | | | | | | | |
| | | EXPIRATION | | ACTUAL
CONTRACTS/
NOTIONAL PAR | | APPRECIATION/
(DEPRECIATION) | |
Futures Contracts PurchasedT | | | | | | | | |
Canada Government Bond Futures | | March 2009 | | 461 | | $ | 2,867,270 | |
Eurodollar Futures | | March 2009 | | 6,522 | | | 35,453,490 | |
Eurodollar Futures | | June 2009 | | 3,836 | | | 14,530,708 | |
Eurodollar Futures | | September 2009 | | 2,273 | | | 5,897,272 | |
German Euro Bund Futures | | March 2009 | | 2,860 | | | 1,513,555 | |
LIBOR Futures | | March 2009 | | 3,515 | | | 25,720,358 | |
LIBOR Futures | | June 2009 | | 2,497 | | | 15,415,041 | |
U.S. Treasury Bond Futures | | March 2009 | | 5,096 | | | 85,138,651 | |
U.S. Treasury Note Futures | | March 2009 | | 9,686 | | | 32,792,331 | |
| | | | | | | | |
| | | | | | $ | 219,328,676 | |
| | | | | | | | |
Futures Contracts WrittenT | | | | | | | | |
U.S. Treasury Note Futures | | March 2009 | | 5,572 | | $ | (47,220,491 | ) |
U.S. Treasury Note Futures | | March 2009 | | 26 | | | (66,505 | ) |
| | | | | | | | |
| | | | | | $ | (47,286,996 | ) |
| | | | | | | | |
Options WrittenT | | | | | | | | |
Barclays Swaption Call, Strike Price $4.95 | | October 2013 | | 124,690,000 | | $ | (12,191,951 | ) |
Barclays Swaption Put, Strike Price $4.00 | | January 2009 | | 405,600,000 | | | 2,960,839 | |
Barclays Swaption Put, Strike Price $4.95 | | October 2013 | | 124,690,000 | | | 4,338,202 | |
Eurodollar Futures Call, Strike Price $97.50 | | March 2009 | | 1,061 | | | (3,501,105 | ) |
Eurodollar Futures Call, Strike Price $97.75 | | March 2009 | | 690 | | | (1,288,575 | ) |
Eurodollar Futures Call, Strike Price $98.00 | | March 2009 | | 801 | | | (1,255,530 | ) |
Eurodollar Futures Put, Strike Price $96.75 | | June 2009 | | 1,657 | | | 1,340,415 | |
Eurodollar Futures Put, Strike Price $97.25 | | June 2009 | | 874 | | | 607,405 | |
82
Annual Report to Shareholders
| | | | | | | | |
| | | EXPIRATION | | ACTUAL
CONTRACTS/
NOTIONAL PAR | | APPRECIATION/
(DEPRECIATION) | |
Options Written—Continued | | | | | | | | |
Eurodollar Futures Put, Strike Price $98.00 | | March 2009 | | 436 | | $ | 185,845 | |
German Federal Republic Bond Futures Put, Strike Price $122.00 | | February 2009 | | 500 | | | 282,680 | |
Greenwich Swaption Call, Strike Price $4.35 | | January 2009 | | 40,750,000 | | | (5,378,466 | ) |
Greenwich Swaption Put, Strike Price $4.00 | | January 2009 | | 419,100,000 | | | 3,017,478 | |
Greenwich Swaption Put, Strike Price $4.35 | | January 2009 | | 40,750,000 | | | 1,055,417 | |
JP Morgan Swaption Call, Strike Price $4.86 | | October 2013 | | 124,700,000 | | | (11,378,177 | ) |
JP Morgan Swaption Put, Strike Price $4.86 | | October 2013 | | 124,700,000 | | | 4,366,470 | |
U.S. Treasury Bond Futures Put, Strike Price $122.00 | | February 2009 | | 500 | | | 1,208,438 | |
U.S. Treasury Bond Futures Put, Strike Price $126.00 | | February 2009 | | 1,773 | | | 2,720,385 | |
U.S. Treasury Bond Futures Put, Strike Price $134.00 | | February 2009 | | 1,000 | | | (503,203 | ) |
U.S. Treasury Note Futures Call, Strike Price $116.00 | | February 2009 | | 261 | | | (2,304,149 | ) |
U.S. Treasury Note Futures Call, Strike Price $118.00 | | February 2009 | | 668 | | | (4,877,653 | ) |
U.S. Treasury Note Futures Call, Strike Price $120.00 | | February 2009 | | 876 | | | (4,904,208 | ) |
U.S. Treasury Note Futures Put, Strike Price $114.00 | | February 2009 | | 302 | | | 450,615 | |
U.S. Treasury Note Futures Put, Strike Price $115.00 | | February 2009 | | 1,096 | | | 1,327,551 | |
U.S. Treasury Note Futures Put, Strike Price $115.00 | | February 2009 | | 1,500 | | | 1,305,000 | |
U.S. Treasury Note Futures Put, Strike Price $116.00 | | February 2009 | | 500 | | | 856,875 | |
U.S. Treasury Note Futures Put, Strike Price $118.00 | | February 2009 | | 1,500 | | | 1,844,031 | |
U.S. Treasury Note Futures Put, Strike Price $119.00 | | February 2009 | | 2,000 | | | 3,021,219 | |
U.S. Treasury Note Futures Put, Strike Price $126.00 | | February 2009 | | 264 | | | (112,695 | ) |
U.S. Treasury Note Futures Put, Strike Price $126.50 | | February 2009 | | 1,000 | | | (1,153,484 | ) |
| | | | | | | | |
| | | | | | $ | (17,960,331 | ) |
| | | | | | | | |
| | | | | | | | | |
N.M. Not Meaningful.
A | | Rule 144a Security – A security purchased pursuant to Rule 144a under the Securities Act of 1933 which may not be resold subject to that rule except to qualified institutional buyers. These securities, which the Fund’s investment adviser has determined to be liquid, represent 8.72% of net assets. |
B | | Indexed Security – The rates of interest earned on these securities are tied to the London Interbank Offered Rate (“LIBOR”), the Euro Interbank Offered Rate (“EURIBOR”) Index, the Consumer Price Index (“CPI”), the one-year Treasury Bill Rate or the ten-year Japanese Government Bond Rate. The coupon rates are the rates as of December 31, 2008. |
C | | Convertible Security – Security may be converted into the issuer’s common stock. |
D | | Credit Linked Security – The rates of interest earned on these securities are tied to the credit rating assigned by Standard & Poor’s Rating Service and/or Moody’s Investors Services. |
E | | Stepped Coupon Security – A security with a predetermined schedule of interest or dividend rate changes at which time it begins to accrue interest or pay dividends according to the predetermined schedule. |
F | | Bond is currently in default. |
G | | Pay-in-Kind (“PIK”) security – A security in which interest or dividends during the initial few years is paid in additional PIK securities rather than in cash. |
H | | Zero coupon bond – A bond with no periodic interest payments which is sold at such a discount as to produce a current yield to maturity. |
I | | Stripped Security – Security with interest-only or principal-only payment streams, denoted by a 1 or 2, respectively. For interest-only securities, the amount shown as principal is the notional balance used to calculate the amount of interest due. |
J | | The coupon rates shown on variable rate securities are the rates at December 31, 2008. These rates vary with the weighted average coupon of the underlying loans. |
K | | On September 7, 2008, the Federal Housing Finance Agency placed Fannie Mae and Freddie Mac into Conservatorship. |
83
Annual Report to Shareholders
Portfolio of Investments—Continued
Western Asset Core Plus Bond Portfolio—Continued
L | | Treasury Inflation-Protected Security –Treasury security whose principal value is adjusted daily in accordance with changes to the Consumer Price Index for All Urban Consumers. Interest is calculated on the basis of the current adjusted principal value. |
M | | All or a portion of this security is collateral to cover futures and options contracts written. |
N | | When-issued Security – Security purchased on a delayed delivery basis. Final settlement amount and maturity date have not yet been announced. |
O | | Yankee Bond – A dollar-denominated bond issued in the U.S. by foreign entities. |
P | | Illiquid security valued at fair value under the procedures approved by the Board of Directors. |
Q | | Bond is in default subsequent to December 31, 2008. |
R | | Inflation-Protected Security – Security whose principal value is adjusted daily or monthly in accordance with changes to the relevant country’s Consumer Price Index or its equivalent used as an inflation proxy. Interest is calculated on the basis of the current adjusted principal value. |
T | | Options and futures are described in more detail in the notes to financial statements. |
U | | Par represents actual number of contracts. |
V | | At December 31, 2008, the aggregate gross unrealized appreciation and depreciation of investments for federal income tax purposes were as follows: |
| | | | |
Gross unrealized appreciation | | $ | 213,064,419 | |
Gross unrealized depreciation | | | (1,941,329,505 | ) |
| | | | |
Net unrealized depreciation | | $ | (1,728,265,086 | ) |
| | | | |
† | | Securities are denominated in U.S. Dollars, unless otherwise noted. |
BRL—Brazilian Real
CAD—Canadian Dollar
EUR—Euro
MYR—Malaysian Ringgit
See notes to financial statements.
84
Annual Report to Shareholders
Statement of Assets and Liabilities
Western Asset Core Plus Bond Portfolio
December 31, 2008
| | | | | | | |
Assets: | | | | | | | |
Investment securities at market value (Cost—$11,766,916,941) | | | | | $ | 10,090,034,048 | |
Short-term securities at value (Cost—$179,070,282) | | | | | | 182,542,270 | |
Foreign currency at value (Cost—$60,247,476) | | | | | | 59,977,176 | |
Restricted cash pledged as collateral for swaps | | | | | | 1,149,570,000 | |
Receivable for securities sold | | | | | | 757,345,396 | |
Unrealized appreciation on swaps | | | | | | 213,865,314 | |
Interest and dividends receivable | | | | | | 88,243,625 | |
Deposits with brokers for open futures contracts | | | | | | 37,312,797 | |
Futures variation margin receivable | | | | | | 30,902,486 | |
Amount receivable for open swaps | | | | | | 24,191,572 | |
Unrealized appreciation of forward foreign currency contracts | | | | | | 18,507,710 | |
Premiums paid on open swaps | | | | | | 16,133,768 | |
Receivable for fund shares sold | | | | | | 9,182,916 | |
Other assets | | | | | | 5,176,727 | |
| | | | | | | |
Total assets | | | | | | 12,682,985,805 | |
| | | | | | | |
| | |
Liabilities: | | | | | | | |
Payable for securities purchased | | $ | 2,194,239,936 | | | | |
Unrealized depreciation on swaps | | | 1,121,868,111 | | | | |
Premiums received on open swaps | | | 159,542,410 | | | | |
Options written (Proceeds—$65,919,361) | | | 83,879,692 | | | | |
Payable for fund shares repurchased | | | 34,613,790 | | | | |
Payable for Lehman settlement | | | 26,708,623 | | | | |
Amount payable for open swaps | | | 15,552,501 | | | | |
Unrealized depreciation of forward foreign currency contracts | | | 14,320,403 | | | | |
Cash overdraft | | | 13,073,973 | | | | |
Income distribution payable | | | 6,583,805 | | | | |
Accrued management fee | | | 3,064,278 | | | | |
Accrued distribution fees | | | 95,126 | | | | |
Accrued expenses and other liabilities | | | 1,968,271 | | | | |
| | | | | | | |
Total liabilities | | | | | | 3,675,510,919 | |
| | | | | | | |
| | |
Net Assets | | | | | $ | 9,007,474,886 | |
| | | | | | | |
| | |
Net assets consist of: | | | | | | | |
Accumulated paid-in-capital | | | | | $ | 11,459,665,795 | |
Undistributed net investment income | | | | | | 43,770,526 | |
Accumulated net realized loss on investments, options, futures, swaps and foreign currency transactions | | | | | | (74,973,617 | ) |
Net unrealized depreciation of investments, options, futures, swaps and foreign currency translations | | | | | | (2,420,987,818 | ) |
| | | | | | | |
| | |
Net Assets | | | | | $ | 9,007,474,886 | |
| | | | | | | |
| | |
Net Asset Value Per Share: | | | | | | | |
Institutional Class (763,242,034 shares outstanding) | | | | | | $8.66 | |
Institutional Select Class (180,197,247 shares outstanding) | | | | | | $8.66 | |
Financial Intermediary Class (97,070,642 shares outstanding) | | | | | | $8.66 | |
| | | | | | | | |
See notes to financial statements.
85
Annual Report to Shareholders
Statement of Operations
Western Asset Core Plus Bond Portfolio
| | | | | | | | | | | | | | | | |
| | | FOR THE
PERIOD ENDED
DECEMBER 31, 2008A | | | FOR THE
YEAR ENDED
MARCH 31, 2008 | |
Investment Income: | | | | | | | | | | | | | | | | |
Interest | | $ | 541,517,843 | | | | | | | $ | 786,416,068 | | | | | |
Dividends | | | 8,165,221 | | | | | | | | 8,749,412 | | | | | |
Income from securities loaned | | | 4,681,641 | | | | | | | | 6,336,863 | | | | | |
Less: Foreign taxes withheld | | | (8 | ) | | | | | | | — | | | | | |
| | | | | | | | | | | | | | | | |
Total income | | | | | | $ | 554,364,697 | | | | | | | $ | 801,502,343 | |
Expenses: | | | | | | | | | | | | | | | | |
Management fees | | | 37,570,426 | | | | | | | | 55,764,726 | | | | | |
Distribution and service fees: | | | | | | | | | | | | | | | | |
Financial Intermediary Class | | | 2,052,242 | | | | | | | | 2,612,165 | | | | | |
Audit and legal fees | | | 330,701 | | | | | | | | 268,024 | | | | | |
Custodian fees | | | 1,213,485 | | | | | | | | 1,734,768 | | | | | |
Directors’ fees and expenses | | | 305,871 | | | | | | | | 325,957 | | | | | |
Registration fees | | | 90,664 | | | | | | | | 249,896 | | | | | |
Reports to shareholdersB | | | — | | | | | | | | 1,001,596 | | | | | |
Reports to shareholders: | | | | | | | | | | | | | | | | |
Institutional Class | | | 1,263,633 | | | | | | | | — | | | | | |
Institutional Select Class | | | 445 | | | | | | | | N/A | | | | | |
Financial Intermediary Class | | | 369,298 | | | | | | | | — | | | | | |
Transfer agent and shareholder servicing expense: | | | | | | | | | | | | | | | | |
Institutional Class | | | 767,454 | | | | | | | | 461,953 | | | | | |
Institutional Select Class | | | 1,788 | | | | | | | | N/A | | | | | |
Financial Intermediary Class | | | 580,100 | | | | | | | | 64,660 | | | | | |
Other expenses | | | 156,951 | | | | | | | | 174,441 | | | | | |
| | | | | | | | | | | | | | | | |
| | | 44,703,058 | | | | | | | | 62,658,186 | | | | | |
Less: Fees waived | | | (312,394 | ) | | | | | | | — | | | | | |
Compensation balance credits | | | (239 | ) | | | | | | | — | | | | | |
| | | | | | | | | | | | | | | | |
Net expenses | | | | | | | 44,390,425 | | | | | | | | 62,658,186 | |
| | | | | | | | | | | | | | | | |
Net Investment Income | | | | | | | 509,974,272 | | | | | | | | 738,844,157 | |
Net Realized and Unrealized Gain/(Loss) on Investments: | | | | | | | | | | | | | | | | |
Net realized gain/(loss) on: | | | | | | | | | | | | | | | | |
Investments | | | (98,546,155 | ) | | | | | | | 169,698,926 | | | | | |
Options | | | 113,732,898 | | | | | | | | 59,897,927 | | | | | |
Futures | | | 98,112,457 | | | | | | | | (505,286,122 | ) | | | | |
Swaps | | | 17,432,632 | | | | | | | | 120,174,271 | | | | | |
Foreign currency transactions | | | 17,728,216 | | | | | | | | 16,272,374 | | | | | |
| | | | | | | | | | | | | | | | |
| | | | | | | 148,460,048 | | | | | | | | (139,242,624 | ) |
Change in unrealized appreciation/(depreciation) of: | | | | | | | | | | | | | | | | |
Investments, options, futures, swaps and foreign currency translations | | | (1,800,347,117 | ) | | | | | | | (693,529,022 | ) | | | | |
Assets and liabilities denominated in foreign currency | | | 2,680,620 | | | | | | | | (364,631 | ) | | | | |
| | | | | | | | | | | | | | | | |
| | | | | | | (1,797,666,497 | ) | | | | | | | (693,893,653 | ) |
| | | | | | | | | | | | | | | | |
Net Realized and Unrealized Loss on Investments | | | | | | | (1,649,206,449 | ) | | | | | | | (833,136,277 | ) |
| | | | | | | | | | | | | | | | | |
Change in Net Assets Resulting From Operations | | | | | | $ | (1,139,232,177 | ) | | | | | | $ | (94,292,120 | ) |
| | | | | | | | | | | | | | | | | |
A | | For the period April 1, 2008 to December 31, 2008. |
B | | Computed on a composite level for year ended March 31, 2008. |
N/A—Not applicable.
See notes to financial statements.
86
Annual Report to Shareholders
Statement of Changes in Net Assets
Western Asset Core Plus Bond Portfolio
| | | | | | | | | | | | |
| | | FOR THE
PERIOD ENDED
DECEMBER 31,
2008A | | | FOR THE
YEARS ENDED
MARCH 31, | |
| | | | 2008 | | | 2007 | |
| | | | | | | | | | | | | |
| Change in Net Assets: | | | | | | | | | |
Net investment income | | $ | 509,974,272 | | | $ | 738,844,157 | | | $ | 456,732,640 | |
| | | |
Net realized gain/(loss) | | | 148,460,048 | | | | (139,242,624 | ) | | | 130,745,217 | |
| | | |
Change in unrealized appreciation/(depreciation) | | | (1,797,666,497 | ) | | | (693,893,653 | ) | | | 163,631,048 | |
| | | | | | | | | | | | |
Change in net assets resulting from operations | | | (1,139,232,177 | ) | | | (94,292,120 | ) | | | 751,108,905 | |
| | | |
Distributions to shareholders from: | | | | | | | | | | | | |
Net investment income: | | | | | | | | | | | | |
Institutional Class | | | (476,291,179 | ) | | | (661,064,696 | ) | | | (451,787,836 | ) |
Institutional Select Class | | | (32,587,186 | ) | | | N/A | | | | N/A | |
Financial Intermediary Class | | | (47,328,816 | ) | | | (51,232,414 | ) | | | (28,392,343 | ) |
| | | |
Net realized gain on investments: | | | | | | | | | | | | |
Institutional Class | | | — | | | | (92,868,453 | ) | | | (3,625,313 | ) |
Financial Intermediary Class | | | — | | | | (6,596,142 | ) | | | (231,118 | ) |
| | | |
Change in net assets from fund share transactions: | | | | | | | | | | | | |
Institutional Class | | | (4,840,376,183 | ) | | | 2,284,647,990 | | | | 4,348,340,511 | |
Institutional Select Class | | | 1,625,591,241 | | | | N/A | | | | N/A | |
Financial Intermediary Class | | | (242,167,517 | ) | | | 517,528,015 | | | | 248,299,738 | |
| | | | | | | | | | | | |
Change in net assets | | | (5,152,391,817 | ) | | | 1,896,122,180 | | | | 4,863,712,544 | |
| | | |
Net Assets: | | | | | | | | | | | | |
Beginning of period | | | 14,159,866,703 | | | | 12,263,744,523 | | | | 7,400,031,979 | |
| | | | | | | | | | | | |
| | | |
End of period | | $ | 9,007,474,886 | | | $ | 14,159,866,703 | | | $ | 12,263,744,523 | |
| | | | | | | | | | | | |
| | | |
Undistributed/(Overdistributed) net investment income | | $ | 43,770,526 | | | $ | 21,015,663 | | | $ | (14,155,123 | ) |
| | | | | | | | | | | | |
| | | | | | | | | | | | | |
A | | For the period April 1, 2008 to December 31, 2008. |
See notes to financial statements.
87
Annual Report to Shareholders
Financial Highlights
Western Asset Core Plus Bond Portfolio
For a share of each class of capital stock outstanding:
Institutional Class:
| | | | | | | | | | | | | | | | | | |
| | | PERIOD ENDED
DECEMBER 31,
2008A | | YEARS ENDED MARCH 31, |
| | | | 2008 | | 2007 | | 2006 | | 2005 | | 2004 |
Net asset value, beginning of period | | | $9.87 | | | $10.55 | | | $10.24 | | | $10.52 | | | $10.71 | | | $10.40 |
| | | | | | | | | | | | | | | | | | |
Investment operations: | | | | | | | | | | | | | | | | | | |
Net investment income | | | .39B | | | .55B | | | .51B | | | .45C | | | .37C | | | .37C |
Net realized and unrealized gain/(loss) | | | (1.17) | | | (.62) | | | .33 | | | (.18) | | | .04 | | | .55 |
| | | | | | | | | | | | | | | | | | |
Total from investment operations | | | (.78) | | | (.07) | | | .84 | | | .27 | | | .41 | | | .92 |
| | | | | | | | | | | | | | | | | | |
Distributions from: | | | | | | | | | | | | | | | | | | |
Net investment income | | | (.43) | | | (.53) | | | (.53) | | | (.52) | | | (.35) | | | (.41) |
Net realized gain on investments | | | — | | | (.08) | | | —D | | | (.03) | | | (.25) | | | (.20) |
| | | | | | | | | | | | | | | | | | |
Total distributions | | | (.43) | | | (.61) | | | (.53) | | | (.55) | | | (.60) | | | (.61) |
| | | | | | | | | | | | | | | | | | |
Net asset value, end of period | | | $8.66 | | | $9.87 | | | $10.55 | | | $10.24 | | | $10.52 | | | $10.71 |
| | | | | | | | | | | | | | | | | | |
Total return | | | (8.01)%E | | | (.72)% | | | 8.48% | | | 2.57% | | | 4.01% | | | 9.12% |
| | | | | | |
Ratios to Average Net Assets:F | | | | | | | | | | | | | | | | | | |
Total expenses | | | .46%G | | | .43% | | | .44% | | | .45% | | | .45% | | | .48% |
Expenses net of waivers, if any | | | .46%G | | | .43% | | | .44% | | | .45% | | | .45% | | | .45% |
Expenses net of all reductions | | | .46%G | | | .43% | | | .44% | | | .45% | | | .45% | | | .45% |
Net investment income | | | 5.5%G | | | 5.4% | | | 4.9% | | | 4.3% | | | 3.3% | | | 3.6% |
| | | | | | |
Supplemental Data: | | | | | | | | | | | | | | | | | | |
Portfolio turnover rate | | | 124.4%E | | | 488.2% | | | 448.6% | | | 549.4% | | | 586.1% | | | 463.8% |
Net assets, end of period (in thousands) | | $ | 6,607,180 | | $ | 12,943,882 | | $ | 11,495,842 | | $ | 6,896,815 | | $ | 4,565,054 | | $ | 3,286,650 |
| | | | | | | | | | | | | | | | | | | |
A | | For the period April 1, 2008 to December 31, 2008. |
B | | Computed using average daily shares outstanding. |
C | | Computed using SEC method. |
D | | Amount less than $.01 per share. |
F | | Total expenses reflects operating expenses prior to any voluntary expense waivers and/or compensating balance credits. Expenses net of waivers reflects total expenses before compensating balance credits but net of any voluntary expense waivers. Expenses net of all reductions reflects expenses less any compensating balance credits and/or voluntary expense waivers. |
See notes to financial statements.
88
Annual Report to Shareholders
Institutional Select Class:
| | | |
| | | PERIOD ENDED
DECEMBER 31,
2008H |
Net asset value, beginning of period | | | $9.34 |
| | | |
Investment operations: | | | |
Net investment income | | | .20B |
Net realized and unrealized loss | | | (.62) |
| | | |
Total from investment operations | | | (.42) |
| | | |
Distributions from: | | | |
Net investment income | | | (.26) |
| | | |
Total distributions | | | (.26) |
| | | |
Net asset value, end of period | | | $8.66 |
| | | |
Total return | | | (4.54)%E |
| |
Ratios to Average Net Assets:F | | | |
Total expenses | | | .44%G |
Expenses net of waivers, if any | | | .44%G |
Expenses net of all reductions | | | .44%G |
Net investment income | | | 5.7%G |
| |
Supplemental Data: | | | |
Portfolio turnover rate | | | 124.4%E |
Net assets, end of period (in thousands) | | $ | 1,559,843 |
| | | | |
H | | For the period August 4, 2008 (commencement of operations) to December 31, 2008. |
See notes to financial statements.
89
Annual Report to Shareholders
Financial Highlights—Continued
Western Asset Core Plus Bond Portfolio
For a share of each class of capital stock outstanding:
Financial Intermediary Class:
| | | | | | | | | | | | | | | | | | |
| | | PERIOD ENDED
DECEMBER 31,
2008A | | YEARS ENDED MARCH 31, |
| | | | 2008 | | 2007 | | 2006 | | 2005 | | 2004 |
Net asset value, beginning of period | | | $9.88 | | | $10.56 | | | $10.24 | | | $10.52 | | | $10.71 | | | $10.40 |
| | | | | | | | | | | | | | | | | | |
Investment operations: | | | | | | | | | | | | | | | | | | |
Net investment income | | | .37B | | | .52B | | | .48B | | | .42C | | | .35C | | | .36C |
Net realized and unrealized gain/(loss) | | | (1.17) | | | (.62) | | | .35 | | | (.18) | | | .04 | | | .54 |
| | | | | | | | | | | | | | | | | | |
Total from investment operations | | | (.80) | | | (.10) | | | .83 | | | .24 | | | .39 | | | .90 |
| | | | | | | | | | | | | | | | | | |
Distributions from: | | | | | | | | | | | | | | | | | | |
Net investment income | | | (.42) | | | (.50) | | | (.51) | | | (.49) | | | (.33) | | | (.39) |
Net realized gain on investments | | | — | | | (.08) | | | —D | | | (.03) | | | (.25) | | | (.20) |
| | | | | | | | | | | | | | | | | | |
Total distributions | | | (.42) | | | (.58) | | | (.51) | | | (.52) | | | (.58) | | | (.59) |
| | | | | | | | | | | | | | | | | | |
Net asset value, end of period | | | $8.66 | | | $9.88 | | | $10.56 | | | $10.24 | | | $10.52 | | | $10.71 |
| | | | | | | | | | | | | | | | | | |
Total return | | | (8.28)%E | | | (.97)% | | | 8.30% | | | 2.32% | | | 3.77% | | | 8.82% |
| | | | | | |
Ratios to Average Net Assets:F | | | | | | | | | | | | | | | | | | |
Total expenses | | | .77%G | | | .68% | | | .69% | | | .70% | | | .70% | | | .73% |
Expenses net of waivers, if any | | | .70%G | | | .68% | | | .69% | | | .70% | | | .70% | | | .70% |
Expenses net of all reductions | | | .70%G | | | .68% | | | .69% | | | .70% | | | .70% | | | .70% |
Net investment income | | | 5.2%G | | | 5.1% | | | 4.7% | | | 4.0% | | | 2.9% | | | 3.2% |
| | | | | | |
Supplemental Data: | | | | | | | | | | | | | | | | | | |
Portfolio turnover rate | | | 124.4%E | | | 488.2% | | | 448.6% | | | 549.4% | | | 586.1% | | | 463.8% |
Net assets, end of period (in thousands) | | $ | 840,452 | | $ | 1,215,985 | | $ | 767,903 | | $ | 503,217 | | $ | 191,085 | | $ | 7,040 |
| | | | | | | | | | | | | | | | | | | |
See notes to financial statements.
90
Annual Report to Shareholders
Notes to Financial Statements
1. Significant Accounting Policies:
Western Asset Funds, Inc. (“Corporation”), consisting of Western Asset Absolute Return Portfolio (“Absolute Return”), Western Asset Core Bond Portfolio (“Core”), Western Asset Core Plus Bond Portfolio (“Core Plus”), Western Asset High Yield Portfolio (“High Yield”), Western Asset Inflation Indexed Plus Bond Portfolio (“Inflation Indexed”), Western Asset Intermediate Bond Portfolio (“Intermediate”), Western Asset Intermediate Plus Bond Portfolio (“Intermediate Plus”), Western Asset Limited Duration Bond Portfolio (“Limited Duration”) and Western Asset Non-U.S. Opportunity Bond Portfolio (“Non-U.S.”) (individually a “Fund,” collectively the “Funds”), is registered under the Investment Company Act of 1940, as amended (“1940 Act”), as a diversified, open-end management investment company with the exception of Non-U.S., which is non-diversified. Financial Statements for Absolute Return, High Yield, Inflation Indexed, Intermediate, Intermediate Plus, Limited Duration, and Non-U.S. are contained in a separate report to shareholders. As of December 31, 2008, the funds’ fiscal year end has changed from March 31 to December 31.
Each Fund offers three classes of shares: Institutional Class, Institutional Select Class and Financial Intermediary Class. Shares in the Financial Intermediary Class bear a distribution fee. The income and expenses of each of the Funds are allocated proportionately to the three classes of shares based on daily net assets, except for Rule 12b-1 distribution fees, which are charged only on the Financial Intermediary Class shares, and transfer agent and shareholder servicing expenses, and certain other expenses, which are determined separately for each class.
Preparation of the financial statements in accordance with accounting principles generally accepted in the United States of America requires management to make estimates and assumptions that affect the reported amounts and disclosures in the financial statements. Actual results could differ from those estimates. The following is a summary of significant accounting policies followed by each Fund in the preparation of its financial statements:
Investment Valuation
The Funds’ securities are valued under policies approved by and under the general oversight of the Board of Directors. Effective April 1, 2008, the Fund adopted Statement of Financial Accounting Standards No. 157 (“FAS 157”). FAS 157 establishes a single definition of fair value, creates a three-tier hierarchy as a framework for measuring fair value based on inputs used to value the Fund’s investments, and requires additional disclosure about fair value. The hierarchy of inputs is summarized below.
| | • | | Level 1—quoted prices in active markets for identical investments |
| | • | | Level 2—other significant observable inputs (including quoted prices for similar investments, interest rates, prepayment speeds, credit risk, etc.) |
| | • | | Level 3—significant unobservable inputs (including each Fund’s own assumptions in determining the fair value of investments) |
Debt securities are valued at the last quoted bid prices provided by an independent pricing service that are based on transactions in debt obligations, quotations from bond dealers, market transactions in comparable securities and various other relationships between securities. Publicly traded foreign government debt securities are typically traded internationally in the over-the-counter market and are valued at the bid price as of the close of business of that market. Equity securities for which market quotations are available are valued at the last sale price or official closing price on the primary market or exchange on which they trade. When prices are not readily available, or are determined not to reflect fair value, such as when the value of a security has been significantly affected by events after the close of the exchange or market on which the security is principally traded, but before the Fund calculates its net asset value, the Fund may value these securities at fair value as determined in accordance with the procedures approved by the Fund’s Board of Directors.
The inputs or methodology used for valuing securities are not necessarily an indication of the risk associated with investing in these securities.
91
Annual Report to Shareholders
Notes to Financial Statements—Continued
The following is a summary of the inputs used in valuing the Funds’ assets carried at fair value:
Core
| | | | | | | | | | | | | | |
| | | 12/31/2008 | | | Quoted Prices
(Level 1) | | Other Significant
Observable
Inputs
(Level 2) | | | Significant
Unobservable
Inputs
(Level 3) |
Investments in Securities | | $ | 5,180,696,232 | | | $ | 2,000,622 | | $ | 5,169,888,870 | | | $ | 8,806,740 |
Other Financial Instruments* | | | (283,901,711 | ) | | | 53,851,158 | | | (337,752,869 | ) | | | — |
| | | | | | | | | | | | | | |
Total | | $ | 4,896,794,521 | | | $ | 55,851,780 | | $ | 4,832,136,001 | | | $ | 8,806,740 |
| | | | | | | | | | | | | | |
| * | | Other financial instruments include written options, futures and swaps. |
The following is a reconciliation of investments in which significant unobservable inputs (Level 3) were used in determining fair value:
| | | | |
| | | Investments
in Securities | |
Balance as of 03/31/08 | | $ | — | |
Accrued Premiums/Discounts | | | — | |
Realized Gain (Loss) | | | 2,321 | |
Change in unrealized appreciation (depreciation) | | | (2,920,667 | ) |
Net purchases (sales) | | | 7,407,685 | |
Transfers in and/or out of Level 3 | | | 4,317,401 | |
| | | | |
Balance as of 12/31/08 | | $ | 8,806,740 | |
| | | | |
Core Plus
| | | | | | | | | | | | | | |
| | | 12/31/2008 | | | Quoted Prices
(Level 1) | | Other Significant
Observable
Inputs
(Level 2) | | | Significant
Unobservable
Inputs
(Level 3) |
Investments in Securities | | $ | 10,272,576,318 | | | $ | 21,074,071 | | $ | 10,216,904,813 | | | $ | 34,597,434 |
Other Financial Instruments* | | | (749,300,372 | ) | | | 167,291,536 | | | (916,591,908 | ) | | | — |
| | | | | | | | | | | | | | |
Total | | $ | 9,523,275,946 | | | $ | 188,365,607 | | $ | 9,300,312,905 | | | $ | 34,597,434 |
| | | | | | | | | | | | | | |
| * | | Other financial instruments include written options, futures, forward foreign currency contracts, spot foreign currency contracts and swaps. |
The following is a reconciliation of investments in which significant unobservable inputs (Level 3) were used in determining fair value:
| | | | |
| | | Investments
in Securities | |
Balance as of 03/31/08 | | $ | — | |
Accrued Premiums/Discounts | | | (719 | ) |
Realized Gain (Loss) | | | 4,194 | |
Change in unrealized appreciation (depreciation) | | | (5,895,975 | ) |
Net purchases (sales) | | | 14,888,262 | |
Transfers in and/or out of Level 3 | | | 25,601,672 | |
| | | | |
Balance as of 12/31/08 | | $ | 34,597,434 | |
| | | | |
92
Annual Report to Shareholders
Security Transactions
Security transactions are accounted for as of the trade date. Realized gains and losses from security transactions are reported on an identified cost basis for both financial reporting and federal income tax purposes.
For the period ended December 31, 2008, security transactions (excluding short-term investments) were:
| | | | | | | | | | | | |
| | | Purchases | | Proceeds From Sales |
| | | U.S. Gov’t
Securities | | Other | | U.S. Gov’t
Securities | | Other |
Core | | $ | 8,646,084,994 | | $ | 124,716,957 | | $ | 10,029,845,875 | | $ | 380,293,410 |
Core Plus | | | 15,194,644,966 | | | 667,323,146 | | | 17,519,281,497 | | | 830,267,505 |
Forward Commitments
The Funds may enter into commitments to purchase securities on a “forward commitment” basis, including purchases on a “when-issued” basis or a “to be announced” basis. When such transactions are negotiated, certain terms may be fixed at the time the commitment is made, but delivery and payment for the securities takes place at a later date. During the period between a commitment and settlement, no payment is made by the purchaser for the securities purchased and, thus, no interest accrues to the purchaser from the transaction. In a “to be announced” transaction, a Fund commits to purchase securities for which all specific information is not yet known at the time of the trade, particularly the exact face amount in forward commitment mortgage-backed securities transactions. Depending on market conditions, a Fund’s forward commitment purchases could cause its net asset value to be more volatile.
A Fund may sell the securities subject to a forward commitment purchase, which may result in a gain or loss. When a Fund purchases securities on a forward commitment basis, it assumes the risks of ownership, including the risk of price fluctuation, at the time of purchase, not at the time of receipt. Purchases of forward commitment securities also involve a risk of loss if the seller fails to deliver after the value of the securities has risen.
Each Fund may also enter into a forward commitment to sell securities it owns and will generally do so only with the intention of actually delivering the securities. In a forward sale, a Fund does not participate in gains or losses on the security occurring after the commitment date. Forward commitments to sell securities also involve a risk of loss if the seller fails to take delivery after the value of the securities has declined.
Foreign Currency Translation
Assets and liabilities initially expressed in non-U.S. currencies are translated into U.S. dollars using currency exchange rates determined prior to the close of trading on the New York Stock Exchange, usually at 2:00 p.m. Eastern time. Purchases and sales of securities and income and expenses are translated into U.S. dollars at the prevailing market rates on the dates of such transactions. The effects of changes in non-U.S. currency exchange rates on investment securities and other assets and liabilities are included with the net realized and unrealized gain or loss on investment securities.
Repurchase Agreements
Each Fund may enter into repurchase agreements with institutions that its investment adviser has determined are creditworthy. Each repurchase agreement is recorded at cost. Under the terms of a typical repurchase agreement, a fund takes possession of an underlying debt obligation subject to an obligation of the seller to repurchase, and of the fund to resell, the obligation at an agreed-upon price and time, thereby determining the yield during a fund’s holding period. When entering into repurchase agreements, it is each Fund’s policy that its custodian acting on the fund’s behalf, or a third party custodian, take possession of the underlying collateral securities, the market value of which, at all times, at least equals the principal amount of the repurchase transaction, including accrued interest. To the extent that any repurchase transaction exceeds one business day, the value of the collateral is marked to market to ensure the adequacy of the collateral. If the counterparty defaults, the affected Fund generally has the right to use the collateral to satisfy the terms of the repurchase transaction. However, if the market value of the collateral declines during the period in which the Fund seeks to assert its rights or if bankruptcy proceedings are commenced with respect to the seller of the security, realization of the collateral by the Fund may be delayed or limited.
93
Annual Report to Shareholders
Notes to Financial Statements—Continued
Options, Futures and Swap Agreements
The current market value of an exchange traded option is the last sale price or, in the absence of a sale, the price obtained by reference to broker-dealer quotations. Futures contracts are valued daily at the settlement price established by the board of trade or exchange on which they are traded. Futures contracts are marked-to-market on a daily basis. As the contract’s value fluctuates, payments known as variation margin are made or received by the Fund each day, depending on the daily fluctuation in the value of the contract. The daily changes in contract value are recorded as unrealized gains or losses, and the Fund recognizes a gain or loss when the contract is closed. Swap agreements are priced daily by vendors or advisor models and the change, if any, is recorded as unrealized appreciation or depreciation.
Investment Income and Distributions to Shareholders
Investment income and distributions to shareholders are allocated at the class level and are recorded on the ex-dividend date. Dividends from net investment income are declared daily and paid monthly for each Fund. Net capital gain distributions, which are calculated at the Fund level, are declared and paid annually in May. An additional distribution may be made in December to the extent necessary in order to comply with federal excise tax requirements. Distributions are determined in accordance with federal income tax regulations, which may differ from those determined in accordance with accounting principles generally accepted in the United States of America; accordingly, periodic reclassifications are made within the Funds’ capital accounts to reflect income and gains available for distribution under federal income tax regulations. Interest income and expenses are recorded on the accrual basis. Bond discounts and premiums are amortized and included in interest income for financial reporting and federal income tax purposes.
Short Sales
The Fund may sell a security it does not own in anticipation of a decline in the market price of that security. The Fund must then borrow the security sold short and deliver it to the dealer that brokered the short sale. A gain, limited to the price at which the security was sold short, or a loss, potentially unlimited in size, will be recognized upon the termination of the short sale. With respect to each short sale, the Fund must maintain collateral in a segregated account consisting of liquid assets with a value at least equal to the current market value of the shorted securities, marked-to-market daily, or take other actions permitted by law to cover its obligations. Dividend expenses and fees paid to brokers to borrow securities in connection with short sales are considered part of the cost of short sale transactions. Dividends declared on securities sold short are recorded as an expense on the ex-dividend date.
Compensating Balance Credits
The Funds have an arrangement with their custodian bank, whereby a portion of the custodian’s fee is paid indirectly by credits earned on each Fund’s cash on deposit with the bank. This deposit arrangement is an alternative to purchasing overnight investments.
Subscription In-Kind
The Fund under certain conditions may accept portfolio securities rather than cash as payment for the purchase of fund shares. The cost basis of contributed securities is equal to the market value of securities on the date of contribution. There are no gains or losses recognized by the Fund and there are no tax consequences on subscription in-kind transactions. During the year ended December 31, 2008, Core Plus accepted $97,748,367 of subscriptions in-kind.
Credit and Market Risk
Investments in structured securities collateralized by residential real estate mortgages are subject to certain credit and liquidity risks. When market conditions result in an increase in default rates of the underlying mortgages and the foreclosure values of underlying real estate properties are materially below the outstanding amount of these underlying mortgages, collection of accrued interest and principal on these investments may be doubtful. Such market conditions may significantly impair the value of these investments resulting in a lack of correlation between their credit ratings and values.
Other
In the normal course of business, each Fund enters into contracts that provide general indemnifications. Each Fund’s maximum exposure under these arrangements is dependent upon claims that may be made against the Fund in the future and, therefore, cannot be estimated; however, based on experience, the risk of material loss from such claims is considered remote.
94
Annual Report to Shareholders
2. Federal Income Taxes:
It is each Fund’s policy to continue to comply with the federal income and excise tax requirements of the Internal Revenue Code of 1986, as amended, applicable to registered investment companies. Accordingly, the Funds intend to distribute substantially all of their taxable income and net realized gains, if any, to shareholders each year. Therefore, no federal income tax provision is required in the Funds’ financial statements. Under the applicable foreign tax laws, a withholding tax may be imposed on interest, dividends and capital gains at various rates.
Management has analyzed each Fund’s tax positions taken on federal income tax returns for all open tax years and has concluded that as of December 31, 2008, no provision for income tax would be required in the Funds’ financial statements. The Funds’ federal and state income and federal excise tax returns for tax years for which the applicable statutes of limitations have not expired are subject to examination by the Internal Revenue Service and state departments of revenue.
Reclassifications:
Accounting principles generally accepted in the United States of America require that certain components of net assets be adjusted to reflect permanent differences between financial and tax reporting. These reclassifications have no effect on net assets or net asset values per share. During the current year, the following reclassifications have been made:
| | | | | | | |
Fund | | Undistributed Net
Investment Income | | Accumulated Net
Realized Loss | |
CoreA | | $ | 56,971,333 | | $ | (56,971,333 | ) |
Core PlusB | | | 68,987,772 | | | (68,987,772 | ) |
A | | Reclassifications are primarily due to losses from mortgage-backed securities treated as capital losses for tax purposes and book/tax differences in the treatment of swap contracts. |
B | | Reclassifications are primarily due to foreign currency transactions treated as ordinary income for tax purposes, losses from mortgage-backed securities treated as capital losses for tax purposes and book/tax differences in the treatment of swap contracts. |
Distributions to Shareholders:
Subsequent to the fiscal year end, the Funds have made the following distributions:
| | | | | | | | | | | | | | | | | | |
| | | Core | | Core Plus |
Record Date Payable Date | | Institutional
Class | | Financial
Intermediary
Class | | Institutional
Select Class | | Institutional
Class | | Financial
Intermediary
Class | | Institutional
Select Class |
Daily 01/30/2009 | | $ | 0.029803 | | $ | 0.027801 | | $ | 0.028253 | | $ | 0.028735 | | $ | 0.027160 | | $ | 0.029254 |
The tax character of distributions paid during the fiscal year ended December 31, 2008 were as follows:
| | | | | | |
| | | Core | | Core Plus |
Distributions paid from: | | | | | | |
Ordinary income | | $ | 291,170,384 | | $ | 556,207,181 |
| | | | | | |
The tax character of distributions paid during the fiscal year ended March 31, 2008 were as follows:
| | | | | | |
| | | Core | | Core Plus |
Distributions paid from: | | | | | | |
Ordinary income | | $ | 362,380,368 | | $ | 780,420,856 |
Net long-term capital gains | | | 23,199,917 | | | 31,340,849 |
| | | | | | |
Total distributions paid | | $ | 385,580,285 | | $ | 811,761,705 |
| | | | | | |
95
Annual Report to Shareholders
Notes to Financial Statements—Continued
Accumulated Earnings on a Tax Basis:
As of December 31, 2008, the components of accumulated earnings on a tax basis were as follows:
| | | | | | | | |
| | | Core | | | Core Plus | |
Undistributed ordinary income—net | | $ | 26,077,706 | | | $ | 166,186,115 | |
Capital loss carryforward(*) | | | (119,420,470 | ) | | | — | |
Other book/tax temporary differences | | | (57,844,049 | )A | | | (142,535,026 | )C |
Unrealized appreciation/(depreciation) | | | (1,211,289,511 | )B | | | (2,475,841,998 | ) |
| | | | | | | | |
Total accumulated earnings/(losses)—net | | $ | (1,362,476,324 | ) | | $ | (2,452,190,909 | ) |
| | | | | | | | |
| * | | During the taxable year ended December 31, 2008, Core Plus utilized $154,595,575 of its capital loss carryovers available from a previous year. |
As of the taxable year ended December 31, 2008, the following capital loss carryforwards are available:
| | | | |
Year of Expiration | | Core | |
12/31/2015 | | $ | (84,734,017 | ) |
12/31/2016 | | | (34,686,453 | ) |
| | | | |
| | $ | (119,420,470 | ) |
| | | | |
These amounts will be available to offset any future taxable capital gains.
A | | Other book/tax temporary differences are attributable primarily to the tax deferral of losses on straddles, the realization for tax purposes of unrealized losses on certain futures contracts, differences between book/tax accrual of interest income on securities in default accrued for tax not book and book/tax differences in the timing of the deductibility of various expenses. |
B | | The difference between book-basis and tax-basis unrealized appreciation/(depreciation) is attributable primarily to the tax deferral of losses on wash sales and book/tax differences in the accrual of income on certain securities. |
C | | Other book/tax temporary differences are attributable primarily to the tax deferral of losses on straddles, the realization for tax purposes of unrealized gains on certain futures and foreign currency contracts, differences between book/tax accrual of interest income on securities in default and book/tax differences in the timing of the deductibility of various expenses. |
Tax Cost of Investments:
As of December 31, 2008, the aggregate cost of investments for federal income tax purposes were as follows:
| | | |
Core | | $ | 6,108,084,035 |
Core Plus | | | 12,000,841,404 |
3. Financial Instruments:
Forward Currency Exchange Contracts
As part of their investment programs, the Funds may utilize forward currency exchange contracts. The nature and risks of these financial instruments and the reasons for using them are set forth more fully in the Corporation’s prospectus and statement of additional information.
Forward foreign currency contracts are marked-to-market daily using forward foreign currency exchange rates supplied by an independent pricing service. The change in a contract’s market value is recorded by a Fund as an unrealized gain or loss. When the contract is closed or delivery is taken, the Fund records a realized gain or loss equal to the difference between the value of the contract at the time it was opened and the value at the time it was closed.
The use of forward foreign currency exchange contracts does not eliminate fluctuations in the underlying prices of the Funds’ securities, but it does establish a rate of exchange that can be achieved in the future. These forward foreign currency exchange contracts involve market risk in excess of amounts reflected in the financial statements. Although forward foreign currency
96
Annual Report to Shareholders
exchange contracts used for hedging purposes limit the risk of loss due to a decline in the value of the hedged currency, they also limit any potential gain that might result should the value of the currency increase. In addition, the Fund could be exposed to risks if the counterparties to the contracts are unable to meet the terms of their contracts.
At December 31, 2008, open forward currency exchange contracts (expressed in the contractual currency) were:
Core Plus
| | | | | | | | | | | | | | |
| Broker | | Settlement
Date | | Contract to | | Unrealized
Gain/(Loss) | |
| | | Receive | | Deliver | |
Credit Suisse First Boston
(London) | | 2/3/09 | | CAD | | 4,477,658 | | USD | | 3,496,531 | | $ | 128,853 | |
| JPMorgan Chase Bank | | 2/3/09 | | CAD | | 14,519,281 | | USD | | 12,099,401 | | | (343,707 | ) |
| Citibank NA | | 2/3/09 | | EUR | | 36,015,954 | | USD | | 47,083,874 | | | 2,906,131 | |
Credit Suisse First Boston
(London) | | 2/3/09 | | EUR | | 25,000,000 | | USD | | 35,143,750 | | | (443,847 | ) |
| Goldman Sachs International | | 2/3/09 | | EUR | | 1,455,108 | | USD | | 1,841,332 | | | 178,353 | |
| Deutsche Bank AG London | | 2/3/09 | | GBP | | 4,153,969 | | USD | | 6,268,204 | | | (301,375 | ) |
| Deutsche Bank AG London | | 2/3/09 | | JPY | | 6,594,775,000 | | USD | | 65,596,807 | | | 7,203,160 | |
| UBS AG London | | 2/3/09 | | JPY | | 3,680,000,000 | | USD | | 36,631,495 | | | 3,992,162 | |
| Citibank NA | | 2/3/09 | | USD | | 45,557,070 | | EUR | | 34,323,632 | | | (2,083,997 | ) |
Credit Suisse First Boston
(London) | | 2/3/09 | | USD | | 17,436,307 | | EUR | | 13,190,836 | | | (872,522 | ) |
| Deutsche Bank AG London | | 2/3/09 | | USD | | 26,794,433 | | GBP | | 15,800,002 | | | 4,099,051 | |
| Deutsche Bank AG London | | 2/3/09 | | USD | | 67,307,359 | | JPY | | 6,594,775,000 | | | (5,492,608 | ) |
| Goldman Sachs International | | 2/3/09 | | USD | | 13,288,973 | | EUR | | 9,943,115 | | | (512,032 | ) |
| UBS AG London | | 2/3/09 | | USD | | 11,868,634 | | EUR | | 9,400,000 | | | (1,178,529 | ) |
| UBS AG London | | 2/3/09 | | USD | | 37,531,871 | | JPY | | 3,680,000,000 | | | (3,091,786 | ) |
| | | | | | | | | | | | | | |
| | | | | | | | | | | | $ | 4,187,307 | |
| | | | | | | | | | | | | | |
CAD—Canadian dollar
EUR—Euro
GBP—British pound
JPY—Japanese yen
USD—United States dollar
Loan Participations and Assignments
The Funds may invest in loans arranged through private negotiation between one or more financial institutions. The Funds’ investment in any such loan may be in the form of a participation in or an assignment of the loan. In connection with purchasing participations, the Funds generally will have no right to enforce compliance by the borrower with the terms of the loan agreement relating to the loan, nor any rights of set-off against the borrower and the Funds may not benefit directly from any collateral supporting the loan in which it has purchased the participation.
The Funds will assume the credit risk of both the borrower and the lender that is selling the participation. In the event of the insolvency of the lender selling the participation, the Funds may be treated as a general creditor of the lender and may not benefit from any set-off between the lender and the borrower.
Options and Futures
As part of their investment programs, the Funds may utilize options and futures. Options may be written (sold) or purchased by the Funds. When a Fund purchases a put or call option, the premium paid is recorded as an investment and its value is marked-to-market daily. When a Fund writes a put or call option, an amount equal to the premium received by the Fund is recorded as a liability and its value is marked-to-market daily.
97
Annual Report to Shareholders
Notes to Financial Statements—Continued
When options, whether written or purchased, expire, are exercised or are closed (by entering into a closing purchase or sale transaction), the Fund realizes a gain or loss as described in the chart below:
| | |
| Purchased option: | | Impact on the Fund: |
| The option expires | | Realize a loss in the amount of the cost of the option. |
| The option is closed through a closing sale transaction | | Realize a gain or loss depending on whether the proceeds from the closing sale transaction are greater or less than the cost of the option. |
| The Fund exercises a call option | | The cost of the security purchased through the exercise of the option will be increased by the premium originally paid to purchase the option. |
| The Fund exercises a put option | | Realize a gain or loss from the sale of the underlying security. The proceeds of that sale will be reduced by the premium originally paid to purchase the put option. |
| |
| Written option: | | Impact on the Fund: |
| The option expires | | Realize a gain equal to the amount of the premium received. |
| The option is closed through a closing purchase transaction | | Realize a gain or loss without regard to any unrealized gain or loss on the underlying security and eliminate the option liability. The Fund will realize a loss in this transaction if the cost of the closing purchase exceeds the premium received when the option was written. |
| A written call option is exercised by the option purchaser | | Realize a gain or loss from the sale of the underlying security. The proceeds of that sale will be increased by the premium originally received when the option was written. |
| A written put option is exercised by the option purchaser | | The amount of the premium originally received will reduce the cost of the security that the Fund purchased when the option was exercised. |
The risk associated with purchasing options is limited to the premium originally paid. Options written by a Fund involve, to varying degrees, risk of loss in excess of the option value reflected in the statement of assets and liabilities. The risk in writing a covered call option is that a Fund may forgo the opportunity of profit if the market price of the underlying security increases and the option is exercised. The risk in writing a put option is that a Fund may incur a loss if the market price of the underlying security decreases and the option is exercised. In addition, there is the risk a Fund may not be able to enter into a closing transaction because of an illiquid secondary market or, for over-the-counter options, because of the counterparty’s inability or unwillingness to perform.
Activity in written call and put options during the period ended December 31, 2008, was as follows:
| | | | | | | |
| Core | | Actual
Contracts/
Notional Par | | | Premiums | |
Options outstanding at March 31, 2008 | | 735,287,925 | | | $ | 28,791,486 | |
Options written | | 2,496,324,494 | | | | 74,700,538 | |
Options closed | | (313,214,228 | ) | | | (17,016,699 | ) |
Options expired | | (1,509,055,183 | ) | | | (30,264,681 | ) |
Options exercised | | (762,052,585 | ) | | | (23,825,004 | ) |
| | | | | | | |
Options outstanding at December 31, 2008 | | 647,290,423 | | | $ | 32,385,640 | |
| | | | | | | |
98
Annual Report to Shareholders
| | | | | | | |
| Core Plus | | Actual
Contracts/
Notional Par | | | Premiums | |
Options outstanding at March 31, 2008 | | 2,121,166,003 | | | $ | 66,700,489 | |
Options written | | 5,138,685,693 | | | | 170,244,709 | |
Options closed | | (672,645,876 | ) | | | (40,113,027 | ) |
Options expired | | (3,108,803,083 | ) | | | (69,586,720 | ) |
Options exercised | | (2,073,403,478 | ) | | | (61,326,090 | ) |
| | | | | | | |
Options outstanding at December 31, 2008 | | 1,404,999,259 | | | $ | 65,919,361 | |
| | | | | | | |
Upon entering into a futures contract, the Funds are required to deposit with the broker cash or cash equivalents in an amount equal to a certain percentage of the contract amount. This is known as the “initial margin.” Subsequent payments (“variation margin”) are made or received by the Fund each day, depending on the daily fluctuation in the value of the contract. For non-U.S. and foreign denominated futures held in Core Plus, payment is not sent daily, but is recorded as a net payable or receivable by the Fund to or from the futures broker, which holds cash collateral from the Fund. The daily changes in contract value are recorded as unrealized gains or losses and each Fund recognizes a realized gain or loss when the contract is closed. Futures contracts are valued daily at the settlement price established by the board of trade or exchange on which they are traded.
The Funds enter into futures contracts for various reasons, including in connection with their interest rate management strategy. Futures contracts involve, to varying degrees, risk of loss in excess of the amounts reflected in the financial statements. The change in the value of futures contracts primarily corresponds with the value of the underlying instruments, which may not correlate with changes in interest rates, if applicable. In addition, there is a risk that a Fund may not be able to enter into a closing transaction because of an illiquid secondary market. The nature and risks of these financial instruments and other reasons for using them are set forth more fully in the Corporation’s prospectus and statement of additional information.
The open futures positions and related appreciation or depreciation at December 31, 2008 are listed at the end of each Fund’s portfolio of investments.
Swap Agreements
The Funds may invest in swaps for the purpose of managing their exposure to interest rate, credit or market risk, or for other purposes. The use of swaps involves risks that are different from those associated with ordinary portfolio transactions.
Each Fund may enter into credit default swap (“CDS”) contracts for investment purposes, to manage its credit risk or to add leverage. CDS agreements involve one party making a stream of payments to another party in exchange for the right to receive a specified return in the event of a default by a third party, typically corporate issuers or sovereign issuers of an emerging country, on a specified obligation or in the event of a write-down, principal shortfall, interest shortfall or default of all or part of the referenced entities comprising a credit index. The Fund may use a CDS to provide a measure of protection against defaults of the issuers (i.e., to reduce risk where a Fund has exposure to the sovereign issuer) or to take an active long or short position with respect to the likelihood of a particular issuer’s default. As a seller of protection, the Fund generally receives an upfront payment or a stream of payments throughout the term of the swap provided that there is no credit event. If the Fund is a seller of protection and a credit event occurs, as defined under the terms of that particular swap agreement, the maximum potential amount of future payments (undiscounted) that the Fund could be required to make under a credit default swap agreement, would be an amount equal to the notional amount of the agreement. These amounts of potential payments will be partially offset by any recovery of values from the respective referenced obligations. As a seller of protection, the Fund effectively adds leverage to its portfolio because, in addition to its total net assets, the Fund would be subject to investment exposure on the notional amount of the swap. As a buyer of protection, the Fund generally receives an amount up to the notional value of the swap if a credit event occurs.
Implied spreads are the theoretical price a lender receives for credit default protection. When spreads rise, market perceived credit risk rises and when spreads fall, market perceived credit risk falls. The implied credit spread of a particular referenced entity reflects the cost of buying/selling protection and may include upfront payments required to enter into the agreement. Wider credit
99
Annual Report to Shareholders
Notes to Financial Statements—Continued
spreads and decreasing market values, when compared to the notional amount of the swap, represent a deterioration of the referenced entity’s credit soundness and a greater likelihood or risk of default or other credit event occurring as defined under the terms of the agreement. Credit spreads utilized in determining the period end market value of credit default swap agreements on corporate issues or sovereign issues of an emerging country are disclosed in the Notes to Financial Statements and serve as an indicator of the current status of the payment/performance risk and represent the likelihood or risk of default for credit derivatives. For credit default swap agreements on asset-backed securities and credit indices, the quoted market prices and resulting values particularly in relation to the notional amount of the contract, as well as the annual payment rate serve as an indication of the current status of the payment/performance risk.
Payments received or made at the beginning of the measurement period are reflected as a premium or deposit, respectively, on the Statement of Assets and Liabilities. These upfront payments are amortized over the life of the swap and are recognized as realized gain or loss on the Statement of Operations. A liquidation payment received or made at the termination of the swap is recognized as realized gain or loss on the Statement of Operations. Net periodic payments received or paid by the Fund are recognized as realized gain or loss at the time of receipt or payment on the Statement of Operations.
Entering into a CDS agreement involves, to varying degrees, elements of credit, market and documentation risk in excess of the related amounts recognized on the Statement of Assets and Liabilities. Such risks involve the possibility that there will be no liquid market for these agreements, that the counterparty to the agreement may default on its obligation to perform or disagree as to the meaning of the contractual terms in the agreement, and that there will be unfavorable changes in net interest rates.
Interest rate swap contracts involve the exchange of commitments to pay and receive interest based on a notional principal amount.
Commodity swaps are agreements to exchange cash flows at specified intervals to gain investment exposure to the relevant spread of commodity reference prices. Total return swaps are agreements to exchange the return generated by one instrument for the return generated by another instrument, for example, the agreement to pay interest in exchange for a market-linked return based on a notional amount. To the extent the total return of the index exceeds the offsetting interest obligation, the Fund will receive a payment from the counterparty. To the extent it is less, the Fund will make a payment to the counterparty. Periodic payments received or made by the Fund are recorded in the accompanying statements of operations as realized gains or losses, respectively.
Swaps are marked-to-market daily and changes in value are recorded as unrealized appreciation/(depreciation). Gains or losses are realized upon termination of the swap agreement. Periodic payments and premiums received or made by a Fund are recorded in the accompanying statements of operations as realized gains or losses, respectively. Collateral, in the form of restricted cash or securities, may be required to be held in segregated accounts with the Fund’s custodian in compliance with the terms of the swap contracts. Risks may exceed amounts recognized on the statements of assets and liabilities. These risks include changes in the returns of the underlying instruments, failure of the counterparties to perform under the contracts’ terms, and the possible lack of liquidity with respect to the swap agreements.
As of December 31, 2008, the one-and three-month London Interbank Offered Rates were 0.44% and 1.43%, respectively. The six-month Euribor Rate was 2.97%.
The following is a summary of open swap contracts outstanding as of December 31, 2008.
| | | | | | | | | | | | | | | | |
| Western Asset Core Bond Portfolio | | | |
Swap Counterparty
(Reference Entity) | | Termination Date | | Periodic
Payments
Made by the
Fund‡ | | Periodic
Payments
Received by the
Fund‡ | | Contract
Notional
Amount | | Upfront
Premiums
Paid/
(Received) | | Unrealized
Appreciation/
(Depreciation) | |
| | | | | | | | | | | | | | | | |
Interest Rate Swaps: | | | | |
Banc of America Securities LLC | | March 1, 2013 | | 5.104%
Semi-Annually | | 3-month LIBOR | | $ | 4,700,000 | | $ | — | | $ | (582,519 | ) |
100
Annual Report to Shareholders
| | | | | | | | | | | | | | | | | |
| Western Asset Core Bond Portfolio—Continued | | | | |
Swap Counterparty
(Reference Entity) | | Termination Date | | Periodic
Payments
Made by the
Fund‡ | | Periodic
Payments
Received by the
Fund‡ | | Contract
Notional
Amount | | Upfront
Premiums
Paid/
(Received) | | | Unrealized
Appreciation/
(Depreciation) | |
| Interest Rate Swaps—Continued | | | | |
| | | | | | | | | | | | | | | | | |
Banc of America Securities LLC | | December 16, 2013 | | 5.381%
Semi-Annually | | 3-month LIBOR | | $ | 2,740,000 | | $ | — | | | $ | (419,094 | ) |
| | | | | | |
Banc of America Securities LLC | | November 10, 2015 | | 4.864%
Semi-Annually | | 3-month LIBOR | | | 4,400,000 | | | — | | | | (701,419 | ) |
| | | | | | |
Banc of America Securities LLC | | January 15, 2016 | | 5.45084%
Semi-Annually | | 3-month LIBOR | | | 2,750,000 | | | — | | | | (550,475 | ) |
| | | | | | |
Banc of America Securities LLC | | October 3, 2016 | | 5.425%
Semi-Annually | | 3-month LIBOR | | | 4,120,000 | | | — | | | | (879,986 | ) |
| | | | | | |
Banc of America Securities LLC | | February 15, 2025 | | 4.29456%
Semi-Annually | | 3-month LIBOR | | | 146,800,000 | | | — | | | | (28,503,275 | ) |
| | | | | | |
Banc of America Securities LLC | | March 18, 2039 | | 4.25%
Semi-Annually | | 3-month LIBOR | | | 14,700,000 | | | (297,293 | ) | | | (4,090,466 | ) |
| | | | | | |
Barclays Capital Inc. | | November 1, 2011 | | 5.439%
Semi-Annually | | 3-month LIBOR | | | 5,600,000 | | | — | | | | (569,434 | ) |
| | | | | | |
Barclays Capital Inc. | | May 31, 2012 | | 3-month LIBOR | | 4.4%
Semi-Annually | | | 17,443,000 | | | 82,720 | | | | 1,374,386 | |
| | | | | | |
Barclays Capital Inc. | | May 31, 2012 | | 3-month LIBOR | | 4.4%
Semi-Annually | | | 18,340,000 | | | 89,679 | | | | 1,442,357 | |
| | | | | | |
Barclays Capital Inc. | | June 25, 2012 | | 5.06%
Semi-Annually | | 3-month LIBOR | | | 3,550,000 | | | — | | | | (383,857 | ) |
| | | | | | |
Barclays Capital Inc. | | September 15, 2012 | | 5.189%
Semi-Annually | | 3-month LIBOR | | | 3,520,000 | | | — | | | | (411,089 | ) |
| | | | | | |
Barclays Capital Inc. | | March 18, 2016 | | 4.4%
Semi-Annually | | 3-month LIBOR | | | 45,700,000 | | | — | | | | (5,886,781 | ) |
| | | | | | |
Barclays Capital Inc. | | October 20, 2016 | | 5.326%
Semi-Annually | | 3-month LIBOR | | | 3,530,000 | | | — | | | | (727,612 | ) |
| | | | | | |
Barclays Capital Inc. | | February 15, 2025 | | 4.3%
Semi-Annually | | 3-month LIBOR | | | 39,100,000 | | | 208,533 | | | | (7,828,095 | ) |
| | | | | | |
Barclays Capital Inc. | | March 18, 2039 | | 4.25%
Semi-Annually | | 3-month LIBOR | | | 12,500,000 | | | (240,000 | ) | | | (3,491,087 | ) |
| | | | | | |
Barclays Capital Inc. | | March 18, 2039 | | 4.25%
Semi-Annually | | 3-month LIBOR | | | 12,500,000 | | | (250,000 | ) | | | (3,481,087 | ) |
| | | | | | |
Barclays Capital Inc. | | March 18, 2039 | | 4.25%
Semi-Annually | | 3-month LIBOR | | | 12,500,000 | | | (168,750 | ) | | | (3,562,337 | ) |
| | | | | | |
Bear Stearns, Inc. | | April 30, 2011 | | 5.05%
Semi-Annually | | 3-month LIBOR | | | 2,500,000 | | | — | | | | (195,350 | ) |
101
Annual Report to Shareholders
Notes to Financial Statements—Continued
| | | | | | | | | | | | | | | | | |
| Western Asset Core Bond Portfolio—Continued | | | | |
Swap Counterparty
(Reference Entity) | | Termination Date | | Periodic
Payments
Made by the
Fund‡ | | Periodic
Payments
Received by the
Fund‡ | | Contract
Notional
Amount | | Upfront
Premiums
Paid/
(Received) | | | Unrealized
Appreciation/
(Depreciation) | |
| Interest Rate Swaps—Continued | | | | |
| | | | | | | | | | | | | | | | | |
Bear Stearns, Inc. | | May 19, 2013 | | 3-month LIBOR | | 3.93%
Semi-Annually | | $ | 72,500,000 | | $ | (813,813 | ) | | $ | 6,560,714 | |
| | | | | | |
Bear Stearns, Inc. | | September 15, 2014 | | 5%
Semi-Annually | | 3-month LIBOR | | | 4,270,000 | | | — | | | | (632,938 | ) |
| | | | | | |
Bear Stearns, Inc. | | April 23, 2018 | | 4.8%
Semi-Annually | | 3-month LIBOR | | | 25,130,000 | | | (260,473 | ) | | | (4,494,364 | ) |
| | | | | | |
Citigroup Global Markets | | April 30, 2011 | | 3.22%
Semi-Annually | | 3-month LIBOR | | | 3,580,000 | | | — | | | | (130,061 | ) |
| | | | | | |
Citigroup Global Markets | | September 15, 2011 | | 3.34%
Semi-Annually | | 3-month LIBOR | | | 5,500,000 | | | — | | | | (236,972 | ) |
| | | | | | |
Citigroup Global Markets | | March 18, 2016 | | 4.4%
Semi-Annually | | 3-month LIBOR | | | 59,100,000 | | | 94,560 | | | | (7,707,443 | ) |
| | | | | | |
Credit Suisse First Boston USA | | August 15, 2010 | | 5.446%
Semi-Annually | | 3-month LIBOR | | | 1,380,000 | | | — | | | | (89,085 | ) |
| | | | | | |
Credit Suisse First Boston USA | | September 15, 2010 | | 5.0025%
Semi-Annually | | 3-month LIBOR | | | 3,070,000 | | | — | | | | (183,413 | ) |
| | | | | | |
Credit Suisse First Boston USA | | March 1, 2011 | | 5.229%
Semi-Annually | | 3-month LIBOR | | | 2,110,000 | | | — | | | | (164,205 | ) |
| | | | | | |
Credit Suisse First Boston USA | | May 1, 2012 | | 5.085%
Semi-Annually | | 3-month LIBOR | | | 2,750,000 | | | — | | | | (285,790 | ) |
| | | | | | |
Credit Suisse First Boston USA | | December 1, 2012 | | 4.9025%
Semi-Annually | | 3-month LIBOR | | | 5,870,000 | | | — | | | | (650,481 | ) |
| | | | | | |
Credit Suisse First Boston USA | | August 15, 2013 | | 5.023%
Semi-Annually | | 3-month LIBOR | | | 3,020,000 | | | — | | | | (392,170 | ) |
| | | | | | |
Credit Suisse First Boston USA | | March 15, 2014 | | 5.131%
Semi-Annually | | 3-month LIBOR | | | 3,290,000 | | | — | | | | (480,093 | ) |
| | | | | | |
Credit Suisse First Boston USA | | September 15, 2015 | | 5.16%
Semi-Annually | | 3-month LIBOR | | | 3,050,000 | | | — | | | | (535,303 | ) |
| | | | | | |
Credit Suisse First Boston USA | | March 1, 2017 | | 5.335%
Semi-Annually | | 3-month LIBOR | | | 2,420,000 | | | — | | | | (517,994 | ) |
| | | | | | |
Deutsche Bank AG | | June 17, 2010 | | 3-month LIBOR | | 4.3132%
Semi-Annually | | | 31,430,000 | | | — | | | | 1,331,029 | |
| | | | | | |
Deutsche Bank AG | | October 11, 2010 | | 3-month LIBOR | | 4.7077%
Semi-Annually | | | 206,790,000 | | | — | | | | 11,753,716 | |
| | | | | | |
Deutsche Bank AG | | July 13, 2011 | | 3-month LIBOR | | 5.6281%
Semi-Annually | | | 83,870,000 | | | — | | | | 8,237,368 | |
102
Annual Report to Shareholders
| | | | | | | | | | | | | | | | | |
| Western Asset Core Bond Portfolio—Continued | | | | |
Swap Counterparty
(Reference Entity) | | Termination Date | | Periodic
Payments
Made by the
Fund‡ | | Periodic
Payments
Received by the
Fund‡ | | Contract
Notional
Amount | | Upfront
Premiums
Paid/
(Received) | | | Unrealized
Appreciation/
(Depreciation) | |
| Interest Rate Swaps—Continued | | | | |
| | | | | | | | | | | | | | | | | |
Deutsche Bank AG | | June 15, 2016 | | 5.1825%
Semi-Annually | | 3-month LIBOR | | $ | 5,620,000 | | $ | — | | | $ | (1,069,924 | ) |
| | | | | | |
Deutsche Bank AG | | April 1, 2017 | | 5.435%
Semi-annually | | 3-month LIBOR | | | 4,120,000 | | | — | | | | (924,020 | ) |
| | | | | | |
Deutsche Bank AG | | March 18, 2039 | | 4.25%
Semi-Annually | | 3-month LIBOR | | | 12,400,000 | | | (214,520 | ) | | | (3,486,719 | ) |
| | | | | | |
Deutsche Bank AG | | March 18, 2039 | | 4.25%
Semi-Annually | | 3-month LIBOR | | | 11,300,000 | | | (234,475 | ) | | | (3,138,428 | ) |
| | | | | | |
JP Morgan Chase & Co. | | June 8, 2009 | | 3-month LIBOR | | 5.393%
Semi-annually | | | 157,400,000 | | | — | | | | 2,585,075 | |
| | | | | | |
JP Morgan Chase & Co. | | December 1, 2012 | | 5.275%
Semi-Annually | | 3-month LIBOR | | | 3,550,000 | | | — | | | | (443,390 | ) |
| | | | | | |
JP Morgan Chase & Co. | | January 22, 2013 | | 3-month LIBOR | | 5.1577%
Semi-Annually | | | 15,410,000 | | | 187,619 | | | | 1,711,116 | |
| | | | | | |
Morgan Stanley & Co., Inc. | | March 15, 2012 | | 4.7625%
Semi-annually | | 3-month LIBOR | | | 2,750,000 | | | — | | | | (251,218 | ) |
| | | | | | |
Morgan Stanley & Co., Inc. | | April 30, 2016 | | 5.189%
Semi-Annually | | 3-month LIBOR | | | 3,400,000 | | | — | | | | (640,152 | ) |
| | | | | | |
RBS Greenwich | | March 1, 2011 | | 4.7%
Semi-Annually | | 3-month LIBOR | | | 1,370,000 | | | — | | | | (91,201 | ) |
| | | | | | |
RBS Greenwich | | March 1, 2016 | | 5.12%
Semi-Annually | | 3-month LIBOR | | | 4,250,000 | | | — | | | | (769,150 | ) |
| | | | | | |
RBS Greenwich | | February 15, 2017 | | 5.115%
Semi-Annually | | 3-month LIBOR | | | 3,580,000 | | | — | | | | (705,517 | ) |
| | | | | | |
RBS Greenwich | | December 18, 2018 | | 4.34%
Semi-Annually | | 3-month LIBOR | | | 19,000,000 | | | — | | | | (2,977,904 | ) |
| | | | | | |
The Goldman Sachs Group, Inc. | | March 10, 2009 | | 3-month LIBOR | | 4.36%
Semi-Annually | | | 54,100,000 | | | (23,264 | ) | | | 246,016 | |
| | | | | | |
The Goldman Sachs Group, Inc. | | July 7, 2011 | | 3-month LIBOR | | 5.7125%
Semi-Annually | | | 71,600,000 | | | — | | | | 7,189,986 | |
| | | | | | |
The Goldman Sachs Group, Inc. | | November 3, 2011 | | 3-month LIBOR | | 5.0435%
Semi-Annually | | | 81,800,000 | | | — | | | | 7,430,949 | |
| | | | | | |
The Goldman Sachs Group, Inc. | | March 18, 2014 | | 3-month LIBOR | | 4%
Semi-Annually | | | 236,470,000 | | | 1,217,231 | | | | 19,059,054 | |
| | | | | | |
The Goldman Sachs Group, Inc. | | May 15, 2016 | | 4.25%
Semi-Annually | | 3-month LIBOR | | | 95,400,000 | | | (343,440 | ) | | | (11,750,847 | ) |
103
Annual Report to Shareholders
Notes to Financial Statements—Continued
| | | | | | | | | | | | | | | | | |
| Western Asset Core Bond Portfolio—Continued | | | | |
Swap Counterparty
(Reference Entity) | | Termination Date | | Periodic
Payments
Made by the
Fund‡ | | Periodic
Payments
Received by the
Fund‡ | | Contract
Notional
Amount | | Upfront
Premiums
Paid/
(Received) | | | Unrealized
Appreciation/
(Depreciation) | |
| Interest Rate Swaps—Continued | | | | |
| | | | | | | | | | | | | | | | | |
The Goldman Sachs Group, Inc. | | March 18, 2039 | | 4.25%
Semi-Annually | | 3-month LIBOR | | $ | 11,900,000 | | $ | (59,500 | ) | | $ | (3,312,210 | ) |
| | | | | | |
The Goldman Sachs Group, Inc. | | March 18, 2039 | | 4.25%
Semi-Annually | | 3-month LIBOR | | | 11,600,000 | | | (234,320 | ) | | | (3,228,129 | ) |
| | | | | | |
The Goldman Sachs Group, Inc. | | March 18, 2039 | | 4.25%
Semi-Annually | | 3-month LIBOR | | | 9,100,000 | | | (72,800 | ) | | | (2,643,431 | ) |
| | | | | | |
The Goldman Sachs Group, Inc. | | March 18, 2039 | | 4.25%
Semi-Annually | | 3-month LIBOR | | | 11,900,000 | | | (239,785 | ) | | | (3,492,495 | ) |
| | | | | | |
UBS Warburg LLC | | December 16, 2018 | | 4.16%
Semi-Annually | | 3-month LIBOR | | | 86,000,000 | | | (1,200,775 | ) | | | (10,891,375 | ) |
| | | | | | | | | | | | | | | | | |
| | Net unrealized depreciation on interest rate swaps | | | | | | $ | (59,658,619 | ) |
| | | | | | | | | | | | | | | | | |
| | | | | | | | | | | | | | | | | | | | |
| Credit Default Swap on Corporate Issues—Sell Protection1 | | | | | | |
Swap Counterparty
(Reference Entity) | | Termination Date | | Implied Credit
Spread At
December 31,
20082 | | Periodic Payments
Received by the
Fund‡ | | Contract
Notional
Amount3 | | Market
Value | | | Upfront
Premiums
Paid/
(Received) | | Unrealized
Appreciation/
(Depreciation) | |
| | | | | | | | | | | | | | | | | | | | |
Barclays Capital Inc.
(MBIA Insurance Corporation,
5.37563%, due 10/6/10) | | December 20, 2012 | | 33.97% | | 3.1%
Quarterly | | $ | 1,970,000 | | $ | (1,002,897 | ) | | $ | — | | $ | (1,002,897 | ) |
| | | | | | | |
Barclays Capital Inc.
(MBIA Insurance Corporation,
5.37563%, due 10/6/10) | | December 20, 2012 | | 33.97% | | 3.05%
Quarterly | | | 1,310,000 | | | (667,983 | ) | | | — | | | (667,983 | ) |
| | | | | | | |
Bear Stearns, Inc.
(Ford Motor Credit Company,
7%, due 10/1/13 ) | | June 20, 2010 | | 13.65% | | 4.83%
Quarterly | | | 12,500,000 | | | (1,415,680 | ) | | | — | | | (1,415,680 | ) |
| | | | | | | |
Bear Stearns, Inc.
(MBIA Insurance Corporation,
5.37563%, due 10/6/10) | | December 20, 2012 | | 33.97% | | 3.1%
Quarterly | | | 4,620,000 | | | (2,351,971 | ) | | | — | | | (2,351,971 | ) |
| | | | | | | |
Credit Suisse First Boston USA
(ConocoPhillips,
4.75%, due 10/15/12) | | September 20, 2012 | | 1.09% | | 0.27%
Quarterly | | | 1,000,000 | | | (29,126 | ) | | | — | | | (29,126 | ) |
| | | | | | | |
Credit Suisse First Boston USA
(Eastman Kodak Company,
7.25%, due 11/15/13) | | March 20, 2010 | | 7.38% | | 1.4%
Quarterly | | | 6,500,000 | | | (445,568 | ) | | | — | | | (445,568 | ) |
104
Annual Report to Shareholders
| | | | | | | | | | | | | | | | | | | | |
| Western Asset Core Bond Portfolio—Continued | | | | | | |
| Credit Default Swap on Corporate Issues—Sell Protection1—Continued | | | | | | |
Swap Counterparty
(Reference Entity) | | Termination Date | | Implied Credit
Spread At
December 31,
20082 | | Periodic Payments
Received by the
Fund‡ | | Contract
Notional
Amount3 | | Market
Value | | | Upfront
Premiums
Paid/
(Received) | | Unrealized
Appreciation/
(Depreciation) | |
| | | | | | | | | | | | | | | | | | | | |
Deutsche Bank AG
(Countrywide Home Loan Inc.,
4%, due 3/22/11) | | March 20, 2017 | | 1.15% | | 0.94%
Quarterly | | $ | 9,600,000 | | $ | (140,869 | ) | | $ | — | | $ | (140,869 | ) |
| | | | | | | |
Deutsche Bank AG
(Eastman Kodak Company,
7.25%, due 11/15/13) | | March 20, 2010 | | 7.38% | | 1.25%
Quarterly | | | 1,100,000 | | | (77,297 | ) | | | — | | | (77,297 | ) |
| | | | | | | |
Deutsche Bank AG
(Eastman Kodak Company,
7.25%, due 11/15/13) | | March 20, 2015 | | 7.45% | | 1.67%
Quarterly | | | 1,300,000 | | | (309,187 | ) | | | — | | | (309,187 | ) |
| | | | | | | |
Deutsche Bank AG
(Ford Motor Credit Company,
7%, due 10/1/13) | | December 20, 2010 | | 12.34% | | 5.05%
Quarterly | | | 17,100,000 | | | (2,068,566 | ) | | | — | | | (2,068,566 | ) |
| | | | | | | |
Deutsche Bank AG
(Ford Motor Credit Company,
7.45%, due 7/16/31) | | March 20, 2015 | | 47.74% | | 2.93%
Quarterly | | | 1,700,000 | | | (1,301,643 | ) | | | — | | | (1,301,643 | ) |
| | | | | | | |
JP Morgan Chase & Co.
(General Motors Acceptance Corporation,
7.125%, due 7/15/13) | | September 20, 2010 | | 113.84% | | 6%
Quarterly | | | 10,500,000 | | | (7,592,643 | ) | | | — | | | (7,592,643 | ) |
| | | | | | | |
RBS Greenwich
(Countrywide Home Loan Inc.,
4%, due 3/22/11) | | March 20, 2012 | | 1.02% | | 0.66%
Quarterly | | | 39,300,000 | | | (439,523 | ) | | | — | | | (439,523 | ) |
| | | | | | | |
RBS Greenwich
(Countrywide Home Loan Inc.,
4%, due 3/22/11) | | June 20, 2012 | | 1.04% | | 0.72%
Quarterly | | | 25,000,000 | | | (263,250 | ) | | | — | | | (263,250 | ) |
| | | | | | | |
RBS Greenwich
(Countrywide Home Loans, Inc.,
4%, due 3/22/11) | | September 20, 2012 | | 1.05% | | 0.86%
Quarterly | | | 9,100,000 | | | (61,423 | ) | | | — | | | (61,423 | ) |
| | | | | | | |
RBS Greenwich
(Countrywide Home Loans, Inc.,
4%, due 3/22/11) | | September 20, 2012 | | 1.05% | | 6%
Quarterly | | | 9,100,000 | | | 1,600,402 | | | | — | | | 1,600,402 | |
| | | | | | | |
RBS Greenwich
(Countrywide Home Loans, Inc.,
4%, due 3/22/11) | | September 20, 2012 | | 1.05% | | 6.1%
Quarterly | | | 9,100,000 | | | 1,632,733 | | | | — | | | 1,632,733 | |
105
Annual Report to Shareholders
Notes to Financial Statements—Continued
| | | | | | | | | | | | | | | | | | | | | |
| Western Asset Core Bond Portfolio—Continued | | | | | | | |
| Credit Default Swap on Corporate Issues—Sell Protection1—Continued | | | | | | | |
Swap Counterparty
(Reference Entity) | | Termination Date | | Implied Credit
Spread At
December 31,
20082 | | Periodic Payments
Received by the
Fund‡ | | Contract
Notional
Amount3 | | Market
Value | | | Upfront
Premiums
Paid/
(Received) | | | Unrealized
Appreciation/
(Depreciation) | |
| | | | | | | | | | | | | | | | | | | | | |
RBS Greenwich
(Countrywide Home Loans, Inc.,
4%, due 3/22/11) | | September 20, 2012 | | 1.05% | | 2.75%
Quarterly | | $ | 10,000,000 | | $ | 603,997 | | | $ | — | | | $ | 603,997 | |
| | | | | | | |
RBS Greenwich
(Countrywide Home Loans, Inc.,
4%, due 3/22/11) | | December 20, 2012 | | 1.06% | | 5%
Quarterly | | | 10,000,000 | | | 1,485,487 | | | | (982,482 | ) | | | 2,467,969 | |
| | | | | | | |
RBS Greenwich
(Ford Motor Credit Company,
7%, due 10/1/13) | | December 20, 2010 | | 12.34% | | 4.26%
Quarterly | | | 25,000,000 | | | (3,352,888 | ) | | | — | | | | (3,352,888 | ) |
| | | | | | | |
RBS Greenwich
(General Motors Acceptance Corporation,
6.875%, due 8/12/12) | | June 20, 2010 | | 9.07% | | 4.53%
Quarterly | | | 15,000,000 | | | (919,679 | ) | | | — | | | | (919,679 | ) |
| | | | | | | |
RBS Greenwich
(General Motors Acceptance Corporation,
6.875%, due 8/28/12) | | June 20, 2010 | | 9.07% | | 4.68%
Quarterly | | | 25,000,000 | | | (1,481,948 | ) | | | — | | | | (1,481,948 | ) |
| | | | | | | |
RBS Greenwich
(General Motors Acceptance Corporation,
6.875%, due 8/28/12) | | September 20, 2010 | | 8.86% | | 5.75%
Quarterly | | | 7,500,000 | | | (362,209 | ) | | | — | | | | (362,209 | ) |
| | | | | | | |
RBS Greenwich
(General Motors Acceptance Corporation,
7.125%, due 7/15/13) | | June 20, 2010 | | 121.49% | | 8.4%
Quarterly | | | 12,500,000 | | | (8,784,006 | ) | | | — | | | | (8,784,006 | ) |
| | | | | | | |
RBS Greenwich
(General Motors Acceptance Corporation,
7.125%, due 7/15/13) | | June 20, 2010 | | 121.49% | | 7.1%
Quarterly | | | 5,800,000 | | | (4,122,890 | ) | | | — | | | | (4,122,890 | ) |
| | | | | | | |
RBS Greenwich
(General Motors Acceptance Corporation,
7.125%, due 7/15/13) | | June 20, 2010 | | 121.49% | | 6.8%
Quarterly | | | 5,900,000 | | | (4,205,033 | ) | | | — | | | | (4,205,033 | ) |
| | | | | | | |
RBS Greenwich
(General Motors Acceptance Corporation,
7.125%, due 7/15/13) | | September 20, 2010 | | 113.84% | | 7.7%
Quarterly | | | 12,500,000 | | | (8,895,761 | ) | | | — | | | | (8,895,761 | ) |
| | | | | | | |
RBS Greenwich
(Residential Capital Corp.,
6.5%, due 4/17/13) | | September 20, 2012 | | 27.37% | | 2.32%
Quarterly | | | 25,000,000 | | | (12,479,988 | ) | | | — | | | | (12,479,988 | ) |
106
Annual Report to Shareholders
| | | | | | | | | | | | | | | | | | | | |
| Western Asset Core Bond Portfolio—Continued | | | | | | |
| Credit Default Swap on Corporate Issues—Sell Protection1—Continued | | | | | | |
Swap Counterparty
(Reference Entity) | | Termination Date | | Implied Credit
Spread At
December 31,
20082 | | Periodic Payments
Received by the
Fund‡ | | Contract
Notional
Amount3 | | Market
Value | | | Upfront
Premiums
Paid/
(Received) | | Unrealized
Appreciation/
(Depreciation) | |
| | | | | | | | | | | | | | | | | | | | |
RBS Greenwich
(Residential Capital, LLC,
7.5%, due 4/17/13) | | September 20, 2012 | | 27.37% | | 4.9%
Quarterly | | $ | 9,100,000 | | $ | (4,074,204 | ) | | $ | — | | $ | (4,074,204 | ) |
| | | | | | | |
RBS Greenwich
(Ryland Group Inc.,
5.375%, due 1/15/15) | | December 20, 2012 | | 6.98% | | 2.4%
Quarterly | | | 9,800,000 | | | (1,329,739 | ) | | | — | | | (1,329,739 | ) |
| | | | | | | |
RBS Greenwich
(SLM Corp.,
5.125%, due 8/27/12) | | June 20, 2012 | | 8.97% | | 1.38%
Quarterly | | | 20,000,000 | | | (4,079,150 | ) | | | — | | | (4,079,150 | ) |
| | | | | | | |
RBS Greenwich
(SLM Corp.,
5.125%, due 8/27/12) | | June 20, 2012 | | 9.11% | | 1.78%
Quarterly | | | 25,000,000 | | | (4,732,290 | ) | | | — | | | (4,732,290 | ) |
| | | | | | | |
RBS Greenwich
(SLM Corp.,
5.125%, due 8/27/12) | | September 20, 2012 | | 8.92% | | 2.35%
Quarterly | | | 1,500,000 | | | (268,403 | ) | | | — | | | (268,403 | ) |
| | | | | | | |
RBS Greenwich
(SLM Corp.,
5.125%, due 8/27/12) | | September 20, 2012 | | 8.92% | | 2.4%
Quarterly | | | 1,500,000 | | | (266,358 | ) | | | — | | | (266,358 | ) |
| | | | | | | |
RBS Greenwich
(SLM Corp.,
5.125%, due 8/27/12) | | September 20, 2012 | | 8.92% | | 2.44%
Quarterly | | | 25,000,000 | | | (4,412,033 | ) | | | — | | | (4,412,033 | ) |
| | | | | | | |
RBS Greenwich
(SLM Corp.,
5.125%, due 8/27/12) | | September 20, 2012 | | 8.92% | | 2.67%
Quarterly | | | 10,000,000 | | | (1,702,107 | ) | | | — | | | (1,702,107 | ) |
| | | | | | | |
RBS Greenwich
(SLM Corp.,
5.125%, due 8/27/12) | | September 20, 2012 | | 8.92% | | 2.67%
Quarterly | | | 10,000,000 | | | (1,702,107 | ) | | | — | | | (1,702,107 | ) |
| | | | | | | |
RBS Greenwich
(Time Warner Inc.
6.875%, due 5/1/12) | | September 20, 2010 | | 1.23% | | 0.47%
Quarterly | | | 5,000,000 | | | (64,307 | ) | | | — | | | (64,307 | ) |
| | | | | | | |
RBS Greenwich
(Time Warner Inc.,
6.875%, due 5/1/12) | | December 20, 2010 | | 1.25% | | 0.5%
Quarterly | | | 12,500,000 | | | (181,411 | ) | | | — | | | (181,411 | ) |
| | | | | | | |
The Goldman Sachs Group, Inc.
(Countrywide Financial,
0.0%, due 2/8/31) | | September 20, 2012 | | 1.05% | | 6%
Quarterly | | | 4,700,000 | | | 826,581 | | | | — | | | 826,581 | |
| | | | | | | |
The Goldman Sachs Group, Inc.
(Eastman Kodak Company,
7.25%, due 11/15/13) | | March 20, 2015 | | 7.45% | | 1.67%
Quarterly | | | 1,400,000 | | | (332,971 | ) | | | — | | | (332,971 | ) |
107
Annual Report to Shareholders
Notes to Financial Statements—Continued
| | | | | | | | | | | | | | | | | | | | |
| Western Asset Core Bond Portfolio—Continued | | | | | | |
| Credit Default Swap on Corporate Issues—Sell Protection1—Continued | | | | | | |
Swap Counterparty
(Reference Entity) | | Termination Date | | Implied Credit
Spread At
December 31,
20082 | | Periodic Payments
Received by the
Fund‡ | | Contract
Notional
Amount3 | | Market
Value | | | Upfront
Premiums
Paid/
(Received) | | Unrealized
Appreciation/
(Depreciation) | |
| | | | | | | | | | | | | | | | | | | | |
The Goldman Sachs Group, Inc.
(Ford Motor Credit Company,
7%, due 10/1/13) | | June 20, 2010 | | 13.65% | | 4.75%
Quarterly | | $ | 1,900,000 | | $ | (217,143 | ) | | $ | — | | $ | (217,143 | ) |
| | | | | | | |
The Goldman Sachs Group, Inc.
(General Motors Acceptance Corporation,
6.875%, due 8/28/12) | | June 20, 2010 | | 9.07% | | 6%
Quarterly | | | 5,000,000 | | | (206,894 | ) | | | — | | | (206,894 | ) |
| | | | | | | |
The Goldman Sachs Group, Inc.
(General Motors Acceptance Corporation,
7.125%, due 7/15/13) | | June 20, 2010 | | 121.49% | | 8.95%
Quarterly | | | 5,000,000 | | | (3,496,421 | ) | | | — | | | (3,496,421 | ) |
| | | | | | | | | | | | | | | | | | | | |
| | Net unrealized depreciation on sales of credit default swaps on corporate issues | | | | | | $ | (82,705,884 | ) |
| | | | | | | | | | | | | | | | | | | | |
| | | | | | | | | | | | | | | |
| Credit Default Swaps on Corporate Issues—Buy Protection4 |
Swap Counterparty
(Reference Entity) | | Termination Date | | Periodic
Payments Made
by the Fund‡ | | Contract
Notional
Amount3 | | Market
Value | | Upfront
Premiums
Paid/
(Received) | | Unrealized
Appreciation/
Depreciation |
| | | | | | | | | | | | | | | |
| | | | | | | | | | | | | | | |
Banc of America Securities LLC
(Home Depot Inc.,
3.75%, due 9/15/09) | | December 20, 2013 | | 0.635%
Quarterly | | $2,740,000 | | $ | 229,472 | | $ | — | | $ | 229,472 |
| | | | | | |
Banc of America Securities LLC
(Marriot International Inc.,
4.625%, due 6/15/12) | | December 20, 2015 | | 0.73%
Monthly | | 4,400,000 | | | 948,066 | | | — | | | 948,066 |
| | | | | | |
Banc of America Securities LLC
(Masco Corp.,
5.875%, due 7/15/12) | | December 20, 2016 | | 1.04%
Quarterly | | 4,120,000 | | | 701,805 | | | — | | | 701,805 |
| | | | | | |
Banc of America Securities LLC
(PHH Corporate Note,
7.125%, due 3/1/13) | | March 20, 2013 | | 1.05%
Monthly | | 5,010,000 | | | 2,894,633 | | | — | | | 2,894,633 |
| | | | | | |
Banc of America Securities LLC
(Viacom Inc.,
4.625%, due 5/15/18) | | December 20, 2015 | | 1.13%
Quarterly | | 2,750,000 | | | 385,100 | | | — | | | 385,100 |
| | | | | | |
Barclays Capital Inc.
(Amerisourcebergen Corp.,
5.625%, due 9/15/12) | | September 20, 2012 | | 0.5%
Quarterly | | 3,520,000 | | | 42,134 | | | — | | | 42,134 |
| | | | | | |
Barclays Capital Inc.
(Cardinal Health Inc.
5.85%, due 12/15/17) | | September 20, 2016 | | 0.49%
Quarterly | | 3,530,000 | | | 70,607 | | | — | | | 70,607 |
108
Annual Report to Shareholders
| | | | | | | | | | | | | | | |
| Western Asset Core Bond Portfolio—Continued |
| Credit Default Swaps on Corporate Issues—Buy Protection4—Continued |
Swap Counterparty
(Reference Entity) | | Termination Date | | Periodic
Payments Made
by the Fund‡ | | Contract
Notional
Amount3 | | Market
Value | | Upfront
Premiums
Paid/
(Received) | | Unrealized
Appreciation/
Depreciation |
| | | | | | | | | | | | | | | |
Barclays Capital Inc.
(Health Care Property Investments Inc.,
6.45%, due 06/25/12) | | June 20, 2012 | | 0.63%
Quarterly | | $3,550,000 | | $ | 1,077,743 | | $ | — | | $ | 1,077,743 |
| | | | | | |
Barclays Capital Inc.
(Juneau Investments LLC,
5.9%, due 2/22/21) | | December 20, 2012 | | 3.6%
Quarterly | | 1,650,000 | | | 659,966 | | | — | | | 659,966 |
| | | | | | |
Barclays Capital Inc.
(Juneau Investments LLC,
5.9%, due 2/22/21) | | December 20, 2012 | | 3.6%
Quarterly | | 1,100,000 | | | 439,977 | | | — | | | 439,977 |
| | | | | | |
Barclays Capital Inc.
(Motorola Inc.,
6.5%, due 9/1/25) | | December 20, 2011 | | 0.32%
Quarterly | | 5,600,000 | | | 890,037 | | | — | | | 890,037 |
| | | | | | |
Bear Stearns, Inc.
(Bell South Corp.,
6%, due 10/15/11) | | September 20, 2014 | | 0.28%
Quarterly | | 4,270,000 | | | 142,242 | | | — | | | 142,242 |
| | | | | | |
Bear Stearns, Inc.
(Juneau Investments LLC,
5.9%, due 2/22/21) | | December 20, 2012 | | 3.65%
Quarterly | | 4,040,000 | | | 1,611,706 | | | — | | | 1,611,706 |
| | | | | | |
Bear Stearns, Inc.
(Viacom Inc.,
6.25%, due 4/30/16) | | March 20, 2011 | | 0.59%
Quarterly | | 2,500,000 | | | 161,509 | | | — | | | 161,509 |
| | | | | | |
Credit Suisse First Boston USA
(AAMES Mortgage Investment Trust
2005-1 M8, 1-Month LIBOR + 160 bp, due 6/25/35) | | April 25, 2035 | | 1.28%
Monthly | | 784,000 | | | 730,303 | | | — | | | 730,303 |
| | | | | | |
Credit Suisse First Boston USA
(AAMES Mortgage Investment Trust
2005-1 M9, 1-Month LIBOR + 250 bp, due 6/25/35) | | April 25, 2035 | | 2.05%
Monthly | | 784,000 | | | 733,589 | | | — | | | 733,589 |
| | | | | | |
Credit Suisse First Boston USA
(ACE Securities Corp.
2005-HE1 M8, 1-Month LIBOR + 138 bp, due 2/25/35) | | February 25, 2035 | | 1.31%
Monthly | | 784,000 | | | 752,335 | | | — | | | 752,335 |
| | | | | | |
Credit Suisse First Boston USA
(ACE Securities Corp.
2005-HE1 M9, 1-Month LIBOR + 220bp, due 2/25/35) | | February 25, 2035 | | 2.06%
Monthly | | 450,115 | | | 440,645 | | | — | | | 440,645 |
109
Annual Report to Shareholders
Notes to Financial Statements—Continued
| | | | | | | | | | | | | | | |
| Western Asset Core Bond Portfolio—Continued |
| Credit Default Swaps on Corporate Issues—Buy Protection4—Continued |
Swap Counterparty
(Reference Entity) | | Termination Date | | Periodic
Payments Made
by the Fund‡ | | Contract
Notional
Amount3 | | Market
Value | | Upfront
Premiums
Paid/
(Received) | | Unrealized
Appreciation/
Depreciation |
| | | | | | | | | | | | | | | |
Credit Suisse First Boston USA
(Aegis Asset Backed Securities Trust 2004-4 B2, 1-Month LIBOR + 190bp, due 10/25/34) | | October 25, 2034 | | 1.37%
Monthly | | $ 581,482 | | $ | 524,397 | | $ | — | | $ | 524,397 |
| | | | | | |
Credit Suisse First Boston USA
(Aegis Asset Backed Securities Trust 2005 B2, 1-Month LIBOR + 130 bp, due 3/25/35) | | March 25, 2035 | | 1.31%
Monthly | | 784,000 | | | 759,100 | | | — | | | 759,100 |
| | | | | | |
Credit Suisse First Boston USA
(Aegis Asset Backed Securities Trust 2005 B3, 1-Month LIBOR + 200 bp, due 3/25/35) | | March 25, 2035 | | 2.18%
Monthly | | 784,000 | | | 772,842 | | | — | | | 772,842 |
| | | | | | |
Credit Suisse First Boston USA
(Amerisource Bergen Corp.,
8.125%, due 9/1/08) | | September 20, 2015 | | 0.9%
Quarterly | | 3,050,000 | | | 6,120 | | | — | | | 6,120 |
| | | | | | |
Credit Suisse First Boston USA
(Argent Securities Inc.
2004-W11 M10, 1-Month LIBOR + 350bp, due 11/25/34) | | November 25, 2034 | | 2.15%
Monthly | | 298,717 | | | 279,832 | | | — | | | 279,832 |
| | | | | | |
Credit Suisse First Boston USA
(Argent Securities Inc.
2004-W11 M9, 1-Month LIBOR + 225bp, due 11/25/34) | | November 25, 2034 | | 1.33%
Monthly | | 298,717 | | | 279,437 | | | — | | | 279,437 |
| | | | | | |
Credit Suisse First Boston USA
(Argent Securities Inc.
2004-W4 M3, 1-Month LIBOR +
300 bp, due 3/25/34) | | March 25, 2034 | | 2.2%
Monthly | | 371,871 | | | 314,632 | | | — | | | 314,632 |
| | | | | | |
Credit Suisse First Boston USA
(Finance America Mortgage Loan Trust 2004-3 M8, 1-Month LIBOR + 180bp, due 11/25/34) | | November 25, 2034 | | 1.31%
Monthly | | 285,027 | | | 273,484 | | | — | | | 273,484 |
| | | | | | |
Credit Suisse First Boston USA
(Finance America Mortgage Loan Trust 2004-3 M9, 1-Month LIBOR + 315bp, due 11/25/34) | | November 25, 2034 | | 2.18%
Monthly | | 285,008 | | | 275,234 | | | — | | | 275,234 |
| | | | | | |
Credit Suisse First Boston USA
(Fremont Home Loan Trust
2005-A M8, 1-Month LIBOR +
135 bp, due 1/25/35) | | January 25, 2035 | | 1.31%
Monthly | | 310,788 | | | 301,196 | | | — | | | 301,196 |
110
Annual Report to Shareholders
| | | | | | | | | | | | | | | |
| Western Asset Core Bond Portfolio—Continued |
| Credit Default Swaps on Corporate Issues—Buy Protection4—Continued |
Swap Counterparty
(Reference Entity) | | Termination Date | | Periodic
Payments Made
by the Fund‡ | | Contract
Notional
Amount3 | | Market
Value | | Upfront
Premiums
Paid/
(Received) | | Unrealized
Appreciation/
Depreciation |
| | | | | | | | | | | | | | | |
Credit Suisse First Boston USA
(Fremont Home Loan Trust 2005-A, 1-Month LIBOR + 100bp, due 1/25/35) | | January 25, 2035 | | 2.08%
Monthly | | $ 313,642 | | $ | 305,586 | | $ | — | | $ | 305,586 |
| | | | | | |
Credit Suisse First Boston USA
(Home Depot Inc.,
3.75%, due 9/15/09) | | September 20, 2010 | | 0.17%
Quarterly | | 1,380,000 | | | 51,793 | | | — | | | 51,793 |
| | | | | | |
Credit Suisse First Boston USA
(IndyMac Home Equity Loan Asset-Backed, Trust 2004-C M8, 1-Month LIBOR + 190bp, due 3/25/35) | | March 25, 2035 | | 1.28%
Monthly | | 409,241 | | | 387,947 | | | — | | | 387,947 |
| | | | | | |
Credit Suisse First Boston USA
(IndyMac Home Equity Loan Asset-Backed, Trust 2004-C M9, 1-Month LIBOR + 325bp, due 3/25/35) | | March 25, 2035 | | 2.05%
Monthly | | 326,584 | | | 308,622 | | | — | | | 308,622 |
| | | | | | |
Credit Suisse First Boston USA
(Limited Brands Inc.,
6.125%, due 12/01/12) | | December 20, 2012 | | 0.6%
Quarterly | | 5,870,000 | | | 948,702 | | | — | | | 948,702 |
| | | | | | |
Credit Suisse First Boston USA
(Long Beach Mortgage Loan Trust 2004-1 M9, 1-Month LIBOR + 350bp,
due 2/25/34) | | February 25, 2034 | | 2.15%
Monthly | | 242,056 | | | 174,320 | | | — | | | 174,320 |
| | | | | | |
Credit Suisse First Boston USA
(Long Beach Mortgage Loan Trust 2005-1 M8, 1-Month LIBOR + 170 bp,
due 2/25/35) | | February 25, 2035 | | 1.31%
Monthly | | 380,679 | | | 363,248 | | | — | | | 363,248 |
| | | | | | |
Credit Suisse First Boston USA
(Long Beach Mortgage Loan Trust 2005-1 M9, 1-Month LIBOR + 275bp,
due 2/25/35) | | February 25, 2035 | | 2.08%
Monthly | | 311,806 | | | 297,574 | | | — | | | 297,574 |
| | | | | | |
Credit Suisse First Boston USA
(Marsh & Mclennan Company, Inc.,
5.375%, due 7/15/14) | | September 20, 2010 | | 0.46%
Quarterly | | 3,070,000 | | | 5,437 | | | — | | | 5,437 |
| | | | | | |
Credit Suisse First Boston USA
(Masco Corp.,
5.875%, due 7/15/12) | | September 20, 2013 | | 0.75%
Quarterly | | 3,320,000 | | | 496,895 | | | — | | | 496,895 |
| | | | | | |
Credit Suisse First Boston USA
(MASTR Asset Backed Securities Trust 2005-NC1 M8, 1-Month LIBOR + 153bp, due 12/25/34) | | December 25, 2034 | | 1.31%
Monthly | | 461,351 | | | 437,342 | | | — | | | 437,342 |
111
Annual Report to Shareholders
Notes to Financial Statements—Continued
| | | | | | | | | | | | | | | |
| Western Asset Core Bond Portfolio—Continued |
| Credit Default Swaps on Corporate Issues—Buy Protection4—Continued |
Swap Counterparty
(Reference Entity) | | Termination Date | | Periodic
Payments Made
by the Fund‡ | | Contract
Notional
Amount3 | | Market
Value | | Upfront
Premiums
Paid/
(Received) | | Unrealized
Appreciation/
Depreciation |
| | | | | | | | | | | | | | | |
Credit Suisse First Boston USA
(MASTR Asset Backed Securities Trust 2005-NC1 M9, 1-Month LIBOR + 240bp, due 12/25/34) | | December 25, 2034 | | 2.08%
Monthly | | $ 414,556 | | $ | 393,813 | | $ | — | | $ | 393,813 |
| | | | | | |
Credit Suisse First Boston USA
(Merrill Lynch Mortgage Investors, Inc.
2004-WMC1 B3, 1-Month LIBOR + 225bp, due 9/25/35) | | September 25, 2035 | | 2.05%
Monthly | | 367,813 | | | 182,213 | | | — | | | 182,213 |
| | | | | | |
Credit Suisse First Boston USA
(Merrill Lynch Mortgage Investors, Inc.
2004-WMC4 B3, 1-Month LIBOR + 375bp, due 4/25/35) | | April 25, 2035 | | 2.15%
Monthly | | 228,419 | | | 213,069 | | | — | | | 213,069 |
| | | | | | |
Credit Suisse First Boston USA
(Merrill Lynch Mortgage Investors, Inc.
2005-NC1 B2, 1-Month LIBOR + 130bp, due 10/25/35) | | October 25, 2035 | | 1.28%
Monthly | | 784,000 | | | 226,056 | | | — | | | 226,056 |
| | | | | | |
Credit Suisse First Boston USA
(Merrill Lynch Mortgage Investors, Inc.
2005-NC1 B3, 1-Month LIBOR + 205bp, due 10/25/35) | | October 25, 2035 | | 2.05%
Monthly | | 523,547 | | | 264,810 | | | — | | | 264,810 |
| | | | | | |
Credit Suisse First Boston USA
(Merrill Lynch Mortgage Investors, Inc.
2005-WMC1 B2, 1-Month LIBOR + 135bp, due 9/25/35) | | September 25, 2035 | | 1.28%
Monthly | | 784,000 | | | 304,731 | | | — | | | 304,731 |
| | | | | | |
Credit Suisse First Boston USA
(Morgan Stanley ABS Capital I 2005-WMC1 B2, 1-Month LIBOR + 130 bp, due 1/25/35) | | January 25, 2035 | | 1.31%
Monthly | | 248,671 | | | 241,339 | | | — | | | 241,339 |
| | | | | | |
Credit Suisse First Boston USA
(Morgan Stanley ABS Capital I 2005-WMC1 B3, 1-Month LIBOR + 215bp, due 1/25/35) | | January 25, 2035 | | 2.18%
Monthly | | 274,715 | | | 269,174 | | | — | | | 269,174 |
| | | | | | |
Credit Suisse First Boston USA
(New Century Home Equity Loan Trust 2004-2 M9, 1-Month LIBOR + 325bp, due 8/25/34) | | August 25, 2034 | | 2.15%
Monthly | | 333,893 | | | 211,154 | | | — | | | 211,154 |
112
Annual Report to Shareholders
| | | | | | | | | | | | | | | |
| Western Asset Core Bond Portfolio—Continued |
| Credit Default Swaps on Corporate Issues—Buy Protection4—Continued |
Swap Counterparty
(Reference Entity) | | Termination Date | | Periodic
Payments Made
by the Fund‡ | | Contract
Notional
Amount3 | | Market
Value | | Upfront
Premiums
Paid/
(Received) | | Unrealized
Appreciation/
Depreciation |
| | | | | | | | | | | | | | | |
Credit Suisse First Boston USA
(New Century Home Equity Loan Trust 2005-1 M8, 1-Month LIBOR +
140 bp, due 3/25/35) | | March 25, 2035 | | 1.31%
Monthly | | $ 452,898 | | $ | 363,719 | | $ | — | | $ | 363,719 |
| | | | | | |
Credit Suisse First Boston USA
(New Century Home Equity Loan Trust 2005-1 M9, 1-Month LIBOR +
205 bp, due 3/25/35) | | March 25, 2035 | | 2.18%
Monthly | | 335,297 | | | 315,637 | | | — | | | 315,637 |
| | | | | | |
Credit Suisse First Boston USA
(Novastar Home Equity Loan 2005-1 B2, 1-Month LIBOR + 135 bp, due 6/25/35) | | June 25, 2035 | | 1.28%
Monthly | | 784,000 | | | 678,140 | | | — | | | 678,140 |
| | | | | | |
Credit Suisse First Boston USA
(Novastar Home Equity Loan 2005-4 B3, 1-Month LIBOR + 195 bp, due 6/25/35) | | June 25, 2035 | | 2.05%
Monthly | | 784,000 | | | 662,362 | | | — | | | 662,362 |
| | | | | | |
Credit Suisse First Boston USA
(Park Place Securities Inc.
2005-WCH1 M8, 1-Month LIBOR + 155bp, due 1/25/36) | | January 25, 2036 | | 1.36%
Monthly | | 784,000 | | | 745,565 | | | — | | | 745,565 |
| | | | | | |
Credit Suisse First Boston USA
(Park Place Securities, Inc.
2005-WCH1 M9, 1-Month LIBOR + 250 bp, due 1/25/36) | | January 25, 2036 | | 2.18%
Monthly | | 755,964 | | | 721,088 | | | — | | | 721,088 |
| | | | | | |
Credit Suisse First Boston USA
(People’s Choice Home Loan Securities Trust 2004-1 M6, 1-Month LIBOR + 230bp, due 6/25/34) | | June 25, 2034 | | 1.37%
Quarterly | | 644,085 | | | 614,458 | | | — | | | 614,458 |
| | | | | | |
Credit Suisse First Boston USA
(People’s Choice Home Loan Securities Trust 2005-1 B3, 1-Month LIBOR + 260bp, due 1/25/35) | | January 25, 2035 | | 2.05%
Monthly | | 614,700 | | | 593,063 | | | — | | | 593,063 |
| | | | | | |
Credit Suisse First Boston USA
(People’s Choice Home Loan Securities Trust 2005-1, 1-Month LIBOR + 165bp, due 1/25/35) | | January 25, 2035 | | 1.28%
Monthly | | 784,000 | | | 749,397 | | | — | | | 749,397 |
| | | | | | |
Credit Suisse First Boston USA
(Pulte Homes Inc.,
7.875%, due 8/1/11) | | March 20, 2011 | | 0.79%
Quarterly | | 2,100,000 | | | 119,937 | | | — | | | 119,937 |
| | | | | | |
Credit Suisse First Boston USA
(Southwest Airlines Co.,
5.25%, due 10/1/14) | | March 20, 2017 | | 0.69%
Quarterly | | 2,420,000 | | | 499,266 | | | — | | | 499,266 |
113
Annual Report to Shareholders
Notes to Financial Statements—Continued
| | | | | | | | | | | | | | | | | |
| Western Asset Core Bond Portfolio—Continued | |
| Credit Default Swaps on Corporate Issues—Buy Protection4—Continued | |
Swap Counterparty
(Reference Entity) | | Termination Date | | Periodic
Payments Made
by the Fund‡ | | Contract
Notional
Amount3 | | Market
Value | | | Upfront
Premiums
Paid/
(Received) | | Unrealized
Appreciation/
Depreciation | |
| | | | | | | | | | | | | | | | | |
Credit Suisse First Boston USA
(Starwood Hotels Resorts,
7.875%, due 8/25/34) | | December 20, 2011 | | 1.37%
Quarterly | | $3,050,000 | | $ | 454,565 | | | $ | — | | $ | 454,565 | |
| | | | | | |
Credit Suisse First Boston USA
(Waste Management Inc.,
7.375%, due 8/1/10) | | March 20, 2014 | | 0.49%
Quarterly | | 3,290,000 | | | 151,746 | | | | — | | | 151,746 | |
| | | | | | |
Deutsche Bank AG
(Autozone Inc.,
6.95%, due 6/15/16) | | June 20, 2016 | | 0.58%
Quarterly | | 5,620,000 | | | 294,401 | | | | — | | | 294,401 | |
| | | | | | |
Deutsche Bank AG
(Centurytel Inc.,
7.875%, due 8/15/12) | | March 20, 2017 | | 0.89%
Quarterly | | 4,120,000 | | | 174,644 | | | | — | | | 174,644 | |
| | | | | | |
JP Morgan Chase & Co.
(Limited Brands Inc.,
6.125%, due 12/1/12) | | December 20, 2012 | | 0.67%
Quarterly | | 3,550,000 | | | 566,060 | | | | — | | | 566,060 | |
| | | | | | |
Morgan Stanley & Co., Inc.
(Pulte Homes Inc.,
5.25%, due 1/15/14) | | March 20, 2011 | | 4%
Quarterly | | 1,370,000 | | | (11,915 | ) | | | — | | | (11,915 | ) |
| | | | | | |
Morgan Stanley & Co., Inc.
(Sara Lee Corp.
6.125% due 11/01/32) | | September 20, 2011 | | 0.62%
Quarterly | | 5,500,000 | | | 13,876 | | | | — | | | 13,876 | |
| | | | | | |
Morgan Stanley & Co., Inc.
(Viacom Inc.,
6.25%, due 4/30/16) | | March 20, 2012 | | 0.36%
Quarterly | | 5,460,000 | | | 527,446 | | | | — | | | 527,446 | |
| | | | | | |
Morgan Stanley & Co., Inc.
(Weyerhaeuser Co.
Note, 7.125%, due 7/15/23) | | March 20, 2012 | | 0.74%
Quarterly | | 2,750,000 | | | 124,352 | | | | — | | | 124,352 | |
| | | | | | |
RBS Greenwich
(DSLA Mortgage Loan Trust 2005-AR5, 1-Month LIBOR + 175 bp, due 8/19/45) | | August 19, 2045 | | 4.5%
Monthly | | 1,291,293 | | | 1,071,343 | | | | — | | | 1,071,343 | |
| | | | | | |
RBS Greenwich
(General Mills Inc.,
5.7%, due 2/15/17) | | March 20, 2017 | | 0.33%
Quarterly | | 3,580,000 | | | 102,063 | | | | — | | | 102,063 | |
| | | | | | |
RBS Greenwich
(Harborview Mortgage Loan Trust 2005-12, 1-Month LIBOR + 175 bp, due 10/19/35) | | October 19, 2035 | | 2.5%
Monthly | | 1,293,334 | | | 1,199,124 | | | | — | | | 1,199,124 | |
114
Annual Report to Shareholders
| | | | | | | | | | | | | | | |
| Western Asset Core Bond Portfolio—Continued |
| Credit Default Swaps on Corporate Issues—Buy Protection4—Continued |
Swap Counterparty
(Reference Entity) | | Termination Date | | Periodic
Payments Made
by the Fund‡ | | Contract
Notional
Amount3 | | Market
Value | | Upfront
Premiums
Paid/
(Received) | | Unrealized
Appreciation/
Depreciation |
| | | | | | | | | | | | | | | |
RBS Greenwich
(Home Depot Inc.,
5.4%, due 3/1/16) | | March 20, 2016 | | 0.48%
Monthly | | $4,250,000 | | $ | 462,982 | | $ | — | | $ | 462,982 |
| | | | | | |
RBS Greenwich
(IndyMac Index Mortgage Loan Trust 2005-AR18, 1-Month LIBOR + 125 bp, due 10/25/36) | | October 25, 2036 | | 2.7%
Monthly | | 1,385,669 | | | 1,210,995 | | | — | | | 1,210,995 |
| | | | | | |
RBS Greenwich
(Washington Mutual 2005-AR11, 1-Month LIBOR + 120 bp, due 8/25/45) | | August 25, 2045 | | 2.55%
Monthly | | 472,340 | | | 334,730 | | | — | | | 334,730 |
| | | | | | |
The Goldman Sachs Group, Inc.
(Viacom Inc.
6.25% due 4/30/2016) | | March 20, 2011 | | 1.4%
Quarterly | | 3,580,000 | | | 170,979 | | | — | | | 170,979 |
| | | | | | | | | | | | | | | |
| | Net unrealized appreciation on buys of credit default swaps on corporate issues | | | | | $ | 35,691,991 |
| | | | | | | | | | | | | | | |
| | | | | | | | | | | | | | | | | | |
| Credit Default Swap On Credit Indices—Sell Protection1 | | | | |
Swap Counterparty
(Reference Entity) | | Termination Date | | Periodic Payments
Received by the
Fund‡ | | Contract
Notional
Amount3 | | Market
Value5 | | | Upfront
Premiums
Paid/
(Received) | | | Unrealized
Appreciation/
(Depreciation) | |
| | | | | | | | | | | | | | | | | | |
Barclays Capital Inc.
(CDX IG 10) | | June 20, 2013 | | 1.55%
Quarterly | | $ 20,984,000 | | $ | (481,476 | ) | | $ | (181,910 | ) | | $ | (299,566 | ) |
| | | | | | |
Barclays Capital Inc.
(CDX IG 10) | | June 20, 2013 | | 1.55%
Quarterly | | 24,107,200 | | | (553,138 | ) | | | (190,267 | ) | | | (362,871 | ) |
| | | | | | |
Barclays Capital Inc.
(CDX IG 10) | | June 20, 2013 | | 1.55%
Quarterly | | 70,760,000 | | | (1,623,581 | ) | | | (417,364 | ) | | | (1,206,217 | ) |
| | | | | | |
Barclays Capital Inc.
(CDX IG 10) | | June 20, 2013 | | 1.55%
Quarterly | | 21,667,200 | | | (497,152 | ) | | | (58,928 | ) | | | (438,224 | ) |
| | | | | | |
Barclays Capital Inc.
(CDX IG 10) | | June 20, 2013 | | 1.55%
Quarterly | | 18,592,800 | | | (426,610 | ) | | | (66,057 | ) | | | (360,553 | ) |
| | | | | | |
Barclays Capital Inc.
(CDX IG 11) | | December 20, 2013 | | 1.5%
Quarterly | | 19,075,000 | | | (380,959 | ) | | | (695,788 | ) | | | 314,829 | |
| | | | | | |
Barclays Capital Inc.
(CDX IG 9) | | December 20, 2017 | | 0.8%
Quarterly | | 47,892,320 | | | (2,445,061 | ) | | | (1,823,118 | ) | | | (621,943 | ) |
| | | | | | |
Barclays Capital Inc.
(CDX IG 9) | | December 20, 2017 | | 0.8%
Quarterly | | 42,621,920 | | | (2,175,990 | ) | | | (1,849,908 | ) | | | (326,082 | ) |
115
Annual Report to Shareholders
Notes to Financial Statements—Continued
| | | | | | | | | | | | | | | | | | |
| Western Asset Core Bond Portfolio—Continued | |
| Credit Default Swap On Credit Indices—Sell Protection1—Continued | | | | |
Swap Counterparty
(Reference Entity) | | Termination Date | | Periodic Payments
Received by the
Fund‡ | | Contract
Notional
Amount3 | | Market
Value5 | | | Upfront
Premiums
Paid/
(Received) | | | Unrealized
Appreciation/
(Depreciation) | |
| | | | | | | | | | | | | | | | | | |
Barclays Capital Inc.
(CDX IG HVOL 8) | | June 20, 2012 | | 0.75%
Quarterly | | $117,900,000 | | $ | (13,851,199 | ) | | $ | (12,844,836 | ) | | $ | (1,006,363 | ) |
| | | | | | |
Barclays Capital Inc.
(CDX IG HVOL 9) | | December 20, 2012 | | 1.4%
Quarterly | | 14,403,383 | | | (2,297,340 | ) | | | (488,861 | ) | | | (1,808,479 | ) |
| | | | | | |
Barclays Capital Inc.
(CDX IG HVOL 9) | | December 20, 2012 | | 1.4%
Quarterly | | 33,833,450 | | | (5,396,435 | ) | | | (1,186,403 | ) | | | (4,210,032 | ) |
| | | | | | |
Barclays Capital Inc.
(CDX IG HVOL 9) | | December 20, 2012 | | 1.4%
Quarterly | | 33,833,450 | | | (5,396,435 | ) | | | (1,176,253 | ) | | | (4,220,182 | ) |
| | | | | | |
Barclays Capital Inc.
(CDX IG HVOL 9) | | December 20, 2012 | | 3%
Quarterly | | 70,663,577 | | | (11,270,841 | ) | | | (2,986,666 | ) | | | (8,284,175 | ) |
| | | | | | |
Barclays Capital Inc.
(CDX IG HVOL 9) | | December 20, 2012 | | 1.4%
Quarterly | | 26,583,425 | | | (4,240,056 | ) | | | (1,316,579 | ) | | | (2,923,477 | ) |
| | | | | | |
Barclays Capital Inc.
(CDX IG HVOL 9) | | December 20, 2012 | | 1.4%
Quarterly | | 21,750,075 | | | (3,469,137 | ) | | | (1,092,864 | ) | | | (2,376,273 | ) |
| | | | | | |
Bear Stearns, Inc.
(ABX. HE-AAA 07-2) | | January 25, 2038 | | 0.76%
Monthly | | 5,000,000 | | | (3,050,000 | ) | | | (141,466 | ) | | | (2,908,534 | ) |
| | | | | | |
Bear Stearns, Inc.
(ABX-HE-A 06-2) | | May 25, 2046 | | 0.44%
Quarterly | | 25,000,000 | | | (23,687,500 | ) | | | (133,276 | ) | | | (23,554,224 | ) |
| | | | | | |
Bear Stearns, Inc.
(CDX HY 9) | | December 20, 2012 | | 2.25%
Quarterly | | 4,430,000 | | | (1,123,370 | ) | | | — | | | | (1,123,370 | ) |
| | | | | | |
Bear Stearns, Inc.
(CDX IG 8) | | June 20, 2012 | | 0.35%
Quarterly | | 35,545,920 | | | (2,154,520 | ) | | | (221,418 | ) | | | (1,933,102 | ) |
| | | | | | |
Bear Stearns, Inc.
(CDX IG 8) | | June 20, 2012 | | 0.35%
Quarterly | | 8,813,280 | | | (534,193 | ) | | | (64,100 | ) | | | (470,093 | ) |
| | | | | | |
Bear Stearns, Inc.
(CDX IG HVOL 8) | | June 20, 2012 | | 0.75%
Quarterly | | 22,000,000 | | | (2,584,617 | ) | | | (160,256 | ) | | | (2,424,361 | ) |
| | | | | | |
Credit Suisse First Boston USA
(ABX.HE-AAA 06-1) | | July 25, 2045 | | 0.18%
Monthly | | 101,031,835 | | | (20,206,367 | ) | | | (8,641,861 | ) | | | (11,564,506 | ) |
| | | | | | |
Credit Suisse First Boston USA
(ABX.HE-AAA 06-1) | | July 25, 2045 | | 0.18%
Monthly | | 15,313,691 | | | (3,062,738 | ) | | | (1,384,519 | ) | | | (1,678,219 | ) |
| | | | | | |
Credit Suisse First Boston USA
(ABX.HE-AAA 06-1) | | July 25, 2045 | | 0.18%
Monthly | | 120,390,652 | | | (24,078,129 | ) | | | (12,130,537 | ) | | | (11,947,592 | ) |
116
Annual Report to Shareholders
| | | | | | | | | | | | | | | | | | |
| Western Asset Core Bond Portfolio—Continued | | | | |
| Credit Default Swap On Credit Indices—Sell Protection1—Continued | | | | |
Swap Counterparty
(Reference Entity) | | Termination Date | | Periodic Payments
Received by the
Fund‡ | | Contract
Notional
Amount3 | | Market
Value5 | | | Upfront
Premiums
Paid/
(Received) | | | Unrealized
Appreciation/
(Depreciation) | |
| | | | | | | | | | | | | | | | | | |
Credit Suisse First Boston USA
(ABX.HE-AAA 07-2) | | January 25, 2038 | | 0.76%
Monthly | | $ 11,800,000 | | $ | (7,198,000 | ) | | $ | (252,964 | ) | | $ | (6,945,036 | ) |
| | | | | | |
Credit Suisse First Boston USA
(ABX.HE-AAA 07-2) | | January 25, 2038 | | 0.76%
Monthly | | 3,200,000 | | | (1,952,000 | ) | | | (133,473 | ) | | | (1,818,527 | ) |
| | | | | | |
Credit Suisse First Boston USA
(ABX.HE-AAA 07-2) | | January 25, 2038 | | 0.76%
Monthly | | 1,300,000 | | | (793,000 | ) | | | (49,576 | ) | | | (743,424 | ) |
| | | | | | |
Credit Suisse First Boston USA
(CDX IG HVOL 10) | | June 20, 2013 | | 3.5%
Quarterly | | 18,850,065 | | | (1,763,978 | ) | | | 257,053 | | | | (2,021,031 | ) |
| | | | | | |
Credit Suisse First Boston USA
(CDX IG HVOL 10) | | June 20, 2013 | | 3.5%
Quarterly | | 18,753,398 | | | (1,754,931 | ) | | | (284,824 | ) | | | (1,470,107 | ) |
| | | | | | |
Deutsche Bank AG
(ABX.HE-AAA 06-1) | | July 25, 2045 | | 0.18%
Monthly | | 20,803,505 | | | (4,160,702 | ) | | | (1,792,160 | ) | | | (2,368,542 | ) |
| | | | | | |
Deutsche Bank AG
(ABX.HE-AAA 06-1) | | July 25, 2045 | | 0.18%
Monthly | | 10,594,377 | | | (2,118,876 | ) | | | (957,843 | ) | | | (1,161,033 | ) |
| | | | | | |
Deutsche Bank AG
(ABX.HE-AAA 06-1) | | July 25, 2045 | | 0.18%
Monthly | | 5,008,251 | | | (1,001,650 | ) | | | (560,779 | ) | | | (440,871 | ) |
| | | | | | |
Deutsche Bank AG
(ABX. HE-AAA 06-2) | | May 25, 2046 | | 0.11%
Monthly | | 7,600,000 | | | (3,800,000 | ) | | | (347,782 | ) | | | (3,452,218 | ) |
| | | | | | |
Deutsche Bank AG
(ABX. HE-AAA 06-2) | | May 25, 2046 | | 0.11%
Monthly | | 7,700,000 | | | (3,850,000 | ) | | | (389,586 | ) | | | (3,460,414 | ) |
| | | | | | |
Deutsche Bank AG
(iBoxx IG Hi-Vol) | | March 20, 2009 | | 1.25%
Quarterly | | 2,262,000 | | | (21,007 | ) | | | 303 | | | | (21,310 | ) |
| | | | | | |
Deutsche Bank AG
(iBoxx IG Hi-Vol2) | | September 20, 2014 | | 1.3%
Quarterly | | 8,042,667 | | | (713,798 | ) | | | 16,962 | | | | (730,760 | ) |
| | | | | | |
JP Morgan Chase & Co.
(CDX HY 9) | | December 20, 2012 | | 6.43%
Quarterly | | 12,000,000 | | | (1,404,488 | ) | | | — | | | | (1,404,488 | ) |
| | | | | | |
JP Morgan Chase & Co.
(CDX IG HVOL 8) | | June 20, 2012 | | 0.75%
Quarterly | | 8,000,000 | | | (939,861 | ) | | | (63,895 | ) | | | (875,966 | ) |
| | | | | | |
JP Morgan Chase & Co.
(CDX IG HVOL 8) | | June 20, 2012 | | 0.75%
Quarterly | | 23,950,000 | | | (2,813,708 | ) | | | (173,191 | ) | | | (2,640,517 | ) |
| | | | | | |
JP Morgan Chase & Co.
(CDX IG HVOL 9) | | December 20, 2012 | | 1.4%
Quarterly | | 33,833,450 | | | (5,396,435 | ) | | | (1,162,635 | ) | | | (4,233,800 | ) |
117
Annual Report to Shareholders
Notes to Financial Statements—Continued
| | | | | | | | | | | | | | | | | | |
| Western Asset Core Bond Portfolio—Continued | | | | |
| Credit Default Swap On Credit Indices—Sell Protection1—Continued | | | | |
Swap Counterparty
(Reference Entity) | | Termination Date | | Periodic Payments
Received by the
Fund‡ | | Contract
Notional
Amount3 | | Market
Value5 | | | Upfront
Premiums
Paid/
(Received) | | | Unrealized
Appreciation/
(Depreciation) | |
| | | | | | | | | | | | | | | | | | |
Merrill Lynch & Co., Inc.
(CDX HY 8) | | June 20, 2012 | | 0.82%
Quarterly | | $ 47,600,000 | | $ | (10,061,935 | ) | | $ | — | | | $ | (10,061,935 | ) |
| | | | | | |
Merrill Lynch & Co., Inc.
(CDX HY 8) | | June 20, 2012 | | 0.9%
Quarterly | | 16,400,000 | | | (3,426,544 | ) | | | — | | | | (3,426,544 | ) |
| | | | | | |
Merrill Lynch & Co., Inc.
(CDX HY 9) | | December 20, 2012 | | 2%
Quarterly | | 4,650,000 | | | (1,217,131 | ) | | | — | | | | (1,217,131 | ) |
| | | | | | |
Merrill Lynch & Co., Inc.
(CDX HY 9) | | December 20, 2012 | | 2.3%
Quarterly | | 4,580,000 | | | (1,153,926 | ) | | | — | | | | (1,153,926 | ) |
| | | | | | |
Merrill Lynch & Co., Inc.
(CDX HY 9) | | December 20, 2012 | | 3.995%
Quarterly | | 25,000,000 | | | (4,914,525 | ) | | | — | | | | (4,914,525 | ) |
| | | | | | |
Merrill Lynch & Co., Inc.
(CDX HY 9) | | December 20, 2012 | | 5.4%
Quarterly | | 50,000,000 | | | (7,534,305 | ) | | | — | | | | (7,534,305 | ) |
| | | | | | |
Merrill Lynch & Co., Inc.
(CDX HY 9) | | December 20, 2012 | | 6.35%
Quarterly | | 10,000,000 | | | (1,196,539 | ) | | | — | | | | (1,196,539 | ) |
| | | | | | |
Merrill Lynch & Co., Inc.
(CDX HY 9) | | December 20, 2012 | | 6.43%
Quarterly | | 8,000,000 | | | (936,326 | ) | | | — | | | | (936,326 | ) |
| | | | | | |
Merrill Lynch & Co., Inc.
(CDX HY 9) | | December 20, 2012 | | 6.2%
Quarterly | | 70,000,000 | | | (8,718,758 | ) | | | — | | | | (8,718,758 | ) |
| | | | | | |
Morgan Stanley & Co., Inc.
(CDX IG HVOL 10) | | June 20, 2013 | | 3.5%
Quarterly | | 9,666,700 | | | (904,604 | ) | | | 57,096 | | | | (961,700 | ) |
| | | | | | |
RBS Greenwich
(CDX IG 8) | | June 20, 2012 | | 0.35%
Quarterly | | 44,798,400 | | | (2,715,334 | ) | | | (215,335 | ) | | | (2,499,999 | ) |
| | | | | | |
RBS Greenwich
(CDX IG 8) | | June 20, 2012 | | 0.35%
Quarterly | | 7,222,400 | | | (437,766 | ) | | | (109,879 | ) | | | (327,887 | ) |
| | | | | | |
RBS Greenwich
(CDX IG 8) | | June 20, 2012 | | 0.35%
Quarterly | | 7,027,200 | | | (425,934 | ) | | | (99,236 | ) | | | (326,698 | ) |
| | | | | | |
RBS Greenwich
(CDX IG HVOL 8) | | June 20, 2012 | | 0.75%
Quarterly | | 7,100,000 | | | (834,127 | ) | | | (45,999 | ) | | | (788,128 | ) |
| | | | | | |
RBS Greenwich
(CDX IG HVOL 8) | | June 20, 2012 | | 0.75%
Quarterly | | 29,300,000 | | | (3,442,241 | ) | | | (273,011 | ) | | | (3,169,230 | ) |
| | | | | | |
RBS Greenwich
(CDX IG HVOL 8) | | June 20, 2012 | | 0.75%
Quarterly | | 14,400,000 | | | (1,691,750 | ) | | | (162,596 | ) | | | (1,529,154 | ) |
| | | | | | |
RBS Greenwich
(CDX IG HVOL 8) | | June 20, 2012 | | 0.75%
Quarterly | | 100,000,000 | | | (11,748,260 | ) | | | (2,118,391 | ) | | | (9,629,869 | ) |
| | | | | | |
RBS Greenwich
(CDX IG HVOL 8) | | June 20, 2012 | | 0.75%
Quarterly | | 55,000,000 | | | (6,461,543 | ) | | | (1,118,624 | ) | | | (5,342,919 | ) |
118
Annual Report to Shareholders
| | | | | | | | | | | | | | | | | | |
| Western Asset Core Bond Portfolio—Continued | | | | |
| Credit Default Swap On Credit Indices—Sell Protection1—Continued | | | | |
Swap Counterparty
(Reference Entity) | | Termination Date | | Periodic Payments
Received by the
Fund‡ | | Contract
Notional
Amount3 | | Market
Value5 | | | Upfront
Premiums
Paid/
(Received) | | | Unrealized
Appreciation/
(Depreciation) | |
| | | | | | | | | | | | | | | | | | |
RBS Greenwich
(CDX IG HVOL 8) | | June 20, 2012 | | 0.75%
Quarterly | | $ 1,600,000 | | $ | (187,972 | ) | | $ | 240,513 | | | $ | (428,485 | ) |
| | | | | | |
RBS Greenwich
(CDX IG HVOL 8) | | June 20, 2012 | | 0.75%
Quarterly | | 7,500,000 | | | (881,119 | ) | | | (161,873 | ) | | | (719,246 | ) |
| | | | | | |
RBS Greenwich
(CDX IG HVOL 9) | | December 20, 2012 | | 1.4%
Quarterly | | 7,250,025 | | | (1,156,379 | ) | | | (159,529 | ) | | | (996,850 | ) |
| | | | | | |
RBS Greenwich
(CDX IG HVOL 9) | | December 20, 2012 | | 1.4%
Quarterly | | 676,669 | | | (107,929 | ) | | | (20,100 | ) | | | (87,829 | ) |
| | | | | | |
RBS Greenwich
(CDX IG HVOL 9) | | December 20, 2012 | | 1.4%
Quarterly | | 14,500,050 | | | (2,312,758 | ) | | | (598,017 | ) | | | (1,714,741 | ) |
| | | | | | |
RBS Greenwich
(CDX IG HVOL 9) | | December 20, 2012 | | 1.4%
Quarterly | | 1,933,340 | | | (308,368 | ) | | | (85,772 | ) | | | (222,596 | ) |
| | | | | | |
RBS Greenwich
(CDX IG HVOL 9) | | December 20, 2012 | | 1.4%
Quarterly | | 14,403,383 | | | (2,297,340 | ) | | | (656,633 | ) | | | (1,640,707 | ) |
| | | | | | |
RBS Greenwich
(CDX IG HVOL 10) | | June 20, 2013 | | 3.5%
Quarterly | | 30,643,439 | | | (2,867,594 | ) | | | 675,873 | | | | (3,543,467 | ) |
| | | | | | |
The Goldman Sachs Group, Inc.
(CDX HY 8) | | June 20, 2012 | | 0.82%
Quarterly | | 47,700,000 | | | (10,083,074 | ) | | | — | | | | (10,083,074 | ) |
| | | | | | |
The Goldman Sachs Group, Inc.
(CDX HY 9) | | October 12, 2012 | | 1.8%
Quarterly | | 17,580,000 | | | (4,716,392 | ) | | | — | | | | (4,716,392 | ) |
| | | | | | |
The Goldman Sachs Group, Inc.
(CDX HY 9) | | December 20, 2012 | | 2%
Quarterly | | 4,360,000 | | | (1,141,224 | ) | | | — | | | | (1,141,224 | ) |
| | | | | | |
The Goldman Sachs Group, Inc.
(CDX HY 9) | | December 20, 2012 | | 5.44%
Quarterly | | 50,000,000 | | | (7,468,975 | ) | | | — | | | | (7,468,975 | ) |
| | | | | | |
The Goldman Sachs Group, Inc.
(CDX HY 9) | | December 20, 2012 | | 6.356%
Quarterly | | 50,000,000 | | | (5,972,895 | ) | | | — | | | | (5,972,895 | ) |
| | | | | | |
The Goldman Sachs Group, Inc.
(CDX IG 9) | | December 20, 2017 | | 0.8%
Quarterly | | 31,329,600 | | | (1,599,479 | ) | | | (1,078,914 | ) | | | (520,565 | ) |
| | | | | | |
The Goldman Sachs Group, Inc.
(CDX IG HVOL 3) | | March 20, 2010 | | 1.05%
Quarterly | | 48,333,000 | | | (2,026,072 | ) | | | 1,240 | | | | (2,027,312 | ) |
119
Annual Report to Shareholders
Notes to Financial Statements—Continued
| | | | | | | | | | | | | | | | | | |
| Western Asset Core Bond Portfolio—Continued | | | | |
| Credit Default Swap On Credit Indices—Sell Protection1—Continued | | | | |
Swap Counterparty
(Reference Entity) | | Termination Date | | Periodic Payments
Received by the
Fund‡ | | Contract
Notional
Amount3 | | Market
Value5 | | | Upfront
Premiums
Paid/
(Received) | | | Unrealized
Appreciation/
(Depreciation) | |
The Goldman Sachs Group, Inc.
(CDX IG HVOL 3) | | March 20, 2010 | | 1.05%
Quarterly | | $ 16,433,220 | | $ | (688,864 | ) | | $ | (17,278 | ) | | $ | (671,586 | ) |
| | | | | | |
The Goldman Sachs Group, Inc.
(CDX IG HVOL 3) | | March 20, 2010 | | 1.05%
Quarterly | | 32,093,112 | | | (1,345,311 | ) | | | (138,128 | ) | | | (1,207,183 | ) |
| | | | | | |
The Goldman Sachs Group, Inc.
(CDX IG HVOL 8) | | June 20, 2012 | | 0.75%
Quarterly | | 59,600,000 | | | (7,001,963 | ) | | | (147,149 | ) | | | (6,854,814 | ) |
| | | | | | |
The Goldman Sachs Group, Inc.
(CDX IG HVOL 8) | | June 20, 2012 | | 0.75%
Quarterly | | 15,200,000 | | | (1,785,735 | ) | | | (74,443 | ) | | | (1,711,292 | ) |
| | | | | | |
The Goldman Sachs Group, Inc.
(CDX IG HVOL 8) | | June 20, 2012 | | 0.75%
Quarterly | | 25,000,000 | | | (2,937,065 | ) | | | (155,708 | ) | | | (2,781,357 | ) |
| | | | | | |
The Goldman Sachs Group, Inc.
(CDX IG HVOL 8) | | June 20, 2012 | | 0.75%
Quarterly | | 15,300,000 | | | (1,797,484 | ) | | | (490,058 | ) | | | (1,307,426 | ) |
| | | | | | |
The Goldman Sachs Group, Inc.
(CDX IG HVOL 9) | | December 20, 2012 | | 1.4%
Quarterly | | 11,600,040 | | | (1,850,207 | ) | | | (510,296 | ) | | | (1,339,911 | ) |
| | | | | | |
The Goldman Sachs Group, Inc.
(CDX IG HVOL 9) | | December 20, 2012 | | 1.4%
Quarterly | | 16,143,389 | | | (2,574,870 | ) | | | (1,891,603 | ) | | | (683,267 | ) |
| | | | | | |
UBS Warburg LLC (ABX.HE-AAA 06-2) | | May 25, 2046 | | 0.11%
Monthly | | 20,300,000 | | | (10,150,000 | ) | | | (5,163,804 | ) | | | (4,986,196 | ) |
| | | | | | | | | | | | | | | | | | |
Net unrealized depreciation on sales of credit default swaps on credit indices | | | $ | (246,084,616 | ) |
| | | | | | | | | | | | | | | | | | |
| | | | | | | | | | | | | | | |
| Credit Default Swap on Credit Indices—Buy Protection4 |
Swap Counterparty
(Reference Entity) | | Termination Date | | Periodic Payments
Made by the Fund‡ | | Contract
Notional
Amount3 | | Market
Value5 | | Upfront
Premiums
Paid/
(Received) | | Unrealized
Appreciation/
(Depreciation) |
Barclays Capital Inc.
(CDX IG 10 6/13) | | June 20, 2013 | | 1.55%
Quarterly | | $9,272,000 | | $ | 212,745 | | $ | 180,161 | | $ | 32,584 |
| | | | | | |
Barclays Capital Inc.
(CDX IG 10) | | June 20, 2013 | | 1.55%
Quarterly | | 10,492,000 | | | 240,738 | | | 30,062 | | | 210,676 |
| | | | | | |
Barclays Capital Inc.
(CDX IG 10) | | June 20, 2013 | | 1.55%
Quarterly | | 37,185,600 | | | 853,219 | | | 222,449 | | | 630,770 |
120
Annual Report to Shareholders
| | | | | | | | | | | | | | | | | | |
| Western Asset Core Bond Portfolio—Continued | |
| Credit Default Swap on Credit Indices—Buy Protection4 | |
Swap Counterparty
(Reference Entity) | | Termination Date | | Periodic Payments
Made by the Fund‡ | | Contract Notional
Amount3 | | Market
Value5 | | | Upfront
Premiums
Paid/
(Received) | | | Unrealized
Appreciation/
(Depreciation) | |
Barclays Capital Inc.
(CDX IG 11) | | December 20, 2013 | | 1.5%
Quarterly | | $2,860,000 | | $ | 57,119 | | | $ | 89,516 | | | $ | (32,397 | ) |
| | | | | | |
Barclays Capital Inc.
(CDX IG HVOL 10) | | June 20, 2013 | | 3.5%
Quarterly | | 9,666,700 | | | 904,604 | | | | (426,422 | ) | | | 1,331,026 | |
| | | | | | |
Credit Suisse First Boston USA
(CMBX 4 2007-2 AJ) | | February 17, 2051 | | 0.96%
Monthly | | 9,900,000 | | | 6,141,940 | | | | 2,147,942 | | | | 3,993,998 | |
| | | | | | |
JP Morgan Chase & Co.
(CDX IG 10 6/13) | | June 20, 2013 | | 1.55%
Quarterly | | 18,836,800 | | | 432,208 | | | | 525,359 | | | | (93,151 | ) |
| | | | | | |
JP Morgan Chase & Co.
(CDX IG 10 6/13) | | June 20, 2013 | | 1.55%
Quarterly | | 4,684,800 | | | 107,492 | | | | 68,096 | | | | 39,396 | |
| | | | | | |
JP Morgan Chase & Co.
(CDX IG HVOL 10) | | June 20, 2013 | | 3.5%
Quarterly | | 20,783,405 | | | 1,944,898 | | | | (983,253 | ) | | | 2,928,151 | |
| | | | | | |
JP Morgan Chase & Co.
(CDX IG HVOL 10) | | June 20, 2013 | | 3.5%
Quarterly | | 21,653,408 | | | 2,026,313 | | | | (1,293,215 | ) | | | 3,319,528 | |
| | | | | | |
Deutsche Bank AG
(iBoxx IG TMT) | | March 20, 2009 | | 0.6%
Quarterly | | 7,400,000 | | | 9,835 | | | | 5,773 | | | | 4,062 | |
| | | | | | |
Merrill Lynch & Co., Inc.
(CMBX 4 2007-2 AJ) | | February 17, 2051 | | 0.96%
Monthly | | 9,900,000 | | | 6,141,940 | | | | 2,147,942 | | | | 3,993,998 | |
| | | | | | |
RBS Greenwich
(iBoxx IG Hi-Vol3) | | March 20, 2010 | | 1.05%
Quarterly | | 17,303,214 | | | (725,334 | ) | | | (8,159 | ) | | | (717,175 | ) |
| | | | | | |
The Goldman Sachs Group, Inc.
(CDX IG 10 6/13) | | June 20, 2013 | | 1.55%
Quarterly | | 18,446,400 | | | 423,251 | | | | 521,840 | | | | (98,589 | ) |
| | | | | | |
The Goldman Sachs Group, Inc.
(CDX IG HVOL 10) | | June 20, 2013 | | 3.5%
Quarterly | | 18,850,065 | | | 1,763,978 | | | | 215,130 | | | | 1,548,848 | |
| | | | | | |
The Goldman Sachs Group, Inc.
(CMBX 4 2007-2 AJ) | | February 17, 2051 | | 0.96%
Monthly | | 10,000,000 | | | 6,203,980 | | | | 2,169,638 | | | | 4,034,342 | |
| | | | | | | | | | | | | | | | | | |
Net unrealized appreciation on buys of credit default swaps on credit indices | | | | | | | $ | 21,126,067 | |
| | | | | | | | | | | | | | | | | | |
121
Annual Report to Shareholders
Notes to Financial Statements—Continued
| | | | | | | | | | | | | | | | | |
| Western Asset Core Plus Bond Portfolio | | | | |
Swap Counterparty
(Reference Entity) | | Termination Date | | Periodic
Payments Made
by the Fund‡ | | Periodic Payments
Received by the
Fund‡ | | Contract
Notional
Amount | | Upfront
Premiums
Paid/
(Received) | | | Unrealized
Appreciation/
(Depreciation) | |
| | | | | | | | | | | | | | | | | |
| Interest Rate Swaps: | | | | |
Banc of America Securities LLC | | March 1, 2013 | | 5.104%
Semi-Annually | | 3-month
LIBOR | | $ | 8,100,000 | | $ | — | | | $ | (1,003,915 | ) |
| | | | | | |
Banc of America Securities LLC | | December 16, 2013 | | 5.381%
Semi-Annually | | 3-month
LIBOR | | | 5,510,000 | | | — | | | | (842,777 | ) |
| | | | | | |
Banc of America Securities LLC | | November 10, 2015 | | 4.864%
Semi-Annually | | 3-month
LIBOR | | | 7,950,000 | | | — | | | | (1,267,336 | ) |
| | | | | | |
Banc of America Securities LLC | | January 15, 2016 | | 5.45084%
Semi-Annually | | 3-month
LIBOR | | | 5,500,000 | | | — | | | | (1,100,949 | ) |
| | | | | | |
Banc of America Securities LLC | | October 3, 2016 | | 5.425%
Semi-Annually | | 3-month
LIBOR | | | 8,270,000 | | | — | | | | (1,766,381 | ) |
| | | | | | |
Banc of America Securities LLC | | February 15, 2025 | | 4.29456%
Semi-Annually | | 3-month
LIBOR | | | 308,300,000 | | | — | | | | (59,860,762 | ) |
| | | | | | |
Banc of America Securities LLC | | March 18, 2039 | | 4.25%
Semi-Annually | | 3-month
LIBOR | | | 34,900,000 | | | (701,609 | ) | | | (9,715,587 | ) |
| | | | | | |
Barclays Capital Inc. | | November 1, 2011 | | 5.439%
Semi-Annually | | 3-month
LIBOR | | | 10,850,000 | | | — | | | | (1,103,279 | ) |
| | | | | | |
Barclays Capital Inc. | | May 31, 2012 | | 3-month
LIBOR | | 4.4%
Semi-Annually | | | 35,905,000 | | | 168,766 | | | | 2,830,569 | |
| | | | | | |
Barclays Capital Inc. | | May 31, 2012 | | 3-month
LIBOR | | 4.4%
Semi-Annually | | | 37,740,000 | | | 182,971 | | | | 2,969,652 | |
| | | | | | |
Barclays Capital Inc. | | June 25, 2012 | | 5.06%
Semi-Annually | | 3-month
LIBOR | | | 6,240,000 | | | — | | | | (674,723 | ) |
| | | | | | |
Barclays Capital Inc. | | September 15, 2012 | | 5.189%
Semi-Annually | | 3-month
LIBOR | | | 6,330,000 | | | — | | | | (739,259 | ) |
| | | | | | |
Barclays Capital Inc. | | March 18, 2016 | | 4.4%
Semi-Annually | | 3-month
LIBOR | | | 95,800,000 | | | — | | | | (12,340,343 | ) |
| | | | | | |
Barclays Capital Inc. | | October 20, 2016 | | 5.326%
Semi-Annually | | 3-month
LIBOR | | | 6,260,000 | | | — | | | | (1,290,327 | ) |
| | | | | | |
Barclays Capital Inc. | | February 15, 2025 | | 4.3%
Semi-Annually | | 3-month
LIBOR | | | 82,100,000 | | | 431,782 | | | | (16,430,912 | ) |
| | | | | | |
Barclays Capital Inc. | | March 18, 2039 | | 4.25%
Semi-Annually | | 3-month
LIBOR | | | 30,400,000 | | | (580,200 | ) | | | (8,493,805 | ) |
| | | | | | |
Barclays Capital Inc. | | March 18, 2039 | | 4.25%
Semi-Annually | | 3-month
LIBOR | | | 29,000,000 | | | (576,707 | ) | | | (8,079,416 | ) |
| | | | | | |
Barclays Capital Inc. | | March 18, 2039 | | 4.25%
Semi-Annually | | 3-month
LIBOR | | | 30,100,000 | | | (404,043 | ) | | | (8,580,416 | ) |
122
Annual Report to Shareholders
| | | | | | | | | | | | | | | | | |
| Western Asset Core Plus Bond Portfolio—Continued | | | | |
Swap Counterparty
(Reference Entity) | | Termination Date | | Periodic
Payments Made
by the Fund‡ | | Periodic Payments
Received by the
Fund‡ | | Contract
Notional
Amount | | Upfront
Premiums
Paid/
(Received) | | | Unrealized
Appreciation/
(Depreciation) | |
| | | | | | | | | | | | | | | | | |
| Interest Rate Swaps—Continued | | | | |
Bear Stearns, Inc. | | April 30, 2011 | | 5.05%
Semi-Annually | | 3-month
LIBOR | | $ | 4,300,000 | | $ | — | | | $ | (336,001 | ) |
Bear Stearns, Inc. | | September 15, 2014 | | 5%
Semi-Annually | | 3-month
LIBOR | | | 8,250,000 | | | — | | | | (1,222,890 | ) |
| | | | | | |
Bear Stearns, Inc. | | April 14, 2018 | | 5%
Semi-Annually | | 3-month
LIBOR | | | 177,970,000 | | | (1,714,864 | ) | | | (34,923,482 | ) |
| | | | | | |
Bear Stearns, Inc. | | April 23, 2018 | | 4.8%
Semi-Annually | | 3-month
LIBOR | | | 50,990,000 | | | (528,513 | ) | | | (9,119,285 | ) |
| | | | | | |
Bear Stearns, Inc. | | May 19, 2013 | | 3-month
LIBOR | | 3.93%
Semi-Annually | | | 150,000,000 | | | (1,658,675 | ) | | | 13,548,815 | |
| | | | | | |
Citigroup Global Markets | | September 15, 2011 | | 3.34%
Semi-Annually | | 3-month
LIBOR | | | 9,750,000 | | | — | | | | (420,088 | ) |
| | | | | | |
Citigroup Global Markets | | April 30, 2011 | | 3.22%
Semi-Annually | | 3-month
LIBOR | | | 6,270,000 | | | — | | | | (227,787 | ) |
| | | | | | |
Citigroup Global Markets | | March 18, 2016 | | 4.4%
Semi-Annually | | 3-month
LIBOR | | | 120,800,000 | | | 188,068 | | | | (15,748,751 | ) |
| | | | | | |
Credit Suisse First Boston USA | | August 15, 2010 | | 5.446%
Semi-Annually | | 3-month
LIBOR | | | 2,720,000 | | | — | | | | (175,589 | ) |
| | | | | | |
Credit Suisse First Boston USA | | September 15, 2010 | | 5.0025%
Semi-Annually | | 3-month
LIBOR | | | 5,990,000 | | | — | | | | (357,865 | ) |
| | | | | | |
Credit Suisse First Boston USA | | March 1, 2011 | | 5.229%
Semi-Annually | | 3-month
LIBOR | | | 4,110,000 | | | — | | | | (319,851 | ) |
| | | | | | |
Credit Suisse First Boston USA | | May 1, 2012 | | 5.085%
Semi-Annually | | 3-month
LIBOR | | | 4,800,000 | | | — | | | | (498,834 | ) |
| | | | | | |
Credit Suisse First Boston USA | | December 1, 2012 | | 4.9025%
Semi-Annually | | 3-month
LIBOR | | | 10,600,000 | | | — | | | | (1,174,633 | ) |
| | | | | | |
Credit Suisse First Boston USA | | August 15, 2013 | | 5.023%
Semi-Annually | | 3-month
LIBOR | | | 5,300,000 | | | — | | | | (688,246 | ) |
| | | | | | |
Credit Suisse First Boston USA | | March 15, 2014 | | 5.131%
Semi-Annually | | 3-month
LIBOR | | | 6,630,000 | | | — | | | | (967,483 | ) |
| | | | | | |
Credit Suisse First Boston USA | | September 15, 2015 | | 5.16%
Semi-Annually | | 3-month
LIBOR | | | 5,350,000 | | | — | | | | (938,974 | ) |
| | | | | | |
Credit Suisse First Boston USA | | March 1, 2017 | | 5.335%
Semi-Annually | | 3-month
LIBOR | | | 4,880,000 | | | — | | | | (1,044,551 | ) |
| | | | | | |
Deutsche Bank AG | | June 17, 2010 | | 3-month
LIBOR | | 4.3132%
Semi-Annually | | | 41,570,000 | | | — | | | | 1,760,448 | |
123
Annual Report to Shareholders
Notes to Financial Statements—Continued
| | | | | | | | | | | | | | | | | |
| Western Asset Core Plus Bond Portfolio—Continued | | | | |
Swap Counterparty
(Reference Entity) | | Termination Date | | Periodic
Payments Made
by the Fund‡ | | Periodic Payments
Received by the
Fund‡ | | Contract
Notional
Amount | | Upfront
Premiums
Paid/
(Received) | | | Unrealized
Appreciation/
(Depreciation) | |
| | | | | | | | | | | | | | | | | |
| Interest Rate Swaps—Continued | | | | |
Deutsche Bank AG | | October 11, 2010 | | 3-month
LIBOR | | 4.7077%
Semi-Annually | | $ | 299,650,000 | | $ | — | | | $ | 17,031,776 | |
| | | | | | |
Deutsche Bank AG | | July 13, 2011 | | 3-month
LIBOR | | 5.6281%
Semi-Annually | | | 133,350,000 | | | — | | | | 13,097,090 | |
| | | | | | |
Deutsche Bank AG | | March 18, 2014 | | 3-month
LIBOR | | 4%
Semi-Annually | | | 42,360,000 | | | 60,890 | | | | 3,571,298 | |
| | | | | | |
Deutsche Bank AG | | June 15, 2016 | | 5.1825%
Semi-Annually | | 3-month
LIBOR | | | 10,890,000 | | | — | | | | (2,073,214 | ) |
| | | | | | |
Deutsche Bank AG | | April 1, 2017 | | 5.435%
Semi-annually | | 3-month
LIBOR | | | 8,270,000 | | | — | | | | (1,854,768 | ) |
| | | | | | |
Deutsche Bank AG | | March 18, 2039 | | 4.25%
Semi-Annually | | 3-month
LIBOR | | | 30,100,000 | | | (517,867 | ) | | | (8,466,591 | ) |
| | | | | | |
Deutsche Bank AG | | March 18, 2039 | | 4.25%
Semi-Annually | | 3-month
LIBOR | | | 27,300,000 | | | (563,259 | ) | | | (7,585,436 | ) |
| | | | | | |
JP Morgan Chase & Co. | | June 8, 2009 | | 3-month
LIBOR | | 5.393%
semi-annually | | | 304,600,000 | | | — | | | | 5,002,629 | |
| | | | | | |
JP Morgan Chase & Co. | | November 6, 2011 | | 3-month
LIBOR | | 5.02%
Semi-Annually | | | 93,600,000 | | | — | | | | 8,500,724 | |
| | | | | | |
JP Morgan Chase & Co. | | December 1, 2012 | | 5.275%
Semi-Annually | | 3-month
LIBOR | | | 6,300,000 | | | — | | | | (786,861 | ) |
| | | | | | |
JP Morgan Chase & Co. | | January 22, 2013 | | 3-month
LIBOR | | 5.1577%
Semi-Annually | | | 28,980,000 | | | 352,832 | | | | 3,217,919 | |
| | | | | | |
Morgan Stanley & Co., Inc. | | March 15, 2012 | | 4.7625%
Semi-annually | | 3-month
LIBOR | | | 5,540,000 | | | — | | | | (506,090 | ) |
| | | | | | |
Morgan Stanley & Co., Inc. | | April 30, 2016 | | 5.189%
Semi-Annually | | 3-month
LIBOR | | | 6,600,000 | | | — | | | | (1,242,650 | ) |
| | | | | | |
RBS Greenwich | | March 1, 2011 | | 4.7%
Semi-Annually | | 3-month
LIBOR | | | 2,780,000 | | | — | | | | (185,065 | ) |
| | | | | | |
RBS Greenwich | | April 1, 2012 | | 5.011%
Semi-Annually | | 3-month
LIBOR | | | 4,560,000 | | | — | | | | (460,960 | ) |
| | | | | | |
RBS Greenwich | | March 1, 2016 | | 5.12%
Semi-Annually | | 3-month
LIBOR | | | 8,230,000 | | | — | | | | (1,489,438 | ) |
| | | | | | |
RBS Greenwich | | February 15, 2017 | | 5.115%
Semi-Annually | | 3-month
LIBOR | | | 7,210,000 | | | — | | | | (1,420,887 | ) |
| | | | | | |
RBS Greenwich | | December 18, 2018 | | 4.34%
Semi-Annually | | 3-month
LIBOR | | | 40,750,000 | | | — | | | | (6,386,821 | ) |
124
Annual Report to Shareholders
| | | | | | | | | | | | | | | | | |
| Western Asset Core Plus Bond Portfolio—Continued | | | | |
Swap Counterparty
(Reference Entity) | | Termination Date | | Periodic
Payments Made
by the Fund‡ | | Periodic Payments
Received by the
Fund‡ | | Contract
Notional
Amount | | Upfront
Premiums
Paid/
(Received) | | | Unrealized
Appreciation/
(Depreciation) | |
| | | | | | | | | | | | | | | | | |
| Interest Rate Swaps—Continued | | | | |
The Goldman Sachs Group, Inc. | | March 10, 2009 | | 3-month
LIBOR | | 4.36%
Semi-Annually | | $ | 74,400,000 | | $ | (33,084 | ) | | $ | 339,418 | |
| | | | | | |
The Goldman Sachs Group, Inc. | | September 24, 2009 | | 3.7135%
Semi-Annually | | 3-month
LIBOR | | | 100,000,000 | | | — | | | | (1,799,050 | ) |
| | | | | | |
The Goldman Sachs Group, Inc. | | July 7, 2011 | | 3-month
LIBOR | | 5.7125%
Semi-Annually | | | 113,400,000 | | | — | | | | 11,387,492 | |
| | | | | | |
The Goldman Sachs Group, Inc. | | November 3, 2011 | | 3-month
LIBOR | | 5.0435%
Semi-Annually | | | 147,000,000 | | | — | | | | 13,353,906 | |
| | | | | | |
The Goldman Sachs Group, Inc. | | March 18, 2014 | | 3-month
LIBOR | | 4%
Semi-Annually | | | 452,210,000 | | | 2,202,682 | | | | 36,572,382 | |
| | | | | | |
The Goldman Sachs Group, Inc. | | May 15, 2016 | | 4.25%
Semi-Annually | | 3-month
LIBOR | | | 207,800,000 | | | (719,471 | ) | | | (25,624,269 | ) |
| | | | | | |
The Goldman Sachs Group, Inc. | | March 18, 2039 | | 4.25%
Semi-Annually | | 3-month
LIBOR | | | 28,700,000 | | | (574,857 | ) | | | (7,991,720 | ) |
| | | | | | |
The Goldman Sachs Group, Inc. | | March 18, 2039 | | 4.25%
Semi-Annually | | 3-month
LIBOR | | | 27,600,000 | | | (554,195 | ) | | | (7,684,046 | ) |
| | | | | | |
The Goldman Sachs Group, Inc. | | March 18, 2039 | | 4.25%
Semi-Annually | | 3-month
LIBOR | | | 21,600,000 | | | (171,819 | ) | | | (6,275,500 | ) |
| | | | | | |
The Goldman Sachs Group, Inc. | | March 18, 2039 | | 4.25%
Semi-Annually | | 3-month
LIBOR | | | 28,500,000 | | | (141,704 | ) | | | (8,365,176 | ) |
| | | | | | |
UBS Warburg LLC | | December 16, 2018 | | 4.16%
Semi-Annually | | 3-month
LIBOR | | | 187,300,000 | | | (2,615,172 | ) | | | (23,720,402 | ) |
| | | | | | | | | | | | | | | | | |
| | Net unrealized depreciation on interest rate swaps | | | | | | $ | (182,189,323 | ) |
| | | | | | | | | | | | | | | | | |
| | | | | | | | | | | | | | | | | | | | |
| Credit Default Swap On Corporate Issues—Sell Protection1 | | | | | | |
Swap Counterparty
(Reference Entity) | | Termination Date | | Implied Credit
Spread At
December 31,
20082 | | Periodic
Payment
Received
by the
Fund‡ | | Contract
Notional
Amount3 | | Market Value | | | Upfront
Premiums
Paid/
(Received) | | Unrealized
Appreciation/
(Depreciation) | |
| | | | | | | | | | | | | | | | | | | | |
Barclays Capital Inc.
(General Motors Corporation,
7.125%, due 7/15/13) | | December 20, 2011 | | 90.80% | | 4.16%
Quarterly | | $ | 7,000,000 | | $ | (5,338,576 | ) | | $ | — | | $ | (5,338,576 | ) |
| | | | | | | |
Barclays Capital Inc.
(MBIA Insurance Corporation,
5.37563%, due 10/6/10) | | December 20, 2012 | | 33.97% | | 3.1%
Quarterly | | | 4,050,000 | | | (2,061,792 | ) | | | — | | | (2,061,792 | ) |
125
Annual Report to Shareholders
Notes to Financial Statements—Continued
| | | | | | | | | | | | | | | | | | | | | |
| Western Asset Core Plus Bond Portfolio—Continued | |
| | |
| Credit Default Swap On Corporate Issues—Sell Protection1—Continued | | | | | | | |
Swap Counterparty
(Reference Entity) | | Termination Date | | Implied Credit
Spread At
December 31,
20082 | | Periodic
Payments
Received
by the
Fund‡ | | Contract
Notional
Amount3 | | Market Value | | | Upfront
Premiums
Paid/
(Received) | | | Unrealized
Appreciation/
(Depreciation) | |
| | | | | | | | | | | | | | | | | | | | | |
Barclays Capital Inc.
(MBIA Insurance Corporation,
5.37563%, due 10/6/10) | | December 20, 2012 | | 33.97% | | 3.05%
Quarterly | | $ | 2,700,000 | | $ | (1,376,759 | ) | | $ | — | | | $ | (1,376,759 | ) |
| | | | | | | |
Bear Stearns, Inc.
(General Motors Acceptance Corporation,
7.125%, due 7/15/13) | | March 20, 2012 | | 87.92% | | 3.2%
Quarterly | | | 9,900,000 | | | (7,683,504 | ) | | | — | | | | (7,683,504 | ) |
| | | | | | | |
Bear Stearns, Inc.
(General Motors Acceptance Corporation,
7.125%, due 7/15/13) | | March 20, 2012 | | 87.92% | | 3.25%
Quarterly | | | 18,500,000 | | | (14,349,562 | ) | | | — | | | | (14,349,562 | ) |
| | | | | | | |
Bear Stearns, Inc. (MBIA Insurance Corporation,
5.37563%, due 10/6/10) | | December 20, 2012 | | 33.97% | | 3.1%
Quarterly | | | 9,530,000 | | | (4,851,576 | ) | | | — | | | | (4,851,576 | ) |
| | | | | | | |
Citigroup Global Markets (General Motors Acceptance Corporation,
7.75%, due 1/19/10) | | March 20, 2010 | | 9.38% | | 3.65%
Quarterly | | | 4,400,000 | | | (286,731 | ) | | | (638,199 | ) | | | 351,468 | |
| | | | | | | |
Credit Suisse First Boston USA (ConocoPhillips,
4.75%, due 10/15/12) | | September 20, 2012 | | 1.09% | | 0.27%
Quarterly | | | 1,460,000 | | | (42,524 | ) | | | — | | | | (42,524 | ) |
| | | | | | | |
Credit Suisse First Boston USA (Eastman Kodak Company,
7.25%, due 11/15/13) | | March 20, 2010 | | 7.38% | | 1.4%
Quarterly | | | 9,000,000 | | | (616,940 | ) | | | — | | | | (616,940 | ) |
| | | | | | | |
Credit Suisse First Boston USA (Eastman Kodak Company,
7.25%, due 11/15/13) | | September 20, 2010 | | 8.15% | | 2.32%
Quarterly | | | 2,400,000 | | | (216,928 | ) | | | — | | | | (216,928 | ) |
| | | | | | | |
Deutsche Bank AG (AES Corp.,
7.75%, due 3/1/14) | | December 20, 2016 | | 7.95% | | 2.21%
Quarterly | | | 1,700,000 | | | (455,468 | ) | | | — | | | | (455,468 | ) |
126
Annual Report to Shareholders
| | | | | | | | | | | | | | | | | | | | |
| Western Asset Core Plus Bond Portfolio—Continued | |
| | |
| Credit Default Swap On Corporate Issues—Sell Protection1—Continued | | | | | | |
Swap Counterparty
(Reference Entity) | | Termination Date | | Implied Credit
Spread At
December 31,
20082 | | Periodic
Payments
Received
by the
Fund‡ | | Contract
Notional
Amount3 | | Market Value | | | Upfront
Premiums
Paid/
(Received) | | Unrealized
Appreciation/
(Depreciation) | |
| | | | | | | | | | | | | | | | | | | | |
Deutsche Bank AG (AES Corp.,
7.75%, due 3/1/14) | | December 20, 2016 | | 7.95% | | 2.2%
Quarterly | | $ | 2,500,000 | | $ | (670,974 | ) | | $ | — | | $ | (670,974 | ) |
| | | | | | | |
Deutsche Bank AG (Eastman Kodak Company,
7.25%, due 11/15/13) | | March 20, 2010 | | 7.38% | | 1.25%
Quarterly | | | 1,600,000 | | | (112,432 | ) | | | — | | | (112,432 | ) |
| | | | | | | |
Deutsche Bank AG (Eastman Kodak Company,
7.25%, due 11/15/13) | | March 20, 2015 | | 7.45% | | 1.67%
Quarterly | | | 1,900,000 | | | (451,889 | ) | | | — | | | (451,889 | ) |
| | | | | | | |
Deutsche Bank AG (Eastman Kodak Company,
7.25%, due 11/15/13) | | September 20, 2010 | | 8.15% | | 2.3%
Quarterly | | | 3,020,000 | | | (273,907 | ) | | | — | | | (273,907 | ) |
| | | | | | | |
Deutsche Bank AG (Eastman Kodak Company,
7.25%, due 11/15/13) | | September 20, 2010 | | 8.15% | | 2.3%
Quarterly | | | 5,430,000 | | | (492,488 | ) | | | — | | | (492,488 | ) |
| | | | | | | |
Deutsche Bank AG (Eastman Kodak Company,
7.25%, due 11/15/13) | | September 20, 2010 | | 8.15% | | 2.32%
Quarterly | | | 3,200,000 | | | (289,237 | ) | | | — | | | (289,237 | ) |
| | | | | | | |
Deutsche Bank AG (Ford Motor Credit Co.,
7.25%, due 10/25/11) | | September 20, 2017 | | 9.36% | | 3.65%
Quarterly | | | 4,450,000 | | | (1,267,240 | ) | | | — | | | (1,267,240 | ) |
| | | | | | | |
Deutsche Bank AG (Ford Motor Credit Co.,
7.25%, due 10/25/11) | | September 20, 2017 | | 9.36% | | 3.65%
Quarterly | | | 3,500,000 | | | (996,706 | ) | | | — | | | (996,706 | ) |
| | | | | | | |
Deutsche Bank AG (Ford Motor Credit Company,
7%, due 10/1/13) | | December 20, 2010 | | 12.34% | | 5.05%
Quarterly | | | 25,400,000 | | | (3,072,608 | ) | | | — | | | (3,072,608 | ) |
| | | | | | | |
Deutsche Bank AG (Ford Motor Credit Company,
7.45%, due 7/16/31) | | March 20, 2015 | | 47.74% | | 2.93%
Quarterly | | | 2,600,000 | | | (1,990,748 | ) | | | — | | | (1,990,748 | ) |
127
Annual Report to Shareholders
Notes to Financial Statements—Continued
| | | | | | | | | | | | | | | | | | | | | |
| Western Asset Core Plus Bond Portfolio—Continued | |
| | |
| Credit Default Swap On Corporate Issues—Sell Protection1—Continued | | | | | | | |
Swap Counterparty
(Reference Entity) | | Termination Date | | Implied Credit
Spread At
December 31,
20082 | | Periodic
Payments
Received
by the
Fund‡ | | Contract
Notional
Amount3 | | Market Value | | | Upfront
Premiums
Paid/
(Received) | | | Unrealized
Appreciation/
(Depreciation) | |
| | | | | | | | | | | | | | | | | | | | | |
JP Morgan Chase & Co. (General Motors Acceptance Corporation,
7.125%, due 7/15/13) | | September 20, 2010 | | 113.84% | | 6%
Quarterly | | $ | 14,300,000 | | $ | (10,340,457 | ) | | $ | — | | | $ | (10,340,457 | ) |
| | | | | | | |
Merrill Lynch & Co., Inc. (AES Corp.,
7.75%, due 3/1/14) | | March 20, 2017 | | 7.95% | | 2.8%
Quarterly | | | 5,600,000 | | | (1,365,876 | ) | | | — | | | | (1,365,876 | ) |
| | | | | | | |
Merrill Lynch & Co., Inc. (AES Corp.,
7.75%, due 3/1/14) | | March 20, 2017 | | 7.95% | | 2.6%
Quarterly | | | 3,600,000 | | | (912,195 | ) | | | — | | | | (912,195 | ) |
| | | | | | | |
Merrill Lynch & Co., Inc. (Eastman Kodak Company,
7.25%, due 11/15/13) | | September 20, 2010 | | 8.15% | | 2.3%
Quarterly | | | 1,610,000 | | | (146,023 | ) | | | — | | | | (146,023 | ) |
| | | | | | | |
RBS Greenwich (Countrywide Home Loan Inc.,
4%, due 3/22/11) | | March 20, 2012 | | 1.02% | | 0.6%
Quarterly | | | 7,400,000 | | | (96,534 | ) | | | — | | | | (96,534 | ) |
| | | | | | | |
RBS Greenwich (Countrywide Home Loans, Inc.,
4%, due 3/22/11) | | September 20, 2012 | | 1.04% | | 0.66%
Quarterly | | | 9,900,000 | | | (124,020 | ) | | | — | | | | (124,020 | ) |
| | | | | | | |
RBS Greenwich (Eastman Kodak Company,
7.25%, due 11/15/13) | | December 20, 2010 | | 8.39% | | 3.2%
Quarterly | | | 19,300,000 | | | (1,741,605 | ) | | | — | | | | (1,741,605 | ) |
| | | | | | | |
RBS Greenwich (Eastman Kodak Company,
7.25%, due 11/15/13) | | September 20, 2012 | | 7.68% | | 2.25%
Quarterly | | | 13,030,000 | | | (2,052,939 | ) | | | — | | | | (2,052,939 | ) |
| | | | | | | |
RBS Greenwich (Eastman Kodak Company,
7.25%, due 11/15/13) | | December 20, 2016 | | 7.29% | | 2.8%
Quarterly | | | 7,200,000 | | | (1,537,751 | ) | | | — | | | | (1,537,751 | ) |
| | | | | | | |
RBS Greenwich (Ford Motor Credit Company,
7%, due 10/1/13) | | September 20, 2011 | | 11.27% | | 3.75%
Quarterly | | | 8,900,000 | | | (1,451,344 | ) | | | (44,298 | ) | | | (1,407,046 | ) |
128
Annual Report to Shareholders
| | | | | | | | | | | | | | | | | | | | |
| Western Asset Core Plus Bond Portfolio—Continued | | | | | | |
| | |
| Credit Default Swap On Corporate Issues—Sell Protection1—Continued | | | | | | |
Swap Counterparty
(Reference Entity) | | Termination Date | | Implied Credit
Spread At
December 31,
20082 | | Periodic
Payments
Received
by the
Fund‡ | | Contract
Notional
Amount3 | | Market Value | | | Upfront
Premiums
Paid/
(Received) | | Unrealized
Appreciation/
(Depreciation) | |
| | | | | | | | | | | | | | | | | | | | |
RBS Greenwich (Ford Motor Credit Company,
7%, due 10/1/13) | | March 20, 2012 | | 58.99% | | 5.38%
Quarterly | | $ | 8,200,000 | | $ | (5,437,875 | ) | | $ | — | | $ | (5,437,875 | ) |
| | | | | | | |
RBS Greenwich (Ford Motor Credit Company,
7.45%, due 7/16/31) | | September 20, 2011 | | 63.11% | | 6.75%
Quarterly | | | 18,400,000 | | | (11,650,608 | ) | | | — | | | (11,650,608 | ) |
| | | | | | | |
RBS Greenwich (Ford Motor Credit Company,
7.45%, due 7/16/31) | | June 20, 2012 | | 57.33% | | 5.85%
Quarterly | | | 7,400,000 | | | (4,912,476 | ) | | | — | | | (4,912,476 | ) |
| | | | | | | |
RBS Greenwich (Ford Motor Credit Company,
7.45%, due 7/16/31) | | June 20, 2012 | | 57.33% | | 5.1%
Quarterly | | | 12,450,000 | | | (8,385,609 | ) | | | — | | | (8,385,609 | ) |
| | | | | | | |
RBS Greenwich (Ford Motor Credit Company,
7.45%, due 7/16/31) | | June 20, 2012 | | 57.33% | | 5.15%
Quarterly | | | 6,900,000 | | | (4,642,986 | ) | | | — | | | (4,642,986 | ) |
| | | | | | | |
RBS Greenwich (General Motors Acceptance Corporation,
6.875%, due 8/28/12) | | September 20, 2012 | | 8.18% | | 5.95%
Quarterly | | | 3,800,000 | | | (255,514 | ) | | | — | | | (255,514 | ) |
| | | | | | | |
RBS Greenwich (General Motors Acceptance Corporation,
7.125%, due 7/15/13) | | September 20, 2010 | | 113.84% | | 6.63%
Quarterly | | | 19,600,000 | | | (14,089,781 | ) | | | — | | | (14,089,781 | ) |
| | | | | | | |
RBS Greenwich (General Motors Acceptance Corporation,
6.875%, due 8/28/12) | | September 20, 2012 | | 8.18% | | 7.2%
Quarterly | | | 10,700,000 | | | (315,347 | ) | | | — | | | (315,347 | ) |
| | | | | | | |
RBS Greenwich (General Motors Acceptance Corporation,
6%, due 4/1/11) | | December 20, 2011 | | 8.33% | | 1.34%
Quarterly | | | 780,000 | | | (136,784 | ) | | | — | | | (136,784 | ) |
| | | | | | | |
RBS Greenwich (General Motors Acceptance Corporation,
6.875%, due 8/28/12) | | September 20, 2010 | | 8.86% | | 5.75%
Quarterly | | | 1,250,000 | | | (60,368 | ) | | | — | | | (60,368 | ) |
129
Annual Report to Shareholders
Notes to Financial Statements—Continued
| | | | | | | | | | | | | | | | | | | | |
| Western Asset Core Plus Bond Portfolio—Continued | | | | | | |
| | |
| Credit Default Swap On Corporate Issues—Sell Protection1—Continued | | | | | | |
Swap Counterparty
(Reference Entity) | | Termination Date | | Implied Credit
Spread At
December 31,
20082 | | Periodic
Payments
Received
by the
Fund‡ | | Contract
Notional
Amount3 | | Market Value | | | Upfront
Premiums
Paid/
(Received) | | Unrealized
Appreciation/
(Depreciation) | |
| | | | | | | | | | | | | | | | | | | | |
RBS Greenwich (General Motors Acceptance Corporation,
6.875%, due 8/28/12) | | December 20, 2011 | | 8.33% | | 1.2%
Quarterly | | $ | 680,000 | | $ | (121,639 | ) | | $ | — | | $ | (121,639 | ) |
| | | | | | | |
RBS Greenwich (General Motors Acceptance Corporation,
6.875%, due 8/28/12) | | March 20, 2012 | | 8.27% | | 1.17%
Quarterly | | | 8,500,000 | | | (1,619,709 | ) | | | — | | | (1,619,709 | ) |
| | | | | | | |
RBS Greenwich (General Motors Acceptance Corporation,
6.875%, due 8/28/12) | | March 2, 2012 | | 8.27% | | 1.4%
Quarterly | | | 9,400,000 | | | (1,733,134 | ) | | | — | | | (1,733,134 | ) |
| | | | | | | |
RBS Greenwich (General Motors Acceptance Corporation,
6.875%, due 8/28/12) | | March 20, 2012 | | 8.27% | | 1.85%
Quarterly | | | 9,700,000 | | | (1,671,199 | ) | | | — | | | (1,671,199 | ) |
| | | | | | | |
RBS Greenwich (General Motors Acceptance Corporation,
6.875%, due 8/28/12) | | March 20, 2012 | | 8.27% | | 2%
Quarterly | | | 9,300,000 | | | (1,564,812 | ) | | | — | | | (1,564,812 | ) |
| | | | | | | |
RBS Greenwich (General Motors Acceptance Corporation,
6.875%, due 8/28/12) | | December 20, 2016 | | 7.89% | | 1.55%
Quarterly | | | 4,200,000 | | | (1,372,854 | ) | | | — | | | (1,372,854 | ) |
| | | | | | | |
RBS Greenwich (General Motors Acceptance Corporation,
7.125%, due 7/15/13) | | June 20, 2010 | | 121.49% | | 8.4%
Quarterly | | | 12,500,000 | | | (8,784,006 | ) | | | — | | | (8,784,006 | ) |
| | | | | | | |
RBS Greenwich (General Motors Acceptance Corporation,
7.125%, due 7/15/13) | | June 20, 2010 | | 121.49% | | 7.1%
Quarterly | | | 8,000,000 | | | (5,686,745 | ) | | | — | | | (5,686,745 | ) |
| | | | | | | |
RBS Greenwich (General Motors Acceptance Corporation,
7.125%, due 7/15/13) | | June 20, 2010 | | 121.49% | | 6.8%
Quarterly | | | 7,500,000 | | | (5,345,381 | ) | | | — | | | (5,345,381 | ) |
| | | | | | | |
RBS Greenwich (General Motors Acceptance Corporation,
7.125%, due 7/15/13) | | September 20, 2010 | | 113.84% | | 6.1%
Quarterly | | | 8,000,000 | | | (5,779,484 | ) | | | — | | | (5,779,484 | ) |
130
Annual Report to Shareholders
| | | | | | | | | | | | | | | | | | | | | |
| Western Asset Core Plus Bond Portfolio—Continued | | | | | | | |
| | |
| Credit Default Swap On Corporate Issues—Sell Protection1—Continued | | | | | | | |
Swap Counterparty
(Reference Entity) | | Termination Date | | Implied Credit
Spread At
December 31,
20082 | | Periodic
Payments
Received
by the
Fund‡ | | Contract
Notional
Amount3 | | Market Value | | | Upfront
Premiums
Paid/
(Received) | | | Unrealized
Appreciation/
(Depreciation) | |
| | | | | | | | | | | | | | | | | | | | | |
RBS Greenwich (General Motors Acceptance Corporation,
7.125%, due 7/15/13) | | September 20, 2010 | | 113.84% | | 6.9%
Quarterly | | $ | 10,000,000 | | $ | (7,170,482 | ) | | $ | — | | | $ | (7,170,482 | ) |
| | | | | | | |
RBS Greenwich (General Motors Acceptance Corporation,
7.125%, due 7/15/13) | | September 20, 2010 | | 113.84% | | 7.2%
Quarterly | | | 7,820,000 | | | (5,591,519 | ) | | | — | | | | (5,591,519 | ) |
| | | | | | | |
RBS Greenwich (General Motors Acceptance Corporation,
7.125%, due 7/15/13) | | September 20, 2010 | | 113.84% | | 7.7%
Quarterly | | | 12,500,000 | | | (8,895,761 | ) | | | — | | | | (8,895,761 | ) |
| | | | | | | |
RBS Greenwich (General Motors Acceptance Corporation,
7.125%, due 7/15/13) | | December 20, 2010 | | 107.60% | | 8.95%
Quarterly | | | 19,300,000 | | | (13,645,314 | ) | | | — | | | | (13,645,314 | ) |
| | | | | | | |
RBS Greenwich (General Motors Acceptance Corporation,
7.125%, due 7/15/13) | | March 20, 2012 | | 87.92% | | 3.7%
Quarterly | | | 8,400,000 | | | (6,480,740 | ) | | | — | | | | (6,480,740 | ) |
| | | | | | | |
RBS Greenwich (General Motors Acceptance Corporation,
7.125%, due 7/15/13) | | December 20, 2012 | | 81.10% | | 4.9%
Quarterly | | | 4,400,000 | | | (3,398,601 | ) | | | — | | | | (3,398,601 | ) |
| | | | | | | |
RBS Greenwich (General Motors Acceptance Corporation,
7.125%, due 7/15/13) | | March 20, 2013 | | 79.34% | | 8.6%
Quarterly | | | 9,000,000 | | | (6,635,219 | ) | | | — | | | | (6,635,219 | ) |
| | | | | | | |
RBS Greenwich (Residential Capital, LLC,
7.5%, due 4/17/13) | | December 20, 2012 | | 26.40% | | 5%
Quarterly | | | 10,800,000 | | | (4,833,946 | ) | | | (1,035,549 | ) | | | (3,798,397 | ) |
| | | | | | | |
RBS Greenwich (Residential Capital, LLC,
7.5%, due 4/17/13) | | December 20, 2012 | | 26.40% | | 5%
Quarterly | | | 10,800,000 | | | (4,833,946 | ) | | | (1,328,314 | ) | | | (3,505,632 | ) |
131
Annual Report to Shareholders
Notes to Financial Statements—Continued
| | | | | | | | | | | | | | | | | | | | |
| Western Asset Core Plus Bond Portfolio—Continued | | | | | | |
| | |
| Credit Default Swap On Corporate Issues—Sell Protection1—Continued | | | | | | |
Swap Counterparty
(Reference Entity) | | Termination Date | | Implied Credit
Spread At
December 31,
20082 | | Periodic
Payments
Received
by the
Fund‡ | | Contract
Notional
Amount3 | | Market Value | | | Upfront
Premiums
Paid/
(Received) | | Unrealized
Appreciation/
(Depreciation) | |
| | | | | | | | | | | | | | | | | | | | |
RBS Greenwich (SLM Corp.,
5.125%, due 8/27/12) | | June 20, 2012 | | 9.11% | | 1.76%
Quarterly | | $ | 24,300,000 | | $ | (4,612,347 | ) | | $ | — | | $ | (4,612,347 | ) |
| | | | | | | |
RBS Greenwich (SLM Corp.,
5.125%, due 8/27/12) | | September 20, 2012 | | 8.92% | | 2.35%
Quarterly | | | 3,600,000 | | | (644,166 | ) | | | — | | | (644,166 | ) |
| | | | | | | |
RBS Greenwich (SLM Corp.,
5.125%, due 8/27/12) | | September 20, 2012 | | 8.92% | | 2.4%
Quarterly | | | 3,600,000 | | | (639,258 | ) | | | — | | | (639,258 | ) |
| | | | | | | |
RBS Greenwich (Time Warner Inc.
6.875%, due 5/1/12) | | September 20, 2010 | | 1.23% | | 0.47%
Quarterly | | | 5,000,000 | | | (64,307 | ) | | | — | | | (64,307 | ) |
| | | | | | | |
RBS Greenwich
(Time Warner Inc.,
6.875%, due 5/1/12) | | December 20, 2010 | | 1.25% | | 0.5%
Quarterly | | | 12,500,000 | | | (181,411 | ) | | | — | | | (181,411 | ) |
| | | | | | | |
The Goldman Sachs Group, Inc. (Eastman Kodak Company,
7.25%, due 11/15/13) | | March 20, 2015 | | 7.45% | | 1.67%
Quarterly | | | 1,900,000 | | | (451,889 | ) | | | — | | | (451,889 | ) |
| | | | | | | |
The Goldman Sachs Group, Inc. (Ford Motor Credit Co.,
7%, due 10/1/2013) | | September 20, 2017 | | 9.36% | | 3.77%
Quarterly | | | 6,400,000 | | | (1,784,217 | ) | | | — | | | (1,784,217 | ) |
| | | | | | | |
The Goldman Sachs Group, Inc. (Ford Motor Credit Co.,
7.45%, due 7/16/31) | | September 20, 2011 | | 63.11% | | 6.8%
Quarterly | | | 10,000,000 | | | (6,326,219 | ) | | | — | | | (6,326,219 | ) |
| | | | | | | |
The Goldman Sachs Group, Inc. (Ford Motor Credit Company,
7%, due 10/1/13) | | June 20, 2010 | | 13.65% | | 4.75%
Quarterly | | | 2,500,000 | | | (285,715 | ) | | | — | | | (285,715 | ) |
| | | | | | | |
The Goldman Sachs Group, Inc. (Ford Motor Credit Company,
7%, due 10/1/13) | | September 20, 2011 | | 11.27% | | 3.8%
Quarterly | | | 9,200,000 | | | (1,500,265 | ) | | | — | | | (1,500,265 | ) |
| | | | | | | |
The Goldman Sachs Group, Inc. (Ford Motor Credit Company,
7.45%, due 7/16/31) | | September 20, 2011 | | 63.11% | | 6.8%
Quarterly | | | 8,400,000 | | | (5,314,024 | ) | | | — | | | (5,314,024 | ) |
132
Annual Report to Shareholders
| | | | | | | | | | | | | | | | | | | | |
| Western Asset Core Plus Bond Portfolio—Continued | | | | | | |
| Credit Default Swap On Corporate Issues—Sell Protection1—Continued | | | | | | |
Swap Counterparty
(Reference Entity) | | Termination Date | | Implied Credit
Spread At
December 31,
20082 | | Periodic
Payments
Received
by the
Fund‡ | | Contract
Notional
Amount3 | | Market Value | | | Upfront
Premiums
Paid/
(Received) | | Unrealized
Appreciation/
(Depreciation) | |
| | | | | | | | | | | | | | | | | | | | |
The Goldman Sachs Group, Inc. (Ford Motor Credit Company,
7.45%, due 7/16/31) | | March 20, 2012 | | 58.99% | | 6.05%
Quarterly | | $ | 11,500,000 | | $ | (7,530,755 | ) | | $ | — | | $ | (7,530,755 | ) |
| | | | | | | |
The Goldman Sachs Group, Inc. (General Motors Acceptance Corporation,
6.875%, due 8/28/12) | | June 20, 2010 | | 9.07% | | 5.75%
Quarterly | | | 2,000,000 | | | (89,538 | ) | | | — | | | (89,538 | ) |
| | | | | | | |
The Goldman Sachs Group, Inc. (General Motors Acceptance Corporation,
6.875%, due 8/28/12) | | June 20, 2010 | | 9.07% | | 5.95%
Quarterly | | | 80,000 | | | (3,365 | ) | | | — | | | (3,365 | ) |
| | | | | | | |
The Goldman Sachs Group, Inc. (General Motors Acceptance Corporation,
6.875%, due 8/28/12) | | June 20, 2010 | | 9.07% | | 6%
Quarterly | | | 1,000,000 | | | (41,379 | ) | | | — | | | (41,379 | ) |
| | | | | | | |
The Goldman Sachs Group, Inc. (General Motors Acceptance Corporation,
7.125%, due 7/15/13) | | June 20, 2010 | | 107.60% | | 8.95%
Quarterly | | | 5,000,000 | | | (3,496,421 | ) | | | — | | | (3,496,421 | ) |
| | | | | | | |
The Goldman Sachs Group, Inc. (General Motors Acceptance Corporation,
7.125%, due 7/15/13) | | March 20, 2012 | | 87.92% | | 3.15%
Quarterly | | | 19,400,000 | | | (15,065,475 | ) | | | — | | | (15,065,475 | ) |
| | | | | | | |
The Goldman Sachs Group, Inc. (General Motors Acceptance Corporation,
7.125%, due 7/15/13) | | March 20, 2012 | | 87.92% | | 4.4%
Quarterly | | | 11,500,000 | | | (8,798,466 | ) | | | — | | | (8,798,466 | ) |
| | | | | | | |
The Goldman Sachs Group, Inc. (General Motors Acceptance Corporation,
8.375%, due 7/15/33) | | December 20, 2010 | | 107.60% | | 7%
Quarterly | | | 42,500,000 | | | (30,644,370 | ) | | | — | | | (30,644,370 | ) |
| | | | | | | |
The Goldman Sachs Group, Inc. (TXU Corp.,
5.55%, due 11/15/2014) | | September 20, 2012 | | 14.11% | | 3.24%
Quarterly | | | 2,700,000 | | | (722,114 | ) | | | — | | | (722,114 | ) |
| | | | | | | | | | | | | | | | | | | | |
Net unrealized depreciation on sales of credit default swaps on corporate issues | | | | | | $ | (296,868,513 | ) |
| | | | | | | | | | | | | | | | | | | | |
133
Annual Report to Shareholders
Notes to Financial Statements—Continued
| | | | | | | | | | | | | | | |
| Western Asset Core Plus Bond Portfolio—Continued | | | | | | | | |
|
| Credit Default Swaps on Corporate Issues—Buy Protection4 |
Swap Counterparty
(Reference Entity) | | Termination Date | | Periodic Payments
Made by the Fund‡ | | Contract Notional
Amount3 | | Market Value | | Upfront
Premiums
Paid/
(Received) | | Unrealized
Appreciation/
Depreciation |
Banc of America Securities LLC
(Home Depot Inc.,
3.75%, due 9/15/09) | | December 20, 2013 | | 0.635%
Quarterly | | $ 5,510,000 | | $ | 461,457 | | $ | — | | $ | 461,457 |
| | | | | | |
Banc of America Securities LLC
(Marriot International Inc.,
4.625%, due 6/15/12) | | December 20, 2015 | | 0.73%
Monthly | | 7,950,000 | | | 1,712,983 | | | — | | | 1,712,983 |
| | | | | | |
Banc of America Securities LLC
(Masco Corp.,
5.875%, due 7/15/12) | | December 20, 2016 | | 1.04%
Quarterly | | 8,270,000 | | | 1,408,720 | | | — | | | 1,408,720 |
| | | | | | |
Banc of America Securities LLC
(PHH Corporate Note,
7.125%, due 3/1/13) | | March 20, 2013 | | 1.05%
Monthly | | 8,640,000 | | | 4,991,942 | | | — | | | 4,991,942 |
| | | | | | |
Banc of America Securities LLC
(Viacom Inc.,
4.625%, due 5/15/18) | | December 20, 2015 | | 1.13%
Quarterly | | 5,500,000 | | | 770,201 | | | — | | | 770,201 |
| | | | | | |
Barclays Capital Inc.
(Amerisourcebergen Corp.,
5.625%, due 9/15/12) | | September 20, 2012 | | 0.5%
Quarterly | | 6,330,000 | | | 75,770 | | | — | | | 75,770 |
| | | | | | |
Barclays Capital Inc.
(Cardinal Health Inc.
5.85%, due 12/15/17) | | September 20, 2016 | | 0.49%
Quarterly | | 6,260,000 | | | 125,213 | | | — | | | 125,213 |
| | | | | | |
Barclays Capital Inc.
(Health Care Property Investments Inc.,
6.45%, due 06/25/12) | | June 20, 2012 | | 0.63%
Quarterly | | 6,240,000 | | | 1,894,400 | | | — | | | 1,894,400 |
| | | | | | |
Barclays Capital Inc.
(Juneau Investments LLC,
5.9%, due 2/22/21) | | December 20, 2012 | | 3.6%
Quarterly | | 3,380,000 | | | 1,351,931 | | | — | | | 1,351,931 |
| | | | | | |
Barclays Capital Inc.
(Juneau Investments LLC,
5.9%, due 2/22/21) | | December 20, 2012 | | 3.6%
Quarterly | | 2,250,000 | | | 899,954 | | | — | | | 899,954 |
134
Annual Report to Shareholders
| | | | | | | | | | | | | | | |
| Western Asset Core Plus Bond Portfolio—Continued |
|
| Credit Default Swaps on Corporate Issues—Buy Protection4—Continued |
Swap Counterparty
(Reference Entity) | | Termination Date | | Periodic Payments
Made by the Fund‡ | | Contract Notional
Amount3 | | Market Value | | Upfront
Premiums
Paid/
(Received) | | Unrealized
Appreciation/
Depreciation |
Barclays Capital Inc.
(Motorola Inc.,
6.5%, due 9/1/25) | | December 20, 2011 | | 0.32%
Quarterly | | $ 10,850,000 | | $ | 1,724,447 | | $ | — | | $ | 1,724,447 |
| | | | | | |
Bear Stearns, Inc.
(Bell South Corp.,
6%, due 10/15/11) | | September 20, 2014 | | 0.28%
Quarterly | | 8,250,000 | | | 274,823 | | | — | | | 274,823 |
| | | | | | |
Bear Stearns, Inc.
(Ford Motor Credit Company,
7%, due 10/1/13) | | June 20, 2010 | | 5.75%
Quarterly | | 12,500,000 | | | 1,065,945 | | | — | | | 1,065,945 |
| | | | | | |
Bear Stearns, Inc.
(Juneau Investments LLC,
5.9%, due 2/22/21) | | December 20, 2012 | | 3.65%
Quarterly | | 8,250,000 | | | 3,291,231 | | | — | | | 3,291,231 |
| | | | | | |
Bear Stearns, Inc.
(Viacom Inc.,
6.25%, due 4/30/16) | | March 20, 2011 | | 0.59%
Quarterly | | 4,300,000 | | | 277,796 | | | — | | | 277,796 |
| | | | | | |
Credit Suisse First Boston USA
(AAMES Mortgage Investment Trust 2005-1 M8, 1-Month LIBOR + 160 bp, due 6/25/35) | | April 25, 2035 | | 1.28%
Monthly | | 1,122,000 | | | 1,045,153 | | | — | | | 1,045,153 |
| | | | | | |
Credit Suisse First Boston USA
(AAMES Mortgage Investment Trust 2005-1 M9, 1-Month LIBOR + 250 bp, due 6/25/35) | | April 25, 2035 | | 2.05%
Monthly | | 1,122,000 | | | 1,049,855 | | | — | | | 1,049,855 |
| | | | | | |
Credit Suisse First Boston USA
(ACE Securities Corp. 2005-HE1 M8, 1-Month LIBOR + 138 bp, due 2/25/35) | | February 25, 2035 | | 1.31%
Monthly | | 1,122,000 | | | 1,076,683 | | | — | | | 1,076,683 |
| | | | | | |
Credit Suisse First Boston USA
(ACE Securities Corp. 2005-HE1 M9, 1-Month LIBOR + 220bp, due 2/25/35) | | February 25, 2035 | | 2.06%
Monthly | | 644,170 | | | 630,617 | | | — | | | 630,617 |
135
Annual Report to Shareholders
Notes to Financial Statements—Continued
| | | | | | | | | | | | | | | |
| Western Asset Core Plus Bond Portfolio—Continued |
|
| Credit Default Swaps on Corporate Issues—Buy Protection4—Continued |
Swap Counterparty
(Reference Entity) | | Termination Date | | Periodic Payments
Made by the Fund‡ | | Contract Notional
Amount3 | | Market Value | | Upfront
Premiums
Paid/
(Received) | | Unrealized
Appreciation/
Depreciation |
Credit Suisse First Boston USA
(Aegis Asset Backed Securities Trust 2004-4 B2, 1-Month LIBOR + 190bp, due 10/25/34) | | October 25, 2034 | | 1.37%
Monthly | | $ 830,530 | | $ | 748,995 | | $ | — | | $ | 748,995 |
| | | | | | |
Credit Suisse First Boston USA
(Aegis Asset Backed Securities Trust 2005 B2, 1-Month LIBOR + 130 bp, due 3/25/35) | | March 25, 2035 | | 1.31%
Monthly | | 1,122,000 | | | 1,086,365 | | | — | | | 1,086,365 |
| | | | | | |
Credit Suisse First Boston USA
(Aegis Asset Backed Securities Trust 2005 B3, 1-Month LIBOR + 200 bp, due 3/25/35) | | March 25, 2035 | | 2.18%
Monthly | | 1,122,000 | | | 1,106,032 | | | — | | | 1,106,032 |
| | | | | | |
Credit Suisse First Boston USA
(Amerisource Bergen Corp.,
8.125%, due 9/1/08) | | September 20, 2015 | | 0.9%
Quarterly | | 5,350,000 | | | 10,735 | | | — | | | 10,735 |
| | | | | | |
Credit Suisse First Boston USA
(Argent Securities Inc. 2004-W4 M3, 1-Month LIBOR + 300 bp, due 3/25/34) | | March 25, 2034 | | 2.2%
Monthly | | 531,142 | | | 449,389 | | | — | | | 449,389 |
| | | | | | |
Credit Suisse First Boston USA
(Argent Securities Inc. 2004-W11 M9, 1-Month LIBOR + 225bp, due 11/25/34) | | November 25, 2034 | | 1.33%
Monthly | | 427,500 | | | 399,909 | | | — | | | 399,909 |
| | | | | | |
Credit Suisse First Boston USA
(Argent Securities Inc. 2004-W11 M10, 1-Month LIBOR + 350bp, due 11/25/34) | | November 25, 2034 | | 2.15%
Monthly | | 427,500 | | | 400,474 | | | — | | | 400,474 |
136
Annual Report to Shareholders
| | | | | | | | | | | | | | | |
| Western Asset Core Plus Bond Portfolio—Continued |
|
| Credit Default Swaps on Corporate Issues—Buy Protection4—Continued |
Swap Counterparty
(Reference Entity) | | Termination Date | | Periodic Payments
Made by the Fund‡ | | Contract Notional
Amount3 | | Market Value | | Upfront
Premiums
Paid/
(Received) | | Unrealized
Appreciation/
Depreciation |
Credit Suisse First Boston USA
(Finance America Mortgage Loan Trust 2004-3 M8, 1-Month LIBOR + 180bp, due 11/25/34) | | November 25, 2034 | | 1.31%
Monthly | | $ 407,909 | | $ | 391,389 | | $ | — | | $ | 391,389 |
| | | | | | |
Credit Suisse First Boston USA
(Finance America Mortgage Loan Trust 2004-3 M9, 1-Month LIBOR + 315bp, due 11/25/34) | | November 25, 2034 | | 2.18%
Monthly | | 407,881 | | | 393,894 | | | — | | | 393,894 |
| | | | | | |
Credit Suisse First Boston USA
(Fremont Home Loan Trust 2005-A M8, 1-Month LIBOR + 135 bp, due 1/25/35) | | January 25, 2035 | | 1.31%
Monthly | | 444,776 | | | 431,048 | | | — | | | 431,048 |
| | | | | | |
Credit Suisse First Boston USA
(Fremont Home Loan Trust 2005-A, 1-Month LIBOR + 100bp, due 1/25/35) | | January 25, 2035 | | 2.08%
Monthly | | 448,860 | | | 437,331 | | | — | | | 437,331 |
| | | | | | |
Credit Suisse First Boston USA
(Home Depot Inc.,
3.75%, due 9/15/09) | | September 20, 2010 | | 0.17%
Quarterly | | 2,720,000 | | | 102,084 | | | — | | | 102,084 |
| | | | | | |
Credit Suisse First Boston USA
(IndyMac Home Equity Loan Asset-Backed, Trust 2004-C M8, 1-Month LIBOR + 190bp, due 3/25/35) | | March 25, 2035 | | 1.28%
Monthly | | 585,674 | | | 555,200 | | | — | | | 555,200 |
| | | | | | |
Credit Suisse First Boston USA
(IndyMac Home Equity Loan Asset-Backed, Trust 2004-C M9, 1-Month LIBOR + 325bp, due 3/25/35) | | March 25, 2035 | | 2.05%
Monthly | | 467,382 | | | 441,676 | | | — | | | 441,676 |
137
Annual Report to Shareholders
Notes to Financial Statements—Continued
| | | | | | | | | | | | | | | |
| Western Asset Core Plus Bond Portfolio—Continued |
|
| Credit Default Swaps on Corporate Issues—Buy Protection4—Continued |
Swap Counterparty
(Reference Entity) | | Termination Date | | Periodic Payments
Made by the Fund‡ | | Contract Notional
Amount3 | | Market Value | | Upfront
Premiums
Paid/
(Received) | | Unrealized
Appreciation/
Depreciation |
Credit Suisse First Boston USA
(Limited Brands Inc.,
6.125%, due 12/01/12) | | December 20, 2012 | | 0.6%
Quarterly | | $ 10,600,000 | | $ | 1,713,159 | | $ | — | | $ | 1,713,159 |
| | | | | | |
Credit Suisse First
Boston USA
(Long Beach Mortgage Loan Trust 2004-1 M9, 1-Month LIBOR + 350bp, due 2/25/34) | | February 25, 2034 | | 2.15%
Monthly | | 345,728 | | | 248,982 | | | — | | | 248,982 |
| | | | | | |
Credit Suisse First
Boston USA
(Long Beach Mortgage Loan Trust 2005-1 M8, 1-Month LIBOR + 170 bp, due 2/25/35) | | February 25, 2035 | | 1.31%
Monthly | | 544,798 | | | 519,853 | | | — | | | 519,853 |
| | | | | | |
Credit Suisse First Boston USA
(Long Beach Mortgage Loan Trust 2005-1 M9, 1-Month LIBOR + 275bp, due 2/25/35) | | February 25, 2035 | | 2.08%
Monthly | | 446,232 | | | 425,865 | | | — | | | 425,865 |
| | | | | | |
Credit Suisse First Boston USA
(Marsh & Mclennan Company, Inc.,
5.375%, due 7/15/14) | | September 20, 2010 | | 0.46%
Quarterly | | 5,990,000 | | | 10,608 | | | — | | | 10,608 |
| | | | | | |
Credit Suisse First Boston USA
(Masco Corp.,
5.875%, due 7/15/12) | | September 20, 2013 | | 0.75%
Quarterly | | 5,830,000 | | | 872,560 | | | — | | | 872,560 |
| | | | | | |
Credit Suisse First Boston USA
(MASTR Asset Backed Securities Trust 2005-NC1 M8, 1-Month LIBOR + 153bp, due 12/25/34) | | December 25, 2034 | | 1.31%
Monthly | | 660,250 | | | 625,891 | | | — | | | 625,891 |
| | | | | | |
Credit Suisse First Boston USA
(MASTR Asset Backed Securities Trust 2005-NC1 M9, 1-Month LIBOR + 240bp, due 12/25/34) | | December 25, 2034 | | 2.08%
Monthly | | 593,281 | | | 563,595 | | | — | | | 563,595 |
138
Annual Report to Shareholders
| | | | | | | | | | | | | | | |
| Western Asset Core Plus Bond Portfolio—Continued |
|
| Credit Default Swaps on Corporate Issues—Buy Protection4—Continued |
Swap Counterparty
(Reference Entity) | | Termination Date | | Periodic
Payments Made
by the Fund‡ | | Contract Notional
Amount3 | | Market Value | | Upfront
Premiums
Paid/
(Received) | | Unrealized
Appreciation/
Depreciation |
Credit Suisse First
Boston USA
(Merrill Lynch Mortgage Investors, Inc. 2004-WMC1 B3, 1-Month LIBOR + 225bp, due 9/25/35) | | September 25, 2035 | | 2.05%
Monthly | | $ 526,385 | | $ | 260,770 | | $ | — | | $ | 260,770 |
| | | | | | |
Credit Suisse First
Boston USA
(Merrill Lynch Mortgage Investors, Inc. 2004-WMC4 B3, 1-Month LIBOR + 375bp, due 4/25/35) | | April 25, 2035 | | 2.15%
Monthly | | 326,250 | | | 304,326 | | | — | | | 304,326 |
| | | | | | |
Credit Suisse First
Boston USA
(Merrill Lynch Mortgage Investors, Inc. 2005-NC1 B2, 1-Month LIBOR + 130bp, due 10/25/35) | | October 25, 2035 | | 1.28%
Monthly | | 1,122,000 | | | 323,514 | | | — | | | 323,514 |
| | | | | | |
Credit Suisse First
Boston USA
(Merrill Lynch Mortgage Investors, Inc. 2005-NC1 B3, 1-Month LIBOR + 205bp, due 10/25/35) | | October 25, 2035 | | 2.05%
Monthly | | 749,260 | | | 378,976 | | | — | | | 378,976 |
| | | | | | |
Credit Suisse First
Boston USA
(Merrill Lynch Mortgage Investors, Inc. 2005-WMC1 B2, 1-Month LIBOR + 135bp, due 9/25/35) | | September 25, 2035 | | 1.28%
Monthly | | 1,122,000 | | | 436,108 | | | — | | | 436,108 |
| | | | | | |
Credit Suisse First
Boston USA
(Morgan Stanley ABS Capital I 2005-WMC1 B2, 1-Month LIBOR + 130 bp, due 1/25/35) | | January 25, 2035 | | 1.31%
Monthly | | 355,878 | | | 345,385 | | | — | | | 345,385 |
| | | | | | |
Credit Suisse First
Boston USA
(Morgan Stanley ABS Capital I 2005-WMC1 B3, 1-Month LIBOR + 215bp, due 1/25/35) | | January 25, 2035 | | 2.18%
Monthly | | 393,151 | | | 385,220 | | | — | | | 385,220 |
139
Annual Report to Shareholders
Notes to Financial Statements—Continued
| | | | | | | | | | | | | | | |
| Western Asset Core Plus Bond Portfolio—Continued |
|
| Credit Default Swaps on Corporate Issues—Buy Protection4—Continued |
Swap Counterparty
(Reference Entity) | | Termination Date | | Periodic
Payments Made
by the Fund‡ | | Contract Notional
Amount3 | | Market Value | | Upfront
Premiums
Paid/
(Received) | | Unrealized
Appreciation/
Depreciation |
Credit Suisse First
Boston USA
(New Century Home Equity Loan Trust 2004-2 M9, 1-Month LIBOR + 325bp, due 8/25/34) | | August 25, 2034 | | 2.15%
Monthly | | $ 476,899 | | $ | 301,591 | | $ | — | | $ | 301,591 |
| | | | | | |
Credit Suisse First
Boston USA
(New Century Home Equity Loan Trust 2005-1 M8, 1-Month LIBOR + 140 bp, due 3/25/35) | | March 25, 2035 | | 1.31%
Monthly | | 648,152 | | | 520,526 | | | — | | | 520,526 |
| | | | | | |
Credit Suisse First
Boston USA
(New Century Home Equity Loan Trust 2005-1 M9, 1-Month LIBOR + 205 bp, due 3/25/35) | | March 25, 2035 | | 2.18%
Monthly | | 479,851 | | | 451,716 | | | — | | | 451,716 |
| | | | | | |
Credit Suisse First
Boston USA
(Novastar Home Equity Loan 2005-1 B2, 1-Month LIBOR + 135 bp, due 6/25/35) | | June 25, 2035 | | 1.28%
Monthly | | 1,122,000 | | | 970,501 | | | — | | | 970,501 |
| | | | | | |
Credit Suisse First
Boston USA
(Novastar Home Equity Loan 2005-4 B3, 1-Month LIBOR + 195 bp, due 6/25/35) | | June 25, 2035 | | 2.05%
Monthly | | 1,122,000 | | | 947,922 | | | — | | | 947,922 |
| | | | | | |
Credit Suisse First
Boston USA
(Park Place Securities Inc. 2005-WCH1 M8, 1-Month LIBOR + 155bp, due 1/25/36) | | January 25, 2036 | | 1.36%
Monthly | �� | 1,122,000 | | | 1,066,995 | | | — | | | 1,066,995 |
| | | | | | |
Credit Suisse First
Boston USA
(Park Place Securities, Inc. 2005-WCH1 M9, 1-Month LIBOR + 250 bp, due 1/25/36) | | January 25, 2036 | | 2.18%
Monthly | | 1,081,878 | | | 1,031,965 | | | — | | | 1,031,965 |
140
Annual Report to Shareholders
| | | | | | | | | | | | | | | | | |
| Western Asset Core Plus Bond Portfolio—Continued | |
|
| Credit Default Swaps on Corporate Issues—Buy Protection4—Continued | |
Swap Counterparty
(Reference Entity) | | Termination Date | | Periodic
Payments
Made by
the Fund‡ | | Contract Notional
Amount3 | | Market Value | | | Upfront
Premiums
Paid/
(Received) | | Unrealized
Appreciation/
Depreciation | |
Credit Suisse First Boston USA
(People’s Choice Home Loan Securities Trust 2004-1 M6, 1-Month LIBOR + 230bp, due 6/25/34) | | June 25, 2034 | | 1.37%
Quarterly | | $ 919,945 | | $ | 877,629 | | | $ | — | | $ | 877,629 | |
| | | | | | |
Credit Suisse First Boston USA
(People’s Choice Home Loan Securities Trust 2005-1 B3, 1-Month LIBOR + 260bp, due 1/25/35) | | January 25, 2035 | | 2.05%
Monthly | | 879,711 | | | 848,745 | | | | — | | | 848,745 | |
| | | | | | |
Credit Suisse First Boston USA
(People’s Choice Home Loan Securities Trust 2005-1, 1-Month LIBOR + 165bp, due 1/25/35) | | January 25, 2035 | | 1.28%
Monthly | | 1,122,000 | | | 1,072,479 | | | | — | | | 1,072,479 | |
| | | | | | |
Credit Suisse First Boston USA
(Pulte Homes Inc.,
7.875%, due 8/1/11) | | March 20, 2011 | | 0.79%
Quarterly | | 4,080,000 | | | 233,020 | | | | — | | | 233,020 | |
| | | | | | |
Credit Suisse First Boston USA
(Southwest Airlines Co.,
5.25%, due 10/1/14) | | March 20, 2017 | | 0.69%
Quarterly | | 4,880,000 | | | 1,006,785 | | | | — | | | 1,006,785 | |
| | | | | | |
Credit Suisse First Boston USA
(Starwood Hotels Resorts,
7.875%, due 8/25/34) | | December 20, 2011 | | 1.37%
Quarterly | | 5,350,000 | | | 797,352 | | | | — | | | 797,352 | |
| | | | | | |
Credit Suisse First Boston USA
(Waste Management Inc.,
7.375%, due 8/1/10) | | March 20, 2014 | | 0.49%
Quarterly | | 6,630,000 | | | 305,799 | | | | — | | | 305,799 | |
| | | | | | |
Deutsche Bank AG
(Autozone Inc.,
6.95%, due 6/15/16) | | June 20, 2016 | | 0.58%
Quarterly | | 10,890,000 | | | 570,467 | | | | — | | | 570,467 | |
| | | | | | |
Deutsche Bank AG
(Centurytel Inc.,
7.875%, due 8/15/12) | | March 20, 2017 | | 0.89%
Quarterly | | 8,270,000 | | | 350,559 | | | | — | | | 350,559 | |
| | | | | | |
JP Morgan Chase & Co.
(Limited Brands Inc.,
6.125%, due 12/1/12) | | December 20, 2012 | | 0.67%
Quarterly | | 6,300,000 | | | 1,004,556 | | | | — | | | 1,004,556 | |
| | | | | | |
Morgan Stanley & Co., Inc.
(Gannett Co.,
6.375%, due 4/01/12) | | March 20, 2012 | | 0.46%
Quarterly | | 4,560,000 | | | 1,033,183 | | | | — | | | 1,033,183 | |
| | | | | | |
Morgan Stanley & Co., Inc.
(Pulte Homes Inc.,
5.25%, due 1/15/14) | | March 20, 2011 | | 4%
Quarterly | | 2,780,000 | | | (24,179 | ) | | | — | | | (24,179 | ) |
141
Annual Report to Shareholders
Notes to Financial Statements—Continued
| | | | | | | | | | | | | | | |
| Western Asset Core Plus Bond Portfolio—Continued |
|
| Credit Default Swaps on Corporate Issues—Buy Protection4—Continued |
Swap Counterparty
(Reference Entity) | | Termination Date | | Periodic
Payments
Made by
the Fund‡ | | Contract Notional
Amount3 | | Market Value | | Upfront
Premiums
Paid/
(Received) | | Unrealized
Appreciation/
Depreciation |
Morgan Stanley & Co., Inc.
(Sara Lee Corp.
6.125% due 11/01/32) | | September 20, 2011 | | 0.62%
Quarterly | | $ 9,750,000 | | $ | 24,598 | | $ | — | | $ | 24,598 |
| | | | | | |
Morgan Stanley & Co., Inc.
(Viacom Inc.,
6.25%, due 4/30/16) | | March 20, 2012 | | 0.36%
Quarterly | | 10,540,000 | | | 1,018,184 | | | — | | | 1,018,184 |
| | | | | | |
Morgan Stanley & Co., Inc.
(Weyerhaeuser Co. Note,
7.125%, due 7/15/23) | | March 20, 2012 | | 0.74%
Quarterly | | 5,540,000 | | | 250,512 | | | — | | | 250,512 |
| | | | | | |
RBS Greenwich
(DSLA Mortgage Loan Trust 2005-AR5, 1-Month LIBOR + 175 bp, due 8/19/45) | | August 19, 2045 | | 4.5%
Monthly | | 2,085,935 | | | 1,730,631 | | | — | | | 1,730,631 |
| | | | | | |
RBS Greenwich
(General Mills Inc.,
5.7%, due 2/15/17) | | March 20, 2017 | | 0.33%
Quarterly | | 7,210,000 | | | 205,552 | | | — | | | 205,552 |
| | | | | | |
RBS Greenwich
(Harborview Mortgage Loan Trust 2005-12, 1-Month LIBOR + 175 bp, due 10/19/35) | | October 19, 2035 | | 2.5%
Monthly | | 1,989,745 | | | 1,844,807 | | | — | | | 1,844,807 |
| | | | | | |
RBS Greenwich
(Home Depot Inc.,
5.4%, due 3/1/16) | | March 20, 2016 | | 0.48%
Monthly | | 8,230,000 | | | 896,552 | | | — | | | 896,552 |
| | | | | | |
RBS Greenwich
(IndyMac Index Mortgage Loan Trust 2005-AR18, 1-Month LIBOR + 125 bp, due 10/25/36) | | October 25, 2036 | | 2.7%
Monthly | | 1,880,550 | | | 1,643,494 | | | — | | | 1,643,494 |
| | | | | | |
RBS Greenwich
(Washington Mutual 2005-AR11, 1-Month LIBOR + 120 bp, due 8/25/45) | | August 25, 2045 | | 2.55%
Monthly | | 687,794 | | | 487,413 | | | — | | | 487,413 |
| | | | | | |
The Goldman Sachs Group, Inc.
(JPM Chase Commercial Mortgage,
5.7966%, due 5/15/47) | | May 15, 2047 | | 0.75%
Monthly | | 5,000,000 | | | 4,362,463 | | | — | | | 4,362,463 |
| | | | | | |
The Goldman Sachs Group, Inc.
(Viacom Inc.
6.25% due 4/30/2016) | | March 20, 2011 | | 1.4%
Quarterly | | 6,270,000 | | | 299,453 | | | — | | | 299,453 |
| | | | | | | | | | | | | | | |
Net unrealized appreciation on buys of credit default swaps on corporate issues | | | | | $ | 64,629,724 |
| | | | | | | | | | | | | | | |
142
Annual Report to Shareholders
| | | | | | | | | | | | | | | | | | |
| Western Asset Core Plus Bond Portfolio—Continued | |
|
| Credit Default Swap on Credit Indices—Sell Protection1—Continued | |
Swap Counterparty
(Reference Entity) | | Termination Date | | Periodic
Payments Received
by the Fund‡ | | Contract
Notional Amount3 | | Market
Value5 | | | Upfront
Premiums
Paid/
(Received) | | | Unrealized
Appreciation/
(Depreciation) | |
| | | | | | | | | | | | | | | | | | |
Barclays Capital Inc.
(CDX IG 10) | | June 20, 2013 | | 1.55%
Quarterly | | $ 45,676,800 | | $ | (1,048,049 | ) | | $ | (379,653 | ) | | $ | (668,396 | ) |
| | | | | | |
Barclays Capital Inc.
(CDX IG 10) | | June 20, 2013 | | 1.55%
Quarterly | | 51,240,000 | | | (1,175,696 | ) | | | (729,132 | ) | | | (446,564 | ) |
| | | | | | |
Barclays Capital Inc.
(CDX IG 10) | | June 20, 2013 | | 1.55%
Quarterly | | 40,552,800 | | | (930,480 | ) | | | (441,537 | ) | | | (488,943 | ) |
| | | | | | |
Barclays Capital Inc.
(CDX IG 11) | | December 20, 2013 | | 1.5%
Quarterly | | 41,565,000 | | | (830,120 | ) | | | (1,510,314 | ) | | | 680,194 | |
| | | | | | |
Barclays Capital Inc.
(CDX IG 9) | | December 20, 2017 | | 0.8%
Quarterly | | 98,946,880 | | | (5,051,565 | ) | | | (3,768,227 | ) | | | (1,283,338 | ) |
| | | | | | |
Barclays Capital Inc.
(CDX IG 9) | | December 20, 2017 | | 0.8%
Quarterly | | 85,595,200 | | | (4,369,918 | ) | | | (3,719,390 | ) | | | (650,528 | ) |
| | | | | | |
Barclays Capital Inc.
(CDX IG HVOL 8) | | June 20, 2012 | | 0.75%
Quarterly | | 27,100,000 | | | (3,183,779 | ) | | | (243,003 | ) | | | (2,940,776 | ) |
| | | | | | |
Barclays Capital Inc.
(CDX IG HVOL 9) | | December 20, 2012 | | 1.4%
Quarterly | | 12,760,044 | | | (2,035,227 | ) | | | (302,613 | ) | | | (1,732,614 | ) |
| | | | | | |
Barclays Capital Inc.
(CDX IG HVOL 9) | | December 20, 2012 | | 1.4%
Quarterly | | 178,930,617 | | | (28,539,434 | ) | | | (6,348,907 | ) | | | (22,190,527 | ) |
| | | | | | |
Barclays Capital Inc.
(CDX IG HVOL 9) | | December 20, 2012 | | 1.4%
Quarterly | | 62,833,550 | | | (10,021,951 | ) | | | (2,279,839 | ) | | | (7,742,112 | ) |
| | | | | | |
Barclays Capital Inc.
(CDX IG HVOL 9) | | December 20, 2012 | | 1.4%
Quarterly | | 62,833,550 | | | (10,021,951 | ) | | | (2,262,362 | ) | | | (7,759,589 | ) |
| | | | | | |
Barclays Capital Inc.
(CDX IG HVOL 9) | | December 20, 2012 | | 1.4%
Quarterly | | 4,833,350 | | | (770,920 | ) | | | (235,342 | ) | | | (535,578 | ) |
| | | | | | |
Barclays Capital Inc.
(CDX IG HVOL 9) | | December 20, 2012 | | 1.4%
Quarterly | | 125,425,433 | | | (20,005,357 | ) | | | (6,293,972 | ) | | | (13,711,385 | ) |
| | | | | | |
Barclays Capital Inc.
(CDX IG HVOL 9) | | December 20, 2012 | | 1.4%
Quarterly | | 11,841,708 | | | (1,888,753 | ) | | | (603,833 | ) | | | (1,284,920 | ) |
| | | | | | |
Barclays Capital Inc.
(CDX IG HVOL 9) | | December 20, 2012 | | 1.4%
Every 3 Days | | 23,103,413 | | | (3,684,994 | ) | | | (1,179,833 | ) | | | (2,505,161 | ) |
| | | | | | |
Barclays Capital Inc.
(CDX IG HVOL 9) | | December 20, 2012 | | 1.4%
Quarterly | | 31,706,776 | | | (5,057,231 | ) | | | (2,046,426 | ) | | | (3,010,805 | ) |
| | | | | | |
Bear Stearns, Inc.
(ABX. HE-AAA 07-2) | | January 25, 2038 | | 0.76%
Monthly | | 10,000,000 | | | (6,100,000 | ) | | | (283,039 | ) | | | (5,816,961 | ) |
| | | | | | |
Bear Stearns, Inc.
(CDX HY 6B) | | June 20, 2011 | | 3%
Quarterly | | 25,000,000 | | | (2,635,405 | ) | | | 136,999 | | | | (2,772,404 | ) |
143
Annual Report to Shareholders
Notes to Financial Statements—Continued
| | | | | | | | | | | | | | | | | | |
| Western Asset Core Plus Bond Portfolio—Continued | |
|
| Credit Default Swap on Credit Indices—Sell Protection1—Continued | |
Swap Counterparty
(Reference Entity) | | Termination Date | | Periodic
Payments Received
by the Fund‡ | | Contract
Notional
Amount3 | | Market
Value5 | | | Upfront
Premiums
Paid/
(Received) | | | Unrealized
Appreciation/
(Depreciation) | |
Bear Stearns, Inc.
(CDX HY 8) | | June 20, 2012 | | 0.91%
Quarterly | | $ 31,750,000 | | $ | (6,623,982 | ) | | $ | — | | | $ | (6,623,982 | ) |
| | | | | | |
Bear Stearns, Inc.
(CDX HY 8) | | June 20, 2012 | | 1.01%
Quarterly | | 31,800,000 | | | (6,537,046 | ) | | | — | | | | (6,537,046 | ) |
| | | | | | |
Bear Stearns, Inc.
(CDX HY 8) | | June 20, 2012 | | 1.05%
Quarterly | | 12,700,000 | | | (2,595,152 | ) | | | — | | | | (2,595,152 | ) |
| | | | | | |
Bear Stearns, Inc.
(CDX HY 9) | | December 20, 2012 | | 2.25%
Quarterly | | 8,900,000 | | | (2,256,882 | ) | | | — | | | | (2,256,882 | ) |
| | | | | | |
Bear Stearns, Inc.
(CDX HY 9) | | December 20, 2012 | | 3.75%
Quarterly | | 2,646,000 | | | (466,349 | ) | | | (245,204 | ) | | | (221,145 | ) |
| | | | | | |
Bear Stearns, Inc.
(CDX HY 9) | | December 20, 2012 | | 6.2%
Quarterly | | 50,000,000 | | | (6,227,685 | ) | | | — | | | | (6,227,685 | ) |
| | | | | | |
Bear Stearns, Inc.
(CDX IG 8) | | June 20, 2012 | | 0.35%
Quarterly | | 83,448,000 | | | (5,057,976 | ) | | | (522,924 | ) | | | (4,535,052 | ) |
| | | | | | |
Bear Stearns, Inc.
(CDX IG 8) | | June 20, 2012 | | 0.35%
Quarterly | | 19,149,120 | | | (1,160,672 | ) | | | (139,542 | ) | | | (1,021,130 | ) |
| | | | | | |
Bear Stearns, Inc.
(CDX IG HVOL 8) | | June 20, 2012 | | 0.75%
Quarterly | | 56,100,000 | | | (6,590,774 | ) | | | (409,302 | ) | | | (6,181,472 | ) |
| | | | | | |
Bear Stearns, Inc.
(CDX IG HVOL 8) | | June 20, 2012 | | 0.75%
Quarterly | | 28,200,000 | | | (3,313,009 | ) | | | (318,876 | ) | | | (2,994,133 | ) |
| | | | | | |
Bear Stearns, Inc.
(CDX IG HVOL 8) | | June 20, 2012 | | 0.75%
Quarterly | | 28,500,000 | | | (3,348,254 | ) | | | (316,239 | ) | | | (3,032,015 | ) |
| | | | | | |
Bear Stearns, Inc.
(CDX IG HVOL 8) | | June 20, 2012 | | 0.75%
Quarterly | | 207,400,000 | | | (24,365,892 | ) | | | (4,363,728 | ) | | | (20,002,164 | ) |
| | | | | | |
Credit Suisse First Boston USA
(ABX.HE-AAA 06-1) | | July 25, 2045 | | 0.18%
Monthly | | 166,331,725 | | | (33,266,345 | ) | | | (14,232,056 | ) | | | (19,034,289 | ) |
| | | | | | |
Credit Suisse First Boston USA
(ABX.HE-AAA 06-1) | | July 25, 2045 | | 0.18%
Monthly | | 23,885,505 | | | (4,777,101 | ) | | | (2,160,215 | ) | | | (2,616,886 | ) |
| | | | | | |
Credit Suisse First Boston USA
(ABX.HE-AAA 07-2) | | January 25, 2038 | | 0.76%
Monthly | | 23,300,000 | | | (14,213,000 | ) | | | (499,769 | ) | | | (13,713,231 | ) |
| | | | | | |
Credit Suisse First Boston USA
(ABX.HE-AAA 07-2) | | January 25, 2038 | | 0.76%
Monthly | | 6,600,000 | | | (4,026,000 | ) | | | (275,340 | ) | | | (3,750,660 | ) |
| | | | | | |
Credit Suisse First Boston USA
(ABX.HE-AAA 07-2) | | January 25, 2038 | | 0.76%
Monthly | | 2,600,000 | | | (1,586,000 | ) | | | (99,171 | ) | | | (1,486,829 | ) |
| | | | | | |
Credit Suisse First Boston USA
(CDX HY 10) | | June 20, 2013 | | 5%
Quarterly | | 13,000,000 | | | (2,058,291 | ) | | | (1,570,632 | ) | | | (487,659 | ) |
| | | | | | |
Credit Suisse First Boston USA
(CDX IG HVOL 10) | | June 20, 2013 | | 3.5%
Quarterly | | 40,310,139 | | | (3,772,198 | ) | | | 518,708 | | | | (4,290,906 | ) |
144
Annual Report to Shareholders
| | | | | | | | | | | | | | | | | | |
| Western Asset Core Plus Bond Portfolio—Continued | |
|
| Credit Default Swap on Credit Indices—Sell Protection1—Continued | |
Swap Counterparty
(Reference Entity) | | Termination Date | | Periodic
Payments Received
by the Fund‡ | | Contract
Notional
Amount3 | | Market
Value5 | | | Upfront
Premiums
Paid/
(Received) | | | Unrealized
Appreciation/
(Depreciation) | |
Credit Suisse First Boston USA
(CDX IG HVOL 10) | | June 20, 2013 | | 3.5%
Quarterly | | $ 40,890,141 | | $ | (3,826,475 | ) | | $ | (595,310 | ) | | $ | (3,231,165 | ) |
| | | | | | |
Credit Suisse First Boston USA
(iBoxx HY 3) | | December 20, 2009 | | 4%
Quarterly | | 3,006,801 | | | (14,498 | ) | | | (14,945 | ) | | | 447 | |
| | | | | | |
Credit Suisse First Boston USA
(iBoxx HY 3) | | December 20, 2009 | | 4%
Quarterly | | 3,006,801 | | | (14,498 | ) | | | (14,945 | ) | | | 447 | |
| | | | | | |
Credit Suisse First Boston USA
(iBoxx IG Hi-Vol) | | March 20, 2009 | | 1.25%
Quarterly | | 48,333,333 | | | (448,867 | ) | | | 4,911 | | | | (453,778 | ) |
| | | | | | |
Deutsche Bank AG
(ABX.HE-AAA 06-1) | | July 25, 2045 | | 0.18%
Monthly | | 32,649,945 | | | (6,529,989 | ) | | | (2,813,625 | ) | | | (3,716,364 | ) |
| | | | | | |
Deutsche Bank AG
(ABX.HE-AAA 06-1) | | July 25, 2045 | | 0.18%
Monthly | | 16,469,441 | | | (3,293,888 | ) | | | (1,482,443 | ) | | | (1,811,445 | ) |
| | | | | | |
Deutsche Bank AG
(ABX.HE-AAA 06-1) | | July 25, 2045 | | 0.18%
Monthly | | 7,897,627 | | | (1,579,525 | ) | | | (881,350 | ) | | | (698,175 | ) |
| | | | | | |
Deutsche Bank AG
(ABX.HE-AAA 06-2) | | May 25, 2046 | | 0.11%
Monthly | | 15,700,000 | | | (7,850,000 | ) | | | (718,551 | ) | | | (7,131,449 | ) |
| | | | | | |
Deutsche Bank AG
(iBoxx HY 2) | | September 20, 2009 | | 4.8%
Quarterly | | 2,498,118 | | | 34,469 | | | | (3,780 | ) | | | 38,249 | |
| | | | | | |
Deutsche Bank AG
(iBoxx HY B) | | March 20, 2009 | | 5%
Quarterly | | 4,651,100 | | | 884 | | | | 4,926 | | | | (4,042 | ) |
| | | | | | |
Deutsche Bank AG
(iBoxx IG Hi-Vol) | | March 20, 2009 | | 1.25%
Quarterly | | 4,118,000 | | | (38,244 | ) | | | 558 | | | | (38,802 | ) |
| | | | | | |
Deutsche Bank AG
(iBoxx IG Hi-Vol2) | | September 20, 2014 | | 1.3%
Quarterly | | 11,174,667 | | | (991,768 | ) | | | 23,614 | | | | (1,015,382 | ) |
| | | | | | |
JP Morgan Chase & Co.
(ABX HE-AAA 06-1) | | July 25, 2045 | | 0.18%
Monthly | | 23,115,005 | | | (4,623,001 | ) | | | (556,209 | ) | | | (4,066,792 | ) |
| | | | | | |
JP Morgan Chase & Co.
(CDX HY 9) | | December 20, 2012 | | 6.43%
Quarterly | | 18,000,000 | | | (2,106,733 | ) | | | — | | | | (2,106,733 | ) |
| | | | | | |
JP Morgan Chase & Co.
(CDX HY 10) | | June 20, 2013 | | 5%
Quarterly | | 12,200,000 | | | (1,931,627 | ) | | | (1,146,427 | ) | | | (785,200 | ) |
| | | | | | |
JP Morgan Chase & Co.
(CDX IG 10) | | June 20, 2013 | | 1.55%
Quarterly | | 154,208,000 | | | (3,538,287 | ) | | | (697,121 | ) | | | (2,841,166 | ) |
| | | | | | |
JP Morgan Chase & Co.
(CDX IG 10) | | June 20, 2013 | | 1.55%
Quarterly | | 141,910,400 | | | (3,256,120 | ) | | | (1,366,868 | ) | | | (1,889,252 | ) |
| | | | | | |
JP Morgan Chase & Co.
(CDX IG HVOL 8) | | June 20, 2012 | | 0.75%
Quarterly | | 56,800,000 | | | (6,673,012 | ) | | | (649,325 | ) | | | (6,023,687 | ) |
| | | | | | |
JP Morgan Chase & Co.
(CDX IG HVOL 8) | | June 20, 2012 | | 0.75%
Quarterly | | 76,900,000 | | | (9,034,412 | ) | | | (1,014,761 | ) | | | (8,019,651 | ) |
145
Annual Report to Shareholders
Notes to Financial Statements—Continued
| | | | | | | | | | | | | | | | | | |
| Western Asset Core Plus Bond Portfolio—Continued | |
|
| Credit Default Swap on Credit Indices—Sell Protection1—Continued | |
Swap Counterparty
(Reference Entity) | | Termination Date | | Periodic
Payments Received
by the Fund‡ | | Contract
Notional
Amount3 | | Market
Value5 | | | Upfront
Premiums
Paid/
(Received) | | | Unrealized
Appreciation/
(Depreciation) | |
JP Morgan Chase & Co.
(CDX IG HVOL 8) | | June 20, 2012 | | 0.75%
Quarterly | | $ 59,175,000 | | $ | (6,952,033 | ) | | $ | (437,663 | ) | | $ | (6,514,370 | ) |
| | | | | | |
JP Morgan Chase & Co.
(CDX IG HVOL 9) | | December 20, 2012 | | 1.4%
Quarterly | | 62,833,550 | | | (10,021,951 | ) | | | (2,238,902 | ) | | | (7,783,049 | ) |
| | | | | | |
Merrill Lynch & Co., Inc.
(ABX.HE-AAA 06-1) | | July 25, 2045 | | 0.18%
Monthly | | 23,837,349 | | | (4,767,470 | ) | | | (1,625,624 | ) | | | (3,141,846 | ) |
| | | | | | |
Merrill Lynch & Co., Inc.
(ABX.HE-AAA 06-1) | | July 25, 2045 | | 0.18%
Monthly | | 24,078,130 | | | (4,815,626 | ) | | | (1,348,919 | ) | | | (3,466,707 | ) |
| | | | | | |
Merrill Lynch & Co., Inc.
(CDX HY 8) | | June 20, 2012 | | 0.82%
Quarterly | | 42,600,000 | | | (9,005,010 | ) | | | — | | | | (9,005,010 | ) |
| | | | | | |
Merrill Lynch & Co., Inc.
(CDX HY 8) | | June 20, 2012 | | 0.92%
Quarterly | | 31,750,000 | | | (6,614,262 | ) | | | — | | | | (6,614,262 | ) |
| | | | | | |
Merrill Lynch & Co., Inc.
(CDX HY 8) | | June 20, 2012 | | 1.125%
Quarterly | | 18,800,000 | | | (3,798,469 | ) | | | — | | | | (3,798,469 | ) |
| | | | | | |
Merrill Lynch & Co., Inc.
(CDX HY 9) | | December 20, 2012 | | 2%
Quarterly | | 9,340,000 | | | (2,444,732 | ) | | | — | | | | (2,444,732 | ) |
| | | | | | |
Merrill Lynch & Co., Inc.
(CDX HY 9) | | December 20, 2012 | | 2.3%
Quarterly | | 9,220,000 | | | (2,322,970 | ) | | | — | | | | (2,322,970 | ) |
| | | | | | |
Merrill Lynch & Co., Inc.
(CDX HY 9) | | December 20, 2012 | | 6.35%
Quarterly | | 15,000,000 | | | (1,794,809 | ) | | | — | | | | (1,794,809 | ) |
| | | | | | |
Merrill Lynch & Co., Inc.
(CDX HY 9) | | December 20, 2012 | | 6.43%
Quarterly | | 12,000,000 | | | (1,404,488 | ) | | | — | | | | (1,404,488 | ) |
| | | | | | |
Merrill Lynch & Co., Inc.
(CDX HY 9) | | December 20, 2012 | | 6.2%
Quarterly | | 80,000,000 | | | (9,964,296 | ) | | | — | | | | (9,964,296 | ) |
| | | | | | |
Morgan Stanley & Co. Inc.
(ABX. HE-AAA 06-2) | | May 25, 2046 | | 0.11%
Monthly | | 17,200,000 | | | (8,600,000 | ) | | | (870,371 | ) | | | (7,729,629 | ) |
| | | | | | |
RBS Greenwich
(CDX HY 9) | | December 20, 2012 | | 3.75%
Quarterly | | 10,094,000 | | | (1,779,033 | ) | | | (357,497 | ) | | | (1,421,536 | ) |
| | | | | | |
RBS Greenwich
(CDX HY 9) | | December 20, 2012 | | 3.75%
Quarterly | | 20,090,000 | | | (3,540,795 | ) | | | (713,073 | ) | | | (2,827,722 | ) |
| | | | | | |
RBS Greenwich
(CDX HY 9) | | December 20, 2012 | | 3.75%
Quarterly | | 1,568,000 | | | (276,355 | ) | | | (145,306 | ) | | | (131,049 | ) |
| | | | | | |
RBS Greenwich
(CDX HY 9) | | December 20, 2012 | | 3.75%
Quarterly | | 12,740,000 | | | (2,245,382 | ) | | | (1,132,002 | ) | | | (1,113,380 | ) |
| | | | | | |
RBS Greenwich
(CDX IG 8) | | June 20, 2012 | | 0.35%
Quarterly | | 16,494,400 | | | (999,764 | ) | | | (251,699 | ) | | | (748,065 | ) |
| | | | | | |
RBS Greenwich
(CDX IG 8) | | June 20, 2012 | | 0.35%
Quarterly | | 14,152,000 | | | (857,786 | ) | | | (200,398 | ) | | | (657,388 | ) |
146
Annual Report to Shareholders
| | | | | | | | | | | | | | | | | | |
| Western Asset Core Plus Bond Portfolio—Continued | |
|
| Credit Default Swap on Credit Indices—Sell Protection1—Continued | |
Swap Counterparty
(Reference Entity) | | Termination Date | | Periodic
Payments Received
by the Fund‡ | | Contract
Notional
Amount3 | | Market
Value5 | | | Upfront
Premiums
Paid/
(Received) | | | Unrealized
Appreciation/
(Depreciation) | |
RBS Greenwich
(CDX IG HVOL 8) | | June 20, 2012 | | 0.75%
Quarterly | | $250,000,000 | | $ | (29,370,650 | ) | | $ | (1,015,640 | ) | | $ | (28,355,010 | ) |
| | | | | | |
RBS Greenwich
(CDX IG HVOL 8) | | June 20, 2012 | | 0.75%
Quarterly | | 100,000 | | | (11,748 | ) | | | (649 | ) | | | (11,099 | ) |
| | | | | | |
RBS Greenwich
(CDX IG HVOL 8) | | June 20, 2012 | | 0.75%
Quarterly | | 33,300,000 | | | (3,912,171 | ) | | | (275,152 | ) | | | (3,637,019 | ) |
| | | | | | |
RBS Greenwich
(CDX IG HVOL 8) | | June 20, 2012 | | 0.75%
Quarterly | | 28,800,000 | | | (3,383,499 | ) | | | (893,107 | ) | | | (2,490,392 | ) |
| | | | | | |
RBS Greenwich
(CDX IG HVOL 8) | | June 20, 2012 | | 0.75%
Quarterly | | 15,400,000 | | | (1,809,232 | ) | | | (332,908 | ) | | | (1,476,324 | ) |
| | | | | | |
RBS Greenwich
(CDX IG HVOL 8) | | June 20, 2012 | | 0.75%
Quarterly | | 31,800,000 | | | (3,735,947 | ) | | | (661,366 | ) | | | (3,074,581 | ) |
| | | | | | |
RBS Greenwich
(CDX IG HVOL 8) | | June 20, 2012 | | 0.75%
Quarterly | | 31,200,000 | | | (3,665,457 | ) | | | (697,509 | ) | | | (2,967,948 | ) |
| | | | | | |
RBS Greenwich
(CDX IG HVOL 9) | | December 20, 2012 | | 1.4%
Quarterly | | 21,363,407 | | | (3,407,464 | ) | | | (242,055 | ) | | | (3,165,409 | ) |
| | | | | | |
RBS Greenwich
(CDX IG HVOL 9) | | December 20, 2012 | | 1.4%
Quarterly | | 15,176,719 | | | (2,420,687 | ) | | | (334,875 | ) | | | (2,085,812 | ) |
| | | | | | |
RBS Greenwich
(CDX IG HVOL 9) | | December 20, 2012 | | 1.4%
Quarterly | | 4,543,349 | | | (724,664 | ) | | | (135,338 | ) | | | (589,326 | ) |
| | | | | | |
RBS Greenwich
(CDX IG HVOL 9) | | December 20, 2012 | | 1.4%
Quarterly | | 30,063,437 | | | (4,795,118 | ) | | | (1,374,367 | ) | | | (3,420,751 | ) |
| | | | | | |
RBS Greenwich
(LCDX HY 9) | | December 20, 2012 | | 2.25%
Quarterly | | 15,680,000 | | | (3,461,948 | ) | | | (1,046,582 | ) | | | (2,415,366 | ) |
| | | | | | |
The Goldman Sachs
Group, Inc.
(CDX HY 8) | | June 20, 2012 | | 0.9%
Quarterly | | 32,000,000 | | | (6,685,939 | ) | | | — | | | | (6,685,939 | ) |
| | | | | | |
The Goldman Sachs
Group, Inc.
(CDX HY 9) | | October 12, 2012 | | 1.8%
Quarterly | | 35,500,000 | | | (9,524,000 | ) | | | — | | | | (9,524,000 | ) |
| | | | | | |
The Goldman Sachs
Group, Inc.
(CDX HY 9) | | December 20, 2012 | | 2%
Quarterly | | 8,780,000 | | | (2,298,153 | ) | | | — | | | | (2,298,153 | ) |
| | | | | | |
The Goldman Sachs
Group, Inc.
(CDX HY 9) | | December 20, 2012 | | 3.75%
Quarterly | | 18,032,000 | | | (3,178,079 | ) | | | (1,442,993 | ) | | | (1,735,086 | ) |
| | | | | | |
The Goldman Sachs
Group, Inc.
(CDX HY 9) | | December 20, 2012 | | 3.75%
Quarterly | | 11,368,000 | | | (2,003,572 | ) | | | (783,482 | ) | | | (1,220,090 | ) |
147
Annual Report to Shareholders
Notes to Financial Statements—Continued
| | | | | | | | | | | | | | | | | | |
| Western Asset Core Plus Bond Portfolio—Continued | |
|
| Credit Default Swap on Credit Indices—Sell Protection1—Continued | |
Swap Counterparty
(Reference Entity) | | Termination Date | | Periodic
Payments Received
by the Fund‡ | | Contract
Notional
Amount3 | | Market
Value5 | | | Upfront
Premiums
Paid/
(Received) | | | Unrealized
Appreciation/
(Depreciation) | |
The Goldman Sachs Group, Inc.
(CDX HY 9) | | December 20, 2012 | | 3.75%
Quarterly | | $21,560,000 | | $ | (3,799,876 | ) | | $ | (1,659,086 | ) | | $ | (2,140,790 | ) |
| | | | | | |
The Goldman Sachs Group, Inc.
(CDX HY 9) | | December 20, 2012 | | 6.356%
Quarterly | | 75,000,000 | | | (8,959,343 | ) | | | — | | | | (8,959,343 | ) |
| | | | | | |
The Goldman Sachs Group, Inc.
(CDX IG 9) | | December 20, 2017 | | 0.8%
Quarterly | | 63,440,000 | | | (3,238,821 | ) | | | (2,187,258 | ) | | | (1,051,563 | ) |
| | | | | | |
The Goldman Sachs Group, Inc.
(CDX IG HVOL 3) | | March 20, 2010 | | 1.05%
Quarterly | | 21,846,516 | | | (915,784 | ) | | | (23,126 | ) | | | (892,658 | ) |
| | | | | | |
The Goldman Sachs Group, Inc.
(CDX IG HVOL 3) | | March 20, 2010 | | 1.05%
Quarterly | | 42,823,038 | | | (1,795,099 | ) | | | (185,562 | ) | | | (1,609,537 | ) |
| | | | | | |
The Goldman Sachs Group, Inc.
(CDX IG HVOL 8) | | June 20, 2012 | | 0.75%
Quarterly | | 128,000,000 | | | (15,037,773 | ) | | | (319,162 | ) | | | (14,718,611 | ) |
| | | | | | |
The Goldman Sachs Group, Inc.
(CDX IG HVOL 8) | | June 20, 2012 | | 0.75%
Quarterly | | 34,300,000 | | | (4,029,654 | ) | | | (176,020 | ) | | | (3,853,634 | ) |
| | | | | | |
The Goldman Sachs Group, Inc.
(CDX IG HVOL 8) | | June 20, 2012 | | 0.75%
Quarterly | | 25,000,000 | | | (2,937,065 | ) | | | (189,084 | ) | | | (2,747,981 | ) |
| | | | | | |
The Goldman Sachs Group, Inc.
(CDX IG HVOL 8) | | June 20, 2012 | | 0.75%
Quarterly | | 4,400,000 | | | (516,923 | ) | | | (61,217 | ) | | | (455,706 | ) |
| | | | | | |
The Goldman Sachs Group, Inc.
(CDX IG HVOL 8) | | June 20, 2012 | | 0.75%
Quarterly | | 31,100,000 | | | (3,653,709 | ) | | | (997,704 | ) | | | (2,656,005 | ) |
| | | | | | |
The Goldman Sachs Group, Inc.
(CDX IG HVOL 8) | | June 20, 2012 | | 0.75%
Quarterly | | 142,300,000 | | | (16,717,774 | ) | | | (14,294,955 | ) | | | (2,422,819 | ) |
| | | | | | |
The Goldman Sachs Group, Inc.
(CDX IG HVOL 9) | | December 20, 2012 | | 1.4%
Quarterly | | 5,413,352 | | | (863,430 | ) | | | 18,165 | | | | (881,595 | ) |
| | | | | | |
The Goldman Sachs Group, Inc.
(CDX IG HVOL 9) | | December 20, 2012 | | 1.4%
Quarterly | | 11,696,707 | | | (1,865,625 | ) | | | (31,508 | ) | | | (1,834,117 | ) |
148
Annual Report to Shareholders
| | | | | | | | | | | | | | | | | | |
| Western Asset Core Plus Bond Portfolio—Continued | |
|
| Credit Default Swap on Credit Indices—Sell Protection1—Continued | |
Swap Counterparty
(Reference Entity) | | Termination Date | | Periodic
Payments Received
by the Fund‡ | | Contract
Notional
Amount3 | | Market
Value5 | | | Upfront
Premiums
Paid/
(Received) | | | Unrealized
Appreciation/
(Depreciation) | |
The Goldman Sachs Group, Inc.
(CDX IG HVOL 9) | | December 20, 2012 | | 1.4%
Quarterly | | $25,036,753 | | $ | (3,993,362 | ) | | $ | (643,885 | ) | | $ | (3,349,477 | ) |
| | | | | | |
The Goldman Sachs Group, Inc.
(CDX IG HVOL 9) | | December 20, 2012 | | 1.4%
Quarterly | | 48,333,500 | | | (7,709,193 | ) | | | (922,953 | ) | | | (6,786,240 | ) |
| | | | | | |
The Goldman Sachs Group, Inc.
(CDX IG HVOL 9) | | December 20, 2012 | | 1.4%
Quarterly | | 12,180,042 | | | (1,942,716 | ) | | | (362,913 | ) | | | (1,579,803 | ) |
| | | | | | |
The Goldman Sachs Group, Inc.
(CDX IG HVOL 9) | | December 20, 2012 | | 1.4%
Quarterly | | 2,900,010 | | | (462,552 | ) | | | (90,352 | ) | | | (372,200 | ) |
| | | | | | |
The Goldman Sachs Group, Inc.
(CDX IG HVOL 9) | | December 20, 2012 | | 1.4%
Quarterly | | 29,290,101 | | | (4,671,771 | ) | | | (855,663 | ) | | | (3,816,108 | ) |
| | | | | | |
The Goldman Sachs Group, Inc.
(CDX IG HVOL 9) | | December 20, 2012 | | 1.4%
Quarterly | | 12,180,042 | | | (1,942,717 | ) | | | (363,738 | ) | | | (1,578,979 | ) |
| | | | | | |
The Goldman Sachs Group, Inc.
(CDX IG HVOL 9) | | December 20, 2012 | | 1.4%
Quarterly | | 29,290,101 | | | (4,671,772 | ) | | | (874,705 | ) | | | (3,797,067 | ) |
| | | | | | |
The Goldman Sachs Group, Inc.
(CDX IG HVOL 9) | | December 20, 2012 | | 1.4%
Quarterly | | 28,420,098 | | | (4,533,006 | ) | | | (1,290,379 | ) | | | (3,242,627 | ) |
| | | | | | |
The Goldman Sachs Group, Inc.
(CDX IG HVOL 9) | | December 20, 2012 | | 1.4%
Quarterly | | 28,420,098 | | | (4,533,006 | ) | | | (1,128,898 | ) | | | (3,404,108 | ) |
| | | | | | |
The Goldman Sachs Group, Inc.
(CDX IG HVOL 9) | | December 20, 2012 | | 1.4%
Quarterly | | 110,490,381 | | | (17,623,216 | ) | | | (12,100,655 | ) | | | (5,522,561 | ) |
| | | | | | |
The Goldman Sachs Group, Inc.
(CDX IG HVOL 10) | | June 20, 2013 | | 3.5%
Quarterly | | 242,730,837 | | | (22,714,606 | ) | | | 3,827,489 | | | | (26,542,095 | ) |
| | | | | | |
The Goldman Sachs Group, Inc.
(CDX IG HVOL 10) | | June 20, 2013 | | 3.5%
Quarterly | | 32,673,446 | | | (3,057,561 | ) | | | 1,124,870 | | | | (4,182,431 | ) |
| | | | | | |
The Goldman Sachs Group, Inc.
(CDX IG HVOL 10) | | June 20, 2013 | | 3.5%
Quarterly | | 32,770,113 | | | (3,066,608 | ) | | | 556,097 | | | | (3,622,705 | ) |
149
Annual Report to Shareholders
Notes to Financial Statements—Continued
| | | | | | | | | | | | | | | | | | |
| Western Asset Core Plus Bond Portfolio—Continued | |
|
| Credit Default Swap on Credit Indices—Sell Protection1—Continued | |
Swap Counterparty
(Reference Entity) | | Termination Date | | Periodic
Payments Received
by the Fund‡ | | Contract
Notional
Amount3 | | Market
Value5 | | | Upfront
Premiums
Paid/
(Received) | | | Unrealized
Appreciation/
(Depreciation) | |
The Goldman Sachs Group, Inc.
(Dow Jones CDX HY B.3) | | December 20, 2009 | | 4%
Quarterly | | $9,640,854 | | $ | (46,487 | ) | | $ | 147,966 | | | $ | (194,453 | ) |
| | | | | | |
The Goldman Sachs Group, Inc.
(iBoxx HY 3) | | December 20, 2009 | | 4%
Quarterly | | 2,844,529 | | | (13,716 | ) | | | (6,175 | ) | | | (7,541 | ) |
| | | | | | |
The Goldman Sachs Group, Inc.
(iBoxx HY 3) | | December 20, 2009 | | 4%
Quarterly | | 954,540 | | | (4,602 | ) | | | (224 | ) | | | (4,378 | ) |
| | | | | | |
The Goldman Sachs Group, Inc.
(iBoxx HY 4) | | June 20, 2010 | | 3.4%
Quarterly | | 2,145,000 | | | (35,375 | ) | | | (13,879 | ) | | | (21,496 | ) |
| | | | | | |
The Goldman Sachs Group, Inc.
(iBoxx HY 6B) | | June 20, 2011 | | 3%
Quarterly | | 11,400,000 | | | (1,201,745 | ) | | | 51,300 | | | | (1,253,045 | ) |
| | | | | | |
The Goldman Sachs Group, Inc.
(iBoxx HY 6B) | | June 20, 2011 | | 3%
Quarterly | | 15,000,000 | | | (1,581,243 | ) | | | 82,200 | | | | (1,663,443 | ) |
| | | | | | |
The Goldman Sachs Group, Inc.
(LCDX 9) | | December 20, 2012 | | 2.25%
Quarterly | | 16,660,000 | | | (3,678,319 | ) | | | 64,324 | | | | (3,742,643 | ) |
| | | | | | |
UBS Warburg LLC
(ABX.HE-AAA 06-2) | | May 25, 2046 | | 0.11%
Monthly | | 54,800,000 | | | (27,400,000 | ) | | | (13,941,766 | ) | | | (13,458,234 | ) |
| | | | | | | | | | | | | | | | | | |
Net unrealized depreciation on sales of credit default swaps on credit indices | | | $ | (506,664,740 | ) |
| | | | | | | | | | | | | | | | | | |
| | | | | | | | | | | | | | | | | |
| Credit Default Swap on Credit Indices—Buy Protection4 | | | |
Swap Counterparty
(Reference Entity) | | Termination Date | | Periodic
Payments Made by
the Fund‡ | | Contract
Notional
Amount3 | | Market
Value5 | | | Upfront
Premiums
Paid/
(Received) | | Unrealized
Appreciation/
(Depreciation) | |
Barclays Capital Inc.
(CDX IG 10 6/13) | | June 20, 2013 | | 1.55%
Quarterly | | $19,617,600 | | $ | 450,123 | | | $ | 357,876 | | $ | 92,247 | |
| | | | | | |
Barclays Capital Inc.
(CDX IG 10) | | June 20, 2013 | | 1.55%
Quarterly | | 22,838,400 | | | 524,025 | | | | 71,254 | | | 452,771 | |
| | | | | | |
Barclays Capital Inc.
(CDX IG 10) | | June 20, 2013 | | 1.55%
Quarterly | | 81,105,600 | | | 1,860,960 | | | | 492,025 | | | 1,368,935 | |
| | | | | | |
Barclays Capital Inc.
(CDX IG 11) | | December 20, 2013 | | 1.5%
Quarterly | | 6,240,000 | | | 124,624 | | | | 188,822 | | | (64,198 | ) |
| | | | | | |
Bear Stearns, Inc.
(CDX HY 6B) | | June 20, 2011 | | 3%
Quarterly | | 11,600,000 | | | (1,222,828 | ) | | | 22,346 | | | (1,245,174 | ) |
150
Annual Report to Shareholders
| | | | | | | | | | | | | | | | | | |
| Western Asset Core Plus Bond Portfolio—Continued | | | | |
| |
| Credit Default Swap on Credit Indices—Buy Protection4—Continued | | | | |
Swap Counterparty
(Reference Entity) | | Termination Date | | Periodic
Payments Made
by the Fund‡ | | Contract
Notional
Amount3 | | Market
Value5 | | | Upfront
Premiums
Paid/
(Received) | | | Unrealized
Appreciation/
(Depreciation) | |
Credit Suisse First Boston USA
(CDX IG HVOL 10) | | June 20, 2013 | | 3.5%
Quarterly | | $11,213,372 | | $ | 1,049,341 | | | $ | (653,311 | ) | | $ | 1,702,652 | |
| | | | | | |
Deutsche Bank AG
(iBoxx IG TMT) | | March 20, 2009 | | 0.6%
Quarterly | | 6,450,000 | | | 8,572 | | | | 5,031 | | | | 3,541 | |
| | | | | | |
Deutsche Bank AG
(iBoxx IG TMT) | | March 20, 2009 | | 0.6%
Quarterly | | 9,500,000 | | | 12,626 | | | | 7,409 | | | | 5,217 | |
| | | | | | |
JP Morgan Chase & Co.
(CDX IG 10 6/13) | | June 20, 2013 | | 1.55%
Quarterly | | 39,820,800 | | | 913,685 | | | | 1,042,700 | | | | (129,015 | ) |
| | | | | | |
JP Morgan Chase & Co.
(CDX IG 10 6/13) | | June 20, 2013 | | 1.55%
Quarterly | | 9,857,600 | | | 226,182 | | | | 134,525 | | | | 91,657 | |
| | | | | | |
JP Morgan Chase & Co.
(CDX IG HVOL 10) | | June 20, 2013 | | 3.5%
Quarterly | | 28,710,099 | | | 2,686,674 | | | | (1,285,282 | ) | | | 3,971,956 | |
| | | | | | |
JP Morgan Chase & Co.
(CDX IG HVOL 10) | | June 20, 2013 | | 3.5%
Quarterly | | 26,100,090 | | | 2,442,431 | | | | (1,486,994 | ) | | | 3,929,425 | |
| | | | | | |
RBS Greenwich
(CDX HY 10) | | June 20, 2013 | | 5%
Quarterly | | 12,200,000 | | | 1,931,627 | | | | 2,182,897 | | | | (251,270 | ) |
| | | | | | |
The Goldman Sachs Group, Inc.
(CDX IG 10 6/13) | | June 20, 2013 | | 1.55%
Quarterly | | 39,040,000 | | | 895,769 | | | | 1,036,896 | | | | (141,127 | ) |
| | | | | | |
The Goldman Sachs Group, Inc.
(CDX IG HVOL 10) | | June 20, 2013 | | 3.5%
Quarterly | | 40,310,139 | | | 3,772,199 | | | | 434,112 | | | | 3,338,087 | |
| | | | | | |
The Goldman Sachs Group, Inc.
(iBoxx HY 3) | | December 20, 2009 | | 4%
Quarterly | | 5,784,512 | | | (27,892 | ) | | | 7,757 | | | | (35,649 | ) |
| | | | | | | | | | | | | | | | | | |
Net unrealized appreciation on buys of credit default swaps on credit indices | | | $ | 13,090,055 | |
| | | | | | | | | | | | | | | | | | |
1 | | If the Fund is a seller of protection and a credit event occurs, as defined under the terms of that particular swap agreement, the Fund will either (i) pay to the buyer of protection an amount equal to the notional amount of the swap and take delivery of the referenced obligation or underlying securities comprising the referenced index or (ii) pay a net settlement amount in the form of cash or securities equal to the notional amount of the swap less the recovery value of the referenced obligation or underlying securities comprising the referenced index. |
2 | | Implied credit spreads, utilized in determining the market value of credit default swap agreements on corporate issues or sovereign issues of an emerging country as of period end serve as an indicator of the current status of the payment/performance risk and represent the likelihood or risk of default for the credit derivative. The implied credit spread of a particular referenced entity reflects the cost of buying/selling protection and may include upfront payments required to be made to enter into the agreement. Wider credit spreads represent a deterioration of the referenced entity’s credit soundness and a greater likelihood or risk of default or other credit event occurring as defined under the terms of the agreement. A credit spread identified as “Defaulted” indicates a credit event has occurred for the referenced entity or obligation. |
3 | | The maximum potential amount the Fund could be required to make as a seller of credit protection or receive as a buyer of credit protection if a credit event occurs as defined under the terms of that particular swap agreement. |
4 | | If the Fund is a buyer of protection and a credit event occurs, as defined under the terms of that particular swap agreement, the Fund will either (i) receive from the seller of protection an amount equal to the notional amount of the swap and deliver the underlying securities comprising the referenced index or (ii) receive a net settlement amount in the form of cash or securities equal to the notional amount of the swap less the recovery value of the underlying securities comprising the referenced index. |
5 | | The quoted market prices and resulting values for credit default swap agreements on asset-backed securities and credit indices serve as an indicator of the current status of the payment/performance risk and represent the likelihood of an expected liability (or profit) for the credit derivative should the notional amount of the swap agreement been closed/sold as of the period end. Decreasing market values when compared to the notional amount of the swap, represent a deterioration of the referenced entity’s credit soundness and a greater likelihood or risk of default or other credit event occurring as defined under the terms of the agreement. |
| ‡ | | Percentage shown is an annual percentage rate. |
151
Annual Report to Shareholders
Notes to Financial Statements—Continued
4. Securities Lending
Each Fund may lend its securities to approved brokers to earn additional income, and will receive cash and U.S. government securities as collateral against the loans. Cash collateral received is invested in a money market pooled account by the Fund’s lending agent. Collateral is maintained over the life of the loan in an amount not less than 100% of the value of the loaned securities. At December 31, 2008, the Funds had no securities on loan.
5. Transactions With Affiliates:
Each Fund has an investment management agreement with Legg Mason Fund Adviser, Inc. (“LMFA”). Western Asset Management Company (“Western Asset”) is the investment adviser to Core and Core Plus. Western Asset Management Company Limited (“WAML”) Western Asset Management Company Pte. Ltd. (“Western Singapore”) and Western Asset Management Company Ltd (“Western Japan”) shares investment advisory responsibilities with Western Asset for Core Plus.
Pursuant to their respective agreements, LMFA provides the Funds with management and administrative services for which each Fund pays a fee, computed daily and payable monthly, at annual rates of each Fund’s average daily net assets. In order to limit the annualized operating expense ratios of the classes offered by each Fund to specified amounts, from August 1, 2007 until July 31, 2008, LMFA was contractually obligated with respect to each Fund to waive its compensation (and, to the extent necessary, bear other expenses of each Fund) when the annualized operating expense ratio of a class of the Fund, as a percentage of average daily net assets of such Fund attributable to such class, exceeded a specified amount (“Fee Cap”). From August 1, 2008 until July 31, 2009, the Manager is contractually obligated to follow the Fee Cap for the Institutional Select and Financial Intermediary Classes of each Fund. The Fee Cap ceased to apply to the Institutional Class of each Fund beginning August 1, 2008. From August 1, 2008 through July 31, 2009, the Manager is contractually obligated to waive its compensation (and, to the extent necessary, bear other expenses of the Portfolio) with respect to the Institutional Class of each Fund in an amount equal to a specified annual rate of such Fund’s average daily net assets attributable to such share class (“Flat Waiver”). Western Asset and WAML also agreed to waive their advisory fees (which are paid by LMFA, and not the Funds) in corresponding amounts under both the Fee Cap and the Flat Waiver.
Any amounts waived or reimbursed in a particular fiscal year under the Fee Cap will be subject to repayment by a Fund on behalf of the applicable class to LMFA to the extent that from time to time during the next three fiscal years the repayment will not cause a Fund’s expenses for such class to exceed a limit agreed between the Fund and LMFA. The following chart shows annual rates of management fees, expense limits or waivers (as applicable), management fees waived and potential fees which may be recaptured for the Funds’ share classes.
| | | | | | | | | | | | | | | |
Fund | | Net Asset
Breakpoint for
Management
Fee | | Management
Fee | | | Expense
Limitation | | | Waiver | | | Management
Fees (Waived)/
Recaptured | | Maximum
Amount
Subject to
Recapture |
| | | | | | |
Core | | | | | | | | | | | | | | | |
Institutional Class | | Up to $500 million Next $500 million In excess of $1 billion | | 0.450
0.425 0.400 | %
% % | | — | * | | 0.00 | % | | — | | — |
Institutional Select Class | | Up to $500 million Next $500 million In excess of $1 billion | | 0.450
0.425 0.400 | %
% % | | 0.50 | % | | — | | | — | | — |
Financial Intermediary Class | | Up to $500 million Next $500 million In excess of $1 billion | | 0.450
0.425 0.400 | %
% % | | 0.75 | % | | — | | | — | | — |
152
Annual Report to Shareholders
| | | | | | | | | | | | | | | |
Fund | | Net Asset
Breakpoint for
Management
Fee | | Management
Fee | | | Expense
Limitation | | | Waiver | | | Management
Fees (Waived)/
Recaptured | | Maximum
Amount
Subject to
Recapture |
| | | | | | |
Core Plus | | | | | | | | | | | | | | | |
Institutional Class | | Up to $500 million Next $500 million In excess of $1 billion | | 0.450
0.425 0.400 | %
% % | | — | * | | 0.00 | % | | — | | — |
Institutional Select Class | | Up to $500 million Next $500 million In excess of $1 billion | | 0.450
0.425 0.400 | %
% % | | 0.45 | % | | — | | | — | | — |
Financial Intermediary Class | | Up to $500 million Next $500 million In excess of $1 billion | | 0.450
0.425 0.400 | %
% % | | 0.70 | % | | — | | | — | | — |
| * | | From August 1, 2007 until July 31, 2008, the following limits on annualized expense ratios were in place under the Fee Cap: |
| | |
Fund | | Expense Limitation |
Core—Institutional Class | | 0.50% |
Core Plus—Institutional Class | | 0.45% |
Legg Mason Investor Services, LLC (“LMIS”) serves as distributor of the Funds’ shares. LMIS receives from each Fund an annual distribution fee of 0.25% of the average daily net assets of the Financial Intermediary Class of each Fund, computed daily and payable monthly.
LMFA, Western Asset, WAML, Western Singapore, Western Japan and LMIS are wholly owned subsidiaries of Legg Mason, Inc.
153
Annual Report to Shareholders
Notes to Financial Statements—Continued
6. Fund Share Transactions:
At December 31, 2008, there were 21.05 billion shares of common stock of the Corporation authorized at $.001 par value. Transactions in the Funds’ shares were as follows:
| | | | | | | | | | | | | | | | | | | | | |
| | | Period Ended
December 31, 2008 A | | | Year Ended
March 31, 2008 | | | Year Ended
March 31, 2007 | |
| | | Shares | | | Amount | | | Shares | | | Amount | | | Shares | | | Amount | |
Core | | | | | | | | | | | | | | | | | | | | | |
Institutional Class | | | | | | | | | | | | | | | | | | | | | |
Shares sold | | 45,809,011 | | | $ | 462,764,704 | | | 145,194,635 | | | $ | 1,603,386,410 | | | 109,207,551 | | | $ | 1,227,540,235 | |
Shares issued on reinvestment | | 19,465,391 | | | | 189,411,274 | | | 24,570,553 | | | | 270,401,252 | | | 18,453,337 | | | | 206,865,857 | |
Shares repurchased | | (271,357,244 | ) | | | (2,560,566,907 | ) | | (119,670,207 | ) | | | (1,306,567,803 | ) | | (73,985,323 | ) | | | (822,762,916 | ) |
| | | | | | | | | | | | | | | | | | | | | |
Net Increase (Decrease) | | (206,082,842 | ) | | $ | (1,908,390,929 | ) | | 50,094,981 | | | $ | 567,219,859 | | | 53,675,565 | | | $ | 611,643,176 | |
| | | | | | | | | | | | | | | | | | | | | |
Institutional Select ClassB | | | | | | | | | | | | | | | | | | | | | |
Shares sold | | 26,523,024 | | | $ | 231,066,783 | | | — | | | $ | — | | | — | | | $ | — | |
Shares issued on reinvestment | | 506,958 | | | | 4,593,497 | | | — | | | | — | | | — | | | | — | |
Shares repurchased | | (546,226 | ) | | | (4,786,801 | ) | | — | | | | — | | | — | | | | — | |
| | | | | | | | | | | | | | | | | | | | | |
Net Increase | | 26,483,756 | | | $ | 230,873,479 | | | — | | | $ | — | | | — | | | $ | — | |
| | | | | | | | | | | | | | | | | | | | | |
Financial Intermediary Class | | | | | | | | | | | | | | | | | | | | | |
Shares sold | | 32,207,905 | | | $ | 319,217,126 | | | 61,374,893 | | | $ | 675,386,074 | | | 104,516,429 | | | $ | 1,162,120,339 | |
Shares issued on reinvestment | | 7,514,997 | | | | 72,497,732 | | | 7,607,185 | | | | 83,678,848 | | | 4,041,530 | | | | 45,485,796 | |
Shares repurchased | | (65,446,508 | ) | | | (633,361,948 | ) | | (37,942,574 | ) | | | (415,583,975 | ) | | (17,801,379 | ) | | | (199,443,677 | ) |
| | | | | | | | | | | | | | | | | | | | | |
Net Increase (Decrease) | | (25,723,606 | ) | | $ | (241,647,090 | ) | | 31,039,504 | | | $ | 343,480,947 | | | 90,756,580 | | | $ | 1,008,162,458 | |
| | | | | | | | | | | | | | | | | | | | | |
Core Plus | | | | | | | | | | | | | | | | | | | | | |
Institutional Class | | | | | | | | | | | | | | | | | | | | | |
Shares sold | | 147,333,326 | | | $ | 1,395,839,016 | | | 431,074,565 | | | $ | 4,418,392,877 | | | 517,391,677 | | | $ | 5,399,183,851 | |
Shares issued on reinvestment | | 46,231,902 | | | | 426,186,161 | | | 60,102,475 | | | | 614,857,736 | | | 35,684,891 | | | | 372,524,266 | |
Shares repurchased | | (741,151,845 | ) | | | (6,662,401,360 | ) | | (269,816,777 | ) | | | (2,748,602,623 | ) | | (137,124,692 | ) | | | (1,423,367,606 | ) |
| | | | | | | | | | | | | | | | | | | | | |
Net Increase (Decrease) | | (547,586,617 | ) | | $ | (4,840,376,183 | ) | | 221,360,263 | | | $ | 2,284,647,990 | | | 415,951,876 | | | $ | 4,348,340,511 | |
| | | | | | | | | | | | | | | | | | | | | |
Institutional Select ClassC | | | | | | | | | | | | | | | | | | | | | |
Shares sold | | 206,086,935 | | | $ | 1,850,661,361 | | | — | | | $ | — | | | — | | | $ | — | |
Shares issued on reinvestment | | 3,637,450 | | | | 31,448,482 | | | — | | | | — | | | — | | | | — | |
Shares repurchased | | (29,527,138 | ) | | | (256,518,602 | ) | | — | | | | — | | | — | | | | — | |
| | | | | | | | | | | | | | | | | | | | | |
Net Increase | | 180,197,247 | | | $ | 1,625,591,241 | | | — | | | $ | — | | | — | | | $ | — | |
| | | | | | | | | | | | | | | | | | | | | |
Financial Intermediary Class | | | | | | | | | | | | | | | | | | | | | |
Shares sold | | 57,558,798 | | | $ | 523,353,929 | | | 92,870,337 | | | $ | 950,307,000 | | | 35,661,598 | | | $ | 372,492,531 | |
Shares issued on reinvestment | | 5,007,719 | | | | 46,006,164 | | | 5,521,041 | | | | 56,470,452 | | | 2,729,449 | | | | 28,500,650 | |
Shares repurchased | | (88,631,269 | ) | | | (811,527,610 | ) | | (48,005,422 | ) | | | (489,249,437 | ) | | (14,763,754 | ) | | | (152,693,443 | ) |
| | | | | | | | | | | | | | | | | | | | | |
Net Increase (Decrease) | | (26,064,752 | ) | | $ | (242,167,517 | ) | | 50,385,956 | | | $ | 517,528,015 | | | 23,627,293 | | | $ | 248,299,738 | |
| | | | | | | | | | | | | | | | | | | | | |
A | | For the period April 1, 2008 to December 31, 2008. |
B | | Institutional Select Class commenced operations August 29, 2008. |
C | | Institutional Select Class commenced operations August 4, 2008. |
7. Recent Accounting Pronouncements
In March 2008, the Financial Accounting Standards Board issued Statement of Financial Accounting Standards No. 161, “Disclosures about Derivative Instruments and Hedging Activities” (“FAS 161”). FAS 161 is effective for fiscal years and interim periods beginning after November 15, 2008. FAS 161 requires enhanced disclosures about a fund’s derivative and hedging activities, including how such activities are accounted for and their effect on a fund’s financial position, performance and cash flows. Management is currently evaluating the impact the adoption of FAS 161 will have on the Funds’ financial statements and related disclosures.
154
Annual Report to Shareholders
Report of Independent Registered Public Accounting Firm
To the Board of Directors of Western Asset Funds, Inc. and to the Shareholders of Western Asset Core Bond Portfolio and Western Asset Core Plus Bond Portfolio:
In our opinion, the accompanying statements of assets and liabilities, including the schedules of investments, and the related statements of operations and of changes in net assets and the financial highlights present fairly, in all material respects, the financial position of Western Asset Core Bond Portfolio and Western Asset Core Plus Bond Portfolio (two of the Portfolios comprising Western Asset Funds, Inc., the “Funds”) at December 31, 2008, the results of their operations, the changes in their net assets, and the financial highlights for each of the periods presented, in conformity with accounting principles generally accepted in the United States of America. These financial statements and financial highlights (hereafter referred to as “financial statements”) are the responsibility of the Funds’ management; our responsibility is to express an opinion on these financial statements based on our audits. We conducted our audits of these financial statements in accordance with the standards of the Public Company Accounting Oversight Board (United States). Those standards require that we plan and perform the audit to obtain reasonable assurance about whether the financial statements are free of material misstatement. An audit includes examining, on a test basis, evidence supporting the amounts and disclosures in the financial statements, assessing the accounting principles used and significant estimates made by management, and evaluating the overall financial statement presentation. We believe that our audits, which included confirmation of securities at December 31, 2008 by correspondence with the custodian and brokers, provide a reasonable basis for our opinion.
PricewaterhouseCoopers LLP
Baltimore, Maryland
February 27, 2009
155
Annual Report to Shareholders
Important Tax Information (Unaudited)
The following information is provided with respect to the distributions paid during the taxable year ended December 31, 2008:
| | | | |
| | | Core |
| Record Date: | | Daily | | Daily |
| Payable Date: | | April 2008 | | May 2008-
December 2008 |
Ordinary Income: | | | | |
Qualified Dividend Income for Individuals | | 0.83% | | 0.08% |
Dividends Qualifying for the Dividends Received Deduction for Corporations | | 0.08% | | 0.08% |
Interest from Federal Obligations | | 1.31% | | 4.08% |
| | | Core Plus |
| Record Date: | | Daily | | Daily |
| Payable Date: | | April 2008 | | May 2008-
December 2008 |
Ordinary Income: | | | | |
Qualified Dividend Income for Individuals | | 0.87% | | 0.84% |
Dividends Qualifying for the Dividends Received Deduction for Corporations | | 0.84% | | 0.84% |
Interest from Federal Obligations | | 19.66% | | 4.90% |
The law varies in each state as to whether and what percentage of dividend income attributable to Federal obligations is exempt from state income tax. We recommend that you consult with your tax adviser to determine if any portion of the dividends you received is exempt from state income taxes.
Please retain this information for your records.
156
Annual Report to Shareholders
Directors and Officers
The Directors and officers of the Funds, their age (as of December 31, 2008) and a description of their principal occupations during the past five years are listed below. Except as shown, each Director’s and officer’s principal occupation and business experience for the last five years has been with the employer(s) indicated, although in some cases the Director or officer may have held different positions with such employer(s). Unless otherwise indicated, the business address of the persons listed below is c/o Western Asset Management Company, 385 East Colorado Blvd., Pasadena, California 91101.
| | | | | | | | | | |
| Name and Year Born | | Position(s)
Held With
Corporation | | Term of Office
and Length of
Time ServedA | | Principal Occupations
During the Past 5 Years | | Number of
Portfolios
In Fund
Complex
OverseenB | | Other
Directorships Held |
| Independent Directors | | | | | | | | | | |
Ronald J. Arnault
65 | | Director | | Served
since 1997 | | Retired. | | 13 | | None |
Anita L. DeFrantz 56 | | Director | | Served
since 1998 | | President (1987-present) and Director (1990-present) of LA84 (formerly Amateur Athletic Foundation of Los Angeles); President and Director of Kids in Sports (1994-present); Vice President, International Rowing Federation (1986-present) Member of the International Olympic Committee (1986-present). | | 13 | | OBN Holdings, Inc. |
Avedick B. Poladian 57 | | Director | | Served
since 2007 | | Executive Vice President and Chief Operating Officer of Lowe Enterprises, Inc. (real estate and hospitality firm) (2002-present); Formerly: Partner, Arthur Andersen, LLP. | | 13 | | Occidental Petroleum Corporation |
William E. B. Siart 62 | | Director and Chairman | | Served
since 1997 | | Vice Chairman of The Getty Trust (2005-present); Chairman of Walt Disney Concert Hall, Inc. (1998-2006); Chairman of Excellent Education Development (2000-present). | | 13 | | None |
Jaynie Miller Studenmund 54 | | Director | | Served
since 2004 | | Chief Operating Officer of Overture Services, Inc. (online marketing firm) (2001-2004); President and Chief Operating Officer of Paymybills.com (2000-2001). | | 13 | | eHarmony.com, Inc. Forest Lawn Orbitz Worldwide |
| Interested Directors | | | | | | | | | | |
R. Jay Gerken 57 | | Director and President | | Served as a Director since 2006 and as President since 2007C | | Managing Director of Legg Mason & Co., LLC, Chairman, President and Chief Executive Officer of certain mutual funds associated with Legg Mason & Co., LLC or its affiliates (2005-present); President of Legg Mason Partners Fund Advisor, LLC (“LMPFA”) (2006-present); Chairman of Smith Barney Fund Management LLC and Citi Fund Management Inc. (2002-2005); Chairman, President and Chief Executive Officer of Travelers Investment Adviser, Inc. (2002-2005). | | 159 | | Trustee or Director of certain funds associated with Legg Mason & Co., LLC or its affiliates (consisting of funds with 159 portfolios). |
157
Annual Report to Shareholders
Directors and Officers—Continued
| | | | | | | | | | |
Name and
Year Born | | Position(s)
Held With
Corporation | | Term of Office
and Length of
Time ServedA | | Principal Occupations
During the Past 5 Years | | Number of
Portfolios
In Fund
Complex
OverseenB | | Other
Directorships Held |
Ronald L. Olson 67 | | Director | | Served
since 2005D | | Senior Partner of Munger, Tolles & Olson LLP (a law partnership) (1968-present). | | 13 | | Edison International, City National Corporation (financial services company), The Washington Post Company, and Berkshire Hathaway, Inc. |
| OfficersE | | | | | | | | | | |
D. Daniel Fleet 51 | | Vice President | | Served
since 2006 | | President of Western Asset (2006-present); Vice President of Western Asset Income Fund and Western Asset Premier Bond Fund (2006-present); Director, Western Asset Management Company Limited (2006-present); Director of Risk Management of Western Asset (1999-2006). | | N/A | | N/A |
Gavin L. James 48 | | Vice President | | Served
since 2001 | | Director of Global Client Services and Marketing of Western Asset (1998-present). | | N/A | | N/A |
S. Kenneth Leech 54 | | Vice President | | Served
since 1990 | | Chief Investment Officer, Emeritus of Western Asset (2008-present); Chief Investment Officer of Western Asset (1998-2008); Vice President of Western Asset Income Fund (1998-present) and Western Asset Premier Bond Fund (2001-present). | | N/A | | N/A |
Stephen A. Walsh 50 | | Vice President | | Served
since 1994 | | Chief Investment Officer Western Asset (2008-present) Deputy Chief Investment Officer of Western Asset (2000-2008); Vice President of Western Asset Income Fund (1999-present) and Western Asset Premier Bond Fund (2001-present). | | N/A | | N/A |
Susanne D. Wilson 47 100 Light Street
Baltimore, MD 21202 | | Vice President | | Served
since 1998 | | Vice President of Legg Mason & Co., LLC (2005-present); Vice President of Legg Mason Wood Walker, Incorporated (1998-2005). | | N/A | | N/A |
Marie K. Karpinski 59 100 Light Street
Baltimore, MD 21202 | | Principal Financial and Accounting Officer | | Served
since 1990 | | Vice President, Legg Mason & Co., LLC (2005-present); Legg Mason Wood Walker, Incorporated (1992-2005); Vice President (1986-present), Chief Financial Officer (2006-present) and Treasurer (1986-2006) of all Legg Mason retail, open-end investment companies; Treasurer and Principal Financial and Accounting Officer, Western Asset/Claymore Inflation-Linked Securities & Income Fund (2003-present) and Western Asset/Claymore Inflation-Linked Opportunities & Income Fund (2004-present); Principal Financial and Accounting Officer of Western Asset Income Fund (2001-present) and Western Asset Premier Bond Fund (2001-present); Treasurer of the Corporation (1990-2006), Western Asset Income Fund (2001-2006) and Western Asset Premier Bond Fund (2001-2006). | | N/A | | N/A |
158
Annual Report to Shareholders
| | | | | | | | | | |
| Name and Year Born | | Position(s)
Held With
Corporation | | Term of Office
and Length of
Time ServedA | | Principal Occupations
During the Past 5 Years | | Number of
Portfolios
In Fund
Complex
OverseenB | | Other
Directorships Held |
Erin K. Morris 42 100 Light Street
Baltimore, MD 21202 | | Treasurer | | Served
since 2006 | | Vice President and Manager, Global Funds Administration, Legg Mason & Co., LLC (2005-present); Assistant Vice President of Legg Mason Wood Walker, Incorporated (2002-2005); Treasurer of Legg Mason Income Trust, Inc., Legg Mason Tax-Free Income Fund, Western Asset Income Fund and Western Asset Premier Bond Fund (2006-present); Assistant Treasurer, Legg Mason Partners Fund fixed income complex (2007-present), Western Asset/Claymore Inflation-Linked Securities & Income Fund (2003-present), Western Asset/Claymore Inflation-Linked Opportunities & Income Fund (2004-present); Assistant Treasurer, the Corporation, Western Asset Income Fund, Western Asset Premier Bond Fund, Legg Mason Income Trust, Inc. and Legg Mason Tax-Free Income Fund (2001-2006); Manager, Funds Accounting, Legg Mason Wood Walker, Incorporated (2000-2005). | | N/A | | N/A |
Susan C. Curry 42 55 Water St. New York, NY 10041 | | Assistant Treasurer | | Served
since 2007 | | Director of Tax – Mutual Funds, Legg Mason & Co., LLC (2005-present); Director of Tax – Mutual Funds, Citigroup (2004-2005); Assistant Treasurer, Western Asset Income Fund, Western Asset Premier Bond Fund, Western Asset Premier Bond Fund, Western Asset/Claymore Inflation-Linked Securities & Income Fund and Western Asset/Claymore Inflation-Linked Opportunities & Income Fund (2007-present); Partner, Deloitte & Touche (1990-2004). | | N/A | | N/A |
Todd F. Kuehl 39 100 Light Street
Baltimore, MD 21202 | | Chief Compliance Officer | | Served
since 2007 | | Director, Legg Mason & Co., LLC (2006-present); Chief Compliance Officer of Legg Mason Private Portfolio Group (2009-present) Chief Compliance Officer of Western Asset/Claymore Inflation-Linked Securities & Income Fund, Western Asset/Claymore Inflation-Linked Opportunities & Income Fund, Western Asset Income Fund, Western Asset Premier Bond Fund (2007-present) and Barrett Growth Fund and Barrett Opportunity Fund (2006-2008); Branch Chief, Division of Investment Management, U.S. Securities and Exchange Commission (2002-2006). | | N/A | | N/A |
159
Annual Report to Shareholders
Directors and Officers—Continued
| | | | | | | | | | |
| Name and Year Born | | Position(s)
Held With
Corporation | | Term of Office
and Length of
Time ServedA | | Principal Occupations
During the Past 5 Years | | Number of
Portfolios
In Fund
Complex
OverseenB | | Other
Directorships Held |
Richard M. Wachterman 61 100 Light Street
Baltimore, MD 21202 | | Secretary | | Served
since 2008 | | Associate General Counsel, Legg Mason & Co. (2004-present); Managing Director, Victory Capital Management (1981-2003); Secretary, Legg Mason Funds (2004-present); Secretary, Western Funds (2008-present); Vice President, Legg Mason Fund Adviser, Inc. (2007-present). | | N/A | | N/A |
Peter J. Ciliberti 34 100 Light Street
Baltimore, MD 21202 | | Assistant Secretary | | Served
since 2008 | | Associate General Counsel, Legg Mason & Co. (2007-present); Assistant Secretary, Legg Mason Funds (2006-present); Asset Management Compliance Officer, Legg Mason & Co. (2005-2007); Asset Management Compliance Officer, Legg Mason Wood Walker, Inc. (2005); and Broker-Dealer Compliance Officer, Legg Mason Wood Walker, Inc. (2001-2005). | | N/A | | N/A |
A | | Each officer holds office until his or her respective successor is chosen and qualified, or in each case until he or she sooner dies, resigns, is removed with or without cause or becomes disqualified. Each of the Directors of the Corporation holds office until his or her successor shall have been duly elected and shall qualify, subject to prior death, resignation, retirement, disqualification or removal from office and applicable law and the rules of the New York Stock Exchange. |
B | | In addition to overseeing the thirteen portfolios of the Corporation, each Director also serves as a Director of Western Asset Income Fund and a Trustee of Western Asset Premier Bond Fund (closed-end investment companies), which are considered part of the same Fund Complex as the Corporation. In addition, Mr. Gerken serves as Director/Trustee to 159 other portfolios associated with Legg Mason & Co., LLC or its affiliates. Legg Mason & Co., LLC is an affiliate of LMFA and Western Asset. |
C | | Mr. Gerken is an “interested person” (as defined in section 2(a)(19) of the Investment Company Act of 1940, as amended (the “1940 Act”)) of the Corporation because of his positions with subsidiaries of, and ownership of shares of common stock of, Legg Mason, Inc., the parent company of Western Asset. |
D | | Mr. Olson is an “interested person” (as defined above) of each Portfolio because his law firm has provided legal services to Western Asset. |
E | | Each officer of the Corporation is an “interested person” (as defined above) of the Corporation. |
160
Annual Report to Shareholders
Board Consideration of Management and Advisory Agreements
The Executive and Contracts Committee of the Board of Directors considered the Investment Management Agreements between the Corporation and LMFA, the Investment Advisory Agreements between LMFA and Western Asset and the Investment Advisory Agreement between LMFA and WAML, with respect to Western Asset Core Plus Bond Portfolio (collectively, the “Agreements”), with respect to each Fund at meetings held on September 9, 2008, October 17, 2008 and October 30, 2008. At a meeting held on November 18, 2008, the Executive and Contracts Committee reported to the full Board of Directors their considerations with respect to the Agreements, and the Board of Directors, including a majority of the Independent Directors, considered and approved renewal of the Agreements.
In arriving at their decision to renew the Agreements, the Directors met with representatives of Western Asset and WAML (together, the “Advisers”), including relevant investment advisory personnel as well as representatives of LMFA; reviewed a variety of information prepared by LMFA and the Advisers and materials provided by Lipper Inc. (“Lipper”) and counsel to the Independent Directors; and reviewed performance and expense information for peer groups of comparable funds selected and prepared by Lipper and for certain other comparable products available from Western Asset. These reviews were in addition to information obtained by the Directors at their regular quarterly meetings with respect to the Funds’ performance and other relevant matters, and related discussions with the Advisers’ personnel.
As part of their review, the Directors examined LMFA’s ability to provide high quality oversight and administrative and shareholder support services to the Funds, and Western Asset’s and WAML’s ability to provide high quality investment management services to the Funds. The Directors considered the experience of LMFA’s personnel in providing the types of services that LMFA is responsible for providing to the Funds; the ability of LMFA to attract and retain capable personnel; the capability and integrity of LMFA’s senior management and staff; and the level of skill required to provide such services to the Funds. The Directors considered the investment philosophy and research and decision-making processes of each Adviser; the experience of its key advisory personnel responsible for management of the Funds; the ability of the Advisers to attract and retain capable research and advisory personnel; the capability and integrity of the Advisers’ senior management and staff; and the level of skill required to manage each Fund. In addition, the Directors reviewed the quality of LMFA and the Advisers’ services with respect to regulatory compliance and compliance with the investment policies of the Funds and conditions that might affect LMFA or an Adviser’s ability to provide high quality services to the Funds in the future under the Agreements, including LMFA and each Adviser’s business reputation, financial condition and operational stability. Based on the foregoing, the Directors concluded that the Advisers’ investment process, research capabilities and philosophy were well suited to the Funds given their respective investment objectives and policies, and that LMFA and each of the Advisers would be able to meet any reasonably foreseeable obligations under the Agreements.
In reviewing the quality of the services provided to the Funds, the Directors also reviewed comparisons of the performance of the Funds to the performance of certain comparable funds in their respective peer groups and to their respective investment benchmarks over one-, three-, five- and ten-year periods ended August 31, 2008 (as applicable). In that connection, the Directors noted that the performance of the Funds for the one-year and three-year periods was below, and near or below, their peer averages, respectively. They also noted, however, that the performance of the Funds was near or above their peer averages for the five-year period ended August 31, 2008 and exceeded their peer averages for the ten-year period ended on that date. With respect to each of the Funds, the Directors considered the factors involved in its performance relative to the performance of its investment benchmark and peer groups.
The Directors also considered the management fees payable by the Funds to LMFA, the total expenses payable by the Funds and the fact that LMFA pays to the Advisers the entire management fee it receives from each Fund. They reviewed information concerning fees paid to investment advisers of similarly-managed funds, as well as fees paid by the Advisers’ other clients, including separate accounts managed by the Advisers. The Directors observed that the management fees paid to LMFA by the Funds were slightly higher than their respective peer groups. The Directors also observed that total expenses for each Fund were lower than the average of the funds in its respective peer group. The Directors noted that the management fees paid by the Funds were generally higher than the fees paid by other clients of the Advisers for accounts with similar investment strategies, but that the administrative and operational responsibilities for the Advisers with respect to the Funds were also relatively higher. In light of these differences, the Directors concluded that the differences in management fees from those paid by the Advisers’ other clients were reasonable.
161
Annual Report to Shareholders
Board Consideration of the Management and Advisory Agreements—Continued
The Directors further evaluated the benefits of the advisory relationship to LMFA and the Advisers, including, among others, the profitability of the relationship to LMFA and the Advisers; the direct and indirect benefits that LMFA and each Adviser may receive from its relationship with the Funds, including any “fallout benefits”, such as reputational value derived from serving as investment manager or adviser; and the affiliations between LMFA, the Advisers and certain service providers for the Portfolios. In that connection, the Directors concluded that LMFA and each Adviser’s profitability was consistent with levels of profitability that had been determined by courts not to be excessive.
Finally, the Directors considered, in light of the profitability information provided by the Advisers, the extent to which economies of scale would be realized by the Advisers as the assets of the Funds grow. They further concluded that, where a Fund’s assets were currently at a level at which the Advisers potentially may realize economies of scale from any future growth in the Fund, fee breakpoints had been implemented to capture a portion of any economies of scale for the benefit of the Fund’s shareholders.
In their deliberations with respect to these matters, the Independent Directors were advised by their independent counsel, who are independent of LMFA and the Advisers within the meaning of the Securities and Exchange Commission rules regarding the independence of counsel. The Independent Directors weighed the foregoing matters in light of the advice given to them by their independent counsel as to the law applicable to the review of investment advisory contracts. In arriving at a decision, the Directors, including the Independent Directors, did not identify any single matter as all-important or controlling, and the foregoing summary does not detail all the matters considered. The Directors judged the terms and conditions of the Agreements, including the investment advisory fees, in light of all of the surrounding circumstances.
Based upon their review, the Directors, including all of the Independent Directors, determined, in the exercise of their business judgment, that they were generally satisfied with the quality of investment advisory services being provided by each Adviser, but would continue to closely monitor the Advisers’ performance in light of the Funds’ recent relative underperformance; that the fees to be paid to the Advisers and LMFA under the relevant Agreements were fair and reasonable, given the scope and quality of the services rendered by the Advisers and LMFA; and that approval of the Agreements was in the best interest of the Corporation and its shareholders.
Approval of Additional Subadvisers
At their September 9, 2008 meeting, the Directors, including the Independent Directors, approved the addition of the following two non-U.S. affiliates of Western Asset as additional investment subadvisers of Western Asset Core Plus Bond Portfolio (“Core Plus”): Western Asset Management Company Pte. Ltd. in Singapore (“Western Asset Singapore”) and Western Asset Management Company Ltd in Japan (together with Western Asset Singapore, the “New Subadvisers”). In approving the addition of the New Subadvisers, the Directors drew on their knowledge of and experience with Western Asset, its personnel, the quality of the services it has provided to Core Plus and its investment philosophy and performance, as well as additional information relating to the New Subadvisers. The Directors noted that Core Plus is permitted to invest in non-U.S. dollar denominated securities and related foreign currency instruments and that the addition of the New Subadvisers will provide Core Plus with greater global investment management and trading resources. The Directors also noted that although the New Subadvisers are separate legal entities from Western Asset, senior investment personnel at Western Asset have supervisory oversight responsibility over the investment decisions made by the New Subadvisers. Finally, the Directors noted that the management fees paid by Core Plus would not change as a result of the addition of the New Subadvisers since Core Plus would not be paying the fees of the New Subadvisers.
162
Annual Report to Shareholders
Privacy Policy
The Funds are committed to keeping nonpublic personal information secure and confidential. This notice is intended to help a shareholder understand how the Funds fulfill this commitment.
From time to time, the Funds, through their service providers, may collect a variety of personal information, including:
| | • | | Information received on applications and forms, via the telephone, and through websites; |
| | • | | Information about transactions with the Funds, affiliates, or others (such as purchases, sales, or account balances); and |
| | • | | Information about shareholders received from consumer reporting agencies. |
The Funds do not disclose shareholder nonpublic personal information, except as permitted by applicable law or regulation. For example, the Funds may share this information with others in order to process transactions. Any information provided to companies that perform services on behalf of the Funds, such as printing and mailing or to other financial institutions with which the Funds have joint marketing agreements are required to protect the confidentiality of shareholders, information and to use it only to perform the services for which the companies are hired.
The Funds, through their service providers, maintain physical, electronic, and procedural safeguards to protect shareholder nonpublic personal information. Access to this information is restricted.
If a shareholder decides at some point either to close his/her account(s) or become an inactive customer, the Funds will continue to adhere to these privacy policies and practices with respect to shareholder nonpublic personal information.
This notice is being provided on behalf of:
Western Asset Funds, Inc.
Western Asset Funds, Inc.
The Board of Directors
William E. B. Siart, Chairman
Ronald J. Arnault
Anita L. DeFrantz
R. Jay Gerken
Ronald L. Olson
Avedick B. Poladian
Jaynie Miller Studenmund
Officers
R. Jay Gerken, President
D. Daniel Fleet, Vice President
Gavin L. James, Vice President
S. Kenneth Leech, Vice President
Stephen A. Walsh, Vice President
Susanne D. Wilson, Vice President
Marie K. Karpinski, Principal Financial and Accounting Officer
Erin K. Morris, Treasurer
Susan C. Curry, Assistant Treasurer
Todd F. Kuehl, Chief Compliance Officer
Richard M. Wachterman, Secretary
Peter J. Ciliberti, Assistant Secretary
Investment Manager
Legg Mason Fund Adviser, Inc.
P.O. Box 17635
Baltimore, Maryland 21297-1635
Investment Advisers
Western Asset Management Company
385 East Colorado Boulevard
Pasadena, California 91101
Investment Advisers
Western Asset Management Company Limited
10 Exchange Square
London, England EC2A2EN
Western Asset Management Company Pte. Ltd.
1 George Street #23-01
Singapore 049145
Western Asset Management Company Ltd
36F Shin-Marunouchi Building
5-1 Marunouchi 1-Chronu Chiyoda
Tokyo 100-6536
Transfer and Shareholder Servicing Agent
Boston Financial Data Services
66 Brooks Drive
Braintree, Massachusetts 02184
Custodian
State Street Bank & Trust Company
P.O Box 1031
Boston, Massachusetts 02103
Counsel
Ropes & Gray LLP
1211 Avenue of the Americas
New York, New York 10036
Independent Registered Public Accounting Firm
PricewaterhouseCoopers LLP
250 West Pratt Street
Baltimore, Maryland 21201
Information about the policies and procedures that each Fund uses to determine how to vote proxies relating to each Fund’s portfolio securities is contained in the Statement of Additional Information, available upon request without charge by calling 1-888-425-6432 or on the Securities and Exchange Commission’s (“SEC”) website (http://www.sec.gov). Information regarding how the Funds voted proxies relating to portfolio securities during the most recent twelve-month period ended June 30 is also available on the SEC’s website or without charge through www.westernassetfunds.com.
Each Fund files a complete schedule of portfolio holdings with the SEC for the first and third quarters of each fiscal year on Form N-Q. Each Fund’s Form N-Q is available on the Securities and Exchange Commission’s (“SEC”) website (http://www.sec.gov) and may be viewed and copied at the SEC’s Public Reference Room in Washington, D.C. Information about the operation of the Public Reference Room may be obtained by calling 1-800-SEC-0330. Quarterly portfolio holdings are also available upon request by calling 1-888-425-6432 or at www.lminstitutionalfunds.com/fund_information/fund_literature/gbl_literature/proxy_report.asp.
This report must be preceded or accompanied by a free prospectus. Investors should consider the Fund’s investment objectives, risks, charges and expenses carefully before investing. The prospectus contains this and other important information about the Fund. Please read the prospectus carefully before investing.
Western Asset Management Company
Legg Mason Investor Services, LLC, Distributor
Legg Mason, Inc. Subsidiaries
| | |
| WAF-A-(2/09) TN09-4347 | | WASX011414 |
Item 2 – Code of Ethics
| | (a) | Western Asset Funds, Inc. (the “Registrant”) has adopted a Code of Ethics, as defined in Item 2 of Form N-CSR, that applies to the Registrant’s Principal Executive, Financial and Accounting Officers a copy of which is attached as an exhibit to this Form N-CSR. |
Page 2 of 6
Item 3 – Audit Committee Financial Expert
The Audit Committee of the Registrant’s Board of Directors is comprised solely of Directors who are “independent” (as such term has been defined by the Securities and Exchange Commission (“SEC”) in regulations implementing Section 407 of the Sarbanes-Oxley Act of 2002 (the “Regulations”)). In addition, the Board of Directors of the Registrant has determined that Mr. Ronald J. Arnault qualifies as an “audit committee financial expert” (as such term has been defined by the Regulations) based on its review of his pertinent experience, knowledge and education. The SEC has stated that the designation or identification of a person as an audit committee financial expert pursuant to this Item 3 of Form N-CSR does not impose on such person any duties, obligations or liability that are greater than the duties, obligations and liability imposed on such person as a member of the Audit Committee and the Board of Directors in absence of such designation or identification.
Item 4 – Principal Accountant Fees and Services
Fiscal Year Ended March 31, 2007 - $310,975
Fiscal Year Ended March 31, 2008 - $366,800
Fiscal Year Ended December 31, 2008 - $360,150
Fiscal Year Ended March 31, 2007 - - $20,750
Fiscal Year Ended March 31, 2008 - $25,500
Fiscal Year Ended December 31, 2008 - $39,500
Services include interim audit security pricing.
PricewaterhouseCoopers LLP billed fees in the amount of $208,000 and $230,000 for non-audit services that required pre-approval by the Audit Committee pursuant to paragraph (C)(7)(ii) of Rule 2-01 of Regulation S-X during the Registrant’s fiscal years ended March 31, 2008 and December 31, 2008, respectively.
PricewaterhouseCoopers LLP conducted a SAS 70 audit to review and test operating effectiveness of controls placed in operation for Western Asset Management Company and reviewed the Australian Superannuation Circular.
Fiscal Year Ended March 31, 2007 - $9,900
Fiscal Year Ended March 31, 2008 - $21,600
Fiscal Year Ended December 31, 2008 - $47,500
Services include preparation of federal and state income tax returns and preparation of excise tax returns.
PricewaterhouseCoopers LLP did not bill fees for tax services that required pre-approval by the Audit Committee pursuant to paragraph (c)(7)(ii) of Rule 2-01 of Regulation S-X during the Registrant’s last two fiscal years.
Page 3 of 6
There were no fees billed to the Registrant during each of the last two fiscal years by PricewaterhouseCoopers LLP that were not disclosed in Items 4(a), (b) or (c) above.
PricewaterhouseCoopers LLP did not bill fees for services not included in Items 4(a), (b) or (c) above that required pre-approval by the Audit Committee pursuant to paragraph (c)(7)(ii) of Rule 2-01 of Regulation S-X during the Registrant’s last two fiscal years.
| | | | | | |
| | (e) | | (1) | | The Audit Committee has determined that all work performed for the Registrant by PricewaterhouseCoopers LLP will be pre-approved by the full Audit Committee and, therefore, has not adopted pre-approval procedures. |
| | | |
| | | | (2) | | None |
PricewaterhouseCoopers LLP did not bill fees for services where pre-approval by the Audit Committee pursuant to paragraph (c)(7)(ii) of Rule 2-01 of Regulation S-X was waived pursuant to paragraph (c)(7)(i)(C) of Rule 2-01 of Regulation S-X during the Registrant’s last two fiscal years.
Fiscal Year Ended March 31, 2007 - $975,316
Fiscal Year Ended March 31, 2008 - $1,236,000
Fiscal Year Ended December 31, 2008 - $1,371,045
| | (h) | The Audit Committee of the Registrant has considered whether the non-audit services that were rendered by the Registrant’s principal accountant to the Registrant’s investment adviser (not including any subadviser whose role is primarily portfolio management and is subcontracted with or overseen by another investment adviser) and any entity controlling, controlled by, or under common control with the investment adviser and that were not pre-approved by the Audit Committee are compatible with maintaining the principal accountant’s independence. |
Item 5 – Audit Committee of Listed Registrants
Not applicable.
Item 6 – Schedule of Investments
The schedule of investments in unaffiliated issuers as of the close of the December 31, 2008, reporting period is included as part of the annual report to shareholders contained in Item 1 hereof.
Page 4 of 6
Item 7 – Disclosure of Proxy Voting Policies and Procedures
Not applicable.
Item 8 – Portfolio Managers of Closed-End Management Investment Companies
Not applicable.
Item 9 – Purchases of Equity Securities by Closed-End Management Investment Companies and Affiliated Purchasers
Not applicable.
Item 10 – Submission of Matters to a Vote of Security Holders
There have been no material changes to the procedures by which shareholders may recommend nominees to the Registrant’s Board of Directors that have been implemented since the Registrant last provided disclosure in response to the requirements of this Item 10.
Item 11 – Controls and Procedures
| | (a) | The Registrant’s principal executive and principal financial officers have concluded, based on their evaluation of the Registrant’s disclosure controls and procedures as of a date within 90 days of the filing date of this report, that the Registrant’s disclosure controls and procedures are reasonably designed to ensure that information required to be disclosed by the Registrant on Form N-CSR is recorded, processed, summarized and reported within the required time periods and that information required to be disclosed by the Registrant in the reports that it files or submits on Form N-CSR is accumulated and communicated to the Registrant’s management, including its principal executive and principal financial officers, as appropriate to allow timely decisions regarding required disclosure. |
| | (b) | There were no changes in the Registrant’s internal control over financial reporting during the Registrant’s second fiscal quarter of the period covered by this report that have materially affected, or are reasonably likely to materially affect, the Registrant’s internal control over financial reporting. |
Item 12 – Exhibits
| | (a) | File the exhibits listed below as part of this Form. |
| | (1) | Code of Ethics subject to disclosure required by Item 2 – filed as an exhibit hereto. |
| | (2) | Certifications pursuant to Rule 30a-2(a) under the Investment Company Act of 1940 – filed as an exhibit hereto. |
| | (b) | Certifications pursuant to Rule 30a-2(b) under the Investment Company Act of 1940 – filed as an exhibit hereto. |
Page 5 of 6
SIGNATURES
Pursuant to the requirements of the Securities Exchange Act of 1934 and the Investment Company Act of 1940, the registrant has duly caused this report to be signed on its behalf by the undersigned, thereunto duly authorized.
| | |
| Western Asset Funds, Inc. |
| |
| By: | | /s/ R. Jay Gerken |
| | R. Jay Gerken |
| | President |
| | Western Asset Funds, Inc. |
|
| Date: March 3, 2009 |
Pursuant to the requirements of the Securities Exchange Act of 1934 and the Investment Company Act of 1940, this report has been signed below by the following persons on behalf of the registrant and in the capacities and on the dates indicated.
| | |
| By: | | /s/ R. Jay Gerken |
| | R. Jay Gerken |
| | President |
| | Western Asset Funds, Inc. |
|
| Date: March 3, 2009 |
| |
| By: | | /s/ Marie K. Karpinski |
| | Marie K. Karpinski |
| | Principal Financial and Accounting Officer |
| | Western Asset Funds, Inc. |
|
| Date: March 3, 2009 |
Page 6 of 6