UNITED STATES
SECURITIES AND EXCHANGE COMMISSION
Washington, D.C. 20549
FORM N-CSR
CERTIFIED SHAREHOLDER REPORT OF REGISTERED
MANAGEMENT INVESTMENT COMPANIES
Investment Company Act file number 811-06110
Western Asset Funds, Inc.
(Exact name of registrant as specified in charter)
55 Water Street, New York, NY 10041
(Address of principal executive offices) (Zip code)
Robert I. Frenkel, Esq.
Legg Mason & Co., LLC
100 First Stamford Place
Baltimore, MD 21202
(Name and address of agent for service)
Registrant’s telephone number, including area code: 1-888-425-6432
Date of fiscal year end: December 31
Date of reporting period: June 30, 2010
| ITEM 1. | REPORT TO STOCKHOLDERS. |
The Semi-Annual Report to Stockholders is filed herewith.
June 30, 2010

Semi-Annual Repor t
Western Asset
High Yield Portfolio
INVESTMENT PRODUCTS: NOT FDIC INSURED • NO BANK GUARANTEE • MAY LOSE VALUE
| | |
| II | | Western Asset High Yield Portfolio |
Fund objective
The Fund seeks to maximize total return, consistent with prudent investment management.
| | |
| Letter from the president | | |
Dear Shareholder,
We are pleased to provide the semi-annual report of Western Asset High Yield Portfolio for the six-month reporting period ended June 30, 2010.
Please read on for Fund performance information and a detailed look at prevailing economic and market conditions during the Fund’s reporting period.
As always, we remain committed to providing you with excellent service and a full spectrum of investment choices. We also remain committed to supplementing the support you receive from your financial advisor. One way we accomplish this is through our website, www.leggmason.com/individualinvestors. Here you can gain immediate access to market and investment information, including:
| Ÿ | | Fund prices and performance, |
| Ÿ | | Market insights and commentaries from our portfolio managers, and |
| Ÿ | | A host of educational resources. |
We look forward to helping you meet your financial goals.
Sincerely,

R. Jay Gerken, CFA
President
July 30, 2010
| | |
| Western Asset High Yield Portfolio | | III |
Investment commentary
Economic review
While the overall U.S. economy continued to expand over the six months ended June 30, 2010, several economic data points weakened toward the end of the reporting period. This, in combination with sovereign debt woes in Europe, caused investor sentiment to turn negative and had significant implications for the financial markets.
Looking back, the U.S. Department of Commerce reported that U.S. gross domestic product (“GDP”)i contracted four consecutive quarters, beginning in the third quarter of 2008 through the second quarter of 2009. Economic conditions then began to improve in the third quarter of 2009, as GDP growth was 1.6%. A variety of factors helped the economy to regain its footing, including the government’s $787 billion stimulus program. Economic growth then accelerated during the fourth quarter of 2009, as GDP growth was 5.0%. A slower drawdown in business inventories and renewed consumer spending were contributing factors spurring the economy’s higher growth rate. While the recovery continued during the first half of 2010, it did so at a more modest pace, as GDP growth was 3.7% during the first quarter of 2010 and an estimated 2.4% during the second quarter. The slower pace of growth in the second quarter was due, in part, to slower consumer spending, which rose an annualized 1.6% during the quarter, versus a 1.9% gain over the first three months of the year.
Even before GDP growth turned positive, there were signs that the economy was on the mend. The manufacturing sector, as measured by the Institute for Supply Management’s PMIii, rose to 52.8 in August 2009, the first time it surpassed 50 since January 2008 (a reading below 50 indicates a contraction, whereas a reading above 50 indicates an expansion). While June 2010’s PMI reading of 56.2 was lower than May’s reading of 59.7, manufacturing has now expanded eleven consecutive months according to PMI data. The manufacturing sector’s growth remained fairly broad-based with thirteen of the eighteen industries tracked by the Institute for Supply Management expanding during June.
After experiencing sharp job losses in 2009, the U.S. Department of Labor reported that over one million new positions were added during the first five months of 2010. Included in that total, however, were 700,000 temporary government jobs tied to the 2010 Census. In June, 225,000 of these temporary positions were eliminated, offsetting private sector growth and resulting in a net loss of 125,000 jobs for the month. However, the unemployment rate fell to 9.5% in June, versus 9.7% and 9.9% in May and April, respectively.
There was mixed news in the housing market during the period. According to the National Association of Realtors, existing home sales increased 7.0% and 8.0% in March and April, respectively, after sales had fallen for the period from December 2009 through February 2010. The rebound was largely attributed to people rushing to take advantage of the government’s $8,000 tax credit for first-time home buyers that expired at the end of April. However, with the end of the tax credit, existing home sales then declined 2.2% and 5.1% in May and June, respectively. In addition, the inventory of unsold homes increased 2.5% to 3.99 million in June. Looking at home prices, the S&P/Case-Shiller Home Price Indexiii indicated that month-to-month U.S. home prices rose 1.3% in May. This marked the second straight monthly increase following six consecutive months of declining prices.
Financial market overview
During the first half of the reporting period, the financial markets were largely characterized by healthy investor risk appetite and solid results by lower-quality bonds. However, the market experienced a sharp sell-off during the second half of the reporting period, during which risk aversion returned and investors flocked to the relative safety of U.S. Treasury securities.
Given certain pockets of weakness in the economy, including elevated unemployment in the U.S., the Federal Reserve Board (“Fed”)iv remained cautious. At its meeting in June 2010, the Fed said it “will maintain the target range for the federal funds ratev at 0 to 1/4 percent and continues to anticipate that economic conditions, including low rates of resource utilization, subdued inflation trends, and stable inflation expectations, are likely to warrant exceptionally low levels of the federal funds rate for an extended period.”
However, the Fed took several steps in reversing its accommodative monetary stance. On February 18, 2010, the Fed raised the discount rate, the interest rate it charges banks for temporary loans, from 1/2 to 3/4 percent. The Fed also concluded its $1.25 trillion mortgage securities purchase program at the end of the first quarter of 2010. However, the Fed left the door open for future stimulus measures if needed. In the minutes of its June meeting that were released on July 14th (after the reporting period ended), the Fed said, “In addition to continuing to develop and test instruments to exit from the period of unusually accommodative monetary policy, the Committee would need to consider whether further policy stimulus might become appropriate if the outlook were to worsen appreciably.”
| | |
| IV | | Western Asset High Yield Portfolio |
Investment commentary (cont’d)
Fixed-income market review
Continuing the trend that began in the second quarter of 2009, nearly every spread sector (non-Treasury) outperformed equal-durationvi Treasuries during the first half of the reporting period. Over that time, investor confidence was high given encouraging economic data, continued low interest rates, benign inflation and rebounding corporate profits. However, robust investor appetite was replaced with heightened risk aversion toward the end of April and during the month of May. This was due to the escalating sovereign debt crisis in Europe, uncertainties regarding new financial reforms in the U.S. and some worse-than-expected economic data. Most spread sectors then produced positive absolute returns in June, as investor demand for these securities began to again increase.
Both short- and long-term Treasury yields fluctuated during the period but generally moved lower. When the period began, two- and ten-year Treasury yields were 1.14% and 3.85%, respectively. Two- and ten-year Treasury yields initially rose, reaching as high as 1.18% and 4.01%, respectively, in early April. Yields then largely declined amid the investor “flight to quality.” On June 30, 2010, two- and ten-year Treasury yields reached their lows for the reporting period: 0.61% and 2.97%, respectively. Over the six-month reporting period, the yield curvevii flattened, with longer-term Treasury yields declining more than their shorter-term counterparts. For the six months ended June 30, 2010, the Barclays Capital U.S. Aggregate Indexviii returned 5.33%.
While the high-yield bond market could not escape the negative impact of the investor flight to quality, it still was able to produce strong results during the reporting period. The asset class posted positive returns during each month except for May 2010 when risk aversion reached extremely elevated levels. The high-yield market was supported by better-than-expected corporate profits and overall strong investor demand. All told, the Barclays Capital U.S. High Yield – 2% Issuer Cap Indexix returned 4.45% for the six months ended June 30, 2010.
Performance review
For the six months ended June 30, 2010, Class I shares of Western Asset High Yield Portfolio returned 4.54%. The Fund’s unmanaged benchmark, the Barclays Capital U.S. High Yield – 2% Issuer Cap Index, returned 4.45% for the same period. The Lipper High Current Yield Funds Category Average1 returned 3.69% over the same time frame.
| | | |
| Performance Snapshot as of June 30, 2010 (unaudited) | |
| | | 6 months | |
| Western Asset High Yield Portfolio: | | | |
Class IS2 | | 4.62 | % |
Class I2 | | 4.54 | % |
| Barclays Capital U.S. High Yield – 2% Issuer Cap Index | | 4.45 | % |
| Lipper High Current Yield Funds Category Average | | 3.69 | % |
The performance shown represents past performance. Past performance is no guarantee of future results and current performance may be higher or lower than the performance shown above. Principal value, investment returns and yields will fluctuate and investors’ shares, when redeemed, may be worth more or less than their original cost. To obtain performance data current to the most recent month-end, please visit our website at www.leggmason.com/individualinvestors.
All share class returns assume the reinvestment of all distributions, including returns of capital, if any, at net asset value and the deduction of all Fund expenses. Returns have not been adjusted to include the deduction of taxes that a shareholder would pay on Fund distributions. Performance figures for periods shorter than one year represent cumulative figures and are not annualized.
The 30-Day SEC Yields for the period ended June 30, 2010 for Class IS and I shares were 8.98% and 8.91%, respectively. The 30-Day SEC Yield is the average annualized net investment income per share for the 30-day period indicated and is subject to change.
|
| Total Annual Operating Expenses (unaudited) |
As of the Fund’s most current prospectus dated April 30, 2010, the gross total operating expense ratios for Class IS and Class I shares were 0.61% and 0.62%, respectively.
Actual expenses may be higher. For example, expenses may be higher than those shown if average net assets decrease. Net assets are more likely to decrease and Fund expense ratios are more likely to increase when markets are volatile.
| 1 | Lipper, Inc., a wholly-owned subsidiary of Reuters, provides independent insight on global collective investments. Returns are based on the six-month period ended June 30, 2010, including the reinvestment of all distributions, including returns of capital, if any, calculated among the 490 funds in the Fund’s Lipper category. |
| 2 | Class IS and Class I shares were formerly known as Institutional Select Class and Institutional Class shares, respectively. Fund share classes were renamed in April 2010. |
| | |
| Western Asset High Yield Portfolio | | V |
As always, thank you for your confidence in our stewardship of your assets.
Sincerely,
R. Jay Gerken, CFA
President
July 30, 2010
RISKS: Fixed-income securities involve interest rate, credit, inflation and reinvestment risks. As interest rates rise, the value of fixed-income securities falls. Derivatives, such as options, futures and swaps, can be illiquid, may disproportionately increase losses, and have a potentially large impact on Fund performance. International investments are subject to special risks including currency fluctuations and social, economic and political uncertainties, which could increase volatility. These risks are magnified in emerging markets. The use of leverage may increase volatility and possibility of loss. Risks of high-yield securities include greater price volatility, illiquidity and possibility of default. Asset-backed, mortgage-backed or mortgage-related securities are subject to prepayment and extension risks. Please see the Fund’s prospectus for more information on these and other risks.
All investments are subject to risk including the possible loss of principal. All index performance reflects no deduction for fees, expenses or taxes. Please note that an investor cannot invest directly in an index.
The information provided is not intended to be a forecast of future events, a guarantee of future results or investment advice. Views expressed may differ from those of the firm as a whole.
| i | Gross domestic product (“GDP”) is the market value of all final goods and services produced within a country in a given period of time. |
| ii | The Institute for Supply Management’s PMI is based on a survey of purchasing executives who buy the raw materials for manufacturing at more than 350 companies. It offers an early reading on the health of the manufacturing sector. |
| iii | The S&P/Case-Shiller Home Price Index measures the residential housing market, tracking changes in the value of the residential real estate market in twenty metropolitan regions across the United States. |
| iv | The Federal Reserve Board (“Fed”) is responsible for the formulation of policies designed to promote economic growth, full employment, stable prices and a sustainable pattern of international trade and payments. |
| v | The federal funds rate is the rate charged by one depository institution on an overnight sale of immediately available funds (balances at the Federal Reserve) to another depository institution; the rate may vary from depository institution to depository institution and from day to day. |
| vi | Duration is the measure of the price sensitivity of a fixed-income security to an interest rate change of 100 basis points. Calculation is based on the weighted average of the present values for all cash flows. |
| vii | The yield curve is the graphical depiction of the relationship between the yield on bonds of the same credit quality but different maturities. |
| viii | The Barclays Capital U.S. Aggregate Index is a broad-based bond index comprised of government, corporate, mortgage- and asset-backed issues, rated investment grade or higher, and having at least one year to maturity. |
| ix | The Barclays Capital U.S. High Yield – 2% Issuer Cap Index is an index of the 2% Issuer Cap component of the Barclays Capital U.S. Corporate High Yield Index, which covers the U.S. dollar-denominated, non-investment grade, fixed-rate, taxable corporate bond market. |
| | |
| Western Asset High Yield Portfolio 2010 Semi-Annual Report | | 1 |
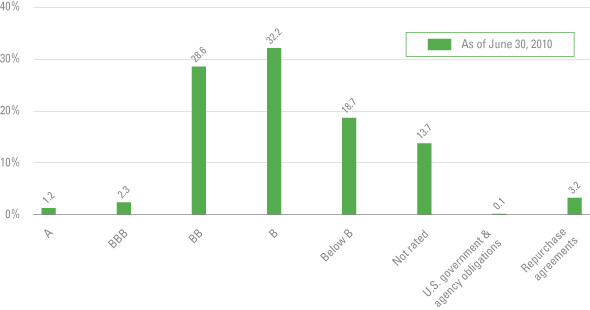
Fund at a glance† (unaudited)
Standard & Poor’s Debt Ratings1 % (as a percent of total investments)
Maturity Schedule % (as a percent of total investments)
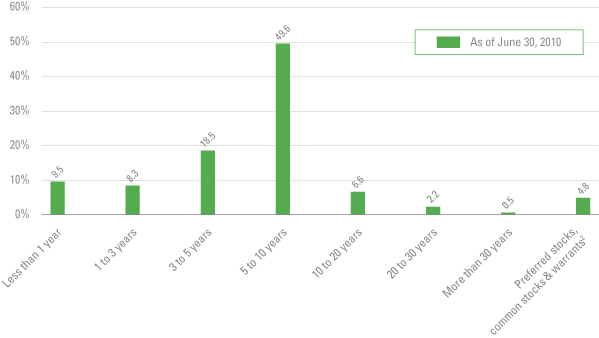
| † | The bar graphs above represents the composition of the Fund’s investments as of June 30, 2010 and do not include derivatives such as Futures Contracts, Options Written and Swaps. The Fund is actively managed. As a result, the composition of the Fund’s investments is subject to change at any time. |
| 1 | Source: Standard & Poor’s Rating Service. The ratings shown are based on each portfolio security’s rating as determined by Standard & Poor’s (“S&P”), a Nationally Recognized Statistical Ratings Organization (“NRSRO”). These ratings are the opinions of S&P and are not measures of quality or guarantees of performance. Securities held by the Fund may be rated by other NRSROs, and these ratings may be higher or lower. The Fund itself has not been rated by a NRSRO and the credit quality of the investments in the Fund’s portfolio does not apply to the stability or safety of the Fund. |
| 2 | Preferred stocks, Common stocks and Warrants do not have defined maturity dates. |
| | |
| 2 | | Western Asset High Yield Portfolio 2010 Semi-Annual Report |
Fund expenses (unaudited)
Example
As a shareholder of the Fund, you may incur two types of costs: (1) transaction costs and (2) ongoing costs, including management fees; distribution and/or service (12b-1) fees; and other Fund expenses. This example is intended to help you understand your ongoing costs (in dollars) of investing in the Fund and to compare these costs with the ongoing costs of investing in other mutual funds.
This example is based on an investment of $1,000 invested on January 1, 2010 and held for the six months ended June 30, 2010.
Actual expenses
The table below titled “Based on Actual Total Return” provides information about actual account values and actual expenses. You may use the information provided in this table, together with the amount you invested, to estimate the expenses that you paid over the period. To estimate the expenses you paid on your account, divide your ending account value by $1,000 (for example, an $8,600 ending account value divided by $1,000 = 8.6), then multiply the result by the number under the heading entitled “Expenses Paid During the Period”.
| | | | | | | | | | | | |
| Based on actual total return1 |
| | | Actual Total
Return2 | | | Beginning
Account
Value | | Ending
Account
Value | | Annualized
Expense
Ratio | | | Expenses
Paid
During
the
Period3 |
| Class IS4 | | 4.62 | % | | 1,000.00 | | 1,046.20 | | 0.60 | % | | 3.04 |
| Class I4 | | 4.54 | % | | 1,000.00 | | 1,045.40 | | 0.64 | % | | 3.25 |
Hypothetical example for comparison purposes
The table below titled “Based on Hypothetical Total Return” provides information about hypothetical account values and hypothetical expenses based on the actual expense ratio and an assumed rate of return of 5.00% per year before expenses, which is not the Fund’s actual return. The hypothetical account values and expenses may not be used to estimate the actual ending account balance or expenses you paid for the period. You may use the information provided in this table to compare the ongoing costs of investing in the Fund and other funds. To do so, compare the 5.00% hypothetical example relating to the Fund with the 5.00% hypothetical examples that appear in the shareholder reports of the other funds.
Please note that the expenses shown in the table below are meant to highlight your ongoing costs only and do not reflect any transactional costs, such as front-end or back-end sales charges (loads). Therefore, the table is useful in comparing ongoing costs only, and will not help you determine the relative total costs of owning different funds. In addition, if these transaction costs were included, your costs would have been higher.
| | | | | | | | | | | | |
| Based on hypothetical total return1 |
| | | Hypothetical
Annualized
Total Return | | | Beginning
Account
Value | | Ending
Account
Value | | Annualized
Expense
Ratio | | | Expenses
Paid
During
the
Period3 |
| Class IS4 | | 5.00 | % | | 1,000.00 | | 1,021.82 | | 0.60 | % | | 3.01 |
| Class I4 | | 5.00 | % | | 1,000.00 | | 1,021.62 | | 0.64 | % | | 3.21 |
| 1 | For the six months ended June 30, 2010. |
| 2 | Assumes the reinvestment of all distributions, including returns of capital, if any, at net asset value. Total return is not annualized, as it may not be representative of the total return for the year. Performance figures may reflect compensating balance arrangements and/or expense reimbursements. In the absence of compensating balance arrangements and/or expense reimbursements, the total return would have been lower. Past performance is no guarantee of future results. |
| 3 | Expenses (net of compensating balance arrangements and/or expense reimbursements) are equal to each class’ respective annualized expense ratio multiplied by the average account value over the period, multiplied by the number of days in the most recent fiscal half-year (181), then divided by 365. |
| 4 | In April 2010, Institutional Select Class and Institutional Class shares were renamed Class IS and Class I shares, respectively. |
| | |
| Western Asset High Yield Portfolio 2010 Semi-Annual Report | | 3 |
Spread duration (unaudited)
Economic exposure — June 30, 2010
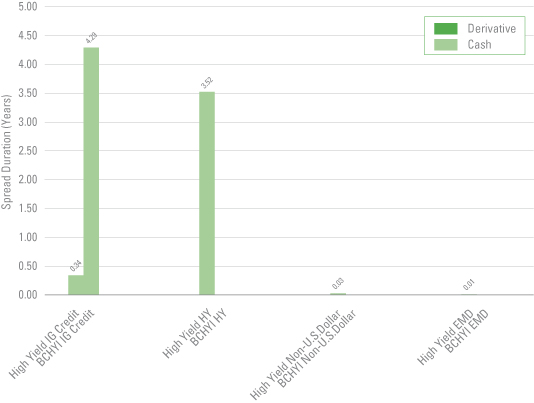
Spread duration is defined as the change in value for a 100 basis point change in the spread relative to Treasuries. The spread over Treasuries is the annual risk-premium demanded by investors to hold non-Treasury securities. This chart highlights the market sector exposure of the Fund’s portfolio and the exposure relative to the selected benchmark as of the end of the reporting period.
| | |
| BCHYI | | —Barclays Capital U.S. High Yield – 2% Issuer Cap Index |
| EMD | | —Emerging Market |
| HY | | —High Yield |
| IG Credit | | —Investment Grade Credit |
| | |
| 4 | | Western Asset High Yield Portfolio 2010 Semi-Annual Report |
Effective duration (unaudited)
Interest rate exposure — June 30, 2010
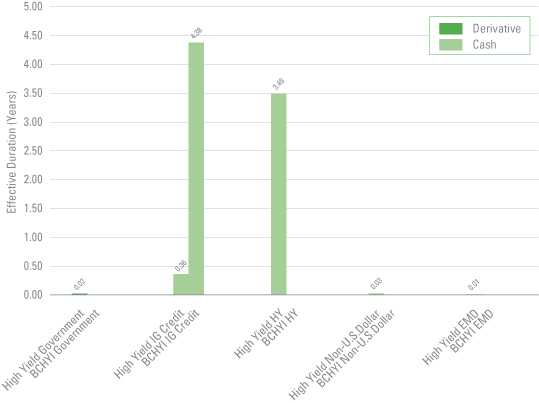
Effective duration is defined as the change in value for a 100 basis point change in Treasury yields. This chart highlights the interest rate exposure of the Fund’s portfolio relative to the selected benchmark as of the end of the reporting period.
| | |
| BCHYI | | —Barclays Capital U.S. High Yield – 2% Issuer Cap Index |
| EMD | | —Emerging Market |
| HY | | —High Yield |
| IG Credit | | —Investment Grade Credit |
| | |
| Western Asset High Yield Portfolio 2010 Semi-Annual Report | | 5 |
Schedule of investments (unaudited)
June 30, 2010
Western Asset High Yield Portfolio
| | | | | | | | | | | | |
| Security | | Rate | | | Maturity Date | | Face Amount† | | | Value | |
| Corporate Bonds & Notes — 85.3% | | | | | | | | | | | | |
| Consumer Discretionary — 16.8% | | | | | | | | | | | | |
Auto Components — 0.6% | | | | | | | | | | | | |
Cooper-Standard Automotive Inc., Senior Notes | | 8.500 | % | | 5/1/18 | | 1,290,000 | | | $ | 1,299,675 | (a) |
Hertz Holdings Netherlands BV, Senior Secured Bonds | | 8.500 | % | | 7/31/15 | | 1,130,000 | EUR | | | 1,374,911 | (a) |
Total Auto Components | | | | | | | | | | | 2,674,586 | |
Automobiles — 0.7% | | | | | | | | | | | | |
Motors Liquidation Co., Senior Debentures | | 8.250 | % | | 7/15/23 | | 1,320,000 | | | | 399,300 | (b) |
Motors Liquidation Co., Senior Debentures | | 8.375 | % | | 7/15/33 | | 3,955,000 | | | | 1,265,600 | (b) |
Motors Liquidation Co., Senior Notes | | 7.200 | % | | 1/15/11 | | 6,180,000 | | | | 1,869,450 | (b) |
Total Automobiles | | | | | | | | | | | 3,534,350 | |
Diversified Consumer Services — 1.2% | | | | | | | | | | | | |
Service Corp. International, Senior Notes | | 7.500 | % | | 4/1/27 | | 1,212,000 | | | | 1,072,620 | |
Sotheby’s, Senior Notes | | 7.750 | % | | 6/15/15 | | 1,290,000 | | | | 1,290,000 | |
Stonemor Operating LLC/Cornerstone Family Services/Osiris Holdings, Senior Notes | | 10.250 | % | | 12/1/17 | | 3,490,000 | | | | 3,542,350 | (a) |
Total Diversified Consumer Services | | | | | | | | | | | 5,904,970 | |
Hotels, Restaurants & Leisure — 7.0% | | | | | | | | | | | | |
Boyd Gaming Corp., Senior Subordinated Notes | | 7.125 | % | | 2/1/16 | | 385,000 | | | | 316,663 | |
Downstream Development Quapaw, Senior Notes | | 12.000 | % | | 10/15/15 | | 1,345,000 | | | | 1,264,300 | (a) |
El Pollo Loco Inc., Senior Notes | | 11.750 | % | | 11/15/13 | | 4,896,000 | | | | 3,794,400 | |
El Pollo Loco Inc., Senior Secured Notes | | 11.750 | % | | 12/1/12 | | 310,000 | | | | 310,000 | |
Fontainebleau Las Vegas Holdings LLC/Fontainebleau Las Vegas Capital Corp. | | 10.250 | % | | 6/15/15 | | 1,455,000 | | | | 5,456 | (a)(b) |
Harrah’s Operating Co. Inc., Senior Bonds | | 5.625 | % | | 6/1/15 | | 7,178,000 | | | | 4,755,425 | |
Harrah’s Operating Co. Inc., Senior Notes | | 10.750 | % | | 2/1/16 | | 1,260,000 | | | | 1,004,850 | |
Harrah’s Operating Co. Inc., Senior Secured Notes | | 10.000 | % | | 12/15/15 | | 1,335,000 | | | | 1,224,862 | |
Inn of the Mountain Gods Resort & Casino, Senior Notes | | 12.000 | % | | 11/15/10 | | 5,655,000 | | | | 2,742,675 | (b)(c) |
Landry’s Restaurants Inc., Senior Secured Notes | | 11.625 | % | | 12/1/15 | | 1,340,000 | | | | 1,386,900 | |
MGM MIRAGE Inc., Notes | | 6.750 | % | | 9/1/12 | | 1,940,000 | | | | 1,804,200 | |
MGM MIRAGE Inc., Senior Notes | | 8.500 | % | | 9/15/10 | | 135,000 | | | | 135,000 | |
MGM MIRAGE Inc., Senior Notes | | 6.750 | % | | 4/1/13 | | 3,060,000 | | | | 2,731,050 | |
MGM MIRAGE Inc., Senior Subordinated Notes | | 8.375 | % | | 2/1/11 | | 435,000 | | | | 439,350 | |
MGM Resorts International, Senior Secured Notes | | 10.375 | % | | 5/15/14 | | 260,000 | | | | 282,750 | |
MGM Resorts International, Senior Secured Notes | | 11.125 | % | | 11/15/17 | | 280,000 | | | | 308,700 | |
Mohegan Tribal Gaming Authority, Senior Notes | | 6.125 | % | | 2/15/13 | | 800,000 | | | | 648,000 | |
Mohegan Tribal Gaming Authority, Senior Secured Notes | | 11.500 | % | | 11/1/17 | | 2,630,000 | | | | 2,603,700 | (a) |
Mohegan Tribal Gaming Authority, Senior Subordinated Notes | | 8.000 | % | | 4/1/12 | | 120,000 | | | | 104,700 | |
NCL Corp. Ltd., Senior Secured Notes | | 11.750 | % | | 11/15/16 | | 1,390,000 | | | | 1,452,550 | |
Penn National Gaming Inc., Senior Subordinated Notes | | 8.750 | % | | 8/15/19 | | 630,000 | | | | 647,325 | |
Pinnacle Entertainment Inc., Senior Notes | | 8.625 | % | | 8/1/17 | | 410,000 | | | | 422,300 | (a) |
Pinnacle Entertainment Inc., Senior Subordinated Notes | | 7.500 | % | | 6/15/15 | | 440,000 | | | | 412,500 | |
Pinnacle Entertainment Inc., Senior Subordinated Notes | | 8.750 | % | | 5/15/20 | | 310,000 | | | | 287,138 | (a) |
Sbarro Inc., Senior Notes | | 10.375 | % | | 2/1/15 | | 2,325,000 | | | | 1,836,750 | |
Snoqualmie Entertainment Authority, Senior Secured Notes | | 4.136 | % | | 2/1/14 | | 2,755,000 | | | | 2,197,112 | (a)(d) |
Station Casinos Inc., Senior Notes | | 6.000 | % | | 4/1/12 | | 2,905,000 | | | | 172,484 | (b)(c) |
Station Casinos Inc., Senior Notes | | 7.750 | % | | 8/15/16 | | 2,625,000 | | | | 165,703 | (b)(c) |
Station Casinos Inc., Senior Subordinated Notes | | 6.625 | % | | 3/15/18 | | 890,000 | | | | 668 | (b)(c) |
Total Hotels, Restaurants & Leisure | | | | | | | | | | | 33,457,511 | |
See Notes to Financial Statements.
| | |
| 6 | | Western Asset High Yield Portfolio 2010 Semi-Annual Report |
Schedule of investments (unaudited) (cont’d)
June 30, 2010
Western Asset High Yield Portfolio
| | | | | | | | | | | |
| Security | | Rate | | | Maturity Date | | Face Amount† | | Value | |
Household Durables — 0.2% | | | | | | | | | | | |
American Greetings Corp., Senior Notes | | 7.375 | % | | 6/1/16 | | 920,000 | | $ | 917,700 | |
Internet & Catalog Retail — 0.7% | | | | | | | | | | | |
Netflix Inc., Senior Notes | | 8.500 | % | | 11/15/17 | | 1,670,000 | | | 1,736,800 | |
QVC Inc., Senior Secured Notes | | 7.375 | % | | 10/15/20 | | 1,620,000 | | | 1,575,450 | (a) |
Total Internet & Catalog Retail | | | | | | | | | | 3,312,250 | |
Media — 4.1% | | | | | | | | | | | |
Allbritton Communications Co., Senior Notes | | 8.000 | % | | 5/15/18 | | 10,000 | | | 9,900 | (a) |
Cablevision Systems Corp., Senior Notes | | 7.750 | % | | 4/15/18 | | 570,000 | | | 570,000 | |
CCH II LLC/CCH II Capital Corp., Senior Notes | | 13.500 | % | | 11/30/16 | | 691,734 | | | 805,870 | |
CCO Holdings LLC/CCO Holdings Capital Corp., Senior Notes | | 7.875 | % | | 4/30/18 | | 1,930,000 | | | 1,939,650 | (a) |
CCO Holdings LLC/CCO Holdings Capital Corp., Senior Notes | | 8.125 | % | | 4/30/20 | | 1,490,000 | | | 1,523,525 | (a) |
Cengage Learning Acquisitions Inc., Senior Subordinated Notes | | 13.250 | % | | 7/15/15 | | 2,815,000 | | | 2,617,950 | (a) |
Charter Communications Operating LLC/Charter Communications Operating Capital, Senior Secured Notes | | 10.875 | % | | 9/15/14 | | 3,830,000 | | | 4,251,300 | (a) |
CMP Susquehanna Corp. | | 3.531 | % | | 5/15/14 | | 172,000 | | | 51,600 | (a)(c)(d)(e) |
CSC Holdings LLC, Senior Notes | | 8.500 | % | | 6/15/15 | | 410,000 | | | 423,325 | |
Nielsen Finance LLC / Nielsen Finance Co., Senior Subordinated Notes, step bond | | 0.000 | % | | 8/1/16 | | 3,330,000 | | | 3,171,825 | |
Sun Media Corp., Senior Notes | | 7.625 | % | | 2/15/13 | | 845,000 | | | 845,000 | |
Univision Communications Inc., Senior Secured Notes | | 12.000 | % | | 7/1/14 | | 1,060,000 | | | 1,136,850 | (a) |
UPC Holding BV, Senior Notes | | 9.875 | % | | 4/15/18 | | 1,160,000 | | | 1,165,800 | (a) |
Virgin Media Finance PLC, Senior Bonds | | 9.500 | % | | 8/15/16 | | 205,000 | | | 216,532 | |
Virgin Media Finance PLC, Senior Notes | | 9.125 | % | | 8/15/16 | | 905,000 | | | 936,675 | |
Total Media | | | | | | | | | | 19,665,802 | |
Multiline Retail — 0.7% | | | | | | | | | | | |
Neiman Marcus Group Inc., Senior Notes | | 9.000 | % | | 10/15/15 | | 232,058 | | | 232,638 | (f) |
Neiman Marcus Group Inc., Senior Secured Notes | | 7.125 | % | | 6/1/28 | | 3,260,000 | | | 2,934,000 | |
Total Multiline Retail | | | | | | | | | | 3,166,638 | |
Specialty Retail — 0.7% | | | | | | | | | | | |
Michaels Stores Inc., Senior Subordinated Bonds | | 11.375 | % | | 11/1/16 | | 710,000 | | | 738,400 | |
Michaels Stores Inc., Senior Subordinated Notes, step bond | | 0.000 | % | | 11/1/16 | | 3,050,000 | | | 2,714,500 | |
Total Specialty Retail | | | | | | | | | | 3,452,900 | |
Textiles, Apparel & Luxury Goods — 0.9% | | | | | | | | | | | |
Oxford Industries Inc., Senior Secured Notes | | 11.375 | % | | 7/15/15 | | 3,080,000 | | | 3,388,000 | |
Phillips-Van Heusen Corp., Senior Notes | | 7.375 | % | | 5/15/20 | | 1,040,000 | | | 1,049,100 | |
Total Textiles, Apparel & Luxury Goods | | | | | | | | | | 4,437,100 | |
Total Consumer Discretionary | | | | | | | | | | 80,523,807 | |
| Consumer Staples — 1.6% | | | | | | | | | | | |
Food Products — 0.8% | | | | | | | | | | | |
Bumble Bee Foods LLC, Senior Secured Notes | | 7.750 | % | | 12/15/15 | | 1,810,000 | | | 1,821,312 | (a) |
Del Monte Corp., Senior Subordinated Notes | | 7.500 | % | | 10/15/19 | | 960,000 | | | 981,600 | (a) |
Michael Foods Inc., Senior Notes | | 9.750 | % | | 7/15/18 | | 960,000 | | | 986,400 | (a) |
Total Food Products | | | | | | | | | | 3,789,312 | |
Household Products — 0.3% | | | | | | | | | | | |
Spectrum Brands Holdings Inc., Senior Secured Notes | | 9.500 | % | | 6/15/18 | | 1,610,000 | | | 1,660,313 | (a) |
See Notes to Financial Statements.
| | |
| Western Asset High Yield Portfolio 2010 Semi-Annual Report | | 7 |
Western Asset High Yield Portfolio
| | | | | | | | | | | |
| Security | | Rate | | | Maturity Date | | Face Amount† | | Value | |
Tobacco — 0.5% | | | | | | | | | | | |
Alliance One International Inc., Senior Notes | | 10.000 | % | | 7/15/16 | | 2,130,000 | | $ | 2,167,275 | (a) |
Total Consumer Staples | | | | | | | | | | 7,616,900 | |
| Energy — 13.0% | | | | | | | | | | | |
Energy Equipment & Services — 2.2% | | | | | | | | | | | |
Basic Energy Services Inc., Senior Secured Notes | | 11.625 | % | | 8/1/14 | | 2,225,000 | | | 2,391,875 | |
Complete Production Services Inc., Senior Notes | | 8.000 | % | | 12/15/16 | | 1,235,000 | | | 1,207,213 | |
GulfMark Offshore Inc., Senior Subordinated Notes | | 7.750 | % | | 7/15/14 | | 1,790,000 | | | 1,700,500 | |
Hercules Offshore LLC, Senior Secured Notes | | 10.500 | % | | 10/15/17 | | 1,280,000 | | | 1,136,000 | (a) |
Key Energy Services Inc., Senior Notes | | 8.375 | % | | 12/1/14 | | 1,850,000 | | | 1,838,437 | |
Parker Drilling Co., Senior Notes | | 9.125 | % | | 4/1/18 | | 1,900,000 | | | 1,805,000 | (a) |
Transocean Inc, Senior Notes | | 6.625 | % | | 4/15/11 | | 520,000 | | | 507,581 | |
Total Energy Equipment & Services | | | | | | | | | | 10,586,606 | |
Oil, Gas & Consumable Fuels — 10.8% | | | | | | | | | | | |
Adaro Indonesia PT, Notes | | 7.625 | % | | 10/22/19 | | 700,000 | | | 707,000 | (a) |
Belden & Blake Corp., Secured Notes | | 8.750 | % | | 7/15/12 | | 6,250,000 | | | 5,828,125 | |
Berry Petroleum Co., Senior Notes | | 10.250 | % | | 6/1/14 | | 930,000 | | | 999,750 | |
Chesapeake Energy Corp., Senior Notes | | 6.500 | % | | 8/15/17 | | 530,000 | | | 522,713 | |
Chesapeake Energy Corp., Senior Notes | | 6.250 | % | | 1/15/18 | | 815,000 | | | 823,150 | |
Chesapeake Energy Corp., Senior Notes | | 7.250 | % | | 12/15/18 | | 1,635,000 | | | 1,688,137 | |
Compagnie Generale de Geophysique SA, Senior Notes | | 7.500 | % | | 5/15/15 | | 1,745,000 | | | 1,662,112 | |
Compagnie Generale de Geophysique-Veritas, Senior Notes | | 9.500 | % | | 5/15/16 | | 265,000 | | | 268,975 | |
CONSOL Energy Inc., Senior Notes | | 8.250 | % | | 4/1/20 | | 2,340,000 | | | 2,439,450 | (a) |
Corral Petroleum Holdings AB, Senior Bonds | | 5.251 | % | | 9/18/11 | | 4,219,493 | | | 3,881,934 | (a)(d) |
Crosstex Energy LP/Crosstex Energy Finance Corp., Senior Notes | | 8.875 | % | | 2/15/18 | | 1,230,000 | | | 1,228,462 | |
Denbury Resources Inc., Senior Subordinated Notes | | 8.250 | % | | 2/15/20 | | 2,232,000 | | | 2,332,440 | |
Enterprise Products Operating LLP, Junior Subordinated Notes | | 8.375 | % | | 8/1/66 | | 2,145,000 | | | 2,142,319 | (d) |
Enterprise Products Operating LLP, Subordinated Notes | | 7.034 | % | | 1/15/68 | | 205,000 | | | 188,600 | (d) |
Griffin Coal Mining Co. Pty Ltd., Senior Notes | | 9.500 | % | | 12/1/16 | | 100,000 | | | 61,125 | (a)(b) |
International Coal Group Inc., Senior Secured Notes | | 9.125 | % | | 4/1/18 | | 2,230,000 | | | 2,230,000 | |
Linn Energy LLC/Linn Energy Finance Corp., Senior Notes | | 8.625 | % | | 4/15/20 | | 1,270,000 | | | 1,300,162 | (a) |
MarkWest Energy Partners LP/MarkWest Energy Finance Corp., Senior Notes | | 8.750 | % | | 4/15/18 | | 840,000 | | | 848,400 | |
Murray Energy Corp., Senior Secured Notes | | 10.250 | % | | 10/15/15 | | 1,460,000 | | | 1,452,700 | (a) |
OPTI Canada Inc., Senior Secured Notes | | 7.875 | % | | 12/15/14 | | 480,000 | | | 417,600 | |
OPTI Canada Inc., Senior Secured Notes | | 8.250 | % | | 12/15/14 | | 465,000 | | | 404,550 | |
Overseas Shipholding Group Inc., Senior Notes | | 8.125 | % | | 3/30/18 | | 1,910,000 | | | 1,876,575 | |
Peabody Energy Corp., Senior Notes | | 7.875 | % | | 11/1/26 | | 2,180,000 | | | 2,289,000 | |
Penn Virginia Resource Partners LP/Penn Virginia Resource Finance Corp., Senior Notes | | 8.250 | % | | 4/15/18 | | 1,260,000 | | | 1,237,950 | |
Petroplus Finance Ltd., Senior Notes | | 6.750 | % | | 5/1/14 | | 995,000 | | | 865,650 | (a) |
Petroplus Finance Ltd., Senior Notes | | 7.000 | % | | 5/1/17 | | 1,050,000 | | | 855,750 | (a) |
Plains Exploration & Production Co., Senior Notes | | 10.000 | % | | 3/1/16 | | 1,460,000 | | | 1,562,200 | |
Plains Exploration & Production Co., Senior Notes | | 8.625 | % | | 10/15/19 | | 165,000 | | | 167,063 | |
Quicksilver Resources Inc., Senior Notes | | 8.250 | % | | 8/1/15 | | 580,000 | | | 572,750 | |
Quicksilver Resources Inc., Senior Notes | | 11.750 | % | | 1/1/16 | | 2,195,000 | | | 2,419,987 | |
Quicksilver Resources Inc., Senior Notes | | 9.125 | % | | 8/15/19 | | 100,000 | | | 101,500 | |
Range Resources Corp., Senior Subordinated Notes | | 8.000 | % | | 5/15/19 | | 380,000 | | | 398,525 | |
See Notes to Financial Statements.
| | |
| 8 | | Western Asset High Yield Portfolio 2010 Semi-Annual Report |
Schedule of investments (unaudited) (cont’d)
June 30, 2010
Western Asset High Yield Portfolio
| | | | | | | | | | | |
| Security | | Rate | | | Maturity Date | | Face Amount† | | Value | |
Oil, Gas & Consumable Fuels — continued | | | | | | | | | | | |
SandRidge Energy Inc., Senior Notes | | 9.875 | % | | 5/15/16 | | 90,000 | | $ | 91,350 | (a) |
SandRidge Energy Inc., Senior Notes | | 8.000 | % | | 6/1/18 | | 1,007,000 | | | 954,133 | (a) |
SandRidge Energy Inc., Senior Notes | | 8.750 | % | | 1/15/20 | | 1,305,000 | | | 1,239,750 | (a) |
SandRidge Energy Inc., Senior Toggle Notes | | 8.625 | % | | 4/1/15 | | 2,695,000 | | | 2,617,519 | (f) |
Stone Energy Corp., Senior Notes | | 8.625 | % | | 2/1/17 | | 890,000 | | | 801,000 | |
Stone Energy Corp., Senior Subordinated Notes | | 6.750 | % | | 12/15/14 | | 465,000 | | | 395,250 | |
Teekay Corp., Senior Notes | | 8.500 | % | | 1/15/20 | | 1,690,000 | | | 1,681,550 | |
Total Oil, Gas & Consumable Fuels | | | | | | | | | | 51,555,206 | |
Total Energy | | | | | | | | | | 62,141,812 | |
| Financials — 14.2% | | | | | | | | | | | |
Capital Markets — 0.1% | | | | | | | | | | | |
Lehman Brothers Holdings Inc., Medium-Term Notes, Senior Notes | | 5.250 | % | | 2/6/12 | | 2,570,000 | | | 507,575 | (b) |
Commercial Banks — 3.0% | | | | | | | | | | | |
BAC Capital Trust VI, Capital Securities, Junior Subordinated Notes | | 5.625 | % | | 3/8/35 | | 1,670,000 | | | 1,406,987 | |
BankAmerica Institutional Capital A, Junior Subordinated Bonds | | 8.070 | % | | 12/31/26 | | 660,000 | | | 640,200 | (a) |
BankAmerica Institutional Capital B, Junior Subordinated Bonds | | 7.700 | % | | 12/31/26 | | 300,000 | | | 287,625 | (a) |
CIT Group Inc., Senior Secured Bonds | | 7.000 | % | | 5/1/14 | | 1,134,065 | | | 1,068,856 | |
CIT Group Inc., Senior Secured Bonds | | 7.000 | % | | 5/1/15 | | 134,065 | | | 123,675 | |
CIT Group Inc., Senior Secured Bonds | | 7.000 | % | | 5/1/16 | | 1,503,443 | | | 1,371,892 | |
CIT Group Inc., Senior Secured Bonds | | 7.000 | % | | 5/1/17 | | 5,892,820 | | | 5,303,538 | |
Credit Agricole SA, Subordinated Notes | | 8.375 | % | | 10/13/19 | | 1,340,000 | | | 1,266,300 | (a)(d)(g) |
NB Capital Trust II, Junior Subordinated Notes | | 7.830 | % | | 12/15/26 | | 780,000 | | | 748,800 | |
NB Capital Trust IV, Junior Subordinated Notes | | 8.250 | % | | 4/15/27 | | 1,210,000 | | | 1,179,750 | |
Santander Finance Preferred SA Unipersonal, Junior Subordinated Notes | | 10.500 | % | | 9/29/14 | | 990,000 | | | 1,038,407 | (d)(g) |
Total Commercial Banks | | | | | | | | | | 14,436,030 | |
Consumer Finance — 3.6% | | | | | | | | | | | |
Ford Motor Credit Co., LLC, Senior Notes | | 7.000 | % | | 4/15/15 | | 1,190,000 | | | 1,177,112 | |
Ford Motor Credit Co., LLC, Senior Notes | | 12.000 | % | | 5/15/15 | | 5,495,000 | | | 6,361,018 | |
GMAC Inc., Senior Notes | | 7.500 | % | | 12/31/13 | | 220,000 | | | 219,450 | |
GMAC Inc., Subordinated Notes | | 8.000 | % | | 12/31/18 | | 404,000 | | | 371,680 | |
GMAC LLC, Debentures | | 0.000 | % | | 6/15/15 | | 3,440,000 | | | 2,158,600 | |
GMAC LLC, Senior Bonds | | 0.000 | % | | 12/1/12 | | 1,170,000 | | | 976,950 | |
SLM Corp., Medium-Term Notes, Senior Notes | | 8.450 | % | | 6/15/18 | | 1,510,000 | | | 1,393,445 | |
SLM Corp., Senior Notes | | 8.000 | % | | 3/25/20 | | 5,060,000 | | | 4,443,621 | |
Total Consumer Finance | | | | | | | | | | 17,101,876 | |
Diversified Financial Services — 6.2% | | | | | | | | | | | |
AAC Group Holding Corp., Senior Discount Notes | | 10.250 | % | | 10/1/12 | | 2,335,000 | | | 2,311,650 | (a) |
AES Red Oak LLC, Secured Notes | | 9.200 | % | | 11/30/29 | | 240,000 | | | 232,800 | |
Astoria Depositor Corp., Pass-Through Certificates | | 8.144 | % | | 5/1/21 | | 1,990,000 | | | 1,970,100 | (a) |
Bank of America Corp., Notes, Preferred Securities | | 8.000 | % | | 1/30/18 | | 640,000 | | | 618,195 | (d)(g) |
Bankrate Inc., Senior Secured Notes | | 11.750 | % | | 7/15/15 | | 820,000 | | | 815,900 | (a) |
Capital One Capital V, Junior Subordinated Notes, Cumulative
Trust Preferred Securities | | 10.250 | % | | 8/15/39 | | 960,000 | | | 1,012,800 | |
CCM Merger Inc., Notes | | 8.000 | % | | 8/1/13 | | 3,735,000 | | | 3,417,525 | (a) |
Countrywide Capital III, Junior Subordinated Notes | | 8.050 | % | | 6/15/27 | | 120,000 | | | 119,100 | |
Express LLC/Express Finance Corp., Senior Notes | | 8.750 | % | | 3/1/18 | | 1,220,000 | | | 1,241,350 | (a) |
See Notes to Financial Statements.
| | |
| Western Asset High Yield Portfolio 2010 Semi-Annual Report | | 9 |
Western Asset High Yield Portfolio
| | | | | | | | | | | |
| Security | | Rate | | | Maturity Date | | Face Amount† | | Value | |
Diversified Financial Services — continued | | | | | | | | | | | |
Fresenius U.S. Finance II Inc., Senior Notes | | 9.000 | % | | 7/15/15 | | 2,015,000 | | $ | 2,183,756 | (a) |
International Lease Finance Corp., Medium-Term Notes | | 6.375 | % | | 3/25/13 | | 2,440,000 | | | 2,287,500 | |
International Lease Finance Corp., Medium-Term Notes, Senior Notes | | 5.625 | % | | 9/20/13 | | 2,320,000 | | | 2,093,800 | |
International Lease Finance Corp., Notes | | 5.875 | % | | 5/1/13 | | 670,000 | | | 618,075 | |
International Lease Finance Corp., Senior Notes | | 8.750 | % | | 3/15/17 | | 1,420,000 | | | 1,345,450 | (a) |
LBI Escrow Corp., Senior Secured Notes | | 8.000 | % | | 11/1/17 | | 990,000 | | | 1,019,700 | (a) |
Leucadia National Corp., Senior Notes | | 8.125 | % | | 9/15/15 | | 2,100,000 | | | 2,152,500 | |
MBNA Capital A, Junior Subordinated Notes | | 8.278 | % | | 12/1/26 | | 1,480,000 | | | 1,443,000 | |
Midwest Gaming Borrower LLC/Midwest Finance Corp., Senior Secured Notes | | 11.625 | % | | 4/15/16 | | 600,000 | | | 589,500 | (a) |
TNK-BP Finance SA, Senior Notes | | 7.500 | % | | 7/18/16 | | 345,000 | | | 357,075 | (a) |
TNK-BP Finance SA, Senior Notes | | 7.875 | % | | 3/13/18 | | 1,889,000 | | | 1,968,338 | (a) |
Vanguard Health Holdings Co., II LLC, Senior Notes | | 8.000 | % | | 2/1/18 | | 1,635,000 | | | 1,569,600 | |
Total Diversified Financial Services | | | | | | | | | | 29,367,714 | |
Insurance — 0.5% | | | | | | | | | | | |
American International Group Inc., Senior Notes | | 8.250 | % | | 8/15/18 | | 2,505,000 | | | 2,536,312 | |
Real Estate Investment Trusts (REITs) — 0.1% | | | | | | | | | | | |
Entertainment Properties Trust, Senior Notes | | 7.750 | % | | 7/15/20 | | 550,000 | | | 551,375 | (a) |
Real Estate Management & Development — 0.7% | | | | | | | | | | | |
Ashton Woods USA LLC/Ashton Woods Finance Co.,
Senior Subordinated Notes, step bond | | 0.000 | % | | 6/30/15 | | 1,003,200 | | | 581,856 | (a)(c) |
Realogy Corp., Senior Notes | | 10.500 | % | | 4/15/14 | | 2,895,000 | | | 2,453,513 | |
Realogy Corp., Senior Toggle Notes | | 11.000 | % | | 4/15/14 | | 328,508 | | | 274,304 | (f) |
Total Real Estate Management & Development | | | | | | | | | | 3,309,673 | |
Total Financials | | | | | | | | | | 67,810,555 | |
| Health Care — 5.7% | | | | | | | | | | | |
Health Care Equipment & Supplies — 0.6% | | | | | | | | | | | |
Biomet Inc., Senior Notes | | 11.625 | % | | 10/15/17 | | 970,000 | | | 1,050,025 | |
Biomet Inc., Senior Toggle Notes | | 10.375 | % | | 10/15/17 | | 1,505,000 | | | 1,617,875 | (f) |
Fresenius Medical Care Capital Trust IV, Senior Subordinated Notes | | 7.875 | % | | 6/15/11 | | 135,000 | | | 139,556 | |
Total Health Care Equipment & Supplies | | | | | | | | | | 2,807,456 | |
Health Care Providers & Services — 5.1% | | | | | | | | | | | |
American Renal Holdings, Senior Secured Notes | | 8.375 | % | | 5/15/18 | | 1,520,000 | | | 1,504,800 | (a) |
Capella Healthcare Inc., Senior Notes | | 9.250 | % | | 7/1/17 | | 590,000 | | | 595,900 | (a) |
CRC Health Corp., Senior Subordinated Notes | | 10.750 | % | | 2/1/16 | | 5,030,000 | | | 4,627,600 | |
HCA Inc., Notes | | 9.000 | % | | 12/15/14 | | 51,000 | | | 49,342 | |
HCA Inc., Notes | | 7.690 | % | | 6/15/25 | | 1,675,000 | | | 1,499,125 | |
HCA Inc., Senior Notes | | 6.300 | % | | 10/1/12 | | 4,060,000 | | | 4,039,700 | |
HCA Inc., Senior Secured Notes | | 9.625 | % | | 11/15/16 | | 201,000 | | | 215,070 | (f) |
HCA Inc., Senior Secured Notes | | 7.875 | % | | 2/15/20 | | 365,000 | | | 375,494 | |
Omnicare Inc., Senior Subordinated Notes | | 7.750 | % | | 6/1/20 | | 1,040,000 | | | 1,060,800 | |
Tenet Healthcare Corp., Senior Notes | | 10.000 | % | | 5/1/18 | | 1,457,000 | | | 1,609,985 | (a) |
Universal Hospital Services Inc., Senior Secured Notes | | 4.134 | % | | 6/1/15 | | 1,080,000 | | | 907,200 | (d) |
Universal Hospital Services Inc., Senior Secured Notes | | 8.500 | % | | 6/1/15 | | 300,000 | | | 295,500 | (f) |
US Oncology Holdings Inc., Senior Notes | | 6.643 | % | | 3/15/12 | | 7,193,000 | | | 6,689,490 | (d)(f) |
US Oncology Inc., Senior Secured Notes | | 9.125 | % | | 8/15/17 | | 1,190,000 | | | 1,222,725 | |
Total Health Care Providers & Services | | | | | | | | | | 24,692,731 | |
Total Health Care | | | | | | | | | | 27,500,187 | |
See Notes to Financial Statements.
| | |
| 10 | | Western Asset High Yield Portfolio 2010 Semi-Annual Report |
Schedule of investments (unaudited) (cont’d)
June 30, 2010
Western Asset High Yield Portfolio
| | | | | | | | | | | |
| Security | | Rate | | | Maturity Date | | Face Amount† | | Value | |
| Industrials — 10.0% | | | | | | | | | | | |
Aerospace & Defense — 1.7% | | | | | | | | | | | |
DynCorp International Inc., Senior Notes | | 10.375 | % | | 7/1/17 | | 1,000,000 | | $ | 1,002,500 | (a) |
Freedom Group Inc., Senior Secured Notes | | 10.250 | % | | 8/1/15 | | 1,525,000 | | | 1,586,000 | (a) |
Kratos Defense & Security Solutions Inc., Senior Secured Notes | | 10.000 | % | | 6/1/17 | | 1,300,000 | | | 1,319,500 | (a) |
Triumph Group Inc., Senior Notes | | 8.625 | % | | 7/15/18 | | 1,660,000 | | | 1,693,200 | (a) |
Wyle Services Corp., Senior Subordinated Notes | | 10.500 | % | | 4/1/18 | | 2,335,000 | | | 2,323,325 | (a) |
Total Aerospace & Defense | | | | | | | | | | 7,924,525 | |
Airlines — 2.6% | | | | | | | | | | | |
Continental Airlines Inc., Pass-Through Certificates | | 7.373 | % | | 12/15/15 | | 985,307 | | | 926,188 | |
Continental Airlines Inc., Pass-Through Certificates, Subordinated Senior Secured Notes | | 7.339 | % | | 4/19/14 | | 2,456,077 | | | 2,351,694 | |
DAE Aviation Holdings Inc., Senior Notes | | 11.250 | % | | 8/1/15 | | 4,935,000 | | | 4,885,650 | (a) |
Delta Air Lines Inc., Pass-Through Certificates | | 7.711 | % | | 9/18/11 | | 2,025,000 | | | 2,004,750 | |
Delta Air Lines Inc., Pass-Through Certificates, Subordinated Secured Notes | | 9.750 | % | | 12/17/16 | | 864,717 | | | 899,306 | |
Delta Air Lines Inc., Secured Notes | | 8.021 | % | | 8/10/22 | | 584,017 | | | 556,277 | |
Delta Air Lines Inc., Senior Secured Notes | | 9.500 | % | | 9/15/14 | | 905,000 | | | 950,250 | (a) |
Total Airlines | | | | | | | | | | 12,574,115 | |
Commercial Services & Supplies — 2.1% | | | | | | | | | | | |
ACCO Brands Corp., Senior Secured Notes | | 10.625 | % | | 3/15/15 | | 2,335,000 | | | 2,533,475 | |
Altegrity Inc., Senior Subordinated Notes | | 11.750 | % | | 5/1/16 | | 3,700,000 | | | 3,357,750 | (a) |
Garda World Security Corp., Senior Notes | | 9.750 | % | | 3/15/17 | | 890,000 | | | 903,350 | (a) |
Geo Group Inc., Senior Notes | | 7.750 | % | | 10/15/17 | | 2,305,000 | | | 2,322,288 | (a) |
RSC Equipment Rental Inc./RSC Holdings III LLC, Senior Secured Notes | | 10.000 | % | | 7/15/17 | | 900,000 | | | 965,250 | (a) |
Total Commercial Services & Supplies | | | | | | | | | | 10,082,113 | |
Electrical Equipment — 0.0% | | | | | | | | | | | |
NES Rentals Holdings Inc., Senior Secured Notes | | 12.250 | % | | 4/15/15 | | 140,000 | | | 119,700 | (a) |
Machinery — 0.2% | | | | | | | | | | | |
Case New Holland Inc., Senior Notes | | 7.750 | % | | 9/1/13 | | 690,000 | | | 705,525 | (c) |
Marine — 0.6% | | | | | | | | | | | |
Trico Shipping AS, Senior Secured Notes | | 11.875 | % | | 11/1/14 | | 3,210,000 | | | 3,081,600 | (a) |
Road & Rail — 1.9% | | | | | | | | | | | |
Kansas City Southern de Mexico, Senior Notes | | 7.625 | % | | 12/1/13 | | 500,000 | | | 510,000 | |
Kansas City Southern de Mexico, Senior Notes | | 12.500 | % | | 4/1/16 | | 3,787,000 | | | 4,525,465 | |
Kansas City Southern de Mexico, Senior Notes | | 8.000 | % | | 2/1/18 | | 1,140,000 | | | 1,179,900 | (a) |
Kansas City Southern Railway, Senior Notes | | 13.000 | % | | 12/15/13 | | 370,000 | | | 444,000 | |
RailAmerica Inc., Senior Secured Notes | | 9.250 | % | | 7/1/17 | | 2,454,000 | | | 2,570,565 | |
Total Road & Rail | | | | | | | | | | 9,229,930 | |
Trading Companies & Distributors — 0.5% | | | | | | | | | | | |
Ashtead Capital Inc., Notes | | 9.000 | % | | 8/15/16 | | 1,076,000 | | | 1,054,480 | (a) |
H&E Equipment Services Inc., Senior Notes | | 8.375 | % | | 7/15/16 | | 1,180,000 | | | 1,109,200 | |
Total Trading Companies & Distributors | | | | | | | | | | 2,163,680 | |
Transportation — 0.4% | | | | | | | | | | | |
Syncreon Global Ireland Ltd./Syncreon Global Finance US Inc., Senior Notes | | 9.500 | % | | 5/1/18 | | 2,210,000 | | | 2,132,650 | (a) |
Total Industrials | | | | | | | | | | 48,013,838 | |
See Notes to Financial Statements.
| | |
| Western Asset High Yield Portfolio 2010 Semi-Annual Report | | 11 |
Western Asset High Yield Portfolio
| | | | | | | | | | | | |
| Security | | Rate | | | Maturity Date | | Face Amount† | | | Value | |
| Information Technology — 3.0% | | | | | | | | | | | | |
Electronic Equipment, Instruments & Components — 1.0% | | | | | | | | | | | | |
Jabil Circuit Inc., Senior Notes | | 8.250 | % | | 3/15/18 | | 110,000 | | | $ | 116,600 | |
KEMET Corp., Senior Secured Notes | | 10.500 | % | | 5/1/18 | | 1,230,000 | | | | 1,217,700 | (a) |
NXP BV/NXP Funding LLC, Senior Secured Notes | | 7.875 | % | | 10/15/14 | | 3,870,000 | | | | 3,550,725 | |
Total Electronic Equipment, Instruments & Components | | | | | | | | | | | 4,885,025 | |
IT Services — 1.3% | | | | | | | | | | | | |
Ceridian Corp., Senior Notes | | 13.000 | % | | 11/15/15 | | 1,682,700 | | | | 1,514,430 | (f) |
First Data Corp., Senior Notes | | 10.550 | % | | 9/24/15 | | 4,968,980 | | | | 3,639,778 | (f) |
GXS Worldwide Inc., Senior Secured Notes | | 9.750 | % | | 6/15/15 | | 1,060,000 | | | | 1,012,300 | (a) |
Total IT Services | | | | | | | | | | | 6,166,508 | |
Semiconductors & Semiconductor Equipment — 0.4% | | | | | | | | | | | | |
Freescale Semiconductor Inc., Senior Secured Notes | | 9.250 | % | | 4/15/18 | | 760,000 | | | | 750,500 | (a) |
Freescale Semiconductor Inc., Senior Subordinated Notes | | 10.125 | % | | 12/15/16 | | 975,000 | | | | 780,000 | |
Freescale Semiconductor Inc., Senior Toggle Notes | | 9.875 | % | | 12/15/14 | | 618,222 | | | | 553,309 | (f) |
Total Semiconductors & Semiconductor Equipment | | | | | | | | | | | 2,083,809 | |
Software — 0.3% | | | | | | | | | | | | |
Aspect Software Inc., Senior Secured Notes | | 10.625 | % | | 5/15/17 | | 1,375,000 | | | | 1,375,000 | (a) |
Total Information Technology | | | | | | | | | | | 14,510,342 | |
| Materials — 8.9% | | | | | | | | | | | | |
Chemicals — 3.1% | | | | | | | | | | | | |
Ashland Inc., Senior Notes | | 9.125 | % | | 6/1/17 | | 3,285,000 | | | | 3,597,075 | (a) |
CF Industries Inc., Senior Notes | | 6.875 | % | | 5/1/18 | | 260,000 | | | | 264,550 | |
CF Industries Inc., Senior Notes | | 7.125 | % | | 5/1/20 | | 1,070,000 | | | | 1,096,750 | |
Georgia Gulf Corp., Senior Secured Notes | | 9.000 | % | | 1/15/17 | | 1,630,000 | | | | 1,654,450 | (a) |
Ineos Finance PLC, Senior Secured Notes | | 9.000 | % | | 5/15/15 | | 1,490,000 | | | | 1,486,275 | (a) |
Kerling PLC, Senior Secured Notes | | 10.625 | % | | 1/28/17 | | 1,334,000 | EUR | | | 1,651,688 | (a) |
Lyondell Chemical Co., Senior Secured Notes | | 11.000 | % | | 5/1/18 | | 2,245,445 | | | | 2,408,240 | |
Solutia Inc., Senior Notes | | 8.750 | % | | 11/1/17 | | 1,000,000 | | | | 1,040,000 | |
Solutia Inc., Senior Notes | | 7.875 | % | | 3/15/20 | | 1,760,000 | | | | 1,755,600 | |
Total Chemicals | | | | | | | | | | | 14,954,628 | |
Containers & Packaging — 1.5% | | | | | | | | | | | | |
Berry Plastics Corp., Senior Secured Notes | | 9.500 | % | | 5/15/18 | | 2,100,000 | | | | 1,921,500 | (a) |
Graham Packaging Co. L.P., Senior Subordinated Notes | | 9.875 | % | | 10/15/14 | | 370,000 | | | | 378,325 | |
Solo Cup Co., Senior Secured Notes | | 10.500 | % | | 11/1/13 | | 2,460,000 | | | | 2,543,025 | |
Viskase Cos. Inc., Senior Secured Notes | | 9.875 | % | | 1/15/18 | | 2,360,000 | | | | 2,371,800 | (a) |
Total Containers & Packaging | | | | | | | | | | | 7,214,650 | |
Metals & Mining — 1.4% | | | | | | | | | | | | |
Metals USA Inc., Senior Secured Notes | | 11.125 | % | | 12/1/15 | | 4,730,000 | | | | 4,966,500 | |
Ryerson Holding Corp., Senior Discount Notes | | 0.000 | % | | 2/1/15 | | 4,000,000 | | | | 1,960,000 | (a) |
Total Metals & Mining | | | | | | | | | | | 6,926,500 | |
Paper & Forest Products — 2.9% | | | | | | | | | | | | |
Abitibi-Consolidated Co. of Canada, Senior Secured Notes | | 13.750 | % | | 4/1/11 | | 1,680,588 | | | | 1,652,053 | (a)(b) |
Appleton Papers Inc., Senior Secured Notes | | 11.250 | % | | 12/15/15 | | 3,000,000 | | | | 2,550,000 | (a) |
Georgia-Pacific LLC, Senior Notes | | 8.250 | % | | 5/1/16 | | 940,000 | | | | 1,002,275 | (a) |
NewPage Corp., Senior Secured Notes | | 11.375 | % | | 12/31/14 | | 2,390,000 | | | | 2,168,925 | |
Smurfit Capital Funding PLC, Debentures | | 7.500 | % | | 11/20/25 | | 1,990,000 | | | | 1,766,125 | |
See Notes to Financial Statements.
| | |
| 12 | | Western Asset High Yield Portfolio 2010 Semi-Annual Report |
Schedule of investments (unaudited) (cont’d)
June 30, 2010
Western Asset High Yield Portfolio
| | | | | | | | | | | |
| Security | | Rate | | | Maturity Date | | Face Amount† | | Value | |
Paper & Forest Products — continued | | | | | | | | | | | |
Verso Paper Holdings LLC, Senior Secured Notes | | 11.500 | % | | 7/1/14 | | 3,305,000 | | $ | 3,561,138 | |
Verso Paper Holdings LLC, Senior Subordinated Notes | | 11.375 | % | | 8/1/16 | | 1,120,000 | | | 954,800 | |
Total Paper & Forest Products | | | | | | | | | | 13,655,316 | |
Total Materials | | | | | | | | | | 42,751,094 | |
| Telecommunication Services — 7.8% | | | | | | | | | | | |
Diversified Telecommunication Services — 4.6% | | | | | | | | | | | |
CC Holdings GS V LLC, Senior Secured Notes | | 7.750 | % | | 5/1/17 | | 600,000 | | | 634,500 | (a) |
Cincinnati Bell Telephone Co., Senior Debentures | | 6.300 | % | | 12/1/28 | | 1,130,000 | | | 779,700 | |
Hawaiian Telcom Communications Inc., Senior Subordinated Notes | | 12.500 | % | | 5/1/15 | | 1,305,000 | | | 131 | (b)(c) |
Inmarsat Finance PLC, Senior Notes | | 7.375 | % | | 12/1/17 | | 1,360,000 | | | 1,390,600 | (a) |
Intelsat Jackson Holdings Ltd., Senior Notes | | 9.500 | % | | 6/15/16 | | 2,635,000 | | | 2,766,750 | |
Intelsat Jackson Holdings Ltd., Senior Notes | | 11.250 | % | | 6/15/16 | | 1,280,000 | | | 1,363,200 | |
Intelsat Jackson Holdings Ltd., Senior Notes | | 11.500 | % | | 6/15/16 | | 5,710,000 | | | 6,052,600 | |
Level 3 Financing Inc., Senior Notes | | 10.000 | % | | 2/1/18 | | 1,400,000 | | | 1,239,000 | (a) |
Nordic Telephone Co. Holdings, Senior Secured Bonds | | 8.875 | % | | 5/1/16 | | 1,035,000 | | | 1,063,462 | (a) |
TW Telecom Holdings Inc., Senior Notes | | 8.000 | % | | 3/1/18 | | 1,430,000 | | | 1,458,600 | (a) |
Wind Acquisition Finance SA, Senior Bonds | | 12.000 | % | | 12/1/15 | | 485,000 | | | 501,975 | (a) |
Wind Acquisition Holdings Finance SpA, Senior Notes | | 12.250 | % | | 7/15/17 | | 3,240,000 | | | 2,948,400 | (a)(f) |
Windstream Corp., Senior Notes | | 8.625 | % | | 8/1/16 | | 1,845,000 | | | 1,858,837 | |
Total Diversified Telecommunication Services | | | | | | | | | | 22,057,755 | |
Wireless Telecommunication Services — 3.2% | | | | | | | | | | | |
Cricket Communications Inc., Senior Secured Notes | | 7.750 | % | | 5/15/16 | | 590,000 | | | 601,800 | |
Sprint Capital Corp., Senior Notes | | 6.875 | % | | 11/15/28 | | 6,020,000 | | | 4,996,600 | |
Sprint Capital Corp., Senior Notes | | 8.750 | % | | 3/15/32 | | 6,340,000 | | | 6,054,700 | |
True Move Co., Ltd. | | 10.750 | % | | 12/16/13 | | 305,000 | | | 299,663 | (a) |
True Move Co., Ltd., Notes | | 10.750 | % | | 12/16/13 | | 3,420,000 | | | 3,360,150 | (a) |
Total Wireless Telecommunication Services | | | | | | | | | | 15,312,913 | |
Total Telecommunication Services | | | | | | | | | | 37,370,668 | |
| Utilities — 4.3% | | | | | | | | | | | |
Electric Utilities — 0.4% | | | | | | | | | | | |
Elwood Energy LLC, Secured Notes | | 8.159 | % | | 7/5/26 | | 1,903,400 | | | 1,798,713 | |
Gas Utilities — 0.2% | | | | | | | | | | | |
Suburban Propane Partners LP/Suburban Energy Finance Corp., Senior Notes | | 7.375 | % | | 3/15/20 | | 1,010,000 | | | 1,022,625 | |
Independent Power Producers & Energy Traders — 3.7% | | | | | | | | | | | |
AES Corp., Senior Notes | | 8.000 | % | | 10/15/17 | | 590,000 | | | 595,900 | |
AES Corp., Senior Notes | | 8.000 | % | | 6/1/20 | | 180,000 | | | 180,900 | |
Dynegy Inc., Bonds | | 7.670 | % | | 11/8/16 | | 1,315,000 | | | 1,157,200 | |
Edison Mission Energy, Senior Notes | | 7.750 | % | | 6/15/16 | | 1,000,000 | | | 695,000 | |
Edison Mission Energy, Senior Notes | | 7.625 | % | | 5/15/27 | | 2,435,000 | | | 1,381,862 | |
Energy Future Holdings Corp., Senior Notes | | 12.000 | % | | 11/1/17 | | 12,636,698 | | | 8,213,854 | (f) |
Mirant Americas Generation LLC, Senior Notes | | 8.500 | % | | 10/1/21 | | 440,000 | | | 409,200 | |
Mirant Americas Generation LLC, Senior Notes | | 9.125 | % | | 5/1/31 | | 520,000 | | | 478,400 | |
Mirant Mid Atlantic LLC, Pass-Through Certificates | | 10.060 | % | | 12/30/28 | | 1,841,416 | | | 1,974,919 | |
NRG Energy Inc., Senior Notes | | 7.375 | % | | 2/1/16 | | 110,000 | | | 109,450 | |
See Notes to Financial Statements.
| | |
| Western Asset High Yield Portfolio 2010 Semi-Annual Report | | 13 |
Western Asset High Yield Portfolio
| | | | | | | | | | | |
| Security | | Rate | | | Maturity Date | | Face Amount† | | Value | |
Independent Power Producers & Energy Traders — continued | | | | | | | | | | | |
NRG Energy Inc., Senior Notes | | 7.375 | % | | 1/15/17 | | 2,375,000 | | $ | 2,351,250 | |
Total Independent Power Producers & Energy Traders | | | | | | | | | | 17,547,935 | |
Total Utilities | | | | | | | | | | 20,369,273 | |
Total Corporate Bonds & Notes (Cost — $418,994,664) | | | | | | | | | | 408,608,476 | |
| Collateralized Mortgage Obligation — 0.0% | | | | | | | | | | | |
BlackRock Capital Finance LP, 1996-R1 (Cost — $296,298) | | 9.580 | % | | 9/25/26 | | 336,882 | | | 32,004 | (d)(e) |
| Collateralized Senior Loans — 4.6% | | | | | | | | | | | |
| Consumer Discretionary — 1.9% | | | | | | | | | | | |
Auto Components — 0.7% | | | | | | | | | | | |
Allison Transmission Inc., Term Loan, Tranche B | | 3.050 - 3.110 | % | | 8/7/14 | | 3,489,333 | | | 3,174,205 | (a)(h) |
Automobiles — 0.4% | | | | | | | | | | | |
Ford Motor Co., Term Loan, Tranche B | | 3.310 - 3.350 | % | | 12/16/13 | | 1,956,952 | | | 1,846,873 | (a)(h) |
Media — 0.6% | | | | | | | | | | | |
Citadel Broadcasting Corp., Term Loan A | | 2.110 | % | | 6/3/15 | | 177,790 | | | 185,524 | (a)(h) |
Newsday LLC, Term Loan | | 10.500 | % | | 8/1/13 | | 2,000,000 | | | 2,085,000 | (a)(h) |
SuperMedia Inc., Term Loan | | 11.000 | % | | 12/31/15 | | 734,701 | | | 628,956 | (a)(h) |
Total Media | | | | | | | | | | 2,899,480 | |
Specialty Retail — 0.2% | | | | | | | | | | | |
Michaels Stores Inc., Term Loan B1 | | 2.625 - 2.813 | % | | 10/31/13 | | 501,781 | | | 465,402 | (a)(h) |
Michaels Stores Inc., Term Loan B2 | | 4.875 - 5.063 | % | | 10/10/14 | | 675,284 | | | 641,038 | (a)(h) |
Total Specialty Retail | | | | | | | | | | 1,106,440 | |
Total Consumer Discretionary | | | | | | | | | | 9,026,998 | |
| Energy — 0.8% | | | | | | | | | | | |
Energy Equipment & Services — 0.8% | | | | | | | | | | | |
Turbo Beta Ltd., Term Loan | | 14.500 | % | | 3/15/18 | | 4,469,969 | | | 3,821,823 | (a)(c)(h) |
| Financials — 0.7% | | | | | | | | | | | |
Real Estate Management & Development — 0.7% | | | | | | | | | | | |
Realogy Corp., Term Loan | | 13.500 | % | | 10/15/17 | | 3,000,000 | | | 3,129,999 | (a)(h) |
| Industrials — 0.9% | | | | | | | | | | | |
Aerospace & Defense — 0.5% | | | | | | | | | | | |
Hawker Beechcraft Acquisition Co., Term Loan | | 2.347 - 2.533 | % | | 3/26/14 | | 2,682,325 | | | 2,161,507 | (h) |
Hawker Beechcraft Acquisition Co. LLC, LC Facility Deposits | | 2.533 | % | | 3/26/14 | | 159,948 | | | 128,891 | (a)(h) |
Total Aerospace & Defense | | | | | | | | | | 2,290,398 | |
Airlines — 0.4% | | | | | | | | | | | |
United Airlines Inc., Term Loan B | | 2.313 - 2.375 | % | | 2/3/14 | | 2,267,247 | | | 1,982,764 | (a)(h) |
Total Industrials | | | | | | | | | | 4,273,162 | |
| Materials — 0.1% | | | | | | | | | | | |
Containers & Packaging — 0.1% | | | | | | | | | | | |
Berry Plastics Group Inc., Term Loan C | | 2.350 | % | | 4/3/14 | | 494,885 | | | 435,980 | (a)(h) |
| Utilities — 0.2% | | | | | | | | | | | |
Independent Power Producers & Energy Traders — 0.2% | | | | | | | | | | | |
Energy Future Holdings, Term Loan B3 | | 3.850 - 4.033 | % | | 10/10/14 | | 1,611,714 | | | 1,186,875 | (a)(h) |
Total Collateralized Senior Loans (Cost — $20,633,351) | | | | | | | | | | 21,874,837 | |
See Notes to Financial Statements.
| | |
| 14 | | Western Asset High Yield Portfolio 2010 Semi-Annual Report |
Schedule of investments (unaudited) (cont’d)
June 30, 2010
Western Asset High Yield Portfolio
| | | | | | | | | | | |
| Security | | Rate | | | Maturity Date | | Face Amount† | | Value | |
| Convertible Bonds & Notes — 0.8% | | | | | | | | | | | |
| Industrials — 0.8% | | | | | | | | | | | |
Marine — 0.8% | | | | | | | | | | | |
Horizon Lines Inc., Senior Notes | | 4.250 | % | | 8/15/12 | | 4,405,000 | | $ | 3,634,125 | |
| Materials — 0.0% | | | | | | | | | | | |
Construction Materials — 0.0% | | | | | | | | | | | |
Cemex SAB de CV, Subordinated Notes | | 4.875 | % | | 3/15/15 | | 130,000 | | | 128,537 | (a) |
Total Convertible Bonds & Notes (Cost — $3,918,929) | | | | | | | | | | 3,762,662 | |
| Sovereign Bond — 0.2% | | | | | | | | | | | |
Russia — 0.2% | | | | | | | | | | | |
Russian Foreign Bond — Eurobond, Senior Bonds (Cost — $792,754) | | 7.500 | % | | 3/31/30 | | 723,378 | | | 815,464 | (a) |
| | | | |
| | | | | | | | Shares | | | |
| Common Stocks — 2.2% | | | | | | | | | | | |
| Consumer Discretionary — 1.5% | | | | | | | | | | | |
Media — 1.5% | | | | | | | | | | | |
Charter Communications Inc. | | | | | | | 126,560 | | | 4,467,568 | (e) |
Charter Communications Inc., Class A Shares | | | | | | | 68,009 | | | 2,400,718 | * |
Dex One Corp. | | | | | | | 2,180 | | | 41,429 | * |
SuperMedia Inc. | | | | | | | 5,949 | | | 108,809 | * |
Total Consumer Discretionary | | | | | | | | | | 7,018,524 | |
| Energy — 0.1% | | | | | | | | | | | |
Oil, Gas & Consumable Fuels — 0.1% | | | | | | | | | | | |
SemGroup Corp., Class A Shares | | | | | | | 13,610 | | | 357,269 | *(e) |
| Industrials — 0.0% | | | | | | | | | | | |
Building Products — 0.0% | | | | | | | | | | | |
Nortek Inc. | | | | | | | 4,801 | | | 201,641 | * |
| Materials — 0.6% | | | | | | | | | | | |
Chemicals — 0.6% | | | | | | | | | | | |
Georgia Gulf Corp. | | | | | | | 78,433 | | | 1,046,296 | * |
LyondellBasell Industries NV, Class A Shares | | | | | | | 63,397 | | | 1,023,862 | * |
LyondellBasell Industries NV, Class B Shares | | | | | | | 58,105 | | | 938,396 | * |
Total Materials | | | | | | | | | | 3,008,554 | |
Total Common Stocks (Cost — $13,063,602) | | | | | | | | | | 10,585,988 | |
| | | | |
| | | Rate | | | Maturity
Date | | | | | |
| Convertible Preferred Stocks — 1.3% | | | | | | | | | | | |
| Financials — 1.3% | | | | | | | | | | | |
Diversified Financial Services — 1.3% | | | | | | | | | | | |
Bank of America Corp. | | 7.250 | % | | | | 4,800 | | | 4,358,400 | |
Citigroup Inc. | | 7.500 | % | | 12/15/12 | | 15,768 | | | 1,781,784 | |
Total Convertible Preferred Stocks (Cost — $6,390,091) | | | | | | | | | | 6,140,184 | |
See Notes to Financial Statements.
| | |
| Western Asset High Yield Portfolio 2010 Semi-Annual Report | | 15 |
Western Asset High Yield Portfolio
| | | | | | | | | | | |
| | | | |
| Security | | Rate | | | | | Shares | | Value | |
| Preferred Stocks — 1.2% | | | | | | | | | | | |
| Consumer Discretionary — 0.0% | | | | | | | | | | | |
Media — 0.0% | | | | | | | | | | | |
CMP Susquehanna Radio Holdings Corp. | | 0.000 | % | | | | 40,019 | | $ | 4 | *(a)(c)(d)(e) |
| Financials — 1.1% | | | | | | | | | | | |
Commercial Banks — 0.2% | | | | | | | | | | | |
Santander Finance Preferred SA Unipersonal | | 10.500 | % | | | | 39,600 | | | 1,055,736 | |
Diversified Financial Services — 0.9% | | | | | | | | | | | |
Citigroup Capital XII | | 8.500 | % | | | | 167,900 | | | 4,197,500 | (d) |
Total Financials | | | | | | | | | | 5,253,236 | |
| Telecommunication Services — 0.1% | | | | | | | | | | | |
Wireless Telecommunication Services — 0.1% | | | | | | | | | | | |
Centaur Funding Corp. | | 9.080 | % | | | | 600 | | | 624,000 | (a) |
Total Preferred Stocks (Cost — $5,974,828) | | | | | | | | | | 5,877,240 | |
| | | | |
| | | | | | Expiration
Date | | Warrants | | | |
| Warrants — 0.1% | | | | | | | | | | | |
Buffets Restaurant Holdings | | | | | 4/28/14 | | 3,104 | | | 31 | *(c)(e) |
Charter Communications Inc. | | | | | 11/30/14 | | 3,493 | | | 13,972 | * |
Citadel Broadcasting Corp. | | | | | 6/3/30 | | 10,367 | | | 259,175 | * |
CNB Capital Trust | | | | | 3/23/19 | | 45,731 | | | 0 | *(a)(c)(e) |
Nortek Inc. | | | | | 12/7/14 | | 5,121 | | | 53,770 | * |
SemGroup Corp. | | | | | 11/30/14 | | 14,327 | | | 68,051 | * |
Turbo Beta Ltd. | | | | | 11/1/14 | | 1 | | | 0 | *(c)(e) |
Total Warrants (Cost — $276,313) | | | | | | | | | | 394,999 | |
Total Investments before Short-Term Investments (Cost — 470,340,830) | | | | | | | | | | 458,091,854 | |
| | | | |
| | | | | | Maturity
Date | | Face
Amount† | | | |
| Short-Term Investments — 3.2% | | | | | | | | | | | |
U.S. Government Agencies — 0.1% | | | | | | | | | | | |
Federal National Mortgage Association (FNMA), Discount Notes | | 0.190 | % | | 8/19/10 | | 307,000 | | | 306,947 | (i)(j) |
Federal National Mortgage Association (FNMA), Discount Notes | | 0.200 | % | | 8/26/10 | | 2,000 | | | 2,000 | (i)(j) |
Total U.S. Government Agencies (Cost — $308,920) | | | | | | | | | | 308,947 | |
Repurchase Agreement — 3.1% | | | | | | | | | | | |
Goldman Sachs & Co. repurchase agreement dated 6/30/10; Proceeds at maturity — $15,112,008; (Fully collateralized by U.S. government agency obligations, 6.625% due 11/15/30; Market value-$15,414,300)
(Cost — $15,112,000) | | 0.020 | % | | 7/1/10 | | 15,112,000 | | | 15,112,000 | |
Total Short-Term Investments (Cost — $15,420,920) | | | | | | | | | | 15,420,947 | |
Total Investments — 98.9% (Cost — $485,761,750#) | | | | | | | | | | 473,512,801 | |
Other Assets in Excess of Liabilities — 1.1% | | | | | | | | | | 5,273,333 | |
Total Net Assets — 100.0% | | | | | | | | | $ | 478,786,134 | |
See Notes to Financial Statements.
| | |
| 16 | | Western Asset High Yield Portfolio 2010 Semi-Annual Report |
Schedule of investments (unaudited) (cont’d)
June 30, 2010
Western Asset High Yield Portfolio
| † | Face amount denominated in U.S. dollars, unless otherwise noted. |
| * | Non-income producing security. |
| (a) | Security is exempt from registration under Rule 144A of the Securities Act of 1933. This security may be resold in transactions that are exempt from registration, normally to qualified institutional buyers. This security has been deemed liquid pursuant to guidelines approved by the Board of Directors, unless otherwise noted. |
| (b) | The coupon payment on these securities is currently in default as of June 30, 2010. |
| (d) | Variable rate security. Interest rate disclosed is that which is in effect at June 30, 2010. |
| (e) | Security is valued in good faith at fair value in accordance with procedures approved by the Board of Directors (See Note 1). |
| (f) | Payment-in-kind security for which part of the income earned may be paid as additional principal. |
| (g) | Security has no maturity date. The date shown represents the next call date. |
| (h) | Interest rates disclosed represent the effective rates on collateralized senior loans. Ranges in interest rates are attributable to multiple contracts under the same loan. |
| (i) | Rate shown represents yield-to-maturity. |
| (j) | All or a portion of this security is held at the broker as collateral for open futures contracts. |
| # | Aggregate cost for federal income tax purposes is substantially the same. |
| | |
Abbreviation used in this schedule: |
| EUR | | — Euro |
See Notes to Financial Statements.
| | |
| Western Asset High Yield Portfolio 2010 Semi-Annual Report | | 17 |
Statement of assets and liabilities (unaudited)
June 30, 2010
| | | |
| |
| Assets: | | | |
Investments, at value (Cost — $485,761,750) | | $ | 473,512,801 |
Foreign currency, at value (Cost — $272,479) | | | 269,542 |
Cash | | | 325 |
Dividends and interest receivable | | | 9,455,018 |
Receivable for securities sold | | | 4,600,806 |
Receivable for Fund shares sold | | | 551,695 |
Unrealized appreciation on forward currency contracts | | | 63,937 |
Receivable from broker — variation margin on open futures contracts | | | 60,828 |
Prepaid expenses | | | 32,543 |
Total Assets | | | 488,547,495 |
| |
| Liabilities: | | | |
Payable for securities purchased | | | 5,085,669 |
Payable for Fund shares repurchased | | | 4,126,604 |
Distributions payable | | | 236,153 |
Investment management fee payable | | | 212,712 |
Directors’ fees payable | | | 5,369 |
Accrued expenses | | | 94,854 |
Total Liabilities | | | 9,761,361 |
| Total Net Assets | | $ | 478,786,134 |
| |
| Net Assets: | | | |
Par value (Note 7) | | $ | 57,096 |
Paid-in capital in excess of par value | | | 622,232,530 |
Undistributed net investment income | | | 9,596,956 |
Accumulated net realized loss on investments, futures contracts and foreign currency transactions | | | (140,780,446) |
Net unrealized depreciation on investments, futures contracts and foreign currencies | | | (12,320,002) |
| Total Net Assets | | $ | 478,786,134 |
| |
| Shares Outstanding: | | | |
Class IS1 | | | 12,158,880 |
Class I1 | | | 44,937,498 |
| |
| Net Asset Value: | | | |
Class IS1 | | | $8.48 |
Class I1 | | | $8.36 |
| 1 | In April 2010, Institutional Select Class and Institutional Class shares were renamed Class IS and Class I shares, respectively. |
See Notes to Financial Statements.
| | |
| 18 | | Western Asset High Yield Portfolio 2010 Semi-Annual Report |
Statement of operations (unaudited)
For the Six Months Ended June 30, 2010
| | | |
| |
| Investment Income: | | | |
Interest | | $ | 28,822,639 |
Dividends | | | 458,186 |
Total Investment Income | | | 29,280,825 |
| |
| Expenses: | | | |
Investment management fee (Note 2) | | | 1,551,970 |
Transfer agent fees (Note 5) | | | 90,486 |
Custody fees | | | 43,026 |
Legal fees | | | 29,826 |
Audit and tax | | | 22,537 |
Shareholder reports (Note 5) | | | 22,215 |
Registration fees | | | 9,867 |
Directors’ fees | | | 8,980 |
Miscellaneous expenses | | | 2,459 |
Total Expenses | | | 1,781,366 |
| Net Investment Income | | | 27,499,459 |
| |
Realized and Unrealized Gain (Loss) on Investments, Futures Contracts
and Foreign Currency Transactions (Notes 1, 3 and 4): | | | |
Net Realized Gain From: | | | |
Investment transactions | | | 10,250,457 |
Futures contracts | | | 181,256 |
Foreign currency transactions | | | 211,199 |
Net Realized Gain | | | 10,642,912 |
Change in Net Unrealized Appreciation/Depreciation From: | | | |
Investments | | | (13,229,185) |
Futures contracts | | | (126,787) |
Foreign currencies | | | 55,719 |
Change in Net Unrealized Appreciation/Depreciation | | | (13,300,253) |
| Net Loss on Investments, Futures Contracts and Foreign Currency Transactions | | | (2,657,341) |
| Increase in Net Assets from Operations | | $ | 24,842,118 |
See Notes to Financial Statements.
| | |
| Western Asset High Yield Portfolio 2010 Semi-Annual Report | | 19 |
Statements of changes in net assets
| | | | | | |
For the Six Months Ended June 30, 2010 (unaudited) and the Year Ended December 31, 2009 | | 2010 | | 2009 |
| | |
| Operations: | | | | | | |
Net investment income | | $ | 27,499,459 | | $ | 77,324,315 |
Net realized gain (loss) | | | 10,642,912 | | | (105,324,724) |
Change in net unrealized appreciation/depreciation | | | (13,300,253) | | | 298,198,341 |
Increase in Net Assets From Operations | | | 24,842,118 | | | 270,197,932 |
| | |
| Distributions to Shareholders From (Notes 1 and 6): | | | | | | |
Net investment income | | | (17,338,024) | | | (77,684,083) |
Decrease in Net Assets from Distributions to Shareholders | | | (17,338,024) | | | (77,684,083) |
| | |
| Fund Share Transactions (Note 7): | | | | | | |
Net proceeds from sale of shares | | | 122,997,002 | | | 177,546,482 |
Reinvestment of distributions | | | 16,834,620 | | | 73,758,900 |
Cost of shares repurchased | | | (287,185,648) | | | (342,424,142) |
Decrease in Net Assets From Fund Share Transactions | | | (147,354,026) | | | (91,118,760) |
Increase (Decrease) in Net Assets | | | (139,849,932) | | | 101,395,089 |
| | |
| Net Assets: | | | | | | |
Beginning of period | | | 618,636,066 | | | 517,240,977 |
End of period* | | $ | 478,786,134 | | $ | 618,636,066 |
* Includes undistributed and (overdistributed) net investment income of: | | | $9,596,956 | | | $(564,479) |
See Notes to Financial Statements.
| | |
| 20 | | Western Asset High Yield Portfolio 2010 Semi-Annual Report |
Financial highlights
| | | | | | | | | |
| For a share of each class of capital stock outstanding throughout each year ended December 31, unless otherwise noted: | |
Class IS Shares1,2 | | 20103 | | | 2009 | | | 20084 | |
| | | |
| Net asset value, beginning of period | | $ 8.38 | | | $ 6.06 | | | $ 8.86 | |
| | | |
| Income (loss) from operations: | | | | | | | | | |
Net investment income | | 0.42 | | | 0.94 | | | 0.37 | |
Net realized and unrealized gain (loss) | | (0.04) | | | 2.34 | | | (2.77) | |
Total income (loss) from operations | | 0.38 | | | 3.28 | | | (2.40) | |
| | | |
| Less distributions from: | | | | | | | | | |
Net investment income | | (0.28) | | | (0.96) | | | (0.40) | |
Total distributions | | (0.28) | | | (0.96) | | | (0.40) | |
| | | |
| Net asset value, end of period | | $8.48 | | | $8.38 | | | $6.06 | |
Total return5 | | 4.62 | % | | 56.74 | % | | (27.16) | % |
| | | |
| Net assets, end of period (000s) | | $103,065 | | | $107,301 | | | $77,795 | |
| | | |
| Ratios to average net assets: | | | | | | | | | |
Gross expenses | | 0.60 | %6 | | 0.61 | % | | 0.60 | %6 |
Net expenses | | 0.60 | 6 | | 0.61 | | | 0.60 | 6,7 |
Net investment income | | 9.77 | 6 | | 12.8 | | | 12.4 | 6 |
| | | |
| Portfolio turnover rate | | 56 | % | | 84 | % | | 41 | % |
| 1 | In April 2010, Institutional Select Class shares were renamed Class IS shares. |
| 2 | Per share amounts have been calculated using the average shares method. |
| 3 | For the six months ended June 30, 2010 (unaudited). |
| 4 | For the period August 4, 2008 (commencement of operations) to December 31, 2008. |
| 5 | Performance figures may reflect fee waivers and/or expense reimbursements. In the absence of fee waivers and/or expense reimbursements, the total return would have been lower. Past performance is no guarantee of future results. Total returns for periods of less than one year are not annualized. |
| 7 | The impact of compensating balance arrangements to the expense ratio was less than 0.01%. |
See Notes to Financial Statements.
| | |
| Western Asset High Yield Portfolio 2010 Semi-Annual Report | | 21 |
| | | | | | | | | | | | | | | | | | | | | |
| For a share of each class of capital stock outstanding throughout each year ended December 31, unless otherwise noted: | |
Class I Shares1 | | 20102 | | | 2009 | | | 20083 | | | 20084 | | | 20074 | | | 20064 | | | 20054 | |
| | | | | | | |
| Net asset value, beginning of period | | $ 8.27 | | | $ 5.99 | | | $ 9.30 | | | $ 10.75 | | | $ 10.34 | | | $ 10.49 | | | $ 10.28 | |
| | | | | | | |
| Income (loss) from operations: | | | | | | | | | | | | | | | | | | | | | |
Net investment income | | 0.41 | 5 | | 0.92 | 5 | | 0.66 | 5 | | 0.83 | 5 | | 0.80 | 5 | | 0.76 | | | 0.61 | |
Net realized and unrealized gain (loss) | | (0.04) | | | 2.32 | | | (3.05) | | | (1.41) | | | 0.39 | | | (0.05) | | | 0.17 | |
Total income (loss) from operations | | 0.37 | | | 3.24 | | | (2.39) | | | (0.58) | | | 1.19 | | | 0.71 | | | 0.78 | |
| | | | | | | |
| Less distributions from: | | | | | | | | | | | | | | | | | | | | | |
Net investment income | | (0.28) | | | (0.96) | | | (0.92) | | | (0.80) | | | (0.78) | | | (0.73) | | | (0.57) | |
Net realized gains | | — | | | — | | | — | | | (0.07) | | | (0.00) | 6 | | (0.13) | | | — | |
Total distributions | | (0.28) | | | (0.96) | | | (0.92) | | | (0.87) | | | (0.78) | | | (0.86) | | | (0.57) | |
| | | | | | | |
| Net asset value, end of period | | $8.36 | | | $8.27 | | | $5.99 | | | $9.30 | | | $10.75 | | | $10.34 | | | $10.49 | |
Total return7 | | 4.54 | % | | 56.73 | % | | (27.19) | % | | (5.88) | % | | 12.14 | % | | 7.30 | % | | 7.81 | % |
| | | | | | | |
| Net assets, end of period (000s) | | $375,721 | | | $511,335 | | | $439,446 | | | $800,103 | | | $879,323 | | | $596,918 | | | $414,417 | |
| | | | | | | |
| Ratios to average net assets: | | | | | | | | | | | | | | | | | | | | | |
Gross expenses | | 0.64 | %8 | | 0.62 | % | | 0.60 | %8 | | 0.59 | % | | 0.61 | % | | 0.62 | % | | 0.62 | % |
Net expenses | | 0.64 | 8 | | 0.62 | | | 0.60 | 8,9 | | 0.58 | 10 | | 0.61 | 9 | | 0.62 | 9 | | 0.62 | 9 |
Net investment income | | 9.74 | 8 | | 12.8 | | | 10.4 | 8 | | 8.3 | | | 7.8 | | | 7.8 | | | 7.0 | |
| | | | | | | |
| Portfolio turnover rate | | 56 | % | | 84 | % | | 41 | % | | 59 | % | | 64 | % | | 147 | % | | 121 | % |
| 1 | In April 2010, Institutional Class shares were renamed Class I shares. |
| 2 | For the six months ended June 30, 2010 (unaudited). |
| 3 | For the period April 1, 2008 through December 31, 2008. |
| 4 | For the year ended March 31. |
| 5 | Per share amounts have been calculated using the average shares method. |
| 6 | Amount represents less than $0.005 per share. |
| 7 | Performance figures may reflect fee waivers and/or expense reimbursements. In the absence of fee waivers and/or expense reimbursements, the total return would have been lower. Past performance is no guarantee of future results. Total returns for periods of less than one year are not annualized. |
| 9 | The impact of compensating balance arrangements to the expense ratio was less than 0.01%. |
| 10 | The impact of compensating balance arrangements to the expense ratio was 0.01%. |
See Notes to Financial Statements.
| | |
| 22 | | Western Asset High Yield Portfolio 2010 Semi-Annual Report |
Notes to financial statements (unaudited)
1. Organization and significant accounting policies
Western Asset High Yield Portfolio (the “Fund”) is a separate diversified investment series of Western Asset Funds, Inc. (the “Corporation”). The Corporation, a Maryland Corporation, is registered under the Investment Company Act of 1940, as amended (the “1940 Act”), as an open-end management investment company.
The Fund offers three classes of shares: Class IS, Class I and Class FI. Prior to April 2010, Class IS, Class I and Class FI shares were known as Institutional Select Class, Institutional Class and Financial Intermediary Class shares, respectively. Shares in the Class FI bear a distribution fee. Class FI shares have not commenced operations. The income and expenses of the Fund are allocated proportionately to each class of shares based on daily net assets, except for Rule 12b-1 distribution fees, which are charged only on the Class FI shares, and transfer agent and shareholder servicing expenses, and certain other expenses, which are determined separately for each class.
The following are significant accounting policies consistently followed by the Fund and are in conformity with U.S. generally accepted accounting principles (“GAAP”). Estimates and assumptions are required to be made regarding assets, liabilities and changes in net assets resulting from operations when financial statements are prepared. Changes in the economic environment, financial markets and any other parameters used in determining these estimates could cause actual results to differ. Subsequent events have been evaluated through the date the financial statements were issued.
(a) Investment valuation. Debt securities are valued at the last quoted bid price provided by an independent pricing service that are based on transactions in debt obligations, quotations from bond dealers, market transactions in comparable securities and various other relationships between securities. Publicly traded foreign government debt securities are typically traded internationally in the over-the-counter market and are valued at the bid price as of the close of business of that market. Futures contracts are valued daily at the settlement price established by the board of trade or exchange on which they are traded. Equity securities for which market quotations are available are valued at the last reported sales price or official closing price on the primary market or exchange on which they trade. When prices are not readily available, or are determined not to reflect fair value, such as when the value of a security has been significantly affected by events after the close of the exchange or market on which the security is principally traded, but before the Fund calculates its net asset value, the Fund may value these securities at fair value as determined in accordance with procedures approved by the Fund’s Board of Directors. Short-term obligations with maturities of 60 days or less are valued at amortized cost, which approximates fair value.
The Fund has adopted Financial Accounting Standards Board Codification Topic 820 (“ASC Topic 820”). ASC Topic 820 establishes a single definition of fair value, creates a three-tier hierarchy as a framework for measuring fair value based on inputs used to value the Fund’s investments, and requires additional disclosure about fair value. The hierarchy of inputs is summarized below.
| Ÿ | | Level 1 — quoted prices in active markets for identical investments |
| Ÿ | | Level 2 — other significant observable inputs (including quoted prices for similar investments, interest rates, prepayment speeds, credit risk, etc.) |
| Ÿ | | Level 3 — significant unobservable inputs (including the Fund’s own assumptions in determining the fair value of investments) |
The inputs or methodology used for valuing securities are not necessarily an indication of the risk associated with investing in those securities.
The Fund uses valuation techniques to measure fair value that are consistent with the market approach and/or income approach, depending on the type of the security and the particular circumstance. The market approach uses prices and other relevant information generated by market transactions involving identical or comparable securities. The income approach uses valuation techniques to convert future amounts of cash flow to a single present amount.
| | |
| Western Asset High Yield Portfolio 2010 Semi-Annual Report | | 23 |
The following is a summary of the inputs used in valuing the Fund’s assets carried at fair value:
| | | | | | | | | | | | |
| Description | | Quoted Prices
(Level 1) | | Other Significant
Observable Inputs (Level 2) | | Significant
Unobservable
Inputs
(Level 3) | | Total |
| Long-term investments†: | | | | | | | | | | | | |
Corporate bonds & notes | | | — | | $ | 408,556,876 | | $ | 51,600 | | $ | 408,608,476 |
Collateralized mortgage obligation | | | — | | | — | | | 32,004 | | | 32,004 |
Collateralized senior loans | | | — | | | 21,874,837 | | | — | | | 21,874,837 |
Convertible bonds & notes | | | — | | | 3,762,662 | | | — | | | 3,762,662 |
Sovereign bond | | | — | | | 815,464 | | | — | | | 815,464 |
Common stocks | | $ | 5,761,151 | | | 4,467,568 | | | 357,269 | | | 10,585,988 |
Convertible preferred stocks | | | 6,140,184 | | | — | | | — | | | 6,140,184 |
Preferred stocks | | | 1,055,736 | | | 4,821,500 | | | 4 | | | 5,877,240 |
Warrants | | | 273,147 | | | 121,821 | | | 31 | | | 394,999 |
| Total long-term investments | | $ | 13,230,218 | | $ | 444,420,728 | | $ | 440,908 | | $ | 458,091,854 |
| Short-term investments† | | | — | | | 15,420,947 | | | — | | | 15,420,947 |
| Total investments | | $ | 13,230,218 | | $ | 459,841,675 | | $ | 440,908 | | $ | 473,512,801 |
| Other financial instruments: | | | | | | | | | | | | |
Futures contracts | | $ | (126,787) | | | — | | | — | | $ | (126,787) |
Forward foreign currency contracts | | | — | | $ | 63,937 | | | — | | | 63,937 |
| Total other financial instruments | | | (126,787) | | | 63,937 | | | — | | | (62,850) |
| Total | | $ | 13,103,431 | | $ | 459,905,612 | | $ | 440,908 | | $ | 473,449,951 |
| † | See Schedule of Investments for additional detailed categorizations. |
Following is a reconciliation of investments in which significant unobservable inputs (Level 3) were used in determining fair value:
| | | | | | | | | | | | | | | | | | |
| Investments in Securities | | Corporate
Bonds & Notes | | Collateralized
Mortgage
Obligations | | Common
Stocks | | Preferred
Stocks | | Warrants | | Total |
| Balance as of December 31, 2009 | | $ | 4,681,201 | | | — | | $ | 326,646 | | $ | 40 | | $ | 65,337 | | $ | 5,073,224 |
| Accrued premiums/discounts | | | 418,094 | | | — | | | — | | | — | | | — | | | 418,094 |
| Realized gain/(loss)1 | | | (177,643) | | | — | | | — | | | (94,737) | | | — | | | (272,380) |
| Change in unrealized appreciation (depreciation)2 | | | 675,906 | | | — | | | 30,623 | | | 94,701 | | | 56,515 | | | 857,745 |
| Net purchases (sales) | | | (5,597,558) | | | — | | | — | | | — | | | — | | | (5,597,558) |
| Transfers in to Level 3 | | | 51,600 | | $ | 32,004 | | | — | | | — | | | — | | | 83,604 |
| Transfers out of Level 3 | | | — | | | — | | | — | | | — | | | (121,821) | | | (121,821) |
| Balance as of June 30, 2010 | | $ | 51,600 | | $ | 32,004 | | $ | 357,269 | | $ | 4 | | $ | 31 | | $ | 440,908 |
| Net change in unrealized appreciation (depreciation) for investments in securities still held at June 30, 20102 | | | — | | | — | | $ | 30,623 | | $ | (36) | | $ | (15) | | $ | 30,572 |
| 1 | This amount is included in net realized gain (loss) from investment transactions in the accompanying Statement of Operations. |
| 2 | This amount is included in the change in net unrealized appreciation (depreciation) in the accompanying Statement of Operations. Change in unrealized appreciation (depreciation) includes net unrealized appreciation (depreciation) resulting from changes in investment values during the reporting period and the reversal of previously recorded unrealized appreciation (depreciation) when gains or losses are realized. |
(b) Repurchase agreements. The Fund may enter into repurchase agreements with institutions that its investment adviser has determined are creditworthy. Each repurchase agreement is recorded at cost. Under the terms of a typical repurchase agreement, a fund takes possession of an underlying debt obligation subject to an obligation of the seller to repurchase, and of the fund to resell, the obligation at an agreed-upon price and time, thereby determining the yield during a fund’s holding period. When entering into repurchase agreements, it is the Fund’s policy that its custodian or a third party custodian, acting on the Fund’s behalf, take possession of the underlying collateral securities, the market value of which, at all times, at least equals the principal amount of the repurchase transaction, including accrued interest. To the extent that any repurchase transaction maturity exceeds one business day, the value of the collateral is marked to market and measured against the value of the agreement in an effort to ensure the adequacy of the collateral. If the counterparty defaults, the Fund generally has the right to use the collateral to satisfy the
| | |
| 24 | | Western Asset High Yield Portfolio 2010 Semi-Annual Report |
Notes to financial statements (unaudited) (cont’d)
terms of the repurchase transaction. However, if the market value of the collateral declines during the period in which the Fund seeks to assert its rights or if bankruptcy proceedings are commenced with respect to the seller of the security, realization of the collateral by the Fund may be delayed or limited.
(c) Forward foreign currency contracts. The Fund may enter into a forward foreign currency contract to hedge against foreign currency exchange rate risk on its non-U.S. dollar denominated securities or to facilitate settlement of a foreign currency denominated portfolio transaction. A forward foreign currency contract is an agreement between two parties to buy and sell a currency at a set price with delivery and settlement at a future date. The contract is marked-to-market daily and the change in value is recorded by the Fund as an unrealized gain or loss. When a forward foreign currency contract is closed, through either delivery or offset by entering into another forward foreign currency contract, the Fund recognizes a realized gain or loss equal to the difference between the value of the contract at the time it was opened and the value of the contract at the time it is closed.
Forward foreign currency contracts involve elements of market risk in excess of the amounts reflected on the Statement of Assets and Liabilities. The Fund bears the risk of an unfavorable change in the foreign exchange rate underlying the forward foreign currency contract. Risks may also arise upon entering into these contracts from the potential inability of the counterparties to meet the terms of their contracts.
(d) Futures contracts. The Fund may use futures contracts to gain exposure to, or hedge against, changes in the value of interest rates or foreign currencies. A futures contract represents a commitment for the future purchase or sale of an asset at a specified price on a specified date.
Upon entering into a futures contract, the Fund is required to deposit cash or cash equivalents with a broker in an amount equal to a certain percentage of the contract amount. This is known as the “initial margin” and subsequent payments (“variation margin”) are made or received by the Fund each day, depending on the daily fluctuation in the value of the contract. For certain futures, including foreign denominated futures, variation margin is not settled daily, but is recorded as a net variation margin payable or receivable. Futures contracts are valued daily at the settlement price established by the board of trade or exchange on which they are traded. The daily changes in contract value are recorded as unrealized gains or losses in the Statement of Operations and the Fund recognizes a realized gain or loss when the contract is closed.
Futures contracts involve, to varying degrees, risk of loss in excess of the amounts reflected in the financial statements. In addition, there is the risk that the Fund may not be able to enter into a closing transaction because of an illiquid secondary market.
(e) Foreign currency translation. Investment securities and other assets and liabilities denominated in foreign currencies are translated into U.S. dollar amounts based upon prevailing exchange rates on the date of valuation. Purchases and sales of investment securities and income and expense items denominated in foreign currencies are translated into U.S. dollar amounts based upon prevailing exchange rates on the respective dates of such transactions.
The Fund does not isolate that portion of the results of operations resulting from fluctuations in foreign exchange rates on investments from the fluctuations arising from changes in market prices of securities held. Such fluctuations are included with the net realized and unrealized gain or loss on investments.
Net realized foreign exchange gains or losses arise from sales of foreign currencies, including gains and losses on forward foreign currency contracts, currency gains or losses realized between the trade and settlement dates on securities transactions, and the difference between the amounts of dividends, interest, and foreign withholding taxes recorded on the Fund’s books and the U.S. dollar equivalent of the amounts actually received or paid. Net unrealized foreign exchange gains and losses arise from changes in the values of assets and liabilities, other than investments in securities, on the date of valuation, resulting from changes in exchange rates.
Foreign security and currency transactions may involve certain considerations and risks not typically associated with those of U.S. dollar denominated transactions as a result of, among other factors, the possibility of lower levels of governmental supervision and regulation of foreign securities markets and the possibility of political or economic instability.
| | |
| Western Asset High Yield Portfolio 2010 Semi-Annual Report | | 25 |
(f) Loan participations. The Fund may invest in loans arranged through private negotiation between one or more financial institutions. The Fund’s investment in any such loan may be in the form of a participation in or an assignment of the loan. In connection with purchasing participations, the Fund generally will have no right to enforce compliance by the borrower with the terms of the loan agreement related to the loan, or any rights of off-set against the borrower and the Fund may not benefit directly from any collateral supporting the loan in which it has purchased the participation.
The Fund assumes the credit risk of the borrower, the lender that is selling the participation and any other persons interpositioned between the Fund and the borrower. In the event of the insolvency of the lender selling the participation, the Fund may be treated as a general creditor of the lender and may not benefit from any off-set between the lender and the borrower.
(g) Credit and market risk. Investments in securities that are collateralized by residential real estate mortgages are subject to certain credit and liquidity risks. When market conditions result in an increase in default rates of the underlying mortgages and foreclosure values of underlying real estate properties are materially below the outstanding amount of these underlying mortgages, collection of the full amount of accrued interest and principal on these investments may be doubtful. Such market conditions may significantly impair the value and liquidity of these investments and may result in a lack of correlation between their credit ratings and values.
(h) Security transactions and investment income. Security transactions are accounted for on a trade date basis. Interest income, adjusted for amortization of premium and accretion of discount, is recorded on the accrual basis. Dividend income is recorded on the ex-dividend date. Foreign dividend income is recorded on the ex-dividend date or as soon as practicable after a Fund determines the existence of a dividend declaration after exercising reasonable due diligence. The cost of investments sold is determined by use of the specific identification method. To the extent any issuer defaults or a credit event occurs that impacts the issuer, a Fund may halt any additional interest income accruals and consider the realizability of interest accrued up to the date of default or credit event.
(i) Distributions to shareholders. Distributions from net investment income for the Fund, if any, are declared, and paid on a quarterly basis. Distributions of net realized gains, if any, are declared at least annually. Distributions are recorded on the ex-dividend date and are determined in accordance with income tax regulations, which may differ from GAAP.
(j) Share class accounting. Investment income, common expenses and realized/unrealized gains (losses) on investments are allocated to the various classes of the Fund on the basis of daily net assets of each class. Fees relating to a specific class are charged directly to that share class.
(k) Compensating balance arrangements. The Fund has an arrangement with its custodian bank whereby a portion of the custodian’s fees is paid indirectly by credits earned on the Fund’s cash on deposit with the bank.
(l) Federal and other taxes. It is the Fund’s policy to comply with the federal income and excise tax requirements of the Internal Revenue Code of 1986 (the “Code”), as amended, applicable to regulated investment companies. Accordingly, the Fund intend to distribute its taxable income and net realized gains, if any, to shareholders in accordance with timing requirements imposed by the Code. Therefore, no federal income tax provision is required in the Fund’s financial statements.
Management has analyzed the Fund’s tax positions taken on federal income tax returns for all open tax years and has concluded that as of June 30, 2010, no provision for income tax is required in the Fund’s financial statements. The Fund’s federal and state income and federal excise tax returns for tax years for which the applicable statutes of limitations have not expired are subject to examination by Internal Revenue Service and state departments of revenue.
Under the applicable foreign tax laws, a withholding tax may be imposed on interest, dividends and capital gains at various rates.
(m) Reclassification. GAAP requires that certain components of net assets be reclassified to reflect permanent differences between financial and tax reporting. These reclassifications have no effect on net assets or net asset value per share.
| | |
| 26 | | Western Asset High Yield Portfolio 2010 Semi-Annual Report |
Notes to financial statements (unaudited) (cont’d)
2. Investment management agreement and other transactions with affiliates
The Fund has an investment management agreement with Legg Mason Partners Fund Advisor, LLC (“LMPFA”). Western Asset Management Company (“Western Asset”) is the investment adviser. LMPFA and Western Asset are wholly-owned subsidiaries of Legg Mason Inc. (“Legg Mason”).
LMPFA provides the Fund with management and administrative services for which the Fund pays a fee, computed daily and payable monthly, at an annual rate of the Fund’s average daily net assets. The manager has agreed to forgo fees and/or reimburse operating expenses (other than interest, taxes, extraordinary expenses and brokerage commissions) so that total operating expenses are not expected to exceed the Fee Cap for Class IS and Class FI. Western Asset also agreed to waive their advisory fees (which is paid by LMPFA, and not the Fund) in corresponding amounts under both the Fee Cap and the Flat Waiver. This arrangement cannot be terminated prior to April 30, 2011 without the Board’s consent.
With respect to Class IS and Class Fl, the manager is permitted to recapture amounts forgone or reimbursed to a class within three years after the day on which the manager earned the fee or incurred the expense if the class’s total annual operating expenses have fallen to a level below the lower of the limit described below or the limit then in effect. The following chart shows the annual rates of management fees, fee caps or flat waivers (as applicable), management fees waived and potential fees which may be recaptured for the Fund’s share classes.
| | | | | | | | | | | | | | |
| | | Asset
Breakpoint for
Management Fee | | Management
Fee | | | Fee
Cap | | | Flat
Waiver | | Management
Fees (Waived)/
Recaptured | | Maximum
Amount
Subject to
Recapture |
| Class IS* | | All asset levels | | 0.550 | % | | 0.65 | % | | — | | — | | — |
| Class I* | | All asset levels | | 0.550 | % | | — | | | — | | — | | — |
| * | In April 2010, Institutional Select Class and Institutional Class shares were renamed Class IS and Class I shares, respectively. |
Legg Mason Investor Services, LLC (“LMIS”), a wholly-owned broker-dealer subsidiary of Legg Mason, serves as distributor of the Fund’s shares.
3. Investments
During the six months ended June 30, 2010, the aggregate cost of purchases and proceeds from sales of investments (excluding short-term investments) were as follows:
| | | |
| Purchases | | $ | 307,297,170 |
| Sales | | | 451,487,606 |
At June 30, 2010, the aggregate gross unrealized appreciation and depreciation of investments for federal income tax purposes were substantially as follows:
| | | |
| Gross unrealized appreciation | | | 24,542,836 |
| Gross unrealized depreciation | | | (36,791,785) |
| Net unrealized depreciation | | $ | (12,248,949) |
At June 30, 2010, the Fund had the following open futures contracts:
| | | | | | | | | | | | | |
| | | Number of
Contracts | | Expiration
Date | | Basis
Value | | Market
Value | | Unrealized
Gain/(Loss) |
| Contracts to Buy: | | | | | | | | | | | | | |
| U.S. Treasury Bonds | | 54 | | 9/10 | | $ | 7,138,613 | | $ | 7,333,875 | | $ | 195,262 |
| | | | | |
| Contracts to Sell: | | | | | | | | | | | | | |
| U.S. Treasury 5-Year Notes | | 217 | | 9/10 | | | 25,360,240 | | | 25,682,289 | | | (322,049) |
| Net unrealized loss on open futures contracts | �� | | | | | | | | | | | $ | (126,787) |
| | |
| Western Asset High Yield Portfolio 2010 Semi-Annual Report | | 27 |
At June 30, 2010, the Fund had the following open forward foreign currency contracts:
| | | | | | | | | | | |
| Foreign Currency | | Counterparty | | Local
Currency | | Market
Value | | Settlement
Date | | Unrealized
Gain/(Loss) |
| Contracts to Sell: | | | | | | | | | | | |
| Euro | | Citibank, N.A. | | 1,325,903 | | 1,621,776 | | 8/17/10 | | $ | 46,276 |
| Euro | | Credit Suisse First Boston Inc. | | 1,342,940 | | 1,642,615 | | 8/17/10 | | | 17,661 |
| Net unrealized gain on open forward foreign currency contracts | | | | | | | | | | $ | 63,937 |
4. Derivative instruments and hedging activities
Financial Accounting Standards Board Codification Topic 815 requires enhanced disclosure about an entity’s derivative and hedging activities.
Below is a table, grouped by derivative type that provides information about the fair value and the location of derivatives within the Statement of Assets and Liabilities at June 30, 2010.
| | | | | | | | | |
| ASSET DERIVATIVES1 |
| | | Interest Rate
Contracts Risk | | Foreign Exchange
Contracts Risk | | Total |
| Futures contracts2 | | $ | 195,262 | | | — | | $ | 195,262 |
| Forward foreign currency contracts | | | — | | $ | 63,937 | | | 63,937 |
| Total | | $ | 195,262 | | $ | 63,937 | | $ | 259,199 |
| | | | | | | | |
| LIABILITY DERIVATIVES1 |
| | | Interest Rate
Contracts Risk | | Foreign Exchange
Contracts Risk | | Total |
| Futures contracts2 | | $ | 322,049 | | — | | $ | 322,049 |
| 1 | Generally, the balance sheet location for asset derivatives is receivables/net unrealized appreciation (depreciation) and for liability derivatives is payables/net unrealized appreciation (depreciation). |
| 2 | Includes cumulative appreciation/depreciation of futures contracts as reported in the footnotes. Only variation margin is reported within the receivables and/or payables of the Statement of Assets and Liabilities. |
The following tables provide information about the effect of derivatives and hedging activities on the Fund’s Statement of Operations for the six months ended June 30, 2010. The first table provides additional detail about the amounts and sources of gains/(losses) realized on derivatives during the period. The second table provides additional information about the changes in unrealized appreciation/(depreciation) resulting from the Fund’s derivatives and hedging activities during the period.
| | | | | | | | | |
| AMOUNT OF REALIZED GAIN OR (LOSS) ON DERIVATIVES RECOGNIZED |
| | | Interest Rate
Contracts Risk | | Foreign Exchange
Contracts Risk | | Total |
| Futures contracts | | $ | 181,256 | | | — | | $ | 181,256 |
| Forward foreign currency contracts | | | — | | $ | 208,578 | | | 208,578 |
| Total | | $ | 181,256 | | $ | 208,578 | | $ | 389,834 |
| | | | | | | | | |
| CHANGE IN UNREALIZED APPRECIATION/DEPRECIATION ON DERIVATIVES RECOGNIZED |
| | | Interest Rate
Contracts Risk | | Foreign Exchange
Contracts Risk | | Total |
| Futures contracts | | $ | (126,787) | | | — | | $ | (126,787) |
| Forward foreign currency contracts | | | — | | $ | 63,937 | | | 63,937 |
| Total | | $ | (126,787) | | $ | 63,937 | | $ | (62,850) |
During the six months ended June 30, 2010, the volume of derivative activity for the Fund was as follows:
| | | |
| | | Average Market
Value |
| Forward foreign currency contracts (to sell) | | $ | 1,728,552 |
| Futures contracts (to buy) | | | 4,873,018 |
| Futures contracts (to sell) | | | 18,031,586 |
| | |
| 28 | | Western Asset High Yield Portfolio 2010 Semi-Annual Report |
Notes to financial statements (unaudited) (cont’d)
The Fund has several credit related contingent features that if triggered would allow its derivatives counterparties to close out and demand payment or additional collateral to cover their exposure from the Fund. Credit related contingent features are established between the Fund and its derivatives counterparties to reduce the risk that the Fund will not fulfill its payment obligations to its counterparties. These triggering features include, but are not limited to, a percentage decrease in the Fund’s net assets and/or a percentage decrease in the Fund’s Net Asset Value or NAV. The contingent features are established within the Fund’s International Swap and Derivatives Association, Inc. master agreements which govern positions in swaps, over-the-counter options, and forward currency exchange contracts for each individual counterparty.
5. Class specific expenses, waivers and/or reimbursements
For the six months ended June 30, 2010, class specific expenses were as follows:
| | | | | | |
| | | Shareholder
Reports | | Transfer Agent
Fees |
| Class IS* | | $ | 1,131 | | $ | 3,654 |
| Class I* | | | 21,084 | | | 86,832 |
| Total | | $ | 22,215 | | $ | 90,486 |
| * | In April 2010, Institutional Select Class and Institutional Class shares were renamed Class IS and Class I shares, respectively. |
6. Distributions to shareholders by class
| | | | | | |
| | | Six Months Ended
June 30, 2010 | | Year Ended
December 31, 2009 |
| Net Investment Income: | | | | | | |
| Class IS* | | $ | 3,393,331 | | $ | 11,675,543 |
| Class I* | | | 13,944,693 | | | 66,008,540 |
| Total | | $ | 17,338,024 | | $ | 77,684,083 |
| * | In April 2010, Institutional Select Class and Institutional Class shares were renamed Class IS and Class I shares, respectively. |
7. Capital shares
At June 30, 2010, the Corporation had 21.15 billion shares of capital stock authorized with a par value of $0.001 per share. Transactions in shares of the Fund were as follows:
| | | | | | | | | | |
| | | Six Months Ended
June 30, 2010 | | Year Ended
December 31, 2009 |
| | | Shares | | Amount | | Shares | | Amount |
| | | | |
| Class IS* | | | | | | | | | | |
| Shares sold | | 1,072,149 | | $ | 9,176,146 | | 988,240 | | $ | 7,223,162 |
| Shares issued on reinvestment | | 403,728 | | | 3,393,331 | | 1,547,337 | | | 11,675,543 |
| Shares repurchased | | (2,117,971) | | | (18,203,680) | | (2,565,699) | | | (18,403,130) |
| Net increase (decrease) | | (642,094) | | $ | (5,634,203) | | (30,122) | | $ | 495,575 |
| | | | |
| Class I* | | | | | | | | | | |
| Shares sold | | 13,422,793 | | $ | 113,820,856 | | 24,567,594 | | $ | 170,323,320 |
| Shares issued on reinvestment | | 1,622,543 | | | 13,441,289 | | 8,373,209 | | | 62,083,357 |
| Shares repurchased | | (31,916,868) | | | (268,981,968) | | (44,466,343) | | | (324,021,012) |
| Net decrease | | (16,871,532) | | $ | (141,719,823) | | (11,525,540) | | $ | (91,614,335) |
| * | In April 2010, Institutional Select Class and Institutional Class shares were renamed Class IS and Class I shares, respectively. |
8. Capital loss carryforward
As of December 31, 2009, the Fund had a net capital loss carryforward of approximately $133,165,665, of which $49,747,397 expires in 2016 and $83,418,268 expires in 2017. These amounts will be available to offset any future taxable capital gains.
Western Asset
High Yield Portfolio
Directors
William E. B. Siart, Chairman
Ronald J. Arnault
Anita L. DeFrantz
R. Jay Gerken
Ronald L. Olson
Avedick B. Poladian
Jaynie Miller Studenmund
Investment manager
Legg Mason Partners Fund Advisor, LLC
Investment adviser
Western Asset Management Company
Transfer agent
Boston Financial Data Services
2000 Crown Colony Drive
Quincy, MA 02169
Custodian
State Street Bank and Trust Company
Counsel
Ropes & Gray LLP
1211 Avenue of the Americas
New York, NY 10036
Independent registered public accounting firm
PricewaterhouseCoopers LLP
Baltimore, MD
Western Asset High Yield Portfolio
The Fund is a separate investment series of Western Asset Funds, Inc.
Western Asset High Yield Portfolio
Legg Mason Funds
55 Water Street
New York, NY 10041
The Fund files its complete schedule of portfolio holdings with the Securities and Exchange Commission (“SEC”) for the first and third quarters of each fiscal year on Form N-Q. The Fund’s Forms N-Q are available on the SEC’s website at www.sec.gov. The Fund’s Forms N-Q may be reviewed and copied at the SEC’s Public Reference Room in Washington, D.C., and information on the operation of the Public Reference Room may be obtained by calling 1-800-SEC-0330. To obtain information on Form N-Q from the Fund, shareholders can call Institutional Shareholder Services at 1-888-425-6432.
Information on how the Fund voted proxies relating to portfolio securities during the prior 12-month period ended June 30th of each year and a description of the policies and procedures that the Fund uses to determine how to vote proxies related to portfolio transactions are available (1) without charge, upon request, by calling Institutional Shareholder Services at 1-888-425-6432, (2) on the Fund’s website at www.leggmason.com/individualinvestors and (3) on the SEC’s website at www.sec.gov.
This report is submitted for the general information of the shareholders of Western Asset High Yield Portfolio. This report is not authorized for distribution to prospective investors in the Fund unless preceded or accompanied by a current prospectus.
Investors should consider the Fund’s investment objectives, risks, charges and expenses carefully before investing. The prospectus contains this and other important information about the Fund. Please read the prospectus carefully before investing.
www.leggmason.com/individualinvestors
© 2010 Legg Mason Investor Services, LLC
Member FINRA, SIPC
Privacy policy
We are committed to keeping nonpublic personal information about you secure and confidential. This notice is intended to help you understand how we fulfill this commitment. From time to time, we may collect a variety of personal information about you, including:
| Ÿ | | Information we receive from you on applications and forms, via the telephone, and through our websites; |
| Ÿ | | Information about your transactions with us, our affiliates, or others (such as your purchases, sales, or account balances); and |
| Ÿ | | Information we receive from consumer reporting agencies. |
We do not disclose nonpublic personal information, about our customers or former customers, except to our affiliates (such as broker-dealers or investment advisers within the Legg Mason family of companies) or as is otherwise permitted by applicable law or regulation. For example, we may share this information with others in order to process your transactions or service an account. We may also provide this information to companies that perform marketing services on our behalf, such as printing and mailing, or to other financial institutions with whom we have joint marketing agreements. When we enter into such agreements, we will require these companies to protect the confidentiality of this information and to use it only to perform the services for which we hired them.
With respect to our internal security procedures, we maintain physical, electronic, and procedural safeguards to protect your nonpublic personal information, and we restrict access to this information.
If you decide at some point either to close your account(s) or become an inactive customer, we will continue to adhere to our privacy policies and practices with respect to your nonpublic personal information.
NOT PART OF THE SEMI-ANNUAL REPORT
At Legg Mason, we’ve assembled a collection of experienced investment management firms and empowered each of them with the tools, the resources and, most importantly, the independence to pursue the strategies they know best.
| Ÿ | | Each was purposefully chosen for their commitment to investment excellence. |
| Ÿ | | Each is focused on specific investment styles and asset classes. |
| Ÿ | | Each exhibits thought leadership in their chosen area of focus. |
Together, we’ve built a powerful portfolio of solutions for financial advisors and their clients. And it has made us a world leader in money management.*
| * | Ranked eighth-largest money manager in the world, according to Pensions & Investments, May 31, 2010, based on 12/31/09 worldwide institutional assets under management. |
Western Asset Management Company
Legg Mason, Inc. Subsidiaries
www.leggmason.com/individualinvestors
©2010 Legg Mason Investor Services, LLC Member FINRA, SIPC
WASX012828 8/10 SR10-1162
NOT PART OF THE SEMI-ANNUAL REPORT
Not applicable.
| ITEM 3. | AUDIT COMMITTEE FINANCIAL EXPERT. |
Not applicable.
| ITEM 4. | PRINCIPAL ACCOUNTANT FEES AND SERVICES. |
Not applicable.
| ITEM 5. | AUDIT COMMITTEE OF LISTED REGISTRANTS. |
Not applicable.
| ITEM 6. | SCHEDULE OF INVESTMENTS. |
Included herein under Item 1.
| ITEM 7. | DISCLOSURE OF PROXY VOTING POLICIES AND PROCEDURES FOR CLOSED-END MANAGEMENT INVESTMENT COMPANIES. |
Not applicable.
| ITEM 8. | PORTFOLIO MANAGERS OF CLOSED-END MANAGEMENT INVESTMENT COMPANIES. |
Not applicable.
| ITEM 9. | PURCHASES OF EQUITY SECURITIES BY CLOSED-END MANAGEMENT INVESTMENT COMPANY AND AFFILIATED PURCHASERS. |
Not applicable.
| ITEM 10. | SUBMISSION OF MATTERS TO A VOTE OF SECURITY HOLDERS. |
Not applicable.
| ITEM 11. | CONTROLS AND PROCEDURES. |
| | (a) | The registrant’s principal executive officer and principal financial officer have concluded that the registrant’s disclosure controls and procedures (as defined in Rule 30a- 3(c) under the Investment Company Act of 1940, as amended (the “1940 Act”)) are effective as of a date within 90 days of the filing date of this report that includes the disclosure required by this paragraph, based on their evaluation of the disclosure controls and procedures required by Rule 30a-3(b) under the 1940 Act and 15d-15(b) under the Securities Exchange Act of 1934. |
| | (b) | There were no changes in the registrant’s internal control over financial reporting (as defined in Rule 30a-3(d) under the 1940 Act) that occurred during the registrant’s last fiscal half-year (the registrant’s second fiscal half-year in the case of an annual report) that have materially affected, or are likely to materially affect the registrant’s internal control over financial reporting. |
(a) (1) Not applicable.
Exhibit 99.CODE ETH
(a) (2) Certifications pursuant to section 302 of the Sarbanes-Oxley Act of 2002 attached hereto.
Exhibit 99.CERT
(b) Certifications pursuant to Section 906 of the Sarbanes-Oxley Act of 2002 attached hereto.
Exhibit 99.906CERT
SIGNATURES
Pursuant to the requirements of the Securities Exchange Act of 1934 and the Investment Company Act of 1940, the registrant has duly caused this Report to be signed on its behalf by the undersigned, there unto duly authorized.
Western Asset Funds, Inc.
| | |
| By: | | /S/ R. JAY GERKEN |
| | (R. Jay Gerken) |
| | President of Western Asset Funds, Inc. |
Date: August 31, 2010
Pursuant to the requirements of the Securities Exchange Act of 1934 and the Investment Company Act of 1940, this report has been signed below by the following persons on behalf of the registrant and in the capacities and on the dates indicated.
| | |
| By: | | /S/ R. JAY GERKEN |
| | (R. Jay Gerken) |
| | President of Western Asset Funds, Inc. |
|
| Date: August 31, 2010 |
| |
| By: | | /S/ KAPREL OZSOLAK |
| | (Kaprel Ozsolak) |
| | Principal Financial and Accounting Officer Western Asset Funds, Inc. |
Date: August 31, 2010