UNITED STATES
SECURITIES AND EXCHANGE COMMISSION
Washington, D.C. 20549
FORM N-CSR
CERTIFIED SHAREHOLDER REPORT OF REGISTERED
MANAGEMENT INVESTMENT COMPANIES
Investment Company Act file number 811-06110
Western Asset Funds, Inc.
(Exact name of registrant as specified in charter)
55 Water Street, New York, NY 10041
(Address of principal executive offices) (Zip code)
Robert I. Frenkel, Esq.
Legg Mason & Co., LLC
100 First Stamford Place
Stamford, CT 06902
(Name and address of agent for service)
Registrant’s telephone number, including area code: 1-877-721-1926
Date of fiscal year end: December 31
Date of reporting period: June 30, 2011
| ITEM 1. | REPORT TO STOCKHOLDERS. |
The Semi-Annual Report to Stockholders is filed herewith.
June 30, 2011

Semi-Annual Repor t
Western Asset
Absolute Return
Portfolio
INVESTMENT PRODUCTS: NOT FDIC INSURED • NO BANK GUARANTEE • MAY LOSE VALUE
| | |
| II | | Western Asset Absolute Return Portfolio |
Fund objective
The Fund seeks to maximize long-term total return.
Letter from the president

Dear Shareholder,
We are pleased to provide the semi-annual report of Western Asset Absolute Return Portfolio for the six-month reporting period ended June 30, 2011. Please read on for Fund performance information and a detailed look at prevailing economic and market conditions during the Fund’s reporting period.
As always, we remain committed to providing you with excellent service and a full spectrum of investment choices. We also remain committed to supplementing the support you receive from your financial advisor. One way we accomplish this is through our website, www.leggmason.com/individualinvestors. Here you can gain immediate access to market and investment information, including:
| Ÿ | | Fund prices and performance, |
| Ÿ | | Market insights and commentaries from our portfolio managers, and |
| Ÿ | | A host of educational resources. |
We look forward to helping you meet your financial goals.
Sincerely,

R. Jay Gerken, CFA
President
July 29, 2011
| | | | |
| Western Asset Absolute Return Portfolio | | | III | |
Investment commentary
Economic review
Although the U.S. economy continued to grow over the six months ended June 30, 2011, the pace of the expansion was disappointing, which resulted in a significant shift in investor sentiment. During the first half of the period, there were expectations of a strengthening economy and generally robust investor risk appetite. However, as the reporting period progressed, weakening economic data triggered a flight to quality as investor risk aversion increased. Despite giving back a portion of their previous gains in late May and June, investors who took on additional risk in their portfolios during the reporting period were generally rewarded.
U.S. gross domestic product (“GDP”)i growth, as reported by the U.S. Department of Commerce, has been less robust than previously realized during most other periods exiting a severe recession. Revised GDP growth was 2.3% during the fourth quarter of 2010 and 3.0% for calendar 2010 as a whole. The Commerce Department then reported that first and second quarter 2011 GDP growth were 0.4% and 1.3%, respectively. This moderation in growth during the first half of the year was due to a variety of factors, including less robust export activity, a decline in government spending and a deceleration in consumer spending given higher oil and food prices.
Turning to the job market, while there was some improvement in the first half of the reporting period, unemployment again moved higher from April through June. After being 9.0% or higher since April 2009, the unemployment rate fell to 8.9% in February and 8.8% in March 2011. The job market then weakened, as unemployment rose to 9.0% in April, 9.1% in May and 9.2% in June. As of the end of the reporting period, approximately 14.1 million Americans looking for work had yet to find a job, and roughly 44% of these individuals have been out of work for more than six months. In June 2011, the Federal Reserve Board (“Fed”)ii projected that unemployment would moderate, but that it would remain elevated and between 7.8% and 8.2% at the end of 2012.
The long-ailing housing market continued to show signs of strain during the reporting period. Looking back, sales increased in the spring of 2010 largely due to the government’s $8,000 tax credit for first-time home buyers. This proved to be only a temporary boost, as sales subsequently weakened after the tax credit expired at the end of April. Existing-home sales did rebound somewhat toward the end of 2010 and in January 2011, as mortgage rates remained relatively low. However, according to the National Association of Realtors (“NAR”), existing-home sales then declined a sharp 8.9% in February. After a 3.5% increase in March, existing-home sales fell 1.8%, 4.0% and 0.8% in April, May and June, respectively. At the end of June, the inventory of unsold homes was a 9.5 month supply at the current sales level, versus a 9.1 month supply in May. Existing-home prices were relatively stagnant versus a year ago, with the NAR reporting that the median existing-home price for all housing types was $184,300 in June 2011, up 0.8% from June 2010.
Even the manufacturing sector, one of the stalwarts of the economy in recent years, softened toward the end of the reporting period. Based on the Institute for Supply Management’s PMIiii, the manufacturing sector grew twenty-three consecutive months since it began expanding in August 2009 (a reading below 50 indicates a contraction, whereas a reading above 50 indicates an expansion). In January 2011, the manufacturing sector expanded at its fastest pace since May 2004, with a reading of 60.8 versus 58.5 for the previous month. Manufacturing activity remained strong during the next three months and was 60.4 in April. However, it then declined to 53.5 in
| | |
| IV | | Western Asset Absolute Return Portfolio |
Investment commentary (cont’d)
May, the lowest reading in the past twelve months. This was attributed, in part, to supply disruptions triggered by the March earthquake and tsunami in Japan. Manufacturing activity then moved modestly higher in June to 55.3, although only twelve of the eighteen industries tracked by the Institute for Supply Management expanded during the month.
Financial market overview
While stocks and lower-quality bonds generated solid results during the reporting period, there were several periods of heightened volatility and periodic sell-offs. These were triggered by a variety of factors, including concerns regarding the global economy, geopolitical unrest, the natural disasters in Japan and the ongoing European sovereign debt crisis. During those periods, investors tended to favor the relative safety of U.S. Treasury securities. However, these setbacks proved to be only temporary and risk aversion was generally replaced with solid demand for riskier assets.
The Fed took a number of actions as it sought to meet its dual mandate of fostering maximum employment and price stability. In November 2010, prior to the beginning of the reporting period, the Fed announced a second round of quantitative easing (often referred to as “QE2”) to help stimulate the economy, entailing the purchase of $600 billion of long-term U.S. Treasury securities by the end of the second quarter of 2011. Also, as has been the case since December 2008, the Fed kept the federal funds rateiv at a historically low range between 0 and 1/4 percent.
Despite these efforts, at its meeting in June 2011, the Fed said, “Information received since the Federal Open Market Committee met in April indicates that the economic recovery is continuing at a moderate pace, though somewhat more slowly than the Committee had expected. . . . To promote the ongoing economic recovery and to help ensure that inflation, over time, is at levels consistent with its mandate, the Committee decided today to keep the target range for the federal funds rate at 0 to 1/4 percent. The Committee continues to anticipate that economic conditions — including low rates of resource utilization and a subdued outlook for inflation over the medium run — are likely to warrant exceptionally low levels for the federal funds rate for an extended period.”
In June, the Fed also announced that it would complete QE2 on schedule at the end of June. However, given ongoing strains in the economy, it made no overtures toward reversing any of its accommodative policies and the Fed said it would “maintain its existing policy of reinvesting principal payments from its securities holdings” rather than seeking to reduce the size of its balance sheet.
Fixed income market review
While volatility was elevated at times, the U.S. spread sectors (non-Treasuries) produced positive results during the reporting period. As was the case for much of 2010, the spread sectors generally outperformed equal-durationv Treasuries during the first four months of the reporting period. A combination of positive economic growth, benign core inflation, rising corporate profits and overall robust investor demand supported the spread sectors from January through April 2011. Investor sentiment then began to shift in May, as optimism about the economic expansion waned and investor risk appetite started to be replaced with increased risk aversion. While the U.S. spread sectors generally posted positive results in May, they underperformed equal-duration Treasuries. Risk aversion then increased in June given a host of disappointing economic data and a further escalation of the European sovereign debt crisis. Against this backdrop, the spread sectors generated relatively poor results during most of June as investors fled the spread sectors in favor of Treasury securities.
| | | | |
| Western Asset Absolute Return Portfolio | | | v | |
Both short- and long-term Treasury yields fluctuated during the six months ended June 30, 2011. When the period began, two- and ten-year Treasury yields were 0.61% and 3.30%, respectively. Yields initially moved higher given expectations for stronger growth in 2011 and the potential for rising inflation. On February 14, 2011, two-year Treasury yields peaked at 0.87%, while ten-year Treasuries peaked at 3.75% on February 8, 2011. Treasury yields then declined as investor risk aversion increased given the uprising in Libya and, later, due to the tragic events in Japan. Yields briefly moved higher toward the end of March, but then generally declined from April through June given disappointing economic data and periodic flights to quality. In late June, two- and ten-year Treasury yields bottomed at 0.35% and 2.88%, respectively, and ended the period at 0.45% and 3.18%, respectively. For the six months ended June 30, 2011, the Barclays Capital U.S. Aggregate Indexvi returned 2.72%.
The U.S. high-yield bond market produced strong results during the first five months of the reporting period. High-yield prices moved higher against a backdrop of generally better-than-expected corporate profits and overall strong investor demand. However, the asset class gave back a portion of its gains in June during the flight to quality, with the high-yield market posting its first monthly loss since November 2010. All told, the Barclays Capital U.S. High Yield — 2% Issuer Cap Indexvii returned 4.98% for the six months ended June 30, 2011.
Despite periods of volatility, the emerging market debt asset class generated a solid return for the six-month reporting period. Investor concerns regarding interest rate hikes in China and unrest in the Middle East and Northern Africa dragged the asset class down from November 2010 (prior to the beginning of the reporting period) through January 2011. Emerging market debt prices then largely stabilized in February and rallied from March through June. Overall, the JPMorgan Emerging Markets Bond Index Global (“EMBI Global”)viii returned 5.09% over the six months ended June 30, 2011.
Performance review
For the six months ended June 30, 2011, Class I shares of Western Asset Absolute Return Portfolio returned 1.75%. The Fund’s unmanaged benchmarks, the Barclays Capital U.S. Aggregate Index and the BofA Merrill Lynch Constant Maturity 3-Month LIBOR Indexix, returned 2.72% and 0.16%, respectively, for the same period. The Lipper Absolute Return Funds Category Average1 returned 0.53% over the same time frame.
| | | | |
| Performance Snapshot as of June 30, 2011 (unaudited) | |
| | | 6 months | |
| Western Asset Absolute Return Portfolio: | | | | |
Class IS | | | 1.75 | % |
Class I | | | 1.75 | % |
Class FI | | | 1.53 | % |
| Barclays Capital U.S. Aggregate Index | | | 2.72 | % |
| BofA Merrill Lynch Constant Maturity 3-Month LIBOR Index | | | 0.16 | % |
| Lipper Absolute Return Funds Category Average | | | 0.53 | % |
The performance shown represents past performance. Past performance is no guarantee of future results and current performance may be higher or lower than the performance shown above. Principal value, investment returns and yields will fluctuate and investors’ shares, when redeemed, may be worth more or less than their original cost. To obtain performance data current to the most recent month-end, please visit our website at www.leggmason.com/individualinvestors.
| 1 | Lipper, Inc., a wholly-owned subsidiary of Reuters, provides independent insight on global collective investments. Returns are based on the six-month period ended June 30, 2011, including the reinvestment of all distributions, including returns of capital, if any, calculated among the 156 funds in the Fund’s Lipper category. |
| | |
| VI | | Western Asset Absolute Return Portfolio |
Investment commentary (cont’d)
All share class returns assume the reinvestment of all distributions, including returns of capital, if any, at net asset value and the deduction of all Fund expenses. Returns have not been adjusted to include the deduction of taxes that a shareholder would pay on Fund distributions. Performance figures for periods shorter than one year represent cumulative figures and are not annualized.
Fund performance figures reflect fees forgone and/or expense reimbursements, without which the performance would have been lower.
The 30-Day SEC Yields for the period ended June 30, 2011 for Class IS, Class I and Class FI shares were 2.00%, 2.00% and 1.75%, respectively. Absent fees forgone and/or expense reimbursements, the 30-Day SEC Yields for Class IS, Class I and Class FI shares would have been 1.80%, 1.95% and 1.54%, respectively. The 30-Day SEC Yield is subject to change and is based on the yield to maturity of the Fund’s investments over a 30-day period and not on the dividends paid by the Fund, which may differ.
| | | | |
| Total Annual Operating Expenses (unaudited) |
As of the Fund’s current prospectus dated May 1, 2011, the gross total annual operating expense ratios for Class IS, Class I and Class FI shares were 0.84%, 0.85% and 1.25%, respectively.
Actual expenses may be higher. For example, expenses may be higher than those shown if average net assets decrease. Net assets are more likely to decrease and Fund expense ratios are more likely to increase when markets are volatile.
As a result of expense limitation arrangements, the ratio of expenses, other than brokerage, interest, taxes, deferred organizational expenses and extraordinary expenses, to average net assets is not expected to exceed 0.80% for Class IS shares, 0.80% for Class I shares and 1.05% for Class FI shares. These expense limitation arrangements cannot be terminated prior to April 30, 2012 without the Board of Directors’ consent.
The manager is permitted to recapture amounts forgone or reimbursed to a class within three years after the day on which the manager earned the fee or incurred the expense if the class’ total annual operating expenses have fallen to a level below the lower of the limit described above or the limit then in effect.
As always, thank you for your confidence in our stewardship of your assets.
Sincerely,
R. Jay Gerken, CFA
President
July 29, 2011
RISKS: Fixed-income securities involve interest rate, credit, inflation and reinvestment risks. As interest rates rise, the value of fixed-income securities falls. High-yield securities include greater price volatility, illiquidity and possibility of default. International investments are subject to special risks including currency fluctuations and social, economic and political uncertainties, which could increase volatility. These risks are magnified in emerging markets. The use of leverage may increase volatility and possibility of loss. Potential active and frequent trading may result in higher transaction costs and increased investor liability. Asset-backed, mortgage-backed or mortgage-related securities are subject to prepayment and extension risks. Derivatives, such as options, futures and swaps, can be illiquid, may disproportionately increase losses, and have a potentially large impact on Fund performance. Please see the Fund’s prospectus for a more complete discussion of these and other risks, and the Fund’s investment strategies.
All investments are subject to risk including the possible loss of principal. Past performance is no guarantee of future results. All index performance reflects no deduction for fees, expenses or taxes. Please note that an investor cannot invest directly in an index.
The information provided is not intended to be a forecast of future events, a guarantee of future results or investment advice. Views expressed may differ from those of the firm as a whole.
| | | | |
| Western Asset Absolute Return Portfolio | | | VII | |
| i | Gross domestic product (“GDP”) is the market value of all final goods and services produced within a country in a given period of time. |
| ii | The Federal Reserve Board (“Fed”) is responsible for the formulation of policies designed to promote economic growth, full employment, stable prices and a sustainable pattern of international trade and payments. |
| iii | The Institute for Supply Management’s PMI is based on a survey of purchasing executives who buy the raw materials for manufacturing at more than 350 companies. It offers an early reading on the health of the manufacturing sector. |
| iv | The federal funds rate is the rate charged by one depository institution on an overnight sale of immediately available funds (balances at the Federal Reserve) to another depository institution; the rate may vary from depository institution to depository institution and from day to day. |
| v | Duration is the measure of the price sensitivity of a fixed-income security to an interest rate change of 100 basis points. Calculation is based on the weighted average of the present values for all cash flows. |
| vi | The Barclays Capital U.S. Aggregate Index is a broad-based bond index comprised of government, corporate, mortgage- and asset-backed issues, rated investment grade or higher, and having at least one year to maturity. |
| vii | The Barclays Capital U.S. High Yield — 2% Issuer Cap Index is an index of the 2% Issuer Cap component of the Barclays Capital U.S. Corporate High Yield Index, which covers the U.S. dollar-denominated, non-investment grade, fixed-rate, taxable corporate bond market. |
| viii | The JPMorgan Emerging Markets Bond Index Global (“EMBI Global”) tracks total returns for U.S. dollar-denominated debt instruments issued by emerging market sovereign and quasi-sovereign entities: Brady bonds, loans, Eurobonds and local market instruments. |
| ix | The BofA Merrill Lynch Constant Maturity 3-Month LIBOR Index is based on the assumed purchase of a synthetic instrument having three months to maturity and with a coupon equal to the closing quote for three-month LIBOR. That issue is sold the following day (priced at a yield equal to the current day closing three-month LIBOR rate) and is rolled into a new three-month instrument. The Index, therefore, will always have a constant maturity equal to exactly three months. |
| | | | |
| Western Asset Absolute Return Portfolio 2011 Semi-Annual Report | | | 1 | |
Fund at a glance† (unaudited)
Investment breakdown (%) as a percent of total investments
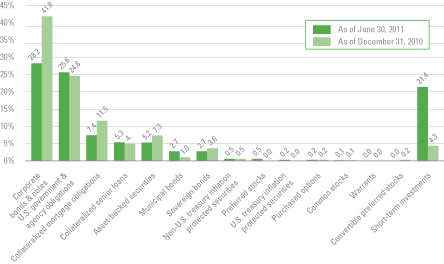
| † | The bar graph above represent the composition of the Fund’s investments as of June 30, 2011 and December 31, 2010 and does not include derivatives such as forward foreign currency contracts, futures contracts, written options and swaps contracts. The Fund is actively managed. As a result, the composition of the Fund’s investments is subject to change at any time. |
| | |
| 2 | | Western Asset Absolute Return Portfolio 2011 Semi-Annual Report |
Fund expenses (unaudited)
Example
As a shareholder of the Fund, you may incur two types of costs: (1) transaction costs and (2) ongoing costs, including management fees; distribution and/or service (12b-1) fees; and other Fund expenses. This example is intended to help you understand your ongoing costs (in dollars) of investing in the Fund and to compare these costs with the ongoing costs of investing in other mutual funds.
This example is based on an investment of $1,000 invested on January 1, 2011 and held for the six months ended June 30, 2011.
Actual expenses
The table below titled “Based on Actual Total Return” provides information about actual account values and actual expenses. You may use the information provided in this table, together with the amount you invested, to estimate the expenses that you paid over the period. To estimate the expenses you paid on your account, divide your ending account value by $1,000 (for example, an $8,600 ending account value divided by $1,000 = 8.6), then multiply the result by the number under the heading entitled “Expenses Paid During the Period”.
Hypothetical example for comparison purposes
The table below titled “Based on Hypothetical Total Return” provides information about hypothetical account values and hypothetical expenses based on the actual expense ratio and an assumed rate of return of 5.00% per year before expenses, which is not the Fund’s actual return. The hypothetical account values and expenses may not be used to estimate the actual ending account balance or expenses you paid for the period. You may use the information provided in this table to compare the ongoing costs of investing in the Fund and other funds. To do so, compare the 5.00% hypothetical example relating to the Fund with the 5.00% hypothetical examples that appear in the shareholder reports of the other funds.
Please note that the expenses shown in the table below are meant to highlight your ongoing costs only and do not reflect any transactional costs, such as front-end or back-end sales charges (loads). Therefore, the table is useful in comparing ongoing costs only, and will not help you determine the relative total costs of owning different funds. In addition, if these transaction costs were included, your costs would have been higher.
| | | | | | | | | | | | | | | | | | | | | | | | | | | | | | | | | | | | | | | | | | | | |
| Based on actual total return1 | | | | | Based on hypothetical total return1 | |
| | | Actual
Total Return2 | | | Beginning
Account
Value | | | Ending
Account
Value | | | Annualized
Expense
Ratio | | | Expenses
Paid
During
the
Period3 | | | | | | | Hypothetical
Annualized
Total Return | | | Beginning
Account
Value | | | Ending
Account
Value | | | Annualized
Expense
Ratio | | | Expenses
Paid
During
the
Period3 | |
| Class IS | | | 1.75 | % | | $ | 1,000.00 | | | $ | 1,017.50 | | | | 0.80 | % | | $ | 4.00 | | | | | Class IS | | | 5.00 | % | | $ | 1,000.00 | | | $ | 1,020.83 | | | | 0.80 | % | | $ | 4.01 | |
| Class I | | | 1.75 | | | | 1,000.00 | | | | 1,017.50 | | | | 0.80 | | | | 4.00 | | | | | Class I | | | 5.00 | | | | 1,000.00 | | | | 1,020.83 | | | | 0.80 | | | | 4.01 | |
| Class FI | | | 1.53 | | | | 1,000.00 | | | | 1,015.30 | | | | 1.05 | | | | 5.25 | | | | | Class FI | | | 5.00 | | | | 1,000.00 | | | | 1,019.59 | | | | 1.05 | | | | 5.26 | |
| 1 | For the six months ended June 30, 2011. |
| 2 | Assumes the reinvestment of all distributions, including returns of capital, if any, at net asset value. Total return is not annualized, as it may not be representative of the total return for the year. Performance figures may reflect compensating balance arrangements, fees forgone, and/or expense reimbursements. In the absence of compensating balance arrangements, fees forgone, and/or expense reimbursements, the total return would have been lower. Past performance is no guarantee of future results. |
| 3 | Expenses (net of compensating balance arrangements, fees forgone, and/or expense reimbursements) are equal to each class’ respective annualized expense ratio multiplied by the average account value over the period, multiplied by the number of days in the most recent fiscal half-year (181), then divided by 365. |
| | | | |
| Western Asset Absolute Return Portfolio 2011 Semi-Annual Report | | | 3 | |
Spread duration (unaudited)
Economic exposure — June 30, 2011
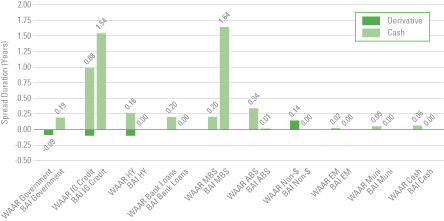
Spread duration measures the sensitivity to changes in spreads. The spread over Treasuries is the annual risk premium demanded by investors to hold non-Treasury securities. Spread duration is quantified as the % change in price resulting from a 100 basis points change in spreads. For a security with positive spread duration, an increase in spreads would result in a price decline and a decline in spreads would result in a price increase. This chart highlights the market sector exposure of the Fund’s sectors relative to the selected benchmark sectors as of the end of the reporting period.
| | |
| ABS | | —Asset Backed Securities |
| BAI | | —Barclays Capital U.S. Aggregate Index |
| EM | | —Emerging Market |
| HY | | —High Yield |
| IG | | —Investment Grade |
| MBS | | —Mortgage Backed Securities |
| Muni | | — Municipal |
| Non-$ | | —Non U.S. Dollar |
| WAAR | | —Western Asset Absolute Return Portfolio |
| | |
| 4 | | Western Asset Absolute Return Portfolio 2011 Semi-Annual Report |
Effective duration (unaudited)
Interest rate exposure — June 30, 2011
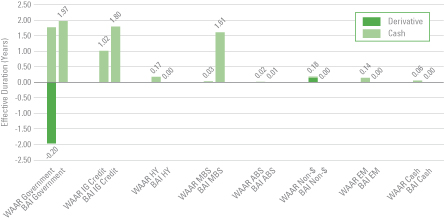
Effective duration measures the sensitivity to changes in relevant interest rates. Effective duration is quantified as the % change in price resulting from a 100 basis points change in interest rates. For a security with positive effective duration, an increase in interest rates would result in a price decline and a decline in interest rates would result in a price increase. This chart highlights the interest rate exposure of the Fund’s sectors relative to the selected benchmark sectors as of the end of the reporting period.
| | |
| ABS | | —Asset Backed Securities |
| BAI | | —Barclays Capital U.S. Aggregate Index |
| EM | | —Emerging Markets |
| HY | | —High Yield |
| IG | | —Investment Grade |
| MBS | | —Mortgage Backed Securities |
| Non-$ | | —Non U.S. Dollar |
| WAAR | | —Western Asset Absolute Return Portfolio |
| | | | |
| Western Asset Absolute Return Portfolio 2011 Semi-Annual Report | | | 5 | |
Schedule of investments (unaudited)
June 30, 2011
Western Asset Absolute Return Portfolio
| | | | | | | | | | | | | | |
| Security | | Rate | | | Maturity
Date | | Face
Amount† | | | Value | |
| Corporate Bonds & Notes — 27.7% | | | | | | | | | | | | | | |
| Consumer Discretionary — 3.0% | | | | | | | | | | | | | | |
Automobiles — 2.1% | | | | | | | | | | | | | | |
Ford Motor Credit Co., LLC, Notes | | | 7.000 | % | | 10/1/13 | | | 4,800,000 | | | $ | 5,129,650 | |
Ford Motor Credit Co., LLC, Senior Notes | | | 12.000 | % | | 5/15/15 | | | 1,610,000 | | | | 1,996,590 | |
Total Automobiles | | | | | | | | | | | | | 7,126,240 | |
Hotels, Restaurants & Leisure — 0.1% | | | | | | | | | | | | | | |
Inn of the Mountain Gods Resort & Casino, Senior Secured Notes | | | 8.750 | % | | 11/30/20 | | | 69,000 | | | | 67,620 | (a) |
MGM Resorts International, Senior Notes | | | 6.625 | % | | 7/15/15 | | | 140,000 | | | | 131,250 | |
MGM Resorts International, Senior Secured Notes | | | 10.375 | % | | 5/15/14 | | | 45,000 | | | | 51,075 | |
MGM Resorts International, Senior Secured Notes | | | 11.125 | % | | 11/15/17 | | | 105,000 | | | | 119,962 | |
Total Hotels, Restaurants & Leisure | | | | | | | | | | | | | 369,907 | |
Media — 0.8% | | | | | | | | | | | | | | |
Charter Communications Operating LLC/Charter Communications Operating Capital, Senior Secured Notes | | | 10.875 | % | | 9/15/14 | | | 160,000 | | | | 176,000 | (a) |
Comcast Cable Communications LLC, Notes | | | 8.875 | % | | 5/1/17 | | | 70,000 | | | | 89,280 | |
Comcast Corp. | | | 5.700 | % | | 5/15/18 | | | 950,000 | | | | 1,059,971 | |
DISH DBS Corp., Senior Notes | | | 7.875 | % | | 9/1/19 | | | 400,000 | | | | 431,500 | |
Gannett Co. Inc. | | | 6.375 | % | | 4/1/12 | | | 40,000 | | | | 41,100 | |
News America Inc., Senior Notes | | | 6.650 | % | | 11/15/37 | | | 50,000 | | | | 53,585 | |
United Business Media Ltd., Notes | | | 5.750 | % | | 11/3/20 | | | 920,000 | | | | 914,094 | (a) |
Virgin Media Finance PLC, Senior Notes | | | 9.125 | % | | 8/15/16 | | | 155,000 | | | | 163,137 | |
Total Media | | | | | | | | | | | | | 2,928,667 | |
Total Consumer Discretionary | | | | | | | | | | | | | 10,424,814 | |
| Consumer Staples — 2.3% | | | | | | | | | | | | | | |
Food & Staples Retailing — 1.8% | | | | | | | | | | | | | | |
CVS Corp. | | | 9.350 | % | | 1/10/23 | | | 500,000 | | | | 544,655 | (a) |
CVS Pass-Through Trust, Secured Notes | | | 5.298 | % | | 1/11/27 | | | 26,641 | | | | 26,151 | (a)(b) |
CVS Pass-Through Trust, Secured Notes | | | 5.880 | % | | 1/10/28 | | | 40,368 | | | | 41,937 | (b) |
CVS Pass-Through Trust, Secured Notes | | | 6.036 | % | | 12/10/28 | | | 82,455 | | | | 87,510 | |
Delhaize Group, Senior Notes | | | 6.500 | % | | 6/15/17 | | | 1,814,000 | | | | 2,091,317 | |
Safeway Inc., Senior Debentures | | | 7.250 | % | | 2/1/31 | | | 1,360,000 | | | | 1,561,177 | |
Safeway Inc., Senior Notes | | | 3.950 | % | | 8/15/20 | | | 160,000 | | | | 155,599 | |
The Kroger Co. | | | 5.000 | % | | 4/15/13 | | | 1,620,000 | | | | 1,726,675 | |
Total Food & Staples Retailing | | | | | | | | | | | | | 6,235,021 | |
Food Products — 0.1% | | | | | | | | | | | | | | |
Kraft Foods Inc., Senior Notes | | | 5.375 | % | | 2/10/20 | | | 400,000 | | | | 437,279 | |
See Notes to Financial Statements.
| | |
| 6 | | Western Asset Absolute Return Portfolio 2011 Semi-Annual Report |
Schedule of investments (unaudited) (cont’d)
June 30, 2011
Western Asset Absolute Return Portfolio
| | | | | | | | | | | | | | |
| Security | | Rate | | | Maturity
Date | | Face
Amount† | | | Value | |
Household Products — 0.1% | | | | | | | | | | | | | | |
Reynolds Group DL Escrow Inc./Reynolds Group Escrow LLC, Senior Secured Notes | | | 8.500 | % | | 10/15/16 | | | 325,000 | | | $ | 338,812 | (a) |
Tobacco — 0.3% | | | | | | | | | | | | | | |
Lorillard Tobacco Co., Senior Notes | | | 8.125 | % | | 6/23/19 | | | 810,000 | | | | 943,449 | |
Total Consumer Staples | | | | | | | | | | | | | 7,954,561 | |
| Energy — 3.1% | | | | | | | | | | | | | | |
Oil, Gas & Consumable Fuels — 3.1% | | | | | | | | | | | | | | |
Anadarko Petroleum Corp., Senior Notes | | | 5.950 | % | | 9/15/16 | | | 20,000 | | | | 22,512 | |
Anadarko Petroleum Corp., Senior Notes | | | 6.375 | % | | 9/15/17 | | | 810,000 | | | | 928,530 | |
BP Capital Markets PLC, Senior Notes | | | 3.125 | % | | 10/1/15 | | | 650,000 | | | | 667,352 | |
Chesapeake Energy Corp., Senior Notes | | | 6.500 | % | | 8/15/17 | | | 100,000 | | | | 105,750 | |
Chesapeake Energy Corp., Senior Notes | | | 7.250 | % | | 12/15/18 | | | 55,000 | | | | 59,950 | |
Compagnie Generale de Geophysique-Veritas, Senior Notes | | | 7.750 | % | | 5/15/17 | | | 250,000 | | | | 257,500 | |
El Paso Corp., Senior Subordinated Notes | | | 7.000 | % | | 6/15/17 | | | 690,000 | | | | 780,649 | |
Energy Transfer Partners LP, Senior Notes | | | 6.700 | % | | 7/1/18 | | | 2,300,000 | | | | 2,591,923 | |
Kinder Morgan Energy Partners LP, Senior Notes | | | 6.000 | % | | 2/1/17 | | | 1,000,000 | | | | 1,127,721 | |
LUKOIL International Finance BV, Senior Notes | | | 7.250 | % | | 11/5/19 | | | 480,000 | | | | 531,216 | (a) |
Newfield Exploration Co., Senior Notes | | | 6.625 | % | | 4/15/16 | | | 1,330,000 | | | | 1,373,225 | |
Petrobras International Finance Co., Senior Notes | | | 5.750 | % | | 1/20/20 | | | 800,000 | | | | 853,404 | |
Petrobras International Finance Co., Senior Notes | | | 5.375 | % | | 1/27/21 | | | 670,000 | | | | 687,962 | |
Ras Laffan Liquefied Natural Gas Co., Ltd. III, Senior Secured Bonds | | | 6.750 | % | | 9/30/19 | | | 440,000 | | | | 506,564 | (a) |
TNK-BP Finance SA | | | 6.625 | % | | 3/20/17 | | | 232,000 | | | | 251,395 | (a) |
TNK-BP Finance SA, Senior Notes | | | 7.500 | % | | 7/18/16 | | | 192,000 | | | | 215,760 | (a) |
Total Energy | | | | | | | | | | | | | 10,961,413 | |
| Financials — 9.9% | | | | | | | | | | | | | | |
Capital Markets — 2.9% | | | | | | | | | | | | | | |
Goldman Sachs Capital II, Junior Subordinated Bonds | | | 5.793 | % | | 6/1/12 | | | 60,000 | | | | 48,000 | (c)(d) |
Goldman Sachs Group Inc., Senior Notes | | | 6.150 | % | | 4/1/18 | | | 1,800,000 | | | | 1,959,018 | |
Goldman Sachs Group Inc., Senior Notes | | | 6.250 | % | | 2/1/41 | | | 780,000 | | | | 786,373 | |
Kaupthing Bank HF, Senior Notes | | | 7.625 | % | | 2/28/15 | | | 3,130,000 | | | | 774,675 | (a)(e)(f) |
Kaupthing Bank HF, Subordinated Notes | | | 7.125 | % | | 5/19/16 | | | 240,000 | | | | 0 | (a)(b)(e)(f)‡ |
Lehman Brothers Holdings Capital Trust VII, Medium-Term Notes | | | 5.857 | % | | 5/31/12 | | | 100,000 | | | | 10 | (c)(d)(e) |
Lehman Brothers Holdings Inc., Medium-Term Notes | | | 6.750 | % | | 12/28/17 | | | 2,350,000 | | | | 1,175 | (e) |
Merrill Lynch & Co. Inc., Senior Notes | | | 5.450 | % | | 2/5/13 | | | 2,190,000 | | | | 2,323,135 | |
Merrill Lynch and Co. Inc. | | | 6.050 | % | | 5/16/16 | | | 1,980,000 | | | | 2,075,812 | |
See Notes to Financial Statements.
| | | | |
| Western Asset Absolute Return Portfolio 2011 Semi-Annual Report | | | 7 | |
Western Asset Absolute Return Portfolio
| | | | | | | | | | | | | | |
| Security | | Rate | | | Maturity
Date | | Face
Amount† | | | Value | |
Capital Markets — continued | | | | | | | | | | | | | | |
Morgan Stanley, Medium-Term Notes | | | 6.625 | % | | 4/1/18 | | | 1,530,000 | | | $ | 1,685,437 | |
State Street Corp., Junior Subordinated Notes | | | 4.956 | % | | 3/15/18 | | | 560,000 | | | | 593,863 | |
Total Capital Markets | | | | | | | | | | | | | 10,247,498 | |
Commercial Banks — 1.8% | | | | | | | | | | | | | | |
BAC Capital Trust XIV, Junior Subordinated Notes | | | 5.630 | % | | 3/15/12 | | | 40,000 | | | | 29,750 | (c)(d) |
BPCE SA, Subordinated Bonds | | | 12.500 | % | | 9/30/19 | | | 1,022,000 | | | | 1,169,536 | (a)(c)(d) |
Credit Agricole SA, Subordinated Notes | | | 8.375 | % | | 10/13/19 | | | 760,000 | | | | 794,200 | (a)(c)(d) |
Glitnir Banki HF, Notes | | | 6.375 | % | | 9/25/12 | | | 680,000 | | | | 188,700 | (a)(e)(f) |
Glitnir Banki HF, Subordinated Bonds | | | 1.000 | % | | 9/14/16 | | | 100,000 | | | | 0 | (a)(b)(d)(e)(f)‡ |
Glitnir Banki HF, Subordinated Notes | | | 6.693 | % | | 6/15/16 | | | 1,810,000 | | | | 0 | (a)(b)(c)(e)(f)‡ |
HBOS Capital Funding LP, Tier 1 Notes, Perpetual Bonds | | | 6.071 | % | | 6/3/14 | | | 230,000 | | | | 198,950 | (a)(c) |
Landsbanki Islands HF, Senior Notes | | | 6.100 | % | | 8/25/11 | | | 2,190,000 | | | | 153,300 | (a)(e)(f) |
Lloyds TSB Bank PLC, Notes | | | 5.800 | % | | 1/13/20 | | | 745,000 | | | | 746,079 | (a) |
Lloyds TSB Bank PLC, Senior Notes | | | 6.375 | % | | 1/21/21 | | | 100,000 | | | | 104,105 | |
Nordea Bank AB, Subordinated Notes | | | 4.875 | % | | 5/13/21 | | | 910,000 | | | | 873,938 | (a) |
Royal Bank of Scotland Group PLC, Subordinated Notes | | | 5.000 | % | | 10/1/14 | | | 1,020,000 | | | | 1,006,775 | |
Wachovia Corp., Subordinated Notes | | | 5.625 | % | | 10/15/16 | | | 730,000 | | | | 792,475 | |
Total Commercial Banks | | | | | | | | | | | | | 6,057,808 | |
Consumer Finance — 1.1% | | | | | | | | | | | | | | |
Ally Financial Inc., Subordinated Notes | | | 8.000 | % | | 12/31/18 | | | 185,000 | | | | 197,950 | |
American Express Co., Subordinated Debentures | | | 6.800 | % | | 9/1/66 | | | 40,000 | | | | 41,100 | (c) |
Ford Motor Credit Co., LLC, Senior Notes | | | 7.000 | % | | 4/15/15 | | | 240,000 | | | | 259,238 | |
GMAC Inc., Senior Notes | | | 6.875 | % | | 9/15/11 | | | 949,000 | | | | 956,118 | |
GMAC Inc., Senior Notes | | | 6.000 | % | | 12/15/11 | | | 1,013,000 | | | | 1,025,662 | |
HSBC Finance Corp., Senior Subordinated Notes | | | 6.676 | % | | 1/15/21 | | | 520,000 | | | | 533,527 | (a) |
John Deere Capital Corp., Medium-Term Notes | | | 5.350 | % | | 4/3/18 | | | 800,000 | | | | 894,874 | |
Total Consumer Finance | | | | | | | | | | | | | 3,908,469 | |
Diversified Financial Services — 3.1% | | | | | | | | | | | | | | |
Air 2 US, Notes | | | 8.027 | % | | 10/1/20 | | | 598,862 | | | | 598,862 | (a) |
Bank of America Corp., Senior Notes | | | 5.000 | % | | 5/13/21 | | | 420,000 | | | | 414,896 | |
Citigroup Inc. | | | 5.500 | % | | 2/15/17 | | | 5,570,000 | | | | 5,858,030 | |
Citigroup Inc., Senior Notes | | | 3.953 | % | | 6/15/16 | | | 660,000 | | | | 675,647 | |
Citigroup Inc., Senior Notes | | | 6.875 | % | | 3/5/38 | | | 410,000 | | | | 456,267 | |
General Electric Capital Corp., Senior Notes | | | 5.625 | % | | 5/1/18 | | | 2,000,000 | | | | 2,187,436 | |
General Electric Capital Corp., Subordinated Debentures | | | 6.375 | % | | 11/15/67 | | | 60,000 | | | | 61,500 | (c) |
PHH Corp. | | | 7.125 | % | | 3/1/13 | | | 110,000 | | | | 114,400 | |
See Notes to Financial Statements.
| | |
| 8 | | Western Asset Absolute Return Portfolio 2011 Semi-Annual Report |
Schedule of investments (unaudited) (cont’d)
June 30, 2011
Western Asset Absolute Return Portfolio
| | | | | | | | | | | | | | |
| Security | | Rate | | | Maturity
Date | | Face
Amount† | | | Value | |
Diversified Financial Services — continued | | | | | | | | | | | | | | |
ZFS Finance USA Trust II, Bonds | | | 6.450 | % | | 12/15/65 | | | 500,000 | | | $ | 507,500 | (a)(c) |
Total Diversified Financial Services | | | | | | | | | | | | | 10,874,538 | |
Insurance — 1.0% | | | | | | | | | | | | | | |
American International Group Inc., Medium-Term Notes, Senior Notes | | | 5.850 | % | | 1/16/18 | | | 518,000 | | | | 542,023 | |
ASIF Global Financing XIX | | | 4.900 | % | | 1/17/13 | | | 1,400,000 | | | | 1,456,000 | (a) |
MetLife Inc., Junior Subordinated Debentures | | | 6.400 | % | | 12/15/66 | | | 50,000 | | | | 48,750 | |
Metropolitan Life Global Funding I | | | 5.125 | % | | 4/10/13 | | | 950,000 | | | | 1,010,827 | (a) |
Teachers Insurance & Annuity Association of America-College Retirement Equity Fund, Notes | | | 6.850 | % | | 12/16/39 | | | 220,000 | | | | 250,335 | (a) |
Total Insurance | | | | | | | | | | | | | 3,307,935 | |
Real Estate Investment Trusts (REITs) — 0.0% | | | | | | | | | | | | | | |
Health Care Property Investors Inc. | | | 6.450 | % | | 6/25/12 | | | 60,000 | | | | 62,974 | |
Total Financials | | | | | | | | | | | | | 34,459,222 | |
| Health Care — 3.1% | | | | | | | | | | | | | | |
Biotechnology — 0.1% | | | | | | | | | | | | | | |
Amgen Inc., Senior Notes | | | 4.500 | % | | 3/15/20 | | | 370,000 | | | | 381,584 | |
Health Care Providers & Services — 2.9% | | | | | | | | | | | | | | |
AmerisourceBergen Corp. | | | 5.875 | % | | 9/15/15 | | | 50,000 | | | | 56,785 | |
HCA Inc., Senior Notes | | | 6.500 | % | | 2/15/16 | | | 619,000 | | | | 629,833 | |
HCA Inc., Senior Secured Notes | | | 9.625 | % | | 11/15/16 | | | 630,000 | | | | 670,163 | (g) |
Humana Inc. | | | 8.150 | % | | 6/15/38 | | | 680,000 | | | | 824,864 | |
Humana Inc., Senior Notes | | | 7.200 | % | | 6/15/18 | | | 340,000 | | | | 394,684 | |
Tenet Healthcare Corp., Senior Secured Notes | | | 10.000 | % | | 5/1/18 | | | 525,000 | | | | 596,531 | |
Tenet Healthcare Corp., Senior Secured Notes | | | 8.875 | % | | 7/1/19 | | | 554,000 | | | | 611,478 | |
UnitedHealth Group Inc. | | | 4.875 | % | | 4/1/13 | | | 940,000 | | | | 996,660 | |
UnitedHealth Group Inc., Senior Notes | | | 4.875 | % | | 2/15/13 | | | 3,000,000 | | | | 3,172,347 | |
UnitedHealth Group Inc., Senior Notes | | | 6.000 | % | | 2/15/18 | | | 510,000 | | | | 578,279 | |
WellPoint Inc., Notes | | | 5.875 | % | | 6/15/17 | | | 1,470,000 | | | | 1,680,677 | |
Total Health Care Providers & Services | | | | | | | | | | | | | 10,212,301 | |
Pharmaceuticals — 0.1% | | | | | | | | | | | | | | |
Giant Funding Corp., Senior Secured Notes | | | 8.250 | % | | 2/1/18 | | | 110,000 | | | | 114,675 | (a) |
Total Health Care | | | | | | | | | | | | | 10,708,560 | |
| Industrials — 1.3% | | | | | | | | | | | | | | |
Airlines — 0.4% | | | | | | | | | | | | | | |
Continental Airlines Inc. | | | 6.820 | % | | 11/1/19 | | | 60,915 | | | | 62,438 | |
Continental Airlines Inc., Pass-Through Certificates | | | 9.250 | % | | 5/10/17 | | | 205,720 | | | | 213,948 | |
Continental Airlines Inc., Pass-Through Certificates | | | 6.703 | % | | 6/15/21 | | | 48,224 | | | | 50,273 | |
See Notes to Financial Statements.
| | | | |
| Western Asset Absolute Return Portfolio 2011 Semi-Annual Report | | | 9 | |
Western Asset Absolute Return Portfolio
| | | | | | | | | | | | | | |
| Security | | Rate | | | Maturity
Date | | Face
Amount† | | | Value | |
Airlines — continued | | | | | | | | | | | | | | |
Continental Airlines Inc., Pass-Through Certificates, Senior Secured Notes | | | 7.250 | % | | 5/10/21 | | | 932,879 | | | $ | 1,005,177 | |
US Airways Pass-Through Trust | | | 6.850 | % | | 7/30/19 | | | 228,770 | | | | 224,769 | (b) |
Total Airlines | | | | | | | | | | | | | 1,556,605 | |
Building Products — 0.0% | | | | | | | | | | | | | | |
Masco Corp. | | | 7.125 | % | | 8/15/13 | | | 50,000 | | | | 53,638 | |
Commercial Services & Supplies — 0.1% | | | | | | | | | | | | | | |
Republic Services Inc., Senior Notes | | | 5.500 | % | | 9/15/19 | | | 290,000 | | | | 316,135 | |
Construction & Engineering — 0.1% | | | | | | | | | | | | | | |
Odebrecht Finance Ltd., Senior Notes | | | 7.000 | % | | 4/21/20 | | | 470,000 | | | | 517,000 | (a) |
Industrial Conglomerates — 0.1% | | | | | | | | | | | | | | |
Leucadia National Corp., Senior Notes | | | 8.125 | % | | 9/15/15 | | | 250,000 | | | | 275,625 | |
Road & Rail — 0.5% | | | | | | | | | | | | | | |
Asciano Finance Ltd., Senior Notes | | | 3.125 | % | | 9/23/15 | | | 1,280,000 | | | | 1,262,933 | (a) |
Asciano Finance Ltd., Senior Notes | | | 4.625 | % | | 9/23/20 | | | 350,000 | | | | 333,958 | (a) |
Total Road & Rail | | | | | | | | | | | | | 1,596,891 | |
Trading Companies & Distributors — 0.1% | | | | | | | | | | | | | | |
Ashtead Capital Inc., Notes | | | 9.000 | % | | 8/15/16 | | | 200,000 | | | | 208,500 | (a) |
Total Industrials | | | | | | | | | | | | | 4,524,394 | |
| Information Technology — 0.2% | | | | | | | | | | | | | | |
Semiconductors & Semiconductor Equipment — 0.2% | | | | | | | | | | | |
National Semiconductor Corp., Senior Notes | | | 6.600 | % | | 6/15/17 | | | 720,000 | | | | 847,400 | |
| Materials — 1.2% | | | | | | | | | | | | | | |
Containers & Packaging — 0.1% | | | | | | | | | | | | | | |
Ball Corp., Senior Notes | | | 6.750 | % | | 9/15/20 | | | 400,000 | | | | 424,500 | |
Reynolds Group Issuer Inc./Reynolds Group Issuer LLC, Senior Secured Notes | | | 6.875 | % | | 2/15/21 | | | 140,000 | | | | 136,500 | (a) |
Total Containers & Packaging | | | | | | | | | | | | | 561,000 | |
Metals & Mining — 1.1% | | | | | | | | | | | | | | |
Freeport-McMoRan Copper & Gold Inc., Senior Notes | | | 8.375 | % | | 4/1/17 | | | 1,910,000 | | | | 2,086,675 | |
Steel Dynamics Inc., Senior Notes | | | 7.625 | % | | 3/15/20 | | | 410,000 | | | | 433,575 | |
Teck Resources Ltd., Senior Secured Notes | | | 9.750 | % | | 5/15/14 | | | 15,000 | | | | 18,157 | |
Teck Resources Ltd., Senior Secured Notes | | | 10.250 | % | | 5/15/16 | | | 17,000 | | | | 20,315 | |
Vale Overseas Ltd., Notes | | | 6.875 | % | | 11/21/36 | | | 636,000 | | | | 690,560 | |
Vedanta Resources PLC, Senior Notes | | | 8.750 | % | | 1/15/14 | | | 330,000 | | | | 353,925 | (a) |
Vedanta Resources PLC, Senior Notes | | | 8.750 | % | | 1/15/14 | | | 160,000 | | | | 171,600 | (a) |
Total Metals & Mining | | | | | | | | | | | | | 3,774,807 | |
Total Materials | | | | | | | | | | | | | 4,335,807 | |
See Notes to Financial Statements.
| | |
| 10 | | Western Asset Absolute Return Portfolio 2011 Semi-Annual Report |
Schedule of investments (unaudited) (cont’d)
June 30, 2011
Western Asset Absolute Return Portfolio
| | | | | | | | | | | | | | |
| Security | | Rate | | | Maturity
Date | | Face
Amount† | | | Value | |
| Telecommunication Services — 1.6% | | | | | | | | | | | | | | |
Diversified Telecommunication Services — 1.1% | | | | | | | | | | | | | | |
AT&T Inc., Global Notes | | | 5.500 | % | | 2/1/18 | | | 1,530,000 | | | $ | 1,706,450 | |
Axtel SAB de CV, Senior Notes | | | 7.625 | % | | 2/1/17 | | | 500,000 | | | | 475,000 | (a) |
Qwest Corp., Senior Notes | | | 7.500 | % | | 10/1/14 | | | 190,000 | | | | 213,037 | |
Telefonica Emisiones SAU, Senior Notes | | | 5.462 | % | | 2/16/21 | | | 320,000 | | | | 324,857 | |
Verizon Communications Inc., Senior Notes | | | 6.100 | % | | 4/15/18 | | | 1,150,000 | | | | 1,317,839 | |
Total Diversified Telecommunication Services | | | | | | | | | | 4,037,183 | |
Wireless Telecommunication Services — 0.5% | | | | | | | | | | | | | | |
America Movil SAB de CV, Senior Notes | | | 5.000 | % | | 3/30/20 | | | 490,000 | | | | 511,168 | |
Cricket Communications Inc., Senior Secured Notes | | | 7.750 | % | | 5/15/16 | | | 315,000 | | | | 333,900 | |
True Move Co., Ltd. | | | 10.750 | % | | 12/16/13 | | | 800,000 | | | | 863,000 | (a) |
Total Wireless Telecommunication Services | | | | | | | | | | | | | 1,708,068 | |
Total Telecommunication Services | | | | | | | | | | | | | 5,745,251 | |
| Utilities — 2.0% | | | | | | | | | | | | | | |
Electric Utilities — 0.0% | | | | | | | | | | | | | | |
FirstEnergy Corp., Notes | | | 6.450 | % | | 11/15/11 | | | 83,000 | | | | 84,553 | |
Gas Utilities — 0.1% | | | | | | | | | | | | | | |
El Paso Performance-Linked Trust Certificates, Senior Notes | | | 7.750 | % | | 7/15/11 | | | 340,000 | | | | 340,206 | (a) |
Independent Power Producers & Energy Traders — 1.9% | | | | | | | | | | | |
AES Corp., Senior Notes | | | 7.750 | % | | 3/1/14 | | | 1,300,000 | | | | 1,404,000 | |
AES Corp., Senior Notes | | | 7.750 | % | | 10/15/15 | | | 300,000 | | | | 320,250 | |
Calpine Corp., Senior Secured Notes | | | 7.875 | % | | 1/15/23 | | | 610,000 | | | | 628,300 | (a) |
Dynegy Inc., Bonds | | | 7.670 | % | | 11/8/16 | | | 420,000 | | | | 373,800 | |
Edison Mission Energy, Senior Notes | | | 7.750 | % | | 6/15/16 | | | 110,000 | | | | 99,000 | |
Edison Mission Energy, Senior Notes | | | 7.625 | % | | 5/15/27 | | | 90,000 | | | | 66,150 | |
Energy Future Holdings Corp., Senior Notes | | | 10.875 | % | | 11/1/17 | | | 4,000 | | | | 3,420 | |
Energy Future Intermediate Holding Co. LLC/EFIH Finance Inc., Senior Secured Notes | | | 10.000 | % | | 12/1/20 | | | 2,395,000 | | | | 2,554,172 | |
Mirant Mid Atlantic LLC, Pass-Through Certificates | | | 10.060 | % | | 12/30/28 | | | 915,837 | | | | 1,025,737 | |
Total Independent Power Producers & Energy Traders | | | | | | | | | | 6,474,829 | |
Total Utilities | | | | | | | | | | | | | 6,899,588 | |
Total Corporate Bonds & Notes (Cost — $99,551,687) | | | | | | | | | | 96,861,010 | |
| Asset-Backed Securities — 5.2% | | | | | | | | | | | | | | |
ABSC Manufactured Housing Contract, 2004-CN1 | | | 8.400 | % | | 12/2/30 | | | 170,000 | | | | 160,756 | (a) |
ACE Securities Corp., 2006-GP1 A | | | 0.316 | % | | 2/25/31 | | | 237,688 | | | | 189,915 | (c) |
Amortizing Residential Collateral Trust, 2005-BC5 M1 | | | 1.221 | % | | 7/25/32 | | | 510,333 | | | | 404,694 | (c) |
Associates Manufactured Housing Pass Through Certificates, 1997-CLB2 | | | 8.900 | % | | 6/15/28 | | | 1,603,023 | | | | 1,627,068 | (b) |
See Notes to Financial Statements.
| | | | |
| Western Asset Absolute Return Portfolio 2011 Semi-Annual Report | | | 11 | |
Western Asset Absolute Return Portfolio
| | | | | | | | | | | | | | |
| Security | | Rate | | | Maturity
Date | | Face
Amount† | | | Value | |
| Asset-Backed Securities — continued | | | | | | | | | | | | | | |
Bear Stearns Asset-Backed Securities Trust, 2006-SD2 | | | 0.386 | % | | 6/25/36 | | | 175,461 | | | $ | 172,915 | (c) |
Centex Home Equity Loan Trust, 2003-B AF4 | | | 3.735 | % | | 2/25/32 | | | 142,664 | | | | 125,630 | |
Citigroup Mortgage Loan Trust Inc., 2006-SHL1 A1 | | | 0.386 | % | | 11/25/45 | | | 99,144 | | | | 87,089 | (a)(c) |
Educap Student Loan Asset-Backed Notes, 2004-1 B | | | 2.030 | % | | 6/25/38 | | | 1,500,000 | | | | 1,320,000 | (b)(c) |
Education Funding Capital Trust, 2003-3 A6 | | | 1.724 | % | | 12/15/42 | | | 300,000 | | | | 285,000 | (c) |
First Franklin Mortgage Loan Asset-Backed Certificates, 2006-FF5 2A5, PO | | | 0.000 | % | | 4/25/36 | | | 1,050,000 | | | | 318,938 | |
Fremont Home Loan Trust, 2006-B 2A2 | | | 0.286 | % | | 8/25/36 | | | 348,198 | | | | 122,183 | (c) |
GMAC Mortgage Corp. Loan Trust, 2006-HE4 A1 | | | 0.366 | % | | 12/25/36 | | | 1,397,820 | | | | 917,922 | (c) |
Greenpoint Manufactured Housing, 1999-2 A2 | | | 3.109 | % | | 3/18/29 | | | 300,000 | | | | 250,500 | (c) |
Greenpoint Manufactured Housing, 1999-3 2A2 | | | 3.696 | % | | 6/19/29 | | | 150,000 | | | | 125,250 | (c) |
Greenpoint Manufactured Housing, 1999-4 A2 | | | 3.695 | % | | 2/20/30 | | | 175,000 | | | | 146,125 | (c) |
Greenpoint Manufactured Housing, 2000-4 A3 | | | 2.253 | % | | 8/21/31 | | | 1,250,000 | | | | 1,050,000 | (c) |
Greenpoint Manufactured Housing, 2000-6 A3 | | | 2.195 | % | | 11/22/31 | | | 225,000 | | | | 186,000 | (c) |
Greenpoint Manufactured Housing, 2000-7 A2 | | | 3.686 | % | | 11/17/31 | | | 575,000 | | | | 485,875 | (c) |
Greenpoint Manufactured Housing, 2001-2 IA2 | | | 3.690 | % | | 2/20/32 | | | 275,000 | | | | 223,424 | (c) |
Greenpoint Manufactured Housing, 2001-2 IIA2 | | | 3.689 | % | | 3/13/32 | | | 350,000 | | | | 275,283 | (c) |
GSAMP Trust, 2006-S3 A1 | | | 6.585 | % | | 5/25/36 | | | 353,627 | | | | 19,980 | |
GSAMP Trust, 2006-SEA1 A | | | 0.486 | % | | 5/25/36 | | | 260,329 | | | | 217,042 | (a)(c) |
GSRPM Mortgage Loan Trust, 2006-2 A2 | | | 0.486 | % | | 9/25/36 | | | 340,112 | | | | 282,936 | (a)(c) |
Hertz Vehicle Financing LLC, 2009-2A A2 | | | 5.290 | % | | 3/25/16 | | | 460,000 | | | | 504,429 | (a) |
Indymac Seconds Asset Backed Trust, 2006-A A | | | 0.316 | % | | 6/25/36 | | | 1,218,939 | | | | 128,097 | (c) |
IXIS Real Estate Capital Trust, 2005-HE4 A3 | | | 0.526 | % | | 2/25/36 | | | 634,581 | | | | 550,638 | (c) |
Lehman XS Trust, 2006-16N A4B | | | 0.426 | % | | 11/25/46 | | | 546,303 | | | | 128,221 | (c) |
Lehman XS Trust, 2006-2N 1A1 | | | 0.446 | % | | 2/25/46 | | | 339,115 | | | | 181,597 | (c) |
Lehman XS Trust, 2006-GP3 2A2 | | | 0.406 | % | | 6/25/46 | | | 280,301 | | | | 23,367 | (c) |
Lehman XS Trust, 2007-2N 3A1 | | | 0.276 | % | | 2/25/37 | | | 119,431 | | | | 115,300 | (c) |
MASTR Specialized Loan Trust, 2006-3 A | | | 0.446 | % | | 6/25/46 | | | 346,642 | | | | 205,876 | (a)(c) |
MASTR Specialized Loan Trust, 2007-1 A | | | 0.556 | % | | 1/25/37 | | | 317,036 | | | | 119,152 | (a)(c) |
Morgan Stanley Home Equity Loans, 2007-1 A3 | | | 0.326 | % | | 12/25/36 | | | 2,720,000 | | | | 802,917 | (c) |
Nelnet Student Loan Trust, 2005-4 A4R2 | | | 1.107 | % | | 3/22/32 | | | 2,900,000 | | | | 2,631,750 | (b)(c) |
Nelnet Student Loan Trust, 2008-4 A4 | | | 1.754 | % | | 4/25/24 | | | 640,000 | | | | 656,836 | (c) |
Oakwood Mortgage Investors Inc., 1999-D A1 | | | 7.840 | % | | 11/15/29 | | | 235,072 | | | | 231,541 | |
Option One Mortgage Loan Trust, 2005-1 A4 | | | 0.586 | % | | 2/25/35 | | | 713,017 | | | | 612,304 | (c) |
Origen Manufactured Housing, 2007-A A2 | | | 3.697 | % | | 4/15/37 | | | 2,500,000 | | | | 1,625,000 | (c) |
Pegasus Aviation Lease Securitization, 2000-1 A2 | | | 8.370 | % | | 3/25/30 | | | 390,000 | | | | 179,400 | (a) |
RAAC Series, 2006-RP4 A | | | 0.476 | % | | 1/25/46 | | | 448,679 | | | | 338,438 | (a)(c) |
Total Asset-Backed Securities (Cost — $22,560,957) | | | | | | | | | | | | | 18,029,388 | |
See Notes to Financial Statements.
| | |
| 12 | | Western Asset Absolute Return Portfolio 2011 Semi-Annual Report |
Schedule of investments (unaudited) (cont’d)
June 30, 2011
Western Asset Absolute Return Portfolio
| | | | | | | | | | | | | | |
| Security | | Rate | | | Maturity
Date | | Face
Amount† | | | Value | |
| Collateralized Mortgage Obligations — 7.2% | | | | | | | | | | | | | | |
Adjustable Rate Mortgage Trust, 2004-1 4A1 | | | 5.508 | % | | 1/25/35 | | | 2,720,737 | | | $ | 2,748,850 | (c) |
Banc of America Funding Corp., 2006-8T2 A2 | | | 5.791 | % | | 10/25/36 | | | 29,890 | | | | 19,263 | |
Banc of America Funding Corp., 2006-D 6A1 | | | 5.387 | % | | 5/20/36 | | | 1,108,624 | | | | 688,070 | (c) |
Banc of America Mortgage Securities Inc., 2003-F 1A1 | | | 2.748 | % | | 7/25/33 | | | 21,375 | | | | 19,595 | (c) |
Banc of America Mortgage Securities Inc., 2004-A 1A1 | | | 2.747 | % | | 2/25/34 | | | 50,151 | | | | 40,070 | (c) |
Bear Stearns Alt-A Trust, 2003-5 2A1 | | | 2.533 | % | | 12/25/33 | | | 502,439 | | | | 469,568 | (c) |
Bear Stearns Alt-A Trust, 2004-10 1A1 | | | 0.866 | % | | 9/25/34 | | | 139,033 | | | | 118,156 | (c) |
Bear Stearns Alt-A Trust, 2004-11 1A2 | | | 1.026 | % | | 11/25/34 | | | 95,075 | | | | 75,176 | (c) |
Bear Stearns Alt-A Trust, 2005-02 1A1 | | | 0.686 | % | | 3/25/35 | | | 40,588 | | | | 33,226 | (c) |
Bear Stearns Alt-A Trust, 2005-10 21A1 | | | 3.058 | % | | 1/25/36 | | | 395,590 | | | | 213,590 | (c) |
Bear Stearns ARM Trust, 2004-12 1A1 | | | 2.743 | % | | 2/25/35 | | | 97,192 | | | | 74,917 | (c) |
Bear Stearns Mortgage Funding Trust, 2006-AR5 1A1 | | | 0.346 | % | | 12/25/46 | | | 900,511 | | | | 547,888 | (c) |
BlackRock Capital Finance LP, 1996-R1 | | | 9.580 | % | | 9/25/26 | | | 114,733 | | | | 12,420 | (b)(c) |
Citigroup Mortgage Loan Trust Inc., 2005-9 1A1 | | | 0.446 | % | | 11/25/35 | | | 432,706 | | | | 238,001 | (c) |
Countrywide Alternative Loan Trust, 2005-24 4A1 | | | 0.416 | % | | 7/20/35 | | | 624,234 | | | | 402,918 | (c) |
Countrywide Alternative Loan Trust, 2005-51 2A1 | | | 0.486 | % | | 11/20/35 | | | 375,796 | | | | 224,319 | (c) |
Countrywide Alternative Loan Trust, 2005-76 3A1 | | | 0.446 | % | | 1/25/46 | | | 379,287 | | | | 206,968 | (c) |
Countrywide Alternative Loan Trust, 2006-OA08 1A2 | | | 0.416 | % | | 7/25/46 | | | 607,690 | | | | 134,684 | (c) |
Countrywide Alternative Loan Trust, 2006-OA10 4A3 | | | 0.456 | % | | 8/25/46 | | | 1,651,975 | | | | 70,437 | (c) |
Countrywide Home Loan, 2003-HYB1 1A1 | | | 2.772 | % | | 5/19/33 | | | 24,302 | | | | 22,542 | (c) |
Countrywide Home Loan Mortgage Pass-Through Trust, 2001-HYB1 1A1 | | | 2.222 | % | | 6/19/31 | | | 28,985 | | | | 26,586 | (c) |
Countrywide Home Loans, 2003-60 1A1 | | | 3.073 | % | | 2/25/34 | | | 413,566 | | | | 348,228 | (c) |
Countrywide Home Loans, 2006-3 1A2 | | | 0.516 | % | | 3/25/36 | | | 396,469 | | | | 122,070 | (c) |
Deutsche Mortgage Securities Inc., 2004-4 7AR2 | | | 0.636 | % | | 6/25/34 | | | 192,826 | | | | 162,618 | (c) |
Federal Home Loan Mortgage Corp. (FHLMC), K007 X1, IO | | | 1.413 | % | | 4/25/20 | | | 1,158,245 | | | | 86,600 | (c) |
Federal Home Loan Mortgage Corp. (FHLMC), K007 X1, IO | | | 1.685 | % | | 8/25/20 | | | 11,481,758 | | | | 1,039,528 | (c) |
Federal Home Loan Mortgage Corp. (FHLMC), K008 X1, IO | | | 1.842 | % | | 6/25/20 | | | 1,182,214 | | | | 118,294 | (c) |
First Horizon Alternative Mortgage Securities, 2005-AA12 1A1 | | | 2.344 | % | | 2/25/36 | | | 481,912 | | | | 346,081 | (c) |
Greenpoint Mortgage Funding Trust, 2006-AR2 1A2 | | | 0.436 | % | | 4/25/36 | | | 2,653,935 | | | | 1,102,593 | (c) |
Greenpoint Mortgage Funding Trust, 2006-AR3 3A1 | | | 0.416 | % | | 4/25/36 | | | 511,110 | | | | 208,787 | (c) |
Greenwich Capital Commercial Funding Corp., 2006-GG7 | | | 6.078 | % | | 7/10/38 | | | 350,000 | | | | 388,584 | (c) |
GSR Mortgage Loan Trust, 2006-0A1 2A2 | | | 0.446 | % | | 8/25/46 | | | 709,035 | | | | 215,038 | (c) |
Harborview Mortgage Loan Trust, 2006-13 A | | | 0.366 | % | | 11/19/46 | | | 468,960 | | | | 246,347 | (c) |
Harborview Mortgage Loan Trust, 2006-14 2A1A | | | 0.336 | % | | 1/25/47 | | | 860,503 | | | | 473,752 | (c) |
Harborview Mortgage Loan Trust, 2007-7 2A1A | | | 1.186 | % | | 11/25/47 | | | 1,219,349 | | | | 839,151 | (c) |
IMPAC CMB Trust, 2004-5 1A1 | | | 0.906 | % | | 10/25/34 | | | 185,905 | | | | 171,501 | (c) |
See Notes to Financial Statements.
| | | | |
| Western Asset Absolute Return Portfolio Semi-Annual Report | | | 13 | |
Western Asset Absolute Return Portfolio
| | | | | | | | | | | | | | |
| Security | | Rate | | | Maturity
Date | | Face
Amount† | | | Value | |
| Collateralized Mortgage Obligations — continued | | | | | | | | | | | | | | |
IMPAC CMB Trust, 2005-7 A1 | | | 0.446 | % | | 11/25/35 | | | 405,383 | | | $ | 223,699 | (c) |
IMPAC Secured Assets Corp., 2004-3 1A4 | | | 0.986 | % | | 11/25/34 | | | 10,611 | | | | 9,883 | (c) |
Indymac Manufactured Housing Contract, A2-2 | | | 6.170 | % | | 12/25/11 | | | 323,425 | | | | 321,629 | |
MASTR ARM Trust, 2003-3 3A4 | | | 2.441 | % | | 9/25/33 | | | 1,615,199 | | | | 1,411,317 | (c) |
Merit Securities Corp., 11PA B2 | | | 1.686 | % | | 9/28/32 | | | 18,337 | | | | 17,655 | (a)(c) |
Merrill Lynch Mortgage Investors Trust, 2004-A3 4A3 | | | 5.006 | % | | 5/25/34 | | | 617,393 | | | | 620,889 | (c) |
Morgan Stanley Mortgage Loan Trust, 2004-6AR | | | 2.938 | % | | 8/25/34 | | | 84,498 | | | | 67,543 | (c) |
Morgan Stanley Mortgage Loan Trust, 2006-3AR 2A3 | | | 2.651 | % | | 3/25/36 | | | 474,337 | | | | 264,131 | (c) |
Nomura Asset Acceptance Corp., 2006-AF2 4A | | | 6.255 | % | | 8/25/36 | | | 437,911 | | | | 219,628 | (c) |
Residential Accredit Loans Inc., 2007-Q01 A1 | | | 0.336 | % | | 2/25/47 | | | 2,516,946 | | | | 1,363,631 | (c) |
Sequoia Mortgage Trust, 2007-4 4A1 | | | 5.481 | % | | 7/20/47 | | | 1,418,107 | | | | 1,112,451 | (c) |
Structured ARM Loan Trust, 2004-07 A1 | | | 0.591 | % | | 6/25/34 | | | 17,791 | | | | 13,825 | (c) |
Structured ARM Loan Trust, 2004-17 A1 | | | 1.102 | % | | 11/25/34 | | | 55,211 | | | | 48,262 | (c) |
Structured ARM Loan Trust, 2004-4 3A2 | | | 2.593 | % | | 4/25/34 | | | 884,149 | | | | 771,521 | (c) |
Structured ARM Loan Trust, 2005-19XS 1A1 | | | 0.506 | % | | 10/25/35 | | | 1,220,799 | | | | 802,293 | (c) |
Structured ARM Loan Trust, 2005-20 4A1 | | | 5.666 | % | | 10/25/35 | | | 1,686,035 | | | | 1,414,553 | (c) |
Structured Asset Mortgage Investments Inc., 2003-AR2 A1 | | | 0.567 | % | | 12/19/33 | | | 92,437 | | | | 80,937 | (c) |
Structured Asset Securities Corp., 2002-08A 7A1 | | | 1.958 | % | | 5/25/32 | | | 70,997 | | | | 63,090 | (c) |
Structured Asset Securities Corp., 2002-11A 1A1 | | | 2.062 | % | | 6/25/32 | | | 24,815 | | | | 24,405 | (c) |
Structured Asset Securities Corp., 2002-16A 1A1 | | | 2.844 | % | | 8/25/32 | | | 235,426 | | | | 228,533 | (c) |
Structured Asset Securities Corp., 2002-18A 1A1 | | | 2.868 | % | | 9/25/32 | | | 8,391 | | | | 7,419 | (c) |
Structured Asset Securities Corp., 2004-NP1 A | | | 0.586 | % | | 9/25/33 | | | 166,514 | | | | 147,575 | (a)(c) |
Thornburg Mortgage Securities Trust, 2004-1 I2A | | | 1.086 | % | | 3/25/44 | | | 30,521 | | | | 27,489 | (c) |
Washington Mutual Inc. Mortgage Pass-Through Certificates, 2006-AR03 A1A | | | 1.248 | % | | 5/25/46 | | | 2,934,345 | | | | 1,564,590 | (c) |
Washington Mutual Inc. Mortgage Pass-Through Certificates, 2006-AR6 2A | | | 1.238 | % | | 8/25/46 | | | 2,154,843 | | | | 1,182,962 | (c) |
Washington Mutual Mortgage Pass-Through Certificates, 2006-AR4 DA | | | 1.265 | % | | 6/25/46 | | | 1,566,967 | | | | 747,338 | (c) |
Wells Fargo Mortgage-Backed Securities Trust, 2005-AR9 4A1 | | | 2.848 | % | | 5/25/35 | | | 292,275 | | | | 261,638 | (c) |
Total Collateralized Mortgage Obligations (Cost — $37,000,050) | | | | 25,275,302 | |
| Collateralized Senior Loans — 5.2% | | | | | | | | | | | | | | |
| Consumer Discretionary — 2.8% | | | | | | | | | | | | | | |
Auto Components — 0.3% | | | | | | | | | | | | | | |
Allison Transmission Inc., Term Loan B | | | 2.940 | % | | 8/7/14 | | | 894,820 | | | | 876,784 | (h) |
Hotels, Restaurants & Leisure — 0.4% | | | | | | | | | | | | | | |
Caesars Entertainment Operating Co. Inc., Term Loan B2 | | | 3.186-3.274 | % | | 1/28/15 | | | 806,853 | | | | 723,478 | (h) |
See Notes to Financial Statements.
| | |
| 14 | | Western Asset Absolute Return Portfolio 2011 Semi-Annual Report |
Schedule of investments (unaudited) (cont’d)
June 30, 2011
Western Asset Absolute Return Portfolio
| | | | | | | | | | | | | | |
| Security | | Rate | | | Maturity
Date | | Face
Amount† | | | Value | |
Hotels, Restaurants & Leisure — continued | | | | | | | | | | | | | | |
Las Vegas Sands LLC, Delayed Draw Term Loan | | | 2.690-3.010 | % | | 11/23/16 | | | 127,347 | | | $ | 123,463 | (h) |
Las Vegas Sands LLC, Term Loan B | | | 2.690-3.010 | % | | 11/23/16 | | | 504,188 | | | | 488,152 | (h) |
Total Hotels, Restaurants & Leisure | | | | | | | | | | | | | 1,335,093 | |
Media — 1.3% | | | | | | | | | | | | | | |
Cengage Learning Acquisitions Inc., Term Loan | | | 0.000-2.500 | % | | 7/3/14 | | | 994,832 | | | | 892,329 | (h) |
Charter Communications Operating LLC, Term Loan C | | | 0.000-3.500 | % | | 9/6/16 | | | 859,423 | | | | 855,733 | (h) |
Insight Midwest Holdings LLC, Term Loan B | | | 1.940-2.060 | % | | 4/7/14 | | | 620,556 | | | | 608,477 | (h) |
Univision Communications Inc., Term Loan B | | | 4.435 | % | | 3/31/17 | | | 874,148 | | | | 834,811 | (h) |
UPC Holding BV, Term Loan N | | | 1.941 | % | | 12/31/14 | | | 1,296,576 | | | | 1,281,449 | (h) |
UPC Holding BV, Term Loan T2 | | | 3.691 | % | | 12/30/16 | | | 170,812 | | | | 170,385 | (h) |
Total Media | | | | | | | | | | | | | 4,643,184 | |
Multiline Retail — 0.3% | | | | | | | | | | | | | | |
Neiman-Marcus Group Inc., Term Loan | | | 4.750 | % | | 5/16/18 | | | 925,000 | | | | 912,387 | (h) |
Specialty Retail — 0.5% | | | | | | | | | | | | | | |
Gymboree Corp., Term Loan | | | 5.000 | % | | 2/23/18 | | | 995,000 | | | | 962,840 | (h) |
Michaels Stores Inc., Term Loan B2 | | | 4.750-4.813 | % | | 7/31/16 | | | 923,012 | | | | 918,397 | (h) |
Total Specialty Retail | | | | | | | | | | | | | 1,881,237 | |
Total Consumer Discretionary | | | | | | | | | | | | | 9,648,685 | |
| Energy — 0.2% | | | | | | | | | | | | | | |
Energy Equipment & Services — 0.2% | | | | | | | | | | | | | | |
Brand Energy and Infrastructure Services Inc., Term Loan B2 | | | 3.563 | % | | 2/7/14 | | | 914,683 | | | | 832,362 | (h) |
| Industrials — 0.3% | | | | | | | | | | | | | | |
Airlines — 0.2% | | | | | | | | | | | | | | |
DAE Aviation Holdings Inc., Term Loan B1 | | | 5.280 | % | | 7/31/14 | | | 563,220 | | | | 560,638 | (h) |
Industrial Conglomerates — 0.1% | | | | | | | | | | | | | | |
Pinafore LLC, Term Loan B | | | 6.250 | % | | 9/29/16 | | | 490,844 | | | | 490,578 | (h) |
Total Industrials | | | | | | | | | | | | | 1,051,216 | |
| Information Technology — 0.8% | | | | | | | | | | | | | | |
IT Services — 0.6% | | | | | | | | | | | | | | |
First Data Corp., Term Loan B | | | 4.186 | % | | 3/23/18 | | | 612,309 | | | | 561,037 | (h) |
First Data Corp., Term Loan B2 | | | 2.936 | % | | 9/24/14 | | | 742,634 | | | | 687,021 | (h) |
SunGard Data Systems Inc., Term Loan B | | | 3.845-3.893 | % | | 2/28/16 | | | 904,549 | | | | 900,772 | (h) |
Total IT Services | | | | | | | | | | | | | 2,148,830 | |
Semiconductors & Semiconductor Equipment — 0.2% | |
Freescale Semiconductor Inc., Term Loan | | | 4.441 | % | | 12/1/16 | | | 496,761 | | | | 493,890 | (h) |
Total Information Technology | | | | | | | | | | | | | 2,642,720 | |
See Notes to Financial Statements.
| | | | |
| Western Asset Absolute Return Portfolio 2011 Semi-Annual Report | | | 15 | |
Western Asset Absolute Return Portfolio
| | | | | | | | | | | | | | |
| Security | | Rate | | | Maturity
Date | | Face
Amount† | | | Value | |
| Materials — 0.5% | | | | | | | | | | | | | | |
Containers & Packaging — 0.4% | | | | | | | | | | | | | | |
Graham Packaging Co. L.P., Term Loan C | | | 6.750 | % | | 4/5/14 | | | 753,518 | | | $ | 755,084 | (h) |
Reynolds Group Holdings Inc., Term Loan E | | | 4.250 | % | | 2/9/18 | | | 997,500 | | | | 991,266 | (h) |
Total Containers & Packaging | | | | | | | | | | | | | 1,746,350 | |
Paper & Forest Products — 0.1% | | | | | | | | | | | | | | |
Georgia-Pacific Corp., Term Loan B1 | | | 2.250-2.246 | % | | 12/21/12 | | | 179,232 | | | | 178,971 | (h) |
Total Materials | | | | | | | | | | | | | 1,925,321 | |
| Telecommunication Services — 0.3% | | | | | | | | | | | | | | |
Diversified Telecommunication Services — 0.3% | | | | | |
Level 3 Financing Inc., Term Loan A | | | 2.533 | % | | 3/13/14 | | | 1,000,000 | | | | 966,667 | (h) |
| Utilities — 0.3% | | | | | | | | | | | | | | |
Independent Power Producers & Energy Traders — 0.3% | |
RRI Energy Inc., Term Loan B | | | 6.000 | % | | 12/3/17 | | | 994,987 | | | | 993,246 | (h) |
Total Collateralized Senior Loans (Cost — $18,380,523) | | | | 18,060,217 | |
| Municipal Bonds — 2.6% | | | | | | | | | | | | | | |
New York — 0.2% | | | | | | | | | | | | | | |
New York State Energy Research & Development Authority Facilities Revenue, Consolidated Edison Co., XLCA | | | 0.369 | % | | 5/1/32 | | | 1,150,000 | | | | 905,625 | (c) |
North Carolina — 1.6% | | | | | | | | | | | | | | |
North Carolina State Education Assistance Authority Revenue, Student Loan Backed Notes | | | 1.210 | % | | 10/25/41 | | | 3,100,000 | | | | 2,887,464 | (c) |
Wake County, NC, Industrial Facilities & Pollution Control Financing Authority Revenue, Carolina Power & Light Co., AMBAC | | | 0.193 | % | | 7/25/11 | | | 2,100,000 | | | | 1,837,500 | (c) |
Wake County, NC, Industrial Facilities & Pollution Control Financing Authority Revenue, Carolina Power & Light Co., AMBAC | | | 0.368 | % | | 10/1/22 | | | 1,025,000 | | | | 881,500 | (b)(c)(i) |
Total North Carolina | | | | | | | | | | | | | 5,606,464 | |
Pennsylvania — 0.8% | | | | | | | | | | | | | | |
Pennsylvania State Higher Education Assistance Agency, Student Loan Revenue | | | 0.239 | % | | 7/12/11 | | | 1,900,000 | | | | 1,729,000 | (c) |
Pennsylvania State Higher Education Assistance Agency, Student Loan Revenue | | | 1.231 | % | | 6/1/47 | | | 1,025,000 | | | | 932,750 | (c) |
Total Pennsylvania | | | | | | | | | | | | | 2,661,750 | |
Total Municipal Bonds (Cost — $9,160,533) | | | | | | | | | | | | | 9,173,839 | |
| Non-U.S. Treasury Inflation Protected Securities — 0.5% | | | | | |
Brazil — 0.2% | | | | | | | | | | | | | | |
Federative Republic of Brazil | | | 6.000 | % | | 5/15/15 | | | 591,000 | BRL | | | 759,283 | |
See Notes to Financial Statements.
| | |
| 16 | | Western Asset Absolute Return Portfolio 2011 Semi-Annual Report |
Schedule of investments (unaudited) (cont’d)
June 30, 2011
Western Asset Absolute Return Portfolio
| | | | | | | | | | | | | | |
| Security | | Rate | | | Maturity
Date | | Face
Amount† | | | Value | |
Sweden — 0.3% | | | | | | | | | | | | | | |
Government of Sweden, Bonds | | | 3.500 | % | | 12/1/28 | | | 3,500,000 | SEK | | $ | 925,327 | |
Total Non-U.S. Treasury Inflation Protected Securities (Cost — $1,035,808) | | | | 1,684,610 | |
| Sovereign Bonds — 2.6% | | | | | | | | | | | | | | |
Brazil — 0.9% | | | | | | | | | | | | | | |
Brazil Nota do Tesouro Nacional, Notes | | | 9.762 | % | | 1/1/14 | | | 274,000 | BRL | | | 166,175 | |
Brazil Nota do Tesouro Nacional, Notes | | | 9.762 | % | | 1/1/17 | | | 5,259,000 | BRL | | | 3,055,032 | |
Total Brazil | | | | | | | | | | | | | 3,221,207 | |
India — 0.1% | | | | | | | | | | | | | | |
ICICI Bank Ltd., Junior Subordinated Bonds | | | 6.375 | % | | 4/30/22 | | | 442,000 | | | | 430,950 | (a)(c) |
Indonesia — 0.4% | | | | | | | | | | | | | | |
Republic of Indonesia, Senior Bonds | | | 10.250 | % | | 7/15/27 | | | 10,665,000,000 | IDR | | | 1,425,432 | |
Malaysia — 0.3% | | | | | | | | | | | | | | |
Government of Malaysia, Senior Bonds | | | 3.835 | % | | 8/12/15 | | | 2,710,000 | MYR | | | 912,350 | |
Government of Malaysia, Senior Bonds | | | 4.262 | % | | 9/15/16 | | | 720,000 | MYR | | | 246,541 | |
Total Malaysia | | | | | | | | | | | | | 1,158,891 | |
Mexico — 0.6% | | | | | | | | | | | | | | |
Mexican Bonos, Bonds | | | 8.000 | % | | 6/11/20 | | | 19,040,000 | MXN | | | 1,740,567 | |
United Mexican States, Bonds | | | 10.000 | % | | 12/5/24 | | | 1,570,000 | MXN | | | 165,250 | |
Total Mexico | | | | | | | | | | | | | 1,905,817 | |
Russia — 0.1% | | | | | | | | | | | | | | |
Russian Foreign Bond-Eurobond, Senior Bonds | | | 7.500 | % | | 3/31/30 | | | 216,250 | | | | 254,905 | (a) |
Thailand — 0.2% | | | | | | | | | | | | | | |
Thailand Government Bond | | | 4.250 | % | | 3/13/13 | | | 22,000,000 | THB | | | 722,398 | |
Total Sovereign Bonds (Cost — $8,503,012) | | | | | | | | | | 9,119,600 | |
| U.S. Government & Agency Obligations — 25.1% | | | | | | | | | | | | | | |
U.S. Government Obligations — 25.1% | | | | | | | | | | | | | | |
U.S. Treasury Bonds | | | 4.375 | % | | 5/15/40 | | | 1,120,000 | | | | 1,119,306 | |
U.S. Treasury Bonds | | | 4.250 | % | | 11/15/40 | | | 430,000 | | | | 420,325 | |
U.S. Treasury Bonds | | | 4.750 | % | | 2/15/41 | | | 52,000 | | | | 55,274 | |
U.S. Treasury Bonds | | | 4.375 | % | | 5/15/41 | | | 470,000 | | | | 469,267 | |
U.S. Treasury Notes | | | 1.250 | % | | 4/15/14 | | | 2,400,000 | | | | 2,433,749 | |
U.S. Treasury Notes | | | 1.750 | % | | 5/31/16 | | | 21,310,000 | | | | 21,343,243 | |
U.S. Treasury Notes | | | 2.625 | % | | 4/30/18 | | | 21,430,000 | | | | 21,697,875 | |
U.S. Treasury Notes | | | 2.375 | % | | 5/31/18 | | | 10,390,000 | | | | 10,334,829 | |
U.S. Treasury Notes | | | 3.625 | % | | 2/15/21 | | | 28,710,000 | | | | 29,936,893 | (c) |
Total U.S. Government & Agency Obligations (Cost — $87,130,760) | | | | | | | 87,810,761 | |
| U.S. Treasury Inflation Protected Securities — 0.2% | | | | | | | | | | | |
U.S. Treasury Bonds, Inflation Indexed
(Cost — $636,423) | | | 2.125 | % | | 2/15/41 | | | 646,878 | | | | 702,822 | |
See Notes to Financial Statements.
| | | | |
| Western Asset Absolute Return Portfolio 2011 Semi-Annual Report | | | 17 | |
Western Asset Absolute Return Portfolio
| | | | | | | | | | | | |
| Security | | Rate | | | | Shares | | | Value | |
| Common Stocks — 0.1% | | | | | | | | | | | | |
| Consumer Discretionary — 0.1% | | | | | | | | | | | | |
Hotels, Restaurants & Leisure — 0.1% | | | | | | | | | | | | |
Tropicana Entertainment Inc. | | | | | | | 17,138 | | | $ | 274,208 | *(b) |
Media — 0.0% | | | | | | | | | | | | |
Citadel Broadcasting Corp., Class A Shares | | | | | | | 2,463 | | | | 82,141 | * |
Total Consumer Discretionary | | | | | | | | | | | 356,349 | |
| Energy — 0.0% | | | | | | | | | | | | |
Oil, Gas & Consumable Fuels — 0.0% | | | | | | | | | | | | |
SemGroup Corp., Class A Shares | | | | | | | 866 | | | | 22,230 | * |
Total Common Stocks (Cost — $359,256) | | | | | | | | | | | 378,579 | |
| Preferred Stocks — 0.5% | | | | | | | | | | | | |
| Financials — 0.5% | | | | | | | | | | | | |
Consumer Finance — 0.5% | | | | | | | | | | | | |
GMAC Capital Trust I | | 8.125% | | | | | 65,000 | | | | 1,664,000 | * |
Thrifts & Mortgage Finance — 0.0% | | | | | | | | | | | | |
Federal National Mortgage Association (FNMA) | | 0.000% | | | | | 1,900 | | | | 6,840 | * |
Total Preferred Stocks (Cost — $1,726,080) | | | | | | | | | 1,670,840 | |
| | | | |
| | | | | Expiration
Date | | Contracts/
Notional Amount | | | | |
| Purchased Options — 0.2% | | | | | | | | | | | | |
Credit default swaption with Credit Suisse First Boston Inc. to buy protection on Markit CDX.NA.HY.16 Index, Put @ $100.00 | | | | 9/21/11 | | | 3,800,000 | | | | 64,372 | |
Eurodollar Mid Curve 1-Year Futures, Put @ $99.00 | | | | 9/16/11 | | | 84 | | | | 17,850 | |
Interest rate swaption with BNP Paribas, Call @ 0.90% | | | | 7/20/11 | | | 20,100,000 | | | | 24,303 | |
Interest rate swaption with Credit Suisse First Boston Inc., Call @ 3.50% | | | | 11/3/17 | | | 1,700,000 | | | | 51,059 | |
Interest rate swaption with Credit Suisse First Boston Inc., Put @ 6.00% | | | | 11/3/17 | | | 8,300,000 | | | | 371,969 | |
U.S. Treasury 10-Year Notes Futures, Call @ $122.50 | | | | 7/22/11 | | | 69 | | | | 53,906 | |
U.S. Treasury 10-Year Notes Futures, Call @ $123.50 | | | | 7/22/11 | | | 63 | | | | 37,406 | |
U.S. Treasury 10-Year Notes Futures, Call @ $124.00 | | | | 8/26/11 | | | 61 | | | | 42,891 | |
Total Purchased Options (Cost — $652,945) | | | | | | | | | 663,756 | |
See Notes to Financial Statements.
| | |
| 18 | | Western Asset Absolute Return Portfolio 2011 Semi-Annual Report |
Schedule of investments (unaudited) (cont’d)
June 30, 2011
Western Asset Absolute Return Portfolio
| | | | | | | | | | | | | | |
| Security | | Rate | | | Expiration
Date | | Warrants | | | Value | |
| Warrants — 0.0% | | | | | | | | | | | | | | |
SemGroup Corp. (Cost — $0) | | | | | | 11/30/14 | | | 912 | | | $ | 6,156 | *(f) |
Total Investments before Short-Term Investments (Cost — $286,698,034) | | | | 269,436,880 | |
| | | | |
| | | | | | Maturity
Date | | Face
Amount† | | | | |
| Short-Term Investments — 20.9% | | | | | | | | | | | | | | |
U.S. Government Agencies — 7.8% | | | | | | | | | | | | | | |
Federal Home Loan Mortgage Corp. (FHLMC), Discount Notes | | | 0.105-0.120 | % | | 1/10/12 | | | 1,271,000 | | | | 1,270,251 | (j)(k) |
Federal Home Loan Mortgage Corp. (FHLMC), Discount Notes | | | 0.120 | % | | 1/12/12 | | | 9,700,000 | | | | 9,694,229 | (j) |
Federal National Mortgage Association (FNMA), Discount Notes | | | 0.120 | % | | 7/5/11 | | | 6,700,000 | | | | 6,699,911 | (j) |
Federal National Mortgage Association (FNMA), Discount Notes | | | 0.100 | % | | 12/7/11 | | | 9,700,000 | | | | 9,696,149 | (j) |
Total U.S. Government Agencies (Cost — $27,359,509) | | | | 27,360,540 | |
U.S. Treasury Bills — 3.2% | | | | | | | | | | | | | | |
U.S. Treasury Bills (Cost — $11,098,136) | | | 0.098 | % | | 9/1/11 | | | 11,100,000 | | | | 11,099,678 | (j) |
Repurchase Agreements — 9.9% | | | | | | | | | | | | | | |
Deutsche Bank Securities Inc. repurchase agreement dated 6/30/11; Proceeds at
maturity — $34,800,010; (Fully collateralized by U.S. government agency obligations, 3.500% due 8/17/20; Market value — $35,496,001)
(Cost — $34,800,000) | | | 0.010 | % | | 7/1/11 | | | 34,800,000 | | | | 34,800,000 | |
Total Short-Term Investments (Cost — $73,257,645) | | | | 73,260,218 | |
Total Investments — 98.0 % (Cost — $359,955,679#) | | | | 342,697,098 | |
Other Assets in Excess of Liabilities — 2.0% | | | | 6,904,879 | |
Total Net Assets — 100.0% | | | $ | 349,601,977 | |
| † | Face amount denominated in U.S. dollars, unless otherwise noted. |
| * | Non-income producing security. |
| (a) | Security is exempt from registration under Rule 144A of the Securities Act of 1933. This security may be resold in transactions that are exempt from registration, normally to qualified institutional buyers. This security has been deemed liquid pursuant to guidelines approved by the Board of Directors, unless otherwise noted. |
| (b) | Security is valued in good faith in accordance with procedures approved by the Board of Directors (See Note 1). |
| (c) | Variable rate security. Interest rate disclosed is as of the most recent information available. |
| (d) | Security has no maturity date. The date shown represents the next call date. |
| (e) | The coupon payment on these securities is currently in default as of June 30, 2011. |
| (g) | Payment-in-kind security for which part of the income earned may be paid as additional principal. |
| (h) | Interest rates disclosed represent the effective rates on collateralized senior loans. Ranges in interest rates are attributable to multiple contracts under the same loan. |
| (i) | Income from this issue is considered a preference item for purposes of calculating the alternative minimum tax (“AMT”). |
| (j) | Rate shown represents yield-to-maturity. |
| (k) | All or a portion of this security is held at the broker as collateral for open futures contracts. |
| # | Aggregate cost for federal income tax purposes is substantially the same. |
See Notes to Financial Statements.
| | | | |
| Western Asset Absolute Return Portfolio 2011 Semi-Annual Report | | | 19 | |
Western Asset Absolute Return Portfolio
| | |
Abbreviations used in this schedule: |
| ARM | | — Adjustable Rate Mortgage |
| BRL | | — Brazilian Real |
| CMB | | — Cash Management Bill |
| EUR | | — Euro |
| IDR | | — Indonesian Rupiah |
| IO | | — Interest Only |
| MXN | | — Mexican Peso |
| MYR | | — Malaysian Ringgit |
| PO | | — Principal Only |
| SEK | | — Swedish Krona |
| THB | | — Thai Baht |
| | | | | | | | | | | | | | | | |
| Schedule of Written Options | |
| Security | | Expiration
Date | | | Strike
Price | | | Contracts/
Notional
Amounts | | | Value | |
| Credit default swaption with Credit Suisse First Boston Inc. to sell protection on Markit CDX.NA.HY.16 Index, Put | | | 9/21/11 | | | $ | 96.00 | | | | 3,800,000 | | | $ | 27,098 | |
| Credit default swaption with Credit Suisse First Boston Inc. to sell protection on Markit CDX.NA.HY.16 Index, Put | | | 9/21/11 | | | | 98.00 | | | | 3,800,000 | | | | 41,832 | |
| Eurodollar Futures, Call | | | 3/19/12 | | | | 99.25 | | | | 58 | | | | 50,750 | |
| Eurodollar Futures, Call | | | 3/19/12 | | | | 99.38 | | | | 82 | | | | 50,738 | |
| Eurodollar Futures, Call | | | 3/19/12 | | | | 99.50 | | | | 59 | | | | 22,863 | |
| Eurodollar Futures, Put | | | 3/19/12 | | | | 99.50 | | | | 59 | | | | 22,863 | |
| Eurodollar Futures, Put | | | 3/19/12 | | | | 99.38 | | | | 82 | | | | 22,037 | |
| Eurodollar Futures, Put | | | 3/19/12 | | | | 99.25 | | | | 58 | | | | 12,325 | |
| Eurodollar Mid Curve 1-Year Futures, Put | | | 9/16/11 | | | | 98.25 | | | | 84 | | | | 1,575 | |
| U.S. Treasury 10-Year Notes Futures, Call | | | 7/22/11 | | | | 125.00 | | | | 126 | | | | 15,750 | |
| U.S. Treasury 10-Year Notes Futures, Call | | | 7/22/11 | | | | 125.50 | | | | 21 | | | | 1,312 | |
| U.S. Treasury 10-Year Notes Futures, Call | | | 8/26/11 | | | | 125.50 | | | | 21 | | | | 6,562 | |
| U.S. Treasury 10-Year Notes Futures, Put | | | 7/22/11 | | | | 121.00 | | | | 126 | | | | 61,031 | |
| U.S. Treasury 10-Year Notes Futures, Put | | | 8/26/11 | | | | 121.50 | | | | 21 | | | | 22,313 | |
| | | | |
| | | | | | Strike
Rate | | | Notional
Par | | | | |
| Interest rate swaption with Barclays Capital Inc., Call | | | 10/2/13 | | | | 4.95 | % | | | 4,770,000 | | | | 416,907 | |
| Interest rate swaption with Barclays Capital Inc., Call | | | 10/3/13 | | | | 4.86 | | | | 4,770,000 | | | | 391,951 | |
| Interest rate swaption with Barclays Capital Inc., Put | | | 10/2/13 | | | | 4.95 | | | | 4,770,000 | | | | 163,208 | |
| Interest rate swaption with Barclays Capital Inc., Put | | | 10/3/13 | | | | 4.86 | | | | 4,770,000 | | | | 175,038 | |
| Interest rate swaption with BNP Paribas, Put | | | 7/20/11 | | | | 1.00 | | | | 20,100,000 | | | | 17,767 | |
| Interest rate swaption with Credit Suisse First Boston Inc., Put | | | 11/3/17 | | | | 7.25 | | | | 6,700,000 | | | | 181,498 | |
| Interest rate swaption with Credit Suisse First Boston Inc., Put | | | 11/3/17 | | | | 9.50 | | | | 6,700,000 | | | | 89,987 | |
| Total Written Options (Premiums received — $1,907,668) | | | | | | | | | | | $ | 1,795,405 | |
See Notes to Financial Statements.
| | |
| 20 | | Western Asset Absolute Return Portfolio 2011 Semi-Annual Report |
Statement of assets and liabilities (unaudited)
June 30, 2011
| | | | |
| |
| Assets: | | | | |
Investments, at value (Cost — $359,955,679) | | $ | 342,697,098 | |
Foreign currency, at value (Cost — $714,601) | | | 725,754 | |
Cash | | | 2,797,035 | |
Receivable for securities sold | | | 2,769,951 | |
Interest receivable | | | 2,541,364 | |
Deposits with brokers for swap contracts | | | 1,200,000 | |
Deposits with brokers for open futures contracts | | | 697,024 | |
Receivable from broker — variation margin on open futures contracts | | | 694,064 | |
Foreign currency collateral for open future contracts, at value (Cost — $529,956) | | | 546,964 | |
Receivable for Fund shares sold | | | 425,626 | |
Swaps, at value (net premiums paid — $103,252) | | | 354,673 | |
Unrealized appreciation on forward foreign currency contracts | | | 135,695 | |
Receivable for open swap contracts | | | 6,434 | |
Prepaid expenses | | | 35,858 | |
Other receivables | | | 198 | |
Total Assets | | | 355,627,738 | |
| |
| Liabilities: | | | | |
Payable for securities purchased | | | 2,840,000 | |
Written options, at value (premiums received $1,907,668) | | | 1,795,405 | |
Swaps, at value (net premium received — $559,753) | | | 721,344 | |
Investment management fee payable | | | 203,512 | |
Payable for Fund shares repurchased | | | 137,070 | |
Unrealized depreciation on forward foreign currency contracts | | | 95,079 | |
Distributions payable | | | 75,149 | |
Payable for open swap contracts | | | 29,088 | |
Accrued foreign capital gains tax | | | 23,423 | |
Directors' fees payable | | | 3,966 | |
Service and/or distribution fees payable | | | 775 | |
Accrued expenses | | | 100,950 | |
Total Liabilities | | | 6,025,761 | |
| Total Net Assets | | $ | 349,601,977 | |
| |
| Net Assets: | | | | |
Par value (Note 7) | | $ | 34,160 | |
Paid-in capital in excess of par value | | | 392,676,806 | |
Undistributed net investment income | | | 245,656 | |
Accumulated net realized loss on investments, futures contracts, written options, swap contracts and foreign currency transactions | | | (25,473,948) | |
Net unrealized depreciation on investments, futures contracts, written options, swap contracts and foreign currencies | | | (17,880,697) | |
| Total Net Assets | | $ | 349,601,977 | |
See Notes to Financial Statements.
| | | | |
| Western Asset Absolute Return Portfolio 2011 Semi-Annual Report | | | 21 | |
| | | | |
| |
| Shares Outstanding: | | | | |
Class IS | | | 22,336,423 | |
Class I | | | 11,432,382 | |
Class FI | | | 391,246 | |
| |
| Net Asset Value: | | | | |
Class IS | | | $10.23 | |
Class I | | | $10.24 | |
Class FI | | | $10.23 | |
See Notes to Financial Statements.
| | |
| 22 | | Western Asset Absolute Return Portfolio 2011 Semi-Annual Report |
Statement of operations (unaudited)
For the Six Months Ended June 30, 2011
| | | | |
| |
| Investment Income: | | | | |
Interest | | $ | 6,777,329 | |
Less: Foreign taxes withheld | | | (28,794) | |
Total Investment Income | | | 6,748,535 | |
| |
| Expenses: | | | | |
Investment management fee (Note 2) | | | 1,227,275 | |
Audit and tax | | | 29,492 | |
Custody fees | | | 27,323 | |
Registration fees | | | 25,865 | |
Legal fees | | | 19,479 | |
Transfer agent fees (Note 5) | | | 16,109 | |
Shareholder reports (Note 5) | | | 15,498 | |
Fund accounting fees | | | 10,945 | |
Directors' fees | | | 8,090 | |
Insurance | | | 4,389 | |
Service and/or distribution fees (Notes 2 and 5) | | | 3,600 | |
Fees recaptured by investment manager (Note 2) | | | 757 | |
Miscellaneous expenses | | | 3,441 | |
Total Expenses | | | 1,392,263 | |
Less: Fees forgone and/or expense reimbursements (Notes 2 and 5) | | | (79,569) | |
Net Expenses | | | 1,312,694 | |
| Net Investment Income | | | 5,435,841 | |
| |
Realized and Unrealized Gain (Loss) on Investments, Futures Contracts, Written Options, Swap Contracts and Foreign Currency Transactions (Notes 1, 3 and 4): | | | | |
Net Realized Gain (Loss) From: | | | | |
Investment transactions | | | (1,488,957) | |
Futures contracts | | | (1,872,545) | |
Written options | | | 564,798 | |
Swap contracts | | | (2,055,025) | |
Foreign currency transactions | | | (707,005) | |
Net Realized Loss | | | (5,558,734) | |
Change in Net Unrealized Appreciation (Depreciation) From: | | | | |
Investments | | | 5,515,984 | |
Futures contracts | | | (2,398,210) | |
Written options | | | 175,214 | |
Swap contracts | | | 1,780,248 | |
Foreign currencies | | | 326,078 | |
Change in Net Unrealized Appreciation (Depreciation) | | | 5,399,314 | |
Net Loss on Investments, Futures Contracts, Written Options, Swap Contracts and Foreign Currency Transactions | | | (159,420) | |
| Increase in Net Assets from Operations | | | $5,276,421 | |
See Notes to Financial Statements.
| | | | |
| Western Asset Absolute Return Portfolio 2011 Semi-Annual Report | | | 23 | |
Statements of changes in net assets
| | | | | | | | |
For the Six Months Ended June 30, 2011 (unaudited)
and the Year Ended December 31, 2010 | | 2011 | | | 2010 | |
| | |
| Operations: | | | | | | | | |
Net investment income | | $ | 5,435,841 | | | $ | 12,231,355 | |
Net realized loss | | | (5,558,734) | | | | (4,848,381) | |
Change in net unrealized appreciation (depreciation) | | | 5,399,314 | | | | 17,706,545 | |
Increase in Net Assets From Operations | | | 5,276,421 | | | | 25,089,519 | |
| | |
| Distributions to Shareholders From (Notes 1 and 6): | | | | | | | | |
Net investment income | | | (5,035,282) | | | | (10,526,158) | |
Return of capital | | | — | | | | (1,241,650) | |
Decrease in Net Assets From Distributions to Shareholders | | | (5,035,282) | | | | (11,767,808) | |
| | |
| Fund Share Transactions (Note 7): | | | | | | | | |
Net proceeds from sale of shares | | | 67,022,177 | | | | 105,945,464 | |
Reinvestment of distributions | | | 4,489,546 | | | | 10,296,241 | |
Cost of shares repurchased | | | (22,331,618) | | | | (120,074,463) | |
Increase (Decrease) in Net Assets From Fund Share Transactions | | | 49,180,105 | | | | (3,832,758) | |
Increase in Net Assets | | | 49,421,244 | | | | 9,488,953 | |
| | |
| Net Assets: | | | | | | | | |
Beginning of period | | | 300,180,733 | | | | 290,691,780 | |
End of period* | | $ | 349,601,977 | | | $ | 300,180,733 | |
* Includes undistributed (overdistributed) net investment income, respectively, of: | | | $245,656 | | | | $(154,903) | |
See Notes to Financial Statements.
| | |
| 24 | | Western Asset Absolute Return Portfolio 2011 Semi-Annual Report |
Financial highlights
| | | | | | | | | | | | | | | | |
For a share of each class of capital stock outstanding throughout each year ended December 31,
unless otherwise noted: | |
| Class IS Shares1,2 | | 20113 | | | 2010 | | | 2009 | | | 20084 | |
| | | | |
| Net asset value, beginning of period | | | $10.21 | | | | $9.79 | | | | $7.82 | | | | $9.15 | |
| | | | |
| Income (loss) from operations: | | | | | | | | | | | | | | | | |
Net investment income | | | 0.17 | | | | 0.38 | | | | 0.46 | | | | 0.20 | |
Net realized and unrealized gain (loss) | | | 0.01 | | | | 0.41 | | | | 2.03 | | | | (1.26) | |
Total income (loss) from operations | | | 0.18 | | | | 0.79 | | | | 2.49 | | | | (1.06) | |
| | | | |
| Less distributions from: | | | | | | | | | | | | | | | | |
Net investment income | | | (0.16) | | | | (0.37) | | | | (0.52) | | | | (0.27) | |
Total distributions | | | (0.16) | | | | (0.37) | | | | (0.52) | | | | (0.27) | |
| | | | |
| Net asset value, end of period | | | $10.23 | | | | $10.21 | | | | $9.79 | | | | $7.82 | |
Total return5 | | | 1.75 | % | | | 8.15 | % | | | 32.81 | % | | | (11.69) | % |
| | | | |
| Net assets, end of period (000s) | | | $228,510 | | | | $216,348 | | | | $187,156 | | | | $161,094 | |
| | | | |
| Ratios to average net assets: | | | | | | | | | | | | | | | | |
Gross expenses | | | 0.84 | %6 | | | 0.84 | % | | | 0.84 | % | | | 0.85 | %6 |
Net expenses7,8 | | | 0.80 | 6 | | | 0.80 | | | | 0.80 | | | | 0.80 | 6 |
Net investment income | | | 3.34 | 6 | | | 3.79 | | | | 5.20 | | | | 5.80 | 6 |
| | | | |
| Portfolio turnover rate | | | 66 | % | | | 131 | % | | | 258 | % | | | 230 | %9 |
| 1 | In April 2010, Institutional Select Class shares were renamed Class IS shares. |
| 2 | Per share amounts have been calculated using the average shares method. |
| 3 | For the six months ended June 30, 2011 (unaudited). |
| 4 | For the period August 4, 2008 (commencement of operations) to December 31, 2008. |
| 5 | Performance figures may reflect compensating balance arrangements, fees forgone and/or expense reimbursements. In the absence of compensating balance arrangements, fees forgone and/or expense reimbursements, the total return would have been lower. Past performance is no guarantee of future results. Total returns for periods of less than one year are not annualized. |
| 7 | Reflects fees forgone and/or expense reimbursements. |
| 8 | The impact of compensating balance arrangements, if any, was less than 0.01%. |
See Notes to Financial Statements.
| | | | |
| Western Asset Absolute Return Portfolio 2011 Semi-Annual Report | | | 25 | |
| | | | | | | | | | | | | | | | | | | | | | | | |
For a share of each class of capital stock outstanding throughout each year ended December 31,
unless otherwise noted: | |
| Class I Shares1,2 | | 20113 | | | 2010 | | | 2009 | | | 20084 | | | 20085 | | | 20076 | |
| | | | | | |
| Net asset value, beginning of period | | | $10.22 | | | | $9.80 | | | | $7.81 | | | | $9.82 | | | | $10.23 | | | | $10.00 | |
| | | | | | |
| Income (loss) from operations: | | | | | | | | | | | | | | | | | | | | | | | | |
Net investment income | | | 0.17 | | | | 0.38 | | | | 0.46 | | | | 0.38 | | | | 0.49 | | | | 0.36 | |
Net realized and unrealized gain (loss) | | | 0.01 | | | | 0.41 | | | | 2.03 | | | | (1.71) | | | | (0.36) | | | | 0.29 | |
Total income (loss) from operations | | | 0.18 | | | | 0.79 | | | | 2.49 | | | | (1.33) | | | | 0.13 | | | | 0.65 | |
| | | | | | |
| Less distributions from: | | | | | | | | | | | | | | | | | | | | | | | | |
Net investment income | | | (0.16) | | | | (0.37) | | | | (0.50) | | | | (0.44) | | | | (0.49) | | | | (0.35) | |
Net realized gains | | | — | | | | — | | | | — | | | | (0.24) | | | | (0.05) | | | | (0.07) | |
Total distributions | | | (0.16) | | | | (0.37) | | | | (0.50) | | | | (0.68) | | | | (0.54) | | | | (0.42) | |
| | | | | | |
| Net asset value, end of period | | | $10.24 | | | | $10.22 | | | | $9.80 | | | | $7.81 | | | | $9.82 | | | | $10.23 | |
Total return7 | | | 1.75 | % | | | 8.14 | % | | | 32.89 | % | | | (14.20) | % | | | 1.31 | % | | | 6.63 | % |
| | | | | | |
| Net assets, end of period (000s) | | | $117,088 | | | | $81,809 | | | | $99,271 | | | | $152,349 | | | | $560,219 | | | | $371,239 | |
| | | | | | |
| Ratios to average net assets: | | | | | | | | | | | | | | | | | | | | | | | | |
Gross expenses | | | 0.86 | %8 | | | 0.85 | % | | | 0.85 | % | | | 0.83 | %8 | | | 0.84 | % | | | 1.09 | %8 |
Net expenses | | | 0.80 | 8,9,10 | | | 0.80 | 9,10 | | | 0.80 | 9 | | | 0.80 | 8,9 | | | 0.83 | 11 | | | 0.89 | 8,9 |
Net investment income | | | 3.29 | 8 | | | 3.78 | | | | 5.20 | | | | 5.50 | 8 | | | 4.90 | | | | 4.90 | 8 |
| | | | | | |
| Portfolio turnover rate | | | 66 | % | | | 131 | % | | | 258 | % | | | 230 | %12 | | | 387 | % | | | 182 | %12 |
| 1 | In April 2010, Institutional Class shares were renamed Class I shares. |
| 2 | Per share amounts have been calculated using the average shares method. |
| 3 | For the six months ended June 30, 2011 (unaudited). |
| 4 | For the period April 1, 2008 through December 31, 2008. |
| 5 | For the year ended March 31. |
| 6 | For the period July 6, 2006 (commencement of operations) to March 31, 2007. |
| 7 | Performance figures may reflect compensating balance arrangements, fees forgone and/or expense reimbursements. In the absence of compensating balance arrangements, fees forgone and/or expense reimbursements, the total return would have been lower. Past performance is no guarantee of future results. Total returns for periods of less than one year are not annualized. |
| 9 | The impact of compensating balance arrangements, if any, was less than 0.01%. |
| 10 | Reflects fees forgone and/or expense reimbursements. |
| 11 | The impact of compensating balance arrangements was 0.01%. |
See Notes to Financial Statements.
| | |
| 26 | | Western Asset Absolute Return Portfolio 2011 Semi-Annual Report |
Financial highlights (cont’d)
| | | | | | | | | | | | | | | | | | | | | | | | |
For a share of each class of capital stock outstanding throughout each year ended December 31,
unless otherwise noted: | |
| Class FI Shares1,2 | | 20113 | | | 2010 | | | 2009 | | | 20084 | | | 20085 | | | 20076 | |
| | | | | | |
| Net asset value, beginning of period | | | $10.22 | | | | $9.79 | | | | $7.82 | | | | $9.82 | | | | $10.23 | | | | $10.17 | |
| | | | | | |
| Income (loss) from operations: | | | | | | | | | | | | | | | | | | | | | | | | |
Net investment income | | | 0.15 | | | | 0.36 | | | | 0.43 | | | | 0.35 | | | | 0.47 | | | | 0.27 | |
Net realized and unrealized gain (loss) | | | 0.01 | | | | 0.41 | | | | 2.05 | | | | (1.69) | | | | (0.37) | | | | 0.13 | |
Total income (loss) from operations | | | 0.16 | | | | 0.77 | | | | 2.48 | | | | (1.34) | | | | 0.10 | | | | 0.40 | |
| | | | | | |
| Less distributions from: | | | | | | | | | | | | | | | | | | | | | | | | |
Net investment income | | | (0.15) | | | | (0.34) | | | | (0.51) | | | | (0.42) | | | | (0.46) | | | | (0.27) | |
Net realized gains | | | — | | | | — | | | | — | | | | (0.24) | | | | (0.05) | | | | (0.07) | |
Total distributions | | | (0.15) | | | | (0.34) | | | | (0.51) | | | | (0.66) | | | | (0.51) | | | | (0.34) | |
| | | | | | |
| Net asset value, end of period | | | $10.23 | | | | $10.22 | | | | $9.79 | | | | $7.82 | | | | $9.82 | | | | $10.23 | |
Total return7 | | | 1.53 | % | | | 7.99 | % | | | 32.55 | % | | | (14.31) | % | | | 1.03 | % | | | 3.99 | % |
| | | | | | |
| Net assets, end of period (000s) | | | $4,004 | | | | $2,024 | | | | $4,265 | | | | $813 | | | | $406 | | | | $17 | |
| | | | | | |
| Ratios to average net assets: | | | | | | | | | | | | | | | | | | | | | | | | |
Gross expenses | | | 1.31 | %8 | | | 1.25 | % | | | 1.42 | % | | | 1.38 | %8 | | | 1.31 | % | | | 85.97 | %8 |
Net expenses9 | | | 1.05 | 8,10 | | | 1.05 | 10 | | | 1.05 | 10 | | | 1.05 | 8,10 | | | 1.03 | 11 | | | 1.16 | 8,11 |
Net investment income | | | 3.01 | 8 | | | 3.58 | | | | 4.70 | | | | 5.50 | 8 | | | 4.70 | | | | 4.60 | 8 |
| | | | | | |
| Portfolio turnover rate | | | 66 | % | | | 131 | % | | | 258 | % | | | 230 | %12 | | | 387 | % | | | 182 | %12 |
| 1 | In April 2010, Financial Intermediary Class shares were renamed Class FI shares. |
| 2 | Per share amounts have been calculated using the average shares method. |
| 3 | For the six months ended June 30, 2011 (unaudited). |
| 4 | For the period April 1, 2008 through December 31, 2008. |
| 5 | For the year ended March 31. |
| 6 | For the period July 6, 2006 (commencement of operations) to March 31, 2007. |
| 7 | Performance figures may reflect compensating balance arrangements, fees forgone and/or expense reimbursements. In the absence of compensating balance arrangements, fees forgone and/or expense reimbursements, the total return would have been lower. Past performance is no guarantee of future results. Total returns for periods of less than one year are not annualized. |
| 9 | Reflects fees forgone and/or expense reimbursements. |
| 10 | The impact of compensating balance arrangements, if any, was less than 0.01%. |
| 11 | The impact of compensating balance arrangements was greater than 0.01%. |
See Notes to Financial Statements.
| | | | |
| Western Asset Absolute Return Portfolio 2011 Semi-Annual Report | | | 27 | |
Notes to financial statements (unaudited)
1. Organization and significant accounting policies
Western Asset Absolute Return Portfolio (the “Fund”) is a separate diversified investment series of Western Asset Funds, Inc. (the "Corporation"). The Corporation, a Maryland Corporation, is registered under the Investment Company Act of 1940, as amended (the “1940 Act”), as an open-end management investment company.
The following are significant accounting policies consistently followed by the Fund and are in conformity with U.S. generally accepted accounting principles (“GAAP”). Estimates and assumptions are required to be made regarding assets, liabilities and changes in net assets resulting from operations when financial statements are prepared. Changes in the economic environment, financial markets and any other parameters used in determining these estimates could cause actual results to differ. Subsequent events have been evaluated through the date the financial statements were issued.
(a) Investment valuation. Debt securities are valued at the last quoted bid price provided by an independent pricing service that are based on transactions in debt obligations, quotations from bond dealers, market transactions in comparable securities and various other relationships between securities. Publicly traded foreign government debt securities are typically traded internationally in the over-the-counter market and are valued at the bid prices as of the close of business of that market. Futures contracts are valued daily at the settlement price established by the board of trade or exchange on which they are traded. Equity securities for which market quotations are available are valued at the last reported sales price or official closing price on the primary market or exchange on which they trade. When reliable prices are not readily available, such as when the value of a security has been significantly affected by events after the close of the exchange or market on which the security is principally traded, but before the Fund calculates its net asset value, the Fund values these securities as determined in accordance with procedures approved by the Fund’s Board of Directors. Short-term obligations with maturities of 60 days or less are valued at amortized cost, which approximates fair value.
The Fund has adopted Financial Accounting Standards Board Codification Topic 820 ("ASC Topic 820"). ASC Topic 820 establishes a single definition of fair value, creates a three-tier hierarchy as a framework for measuring fair value based on inputs used to value the Fund’s investments, and requires additional disclosure about fair value. The hierarchy of inputs is summarized below.
| Ÿ | | Level 1 — quoted prices in active markets for identical investments |
| Ÿ | | Level 2 — other significant observable inputs (including quoted prices for similar investments, interest rates, prepayment speeds, credit risk, etc.) |
| Ÿ | | Level 3 — significant unobservable inputs (including the Fund’s own assumptions in determining the fair value of investments) |
The inputs or methodology used for valuing securities are not necessarily an indication of the risk associated with investing in those securities.
| | |
| 28 | | Western Asset Absolute Return Portfolio 2011 Semi-Annual Report |
Notes to financial statements (unaudited) (cont’d)
The Fund uses valuation techniques to measure fair value that are consistent with the market approach and/or income approach, depending on the type of security and the particular circumstance. The market approach uses prices and other relevant information generated by market transactions involving identical or comparable securities. The income approach uses valuation techniques to discount estimated future cash flows to present value.
The following is a summary of the inputs used in valuing the Fund’s assets and liabilities carried at fair value:
| | | | | | | | | | | | | | | | |
| ASSETS | |
| Description | | Quoted Prices
(Level 1) | | | Other Significant
Observable Inputs
(Level 2) | | | Significant
Unobservable
Inputs
(Level 3) | | | Total | |
| Long-term investments†: | | | | | | | | | | | | | | | | |
Corporate bonds & notes | | | — | | | $ | 96,792,922 | | | $ | 68,088 | | | $ | 96,861,010 | |
Asset-backed securities | | | — | | | | 12,450,570 | | | | 5,578,818 | | | | 18,029,388 | |
Collateralized mortgage obligations | | | — | | | | 25,262,882 | | | | 12,420 | | | | 25,275,302 | |
Collateralized senior loans | | | — | | | | 18,060,217 | | | | — | | | | 18,060,217 | |
Municipal bonds | | | — | | | | 8,292,339 | | | | 881,500 | | | | 9,173,839 | |
Non-U.S. treasury inflation protected securities | | | — | | | | 1,684,610 | | | | — | | | | 1,684,610 | |
Sovereign bonds | | | — | | | | 9,119,600 | | | | — | | | | 9,119,600 | |
U.S. government & agency obligations | | | — | | | | 87,810,761 | | | | — | | | | 87,810,761 | |
U.S. treasury inflation protected securities | | | — | | | | 702,822 | | | | — | | | | 702,822 | |
Common stocks | | $ | 104,371 | | | | — | | | | 274,208 | | | | 378,579 | |
Preferred stocks | | | 1,664,000 | | | | 6,840 | | | | — | | | | 1,670,840 | |
Purchased options | | | 152,053 | | | | 511,703 | | | | — | | | | 663,756 | |
Warrants | | | 6,156 | | | | — | | | | — | | | | 6,156 | |
| Total long-term investments | | $ | 1,926,580 | | | $ | 260,695,266 | | | $ | 6,815,034 | | | $ | 269,436,880 | |
| Short-term investments† | | | — | | | | 73,260,218 | | | | — | | | | 73,260,218 | |
| Total investments | | $ | 1,926,580 | | | $ | 333,955,484 | | | $ | 6,815,034 | | | $ | 342,697,098 | |
| Other financial instruments: | | | | | | | | | | | | | | | | |
Futures contracts | | | 243,907 | | | | — | | | | — | | | | 243,907 | |
Forward foreign currency contracts | | | — | | | | 135,695 | | | | — | | | | 135,695 | |
Credit default swaps on corporate issues — sell protection | | | — | | | | 185,111 | | | | — | | | | 185,111 | |
Credit default swaps on corporate issues — buy protection | | | — | | | | 2,124 | | | | — | | | | 2,124 | |
Credit default swaps on credit indices — buy protection‡ | | | — | | | | 167,438 | | | | — | | | | 167,438 | |
| Total other financial instruments | | $ | 243,907 | | | $ | 490,368 | | | | — | | | $ | 734,275 | |
| Total | | $ | 2,170,487 | | | $ | 334,445,852 | | | $ | 6,815,034 | | | $ | 343,431,373 | |
| | | | |
| Western Asset Absolute Return Portfolio 2011 Semi-Annual Report | | | 29 | |
| | | | | | | | | | | | | | | | |
| LIABILITIES | |
| Description | | Quoted Prices
(Level 1) | | | Other Significant
Observable Inputs
(Level 2) | | | Significant
Unobservable
Inputs
(Level 3) | | | Total | |
| Other financial instruments: | | | | | | | | | | | | | | | | |
Written options | | $ | 290,119 | | | $ | 1,505,286 | | | | — | | | $ | 1,795,405 | |
Futures contracts | | | 1,123,154 | | | | — | | | | — | | | | 1,123,154 | |
Forward foreign currency contracts | | | — | | | | 95,079 | | | | — | | | | 95,079 | |
Interest rate swaps | | | — | | | | 23,392 | | | | — | | | | 23,392 | |
Credit default swaps on corporate issues — buy protection‡ | | | — | | | | 106,172 | | | | — | | | | 106,172 | |
Credit default swaps on credit
indices — sell protection‡ | | | — | | | | 149,114 | | | | — | | | | 149,114 | |
Credit default swaps on credit
indices — buy protection‡ | | | — | | | | 440,958 | | | | — | | | | 440,958 | |
Total return swaps | | | — | | | | 1,708 | | | | — | | | | 1,708 | |
| Total | | $ | 1,413,273 | | | $ | 2,321,709 | | | | — | | | $ | 3,734,982 | |
| † | See Schedule of Investments for additional detailed categorizations. |
| ‡ | Values include any premiums paid or received with respect to swap contracts. |
The following is a reconciliation of investments in which significant unobservable inputs (Level 3) were used in determining fair value:
| | | | | | | | | | | | | | | | | | | | | | | | |
| Investments in Securities | | Corporate
Bonds & Notes | | | Asset-
Backed
Securities | | | Collateralized
Mortgage
Obligations | | | Municipal
Bonds | | | Common
Stock | | | Total | |
| Balance as of December 31, 2010 | | $ | 0 | * | | $ | 4,534,504 | | | $ | 18,643 | | | | — | | | $ | 261,354 | | | $ | 4,814,501 | |
| Accrued premiums/discounts | | | — | | | | 41,736 | | | | 314 | | | $ | 975 | | | | — | | | | 43,025 | |
| Realized gain (loss)1 | | | — | | | | (20,211) | | | | (55,760) | | | | — | | | | — | | | | (75,971) | |
| Change in unrealized appreciation (depreciation)2 | | | — | | | | 16,039 | | | | 49,223 | | | | (975) | | | | 12,854 | | | | 77,141 | |
| Net purchases (sales) | | | — | | | | — | | | | — | | | | 881,500 | | | | — | | | | 881,500 | |
| Transfers into Level 3 | | | 68,088 | | | | 2,631,750 | | | | — | | | | — | | | | — | | | | 2,699,838 | |
| Transfers out of Level 3 | | | — | | | | (1,625,000) | | | | — | | | | — | | | | — | | | | (1,625,000) | |
| Balance as of June 30, 2011 | | $ | 68,088 | | | $ | 5,578,818 | | | $ | 12,420 | | | $ | 881,500 | | | $ | 274,208 | | | $ | 6,815,034 | |
| Net change in unrealized appreciation (depreciation) for investments in securities still held at June 30, 20112 | | | — | | | $ | (41,051) | | | $ | 49,223 | | | $ | (975) | | | $ | 12,854 | | | $ | 20,051 | |
| 1 | This amount is included in net realized gain (loss) from investment transactions in the accompanying Statement of Operations. |
| 2 | This amount is included in the change in net unrealized appreciation (depreciation) in the accompanying Statement of Operations. Change in unrealized appreciation (depreciation) includes net unrealized appreciation (depreciation) resulting from changes in investment values during the reporting period and the reversal of previously recorded unrealized appreciation (depreciation) when gains or losses are realized. |
(b) Repurchase agreements. The Fund may enter into repurchase agreements with institutions that its investment adviser has determined are creditworthy. Each repurchase agreement is recorded at cost. Under the terms of a typical repurchase agreement, the Fund acquires a debt security subject to an obligation of the seller to
| | |
| 30 | | Western Asset Absolute Return Portfolio 2011 Semi-Annual Report |
Notes to financial statements (unaudited) (cont’d)
repurchase, and of the Fund to resell, the security at an agreed-upon price and time, thereby determining the yield during the Fund’s holding period. When entering into repurchase agreements, it is the Fund’s policy that its custodian or a third party custodian, acting on the Fund’s behalf, take possession of the underlying collateral securities, the market value of which, at all times, at least equals the principal amount of the repurchase transaction, including accrued interest. To the extent that any repurchase transaction maturity exceeds one business day, the value of the collateral is marked-to-market and measured against the value of the agreement in an effort to ensure the adequacy of the collateral. If the counterparty defaults, the Fund generally has the right to use the collateral to satisfy the terms of the repurchase transaction. However, if the market value of the collateral declines during the period in which the Fund seeks to assert its rights or if bankruptcy proceedings are commenced with respect to the seller of the security, realization of the collateral by the Fund may be delayed or limited.
(c) Inflation-indexed bonds. Inflation-indexed bonds are fixed-income securities whose principal value or interest rate is periodically adjusted according to the rate of inflation. As the index measuring inflation changes, the principal value or interest rate of inflation-indexed bonds will be adjusted accordingly. Inflation adjustments to the principal amount of inflation-indexed bonds are reflected as an increase or decrease to investment income on the Statement of Operations. Repayment of the original bond principal upon maturity (as adjusted for inflation) is guaranteed in the case of U.S. Treasury inflation-indexed bonds. For bonds that do not provide a similar guarantee, the adjusted principal value of the bond repaid at maturity may be less than the original principal.
(d) Forward foreign currency contracts. The Fund enters into a forward foreign currency contract to hedge against foreign currency exchange rate risk on its non-U.S. dollar denominated securities or to facilitate settlement of a foreign currency denominated portfolio transaction. A forward foreign currency contract is an agreement between two parties to buy and sell a currency at a set price with delivery and settlement at a future date. The contract is marked-to-market daily and the change in value is recorded by the Fund as an unrealized gain or loss. When a forward foreign currency contract is closed, through either delivery or offset by entering into another forward foreign currency contract, the Fund recognizes a realized gain or loss equal to the difference between the value of the contract at the time it was opened and the value of the contract at the time it is closed.
Forward foreign currency contracts involve elements of market risk in excess of the amounts reflected on the Statement of Assets and Liabilities. The Fund bears the risk of an unfavorable change in the foreign exchange rate underlying the forward foreign currency contract. Risks may also arise upon entering into these contracts from the potential inability of the counterparties to meet the terms of their contracts.
(e) Loan participations. The Fund may invest in loans arranged through private negotiation between one or more financial institutions. The Fund’s investment in any such loan may be in the form of a participation in or an assignment of the loan. In connection with purchasing participations, the Fund generally will have no right to enforce compliance by the borrower with the terms of the loan agreement related to
| | | | |
| Western Asset Absolute Return Portfolio 2011 Semi-Annual Report | | | 31 | |
the loan, or any rights of off-set against the borrower and the Fund may not benefit directly from any collateral supporting the loan in which it has purchased the participation.
The Fund assumes the credit risk of the borrower, the lender that is selling the participation and any other persons interpositioned between the Fund and the borrower. In the event of the insolvency of the lender selling the participation, the Fund may be treated as a general creditor of the lender and may not benefit from any off-set between the lender and the borrower.
(f) Written options. When the Fund writes an option, an amount equal to the premium received by the Fund is recorded as a liability, the value of which is marked-to-market daily to reflect the current market value of the option written. If the option expires, the premium received is recorded as a realized gain. When a written call option is exercised, the difference between the premium received plus the option exercise price and the Fund’s basis in the underlying security (in the case of a covered written call option), or the cost to purchase the underlying security (in the case of an uncovered written call option), including brokerage commission, is recognized as a realized gain or loss. When a written put option is exercised, the amount of the premium received is subtracted from the cost of the security purchased by the Fund from the exercise of the written put option to form the Fund’s basis in the underlying security purchased. The writer or buyer of an option traded on an exchange can liquidate the position before the exercise of the option by entering into a closing transaction. The cost of a closing transaction is deducted from the original premium received resulting in a realized gain or loss to the Fund.
The risk in writing a covered call option is that the Fund may forego the opportunity of profit if the market price of the underlying security increases and the option is exercised. The risk in writing a put option is that the Fund may incur a loss if the market price of the underlying security decreases and the option is exercised. The risk in writing an uncovered call option is that the Fund is exposed to the risk of loss if the market price of the underlying security increases. In addition, there is the risk that the Fund may not be able to enter into a closing transaction because of an illiquid secondary market.
(g) Futures contracts. The Fund uses futures contracts generally to gain exposure to, or hedge against, changes in interest rates or gain exposure to, or hedge against changes in certain asset classes. A futures contract represents a commitment for the future purchase or sale of an asset at a specified price on a specified date.
Upon entering into a futures contract, the Fund is required to deposit cash or cash equivalents with a broker in an amount equal to a certain percentage of the contract amount. This is known as the ‘‘initial margin’’ and subsequent payments (‘‘variation margin’’) are made or received by the Fund each day, depending on the daily fluctuation in the value of the contract. For certain futures, including foreign denominated futures, variation margin is not settled daily, but is recorded as a net variation margin payable or receivable. Futures contracts are valued daily at the settlement price established by the board of trade or exchange on which they are traded. The daily changes in contract value are recorded as unrealized gains or losses in the Statement of Operations and the Fund recognizes a realized gain or loss when the contract is closed.
| | |
| 32 | | Western Asset Absolute Return Portfolio 2011 Semi-Annual Report |
Notes to financial statements (unaudited) (cont’d)
Futures contracts involve, to varying degrees, risk of loss in excess of the amounts reflected in the financial statements. In addition, there is the risk that the Fund may not be able to enter into a closing transaction because of an illiquid secondary market.
(h) Swap agreements. The Fund invests in swaps for the purpose of managing its exposure to interest rate, credit or market risk, or for other purposes. The use of swaps involves risks that are different from those associated with ordinary portfolio transactions.
Swap contracts are marked-to-market daily and changes in value are recorded as unrealized appreciation (depreciation). Gains or losses are realized upon termination of the swap agreement. Collateral, in the form of restricted cash or securities, may be required to be held in segregated accounts with the Fund’s custodian in compliance with the terms of the swap contracts. Securities posted as collateral for swap contracts are identified in the Schedule of Investments and restricted cash, if any, is identified on the Statement of Assets and Liabilities. Risks may exceed amounts recorded in the Statement of Assets and Liabilities. These risks include changes in the returns of the underlying instruments, failure of the counterparties to perform under the contracts’ terms, and the possible lack of liquidity with respect to the swap agreements.
Payments received or made at the beginning of the measurement period are reflected as a premium or deposit, respectively, on the Statement of Assets and Liabilities. These upfront payments are amortized over the life of the swap and are recognized as realized gain or loss in the Statement of Operations. Net periodic payments received or paid by the Fund are recognized as a realized gain or loss in the Statement of Operations.
The Fund’s maximum exposure in the event of a defined credit event on a credit default swap to sell protection is the notional amount. As of June 30, 2011, the total notional value of all credit default swaps to sell protection is $7,400,000. This amount would be offset by the value of the swap’s reference entity, upfront premiums received on the swap and any amounts received from the settlement of a credit default swap where the Fund bought protection for the same referenced security/entity.
For average notional amounts of swaps held during the six months ended June 30, 2011 see Note 4.
Credit default swaps
The Fund enters into credit default swap (“CDS”) contracts for investment purposes, to manage its credit risk or to add leverage. CDS agreements involve one party making a stream of payments to another party in exchange for the right to receive a specified return in the event of a default by a third party, typically corporate or sovereign issuers, on a specified obligation, or in the event of a write-down, principal shortfall, interest shortfall or default of all or part of the referenced entities comprising a credit index. The Fund may use a CDS to provide protection against defaults of the issuers (i.e., to reduce risk where the Fund has exposure to an issuer)
| | | | |
| Western Asset Absolute Return Portfolio 2011 Semi-Annual Report | | | 33 | |
or to take an active long or short position with respect to the likelihood of a particular issuer’s default. As a seller of protection, the Fund generally receives an upfront payment or a stream of payments throughout the term of the swap provided that there is no credit event. If the Fund is a seller of protection and a credit event occurs, as defined under the terms of that particular swap agreement, the maximum potential amount of future payments (undiscounted) that the Fund could be required to make under a credit default swap agreement would be an amount equal to the notional amount of the agreement. These amounts of potential payments will be partially offset by any recovery of values from the respective referenced obligations. As a seller of protection, the Fund effectively adds leverage to its portfolio because, in addition to its total net assets, the Fund is subject to investment exposure on the notional amount of the swap. As a buyer of protection, the Fund generally receives an amount up to the notional value of the swap if a credit event occurs.
Implied spreads are the theoretical prices a lender receives for credit default protection. When spreads rise, market perceived credit risk rises and when spreads fall, market perceived credit risk falls. The implied credit spread of a particular referenced entity reflects the cost of buying/selling protection and may include upfront payments required to enter into the agreement. Wider credit spreads and decreasing market values, when compared to the notional amount of the swap, represent a deterioration of the referenced entity’s credit soundness and a greater likelihood or risk of default or other credit event occurring as defined under the terms of the agreement. Credit spreads utilized in determining the period end market value of credit default swap agreements on corporate or sovereign issues are disclosed in the Notes to Financial Statements and serve as an indicator of the current status of the payment/performance risk and represent the likelihood or risk of default for credit derivatives. For credit default swap agreements on asset-backed securities and credit indices, the quoted market prices and resulting values, particularly in relation to the notional amount of the contract as well as the annual payment rate, serve as an indication of the current status of the payment/performance risk.
The Fund’s maximum risk of loss from counterparty risk, as the protection buyer, is the fair value of the contract (this risk is mitigated by the posting of collateral by the counterparty to the Fund to cover the Fund’s exposure to the counterparty). As the protection seller, the Fund’s maximum risk is the notional amount of the contract. Credit default swaps are considered to have credit risk-related contingent features since they require payment by the protection seller to the protection buyer upon the occurrence of a defined credit event.
Entering into a CDS agreement involves, to varying degrees, elements of credit, market and documentation risk in excess of the related amounts recognized on the Statement of Assets and Liabilities. Such risks involve the possibility that there will be no liquid market for these agreements, that the counterparty to the agreement may default on its obligation to perform or disagree as to the meaning of the contractual terms in the agreement, and that there will be unfavorable changes in net interest rates.
| | |
| 34 | | Western Asset Absolute Return Portfolio 2011 Semi-Annual Report |
Notes to financial statements (unaudited) (cont’d)
Interest rate swaps
The Fund enters into interest rate swap contracts to manage its exposure to interest rate risk. Interest rate swaps are agreements between two parties to exchange cash flows based on a notional principal amount. The Fund may elect to pay a fixed rate and receive a floating rate, or, receive a fixed rate and pay a floating rate on a notional principal amount. Interest rate swaps are marked-to-market daily based upon quotations from market makers and the change, if any, is recorded as an unrealized gain or loss in the Statement of Operations. When a swap contract is terminated early, the Fund records a realized gain or loss equal to the difference between the original cost and the settlement amount of the closing transaction.
The risks of interest rate swaps include changes in market conditions that will affect the value of the contract or changes in the present value of the future cash flow streams and the possible inability of the counterparty to fulfill its obligations under the agreement. The Fund’s maximum risk of loss from counterparty credit risk is the discounted net value of the cash flows to be received from the counterparty over the contract’s remaining life, to the extent that that amount is positive. This risk is mitigated by the posting of collateral by the counterparty to the Fund to cover the Fund’s exposure to the counterparty.
Total return swaps
The Fund enters into total return swaps for investment purposes. Total return swaps are agreements to exchange the return generated by one instrument for the return generated by another instrument. For example, the agreement to pay a predetermined or fixed interest rate in exchange for a market-linked return based on a notional amount. To the extent the total return of a referenced index or instrument exceeds the offsetting interest obligation, the Fund will receive a payment from the counterparty. To the extent it is less, the Fund will make a payment to the counterparty.
(i) Foreign currency translation. Investment securities and other assets and liabilities denominated in foreign currencies are translated into U.S. dollar amounts based upon prevailing exchange rates on the date of valuation. Purchases and sales of investment securities and income and expense items denominated in foreign currencies are translated into U.S. dollar amounts based upon prevailing exchange rates on the respective dates of such transactions.
The Fund does not isolate that portion of the results of operations resulting from fluctuations in foreign exchange rates on investments from the fluctuations arising from changes in market prices of securities held. Such fluctuations are included with the net realized and unrealized gain or loss on investments.
Net realized foreign exchange gains or losses arise from sales of foreign currencies, including gains and losses on forward foreign currency contracts, currency gains or losses realized between the trade and settlement dates on securities transactions, and the difference between the amounts of dividends, interest, and foreign withholding taxes recorded on the Fund's books and the U.S. dollar equivalent of the amounts actually received or paid. Net unrealized foreign exchange gains and losses arise from changes in the values of assets and liabilities, other than investments in securities, on the date of valuation, resulting from changes in exchange rates.
| | | | |
| Western Asset Absolute Return Portfolio 2011 Semi-Annual Report | | | 35 | |
Foreign security and currency transactions may involve certain considerations and risks not typically associated with those of U.S. dollar denominated transactions as a result of, among other factors, the possibility of lower levels of governmental supervision and regulation of foreign securities markets and the possibility of political or economic instability.
(j) Stripped securities. The Fund may invest in ‘‘Stripped Securities,’’ a term used collectively for components, or strips, of fixed income securities. Stripped securities can be principal only securities (“PO”), which are debt obligations that have been stripped of unmatured interest coupons or, interest only securities (“IO”), which are unmatured interest coupons that have been stripped from debt obligations. The market value of Stripped Securities will fluctuate in response to changes in economic conditions, rates of pre-payment, interest rates and the market’s perception of the securities. However, fluctuations in response to interest rates may be greater in Stripped Securities than for debt obligations of comparable maturities that pay interest currently. The amount of fluctuation may increase with a longer period of maturity.
The yield to maturity on IO’s is sensitive to the rate of principal repayments (including prepayments) on the related underlying debt obligation and principal payments may have a material effect on yield to maturity. If the underlying debt obligation experiences greater than anticipated prepayments of principal, the Fund may not fully recoup its initial investment in IO’s.
(k) Swaptions. The Fund writes swaption contracts to manage exposure to fluctuations in interest rates and to enhance portfolio yield. Swaption contracts written by the Fund represent an option that gives the purchaser the right, but not the obligation, to enter into a previously agreed upon swap contract at a future date. If a written call swaption is exercised, the writer enters a swap and is obligated to pay the fixed rate and receive a floating rate in exchange. If a written put swaption is exercised, the writer enters a swap and is obligated to pay the floating rate and receive a fixed rate in exchange. Swaptions are marked-to-market daily based upon quotations from market makers. Changes in the value of the swaption are reported as unrealized gains or losses in the Statement of Operations.
When the Fund writes a swaption, an amount equal to the premium received by the Fund is recorded as a liability, the value of which is marked-to-market daily to reflect the current market value of the swaption written. If the swaption expires, the Fund realizes a gain equal to the amount of the premium received.
(l) Credit and market risk. Investments in securities that are collateralized by residential real estate mortgages are subject to certain credit and liquidity risks. When market conditions result in an increase in default rates of the underlying mortgages and foreclosure values of underlying real estate properties are materially below the outstanding amount of these underlying mortgages, collection of the full amount of accrued interest and principal on these investments may be doubtful. Such market conditions may significantly impair the value and liquidity of these investments and may result in a lack of correlation between their credit ratings and values.
| | |
| 36 | | Western Asset Absolute Return Portfolio 2011 Semi-Annual Report |
Notes to financial statements (unaudited) (cont’d)
(m) Foreign investment risks. The Fund’s investments in foreign securities may involve risks not present in domestic investments. Since securities may be denominated in foreign currencies, may require settlement in foreign currencies or pay interest or dividends in foreign currencies, changes in the relationship of these foreign currencies to the U.S. dollar can significantly affect the value of the investments and earnings of the Fund. Foreign investments may also subject the Fund to foreign government exchange restrictions, expropriation, taxation or other political, social or economic developments, all of which affect the market and/or credit risk of the investments.
(n) Counterparty risk and credit-risk-related contingent features of derivative instruments. The Fund may invest in certain securities or engage in other transactions, where the Fund is exposed to counterparty credit risk in addition to broader market risks. The Fund may invest in securities of issuers, which may also be considered counterparties as trading partners in other transactions. This may increase the risk of loss in the event of default or bankruptcy by the counterparty or if the counterparty otherwise fails to meet its contractual obligations. The Fund’s investment manager attempts to mitigate counterparty risk by (i) periodically assessing the creditworthiness of its trading partners, (ii) monitoring and/or limiting the amount of its net exposure to each individual counterparty based on its assessment and (iii) requiring collateral from the counterparty for certain transactions. Market events and changes in overall economic conditions may impact the assessment of such counterparty risk by the investment manager. In addition, declines in the values of underlying collateral received may expose the Fund to increased risk of loss.
The Fund has entered into master agreements with certain of its derivative counterparties that provide for general obligations, representations, agreements, collateral, events of default or termination and credit related contingent features. The credit related contingent features include, but are not limited to, a percentage decrease in the Fund’s net assets or NAV over a specified period of time. If these credit related contingent features were triggered, the derivatives counterparty could terminate the positions and demand payment or require additional collateral.
As of June 30, 2011, the Fund held credit default swaps, written options, forward foreign currency contracts, interest rate swaps and total return swaps with credit related contingent features which had a liability position of $2,611,828. If a contingent feature in the Master Agreements would have been triggered, the Fund would have been required to pay this amount to its derivatives counterparties. As of June 30, 2011, the Fund had posted with its counterparties cash as collateral to cover the net liability of these derivatives amounting to $1,200,000, which could be used to reduce the required payment.
(o) Security transactions and investment income. Security transactions are accounted for on a trade date basis. Interest income, adjusted for amortization of premium and accretion of discount, is recorded on the accrual basis. Dividend income is recorded on the ex-dividend date. Foreign dividend income is recorded on the ex-dividend date or as soon as practicable after the Fund determines the
| | | | |
| Western Asset Absolute Return Portfolio 2011 Semi-Annual Report | | | 37 | |
existence of a dividend declaration after exercising reasonable due diligence. The cost of investments sold is determined by use of the specific identification method. To the extent any issuer defaults or a credit event occurs that impacts the issuer, the Fund may halt any additional interest income accruals and consider the realizability of interest accrued up to the date of default or credit event.
(p) Distributions to shareholders. Distributions from net investment income of the Fund are declared each business day to shareholders of record, and are paid monthly. Distributions of net realized gains, if any, are declared at least annually. Distributions to shareholders of the Fund are recorded on the ex-dividend date and are determined in accordance with income tax regulations, which may differ from GAAP.
(q) Share class accounting. Investment income, common expenses and realized/unrealized gains (losses) on investments are allocated to the various classes of the Fund on the basis of daily net assets of each class. Fees relating to a specific class are charged directly to that share class.
(r) Compensating balance arrangements. The Fund has an arrangement with its custodian bank whereby a portion of the custodian’s fees is paid indirectly by credits earned on the Fund’s cash on deposit with the bank.
(s) Federal and other taxes. It is the Fund’s policy to comply with the federal income and excise tax requirements of the Internal Revenue Code of 1986 (the "Code"), as amended, applicable to regulated investment companies. Accordingly, the Fund intends to distribute its taxable income and net realized gains, if any, to shareholders in accordance with timing requirements imposed by the Code. Therefore, no federal or state income tax provision is required in the Fund’s financial statements.
Management has analyzed the Fund’s tax positions taken on income tax returns for all open tax years and has concluded that as of June 30, 2011, no provision for income tax is required in the Fund’s financial statements. The Fund’s federal and state income and federal excise tax returns for tax years for which the applicable statutes of limitations have not expired are subject to examination by Internal Revenue Service and state departments of revenue.
Under the applicable foreign tax laws, a withholding tax may be imposed on interest, dividends and capital gains at various rates.
(t) Reclassification. GAAP requires that certain components of net assets be reclassified to reflect permanent differences between financial and tax reporting. These reclassifications have no effect on net assets or net asset value per share.
2. Investment management agreement and other transactions with affiliates
The Fund has an investment management agreement with Legg Mason Partners Fund Advisor, LLC (“LMPFA”). Western Asset Management Company (“Western Asset”) is the investment adviser. Western Asset Management Company Limited (“Western Asset Limited”), Western Asset Management Company Pte. Ltd. (“Western Singapore”) and Western Asset Management Company Ltd (“Western
| | |
| 38 | | Western Asset Absolute Return Portfolio 2011 Semi-Annual Report |
Notes to financial statements (unaudited) (cont’d)
Japan”) share advisory responsibilities with Western Asset. LMPFA, Western Asset, Western Asset Limited, Western Singapore and Western Japan are wholly owned subsidiaries of Legg Mason, Inc (“Legg Mason”).
LMPFA provides the Fund with management and administrative services for which the Fund pays a fee calculated daily and paid monthly, at an annual rate of 0.750% of the Fund’s average daily net assets.
The manager has agreed to forgo fees and/or reimburse operating expenses (other than interest, taxes, extraordinary expenses and brokerage commissions) so that total operating expenses are not expected to exceed: 0.80%, 0.80% and 1.05% for Class IS, Class I and Class FI shares, respectively. Western Asset and Western Asset Limited also agreed to waive their advisory fees (which are paid by LMPFA and not the Fund) under corresponding amounts under the Fee Cap. This arrangement cannot be terminated prior to April 30, 2012 without the Board’s consent.
During the six months ended June 30, 2011, fees forgone and/or expenses reimbursed for the Fund amounted to $79,569.
The manager is permitted to recapture amounts previously forgone or reimbursed to a class within three years after the day on which the manager earned the fee or incurred the expense if the class’ total annual operating expenses have fallen to a level below the lower of the limit described above or the limit then in effect.
Pursuant to these arrangements, at June 30, 2011, the Fund had remaining fees forgone and/or expense reimbursements subject to recapture by LMPFA and date of expiration as follows:
| | | | | | | | | | | | |
| | | Class IS | | | Class I | | | Class FI | |
| Expires December 31, 2011 | | $ | 33,468 | | | $ | 90,953 | | | $ | 408 | |
| Expires December 31, 2012 | | | 72,269 | | | | 49,077 | | | | 5,050 | |
| Expires December 31, 2013 | | | 90,156 | | | | 51,766 | | | | 3,823 | |
| Expires December 31, 2014 | | | 45,305 | | | | 30,487 | | | | 3,777 | |
| Fees forgone/expense, reimbursements subject to recapture | | $ | 241,198 | | | $ | 222,283 | | | $ | 13,058 | |
For the six months ended June 30, 2011, LMPFA recaptured $517 and $240 for Class IS and Class I, respectively.
Legg Mason Investor Services, LLC, a wholly-owned broker-dealer subsidiary of Legg Mason serves as the distributor of the Fund’s shares.
3. Investments
During the six months ended June 30, 2011, the aggregate cost of purchases and proceeds from sales of investments (excluding short-term investments) and U.S Government & Agency Obligations were as follows:
| | | | | | | | |
| | | Investments | | | U.S. Government & Agency Obligations | |
| Purchases | | $ | 33,199,014 | | | $ | 152,622,776 | |
| Sales | | | 65,900,429 | | | | 142,103,898 | |
| | | | |
| Western Asset Absolute Return Portfolio 2011 Semi-Annual Report | | | 39 | |
At June 30, 2011, the aggregate gross unrealized appreciation and depreciation of investments for federal income tax purposes were substantially as follows:
| | | | |
| Gross unrealized appreciation | | $ | 11,374,217 | |
| Gross unrealized depreciation | | | (28,632,798) | |
| Net unrealized depreciation | | $ | (17,258,581) | |
At June 30, 2011, the Fund had the following open futures contracts:
| | | | | | | | | | | | | | | | | | | | |
| | | Number of
Contracts | | | Expiration
Date | | | Basis
Value | | | Market
Value | | | Unrealized
Gain (Loss) | |
| Contracts to Buy: | | | | | | | | | | | | | | | | | | | | |
| 3 Months Euribor | | | 120 | | | | 9/11 | | | $ | 42,713,285 | | | $ | 42,751,862 | | | $ | 38,577 | |
| 3 Months Euribor | | | 21 | | | | 3/12 | | | | 7,433,282 | | | | 7,463,304 | | | | 30,022 | |
| 90-Day Eurodollar | | | 158 | | | | 12/11 | | | | 39,342,513 | | | | 39,334,100 | | | | (8,413) | |
| U.S. Treasury Ultra Long-Term Bonds | | | 204 | | | | 9/11 | | | | 26,034,749 | | | | 25,755,000 | | | | (279,749) | |
| | | | | | | | | | | | | | | | | | | $ | (219,563) | |
| Contracts to Sell: | | | | | | | | | | | | | | | | | | | | |
| 90-Day Eurodollar | | | 158 | | | | 3/12 | | | $ | 39,294,086 | | | $ | 39,308,425 | | | $ | (14,339) | |
| U.S. Treasury 2-Year Notes | | | 75 | | | | 9/11 | | | | 16,417,069 | | | | 16,450,781 | | | | (33,712) | |
| U.S. Treasury 5-Year Notes | | | 179 | | | | 9/11 | | | | 21,402,871 | | | | 21,335,961 | | | | 66,910 | |
| U.S. Treasury 10-Year Notes | | | 1,078 | | | | 9/11 | | | | 131,082,778 | | | | 131,869,719 | | | | (786,941) | |
| U.S. Treasury 30-Year Bonds | | | 118 | | | | 9/11 | | | | 14,626,085 | | | | 14,517,688 | | | | 108,398 | |
| | | | | | | | | | | | | | | | | | | $ | (659,684) | |
| Net unrealized loss on open futures contracts | | | | | | | | | | | $ | (879,247) | |
During the six months ended June 30, 2011, written option transactions for the Fund were as follows:
| | | | | | | | |
| | | Number of
Contracts | | | Premiums | |
| Written options, outstanding December 31, 2010 | | | 43,280,836 | | | $ | 1,704,609 | |
| Options written | | | 90,701,735 | | | | 1,086,353 | |
| Options closed | | | (52,500,744) | | | | (363,926) | |
| Options exercised | | | (10,500,185) | | | | (128,955) | |
| Options expired | | | (10,800,845) | | | | (390,413) | |
| Written options, outstanding June 30, 2011 | | | 60,180,797 | | | $ | 1,907,668 | |
| | |
| 40 | | Western Asset Absolute Return Portfolio 2011 Semi-Annual Report |
Notes to financial statements (unaudited) (cont’d)
At June 30, 2011, the Fund had the following open forward foreign currency contracts:
| | | | | | | | | | | | | | | | | | |
| Foreign Currency | | Counterparty | | Local
Currency | | | Market
Value | | | Settlement
Date | | | Unrealized
Gain (Loss) | |
| Contracts to Buy: | | | | | | | | | | | | | | | | | | |
| Mexican Peso | | Morgan Stanley & Co., Inc. | | | 39,789,122 | | | $ | 3,383,366 | | | | 8/18/11 | | | $ | 17,168 | |
| Contracts to Sell: | | | | | | | | | | | | | | | | | | |
| Euro | | Citibank N.A. | | | 2,421,609 | | | | 3,506,764 | | | | 8/18/11 | | | | 87,594 | |
| Euro | | Citibank N.A. | | | 2,480,000 | | | | 3,591,321 | | | | 8/18/11 | | | | (95,079) | |
| Euro | | Morgan Stanley & Co., Inc. | | | 1,826,000 | | | | 2,644,255 | | | | 8/18/11 | | | | 2,687 | |
| Euro | | UBS AG | | | 500,000 | | | | 724,057 | | | | 8/18/11 | | | | 973 | |
| Japanese Yen | | Citibank N.A. | | | 438,787,200 | | | | 5,451,844 | | | | 8/18/11 | | | | 21,673 | |
| Japanese Yen | | Credit Suisse First
Boston Inc. | | | 165,039,620 | | | | 2,050,584 | | | | 8/18/11 | | | | 5,600 | |
| | | | | | | | | | | | | | | | | | 23,448 | |
| Net unrealized gain on open forward foreign currency contracts | | | $ | 40,616 | |
At June 30, 2011, the Fund held the following open swap contracts:
| | | | | | | | | | | | | | | | | | | | | | |
| INTEREST RATE SWAPS | |
| Swap Counterparty | | Notional
Amount | | | Termination
Date | | | Payments
Made By
The Fund‡ | | Payments
Received By
The Fund‡ | | | Upfront
Premiums
Paid
(Received) | | | Unrealized
Depreciation | |
Credit Suisse First Boston Inc. | | $ | 50,000 | | | | 9/15/15 | | | 5.160% semi-annually | | | 3-Month LIBOR | | | | — | | | $ | (7,148) | |
| Banc of America Securities LLC | | | 100,000 | | | | 3/1/13 | | | 5.104% semi-annually | | | 3-Month LIBOR | | | | — | | | | (7,550) | |
| Barclays Capital Inc. | | | 60,000 | | | | 6/25/12 | | | 5.060% semi-annually | | | 3-Month LIBOR | | | | — | | | | (2,761) | |
| RBS Greenwich | | | 40,000 | | | | 4/1/12 | | | 5.011% semi-Annually | | | 3-Month LIBOR | | | | — | | | | (1,407) | |
Credit Suisse First Boston Inc. | | | 50,000 | | | | 8/15/13 | | | 5.023% semi-annually | | | 3-month LIBOR | | | | — | | | | (4,526) | |
| Total | | $ | 300,000 | | | | | | | | | | | | | | — | | | $ | (23,392) | |
At June 30, 2011, the Fund held the following credit default swap contracts:
| | | | | | | | | | | | | | | | | | | | | | | | |
| CREDIT DEFAULT SWAPS ON CORPORATE ISSUES — SELL PROTECTION1 | | | | |
Swap Counterparty
(Reference Entity) | | Notional
Amount2 | | | Termination
Date | | | Implied
Credit
Spread at
June 30,
20113 | | Periodic
Payments
Received By
The Fund‡ | | Market
Value | | | Upfront
Premiums
Paid
(Received) | | | Unrealized
Appreciation | |
| Barclays Capital Inc. (AES Corp., 7.750%, due 3/1/14) | | $ | 3,000,000 | | | | 9/20/12 | | | 0.89% | | 3.150% quarterly | | $ | 83,324 | | | | — | | | $ | 83,324 | |
| Barclays Capital Inc. (AES Corp., 7.750%, due 3/1/14) | | | 3,000,000 | | | | 9/20/12 | | | 0.89% | | 3.650% quarterly | | | 101,787 | | | | — | | | | 101,787 | |
| Total | | $ | 6,000,000 | | | | | | | | | | | $ | 185,111 | | | | — | | | $ | 185,111 | |
| | | | |
| Western Asset Absolute Return Portfolio 2011 Semi-Annual Report | | | 41 | |
| | | | | | | | | | | | | | | | | | | | | | |
| CREDIT DEFAULT SWAPS ON CORPORATE ISSUES — BUY PROTECTION4 | |
Swap Counterparty
(Reference Entity) | | Notional
Amount2 | | | Termination
Date | | | Periodic
Payments
Made By
The Fund‡ | | Market
Value | | | Upfront
Premiums
Paid
(Received) | | | Unrealized
Appreciation
(Depreciation) | |
| Credit Suisse First Boston Inc. (AmerisourceBergen Corp., 5.875%, due 9/15/15) | | $ | 50,000 | | | | 9/20/15 | | | 0.900% quarterly | | $ | (551) | | | | — | | | $ | (551) | |
| Banc of America Securities LLC (PHH Corporate Note, 7.125%, due 3/1/13 ) | | | 110,000 | | | | 3/20/13 | | | 1.050% monthly | | | 1,484 | | | | — | | | | 1,484 | |
| Barclays Capital Inc. (Health Care Property Investments Inc., 6.450%, due 6/25/12) | | | 60,000 | | | | 6/20/12 | | | 0.630% quarterly | | | (176) | | | | — | | | | (176) | |
| Morgan Stanley & Co. Inc. (Gannett Co., 6.375%, due 4/1/12) | | | 40,000 | | | | 3/20/12 | | | 0.460% quarterly | | | 19 | | | | — | | | | 19 | |
| Credit Suisse First Boston Inc. (Masco Corp., 5.875%, due 7/15/12) | | | 50,000 | | | | 9/20/13 | | | 0.750% quarterly | | | 621 | | | | — | | | | 621 | |
| Goldman Sachs Group Inc. (Citigroup Inc., 6.125%, due 5/15/18) | | | 1,000,000 | | | | 3/20/14 | | | 4.700% quarterly | | | (105,445) | | | | — | | | | (105,445) | |
| Total | | $ | 1,310,000 | | | | | | | | | $ | (104,048) | | | | — | | | $ | (104,048) | |
| | | | | | | | | | | | | | | | | | | | | | |
| CREDIT DEFAULT SWAPS ON CREDIT INDICES — SELL PROTECTION1 | |
Swap Counterparty
(Reference Entity) | | Notional
Amount2 | | | Termination
Date | | | Periodic
Payments
Received By
The Fund‡ | | Market
Value5 | | | Upfront
Premiums
Paid
(Received) | | | Unrealized
Depreciation | |
| JP Morgan Securities Inc. (CMBX.NA.AM.3) | | $ | 500,000 | | | | 12/13/49 | | | 0.500% monthly | | $ | (65,204) | | | $ | (38,890) | | | $ | (26,314) | |
| JP Morgan Securities Inc. (CMBX.NA.AM.2) | | | 900,000 | | | | 3/15/49 | | | 0.500% monthly | | | (83,910) | | | | (52,212) | | | | (31,698) | |
| Total | | $ | 1,400,000 | | | | | | | | | $ | (149,114) | | | $ | (91,102) | | | $ | (58,012) | |
| | | | | | | | | | | | | | | | | | | | | | |
| CREDIT DEFAULT SWAPS ON CREDIT INDICES — BUY PROTECTION4 | |
Swap Counterparty
(Reference Entity) | | Notional
Amount2 | | | Termination
Date | | | Periodic
Payments
Made By
The Fund‡ | | Market
Value5 | | | Upfront
Premiums
Paid
(Received) | | | Unrealized
Appreciation | |
Credit Suisse First Boston Inc.
(CMBX NA AM 4) | | $ | 1,100,000 | | | | 2/17/51 | | | 0.500% monthly | | $ | 167,438 | | | $ | 103,252 | | | $ | 64,186 | |
Barclays Capital Inc.
(MARKIT CDX HY 15) | | | 11,400,000 | | | | 12/20/15 | | | 5.000% quarterly | | | (365,936) | | | | (377,868) | | | | 11,932 | |
| BNP Paribas (MARKIT CDX.NA.IG.16) | | | 15,500,000 | | | | 6/20/16 | | | 1.000% quarterly | | | (57,853) | | | | (70,841) | | | | 12,988 | |
| BNP Paribas (MARKIT CDX.NA.IG.16) | | | 4,600,000 | | | | 6/20/16 | | | 1.000% quarterly | | | (17,169) | | | | (19,942) | | | | 2,773 | |
| Total | | $ | 32,600,000 | | | | | | | | | $ | (273,520) | | | $ | (365,399) | | | $ | 91,879 | |
| | | | | | | | | | | | | | | | | | | | | | |
| TOTAL RETURN SWAPS | |
| Swap Counterparty | | Notional
Amount | | | Termination
Date | | | Periodic
Payments
Made By
The Fund‡ | | Periodic
Payments
Received
By The
Fund‡ | | | Upfront
Premiums
Paid
(Received) | | | Unrealized
Depreciation | |
| Morgan Stanley & Co. Inc. | | $ | 350,000 | | | | 1/1/12 | | | TRX-CMBS | | | TRX-CMBS Reset | | | | — | | | $ | (1,708) | |
| | |
| 42 | | Western Asset Absolute Return Portfolio 2011 Semi-Annual Report |
Notes to financial statements (unaudited) (cont’d)
| 1 | If the Fund is a seller of protection and a credit event occurs, as defined under the terms of that particular swap agreement, the Fund will either (i) pay to the buyer of protection an amount equal to the notional amount of the swap and take delivery of the referenced obligation or underlying securities comprising the referenced index or (ii) pay a net settlement amount in the form of cash or securities equal to the notional amount of the swap less the recovery value of the referenced obligation or underlying securities comprising the referenced index. |
| 2 | The maximum potential amount the Fund could be required to pay as a seller of credit protection or receive as a buyer of credit protection if a credit event occurs as defined under the terms of that particular swap agreement. |
| 3 | Implied credit spreads, utilized in determining the market value of credit default swap agreements on corporate issues or sovereign issues of an emerging country as of period end serve as an indicator of the current status of the payment/performance risk and represent the likelihood or risk of default for the credit derivative. The implied credit spread of a particular referenced entity reflects the cost of buying/selling protection and may include upfront payments required to be made to enter into the agreement. Wider credit spreads represent a deterioration of the referenced entity’s credit soundness and a greater likelihood or risk of default or other credit event occurring as defined under the terms of the agreement. A credit spread identified as “Defaulted” indicates a credit event has occurred for the referenced entity or obligation. |
| 4 | If the Fund is a buyer of protection and a credit event occurs, as defined under the terms of that particular swap agreement, the Fund will either (i) receive from the seller of protection an amount equal to the notional amount of the swap and deliver the underlying securities comprising the referenced index or (ii) receive a net settlement amount in the form of cash or securities equal to the notional amount of the swap less the recovery value of the underlying securities comprising the referenced index. |
| 5 | The quoted market prices and resulting values for credit default swap agreements on asset-backed securities and credit indices serve as an indicator of the current status of the payment/performance risk and represent the likelihood of an expected liability (or profit) for the credit derivative should the notional amount of the swap agreement been closed/sold as of the period end. Decreasing market values when compared to the notional amount of the swap, represent a deterioration of the referenced entity’s credit soundness and a greater likelihood or risk of default or other credit event occurring as defined under the terms of the agreement. |
| ‡ | Percentage shown is an annual percentage rate. |
4. Derivative instruments and hedging activities
Financial Accounting Standards Board Codification Topic 815 requires enhanced disclosure about an entity’s derivative and hedging activities.
Below is a table, grouped by derivative type that provides information about the fair value and the location of derivatives within the Statement of Assets and Liabilities at June 30, 2011.
| | | | | | | | | | | | | | | | |
| ASSET DERIVATIVES1 | |
| | | Interest Rate
Contracts Risk | | | Foreign Exchange
Contracts Risk | | | Credit
Contracts Risk | | | Total | |
| Purchased options2 | | $ | 599,384 | | | | — | | | $ | 64,372 | | | $ | 663,756 | |
| Futures contracts3 | | | 243,907 | | | | — | | | | — | | | | 243,907 | |
| Swap contracts4 | | | — | | | | — | | | | 354,673 | | | | 354,673 | |
| Forward foreign currency Contracts | | | — | | | $ | 135,695 | | | | — | | | | 135,695 | |
| Total | | $ | 843,291 | | | $ | 135,695 | | | $ | 419,045 | | | $ | 1,398,031 | |
| | | | | | | | | | | | | | | | |
| LIABILITY DERIVATIVES1 | |
| | | Interest Rate
Contracts Risk | | | Foreign Exchange
Contracts Risk | | | Credit
Contracts Risk | | | Total | |
| Written options | | $ | 1,726,475 | | | | — | | | $ | 68,930 | | | $ | 1,795,405 | |
| Futures contracts3 | | | 1,123,154 | | | | — | | | | — | | | | 1,123,154 | |
| Swap contracts4 | | | 23,392 | | | | — | | | | 697,952 | | | | 721,344 | |
| Forward foreign currency contracts | | | — | | | $ | 95,079 | | | | — | | | | 95,079 | |
| Total | | $ | 2,873,021 | | | $ | 95,079 | | | $ | 766,882 | | | $ | 3,734,982 | |
| | | | |
| Western Asset Absolute Return Portfolio 2011 Semi-Annual Report | | | 43 | |
| 1 | Generally, the balance sheet location for asset derivatives is receivables/net unrealized appreciation (depreciation) and for liability derivatives is payables/net unrealized appreciation (depreciation). |
| 2 | Market value of purchased options is reported in Investments at value in the Statement of Assets and Liabilities. |
| 3 | Includes cumulative appreciation (depreciation) of futures contracts as reported in the footnotes. Only variation margin is reported within the receivables and/or payables of the Statement of Assets and Liabilities. |
| 4 | Values include premiums paid (received) on swap contracts which are shown separately in the Statement of Assets and Liabilities. |
The following tables provide information about the effect of derivatives and hedging activities on the Fund's Statement of Operations for the six months ended June 30, 2011. The first table provides additional detail about the amounts and sources of gains (losses) realized on derivatives during the period. The second table provides additional information about the change in unrealized appreciation (depreciation) resulting from the Fund's derivatives and hedging activities during the period.
| | | | | | | | | | | | | | | | |
| AMOUNT OF REALIZED GAIN (LOSS) ON DERIVATIVES RECOGNIZED | |
| | | Interest Rate
Contracts Risk | | | Foreign Exchange
Contracts Risk | | | Credit
Contracts Risk | | | Total | |
| Purchased options | | $ | (759,305) | | | | — | | | | — | | | $ | (759,305) | |
| Written options | | | 564,798 | | | | — | | | | — | | | | 564,798 | |
| Futures contracts | | | (1,872,545) | | | | — | | | | — | | | | (1,872,545) | |
| Swap contracts | | | (23,898) | | | | — | | | $ | (2,031,127) | | | | (2,055,025) | |
| Forward foreign currency contracts | | | — | | | $ | (754,879) | | | | — | | | | (754,879) | |
| Total | | $ | (2,090,950) | | | $ | (754,879) | | | $ | (2,031,127) | | | $ | (4,876,956) | |
| | | | | | | | | | | | | | | | |
| CHANGE IN UNREALIZED APPRECIATION (DEPRECIATION) ON DERIVATIVES RECOGNIZED | |
| | | Interest Rate
Contracts Risk | | | Foreign Exchange
Contracts Risk | | | Credit
Contracts Risk | | | Total | |
| Purchased options | | $ | 354,203 | | | | — | | | $ | (45,828) | | | $ | 308,375 | |
| Written options | | | 113,044 | | | | — | | | | 62,170 | | | | 175,214 | |
| Futures contracts | | | (2,398,210) | | | | — | | | | — | | | | (2,398,210) | |
| Swap contracts | | | (16,244) | | | | — | | | | 1,796,492 | | | | 1,780,248 | |
| Forward foreign currency contracts | | | — | | | $ | 300,483 | | | | — | | | | 300,483 | |
| Total | | $ | (1,947,207) | | | $ | 300,483 | | | $ | 1,812,834 | | | $ | 166,110 | |
During the six months ended June 30, 2011, the volume of derivative activity for the Fund was as follows:
| | | | |
| | | Average Market
Value | |
| Purchased options | | $ | 574,262 | |
| Written options | | | 1,660,550 | |
| Forward foreign currency contracts (to buy) | | | 7,942,094 | |
| Forward foreign currency contracts (to sell) | | | 18,933,753 | |
| Futures contracts (to buy) | | | 99,035,797 | |
| Futures contracts (to sell) | | | 161,852,756 | |
| | |
| 44 | | Western Asset Absolute Return Portfolio 2011 Semi-Annual Report |
Notes to financial statements (unaudited) (cont’d)
| | | | |
| |
| | | Average Notional
Balance | |
| Interest rate swap contracts | | $ | 1,740,000 | |
| Credit default swap contracts (to buy protection) | | | 23,372,571 | |
| Credit default swap contracts (to sell protection) | | | 8,012,857 | |
| Total return swap contracts | | | 1,758,571 | |
5. Class specific expenses, fees forgone and/or expense reimbursements
The Fund has adopted a Rule 12b-1distribution plan and under that plan the Fund pays a distribution fee with respect to its Class FI shares calculated at the annual rate of 0.25% of the average daily net assets of the class. Service and distribution fees are accrued and paid monthly.
For the six months ended June 30, 2011, class specific expenses were as follows:
| | | | | | | | | | | | |
| | | Service and/or
Distribution Fees | | | Transfer
Agent Fees | | | Shareholder
Reports | |
| Class IS | | | — | | | $ | 3,357 | | | $ | 9,819 | |
| Class I | | | — | | | | 9,535 | | | | 5,588 | |
| Class FI | | $ | 3,600 | | | | 3,217 | | | | 91 | |
| Total | | $ | 3,600 | | | $ | 16,109 | | | $ | 15,498 | |
For the six months ended June 30, 2011, class specific fees forgone and/or expense reimbursements were as follows:
| | | | |
| | | Fees Forgone/
Expense Reimbursements | |
| Class IS | | $ | 45,305 | |
| Class I | | | 30,487 | |
| Class FI | | | 3,777 | |
| Total | | $ | 79,569 | |
6. Distributions to shareholders by class
| | | | | | | | |
| | | Six Months Ended
June 30, 2011 | | | Year Ended
December 31, 20101 | |
| Net Investment Income: | | | | | | | | |
| Class IS | | $ | 3,470,151 | | | $ | 7,897,272 | |
| Class I | | | 1,525,669 | | | | 3,803,925 | |
| Class FI | | | 39,462 | | | | 66,611 | |
| Total | | $ | 5,035,282 | | | $ | 11,767,808 | |
| 1 | In April 2010, Institutional Select Class, Institutional Class and Financial Intermediary Class shares were renamed Class IS, Class I and Class FI shares, respectively. |
| | | | |
| Western Asset Absolute Return Portfolio 2011 Semi-Annual Report | | | 45 | |
7. Capital shares
At June 30, 2011, the Corporation had 21.15 billion shares of capital stock authorized with a par value of $0.001 per share.
Transactions in shares of each class were as follows:
| | | | | | | | | | | | | | | | |
| | | Six Months Ended
June 30, 2011 | | | Year Ended
December 31, 20101 | |
| | | Shares | | | Amount | | | Shares | | | Amount | |
| Class IS | | | | | | | | | | | | | | | | |
| Shares sold | | | 2,255,475 | | | $ | 23,204,566 | | | | 7,685,550 | | | $ | 76,833,441 | |
| Shares issued on reinvestment | | | 335,655 | | | | 3,455,014 | | | | 785,844 | | | | 7,922,397 | |
| Shares repurchased | | | (1,439,891) | | | | (14,805,039) | | | | (6,406,128) | | | | (64,351,963) | |
| Net increase | | | 1,151,239 | | | $ | 11,854,541 | | | | 2,065,266 | | | $ | 20,403,875 | |
| | | | |
| Class I | | | | | | | | | | | | | | | | |
| Shares sold | | | 4,045,328 | | | $ | 41,669,577 | | | | 2,511,319 | | | $ | 25,295,244 | |
| Shares issued on reinvestment | | | 96,581 | | | | 995,070 | | | | 232,239 | | | | 2,341,939 | |
| Shares repurchased | | | (711,184) | | | | (7,327,400) | | | | (4,872,006) | | | | (49,518,469) | |
| Net increase (decrease) | | | 3,430,725 | | | $ | 35,337,247 | | | | (2,128,448) | | | $ | (21,881,286) | |
| | | | |
| Class FI | | | | | | | | | | | | | | | | |
| Shares sold | | | 208,632 | | | $ | 2,148,034 | | | | 381,383 | | | $ | 3,816,779 | |
| Shares issued on reinvestment | | | 3,834 | | | | 39,462 | | | | 3,136 | | | | 31,905 | |
| Shares repurchased | | | (19,353) | | | | (199,179) | | | | (622,189) | | | | (6,204,031) | |
| Net increase (decrease) | | | 193,113 | | | $ | 1,988,317 | | | | (237,670) | | | $ | (2,355,347) | |
| 1 | In April 2010, Institutional Select Class, Institutional Class and Financial Intermediary Class shares were renamed Class IS, Class I and Class FI shares, respectively. |
8. Capital loss carryforward
As of December 31, 2010, the Fund had a net capital loss carryforward of approximately $17,231,515, of which $1,073,088 expires in 2016, $13,463,088 expires in 2017 and $2,695,339 expires in 2018. These amounts will be available to offset any future taxable capital gains.
Under the recently enacted Regulated Investment Company Modernization Act of 2010, the Fund will be permitted to carry forward capital losses incurred in taxable years beginning after December 22, 2010 for an unlimited period. However, any losses incurred during those future years will be required to be utilized prior to the losses incurred in pre-enactment taxable years. As a result of this ordering rule, pre-enactment capital loss carryforwards may be more likely to expire unused. Additionally, post-enactment capital losses that are carried forward will retain their character as either short-term or long-term capital losses rather than being considered all short-term as under previous law.
| | |
| 46 | | Western Asset Absolute Return Portfolio 2011 Semi-Annual Report |
Notes to financial statements (unaudited) (cont’d)
9. Other tax information
On December 22, 2010, President Obama signed into law the Regulated Investment Company Modernization Act of 2010 (the “Act”). The Act updates certain tax rules applicable to regulated investment companies (“RICs”). The various provisions of the Act will generally be effective for RICs with taxable years beginning after December 22, 2010. Additional information regarding the impact of the Act on the Fund, if any, will be contained within the relevant sections of the notes to the financial statements for the fiscal year ending December 31, 2011.
Western Asset
Absolute Return Portfolio
Directors
William E. B. Siart, Chairman
Ronald J. Arnault
Anita L. DeFrantz
R. Jay Gerken, CFA
President
Ronald L. Olson
Avedick B. Poladian
Jaynie Miller Studenmund
Investment manager
Legg Mason Partners Fund Advisor, LLC
Investment advisers
Western Asset Management Company
Western Asset Management Company Limited
Western Asset Management Company Ltd
Western Asset Management Company Pte. Ltd.
Transfer agent
Boston Financial Data Services
2000 Crown Colony Drive
Quincy, MA 02169
Custodian
State Street Bank and Trust Company
Independent registered public accounting firm
PricewaterhouseCoopers LLP
Baltimore, MD
Counsel
Ropes & Gray LLP
1211 Avenue of the Americas
New York, NY 10036
Western Asset Absolute Return Portfolio
The Fund is a separate investment series of Western Asset Funds, Inc.
Western Asset Absolute Return Portfolio
Legg Mason Funds
55 Water Street
New York, NY 10041
The Fund files its complete schedule of portfolio holdings with the Securities and Exchange Commission (“SEC”) for the first and third quarters of each fiscal year on Form N-Q. The Fund’s Forms N-Q are available on the SEC’s website at www.sec.gov. The Fund’s Forms N-Q may be reviewed and copied at the SEC’s Public Reference Room in Washington, D.C., and information on the operation of the Public Reference Room may be obtained by calling 1-800-SEC-0330. To obtain information on Form N-Q, shareholders can call the Fund at 1-877-721-1926.
Information on how the Fund voted proxies relating to portfolio securities during the prior 12-month period ended June 30th of each year and a description of the policies and procedures that the Fund uses to determine how to vote proxies related to portfolio transactions are available (1) without charge, upon request, by calling the Fund at 1-877-721-1926, (2) on the Fund’s website at www.leggmason.com/individualinvestors and (3) on the SEC’s website at www.sec.gov.
This report is submitted for the general information of the shareholders of Western Asset Absolute Return Portfolio. This report is not authorized for distribution to prospective investors in the Fund unless preceded or accompanied by a current prospectus.
Investors should consider the Fund’s investment objectives, risks, charges and expenses carefully before investing. The prospectus contains this and other important information about the Fund. Please read the prospectus carefully before investing.
www.leggmason.com/individualinvestors
©2011 Legg Mason Investor Services, LLC
Member FINRA, SIPC
Legg Mason Funds Privacy and Security Notice
Your Privacy and the Security of Your Personal Information is Very Important to the Legg Mason Funds
This Privacy and Security Notice (the “Privacy Notice”) addresses the Legg Mason Funds’ privacy and data protection practices with respect to nonpublic personal information the Funds receive. The Legg Mason Funds include any funds sold by the Funds’ distributor, Legg Mason Investor Services, LLC, as well as Legg Mason-sponsored closed-end funds. The provisions of this Privacy Notice apply to your information both while you are a shareholder and after you are no longer invested with the Funds.
The Type of Nonpublic Personal Information the Funds Collect About You
The Funds collect and maintain nonpublic personal information about you in connection with your shareholder account. Such information may include, but is not limited to:
| Ÿ | | Personal information included on applications or other forms; |
| Ÿ | | Account balances, transactions, and mutual fund holdings and positions; |
| Ÿ | | Online account access user IDs, passwords, security challenge question responses; and |
| Ÿ | | Information received from consumer reporting agencies regarding credit history and creditworthiness (such as the amount of an individual’s total debt, payment history, etc.). |
How the Funds Use Nonpublic Personal Information About You
The Funds do not sell or share your nonpublic personal information with third parties or with affiliates for their marketing purposes, or with other financial institutions or affiliates for joint marketing purposes, unless you have authorized the Funds to do so. The Funds do not disclose any nonpublic personal information about you except as may be required to perform transactions or services you have authorized or as permitted or required by law. The Funds may disclose information about you to:
| Ÿ | | Employees, agents, and affiliates on a “need to know” basis to enable the Funds to conduct ordinary business or comply with obligations to government regulators; |
| Ÿ | | Service providers, including the Funds’ affiliates, who assist the Funds as part of the ordinary course of business (such as printing, mailing services, or processing or servicing your account with us) or otherwise perform services on the Funds’ behalf, including companies that may perform marketing services solely for the Funds; |
| Ÿ | | The Funds’ representatives such as legal counsel, accountants and auditors; and |
| Ÿ | | Fiduciaries or representatives acting on your behalf, such as an IRA custodian or trustee of a grantor trust. |
|
| NOT PART OF THE SEMI-ANNUAL REPORT |
Legg Mason Funds Privacy and Security Notice (cont’d)
Except as otherwise permitted by applicable law, companies acting on the Funds’ behalf are contractually obligated to keep nonpublic personal information the Funds provide to them confidential and to use the information the Funds share only to provide the services the Funds ask them to perform.
The Funds may disclose nonpublic personal information about you when necessary to enforce their rights or protect against fraud, or as permitted or required by applicable law, such as in connection with a law enforcement or regulatory request, subpoena, or similar legal process. In the event of a corporate action or in the event a Fund service provider changes, the Funds may be required to disclose your nonpublic personal information to third parties. While it is the Funds’ practice to obtain protections for disclosed information in these types of transactions, the Funds cannot guarantee their privacy policy will remain unchanged.
Keeping You Informed of the Funds’ Privacy and Security Practices
The Funds will notify you annually of their privacy policy as required by federal law. While the Funds reserve the right to modify this policy at any time they will notify you promptly if this privacy policy changes.
The Funds’ Security Practices
The Funds maintain appropriate physical, electronic and procedural safeguards designed to guard your nonpublic personal information. The Funds’ internal data security policies restrict access to your nonpublic personal information to authorized employees, who may use your nonpublic personal information for Fund business purposes only.
Although the Funds strive to protect your nonpublic personal information, they cannot ensure or warrant the security of any information you provide or transmit to them, and you do so at your own risk. In the event of a breach of the confidentiality or security of your nonpublic personal information, the Funds will attempt to notify you as necessary so you can take appropriate protective steps. If you have consented to the Funds using electronic communications or electronic delivery of statements, they may notify you under such circumstances using the most current email address you have on record with them.
In order for the Funds to provide effective service to you, keeping your account information accurate is very important. If you believe that your account information is incomplete, not accurate or not current, or if you have questions about the Funds’ privacy practices, write the Funds using the contact information on your account statements, email the Funds by clicking on the Contact Us section of the Funds’ website at www.leggmason.com, or contact the Fund at 1-877-721-1926.
Revised April 2011
|
| NOT PART OF THE SEMI-ANNUAL REPORT |
Western Asset Management Company
Legg Mason, Inc. Subsidiaries
www.leggmason.com/individualinvestors
©2011 Legg Mason Investor Services, LLC Member FINRA, SIPC
WASX012827 8/11 SR11-1443
Not applicable.
| ITEM 3. | AUDIT COMMITTEE FINANCIAL EXPERT. |
Not applicable.
| ITEM 4. | PRINCIPAL ACCOUNTANT FEES AND SERVICES. |
Not applicable.
| ITEM 5. | AUDIT COMMITTEE OF LISTED REGISTRANTS. |
Not applicable.
| ITEM 6. | SCHEDULE OF INVESTMENTS. |
Included herein under Item 1.
| ITEM 7. | DISCLOSURE OF PROXY VOTING POLICIES AND PROCEDURES FOR CLOSED-END MANAGEMENT INVESTMENT COMPANIES. |
Not applicable.
| ITEM 8. | PORTFOLIO MANAGERS OF CLOSED-END MANAGEMENT INVESTMENT COMPANIES. |
Not applicable.
| ITEM 9. | PURCHASES OF EQUITY SECURITIES BY CLOSED-END MANAGEMENT INVESTMENT COMPANY AND AFFILIATED PURCHASERS. |
Not applicable.
| ITEM 10. | SUBMISSION OF MATTERS TO A VOTE OF SECURITY HOLDERS. |
Not applicable.
| ITEM 11. | CONTROLS AND PROCEDURES. |
| | (a) | The registrant’s principal executive officer and principal financial officer have concluded that the registrant’s disclosure controls and procedures (as defined in Rule 30a- 3(c) under the Investment Company Act of 1940, as amended (the “1940 Act”)) are effective as of a date within 90 days of the filing date of this report that includes the disclosure required by this paragraph, based on their evaluation of the disclosure controls and procedures required by Rule 30a-3(b) under the 1940 Act and 15d-15(b) under the Securities Exchange Act of 1934. |
| | (b) | There were no changes in the registrant’s internal control over financial reporting (as defined in Rule 30a-3(d) under the 1940 Act) that occurred during the registrant’s last fiscal half-year (the registrant’s second fiscal half-year in the case of an annual report) that have materially affected, or are likely to materially affect the registrant’s internal control over financial reporting. |
(a) (1) Not applicable.
Exhibit 99.CODE ETH
(a) (2) Certifications pursuant to section 302 of the Sarbanes-Oxley Act of 2002 attached hereto.
Exhibit 99.CERT
(b) Certifications pursuant to Section 906 of the Sarbanes-Oxley Act of 2002 attached hereto.
Exhibit 99.906CERT
SIGNATURES
Pursuant to the requirements of the Securities Exchange Act of 1934 and the Investment Company Act of 1940, the registrant has duly caused this Report to be signed on its behalf by the undersigned, there unto duly authorized.
Western Asset Funds, Inc.
| | |
| By: | | /s/ R. Jay Gerken |
| | (R. Jay Gerken) |
| | President of |
| | Western Asset Funds, Inc. |
Date: August 26, 2011
Pursuant to the requirements of the Securities Exchange Act of 1934 and the Investment Company Act of 1940, this report has been signed below by the following persons on behalf of the registrant and in the capacities and on the dates indicated.
| | |
| |
| By: | | /s/ R. Jay Gerken |
| | (R. Jay Gerken) |
| | President of |
| | Western Asset Funds, Inc. |
Date: August 26, 2011
| | |
| By: | | /s/ Kaprel Ozsolak |
| | (Kaprel Ozsolak) |
| | Principal Financial and Accounting Officer |
| | Western Asset Funds, Inc. |
Date: August 26, 2011