June 30, 2010
Exhibit 17(e)

Semi-Annual Repor t
Western Asset
Intermediate Bond Portfolio
INVESTMENT PRODUCTS: NOT FDIC INSURED • NO BANK GUARANTEE • MAY LOSE VALUE
| | |
| II | | Western Asset Intermediate Bond Portfolio |
Fund objective
The Fund seeks to maximize total return, consistent with prudent investment management and liquidity needs, by investing to obtain the average duration which is expected to range within 20% of the duration of its benchmark.
| | |
| Letter from the president | | |
Dear Shareholder,
We are pleased to provide the semi-annual report of Western Asset Intermediate Bond Portfolio for the six-month reporting period ended June 30, 2010.
Please read on for Fund performance information and a detailed look at prevailing economic and market conditions during the Fund’s reporting period.
As always, we remain committed to providing you with excellent service and a full spectrum of investment choices. We also remain committed to supplementing the support you receive from your financial advisor. One way we accomplish this is through our website, www.leggmason.com/individualinvestors. Here you can gain immediate access to market and investment information, including:
| Ÿ | | Fund prices and performance, |
| Ÿ | | Market insights and commentaries from our portfolio managers, and |
| Ÿ | | A host of educational resources. |
We look forward to helping you meet your financial goals.
Sincerely,

R. Jay Gerken, CFA
President
July 30, 2010
| | |
| Western Asset Intermediate Bond Portfolio | | III |
Investment commentary
Economic review
While the overall U.S. economy continued to expand over the six months ended June 30, 2010, several economic data points weakened toward the end of the reporting period. This, in combination with sovereign debt woes in Europe, caused investor sentiment to turn negative and had significant implications for the financial markets.
Looking back, the U.S. Department of Commerce reported that U.S. gross domestic product (“GDP”)i contracted four consecutive quarters, beginning in the third quarter of 2008 through the second quarter of 2009. Economic conditions then began to improve in the third quarter of 2009, as GDP growth was 1.6%. A variety of factors helped the economy to regain its footing, including the government’s $787 billion stimulus program. Economic growth then accelerated during the fourth quarter of 2009, as GDP growth was 5.0%. A slower drawdown in business inventories and renewed consumer spending were contributing factors spurring the economy’s higher growth rate. While the recovery continued during the first half of 2010, it did so at a more modest pace, as GDP growth was 3.7% during the first quarter of 2010 and an estimated 2.4% during the second quarter. The slower pace of growth in the second quarter was due, in part, to slower consumer spending, which rose an annualized 1.6% during the quarter, versus a 1.9% gain over the first three months of the year.
Even before GDP growth turned positive, there were signs that the economy was on the mend. The manufacturing sector, as measured by the Institute for Supply Management’s PMIii, rose to 52.8 in August 2009, the first time it surpassed 50 since January 2008 (a reading below 50 indicates a contraction, whereas a reading above 50 indicates an expansion). While June 2010’s PMI reading of 56.2 was lower than May’s reading of 59.7, manufacturing has now expanded eleven consecutive months according to PMI data. The manufacturing sector’s growth remained fairly broad-based with thirteen of the eighteen industries tracked by the Institute for Supply Management expanding during June.
After experiencing sharp job losses in 2009, the U.S. Department of Labor reported that over one million new positions were added during the first five months of 2010. Included in that total, however, were 700,000 temporary government jobs tied to the 2010 Census. In June, 225,000 of these temporary positions were eliminated, offsetting private sector growth and resulting in a net loss of 125,000 jobs for the month. However, the unemployment rate fell to 9.5% in June, versus 9.7% and 9.9% in May and April, respectively.
There was mixed news in the housing market during the period. According to the National Association of Realtors, existing home sales increased 7.0% and 8.0% in March and April, respectively, after sales had fallen for the period from December 2009 through February 2010. The rebound was largely attributed to people rushing to take advantage of the government’s $8,000 tax credit for first-time home buyers that expired at the end of April. However, with the end of the tax credit, existing home sales then declined 2.2% and 5.1% in May and June, respectively. In addition, the inventory of unsold homes increased 2.5% to 3.99 million in June. Looking at home prices, the S&P/Case-Shiller Home Price Indexiii indicated that month-to-month U.S. home prices rose 1.3% in May. This marked the second straight monthly increase following six consecutive months of declining prices.
Financial market overview
During the first half of the reporting period, the financial markets were largely characterized by healthy investor risk appetite and solid results by lower-quality bonds. However, the market experienced a sharp sell-off during the second half of the reporting period, during which risk aversion returned and investors flocked to the relative safety of U.S. Treasury securities.
Given certain pockets of weakness in the economy, including elevated unemployment in the U.S., the Federal Reserve Board (“Fed”)iv remained cautious. At its meeting in June 2010, the Fed said it “will maintain the target range for the federal funds ratev at 0 to 1/4 percent and continues to anticipate that economic conditions, including low rates of resource utilization, subdued inflation trends, and stable inflation expectations, are likely to warrant exceptionally low levels of the federal funds rate for an extended period.”
However, the Fed took several steps in reversing its accommodative monetary stance. On February 18, 2010, the Fed raised the discount rate, the interest rate it charges banks for temporary loans, from 1/2 to 3/4 percent. The Fed also concluded its $1.25 trillion mortgage securities purchase program at the end of the first quarter of 2010. However, the Fed left the door open for future stimulus measures if needed. In the minutes of its June meeting that were released on July 14th (after the reporting period ended), the Fed said, “In addition to continuing to develop and test instruments to exit from the period of unusually accommodative monetary policy, the Committee would need to consider whether further policy stimulus might become appropriate if the outlook were to worsen appreciably.”
| | |
| IV | | Western Asset Intermediate Bond Portfolio |
Investment commentary (cont’d)
Fixed-income market review
Continuing the trend that began in the second quarter of 2009, nearly every spread sector (non-Treasury) outperformed equal-durationvi Treasuries during the first half of the reporting period. Over that time, investor confidence was high given encouraging economic data, continued low interest rates, benign inflation and rebounding corporate profits. However, robust investor appetite was replaced with heightened risk aversion toward the end of April and during the month of May. This was due to the escalating sovereign debt crisis in Europe, uncertainties regarding new financial reforms in the U.S. and some worse-than-expected economic data. Most spread sectors then produced positive absolute returns in June, as investor demand for these securities began to again increase.
Both short- and long-term Treasury yields fluctuated during the period but generally moved lower. When the period began, two- and ten-year Treasury yields were 1.14% and 3.85%, respectively. Two- and ten-year Treasury yields initially rose, reaching as high as 1.18% and 4.01%, respectively, in early April. Yields then largely declined amid the investor “flight to quality.” On June 30, 2010, two- and ten-year Treasury yields reached their lows for the reporting period: 0.61% and 2.97%, respectively. Over the six-month reporting period, the yield curvevii flattened, with longer-term Treasury yields declining more than their shorter-term counterparts. For the six months ended June 30, 2010, the Barclays Capital U.S. Aggregate Indexviii returned 5.33%.
Performance review
For the six months ended June 30, 2010, Class I shares of Western Asset Intermediate Bond Portfolio returned 5.39%. The Fund’s unmanaged benchmark, the Barclays Capital Intermediate U.S. Government/Credit Indexix, returned 4.56% for the same period. The Lipper Intermediate Investment Grade Debt Funds Category Average1 returned 5.35% over the same time frame.
| | | |
| Performance Snapshot as of June 30, 2010 (unaudited) | |
| | | 6 months | |
| Western Asset Intermediate Bond Portfolio: | | | |
Class IS2 | | 5.40 | % |
Class I2 | | 5.39 | % |
| Barclays Capital Intermediate U.S. Government/Credit Index | | 4.56 | % |
| Lipper Intermediate Investment Grade Debt Funds Category Average | | 5.35 | % |
The performance shown represents past performance. Past performance is no guarantee of future results and current performance may be higher or lower than the performance shown above. Principal value, investment returns and yields will fluctuate and investors’ shares, when redeemed, may be worth more or less than their original cost. To obtain performance data current to the most recent month-end, please visit our website at www.leggmason.com/individualinvestors.
All share class returns assume the reinvestment of all distributions, including returns of capital, if any, at net asset value and the deduction of all Fund expenses. Returns have not been adjusted to include the deduction of taxes that a shareholder would pay on Fund distributions. Performance figures for periods shorter than one year represent cumulative figures and are not annualized.
Performance figures reflect expense reimbursements and/or fee waivers, without which the performance would have been lower.
The 30-Day SEC Yields for the period ended June 30, 2010 for Class IS and I shares were 3.27% and 3.25%, respectively. Absent current expense reimbursements and/or fee waivers, the 30-Day SEC Yield for Class IS shares would have been 3.24%. The 30-Day SEC Yield is the average annualized net investment income per share for the 30-day period indicated and is subject to change.
|
| Total Annual Operating Expenses (unaudited) |
As of the Fund’s most current prospectus dated April 30, 2010, the gross total operating expense ratios for Class IS and Class I shares were 0.46% and 0.47%, respectively.
Actual expenses may be higher. For example, expenses may be higher than those shown if average net assets decrease. Net assets are more likely to decrease and Fund expense ratios are more likely to increase when markets are volatile.
As a result of an expense limitation agreement, the ratio of expenses, other than interest, brokerage, taxes, deferred organizational expenses and extraordinary expenses, to average net assets will not exceed 0.45% for Class IS shares. This expense limitation agreement cannot be terminated prior to April 30, 2011 without the Board of Directors’ consent.
The manager is permitted to recapture amounts forgone or reimbursed to the class within three years after the day on which the manager earned the fee or incurred the expense if the class’ total annual operating expenses have fallen to a level below the lower of the limit described above or the limit then in effect.
| 1 | Lipper, Inc., a wholly-owned subsidiary of Reuters, provides independent insight on global collective investments. Returns are based on the six-month period ended June 30, 2010, including the reinvestment of all distributions, including returns of capital, if any, calculated among the 588 funds in the Fund’s Lipper category. |
| 2 | Class IS and Class I shares were formerly known as Institutional Select Class and Institutional Class shares, respectively. Fund share classes were renamed in April 2010. |
| | |
| Western Asset Intermediate Bond Portfolio | | V |
As always, thank you for your confidence in our stewardship of your assets.
Sincerely,
R. Jay Gerken, CFA
President
July 30, 2010
RISKS: Fixed-income securities involve interest rate, credit, inflation and reinvestment risks. As interest rates rise, the value of fixed-income securities falls. Derivatives, such as options, futures and swaps, can be illiquid, may disproportionately increase losses, and have a potentially large impact on Fund performance. International investments are subject to special risks including social, economic and political uncertainties, which could increase volatility. Asset-backed, mortgage-backed or mortgage-related securities are subject to prepayment and extension risks. Please see the Fund’s prospectus for more information on these and other risks.
All investments are subject to risk including the possible loss of principal. All index performance reflects no deduction for fees, expenses or taxes. Please note that an investor cannot invest directly in an index.
The information provided is not intended to be a forecast of future events, a guarantee of future results or investment advice. Views expressed may differ from those of the firm as a whole.
| i | Gross domestic product (“GDP”) is the market value of all final goods and services produced within a country in a given period of time. |
| ii | The Institute for Supply Management’s PMI is based on a survey of purchasing executives who buy the raw materials for manufacturing at more than 350 companies. It offers an early reading on the health of the manufacturing sector. |
| iii | The S&P/Case-Shiller Home Price Index measures the residential housing market, tracking changes in the value of the residential real estate market in twenty metropolitan regions across the United States. |
| iv | The Federal Reserve Board (“Fed”) is responsible for the formulation of policies designed to promote economic growth, full employment, stable prices and a sustainable pattern of international trade and payments. |
| v | The federal funds rate is the rate charged by one depository institution on an overnight sale of immediately available funds (balances at the Federal |
Reserve) to another depository institution; the rate may vary from depository institution to depository institution and from day to day.
| vi | Duration is the measure of the price sensitivity of a fixed-income security to an interest rate change of 100 basis points. Calculation is based on the weighted average of the present values for all cash flows. |
| vii | The yield curve is the graphical depiction of the relationship between the yield on bonds of the same credit quality but different maturities. |
| viii | The Barclays Capital U.S. Aggregate Index is a broad-based bond index comprised of government, corporate, mortgage- and asset-backed issues, rated investment grade or higher, and having at least one year to maturity. |
| ix | The Barclays Capital Intermediate U.S. Government/Credit Index is a market value weighted performance benchmark for government and corporate fixed-rate debt issues (rated Baa/BBB or higher) with maturities between one and ten years. |
| | |
| Western Asset Intermediate Bond Portfolio 2010 Semi-Annual Report | | 1 |
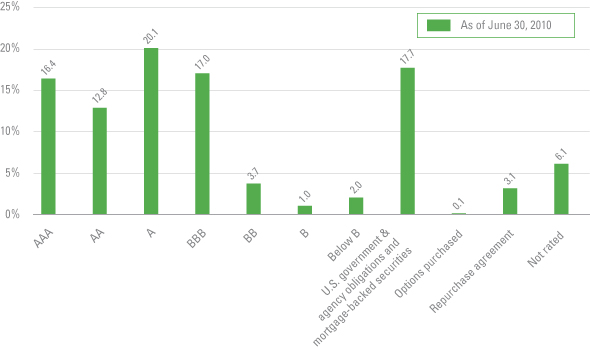
Fund at a glance† (unaudited)
Standard & Poor’s Debt Ratings1 (%) as a percent of total investments
Maturity Schedule (%) as a percent of total investments
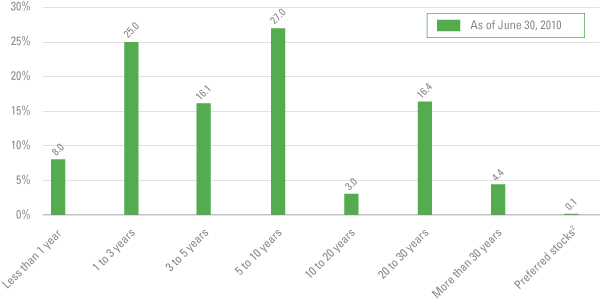
| † | The bar graphs above represent the composition of the Fund’s investments as of June 30, 2010 and do not include derivatives such as Futures Contracts, Options Written and Swaps. The Fund is actively managed. As a result, the composition of the Fund’s investments is subject to change at any time. |
| 1 | Source: Standard & Poor’s Rating Service. The ratings shown are based on each portfolio security’s rating as determined by Standard & Poor’s (“S&P”), a Nationally Recognized Statistical Ratings Organization (“NRSRO”). These ratings are the opinions of S&P and are not measures of quality or guarantees of performance. Securities held by the Fund may be rated by other NRSROs, and these ratings may be higher or lower. The Fund itself has not been rated by a NRSRO and the credit quality of the investments in the Fund’s portfolio does not apply to the stability or safety of the Fund. |
| 2 | Preferred stocks do not have defined maturity dates. |
| | |
| 2 | | Western Asset Intermediate Bond Portfolio 2010 Semi-Annual Report |
Fund expenses (unaudited)
Example
As a shareholder of the Fund, you may incur two types of costs: (1) transaction costs and (2) ongoing costs, including management fees; distribution and/or service (12b-1) fees; and other Fund expenses. This example is intended to help you understand your ongoing costs (in dollars) of investing in the Fund and to compare these costs with the ongoing costs of investing in other mutual funds.
This example is based on an investment of $1,000 invested on January 1, 2010 and held for the six months ended June 30, 2010.
Actual expenses
The table below titled “Based on Actual Total Return” provides information about actual account values and actual expenses. You may use the information provided in this table, together with the amount you invested, to estimate the expenses that you paid over the period. To estimate the expenses you paid on your account, divide your ending account value by $1,000 (for example, an $8,600 ending account value divided by $1,000 = 8.6), then multiply the result by the number under the heading entitled “Expenses Paid During the Period”.
| | | | | | | | | | | | | | | |
| Based on actual total return1 |
| | | Actual Total
Return2 | | | Beginning
Account
Value | | Ending
Account
Value | | Annualized
Expense
Ratio | | | Expenses
Paid
During
the
Period3 |
| Class IS4 | | 5.40 | % | | $ | 1,000.00 | | $ | 1,054.00 | | 0.45 | % | | $ | 2.29 |
| Class I4 | | 5.39 | | | | 1,000.00 | | | 1.053.90 | | 0.47 | | | | 2.39 |
Hypothetical example for comparison purposes
The table below titled “Based on Hypothetical Total Return” provides information about hypothetical account values and hypothetical expenses based on the actual expense ratio and an assumed rate of return of 5.00% per year before expenses, which is not the Fund’s actual return. The hypothetical account values and expenses may not be used to estimate the actual ending account balance or expenses you paid for the period. You may use the information provided in this table to compare the ongoing costs of investing in the Fund and other funds. To do so, compare the 5.00% hypothetical example relating to the Fund with the 5.00% hypothetical examples that appear in the shareholder reports of the other funds.
Please note that the expenses shown in the table below are meant to highlight your ongoing costs only and do not reflect any transactional costs, such as front-end or back-end sales charges (loads). Therefore, the table is useful in comparing ongoing costs only, and will not help you determine the relative total costs of owning different funds. In addition, if these transaction costs were included, your costs would have been higher.
| | | | | | | | | | | | | | | |
| Based on hypothetical total return1 |
| | | Hypothetical
Annualized
Total Return | | | Beginning
Account
Value | | Ending
Account
Value | | Annualized
Expense
Ratio | | | Expenses
Paid
During
the
Period3 |
| Class IS4 | | 5.00 | % | | $ | 1,000.00 | | $ | 1,022.56 | | 0.45 | % | | $ | 2.26 |
| Class I4 | | 5.00 | | | | 1,000.00 | | | 1,022.46 | | 0.47 | | | | 2.36 |
| 1 | For the six months ended June 30, 2010. |
| 2 | Assumes the reinvestment of all distributions, including returns of capital, if any, at net asset value. Total return is not annualized, as it may not be representative of the total return for the year. Performance figures may reflect compensating balance arrangements and/or expense reimbursements. In the absence of compensating balance arrangements and/or expense reimbursements, the total return would have been lower. Past performance is no guarantee of future results. |
| 3 | Expenses (net of compensating balance arrangements and/or expense reimbursements) are equal to each class’ respective annualized expense ratio multiplied by the average account value over the period, multiplied by the number of days in the most recent fiscal half-year (181), then divided by 365. |
| 4 | In April 2010, Institutional Select Class and Institutional Class shares were renamed Class IS and Class I shares respectively. |
| | |
| Western Asset Intermediate Bond Portfolio 2010 Semi-Annual Report | | 3 |
Spread duration (unaudited)
Economic exposure — June 30, 2010
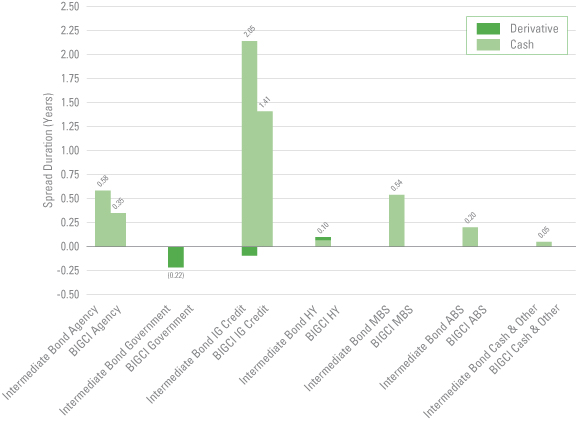
Spread duration is defined as the change in value for a 100 basis point change in the spread relative to Treasuries. The spread over Treasuries is the annual risk-premium demanded by investors to hold non-Treasury securities. This chart highlights the market sector exposure of the Fund’s portfolio and the exposure relative to the selected benchmark as of the end of the reporting period.
| | |
| ABS | | —Asset Backed Securities |
| BIGCI | | —Barclays Capital Intermediate U.S. Government/Credit Index |
| HY | | —High Yield |
| IG Credit | | —Investment Grade Credit |
| MBS | | —Mortgage Backed Securities |
| | |
| 4 | | Western Asset Intermediate Bond Portfolio 2010 Semi-Annual Report |
Effective duration (unaudited)
Interest rate exposure — June 30, 2010
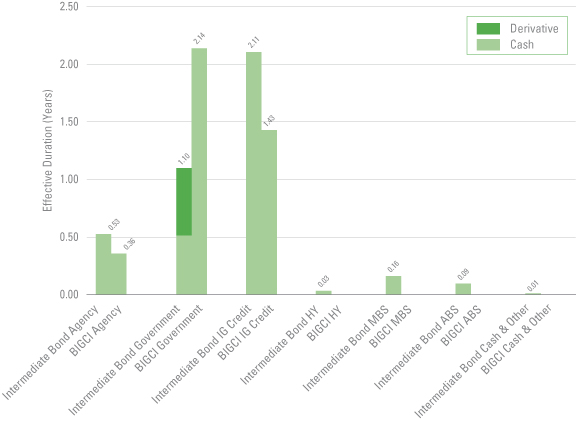
Effective duration is defined as the change in value for a 100 basis point change in Treasury yields. This chart highlights the interest rate exposure of the Fund’s portfolio relative to the selected benchmark as of the end of the reporting period.
| | |
| ABS | | —Asset Backed Securities |
| BIGCI | | —Barclays Capital Intermediate U.S. Government/Credit Index |
| HY | | —High Yield |
| IG Credit | | —Investment Grade Credit |
| MBS | | —Mortgage Backed Securities |
| | |
| Western Asset Intermediate Bond Portfolio 2010 Semi-Annual Report | | 5 |
Schedule of investments (unaudited)
June 30, 2010
Western Asset Intermediate Bond Portfolio
| | | | | | | | | | | | |
| Security | | Rate | | | Maturity
Date | | Face
Amount | | Value | |
| Corporate Bonds & Notes — 60.4% | | | | | | | | | | | | |
| Consumer Discretionary — 2.9% | | | | | | | | | | | | |
Automobiles — 0.1% | | | | | | | | | | | | |
Motors Liquidation Co., Senior Debentures | | 8.375 | % | | 7/15/33 | | $ | 1,178,000 | | $ | 376,960 | (a) |
Media — 2.0% | | | | | | | | | | | | |
Comcast Corp., Senior Notes | | 6.500 | % | | 1/15/17 | | | 1,190,000 | | | 1,363,547 | |
Comcast Corp., Senior Notes | | 5.150 | % | | 3/1/20 | | | 500,000 | | | 523,474 | |
Omnicom Group Inc., Senior Notes | | 5.900 | % | | 4/15/16 | | | 630,000 | | | 716,171 | |
Reed Elsevier Capital Inc. | | 7.750 | % | | 1/15/14 | | | 580,000 | | | 670,999 | |
Time Warner Cable Inc., Senior Notes | | 6.200 | % | | 7/1/13 | | | 40,000 | | | 44,738 | |
Time Warner Cable Inc., Senior Notes | | 8.250 | % | | 2/14/14 | | | 2,140,000 | | | 2,529,578 | |
Time Warner Inc., Senior Subordinated Notes | | 6.875 | % | | 5/1/12 | | | 1,248,000 | | | 1,359,626 | |
WPP Finance UK, Senior Notes | | 8.000 | % | | 9/15/14 | | | 890,000 | | | 1,043,489 | |
Total Media | | | | | | | | | | | 8,251,622 | |
Multiline Retail — 0.8% | | | | | | | | | | | | |
JC Penney Corp. Inc. | | 5.750 | % | | 2/15/18 | | | 610,000 | | | 611,525 | |
Macy’s Retail Holdings Inc. | | 5.350 | % | | 3/15/12 | | | 1,050,000 | | | 1,073,625 | |
Macy’s Retail Holdings Inc., Notes | | 5.750 | % | | 7/15/14 | | | 1,470,000 | | | 1,477,350 | |
Total Multiline Retail | | | | | | | | | | | 3,162,500 | |
Total Consumer Discretionary | | | | | | | | | | | 11,791,082 | |
| Consumer Staples — 2.9% | | | | | | | | | | | | |
Beverages — 1.0% | | | | | | | | | | | | |
Anheuser-Busch InBev Worldwide Inc., Senior Notes | | 5.375 | % | | 1/15/20 | | | 1,200,000 | | | 1,293,112 | |
Anheuser-Busch InBev Worldwide Inc., Senior Notes | | 5.000 | % | | 4/15/20 | | | 130,000 | | | 135,919 | (b) |
Bottling Group LLC | | 6.950 | % | | 3/15/14 | | | 1,310,000 | | | 1,546,048 | |
Diageo Capital PLC, Senior Bonds | | 4.828 | % | | 7/15/20 | | | 1,050,000 | | | 1,113,777 | |
Total Beverages | | | | | | | | | | | 4,088,856 | |
Food & Staples Retailing — 0.6% | | | | | | | | | | | | |
Kroger Co., Notes | | 3.900 | % | | 10/1/15 | | | 865,000 | | | 912,467 | |
Wal-Mart Stores Inc. | | 4.250 | % | | 4/15/13 | | | 930,000 | | | 1,000,457 | |
Walgreen Co., Senior Notes | | 5.250 | % | | 1/15/19 | | | 540,000 | | | 612,536 | |
Total Food & Staples Retailing | | | | | | | | | | | 2,525,460 | |
Food Products — 0.4% | | | | | | | | | | | | |
Kraft Foods Inc., Senior Notes | | 5.375 | % | | 2/10/20 | | | 1,440,000 | | | 1,543,033 | |
Tobacco — 0.9% | | | | | | | | | | | | |
Altria Group Inc., Senior Notes | | 8.500 | % | | 11/10/13 | | | 400,000 | | | 466,939 | |
Altria Group Inc., Senior Notes | | 9.250 | % | | 8/6/19 | | | 660,000 | | | 823,750 | |
Philip Morris International Inc. | | 5.650 | % | | 5/16/18 | | | 970,000 | | | 1,061,105 | |
Reynolds American Inc., Senior Notes | | 7.250 | % | | 6/1/13 | | | 1,160,000 | | | 1,276,130 | |
Total Tobacco | | | | | | | | | | | 3,627,924 | |
Total Consumer Staples | | | | | | | | | | | 11,785,273 | |
| Energy — 6.4% | | | | | | | | | | | | |
Energy Equipment & Services — 1.2% | | | | | | | | | | | | |
Baker Hughes Inc., Senior Notes | | 7.500 | % | | 11/15/18 | | | 720,000 | | | 880,282 | |
Sonat Inc., Notes | | 7.625 | % | | 7/15/11 | | | 2,454,000 | | | 2,531,483 | |
Transocean Inc., Senior Notes | | 5.250 | % | | 3/15/13 | | | 1,670,000 | | | 1,570,952 | |
Total Energy Equipment & Services | | | | | | | | | | | 4,982,717 | |
See Notes to Financial Statements.
| | |
| 6 | | Western Asset Intermediate Bond Portfolio 2010 Semi-Annual Report |
Schedule of investments (unaudited) (cont’d)
June 30, 2010
Western Asset Intermediate Bond Portfolio
| | | | | | | | | | | | |
| Security | | Rate | | | Maturity
Date | | Face
Amount | | Value | |
Oil, Gas & Consumable Fuels — 5.2% | | | | | | | | | | | | |
Anadarko Petroleum Corp., Senior Notes | | 5.950 | % | | 9/15/16 | | $ | 2,200,000 | | $ | 1,893,533 | |
BP Capital Markets PLC, Guaranteed Notes | | 5.250 | % | | 11/7/13 | | | 940,000 | | | 864,101 | |
BP Capital Markets PLC, Senior Notes | | 3.125 | % | | 3/10/12 | | | 150,000 | | | 138,678 | |
ConocoPhillips | | 5.200 | % | | 5/15/18 | | | 1,910,000 | | | 2,115,980 | |
Devon Energy Corp. | | 6.300 | % | | 1/15/19 | | | 1,170,000 | | | 1,355,427 | |
Enbridge Energy Partners LP | | 9.875 | % | | 3/1/19 | | | 590,000 | | | 775,179 | |
Energy Transfer Partners LP, Senior Notes | | 9.700 | % | | 3/15/19 | | | 800,000 | | | 966,605 | |
Energy Transfer Partners LP, Senior Notes | | 9.000 | % | | 4/15/19 | | | 500,000 | | | 588,013 | |
Enterprise Products Operating LLP, Senior Bonds | | 6.300 | % | | 9/15/17 | | | 1,500,000 | | | 1,677,936 | |
Gazprom, Loan Participation Notes | | 6.212 | % | | 11/22/16 | | | 120,000 | | | 121,056 | (b) |
Kinder Morgan Energy Partners LP, Senior Notes | | 6.000 | % | | 2/1/17 | | | 1,710,000 | | | 1,862,753 | |
Noble Energy Inc., Senior Notes | | 8.250 | % | | 3/1/19 | | | 340,000 | | | 411,487 | |
Pemex Project Funding Master Trust | | 5.750 | % | | 3/1/18 | | | 190,000 | | | 199,041 | |
Petrobras International Finance Co., Senior Notes | | 5.750 | % | | 1/20/20 | | | 1,233,000 | | | 1,241,690 | |
Petroleos Mexicanos, Notes | | 8.000 | % | | 5/3/19 | | | 1,720,000 | | | 2,046,800 | |
Shell International Finance BV, Senior Notes | | 4.375 | % | | 3/25/20 | | | 1,320,000 | | | 1,364,524 | |
Williams Cos. Inc., Notes | | 7.875 | % | | 9/1/21 | | | 533,000 | | | 610,867 | |
Williams Partners LP, Senior Notes | | 5.250 | % | | 3/15/20 | | | 460,000 | | | 470,381 | (b) |
XTO Energy Inc., Senior Notes | | 7.500 | % | | 4/15/12 | | | 859,000 | | | 956,450 | |
XTO Energy Inc., Senior Notes | | 6.250 | % | | 4/15/13 | | | 1,645,000 | | | 1,856,817 | |
Total Oil, Gas & Consumable Fuels | | | | | | | | | | | 21,517,318 | |
Total Energy | | | | | | | | | | | 26,500,035 | |
| Financials — 32.7% | | | | | | | | | | | | |
Capital Markets — 4.3% | | | | | | | | | | | | |
Bear Stearns Co. Inc., Senior Notes | | 6.400 | % | | 10/2/17 | | | 710,000 | | | 788,629 | |
Bear Stearns Cos. LLC, Senior Notes | | 7.250 | % | | 2/1/18 | | | 1,110,000 | | | 1,296,147 | |
Goldman Sachs Capital II, Junior Subordinated Bonds | | 5.793 | % | | 6/1/12 | | | 3,380,000 | | | 2,551,900 | (c)(d) |
Goldman Sachs Capital III, Preferred Securities | | 1.308 | % | | 9/1/12 | | | 2,590,000 | | | 1,502,200 | (c)(d) |
Goldman Sachs Group Inc., Notes | | 6.600 | % | | 1/15/12 | | | 100,000 | | | 105,764 | |
Goldman Sachs Group Inc., Notes | | 5.450 | % | | 11/1/12 | | | 40,000 | | | 42,138 | |
Goldman Sachs Group Inc., Notes | | 5.250 | % | | 10/15/13 | | | 210,000 | | | 221,363 | |
Goldman Sachs Group Inc., Senior Notes | | 5.300 | % | | 2/14/12 | | | 40,000 | | | 41,633 | |
Goldman Sachs Group Inc., Senior Notes | | 5.250 | % | | 4/1/13 | | | 950,000 | | | 999,852 | |
Goldman Sachs Group Inc., Senior Notes | | 6.000 | % | | 5/1/14 | | | 70,000 | | | 75,226 | |
Goldman Sachs Group Inc., Senior Notes | | 5.375 | % | | 3/15/20 | | | 420,000 | | | 415,009 | |
Kaupthing Bank HF, Senior Notes | | 5.750 | % | | 10/4/11 | | | 4,090,000 | | | 981,600 | (a)(b)(e) |
Kaupthing Bank HF, Senior Notes | | 7.625 | % | | 2/28/15 | | | 1,590,000 | | | 381,600 | (a)(b)(e) |
Lehman Brothers Holdings Capital Trust VII, Medium-Term Notes | | 5.857 | % | | 5/31/12 | | | 6,200,000 | | | 620 | (a)(c)(d) |
Lehman Brothers Holdings E-Capital Trust I, Notes | | 3.850 | % | | 8/19/65 | | | 360,000 | | | 36 | (a)(c) |
Lehman Brothers Holdings Inc., Medium-Term Notes | | 5.625 | % | | 1/24/13 | | | 600,000 | | | 121,500 | (a) |
Lehman Brothers Holdings Inc., Subordinated Notes | | 6.500 | % | | 7/19/17 | | | 30,000 | | | 15 | (a) |
Merrill Lynch & Co. Inc., Subordinated Notes | | 5.700 | % | | 5/2/17 | | | 1,500,000 | | | 1,504,533 | |
Morgan Stanley | | 5.550 | % | | 4/27/17 | | | 1,180,000 | | | 1,170,411 | |
Morgan Stanley | | 7.300 | % | | 5/13/19 | | | 2,100,000 | | | 2,258,380 | |
UBS AG Stamford CT, Senior Notes | | 3.875 | % | | 1/15/15 | | | 3,190,000 | | | 3,174,210 | |
Total Capital Markets | | | | | | | | | | | 17,632,766 | |
See Notes to Financial Statements.
| | |
| Western Asset Intermediate Bond Portfolio 2010 Semi-Annual Report | | 7 |
Western Asset Intermediate Bond Portfolio
| | | | | | | | | | | | |
| Security | | Rate | | | Maturity
Date | | Face
Amount | | Value | |
Commercial Banks — 11.6% | | | | | | | | | | | | |
Achmea Hypotheekbank NV | | 3.200 | % | | 11/3/14 | | $ | 3,690,000 | | $ | 3,812,349 | (b) |
ANZ National International Ltd., Senior Notes | | 2.375 | % | | 12/21/12 | | | 1,590,000 | | | 1,610,501 | (b) |
BAC Capital Trust XIV, Junior Subordinated Notes | | 5.630 | % | | 3/15/12 | | | 50,000 | | | 33,750 | (c)(d) |
Bank of Ireland Governor & Co., Senior Notes | | 2.750 | % | | 3/2/12 | | | 2,690,000 | | | 2,669,669 | (b) |
Bank of Montreal, Secured Bonds | | 2.850 | % | | 6/9/15 | | | 1,070,000 | | | 1,087,489 | (b) |
Bank of Tokyo-Mitsubishi UFJ Ltd., Senior Notes | | 2.600 | % | | 1/22/13 | | | 380,000 | | | 386,214 | (b) |
Bank of Tokyo-Mitsubishi UFJ Ltd., Senior Notes | | 3.850 | % | | 1/22/15 | | | 720,000 | | | 749,075 | (b) |
Barclays Bank PLC, Junior Subordinated Bonds | | 7.434 | % | | 12/15/17 | | | 390,000 | | | 347,100 | (b)(c)(d) |
Barclays Bank PLC, Senior Notes | | 5.200 | % | | 7/10/14 | | | 310,000 | | | 327,159 | |
Barclays Bank PLC, Subordinated Notes | | 6.050 | % | | 12/4/17 | | | 960,000 | | | 968,874 | (b) |
Barclays Bank PLC, Subordinated Notes | | 10.179 | % | | 6/12/21 | | | 720,000 | | | 901,685 | (b) |
BB&T Corp., Senior Notes | | 3.850 | % | | 7/27/12 | | | 750,000 | | | 781,861 | |
BNP Paribas, Senior Notes | | 2.125 | % | | 12/21/12 | | | 700,000 | | | 698,100 | |
Cie de Financement Foncier, Secured Bonds | | 2.125 | % | | 4/22/13 | | | 2,000,000 | | | 2,019,362 | (b) |
Commonwealth Bank of Australia, Senior Notes | | 2.900 | % | | 9/17/14 | | | 4,630,000 | | | 4,720,327 | (b) |
Commonwealth Bank of Australia, Senior Notes | | 3.750 | % | | 10/15/14 | | | 650,000 | | | 668,216 | (b) |
Credit Agricole SA, Subordinated Notes | | 8.375 | % | | 10/13/19 | | | 1,350,000 | | | 1,275,750 | (b)(c)(d) |
Dexia Credit Local NY, Senior Notes | | 2.000 | % | | 3/5/13 | | | 4,910,000 | | | 4,907,285 | (b) |
Glitnir Banki HF | | 6.329 | % | | 7/28/11 | | | 120,000 | | | 31,200 | (a)(b)(c)(e) |
Glitnir Banki HF, Notes | | 5.815 | % | | 1/21/11 | | | 4,430,000 | | | 1,151,800 | (a)(b)(c)(e) |
Glitnir Banki HF, Notes | | 6.375 | % | | 9/25/12 | | | 1,980,000 | | | 514,800 | (a)(b)(e) |
Glitnir Banki HF, Senior Notes | | 5.678 | % | | 1/18/12 | | | 100,000 | | | 26,000 | (a)(b)(c)(e) |
Glitnir Banki HF, Subordinated Notes | | 6.693 | % | | 6/15/16 | | | 910,000 | | | 1,138 | (a)(b)(e) |
Landsbanki Islands HF | | 7.431 | % | | 10/19/17 | | | 1,830,000 | | | 2,288 | (a)(b)(d)(e) |
Landsbanki Islands HF, Senior Notes | | 6.100 | % | | 8/25/11 | | | 2,330,000 | | | 262,125 | (a)(b)(e) |
Lloyds TSB Bank PLC, Notes | | 5.800 | % | | 1/13/20 | | | 1,210,000 | | | 1,142,113 | (b) |
Nordea Bank AB, Senior Notes | | 3.700 | % | | 11/13/14 | | | 900,000 | | | 916,837 | (b) |
Nordea Bank AB, Senior Notes | | 4.875 | % | | 1/27/20 | | | 690,000 | | | 708,660 | (b) |
Rabobank Nederland NV, Junior Subordinated Notes | | 11.000 | % | | 6/30/19 | | | 745,000 | | | 920,075 | (b)(c)(d) |
Royal Bank of Scotland Group PLC, Senior Notes | | 6.400 | % | | 10/21/19 | | | 1,170,000 | | | 1,185,955 | |
RSHB Capital, Loan Participation Notes, Senior Secured Bonds | | 6.299 | % | | 5/15/17 | | | 270,000 | | | 267,975 | (b) |
Santander Issuances SA Unipersonal, Subordinated Notes | | 5.805 | % | | 6/20/16 | | | 1,030,000 | | | 997,373 | (b)(c) |
Shinsei Finance Cayman Ltd., Junior Subordinated Bonds | | 6.418 | % | | 7/20/16 | | | 1,075,000 | | | 691,091 | (b)(c)(d) |
SunTrust Capital, Trust Preferred Securities | | 6.100 | % | | 12/1/66 | | | 550,000 | | | 418,688 | (c) |
Swedbank AB | | 0.750 | % | | 1/14/13 | | | 2,400,000 | | | 2,392,699 | (b)(c) |
U.S. Bancorp | | 4.200 | % | | 5/15/14 | | | 1,050,000 | | | 1,123,173 | |
Wachovia Capital Trust III, Junior Subordinated Bonds | | 5.800 | % | | 3/15/11 | | | 708,000 | | | 562,860 | (c)(d) |
Wachovia Corp., Subordinated Notes | | 0.678 | % | | 10/28/15 | | | 1,170,000 | | | 1,047,441 | (c) |
Wells Fargo & Co., Senior Notes | | 3.750 | % | | 10/1/14 | | | 2,720,000 | | | 2,784,818 | |
Wells Fargo Capital X, Capital Securities | | 5.950 | % | | 12/1/86 | | | 790,000 | | | 700,660 | |
Westpac Banking Corp., Notes | | 3.250 | % | | 12/16/11 | | | 600,000 | | | 617,154 | (b) |
Westpac Banking Corp., Senior Notes | | 2.900 | % | | 9/10/14 | | | 1,010,000 | | | 1,035,004 | (b) |
Total Commercial Banks | | | | | | | | | | | 47,466,693 | |
See Notes to Financial Statements.
| | |
| 8 | | Western Asset Intermediate Bond Portfolio 2010 Semi-Annual Report |
Schedule of investments (unaudited) (cont’d)
June 30, 2010
Western Asset Intermediate Bond Portfolio
| | | | | | | | | | | | |
| Security | | Rate | | | Maturity
Date | | Face
Amount | | Value | |
Consumer Finance — 4.0% | | | | | | | | | | | | |
Aiful Corp., Notes | | 5.000 | % | | 8/10/10 | | $ | 551,000 | | $ | 533,093 | (b) |
American Express Co., Senior Notes | | 8.125 | % | | 5/20/19 | | | 120,000 | | | 148,991 | |
American Express Credit Corp., Senior Notes | | 5.125 | % | | 8/25/14 | | | 2,010,000 | | | 2,162,501 | |
American Honda Finance Corp., Senior Notes | | 3.500 | % | | 3/16/15 | | | 1,020,000 | | | 1,040,253 | (b) |
Caterpillar Financial Services Corp., Notes | | 1.900 | % | | 12/17/12 | | | 1,370,000 | | | 1,387,147 | |
FIA Credit Services N.A., Subordinated Notes | | 7.125 | % | | 11/15/12 | | | 1,330,000 | | | 1,448,190 | |
GMAC Inc., Notes | | 2.200 | % | | 12/19/12 | | | 5,160,000 | | | 5,301,910 | |
GMAC Inc., Senior Notes | | 7.500 | % | | 12/31/13 | | | 390,000 | | | 389,025 | |
GMAC Inc., Senior Notes | | 6.750 | % | | 12/1/14 | | | 955,000 | | | 923,963 | |
GMAC Inc., Subordinated Notes | | 8.000 | % | | 12/31/18 | | | 325,000 | | | 299,000 | |
SLM Corp., Medium-Term Notes, Senior Notes | | 8.450 | % | | 6/15/18 | | | 3,000,000 | | | 2,768,433 | |
Total Consumer Finance | | | | | | | | | | | 16,402,506 | |
Diversified Financial Services — 8.6% | | | | | | | | | | | | |
Bank of America Corp., Senior Notes | | 4.500 | % | | 4/1/15 | | | 290,000 | | | 293,109 | |
Bank of America Corp., Senior Notes | | 7.625 | % | | 6/1/19 | | | 760,000 | | | 870,586 | |
CDP Financial Inc. | | 4.400 | % | | 11/25/19 | | | 890,000 | | | 913,878 | (b) |
Citigroup Funding Inc., Notes | | 2.250 | % | | 12/10/12 | | | 6,850,000 | | | 7,051,411 | |
Citigroup Inc., Notes | | 6.000 | % | | 12/13/13 | | | 1,100,000 | | | 1,154,024 | |
Citigroup Inc., Senior Notes | | 6.375 | % | | 8/12/14 | | | 730,000 | | | 775,372 | |
Citigroup Inc., Senior Notes | | 5.500 | % | | 10/15/14 | | | 470,000 | | | 483,214 | |
Citigroup Inc., Senior Notes | | 6.010 | % | | 1/15/15 | | | 110,000 | | | 115,377 | |
Citigroup Inc., Senior Notes | | 8.500 | % | | 5/22/19 | | | 3,750,000 | | | 4,470,465 | |
FDIC Structured Sale Guaranteed Notes, Notes | | 0.000 | % | | 10/25/13 | | | 1,400,000 | | | 1,315,594 | (b) |
General Electric Capital Corp., Senior Notes | | 5.900 | % | | 5/13/14 | | | 2,000,000 | | | 2,207,632 | |
General Electric Capital Corp., Senior Notes | | 5.625 | % | | 5/1/18 | | | 1,020,000 | | | 1,083,968 | |
General Electric Capital Corp., Senior Notes | | 6.000 | % | | 8/7/19 | | | 220,000 | | | 238,166 | |
General Electric Capital Corp., Subordinated Debentures | | 6.375 | % | | 11/15/67 | | | 1,875,000 | | | 1,743,750 | (c) |
ILFC E-Capital Trust I | | 5.900 | % | | 12/21/65 | | | 250,000 | | | 160,313 | (b)(c) |
JPMorgan Chase Capital XXII | | 6.450 | % | | 2/2/37 | | | 1,590,000 | | | 1,500,839 | |
Merna Reinsurance Ltd., Subordinated Notes | | 2.040 | % | | 6/30/12 | | | 1,300,000 | | | 1,299,740 | (b)(c) |
MUFG Capital Finance 1 Ltd., Preferred Securities | | 6.346 | % | | 7/25/16 | | | 1,872,000 | | | 1,811,141 | (c)(d) |
Private Export Funding Corp. | | 3.550 | % | | 4/15/13 | | | 1,640,000 | | | 1,746,011 | |
TNK-BP Finance SA | | 6.875 | % | | 7/18/11 | | | 703,000 | | | 723,246 | (b) |
TNK-BP Finance SA, Notes | | 6.125 | % | | 3/20/12 | | | 210,000 | | | 214,200 | (b) |
Westpac Securities NZ Ltd., Senior Notes | | 2.500 | % | | 5/25/12 | | | 1,710,000 | | | 1,749,125 | (b) |
ZFS Finance USA Trust I | | 1.687 | % | | 12/15/65 | | | 1,570,000 | | | 1,416,925 | (b)(c) |
ZFS Finance USA Trust II, Bonds | | 6.450 | % | | 12/15/65 | | | 2,060,000 | | | 1,843,700 | (b)(c) |
Total Diversified Financial Services | | | | | | | | | | | 35,181,786 | |
Insurance — 3.3% | | | | | | | | | | | | |
Allstate Life Global Funding Trust | | 5.375 | % | | 4/30/13 | | | 1,210,000 | | | 1,326,729 | |
American International Group Inc., Medium-Term Notes, Senior Notes | | 5.850 | % | | 1/16/18 | | | 250,000 | | | 223,437 | |
American International Group Inc., Senior Notes | | 8.250 | % | | 8/15/18 | | | 500,000 | | | 506,250 | |
Berkshire Hathaway Inc., Senior Notes | | 3.200 | % | | 2/11/15 | | | 2,080,000 | | | 2,142,007 | |
MetLife Capital Trust IV, Junior Subordinated Notes | | 7.875 | % | | 12/15/67 | | | 1,130,000 | | | 1,084,800 | (b) |
MetLife Inc., Junior Subordinated Debentures | | 6.400 | % | | 12/15/66 | | | 70,000 | | | 61,600 | |
Metropolitan Life Global Funding I, Notes | | 2.875 | % | | 9/17/12 | | | 1,460,000 | | | 1,494,688 | (b) |
See Notes to Financial Statements.
| | |
| Western Asset Intermediate Bond Portfolio 2010 Semi-Annual Report | | 9 |
Western Asset Intermediate Bond Portfolio
| | | | | | | | | | | | |
| Security | | Rate | | | Maturity
Date | | Face
Amount | | Value | |
Insurance — continued | | | | | | | | | | | | |
Prudential Financial Inc., Senior Notes | | 2.750 | % | | 1/14/13 | | $ | 1,820,000 | | $ | 1,828,889 | |
Suncorp-Metway Ltd., Senior Notes | | 1.803 | % | | 7/16/12 | | | 2,350,000 | | | 2,413,906 | (b)(c) |
Teachers Insurance & Annuity Association of America — College Retirement Equity Fund, Notes | | 6.850 | % | | 12/16/39 | | | 330,000 | | | 384,366 | (b) |
Travelers Cos. Inc., Junior Subordinated Debentures | | 6.250 | % | | 3/15/67 | | | 2,370,000 | | | 2,223,939 | (c) |
Total Insurance | | | | | | | | | | | 13,690,611 | |
Thrifts & Mortgage Finance — 0.9% | | | | | | | | | | | | |
Countrywide Financial Corp., Medium-Term Notes | | 5.800 | % | | 6/7/12 | | | 2,820,000 | | | 2,965,354 | |
Countrywide Financial Corp., Subordinated Notes | | 6.250 | % | | 5/15/16 | | | 810,000 | | | 844,419 | |
Total Thrifts & Mortgage Finance | | | | | | | | | | | 3,809,773 | |
Total Financials | | | | | | | | | | | 134,184,135 | |
| Health Care — 2.6% | | | | | | | | | | | | |
Health Care Equipment & Supplies — 0.7% | | | | | | | | | | | | |
Baxter International Inc., Senior Notes | | 5.900 | % | | 9/1/16 | | | 500,000 | | | 586,652 | |
Hospira Inc., Senior Notes | | 5.550 | % | | 3/30/12 | | | 1,700,000 | | | 1,810,075 | |
Medtronic Inc., Senior Notes | | 4.450 | % | | 3/15/20 | | | 390,000 | | | 415,586 | |
Total Health Care Equipment & Supplies | | | | | | | | | | | 2,812,313 | |
Health Care Providers & Services — 0.7% | | | | | | | | | | | | |
HCA Inc., Notes | | 8.750 | % | | 9/1/10 | | | 822,000 | | | 827,138 | |
Universal Health Services Inc. | | 6.750 | % | | 11/15/11 | | | 1,720,000 | | | 1,824,113 | |
WellPoint Inc., Notes | | 5.875 | % | | 6/15/17 | | | 100,000 | | | 111,406 | |
Total Health Care Providers & Services | | | | | | | | | | | 2,762,657 | |
Pharmaceuticals — 1.2% | | | | | | | | | | | | |
Abbott Laboratories, Senior Notes | | 5.125 | % | | 4/1/19 | | | 1,270,000 | | | 1,417,027 | |
GlaxoSmithKline Capital Inc., Senior Bonds | | 5.650 | % | | 5/15/18 | | | 1,260,000 | | | 1,441,785 | |
Pfizer Inc., Senior Notes | | 6.200 | % | | 3/15/19 | | | 1,190,000 | | | 1,414,194 | |
Roche Holdings Inc., Senior Notes | | 6.000 | % | | 3/1/19 | | | 650,000 | | | 757,180 | (b) |
Total Pharmaceuticals | | | | | | | | | | | 5,030,186 | |
Total Health Care | | | | | | | | | | | 10,605,156 | |
| Industrials — 2.7% | | | | | | | | | | | | |
Aerospace & Defense — 0.6% | | | | | | | | | | | | |
Boeing Co., Senior Notes | | 6.000 | % | | 3/15/19 | | | 1,250,000 | | | 1,472,120 | |
Systems 2001 Asset Trust | | 6.664 | % | | 9/15/13 | | | 757,301 | | | 802,739 | (b) |
Total Aerospace & Defense | | | | | | | | | | | 2,274,859 | |
Airlines — 0.4% | | | | | | | | | | | | |
Continental Airlines Inc., Pass-Through Certificates | | 6.545 | % | | 2/2/19 | | | 615,339 | | | 618,416 | |
US Airways Pass-Through Trust | | 6.850 | % | | 1/30/18 | | | 1,235,978 | | | 1,137,100 | |
Total Airlines | | | | | | | | | | | 1,755,516 | |
Commercial Services & Supplies — 0.3% | | | | | | | | | | | | |
Allied Waste North America Inc., Senior Notes | | 7.125 | % | | 5/15/16 | | | 1,230,000 | | | 1,319,175 | |
Industrial Conglomerates — 0.8% | | | | | | | | | | | | |
Tyco International Group SA, Notes | | 6.000 | % | | 11/15/13 | | | 1,358,000 | | | 1,520,012 | |
United Technologies Corp., Senior Notes | | 4.500 | % | | 4/15/20 | | | 1,430,000 | | | 1,547,113 | |
Total Industrial Conglomerates | | | | | | | | | | | 3,067,125 | |
See Notes to Financial Statements.
| | |
| 10 | | Western Asset Intermediate Bond Portfolio 2010 Semi-Annual Report |
Schedule of investments (unaudited) (cont’d)
June 30, 2010
Western Asset Intermediate Bond Portfolio
| | | | | | | | | | | | |
| Security | | Rate | | | Maturity
Date | | Face
Amount | | Value | |
Road & Rail — 0.6% | | | | | | | | | | | | |
Canadian National Railway Co. Financing Pass-Through Trusts,
Secured Bonds | | 7.195 | % | | 1/2/16 | | $ | 2,152,155 | | $ | 2,566,746 | |
Total Industrials | | | | | | | | | | | 10,983,421 | |
| Materials — 2.6% | | | | | | | | | | | | |
Chemicals — 0.8% | | | | | | | | | | | | |
Dow Chemical Co. | | 6.000 | % | | 10/1/12 | | | 1,770,000 | | | 1,903,187 | |
Lubrizol Corp., Senior Notes | | 8.875 | % | | 2/1/19 | | | 1,130,000 | | | 1,414,154 | |
Total Chemicals | | | | | | | | | | | 3,317,341 | |
Metals & Mining — 1.3% | | | | | | | | | | | | |
Alcoa Inc., Notes | | 6.000 | % | | 7/15/13 | | | 70,000 | | | 73,723 | |
BHP Billiton Finance USA Ltd., Senior Notes | | 6.500 | % | | 4/1/19 | | | 1,000,000 | | | 1,199,246 | |
Rio Tinto Finance USA Ltd. | | 8.950 | % | | 5/1/14 | | | 2,210,000 | | | 2,680,589 | |
Vale Overseas Ltd., Notes | | 6.250 | % | | 1/23/17 | | | 1,390,000 | | | 1,514,013 | |
Total Metals & Mining | | | | | | | | | | | 5,467,571 | |
Paper & Forest Products — 0.5% | | | | | | | | | | | | |
Willamette Industries Inc. | | 7.125 | % | | 7/22/13 | | | 1,839,000 | | | 1,971,132 | |
Total Materials | | | | | | | | | | | 10,756,044 | |
| Telecommunication Services — 5.4% | | | | | | | | | | | | |
Diversified Telecommunication Services — 2.8% | | | | | | | | | | | | |
AT&T Inc., Global Notes | | 5.600 | % | | 5/15/18 | | | 220,000 | | | 244,731 | |
Deutsche Telekom International Finance BV, Senior Notes | | 5.750 | % | | 3/23/16 | | | 1,800,000 | | | 1,969,456 | |
Embarq Corp., Notes | | 7.082 | % | | 6/1/16 | | | 1,380,000 | | | 1,471,161 | |
Qwest Corp., Notes | | 8.875 | % | | 3/15/12 | | | 1,510,000 | | | 1,619,475 | |
Telecom Italia Capital S.p.A., Senior Notes | | 5.250 | % | | 10/1/15 | | | 1,400,000 | | | 1,412,949 | |
Telecom Italia Capital SA, Senior Notes | | 6.999 | % | | 6/4/18 | | | 1,350,000 | | | 1,437,970 | |
Telefonica Emisiones SAU | | 0.674 | % | | 2/4/13 | | | 3,570,000 | | | 3,442,255 | (c) |
Telefonica Emisiones SAU, Senior Notes | | 5.134 | % | | 4/27/20 | | | 90,000 | | | 90,206 | |
Total Diversified Telecommunication Services | | | | | | | | | | | 11,688,203 | |
Wireless Telecommunication Services — 2.6% | | | | | | | | | | | | |
America Movil SAB de CV, Senior Notes | | 3.625 | % | | 3/30/15 | | | 730,000 | | | 748,507 | (b) |
America Movil SAB de CV, Senior Notes | | 5.625 | % | | 11/15/17 | | | 450,000 | | | 491,902 | |
Cellco Partnership/Verizon Wireless Capital LLC | | 5.550 | % | | 2/1/14 | | | 3,000,000 | | | 3,363,435 | |
New Cingular Wireless Services Inc., Notes | | 8.125 | % | | 5/1/12 | | | 3,000,000 | | | 3,356,982 | |
Sprint Capital Corp., Senior Notes | | 8.375 | % | | 3/15/12 | | | 2,669,000 | | | 2,799,114 | |
Total Wireless Telecommunication Services | | | | | | | | | | | 10,759,940 | |
Total Telecommunication Services | | | | | | | | | | | 22,448,143 | |
| Utilities — 2.2% | | | | | | | | | | | | |
Electric Utilities — 1.1% | | | | | | | | | | | | |
Duke Energy Corp., Notes | | 6.250 | % | | 1/15/12 | | | 1,078,000 | | | 1,161,366 | |
Duke Energy Corp., Senior Notes | | 6.300 | % | | 2/1/14 | | | 750,000 | | | 844,131 | |
FirstEnergy Corp., Notes | | 7.375 | % | | 11/15/31 | | | 140,000 | | | 147,615 | |
FirstEnergy Solutions Corp., Senior Notes | | 4.800 | % | | 2/15/15 | | | 1,510,000 | | | 1,580,053 | |
MidAmerican Energy Holdings Co., Senior Notes | | 5.875 | % | | 10/1/12 | | | 827,000 | | | 895,366 | |
Total Electric Utilities | | | | | | | | | | | 4,628,531 | |
Independent Power Producers & Energy Traders — 0.4% | | | | | | | | | | | | |
TXU Corp., Senior Notes | | 5.550 | % | | 11/15/14 | | | 2,480,000 | | | 1,761,730 | |
See Notes to Financial Statements.
| | |
| Western Asset Intermediate Bond Portfolio 2010 Semi-Annual Report | | 11 |
Western Asset Intermediate Bond Portfolio
| | | | | | | | | | | | |
| Security | | Rate | | | Maturity
Date | | Face
Amount | | Value | |
Multi-Utilities — 0.7% | | | | | | | | | | | | |
Dominion Resources Inc., Senior Notes | | 5.700 | % | | 9/17/12 | | $ | 1,046,000 | | $ | 1,130,614 | |
Dominion Resources Inc., Senior Notes | | 8.875 | % | | 1/15/19 | | | 1,160,000 | | | 1,532,191 | |
Total Multi-Utilities | | | | | | | | | | | 2,662,805 | |
Total Utilities | | | | | | | | | | | 9,053,066 | |
Total Corporate Bonds & Notes (Cost — $259,824,207) | | | | | | | | | | | 248,106,355 | |
| Asset-Backed Securities — 6.9% | | | | | | | | | | | | |
| Financials — 6.9% | | | | | | | | | | | | |
Automobiles — 0.6% | | | | | | | | | | | | |
Hertz Vehicle Financing LLC, 2009-2A A1 | | 4.260 | % | | 3/25/14 | | | 1,980,000 | | | 2,063,301 | (b) |
Hertz Vehicle Financing LLC, 2009-2A A2 | | 5.290 | % | | 3/25/16 | | | 430,000 | | | 465,291 | (b) |
Total Automobiles | | | | | | | | | | | 2,528,592 | |
Credit Cards — 1.3% | | | | | | | | | | | | |
Bank of America Credit Card Trust, 2010-A1 A1 | | 0.650 | % | | 9/15/15 | | | 2,440,000 | | | 2,433,541 | (c) |
Citibank Credit Card Issuance Trust, 2009-A5 A5 | | 2.250 | % | | 12/23/14 | | | 2,840,000 | | | 2,890,629 | |
Total Credit Cards | | | | | | | | | | | 5,324,170 | |
Home Equity — 4.0% | | | | | | | | | | | | |
ABFS Mortgage Loan Trust, 2002-3 A | | 4.763 | % | | 9/15/33 | | | 35,779 | | | 35,110 | |
AFC Home Equity Loan Trust, 2003-3 1A | | 0.697 | % | | 10/25/30 | | | 564,529 | | | 304,676 | (b)(c)(f) |
Bear Stearns Asset-Backed Securities Trust, 2007-HE6 1A1 | | 1.597 | % | | 8/25/37 | | | 1,848,906 | | | 1,226,319 | (c) |
Countrywide Asset-Backed Certificates, 2002-BC1 | | 1.007 | % | | 4/25/32 | | | 267,739 | | | 147,930 | (c) |
Countrywide Asset-Backed Certificates, 2005-5 M1 | | 0.807 | % | | 10/25/35 | | | 800,000 | | | 719,387 | (c) |
Countrywide Asset-Backed Certificates, 2005-6 M1 | | 0.837 | % | | 12/25/35 | | | 1,950,000 | | | 1,764,914 | (c) |
Countrywide Home Equity Loan Trust, 2006-HW 2A1B | | 0.487 | % | | 11/15/36 | | | 2,952,001 | | | 2,127,935 | (c) |
Credit-Based Asset Servicing and Securitization LLC, 2005-CB3 M1 | | 0.787 | % | | 5/25/35 | | | 800,000 | | | 729,989 | (c) |
Credit-Based Asset Servicing and Securitization LLC, 2005-RP1 M1 | | 0.967 | % | | 1/25/35 | | | 1,320,000 | | | 1,145,379 | (b)(c) |
First Horizon ABS Trust, 2007-HE1 A | | 0.473 | % | | 9/25/29 | | | 779,592 | | | 576,103 | (c) |
GRMT Mortgage Loan Trust, 2001-1A A5 | | 6.650 | % | | 7/20/31 | | | 388,790 | | | 392,238 | (b) |
Home Equity Asset Trust, 2005-3 M2 | | 0.787 | % | | 8/25/35 | | | 860,000 | | | 781,437 | (c) |
Indymac Home Equity Loan Asset-Backed Trust, 2001-A | | 0.607 | % | | 3/25/31 | | | 156,578 | | | 80,024 | (c) |
MSDWCC Heloc Trust, 2003-1 A | | 0.887 | % | | 11/25/15 | | | 315,272 | | | 256,870 | (c) |
Novastar Home Equity Loan, 2004-1 M3 | | 1.172 | % | | 6/25/34 | | | 2,400,000 | | | 1,742,282 | (c) |
Park Place Securities Inc., 2004-WCW1 M2 | | 1.027 | % | | 9/25/34 | | | 2,500,000 | | | 2,100,510 | (c) |
Quest Trust, 2005-X1 M1 | | 0.847 | % | | 3/25/35 | | | 423,446 | | | 410,396 | (b)(c) |
Residential Asset Mortgage Products Inc., 2003-RZ4 A7 | | 4.790 | % | | 6/25/33 | | | 721,736 | | | 719,342 | |
Soundview Home Equity Loan Trust, 2005-3 M2 | | 0.867 | % | | 6/25/35 | | | 735,150 | | | 698,628 | (c) |
UCFC Home Equity Loan, 1998-D MF1 | | 6.905 | % | | 4/15/30 | | | 618,201 | | | 572,325 | |
Total Home Equity | | | | | | | | | | | 16,531,794 | |
Manufactured Housing — 0.4% | | | | | | | | | | | | |
Conseco Finance Securitizations Corp., 2000-4 A6 | | 8.310 | % | | 5/1/32 | | | 515,767 | | | 406,409 | (c) |
CS First Boston Mortgage Securities Corp., 2002-MH3 A | | 6.700 | % | | 12/25/31 | | | 1,019,900 | | | 1,080,991 | |
Total Manufactured Housing | | | | | | | | | | | 1,487,400 | |
Student Loan — 0.6% | | | | | | | | | | | | |
Education Funding Capital Trust, 2003-3 A6 | | 1.431 | % | | 12/15/42 | | | 200,000 | | | 190,000 | (c) |
Nelnet Student Loan Trust, 2008-4 A4 | | 1.796 | % | | 4/25/24 | | | 1,140,000 | | | 1,174,390 | (c) |
Student Loan Consolidation Center, 2002-1 A3 | | 1.918 | % | | 3/1/42 | | | 500,000 | | | 445,000 | (b)(c)(f) |
See Notes to Financial Statements.
| | |
| 12 | | Western Asset Intermediate Bond Portfolio 2010 Semi-Annual Report |
Schedule of investments (unaudited) (cont’d)
June 30, 2010
Western Asset Intermediate Bond Portfolio
| | | | | | | | | | | | |
| Security | | Rate | | | Maturity
Date | | Face
Amount | | Value | |
Student Loan — continued | | | | | | | | | | | | |
Student Loan Consolidation Center, 2002-2 A14 | | 1.851 | % | | 7/1/42 | | $ | 800,000 | | $ | 712,000 | (b)(c)(f) |
Total Student Loan | | | | | | | | | | | 2,521,390 | |
Total Asset-backed Securities (Cost — $28,795,712) | | | | | | | | | | | 28,393,346 | |
| Collateralized Mortgage Obligations — 9.9% | | | | | | | | | | | | |
ARM Trust, 2004-5 4A1 | | 5.293 | % | | 4/25/35 | | | 591,714 | | | 538,784 | (c) |
Banc of America Funding Corp., 2005-B 2A1 | | 3.017 | % | | 4/20/35 | | | 1,441,459 | | | 1,042,831 | (c) |
Bayview Commercial Asset Trust, 2005-1A A2 | | 0.697 | % | | 4/25/35 | | | 1,112,862 | | | 749,054 | (b)(c) |
Bear Stearns Alt-A Trust, 2005-2 2A4 | | 3.007 | % | | 4/25/35 | | | 1,085,863 | | | 811,434 | (c) |
Citigroup Mortgage Loan Trust Inc., 2005-11A3 | | 4.900 | % | | 12/25/35 | | | 1,928,453 | | | 1,615,064 | (c) |
Citigroup Mortgage Loan Trust Inc., 2005-8, 1A1A | | 5.195 | % | | 10/25/35 | | | 1,282,342 | | | 969,424 | (c) |
Citigroup Mortgage Loan Trust Inc., 2010-3 4A1 | | 4.625 | % | | 2/25/36 | | | 1,298,161 | | | 1,288,424 | (b)(c) |
Countrywide Home Loans, 2004-20 2A1 | | 2.947 | % | | 9/25/34 | | | 395,850 | | | 166,517 | (c) |
Countrywide Home Loans, 2004-R1 1AF | | 0.747 | % | | 11/25/34 | | | 452,482 | | | 371,747 | (b)(c) |
Countrywide Home Loans, 2006-R2 AF1 | | 0.767 | % | | 7/25/36 | | | 724,592 | | | 544,852 | (b)(c) |
Credit Suisse Mortgage Capital Certificates, 2009-3R 25A1 | | 5.650 | % | | 7/27/36 | | | 560,819 | | | 545,543 | (b)(c) |
CS First Boston Mortgage Securities Corp., 2005-9 3A1 | | 6.000 | % | | 10/25/35 | | | 1,586,951 | | | 1,000,047 | |
Deutsche Mortgage Securities Inc., 2004-4 3AR1 | | 2.921 | % | | 6/25/34 | | | 506,435 | | | 352,372 | (c) |
FDIC Structured Sale Guaranteed Notes, 2010-S1 1A | | 0.904 | % | | 2/25/48 | | | 1,835,164 | | | 1,841,921 | (b)(c) |
First Horizon Mortgage Pass-Through Trust, 2003-AR2 2A1 | | 2.841 | % | | 7/25/33 | | | 919,279 | | | 903,976 | (c) |
GE Capital Commercial Mortgage Corp., 2001-2 A4 | | 6.290 | % | | 8/11/33 | | | 2,398,966 | | | 2,475,152 | |
GMAC Mortgage Corporation Loan Trust, 2005-AR5 3A1 | | 4.722 | % | | 9/19/35 | | | 932,338 | | | 890,183 | (c) |
GSMPS Mortgage Loan Trust, 2005-RP1 1AF | | 0.697 | % | | 1/25/35 | | | 373,542 | | | 307,975 | (b)(c) |
Harborview Mortgage Loan Trust, 2004-10 4A | | 2.680 | % | | 1/19/35 | | | 943,879 | | | 905,379 | (c) |
HSI Asset Securitization Corp. Trust, 2005-NC1 2A3 | | 0.707 | % | | 7/25/35 | | | 256,761 | | | 235,184 | (c) |
Indymac Inda Mortgage Loan Trust, 2007-AR7 1A1 | | 6.020 | % | | 11/25/37 | | | 2,094,926 | | | 1,592,808 | (c) |
JPMorgan Mortgage Trust, 2004-A3 SF3 | | 4.559 | % | | 6/25/34 | | | 1,076,386 | | | 1,088,376 | (c) |
MASTR ARM Trust, 2004-11 M1 | | 0.987 | % | | 11/25/34 | | | 1,009,370 | | | 887,308 | (c) |
MASTR ARM Trust, 2004-13 3A7 | | 2.959 | % | | 11/21/34 | | | 6,815,190 | | | 5,895,978 | (c) |
MASTR Reperforming Loan Trust, 2005-2 1A1F | | 0.697 | % | | 5/25/35 | | | 325,621 | | | 262,953 | (b)(c) |
Merrill Lynch Mortgage Investors Inc., 2005-A2 | | 2.800 | % | | 2/25/35 | | | 960,764 | | | 945,882 | (c) |
Merrill Lynch Mortgage Investors Trust, 2004-A1 2A1 | | 2.821 | % | | 2/25/34 | | | 1,179,006 | | | 1,099,054 | (c) |
MLCC Mortgage Investors Inc., 2005-1 2A2 | | 2.258 | % | | 4/25/35 | | | 1,130,050 | | | 1,053,028 | (c) |
MLCC Mortgage Investors Inc., 2005-1, 2A1 | | 2.258 | % | | 4/25/35 | | | 363,134 | | | 346,194 | (c) |
Prime Mortgage Trust, 2006-DR1 2A2 | | 6.000 | % | | 5/25/35 | | | 1,542,784 | | | 1,317,001 | (b) |
Residential Asset Securitization Trust, 2003-A14 A1 | | 4.750 | % | | 2/25/19 | | | 1,569,261 | | | 1,584,065 | |
SACO I Trust, 2007-VA1 A | | 8.657 | % | | 6/25/21 | | | 1,429,943 | | | 1,474,407 | (b)(c) |
Sequoia Mortgage Trust, 2003-3 A1 | | 0.678 | % | | 7/20/33 | | | 904,456 | | | 800,682 | (c) |
Structured Asset Mortgage Investments Inc., 2004-AR8 A1 | | 0.688 | % | | 5/19/35 | | | 1,382,564 | | | 985,958 | (c) |
Structured Asset Securities Corp., 2005-4XS 3A4 | | 4.790 | % | | 3/25/35 | | | 2,830,000 | | | 2,597,739 | |
Structured Asset Securities Corp., 2005-RF2 A | | 0.697 | % | | 4/25/35 | | | 876,415 | | | 701,012 | (b)(c) |
Structured Asset Securities Corp., 2006-2 1A1 | | 0.750 | % | | 9/15/34 | | | 324,866 | | | 322,592 | (b)(c)(f) |
Washington Mutual Inc., 2004-AR11 | | 2.830 | % | | 10/25/34 | | | 207,008 | | | 198,550 | (c) |
Total Collateralized Mortgage Obligations (Cost — $44,142,477) | | | | | | | | | | | 40,709,450 | |
See Notes to Financial Statements.
| | |
| Western Asset Intermediate Bond Portfolio 2010 Semi-Annual Report | | 13 |
Western Asset Intermediate Bond Portfolio
| | | | | | | | | | | | |
| Security | | Rate | | | Maturity
Date | | Face
Amount | | Value | |
| Mortgage-backed Securities — 3.0% | | | | | | | | | | | | |
FHLMC — 0.7% | | | | | | | | | | | | |
Federal Home Loan Mortgage Corp. (FHLMC) | | 3.427 | % | | 1/1/19 | | $ | 6,097 | | $ | 6,253 | (c) |
Federal Home Loan Mortgage Corp. (FHLMC) | | 9.300 | % | | 4/15/19 | | | 26,597 | | | 29,951 | |
Federal Home Loan Mortgage Corp. (FHLMC) | | 3.002 | % | | 12/1/34 | | | 792,634 | | | 819,401 | (c) |
Federal Home Loan Mortgage Corp. (FHLMC) | | 3.213 | % | | 7/1/35 | | | 1,815,509 | | | 1,893,099 | (c) |
Federal Home Loan Mortgage Corp. (FHLMC), IO | | 10.000 | % | | 3/1/21 | | | 2,896 | | | 602 | (e) |
Total FHLMC | | | | | | | | | | | 2,749,306 | |
FNMA — 1.6% | | | | | | | | | | | | |
Federal National Mortgage Association (FNMA) | | 8.000 | % | | 9/1/15 | | | 18,420 | | | 19,890 | |
Federal National Mortgage Association (FNMA) | | 3.074 | % | | 3/1/18 | | | 11,715 | | | 11,872 | (c) |
Federal National Mortgage Association (FNMA) | | 9.500 | % | | 4/15/21 | | | 22,143 | | | 25,479 | |
Federal National Mortgage Association (FNMA) | | 2.960 | % | | 12/1/34 | | | 384,761 | | | 398,949 | (c) |
Federal National Mortgage Association (FNMA) | | 2.082 | % | | 1/1/35 | | | 2,222,697 | | | 2,326,872 | (c) |
Federal National Mortgage Association (FNMA), Grantor Trust | | 5.763 | % | | 12/25/11 | | | 3,663,449 | | | 3,895,961 | |
Federal National Mortgage Association (FNMA), PO PAC | | 0.000 | % | | 5/25/22 | | | 2,970 | | | 2,864 | (e) |
Total FNMA | | | | | | | | | | | 6,681,887 | |
GNMA — 0.7% | | | | | | | | | | | | |
Government National Mortgage Association (GNMA) | | 1.000 | % | | 7/22/40 | | | 2,850,000 | | | 2,996,490 | (g) |
Total Mortgage-Backed Securities (Cost — $12,064,771) | | | | | | | | | | | 12,427,683 | |
| Municipal Bonds — 1.3% | | | | | | | | | | | | |
California — 0.1% | | | | | | | | | | | | |
California State, GO | | 6.200 | % | | 10/1/19 | | | 450,000 | | | 470,417 | |
Pennsylvania — 0.6% | | | | | | | | | | | | |
Pennsylvania State Higher Education Assistance Agency, Student Loan Revenue | | 0.340 | % | | 5/1/46 | | | 2,700,000 | | | 2,389,500 | (c) |
Virginia — 0.6% | | | | | | | | | | | | |
Virginia State Housing Development Authority | | 6.000 | % | | 6/25/34 | | | 2,598,978 | | | 2,606,177 | |
Total Municipal Bonds (Cost — $5,404,470) | | | | | | | | | | | 5,466,094 | |
| Sovereign Bonds — 1.1% | | | | | | | | | | | | |
Canada — 0.4% | | | | | | | | | | | | |
Province of Ontario | | 4.000 | % | | 10/7/19 | | | 1,620,000 | | | 1,672,731 | |
Japan — 0.7% | | | | | | | | | | | | |
Japan Bank for International Coop., Senior Notes | | 2.875 | % | | 2/2/15 | | | 2,690,000 | | | 2,764,997 | |
Russia — 0.0% | | | | | | | | | | | | |
Russian Foreign Bond-Eurobond, Senior Bonds | | 7.500 | % | | 3/31/30 | | | 16,305 | | | 18,381 | (b) |
Total Sovereign Bonds (Cost — $4,318,710) | | | | | | | | | | | 4,456,109 | |
| U.S. Government & Agency Obligations — 13.0% | | | | | | | | | | | | |
U.S. Government Agencies — 9.6% | | | | | | | | | | | | |
Farmer Mac | | 3.000 | % | | 9/22/14 | | | 120,000 | | | 125,952 | |
Farmer Mac, Guaranteed Trust | | 5.125 | % | | 4/19/17 | | | 3,350,000 | | | 3,661,453 | (b) |
Federal Farm Credit Bank (FFCB) | | 4.875 | % | | 4/4/12 | | | 2,561,000 | | | 2,748,708 | |
Federal Home Loan Mortgage Corp. (FHLMC), Notes | | 0.254 | % | | 5/4/11 | | | 15,200,000 | | | 15,211,370 | (c) |
Federal Home Loan Mortgage Corp. (FHLMC), Senior Notes | | 5.000 | % | | 2/16/17 | | | 3,430,000 | | | 3,914,817 | |
Federal National Mortgage Association (FNMA) | | 0.000 | % | | 10/9/19 | | | 4,320,000 | | | 2,670,710 | |
Federal National Mortgage Association (FNMA), Subordinated Notes | | 5.250 | % | | 8/1/12 | | | 4,420,000 | | | 4,770,418 | |
Federal National Mortgage Association (FNMA), Subordinated Notes | | 4.625 | % | | 5/1/13 | | | 1,590,000 | | | 1,717,025 | |
See Notes to Financial Statements.
| | |
| 14 | | Western Asset Intermediate Bond Portfolio 2010 Semi-Annual Report |
Schedule of investments (unaudited) (cont’d)
June 30, 2010
Western Asset Intermediate Bond Portfolio
| | | | | | | | | | | | |
| Security | | Rate | | | Maturity
Date | | Face
Amount | | Value | |
U.S. Government Agencies — continued | | | | | | | | | | | | |
Tennessee Valley Authority | | 5.625 | % | | 1/18/11 | | $ | 373,000 | | $ | 383,713 | |
Tennessee Valley Authority, Bonds | | 6.790 | % | | 5/23/12 | | | 2,747,000 | | | 3,053,972 | |
Tennessee Valley Authority, Bonds | | 5.980 | % | | 4/1/36 | | | 70,000 | | | 83,763 | |
Tennessee Valley Authority, Notes | | 5.250 | % | | 9/15/39 | | | 1,090,000 | | | 1,204,985 | |
Total U.S. Government Agencies | | | | | | | | | | | 39,546,886 | |
U.S. Government Obligations — 3.4% | | | | | | | | | | | | |
U.S. Treasury Bonds | | 4.500 | % | | 8/15/39 | | | 1,000,000 | | | 1,101,406 | |
U.S. Treasury Bonds | | 4.375 | % | | 11/15/39 | | | 2,220,000 | | | 2,396,559 | |
U.S. Treasury Notes | | 1.000 | % | | 4/30/12 | | | 670,000 | | | 675,025 | |
U.S. Treasury Notes | | 1.375 | % | | 5/15/13 | | | 680,000 | | | 688,289 | |
U.S. Treasury Notes | | 2.125 | % | | 5/31/15 | | | 500,000 | | | 508,595 | |
U.S. Treasury Notes | | 3.125 | % | | 1/31/17 | | | 1,090,000 | | | 1,139,986 | |
U.S. Treasury Notes | | 2.500 | % | | 6/30/17 | | | 1,810,000 | | | 1,817,919 | |
U.S. Treasury Notes | | 3.375 | % | | 11/15/19 | | | 1,040,000 | | | 1,077,131 | |
U.S. Treasury Notes | | 3.625 | % | | 2/15/20 | | | 2,720,000 | | | 2,873,849 | |
U.S. Treasury Notes | | 3.500 | % | | 5/15/20 | | | 1,430,000 | | | 1,496,581 | |
Total U.S. Government Obligations | | | | | | | | | | | 13,775,340 | |
Total U.S. Government & Agency Obligations (Cost — $51,258,198) | | | | | | | | | | | 53,322,226 | |
| U.S. Treasury Inflation Protected Securities — 1.5% | | | | | | | | | | | | |
U.S. Treasury Bonds, Inflation Indexed | | 2.375 | % | | 1/15/25 | | | 1,589,031 | | | 1,762,707 | (h) |
U.S. Treasury Bonds, Inflation Indexed | | 1.750 | % | | 1/15/28 | | | 2,643,048 | | | 2,681,042 | (h) |
U.S. Treasury Bonds, Inflation Indexed | | 2.500 | % | | 1/15/29 | | | 1,472,258 | | | 1,663,995 | (h) |
Total U.S. Treasury Inflation Protected Securities (Cost — $5,290,964) | | | | | | | | | | | 6,107,744 | |
| | | | |
| | | | | | | | Shares | | | |
| Preferred Stocks — 0.1% | | | | | | | | | | | | |
| Financials — 0.1% | | | | | | | | | | | | |
Diversified Financial Services — 0.1% | | | | | | | | | | | | |
Home Ownership Funding Corp. | | 1.000 | % | | | | | 600 | | | 57,679 | (b)(e)(f) |
Home Ownership Funding II | | 1.000 | % | | | | | 1,800 | | | 173,038 | (b)(e)(f) |
Total Diversified Financial Services | | | | | | | | | | | 230,717 | |
Thrifts & Mortgage Finance — 0.0% | | | | | | | | | | | | |
Federal Home Loan Mortgage Corp. (FHLMC) | | 8.375 | % | | | | | 84,900 | | | 28,866 | *(c) |
Federal National Mortgage Association (FNMA) | | 8.250 | % | | | | | 61,925 | | | 21,054 | *(c) |
Total Thrifts & Mortgage Finance | | | | | | | | | | | 49,920 | |
Total Preferred Stocks (Cost — $5,612,735) | | | | | | | | | | | 280,637 | |
| | | | |
| | | | | | Expiration
Date | | Contracts | | | |
| Purchased Options — 0.1% | | | | | | | | | | | | |
Eurodollar Futures, Put @ $99.38 | | | | | 9/13/10 | | | 257 | | | 65,856 | |
Eurodollar Mid Curve 1-Year Futures, Put @ $98.75 | | | | | 9/10/10 | | | 116 | | | 22,475 | |
U.S. Treasury 10-Year Notes Futures, Call @ $119.50 | | | | | 8/27/10 | | | 27 | | | 92,812 | |
U.S. Treasury 10-Year Notes Futures, Call @ $121.50 | | | | | 8/27/10 | | | 37 | | | 72,266 | |
U.S. Treasury 10-Year Notes Futures, Call @ $124.00 | | | | | 8/27/10 | | | 76 | | | 55,813 | |
Total Purchased Options (Cost — $243,136) | | | | | | | | | | | 309,222 | |
Total Investments before Short-term Investments (Cost — $416,955,380) | | | | | | | | | | | 399,578,866 | |
See Notes to Financial Statements.
| | |
| Western Asset Intermediate Bond Portfolio 2010 Semi-Annual Report | | 15 |
Western Asset Intermediate Bond Portfolio
| | | | | | | | | | | | |
| Security | | Rate | | | Maturity
Date | | Face
Amount | | Value | |
| Short-Term Investments — 3.5% | | | | | | | | | | | | |
U.S. Government Agency — 0.4% | | | | | | | | | | | | |
Federal National Mortgage Association (FNMA), Discount Notes (Cost — $1,499,603) | | 0.180 | % | | 8/23/10 | | $ | 1,500,000 | | $ | 1,499,750 | (h)(i) |
Repurchase Agreement — 3.1% | | | | | | | | | | | | |
Goldman Sachs & Co. repurchase agreement dated 6/30/10; Proceeds at maturity — $12,741,007; (Fully collateralized by U.S. government agency obligations, 6.625% due 11/15/30; Market value — $12,994,463) (Cost — $12,741,000) | | 0.020 | % | | 7/1/10 | | | 12,741,000 | | | 12,741,000 | |
Total Short-Term Investments (Cost — $14,240,603) | | | | | | | | | | | 14,240,750 | |
Total Investments — 100.8% (Cost — $431,195,983#) | | | | | | | | | | | 413,819,616 | |
Liabilities in Excess of Other Assets — (0.8)% | | | | | | | | | | | (3,095,889 | ) |
Total Net Assets — 100.0% | | | | | | | | | | $ | 410,723,727 | |
| * | Non-income producing security. |
| (a) | The coupon payment on these securities is currently in default as of June 30, 2010. |
| (b) | Security is exempt from registration under Rule 144A of the Securities Act of 1933. This security may be resold in transactions that are exempt from registration, normally to qualified institutional buyers. This security has been deemed liquid pursuant to guidelines approved by the Board of Directors, unless otherwise noted. |
| (c) | Variable rate security. Interest rate disclosed is that which is in effect at June 30, 2010. |
| (d) | Security has no maturity date. The date shown represents the next call date. |
| (f) | Security is valued in good faith at fair value in accordance with procedures approved by the Board of Directors (See Note 1). |
| (g) | This security is traded on a to-be-announced (“TBA”) basis (See Note 1). |
| (h) | All or a portion of this security is held at the broker as collateral for open futures contracts. |
| (i) | Rate shown represents yield-to-maturity. |
| # | Aggregate cost for federal income tax purposes is substantially the same. |
| | |
Abbreviations used in this schedule: |
| ARM | | — Adjustable Rate Mortgage |
| GO | | — General Obligation |
| IO | | — Interest Only |
| PAC | | — Planned Amortization Class |
| PO | | — Principal Only |
| | | | | | | | | | |
| Schedule of Written Options | | | | | | | | |
| Security | | Expiration
Date | | Strike
Price | | Contracts | | Value |
| Eurodollar Futures, Call | | 3/14/11 | | $ | 98.88 | | 226 | | $ | 235,887 |
| Eurodollar Futures, Call | | 9/13/10 | | | 98.75 | | 209 | | | 326,563 |
| Eurodollar Futures, Call | | 9/13/10 | | | 99.13 | | 193 | | | 131,481 |
| Eurodollar Futures, Call | | 9/13/10 | | | 99.25 | | 115 | | | 48,156 |
| Eurodollar Futures, Put | | 9/13/10 | | | 99.13 | | 450 | | | 59,062 |
| Eurodollar Futures, Put | | 3/14/11 | | | 98.88 | | 226 | | | 74,863 |
| Eurodollar Futures, Put | | 9/13/10 | | | 99.00 | | 312 | | | 31,200 |
| Eurodollar Mid Curve 1-Year Futures, Put | | 9/10/10 | | | 98.50 | | 116 | | | 11,600 |
| U.S. Treasury 10-Year Notes Futures, Call | | 8/27/10 | | | 123.50 | | 14 | | | 13,125 |
| Total Written Options (Premiums received — $996,889) | | | | | | | | | $ | 931,937 |
See Notes to Financial Statements.
| | |
| 16 | | Western Asset Intermediate Bond Portfolio 2010 Semi-Annual Report |
Statement of assets and liabilities (unaudited)
June 30, 2010
| | | |
| |
| Assets: | | | |
Investments, at value (Cost — $431,195,983) | | $ | 413,819,616 |
Cash | | | 112 |
Interest receivable | | | 3,763,804 |
Deposits with brokers for swap contracts | | | 400,000 |
Premiums paid for open swaps | | | 278,307 |
Unrealized appreciation on swaps | | | 164,902 |
Receivable for Fund shares sold | | | 92,771 |
Principal paydown receivable | | | 54,758 |
Receivable from broker — variation margin on open futures contracts | | | 11,241 |
Receivable for open swap contracts | | | 3,096 |
Prepaid expenses | | | 22,551 |
Total Assets | | | 418,611,158 |
| |
| Liabilities: | | | |
Payable for securities purchased | | | 5,418,352 |
Written options, at value (premium received $996,889) | | | 931,937 |
Unrealized depreciation on swaps | | | 531,273 |
Distributions payable | | | 471,679 |
Payable for Fund shares repurchased | | | 155,047 |
Investment management fee payable | | | 136,669 |
Premiums received for open swaps | | | 112,049 |
Payable for open swap contracts | | | 6,604 |
Directors’ fees payable | | | 4,231 |
Accrued expenses | | | 119,590 |
Total Liabilities | | | 7,887,431 |
| Total Net Assets | | $ | 410,723,727 |
| |
| Net Assets: | | | |
Par value (Note 7) | | $ | 38,564 |
Paid-in capital in excess of par value | | | 425,685,397 |
Undistributed net investment income | | | 357,662 |
Accumulated net realized gain on investments, futures contracts, written options and swap contracts | | | 1,606,916 |
Net unrealized depreciation on investments, futures contracts, written options and swap contracts | | | (16,964,812) |
| Total Net Assets | | $ | 410,723,727 |
| |
| Shares Outstanding: | | | |
Class IS1 | | | 5,115,251 |
Class I1 | | | 33,448,550 |
| |
| Net Asset Value: | | | |
Class IS1 | | | $10.65 |
Class I1 | | | $10.65 |
| 1 | In April 2010, Institutional Select Class and Institutional Class shares were renamed Class IS and Class I shares, respectively. |
See Notes to Financial Statements.
| | |
| Western Asset Intermediate Bond Portfolio 2010 Semi-Annual Report | | 17 |
Statement of operations (unaudited)
For the Six Months Ended June 30, 2010
| | | |
| |
| Investment Income: | | | |
Interest | | $ | 10,069,290 |
Dividends | | | 10,120 |
Total Investment Income | | | 10,079,410 |
| |
| Expenses: | | | |
Investment management fee (Note 2) | | | 946,523 |
Transfer agent fees (Note 5) | | | 35,912 |
Shareholder reports (Note 5) | | | 31,774 |
Custody fees | | | 29,562 |
Legal fees | | | 25,383 |
Audit and tax | | | 24,631 |
Directors’ fees | | | 9,005 |
Registration fees | | | 5,327 |
Miscellaneous expenses | | | 4,141 |
Total Expenses | | | 1,112,258 |
Less: Fee waivers and/or expense reimbursements (Notes 2 and 5) | | | (5,544) |
Net Expenses | | | 1,106,714 |
| Net Investment Income | | | 8,972,696 |
| |
Realized and Unrealized Gain (Loss) on Investments, Futures Contracts, Written Options
and Swap Contracts (Notes 1, 3 and 4): | | | |
Net Realized Gain (Loss) From: | | | |
Investment transactions | | | 2,732,659 |
Futures contracts | | | 1,493,426 |
Written options | | | 696,868 |
Swap contracts | | | (1,273,767) |
Net Realized Gain | | | 3,649,186 |
Change in Net Unrealized Appreciation/Depreciation From: | | | |
Investments | | | 10,275,956 |
Futures contracts | | | 1,812,801 |
Written options | | | (13,515) |
Swap contracts | | | 623,135 |
Change in Net Unrealized Appreciation/Depreciation | | | 12,698,377 |
| Net Gain on Investments, Futures Contracts, Written Options and Swap Contracts | | | 16,347,563 |
| Increase in Net Assets from Operations | | $ | 25,320,259 |
See Notes to Financial Statements.
| | |
| 18 | | Western Asset Intermediate Bond Portfolio 2010 Semi-Annual Report |
Statements of changes in net assets
| | | | | | |
For the Six Months Ended June 30, 2010 (unaudited)
and the Year Ended December 31, 2009 | | 2010 | | 2009 |
| | |
| Operations: | | | | | | |
Net investment income | | $ | 8,972,696 | | $ | 21,559,013 |
Net realized gain | | | 3,649,186 | | | 2,258,102 |
Change in net unrealized appreciation/depreciation | | | 12,698,377 | | | 58,157,899 |
Increase in Net Assets From Operations | | | 25,320,259 | | | 81,975,014 |
| | |
| Distributions to Shareholders From (Notes 1 and 6): | | | | | | |
Net investment income | | | (9,612,719) | | | (21,688,494) |
Net realized gains | | | — | | | (8,292,062) |
Decrease in Net Assets From Distributions to Shareholders | | | (9,612,719) | | | (29,980,556) |
| | |
| Fund Share Transactions (Note 7): | | | | | | |
Net proceeds from sale of shares | | | 32,539,734 | | | 122,163,386 |
Reinvestment of distributions | | | 6,846,876 | | | 25,265,859 |
Cost of shares repurchased | | | (127,092,455) | | | (242,593,163) |
Decrease in Net Assets From Fund Share Transactions | | | (87,705,845) | | | (95,163,918) |
Decrease in Net Assets | | | (71,998,305) | | | (43,169,460) |
| | |
| Net Assets: | | | | | | |
Beginning of period | | | 482,722,032 | | | 525,891,492 |
End of period* | | $ | 410,723,727 | | $ | 482,722,032 |
* Includes undistributed net investment income of: | | | $357,662 | | | $997,685 |
See Notes to Financial Statements.
| | |
| Western Asset Intermediate Bond Portfolio 2010 Semi-Annual Report | | 19 |
Financial highlights
| | | | | | | | | |
| For a share of each class of capital stock outstanding throughout each year ended December 31, unless otherwise noted: | |
Class IS Shares1,2 | | 20103 | | | 2009 | | | 20084 | |
| | | |
| Net asset value, beginning of period | | $ 10.31 | | | $ 9.31 | | | $ 9.49 | |
| | | |
| Income (loss) from operations: | | | | | | | | | |
Net investment income | | 0.20 | | | 0.42 | | | 0.09 | |
Net realized and unrealized gain (loss) | | 0.35 | | | 1.15 | | | (0.13) | |
Total income (loss) from operations | | 0.55 | | | 1.57 | | | (0.04) | |
| | | |
| Less distributions from: | | | | | | | | | |
Net investment income | | (0.21) | | | (0.42) | | | (0.14) | |
Net realized gains | | — | | | (0.15) | | | — | |
Total distributions | | (0.21) | | | (0.57) | | | (0.14) | |
| | | |
| Net asset value, end of period | | $10.65 | | | $10.31 | | | $9.31 | |
Total return5 | | 5.40 | % | | 17.39 | % | | (0.41) | % |
| | | |
| Net assets, end of period (000s) | | $54,474 | | | $60,112 | | | $50,196 | |
| | | |
| Ratios to average net assets: | | | | | | | | | |
Gross expenses | | 0.46 | %6 | | 0.46 | % | | 0.46 | %6 |
Net expenses7 | | 0.45 | 6 | | 0.45 | | | 0.45 | 6,8 |
Net investment income | | 3.82 | 6 | | 4.2 | | | 4.5 | 6 |
| | | |
| Portfolio turnover rate | | 60 | % | | 175 | % | | 165 | % |
| 1 | In April 2010, Institutional Select Class shares were renamed Class IS shares. |
| 2 | Per share amounts have been calculated using the average shares method. |
| 3 | For the six months ended June 30, 2010 (unaudited). |
| 4 | For the period October 3, 2008 (commencement of operations) to December 31, 2008. |
| 5 | Performance figures may reflect fee waivers and/or expense reimbursements. In the absence of fee waivers and/or expense reimbursements, the total return would have been lower. Past performance is no guarantee of future results. Total returns for periods of less than one year are not annualized. |
| 7 | Reflects fee waivers and/or expense reimbursements. |
| 8 | The impact of compensating balance arrangements to the expense ratio was less than 0.01%. |
See Notes to Financial Statements.
| | |
| 20 | | Western Asset Intermediate Bond Portfolio 2010 Semi-Annual Report |
Financial highlights (cont’d)
| | | | | | | | | | | | | | | | | | | | | |
| For a share of each class of capital stock outstanding throughout each year ended December 31, unless otherwise noted: | |
Class I Shares1 | | 20102 | | | 2009 | | | 20083 | | | 20084 | | | 20074 | | | 20064 | | | 20054 | |
| | | | | | | |
| Net asset value, beginning of period | | $10.31 | | | $9.32 | | | $10.30 | | | $10.43 | | | $10.21 | | | $10.51 | | | $11.01 | |
| | | | | | | |
| Income (loss) from operations: | | | | | | | | | | | | | | | | | | | | | |
Net investment income | | 0.20 | 5 | | 0.42 | 5 | | 0.34 | 5 | | 0.52 | 5 | | 0.49 | 5 | | 0.44 | | | 0.38 | |
Net realized and unrealized gain (loss) | | 0.35 | | | 1.14 | | | (0.82) | | | (0.14) | | | 0.22 | | | (0.20) | | | (0.22) | |
Total income (loss) from operations | | 0.55 | | | 1.56 | | | (0.48) | | | 0.38 | | | 0.71 | | | 0.24 | | | 0.16 | |
| | | | | | | |
| Less distributions from: | | | | | | | | | | | | | | | | | | | | | |
Net investment income | | (0.21) | | | (0.42) | | | (0.37) | | | (0.51) | | | (0.49) | | | (0.44) | | | (0.38) | |
Net realized gains | | — | | | (0.15) | | | (0.13) | | | — | | | — | | | (0.10) | | | (0.28) | |
Total distributions | | (0.21) | | | (0.57) | | | (0.50) | | | (0.51) | | | (0.49) | | | (0.54) | | | (0.66) | |
| | | | | | | |
| Net asset value, end of period | | $10.65 | | | $10.31 | | | $9.32 | | | $10.30 | | | $10.43 | | | $10.21 | | | $10.51 | |
Total return6 | | 5.39 | % | | 17.24 | % | | (4.72) | % | | 3.77 | % | | 7.17 | % | | 2.37 | % | | 1.66 | % |
| | | | | | | |
| Net assets, end of period (000s) | | $356,250 | | | $422,610 | | | $475,695 | | | $706,873 | | | $639,735 | | | $739,492 | | | $660,480 | |
| | | | | | | |
| Ratios to average net assets: | | | | | | | | | | | | | | | | | | | | | |
Gross expenses | | 0.47 | %7 | | 0.47 | % | | 0.46 | %7 | | 0.45 | % | | 0.46 | % | | 0.47 | % | | 0.46 | % |
Net expenses | | 0.47 | 7 | | 0.47 | | | 0.46 | 7,8 | | 0.45 | 8 | | 0.45 | 8,9 | | 0.45 | 8,9 | | 0.45 | 8,9 |
Net investment income | | 3.79 | 7 | | 4.2 | | | 4.6 | 7 | | 5.0 | | | 4.8 | | | 4.3 | | | 3.6 | |
| | | | | | | |
| Portfolio turnover rate | | 60 | % | | 175 | % | | 165 | % | | 239 | % | | 244 | % | | 266 | % | | 216 | % |
| 1 | In April 2010, Institutional Class shares were renamed Class I shares. |
| 2 | For the six months ended June 30, 2010 (unaudited). |
| 3 | For the period April 1, 2008 through December 31, 2008. |
| 4 | For the year ended March 31. |
| 5 | Per share amounts have been calculated using the average shares method. |
| 6 | Performance figures may reflect fee waivers and/or expense reimbursements. In the absence of fee waivers and/or expense reimbursements, the total return would have been lower. Past performance is no guarantee of future results. Total returns for periods of less than one year are not annualized. |
| 8 | The impact of compensating balance arrangements to the expense ratio was less than 0.01%. |
| 9 | Reflects fee waivers and/or expense reimbursements. |
See Notes to Financial Statements.
| | |
| Western Asset Intermediate Bond Portfolio 2010 Semi-Annual Report | | 21 |
Notes to financial statements (unaudited)
1. Organization and significant accounting policies
Western Asset Intermediate Bond Portfolio (the “Fund”) is a separate diversified investment series of Western Asset Funds, Inc. (the “Corporation”). The Corporation, a Maryland corporation, is registered under the Investment Company Act of 1940, as amended (the “1940 Act”), as an open-end management investment company.
The Fund offers three classes of shares: Class IS, Class I and Class FI. Prior to April 2010, Class IS, Class I and Class FI shares were known as Institutional Select Class, Institutional Class and Financial Intermediary Class shares, respectively. Shares in the Class FI bear a distribution fee. Class FI shares have not commenced operations. The income and expenses of the Fund are allocated proportionately to each class of shares based on daily net assets, except for Rule 12b-1 distribution fees, which are charged only on the Class FI shares, and transfer agent and shareholder servicing expenses, and certain other expenses, which are determined separately for each class.
The following are significant accounting policies consistently followed by the Fund and are in conformity with U.S. generally accepted accounting principles (“GAAP”). Estimates and assumptions are required to be made regarding assets, liabilities and changes in net assets resulting from operations when financial statements are prepared. Changes in the economic environment, financial markets and any other parameters used in determining these estimates could cause actual results to differ. Subsequent events have been evaluated through the date the financial statements were issued.
(a) Investment valuation. Debt securities are valued at the last quoted bid price provided by an independent pricing service that are based on transactions in debt obligations, quotations from bond dealers, market transactions in comparable securities and various other relationships between securities. Publicly traded foreign government debt securities are typically traded internationally in the over-the-counter market, and are valued at the last quoted bid price as of the close of business of that market. Futures contracts are valued daily at the settlement price established by the board of trade or exchange on which they are traded. Equity securities for which market quotations are available are valued at the last reported sales price or official closing price on the primary market or exchange on which they trade. When prices are not readily available, or are determined not to reflect fair value, such as when the value of a security has been significantly affected by events after the close of the exchange or market on which the security is principally traded, but before the Fund calculates its net asset value, the Fund values these securities at fair value as determined in accordance with procedures approved by the Fund’s Board of Directors. Short-term obligations with maturities of 60 days or less are valued at amortized cost, which approximates fair value.
The Fund has adopted Financial Accounting Standards Board Codification Topic 820 (“ASC Topic 820”). ASC Topic 820 establishes a single definition of fair value, creates a three-tier hierarchy as a framework for measuring fair value based on inputs used to value the Fund’s investments, and requires additional disclosure about fair value. The hierarchy of inputs is summarized below.
| Ÿ | | Level 1 — quoted prices in active markets for identical investments |
| Ÿ | | Level 2 — other significant observable inputs (including quoted prices for similar investments, interest rates, prepayment speeds, credit risk, etc.) |
| Ÿ | | Level 3 — significant unobservable inputs (including the Fund’s own assumptions in determining the fair value of investments) |
The inputs or methodology used for valuing securities are not necessarily an indication of the risk associated with investing in those securities.
The Fund uses valuation techniques to measure fair value that are consistent with the market approach and/or income approach, depending on the type of the security and the particular circumstance. The market approach uses prices and other relevant information generated by market transactions involving identical or comparable securities. The income approach uses valuation techniques to convert future amounts of cash flow to a single present amount.
| | |
| 22 | | Western Asset Intermediate Bond Portfolio 2010 Semi-Annual Report |
Notes to financial statements (unaudited) (cont’d)
The following is a summary of the inputs used in valuing the Fund’s assets carried at fair value:
| | | | | | | | | | | | |
| Description | | Quoted Prices
(Level 1) | | Other Significant
Observable Inputs
(Level 2) | | Significant
Unobservable
Inputs (Level 3) | | Total |
| Long-term investments†: | | | | | | | | | | | | |
Corporate bonds & notes | | | — | | $ | 248,106,355 | | | — | | $ | 248,106,355 |
Asset-backed securities | | | — | | | 26,931,670 | | $ | 1,461,676 | | | 28,393,346 |
Collateralized mortgage obligations | | | — | | | 40,386,858 | | | 322,592 | | | 40,709,450 |
Mortgage-backed securities | | | — | | | 12,427,683 | | | — | | | 12,427,683 |
Municipal bonds | | | — | | | 5,466,094 | | | — | | | 5,466,094 |
Sovereign bonds | | | — | | | 4,456,109 | | | — | | | 4,456,109 |
U.S. government & agency obligations | | | — | | | 53,322,226 | | | — | | | 53,322,226 |
U.S. treasury inflation protected securities | | | — | | | 6,107,744 | | | — | | | 6,107,744 |
Preferred stocks | | $ | 49,920 | | | — | | | 230,717 | | | 280,637 |
Purchased options | | | 309,222 | | | — | | | — | | | 309,222 |
| Total long-term investments | | $ | 359,142 | | $ | 397,204,739 | | $ | 2,014,985 | | $ | 399,578,866 |
| Short-term investments† | | | — | | | 14,240,750 | | | — | | | 14,240,750 |
| Total investments | | $ | 359,142 | | $ | 411,445,489 | | $ | 2,014,985 | | $ | 413,819,616 |
| Other financial instruments: | | | | | | | | | | | | |
Futures contracts | | $ | 712,974 | | | — | | | — | | $ | 712,974 |
Written options | | | (931,937) | | | — | | | — | | | (931,937) |
Credit default swaps on corporate issues — sell protection | | | — | | $ | (34,682) | | | — | | | (34,682) |
Credit default swaps on corporate issues — buy protection‡ | | | — | | | 135,348 | | | — | | | 135,348 |
Credit default swaps on credit indices — sell protection‡ | | | — | | | (220,310) | | | — | | | (220,310) |
Credit default swaps on credit indices — buy protection‡ | | | — | | | (80,469) | | | — | | | (80,469) |
| Total other financial instruments | | | (218,963) | | | (200,113) | | | — | | | (419,076) |
| Total | | $ | 140,179 | | $ | 411,245,376 | | $ | 2,014,985 | | $ | 413,400,540 |
| † | See Schedule of Investments for additional detailed categorizations. |
| ‡ | Values include any premiums paid or received with respect to swap contracts. |
Following is a reconciliation of investments in which significant unobservable inputs (Level 3) were used in determining fair value:
| | | | | | | | | | | | |
| Investments in Securities | | Asset-
Backed
Securities | | Collateralized
Mortgage
Obligations | | Preferred
Stocks | | Total |
| Balance as of December 31, 2009 | | $ | 328,129 | | | — | | $ | 230,595 | | $ | 558,724 |
| Accrued premiums/discounts | | | 351 | | $ | 141 | | | — | | | 492 |
| Realized gain/(loss)1 | | | (57) | | | 4,631 | | | — | | | 4,574 |
| Change in unrealized appreciation (depreciation)2 | | | (16,043) | | | 13,031 | | | 122 | | | (2,890) |
| Net purchases (sales) | | | 1,149,296 | | | 304,789 | | | — | | | 1,454,085 |
| Transfers in to Level 3 | | | — | | | — | | | — | | | — |
| Transfers out of Level 3 | | | — | | | — | | | — | | | — |
| Balance as of June 30, 2010 | | $ | 1,461,676 | | $ | 322,592 | | $ | 230,717 | | $ | 2,014,985 |
| Net change in unrealized appreciation (depreciation) for investments in securities still held at June 30, 20102 | | $ | (16,043) | | $ | 13,031 | | $ | 122 | | $ | (2,890) |
| 1 | This amount is included in net realized gain (loss) from investment transactions in the accompanying Statement of Operations. |
| 2 | This amount is included in the change in net unrealized appreciation (depreciation) in the accompanying Statement of Operations. Change in unrealized appreciation (depreciation) includes net unrealized appreciation (depreciation) resulting from changes in investment values during the reporting period and the reversal of previously recorded unrealized appreciation (depreciation) when gains or losses are realized. |
(b) Repurchase agreements. The Fund may enter into repurchase agreements with institutions that its investment adviser has determined are creditworthy. Each repurchase agreement is recorded at cost. Under
| | |
| Western Asset Intermediate Bond Portfolio 2010 Semi-Annual Report | | 23 |
the terms of a typical repurchase agreement, a fund takes possession of an underlying debt obligation subject to an obligation of the seller to repurchase, and of the fund to resell, the obligation at an agreed-upon price and time, thereby determining the yield during a fund’s holding period. When entering into repurchase agreements, it is the Fund’s policy that its custodian or a third party custodian, acting on the Fund’s behalf, take possession of the underlying collateral securities, the market value of which, at all times, at least equals the principal amount of the repurchase transaction, including accrued interest. To the extent that any repurchase transaction maturity exceeds one business day, the value of the collateral is marked to market and measured against the value of the agreement in an effort to ensure the adequacy of the collateral. If the counterparty defaults, the Fund generally has the right to use the collateral to satisfy the terms of the repurchase transaction. However, if the market value of the collateral declines during the period in which the Fund seeks to assert its rights or if bankruptcy proceedings are commenced with respect to the seller of the security, realization of the collateral by the Fund may be delayed or limited.
(c) Inflation-indexed bonds. Inflation-indexed bonds are fixed-income securities whose principal value or interest rate is periodically adjusted according to the rate of inflation. As the index measuring inflation changes, the principal value or interest rate of inflation-indexed bonds will be adjusted accordingly. Inflation adjustments to the principal amount of inflation-indexed bonds are reflected as an increase or decrease to investment income on the Statement of Operations. Repayment of the original bond principal upon maturity (as adjusted for inflation) is guaranteed in the case of U.S. Treasury inflation-indexed bonds. For bonds that do not provide a similar guarantee, the adjusted principal value of the bond repaid at maturity may be less than the original principal.
(d) Written options. When the Fund writes an option, an amount equal to the premium received by the Fund is recorded as a liability, the value of which is marked to market daily to reflect the current market value of the option written. If the option expires, the premium received is recorded as a realized gain. When a written call option is exercised, the difference between the premium received plus the option exercise price and the Fund’s basis in the underlying security (in the case of a covered written call option), or the cost to purchase the underlying security (in the case of an uncovered written call option), including brokerage commission, is recognized as a realized gain or loss. When a written put option is exercised, the amount of the premium received is subtracted from the cost of the security purchased by the Fund from the exercise of the written put option to form the Fund’s basis in the underlying security purchased. The writer or buyer of an option traded on an exchange can liquidate the position before the exercise of the option by entering into a closing transaction. The cost of a closing transaction is deducted from the original premium received resulting in a realized gain or loss to the Fund.
The risk in writing a covered call option is that the Fund may forego the opportunity of profit if the market price of the underlying security increases and the option is exercised. The risk in writing a put option is that the Fund may incur a loss if the market price of the underlying security decreases and the option is exercised. The risk in writing a call option is that the Fund is exposed to the risk of loss if the market price of the underlying security increases. In addition, there is the risk that the Fund may not be able to enter into a closing transaction because of an illiquid secondary market.
(e) Futures contracts. The Fund may use futures contracts to gain exposure to, or hedge against, changes in the value of interest rates. A futures contract represents a commitment for the future purchase or sale of an asset at a specified price on a specified date.
Upon entering into a futures contract, the Fund is required to deposit cash or cash equivalents with a broker in an amount equal to a certain percentage of the contract amount. This is known as the “initial margin” and subsequent payments (“variation margin”) are made or received by the Fund each day, depending on the daily fluctuation in the value of the contract. For certain futures, including foreign denominated futures, variation margin is not settled daily, but is recorded as a net variation margin payable or receivable. Futures contracts are valued daily at the settlement price established by the board of trade or exchange on which they are traded. The daily changes in contract value are recorded as unrealized gains or losses in the Statement of Operations and the Fund recognizes a realized gain or loss when the contract is closed.
Futures contracts involve, to varying degrees, risk of loss in excess of the amounts reflected in the financial statements. In addition, there is the risk that the Fund may not be able to enter into a closing transaction because of an illiquid secondary market.
| | |
| 24 | | Western Asset Intermediate Bond Portfolio 2010 Semi-Annual Report |
Notes to financial statements (unaudited) (cont’d)
(f) Swap agreements. The Fund may invest in swaps for the purpose of managing its exposure to interest rate, credit or market risk, or for other purposes. The use of swaps involves risks that are different from those associated with ordinary portfolio transactions.
Swap contracts are marked to market daily and changes in value are recorded as unrealized appreciation/(depreciation). Gains or losses are realized upon termination of the swap agreement. Periodic payments and premiums received or made by the Fund are recognized in the Statement of Operations as realized gains or losses, respectively. Collateral, in the form of restricted cash or securities, may be required to be held in segregated accounts with the Fund’s custodian in compliance with the terms of the swap contracts. Securities held as collateral for swap contracts are identified in the Schedule of Investments and restricted cash, if any, is identified on the Statement of Assets and Liabilities. Risks may exceed amounts recorded in the Statement of Assets and Liabilities. These risks include changes in the returns of the underlying instruments, failure of the counterparties to perform under the contracts’ terms, and the possible lack of liquidity with respect to the swap agreements.
Payments received or made at the beginning of the measurement period are reflected as a premium or deposit, respectively, on the Statement of Assets and Liabilities. These upfront payments are amortized over the life of the swap and are recognized as realized gain or loss in the Statement of Operations. A liquidation payment received or made at the termination of the swap is recognized as realized gain or loss in the Statement of Operations. Net periodic payments received or paid by the Fund are recognized as realized gain or loss at the time of receipt or payment in the Statement of Operations.
As disclosed in the Fund’s summary of open swap contracts, the aggregate fair value of credit default swaps in a net liability position as of June 30, 2010 was $335,461. The aggregate fair value of assets posted as collateral, net of assets received as collateral, for all swaps was $400,000. If a defined credit event had occurred as of June 30, 2010, the swaps’ credit-risk-related contingent features would have been triggered and the Fund would have been required to pay up to $9,433,605 less the value of the contracts’ related reference obligations.
Credit default swaps
The Fund may enter into credit default swap (“CDS”) contracts for investment purposes, to manage its credit risk or to add leverage. CDS agreements involve one party making a stream of payments to another party in exchange for the right to receive a specified return in the event of a default by a third party, typically corporate or sovereign issuers, on a specified obligation, or in the event of a write-down, principal shortfall, interest shortfall or default of all or part of the referenced entities comprising a credit index. The Fund may use a CDS to provide protection against defaults of the issuers (i.e., to reduce risk where the Fund has exposure to a sovereign issuer) or to take an active long or short position with respect to the likelihood of a particular issuer’s default. As a seller of protection, the Fund generally receives an upfront payment or a stream of payments throughout the term of the swap provided that there is no credit event. If the Fund is a seller of protection and a credit event occurs, as defined under the terms of that particular swap agreement, the maximum potential amount of future payments (undiscounted) that the Fund could be required to make under a credit default swap agreement would be an amount equal to the notional amount of the agreement. These amounts of potential payments will be partially offset by any recovery of values from the respective referenced obligations. As a seller of protection, the Fund effectively adds leverage to its portfolio because, in addition to its total net assets, the Fund is subject to investment exposure on the notional amount of the swap. As a buyer of protection, the Fund generally receives an amount up to the notional value of the swap if a credit event occurs.
Implied spreads are the theoretical prices a lender receives for credit default protection. When spreads rise, market perceived credit risk rises and when spreads fall, market perceived credit risk falls. The implied credit spread of a particular referenced entity reflects the cost of buying/selling protection and may include upfront payments required to enter into the agreement. Wider credit spreads and decreasing market values, when compared to the notional amount of the swap, represent a deterioration of the referenced entity’s credit soundness and a greater likelihood or risk of default or other credit event occurring as defined under the terms of the agreement. Credit spreads utilized in determining the period end market value of credit default swap agreements on corporate or sovereign issues are disclosed in the Notes to Financial Statements and serve as an indicator of the current status of the payment/performance risk and represent the
| | |
| Western Asset Intermediate Bond Portfolio 2010 Semi-Annual Report | | 25 |
likelihood or risk of default for credit derivatives. For credit default swap agreements on asset-backed securities and credit indices, the quoted market prices and resulting values, particularly in relation to the notional amount of the contract as well as the annual payment rate, serve as an indication of the current status of the payment/performance risk.
The Fund’s maximum risk of loss from counterparty risk, as the protection buyer, is the fair value of the contract (this risk is mitigated by the posting of collateral by the counterparty to the Fund to cover the Fund’s exposure to the counterparty). As the protection seller, the Fund’s maximum risk is the notional amount of the contract. Credit default swaps are considered to have credit risk-related contingent features since they require payment by the protection seller to the protection buyer upon the occurrence of a defined credit event.
Entering into a CDS agreement involves, to varying degrees, elements of credit, market and documentation risk in excess of the related amounts recognized on the Statement of Assets and Liabilities. Such risks involve the possibility that there will be no liquid market for these agreements, that the counterparty to the agreement may default on its obligation to perform or disagree as to the meaning of the contractual terms in the agreement, and that there will be unfavorable changes in net interest rates.
Interest rate swaps
The Fund may enter into interest rate swap contracts. Interest rate swaps are agreements between two parties to exchange cash flows based on a notional principal amount. The Fund may elect to pay a fixed rate and receive a floating rate, or, receive a fixed rate and pay a floating rate on a notional principal amount. The net interest received or paid on interest rate swap agreements is accrued daily as interest income. Interest rate swaps are marked to market daily based upon quotations from market makers and the change, if any, is recorded as an unrealized gain or loss in the Statement of Operations. When a swap contract is terminated early, the Fund records a realized gain or loss equal to the difference between the original cost and the settlement amount of the closing transaction.
The risks of interest rate swaps include changes in market conditions that will affect the value of the contract or changes in the present value of the future cash flow streams and the possible inability of the counterparty to fulfill its obligations under the agreement. The Fund’s maximum risk of loss from counterparty credit risk is the discounted net value of the cash flows to be received from the counterparty over the contract’s remaining life, to the extent that amount is positive. This risk is mitigated by the posting of collateral by the counterparty to the Fund to cover the Fund’s exposure to the counterparty.
(g) Stripped securities. The Fund may invest in “Stripped Securities,” a term used collectively for components, or strips, of fixed income securities. Stripped securities can be principal only securities (“PO”), which are debt obligations that have been stripped of unmatured interest coupons or, interest only securities (“IO”), which are unmatured interest coupons that have been stripped from debt obligations. The market value of Stripped Securities will fluctuate in response to changes in economic conditions, rates of pre-payment, interest rates and the market’s perception of the securities. However, fluctuations in response to interest rates may be greater in Stripped Securities than for debt obligations of comparable maturities that pay interest currently. The amount of fluctuation may increase with a longer period of maturity.
The yield to maturity on IO’s is sensitive to the rate of principal repayments (including prepayments) on the related underlying debt obligation and principal payments may have a material effect on yield to maturity. If the underlying debt obligation experiences greater than anticipated prepayments of principal, the Fund may not fully recoup its initial investment in IO’s.
(h) Loan participations. The Fund may invest in loans arranged through private negotiation between one or more financial institutions. The Fund’s investment in any such loan may be in the form of a participation in or an assignment of the loan. In connection with purchasing participations, the Fund generally will have no right to enforce compliance by the borrower with the terms of the loan agreement related to the loan, or any rights of off-set against the borrower and the Fund may not benefit directly from any collateral supporting the loan in which it has purchased the participation.
| | |
| 26 | | Western Asset Intermediate Bond Portfolio 2010 Semi-Annual Report |
Notes to financial statements (unaudited) (cont’d)
The Fund assumes the credit risk of the borrower, the lender that is selling the participation and any other persons interpositioned between the Fund and the borrower. In the event of the insolvency of the lender selling the participation, the Fund may be treated as a general creditor of the lender and may not benefit from any off-set between the lender and the borrower.
(i) Credit and market risk. Investments in securities that are collateralized by residential real estate mortgages are subject to certain credit and liquidity risks. When market conditions result in an increase in default rates of the underlying mortgages and foreclosure values of underlying real estate properties are materially below the outstanding amount of these underlying mortgages, collection of the full amount of accrued interest and principal on these investments may be doubtful. Such market conditions may significantly impair the value and liquidity of these investments and may result in a lack of correlation between their credit ratings and values.
(j) Security transactions and investment income. Security transactions are accounted for on a trade date basis. Interest income, adjusted for amortization of premium and accretion of discount, is recorded on the accrual basis. Dividend income is recorded on the ex-dividend date. The cost of investments sold is determined by use of the specific identification method. To the extent any issuer defaults or a credit event occurs that impacts the issuer, a Fund may halt any additional interest income accruals and consider the realizability of interest accrued up to the date of default or credit event.
(k) Distributions to shareholders. Distributions from net investment income on the shares of the Fund are declared each business day to shareholders of record, and are paid monthly. Distributions of net realized gains, if any, are declared at least annually. Distributions are recorded on the ex-dividend date and are determined in accordance with income tax regulations, which may differ from GAAP.
(l) Share class accounting. Investment income, common expenses and realized/unrealized gains (losses) on investments are allocated to the various classes of the Fund on the basis of daily net assets of each class. Fees relating to a specific class are charged directly to that share class.
(m) Compensating balance arrangements. The Fund has an arrangement with its custodian bank whereby a portion of the custodian’s fees is paid indirectly by credits earned on the Fund’s cash on deposit with the bank.
(n) Federal and other taxes. It is the Fund’s policy to comply with the federal income and excise tax requirements of the Internal Revenue Code of 1986 (the “Code”), as amended, applicable to regulated investment companies. Accordingly, the Fund intend to distribute its taxable income and net realized gains, if any, to shareholders in accordance with timing requirements imposed by the Code. Therefore, no federal income tax provision is required in the Fund’s financial statements.
Management has analyzed the Fund’s tax positions taken on federal income tax returns for all open tax years and has concluded that as of June 30, 2010, no provision for income tax is required in the Fund’s financial statements. The Fund’s federal and state income and federal excise tax returns for tax years for which the applicable statutes of limitations have not expired are subject to examination by Internal Revenue Service and state departments of revenue.
(o) Reclassification. GAAP requires that certain components of net assets be reclassified to reflect permanent differences between financial and tax reporting. These reclassifications have no effect on net assets or net asset value per share.
2. Investment management agreement and other transactions with affiliates
The Fund has an investment management agreement with Legg Mason Partners Fund Advisor, LLC (“LMPFA”). Western Asset Management Company (“Western Asset”) is the investment adviser. LMPFA and Western Asset are wholly-owned subsidiaries of Legg Mason, Inc. (“Legg Mason”).
LMPFA provides the Fund with management and administrative services for which the Fund pays a fee, computed daily and payable monthly, at an annual rate of the Fund’s average daily net assets. The manager has agreed to forgo fees and/or reimburse operating expenses (other than interest, taxes, extraordinary expenses and brokerage commissions) so that total operating expenses are not expected to exceed the Fee Cap for Class IS and Class FI. Western Asset also agreed to waive its advisory fees (which is
| | |
| Western Asset Intermediate Bond Portfolio 2010 Semi-Annual Report | | 27 |
paid by LMPFA, and not the Fund) in corresponding amounts under both the Fee Cap and the Flat Waiver. This arrangement cannot be terminated prior to April 30, 2011 without the Board’s consent.
With respect to Class IS and Class FI, the manager is permitted to recapture amounts forgone or reimbursed to a class within three years after the day on which the manager earned the fee or incurred the expense if the class’s total annual operating expenses have fallen to a level below the lower of the limit described below or the limit in effect. The following chart shows the annual rates of management fees, fee caps or flat waivers (as applicable), management fees waived and potential fees which may be recaptured for the Fund’s share classes.
| | | | | | | | | | | | | | | | |
| | | Asset
Breakpoint for
Management
Fee | | Management
Fee | | | Fee
Cap | | | Flat
Waiver | | Management
Fees
(Waived)/
Recaptured | | Maximum
Amount
Subject to
Recapture |
| Class IS1 | | All asset levels | | 0.400 | % | | 0.45 | % | | — | | $ | (312) | | $ | 8,867 |
| Class I1 | | All asset levels | | 0.400 | % | | — | | | — | | | (2,135) | | | 2,448 |
| 1 | In April 2010, Institutional Select Class and Institutional Class shares were renamed Class IS and Class I shares, respectively. |
Legg Mason Investor Services, LLC, a wholly-owned broker-dealer subsidiary of Legg Mason, serves as distributor of the Fund’s shares.
3. Investments
During the six months ended June 30, 2010, the aggregate cost of purchases and proceeds from sales of investments (excluding short-term investments) and U.S. Government and Agency Obligations were as follows:
| | | | | | |
| | | Investments | | U.S. Government & Agency Obligations |
| Purchases | | $ | 91,162,047 | | $ | 185,745,118 |
| Sales | | | 77,444,507 | | | 260,208,104 |
At June 30, 2010, the aggregate gross unrealized appreciation and depreciation of investments for federal income tax purposes were substantially as follows:
| | | | |
| Gross unrealized appreciation | | $ | 18,260,222 | |
| Gross unrealized depreciation | | | (35,636,589 | ) |
| Net unrealized depreciation | | $ | (17,376,367 | ) |
At June 30, 2010, the Fund had the following open futures contracts:
| | | | | | | | | | | | | |
| | | Number of
Contracts | | Expiration
Date | | Basis Value | | Market Value | | Unrealized
Gain/(Loss) |
| Contracts to Buy: | | | | | | | | | | | | | |
| 90-Day Eurodollar | | 94 | | 9/10 | | $ | 23,291,656 | | $ | 23,346,075 | | $ | 54,419 |
| U.S. Treasury 5-Year Notes | | 194 | | 9/10 | | | 22,650,475 | | | 22,960,203 | | | 309,728 |
| U.S. Treasury 10-Year Notes | | 110 | | 9/10 | | | 13,277,295 | | | 13,480,156 | | | 202,861 |
| U.S. Treasury 30-Year Bonds | | 56 | | 9/10 | | | 6,975,683 | | | 7,140,000 | | | 164,317 |
| | | | | | | | | | | | | | 731,325 |
| | | | | |
| Contracts to Sell: | | | | | | | | | | | | | |
| U.S. Treasury 2-Year Notes | | 55 | | 9/10 | | | 12,017,196 | | | 12,035,547 | | | (18,351) |
| Net unrealized gain on open futures contracts | | | | | | | | | | | | $ | 712,974 |
During the six months ended June 30, 2010, written option transactions for the Fund were as follows:
| | | | | |
| | | Number of Contracts | | Premiums |
| Written options, outstanding December 31, 2009 | | 1,445 | | $ | 823,626 |
| Options written | | 4,640 | | | 1,713,814 |
| Options closed | | (3,615) | | | (1,461,042) |
| Options exercised | | — | | | — |
| Options expired | | (609) | | | (79,509) |
| Written options, outstanding June 30, 2010 | | 1,861 | | $ | 996,889 |
| | |
| 28 | | Western Asset Intermediate Bond Portfolio 2010 Semi-Annual Report |
Notes to financial statements (unaudited) (cont’d)
At June 30, 2010, the Fund had the following open swap contracts:
| | | | | | | | | | | | | | | | | |
| CREDIT DEFAULT SWAPS ON CORPORATE ISSUES — SELL PROTECTION1 |
Swap Counterparty
(Reference Entity) | | Notional
Amount2 | | Termination
Date | | Implied
Credit
Spread at
June 30,
20103 | | Periodic
Payments
Received By
The Fund‡ | | Market
Value | | Upfront
Premiums
Paid/
(Received) | | Unrealized
Appreciation/
(Depreciation) |
| Morgan Stanley & Co. Inc. (SLM Corp., 5.125% due 8/27/12) | | $ | 800,000 | | 9/20/12 | | 4.95% | | 2.600% quarterly | | $ | (34,682) | | — | | $ | (34,682) |
| | | | | | | | | | | | | | | | |
| CREDIT DEFAULT SWAPS ON CORPORATE ISSUES — BUY PROTECTION4 |
Swap Counterparty
(Reference Entity) | | Notional
Amount2 | | Termination
Date | | Periodic
Payments
Made By
The Fund‡ | | Market
Value | | Upfront
Premiums
Paid/
(Received) | | Unrealized
Appreciation/
(Depreciation) |
| Goldman Sachs Group Inc. (Assured Guaranty Municipal Corp., 0.480% due 11/15/13) | | $ | 100,000 | | 3/20/11 | | 5.000% quarterly | | $ | 1,335 | | $ | (685) | | $ | 2,020 |
| Goldman Sachs Group Inc. (Assured Guaranty Municipal Corp., 0.480% due 11/15/13) | | | 60,000 | | 3/20/13 | | 5.000% quarterly | | | 4,512 | | | (217) | | | 4,729 |
| Goldman Sachs Group Inc. (Assured Guaranty Municipal Corp., 0.480% due 11/15/13) | | | 40,000 | | 3/20/20 | | 5.000% quarterly | | | 5,049 | | | 1,243 | | | 3,806 |
| Goldman Sachs Group Inc. (Assured Guaranty Municipal Corp., 0.480% due 11/15/13) | | | 100,000 | | 3/20/15 | | 5.000% quarterly | | | 11,739 | | | 1,288 | | | 10,451 |
| Goldman Sachs Group Inc. (Assured Guaranty Municipal Corp., 0.480% due 11/15/13) | | | 330,000 | | 3/20/15 | | 5.000% quarterly | | | 38,740 | | | 3,049 | | | 35,691 |
| Goldman Sachs Group Inc. (Assured Guaranty Municipal Corp., 0.480% due 11/15/13) | | | 420,000 | | 3/20/20 | | 5.000% quarterly | | | 53,020 | | | 10,770 | | | 42,250 |
| Goldman Sachs Group Inc. (Assured Guaranty Municipal Corp., 0.480% due 11/15/13) | | | 330,000 | | 3/20/11 | | 5.000% quarterly | | | 4,407 | | | (2,504) | | | 6,911 |
| Goldman Sachs Group Inc. (Assured Guaranty Municipal Corp., 0.480% due 11/15/13) | | | 220,000 | | 3/20/13 | | 5.000% quarterly | | | 16,546 | | | (1,329) | | | 17,875 |
| Total | | $ | 1,600,000 | | | | | | $ | 135,348 | | $ | 11,615 | | $ | 123,733 |
| | | | | | | | | | | | | | | | |
| CREDIT DEFAULT SWAPS ON CREDIT INDICES — SELL PROTECTION1 |
Swap Counterparty
(Reference Entity) | | Notional
Amount2 | | Termination
Date | | Periodic
Payments
Received By
The Fund‡ | | Market
Value5 | | Upfront
Premiums
Paid/
(Received) | | Unrealized
Appreciation/
(Depreciation) |
Goldman Sachs Group Inc.
(CDX IG HVOL 9) | | $ | 1,082,663 | | 12/20/12 | | 1.400% quarterly | | $ | (32,955) | | $ | (74,124) | | $ | 41,169 |
Goldman Sachs Group Inc.
(iBoxx IG HiVol4) | | | 7,550,942 | | 6/20/12 | | 1.000% quarterly | | | (187,355) | | | (33,190) | | | (154,165) |
| Total | | $ | 8,633,605 | | | | | | $ | (220,310) | | $ | (107,314) | | $ | (112,996) |
| | | | | | | | | | | | | | | | |
| CREDIT DEFAULT SWAPS ON CREDIT INDICES — BUY PROTECTION4 |
Swap Counterparty
(Reference Entity) | | Notional
Amount2 | | Termination
Date | | Periodic
Payments
Made By
The Fund‡ | | Market
Value5 | | Upfront
Premiums
Paid/
(Received) | | Unrealized
Appreciation/
(Depreciation) |
Barclay’s Capital Inc. (CDX IG 11) | | $ | 10,515,200 | | 12/20/13 | | 1.500% quarterly | | $ | (80,469) | | $ | 261,957 | | $ | (342,426) |
| 1 | If the Fund is a seller of protection and a credit event occurs, as defined under the terms of that particular swap agreement, the Fund will either (i) pay to the buyer of protection an amount equal to the notional amount of the swap and take delivery of the referenced obligation or underlying securities comprising the referenced index or (ii) pay a net settlement amount in the form of cash or securities equal to the notional amount of the swap less the recovery value of the referenced obligation or underlying securities comprising the referenced index. |
| 2 | The maximum potential amount the Fund could be required to make as a seller of credit protection or receive as a buyer of credit protection if a credit event occurs as defined under the terms of that particular swap agreement. |
| | |
| Western Asset Intermediate Bond Portfolio 2010 Semi-Annual Report | | 29 |
| 3 | Implied credit spreads, utilized in determining the market value of credit default swap agreements on corporate issues or sovereign issues of an emerging country as of period end serve as an indicator of the current status of the payment/performance risk and represent the likelihood or risk of default for the credit derivative. The implied credit spread of a particular referenced entity reflects the cost of buying/selling protection and may include upfront payments required to be made to enter into the agreement. Wider credit spreads represent a deterioration of the referenced entity’s credit soundness and a greater likelihood or risk of default or other credit event occurring as defined under the terms of the agreement. A credit spread identified as “Defaulted” indicates a credit event has occurred for the referenced entity or obligation. |
| 4 | If the Fund is a buyer of protection and a credit event occurs, as defined under the terms of that particular swap agreement, the Fund will either (i) receive from the seller of protection an amount equal to the notional amount of the swap and deliver the underlying securities comprising the referenced index or (ii) receive a net settlement amount in the form of cash or securities equal to the notional amount of the swap less the recovery value of the underlying securities comprising the referenced index. |
| 5 | The quoted market prices and resulting values for credit default swap agreements on asset-backed securities and credit indices serve as an indicator of the current status of the payment/performance risk and represent the likelihood of an expected liability (or profit) for the credit derivative should the notional amount of the swap agreement been closed/sold as of the period end. Decreasing market values when compared to the notional amount of the swap, represent a deterioration of the referenced entity’s credit soundness and a greater likelihood or risk of default or other credit event occurring as defined under the terms of the agreement. |
| ‡ | Percentage shown is an annual percentage rate. |
4. Derivative instruments and hedging activities
Financial Accounting Standards Board Codification Topic 815 requires enhanced disclosure about an entity’s derivative and hedging activities.
Below is a table, grouped by derivative type that provides information about the fair value and the location of derivatives within the Statement of Assets and Liabilities at June 30, 2010.
| | | | | | | | | |
| ASSET DERIVATIVES1 |
| | | Interest Rate
Contracts Risk | | Credit
Contracts Risk | | Total |
| Purchased options2 | | $ | 309,222 | | | — | | $ | 309,222 |
| Futures contracts3 | | | 731,325 | | | — | | | 731,325 |
| Swap contracts4 | | | — | | $ | 443,209 | | | 443,209 |
| Total | | $ | 1,040,547 | | $ | 443,209 | | $ | 1,483,756 |
| | | | | | | | | |
| LIABILITY DERIVATIVES1 |
| | | Interest Rate
Contracts Risk | | Credit
Contracts Risk | | Total |
| Written options | | $ | 931,937 | | | — | | $ | 931,937 |
| Futures contracts3 | | | 18,351 | | | — | | | 18,351 |
| Swap contracts4 | | | — | | $ | 643,322 | | | 643,322 |
| Total | | $ | 950,288 | | $ | 643,322 | | $ | 1,593,610 |
| 1 | Generally, the balance sheet location for asset derivatives is receivables/net unrealized appreciation (depreciation) and for liability derivatives is payables/net unrealized appreciation (depreciation). |
| 2 | Market value of purchased options is reported in Investments of value in the Statement of Assets and Liabilities. |
| 3 | Includes cumulative appreciation/depreciation of futures contracts as reported in the footnotes. Only variation margin is reported within the receivables and/or payables of the Statement of Assets and Liabilities. |
| 4 | Values include premiums paid/(received) on swap contracts which are shown separately in the Statement of Assets and Liabilities. |
The following tables provide information about the effect of derivatives and hedging activities on the Fund’s Statement of Operations for the six months ended June 30, 2010. The first table provides additional detail about the amounts and sources of gains/(losses) realized on derivatives during the period. The second table provides additional information about the changes in unrealized appreciation/(depreciation) resulting from the Fund’s derivatives and hedging activities during the period.
| | | | | | | | | |
| AMOUNT OF REALIZED GAIN OR (LOSS) ON DERIVATIVES RECOGNIZED |
| | | Interest Rate
Contracts Risk | | Credit
Contracts Risk | | Total |
| Purchased options | | $ | (254,147) | | | — | | $ | (254,147) |
| Written options | | | 696,868 | | | — | | | 696,868 |
| Futures contracts | | | 1,493,426 | | | — | | | 1,493,426 |
| Swap contracts | | | (1,202,203) | | $ | (71,564) | | | (1,273,767) |
| Total | | $ | 733,944 | | $ | (71,564) | | $ | 662,380 |
| | |
| 30 | | Western Asset Intermediate Bond Portfolio 2010 Semi-Annual Report |
Notes to financial statements (unaudited) (cont’d)
| | | | | | | | | |
| CHANGE IN UNREALIZED APPRECIATION/DEPRECIATION ON DERIVATIVES RECOGNIZED |
| | | Interest Rate
Contracts Risk | | Credit
Contracts Risk | | Total |
| Purchased options | | $ | 41,883 | | | — | | $ | 41,883 |
| Written options | | | (13,515) | | | — | | | (13,515) |
| Futures contracts | | | 1,812,801 | | | — | | | 1,812,801 |
| Swap contracts | | | 267,239 | | $ | 355,896 | | | 623,135 |
| Total | | $ | 2,108,408 | | $ | 355,896 | | $ | 2,464,304 |
During the six months ended June 30, 2010, the volume of derivative activity for the Fund was as follows:
| | | |
| | | Average Market
Value |
| Purchased options | | $ | 139,134 |
| Written options | | | 844,490 |
| Futures contracts (to buy) | | | 92,062,239 |
| Futures contracts (to sell) | | | 33,606,357 |
| |
| | | Average Notional
Balance‡ |
| Interest rate swap contracts† | | $ | 21,685,714 |
| Credit default swap contracts (to buy protection) | | | 11,658,057 |
| Credit default swap contracts (to sell protection) | | | 9,433,604 |
| † | At June 30, 2010, there were no open positions held in this derivative. |
| ‡ | Amounts are denominated in U.S. dollars, unless otherwise noted. |
The Fund has several credit related contingent features that if triggered would allow its derivatives counterparties to close out and demand payment or additional collateral to cover their exposure from the Fund. Credit related contingent features are established between the Fund and its derivatives counterparties to reduce the risk that the Fund will not fulfill its payment obligations to its counterparties. These triggering features include, but are not limited to, a percentage decrease in the Fund’s net assets and/or a percentage decrease in the Fund’s Net Asset Value or NAV. The contingent features are established within the Fund’s International Swap and Derivatives Association, Inc. master agreements which govern positions in swaps, over-the-counter options, and forward currency exchange contracts for each individual counterparty.
As of June 30, 2010, the total value of swap positions with credit related contingent features in a net liability position was $335,461. If a contingent feature would have been triggered as of June 30, 2010, the Fund would have been required to pay this amount in cash to its counterparties. The Fund posted collateral for its swap transactions in the amount of $400,000.
5. Class specific expenses, waivers and/or reimbursements
The Fund has adopted a Rule 12b-1 distribution plan and under that plan the Fund pays a distribution fee with respect to its Class FI shares calculated at an annual rate of 0.25% of the average daily net assets of the Class FI. Distribution fees are accrued and paid monthly. At June 30, 2010, Class FI had not commenced operations.
For the six months ended June 30, 2010, class specific expenses were as follows:
| | | | | | |
| | | Shareholder
Reports | | Transfer Agent
Fees |
| Class IS1 | | $ | 2,748 | �� | $ | 3,233 |
| Class I1 | | | 29,026 | | | 32,679 |
| Total | | $ | 31,774 | | $ | 35,912 |
| 1 | In April 2010, Institutional Select Class and Institutional Class shares were renamed Class IS and Class I shares, respectively. |
| | |
| Western Asset Intermediate Bond Portfolio 2010 Semi-Annual Report | | 31 |
For the six months ended June 30, 2010, waivers and/or reimbursements by class were as follows:
| | | |
| | | Waivers/
Reimbursements |
| Class IS1 | | $ | 3,409 |
| Class I1 | | | 2,135 |
| Total | | $ | 5,544 |
| 1 | In April 2010, Institutional Select Class and Institutional Class shares were renamed Class IS and Class I shares, respectively. |
6. Distributions to shareholders by class
| | | | | | |
| | | Six Months Ended
June 30, 2010 | | Year Ended
December 31, 2009 |
| Net Investment Income: | | | | | | |
| Class IS1 | | $ | 1,234,752 | | $ | 2,433,197 |
| Class I1 | | | 8,377,967 | | | 19,255,297 |
| Total | | $ | 9,612,719 | | $ | 21,688,494 |
| | |
| Net Realized Gains | | | | | | |
| Class IS1 | | | — | | $ | 920,490 |
| Class I1 | | | — | | | 7,371,572 |
| Total | | | — | | $ | 8,292,062 |
| 1 | In April 2010, Institutional Select Class and Institutional Class shares were renamed Class IS and Class I shares, respectively. |
7. Capital shares
At June 30, 2010, the Corporation had 21.15 billion shares of capital stock authorized with a par value of $0.001 per share. Transactions in shares of the Fund were as follows:
| | | | | | | | | | |
| | | Six Months Ended
June 30, 2010 | | Year Ended
December 31, 2009 |
| | | Shares | | Amount | | Shares | | Amount |
| | | | |
| Class IS1 | | | | | | | | | | |
| Shares sold | | — | | | — | | 850,572 | | $ | 8,100,000 |
| Shares issued on reinvestment | | 116,968 | | $ | 1,234,205 | | 342,029 | | | 3,350,308 |
| Shares repurchased | | (832,625) | | | (8,800,000) | | (751,801) | | | (7,400,000) |
| Net increase (decrease) | | (715,657) | | $ | (7,565,795) | | 440,800 | | $ | 4,050,308 |
| | | | |
| Class I1 | | | | | | | | | | |
| Shares sold | | 3,095,542 | | $ | 32,539,734 | | 11,581,116 | | $ | 114,063,386 |
| Shares issued on reinvestment | | 532,101 | | | 5,612,671 | | 2,249,963 | | | 21,915,551 |
| Shares repurchased | | (11,168,244) | | | (118,292,455) | | (23,905,691) | | | (235,193,163) |
| Net decrease | | (7,540,601) | | $ | (80,140,050) | | (10,074,612) | | $ | (99,214,226) |
| 1 | In April 2010, Institutional Select Class and Institutional Class shares were renamed Class IS and Class I shares, respectively. |
8. Capital loss carryforward
As of December 31, 2009, the Fund had a net capital loss carryforward of approximately $2,434,470 all of which expires in 2017. This amount will be available to offset any future taxable capital gains.
Western Asset
Intermediate Bond Portfolio
Directors
William E. B. Siart, Chairman
Ronald J. Arnault
Anita L. DeFrantz
R. Jay Gerken
Ronald L. Olson
Avedick B. Poladian
Jaynie Miller Studenmund
Investment manager
Legg Mason Partners Fund Advisor, LLC
Investment adviser
Western Asset Management Company
Transfer agent
Boston Financial Data Services
2000 Crown Colony Drive
Quincy, MA 02169
Custodian
State Street Bank and Trust Company
Counsel
Ropes & Gray LLP
1211 Avenue of the Americas
New York, NY 10036
Independent registered public accounting firm
PricewaterhouseCoopers LLP
Baltimore, MD
Western Asset Intermediate Bond Portfolio
The Fund is a separate investment series of Western Asset Funds, Inc.
Western Asset Intermediate Bond Portfolio
Legg Mason Funds
55 Water Street
New York, NY 10041
The Fund files its complete schedule of portfolio holdings with the Securities and Exchange Commission (“SEC”) for the first and third quarters of each fiscal year on Form N-Q. The Fund’s Forms N-Q are available on the SEC’s website at www.sec.gov. The Fund’s Forms N-Q may be reviewed and copied at the SEC’s Public Reference Room in Washington, D.C., and information on the operation of the Public Reference Room may be obtained by calling 1-800-SEC-0330. To obtain information on Form N-Q from the Fund, shareholders can call Institutional Shareholder Services at 1-888-425-6432.
Information on how the Fund voted proxies relating to portfolio securities during the prior 12-month period ended June 30th of each year and a description of the policies and procedures that the Fund uses to determine how to vote proxies related to portfolio transactions are available (1) without charge, upon request, by calling Institutional Shareholder Services at 1-888-425-6432, (2) on the Fund’s website at www.leggmason.com/individualinvestors and (3) on the SEC’s website at www.sec.gov.
This report is submitted for the general information of the shareholders of Western Asset Intermediate Bond Portfolio. This report is not authorized for distribution to prospective investors in the Fund unless preceded or accompanied by a current prospectus.
Investors should consider the Fund’s investment objectives, risks, charges and expenses carefully before investing. The prospectus contains this and other important information about the Fund. Please read the prospectus carefully before investing.
www.leggmason.com/individualinvestors
© 2010 Legg Mason Investor Services, LLC
Member FINRA, SIPC
Privacy policy
We are committed to keeping nonpublic personal information about you secure and confidential. This notice is intended to help you understand how we fulfill this commitment. From time to time, we may collect a variety of personal information about you, including:
| Ÿ | | Information we receive from you on applications and forms, via the telephone, and through our websites; |
| Ÿ | | Information about your transactions with us, our affiliates, or others (such as your purchases, sales, or account balances); and |
| Ÿ | | Information we receive from consumer reporting agencies. |
We do not disclose nonpublic personal information, about our customers or former customers, except to our affiliates (such as broker-dealers or investment advisers within the Legg Mason family of companies) or as is otherwise permitted by applicable law or regulation. For example, we may share this information with others in order to process your transactions or service an account. We may also provide this information to companies that perform marketing services on our behalf, such as printing and mailing, or to other financial institutions with whom we have joint marketing agreements. When we enter into such agreements, we will require these companies to protect the confidentiality of this information and to use it only to perform the services for which we hired them.
With respect to our internal security procedures, we maintain physical, electronic, and procedural safeguards to protect your nonpublic personal information, and we restrict access to this information.
If you decide at some point either to close your account(s) or become an inactive customer, we will continue to adhere to our privacy policies and practices with respect to your nonpublic personal information.
|
NOT PART OF THE SEMI-ANNUAL REPORT |
At Legg Mason, we’ve assembled a collection of experienced investment management firms and empowered each of them with the tools, the resources and, most importantly, the independence to pursue the strategies they know best.
| Ÿ | | Each was purposefully chosen for their commitment to investment excellence. |
| Ÿ | | Each is focused on specific investment styles and asset classes. |
| Ÿ | | Each exhibits thought leadership in their chosen area of focus. |
Together, we’ve built a powerful portfolio of solutions for financial advisors and their clients. And it has made us a world leader in money management.*
| * | Ranked eighth-largest money manager in the world, according to Pensions & Investments, May 31, 2010, based on 12/31/09 worldwide institutional assets under management. |
Western Asset Management Company
Legg Mason, Inc. Subsidiaries
www.leggmason.com/individualinvestors
©2010 Legg Mason Investor Services, LLC Member FINRA, SIPC
WASX012830 8/10 SR10-1164
|
NOT PART OF THE SEMI-ANNUAL REPORT |