Exhibit 17(c)

Annual Report to Shareholders
December 31, 2009
Western Asset Funds, Inc.
Western Asset Absolute Return Portfolio
Western Asset High Yield Portfolio
Western Asset Inflation Indexed Plus Bond Portfolio
Western Asset Intermediate Bond Portfolio
Western Asset Intermediate Plus Bond Portfolio
Western Asset Limited Duration Bond Portfolio
Western Asset Non-U.S. Opportunity Bond Portfolio
Contents
For more information, visit us on the web
at www.westernassetfunds.com.
Annual Report to Shareholders
Investment Commentary
Western Asset Funds, Inc.
Financial Market Overview
While 2008 was characterized by upheaval in the financial markets, periods of extreme volatility, illiquidity and heightened risk aversion, 2009 was largely a return to more normal conditions and increased investor risk appetite.
Looking back at the tail end of 2008, investors fled fixed-income securities that were seen as being risky and flocked to the relative safety of short-term Treasuries, driving the latter’s prices higher and their yields to historically low levels. In contrast, non-Treasury spreads widened to historically wide levels in some cases, as the market priced in worst-case scenarios. This caused nearly every spread sector to lag equal-durationi Treasuries during the year. While this trend continued in early 2009, some encouraging economic data and a thawing of the once frozen credit markets helped bolster investor confidence.
In a stunning turnaround, by the end of the first quarter of 2009, risk aversion had been replaced by robust demand for riskier, and higher-yielding, fixed-income securities. Despite some temporary setbacks, riskier assets continued to perform well during the remainder of the year. Looking at 2009 as a whole, every spread sector outperformed equal-duration Treasuries.
While economic news often surprised on the upside during 2009, incoming economic data did not suggest a dramatic rebound in growth in 2010. As such, the Federal Reserve Board (“Fed”)ii continued its accommodative monetary policy during 2009. The Fed met eight times in 2009 and, on each occasion, kept the federal funds rateiii in a range of 0 to 1/4 percent. This trend continued at the Fed’s meeting in January 2010. At that time, the Fed said that it “will maintain the target range for the federal funds rate at 0 to 1/4 percent and continues to anticipate that economic conditions, including low rates of resource utilization, subdued inflation trends, and stable inflation expectations, are likely to warrant exceptionally low levels of the federal funds rate for an extended period.”
Economic Review
While the U.S. economy was weak during the first half of the twelve-month reporting period ended December 31, 2009, the lengthiest recession since the Great Depression finally appeared to have ended during the second half of the year.
Looking back, the U.S. Department of Commerce reported that first quarter 2009 U.S. gross domestic product (“GDP”)iv contracted 6.4%. The economic environment then started to get relatively better during the second quarter, as GDP fell 0.7%. The economy’s more modest contraction was due, in part, to smaller declines in both exports and business spending. After contracting four consecutive quarters, the Commerce Department reported that third quarter 2009 GDP growth was 2.2%. A variety of factors helped the economy to expand, including the government’s $787 billion stimulus program, its “Cash for Clunkers” car rebate program, which helped spur an increase in car sales, and tax credits for first-time home buyers. Economic growth then accelerated during the fourth quarter of 2009, as the advance estimate for GDP growth was 5.7%. The Commerce Department cited a slower drawdown in business inventories and consumer spending as contributing factors spurring the economy’s higher growth rate.
Even before GDP advanced in the third quarter, there were signs that the economy was starting to regain its footing. The manufacturing sector, as measured by the Institute for Supply Management’s PMIv, rose to 52.9 in August 2009, the first time it surpassed 50 since January 2008 (a reading below 50 indicates a contraction, whereas a reading above 50 indicates an expansion). PMI data subsequently showed that manufacturing expanded from September through December as well. In addition, December’s PMI reading of 55.9 was the highest since April 2006.
There were some mixed signals from the housing market toward the end of the reporting period. According to its most recent data, the S&P/Case-Shiller Home Price Indexvi indicated that month-over-month home prices rose for the sixth straight month in November. However, according to the National Association of Realtors, while existing home sales rose 7.4% in November, sales fell by nearly 17% in December.
One area that remained weak—and could hamper the magnitude of economic recovery—was the labor market. While monthly job losses have moderated compared to earlier in the year, the unemployment rate remained elevated during the reporting period. After reaching a twenty-six-year high of 10.1% in October 2009, the unemployment rate fell to 10.0% in November and remained unchanged the following month. Since December 2007, the unemployment rate has more than doubled and the number of unemployed workers has risen by more than eight million.
ii
Annual Report to Shareholders
Market Review
Both short- and long-term Treasury yields fluctuated during the reporting period. When the period began, Treasury yields were extremely low, given numerous “flights to quality” that were triggered by the fallout from the financial crisis in 2008. After starting the period at 0.76% and 2.25%, respectively, two- and ten-year Treasury yields then generally moved higher (and their prices lower) until early June. Two- and ten-year yields peaked at 1.42% and 3.98%, respectively, before falling and ending the reporting period at 1.14% and 3.85%, respectively. Over the twelve months ended December 31, 2009, longer-term yields moved higher than their shorter-term counterparts as economic data improved and there were concerns regarding future inflation given the government’s massive stimulus program. In a reversal from 2008, investor risk aversion faded during the twelve-month reporting period, driving spread sector (non-Treasury) prices higher. For the twelve months ended December 31, 2009, the Barclays Capital U.S. Aggregate Indexvii returned 5.93%.
During the reporting period, there was a shift in terms of expectations for inflation. Fears of inflation had increased in mid-2008 (before the reporting period began). This was, in part, due to sharply rising oil prices, which peaked at $145 a barrel in July 2008. Fears of inflation were then replaced with fears of deflation, as global economic conditions weakened and the financial crisis took hold in the fall of 2008. By the end of 2008, oil prices had fallen to $45 a barrel as demand waned and oil reserves moved higher. While inflation, as measured by the Consumer Price Index for All Urban Consumers (“CPI-U”)viii, was 2.7% during the twelve-month period ended December 31, 2009, there were fears of higher inflation in the future. This was due to central banks’ accommodative monetary policies, signs that the global economy was recovering and rising oil prices, which hit $79 a barrel in December 2009. Inflation expectations led to increased demand for U.S. Treasury Inflation-Protected Securities (“TIPS”)ix, and the Barclays Capital Global Real Index: U.S. TIPSx gained 11.41% during the twelve months ended December 31, 2009.
The investment grade bond market generated solid results during the reporting period. Spreads on these securities had moved to extremely wide levels in late 2008, as the weakening economy and credit crunch triggered fears of escalating default rates. Investment grade bond spreads then significantly narrowed in 2009, as the economic environment improved and corporate profits were often better than expected. All told, the investment grade bond asset class, as measured by the Barclays Capital U.S. Credit Indexxi, returned 16.04% during the twelve-month period ended December 31, 2009.
In the mortgage-backed securities market, both agency and non-agency issues did well during the year. Agencies were supported by the government’s purchase programs of these securities as they sought to keep long-term interest rates low in an attempt to revive the housing market. The non-agency sector improved, particularly later in the year, as housing data stabilized and there was positive sentiment surrounding the launch of the Public-Private Investment Program (“PPIP”).
The high-yield bond market produced very strong results during the twelve months ended December 31, 2009. In sharp contrast to its poor results in 2008, the asset class posted positive returns during eleven of the twelve months of the reporting period. This strong rally was due to a variety of factors, including the unfreezing of the credit markets, improving economic data and strong investor demand. All told, the Barclays Capital U.S. Corporate High Yield 2% Issuer Cap Indexxii returned 58.76% for the twelve months ended December 31, 2009.
Emerging market debt prices rallied sharply—posting positive returns during every month but February of 2009. This rally was triggered by rising commodity prices, optimism that the worst of the global recession was over and increased investor risk appetite. Over the twelve months ended December 31, 2009, the JPMorgan Emerging Markets Bond Index Global (“EMBI Global”)xiii returned 28.18%.
Market Outlook
Some economists have floated the notion of a double-dip economic recession because of the expiration of various fiscal and monetary stimulus programs. However, we believe this economic phenomenon seems unlikely. As long as the Fed maintains the current low rate environment, which we believe it will, access to credit should remain sufficient. Given the elevated levels of unemployment, the recent dip in jobless claims is a positive sign that the labor market is stabilizing. The financial market is focused on consumer spending, but we believe more sustained gains in capital expenditures and exports will be key to the U.S. recovery.
We believe that the Fed is likely to keep the federal funds rate anchored at 0 to 1/4 percent in the near future. A large concern the Fed now faces is excess bank reserves. Government support from the Troubled Asset Relief Program (“TARP”) and the Fed’s various special liquidity programs helped banks restore their balance sheets, but banks then held on to reserves in
iii
Annual Report to Shareholders
excess of their capital requirements. As the recovery accelerates, banks may quickly reduce these excess reserves by extending credit. We believe increased lending should stimulate economic activity but, in doing so, might also contribute to inflationary pressures. Therefore, as the Fed manages the level of bank reserves, in our opinion, it must be careful not to inhibit economic growth and increase inflation. As long as the economic recovery is still in its infancy, we believe the Fed should continue its current policies.
Although the labor market is stabilizing, the declining trend in jobless claims reflects a drop-off in layoffs rather than an increase in hires. For unemployment to truly decline, we will need to see specific types of job growth. We believe the source of new job growth will probably have to come from the service sector, as the housing market remains weak and is unlikely to contribute significant new jobs any time soon. The recent increase in industrial production and capacity utilization indicates that factory-related jobs could increase in the coming year.
Despite an uptick in consumer spending in November, most likely due to the holidays, we think consumers will likely continue to demonstrate a more conservative mindset with increased savings and less consumption. Businesses, especially those that are export-oriented, should benefit from a lower U.S. dollar and increased future spending. Corporate profits in the fourth quarter of 2009 showed improvement, leading to a better outlook for the business sector compared to a year ago. Therefore, we think that businesses, rather than consumers, are likely to be the primary contributors to future economic growth. Considering current Fed policies, the likelihood of moderate inflation in the months ahead, a stabilizing labor market and an improved business climate, we find fears of a double-dip recession to be exaggerated.
Western Asset Management Company
January 29, 2010
iv
Annual Report to Shareholders
The views expressed in this commentary reflect those solely of Western Asset Management Company (“Western Asset”) as of the date of the commentary and may differ from those of Legg Mason, Inc. or its affiliates. Any such views are subject to change at any time based on market or other conditions, and Western Asset and Legg Mason Investor Services, LLC disclaim any responsibility to update such views. These views are not intended to be a forecast of future events, a guarantee of future results or investment advice. Forecasts are inherently limited and should not be relied upon as an indication of actual or future performance. Because investment decisions for the Funds are based on numerous factors, these views may not be relied upon as an indication of trading intent on behalf of the Funds or any Legg Mason fund. The information contained herein has been prepared from sources believed to be reliable, but is not guaranteed by Western Asset or Legg Mason Investor Services, LLC as to its accuracy or completeness.
All investments are subject to risk including the loss of principal. All index performance reflects no deduction for fees, expenses or taxes. Please note that an investor cannot invest directly in an index.
| i | | Duration is the measure of the price sensitivity of a fixed-income security to an interest rate change of 100 basis points. Calculation is based on the weighted average of the present values for all cash flows. |
| ii | | The Federal Reserve Board (“Fed”) is responsible for the formulation of policies designed to promote economic growth, full employment, stable prices and a sustainable pattern of international trade and payments. |
| iii | | The federal funds rate is the rate charged by one depository institution on an overnight sale of immediately available funds (balances at the Federal Reserve) to another depository institution; the rate may vary from depository institution to depository institution and from day to day. |
| iv | | Gross domestic product (“GDP”) is the market value of all final goods and services produced within a country in a given period of time. |
| v | | The Institute for Supply Management’s PMI is based on a survey of purchasing executives who buy the raw materials for manufacturing at more than 350 companies. It offers an early reading on the health of the manufacturing sector. |
| vi | | The S&P/Case-Shiller Home Price Index measures the residential housing market, tracking changes in the value of the residential real estate market in twenty metropolitan regions across the United States. |
| vii | | The Barclays Capital U.S. Aggregate Index is a broad-based bond index comprised of government, corporate, mortgage- and asset-backed issues, rated investment grade or higher, and having at least one year to maturity. |
| viii | | The Consumer Price Index for All Urban Consumers (“CPI-U”) is a measure of the average change in prices over time of goods and services purchased by households, which covers approximately 87% of the total population and includes, in addition to wage earners and clerical worker households, groups such as professional, managerial and technical workers, the self-employed, short-term workers, the unemployed and retirees and others not in the labor force. |
| ix | | U.S. Treasury Inflation-Protected Securities (“TIPS”) are inflation-indexed securities issued by the U.S. Treasury in five-year, ten-year and twenty-year maturities. The principal is adjusted to the Consumer Price Index, the commonly used measure of inflation. The coupon rate is constant, but generates a different amount of interest when multiplied by the inflation-adjusted principal. |
| x | | The Barclays Capital Global Real Index: U.S. TIPS represents an unmanaged market index made up of U.S. Treasury Inflation-Linked Index securities. |
| xi | | The Barclays Capital U.S. Credit Index is an index composed of corporate and non-corporate debt issues that are investment grade (rated Baa3/BBB- or higher). |
| xii | | The Barclays Capital U.S. Corporate High Yield 2% Issuer Cap Index is an index of the 2% Issuer Cap component of the Barclays Capital U.S. Corporate High Yield Index, which covers the U.S. dollar-denominated, non-investment grade, fixed-rate, taxable corporate bond market. |
| xiii | | The JPMorgan Emerging Markets Bond Index Global (“EMBI Global”) tracks total returns for U.S. dollar-denominated debt instruments issued by emerging market sovereign and quasi-sovereign entities: Brady bonds, loans, Eurobonds and local market instruments. |
v
Annual Report to Shareholders
Management’s Discussion of Fund Performance
Western Asset Absolute Return Portfolio
Performance Review
For the twelve months ended December 31, 2009, Institutional Class shares of Western Asset Absolute Return Portfolio returned 32.89%. The Fund’s unmanaged benchmarks, the Barclays Capital U.S. Aggregate Indexi and the Merrill Lynch Constant Maturity 3-Month LIBOR Indexii, returned 5.93% and 0.99%, respectively, for the same period. The Lipper Flexible Income Funds Category Average1 returned 30.34% over the same time frame.
PERFORMANCE SNAPSHOT as of December 31, 2009 (unaudited)
| | | | |
| | | 6 MONTHS | | 12 MONTHS |
Western Asset Absolute Return Portfolio: | | | | |
Institutional Class | | 15.70% | | 32.89% |
Financial Intermediary Class | | 15.59% | | 32.55% |
Institutional Select Class | | 15.73% | | 32.81% |
Barclays Capital U.S. Aggregate Index | | 3.95% | | 5.93% |
Merrill Lynch Constant Maturity 3-Month LIBOR Index | | 0.26% | | 0.99% |
Lipper Flexible Income Funds Category Average1 | | 15.11% | | 30.34% |
The performance shown represents past performance. Past performance is no guarantee of future results and current performance may be higher or lower than the performance shown above. Principal value, investment returns and yields will fluctuate and investors’ shares, when redeemed, may be worth more or less than their original cost. To obtain performance data current to the most recent month-end, please visit our website at www.leggmason.com/individualinvestors.
All share class returns assume the reinvestment of all distributions, including returns of capital, if any, at net asset value and the deduction of all Fund expenses. Returns have not been adjusted to include the deduction of taxes that a shareholder would pay on Fund distributions. Performance figures for periods shorter than one year represent cumulative figures and are not annualized.
Performance figures reflect expense reimbursements and/or fee waivers, without which the performance would have been lower.
The 30-Day SEC Yields for the period ended December 31, 2009 for Institutional, Financial Intermediary and Institutional Select Class shares were 4.42%, 4.18% and 4.42%, respectively. Absent current expense reimbursements and/or fee waivers, the 30-Day SEC Yields for Institutional, Financial Intermediary and Institutional Select Class shares would have been 4.42%, 4.06% and 4.39%, respectively. The 30-Day SEC Yield is the average annualized net investment income per share for the 30-day period indicated and is subject to change.
TOTAL ANNUAL OPERATING EXPENSES (unaudited)
As of the Fund’s most current prospectus dated July 1, 2009, the gross total operating expense ratios for Institutional, Financial Intermediary and Institutional Select Class shares were 0.83%, 1.38% and 0.85%, respectively.
Actual expenses may be higher. For example, expenses may be higher than those shown if average net assets decrease. Net assets are more likely to decrease and Fund expense ratios are more likely to increase when markets are volatile.
As a result of contractual expense limitations, the ratio of expenses, other than interest, brokerage, taxes, deferred organizational expenses and extraordinary expenses, to average net assets will not exceed 0.80% for Institutional Class shares, 1.05% for Financial Intermediary Class shares and 0.80% for Institutional Select Class shares until April 30, 2010.
| 1 | | Lipper, Inc., a wholly-owned subsidiary of Reuters, provides independent insight on global collective investments. Returns are based on the period ended December 31, 2009, including the reinvestment of all distributions, including returns of capital, if any, calculated among the 14 funds for the six-month period and among the 14 funds for the twelve-month period in the Fund’s Lipper category. |
1
Annual Report to Shareholders
In 2009, the financial markets largely stabilized, economic conditions improved and investor risk aversion abated. Collectively, this helped the spread sectors (non-Treasuries) to generate strong returns. Against this backdrop, the Fund generated very strong performance for the period and significantly outperformed its benchmarks.
The largest contributors to relative performance for the period were the portfolio’s exposures to the high-yield sector and bank loans. Within the high-yield sector, our Industrials holdings were the strongest performers. Among our high-yield holdings, Ford Motor Credit Co. and SandRidge Energy Inc. were significant contributors as, in both cases, their spreads tightened from their elevated levels in 2008 and early 2009. Among our bank loan holdings, SunGard Data Systems Inc. was a standout. Our overweight to investment grade bonds was another meaningful contributor to results, particularly within the Industrials and Financials sectors. Within the investment grade bond space, Wachovia Corp., Morgan Stanley, United Health Group Inc. and Continental Airlines Inc. were strong performers. Our exposure to non-agency mortgage-backed securities (“MBS”) was also a large contributor to performance. The asset class generated strong results as housing data improved and there was positive sentiment surrounding the launch of the Public-Private Investment Program (“PPIP”). Elsewhere, our asset-backed securities, emerging market debt and non-dollar investments also contributed to results, albeit to a lesser extent. While the Fund significantly outperformed its benchmarks during the reporting period, its cash position was a detractor from relative results given the extremely low yields available from short-term money market instruments.
We made several adjustments to the portfolio during the twelve-month reporting period. We significantly reduced our exposure to agency MBS, finding them less attractive as their spreads had narrowed given the government’s direct purchase of these securities. With the government set to phase out its purchasing program, we determined that more attractive opportunities could be found in other areas of the market. We also pared our exposure to high-yield bonds given their strong performance during the fiscal year. In contrast, the portfolio’s cash position increased as we looked for compelling opportunities in the marketplace.
During the reporting period, we utilized Eurodollar futures/options and Treasury futures/options to manage the portfolio’s durationiii and yield curveiv exposure. Interest rate swaps were utilized to manage our interest rate exposure throughout the yield curve. We also used credit default swaps and index credit default swaps to manage the portfolio’s exposure to the corporate market. Overall, the use of these instruments positively contributed to performance.
Western Asset Management Company
January 19, 2010
2
Annual Report to Shareholders
The information provided is not intended to be a forecast of future events, a guarantee of future results or investment advice. Views expressed may differ from those of the firm as a whole.
Portfolio holdings and breakdowns are as of December 31, 2009 and are subject to change and may not be representative of the portfolio managers’ current or future investments. Please refer to pages 12 through 30 for a list and percentage breakdown of the Fund’s holdings.
The mention of sector breakdowns is for informational purposes only and should not be construed as a recommendation to purchase or sell any securities. The information provided regarding such sectors is not a sufficient basis upon which to make an investment decision. Investors seeking financial advice regarding the appropriateness of investing in any securities or investment strategies discussed should consult their financial professional. The Fund’s top five sector holdings (as a percentage of net assets) as of December 31, 2009 were: Corporate Bonds and Notes (41.0%), Mortgage-Backed Securities (12.3%), U.S. Government and Agency Obligations (11.5%), Loan Participations and Assignments (7.7%) and Asset-Backed Securities (6.0%). The Fund’s portfolio composition is subject to change at any time.
RISKS: All investments are subject to risk including the loss of principal. Fixed-income securities involve interest rate, credit, inflation and reinvestment risks. As interest rates rise, the value of fixed-income securities falls. High-yield securities include greater price volatility, illiquidity and possibility of default. International investments are subject to special risks including currency fluctuations and social, economic and political uncertainties, which could increase volatility. These risks are magnified in emerging markets. The use of leverage may increase volatility and possibility of loss. Potential active and frequent trading may result in higher transaction costs and increased investor liability. Asset-backed, mortgage-backed or mortgage-related securities are subject to prepayment and extension risks. Derivatives, such as options, futures and swaps, can be illiquid, may disproportionately increase losses, and have a potentially large impact on Fund performance. Please see the Fund’s prospectus for more information on these and other risks.
All index performance reflects no deduction for fees, expenses or taxes. Please note that an investor cannot invest directly in an index.
| i | | The Barclays Capital U.S. Aggregate Index is a broad-based bond index comprised of government, corporate, mortgage- and asset-backed issues, rated investment grade or higher, and having at least one year to maturity. |
| ii | | The Merrill Lynch Constant Maturity 3-Month LIBOR Index is based on the assumed purchase of a synthetic instrument having three months to maturity and with a coupon equal to the closing quote for three-month LIBOR. That issue is sold the following day (priced at a yield equal to the current day closing three-month LIBOR rate) and is rolled into a new three-month instrument. The Index, therefore, will always have a constant maturity equal to exactly three months. |
| iii | | Duration is the measure of the price sensitivity of a fixed-income security to an interest rate change of 100 basis points. Calculation is based on the weighted average of the present values for all cash flows. |
| iv | | The yield curve is the graphical depiction of the relationship between the yield on bonds of the same credit quality but different maturities. |
3
Annual Report to Shareholders
Special Shareholder Notice
Western Asset Absolute Return Portfolio
Effective August 20, 2009, the Fund is managed by a team of portfolio managers, sector specialists and other investment professionals. S. Kenneth Leech, Stephen A. Walsh, Michael C. Buchanan and Keith J. Gardner serve as co-leaders of this team and are responsible for the day-to-day strategic oversight of the Fund’s investments and for supervising the day-to-day operations of the various sector specialist teams dedicated to the specific asset classes in which the Fund invests. Messrs. Leech, Walsh, Buchanan and Gardner are employed by Western Asset Management Company. As portfolio managers, their focus is on portfolio structure, including sector allocation, duration i weighting and term structure decisions. Each portfolio manager has been responsible for the Fund since its inception.
| i | | Duration is the measure of the price sensitivity of a fixed-income security to an interest rate change of 100 basis points. Calculation is based on the weighted average of the present values for all cash flows. |
4
Annual Report to Shareholders
Expense Example (Unaudited)
Western Asset Absolute Return Portfolio
As a shareholder of the Fund, you may incur two types of costs; (1) transaction cost and (2) ongoing costs including management fees, distribution (12b-1) fees on Financial Intermediary Class shares, and other Fund expenses. These examples are intended to help you understand your ongoing costs (in dollars) of investing in the Fund and to compare these costs with the ongoing costs of investing in other mutual funds.
The examples are based on an investment of $1,000 invested on July 1, 2009 and held through December 31, 2009. The ending values assume dividends were reinvested at the time they were paid.
Actual Expense
The first line for each class in the table below provides information about actual account values and actual expenses for each class. You may use the information in this line, together with the amount you invested, to estimate the expenses that you paid over the period. Simply divide your account value by $1,000 (for example, an $8,600 account value divided by $1,000 = 8.6), then multiply the result by the number in the first line under the heading entitled “Expenses Paid During the Period” to estimate the expenses you paid on your account if your shares were held through the entire period.
Hypothetical Examples for Comparison Purposes
The second line for each class in the table below provides information about hypothetical account values and hypothetical expenses based on the relevant class’s actual expense ratio and an assumed rate of return of 5% per year before expenses, which is not the class’s actual return. The hypothetical account values and expenses may not be used to estimate the actual ending account balance or expenses you paid for the period. You may use this information to compare the ongoing costs of investing in the Fund and other funds. To do so, compare these 5% hypothetical examples with the 5% hypothetical examples for the relevant classes that appear in the shareholder reports of other funds. Because each example is intended to be comparable to the examples provided by other funds, it is based on a hypothetical investment of $1,000 invested on July 1, 2009 and held through December 31, 2009. The ending values assume dividends were reinvested at the time they were paid.
| | | | | | | | | |
| | | Beginning Account Value
7/1/09 | | Ending Account Value
12/31/09 | | Expenses Paid A During the Period 7/1/09 to 12/31/09 |
Institutional Class: | | | | | | | | | |
Actual | | $ | 1,000.00 | | $ | 1,157.00 | | $ | 4.35 |
Hypothetical (5% return before expenses) | | | 1,000.00 | | | 1,021.17 | | | 4.08 |
Institutional Select Class: | | | | | | | | | |
Actual | | $ | 1,000.00 | | $ | 1,157.30 | | $ | 4.35 |
Hypothetical (5% return before expenses) | | | 1,000.00 | | | 1,021.17 | | | 4.08 |
Financial Intermediary Class: | | | | | | | | | |
Actual | | $ | 1,000.00 | | $ | 1,155.90 | | $ | 5.71 |
Hypothetical (5% return before expenses) | | | 1,000.00 | | | 1,019.91 | | | 5.35 |
| A | | These calculations are based on expenses incurred from July 1, 2009 to December 31, 2009. The dollar amounts shown as “Expenses Paid” are equal to the annualized expense ratios of 0.80%, 0.80% and 1.05% for the Institutional Class, Institutional Select Class and the Financial Intermediary Class, respectively, multiplied by the average values over the period, multiplied by the number of days in the most recent fiscal half-year then divided by 365. |
5
Annual Report to Shareholders
Performance Information (Unaudited)
Western Asset Absolute Return Portfolio
The graphs compare the Fund’s total returns to that of two broad-based securities market indexes. The graphs illustrate the cumulative total return of an initial $1,000,000 investment in each of the Institutional Class, Institutional Select Class and Financial Intermediary Class of the Fund, for the periods indicated. The lines for the Fund represent the total return after deducting all Fund investment management and other administrative expenses and the transaction costs of buying and selling securities. The lines representing the securities market indexes do not include any transaction costs associated with buying and selling securities in the indexes or other investment management or administrative expenses.
Total return measures investment performance in terms of appreciation or depreciation in the Fund’s net asset value per share, plus dividends and any capital gain distributions. It assumes that dividends and distributions were reinvested at the time they were paid. Returns (and the graphs and tables found below) do not reflect the deduction of taxes that a shareholder would pay on Fund distributions or the redemption of Fund shares. Average annual returns tend to smooth out variations in a fund’s return, so that they differ from actual year-to-year results.
Bonds are subject to a variety of risks, including interest rate, credit and inflation risk. Non-U.S. investments are subject to currency fluctuations, social, economic and political risk.
Growth of a $1,000,000 Investment—Institutional Class
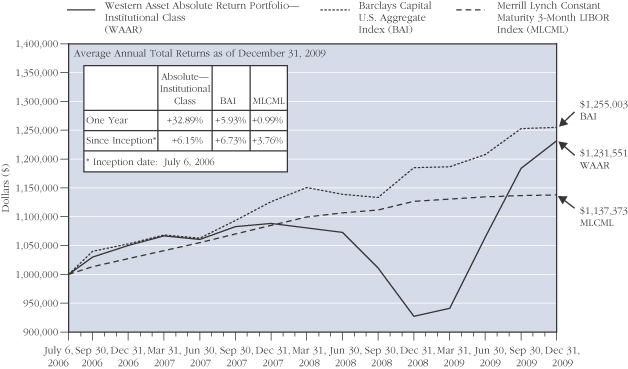
The performance data quoted represent past performance and do not guarantee future results. Current performance may be lower or higher than the performance data quoted. To obtain the most recent month-end performance information, please visit www.westernassetfunds.com. The investment return and principal value of the Fund will fluctuate so that an investor’s shares, when redeemed, may be worth more or less than the original cost. Calculations assume reinvestment of all distributions, including returns of capital, if any, at net asset value and the deduction of all Fund expenses. Performance would have been lower if fees had not been waived in various periods.
6
Annual Report to Shareholders
Growth of a $1,000,000 Investment—Institutional Select Class (Unaudited)
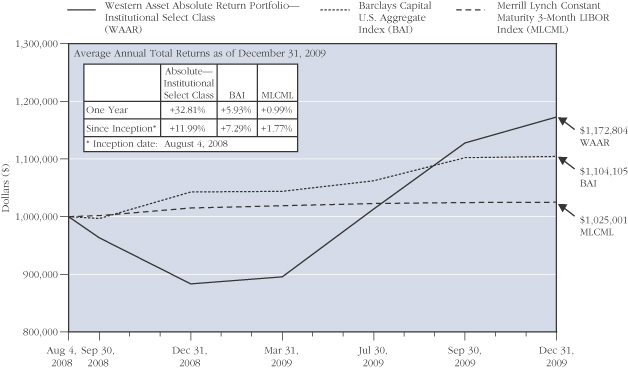
The performance data quoted represent past performance and do not guarantee future results. Current performance may be lower or higher than the performance data quoted. To obtain the most recent month-end performance information, please visit www.westernassetfunds.com. The investment return and principal value of the Fund will fluctuate so that an investor’s shares, when redeemed, may be worth more or less than the original cost. Calculations assume reinvestment of all distributions, including returns of capital, if any, at net asset value and the deduction of all Fund expenses. Performance would have been lower if fees had not been waived in various periods.
7
Annual Report to Shareholders
Performance Information—(Unaudited) Continued
Growth of a $1,000,000 Investment—Financial Intermediary Class
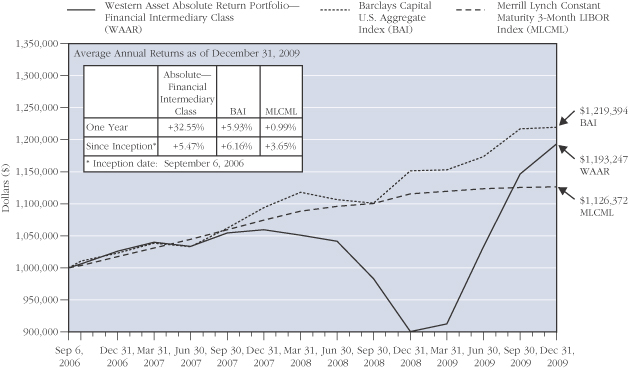
The performance data quoted represent past performance and do not guarantee future results. Current performance may be lower or higher than the performance data quoted. To obtain the most recent month-end performance information, please visit www.westernassetfunds.com. The investment return and principal value of the Fund will fluctuate so that an investor’s shares, when redeemed, may be worth more or less than the original cost. Calculations assume reinvestment of all distributions, including returns of capital, if any, at net asset value and the deduction of all Fund expenses. Performance would have been lower if fees had not been waived in various periods.
8
Annual Report to Shareholders
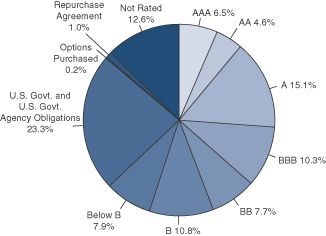
Portfolio Composition (Unaudited) (as of December 31, 2009)A
Standard & Poor’s Debt RatingsB
(as a percentage of the portfolio)
Maturity Schedule
(as a percentage of the portfolio)
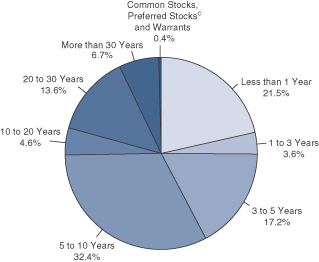
| A | | The pie charts above represent the composition of the Fund’s portfolio as of December 31, 2009 and do not include derivatives such as Futures Contracts, Options Written, and Swaps. The Fund is actively managed. As a result, the composition of the portfolio holdings and sectors are subject to change at any time. |
| B | | Standard & Poor’s Ratings Service provides capital markets with credit ratings for the evaluation and assessment of credit risk. These ratings are the opinions of S&P and not absolute measures of quality or guarantees of performance. |
| C | | Common Stocks, Preferred Stocks and Warrants do not have defined maturity dates. |
9
Annual Report to Shareholders
Spread Duration
Western Asset Absolute Return Portfolio
December 31, 2009 (Unaudited)
Economic Exposure
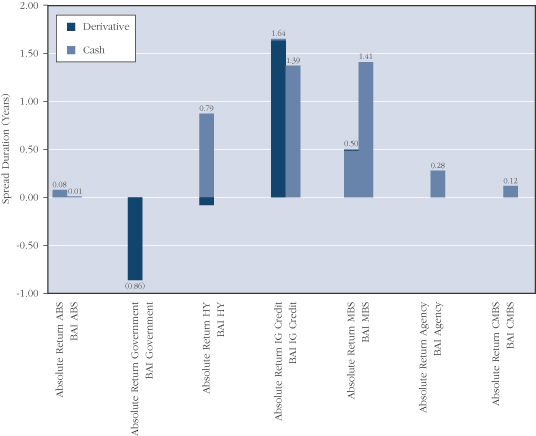
Spread duration is defined as the change in value for a 100 basis point change in the spread relative to Treasuries. The spread over Treasuries is the annual risk-premium demanded by investors to hold non-Treasury securities. This chart highlights the market sector exposure of the Fund’s portfolio and the exposure relative to the selected benchmarks as of the end of the reporting period.
| | | | |
| ABS | | — | | Asset Backed Securities |
| BAI | | — | | Barclays Capital U.S. Aggregate Index |
| CMBS | | — | | Commercial Mortgage Backed Securities |
| HY | | — | | High Yield |
| IG Credit | | — | | Investment Grade Credit |
| MBS | | — | | Mortgage Backed Securities |
10
Annual Report to Shareholders
Effective Duration
Western Asset Absolute Return Portfolio
December 31, 2009 (Unaudited)
Interest Rate Exposure
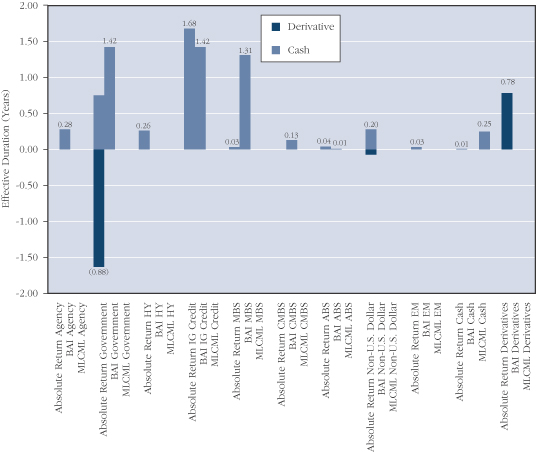
Effective duration is defined as the change in value for a 100 basis point change in Treasury yields. This chart highlights the interest rate exposure of the Fund’s portfolio relative to the selected benchmarks as of the end of the reporting period.
| | | | |
| ABS | | — | | Asset Backed Securities |
| BAI | | — | | Barclays Capital U.S. Aggregate Index |
| CMBS | | — | | Commercial Mortgage Backed Securities |
| EM | | — | | Emerging Markets |
| HY | | — | | High Yield |
| IG Credit | | — | | Investment Grade Credit |
| MBS | | — | | Mortgage Backed Securities |
| MLCML | | — | | Merrill Lynch Constant Maturity 3-Month LIBOR Index |
11
Annual Report to Shareholders
Portfolio of Investments
Western Asset Absolute Return Portfolio
December 31, 2009
| | | | | | | | | | | | | |
| | | % OF
NET ASSETS | | RATE | | MATURITY
DATE | | PAR/
SHARES† | | VALUE | |
| | | | | | | | | | | | | |
| | | | | | | | | | | | | |
Long-Term Securities | | 86.3% | | | | | | | | | | | |
| | | | | |
Corporate Bonds and Notes | | 41.0% | | | | | | | | | | | |
| | | | | |
Aerospace and Defense | | 0.5% | | | | | | | | | | | |
L-3 Communications Corp. | | | | 5.875% | | 1/15/15 | | $ | 130,000 | | $ | 129,837 | |
L-3 Communications Corp. | | | | 6.375% | | 10/15/15 | | | 960,000 | | | 963,600 | |
L-3 Communications Corp. | | | | 5.200% | | 10/15/19 | | | 520,000 | | | 514,351 | A |
| | | | | | | | | | | | | |
| | | | | | | | | | | | 1,607,788 | |
| | | | | | | | | | | | | |
Airlines | | 0.6% | | | | | | | | | | | |
Continental Airlines Inc. | | | | 9.250% | | 5/10/17 | | | 230,000 | | | 233,738 | |
Continental Airlines Inc. | | | | 6.820% | | 5/1/18 | | | 60,915 | | | 55,433 | |
Continental Airlines Inc. Pass-Through Certificates | | | | 7.250% | | 11/10/19 | | | 980,000 | | | 997,150 | |
Continental Airlines Inc. | | | | 6.703% | | 6/15/21 | | | 53,553 | | | 49,805 | |
United Air Lines Inc. | | | | 7.032% | | 10/1/10 | | | 12,818 | | | 12,818 | |
United Air Lines Inc. | | | | 7.186% | | 10/1/12 | | | 48,504 | | | 48,747 | |
US Airways Pass-Through Trust | | | | 6.850% | | 1/30/18 | | | 301,948 | | | 247,597 | |
| | | | | | | | | | | | | |
| | | | | | | | | | | | 1,645,288 | |
| | | | | | | | | | | | | |
Beverages | | 0.2% | | | | | | | | | | | |
Dr. Pepper Snapple Group Inc. | | | | 6.820% | | 5/1/18 | | | 460,000 | | | 516,036 | |
| | | | | | | | | | | | | |
| | | | | |
Building Products | | N.M. | | | | | | | | | | | |
Associated Materials Inc. | | | | 11.250% | | 3/1/14 | | | 55,000 | | | 53,075 | |
Masco Corp. | | | | 7.125% | | 8/15/13 | | | 50,000 | | | 52,044 | |
| | | | | | | | | | | | | |
| | | | | | | | | | | | 105,119 | |
| | | | | | | | | | | | | |
Capital Markets | | 3.5% | | | | | | | | | | | |
Goldman Sachs Capital II | | | | 5.793% | | 12/29/49 | | | 60,000 | | | 46,500 | B |
Lehman Brothers Holdings Capital Trust VII | | | | 5.857% | | 11/29/49 | | | 100,000 | | | 30 | B,C |
Lehman Brothers Holdings Inc. | | | | 5.625% | | 1/24/13 | | | 1,000,000 | | | 205,000 | C |
Lehman Brothers Holdings Inc. | | | | 6.200% | | 9/26/14 | | | 320,000 | | | 62,400 | C |
Lehman Brothers Holdings Inc. | | | | 6.750% | | 12/28/17 | | | 2,350,000 | | | 705 | C |
Merrill Lynch and Co. Inc. | | | | 5.450% | | 2/5/13 | | | 3,490,000 | | | 3,672,426 | |
Merrill Lynch and Co. Inc. | | | | 6.050% | | 5/16/16 | | | 1,980,000 | | | 1,997,816 | |
Morgan Stanley | | | | 6.625% | | 4/1/18 | | | 2,160,000 | | | 2,335,323 | |
The Goldman Sachs Group Inc. | | | | 6.150% | | 4/1/18 | | | 1,800,000 | | | 1,926,898 | |
| | | | | | | | | | | | | |
| | | | | | | | | | | | 10,247,098 | |
| | | | | | | | | | | | | |
Commercial Banks | | 2.4% | | | | | | | | | | | |
Wachovia Corp. | | | | 5.625% | | 10/15/16 | | | 730,000 | | | 746,419 | |
Wachovia Corp. | | | | 5.750% | | 2/1/18 | | | 6,120,000 | | | 6,386,636 | |
| | | | | | | | | | | | | |
| | | | | | | | | | | | 7,133,055 | |
| | | | | | | | | | | | | |
12
Annual Report to Shareholders
| | | | | | | | | | | | | |
| | | % OF
NET ASSETS | | RATE | | MATURITY
DATE | | PAR/
SHARES† | | VALUE | |
| | | | | | | | | | | | | |
Corporate Bonds and Notes—Continued | | | | | | | | | | | | | |
| | | | | |
Commercial Services and Supplies | | 0.1% | | | | | | | | | | | |
Republic Services Inc. | | | | 5.500% | | 9/15/19 | | $ | 290,000 | | $ | 294,481 | A |
| | | | | | | | | | | | | |
| | | | | |
Consumer Finance | | 6.2% | | | | | | | | | | | |
American Express Co. | | | | 6.800% | | 9/1/66 | | | 40,000 | | | 35,800 | B |
American General Finance Corp. | | | | 6.900% | | 12/15/17 | | | 1,000,000 | | | 694,354 | |
Caterpillar Financial Services Corp. | | | | 5.450% | | 4/15/18 | | | 500,000 | | | 520,788 | |
Ford Motor Credit Co. | | | | 5.700% | | 1/15/10 | | | 270,000 | | | 270,010 | |
Ford Motor Credit Co. | | | | 9.750% | | 9/15/10 | | | 2,000,000 | | | 2,063,698 | |
Ford Motor Credit Co. | | | | 7.000% | | 10/1/13 | | | 7,800,000 | | | 7,788,253 | |
Ford Motor Credit Co. | | | | 12.000% | | 5/15/15 | | | 1,610,000 | | | 1,867,001 | |
GMAC LLC | | | | 6.875% | | 9/15/11 | | | 949,000 | | | 934,765 | A |
GMAC LLC | | | | 6.000% | | 12/15/11 | | | 1,013,000 | | | 992,740 | A |
GMAC LLC | | | | 6.625% | | 5/15/12 | | | 949,000 | | | 930,020 | A |
GMAC LLC | | | | 7.500% | | 12/31/13 | | | 273,000 | | | 263,445 | A |
GMAC LLC | | | | 8.000% | | 12/31/18 | | | 185,000 | | | 162,800 | A |
GMAC LLC | | | | 8.000% | | 11/1/31 | | | 729,000 | | | 656,100 | A |
John Deere Capital Corp. | | | | 5.350% | | 4/3/18 | | | 800,000 | | | 845,474 | |
| | | | | | | | | | | | | |
| | | | | | | | | | | | 18,025,248 | |
| | | | | | | | | | | | | |
Diversified Financial Services | | 4.2% | | | | | | | | | | | |
Air 2 US | | | | 8.027% | | 10/1/19 | | | 856,466 | | | 738,166 | A |
BAC Capital Trust XIV | | | | 5.630% | | 12/31/49 | | | 40,000 | | | 27,600 | B |
Citigroup Inc. | | | | 5.500% | | 2/15/17 | | | 5,570,000 | | | 5,271,064 | |
Citigroup Inc. | | | | 6.875% | | 3/5/38 | | | 1,380,000 | | | 1,377,265 | |
East Lane Re Ltd. | | | | 6.281% | | 5/6/11 | | | 300,000 | | | 292,500 | A,D |
El Paso Performance-Linked | | | | 7.750% | | 7/15/11 | | | 340,000 | | | 348,555 | A |
General Electric Capital Corp. | | | | 5.625% | | 5/1/18 | | | 2,800,000 | | | 2,869,275 | |
General Electric Capital Corp. | | | | 6.375% | | 11/15/67 | | | 60,000 | | | 52,050 | B |
Leucadia National Corp. | | | | 8.125% | | 9/15/15 | | | 250,000 | | | 255,000 | |
PHH Corp. | | | | 7.125% | | 3/1/13 | | | 110,000 | | | 101,750 | |
Vanguard Health Holding Co. II LLC | | | | 9.000% | | 10/1/14 | | | 330,000 | | | 341,962 | |
ZFS Finance USA Trust II | | | | 6.450% | | 12/15/65 | | | 500,000 | | | 445,000 | A,B |
| | | | | | | | | | | | | |
| | | | | | | | | | | | 12,120,187 | |
| | | | | | | | | | | | | |
Diversified Telecommunication Services | | 1.8% | | | | | | | | | | | |
AT&T Inc. | | | | 5.500% | | 2/1/18 | | | 2,930,000 | | | 3,057,209 | |
Citizens Communications Co. | | | | 7.875% | | 1/15/27 | | | 160,000 | | | 147,200 | |
Level 3 Financing Inc. | | | | 9.250% | | 11/1/14 | | | 180,000 | | | 170,100 | |
Qwest Corp. | | | | 7.500% | | 10/1/14 | | | 190,000 | | | 197,363 | |
Verizon Communications Inc. | | | | 6.100% | | 4/15/18 | | | 1,150,000 | | | 1,249,945 | |
13
Annual Report to Shareholders
Portfolio of Investments—Continued
Western Asset Absolute Return Portfolio—Continued
| | | | | | | | | | | | | |
| | | % OF
NET ASSETS | | RATE | | MATURITY
DATE | | PAR/
SHARES† | | VALUE | |
| | | | | | | | | | | | | |
Corporate Bonds and Notes—Continued | | | | | | | | | | | | | |
| | | | | |
Diversified Telecommunication Services—Continued | | | | | | | | | | | | | |
Windstream Corp. | | | | 8.625% | | 8/1/16 | | $ | 480,000 | | $ | 488,400 | |
| | | | | | | | | | | | | |
| | | | | | | | | | | | 5,310,217 | |
| | | | | | | | | | | | | |
Electric Utilities | | 1.4% | | | | | | | | | | | |
Energy Future Holdings Corp. | | | | 10.875% | | 11/1/17 | | | 20,000 | | | 16,350 | |
Energy Future Holdings Corp. | | | | 11.250% | | 11/1/17 | | | 5,404,516 | | | 3,823,695 | E |
FirstEnergy Corp. | | | | 6.450% | | 11/15/11 | | | 83,000 | | | 88,997 | |
FirstEnergy Corp. | | | | 7.375% | | 11/15/31 | | | 100,000 | | | 108,390 | |
| | | | | | | | | | | | | |
| | | | | | | | | | | | 4,037,432 | |
| | | | | | | | | | | | | |
Energy Equipment and Services | | 0.1% | | | | | | | | | | | |
Parker Drilling Co. | | | | 9.625% | | 10/1/13 | | | 180,000 | | | 184,950 | |
| | | | | | | | | | | | | |
| | | | | |
Food and Staples Retailing | | 1.7% | | | | | | | | | | | |
CVS Corp. | | | | 9.350% | | 1/10/23 | | | 500,000 | | | 487,205 | A,F |
CVS Corp. | | | | 5.298% | | 1/11/27 | | | 29,766 | | | 27,147 | A,G |
CVS Lease Pass-Through Trust | | | | 5.880% | | 1/10/28 | | | 42,437 | | | 39,702 | |
CVS Lease Pass-Through Trust | | | | 6.036% | | 12/10/28 | | | 114,152 | | | 108,027 | |
Safeway Inc. | | | | 7.250% | | 2/1/31 | | | 1,360,000 | | | 1,565,284 | |
The Kroger Co. | | | | 5.000% | | 4/15/13 | | | 1,620,000 | | | 1,713,174 | |
The Kroger Co. | | | | 6.150% | | 1/15/20 | | | 1,100,000 | | | 1,177,273 | |
| | | | | | | | | | | | | |
| | | | | | | | | | | | 5,117,812 | |
| | | | | | | | | | | | | |
Food Products | | 0.1% | | | | | | | | | | | |
Sara Lee Corp. | | | | 6.250% | | 9/15/11 | | | 150,000 | | | 160,034 | |
| | | | | | | | | | | | | |
| | | | | |
Health Care Equipment and Supplies | | 0.2% | | | | | | | | | | | |
Zimmer Holdings Inc. | | | | 4.625% | | 11/30/19 | | | 660,000 | | | 654,009 | |
| | | | | | | | | | | | | |
| | | | | |
Health Care Providers and Services | | 5.1% | | | | | | | | | | | |
AmerisourceBergen Corp. | | | | 5.875% | | 9/15/15 | | | 50,000 | | | 54,491 | |
HCA Inc. | | | | 6.300% | | 10/1/12 | | | 274,000 | | | 274,000 | |
HCA Inc. | | | | 9.125% | | 11/15/14 | | | 10,000 | | | 10,550 | |
HCA Inc. | | | | 6.500% | | 2/15/16 | | | 619,000 | | | 588,050 | |
HCA Inc. | | | | 9.250% | | 11/15/16 | | | 910,000 | | | 977,113 | |
HCA Inc. | | | | 9.625% | | 11/15/16 | | | 630,000 | | | 681,975 | E |
Humana Inc. | | | | 7.200% | | 6/15/18 | | | 340,000 | | | 347,731 | H |
Tenet Healthcare Corp. | | | | 9.000% | | 5/1/15 | | | 525,000 | | | 567,000 | A |
Tenet Healthcare Corp. | | | | 10.000% | | 5/1/18 | | | 525,000 | | | 588,000 | A |
Tenet Healthcare Corp. | | | | 8.875% | | 7/1/19 | | | 29,000 | | | 31,320 | A |
14
Annual Report to Shareholders
| | | | | | | | | | | | | |
| | | % OF
NET ASSETS | | RATE | | MATURITY
DATE | | PAR/
SHARES† | | VALUE | |
| | | | | | | | | | | | | |
Corporate Bonds and Notes—Continued | | | | | | | | | | | | | |
| | | | |
Health Care Providers and Services—Continued | | | | | | | | | | | |
U.S. Oncology Holdings Inc. | | | | 7.178% | | 3/15/12 | | $ | 382,000 | | $ | 357,170 | D,E |
UnitedHealth Group Inc. | | | | 4.875% | | 2/15/13 | | | 6,360,000 | | | 6,654,239 | |
UnitedHealth Group Inc. | | | | 4.875% | | 4/1/13 | | | 940,000 | | | 985,045 | |
UnitedHealth Group Inc. | | | | 6.000% | | 2/15/18 | | | 1,210,000 | | | 1,249,867 | |
WellPoint Inc. | | | | 5.875% | | 6/15/17 | | | 1,470,000 | | | 1,514,470 | |
| | | | | | | | | | | | | |
| | | | | | | | | | | | 14,881,021 | |
| | | | | | | | | | | | | |
Hotels, Restaurants and Leisure | | 0.2% | | | | | | | | | | | |
Inn of the Mountain Gods Resort and Casino | | | | 12.000% | | 11/15/10 | | | 250,000 | | | 103,438 | C,F |
MGM MIRAGE | | | | 10.375% | | 5/15/14 | | | 45,000 | | | 48,825 | A |
MGM MIRAGE | | | | 6.625% | | 7/15/15 | | | 140,000 | | | 108,850 | |
MGM MIRAGE | | | | 11.125% | | 11/15/17 | | | 105,000 | | | 116,287 | A |
River Rock Entertainment Authority | | | | 9.750% | | 11/1/11 | | | 220,000 | | | 207,350 | |
| | | | | | | | | | | | | |
| | | | | | | | | | | | 584,750 | |
| | | | | | | | | | | | | |
Household Durables | | 0.2% | | | | | | | | | | | |
Norcraft Cos. | | | | 9.000% | | 11/1/11 | | | 480,000 | | | 480,600 | F |
| | | | | | | | | | | | | |
| | | | | |
Household Products | | 0.2% | | | | | | | | | | | |
Reynolds Group DL Escrow Inc./Reynolds Group Escrow LLC | | | | 7.750% | | 10/15/16 | | | 465,000 | | | 475,462 | A |
| | | | | | | | | | | | | |
| | | | | |
Independent Power Producers and Energy Traders | | 1.8% | | | | | | | | | | | |
Calpine Corp. | | | | 8.000% | | 6/1/16 | | | 355,000 | | | 365,650 | A |
Dynegy Holdings Inc. | | | | 7.750% | | 6/1/19 | | | 30,000 | | | 26,025 | |
Edison Mission Energy | | | | 7.750% | | 6/15/16 | | | 110,000 | | | 93,500 | |
Edison Mission Energy | | | | 7.000% | | 5/15/17 | | | 80,000 | | | 63,200 | |
Edison Mission Energy | | | | 7.200% | | 5/15/19 | | | 250,000 | | | 189,375 | |
Edison Mission Energy | | | | 7.625% | | 5/15/27 | | | 90,000 | | | 60,975 | |
Mirant Mid Atlantic LLC | | | | 10.060% | | 12/30/28 | | | 915,837 | | | 966,208 | |
NRG Energy Inc. | | | | 7.375% | | 2/1/16 | | | 250,000 | | | 250,313 | |
The AES Corp. | | | | 7.750% | | 3/1/14 | | | 1,300,000 | | | 1,319,500 | |
The AES Corp. | | | | 7.750% | | 10/15/15 | | | 300,000 | | | 304,500 | |
The AES Corp. | | | | 8.000% | | 10/15/17 | | | 1,630,000 | | | 1,672,787 | |
| | | | | | | | | | | | | |
| | | | | | | | | | | | 5,312,033 | |
| | | | | | | | | | | | | |
| | | | | |
Insurance | | 2.8% | | | | | | | | | | | |
Allstate Life Global Funding Trust | | | | 5.375% | | 4/30/13 | | | 440,000 | | | 469,689 | |
American International Group Inc. | | | | 5.850% | | 1/16/18 | | | 4,420,000 | | | 3,626,738 | |
15
Annual Report to Shareholders
Portfolio of Investments—Continued
Western Asset Absolute Return Portfolio—Continued
| | | | | | | | | | | | | |
| | | % OF
NET ASSETS | | RATE | | MATURITY
DATE | | PAR/
SHARES† | | VALUE | |
| | | | | | | | | | | | | |
Corporate Bonds and Notes—Continued | | | | | | | | | | | | | |
| | | | | |
Insurance—Continued | | | | | | | | | | | | | |
ASIF Global Financing XIX | | | | 4.900% | | 1/17/13 | | $ | 1,400,000 | | $ | 1,288,354 | A |
MetLife Inc. | | | | 6.400% | | 12/15/36 | | | 50,000 | | | 43,750 | |
Metropolitan Life Global Funding I | | | | 5.125% | | 4/10/13 | | | 1,130,000 | | | 1,197,111 | A |
Pacific Life Global Funding | | | | 5.150% | | 4/15/13 | | | 1,040,000 | | | 1,086,693 | A |
Teachers Insurance & Annuity Association of America | | | | 6.850% | | 12/16/39 | | | 220,000 | | | 227,422 | A |
The Travelers Cos. Inc. | | | | 6.250% | | 3/15/37 | | | 120,000 | | | 109,319 | B |
| | | | | | | | | | | | | |
| | | | | | | | | | | | 8,049,076 | |
| | | | | | | | | | | | | |
| | | | | |
Media | | 1.3% | | | | | | | | | | | |
Affinion Group Inc. | | | | 11.500% | | 10/15/15 | | | 430,000 | | | 450,425 | |
Charter Communications Operating LLC | | | | 10.875% | | 9/15/14 | | | 160,000 | | | 179,200 | A |
Comcast Corp. | | | | 6.500% | | 1/15/17 | | | 70,000 | | | 77,494 | |
Comcast Corp. | | | | 5.700% | | 5/15/18 | | | 2,350,000 | | | 2,470,438 | |
DISH DBS Corp. | | | | 7.875% | | 9/1/19 | | | 400,000 | | | 419,500 | |
Gannett Co. Inc. | | | | 6.375% | | 4/1/12 | | | 40,000 | | | 40,000 | |
News America Inc. | | | | 6.650% | | 11/15/37 | | | 50,000 | | | 52,815 | |
| | | | | | | | | | | | | |
| | | | | | | | | | | | 3,689,872 | |
| | | | | | | | | | | | | |
| | | | | |
Metals and Mining | | 0.9% | | | | | | | | | | | |
Freeport-McMoRan Copper & Gold Inc. | | | | 8.375% | | 4/1/17 | | | 1,910,000 | | | 2,091,450 | |
Steel Dynamics Inc. | | | | 7.750% | | 4/15/16 | | | 410,000 | | | 426,912 | G |
| | | | | | | | | | | | | |
| | | | | | | | | | | | 2,518,362 | |
| | | | | | | | | | | | | |
| | | | | |
Multiline Retail | | 0.2% | | | | | | | | | | | |
The Neiman-Marcus Group Inc. | | | | 9.000% | | 10/15/15 | | | 505,212 | | | 493,845 | E |
| | | | | | | | | | | | | |
| | | | | |
Oil, Gas and Consumable Fuels | | 4.6% | | | | | | | | | | | |
Anadarko Petroleum Corp. | | | | 5.950% | | 9/15/16 | | | 540,000 | | | 584,116 | |
Belden and Blake Corp. | | | | 8.750% | | 7/15/12 | | | 1,060,000 | | | 991,100 | |
Chesapeake Energy Corp. | | | | 6.375% | | 6/15/15 | | | 400,000 | | | 392,000 | |
Chesapeake Energy Corp. | | | | 6.500% | | 8/15/17 | | | 100,000 | | | 98,000 | |
Chesapeake Energy Corp. | | | | 7.250% | | 12/15/18 | | | 55,000 | | | 55,413 | |
Dynegy Roseton/Danskammer Pass Through Trust | | | | 7.670% | | 11/8/16 | | | 420,000 | | | 405,300 | |
El Paso Corp. | | | | 7.000% | | 6/15/17 | | | 1,690,000 | | | 1,676,128 | |
Energy Transfer Partners LP | | | | 6.700% | | 7/1/18 | | | 3,800,000 | | | 4,068,660 | |
Kinder Morgan Energy Partners LP | | | | 6.000% | | 2/1/17 | | | 1,000,000 | | | 1,049,914 | |
Petrohawk Energy Corp. | | | | 9.125% | | 7/15/13 | | | 250,000 | | | 261,250 | |
16
Annual Report to Shareholders
| | | | | | | | | | | | | |
| | | % OF
NET ASSETS | | RATE | | MATURITY
DATE | | PAR/
SHARES† | | VALUE | |
| | | | | | | | | | | | | |
Corporate Bonds and Notes—Continued | | | | | | | | | | | | | |
| | | | | |
Oil, Gas and Consumable Fuels—Continued | | | | | | | | | | | | | |
SandRidge Energy Inc. | | | | 8.625% | | 4/1/15 | | $ | 1,000,000 | | $ | 1,000,000 | E |
Whiting Petroleum Corp. | | | | 7.250% | | 5/1/12 | | | 160,000 | | | 160,800 | |
XTO Energy Inc. | | | | 5.500% | | 6/15/18 | | | 2,508,000 | | | 2,675,201 | |
| | | | | | | | | | | | | |
| | | | | | | | | | | | 13,417,882 | |
| | | | | | | | | | | | | |
Pharmaceuticals | | N.M. | | | | | | | | | | | |
Leiner Health Products Inc. | | | | 11.000% | | 6/1/12 | | | 250,000 | | | 25 | C,F |
| | | | | | | | | | | | | |
| | | | | |
Real Estate Investment Trusts (REITs) | | N.M. | | | | | | | | | | | |
Health Care Property Investors Inc. | | | | 6.450% | | 6/25/12 | | | 60,000 | | | 61,773 | |
| | | | | | | | | | | | | |
| | | | | |
Real Estate Management and Development | | 0.2% | | | | | | | | | | | |
Realogy Corp. | | | | 10.500% | | 4/15/14 | | | 755,000 | | | 653,075 | |
| | | | | | | | | | | | | |
| | | | | |
Tobacco | | 0.3% | | | | | | | | | | | |
Lorillard Tobacco Co. | | | | 8.125% | | 6/23/19 | | | 900,000 | | | 989,447 | |
| | | | | | | | | | | | | |
| | | | | |
Trading Companies and Distributors | | 0.1% | | | | | | | | | | | |
Ashtead Capital Inc. | | | | 9.000% | | 8/15/16 | | | 200,000 | | | 200,250 | A |
| | | | | | | | | | | | | |
| | | | | |
Wireless Telecommunication Services | | 0.1% | | | | | | | | | | | |
Cricket Communications Inc. | | | | 7.750% | | 5/15/16 | | | 315,000 | | | 314,212 | |
| | | | | | | | | | | | | |
Total Corporate Bonds and Notes
(Cost—$119,020,795) | | | | | | | | | | | | 119,280,439 | |
Asset-Backed Securities | | 6.0% | | | | | | | | | | | |
| | | | | |
Fixed Rate Securities | | 1.6% | | | | | | | | | | | |
ABSC Manufactured Housing Contract 2004-CN1 | | | | 8.400% | | 12/2/30 | | | 170,000 | | | 127,500 | A |
Associates Manufactured Housing Pass Through Certificates 1997-CLB2 | | | | 8.900% | | 6/15/28 | | | 1,798,409 | | | 1,649,861 | G |
Bombardier Capital Mortgage Securitization Corp. 2000-A A3 | | | | 7.830% | | 6/15/30 | | | 1,637,648 | | | 1,065,893 | |
Centex Home Equity 2003-B AF4 | | | | 3.735% | | 2/25/32 | | | 142,664 | | | 110,372 | |
Hertz Vehicle Financing LLC 2009-2A A2 | | | | 5.290% | | 3/25/16 | | | 510,000 | | | 508,849 | A |
Lehman XS Trust 2007-1 WF1 | | | | 7.000% | | 1/25/37 | | | 1,294,520 | | | 745,360 | |
Oakwood Mortgage Investors Inc. 1999-D A1 | | | | 7.840% | | 11/15/29 | | | 267,276 | | | 215,685 | |
Pegasus Aviation Lease Securitization 2000-1 A2 | | | | 8.370% | | 3/25/30 | | | 390,000 | | | 120,900 | A,G |
| | | | | | | | | | | | | |
| | | | | | | | | | | | 4,544,420 | |
| | | | | | | | | | | | | |
17
Annual Report to Shareholders
Portfolio of Investments—Continued
Western Asset Absolute Return Portfolio—Continued
| | | | | | | | | | | | | |
| | | % OF
NET ASSETS | | RATE | | MATURITY
DATE | | PAR/
SHARES† | | VALUE | |
| | | | | | | | | | | | | |
Asset-Backed Securities—Continued | | | | | | | | | | | | | |
| | | | | |
Indexed SecuritiesD | | 4.3% | | | | | | | | | | | |
ACE Securities Corp. 2006-GP1 A | | | | 0.361% | | 2/25/31 | | $ | 382,749 | | $ | 286,798 | |
Amortizing Residential Collateral Trust 2005-BC5 M1 | | | | 1.266% | | 7/25/32 | | | 594,682 | | | 383,675 | |
Bear Stearns Asset-Backed Securities Trust 2006-SD2 | | | | 0.431% | | 6/25/36 | | | 495,261 | | | 465,943 | |
Citigroup Mortgage Loan Trust Inc. 2006-SHL1 A1 | | | | 0.431% | | 11/25/45 | | | 141,665 | | | 103,878 | A |
Citigroup Mortgage Loan Trust Inc. 2007-SHL1 A | | | | 0.631% | | 11/25/46 | | | 439,661 | | | 208,753 | A |
Countrywide Home Equity Loan Trust 2006-B 2A | | | | 0.403% | | 5/15/36 | | | 326,054 | | | 121,841 | |
Fremont Home Loan Trust 2006-B 2A2 | | | | 0.331% | | 8/25/36 | | | 1,017,089 | | | 723,571 | |
GMAC Mortgage Corp. Loan Trust 2006-HE4 A1 | | | | 0.411% | | 12/25/36 | | | 1,819,841 | | | 729,320 | |
GSAA Home Equity Trust 2007-6 A4 | | | | 0.531% | | 5/25/47 | | | 2,090,000 | | | 1,130,968 | |
GSAMP Trust 2006-SEA1 A | | | | 0.531% | | 5/25/36 | | | 336,413 | | | 232,125 | A |
GSRPM Mortgage Loan Trust 2006-2 A2 | | | | 0.531% | | 9/25/36 | | | 480,661 | | | 290,121 | A |
HSI Asset Securitization Corp. Trust 2007-NC1 A3 | | | | 0.411% | | 4/25/37 | | | 2,740,000 | | | 946,870 | |
Indymac Seconds Asset Backed Trust A-A | | | | 0.361% | | 6/25/36 | | | 1,295,992 | | | 123,003 | |
IXIS Real Estate Capital Trust 2005-HE4 A3 | | | | 0.571% | | 2/25/36 | | | 882,158 | | | 765,025 | |
Lehman XS Trust 2006-16N A4B | | | | 0.471% | | 11/25/46 | | | 654,891 | | | 180,803 | |
Lehman XS Trust 2006-2N 1A1 | | | | 0.491% | | 2/25/46 | | | 409,850 | | | 212,947 | |
Lehman XS Trust 2006-GP3 2A2 | | | | 0.451% | | 6/25/46 | | | 652,388 | | | 109,008 | |
Lehman XS Trust 2007-2N 3A1 | | | | 0.321% | | 2/25/37 | | | 1,550,614 | | | 1,344,192 | |
MASTR Second Lien Trust 2005-1 A | | | | 0.501% | | 9/25/35 | | | 216,625 | | | 181,882 | |
MASTR Specialized Loan Trust 2006-3 A | | | | 0.491% | | 6/25/46 | | | 409,005 | | | 226,118 | A |
MASTR Specialized Loan Trust 2007-1 A | | | | 0.601% | | 1/25/37 | | | 355,415 | | | 92,408 | A |
Morgan Stanley Home Equity Loans 2007-1 A3 | | | | 0.371% | | 12/25/36 | | | 2,720,000 | | | 924,669 | |
Morgan Stanley Mortgage Loan Trust 2006-12XS | | | | 0.351% | | 10/25/36 | | | 80,886 | | | 80,936 | |
Nelnet Student Loan Trust 2008-4 A4 | | | | 1.762% | | 4/25/24 | | | 860,000 | | | 897,836 | |
Option One Mortgage Loan Trust 2005-1 A4 | | | | 0.631% | | 2/25/35 | | | 803,209 | | | 619,998 | |
RAAC 2006-RP4 A | | | | 0.521% | | 1/25/46 | | | 586,006 | | | 353,256 | A |
Structured Asset Securities Corp. 2007-BC4 A3 | | | | 0.481% | | 11/25/37 | | | 882,229 | | | 822,977 | |
| | | | | | | | | | | | | |
| | | | | | | | | | | | 12,558,921 | |
| | | | | | | | | | | | | |
Stripped Securities | | 0.1% | | | | | | | | | | | |
First Franklin Mortgage Loan Asset-Backed Certificates 2006-FF5 2A5 | | | | 0.000% | | 4/25/36 | | | 1,050,000 | | | 263,894 | I2 |
| | | | | | | | | | | | | |
18
Annual Report to Shareholders
| | | | | | | | | | | | | |
| | | % OF
NET ASSETS | | RATE | | MATURITY
DATE | | PAR/
SHARES† | | VALUE | |
| | | | | | | | | | | | | |
Asset-Backed Securities—Continued | | | | | | | | | | | | | |
| | | | | |
Variable Rate SecuritiesJ | | N.M. | | | | | | | | | | | |
GSAMP Trust 2006-S3 A1 | | | | 6.085% | | 5/25/36 | | $ | 359,238 | | $ | 23,175 | B |
| | | | | | | | | | | | | |
Total Asset-Backed Securities
(Cost—$26,745,178) | | | | | | | | | | | | 17,390,410 | |
Mortgage-Backed Securities | | 12.3% | | | | | | | | | | | |
| | | | | |
Fixed Rate Securities | | 0.2% | | | | | | | | | | | |
Banc of America Funding Corp. 2006-8T2 A2 | | | | 5.791% | | 10/25/36 | | | 119,554 | | | 117,036 | |
BlackRock Capital Finance LP 1997-R1 | | | | 7.750% | | 3/25/37 | | | 62,490 | | | 9,530 | A,G |
Indymac Manufactured Housing Contract A2-2 | | | | 6.170% | | 12/25/11 | | | 450,724 | | | 419,316 | |
| | | | | | | | | | | | | |
| | | | | | | | | | | | 545,882 | |
| | | | | | | | | | | | | |
Indexed SecuritiesD | | 7.5% | | | | | | | | | | | |
American Home Mortgage Assets 2006-6 A1A | | | | 0.421% | | 12/25/46 | | | 309,703 | | | 150,931 | |
American Home Mortgage Investment Trust 2005-4 5A | | | | 5.350% | | 11/25/45 | | | 729,178 | | | 532,266 | |
Banc of America Mortgage Securities 2003-F 1A1 | | | | 4.123% | | 7/25/33 | | | 29,058 | | | 26,088 | |
Banc of America Mortgage Securities 2004-A 1A1 | | | | 5.409% | | 2/25/34 | | | 64,129 | | | 53,113 | |
Bear Stearns Adjustable Rate Mortgage Trust 2005-12 23A1 | | | | 5.727% | | 2/25/36 | | | 2,686,819 | | | 1,708,864 | |
Bear Stearns Alt-A Trust 2004-10 1A1 | | | | 0.911% | | 9/25/34 | | | 169,729 | | | 124,159 | |
Bear Stearns Alt-A Trust 2004-11 1A2 | | | | 1.071% | | 11/25/34 | | | 113,886 | | | 59,117 | |
Bear Stearns Alt-A Trust 2005-2 1A1 | | | | 0.731% | | 3/25/35 | | | 52,376 | | | 32,999 | |
Bear Stearns Mortgage Funding Trust 2006-AR5 1A1 | | | | 0.391% | | 12/25/46 | | | 1,005,480 | | | 473,505 | |
Citigroup Mortgage Loan Trust Inc. 2005-9 1A1 | | | | 0.491% | | 11/25/35 | | | 505,391 | | | 267,842 | |
Countrywide Alternative Loan Trust 2005-24 4A1 | | | | 0.463% | | 7/20/35 | | | 706,838 | | | 373,478 | |
Countrywide Alternative Loan Trust 2005-51 2A1 | | | | 0.533% | | 11/20/35 | | | 433,015 | | | 231,080 | |
Countrywide Alternative Loan Trust 2005-59 1A1 | | | | 0.616% | | 11/20/35 | | | 604,306 | | | 317,188 | |
Countrywide Alternative Loan Trust 2005-76 3A1 | | | | 0.491% | | 1/25/46 | | | 462,832 | | | 252,834 | |
Countrywide Alternative Loan Trust 2005-J12 | | | | 0.501% | | 8/25/35 | | | 255,505 | | | 128,496 | |
Countrywide Alternative Loan Trust 2006-OA10 4A3 | | | | 0.501% | | 8/25/46 | | | 2,030,608 | | | 308,019 | |
19
Annual Report to Shareholders
Portfolio of Investments—Continued
Western Asset Absolute Return Portfolio—Continued
| | | | | | | | | | | | | |
| | | % OF
NET ASSETS | | RATE | | MATURITY
DATE | | PAR/
SHARES† | | VALUE | |
| | | | | | | | | | | | | |
Mortgage-Backed Securities—Continued | | | | | | | | | | | | | |
| | | | | |
Indexed Securities—Continued | | | | | | | | | | | | | |
Countrywide Alternative Loan Trust 2006-OA8 1A2 | | | | 0.461% | | 7/25/46 | | $ | 670,001 | | $ | 171,113 | |
Countrywide Home Loans 2001-HYB1 1A1 | | | | 3.666% | | 6/19/31 | | | 30,840 | | | 29,446 | |
Countrywide Home Loans 2003-60 1A1 | | | | 4.727% | | 2/25/34 | | | 449,939 | | | 387,940 | |
Countrywide Home Loans 2003-HYB1 1A1 | | | | 5.044% | | 5/19/33 | | | 32,068 | | | 29,039 | |
Countrywide Home Loans 2006-3 1A2 | | | | 0.561% | | 3/25/36 | | | 491,670 | | | 99,054 | |
Deutsche Mortgage Securities Inc. 2004-4 7AR2 | | | | 0.681% | | 6/25/34 | | | 272,210 | | | 202,491 | |
First Horizon Alternative Mortgage Securities 2005-AA12 1A1 | | | | 2.707% | | 2/25/36 | | | 497,767 | | | 274,707 | |
Greenpoint Mortgage Funding Trust 2006-AR2 1A2 | | | | 0.481% | | 4/25/36 | | | 3,257,473 | | | 1,031,886 | |
Greenpoint Mortgage Funding Trust 2006-AR3 3A1 | | | | 0.461% | | 4/25/36 | | | 627,887 | | | 264,891 | |
GSR Mortgage Loan Trust 2006-0A1 2A2 | | | | 0.491% | | 8/25/46 | | | 709,035 | | | 189,648 | |
Harborview Mortgage Loan Trust 2006-13 A | | | | 0.413% | | 11/19/46 | | | 515,122 | | | 245,571 | |
Harborview Mortgage Loan Trust 2006-14 2A1A | | | | 0.383% | | 1/25/47 | | | 1,068,314 | | | 519,345 | |
Harborview Mortgage Loan Trust 2007-7 2A1A | | | | 1.231% | | 11/25/47 | | | 1,475,100 | | | 767,159 | |
Impac CMB Trust 2004-5 1A1 | | | | 0.591% | | 10/25/34 | | | 238,572 | | | 171,929 | |
Impac CMB Trust 2004-6 1A2 | | | | 1.011% | | 10/25/34 | | | 337,015 | | | 241,009 | |
Impac CMB Trust 2005-7 A1 | | | | 0.491% | | 11/25/35 | | | 464,800 | | | 263,693 | |
Impac Secured Assets Corp. 2004-3 1A4 | | | | 1.031% | | 11/25/34 | | | 15,019 | | | 13,416 | |
Impac Secured Assets Corp. 2005-2 | | | | 0.551% | | 3/25/36 | | | 350,372 | | | 134,898 | |
Lehman XS Trust 2006-GP2 1A1A | | | | 0.301% | | 6/25/46 | | | 10,771 | | | 10,657 | |
Merit Securities Corp. 11PA B2 | | | | 1.731% | | 9/28/32 | | | 31,607 | | | 25,711 | A |
Merrill Lynch Mortgage Investors Trust 2004-A3 4A3 | | | | 5.055% | | 5/25/34 | | | 963,198 | | | 915,962 | |
Residential Accredit Loans Inc. 2007-Q01 A1 | | | | 0.381% | | 2/25/47 | | | 3,044,336 | | | 1,573,938 | |
Structured Adjustable Rate Mortgage Loan Trust 2004-7 A1 | | | | 0.636% | | 6/25/34 | | | 21,077 | | | 14,593 | |
Structured Adjustable Rate Mortgage Loan Trust 2005-19XS | | | | 0.551% | | 10/25/35 | | | 1,509,538 | | | 908,378 | |
Structured Asset Mortgage Investments Inc. 2003-AR2 A1 | | | | 0.603% | | 12/19/33 | | | 109,654 | | | 89,394 | |
Structured Asset Mortgage Investments Inc. 2006-AR6 | | | | 0.421% | | 7/25/46 | | | 1,929,220 | | | 963,563 | |
Structured Asset Mortgage Investments Inc. 2007-AR4 A1 | | | | 0.431% | | 9/25/47 | | | 1,128,962 | | | 1,052,530 | |
20
Annual Report to Shareholders
| | | | | | | | | | | | | |
| | | % OF
NET ASSETS | | RATE | | MATURITY
DATE | | PAR/
SHARES† | | VALUE | |
| | | | | | | | | | | | | |
Mortgage-Backed Securities—Continued | | | | | | | | | | | | | |
| | | | | |
Indexed Securities—Continued | | | | | | | | | | | | | |
Structured Asset Securities Corp. 2002-08A 7A1 | | | | 3.123% | | 5/25/32 | | $ | 101,035 | | $ | 88,169 | |
Structured Asset Securities Corp. 2002-11A 1A1 | | | | 3.242% | | 6/25/32 | | | 26,268 | | | 22,527 | |
Structured Asset Securities Corp. 2002-16A 1A1 | | | | 4.320% | | 8/25/32 | | | 239,808 | | | 239,507 | |
Structured Asset Securities Corp. 2002-18A 1A1 | | | | 4.226% | | 9/25/32 | | | 16,220 | | | 13,357 | |
Structured Asset Securities Corp. 2004-NP1 A | | | | 0.631% | | 9/25/33 | | | 218,944 | | | 185,008 | A,F |
Thornburg Mortgage Securities Trust 2004-1 I2A | | | | 0.681% | | 3/25/44 | | | 37,651 | | | 35,283 | |
WaMu Mortgage Pass-Through Certificates 2006-AR2 A1A | | | | 1.484% | | 4/25/46 | | | 4,143,643 | | | 2,038,485 | |
WaMu Mortgage Pass-Through Certificates 2006-AR3 A1A | | | | 1.514% | | 5/25/46 | | | 3,368,978 | | | 1,653,608 | |
WaMu Mortgage Pass-Through Certificates 2006-AR4 DA | | | | 1.514% | | 6/25/46 | | | 1,803,344 | | | 718,749 | |
WaMu Mortgage Pass-Through Certificates 2006-AR6 2A | | | | 1.504% | | 8/25/46 | | | 2,466,622 | | | 1,303,161 | |
| | | | | | | | | | | | | |
| | | | | | | | | | | | 21,929,794 | |
| | | | | | | | | | | | | |
| | | | | |
Variable Rate SecuritiesJ | | 4.6% | | | | | | | | | | | |
Adjustable Rate Mortgage Trust 2004-1 4A1 | | | | 5.552% | | 1/25/35 | | | 3,791,451 | | | 3,534,985 | |
Banc of America Funding Corp. 2006-D 6A1 | | | | 5.851% | | 5/20/36 | | | 1,291,439 | | | 795,940 | |
Bear Stearns Adjustable Rate Mortgage Trust 2004-12 1A1 | | | | 4.804% | | 2/25/35 | | | 123,374 | | | 101,449 | |
Bear Stearns Alt-A Trust 2003-5 2A1 | | | | 3.080% | | 12/25/33 | | | 592,703 | | | 521,209 | |
Bear Stearns Alt-A Trust 2005 -10 21A1 | | | | 3.820% | | 1/25/36 | | | 451,903 | | | 249,200 | |
BlackRock Capital Finance LP 1996-R1 | | | | 9.580% | | 9/25/26 | | | 261,329 | | | 71,866 | G |
MASTR Adjustable Rate Mortgages Trust 2003-3 3A4 | | | | 3.194% | | 9/25/33 | | | 1,797,705 | | | 1,491,043 | |
Morgan Stanley Mortgage Loan Trust 2004-6AR | | | | 3.929% | | 8/25/34 | | | 104,491 | | | 77,627 | |
Morgan Stanley Mortgage Loan Trust 2006-3AR 2A3 | | | | 5.187% | | 3/25/36 | | | 536,281 | | | 329,918 | |
Nomura Asset Acceptance Corp. 2006-AF2 4A | | | | 6.573% | | 8/25/36 | | | 575,398 | | | 258,330 | |
Sequoia Mortgage Trust 2007-4 4A1 | | | | 5.965% | | 7/20/47 | | | 1,547,103 | | | 1,068,430 | |
Structured Adjustable Rate Mortgage Loan Trust 2004-17 A1 | | | | 1.752% | | 11/25/34 | | | 59,243 | | | 44,953 | |
21
Annual Report to Shareholders
Portfolio of Investments—Continued
Western Asset Absolute Return Portfolio—Continued
| | | | | | | | | | | | |
| | | % OF
NET ASSETS | | RATE | | MATURITY
DATE | | PAR/
SHARES† | | VALUE |
| | | | | | | | | | | | |
Mortgage-Backed Securities—Continued | | | | | | | | | | |
| | | | | |
Variable Rate Securities—Continued | | | | | | | | | | | | |
Structured Adjustable Rate Mortgage Loan Trust 2004-4 3A2 | | | | 3.262% | | 4/25/34 | | $ | 988,130 | | $ | 805,837 |
Structured Adjustable Rate Mortgage Loan Trust 2005-20 4A1 | | | | 5.912% | | 10/25/35 | | | 2,014,390 | | | 1,402,066 |
Thornburg Mortgage Securities Trust 2007-4 2A1 | | | | 6.200% | | 9/25/37 | | | 1,368,282 | | | 1,092,969 |
Thornburg Mortgage Securities Trust 2007-4 3A1 | | | | 6.198% | | 9/25/37 | | | 1,375,790 | | | 1,099,421 |
Wells Fargo Mortgage-Backed Securities Trust 2005-AR9 4A1 | | | | 3.685% | | 5/25/35 | | | 452,017 | | | 406,081 |
| | | | | | | | | | | | |
| | | | | | | | | | | | 13,351,324 |
| | | | | | | | | | | | |
Total Mortgage-Backed Securities
(Cost—$57,552,078) | | | | | | | | | | | | 35,827,000 |
Loan Participations and AssignmentsD | | 7.7% | | | | | | | | | | |
| | | | | |
Aerospace and Defense | | 0.2% | | | | | | | | | | |
Dubai Aerospace Enterprise, Term Loan, Tranche B1 | | | | 4.040% | | 1/29/10 | | | 287,234 | | | 262,819 |
Dubai Aerospace Enterprise, Term Loan, Tranche B2 | | | | 4.010% | | 1/29/10 | | | 280,287 | | | 256,463 |
| | | | | | | | | | | | |
| | | | | | | | | | | | 519,282 |
| | | | | | | | | | | | |
Auto Components | | 0.3% | | | | | | | | | | |
Allison Transmission Inc., Term Loan, Tranche B | | | | 2.990% to 3.040% | | 2/10/10 | | | 956,866 | | | 875,771 |
| | | | | | | | | | | | |
| | | | | |
Automobiles | | 0.3% | | | | | | | | | | |
Chrysler Financial Services NA LLC, First Lien Term Loan | | | | 4.240% | | 1/15/10 | | | 977,500 | | | 951,433 |
| | | | | | | | | | | | |
| | | | | |
Containers and Packaging | | 0.6% | | | | | | | | | | |
Amscan Holdings Inc., Term Loan, Tranche B | | | | 2.501% | | 3/25/10 | | | 972,500 | | | 875,250 |
Graham Packaging Company LP, Term Loan C | | | | 6.750% | | 3/31/10 | | | 873,303 | | | 877,306 |
| | | | | | | | | | | | |
| | | | | | | | | | | | 1,752,556 |
| | | | | | | | | | | | |
22
Annual Report to Shareholders
| | | | | | | | | | | | | |
| | | % OF
NET ASSETS | | RATE | | MATURITY
DATE | | PAR/
SHARES† | | VALUE | |
| | | | | | | | | | | | | |
Loan Participations and Assignments—Continued | | | | | | | | | | | | | |
| | | | | |
Distributors | | 0.2% | | | | | | | | | | | |
Keystone Automotive Industries Inc., Term Loan, Tranche B | | | | 3.741% to 5.750% | | 3/31/10 | | $ | 941,200 | | $ | 592,956 | |
| | | | | | | | | | | | | |
| | | | | |
Electric Utilities | | 0.4% | | | | | | | | | | | |
TXU, Term Loan, Tranche B2 | | | | 3.735% to 3.751% | | 3/31/10 | | | 1,221,875 | | | 992,774 | |
| | | | | | | | | | | | | |
| | | | | |
Energy Equipment and Services | | 0.3% | | | | | | | | | | | |
Brand Energy, Term Loan, Tranche B | | | | 3.563% | | 2/26/10 | | | 977,500 | | | 905,409 | |
| | | | | | | | | | | | | |
| | | | | |
Hotels, Restaurants and Leisure | | 0.6% | | | | | | | | | | | |
Harrah’s Entertainment Inc., Term Loan B | | | | 3.282% | | 1/26/10 | | | 806,853 | | | 651,366 | |
Las Vegas Sands LLC, Delayed Term Loan | | | | 2.010% | | 3/31/10 | | | 197,000 | | | 171,988 | |
Las Vegas Sands LLC, Term Loan, Tranche B | | | | 2.010% | | 3/31/10 | | | 780,000 | | | 680,968 | |
Wimar Opco LLC, Term Loan, Tranche B | | | | 3.250% | | 3/31/10 | | | 947,645 | | | 285,478 | C |
| | | | | | | | | | | | | |
| | | | | | | | | | | | 1,789,800 | |
| | | | | | | | | | | | | |
IT Services | | 0.6% | | | | | | | | | | | |
First Data Corp., Term Loan B2 | | | | 2.999% to 3.001% | | 3/31/10 | | | 989,873 | | | 879,255 | |
SunGard Data Systems Inc., Term Loan, Tranche A | | | | 1.985% | | 1/11/10 | | | 28,206 | | | 26,588 | |
SunGard Data Systems Inc., Term Loan, Tranche B | | | | 3.869% to 3.900% | | 2/9/10 | | | 932,103 | | | 895,013 | |
| | | | | | | | | | | | | |
| | | | | | | | | | | | 1,800,856 | |
| | | | | | | | | | | | | |
Media | | 2.4% | | | | | | | | | | | |
Cedar Fair LP, Term Loan, Tranche B | | | | 2.231% to 4.231% | | 1/29/10 | | | 923,652 | | | 911,337 | |
Charter Communications Operating LLC, Term Loan | | | | 2.260% | | 2/26/10 | | | 980,000 | | | 917,525 | |
Citadel Communication Group, Term Loan, Tranche B | | | | 1.990% | | 1/29/10 | | | 996,220 | | | 735,127 | C |
Idearc Inc., Term Loan | | | | 10.250% | | 3/31/10 | | | 385,750 | | | 379,000 | |
Insight Midwest Holdings LLC, Term Loan, Tranche B | | | | 2.290% | | 1/4/10 | | | 675,000 | | | 641,250 | |
23
Annual Report to Shareholders
Portfolio of Investments—Continued
Western Asset Absolute Return Portfolio—Continued
| | | | | | | | | | | | |
| | | % OF
NET ASSETS | | RATE | | MATURITY
DATE | | PAR/
SHARES† | | VALUE |
| | | | | | | | | | | | |
Loan Participations and Assignments—Continued | | | | | | | | | | | | |
| | | | | |
Media—Continued | | | | | | | | | | | | |
Lodgenet Entertainment Corp., Term Loan, Tranche B | | | | 2.260% | | 3/31/10 | | $ | 795,225 | | $ | 719,679 |
Univision Communications, Term Loan, Tranche B | | | | 2.501% | | 3/31/10 | | | 1,000,000 | | | 867,000 |
UPC Broadband Holding, Term Loan, Tranche N1 | | | | 1.985% | | 1/4/10 | | | 1,296,576 | | | 1,211,218 |
UPC, Term Loan | | | | 3.735% | | 1/4/10 | | | 703,424 | | | 681,970 |
| | | | | | | | | | | | |
| | | | | | | | | | | | 7,064,106 |
| | | | | | | | | | | | |
Metals and Mining | | 0.3% | | | | | | | | | | |
Noranda Aluminum Acquisition Corp., Term Loan | | | | 2.231% | | 1/29/10 | | | 868,118 | | | 714,750 |
| | | | | | | | | | | | |
| | | | | |
Multiline Retail | | 0.3% | | | | | | | | | | |
Neiman Marcus Group Inc., Term Loan | | | | 2.255% | | 3/8/10 | | | 983,620 | | | 888,420 |
| | | | | | | | | | | | |
| | | | | |
Oil, Gas and Consumable Fuels | | 0.2% | | | | | | | | | | |
Ashmore Energy, Term Loan | | | | 3.231% | | 1/29/10 | | | 50,966 | | | 46,443 |
Ashmore Energy, Term Loan | | | | 3.251% | | 3/31/10 | | | 433,453 | | | 394,984 |
| | | | | | | | | | | | |
| | | | | | | | | | | | 441,427 |
| | | | | | | | | | | | |
Paper and Forest Products | | 0.1% | | | | | | | | | | |
Georgia-Pacific Corp., New Term Loan B | | | | 2.251% to 2.256% | | 3/31/10 | | | 257,311 | | | 248,144 |
Georgia-Pacific Corp., New Term Loan C | | | | 3.481% to 3.506% | | 3/31/10 | | | 159,487 | | | 158,410 |
| | | | | | | | | | | | |
| | | | | | | | | | | | 406,554 |
| | | | | | | | | | | | |
Road and Rail | | 0.3% | | | | | | | | | | |
Swift Transportation, Term Loan | | | | 3.563% | | 1/8/10 | | | 878,721 | | | 795,609 |
| | | | | | | | | | | | |
| | | | | |
Semiconductors and Semiconductor Equipment | | 0.3% | | | | | | | | | | |
Sensata Technologies, Term Loan, Tranche B | | | | 2.031% | | 1/29/10 | | | 965,000 | | | 855,834 |
| | | | | | | | | | | | |
| | | | | |
Specialty Retail | | 0.3% | | | | | | | | | | |
Michaels Stores Inc., Term Loan B | | | | 2.563% | | 2/26/10 | | | 415,588 | | | 374,159 |
24
Annual Report to Shareholders
| | | | | | | | | | | | | |
| | | % OF
NET ASSETS | | RATE | | MATURITY
DATE | | PAR/
SHARES† | | VALUE | |
| | | | | | | | | | | | | |
Loan Participations and Assignments—Continued | | | | | | | | | | | | | |
| | | | | |
Specialty Retail—Continued | | | | | | | | | | | | | |
Michaels Stores Inc., Term Loan B2 | | | | 4.813% | | 2/26/10 | | $ | 559,287 | | $ | 525,330 | |
| | | | | | | | | | | | | |
| | | | | | | | | | | | 899,489 | |
| | | | | | | | | | | | | |
Total Loan Participations and Assignments
(Cost—$25,557,045) | | | | | | | | | | | | 22,247,026 | |
U.S. Government and Agency Obligations | | 11.5% | | | | | | | | | | | |
| | | | | |
Fixed Rate Securities | | 11.0% | | | | | | | | | | | |
United States Treasury Bonds | | | | 3.500% | | 2/15/39 | | | 63,000 | | | 51,601 | |
United States Treasury Bonds | | | | 4.500% | | 8/15/39 | | | 170,000 | | | 166,148 | |
United States Treasury Bonds | | | | 4.375% | | 11/15/39 | | | 1,160,000 | | | 1,110,338 | |
United States Treasury Notes | | | | 2.125% | | 11/30/14 | | | 19,050,000 | | | 18,599,087 | |
United States Treasury Notes | | | | 3.125% | | 10/31/16 | | | 2,590,000 | | | 2,557,423 | |
United States Treasury Notes | | | | 2.750% | | 11/30/16 | | | 4,020,000 | | | 3,870,191 | |
United States Treasury Notes | | | | 3.375% | | 11/15/19 | | | 5,680,000 | | | 5,463,478 | |
| | | | | | | | | | | | | |
| | | | | | | | | | | | 31,818,266 | |
| | | | | | | | | | | | | |
Treasury Inflation-Protected SecuritiesK | | 0.5% | | | | | | | | | | | |
United States Treasury Inflation-Protected Security | | | | 2.375% | | 1/15/27 | | | 1,457,825 | | | 1,534,133 | |
| | | | | | | | | | | | | |
Total U.S. Government and Agency Obligations
(Cost—$33,845,711) | | | | | | | | | | 33,352,399 | |
Yankee BondsL | | 4.1% | | | | | | | | | | | |
| | | | | |
Commercial Banks | | 1.7% | | | | | | | | | | | |
Credit Agricole SA | | | | 8.375% | | 10/13/19 | | | 760,000 | | | 805,600 | A,B |
Glitnir Banki Hf | | | | 6.375% | | 9/25/12 | | | 680,000 | | | 142,800 | A,C,F |
Glitnir Banki Hf | | | | 6.693% | | 6/15/16 | | | 1,810,000 | | | 181 | A,B,C,F |
Glitnir Banki Hf | | | | 7.451% | | 9/14/49 | | | 100,000 | | | 10 | A,B,C,F |
Groupe BPCE SA | | | | 12.500% | | 6/29/49 | | | 1,022,000 | | | 1,125,958 | A,B |
HBOS Capital Funding LP | | | | 6.071% | | 6/30/49 | | | 230,000 | | | 149,500 | A,B |
ICICI Bank Ltd. | | | | 6.375% | | 4/30/22 | | | 442,000 | | | 396,789 | A,B |
Kaupthing Bank Hf | | | | 7.625% | | 2/28/15 | | | 3,130,000 | | | 774,675 | A,C,F |
Kaupthing Bank Hf | | | | 7.125% | | 5/19/16 | | | 240,000 | | | 24 | A,C,F |
Landsbanki Islands Hf | | | | 6.100% | | 8/25/11 | | | 2,190,000 | | | 98,550 | A,C,F |
Royal Bank of Scotland Group PLC | | | | 6.375% | | 2/1/11 | | | 500,000 | | | 501,390 | |
Royal Bank of Scotland Group PLC | | | | 5.000% | | 10/1/14 | | | 930,000 | | | 821,901 | |
Shinsei Finance Cayman Ltd. | | | | 6.418% | | 1/29/49 | | | 300,000 | | | 174,750 | A,B |
| | | | | | | | | | | | | |
| | | | | | | | | | | | 4,992,128 | |
| | | | | | | | | | | | | |
25
Annual Report to Shareholders
Portfolio of Investments—Continued
Western Asset Absolute Return Portfolio—Continued
| | | | | | | | | | | | | | |
| | | % OF
NET ASSETS | | RATE | | MATURITY
DATE | | PAR/
SHARES† | | | VALUE | |
| | | | | | | | | | | | | | |
Yankee Bonds—Continued | | | | | | | | | | | | | | |
| | | | | |
Diversified Financial Services | | 0.2% | | | | | | | | | | | | |
TNK-BP Finance SA | | | | 7.500% | | 7/18/16 | | $ | 192,000 | | | $ | 197,520 | |
TNK-BP Finance SA | | | | 6.625% | | 3/20/17 | | | 232,000 | | | | 226,780 | |
| | | | | | | | | | | | | | |
| | | | | | | | | | | | | 424,300 | |
| | | | | | | | | | | | | | |
Diversified Telecommunication Services | | 0.1% | | | | | | | | | | | | |
Wind Acquisition Finance SA | | | | 12.000% | | 12/1/15 | | | 300,000 | | | | 321,000 | A |
| | | | | | | | | | | | | | |
| | | | | |
Energy Equipment and Services | | 0.1% | | | | | | | | | | | | |
Compagnie Generale de Geophysique-Veritas | | | | 7.750% | | 5/15/17 | | | 250,000 | | | | 248,125 | |
| | | | | | | | | | | | | | |
| | | | | |
Food and Staples Retailing | | 1.1% | | | | | | | | | | | | |
Delhaize Group | | | | 6.500% | | 6/15/17 | | | 3,014,000 | | | | 3,273,301 | |
| | | | | | | | | | | | | | |
| | | | | |
Foreign Government | | 0.1% | | | | | | | | | | | | |
Russian Federation | | | | 7.500% | | 3/31/30 | | | 235,000 | | | | 265,256 | |
| | | | | | | | | | | | | | |
| | | | | |
Media | | 0.1% | | | | | | | | | | | | |
NTL Cable PLC | | | | 9.125% | | 8/15/16 | | | 155,000 | | | | 163,331 | |
| | | | | | | | | | | | | | |
| | | | | |
Metals and Mining | | 0.5% | | | | | | | | | | | | |
Novelis Inc. | | | | 7.250% | | 2/15/15 | | | 440,000 | | | | 419,100 | |
Teck Resources Ltd. | | | | 9.750% | | 5/15/14 | | | 40,000 | | | | 46,150 | |
Teck Resources Ltd. | | | | 10.250% | | 5/15/16 | | | 30,000 | | | | 34,950 | |
Teck Resources Ltd. | | | | 10.750% | | 5/15/19 | | | 65,000 | | | | 77,675 | |
Vale Overseas Ltd. | | | | 6.875% | | 11/21/36 | | | 546,000 | | | | 545,542 | |
Vedanta Resources PLC | | | | 8.750% | | 1/15/14 | | | 330,000 | | | | 337,425 | A |
| | | | | | | | | | | | | | |
| | | | | | | | | | | | | 1,460,842 | |
| | | | | | | | | | | | | | |
Oil, Gas and Consumable Fuels | | 0.2% | | | | | | | | | | | | |
Petrobras International Finance Co. | | | | 5.750% | | 1/20/20 | | | 480,000 | | | | 488,298 | |
Teekay Shipping Corp. | | | | 8.875% | | 7/15/11 | | | 140,000 | | | | 145,075 | |
| | | | | | | | | | | | | | |
| | | | | | | | | | | | | 633,373 | |
| | | | | | | | | | | | | | |
Paper and Forest Products | | N.M. | | | | | | | | | | | | |
Abitibi-Consolidated Co. of Canada | | | | 13.750% | | 4/1/11 | | | 65,477 | | | | 65,559 | A |
| | | | | | | | | | | | | | |
Total Yankee Bonds (Cost—$18,373,979) | | | | | | | | | | | | | 11,847,215 | |
Foreign Government Obligations | | 3.3% | | | | | | | | | | | | |
Brazil Notas do Tesouro Nacional Series F | | | | 10.000% | | 1/1/12 | | | 4,023,000 | BRL | | | 2,237,259 | |
Commonwealth of Australia | | | | 4.000% | | 8/20/20 | | | 1,730,000 | AUD | | | 2,406,186 | M |
26
Annual Report to Shareholders
| | | | | | | | | | | | | | |
| | | % OF
NET ASSETS | | RATE | | MATURITY
DATE | | PAR/
SHARES† | | | VALUE | |
| | | | | | | | | | | | | | |
Foreign Government Obligations—Continued | | | | | | | | | | | | |
Federative Republic of Brazil | | | | 10.000% | | 7/1/10 | | | 268,000 | BRL | | $ | 154,596 | |
Federative Republic of Brazil | | | | 6.000% | | 5/15/15 | | | 591,000 | BRL | | | 614,830 | M |
Government of Indonesia | | | | 10.250% | | 7/15/27 | | | 10,665,000,000 | IDR | | | 1,092,457 | |
Kingdom of Sweden Inflation-Protected Notes | | | | 3.500% | | 12/1/28 | | | 7,000,000 | SEK | | | 1,500,412 | M |
Thailand Government Bond | | | | 4.250% | | 3/13/13 | | | 22,000,000 | THB | | | 685,124 | |
United Kingdom Treasury Gilt | | | | 1.250% | | 11/22/55 | | | 387,680 | GBP | | | 836,378 | M |
| | | | | | | | | | | | | | |
Total Foreign Government Obligations
(Cost—$8,709,239) | | | | | | | | | | | 9,527,242 | |
Common Stocks and Equity Interests | | N.M. | | | | | | | | | | | | |
| | | | | |
Media | | N.M. | | | | | | | | | | | | |
SuperMedia Inc. | | | | | | | | | 1,788 | shs | | | 69,160 | N |
| | | | | | | | | | | | | | |
| | | | | |
Oil, Gas and Consumable Fuels | | N.M. | | | | | | | | | | | | |
SemGroup Corp., Class A | | | | | | | | | 867 | | | | 20,803 | G,N |
| | | | | | | | | | | | | | |
Total Common Stocks and Equity Interests
(Cost—$143,989) | | | | | | | | | | | 89,963 | |
Preferred Stocks | | 0.4% | | | | | | | | | | | | |
Fannie Mae | | | | 7.000% | | | | $ | 1,900 | | | | 2,565 | D,N,O |
Motors Liquidation Co. | | | | 5.250% | | | | | 64,000 | | | | 364,800 | |
GMAC Inc. | | | | 7.000% | | | | | 1,226 | | | | 808,087 | A,N |
| | | | | | | | | | | | | | |
Total Preferred Stocks (Cost—$602,439) | | | | | | | | | | | 1,175,452 | |
Warrants | | N.M. | | | | | | | | | | | | |
| | | | | |
Oil, Gas and Consumable Fuels | | N.M. | | | | | | | | | | | | |
SemGroup Corp. | | | | | | | | | 912 | | | | — | G,F,N |
| | | | | | | | | | | | | | |
Total Warrants (Cost—$—) | | | | | | | | | | | | | — | |
| | | | | | | | | | | | | | |
Total Long-Term Securities (Cost—$290,550,453) | | | | | | | | | 250,737,146 | |
Short-Term Securities | | 12.8% | | | | | | | | | | | | |
| | | | | |
U.S. Government and Agency Obligations | | 11.6% | | | | | | | | | | | | |
Fannie Mae | | | | 0.100% | | 1/25/10 | | | 1,500,000 | | | | 1,499,900 | O,Q ,S |
Fannie Mae | | | | 0.350% | | 1/15/10 | | | 25,000,000 | | | | 24,996,597 | O ,S |
Freddie Mac | | | | 0.070% to 0.110% | | 1/25/10 | | | 205,000 | | | | 204,986 | O,Q ,S |
United States Treasury Bill | | | | 0.160% | | 4/29/10 | | | 7,000,000 | | | | 6,998,054 | S |
| | | | | | | | | | | | | | |
| | | | | | | | | | | | | 33,699,537 | |
| | | | | | | | | | | | | | |
27
Annual Report to Shareholders
Portfolio of Investments—Continued
Western Asset Absolute Return Portfolio—Continued
| | | | | | | | | |
| | | % OF
NET ASSETS | | PAR/
SHARES† | | | VALUE |
| | | | | | | | | |
Short-Term Securities—Continued | | | | | | | | | |
| | | |
Options Purchased | | 0.2% | | | | | | | |
Credit Suisse First Boston Swaption Put, April 2011, Strike Price $5.18 | | | | | 2,570,000 | R | | $ | 87,704 |
Credit Suisse First Boston Swaption Put, April 2012, Strike Price $5.20 | | | | | 1,290,000 | R | | | 114,968 |
Credit Suisse First Boston Swaption Put, May 2011, Strike Price $5.12 | | | | | 1,290,000 | R | | | 47,870 |
U.S. Treasury Note Futures Put, February 2010, Strike Price $116.50 | | | | | 52 | R | | | 73,125 |
U.S. Treasury Note Futures Put, March 2010, Strike Price $116.50 | | | | | 207 | R | | | 359,016 |
| | | | | | | | | |
| | | | | | | | | 682,683 |
| | | | | | | | | |
Repurchase Agreement | | 1.0% | | | | | | | |
Morgan Stanley repurchase agreement dated 12/31/09, 0.005% due 1/4/10; Proceeds at maturity—$2,911,002; (Fully collateralized by U.S. government agency obligation, 3.125% due 9/29/14; Market value—$2,969,219) | | | | $ | 2,911,000 | | | | 2,911,000 |
| | | | | | | | | |
Total Short-Term Securities (Cost—$36,904,455) | | | | | | | | | 37,293,220 |
Total Investments (Cost—$327,454,908#) | | 99.1% | | | | | | | 288,030,366 |
Other Assets Less Liabilities | | 0.9% | | | | | | | 2,661,414 |
| | | | | | | | | |
| | | |
Net Assets | | 100.0% | | | | | | $ | 290,691,780 |
| | | | | | | | | |
| | | | | | | | |
| | | EXPIRATION | | ACTUAL
CONTRACTS | | APPRECIATION/
(DEPRECIATION) | |
Futures Contracts PurchasedT | | | | | | | | |
Eurodollar Futures | | March 2010 | | 113 | | $ | 184,721 | |
Eurodollar Futures | | June 2010 | | 28 | | | 36,960 | |
Eurodollar Futures | | September 2010 | | 14 | | | 27,755 | |
Eurodollar Futures | | December 2011 | | 129 | | | (27,832 | ) |
U.S. Treasury Note Futures | | March 2010 | | 7 | | | (6,679 | ) |
| | | | | | | | |
| | | | | | $ | 214,925 | |
| | | | | | | | |
Futures Contracts WrittenT | | | | | | | | |
Eurodollar Futures | | December 2010 | | 129 | | $ | (31,057 | ) |
German Euro Bund Futures | | March 2010 | | 16 | | | 29,932 | |
U.S. Treasury Bond Futures | | March 2010 | | 15 | | | 49,170 | |
U.S. Treasury Note Futures | | March 2010 | | 147 | | | 366,741 | |
U.S. Treasury Note Futures | | March 2010 | | 84 | | | 140,071 | |
| | | | | | | | |
| | | | | | $ | 554,857 | |
| | | | | | | | |
Options WrittenT | | | | | | | | |
Barclays Swaption Call, Strike Price $4.86 | | October 2013 | | 4,770,000 | | $ | 26,197 | |
Barclays Swaption Call, Strike Price $4.95 | | October 2013 | | 4,770,000 | | | 5,211 | |
Barclays Swaption Put, Strike Price $4.86 | | October 2013 | | 4,770,000 | | | (103,724 | ) |
28
Annual Report to Shareholders
| | | | | | | | |
| | | EXPIRATION | | ACTUAL
CONTRACTS | | APPRECIATION/
(DEPRECIATION) | |
Options Written—Continued | | | | | | | | |
Barclays Swaption Put, Strike Price $4.95 | | October 2013 | | 4,770,000 | | $ | (93,968 | ) |
Credit Suisse First Boston Swaption Put, Strike Price $5.03 | | April 2010 | | 1,290,000 | | | (1,252 | ) |
Eurodollar Futures Call, Strike Price $99.00 | | March 2010 | | 88 | | | (87,390 | ) |
Eurodollar Futures Call, Strike Price $99.13 | | September 2010 | | 12 | | | 2,661 | |
Eurodollar Futures Put, Strike Price $98.88 | | March 2010 | | 88 | | | 56,560 | |
Eurodollar Futures Put, Strike Price $99.13 | | September 2010 | | 12 | | | (4,089 | ) |
Eurodollar Futures Put, Strike Price $99.38 | | March 2010 | | 7 | | | 2,340 | |
U.S. Treasury Note Futures Put, Strike Price $115.00 | | February 2010 | | 52 | | | (27,794 | ) |
U.S. Treasury Note Futures Put, Strike Price $115.00 | | March 2010 | | 207 | | | (130,048 | ) |
| | | | | | | | |
| | | | | | $ | (355,296 | ) |
| | | | | | | | |
| | | | | | | | | |
N.M. Not Meaningful.
| A | | Rule 144a Security – A security purchased pursuant to Rule 144a under the Securities Act of 1933 which may not be resold subject to that rule except to qualified institutional buyers. These securities, which the Fund’s investment adviser has determined to be liquid, unless otherwise noted, represent 7.27% of net assets. |
| B | | Stepped Coupon Security – A security with a predetermined schedule of interest or dividend rate changes at which time it begins to accrue interest or pay dividends according to the predetermined schedule. |
| C | | The coupon payment on these securities is currently in default as of December 31, 2009. |
| D | | Indexed Security – The rates of interest earned on these securities are tied to the London Interbank Offered Rate (“LIBOR”), the Euro Interbank Offered Rate (“EURIBOR”) Index, the Consumer Price Index (“CPI”), the one-year Treasury Bill Rate or the ten-year Japanese Government Bond Rate. The coupon rates are the rates as of December 31, 2009. |
| E | | Pay-in-Kind (“PIK”) security – A security in which interest or dividends during the initial few years is paid in additional PIK securities rather than in cash. |
| G | | Security is valued in good faith at fair value by or under the direction of the Board of Directors. |
| H | | Credit Linked Security – The rates of interest earned on these securities are tied to the credit rating assigned by Standard & Poor’s Rating Service and/or Moody’s Investors Services. |
| I | | Stripped Security – Security with interest-only or principal-only payment streams, denoted by a 1 or 2, respectively. For interest-only securities, the amount shown as principal is the notional balance used to calculate the amount of interest due. |
| J | | The coupon rates shown on variable rate securities are the rates at December 31, 2009. These rates vary with the weighted average coupon of the underlying loans. |
| K | | Treasury Inflation-Protected Security – Treasury security whose principal value is adjusted daily in accordance with changes to the Consumer Price Index for All Urban Consumers. Interest is calculated on the basis of the current adjusted principal value. |
| L | | Yankee Bond – A dollar-denominated bond issued in the U.S. by foreign entities. |
| M | | Inflation-Protected Security – Security whose principal value is adjusted daily or monthly in accordance with changes to the relevant country’s Consumer Price Index or its equivalent used as an inflation proxy. Interest is calculated on the basis of the current adjusted principal value. |
| O | | On September 7, 2008, the Federal Housing Finance Agency placed Fannie Mae (FNMA) and Freddie Mac (FHLMC) into conservatorship. |
| P | | Zero coupon bond – A bond with no periodic interest payments which is sold at such a discount as to produce a current yield to maturity. |
| Q | | All or a portion of this security is collateral to cover futures and options contracts written. |
| R | | Par represents actual number of contracts. |
29
Annual Report to Shareholders
Portfolio of Investments—Continued
Western Asset Absolute Return Portfolio—Continued
| S | | Rate shown represents yield-to-maturity. |
| T | | Options written and futures are described in more detail in the notes to financial statements. |
| # | | Aggregate cost for federal income tax purposes is $328,665,523. |
| † | | Securities are denominated in U.S. Dollars, unless otherwise noted. |
Abbreviations used in Portfolio:
| | | | |
| AUD | | — | | Australian Dollar |
| BRL | | — | | Brazilian Real |
| GBP | | — | | British Pound |
| IDR | | — | | Indonesian Rupiah |
| SEK | | — | | Swedish Krona |
| THB | | — | | Thai Baht |
See notes to financial statements.
30
Annual Report to Shareholders
Statement of Assets and Liabilities
Western Asset Absolute Return Portfolio
December 31, 2009
| | | | | | | |
Assets: | | | | | | | |
Investment securities at value (Cost—$290,550,453) | | | | | $ | 250,737,146 | |
Short-term securities at value (Cost—$36,904,455) | | | | | | 37,293,220 | |
Foreign currency at value (Cost—$864,259) | | | | | | 887,504 | |
Receivable for securities sold | | | | | | 43,438,406 | |
Interest receivable | | | | | | 2,983,883 | |
Restricted cash pledged for swaps | | | | | | 2,200,000 | |
Premiums paid on open swaps | | | | | | 1,015,224 | |
Unrealized appreciation of swaps | | | | | | 889,490 | |
Deposits with brokers for open futures contracts | | | | | | 114,332 | |
Futures variation margin receivable | | | | | | 110,361 | |
Unrealized appreciation of forward foreign currency contracts | | | | | | 74,605 | |
Receivable for fund shares sold | | | | | | 55,071 | |
Amounts receivable for open swaps | | | | | | 13,853 | |
| | | | | | | |
Total assets | | | | | | 339,813,095 | |
| | | | | | | |
| | |
Liabilities: | | | | | | | |
Payable for securities purchased | | $ | 43,322,861 | | | | |
Unrealized depreciation of swaps | | | 2,887,032 | | | | |
Options written (Proceeds—$1,372,753) | | | 1,728,049 | | | | |
Income distribution payable | | | 716,466 | | | | |
Accrued management fee | | | 176,629 | | | | |
Unrealized depreciation of forward foreign currency contracts | | | 80,949 | | | | |
Amounts payable for open swaps | | | 59,825 | | | | |
Payable for fund shares repurchased | | | 32,980 | | | | |
Premiums received on open swaps | | | 31,058 | | | | |
Accrued distribution | | | 1,072 | | | | |
Due to Custodian | | | 571 | | | | |
Accrued expenses | | | 83,823 | | | | |
| | | | | | | |
Total liabilities | | | | | | 49,121,315 | |
| | | | | | | |
| | |
Net Assets | | | | | $ | 290,691,780 | |
| | | | | | | |
| | |
Net assets consist of: | | | | | | | |
Accumulated paid-in-capital (Note 7) | | | | | $ | 348,605,269 | |
Undistributed net investment income | | | | | | 218,214 | |
Accumulated net realized loss on investments, options, futures, swaps and foreign currency transactions | | | | | | (17,145,147 | ) |
Net unrealized depreciation of investments, options, futures, swaps and foreign currency translations | | | | | | (40,986,556 | ) |
| | | | | | | |
| | |
Net Assets | | | | | $ | 290,691,780 | |
| | | | | | | |
| | |
Net Asset Value Per Share: | | | | | | | |
Institutional Class (10,130,105 shares outstanding) | | | | | | $9.80 | |
| | | | | | | |
Institutional Select Class (19,119,918 shares outstanding) | | | | | | $9.79 | |
| | | | | | | |
Financial Intermediary Class (435,803 shares outstanding) | | | | | | $9.79 | |
| | | | | | | |
| | | | | | | | |
See notes to financial statements.
31
Annual Report to Shareholders
Statement of Operations
Western Asset Absolute Return Portfolio
| | | | | | | | |
| | | FOR THE
YEAR ENDED
DECEMBER 31, 2009 | |
Investment Income: | | | | |
Interest | | $ | 16,907,127 | | | | | |
Dividends | | | 76,429 | | | | | |
Less: Foreign taxes withheld | | | (15,775 | ) | | | | |
| | | | | | | | |
Total income | | | | | | $ | 16,967,781 | |
Expenses: | | | | | | | | |
Management fees (Note 2) | | | 2,109,744 | | | | | |
Audit and legal fees | | | 92,374 | | | | | |
Custodian fees | | | 85,790 | | | | | |
Registration fees | | | 29,940 | | | | | |
Transfer agent and shareholder servicing expense (Note 6) | | | 24,932 | | | | | |
Directors’ fees and expenses | | | 14,759 | | | | | |
Reports to shareholders (Note 6) | | | 7,989 | | | | | |
Distribution fees (Notes 2 and 6) | | | 3,384 | | | | | |
Other expenses | | | 11,261 | | | | | |
| | | | | | | | |
| | | 2,380,173 | | | | | |
Less: Fees waived (Notes 2 and 6) | | | (126,396 | ) | | | | |
| | | | | | | | |
Net expenses | | | | | | | 2,253,777 | |
| | | | | | | | |
Net Investment Income | | | | | | | 14,714,004 | |
Net Realized and Unrealized Gain/(Loss) on Investments (Notes 1, 3 and 4): | | | | | | | | |
Net realized gain/(loss) on: | | | | | | | | |
Investments | | | (8,896,004 | ) | | | | |
Options written | | | 3,019,995 | | | | | |
Futures | | | (1,945,345 | ) | | | | |
Swaps | | | (3,451,887 | ) | | | | |
Foreign currency transactions | | | 1,318,981 | | | | | |
| | | | | | | | |
| | | | | | | (9,954,260 | ) |
Change in unrealized appreciation/(depreciation) of: | | | | | | | | |
Investments | | | 66,097,183 | | | | | |
Options written | | | 1,068,832 | | | | | |
Futures | | | 138,886 | | | | | |
Swaps | | | 7,031,739 | | | | | |
Foreign currency translations | | | (1,484,780 | ) | | | | |
| | | | | | | | |
| | | | | | | 72,851,860 | |
| | | | | | | | |
Net Realized and Unrealized Gain on Investments | | | | | | | 62,897,600 | |
| | | | | | | | | |
Change in Net Assets Resulting From Operations | | | | | | $ | 77,611,604 | |
| | | | | | | | | |
See notes to financial statements.
32
Annual Report to Shareholders
Statement of Changes in Net Assets
Western Asset Absolute Return Portfolio
| | | | | | | | | | | | |
| | | FOR THE
YEAR ENDED
DECEMBER 31, 2009 | | | FOR THE
PERIOD ENDED
DECEMBER 31, 2008A | | | FOR THE
YEAR ENDED
MARCH 31, 2008 | |
Change in Net Assets: | | | | | | | | | | | | |
Net investment income | | $ | 14,714,004 | | | $ | 19,337,226 | | | $ | 23,988,721 | |
| | | |
Net realized gain/(loss) | | | (9,954,260 | ) | | | (4,238,777 | ) | | | 15,106,897 | |
| | | |
Change in unrealized appreciation/(depreciation) | | | 72,851,860 | | | | (83,791,340 | ) | | | (31,265,829 | ) |
| | | | | | | | | | | | |
Change in net assets resulting from operations | | | 77,611,604 | | | | (68,692,891 | ) | | | 7,829,789 | |
| | | |
Distributions to shareholders from (Note 1): | | | | | | | | | | | | |
Net investment income: | | | | | | | | | | | | |
Institutional Class | | | (5,966,791 | ) | | | (16,087,470 | ) | | | (23,789,518 | ) |
Institutional Select Class | | | (10,557,365 | ) | | | (5,703,469 | ) | | | N/A | |
Financial Intermediary Class | | | (98,946 | ) | | | (36,322 | ) | | | (4,728 | ) |
| | | |
Net realized gain on investments: | | | | | | | | | | | | |
Institutional Class | | | — | | | | (12,841,701 | ) | | | (2,180,665 | ) |
Institutional Select Class | | | — | | | | — | | | | N/A | |
Financial Intermediary Class | | | — | | | | (9,321 | ) | | | (163 | ) |
| | | |
Change in net assets from fund share transactions (Note 7): | | | | | | | | | | | | |
Institutional Class | | | (73,381,560 | ) | | | (334,535,983 | ) | | | 207,117,247 | |
Institutional Select Class | | | (14,400,106 | ) | | | 190,945,457 | | | | N/A | |
Financial Intermediary Class | | | 3,228,877 | | | | 593,184 | | | | 396,921 | |
| | | | | | | | | | | | |
Change in net assets | | | (23,564,287 | ) | | | (246,368,516 | ) | | | 189,368,883 | |
| | | |
Net Assets: | | | | | | | | | | | | |
Beginning of year | | | 314,256,067 | | | | 560,624,583 | | | | 371,255,700 | |
| | | | | | | | | | | | |
| | | |
End of year | | $ | 290,691,780 | | | $ | 314,256,067 | | | $ | 560,624,583 | |
| | | | | | | | | | | | |
| | | |
Undistributed net investment income | | $ | 218,214 | | | $ | 521,558 | | | $ | 1,582,356 | |
| | | | | | | | | | | | |
| | | | | | | | | | | | | |
| A | | For the period April 1, 2008 to December 31, 2008. |
N/A—Not applicable
See notes to financial statements.
33
Annual Report to Shareholders
Financial Highlights
Western Asset Absolute Return Portfolio
For a share of each class of capital stock outstanding:
Institutional Class:
| | | | | | | | | | | | | | | | |
| | | YEAR ENDED
DECEMBER 31,
2009 | | | PERIOD ENDED
DECEMBER 31,
2008A | | | YEARS ENDED
MARCH 31, | |
| | | | | 2008 | | | 2007B | |
Net asset value, beginning of year | | $ | 7.81 | | | $ | 9.82 | | | $ | 10.23 | | | $ | 10.00 | |
| | | | | | | | | | | | | | | | |
Investment operations: | | | | | | | | | | | | | | | | |
Net investment incomeC | | | .46 | | | | .38 | | | | .49 | | | | .36 | |
Net realized and unrealized gain/(loss) | | | 2.03 | | | | (1.71 | ) | | | (.36 | ) | | | .29 | |
| | | | | | | | | | | | | | | | |
Total from investment operations | | | 2.49 | | | | (1.33 | ) | | | .13 | | | | .65 | |
| | | | | | | | | | | | | | | | |
Distributions from: | | | | | | | | | | | | | | | | |
Net investment income | | | (.50 | ) | | | (.44 | ) | | | (.49 | ) | | | (.35 | ) |
Net realized gain on investments | | | — | | | | (.24 | ) | | | (.05 | ) | | | (.07 | ) |
| | | | | | | | | | | | | | | | |
Total distributions | | | (.50 | ) | | | (.68 | ) | | | (.54 | ) | | | (.42 | ) |
| | | | | | | | | | | | | | | | |
Net asset value, end of year | | $ | 9.80 | | | $ | 7.81 | | | $ | 9.82 | | | $ | 10.23 | |
| | | | | | | | | | | | | | | | |
Total returnD | | | 32.89 | % | | | (14.20 | )% | | | 1.31 | % | | | 6.63 | % |
| | | | |
Ratios to Average Net Assets: | | | | | | | | | | | | | | | | |
Total expensesE | | | .85 | % | | | .83 | %F | | | .84 | % | | | 1.09 | %F |
Expenses net of waivers, if anyE | | | .80 | % | | | .80 | %F | | | .84 | % | | | .93 | %F |
Expenses net of all reductionsE | | | .80 | % | | | .80 | %F | | | .83 | % | | | .89 | %F |
Net investment income | | | 5.2 | % | | | 5.5 | %F | | | 4.9 | % | | | 4.9 | %F |
| | | | |
Supplemental Data: | | | | | | | | | | | | | | | | |
Portfolio turnover rate | | | 257.6 | % | | | 229.6 | %G | | | 386.9 | % | | | 182.2 | %G |
Net assets, end of year (in thousands) | | $ | 99,271 | | | $ | 152,349 | | | $ | 560,219 | | | $ | 371,239 | |
| | | | | | | | | | | | | | | | | |
| A | | For the period April 1, 2008 to December 31, 2008. |
| B | | For the period July 6, 2006 (commencement of operations) to March 31, 2007. |
| C | | Computed using average daily shares outstanding. |
| D | | Performance figures may reflect compensating balance credits, fee waivers and/or expense reimbursements. In the absence of compensating balance credits, fee waivers and/or expense reimbursements, the total return would have been lower. Past performance is no guarantee of future results. Total returns for periods of less than one year are not annualized. |
| E | | Total expenses reflects operating expenses prior to any voluntary expense waivers and/or compensating balance credits. Expenses net of waivers reflects total expenses before compensating balance credits but net of any voluntary expense waivers. Expenses net of all reductions reflects expenses less any compensating balance credits and/or contractual expense waivers. |
See notes to financial statements.
34
Annual Report to Shareholders
For a share of each class of capital stock outstanding:
Institutional Select Class:
| | | | | | | | |
| | | YEAR ENDED
DECEMBER 31,
2009 | | | PERIOD ENDED DECEMBER 31,
2008A | |
Net asset value, beginning of year | | $ | 7.82 | | | $ | 9.15 | |
| | | | | | | | |
Investment operations: | | | | | | | | |
Net investment incomeB | | | .46 | | | | .20 | |
Net realized and unrealized gain/(loss) | | | 2.03 | | | | (1.26 | ) |
| | | | | | | | |
Total from investment operations | | | 2.49 | | | | (1.06 | ) |
| | | | | | | | |
Distributions from: | | | | | | | | |
Net investment income | | | (.52 | ) | | | (.27 | ) |
| | | | | | | | |
Total distributions | | | (.52 | ) | | | (.27 | ) |
| | | | | | | | |
Net asset value, end of year | | $ | 9.79 | | | $ | 7.82 | |
| | | | | | | | |
Total returnC | | | 32.81 | % | | | (11.69 | )% |
| | |
Ratios to Average Net Assets: | | | | | | | | |
Total expensesD | | | .84 | % | | | .85 | %E |
Expenses net of waivers, if anyD | | | .80 | % | | | .80 | %E |
Expenses net of all reductionsD | | | .80 | % | | | .80 | %E |
Net investment income | | | 5.2 | % | | | 5.8 | %E |
| | |
Supplemental Data: | | | | | | | | |
Portfolio turnover rate | | | 257.6 | % | | | 229.6 | %F |
Net assets, end of year (in thousands) | | $ | 187,156 | | | $ | 161,094 | |
| | | | | | | | | |
| A | | For the period August 4, 2008 (commencement of operations) to December 31, 2008. |
| B | | Computed using average daily shares outstanding. |
| C | | Performance figures may reflect compensating balance credits, fee waivers and/or expense reimbursements. In the absence of compensating balance credits, fee waivers and/or expense reimbursements, the total return would have been lower. Past performance is no guarantee of future results. Total returns for periods of less than one year are not annualized. |
| D | | Total expenses reflects operating expenses prior to any voluntary expense waivers and/or compensating balance credits. Expenses net of waivers reflects total expenses before compensating balance credits but net of any voluntary expense waivers. Expenses net of all reductions reflects expenses less any compensating balance credits and/or contractual expense waivers. |
See notes to financial statements.
35
Annual Report to Shareholders
Financial Highlights
Western Asset Absolute Return Portfolio
For a share of each class of capital stock outstanding:
Financial Intermediary Class:
| | | | | | | | | | | | | | | | |
| | | YEAR ENDED
DECEMBER 31,
2009 | | | PERIOD ENDED
DECEMBER 31,
2008A | | | YEARS ENDED
MARCH 31, | |
| | | | | 2008 | | | 2007B | |
Net asset value, beginning of year | | $ | 7.82 | | | $ | 9.82 | | | $ | 10.23 | | | $ | 10.17 | |
| | | | | | | | | | | | | | | | |
Investment operations: | | | | | | | | | | | | | | | | |
Net investment incomeC | | | .43 | | | | .35 | | | | .47 | | | | .27 | |
Net realized and unrealized gain/(loss) | | | 2.05 | | | | (1.69 | ) | | | (.37 | ) | | | .13 | |
| | | | | | | | | | | | | | | | |
Total from investment operations | | | 2.48 | | | | (1.34 | ) | | | .10 | | | | .40 | |
| | | | | | | | | | | | | | | | |
Distributions from: | | | | | | | | | | | | | | | | |
Net investment income | | | (.51 | ) | | | (.42 | ) | | | (.46 | ) | | | (.27 | ) |
Net realized gain on investments | | | — | | | | (.24 | ) | | | (.05 | ) | | | (.07 | ) |
| | | | | | | | | | | | | | | | |
Total distributions | | | (.51 | ) | | | (.66 | ) | | | (.51 | ) | | | (.34 | ) |
| | | | | | | | | | | | | | | | |
Net asset value, end of year | | $ | 9.79 | | | $ | 7.82 | | | $ | 9.82 | | | $ | 10.23 | |
| | | | | | | | | | | | | | | | |
Total returnD | | | 32.55 | % | | | (14.31 | )% | | | 1.03 | % | | | 3.99 | % |
| | | | |
Ratios to Average Net Assets: | | | | | | | | | | | | | | | | |
Total expensesE | | | 1.42 | % | | | 1.38 | %F | | | 1.31 | % | | | 85.97 | %F |
Expenses net of waivers, if anyE | | | 1.05 | % | | | 1.05 | %F | | | 1.06 | % | | | 1.18 | %F |
Expenses net of all reductionsE | | | 1.05 | % | | | 1.05 | %F | | | 1.03 | % | | | 1.16 | %F |
Net investment income | | | 4.7 | % | | | 5.5 | %F | | | 4.7 | % | | | 4.6 | %F |
| | | | |
Supplemental Data: | | | | | | | | | | | | | | | | |
Portfolio turnover rate | | | 257.6 | % | | | 229.6 | %G | | | 386.9 | % | | | 182.2 | %G |
Net assets, end of year (in thousands) | | $ | 4,265 | | | $ | 813 | | | $ | 406 | | | $ | 17 | |
| | | | | | | | | | | | | | | | | |
| A | | For the period April 1, 2008 to December 31, 2008. |
| B | | For the period September 6, 2006 (commencement of operations) to March 31, 2007. |
| C | | Computed using average daily shares outstanding. |
| D | | Performance figures may reflect compensating balance credits, fee waivers and/or expense reimbursements. In the absence of compensating balance credits, fee waivers and/or expense reimbursements, the total return would have been lower. Past performance is no guarantee of future results. Total returns for periods of less than one year are not annualized. |
| E | | Total expenses reflects operating expenses prior to any voluntary expense waivers and/or compensating balance credits. Expenses net of waivers reflects total expenses before compensating balance credits but net of any voluntary expense waivers. Expenses net of all reductions reflects expenses less any compensating balance credits and/or contractual expense waivers. |
See notes to financial statements.
36
Annual Report to Shareholders
Management’s Discussion of Fund Performance
Western Asset High Yield Portfolio
Performance Review
For the twelve months ended December 31, 2009, Institutional Class shares of Western Asset High Yield Portfolio returned 56.73%. The Fund’s unmanaged benchmark, the Barclays Capital U.S. Corporate High Yield 2% Issuer Cap Indexi, returned 58.76% for the same period. The Lipper High Current Yield Funds Category Average1 returned 46.41% over the same time frame.
PERFORMANCE SNAPSHOT as of December 31, 2009 (unaudited)
| | | | |
| | | 6 MONTHS | | 12 MONTHS |
Western Asset High Yield Portfolio: | | | | |
Institutional Class | | 23.54% | | 56.73% |
Institutional Select Class | | 23.54% | | 56.74% |
Barclays Capital U.S. Corporate High Yield 2% Issuer Cap Index | | 21.27% | | 58.76% |
Lipper High Current Yield Funds Category Average1 | | 19.45% | | 46.41% |
The performance shown represents past performance. Past performance is no guarantee of future results and current performance may be higher or lower than the performance shown above. Principal value, investment returns and yields will fluctuate and investors’ shares, when redeemed, may be worth more or less than their original cost. To obtain performance data current to the most recent month-end, please visit our website at www.leggmason.com/individualinvestors.
All share class returns assume the reinvestment of all distributions, including returns of capital, if any, at net asset value and the deduction of all Fund expenses. Returns have not been adjusted to include the deduction of taxes that a shareholder would pay on Fund distributions. Performance figures for periods shorter than one year represent cumulative figures and are not annualized.
The 30-Day SEC Yields for the period ended December 31, 2009 for Institutional and Institutional Select Class shares were 9.36% and 9.51%, respectively. The 30-Day SEC Yield is the average annualized net investment income per share for the 30-day period indicated and is subject to change.
TOTAL ANNUAL OPERATING EXPENSES (unaudited)
As of the Fund’s most current prospectus dated July 1, 2009, the gross total operating expense ratios for Institutional and Institutional Select Class shares were 0.60% and 0.60%, respectively.
Actual expenses may be higher. For example, expenses may be higher than those shown if average net assets decrease. Net assets are more likely to decrease and Fund expense ratios are more likely to increase when markets are volatile.
While the Fund generated a strong absolute return during the reporting period, it lagged its benchmark on a relative basis. The largest detractor from relative results was an underweight to the strong-performing Financials sector. At the end of 2008, a number of large financial institutions’ securities were downgraded to below investment grade status. As a result, the Financials sector portion of the benchmark substantially increased. Given valuations that implied a high probability of default despite evidence of stabilizing fundamentals at many of these banks, we significantly increased the portfolio’s exposure to the Financials sector in an attempt to reduce its underweight versus the benchmark.
| 1 | | Lipper, Inc., a wholly-owned subsidiary of Reuters, provides independent insight on global collective investments. Returns are based on the period ended December 31, 2009, including the reinvestment of all distributions, including returns of capital, if any, calculated among the 474 funds for the six-month period and among the 459 funds for the twelve-month period in the Fund’s Lipper category. |
37
Annual Report to Shareholders
Management’s Discussion of Fund Performance—Continued
An underweight in the Information Technology (“IT”) sector was another detractor from the Fund’s relative performance, as it was one of the top performers within the benchmark during the reporting period. The IT sector’s performance did a turnaround from 2008 when the sector came under tremendous distress as a number of leveraged buyout technology companies weakened dramatically. Our overweight in Utilities, historically a defensive industry, also detracted from performance. The sector was negatively impacted by the poor performance of both Electric Utilities and Gas Utilities issuers.
The largest contributor to relative performance for the period was our overweight to CCC-rated bonds, which returned 95.28%, and underweight to BB-rated securities, which returned 45.88%, during the reporting period.1 Overall security selection was also a positive for results. In particular, our decision to overweight Ford Motor Co., Ford Motor Credit Co. DAE Aviation Holdings Inc. and Affinion Group Inc. all positively contributed to results. Ford Motor Co. has been able to outperform its peers in what has been an extremely difficult economic environment for the Automobiles sector. Unlike its domestic peers, Ford Motor Co. has been able to make tremendous progress in its restructuring plan, which included a more focused product line on sporty fuel efficient vehicles and reductions in both its cost structure and debt. Ford Motor Credit Co. benefited from its historically high underwriting standards and a sole focus on automotive financing. DEA Aviation Holdings Inc., an aircraft maintenance, repair and overhaul company, maintained strong credit metrics throughout the year. Direct marketing company Affinion Group Inc. benefited from stable sales and EBITDAii versus its peers despite a depressed economic environment. Security selection also contributed to performance in that the portfolio was underweight or had no exposure to eight of the ten worst performers in the benchmark. What’s more, the annual default rate of the portfolio’s holdings (7.8%) was significantly less than the benchmark’s default rate (13.7%). An overweight to the Transportation2 sector was also rewarded during the reporting period.
The portfolio utilized index credit default swaps during the fiscal year to increase its credit exposure. This strategy modestly detracted from performance.
We made a number of adjustments to the portfolio during the twelve-month reporting period. In addition to adding to its Financials exposure, we sought to increase the overall quality of the portfolio by reducing its significant overweight to CCC-rated securities. In addition, given positive signs on the economic front, we increased our exposure to select Consumer Cyclicals3.
Western Asset Management Company
January 19, 2010
| 1 | | All returns cited represent respective position and/or sector return within the Barclays Capital U.S. Corporate High Yield 2% Issuer Cap Index. |
| 2 | | Transportation consists of the following industries: Airlines, Railroads and other transportation-related services. |
| 3 | | Consumer Cyclicals consists of the following industries: Automotive, Entertainment, Gaming, Home Construction, Lodging, Retailers, Restaurants, Textiles and other consumer services. |
38
Annual Report to Shareholders
The information provided is not intended to be a forecast of future events, a guarantee of future results or investment advice. Views expressed may differ from those of the firm as a whole.
Portfolio holdings and breakdowns are as of December 31, 2009 and are subject to change and may not be representative of the portfolio managers’ current or future investments. Please refer to pages 46 through 61 for a list and percentage breakdown of the Fund’s holdings.
The mention of sector breakdowns is for informational purposes only and should not be construed as a recommendation to purchase or sell any securities. The information provided regarding such sectors is not a sufficient basis upon which to make an investment decision. Investors seeking financial advice regarding the appropriateness of investing in any securities or investment strategies discussed should consult their financial professional. The Fund’s top five sector holdings (as a percentage of net assets) as of December 31, 2009 were: Corporate Bonds and Notes (77.5%), Yankee Bonds (12.3%), Loan Participations and Assignments (4.3%), Common Stocks and Equity Interests (1.6%) and Preferred Stocks (1.3%). The Fund’s portfolio composition is subject to change at any time.
RISKS: All investments are subject to risk including the loss of principal. Fixed-income securities involve interest rate, credit, inflation and reinvestment risks. As interest rates rise, the value of fixed-income securities falls. Derivatives, such as options, futures and swaps, can be illiquid, may disproportionately increase losses, and have a potentially large impact on Fund performance. International investments are subject to special risks including currency fluctuations and social, economic and political uncertainties, which could increase volatility. These risks are magnified in emerging markets. The use of leverage may increase volatility and possibility of loss. Risks of high-yield securities include greater price volatility, illiquidity and possibility of default. Asset-backed, mortgage-backed or mortgage-related securities are subject to prepayment and extension risks. Please see the Fund’s prospectus for more information on these and other risks.
All index performance reflects no deduction for fees, expenses or taxes. Please note that an investor cannot invest directly in an index.
| i | | The Barclays Capital U.S. Corporate High Yield 2% Issuer Cap Index is an index of the 2% Issuer Cap component of the Barclays Capital U.S. Corporate High Yield Index, which covers the U.S. dollar-denominated, non-investment grade, fixed-rate, taxable corporate bond market. |
| ii | | EBITDA = Earnings Before Interest, Taxes, Depreciation and Amortization. |
39
Annual Report to Shareholders
Expense Example (Unaudited)
Western Asset High Yield Portfolio
As a shareholder of the Fund, you may incur two types of costs: (1) transaction costs and (2) ongoing costs, including management fees and other Fund expenses. These examples are intended to help you understand your ongoing costs (in dollars) of investing in the Fund and to compare these costs with the ongoing costs of investing in other mutual funds.
The example is based on an investment of $1,000 invested on July 1, 2009 and held through December 31, 2009. The ending values assume dividends were reinvested at the time they were paid.
Actual Expenses
The first line for each class in the table below provides information about actual account values and actual expenses for the Fund. You may use the information in this line, together with the amount you invested, to estimate the expenses that you paid over the period. Simply divide your account value by $1,000 (for example, an $8,600 account value divided by $1,000 = 8.6), then multiply the result by the number in the first line under the heading entitled “Expenses Paid During the Period” to estimate the expenses you paid on your account if your shares were held through the entire period.
Hypothetical Example for Comparison Purposes
The second line for each class in the table below provides information about hypothetical account values and hypothetical expenses based on the Fund’s actual expense ratio and an assumed rate of return of 5% per year before expenses, which is not the Class’s actual return. The hypothetical account values and expenses may not be used to estimate the actual ending account balance or expenses you paid for the period. You may use this information to compare the ongoing costs of investing in the Fund and other funds. To do so, compare these 5% hypothetical examples with the 5% hypothetical examples that appear in the shareholder reports of other funds. Because each example is intended to be comparable to the examples provided by other funds, it is based on a hypothetical investment of $1,000 invested on July 1, 2009 and held through December 31, 2009. The ending values assume dividends were reinvested at the time they were paid.
| | | | | | | | | |
| | | Beginning
Account Value
7/1/09 | | Ending
Account Value
12/31/09 | | Expenses Paid A
During the Period
7/1/09 to 12/31/09 |
Institutional Class: | | | | | | | | | |
Actual | | $ | 1,000.00 | | $ | 1,235.40 | | $ | 3.49 |
Hypothetical (5% return before expenses) | | | 1,000.00 | | | 1,022.08 | | | 3.16 |
Institutional Select Class: | | | | | | | | | |
Actual | | $ | 1,000.00 | | $ | 1,235.40 | | $ | 3.44 |
Hypothetical (5% return before expenses) | | | 1,000.00 | | | 1,022.13 | | | 3.11 |
| A | | These calculations are based on expenses incurred from July 1, 2009 to December 31, 2009. The dollar amounts shown as “Expenses Paid” are equal to the annualized expense ratio of 0.62% and 0.61% for the Institutional Class and Institutional Select Class, respectively, multiplied by the average value over the period, multiplied by the number of days in the most recent half-year then divided by 365. |
40
Annual Report to Shareholders
Performance Information (Unaudited)
Western Asset High Yield Portfolio
The graphs compare the Fund’s total returns to that of an appropriate broad-based securities market indexes. The graphs illustrate the cumulative total return of an initial $1,000,000 investment in each of the Institutional Class and Institutional Select Class of the Fund, for the periods indicated. The lines for the Fund represents the total return after deducting all Fund investment management and other administrative expenses and the transaction costs of buying and selling securities. The lines representing the securities market indexes do not include any transaction costs associated with buying and selling securities in the indexes or other investment management or administrative expenses.
Total return measures investment performance in terms of appreciation or depreciation in the Fund’s net asset value per share, plus dividends and any capital gain distributions. It assumes that dividends and distributions were reinvested at the time they were paid. Returns (and the graph and table found below) do not reflect the deduction of taxes that a shareholder would pay on Fund distributions or the redemption of Fund shares. Average annual returns tend to smooth out variations in a fund’s return, so that they differ from actual year-to-year results.
Bonds are subject to a variety of risks, including interest rate, credit and inflation risks. Non-U.S. investments are subject to currency fluctuations, social, economic, and political risk.
Growth of a $1,000,000 Investment—Institutional Class
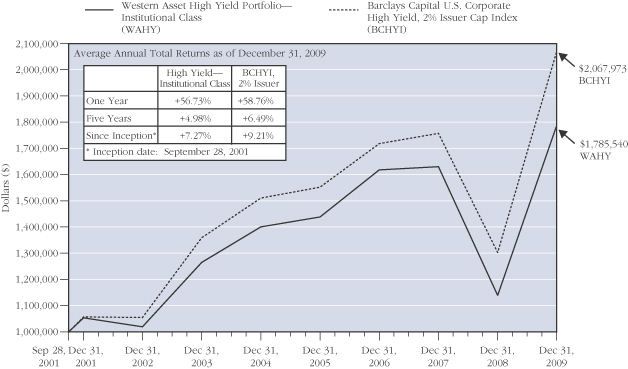
The performance data quoted represent past performance and do not guarantee future results. Current performance may be lower or higher than the performance data quoted. To obtain the most recent month-end performance information, please visit www.westernassetfunds.com. The investment return and principal value of the Fund will fluctuate so that an investor’s shares, when redeemed, may be worth more or less than the original cost. Calculations assume reinvestment of all distributions, including returns of capital, if any, at net asset value and the deduction of all Fund expenses. Performance would have been lower if fees had not been waived in various periods.
41
Annual Report to Shareholders
Performance Information (Unaudited)—Continued
Growth of a $1,000,000 Investment—Institutional Select Class
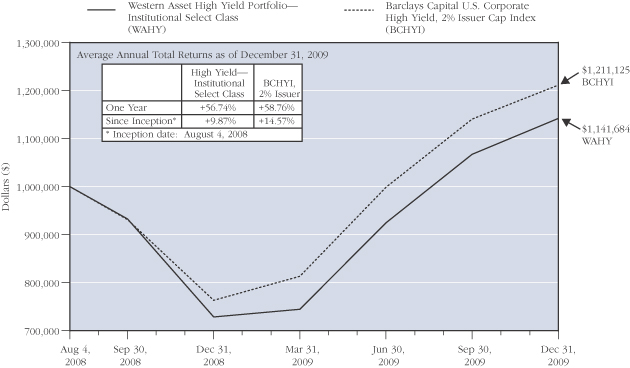
The performance data quoted represent past performance and do not guarantee future results. Current performance may be lower or higher than the performance data quoted. To obtain the most recent month-end performance information, please visit www.westernassetfunds.com. The investment return and principal value of the Fund will fluctuate so that an investor’s shares, when redeemed, may be worth more or less than the original cost. Calculations assume reinvestment of all distributions, including returns of capital, if any, at net asset value and the deduction of all Fund expenses. Performance would have been lower if fees had not been waived in various periods.
42
Annual Report to Shareholders
Portfolio Composition (Unaudited) (as of December 31, 2009)A
Standard & Poor’s Debt RatingsB (as a percentage of the portfolio)
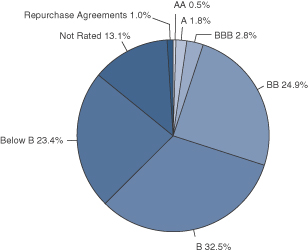
Maturity Schedule
(as a percentage of the portfolio)
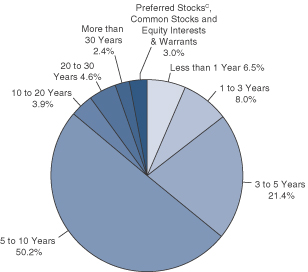
| A | | The pie charts above represent the composition of the Fund’s portfolio as of December 31, 2009 and do not include derivatives such as Futures Contracts, Options Written, and Swaps. The Fund is actively managed. As a result, the composition of the portfolio holdings and sectors are subject to change at any time. |
| B | | Standard & Poor’s Ratings Service provides capital markets with credit ratings for the evaluation and assessment of credit risk. These ratings are the opinions of S&P and not absolute measures of quality or guarantees of performance. |
| C | | Preferred Stocks, Common Stocks and Equity Interests and Warrants do not have defined maturity dates. |
43
Annual Report to Shareholders
Spread Duration
Western Asset High Yield Portfolio
December 31, 2009 (Unaudited)
Economic Exposure
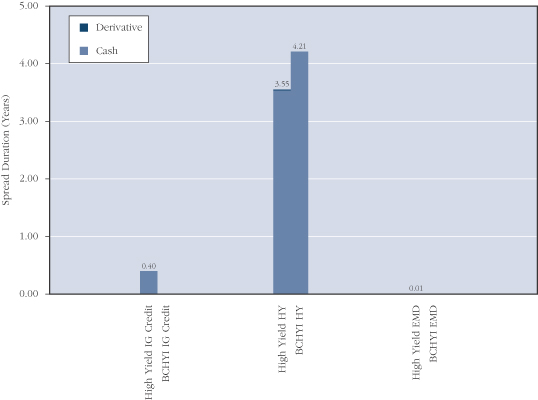
Spread duration is defined as the change in value for a 100 basis point change in the spread relative to Treasuries. The spread over Treasuries is the annual risk-premium demanded by investors to hold non-Treasury securities. This chart highlights the market sector exposure of the Fund’s portfolio and the exposure relative to the selected benchmark as of the end of the reporting period.
| | | | |
| BCHYI | | — | | Barclays Capital U.S. Corporate High Yield, 2% Issuer Cap Index |
| EMD | | — | | Emerging Market |
| HY | | — | | High Yield |
| IG Credit | | — | | Investment Grade Credit |
44
Annual Report to Shareholders
Effective Duration
Western Asset High Yield Portfolio
December 31, 2009 (Unaudited)
Interest Rate Exposure
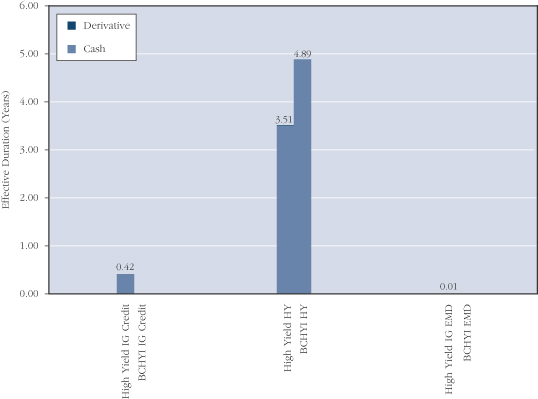
Effective duration is defined as the change in value for a 100 basis point change in Treasury yields. This chart highlights the interest rate exposure of the Fund’s portfolio relative to the selected benchmark as of the end of the reporting period.
| | | | |
| BCHYI | | — | | Barclays Capital U.S. Corporate High Yield, 2% Issuer Cap Index |
| EMD | | — | | Emerging Market |
| HY | | — | | High Yield |
| IG Credit | | — | | Investment Grade Credit |
45
Annual Report to Shareholders
Portfolio of Investments
Western Asset High Yield Portfolio
December 31, 2009
| | | | | | | | | | | | | |
| | | % OF
NET ASSESTS | | RATE | | MATURITY
DATE | | PAR/
SHARES | | VALUE | |
| | | | | | | | | | | | | |
Long-Term Securities | | 97.0% | | | | | | | | | | | |
| | | | | |
Corporate Bonds and Notes | | 77.5% | | | | | | | | | | | |
| | | | | |
Aerospace and Defense | | 0.4% | | | | | | | | | | | |
Freedom Group Inc. | | | | 10.250% | | 8/1/15 | | $ | 270,000 | | $ | 286,538 | A |
TransDigm Inc. | | | | 7.750% | | 7/15/14 | | | 1,955,000 | | | 1,984,325 | A |
| | | | | | | | | | | | | |
| | | | | | | | | | | | 2,270,863 | |
| | | | | | | | | | | | | |
Airlines | | 2.8% | | | | | | | | | | | |
American Airlines Inc. | | | | 10.500% | | 10/15/12 | | | 670,000 | | | 700,150 | A |
AMR Corp. | | | | 6.250% | | 10/15/14 | | | 185,000 | | | 191,706 | B |
Continental Airlines Inc. | | | | 7.339% | | 4/19/14 | | | 1,305,000 | | | 1,190,812 | |
Continental Airlines Inc. | | | | 9.250% | | 5/10/17 | | | 560,000 | | | 569,100 | |
DAE Aviation Holdings Inc. | | | | 11.250% | | 8/1/15 | | | 7,755,000 | | | 6,552,975 | A |
Delta Air Lines Inc. | | | | 7.711% | | 9/18/11 | | | 3,485,000 | | | 3,432,725 | |
Delta Air Lines Inc. | | | | 8.954% | | 8/10/14 | | | 1,597,852 | | | 1,422,089 | |
Delta Air Lines Inc. | | | | 9.500% | | 9/15/14 | | | 905,000 | | | 940,069 | A |
Delta Air Lines Inc. | | | | 12.250% | | 3/15/15 | | | 1,000,000 | | | 1,000,000 | A |
Delta Air Lines Inc. | | | | 9.750% | | 12/17/16 | | | 910,000 | | | 925,925 | |
United Air Lines Inc. | | | | 7.032% | | 10/1/10 | | | 59,325 | | | 59,325 | |
United Air Lines Inc. | | | | 7.186% | | 10/1/12 | | | 170,360 | | | 171,211 | |
| | | | | | | | | | | | | |
| | | | | | | | | | | | 17,156,087 | |
| | | | | | | | | | | | | |
Auto Components | | 0.6% | | | | | | | | | | | |
Affinia Group Inc. | | | | 10.750% | | 8/15/16 | | | 650,000 | | | 704,437 | A |
Allison Transmission | | | | 11.000% | | 11/1/15 | | | 315,000 | | | 330,750 | A |
Allison Transmission | | | | 12.000% | | 11/1/15 | | | 1,073,400 | | | 1,121,703 | A,C |
American Axle & Manufacturing Inc. | | | | 9.250% | | 1/15/17 | | | 240,000 | | | 243,600 | A |
TRW Automotive Inc. | | | | 8.875% | | 12/1/17 | | | 610,000 | | | 634,400 | A |
Visteon Corp. | | | | 8.250% | | 8/1/10 | | | 982,000 | | | 257,775 | D |
Visteon Corp. | | | | 12.250% | | 12/31/16 | | | 1,636,000 | | | 687,120 | A,D |
| | | | | | | | | | | | | |
| | | | | | | | | | | | 3,979,785 | |
| | | | | | | | | | | | | |
Automobiles | | 0.7% | | | | | | | | | | | |
Motors Liquidation Co. | | | | 7.200% | | 1/15/11 | | | 6,180,000 | | | 1,668,600 | D |
Motors Liquidation Co. | | | | 8.250% | | 7/15/23 | | | 1,320,000 | | | 349,800 | D |
Motors Liquidation Co. | | | | 8.375% | | 7/15/33 | | | 9,260,000 | | | 2,500,200 | D |
| | | | | | | | | | | | | |
| | | | | | | | | | | | 4,518,600 | |
| | | | | | | | | | | | | |
Biotechnology | | 0.2% | | | | | | | | | | | |
Talecris Biotherapeutics Holdings Corp. | | | | 7.750% | | 11/15/16 | | | 1,110,000 | | | 1,126,650 | A |
| | | | | | | | | | | | | |
46
Annual Report to Shareholders
| | | | | | | | | | | | | |
| | | % OF
NET ASSETS | | RATE | | MATURITY
DATE | | PAR/
SHARES | | VALUE | |
| | | | | | | | | | | | | |
Corporate Bonds and Notes—Continued | | | | | | | | | | | | | |
| | | | | |
Building Products | | 1.5% | | | | | | | | | | | |
Associated Materials Inc. | | | | 11.250% | | 3/1/14 | | $ | 6,080,000 | | $ | 5,867,200 | |
Nortek Inc. | | | | 11.000% | | 12/1/13 | | | 2,867,689 | | | 2,996,735 | |
USG Corp. | | | | 9.750% | | 8/1/14 | | | 370,000 | | | 394,975 | A |
| | | | | | | | | | | | | |
| | | | | | | | | | | | 9,258,910 | |
| | | | | | | | | | | | | |
Capital Markets | | 0.1% | | | | | | | | | | | |
Lehman Brothers Holdings Inc. | | | | 5.250% | | 2/6/12 | | | 2,570,000 | | | 501,150 | D |
| | | | | | | | | | | | | |
| | | | | |
Chemicals | | 1.1% | | | | | | | | | | | |
ARCO Chemical Co. | | | | 9.800% | | 2/1/20 | | | 70,000 | | | 49,700 | D,E |
Ashland Inc. | | | | 9.125% | | 6/1/17 | | | 1,145,000 | | | 1,256,637 | A |
Georgia Gulf Corp. | | | | 9.000% | | 1/15/17 | | | 2,340,000 | | | 2,363,400 | A |
Koppers Inc. | | | | 7.875% | | 12/1/19 | | | 770,000 | | | 777,700 | A |
Solutia Inc. | | | | 8.750% | | 11/1/17 | | | 1,000,000 | | | 1,041,250 | |
Terra Capital Inc. | | | | 7.750% | | 11/1/19 | | | 1,360,000 | | | 1,455,200 | A |
| | | | | | | | | | | | | |
| | | | | | | | | | | | 6,943,887 | |
| | | | | | | | | | | | | |
Commercial Banks | | 0.7% | | | | | | | | | | | |
BankAmerica Institutional Capital B | | | | 7.700% | | 12/31/26 | | | 300,000 | | | 282,750 | A |
Wells Fargo Capital XIII | | | | 7.700% | | 12/29/49 | | | 2,875,000 | | | 2,788,750 | F |
Wells Fargo Capital XV | | | | 9.750% | | 12/29/49 | | | 910,000 | | | 973,700 | F |
| | | | | | | | | | | | | |
| | | | | | | | | | | | 4,045,200 | |
| | | | | | | | | | | | | |
Commercial Services and Supplies | | 1.6% | | | | | | | | | | | |
ACCO Brands Corp. | | | | 10.625% | | 3/15/15 | | | 1,505,000 | | | 1,655,500 | A |
RCS Equipment Rental Inc. | | | | 9.500% | | 12/1/14 | | | 3,480,000 | | | 3,484,350 | |
The Geo Group Inc. | | | | 7.750% | | 10/15/17 | | | 1,135,000 | | | 1,161,956 | A |
Altegrity Inc. | | | | 10.500% | | 11/1/15 | | | 320,000 | | | 285,600 | A |
Altegrity Inc. | | | | 11.750% | | 5/1/16 | | | 3,700,000 | | | 3,186,625 | A |
| | | | | | | | | | | | | |
| | | | | | | | | | | | 9,774,031 | |
| | | | | | | | | | | | | |
Communications Equipment | | 0.2% | | | | | | | | | | | |
EchoStar DBS Corp. | | | | 6.625% | | 10/1/14 | | | 1,460,000 | | | 1,472,775 | |
| | | | | | | | | | | | | |
| | | | | |
Construction Materials | | 0.1% | | | | | | | | | | | |
Headwaters Inc. | | | | 11.375% | | 11/1/14 | | | 665,000 | | | 693,263 | A |
| | | | | | | | | | | | | |
| | | | | |
Consumer Finance | | 4.6% | | | | | | | | | | | |
Capital One Capital V | | | | 10.250% | | 8/15/39 | | | 1,830,000 | | | 2,127,375 | |
Ford Motor Credit Co. | | | | 12.000% | | 5/15/15 | | | 14,095,000 | | | 16,344,957 | |
GMAC LLC | | | | 8.000% | | 12/31/18 | | | 404,000 | | | 355,520 | A |
GMAC LLC | | | | 8.000% | | 11/1/31 | | | 7,258,000 | | | 6,532,200 | A |
47
Annual Report to Shareholders
Portfolio of Investments—Continued
Western Asset High Yield Portfolio—Continued
| | | | | | | | | | | | | |
| | | % OF
NET ASSETS | | RATE | | MATURITY
DATE | | PAR/
SHARES | | VALUE | |
| | | | | | | | | | | | | |
Corporate Bonds and Notes—Continued | | | | | | | | | | | | | |
| | | | | |
Consumer Finance—Continued | | | | | | | | | | | | | |
SLM Corp. | | | | 8.450% | | 6/15/18 | | $ | 2,060,000 | | $ | 2,032,711 | |
SLM Corp. | | | | 5.625% | | 8/1/33 | | | 1,270,000 | | | 957,528 | |
| | | | | | | | | | | | | |
| | | | | | | | | | | | 28,350,291 | |
| | | | | | | | | | | | | |
Containers and Packaging | | 1.1% | | | | | | | | | | | |
Berry Plastics Escrow LLC/Berry Plastics Escrow Corp. | | | | 8.250% | | 11/15/15 | | | 750,000 | | | 753,750 | A |
Rock-Tenn Co. | | | | 9.250% | | 3/15/16 | | | 975,000 | | | 1,059,094 | |
Solo Cup Co. | | | | 10.500% | | 11/1/13 | | | 2,460,000 | | | 2,619,900 | A |
Viskase Cos. Inc. | | | | 9.875% | | 1/15/18 | | | 2,260,000 | | | 2,276,950 | A |
| | | | | | | | | | | | | |
| | | | | | | | | | | | 6,709,694 | |
| | | | | | | | | | | | | |
Distributors | | 0.1% | | | | | | | | | | | |
Keystone Automotive Operations Inc. | | | | 9.750% | | 11/1/13 | | | 1,450,000 | | | 623,500 | |
| | | | | | | | | | | | | |
| | | | | |
Diversified Consumer Services | | 0.5% | | | | | | | | | | | |
Service Corp. International | | | | 7.500% | | 4/1/27 | | | 1,212,000 | | | 1,078,680 | |
Stonemor Operating LLC/Cornerstone Family Services/Osiris Holdings | | | | 10.250% | | 12/1/17 | | | 2,170,000 | | | 2,207,975 | A |
| | | | | | | | | | | | | |
| | | | | | | | | | | | 3,286,655 | |
| | | | | | | | | | | | | |
Diversified Financial Services | | 4.8% | | | | | | | | | | | |
AAC Group Holding Corp. | | | | 10.250% | | 10/1/12 | | | 2,335,000 | | | 2,340,837 | A |
BAC Capital Trust VI | | | | 5.625% | | 3/8/35 | | | 1,670,000 | | | 1,336,746 | |
Bank of America Corp. | | | | 8.000% | | 12/29/49 | | | 640,000 | | | 616,154 | F |
CCM Merger Inc. | | | | 8.000% | | 8/1/13 | | | 3,735,000 | | | 3,030,019 | A |
CIT Group Inc. | | | | 7.000% | | 5/1/13 | | | 289,378 | | | 269,845 | |
CIT Group Inc. | | | | 7.000% | | 5/1/14 | | | 434,066 | | | 403,139 | |
CIT Group Inc. | | | | 7.000% | | 5/1/15 | | | 434,066 | | | 388,489 | |
CIT Group Inc. | | | | 7.000% | | 5/1/16 | | | 853,444 | | | 751,031 | |
CIT Group Inc. | | | | 7.000% | | 5/1/17 | | | 3,932,821 | | | 3,411,723 | |
Countrywide Capital III | | | | 8.050% | | 6/15/27 | | | 120,000 | | | 112,500 | |
El Paso Performance-Linked | | | | 7.750% | | 7/15/11 | | | 140,000 | | | 143,523 | A |
Fresenius US Finance II Inc. | | | | 9.000% | | 7/15/15 | | | 2,865,000 | | | 3,151,500 | A |
International Lease Finance Corp. | | | | 5.750% | | 6/15/11 | | | 325,000 | | | 298,610 | |
JPMorgan Chase and Co. | | | | 7.900% | | 4/29/49 | | | 2,960,000 | | | 3,053,122 | F |
Leucadia National Corp. | | | | 7.750% | | 8/15/13 | | | 490,000 | | | 491,837 | |
Leucadia National Corp. | | | | 8.125% | | 9/15/15 | | | 2,100,000 | | | 2,142,000 | |
TNK-BP Finance SA | | | | 7.875% | | 3/13/18 | | | 815,000 | | | 837,412 | A |
UPC Germany GmbH | | | | 8.125% | | 12/1/17 | | | 1,800,000 | | | 1,820,250 | A |
48
Annual Report to Shareholders
| | | | | | | | | | | | | |
| | | % OF
NET ASSETS | | RATE | | MATURITY
DATE | | PAR/
SHARES | | VALUE | |
| | | | | | | | | | | | | |
Corporate Bonds and Notes—Continued | | | | | | | | | | | | | |
| | | | | |
Diversified Financial Services—Continued | | | | | | | | | | | | | |
Vanguard Health Holding Co. I LLC | | | | 11.250% | | 10/1/15 | | $ | 655,000 | | $ | 689,387 | |
Vanguard Health Holding Co. II LLC | | | | 9.000% | | 10/1/14 | | | 4,424,000 | | | 4,584,370 | |
| | | | | | | | | | | | | |
| | | | | | | | | | | | 29,872,494 | |
| | | | | | | | | | | | | |
Diversified Telecommunication Services | | 1.3% | | | | | | | | | | | |
Cincinnati Bell Inc. | | | | 6.300% | | 12/1/28 | | | 1,130,000 | | | 881,400 | |
Hawaiian Telcom Communications Inc. | | | | 12.500% | | 5/1/15 | | | 1,305,000 | | | 131 | D,E |
Level 3 Financing Inc. | | | | 12.250% | | 3/15/13 | | | 3,105,000 | | | 3,291,300 | |
Level 3 Financing Inc. | | | | 9.250% | | 11/1/14 | | | 1,815,000 | | | 1,715,175 | |
Qwest Communications International Inc. | | | | 7.250% | | 2/15/11 | | | 337,000 | | | 338,685 | |
Windstream Corp. | | | | 8.625% | | 8/1/16 | | | 1,765,000 | | | 1,795,887 | |
| | | | | | | | | | | | | |
| | | | | | | | | | | | 8,022,578 | |
| | | | | | | | | | | | | |
Electric Utilities | | 3.5% | | | | | | | | | | | |
Elwood Energy LLC | | | | 8.159% | | 7/5/26 | | | 2,024,211 | | | 1,861,361 | |
Energy Future Holdings Corp. | | | | 10.875% | | 11/1/17 | | | 3,335,000 | | | 2,726,362 | |
Energy Future Holdings Corp. | | | | 11.250% | | 11/1/17 | | | 16,289,338 | | | 11,524,707 | C |
North American Energy Alliance LLC | | | | 10.875% | | 6/1/16 | | | 910,000 | | | 966,875 | A |
Texas Competitive Electric Holdings Co. LLC | | | | 10.250% | | 11/1/15 | | | 4,520,000 | | | 3,661,200 | |
Texas Competitive Electric Holdings Co. LLC | | | | 10.250% | | 11/1/15 | | | 880,000 | | | 712,800 | |
| | | | | | | | | | | | | |
| | | | | | | | | | | | 21,453,305 | |
| | | | | | | | | | | | | |
Energy Equipment and Services | | 1.6% | | | | | | | | | | | |
Basic Energy Services Inc. | | | | 11.625% | | 8/1/14 | | | 2,125,000 | | | 2,273,750 | |
Complete Production Services Inc. | | | | 8.000% | | 12/15/16 | | | 1,235,000 | | | 1,218,019 | |
Geokinetics Holdings Inc. | | | | 9.750% | | 12/15/14 | | | 870,000 | | | 854,775 | A |
Hercules Offshore LLC | | | | 10.500% | | 10/15/17 | | | 900,000 | | | 949,500 | A |
Key Energy Services Inc. | | | | 8.375% | | 12/1/14 | | | 2,470,000 | | | 2,476,175 | |
Parker Drilling Co. | | | | 9.625% | | 10/1/13 | | | 836,000 | | | 858,990 | |
RRI Energy Inc. | | | | 7.875% | | 6/15/17 | | | 1,420,000 | | | 1,395,150 | |
| | | | | | | | | | | | | |
| | | | | | | | | | | | 10,026,359 | |
| | | | | | | | | | | | | |
Food Products | | 0.7% | | | | | | | | | | | |
Bumble Bee Foods LLC | | | | 7.750% | | 12/15/15 | | | 790,000 | | | 791,975 | A |
Del Monte Foods Co. | | | | 7.500% | | 10/15/19 | | | 1,230,000 | | | 1,266,900 | A |
Dole Food Co. Inc. | | | | 13.875% | | 3/15/14 | | | 42,000 | | | 50,505 | A |
Dole Food Co. Inc. | | | | 8.000% | | 10/1/16 | | | 1,170,000 | | | 1,187,550 | A |
Smithfield Foods Inc. | | | | 10.000% | | 7/15/14 | | | 880,000 | | | 954,800 | A |
| | | | | | | | | | | | | |
| | | | | | | | | | | | 4,251,730 | |
| | | | | | | | | | | | | |
49
Annual Report to Shareholders
Portfolio of Investments—Continued
Western Asset High Yield Portfolio—Continued
| | | | | | | | | | | | | |
| | | % OF
NET ASSETS | | RATE | | MATURITY
DATE | | PAR/
SHARES | | VALUE | |
| | | | | | | | | | | | | |
Corporate Bonds and Notes—Continued | | | | | | | | | | | | | |
| | | | | |
Health Care Equipment and Supplies | | 0.5% | | | | | | | | | | | |
Biomet Inc. | | | | 10.000% | | 10/15/17 | | $ | 1,380,000 | | $ | 1,499,025 | |
Biomet Inc. | | | | 10.375% | | 10/15/17 | | | 1,615,000 | | | 1,752,275 | C |
| | | | | | | | | | | | | |
| | | | | | | | | | | | 3,251,300 | |
| | | | | | | | | | | | | |
Health Care Providers and Services | | 5.5% | | | | | | | | | | | |
CRC Health Corp. | | | | 10.750% | | 2/1/16 | | | 6,430,000 | | | 5,401,200 | |
Fresenius Medical Care Capital Trust IV | | | | 7.875% | | 6/15/11 | | | 135,000 | | | 139,894 | |
HCA Inc. | | | | 9.000% | | 12/15/14 | | | 51,000 | | | 50,909 | |
HCA Inc. | | | | 6.375% | | 1/15/15 | | | 1,013,000 | | | 956,019 | |
HCA Inc. | | | | 9.250% | | 11/15/16 | | | 490,000 | | | 526,137 | |
HCA Inc. | | | | 9.625% | | 11/15/16 | | | 4,711,000 | | | 5,099,657 | C |
HCA Inc. | | | | 7.875% | | 2/15/20 | | | 1,725,000 | | | 1,796,156 | A |
HCA Inc. | | | | 7.500% | | 12/15/23 | | | 150,000 | | | 137,062 | |
HCA Inc. | | | | 7.690% | | 6/15/25 | | | 1,675,000 | | | 1,533,801 | |
IASIS Healthcare LLC | | | | 8.750% | | 6/15/14 | | | 405,000 | | | 410,063 | |
Tenet Healthcare Corp. | | | | 9.000% | | 5/1/15 | | | 2,007,000 | | | 2,167,560 | A |
Tenet Healthcare Corp. | | | | 10.000% | | 5/1/18 | | | 3,877,000 | | | 4,342,240 | A |
Tenet Healthcare Corp. | | | | 8.875% | | 7/1/19 | | | 819,000 | | | 884,520 | A |
U.S. Oncology Holdings Inc. | | | | 7.178% | | 3/15/12 | | | 6,971,000 | | | 6,517,885 | C,G |
U.S. Oncology Inc. | | | | 9.125% | | 8/15/17 | | | 2,390,000 | | | 2,509,500 | |
Universal Hospital Services Inc. | | | | 3.859% | | 6/1/15 | | | 840,000 | | | 707,700 | G |
Universal Hospital Services Inc. | | | | 8.500% | | 6/1/15 | | | 1,015,000 | | | 999,775 | C |
| | | | | | | | | | | | | |
| | | | | | | | | | | | 34,180,078 | |
| | | | | | | | | | | | | |
Hotels, Restaurants and Leisure | | 6.5% | | | | | | | | | | | |
Ameristar Casinos Inc. | | | | 9.250% | | 6/1/14 | | | 1,290,000 | | | 1,338,375 | A |
Boyd Gaming Corp. | | | | 6.750% | | 4/15/14 | | | 620,000 | | | 558,775 | |
Boyd Gaming Corp. | | | | 7.125% | | 2/1/16 | | | 385,000 | | | 334,950 | |
Denny’s Holdings Inc. | | | | 10.000% | | 10/1/12 | | | 110,000 | | | 112,475 | |
El Pollo Loco Inc. | | | | 11.750% | | 12/1/12 | | | 310,000 | | | 321,625 | A |
El Pollo Loco Inc. | | | | 11.750% | | 11/15/13 | | �� | 4,896,000 | | | 4,455,360 | |
Fontainebleau Las Vegas Holdings LLC/Fontainebleau Las Vegas Capital Corp. | | | | 11.000% | | 6/15/15 | | | 1,455,000 | | | 14,550 | A,D |
Harrah’s Operating Co. Inc. | | | | 10.000% | | 12/15/15 | | | 415,000 | | | 338,225 | A |
Harrah’s Operating Co. Inc. | | | | 10.750% | | 2/1/16 | | | 4,500,000 | | | 3,667,500 | |
Harrahs Operating Escrow LLC | | | | 11.250% | | 6/1/17 | | | 3,080,000 | | | 3,222,450 | A |
Indianapolis Downs LLC and Capital Corp. | | | | 11.000% | | 11/1/12 | | | 505,000 | | | 328,250 | A |
Indianapolis Downs LLC and Capital Corp. | | | | 15.500% | | 11/1/13 | | | 3,621,653 | | | 1,199,673 | A,C |
Inn of the Mountain Gods Resort and Casino | | | | 12.000% | | 11/15/10 | | | 5,655,000 | | | 2,339,756 | D,E |
Landry’s Restaurants Inc. | | | | 11.625% | | 12/1/15 | | | 1,340,000 | | | 1,420,400 | A |
50
Annual Report to Shareholders
| | | | | | | | | | | | | |
| | | % OF
NET ASSETS | | RATE | | MATURITY
DATE | | PAR/
SHARES | | VALUE | |
| | | | | | | | | | | | | |
Corporate Bonds and Notes—Continued | | | | | | | | | | | | | |
| | | | | |
Hotels, Restaurants and Leisure—Continued | | | | | | | | | | | | | |
MGM MIRAGE | | | | 8.500% | | 9/15/10 | | $ | 135,000 | | $ | 134,325 | |
MGM MIRAGE | | | | 8.375% | | 2/1/11 | | | 5,125,000 | | | 4,855,938 | |
MGM MIRAGE | | | | 10.375% | | 5/15/14 | | | 260,000 | | | 282,100 | A |
MGM MIRAGE | | | | 11.125% | | 11/15/17 | | | 280,000 | | | 310,100 | A |
MGM MIRAGE | | | | 11.375% | | 3/1/18 | | | 2,395,000 | | | 2,143,525 | A |
Mohegan Tribal Gaming Authority | | | | 11.500% | | 11/1/17 | | | 2,290,000 | | | 2,335,800 | A |
Penn National Gaming Inc. | | | | 8.750% | | 8/15/19 | | | 710,000 | | | 725,975 | A |
Pinnacle Entertainment Inc. | | | | 8.625% | | 8/1/17 | | | 2,590,000 | | | 2,641,800 | A |
Quapaw Downstream Development | | | | 12.000% | | 10/15/15 | | | 2,815,000 | | | 2,318,856 | A |
Sbarro Inc. | | | | 10.375% | | 2/1/15 | | | 2,325,000 | | | 1,825,125 | |
Snoqualmie Entertainment Authority | | | | 4.680% | | 2/1/14 | | | 2,755,000 | | | 1,349,950 | A,G |
Station Casinos Inc. | | | | 6.000% | | 4/1/12 | | | 2,905,000 | | | 439,381 | D,E |
Station Casinos Inc. | | | | 7.750% | | 8/15/16 | | | 2,625,000 | | | 410,156 | D,E |
Station Casinos Inc. | | | | 6.625% | | 3/15/18 | | | 890,000 | | | 4,450 | D,E |
The Choctaw Resort Development Enterprise | | | | 7.250% | | 11/15/19 | | | 285,000 | | | 188,813 | A |
Wynn Las Vegas LLC/Wynn Las Vegas Capital Corp. | | | | 7.875% | | 11/1/17 | | | 500,000 | | | 506,250 | A |
| | | | | | | | | | | | | |
| | | | | | | | | | | | 40,124,908 | |
| | | | | | | | | | | | | |
Household Durables | | 1.1% | | | | | | | | | | | |
American Greetings Corp. | | | | 7.375% | | 6/1/16 | | | 725,000 | | | 706,875 | |
American Greetings Corp. | | | | 7.375% | | 6/1/16 | | | 195,000 | | | 179,400 | |
Norcraft Cos. | | | | 9.000% | | 11/1/11 | | | 5,460,000 | | | 5,466,825 | E |
Norcraft Holdings LP | | | | 9.750% | | 9/1/12 | | | 516,000 | | | 495,360 | E |
| | | | | | | | | | | | | |
| | | | | | | | | | | | 6,848,460 | |
| | | | | | | | | | | | | |
Household Products | | 0.2% | | | | | | | | | | | |
Reynolds Group DL Escrow Inc./Reynolds Group Escrow LLC | | | | 7.750% | | 10/15/16 | | | 1,350,000 | | | 1,380,375 | A |
| | | | | | | | | | | | | |
| | | | | |
Independent Power Producers and Energy Traders | | 3.4% | | | | | | | | | | | |
Dynegy Holdings Inc. | | | | 7.750% | | 6/1/19 | | | 4,000,000 | | | 3,470,000 | |
Edison Mission Energy | | | | 7.500% | | 6/15/13 | | | 2,575,000 | | | 2,420,500 | |
Edison Mission Energy | | | | 7.750% | | 6/15/16 | | | 1,960,000 | | | 1,666,000 | |
Edison Mission Energy | | | | 7.625% | | 5/15/27 | | | 2,435,000 | | | 1,649,712 | |
Mirant Americas Generation Inc. | | | | 9.125% | | 5/1/31 | | | 860,000 | | | 774,000 | |
Mirant Mid Atlantic LLC | | | | 9.125% | | 6/30/17 | | | 818,493 | | | 859,418 | |
Mirant Mid Atlantic LLC | | | | 10.060% | | 12/30/28 | | | 1,841,416 | | | 1,942,694 | |
Mirant North America LLC | | | | 7.375% | | 12/31/13 | | | 780,000 | | | 771,225 | |
51
Annual Report to Shareholders
Portfolio of Investments—Continued
Western Asset High Yield Portfolio—Continued
| | | | | | | | | | | | | |
| | | % OF
NET ASSETS | | RATE | | MATURITY
DATE | | PAR/
SHARES | | VALUE | |
| | | | | | | | | | | | | |
Corporate Bonds and Notes—Continued | | | | | | | | | | | | | |
| | | | | |
Independent Power Producers and
Energy Traders—Continued | | | | | | | | | | | | | |
NRG Energy Inc. | | | | 7.250% | | 2/1/14 | | $ | 770,000 | | $ | 779,625 | |
NRG Energy Inc. | | | | 7.375% | | 2/1/16 | | | 110,000 | | | 110,138 | |
NRG Energy Inc. | | | | 7.375% | | 1/15/17 | | | 2,785,000 | | | 2,791,962 | |
The AES Corp. | | | | 8.000% | | 10/15/17 | | | 3,315,000 | | | 3,402,019 | |
The AES Corp. | | | | 8.000% | | 6/1/20 | | | 600,000 | | | 610,500 | |
| | | | | | | | | | | | | |
| | | | | | | | | | | | 21,247,793 | |
| | | | | | | | | | | | | |
Insurance | | 1.5% | | | | | | | | | | | |
American International Group Inc. | | | | 5.050% | | 10/1/15 | | | 310,000 | | | 258,619 | |
American International Group Inc. | | | | 5.450% | | 5/18/17 | | | 4,000,000 | | | 3,237,224 | |
American International Group Inc. | | | | 8.250% | | 8/15/18 | | | 2,505,000 | | | 2,351,819 | |
American International Group Inc. | | | | 8.175% | | 5/15/58 | | | 1,245,000 | | | 821,700 | F |
Everest Reinsurance Holdings Inc. | | | | 6.600% | | 5/15/37 | | | 1,630,000 | | | 1,189,900 | F |
MetLife Capital Trust IV | | | | 7.875% | | 12/15/37 | | | 1,585,000 | | | 1,577,075 | A,F |
| | | | | | | | | | | | | |
| | | | | | | | | | | | 9,436,337 | |
| | | | | | | | | | | | | |
IT Services | | 0.9% | | | | | | | | | | | |
Ceridian Corp. | | | | 12.250% | | 11/15/15 | | | 1,682,700 | | | 1,590,151 | C |
First Data Corp. | | | | 9.875% | | 9/24/15 | | | 2,300,000 | | | 2,121,750 | |
GXS Worldwide Inc. | | | | 9.750% | | 6/15/15 | | | 2,030,000 | | | 1,994,475 | A |
| | | | | | | | | | | | | |
| | | | | | | | | | | | 5,706,376 | |
| | | | | | | | | | | | | |
Machinery | | 0.3% | | | | | | | | | | | |
American Railcar Industries Inc. | | | | 7.500% | | 3/1/14 | | | 1,120,000 | | | 1,045,800 | |
TriMas Corp. | | | | 9.750% | | 12/15/17 | | | 750,000 | | | 735,938 | A |
| | | | | | | | | | | | | |
| | | | | | | | | | | | 1,781,738 | |
| | | | | | | | | | | | | |
Marine | | 0.4% | | | | | | | | | | | |
Horizon Lines Inc. | | | | 4.250% | | 8/15/12 | | | 3,225,000 | | | 2,620,312 | B |
| | | | | | | | | | | | | |
| | | | | |
Media | | 5.1% | | | | | | | | | | | |
Affinion Group Inc. | | | | 10.125% | | 10/15/13 | | | 1,895,000 | | | 1,947,113 | |
Affinion Group Inc. | | | | 10.125% | | 10/15/13 | | | 2,615,000 | | | 2,686,912 | |
Affinion Group Inc. | | | | 11.500% | | 10/15/15 | | | 4,050,000 | | | 4,242,375 | |
CCH II Holdings LLC | | | | 13.500% | | 11/30/16 | | | 691,734 | | | 807,599 | |
Charter Communications Operating LLC | | | | 10.875% | | 9/15/14 | | | 7,480,000 | | | 8,377,600 | A |
CMP Susquehanna Corp. | | | | 4.774% | | 5/15/14 | | | 172,000 | | | 59,520 | A,E,H,I |
CSC Holdings Inc. | | | | 6.750% | | 4/15/12 | | | 1,950,000 | | | 2,013,375 | |
DISH DBS Corp. | | | | 7.875% | | 9/1/19 | | | 2,835,000 | | | 2,973,206 | |
R.H. Donnelley Corp. | | | | 6.875% | | 1/15/13 | | | 685,000 | | | 64,219 | D |
TL Acquisitions Inc. | | | | 13.250% | | 7/15/15 | | | 2,815,000 | | | 2,734,069 | A |
52
Annual Report to Shareholders
| | | | | | | | | | | | | |
| | | % OF
NET ASSETS | | RATE | | MATURITY
DATE | | PAR/
SHARES | | VALUE | |
| | | | | | | | | | | | | |
Corporate Bonds and Notes—Continued | | | | | | | | | | | | | |
| | | | | |
Media—Continued | | | | | | | | | | | | | |
Univision Communications Inc. | | | | 12.000% | | 7/1/14 | | $ | 3,240,000 | | $ | 3,568,050 | A |
UPC Holding BV | | | | 9.875% | | 4/15/18 | | | 1,160,000 | | | 1,223,800 | A |
Virgin Media Finance PLC | | | | 9.500% | | 8/15/16 | | | 590,000 | | | 633,513 | |
| | | | | | | | | | | | | |
| | | | | | | | | | | | 31,331,351 | |
| | | | | | | | | | | | | |
Metals and Mining | | 1.4% | | | | | | | | | | | |
Metals USA Inc. | | | | 11.125% | | 12/1/15 | | | 5,280,000 | | | 5,339,400 | |
Novelis Inc. | | | | 11.500% | | 2/15/15 | | | 955,000 | | | 1,023,044 | A |
Ryerson Inc. | | | | 12.000% | | 11/1/15 | | | 1,945,000 | | | 2,032,525 | |
| | | | | | | | | | | | | |
| | | | | | | | | | | | 8,394,969 | |
| | | | | | | | | | | | | |
Multiline Retail | | 1.1% | | | | | | | | | | | |
Dollar General Corp. | | | | 10.625% | | 7/15/15 | | | 271,000 | | | 300,133 | |
The Neiman-Marcus Group Inc. | | | | 9.000% | | 10/15/15 | | | 3,519,375 | | | 3,440,189 | C |
The Neiman-Marcus Group Inc. | | | | 7.125% | | 6/1/28 | | | 3,110,000 | | | 2,736,800 | |
| | | | | | | | | | | | | |
| | | | | | | | | | | | 6,477,122 | |
| | | | | | | | | | | | | |
Oil, Gas and Consumable Fuels | | 9.2% | | | | | | | | | | | |
Arch Coal Inc. | | | | 8.750% | | 8/1/16 | | | 2,015,000 | | | 2,130,862 | A |
Atlas Pipeline Partners LP | | | | 8.750% | | 6/15/18 | | | 2,625,000 | | | 2,323,125 | |
Belden and Blake Corp. | | | | 8.750% | | 7/15/12 | | | 6,250,000 | | | 5,843,750 | |
Berry Petroleum Co. | | | | 10.250% | | 6/1/14 | | | 1,915,000 | | | 2,082,562 | |
Chesapeake Energy Corp. | | | | 6.500% | | 8/15/17 | | | 530,000 | | | 519,400 | |
Chesapeake Energy Corp. | | | | 6.250% | | 1/15/18 | | | 2,250,000 | | | 2,160,000 | |
Chesapeake Energy Corp. | | | | 7.250% | | 12/15/18 | | | 3,420,000 | | | 3,445,650 | |
El Paso Corp. | | | | 8.250% | | 2/15/16 | | | 1,490,000 | | | 1,590,575 | |
El Paso Corp. | | | | 7.800% | | 8/1/31 | | | 945,000 | | | 889,654 | |
El Paso Natural Gas Co. | | | | 8.375% | | 6/15/32 | | | 830,000 | | | 985,691 | |
Encore Acquisition Co. | | | | 9.500% | | 5/1/16 | | | 550,000 | | | 580,250 | |
Enterprise Products Operating LP | | | | 8.375% | | 8/1/66 | | | 2,905,000 | | | 2,832,375 | F |
Enterprise Products Operating LP | | | | 7.034% | | 1/15/68 | | | 205,000 | | | 188,088 | F |
Forest Oil Corp. | | | | 8.500% | | 2/15/14 | | | 1,570,000 | | | 1,640,650 | A |
Inergy LP | | | | 8.250% | | 3/1/16 | | | 680,000 | | | 690,200 | |
International Coal Group Inc. | | | | 10.250% | | 7/15/14 | | | 4,215,000 | | | 4,051,669 | |
Mariner Energy Inc. | | | | 7.500% | | 4/15/13 | | | 835,000 | | | 830,825 | |
Mariner Energy Inc. | | | | 8.000% | | 5/15/17 | | | 1,260,000 | | | 1,209,600 | |
MarkWest Energy Partners LP | | | | 8.750% | | 4/15/18 | | | 840,000 | | | 865,200 | |
Murray Energy Corp. | | | | 10.250% | | 10/15/15 | | | 2,550,000 | | | 2,537,250 | A |
Petrohawk Energy Corp. | | | | 9.125% | | 7/15/13 | | | 2,255,000 | | | 2,356,475 | |
Plains Exploration and Production Co. | | | | 10.000% | | 3/1/16 | | | 2,180,000 | | | 2,387,100 | |
53
Annual Report to Shareholders
Portfolio of Investments—Continued
Western Asset High Yield Portfolio—Continued
| | | | | | | | | | | | | |
| | | % OF
NET ASSETS | | RATE | | MATURITY
DATE | | PAR/
SHARES | | VALUE | |
| | | | | | | | | | | | | |
Corporate Bonds and Notes—Continued | | | | | | | | | | | | | |
| | | | | |
Oil, Gas and Consumable Fuels—Continued | | | | | | | | | | | | | |
Plains Exploration and Production Co. | | | | 8.625% | | 10/15/19 | | $ | 865,000 | | $ | 888,788 | |
Quicksilver Resources Inc. | | | | 8.250% | | 8/1/15 | | | 810,000 | | | 830,250 | |
Quicksilver Resources Inc. | | | | 11.750% | | 1/1/16 | | | 2,195,000 | | | 2,491,325 | |
SandRidge Energy Inc. | | | | 8.625% | | 4/1/15 | | | 2,695,000 | | | 2,695,000 | C |
SandRidge Energy Inc. | | | | 9.875% | | 5/15/16 | | | 90,000 | | | 94,725 | A |
SandRidge Energy Inc. | | | | 8.000% | | 6/1/18 | | | 2,007,000 | | | 1,971,877 | A |
SandRidge Energy Inc. | | | | 8.750% | | 1/15/20 | | | 1,005,000 | | | 1,005,000 | A |
Stone Energy Corp. | | | | 8.250% | | 12/15/11 | | | 280,000 | | | 278,950 | |
Stone Energy Corp. | | | | 6.750% | | 12/15/14 | | | 465,000 | | | 415,013 | |
W&T Offshore Inc. | | | | 8.250% | | 6/15/14 | | | 2,130,000 | | | 2,023,500 | A |
Whiting Petroleum Corp. | | | | 7.250% | | 5/1/12 | | | 175,000 | | | 175,875 | |
Whiting Petroleum Corp. | | | | 7.000% | | 2/1/14 | | | 1,775,000 | | | 1,781,656 | |
| | | | | | | | | | | | | |
| | | | | | | | | | | | 56,792,910 | |
| | | | | | | | | | | | | |
Paper and Forest Products | | 2.2% | | | | | | | | | | | |
Appleton Papers Inc. | | | | 11.250% | | 12/15/15 | | | 4,925,000 | | | 4,167,781 | A |
NewPage Corp. | | | | 11.375% | | 12/31/14 | | | 3,840,000 | | | 3,878,400 | A |
Newpage Holding Corp. | | | | 7.564% | | 11/1/13 | | | 4,639,434 | | | 1,397,630 | C,G |
Verso Paper Holdings LLC | | | | 11.500% | | 7/1/14 | | | 2,285,000 | | | 2,513,500 | A |
Verso Paper Holdings LLC | | | | 9.125% | | 8/1/14 | | | 1,550,000 | | | 1,480,250 | |
| | | | | | | | | | | | | |
| | | | | | | | | | | | 13,437,561 | |
| | | | | | | | | | | | | |
Personal Products | | 0.2% | | | | | | | | | | | |
Revlon Consumer Products Corp. | | | | 9.750% | | 11/15/15 | | | 1,100,000 | | | 1,135,750 | A |
| | | | | | | | | | | | | |
| | | | | |
Pharmaceuticals | | N.M. | | | | | | | | | | | |
Leiner Health Products Inc. | | | | 11.000% | | 6/1/12 | | | 8,470,000 | | | 847 | D,E |
| | | | | | | | | | | | | |
| | | | | |
Real Estate Investment Trusts (REITs) | | 0.3% | | | | | | | | | | | |
DuPont Fabros Technology LP | | | | 8.500% | | 12/15/17 | | | 980,000 | | | 995,925 | A |
Ventas Inc. | | | | 9.000% | | 5/1/12 | | | 682,000 | | | 712,690 | |
| | | | | | | | | | | | | |
| | | | | | | | | | | | 1,708,615 | |
| | | | | | | | | | | | | |
Real Estate Management and Development | | 0.8% | | | | | | | | | | | |
Ashton Woods USA LLC | | | | 0.000% | | 6/30/15 | | | 1,003,200 | | | 250,800 | A,E,F |
Realogy Corp. | | | | 10.500% | | 4/15/14 | | | 4,875,000 | | | 4,216,875 | |
Realogy Corp. | | | | 11.000% | | 4/15/14 | | | 310,279 | | | 255,980 | C |
| | | | | | | | | | | | | |
| | | | | | | | | | | | 4,723,655 | |
| | | | | | | | | | | | | |
54
Annual Report to Shareholders
| | | | | | | | | | | | | |
| | | % OF
NET ASSETS | | RATE | | MATURITY
DATE | | PAR/
SHARES | | VALUE | |
| | | | | | | | | | | | | |
Corporate Bonds and Notes—Continued | | | | | | | | | | | | | |
| | | | | |
Road and Rail | | 0.7% | | | | | | | | | | | |
Kansas City Southern Railway | | | | 13.000% | | 12/15/13 | | $ | 570,000 | | $ | 661,200 | |
RailAmerica Inc. | | | | 9.250% | | 7/1/17 | | | 3,303,000 | | | 3,513,566 | |
| | | | | | | | | | | | | |
| | | | | | | | | | | | 4,174,766 | |
| | | | | | | | | | | | | |
Semiconductors and Semiconductor Equipment | | 0.5% | | | | | | | | | | | |
Advanced Micro Devices Inc. | | | | 8.125% | | 12/15/17 | | | 490,000 | | | 488,163 | A |
Freescale Semiconductor Inc. | | | | 8.875% | | 12/15/14 | | | 1,105,000 | | | 1,013,837 | |
Freescale Semiconductor Inc. | | | | 9.125% | | 12/15/14 | | | 589,138 | | | 520,650 | C |
Freescale Semiconductor Inc. | | | | 10.125% | | 12/15/16 | | | 1,505,000 | | | 1,211,525 | |
| | | | | | | | | | | | | |
| | | | | | | | | | | | 3,234,175 | |
| | | | | | | | | | | | | |
Specialty Retail | | 1.5% | | | | | | | | | | | |
Blockbuster Inc. | | | | 11.750% | | 10/1/14 | | | 2,480,000 | | | 2,356,000 | A |
Eye Care Centers of America Inc. | | | | 10.750% | | 2/15/15 | | | 895,000 | | | 919,612 | |
Limited Brands Inc. | | | | 8.500% | | 6/15/19 | | | 270,000 | | | 293,625 | A |
Michaels Stores Inc. | | | | 10.000% | | 11/1/14 | | | 2,515,000 | | | 2,603,025 | |
Michaels Stores Inc. | | | | 0.000% | | 11/1/16 | | | 2,310,000 | | | 1,905,750 | F |
Michaels Stores Inc. | | | | 11.375% | | 11/1/16 | | | 920,000 | | | 968,300 | |
| | | | | | | | | | | | | |
| | | | | | | | | | | | 9,046,312 | |
| | | | | | | | | | | | | |
Textiles, Apparel and Luxury Goods | | 0.6% | | | | | | | | | | | |
Oxford Industries Inc. | | | | 11.375% | | 7/15/15 | | | 3,520,000 | | | 3,872,000 | |
| | | | | | | | | | | | | |
| | | | | |
Thrifts and Mortgage Finance | | 0.1% | | | | | | | | | | | |
Ocwen Capital Trust I | | | | 10.875% | | 8/1/27 | | | 635,000 | | | 561,975 | |
| | | | | | | | | | | | | |
| | | | | |
Tobacco | | 0.3% | | | | | | | | | | | |
Alliance One International Inc. | | | | 10.000% | | 7/15/16 | | | 860,000 | | | 903,000 | A |
Alliance One International Inc. | | | | 10.000% | | 7/15/16 | | | 1,120,000 | | | 1,176,000 | A |
| | | | | | | | | | | | | |
| | | | | | | | | | | | 2,079,000 | |
| | | | | | | | | | | | | |
Trading Companies and Distributors | | 1.0% | | | | | | | | | | | |
Ashtead Capital Inc. | | | | 9.000% | | 8/15/16 | | | 1,376,000 | | | 1,377,720 | A |
H&E Equipment Services Inc. | | | | 8.375% | | 7/15/16 | | | 1,610,000 | | | 1,612,013 | |
Penhall International Corp. | | | | 12.000% | | 8/1/14 | | | 2,855,000 | | | 1,791,512 | A,E |
RSC Equipment Rental Inc. | | | | 10.000% | | 7/15/17 | | | 1,380,000 | | | 1,500,750 | A |
| | | | | | | | | | | | | |
| | | | | | | | | | | | 6,281,995 | |
| | | | | | | | | | | | | |
Transportation Infrastructure | | 0.7% | | | | | | | | | | | |
Hawker Beechcraft Acquisition Co. | | | | 8.875% | | 4/1/15 | | | 7,142,756 | | | 4,357,081 | C |
| | | | | | | | | | | | | |
55
Annual Report to Shareholders
Portfolio of Investments—Continued
Western Asset High Yield Portfolio—Continued
| | | | | | | | | | | | | |
| | | % OF
NET ASSETS | | RATE | | MATURITY
DATE | | PAR/
SHARES | | VALUE | |
| | | | | | | | | | | | | |
Corporate Bonds and Notes—Continued | | | | | | | | | | | | | |
| | | | | |
Wireless Telecommunication Services | | 3.3% | | | | | | | | | | | |
ALLTEL Communications Inc. | | | | 10.375% | | 12/1/17 | | $ | 2,300,000 | | $ | 2,773,151 | A,C , E |
CC Holdings GS V LLC/Crown Castle GS III Corp. | | | | 7.750% | | 5/1/17 | | | 600,000 | | | 639,000 | A |
Cricket Communications Inc. | | | | 7.750% | | 5/15/16 | | | 2,180,000 | | | 2,174,550 | |
iPCS Inc. | | | | 2.406% | | 5/1/13 | | | 1,050,000 | | | 981,750 | G |
Sprint Capital Corp. | | | | 8.375% | | 3/15/12 | | | 965,000 | | | 998,775 | |
Sprint Capital Corp. | | | | 6.875% | | 11/15/28 | | | 6,020,000 | | | 5,004,125 | |
Sprint Capital Corp. | | | | 8.750% | | 3/15/32 | | | 8,560,000 | | | 8,067,800 | |
| | | | | | | | | | | | | |
| | | | | | | | | | | | 20,639,151 | |
| | | | | | | | | | | | | |
Total Corporate Bonds and Notes
(Cost—$484,518,398) | | | | | | | | | | | | 479,164,719 | |
Mortgage-Backed Securities | | N.M. | | | | | | | | | | | |
| | | | | |
Variable Rate SecuritiesI | | N.M. | | | | | | | | | | | |
BlackRock Capital Finance LP 1996-R1 | | | | 9.580% | | 9/25/26 | | | 380,984 | | | 104,771 | H |
| | | | | | | | | | | | | |
Total Mortgage-Backed Securities
(Cost—$334,586) | | | | | | | | | | | | 104,771 | |
Yankee BondsJ | | 12.3% | | | | | | | | | | | |
| | | | | |
Biotechnology | | N.M. | | | | | | | | | | | |
FMC Finance III SA | | | | 6.875% | | 7/15/17 | | | 10,000 | | | 9,925 | |
| | | | | | | | | | | | | |
| | | | | |
Commercial Banks | | 1.0% | | | | | | | | | | | |
Credit Agricole SA | | | | 8.375% | | 10/13/19 | | | 1,100,000 | | | 1,166,000 | A,F |
Rabobank Nederland NV | | | | 11.000% | | 12/29/49 | | | 2,690,000 | | | 3,279,793 | A,F |
Royal Bank of Scotland Group PLC | | | | 5.000% | | 11/12/13 | | | 1,330,000 | | | 1,194,453 | |
Royal Bank of Scotland Group PLC | | | | 5.050% | | 1/8/15 | | | 560,000 | | | 485,779 | |
| | | | | | | | | | | | | |
| | | | | | | | | | | | 6,126,025 | |
| | | | | | | | | | | | | |
Containers and Packaging | | 0.3% | | | | | | | | | | | |
Smurfit Capital Funding PLC | | | | 7.500% | | 11/20/25 | | | 1,990,000 | | | 1,696,475 | |
| | | | | | | | | | | | | |
| | | | | |
Diversified Financial Services | | 0.7% | | | | | | | | | | | |
Petroplus Finance Ltd. | | | | 6.750% | | 5/1/14 | | | 995,000 | | | 935,300 | A |
Petroplus Finance Ltd. | | | | 7.000% | | 5/1/17 | | | 1,050,000 | | | 945,000 | A |
TNK-BP Finance SA | | | | 7.500% | | 7/18/16 | | | 635,000 | | | 650,875 | A |
TNK-BP Finance SA | | | | 7.500% | | 7/18/16 | | | 250,000 | | | 257,187 | |
TNK-BP Finance SA | | | | 7.875% | | 3/13/18 | | | 1,704,000 | | | 1,755,120 | |
| | | | | | | | | | | | | |
| | | | | | | | | | | | 4,543,482 | |
| | | | | | | | | | | | | |
56
Annual Report to Shareholders
| | | | | | | | | | | | | |
| | | % OF
NET ASSETS | | RATE | | MATURITY
DATE | | PAR/
SHARES | | VALUE | |
| | | | | | | | | | | | | |
Yankee Bonds—Continued | | | | | | | | | | | | | |
| | | | | |
Diversified Telecommunication Services | | 3.4% | | | | | | | | | | | |
Intelsat Bermuda Ltd. | | | | 11.250% | | 6/15/16 | | $ | 805,000 | | $ | 871,413 | |
Intelsat Intermediate Holding Co. Ltd. | | | | 0.000% | | 2/1/15 | | | 2,745,000 | | | 2,820,487 | F |
Intelsat Jackson Holdings Ltd. | | | | 9.500% | | 6/15/16 | | | 2,765,000 | | | 2,958,550 | |
Intelsat Jackson Holdings Ltd. | | | | 11.500% | | 6/15/16 | | | 5,750,000 | | | 6,210,000 | |
Nordic Telephone Co. Holdings ApS | | | | 8.875% | | 5/1/16 | | | 2,535,000 | | | 2,680,763 | A |
Wind Acquisition Finance SA | | | | 12.000% | | 12/1/15 | | | 485,000 | | | 518,950 | A |
Wind Acquisition Finance SA | | | | 11.750% | | 7/15/17 | | | 2,625,000 | | | 2,867,812 | A |
Wind Acquisition Holdings Finance SA | | | | 12.250% | | 7/15/17 | | | 2,050,000 | | | 2,019,250 | A,C |
| | | | | | | | | | | | | |
| | | | | | | | | | | | 20,947,225 | |
| | | | | | | | | | | | | |
Energy Equipment and Services | | 0.3% | | | | | | | | | | | |
Compagnie Generale de Geophysique-Veritas | | | | 7.500% | | 5/15/15 | | | 1,745,000 | | | 1,731,913 | |
Compagnie Generale de Geophysique-Veritas | | | | 9.500% | | 5/15/16 | | | 265,000 | | | 283,550 | A |
| | | | | | | | | | | | | |
| | | | | | | | | | | | 2,015,463 | |
| | | | | | | | | | | | | |
Foreign Government | | 0.1% | | | | | | | | | | | |
Russian Federation | | | | 7.500% | | 3/31/30 | | | 739,103 | | | 834,263 | |
| | | | | | | | | | | | | |
| | | | | |
Hotels, Restaurants and Leisure | | 0.3% | | | | | | | | | | | |
NCL Corp. Ltd. | | | | 11.750% | | 11/15/16 | | | 2,080,000 | | | 2,054,000 | A |
| | | | | | | | | | | | | |
| | | | | |
Marine | | 0.5% | | | | | | | | | | | |
Trico Shipping AS | | | | 11.875% | | 11/1/14 | | | 2,850,000 | | | 2,967,562 | A |
| | | | | | | | | | | | | |
| | | | | |
Media | | 0.4% | | | | | | | | | | | |
NTL Cable PLC | | | | 9.125% | | 8/15/16 | | | 905,000 | | | 953,644 | |
Sun Media Corp. | | | | 7.625% | | 2/15/13 | | | 1,475,000 | | | 1,344,093 | |
| | | | | | | | | | | | | |
| | | | | | | | | | | | 2,297,737 | |
| | | | | | | | | | | | | |
Metals and Mining | | 0.9% | | | | | | | | | | | |
FMG Finance Pty Ltd. | | | | 10.625% | | 9/1/16 | | | 2,085,000 | | | 2,306,531 | A |
Novelis Inc. | | | | 7.250% | | 2/15/15 | | | 2,695,000 | | | 2,566,988 | |
Teck Resources Ltd. | | | | 10.250% | | 5/15/16 | | | 870,000 | | | 1,013,550 | |
| | | | | | | | | | | | | |
| | | | | | | | | | | | 5,887,069 | |
| | | | | | | | | | | | | |
Oil, Gas and Consumable Fuels | | 1.7% | | | | | | | | | | | |
Adaro Indonesia PT | | | | 7.625% | | 10/22/19 | | | 700,000 | | | 692,125 | A |
Corral Finans AB | | | | 1.784% | | 4/15/10 | | | 5,779,260 | | | 4,681,201 | A,C,G,H |
Griffin Coal Mining Co. Pty Ltd. | | | | 9.500% | | 12/1/16 | | | 100,000 | | | 59,125 | A,D |
57
Annual Report to Shareholders
Portfolio of Investments—Continued
Western Asset High Yield Portfolio—Continued
| | | | | | | | | | | | | | |
| | | % OF
NET ASSETS | | RATE | | MATURITY
DATE | | PAR/
SHARES | | | VALUE | |
| | | | | | | | | | | | | | |
Yankee Bonds—Continued | | | | | | | | | | | | | | |
| | | | | |
Oil, Gas and Consumable Fuels—Continued | | | | | | | | | | | | | | |
OPTI Canada Inc. | | | | 9.000% | | 12/15/12 | | $ | 1,440,000 | | | $ | 1,472,400 | A |
OPTI Canada Inc. | | | | 7.875% | | 12/15/14 | | | 480,000 | | | | 393,600 | |
OPTI Canada Inc. | | | | 8.250% | | 12/15/14 | | | 985,000 | | | | 811,394 | |
Teekay Shipping Corp. | | | | 8.875% | | 7/15/11 | | | 2,252,000 | | | | 2,333,635 | |
| | | | | | | | | | | | | | |
| | | | | | | | | | | | | 10,443,480 | |
| | | | | | | | | | | | | | |
Paper and Forest Products | | 0.7% | | | | | | | | | | | | |
Abitibi-Consolidated Co. of Canada | | | | 13.750% | | 4/1/11 | | | 3,543,058 | | | | 3,547,487 | A,D |
PE Paper Escrow GmbH | | | | 12.000% | | 8/1/14 | | | 910,000 | | | | 1,005,550 | A |
| | | | | | | | | | | | | | |
| | | | | | | | | | | | | 4,553,037 | |
| | | | | | | | | | | | | | |
Road and Rail | | 1.4% | | | | | | | | | | | | |
Grupo Transportacion Ferroviaria Mexicana SA de CV | | | | 7.625% | | 12/1/13 | | | 1,200,000 | | | | 1,182,000 | |
Kansas City Southern de Mexico SA de CV | | | | 7.375% | | 6/1/14 | | | 1,235,000 | | | | 1,204,125 | |
Kansas City Southern de Mexico SA de CV | | | | 12.500% | | 4/1/16 | | | 5,229,000 | | | | 6,013,350 | |
| | | | | | | | | | | | | | |
| | | | | | | | | | | | | 8,399,475 | |
| | | | | | | | | | | | | | |
Wireless Telecommunication Services | | 0.6% | | | | | | | | | | | | |
True Move Co. Ltd. | | | | 10.750% | | 12/16/13 | | | 3,420,000 | | | | 3,300,300 | A |
True Move Co. Ltd. | | | | 10.750% | | 12/16/13 | | | 305,000 | | | | 294,325 | A |
| | | | | | | | | | | | | | |
| | | | | | | | | | | | | 3,594,625 | |
| | | | | | | | | | | | | | |
Total Yankee Bonds (Cost—$69,996,777) | | | | | | | | | | | | | 76,369,843 | |
Common Stocks and Equity Interests | | 1.6% | | | | | | | | | | | | |
| | | | | |
Building Products | | N.M. | | | | | | | | | | | | |
Nortek Inc. | | | | | | | | | 4,801 | shs | | | 168,035 | K |
| | | | | | | | | | | | | | |
| | | | | |
Chemicals | | 0.3% | | | | | | | | | | | | |
Georgia Gulf Corp. | | | | | | | | | 105,210 | | | | 1,828,550 | K |
| | | | | | | | | | | | | | |
| | | | | |
Diversified Financial Services | | 0.1% | | | | | | | | | | | | |
CIT Group Inc. | | | | | | | | | 24,909 | | | | 687,734 | K |
| | | | | | | | | | | | | | |
| | | | | |
Media | | 1.1% | | | | | | | | | | | | |
Charter Communications | | | | | | | | | 126,560 | | | | 4,492,880 | H |
Charter Communications Inc. | | | | | | | | | 68,010 | | | | 2,414,369 | K |
Idearc Inc. | | | | | | | | | 5,949 | | | | 196,320 | |
| | | | | | | | | | | | | | |
| | | | | | | | | | | | | 7,103,569 | |
| | | | | | | | | | | | | | |
58
Annual Report to Shareholders
| | | | | | | | | | | | | | |
| | | % OF
NET ASSETS | | RATE | | MATURITY
DATE | | PAR/
SHARES | | | VALUE | |
| | | | | | | | | | | | | | |
Common Stocks and Equity Interests—Continued | | | | | | | | | | | | | | |
| | | | | |
Oil, Gas and Consumable Fuels | | 0.1% | | | | | | | | | | | | |
SemGroup Corp., Class A | | | | | | | | | 13,610 | shs | | $ | 326,646 | H,K |
| | | | | | | | | | | | | | |
Total Common Stocks and Equity Interests
(Cost—$12,659,171) | | | | | | | | | | | 10,114,534 | |
Preferred Stocks | | 1.3% | | | | | | | | | | | | |
Bank of America Corp. | | | | 7.250% | | | | | 4,800 | | | | 4,219,200 | |
Citigroup Inc. | | | | 7.500% | | | | | 25,900 | | | | 2,702,406 | B,K |
CMP Susquehanna Radio Holdings Corp. | | | | 0.000% | | | | | 40,019 | | | | 40 | A,E,H,I,K |
GMAC Inc. | | | | 7.000% | | | | | 1,649 | | | | 1,086,897 | A,K |
ION Media Networks Inc. | | | | 12.000% | | | | | 7 | | | | — | E,H,K |
| | | | | | | | | | | | | | |
Total Preferred Stocks (Cost—$8,009,949) | | | | | | | | | | | 8,008,543 | |
Warrants | | N.M. | | | | | | | | | | | | |
Buffets Restaurants Holdings Inc. | | | | | | | | | 3,104 | wts | | | — | E,H,K |
Charter Communications Inc. | | | | | | | | | 3,493 | | | | 17,467 | K |
CNB Capital Trust | | | | | | | | | 45,731 | | | | 46 | A,E,H,K |
Nortek Inc. | | | | | | | | | 5,121 | | | | 65,291 | H,K |
SemGroup Corp. | | | | | | | | | 14,327 | | | | — | E,H,K |
Turbo Cayman Co. Ltd. | | | | | | | | | 1 | | | | — | E,H,K |
| | | | | | | | | | | | | | |
Total Warrants (Cost—$73,536) | | | | | | | | | | | | | 82,804 | |
Loan Participations and AssignmentsG | | 4.3% | | | | | | | | | | | | |
| | | | | |
Airlines | | 0.3% | | | | | | | | | | | | |
United Airlines Inc. Term Loan B | | | | 2.313% | | 1/28/10 | | $ | 2,283,623 | | | | 1,785,794 | |
| | | | | | | | | | | | | | |
| | | | | |
Auto Components | | 0.5% | | | | | | | | | | | | |
Allison Transmission Inc., Term Loan, Tranche B | | | | 2.990% to 3.040% | | 2/10/10 | | | 3,573,178 | | | | 3,270,351 | |
| | | | | | | | | | | | | | |
| | | | | |
Automobiles | | 0.3% | | | | | | | | | | | | |
Ford Motor Company, Term Loan, Tranche B | | | | 3.240% to 3.290% | | 1/15/10 | | | 1,972,160 | | | | 1,819,317 | |
| | | | | | | | | | | | | | |
| | | | | |
Chemicals | | 0.7% | | | | | | | | | | | | |
Lyondell Chemical Term Loan | | | | 3.731% to 7.000% | | 1/29/10 | | | 913,099 | | | | 674,552 | |
Lyondell Chemical Term Loan | | | | 3.731% to 7.000% | | 1/29/10 | | | 1,396,341 | | | | 1,031,547 | |
Lyondell Chemical Term Loan | | | | 0.000% to 6.560% | | 4/6/10 | | | 2,249,260 | | | | 2,322,361 | |
| | | | | | | | | | | | | | |
| | | | | | | | | | | | | 4,028,460 | |
| | | | | | | | | | | | | | |
59
Annual Report to Shareholders
Portfolio of Investments—Continued
Western Asset High Yield Portfolio—Continued
| | | | | | | | | | | | | |
| | | % OF
NET ASSETS | | RATE | | MATURITY
DATE | | PAR/
SHARES | | VALUE | |
| | | | | | | | | | | | | |
Loan Participations and Assignments—Continued | | | | | | | | | | | | | |
| | | | | |
Containers and Packaging | | 0.1% | | | | | | | | | | | |
Berry Plastics Holding Corp., Term Loan | | | | 2.254% | | 3/15/10 | | $ | 497,442 | | $ | 430,288 | |
| | | | | | | | | | | | | |
| | | | | |
Diversified Financial Services | | 0.2% | | | | | | | | | | | |
CIT Group Inc., Term Loan | | | | 13.000% | | 1/11/10 | | | 1,500,000 | | | 1,553,438 | |
| | | | | | | | | | | | | |
| | | | | |
Energy Equipment and Services | | 0.6% | | | | | | | | | | | |
Turbo Beta Ltd., Term Loan | | | | 14.500% | | 5/13/10 | | | 4,414,481 | | | 3,752,309 | E |
| | | | | | | | | | | | | |
| | | | | |
Media | | 0.5% | | | | | | | | | | | |
Idearc Inc., Term Loan | | | | 10.250% | | 3/31/10 | | | 785,242 | | | 771,501 | |
Newsday LLC, Term Loan | | | | 10.500% | | 1/15/10 | | | 2,000,000 | | | 2,111,666 | |
| | | | | | | | | | | | | |
| | | | | | | | | | | | 2,883,167 | |
| | | | | | | | | | | | | |
Metals and Mining | | 0.1% | | | | | | | | | | | |
Noranda Aluminum Acquisition Corp., Term Loan | | | | 2.231% | | 1/29/10 | | | 937,730 | | | 772,064 | |
| | | | | | | | | | | | | |
| | | | | |
Real Estate Management and Development | | 0.5% | | | | | | | | | | | |
Realogy Corp. Term Loan | | | | 13.500% | | 4/15/10 | | | 3,000,000 | | | 3,170,001 | |
| | | | | | | | | | | | | |
| | | | | |
Specialty Retail | | 0.2% | | | | | | | | | | | |
Michaels Stores Inc., Term Loan B | | | | 2.563% | | 2/26/10 | | | 530,686 | | | 477,783 | |
Michaels Stores Inc., Term Loan B2 | | | | 4.813% | | 2/26/10 | | | 714,183 | | | 670,822 | |
| | | | | | | | | | | | | |
| | | | | | | | | | | | 1,148,605 | |
| | | | | | | | | | | | | |
| | | | | |
Transportation Infrastructure | | 0.3% | | | | | | | | | | | |
Hawker Beechcraft Acquisition Co., Term Loan | | | | 2.251% | | 3/31/10 | | | 66,360 | | | 49,439 | |
Hawker Beechcraft Acquisition Co., Term Loan | | | | 2.231% to 2.251% | | 3/31/10 | | | 2,169,775 | | | 1,616,482 | |
| | | | | | | | | | | | | |
| | | | | | | | | | | | 1,665,921 | |
| | | | | | | | | | | | | |
Total Loan Participations and Assignments
(Cost—$23,552,276) | | | | | | | | | | 26,279,715 | |
| | | | | | | | | | | | | |
Total Long-Term Securities (Cost—$599,144,693) | | | | | | | | | | 600,124,929 | |
60
Annual Report to Shareholders
| | | | | | | | | | | | |
| | | % OF
NET ASSETS | | RATE | | MATURITY
DATE | | PAR/
SHARES | | VALUE |
| | | | | | | | | | | | |
Short-Term Securities | | 0.9% | | | | | | | | | | |
| | | | | |
Repurchase Agreement | | 0.9% | | | | | | | | | | |
Morgan Stanley repurchase agreement dated 12/31/09, 0.005% due 1/4/10; Proceeds at maturity—$5,812,003; (Fully collateralized by U.S. government agency obligation, 3.125% due 9/29/14; Market value—$5,928,242) | | | | | | | | $ | 5,812,000 | | $ | 5,812,000 |
| | | | | | | | | | | | |
Total Short-Term Securities (Cost—$5,812,000) | | | | | | | | | | 5,812,000 |
Total Investments (Cost—$604,956,693#) | | 97.9% | | | | | | | | | | 605,936,929 |
Other Assets Less Liabilities | | 2.1% | | | | | | | | | | 12,699,137 |
| | | | | | | | | | | | |
| | | | | |
Net Assets | | 100.0% | | | | | | | | | $ | 618,636,066 |
| | | | | | | | | | | | |
| | | | | | | | | | | | | |
N.M.—Not Meaningful.
| A | | Rule 144a Security – A security purchased pursuant to Rule 144a under the Securities Act of 1933 which may not be resold subject to that rule except to qualified institutional buyers. These securities, which the Fund’s investment adviser has determined to be liquid, unless otherwise noted, represent 30.90% of net assets. |
| B | | Convertible Security – Security may be converted into the issuer’s common stock. |
| C | | Pay-in-Kind (“PIK”) security – A security in which interest or dividends during the initial few years is paid in additional PIK securities rather than in cash. |
| D | | The coupon payment on these securities is currently in default as of December 31, 2009. |
| F | | Stepped Coupon Security – A security with a predetermined schedule of interest or dividend rate changes at which time it begins to accrue interest or pay dividends according to the predetermined schedule. |
| G | | Indexed Security – The rates of interest earned on these securities are tied to the London Interbank Offered Rate (“LIBOR”), the Euro Interbank Offered Rate (“EURIBOR”) Index, the Consumer Price Index (“CPI”), the one-year Treasury Bill Rate or the ten-year Japanese Government Bond Rate. The coupon rates are the rates as of December 31, 2009. |
| H | | Security is valued in good faith at fair value by or under the direction of the Board of Directors. |
| I | | The coupon rates shown on variable rate securities are the rates at December 31, 2009. These rates vary with the weighted average coupon of the underlying loans. |
| J | | Yankee Bond – A dollar-denominated bond issued in the U.S. by foreign entities. |
| # | | Aggregate cost for federal income tax purposes is $608,778,235. |
See notes to financial statements.
61
Annual Report to Shareholders
Statement of Assets and Liabilities
Western Asset High Yield Portfolio
December 31, 2009
| | | | | | | |
Assets: | | | | | | | |
Investment securities at value (Cost—$599,144,693) | | | | | $ | 600,124,929 | |
Short-term securities at value (Cost—$5,812,000) | | | | | | 5,812,000 | |
Cash | | | | | | 892 | |
Foreign currency at value (Cost—$1,968) | | | | | | 1,983 | |
Interest and dividends receivable | | | | | | 13,459,152 | |
Receivable for securities sold | | | | | | 3,702,292 | |
Receivable for fund shares sold | | | | | | 1,321,642 | |
| | | | | | | |
Total assets | | | | | | 624,422,890 | |
| | | | | | | |
| | |
Liabilities: | | | | | | | |
Payable for securities purchased | | $ | 5,327,046 | | | | |
Accrued management fee | | | 285,701 | | | | |
Payable for fund shares repurchased | | | 57,499 | | | | |
Accrued expenses | | | 116,578 | | | | |
| | | | | | | |
Total liabilities | | | | | | 5,786,824 | |
| | | | | | | |
| | |
Net Assets | | | | | $ | 618,636,066 | |
| | | | | | | |
| | |
Net assets consist of: | | | | | | | |
Accumulated paid-in-capital (Note 7) | | | | | $ | 769,643,652 | |
Overdistributed net investment income | | | | | | (564,479 | ) |
Accumulated net realized loss on investments, swaps and foreign currency transactions | | | | | | (151,423,358 | ) |
Net unrealized appreciation of investments and foreign currency translations | | | | | | 980,251 | |
| | | | | | | |
| | |
Net Assets | | | | | $ | 618,636,066 | |
| | | | | | | |
| | |
Net Asset Value Per Share: | | | | | | | |
Institutional Class (61,809,030 shares outstanding) | | | | | | $8.27 | |
Institutional Select Class (12,800,974 shares outstanding) | | | | | | $8.38 | |
| | | | | | | | |
See notes to financial statements.
62
Annual Report to Shareholders
Statement of Operations
Western Asset High Yield Portfolio
| | | | | | | | |
| | | FOR THE
YEAR ENDED
DECEMBER 31, 2009 | |
Investment Income: | | | | | | | | |
Interest | | $ | 80,550,011 | | | | | |
Dividends | | | 486,442 | | | | | |
| | | | | | | | |
Total income | | | | | | $ | 81,036,453 | |
Expenses: | | | | | | | | |
Management fees (Note 2) | | | 3,320,448 | | | | | |
Custodian fees | | | 98,045 | | | | | |
Transfer agent and shareholder servicing expense (Note 6) | | | 89,207 | | | | | |
Audit and legal fees | | | 86,014 | | | | | |
Registration fees | | | 43,952 | | | | | |
Directors’ fees and expenses | | | 25,062 | | | | | |
Reports to shareholders (Note 6) | | | 22,184 | | | | | |
Other expenses | | | 27,226 | | | | | |
| | | | | | | | |
Net expenses | | | | | | | 3,712,138 | |
| | | | | | | | |
Net Investment Income | | | | | | | 77,324,315 | |
Net Realized and Unrealized Gain/(Loss) on Investments (Notes 1, 3 and 4): | | | | | | | | |
Net realized loss on: | | | | | | | | |
Investments | | | (104,105,611 | ) | | | | |
Swaps | | | (1,219,111 | ) | | | | |
Foreign currency transactions | | | (2 | ) | | | | |
| | | | | | | | |
| | | | | | | (105,324,724 | ) |
Change in unrealized appreciation/(depreciation) of: | | | | | | | | |
Investments | | | 297,662,977 | | | | | |
Swaps | | | 535,349 | | | | | |
Foreign currency translations | | | 15 | | | | | |
| | | | | | | | |
| | | | | | | 298,198,341 | |
| | | | | | | | |
Net Realized and Unrealized Gain on Investments | | | | | | | 192,873,617 | |
| | | | | | | | | |
Change in Net Assets Resulting From Operations | | | | | | $ | 270,197,932 | |
| | | | | | | | | |
See notes to financial statements.
63
Annual Report to Shareholders
Statement of Changes in Net Assets
Western Asset High Yield Portfolio
| | | | | | | | | | | | |
| | | FOR THE
YEAR ENDED
DECEMBER 31, 2009 | | | FOR THE
PERIOD ENDED
DECEMBER 31, 2008A | | | FOR THE
YEAR ENDED
MARCH 31, 2008 | |
Change in Net Assets: | | | | | | | | | | | | |
Net investment income | | $ | 77,324,315 | | | $ | 55,414,396 | | | $ | 75,936,400 | |
| | | |
Net realized loss | | | (105,324,724 | ) | | | (52,171,835 | ) | | | (17,433,816 | ) |
| | | |
Change in unrealized appreciation/(depreciation) | | | 298,198,341 | | | | (203,191,273 | ) | | | (113,737,089 | ) |
| | | | | | | | | | | | |
Change in net assets resulting from operations | | | 270,197,932 | | | | (199,948,712 | ) | | | (55,234,505 | ) |
| | | |
Distributions to shareholders from (Note 1): | | | | | | | | | | | | |
Net investment income: | | | | | | | | | | | | |
Institutional Class | | | (66,008,540 | ) | | | (70,179,099 | ) | | | (73,407,062 | ) |
Institutional Select Class | | | (11,675,543 | ) | | | (4,937,498 | ) | | | N/A | |
| | | |
Net realized gain on investments: | | | | | | | | | | | | |
Institutional Class | | | — | | | | — | | | | (5,888,441 | ) |
Institutional Select Class | | | — | | | | — | | | | — | |
| | | |
Change in net assets from fund share transactions (Notes 5 and 7): | | | | | | | | | | | | |
Institutional Class | | | (91,614,335 | ) | | | (121,890,768 | ) | | | 55,309,962 | |
Institutional Select Class | | | 495,575 | | | | 114,094,156 | | | | N/A | |
| | | | | | | | | | | | |
Change in net assets | | | 101,395,089 | | | | (282,861,921 | ) | | | (79,220,046 | ) |
| | | |
Net Assets: | | | | | | | | | | | | |
Beginning of year | | | 517,240,977 | | | | 800,102,898 | | | | 879,322,944 | |
| | | | | | | | | | | | |
| | | |
End of year | | $ | 618,636,066 | | | $ | 517,240,977 | | | $ | 800,102,898 | |
| | | | | | | | | | | | |
| | | |
(Overdistributed) and undistributed net investment income, respectively | | $ | (564,479 | ) | | $ | (301,203 | ) | | $ | 19,427,792 | |
| | | | | | | | | | | | |
| | | | | | | | | | | | | |
| A | | For the period April 1, 2008 to December 31, 2008. |
N/A—Not applicable.
See notes to financial statements.
64
Annual Report to Shareholders
Financial Highlights
Western Asset High Yield Portfolio
For a share of each class of capital stock outstanding:
Institutional Class:
| | | | | | | | | | | | | | | | | | | | | | | | |
| | | YEAR ENDED
DECEMBER 31,
2009 | | | PERIOD ENDED
DECEMBER 31,
2008A | | | YEARS ENDED MARCH 31, | |
| | | | | 2008 | | | 2007 | | | 2006 | | | 2005 | |
Net asset value, beginning of year | | $ | 5.99 | | | $ | 9.30 | | | $ | 10.75 | | | $ | 10.34 | | | $ | 10.49 | | | $ | 10.28 | |
| | | | | | | | | | | | | | | | | | | | | | | | |
Investment operations: | | | | | | | | | | | | | | | | | | | | | | | | |
Net investment income | | | .92 | B | | | .66 | B | | | .83 | B | | | .80 | B | | | .76 | C | | | .61 | C |
Net realized and unrealized gain/(loss) | | | 2.32 | | | | (3.05 | ) | | | (1.41 | ) | | | .39 | | | | (.05 | ) | | | .17 | |
| | | | | | | | | | | | | | | | | | | | | | | | |
Total from investment operations | | | 3.24 | | | | (2.39 | ) | | | (.58 | ) | | | 1.19 | | | | .71 | | | | .78 | |
| | | | | | | | | | | | | | | | | | | | | | | | |
Distributions from: | | | | | | | | | | | | | | | | | | | | | | | | |
Net investment income | | | (.96 | ) | | | (.92 | ) | | | (.80 | ) | | | (.78 | ) | | | (.73 | ) | | | (.57 | ) |
Net realized gain on investments | | | — | | | | — | | | | (.07 | ) | | | — | D | | | (.13 | ) | | | — | |
| | | | | | | | | | | | | | | | | | | | | | | | |
Total distributions | | | (.96 | ) | | | (.92 | ) | | | (.87 | ) | | | (.78 | ) | | | (.86 | ) | | | (.57 | ) |
| | | | | | | | | | | | | | | | | | | | | | | | |
Net asset value, end of year | | $ | 8.27 | | | $ | 5.99 | | | $ | 9.30 | | | $ | 10.75 | | | $ | 10.34 | | | $ | 10.49 | |
| | | | | | | | | | | | | | | | | | | | | | | | |
Total returnE | | | 56.73 | % | | | (27.19 | )% | | | (5.88 | )% | | | 12.14 | % | | | 7.30 | % | | | 7.81 | % |
| | | | | | |
Ratios to Average Net Assets: | | | | | | | | | | | | | | | | | | | | | | | | |
Total expensesF | | | .62 | % | | | .60 | %G | | | .59 | % | | | .61 | % | | | .62 | % | | | .62 | % |
Expenses net of waivers, if anyF | | | .62 | % | | | .60 | %G | | | .59 | % | | | .61 | % | | | .62 | % | | | .62 | % |
Expenses net of all reductionsF | | | .62 | % | | | .60 | %G | | | .58 | % | | | .61 | % | | | .62 | % | | | .62 | % |
Net investment income | | | 12.8 | % | | | 10.4 | %G | | | 8.3 | % | | | 7.8 | % | | | 7.8 | % | | | 7.0 | % |
| | | | | | |
Supplemental Data: | | | | | | | | | | | | | | | | | | | | | | | | |
Portfolio turnover rate | | | 83.7 | % | | | 40.9 | %H | | | 59.1 | % | | | 63.6 | % | | | 147.2 | % | | | 121.0 | % |
Net assets, end of year (in thousands) | | $ | 511,335 | | | $ | 439,446 | | | $ | 800,103 | | | $ | 879,323 | | | $ | 596,918 | | | $ | 414,417 | |
| | | | | | | | | | | | | | | | | | | | | | | | | |
| A | | For the period April 1, 2008 to December 31, 2008. |
| B | | Computed using average daily shares outstanding. |
| C | | Computed using SEC method. |
| D | | Amount represents less than $.01 per share. |
| E | | Performance figures may reflect compensating balance credits, fee waivers and/or expense reimbursements. In the absence of compensating balance credits, fee waivers and/or expense reimbursements, the total return would have been lower. Past performance is no guarantee of future results. Total returns for periods of less than one year are not annualized. |
| F | | Total expenses reflects operating expenses prior to any voluntary expense waivers and/or compensating balance credits. Expenses net of waivers reflects total expenses before compensating balance credits but net of any voluntary expense waivers. Expenses net of all reductions reflects expenses less any compensating balance credits and/or voluntary expense waivers. |
See notes to financial statements.
65
Annual Report to Shareholders
Financial Highlights—Continued
Western Asset High Yield Portfolio—Continued
For a share of each class of capital stock outstanding:
Institutional Select Class:
| | | | | | | | |
| | | YEAR ENDED
DECEMBER 31,
2009 | | | PERIOD ENDED
DECEMBER 31,
2008A | |
Net asset value, beginning of year | | $ | 6.06 | | | $ | 8.86 | |
| | | | | | | | |
Investment operations: | | | | | | | | |
Net investment incomeB | | | .94 | | | | .37 | |
Net realized and unrealized gain/(loss) | | | 2.34 | | | | (2.77 | ) |
| | | | | | | | |
Total from investment operations | | | 3.28 | | | | (2.40 | ) |
| | | | | | | | |
Distributions from: | | | | | | | | |
Net investment income | | | (.96 | ) | | | (.40 | ) |
| | | | | | | | |
Total distributions | | | (.96 | ) | | | (.40 | ) |
| | | | | | | | |
Net asset value, end of year | | $ | 8.38 | | | $ | 6.06 | |
| | | | | | | | |
Total returnC | | | 56.74 | % | | | (27.16 | )% |
| | |
Ratios to Average Net Assets: | | | | | | | | |
Total expensesD | | | .61 | % | | | .60 | %E |
Expenses net of waivers, if anyD | | | .61 | % | | | .60 | %E |
Expenses net of all reductionsD | | | .61 | % | | | .60 | %E |
Net investment income | | | 12.8 | % | | | 12.4 | %E |
| | |
Supplemental Data: | | | | | | | | |
Portfolio turnover rate | | | 83.7 | % | | | 40.9 | %F |
Net assets, end of year (in thousands) | | $ | 107,301 | | | $ | 77,795 | |
| | | | | | | | | |
| A | | For the period August 4, 2008 (commencement of operations) to December 31, 2008. |
| B | | Computed using average daily shares outstanding. |
| C | | Performance figures may reflect compensating balance credits, fee waivers and/or expense reimbursements. In the absence of compensating balance credits, fee waivers and/or expense reimbursements, the total return would have been lower. Past performance is no guarantee of future results. Total returns for periods of less than one year are not annualized. |
| D | | Total expenses reflects operating expenses prior to any voluntary expense waivers and/or compensating balance credits. Expenses net of waivers reflects total expenses before compensating balance credits but net of any voluntary expense waivers. Expenses net of all reductions reflects expenses less any compensating balance credits and/or voluntary expense waivers. |
See notes to financial statements.
66
Annual Report to Shareholders
Management’s Discussion of Fund Performance
Western Asset Inflation Indexed Plus Bond Portfolio
Performance Review
For the twelve months ended December 31, 2009, Institutional Class shares of Western Asset Inflation Indexed Plus Bond Portfolio returned 12.86%. The Fund’s unmanaged benchmark, the Barclays Capital U.S. TIPS Indexi (the “Index”), returned 11.41% for the same period. The Lipper Treasury Inflation Protected Funds Category Average1 returned 10.75% over the same time frame.
PERFORMANCE SNAPSHOT as of December 31, 2009 (unaudited)
| | | | |
| | | 6 MONTHS | | 12 MONTHS |
Western Asset Inflation Indexed Plus Bond Portfolio: | | | | |
Institutional Class | | 6.13% | | 12.86% |
Financial Intermediary Class | | 5.97% | | 12.53% |
Institutional Select Class | | 6.35% | | 12.99% |
Barclays Capital U.S. TIPS Index | | 4.90% | | 11.41% |
Lipper Treasury Inflation Protected Funds Category Average1 | | 5.37% | | 10.75% |
The performance shown represents past performance. Past performance is no guarantee of future results and current performance may be higher or lower than the performance shown above. Principal value, investment returns and yields will fluctuate and investors’ shares, when redeemed, may be worth more or less than their original cost. To obtain performance data current to the most recent month-end, please visit our website at www.leggmason.com/individualinvestors.
All share class returns assume the reinvestment of all distributions, including returns of capital, if any, at net asset value and the deduction of all Fund expenses. Returns have not been adjusted to include the deduction of taxes that a shareholder would pay on Fund distributions. Performance figures for periods shorter than one year represent cumulative figures and are not annualized.
Performance figures reflect expense reimbursements and/or fee waivers, without which the performance would have been lower.
The 30-Day SEC Yields for the period ended December 31, 2009 for Institutional, Financial Intermediary and Institutional Select Class shares were 1.69%, 1.30% and 1.80%, respectively. Absent current expense reimbursements and/or fee waivers, the 30-Day SEC Yields for Institutional, Financial Intermediary and Institutional Select Class shares would have been 1.67%, 1.30% and 1.80%, respectively. The 30-Day SEC Yield is the average annualized net investment income per share for the 30-day period indicated and is subject to change.
TOTAL ANNUAL OPERATING EXPENSES (unaudited)
As of the Fund’s most current prospectus dated July 1, 2009, the gross total operating expense ratios for Institutional, Financial Intermediary and Institutional Select Class shares were 0.27%, 0.77% and 0.38%, respectively.
Actual expenses may be higher. For example, expenses may be higher than those shown if average net assets decrease. Net assets are more likely to decrease and Fund expense ratios are more likely to increase when markets are volatile.
As a result of contractual expense limitations, the ratio of expenses, other than interest, brokerage, taxes, deferred organizational expenses and extraordinary expenses, to average net assets will not exceed 0.75% for Financial Intermediary Class shares and 0.25% for Institutional Select Class shares until April 30, 2010.
| 1 | | Lipper, Inc., a wholly-owned subsidiary of Reuters, provides independent insight on global collective investments. Returns are based on the period ended December 31, 2009, including the reinvestment of all distributions, including returns of capital, if any, calculated among the 132 funds for the six-month period and among the 130 funds for the twelve-month period in the Fund’s Lipper category. |
67
Annual Report to Shareholders
During the reporting period, there were changing perceptions regarding inflation. Initially, the credit crisis and deepening recession led to mounting concerns about the prospects for deflation. However, as the reporting period progressed and the economy stabilized and then expanded in the third quarter of 2009, fears of inflation returned. Against this backdrop, the Fund produced a strong return for the period
The largest single contributor to the Fund’s relative performance for the period was its small out-of-Index allocation to high-yield and investment grade bonds, as their spreads recovered during the reporting period. In particular, our holdings in the Financials sector generated strong returns.
In the U.S. Treasury Inflation-Protected Securities (“TIPS”)ii market, we tactically adjusted our exposure during the fiscal year. At the beginning of 2009, we were still underweight TIPS, favoring mortgage-backed security pass-throughs, believing they would be the first sector to recover as the Federal Reserve Board (“Fed”)iii began its purchase program. However, we quickly moved back into TIPS in the January 2009 auctions, because we felt the market was mispricing future inflation. We then gradually moved to a neutral stance in February as economic conditions started to become less negative. After the Fed announced its quantitative easing program and the market rallied sharply, we reduced our real yield durationiv and focused more on yield curvev positioning. We added an overweight to the shorter maturity TIPS, a position we maintained through most of the year, until we moved back to an underweight position, finding more compelling opportunities elsewhere. In April, we added a position in Canadian inflation-linked securities and, in September, we began accumulating a position in Australian inflation-linked securities.
While our exposure to TIPS represented approximately 85% of the portfolio, having an underweight somewhat hurt relative results in the latter half of the year. The portfolio’s cash position was also a drag on performance given the extremely low yields available from short-term money market instruments.
During the fiscal year, we employed the use of Treasury futures and options, Eurodollar futures and interest rate swaps to manage the portfolio’s yield curve strategy and duration. Index credit default swaps were also used during the fiscal year to increase the portfolio’s high-yield corporate exposure. The use of these derivative instruments was, overall, positive for performance.
Western Asset Management Company
January 19, 2010
68
Annual Report to Shareholders
Management’s Discussion of Fund Performance—Continued
The information provided is not intended to be a forecast of future events, a guarantee of future results or investment advice. Views expressed may differ from those of the firm as a whole.
The mention of sector breakdowns is for informational purposes only and should not be construed as a recommendation to purchase or sell any securities. The information provided regarding such sectors is not a sufficient basis upon which to make an investment decision. Investors seeking financial advice regarding the appropriateness of investing in any securities or investment strategies discussed should consult their financial professional. Portfolio holdings are subject to change at any time and may not be representative of the portfolio managers’ current or future investments. The Fund’s top five sector holdings (as a percentage of net assets) as of December 31, 2009 were: U.S. Government & Agency Obligations (86.0%), Foreign Government Obligations (5.4%), Corporate Bonds and Notes (2.9%), Preferred Stocks (0.2%) and Asset-Backed Securities (0.1%). The Fund’s portfolio composition is subject to change at any time.
RISKS: All investments are subject to risk including the loss of principal. Fixed-income securities involve interest rate, credit, inflation and reinvestment risks. As interest rates rise, the value of fixed-income securities falls. Derivatives, such as options, futures and swaps, can be illiquid, may disproportionately increase losses, and have a potentially large impact on Fund performance. The use of leverage may increase volatility and possibility of loss. Risks of high-yield securities include greater price volatility, illiquidity and possibility of default. The Fund may be subject to interest rate, income and deflation risks. Changes in inflation will cause the Fund’s income to fluctuate. Periods of deflation may adversely affect the Fund. Potential active and frequent trading may result in higher transaction costs and increased investor liability. International investments are subject to special risks including currency fluctuations and social, economic and political uncertainties, which could increase volatility. These risks are magnified in emerging markets. Asset-backed, mortgage-backed or mortgage-related securities are subject to prepayment and extension risks. Please see the Fund’s prospectus for more information on these and other risks.
All index performance reflects no deduction for fees, expenses or taxes. Please note that an investor cannot invest directly in an index.
| i | | The Barclays Capital U.S. TIPS Index represents an unmanaged market index made up of U.S. Treasury Inflation-Linked Index securities. |
| ii | | U.S. Treasury Inflation-Protected Securities (“TIPS”) are inflation-indexed securities issued by the U.S. Treasury in five-year, ten-year and twenty-year maturities. The principal is adjusted to the Consumer Price Index, the commonly used measure of inflation. The coupon rate is constant, but generates a different amount of interest when multiplied by the inflation-adjusted principal. |
| iii | | The Federal Reserve Board (“Fed”) is responsible for the formulation of policies designed to promote economic growth, full employment, stable prices and a sustainable pattern of international trade and payments. |
| iv | | Duration is the measure of the price sensitivity of a fixed-income security to an interest rate change of 100 basis points. Calculation is based on the weighted average of the present values for all cash flows. |
| v | | The yield curve is the graphical depiction of the relationship between the yield on bonds of the same credit quality but different maturities. |
69
Annual Report to Shareholders
Expense Example (Unaudited)
Western Asset Inflation Indexed Plus Bond Portfolio
As a shareholder of the Fund, you may incur two types of costs; (1) transaction costs and (2) ongoing costs, including management fees, distribution (12b-1) fees on Financial Intermediary Class shares, and other Fund expenses. These examples are intended to help you understand your ongoing costs (in dollars) of investing in the Fund and to compare these costs with the ongoing costs of investing in other mutual funds.
The example are based on an investment of $1,000 invested on July 1, 2009 and held through December 31, 2009. The ending values assume dividends were reinvested at the time they were paid.
Actual Expenses
The first line for each class in the table below provides information about actual account values and actual expenses for the Fund. You may use the information in this line, together with the amount you invested, to estimate the expenses that you paid over the period. Simply divide your account value by $1,000 (for example, an $8,600 account value divided by $1,000 = 8.6), then multiply the result by the number in the first line under the heading entitled “Expenses Paid During the Period” to estimate the expenses you paid on your account if your shares were held through the entire period.
Hypothetical Example for Comparison Purposes
The second line for each class in the table below provides information about hypothetical account values and hypothetical expenses based on the Fund’s actual expense ratio and an assumed rate of return of 5% per year before expenses, which is not the Class’s actual return. The hypothetical account values and expenses may not be used to estimate the actual ending account balance or expenses you paid for the period. You may use this information to compare the ongoing costs of investing in the Fund and other funds. To do so, compare these 5% hypothetical examples with the 5% hypothetical examples that appear in the shareholder reports of other funds. Because each example is intended to be comparable to the examples provided by other funds, it is based on a hypothetical investment of $1,000 invested on July 1, 2009 and held through December 31, 2009. The ending values assume dividends were reinvested at the time they were paid.
| | | | | | | | | |
| | | Beginning
Account Value
7/1/09 | | Ending
Account Value
12/31/09 | | Expenses Paid A
During the Period
7/1/09 to 12/31/09 |
Institutional Class: | | | | | | | | | |
Actual | | $ | 1,000.00 | | $ | 1,061.30 | | $ | 1.66 |
Hypothetical (5% return before expenses) | | | 1,000.00 | | | 1,023.59 | | | 1.63 |
Institutional Select Class: | | | | | | | | | |
Actual | | $ | 1,000.00 | | $ | 1,063.50 | | $ | 1.30 |
Hypothetical (5% return before expenses) | | | 1,000.00 | | | 1,023.95 | | | 1.28 |
Financial Intermediary Class: | | | | | | | | | |
Actual | | $ | 1,000.00 | | $ | 1,059.70 | | $ | 3.53 |
Hypothetical (5% return before expenses) | | | 1,000.00 | | | 1,021.78 | | | 3.47 |
| A | | These calculations are based on expenses incurred from July 1, 2009 to December 31, 2009. The dollar amounts shown as “Expenses Paid” are equal to the annualized expense ratios of 0.32%, 0.25% and 0.68% for the Institutional Class, Institutional Select Class and the Financial Intermediary Class, respectively, multiplied by the average value over the period, multiplied by the number of days in the most recent fiscal half-year then divided by 365. |
70
Annual Report to Shareholders
Performance Information (Unaudited)
Western Asset Inflation Indexed Plus Bond Portfolio
The graphs compare the Fund’s total returns to that of an appropriate broad-based securities market index. The graphs illustrate the cumulative total return of an initial $1,000,000 investment in each of the Institutional Class, Institutional Select Class and Financial Intermediary Class of the Fund, for the periods indicated. The lines for the Fund represent the total return after deducting all Fund investment management and other administrative expenses and the transaction costs of buying and selling securities. The lines representing the securities market index does not include any transaction costs associated with buying and selling securities in the index or other investment management or administrative expenses.
Total return measures investment performance in terms of appreciation or depreciation in the Fund’s net asset value per share, plus dividends and any capital gain distributions. It assumes that dividends and distributions were reinvested at the time they were paid. Returns (and the graph and table found below) do not reflect the deduction of taxes that a shareholder would pay on Fund distributions or the redemption of Fund shares. Average annual returns tend to smooth out variations in a fund’s return, so that they differ from actual year-to-year results.
Bonds are subject to a variety of risks, including interest rate, credit and inflation risk.
Growth of a $1,000,000 Investment—Institutional Class
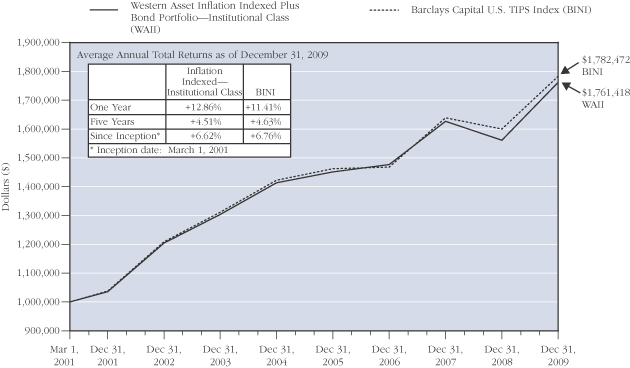
The performance data quoted represent past performance and do not guarantee future results. Current performance may be lower or higher than the performance data quoted. To obtain the most recent month-end performance information, please visit www.westernassetfunds.com. The investment return and principal value of the Fund will fluctuate so that an investor’s shares, when redeemed, may be worth more or less than the original cost. Calculations assume reinvestment of all distributions, including returns of capital, if any, at net asset value and the deduction of all Fund expenses. Performance would have been lower if fees had not been waived in various periods.
71
Annual Report to Shareholders
Performance Information (Unaudited)—Continued
Growth of a $1,000,000 Investment—Institutional Select Class
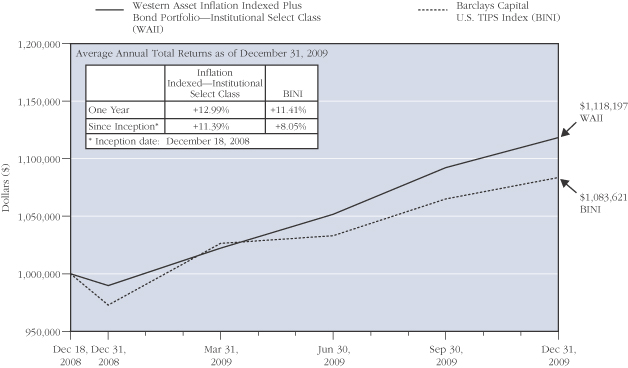
The performance data quoted represent past performance and do not guarantee future results. Current performance may be lower or higher than the performance data quoted. To obtain the most recent month-end performance information, please visit www.westernassetfunds.com. The investment return and principal value of the Fund will fluctuate so that an investor’s shares, when redeemed, may be worth more or less than the original cost. Calculations assume reinvestment of all distributions, including returns of capital, if any, at net asset value and the deduction of all Fund expenses. Performance would have been lower if fees had not been waived in various periods.
72
Annual Report to Shareholders
Growth of a $1,000,000 Investment—Financial Intermediary Class (Unaudited)
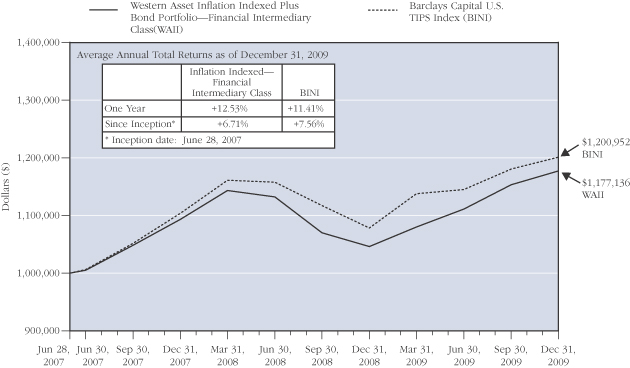
The performance data quoted represent past performance and do not guarantee future results. Current performance may be lower or higher than the performance data quoted. To obtain the most recent month-end performance information, please visit www.westernassetfunds.com. The investment return and principal value of the Fund will fluctuate so that an investor’s shares, when redeemed, may be worth more or less than the original cost. Calculations assume reinvestment of all distributions, including returns of capital, if any, at net asset value and the deduction of all Fund expenses. Performance would have been lower if fees had not been waived in various periods.
73
Annual Report to Shareholders
Performance Information (Unaudited)—Continued
Portfolio Composition (as of December 31, 2009)A
Standard & Poor’s Debt RatingsB (as a percentage of the portfolio)
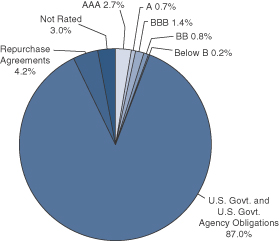
Maturity Schedule
(as a percentage of the portfolio)
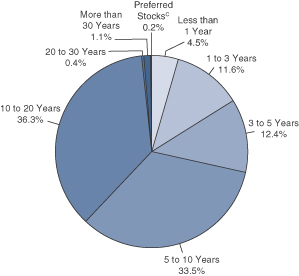
| A | | The pie charts above represent the composition of the Fund’s portfolio as of December 31, 2009 and do not include derivatives such as Futures Contracts, Options Written and Swaps. The Fund is actively managed. As a result, the composition of the portfolio holdings and sectors are subject to change at any time. |
| B | | Standard & Poor’s Rating Service provides capital markets with credit ratings for the evaluation and assessment of credit risk. These ratings are the opinions of S&P and not absolute measures of quality or guarantees of performance. |
| C | | Preferred stocks do not have defined maturity dates. |
74
Annual Report to Shareholders
Spread Duration
Western Asset Inflation Indexed Plus Bond Portfolio
December 31, 2009 (Unaudited)
Economic Exposure
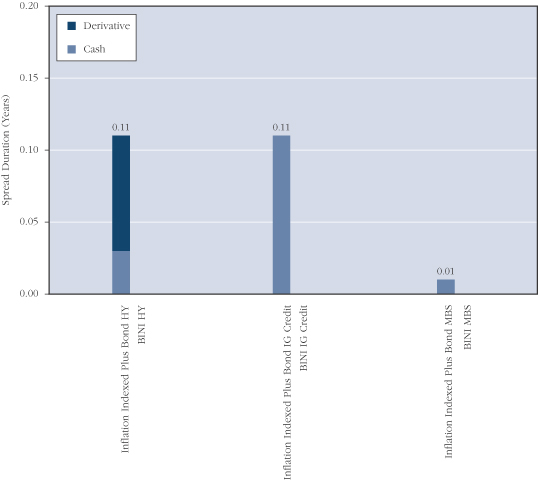
Spread duration is defined as the change in value for a 100 basis point change in the spread relative to Treasuries. The spread over Treasuries is the annual risk-premium demanded by investors to hold non-Treasury securities. This chart highlights the market sector exposure of the Fund’s portfolio and the exposure relative to the selected benchmark as of the end of the reporting period.
| | | | |
| BINI | | — | | Barclays Capital U.S. TIPS Index |
| HY | | — | | High Yield |
| IG Credit | | — | | Investment Grade Credit |
| MBS | | — | | Mortgage Backed Securities |
75
Annual Report to Shareholders
Effective Duration
Western Asset Inflation Indexed Plus Bond Portfolio
December 31, 2009 (Unaudited)
Interest Rate Exposure
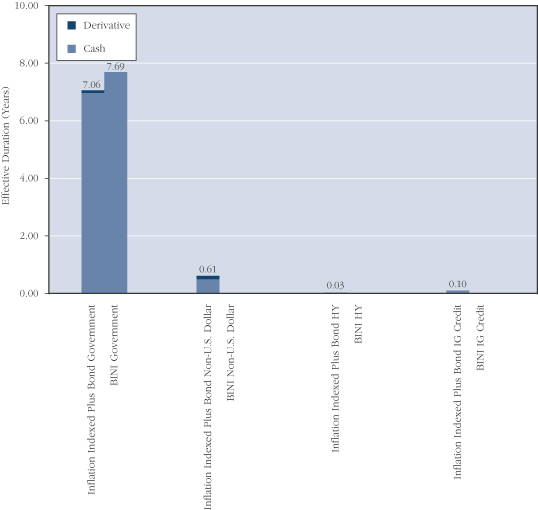
Effective duration is defined as the change in value for a 100 basis point change in Treasury yields. This chart highlights the interest rate exposure of the Fund’s portfolio relative to the selected benchmark as of the end of the reporting period.
| | | | |
| BINI | | — | | Barclays Capital U.S. TIPS Index |
| HY | | — | | High Yield |
| IG Credit | | — | | Investment Grade Credit |
76
Annual Report to Shareholders
Portfolio of Investments
Western Asset Inflation Indexed Plus Bond Portfolio
December 31, 2009
| | | | | | | | | | | | | |
| | | % OF
NET ASSETS | | RATE | | MATURITY
DATE | | PAR/
SHARES† | | VALUE | |
| | | | | | | | | | | | | |
Long-Term Securities | | 94.7% | | | | | | | | | | | |
| | | | | |
Corporate Bonds and Notes | | 2.9% | | | | | | | | | | | |
| | | | | |
Consumer Finance | | 0.8% | | | | | | | | | | | |
SLM Corp. | | | | 0.000% | | 2/1/10 | | $ | 1,320,000 | | $ | 1,321,135 | A |
SLM Corp. | | | | 5.375% | | 1/15/13 | | | 1,775,000 | | | 1,674,411 | |
SLM Corp. | | | | 5.375% | | 5/15/14 | | | 1,010,000 | | | 931,594 | |
| | | | | | | | | | | | | |
| | | | | | | | | | | | 3,927,140 | |
| | | | | | | | | | | | | |
Diversified Financial Services | | 1.8% | | | | | | | | | | | |
Bank of America Corp. | | | | 8.000% | | 12/29/49 | | | 2,270,000 | | | 2,185,420 | B |
Citigroup Inc. | | | | 6.010% | | 1/15/15 | | | 1,590,000 | | | 1,623,546 | |
JP Morgan and Co. Inc. | | | | 1.721% | | 2/15/12 | | | 1,720,000 | | | 1,660,522 | A |
JPMorgan Chase and Co. | | | | 7.900% | | 12/31/49 | | | 2,650,000 | | | 2,733,369 | B |
| | | | | | | | | | | | | |
| | | | | | | | | | | | 8,202,857 | |
| | | | | | | | | | | | | |
Oil, Gas and Consumable Fuels | | 0.3% | | | | | | | | | | | |
The Williams Cos. Inc. | | | | 8.750% | | 3/15/32 | | | 1,220,000 | | | 1,459,938 | |
| | | | | | | | | | | | | |
Total Corporate Bonds and Notes
(Cost—$13,602,309) | | | | | | | | | | | | 13,589,935 | |
Asset-Backed Securities | | 0.1% | | | | | | | | | | | |
| | | | | |
Indexed SecuritiesA | | 0.1% | | | | | | | | | | | |
Bear Stearns Asset Backed Securities Inc. 2003-ABF1 | | | | 0.601% | | 2/25/34 | | | 117,897 | | | 77,663 | |
Chase Funding Mortgage Loan Asset-Backed Certificates 2002-4 | | | | 0.971% | | 10/25/32 | | | 102,072 | | | 71,267 | |
Countrywide Asset-Backed Certificates 2002-1 | | | | 0.791% | | 8/25/32 | | | 34,182 | | | 16,596 | |
EMC Mortgage Loan Trust 2003-B | | | | 0.781% | | 11/25/41 | | | 284,850 | | | 225,047 | C |
Residential Asset Mortgage Products Inc. 2003-RS2 | | | | 0.916% | | 3/25/33 | | | 34,896 | | | 22,119 | |
| | | | | | | | | | | | | |
Total Asset-Backed Securities (Cost���$574,068) | | | | | | | | | | | | 412,692 | |
Mortgage-Backed Securities | | 0.1% | | | | | | | | | | | |
| | | | | |
Indexed SecuritiesA | | 0.1% | | | | | | | | | | | |
Credit Suisse First Boston Mortgage Securities Corp. 2001-28 | | | | 0.881% | | 11/25/31 | | | 516,398 | | | 326,144 | |
Sequoia Mortgage Trust 2004-4 A | | | | 1.111% | | 5/20/34 | | | 87,908 | | | 67,830 | |
| | | | | | | | | | | | | |
Total Mortgage-Backed Securities
(Cost—$581,590) | | | | | | | | | | | | 393,974 | |
77
Annual Report to Shareholders
Portfolio of Investments—Continued
Western Asset Inflation Indexed Plus Bond Portfolio—Continued
| | | | | | | | | | | | | |
| | | % OF
NET ASSETS | | RATE | | MATURITY
DATE | | PAR/
SHARES† | | VALUE | |
| | | | | | | | | | | | | |
U.S. Government and Agency Obligations | | 86.0% | | | | | | | | | | | |
| | | | | |
Fixed Rate Securities | | 2.0% | | | | | | | | | | | |
United States Treasury Notes | | | | 2.625% | | 7/31/14 | | $ | 9,500,000 | | $ | 9,547,500 | |
| | | | | | | | | | | | | |
| | | | | |
Treasury Inflation-Protected SecuritiesD | | 84.0% | | | | | | | | | | | |
United States Treasury Inflation-Protected Security | | | | 3.500% | | 1/15/11 | | | 14,047,472 | | | 14,570,965 | |
United States Treasury Inflation-Protected Security | | | | 2.375% | | 4/15/11 | | | 6,447,413 | | | 6,637,811 | E |
United States Treasury Inflation-Protected Security | | | | 3.375% | | 1/15/12 | | | 3,092,247 | | | 3,307,254 | |
United States Treasury Inflation-Protected Security | | | | 3.000% | | 7/15/12 | | | 25,247,880 | | | 27,145,410 | |
United States Treasury Inflation-Protected Security | | | | 1.875% | | 7/15/13 | | | 19,384,861 | | | 20,416,193 | |
United States Treasury Inflation-Protected Security | | | | 2.000% | | 1/15/14 | | | 22,942,131 | | | 24,261,304 | |
United States Treasury Inflation-Protected Security | | | | 1.625% | | 1/15/15 | | | 34,724,078 | | | 36,113,041 | |
United States Treasury Inflation-Protected Security | | | | 1.875% | | 7/15/15 | | | 28,070,731 | | | 29,577,343 | F |
United States Treasury Inflation-Protected Security | | | | 2.000% | | 1/15/16 | | | 21,466,949 | | | 22,669,442 | |
United States Treasury Inflation-Protected Security | | | | 2.500% | | 7/15/16 | | | 5,384,162 | | | 5,863,267 | |
United States Treasury Inflation-Protected Security | | | | 1.625% | | 1/15/18 | | | 22,396,521 | | | 22,926,692 | |
United States Treasury Inflation-Protected Security | | | | 1.375% | | 7/15/18 | | | 22,254,612 | | | 22,299,811 | |
United States Treasury Inflation-Protected Security | | | | 2.125% | | 1/15/19 | | | 3,372,948 | | | 3,576,906 | |
United States Treasury Inflation-Protected Security | | | | 1.875% | | 7/15/19 | | | 8,808,054 | | | 9,142,487 | |
United States Treasury Inflation-Protected Security | | | | 2.375% | | 1/15/25 | | | 18,727,407 | | | 19,760,336 | |
United States Treasury Inflation-Protected Security | | | | 2.000% | | 1/15/26 | | | 51,374,734 | | | 51,595,491 | |
United States Treasury Inflation-Protected Security | | | | 1.750% | | 1/15/28 | | | 25,342,482 | | | 24,301,058 | |
United States Treasury Inflation-Protected Security | | | | 3.625% | | 4/15/28 | | | 9,957,149 | | | 12,307,195 | |
78
Annual Report to Shareholders
| | | | | | | | | | | | | | |
| | | % OF
NET ASSETS | | RATE | | MATURITY
DATE | | PAR/
SHARES† | | | VALUE | |
| | | | | | | | | | | | | | |
U.S. Government and Agency Obligations—Continued | | | | | | | | | | | | | | |
| | | | | |
Treasury Inflation-Protected Securities D—Continued | | | | | | | | | | | | | | |
United States Treasury Inflation-Protected Security | | | | 3.875% | | 4/15/29 | | $ | 26,194,003 | | | $ | 33,706,365 | |
| | | | | | | | | | | | | | |
| | | | | | | | | | | | | 390,178,371 | |
| | | | | | | | | | | | | | |
Total U.S. Government and Agency Obligations (Cost—$389,794,966) | | | | | | | | | | | | | 399,725,871 | |
Yankee Bonds G | | N.M. | | | | | | | | | | | | |
| | | | | |
Commercial Banks | | N.M. | | | | | | | | | | | | |
Glitnir Banki Hf | | | | 6.693% | | 6/15/16 | | | 1,760,000 | | | | 176 | B,C,H ,I |
Kaupthing Bank Hf | | | | 7.125% | | 5/19/16 | | | 2,940,000 | | | | 294 | C,H ,I |
| | | | | | | | | | | | | | |
Total Yankee Bonds (Cost—$4,692,388) | | | | | | | | | | | | | 470 | |
Foreign Government Obligations | | 5.4% | | | | | | | | | | | | |
Canadian Government Bond | | | | 4.250% | | 12/1/21 | | | 9,380,464 | CAD | | | 11,824,399 | |
Commonwealth of Australia | | | | 4.000% | | 8/20/20 | | | 9,590,000 | AUD | | | 13,338,338 | J |
| | | | | | | | | | | | | | |
Total Foreign Government Obligations
(Cost—$22,356,947) | | | | | | | | | | | | | 25,162,737 | |
Preferred Stocks | | 0.2% | | | | | | | | | | | | |
Fannie Mae | | | | 8.250% | | | | | 303,900 | shs | | | 334,290 | B,K ,L |
Freddie Mac | | | | 8.375% | | | | | 362,400 | | | | 380,520 | B,K ,L |
| | | | | | | | | | | | | | |
Total Preferred Stocks (Cost—$16,806,538) | | | | | | | | | | | | | 714,810 | |
| | | | | | | | | | | | | | |
Total Long-Term Securities
(Cost—$448,408,806) | | | | | | | | | | | | | 440,000,489 | |
Short-Term Securities | | 4.2% | | | | | | | | | | | | |
| | | | | |
Repurchase Agreement | | 4.2% | | | | | | | | | | | | |
JPMorgan Chase & Co. repurchase agreement dated 12/31/09, 0.005% due 1/4/10; Proceeds at maturity—$19,589,011; (Fully collateralized by U.S. government agency obligation, 0.000% due 3/31/10; Market value—$19,980,780) | | | | | | | | $ | 19,589,000 | | | | 19,589,000 | |
| | | | | | | | | | | | | | |
Total Short-Term Securities (Cost—$19,589,000) | | | | | | | | | | | | | 19,589,000 | |
Total Investments (Cost—$467,997,806#) | | 98.9% | | | | | | | | | | | 459,589,489 | |
Other Assets Less Liabilities | | 1.1% | | | | | | | | | | | 5,138,552 | |
| | | | | | | | | | | | | | |
| | | | | |
Net Assets | | 100.0% | | | | | | | | | | $ | 464,728,041 | |
| | | | | | | | | | | | | | |
79
Annual Report to Shareholders
Portfolio of Investments—Continued
Western Asset Inflation Indexed Plus Bond Portfolio—Continued
| | | | | | | | |
| | | EXPIRATION | | ACTUAL
CONTRACTS | | APPRECIATION/
(DEPRECIATION) | |
Futures Contracts PurchasedM | | | | | | | | |
German Euro Bobl Futures | | March 2010 | | 66 | | $ | (82,788 | ) |
U.S. Treasury Bond Futures | | March 2010 | | 14 | | | (36,795 | ) |
U.S. Treasury Note Futures | | March 2010 | | 37 | | | (119,792 | ) |
| | | | | | | | |
| | | | | | $ | (239,375 | ) |
| | | | | | | | |
| | | | | | | | | |
N.M. Not Meaningful.
| A | | Indexed Security – The rates of interest earned on these securities are tied to the London Interbank Offered Rate (“LIBOR”), the Euro Interbank Offered Rate (“EURIBOR”) Index, the Consumer Price Index (“CPI”), the one-year Treasury Bill Rate or the ten-year Japanese Government Bond Rate. The coupon rates are the rates as of December 31, 2009. |
| B | | Stepped Coupon Security – A security with a predetermined schedule of interest or dividend rate changes at which time it begins to accrue interest or pay dividends according to the predetermined schedule. |
| C | | Rule 144a Security – A security purchased pursuant to Rule 144a under the Securities Act of 1933 which may not be resold subject to that rule except to qualified institutional buyers. These securities, which the Fund’s investment adviser has determined to be liquid, unless otherwise noted, represent 0.05% of net assets. |
| D | | Treasury Inflation-Protected Security – Treasury security whose principal value is adjusted daily in accordance with changes to the Consumer Price Index for All Urban Consumers. Interest is calculated on the basis of the current adjusted principal value. |
| E | | All or a portion of this security is collateral to cover futures. |
| F | | All or portion of this security is collateral for swaps. |
| G | | Yankee Bond – A dollar-denominated bond issued in the U.S. by foreign entities. |
| H | | The coupon payment on these securities is currently in default as of December 31, 2009. |
| J | | Inflation-Protected Security – Security whose principal value is adjusted daily or monthly in accordance with changes to the relevant country’s Consumer Price Index or its equivalent used as an inflation proxy. Interest is calculated on the basis of the current adjusted principal value. |
| K | | On September 7, 2008, the Federal Housing Finance Agency placed Fannie Mae (FNMA) and Freddie Mac (FHLMC) into conservatorship. |
| M | | Futures are described in more detail in the notes to financial statements. Par represents actual number of contracts. |
| # | | Aggregate cost for federal income tax purposes is $468,491,414. |
| † | | Securities are denominated in U.S. Dollars, unless otherwise noted. |
| | | | |
| AUD | | — | | Australian Dollar |
| CAD | | — | | Canadian Dollar |
See notes to financial statements.
80
Annual Report to Shareholders
Statement of Assets and Liabilities
Western Asset Inflation Indexed Plus Bond Portfolio
December 31, 2009
| | | | | | | |
Assets: | | | | | | | |
Investment securities at value (Cost—$448,408,806) | | | | | $ | 440,000,489 | |
Short-term securities at value (Cost—$19,589,000) | | | | | | 19,589,000 | |
Cash | | | | | | 431 | |
Foreign currency at value (Cost—$378,722) | | | | | | 383,206 | |
Interest receivable | | | | | | 3,804,121 | |
Receivable for fund shares sold | | | | | | 1,904,507 | |
Unrealized appreciation of forward foreign currency contracts | | | | | | 1,727,878 | |
Unrealized appreciation of swaps | | | | | | 282,601 | |
Deposits with brokers for open futures contracts | | | | | | 136,420 | |
Amounts receivable for open swaps | | | | | | 13,895 | |
| | | | | | | |
Total assets | | | | | | 467,842,548 | |
| | | | | | | |
| | |
Liabilities: | | | | | | | |
Unrealized depreciation of forward foreign currency contracts | | $ | 1,575,423 | | | | |
Payable for fund shares repurchased | | | 761,067 | | | | |
Premiums received on open swaps | | | 342,416 | | | | |
Futures variation margin payable | | | 104,241 | | | | |
Income distribution payable | | | 101,871 | | | | |
Accrued management fee | | | 70,156 | | | | |
Accrued distribution fees | | | 65 | | | | |
Accrued expenses | | | 159,268 | | | | |
| | | | | | | |
Total liabilities | | | | | | 3,114,507 | |
| | | | | | | |
| | |
Net Assets | | | | | $ | 464,728,041 | |
| | | | | | | |
| | |
Net assets consist of: | | | | | | | |
Accumulated paid-in-capital (Note 7) | | | | | $ | 486,644,265 | |
Undistributed net investment income | | | | | | 3,141,406 | |
Accumulated net realized loss on investments, options, futures, swaps and foreign currency transactions | | | | | | (16,849,482 | ) |
Net unrealized depreciation of investments, futures, swaps and foreign currency translations | | | | | | (8,208,148 | ) |
| | | | | | | |
| | |
Net Assets | | | | | $ | 464,728,041 | |
| | | | | | | |
| | |
Net Asset Value Per Share: | | | | | | | |
Institutional Class (41,474,194 shares outstanding) | | | | | | $10.63 | |
| | | | | | | |
Institutional Select Class (2,205,958 shares outstanding) | | | | | | $10.64 | |
| | | | | | | |
Financial Intermediary Class (28,395 shares outstanding) | | | | | | $10.59 | |
| | | | | | | |
| | | | | | | | |
See notes to financial statements.
81
Annual Report to Shareholders
Statement of Operations
Western Asset Inflation Indexed Plus Bond Portfolio
| | | | | | | | |
| | | FOR THE
YEAR ENDED
DECEMBER 31, 2009 | |
Investment Income: | | | | | | | | |
Interest | | $ | 6,647,050 | | | | | |
Dividends | | | 95,977 | | | | | |
| | | | | | | | |
Total income | | | | | | $ | 6,743,027 | |
Expenses: | | | | | | | | |
Management fees (Note 2) | | | 960,333 | | | | | |
Transfer agent and shareholder servicing expense (Note 6) | | | 213,858 | | | | | |
Reports to shareholders (Note 6) | | | 167,425 | | | | | |
Audit and legal fees | | | 73,094 | | | | | |
Custodian fees | | | 62,521 | | | | | |
Registration fees | | | 27,419 | | | | | |
Directors’ fees and expenses | | | 21,832 | | | | | |
Distribution fees (Notes 2 and 6) | | | 556 | | | | | |
Other expenses | | | 14,104 | | | | | |
| | | | | | | | |
| | | 1,541,142 | | | | | |
Less: Fees waived (Notes 2 and 6) | | | (98,306 | ) | | | | |
| | | | | | | | |
Net expenses | | | | | | | 1,442,836 | |
| | | | | | | | |
Net Investment Income | | | | | | | 5,300,191 | |
Net Realized and Unrealized Gain/(Loss) on Investments (Notes 1, 3 and 4): | | | | | | | | |
Net realized gain/(loss) on: | | | | | | | | |
Investments | | | (6,095,011 | ) | | | | |
Options written | | | 491,322 | | | | | |
Futures | | | (1,940,700 | ) | | | | |
Swaps | | | 1,326,460 | | | | | |
Foreign currency transactions | | | (969,674 | ) | | | | |
| | | | | | | | |
| | | | | | | (7,187,603 | ) |
Change in unrealized appreciation/(depreciation) of: | | | | | | | | |
Investments | | | 49,465,493 | | | | | |
Futures | | | 3,402,002 | | | | | |
Swaps | | | 6,936,623 | | | | | |
Foreign currency translations | | | (32,602 | ) | | | | |
| | | | | | | | |
| | | | | | | 59,771,516 | |
| | | | | | | | |
Net Realized and Unrealized Gain on Investments | | | | | | | 52,583,913 | |
| | | | | | | | | |
Change in Net Assets Resulting From Operations | | | | | | $ | 57,884,104 | |
| | | | | | | | | |
See notes to financial statements.
82
Annual Report to Shareholders
Statement of Changes in Net Assets
Western Asset Inflation Indexed Plus Bond Portfolio
| | | | | | | | | | | | |
| | | FOR THE
YEAR ENDED
DECEMBER 31, 2009 | | | FOR THE
PERIOD ENDED
DECEMBER 31, 2008A | | | FOR THE
YEAR ENDED
MARCH 31, 2008 | |
Change in Net Assets: | | | | | | | | | | | | |
Net investment income | | $ | 5,300,191 | | | $ | 33,825,189 | | | $ | 42,360,024 | |
| | | |
Net realized gain/(loss) | | | (7,187,603 | ) | | | (26,550,690 | ) | | | 19,288,128 | |
| | | |
Change in unrealized appreciation/(depreciation) | | | 59,771,516 | | | | (102,387,328 | ) | | | 29,251,587 | |
| | | | | | | | | | | | |
Change in net assets resulting from operations | | | 57,884,104 | | | | (95,112,829 | ) | | | 90,899,739 | |
| | | |
Distributions to shareholders from (Note 1): | | | | | | | | | | | | |
Net investment income: | | | | | | | | | | | | |
Institutional Class | | | (5,181,270 | ) | | | (39,535,523 | ) | | | (42,554,324 | ) |
Institutional Select Class | | | (279,577 | ) | | | — | | | | N/A | |
Financial Intermediary Class | | | (2,557 | ) | | | (3,568 | ) | | | (1,115 | ) |
| | | |
Net realized gain on investments: | | | | | | | | | | | | |
Institutional Class | | | — | | | | (15,894,795 | ) | | | — | |
Institutional Select Class | | | — | | | | — | | | | N/A | |
Financial Intermediary Class | | | — | | | | (667 | ) | | | — | |
| | | |
Change in net assets from fund share transactions (Note 7): | | | | | | | | | | | | |
Institutional Class | | | (77,960,103 | ) | | | (226,348,181 | ) | | | 154,011,663 | |
Institutional Select Class | | | (2,541,998 | ) | | | 22,814,947 | | | | N/A | |
Financial Intermediary Class | | | 115,338 | | | | 144,350 | | | | 37,906 | |
| | | | | | | | | | | | |
Change in net assets | | | (27,966,063 | ) | | | (353,936,266 | ) | | | 202,393,869 | |
| | | |
Net Assets: | | | | | | | | | | | | |
Beginning of year | | | 492,694,104 | | | | 846,630,370 | | | | 644,236,501 | |
| | | | | | | | | | | | |
| | | |
End of year | | $ | 464,728,041 | | | $ | 492,694,104 | | | $ | 846,630,370 | |
| | | | | | | | | | | | |
| | | |
Undistributed net investment income | | $ | 3,141,406 | | | $ | 2,305,323 | | | $ | 3,777,864 | |
| | | | | | | | | | | | |
| | | | | | | | | | | | | |
| A | | For the period April 1, 2008 to December 31, 2008. |
N/A—Not applicable
See notes to financial statements.
83
Annual Report to Shareholders
Financial Highlights
Western Asset Inflation Indexed Plus Bond Portfolio
For a share of each class of capital stock outstanding:
Institutional Class:
| | | | | | | | | | | | | | | | | | | | | | | | |
| | | YEAR ENDED
DECEMBER 31,
2009 | | | PERIOD ENDED
DECEMBER 31,
2008A | | | YEARS ENDED MARCH 31, | |
| | | | | 2008 | | | 2007 | | | 2006 | | | 2005 | |
Net asset value, beginning of year | | $ | 9.53 | | | $ | 11.08 | | | $ | 10.43 | | | $ | 10.25 | | | $ | 10.74 | | | $ | 11.24 | |
| | | | | | | | | | | | | | | | | | | | | | | | |
Investment operations: | | | | | | | | | | | | | | | | | | | | | | | | |
Net investment income | | | .11 | B | | | .44 | B | | | .61 | B | | | .39 | B | | | .54 | C | | | .42 | C |
Net realized and unrealized gain/(loss) | | | 1.11 | | | | (1.32 | ) | | | .67 | | | | .20 | | | | (.38 | ) | | | (.10 | ) |
| | | | | | | | | | | | | | | | | | | | | | | | |
Total from investment operations | | | 1.22 | | | | (.88 | ) | | | 1.28 | | | | .59 | | | | .16 | | | | .32 | |
| | | | | | | | | | | | | | | | | | | | | | | | |
Distributions from: | | | | | | | | | | | | | | | | | | | | | | | | |
Net investment income | | | (.12 | ) | | | (.47 | ) | | | (.63 | ) | | | (.41 | ) | | | (.56 | ) | | | (.42 | ) |
Net realized gain on investments | | | — | | | | (.20 | ) | | | — | | | | — | | | | (.09 | ) | | | (.40 | ) |
| | | | | | | | | | | | | | | | | | | | | | | | |
Total distributions | | | (.12 | ) | | | (.67 | ) | | | (.63 | ) | | | (.41 | ) | | | (.65 | ) | | | (.82 | ) |
| | | | | | | | | | | | | | | | | | | | | | | | |
Net asset value, end of year | | $ | 10.63 | | | $ | 9.53 | | | $ | 11.08 | | | $ | 10.43 | | | $ | 10.25 | | | $ | 10.74 | |
| | | | | | | | | | | | | | | | | | | | | | | | |
Total returnD | | | 12.86 | % | | | (8.32 | )% | | | 12.77 | % | | | 5.89 | % | | | 1.44 | % | | | 3.27 | % |
| | | | | | |
Ratios to Average Net Assets: | | | | | | | | | | | | | | | | | | | | | | | | |
Total expensesE | | | .32 | % | | | .27 | %F | | | .27 | % | | | .29 | % | | | .27 | % | | | .27 | % |
Expenses net of waivers, if anyE | | | .30 | % | | | .25 | %F | | | .25 | % | | | .25 | % | | | .25 | % | | | .25 | % |
Expenses net of all reductionsE | | | .30 | % | | | .25 | %F | | | .25 | % | | | .25 | % | | | .25 | % | | | .25 | % |
Net investment income | | | 1.1 | % | | | 5.8 | %F | | | 5.8 | % | | | 3.8 | % | | | 5.0 | % | | | 3.8 | % |
| | | | | | |
Supplemental Data: | | | | | | | | | | | | | | | | | | | | | | | | |
Portfolio turnover rate | | | 41.1 | % | | | 74.4 | %G | | | 141.7 | % | | | 96.4 | % | | | 177.1 | % | | | 255.5 | % |
Net assets, end of year (in thousands) | | $ | 440,964 | | | $ | 469,959 | | | $ | 846,594 | | | $ | 644,236 | | | $ | 542,532 | | | $ | 461,746 | |
| | | | | | | | | | | | | | | | | | | | | | | | | |
| A | | For the period April 1, 2008 to December 31, 2008. |
| B | | Computed using average daily shares outstanding. |
| C | | Computed using SEC method. |
| D | | Performance figures may reflect compensating balance credits, fee waivers and/or expense reimbursements. In the absence of compensating balance credits, fee waivers and/or expense reimbursements, the total return would have been lower. Past performance is no guarantee of future results. Total returns for periods of less than one year are not annualized. |
| E | | Total expenses reflects operating expenses prior to any voluntary expense waivers and/or compensating balance credits. Expenses net of waivers reflects total expenses before compensating balance credits but net of any voluntary expense waivers. Expenses net of all reductions reflects expenses less any compensating balance credits and/or voluntary expense waivers. |
See notes to financial statements.
84
Annual Report to Shareholders
For a share of each class of capital stock outstanding:
Institutional Select Class:
| | | | | | | | |
| | | YEAR ENDED
DECEMBER 31, 2009 | | | PERIOD ENDED
DECEMBER 31, 2008A | |
Net asset value, beginning of year | | $ | 9.53 | | | $ | 9.63 | |
| | | | | | | | |
Investment operations: | | | | | | | | |
Net investment income/(loss)B | | | .18 | | | | (.03 | ) |
Net realized and unrealized gain/(loss) | | | 1.05 | | | | (.07 | ) |
| | | | | | | | |
Total from investment operations | | | 1.23 | | | | (.10 | ) |
| | | | | | | | |
Distributions from: | | | | | | | | |
Net investment income | | | (.12 | ) | | | — | |
| | | | | | | | |
Total distributions | | | (.12 | ) | | | — | |
| | | | | | | | |
Net asset value, end of year | | $ | 10.64 | | | $ | 9.53 | |
| | | | | | | | |
Total returnC | | | 12.99 | % | | | (1.04 | )% |
| | |
Ratios to Average Net Assets: | | | | | | | | |
Total expensesD | | | .28 | % | | | .24 | %E |
Expenses net of waivers, if anyD | | | .25 | % | | | .24 | %E |
Expenses net of all reductionsD | | | .25 | % | | | .24 | %E |
Net investment income (loss) | | | 1.8 | % | | | (10.0 | )%E |
| | |
Supplemental Data: | | | | | | | | |
Portfolio turnover rate | | | 41.1 | % | | | 74.4 | %F |
Net assets, end of year (in thousands) | | $ | 23,463 | | | $ | 22,573 | |
| | | | | | | | | |
| A | | For the period December 18, 2008 (commencement of operations) to December 31, 2008. |
| B | | Computed using average daily shares outstanding. |
| C | | Performance figures may reflect compensating balance credits, fee waivers and/or expense reimbursements. In the absence of compensating balance credits, fee waivers and/or expense reimbursements, the total return would have been lower. Past performance is no guarantee of future results. Total returns for periods of less than one year are not annualized. |
| D | | Total expenses reflects operating expenses prior to any voluntary expense waivers and/or compensating balance credits. Expenses net of waivers reflects total expenses before compensating balance credits but net of any voluntary expense waivers. Expenses net of all reductions reflects expenses less any compensating balance credits and/or voluntary expense waivers. |
See notes to financial statements.
85
Annual Report to Shareholders
Financial Highlights
Western Asset Inflation Indexed Plus Bond Portfolio
For a share of each class of capital stock outstanding:
Financial Intermediary Class:
| | | | | | | | | | | | |
| | | YEAR ENDED
DECEMBER 31,
2009 | | | PERIOD ENDED
DECEMBER 31,
2008A | | | PERIOD ENDED
MARCH 31,
2008B | |
Net asset value, beginning of year | | $ | 9.51 | | | $ | 11.06 | | | $ | 10.02 | |
| | | | | | | | | | | | |
Investment operations: | | | | | | | | | | | | |
Net investment incomeC | | | .14 | | | | .17 | | | | .35 | |
Net realized and unrealized gain/(loss) | | | 1.04 | | | | (1.06 | ) | | | 1.06 | |
| | | | | | | | | | | | |
Total from investment operations | | | 1.18 | | | | (.89 | ) | | | 1.41 | |
| | | | | | | | | | | | |
Distributions from: | | | | | | | | | | | | |
Net investment income | | | (.10 | ) | | | (.46 | ) | | | (.37 | ) |
Net realized gain on investments | | | — | | | | (.20 | ) | | | — | |
| | | | | | | | | | | | |
Total distributions | | | (.10 | ) | | | (.66 | ) | | | (.37 | ) |
| | | | | | | | | | | | |
Net asset value, end of year | | $ | 10.59 | | | $ | 9.51 | | | $ | 11.06 | |
| | | | | | | | | | | | |
Total returnD | | | 12.53 | % | | | (8.47 | )% | | | 14.29 | % |
| | | |
Ratios to Average Net Assets: | | | | | | | | | | | | |
Total expensesE | | | .79 | % | | | .77 | %F | | | .71 | %F |
Expenses net of waivers, if anyE | | | .62 | % | | | .52 | %F | | | .48 | %F |
Expenses net of all reductionsE | | | .62 | % | | | .52 | %F | | | .48 | %F |
Net investment income | | | 1.4 | % | | | 2.4 | %F | | | 4.1 | %F |
| | | |
Supplemental Data: | | | | | | | | | | | | |
Portfolio turnover rate | | | 41.1 | % | | | 74.4 | %G | | | 141.7 | %G |
Net assets, end of year (in thousands) | | $ | 301 | | | $ | 162 | | | $ | 36 | |
| | | | | | | | | | | | | |
| A | | For the period April 1, 2008 to December 31, 2008. |
| B | | For the period June 28, 2007 (commencement of operations) to March 31, 2008. |
| C | | Computed using average daily shares outstanding. |
| D | | Performance figures may reflect compensating balance credits, fee waivers and/or expense reimbursements. In the absence of compensating balance credits, fee waivers and/or expense reimbursements, the total return would have been lower. Past performance is no guarantee of future results. Total returns for periods of less than one year are not annualized. |
| E | | Total expenses reflects operating expenses prior to any voluntary expense waivers and/or compensating balance credits. Expenses net of waivers reflects total expenses before compensating balance credits but net of any voluntary expense waivers. Expenses net of all reductions reflects expenses less any compensating balance credits and/or voluntary expense waivers. |
See notes to financial statements.
86
Annual Report to Shareholders
Management’s Discussion of Fund Performance
Western Asset Intermediate Bond Portfolio
Performance Review
For the twelve months ended December 31, 2009, Institutional Class shares of Western Asset Intermediate Bond Portfolio returned 17.24%. The Fund’s unmanaged benchmark, the Barclays Capital Intermediate U.S. Government/Credit Indexi, returned 5.24% for the same period. The Lipper Short-Intermediate Investment Grade Debt Funds Category Average1 returned 11.84% over the same time frame.
PERFORMANCE SNAPSHOT as of December 31, 2009 (unaudited)
| | | | |
| | | 6 MONTHS | | 12 MONTHS |
Western Asset Intermediate Bond Portfolio: | | | | |
Institutional Class | | 7.90% | | 17.24% |
Institutional Select Class | | 8.02% | | 17.39% |
Barclays Capital Intermediate U.S. Government/Credit Index | | 3.57% | | 5.24% |
Lipper Short-Intermediate Investment Grade Debt Funds Category Average1 | | 5.50% | | 11.84% |
The performance shown represents past performance. Past performance is no guarantee of future results and current performance may be higher or lower than the performance shown above. Principal value, investment returns and yields will fluctuate and investors’ shares, when redeemed, may be worth more or less than their original cost. To obtain performance data current to the most recent month-end, please visit our website at www.leggmason.com/individualinvestors.
All share class returns assume the reinvestment of all distributions, including returns of capital, if any, at net asset value and the deduction of all Fund expenses. Returns have not been adjusted to include the deduction of taxes that a shareholder would pay on Fund distributions. Performance figures for periods shorter than one year represent cumulative figures and are not annualized.
Performance figures reflect expense reimbursements and/or fee waivers, without which the performance would have been lower.
The 30-Day SEC Yields for the period ended December 31, 2009 for Institutional and Institutional Select Class shares were 3.15% and 3.24%, respectively. Absent current expense reimbursements and/or fee waivers, the 30-Day SEC Yields for Institutional and Institutional Select Class shares would have been 3.15% and 3.20%, respectively. The 30-Day SEC Yield is the average annualized net investment income per share for the 30-day period indicated and is subject to change.
TOTAL ANNUAL OPERATING EXPENSES (unaudited)
As of the Fund’s most current prospectus dated July 1, 2009, the gross total operating expense ratios for Institutional and Institutional Select Class shares were 0.47% and 0.51%, respectively.
Actual expenses may be higher. For example, expenses may be higher than those shown if average net assets decrease. Net assets are more likely to decrease and Fund expense ratios are more likely to increase when markets are volatile.
As a result of a contractual expense limitation, the ratio of expenses, other than interest, brokerage, taxes, deferred organizational expenses and extraordinary expenses, to average net assets will not exceed 0.45% for Institutional Select Class shares until April 30, 2010.
87
| 1Lipper, | | Inc., a wholly-owned subsidiary of Reuters, provides independent insight on global collective investments. Returns are based on the period ended December 31, 2009, including the reinvestment of all distributions, including returns of capital, if any, calculated among the 152 funds for the six-month period and among the 150 funds for the twelve-month period in the Fund’s Lipper category. |
Annual Report to Shareholders
Management’s Discussion of Fund Performance—Continued
Improving market conditions and strong performance in the spread sectors (non-Treasuries) helped the Fund to significantly outperform its benchmark during the reporting period. The largest contributor to the Fund’s relative performance during the reporting period was its overweight exposure to investment grade bonds. In particular, our subordinated Financials holdings were rewarded as their spreads significantly narrowed during the year. Exposure to several “fallen angels” (investment grade corporate bonds that were subsequently downgraded to non-investment grade status) also contributed to performance. Within this area, the Fund’s Financials holdings again produced strong results. Our non-agency mortgage-backed securities (“MBS”) also meaningfully contributed to performance, as they were supported by improvements in the housing market. Elsewhere, our U.S. Treasury Inflation-Protected Securities (“TIPS”)ii and agency MBS benefited results, albeit to a lesser extent.
The portfolio’s shorter durationiii than that of its benchmark modestly contributed to performance as yields rose during the year. In contrast, our yield curveiv positioning detracted from performance. Having an overweight to the longer end of the curve was also not rewarded as long-term rates rose more than their short-term counterparts given concerns for future inflation.
There were a number of adjustments made to the portfolio during the reporting period. We substantially decreased the portfolio’s exposure to agency MBS, finding them less attractive as their spreads had narrowed given the government’s direct purchase of these securities. With the government set to phase out its purchasing program, we determined that more attractive opportunities could be found in other areas of the market. In contrast, we significantly increased the portfolio’s exposure to Treasuries and bank debt issued under the Term Loan Guarantee Program (“TLGP”).
During the reporting period, we utilized Eurodollar futures/options and Treasury futures/options to manage the portfolio’s duration and yield curve exposure. Interest rate swaps/swaptions were used to manage our interest rate exposure throughout the yield curve. We also utilized index credit default swap/swaptions to manage the portfolio’s exposure to the investment grade market, and credit default swaps were used to manage exposure to specific corporate names. Overall, the use of these derivative instruments was positive for performance.
Western Asset Management Company
January 19, 2010
88
Annual Report to Shareholders
The information provided is not intended to be a forecast of future events, a guarantee of future results or investment advice. Views expressed may differ from those of the firm as a whole.
The mention of sector breakdowns is for informational purposes only and should not be construed as a recommendation to purchase or sell any securities. The information provided regarding such sectors is not a sufficient basis upon which to make an investment decision. Investors seeking financial advice regarding the appropriateness of investing in any securities or investment strategies discussed should consult their financial professional. Portfolio holdings are subject to change at any time and may not be representative of the portfolio managers’ current or future investments. The Fund’s top five sector holdings (as a percentage of net assets) as of December 31, 2009 were: Corporate Bonds and Notes (39.9%), U.S. Government and Agency Obligations (26.9%), Yankee Bonds (14.0%), Mortgage-Backed Securities (7.3%) and Asset-Backed Securities (2.3%). The Fund’s portfolio composition is subject to change at any time.
RISKS: All investments are subject to risk including the loss of principal. Fixed-income securities involve interest rate, credit, inflation and reinvestment risks. As interest rates rise, the value of fixed-income securities falls. Derivatives, such as options, futures and swaps, can be illiquid, may disproportionately increase losses, and have a potentially large impact on Fund performance. International investments are subject to special risks including social, economic and political uncertainties, which could increase volatility. Asset-backed, mortgage-backed or mortgage-related securities are subject to prepayment and extension risks. Please see the Fund’s prospectus for more information on these and other risks.
All index performance reflects no deduction for fees, expenses or taxes. Please note that an investor cannot invest directly in an index.
| i | | The Barclays Capital Intermediate U.S. Government/Credit Index is a market value weighted performance benchmark for government and corporate fixed-rate debt issues (rated Baa/BBB or higher) with maturities between one and ten years. |
| ii | | U.S. Treasury Inflation-Protected Securities (“TIPS”) are inflation-indexed securities issued by the U.S. Treasury in five-year, ten-year and twenty-year maturities. The principal is adjusted to the Consumer Price Index, the commonly used measure of inflation. The coupon rate is constant, but generates a different amount of interest when multiplied by the inflation-adjusted principal. |
| iii | | Duration is the measure of the price sensitivity of a fixed-income security to an interest rate change of 100 basis points. Calculation is based on the weighted average of the present values for all cash flows. |
| iv | | The yield curve is the graphical depiction of the relationship between the yield on bonds of the same credit quality but different maturities. |
89
Annual Report to Shareholders
Expense Example (Unaudited)
Western Asset Intermediate Bond Portfolio
As a shareholder of the Fund, you may incur two types of costs; (1) transaction costs and (2) ongoing costs, including management fees and other Fund expenses. These examples are intended to help you understand your ongoing costs (in dollars) of investing in the Fund and to compare these costs with the ongoing costs of investing in other mutual funds.
The example is based on an investment of $1,000 invested on July 1, 2009 and held through December 31, 2009. The ending values assume dividends were reinvested at the time they were paid.
Actual Expenses
The first line for each class in the table below provides information about actual account values and actual expenses for the Fund. You may use the information in this line, together with the amount you invested, to estimate the expenses that you paid over the period. Simply divide your account value by $1,000 (for example, an $8,600 account value divided by $1,000 = 8.6), then multiply the result by the number in the first line under the heading entitled “Expenses Paid During the Period” to estimate the expenses you paid on your account if your shares were held through the entire period.
Hypothetical Example for Comparison Purposes
The second line for each class in the table below provides information about hypothetical account values and hypothetical expenses based on the Fund’s actual expense ratio and an assumed rate of return of 5% per year before expenses, which is not the Fund’s actual return. The hypothetical account values and expenses may not be used to estimate the actual ending account balance or expenses you paid for the period. You may use this information to compare the ongoing costs of investing in the Fund and other funds. To do so, compare this 5% hypothetical example with the 5% hypothetical examples that appear in the shareholder reports of other funds. Because each example is intended to be comparable to the examples provided by other funds, it is based on a hypothetical investment of $1,000 invested on July 1, 2009 and held through December 31, 2009. The ending values assume dividends were reinvested at the time they were paid.
| | | | | | | | | |
| | | Beginning
Account Value
7/1/09 | | Ending
Account Value
12/31/09 | | Expenses PaidA
During the Period
7/1/09 to 12/31/09 |
Institutional Class: | | | | | | | | | |
Actual | | $ | 1,000.00 | | $ | 1,079.00 | | $ | 2.52 |
Hypothetical (5% return before expenses) | | | 1,000.00 | | | 1,022.79 | | | 2.45 |
Institutional Select Class: | | | | | | | | | |
Actual | | $ | 1,000.00 | | $ | 1,080.20 | | $ | 2.36 |
Hypothetical (5% return before expenses) | | | 1,000.00 | | | 1,022.94 | | | 2.29 |
| A | | These calculations are based on expenses incurred from July 1, 2009 to December 31, 2009. The dollar amounts shown as “Expenses Paid” are equal to the annualized expense ratio of 0.48% and 0.45% for the Institutional Class and Institutional Select Class, respectively, multiplied by the average value over the period, multiplied by the number of days in the most recent fiscal half-year then divided by 365. |
90
Annual Report to Shareholders
Performance Information (Unaudited)
Western Asset Intermediate Bond Portfolio
The graphs compare the Fund’s total returns to that of an appropriate broad-based securities market index. The graphs illustrate the cumulative total return of an initial $1,000,000 investment in each of Institutional Class and Institutional Select Class for the periods indicated. The line for the Fund represents the total return after deducting all Fund investment management and other administrative expenses and the transaction costs of buying and selling securities. The line representing the securities market index does not include any transaction costs associated with buying and selling securities in the index or other investment management or administrative expenses.
Total return measures investment performance in terms of appreciation or depreciation in the Fund’s net asset value per share, plus dividends and any capital gain distributions. It assumes that dividends and distributions were reinvested at the time they were paid. Returns (and the graph and table found below) do not reflect the deduction of taxes that a shareholder would pay on Fund distributions or the redemption of Fund shares. Average annual returns tend to smooth out variations in a fund’s return, so that they differ from actual year-to-year results.
Bonds are subject to a variety of risks, including interest rate, credit, and inflation risk.
Growth of a $1,000,000 Investment—Institutional Class
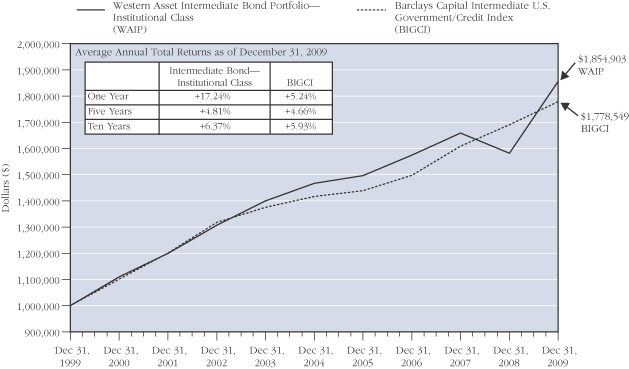
The performance data quoted represent past performance and do not guarantee future results. Current performance may be lower or higher than the performance data quoted. To obtain the most recent month-end performance information, please visit www.westernassetfunds.com. The investment return and principal value of the Fund will fluctuate so that an investor’s shares, when redeemed, may be worth more or less than the original cost. Calculations assume reinvestment of all distributions, including returns of capital, if any, at net asset value and the deduction of all Fund expenses. Performance would have been lower if fees had not been waived in various periods.
91
Annual Report to Shareholders
Performance Information (Unaudited)—Continued
Growth of a $1,000,000 Investment—Institutional Select Class
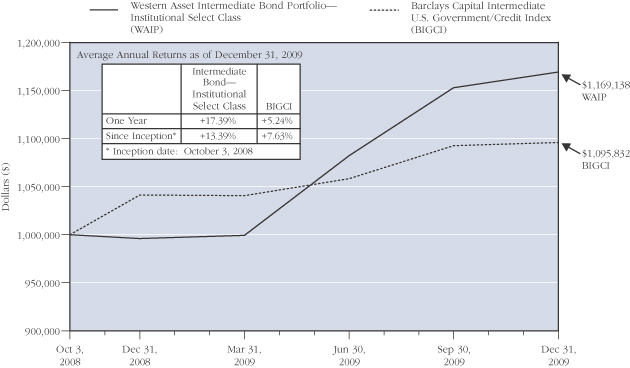
The performance data quoted represent past performance and do not guarantee future results. Current performance may be lower or higher than the performance data quoted. To obtain the most recent month-end performance information, please visit www.westernassetfunds.com. The investment return and principal value of the Fund will fluctuate so that an investor’s shares, when redeemed, may be worth more or less than the original cost. Calculations assume reinvestment of all distributions, including returns of capital, if any, at net asset value and the deduction of all Fund expenses. Performance would have been lower if fees had not been waived in various periods.
92
Annual Report to Shareholders
Portfolio Composition (Unaudited) (as of December 31, 2009)A
Standard & Poor’s Debt RatingsB (as a percentage of the portfolio)
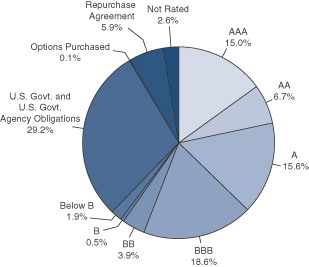
Maturity Schedule (as a percentage of the portfolio)
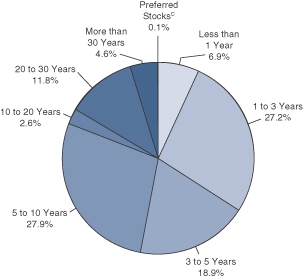
| A | | The pie charts above represent the composition of the Fund’s portfolio as of December 31, 2009 and do not include derivatives such as Futures Contracts, Options Written, and Swaps. The Fund is actively managed. As a result, the composition of the portfolio holdings and sectors are subject to change at any time. |
| B | | Standard & Poor’s Ratings Service provides capital markets with credit ratings for the evaluation and assessment of credit risks. These ratings are the opinions of S&P and not absolute measures of quality or guarantees of performance. |
| C | | Preferred stocks do not have defined maturity dates. |
93
Annual Report to Shareholders
Spread Duration
Western Asset Intermediate Bond Portfolio
December 31, 2009 (Unaudited)
Economic Exposure
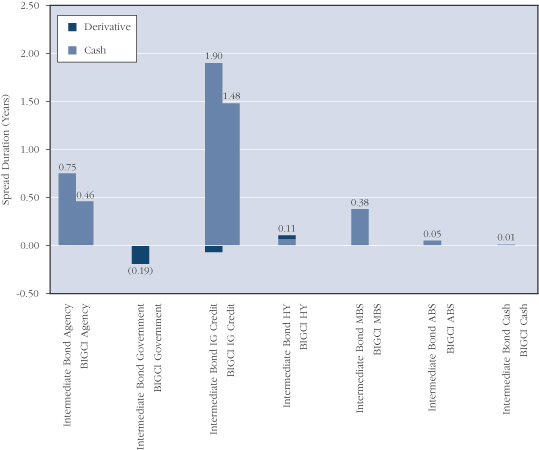
Spread duration is defined as the change in value for a 100 basis point change in the spread relative to Treasuries. The spread over Treasuries is the annual risk-premium demanded by investors to hold non-Treasury securities. This chart highlights the market sector exposure of the Fund’s portfolio and the exposure relative to the selected benchmark as of the end of the reporting period.
| | | | |
| ABS | | — | | Asset Backed Securities |
| BIGCI | | — | | Barclays Capital Intermediate U.S. Government/Credit Index |
| HY | | — | | High Yield |
| IG Credit | | — | | Investment Grade Credit |
| MBS | | — | | Mortgage Backed Securities |
94
Annual Report to Shareholders
Effective Duration
Western Asset Intermediate Bond Portfolio
December 31, 2009 (Unaudited)
Interest Rate Exposure
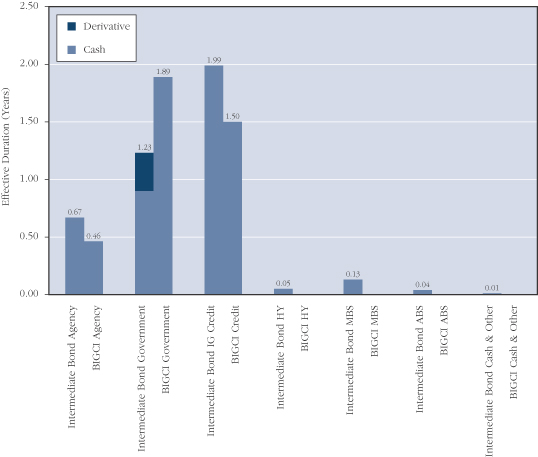
Effective duration is defined as the change in value for a 100 basis point change in Treasury yields. This chart highlights the interest rate exposure of the Fund’s portfolio relative to the selected benchmark as of the end of the reporting period.
| | | | |
| ABS | | — | | Asset Backed Security |
| BIGCI | | — | | Barclays Capital Intermediate U.S. Government/Credit Index |
| HY | | — | | High Yield |
| IG Credit | | — | | Investment Grade Credit |
| MBS | | — | | Mortgage Backed Securities |
95
Annual Report to Shareholders
Portfolio of Investments
Western Asset Intermediate Bond Portfolio
December 31, 2009
| | | | | | | | | | | | | |
| | | % OF
NET ASSETS | | RATE | | MATURITY
DATE | | PAR/
SHARES | | VALUE | |
| | | | | | | | | | | | | |
Long-Term Securities | | 93.0% | | | | | | | | | | | |
| | | | | |
Corporate Bonds and Notes | | 39.9% | | | | | | | | | | | |
| | | | | |
Aerospace and Defense | | 0.3% | | | | | | | | | | | |
The Boeing Co. | | | | 1.875% | | 11/20/12 | | $ | 300,000 | | $ | 296,658 | |
The Boeing Co. | | | | 6.000% | | 3/15/19 | | | 1,250,000 | | | 1,356,455 | |
| | | | | | | | | | | | | |
| | | | | | | | | | | | 1,653,113 | |
| | | | | | | | | | | | | |
Airlines | | 0.4% | | | | | | | | | | | |
Continental Airlines Inc. | | | | 6.545% | | 2/2/19 | | | 775,366 | | | 759,859 | |
US Airways Pass-Through Trust | | | | 6.850% | | 1/30/18 | | | 1,367,674 | | | 1,121,493 | |
| | | | | | | | | | | | | |
| | | | | | | | | | | | 1,881,352 | |
| | | | | | | | | | | | | |
Automobiles | | 0.1% | | | | | | | | | | | |
Motors Liquidation Co. | | | | 8.375% | | 7/15/33 | | | 1,178,000 | | | 318,060 | A |
| | | | | | | | | | | | | |
| | | | | |
Beverages | | 0.6% | | | | | | | | | | | |
Anheuser-Busch InBev Worldwide Inc. | | | | 5.375% | | 1/15/20 | | | 1,200,000 | | | 1,224,311 | B |
Bottling Group LLC | | | | 6.950% | | 3/15/14 | | | 1,310,000 | | | 1,507,296 | |
| | | | | | | | | | | | | |
| | | | | | | | | | | | 2,731,607 | |
| | | | | | | | | | | | | |
Capital Markets | | 3.1% | | | | | | | | | | | |
Goldman Sachs Capital II | | | | 5.793% | | 12/29/49 | | | 5,010,000 | | | 3,882,750 | C |
Goldman Sachs Capital III | | | | 1.026% | | 9/29/49 | | | 2,590,000 | | | 1,703,702 | D |
Goldman Sachs Group Inc. Senior Notes | | | | 6.000% | | 5/1/14 | | | 70,000 | | | 76,564 | |
Lehman Brothers Holdings Capital Trust VII | | | | 5.857% | | 12/31/49 | | | 6,200,000 | | | 1,860 | A,C |
Lehman Brothers Holdings E-Capital Trust I | | | | 3.850% | | 8/19/65 | | | 360,000 | | | 108 | A,D |
Lehman Brothers Holdings Inc. | | | | 5.625% | | 1/24/13 | | | 600,000 | | | 123,000 | A |
Lehman Brothers Holdings Inc. | | | | 6.500% | | 7/19/17 | | | 30,000 | | | 9 | A |
Merrill Lynch and Co. Inc. | | | | 0.498% | | 2/5/10 | | | 480,000 | | | 480,156 | D |
Merrill Lynch and Co. Inc. | | | | 5.700% | | 5/2/17 | | | 1,500,000 | | | 1,470,258 | |
Morgan Stanley | | | | 5.550% | | 4/27/17 | | | 1,180,000 | | | 1,185,224 | |
Morgan Stanley | | | | 7.300% | | 5/13/19 | | | 2,100,000 | | | 2,358,153 | |
State Street Corp. | | | | 4.300% | | 5/30/14 | | | 820,000 | | | 848,543 | |
The Bear Stearns Cos. Inc. | | | | 6.400% | | 10/2/17 | | | 1,450,000 | | | 1,580,617 | |
The Bear Stearns Cos. Inc. | | | | 7.250% | | 2/1/18 | | | 1,110,000 | | | 1,274,117 | |
| | | | | | | | | | | | | |
| | | | | | | | | | | | 14,985,061 | |
| | | | | | | | | | | | | |
Chemicals | | 0.7% | | | | | | | | | | | |
Lubrizol Corp. | | | | 8.875% | | 2/1/19 | | | 1,130,000 | | | 1,404,911 | |
The Dow Chemical Co. | | | | 6.000% | | 10/1/12 | | | 1,770,000 | | | 1,904,001 | |
| | | | | | | | | | | | | |
| | | | | | | | | | | | 3,308,912 | |
| | | | | | | | | | | | | |
96
Annual Report to Shareholders
| | | | | | | | | | | | | |
| | | % OF
NET ASSETS | | RATE | | MATURITY
DATE | | PAR/
SHARES | | VALUE | |
| | | | | | | | | | | | | |
Corporate Bonds and Notes—Continued | | | | | | | | | | | | | |
| | | | | |
Commercial Banks | | 1.9% | | | | | | | | | | | |
BB&T Corp. | | | | 3.850% | | 7/27/12 | | $ | 750,000 | | $ | 776,291 | |
Comerica Capital Trust II | | | | 6.576% | | 2/20/37 | | | 960,000 | | | 768,000 | C |
SunTrust Capital VIII | | | | 6.100% | | 12/15/36 | | | 550,000 | | | 383,084 | C |
U.S. Bancorp | | | | 4.200% | | 5/15/14 | | | 1,050,000 | | | 1,089,943 | |
Wachovia Capital Trust III | | | | 5.800% | | 3/15/49 | | | 708,000 | | | 541,620 | C |
Wells Fargo and Co. | | | | 3.750% | | 10/1/14 | | | 3,530,000 | | | 3,519,601 | |
Wells Fargo Capital X | | | | 5.950% | | 12/15/36 | | | 2,500,000 | | | 2,175,000 | |
| | | | | | | | | | | | | |
| | | | | | | | | | | | 9,253,539 | |
| | | | | | | | | | | | | |
Consumer Finance | | 4.9% | | | | | | | | | | | |
American Express Co. | | | | 8.125% | | 5/20/19 | | | 550,000 | | | 651,783 | |
American Express Credit Corp. | | | | 5.125% | | 8/25/14 | | | 3,240,000 | | | 3,414,095 | |
Caterpillar Financial Services Corp. Series 2009 | | | | 1.900% | | 12/17/12 | | | 1,370,000 | | | 1,364,656 | |
FIA Card Services N.A. | | | | 7.125% | | 11/15/12 | | | 1,330,000 | | | 1,447,786 | |
GMAC LLC | | | | 2.200% | | 12/19/12 | | | 11,160,000 | | | 11,228,433 | |
GMAC LLC | | | | 7.500% | | 12/31/13 | | | 390,000 | | | 376,350 | B |
GMAC LLC | | | | 6.750% | | 12/1/14 | | | 955,000 | | | 907,250 | B |
GMAC LLC | | | | 8.000% | | 12/31/18 | | | 325,000 | | | 286,000 | B |
Nelnet Inc. | | | | 7.400% | | 9/29/36 | | | 1,250,000 | | | 910,389 | C |
SLM Corp. | | | | 8.450% | | 6/15/18 | | | 3,000,000 | | | 2,960,259 | |
| | | | | | | | | | | | | |
| | | | | | | | | | | | 23,547,001 | |
| | | | | | | | | | | | | |
Diversified Financial Services | | 8.1% | | | | | | | | | | | |
AGFC Capital Trust I | | | | 6.000% | | 1/15/67 | | | 700,000 | | | 245,000 | B,C |
BAC Capital Trust XIV | | | | 5.630% | | 12/31/49 | | | 50,000 | | | 34,500 | C |
Bank of America Corp. | | | | 8.000% | | 12/29/49 | | | 1,420,000 | | | 1,367,091 | C |
Citigroup Funding Inc. | | | | 2.250% | | 12/10/12 | | | 13,850,000 | | | 13,958,722 | |
Citigroup Inc. | | | | 6.375% | | 8/12/14 | | | 1,110,000 | | | 1,162,067 | |
Citigroup Inc. | | | | 5.500% | | 10/15/14 | | | 470,000 | | | 475,890 | |
Citigroup Inc. | | | | 6.010% | | 1/15/15 | | | 280,000 | | | 285,907 | |
Citigroup Inc. | | | | 8.500% | | 5/22/19 | | | 5,680,000 | | | 6,558,997 | |
General Electric Capital Corp. | | | | 5.900% | | 5/13/14 | | | 2,390,000 | | | 2,583,762 | |
General Electric Capital Corp. | | | | 5.625% | | 5/1/18 | | | 2,000,000 | | | 2,049,482 | |
General Electric Capital Corp. | | | | 6.000% | | 8/7/19 | | | 220,000 | | | 228,365 | |
General Electric Capital Corp. | | | | 6.375% | | 11/15/67 | | | 2,855,000 | | | 2,476,712 | C |
ILFC E-Capital Trust I | | | | 5.900% | | 12/21/65 | | | 250,000 | | | 130,000 | B,C |
JPMorgan Chase Capital XXII | | | | 6.450% | | 2/2/37 | | | 2,600,000 | | | 2,386,114 | C |
Private Export Funding Corp. | | | | 3.550% | | 4/15/13 | | | 1,640,000 | | | 1,714,545 | |
TNK-BP Finance SA | | | | 6.125% | | 3/20/12 | | | 210,000 | | | 215,250 | B |
ZFS Finance USA Trust II | | | | 6.450% | | 12/15/65 | | | 2,060,000 | | | 1,833,400 | B,C |
ZFS Finance USA Trust III | | | | 1.404% | | 12/15/65 | | | 1,570,000 | | | 1,271,700 | B,D |
| | | | | | | | | | | | | |
| | | | | | | | | | | | 38,977,504 | |
| | | | | | | | | | | | | |
97
Annual Report to Shareholders
Portfolio of Investments—Continued
Western Asset Intermediate Bond Portfolio—Continued
| | | | | | | | | | | | |
| | | % OF
NET ASSETS | | RATE | | MATURITY
DATE | | PAR/
SHARES | | VALUE |
| | | | | | | | | | | | |
Corporate Bonds and Notes—Continued | | | | | | | | | | | | |
| | | | | |
Diversified Telecommunication Services | | 0.8% | | | | | | | | | | |
AT&T Inc. | | | | 5.600% | | 5/15/18 | | $ | 720,000 | | $ | 754,530 |
Embarq Corp. | | | | 7.082% | | 6/1/16 | | | 1,380,000 | | | 1,524,318 |
Qwest Corp. | | | | 8.875% | | 3/15/12 | | | 1,510,000 | | | 1,623,250 |
| | | | | | | | | | | | |
| | | | | | | | | | | | 3,902,098 |
| | | | | | | | | | | | |
Electric Utilities | | 1.0% | | | | | | | | | | |
Duke Energy Corp. | | | | 6.250% | | 1/15/12 | | | 1,078,000 | | | 1,165,450 |
Duke Energy Corp. | | | | 6.300% | | 2/1/14 | | | 750,000 | | | 824,714 |
FirstEnergy Corp. | | | | 7.375% | | 11/15/31 | | | 140,000 | | | 151,746 |
FirstEnergy Solutions Corp. | | | | 4.800% | | 2/15/15 | | | 1,510,000 | | | 1,541,246 |
MidAmerican Energy Holdings Co. | | | | 5.875% | | 10/1/12 | | | 827,000 | | | 900,679 |
Pacific Gas and Electric Co. | | | | 4.800% | | 3/1/14 | | | 70,000 | | | 74,340 |
| | | | | | | | | | | | |
| | | | | | | | | | | | 4,658,175 |
| | | | | | | | | | | | |
Energy Equipment and Services | | 0.2% | | | | | | | | | | |
Baker Hughes Inc. | | | | 7.500% | | 11/15/18 | | | 890,000 | | | 1,062,379 |
| | | | | | | | | | | | |
| | | | | |
Food and Staples Retailing | | 0.5% | | | | | | | | | | |
The Kroger Co. | | | | 3.900% | | 10/1/15 | | | 865,000 | | | 869,721 |
Wal-Mart Stores Inc. | | | | 4.250% | | 4/15/13 | | | 930,000 | | | 986,048 |
Walgreen Co. | | | | 5.250% | | 1/15/19 | | | 540,000 | | | 573,053 |
| | | | | | | | | | | | |
| | | | | | | | | | | | 2,428,822 |
| | | | | | | | | | | | |
Health Care Equipment and Supplies | | 0.5% | | | | | | | | | | |
Baxter International Inc. | | | | 5.900% | | 9/1/16 | | | 500,000 | | | 550,857 |
Hospira Inc. | | | | 5.550% | | 3/30/12 | | | 1,700,000 | | | 1,811,972 |
| | | | | | | | | | | | |
| | | | | | | | | | | | 2,362,829 |
| | | | | | | | | | | | |
Health Care Providers and Services | | 0.6% | | | | | | | | | | |
HCA Inc. | | | | 8.750% | | 9/1/10 | | | 822,000 | | | 841,523 |
Universal Health Services Inc. | | | | 6.750% | | 11/15/11 | | | 1,720,000 | | | 1,834,973 |
WellPoint Inc. | | | | 5.875% | | 6/15/17 | | | 100,000 | | | 103,025 |
| | | | | | | | | | | | |
| | | | | | | | | | | | 2,779,521 |
| | | | | | | | | | | | |
Independent Power Producers and Energy Traders | | 0.3% | | | | | | | | | | |
TXU Corp. | | | | 5.550% | | 11/15/14 | | | 2,480,000 | | | 1,758,811 |
| | | | | | | | | | | | |
| | | | | |
Insurance | | 2.3% | | | | | | | | | | |
Allstate Life Global Funding Trust | | | | 5.375% | | 4/30/13 | | | 1,900,000 | | | 2,028,201 |
American International Group Inc. | | | | 5.850% | | 1/16/18 | | | 250,000 | | | 205,132 |
98
Annual Report to Shareholders
| | | | | | | | | | | | | |
| | | % OF
NET ASSETS | | RATE | | MATURITY
DATE | | PAR/
SHARES | | VALUE | |
| | | | | | | | | | | | | |
Corporate Bonds and Notes—Continued | | | | | | | | | | | | | |
| | | | | |
Insurance—Continued | | | | | | | | | | | | | |
American International Group Inc. | | | | 8.250% | | 8/15/18 | | $ | 500,000 | | $ | 469,425 | |
Genworth Life Insurance Co. | | | | 5.875% | | 5/3/13 | | | 1,520,000 | | | 1,505,846 | B |
MetLife Capital Trust IV | | | | 7.875% | | 12/15/37 | | | 3,100,000 | | | 3,084,500 | B |
MetLife Inc. | | | | 6.400% | | 12/15/36 | | | 70,000 | | | 61,250 | C |
Metropolitan Life Global Funding I | | | | 2.875% | | 9/17/12 | | | 1,460,000 | | | 1,471,457 | B |
Teachers Insurance & Annuity Association of America | | | | 6.850% | | 12/16/39 | | | 330,000 | | | 341,133 | B |
The Travelers Cos. Inc. | | | | 6.250% | | 3/15/37 | | | 2,370,000 | | | 2,159,046 | C |
| | | | | | | | | | | | | |
| | | | | | | | | | | | 11,325,990 | |
| | | | | | | | | | | | | |
Media | | 1.5% | | | | | | | | | | | |
Comcast Corp. | | | | 6.500% | | 1/15/17 | | | 2,150,000 | | | 2,380,188 | |
News America Inc. | | | | 6.650% | | 11/15/37 | | | 70,000 | | | 73,942 | |
Reed Elsevier Capital Inc. | | | | 7.750% | | 1/15/14 | | | 580,000 | | | 660,345 | |
Time Warner Cable Inc. | | | | 6.200% | | 7/1/13 | | | 40,000 | | | 43,938 | |
Time Warner Cable Inc. | | | | 8.250% | | 2/14/14 | | | 2,140,000 | | | 2,501,114 | |
Time Warner Inc. | | | | 5.500% | | 11/15/11 | | | 70,000 | | | 74,317 | |
Time Warner Inc. | | | | 6.875% | | 5/1/12 | | | 1,248,000 | | | 1,366,239 | |
| | | | | | | | | | | | | |
| | | | | | | | | | | | 7,100,083 | |
| | | | | | | | | | | | | |
Metals and Mining | | 0.3% | | | | | | | | | | | |
Alcoa Inc. | | | | 6.000% | | 7/15/13 | | | 1,230,000 | | | 1,295,721 | |
| | | | | | | | | | | | | |
| | | | | |
Multi-Utilities | | 0.5% | | | | | | | | | | | |
Dominion Resources Inc. | | | | 4.750% | | 12/15/10 | | | 50,000 | | | 51,467 | |
Dominion Resources Inc. | | | | 5.700% | | 9/17/12 | | | 1,046,000 | | | 1,130,318 | |
Dominion Resources Inc. | | | | 8.875% | | 1/15/19 | | | 1,160,000 | | | 1,445,609 | |
| | | | | | | | | | | | | |
| | | | | | | | | | | | 2,627,394 | |
| | | | | | | | | | | | | |
Multiline Retail | | 0.6% | | | | | | | | | | | |
Federated Retail Holdings Inc. | | | | 5.350% | | 3/15/12 | | | 1,050,000 | | | 1,072,312 | |
JC Penney Corp. Inc. | | | | 5.750% | | 2/15/18 | | | 610,000 | | | 601,613 | |
May Department Stores Co. | | | | 5.750% | | 7/15/14 | | | 1,470,000 | | | 1,473,675 | |
| | | | | | | | | | | | | |
| | | | | | | | | | | | 3,147,600 | |
| | | | | | | | | | | | | |
Oil, Gas and Consumable Fuels | | 5.1% | | | | | | | | | | | |
Anadarko Petroleum Corp. | | | | 5.950% | | 9/15/16 | | | 2,200,000 | | | 2,379,733 | |
ConocoPhillips | | | | 5.200% | | 5/15/18 | | | 2,830,000 | | | 2,968,585 | |
ConocoPhillips | | | | 5.750% | | 2/1/19 | | | 580,000 | | | 634,837 | |
Devon Energy Corp. | | | | 6.300% | | 1/15/19 | | | 1,800,000 | | | 2,004,223 | |
Enbridge Energy Partners LP | | | | 9.875% | | 3/1/19 | | | 590,000 | | | 747,083 | |
99
Annual Report to Shareholders
Portfolio of Investments—Continued
Western Asset Intermediate Bond Portfolio—Continued
| | | | | | | | | | | | | |
| | | % OF
NET ASSETS | | RATE | | MATURITY
DATE | | PAR/
SHARES | | VALUE | |
| | | | | | | | | | | | | |
Corporate Bonds and Notes—Continued | | | | | | | | | | | | | |
| | | | | |
Oil, Gas and Consumable Fuels—Continued | | | | | | | | | | | | | |
Energy Transfer Partners LP | | | | 9.700% | | 3/15/19 | | $ | 800,000 | | $ | 988,082 | |
Energy Transfer Partners LP | | | | 9.000% | | 4/15/19 | | | 500,000 | | | 595,990 | |
Enterprise Products Operating LLP | | | | 6.300% | | 9/15/17 | | | 2,150,000 | | | 2,314,524 | |
Kinder Morgan Energy Partners LP | | | | 6.000% | | 2/1/17 | | | 2,150,000 | | | 2,257,315 | |
Noble Energy Inc. | | | | 8.250% | | 3/1/19 | | | 340,000 | | | 406,770 | |
Pemex Project Funding Master Trust | | | | 5.750% | | 3/1/18 | | | 190,000 | | | 192,114 | |
Sonat Inc. | | | | 7.625% | | 7/15/11 | | | 2,454,000 | | | 2,529,340 | |
The Williams Cos. Inc. | | | | 7.125% | | 9/1/11 | | | 600,000 | | | 641,224 | |
The Williams Cos. Inc. | | | | 8.125% | | 3/15/12 | | | 1,540,000 | | | 1,683,935 | |
The Williams Cos. Inc. | | | | 7.875% | | 9/1/21 | | | 720,000 | | | 825,854 | |
XTO Energy Inc. | | | | 7.500% | | 4/15/12 | | | 859,000 | | | 957,813 | |
XTO Energy Inc. | | | | 6.250% | | 4/15/13 | | | 1,645,000 | | | 1,811,744 | |
XTO Energy Inc. | | | | 5.650% | | 4/1/16 | | | 500,000 | | | 546,466 | |
| | | | | | | | | | | | | |
| | | | | | | | | | | | 24,485,632 | |
| | | | | | | | | | | | | |
Paper and Forest Products | | 0.4% | | | | | | | | | | | |
Willamette Industries Inc. | | | | 7.125% | | 7/22/13 | | | 1,839,000 | | | 1,801,628 | |
| | | | | | | | | | | | | |
| | | | | |
Pharmaceuticals | | 1.1% | | | | | | | | | | | |
Abbott Laboratories | | | | 5.125% | | 4/1/19 | | | 1,270,000 | | | 1,328,380 | |
GlaxoSmithKline Capital Inc. | | | | 5.650% | | 5/15/18 | | | 1,690,000 | | | 1,822,822 | |
Pfizer Inc. | | | | 6.200% | | 3/15/19 | | | 1,190,000 | | | 1,322,830 | |
Roche Holdings Inc. | | | | 6.000% | | 3/1/19 | | | 650,000 | | | 714,253 | B |
| | | | | | | | | | | | | |
| | | | | | | | | | | | 5,188,285 | |
| | | | | | | | | | | | | |
Thrifts and Mortgage Finance | | 1.7% | | | | | | | | | | | |
Countrywide Financial Corp. | | | | 5.800% | | 6/7/12 | | | 4,400,000 | | | 4,670,648 | |
US Central Federal Credit Union | | | | 1.900% | | 10/19/12 | | | 3,500,000 | | | 3,497,263 | |
| | | | | | | | | | | | | |
| | | | | | | | | | | | 8,167,911 | |
| | | | | | | | | | | | | |
Tobacco | | 0.5% | | | | | | | | | | | |
Philip Morris International Inc. | | | | 5.650% | | 5/16/18 | | | 970,000 | | | 1,020,033 | |
Reynolds American Inc. | | | | 7.250% | | 6/1/13 | | | 1,160,000 | | | 1,265,588 | |
| | | | | | | | | | | | | |
| | | | | | | | | | | | 2,285,621 | |
| | | | | | | | | | | | | |
Wireless Telecommunication Services | | 1.9% | | | | | | | | | | | |
Cellco Partnership/Verizon Wireless Capital LLC | | | | 5.550% | | 2/1/14 | | | 3,000,000 | | | 3,255,834 | |
New Cingular Wireless Services Inc. | | | | 8.125% | | 5/1/12 | | | 3,000,000 | | | 3,389,799 | |
Sprint Capital Corp. | | | | 8.375% | | 3/15/12 | | | 2,669,000 | | | 2,762,415 | |
| | | | | | | | | | | | | |
| | | | | | | | | | | | 9,408,048 | |
| | | | | | | | | | | | | |
Total Corporate Bonds and Notes
(Cost—$194,774,058) | | | | | | | | | | | | 192,442,697 | |
100
Annual Report to Shareholders
| | | | | | | | | | | | | |
| | | % OF
NET ASSETS | | RATE | | MATURITY
DATE | | PAR/
SHARES | | VALUE | |
| | | | | | | | | | | | | |
Asset-Backed Securities | | 2.3% | | | | | | | | | | | |
| | | | | |
Fixed Rate Securities | | 1.3% | | | | | | | | | | | |
ABFS Mortgage Loan Trust 2002-3 | | | | 4.763% | | 9/15/33 | | $ | 37,060 | | $ | 35,532 | C |
Citibank Credit Card Issuance Trust 2009-A5 A5 | | | | 2.250% | | 12/23/14 | | | 2,840,000 | | | 2,806,204 | |
Conseco Finance Securitizations Corp. 2000-4 | | | | 8.310% | | 5/1/32 | | | 529,554 | | | 412,517 | |
Hertz Vehicle Financing LLC 2009-2A A1 | | | | 4.260% | | 3/25/14 | | | 1,980,000 | | | 1,973,157 | B |
Hertz Vehicle Financing LLC 2009-2A A2 | | | | 5.290% | | 3/25/16 | | | 480,000 | | | 478,916 | B |
UCFC Home Equity Loan 1998-D | | | | 6.905% | | 4/15/30 | | | 618,201 | | | 521,088 | |
| | | | | | | | | | | | | |
| | | | | | | | | | | | 6,227,414 | |
| | | | | | | | | | | | | |
Indexed SecuritiesD | | 1.0% | | | | | | | | | | | |
AFC Home Equity Loan Trust 2003-3 | | | | 0.581% | | 10/25/30 | | | 607,984 | | | 328,129 | B,E |
Bear Stearns Asset Backed Securities Trust 2007-HE6 1A1 | | | | 1.481% | | 6/25/37 | | | 2,041,594 | | | 1,268,142 | |
Countrywide Asset-Backed Certificates 2002-BC1 | | | | 0.891% | | 4/25/32 | | | 294,843 | | | 143,620 | |
Countrywide Asset-Backed Certificates 2005-6 M1 | | | | 0.721% | | 12/25/35 | | | 1,950,000 | | | 1,712,246 | |
Indymac Home Equity Loan Asset-Backed Trust 2001-A | | | | 0.491% | | 3/25/31 | | | 165,090 | | | 86,806 | |
MSDWCC Heloc Trust 2003-1 | | | | 0.771% | | 11/25/15 | | | 369,241 | | | 238,820 | |
Nelnet Student Loan Trust 2008-4 A4 | | | | 1.762% | | 4/25/24 | | | 1,140,000 | | | 1,190,154 | |
| | | | | | | | | | | | | |
| | | | | | | | | | | | 4,967,917 | |
| | | | | | | | | | | | | |
Total Asset-Backed Securities
(Cost—$12,390,930) | | | | | | | | | | | | 11,195,331 | |
Foreign Government Obligations | | 0.7% | | | | | | | | | | | |
Province of Ontario | | | | 4.000% | | 10/7/19 | | | 3,600,000 | | | 3,447,155 | F |
| | | | | | | | | | | | | |
Total Foreign Government Obligations
(Cost—$3,593,928) | | | | | | | | | | | | 3,447,155 | |
Mortgage-Backed Securities | | 7.3% | | | | | | | | | | | |
| | | | | |
Fixed Rate Securities | | 2.3% | | | | | | | | | | | |
CS First Boston Mortgage Securities Corp. 2005-9 3A1 | | | | 6.000% | | 10/25/35 | | | 1,645,697 | | | 1,249,187 | |
Fannie Mae Grantor Trust 2002-T3 | | | | 5.763% | | 12/25/11 | | | 3,663,449 | | | 3,912,924 | G |
Prime Mortgage Trust 2006-DR1 2A2 | | | | 6.000% | | 11/25/36 | | | 1,608,697 | | | 1,349,797 | B |
Residential Asset Securitization Trust 2003-A14 | | | | 4.750% | | 2/25/19 | | | 1,871,851 | | | 1,806,336 | |
Virginia Housing Development Mortgage Bonds Pass-Through Certificates 2006 | | | | 6.000% | | 6/25/34 | | | 2,855,114 | | | 2,685,121 | |
| | | | | | | | | | | | | |
| | | | | | | | | | | | 11,003,365 | |
| | | | | | | | | | | | | |
101
Annual Report to Shareholders
Portfolio of Investments—Continued
Western Asset Intermediate Bond Portfolio—Continued
| | | | | | | | | | | | | |
| | | % OF
NET ASSETS | | RATE | | MATURITY
DATE | | PAR/
SHARES | | VALUE | |
| | | | | | | | | | | | | |
Mortgage-Backed Securities—Continued | | | | | | | | | | | | | |
| | | | | |
Indexed SecuritiesD | | 3.0% | | | | | | | | | | | |
Bayview Commercial Asset Trust 2005-1A A2 | | | | 0.581% | | 4/25/35 | | $ | 1,198,262 | | $ | 832,202 | B |
Citigroup Mortgage Loan Trust Inc. 2005-11 A3 | | | | 4.900% | | 12/25/35 | | | 2,080,539 | | | 1,569,014 | |
Countrywide Home Loans 2004-R1 1AF | | | | 0.631% | | 11/25/34 | | | 510,104 | | | 381,321 | B |
Countrywide Home Loans 2006-R2 AF1 | | | | 0.651% | | 7/25/36 | | | 848,824 | | | 639,802 | B |
First Horizon Mortgage Pass-Through Trust 2003-AR2 2A1 | | | | 3.148% | | 7/25/33 | | | 1,090,772 | | | 995,760 | |
GMAC Mortgage Corp. Loan Trust 2005-AR5 3A1 | | | | 5.020% | | 9/19/35 | | | 1,045,796 | | | 862,524 | |
GSMPS Mortgage Loan Trust 2005-RP1 1AF | | | | 0.581% | | 1/25/35 | | | 391,013 | | | 304,306 | B |
IndyMac Inda Mortgage Loan Trust 2007-AR7 1A1 | | | | 6.158% | | 11/25/37 | | | 2,300,139 | | | 1,595,809 | |
MASTR Adjustable Rate Mortgages Trust 2004-13 | | | | 3.096% | | 11/21/34 | | | 6,815,190 | | | 5,530,357 | |
MASTR Reperforming Loan Trust 2005-2 1A1F | | | | 0.581% | | 5/25/35 | | | 339,238 | | | 269,226 | B |
Structured Asset Mortgage Investments Inc. 2004-AR8 A1 | | | | 0.573% | | 5/19/35 | | | 1,443,045 | | | 1,022,695 | |
Structured Asset Securities Corp. 2005-RF2 A | | | | 0.581% | | 4/25/35 | | | 926,362 | | | 714,906 | B |
| | | | | | | | | | | | | |
| | | | | | | | | | | | 14,717,922 | |
| | | | | | | | | | | | | |
| | | | | |
Variable Rate SecuritiesH | | 2.0% | | | | | | | | | | | |
Banc of America Funding Corp. 2005-B | | | | 5.058% | | 4/20/35 | | | 1,584,540 | | | 1,051,372 | |
Bear Stearns Alt-A Trust 2005-2 | | | | 4.179% | | 4/25/35 | | | 1,173,790 | | | 760,553 | |
Citigroup Mortgage Loan Trust Inc. 2005-8 1A1A | | | | 5.259% | | 10/25/35 | | | 1,351,442 | | | 951,652 | |
Countrywide Home Loans 2004-20 | | | | 3.119% | | 9/25/34 | | | 418,692 | | | 281,773 | |
JP Morgan Mortgage Trust 2004-A3 SF3 | | | | 4.572% | | 6/25/34 | | | 1,294,583 | | | 1,238,223 | |
Merrill Lynch Mortgage Investors Inc. 2005-A2 | | | | 4.258% | | 2/25/35 | | | 1,072,051 | | | 930,794 | |
Merrill Lynch Mortgage Investors Trust 2004-A1 2A1 | | | | 3.789% | | 2/25/34 | | | 1,220,143 | | | 1,185,636 | |
MLCC Mortgage Investors Inc. 2005-1 2A1 | | | | 4.434% | | 4/25/35 | | | 448,919 | | | 384,999 | |
MLCC Mortgage Investors Inc. 2005-1 2A2 | | | | 4.434% | | 4/25/35 | | | 1,397,009 | | | 1,187,033 | |
SACO I Trust 2007-VA1 A | | | | 8.965% | | 6/25/21 | | | 1,519,256 | | | 1,542,581 | B |
WaMu Mortgage Pass-Through Certificates 2004-AR11 | | | | 2.896% | | 10/25/34 | | | 231,438 | | | 203,094 | |
| | | | | | | | | | | | | |
| | | | | | | | | | | | 9,717,710 | |
| | | | | | | | | | | | | |
Total Mortgage-Backed Securities
(Cost—$40,405,592) | | | | | | | | | | | | 35,438,997 | |
102
Annual Report to Shareholders
| | | | | | | | | | | | | |
| | | % OF
NET ASSETS | | RATE | | MATURITY
DATE | | PAR/
SHARES | | VALUE | |
| | | | | | | | | | | | | |
Municipal Bonds | | 0.1% | | | | | | | | | | | |
| | | | | |
California | | 0.1% | | | | | | | | | | | |
State of California Series 2009 | | | | 6.200% | | 10/1/19 | | $ | 450,000 | | $ | 434,214 | |
| | | | | | | | | | | | | |
Total Municipal Bonds
(Cost—$454,667) | | | | | | | | | | | | 434,214 | |
U.S. Government and Agency Obligations | | 26.9% | | | | | | | | | | | |
| | | | | |
Fixed Rate Securities | | 20.5% | | | | | | | | | | | |
Fannie Mae | | | | 7.250% | | 1/15/10 | | | 162,000 | | | 162,361 | G |
Fannie Mae | | | | 6.250% | | 2/1/11 | | | 1,900,000 | | | 1,996,083 | G |
Fannie Mae | | | | 5.250% | | 8/1/12 | | | 4,420,000 | | | 4,716,715 | G |
Fannie Mae | | | | 4.625% | | 5/1/13 | | | 1,590,000 | | | 1,672,728 | G |
Fannie Mae | | | | 2.625% | | 11/20/14 | | | 5,420,000 | | | 5,377,973 | G |
Fannie Mae | | | | 5.000% | | 2/13/17 | | | 6,530,000 | | | 7,088,295 | G |
Fannie Mae | | | | 0.000% | | 10/9/19 | | | 6,820,000 | | | 3,703,260 | G,I |
Farmer Mac | | | | 4.875% | | 4/4/12 | | | 2,561,000 | | | 2,753,198 | |
Farmer Mac | | | | 3.000% | | 9/22/14 | | | 120,000 | | | 120,384 | |
Farmer Mac | | | | 5.125% | | 4/19/17 | | | 3,350,000 | | | 3,491,387 | B |
Freddie Mac | | | | 2.000% | | 2/25/11 | | | 7,520,000 | | | 7,534,235 | G |
Tennessee Valley Authority | | | | 5.625% | | 1/18/11 | | | 373,000 | | | 392,362 | |
Tennessee Valley Authority | | | | 6.790% | | 5/23/12 | | | 2,747,000 | | | 3,077,478 | |
Tennessee Valley Authority | | | | 5.980% | | 4/1/36 | | | 70,000 | | | 74,418 | |
Tennessee Valley Authority | | | | 5.250% | | 9/15/39 | | | 1,090,000 | | | 1,080,032 | |
United States Treasury Bonds | | | | 4.500% | | 8/15/39 | | | 1,960,000 | | | 1,915,594 | |
United States Treasury Notes | | | | 1.125% | | 12/15/12 | | | 3,800,000 | | | 3,739,124 | |
United States Treasury Notes | | | | 2.125% | | 11/30/14 | | | 11,440,000 | | | 11,169,215 | |
United States Treasury Notes | | | | 4.000% | | 2/15/15 | | | 4,710,000 | | | 5,005,845 | |
United States Treasury Notes | | | | 2.750% | | 11/30/16 | | | 15,540,000 | | | 14,960,886 | |
United States Treasury Notes | | | | 3.250% | | 12/31/16 | | | 8,610,000 | | | 8,537,349 | |
United States Treasury Notes | | | | 3.375% | | 11/15/19 | | | 10,640,000 | | | 10,234,403 | |
| | | | | | | | | | | | | |
| | | | | | | | | | | | 98,803,325 | |
| | | | | | | | | | | | | |
Indexed SecuritiesD | | 5.2% | | | | | | | | | | | |
Freddie Mac | | | | 0.189% | | 5/4/11 | | | 25,200,000 | | | 25,222,302 | G |
| | | | | | | | | | | | | |
| | | | | |
Treasury Inflation-Protected SecuritiesJ | | 1.2% | | | | | | | | | | | |
United States Treasury Inflation-Protected Security | | | | 2.375% | | 1/15/25 | | | 1,575,717 | | | 1,662,627 | K |
United States Treasury Inflation-Protected Security | | | | 1.750% | | 1/15/28 | | | 2,620,924 | | | 2,513,220 | K |
United States Treasury Inflation-Protected Security | | | | 2.500% | | 1/15/29 | | | 1,459,933 | | | 1,565,892 | |
| | | | | | | | | | | | | |
| | | | | | | | | | | | 5,741,739 | |
| | | | | | | | | | | | | |
Total U.S. Government and Agency Obligations
(Cost—$130,235,403) | | | | | | | | | | | | 129,767,366 | |
103
Annual Report to Shareholders
Portfolio of Investments—Continued
Western Asset Intermediate Bond Portfolio—Continued
| | | | | | | | | | | | | |
| | | % OF
NET ASSETS | | RATE | | MATURITY
DATE | | PAR/
SHARES | | VALUE | |
| | | | | | | | | | | | | |
U.S. Government Agency Mortgage-Backed Securities | | 1.7% | | | | | | | | | | | |
| | | | | |
Fixed Rate Securities | | N.M. | | | | | | | | | | | |
Fannie Mae | | | | 8.000% | | 9/1/15 | | $ | 21,466 | | $ | 23,139 | G |
Fannie Mae | | | | 9.500% | | 4/15/21 | | | 23,660 | | | 27,017 | G |
Freddie Mac | | | | 9.300% | | 4/15/19 | | | 30,617 | | | 33,746 | G |
| | | | | | | | | | | | | |
| | | | | | | | | | | | 83,902 | |
| | | | | | | | | | | | | |
Indexed SecuritiesD | | 1.7% | | | | | | | | | | | |
Fannie Mae | | | | 3.195% | | 3/1/18 | | | 13,393 | | | 13,597 | G |
Fannie Mae | | | | 3.896% | | 12/1/34 | | | 419,388 | | | 430,337 | G |
Fannie Mae | | | | 4.352% | | 1/1/35 | | | 2,405,753 | | | 2,472,237 | G |
Fannie Mae | | | | 4.232% | | 3/1/35 | | | 530,523 | | | 544,915 | G |
Fannie Mae | | | | 4.760% | | 4/1/35 | | | 624,645 | | | 645,904 | G |
Freddie Mac | | | | 3.359% | | 1/1/19 | | | 6,492 | | | 6,464 | G |
Freddie Mac | | | | 3.174% | | 12/1/34 | | | 899,756 | | | 921,248 | G |
Freddie Mac | | | | 4.361% | | 12/1/34 | | | 149,597 | | | 153,257 | G |
Freddie Mac | | | | 3.834% | | 1/1/35 | | | 161,320 | | | 167,186 | G |
Freddie Mac | | | | 3.965% | | 1/1/35 | | | 267,349 | | | 274,517 | G |
Freddie Mac | | | | 3.444% | | 7/1/35 | | | 2,264,876 | | | 2,328,061 | G |
| | | | | | | | | | | | | |
| | | | | | | | | | | | 7,957,723 | |
| | | | | | | | | | | | | |
Stripped Securities | | N.M. | | | | | | | | | | | |
Fannie Mae | | | | 0.000% | | 5/25/22 | | | 3,259 | | | 3,066 | G,L2,M |
Freddie Mac | | | | 10.000% | | 3/1/21 | | | 3,170 | | | 729 | G,L1,M |
| | | | | | | | | | | | | |
| | | | | | | | | | | | 3,795 | |
| | | | | | | | | | | | | |
Total U.S. Government Agency Mortgage-Backed
Securities (Cost—$7,840,206) | | | | | | | | 8,045,420 | |
Yankee BondsF | | 14.0% | | | | | | | | | | | |
| | | | | |
Aerospace and Defense | | 0.2% | | | | | | | | | | | |
Systems 2001 Asset Trust | | | | 6.664% | | 9/15/13 | | | 802,471 | | | 820,943 | B |
| | | | | | | | | | | | | |
| | | | | |
Beverages | | 0.2% | | | | | | | | | | | |
Diageo Capital PLC | | | | 7.375% | | 1/15/14 | | | 1,050,000 | | | 1,214,654 | |
| | | | | | | | | | | | | |
| | | | | |
Capital Markets | | 0.5% | | | | | | | | | | | |
NIBC Bank NV | | | | 2.800% | | 12/2/14 | | | 2,530,000 | | | 2,461,897 | B |
| | | | | | | | | | | | | |
| | | | | |
Commercial Banks | | 6.7% | | | | | | | | | | | |
Achmea Hypotheekbank NV | | | | 3.200% | | 11/3/14 | | | 3,690,000 | | | 3,682,856 | B |
ANZ National (Int’l) Ltd. | | | | 2.375% | | 12/21/12 | | | 1,590,000 | | | 1,578,418 | B |
104
Annual Report to Shareholders
| | | | | | | | | | | | | |
| | | % OF
NET ASSETS | | RATE | | MATURITY
DATE | | PAR/
SHARES | | VALUE | |
| | | | | | | | | | | | | |
Yankee Bonds—Continued | | | | | | | | | | | | | |
| | | | | |
Commercial Banks—Continued | | | | | | | | | | | | | |
Barclays Bank PLC | | | | 5.200% | | 7/10/14 | | $ | 310,000 | | $ | 328,603 | |
Barclays Bank PLC | | | | 6.050% | | 12/4/17 | | | 960,000 | | | 976,994 | B |
Barclays Bank PLC | | | | 10.179% | | 6/12/21 | | | 720,000 | | | 929,282 | B |
Barclays Bank PLC | | | | 7.434% | | 9/29/49 | | | 390,000 | | | 354,900 | B,C |
BNP Paribas | | | | 2.125% | | 12/21/12 | | | 700,000 | | | 696,387 | |
Commonwealth Bank of Australia | | | | 2.900% | | 9/17/14 | | | 4,630,000 | | | 4,553,258 | B |
Commonwealth Bank of Australia | | | | 3.750% | | 10/15/14 | | | 650,000 | | | 651,581 | B |
Credit Agricole SA | | | | 8.375% | | 12/31/49 | | | 1,350,000 | | | 1,431,000 | B,C |
Glitnir Banki Hf | | | | 5.815% | | 1/21/11 | | | 4,430,000 | | | 930,300 | A,B,D,M |
Glitnir Banki Hf | | | | 6.329% | | 7/28/11 | | | 120,000 | | | 25,200 | A,B,D,M |
Glitnir Banki Hf | | | | 5.678% | | 1/18/12 | | | 100,000 | | | 21,000 | A,B,D,M |
Glitnir Banki Hf | | | | 6.375% | | 9/25/12 | | | 1,980,000 | | | 415,800 | A,B,M |
Glitnir Banki Hf | | | | 6.693% | | 6/15/16 | | | 910,000 | | | 91 | A,B,C,M |
Kaupthing Bank Hf | | | | 5.750% | | 10/4/11 | | | 4,090,000 | | | 1,012,275 | A,B,M |
Kaupthing Bank Hf | | | | 7.625% | | 2/28/15 | | | 1,590,000 | | | 393,525 | A,B,M |
Landsbanki Islands Hf | | | | 6.100% | | 8/25/11 | | | 2,330,000 | | | 104,850 | A,B,M |
Landsbanki Islands Hf | | | | 7.431% | | 12/31/49 | | | 1,830,000 | | | 183 | A,B,C,M |
Nordea Bank AB | | | | 3.700% | | 11/13/14 | | | 900,000 | | | 898,265 | B |
Rabobank Nederland NV | | | | 11.000% | | 12/29/49 | | | 745,000 | | | 908,344 | B,C |
Royal Bank of Scotland Group PLC | | | | 6.400% | | 10/21/19 | | | 1,170,000 | | | 1,166,244 | |
Royal Bank of Scotland Group PLC | | | | 9.118% | | 3/31/49 | | | 2,431,000 | | | 2,224,365 | |
RSHB Capital SA | | | | 6.299% | | 5/15/17 | | | 270,000 | | | 271,890 | B |
Santander Issuances | | | | 5.805% | | 6/20/16 | | | 1,030,000 | | | 957,900 | B,C |
Shinsei Finance Cayman Ltd. | | | | 6.418% | | 1/29/49 | | | 3,275,000 | | | 1,907,688 | B,C |
Swedbank AB | | | | 0.734% | | 1/14/13 | | | 2,400,000 | | | 2,393,009 | B,D |
Westpac Banking Corp. | | | | 3.250% | | 12/16/11 | | | 1,610,000 | | | 1,662,212 | B |
Westpac Banking Corp. | | | | 2.500% | | 5/25/12 | | | 1,710,000 | | | 1,733,803 | B |
| | | | | | | | | | | | | |
| | | | | | | | | | | | 32,210,223 | |
| | | | | | | | | | | | | |
Consumer Finance | | 0.1% | | | | | | | | | | | |
Aiful Corp. | | | | 5.000% | | 8/10/10 | | | 601,000 | | | 516,860 | B |
| | | | | | | | | | | | | |
| | | | | |
Diversified Financial Services | | 0.7% | | | | | | | | | | | |
CDP Financial Inc. | | | | 4.400% | | 11/25/19 | | | 890,000 | | | 852,522 | B |
MUFG Capital Finance 1 Ltd. | | | | 6.346% | | 7/29/49 | | | 1,872,000 | | | 1,703,793 | C |
TNK-BP Finance SA | | | | 6.875% | | 7/18/11 | | | 703,000 | | | 725,848 | B |
| | | | | | | | | | | | | |
| | | | | | | | | | | | 3,282,163 | |
| | | | | | | | | | | | | |
Diversified Telecommunication Services | | 1.7% | | | | | | | | | | | |
Deutsche Telekom International Finance BV | | | | 5.750% | | 3/23/16 | | | 1,800,000 | | | 1,911,335 | |
105
Annual Report to Shareholders
Portfolio of Investments—Continued
Western Asset Intermediate Bond Portfolio—Continued
| | | | | | | | | | | | | |
| | | % OF
NET ASSETS | | RATE | | MATURITY
DATE | | PAR/
SHARES | | VALUE | |
| | | | | | | | | | | | | |
Yankee Bonds—Continued | | | | | | | | | | | | | |
| | | | |
Diversified Telecommunication Services—Continued | | | | | | | | | | | |
Telecom Italia Capital SpA | | | | 5.250% | | 10/1/15 | | $ | 1,400,000 | | $ | 1,463,766 | |
Telecom Italia Capital SpA | | | | 6.999% | | 6/4/18 | | | 1,350,000 | | | 1,485,393 | |
Telefonica Emisiones S.A.U. | | | | 0.609% | | 2/4/13 | | | 3,570,000 | | | 3,514,479 | D |
| | | | | | | | | | | | | |
| | | | | | | | | | | | 8,374,973 | |
| | | | | | | | | | | | | |
Energy Equipment and Services | | 0.4% | | | | | | | | | | | |
Transocean Inc. | | | | 5.250% | | 3/15/13 | | | 1,670,000 | | | 1,789,637 | |
| | | | | | | | | | | | | |
| | | | | |
Foreign Government | | N.M. | | | | | | | | | | | |
Russian Federation | | | | 7.500% | | 3/31/30 | | | 16,660 | | | 18,805 | |
| | | | | | | | | | | | | |
| | | | | |
Industrial Conglomerates | | 0.3% | | | | | | | | | | | |
Tyco International Group SA | | | | 6.000% | | 11/15/13 | | | 1,358,000 | | | 1,487,532 | |
| | | | | | | | | | | | | |
| | | | | |
Insurance | | 0.8% | | | | | | | | | | | |
Merna Reinsurance Ltd. | | | | 2.033% | | 6/30/12 | | | 1,300,000 | | | 1,280,630 | B,D |
Suncorp-Metway Ltd. | | | | 1.784% | | 7/16/12 | | | 2,350,000 | | | 2,430,008 | B,D |
| | | | | | | | | | | | | |
| | | | | | | | | | | | 3,710,638 | |
| | | | | | | | | | | | | |
Media | | 0.2% | | | | | | | | | | | |
WPP Finance | | | | 8.000% | | 9/15/14 | | | 890,000 | | | 1,012,161 | |
| | | | | | | | | | | | | |
| | | | | |
Metals and Mining | | 1.3% | | | | | | | | | | | |
BHP Billiton Finance USA Ltd. | | | | 6.500% | | 4/1/19 | | | 1,000,000 | | | 1,147,057 | |
Rio Tinto Finance USA Ltd. | | | | 8.950% | | 5/1/14 | | | 2,960,000 | | | 3,546,971 | N |
Vale Overseas Ltd. | | | | 6.250% | | 1/23/17 | | | 1,390,000 | | | 1,449,931 | |
| | | | | | | | | | | | | |
| | | | | | | | | | | | 6,143,959 | |
| | | | | | | | | | | | | |
Oil, Gas and Consumable Fuels | | 0.8% | | | | | | | | | | | |
Anadarko Finance Co. | | | | 6.750% | | 5/1/11 | | | 720,000 | | | 760,847 | |
Gazprom | | | | 6.212% | | 11/22/16 | | | 120,000 | | | 114,900 | B |
Petrobras International Finance Co. | | | | 5.750% | | 1/20/20 | | | 1,233,000 | | | 1,254,315 | |
Petroleos Mexicanos | | | | 8.000% | | 5/3/19 | | | 1,720,000 | | | 1,990,900 | |
| | | | | | | | | | | | | |
| | | | | | | | | | | | 4,120,962 | |
| | | | | | | | | | | | | |
Wireless Telecommunication Services | | 0.1% | | | | | | | | | | | |
America Movil SA de CV | | | | 5.625% | | 11/15/17 | | | 450,000 | | | 465,903 | |
| | | | | | | | | | | | | |
Total Yankee Bonds (Cost—$81,257,140) | | | | | | | | | | | | 67,631,310 | |
106
Annual Report to Shareholders
| | | | | | | | | | | | | | |
| | | % OF
NET ASSETS | | RATE | | MATURITY
DATE | | PAR/
SHARES | | | VALUE | |
| | | | | | | | | | | | | | |
Preferred Stocks | | 0.1% | | | | | | | | | | | | |
Fannie Mae | | | | 8.250% | | | | | 61,925 | shs | | $ | 68,117 | G,O |
Freddie Mac | | | | 8.375% | | | | | 84,900 | | | | 89,145 | G,O |
GMAC Inc. | | | | 7.000% | | | | | 238 | | | | 156,872 | B,O |
Home Ownership Funding Corp. | | | | 1.000% | | | | | 600 | | | | 57,649 | B,E,M |
Home Ownership Funding Corp. II | | | | 1.000% | | | | | 1,800 | | | | 172,946 | B,E,M |
| | | | | | | | | | | | | | |
Total Preferred Stocks (Cost—$5,672,235) | | | | | | | | | | | | | 544,729 | |
| | | | | | | | | | | | | | |
Total Long-Term Securities (Cost—$476,624,159) | | | | | | | | | | | 448,947,219 | |
Short-Term Securities | | 6.4% | | | | | | | | | | | | |
| | | | | |
U.S. Government and Agency Obligations | | 0.4% | | | | | | | | | | | | |
Fannie Mae | | | | 0.330% | | 2/1/10 | | $ | 2,250,000 | | | | 2,249,775 | G ,K,Q |
| | | | | | | | | | | | | | |
| | | | | |
Options Purchased | | 0.1% | | | | | | | | | | | | |
Eurodollar Futures Put, March 2010,
Strike Price $99.13 | | | | | | | | | 164 | P | | | 4,100 | |
U.S. Treasury Note Futures Call, February 2010,
Strike Price $116.50 | | | | | | | | | 217 | P | | | 77,985 | |
U.S. Treasury Note Futures Put, February 2010,
Strike Price $116.50 | | | | | | | | | 149 | P | | | 209,531 | |
| | | | | | | | | | | | | | |
| | | | | | | | | | | | | 291,616 | |
| | | | | | | | | | | | | | |
Repurchase Agreement | | 5.9% | | | | | | | | | | | | |
Morgan Stanley repurchase agreement dated 12/31/09, 0.005% due 1/4/10; Proceeds at maturity—$28,356,016; (Fully collateralized by U.S. government agency obligation, 3.125% due 9/29/14; Market value—$28,923,127) | | | | | | | | | 28,356,000 | | | | 28,356,000 | |
| | | | | | | | | | | | | | |
Total Short-Term Securities (Cost—$30,872,774) | | | | | | | | | | | | | 30,897,391 | |
Total Investments (Cost—$507,496,933#) | | 99.4% | | | | | | | | | | | 479,844,610 | |
Other Assets Less Liabilities | | 0.6% | | | | | | | | | | | 2,877,422 | |
| | | | | | | | | | | | | | |
| | | | | |
Net Assets | | 100.0% | | | | | | | | | | $ | 482,722,032 | |
| | | | | | | | | | | | | | |
107
Annual Report to Shareholders
Portfolio of Investments—Continued
Western Asset Intermediate Bond Portfolio—Continued
| | | | | | | | |
| | | EXPIRATION | | ACTUAL
CONTRACTS | | APPRECIATION/
(DEPRECIATION) | |
Futures Contracts PurchasedR | | | | | | | | |
Eurodollar Futures | | December 2011 | | 184 | | $ | 977 | |
U.S. Treasury Bond Futures | | March 2010 | | 28 | | | (127,717 | ) |
U.S. Treasury Note Futures | | March 2010 | | 73 | | | (74,332 | ) |
U.S. Treasury Note Futures | | March 2010 | | 529 | | | (990,282 | ) |
| | | | | | | | |
| | | | | | $ | (1,191,354 | ) |
| | | | | | | | |
Futures Contracts WrittenR | | | | | | | | |
Eurodollar Futures | | December 2010 | | 184 | | $ | (51,723 | ) |
U.S. Treasury Note Futures | | March 2010 | | 72 | | | 143,250 | |
| | | | | | | | |
| | | | | | $ | 91,527 | |
| | | | | | | | |
Options WrittenR | | | | | | | | |
Eurodollar Futures Call, Strike Price $99.25 | | September 2010 | | 106 | | $ | 23,905 | |
Eurodollar Futures Call, Strike Price $98.75 | | September 2010 | | 209 | | | 18,096 | |
Eurodollar Futures Call, Strike Price $99.38 | | June 2010 | | 153 | | | 16,578 | |
Eurodollar Futures Put, Strike Price $98.75 | | September 2010 | | 294 | | | 12,207 | |
Eurodollar Futures Put, Strike Price $99.38 | | June 2010 | | 153 | | | (9,647 | ) |
Eurodollar Futures Put, Strike Price $98.50 | | March 2010 | | 164 | | | 67,205 | |
U.S. Treasury Note Futures Call, Strike Price $118.00 | | February 2010 | | 217 | | | 29,764 | |
U.S. Treasury Note Futures Put, Strike Price $115.00 | | February 2010 | | 149 | | | (79,641 | ) |
| | | | | | | | |
| | | | | | $ | 78,467 | |
| | | | | | | | |
| | | | | | | | | |
N.M.—Not Meaningful.
| A | | The coupon payment on these securities is currently in default as of December 31, 2009. |
| B | | Rule 144a Security – A security purchased pursuant to Rule 144a under the Securities Act of 1933 which may not be resold subject to that rule except to qualified institutional buyers. These securities, which the Fund’s investment adviser has determined to be liquid, unless otherwise noted, represent 13.11% of net assets. |
| C | | Stepped Coupon Security – A security with a predetermined schedule of interest or dividend rate changes at which time it begins to accrue interest or pay dividends according to the predetermined schedule. |
| D | | Indexed Security – The rates of interest earned on these securities are tied to the London Interbank Offered Rate (“LIBOR”), the Euro Interbank Offered Rate (“EURIBOR”) Index, the Consumer Price Index (“CPI”), the one-year Treasury Bill Rate or the ten-year Japanese Government Bond Rate. The coupon rates are the rates as of December 31, 2009. |
| E | | Security is valued in good faith at fair value by or under the direction of the Board of Directors. |
| F | | Yankee Bond – A dollar-denominated bond issued in the U.S. by foreign entities. |
| G | | On September 7, 2008, the Federal Housing Finance Agency placed Fannie Mae (FNMA) and Freddie Mac (FHLMC) into conservatorship. |
| H | | The coupon rates shown on variable rate securities are the rates at December 31, 2009. These rates vary with the weighted average coupon of the underlying loans. |
| I | | Zero coupon bond – A bond with no periodic interest payments which is sold at such a discount as to produce a current yield to maturity. |
| J | | Treasury Inflation-Protected Security –Treasury security whose principal value is adjusted daily in accordance with changes to the Consumer Price Index for All Urban Consumers. Interest is calculated on the basis of the current adjusted principal value. |
| K | | All or a portion of this security is collateral to cover futures and options contracts written. |
| L | | Stripped Security – Security with interest-only or principal-only payment streams, denoted by a 1 or 2, respectively. For interest-only securities, the amount shown as principal is the notional balance used to calculate the amount of interest due. |
| N | | Credit Linked Security – The rates of interest earned on these securities are tied to the credit rating assigned by Standard & Poor’s Rating Service and/or Moody’s Investors Services. |
| P | | Par represents actual number of contracts. |
108
Annual Report to Shareholders
| Q | | Rate shown represents yield-to-maturity. |
| R | | Options written and futures are described in more detail in the notes to financial statements. |
| # | | Aggregate cost for federal income tax purposes is $508,033,027. |
See notes to financial statements.
109
Annual Report to Shareholders
Statement of Assets and Liabilities
Western Asset Intermediate Bond Portfolio
December 31, 2009
| | | | | | | |
Assets: | | | | | | | |
Investment securities at value (Cost—$476,624,159) | | | | | $ | 448,947,219 | |
Short-term securities at value (Cost—$30,872,774) | | | | | | 30,897,391 | |
Cash | | | | | | 6,532 | |
Interest receivable | | | | | | 4,176,311 | |
Restricted cash pledged as collateral for swaps | | | | | | 700,000 | |
Receivable for fund shares sold | | | | | | 524,976 | |
Premiums paid on open swaps | | | | | | 298,380 | |
Unrealized appreciation of swaps | | | | | | 43,900 | |
Amounts receivable for open swaps | | | | | | 3,406 | |
| | | | | | | |
Total assets | | | | | | 485,598,115 | |
| | | | | | | |
| | |
Liabilities: | | | | | | | |
Unrealized depreciation of swaps | | $ | 1,033,406 | | | | |
Options written (Proceeds—$823,626) | | | 745,159 | | | | |
Income distribution payable | | | 413,810 | | | | |
Accrued management fee | | | 159,992 | | | | |
Futures variation margin payable | | | 159,376 | | | | |
Premiums received on open swaps | | | 129,868 | | | | |
Payable for fund shares repurchased | | | 107,736 | | | | |
Amounts payable for open swaps | | | 4,819 | | | | |
Accrued expenses | | | 121,917 | | | | |
| | | | | | | |
Total liabilities | | | | | | 2,876,083 | |
| | | | | | | |
| | |
Net Assets | | | | | $ | 482,722,032 | |
| | | | | | | |
| | |
Net assets consist of: | | | | | | | |
Accumulated paid-in-capital (Note 7) | | | | | $ | 513,429,806 | |
Undistributed net investment income | | | | | | 997,685 | |
Accumulated net realized loss on investments, options, futures and swaps | | | | | | (2,042,270 | ) |
Net unrealized depreciation of investments, options, futures and swaps | | | | | | (29,663,189 | ) |
| | | | | | | |
| | |
Net Assets | | | | | $ | 482,722,032 | |
| | | | | | | |
| | |
Net Asset Value Per Share: | | | | | | | |
Institutional Class (40,989,151 shares outstanding) | | | | | | $10.31 | |
Institutional Select Class (5,830,908 shares outstanding) | | | | | | $10.31 | |
| | | | | | | | |
See notes to financial statements.
110
Annual Report to Shareholders
Statement of Operations
Western Asset Intermediate Bond Portfolio
| | | | | | | |
| | | FOR THE
YEAR ENDED
DECEMBER 31, 2009 |
Investment Income: | | | | | | | |
Interest | | $ | 23,909,328 | | | | |
Dividends | | | 20,837 | | | | |
| | | | | | | |
Total income | | | | | | $ | 23,930,165 |
Expenses: | | | | | | | |
Management fees (Note 2) | | | 2,034,099 | | | | |
Audit and legal fees | | | 89,831 | | | | |
Transfer agent and shareholder servicing expense (Note 6) | | | 77,074 | | | | |
Custodian fees | | | 64,418 | | | | |
Reports to shareholders (Note 6) | | | 42,027 | | | | |
Registration fees | | | 31,531 | | | | |
Directors’ fees and expenses | | | 21,538 | | | | |
Other expenses | | | 15,273 | | | | |
| | | | | | | |
| | | 2,375,791 | | | | |
Less: Fees waived (Notes 2 and 6) | | | (4,639 | ) | | | |
| | | | | | | |
Net expenses | | | | | | | 2,371,152 |
| | | | | | | |
Net Investment Income | | | | | | | 21,559,013 |
Net Realized and Unrealized Gain/(Loss) on Investments (Notes 1, 3 and 4): | | | | | | | |
Net realized gain/(loss) on: | | | | | | | |
Investments | | | (8,435,862 | ) | | | |
Options written | | | 3,308,754 | | | | |
Futures | | | 4,475,321 | | | | |
Swaps | | | 2,909,889 | | | | |
| | | | | | | |
| | | | | | | 2,258,102 |
Change in unrealized appreciation/(depreciation) of: | | | | | | | |
Investments | | | 61,997,537 | | | | |
Options written | | | 3,839,054 | | | | |
Futures | | | (7,982,446 | ) | | | |
Swaps | | | 303,754 | | | | |
| | | | | | | |
| | | | | | | 58,157,899 |
| | | | | | | |
Net Realized and Unrealized Gain on Investments | | | | | | | 60,416,001 |
| | | | | | | | |
Change in Net Assets Resulting From Operations | | | | | | $ | 81,975,014 |
| | | | | | | | |
See notes to financial statements.
111
Annual Report to Shareholders
Statement of Changes in Net Assets
Western Asset Intermediate Bond Portfolio
| | | | | | | | | | | | |
| | | FOR THE
YEAR ENDED
DECEMBER 31, 2009 | | | FOR THE
PERIOD ENDED
DECEMBER 31, 2008A | | | FOR THE
YEAR ENDED
MARCH 31, 2008 | |
Change in Net Assets: | | | | | | | | | | | | |
Net investment income | | $ | 21,559,013 | | | $ | 22,409,836 | | | $ | 35,284,401 | |
| | | |
Net realized gain | | | 2,258,102 | | | | 10,029,329 | | | | 11,725,679 | |
| | | |
Change in unrealized appreciation/(depreciation) | | | 58,157,899 | | | | (67,968,240 | ) | | | (19,855,767 | ) |
| | | | | | | | | | | | |
Change in net assets resulting from operations | | | 81,975,014 | | | | (35,529,075 | ) | | | 27,154,313 | |
| | | |
Distributions to shareholders from (Note 1): | | | | | | | | | | | | |
Net investment income: | | | | | | | | | | | | |
Institutional Class | | | (19,255,297 | ) | | | (23,850,535 | ) | | | (35,155,441 | ) |
Institutional Select Class | | | (2,433,197 | ) | | | (511,463 | ) | | | N/A | |
| | | |
Net realized gain on investments: | | | | | | | | | | | | |
Institutional Class | | | (7,371,572 | ) | | | (9,280,041 | ) | | | — | |
Institutional Select Class | | | (920,490 | ) | | | — | | | | N/A | |
| | | |
Change in net assets from fund share transactions (Note 7): | | | | | | | | | | | | |
Institutional Class | | | (99,214,226 | ) | | | (160,875,180 | ) | | | 75,139,298 | |
Institutional Select Class | | | 4,050,308 | | | | 49,065,033 | | | | N/A | |
| | | | | | | | | | | | |
Change in net assets | | | (43,169,460 | ) | | | (180,981,261 | ) | | | 67,138,170 | |
| | | |
Net Assets: | | | | | | | | | | | | |
Beginning of year | | | 525,891,492 | | | | 706,872,753 | | | | 639,734,583 | |
| | | | | | | | | | | | |
| | | |
End of year | | $ | 482,722,032 | | | $ | 525,891,492 | | | $ | 706,872,753 | |
| | | | | | | | | | | | |
| | | |
Undistributed net investment income | | $ | 997,685 | | | $ | 543,818 | | | $ | 1,507,535 | |
| | | | | | | | | | | | |
| | | | | | | | | | | | | |
| A | | For the period April 1, 2008 to December 31, 2008. |
N/A—Not applicable.
See notes to financial statements.
112
Annual Report to Shareholders
Financial Highlights
Western Asset Intermediate Bond Portfolio
For a share of each class of capital stock outstanding:
Institutional Class:
| | | | | | | | | | | | | | | | | | | | | | | | |
| | | YEAR ENDED
DECEMBER 31,
2009 | | | PERIOD ENDED
DECEMBER 31,
2008A | | | YEARS ENDED MARCH 31, | |
| | | | | 2008 | | | 2007 | | | 2006 | | | 2005 | |
Net asset value, beginning of year | | $ | 9.32 | | | $ | 10.30 | | | $ | 10.43 | | | $ | 10.21 | | | $ | 10.51 | | | $ | 11.01 | |
| | | | | | | | | | | | | | | | | | | | | | | | |
Investment operations: | | | | | | | | | | | | | | | | | | | | | | | | |
Net investment income | | | .42 | B | | | .34 | B | | | .52 | B | | | .49 | B | | | .44 | C | | | .38 | C |
Net realized and unrealized gain/(loss) | | | 1.14 | | | | (.82 | ) | | | (.14 | ) | | | .22 | | | | (.20 | ) | | | (.22 | ) |
| | | | | | | | | | | | | | | | | | | | | | | | |
Total from investment operations | | | 1.56 | | | | (.48 | ) | | | .38 | | | | .71 | | | | .24 | | | | .16 | |
| | | | | | | | | | | | | | | | | | | | | | | | |
Distributions from: | | | | | | | | | | | | | | | | | | | | | | | | |
Net investment income | | | (.42 | ) | | | (.37 | ) | | | (.51 | ) | | | (.49 | ) | | | (.44 | ) | | | (.38 | ) |
Net realized gain on investments | | | (.15 | ) | | | (.13 | ) | | | — | | | | — | | | | (.10 | ) | | | (.28 | ) |
| | | | | | | | | | | | | | | | | | | | | | | | |
Total distributions | | | (.57 | ) | | | (.50 | ) | | | (.51 | ) | | | (.49 | ) | | | (.54 | ) | | | (.66 | ) |
| | | | | | | | | | | | | | | | | | | | | | | | |
Net asset value, end of year | | $ | 10.31 | | | $ | 9.32 | | | $ | 10.30 | | | $ | 10.43 | | | $ | 10.21 | | | $ | 10.51 | |
| | | | | | | | | | | | | | | | | | | | | | | | |
Total returnD | | | 17.24 | % | | | (4.72 | )% | | | 3.77 | % | | | 7.17 | % | | | 2.37 | % | | | 1.66 | % |
| | | | | | |
Ratios to Average Net Assets: | | | | | | | | | | | | | | | | | | | | | | | | |
Total expensesE | | | .47 | % | | | .46 | %F | | | .45 | % | | | .46 | % | | | .47 | % | | | .46 | % |
Expenses net of waivers, if anyE | | | .47 | % | | | .46 | %F | | | .45 | % | | | .45 | % | | | .45 | % | | | .45 | % |
Expenses net of all reductionsE | | | .47 | % | | | .46 | %F | | | .45 | % | | | .45 | % | | | .45 | % | | | .45 | % |
Net investment income | | | 4.2 | % | | | 4.6 | %F | | | 5.0 | % | | | 4.8 | % | | | 4.3 | % | | | 3.6 | % |
| | | | | | |
Supplemental Data: | | | | | | | | | | | | | | | | | | | | | | | | |
Portfolio turnover rate | | | 174.7 | % | | | 164.7 | %G | | | 239.0 | % | | | 244.1 | % | | | 266.1 | % | | | 215.7 | % |
Net assets, end of year (in thousands) | | $ | 422,610 | | | $ | 475,695 | | | $ | 706,873 | | | $ | 639,735 | | | $ | 739,492 | | | $ | 660,480 | |
| | | | | | | | | | | | | | | | | | | | | | | | | |
| A | | For the period April 1, 2008 to December 31, 2008. |
| B | | Computed using average daily shares outstanding. |
| C | | Computed using SEC method. |
| D | | Performance figures may reflect compensating balance credits, fee waivers and/or expense reimbursements. In the absence of compensating balance credits, fee waivers and/or expense reimbursements, the total return would have been lower. Past performance is no guarantee of future results. Total returns for periods of less than one year are not annualized. |
| E | | Total expenses reflects operating expenses prior to any voluntary expense waivers and/or compensating balance credits. Expenses net of waivers reflects total expenses before compensating balance credits but net of any voluntary expense waivers. Expenses net of all reductions reflects expenses less any compensating balance credits and/or voluntary expense waivers. |
See notes to financial statements.
113
Annual Report to Shareholders
Financial Highlights—Continued
Western Asset Intermediate Bond Portfolio—Continued
For a share of each class of capital stock outstanding:
Institutional Select Class:
| | | | | | | | |
| | | YEAR ENDED
DECEMBER 31,
2009 | | | PERIOD ENDED
DECEMBER 31,
2008A | |
Net asset value, beginning of year | | $ | 9.31 | | | $ | 9.49 | |
| | | | | | | | |
Investment operations: | | | | | | | | |
Net investment incomeB | | | .42 | | | | .09 | |
Net realized and unrealized gain/(loss) | | | 1.15 | | | | (.13 | ) |
| | | | | | | | |
Total from investment operations | | | 1.57 | | | | (.04 | ) |
| | | | | | | | |
Distributions from: | | | | | | | | |
Net investment income | | | (.42 | ) | | | (.14 | ) |
Net realized gain on investments | | | (.15 | ) | | | — | |
| | | | | | | | |
Total distributions | | | (.57 | ) | | | (.14 | ) |
| | | | | | | | |
Net asset value, end of year | | $ | 10.31 | | | $ | 9.31 | |
| | | | | | | | |
Total returnC | | | 17.39 | % | | | (.41 | )% |
| | |
Ratios to Average Net Assets: | | | | | | | | |
Total expensesD | | | .46 | % | | | .46 | %E |
Expenses net of waivers, if anyD | | | .45 | % | | | .45 | %E |
Expenses net of all reductionsD | | | .45 | % | | | .45 | %E |
Net investment income | | | 4.2 | % | | | 4.5 | %E |
| | |
Supplemental Data: | | | | | | | | |
Portfolio turnover rate | | | 174.7 | % | | | 164.7 | %F |
Net assets, end of year (in thousands) | | $ | 60,112 | | | $ | 50,196 | |
| | | | | | | | | |
| A | | For the period October 3, 2008 (commencement of operations) to December 31, 2008. |
| B | | Computed using average daily shares outstanding. |
| C | | Performance figures may reflect compensating balance credits, fee waivers and/or expense reimbursements. In the absence of compensating balance credits, fee waivers and/or expense reimbursements, the total return would have been lower. Past performance is no guarantee of future results. Total returns for periods of less than one year are not annualized. |
| D | | Total expenses reflects operating expenses prior to any voluntary expense waivers and/or compensating balance credits. Expenses net of waivers reflects total expenses before compensating balance credits but net of any voluntary expense waivers. Expenses net of all reductions reflects expenses less any compensating balance credits and/or voluntary expense waivers. |
See notes to financial statements.
114
Annual Report to Shareholders
Management’s Discussion of Fund Performance
Western Asset Intermediate Plus Bond Portfolio
Performance Review
For the twelve months ended December 31, 2009, Institutional Class shares of Western Asset Intermediate Plus Bond Portfolio returned 19.84%. The Fund’s unmanaged benchmark, the Barclays Capital Intermediate U.S. Government/Credit Indexi, returned 5.24% for the same period. The Lipper Short-Intermediate Investment Grade Debt Funds Category Average1 returned 11.84% over the same time frame.
PERFORMANCE SNAPSHOT as of December 31, 2009 (unaudited)
| | | | |
| | | 6 MONTHS | | 12 MONTHS |
Western Asset Intermediate Plus Bond Portfolio: | | | | |
Institutional Class | | 9.24% | | 19.84% |
Institutional Select Class | | 9.25% | | 19.89% |
Barclays Capital Intermediate U.S. Government/Credit Index | | 3.57% | | 5.24% |
Lipper Short-Intermediate Investment Grade Debt Funds Category Average1 | | 5.50% | | 11.84% |
The performance shown represents past performance. Past performance is no guarantee of future results and current performance may be higher or lower than the performance shown above. Principal value, investment returns and yields will fluctuate and investors’ shares, when redeemed, may be worth more or less than their original cost. To obtain performance data current to the most recent month-end, please visit our website at www.leggmason.com/individualinvestors.
All share class returns assume the reinvestment of all distributions, including returns of capital, if any, at net asset value and the deduction of all Fund expenses. Returns have not been adjusted to include the deduction of taxes that a shareholder would pay on Fund distributions. Performance figures for periods shorter than one year represent cumulative figures and are not annualized.
Performance figures reflect expense reimbursements and/or fee waivers, without which the performance would have been lower.
The 30-Day SEC Yields for the period ended December 31, 2009 for Institutional and Institutional Select Class shares were 3.91% and 3.55%, respectively. Absent current expense reimbursements and/or fee waivers, the 30-Day SEC Yields for Institutional and Institutional Select Class shares would have been 3.74% and 3.38%, respectively. The 30-Day SEC Yield is the average annualized net investment income per share for the 30-day period indicated and is subject to change.
TOTAL ANNUAL OPERATING EXPENSES (unaudited)
As of the Fund’s most current prospectus dated July 1, 2009, the gross total operating expense ratios for Institutional and Institutional Select Class shares were 0.68% and 0.86%, respectively.
Actual expenses may be higher. For example, expenses may be higher than those shown if average net assets decrease. Net assets are more likely to decrease and Fund expense ratios are more likely to increase when markets are volatile.
As a result of a contractual expense limitation, the ratio of expenses, other than interest, brokerage, taxes, deferred organizational expenses and extraordinary expenses, to average net assets will not exceed 0.45% for Institutional Select Class shares until April 30, 2010.
| 1 | | Lipper, Inc., a wholly-owned subsidiary of Reuters, provides independent insight on global collective investments. Returns are based on the period ended December 31, 2009, including the reinvestment of all distributions, including returns of capital, if any, calculated among the 152 funds for the six-month period and among the 150 funds for the twelve-month period in the Fund’s Lipper category. |
115
Annual Report to Shareholders
Management’s Discussion of Fund Performance—Continued
In 2009, the financial markets largely stabilized, economic conditions improved and investor risk aversion abated. Collectively, this helped the spread sectors (non-Treasuries) to generate strong returns. Against this backdrop, the Fund significantly outperformed its benchmark during the period.
The largest contributors to relative results for the period were our overweight exposures to investment grade and high-yield bonds. In particular, our Financials and Industrials holdings performed well as their spreads tightened from their elevated levels in 2008 and early 2009. Within the investment grade space, Financials such as Goldman Sachs Capital II and JP Morgan Chase, as well as Industrials such as Abbott Laboratories and Telecom Italia Capital SpA, meaningfully enhanced the Fund’s results. High-yield holdings Ford Motor Credit Co., GMAC and TXU Corp. generated strong returns during the reporting period. Our overweight to non-agency mortgage-backed securities (“MBS”) also contributed to results. The asset class posted solid returns as housing data improved and there was positive sentiment surrounding the launch of the Public-Private Investment Program (“PPIP”).
Detracting from relative performance for the period was our longer durationii than that of the benchmark as rates rose across the yield curve during the fiscal year. Our underweight exposure to government agencies was also a modest drag on results given the tightening of spreads in the sector.
We made several adjustments to the portfolio during the twelve-month reporting period. We increased the portfolio’s exposure to Treasuries and investment grade bonds. In contrast, we significantly reduced our exposure to agency MBS, finding them less attractive as their spreads had narrowed given the government’s direct purchase of these securities. With the government set to phase out its purchasing program, we determined that more attractive opportunities could be found in other areas of the market.
During the reporting period, we utilized Eurodollar futures/options and Treasury futures/options to manage the portfolio’s duration and yield curveiii exposure. Interest rate swaps were used to manage our interest rate exposure throughout the yield curve. We also utilized credit default swaps to manage the portfolio’s investment grade bond exposure. We employed Euro-bund futures to manage our exposure to the Germany yield curve. Finally, we used foreign exchange contracts to adjust our currency exposure. Overall, the use of these derivative instruments was positive for performance.
Western Asset Management Company
January 19, 2010
116
Annual Report to Shareholders
The information provided is not intended to be a forecast of future events, a guarantee of future results or investment advice. Views expressed may differ from those of the firm as a whole.
Portfolio holdings and breakdowns are as of December 31, 2009 and are subject to change and may not be representative of the portfolio managers’ current or future investments. Please refer to pages 124 through 136 for a list and percentage breakdown of the Fund’s holdings.
The mention of sector breakdowns is for informational purposes only and should not be construed as a recommendation to purchase or sell any securities. The information provided regarding such sectors is not a sufficient basis upon which to make an investment decision. Investors seeking financial advice regarding the appropriateness of investing in any securities or investment strategies discussed should consult their financial professional. The Fund’s top five sector holdings (as a percentage of net assets) as of December 31, 2009 were: Corporate Bonds and Notes (41.1%), U.S. Government and Agency Obligations (21.2%), Yankee Bonds (13.8%), Mortgage-Backed Securities (8.6%) and Asset-Backed Securities (2.3%). The Fund’s portfolio composition is subject to change at any time.
RISKS: All investments are subject to risk including the loss of principal. Fixed-income securities involve interest rate, credit, inflation and reinvestment risks. As interest rates rise, the value of fixed-income securities falls. Derivatives, such as options, futures and swaps, can be illiquid, may disproportionately increase losses, and have a potentially large impact on Fund performance. International investments are subject to special risks including currency fluctuations and social, economic and political uncertainties, which could increase volatility. These risks are magnified in emerging markets. Asset-backed, mortgage-backed or mortgage-related securities are subject to prepayment and extension risks. Risks of high-yield securities include greater price volatility, illiquidity and possibility of default. Please see the Fund’s prospectus for more information on these and other risks.
All index performance reflects no deduction for fees, expenses or taxes. Please note that an investor cannot invest directly in an index.
| i | | The Barclays Capital Intermediate U.S. Government/Credit Index is a market value weighted performance benchmark for government and corporate fixed-rate debt issues (rated Baa/BBB or higher) with maturities between one and ten years. |
| ii | | Duration is the measure of the price sensitivity of a fixed-income security to an interest rate change of 100 basis points. Calculation is based on the weighted average of the present values for all cash flows. |
| iii | | The yield curve is the graphical depiction of the relationship between the yield on bonds of the same credit quality but different maturities. |
117
Annual Report to Shareholders
Expense Example (Unaudited)
Western Asset Intermediate Plus Bond Portfolio
As a shareholder of the Fund, you may incur two types of costs; (1) transaction cost and (2) ongoing costs, including management fees and other Fund expenses. These examples are intended to help you understand your ongoing costs (in dollars) of investing in the Fund and to compare these costs with the ongoing costs of investing in other mutual funds.
The example is based on an investment of $1,000 invested on July 1, 2009 and held through December 31, 2009. The ending values assume dividends were reinvested at the time they were paid.
Actual Expenses
The first line for each class in the table below provides information about actual account values and actual expenses for the Fund. You may use the information in this line, together with the amount you invested, to estimate the expenses that you paid over the period. Simply divide your account value by $1,000 (for example, an $8,600 account value divided by $1,000 = 8.6), then multiply the result by the number in the first line under the heading entitled “Expenses Paid During the Period” to estimate the expenses you paid on your account if your shares were held through the entire period.
Hypothetical Example for Comparison Purposes
The second line for each class in the table below provides information about hypothetical account values and hypothetical expenses based on the Fund’s actual expense ratio and an assumed rate of return of 5% per year before expenses, which is not the Fund’s actual return. The hypothetical account values and expenses may not be used to estimate the actual ending account balance or expenses you paid for the period. You may use this information to compare the ongoing costs of investing in the Fund and other funds. To do so, compare this 5% hypothetical example with the 5% hypothetical examples that appear in the shareholder reports of other funds. Because each example is intended to be comparable to the examples provided by other funds, it is based on a hypothetical investment of $1,000 invested on July 1, 2009 and held through December 31, 2009. The ending values assume dividends were reinvested at the time they were paid.
| | | | | | | | | |
| | | Beginning
Account Value
7/1/09 | | Ending
Account Value
12/31/09 | | Expenses PaidA
During the Period
7/1/09 to 12/31/09 |
Institutional Class: | | | | | | | | | |
Actual | | $ | 1,000.00 | | $ | 1,092.40 | | $ | 2.48 |
Hypothetical (5% return before expenses) | | | 1,000.00 | | | 1,022.84 | | | 2.40 |
Institutional Select Class: | | | | | | | | | |
Actual | | $ | 1,000.00 | | $ | 1,092.50 | | $ | 2.37 |
Hypothetical (5% return before expenses) | | | 1,000.00 | | | 1,022.94 | | | 2.29 |
| A | | These calculations are based on expenses incurred from July 1, 2009 to December 31, 2009. The dollar amounts shown as “Expenses Paid” are equal to the annualized expense ratio of 0.47% and 0.45% for the Institutional Class and Institutional Select Class, respectively, multiplied by the average value over the period, multiplied by the number of days in the most recent fiscal half-year then divided by 365. |
118
Annual Report to Shareholders
Performance Information (Unaudited)
Western Asset Intermediate Plus Bond Portfolio
The graphs compare the Fund’s total returns to that of an appropriate broad-based securities market index. The graphs illustrate the cumulative total return of an initial $1,000,000 investment in each of Institutional Class and Institutional Select Class for the periods indicated. The line for the Fund represents the total return after deducting all Fund investment management and other administrative expenses and the transaction costs of buying and selling securities. The line representing the securities market index does not include any transaction costs associated with buying and selling securities in the index or other investment management or administrative expenses.
Total return measures investment performance in terms of appreciation or depreciation in the Fund’s net asset value per share, plus dividends and any capital gain distributions. It assumes that dividends and distributions were reinvested at the time they were paid. Returns (and the graph and table found below) do not reflect the deduction of taxes that a shareholder would pay on Fund distributions or the redemption of Fund shares. Average annual returns tend to smooth out variations in a fund’s return, so that they differ from actual year-to-year results.
Bonds are subject to a variety of risks, including interest rate, credit, and inflation risk. Non-U.S. investments are subject to currency fluctuations, social, economic and political risk.
Growth of a $1,000,000 Investment—Institutional Class
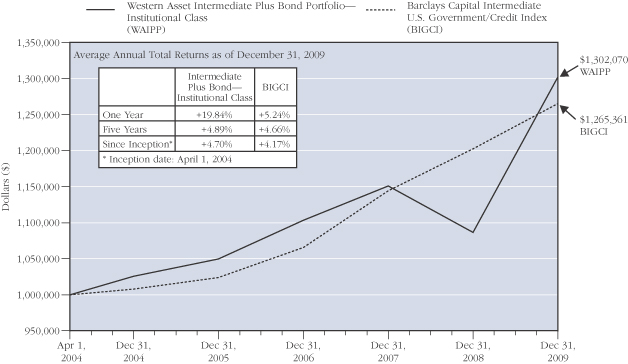
The performance data quoted represent past performance and do not guarantee future results. Current performance may be lower or higher than the performance data quoted. To obtain the most recent month-end performance information, please visit www.westernassetfunds.com. The investment return and principal value of the Fund will fluctuate so that an investor’s shares, when redeemed, may be worth more or less than the original cost. Calculations assume reinvestment of all distributions, including returns of capital, if any, at net asset value and the deduction of all Fund expenses. Performance would have been lower if fees had not been waived in various periods.
119
Annual Report to Shareholders
Performance Information (Unaudited)—Continued
Growth of a $1,000,000 Investment—Institutional Select Class
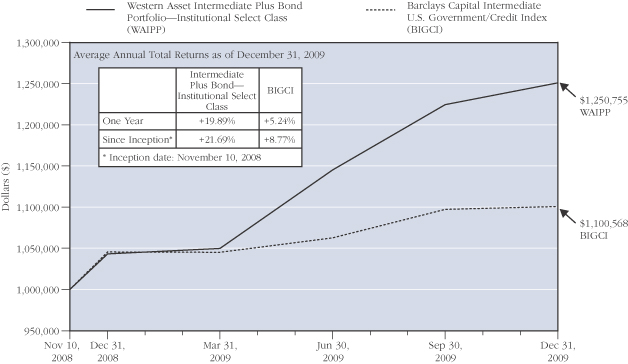
The performance data quoted represent past performance and do not guarantee future results. Current performance may be lower or higher than the performance data quoted. To obtain the most recent month-end performance information, please visit www.westernassetfunds.com. The investment return and principal value of the Fund will fluctuate so that an investor’s shares, when redeemed, may be worth more or less than the original cost. Calculations assume reinvestment of all distributions, including returns of capital, if any, at net asset value and the deduction of all Fund expenses. Performance would have been lower if fees had not been waived in various periods.
120
Annual Report to Shareholders
Portfolio Composition (Unaudited) (as of December 31, 2009)A
Standard & Poor’s Debt RatingsB (as a percentage of the portfolio)
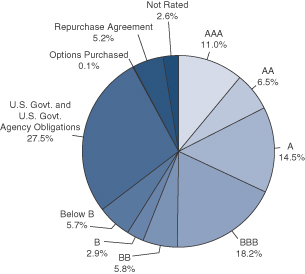
Maturity Schedule (as a percentage of the portfolio)
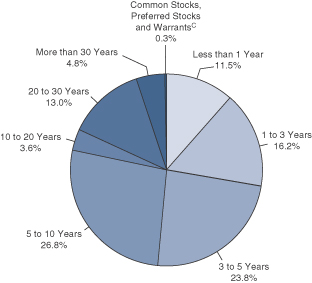
| A | | The pie charts above represent the composition of the Fund’s Portfolio as of December 31, 2009 and do not include derivatives such as Futures Contracts, Options Written, and Swaps. The Fund is actively managed. As a result, the composition of the portfolio holdings and sectors are subject to change at any time. |
| B | | Standard & Poor’s Rating Service provides capital markets with credit ratings for the evaluation and assessment of credit risk. These ratings are the opinions of S&P and not absolute measures of quality or guarantees of performance. |
| C | | Common Stock, Preferred stocks and Warrants do not have defined maturity dates. |
121
Annual Report to Shareholders
Spread Duration
Western Asset Intermediate Plus Bond Portfolio
December 31, 2009 (Unaudited)
Economic Exposure
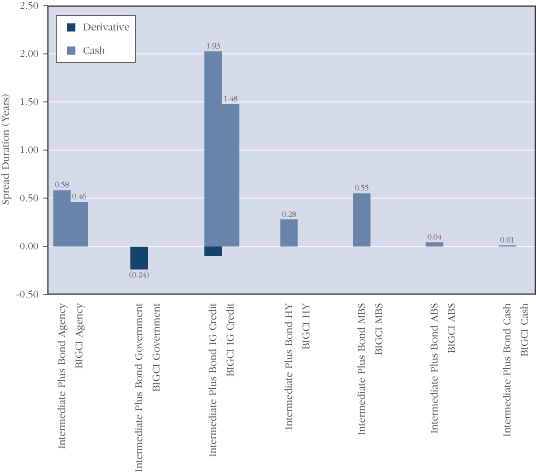
Spread duration is defined as the change in value for a 100 basis point change in the spread relative to Treasuries. The spread over Treasuries is the annual risk-premium demanded by investors to hold non-Treasury securities. This chart highlights the market sector exposure of the Fund’s portfolio and the exposure relative to the selected benchmark as of the end of the reporting period.
| | | | |
| ABS | | — | | Asset Backed Securities |
| BIGCI | | — | | Barclays Capital Intermediate U.S. Government/Credit Index |
| HY | | — | | High Yield |
| IG Credit | | — | | Investment Grade Credit |
| MBS | | — | | Mortgage Backed Securities |
122
Annual Report to Shareholders
Effective Duration
Western Asset Intermediate Plus Bond Portfolio
December 31, 2009 (Unaudited)
Interest Rate Exposure
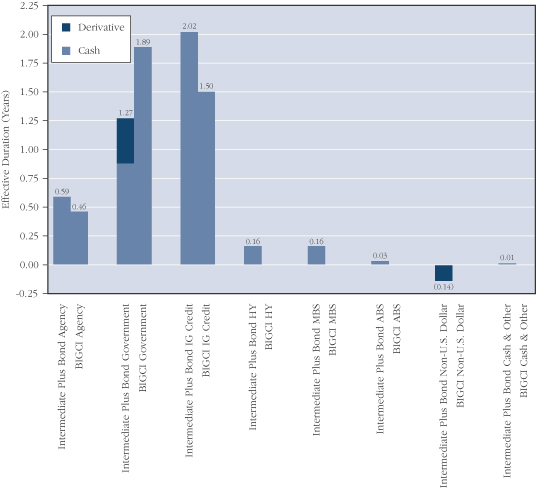
Effective duration is defined as the change interest rate exposure of the Fund’s portfolio in value for a 100 basis point change in Treasury yields. This chart highlights the relative to the selected benchmark as of the end of the reporting period.
| | | | |
| ABS | | — | | Asset Backed Securities |
| BIGCI | | — | | Barclays Capital Intermediate U.S. Government/Credit Index |
| HY | | — | | High Yield |
| IG Credit | | — | | Investment Grade Credit |
| MBS | | — | | Mortgage Backed Securities |
123
Annual Report to Shareholders
Portfolio of Investments
Western Asset Intermediate Plus Bond Portfolio
December 31, 2009
| | | | | | | | | | | | | | |
| | | % OF
NET ASSETS | | RATE | | MATURITY
DATE | | PAR/
SHARES† | | | VALUE | |
| | | | | | | | | | | | | | |
Long-Term Securities | | 88.8% | | | | | | | | | | | | |
| | | | | |
Corporate Bonds and Notes | | 41.1% | | | | | | | | | | | | |
| | | | | |
Aerospace and Defense | | 0.4% | | | | | | | | | | | | |
The Boeing Co. | | | | 1.875% | | 11/20/12 | | $ | 10,000 | | | $ | 9,889 | |
The Boeing Co. | | | | 6.000% | | 3/15/19 | | | 180,000 | | | | 195,329 | |
| | | | | | | | | | | | | | |
| | | | | | | | | | | | | 205,218 | |
| | | | | | | | | | | | | | |
Airlines | | 0.4% | | | | | | | | | | | | |
Delta Air Lines Inc. | | | | 6.821% | | 8/10/22 | | | 262,606 | | | | 250,788 | |
| | | | | | | | | | | | | | |
| | | | | |
Automobiles | | 0.6% | | | | | | | | | | | | |
DaimlerChrysler NA Holding Corp. | | | | 6.500% | | 11/15/13 | | | 250,000 | | | | 274,059 | |
Motors Liquidation Co. | | | | 8.375% | | 7/5/33 | | | 50,000 | EUR | | | 14,694 | A |
Motors Liquidation Co. | | | | 8.375% | | 7/15/33 | | | 120,000 | | | | 32,400 | A |
| | | | | | | | | | | | | | |
| | | | | | | | | | | | | 321,153 | |
| | | | | | | | | | | | | | |
Beverages | | 0.6% | | | | | | | | | | | | |
Anheuser-Busch InBev Worldwide Inc. | | | | 5.375% | | 1/15/20 | | | 140,000 | | | | 142,836 | B |
Bottling Group LLC | | | | 6.950% | | 3/15/14 | | | 190,000 | | | | 218,616 | |
| | | | | | | | | | | | | | |
| | | | | | | | | | | | | 361,452 | |
| | | | | | | | | | | | | | |
Capital Markets | | 1.9% | | | | | | | | | | | | |
Goldman Sachs Capital II | | | | 5.793% | | 12/29/49 | | | 500,000 | | | | 387,500 | C |
Lehman Brothers Holdings Capital Trust VII | | | | 5.857% | | 12/31/49 | | | 920,000 | | | | 276 | A,C |
Lehman Brothers Holdings Capital Trust VIII | | | | 3.915% | | 5/29/49 | | | 20,000 | | | | 6 | A,D |
Lehman Brothers Holdings Inc. | | | | 4.500% | | 7/26/10 | | | 140,000 | | | | 27,300 | A |
Morgan Stanley | | | | 5.550% | | 4/27/17 | | | 170,000 | | | | 170,753 | |
Morgan Stanley | | | | 7.300% | | 5/13/19 | | | 310,000 | | | | 348,108 | |
State Street Corp. | | | | 4.300% | | 5/30/14 | | | 120,000 | | | | 124,177 | |
The Bear Stearns Cos. Inc. | | | | 7.250% | | 2/1/18 | | | 20,000 | | | | 22,957 | |
| | | | | | | | | | | | | | |
| | | | | | | | | | | | | 1,081,077 | |
| | | | | | | | | | | | | | |
Chemicals | | 0.5% | | | | | | | | | | | | |
Lubrizol Corp. | | | | 8.875% | | 2/1/19 | | | 170,000 | | | | 211,358 | |
The Dow Chemical Co. | | | | 5.700% | | 5/15/18 | | | 70,000 | | | | 71,110 | |
| | | | | | | | | | | | | | |
| | | | | | | | | | | | | 282,468 | |
| | | | | | | | | | | | | | |
Commercial Banks | | 2.1% | | | | | | | | | | | | |
BB&T Corp. | | | | 3.850% | | 7/27/12 | | | 90,000 | | | | 93,155 | |
Comerica Capital Trust II | | | | 6.576% | | 2/20/37 | | | 130,000 | | | | 104,000 | C |
SunTrust Capital VIII | | | | 6.100% | | 12/15/36 | | | 80,000 | | | | 55,721 | C |
U.S. Bancorp | | | | 4.200% | | 5/15/14 | | | 150,000 | | | | 155,706 | |
124
Annual Report to Shareholders
| | | | | | | | | | | | | |
| | | % OF
NET ASSETS | | RATE | | MATURITY
DATE | | PAR/
SHARES† | | VALUE | |
| | | | | | | | | | | | | |
Corporate Bonds and Notes—Continued | | | | | | | | | | | | | |
| | | | | |
Commercial Banks—Continued | | | | | | | | | | | | | |
Wells Fargo and Co. | | | | 3.750% | | 10/1/14 | | $ | 220,000 | | $ | 219,352 | |
Wells Fargo Capital X | | | | 5.950% | | 12/15/36 | | | 640,000 | | | 556,800 | |
| | | | | | | | | | | | | |
| | | | | | | | | | | | 1,184,734 | |
| | | | | | | | | | | | | |
Communications Equipment | | 0.2% | | | | | | | | | | | |
EchoStar DBS Corp. | | | | 7.750% | | 5/31/15 | | | 130,000 | | | 136,175 | |
| | | | | | | | | | | | | |
| | | | | |
Consumer Finance | | 3.9% | | | | | | | | | | | |
American Express Co. | | | | 8.125% | | 5/20/19 | | | 100,000 | | | 118,506 | |
American Express Credit Corp. | | | | 5.125% | | 8/25/14 | | | 300,000 | | | 316,120 | |
Caterpillar Financial Services Corp. Series 2009 | | | | 1.900% | | 12/17/12 | | | 170,000 | | | 169,337 | |
FIA Card Services N.A. | | | | 7.125% | | 11/15/12 | | | 150,000 | | | 163,284 | |
Ford Motor Credit Co. | | | | 3.034% | | 1/13/12 | | | 500,000 | | | 465,000 | D |
GMAC LLC | | | | 6.875% | | 9/15/11 | | | 13,000 | | | 12,805 | B |
GMAC LLC | | | | 7.500% | | 12/31/13 | | | 108,000 | | | 104,220 | B |
GMAC LLC | | | | 6.750% | | 12/1/14 | | | 24,000 | | | 22,800 | B |
GMAC LLC | | | | 8.000% | | 12/31/18 | | | 90,000 | | | 79,200 | B |
John Deere Capital Corp. | | | | 5.100% | | 1/15/13 | | | 100,000 | | | 106,299 | |
Nelnet Inc. | | | | 7.400% | | 9/29/36 | | | 180,000 | | | 131,096 | C |
SLM Corp. | | | | 0.582% | | 1/27/14 | | | 700,000 | | | 539,984 | D |
| | | | | | | | | | | | | |
| | | | | | | | | | | | 2,228,651 | |
| | | | | | | | | | | | | |
Diversified Financial Services | | 7.9% | | | | | | | | | | | |
AGFC Capital Trust I | | | | 6.000% | | 1/15/67 | | | 110,000 | | | 38,500 | B,C |
BAC Capital Trust XIII | | | | 0.654% | | 3/15/43 | | | 120,000 | | | 74,122 | D |
BAC Capital Trust XIV | | | | 5.630% | | 12/31/49 | | | 10,000 | | | 6,900 | C |
Bank of America Corp. | | | | 8.000% | | 12/29/49 | | | 300,000 | | | 288,822 | C |
Beaver Valley II Funding | | | | 9.000% | | 6/1/17 | | | 179,000 | | | 195,640 | |
Citigroup Funding Inc. | | | | 2.250% | | 12/10/12 | | | 1,550,000 | | | 1,562,167 | |
Citigroup Inc. | | | | 5.500% | | 10/15/14 | | | 70,000 | | | 70,877 | |
Citigroup Inc. | | | | 8.500% | | 5/22/19 | | | 810,000 | | | 935,350 | |
General Electric Capital Corp. | | | | 5.900% | | 5/13/14 | | | 300,000 | | | 324,322 | |
General Electric Capital Corp. | | | | 6.375% | | 11/15/67 | | | 380,000 | | | 329,650 | C |
ILFC E-Capital Trust I | | | | 5.900% | | 12/21/65 | | | 170,000 | | | 88,400 | B,C |
JPMorgan Chase Capital XXII | | | | 6.450% | | 2/2/37 | | | 380,000 | | | 348,740 | C |
ZFS Finance USA Trust II | | | | 6.450% | | 12/15/65 | | | 240,000 | | | 213,600 | B,C |
| | | | | | | | | | | | | |
| | | | | | | | | | | | 4,477,090 | |
| | | | | | | | | | | | | |
Diversified Telecommunication Services | | 1.0% | | | | | | | | | | | |
AT&T Inc. | | | | 5.600% | | 5/15/18 | | | 150,000 | | | 157,194 | |
Embarq Corp. | | | | 7.082% | | 6/1/16 | | | 250,000 | | | 276,144 | |
125
Annual Report to Shareholders
Portfolio of Investments—Continued
Western Asset Intermediate Plus Bond Portfolio—Continued
| | | | | | | | | | | | | |
| | | % OF
NET ASSETS | | RATE | | MATURITY
DATE | | PAR/
SHARES† | | VALUE | |
| | | | | | | | | | | | | |
Corporate Bonds and Notes—Continued | | | | | | | | | | | | | |
| | | | | |
Diversified Telecommunication Services—Continued | | | | | | | | | | | | | |
Qwest Communications International Inc. | | | | 7.500% | | 2/15/14 | | $ | 30,000 | | $ | 30,113 | |
Qwest Corp. | | | | 3.504% | | 6/15/13 | | | 70,000 | | | 67,375 | D |
Windstream Corp. | | | | 8.625% | | 8/1/16 | | | 30,000 | | | 30,525 | |
| | | | | | | | | | | | | |
| | | | | | | | | | | | 561,351 | |
| | | | | | | | | | | | | |
Electric Utilities | | 0.8% | | | | | | | | | | | |
Duke Energy Corp. | | | | 6.250% | | 1/15/12 | | | 200,000 | | | 216,224 | |
Duke Energy Corp. | | | | 6.300% | | 2/1/14 | | | 10,000 | | | 10,996 | |
Energy Future Holdings Corp. | | | | 11.250% | | 11/1/17 | | | 280,900 | | | 198,737 | E |
FirstEnergy Solutions Corp. | | | | 4.800% | | 2/15/15 | | | 10,000 | | | 10,207 | |
| | | | | | | | | | | | | |
| | | | | | | | | | | | 436,164 | |
| | | | | | | | | | | | | |
Energy Equipment and Services | | 0.1% | | | | | | | | | | | |
Key Energy Services Inc. | | | | 8.375% | | 12/1/14 | | | 70,000 | | | 70,175 | |
| | | | | | | | | | | | | |
| | | | | |
Food and Staples Retailing | | 0.8% | | | | | | | | | | | |
The Kroger Co. | | | | 3.900% | | 10/1/15 | | | 160,000 | | | 160,873 | |
Wal-Mart Stores Inc. | | | | 4.250% | | 4/15/13 | | | 200,000 | | | 212,053 | |
Walgreen Co. | | | | 5.250% | | 1/15/19 | | | 80,000 | | | 84,897 | |
| | | | | | | | | | | | | |
| | | | | | | | | | | | 457,823 | |
| | | | | | | | | | | | | |
Health Care Equipment and Supplies | | 0.4% | | | | | | | | | | | |
Hospira Inc. | | | | 5.550% | | 3/30/12 | | | 200,000 | | | 213,173 | |
| | | | | | | | | | | | | |
| | | | | |
Health Care Providers and Services | | 1.6% | | | | | | | | | | | |
DaVita Inc. | | | | 7.250% | | 3/15/15 | | | 30,000 | | | 30,075 | |
HCA Inc. | | | | 8.750% | | 9/1/10 | | | 50,000 | | | 51,188 | |
HCA Inc. | | | | 6.250% | | 2/15/13 | | | 30,000 | | | 29,175 | |
HCA Inc. | | | | 6.750% | | 7/15/13 | | | 70,000 | | | 68,950 | |
HCA Inc. | | | | 9.250% | | 11/15/16 | | | 70,000 | | | 75,162 | |
HCA Inc. | | | | 9.625% | | 11/15/16 | | | 63,000 | | | 68,197 | E |
Tenet Healthcare Corp. | | | | 8.875% | | 7/1/19 | | | 171,000 | | | 184,680 | B |
UnitedHealth Group Inc. | | | | 6.000% | | 11/15/17 | | | 160,000 | | | 165,182 | |
Universal Health Services Inc. | | | | 6.750% | | 11/15/11 | | | 240,000 | | | 256,043 | |
WellPoint Inc. | | | | 5.875% | | 6/15/17 | | | 10,000 | | | 10,303 | |
| | | | | | | | | | | | | |
| | | | | | | | | | | | 938,955 | |
| | | | | | | | | | | | | |
126
Annual Report to Shareholders
| | | | | | | | | | | | | |
| | | % OF
NET ASSETS | | RATE | | MATURITY
DATE | | PAR/
SHARES† | | VALUE | |
| | | | | | | | | | | | | |
Corporate Bonds and Notes—Continued | | | | | | | | | | | | | |
| | | | | |
Hotels, Restaurants and Leisure | | 0.1% | | | | | | | | | | | |
MGM MIRAGE | | | | 10.375% | | 5/15/14 | | $ | 10,000 | | $ | 10,850 | B |
MGM MIRAGE | | | | 11.125% | | 11/15/17 | | | 20,000 | | | 22,150 | B |
| | | | | | | | | | | | | |
| | | | | | | | | | | | 33,000 | |
| | | | | | | | | | | | | |
Independent Power Producers and Energy Traders | | 1.5% | | | | | | | | | | | |
Calpine Corp. | | | | 8.000% | | 6/1/16 | | | 50,000 | | | 51,500 | B |
Dynegy Holdings Inc. | | | | 7.750% | | 6/1/19 | | | 70,000 | | | 60,725 | |
Edison Mission Energy | | | | 7.625% | | 5/15/27 | | | 70,000 | | | 47,425 | |
Mirant Mid Atlantic LLC | | | | 10.060% | | 12/30/28 | | | 97,429 | | | 102,788 | |
NRG Energy Inc. | | | | 7.375% | | 2/1/16 | | | 60,000 | | | 60,075 | |
The AES Corp. | | | | 7.750% | | 10/15/15 | | | 50,000 | | | 50,750 | |
The AES Corp. | | | | 8.000% | | 6/1/20 | | | 160,000 | | | 162,800 | |
TXU Corp. | | | | 5.550% | | 11/15/14 | | | 480,000 | | | 340,415 | |
| | | | | | | | | | | | | |
| | | | | | | | | | | | 876,478 | |
| | | | | | | | | | | | | |
Insurance | | 2.2% | | | | | | | | | | | |
Allstate Life Global Funding Trust | | | | 5.375% | | 4/30/13 | | | 300,000 | | | 320,242 | |
American International Group Inc. | | | | 5.850% | | 1/16/18 | | | 40,000 | | | 32,821 | |
American International Group Inc. | | | | 8.250% | | 8/15/18 | | | 100,000 | | | 93,885 | |
Genworth Life Insurance Co. | | | | 5.875% | | 5/3/13 | | | 190,000 | | | 188,231 | B |
MetLife Capital Trust IV | | | | 7.875% | | 12/15/37 | | | 220,000 | | | 218,900 | B,C |
MetLife Inc. | | | | 6.750% | | 6/1/16 | | | 100,000 | | | 111,984 | |
MetLife Inc. | | | | 6.400% | | 12/15/36 | | | 10,000 | | | 8,750 | C |
Metropolitan Life Global Funding I | | | | 5.125% | | 4/10/13 | | | 190,000 | | | 201,284 | B |
Teachers Insurance & Annuity Association of America | | | | 6.850% | | 12/16/39 | | | 40,000 | | | 41,349 | B |
The Travelers Cos. Inc. | | | | 6.250% | | 3/15/37 | | | 30,000 | | | 27,330 | C |
| | | | | | | | | | | | | |
| | | | | | | | | | | | 1,244,776 | |
| | | | | | | | | | | | | |
Media | | 1.4% | | | | | | | | | | | |
Reed Elsevier Capital Inc. | | | | 8.625% | | 1/15/19 | | | 150,000 | | | 182,515 | |
Time Warner Cable Inc. | | | | 8.250% | | 2/14/14 | | | 320,000 | | | 373,998 | |
Time Warner Inc. | | | | 6.875% | | 5/1/12 | | | 200,000 | | | 218,949 | |
| | | | | | | | | | | | | |
| | | | | | | | | | | | 775,462 | |
| | | | | | | | | | | | | |
Metals and Mining | | 1.0% | | | | | | | | | | | |
Alcoa Inc. | | | | 6.000% | | 7/15/13 | | | 190,000 | | | 200,152 | |
Freeport-McMoRan Copper & Gold Inc. | | | | 8.375% | | 4/1/17 | | | 300,000 | | | 328,500 | |
Steel Dynamics Inc. | | | | 7.750% | | 4/15/16 | | | 50,000 | | | 52,063 | F |
| | | | | | | | | | | | | |
| | | | | | | | | | | | 580,715 | |
| | | | | | | | | | | | | |
127
Annual Report to Shareholders
Portfolio of Investments—Continued
Western Asset Intermediate Plus Bond Portfolio—Continued
| | | | | | | | | | | | | |
| | | % OF
NET ASSETS | | RATE | | MATURITY
DATE | | PAR/
SHARES† | | VALUE | |
| | | | | | | | | | | | | |
Corporate Bonds and Notes—Continued | | | | | | | | | | | | | |
| | | | | |
Multi-Utilities | | 0.3% | | | | | | | | | | | |
Dominion Resources Inc. | | | | 8.875% | | 1/15/19 | | $ | 140,000 | | $ | 174,470 | |
| | | | | | | | | | | | | |
| | | | | |
Multiline Retail | | 0.8% | | | | | | | | | | | |
Federated Retail Holdings Inc. | | | | 5.350% | | 3/15/12 | | | 140,000 | | | 142,975 | |
JC Penney Corp. Inc. | | | | 5.750% | | 2/15/18 | | | 80,000 | | | 78,900 | |
May Department Stores Co. | | | | 5.750% | | 7/15/14 | | | 210,000 | | | 210,525 | |
| | | | | | | | | | | | | |
| | | | | | | | | | | | 432,400 | |
| | | | | | | | | | | | | |
Oil, Gas and Consumable Fuels | | 5.2% | | | | | | | | | | | |
Anadarko Petroleum Corp. | | | | 5.950% | | 9/15/16 | | | 220,000 | | | 237,973 | |
Chesapeake Energy Corp. | | | | 7.250% | | 12/15/18 | | | 70,000 | | | 70,525 | |
ConocoPhillips | | | | 5.750% | | 2/1/19 | | | 250,000 | | | 273,637 | |
Devon Energy Corp. | | | | 6.300% | | 1/15/19 | | | 170,000 | | | 189,288 | |
El Paso Corp. | | | | 7.000% | | 5/15/11 | | | 80,000 | | | 81,756 | |
El Paso Corp. | | | | 6.875% | | 6/15/14 | | | 120,000 | | | 119,911 | |
Enbridge Energy Partners LP | | | | 9.875% | | 3/1/19 | | | 100,000 | | | 126,624 | |
Energy Transfer Partners LP | | | | 9.700% | | 3/15/19 | | | 130,000 | | | 160,563 | |
Energy Transfer Partners LP | | | | 9.000% | | 4/15/19 | | | 50,000 | | | 59,599 | |
Enterprise Products Operating LLP | | | | 6.300% | | 9/15/17 | | | 190,000 | | | 204,539 | |
Hess Corp. | | | | 8.125% | | 2/15/19 | | | 200,000 | | | 241,192 | |
Kinder Morgan Energy Partners LP | | | | 6.000% | | 2/1/17 | | | 320,000 | | | 335,973 | |
Noble Energy Inc. | | | | 8.250% | | 3/1/19 | | | 50,000 | | | 59,819 | |
SandRidge Energy Inc. | | | | 9.875% | | 5/15/16 | | | 45,000 | | | 47,363 | B |
The Williams Cos. Inc. | | | | 2.290% | | 10/1/10 | | | 280,000 | | | 279,836 | B,D |
The Williams Cos. Inc. | | | | 6.375% | | 10/1/10 | | | 60,000 | | | 61,086 | B |
The Williams Cos. Inc. | | | | 7.875% | | 9/1/21 | | | 110,000 | | | 126,172 | |
XTO Energy Inc. | | | | 5.650% | | 4/1/16 | | | 250,000 | | | 273,233 | |
| | | | | | | | | | | | | |
| | | | | | | | | | | | 2,949,089 | |
| | | | | | | | | | | | | |
Pharmaceuticals | | 1.1% | | | | | | | | | | | |
Abbott Laboratories | | | | 5.125% | | 4/1/19 | | | 180,000 | | | 188,274 | |
GlaxoSmithKline Capital Inc. | | | | 5.650% | | 5/15/18 | | | 150,000 | | | 161,789 | |
Pfizer Inc. | | | | 6.200% | | 3/15/19 | | | 170,000 | | | 188,976 | |
Roche Holdings Inc. | | | | 6.000% | | 3/1/19 | | | 90,000 | | | 98,896 | B |
| | | | | | | | | | | | | |
| | | | | | | | | | | | 637,935 | |
| | | | | | | | | | | | | |
Real Estate Investment Trusts (REITs) | | 0.1% | | | | | | | | | | | |
Ventas Inc. | | | | 9.000% | | 5/1/12 | | | 30,000 | | | 31,350 | |
| | | | | | | | | | | | | |
| | | | | |
Real Estate Management and Development | | 0.1% | | | | | | | | | | | |
Realogy Corp. | | | | 12.375% | | 4/15/15 | | | 90,000 | | | 69,975 | |
| | | | | | | | | | | | | |
128
Annual Report to Shareholders
| | | | | | | | | | | | | |
| | | % OF
NET ASSETS | | RATE | | MATURITY
DATE | | PAR/
SHARES† | | VALUE | |
| | | | | | | | | | | | | |
Corporate Bonds and Notes—Continued | | | | | | | | | | | | | |
| | | | | |
Thrifts and Mortgage Finance | | 1.8% | | | | | | | | | | | |
Countrywide Financial Corp. | | | | 5.800% | | 6/7/12 | | $ | 600,000 | | $ | 636,907 | |
US Central Federal Credit Union | | | | 1.900% | | 10/19/12 | | | 400,000 | | | 399,687 | |
| | | | | | | | | | | | | |
| | | | | | | | | | | | 1,036,594 | |
| | | | | | | | | | | | | |
Tobacco | | 0.5% | | | | | | | | | | | |
Philip Morris International Inc. | | | | 5.650% | | 5/16/18 | | | 140,000 | | | 147,221 | |
Reynolds American Inc. | | | | 7.250% | | 6/1/13 | | | 140,000 | | | 152,744 | |
| | | | | | | | | | | | | |
| | | | | | | | | | | | 299,965 | |
| | | | | | | | | | | | | |
Wireless Telecommunication Services | | 1.8% | | | | | | | | | | | |
Cricket Communications Inc. | | | | 7.750% | | 5/15/16 | | | 45,000 | | | 44,888 | |
New Cingular Wireless Services Inc. | | | | 8.125% | | 5/1/12 | | | 400,000 | | | 451,973 | |
Sprint Capital Corp. | | | | 8.375% | | 3/15/12 | | | 200,000 | | | 207,000 | |
Vodafone Group PLC | | | | 5.350% | | 2/27/12 | | | 330,000 | | | 352,086 | |
| | | | | | | | | | | | | |
| | | | | | | | | | | | 1,055,947 | |
| | | | | | | | | | | | | |
Total Corporate Bonds and Notes
(Cost—$24,019,973) | | | | | | | | | | | | 23,404,603 | |
Asset-Backed Securities | | 2.3% | | | | | | | | | | | |
| | | | | |
Fixed Rate Securities | | 1.1% | | | | | | | | | | | |
Citibank Credit Card Issuance Trust 2009-A5 A5 | | | | 2.250% | | 12/23/14 | | | 350,000 | | | 345,835 | |
Hertz Vehicle Financing LLC 2009-2A A1 | | | | 4.260% | | 3/25/14 | | | 230,000 | | | 229,205 | B |
Hertz Vehicle Financing LLC 2009-2A A2 | | | | 5.290% | | 3/25/16 | | | 60,000 | | | 59,865 | B |
| | | | | | | | | | | | | |
| | | | | | | | | | | | 634,905 | |
| | | | | | | | | | | | | |
Indexed SecuritiesD | | 1.2% | | | | | | | | | | | |
Countrywide Asset-Backed Certificates 2005-6 M1 | | | | 0.721% | | 12/25/35 | | | 320,000 | | | 280,984 | |
GSAA Home Equity Trust 2007-7 A4 | | | | 0.501% | | 7/25/37 | | | 410,000 | | | 193,341 | |
Nelnet Student Loan Trust 2008-4 A4 | | | | 1.762% | | 4/25/24 | | | 170,000 | | | 177,479 | |
| | | | | | | | | | | | | |
| | | | | | | | | | | | 651,804 | |
| | | | | | | | | | | | | |
Total Asset-Backed Securities
(Cost—$1,351,263) | | | | | | | | | | | | 1,286,709 | |
Foreign Government Obligations | | 0.7% | | | | | | | | | | | |
Province of Ontario | | | | 4.000% | | 10/7/19 | | | 400,000 | | | 383,017 | G |
| | | | | | | | | | | | | |
Total Foreign Government Obligations
(Cost—$399,325) | | | | | | | | | | | | 383,017 | |
129
Annual Report to Shareholders
Portfolio of Investments—Continued
Western Asset Intermediate Plus Bond Portfolio—Continued
| | | | | | | | | | | | | |
| | | % OF
NET ASSETS | | RATE | | MATURITY
DATE | | PAR/
SHARES† | | VALUE | |
| | | | | | | | | | | | | |
Mortgage-Backed Securities | | 8.6% | | | | | | | | | | | |
| | | | | |
Fixed Rate Securities | | 0.8% | | | | | | | | | | | |
CS First Boston Mortgage Securities Corp. 2005-9 3A1 | | | | 6.000% | | 10/25/35 | | $ | 270,308 | | $ | 205,180 | |
Residential Accredit Loans Inc. 2006-QS8 A2 | | | | 6.000% | | 8/25/36 | | | 400,000 | | | 221,755 | |
Washington Mutual MSC Mortgage Pass-Through Certificates 2004-RA1 | | | | 7.000% | | 3/25/34 | | | 11,416 | | | 11,596 | |
| | | | | | | | | | | | | |
| | | | | | | | | | | | 438,531 | |
| | | | | | | | | | | | | |
Indexed SecuritiesD | | 2.5% | | | | | | | | | | | |
GMAC Mortgage Corp. Loan Trust 2005-AR5 3A1 | | | | 5.020% | | 9/19/35 | | | 105,659 | | | 87,143 | |
IndyMac Inda Mortgage Loan Trust 2007-AR7 1A1 | | | | 6.158% | | 11/25/37 | | | 315,087 | | | 218,604 | |
MASTR Adjustable Rate Mortgages Trust 2004-13 | | | | 3.096% | | 11/21/34 | | | 950,000 | | | 770,901 | |
MLCC Mortgage Investors Inc. 2004-B | | | | 2.530% | | 5/25/29 | | | 10,350 | | | 9,241 | |
WaMu Mortgage Pass-Through Certificates 2007-HY1 3A3 | | | | 5.868% | | 2/25/37 | | | 520,000 | | | 363,024 | |
| | | | | | | | | | | | | |
| | | | | | | | | | | | 1,448,913 | |
| | | | | | | | | | | | | |
Variable Rate SecuritiesH | | 5.3% | | | | | | | | | | | |
Banc of America Funding Corp. 2005-B | | | | 5.058% | | 4/20/35 | | | 129,092 | | | 85,655 | |
Banc of America Funding Corp. 2006-H 3A1 | | | | 6.147% | | 9/20/46 | | | 475,394 | | | 316,683 | |
Bear Stearns Alt-A Trust 2005-2 | | | | 4.179% | | 4/25/35 | | | 88,689 | | | 57,466 | |
Countrywide Home Loans 2004-20 | | | | 3.119% | | 9/25/34 | | | 10,019 | | | 6,743 | |
Countrywide Home Loans 2005-31 2A3 | | | | 5.418% | | 1/25/36 | | | 430,000 | | | 179,210 | |
JP Morgan Mortgage Trust 2004-A3 | | | | 3.548% | | 7/25/34 | | | 257,243 | | | 228,987 | |
MASTR Adjustable Rate Mortgages Trust 2007-R5 A1 | | | | 5.617% | | 11/25/35 | | | 260,955 | | | 146,572 | B |
Merrill Lynch Mortgage Investors Trust 2004-A1 2A1 | | | | 3.789% | | 2/25/34 | | | 168,608 | | | 163,840 | |
MLCC Mortgage Investors Inc. 2005-1 2A1 | | | | 4.434% | | 4/25/35 | | | 33,076 | | | 28,366 | |
MLCC Mortgage Investors Inc. 2005-1 2A2 | | | | 4.434% | | 4/25/35 | | | 107,496 | | | 91,339 | |
Structured Adjustable Rate Mortgage Loan Trust 2004-6 3A2 | | | | 2.882% | | 6/25/34 | | | 118,456 | | | 97,570 | |
Structured Asset Securities Corp. 2003-31A 2A7 | | | | 3.077% | | 10/25/33 | | | 95,962 | | | 77,967 | |
WaMu Mortgage Pass-Through Certificates 2005-AR4 | | | | 4.651% | | 4/25/35 | | | 300,000 | | | 236,348 | |
WaMu Mortgage Pass-Through Certificates 2006-AR12 1A2 | | | | 5.788% | | 10/25/36 | | | 960,000 | | | 701,799 | |
WaMu Mortgage Pass-Through Certificates 2006-AR14 1A3 | | | | 5.607% | | 11/25/36 | | | 600,000 | | | 410,209 | |
130
Annual Report to Shareholders
| | | | | | | | | | | | | |
| | | % OF
NET ASSETS | | RATE | | MATURITY
DATE | | PAR/
SHARES† | | VALUE | |
| | | | | | | | | | | | | |
Mortgage-Backed Securities—Continued | | | | | | | | | | | | | |
| | | | | |
Variable Rate Securities—Continued | | | | | | | | | | | | | |
Washington Mutual Inc. 2005-AR12 | | | | 4.826% | | 10/25/35 | | $ | 241,055 | | $ | 166,187 | |
| | | | | | | | | | | | | |
| | | | | | | | | | | | 2,994,941 | |
| | | | | | | | | | | | | |
Total Mortgage-Backed Securities
(Cost—$5,283,818) | | | | | | | | | | | | 4,882,385 | |
Municipal Bonds | | 0.1% | | | | | | | | | | | |
| | | | | |
California | | 0.1% | | | | | | | | | | | |
State of California Series 2009 | | | | 6.200% | | 10/1/19 | | | 50,000 | | | 48,246 | |
| | | | | | | | | | | | | |
Total Municipal Bonds (Cost—$50,519) | | | | | | | | | | | | 48,246 | |
U.S. Government and Agency Obligations | | 21.2% | | | | | | | | | | | |
| | | | | |
Fixed Rate Securities | | 19.9% | | | | | | | | | | | |
Fannie Mae | | | | 6.250% | | 2/1/11 | | | 10,000 | | | 10,506 | I |
Fannie Mae | | | | 5.250% | | 8/1/12 | | | 520,000 | | | 554,908 | I |
Fannie Mae | | | | 4.625% | | 5/1/13 | | | 180,000 | | | 189,365 | I |
Fannie Mae | | | | 2.625% | | 11/20/14 | | | 810,000 | | | 803,719 | I |
Fannie Mae | | | | 5.000% | | 2/13/17 | | | 620,000 | | | 673,008 | I |
Fannie Mae | | | | 0.000% | | 10/9/19 | | | 840,000 | | | 456,120 | I,J |
Farmer Mac | | | | 3.000% | | 9/22/14 | | | 30,000 | | | 30,096 | |
Farmer Mac | | | | 5.125% | | 4/19/17 | | | 400,000 | | | 416,882 | B |
Freddie Mac | | | | 2.000% | | 2/25/11 | | | 880,000 | | | 881,666 | I |
Freddie Mac | | | | 1.750% | | 6/15/12 | | | 200,000 | | | 200,886 | I |
Tennessee Valley Authority | | | | 5.625% | | 1/18/11 | | | 10,000 | | | 10,519 | |
Tennessee Valley Authority | | | | 6.790% | | 5/23/12 | | | 210,000 | | | 235,264 | |
Tennessee Valley Authority | | | | 5.980% | | 4/1/36 | | | 10,000 | | | 10,631 | |
Tennessee Valley Authority | | | | 5.250% | | 9/15/39 | | | 160,000 | | | 158,537 | |
United States Treasury Bonds | | | | 4.500% | | 8/15/39 | | | 225,000 | | | 219,902 | |
United States Treasury Notes | | | | 1.125% | | 12/15/12 | | | 240,000 | | | 236,155 | |
United States Treasury Notes | | | | 2.125% | | 11/30/14 | | | 3,620,000 | | | 3,534,315 | |
United States Treasury Notes | | | | 4.000% | | 2/15/15 | | | 80,000 | | | 85,025 | |
United States Treasury Notes | | | | 2.750% | | 11/30/16 | | | 1,670,000 | | | 1,607,766 | |
United States Treasury Notes | | | | 3.250% | | 12/31/16 | | | 210,000 | | | 208,228 | |
United States Treasury Notes | | | | 3.375% | | 11/15/19 | | | 840,000 | | | 807,979 | |
| | | | | | | | | | | | | |
| | | | | | | | | | | | 11,331,477 | |
| | | | | | | | | | | | | |
Treasury Inflation-Protected SecuritiesK | | 1.3% | | | | | | | | | | | |
United States Treasury Inflation-Protected Security | | | | 2.375% | | 1/15/25 | | | 80,277 | | | 84,704 | |
United States Treasury Inflation-Protected Security | | | | 1.750% | | 1/15/28 | | | 433,381 | | | 415,572 | |
131
Annual Report to Shareholders
Portfolio of Investments—Continued
Western Asset Intermediate Plus Bond Portfolio—Continued
| | | | | | | | | | | | | |
| | | % OF
NET ASSETS | | RATE | | MATURITY
DATE | | PAR/
SHARES† | | VALUE | |
| | | | | | | | | | | | | |
U.S. Government and Agency Obligations—Continued | | | | | | | | | | | | | |
| | | | | |
Treasury Inflation-Protected Securities—Continued | | | | | | | | | | | | | |
United States Treasury Inflation-Protected Security | | | | 2.500% | | 1/15/29 | | $ | 241,644 | | $ | 259,182 | |
| | | | | | | | | | | | | |
| | | | | | | | | | | | 759,458 | |
| | | | | | | | | | | | | |
Total U.S. Government and Agency Obligations
(Cost—$12,177,560) | | | | | | | | | | | | 12,090,935 | |
U.S. Government Agency Mortgage-Backed Securities | | 0.7% | | | | | | | | | | | |
| | | | | |
Indexed SecuritiesD | | 0.7% | | | | | | | | | | | |
Fannie Mae | | | | 3.592% | | 12/1/34 | | | 339,176 | | | 348,700 | I |
Freddie Mac | | | | 3.834% | | 1/1/35 | | | 11,935 | | | 12,369 | I |
Freddie Mac | | | | 3.965% | | 1/1/35 | | | 20,061 | | | 20,599 | I |
| | | | | | | | | | | | | |
Total U.S. Government Agency
Mortgage-Backed Securities (Cost—$372,570) | | | | | | | | | | 381,668 | |
Yankee BondsG | | 13.8% | | | | | | | | | | | |
| | | | | |
Beverages | | 0.3% | | | | | | | | | | | |
Diageo Capital PLC | | | | 7.375% | | 1/15/14 | | | 140,000 | | | 161,954 | |
| | | | | | | | | | | | | |
| | | | | |
Capital Markets | | 0.6% | | | | | | | | | | | |
NIBC Bank NV | | | | 2.800% | | 12/2/14 | | | 320,000 | | | 311,386 | B |
| | | | | | | | | | | | | |
| | | | | |
Commercial Banks | | 6.8% | | | | | | | | | | | |
Achmea Hypotheekbank NV | | | | 3.200% | | 11/3/14 | | | 470,000 | | | 469,090 | B |
ANZ National (Int’l) Ltd. | | | | 2.375% | | 12/21/12 | | | 200,000 | | | 198,543 | B |
Barclays Bank PLC | | | | 5.200% | | 7/10/14 | | | 190,000 | | | 201,401 | |
Barclays Bank PLC | | | | 10.179% | | 6/12/21 | | | 80,000 | | | 103,254 | B |
BNP Paribas | | | | 2.125% | | 12/21/12 | | | 100,000 | | | 99,484 | |
Commonwealth Bank of Australia | | | | 2.900% | | 9/17/14 | | | 690,000 | | | 678,563 | B |
Commonwealth Bank of Australia | | | | 3.750% | | 10/15/14 | | | 70,000 | | | 70,170 | B |
Credit Agricole SA | | | | 8.375% | | 12/31/49 | | | 160,000 | | | 169,600 | B,C |
Glitnir Banki Hf | | | | 5.815% | | 1/21/11 | | | 640,000 | | | 134,400 | A,B,D,L |
Glitnir Banki Hf | | | | 5.678% | | 1/18/12 | | | 100,000 | | | 21,000 | A,B,D,L |
Glitnir Banki Hf | | | | 6.375% | | 9/25/12 | | | 260,000 | | | 54,600 | A,B,L |
Glitnir Banki Hf | | | | 6.693% | | 6/15/16 | | | 100,000 | | | 10 | A,B,C,L |
Kaupthing Bank Hf | | | | 5.750% | | 10/4/11 | | | 580,000 | | | 143,550 | A,B,L |
Kaupthing Bank Hf | | | | 7.625% | | 2/28/15 | | | 360,000 | | | 89,100 | A,B,L |
132
Annual Report to Shareholders
| | | | | | | | | | | | | |
| | | % OF
NET ASSETS | | RATE | | MATURITY
DATE | | PAR/
SHARES† | | VALUE | |
| | | | | | | | | | | | | |
Yankee Bonds—Continued | | | | | | | | | | | | | |
| | | | | |
Commercial Banks—Continued | | | | | | | | | | | | | |
Landsbanki Islands Hf | | | | 6.100% | | 8/25/11 | | $ | 330,000 | | $ | 14,850 | A,B,L |
Landsbanki Islands Hf | | | | 7.431% | | 10/19/17 | | | 250,000 | | | 25 | A,B,C,L |
Nordea Bank AB | | | | 3.700% | | 11/13/14 | | | 110,000 | | | 109,788 | B |
Rabobank Nederland NV | | | | 11.000% | | 12/29/49 | | | 90,000 | | | 109,733 | B,C |
Royal Bank of Scotland Group PLC | | | | 6.400% | | 10/21/19 | | | 130,000 | | | 129,583 | |
Royal Bank of Scotland Group PLC | | | | 9.118% | | 3/31/49 | | | 180,000 | | | 164,700 | |
Santander Issuances | | | | 5.805% | | 6/20/16 | | | 140,000 | | | 130,200 | B,C |
Shinsei Finance Cayman Ltd. | | | | 6.418% | | 1/29/49 | | | 500,000 | | | 291,250 | B,C |
Westpac Banking Corp. | | | | 3.250% | | 12/16/11 | | | 240,000 | | | 247,783 | B |
Westpac Banking Corp. | | | | 2.500% | | 5/25/12 | | | 240,000 | | | 243,341 | B |
| | | | | | | | | | | | | |
| | | | | | | | | | | | 3,874,018 | |
| | | | | | | | | | | | | |
Diversified Financial Services | | 1.2% | | | | | | | | | | | |
CDP Financial Inc. | | | | 4.400% | | 11/25/19 | | | 250,000 | | | 239,472 | B |
MUFG Capital Finance 1 Ltd. | | | | 6.346% | | 7/29/49 | | | 300,000 | | | 273,044 | C |
TNK-BP Finance SA | | | | 6.875% | | 7/18/11 | | | 180,000 | | | 185,850 | B |
| | | | | | | | | | | | | |
| | | | | | | | | | | | 698,366 | |
| | | | | | | | | | | | | |
Diversified Telecommunication Services | | 1.5% | | | | | | | | | | | |
Deutsche Telekom International Finance BV | | | | 5.750% | | 3/23/16 | | | 350,000 | | | 371,648 | |
Intelsat Bermuda Ltd. | | | | 11.250% | | 6/15/16 | | | 30,000 | | | 32,475 | |
Intelsat Jackson Holdings Ltd. | | | | 9.500% | | 6/15/16 | | | 15,000 | | | 16,050 | |
Telecom Italia Capital SpA | | | | 5.250% | | 10/1/15 | | | 220,000 | | | 230,020 | |
Telefonica Emisiones S.A.U. | | | | 0.609% | | 2/4/13 | | | 200,000 | | | 196,890 | D |
| | | | | | | | | | | | | |
| | | | | | | | | | | | 847,083 | |
| | | | | | | | | | | | | |
Energy Equipment and Services | | 0.4% | | | | | | | | | | | |
Transocean Inc. | | | | 5.250% | | 3/15/13 | | | 220,000 | | | 235,761 | |
| | | | | | | | | | | | | |
| | | | | |
Industrial Conglomerates | | 0.4% | | | | | | | | | | | |
Tyco International Group SA | | | | 6.000% | | 11/15/13 | | | 200,000 | | | 219,077 | |
| | | | | | | | | | | | | |
| | | | | |
Media | | 0.2% | | | | | | | | | | | |
WPP Finance | | | | 8.000% | | 9/15/14 | | | 120,000 | | | 136,471 | |
| | | | | | | | | | | | | |
| | | | | |
Metals and Mining | | 1.3% | | | | | | | | | | | |
BHP Billiton Finance USA Ltd. | | | | 6.500% | | 4/1/19 | | | 150,000 | | | 172,059 | |
Rio Tinto Finance USA Ltd. | | | | 8.950% | | 5/1/14 | | | 300,000 | | | 359,490 | M |
Teck Resources Ltd. | | | | 9.750% | | 5/15/14 | | | 5,000 | | | 5,769 | |
Teck Resources Ltd. | | | | 10.250% | | 5/15/16 | | | 5,000 | | | 5,825 | |
133
Annual Report to Shareholders
Portfolio of Investments—Continued
Western Asset Intermediate Plus Bond Portfolio—Continued
| | | | | | | | | | | | | | |
| | | % OF
NET ASSETS | | RATE | | MATURITY
DATE | | PAR/
SHARES† | | | VALUE | |
| | | | | | | | | | | | | | |
Yankee Bonds—Continued | | | | | | | | | | | | | | |
| | | | | |
Metals and Mining—Continued | | | | | | | | | | | | | | |
Teck Resources Ltd. | | | | 10.750% | | 5/15/19 | | $ | 10,000 | | | $ | 11,950 | |
Vale Overseas Ltd. | | | | 6.250% | | 1/23/17 | | | 190,000 | | | | 198,192 | |
| | | | | | | | | | | | | | |
| | | | | | | | | | | | | 753,285 | |
| | | | | | | | | | | | | | |
Oil, Gas and Consumable Fuels | | 0.9% | | | | | | | | | | | | |
OPTI Canada Inc. | | | | 8.250% | | 12/15/14 | | | 100,000 | | | | 82,375 | |
Petrobras International Finance Co. | | | | 5.750% | | 1/20/20 | | | 159,000 | | | | 161,748 | |
Petroleos Mexicanos | | | | 8.000% | | 5/3/19 | | | 210,000 | | | | 243,075 | |
| | | | | | | | | | | | | | |
| | | | | | | | | | | | | 487,198 | |
| | | | | | | | | | | | | | |
Road and Rail | | 0.1% | | | | | | | | | | | | |
Kansas City Southern de Mexico SA de CV | | | | 12.500% | | 4/1/16 | | | 45,000 | | | | 51,750 | |
| | | | | | | | | | | | | | |
| | | | | |
Wireless Telecommunication Services | | 0.1% | | | | | | | | | | | | |
America Movil SA de CV | | | | 5.625% | | 11/15/17 | | | 70,000 | | | | 72,474 | |
| | | | | | | | | | | | | | |
Total Yankee Bonds (Cost—$9,912,154) | | | | | | | | | | | | | 7,848,823 | |
Common Stocks and Equity Interests | | N.M. | | | | | | | | | | | | |
| | | | | |
Oil, Gas and Consumable Fuels | | N.M. | | | | | | | | | | | | |
SemGroup Corp., Class A | | | | | | | | | 52 | shs | | | 1,242 | F,N |
| | | | | | | | | | | | | | |
Total Common Stocks and Equity Interests (Cost—$1,600) | | | | | | | | | | | | | 1,242 | |
Preferred Stocks | | 0.3% | | | | | | | | | | | | |
Fannie Mae | | | | 8.250% | | | | | 8,850 | | | | 9,735 | I,N |
Freddie Mac | | | | 8.375% | | | | | 12,075 | | | | 12,679 | I,N |
GMAC Inc. | | | | 7.000% | | | | | 258 | | | | 170,054 | B,N |
| | | | | | | | | | | | | | |
Total Preferred Stocks (Cost—$583,049) | | | | | | | | | | | | | 192,468 | |
Warrants | | N.M. | | | | | | | | | | | | |
| | | | | |
Oil, Gas and Consumable Fuels | | N.M. | | | | | | | | | | | | |
SemGroup Corp. | | | | | | 11/30/14 | | | 54 | wts | | | — | F,L,N |
| | | | | | | | | | | | | | |
Total Warrants (Cost—$—) | | | | | | | | | | | | | — | |
| | | | | | | | | | | | | | |
Total Long-Term Securities (Cost—$54,151,831) | | | | | | | | | | | | | 50,520,096 | |
Short-Term Securities | | 10.7% | | | | | | | | | | | | |
| | | | | |
U.S. Government and Agency Obligations | | 5.4% | | | | | | | | | | | | |
Fannie Mae | | | | 0.400% | | 1/25/10 | | $ | 436,000 | | | | 435,884 | I,O ,Q |
Fannie Mae | | | | 0.330% | | 2/1/10 | | | 470,000 | | | | 469,867 | I,O ,Q |
Fannie Mae | | | | 0.080% | | 2/16/10 | | | 2,200,000 | | | | 2,199,775 | I ,Q |
| | | | | | | | | | | | | | |
| | | | | | | | | | | | | 3,105,526 | |
| | | | | | | | | | | | | | |
134
Annual Report to Shareholders
| | | | | | | | | |
| | | % OF
NET ASSETS | | PAR/
SHARES† | | | VALUE |
| | | | | | | | | |
Short-Term Securities—Continued | | | | | | | | | |
| | | |
Options Purchased | | 0.1% | | | | | | | |
Eurodollar Futures Put, March 2010, Strike Price $99.13 | | | | | 25 | P | | $ | 625 |
U.S. Treasury Note Futures Call, February 2010, Strike Price $116.50 | | | | | 26 | P | | | 9,344 |
U.S. Treasury Note Futures Put, February 2010, Strike Price $116.50 | | | | | 18 | P | | | 25,312 |
| | | | | | | | | |
| | | | | | | | | 35,281 |
| | | | | | | | | |
Repurchase Agreement | | 5.2% | | | | | | | |
Bank of America repurchase agreement dated 12/31/09, 0.010% due 1/4/10; Proceeds at maturity—$2,946,003; (Fully collateralized by U.S. Government Obligation, 4.125% due 5/15/15; Market value—$3,004,919) | | | | $ | 2,946,000 | | | | 2,946,000 |
| | | | | | | | | |
Total Short-Term Securities (Cost—$6,085,765) | | | | | | | | | 6,086,807 |
Total Investments (Cost—$60,237,596#) | | 99.5% | | | | | | | 56,606,903 |
Other Assets Less Liabilities | | 0.5% | | | | | | | 261,661 |
| | | | | | | | | |
| | | |
Net Assets | | 100.0% | | | | | | $ | 56,868,564 |
| | | | | | | | | |
| | | | | | | | |
| | | EXPIRATION | | ACTUAL
CONTRACTS | | APPRECIATION/
(DEPRECIATION) | |
Futures Contracts PurchasedR | | | | | | | | |
Eurodollar Futures | | December 2011 | | 24 | | $ | 147 | |
U.S. Treasury Bond Futures | | March 2010 | | 4 | | | (9,310 | ) |
U.S. Treasury Note Futures | | March 2010 | | 10 | | | (1,142 | ) |
U.S. Treasury Note Futures | | March 2010 | | 54 | | | (102,995 | ) |
| | | | | | | | |
| | | | | | | $(113,300) | |
| | | | | | | | |
Futures Contracts WrittenR | | | | | | | | |
Eurodollar Futures | | December 2010 | | 24 | | $ | (6,778 | ) |
German Euro Bund Futures | | March 2010 | | 6 | | | 14,608 | |
U.S. Treasury Note Futures | | March 2010 | | 1 | | | 903 | |
| | | | | | | | |
| | | | | | $ | 8,733 | |
| | | | | | | | |
Options WrittenR | | | | | | | | |
Eurodollar Futures Call, Strike Price $98.75 | | September 2010 | | 28 | | $ | 2,347 | |
Eurodollar Futures Call, Strike Price $99.25 | | September 2010 | | 13 | | | 2,927 | |
Eurodollar Futures Call, Strike Price $99.38 | | June 2010 | | 18 | | | 1,954 | |
Eurodollar Futures Put, Strike Price $98.50 | | March 2010 | | 25 | | | 10,256 | |
Eurodollar Futures Put, Strike Price $98.75 | | September 2010 | | 38 | | | 2,102 | |
Eurodollar Futures Put, Strike Price $99.38 | | June 2010 | | 18 | | | (1,134 | ) |
135
Annual Report to Shareholders
Portfolio of Investments—Continued
Western Asset Intermediate Plus Bond Portfolio—Continued
| | | | | | | | |
| | | EXPIRATION | | ACTUAL
CONTRACTS | | APPRECIATION/
(DEPRECIATION) | |
Options Written—Continued | | | | | | | | |
U.S. Treasury Note Futures Call, Strike Price $118.00 | | February 2010 | | 26 | | $ | 3,587 | |
U.S. Treasury Note Futures Put, Strike Price $115.00 | | February 2010 | | 18 | | | (9,621 | ) |
| | | | | | | | |
| | | | | | $ | 12,418 | |
| | | | | | �� | | |
| | | | | | | | | |
N.M.—Not Meaningful.
| † | | Securities are denominated in U.S. Dollars, unless otherwise noted. |
| A | | The coupon payment on these securities is currently in default as of December 31, 2009. |
| B | | Rule 144a Security – A security purchased pursuant to Rule 144a under the Securities Act of 1933 which may not be resold subject to that rule except to qualified institutional buyers. These securities, which the Fund’s investment adviser has determined to be liquid, unless otherwise noted, represent 12.57% of net assets. |
| C | | Stepped Coupon Security – A security with a predetermined schedule of interest or dividend rate changes at which time it begins to accrue interest or pay dividends according to the predetermined schedule. |
| D | | Indexed Security – The rates of interest earned on these securities are tied to the London Interbank Offered Rate (“LIBOR”), the Euro Interbank Offered Rate (“EURIBOR”) Index, the Consumer Price Index (“CPI”), the one-year Treasury Bill Rate or the ten-year Japanese Government Bond Rate. The coupon rates are the rates as of December 31, 2009. |
| E | | Pay-in-Kind (“PIK”) security – A security in which interest or dividends during the initial few years is paid in additional PIK securities rather than in cash. |
| F | | Security is valued in good faith at fair value by or under the direction of the Board of Directors. |
| G | | Yankee Bond – A dollar-denominated bond issued in the U.S. by foreign entities. |
| H | | The coupon rates shown on variable rate securities are the rates at December 31, 2009. These rates vary with the weighted average coupon of the underlying loans. |
| I | | On September 7, 2008, the Federal Housing Finance Agency placed Fannie Mae and Freddie Mac into conservatorship. |
| J | | Zero coupon bond – A bond with no periodic interest payments which is sold at such a discount as to produce a current yield to maturity. |
| K | | Treasury Inflation-Protected Security –Treasury security whose principal value is adjusted daily in accordance with changes to the Consumer Price Index for All Urban Consumers. Interest is calculated on the basis of the current adjusted principal value. |
| M | | Credit Linked Security – The rates of interest earned on these securities are tied to the credit rating assigned by Standard & Poor’s Rating Service and/or Moody’s Investors Services. |
| O | | All or a portion of this security is collateral to cover futures and options contracts written. |
| P | | Par represents actual number of contracts. |
| Q | | Rate shown represents yield-to-maturity. |
| R | | Options written and futures are described in more detail in the notes to financial statements. |
| # | | Aggregate cost for federal income tax purposes is $60,277,216. |
Abbreviation used in this Portfolio:
EUR—Euro
See notes to financial statements.
136
Annual Report to Shareholders
Statement of Assets and Liabilities
Western Asset Intermediate Plus Bond Portfolio
December 31, 2009
| | | | | | | |
Assets: | | | | | | | |
Investment securities at value (Cost—$54,151,831) | | | | | $ | 50,520,096 | |
Short-term securities at value (Cost—$6,085,765) | | | | | | 6,086,807 | |
Cash | | | | | | 588 | |
Foreign currency at value (Cost—$29,324) | | | | | | 28,315 | |
Interest receivable | | | | | | 519,179 | |
Unrealized appreciation of forward foreign currency contracts | | | | | | 86,549 | |
Premiums paid on open swaps | | | | | | 43,631 | |
Deposits with brokers for open futures contracts | | | | | | 9,433 | |
Amounts receivable for open swaps | | | | | | 79 | |
| | | | | | | |
Total assets | | | | | | 57,294,677 | |
| | | | | | | |
| | |
Liabilities: | | | | | | | |
Unrealized depreciation of swaps | | $ | 117,672 | | | | |
Options written (Proceeds—$106,886) | | | 94,468 | | | | |
Unrealized depreciation of forward foreign currency contracts | | | 90,327 | | | | |
Income distribution payable | | | 27,182 | | | | |
Accrued management fee | | | 13,596 | | | | |
Futures variation margin payable | | | 7,620 | | | | |
Amounts payable for open swaps | | | 705 | | | | |
Accrued expenses | | | 74,543 | | | | |
| | | | | | | |
Total liabilities | | | | | | 426,113 | |
| | | | | | | |
| | |
Net Assets | | | | | $ | 56,868,564 | |
| | | | | | | |
| | |
Net assets consist of: | | | | | | | |
Accumulated paid-in-capital (Note 7) | | | | | $ | 61,507,796 | |
Underdistributed net investment income | | | | | | 94,381 | |
Accumulated net realized loss on investments, options, futures, swaps
and foreign currency transactions | | | | | | (888,312 | ) |
Net unrealized depreciation of investments, options, futures, swaps
and foreign currency translations | | | | | | (3,845,301 | ) |
| | | | | | | |
| | |
Net Assets | | | | | $ | 56,868,564 | |
| | | | | | | |
| | |
Net Asset Value Per Share: | | | | | | | |
Institutional Class (5,118,929 shares outstanding) | | | | | | $9.79 | |
| | | | | | | |
Institutional Select Class (687,976 shares outstanding) | | | | | | $9.78 | |
| | | | | | | |
| | | | | | | | |
See notes to financial statements.
137
Annual Report to Shareholders
Statement of Operations
Western Asset Intermediate Plus Bond Portfolio
| | | | | | | |
| | | FOR THE
YEAR ENDED
DECEMBER 31, 2009 |
Investment Income: | | | | | | | |
Interest | | $ | 3,589,089 | | | | |
Dividends | | | 16,084 | | | | |
Less: Foreign taxes withheld | | | (2,207 | ) | | | |
| | | | | | | |
Total income | | | | | | $ | 3,602,966 |
Expenses: | | | | | | | |
Management fees (Note 2) | | | 285,481 | | | | |
Audit and legal fees | | | 83,471 | | | | |
Registration fees | | | 35,032 | | | | |
Custodian fees | | | 30,350 | | | | |
Transfer agent and shareholder servicing expense (Note 6) | | | 19,063 | | | | |
Reports to shareholders (Note 6) | | | 6,451 | | | | |
Directors’ fees and expenses | | | 3,766 | | | | |
Other expenses | | | 25,359 | | | | |
| | | | | | | |
| | | 488,973 | | | | |
Less: Fees waived (Notes 2 and 6) | | | (157,493 | ) | | | |
| | | | | | | |
Net expenses | | | | | | | 331,480 |
| | | | | | | |
Net Investment Income | | | | | | | 3,271,486 |
Net Realized and Unrealized Gain/(Loss) on Investments (Notes 1, 3 and 4): | | | | | | | |
Net realized gain/(loss) on: | | | | | | | |
Investments | | | (1,284,133 | ) | | | |
Options written | | | 477,174 | | | | |
Futures | | | 554,306 | | | | |
Swaps | | | 342,038 | | | | |
Foreign currency transactions | | | 60,217 | | | | |
| | | | | | | |
| | | | | | | 149,602 |
Change in unrealized appreciation/(depreciation) of: | | | | | | | |
Investments | | | 10,598,075 | | | | |
Options written | | | 551,250 | | | | |
Futures | | | (1,132,037 | ) | | | |
Swaps | | | (35,576 | ) | | | |
Foreign currency translations | | | (68,450 | ) | | | |
| | | | | | | |
| | | | | | | 9,913,262 |
| | | | | | | |
Net Realized and Unrealized Gain on Investments | | | | | | | 10,062,864 |
| | | | | | | | |
Change in Net Assets Resulting From Operations | | | | | | $ | 13,334,350 |
| | | | | | | | |
See notes to financial statements.
138
Annual Report to Shareholders
Statement of Changes in Net Assets
Western Asset Intermediate Plus Bond Portfolio
| | | | | | | | | | | | |
| | | FOR THE
YEAR ENDED
DECEMBER 31, 2009 | | | FOR THE
PERIOD ENDED
DECEMBER 31, 2008A | | | FOR THE
YEAR ENDED
MARCH 31, 2008 | |
Change in Net Assets: | | | | | | | | | | | | |
Net investment income | | $ | 3,271,486 | | | $ | 3,347,354 | | | $ | 5,072,758 | |
| | | |
Net realized gain | | | 149,602 | | | | 713,552 | | | | 1,686,370 | |
| | | |
Change in unrealized appreciation/(depreciation) | | | 9,913,262 | | | | (9,623,728 | ) | | | (4,387,095 | ) |
| | | | | | | | | | | | |
Change in net assets resulting from operations | | | 13,334,350 | | | | (5,562,822 | ) | | | 2,372,033 | |
| | | |
Distributions to shareholders from (Note 1): | | | | | | | | | | | | |
Net investment income: | | | | | | | | | | | | |
Institutional Class | | | (2,901,648 | ) | | | (3,930,720 | ) | | | (4,962,617 | ) |
Institutional Select Class | | | (296,845 | ) | | | (114,207 | ) | | | N/A | |
| | | |
Net realized gain on investments: | | | | | | | | | | | | |
Institutional Class | | | — | | | | (2,548,887 | ) | | | (254,925 | ) |
Institutional Select Class | | | — | | | | — | | | | N/A | |
| | | |
Change in net assets from fund share transactions (Note 7): | | | | | | | | | | | | |
Institutional Class | | | (29,196,841 | ) | | | (28,378,624 | ) | | | 26,837,152 | |
Institutional Select Class | | | (1,220,000 | ) | | | 6,871,040 | | | | N/A | |
| | | | | | | | | | | | |
Change in net assets | | | (20,280,984 | ) | | | (33,664,220 | ) | | | 23,991,643 | |
| | | |
Net Assets: | | | | | | | | | | | | |
Beginning of year | | | 77,149,548 | | | | 110,813,768 | | | | 86,822,125 | |
| | | | | | | | | | | | |
| | | |
End of year | | $ | 56,868,564 | | | $ | 77,149,548 | | | $ | 110,813,768 | |
| | | | | | | | | | | | |
| | | |
Undistributed (Overdistributed) net investment income, respectively, of | | $ | 94,381 | | | $ | (185,602 | ) | | $ | 34,069 | |
| | | | | | | | | | | | |
| | | | | | | | | | | | | |
| A | | For the period April 1, 2008 to December 31, 2008. |
N/A—Not applicable
See notes to financial statements.
139
Annual Report to Shareholders
Financial Highlights
Western Asset Intermediate Plus Bond Portfolio
For a share of each class of capital stock outstanding:
Institutional Class:
| | | | | | | | | | | | | | | | | | | | | | | | |
| | | YEAR ENDED
DECEMBER 31,
2009 | | | PERIOD ENDED
DECEMBER 31,
2008A | | | YEARS ENDED MARCH 31, | |
| | | | 2008 | | | 2007 | | | 2006 | | | 2005 | |
Net asset value, beginning of year | | $ | 8.54 | | | $ | 9.67 | | | $ | 9.95 | | | $ | 9.74 | | | $ | 9.86 | | | $ | 10.00 | |
| | | | | | | | | | | | | | | | | | | | | | | | |
Investment operations: | | | | | | | | | | | | | | | | | | | | | | | | |
Net investment income | | | .42 | B | | | .32 | B | | | .49 | B | | | .45 | B | | | .40 | C | | | .32 | C |
Net realized and unrealized gain/(loss) | | | 1.24 | | | | (.81 | ) | | | (.26 | ) | | | .21 | | | | (.11 | ) | | | (.14 | ) |
| | | | | | | | | | | | | | | | | | | | | | | | |
Total from investment operations | | | 1.66 | | | | (.49 | ) | | | .23 | | | | .66 | | | | .29 | | | | .18 | |
| | | | | | | | | | | | | | | | | | | | | | | | |
Distributions from: | | | | | | | | | | | | | | | | | | | | | | | | |
Net investment income | | | (.41 | ) | | | (.40 | ) | | | (.49 | ) | | | (.45 | ) | | | (.41 | ) | | | (.32 | ) |
Net realized gain on investments | | | — | | | | (.24 | ) | | | (.02 | ) | | | — | | | | — | | | | — | |
| | | | | | | | | | | | | | | | | | | | | | | | |
Total distributions | | | (.41 | ) | | | (.64 | ) | | | (.51 | ) | | | (.45 | ) | | | (.41 | ) | | | (.32 | ) |
| | | | | | | | | | | | | | | | | | | | | | | | |
Net asset value, end of year | | $ | 9.79 | | | $ | 8.54 | | | $ | 9.67 | | | $ | 9.95 | | | $ | 9.74 | | | $ | 9.86 | |
| | | | | | | | | | | | | | | | | | | | | | | | |
Total returnD | | | 19.84 | % | | | (5.37 | )% | | | 2.35 | % | | | 6.98 | % | | | 2.99 | % | | | 1.81 | % |
| | | | | | |
Ratios to Average Net Assets: | | | | | | | | | | | | | | | | | | | | | | | | |
Total expensesE | | | .68 | % | | | .64 | %F | | | .58 | % | | | .63 | % | | | .76 | % | | | 1.22 | % |
Expenses net of waivers, if anyE | | | .47 | % | | | .49 | %F | | | .45 | % | | | .45 | % | | | .45 | % | | | .45 | % |
Expenses net of all reductionsE | | | .47 | % | | | .49 | %F | | | .45 | % | | | .45 | % | | | .45 | % | | | .45 | % |
Net investment income | | | 4.6 | % | | | 4.7 | %F | | | 5.0 | % | | | 4.6 | % | | | 4.1 | % | | | 3.1 | % |
| | | | | | |
Supplemental Data: | | | | | | | | | | | | | | | | | | | | | | | | |
Portfolio turnover rate | | | 153.7 | % | | | 181.5 | %G | | | 300.0 | % | | | 312.2 | % | | | 368.6 | % | | | 463.5 | % |
Net assets, end of year (in thousands) | | $ | 50,139 | | | $ | 70,093 | | | $ | 110,814 | | | $ | 86,822 | | | $ | 69,908 | | | $ | 40,637 | |
| | | | | | | | | | | | | | | | | | | | | | | | | |
| A | | For the period April 1, 2008 to December 31, 2008. |
| B | | Computed using average daily shares outstanding. |
| C | | Computed using SEC method. |
| D | | Performance figures may reflect compensating balance credits, fee waivers and/or expense reimbursements. In the absence of compensating balance credits, fee waivers and/or expense reimbursements, the total return would have been lower. Past performance is no guarantee of future results. Total returns for periods of less than one year are not annualized. |
| E | | Total expenses reflects operating expenses prior to any voluntary expense waivers and/or compensating balance credits. Expenses net of waivers reflects total expenses before compensating balance credits but net of any voluntary expense waivers. Expenses net of all reductions reflects expenses less any compensating balance credits and/or voluntary expense waivers. |
See notes to financial statements.
140
Annual Report to Shareholders
For a share of each class of capital stock outstanding:
Institutional Select Class:
| | | | | | | | |
| | | YEAR ENDED
DECEMBER 31,
2009 | | | PERIOD ENDED
DECEMBER 31,
2008A | |
Net asset value, beginning of year | | $ | 8.53 | | | $ | 8.31 | |
| | | | | | | | |
Investment operations: | | | | | | | | |
Net investment incomeB | | | .42 | | | | .05 | |
Net realized and unrealized gain | | | 1.24 | | | | .31 | |
| | | | | | | | |
Total from investment operations | | | 1.66 | | | | .36 | |
| | | | | | | | |
Distributions from: | | | | | | | | |
Net investment income | | | (.41 | ) | | | (.14 | ) |
| | | | | | | | |
Total distributions | | | (.41 | ) | | | (.14 | ) |
| | | | | | | | |
Net asset value, end of year | | $ | 9.78 | | | $ | 8.53 | |
| | | | | | | | |
Total returnC | | | 19.89 | % | | | 4.32 | % |
| | |
Ratios to Average Net Assets: | | | | | | | | |
Total expensesD | | | .76 | % | | | .63 | %E |
Expenses net of waivers, if anyD | | | .45 | % | | | .45 | %E |
Expenses net of all reductionsD | | | .45 | % | | | .45 | %E |
Net investment income | | | 4.6 | % | | | 4.6 | %E |
| | |
Supplemental Data: | | | | | | | | |
Portfolio turnover rate | | | 153.7 | % | | | 181.5 | %F |
Net assets, end of year (in thousands) | | $ | 6,730 | | | $ | 7,057 | |
| | | | | | | | | |
| A | | For the period November 10, 2008 (commencement of operations) to December 31, 2008. |
| B | | Computed using average daily shares outstanding. |
| C | | Performance figures may reflect compensating balance credits, fee waivers and/or expense reimbursements. In the absence of compensating balance credits, fee waivers and/or expense reimbursements, the total return would have been lower. Past performance is no guarantee of future results. Total returns for periods of less than one year are not annualized. |
| D | | Total expenses reflects operating expenses prior to any voluntary expense waivers and/or compensating balance credits. Expenses net of waivers reflects total expenses before compensating balance credits but net of any voluntary expense waivers. Expenses net of all reductions reflects expenses less any compensating balance credits and/or voluntary expense waivers. |
See notes to financial statements.
141
Annual Report to Shareholders
Management’s Discussion of Fund Performance
Western Asset Limited Duration Bond Portfolio
Performance Review
For the twelve months ended December 31, 2009, Institutional Class shares of Western Asset Limited Duration Bond Portfolio returned 16.38%. The Fund’s unmanaged benchmark, the Merrill Lynch 1-3 Year Treasury Indexi (the “Index”), returned 0.78% for the same period. The Lipper Short-Intermediate Investment Grade Debt Funds Category Average1 returned 11.84% over the same time frame.
PERFORMANCE SNAPSHOT as of December 31, 2009 (unaudited)
| | | | |
| | | 6 MONTHS | | 12 MONTHS |
Western Asset Limited Duration Bond Portfolio: | | | | |
Institutional Class | | 7.45% | | 16.38% |
Institutional Select Class | | 7.47% | | 16.42% |
Merrill Lynch 1-3 Year Treasury Index | | 0.81% | | 0.78% |
Lipper Short-Intermediate Investment Grade Debt Funds Category Average1 | | 5.50% | | 11.84% |
The performance shown represents past performance. Past performance is no guarantee of future results and current performance may be higher or lower than the performance shown above. Principal value, investment returns and yields will fluctuate and investors’ shares, when redeemed, may be worth more or less than their original cost. To obtain performance data current to the most recent month-end, please visit our website at www.leggmason.com/individualinvestors.
All share class returns assume the reinvestment of all distributions, including returns of capital, if any, at net asset value and the deduction of all Fund expenses. Returns have not been adjusted to include the deduction of taxes that a shareholder would pay on Fund distributions. Performance figures for periods shorter than one year represent cumulative figures and are not annualized.
Performance figures reflect expense reimbursements and/or fee waivers, without which the performance would have been lower.
The 30-Day SEC Yields for the period ended December 31, 2009 for Institutional and Institutional Select Class shares were 2.75% and 2.79%, respectively. Absent current expense reimbursements and/or fee waivers, the 30-Day SEC Yields for Institutional and Institutional Select Class shares would have been 2.54% and 2.59%, respectively. The 30-Day SEC Yield is the average annualized net investment income per share for the 30-day period indicated and is subject to change.
TOTAL ANNUAL OPERATING EXPENSES (unaudited)
As of the Fund’s most current prospectus dated July 1, 2009, the gross total operating expense ratios for Institutional and Institutional Select Class shares were 0.63% and 0.72%, respectively.
Actual expenses may be higher. For example, expenses may be higher than those shown if average net assets decrease. Net assets are more likely to decrease and Fund expense ratios are more likely to increase when markets are volatile.
As a result of a contractual expense limitation, the ratio of expenses, other than interest, brokerage, taxes, deferred organizational expenses and extraordinary expenses, to average net assets will not exceed 0.40% for Institutional Select Class shares until April 30, 2010.
| 1 | | Lipper, Inc., a wholly-owned subsidiary of Reuters, provides independent insight on global collective investments. Returns are based on the period ended December 31, 2009, including the reinvestment of all distributions, including returns of capital, if any, calculated among the 152 funds for the six-month period and among the 150 funds for the twelve-month period in the Fund’s Lipper category. |
142
Annual Report to Shareholders
Improving market conditions and strong performance in the spread sectors (non-Treasuries) helped the Fund to significantly outperform its benchmark during the reporting period. The largest contributor to relative performance for the period was our overweight exposure to investment grade bonds. In particular, our Financials and Industrials holdings performed well as their spreads tightened from their elevated levels in 2008 and early 2009. Within this space, Goldman Sachs Capital II, Wells Fargo Capital, XTO Energy Inc. and Telefonica Emisiones S.A.U. meaningfully enhanced performance. Our overweight to agency mortgage-backed securities (“MBS”) also contributed to performance. The asset class posted solid returns due to the government’s direct purchase of these securities and improved housing data. Also benefiting performance was out-of-Index exposure to several “fallen angels” (investment grade corporate bonds that were subsequently downgraded to non-investment grade status). Within this area, our Financials holdings generated strong returns.
Detracting from the Fund’s strong results during the reporting period was our cash position, which was a drag on performance given the extremely low yields available from short-term money market instruments.
We made several adjustments to the portfolio during the twelve-month reporting period. We significantly reduced our exposure to agency MBS, finding them less attractive as their spreads had narrowed given the government’s direct purchase of these securities. With the government set to phase out its purchasing program, we determined that more attractive opportunities could be found in other areas of the market. We also pared our exposure to investment grade bonds and government agencies. In contrast, we increased the portfolio’s exposure to asset-backed securities, as their spreads did not tighten as much as other spread sectors.
During the reporting period, we utilized Eurodollar futures/options and Treasury futures/options to manage the portfolio’s durationii and yield curveiii exposure. Interest rate swaps were used to manage our interest rate exposure throughout the yield curve. We also utilized credit default swaps to manage the portfolio’s investment grade bond exposure. We employed Euro-bund futures to manage our yield curve exposure in Germany. Overall, the use of these derivative instruments was a modest contributor to performance.
Western Asset Management Company
January 19, 2010
143
Annual Report to Shareholders
Management’s Discussion of Fund Performance—Continued
The information provided is not intended to be a forecast of future events, a guarantee of future results or investment advice. Views expressed may differ from those of the firm as a whole.
Portfolio holdings and breakdowns are as of December 31, 2009 and are subject to change and may not be representative of the portfolio managers’ current or future investments. Please refer to pages 151 through 160 for a list and percentage breakdown of the Fund’s holdings.
The mention of sector breakdowns is for informational purposes only and should not be construed as a recommendation to purchase or sell any securities. The information provided regarding such sectors is not a sufficient basis upon which to make an investment decision. Investors seeking financial advice regarding the appropriateness of investing in any securities or investment strategies discussed should consult their financial professional. The Fund’s top five sector holdings (as a percentage of net assets) as of December 31, 2009 were: Corporate Bonds and Notes (24.5%), Yankee Bonds (18.3%), Asset-Backed Securities (16.1%), U.S. Government and Agency Obligations (11.6%) and U.S. Government Agency Mortgage-Backed Securities (10.7%). The Fund’s portfolio composition is subject to change at any time.
RISKS: All investments are subject to risk including the loss of principal. Fixed-income securities involve interest rate, credit, inflation and reinvestment risks. As interest rates rise, the value of fixed-income securities falls. Derivatives, such as options, futures and swaps, can be illiquid, may disproportionately increase losses, and have a potentially large impact on Fund performance. International investments are subject to special risks including social, economic and political uncertainties, which could increase volatility. Asset-backed, mortgage-backed or mortgage-related securities are subject to prepayment and extension risks. Diversification does not assure a profit or protect against market loss. Please see the Fund’s prospectus for more information on these and other risks.
All index performance reflects no deduction for fees, expenses or taxes. Please note that an investor cannot invest directly in an index.
| i | | The Merrill Lynch 1-3 Year Treasury Index is a market capitalization-weighted index including all U.S. Treasury notes and bonds with maturities greater than or equal to one year and less than three years. |
| ii | | Duration is the measure of the price sensitivity of a fixed-income security to an interest rate change of 100 basis points. Calculation is based on the weighted average of the present values for all cash flows. |
| iii | | The yield curve is the graphical depiction of the relationship between the yield on bonds of the same credit quality but different maturities. |
144
Annual Report to Shareholders
Expense Example (Unaudited)
Western Asset Limited Duration Bond Portfolio
As a shareholder of the Fund, you may incur two types of costs; (1) transaction cost and (2) ongoing costs, including management fees; distribution (12b-1) fees, and other Fund expenses. These examples are intended to help you understand your ongoing costs (in dollars) of investing in the Fund and to compare these costs with the ongoing costs of investing in other mutual funds.
The examples are based on an investment of $1,000 invested on July 1, 2009 and held through December 31, 2009. The ending values assume dividends were reinvested at the time they were paid.
Actual Expenses
The first line for each class in the table below provides information about actual account values and actual expenses for the Fund. You may use the information in this line, together with the amount you invested, to estimate the expenses that you paid over the period. Simply divide your account value by $1,000 (for example, an $8,600 account value divided by $1,000 = 8.6), then multiply the result by the number in the first line under the heading entitled “Expenses Paid During the Period” to estimate the expenses you paid on your account if your shares were held through the entire period.
Hypothetical Example for Comparison Purposes
The second line for each class in the table below provides information about hypothetical account values and hypothetical expenses based on the Fund’s actual expense ratio and an assumed rate of return of 5% per year before expenses, which is not the Fund’s actual return. The hypothetical account values and expenses may not be used to estimate the actual ending account balance or expenses you paid for the period. You may use this information to compare the ongoing costs of investing in the Fund and other funds. To do so, compare this 5% hypothetical example with the 5% hypothetical examples that appear in the shareholder reports of other funds. Because each example is intended to be comparable to the examples provided by other funds, it is based on a hypothetical investment of $1,000 invested on July 1, 2009 and held through December 31, 2009. The ending values assume dividends were reinvested at the time they were paid.
| | | | | | | | | | |
| | | Beginning
Account Value
7/1/09 | | | Ending
Account Value
12/31/09 | | Expenses Paid
During the PeriodA
7/1/09 to 12/31/09 |
Institutional Class: | | | | | | | | | | |
Actual | | $ | 1,000.00 | | | $ | 1,074.50 | | $ | 2.25 |
Hypothetical (5% return before expenses) | | | 1,000.00 | | | | 1,023.04 | | | 2.19 |
Institutional Select Class: | | | | | | | | | | |
Actual | | $ | 1,000.00 | | | $ | 1,074.70 | | $ | 2.09 |
Hypothetical (5% return before expenses) | | | 1,000.00 | | | | 1,023.19 | | | 2.04 |
| A | | These calculations are based on expenses incurred from July 1, 2009 to December 31, 2009. The dollar amounts shown as “Expenses Paid” are equal to the annualized expense ratio of 0.43% and 0.40% for the Institutional Class and Institutional Select Class, respectively, multiplied by the average value over the period, multiplied by the number of days in the most recent half-year then divided by 365. |
145
Annual Report to Shareholders
Performance Information (Unaudited)
Western Asset Limited Duration Bond Portfolio
The graphs compare the Fund’s total returns to that of an appropriate broad-based securities market index. The graphs illustrate the cumulative total return of an initial $1,000,000 investment in each of the Institutional Class and Institutional Select Class for the periods indicated. The line for the Fund represents the total return after deducting all Fund investment management and other administrative expenses and the transaction costs of buying and selling securities. The line representing the securities market index does not include any transaction costs associated with buying and selling securities in the index or other investment management or administrative expenses.
Total return measures investment performance in terms of appreciation or depreciation in the Fund’s net asset value per share, plus dividends and any capital gain distributions. It assumes that dividends and distributions were reinvested at the time they were paid. Returns (and the graph and table found below) do not reflect the deduction of taxes that a shareholder would pay on Fund distributions or the redemption of Fund shares. Average annual returns tend to smooth out variations in a fund’s return, so that they differ from actual year-to-year results.
Bonds are subject to a variety of risks, including interest rate, credit and inflation risk. Non-U.S. investments are subject to currency fluctuations, social, economical and political risk.
Growth of a $1,000,000 Investment—Institutional Class
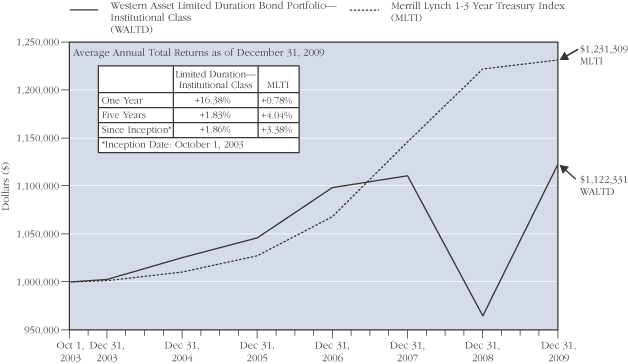
The performance data quoted represent past performance and do not guarantee future results. Current performance may be lower or higher than the performance data quoted. To obtain the most recent month-end performance information, please visit www.westernassetfunds.com. The investment return and principal value of the Fund will fluctuate so that an investor’s shares, when redeemed, may be worth more or less than the original cost. Calculations assume reinvestment of all distributions, including returns of capital, if any, at net asset value and the deduction of all Fund expenses. Performance would have been lower if fees had not been waived in various periods.
146
Annual Report to Shareholders
Growth of a $1,000,000 Investment—Institutional Select Class (Unaudited)
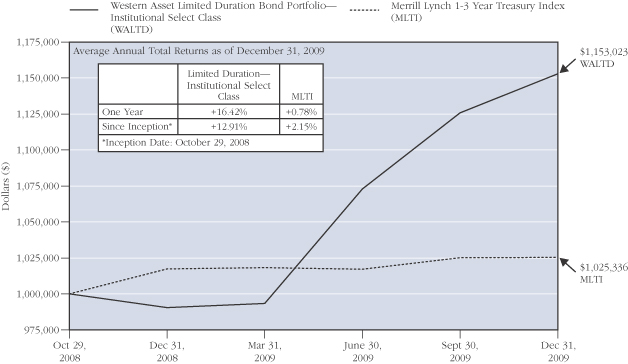
The performance data quoted represent past performance and do not guarantee future results. Current performance may be lower or higher than the performance data quoted. To obtain the most recent month-end performance information, please visit www.westernassetfunds.com. The investment return and principal value of the Fund will fluctuate so that an investor’s shares, when redeemed, may be worth more or less than the original cost. Calculations assume reinvestment of all distributions, including returns of capital, if any, at net asset value and the deduction of all Fund expenses. Performance would have been lower if fees had not been waived in various periods.
147
Annual Report to Shareholders
Performance Information (Unaudited)—Continued
Portfolio Composition (as of December 31, 2009)A
Standard & Poor’s Debt RatingsB
(as a percentage of the portfolio)
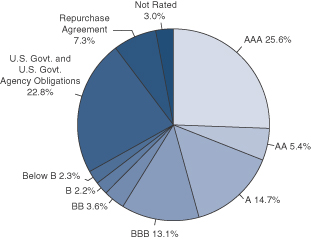
Maturity Schedule
(as a percentage of the portfolio)

| A | | The pie charts above represent the composition of the Fund’s portfolio as of December 31, 2009 and do not include derivatives such as Futures Contracts, Options Written, and Swaps. The Fund is actively managed. As a result, the composition of the portfolio holdings and sectors are subject to change at any time. |
| B | | Standard & Poor’s Ratings Service provides capital markets with credit ratings for the evaluation and assessment of credit risk. These ratings are the opinions of S&P and not absolute measures of quality or guarantees of performance. |
148
Annual Report to Shareholders
Spread Duration
Western Asset Limited Duration Bond Portfolio
December 31, 2009 (Unaudited)
Economic Exposure
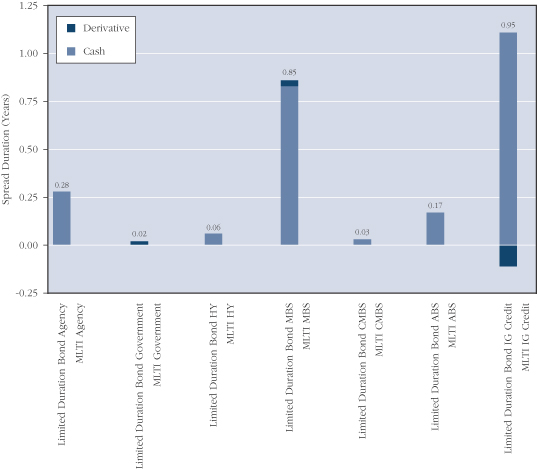
Spread duration is defined as the change in value for a 100 basis point change in the spread relative to Treasuries. The spread over Treasuries is the annual risk-premium demanded by investors to hold non-Treasury securities. This chart highlights the market sector exposure of the Fund’s portfolio and the exposure relative to the selected benchmark as of the end of the reporting period.
| | | | |
| ABS | | — | | Asset Backed Securities |
| CMBS | | — | | Commercial Mortgage Backed Securities |
| HY | | — | | High Yield |
| IG Credit | | — | | Investment Grade Credit |
| MBS | | — | | Mortgage Backed Securities |
| MLTI | | — | | Merrill Lynch 1-3 Year Treasury Index |
149
Annual Report to Shareholders
Effective Duration
Western Asset Limited Duration Bond Portfolio
December 31, 2009 (Unaudited)
Interest Rate Exposure
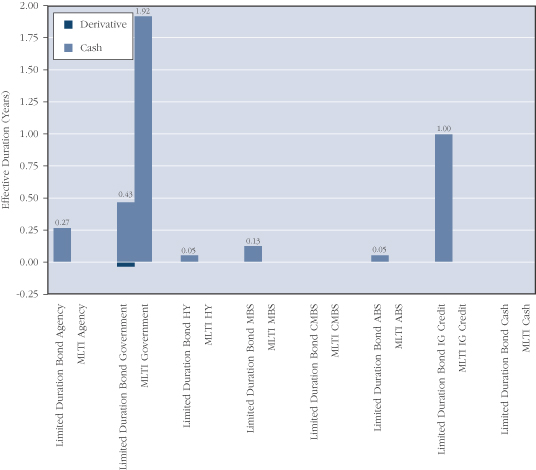
Effective duration is defined as the change in value for a 100 basis point change in Treasury yields. This chart highlights the interest rate exposure of the Fund’s portfolio relative to the selected benchmark as of the end of the reporting period.
| | | | |
| ABS | | — | | Asset Backed Securities |
| CMBS | | — | | Commercial Mortgage Backed Securities |
| HY | | — | | High Yield |
| IG Credit | | — | | Investment Grade Credit |
| MBS | | — | | Mortgage Backed Securities |
| MLTI | | — | | Merrill Lynch 1-3 Year Treasury Index |
150
Annual Report to Shareholders
Portfolio of Investments
Western Asset Limited Duration Bond Portfolio
December 31, 2009
| | | | | | | | | | | | | |
| | | % OF
NET ASSETS | | RATE | | MATURITY
DATE | | PAR/
SHARES | | VALUE | |
| | | | | | | | | | | | | |
| | | | | | | | | | | | | |
Long-Term Securities | | 91.8% | | | | | | | | | | | |
| | | | | |
Corporate Bonds and Notes | | 24.5% | | | | | | | | | | | |
| | | | | |
Aerospace and Defense | | 0.5% | | | | | | | | | | | |
The Boeing Co. | | | | 1.875% | | 11/20/12 | | $ | 140,000 | | $ | 138,440 | |
United Technologies Corp. | | | | 5.375% | | 12/15/17 | | | 140,000 | | | 149,191 | |
| | | | | | | | | | | | | |
| | | | | | | | | | | | 287,631 | |
| | | | | | | | | | | | | |
Airlines | | 1.7% | | | | | | | | | | | |
Continental Airlines Inc. | | | | 6.900% | | 1/2/18 | | | 290,822 | | | 281,370 | |
Continental Airlines Inc. | | | | 6.545% | | 8/2/20 | | | 221,362 | | | 216,935 | |
Continental Airlines Inc. | | | | 6.703% | | 6/15/21 | | | 182,082 | | | 169,336 | |
Northwest Airlines Inc. | | | | 1.019% | | 5/20/14 | | | 359,903 | | | 302,318 | A |
| | | | | | | | | | | | | |
| | | | | | | | | | | | 969,959 | |
| | | | | | | | | | | | | |
Beverages | | 0.4% | | | | | | | | | | | |
Anheuser-Busch InBev Worldwide Inc. | | | | 4.125% | | 1/15/15 | | | 180,000 | | | 182,763 | B |
Dr. Pepper Snapple Group Inc. | | | | 2.350% | | 12/21/12 | | | 70,000 | | | 70,075 | |
| | | | | | | | | | | | | |
| | | | | | | | | | | | 252,838 | |
| | | | | | | | | | | | | |
Capital Markets | | 2.7% | | | | | | | | | | | |
Goldman Sachs Capital II | | | | 5.793% | | 12/29/49 | | | 440,000 | | | 341,000 | C |
Lehman Brothers Holdings Capital Trust VII | | | | 5.857% | | 11/29/49 | | | 570,000 | | | 171 | C,D |
Lehman Brothers Holdings Inc. | | | | 6.500% | | 7/19/17 | | | 200,000 | | | 60 | D |
Merrill Lynch and Co. Inc. | | | | 6.150% | | 4/25/13 | | | 450,000 | | | 481,571 | |
Morgan Stanley | | | | 6.600% | | 4/1/12 | | | 200,000 | | | 217,599 | |
The Bear Stearns Cos. Inc. | | | | 6.400% | | 10/2/17 | | | 230,000 | | | 250,718 | |
The Goldman Sachs Group Inc. | | | | 6.600% | | 1/15/12 | | | 210,000 | | | 228,299 | |
| | | | | | | | | | | | | |
| | | | | | | | | | | | 1,519,418 | |
| | | | | | | | | | | | | |
Chemicals | | 0.4% | | | | | | | | | | | |
E.I. du Pont de Nemours and Co. | | | | 3.250% | | 1/15/15 | | | 170,000 | | | 168,407 | |
The Dow Chemical Co. | | | | 5.700% | | 5/15/18 | | | 60,000 | | | 60,952 | |
| | | | | | | | | | | | | |
| | | | | | | | | | | | 229,359 | |
| | | | | | | | | | | | | |
Commercial Banks | | 1.9% | | | | | | | | | | | |
SunTrust Capital VIII | | | | 6.100% | | 12/15/36 | | | 60,000 | | | 41,791 | C |
Wachovia Capital Trust III | | | | 5.800% | | 3/15/42 | | | 770,000 | | | 589,050 | C |
Wells Fargo Capital X | | | | 5.950% | | 12/15/36 | | | 150,000 | | | 130,500 | C |
Wells Fargo Capital XIII | | | | 7.700% | | 12/29/49 | | | 290,000 | | | 281,300 | C |
| | | | | | | | | | | | | |
| | | | | | | | | | | | 1,042,641 | |
| | | | | | | | | | | | | |
Consumer Finance | | 3.2% | | | | | | | | | | | |
American Express Co. | | | | 6.800% | | 9/1/66 | | | 300,000 | | | 268,500 | C |
American Express Credit Corp. | | | | 5.125% | | 8/25/14 | | | 50,000 | | | 52,687 | |
151
Annual Report to Shareholders
Portfolio of Investments—Continued
Western Asset Limited Duration Bond Portfolio—Continued
| | | | | | | | | | | | | |
| | | % OF
NET ASSETS | | RATE | | MATURITY
DATE | | PAR/
SHARES | | VALUE | |
| | | | | | | | | | | | | |
Corporate Bonds and Notes—Continued | | | | | | | | | | | | | |
| | | | | |
Consumer Finance—Continued | | | | | | | | | | | | | |
Caterpillar Financial Services Corp. | | | | 1.001% | | 6/24/11 | | $ | 480,000 | | $ | 483,970 | A |
FIA Card Services N.A. | | | | 7.125% | | 11/15/12 | | | 150,000 | | | 163,284 | |
GMAC LLC | | | | 7.500% | | 12/31/13 | | | 153,000 | | | 147,645 | B |
GMAC LLC | | | | 8.000% | | 12/31/18 | | | 127,000 | | | 111,760 | B |
Nelnet Inc. | | | | 7.400% | | 9/29/36 | | | 210,000 | | | 152,945 | C |
SLM Corp. | | | | 8.450% | | 6/15/18 | | | 420,000 | | | 414,436 | |
| | | | | | | | | | | | | |
| | | | | | | | | | | | 1,795,227 | |
| | | | | | | | | | | | | |
Diversified Financial Services | | 3.3% | | | | | | | | | | | |
Bank of America Corp. | | | | 8.000% | | 12/29/49 | | | 300,000 | | | 288,822 | C |
Citigroup Inc. | | | | 5.000% | | 9/15/14 | | | 500,000 | | | 482,012 | |
Citigroup Inc. | | | | 5.500% | | 10/15/14 | | | 60,000 | | | 60,752 | |
General Electric Capital Corp. | | | | 6.375% | | 11/15/67 | | | 450,000 | | | 390,375 | C |
JPMorgan Chase Bank NA | | | | 3.123% | | 2/11/11 | | | 205,000 | | | 206,353 | A ,B |
ZFS Finance USA Trust III | | | | 1.404% | | 12/15/65 | | | 540,000 | | | 437,400 | A,B |
| | | | | | | | | | | | | |
| | | | | | | | | | | | 1,865,714 | |
| | | | | | | | | | | | | |
Diversified Telecommunication Services | | 1.0% | | | | | | | | | | | |
AT&T Inc. | | | | 4.850% | | 2/15/14 | | | 250,000 | | | 265,824 | |
Qwest Corp. | | | | 8.875% | | 3/15/12 | | | 130,000 | | | 139,750 | |
Verizon Communications Inc. | | | | 8.750% | | 11/1/18 | | | 120,000 | | | 149,882 | |
| | | | | | | | | | | | | |
| | | | | | | | | | | | 555,456 | |
| | | | | | | | | | | | | |
Electric Utilities | | 1.1% | | | | | | | | | | | |
FirstEnergy Corp. | | | | 6.450% | | 11/15/11 | | | 5,000 | | | 5,361 | |
FirstEnergy Solutions Corp. | | | | 4.800% | | 2/15/15 | | | 160,000 | | | 163,311 | |
Pacific Gas and Electric Co. | | | | 4.800% | | 3/1/14 | | | 400,000 | | | 424,799 | |
| | | | | | | | | | | | | |
| | | | | | | | | | | | 593,471 | |
| | | | | | | | | | | | | |
Food and Staples Retailing | | 0.1% | | | | | | | | | | | |
The Kroger Co. | | | | 3.900% | | 10/1/15 | | | 80,000 | | | 80,437 | |
| | | | | | | | | | | | | |
| | | | | |
Health Care Equipment and Supplies | | 0.4% | | | | | | | | | | | |
Hospira Inc. | | | | 5.550% | | 3/30/12 | | | 200,000 | | | 213,173 | |
| | | | | | | | | | | | | |
| | | | | |
Health Care Providers and Services | | 0.2% | | | | | | | | | | | |
UnitedHealth Group Inc. | | | | 4.875% | | 2/15/13 | | | 110,000 | | | 115,089 | |
| | | | | | | | | | | | | |
| | | | | |
Insurance | | 0.3% | | | | | | | | | | | |
Metropolitan Life Global Funding I | | | | 2.875% | | 9/17/12 | | | 170,000 | | | 171,334 | B |
| | | | | | | | | | | | | |
152
Annual Report to Shareholders
| | | | | | | | | | | | | |
| | | % OF
NET ASSETS | | RATE | | MATURITY
DATE | | PAR/
SHARES | | VALUE | |
| | | | | | | | | | | | | |
Corporate Bonds and Notes—Continued | | | | | | | | | | | | | |
| | | | | |
Leisure Equipment and Products | | N.M. | | | | | | | | | | | |
Eastman Kodak Co. | | | | 7.250% | | 11/15/13 | | $ | 10,000 | | $ | 8,250 | |
| | | | | | | | | | | | | |
| | | | | |
Media | | 1.0% | | | | | | | | | | | |
Comcast Cable Communications Inc. | | | | 6.750% | | 1/30/11 | | | 200,000 | | | 211,073 | |
The Walt Disney Co. | | | | 4.700% | | 12/1/12 | | | 160,000 | | | 172,265 | |
Time Warner Cable Inc. | | | | 8.250% | | 2/14/14 | | | 140,000 | | | 163,624 | |
| | | | | | | | | | | | | |
| | | | | | | | | | | | 546,962 | |
| | | | | | | | | | | | | |
Multiline Retail | | 0.3% | | | | | | | | | | | |
Federated Retail Holdings Inc. | | | | 5.350% | | 3/15/12 | | | 150,000 | | | 153,188 | |
| | | | | | | | | | | | | |
| | | | | |
Oil, Gas and Consumable Fuels | | 3.9% | | | | | | | | | | | |
Devon Financing Corp. ULC | | | | 6.875% | | 9/30/11 | | | 260,000 | | | 282,442 | |
El Paso Natural Gas Co. | | | | 5.950% | | 4/15/17 | | | 370,000 | | | 381,110 | |
Energy Transfer Partners LP | | | | 9.700% | | 3/15/19 | | | 90,000 | | | 111,159 | |
Kinder Morgan Energy Partners LP | | | | 6.750% | | 3/15/11 | | | 310,000 | | | 327,836 | |
Occidental Petroleum Corp. | | | | 7.000% | | 11/1/13 | | | 400,000 | | | 459,593 | |
Pemex Project Funding Master Trust | | | | 0.855% | | 12/3/12 | | | 320,000 | | | 308,800 | A,B |
XTO Energy Inc. | | | | 5.650% | | 4/1/16 | | | 290,000 | | | 316,950 | |
| | | | | | | | | | | | | |
| | | | | | | | | | | | 2,187,890 | |
| | | | | | | | | | | | | |
Thrifts and Mortgage Finance | | 0.8% | | | | | | | | | | | |
Countrywide Financial Corp. | | | | 5.800% | | 6/7/12 | | | 60,000 | | | 63,691 | |
US Central Federal Credit Union | | | | 1.900% | | 10/19/12 | | | 390,000 | | | 389,695 | |
| | | | | | | | | | | | | |
| | | | | | | | | | | | 453,386 | |
| | | | | | | | | | | | | |
Tobacco | | 0.8% | | | | | | | | | | | |
Philip Morris International Inc. | | | | 4.875% | | 5/16/13 | | | 300,000 | | | 316,697 | |
Reynolds American Inc. | | | | 7.250% | | 6/1/13 | | | 120,000 | | | 130,923 | |
| | | | | | | | | | | | | |
| | | | | | | | | | | | 447,620 | |
| | | | | | | | | | | | | |
Wireless Telecommunication Services | | 0.5% | | | | | | | | | | | |
Cellco Partnership/Verizon Wireless Capital LLC | | | | 3.750% | | 5/20/11 | | | 260,000 | | | 268,103 | |
| | | | | | | | | | | | | |
Total Corporate Bonds and Notes
(Cost—$14,471,448) | | | | | | | | | | | | 13,757,146 | |
Asset-Backed Securities | | 16.1% | | | | | | | | | | | |
| | | | | |
Fixed Rate Securities | | 3.5% | | | | | | | | | | | |
Citibank Credit Card Issuance Trust 2009-A5 A5 | | | | 2.250% | | 12/23/14 | | | 470,000 | | | 464,407 | |
Countryplace Manufactured Housing Contract Trust 2007-1 A2 | | | | 5.232% | | 7/15/37 | | | 314,650 | | | 305,950 | B,E |
153
Annual Report to Shareholders
Portfolio of Investments—Continued
Western Asset Limited Duration Bond Portfolio—Continued
| | | | | | | | | | | | | |
| | | % OF
NET ASSETS | | RATE | | MATURITY
DATE | | PAR/
SHARES | | VALUE | |
| | | | | | | | | | | | | |
Asset-Backed Securities—Continued | | | | | | | | | | | | | |
| | | | | |
Fixed Rate Securities—Continued | | | | | | | | | | | | | |
Drive Auto Receivables Trust 2006-1 A4 | | | | 5.540% | | 12/16/13 | | $ | 362,812 | | $ | 369,297 | B |
Ford Credit Auto Owner Trust 2009-B A2 | | | | 2.100% | | 11/15/11 | | | 500,000 | | | 503,134 | |
Ford Credit Auto Owner Trust 2009-D A2 | | | | 1.210% | | 1/15/12 | | | 270,000 | | | 270,745 | |
UCFC Home Equity Loan 1998-D | | | | 6.905% | | 4/15/30 | | | 33,160 | | | 27,951 | |
| | | | | | | | | | | | | |
| | | | | | | | | | | | 1,941,484 | |
| | | | | | | | | | | | | |
Indexed SecuritiesA | | 11.9% | | | | | | | | | | | |
Ameriquest Mortgage Securities Inc. 2005-R11 A2D | | | | 0.561% | | 1/25/36 | | | 240,000 | | | 155,833 | |
Asset Backed Funding Certificates 2004-OPT2 M1 | | | | 0.781% | | 8/25/33 | | | 180,000 | | | 128,477 | |
Bank of America Credit Card Trust 2006-A9 A9 | | | | 0.243% | | 2/15/13 | | | 650,000 | | | 646,239 | |
Bank of America Credit Card Trust 2008-A1 A1 | | | | 0.813% | | 4/15/13 | | | 420,000 | | | 419,046 | |
Bayview Financial Acquisition Trust 2004-C | | | | 0.861% | | 5/28/44 | | | 59,005 | | | 47,717 | |
Bayview Financial Acquisition Trust 2006-D 2A4 | | | | 0.511% | | 12/28/36 | | | 446,949 | | | 265,396 | |
Bear Stearns Asset-Backed Securities Inc. 2007-SD2 2A1 | | | | 0.631% | | 9/25/46 | | | 280,084 | | | 168,547 | |
Bear Stearns Asset-Backed Securities Trust 2006-SD2 | | | | 0.431% | | 6/25/36 | | | 206,359 | | | 194,143 | |
Chase Issuance Trust 2006-A5 A | | | | 0.253% | | 11/15/13 | | | 600,000 | | | 594,836 | |
Chase Issuance Trust 2009-A4 A4 | | | | 0.983% | | 6/15/12 | | | 470,000 | | | 471,191 | |
Countrywide Asset-Backed Certificates 2007-SE1 1A1 | | | | 0.781% | | 5/25/47 | | | 760,447 | | | 379,169 | B |
Countrywide Home Equity Loan Trust 2004-O | | | | 0.513% | | 2/15/34 | | | 49,539 | | | 18,022 | |
Ellington Loan Acquisition Trust 2007-1 A2A1 | | | | 1.231% | | 5/26/37 | | | 194,251 | | | 163,788 | B |
MASTR Specialized Loan Trust 2006-2 | | | | 0.491% | | 2/25/36 | | | 237,006 | | | 121,216 | B |
MASTR Specialized Loan Trust 2006-3 A | | | | 0.491% | | 6/25/46 | | | 409,005 | | | 226,118 | B |
Morgan Stanley Mortgage Loan Trust 2006-12XS | | | | 0.351% | | 10/25/36 | | | 51,998 | | | 52,031 | |
Nelnet Student Loan Trust 2008-4 A4 | | | | 1.762% | | 4/25/24 | | | 1,090,000 | | | 1,137,954 | |
Origen Manufactured Housing 2006-A | | | | 0.383% | | 11/15/18 | | | 300,490 | | | 276,335 | |
Residential Asset Securities Corp. 2006-KS1 A4 | | | | 0.531% | | 2/25/36 | | | 310,000 | | | 119,289 | |
SACO I Trust 2006-3 A3 | | | | 0.461% | | 4/25/36 | | | 596,253 | | | 98,533 | |
SLM Student Loan Trust 2005-10 A3 | | | | 0.332% | | 10/25/16 | | | 574,740 | | | 573,757 | |
SLM Student Loan Trust 2007-6 A1 | | | | 0.452% | | 4/27/15 | | | 241,706 | | | 241,553 | |
Specialty Underwriting & Residential Finance Trust 2001-BC4 M1 | | | | 0.831% | | 11/25/34 | | | 240,000 | | | 167,242 | |
| | | | | | | | | | | | | |
| | | | | | | | | | | | 6,666,432 | |
| | | | | | | | | | | | | |
Variable Rate SecuritiesF | | 0.7% | | | | | | | | | | | |
Green Tree 2008-MH1 A1 | | | | 7.000% | | 4/25/38 | | | 415,002 | | | 422,719 | B |
| | | | | | | | | | | | | |
Total Asset-Backed Securities
(Cost—$10,775,063) | | | | | | | | | | | | 9,030,635 | |
154
Annual Report to Shareholders
| | | | | | | | | | | | | |
| | | % OF
NET ASSETS | | RATE | | MATURITY
DATE | | PAR/
SHARES | | VALUE | |
| | | | | | | | | | | | | |
Mortgage-Backed Securities | | 10.5% | | | | | | | | | | | |
| | | | | |
Fixed Rate Securities | | 1.5% | | | | | | | | | | | |
GS Mortgage Securities Corp. II 2001-1285 C | | | | 6.712% | | 8/15/18 | | $ | 200,000 | | $ | 206,745 | B |
LB-UBS Commercial Mortgage Trust 2001-WM A2 | | | | 6.530% | | 7/14/16 | | | 170,000 | | | 179,006 | B |
Residential Asset Mortgage Products Inc. 2004-SL1 | | | | 7.000% | | 11/25/31 | | | 48,297 | | | 48,364 | |
Residential Asset Mortgage Products Inc. 2004-SL2 | | | | 8.500% | | 10/25/31 | | | 21,284 | | | 20,193 | |
Residential Asset Mortgage Products Inc. 2005-SL1 | | | | 8.000% | | 5/25/32 | | | 407,896 | | | 370,676 | |
| | | | | | | | | | | | | |
| | | | | | | | | | | | 824,984 | |
| | | | | | | | | | | | | |
Indexed SecuritiesA | | 6.1% | | | | | | | | | | | |
American Home Mortgage Investment Trust 2005-SD1 | | | | 0.681% | | 9/25/35 | | | 400,588 | | | 176,866 | B |
Banc of America Mortgage Securities 2003-D | | | | 4.569% | | 5/25/33 | | | 84,850 | | | 76,580 | |
Bayview Commercial Asset Trust 2005-2A A2 | | | | 0.581% | | 8/25/35 | | | 290,846 | | | 186,366 | B |
Bear Stearns ARM Trust 2004-10 | | | | 3.547% | | 1/25/35 | | | 172,755 | | | 138,913 | |
Bear Stearns Second Lien Trust 2007-SV1A A1 | | | | 0.451% | | 12/25/36 | | | 196,485 | | | 135,897 | B |
CBA Commercial Small Balance Commercial Trust 2005-1A | | | | 0.551% | | 7/25/35 | | | 290,889 | | | 145,444 | B |
Citigroup Mortgage Loan Trust Inc. 2005-5 | | | | 5.388% | | 8/25/35 | | | 206,987 | | | 117,035 | |
Countrywide Alternative Loan Trust 2005-51 2A1 | | | | 0.533% | | 11/20/35 | | | 252,592 | | | 134,797 | |
Countrywide Asset-Backed Certificates 2005-IM1 | | | | 0.511% | | 11/25/35 | | | 180,235 | | | 161,486 | |
Countrywide Home Loans 2005-R3 | | | | 0.631% | | 9/25/35 | | | 398,098 | | | 298,606 | B |
Crusade Global Trust 2003-2 | | | | 0.444% | | 9/18/34 | | | 29,177 | | | 28,653 | G |
CS First Boston Mortgage Securities Corp. 2004-AR5 7A2 | | | | 3.630% | | 6/25/34 | | | 214,649 | | | 198,070 | |
CS First Boston Mortgage Securities Corp. 2004-AR6 1A1 | | | | 4.075% | | 10/25/34 | | | 137,092 | | | 123,218 | |
| | | | | | | | | | | | | |
First Horizon Alternative Mortgage Securities 2004-AA4 A1 | | | | 2.873% | | 10/25/34 | | | 179,463 | | | 141,118 | |
Greenpoint Mortgage Funding Trust
2006-AR7 1A1B | | | | 0.351% | | 12/25/46 | | | 209,165 | | | 41,742 | |
GSMPS Mortgage Loan Trust 2005-RP3 | | | | 0.581% | | 9/25/35 | | | 338,679 | | | 251,102 | B |
Luminent Mortgage Trust 2006-7 2A2 | | | | 0.451% | | 12/25/36 | | | 969,744 | | | 218,947 | |
Medallion Trust 2003-1G | | | | 0.443% | | 12/21/33 | | | 33,032 | | | 31,197 | G |
MLCC Mortgage Investors Inc. 2003-H | | | | 2.412% | | 1/25/29 | | | 14,121 | | | 12,638 | |
Sequoia Mortgage Trust 2003-2 A2 | | | | 0.931% | | 6/20/33 | | | 20,935 | | | 17,877 | |
Wachovia Mortgage Loan Trust LLC 2005-A | | | | 4.191% | | 8/20/35 | | | 132,746 | | | 90,982 | |
WaMu Mortgage Pass-Through Certificates 2003-AR8 A | | | | 2.851% | | 8/25/33 | | | 183,534 | | | 170,212 | |
155
Annual Report to Shareholders
Portfolio of Investments—Continued
Western Asset Limited Duration Bond Portfolio—Continued
| | | | | | | | | | | | | |
| | | % OF
NET ASSETS | | RATE | | MATURITY
DATE | | PAR/
SHARES | | VALUE | |
| | | | | | | | | | | | | |
Mortgage-Backed Securities—Continued | | | | | | | | | | | | | |
| | | | | |
Indexed Securities—Continued | | | | | | | | | | | | | |
WaMu Mortgage Pass-Through Certificates
2005-AR19 | | | | 0.641% | | 12/25/45 | | $ | 432,176 | | $ | 177,985 | |
WaMu Mortgage Pass-Through Certificates 2006-AR4 DA | | | | 1.514% | | 6/25/46 | | | 407,207 | | | 162,298 | |
WaMu Mortgage Pass-Through Certificates 2007-HY7 1A1 | | | | 5.673% | | 7/25/37 | | | 301,425 | | | 201,187 | |
| | | | | | | | | | | | | |
| | | | | | | | | | | | 3,439,216 | |
| | | | | | | | | | | | | |
Variable Rate SecuritiesF | | 2.9% | | | | | | | | | | | |
Banc of America Funding Corp. 2004-B | | | | 3.461% | | 12/20/34 | | | 69,211 | | | 53,980 | |
Citigroup Mortgage Loan Trust Inc.
2007-AR8 1A1A | | | | 5.700% | | 8/25/47 | | | 449,727 | | | 322,441 | |
IndyMac INDX Mortgage Loan Trust 2004-AR15 | | | | 4.220% | | 2/25/35 | | | 168,550 | | | 97,239 | |
Merrill Lynch Mortgage Investors Trust
2004-A1 2A1 | | | | 3.789% | | 2/25/34 | | | 184,925 | | | 179,695 | |
Prime Mortgage Trust 2005-2 | | | | 7.461% | | 10/25/32 | | | 87,468 | | | 76,753 | |
Small Business Administration Series 2004-2 | | | | 3.080% | | 9/25/18 | | | 240,090 | | | 247,371 | |
Structured Adjustable Rate Mortgage Loan Trust 2005-12 3A1 | | | | 5.485% | | 6/25/35 | | | 292,574 | | | 183,425 | |
Structured Asset Securities Corp. 2003-22A 3A | | | | 2.824% | | 6/25/33 | | | 498,465 | | | 400,434 | |
Structured Asset Securities Corp. 2004-SC1 | | | | 8.769% | | 12/25/29 | | | 67,387 | | | 51,482 | B |
| | | | | | | | | | | | | |
| | | | | | | | | | | | 1,612,820 | |
| | | | | | | | | | | | | |
Total Mortgage-Backed Securities
(Cost—$8,981,492) | | | | | | | | | | | | 5,877,020 | |
U.S. Government and Agency Obligations | | 11.6% | | | | | | | | | | | |
| | | | | |
Fixed Rate Securities | | 11.6% | | | | | | | | | | | |
Fannie Mae | | | | 2.625% | | 11/20/14 | | | 620,000 | | | 615,193 | H |
Freddie Mac | | | | 2.000% | | 2/25/11 | | | 320,000 | | | 320,606 | H |
United States Treasury Notes | | | | 1.125% | | 12/15/12 | | | 2,050,000 | | | 2,017,159 | |
United States Treasury Notes | | | | 2.125% | | 11/30/14 | | | 2,710,000 | | | 2,645,854 | |
United States Treasury Notes | | | | 3.375% | | 11/15/19 | | | 930,000 | | | 894,548 | |
| | | | | | | | | | | | | |
Total U.S. Government and Agency Obligations (Cost—$6,633,069) | | | | | | | | | | | | 6,493,360 | |
U.S. Government Agency Mortgage-Backed Securities | | 10.7% | | | | | | | | | | | |
| | | | | |
Indexed SecuritiesA | | 10.7% | | | | | | | | | | | |
Fannie Mae | | | | 3.245% | | 12/1/34 | | | 61,011 | | | 62,439 | H |
Fannie Mae | | | | 3.758% | | 12/1/34 | | | 80,436 | | | 82,303 | H |
156
Annual Report to Shareholders
| | | | | | | | | | | | | |
| | | % OF
NET ASSETS | | RATE | | MATURITY
DATE | | PAR/
SHARES | | VALUE | |
| | | | | | | | | | | | | |
U.S. Government Agency Mortgage-Backed Securities—Continued | | | | | | | | | | | | | |
| | | | | |
Indexed Securities—Continued | | | | | | | | | | | | | |
Fannie Mae | | | | 4.296% | | 1/1/35 | | $ | 91,933 | | $ | 93,879 | H |
Fannie Mae | | | | 4.352% | | 1/1/35 | | | 171,582 | | | 176,324 | H |
Fannie Mae | | | | 4.572% | | 2/1/35 | | | 387,468 | | | 398,441 | H |
Fannie Mae | | | | 4.556% | | 3/1/35 | | | 161,871 | | | 166,950 | H |
Fannie Mae | | | | 5.107% | | 3/1/35 | | | 268,253 | | | 276,220 | H |
Fannie Mae | | | | 5.503% | | 7/1/37 | | | 2,384,145 | | | 2,517,552 | H |
Freddie Mac | | | | 3.834% | | 1/1/35 | | | 23,567 | | | 24,424 | H |
Freddie Mac | | | | 4.586% | | 1/1/35 | | | 102,811 | | | 105,532 | H |
Freddie Mac | | | | 6.197% | | 12/1/36 | | | 1,990,496 | | | 2,116,309 | H |
| | | | | | | | | | | | | |
Total U.S. Government Agency Mortgage-Backed Securities
(Cost—$5,764,360) | | | | | | | | | | | | 6,020,373 | |
Yankee BondsG | | 18.3% | | | | | | | | | | | |
| | | | | |
Beverages | | 0.4% | | | | | | | | | | | |
Diageo Capital PLC | | | | 5.200% | | 1/30/13 | | | 210,000 | | | 224,816 | |
| | | | | | | | | | | | | |
| | | | | |
Capital Markets | | 2.4% | | | | | | | | | | | |
Deutsche Bank AG | | | | 6.000% | | 9/1/17 | | | 300,000 | | | 327,067 | |
Macquarie Bank Ltd. | | | | 2.600% | | 1/20/12 | | | 580,000 | | | 592,209 | B |
NIBC Bank NV | | | | 2.800% | | 12/2/14 | | | 440,000 | | | 428,156 | B |
| | | | | | | | | | | | | |
| | | | | | | | | | | | 1,347,432 | |
| | | | | | | | | | | | | |
Commercial Banks | | 10.6% | | | | | | | | | | | |
Achmea Hypotheekbank NV | | | | 3.200% | | 11/3/14 | | | 360,000 | | | 359,303 | B |
ANZ National (Int’l) Ltd. | | | | 2.375% | | 12/21/12 | | | 200,000 | | | 198,543 | B |
Bank of Scotland PLC | | | | 5.000% | | 11/21/11 | | | 310,000 | | | 321,547 | |
Barclays Bank PLC | | | | 2.500% | | 1/23/13 | | | 160,000 | | | 159,816 | |
Barclays Bank PLC | | | | 5.200% | | 7/10/14 | | | 120,000 | | | 127,201 | |
BNP Paribas | | | | 2.125% | | 12/21/12 | | | 100,000 | | | 99,484 | |
Commonwealth Bank of Australia | | | | 2.900% | | 9/17/14 | | | 530,000 | | | 521,215 | B |
Commonwealth Bank of Australia | | | | 3.750% | | 10/15/14 | | | 150,000 | | | 150,365 | B |
Credit Agricole SA | | | | 8.375% | | 12/31/49 | | | 100,000 | | | 106,000 | B,C |
Glitnir Banki Hf | | | | 5.815% | | 1/21/11 | | | 720,000 | | | 151,200 | A,B,D,I |
Kaupthing Bank Hf | | | | 5.750% | | 10/4/11 | | | 290,000 | | | 71,775 | B,D,I |
Kaupthing Bank Hf | | | | 7.625% | | 2/28/15 | | | 700,000 | | | 173,250 | B,D,I |
Landsbanki Islands Hf | | | | 6.100% | | 8/25/11 | | | 410,000 | | | 18,450 | B,D,I |
Landsbanki Islands Hf | | | | 7.431% | | 10/19/17 | | | 140,000 | | | 14 | B,C,D,I |
Landwirtschaftliche Rentenbank | | | | 1.875% | | 9/24/12 | | | 250,000 | | | 249,273 | |
157
Annual Report to Shareholders
Portfolio of Investments—Continued
Western Asset Limited Duration Bond Portfolio—Continued
| | | | | | | | | | | | | |
| | | % OF
NET ASSETS | | RATE | | MATURITY
DATE | | PAR/
SHARES | | VALUE | |
| | | | | | | | | | | | | |
Yankee Bonds—Continued | | | | | | | | | | | | | |
| | | | | |
Commercial Banks—Continued | | | | | | | | | | | | | |
Nordea Bank AB | | | | 3.700% | | 11/13/14 | | $ | 100,000 | | $ | 99,807 | B |
Resona Preferred Global Securities | | | | 7.191% | | 12/29/49 | | | 360,000 | | | 294,455 | B,C |
Santander US Debt SA Unipersonal | | | | 0.333% | | 7/23/10 | | | 550,000 | | | 549,465 | A,B |
Shinsei Finance Cayman Ltd. | | | | 6.418% | | 1/29/49 | | | 410,000 | | | 238,825 | B,C |
Societe Financement de l’Economie Francaise | | | | 2.125% | | 1/30/12 | | | 430,000 | | | 435,473 | B |
Swedbank AB | | | | 3.000% | | 12/22/11 | | | 320,000 | | | 327,945 | B |
Westpac Banking Corp. | | | | 3.250% | | 12/16/11 | | | 570,000 | | | 588,485 | B |
Westpac Banking Corp. | | | | 2.500% | | 5/25/12 | | | 130,000 | | | 131,810 | B |
Westpac Banking Corp. | | | | 2.250% | | 11/19/12 | | | 350,000 | | | 349,175 | |
Westpac Banking Corp. | | | | 2.900% | | 9/10/14 | | | 200,000 | | | 197,382 | B |
| | | | | | | | | | | | | |
| | | | | | | | | | | | 5,920,258 | |
| | | | | | | | | | | | | |
| | | | | |
Diversified Financial Services | | 0.7% | | | | | | | | | | | |
MUFG Capital Finance 1 Ltd. | | | | 6.346% | | 7/29/49 | | | 240,000 | | | 218,435 | C |
TNK-BP Finance SA | | | | 6.875% | | 7/18/11 | | | 190,000 | | | 196,175 | B |
| | | | | | | | | | | | | |
| | | | | | | | | | | | 414,610 | |
| | | | | | | | | | | | | |
Diversified Telecommunication Services | | 1.1% | | | | | | | | | | | |
France Telecom SA | | | | 7.750% | | 3/1/11 | | | 200,000 | | | 214,354 | J |
Telefonica Emisiones S.A.U. | | | | 0.609% | | 2/4/13 | | | 400,000 | | | 393,779 | A |
| | | | | | | | | | | | | |
| | | | | | | | | | | | 608,133 | |
| | | | | | | | | | | | | |
Foreign Governments | | 0.1% | | | | | | | | | | | |
Russian Federation | | | | 8.250% | | 3/31/10 | | | 4,446 | | | 4,526 | |
Russian Federation | | | | 8.250% | | 3/31/10 | | | 41,129 | | | 41,952 | B |
| | | | | | | | | | | | | |
| | | | | | | | | | | | 46,478 | |
| | | | | | | | | | | | | |
Health Care Equipment and Supplies | | 0.5% | | | | | | | | | | | |
Baxter Finco BV | | | | 4.750% | | 10/15/10 | | | 260,000 | | | 268,343 | |
| | | | | | | | | | | | | |
| | | | | |
Industrial Conglomerates | | 0.6% | | | | | | | | | | | |
Tyco International Group SA | | | | 6.375% | | 10/15/11 | | | 300,000 | | | 321,690 | |
| | | | | | | | | | | | | |
| | | | | |
Insurance | | 0.8% | | | | | | | | | | | |
Suncorp-Metway Ltd. | | | | 1.784% | | 7/16/12 | | | 450,000 | | | 465,321 | A,B |
| | | | | | | | | | | | | |
| | | | | |
Metals and Mining | | 0.1% | | | | | | | | | | | |
Vale Overseas Ltd. | | | | 6.250% | | 1/23/17 | | | 80,000 | | | 83,449 | |
| | | | | | | | | | | | | |
| | | | | |
Oil, Gas and Consumable Fuels | | 0.4% | | | | | | | | | | | |
Anadarko Finance Co. | | | | 6.750% | | 5/1/11 | | | 200,000 | | | 211,347 | |
| | | | | | | | | | | | | |
158
Annual Report to Shareholders
| | | | | | | | | | | | | | |
| | | % OF
NET ASSETS | | RATE | | MATURITY
DATE | | PAR/
SHARES | | | VALUE | |
| | | | | | | | | | | | | | |
Yankee Bonds—Continued | | | | | | | | | | | | | | |
| | | | | |
Wireless Telecommunication Services | | 0.6% | | | | | | | | | | | | |
Rogers Wireless Inc. | | | | 6.375% | | 3/1/14 | | $ | 300,000 | | | $ | 332,158 | |
| | | | | | | | | | | | | | |
Total Yankee Bonds (Cost—$12,109,154) | | | | | | | | | | | | | 10,244,035 | |
Preferred Stocks | | 0.1% | | | | | | | | | | | | |
Fannie Mae | | | | 8.250% | | | | | 8,850 | shs | | | 9,735 | C,H,K |
Freddie Mac | | | | 8.375% | | | | | 12,125 | | | | 12,731 | C,H,K |
| | | | | | | | | | | | | | |
Total Preferred Stocks (Cost—$524,375) | | | | | | | | | | | | | 22,466 | |
| | | | | | | | | | | | | | |
Total Long-Term Securities
(Cost—$59,258,961) | | | | | | | | | 51,445,035 | |
Short-Term Securities | | 7.5% | | | | | | | | | | | | |
| | | | | |
U.S. Government and Agency Obligations | | 0.3% | | | | | | | | | | | | |
Fannie Mae | | | | 0.020% to 0.330% | | 2/1/10 | | $ | 130,000 | | | | 129,990 | H,M ,O |
Fannie Mae | | | | 0.020% | | 1/25/10 | | | 40,000 | | | | 39,999 | H,M ,O |
| | | | | | | | | | | | | | |
| | | | | | | | | | | | | 169,989 | |
| | | | | | | | | | | | | | |
Options Purchased | | N.M. | | | | | | | | | | | | |
Eurodollar Futures Put, March 2010, Strike Price $99.13 | | | | | | | | | 17 | N | | | 425 | |
| | | | | | | | | | | | | | |
| | | | | |
Repurchase Agreement | | 7.2% | | | | | | | | | | | | |
Morgan Stanley repurchase agreement dated 12/31/09, 0.005% due 1/4/10; Proceeds at maturity—$4,058,002; (Fully collateralized by U.S. government agency obligation, 3.125% due 9/29/14; Market value—$4,139,158) | | | | | | | | | 4,058,000 | | | | 4,058,000 | |
| | | | | | | | | | | | | | |
Total Short-Term Securities
(Cost—$4,234,632) | | | | | | | | | | | | | 4,228,414 | |
Total Investments (Cost—$63,493,593#) | | 99.3% | | | | | | | | | | | 55,673,449 | |
Other Assets Less Liabilities | | 0.7% | | | | | | | | | | | 411,680 | |
| | | | | | | | | | | | | | |
| | | | | |
Net Assets | | 100.0% | | | | | | | | | | $ | 56,085,129 | |
| | | | | | | | | | | | | | |
| | | | | | | |
| | | EXPIRATION | | ACTUAL
CONTRACTS | | APPRECIATION/
(DEPRECIATION) |
| | | | | | | |
Futures Contracts PurchasedP | | | | | | | |
Eurodollar Futures | | December 2011 | | 23 | | $ | 338 |
| | | | | | | |
159
Annual Report to Shareholders
Portfolio of Investments—Continued
Western Asset Limited Duration Bond Portfolio—Continued
| | | | | | | | |
| | | EXPIRATION | | ACTUAL
CONTRACTS | | APPRECIATION/
(DEPRECIATION) | |
Futures Contracts WrittenP | | | | | | | | |
Eurodollar Futures | | December 2010 | | 23 | | $ | (6,837 | ) |
U.S. Treasury Note Futures | | March 2010 | | 1 | | | 887 | |
U.S. Treasury Note Futures | | March 2010 | | 4 | | | 3,456 | |
| | | | | | | | |
| | | | | | $ | (2,494 | ) |
| | | | | | | | |
Options WrittenP | | | | | | | | |
Eurodollar Futures Call, Strike Price $98.75 | | September 2010 | | 7 | | | 1,377 | |
Eurodollar Futures Call, Strike Price $99.38 | | June 2010 | | 18 | | | 1,954 | |
Eurodollar Futures Put, Strike Price $98.50 | | March 2010 | | 17 | | | 6,821 | |
Eurodollar Futures Put, Strike Price $98.75 | | September 2010 | | 7 | | | (373 | ) |
Eurodollar Futures Put, Strike Price $99.38 | | June 2010 | | 18 | | | (1,133 | ) |
| | | | | | | | |
| | | | | | $ | 8,646 | |
| | | | | | | | |
| | | | | | | | | |
N.M.—Not Meaningful.
| A | | Indexed Security – The rates of interest earned on these securities are tied to the London Interbank Offered Rate (“LIBOR”), the Euro Interbank Offered Rate (“EURIBOR”) Index, the Consumer Price Index (“CPI”), the one-year Treasury Bill Rate or the ten-year Japanese Government Bond Rate. The coupon rates are the rates as of December 31, 2009. |
| B | | Rule 144a Security – A security purchased pursuant to Rule 144a under the Securities Act of 1933 which may not be resold subject to that rule except to qualified institutional buyers. These securities, which the Fund’s investment adviser has determined to be liquid, unless otherwise noted, represent 20.55% of net assets. |
| C | | Stepped Coupon Security – A security with a predetermined schedule of interest or dividend rate changes at which time it begins to accrue interest or pay dividends according to the predetermined schedule. |
| D | | The coupon payment on these securities is currently in default as of December 31, 2009. |
| E | | Security is valued in good faith at fair value by or under the direction of the Board of Directors. |
| F | | The coupon rates shown on variable rate securities are the rates at December 31, 2009. These rates vary with the weighted average coupon of the underlying loans. |
| G | | Yankee Bond – A dollar-denominated bond issued in the U.S. by foreign entities. |
| H | | On September 7, 2008, the Federal Housing Finance Agency placed Fannie Mae and Freddie Mac into conservatorship. |
| J | | Credit Linked Security – The rates of interest earned on these securities are tied to the credit rating assigned by Standard & Poor’s Rating Service and/or Moody’s Investors Services. |
| L | | Zero coupon bond – A bond with no periodic interest payments which is sold at such a discount as to produce a current yield to maturity. |
| M | | All or a portion of this security is collateral to cover futures and options contracts written. |
| N | | Par represents actual number of contracts. |
| O | | Rate shown represents yield-to-maturity. |
| P | | Options written and futures are described in more detail in the notes to financial statements. |
| # | | Aggregate cost for federal income tax purposes is $63,495,612. |
See notes to financial statements.
160
Annual Report to Shareholders
Statement of Assets and Liabilities
Western Asset Limited Duration Bond Portfolio
December 31, 2009
| | | | | | | |
Assets: | | | | | | | |
Investment securities at value (Cost—$59,258,961) | | | | | $ | 51,445,035 | |
Short-term securities at value (Cost—$4,234,632) | | | | | | 4,228,414 | |
Cash | | | | | | 94 | |
Interest receivable | | | | | | 479,631 | |
Receivable for fund shares sold | | | | | | 150,011 | |
Premiums paid on open swaps | | | | | | 45,038 | |
Futures variation margin receivable | | | | | | 685 | |
Amounts receivable for open swaps | | | | | | 73 | |
| | | | | | | |
Total assets | | | | | | 56,348,981 | |
| | | | | | | |
| | |
Liabilities: | | | | | | | |
Unrealized depreciation of swaps | | $ | 122,511 | | | | |
Options written (Proceeds—$38,853) | | | 30,207 | | | | |
Premiums received on open swaps | | | 24,159 | | | | |
Income distribution payable | | | 14,531 | | | | |
Accrued management fee | | | 7,001 | | | | |
Amounts payable for open swaps | | | 727 | | | | |
Payable for fund shares repurchased | | | 311 | | | | |
Accrued expenses | | | 64,405 | | | | |
| | | | | | | |
Total liabilities | | | | | | 263,852 | |
| | | | | | | |
| | |
Net Assets | | | | | $ | 56,085,129 | |
| | | | | | | |
| | |
Net assets consist of: | | | | | | | |
Accumulated paid-in-capital (Note 7) | | | | | $ | 73,214,389 | |
Overdistributed net investment income | | | | | | (43,546 | ) |
Accumulated net realized loss on investments, options, futures and swaps | | | | | | (9,149,549 | ) |
Net unrealized depreciation of investments, options, futures and swaps | | | | | | (7,936,165 | ) |
| | | | | | | |
| | |
Net Assets | | | | | $ | 56,085,129 | |
| | | | | | | |
| | |
Net Asset Value Per Share: | | | | | | | |
Institutional Class (3,861,586 shares outstanding) | | | | | | $8.82 | |
| | | | | | | |
Institutional Select Class (2,499,901 shares outstanding) | | | | | | $8.82 | |
| | | | | | | |
| | | | | | | | |
See notes to financial statements.
161
Annual Report to Shareholders
Statement of Operations
Western Asset Limited Duration Bond Portfolio
| | | | | | | |
| | | FOR THE
YEAR ENDED
DECEMBER 31, 2009 | |
Investment Income: | | | | | | | |
Interest | | | | | $ | 2,591,219 | |
Expenses: | | | | | | | |
Management fees (Note 2) | | 220,333 | | | | | |
Audit and legal fees | | 67,278 | | | | | |
Registration fees | | 32,206 | | | | | |
Custodian fees | | 26,981 | | | | | |
Transfer agent and shareholder servicing expense (Note 6) | | 16,002 | | | | | |
Reports to shareholders (Note 6) | | 10,761 | | | | | |
Directors’ fees and expenses | | 3,629 | | | | | |
Other expenses | | 27,462 | | | | | |
| | | | | | | |
| | 404,652 | | | | | |
Less: Fees waived (Notes 2 and 6) | | (136,133 | ) | | | | |
| | | | | | | |
Net expenses | | | | | | 268,519 | |
| | | | | | | |
Net Investment Income | | | | | | 2,322,700 | |
Net Realized and Unrealized Gain/(Loss) on Investments (Notes 1, 3 and 4): | | | | | | | |
Net realized gain/(loss) on: | | | | | | | |
Investments | | (971,194 | ) | | | | |
Options written | | (493,351 | ) | | | | |
Futures | | 2,040,121 | | | | | |
Swaps | | (1,809,761 | ) | | | | |
| | | | | | | |
| | | | | | (1,234,185 | ) |
Change in unrealized appreciation/(depreciation) of: | | | | | | | |
Investments | | 7,345,600 | | | | | |
Options written | | 573,317 | | | | | |
Futures | | (2,009,780 | ) | | | | |
Swaps | | 1,894,152 | | | | | |
| | | | | | | |
| | | | | | 7,803,289 | |
| | | | | | | |
Net Realized and Unrealized Gain on Investments | | | | | | 6,569,104 | |
| | | | | | | | |
Change in Net Assets Resulting From Operations | | | | | $ | 8,891,804 | |
| | | | | | | | |
See notes to financial statements.
162
Annual Report to Shareholders
Statement of Changes in Net Assets
Western Asset Limited Duration Bond Portfolio
| | | | | | | | | | | | |
| | | FOR THE
YEAR ENDED
DECEMBER 31, 2009 | | | FOR THE
PERIOD ENDED
DECEMBER 31, 2008A | | | FOR THE
YEAR ENDED
MARCH 31, 2008 | |
Change in Net Assets: | | | | | | | | | | | | |
Net investment income | | $ | 2,322,700 | | | $ | 3,152,617 | | | $ | 5,515,303 | |
| | | |
Net realized loss | | | (1,234,185 | ) | | | (6,719,045 | ) | | | (1,262,061 | ) |
| | | |
Change in unrealized appreciation/(depreciation) | | | 7,803,289 | | | | (6,251,969 | ) | | | (9,569,232 | ) |
| | | | | | | | | | | | |
Change in net assets resulting from operations | | | 8,891,804 | | | | (9,818,397 | ) | | | (5,315,990 | ) |
| | | |
Distributions to shareholders from (Note 1): | | | | | | | | | | | | |
Net investment income: | | | | | | | | | | | | |
Institutional Class | | | (1,798,663 | ) | | | (3,140,101 | ) | | | (4,689,218 | ) |
Institutional Select Class | | | (563,500 | ) | | | (104,712 | ) | | | N/A | |
| | | |
Return of capital: | | | | | | | | | | | | |
Institutional Class | | | — | | | | — | | | | (547,710 | ) |
| | |
Change in net assets from fund share transactions (Note 7): | | | | | | | | | |
Institutional Class | | | (36,213,243 | ) | | | (25,328,029 | ) | | | 21,640,200 | |
Institutional Select Class | | | 7,157,836 | | | | 13,514,889 | | | | N/A | |
| | | | | | | | | | | | |
Change in net assets | | | (22,525,766 | ) | | | (24,876,350 | ) | | | 11,087,282 | |
| | | |
Net Assets: | | | | | | | | | | | | |
Beginning of year | | | 78,610,895 | | | | 103,487,245 | | | | 92,399,963 | |
| | | | | | | | | | | | |
| | | |
End of year | | $ | 56,085,129 | | | $ | 78,610,895 | | | $ | 103,487,245 | |
| | | | | | | | | | | | |
| | | |
Overdistributed net investment income | | $ | (43,546 | ) | | $ | (20,309 | ) | | $ | (8,842 | ) |
| | | | | | | | | | | | |
| | | | | | | | | | | | | |
| A | | For the period April 1, 2008 to December 31, 2008. |
N/A—Not applicable.
See notes to financial statements.
163
Annual Report to Shareholders
Financial Highlights
Western Asset Limited Duration Bond Portfolio
For a share of each class of capital stock outstanding:
Institutional Class:
| | | | | | | | | | | | | | | | | | | | | | | | |
| | | YEAR ENDED
DECEMBER 31,
2009 | | | PERIOD ENDED
DECEMBER 31,
2008A | | | YEARS ENDED MARCH 31, | |
| | | | 2008 | | | 2007 | | | 2006 | | | 2005 | |
Net asset value, beginning of year | | $ | 7.87 | | | $ | 8.96 | | | $ | 9.88 | | | $ | 9.80 | | | $ | 9.89 | | | $ | 10.09 | |
| | | | | | | | | | | | | | | | | | | | | | | | |
Investment operations: | | | | | | | | | | | | | | | | | | | | | | | | |
Net investment income | | | .30 | B | | | .27 | B | | | .50 | B | | | .47 | B | | | .38 | C | | | .24 | C |
Net realized and unrealized gain/(loss) | | | .97 | | | | (1.08 | ) | | | (.94 | ) | | | .08 | | | | (.09 | ) | | | (.17 | ) |
| | | | | | | | | | | | | | | | | | | | | | | | |
Total from investment operations | | | 1.27 | | | | (.81 | ) | | | (.44 | ) | | | .55 | | | | .29 | | | | .07 | |
| | | | | | | | | | | | | | | | | | | | | | | | |
Distributions from: | | | | | | | | | | | | | | | | | | | | | | | | |
Net investment income | | | (.32 | ) | | | (.28 | ) | | | (.43 | ) | | | (.47 | ) | | | (.38 | ) | | | (.25 | ) |
Net realized gain on investments | | | — | | | | — | | | | — | | | | — | | | | — | | | | (.02 | ) |
Return of capital | | | — | | | | — | | | | (.05 | ) | | | — | | | | — | | | | — | |
| | | | | | | | | | | | | | | | | | | | | | | | |
Total distributions | | | (.32 | ) | | | (.28 | ) | | | (.48 | ) | | | (.47 | ) | | | (.38 | ) | | | (.27 | ) |
| | | | | | | | | | | | | | | | | | | | | | | | |
Net asset value, end of year | | $ | 8.82 | | | $ | 7.87 | | | $ | 8.96 | | | $ | 9.88 | | | $ | 9.80 | | | $ | 9.89 | |
| | | | | | | | | | | | | | | | | | | | | | | | |
Total returnD | | | 16.38 | % | | | (9.23 | )% | | | (4.72 | )% | | | 5.73 | % | | | 3.01 | % | | | .69 | % |
| | | | | | |
Ratios to Average Net Assets: | | | | | | | | | | | | | | | | | | | | | | | | |
Total expensesE | | | .64 | % | | | .58 | %F | | | .50 | % | | | .58 | % | | | .68 | % | | | .73 | % |
Expenses net of waivers, if anyE | | | .43 | % | | | .46 | %F | | | .40 | % | | | .40 | % | | | .40 | % | | | .40 | % |
Expenses net of all reductionsE | | | .43 | % | | | .46 | %F | | | .40 | % | | | .40 | % | | | .40 | % | | | .40 | % |
Net investment income | | | 3.7 | % | | | 4.2 | %F | | | 5.2 | % | | | 4.8 | % | | | 3.9 | % | | | 2.4 | % |
| | | | | | |
Supplemental Data: | | | | | | | | | | | | | | | | | | | | | | | | |
Portfolio turnover rate | | | 167.7 | % | | | 261.3 | %G | | | 312.1 | % | | | 270.5 | % | | | 244.7 | % | | | 231.5 | % |
Net assets, end of year (in thousands) | | $ | 34,048 | | | $ | 65,337 | | | $ | 103,487 | | | $ | 92,400 | | | $ | 74,143 | | | $ | 37,426 | |
| | | | | | | | | | | | | | | | | | | | | | | | | |
| A | | For the period April 1, 2008 to December 31, 2008. |
| B | | Computed using average daily shares outstanding. |
| C | | Computed using SEC method. |
| D | | Performance figures may reflect compensating balance credits, fee waivers and/or expense reimbursements. In the absence of compensating balance credits, fee waivers and/or expense reimbursements, the total return would have been lower. Past performance is no guarantee of future results. Total returns for periods of less than one year are not annualized. |
| E | | Total expenses reflects operating expenses prior to any voluntary expense waivers and/or compensating balance credits. Expenses net of waivers reflects total expenses before compensating balance credits but net of any voluntary expense waivers. Expenses net of all reductions reflects expenses less any compensating balance credits and/or voluntary expense waivers. |
See notes to financial statements.
164
Annual Report to Shareholders
Financial Highlights
Western Asset Limited Duration Bond Portfolio
For a share of each class of capital stock outstanding:
Institutional Select Class:
| | | | | | | | |
| | | YEAR ENDED
DECEMBER 31,
2009 | | | PERIOD ENDED
DECEMBER 31,
2008A | |
Net asset value, beginning of year | | $ | 7.87 | | | $ | 8.01 | |
| | | | | | | | |
Investment operations: | | | | | | | | |
Net investment incomeB | | | .31 | | | | .05 | |
Net realized and unrealized gain/(loss) | | | .96 | | | | (.13 | ) |
| | | | | | | | |
Total from investment operations | | | 1.27 | | | | (.08 | ) |
| | | | | | | | |
Distributions from: | | | | | | | | |
Net investment income | | | (.32 | ) | | | (.06 | ) |
| | | | | | | | |
Total distributions | | | (.32 | ) | | | (.06 | ) |
| | | | | | | | |
Net asset value, end of year | | $ | 8.82 | | | $ | 7.87 | |
| | | | | | | | |
Total returnC | | | 16.42 | % | | | (.96 | )% |
| | |
Ratios to Average Net Assets: | | | | | | | | |
Total expensesD | | | .65 | % | | | .58 | %E |
Expenses net of waivers, if anyD | | | .40 | % | | | .41 | %E |
Expenses net of all reductionsD | | | .40 | % | | | .40 | %E |
Net investment income | | | 3.8 | % | | | 3.7 | %E |
| | |
Supplemental Data: | | | | | | | | |
Portfolio turnover rate | | | 167.7 | % | | | 261.3 | %F |
Net assets, end of year (in thousands) | | $ | 22,037 | | | $ | 13,274 | |
| | | | | | | | | |
| A | | For the period October 29, 2008 (commencement of operations) to December 31, 2008 |
| B | | Computed using average daily shares outstanding. |
| C | | Performance figures may reflect compensating balance credits, fee waivers and/or expense reimbursements. In the absence of compensating balance credits, fee waivers and/or expense reimbursements, the total return would have been lower. Past performance is no guarantee of future results. Total returns for periods of less than one year are not annualized. |
| D | | Total expenses reflects operating expenses prior to any voluntary expense waivers and/or compensating balance credits. Expenses net of waivers reflects total expenses before compensating balance credits but net of any voluntary expense waivers. Expenses net of all reductions reflects expenses less any compensating balance credits and/or voluntary expense waivers. |
See notes to financial statements.
165
Annual Report to Shareholders
Management’s Discussion of Fund Performance
Western Asset Non-U.S. Opportunity Bond Portfolio
Performance Review
For the twelve months ended December 31, 2009, Institutional Class shares of Western Asset Non-U.S. Opportunity Bond Portfolio returned 4.95%. The Fund’s unmanaged benchmark, the Citigroup World Government Ex-U.S. Index (Hedged)i, returned 2.38% for the same period. The Lipper International Income Funds Category Average1 returned 10.84% over the same time frame.
PERFORMANCE SNAPSHOT as of December 31, 2009 (unaudited)
| | | | |
| | | 6 MONTHS | | 12 MONTHS |
Western Asset Non-U.S. Opportunity Bond Portfolio: | | | | |
Institutional Class | | 5.60% | | 4.95% |
Citigroup World Government Ex-U.S. Index (Hedged) | | 2.17% | | 2.38% |
Lipper International Income Funds Category Average1 | | 7.57% | | 10.84% |
The performance shown represents past performance. Past performance is no guarantee of future results and current performance may be higher or lower than the performance shown above. Principal value, investment returns and yields will fluctuate and investors’ shares, when redeemed, may be worth more or less than their original cost. To obtain performance data current to the most recent month-end, please visit our website at www.leggmason.com/individualinvestors.
All share class returns assume the reinvestment of all distributions, including returns of capital, if any, at net asset value and the deduction of all Fund expenses. Returns have not been adjusted to include the deduction of taxes that a shareholder would pay on Fund distributions. Performance figures for periods shorter than one year represent cumulative figures and are not annualized.
Performance figures reflect expense reimbursements and/or fee waivers, without which the performance would have been lower.
The 30-Day SEC Yield for the period ended December 31, 2009 for Institutional Class shares was 2.30%. Absent current expense reimbursements and/or fee waivers, the 30-Day SEC Yield for Institutional Class shares would have been 2.26%. The 30-Day SEC Yield is the average annualized net investment income per share for the 30-day period indicated and is subject to change.
TOTAL ANNUAL OPERATING EXPENSES (unaudited)
As of the Fund’s most current prospectus dated July 1, 2009, the gross total operating expense ratio for Institutional Class shares was 0.64%.
Actual expenses may be higher. For example, expenses may be higher than those shown if average net assets decrease. Net assets are more likely to decrease and Fund expense ratios are more likely to increase when markets are volatile.
While the financial crisis in 2008 led to periods of extreme risk aversion and frozen credit conditions, the financial markets in both the U.S. and abroad largely stabilized in 2009. Against this backdrop, the Fund outperformed its benchmark.
| 1 | | Lipper, Inc., a wholly-owned subsidiary of Reuters, provides independent insight on global collective investments. Returns are based on the period ended December 31, 2009, including the reinvestment of all distributions, including returns of capital, if any, calculated among the 103 funds for the six-month period and among the 100 funds for the twelve-month period in the Fund’s Lipper category. |
166
Annual Report to Shareholders
The largest contributor to the Fund’s relative performance for the reporting period was its overweight exposure to the corporate bond market. In particular, an overweight in and strong security selection of European Tier 1 financial companies enhanced the Fund’s results as the spreads of these securities significantly narrowed during the year. The Fund also benefited from its overweights in the Industrials and Utilities sectors. We subsequently pared our exposures to these areas given their price rallies and our belief that they were fairly valued. Also enhancing the Fund’s performance was our exposure to the U.S. markets. The largest detractor from relative performance during the reporting period was the Fund’s overweight to the European markets as European yields rose in the reporting period. Overweight exposures in Australia and Poland also detracted from results, albeit to lesser extents.
There were no significant changes made to the portfolio during the reporting period. Rather, we made tactical adjustments as we sought to capitalize on changing opportunities in the marketplace. We used a number of instruments to help manage the Fund’s durationii and yield curveiii positioning during the year. These included futures, options and currency contracts. We also used index credit default swaps in an attempt to hedge the Fund’s credit risk. In aggregate, the use of these derivative instruments detracted from performance during the reporting period.
Western Asset Management Company
January 19, 2010
167
Annual Report to Shareholders
Management’s Discussion of Fund Performance—Continued
The information provided is not intended to be a forecast of future events, a guarantee of future results or investment advice. Views expressed may differ from those of the firm as a whole.
The mention of sector breakdowns is for informational purposes only and should not be construed as a recommendation to purchase or sell any securities. The information provided regarding such sectors is not a sufficient basis upon which to make an investment decision. Investors seeking financial advice regarding the appropriateness of investing in any securities or investment strategies discussed should consult their financial professional. Portfolio holdings are subject to change at any time and may not be representative of the portfolio managers’ current or future investments. The Fund’s top sector holdings (as a percentage of net assets) as of December 31, 2009 were: Foreign Government Obligations (49.9%), Corporate Bonds and Notes (37.4%) and Short Term Investments (5.7%). The Fund’s portfolio composition is subject to change at any time.
RISKS: All investments are subject to risk including the loss of principal. Fixed-income securities involve interest rate, credit, inflation and reinvestment risks. As interest rates rise, the value of fixed-income securities falls. Derivatives, such as options, futures and swaps, can be illiquid, may disproportionately increase losses, and have a potentially large impact on Fund performance. International investments are subject to special risks including currency fluctuations and social, economic and political uncertainties, which could increase volatility. These risks are magnified in emerging markets. The use of leverage may increase volatility and possibility of loss. Asset-backed, mortgage-backed or mortgage-related securities are subject to prepayment and extension risks. The Fund is not diversified, which means that it is permitted to invest a higher percentage of its assets in any one issuer than a diversified fund. This may magnify the Fund’s losses from events affecting a particular issuer. Please see the Fund’s prospectus for more information on these and other risks.
All index performance reflects no deduction for fees, expenses or taxes. Please note that an investor cannot invest directly in an index.
| i | | The Citigroup World Government Ex-U.S. Index (Hedged) encompasses an all-inclusive universe of institutionally traded bonds, including all fixed-rate bonds with remaining maturities of one year or longer with amounts outstanding of at least the equivalent of $25 million USD. This Index excludes the U.S. and is currency-hedged as a means of achieving low-risk interest rate diversification. |
| ii | | Duration is the measure of the price sensitivity of a fixed-income security to an interest rate change of 100 basis points. Calculation is based on the weighted average of the present values for all cash flows. |
| iii | | The yield curve is the graphical depiction of the relationship between the yield on bonds of the same credit quality but different maturities. |
168
Annual Report to Shareholders
Special Shareholder Notice
Western Asset Non-U.S. Opportunity Bond Portfolio
Effective August 20, 2009, the Fund is managed by a team of portfolio managers, sector specialists and other investment professionals. S. Kenneth Leech and Stephen A. Walsh serve as co-leaders of this team and are responsible for the day-to-day strategic oversight of the Fund’s investments and for supervising the day-to-day operations of the various sector specialist teams dedicated to the specific asset classes in which the Fund invests. As portfolio managers, their focus is on portfolio structure, including sector allocation, durationi weighting and term structure decisions. Mr. Leech and Mr. Walsh are employed by Western Asset Management Company and have served as portfolio managers to the Fund since its inception in 1998.
| i | | Duration is the measure of the price sensitivity of a fixed-income security to an interest rate change of 100 basis points. Calculation is based on the weighted average of the present values for all cash flows. |
169
Annual Report to Shareholders
Expense Example (Unaudited)
Western Asset Non-U.S. Opportunity Bond Portfolio
As a shareholder of the Fund, you may incur two types of costs (1) transaction cost and (2) ongoing costs, including management fees and other Fund expenses. These examples are intended to help you understand your ongoing costs (in dollars) of investing in the Fund and to compare these costs with the ongoing costs of investing in other mutual funds.
The example is based on an investment $1,000 invested on July 1, 2009 and held through December 31, 2009. The ending values assume dividends were reinvested at the time they were paid.
Actual Expenses
The first line in the table below provides information about actual account values and actual expenses for the Fund. You may use the information in this line, together with the amount you invested, to estimate the expenses that you paid over the period. Simply divide your account value by $1,000 (for example, an $8,600 account value divided by $1,000 = 8.6), then multiply the result by the number in the first line under the heading entitled “Expenses Paid During the Period” to estimate the expenses you paid on your account if your shares were held through the entire period.
Hypothetical Example for Comparison Purposes
The second line in the table below provides information about hypothetical account values and hypothetical expenses based on the Fund’s actual expense ratio and an assumed rate of return of 5% per year before expenses, which is not the Fund’s actual return. The hypothetical account values and expenses may not be used to estimate the actual ending account balance or expenses you paid for the period. You may use this information to compare the ongoing costs of investing in the Fund and other funds. To do so, compare this 5% hypothetical example with the 5% hypothetical examples for the relevant classes that appear in the shareholder reports of other funds. Because each example is intended to be comparable to the examples provided by other funds, it is based on a hypothetical investment of $1,000 invested on July 1, 2009 and held through December 31, 2009. The ending values assume dividends were reinvested at the time they were paid.
| | | | | | | | | |
| | | Beginning
Account Value
7/1/09 | | Ending
Account Value
12/31/09 | | Expenses Paid
During the PeriodA
7/1/09 to 12/31/09 |
Institutional Class: | | | | | | | | | |
Actual | | $ | 1,000.00 | | $ | 1,056.00 | | $ | 3.26 |
Hypothetical (5% return before expenses) | | | 1,000.00 | | | 1,022.03 | | | 3.21 |
| A | | These calculations are based on expenses incurred from July 1, 2009 to December 31, 2009. The dollar amounts shown as “Expenses Paid” are equal to the annualized expense ratio of 0.63% multiplied by the average value over the period, multiplied by the number of days in the most recent fiscal half-year then divided by 365. |
170
Annual Report to Shareholders
Performance Information (Unaudited)
Western Asset Non-U.S. Opportunity Bond Portfolio
The graph compares the Fund’s total returns against that of an appropriate broad-based securities market index. The graph illustrates the cumulative total return of an initial $1,000,000 investment for the periods indicated. The line for the Fund represents the total return after deducting all Fund investment management and other administrative expenses and the transaction costs of buying and selling securities. The line representing the securities market index does not include any transaction costs associated with buying and selling securities in the index or other investment management or administrative expenses.
Total return measures investment performance in terms of appreciation or depreciation in the Fund’s net asset value per share, plus dividends and any capital gain distributions. It assumes that dividends and distributions were reinvested at the time they were paid. Returns (and the graph and table found below) do not reflect the deduction of taxes that a shareholder would pay on Fund distributions or the redemption of Fund shares. Average annual returns tend to smooth out variations in a fund’s return, so that they differ from actual year-to-year results.
Bonds are subject to a variety of risks, including interest rate, credit and inflation risk. Non U.S. investments are subject to currency fluctuations, social, economic, and political risk.
Growth of a $1,000,000 Investment—Institutional Class
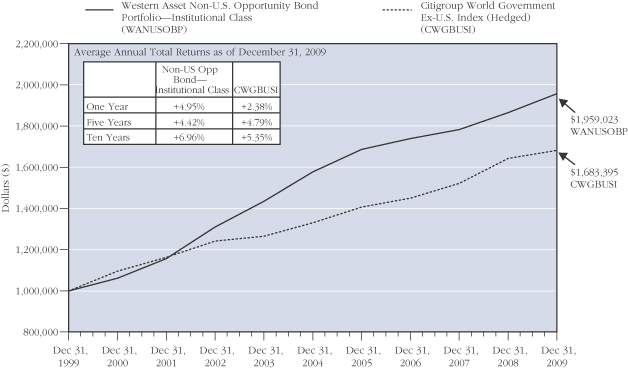
The performance data quoted represent past performance and do not guarantee future results. Current performance may be lower or higher than the performance data quoted. To obtain the most recent month-end performance information, please visit www.westernassetfunds.com. The investment return and principal value of the Fund will fluctuate so that an investor’s shares, when redeemed, may be worth more or less than the original cost. Calculations assume reinvestment of all distributions, including returns of capital, if any, at net asset value and the deduction of all Fund expenses. Performance would have been lower if fees had not been waived in various periods.
171
Annual Report to Shareholders
Performance Information (Unaudited)—Continued
Portfolio Composition (as of December 31, 2009)A
Standard & Poor’s Debt RatingsB
(as a percentage of the portfolio)
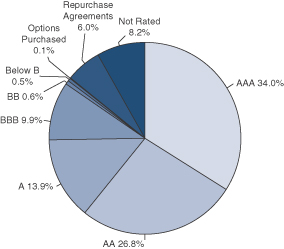
Maturity Schedule
(as a percentage of the portfolio)
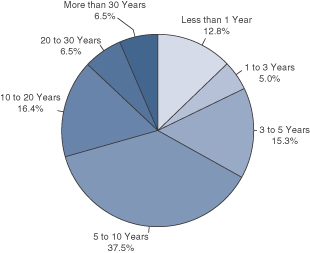
| A | | The pie charts above represent the composition of the Fund’s portfolio as of December 31, 2009 and do not include derivatives such as Futures Contracts, Options Written, and Swaps. The Fund is actively managed. As a result, the composition of the portfolio holdings and sectors are subject to change at any time. |
| B | | Standard & Poor’s Ratings Service provides capital markets with credit ratings for the evaluation and assessment of credit risk. These ratings are the opinions of S&P and not absolute measures of quality or guarantees of performance. |
172
Annual Report to Shareholders
Spread Duration
Western Asset Non-U.S. Opportunity Bond Portfolio
December 31, 2009 (Unaudited)
Economic Exposure
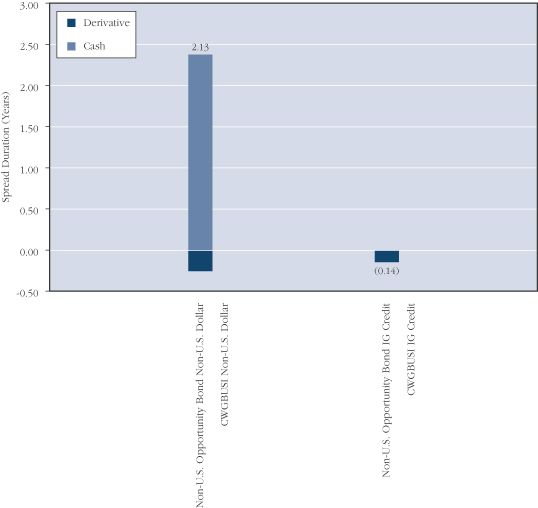
Spread duration is defined as the change in value for a 100 basis point change in the spread relative to Treasuries. The spread over Treasuries is the annual risk-premium demanded by investors to hold non-Treasury securities. This chart highlights the market sector exposure of the Fund’s portfolio and the exposure relative to the selected benchmark as of the end of the reporting period.
| | | | |
| CWGBUSI | | — | | Citigroup World Government Ex-U.S. Index (Hedged) |
| IG Credit | | — | | Investment Grade Credit |
173
Annual Report to Shareholders
Effective Duration
Western Asset Non-U.S. Opportunity Bond Portfolio
December 31, 2009 (Unaudited)
Interest Rate Exposure
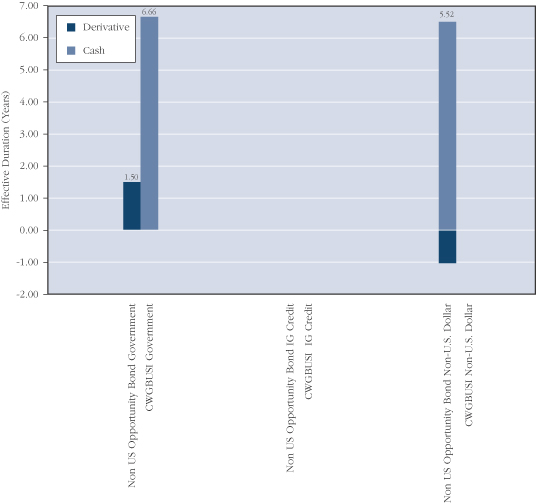
Effective duration is defined as the change in value for a 100 basis point change in Treasury yields. This chart highlights the interest rate exposure of the Fund’s portfolio relative to the selected benchmark as of the end of the reporting period.
| | | | |
| CWGBUSI | | — | | Citigroup World Government Ex-U.S. Index (Hedged) |
| IG Credit | | — | | Investment Grade Credit |
174
Annual Report to Shareholders
Portfolio of Investments
Western Asset Non-U.S. Opportunity Bond Portfolio
December 31, 2009
| | | | | | | | | | | | | |
| | | % OF
NET ASSETS | | RATE | | MATURITY
DATE | | PAR† | | | VALUE | |
| | | | | | | | | | | | | |
| | | | | | | | | | | | | |
Long-Term Securities | | 87.3% | | | | | | | | | | | |
| | | | | |
Corporate Bonds and Notes | | 37.4% | | | | | | | | | | | |
| | | | | |
Capital Markets | | 1.6% | | | | | | | | | | | |
Lehman Brothers Holdings Inc. | | | | 4.625% | | 3/14/19 | | 1,300,000 | EUR | | $ | 2,702 | A,B,C |
Merrill Lynch and Co. Inc. | | | | 6.750% | | 5/21/13 | | 100,000 | EUR | | | 154,765 | |
The Goldman Sachs Group Inc. | | | | 6.375% | | 5/2/18 | | 374,000 | EUR | | | 591,513 | |
The Goldman Sachs Group Inc. | | | | 5.125% | | 10/23/19 | | 150,000 | EUR | | | 217,777 | |
UBS AG London | | | | 6.000% | | 4/18/18 | | 200,000 | EUR | | | 311,814 | |
| | | | | | | | | | | | | |
| | | | | | | | | | | | 1,278,571 | |
| | | | | | | | | | | | | |
Commercial Banks | | 11.5% | | | | | | | | | | | |
Alliance and Leicester PLC | | | | 5.000% | | 10/4/10 | | 1,000,000 | EUR | | | 1,465,226 | |
Australia and New Zealand
Banking Group Ltd. | | | | 5.125% | | 9/10/19 | | 250,000 | EUR | | | 370,896 | |
Banco Popolare di Verona e Novara Scrl | | | | 6.156% | | 6/29/49 | | 500,000 | EUR | | | 415,729 | B |
Barclays Bank PLC | | | | 5.250% | | 5/27/14 | | 390,000 | EUR | | | 596,677 | |
Bayerische Landesbank | | | | 5.750% | | 10/23/17 | | 250,000 | EUR | | | 342,580 | |
BES Finance Ltd. | | | | 4.500% | | 12/29/49 | | 50,000 | EUR | | | 61,643 | B |
Commonwealth Bank of Australia | | | | 5.500% | | 8/6/19 | | 200,000 | EUR | | | 304,277 | |
Dexia Municipal Agency | | | | 1.550% | | 10/31/13 | | 282,000,000 | JPY | | | 2,995,041 | |
HSH Nordbank Luxembourg | | | | 7.408% | | 6/29/49 | | 647,000 | EUR | | | 201,733 | B |
HT1 Funding GmbH | | | | 6.352% | | 7/29/49 | | 266,000 | EUR | | | 223,978 | B |
Intesa Sanpaolo SpA | | | | 5.750% | | 5/28/18 | | 400,000 | EUR | | | 604,580 | B |
Lloyds TSB Bank PLC | | | | 6.375% | | 6/17/16 | | 250,000 | EUR | | | 388,679 | |
Royal Bank of Scotland PLC | | | | 6.934% | | 4/9/18 | | 550,000 | EUR | | | 731,451 | |
Shinsei Bank Ltd. | | | | 3.750% | | 2/23/16 | | 100,000 | EUR | | | 120,418 | B,D |
Swedbank AB | | | | 5.570% | | 9/27/17 | | 100,000 | EUR | | | 140,929 | B |
UniCredit SpA | | | | 4.375% | | 1/29/20 | | 200,000 | EUR | | | 287,585 | |
| | | | | | | | | | | | | |
| | | | | | | | | | | | 9,251,422 | |
| | | | | | | | | | | | | |
Diversified Financial Services | | 17.2% | | | | | | | | | | | |
Banca Italease SpA | | | | 0.922% | | 2/2/10 | | 250,000 | EUR | | | 357,829 | E |
Banca Italease SpA | | | | 0.965% | | 11/23/10 | | 200,000 | EUR | | | 281,626 | E |
Banca Italease SpA | | | | 1.016% | | 2/8/12 | | 50,000 | EUR | | | 68,364 | E |
Banca Italease SpA | | | | 0.964% | | 3/14/12 | | 50,000 | EUR | | | 68,142 | E |
Bank of America Corp. | | | | 7.000% | | 6/15/16 | | 400,000 | EUR | | | 644,175 | |
Caisse Refinancement de l’Habitat | | | | 4.200% | | 4/25/11 | | 635,000 | EUR | | | 942,190 | |
Citigroup Inc. | | | | 7.375% | | 6/16/14 | | 300,000 | EUR | | | 473,163 | |
Citigroup Inc. | | | | 7.375% | | 9/4/19 | | 230,000 | EUR | | | 359,652 | |
Eksportfinans ASA | | | | 1.600% | | 3/20/14 | | 365,000,000 | JPY | | | 3,930,404 | |
Eurohypo Capital Funding Trust 1 | | | | 6.445% | | 5/29/49 | | 61,000 | EUR | | | 35,853 | B |
175
Annual Report to Shareholders
Portfolio of Investments—Continued
Western Asset Non-U.S. Opportunity Bond Portfolio—Continued
| | | | | | | | | | | | | |
| | | % OF
NET ASSETS | | RATE | | MATURITY
DATE | | PAR† | | | VALUE | |
| | | | | | | | | | | | | |
Corporate Bonds and Notes—Continued | | | | | | | | | | | | | |
| | | | | |
Diversified Financial Services—Continued | | | | | | | | | | | | | |
European Investment Bank | | | | 4.250% | | 12/7/10 | | 1,512,000 | GBP | | $ | 2,518,019 | |
European Investment Bank | | | | 1.900% | | 1/26/26 | | 236,000,000 | JPY | | | 2,448,331 | D |
GE Capital European Funding | | | | 5.375% | | 1/23/20 | | 150,000 | EUR | | | 219,863 | |
Investor AB | | | | 4.875% | | 11/18/21 | | 90,000 | EUR | | | 129,278 | |
Kreditanstalt fuer Wiederaufbau | | | | 2.600% | | 6/20/37 | | 42,000,000 | JPY | | | 461,857 | |
Landesbank Hessen-Thueringen Girozentrale | | | | 5.375% | | 3/7/12 | | 200,000 | GBP | | | 339,535 | |
Resona Bank Ltd. | | | | 4.125% | | 9/29/49 | | 200,000 | EUR | | | 249,438 | B,D |
Total Capital SA | | | | 3.500% | | 2/27/14 | | 210,000 | EUR | | | 309,346 | |
| | | | | | | | | | | | | |
| | | | | | | | | | | | 13,837,065 | |
| | | | | | | | | | | | | |
Diversified Telecommunication Services | | 2.0% | | | | | | | | | | | |
British Telecommunications PLC | | | | 5.250% | | 1/22/13 | | 75,000 | EUR | | | 112,928 | |
British Telecommunications PLC | | | | 5.250% | | 6/23/14 | | 274,000 | EUR | | | 410,421 | |
Deutsche Telekom International Finance BV | | | | 7.125% | | 7/11/11 | | 108,000 | EUR | | | 166,778 | F |
Koninklijke (Royal) KPN N.V. | | | | 5.000% | | 11/13/12 | | 149,000 | EUR | | | 225,640 | |
Telecom Italia SpA | | | | 7.875% | | 1/22/14 | | 250,000 | EUR | | | 414,328 | |
Telecom Italia SpA | | | | 5.250% | | 3/17/55 | | 200,000 | EUR | | | 236,412 | |
| | | | | | | | | | | | | |
| | | | | | | | | | | | 1,566,507 | |
| | | | | | | | | | | | | |
Electric Utilities | | 0.2% | | | | | | | | | | | |
Electricite de France (EDF) | | | | 4.625% | | 9/11/24 | | 100,000 | EUR | | | 142,711 | |
| | | | | | | | | | | | | |
| | | | | |
Food and Staples Retailing | | 0.4% | | | | | | | | | | | |
Tesco PLC | | | | 5.125% | | 2/24/15 | | 200,000 | EUR | | | 309,574 | |
| | | | | | | | | | | | | |
| | | | | |
Insurance | | 1.9% | | | | | | | | | | | |
Aviva PLC | | | | 5.250% | | 10/2/23 | | 320,000 | EUR | | | 449,561 | B |
AXA SA | | | | 6.211% | | 10/29/49 | | 200,000 | EUR | | | 241,553 | B |
Mapfre SA | | | | 5.921% | | 7/24/37 | | 400,000 | EUR | | | 481,039 | B |
Muenchener Rueckversicherungs-Gesellschaft AG (MunichRe) | | | | 5.767% | | 6/29/49 | | 250,000 | EUR | | | 320,757 | B |
| | | | | | | | | | | | | |
| | | | | | | | | | | | 1,492,910 | |
| | | | | | | | | | | | | |
Oil, Gas and Consumable Fuels | | 0.8% | | | | | | | | | | | |
BG Energy Capital PLC | | | | 3.375% | | 7/15/13 | | 50,000 | EUR | | | 72,470 | |
BP Capital Markets PLC | | | | 5.750% | | 2/26/10 | | 250,000 | GBP | | | 406,499 | |
Dong Energy A/S | | | | 4.000% | | 12/16/16 | | 60,000 | EUR | | | 85,340 | |
176
Annual Report to Shareholders
| | | | | | | | | | | | | |
| | | % OF
NET ASSETS | | RATE | | MATURITY
DATE | | PAR† | | | VALUE | |
| | | | | | | | | | | | | |
Corporate Bonds and Notes—Continued | | | | | | | | | | | | | |
| | | | | |
Oil, Gas and Consumable Fuels—Continued | | 0.8% | | | | | | | | | | | |
Dong Energy A/S | | | | 4.875% | | 12/16/21 | | 50,000 | EUR | | $ | 71,091 | |
| | | | | | | | | | | | | |
| | | | | | | | | | | | 635,400 | |
| | | | | | | | | | | | | |
Thrifts and Mortgage Finance | | 0.1% | | | | | | | | | | | |
Hypo Real Estate International Trust I | | | | 5.864% | | 6/14/17 | | 350,000 | EUR | | | 120,418 | A,B |
| | | | | | | | | | | | | |
| | | | | |
Tobacco | | 0.9% | | | | | | | | | | | |
BAT International Finance PLC | | | | 5.375% | | 6/29/17 | | 150,000 | EUR | | | 229,088 | |
Imperial Tobacco Group PLC | | | | 7.250% | | 9/15/14 | | 310,000 | EUR | | | 505,328 | |
| | | | | | | | | | | | | |
| | | | | | | | | | | | 734,416 | |
| | | | | | | | | | | | | |
Water Utilities | | 0.8% | | | | | | | | | | | |
Anglian Water Services Ltd | | | | 6.250% | | 6/27/16 | | 230,000 | EUR | | | 366,770 | |
Thames Water Utilities Cayman Finance Ltd. | | | | 6.125% | | 2/4/13 | | 200,000 | EUR | | | 309,077 | |
| | | | | | | | | | | | | |
| | | | | | | | | | | | 675,847 | |
| | | | | | | | | | | | | |
Total Corporate Bonds and Notes (Cost—$30,651,319) | | | | | | | | | | | | 30,044,841 | |
Foreign Government Obligations | | 49.9% | | | | | | | | | | | |
Bundesrepublik Deutschland | | | | 4.250% | | 7/4/17 | | 10,000 | EUR | | | 15,432 | |
Canadian Real Return Bond | | | | 4.000% | | 12/1/31 | | 200,656 | CAD | | | 280,822 | G |
Development Bank of Japan | | | | 1.750% | | 3/17/17 | | 100,000,000 | JPY | | | 1,132,358 | |
France Government Bond OAT | | | | 4.000% | | 4/25/55 | | 2,080,000 | EUR | | | 2,847,633 | G |
Government of Canada | | | | 4.000% | | 6/1/16 | | 2,300,000 | CAD | | | 2,313,085 | |
Government of Japan | | | | 0.400% | | 6/15/11 | | 179,000,000 | JPY | | | 1,929,001 | |
Government of Japan | | | | 0.900% | | 3/20/14 | | 58,000,000 | JPY | | | 635,919 | |
Government of Japan | | | | 1.300% | | 9/10/17 | | 36,000,000 | JPY | | | 375,056 | G |
Government of Japan | | | | 1.500% | | 9/20/18 | | 333,400,000 | JPY | | | 3,701,110 | |
Government of Japan | | | | 0.410% | | 7/20/20 | | 30,000,000 | JPY | | | 307,457 | E |
Government of Japan | | | | 2.100% | | 3/20/27 | | 33,000,000 | JPY | | | 362,311 | |
Government of Japan | | | | 2.100% | | 6/20/29 | | 58,000,000 | JPY | | | 626,775 | |
Government of Poland | | | | 5.000% | | 10/24/13 | | 1,400,000 | PLN | | | 479,669 | |
Government of Poland | | | | 5.750% | | 9/23/22 | | 13,560,000 | PLN | | | 4,501,758 | |
Hellenic Republic Government Bond | | | | 3.700% | | 7/20/15 | | 2,190,000 | EUR | | | 2,914,123 | |
Japan Development Bank | | | | 2.300% | | 3/19/26 | | 240,000,000 | JPY | | | 2,674,046 | |
Kingdom of Norway | | | | 4.250% | | 5/19/17 | | 37,660,000 | NOK | | | 6,611,770 | |
Netherlands Government Bond | | | | 4.000% | | 1/15/37 | | 2,500,000 | EUR | | | 3,453,780 | |
Republic of France | | | | 4.750% | | 4/25/35 | | 140,000 | EUR | | | 216,004 | G |
177
Annual Report to Shareholders
Portfolio of Investments—Continued
Western Asset Non-U.S. Opportunity Bond Portfolio—Continued
| | | | | | | | | | | | | | |
| | | % OF
NET ASSETS | | RATE | | MATURITY
DATE | | PAR† | | | VALUE | |
| | | | | | | | | | | | | | |
Foreign Government Obligations—Continued | | | | | | | | | | | | | | |
United Kingdom Gilt | | | | 3.750% | | 9/7/19 | | | 3,000,000 | GBP | | $ | 4,704,838 | |
| | | | | | | | | | | | | | |
Total Foreign Government Obligations
(Cost—$39,366,425) | | | | | | | | | | | | | 40,082,947 | |
| | | | | | | | | | | | | | |
Total Long-Term Securities (Cost—$70,017,744) | | | | | | | | | | | | | 70,127,788 | |
Short-Term Securities | | 5.7% | | | | | | | | | | | | |
| | | | | |
Options Purchased | | 0.1% | | | | | | | | | | | | |
Eurodollar Futures Put, February 2010,
Strike Price $1.44 | | | | | | | | | 1,710,000 | H | | | 38,597 | C |
Eurodollar Futures Put, February 2010,
Strike Price $1.45 | | | | | | | | | 1,680,000 | H | | | 49,947 | C |
U.S. Treasury Note Futures Call, February 2010, Strike Price $119.50 | | | | | | | | | 200 | H | | | 15,625 | |
| | | | | | | | | | | | | | |
| | | | | | | | | | | | | 104,169 | |
| | | | | | | | | | | | | | |
Repurchase Agreement | | 5.6% | | | | | | | | | | | | |
JPMorgan Chase & Co. repurchase agreement dated 12/31/09, 0.005% due 1/4/10; Proceeds at maturity—$4,456,002; (Fully collateralized by U.S. government agency obligation, 0.930% due 3/30/10; Market value—$4,545,119) | | | | | | | | $ | 4,456,000 | | | | 4,456,000 | |
| | | | | | | | | | | | | | |
Total Short-Term Securities (Cost—$4,614,675) | | | | | | | | | | | | | 4,560,169 | |
Total Investments (Cost—$74,632,419#) | | 93.0% | | | | | | | | | | | 74,687,957 | |
Other Assets Less Liabilities | | 7.0% | | | | | | | | | | | 5,616,643 | |
| | | | | | | | | | | | | | |
| | | | | |
Net Assets | | 100.0% | | | | | | | | | | $ | 80,304,600 | |
| | | | | | | | | | | | | | |
| | | | | | | | |
| | | EXPIRATION | | ACTUAL
CONTRACTS | | APPRECIATION/
(DEPRECIATION) | |
Futures Contracts PurchasedI | | | | | | | | |
German Euro Bund Futures | | March 2010 | | 14 | | $ | (17,731 | ) |
U.S. Treasury Bond Futures | | March 2010 | | 48 | | | (210,531 | ) |
U.S. Treasury Note Futures | | March 2010 | | 60 | | | (102,242 | ) |
| | | | | | | | |
| | | | | | $ | (330,504 | ) |
| | | | | | | | |
178
Annual Report to Shareholders
| | | | | | | | | | |
| | | | | EXPIRATION | | ACTUAL
CONTRACTS | | APPRECIATION/
(DEPRECIATION) | |
Futures Contracts WrittenI | | | | | | | | | | |
German Euro Bobl Futures | | | | March 2010 | | 136 | | $ | 156,435 | |
U.S. Treasury Note Futures | | | | March 2010 | | 91 | | | 158,024 | |
| | | | | | | | | | |
| | | | | | | | $ | 314,459 | |
| | | | | | | | | | |
Options WrittenI | | | | | | | | | | |
U.S. Treasury Note Futures Put, Strike Price $114.50 | | | | February 2010 | | 200 | | $ | (97,525 | ) |
| | | | | | | | | | |
| | | | | | | | | | | |
| A | | The coupon payment on these securities is currently in default as of December 31, 2009. |
| B | | Stepped Coupon Security – A security with a predetermined schedule of interest or dividend rate changes at which time it begins to accrue interest or pay dividends according to the predetermined schedule. |
| C | | Security is valued in good faith at fair value by or under the direction of the Board of Directors. |
| D | | Rule 144a Security – A security purchased pursuant to Rule 144a under the Securities Act of 1933 which may not be resold subject to that rule except to qualified institutional buyers. These securities, which the Fund’s investment adviser has determined to be liquid, unless otherwise noted, represent 3.51% of net assets. |
| E | | Indexed Security – The rates of interest earned on these securities are tied to the London Interbank Offered Rate (“LIBOR”), the Euro Interbank Offered Rate (“EURIBOR”) Index, the Consumer Price Index (“CPI”), the one-year Treasury Bill Rate or the ten-year Japanese Government Bond Rate. The coupon rates are the rates as of December 31, 2009. |
| F | | Credit Linked Security – The rates of interest earned on these securities are tied to the credit rating assigned by Standard & Poor’s Rating Service and/or Moody’s Investors Services. |
| G | | Inflation-Protected Security – Security whose principal value is adjusted daily or monthly in accordance with changes to the relevant country’s Consumer Price Index or its equivalent used as an inflation proxy. Interest is calculated on the basis of the current adjusted principal value. |
| H | | Par represents actual number of contracts. |
| I | | Options written and futures are described in more detail in the notes to financial statements. |
| # | | Aggregate cost for federal income tax purposes is $74,690,254. |
| † | | Securities are denominated in U.S. Dollars, unless otherwise noted. |
Abbreviation used in this Portfolio:
| | | | |
| CAD | | — | | Canadian Dollar |
| EUR | | — | | Euro |
| GBP | | — | | British Pound |
| JPY | | — | | Japanese Yen |
| NOK | | — | | Norwegian Krone |
| PLN | | — | | Polish Zloty |
See notes to financial statements.
179
Annual Report to Shareholders
Statement of Assets and Liabilities
Western Asset Non-U.S. Opportunity Bond Portfolio
December 31, 2009
| | | | | | | |
Assets: | | | | | | | |
Investment securities at value (Cost—$70,017,744) | | | | | $ | 70,127,788 | |
Short-term securities at value (Cost—$4,614,675) | | | | | | 4,560,169 | |
Cash | | | | | | 607 | |
Foreign currency at value (Cost—$360,697) | | | | | | 358,990 | |
Unrealized appreciation of forward foreign currency contracts | | | | | | 4,413,249 | |
Deposits with brokers for open futures contracts | | | | | | 1,543,826 | |
Interest receivable | | | | | | 1,259,790 | |
Receivable for fund shares sold | | | | | | 402,497 | |
Premiums paid on open swaps | | | | | | 60,163 | |
Unrealized appreciation of swaps | | | | | | 2,113 | |
| | | | | | | |
Total assets | | | | | | 82,729,192 | |
| | | | | | | |
| | |
Liabilities: | | | | | | | |
Unrealized depreciation of forward foreign currency contracts | | $ | 2,103,504 | | | | |
Options written (Proceeds—$55,600) | | | 153,125 | | | | |
Premiums received on open swaps | | | 36,998 | | | | |
Accrued management fee | | | 28,071 | | | | |
Futures variation margin payable | | | 16,193 | | | | |
Unrealized depreciation of swaps | | | 13,999 | | | | |
Amounts payable for open swaps | | | 2,081 | | | | |
Accrued expenses | | | 70,621 | | | | |
| | | | | | | |
Total liabilities | | | | | | 2,424,592 | |
| | | | | | | |
| | |
Net Assets | | | | | $ | 80,304,600 | |
| | | | | | | |
| | |
Net assets consist of: | | | | | | | |
Accumulated paid-in-capital (Note 7) | | | | | $ | 80,574,596 | |
Accumulated net investment loss | | | | | | (2,870,182 | ) |
Accumulated net realized gain on investments, options, futures, swaps and foreign currency transactions | | | | | | 368,825 | |
Unrealized appreciation of investments, options, futures, swaps and foreign currency translations | | | | | | 2,231,361 | |
| | | | | | | |
| | |
Net Assets | | | | | $ | 80,304,600 | |
| | | | | | | |
| | |
Net Asset Value Per Share: | | | | | | | |
Institutional Class (8,787,670 shares outstanding) | | | | | | $9.14 | |
| | | | | | | |
| | | | | | | | |
See notes to financial statements.
180
Annual Report to Shareholders
Statement of Operations
Western Asset Non-U.S. Opportunity Bond Portfolio
| | | | | | | | |
| | | FOR THE
YEAR ENDED
DECEMBER 31, 2009 | |
Investment Income: | | | | | | | | |
Interest | | $ | 2,952,763 | | | | | |
Less: Foreign taxes withheld | | | (4,192 | ) | | | | |
| | | | | | | | |
Total income | | | | | | $ | 2,948,571 | |
Expenses: | | | | | | | | |
Management fees (Note 2) | | | 398,232 | | | | | |
Audit and legal fees | | | 64,935 | | | | | |
Custodian fees | | | 57,210 | | | | | |
Transfer agent and shareholder servicing expense (Note 6) | | | 38,710 | | | | | |
Registration fees | | | 25,212 | | | | | |
Reports to shareholders (Note 6) | | | 12,104 | | | | | |
Directors’ fees and expenses | | | 4,982 | | | | | |
Other expenses | | | 15,711 | | | | | |
| | | | | | | | |
| | | 617,096 | | | | | |
Less: Fees waived (Notes 2 and 6) | | | (35,398 | ) | | | | |
| | | | | | | | |
Net expenses | | | | | | | 581,698 | |
| | | | | | | | |
Net Investment Income | | | | | | | 2,366,873 | |
Net Realized and Unrealized Gain/(Loss) on Investments (Notes 1, 3 and 4): | | | | | | | | |
Net realized gain/(loss) on: | | | | | | | | |
Investments | | | 3,874,650 | | | | | |
Options written | | | 844,253 | | | | | |
Futures | | | (707,738 | ) | | | | |
Swaps | | | (257,113 | ) | | | | |
Foreign currency transactions | | | (5,327,165 | ) | | | | |
| | | | | | | | |
| | | | | | | (1,573,113 | ) |
Change in unrealized appreciation/(depreciation) of: | | | | | | | | |
Investments | | | (960,727 | ) | | | | |
Options written | | | (257,591 | ) | | | | |
Futures | | | 314,494 | | | | | |
Swaps | | | (11,886 | ) | | | | |
Foreign currency translations | | | 3,917,377 | | | | | |
| | | | | | | | |
| | | | | | | 3,001,667 | |
| | | | | | | | |
Net Realized and Unrealized Gain on Investments | | | | | | | 1,428,554 | |
| | | | | | | | | |
Change in Net Assets Resulting From Operations | | | | | | $ | 3,795,427 | |
| | | | | | | | | |
See notes to financial statements.
181
Annual Report to Shareholders
Statement of Changes in Net Assets
Western Asset Non-U.S. Opportunity Bond Portfolio
| | | | | | | | | | | | |
| | | FOR THE
YEAR ENDED
DECEMBER 31, 2009 | | | FOR THE
PERIOD ENDED
DECEMBER 31, 2008A | | | FOR THE
YEAR ENDED
MARCH 31, 2008 | |
Change in Net Assets: | | | | | | | | | | | | |
Net investment income | | $ | 2,366,873 | | | $ | 4,205,480 | | | $ | 6,689,758 | |
| | | |
Net realized gain/(loss) | | | (1,573,113 | ) | | | 12,768,538 | | | | (10,535,630 | ) |
| | | |
Change in unrealized appreciation/(depreciation) | | | 3,001,667 | | | | (12,829,475 | ) | | | 7,401,331 | |
| | | | | | | | | | | | |
Change in net assets resulting from operations | | | 3,795,427 | | | | 4,144,543 | | | | 3,555,459 | |
| | | |
Distributions to shareholders from (Note 1): | | | | | | | | | | | | |
Net investment income: | | | | | | | | | | | | |
Institutional Class | | | — | | | | (17,500,005 | ) | | | — | |
| | | |
Net realized gain on investments: | | | | | | | | | | | | |
Institutional Class | | | (641,931 | ) | | | — | | | | (461,385 | ) |
| | |
Change in net assets from fund share transactions (Note 7): | | | | | | | | | |
Institutional Class | | | (27,211,075 | ) | | | (87,936,589 | ) | | | 25,251,687 | |
| | | | | | | | | | | | |
Change in net assets | | | (24,057,579 | ) | | | (101,292,051 | ) | | | 28,345,761 | |
| | | |
Net Assets: | | | | | | | | | | | | |
Beginning of year | | | 104,362,179 | | | | 205,654,230 | | | | 177,308,469 | |
| | | | | | | | | | | | |
| | | |
End of year | | $ | 80,304,600 | | | $ | 104,362,179 | | | $ | 205,654,230 | |
| | | | | | | | | | | | |
| | | |
Overdistributed net investment income | | $ | (2,870,182 | ) | | $ | (3,950,890 | ) | | $ | (2,442,558 | ) |
| | | | | | | | | | | | |
| | | | | | | | | | | | | |
| A | | For the period April 1, 2008 to December 31, 2008. |
See notes to financial statements.
182
Annual Report to Shareholders
Financial Highlights
Western Asset Non-U.S. Opportunity Bond Portfolio
For a share of capital stock outstanding:
Institutional Class:
| | | | | | | | | | | | | | | | | | | | | | | | |
| | | YEAR ENDED
DECEMBER 31,
2009 | | | PERIOD ENDED
DECEMBER 31,
2008A | | | YEARS ENDED MARCH 31, | |
| | | | | 2008 | | | 2007 | | | 2006 | | | 2005 | |
Net asset value, beginning of year | | $ | 8.77 | | | $ | 9.93 | | | $ | 9.75 | | | $ | 9.59 | | | $ | 10.98 | | | $ | 10.52 | |
| | | | | | | | | | | | | | | | | | | | | | | | |
Investment operations: | | | | | | | | | | | | | | | | | | | | | | | | |
Net investment income | | | .23 | B | | | .24 | B | | | .37 | B | | | .36 | B | | | .64 | C | | | .19 | C |
Net realized and unrealized gain/(loss) | | | .20 | | | | .21 | | | | (.16 | ) | | | — | D | | | (.07 | ) | | | .57 | |
| | | | | | | | | | | | | | | | | | | | | | | | |
Total from investment operations | | | .43 | | | | .45 | | | | .21 | | | | .36 | | | | .57 | | | | .76 | |
| | | | | | | | | | | | | | | | | | | | | | | | |
Distributions from: | | | | | | | | | | | | | | | | | | | | | | | | |
Net investment income | | | — | | | | (1.61 | ) | | | — | | | | (.20 | ) | | | (1.16 | ) | | | (.29 | ) |
Net realized gain on investments | | | (.06 | ) | | | — | | | | (.03 | ) | | | — | | | | (.80 | ) | | | (.01 | ) |
| | | | | | | | | | | | | | | | | | | | | | | | |
Total distributions | | | (.06 | ) | | | (1.61 | ) | | | (.03 | ) | | | (.20 | ) | | | (1.96 | ) | | | (.30 | ) |
| | | | | | | | | | | | | | | | | | | | | | | | |
Net asset value, end of year | | $ | 9.14 | | | $ | 8.77 | | | $ | 9.93 | | | $ | 9.75 | | | $ | 9.59 | | | $ | 10.98 | |
| | | | | | | | | | | | | | | | | | | | | | | | |
Total returnE | | | 4.95 | % | | | 4.49 | % | | | 2.11 | % | | | 3.89 | % | | | 5.33 | % | | | 7.60 | % |
| | | | | | |
Ratios to Average Net Assets: | | | | | | | | | | | | | | | | | | | | | | | | |
Total expensesF | | | .70 | % | | | .62 | %G | | | .59 | % | | | .64 | % | | | .74 | % | | | .68 | % |
Expenses net of waivers, if anyF | | | .66 | % | | | .58 | %G | | | .55 | % | | | .55 | % | | | .55 | % | | | .55 | % |
Expenses net of all reductionsF | | | .66 | % | | | .58 | %G | | | .55 | % | | | .55 | % | | | .55 | % | | | .55 | % |
Net investment income | | | 2.7 | % | | | 3.2 | %G | | | 3.7 | % | | | 3.7 | % | | | 3.3 | % | | | 3.2 | % |
| | | | | | |
Supplemental Data: | | | | | | | | | | | | | | | | | | | | | | | | |
Portfolio turnover rate | | | 87.2 | % | | | 52.2 | %H | | | 68.4 | % | | | 117.9 | % | | | 140.1 | % | | | 40.8 | % |
Net assets, end of year (in thousands) | | $ | 80,305 | | | $ | 104,362 | | | $ | 205,654 | | | $ | 177,308 | | | $ | 90,421 | | | $ | 89,170 | |
| | | | | | | | | | | | | | | | | | | | | | | | | |
| A | | For the period April 1, 2008 to December 31, 2008. |
| B | | Computed using average daily shares outstanding. |
| C | | Computed using SEC method |
| D | | Amount represents less than $.01 per share. |
| E | | Performance figures may reflect compensating balance credits, fee waivers and/or expense reimbursements. In the absence of compensating balance credits, fee waivers and/or expense reimbursements, the total return would have been lower. Past performance is no guarantee of future results. Total returns for periods of less than one year are not annualized. |
| F | | Total expenses reflects operating expenses prior to any voluntary expense waivers and/or compensating balance credits. Expenses net of waivers reflects total expenses before compensating balance credits but net of any voluntary expense waivers. Expenses net of all reductions reflects expenses less any compensating balance credits and/or voluntary expense waivers. |
See notes to financial statements.
183
Annual Report to Shareholders
Notes to Financial Statements
1. Organization and Significant Accounting Policies
Western Asset Funds, Inc. (“Corporation”), consisting of Western Asset Absolute Return Portfolio (“Absolute Return”), Western Asset Core Bond Portfolio (“Core”), Western Asset Core Plus Bond Portfolio (“Core Plus”), Western Asset High Yield Portfolio (“High Yield”), Western Asset Inflation Indexed Plus Bond Portfolio (“Inflation Indexed”), Western Asset Intermediate Bond Portfolio (“Intermediate”), Western Asset Intermediate Plus Bond Portfolio (“Intermediate Plus”), Western Asset Limited Duration Bond Portfolio (“Limited Duration”) and Western Asset Non-U.S. Opportunity Bond Portfolio (“Non-U.S.”) (individually a “Fund,” collectively the “Funds”), is registered under the Investment Company Act of 1940, as amended (“1940 Act”), as a diversified, open-end management investment company with the exception of Non-U.S., which is non-diversified. Financial Statements for Core and Core Plus are contained in a separate Report to Shareholders.
Each Fund offers three classes of shares: Institutional Class, Institutional Select Class and Financial Intermediary Class. Shares in the Financial Intermediary Class bear a distribution fee. The Institutional Select Class shares of Non-U.S. have not commenced operations. The Financial Intermediary Class shares of Limited Duration, Intermediate, Intermediate Plus, High Yield, and Non-U.S. have not commenced operations. The income and expenses of each of the Funds are allocated proportionately to the three classes of shares based on daily net assets, except for Rule 12b-1 distribution fees, which are charged only on the Financial Intermediary Class shares, and transfer agent and shareholder servicing expenses, and certain other expenses, which are determined separately for each class.
The following are significant accounting policies consistently followed by the Funds and are in conformity with U.S. generally accepted accounting principles (“GAAP”). Estimates and assumptions are required to be made regarding assets, liabilities and changes in net assets resulting from operations when financial statements are prepared. Changes in the economic environment, financial markets and any other parameters used in determining these estimates could cause actual results to differ. Subsequent events have been evaluated through February 23, 2010, the issuance date of the financial statements.
(a) Investment Valuation. Debt securities are valued at the last quoted bid provided by an independent pricing service that are based on transactions in debt obligations, quotations from bond dealers, market transactions in comparable securities and various other relationships between securities. Publicly traded foreign government debt securities are typically traded internationally in the over-the-counter market, and are valued at the mean between the last quoted bid and asked prices as of the close of business of that market. Futures contracts are valued daily at the settlement price established by the board of trade or exchange on which they are traded. Equity securities for which market quotations are available are valued at the last reported sales price or official closing price on the primary market or exchange on which they trade. When prices are not readily available, or are determined not to reflect fair value, such as when the value of a security has been significantly affected by events after the close of the exchange or market on which the security is principally traded, but before each Fund calculates its net asset value, the Fund values these securities at fair value as determined in accordance with procedures approved by the Funds’ Board of Directors.
Each Fund has adopted Financial Accounting Standards Board Codification Topic 820 (formerly, Statement of Financial Accounting Standards No. 157) (“ASC Topic 820”). ASC Topic 820 establishes a single definition of fair value, creates a three-tier hierarchy as a framework for measuring fair value based on inputs used to value each Fund’s investments, and requires additional disclosure about fair value. The hierarchy of inputs is summarized below.
| | • | | Level 1—quoted prices in active markets for identical investments |
| | • | | Level 2—other significant observable inputs (including quoted prices for similar investments, interest rates, prepayment speeds, credit risk, etc.) |
| | • | | Level 3—significant unobservable inputs (including each Fund’s own assumptions in determining the fair value of investments) |
The inputs or methodology used for valuing securities are not necessarily an indication of the risk associated with investing in those securities.
184
Annual Report to Shareholders
The Funds use valuation techniques to measure fair value that are consistent with the market approach and/or income approach, depending on the type of the security and the particular circumstance. The market approach uses prices and other relevant information generated by market transactions involving identical or comparable securities. The income approach uses valuation techniques to convert future amounts to a single present amount.
The following is a summary of the inputs used in valuing the Funds’ assets carried at fair value:
Absolute Return
| | | | | | | | | | | | | | | |
| Description | | Quoted Prices
(Level 1) | | | Other Significant
Observable
Inputs
(Level 2) | | | Significant
Unobservable
Inputs
(Level 3) | | Total | |
Long-Term Securities†: | | | | | | | | | | | | | | | |
Corporate Bonds and Notes | | | — | | | $ | 118,853,527 | | | $ | 426,912 | | $ | 119,280,439 | |
Asset-Backed Securities | | | — | | | | 15,740,549 | | | | 1,649,861 | | | 17,390,410 | |
Mortgage-Backed Securities | | | — | | | | 35,827,000 | | | | — | | | 35,827,000 | |
Loan Participations and Assignments | | | — | | | | 22,247,026 | | | | — | | | 22,247,026 | |
U.S. Government and Agency Obligations | | | — | | | | 33,352,399 | | | | — | | | 33,352,399 | |
Yankee Bonds | | | — | | | | 11,847,215 | | | | — | | | 11,847,215 | |
Foreign Government Obligations | | | — | | | | 9,527,242 | | | | — | | | 9,527,242 | |
Common Stocks and Equity Interests | | $ | 69,160 | | | | — | | | | 20,803 | | | 89,963 | |
Preferred Stocks | | | 2,565 | | | | 1,172,887 | | | | — | | | 1,175,452 | |
Warrants | | | — | | | | — | | | | — | | | — | |
Total Long-Term Securities | | | 71,725 | | | | 248,567,845 | | | | 2,097,576 | | | 250,737,146 | |
Short-Term Securities: | | | | | | | | | | | | | | | |
U.S. Government and Agency Obligations | | | — | | | | 33,699,537 | | | | — | | | 33,699,537 | |
Options Purchased | | | 432,141 | | | | 250,542 | | | | — | | | 682,683 | |
Repurchase Agreement | | | — | | | | 2,911,000 | | | | — | | | 2,911,000 | |
Total Short-Term Securities | | | 432,141 | | | | 36,861,079 | | | | — | | | 37,293,220 | |
Total Investments | | $ | 503,866 | | | $ | 285,428,924 | | | $ | 2,097,576 | | $ | 288,030,366 | |
Other Financial Instruments: | | | | | | | | | | | | | | | |
Futures Contracts | | | 769,782 | | | | — | | | | — | | | 769,782 | |
Options Written | | | (399,006 | ) | | | (1,329,043 | ) | | | — | | | (1,728,049 | ) |
Forward Currency Contracts | | | — | | | | (6,344 | ) | | | — | | | (6,344 | ) |
Swaps: | | | | | | | | | | | | | | | |
Total Return Swaps‡ | | | — | | | | (646,883 | ) | | | — | | | (646,883 | ) |
Interest Rate Swaps‡ | | | — | | | | 610,808 | | | | — | | | 610,808 | |
Credit Default Swaps on Corporate Issues—Sell Protection‡ | | | — | | | | (414,404 | ) | | | — | | | (414,404 | ) |
Credit Default Swaps on Corporate Issues—Buy Protection‡ | | | — | | | | (105,885 | ) | | | — | | | (105,885 | ) |
Credit Default Swaps on Credit Indices—Sell Protection‡ | | | — | | | | (262,288 | ) | | | — | | | (262,288 | ) |
Credit Default Swaps on Credit Indices—Buy Protection‡ | | | — | | | | (194,724 | ) | | | — | | | (194,724 | ) |
Total Other Financial Instruments | | $ | 370,776 | | | $ | (2,348,763 | ) | | | — | | $ | (1,977,987 | ) |
Total | | $ | 874,642 | | | $ | 283,080,161 | | | $ | 2,097,576 | | $ | 286,052,379 | |
| | | | | | | | | | | | | | | | |
| † | | See Portfolio of Investments for additional detailed categorizations. |
| ‡ | | Values include any premiums paid or received with respect to swap contracts. |
185
Annual Report to Shareholders
Notes to Financial Statements—Continued
Following is a reconciliation of investments in which significant unobservable inputs (Level 3) were used in determining fair value:
| | | | | | | | | | | | | | | | | | | | | | | | | |
| Investments in Securities | | Corporate
Bonds and
Notes | | Asset-Backed
Securities | | | Mortgage-Backed
Securities | | | Yankee
Bonds | | | Common Stocks
and Equity
Interests | | | Warrants | | Total | |
Balance as of December 31, 2008 | | | — | | | — | | | $ | 1,952,353 | | | $ | 187,800 | | | | — | | | — | | $ | 2,140,153 | |
Accrued Premiums/Discounts | | | — | | $ | 40,109 | | | | 2,234 | | | | 56,363 | | | | — | | | — | | | 98,706 | |
Realized Gain/(Loss)(1) | | | — | | | (108,392 | ) | | | 10,524 | | | | — | | | | — | | | — | | | (97,868 | ) |
Change in Unrealized Appreciation (Depreciation)(2) | | $ | 16,912 | | | 713,150 | | | | 634,197 | | | | 530,512 | | | $ | (6,002 | ) | | — | | | 1,888,769 | |
Net Purchases (Sales) | | | 410,000 | | | 1,004,994 | | | | (560,823 | ) | | | — | | | | 26,805 | | | — | | | 880,976 | |
Net Transfers in and/or (out) of Level 3 | | | — | | | — | | | | (2,038,485 | ) | | | (774,675 | ) | | | — | | | — | | | (2,813,160 | ) |
Balance as of December 31, 2009 | | $ | 426,912 | | $ | 1,649,861 | | | | — | | | | — | | | $ | 20,803 | | | — | | $ | 2,097,576 | |
Net Change in Unrealized Appreciation (Depreciation) for Investments in securities still held at December 31, 2009(2) | | $ | 16,912 | | $ | 713,150 | | | | — | | | | — | | | $ | (6,002 | ) | | — | | $ | 724,060 | |
| (1) | | This amount is included in net realized gain (loss) from investment transactions in the accompanying Statement of Operations. |
| (2) | | This amount is included in the change in net unrealized appreciation (depreciation) in the accompanying Statement of Operations. Change in unrealized appreciation (depreciation) includes net unrealized appreciation (depreciation) resulting from changes in investment values during the reporting period and the reversal of previously recorded unrealized appreciation (depreciation) when gains or losses are realized. |
High Yield
| | | | | | | | | | | | |
| Description | | Quoted Prices
(Level 1) | | Other Significant
Observable
Inputs
(Level 2) | | Significant
Unobservable
Inputs
(Level 3) | | Total |
Long-Term Securities†: | | | | | | | | | | | | |
Corporate Bonds and Notes | | | — | | $ | 479,164,719 | | | — | | $ | 479,164,719 |
Mortgage-Backed Securities | | | — | | | 104,771 | | | — | | | 104,771 |
Yankee Bonds | | | — | | | 71,688,642 | | $ | 4,681,201 | | | 76,369,843 |
Common Stocks and Equity Interests | | $ | 5,295,008 | | | 4,492,880 | | | 326,646 | | | 10,114,534 |
Preferred Stocks | | | 6,921,606 | | | 1,086,897 | | | 40 | | | 8,008,543 |
Warrants | | | — | | | 17,467 | | | 65,337 | | | 82,804 |
Loan Participations and Assignments | | | — | | | 26,279,715 | | | — | | | 26,279,715 |
Total Long-Term Securities | | $ | 12,216,614 | | $ | 582,835,091 | | $ | 5,073,224 | | $ | 600,124,929 |
Short-Term Securities† | | | — | | | 5,812,000 | | | — | | | 5,812,000 |
Total Investments | | $ | 12,216,614 | | $ | 588,647,091 | | $ | 5,073,224 | | $ | 605,936,929 |
| | | | | | | | | | | | | |
| † | | See Portfolio of Investments for additional detailed categorizations. |
186
Annual Report to Shareholders
Following is a reconciliation of investments in which significant unobservable inputs (Level 3) were used in determining fair value:
| | | | | | | | | | | | | | | | | | | |
| Investments in Securities | | Yankee
Bonds | | Common Stocks
and Equity
Interests | | | Preferred
Stocks | | | Warrants | | | Total | |
Balance as of December 31, 2008 | | | — | | | — | | | | — | | | | — | | | | — | |
Accrued Premiums/Discounts | | | — | | | — | | | | — | | | | — | | | | — | |
Realized Gain/(Loss) | | | — | | | — | | | | — | | | | — | | | | — | |
Change in Unrealized Appreciation (Depreciation)(1) | | | — | | $ | (94,234 | ) | | $ | (16,968 | ) | | $ | (1,212 | ) | | $ | (112,414 | ) |
Net Purchases (Sales) | | | — | | | 420,880 | | | | 17,008 | | | | 66,549 | | | | 504,437 | |
Net Transfers in and/or (out) of Level 3 | | $ | 4,681,201 | | | — | | | | — | | | | — | | | | 4,681,201 | |
Balance as of December 31, 2009 | | $ | 4,681,201 | | $ | 326,646 | | | $ | 40 | | | $ | 65,337 | | | $ | 5,073,224 | |
Net Change in Unrealized Appreciation (Depreciation) for Investments in securities still held at December 31, 2009(1) | | | — | | $ | (94,234 | ) | | $ | (16,968 | ) | | $ | (1,212 | ) | | $ | (112,414 | ) |
| (1) | | This amount is included in the change in net unrealized appreciation (depreciation) in the accompanying Statement of Operations. Change in unrealized appreciation (depreciation) includes net unrealized appreciation (depreciation) resulting from changes in investment values during the reporting period and the reversal of previously recorded unrealized appreciation (depreciation) when gains or losses are realized. |
Inflation Indexed
| | | | | | | | | | | | | | |
| Description | | Quoted Prices
(Level 1) | | | Other Significant
Observable
Inputs
(Level 2) | | | Significant
Unobservable
Inputs
(Level 3) | | Total | |
Long-Term Securities†: | | | | | | | | | | | | | | |
Corporate Bonds and Notes | | | — | | | $ | 13,589,935 | | | — | | $ | 13,589,935 | |
Asset-Backed Securities | | | — | | | | 412,692 | | | — | | | 412,692 | |
Mortgage-Backed Securities | | | — | | | | 393,974 | | | — | | | 393,974 | |
U.S. Government and Agency Obligations | | | — | | | | 399,725,871 | | | — | | | 399,725,871 | |
Yankee Bonds | | | — | | | | 470 | | | — | | | 470 | |
Foreign Government Obligations | | | — | | | | 25,162,737 | | | — | | | 25,162,737 | |
Preferred Stocks | | $ | 714,810 | | | | — | | | — | | | 714,810 | |
Total Long-Term Securities | | | 714,810 | | | | 439,285,679 | | | — | | | 440,000,489 | |
Short-Term Securities† | | | — | | | | 19,589,000 | | | — | | | 19,589,000 | |
Total Investments | | $ | 714,810 | | | $ | 458,874,679 | | | — | | $ | 459,589,489 | |
Other Financial Instruments: | | | | | | | | | | | | | | |
Futures Contracts Purchased | | | (239,375 | ) | | | — | | | — | | | (239,375 | ) |
Forward Currency Contracts | | | — | | | | 152,455 | | | — | | | 152,455 | |
Credit Default Swaps on Credit Indices—Sell Protection‡ | | | — | | | | (59,815 | ) | | — | | | (59,815 | ) |
Total Other Financial Instruments | | $ | (239,375 | ) | | $ | 92,640 | | | — | | $ | (146,735 | ) |
Total | | $ | 475,435 | | | $ | 458,967,319 | | | — | | $ | 459,442,754 | |
| | | | | | | | | | | | | | | |
| † | | See Portfolio of Investments for additional detailed categorizations. |
| ‡ | | Values include any premiums paid or received with respect to swap contracts. |
187
Annual Report to Shareholders
Notes to Financial Statements—Continued
Intermediate
| | | | | | | | | | | | | | | |
| Description | | Quoted Prices
(Level 1) | | | Other Significant
Observable
Inputs
(Level 2) | | | Significant
Unobservable
Inputs
(Level 3) | | Total | |
Long-Term Securities†: | | | | | | | | | | | | | | | |
Corporate Bonds and Notes | | | — | | | $ | 192,442,697 | | | | — | | $ | 192,442,697 | |
Asset-Backed Securities | | | — | | | | 10,867,202 | | | $ | 328,129 | | | 11,195,331 | |
Foreign Government Obligations | | | — | | | | 3,447,155 | | | | — | | | 3,447,155 | |
Mortgage-Backed Securities | | | — | | | | 35,438,997 | | | | — | | | 35,438,997 | |
Municipal Bonds | | | — | | | | 434,214 | | | | — | | | 434,214 | |
U.S. Government and Agency Obligations | | | — | | | | 129,767,366 | | | | — | | | 129,767,366 | |
U.S. Government Agency Mortgage-Backed Securities | | | — | | | | 8,045,420 | | | | — | | | 8,045,420 | |
Yankee Bonds | | | — | | | | 67,631,310 | | | | — | | | 67,631,310 | |
Preferred Stocks | | $ | 157,262 | | | | 156,872 | | | | 230,595 | | | 544,729 | |
Total Long-Term Securities | | | 157,262 | | | | 448,231,233 | | | | 558,724 | | | 448,947,219 | |
Short-Term Securities†: | | | | | | | | | | | | | | | |
U.S. Government and Agency Obligations | | | — | | | | 2,249,775 | | | | — | | | 2,249,775 | |
Options Purchased | | | 291,616 | | | | — | | | | — | | | 291,616 | |
Repurchase Agreement | | | — | | | | 28,356,000 | | | | — | | | 28,356,000 | |
Total Short-Term Securities | | | 291,616 | | | | 30,605,775 | | | | — | | | 30,897,391 | |
Total Investments | | $ | 448,878 | | | $ | 478,837,008 | | | $ | 558,724 | | $ | 479,844,610 | |
Other Financial Instruments: | | | | | | | | | | | | | | | |
Futures Contracts | | | (1,099,827 | ) | | | — | | | | — | | | (1,099,827 | ) |
Options Written | | | (745,159 | ) | | | — | | | | — | | | (745,159 | ) |
Swaps: | | | | | | | | | | | | | | | |
Interest Rate Swaps‡ | | | — | | | | (267,239 | ) | | | — | | | (267,239 | ) |
Credit Default Swaps on Corporate Issues—Sell Protection‡ | | | — | | | | (43,746 | ) | | | — | | | (43,746 | ) |
Credit Default Swaps on Credit Indices—Sell Protection‡ | | | — | | | | (310,819 | ) | | | — | | | (310,819 | ) |
Credit Default Swaps on Credit Indices—Buy Protection‡ | | | — | | | | (199,190 | ) | | | — | | | (199,190 | ) |
Total Other Financial Instruments | | $ | (1,844,986 | ) | | $ | (820,994 | ) | | | — | | $ | (2,665,980 | ) |
Total | | $ | (1,396,108 | ) | | $ | 478,016,014 | | | $ | 558,724 | | $ | 477,178,630 | |
| | | | | | | | | | | | | | | | |
| † | | See Portfolio of Investments for additional detailed categorizations. |
| ‡ | | Values include any premiums paid or received with respect to swap contracts. |
188
Annual Report to Shareholders
Following is a reconciliation of investments in which significant unobservable inputs (Level 3) were used in determining fair value:
| | | | | | | | | | | | | | | |
| Investments in Securities | | Asset-backed
Securities | | Yankee
Bonds | | | Preferred
Stocks | | | Total | |
Balance as of December 31, 2008 | | | — | | $ | 95,400 | | | $ | 236,520 | | | $ | 331,920 | |
Accrued Premiums/Discounts | | | — | | | 28,631 | | | | — | | | | 28,631 | |
Realized Gain/(Loss) | | | — | | | — | | | | — | | | | — | |
Change in Unrealized Appreciation (Depreciation)(1) | | | — | | | 269,494 | | | | (5,925 | ) | | | 263,569 | |
Net Purchases (Sales) | | | — | | | — | | | | — | | | | — | |
Net Transfers in and/or (out) of Level 3 | | $ | 328,129 | | | (393,525 | ) | | | — | | | | (65,396 | ) |
Balance as of December 31, 2009 | | $ | 328,129 | | | — | | | $ | 230,595 | | | $ | 558,724 | |
Net Change in Unrealized Appreciation (Depreciation) for Investments in securities still held at December 31, 2009(1) | | | — | | | — | | | $ | (5,925 | ) | | $ | (5,925 | ) |
| (1) | | This amount is included in the change in net unrealized appreciation (depreciation) in the accompanying Statement of Operations. Change in unrealized appreciation (depreciation) includes net unrealized appreciation (depreciation) resulting from changes in investment values during the reporting period and the reversal of previously recorded unrealized appreciation (depreciation) when gains or losses are realized. |
189
Annual Report to Shareholders
Notes to Financial Statements—Continued
Intermediate Plus
| | | | | | | | | | | | | | | |
| Description | | Quoted Prices
(Level 1) | | | Other Significant
Observable
Inputs
(Level 2) | | | Significant
Unobservable
Inputs
(Level 3) | | Total | |
Long-Term Securities†: | | | | | | | | | | | | | | | |
Corporate Bonds and Notes | | | — | | | $ | 23,352,540 | | | $ | 52,063 | | $ | 23,404,603 | |
Asset-Backed Securities | | | — | | | | 1,286,709 | | | | — | | | 1,286,709 | |
Foreign Government Obligations | | | — | | | | 383,017 | | | | — | | | 383,017 | |
Mortgage-Backed Securities | | | — | | | | 4,882,385 | | | | — | | | 4,882,385 | |
Municipal Bonds | | | — | | | | 48,246 | | | | — | | | 48,246 | |
U.S. Government and Agency Obligations | | | — | | | | 12,090,935 | | | | — | | | 12,090,935 | |
U.S. Government Agency Mortgage-backed Securities | | | — | | | | 381,668 | | | | — | | | 381,668 | |
Yankee Bonds | | | — | | | | 7,848,823 | | | | — | | | 7,848,823 | |
Common Stocks and Equity Interests | | | — | | | | — | | | | 1,242 | | | 1,242 | |
Preferred Stocks | | $ | 22,414 | | | | 170,054 | | | | — | | | 192,468 | |
Warrants | | | — | | | | — | | | | — | | | — | |
Total Long-Term Securities: | | | 22,414 | | | | 50,444,377 | | | | 53,305 | | | 50,520,096 | |
Short-Term Securities: | | | | | | | | | | | | | | | |
U.S. Government and Agency Obligations | | | — | | | | 3,105,526 | | | | — | | | 3,105,526 | |
Options Purchased | | | 35,281 | | | | — | | | | — | | | 35,281 | |
Repurchase Agreement | | | — | | | | 2,946,000 | | | | — | | | 2,946,000 | |
Total Short-Term Securities | | | 35,281 | | | | 6,051,526 | | | | — | | | 6,086,807 | |
Total Investments | | $ | 57,695 | | | $ | 56,495,903 | | | $ | 53,305 | | $ | 56,606,903 | |
Other Financial Instruments: | | | | | | | | | | | | | | | |
Futures Contracts | | | (104,567 | ) | | | — | | | | — | | | (104,567 | ) |
Options Written | | | (94,468 | ) | | | — | | | | — | | | (94,468 | ) |
Forward Currency Contracts | | | — | | | | (3,778 | ) | | | — | | | (3,778 | ) |
Swaps: | | | | | | | | | | | | | | | |
Interest Rate Swaps‡ | | | — | | | | (39,446 | ) | | | — | | | (39,446 | ) |
Credit Default Swaps on Corporate Issues—Sell Protection‡ | | | — | | | | (5,468 | ) | | | — | | | (5,468 | ) |
Credit Default Swaps on Credit Indices—Buy Protection‡ | | | — | | | | (29,127 | ) | | | — | | | (29,127 | ) |
Total Other Financial Instruments | | $ | (199,035 | ) | | $ | (77,819 | ) | | | — | | $ | (276,854 | ) |
Total | | $ | (141,340 | ) | | $ | 56,418,084 | | | $ | 53,305 | | $ | 56,330,049 | |
| | | | | | | | | | | | | | | | |
| † | | See Portfolio of Investments for additional detailed categorizations. |
| ‡ | | Values include any premiums paid or received with respect to swap contracts. |
190
Annual Report to Shareholders
Following is a reconciliation of investments in which significant unobservable inputs (Level 3) were used in determining fair value:
| | | | | | | | | | | | | | | | | |
| Investments in Securities | | Corporate
Bonds and
Notes | | Yankee
Bonds | | | Common Stocks
and Equity
Interests | | | Warrants | | Total | |
Balance as of December 31, 2008 | | | — | | $ | 21,600 | | | | — | | | — | | $ | 21,600 | |
Accrued Premiums/Discounts | | | — | | | 6,483 | | | | — | | | — | | | 6,483 | |
Realized Gain/(Loss) | | | — | | | — | | | | — | | | — | | | — | |
Change in Unrealized Appreciation (Depreciation)(1) | | $ | 2,063 | | | 61,017 | | | $ | (358 | ) | | — | | | 62,722 | |
Net Purchases (Sales) | | | 50,000 | | | — | | | | 1,600 | | | — | | | 51,600 | |
Net Transfers in and/or (out) of Level 3 | | | — | | | (89,100 | ) | | | — | | | — | | | (89,100 | ) |
Balance as of December 31, 2009 | | $ | 52,063 | | | — | | | $ | 1,242 | | | — | | $ | 53,305 | |
Net Change in Unrealized Appreciation (Depreciation) for Investments in securities still held at December 31, 2009(1) | | $ | 2,063 | | | — | | | | (358 | ) | | — | | $ | 1,705 | |
| (1) | | This amount is included in the change in net unrealized appreciation (depreciation) in the accompanying Statement of Operations. Change in unrealized appreciation (depreciation) includes net unrealized appreciation (depreciation) resulting from changes in investment values during the reporting period and the reversal of previously recorded unrealized appreciation (depreciation) when gains or losses are realized. |
191
Annual Report to Shareholders
Notes to Financial Statements—Continued
Limited Duration
| | | | | | | | | | | | | | |
| Description | | Quoted Prices
(Level 1) | | | Other Significant
Observable
Inputs
(Level 2) | | | Significant
Unobservable
Inputs
(Level 3) | | Total | |
Long-Term Securities†: | | | | | | | | | | | | | | |
Corporate Bonds and Notes | | | — | | | $ | 13,757,146 | | | — | | $ | 13,757,146 | |
Asset-Backed Securities | | | — | | | | 9,030,635 | | | — | | | 9,030,635 | |
Mortgage-Backed Securities | | | — | | | | 5,877,020 | | | — | | | 5,877,020 | |
U.S. Government and Agency Obligations | | | — | | | | 6,493,360 | | | — | | | 6,493,360 | |
U.S. Government Agency Mortgage-Backed Securities | | | — | | | | 6,020,373 | | | — | | | 6,020,373 | |
Yankee Bonds | | | — | | | | 10,244,035 | | | — | | | 10,244,035 | |
Preferred Stocks | | $ | 22,466 | | | | — | | | — | | | 22,466 | |
Total Long-Term Securities | | | 22,466 | | | | 51,422,569 | | | — | | | 51,445,035 | |
Short-Term Securities†: | | | | | | | | | | | | | | |
U.S. Government and Agency Obligations | | | — | | | | 169,989 | | | — | | | 169,989 | |
Options Purchased | | | 425 | | | | — | | | — | | | 425 | |
Repurchase Agreement | | | — | | | | 4,058,000 | | | — | | | 4,058,000 | |
Total Short-Term Securities | | | 425 | | | | 4,227,989 | | | — | | | 4,228,414 | |
Total Investments | | $ | 22,891 | | | $ | 55,650,558 | | | — | | $ | 55,673,449 | |
Other Financial Instruments: | | | | | | | | | | | | | | |
Futures Contracts | | | (2,156 | ) | | | — | | | — | | | (2,156 | ) |
Options Written | | | (30,207 | ) | | | — | | | — | | | (30,207 | ) |
Swaps: | | | | | | | | | | | | | | |
Credit Default Swaps on Credit Indices—Sell Protection‡ | | | — | | | | (71,565 | ) | | — | | | (71,565 | ) |
Credit Default Swaps on Credit Indices—Buy Protection‡ | | | — | | | | (30,067 | ) | | — | | | (30,067 | ) |
Total Other Financial Instruments | | $ | (32,363 | ) | | $ | (101,632 | ) | | — | | $ | (133,995 | ) |
Total | | $ | (9,472 | ) | | $ | 55,548,926 | | | — | | $ | 55,539,454 | |
| | | | | | | | | | | | | | | |
| † | | See Portfolio of Investments for additional detailed categorizations. |
| ‡ | | Values include any premiums paid or received with respect to swap contracts. |
Following is a reconciliation of investments in which significant unobservable inputs (Level 3) were used in determining fair value:
| | | | |
| Investments in Securities | | Yankee
Bonds | |
Balance as of December 31, 2008 | | $ | 42,000 | |
Accrued Premiums/Discounts | | | 12,605 | |
Realized Gain/(Loss) | | | — | |
Change in Unrealized Appreciation (Depreciation)(1) | | | 118,645 | |
Net Purchases (Sales) | | | — | |
Net Transfers in and/or out of Level 3 | | | (173,250 | ) |
Balance as of December 31, 2009 | | | — | |
Net Change in Unrealized Appreciation (Depreciation) for Investments in securities still held at December 31, 2009 | | | — | |
192
Annual Report to Shareholders
| (1) | | This amount is included in the change in net unrealized appreciation (depreciation) in the accompanying Statement of Operations. Change in unrealized appreciation (depreciation) includes net unrealized appreciation (depreciation) resulting from changes in investment values during the reporting period and the reversal of previously recorded unrealized appreciation (depreciation) when gains or losses are realized. |
Non-U.S.
| | | | | | | | | | | | | | | |
| Description | | Quoted Prices
(Level 1) | | | Other Significant
Observable
Inputs
(Level 2) | | | Significant
Unobservable
Inputs
(Level 3) | | Total | |
Long-Term Securities†: | | | | | | | | | | | | | | | |
Corporate Bonds and Notes | | | — | | | $ | 30,042,139 | | | $ | 2,702 | | $ | 30,044,841 | |
Foreign Government Obligations | | | — | | | | 40,082,947 | | | | — | | | 40,082,947 | |
Total Long-Term Investments | | | — | | | | 70,125,086 | | | | 2,702 | | | 70,127,788 | |
Short-Term Securities†: | | | | | | | | | | | | | | | |
Options Purchased | | $ | 15,625 | | | | 88,544 | | | | — | | | 104,169 | |
Repurchase Agreement | | | — | | | | 4,456,000 | | | | — | | | 4,456,000 | |
Total Short-Term Securities | | | 15,625 | | | | 4,544,544 | | | | — | | | 4,560,169 | |
Total Investments | | $ | 15,625 | | | $ | 74,669,630 | | | $ | 2,702 | | $ | 74,687,957 | |
Other Financial Instruments: | | | | | | | | | | | | | | | |
Futures Contracts | | | (16,045 | ) | | | — | | | | — | | | (16,045 | ) |
Options Written | | | (153,125 | ) | | | — | | | | — | | | (153,125 | ) |
Forward Foreign Currency Contracts | | | — | | | | 2,309,745 | | | | — | | | 2,309,745 | |
Swaps: | | | | | | | | | | | | | | | |
Credit Default Swaps on Corporate Issues—Buy Protection‡ | | | — | | | | 62,276 | | | | — | | | 62,276 | |
Credit Default Swaps on Credit Indices—Buy Protection‡ | | | — | | | | (50,997 | ) | | | — | | | (50,997 | ) |
Total Other Financial Instruments | | $ | (169,170 | ) | | $ | 2,321,024 | | | | — | | $ | 2,151,854 | |
Total | | $ | (153,545 | ) | | $ | 76,990,654 | | | $ | 2,702 | | $ | 76,839,811 | |
| | | | | | | | | | | | | | | | |
| † | | See Portfolio of Investments for additional detailed categorizations. |
| ‡ | | Values include any premiums paid or received with respect to swap contracts. |
Following is a reconciliation of investments in which significant unobservable inputs (Level 3) were used in determining fair value:
| | | |
| Investments in Securities | | Corporate
Bonds and
Notes |
Balance as of December 31, 2008 | | | — |
Accrued Premiums/Discounts | | | — |
Realized Gain/(Loss) | | | — |
Change in Unrealized Appreciation (Depreciation) | | | — |
Net Purchases (Sales) | | | — |
Net Transfers in and/or out of Level 3 | | $ | 2,702 |
Balance as of December 31, 2009 | | $ | 2,702 |
Net Change in Unrealized Appreciation (Depreciation) for investments in securities still held at December 31, 2009 | | | — |
193
Annual Report to Shareholders
Notes to Financial Statements—Continued
(b) Repurchase Agreements. Each Fund may enter into repurchase agreements with institutions that its investment adviser has determined are creditworthy. Each repurchase agreement is recorded at cost. Under the terms of a typical repurchase agreement, a fund takes possession of an underlying debt obligation subject to an obligation of the seller to repurchase, and of the fund to resell, the obligation at an agreed-upon price and time, thereby determining the yield during a fund’s holding period. When entering into repurchase agreements, it is each Fund’s policy that its custodian or a third party custodian, acting on the Fund’s behalf, take possession of the underlying collateral securities, the market value of which, at all times, at least equals the principal amount of the repurchase transaction, including accrued interest. To the extent that any repurchase transaction maturity exceeds one business day, the value of the collateral is marked to market and measured against the value of the agreement to ensure the adequacy of the collateral. If the counterparty defaults, the affected Fund generally has the right to use the collateral to satisfy the terms of the repurchase transaction. However, if the market value of the collateral declines during the period in which a Fund seeks to assert its rights or if bankruptcy proceedings are commenced with respect to the seller of the security, realization of the collateral by the Fund may be delayed or limited.
(c) Inflation-Indexed Bonds. Inflation-indexed bonds are fixed-income securities whose principal value or interest rate is periodically adjusted according to the rate of inflation. As the index measuring inflation changes, the principal value or interest rate of inflation-indexed bonds will be adjusted accordingly. Inflation adjustments to the principal amount of inflation-indexed bonds are reflected as an increase or decrease to investment income on the Statement of Operations. Repayment of the original bond principal upon maturity (as adjusted for inflation) is guaranteed in the case of U.S. Treasury inflation-indexed bonds. For bonds that do not provide a similar guarantee, the adjusted principal value of the bond repaid at maturity may be less than the original principal.
(d) Forward Foreign Currency Contracts. Absolute, High Yield, Inflation Indexed, Intermediate Plus and Non-U.S. may enter into a forward foreign currency contract to hedge against foreign currency exchange rate risk on its non-U.S. dollar denominated securities or to facilitate settlement of a foreign currency denominated portfolio transaction. A forward foreign currency contract is an agreement between two parties to buy and sell a currency at a set price with delivery and settlement at a future date. The contract is marked to market daily and the change in value is recorded by a Fund as an unrealized gain or loss. When a forward foreign currency contract is closed, through either delivery or offset by entering into another forward foreign currency contract, the Fund recognizes a realized gain or loss equal to the difference between the value of the contract at the time it was opened and the value of the contract at the time it is closed.
Forward foreign currency contracts involve elements of market risk in excess of the amounts reflected on the Statement of Assets and Liabilities. Each Fund bears the risk of an unfavorable change in the foreign exchange rate underlying the forward foreign currency contract. Risks may also arise upon entering into these contracts from the potential inability of the counterparties to meet the terms of their contracts.
(e) Loan Participations. Each Fund may invest in loans arranged through private negotiation between one or more financial institutions. Each Fund’s investment in any such loan may be in the form of a participation in or an assignment of the loan. In connection with purchasing participations, each Fund generally will have no right to enforce compliance by the borrower with the terms of the loan agreement related to the loan, or any rights of off-set against the borrower and each Fund may not benefit directly from any collateral supporting the loan in which it has purchased the participation.
Each Fund assumes the credit risk of the borrower, the lender that is selling the participation and any other persons interpositioned between the Fund and the borrower. In the event of the insolvency of the lender selling the participation, the Fund may be treated as a general creditor of the lender and may not benefit from any off-set between the lender and the borrower.
(f) Written Options. When a Fund writes an option, an amount equal to the premium received by the Fund is recorded as a liability, the value of which is marked to market daily to reflect the current market value of the option written. If the option expires, the premium received is recorded as a realized gain. When a written call option is exercised, the difference between the premium received plus the option exercise price and a Fund’s basis in the underlying security (in the case of a covered written call option), or the cost to purchase the underlying security (in the case of an uncovered written call option), including brokerage commission, is recognized as a realized gain or loss. When a written put option is exercised, the amount of the premium received is subtracted from the cost of the security purchased by the Fund from the exercise of the written put option to form the Fund’s basis in the underlying security purchased. The writer or buyer of an option traded on an exchange can liquidate the position
194
Annual Report to Shareholders
before the exercise of the option by entering into a closing transaction. The cost of a closing transaction is deducted from the original premium received resulting in a realized gain or loss to the Fund.
The risk in writing a covered call option is that a Fund may forego the opportunity of profit if the market price of the underlying security increases and the option is exercised. The risk in writing a put option is that a Fund may incur a loss if the market price of the underlying security decreases and the option is exercised. The risk in writing a call option is that a Fund is exposed to the risk of loss if the market price of the underlying security increases. In addition, there is the risk that a Fund may not be able to enter into a closing transaction because of an illiquid secondary market.
(g) Futures Contracts. Each Fund may use futures contracts to gain exposure to, or hedge against, changes in the value of interest rates and foreign currencies. A futures contract represents a commitment for the future purchase or sale of an asset at a specified price on a specified date.
Upon entering into a futures contract, the Funds are required to deposit cash or cash equivalents with a broker in an amount equal to a certain percentage of the contract amount. This is known as the “initial margin” and subsequent payments (“variation margin”) are made or received by the Funds each day, depending on the daily fluctuation in the value of the contract. For certain futures, including foreign denominated futures held in Absolute Return, High Yield, Inflation Indexed, Intermediate Plus and Non-U.S., variation margin is not settled daily, but is recorded as a net variation margin payable or receivable. Futures contracts are valued daily at the settlement price established by the board of trade or exchange on which they are traded. The daily changes in contract value are recorded as unrealized gains or losses in the Statement of Operations and the Funds recognize a realized gain or loss when the contract is closed.
Futures contracts involve, to varying degrees, risk of loss in excess of the amounts reflected in the financial statements. In addition, there is the risk that the Funds may not be able to enter into a closing transaction because of an illiquid secondary market.
(h) Swap agreements. Each Fund may invest in swaps for the purpose of managing its exposure to interest rate, credit or market risk, or for other purposes. The use of swaps involves risks that are different from those associated with ordinary portfolio transactions.
Swap contracts are marked to market daily and changes in value are recorded as unrealized appreciation/(depreciation). Gains or losses are realized upon termination of the swap agreement. Periodic payments and premiums received or made by the Funds are recognized in the Statement of Operations as realized gains or losses, respectively. Collateral, in the form of restricted cash or securities, may be required to be held in segregated accounts with the Funds’ custodian in compliance with the terms of the swap contracts. Securities held as collateral for swap contracts are identified in the Portfolio of Investments and restricted cash, if any, is identified on the Statement of Assets and Liabilities. Risks may exceed amounts recorded in the Statement of Assets and Liabilities. These risks include changes in the returns of the underlying instruments, failure of the counterparties to perform under the contracts’ terms, and the possible lack of liquidity with respect to the swap agreements.
Payments received or made at the beginning of the measurement period are reflected as a premium or deposit, respectively, on the Statement of Assets and Liabilities. These upfront payments are amortized over the life of the swap and are recognized as realized gain or loss in the Statement of Operations. A liquidation payment received or made at the termination of the swap is recognized as realized gain or loss in the Statement of Operations. Net periodic payments received or paid by the Funds are recognized as realized gain or loss at the time of receipt or payment in the Statement of Operations.
As disclosed in each Fund’s summary of open swap contracts, the aggregate fair values of credit default swaps in a net liability position as of December 31, 2009 were:
| | |
Absolute Return | | 1,177,604 |
Inflation Indexed | | 59,815 |
Intermediate | | 553,755 |
Intermediate Plus | | 34,595 |
Limited Duration | | 101,632 |
Non-U.S. | | 50,997 |
195
Annual Report to Shareholders
Notes to Financial Statements—Continued
The aggregate fair value of assets posted as collateral for all swaps were:
| | |
Absolute | | 2,200,000 |
Inflation Indexed | | 590,056 |
Intermediate | | 700,000 |
Intermediate Plus | | — |
Limited Duration | | — |
Non-US | | — |
If a defined credit event had occurred as of December 31, 2009, the swaps’ credit-risk-related contingent features would have been triggered and the Funds would have been required to pay up to what is listed below less the value of the contracts’ related reference obligations.
| | |
Absolute | | 18,595,167 |
Inflation Indexed | | 16,182,000 |
Intermediate | | 9,433,604 |
Intermediate Plus | | 100,000 |
Limited Duration | | 392,139 |
Non-US | | — |
Credit Default Swaps. Each Fund may enter into credit default swap (“CDS”) contracts for investment purposes, to manage their credit risk or to add leverage. CDS agreements involve one party making a stream of payments to another party in exchange for the right to receive a specified return in the event of a default by a third party, typically corporate or sovereign issuers, on a specified obligation, or in the event of a write-down, principal shortfall, interest shortfall or default of all or part of the referenced entities comprising a credit index. Each Fund may use a CDS to provide protection against defaults of the issuers (i.e., to reduce risk where the Funds have exposure to a sovereign issuer) or to take an active long or short position with respect to the likelihood of a particular issuer’s default. As a seller of protection, the Funds generally receive an upfront payment or a stream of payments throughout the term of the swap provided that there is no credit event. If the Funds are a seller of protection and a credit event occurs, as defined under the terms of that particular swap agreement, the maximum potential amount of future payments (undiscounted) that the Funds could be required to make under a credit default swap agreement would be an amount equal to the notional amount of the agreement. These amounts of potential payments will be partially offset by any recovery of values from the respective referenced obligations. As a seller of protection, the Funds effectively add leverage to their portfolios because, in addition to their total net assets, the Funds are subject to investment exposure on the notional amount of the swap. As a buyer of protection, the Funds generally receive an amount up to the notional value of the swap if a credit event occurs.
Implied spreads are the theoretical prices a lender receives for credit default protection. When spreads rise, market perceived credit risk rises and when spreads fall, market perceived credit risk falls. The implied credit spread of a particular referenced entity reflects the cost of buying/selling protection and may include upfront payments required to enter into the agreement. Wider credit spreads and decreasing market values, when compared to the notional amount of the swap, represent a deterioration of the referenced entity’s credit soundness and a greater likelihood or risk of default or other credit event occurring as defined under the terms of the agreement. Credit spreads utilized in determining the period end market value of credit default swap agreements on corporate or sovereign issues are disclosed in the Notes to Financial Statements and serve as an indicator of the current status of the payment/performance risk and represent the likelihood or risk of default for credit derivatives. For credit default swap agreements on asset-backed securities and credit indices, the quoted market prices and resulting values, particularly in relation to the notional amount of the contract as well as the annual payment rate, serve as an indication of the current status of the payment/performance risk.
Each Fund’s maximum risk of loss from counterparty risk, as the protection buyer, is the fair value of the contract (this risk is mitigated by the posting of collateral by the counterparty to each Fund to cover each Fund’s exposure to the counterparty). As the protection seller, the Fund’s maximum risk is the notional amount of the contract. Credit default swaps are considered to have credit risk-related contingent features since they require payment by the protection seller to the protection buyer upon the occurrence of a defined credit event.
196
Annual Report to Shareholders
Entering into a CDS agreement involves, to varying degrees, elements of credit, market and documentation risk in excess of the related amounts recognized on the Statement of Assets and Liabilities. Such risks involve the possibility that there will be no liquid market for these agreements, that the counterparty to the agreement may default on its obligation to perform or disagree as to the meaning of the contractual terms in the agreement, and that there will be unfavorable changes in net interest rates.
Interest Rate Swaps. Each Fund may enter into interest rate swap contracts. Interest rate swaps are agreements between two parties to exchange cash flows based on a notional principal amount. The Funds may elect to pay a fixed rate and receive a floating rate, or, receive a fixed rate and pay a floating rate on a notional principal amount. The net interest received or paid on interest rate swap agreements is accrued daily as interest income. Interest rate swaps are marked to market daily based upon quotations from market makers and the change, if any, is recorded as an unrealized gain or loss in the Statement of Operations. When a swap contract is terminated early, the Funds record a realized gain or loss equal to the difference between the original cost and the settlement amount of the closing transaction.
The risks of interest rate swaps include changes in market conditions that will affect the value of the contract or changes in the present value of the future cash flow streams and the possible inability of the counterparty to fulfill its obligations under the agreement. The Funds’ maximum risk of loss from counterparty credit risk is the discounted net value of the cash flows to be received from the counterparty over the contract’s remaining life, to the extent that amount is positive. This risk is mitigated by the posting of collateral by the counterparty to the Funds to cover the Funds’ exposure to the counterparty.
Total Return Swaps. Each Fund may enter into total return swaps for investment purposes. Total return swaps are agreements to exchange the return generated by one instrument for the return generated by another instrument. For example, the agreement to pay a predetermined or fixed interest rate in exchange for a market-linked return based on a notional amount. To the extent the total return of a referenced index or instrument exceeds the offsetting interest obligation, the Funds will receive a payment from the counterparty. To the extent it is less, the Funds will make a payment to the counterparty. Periodic payments received or made by the Funds are recorded in the Statement of Operations as realized gains or losses, respectively.
(i) Foreign Currency Translation. Investment securities and other assets and liabilities denominated in foreign currencies are translated into U.S. dollar amounts based upon prevailing exchange rates on the date of valuation. Purchases and sales of investment securities and income and expense items denominated in foreign currencies are translated into U.S. dollar amounts based upon prevailing exchange rates on the respective dates of such transactions.
The Funds do not isolate that portion of the results of operations resulting from fluctuations in foreign exchange rates on investments from the fluctuations arising from changes in market prices of securities held. Such fluctuations are included with the net realized and unrealized gain or loss on investments.
Net realized foreign exchange gains or losses arise from sales of foreign currencies, including gains and losses on forward foreign currency contracts, currency gains or losses realized between the trade and settlement dates on securities transactions, and the difference between the amounts of dividends, interest, and foreign withholding taxes recorded on each Fund’s books and the U.S. dollar equivalent of the amounts actually received or paid. Net unrealized foreign exchange gains and losses arise from changes in the fair values of assets and liabilities, other than investments in securities, on the date of valuation, resulting from changes in exchange rates.
Foreign security and currency transactions may involve certain considerations and risks not typically associated with those of U.S. dollar denominated transactions as a result of, among other factors, the possibility of lower levels of governmental supervision and regulation of foreign securities markets and the possibility of political or economic instability.
(j) Stripped Securities. Each Fund may invest in ‘‘Stripped Securities,’’ a term used collectively for components, or strips, of fixed income securities. Stripped securities can be principal only securities (“PO”), which are debt obligations that have been stripped of unmatured interest coupons or, interest only securities (“IO”), which are unmatured interest coupons that have been stripped from debt obligations. The market value of Stripped Securities will fluctuate in response to changes in economic conditions, rates of pre-payment, interest rates and the market’s perception of the securities. However, fluctuations in response to
197
Annual Report to Shareholders
Notes to Financial Statements—Continued
interest rates may be greater in Stripped Securities than for debt obligations of comparable maturities that pay interest currently. The amount of fluctuation may increase with a longer period of maturity.
The yield to maturity on IO’s is sensitive to the rate of principal repayments (including prepayments) on the related underlying debt obligation and principal payments may have a material effect on yield to maturity. If the underlying debt obligation experiences greater than anticipated prepayments of principal, the Fund may not fully recoup its initial investment in IO’s.
(k) Swaptions. Each Fund may write swaption contracts to manage exposure to fluctuations in interest rates and to enhance portfolio yield. Swaption contracts written by the Fund represent an option that gives the purchaser the right, but not the obligation, to enter into a previously agreed upon swap contract at a future date. If a written call swaption is exercised, the writer enters a swap and is obligated to pay the fixed rate and receive a floating rate in exchange. If a written put swaption is exercised, the writer enters a swap and is obligated to pay the floating rate and receive a fixed rate in exchange. Swaptions are marked to market daily based upon quotations from market makers. Changes in the value of the swaption are reported as unrealized gains or losses in the Statement of Operations.
When a Fund writes a swaption, an amount equal to the premium received by the Fund is recorded as a liability, the value of which is marked to market daily to reflect the current market value of the swaption written. If the swaption expires, the Fund realizes a gain equal to the amount of the premium received.
(l) Share Class Accounting. Investment income, common expenses and realized/unrealized gains (losses) on investments are allocated to the various classes of each Fund on the basis of daily net assets of each class. Fees relating to a specific class are changed directly to that share class.
(m) Security Transactions and Investment Income. Security transactions are accounted for on a trade date basis. Interest income, adjusted for amortization of premium and accretion of discount, is recorded on the accrual basis. Dividend income is recorded on the ex-dividend date. Foreign dividend income is recorded on the ex-dividend date or as soon as practicable after a Fund determines the existence of a dividend declaration after exercising reasonable due diligence. The cost of investments sold is determined by use of the specific identification method. To the extent any issuer defaults or credit event occurs by the issuer, a Fund may halt any additional interest income accruals and consider the realizability of interest accrued up to the date of default or credit event.
(n) Distributions to Shareholders. Distributions from net investment income on the shares of the Funds are declared each business day to shareholders of record, and are paid monthly for each Fund except High Yield and Non-U.S., which declare and pay dividends quarterly. Distributions of net realized gains, if any, are declared at least annually. Distributions are recorded on the ex-dividend date and are determined in accordance with income tax regulations, which may differ from GAAP.
(o) Compensating Balance Agreements. Each Fund has an arrangement with its custodian bank whereby a portion of the custodian’s fees is paid indirectly by credits earned on each Fund’s cash deposit with the bank.
(p) Credit and Market Risk. Investments in securities that are collateralized by residential real estate mortgages are subject to certain credit and liquidity risks. When market conditions result in an increase in default rates of the underlying mortgages and foreclosure values of underlying real estate properties are materially below the outstanding amount of these underlying mortgages, collection of the full amount of accrued interest and principal on these investments may be doubtful. Such market conditions may significantly impair the value and liquidity of these investments and may result in a lack of correlation between their credit ratings and values.
(q) Other. In the normal course of business, each Fund enters into contracts that provide general indemnifications. Each Fund’s maximum exposure under these arrangements is dependent upon claims that may be made against the Fund in the future and, therefore, cannot be estimated; however, based on experience, the risk of material loss from such claims is considered remote.
198
Annual Report to Shareholders
(r) Federal and Other Taxes. It is each Fund’s policy to comply with the federal income and excise tax requirements of the Internal Revenue Code of 1986 (the “Code”), as amended, applicable to regulated investment companies. Accordingly, the Funds intend to distribute its taxable income and net realized gains, if any, to shareholders in accordance with timing requirements imposed by the Code. Therefore, no federal income tax provision is required in the Funds’ financial statements.
Management has analyzed the Funds’ tax positions taken on federal income tax returns for all open tax years and has concluded that as of December 31, 2009, no provision for income tax is required in the Funds’ financial statements. The Funds’ federal and state income and federal excise tax returns for tax years for which the applicable statutes of limitations have not expired are subject to examination by Internal Revenue Service and state departments of revenue.
Under the applicable foreign tax laws, a withholding tax may be imposed on interest, dividends and capital gains at various rates.
(s) Reclassification. GAAP requires that certain components of net assets be adjusted to reflect permanent differences between financial and tax reporting. These reclassifications have no effect on net assets or net asset values per share. During the current year, the following reclassifications have been made:
| | | | | | | | | | | | | |
Fund | | | | (Over)/Undistributed
Net Investment Income | | Accumulated Net Realized Loss Gain/(Loss) | | | Paid-in Capital | |
Absolute Return | | (a) | | $ | 1,605,754 | | $ | (1,605,754 | ) | | | — | |
High Yield | | (b) | | | — | | | 25,944,937 | | | $ | (25,944,937 | ) |
| | (a) | | | 96,492 | | | (96,492 | ) | | | — | |
Inflation Indexed | | (c) | | | 999,296 | | | (999,296 | ) | | | — | |
Intermediate | | (d) | | | 583,348 | | | (583,348 | ) | | | — | |
Intermediate Plus | | (c) | | | 206,990 | | | (206,990 | ) | | | — | |
Limited Duration | | (e) | | | 16,226 | | | (16,226 | ) | | | — | |
Non-U.S. | | (f) | | | 911,355 | | | — | | | | (911,355 | ) |
| | (g) | | | (2,197,520) | | | 2,197,520 | | | | — | |
| (a) | | Reclassifications are primarily due to foreign currency transactions treated as ordinary income for tax purposes, losses from mortgage backed securities treated as capital losses for tax purposes and book/tax differences in the treatment of swap contracts. |
| (b) | | Reclassifications are primarily due to book/tax differences in the treatment of an in-kind distribution of securities. |
| (c) | | Reclassifications are primarily due to foreign currency transactions treated as ordinary income for tax purposes, losses from mortgage backed securities treated as capital losses for tax purposes, book/tax differences in the treatment of swap contracts and book/tax differences in the treatment of Treasury Inflation-Protected Securities. |
| (d) | | Reclassifications are primarily due to losses from mortgage backed securities treated as capital losses for tax purposes, book/tax differences in the treatment of Treasury Inflation-Protected Securities, book/tax differences in the treatment of swap contacts and book/tax differences in the treatment of distributions. |
| (e) | | Reclassifications are primarily due to losses from mortgage backed securities treated as capital losses for tax purposes and book/tax differences in the treatment of swap contracts. |
| (f) | | Reclassifications are primarily due to a tax net operating loss. |
| (g) | | Reclassifications are primarily due to foreign currency transactions treated as ordinary income for tax purposes, a tax net operating loss which offsets short-term capital gains for tax purposes and book/tax differences in the treatment of swap contracts. |
2. Investment Management Agreement and Other Transactions with Affiliates
Each Fund has an investment management agreement with Legg Mason Partners Fund Advisor, LLC (“LMPFA”). Prior to September 30, 2009, Legg Mason Fund Adviser, Inc. (“LMFA”) was the investment manager. Western Asset Management Company
199
Annual Report to Shareholders
Notes to Financial Statements—Continued
(“Western Asset”) is the investment adviser to Absolute Return, High Yield, Inflation Indexed, Intermediate, Intermediate Plus and Limited Duration. Western Asset Management Company Limited (“WAML”) is the investment adviser to Non-U.S. and shares advisory responsibilities with Western Asset for Absolute Return, Inflation Indexed, and Intermediate Plus. WAML, Western Asset Management Company Pte Ltd. (“Western Singapore”) and Western Asset Management Company Limited (“Western Japan”) share advisory responsibilities with Non-U.S., Absolute Return and Inflation Indexed.
Pursuant to their respective agreements, LMPFA provides the Funds with management and administrative services for which each Fund pays a fee, computed daily and payable monthly, at annual rates of each Fund’s average daily net assets. From August 1, 2008 through April 30, 2010, the manager is contractually obligated to follow the Fee Cap for the Institutional Select and Financial Intermediary Classes of each Fund offering those classes. From August 1, 2008 through April 30, 2010, the manager is contractually obligated to waive its compensation (and, to the extent necessary, bear other expenses of the Fund) with respect to the Institutional Class of certain Funds in amounts equal to specified annual rates of each such Fund’s average daily net assets attributable to such share class (“Flat Waiver”). Western Asset and WAML also agreed to waive their advisory fees (which are paid by LMPFA, and not the Funds) in corresponding amounts under both the Fee Cap and the Flat Waiver.
Any amounts waived or reimbursed in a particular fiscal year under the Fee Cap will be subject to repayment by a Fund on behalf of the applicable class to LMPFA to the extent that from time to time during the next three fiscal years the repayment will not cause a Fund’s expenses for such class to exceed a limit agreed between the Fund and LMPFA. The following chart shows annual rates of management fees, expense limits or waivers (as applicable), management fees waived and potential fees which may be recaptured for the Funds’ share classes.
| | | | | | | | | | | | | | | | | | |
Fund | | Asset
Breakpoint for
Management
Fee | | Management
Fee | | | Expense
Limitation
8/1/08-4/30/10 | | | Waiver | | | Management
Fees (Waived)/
Recaptured | | | Maximum
Amount
Subject to
Recapture |
Absolute Return | | | | | | | | | | | | | | | | | | |
Institutional Class | | All asset levels | | 0.750 | % | | 0.80 | % | | — | | | $ | (35,445 | ) | | $ | 140,270 |
Institutional Select Class | | All asset levels | | 0.750 | % | | 0.80 | % | | — | | | | (62,257 | ) | | | 106,254 |
Financial Intermediary Class | | All asset levels | | 0.750 | % | | 1.05 | % | | — | | | | (467 | ) | | | 5,458 |
| | | | | | |
High Yield | | | | | | | | | | | | | | | | | | |
Institutional Class | | All asset levels | | 0.550 | % | | — | | | — | | | | — | | | | — |
Institutional Select Class | | All asset levels | | 0.550 | % | | 0.65 | % | | — | | | | — | | | | — |
| | | | | | |
Inflation Indexed | | | | | | | | | | | | | | | | | | |
Institutional Class | | All asset levels | | 0.200 | % | | — | | | 0.02 | % | | | (2,914 | ) | | $ | 403,332 |
Institutional Select Class | | All asset levels | | 0.200 | % | | 0.25 | % | | — | | | | (140 | ) | | | 7,387 |
Financial Intermediary Class | | All asset levels | | 0.200 | % | | 0.75 | % | | — | | | | (1 | ) | | | 392 |
| | | | | | |
Intermediate | | | | | | | | | | | | | | | | | | |
Institutional Class | | All asset levels | | 0.400 | % | | — | | | — | | | | — | | | $ | 7,780 |
Institutional Select Class | | All asset levels | | 0.400 | % | | 0.45 | % | | — | | | | — | | | | 5,458 |
| | | | | | |
Intermediate Plus | | | | | | | | | | | | | | | | | | |
Institutional Class | | All asset levels | | 0.400 | % | | 0.55 | % | | 0.13 | % | | | (136,695 | ) | | $ | 396,951 |
Institutional Select Class | | All asset levels | | 0.400 | % | | 0.45 | % | | — | | | | (13,773 | ) | | | 22,594 |
| | | | | | |
Limited Duration | | | | | | | | | | | | | | | | | | |
Institutional Class | | All asset levels | | 0.350 | % | | 0.53 | % | | 0.10 | % | | | (95,243 | ) | | $ | 318,599 |
Institutional Select Class | | All asset levels | | 0.350 | % | | 0.40 | % | | — | | | | (29,027 | ) | | | 39,168 |
| | | | | | |
Non-U.S. | | | | | | | | | | | | | | | | | | |
Institutional Class | | All asset levels | | 0.450 | % | | — | | | 0.04 | % | | | (6,759 | ) | | $ | 157,147 |
200
Annual Report to Shareholders
Legg Mason Investor Services, LLC (“LMIS”) serves as distributor of the Funds’ shares. LMIS receives from each Fund an annual distribution fee of 0.25% of the average daily net assets of the Financial Intermediary Class of each Fund, computed daily and payable monthly.
As of September 30, 2009, LMPFA replaced LMFA. Effective upon the substitution, LMPFA assumed the rights and responsibilities of LMFA under its management agreement with the Fund including all of the responsibilities to the Fund described in the Fund’s prospectus.
LMPFA, Western Asset, WAML, Western Singapore, Western Japan and LMIS are wholly owned subsidiaries of Legg Mason, Inc.
3. Investments
During the year ended December 31, 2009, the aggregate cost of purchases and proceeds from sales of investments (excluding short-term investments) and U.S Government & Agency Obligations were as follows:
| | | | | | | | | | | | |
| | | Purchases | | Sales |
| | | Investments | | U.S. Government
& Agency
Obligations | | Investments | | U.S. Government
& Agency
Obligations |
Absolute Return | | $ | 27,490,497 | | $ | 713,386,641 | | $ | 97,905,893 | | $ | 805,324,003 |
High Yield | | | 475,571,112 | | | — | | | 491,712,652 | | | — |
Inflation Indexed | | | 26,156,655 | | | 168,668,182 | | | 3,561,181 | | | 285,170,237 |
Intermediate | | | 209,323,838 | | | 596,586,729 | | | 231,744,213 | | | 619,162,229 |
Intermediate Plus | | | 25,135,116 | | | 68,915,376 | | | 32,075,381 | | | 82,738,267 |
Limited Duration | | | 29,149,187 | | | 73,659,070 | | | 35,966,595 | | | 92,824,680 |
Non-U.S. | | | 71,819,782 | | | — | | | 99,018,105 | | | 1,311,796 |
At December 31, 2009, the aggregate gross unrealized appreciation and depreciation of investments for federal income tax purposes were as follows:
| | | | | | | | | | | |
Fund | | Gross
Unrealized
Appreciation | | Gross
Unrealized
Depreciation | | | Net
Unrealized
Depreciation | |
Absolute Return | | $ | 11,248,452 | | $ | (51,883,609 | ) | | $ | (40,635,157 | ) |
High Yield | | | 50,542,618 | | | (53,383,924 | ) | | | (2,841,306 | ) |
Inflation Indexed | | | 13,216,060 | | | (22,117,985 | ) | | | (8,901,925 | ) |
Intermediate | | | 14,432,885 | | | (42,621,302 | ) | | | (28,188,417 | ) |
Intermediate Plus | | | 2,217,934 | | | (5,888,247 | ) | | | (3,670,313 | ) |
Limited Duration | | | 1,085,261 | | | (8,907,424 | ) | | | (7,822,163 | ) |
Non-U.S. | | | 4,724,549 | | | (4,726,846 | ) | | | (2,297 | ) |
201
Annual Report to Shareholders
Notes to Financial Statements—Continued
During the year ended December 31, 2009, written option transactions for the Funds were as follows:
| | | | | | | |
| Absolute Return | | Number of
Contracts | | | Premiums | |
Written options, outstanding December 31, 2008 | | 51,281,761 | | | $ | 2,682,008 | |
Options written | | 364,103,294 | | | | 5,130,609 | |
Options closed | | (178,271,767 | ) | | | (2,618,312 | ) |
Options exercised | | (9,400,944 | ) | | | (789,404 | ) |
Options expired | | (207,341,878 | ) | | | (3,032,148 | ) |
| | | | | | | |
Written options, outstanding December 31, 2009 | | 20,370,466 | | | $ | 1,372,753 | |
| | | | | | | |
| | |
| Inflation Indexed | | Number of
Contracts | | | Premiums | |
Written options, outstanding December 31, 2008 | | — | | | | — | |
Options written | | 477 | | | $ | 491,322 | |
Options closed | | — | | | | — | |
Options exercised | | (121 | ) | | | (168,924 | ) |
Options expired | | (356 | ) | | | (322,398 | ) |
| | | | | | | |
Written options, outstanding December 31, 2009 | | — | | | | — | |
| | | | | | | |
| | |
| Intermediate | | Number of
Contracts | | | Premiums | |
Written options, outstanding December 31, 2008 | | 1,716 | | | $ | 1,532,092 | |
Options written | | 63,610,878 | | | | 5,711,927 | |
Options closed | | (21,207,611 | ) | | | (3,849,718 | ) |
Options exercised | | (42,401,028 | ) | | | (1,250,169 | ) |
Options expired | | (2,510 | ) | | | (1,320,506 | ) |
| | | | | | | |
Written options, outstanding December 31, 2009 | | 1,445 | | | $ | 823,626 | |
| | | | | | | |
| | |
| Intermediate Plus | | Number of
Contracts | | | Premiums | |
Written options, outstanding December 31, 2008 | | 242 | | | $ | 214,812 | |
Options written | | 9,301,538 | | | | 809,511 | |
Options closed | | (3,101,091 | ) | | | (550,705 | ) |
Options exercised | | (6,200,143 | ) | | | (174,118 | ) |
Options expired | | (362 | ) | | | (192,614 | ) |
| | | | | | | |
Written options, outstanding December 31, 2009 | | 184 | | | $ | 106,886 | |
| | | | | | | |
| | |
| Limited Duration | | Number of
Contracts | | | Premiums | |
Written options, outstanding December 31, 2008 | | 263 | | | $ | 226,219 | |
Options written | | 12,700,245 | | | | 224,960 | |
Options closed | | (3,300,401 | ) | | | (321,061 | ) |
Options exercised | | (6,600,020 | ) | | | (61,860 | ) |
Options expired | | (2,800,020 | ) | | | (29,405 | ) |
| | | | | | | |
Written options, outstanding December 31, 2009 | | 67 | | | $ | 38,853 | |
| | | | | | | |
202
Annual Report to Shareholders
| | | | | | | |
| Non-U.S. | | Number of
Contracts | | | Premiums | |
Written options, outstanding December 31, 2008 | | 235 | | | $ | 197,632 | |
Options written | | 1,547 | | | | 820,021 | |
Options closed | | (1,039 | ) | | | (572,413 | ) |
Options exercised | | (158 | ) | | | (101,361 | ) |
Options expired | | (385 | ) | | | (288,279 | ) |
| | | | | | | |
Written options, outstanding December 31, 2009 | | 200 | | | $ | 55,600 | |
| | | | | | | |
At December 31, 2009, the Funds had the following open forward foreign currency contracts:
Absolute Return
| | | | | | | | | | | | | | |
Broker | | Settlement
Date | | Contract to | | Unrealized
Gain/(Loss) | |
| | | ReceiveA | | DeliverA | |
Citibank NA | | 2/17/10 | | JPY | | 173,092,800 | | USD | | 1,922,100 | | $ | (63,148 | ) |
Citibank NA | | 2/17/10 | | USD | | 1,081,923 | | CAD | | 1,150,138 | | | (17,801 | ) |
Credit Suisse First Boston (London) | | 2/17/10 | | USD | | 771,264 | | GBP | | 467,515 | | | 16,347 | |
Credit Suisse First Boston (London) | | 2/17/10 | | USD | | 1,830,722 | | JPY | | 165,039,620 | | | 58,258 | |
| | | | | | | | | | | | | | |
| | | | | | | | | | | | $ | (6,344 | ) |
| | | | | | | | | | | | | | |
A Definitions of currency abbreviations:
| | | | |
| CAD | | — | | Canadian Dollar |
| GBP | | — | | British Pound |
| JPY | | — | | Japanese Yen |
| USD | | — | | United States Dollar |
Inflation Indexed
| | | | | | | | | | | | | | |
Broker | | Settlement
Date | | Contract to | | Unrealized
Gain/(Loss) | |
| | | ReceiveA | | DeliverA | |
UBS AG London | | 2/17/10 | | CAD | | 12,862,436 | | USD | | 12,089,097 | | | 209,537 | |
Morgan Stanley London FX | | 2/17/10 | | EUR | | 2,834,218 | | USD | | 4,205,696 | | | (142,961 | ) |
Credit Suisse First Boston (London) | | 2/17/10 | | GBP | | 13,406,133 | | USD | | 22,116,231 | | | (468,741 | ) |
Deutsche Bank AG London | | 2/17/10 | | JPY | | 640,263,600 | | USD | | 7,098,817 | | | (222,623 | ) |
UBS AG London | | 2/17/10 | | JPY | | 1,182,190,000 | | USD | | 13,104,140 | | | (407,858 | ) |
Deutsche Bank AG London | | 2/17/10 | | SEK | | 8,862,930 | | USD | | 1,257,421 | | | (18,337 | ) |
Citibank NA | | 2/17/10 | | USD | | 1,959,760 | | EUR | | 1,320,255 | | | 67,229 | |
Credit Suisse First Boston (London) | | 2/17/10 | | USD | | 4,294,607 | | AUD | | 4,719,867 | | | 75,192 | |
Credit Suisse First Boston (London) | | 2/17/10 | | USD | | 3,196,279 | | AUD | | 3,519,743 | | | 49,737 | |
Credit Suisse First Boston (London) | | 2/17/10 | | USD | | 5,822,880 | | AUD | | 6,485,359 | | | 25,170 | |
Credit Suisse First Boston (London) | | 2/17/10 | | USD | | 11,817,035 | | CAD | | 12,573,916 | | | (205,726 | ) |
Credit Suisse First Boston (London) | | 2/17/10 | | USD | | 3,652,702 | | EUR | | 2,458,308 | | | 128,818 | |
Credit Suisse First Boston (London) | | 2/17/10 | | USD | | 20,216,714 | | JPY | | 1,822,536,810 | | | 643,345 | |
Deutsche Bank AG London | | 2/17/10 | | USD | | 6,518,243 | | CAD | | 6,931,239 | | | (109,177 | ) |
UBS AG London | | 2/17/10 | | USD | | 22,422,332 | | GBP | | 13,569,801 | | | 510,560 | |
UBS AG London | | 2/17/10 | | USD | | 1,256,526 | | SEK | | 8,856,860 | | | 18,290 | |
| | | | | | | | | | | | | | |
| | | | | | | | | | | | $ | 152,455 | |
| | | | | | | | | | | | | | |
ADefinitions of currency abbreviations:
AUD—Australian Dollar
203
Annual Report to Shareholders
Notes to Financial Statements—Continued
| | | | |
| EUR | | — | | Euro |
| GBP | | — | | British Pound |
| JPY | | — | | Japanese Yen |
| SEK | | — | | Swedish Krona |
| USD | | — | | United States Dollar |
Intermediate Plus
| | | | | | | | | | | | | | |
Broker | | Settlement
Date | | Contract to | | Unrealized
Gain/(Loss) | |
| | | ReceiveA | | DeliverA | |
Credit Suisse First Boston (London) | | 2/17/10 | | AUD | | 289,277 | | USD | | 259,727 | | $ | (1,123 | ) |
Credit Suisse First Boston (London) | | 2/17/10 | | EUR | | 660,000 | | USD | | 988,020 | | | (41,937 | ) |
Credit Suisse First Boston (London) | | 2/17/10 | | JPY | | 104,501,670 | | USD | | 1,169,577 | | | (47,267 | ) |
Citibank NA | | 2/17/10 | | USD | | 1,386,885 | | EUR | | 934,319 | | | 47,576 | |
Credit Suisse First Boston (London) | | 2/17/10 | | USD | | 1,180,033 | | JPY | | 106,380,000 | | | 37,552 | |
UBS AG London | | 2/17/10 | | USD | | 244,338 | | AUD | | 271,728 | | | 1,421 | |
| | | | | | | | | | | | | | |
| | | | | | | | | | | | $ | (3,778 | ) |
| | | | | | | | | | | | | | |
ADefinitions of currency abbreviations:
| | | | |
| AUD | | — | | Australian Dollar |
| EUR | | — | | Euro |
| JPY | | — | | Japanese Yen |
| USD | | — | | United States Dollar |
Non-U.S.
| | | | | | | | | | | | | | |
Broker | | Settlement
Date | | Contract to | | Unrealized
Gain/(Loss) | |
| | | ReceiveA | | DeliverA | |
Citibank NA | | 2/17/10 | | AUD | | 144,642 | | USD | | 132,000 | | $ | (2,695 | ) |
UBS AG London | | 2/17/10 | | AUD | | 5,300,000 | | USD | | 4,765,760 | | | (27,724 | ) |
Deutsche Bank AG London | | 2/17/10 | | CAD | | 4,007,217 | | USD | | 3,768,448 | | | 63,120 | |
Goldman Sachs International | | 2/17/10 | | CAD | | 880,000 | | EUR | | 560,474 | | | 38,010 | |
Goldman Sachs International | | 2/17/10 | | CAD | | 870,000 | | USD | | 814,530 | | | 17,335 | |
JPMorgan Chase Bank | | 2/17/10 | | DKK | | 920,000 | | USD | | 184,802 | | | (7,669 | ) |
JPMorgan Chase Bank | | 2/17/10 | | DKK | | 19,157,868 | | USD | | 3,877,497 | | | (188,918 | ) |
UBS AG London | | 2/17/10 | | DKK | | 4,436,174 | | USD | | 883,682 | | | (29,559 | ) |
Citibank NA | | 2/17/10 | | EUR | | 5,936,781 | | USD | | 8,812,440 | | | (302,307 | ) |
Citibank NA | | 2/17/10 | | EUR | | 560,000 | | USD | | 800,856 | | | 1,881 | |
Deutsche Bank AG London | | 2/17/10 | | EUR | | 1,110,000 | | NOK | | 9,267,834 | | | (6,222 | ) |
JPMorgan Chase Bank | | 2/17/10 | | EUR | | 560,000 | | USD | | 831,281 | | | (28,544 | ) |
JPMorgan Chase Bank | | 2/17/10 | | EUR | | 1,500,000 | | USD | | 2,153,280 | | | (3,092 | ) |
JPMorgan Chase Bank | | 2/17/10 | | EUR | | 165,000 | | USD | | 235,926 | | | 595 | |
JPMorgan Chase Bank | | 2/17/10 | | EUR | | 1,500,000 | | USD | | 2,156,940 | | | (6,752 | ) |
JPMorgan Chase Bank | | 2/17/10 | | EUR | | 1,500,000 | | USD | | 2,230,800 | | | (80,612 | ) |
JPMorgan Chase Bank | | 2/17/10 | | EUR | | 400,000 | | USD | | 596,160 | | | (22,776 | ) |
UBS AG London | | 2/17/10 | | EUR | | 500,000 | | USD | | 731,425 | | | (14,696 | ) |
UBS AG London | | 2/17/10 | | EUR | | 1,500,000 | | USD | | 2,149,317 | | | 871 | |
UBS AG London | | 2/17/10 | | EUR | | 7,748,848 | | USD | | 11,495,339 | | | (387,683 | ) |
Citibank NA | | 2/17/10 | | GBP | | 3,593,605 | | USD | | 5,934,156 | | | (131,399 | ) |
Deutsche Bank AG London | | 2/17/10 | | GBP | | 580,000 | | CAD | | 1,003,719 | | | (23,170 | ) |
Deutsche Bank AG London | | 2/17/10 | | GBP | | 400,000 | | USD | | 651,784 | | | (5,886 | ) |
JPMorgan Chase Bank | | 2/17/10 | | GBP | | 1,100,000 | | USD | | 1,816,100 | | | (39,880 | ) |
UBS AG London | | 2/17/10 | | GBP | | 5,945,581 | | USD | | 9,824,300 | | | (223,701 | ) |
204
Annual Report to Shareholders
Non-U.S.—Continued
| | | | | | | | | | | | | | |
Broker | | Settlement
Date | | Contract to | | Unrealized
Gain/(Loss) | |
| | | ReceiveA | | DeliverA | |
Credit Suisse First Boston (London) | | 2/17/10 | | JPY | | 63,714,509 | | USD | | 706,761 | | $ | (22,491 | ) |
Deutsche Bank AG London | | 2/17/10 | | JPY | | 672,560,000 | | USD | | 7,456,898 | | | (233,853 | ) |
JPMorgan Chase Bank | | 2/17/10 | | JPY | | 185,678,243 | | USD | | 2,089,136 | | | (95,021 | ) |
Morgan Stanley London FX | | 2/17/10 | | JPY | | 41,140,000 | | USD | | 456,290 | | | (14,461 | ) |
Deutsche Bank AG London | | 2/17/10 | | NOK | | 6,326,250 | | USD | | 1,123,129 | | | (32,766 | ) |
Goldman Sachs International | | 2/17/10 | | NOK | | 4,750,000 | | EUR | | 561,598 | | | 13,660 | |
UBS AG London | | 2/17/10 | | NOK | | 6,237,866 | | USD | | 1,089,945 | | | (14,815 | ) |
UBS AG London | | 2/17/10 | | PLN | | 7,000,000 | | USD | | 2,414,642 | | | 22,426 | |
Credit Suisse First Boston (London) | | 2/17/10 | | SEK | | 12,241,600 | | USD | | 1,737,136 | | | (25,696 | ) |
BNP Paribas | | 2/17/10 | | USD | | 737,702 | | EUR | | 500,000 | | | 20,972 | |
Citibank NA | | 2/17/10 | | USD | | 1,249,923 | | AUD | | 1,391,121 | | | 6,303 | |
Citibank NA | | 2/17/10 | | USD | | 1,533,625 | | CAD | | 1,630,320 | | | (25,233 | ) |
Citibank NA | | 2/17/10 | | USD | | 1,634,954 | | DKK | | 8,205,016 | | | 55,193 | |
Citibank NA | | 2/17/10 | | USD | | 1,200,000 | | EUR | | 807,803 | | | 42,047 | |
Citibank NA | | 2/17/10 | | USD | | 20,194,614 | | JPY | | 1,818,605,748 | | | 663,463 | |
Citibank NA | | 2/17/10 | | USD | | 527,915 | | NOK | | 3,018,354 | | | 7,685 | |
Citibank NA | | 2/17/10 | | USD | | 260,000 | | NOK | | 1,471,522 | | | 6,375 | |
Citibank NA | | 2/17/10 | | USD | | 5,726,097 | | PLN | | 16,571,326 | | | (43,254 | ) |
Credit Suisse First Boston (London) | | 2/17/10 | | USD | | 1,771,354 | | CAD | | 1,884,809 | | | (30,838 | ) |
Credit Suisse First Boston (London) | | 2/17/10 | | USD | | 7,340,148 | | EUR | | 4,940,000 | | | 258,861 | |
Credit Suisse First Boston (London) | | 2/17/10 | | USD | | 2,753,745 | | GBP | | 1,700,000 | | | 8,678 | |
Credit Suisse First Boston (London) | | 2/17/10 | | USD | | 6,709,927 | | GBP | | 4,067,337 | | | 142,213 | |
Credit Suisse First Boston (London) | | 2/17/10 | | USD | | 137,269 | | GBP | | 84,261 | | | 1,209 | |
Deutsche Bank AG London | | 2/17/10 | | USD | | 3,276,459 | | EUR | | 2,207,857 | | | 111,587 | |
Deutsche Bank AG London | | 2/17/10 | | USD | | 17,695,537 | | GBP | | 10,728,469 | | | 371,792 | |
Deutsche Bank AG London | | 2/17/10 | | USD | | 798,483 | | JPY | | 71,810,000 | | | 27,271 | |
Deutsche Bank AG London | | 2/17/10 | | USD | | 5,869,545 | | NOK | | 33,567,925 | | | 83,931 | |
Goldman Sachs International | | 2/17/10 | | USD | | 526,325 | | AUD | | 585,391 | | | 3,004 | |
Goldman Sachs International | | 2/17/10 | | USD | | 1,495,775 | | AUD | | 1,666,008 | | | 6,416 | |
Goldman Sachs International | | 2/17/10 | | USD | | 1,312,288 | | CAD | | 1,391,052 | | | (17,789 | ) |
Goldman Sachs International | | 2/17/10 | | USD | | 8,645,961 | | EUR | | 5,860,000 | | | 245,892 | |
Goldman Sachs International | | 2/17/10 | | USD | | 413,000 | | GBP | | 250,000 | | | 9,314 | |
Goldman Sachs International | | 2/17/10 | | USD | | 4,150,870 | | JPY | | 377,280,859 | | | 99,013 | |
Goldman Sachs International | | 2/17/10 | | USD | | 820,000 | | JPY | | 71,859,060 | | | 48,260 | |
JPMorgan Chase Bank | | 2/17/10 | | USD | | 887,664 | | CAD | | 943,001 | | | (14,002 | ) |
JPMorgan Chase Bank | | 2/17/10 | | USD | | 3,146,930 | | DKK | | 15,791,295 | | | 106,538 | |
JPMorgan Chase Bank | | 2/17/10 | | USD | | 482,442 | | EUR | | 323,000 | | | 19,434 | |
JPMorgan Chase Bank | | 2/17/10 | | USD | | 1,004,243 | | EUR | | 670,000 | | | 43,825 | |
JPMorgan Chase Bank | | 2/17/10 | | USD | | 15,335,263 | | EUR | | 10,352,571 | | | 495,278 | |
JPMorgan Chase Bank | | 2/17/10 | | USD | | 3,767,840 | | EUR | | 2,500,000 | | | 184,193 | |
JPMorgan Chase Bank | | 2/17/10 | | USD | | 2,386,238 | | JPY | | 215,000,000 | | | 77,217 | |
JPMorgan Chase Bank | | 2/17/10 | | USD | | 820,000 | | JPY | | 71,555,660 | | | 51,519 | |
Morgan Stanley London FX | | 2/17/10 | | USD | | 1,628,542 | | AUD | | 1,790,000 | | | 28,338 | |
Morgan Stanley London FX | | 2/17/10 | | USD | | 23,795,122 | | EUR | | 16,035,530 | | | 808,849 | |
UBS AG London | | 2/17/10 | | USD | | 6,277,531 | | JPY | | 566,327,465 | | | 195,384 | |
UBS AG London | | 2/17/10 | | USD | | 1,737,912 | | SEK | | 12,250,000 | | | 25,297 | |
| | | | | | | | | | | | | | |
| | | | | | | | | | | | $ | 2,309,745 | |
| | | | | | | | | | | | | | |
205
Annual Report to Shareholders
Notes to Financial Statements—Continued
ADefinitions of currency abbreviations:
| | | | |
| AUD | | — | | Australian Dollar |
| CAD | | — | | Canadian Dollar |
| DKK | | — | | Danish Krone |
| EUR | | — | | Euro |
| GBP | | — | | British Pound |
| JPY | | — | | Japanese Yen |
| NOK | | — | | Norwegian Krone |
| PLN | | — | | Polish Zloty |
| SEK | | — | | Swedish Krona |
| USD | | — | | United States Dollar |
As of December 31, 2009, the one- and three-month London Interbank Offered Rates (“LIBOR”) were 0.231% and 0.251%, respectively. At December 31, 2009, the Funds had the following open swap contracts:
| | | | | | | | | | | | | | | |
Absolute Return | | | | | | | | | | | | | |
| | | | | |
Total Return Swap: | | | | | | | | | | | | | |
Swap Counterparty | | Termination Date | | Periodic Payments
Made by
the Fund‡ | | Periodic Payments
Received by
the Fund‡ | | Contract
Notional
Amount | | Upfront
Premiums
Paid/(Received) | | Unrealized
Appreciation/
(Depreciation) | |
Credit Suisse First Boston USA | | March 10, 2010 | | 3-month
LIBOR | | 4.375% | | $ | 14,500,000 | | — | | $ | (646,883 | )* |
| | | | | |
Interest Rate Swaps: | | | | | | | | | | | | | |
Swap Counterparty | | Termination Date | | Periodic
Payments Made
by the Fund‡ | | Periodic Payments
Received by the
Fund‡ | | Contract
Notional
Amount | | Upfront
Premiums
Paid/(Received) | | Unrealized
Appreciation/
(Depreciation) | |
Banc of America Securities LLC | | March 1, 2013 | | 5.104%
Semi-Annually | | 3-month
LIBOR | | $ | 100,000 | | — | | $ | (9,096 | ) |
| | | | | | |
Barclays Capital Inc. | | June 25, 2012 | | 5.06%
Semi-Annually | | 3-month LIBOR | | | 60,000 | | — | | | (4,857 | ) |
| | | | | | |
Citigroup Global Markets | | September 15, 2011 | | 3.34%
Semi-Annually | | 3-month LIBOR | | | 150,000 | | — | | | (5,435 | ) |
| | | | | | |
Credit Suisse First Boston USA | | September 15, 2015 | | 5.16%
Semi-Annually | | 3-month LIBOR | | | 50,000 | | — | | | (5,197 | ) |
| | | | | | |
Credit Suisse First Boston USA | | August 15, 2013 | | 5.023%
Semi-Annually | | 3-month LIBOR | | | 50,000 | | — | | | (4,606 | ) |
| | | | | | |
Credit Suisse First Boston USA | | February 28, 2014 | | 2.75013%
Semi-Annually | | 3-month LIBOR | | | 15,740,000 | | — | | | (68,053 | ) |
| | | | | | |
Credit Suisse First Boston USA | | December 10, 2039 | | 4.2139%
Semi-Annually | | 3-month LIBOR | | | 13,870,000 | | — | | | 711,090 | |
| | | | | | |
RBS Greenwich | | April 1, 2012 | | 5.011%
Semi-Annually | | 3-month LIBOR | | | 40,000 | | — | | | (3,038 | ) |
| | | | | | | | | | | | | | | |
| Total | | $ | 30,060,000 | | — | | $ | 610,808 | |
| | | | | | | | | | | | | | | |
206
Annual Report to Shareholders
| | | | | | | | | | | | | | | | | | | |
Absolute Return—Continued | |
|
Credit Default Swap on Corporate Issues—Sell Protection(1) | |
Swap Counterparty
(Reference Entity) | | Termination Date | | Implied Credit
Spread At
December 31,
2009(2) | | Periodic
Payments
Received by
the Fund‡ | | Contract
Notional
Amount(3) | | Market Value | | | Upfront
Premiums
Paid/(Received) | | Unrealized
Appreciation/
(Depreciation) | |
Barclays Capital Inc. (SLM Corp., 5.125%, due 8/27/212) | | September 20, 2012 | | 0.93% | | 2.35% Quarterly | | $ | 2,350,000 | | $ | (155,400 | ) | | — | | $ | (155,400 | ) |
| | | | | | | |
Barclays Capital Inc. (The AES Corp., 7.75%, due 3/1/14) | | September 20, 2012 | | 1.00% | | 3.15% Quarterly | | | 3,000,000 | | | 13,359 | | | — | | | 13,359 | |
| | | | | | | |
Barclays Capital Inc. (The AES Corp., 7.75%, due 3/1/14) | | September 20, 2012 | | 1.02% | | 3.65% Quarterly | | | 3,000,000 | | | 51,844 | | | — | | | 51,844 | |
| | | | | | | |
Barclays Capital Inc. (TXU Corp., 5.55%, due 11/15/14) | | September 20, 2012 | | 0.84% | | 2.97% Quarterly | | | 2,000,000 | | | (324,207 | ) | | — | | | (324,207 | ) |
| | | | | | | | | | | | | | | | | | | |
| Total | | $ | 10,350,000 | | $ | (414,404 | ) | | — | | $ | (414,404 | ) |
| | | | | | | | | | | | | | | | | | | |
| | | | | | | | | | | | | | | | | |
Credit Default Swaps on Corporate Issues—Buy Protection(4) | |
Swap Counterparty
(Reference Entity) | | Termination Date | | Periodic Payments
Made by the
Fund‡ | | Contract
Notional
Amount(3) | | Market
Value | | | Upfront
Premiums
Paid/(Received) | | Unrealized
Appreciation/
(Depreciation) | |
Banc of America Securities LLC
(PHH Corporate Note, 7.125%, due 3/1/13 ) | | March 20, 2013 | | 1.05%
Monthly | | $ | 110,000 | | $ | 16,316 | | | — | | $ | 16,316 | |
| | | | | | |
Barclays Capital Inc.
(Health Care Property Investments Inc., 6.45%, due 6/25/12) | | June 20, 2012 | | 0.63%
Quarterly | | | 60,000 | | | 976 | | | — | | | 976 | |
| | | | | | |
Credit Suisse First Boston USA
(Amerisource Bergen Corp., 8.125%, due 9/1/08) | | September 20, 2015 | | 0.9%
Quarterly | | | 50,000 | | | (1,111 | ) | | — | | | (1,111 | ) |
| | | | | | |
Credit Suisse First Boston USA
(Masco Corp., 5.875%, due 7/15/12) | | September 20, 2013 | | 0.75%
Quarterly | | | 50,000 | | | 1,727 | | | — | | | 1,727 | |
| | | | | | |
Morgan Stanley & Co., Inc. (Gannett Co., 6.375%, due 4/01/12) | | March 20, 2012 | | 0.46%
Quarterly | | | 40,000 | | | 1,458 | | | — | | | 1,458 | |
| | | | | | |
Morgan Stanley & Co., Inc. (Sara Lee Corp. 6.125% due 11/01/32) | | September 20, 2011 | | 0.62%
Quarterly | | | 150,000 | | | (817 | ) | | — | | | (817 | ) |
| | | | | | |
The Goldman Sachs Group, Inc.
(Citigroup Inc., 6.5%, due 1/18/11) | | March 20, 2014 | | 4.7%
Quarterly | | | 1,000,000 | | | (124,434 | ) | | — | | | (124,434 | ) |
| | | | | | | | | | | | | | | | | |
| Total | | $ | 1,460,000 | | $ | (105,885 | ) | | — | | $ | (105,885 | ) |
| | | | | | | | | | | | | | | | | |
207
Annual Report to Shareholders
Notes to Financial Statements—Continued
| | | | | | | | | | | | | | | | | | |
Absolute Return—Continued | |
|
Credit Default Swap on Credit Indices—Sell Protection(1) | |
Swap Counterparty
(Reference Entity) | | Termination Date | | Periodic Payments
Received by
the Fund‡ | | Contract
Notional
Amount(3) | | Market
Value(5) | | | Upfront
Premiums
Paid/(Received) | | | Unrealized
Appreciation/
(Depreciation) | |
Barclays Capital Inc.
(CDX IG 10) | | June 20, 2013 | | 1.55%
Quarterly | | $5,808,000 | | $ | 88,172 | | | $ | 17,768 | | | $ | 70,404 | |
| | | | | | |
Deutsche Bank AG
(ABX.HE-AAA 06-2) | | May 25, 2046 | | 0.11%
Monthly | | 694,767 | | | (376,911 | ) | | | (31,058 | ) | | | (345,853 | ) |
| | | | | | |
Barclays Capital Inc.
(CDX IG 10) | | June 20, 2013 | | 1.55%
Quarterly | | 1,742,400 | | | 26,451 | | | | 4,135 | | | | 22,316 | |
| | | | | | | | | | | | | | | | | | |
| Total | | $8,245,167 | | $ | (262,288 | ) | | $ | (9,155 | ) | | $ | (253,133 | ) |
| | | | | | | | | | | | | | | | | | |
| | | | | | | | | | | | | | | | | | |
Credit Default Swap on Credit Indices—Buy Protection(4) | |
Swap Counterparty
(Reference Entity) | | Termination Date | | Periodic Payments
Made by
the Fund‡ | | Contract
Notional
Amount(3) | | Market
Value(5) | | | Upfront
Premiums
Paid/(Received) | | Unrealized
Appreciation/
(Depreciation) | |
Barclays Capital Inc.
(CDX IG 10 6/13) | | June 20, 2013 | | 1.55%
Quarterly | | $ | 774,400 | | $ | (11,756 | ) | | $ | 10,988 | | $ | (22,744 | ) |
| | | | | | |
Barclays Capital Inc.
(CDX IG 10) | | June 20, 2013 | | 1.55%
Quarterly | | | 3,097,600 | | | (47,024 | ) | | | 17,353 | | | (64,377 | ) |
| | | | | | |
Credit Suisse First Boston USA (CDX HY 12) | | June 20, 2014 | | 5%
Quarterly | | | 470,000 | | | (3,736 | ) | | | 19,474 | | | (23,210 | ) |
| | | | | | |
Credit Suisse First Boston USA (CDX IG 11) | | December 20, 2013 | | 1.5%
Quarterly | | | 2,876,800 | | | (54,496 | ) | | | 81,632 | | | (136,128 | ) |
| | | | | | |
Morgan Stanley & Co., Inc. (CDX HY 12) | | June 20, 2014 | | 5%
Quarterly | | | 8,836,000 | | | (70,239 | ) | | | 819,798 | | | (890,037 | ) |
| | | | | | |
Morgan Stanley & Co., Inc. (CDX HY 12) | | June 20, 2014 | | 5%
Quarterly | | | 940,000 | | | (7,473 | ) | | | 44,076 | | | (51,549 | ) |
| | | | | | | | | | | | | | | | | | |
| Total | | $ | 16,994,800 | | $ | (194,724 | ) | | $ | 993,321 | | $ | (1,188,045 | ) |
| | | | | | | | | | | | | | | | | | |
| | | | | | | | | | | | | | | | | | |
Inflation Indexed |
|
Credit Default Swap on Credit Indices—Sell Protection(1) |
Swap Counterparty
(Reference Entity) | | Termination Date | | Periodic
Payments
Received
by the
Fund‡ | | Contract
Notional
Amount(3) | | Market
Value(5) | | | Upfront
Premiums
Paid/(Received) | | | Unrealized
Appreciation/
(Depreciation) |
Barclays Capital Inc.
(CDX HY 8) | | June 20, 2012 | | 2.75%
Quarterly | | | $6,264,000 | | $ | (23,154 | ) | | $ | (224,900 | ) | | $ | 201,746 |
| | | | | | |
Bear Stearns, Inc.
(CDX HY 8) | | June 20, 2012 | | 2.75%
Quarterly | | | 9,918,000 | | | (36,661 | ) | | | (117,516 | ) | | | 80,855 |
| | | | | | | | | | | | | | | | | | |
| Total | | $ | 16,182,000 | | $ | (59,815 | ) | | $ | (342,416 | ) | | $ | 282,601 |
| | | | | | | | | | | | | | | | | | |
208
Annual Report to Shareholders
| | | | | | | | | | | | | | | |
Intermediate | |
| | | | | | |
Interest Rate Swaps: | | | | | | | | | | | | | | | |
Swap Counterparty | | Termination Date | | Periodic
Payments
Made by the
Fund‡ | | Periodic
Payments
Received by
the Fund‡ | | Contract
Notional
Amount | | Upfront
Premiums
Paid/(Received) | | Unrealized
Appreciation/
(Depreciation) | |
| | | | | | |
Morgan Stanley & Co., Inc. | | February 28, 2014 | | 2.9075%
Semi-Annually | | 3-month
LIBOR | | $ | 25,300,000 | | — | | $ | (267,239 | ) |
| | | | | | | | | | | | | | | | | | | |
Credit Default Swap on Corporate Issues—Sell Protection(1) | | | | | | | |
Swap Counterparty
(Reference Entity) | | Termination Date | | Implied Credit
Spread At
December 31,
2009(2) | | Periodic
Payments
Received by
the Fund‡ | | Contract
Notional
Amount(3) | | Market
Value | | | Upfront
Premiums
Paid/(Received) | | Unrealized
Appreciation/
(Depreciation) | |
Morgan Stanley & Co., Inc. (SLM Corp., 5.125%, due 8/27/12) | | September 20, 2012 | | 5.06% | | 2.6% Quarterly | | $ | 800,000 | | $ | (43,746 | ) | | — | | $ | (43,746 | ) |
| | | | | | | | | | | | | | | | | | |
Credit Default Swap on Credit Indices—Sell Protection(1) | | | | | | | | | |
Swap Counterparty
(Reference Entity) | | Termination Date | | Periodic
Payments
Received by
the Fund‡ | | Contract
Notional
Amount(3) | | Market
Value(5) | | | Upfront
Premiums
Paid/(Received) | | | Unrealized
Appreciation/
(Depreciation) | |
The Goldman Sachs Group, Inc. (CDX IG HVOL 9) | | December 20, 2012 | | 1.4% Quarterly | | $1,082,663 | | $ | (44,674 | ) | | $ | (88,574 | ) | | $ | 43,900 | |
| | | | | | |
The Goldman Sachs Group, Inc. (iBoxx IG HiVol4) | | June 20, 2012 | | 1% Quarterly | | 7,550,941 | | | (266,145 | ) | | | (41,294 | ) | | | (224,851 | ) |
| | | | | | | | | | | | | | | | | | |
| Total | | $8,633,604 | | $ | (310,819 | ) | | $ | (129,868 | ) | | $ | (180,951 | ) |
| | | | | | | | | | | | | | | | | | |
| | | | | | | | | | | | | | | | | |
Credit Default Swap on Credit Indices—Buy Protection(4) | |
Swap Counterparty
(Reference Entity) | | Termination Date | | Periodic
Payments
Made by
the Fund‡ | | Contract
Notional
Amount(3) | | Market
Value(5) | | | Upfront
Premiums
Paid/(Received) | | Unrealized
Appreciation/
(Depreciation) | |
Barclays Capital Inc.
(CDX IG 11) | | December 20, 2013 | | 1.5% Quarterly | | $10,515,200 | | $ | (199,190 | ) | | $ | 298,380 | | $ | (497,570 | ) |
| | | | | | | | | | | | | | | |
Intermediate Plus | | | | | | | | | | | | | | | |
| | | | | | |
Interest Rate Swaps: | | | | | | | | | | | | | | | |
Swap Counterparty | | Termination Date | | Periodic
Payments
Made by
the Fund‡ | | Periodic
Payments
Received by
the Fund‡ | | Contract
Notional
Amount | | Upfront
Premiums
Paid/(Received) | | Unrealized
Appreciation/
(Depreciation) | |
Deutsche Bank AG | | February 28, 2014 | | 2.90288% Semi-Annually | | 3-month LIBOR | | $ | 3,800,000 | | — | | $ | (39,446 | ) |
209
Annual Report to Shareholders
Notes to Financial Statements—Continued
| | | | | | | | | | | | | | | | | | | |
Intermediate Plus—Continued | |
|
Credit Default Swap on Corporate Issues—Sell Protection(1) | |
Swap Counterparty
(Reference Entity) | | Termination Date | | Implied Credit
Spread At
December 31,
2009(2) | | Periodic
Payments
Received by
the Fund‡ | | Contract
Notional
Amount(3) | | Market
Value | | | Upfront
Premiums
Paid/(Received) | | Unrealized
Appreciation/
(Depreciation) | |
Morgan Stanley & Co., Inc. (SLM Corp., 5.125%, due 8/27/12) | | September 20, 2012 | | 5.06% | | 2.6% Quarterly | | $ | 100,000 | | $ | (5,468 | ) | | — | | $ | (5,468 | ) |
| | | | | | | | | | | | | | | | | |
Credit Default Swap on Credit Indices—Buy Protection(4) | |
Swap Counterparty
(Reference Entity) | | Termination Date | | Periodic
Payments
Made by
the Fund‡ | | Contract
Notional
Amount(3) | | Market
Value(5) | | | Upfront
Premiums
Paid/(Received) | | Unrealized
Appreciation/
(Depreciation) | |
Barclays Capital Inc.
(CDX IG 11) | | December 20, 2013 | | 1.5% Quarterly | | $1,537,600 | | $ | (29,127 | ) | | $ | 43,631 | | $ | (72,758 | ) |
| | | | | | | | | | | | | | | | | | |
Limited Duration | |
|
Credit Default Swap on Credit Indices—Sell Protection(1) | |
Swap Counterparty (Reference Entity) | | Termination Date | | Periodic
Payments
Received by
the Fund‡ | | Contract
Notional
Amount(3) | | Market
Value(5) | | | Upfront
Premiums
Paid/(Received) | | | Unrealized
Appreciation/
(Depreciation) | |
Credit Suisse First Boston USA (ABX.HE-AAA 06-1) | | July 25, 2045 | | 0.18%
Monthly | | $392,139 | | $ | (71,565 | ) | | $ | (24,159 | ) | | $ | (47,406 | ) |
| | | | | | | | | | | | | | | | | |
Credit Default Swap on Credit Indices—Buy Protection(4) | |
Swap Counterparty
(Reference Entity) | | Termination Date | | Periodic
Payments
Made by
the Fund‡ | | Contract
Notional
Amount(3) | | Market
Value(5) | | | Upfront
Premiums
Paid/(Received) | | Unrealized
Appreciation/
(Depreciation) | |
Barclays Capital Inc.
(CDX IG 11) | | December 20, 2013 | | 1.5%
Quarterly | | $1,587,200 | | $ | (30,067 | ) | | $ | 45,038 | | $ | (75,105 | ) |
| | | | | | | | | | | | | | | | |
Non-U.S. |
|
Credit Default Swaps on Corporate Issues—Buy Protection(4) |
Swap Counterparty
(Reference Entity) | | Termination Date | | Periodic
Payments
Made by
the Fund‡ | | Contract
Notional
Amount(3) | | Market
Value | | Upfront
Premiums
Paid/(Received) | | Unrealized
Appreciation/
(Depreciation) |
JP Morgan Chase & Co.
(Republic of Ireland,
3.875%, due 07/15/10) | | September 20, 2014 | | 1%
Quarterly | | $ | 2,605,000 | | $ | 62,276 | | $ | 60,163 | | $ | 2,113 |
210
Annual Report to Shareholders
| | | | | | | | | | | | | | | | | | | |
Non-U.S.—Continued | |
|
Credit Default Swap on Credit Indices—Buy Protection(4) | |
Swap Counterparty
(Reference Entity) | | Termination Date | | Periodic
Payments
Made by
the Fund‡ | | Contract
Notional
Amount(3) | | Market
Value(5) | | | Upfront
Premiums
Paid/(Received) | | | Unrealized
Appreciation/
(Depreciation) | |
JP Morgan Chase & Co. (ITRAXX EURPOE 5YR S12) | | December 20, 2014 | | 1%
Quarterly | | $ | 2,934,000 | | $ | (50,997 | ) | | $ | (36,998 | ) | | $ | (13,999 | ) |
| (1) | | If the Fund is a seller of protection and a credit event occurs, as defined under the terms of that particular swap agreement, the Fund will either (i) pay to the buyer of protection an amount equal to the notional amount of the swap and take delivery of the referenced obligation or underlying securities comprising the referenced index or (ii) pay a net settlement amount in the form of cash or securities equal to the notional amount of the swap less the recovery value of the referenced obligation or underlying securities comprising the referenced index. |
| (2) | | Implied credit spreads, utilized in determining the market value of credit default swap agreements on corporate issues or sovereign issues of an emerging country as of period end serve as an indicator of the current status of the payment/performance risk and represent the likelihood or risk of default for the credit derivative. The implied credit spread of a particular referenced entity reflects the cost of buying/selling protection and may include upfront payments required to be made to enter into the agreement. Wider credit spreads represent a deterioration of the referenced entity’s credit soundness and a greater likelihood or risk of default or other credit event occurring as defined under the terms of the agreement. A credit spread identified as “Defaulted” indicates a credit event has occurred for the referenced entity or obligation. |
| (3) | | The maximum potential amount the Fund could be required to make as a seller of credit protection or receive as a buyer of credit protection if a credit event occurs as defined under the terms of that particular swap agreement. |
| (4) | | If the Fund is a buyer of protection and a credit event occurs, as defined under the terms of that particular swap agreement, the Fund will either (i) receive from the seller of protection an amount equal to the notional amount of the swap and deliver the underlying securities comprising the referenced index or (ii) receive a net settlement amount in the form of cash or securities equal to the notional amount of the swap less the recovery value of the underlying securities comprising the referenced index. |
| (5) | | The quoted market prices and resulting values for credit default swap agreements on asset-backed securities and credit indices serve as an indicator of the current status of the payment/performance risk and represent the likelihood of an expected liability (or profit) for the credit derivative should the notional amount of the swap agreement been closed/sold as of the period end. Decreasing market values when compared to the notional amount of the swap, represent a deterioration of the referenced entity’s credit soundness and a greater likelihood or risk of default or other credit event occurring as defined under the terms of the agreement. |
| ‡ | | Percentage shown is an annual percentage rate. |
| * | | Security is valued in good faith at fair value by or under the direction of the Board of Directors. |
4. Derivative Instruments and Hedging Activities
Financial Accounting Standards Board Codification Topic 815 (formerly, Statement of Financial Accounting Standards No. 161) (“ASC Topic 815”) requires enhanced disclosure about an entity’s derivative and hedging activities.
Below are tables, grouped by derivative type that provides information about the fair value and the location of derivatives within the Statement of Assets and Liabilities at December 31, 2009.
Absolute Return
| | | | | | | | | | | | | | |
| | | Asset Derivatives1 |
| | | Interest Rate
Contracts Risk | | Foreign Exchange
Contracts Risk | | Credit
Contracts Risk | | Other
Contracts Risk | | Total |
Options Purchased | | $ | 682,683 | | | — | | | — | | — | | $ | 682,683 |
Futures Contracts2 | | | 835,350 | | | — | | | — | | — | | | 835,350 |
Swap Contracts3 | | | 711,090 | | | — | | $ | 1,193,624 | | — | | | 1,904,714 |
Forward Foreign Currency Contracts | | | — | | $ | 74,605 | | | — | | — | | | 74,605 |
Total | | $ | 2,229,123 | | $ | 74,605 | | $ | 1,193,624 | | — | | $ | 3,497,352 |
| | | | | | | | | | | | | | | |
211
Annual Report to Shareholders
Notes to Financial Statements—Continued
Absolute Return—Continued
| | | | | | | | | | | | | | |
| | | Liability Derivatives1 |
| | | Interest Rate
Contracts Risk | | Foreign Exchange
Contracts Risk | | Credit
Contracts Risk | | Other
Contracts Risk | | Total |
Written Options | | $ | 1,728,049 | | | — | | | — | | — | | $ | 1,728,049 |
Futures Contracts2 | | | 65,568 | | | — | | | — | | — | | | 65,568 |
Swap Contracts3 | | | 100,282 | | | — | | $ | 2,817,808 | | — | | | 2,918,090 |
Forward Foreign Currency Contracts | | | — | | $ | 80,949 | | | — | | — | | | 80,949 |
Total | | $ | 1,893,899 | | $ | 80,949 | | $ | 2,817,808 | | — | | $ | 4,792,656 |
| | | | | | | | | | | | | | | |
| 1 | | Generally, the balance sheet location for asset derivatives is receivables/net unrealized appreciation (depreciation) and for liability derivatives is payables/net unrealized appreciation (depreciation). |
| 2 | | Includes cumulative appreciation/depreciation of futures contracts as reported in the footnotes. Only current day’s variation margin is reported within the receivables and/or payables of the Statement of Assets and Liabilities. |
| 3 | | Values include premiums paid/(received) on swap contracts which are shown separately in the Statement of Assets and liabilities. |
Inflation Indexed
| | | | | | | | | | | | | |
| | | Asset Derivatives1 |
| | | Interest Rate
Contracts Risk | | Foreign Exchange
Contracts Risk | | Credit
Contracts Risk | | Other
Contract Risk | | Total |
Swap Contracts3 | | — | | | — | | $ | 282,601 | | — | | $ | 282,601 |
Forward Foreign Currency Contracts | | — | | $ | 1,727,878 | | | — | | — | | | 1,727,878 |
Total | | — | | $ | 1,728,878 | | $ | 282,601 | | — | | $ | 2,010,479 |
| | | | | | | | | | | | | | |
| | | | | | | | | | | | | | |
| | | Liability Derivatives1 |
| | | Interest Rate
Contracts Risk | | Foreign Exchange
Contracts Risk | | Credit
Contracts Risk | | Other
Contracts Risk | | Total |
Futures Contracts2 | | $ | 239,375 | | | — | | | — | | — | | $ | 239,375 |
Swap Contracts3 | | | — | | | — | | $ | 342,416 | | — | | | 342,416 |
Forward Foreign Currency Contracts | | | — | | $ | 1,575,423 | | | — | | — | | | 1,575,423 |
Total | | $ | 239,375 | | $ | 1,575,423 | | $ | 342,416 | | — | | $ | 2,157,214 |
| | | | | | | | | | | | | | | |
| 1 | | Generally, the balance sheet location for asset derivatives is receivables/net unrealized appreciation (depreciation) and for liability derivatives is payables/net unrealized appreciation (depreciation). |
| 2 | | Includes cumulative appreciation/depreciation of futures contracts as reported in the footnotes. Only current day’s variation margin is reported within the receivables and/or payables of the Statement of Assets and Liabilities. |
| 3 | | Values include premiums paid/(received) on swap contracts which are shown separately in the Statement of Assets and liabilities. |
Intermediate
| | | | | | | | | | | |
| | | Asset Derivatives1 |
| | | Interest Rate
Contracts Risk | | Credit
Contract Risk | | Other
Contracts Risk | | Total |
Options Purchased | | $ | 291,616 | | | — | | — | | $ | 291,616 |
Futures Contracts2 | | | 144,227 | | | — | | — | | | 144,227 |
Swap Contracts3 | | | — | | $ | 342,280 | | — | | | 342,280 |
Total | | $ | 435,843 | | $ | 342,280 | | — | | $ | 778,123 |
| | | | | | | | | | | | |
212
Annual Report to Shareholders
Intermediate—Continued
| | | | | | | | | | | |
| | | Liability Derivatives1 |
| | | Interest Rate
Contracts Risk | | Credit
Contracts Risk | | Other
Contracts Risk | | Total |
Written Options | | $ | 745,159 | | | — | | — | | $ | 745,159 |
Futures Contracts2 | | | 1,244,054 | | | — | | — | | | 1,244,054 |
Swap Contracts3 | | | 267,239 | | $ | 896,035 | | — | | | 1,163,274 |
Total | | $ | 2,256,452 | | $ | 896,035 | | — | | $ | 3,152,487 |
| | | | | | | | | | | | |
| 1 | | Generally, the balance sheet location for asset derivatives is receivables/net unrealized appreciation (depreciation) and for liability derivatives is payables/net unrealized appreciation (depreciation). |
| 2 | | Includes cumulative appreciation/depreciation of futures contracts as reported in the footnotes. Only current day’s variation margin is reported within the receivables and/or payables of the Statement of Assets and Liabilities. |
| 3 | | Values include premiums paid/(received) on swap contracts which are shown separately in the Statement of Assets and liabilities. |
Intermediate Plus
| | | | | | | | | | | | | | |
| | | Asset Derivatives1 |
| | | Interest Rate
Contracts Risk | | Foreign Exchange
Contracts Risk | | Credit
Contract Risk | | Other
Contracts Risk | | Total |
Options Purchased | | $ | 35,281 | | | — | | | — | | — | | $ | 35,281 |
Futures Contracts2 | | | 15,658 | | | — | | | — | | — | | | 15,658 |
Swap Contracts3 | | | — | | | — | | $ | 43,631 | | — | | | 43,631 |
Forward Foreign Currency Contracts | | | — | | $ | 86,549 | | | — | | — | | | 86,549 |
Total | | $ | 50,939 | | $ | 86,549 | | $ | 43,631 | | — | | $ | 181,119 |
| | | | | | | | | | | | | | | |
| | | | | | | | | | | | | | |
| | | Liability Derivatives1 |
| | | Interest Rate
Contracts Risk | | Foreign Exchange
Contracts Risk | | Credit
Contracts Risk | | Other
Contracts Risk | | Total |
Written Options | | $ | 94,468 | | | — | | | — | | — | | $ | 94,468 |
Futures Contracts2 | | | 120,225 | | | — | | | — | | — | | | 120,225 |
Swap Contracts3 | | | 39,446 | | | — | | $ | 78,226 | | — | | | 117,672 |
Forward Foreign Currency Contracts | | | — | | $ | 90,327 | | | — | | — | | | 90,327 |
Total | | $ | 254,139 | | $ | 90,327 | | $ | 78,226 | | — | | $ | 422,692 |
| | | | | | | | | | | | | | | |
| 1 | | Generally, the balance sheet location for asset derivatives is receivables/net unrealized appreciation (depreciation) and for liability derivatives is payables/net unrealized appreciation (depreciation). |
| 2 | | Includes cumulative appreciation/depreciation of futures contracts as reported in the footnotes. Only current day’s variation margin is reported within the receivables and/or payables of the Statement of Assets and Liabilities. |
| 3 | | Values include premiums paid/(received) on swap contracts which are shown separately in the Statement of Assets and liabilities. |
Limited Duration
| | | | | | | | | | | |
| | | Asset Derivatives1 |
| | | Interest Rate
Contracts Risk | | Credit
Contract Risk | | Other
Contracts Risk | | Total |
Options Purchased | | $ | 425 | | | — | | — | | $ | 425 |
Futures Contracts2 | | | 4,681 | | | — | | — | | | 4,681 |
Swap Contracts3 | | | — | | $ | 45,038 | | — | | | 45,038 |
Total | | $ | 5,106 | | $ | 45,038 | | — | | $ | 50,144 |
| | | | | | | | | | | | |
213
Annual Report to Shareholders
Notes to Financial Statements—Continued
Limited Duration—Continued
| | | | | | | | | | | |
| | | Liability Derivatives1 |
| | | Interest Rate
Contracts Risk | | Credit
Contracts Risk | | Other
Contracts Risk | | Total |
Written Options | | $ | 30,207 | | | — | | — | | $ | 30,207 |
Futures Contracts2 | | | 6,837 | | | — | | — | | | 6,837 |
Swap Contracts3 | | | — | | $ | 146,670 | | — | | | 146,670 |
Total | | $ | 37,044 | | $ | 146,670 | | — | | $ | 183,714 |
| | | | | | | | | | | | |
| 1 | | Generally, the balance sheet location for asset derivatives is receivables/net unrealized appreciation (depreciation) and for liability derivatives is payables/net unrealized appreciation (depreciation). |
| 2 | | Includes cumulative appreciation/depreciation of futures contracts as reported in the footnotes. Only current day’s variation margin is reported within the receivables and/or payables of the Statement of Assets and Liabilities. |
| 3 | | Values include premiums paid/(received) on swap contracts which are shown separately in the Statement of Assets and liabilities. |
Non-U.S.
| | | | | | | | | | | | | | |
| | | Asset Derivatives1 |
| | | Interest Rate
Contracts Risk | | Foreign Exchange
Contracts Risk | | Credit
Contracts Risk | | Other
Contracts Risk | | Total |
Options Purchased | | $ | 15,625 | | $ | 88,544 | | | — | | — | | $ | 104,169 |
Futures Contracts2 | | | 314,459 | | | — | | | — | | — | | | 314,459 |
Swap Contracts3 | | | — | | | — | | $ | 62,276 | | — | | | 62,276 |
Forward Foreign Currency Contracts | | | — | | | 4,413,249 | | | — | | — | | | 4,413,249 |
Total | | $ | 330,084 | | $ | 4,501,793 | | $ | 62,276 | | — | | $ | 4,894,153 |
| | | | | | | | | | | | | | | |
| | | | | | | | | | | | | | |
| | | Liability Derivatives1 |
| | | Interest Rate
Contracts Risk | | Foreign Exchange
Contracts Risk | | Credit
Contracts Risk | | Other
Contracts Risk | | Total |
Written Options | | $ | 153,125 | | | — | | | — | | — | | $ | 153,125 |
Futures Contracts2 | | | 330,504 | | | — | | | — | | — | | | 330,504 |
Swap Contracts3 | | | — | | | — | | $ | 50,997 | | — | | | 50,997 |
Forward Foreign Currency Contracts | | | — | | $ | 2,103,504 | | | — | | — | | | 2,103,504 |
Total | | $ | 483,629 | | $ | 2,103,504 | | $ | 50,997 | | — | | $ | 2,638,130 |
| 1 | | Generally, the balance sheet location for asset derivatives is receivables/net unrealized appreciation (depreciation) and for liability derivatives is payables/net unrealized appreciation (depreciation). |
| 2 | | Includes cumulative appreciation/depreciation of futures contracts as reported in the footnotes. Only current day’s variation margin is reported within the receivables and/or payables of the Statement of Assets and Liabilities. |
| 3 | | Values include premiums paid/(received) on swap contracts which are shown separately in the Statement of Assets and liabilities. |
214
Annual Report to Shareholders
The following tables provide information about the effect of derivatives and hedging activities on each Fund’s Statement of Operations for the year ended December 31, 2009. The first table provides additional detail about the amounts and sources of gains/(losses) realized on derivatives during the period. The second table provides additional information about the changes in unrealized appreciation/(depreciation) resulting from each Fund’s derivatives and hedging activities during the period.
Absolute Return
| | | | | | | | | | | | | | |
| | | Amount of Realized Gain or (Loss) on Derivatives
Recognized | |
| | | Interest Rate
Contracts Risk | | | Credit
Contracts Risk | | | Other
Contracts Risk | | Total | |
Options Purchased | | $ | (643,867 | ) | | | — | | | — | | $ | (643,867 | ) |
Written Options | | | 3,019,995 | | | | — | | | — | | | 3,019,995 | |
Futures Contracts | | | (1,945,345 | ) | | | — | | | — | | | (1,945,345 | ) |
Swap Contracts | | | (1,430,355 | ) | | $ | (2,021,532 | ) | | — | | | (3,451,887 | ) |
Total | | $ | (999,572 | ) | | $ | (2,021,532 | ) | | — | | $ | (3,021,104 | ) |
| | | | | | | | | | | | | | | |
| | | | | | | | | | | | | | | | |
| | | Change in Unrealized Appreciation (Depreciation) on Derivatives Recognized | |
| | | Interest Rate
Contracts Risk | | Foreign Exchange
Contracts Risk | | | Credit
Contracts Risk | | Other
Contracts Risk | | Total | |
Options Purchased | | $ | 265,184 | | | — | | | | — | | — | | $ | 265,184 | |
Written Options | | | 1,068,832 | | | — | | | | — | | — | | | 1,068,832 | |
Futures Contracts | | | 138,886 | | | — | | | | — | | — | | | 138,886 | |
Swap Contracts | | | 4,518,248 | | | — | | | $ | 2,513,491 | | — | | | 7,031,739 | |
Forward Foreign Currency Contracts | | | — | | $ | (1,568,624 | ) | | | — | | — | | | (1,568,624 | ) |
Total | | $ | 5,991,150 | | $ | (1,568,624 | ) | | $ | 2,513,491 | | — | | $ | 6,936,017 | |
| | | | | | | | | | | | | | | | | |
High Yield
| | | | | | | | | | |
| | | Amount of Realized Gain or (Loss) on Derivatives Recognized | |
| | | Credit
Contracts Risk | | | Other Contracts Risk | | Total | |
Swap Contracts | | $ | (1,219,111 | ) | | — | | $ | (1,219,111 | ) |
| | | | | | | | | | | |
| | | | | | | | |
| | | Change in Unrealized Appreciation(Depreciation) on Derivatives Recognized |
| | | Credit Contracts Risk | | Other Contracts Risk | | Total |
Swap Contracts | | $ | 535,349 | | — | | $ | 535,349 |
| | | | | | | | | |
Inflation Indexed
| | | | | | | | | | | | | | | | | | |
| | | Amount of Realized Gain or (Loss) on Derivatives Recognized | |
| | | Interest Rate
Contracts Risk | | | Foreign Exchange
Contracts Risk | | | Credit
Contracts Risk | | | Other
Contracts Risk | | Total | |
Written Options | | $ | 491,322 | | | | — | | | | — | | | — | | $ | 491,322 | |
Futures Contracts | | | (1,940,700 | ) | | | — | | | | — | | | — | | | (1,940,700 | ) |
Swap Contracts | | | 3,088,186 | | | | — | | | $ | (1,761,726 | ) | | — | | | 1,326,460 | |
Forward Foreign Currency Contracts | | | — | | | $ | (887,281 | ) | | | — | | | — | | | (887,281 | ) |
Total | | $ | 1,638,808 | | | $ | (887,281 | ) | | $ | (1,761,726 | ) | | — | | $ | (1,010,199 | ) |
| | | | | | | | | | | | | | | | | | | |
215
Annual Report to Shareholders
Notes to Financial Statements—Continued
Inflation Indexed—Continued
| | | | | | | | | | | | | | | | |
| | | Change in Unrealized Appreciation (Depreciation) on Derivatives Recognized | |
| | | Interest Rate
Contracts Risk | | Foreign Exchange
Contracts Risk | | | Credit
Contracts Risk | | Other
Contracts Risk | | Total | |
Futures Contracts | | $ | 3,402,002 | | | — | | | | — | | — | | $ | 3,402,002 | |
Swap Contracts | | | — | | | — | | | $ | 6,936,623 | | — | | | 6,936,623 | |
Forward Foreign Currency Contracts | | | — | | $ | (52,445 | ) | | | — | | — | | | (52,445 | ) |
Total | | $ | 3,402,002 | | $ | (52,445 | ) | | $ | 6,936,623 | | — | | $ | 10,286,180 | |
| | | | | | | | | | | | | | | | | |
Intermediate
| | | | | | | | | | | | | |
| | | Amount of Realized Gain or (Loss) on Derivatives Recognized | |
| | | Interest Rate
Contracts Risk | | | Credit
Contracts Risk | | Other
Contracts Risk | | Total | |
Purchased Options | | $ | (317,015 | ) | | | — | | — | | $ | (317,015 | ) |
Written Options | | | 3,308,754 | | | | — | | — | | | 3,308,754 | |
Futures Contracts | | | 4,475,321 | | | | — | | — | | | 4,475,321 | |
Swap Contracts | | | 1,973,298 | | | $ | 936,591 | | — | | | 2,909,889 | |
Total | | $ | 9,440,358 | | | $ | 936,591 | | — | | $ | 10,376,949 | |
| | | | | | | | | | | | | | |
| | | | | | | | | | | | | |
| | | Change in Unrealized Appreciation (Depreciation) on Derivatives Recognized | |
| | | Interest Rate
Contracts Risk | | | Credit
Contracts Risk | | Other
Contracts Risk | | Total | |
Purchased Options | | $ | 24,203 | | | | — | | — | | $ | 24,203 | |
Written Options | | | 3,839,054 | | | | — | | — | | | 3,839,054 | |
Futures Contracts | | | (7,982,446 | ) | | | — | | — | | | (7,982,446 | ) |
Swap Contracts | | | (2,017,039 | ) | | $ | 2,320,793 | | — | | | 303,754 | |
Total | | $ | (6,136,228 | ) | | $ | 2,320,793 | | — | | $ | (3,815,435 | ) |
| | | | | | | | | | | | | | |
Intermediate Plus
| | | | | | | | | | | | | | | | |
| | | Amount of Realized Gain or (Loss) on Derivatives Recognized | |
| | | Interest Rate
Contracts Risk | | | Foreign Exchange
Credit Risk | | Credit
Contracts Risk | | Other
Contracts Risk | | Total | |
Options Purchased | | $ | (47,219 | ) | | | — | | | — | | — | | $ | (47,219 | ) |
Written Options | | | 477,174 | | | | — | | | — | | — | | | 477,174 | |
Futures Contracts | | | 554,306 | | | | — | | | — | | — | | | 554,306 | |
Swap Contracts | | | 271,220 | | | | — | | $ | 70,818 | | — | | | 342,038 | |
Forward Foreign Currency Contracts | | | — | | | $ | 60,233 | | | — | | — | | | 60,233 | |
Total | | $ | 1,255,481 | | | $ | 60,233 | | $ | 70,818 | | — | | $ | 1,386,532 | |
| | | | | | | | | | | | | | | | | |
| | | | | | | | | | | | | | | | | |
| | | Change in Unrealized Appreciation (Depreciation) on Derivatives Recognized | |
| | | Interest Rate
Contracts Risk | | | Foreign Exchange
Contracts Risk | | | Credit
Contracts Risk | | Other
Contracts Risk | | Total | |
Options Purchased | | $ | 1,041 | | | | — | | | | — | | — | | $ | 1,041 | |
Written Options | | | 551,250 | | �� | | — | | | | — | | — | | | 551,250 | |
Futures Contracts | | | (1,132,037 | ) | | | — | | | | — | | — | | | (1,132,037 | ) |
Swap Contracts | | | (261,220 | ) | | | — | | | $ | 225,644 | | — | | | (35,576 | ) |
Forward Foreign Currency Contracts | | | — | | | $ | (66,815 | ) | | | — | | — | | | (66,815 | ) |
Total | | $ | (840,966 | ) | | $ | (66,815 | ) | | $ | 225,644 | | — | | $ | (682,137 | ) |
| | | | | | | | | | | | | | | | | | |
216
Annual Report to Shareholders
Limited Duration
| | | | | | | | | | | | | | |
| | | Amount of Realized Gain or (Loss) on Derivatives Recognized | |
| | | Interest Rate
Contracts Risk | | | Credit
Contracts Risk | | | Other
Contracts Risk | | Total | |
Options Purchased | | $ | (67,683 | ) | | | — | | | — | | $ | (67,683 | ) |
Written Options | | | (493,351 | ) | | | — | | | — | | | (493,351 | ) |
Futures Contracts | | | 2,040,121 | | | | — | | | — | | | 2,040,121 | |
Swap Contracts | | | (1,524,602 | ) | | $ | (285,159 | ) | | — | | | (1,809,761 | ) |
Total | | $ | (45,515 | ) | | $ | (285,159 | ) | | — | | $ | (330,674 | ) |
| | | | | | | | | | | | | | | |
| | | | | | | | | | | | | |
| | | Change in Unrealized Appreciation (Depreciation) on Derivatives Recognized | |
| | | Interest Rate
Contracts Risk | | | Credit
Contracts Risk | | Other
Contracts Risk | | Total | |
Options Purchased | | $ | (4,299 | ) | | | — | | — | | $ | (4,299 | ) |
Written Options | | | 573,317 | | | | — | | — | | | 573,317 | |
Futures Contracts | | | (2,009,780 | ) | | | — | | — | | | (2,009,780 | ) |
Swap Contracts | | | 1,468,833 | | | $ | 425,319 | | — | | | 1,894,152 | |
Total | | $ | 28,071 | | | $ | 425,319 | | — | | $ | 453,390 | |
| | | | | | | | | | | | | | |
Non-U.S.
| | | | | | | | | | | | | | | | | | |
| | | Amount of Realized Gain or (Loss) on Derivatives Recognized | |
| | | Interest Rate
Contracts Risk | | | Foreign Exchange
Contracts Risk | | | Credit
Contracts Risk | | | Other
Contracts Risk | | Total | |
Options Purchased | | $ | (505,218 | ) | | | — | | | | — | | | — | | $ | (505,218 | ) |
Written Options | | | 844,253 | | | | — | | | | — | | | — | | | 844,253 | |
Futures Contracts | | | (707,738 | ) | | | — | | | | — | | | — | | | (707,738 | ) |
Swap Contracts | | | — | | | | — | | | $ | (257,113 | ) | | — | | | (257,113 | ) |
Forward Foreign Currency Contracts | | | — | | | $ | (5,696,713 | ) | | | — | | | — | | | (5,696,713 | ) |
Total | | $ | (368,703 | ) | | | (5,696,713 | ) | | $ | (257,113 | ) | | — | | $ | (6,322,529 | ) |
| | | | | | | | | | | | | | | | | | | |
| | | | | | | | | | | | | | | | | |
| | | Change in Unrealized Appreciation (Depreciation) on Derivatives Recognized | |
| | | Interest Rate
Contracts Risk | | | Foreign Exchange
Contracts Risk | | Credit
Contracts Risk | | | Other
Contracts Risk | | Total | |
Options Purchased | | $ | (695,791 | ) | | $ | 8,097 | | | — | | | — | | $ | (687,694 | ) |
Written Options | | | (257,591 | ) | | | — | | | — | | | — | | | (257,591 | ) |
Futures Contracts | | | 314,494 | | | | — | | | — | | | — | | | 314,494 | |
Swap Contracts | | | — | | | | — | | $ | (11,886 | ) | | — | | | (11,886 | ) |
Forward Foreign Currency Contracts | | | — | | | | 3,843,786 | | | — | | | — | | | 3,843,786 | |
Total | | $ | (638,888 | ) | | $ | 3,851,883 | | $ | (11,886 | ) | | — | | $ | 3,201,109 | |
| | | | | | | | | | | | | | | | | | |
217
Annual Report to Shareholders
Notes to Financial Statements—Continued
The Funds had average market values in purchased options, written options, futures contracts to buy, futures contracts to sell, forward foreign currency contracts to buy and forward foreign currency contracts to sell, of:
| | | | | | | | | |
| | | Purchased
Options | | Written
Options | | Futures
Contracts
to Buy |
Absolute Return | | $ | 870,998 | | $ | 3,226,471 | | $ | 136,763,859 |
High Yield | | | — | | | — | | | — |
Inflation Indexed | | | — | | | 36,138 | | | 14,523,911 |
Intermediate | | | 130,483 | | | 1,324,705 | | | 184,928,964 |
Intermediate Plus | | | 18,615 | | | 190,791 | | | 30,587,469 |
Limited Duration | | | 16,109 | | | 87,971 | | | 25,427,911 |
Non-U.S. | | | 223,985 | | | 48,411 | | | 27,344,928 |
| | | | | | | | | |
| | | Futures
Contracts
to Sell | | Forward Foreign
Currency Contracts
to Buy | | Forward Foreign
Currency Contracts
to Sell |
Absolute Return | | $ | 38,448,796 | | $ | 6,430,370 | | $ | 8,055,326 |
High Yield | | | — | | | — | | | — |
Inflation Indexed | | | 4,677,428 | | | 76,604,491 | | | 84,048,388 |
Intermediate | | | 17,264,795 | | | — | | | — |
Intermediate Plus | | | 2,982,260 | | | 3,531,273 | | | 3,923,187 |
Limited Duration | | | 6,934,253 | | | — | | | — |
Non-U.S. | | | 28,727,257 | | | 89,515,243 | | | 174,504,804 |
The Funds had average notional balances in interest rate swap contracts, credit default swap contracts to buy protection and credit default swap contracts (to sell protection), of:
| | | | | | | | | |
| | | Interest Rate
Swap Contracts | | Credit Default
Swap Contracts
to Buy | | Credit Default
Swap Contracts
to Sell |
Absolute Return | | $ | 23,604,077 | | $ | 14,859,508 | | $ | 28,045,039 |
High Yield | | | — | | | — | | | 738,462 |
Inflation Indexed | | | 8,976,923 | | | — | | | 49,728,154 |
Intermediate | | | 12,907,692 | | | 11,956,160 | | | 36,018,664 |
Intermediate Plus | | | 1,900,000 | | | 1,728,843 | | | 5,046,004 |
Limited Duration | | | — | | | 1,113,415 | | | 2,291,384 |
Non-U.S. | | | — | | | 1,202,308 | | | 2,534,077 |
The Funds have several credit related contingent features that if triggered would allow their derivatives counterparties to close out and demand payment or additional collateral to cover their exposure from the Funds. Credit related contingent features are established between the Funds and their derivatives counterparties to reduce the risk that the Funds will not fulfill their payment obligations to their counterparties. These triggering features include, but are not limited to, a percentage decrease in the Funds’ net assets and or percentage decrease in the Funds’ Net Asset Value or NAV. The contingent features are established within the Funds’ International Swap and Derivatives Association, Inc. master agreements which govern positions in swaps, over-the-counter options, and forward currency exchange contracts for each individual counterparty.
5. Redemptions-In-Kind
The Funds may make payment for Fund shares redeemed wholly or in part by distributing portfolio securities to shareholders. For the year, High Yield had redemptions-in-kind with total proceeds in the amount of $50,880,254. The net realized losses on these redemptions-in-kind amounted to $25,638,725, which will not be realized for tax purposes.
218
Annual Report to Shareholders
6. Class Specific Expenses, Waivers and/or Reimbursements
The Funds have adopted a Rule 12b-1 distribution plan and under that plan each Fund pays a distribution fee with respect to its Financial Intermediary Class shares calculated at an annual rate of 0.25% of the average daily net assets of the Financial Intermediary class. Distribution fees are accrued and paid monthly.
For the year ended December 31, 2009, class specific expenses were as follows:
Absolute Return
| | | | | | | | | |
| | | Distribution
Fees | | Transfer Agent and
Shareholder Servicing
Expenses | | Reports to
Shareholders |
Institutional Class | | | — | | $ | 12,504 | | $ | 2,840 |
Institutional Select Class | | | — | | | 9,489 | | | 3,496 |
Financial Intermediary Class | | $ | 3,384 | | | 2,939 | | | 1,653 |
| | | | | | | | | |
Total | | $ | 3,384 | | $ | 24,932 | | $ | 7,989 |
| | | | | | | | | |
High Yield
| | | | | | | | |
| | | Distribution
Fees | | Transfer Agent and
Shareholder Servicing
Expenses | | Reports to
Shareholders |
Institutional Class | | — | | $ | 77,740 | | $ | 19,551 |
Institutional Select Class | | — | | | 11,467 | | | 2,633 |
| | | | | | | | |
Total | | — | | $ | 89,207 | | $ | 22,184 |
| | | | | | | | |
Inflation Indexed
| | | | | | | | | |
| | | Distribution
Fees | | Transfer Agent and
Shareholder Servicing
Expenses | | Reports to
Shareholders |
Institutional Class | | | — | | $ | 203,888 | | $ | 167,017 |
Institutional Select Class | | | — | | | 9,362 | | | 340 |
Financial Intermediary Class | | $ | 556 | | | 608 | | | 68 |
| | | | | | | | | |
Total | | $ | 556 | | $ | 213,858 | | $ | 167,425 |
| | | | | | | | | |
Intermediate
| | | | | | | | |
| | | Distribution
Fees | | Transfer Agent and
Shareholder Servicing
Expenses | | Reports to
Shareholders |
Institutional Class | | — | | $ | 71,780 | | $ | 40,002 |
Institutional Select Class | | — | | | 5,294 | | | 2,025 |
| | | | | | | | |
Total | | — | | $ | 77,074 | | $ | 42,027 |
| | | | | | | | |
219
Annual Report to Shareholders
Notes to Financial Statements—Continued
Intermediate Plus
| | | | | | | | |
| | | Distribution
Fees | | Transfer Agent and
Shareholder Servicing
Expenses | | Reports to
Shareholders |
Institutional Class | | — | | $ | 12,272 | | $ | 5,627 |
Institutional Select Class | | — | | | 6,791 | | | 824 |
| | | | | | | | |
Total | | — | | $ | 19,063 | | $ | 6,451 |
| | | | | | | | |
Limited Duration
| | | | | | | | |
| | | Distribution
Fees | | Transfer Agent and
Shareholder Servicing
Expenses | | Reports to
Shareholders |
Institutional Class | | — | | $ | 10,052 | | $ | 10,228 |
Institutional Select Class | | — | | | 5,950 | | | 533 |
| | | | | | | | |
Total | | — | | $ | 16,002 | | $ | 10,761 |
| | | | | | | | |
Non-U.S.
| | | | | | | | |
| | | Distribution
Fees | | Transfer Agent and
Shareholder Servicing
Expenses | | Reports to
Shareholders |
Institutional Class | | — | | $ | 38,710 | | $ | 12,104 |
| | | | | | | | |
Total | | — | | $ | 38,710 | | $ | 12,104 |
| | | | | | | | |
For year ended December 31, 2009, waivers and/or reimbursements by class were as follows:
Absolute Return
| | | |
| | | Fees Waived |
Institutional Class | | $ | 49,077 |
Institutional Select Class | | | 72,269 |
Financial Intermediary Class | | | 5,050 |
| | | |
Total | | $ | 126,396 |
| | | |
Inflation Indexed
| | | |
| | | Fees Waived |
Institutional Class | | $ | 90,535 |
Institutional Select Class | | | 7,387 |
Financial Intermediary Class | | | 384 |
| | | |
Total | | $ | 98,306 |
| | | |
Intermediate
| | | |
| | | Fees Waived |
Institutional Class | | | — |
Institutional Select Class | | $ | 4,639 |
| | | |
Total | | $ | 4,639 |
| | | |
220
Annual Report to Shareholders
Intermediate Plus
| | | |
| | | Fees Waived |
Institutional Class | | $ | 136,696 |
Institutional Select Class | | | 20,797 |
| | | |
Total | | $ | 157,493 |
| | | |
Limited Duration
| | | |
| | | Fees Waived |
Institutional Class | | $ | 100,604 |
Institutional Select Class | | | 35,529 |
| | | |
Total | | $ | 136,133 |
| | | |
Non-U.S.
| | | |
| | | Fees Waived |
Institutional Class | | $ | 35,398 |
| | | |
Total | | $ | 35,398 |
| | | |
7. Capital Shares
At December 31, 2009, the Funds had 21.05 billion shares of capital stock authorized with a par value of $0.001 per share. Transactions in shares of the Funds were as follows:
| | | | | | | | | | | | | | | | | | | | | |
| | | For the Year Ended
December 31, 2009 | | | For the Period Ended
December 31, 2008A | | | For the Year Ended
March 31, 2008 | |
| | | Shares | | | Amount | | | Shares | | | Amount | | | Shares | | | Amount | |
Absolute Return | | | | | | | | | | | | | | | | | | | | | |
Institutional Class | | | | | | | | | | | | | | | | | | | | | |
Shares sold | | 1,007,091 | | | $ | 9,595,633 | | | 6,412,606 | | | $ | 58,970,805 | | | 25,040,517 | | | $ | 250,612,343 | |
Shares issued on reinvestment | | 483,643 | | | | 4,132,380 | | | 2,838,025 | | | | 26,290,859 | | | 2,465,367 | | | | 24,781,815 | |
Shares repurchased | | (10,855,602 | ) | | | (87,109,573 | ) | | (46,775,614 | ) | | | (419,797,647 | ) | | (6,792,146 | ) | | | (68,276,911 | ) |
| | | | | | | | | | | | | | | | | | | | | |
Net Increase (Decrease) | | (9,364,868 | ) | | $ | (73,381,560 | ) | | (37,524,983 | ) | | $ | (334,535,983 | ) | | 20,713,738 | | | $ | 207,117,247 | |
| | | | | | | | | | | | | | | | | | | | | |
Institutional Select ClassB | | | | | | | | | | | | | | | | | | | | | |
Shares sold | | 4,518,361 | | | $ | 37,943,521 | | | 24,180,661 | | | $ | 220,281,667 | | | — | | | | — | |
Shares issued on reinvestment | | 1,163,813 | | | | 10,197,328 | | | 702,878 | | | | 5,730,893 | | | — | | | | — | |
Shares repurchased | | (7,162,682 | ) | | | (62,540,955 | ) | | (4,283,113 | ) | | | (35,067,103 | ) | | — | | | | — | |
| | | | | | | | | | | | | | | | | | | | | |
Net Increase (Decrease) | | (1,480,508 | ) | | $ | (14,400,106 | ) | | 20,600,426 | | | $ | 190,945,457 | | | — | | | | — | |
| | | | | | | | | | | | | | | | | | | | | |
Financial Intermediary Class | | | | | | | | | | | | | | | | | | | | | |
Shares sold | | 497,697 | | | $ | 4,735,765 | | | 111,254 | | | $ | 973,495 | | | 39,400 | | | $ | 395,029 | |
Shares issued on reinvestment | | 1,040 | | | | 9,260 | | | 2,805 | | | | 24,845 | | | 488 | | | | 4,892 | |
Shares repurchased | | (166,795 | ) | | | (1,516,148 | ) | | (51,496 | ) | | | (405,156 | ) | | (298 | ) | | | (3,000 | ) |
| | | | | | | | | | | | | | | | | | | | | |
Net Increase | | 331,942 | | | $ | 3,228,877 | | | 62,563 | | | $ | 593,184 | | | 39,590 | | | $ | 396,921 | |
| | | | | | | | | | | | | | | | | | | | | |
221
Annual Report to Shareholders
Notes to Financial Statements—Continued
| | | | | | | | | | | | | | | | | | | | | |
| | | For the Year Ended
December 31, 2009 | | | For the Period Ended
December 31, 2008A | | | For the Year Ended
March 31, 2008 | |
| | | Shares | | | Amount | | | Shares | | | Amount | | | Shares | | | Amount | |
High Yield | | | | | | | | | | | | | | | | | | | | | |
Institutional Class | | | | | | | | | | | | | | | | | | | | | |
Shares sold | | 24,567,594 | | | $ | 170,323,320 | | | 4,570,280 | | | $ | 40,466,782 | | | 23,467,385 | | | $ | 240,438,693 | |
Shares issued on reinvestment | | 8,373,209 | | | | 62,083,357 | | | 9,329,465 | | | | 70,111,837 | | | 7,766,638 | | | | 79,240,754 | |
Shares repurchased | | (44,466,343 | ) | | | (324,021,012 | ) | | (26,564,923 | ) | | | (232,469,387 | ) | | (27,068,309 | ) | | | (264,369,485 | ) |
| | | | | | | | | | | | | | | | | | | | | |
Net Increase (Decrease) | | (11,525,540 | ) | | $ | (91,614,335 | ) | | (12,665,178 | ) | | $ | (121,890,768 | ) | | 4,165,714 | | | $ | 55,309,962 | |
| | | | | | | | | | | | | | | | | | | | | |
Institutional Select ClassB | | | | | | | | | | | | | | | | | | | | | |
Shares sold | | 988,240 | | | $ | 7,223,162 | | | 13,646,907 | | | $ | 120,053,238 | | | — | | | | — | |
Shares issued on reinvestment | | 1,547,337 | | | | 11,675,543 | | | 797,924 | | | | 4,937,498 | | | — | | | | — | |
Shares repurchased | | (2,565,699 | ) | | | (18,403,130 | ) | | (1,613,735 | ) | | | (10,896,580 | ) | | — | | | | — | |
| | | | | | | | | | | | | | | | | | | | | |
Net Increase (Decrease) | | (30,122 | ) | | $ | 495,575 | | | 12,831,096 | | | $ | 114,094,156 | | | — | | | | — | |
| | | | | | | | | | | | | | | | | | | | | |
| | | | | | |
Inflation Indexed | | | | | | | | | | | | | | | | | | | | | |
Institutional Class | | | | | | | | | | | | | | | | | | | | | |
Shares sold | | 13,542,650 | | | $ | 136,589,424 | | | 16,828,142 | | | $ | 174,272,074 | | | 19,972,862 | | | $ | 211,161,547 | |
Shares issued on reinvestment | | 496,631 | | | | 4,869,388 | | | 5,004,860 | | | | 52,182,331 | | | 3,763,953 | | | | 39,571,513 | |
Shares repurchased | | (21,886,081 | ) | | | (219,418,915 | ) | | (48,896,241 | ) | | | (452,802,586 | ) | | (9,104,549 | ) | | | (96,721,397 | ) |
| | | | | | | | | | | | | | | | | | | | | |
Net Increase (Decrease) | | (7,846,800 | ) | | $ | (77,960,103 | ) | | (27,063,239 | ) | | $ | (226,348,181 | ) | | 14,632,266 | | | $ | 154,011,663 | |
| | | | | | | | | | | | | | | | | | | | | |
Institutional Select ClassC | | | | | | | | | | | | | | | | | | | | | |
Shares sold | | 1,175,125 | | | $ | 11,671,909 | | | 2,369,153 | | | $ | 22,814,947 | | | — | | | | — | |
Shares issued on reinvestment | | 4,778 | | | | 51,233 | | | — | | | | — | | | — | | | | — | |
Shares repurchased | | (1,343,098 | ) | | | (14,265,140 | ) | | — | | | | — | | | — | | | | — | |
| | | | | | | | | | | | | | | | | | | | | |
Net Increase (Decrease) | | (163,195 | ) | | $ | (2,541,998 | ) | | 2,369,153 | | | $ | 22,814,947 | | | — | | | | — | |
| | | | | | | | | | | | | | | | | | | | | |
Financial Intermediary Class | | | | | | | | | | | | | | | | | | | | | |
Shares sold | | 16,416 | | | $ | 163,717 | | | 16,934 | | | $ | 172,659 | | | 21,815 | | | $ | 238,876 | |
Shares issued on reinvestment | | 248 | | | | 2,467 | | | 415 | | | | 4,253 | | | 108 | | | | 1,186 | |
Shares repurchased | | (5,351 | ) | | | (50,846 | ) | | (3,518 | ) | | | (32,562 | ) | | (18,672 | ) | | | (202,156 | ) |
| | | | | | | | | | | | | | | | | | | | | |
Net Increase | | 11,313 | | | $ | 115,338 | | | 13,831 | | | $ | 144,350 | | | 3,251 | | | $ | 37,906 | |
| | | | | | | | | | | | | | | | | | | | | |
| | | | | | |
Intermediate | | | | | | | | | | | | | | | | | | | | | |
Institutional Class | | | | | | | | | | | | | | | | | | | |
Shares sold | | 11,581,116 | | | $ | 114,063,386 | | | 5,956,977 | | | $ | 59,086,946 | | | 32,296,580 | | | $ | 334,375,744 | |
Shares issued on reinvestment | | 2,249,963 | | | | 21,915,551 | | | 2,751,284 | | | | 26,924,151 | | | 2,690,562 | | | | 27,904,316 | |
Shares repurchased | | (23,905,691 | ) | | | (235,193,163 | ) | | (26,268,220 | ) | | | (246,886,277 | ) | | (27,670,873 | ) | | | (287,140,762 | ) |
| | | | | | | | | | | | | | | | | | | | | |
Net Increase (Decrease) | | (10,074,612 | ) | | $ | (99,214,226 | ) | | (17,559,959 | ) | | $ | (160,875,180 | ) | | 7,316,269 | | | $ | 75,139,298 | |
| | | | | | | | | | | | | | | | | | | | | |
Institutional Select ClassD | | | | | | | | | | | | | | | | | | | |
Shares sold | | 850,572 | | | $ | 8,100,000 | | | 5,462,341 | | | $ | 49,716,313 | | | — | | | | — | |
Shares issued on reinvestment | | 342,029 | | | | 3,350,308 | | | 55,831 | | | | 515,387 | | | — | | | | — | |
Shares repurchased | | (751,801 | ) | | | (7,400,000 | ) | | (128,064 | ) | | | (1,166,667 | ) | | — | | | | — | |
| | | | | | | | | | | | | | | | | | | | | |
Net Increase | | 440,800 | | | $ | 4,050,308 | | | 5,390,108 | | | $ | 49,065,033 | | | — | | | | — | |
| | | | | | | | | | | | | | | | | | | | | |
222
Annual Report to Shareholders
| | | | | | | | | | | | | | | | | | | | | |
| | | For the Year Ended
December 31, 2009 | | | For the Period Ended
December 31, 2008A | | | For the Year Ended
March 31, 2008 | |
| | | Shares | | | Amount | | | Shares | | | Amount | | | Shares | | | Amount | |
Intermediate Plus | | | | | | | | | | | | | | | | | | | | | |
Institutional Class | | | | | | | | | | | | | | | | | | | | | |
Shares sold | | 30,643 | | | $ | 300,000 | | | 174,919 | | | $ | 1,596,448 | | | 2,821,735 | | | $ | 27,713,562 | |
Shares issued on reinvestment | | 316,156 | | | | 2,888,512 | | | 686,190 | | | | 6,232,310 | | | 491,208 | | | | 4,818,988 | |
Shares repurchased | | (3,431,527 | ) | | | (32,385,353 | ) | | (4,119,709 | ) | | | (36,207,382 | ) | | (580,831 | ) | | | (5,695,398 | ) |
| | | | | | | | | | | | | | | | | | | | | |
Net Increase (Decrease) | | (3,084,728 | ) | | $ | (29,196,841 | ) | | (3,258,600 | ) | | $ | (28,378,624 | ) | | 2,732,112 | | | $ | 26,837,152 | |
| | | | | | | | | | | | | | | | | | | | | |
Institutional Select ClassE | | | | | | | | | | | | | | | | | | | |
Shares sold | | — | | | | — | | | 826,840 | | | $ | 6,871,040 | | | — | | | | — | |
Shares repurchased | | (138,864 | ) | | $ | (1,220,000 | ) | | — | | | | — | | | — | | | | — | |
| | | | | | | | | | | | | | | | | | | | | |
Net Increase (Decrease) | | (138,864 | ) | | $ | (1,220,000 | ) | | 826,840 | | | $ | 6,871,040 | | | — | | | | — | |
| | | | | | | | | | | | | | | | | | | | | |
Limited Duration | | | | | | | | | | | | | | | | | | | | | |
Institutional Class | | | | | | | | | | | | | | | | | | | | | |
Shares sold | | 580,339 | | | $ | 4,916,606 | | | 1,956,595 | | | $ | 16,372,393 | | | 4,509,320 | | | $ | 43,936,448 | |
Shares issued on reinvestment | | 174,268 | | | | 1,445,687 | | | 328,775 | | | | 2,799,456 | | | 541,671 | | | | 5,205,159 | |
Shares repurchased | | (5,199,750 | ) | | | (42,575,536 | ) | | (5,530,590 | ) | | | (44,499,878 | ) | | (2,848,957 | ) | | | (27,501,407 | ) |
| | | | | | | | | | | | | | | | | | | | | |
Net Increase (Decrease) | | (4,445,143 | ) | | $ | (36,213,243 | ) | | (3,245,220 | ) | | $ | (25,328,029 | ) | | 2,202,034 | | | $ | 21,640,200 | |
| | | | | | | | | | | | | | | | | | | | | |
Institutional Select ClassF | | | | | | | | | | | | | | | | | | | |
Shares sold | | 745,408 | | | $ | 6,596,862 | | | 1,674,034 | | | $ | 13,409,011 | | | — | | | | — | |
Shares issued on reinvestment | | 66,970 | | | | 560,974 | | | 13,489 | | | | 105,878 | | | — | | | | — | |
| | | | | | | | | | | | | | | | | | | | | |
Net Increase | | 812,378 | | | $ | 7,157,836 | | | 1,687,523 | | | $ | 13,514,889 | | | — | | | | — | |
| | | | | | | | | | | | | | | | | | | | | |
| | | |
Non-U.S. | | | | | | | | | |
Institutional Class | | | | | | | | | | | | | | | | | | | | | |
Shares sold | | 2,862,417 | | | $ | 25,242,828 | | | 4,393,007 | | | $ | 43,328,054 | | | 7,776,592 | | | $ | 76,569,432 | |
Shares issued on reinvestment | | 56,330 | | | | 478,260 | | | 1,324,270 | | | | 11,640,333 | | | 39,858 | | | | 394,372 | |
Shares repurchased | | (6,036,686 | ) | | | (52,932,163 | ) | | (14,513,511 | ) | | | (142,904,976 | ) | | (5,293,702 | ) | | | (51,712,115 | ) |
| | | | | | | | | | | | | | | | | | | | | |
Net Increase (Decrease) | | (3,117,939 | ) | | $ | (27,211,075 | ) | | (8,796,234 | ) | | $ | (87,936,589 | ) | | 2,522,748 | | | $ | 25,251,689 | |
| | | | | | | | | | | | | | | | | | | | | |
| | | | | | | | | | | | | | | | | | | | | | |
| A | | For the period April 1, 2008 to December 31, 2008. |
| B | | Institutional Select Class commenced operations August 4, 2008. |
| C | | Institutional Select Class commenced operations December 18, 2008. |
| D | | Institutional Select Class commenced operations October 3, 2008. |
| E | | Institutional Select Class commenced operations November 10, 2008. |
| F | | Institutional Select Class commenced operations October 29, 2008. |
8. Income Tax Information and Distributions to Shareholders
The tax character of distributions paid during the fiscal year ended December 31, 2009 were as follows:
| | | | | | | | | | | | |
| Distributions paid from: | | Absolute Return | | High Yield | | Inflation Indexed | | |
Ordinary Income | | $ | 16,623,102 | | $ | 77,684,083 | | $ | 5,463,404 | | | |
| | | | | | | | | | | | |
| | | | |
| Distributions paid from: | | Intermediate | | Intermediate Plus | | Limited Duration | | Non-U.S. |
Ordinary Income | | $ | 29,948,965 | | $ | 3,198,493 | | $ | 2,362,163 | | | — |
Net Long-term Capital Gains | | | 31,591 | | | — | | | — | | $ | 641,931 |
| | | | | | | | | | | | |
Total Distributions Paid | | $ | 29,980,556 | | $ | 3,198,493 | | $ | 2,362,163 | | $ | 641,931 |
| | | | | | | | | | | | |
223
Annual Report to Shareholders
Notes to Financial Statements—Continued
The tax character of distributions paid during the fiscal year ended December 31, 2008 were as follows:
| | | | | | | | | | | | |
| Distributions paid from: | | Absolute Return | | High Yield | | Inflation Indexed | | |
Ordinary Income | | $ | 29,928,294 | | $ | 75,116,597 | | $ | 49,148,590 | | | |
Net Long-term Capital Gains | | | 4,749,989 | | | — | | | 6,285,963 | | | |
| | | | | | | | | | | | |
Total Distributions Paid | | $ | 34,678,283 | | $ | 75,116,597 | | | 55,434,553 | | | |
| | | | | | | | | | | | |
| | | | |
| Distributions paid from: | | Intermediate | | Intermediate Plus | | Limited Duration | | Non-U.S. |
Ordinary Income | | $ | 26,856,484 | | $ | 5,237,065 | | $ | 3,244,813 | | $ | 17,500,005 |
Net Long-term Capital Gains | | | 6,785,555 | | | 1,356,749 | | | — | | | — |
| | | | | | | | | | | | |
Total Distributions Paid | | $ | 33,642,039 | | $ | 6,593,814 | | $ | 3,244,813 | | $ | 17,500,005 |
| | | | | | | | | | | | |
Subsequent to the fiscal year end, the Funds have made the following distributions:
| | | | | | | | | |
| | | Absolute Return |
Record Date Payable Date | | Institutional Class | | Institutional Select Class | | Financial
Intermediary Class |
Daily
01/29/2010 | | $ | 0.029277 | | $ | 0.029316 | | $ | 0.027391 |
| |
| | | Inflation Indexed |
Record Date Payable Date | | Institutional Class | | Institutional Select Class | | Financial
Intermediary Class |
Daily
01/29/2010 | | $ | 0.018215 | | $ | 0.018229 | | $ | 0.014153 |
| | |
| | | Intermediate | | |
Record Date Payable Date | | Institutional Class | | Institutional Select Class | | |
Daily
01/29/2010 | | $ | 0.031225 | | $ | 0.031467 | | | |
| | |
| | | Intermediate Plus | | |
Record Date Payable Date | | Institutional Class | | Institutional Select Class | | |
Daily
01/29/2010 | | $ | 0.031267 | | $ | 0.032015 | | | |
| | |
| | | Limited Duration | | |
Record Date Payable Date | | Institutional Class | | Institutional Select Class | | |
Daily
01/29/2010 | | $ | 0.020057 | | $ | 0.020804 | | | |
As of December 31, 2009, the components of accumulated earnings on a tax basis were as follows:
| | | | | | | | | | | | |
| | | Absolute Return | | | High Yield | | | Inflation Indexed | |
Undistributed ordinary income—net | | $ | 455,229 | | | $ | 986,997 | | | $ | 3,874,058 | |
Capital loss carryforward (*) | | | (14,536,176 | ) | | | (133,165,665 | ) | | | (14,862,554 | ) |
Other book/tax temporary differences | | | (1,635,371 | )(a) | | | (15,987,627 | )(c) | | | (2,225,972 | )(d) |
Unrealized appreciation/(depreciation) | | | (42,197,171 | )(b) | | | (2,841,291 | )(b) | | | (8,701,756 | )(b) |
| | | | | | | | | | | | |
Total accumulated earnings/(losses)—net | | $ | (57,913,489 | ) | | $ | (151,007,586 | ) | | $ | (21,916,224 | ) |
| | | | | | | | | | | | |
224
Annual Report to Shareholders
| | | | | | | | | | | | | | | | |
| | | | |
| | | Intermediate | | | Intermediate Plus | | | Limited Duration | | | Non-U.S. | |
Undistributed ordinary income—net | | $ | 1,292,458 | | | $ | 179,896 | | | $ | 11,193 | | | $ | — | |
Undistributed long-term capital gains—net | | | — | | | | — | | | | — | | | | 59,063 | |
| | | | | | | | | | | | | | | | |
Total undistributed earnings | | $ | 1,292,458 | | | $ | 179,896 | | | $ | 11,193 | | | $ | 59,063 | |
| | | | |
Capital loss carryforward(*) | | $ | (2,434,470 | ) | | $ | (924,264 | ) | | $ | (9,047,525 | ) | | $ | — | |
Other book/tax temporary differences | | | 633,521 | (d) | | | (9,943 | )(d) | | | (154,744 | )(e) | | | (2,502,585 | )(d) |
Unrealized appreciation/(depreciation) | | | (30,199,283 | )(b) | | | (3,884,921 | )(b) | | | (7,938,184 | )(b) | | | 2,173,526 | (b) |
| | | | | | | | | | | | | | | | |
Total accumulated
earnings/(losses)—net | | $ | (30,707,774 | ) | | $ | (4,639,232 | ) | | $ | (17,129,260 | ) | | $ | (269,996 | ) |
| | | | | | | | | | | | | | | | |
(*) As of December 31, 2009, the Funds had the following net capital loss carryforwards remaining:
| | | | | | | | | | | | |
Year of Expiration | | Absolute Return | | | High Yield | | | Inflation Indexed | |
12/31/2016 | | $ | (1,073,088 | ) | | $ | (49,747,397 | ) | | $ | (6,600,414 | ) |
12/31/2017 | | | (13,463,088 | ) | | | (83,418,268 | ) | | | (8,262,140 | ) |
| | | | | | | | | | | | |
| | $ | (l4,536,176 | ) | | $ | (133,165,665 | ) | | $ | (14,862,554 | ) |
| | | | | | | | | | | | |
| | | | | | | | | | | | |
Year of Expiration | | Intermediate | | | Intermediate Plus | | | Limited Duration | |
12/31/2013 | | | — | | | | — | | | $ | (234,847 | ) |
12/31/2014 | | | — | | | | — | | | | (394,050 | ) |
12/31/2015 | | | — | | | | — | | | | (34,113 | ) |
12/31/2016 | | | — | | | | — | | | | (5,768,220 | ) |
12/31/2017 | | $ | (2,434,470 | ) | | $ | (924,264 | ) | | | (2,616,295 | ) |
| | | | | | | | | | | | |
| | $ | (2,434,470 | ) | | $ | (924,264 | ) | | $ | (9,047,525 | ) |
| | | | | | | | | | | | |
These amounts will be available to offset any future taxable capital gains.
| (a) | | Other book/tax temporary differences are attributable primarily to the tax deferral of losses on straddles, the realization for tax purposes of unrealized gains/(losses) on certain futures and foreign currency contracts, the deferral of post-October capital losses for tax purposes, differences between book/tax accrual of interest income on securities in default and book/tax differences in the timing of the deductibility of various expenses. |
| (b) | | The difference between book-basis and tax-basis unrealized appreciation/(depreciation) is attributable primarily to the tax deferral of losses on wash sales. |
| (c) | | Other book/tax temporary differences are attributable primarily to the deferral of post-October capital losses for tax purposes, differences between book/tax accrual of interest income on securities in default and book/tax differences in the timing of the deductibility of various expenses. |
| (d) | | Other book/tax temporary differences are attributable primarily to the tax deferral of losses on straddles, the realization for tax purposes of unrealized gains/(losses) on certain futures and/or foreign currency contracts, differences between book/tax accrual of interest income on securities in default and book/tax differences in the timing of the deductibility of various expenses. |
| (e) | | Other book/tax temporary differences are attributable primarily to the realization for tax purposes of unrealized gains on certain futures contracts, the deferral of post-October capital losses for tax purposes, differences between book/tax accrual of interest income on securities in default and book/tax differences in the timing of the deductibility of various expenses. |
225
Annual Report to Shareholders
Report of Independent Registered Public Accounting Firm
To the Board of Directors of Western Asset Funds, Inc. and to the Shareholders of Western Asset Absolute Return Portfolio, Western Asset High Yield Portfolio, Western Asset Inflation Indexed Plus Bond Portfolio, Western Asset Intermediate Bond Portfolio, Western Asset Intermediate Plus Bond Portfolio, Western Asset Limited Duration Bond Portfolio, and Western Asset Non-U.S. Opportunity Bond Portfolio:
In our opinion, the accompanying statements of assets and liabilities, including the portfolios of investments, and the related statements of operations and of changes in net assets and the financial highlights present fairly, in all material respects, the financial position of Western Asset Absolute Return Portfolio, Western Asset High Yield Portfolio, Western Asset Inflation Indexed Plus Bond Portfolio, Western Asset Intermediate Bond Portfolio, Western Asset Intermediate Plus Bond Portfolio, Western Asset Limited Duration Bond Portfolio, and Western Asset Non-U.S. Opportunity Bond Portfolio (seven of the Portfolios comprising Western Asset Funds, Inc., the “Funds”) at December 31, 2009, the results of each of their operations, the changes in each of their net assets, and their financial highlights for each of the periods presented, in conformity with accounting principles generally accepted in the United States of America. These financial statements and financial highlights (hereafter referred to as “financial statements”) are the responsibility of the Funds’ management; our responsibility is to express an opinion on these financial statements based on our audits. We conducted our audits of these financial statements in accordance with the standards of the Public Company Accounting Oversight Board (United States). Those standards require that we plan and perform the audit to obtain reasonable assurance about whether the financial statements are free of material misstatement. An audit includes examining, on a test basis, evidence supporting the amounts and disclosures in the financial statements, assessing the accounting principles used and significant estimates made by management, and evaluating the overall financial statement presentation. We believe that our audits, which included confirmation of securities at December 31, 2009 by correspondence with the custodian and brokers, provide a reasonable basis for our opinion.
PricewaterhouseCoopers LLP
Baltimore, Maryland
February 23, 2010
226
Annual Report to Shareholders
Board Consideration of the Management and Advisory Agreements (Unaudited)
The Executive and Contracts Committee of the Board of Directors considered the Investment Management Agreement (the “Management Agreement”) between the Corporation and LMPFA and the Investment Advisory Agreements (together with the Management Agreement, the “Agreements”) between LMPFA and, as applicable, Western Asset, Western Asset Management Limited (“WAML”), Western Asset Management Company Pte. Ltd. in Singapore (“Western Singapore”) and Western Asset Management Company Ltd in Japan (“Western Japan,” and together with Western Singapore and WAML the “Non-U.S. Advisers” and together with Western Asset, the “Advisers”) at meetings held on September 15, October 23 and November 3, 2009. At a meeting held on November 17, 2009, the Executive and Contracts Committee reported to the full Board of Directors their considerations and recommendation with respect to the Agreements, and the Board of Directors, including a majority of the Independent Directors, considered and approved renewal of the Agreements.
The Directors noted that although Western Asset’s business is operated through separate legal entities, such as the Non-U.S. Advisers, its business is highly integrated and senior investment personnel at Western Asset have supervisory oversight responsibility over the investment decisions made by the Non-U.S. Advisers. Therefore, in connection with their deliberations noted below, the Directors primarily focused on the information provided by Western Asset when considering the approval of the Investment Advisory Agreements between LMPFA and the Non-U.S. Advisers with respect to the Funds they advise. The Directors also noted that none of Funds pay any management fees directly to any of the Non-U.S. Advisers or Western Asset because LMPFA pays the Advisers for services provided to the Funds they advise out of the management fees LMPFA receives from such Funds.
In arriving at their decision to renew the Agreements, the Directors met with representatives of Western Asset, including relevant investment advisory personnel as well as representatives of LMPFA; reviewed a variety of information prepared by LMPFA and Western Asset and materials provided by Lipper Inc. (“Lipper”) and counsel to the Independent Directors; and reviewed performance and expense information for the Funds’ respective peer groups of comparable funds selected and prepared by Lipper and for certain other comparable products available from Western Asset, including separate accounts managed by Western Asset. These reviews were in addition to information obtained by the Directors at their regular quarterly meetings with respect to the Funds’ performance and other relevant matters, and related discussions with Western Asset’s personnel.
As part of their review, the Directors examined LMPFA’s ability to provide high quality oversight and administrative and shareholder support services to the Funds, and the Advisers’ ability to provide high quality investment management services to the applicable Funds. The Directors considered the experience of LMPFA’s personnel in providing the types of services that LMPFA is responsible for providing to the Funds; the ability of LMPFA to attract and retain capable personnel; the capability and integrity of LMPFA’s senior management and staff; and the level of skill required to provide such services to the Funds. The Directors considered the investment philosophy and research and decision-making processes of the Advisers; the experience of the Advisers’ key advisory personnel responsible for management of the Funds; the ability of the Advisers to attract and retain capable research and advisory personnel; the capability and integrity of the Advisers’ senior management and staff; and the level of skill required to manage each Fund. In addition, the Directors reviewed the quality of LMPFA’s and the Advisers’ services with respect to regulatory compliance and compliance with the investment policies of the Funds and conditions that might affect LMPFA’s or an Adviser’s ability to provide high quality services to the Funds in the future under the Agreements, including its business reputation, financial condition and operational stability. Based on the foregoing, the Directors concluded that the Advisers’ investment process, research capabilities and philosophy were well suited to the Funds given their respective investment objectives and policies, and that LMPFA and each of the Advisers would be able to meet any reasonably foreseeable obligations under the Agreements.
In reviewing the quality of the services provided to the Funds, the Directors also reviewed comparisons of the performance of the Funds to the performance of certain comparable funds in their respective peer groups and to their respective investment benchmarks over one-, three-, five- and ten-year periods ended August 31, 2009 (as applicable). In that connection, the Directors noted that the performance of a majority of the Funds for the one-year period was above the average of their peer groups. They also noted that the performance of the Intermediate Bond Portfolio, Intermediate Plus Bond Portfolio and Inflation Indexed Plus Bond Portfolio was near or above their peer averages for the three- and five-year periods ended August 31, 2009. The performance of the two Funds in existence for at least ten years exceeded their peer averages for the ten-year period ended on August 31, 2009. With respect to each of the Funds, the Directors considered the factors involved in its performance relative to the performance of its investment benchmark and peer group.
227
Annual Report to Shareholders
Board Consideration of the Management and Advisory Agreements (Unaudited)—Continued
The Directors also considered the management fees payable by the Funds to LMPFA, the total expenses payable by the Funds and the fact that LMPFA pays to the Advisers the entire management fee it receives from each Fund. They reviewed information concerning management fees paid to investment advisers of similarly-managed funds, as well as fees paid by the Advisers’ other clients, including separate accounts managed by the Advisers. The Directors observed that the management fees paid to LMPFA by the Funds were lower than the average of the funds in their respective peer groups, except the fees with respect to the Absolute Return Portfolio and High Yield Portfolio which were higher than the applicable averages. The Directors also observed that total expenses for each Fund except the Absolute Return Portfolio were lower than the average of the funds in its respective peer group. The Directors noted that the management fees paid by the Funds were generally higher than the fees paid by other clients of the Advisers for separate accounts with similar investment strategies, but that the administrative and operational responsibilities for the Advisers with respect to the Funds were also relatively higher. In light of this difference, the Directors concluded that the difference in management fees paid by each Fund from those paid by the Advisers’ other clients was reasonable.
The Directors further evaluated the benefits of the advisory relationship to LMPFA and the Advisers, including, among others, the profitability of the relationship to LMPFA and the Advisers; the direct and indirect benefits that LMPFA and each Adviser may receive from its relationship with the Funds, including any “fallout benefits”, such as reputational value derived from serving as investment manager or adviser; and the affiliations between LMPFA, the Advisers and certain service providers for the Funds. In that connection, the Directors concluded that LMPFA and each Adviser’s profitability was consistent with levels of profitability that had been determined by courts not to be excessive. The Directors noted that Western Asset does not have soft dollar arrangements.
Finally, the Directors considered, in light of the profitability information provided by LMPFA and the Advisers, the extent to which economies of scale would be realized by the Advisers as the assets of the Funds grow. They further concluded that, where a Fund’s assets were currently at a level at which the Advisers potentially may realize economies of scale from any future growth in the Fund, fee breakpoints had been implemented to capture a portion of any economies of scale for the benefit of the Fund’s shareholders.
In their deliberations with respect to these matters, the Independent Directors were advised by their independent counsel, who is independent of LMPFA and the Advisers within the meaning of the Securities and Exchange Commission rules regarding the independence of counsel. The Independent Directors weighed the foregoing matters in light of the advice given to them by their independent counsel as to the law applicable to the review of investment advisory contracts. In arriving at a decision, the Directors, including the Independent Directors, did not identify any single matter as all-important or controlling, and the foregoing summary does not detail all the matters considered. The Directors judged the terms and conditions of the Agreements, including the investment advisory fees, in light of all of the surrounding circumstances.
Based upon their review, the Directors, including all of the Independent Directors, determined, in the exercise of their business judgment, that they were generally satisfied with the quality of investment advisory services being provided by the Advisers and LMPFA, but would continue to closely monitor the Advisers’ performance in light of some of the Funds’ recent relative underperformance; that the fees to be paid to the Advisers and LMPFA under the relevant Agreements were fair and reasonable given the scope and quality of the services rendered by the Advisers and LMPFA; and that approval of the Agreements was in the best interest of the Corporation and its shareholders.
228
Annual Report to Shareholders
Directors and Officers
The Directors and officers of the Fund, their age (as of December 31, 2009) and a description of their principal occupations during the past five years are listed below. Except as shown, each Director’s and officer’s principal occupation and business experience for the last five years has been with the employer(s) indicated, although in some cases the Director or officer may have held different positions with such employer(s). Unless otherwise indicated, the business address of the persons listed below is c/o Western Asset Management Company, 385 East Colorado Blvd., Pasadena, California 91101.
| | | | | | | | | | |
| Name and Year of Birth | | Position(s)
Held With
Fund | | Term of Office
and Length of
Time ServedA | | Principal Occupations
During the Past 5 Years | | Number of
Portfolios in
Fund Complex
OverseenB | | Other
Directorships Held |
| Independent Directors | | | | | | | | | | |
Ronald J. Arnault
1943 | | Director | | Served
since 1997 | | Retired. | | 13 | | None |
Anita L. DeFrantz
1953 | | Director | | Served
since 1998 | | President (1987-present) and Director (1990-present) of LA84 (formerly Amateur Athletic Foundation of Los Angeles); President and Director of Kids in Sports (1994-present); Vice President, International Rowing Federation (1986-present); Member of the International Olympic Committee (1986-present). | | 13 | | OBN Holdings, Inc. (film, television and media company) |
Avedick B. Poladian
1952 | | Director | | Served
since 2007 | | Executive Vice President and Chief Operating Officer of Lowe Enterprises, Inc. (real estate and hospitality firm) (2002-present); Partner, Arthur Andersen, LLP (1974-2002). | | 13 | | Occidental Petroleum Corporation |
William E. B. Siart
1946 | | Director
and Chairman | | Served
since 1997 | | Vice Chairman of The Getty Trust (2005-present); Chairman of Walt Disney Concert Hall, Inc. (1998-2006); Chairman of Excellent Education Development (2000-present). | | 13 | | None |
| Jaynie Miller Studenmund 1954 | | Director | | Served
since 2004 | | Chief Operating Officer of Overture Services, Inc. (online marketing firm) (2001-2004); President and Chief Operating Officer of Paymybills.com (2000-2001). | | 13 | | Orbitz Worldwide (global on-line travel company) |
| Interested Directors | | | | | | | | | | |
R. Jay GerkenC
1951 | | Director
and President | | Served as a Director since 2006 and as President since 2007 | | Managing Director of Legg Mason & Co., LLC, Chairman, President and Chief Executive Officer of certain mutual funds associated with Legg Mason & Co., LLC or its affiliates (2005-present); President of Legg Mason Partners Fund Advisor, LLC (“LMPFA”) (2006-present); Chairman of Smith Barney Fund Management LLC and Citi Fund Management Inc. (2002-2005); Chairman, President and Chief Executive Officer of Travelers Investment Adviser, Inc. (2002-2005). | | 147 | | N/A |
Ronald L. OlsonD
1941 | | Director | | Served
since 2005 | | Senior Partner of Munger, Tolles & Olson LLP (a law partnership) (1968-present). | | 13 | | Edison International, City National Corporation (financial services company), The Washington Post Company, and Berkshire Hathaway, Inc. |
229
Annual Report to Shareholders
Directors and Officers—Continued
| | | | | | | | | | |
| Name and Year of Birth | | Position(s)
Held With
Fund | | Term of Office
and Length of
Time ServedA | | Principal Occupations
During the Past 5 Years | | Number of
Portfolios in
Fund Complex
OverseenB | | Other
Directorships Held |
| OfficersE | | | | | | | | | | |
Gavin L. James
1961 | | Vice President | | Served
since 2001 | | Director of Global Client Services and Marketing of Western Asset (1998-present). | | N/A | | N/A |
S. Kenneth Leech
1954 | | Vice President | | Served
since 1990 | | Chief Investment Officer Emeritus of Western Asset (1998- present); Vice President of Western Asset Income Fund (1998-present) and Western Asset Premier Bond Fund (2001-present). | | N/A | | N/A |
Stephen A. Walsh
1959 | | Vice President | | Served since 1994 | | Chief Investment Officer of Western Asset (2000-present); Vice President of Western Asset Income Fund (1999-present) and Western Asset Premier Bond Fund (2001-present). | | N/A | | N/A |
Susanne D. Wilson
1962
100 International Drive
Baltimore, MD 21202 | | Vice President | | Served
since 1998 | | Vice President of Legg Mason & Co., LLC (2005-present); Vice President of Legg Mason Wood Walker, Incorporated (1998-2005). | | N/A | | N/A |
Frances M. Guggino 1957 55 Water Street New York, NY 10041 | | Principal Financial and Accounting Officer | | Served
since 2009 | | Director of Legg Mason & Co. (since 2005); Director at Citigroup Asset Management (“CAM”) (1992 to 2005); Treasurer and/or Controller of certain funds associated with Legg Mason & Co. (since 2005); Treasurer and/or Controller of certain funds associated with CAM (1992 to 2005) | | N/A | | N/A |
Erin K. Morris 1966 100 International Drive Baltimore, MD 21202 | | Treasurer | | Served
since 2006 | | Vice President and Manager, Global Funds Administration, Legg Mason & Co., LLC (2005-present); Assistant Vice President of Legg Mason Wood Walker, Incorporated (2002-2005); Treasurer of Legg Mason Income Trust, Inc., Legg Mason Tax-Free Income Fund, Western Asset Income Fund and Western Asset Premier Bond Fund (2006-present); Assistant Treasurer, Legg Mason Partners Fund complex (2007-present), Western Asset/Claymore Inflation-Linked Securities & Income Fund (2003- present), Western Asset/Claymore Inflation-Linked Opportunities & Income Fund (2004-present); Assistant Treasurer, the Corporation, Western Asset Income Fund, Western Asset Premier Bond Fund, Legg Mason Income Trust, Inc. and Legg Mason Tax-Free Income Fund (2001-2006); Manager, Funds Accounting, Legg Mason Wood Walker, Incorporated (2000-2005). | | N/A | | N/A |
230
Annual Report to Shareholders
| | | | | | | | | | |
| Name and Year of Birth | | Position(s)
Held With
Fund | | Term of Office
and Length of
Time ServedA | | Principal Occupations
During the Past 5 Years | | Number of
Portfolios in
Fund Complex
OverseenB | | Other
Directorships Held |
Todd F. Kuehl 1968 100 International Drive Baltimore, MD 21202 | | Chief Compliance Officer | | Served
since 2007 | | Director, Legg Mason & Co., LLC (2006-present); Chief Compliance Officer of Legg Mason Private Portfolio Group (2009-present); Chief Compliance Officer of Western Asset/Claymore Inflation-Linked Securities & Income Fund, Western Asset/Claymore Inflation-Linked Opportunities & Income Fund, Western Asset Income Fund, Western Asset Premier Bond Fund and Western Asset Funds, Inc. (2007-present) and Barrett Growth Fund and Barrett Opportunity Fund (2006-2008); Branch Chief, Division of Investment Management, U.S. Securities and Exchange Commission (2002-2006). | | N/A | | N/A |
Robert I. Frenkel 1954 100 First Stamford Place Stamford, CT 06902 | | Secretary and Chief Legal Officer | | Served
since 2009 | | Managing Director and General Counsel of Global Mutual Funds for Legg Mason & Co. (2005-present); Secretary and Chief Legal Officer of certain mutual funds associated with Legg Mason & Co. (2003-present); formerly, Managing Director and General Counsel of Global Mutual Funds for CAM (2000 to 2005); formerly, Secretary of CFM (2001 to 2004). | | N/A | | N/A |
| A | | Each Officer holds office until his or her respective successor is chosen and qualified, or in each case until he or she sooner dies, resigns, is removed with or without cause or becomes disqualified. Each of the Directors of the Corporation holds office until his or her successor shall have been duly elected and shall qualify, subject to prior death, resignation, retirement, disqualification or removed from office and applicable law and the rules of the New York Stock Exchange. |
| B | | In addition to overseeing the nine portfolios of the Corporation each Director also serves as a Trustee of Western Asset Premier Bond Fund and as a Director of Western Asset Income Funds, Inc. (closed-end investment companies), which are considered part of the same Fund Complex as the Fund. In addition, Mr. Gerken serves as Director/Trustee to 147 other portfolios associated with Legg Mason & Co., LLC or its affiliates. Legg Mason & Co., LLC is an affiliate of Western Asset Management Co. (“WAM”). |
| C | | Mr. Gerken is an “Interested person” (as defined in section 2(a)(19) of the Investment Company Act of 1940, as amended (the “1940 Act”)) of each Fund because of his positions with subsidiaries of, and ownership of shares of common stock of, Legg Mason, Inc., the parent company of WAM. |
| D | | Mr. Olson is an “Interested person” (as defined above) of each Fund because his law firm has provided legal services to WAM. |
| E | | Each officer of the Corporation is an “Interested person” (as defined above) of the Corporation. |
ADDITIONAL INFORMATION ABOUT THE CORPORATION’S DIRECTORS AND OFFICERS IS CONTAINED IN THE STATEMENT OF ADDITIONAL INFORMATION, AVAILABLE WITHOUT CHARGE UPON REQUEST BY CALLING FUNDS INVESTOR SERVICES AT 1-800-822-5544 OR INSTITUTIONAL SHAREHOLDER SERVICES AT 1-888-425-6432 OR ON THE SECURITIES AND EXCHANGE COMMISSION WEBSITE (http://www.sec.gov).
231
Annual Report to Shareholders
Important Tax Information (Unaudited)
The following information is provided with respect to the distributions paid during the taxable year ended December 31, 2009:
| | | | | | | | | | | |
| | | Absolute Return | | | |
Record Date: | | Daily | | | Daily | | | Monthly | | | |
Payable Date: | | 01/30/2009 | | | 02/27/2009 | | | March 2009–
December 2009 |
| | |
| | | | | | | | | | | |
Ordinary Income: | | | | | | | | | | | |
Qualified Dividend Income for Individuals | | — | | | 0.25 | % | | 0.52 | % | | |
| | | | | | | | | | | |
Dividends Qualifying for the Dividends | | | | | | | | | | | |
Received Deduction for Corporations | | — | | | 0.25 | % | | 0.52 | % | | |
| | | | | | | | | | | |
Interest from Federal Obligations | | 1.60 | % | | 1.60 | % | | 1.60 | % | | |
| | | | | | | | | | | |
| | | | | | | | | | | | | | | | |
| |
| | | High Yield | |
Record Date: | | | 02/26/2009 | | | | 06/29/2009 | | | | 09/29/2009 | | | | 12/28/2009 | |
Payable Date: | | | 02/27/2009 | | | | 06/30/2009 | | | | 09/30/2009 | | | | 12/29/2009 | |
| | | | | | | | | | | | | | | | |
Ordinary Income: | | | | | | | | | | | | | | | | |
Qualified Dividend Income for Individuals | | | 0.60 | % | | | 0.63 | % | | | 0.63 | % | | | 0.63 | % |
| | | | | | | | | | | | | | | | |
Dividends Qualifying for the Dividends | | | | | | | | | | | | | | | | |
Received Deduction for Corporations | | | 0.60 | % | | | 0.63 | % | | | 0.63 | % | | | 0.63 | % |
| | | | | | | | | | | | | | | | |
| | | |
| | | | | | Inflation Indexed | | | | |
Record Date: | | | | | | | Daily | | | | Daily | | | | | |
Payable Date: | | | | | | | 02/27/2009 | | |
| October 2009–
December 2009 |
| | | | |
| | | | | | | | | | | | | | | | |
Ordinary Income: | | | | | | | | | | | | | | | | |
Qualified Dividend Income for Individuals | | | | | | | — | | | | 1.92 | % | | | | |
| | | | | | | | | | | | | | | | |
Dividends Qualifying for the Dividends | | | | | | | | | | | | | | | | |
Received Deduction for Corporations | | | | | | | — | | | | 1.92 | % | | | | |
| | | | | | | | | | | | | | | | |
Interest from Federal Obligations | | | | | | | 59.17 | % | | | 59.17 | % | | | | |
| | | | | | | | | | | | | | | | |
| | | |
| | | Intermediate | | | Intermediate Plus | | | Limited Duration | |
Record Date: | | | 06/10/2009 | | | | Daily | | | | Daily | | | | Daily | |
Payable Date: | | | 06/11/2009 | | |
| January 2009–
December 2009 |
| |
| January 2009–
December 2009 |
| |
| January 2009–
December 2009 |
|
| | | | | | | | | | | | | | | | |
Ordinary Income: | | | | | | | | | | | | | | | | |
Qualified Dividend Income for Individuals | | | — | | | | 0.07 | % | | | 0.50 | % | | | — | |
| | | | | | | | | | | | | | | | |
Dividends qualifying for the Dividends | | | | | | | | | | | | | | | | |
Received Deduction for Corporations | | | —. | | | | 0.07 | % | | | 0.50 | % | | | — | |
| | | | | | | | | | | | | | | | |
Interest from Federal Obligations | | | — | | | | 7.46 | % | | | 7.62 | % | | | 3.31 | % |
| | | | | | | | | | | | | | | | |
Long-Term Capital Gain Dividend | | $ | 0.000590 | | | $ | — | | | $ | — | | | $ | — | |
| | | | | | | | | | | | | | | | |
232
Annual Report to Shareholders
| | | | | | | | | | |
| | | |
| | | | | | | Non-U.S. |
Record Date: | | | | | | | 02/26/2009 | | | 12/09/2009 |
Payable Date: | | | | | | | 02/27/2009 | | | 12/10/2009 |
| | | | | | | | | | |
Long-Term Capital Gain Dividend | | | | | | $ | 0.054550 | | $ | 0.004990 |
| | | | | | | | | | |
The law varies in each state as to whether and what percentage of dividend income attributable to Federal obligations is exempt from state income tax. We recommend that you consult with your tax adviser to determine if any portion of the dividends you received is exempt from state income taxes.
The following information is provided for shareholders who are not residents of the United States:
| | | | | | | | | |
| | | | | | | | | Intermediate | |
Record Date: | | | | | | | | Daily | |
Payable Date: | | | | | | | | January 2009–
December 2009 |
|
| | | | | | | | | |
Qualified Interest Income | | | | | | | | 84.61 | % |
| | | | | | | | | |
Additionally, the Fund paid $0.15319 per share to shareholders of record on June 10, 2009, all of which is qualified short-term capital gains not subject to U.S. withholding tax for non resident alien shareholders.
Please retain this information for your records.
233
Annual Report to Shareholders
Privacy policy
We are committed to keeping nonpublic personal information about you secure and confidential. This notice is intended to help you understand how we fulfill this commitment. From time to time, we may collect a variety of personal information about you, including:
| | • | | Information we receive from you on applications and forms, via the telephone, and through our websites; |
| | • | | Information about your transactions with us, our affiliates, or others (such as your purchases, sales, or account balances); and |
| | • | | Information we receive from consumer reporting agencies. |
We do not disclose nonpublic personal information about our customers or former customers, except to our affiliates (such as broker-dealers or investment advisers within the Legg Mason family of companies) or as is otherwise permitted by applicable law or regulation. For example, we may share this information with others in order to process your transactions or service an account. We may also provide this information to companies that perform marketing services on our behalf, such as printing and mailing, or to other financial institutions with whom we have joint marketing agreements. When we enter into such agreements, we will require these companies to protect the confidentiality of this information and to use it only to perform the services for which we hired them.
With respect to our internal security procedures, we maintain physical, electronic, and procedural safeguards to protect your nonpublic personal information, and we restrict access to this information.
If you decide at some point either to close your account(s) or become an inactive customer, we will continue to adhere to our privacy policies and practices with respect to your nonpublic personal information.
NOT PART OF THE ANNUAL REPORT
Western Asset Funds, Inc.
The Board of Directors
William E. B. Siart, Chairman
Ronald J. Arnault
Anita L. DeFrantz
R. Jay Gerken
Ronald L. Olson
Avedick B. Poladian
Jaynie Miller Studenmund
Officers
R. Jay Gerken, President
Gavin L. James, Vice President
S. Kenneth Leech, Vice President
Stephen A. Walsh, Vice President
Frances M. Guggino, Principal Financial and Accounting Officer
Erin K. Morris, Treasurer
Todd F. Kuehl, Chief Compliance Officer
Robert I. Frenkel, Secretary and Chief Legal Officer
Investment Manager
Legg Mason Partners Fund Advisor, LLC
55 Water Street
NewYork, NY 10041
Investment Advisers
Western Asset Management Company
385 East Colorado Boulevard
Pasadena, California 91101
Western Asset Management Company Limited
10 Exchange Square
London, England EC2A2EN
Western Asset Management Company Ltd
36F Shin-Marunouchi Building
5-1 Marunouchi 1-Chrome Chiyoda-Ku
Tokyo 100-6536
Western Asset Management Company Pte. Ltd.
1 George Street #23-01
Singapore 049145
Transfer and Shareholder Servicing Agent
Boston Financial Data Services
2000 Crown Colony Drive
Quincy, Massachusetts 02169
Custodian
State Street Bank and Trust Company
1 Lincoln Street
Boston, Massachusetts 02111
Counsel
Ropes & Gray LLP
1211 Avenue of the Americas
New York, New York 10036
Independent Registered Public Accounting Firm
PricewaterhouseCoopers LLP
100 East Pratt Street
Baltimore, Maryland 21201
Information about the policies and procedures that each Fund uses to determine how to vote proxies relating to each Fund’s portfolio securities is contained in the Statement of Additional Information, available upon request without charge by calling 1-888-425-6432 or on the Securities and Exchange Commission’s (“SEC”) website (http://www.sec.gov). Information regarding how the Funds voted proxies relating to portfolio securities during the most recent twelve-month period ended June 30 is also available on the SEC’s website or without charge through www.westernassetfunds.com.
Each Fund files a complete schedule of portfolio holdings with the SEC for the first and third quarters of each fiscal year on Form N-Q. Each Fund’s Form N-Q is available on the Securities and Exchange Commission’s (“SEC”) website (http://www.sec.gov) and may be viewed and copied at the SEC’s Public Reference Room in Washington, D.C. Information about the operation of the Public Reference Room may be obtained by calling 1-800-SEC-0330. Quarterly portfolio holdings are also available upon request by calling 1-888-425-6432 or at www.lminstitutionalfunds.com/fund_information/fund_literature/gbl_literature/proxy_report.asp.
This report must be preceded or accompanied by a free prospectus. Investors should consider the Fund’s investment objectives, risks, charges and expenses carefully before investing. The prospectus contains this and other important information about the Fund. Please read the prospectus carefully before investing.
Western Asset Management Company
Legg Mason Investor Services, LLC, Distributor
Legg Mason, Inc. Subsidiaries
| | |
| WAF-A (2/10) SR10-1045 | | WASX011417 |