UNITED STATES
SECURITIES AND EXCHANGE COMMISSION
Washington, D.C. 20549
FORMN-CSR
CERTIFIED SHAREHOLDER REPORT OF REGISTERED
MANAGEMENT INVESTMENT COMPANIES
Investment Company Act file number811-06110
Western Asset Funds, Inc.
(Exact name of registrant as specified in charter)
620 Eighth Avenue, 49th Floor, New York, NY 10018
(Address of principal executive offices) (Zip code)
Robert I. Frenkel, Esq.
Legg Mason & Co., LLC
100 First Stamford Place
Stamford, CT 06902
(Name and address of agent for service)
Registrant’s telephone number, including area code:1-877-721-1926
Date of fiscal year end: December 31
Date of reporting period: December 31, 2018
| ITEM 1. | REPORT TO STOCKHOLDERS. |
TheAnnual Report to Stockholders is filed herewith.

| | |
| Annual Report | | December 31, 2018 |
WESTERN ASSET
CORE PLUS BOND FUND
Beginning in January 2021 as permitted by regulations adopted by the Securities and Exchange Commission, the Fund intends to no longer mail paper copies of the Fund’s shareholder reports like this one, unless you specifically request paper copies of the reports from the Fund or from your Service Agent or financial intermediary (such as a broker-dealer or bank). Instead, the reports will be made available on a website, and you will be notified by mail each time a report is posted and provided with a website link to access the report.
If you already elected to receive shareholder reports electronically(“e-delivery”), you will not be affected by this change and you need not take any action. If you have not already electede-delivery, you may elect to receive shareholder reports and other communications from the Fund electronically by contacting your Service Agent or, if you are a direct shareholder with the Fund, by calling1-877-721-1926.
You may elect to receive all future reports in paper free of charge. If you invest through a Service Agent, you can contact your Service Agent to request that you continue to receive paper copies of your shareholder reports. That election will apply to all Legg Mason funds held in your account at that Service Agent. If you are a direct shareholder with the Fund, you can call the Fund at1-877-721-1926, or write to the Fund by regular mail at Legg Mason Funds, P.O. Box 9699, Providence, RI 02940-9699 or by express, certified or registered mail to Legg Mason Funds, 4400 Computer Drive, Westborough, MA 01581 to let the Fund know you wish to continue receiving paper copies of your shareholder reports. That election will apply to all Legg Mason Funds held in your account held directly with the fund complex.

|
| INVESTMENT PRODUCTS: NOT FDIC INSURED • NO BANK GUARANTEE • MAY LOSE VALUE |
Fund objective
The Fund seeks to maximize total return, consistent with prudent investment management and liquidity needs, by investing to obtain an average effective duration which is expected to range within 30% of the average duration of the domestic bond market as a whole as estimated by the Fund’s subadviser.
Letter from the president

Dear Shareholder,
We are pleased to provide the annual report of Western Asset Core Plus Bond Fund for the twelve-month reporting period ended December 31, 2018. Please read on for a detailed look at prevailing economic and market conditions during the Fund’s reporting period and to learn how those conditions have affected Fund performance.
As always, we remain committed to providing you with excellent service and a full spectrum of investment choices. We also remain committed to supplementing the support you receive from your financial advisor. One way we accomplish this is through our website, www.leggmason.com. Here you can gain immediate access to market and investment information, including:
| • | | Fund prices and performance, |
| • | | Market insights and commentaries from our portfolio managers, and |
| • | | A host of educational resources. |
We look forward to helping you meet your financial goals.
Sincerely,

Jane Trust, CFA
President and Chief Executive Officer
January 31, 2019
| | |
| II | | Western Asset Core Plus Bond Fund |
Investment commentary
Economic review
Economic activity in the U.S. was mixed during the twelve months ended December 31, 2018 (the “reporting period”). Looking back, the U.S. Department of Commerce reported that first quarter 2018 U.S. gross domestic product (“GDP”)i growth was 2.2%. GDP growth then accelerated to 4.2% during the second quarter of 2018 — the strongest reading since the third quarter of 2014. Third quarter 2018 GDP growth was 3.4%. The deceleration in GDP growth in the third quarter of 2018 reflected a downturn in exports and decelerations in nonresidential fixed investment and personal consumption expenditures. Imports increased in the third quarter after decreasing in the second. These movements were partly offset by an upturn in private inventory investment. Finally, the U.S. Department of Commerce’s initial reading for fourth quarter 2018 GDP growth was delayed due to the partial shutdown of the U.S. government.
Job growth in the U.S. was solid overall and supported the economy during the reporting period. As reported by the U.S. Department of Labor, when the reporting period ended on December 31, 2018, the unemployment rate was 3.9%, versus 4.1% when the period began. The percentage of longer-term unemployed also declined during the reporting period. In December 2018, 20.5% of Americans looking for a job had been out of work for more than six months, versus 21.5% when the period began.
Turning to the global economy, in its January 2019World Economic Outlook Update —released after the reporting period ended — theInternational Monetary Fund (“IMF”)ii said, “The global expansion has weakened. Global growth for 2018 is estimated at 3.7 percent, as in the October 2018World Economic Outlook forecast, despite weaker performance in some economies, notably Europe and Asia…. Risks to global growth tilt to the downside. An escalation of trade tensions beyond those already incorporated in the forecast remains a key source of risk to the outlook.” From a regional perspective, the IMF projects 2019 growth in the Eurozone will be 1.6%, versus 1.8% in 2018. Japan’s economy is expected to expand 1.1% in 2019, compared to 0.9% in 2018. Elsewhere, the IMF projects that overall growth in emerging market countries will decelerate to 4.5% in 2019, versus 4.6% in 2018.
The Federal Reserve Board (the “Fed”)iii continued tightening monetary policy during the reporting period, as it raised interest rates four times in 2018 and further reduced its balance sheet. As widely expected, the Fed raised the federal funds rateiv at its meetings that ended on March 21, 2018 (to a range between 1.50% and 1.75%), June 13, 2018 (to a range between 1.75% and 2.00%), September 26, 2018 (to a range between 2.00% and 2.25%) and December 19, 2018 (to a range between 2.25% and 2.50%). At its meeting that concluded on January 30, 2019, after the reporting period ended, the Fed kept interest rates on hold and said, “In light of global economic and financial developments and muted inflation pressures, the Committee will be patient as it determines what future adjustments to the target range for the federal funds rate may be appropriate....”
Central banks outside the U.S. took different approaches to monetary policy during the reporting period. Looking back, in December 2016, the European Central Bank (“ECB”)v
| | |
| Western Asset Core Plus Bond Fund | | III |
Investment commentary (cont’d)
extended its bond buying program until December 2017. From April 2017 through December 2017, the ECB purchased€60billion-per-month of bonds. In October 2017, the ECB announced that it would continue to buy bonds through September 2018, but after December 2017 it would pare its purchases to€30billion-per-month. In December 2018, the ECB ended its bond buying program, and again affirmed that it did not anticipate raising interest rates “at least through the summer of 2019”. In other developed countries, on November 2, 2017, the Bank of Englandvi raised rates from 0.25% to 0.50% — the first increase since July 2007. It then raised rates to 0.75% at its meeting on August 2, 2018. After holding rates steady at 0.10% for more than five years, in January 2016, the Bank of Japanvii announced that it cut the rate on current accounts that commercial banks hold with it to-0.10% and kept rates on hold during the reporting period. Elsewhere, the People’s Bank of Chinaviii kept rates steady at 4.35% during the reporting period.
As always, thank you for your confidence in our stewardship of your assets.
Sincerely,
Jane Trust, CFA
President and Chief Executive Officer
January 31, 2019
All investments are subject to risk including the possible loss of principal. Past performance is no guarantee of future results. Forecasts and predictions are inherently limited and should not be relied upon as an indication of actual or future performance.
| i | Gross domestic product (“GDP”) is the market value of all final goods and services produced within a country in a given period of time. |
| ii | The International Monetary Fund (“IMF”) is an organization of 189 countries, working to foster global monetary cooperation, secure financial stability, facilitate international trade, promote high employment and sustainable economic growth, and reduce poverty around the world. |
| iii | The Federal Reserve Board (the “Fed”) is responsible for the formulation of U.S. policies designed to promote economic growth, full employment, stable prices, and a sustainable pattern of international trade and payments. |
| iv | The federal funds rate is the rate charged by one depository institution on an overnight sale of immediately available funds (balances at the Federal Reserve) to another depository institution; the rate may vary from depository institution to depository institution and from day to day. |
| v | The European Central Bank (“ECB”) is responsible for the monetary system of the European Union and the euro currency. |
| vi | The Bank of England (“BoE”), formally the Governor and Company of the BoE, is the central bank of the United Kingdom. The BoE’s purpose is to maintain monetary and financial stability. |
| vii | The Bank of Japan is the central bank of Japan. The bank is responsible for issuing and handling currency and treasury securities, implementing monetary policy, maintaining the stability of the Japanese financial system and the yen currency. |
| viii | The People’s Bank of China is the central bank of the People’s Republic of China with the power to carry out monetary policy and regulate financial institutions in mainland China. |
| | |
| IV | | Western Asset Core Plus Bond Fund |
Fund overview
Q. What is the Fund’s investment strategy?
A. The Fund seeks to maximize total return, consistent with prudent investment management and liquidity needs, by investing to obtain the average durationi specified below. The Fund invests in a portfolio of fixed-income securities of various maturities and, under normal market conditions, will invest at least 80% of its net assets in debt and fixed-income securities. Although the Fund may invest in securities of any maturity, the Fund will normally maintain a dollar weighted average effective durationii within 30% of the average duration of the domestic bond market as a whole as estimated by Western Asset Management Company, LLC (formerly known as Western Asset Management Company) (“Western Asset”), the Fund’s subadviser.
The Fund may invest up to 20% of its total assets innon-U.S. dollar-denominated securities. Up to 20% of the Fund’s net assets may be invested in debt securities that are not rated in the Baa or BBB categories or above at the time of purchase by one or more Nationally Recognized Statistical Rating Organizations (“NRSROs”) or unrated securities that we determined to be of comparable quality at the time of purchase. These securities are known as “high-yield securities” or “junk bonds.” The Fund may invest up to 25% of its total assets in the securities ofnon-U.S. issuers. The Fund may invest a substantial portion of its assets in mortgage-backed and asset-backed securities.
The Fund may also enter into various exchange-traded andover-the-counter derivative transactions for both hedging andnon-hedging purposes, including for purposes of enhancing returns. These derivative
transactions include, but are not limited to, futures, options, swaps, foreign currency futures and forwards. In particular, the Fund may use interest rate swaps, credit default swaps (including buying and selling credit default swaps on individual securities and/or baskets of securities), options (including options on credit default swaps) and futures contracts to a significant extent, although the amounts invested in these instruments may change from time to time. Other instruments may also be used to a significant extent from time to time.
At Western Asset, we utilize a fixed-income team approach, with decisions derived from interaction among various investment management sector specialists. The sector teams are comprised of Western Asset’s senior portfolio management personnel, research analysts and anin-house economist. Under this team approach, management of client fixed-income portfolios will reflect a consensus of interdisciplinary views.
Q. What were the overall market conditions during the Fund’s reporting period?
A.Fixed income markets generally posted weak results over the twelve-month reporting period ended December 31, 2018. Spread sectors(non-Treasuries) experienced periods of elevated volatility as they were impacted by a number of factors, including generally solid economic growth in the U.S., moderating growth overseas, four interest rate hikes by the Federal Reserve Board (the “Fed”)iii, concerns over a global trade war, geopolitical issues and, more recently, a partial shutdown of the U.S. government.
Both short- and long-term U.S. Treasury yields moved higher and the yield curveiv
| | |
| Western Asset Core Plus Bond Fund 2018 Annual Report | | 1 |
Fund overview (cont’d)
flattened during the reporting period. The yield for thetwo-year Treasury note began the reporting period at 1.89% — the low for the period — and ended the period at 2.48%. The high for the period of 2.98% occurred on November 8, 2018. The yield for theten-year Treasury began the reporting period at 2.40% — the low for the period — and ended the period at 2.69%. The peak for the period of 3.24% took place on November 8, 2018.
All told, the Bloomberg Barclays U.S. Aggregate Indexv returned 0.01% for the twelve months ended December 31, 2018. Comparatively, riskier fixed-income securities, including high-yield bonds and emerging market debt, produced worse results. Over the reporting period, the Bloomberg Barclays U.S. High Yield — 2% Issuer Cap Indexvi returned-2.08%. U.S. dollar-denominated emerging market debt, as measured by the JPMorgan Emerging Markets Bond Index Global (“EMBI Global”)vii, returned-4.61% over the same period.
Q. How did we respond to these changing market conditions?
A.A number of adjustments were made to the Fund during the reporting period. We tactically adjusted the Fund’s duration throughout the period and ended the reporting period with a slightly reduced long position versus that of the benchmark. From a yield curve positioning perspective, we increased the Fund’s allocations to thetwo- and five-year portions of the curve and pared its exposure to the twenty year part of the curve and greater, during the first half of the reporting period as the curve flattened. We then trimmed the Fund’s allocation to the five-year portion of the curve and increased its exposure to the twenty year part of the curve and greater in the fourth quarter of 2018 as the curve steepened. The Fund’s allocation to Treasury Inflation-Protected Securities (“TIPS”)viii was tactically adjusted during the reporting period. In particular, we reduced the Fund’s TIPS exposure during the first quarter of 2018 when breakeven inflation rates rose, and then added back some exposure in December 2018 when breakeven inflation rates declined. The Fund’s allocation to investment-grade corporate bonds was increased — largely in December 2018 — as their spreads widened, and we felt that the economic recovery would continue and growth would stabilize, albeit at a lower level, in 2019. Within structured products, we added to the Fund’s agency mortgage-backed security (“MBS”) exposure as their spreads widened and pared the allocation to commercial mortgage-backed securities (“CMBS”) in September and October 2018 as their spreads reached post credit-crisis tight levels. The Fund’s allocation to bank loans was reduced as their spreads tightened throughout most of the year, and we wanted to upgrade the credit quality and liquidity of our corporate credit holdings. Finally, we added to select emerging market currencies (i.e. the Mexican peso and Brazilian real) as their valuations, in our view, became more compelling.
The Fund used U.S. Treasury futures, and options and interest rate swaps, Eurodollar futures and options and interest rate swaps, and futures onnon-U.S. rates to manage its duration and yield curve exposure. The use of these instruments in total detracted from performance. Credit default swaps (“CDS”), which were used to manage the Fund’s exposure to individual credits, in aggregate did not have a material impact on results. Finally, the use of currency forwards to
| | |
| 2 | | Western Asset Core Plus Bond Fund 2018 Annual Report |
hedge itsnon-U.S. dollar currency exposure was negative for performance.
Performance review
For the twelve months ended December 31, 2018, Class I shares of Western Asset Core Plus Bond Fund returned-1.49%. The Fund’s unmanaged benchmark, the Bloomberg Barclays U.S. Aggregate Index, returned 0.01% for the same period. The Lipper Core Plus Bond Funds Category Average1 returned-0.90% over the same time frame.
| | | | | | | | |
Performance Snapshotas of December 31, 2018
(unaudited) | |
| (excluding sales charges) | | 6 months | | | 12 months | |
| Western Asset Core Plus Bond Fund: | | | | | | | | |
Class A | | | 0.96 | % | | | -1.86 | % |
Class C | | | 0.60 | % | | | -2.53 | % |
Class C1 | | | 0.78 | % | | | -2.22 | % |
Class FI | | | 0.95 | % | | | -1.87 | % |
Class R | | | 0.79 | % | | | -2.16 | % |
Class I | | | 1.15 | % | | | -1.49 | % |
Class IS | | | 1.08 | % | | | -1.47 | % |
| Bloomberg Barclays U.S. Aggregate Index | | | 1.65 | % | | | 0.01 | % |
| Lipper Core Plus Bond Funds Category Average1 | | | 0.88 | % | | | -0.90 | % |
The performance shown represents past performance. Past performance is no guarantee of future results and current performance may be higher or lower than the performance shown above. Principal value, investment returns and yields will fluctuate and investors’ shares, when redeemed, may be worth more or less than their original cost. To obtain performance data current to the most recentmonth-end, please visit our website at www.leggmason.com/mutualfunds.
All share class returns assume the reinvestment of all distributions at net asset value and the deduction of all Fund expenses. Returns have not been adjusted to include sales charges that may apply or the deduction of taxes that a shareholder would pay on Fund distributions. If sales charges were reflected, the performance quoted would be lower. Performance figures for periods shorter than one year represent cumulative figures and are not annualized.
Fund performance figures reflect fee waivers and/or expense reimbursements, without which the performance would have been lower.
The30-Day SEC Yields for the period ended December 31, 2018 for Class A, Class C, Class C1, Class FI, Class R, Class I and Class IS shares were 3.31%, 2.75%, 3.14%, 3.44%, 3.14%, 3.82% and 3.85%, respectively. Absent fee waivers and/or expense reimbursements, the30-Day SEC Yield for Class A, Class I and Class IS shares would have been 3.26%, 3.72% and 3.84%, respectively. The30-Day SEC Yield, calculated pursuant to the standard SEC formula, is based on a Fund’s investments over an annualized trailing30-day period, and not on the distributions paid by the Fund, which may differ.
|
| Total Annual Operating Expenses (unaudited) |
As of the Fund’s current prospectus dated May 1, 2018, the gross total annual fund operating expense ratios for Class A, Class C, Class C1, Class FI, Class R, Class I and Class IS shares were 0.85%, 1.52%, 1.21%, 0.83%, 1.13%, 0.52% and 0.43%, respectively.
Actual expenses may be higher. For example, expenses may be higher than those shown if average net assets decrease. Net assets are more likely to decrease and Fund
| 1 | Lipper, Inc., a wholly-owned subsidiary of Reuters, provides independent insight on global collective investments. Returns are based on the period ended December 31, 2018, including the reinvestment of all distributions, including returns of capital, if any, calculated among the 306 funds for thesix-month period and among the 282 funds for the twelve-month period in the Fund’s Lipper category, excluding sales charges, if any. |
| | |
| Western Asset Core Plus Bond Fund 2018 Annual Report | | 3 |
Fund overview (cont’d)
expense ratios are more likely to increase when markets are volatile.
As a result of expense limitation arrangements, the ratio of total annual fund operating expenses, other than interest, brokerage commissions, taxes, extraordinary expenses, deferred organizational expenses and acquired fund fees and expenses, to average net assets will not exceed 0.82% for Class A shares, 1.65% for Class C shares, 1.51% for Class C1 shares, 0.85% for Class FI shares, 1.15% for Class R shares, 0.45% for Class I shares and 0.45% for Class IS shares. In addition, the ratio of total annual fund operating expenses for Class IS shares will not exceed the ratio of total annual fund operating expenses for Class I shares. These expense limitation arrangements cannot be terminated prior to December 31, 2020 without the Board of Directors’ consent.
The manager is permitted to recapture amounts waived and/or reimbursed to a class within two years after the fiscal year in which the manager earned the fee or incurred the expense if the class’ total annual operating expenses have fallen to a level below the expense limitation (“expense cap”) in effect at the time the fees were earned or the expenses incurred. In no case will the manager recapture any amount that would result, on any particular business day of the Fund, in the class’ total annual operating expenses exceeding the expense cap or any other lower limit then in effect.
Q. What were the leading contributors to performance?
A.The largest contributor to the Fund’s relative performance during the reporting period was our tactical duration positioning. In particular, having a long U.S. duration in the fourth quarter of 2018 was beneficial as rates moved lower across the yield curve. This was partially offset by a short duration in Germany.
Structured product exposure, includingnon-agency residential mortgage-backed securities (“RMBS”), CMBS and asset-backed securities (“ABS”) contributed to results. Their spreads largely widened for the year as a whole, especially during the fourth quarter of 2018. However, coupon payments were able to offset spread widening and they generated slightly positive excess returns for the reporting period as a whole.
The Fund’snon-U.S. dollar developed exposure was additive for performance. In particular, shorts to the euro and Australian dollar were rewarded as they both depreciated versus the U.S. dollar in 2018.
Finally, a number of individual investment-grade corporate bonds performed well during the reporting, including CVS Caremark, Comcast Cable Communications Holdings Inc. and Williams Partners LP. Examples of strong high-yield corporate bond performers were overweights in Petrobras Global Finance BV and Valeant Pharmaceuticals International Inc.
Q. What were the leading detractors from performance?
A.The largest detractor from the Fund’s relative performance during the reporting period was its emerging market debt exposure, as their spreads widened. Signs of moderating growth, monetary policy tightening in the U.S., rising rates and a generally strengthening U.S. dollar negatively impacted the asset class during the year. In addition, the Fund’s long positions in the Brazilian real and Russian ruble detracted from returns as they both depreciated against the U.S. dollar.
| | |
| 4 | | Western Asset Core Plus Bond Fund 2018 Annual Report |
Elsewhere, the Fund’s allocation to investment-grade corporate bonds detracted from performance as their spreads widened amid rising rates. Individual investment-grade corporate bonds that detracted from results included overweight positions in General Electric Co., Reynolds American Inc. and Goldman Sachs Group Inc. Examples of weak high-yield corporate bond holdings were the Fund’s overweights in Envision Healthcare, Petco Animal Supplies and Range Resources Corp.
Finally, yield curve positioning was a negative for results overall. While the yield curve flattened during the first half of the year, it then steepened during the second half of 2018.
Thank you for your investment in Western Asset Core Plus Bond Fund. As always, we appreciate that you have chosen us to manage your assets and we remain focused on achieving the Fund’s investment goals.
Sincerely,
Western Asset Management Company, LLC
January 24, 2019
RISKS: Bonds are subject to a variety of risks, including interest rate, credit and inflation risks. As interest rates rise, bond prices fall, reducing the value of the Fund’s share price. The Fund may invest in high-yield bonds (commonly known as “junk bonds”), which are rated below investment grade and carry more risk than higher rated securities. Investments in asset-backed and mortgage-backed securities involve additional risks, including prepayment and extension risks.Non-U.S. investments are subject to currency fluctuations and social, economic and political uncertainties, which could increase volatility. These risks are magnified in emerging markets. The Fund may use derivatives, such as options, futures and swaps, which can be illiquid, may disproportionately increase losses, and have a potentially large impact on Fund performance. Please see the Fund’s prospectus for a more complete discussion of these and other risks and the Fund’s investment strategies.
Portfolio holdings and breakdowns are as of December 31, 2018 and are subject to change and may not be representative of the portfolio managers’ current or future investments. Please refer to pages 14 through 74 for a list and percentage breakdown of the Fund’s holdings.
The mention of sector breakdowns is for informational purposes only and should not be construed as a recommendation to purchase or sell any securities. The information provided regarding such sectors is not a sufficient basis upon which to make an investment decision. Investors seeking financial advice regarding the appropriateness of investing in any securities or investment strategies discussed should consult their financial professional. The Fund’s top five sector holdings (as a percentage of net assets) as of December 31, 2018 were: Corporate Bonds & Notes (30.1%), Mortgage-Backed Securities (26.6%), U.S. Government & Agency Obligations (18.4%), Collateralized Mortgage Obligations (11.7%) and Sovereign Bonds (6.4%). The Fund’s portfolio composition is subject to change at any time.
All investments are subject to risk including the possible loss of principal. Past performance is no guarantee of future results. All index performance reflects no deduction for fees, expenses or taxes. Please note that an investor cannot invest directly in an index.
The information provided is not intended to be a forecast of future events, a guarantee of future results or investment advice. Views expressed may differ from those of the firm as a whole.
| | |
| Western Asset Core Plus Bond Fund 2018 Annual Report | | 5 |
Fund overview (cont’d)
| i | Duration is the measure of the price sensitivity of a fixed-income security to an interest rate change of 100 basis points. Calculation is based on the weighted average of the present values for all cash flows. |
| ii | Effective duration is a duration calculation for bonds with embedded options. Effective duration takes into account that expected cash flows will fluctuate as interest rates change. Please note, duration measures the sensitivity of price (the value of principal) of a fixed-income investment to a change in interest rates. |
| iii | The Federal Reserve Board (the “Fed”) is responsible for the formulation of U.S. policies designed to promote economic growth, full employment, stable prices, and a sustainable pattern of international trade and payments. |
| iv | The yield curve is the graphical depiction of the relationship between the yield on bonds of the same credit quality but different maturities. |
| v | The Bloomberg Barclays U.S. Aggregate Index is a broad-based bond index comprised of government, corporate, mortgage- and asset-backed issues, rated investment grade or higher, and having at least one year to maturity. |
| vi | The Bloomberg Barclays U.S. Corporate High Yield — 2% Issuer Cap Index is an index of the 2% Issuer Cap component of the Barclays U.S. Corporate High Yield Index, which covers the U.S. dollar-denominated,non-investment grade, fixed-rate, taxable corporate bond market. |
| vii | The JPMorgan Emerging Markets Bond Index Global (“EMBI Global”) tracks total returns for U.S. dollar-denominated debt instruments issued by emerging market sovereign and quasi-sovereign entities: Brady bonds, loans, Eurobonds and local market instruments. |
| viii | U.S. Treasury Inflation-Protected Securities (“TIPS”) are inflation-indexed securities issued by the U.S. Treasury in five-year,ten-year and thirty-year maturities. The principal is adjusted to the Consumer Price Index, the commonly used measure of inflation. The coupon rate is constant, but generates a different amount of interest when multiplied by the inflation-adjusted principal. |
| | |
| 6 | | Western Asset Core Plus Bond Fund 2018 Annual Report |
Fund at a glance†(unaudited)
Investment breakdown(%) as a percent of total investments
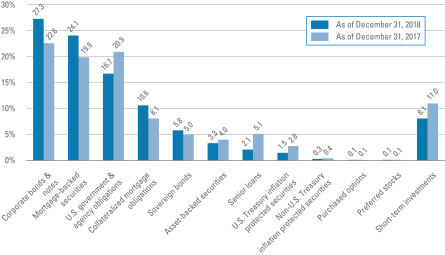
| † | The bar graph above represents the composition of the Fund’s investments as of December 31, 2018 and December 31, 2017 and does not include derivatives such as futures contracts, written options, forward foreign currency contracts and swap contracts. The Fund is actively managed. As a result, the composition of the Fund’s investments is subject to change at any time. |
| | |
| Western Asset Core Plus Bond Fund 2018 Annual Report | | 7 |
Fund expenses(unaudited)
Example
As a shareholder of the Fund, you may incur two types of costs: (1) transaction costs, includingfront-end andback-end sales charges (loads) on purchase payments; and (2) ongoing costs, including management fees; service and/or distribution(12b-1) fees; and other Fund expenses. This example is intended to help you understand your ongoing costs (in dollars) of investing in the Fund and to compare these costs with the ongoing costs of investing in other mutual funds.
This example is based on an investment of $1,000 invested on July 1, 2018 and held for the six months ended December 31, 2018.
Actual expenses
The table below titled “Based on Actual Total Return” provides information about actual account values and actual expenses. You may use the information provided in this table, together with the amount you invested, to estimate the expenses that you paid over the period. To estimate the expenses you paid on your account, divide your ending account value by $1,000 (for example, an $8,600 ending account value divided by $1,000 = 8.6), then multiply the result by the number under the heading entitled “Expenses Paid During the Period”.
Hypothetical example for comparison purposes
The table below titled “Based on Hypothetical Total Return” provides information about hypothetical account values and hypothetical expenses based on the actual expense ratio and an assumed rate of return of 5.00% per year before expenses, which is not the Fund’s actual return. The hypothetical account values and expenses may not be used to estimate the actual ending account balance or expenses you paid for the period. You may use the information provided in this table to compare the ongoing costs of investing in the Fund and other funds. To do so, compare the 5.00% hypothetical example relating to the Fund with the 5.00% hypothetical examples that appear in the shareholder reports of the other funds.
Please note that the expenses shown in the table below are meant to highlight your ongoing costs only and do not reflect any transactional costs, such asfront-end orback-end sales charges (loads). Therefore, the table is useful in comparing ongoing costs only, and will not help you determine the relative total costs of owning different funds. In addition, if these transaction costs were included, your costs would have been higher.
| | | | | | | | | | | | | | | | | | | | | | | | | | | | | | | | | | | | | | | | | | | | | | |
| | | |
| Based on actual total return1 | | | | | | | | | Based on hypothetical total return1 | |
| | | Actual
Total Return
Without
Sales
Charge2 | | | Beginning
Account
Value | | | Ending
Account
Value | | | Annualized
Expense
Ratio | | | Expenses
Paid
During
the
Period3 | | | | | | | | Hypothetical
Annualized
Total Return | | | Beginning
Account
Value | | | Ending
Account
Value | | | Annualized
Expense
Ratio | | | Expenses
Paid
During
the
Period3 | |
| Class A | | | 0.96 | % | | $ | 1,000.00 | | | $ | 1,009.60 | | | | 0.82 | % | | $ | 4.15 | | | | | | | Class A | | | 5.00 | % | | $ | 1,000.00 | | | $ | 1,021.07 | | | | 0.82 | % | | $ | 4.18 | |
| Class C | | | 0.60 | | | | 1,000.00 | | | | 1,006.00 | | | | 1.53 | | | | 7.74 | | | | | | | Class C | | | 5.00 | | | | 1,000.00 | | | | 1,017.49 | | | | 1.53 | | | | 7.78 | |
| Class C1 | | | 0.78 | | | | 1,000.00 | | | | 1,007.80 | | | | 1.18 | | | | 5.97 | | | | | | | Class C1 | | | 5.00 | | | | 1,000.00 | | | | 1,019.26 | | | | 1.18 | | | | 6.01 | |
| Class FI | | | 0.95 | | | | 1,000.00 | | | | 1,009.50 | | | | 0.84 | | | | 4.25 | | | | | | | Class FI | | | 5.00 | | | | 1,000.00 | | | | 1,020.97 | | | | 0.84 | | | | 4.28 | |
| Class R | | | 0.79 | | | | 1,000.00 | | | | 1,007.90 | | | | 1.14 | | | | 5.77 | | | | | | | Class R | | | 5.00 | | | | 1,000.00 | | | | 1,019.46 | | | | 1.14 | | | | 5.80 | |
| Class I | | | 1.15 | | | | 1,000.00 | | | | 1,011.50 | | | | 0.45 | | | | 2.28 | | | | | | | Class I | | | 5.00 | | | | 1,000.00 | | | | 1,022.94 | | | | 0.45 | | | | 2.29 | |
| Class IS | | | 1.08 | | | | 1,000.00 | | | | 1,010.80 | | | | 0.42 | | | | 2.13 | | | | | | | Class IS | | | 5.00 | | | | 1,000.00 | | | | 1,023.09 | | | | 0.42 | | | | 2.14 | |
| | |
| 8 | | Western Asset Core Plus Bond Fund 2018 Annual Report |
| 1 | For the six months ended December 31, 2018. |
| 2 | Assumes the reinvestment of all distributions, including returns of capital, if any, at net asset value and does not reflect the deduction of the applicable sales charge with respect to Class A shares or the applicable contingent deferred sales charge (“CDSC”) with respect to Class C and Class C1 shares. Total return is not annualized, as it may not be representative of the total return for the year. Performance figures may reflect compensating balance arrangements, fee waivers and/or expense reimbursements. In the absence of compensating balance arrangements, fee waivers and/or expense reimbursements, the total return would have been lower. Past performance is no guarantee of future results. |
| 3 | Expenses (net of compensating balance arrangements, fee waivers and/or expense reimbursements) are equal to each class’ respective annualized expense ratio multiplied by the average account value over the period, multiplied by the number of days in the most recent fiscal half-year (184), then divided by 365. |
| | |
| Western Asset Core Plus Bond Fund 2018 Annual Report | | 9 |
Fund performance(unaudited)
| | | | | | | | | | | | | | | | | | | | | | | | | | | | |
| Average annual total returns | |
| Without sales charges1 | | Class A | | | Class C | | | Class C1 | | | Class FI | | | Class R | | | Class I | | | Class IS | |
| Twelve Months Ended 12/31/18 | | | -1.86 | % | | | -2.53 | % | | | -2.22 | % | | | -1.87 | % | | | -2.16 | % | | | -1.49 | % | | | -1.47 | % |
| Five Years Ended 12/31/18 | | | 3.39 | | | | 2.67 | | | | 3.02 | | | | 3.41 | | | | 3.08 | | | | 3.79 | | | | 3.81 | |
| Ten Years Ended 12/31/18 | | | N/A | | | | N/A | | | | N/A | | | | 6.57 | | | | N/A | | | | 6.90 | | | | 6.92 | |
| Inception* through 12/31/18 | | | 3.06 | | | | 2.34 | | | | 2.19 | | | | — | | | | 2.73 | | | | — | | | | — | |
| | | | | | | |
| With sales charges2 | | Class A | | | Class C | | | Class C1 | | | Class FI | | | Class R | | | Class I | | | Class IS | |
| Twelve Months Ended 12/31/18 | | | -6.07 | % | | | -3.48 | % | | | -3.17 | % | | | -1.87 | % | | | -2.16 | % | | | -1.49 | % | | | -1.47 | % |
| Five Years Ended 12/31/18 | | | 2.49 | | | | 2.67 | | | | 3.02 | | | | 3.41 | | | | 3.08 | | | | 3.79 | | | | 3.81 | |
| Ten Years Ended 12/31/18 | | | N/A | | | | N/A | | | | N/A | | | | 6.57 | | | | N/A | | | | 6.90 | | | | 6.92 | |
| Inception* through 12/31/18 | | | 2.39 | | | | 2.34 | | | | 2.19 | | | | — | | | | 2.73 | | | | — | | | | — | |
| | | | |
| Cumulative total returns | | | |
| Without sales charges1 | | | |
| Class A (Inception date of 4/30/12 through 12/31/18) | | | 22.24 | % |
| Class C (Inception date of 4/30/12 through 12/31/18) | | | 16.67 | |
| Class C1 (Inception date of 10/4/12 through 12/31/18) | | | 14.49 | |
| Class FI (12/31/08 through 12/31/18) | | | 88.95 | |
| Class R (Inception date of 4/30/12 through 12/31/18) | | | 19.66 | |
| Class I (12/31/08 through 12/31/18) | | | 94.86 | |
| Class IS (12/31/08 through 12/31/18) | | | 95.34 | |
All figures represent past performance and are not a guarantee of future results. Investment return and principal value of an investment will fluctuate so that an investor’s shares, when redeemed, may be worth more or less than their original cost. The returns shown do not reflect the deduction of taxes that a shareholder would pay on Fund distributions or the redemption of Fund shares. Performance figures may reflect compensating balance arrangements, fee waivers and/or expense reimbursements. In the absence of compensating balance arrangements, fee waivers and/or expense reimbursements, the total return would have been lower.
| 1 | Assumes the reinvestment of all distributions, including returns of capital, if any, at net asset value and does not reflect the deduction of the applicable sales charge with respect to Class A shares or the applicable contingent deferred sales charge (“CDSC”) with respect to Class C shares and Class C1 shares. |
| 2 | Assumes the reinvestment of all distributions, including returns of capital, if any, at net asset value. In addition, Class A shares reflect the deduction of the maximum initial sales charge of 4.25%. Class C shares and Class C1 shares reflect the deduction of a 1.00% CDSC, which applies if shares are redeemed within one year from purchase payment. |
| * | Inception dates for Class A, C, C1, FI, R, I and IS shares are April 30, 2012, April 30, 2012, October 4, 2012, January 8, 2002, April 30, 2012, July 8, 1998 and August 4, 2008, respectively. |
| | |
| 10 | | Western Asset Core Plus Bond Fund 2018 Annual Report |
Historical performance
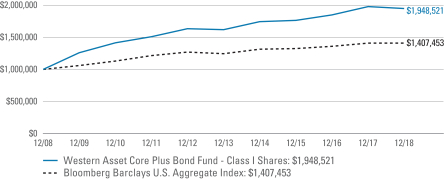
Value of $1,000,000 invested in
Class I Shares of Western Asset Core Plus Bond Fund vs. Bloomberg Barclays U.S. Aggregate Index† — December 2008 - December 2018
All figures represent past performance and are not a guarantee of future results. Investment return and principal value of an investment will fluctuate so that an investor’s shares, when redeemed, may be worth more or less than their original cost. The returns shown do not reflect the deduction of taxes that a shareholder would pay on Fund distributions or the redemption of Fund shares. Performance figures may reflect compensating balance arrangements, fee waivers and/or expense reimbursements. In the absence of compensating balance arrangements, fee waivers and/or expense reimbursements, the total return would have been lower.
| † | Hypothetical illustration of $1,000,000 invested in Class I shares of Western Asset Core Plus Bond Fund on December 31, 2008, assuming the reinvestment of all distributions, including returns of capital, if any, at net asset value through December 31, 2018. The hypothetical illustration also assumes a $1,000,000 investment in the Bloomberg Barclays U.S. Aggregate Index. The Bloomberg Barclays U.S. Aggregate Index is a broad-based bond index comprised of government, corporate, mortgage- and asset-backed issues, rated investment grade or higher, and having at least one year to maturity. The index is unmanaged and not subject to the same management and trading expenses as a mutual fund. Please note that an investor cannot invest directly in an index. The performance of the Fund’s other classes may be greater or less than Class I shares performance indicated on this chart, depending on whether greater or lesser sales charges and fees were incurred by shareholders investing in the other classes. |
| | |
| Western Asset Core Plus Bond Fund 2018 Annual Report | | 11 |
Spread duration(unaudited)
Economic exposure— December 31, 2018
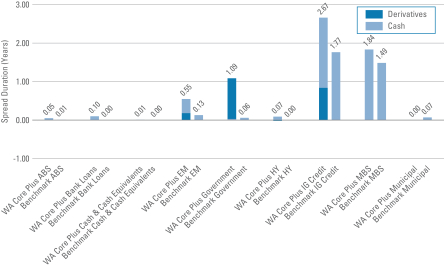
Spread duration measures the sensitivity to changes in spreads. The spread over Treasuries is the annual risk-premium demanded by investors to holdnon-Treasury securities. Spread duration is quan-tified as the % change in price resulting from a 100 basis points change in spreads. For a security with positive spread duration, an increase in spreads would result in a price decline and a decline in spreads would result in a price increase. This chart highlights the market sector exposure of the Fund’s sectors relative to the selected benchmark sectors as of the end of the reporting period.
| | |
| |
| ABS | | — Asset-Backed Securities |
| |
| Benchmark | | — Bloomberg Barclays U.S. Aggregate Index |
| |
| EM | | — Emerging Markets |
| |
| HY | | — High Yield |
| |
| IG Credit | | — Investment Grade Credit |
| |
| MBS | | — Mortgage-Backed Securities |
| |
| WA Core Plus | | — Western Asset Core Plus Bond Fund |
| | |
| 12 | | Western Asset Core Plus Bond Fund 2018 Annual Report |
Effective duration(unaudited)
Interest rate exposure— December 31, 2018
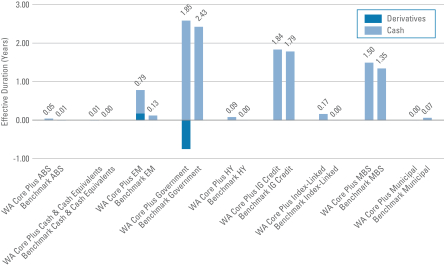
Effective duration measures the sensitivity to changes in relevant interest rates. Effective duration is quantified as the % change in price resulting from a 100 basis points change in interest rates. For a security with positive effective duration, an increase in interest rates would result in a price decline and a decline in interest rates would result in a price increase. This chart highlights the interest rate exposure of the Fund’s sectors relative to the selected benchmark sectors as of the end of the reporting period.
| | |
| |
| ABS | | — Asset-Backed Securities |
| |
| Benchmark | | — Bloomberg Barclays U.S. Aggregate Index |
| |
| EM | | — Emerging Markets |
| |
| HY | | — High Yield |
| |
| IG Credit | | — Investment Grade Credit |
| |
| MBS | | — Mortgage-Backed Securities |
| |
| WA Core Plus | | — Western Asset Core Plus Bond Fund |
| | |
| Western Asset Core Plus Bond Fund 2018 Annual Report | | 13 |
Schedule of investments
December 31, 2018
Western Asset Core Plus Bond Fund
| | | | | | | | | | | | | | | | |
| Security | | Rate | | | Maturity
Date | | | Face
Amount† | | | Value | |
| Corporate Bonds & Notes — 30.1% | | | | | | | | | | | | | | | | |
| Communication Services — 3.1% | | | | | | | | | | | | | | | | |
Diversified Telecommunication Services — 0.9% | |
AT&T Inc., Senior Notes | | | 4.450 | % | | | 5/15/21 | | | | 1,460,000 | | | $ | 1,492,459 | |
AT&T Inc., Senior Notes | | | 3.000 | % | | | 2/15/22 | | | | 2,516,000 | | | | 2,474,449 | |
AT&T Inc., Senior Notes | | | 3.400 | % | | | 5/15/25 | | | | 31,645,000 | | | | 29,840,590 | |
AT&T Inc., Senior Notes | | | 4.350 | % | | | 6/15/45 | | | | 21,939,000 | | | | 18,607,735 | |
AT&T Inc., Senior Notes | | | 4.750 | % | | | 5/15/46 | | | | 3,650,000 | | | | 3,252,552 | |
AT&T Inc., Senior Notes | | | 4.500 | % | | | 3/9/48 | | | | 13,290,000 | | | | 11,415,292 | |
Bharti Airtel Ltd., Senior Notes | | | 4.375 | % | | | 6/10/25 | | | | 570,000 | | | | 519,963 | (a) |
British Telecommunications PLC, Senior Notes | | | 9.625 | % | | | 12/15/30 | | | | 5,310,000 | | | | 7,195,680 | |
Qwest Corp., Debentures | | | 6.875 | % | | | 9/15/33 | | | | 4,760,000 | | | | 4,264,213 | |
Telecom Italia SpA, Senior Notes | | | 5.303 | % | | | 5/30/24 | | | | 7,244,000 | | | | 6,908,965 | (a) |
Telefonica Emisiones SA, Senior Notes | | | 4.103 | % | | | 3/8/27 | | | | 170,000 | | | | 163,582 | |
Telefonica Emisiones SA, Senior Notes | | | 5.213 | % | | | 3/8/47 | | | | 6,160,000 | | | | 5,658,745 | |
Telefonica Emisiones SAU, Senior Notes | | | 5.877 | % | | | 7/15/19 | | | | 1,465,000 | | | | 1,482,746 | |
Telefonica Emisiones SAU, Senior Notes | | | 5.134 | % | | | 4/27/20 | | | | 4,485,000 | | | | 4,579,017 | |
Telefonica Emisiones SAU, Senior Notes | | | 4.895 | % | | | 3/6/48 | | | | 11,960,000 | | | | 10,594,631 | |
UPCB Finance IV Ltd., Senior Secured Notes | | | 5.375 | % | | | 1/15/25 | | | | 910,000 | | | | 853,234 | (a) |
Verizon Communications Inc., Senior Notes | | | 3.500 | % | | | 11/1/24 | | | | 6,660,000 | | | | 6,577,186 | |
Verizon Communications Inc., Senior Notes | | | 3.376 | % | | | 2/15/25 | | | | 27,705,000 | | | | 26,921,911 | |
Verizon Communications Inc., Senior Notes | | | 2.625 | % | | | 8/15/26 | | | | 5,622,000 | | | | 5,105,722 | |
Verizon Communications Inc., Senior Notes | | | 4.125 | % | | | 3/16/27 | | | | 10,520,000 | | | | 10,546,303 | |
Verizon Communications Inc., Senior Notes | | | 4.329 | % | | | 9/21/28 | | | | 27,937,438 | | | | 28,107,545 | |
Verizon Communications Inc., Senior Notes | | | 4.500 | % | | | 8/10/33 | | | | 2,130,000 | | | | 2,108,066 | |
Verizon Communications Inc., Senior Notes | | | 4.400 | % | | | 11/1/34 | | | | 2,200,000 | | | | 2,126,294 | |
Verizon Communications Inc., Senior Notes | | | 4.272 | % | | | 1/15/36 | | | | 1,140,000 | | | | 1,067,761 | |
Verizon Communications Inc., Senior Notes | | | 5.250 | % | | | 3/16/37 | | | | 11,010,000 | | | | 11,502,619 | |
Verizon Communications Inc., Senior Notes | | | 3.850 | % | | | 11/1/42 | | | | 3,010,000 | | | | 2,604,451 | |
Verizon Communications Inc., Senior Notes | | | 4.125 | % | | | 8/15/46 | | | | 1,390,000 | | | | 1,231,162 | |
Verizon Communications Inc., Senior Notes | | | 4.862 | % | | | 8/21/46 | | | | 7,218,000 | | | | 7,120,313 | |
Verizon Communications Inc., Senior Notes | | | 5.500 | % | | | 3/16/47 | | | | 1,455,000 | | | | 1,552,960 | |
Verizon Communications Inc., Senior Notes | | | 4.522 | % | | | 9/15/48 | | | | 5,339,000 | | | | 5,023,820 | |
Total Diversified Telecommunication Services | | | | | | | | | | | | 220,899,966 | |
Entertainment — 0.0% | |
Viacom Inc., Senior Notes | | | 4.250 | % | | | 9/1/23 | | | | 2,512,000 | | | | 2,504,818 | |
Viacom Inc., Senior Notes | | | 3.875 | % | | | 4/1/24 | | | | 1,720,000 | | | | 1,689,084 | |
Total Entertainment | | | | | | | | | | | | | | | 4,193,902 | |
See Notes to Financial Statements.
| | |
| 14 | | Western Asset Core Plus Bond Fund 2018 Annual Report |
Western Asset Core Plus Bond Fund
| | | | | | | | | | | | | | | | |
| Security | | Rate | | | Maturity
Date | | | Face
Amount† | | | Value | |
Media — 1.8% | |
21st Century Fox America Inc., Debentures | | | 6.750 | % | | | 1/9/38 | | | | 200,000 | | | $ | 266,567 | |
21st Century Fox America Inc., Senior Notes | | | 4.500 | % | | | 2/15/21 | | | | 8,000 | | | | 8,218 | |
21st Century Fox America Inc., Senior Notes | | | 6.200 | % | | | 12/15/34 | | | | 260,000 | | | | 316,958 | |
21st Century Fox America Inc., Senior Notes | | | 6.650 | % | | | 11/15/37 | | | | 5,240,000 | | | | 6,920,061 | |
21st Century Fox America Inc., Senior Notes | | | 6.900 | % | | | 8/15/39 | | | | 120,000 | | | | 158,188 | |
Altice France SA, Senior Secured Notes | | | 7.375 | % | | | 5/1/26 | | | | 24,015,000 | | | | 22,093,800 | (a) |
Altice France SA, Senior Secured Notes | | | 8.125 | % | | | 2/1/27 | | | | 8,950,000 | | | | 8,457,750 | (a) |
CCO Holdings LLC/CCO Holdings Capital Corp., Senior Notes | | | 5.250 | % | | | 9/30/22 | | | | 880,000 | | | | 873,950 | |
CCO Holdings LLC/CCO Holdings Capital Corp., Senior Notes | | | 5.125 | % | | | 5/1/27 | | | | 17,257,000 | | | | 16,116,312 | (a) |
CCO Holdings LLC/CCO Holdings Capital Corp., Senior Notes | | | 5.000 | % | | | 2/1/28 | | | | 9,190,000 | | | | 8,477,775 | (a) |
Charter Communications Operating LLC/Charter Communications Operating Capital Corp., Senior Secured Notes | | | 3.579 | % | | | 7/23/20 | | | | 9,780,000 | | | | 9,773,120 | |
Charter Communications Operating LLC/Charter Communications Operating Capital Corp., Senior Secured Notes | | | 4.908 | % | | | 7/23/25 | | | | 10,537,000 | | | | 10,492,100 | |
Charter Communications Operating LLC/Charter Communications Operating Capital Corp., Senior Secured Notes | | | 4.200 | % | | | 3/15/28 | | | | 44,250,000 | | | | 41,761,640 | |
Charter Communications Operating LLC/Charter Communications Operating Capital Corp., Senior Secured Notes | | | 5.375 | % | | | 4/1/38 | | | | 15,910,000 | | | | 14,855,616 | |
Charter Communications Operating LLC/Charter Communications Operating Capital Corp., Senior Secured Notes | | | 6.484 | % | | | 10/23/45 | | | | 6,620,000 | | | | 6,826,663 | |
Charter Communications Operating LLC/Charter Communications Operating Capital Corp., Senior Secured Notes | | | 5.750 | % | | | 4/1/48 | | | | 450,000 | | | | 422,825 | |
Charter Communications Operating LLC/Charter Communications Operating Capital Corp., Senior Secured Notes | | | 6.834 | % | | | 10/23/55 | | | | 2,608,000 | | | | 2,661,228 | |
Comcast Cable Communications Holdings Inc., Senior Notes | | | 9.455 | % | | | 11/15/22 | | | | 3,150,000 | | | | 3,828,985 | |
Comcast Corp., Senior Notes | | | 3.375 | % | | | 8/15/25 | | | | 3,940,000 | | | | 3,842,594 | |
Comcast Corp., Senior Notes | | | 3.950 | % | | | 10/15/25 | | | | 23,330,000 | | | | 23,626,660 | |
Comcast Corp., Senior Notes | | | 3.150 | % | | | 3/1/26 | | | | 2,900,000 | | | | 2,777,396 | |
Comcast Corp., Senior Notes | | | 4.150 | % | | | 10/15/28 | | | | 55,830,000 | | | | 56,758,234 | |
Comcast Corp., Senior Notes | | | 4.250 | % | | | 10/15/30 | | | | 14,475,000 | | | | 14,658,599 | |
Comcast Corp., Senior Notes | | | 4.250 | % | | | 1/15/33 | | | | 1,710,000 | | | | 1,701,000 | |
Comcast Corp., Senior Notes | | | 4.200 | % | | | 8/15/34 | | | | 244,000 | | | | 235,662 | |
Comcast Corp., Senior Notes | | | 5.650 | % | | | 6/15/35 | | | | 60,000 | | | | 65,885 | |
Comcast Corp., Senior Notes | | | 6.500 | % | | | 11/15/35 | | | | 2,250,000 | | | | 2,697,641 | |
Comcast Corp., Senior Notes | | | 3.900 | % | | | 3/1/38 | | | | 17,500,000 | | | | 16,231,786 | |
Comcast Corp., Senior Notes | | | 3.969 | % | | | 11/1/47 | | | | 221,000 | | | | 198,027 | |
Comcast Corp., Senior Notes | | | 4.700 | % | | | 10/15/48 | | | | 3,410,000 | | | | 3,455,337 | |
Comcast Corp., Senior Notes | | | 3.999 | % | | | 11/1/49 | | | | 2,626,000 | | | | 2,359,009 | |
DISH DBS Corp., Senior Notes | | | 5.875 | % | | | 11/15/24 | | | | 21,394,000 | | | | 17,302,398 | |
See Notes to Financial Statements.
| | |
| Western Asset Core Plus Bond Fund 2018 Annual Report | | 15 |
Schedule of investments (cont’d)
December 31, 2018
Western Asset Core Plus Bond Fund
| | | | | | | | | | | | | | | | |
| Security | | Rate | | | Maturity
Date | | | Face
Amount† | | | Value | |
Media — continued | |
DISH DBS Corp., Senior Notes | | | 7.750 | % | | | 7/1/26 | | | | 3,240,000 | | | $ | 2,689,200 | |
Myriad International Holdings BV, Senior Notes | | | 4.850 | % | | | 7/6/27 | | | | 18,070,000 | | | | 17,377,232 | (a) |
NBCUniversal Enterprise Inc., Senior Notes | | | 1.974 | % | | | 4/15/19 | | | | 22,040,000 | | | | 21,970,778 | (a) |
NBCUniversal Media LLC | | | 4.375 | % | | | 4/1/21 | | | | 11,230,000 | | | | 11,514,187 | |
Time Warner Cable LLC, Senior Secured Notes | | | 8.250 | % | | | 4/1/19 | | | | 15,880,000 | | | | 16,059,202 | |
Time Warner Cable LLC, Senior Secured Notes | | | 5.000 | % | | | 2/1/20 | | | | 2,460,000 | | | | 2,495,152 | |
Time Warner Cable LLC, Senior Secured Notes | | | 4.125 | % | | | 2/15/21 | | | | 8,351,000 | | | | 8,388,941 | |
Time Warner Cable LLC, Senior Secured Notes | | | 7.300 | % | | | 7/1/38 | | | | 8,925,000 | | | | 9,701,097 | |
Time Warner Cable LLC, Senior Secured Notes | | | 6.750 | % | | | 6/15/39 | | | | 3,295,000 | | | | 3,357,429 | |
Time Warner Cable LLC, Senior Secured Notes | | | 5.875 | % | | | 11/15/40 | | | | 8,447,000 | | | | 8,091,583 | |
Time Warner Entertainment Co. LP, Senior Secured Notes | | | 8.375 | % | | | 7/15/33 | | | | 2,060,000 | | | | 2,517,029 | |
UBM PLC, Senior Notes | | | 5.750 | % | | | 11/3/20 | | | | 6,060,000 | | | | 6,208,892 | (a) |
Virgin Media Secured Finance PLC, Senior Secured Notes | | | 5.250 | % | | | 1/15/26 | | | | 1,540,000 | | | | 1,416,800 | (a) |
Virgin Media Secured Finance PLC, Senior Secured Notes | | | 5.500 | % | | | 8/15/26 | | | | 200,000 | | | | 185,470 | (a) |
Warner Media LLC, Senior Notes | | | 4.700 | % | | | 1/15/21 | | | | 20,000 | | | | 20,519 | |
Warner Media LLC, Senior Notes | | | 4.750 | % | | | 3/29/21 | | | | 9,220,000 | | | | 9,457,512 | |
Warner Media LLC, Senior Notes | | | 6.250 | % | | | 3/29/41 | | | | 970,000 | | | | 1,050,416 | |
Total Media | | | | | | | | | | | | | | | 422,723,423 | |
Wireless Telecommunication Services — 0.4% | |
America Movil SAB de CV, Senior Notes | | | 5.000 | % | | | 3/30/20 | | | | 3,680,000 | | | | 3,746,114 | |
Deutsche Telekom International Finance BV, Senior Notes | | | 2.820 | % | | | 1/19/22 | | | | 3,050,000 | | | | 2,984,806 | (a) |
Sprint Corp., Senior Notes | | | 7.250 | % | | | 9/15/21 | | | | 1,880,000 | | | | 1,928,880 | |
Sprint Corp., Senior Notes | | | 7.875 | % | | | 9/15/23 | | | | 2,900,000 | | | | 2,983,375 | |
Sprint Corp., Senior Notes | | | 7.625 | % | | | 2/15/25 | | | | 8,405,000 | | | | 8,426,012 | |
Sprint Spectrum Co. LLC/Sprint Spectrum Co. II LLC/Sprint Spectrum Co. III LLC, Senior Secured Notes | | | 3.360 | % | | | 9/20/21 | | | | 3,162,500 | | | | 3,130,875 | (a) |
Sprint Spectrum Co. LLC/Sprint Spectrum Co. II LLC/Sprint Spectrum Co. III LLC, Senior Secured Notes | | | 4.738 | % | | | 3/20/25 | | | | 1,690,000 | | | | 1,662,538 | (a) |
Vodafone Group PLC, Senior Notes | | | 4.375 | % | | | 5/30/28 | | | | 48,590,000 | | | | 47,225,323 | |
Vodafone Group PLC, Senior Notes | | | 5.250 | % | | | 5/30/48 | | | | 23,580,000 | | | | 22,217,893 | |
Total Wireless Telecommunication Services | | | | | | | | | | | | | | | 94,305,816 | |
Total Communication Services | | | | | | | | | | | | | | | 742,123,107 | |
| Consumer Discretionary — 0.9% | | | | | | | | | | | | | | | | |
Auto Components — 0.0% | |
Adient Global Holdings Ltd., Senior Notes | | | 4.875 | % | | | 8/15/26 | | | | 335,000 | | | | 257,950 | (a) |
American Axle & Manufacturing Inc., Senior Notes | | | 6.625 | % | | | 10/15/22 | | | | 315,000 | | | | 312,637 | |
Total Auto Components | | | | | | | | | | | | | | | 570,587 | |
See Notes to Financial Statements.
| | |
| 16 | | Western Asset Core Plus Bond Fund 2018 Annual Report |
Western Asset Core Plus Bond Fund
| | | | | | | | | | | | | | | | |
| Security | | Rate | | | Maturity
Date | | | Face
Amount† | | | Value | |
Automobiles — 0.3% | |
BMW US Capital LLC, Senior Notes | | | 1.850 | % | | | 9/15/21 | | | | 1,590,000 | | | $ | 1,524,794 | (a) |
Daimler Finance North America LLC, Senior Notes | | | 2.450 | % | | | 5/18/20 | | | | 2,260,000 | | | | 2,233,581 | (a) |
Ford Motor Co., Senior Notes | | | 4.750 | % | | | 1/15/43 | | | | 6,390,000 | | | | 4,943,640 | |
Ford Motor Credit Co. LLC, Senior Notes | | | 8.125 | % | | | 1/15/20 | | | | 1,020,000 | | | | 1,059,204 | |
Ford Motor Credit Co. LLC, Senior Notes | | | 3.200 | % | | | 1/15/21 | | | | 3,750,000 | | | | 3,638,342 | |
Ford Motor Credit Co. LLC, Senior Notes | | | 5.750 | % | | | 2/1/21 | | | | 2,940,000 | | | | 2,999,956 | |
Ford Motor Credit Co. LLC, Senior Notes | | | 5.875 | % | | | 8/2/21 | | | | 12,560,000 | | | | 12,888,805 | |
Ford Motor Credit Co. LLC, Senior Notes | | | 3.664 | % | | | 9/8/24 | | | | 1,190,000 | | | | 1,065,657 | |
General Motors Co., Senior Notes | | | 5.150 | % | | | 4/1/38 | | | | 2,050,000 | | | | 1,756,469 | |
General Motors Co., Senior Notes | | | 6.250 | % | | | 10/2/43 | | | | 3,640,000 | | | | 3,422,288 | |
General Motors Financial Co. Inc., Senior Notes | | | 2.450 | % | | | 11/6/20 | | | | 3,110,000 | | | | 3,021,999 | |
General Motors Financial Co. Inc., Senior Notes | | | 4.375 | % | | | 9/25/21 | | | | 3,650,000 | | | | 3,659,393 | |
General Motors Financial Co. Inc., Senior Notes | | | 3.450 | % | | | 4/10/22 | | | | 7,930,000 | | | | 7,674,641 | |
General Motors Financial Co. Inc., Senior Notes | | | 4.250 | % | | | 5/15/23 | | | | 920,000 | | | | 900,789 | |
General Motors Financial Co. Inc., Senior Notes | | | 4.350 | % | | | 1/17/27 | | | | 2,340,000 | | | | 2,157,391 | |
Total Automobiles | | | | | | | | | | | | | | | 52,946,949 | |
Diversified Consumer Services — 0.0% | |
Service Corp. International, Senior Notes | | | 7.500 | % | | | 4/1/27 | | | | 3,592,000 | | | | 3,897,320 | |
Hotels, Restaurants & Leisure — 0.3% | |
1011778 BC ULC/New Red Finance Inc., Secured Notes | | | 5.000 | % | | | 10/15/25 | | | | 5,920,000 | | | | 5,461,200 | (a) |
GLP Capital LP/GLP Financing II Inc., Senior Notes | | | 5.250 | % | | | 6/1/25 | | | | 320,000 | | | | 318,534 | |
GLP Capital LP/GLP Financing II Inc., Senior Notes | | | 5.375 | % | | | 4/15/26 | | | | 4,009,000 | | | | 3,974,964 | |
Hilton Domestic Operating Co. Inc., Senior Notes | | | 5.125 | % | | | 5/1/26 | | | | 3,130,000 | | | | 3,012,625 | (a) |
Hilton Worldwide Finance LLC/Hilton Worldwide Finance Corp., Senior Notes | | | 4.625 | % | | | 4/1/25 | | | | 605,000 | | | | 574,750 | |
Hilton Worldwide Finance LLC/Hilton Worldwide Finance Corp., Senior Notes | | | 4.875 | % | | | 4/1/27 | | | | 4,930,000 | | | | 4,640,363 | |
McDonald’s Corp., Senior Notes | | | 3.700 | % | | | 1/30/26 | | | | 10,820,000 | | | | 10,623,083 | |
McDonald’s Corp., Senior Notes | | | 3.500 | % | | | 3/1/27 | | | | 13,950,000 | | | | 13,572,164 | |
NCL Corp. Ltd., Senior Notes | | | 4.750 | % | | | 12/15/21 | | | | 1,881,000 | | | | 1,871,595 | (a) |
Sands China Ltd., Senior Notes | | | 4.600 | % | | | 8/8/23 | | | | 8,360,000 | | | | 8,325,557 | (a) |
Sands China Ltd., Senior Notes | | | 5.125 | % | | | 8/8/25 | | | | 15,550,000 | | | | 15,419,691 | (a) |
VOC Escrow Ltd., Senior Secured Notes | | | 5.000 | % | | | 2/15/28 | | | | 9,225,000 | | | | 8,556,187 | (a) |
Total Hotels, Restaurants & Leisure | | | | | | | | | | | | 76,350,713 | |
Household Durables — 0.1% | |
Lennar Corp., Senior Notes | | | 4.500 | % | | | 4/30/24 | | | | 5,640,000 | | | | 5,343,900 | |
Lennar Corp., Senior Notes | | | 4.750 | % | | | 5/30/25 | | | | 1,350,000 | | | | 1,270,688 | |
Lennar Corp., Senior Notes | | | 5.000 | % | | | 6/15/27 | | | | 820,000 | | | | 751,325 | |
Lennar Corp., Senior Notes | | | 4.750 | % | | | 11/29/27 | | | | 8,000,000 | | | | 7,250,000 | |
See Notes to Financial Statements.
| | |
| Western Asset Core Plus Bond Fund 2018 Annual Report | | 17 |
Schedule of investments (cont’d)
December 31, 2018
Western Asset Core Plus Bond Fund
| | | | | | | | | | | | | | | | |
| Security | | Rate | | | Maturity
Date | | | Face
Amount† | | | Value | |
Household Durables — continued | |
Newell Brands Inc., Senior Notes | | | 3.850 | % | | | 4/1/23 | | | | 3,320,000 | | | $ | 3,274,516 | |
Newell Brands Inc., Senior Notes | | | 4.200 | % | | | 4/1/26 | | | | 5,000,000 | | | | 4,891,120 | |
Toll Brothers Finance Corp., Senior Notes | | | 4.375 | % | | | 4/15/23 | | | | 4,740,000 | | | | 4,467,450 | |
Total Household Durables | | | | | | | | | | | | | | | 27,248,999 | |
Internet & Direct Marketing Retail — 0.2% | |
Amazon.com Inc., Senior Notes | | | 3.150 | % | | | 8/22/27 | | | | 15,280,000 | | | | 14,769,104 | |
Amazon.com Inc., Senior Notes | | | 3.875 | % | | | 8/22/37 | | | | 6,800,000 | | | | 6,580,023 | |
Amazon.com Inc., Senior Notes | | | 4.950 | % | | | 12/5/44 | | | | 10,095,000 | | | | 11,216,767 | |
Amazon.com Inc., Senior Notes | | | 4.050 | % | | | 8/22/47 | | | | 8,290,000 | | | | 8,120,491 | |
QVC Inc., Senior Secured Notes | | | 5.950 | % | | | 3/15/43 | | | | 500,000 | | | | 449,876 | |
Total Internet & Direct Marketing Retail | | | | | | | | | | | | | | | 41,136,261 | |
Specialty Retail — 0.0% | |
TJX Cos. Inc., Senior Notes | | | 2.250 | % | | | 9/15/26 | | | | 1,520,000 | | | | 1,380,515 | |
Textiles, Apparel & Luxury Goods — 0.0% | |
Hanesbrands Inc., Senior Notes | | | 4.625 | % | | | 5/15/24 | | | | 1,177,000 | | | | 1,109,323 | (a) |
Hanesbrands Inc., Senior Notes | | | 4.875 | % | | | 5/15/26 | | | | 4,810,000 | | | | 4,359,062 | (a) |
Total Textiles, Apparel & Luxury Goods | | | | | | | | | | | | | | | 5,468,385 | |
Total Consumer Discretionary | | | | | | | | | | | | | | | 208,999,729 | |
| Consumer Staples — 2.1% | | | | | | | | | | | | | | | | |
Beverages — 0.8% | |
Anheuser-Busch Cos. LLC/Anheuser-Busch InBev Worldwide Inc., Senior Notes | | | 3.650 | % | | | 2/1/26 | | | | 37,240,000 | | | | 35,244,637 | (a) |
Anheuser-Busch InBev Finance Inc., Senior Notes | | | 2.650 | % | | | 2/1/21 | | | | 5,177,000 | | | | 5,093,588 | |
Anheuser-Busch InBev Finance Inc., Senior Notes | | | 3.300 | % | | | 2/1/23 | | | | 19,690,000 | | | | 19,163,595 | |
Anheuser-Busch InBev Finance Inc., Senior Notes | | | 4.900 | % | | | 2/1/46 | | | | 22,020,000 | | | | 20,465,267 | (a) |
Anheuser-Busch InBev Worldwide Inc., Senior Notes | | | 2.500 | % | | | 7/15/22 | | | | 18,900,000 | | | | 18,060,596 | |
Anheuser-Busch InBev Worldwide Inc., Senior Notes | | | 3.500 | % | | | 1/12/24 | | | | 15,450,000 | | | | 15,129,571 | |
Anheuser-Busch InBev Worldwide Inc., Senior Notes | | | 4.000 | % | | | 4/13/28 | | | | 21,410,000 | | | | 20,518,487 | |
Anheuser-Busch InBev Worldwide Inc., Senior Notes | | | 4.600 | % | | | 4/15/48 | | | | 1,500,000 | | | | 1,349,523 | |
Constellation Brands Inc., Senior Notes | | | 4.250 | % | | | 5/1/23 | | | | 1,395,000 | | | | 1,411,716 | |
Cott Holdings Inc., Senior Notes | | | 5.500 | % | | | 4/1/25 | | | | 6,830,000 | | | | 6,462,888 | (a) |
Diageo Capital PLC, Senior Bonds | | | 4.828 | % | | | 7/15/20 | | | | 620,000 | | | | 637,122 | |
Diageo Investment Corp., Senior Notes | | | 2.875 | % | | | 5/11/22 | | | | 15,570,000 | | | | 15,425,580 | |
Molson Coors Brewing Co., Senior Notes | | | 3.500 | % | | | 5/1/22 | | | | 1,370,000 | | | | 1,362,861 | |
Molson Coors Brewing Co., Senior Notes | | | 3.000 | % | | | 7/15/26 | | | | 6,635,000 | | | | 5,918,824 | |
PepsiCo Inc., Senior Notes | | | 4.000 | % | | | 3/5/42 | | | | 4,980,000 | | | | 4,906,325 | |
Pernod Ricard SA, Senior Notes | | | 4.450 | % | | | 1/15/22 | | | | 10,485,000 | | | | 10,701,755 | (a) |
Pernod Ricard SA, Senior Notes | | | 5.500 | % | | | 1/15/42 | | | | 4,170,000 | | | | 4,566,029 | (a) |
Total Beverages | | | | | | | | | | | | | | | 186,418,364 | |
See Notes to Financial Statements.
| | |
| 18 | | Western Asset Core Plus Bond Fund 2018 Annual Report |
Western Asset Core Plus Bond Fund
| | | | | | | | | | | | | | | | |
| Security | | Rate | | | Maturity
Date | | | Face
Amount† | | | Value | |
Food & Staples Retailing — 0.2% | |
CVS Pass-Through Trust, Secured Trust | | | 5.298 | % | | | 1/11/27 | | | | 288,256 | | | $ | 293,870 | (a) |
CVS Pass-Through Trust, Secured Trust | | | 5.880 | % | | | 1/10/28 | | | | 3,477,047 | | | | 3,666,565 | |
CVS Pass-Through Trust, Secured Trust | | | 6.036 | % | | | 12/10/28 | | | | 9,329,884 | | | | 9,938,590 | |
CVS Pass-Through Trust, Secured Trust | | | 6.943 | % | | | 1/10/30 | | | | 2,212,855 | | | | 2,459,804 | |
Kroger Co. (The), Senior Notes | | | 5.150 | % | | | 8/1/43 | | | | 780,000 | | | | 748,485 | |
Walgreens Boots Alliance Inc., Senior Notes | | | 3.450 | % | | | 6/1/26 | | | | 12,000,000 | | | | 11,308,822 | |
Walmart, Inc., Senior Notes | | | 3.700 | % | | | 6/26/28 | | | | 25,130,000 | | | | 25,535,053 | |
Total Food & Staples Retailing | | | | | | | | | | | | | | | 53,951,189 | |
Food Products — 0.5% | |
Danone SA, Senior Notes | | | 2.077 | % | | | 11/2/21 | | | | 15,860,000 | | | | 15,332,052 | (a) |
Danone SA, Senior Notes | | | 2.589 | % | | | 11/2/23 | | | | 20,650,000 | | | | 19,653,756 | (a) |
Danone SA, Senior Notes | | | 2.947 | % | | | 11/2/26 | | | | 6,540,000 | | | | 5,977,295 | (a) |
Kraft Heinz Foods Co., Secured Notes | | | 4.875 | % | | | 2/15/25 | | | | 2,963,000 | | | | 2,978,136 | (a) |
Kraft Heinz Foods Co., Senior Notes | | | 5.375 | % | | | 2/10/20 | | | | 9,526,000 | | | | 9,746,287 | |
Kraft Heinz Foods Co., Senior Notes | | | 3.500 | % | | | 6/6/22 | | | | 190,000 | | | | 188,234 | |
Kraft Heinz Foods Co., Senior Notes | | | 3.500 | % | | | 7/15/22 | | | | 3,730,000 | | | | 3,678,910 | |
Kraft Heinz Foods Co., Senior Notes | | | 4.000 | % | | | 6/15/23 | | | | 690,000 | | | | 688,887 | |
Kraft Heinz Foods Co., Senior Notes | | | 3.950 | % | | | 7/15/25 | | | | 5,016,000 | | | | 4,861,158 | |
Kraft Heinz Foods Co., Senior Notes | | | 3.000 | % | | | 6/1/26 | | | | 4,963,000 | | | | 4,434,603 | |
Kraft Heinz Foods Co., Senior Notes | | | 5.000 | % | | | 7/15/35 | | | | 4,830,000 | | | | 4,545,278 | |
Kraft Heinz Foods Co., Senior Notes | | | 5.000 | % | | | 6/4/42 | | | | 440,000 | | | | 394,772 | |
Kraft Heinz Foods Co., Senior Notes | | | 5.200 | % | | | 7/15/45 | | | | 3,930,000 | | | | 3,603,523 | |
Kraft Heinz Foods Co., Senior Notes | | | 4.375 | % | | | 6/1/46 | | | | 13,460,000 | | | | 11,129,351 | |
Lamb Weston Holdings Inc., Senior Notes | | | 4.625 | % | | | 11/1/24 | | | | 90,000 | | | | 87,750 | (a) |
Lamb Weston Holdings Inc., Senior Notes | | | 4.875 | % | | | 11/1/26 | | | | 6,470,000 | | | | 6,243,550 | (a) |
WM Wrigley Jr. Co., Senior Notes | | | 2.900 | % | | | 10/21/19 | | | | 7,490,000 | | | | 7,479,709 | (a) |
WM Wrigley Jr. Co., Senior Notes | | | 3.375 | % | | | 10/21/20 | | | | 690,000 | | | | 692,106 | (a) |
Total Food Products | | | | | | | | | | | | | | | 101,715,357 | |
Household Products — 0.0% | |
Spectrum Brands Inc., Senior Notes | | | 5.750 | % | | | 7/15/25 | | | | 7,400,000 | | | | 7,064,780 | |
Tobacco — 0.6% | |
Altria Group Inc., Senior Notes | | | 9.250 | % | | | 8/6/19 | | | | 11,710,000 | | | | 12,104,387 | |
Altria Group Inc., Senior Notes | | | 4.750 | % | | | 5/5/21 | | | | 11,110,000 | | | | 11,361,158 | |
Altria Group Inc., Senior Notes | | | 2.850 | % | | | 8/9/22 | | | | 5,100,000 | | | | 4,900,013 | |
BAT Capital Corp., Senior Notes | | | 3.557 | % | | | 8/15/27 | | | | 15,851,000 | | | | 14,097,113 | |
BAT Capital Corp., Senior Notes | | | 4.540 | % | | | 8/15/47 | | | | 43,950,000 | | | | 35,112,218 | |
Philip Morris International Inc., Senior Notes | | | 1.875 | % | | | 11/1/19 | | | | 23,600,000 | | | | 23,318,914 | |
Philip Morris International Inc., Senior Notes | | | 2.900 | % | | | 11/15/21 | | | | 12,470,000 | | | | 12,319,804 | |
See Notes to Financial Statements.
| | |
| Western Asset Core Plus Bond Fund 2018 Annual Report | | 19 |
Schedule of investments (cont’d)
December 31, 2018
Western Asset Core Plus Bond Fund
| | | | | | | | | | | | | | | | |
| Security | | Rate | | | Maturity
Date | | | Face
Amount† | | | Value | |
Tobacco — continued | |
Philip Morris International Inc., Senior Notes | | | 2.500 | % | | | 8/22/22 | | | | 4,200,000 | | | $ | 4,049,318 | |
Philip Morris International Inc., Senior Notes | | | 2.500 | % | | | 11/2/22 | | | | 14,810,000 | | | | 14,241,626 | |
Philip Morris International Inc., Senior Notes | | | 4.500 | % | | | 3/20/42 | | | | 3,085,000 | | | | 2,935,703 | |
Reynolds American Inc., Senior Notes | | | 8.125 | % | | | 6/23/19 | | | | 2,160,000 | | | | 2,203,819 | |
Reynolds American Inc., Senior Notes | | | 3.250 | % | | | 6/12/20 | | | | 3,842,000 | | | | 3,819,737 | |
Reynolds American Inc., Senior Notes | | | 5.850 | % | | | 8/15/45 | | | | 7,579,000 | | | | 7,063,923 | |
Total Tobacco | | | | | | | | | | | | | | | 147,527,733 | |
Total Consumer Staples | | | | | | | | | | | | | | | 496,677,423 | |
| Energy — 4.4% | | | | | | | | | | | | | | | | |
Energy Equipment & Services — 0.1% | |
Baker Hughes a GE Co., LLC, Senior Notes | | | 3.200 | % | | | 8/15/21 | | | | 2,487,000 | | | | 2,459,188 | |
Halliburton Co., Senior Notes | | | 3.800 | % | | | 11/15/25 | | | | 13,610,000 | | | | 13,207,622 | |
Halliburton Co., Senior Notes | | | 4.850 | % | | | 11/15/35 | | | | 5,440,000 | | | | 5,356,598 | |
Halliburton Co., Senior Notes | | | 5.000 | % | | | 11/15/45 | | | | 8,510,000 | | | | 8,385,963 | |
Schlumberger Norge AS, Senior Notes | | | 4.200 | % | | | 1/15/21 | | | | 720,000 | | | | 730,866 | (a) |
Total Energy Equipment & Services | | | | | | | | | | | | | | | 30,140,237 | |
Oil, Gas & Consumable Fuels — 4.3% | |
Anadarko Finance Co., Senior Notes | | | 7.500 | % | | | 5/1/31 | | | | 6,470,000 | | | | 7,667,137 | |
Anadarko Petroleum Corp., Senior Notes | | | 8.700 | % | | | 3/15/19 | | | | 30,000 | | | | 30,310 | |
Anadarko Petroleum Corp., Senior Notes | | | 4.850 | % | | | 3/15/21 | | | | 12,852,000 | | | | 13,165,495 | |
Anadarko Petroleum Corp., Senior Notes | | | 5.550 | % | | | 3/15/26 | | | | 1,010,000 | | | | 1,059,335 | |
Anadarko Petroleum Corp., Senior Notes | | | 6.450 | % | | | 9/15/36 | | | | 14,395,000 | | | | 15,588,484 | |
Anadarko Petroleum Corp., Senior Notes | | | 4.500 | % | | | 7/15/44 | | | | 1,880,000 | | | | 1,598,745 | |
Anadarko Petroleum Corp., Senior Notes | | | 6.600 | % | | | 3/15/46 | | | | 13,540,000 | | | | 14,999,811 | |
Apache Corp., Senior Notes | | | 3.250 | % | | | 4/15/22 | | | | 2,526,000 | | | | 2,475,926 | |
Apache Corp., Senior Notes | | | 4.375 | % | | | 10/15/28 | | | | 2,060,000 | | | | 1,927,803 | |
Apache Corp., Senior Notes | | | 6.000 | % | | | 1/15/37 | | | | 1,006,000 | | | | 1,033,612 | |
Apache Corp., Senior Notes | | | 5.100 | % | | | 9/1/40 | | | | 15,199,000 | | | | 13,809,516 | |
Apache Corp., Senior Notes | | | 4.750 | % | | | 4/15/43 | | | | 5,980,000 | | | | 5,146,707 | |
Apache Corp., Senior Notes | | | 4.250 | % | | | 1/15/44 | | | | 18,548,000 | | | | 14,986,547 | |
BP Capital Markets America Inc., Senior Notes | | | 3.119 | % | | | 5/4/26 | | | | 4,790,000 | | | | 4,508,548 | |
BP Capital Markets America Inc., Senior Notes | | | 3.588 | % | | | 4/14/27 | | | | 7,160,000 | | | | 6,972,854 | |
BP Capital Markets PLC, Senior Notes | | | 3.561 | % | | | 11/1/21 | | | | 510,000 | | | | 514,747 | |
BP Capital Markets PLC, Senior Notes | | | 3.245 | % | | | 5/6/22 | | | | 1,650,000 | | | | 1,636,464 | |
BP Capital Markets PLC, Senior Notes | | | 3.216 | % | | | 11/28/23 | | | | 16,310,000 | | | | 16,085,483 | |
BP Capital Markets PLC, Senior Notes | | | 3.535 | % | | | 11/4/24 | | | | 2,390,000 | | | | 2,370,895 | |
BP Capital Markets PLC, Senior Notes | | | 3.506 | % | | | 3/17/25 | | | | 21,110,000 | | | | 20,723,764 | |
See Notes to Financial Statements.
| | |
| 20 | | Western Asset Core Plus Bond Fund 2018 Annual Report |
Western Asset Core Plus Bond Fund
| | | | | | | | | | | | | | | | |
| Security | | Rate | | | Maturity
Date | | | Face
Amount† | | | Value | |
Oil, Gas & Consumable Fuels — continued | |
Cheniere Corpus Christi Holdings LLC, Senior Secured Notes | | | 5.125 | % | | | 6/30/27 | | | | 6,420,000 | | | $ | 6,084,876 | |
Chesapeake Energy Corp., Senior Notes | | | 6.875 | % | | | 11/15/20 | | | | 5,000 | | | | 4,875 | |
Chesapeake Energy Corp., Senior Notes | | | 6.125 | % | | | 2/15/21 | | | | 4,690,000 | | | | 4,432,050 | |
Chesapeake Energy Corp., Senior Notes | | | 8.000 | % | | | 6/15/27 | | | | 2,510,000 | | | | 2,120,950 | |
Chevron Corp., Senior Notes | | | 2.954 | % | | | 5/16/26 | | | | 12,640,000 | | | | 12,180,175 | |
Cimarex Energy Co., Senior Notes | | | 3.900 | % | | | 5/15/27 | | | | 17,516,000 | | | | 16,282,247 | |
CNOOC Finance 2015 USA LLC, Senior Notes | | | 3.500 | % | | | 5/5/25 | | | | 35,600,000 | | | | 34,541,932 | |
Concho Resources Inc., Senior Notes | | | 4.375 | % | | | 1/15/25 | | | | 3,590,000 | | | | 3,550,506 | |
Concho Resources Inc., Senior Notes | | | 4.300 | % | | | 8/15/28 | | | | 12,940,000 | | | | 12,682,567 | |
Conoco Funding Co., Senior Bonds | | | 7.250 | % | | | 10/15/31 | | | | 810,000 | | | | 1,056,407 | |
ConocoPhillips, Senior Notes | | | 5.900 | % | | | 10/15/32 | | | | 10,000 | | | | 11,800 | |
ConocoPhillips, Senior Notes | | | 6.500 | % | | | 2/1/39 | | | | 90,000 | | | | 111,585 | |
ConocoPhillips Holding Co., Senior Notes | | | 6.950 | % | | | 4/15/29 | | | | 693,000 | | | | 857,887 | |
Continental Resources Inc., Senior Notes | | | 4.500 | % | | | 4/15/23 | | | | 845,000 | | | | 832,430 | |
Continental Resources Inc., Senior Notes | | | 3.800 | % | | | 6/1/24 | | | | 2,650,000 | | | | 2,511,691 | |
Continental Resources Inc., Senior Notes | | | 4.375 | % | | | 1/15/28 | | | | 3,610,000 | | | | 3,402,365 | |
Devon Energy Corp., Senior Notes | | | 3.250 | % | | | 5/15/22 | | | | 5,750,000 | | | | 5,607,504 | |
Devon Energy Corp., Senior Notes | | | 5.850 | % | | | 12/15/25 | | | | 11,916,000 | | | | 12,656,035 | |
Devon Energy Corp., Senior Notes | | | 5.600 | % | | | 7/15/41 | | | | 9,920,000 | | | | 9,435,468 | |
Devon Energy Corp., Senior Notes | | | 5.000 | % | | | 6/15/45 | | | | 24,090,000 | | | | 21,294,178 | |
Diamondback Energy Inc., Senior Notes | | | 5.375 | % | | | 5/31/25 | | | | 4,420,000 | | | | 4,320,550 | |
Ecopetrol SA, Senior Notes | | | 5.875 | % | | | 5/28/45 | | | | 27,530,000 | | | | 26,097,614 | |
Energy Transfer Operating LP, Senior Notes | | | 4.950 | % | | | 6/15/28 | | | | 3,015,000 | | | | 2,955,411 | |
Energy Transfer Partners LP/Regency Energy Finance Corp. | | | 4.500 | % | | | 11/1/23 | | | | 510,000 | | | | 510,714 | |
Energy Transfer Partners LP/Regency Energy Finance Corp., Senior Notes | | | 5.875 | % | | | 3/1/22 | | | | 5,781,000 | | | | 6,018,992 | |
Enterprise Products Operating LLC, Senior Notes | | | 4.150 | % | | | 10/16/28 | | | | 19,083,000 | | | | 19,024,723 | |
EOG Resources Inc., Senior Notes | | | 4.150 | % | | | 1/15/26 | | | | 5,682,000 | | | | 5,840,442 | |
EP Energy LLC/Everest Acquisition Finance Inc., Secured Notes | | | 9.375 | % | | | 5/1/24 | | | | 5,110,000 | | | | 2,299,500 | (a) |
EP Energy LLC/Everest Acquisition Finance Inc., Secured Notes | | | 8.000 | % | | | 2/15/25 | | | | 2,220,000 | | | | 926,850 | (a) |
Exxon Mobil Corp., Senior Notes | | | 3.043 | % | | | 3/1/26 | | | | 11,540,000 | | | | 11,268,802 | |
Exxon Mobil Corp., Senior Notes | | | 4.114 | % | | | 3/1/46 | | | | 22,720,000 | | | | 23,120,315 | |
KazMunayGas National Co. JSC, Senior Notes | | | 5.375 | % | | | 4/24/30 | | | | 2,050,000 | | | | 2,020,812 | (a) |
KazMunayGas National Co. JSC, Senior Notes | | | 6.375 | % | | | 10/24/48 | | | | 7,310,000 | | | | 7,377,618 | (a) |
Kerr-McGee Corp., Senior Notes | | | 6.950 | % | | | 7/1/24 | | | | 3,151,000 | | | | 3,516,975 | |
Kerr-McGee Corp., Senior Notes | | | 7.875 | % | | | 9/15/31 | | | | 2,087,000 | | | | 2,504,560 | |
Kinder Morgan Energy Partners LP, Senior Notes | | | 3.500 | % | | | 3/1/21 | | | | 4,510,000 | | | | 4,498,448 | |
Kinder Morgan Energy Partners LP, Senior Notes | | | 3.950 | % | | | 9/1/22 | | | | 12,600,000 | | | | 12,604,660 | |
See Notes to Financial Statements.
| | |
| Western Asset Core Plus Bond Fund 2018 Annual Report | | 21 |
Schedule of investments (cont’d)
December 31, 2018
Western Asset Core Plus Bond Fund
| | | | | | | | | | | | | | | | |
| Security | | Rate | | | Maturity
Date | | | Face
Amount† | | | Value | |
Oil, Gas & Consumable Fuels — continued | |
Kinder Morgan Inc., Senior Notes | | | 4.300 | % | | | 3/1/28 | | | | 16,590,000 | | | $ | 16,267,643 | |
Kinder Morgan Inc., Senior Notes | | | 7.800 | % | | | 8/1/31 | | | | 3,276,000 | | | | 3,933,000 | |
MEG Energy Corp., Secured Notes | | | 6.500 | % | | | 1/15/25 | | | | 680,000 | | | | 692,750 | (a) |
MEG Energy Corp., Senior Notes | | | 6.375 | % | | | 1/30/23 | | | | 350,000 | | | | 332,063 | (a) |
MEG Energy Corp., Senior Notes | | | 7.000 | % | | | 3/31/24 | | | | 960,000 | | | | 921,600 | (a) |
MPLX LP, Senior Notes | | | 4.875 | % | | | 12/1/24 | | | | 9,800,000 | | | | 9,987,979 | |
MPLX LP, Senior Notes | | | 4.875 | % | | | 6/1/25 | | | | 7,870,000 | | | | 7,952,593 | |
MPLX LP, Senior Notes | | | 4.800 | % | | | 2/15/29 | | | | 8,850,000 | | | | 8,845,735 | |
MPLX LP, Senior Notes | | | 4.500 | % | | | 4/15/38 | | | | 11,800,000 | | | | 10,337,153 | |
MPLX LP, Senior Notes | | | 4.700 | % | | | 4/15/48 | | | | 22,620,000 | | | | 19,718,546 | |
MPLX LP, Senior Notes | | | 5.500 | % | | | 2/15/49 | | | | 9,296,000 | | | | 9,075,041 | |
Noble Energy Inc., Senior Notes | | | 4.150 | % | | | 12/15/21 | | | | 10,000 | | | | 10,053 | |
Noble Energy Inc., Senior Notes | | | 3.850 | % | | | 1/15/28 | | | | 12,560,000 | | | | 11,376,942 | |
Noble Energy Inc., Senior Notes | | | 5.250 | % | | | 11/15/43 | | | | 6,205,000 | | | | 5,525,816 | |
Noble Energy Inc., Senior Notes | | | 5.050 | % | | | 11/15/44 | | | | 1,741,000 | | | | 1,504,685 | |
Noble Energy Inc., Senior Notes | | | 4.950 | % | | | 8/15/47 | | | | 4,490,000 | | | | 3,898,577 | |
Oasis Petroleum Inc., Senior Notes | | | 6.875 | % | | | 3/15/22 | | | | 4,116,000 | | | | 3,889,620 | |
Occidental Petroleum Corp., Senior Notes | | | 3.125 | % | | | 2/15/22 | | | | 5,170,000 | | | | 5,143,258 | |
Occidental Petroleum Corp., Senior Notes | | | 3.400 | % | | | 4/15/26 | | | | 9,455,000 | | | | 9,259,561 | |
Occidental Petroleum Corp., Senior Notes | | | 3.000 | % | | | 2/15/27 | | | | 7,460,000 | | | | 7,087,990 | |
Occidental Petroleum Corp., Senior Notes | | | 4.625 | % | | | 6/15/45 | | | | 5,705,000 | | | | 5,676,973 | |
Occidental Petroleum Corp., Senior Notes | | | 4.400 | % | | | 4/15/46 | | | | 2,710,000 | | | | 2,642,882 | |
Occidental Petroleum Corp., Senior Notes | | | 4.100 | % | | | 2/15/47 | | | | 10,210,000 | | | | 9,547,563 | |
Occidental Petroleum Corp., Senior Notes | | | 4.200 | % | | | 3/15/48 | | | | 7,630,000 | | | | 7,310,328 | |
Petrobras Global Finance BV, Senior Notes | | | 6.125 | % | | | 1/17/22 | | | | 3,125,000 | | | | 3,214,844 | |
Petrobras Global Finance BV, Senior Notes | | | 6.250 | % | | | 3/17/24 | | | | 14,259,000 | | | | 14,519,227 | |
Petrobras Global Finance BV, Senior Notes | | | 5.299 | % | | | 1/27/25 | | | | 92,550,000 | | | | 88,616,625 | |
Petrobras Global Finance BV, Senior Notes | | | 7.375 | % | | | 1/17/27 | | | | 7,710,000 | | | | 7,937,445 | |
Petrobras Global Finance BV, Senior Notes | | | 5.750 | % | | | 2/1/29 | | | | 16,560,000 | | | | 15,359,400 | |
Petrobras Global Finance BV, Senior Notes | | | 7.250 | % | | | 3/17/44 | | | | 23,200,000 | | | | 22,936,332 | |
Petroleos Mexicanos, Senior Notes | | | 6.875 | % | | | 8/4/26 | | | | 4,350,000 | | | | 4,239,075 | |
Petroleos Mexicanos, Senior Notes | | | 6.625 | % | | | 6/15/35 | | | | 14,490,000 | | | | 12,722,220 | |
Petroleos Mexicanos, Senior Notes | | | 5.500 | % | | | 6/27/44 | | | | 3,860,000 | | | | 2,936,225 | |
Petroleos Mexicanos, Senior Notes | | | 6.375 | % | | | 1/23/45 | | | | 14,210,000 | | | | 11,492,338 | |
QEP Resources Inc., Senior Notes | | | 6.875 | % | | | 3/1/21 | | | | 8,110,000 | | | | 8,211,375 | |
Range Resources Corp., Senior Notes | | | 5.875 | % | | | 7/1/22 | | | | 1,440,000 | | | | 1,339,200 | |
Range Resources Corp., Senior Notes | | | 5.000 | % | | | 3/15/23 | | | | 8,140,000 | | | | 7,193,725 | |
Range Resources Corp., Senior Notes | | | 4.875 | % | | | 5/15/25 | | | | 3,030,000 | | | | 2,499,750 | |
See Notes to Financial Statements.
| | |
| 22 | | Western Asset Core Plus Bond Fund 2018 Annual Report |
Western Asset Core Plus Bond Fund
| | | | | | | | | | | | | | | | |
| Security | | Rate | | | Maturity
Date | | | Face
Amount† | | | Value | |
Oil, Gas & Consumable Fuels — continued | |
Sabine Pass Liquefaction LLC, Senior Secured Notes | | | 5.750 | % | | | 5/15/24 | | | | 2,870,000 | | | $ | 2,997,742 | |
Schlumberger Holdings Corp., Senior Notes | | | 3.000 | % | | | 12/21/20 | | | | 10,900,000 | | | | 10,810,636 | (a) |
Schlumberger Holdings Corp., Senior Notes | | | 4.000 | % | | | 12/21/25 | | | | 7,580,000 | | | | 7,493,027 | (a) |
Shell International Finance BV, Senior Notes | | | 4.375 | % | | | 3/25/20 | | | | 1,980,000 | | | | 2,014,514 | |
Shell International Finance BV, Senior Notes | | | 2.875 | % | | | 5/10/26 | | �� | | 5,450,000 | | | | 5,232,542 | |
Shell International Finance BV, Senior Notes | | | 6.375 | % | | | 12/15/38 | | | | 4,655,000 | | | | 5,891,807 | |
Shell International Finance BV, Senior Notes | | | 4.550 | % | | | 8/12/43 | | | | 6,360,000 | | | | 6,625,624 | |
Shell International Finance BV, Senior Notes | | | 4.375 | % | | | 5/11/45 | | | | 13,770,000 | | | | 14,153,007 | |
Shell International Finance BV, Senior Notes | | | 4.000 | % | | | 5/10/46 | | | | 20,780,000 | | | | 20,115,710 | |
Shell International Finance BV, Senior Notes | | | 3.750 | % | | | 9/12/46 | | | | 690,000 | | | | 640,275 | |
Sinopec Group Overseas Development 2014 Ltd., Senior Notes | | | 4.375 | % | | | 4/10/24 | | | | 17,660,000 | | | | 18,059,310 | (a) |
Southern Natural Gas Co. LLC, Senior Notes | | | 8.000 | % | | | 3/1/32 | | | | 9,413,000 | | | | 11,998,842 | |
Targa Resources Partners LP/Targa Resources Partners Finance Corp., Senior Notes | | | 4.250 | % | | | 11/15/23 | | | | 3,510,000 | | | | 3,259,913 | |
Targa Resources Partners LP/Targa Resources Partners Finance Corp., Senior Notes | | | 5.875 | % | | | 4/15/26 | | | | 3,145,000 | | | | 3,074,238 | (a) |
Targa Resources Partners LP/Targa Resources Partners Finance Corp., Senior Notes | | | 5.375 | % | | | 2/1/27 | | | | 1,020,000 | | | | 961,350 | |
Transcontinental Gas Pipe Line Co. LLC, Senior Notes | | | 7.850 | % | | | 2/1/26 | | | | 35,460,000 | | | | 42,925,502 | |
Transocean Pontus Ltd., Senior Secured Notes | | | 6.125 | % | | | 8/1/25 | | | | 5,095,000 | | | | 4,942,150 | (a) |
Whiting Petroleum Corp., Senior Notes | | | 6.250 | % | | | 4/1/23 | | | | 2,480,000 | | | | 2,269,200 | |
Whiting Petroleum Corp., Senior Notes | | | 6.625 | % | | | 1/15/26 | | | | 5,825,000 | | | | 5,024,063 | |
Williams Cos. Inc., Senior Notes | | | 5.250 | % | | | 3/15/20 | | | | 4,750,000 | | | | 4,845,841 | |
Williams Cos. Inc., Senior Notes | | | 7.875 | % | | | 9/1/21 | | | | 7,903,000 | | | | 8,640,942 | |
Williams Cos. Inc., Senior Notes | | | 3.700 | % | | | 1/15/23 | | | | 3,960,000 | | | | 3,868,026 | |
Williams Cos. Inc., Senior Notes | | | 4.550 | % | | | 6/24/24 | | | | 1,790,000 | | | | 1,809,465 | |
Williams Cos. Inc., Senior Notes | | | 7.500 | % | | | 1/15/31 | | | | 4,249,000 | | | | 5,088,917 | |
Williams Cos. Inc., Senior Notes | | | 7.750 | % | | | 6/15/31 | | | | 6,418,000 | | | | 7,785,317 | |
Williams Cos. Inc., Senior Notes | | | 8.750 | % | | | 3/15/32 | | | | 3,035,000 | | | | 3,961,879 | |
Williams Cos. Inc., Senior Notes | | | 5.750 | % | | | 6/24/44 | | | | 900,000 | | | | 907,519 | |
WPX Energy Inc., Senior Notes | | | 6.000 | % | | | 1/15/22 | | | | 270,000 | | | | 263,925 | |
WPX Energy Inc., Senior Notes | | | 8.250 | % | | | 8/1/23 | | | | 1,440,000 | | | | 1,512,000 | |
Total Oil, Gas & Consumable Fuels | | | | | | | | | | | | | | | 1,002,196,112 | |
Total Energy | | | | | | | | | | | | | | | 1,032,336,349 | |
| Financials — 11.0% | | | | | | | | | | | | | | | | |
Banks — 8.3% | |
ABN AMRO Bank NV, Senior Notes | | | 2.450 | % | | | 6/4/20 | | | | 4,912,000 | | | | 4,854,235 | (a) |
ABN AMRO Bank NV, Subordinated Notes | | | 4.750 | % | | | 7/28/25 | | | | 8,210,000 | | | | 8,184,894 | (a) |
See Notes to Financial Statements.
| | |
| Western Asset Core Plus Bond Fund 2018 Annual Report | | 23 |
Schedule of investments (cont’d)
December 31, 2018
Western Asset Core Plus Bond Fund
| | | | | | | | | | | | | | | | |
| Security | | Rate | | | Maturity
Date | | | Face
Amount† | | | Value | |
Banks — continued | |
BAC Capital Trust XIV, Junior Subordinated Notes (the greater of 3 mo. USD LIBOR + 0.400% or 4.000%) | | | 4.000 | % | | | 1/23/19 | | | | 12,050,000 | | | $ | 8,561,525 | (b)(c) |
Banco Santander SA, Senior Notes | | | 3.848 | % | | | 4/12/23 | | | | 8,600,000 | | | | 8,364,438 | |
Banco Santander SA, Senior Notes | | | 4.379 | % | | | 4/12/28 | | | | 32,000,000 | | | | 29,935,005 | |
Banco Santander SA, Senior Notes (3 mo. USD LIBOR + 1.120%) | | | 3.545 | % | | | 4/12/23 | | | | 6,200,000 | | | | 6,083,189 | (c) |
Bank of America Corp., Junior Subordinated Notes (6.250% to 9/5/24 then 3 mo. USD LIBOR + 3.705%) | | | 6.250 | % | | | 9/5/24 | | | | 4,090,000 | | | | 4,046,033 | (b)(c) |
Bank of America Corp., Junior Subordinated Notes (6.100% to 3/17/25 then 3 mo. USD LIBOR + 3.898%) | | | 6.100 | % | | | 3/17/25 | | | | 7,780,000 | | | | 7,673,025 | (b)(c) |
Bank of America Corp., Senior Notes | | | 2.600 | % | | | 1/15/19 | | | | 1,176,000 | | | | 1,175,777 | |
Bank of America Corp., Senior Notes | | | 3.300 | % | | | 1/11/23 | | | | 28,960,000 | | | | 28,537,475 | |
Bank of America Corp., Senior Notes | | | 4.125 | % | | | 1/22/24 | | | | 230,000 | | | | 233,293 | |
Bank of America Corp., Senior Notes | | | 4.000 | % | | | 4/1/24 | | | | 13,890,000 | | | | 13,976,827 | |
Bank of America Corp., Senior Notes | | | 3.500 | % | | | 4/19/26 | | | | 16,160,000 | | | | 15,566,183 | |
Bank of America Corp., Senior Notes | | | 5.000 | % | | | 1/21/44 | | | | 39,300,000 | | | | 40,758,359 | |
Bank of America Corp., Senior Notes (3.004% to 12/20/22 then 3 mo. USD LIBOR + 0.790%) | | | 3.004 | % | | | 12/20/23 | | | | 39,972,000 | | | | 38,874,654 | (c) |
Bank of America Corp., Senior Notes (3.419% to 12/20/27 then 3 mo. USD LIBOR + 1.040%) | | | 3.419 | % | | | 12/20/28 | | | | 27,181,000 | | | | 25,420,017 | (c) |
Bank of America Corp., Senior Notes (3.550% to 3/5/23 then 3 mo. USD LIBOR + 0.780%) | | | 3.550 | % | | | 3/5/24 | | | | 20,980,000 | | | | 20,738,213 | (c) |
Bank of America Corp., Senior Notes (3.593% to 7/21/27 then 3 mo. USD LIBOR + 1.370%) | | | 3.593 | % | | | 7/21/28 | | | | 7,230,000 | | | | 6,863,803 | (c) |
Bank of America Corp., Senior Notes (3.970% to 3/05/28 then 3 mo. USD LIBOR + 1.070%) | | | 3.970 | % | | | 3/5/29 | | | | 85,750,000 | | | | 83,447,194 | (c) |
Bank of America Corp., Subordinated Notes | | | 4.200 | % | | | 8/26/24 | | | | 14,080,000 | | | | 13,974,973 | |
Bank of America Corp., Subordinated Notes | | | 4.000 | % | | | 1/22/25 | | | | 4,300,000 | | | | 4,192,165 | |
Bank of America Corp., Subordinated Notes | | | 4.450 | % | | | 3/3/26 | | | | 3,050,000 | | | | 3,019,794 | |
Bank of America Corp., Subordinated Notes | | | 4.250 | % | | | 10/22/26 | | | | 12,000,000 | | | | 11,682,660 | |
Bank of Montreal, Subordinated Notes (3.803% to 12/15/27 then USD 5 year Swap Rate + 1.432%) | | | 3.803 | % | | | 12/15/32 | | | | 3,780,000 | | | | 3,505,005 | (c) |
Banque Federative du Credit Mutuel SA, Senior Notes | | | 2.200 | % | | | 7/20/20 | | | | 5,000,000 | | | | 4,909,366 | (a) |
Barclays PLC, Senior Notes (4.972% to 5/16/28 then 3 mo. USD LIBOR + 1.902%) | | | 4.972 | % | | | 5/16/29 | | | | 10,900,000 | | | | 10,528,905 | (c) |
BNP Paribas SA, Senior Notes | | | 4.400 | % | | | 8/14/28 | | | | 46,530,000 | | | | 45,503,122 | (a) |
BNP Paribas SA, Subordinated Notes | | | 4.625 | % | | | 3/13/27 | | | | 9,790,000 | | | | 9,518,736 | (a) |
BNP Paribas SA, Subordinated Notes (4.375% to 3/1/28 then USD 5 year Swap Rate + 1.483%) | | | 4.375 | % | | | 3/1/33 | | | | 10,910,000 | | | | 10,226,522 | (a)(c) |
BPCE SA, Subordinated Notes | | | 5.150 | % | | | 7/21/24 | | | | 3,300,000 | | | | 3,317,637 | (a) |
CIT Group Inc., Senior Notes | | | 4.750 | % | | | 2/16/24 | | | | 8,610,000 | | | | 8,297,887 | |
See Notes to Financial Statements.
| | |
| 24 | | Western Asset Core Plus Bond Fund 2018 Annual Report |
Western Asset Core Plus Bond Fund
| | | | | | | | | | | | | | | | |
| Security | | Rate | | | Maturity
Date | | | Face
Amount† | | | Value | |
Banks — continued | |
CIT Group Inc., Senior Notes | | | 5.250 | % | | | 3/7/25 | | | | 5,730,000 | | | $ | 5,615,400 | |
Citigroup Inc., Junior Subordinated Notes (6.300% to 5/5/24 then 3 mo. USD LIBOR + 3.423%) | | | 6.300 | % | | | 5/15/24 | | | | 8,170,000 | | | | 7,547,037 | (b)(c) |
Citigroup Inc., Junior Subordinated Notes (5.350% to 5/15/23 them 3 mo. USD LIBOR + 3.466%) | | | 5.350 | % | | | 5/15/23 | | | | 6,200,000 | | | | 5,580,000 | (b)(c) |
Citigroup Inc., Junior Subordinated Notes (5.900% to 2/15/23 then 3 mo. USD LIBOR + 4.230%) | | | 5.900 | % | | | 2/15/23 | | | | 2,140,000 | | | | 1,999,830 | (b)(c) |
Citigroup Inc., Junior Subordinated Notes (5.950% to 1/30/23 then 3 mo. USD LIBOR + 4.068%) | | | 5.950 | % | | | 1/30/23 | | | | 6,050,000 | | | | 5,528,793 | (b)(c) |
Citigroup Inc., Junior Subordinated Notes (5.950% to 5/15/25 then 3 mo. USD LIBOR + 3.905%) | | | 5.950 | % | | | 5/15/25 | | | | 28,020,000 | | | | 25,393,125 | (b)(c) |
Citigroup Inc., Senior Notes | | | 8.125 | % | | | 7/15/39 | | | | 2,195,000 | | | | 3,054,028 | |
Citigroup Inc., Senior Notes | | | 4.650 | % | | | 7/30/45 | | | | 24,812,000 | | | | 24,258,616 | |
Citigroup Inc., Senior Notes | | | 4.650 | % | | | 7/23/48 | | | | 3,000,000 | | | | 2,943,573 | |
Citigroup Inc., Senior Notes (3.520% to 10/27/27 then 3 mo. USD LIBOR + 1.151%) | | | 3.520 | % | | | 10/27/28 | | | | 65,050,000 | | | | 60,777,997 | (c) |
Citigroup Inc., Senior Notes (4.075% to 4/23/28 then 3 mo. USD LIBOR + 1.192%) | | | 4.075 | % | | | 4/23/29 | | | | 16,280,000 | | | | 15,857,810 | (c) |
Citigroup Inc., Subordinated Notes | | | 4.050 | % | | | 7/30/22 | | | | 704,000 | | | | 707,784 | |
Citigroup Inc., Subordinated Notes | | | 4.400 | % | | | 6/10/25 | | | | 19,090,000 | | | | 18,697,830 | |
Citigroup Inc., Subordinated Notes | | | 5.500 | % | | | 9/13/25 | | | | 25,260,000 | | | | 26,544,636 | |
Citigroup Inc., Subordinated Notes | | | 4.300 | % | | | 11/20/26 | | | | 11,500,000 | | | | 11,076,856 | |
Citigroup Inc., Subordinated Notes | | | 4.450 | % | | | 9/29/27 | | | | 38,920,000 | | | | 37,551,885 | |
Citigroup Inc., Subordinated Notes | | | 6.625 | % | | | 6/15/32 | | | | 1,660,000 | | | | 1,936,510 | |
Citigroup Inc., Subordinated Notes | | | 6.125 | % | | | 8/25/36 | | | | 133,000 | | | | 143,884 | |
Citigroup Inc., Subordinated Notes | | | 6.675 | % | | | 9/13/43 | | | | 2,824,000 | | | | 3,342,286 | |
Citigroup Inc., Subordinated Notes | | | 5.300 | % | | | 5/6/44 | | | | 1,789,000 | | | | 1,789,073 | |
Citigroup Inc., Subordinated Notes | | | 4.750 | % | | | 5/18/46 | | | | 2,080,000 | | | | 1,929,970 | |
Commonwealth Bank of Australia, Senior Notes | | | 5.000 | % | | | 10/15/19 | | | | 4,160,000 | | | | 4,220,688 | (a) |
Commonwealth Bank of Australia, Senior Notes | | | 3.900 | % | | | 7/12/47 | | | | 16,490,000 | | | | 15,439,575 | (a) |
Cooperatieve Rabobank U.A., Senior Notes | | | 5.250 | % | | | 8/4/45 | | | | 8,420,000 | | | | 8,713,461 | |
Cooperatieve Rabobank UA, Junior Subordinated Notes (11.000% to 6/30/19 then 3 mo. USD LIBOR + 10.868%) | | | 11.000 | % | | | 6/30/19 | | | | 11,522,000 | | | | 11,939,672 | (a)(b)(c) |
Cooperatieve Rabobank UA, Senior Notes | | | 2.250 | % | | | 1/14/20 | | | | 8,520,000 | | | | 8,448,463 | |
Cooperatieve Rabobank UA, Senior Notes | | | 4.750 | % | | | 1/15/20 | | | | 10,434,000 | | | | 10,607,324 | (a) |
Cooperatieve Rabobank UA, Senior Notes | | | 4.625 | % | | | 12/1/23 | | | | 24,060,000 | | | | 24,421,768 | |
Cooperatieve Rabobank UA, Senior Notes | | | 4.375 | % | | | 8/4/25 | | | | 32,450,000 | | | | 31,916,165 | |
Credit Agricole SA, Junior Subordinated Notes (8.375% to 10/13/19 then 3 mo. USD LIBOR + 6.982%) | | | 8.375 | % | | | 10/13/19 | | | | 16,980,000 | | | | 17,446,950 | (a)(b)(c) |
Credit Agricole SA, Senior Notes | | | 2.500 | % | | | 4/15/19 | | | | 8,480,000 | | | | 8,467,204 | (a) |
See Notes to Financial Statements.
| | |
| Western Asset Core Plus Bond Fund 2018 Annual Report | | 25 |
Schedule of investments (cont’d)
December 31, 2018
Western Asset Core Plus Bond Fund
| | | | | | | | | | | | | | | | |
| Security | | Rate | | | Maturity
Date | | | Face
Amount† | | | Value | |
Banks — continued | |
Credit Agricole SA, Subordinated Notes (4.000% to 1/10/28 then USD 5 year Swap Rate + 1.644%) | | | 4.000 | % | | | 1/10/33 | | | | 11,180,000 | | | $ | 10,256,970 | (a)(c) |
HSBC Bank USA NA, Subordinated Notes | | | 4.875 | % | | | 8/24/20 | | | | 17,967,000 | | | | 18,413,007 | |
HSBC Holdings PLC, Junior Subordinated Notes (6.250% to 3/23/23 then USD 5 year ICE Swap Rate + 3.453%) | | | 6.250 | % | | | 3/23/23 | | | | 21,490,000 | | | | 20,173,737 | (b)(c) |
HSBC Holdings PLC, Junior Subordinated Notes (6.375% to 9/17/24 then USD 5 year ICE Swap Rate + 3.705%) | | | 6.375 | % | | | 9/17/24 | | | | 10,440,000 | | | | 9,735,300 | (b)(c) |
HSBC Holdings PLC, Junior Subordinated Notes (6.500% to 3/23/28 then USD 5 year ICE Swap Rate + 3.606%) | | | 6.500 | % | | | 3/23/28 | | | | 24,390,000 | | | | 22,194,900 | (b)(c) |
HSBC Holdings PLC, Senior Notes | | | 3.400 | % | | | 3/8/21 | | | | 26,610,000 | | | | 26,549,242 | |
HSBC Holdings PLC, Senior Notes | | | 4.300 | % | | | 3/8/26 | | | | 1,750,000 | | | | 1,727,812 | |
HSBC Holdings PLC, Senior Notes | | | 3.900 | % | | | 5/25/26 | | | | 19,275,000 | | | | 18,486,939 | |
HSBC Holdings PLC, Senior Notes (4.583% to 6/19/28 then 3 mo. USD LIBOR + 1.535%) | | | 4.583 | % | | | 6/19/29 | | | | 47,560,000 | | | | 47,197,033 | (c) |
HSBC Holdings PLC, Subordinated Notes | | | 4.250 | % | | | 3/14/24 | | | | 8,270,000 | | | | 8,216,712 | |
HSBC Holdings PLC, Subordinated Notes | | | 4.250 | % | | | 8/18/25 | | | | 17,750,000 | | | | 17,252,507 | |
ING Bank NV, Senior Notes | | | 2.500 | % | | | 10/1/19 | | | | 6,050,000 | | | | 6,023,134 | (a) |
ING Bank NV, Subordinated Notes | | | 5.800 | % | | | 9/25/23 | | | | 13,820,000 | | | | 14,450,265 | (a) |
Intesa Sanpaolo SpA, Senior Notes | | | 3.125 | % | | | 7/14/22 | | | | 9,160,000 | | | | 8,476,382 | (a) |
Intesa Sanpaolo SpA, Senior Notes | | | 3.375 | % | | | 1/12/23 | | | | 7,160,000 | | | | 6,638,793 | (a) |
Intesa Sanpaolo SpA, Senior Notes | | | 3.875 | % | | | 7/14/27 | | | | 40,634,000 | | | | 35,013,877 | (a) |
Intesa Sanpaolo SpA, Senior Notes | | | 3.875 | % | | | 1/12/28 | | | | 7,925,000 | | | | 6,780,694 | (a) |
Intesa Sanpaolo SpA, Senior Notes | | | 4.375 | % | | | 1/12/48 | | | | 17,902,000 | | | | 13,528,109 | (a) |
Intesa Sanpaolo SpA, Subordinated Notes | | | 5.017 | % | | | 6/26/24 | | | | 36,780,000 | | | | 33,393,995 | (a) |
Intesa Sanpaolo SpA, Subordinated Notes | | | 5.710 | % | | | 1/15/26 | | | | 13,320,000 | | | | 12,227,330 | (a) |
JPMorgan Chase & Co., Senior Notes | | | 6.300 | % | | | 4/23/19 | | | | 9,630,000 | | | | 9,724,588 | |
JPMorgan Chase & Co., Senior Notes | | | 4.400 | % | | | 7/22/20 | | | | 10,770,000 | | | | 10,967,232 | |
JPMorgan Chase & Co., Senior Notes | | | 2.550 | % | | | 3/1/21 | | | | 4,220,000 | | | | 4,161,797 | |
JPMorgan Chase & Co., Senior Notes | | | 4.350 | % | | | 8/15/21 | | | | 1,780,000 | | | | 1,822,193 | |
JPMorgan Chase & Co., Senior Notes | | | 4.500 | % | | | 1/24/22 | | | | 9,480,000 | | | | 9,772,226 | |
JPMorgan Chase & Co., Senior Notes | | | 3.625 | % | | | 5/13/24 | | | | 20,000 | | | | 19,881 | |
JPMorgan Chase & Co., Senior Notes (3.509% to 1/23/28 then 3 mo. USD LIBOR + 0.945%) | | | 3.509 | % | | | 1/23/29 | | | | 29,830,000 | | | | 28,278,513 | (c) |
JPMorgan Chase & Co., Senior Notes (4.023% to 12/5/23 then 3 mo. USD LIBOR + 1.000%) | | | 4.023 | % | | | 12/5/24 | | | | 35,640,000 | | | | 35,947,468 | (c) |
JPMorgan Chase & Co., Senior Notes (4.203% to 7/23/28 then 3 mo. USD LIBOR + 1.260%) | | | 4.203 | % | | | 7/23/29 | | | | 18,900,000 | | | | 18,864,605 | (c) |
JPMorgan Chase & Co., Senior Notes (4.452% to 12/5/28 then 3 mo. USD LIBOR + 1.330%) | | | 4.452 | % | | | 12/5/29 | | | | 7,130,000 | | | | 7,260,927 | (c) |
JPMorgan Chase & Co., Subordinated Notes | | | 3.875 | % | | | 9/10/24 | | | | 3,195,000 | | | | 3,146,183 | |
See Notes to Financial Statements.
| | |
| 26 | | Western Asset Core Plus Bond Fund 2018 Annual Report |
Western Asset Core Plus Bond Fund
| | | | | | | | | | | | | | | | |
| Security | | Rate | | | Maturity
Date | | | Face
Amount† | | | Value | |
Banks — continued | |
JPMorgan Chase & Co., Subordinated Notes | | | 4.125 | % | | | 12/15/26 | | | | 20,000,000 | | | $ | 19,546,291 | |
JPMorgan Chase & Co., Subordinated Notes | | | 4.250 | % | | | 10/1/27 | | | | 4,050,000 | | | | 3,994,062 | |
JPMorgan Chase & Co., Subordinated Notes | | | 4.950 | % | | | 6/1/45 | | | | 20,670,000 | | | | 21,008,625 | |
Lloyds Bank PLC, Senior Notes | | | 2.700 | % | | | 8/17/20 | | | | 2,110,000 | | | | 2,083,802 | |
Lloyds Bank PLC, Senior Notes | | | 6.500 | % | | | 9/14/20 | | | | 100,000 | | | | 103,753 | (a) |
Lloyds Banking Group PLC, Junior Subordinated Notes (7.500% to 9/27/25 then USD 5 year Swap Rate + 4.496%) | | | 7.500 | % | | | 9/27/25 | | | | 1,000,000 | | | | 967,700 | (b)(c) |
Lloyds Banking Group PLC, Senior Notes | | | 4.375 | % | | | 3/22/28 | | | | 18,830,000 | | | | 17,897,094 | |
Lloyds Banking Group PLC, Senior Notes | | | 4.550 | % | | | 8/16/28 | | | | 200,000 | | | | 192,531 | |
Lloyds Banking Group PLC, Senior Notes (3.574% to 11/7/27 then 3 mo. USD LIBOR + 1.205%) | | | 3.574 | % | | | 11/7/28 | | | | 3,000,000 | | | | 2,673,501 | (c) |
Lloyds Banking Group PLC, Subordinated Notes | | | 4.500 | % | | | 11/4/24 | | | | 15,350,000 | | | | 14,841,093 | |
Mitsubishi UFJ Financial Group Inc., Senior Notes | | | 2.998 | % | | | 2/22/22 | | | | 7,240,000 | | | | 7,141,801 | |
Nordea Bank Abp, Subordinated Notes | | | 4.875 | % | | | 5/13/21 | | | | 14,640,000 | | | | 14,898,433 | (a) |
Royal Bank of Canada, Senior Notes | | | 2.150 | % | | | 10/26/20 | | | | 9,960,000 | | | | 9,809,606 | |
Royal Bank of Canada, Senior Notes | | | 3.200 | % | | | 4/30/21 | | | | 11,940,000 | | | | 11,942,758 | |
Royal Bank of Scotland Group PLC, Senior Notes (3 mo. USD LIBOR + 1.905%) | | | 5.076 | % | | | 1/27/30 | | | | 3,000,000 | | | | 2,898,405 | (c) |
Royal Bank of Scotland Group PLC, Senior Notes (4.519% to 6/25/23 then 3 mo. USD LIBOR + 1.550%) | | | 4.519 | % | | | 6/25/24 | | | | 10,000,000 | | | | 9,822,118 | (c) |
Royal Bank of Scotland Group PLC, Senior Notes (4.892% to 5/18/28 then 3 mo. USD LIBOR + 1.754%) | | | 4.892 | % | | | 5/18/29 | | | | 5,450,000 | | | | 5,211,888 | (c) |
Royal Bank of Scotland Group PLC, Subordinated Notes | | | 6.125 | % | | | 12/15/22 | | | | 6,229,000 | | | | 6,318,322 | |
Royal Bank of Scotland Group PLC, Subordinated Notes | | | 6.100 | % | | | 6/10/23 | | | | 12,920,000 | | | | 13,136,676 | |
Royal Bank of Scotland Group PLC, Subordinated Notes | | | 6.000 | % | | | 12/19/23 | | | | 15,075,000 | | | | 15,273,665 | |
Royal Bank of Scotland Group PLC, Subordinated Notes | | | 5.125 | % | | | 5/28/24 | | | | 24,180,000 | | | | 23,471,338 | |
Santander UK Group Holdings PLC, Subordinated Notes | | | 5.625 | % | | | 9/15/45 | | | | 3,560,000 | | | | 3,471,259 | (a) |
Santander UK PLC, Senior Notes | | | 2.375 | % | | | 3/16/20 | | | | 6,130,000 | | | | 6,064,124 | |
Standard Chartered PLC, Subordinated Notes | | | 3.950 | % | | | 1/11/23 | | | | 2,130,000 | | | | 2,079,839 | (a) |
Standard Chartered PLC, Subordinated Notes | | | 5.700 | % | | | 3/26/44 | | | | 19,190,000 | | | | 19,267,005 | (a) |
Sumitomo Mitsui Financial Group Inc., Senior Notes | | | 2.058 | % | | | 7/14/21 | | | | 10,680,000 | | | | 10,346,959 | |
Svenska Handelsbanken AB, Senior Notes | | | 3.350 | % | | | 5/24/21 | | | | 13,040,000 | | | | 13,037,358 | |
Toronto-Dominion Bank, Senior Notes | | | 3.250 | % | | | 6/11/21 | | | | 14,710,000 | | | | 14,775,421 | |
UBS AG, Senior Notes | | | 4.500 | % | | | 6/26/48 | | | | 3,490,000 | | | | 3,614,250 | (a) |
UBS Group Funding Switzerland AG, Senior Notes | | | 3.491 | % | | | 5/23/23 | | | | 32,680,000 | | | | 31,889,796 | (a) |
UBS Group Funding Switzerland AG, Senior Notes | | | 4.125 | % | | | 9/24/25 | | | | 4,880,000 | | | | 4,866,202 | (a) |
UBS Group Funding Switzerland AG, Senior Notes | | | 4.253 | % | | | 3/23/28 | | | | 29,370,000 | | | | 28,989,801 | (a) |
US Bank NA, Senior Notes | | | 3.150 | % | | | 4/26/21 | | | | 11,950,000 | | | | 11,964,850 | |
See Notes to Financial Statements.
| | |
| Western Asset Core Plus Bond Fund 2018 Annual Report | | 27 |
Schedule of investments (cont’d)
December 31, 2018
Western Asset Core Plus Bond Fund
| | | | | | | | | | | | | | | | |
| Security | | Rate | | | Maturity
Date | | | Face
Amount† | | | Value | |
Banks — continued | |
Wachovia Capital Trust III Ltd., Gtd., Junior Subordinated Bonds (the greater of 3 mo. USD LIBOR + 0.930% or 5.570%) | | | 5.570 | % | | | 2/7/19 | | | | 38,301,000 | | | $ | 34,691,131 | (b)(c) |
Wells Fargo & Co., Junior Subordinated Notes (5.875% to 6/15/25 then 3 mo. USD LIBOR + 3.990%) | | | 5.875 | % | | | 6/15/25 | | | | 3,480,000 | | | | 3,444,156 | (b)(c) |
Wells Fargo & Co., Senior Notes | | | 4.600 | % | | | 4/1/21 | | | | 13,950,000 | | | | 14,289,624 | |
Wells Fargo & Co., Senior Notes | | | 3.000 | % | | | 10/23/26 | | | | 29,510,000 | | | | 27,346,167 | |
Wells Fargo & Co., Senior Notes (3.584% to 5/22/27 then 3 mo. USD LIBOR + 1.310%) | | | 3.584 | % | | | 5/22/28 | | | | 23,440,000 | | | | 22,528,308 | (c) |
Wells Fargo & Co., Subordinated Notes | | | 3.450 | % | | | 2/13/23 | | | | 6,860,000 | | | | 6,722,429 | |
Wells Fargo & Co., Subordinated Notes | | | 4.480 | % | | | 1/16/24 | | | | 1,802,000 | | | | 1,825,657 | |
Wells Fargo & Co., Subordinated Notes | | | 4.300 | % | | | 7/22/27 | | | | 36,290,000 | | | | 35,760,394 | |
Wells Fargo & Co., Subordinated Notes | | | 5.375 | % | | | 11/2/43 | | | | 8,140,000 | | | | 8,512,394 | |
Wells Fargo & Co., Subordinated Notes | | | 5.606 | % | | | 1/15/44 | | | | 1,840,000 | | | | 1,999,656 | |
Wells Fargo & Co., Subordinated Notes | | | 4.650 | % | | | 11/4/44 | | | | 20,450,000 | | | | 19,293,878 | |
Wells Fargo & Co., Subordinated Notes | | | 4.900 | % | | | 11/17/45 | | | | 16,404,000 | | | | 16,030,459 | |
Wells Fargo & Co., Subordinated Notes | | | 4.400 | % | | | 6/14/46 | | | | 3,070,000 | | | | 2,822,619 | |
Wells Fargo & Co., Subordinated Notes | | | 4.750 | % | | | 12/7/46 | | | | 22,515,000 | | | | 21,727,836 | |
Wells Fargo Capital X, Junior Subordinated Bonds | | | 5.950 | % | | | 12/15/36 | | | | 5,612,000 | | | | 5,822,450 | |
Westpac Banking Corp., Senior Notes | | | 2.300 | % | | | 5/26/20 | | | | 1,525,000 | | | | 1,507,645 | |
Westpac Banking Corp., Senior Notes | | | 2.600 | % | | | 11/23/20 | | | | 12,004,000 | | | | 11,854,108 | |
Total Banks | | | | | | | | | | | | | | | 1,942,350,692 | |
Capital Markets — 1.7% | |
CME Group Inc., Senior Notes | | | 5.300 | % | | | 9/15/43 | | | | 4,500,000 | | | | 5,263,382 | |
Credit Suisse Group AG, Junior Subordinated Notes (7.500% to 7/17/23 then USD 5 year Swap Rate + 4.600%) | | | 7.500 | % | | | 7/17/23 | | | | 2,000,000 | | | | 1,955,000 | (a)(b)(c) |
Credit Suisse Group AG, Senior Notes (3.869% to 1/12/28 then 3 mo. USD LIBOR + 1.410%) | | | 3.869 | % | | | 1/12/29 | | | | 19,940,000 | | | | 18,585,047 | (a)(c) |
Credit Suisse Group Funding Guernsey Ltd., Senior Notes | | | 4.550 | % | | | 4/17/26 | | | | 6,730,000 | | | | 6,673,506 | |
Credit Suisse Group Funding Guernsey Ltd., Senior Notes | | | 4.875 | % | | | 5/15/45 | | | | 21,835,000 | | | | 21,628,433 | |
Goldman Sachs Capital II Ltd. Gtd., Junior Subordinated Bonds (3 mo. USD LIBOR + 0.768%, 4.000% floor) | | | 4.000 | % | | | 2/7/19 | | | | 413,000 | | | | 281,872 | (b)(c) |
Goldman Sachs Group Inc., Senior Notes | | | 5.375 | % | | | 3/15/20 | | | | 25,760,000 | | | | 26,340,595 | |
Goldman Sachs Group Inc., Senior Notes | | | 6.000 | % | | | 6/15/20 | | | | 3,946,000 | | | | 4,086,265 | |
Goldman Sachs Group Inc., Senior Notes | | | 5.250 | % | | | 7/27/21 | | | | 5,320,000 | | | | 5,524,636 | |
Goldman Sachs Group Inc., Senior Notes | | | 4.000 | % | | | 3/3/24 | | | | 5,100,000 | | | | 5,036,032 | |
Goldman Sachs Group Inc., Senior Notes | | | 3.850 | % | | | 7/8/24 | | | | 5,410,000 | | | | 5,292,531 | |
Goldman Sachs Group Inc., Senior Notes | | | 3.500 | % | | | 1/23/25 | | | | 10,000,000 | | | | 9,486,752 | |
Goldman Sachs Group Inc., Senior Notes | | | 3.500 | % | | | 11/16/26 | | | | 10,633,000 | | | | 9,831,122 | |
See Notes to Financial Statements.
| | |
| 28 | | Western Asset Core Plus Bond Fund 2018 Annual Report |
Western Asset Core Plus Bond Fund
| | | | | | | | | | | | | | | | |
| Security | | Rate | | | Maturity
Date | | | Face
Amount† | | | Value | |
Capital Markets — continued | |
Goldman Sachs Group Inc., Senior Notes | | | 6.250 | % | | | 2/1/41 | | | | 29,580,000 | | | $ | 33,801,383 | |
Goldman Sachs Group Inc., Senior Notes | | | 4.750 | % | | | 10/21/45 | | | | 20,030,000 | | | | 19,100,126 | |
Goldman Sachs Group Inc., Senior Notes (2.876% to 10/31/21 then 3 mo. USD LIBOR + 0.821%) | | | 2.876 | % | | | 10/31/22 | | | | 34,600,000 | | | | 33,617,325 | (c) |
Goldman Sachs Group Inc., Senior Notes (3.691% to 6/5/27 then 3 mo. USD LIBOR + 1.510%) | | | 3.691 | % | | | 6/5/28 | | | | 5,760,000 | | | | 5,358,877 | (c) |
Goldman Sachs Group Inc., Senior Notes (3.814% to 4/23/28 then 3 mo. USD LIBOR + 1.158%) | | | 3.814 | % | | | 4/23/29 | | | | 78,315,000 | | | | 73,201,167 | (c) |
Goldman Sachs Group Inc., Senior Notes (4.223% to 5/1/28 then 3 mo. USD LIBOR + 1.301%) | | | 4.223 | % | | | 5/1/29 | | | | 21,650,000 | | | | 20,875,300 | (c) |
Goldman Sachs Group Inc., Subordinated Notes | | | 4.250 | % | | | 10/21/25 | | | | 24,160,000 | | | | 23,156,365 | |
Goldman Sachs Group Inc., Subordinated Notes | | | 6.750 | % | | | 10/1/37 | | | | 8,640,000 | | | | 9,773,239 | |
Goldman Sachs Group Inc., Subordinated Notes | | | 5.150 | % | | | 5/22/45 | | | | 21,841,000 | | | | 20,467,090 | |
KKR Group Finance Co. II LLC, Senior Notes | | | 5.500 | % | | | 2/1/43 | | | | 1,398,000 | | | | 1,424,146 | (a) |
Lehman Brothers Holdings Capital Trust VII, Junior Subordinated Notes | | | 5.857 | % | | | 2/7/19 | | | | 5,550,000 | | | | 0 | *(b)(d)(e)(f)(g) |
Lehman Brothers HoldingsE-Capital Trust I, Junior Subordinated Notes | | | 3.589 | % | | | 8/19/65 | | | | 190,000 | | | | 0 | *(d)(e)(f)(g) |
Lehman Brothers Holdings Inc., Subordinated Notes | | | 6.500 | % | | | 7/19/17 | | | | 5,280,000 | | | | 0 | *(e)(f)(g)(h) |
Lehman Brothers Holdings Inc., Subordinated Notes | | | 6.750 | % | | | 12/28/17 | | | | 1,070,000 | | | | 0 | *(e)(f)(g)(h) |
Morgan Stanley, Senior Notes | | | 5.500 | % | | | 7/24/20 | | | | 1,710,000 | | | | 1,763,455 | |
Morgan Stanley, Senior Notes (3.772% to 1/24/28 then 3 mo. USD LIBOR + 1.140%) | | | 3.772 | % | | | 1/24/29 | | | | 43,070,000 | | | | 41,255,034 | (c) |
Total Capital Markets | | | | | | | | | | | | | | | 403,778,680 | |
Consumer Finance — 0.1% | |
Ally Financial Inc., Senior Notes | | | 7.500 | % | | | 9/15/20 | | | | 2,699,000 | | | | 2,806,960 | |
Ally Financial Inc., Senior Notes | | | 8.000 | % | | | 11/1/31 | | | | 3,690,000 | | | | 4,114,350 | |
American Express Credit Corp., Senior Notes | | | 2.375 | % | | | 5/26/20 | | | | 12,230,000 | | | | 12,104,221 | |
Navient Corp., Senior Notes | | | 8.000 | % | | | 3/25/20 | | | | 60,000 | | | | 61,116 | |
Total Consumer Finance | | | | | | | | | | | | | | | 19,086,647 | |
Diversified Financial Services — 0.7% | |
AerCap Ireland Capital DAC/AerCap Global Aviation Trust, Senior Notes | | | 3.750 | % | | | 5/15/19 | | | | 8,550,000 | | | | 8,550,132 | |
AerCap Ireland Capital DAC/AerCap Global Aviation Trust, Senior Notes | | | 4.500 | % | | | 5/15/21 | | | | 2,590,000 | | | | 2,598,919 | |
AerCap Ireland Capital DAC/AerCap Global Aviation Trust, Senior Notes | | | 5.000 | % | | | 10/1/21 | | | | 1,180,000 | | | | 1,199,316 | |
Ahold Lease USA Inc. Pass-Through-Trust, 2001,A-2 | | | 8.620 | % | | | 1/2/25 | | | | 6,003,497 | | | | 6,841,066 | |
Boeing Capital Corp., Senior Notes | | | 4.700 | % | | | 10/27/19 | | | | 5,890,000 | | | | 5,963,981 | |
DAE Funding LLC, Senior Notes | | | 4.500 | % | | | 8/1/22 | | | | 50,000 | | | | 48,125 | (a) |
See Notes to Financial Statements.
| | |
| Western Asset Core Plus Bond Fund 2018 Annual Report | | 29 |
Schedule of investments (cont’d)
December 31, 2018
Western Asset Core Plus Bond Fund
| | | | | | | | | | | | | | | | |
| Security | | Rate | | | Maturity
Date | | | Face
Amount† | | | Value | |
Diversified Financial Services — continued | |
DAE Funding LLC, Senior Notes | | | 5.750 | % | | | 11/15/23 | | | | 6,310,000 | | | $ | 6,262,675 | (a) |
GE Capital International Funding Co. Unlimited Co., Senior Notes | | | 2.342 | % | | | 11/15/20 | | | | 17,167,000 | | | | 16,574,556 | |
GE Capital International Funding Co. Unlimited Co., Senior Notes | | | 4.418 | % | | | 11/15/35 | | | | 5,171,000 | | | | 4,343,228 | |
ILFCE-Capital Trust II, Ltd. GTD ((Highest of 3 mo. USD LIBOR, 10 year U.S. Treasury Constant Maturity Rate and 30 year U.S. Treasury Constant Maturity Rate) + 1.800%) | | | 4.800 | % | | | 12/21/65 | | | | 2,870,000 | | | | 2,252,950 | (a)(c) |
International Lease Finance Corp., Senior Notes | | | 8.625 | % | | | 1/15/22 | | | | 8,880,000 | | | | 9,879,026 | |
International Lease Finance Corp., Senior Notes | | | 5.875 | % | | | 8/15/22 | | | | 3,540,000 | | | | 3,711,006 | |
Magnolia Finance X Ltd., 2015-3GNA A1 (3 mo. GBP LIBOR + 2.483%) | | | 3.242 | % | | | 3/12/20 | | | | 43,615,623 | GBP | | | 54,202,661 | (a)(c)(f) |
Magnolia Finance X Ltd., 2015-3GNA A2 (3 mo. GBP LIBOR + 3.750%) | | | 4.509 | % | | | 3/12/20 | | | | 14,345,338 | GBP | | | 17,827,454 | (a)(c)(f) |
Park Aerospace Holdings Ltd., Senior Notes | | | 5.250 | % | | | 8/15/22 | | | | 2,510,000 | | | | 2,437,837 | (a) |
Park Aerospace Holdings Ltd., Senior Notes | | | 5.500 | % | | | 2/15/24 | | | | 3,960,000 | | | | 3,831,300 | (a) |
Syngenta Finance NV, Senior Notes | | | 3.933 | % | | | 4/23/21 | | | | 22,950,000 | | | | 22,648,745 | (a) |
Total Diversified Financial Services | | | | | | | | | | | | | | | 169,172,977 | |
Insurance — 0.2% | |
Ambac Assurance Corp., Subordinated Notes | | | 5.100 | % | | | 6/7/20 | | | | 298,644 | | | | 398,689 | (a) |
Ambac LSNI LLC, Senior Secured Notes (3 mo. USD LIBOR + 5.000%) | | | 7.803 | % | | | 2/12/23 | | | | 1,293,052 | | | | 1,299,517 | (a)(c) |
American International Group Inc., Junior Subordinated Notes (6.250% to 3/15/37 then 3 mo. USD LIBOR + 2.056%) | | | 6.250 | % | | | 3/15/37 | | | | 446,000 | | | | 431,505 | (c) |
American International Group Inc., Senior Notes | | | 3.750 | % | | | 7/10/25 | | | | 12,460,000 | | | | 11,946,820 | |
Brighthouse Financial Inc., Senior Notes | | | 4.700 | % | | | 6/22/47 | | | | 2,900,000 | | | | 2,166,801 | |
Chubb INA Holdings Inc., Senior Notes | | | 2.300 | % | | | 11/3/20 | | | | 4,100,000 | | | | 4,042,443 | |
Chubb INA Holdings Inc., Senior Notes | | | 3.350 | % | | | 5/3/26 | | | | 5,420,000 | | | | 5,307,084 | |
MetLife Capital Trust IV, Junior Subordinated Notes | | | 7.875 | % | | | 12/15/37 | | | | 8,900,000 | | | | 10,123,750 | (a) |
MetLife Inc., Junior Subordinated Notes | | | 6.400 | % | | | 12/15/36 | | | | 5,493,000 | | | | 5,593,852 | |
MetLife Inc., Senior Notes | | | 4.750 | % | | | 2/8/21 | | | | 2,030,000 | | | | 2,095,234 | |
Prudential Financial Inc., Senior Notes | | | 4.500 | % | | | 11/16/21 | | | | 300,000 | | | | 309,831 | |
Reliance Standard Life Global Funding II, Senior Secured Notes | | | 2.500 | % | | | 1/15/20 | | | | 3,726,000 | | | | 3,690,940 | (a) |
Teachers Insurance & Annuity Association of America, Subordinated Notes | | | 4.900 | % | | | 9/15/44 | | | | 7,755,000 | | | | 8,059,132 | (a) |
Total Insurance | | | | | | | | | | | | | | | 55,465,598 | |
Total Financials | | | | | | | | | | | | | | | 2,589,854,594 | |
See Notes to Financial Statements.
| | |
| 30 | | Western Asset Core Plus Bond Fund 2018 Annual Report |
Western Asset Core Plus Bond Fund
| | | | | | | | | | | | | | | | |
| Security | | Rate | | | Maturity
Date | | | Face
Amount† | | | Value | |
| Health Care — 3.2% | | | | | | | | | | | | | | | | |
Biotechnology — 0.4% | |
AbbVie Inc., Senior Notes | | | 3.600 | % | | | 5/14/25 | | | | 9,430,000 | | | $ | 9,057,803 | |
Amgen Inc., Senior Notes | | | 2.125 | % | | | 5/1/20 | | | | 3,318,000 | | | | 3,274,847 | |
Amgen Inc., Senior Notes | | | 3.625 | % | | | 5/22/24 | | | | 1,480,000 | | | | 1,477,296 | |
Amgen Inc., Senior Notes | | | 4.663 | % | | | 6/15/51 | | | | 1,933,000 | | | | 1,828,632 | |
Celgene Corp., Senior Notes | | | 2.250 | % | | | 8/15/21 | | | | 10,330,000 | | | | 10,020,885 | |
Celgene Corp., Senior Notes | | | 3.550 | % | | | 8/15/22 | | | | 4,650,000 | | | | 4,602,791 | |
Celgene Corp., Senior Notes | | | 3.625 | % | | | 5/15/24 | | | | 2,200,000 | | | | 2,148,268 | |
Celgene Corp., Senior Notes | | | 3.875 | % | | | 8/15/25 | | | | 9,750,000 | | | | 9,399,470 | |
Celgene Corp., Senior Notes | | | 5.250 | % | | | 8/15/43 | | | | 3,712,000 | | | | 3,582,964 | |
Celgene Corp., Senior Notes | | | 5.000 | % | | | 8/15/45 | | | | 15,520,000 | | | | 14,401,904 | |
Gilead Sciences Inc., Senior Notes | | | 2.550 | % | | | 9/1/20 | | | | 2,500,000 | | | | 2,480,381 | |
Gilead Sciences Inc., Senior Notes | | | 3.700 | % | | | 4/1/24 | | | | 399,000 | | | | 398,616 | |
Gilead Sciences Inc., Senior Notes | | | 3.500 | % | | | 2/1/25 | | | | 5,000,000 | | | | 4,937,946 | |
Gilead Sciences Inc., Senior Notes | | | 3.650 | % | | | 3/1/26 | | | | 1,560,000 | | | | 1,530,545 | |
Gilead Sciences Inc., Senior Notes | | | 4.750 | % | | | 3/1/46 | | | | 6,165,000 | | | | 6,130,143 | |
Gilead Sciences Inc., Senior Notes | | | 4.150 | % | | | 3/1/47 | | | | 7,660,000 | | | | 7,072,892 | |
Total Biotechnology | | | | | | | | | | | | | | | 82,345,383 | |
Health Care Equipment & Supplies — 0.3% | |
Abbott Laboratories, Senior Notes | | | 3.750 | % | | | 11/30/26 | | | | 6,580,000 | | | | 6,509,405 | |
Abbott Laboratories, Senior Notes | | | 4.750 | % | | | 11/30/36 | | | | 6,660,000 | | | | 6,973,343 | |
Abbott Laboratories, Senior Notes | | | 4.900 | % | | | 11/30/46 | | | | 10,150,000 | | | | 10,695,587 | |
Becton Dickinson and Co., Senior Notes | | | 3.363 | % | | | 6/6/24 | | | | 19,160,000 | | | | 18,425,261 | |
Becton Dickinson and Co., Senior Notes | | | 3.734 | % | | | 12/15/24 | | | | 3,922,000 | | | | 3,793,624 | |
Becton Dickinson and Co., Senior Notes | | | 4.685 | % | | | 12/15/44 | | | | 2,880,000 | | | | 2,705,392 | |
Medtronic Inc., Senior Notes | | | 3.125 | % | | | 3/15/22 | | | | 1,010,000 | | | | 1,006,595 | |
Medtronic Inc., Senior Notes | | | 3.500 | % | | | 3/15/25 | | | | 26,870,000 | | | | 26,786,046 | |
Total Health Care Equipment & Supplies | | | | | | | | | | | | | | | 76,895,253 | |
Health Care Providers & Services — 1.7% | |
Aetna Inc., Senior Notes | | | 2.800 | % | | | 6/15/23 | | | | 2,610,000 | | | | 2,484,692 | |
Anthem Inc., Senior Notes | | | 3.700 | % | | | 8/15/21 | | | | 2,130,000 | | | | 2,145,523 | |
Anthem Inc., Senior Notes | | | 3.125 | % | | | 5/15/22 | | | | 5,280,000 | | | | 5,206,529 | |
Anthem Inc., Senior Notes | | | 2.950 | % | | | 12/1/22 | | | | 9,320,000 | | | | 9,097,522 | |
Anthem Inc., Senior Notes | | | 3.350 | % | | | 12/1/24 | | | | 4,140,000 | | | | 4,038,519 | |
Anthem Inc., Senior Notes | | | 3.650 | % | | | 12/1/27 | | | | 12,660,000 | | | | 12,118,385 | |
Anthem Inc., Senior Notes | | | 4.375 | % | | | 12/1/47 | | | | 4,000,000 | | | | 3,734,933 | |
Cardinal Health Inc., Senior Notes | | | 2.616 | % | | | 6/15/22 | | | | 5,440,000 | | | | 5,244,815 | |
See Notes to Financial Statements.
| | |
| Western Asset Core Plus Bond Fund 2018 Annual Report | | 31 |
Schedule of investments (cont’d)
December 31, 2018
Western Asset Core Plus Bond Fund
| | | | | | | | | | | | | | | | |
| Security | | Rate | | | Maturity
Date | | | Face
Amount† | | | Value | |
Health Care Providers & Services — continued | |
Cardinal Health Inc., Senior Notes | | | 3.079 | % | | | 6/15/24 | | | | 7,100,000 | | | $ | 6,675,542 | |
Catholic Health Initiatives, Secured Notes | | | 4.350 | % | | | 11/1/42 | | | | 1,410,000 | | | | 1,278,355 | |
Centene Corp., Senior Notes | | | 5.625 | % | | | 2/15/21 | | | | 2,660,000 | | | | 2,673,300 | |
Centene Corp., Senior Notes | | | 4.750 | % | | | 5/15/22 | | | | 5,032,000 | | | | 4,987,970 | |
Centene Corp., Senior Notes | | | 6.125 | % | | | 2/15/24 | | | | 7,362,000 | | | | 7,555,253 | |
Centene Corp., Senior Notes | | | 4.750 | % | | | 1/15/25 | | | | 3,120,000 | | | | 2,987,400 | |
Centene Corp., Senior Notes | | | 5.375 | % | | | 6/1/26 | | | | 5,030,000 | | | | 4,904,250 | (a) |
Cigna Corp., Senior Notes | | | 3.400 | % | | | 9/17/21 | | | | 9,330,000 | | | | 9,314,747 | (a) |
Cigna Corp., Senior Notes | | | 3.750 | % | | | 7/15/23 | | | | 24,540,000 | | | | 24,483,559 | (a) |
Cigna Corp., Senior Notes | | | 4.125 | % | | | 11/15/25 | | | | 8,050,000 | | | | 8,050,591 | (a) |
Cigna Corp., Senior Notes | | | 4.375 | % | | | 10/15/28 | | | | 22,000,000 | | | | 22,165,623 | (a) |
CVS Health Corp., Senior Notes | | | 2.750 | % | | | 12/1/22 | | | | 16,440,000 | | | | 15,836,449 | |
CVS Health Corp., Senior Notes | | | 3.700 | % | | | 3/9/23 | | | | 28,650,000 | | | | 28,370,510 | |
CVS Health Corp., Senior Notes | | | 4.100 | % | | | 3/25/25 | | | | 13,250,000 | | | | 13,135,650 | |
CVS Health Corp., Senior Notes | | | 3.875 | % | | | 7/20/25 | | | | 4,447,000 | | | | 4,339,795 | |
CVS Health Corp., Senior Notes | | | 4.300 | % | | | 3/25/28 | | | | 89,790,000 | | | | 87,944,759 | |
CVS Health Corp., Senior Notes | | | 5.125 | % | | | 7/20/45 | | | | 12,410,000 | | | | 12,123,154 | |
CVS Health Corp., Senior Notes | | | 5.050 | % | | | 3/25/48 | | | | 9,550,000 | | | | 9,323,347 | |
Fresenius Medical Care U.S. Finance II Inc., Senior Notes | | | 5.875 | % | | | 1/31/22 | | | | 5,140,000 | | | | 5,362,387 | (a) |
Fresenius Medical Care U.S. Finance II Inc., Senior Notes | | | 4.750 | % | | | 10/15/24 | | | | 780,000 | | | | 795,235 | (a) |
Fresenius Medical Care U.S. Finance Inc., Senior Notes | | | 5.750 | % | | | 2/15/21 | | | | 2,045,000 | | | | 2,107,395 | (a) |
HCA Inc., Senior Notes | | | 7.500 | % | | | 2/15/22 | | | | 738,000 | | | | 785,970 | |
HCA Inc., Senior Notes | | | 7.690 | % | | | 6/15/25 | | | | 723,000 | | | | 771,803 | |
HCA Inc., Senior Notes | | | 5.625 | % | | | 9/1/28 | | | | 140,000 | | | | 135,450 | |
HCA Inc., Senior Notes | | | 7.500 | % | | | 11/15/95 | | | | 15,410,000 | | | | 15,024,750 | |
HCA Inc., Senior Secured Notes | | | 5.875 | % | | | 3/15/22 | | | | 4,150,000 | | | | 4,264,125 | |
HCA Inc., Senior Secured Notes | | | 5.000 | % | | | 3/15/24 | | | | 330,000 | | | | 327,525 | |
HCA Inc., Senior Secured Notes | | | 5.250 | % | | | 6/15/26 | | | | 2,960,000 | | | | 2,945,200 | |
HCA Inc., Senior Secured Notes | | | 4.500 | % | | | 2/15/27 | | | | 1,780,000 | | | | 1,686,550 | |
HCA Inc., Senior Secured Notes | | | 5.500 | % | | | 6/15/47 | | | | 5,920,000 | | | | 5,624,000 | |
Humana Inc., Senior Notes | | | 3.150 | % | | | 12/1/22 | | | | 2,470,000 | | | | 2,421,915 | |
Humana Inc., Senior Notes | | | 3.950 | % | | | 3/15/27 | | | | 8,340,000 | | | | 8,162,159 | |
Humana Inc., Senior Notes | | | 4.625 | % | | | 12/1/42 | | | | 3,460,000 | | | | 3,432,955 | |
Humana Inc., Senior Notes | | | 4.950 | % | | | 10/1/44 | | | | 2,476,000 | | | | 2,552,557 | |
Humana Inc., Senior Notes | | | 4.800 | % | | | 3/15/47 | | | | 600,000 | | | | 602,767 | |
Medtronic Global Holdings SCA, Senior Notes | | | 3.350 | % | | | 4/1/27 | | | | 10,300,000 | | | | 10,099,443 | |
UnitedHealth Group Inc., Senior Notes | | | 1.625 | % | | | 3/15/19 | | | | 1,540,000 | | | | 1,535,887 | |
See Notes to Financial Statements.
| | |
| 32 | | Western Asset Core Plus Bond Fund 2018 Annual Report |
Western Asset Core Plus Bond Fund
| | | | | | | | | | | | | | | | |
| Security | | Rate | | | Maturity
Date | | | Face
Amount† | | | Value | |
Health Care Providers & Services — continued | |
UnitedHealth Group Inc., Senior Notes | | | 2.700 | % | | | 7/15/20 | | | | 10,392,000 | | | $ | 10,357,173 | |
UnitedHealth Group Inc., Senior Notes | | | 3.875 | % | | | 10/15/20 | | | | 3,000,000 | | | | 3,040,710 | |
UnitedHealth Group Inc., Senior Notes | | | 2.875 | % | | | 12/15/21 | | | | 6,088,000 | | | | 6,070,879 | |
UnitedHealth Group Inc., Senior Notes | | | 5.700 | % | | | 10/15/40 | | | | 10,000,000 | | | | 11,841,493 | |
Total Health Care Providers & Services | | | | | | | | | | | | | | | 410,169,500 | |
Pharmaceuticals — 0.8% | |
Allergan Funding SCS, Senior Notes | | | 3.450 | % | | | 3/15/22 | | | | 7,230,000 | | | | 7,119,962 | |
Allergan Funding SCS, Senior Notes | | | 3.800 | % | | | 3/15/25 | | | | 10,140,000 | | | | 9,912,426 | |
Allergan Funding SCS, Senior Notes | | | 4.550 | % | | | 3/15/35 | | | | 2,770,000 | | | | 2,634,995 | |
Allergan Funding SCS, Senior Notes | | | 4.750 | % | | | 3/15/45 | | | | 15,252,000 | | | | 14,531,310 | |
Bausch Health Cos. Inc., Senior Notes | | | 5.625 | % | | | 12/1/21 | | | | 2,387,000 | | | | 2,352,687 | (a) |
Bausch Health Cos. Inc., Senior Notes | | | 5.500 | % | | | 3/1/23 | | | | 5,010,000 | | | | 4,602,937 | (a) |
Bausch Health Cos. Inc., Senior Notes | | | 6.125 | % | | | 4/15/25 | | | | 10,351,000 | | | | 9,057,125 | (a) |
Bausch Health Cos. Inc., Senior Notes | | | 9.000 | % | | | 12/15/25 | | | | 5,150,000 | | | | 5,143,562 | (a) |
Bausch Health Cos. Inc., Senior Secured Notes | | | 7.000 | % | | | 3/15/24 | | | | 7,900,000 | | | | 7,998,750 | (a) |
CVS Health Corp., Senior Notes | | | 3.350 | % | | | 3/9/21 | | | | 8,290,000 | | | | 8,270,649 | |
Eli Lilly & Co., Senior Notes | | | 3.100 | % | | | 5/15/27 | | | | 6,100,000 | | | | 5,912,454 | |
GlaxoSmithKline Capital PLC, Senior Notes | | | 2.850 | % | | | 5/8/22 | | | | 10,240,000 | | | | 10,120,630 | |
Johnson & Johnson, Senior Notes | | | 3.625 | % | | | 3/3/37 | | | | 29,750,000 | | | | 28,672,877 | |
Merck & Co. Inc., Senior Notes | | | 2.750 | % | | | 2/10/25 | | | | 6,700,000 | | | | 6,486,904 | |
Pfizer Inc., Senior Notes | | | 7.200 | % | | | 3/15/39 | | | | 5,000 | | | | 6,917 | |
Teva Pharmaceutical Finance Co. BV, Senior Notes | | | 3.650 | % | | | 11/10/21 | | | | 3,190,000 | | | | 3,024,414 | |
Teva Pharmaceutical Finance Co. BV, Senior Notes | | | 2.950 | % | | | 12/18/22 | | | | 3,013,000 | | | | 2,667,000 | |
Teva Pharmaceutical Finance IV BV, Senior Notes | | | 3.650 | % | | | 11/10/21 | | | | 5,973,000 | | | | 5,662,955 | |
Teva Pharmaceutical Finance Netherlands III BV, Senior Notes | | | 1.700 | % | | | 7/19/19 | | | | 4,849,000 | | | | 4,785,852 | |
Teva Pharmaceutical Finance Netherlands III BV, Senior Notes | | | 2.200 | % | | | 7/21/21 | | | | 30,377,000 | | | | 27,939,824 | |
Teva Pharmaceutical Finance Netherlands III BV, Senior Notes | | | 2.800 | % | | | 7/21/23 | | | | 1,667,000 | | | | 1,437,186 | |
Valeant Pharmaceuticals International, Senior Notes | | | 8.500 | % | | | 1/31/27 | | | | 1,030,000 | | | | 1,001,675 | (a) |
Wyeth LLC, Senior Notes | | | 5.950 | % | | | 4/1/37 | | | | 5,098,000 | | | | 6,124,648 | |
Total Pharmaceuticals | | | | | | | | | | | | | | | 175,467,739 | |
Total Health Care | | | | | | | | | | | | | | | 744,877,875 | |
| Industrials — 1.6% | | | | | | | | | | | | | | | | |
Aerospace & Defense — 0.5% | |
Air 2 US Pass-Through Certificates | | | 8.027 | % | | | 10/1/19 | | | | 275,407 | | | | 279,711 | (a) |
Boeing Co., Senior Notes | | | 6.000 | % | | | 3/15/19 | | | | 8,370,000 | | | | 8,410,746 | |
Boeing Co., Senior Notes | | | 4.875 | % | | | 2/15/20 | | | | 3,180,000 | | | | 3,248,803 | |
Lockheed Martin Corp., Senior Notes | | | 3.100 | % | | | 1/15/23 | | | | 2,269,000 | | | | 2,251,042 | |
See Notes to Financial Statements.
| | |
| Western Asset Core Plus Bond Fund 2018 Annual Report | | 33 |
Schedule of investments (cont’d)
December 31, 2018
Western Asset Core Plus Bond Fund
| | | | | | | | | | | | | | | | |
| Security | | Rate | | | Maturity
Date | | | Face
Amount† | | | Value | |
Aerospace & Defense — continued | |
Lockheed Martin Corp., Senior Notes | | | 3.550 | % | | | 1/15/26 | | | | 13,115,000 | | | $ | 13,033,985 | |
Lockheed Martin Corp., Senior Notes | | | 4.500 | % | | | 5/15/36 | | | | 2,420,000 | | | | 2,504,424 | |
Northrop Grumman Corp., Senior Notes | | | 2.930 | % | | | 1/15/25 | | | | 16,925,000 | | | | 16,081,788 | |
Northrop Grumman Corp., Senior Notes | | | 3.250 | % | | | 1/15/28 | | | | 29,720,000 | | | | 27,782,178 | |
Raytheon Co., Senior Notes | | | 3.125 | % | | | 10/15/20 | | | | 4,520,000 | | | | 4,535,248 | |
United Technologies Corp., Senior Notes | | | 3.950 | % | | | 8/16/25 | | | | 14,150,000 | | | | 14,060,682 | |
United Technologies Corp., Senior Notes | | | 4.125 | % | | | 11/16/28 | | | | 18,210,000 | | | | 18,076,920 | |
United Technologies Corp., Senior Notes | | | 4.500 | % | | | 6/1/42 | | | | 5,359,000 | | | | 5,080,743 | |
Total Aerospace & Defense | | | | | | | | | | | | | | | 115,346,270 | |
Air Freight & Logistics — 0.0% | |
United Parcel Service Inc., Senior Notes | | | 2.500 | % | | | 4/1/23 | | | | 5,090,000 | | | | 4,954,925 | |
United Parcel Service Inc., Senior Notes | | | 3.050 | % | | | 11/15/27 | | | | 3,680,000 | | | | 3,509,175 | |
Total Air Freight & Logistics | | | | | | | | | | | | | | | 8,464,100 | |
Airlines — 0.1% | |
Continental Airlines2001-1Class A-1 Pass-Through Trust | | | 6.703 | % | | | 6/15/21 | | | | 19,016 | | | | 20,252 | |
Continental Airlines2001-1Class A-1 Pass-Through Trust | | | 5.983 | % | | | 4/19/22 | | | | 8,008,137 | | | | 8,371,707 | |
Delta Air Lines2007-1 Class A Pass-Through Trust | | | 6.821 | % | | | 8/10/22 | | | | 6,381,901 | | | | 6,852,247 | (f) |
Northwest Airlines1999-2 Class A Pass-Through Trust | | | 7.575 | % | | | 3/1/19 | | | | 488,130 | | | | 485,528 | |
Total Airlines | | | | | | | | | | | | | | | 15,729,734 | |
Commercial Services & Supplies — 0.2% | |
Cintas Corp. No 2, Senior Notes | | | 2.900 | % | | | 4/1/22 | | | | 7,980,000 | | | | 7,855,515 | |
Cintas Corp. No 2, Senior Notes | | | 3.700 | % | | | 4/1/27 | | | | 7,500,000 | | | | 7,337,831 | |
Monitronics International Inc., Senior Notes | | | 9.125 | % | | | 4/1/20 | | | | 190,000 | | | | 49,163 | |
United Rentals North America Inc., Senior Notes | | | 5.750 | % | | | 11/15/24 | | | | 2,000,000 | | | | 1,932,500 | |
United Rentals North America Inc., Senior Notes | | | 5.500 | % | | | 7/15/25 | | | | 2,505,000 | | | | 2,367,225 | |
United Rentals North America Inc., Senior Notes | | | 5.875 | % | | | 9/15/26 | | | | 3,060,000 | | | | 2,895,525 | |
United Rentals North America Inc., Senior Notes | | | 6.500 | % | | | 12/15/26 | | | | 3,620,000 | | | | 3,574,750 | |
United Rentals North America Inc., Senior Notes | | | 5.500 | % | | | 5/15/27 | | | | 630,000 | | | | 585,900 | |
United Rentals North America Inc., Senior Notes | | | 4.875 | % | | | 1/15/28 | | | | 5,413,000 | | | | 4,763,440 | |
Waste Management Inc., Senior Notes | | | 4.600 | % | | | 3/1/21 | | | | 2,370,000 | | | | 2,444,554 | |
Waste Management Inc., Senior Notes | | | 3.500 | % | | | 5/15/24 | | | | 4,440,000 | | | | 4,440,693 | |
Waste Management Inc., Senior Notes | | | 7.375 | % | | | 5/15/29 | | | | 1,280,000 | | | | 1,584,688 | |
Total Commercial Services & Supplies | | | | | | | | | | | | | | | 39,831,784 | |
Electrical Equipment — 0.1% | |
ABB Finance USA Inc., Senior Notes | | | 4.375 | % | | | 5/8/42 | | | | 1,373,000 | | | | 1,395,818 | |
Eaton Corp., Senior Notes | | | 2.750 | % | | | 11/2/22 | | | | 25,195,000 | | | | 24,526,529 | |
Eaton Corp., Senior Notes | | | 4.150 | % | | | 11/2/42 | | | | 6,590,000 | | | | 6,209,373 | |
Total Electrical Equipment | | | | | | | | | | | | | | | 32,131,720 | |
See Notes to Financial Statements.
| | |
| 34 | | Western Asset Core Plus Bond Fund 2018 Annual Report |
Western Asset Core Plus Bond Fund
| | | | | | | | | | | | | | | | |
| Security | | Rate | | | Maturity
Date | | | Face
Amount† | | | Value | |
Industrial Conglomerates — 0.3% | |
General Electric Co., Senior Notes | | | 5.500 | % | | | 1/8/20 | | | | 1,640,000 | | | $ | 1,659,726 | |
General Electric Co., Senior Notes | | | 4.375 | % | | | 9/16/20 | | | | 4,836,000 | | | | 4,831,075 | |
General Electric Co., Senior Notes | | | 4.650 | % | | | 10/17/21 | | | | 410,000 | | | | 411,496 | |
General Electric Co., Senior Notes | | | 5.875 | % | | | 1/14/38 | | | | 10,903,000 | | | | 10,453,434 | |
General Electric Co., Senior Notes | | | 6.875 | % | | | 1/10/39 | | | | 35,494,000 | | | | 37,211,389 | |
General Electric Co., Senior Notes | | | 4.500 | % | | | 3/11/44 | | | | 8,660,000 | | | | 7,087,318 | |
General Electric Co., Subordinated Notes | | | 5.300 | % | | | 2/11/21 | | | | 4,382,000 | | | | 4,389,594 | |
Total Industrial Conglomerates | | | | | | | | | | | | | | | 66,044,032 | |
Machinery — 0.1% | |
Allison Transmission Inc., Senior Notes | | | 5.000 | % | | | 10/1/24 | | | | 3,235,000 | | | | 3,117,731 | (a) |
Allison Transmission Inc., Senior Notes | | | 4.750 | % | | | 10/1/27 | | | | 5,380,000 | | | | 4,815,100 | (a) |
John Deere Capital Corp., Senior Notes | | | 2.250 | % | | | 4/17/19 | | | | 5,268,000 | | | | 5,256,389 | |
John Deere Capital Corp., Senior Notes | | | 1.700 | % | | | 1/15/20 | | | | 2,490,000 | | | | 2,457,884 | |
Total Machinery | | | | | | | | | | | | | | | 15,647,104 | |
Road & Rail — 0.2% | |
Union Pacific Corp., Senior Notes | | | 3.750 | % | | | 7/15/25 | | | | 8,730,000 | | | | 8,825,244 | |
Union Pacific Corp., Senior Notes | | | 3.950 | % | | | 9/10/28 | | | | 28,460,000 | | | | 28,478,001 | |
Union Pacific Corp., Senior Notes | | | 4.500 | % | | | 9/10/48 | | | | 23,430,000 | | | | 23,196,906 | |
Total Road & Rail | | | | | | | | | | | | | | | 60,500,151 | |
Trading Companies & Distributors — 0.0% | |
Ashtead Capital Inc., Secured Notes | | | 4.125 | % | | | 8/15/25 | | | | 3,066,000 | | | | 2,820,720 | (a) |
Beacon Roofing Supply Inc., Senior Notes | | | 4.875 | % | | | 11/1/25 | | | | 3,790,000 | | | | 3,344,675 | (a) |
Total Trading Companies & Distributors | | | | | | | | | | | | | | | 6,165,395 | |
Transportation Infrastructure — 0.1% | |
DP World Ltd., Senior Notes | | | 5.625 | % | | | 9/25/48 | | | | 24,030,000 | | | | 22,684,320 | (a) |
Total Industrials | | | | | | | | | | | | | | | 382,544,610 | |
| Information Technology — 1.7% | | | | | | | | | | | | | | | | |
Communications Equipment — 0.0% | |
CommScope Technologies LLC, Senior Notes | | | 5.000 | % | | | 3/15/27 | | | | 3,720,000 | | | | 3,022,500 | (a) |
Harris Corp., Senior Notes | | | 4.854 | % | | | 4/27/35 | | | | 2,988,000 | | | | 2,972,755 | |
Harris Corp., Senior Notes | | | 5.054 | % | | | 4/27/45 | | | | 6,087,000 | | | | 6,284,297 | |
Total Communications Equipment | | | | | | | | | | | | | | | 12,279,552 | |
IT Services — 0.3% | |
First Data Corp., Senior Secured Notes | | | 5.000 | % | | | 1/15/24 | | | | 21,169,000 | | | | 20,454,546 | (a) |
Visa Inc., Senior Notes | | | 3.150 | % | | | 12/14/25 | | | | 26,130,000 | | | | 25,701,517 | |
Visa Inc., Senior Notes | | | 4.300 | % | | | 12/14/45 | | | | 16,470,000 | | | | 17,062,123 | |
Total IT Services | | | | | | | | | | | | | | | 63,218,186 | |
See Notes to Financial Statements.
| | |
| Western Asset Core Plus Bond Fund 2018 Annual Report | | 35 |
Schedule of investments (cont’d)
December 31, 2018
Western Asset Core Plus Bond Fund
| | | | | | | | | | | | | | | | |
| Security | | Rate | | | Maturity
Date | | | Face
Amount† | | | Value | |
Semiconductors & Semiconductor Equipment — 0.1% | |
Broadcom Corp./Broadcom Cayman Finance Ltd., Senior Notes | | | 3.125 | % | | | 1/15/25 | | | | 9,800,000 | | | $ | 8,858,959 | |
Broadcom Corp./Broadcom Cayman Finance Ltd., Senior Notes | | | 3.875 | % | | | 1/15/27 | | | | 520,000 | | | | 467,279 | |
Intel Corp., Senior Notes | | | 3.700 | % | | | 7/29/25 | | | | 4,050,000 | | | | 4,088,803 | |
Intel Corp., Senior Notes | | | 3.734 | % | | | 12/8/47 | | | | 3,104,000 | | | | 2,881,441 | |
Total Semiconductors & Semiconductor Equipment | | | | | | | | 16,296,482 | |
Software — 0.8% | |
Microsoft Corp., Senior Notes | | | 1.550 | % | | | 8/8/21 | | | | 18,543,000 | | | | 18,020,723 | |
Microsoft Corp., Senior Notes | | | 2.400 | % | | | 2/6/22 | | | | 14,850,000 | | | | 14,685,422 | |
Microsoft Corp., Senior Notes | | | 2.875 | % | | | 2/6/24 | | | | 19,298,000 | | | | 19,129,558 | |
Microsoft Corp., Senior Notes | | | 2.700 | % | | | 2/12/25 | | | | 4,322,000 | | | | 4,195,404 | |
Microsoft Corp., Senior Notes | | | 2.400 | % | | | 8/8/26 | | | | 74,200,000 | | | | 69,251,257 | |
Microsoft Corp., Senior Notes | | | 3.300 | % | | | 2/6/27 | | | | 40,450,000 | | | | 40,108,156 | |
Microsoft Corp., Senior Notes | | | 3.450 | % | | | 8/8/36 | | | | 770,000 | | | | 726,640 | |
Microsoft Corp., Senior Notes | | | 4.100 | % | | | 2/6/37 | | | | 4,530,000 | | | | 4,657,258 | |
Microsoft Corp., Senior Notes | | | 3.950 | % | | | 8/8/56 | | | | 3,840,000 | | | | 3,757,447 | |
salesforce.com Inc., Senior Notes | | | 3.250 | % | | | 4/11/23 | | | | 11,370,000 | | | | 11,435,088 | |
salesforce.com Inc., Senior Notes | | | 3.700 | % | | | 4/11/28 | | | | 3,480,000 | | | | 3,502,391 | |
Total Software | | | | | | | | | | | | | | | 189,469,344 | |
Technology Hardware, Storage & Peripherals — 0.5% | |
Apple Inc., Senior Notes | | | 2.000 | % | | | 11/13/20 | | | | 11,350,000 | | | | 11,203,527 | |
Apple Inc., Senior Notes | | | 1.550 | % | | | 8/4/21 | | | | 5,190,000 | | | | 5,034,087 | |
Apple Inc., Senior Notes | | | 2.450 | % | | | 8/4/26 | | | | 32,030,000 | | | | 29,633,410 | |
Dell International LLC/EMC Corp., Senior Secured Notes | | | 3.480 | % | | | 6/1/19 | | | | 36,680,000 | | | | 36,575,308 | (a) |
Dell International LLC/EMC Corp., Senior Secured Notes | | | 4.420 | % | | | 6/15/21 | | | | 37,507,000 | | | | 37,466,641 | (a) |
Total Technology Hardware, Storage & Peripherals | | | | | | | | | | | | | | | 119,912,973 | |
Total Information Technology | | | | | | | | | | | | | | | 401,176,537 | |
| Materials — 1.2% | | | | | | | | | | | | | | | | |
Chemicals — 0.1% | |
Equate Petrochemical BV, Senior Notes | | | 4.250 | % | | | 11/3/26 | | | | 12,930,000 | | | | 12,553,026 | (a) |
LyondellBasell Industries NV, Senior Notes | | | 5.000 | % | | | 4/15/19 | | | | 1,311,000 | | | | 1,312,451 | |
LyondellBasell Industries NV, Senior Notes | | | 6.000 | % | | | 11/15/21 | | | | 2,360,000 | | | | 2,496,074 | |
LyondellBasell Industries NV, Senior Notes | | | 5.750 | % | | | 4/15/24 | | | | 2,690,000 | | | | 2,882,012 | |
Nutrien Ltd., Senior Notes | | | 4.875 | % | | | 3/30/20 | | | | 330,000 | | | | 335,853 | |
OCP SA, Senior Notes | | | 4.500 | % | | | 10/22/25 | | | | 10,510,000 | | | | 10,097,251 | (a) |
Total Chemicals | | | | | | | | | | | | | | | 29,676,667 | |
Containers & Packaging — 0.1% | |
Ardagh Packaging Finance PLC/Ardagh Holdings USA Inc., Senior Secured Notes | | | 4.625 | % | | | 5/15/23 | | | | 4,500,000 | | | | 4,308,750 | (a) |
See Notes to Financial Statements.
| | |
| 36 | | Western Asset Core Plus Bond Fund 2018 Annual Report |
Western Asset Core Plus Bond Fund
| | | | | | | | | | | | | | | | |
| Security | | Rate | | | Maturity
Date | | | Face
Amount† | | | Value | |
Containers & Packaging — continued | |
Ardagh Packaging Finance PLC/Ardagh MP Holdings USA Inc., Senior Notes | | | 6.000 | % | | | 2/15/25 | | | | 940,000 | | | $ | 870,083 | (a) |
Ball Corp., Senior Notes | | | 4.000 | % | | | 11/15/23 | | | | 2,790,000 | | | | 2,720,250 | |
Berry Global Inc., Secured Notes | | | 4.500 | % | | | 2/15/26 | | | | 1,620,000 | | | | 1,486,350 | (a) |
Reynolds Group Issuer Inc./Reynolds Group Issuer LLC/Reynolds Group Issuer (Luxembourg) SA, Senior Secured Notes | | | 6.875 | % | | | 2/15/21 | | | | 1,789,865 | | | | 1,792,103 | |
Reynolds Group Issuer Inc./Reynolds Group Issuer LLC/Reynolds Group Issuer (Luxembourg) SA, Senior Secured Notes | | | 5.125 | % | | | 7/15/23 | | | | 5,190,000 | | | | 4,949,962 | (a) |
WestRock RKT Co., Senior Notes | | | 3.500 | % | | | 3/1/20 | | | | 2,855,000 | | | | 2,853,247 | |
WestRock RKT Co., Senior Notes | | | 4.000 | % | | | 3/1/23 | | | | 2,250,000 | | | | 2,251,086 | |
Total Containers & Packaging | | | | | | | | | | | | | | | 21,231,831 | |
Metals & Mining — 1.0% | |
Alcoa Nederland Holding BV, Senior Notes | | | 6.750 | % | | | 9/30/24 | | | | 12,985,000 | | | | 13,244,700 | (a) |
Alcoa Nederland Holding BV, Senior Notes | | | 6.125 | % | | | 5/15/28 | | | | 435,000 | | | | 417,600 | (a) |
Anglo American Capital PLC, Senior Notes | | | 3.750 | % | | | 4/10/22 | | | | 12,605,000 | | | | 12,314,166 | (a) |
Anglo American Capital PLC, Senior Notes | | | 3.625 | % | | | 9/11/24 | | | | 3,400,000 | | | | 3,216,695 | (a) |
Anglo American Capital PLC, Senior Notes | | | 4.750 | % | | | 4/10/27 | | | | 9,785,000 | | | | 9,380,824 | (a) |
Anglo American Capital PLC, Senior Notes | | | 4.000 | % | | | 9/11/27 | | | | 13,125,000 | | | | 11,889,030 | (a) |
ArcelorMittal, Senior Notes | | | 6.250 | % | | | 2/25/22 | | | | 3,510,000 | | | | 3,712,557 | |
ArcelorMittal, Senior Notes | | | 7.000 | % | | | 10/15/39 | | | | 3,490,000 | | | | 3,684,034 | |
Barrick Gold Corp., Senior Notes | | | 5.250 | % | | | 4/1/42 | | | | 1,590,000 | | | | 1,593,227 | |
Barrick North America Finance LLC, Senior Notes | | | 5.700 | % | | | 5/30/41 | | | | 8,454,000 | | | | 8,930,351 | |
Barrick North America Finance LLC, Senior Notes | | | 5.750 | % | | | 5/1/43 | | | | 8,260,000 | | | | 8,687,966 | |
BHP Billiton Finance USA Ltd., Senior Notes | | | 2.875 | % | | | 2/24/22 | | | | 983,000 | | | | 976,000 | |
BHP Billiton Finance USA Ltd., Senior Notes | | | 5.000 | % | | | 9/30/43 | | | | 7,630,000 | | | | 8,347,276 | |
BHP Billiton Finance USA Ltd., Senior Notes (6.750% to 10/19/25 then USD 5 year Swap Rate + 5.093% to 10/19/45 then USD 5 year Swap Rate + 5.843%) | | | 6.750 | % | | | 10/19/75 | | | | 28,735,000 | | | | 29,840,004 | (a)(c) |
Freeport-McMoRan Inc., Senior Notes | | | 4.000 | % | | | 11/14/21 | | | | 6,825,000 | | | | 6,662,906 | |
Freeport-McMoRan Inc., Senior Notes | | | 3.550 | % | | | 3/1/22 | | | | 590,000 | | | | 559,763 | |
Freeport-McMoRan Inc., Senior Notes | | | 6.875 | % | | | 2/15/23 | | | | 2,091,000 | | | | 2,164,185 | |
Freeport-McMoRan Inc., Senior Notes | | | 3.875 | % | | | 3/15/23 | | | | 40,000 | | | | 37,100 | |
Freeport-McMoRan Inc., Senior Notes | | | 4.550 | % | | | 11/14/24 | | | | 130,000 | | | | 120,413 | |
Freeport-McMoRan Inc., Senior Notes | | | 5.450 | % | | | 3/15/43 | | | | 4,172,000 | | | | 3,196,795 | |
Glencore Finance Canada Ltd., Senior Notes | | | 6.000 | % | | | 11/15/41 | | | | 2,120,000 | | | | 2,047,400 | (a) |
Glencore Funding LLC, Senior Notes | | | 2.875 | % | | | 4/16/20 | | | | 2,010,000 | | | | 1,992,184 | (a) |
Glencore Funding LLC, Senior Notes | | | 3.000 | % | | | 10/27/22 | | | | 29,060,000 | | | | 27,742,420 | (a) |
Glencore Funding LLC, Senior Notes | | | 4.125 | % | | | 5/30/23 | | | | 4,620,000 | | | | 4,540,577 | (a) |
Glencore Funding LLC, Senior Notes | | | 4.000 | % | | | 3/27/27 | | | | 18,890,000 | | | | 17,226,647 | (a) |
See Notes to Financial Statements.
| | |
| Western Asset Core Plus Bond Fund 2018 Annual Report | | 37 |
Schedule of investments (cont’d)
December 31, 2018
Western Asset Core Plus Bond Fund
| | | | | | | | | | | | | | | | |
| Security | | Rate | | | Maturity
Date | | | Face
Amount† | | | Value | |
Metals & Mining — continued | |
Southern Copper Corp., Senior Notes | | | 5.250 | % | | | 11/8/42 | | | | 24,800,000 | | | $ | 23,648,493 | |
Vale Overseas Ltd., Senior Notes | | | 6.875 | % | | | 11/21/36 | | | | 6,581,000 | | | | 7,558,279 | |
Yamana Gold Inc., Senior Notes | | | 4.625 | % | | | 12/15/27 | | | | 10,350,000 | | | | 9,621,108 | |
Total Metals & Mining | | | | | | | | | | | | | | | 223,352,700 | |
Total Materials | | | | | | | | | | | | | | | 274,261,198 | |
| Real Estate — 0.1% | | | | | | | | | | | | | | | | |
Equity Real Estate Investment Trusts (REITs) — 0.1% | |
CoreCivic Inc., Senior Notes | | | 4.750 | % | | | 10/15/27 | | | | 634,000 | | | | 527,013 | |
MGM Growth Properties Operating Partnership LP/MGP FinanceCo-Issuer Inc., Senior Notes | | | 5.625 | % | | | 5/1/24 | | | | 1,610,000 | | | | 1,599,937 | |
MGM Growth Properties Operating Partnership LP/MGP FinanceCo-Issuer Inc., Senior Notes | | | 4.500 | % | | | 1/15/28 | | | | 400,000 | | | | 352,000 | |
WEA Finance LLC/Westfield UK & Europe Finance PLC, Senior Notes | | | 3.750 | % | | | 9/17/24 | | | | 23,980,000 | | | | 23,836,071 | (a) |
WEA Finance LLC/Westfield UK & Europe Finance PLC, Senior Notes | | | 4.750 | % | | | 9/17/44 | | | | 600,000 | | | | 600,682 | (a) |
Total Real Estate | | | | | | | | | | | | | | | 26,915,703 | |
| Utilities — 0.8% | | | | | | | | | | | | | | | | |
Electric Utilities — 0.8% | |
Berkshire Hathaway Energy Co., Senior Notes | | | 6.125 | % | | | 4/1/36 | | | | 156,000 | | | | 187,049 | |
Duke Energy Carolinas LLC | | | 5.300 | % | | | 2/15/40 | | | | 3,000,000 | | | | 3,419,345 | |
Duke Energy Progress LLC, Secured Bonds | | | 2.800 | % | | | 5/15/22 | | | | 400,000 | | | | 394,791 | |
Exelon Corp., Senior Bonds | | | 5.625 | % | | | 6/15/35 | | | | 5,126,000 | | | | 5,544,747 | |
FirstEnergy Corp., Senior Notes | | | 4.250 | % | | | 3/15/23 | | | | 18,500,000 | | | | 18,812,962 | |
FirstEnergy Corp., Senior Notes | | | 3.900 | % | | | 7/15/27 | | | | 15,802,000 | | | | 15,342,886 | |
FirstEnergy Corp., Senior Notes | | | 7.375 | % | | | 11/15/31 | | | | 56,186,000 | | | | 71,150,958 | |
FirstEnergy Corp., Senior Notes | | | 4.850 | % | | | 7/15/47 | | | | 10,344,000 | | | | 10,367,324 | |
Pacific Gas & Electric Co., Senior Notes | | | 3.500 | % | | | 10/1/20 | | | | 10,330,000 | | | | 9,894,924 | |
Pacific Gas & Electric Co., Senior Notes | | | 3.300 | % | | | 12/1/27 | | | | 8,470,000 | | | | 6,954,283 | |
Pacific Gas & Electric Co., Senior Notes | | | 6.050 | % | | | 3/1/34 | | | | 21,485,000 | | | | 20,002,840 | |
Pacific Gas & Electric Co., Senior Notes | | | 5.800 | % | | | 3/1/37 | | | | 10,590,000 | | | | 9,867,729 | |
Progress Energy Inc., Senior Notes | | | 4.400 | % | | | 1/15/21 | | | | 5,200,000 | | | | 5,301,488 | |
Progress Energy Inc., Senior Notes | | | 6.000 | % | | | 12/1/39 | | | | 4,800,000 | | | | 5,653,850 | |
Total Electric Utilities | | | | | | | | | | | | | | | 182,895,176 | |
Multi-Utilities — 0.0% | |
Dominion Energy Inc., Senior Notes | | | 7.000 | % | | | 6/15/38 | | | | 3,600,000 | | | | 4,492,054 | |
Total Utilities | | | | | | | | | | | | | | | 187,387,230 | |
Total Corporate Bonds & Notes (Cost — $7,295,700,251) | | | | | | | | 7,087,154,355 | |
See Notes to Financial Statements.
| | |
| 38 | | Western Asset Core Plus Bond Fund 2018 Annual Report |
Western Asset Core Plus Bond Fund
| | | | | | | | | | | | | | | | |
| Security | | Rate | | | Maturity
Date | | | Face
Amount† | | | Value | |
| Mortgage-Backed Securities — 26.6% | | | | | | | | | | | | | |
FHLMC — 5.6% | |
Federal Home Loan Mortgage Corp. (FHLMC), Gold | | | 6.000 | % | | | 3/1/19-11/1/36 | | | | 30,489 | | | $ | 32,305 | |
Federal Home Loan Mortgage Corp. (FHLMC), Gold | | | 6.500 | % | | | 6/1/19-9/1/39 | | | | 2,885,586 | | | | 3,242,877 | |
Federal Home Loan Mortgage Corp. (FHLMC), Gold | | | 5.500 | % | | | 7/1/20-12/1/38 | | | | 3,977,168 | | | | 4,270,798 | |
Federal Home Loan Mortgage Corp. (FHLMC), Gold | | | 5.000 | % | | | 6/1/23-1/1/49 | | | | 142,162,111 | | | | 149,249,383 | |
Federal Home Loan Mortgage Corp. (FHLMC), Gold | | | 4.500 | % | | | 7/1/23-9/1/47 | | | | 48,760,770 | | | | 50,701,098 | |
Federal Home Loan Mortgage Corp. (FHLMC), Gold | | | 4.000 | % | | | 10/1/25-9/1/48 | | | | 343,915,615 | | | | 351,280,152 | |
Federal Home Loan Mortgage Corp. (FHLMC), Gold | | | 2.500 | % | | | 6/1/27 | | | | 2,493,101 | | | | 2,466,135 | |
Federal Home Loan Mortgage Corp. (FHLMC), Gold | | | 7.000 | % | | | 4/1/32-3/1/39 | | | | 801,968 | | | | 913,828 | |
Federal Home Loan Mortgage Corp. (FHLMC), Gold | | | 3.500 | % | | | 8/1/33-3/1/45 | | | | 72,168,210 | | | | 72,749,814 | |
Federal Home Loan Mortgage Corp. (FHLMC), Gold | | | 3.000 | % | | | 2/1/38-9/1/48 | | | | 297,658,434 | | | | 290,707,503 | |
Federal Home Loan Mortgage Corp. (FHLMC), Gold | | | 3.000 | % | | | 1/1/49 | | | | 153,725,000 | | | | 149,811,048 | (i) |
Federal Home Loan Mortgage Corp. (FHLMC), Gold | | | 4.000 | % | | | 1/1/49 | | | | 198,900,000 | | | | 202,780,879 | (i) |
Federal Home Loan Mortgage Corp. (FHLMC), Gold | | | 4.500 | % | | | 1/1/49 | | | | 30,100,000 | | | | 31,160,977 | (i) |
Federal Home Loan Mortgage Corp. (FHLMC), Gold | | | 5.000 | % | | | 1/1/49 | | | | 3,100,000 | | | | 3,246,939 | (i) |
Total FHLMC | | | | | | | | | | | | | | | 1,312,613,736 | |
FNMA — 13.8% | |
Federal National Mortgage Association (FNMA) | | | 3.000 | % | | | 1/1/49 | | | | 195,895,000 | | | | 191,925,082 | (i) |
Federal National Mortgage Association (FNMA) | | | 5.000 | % | | | 1/1/49 | | | | 27,400,000 | | | | 28,702,391 | (i) |
Federal National Mortgage Association (FNMA) | | | 2.680 | % | | | 4/1/19 | | | | 19,268,833 | | | | 19,229,979 | |
Federal National Mortgage Association (FNMA) | | | 9.500 | % | | | 11/1/21 | | | | 9 | | | | 9 | |
Federal National Mortgage Association (FNMA) | | | 4.500 | % | | | 7/1/23-9/1/57 | | | | 288,925,852 | | | | 301,617,826 | |
Federal National Mortgage Association (FNMA) | | | 6.000 | % | | | 4/1/24-2/1/41 | | | | 26,870,684 | | | | 29,323,305 | |
Federal National Mortgage Association (FNMA) | | | 2.810 | % | | | 4/1/25 | | | | 3,140,000 | | | | 3,114,698 | |
Federal National Mortgage Association (FNMA) | | | 2.950 | % | | | 7/1/27 | | | | 21,420,000 | | | | 20,825,854 | |
Federal National Mortgage Association (FNMA) | | | 2.500 | % | | | 1/1/28-10/1/42 | | | | 11,868,105 | | | | 11,500,332 | |
Federal National Mortgage Association (FNMA) | | | 3.660 | % | | | 2/1/28 | | | | 18,650,000 | | | | 18,670,399 | (e)(f) |
Federal National Mortgage Association (FNMA) | | | 3.740 | % | | | 11/1/28 | | | | 17,720,000 | | | | 17,925,177 | |
Federal National Mortgage Association (FNMA) | | | 3.530 | % | | | 1/1/29 | | | | 7,300,000 | | | | 7,305,703 | (e)(f) |
Federal National Mortgage Association (FNMA) | | | 3.570 | % | | | 1/1/29 | | | | 520,000 | | | | 520,325 | (e)(f) |
Federal National Mortgage Association (FNMA) | | | 3.770 | % | | | 1/1/29 | | | | 12,019,000 | | | | 12,030,268 | (e)(f) |
Federal National Mortgage Association (FNMA) | | | 3.790 | % | | | 1/1/29 | | | | 4,775,000 | | | | 4,869,008 | (e)(f) |
Federal National Mortgage Association (FNMA) | | | 3.800 | % | | | 1/1/29 | | | | 3,705,000 | | | | 3,745,523 | (e)(f) |
Federal National Mortgage Association (FNMA) | | | 3.820 | % | | | 1/1/29 | | | | 6,190,000 | | | | 6,332,177 | (e)(f) |
Federal National Mortgage Association (FNMA) | | | 3.820 | % | | | 1/1/29 | | | | 8,708,000 | | | | 9,010,699 | (e)(f) |
Federal National Mortgage Association (FNMA) | | | 3.830 | % | | | 1/1/29 | | | | 4,880,000 | | | | 4,983,700 | (e)(f) |
Federal National Mortgage Association (FNMA) | | | 6.500 | % | | | 2/1/29-5/1/40 | | | | 12,704,217 | | | | 14,428,626 | |
See Notes to Financial Statements.
| | |
| Western Asset Core Plus Bond Fund 2018 Annual Report | | 39 |
Schedule of investments (cont’d)
December 31, 2018
Western Asset Core Plus Bond Fund
| | | | | | | | | | | | | | | | |
| Security | | Rate | | | Maturity
Date | | | Face
Amount† | | | Value | |
FNMA — continued | |
Federal National Mortgage Association (FNMA) | | | 7.000 | % | | | 8/1/29-2/1/39 | | | | 4,011,749 | | | $ | 4,545,881 | |
Federal National Mortgage Association (FNMA) | | | 7.500 | % | | | 11/1/29 | | | | 2,545 | | | | 2,935 | |
Federal National Mortgage Association (FNMA) | | | 5.000 | % | | | 8/1/31-11/1/48 | | | | 266,837,331 | | | | 281,092,295 | |
Federal National Mortgage Association (FNMA) | | | 3.500 | % | | | 9/1/33-3/1/57 | | | | 306,467,099 | | | | 306,654,040 | |
Federal National Mortgage Association (FNMA) | | | 3.500 | % | | | 1/1/34-1/1/49 | | | | 323,600,000 | | | | 326,499,494 | (i) |
Federal National Mortgage Association (FNMA) | | | 5.500 | % | | | 11/1/36-9/1/56 | | | | 37,026,471 | | | | 39,769,834 | |
Federal National Mortgage Association (FNMA) | | | 3.000 | % | | | 12/1/37-11/1/48 | | | | 208,319,221 | | | | 203,502,800 | |
Federal National Mortgage Association (FNMA) | | | 4.000 | % | | | 4/1/42-6/1/57 | | | | 488,537,014 | | | | 500,238,216 | |
Federal National Mortgage Association (FNMA) | | | 4.000 | % | | | 1/1/49 | | | | 181,750,000 | | | | 185,285,606 | (i) |
Federal National Mortgage Association (FNMA) | | | 4.500 | % | | | 1/1/49 | | | | 681,200,000 | | | | 705,481,054 | (i) |
Federal National Mortgage Association (FNMA) (Federal Reserve US 12 mo. Cumulative Average 1 Year CMT + 1.949%) | | | 4.101 | % | | | 11/1/35 | | | | 33,756 | | | | 34,527 | (c) |
Total FNMA | | | | | | | | | | | | | | | 3,259,167,763 | |
GNMA — 7.2% | |
Government National Mortgage Association (GNMA) | | | 4.000 | % | | | 5/1/47 | | | | 13,700,000 | | | | 14,028,586 | (i) |
Government National Mortgage Association (GNMA) | | | 7.500 | % | | | 3/15/23-9/15/31 | | | | 30,017 | | | | 31,912 | |
Government National Mortgage Association (GNMA) | | | 7.000 | % | | | 9/15/23-7/15/31 | | | | 75,470 | | | | 81,470 | |
Government National Mortgage Association (GNMA) | | | 6.500 | % | | | 4/15/28-3/15/39 | | | | 2,954,668 | | | | 3,300,330 | |
Government National Mortgage Association (GNMA) | | | 6.000 | % | | | 1/15/29-2/15/37 | | | | 7,373,089 | | | | 7,969,073 | |
Government National Mortgage Association (GNMA) | | | 8.000 | % | | | 12/15/30-1/15/31 | | | | 10,801 | | | | 10,979 | |
Government National Mortgage Association (GNMA) | | | 5.500 | % | | | 7/15/33- 6/15/36 | | | | 6,344,036 | | | | 6,865,137 | |
Government National Mortgage Association (GNMA) | | | 4.000 | % | | | 4/15/47- 4/15/48 | | | | 28,783,471 | | | | 29,728,216 | |
Government National Mortgage Association (GNMA) | | | 3.500 | % | | | 6/15/48 | | | | 8,947,071 | | | | 9,050,361 | |
Government National Mortgage Association (GNMA) II | | | 5.000 | % | | | 4/20/35- 1/20/49 | | | | 92,855,414 | | | | 97,082,765 | |
Government National Mortgage Association (GNMA) II | | | 6.500 | % | | | 10/20/37 | | | | 1,772,819 | | | | 2,041,641 | |
Government National Mortgage Association (GNMA) II | | | 6.000 | % | | | 9/20/38-11/20/41 | | | | 4,525,529 | | | | 4,883,328 | |
Government National Mortgage Association (GNMA) II | | | 4.500 | % | | | 1/20/40- 9/20/48 | | | | 214,647,482 | | | | 222,870,871 | |
See Notes to Financial Statements.
| | |
| 40 | | Western Asset Core Plus Bond Fund 2018 Annual Report |
Western Asset Core Plus Bond Fund
| | | | | | | | | | | | | | | | |
| Security | | Rate | | | Maturity
Date | | | Face
Amount† | | | Value | |
GNMA — continued | |
Government National Mortgage Association (GNMA) II | | | 3.500 | % | | | 6/20/44-11/20/47 | | | | 59,130,300 | | | $ | 59,598,792 | |
Government National Mortgage Association (GNMA) II | | | 4.000 | % | | | 8/20/47 | | | | 85,410,054 | | | | 87,551,809 | |
Government National Mortgage Association (GNMA) II | | | 3.000 | % | | | 9/20/47-3/20/48 | | | | 232,987,282 | | | | 229,576,000 | |
Government National Mortgage Association (GNMA) II | | | 3.500 | % | | | 1/20/49 | | | | 8,700,000 | | | | 8,754,375 | (i) |
Government National Mortgage Association (GNMA) II | | | 4.500 | % | | | 1/20/49 | | | | 480,980,000 | | | | 497,767,327 | (i) |
Government National Mortgage Association (GNMA) II | | | 5.000 | % | | | 1/20/49-2/20/49 | | | | 385,500,000 | | | | 401,248,743 | (i) |
Total GNMA | | | | | | | | | | | | | | | 1,682,441,715 | |
Total Mortgage-Backed Securities (Cost — $6,268,968,640) | | | | 6,254,223,214 | |
| U.S. Government & Agency Obligations — 18.4% | | | | | | | | | | | | | |
U.S. Government Agencies — 0.6% | |
Federal Home Loan Bank (FHLB), Global Bonds | | | 5.500 | % | | | 7/15/36 | | | | 2,585,000 | | | | 3,329,744 | |
Federal National Mortgage Association (FNMA), Bonds | | | 6.625 | % | | | 11/15/30 | | | | 45,010,000 | | | | 60,412,287 | |
Federal National Mortgage Association (FNMA), Debentures | | | 0.000 | % | | | 10/9/19 | | | | 83,870,000 | | | | 82,133,073 | |
Total U.S. Government Agencies | | | | | | | | | | | | | | | 145,875,104 | |
U.S. Government Obligations — 17.8% | |
Department of Housing and Urban Development, Notes | | | 2.850 | % | | | 8/1/24 | | | | 4,537,000 | | | | 4,574,725 | |
Department of Housing and Urban Development, Senior Notes | | | 2.450 | % | | | 8/1/22 | | | | 9,000,000 | | | | 8,963,127 | |
U.S. Treasury Strip Principal (STRIPS) | | | 0.000 | % | | | 11/15/24 | | | | 6,080,000 | | | | 5,240,120 | |
U.S. Treasury Bonds | | | 3.750 | % | | | 11/15/43 | | | | 409,880,000 | | | | 463,052,322 | |
U.S. Treasury Bonds | | | 2.500 | % | | | 2/15/45 | | | | 347,860,000 | | | | 315,363,625 | |
U.S. Treasury Bonds | | | 3.000 | % | | | 5/15/45 | | | | 622,540,000 | | | | 621,542,965 | |
U.S. Treasury Bonds | | | 2.875 | % | | | 8/15/45 | | | | 539,930,000 | | | | 526,052,114 | |
U.S. Treasury Bonds | | | 3.000 | % | | | 5/15/47 | | | | 182,636,000 | | | | 181,908,309 | |
U.S. Treasury Bonds | | | 2.750 | % | | | 8/15/47 | | | | 127,085,000 | | | | 120,398,144 | |
U.S. Treasury Bonds | | | 2.750 | % | | | 11/15/47 | | | | 206,740,000 | | | | 195,692,331 | |
U.S. Treasury Bonds | | | 3.000 | % | | | 2/15/48 | | | | 2,590,000 | | | | 2,576,999 | |
U.S. Treasury Bonds | | | 3.125 | % | | | 5/15/48 | | | | 150,460,000 | | | | 153,360,469 | |
U.S. Treasury Bonds | | | 3.000 | % | | | 8/15/48 | | | | 329,059,000 | | | | 327,600,087 | |
U.S. Treasury Notes | | | 2.875 | % | | | 10/15/21 | | | | 50,330,000 | | | | 50,868,688 | |
U.S. Treasury Notes | | | 2.000 | % | | | 12/31/21 | | | | 13,510,000 | | | | 13,328,459 | |
See Notes to Financial Statements.
| | |
| Western Asset Core Plus Bond Fund 2018 Annual Report | | 41 |
Schedule of investments (cont’d)
December 31, 2018
Western Asset Core Plus Bond Fund
| | | | | | | | | | | | | | | | |
| Security | | Rate | | | Maturity
Date | | | Face
Amount† | | | Value | |
U.S. Government Obligations — continued | |
U.S. Treasury Notes | | | 1.875 | % | | | 2/28/22 | | | | 43,670,000 | | | $ | 42,887,863 | |
U.S. Treasury Notes | | | 1.875 | % | | | 4/30/22 | | | | 71,400,000 | | | | 70,050,094 | |
U.S. Treasury Notes | | | 1.875 | % | | | 8/31/22 | | | | 221,160,000 | | | | 216,477,627 | |
U.S. Treasury Notes | | | 2.875 | % | | | 9/30/23 | | | | 560,000 | | | | 569,188 | |
U.S. Treasury Notes | | | 2.000 | % | | | 5/31/24 | | | | 147,285,000 | | | | 143,341,100 | |
U.S. Treasury Notes | | | 2.000 | % | | | 6/30/24 | | | | 140,220,000 | | | | 136,388,598 | |
U.S. Treasury Notes | | | 2.125 | % | | | 11/30/24 | | | | 68,830,000 | | | | 67,200,665 | |
U.S. Treasury Notes | | | 2.000 | % | | | 2/15/25 | | | | 141,740,000 | | | | 137,155,597 | |
U.S. Treasury Notes | | | 2.875 | % | | | 4/30/25 | | | | 63,290,000 | | | | 64,403,756 | |
U.S. Treasury Notes | | | 2.750 | % | | | 6/30/25 | | | | 122,566,000 | | | | 123,827,568 | |
U.S. Treasury Notes | | | 3.000 | % | | | 9/30/25 | | | | 71,210,000 | | | | 73,051,446 | |
U.S. Treasury Notes | | | 2.250 | % | | | 11/15/25 | | | | 21,730,000 | | | | 21,256,354 | |
U.S. Treasury Notes | | | 2.750 | % | | | 2/15/28 | | | | 6,000 | | | | 6,032 | |
U.S. Treasury Notes | | | 1.875 | % | | | 12/15/20 | | | | 94,230,000 | | | | 93,127,583 | |
Total U.S. Government Obligations | | | | | | | | | | | | | | | 4,180,265,955 | |
Total U.S. Government & Agency Obligations (Cost — $4,308,273,653) | | | | 4,326,141,059 | |
| Collateralized Mortgage Obligations (j) — 11.7% | | | | | | | | | | | | | | | | |
Alternative Loan Trust,2006-6CB, 1A4 | | | 5.500 | % | | | 5/25/36 | | | | 5,888,926 | | | | 5,422,318 | |
Banc of America Alternative Loan Trust,2004-11, 2CB1 | | | 6.000 | % | | | 12/25/34 | | | | 6,232,751 | | | | 6,039,790 | |
Banc of America Commercial Mortgage Trust,2007-2 AJ | | | 5.672 | % | | | 4/10/49 | | | | 786,332 | | | | 483,268 | (c) |
Banc of America Funding Trust,2015-R2, 10A1 (1 mo. USD LIBOR + 0.190%) | | | 2.696 | % | | | 6/29/37 | | | | 11,859,559 | | | | 11,863,491 | (a)(c) |
Banc of America Funding Trust,2015-R2, 3A1 (1 mo. USD LIBOR + 0.260%) | | | 2.766 | % | | | 4/29/37 | | | | 10,364,178 | | | | 10,357,417 | (a)(c) |
Banc of America Funding Trust,2015-R2, 3A2 (1 mo. USD LIBOR + 0.260%) | | | 2.766 | % | | | 4/29/37 | | | | 25,428,000 | | | | 24,801,502 | (a)(c) |
BBCCRE Trust,2015-GTP, E | | | 4.563 | % | | | 8/10/33 | | | | 33,260,000 | | | | 30,038,520 | (a)(c) |
BBCMS Trust,2018-CBM D (1 mo. LIBOR + 2.391% to 7/15/23 then 1 mo. LIBOR + 2.641%) | | | 4.846 | % | | | 7/15/37 | | | | 16,390,000 | | | | 16,081,599 | (a)(c) |
BCAP LLC Trust,2010-RR9, 6A2 | | | 6.000 | % | | | 10/26/35 | | | | 14,529,818 | | | | 12,678,123 | (a) |
Bear Stearns Asset Backed Securities I Trust,2004-AC6, A1 | | | 5.750 | % | | | 11/25/34 | | | | 3,411,365 | | | | 3,334,526 | |
Bear Stearns Asset Backed Securities I Trust,2006-AC4, A2(-4.333% x 1 mo. USD LIBOR + 33.583%) | | | 22.723 | % | | | 7/25/36 | | | | 3,373,003 | | | | 5,113,553 | (c) |
Bear Stearns Mortgage Funding Trust,2007-AR2, A1 (1 mo. USD LIBOR + 0.170%) | | | 2.676 | % | | | 3/25/37 | | | | 19,810,661 | | | | 18,038,824 | (c) |
BHMS Mortgage Trust,2018-MZB | | | 9.092 | % | | | 7/15/20 | | | | 93,060,000 | | | | 93,870,413 | (a)(c) |
BX Trust,2017-IMC F (1 mo. USD LIBOR + 4.250%) | | | 6.705 | % | | | 10/15/32 | | | | 37,710,000 | | | | 37,754,686 | (a)(c) |
Chevy Chase Funding LLC Mortgage-Backed Certificates Series,2005-4A, A1 (1 mo. USD LIBOR + 0.200%) | | | 2.706 | % | | | 10/25/36 | | | | 446,751 | | | | 422,513 | (a)(c) |
See Notes to Financial Statements.
| | |
| 42 | | Western Asset Core Plus Bond Fund 2018 Annual Report |
Western Asset Core Plus Bond Fund
| | | | | | | | | | | | | | | | |
| Security | | Rate | | | Maturity
Date | | | Face
Amount† | | | Value | |
| Collateralized Mortgage Obligations (j) — continued | | | | | | | | | | | | | | | | |
CHT Mortgage Trust, 2017-CSMO, A (1 mo. USD LIBOR + 0.930% to 12/25/22 then 1 mo. USD LIBOR + 1.080%) | | | 3.385 | % | | | 11/15/36 | | | | 25,085,000 | | | $ | 24,862,446 | (a)(c) |
Citigroup Commercial Mortgage Trust, 2014-GC25, AS | | | 4.017 | % | | | 10/10/47 | | | | 2,800,000 | | | | 2,849,121 | |
Citigroup Commercial Mortgage Trust,2017-P7, B | | | 4.137 | % | | | 4/14/50 | | | | 9,194,000 | | | | 9,196,868 | (c) |
Citigroup Mortgage Loan Trust,2006-AR9, 1A4 (1 mo. USD LIBOR + 0.240%) | | | 2.746 | % | | | 11/25/36 | | | | 1,803,604 | | | | 1,799,213 | (c) |
Citigroup Mortgage Loan Trust Inc.,2005-5 1A5 | | | 3.130 | % | | | 8/25/35 | | | | 73,139 | | | | 62,974 | (c) |
COBALT CMBS Commercial Mortgage Trust,2007-C2, AJFL (1 mo. LIBOR + 0.270%) | | | 2.670 | % | | | 4/15/47 | | | | 3,233,175 | | | | 3,199,531 | (a)(c) |
Cold Storage Trust, 2017-ICE3, A (1 mo. LIBOR + 1.000%) | | | 3.455 | % | | | 4/15/36 | | | | 20,980,000 | | | | 20,634,610 | (a)(c) |
Commercial Mortgage Pass-Through Certificates, 2014-CR21, A3 | | | 3.528 | % | | | 12/10/47 | | | | 590,000 | | | | 593,418 | |
Commercial Mortgage Pass-Through Certificates,2015-DC1, C | | | 4.351 | % | | | 2/10/48 | | | | 3,070,000 | | | | 2,985,901 | (c) |
Commercial Mortgage Trust, 2013-CR12, AM | | | 4.300 | % | | | 10/10/46 | | | | 1,723,000 | | | | 1,775,159 | |
Commercial Mortgage Trust, 2013-CR12, B | | | 4.762 | % | | | 10/10/46 | | | | 1,470,000 | | | | 1,519,664 | (c) |
Commercial Mortgage Trust, 2013-CR12, C | | | 5.085 | % | | | 10/10/46 | | | | 730,000 | | | | 739,453 | (c) |
Commercial Mortgage Trust, 2014-CR19, B | | | 4.703 | % | | | 8/10/47 | | | | 8,410,000 | | | | 8,651,355 | (c) |
Commercial Mortgage Trust, 2014-CR21, C | | | 4.418 | % | | | 12/10/47 | | | | 11,948,000 | | | | 12,001,766 | (c) |
Commercial Mortgage Trust,2015-DC1, B | | | 4.035 | % | | | 2/10/48 | | | | 7,160,000 | | | | 7,168,210 | (c) |
Countrywide Alternative Loan Trust, 2006-18CB, A6, PAC(-4.000 x 1 mo. USD LIBOR + 28.600%) | | | 18.575 | % | | | 7/25/36 | | | | 8,183,627 | | | | 11,887,192 | (c) |
Countrywide Alternative Loan Trust,2006-OA9 2A1B (1 mo. USD LIBOR + 0.200%) | | | 2.670 | % | | | 7/20/46 | | | | 468,974 | | | | 357,978 | (c) |
Countrywide Alternative Loan Trust, 2006-23CB, 2A6 PAC-11(-4.000 x 1 mo. USD LIBOR + 28.400%) | | | 18.375 | % | | | 8/25/36 | | | | 3,159,400 | | | | 3,962,896 | (c) |
Countrywide Alternative Loan Trust, 2006-43CB, 1A10 | | | 6.000 | % | | | 2/25/37 | | | | 5,835,320 | | | | 4,866,753 | |
Countrywide Alternative Loan Trust, 2006-43CB, 3A3 IO(-1.000 x 1 mo. USD LIBOR + 6.630%) | | | 4.124 | % | | | 2/25/37 | | | | 16,087,800 | | | | 3,787,919 | (c) |
Credit Suisse Commercial Mortgage Trust,2006-C3 AJ | | | 6.482 | % | | | 6/15/38 | | | | 1,536,938 | | | | 859,092 | (c) |
Credit Suisse Commercial Mortgage Trust,2006-C5 AJ | | | 5.373 | % | | | 12/15/39 | | | | 5,899,773 | | | | 4,016,993 | |
Credit Suisse Commercial Mortgage Trust,2007-C5 AM | | | 5.869 | % | | | 9/15/40 | | | | 4,760,147 | | | | 4,616,890 | (c) |
CSMC Trust,2014-USA E | | | 4.373 | % | | | 9/15/37 | | | | 1,970,000 | | | | 1,772,608 | (a) |
CSMC Trust,2014-USA, A2 | | | 3.953 | % | | | 9/15/37 | | | | 12,520,000 | | | | 12,683,734 | (a) |
CSMC Trust,2014-USA, D | | | 4.373 | % | | | 9/15/37 | | | | 10,950,000 | | | | 10,402,000 | (a) |
CSMC Trust,2015-2R, 7A1 | | | 3.742 | % | | | 8/27/36 | | | | 22,758,886 | | | | 23,274,552 | (a)(c) |
CSMC Trust,2015-4R, 3A3 (1 mo. USD LIBOR + 0.310%) | | | 2.625 | % | | | 10/27/36 | | | | 48,456,954 | | | | 28,474,052 | (a)(c) |
CSMC Trust, 2015-GLPA, A | | | 3.881 | % | | | 11/15/37 | | | | 4,004,378 | | | | 4,088,033 | (a) |
CSMC Trust, 2017-CHOP G (1 mo. LIBOR + 5.620%) | | | 8.075 | % | | | 7/15/32 | | | | 23,400,000 | | | | 23,005,476 | (a)(c) |
CSMC Trust, 2017-TIME, A | | | 3.646 | % | | | 11/13/39 | | | | 21,200,000 | | | | 21,146,936 | (a) |
CSMC Trust, 2018- PLUM A (1 mo. USD LIBOR + 3.231%) | | | 5.687 | % | | | 8/15/20 | | | | 74,725,000 | | | | 74,815,343 | (a)(c) |
See Notes to Financial Statements.
| | |
| Western Asset Core Plus Bond Fund 2018 Annual Report | | 43 |
Schedule of investments (cont’d)
December 31, 2018
Western Asset Core Plus Bond Fund
| | | | | | | | | | | | | | | | |
| Security | | Rate | | | Maturity
Date | | | Face
Amount† | | | Value | |
| Collateralized Mortgage Obligations (j) — continued | | | | | | | | | | | | | | | | |
CSMC Trust,2018-J1 A2 | | | 3.500 | % | | | 2/25/48 | | | | 212,791,065 | | | $ | 206,543,476 | (a)(c) |
Federal Home Loan Mortgage Corp. (FHLMC) Multifamily Structured Pass Through Certificates, 20K007, X1, IO | | | 1.034 | % | | | 4/25/20 | | | | 60,495,655 | | | | 609,361 | (c) |
Federal Home Loan Mortgage Corp. (FHLMC) Multifamily Structured Pass Through Certificates, 20K015, X1, IO | | | 1.574 | % | | | 7/25/21 | | | | 19,557,863 | | | | 656,000 | (c) |
Federal Home Loan Mortgage Corp. (FHLMC) Multifamily Structured Pass Through Certificates, 20K016, X1, IO | | | 1.492 | % | | | 10/25/21 | | | | 7,621,167 | | | | 267,308 | (c) |
Federal Home Loan Mortgage Corp. (FHLMC) Reference REMIC, R007 ZA | | | 6.000 | % | | | 5/15/36 | | | | 8,243,398 | | | | 9,184,389 | |
Federal Home Loan Mortgage Corp. (FHLMC) REMIC, 202957, ZA, PAC | | | 5.000 | % | | | 3/15/35 | | | | 12,925,120 | | | | 13,832,520 | |
Federal Home Loan Mortgage Corp. (FHLMC) REMIC, 203242, SC, IO(-1.000 x 1 mo. USD LIBOR + 6.290%) | | | 3.835 | % | | | 11/15/36 | | | | 1,403,072 | | | | 191,765 | (c) |
Federal Home Loan Mortgage Corp. (FHLMC) REMIC, 203368, AI, IO(-1.000 x 1 mo. USD LIBOR + 6.030%) | | | 3.575 | % | | | 9/15/37 | | | | 2,028,311 | | | | 258,202 | (c) |
Federal Home Loan Mortgage Corp. (FHLMC) REMIC, 203621, SB, IO(-1.000 x 1 mo. USD LIBOR + 6.230%) | | | 3.775 | % | | | 1/15/40 | | | | 3,095,337 | | | | 418,035 | (c) |
Federal Home Loan Mortgage Corp. (FHLMC) REMIC, 203639, EY | | | 5.000 | % | | | 2/15/30 | | | | 5,766,708 | | | | 6,021,841 | |
Federal Home Loan Mortgage Corp. (FHLMC) REMIC, 203973, SA, IO(-1.000 x 1 mo. USD LIBOR + 6.490%) | | | 4.035 | % | | | 12/15/41 | | | | 5,843,615 | | | | 1,057,174 | (c) |
Federal Home Loan Mortgage Corp. (FHLMC) REMIC, 204054, SA, IO(-1.000 x 1 mo. USD LIBOR + 6.050%) | | | 3.595 | % | | | 8/15/39 | | | | 3,580,055 | | | | 413,213 | (c) |
Federal Home Loan Mortgage Corp. (FHLMC) REMIC, 204099, ST, IO(-1.000 x 1 mo. USD LIBOR + 6.000%) | | | 3.545 | % | | | 8/15/42 | | | | 1,919,627 | | | | 338,493 | (c) |
Federal Home Loan Mortgage Corp. (FHLMC) REMIC, 204119, IN, IO | | | 3.500 | % | | | 10/15/32 | | | | 5,127,699 | | | | 707,191 | |
Federal Home Loan Mortgage Corp. (FHLMC) REMIC, 204174, SA, IO(-1.000 x 1 mo. USD LIBOR + 6.200%) | | | 3.745 | % | | | 5/15/39 | | | | 3,466,470 | | | | 309,339 | (c) |
Federal Home Loan Mortgage Corp. (FHLMC) REMIC, 204239, IO, IO | | | 3.500 | % | | | 6/15/27 | | | | 4,165,986 | | | | 378,941 | |
Federal Home Loan Mortgage Corp. (FHLMC) REMIC, 204298, PI, IO, PAC | | | 4.000 | % | | | 4/15/43 | | | | 2,696,872 | | | | 363,044 | |
Federal Home Loan Mortgage Corp. (FHLMC) REMIC, 204415, IO | | | 1.617 | % | | | 4/15/41 | | | | 8,693,791 | | | | 428,077 | (c) |
Federal Home Loan Mortgage Corp. (FHLMC) REMIC, 204793, CB | | | 3.000 | % | | | 5/15/48 | | | | 52,231,237 | | | | 51,173,931 | |
Federal Home Loan Mortgage Corp. (FHLMC) REMIC, 204793, CD | | | 3.000 | % | | | 6/15/48 | | | | 39,189,750 | | | | 38,201,737 | |
Federal Home Loan Mortgage Corp. (FHLMC) REMIC, 3281 AI, IO(-1.000 x 1 mo. USD LIBOR + 6.430%) | | | 3.975 | % | | | 2/15/37 | | | | 7,821,580 | | | | 1,148,226 | (c) |
Federal Home Loan Mortgage Corp. (FHLMC) REMIC, 3422, AI, IO | | | 0.250 | % | | | 1/15/38 | | | | 928,792 | | | | 6,705 | |
See Notes to Financial Statements.
| | |
| 44 | | Western Asset Core Plus Bond Fund 2018 Annual Report |
Western Asset Core Plus Bond Fund
| | | | | | | | | | | | | | | | |
| Security | | Rate | | | Maturity
Date | | | Face
Amount† | | | Value | |
| Collateralized Mortgage Obligations (j) — continued | | | | | | | | | | | | | | | | |
Federal Home Loan Mortgage Corp. (FHLMC) REMIC, 3768, MB, PAC | | | 4.000 | % | | | 12/15/39 | | | | 18,608,673 | | | $ | 19,171,500 | |
Federal Home Loan Mortgage Corp. (FHLMC) REMIC, 3947 SG, IO(-1.000 x 1 mo. USD LIBOR + 5.950%) | | | 3.495 | % | | | 10/15/41 | | | | 9,230,746 | | | | 1,372,501 | (c) |
Federal Home Loan Mortgage Corp. (FHLMC) REMIC, 4146, DI, IO | | | 3.000 | % | | | 12/15/31 | | | | 3,706,218 | | | | 344,804 | |
Federal Home Loan Mortgage Corp. (FHLMC) REMIC, 4203 PS, IO, PAC(-1.000 x 1 mo. USD LIBOR + 6.250%) | | | 3.795 | % | | | 9/15/42 | | | | 3,474,282 | | | | 489,448 | (c) |
Federal Home Loan Mortgage Corp. (FHLMC) REMIC, 4813 CJ | | | 3.000 | % | | | 8/15/48 | | | | 58,813,631 | | | | 57,260,469 | |
Federal Home Loan Mortgage Corp. (FHLMC) STRIPS, 20283, IO, IO | | | 3.500 | % | | | 10/15/27 | | | | 1,026,660 | | | | 93,515 | |
Federal Home Loan Mortgage Corp. (FHLMC) STRIPS, 20334, S7, IO(-1.000 x 1 mo. USD LIBOR + 6.100%) | | | 3.645 | % | | | 8/15/44 | | | | 11,397,747 | | | | 2,099,343 | (c) |
Federal Home Loan Mortgage Corp. (FHLMC) STRIPS, 20353, S1, IO(-1.000 x 1 mo. USD LIBOR + 6.000%) | | | 3.545 | % | | | 12/15/46 | | | | 25,479,301 | | | | 4,470,784 | (c) |
Federal Home Loan Mortgage Corp. (FHLMC) STRIPS, 328 S4, IO | | | 1.642 | % | | | 2/15/38 | | | | 1,520,893 | | | | 98,673 | (c) |
Federal Home Loan Mortgage Corp. (FHLMC) Structured Agency Credit Risk Debt Notes, 2018-DNA1, M2 (1 mo. USD LIBOR + 1.800%) | | | 4.306 | % | | | 7/25/30 | | | | 55,580,000 | | | | 53,053,945 | (a)(c) |
Federal National Mortgage Association (FNMA) — CAS,2014-C03, 1M1 (1 mo. USD LIBOR + 3.000%) | | | 5.506 | % | | | 7/25/24 | | | | 72,614,819 | | | | 76,411,078 | (c) |
Federal National Mortgage Association (FNMA) — CAS,2015-C01, 2M2 (1 mo. USD LIBOR + 4.550%) | | | 7.056 | % | | | 2/25/25 | | | | 5,075,239 | | | | 5,417,454 | (c) |
Federal National Mortgage Association (FNMA) — CAS,2017-C03, 1M1 (1 mo. USD LIBOR + 0.950%) | | | 3.456 | % | | | 10/25/29 | | | | 26,782,223 | | | | 26,812,931 | (a)(c) |
Federal National Mortgage Association (FNMA) — CAS,2018-C05 1B1 (1 mo. USD LIBOR + 4.250%) | | | 6.756 | % | | | 1/25/31 | | | | 19,130,000 | | | | 18,364,477 | (a)(c) |
Federal National Mortgage Association (FNMA) — CAS,2015-C03, 1M2 (1 mo. USD LIBOR + 5.000%) | | | 7.506 | % | | | 7/25/25 | | | | 28,061,264 | | | | 31,003,443 | (a)(c) |
Federal National Mortgage Association (FNMA) REMIC,2005-88, IP, IO | | | 1.390 | % | | | 10/25/35 | | | | 3,346,189 | | | | 272,842 | (c) |
Federal National Mortgage Association (FNMA) REMIC,2006-118, IP1, IO | | | 2.375 | % | | | 12/25/36 | | | | 5,417,387 | | | | 442,667 | (c) |
Federal National Mortgage Association (FNMA) REMIC,2006-118, IP2, IO | | | 2.375 | % | | | 12/25/36 | | | | 6,333,662 | | | | 514,757 | (c) |
Federal National Mortgage Association (FNMA) REMIC,2006-28, IP, IO | | | 1.588 | % | | | 4/25/36 | | | | 2,179,057 | | | | 135,674 | |
Federal National Mortgage Association (FNMA) REMIC,2006-59, IP, IO | | | 2.395 | % | | | 7/25/36 | | | | 3,945,164 | | | | 377,890 | (c) |
Federal National Mortgage Association (FNMA) REMIC,2010-123, PM, PAC | | | 4.000 | % | | | 7/25/40 | | | | 19,331,985 | | | | 19,885,160 | |
Federal National Mortgage Association (FNMA) REMIC,2010-27, AS, IO(-1.000 x 1 mo. USD LIBOR + 6.480%) | | | 3.974 | % | | | 4/25/40 | | | | 2,585,715 | | | | 435,910 | (c) |
See Notes to Financial Statements.
| | |
| Western Asset Core Plus Bond Fund 2018 Annual Report | | 45 |
Schedule of investments (cont’d)
December 31, 2018
Western Asset Core Plus Bond Fund
| | | | | | | | | | | | | | | | |
| Security | | Rate | | | Maturity
Date | | | Face
Amount† | | | Value | |
| Collateralized Mortgage Obligations (j) — continued | | | | | | | | | | | | | | | | |
Federal National Mortgage Association (FNMA) REMIC,2011-99, KS, IO(-1.000 x 1 mo. USD LIBOR + 6.700%) | | | 4.194 | % | | | 10/25/26 | | | | 1,328,448 | | | $ | 114,944 | (c) |
Federal National Mortgage Association (FNMA) REMIC,2012-101, BI, IO | | | 4.000 | % | | | 9/25/27 | | | | 2,616,997 | | | | 224,411 | |
Federal National Mortgage Association (FNMA) REMIC,2012-133, CS, IO(-1.000 x 1 mo. USD LIBOR + 6.150%) | | | 3.644 | % | | | 12/25/42 | | | | 4,380,204 | | | | 738,114 | (c) |
Federal National Mortgage Association (FNMA) REMIC,2012-134, MS, IO(-1.000 x 1 mo. USD LIBOR + 6.150%) | | | 3.644 | % | | | 12/25/42 | | | | 3,474,718 | | | | 596,239 | (c) |
Federal National Mortgage Association (FNMA) REMIC,2012-134, SK, IO(-1.000 x 1 mo. LIBOR + 6.150%) | | | 3.644 | % | | | 12/25/42 | | | | 11,103,622 | | | | 1,819,637 | (c) |
Federal National Mortgage Association (FNMA) REMIC,2012-35, SC, IO(-1.000% x 1 mo. USD LIBOR + 6.500%) | | | 3.994 | % | | | 4/25/42 | | | | 3,158,380 | | | | 544,295 | (c) |
Federal National Mortgage Association (FNMA) REMIC,2012-46, BA | | | 6.000 | % | | | 5/25/42 | | | | 4,803,146 | | | | 5,174,101 | |
Federal National Mortgage Association (FNMA) REMIC,2012-70, YS, IO(-1.000 x 1 mo. USD LIBOR + 6.650%) | | | 4.144 | % | | | 2/25/41 | | | | 1,485,600 | | | | 164,711 | (c) |
Federal National Mortgage Association (FNMA) REMIC,2012-74, OA, PO | | | 0.000 | % | | | 3/25/42 | | | | 476,256 | | | | 432,339 | |
Federal National Mortgage Association (FNMA) REMIC,2012-74, SA, IO(-1.000 x 1 mo. USD LIBOR + 6.650%) | | | 4.144 | % | | | 3/25/42 | | | | 5,398,872 | | | | 652,801 | (c) |
Federal National Mortgage Association (FNMA) REMIC,2012-75, AO, PO | | | 0.000 | % | | | 3/25/42 | | | | 284,973 | | | | 251,778 | |
Federal National Mortgage Association (FNMA) REMIC,2012-93, UI, IO | | | 3.000 | % | | | 9/25/27 | | | | 1,709,780 | | | | 139,626 | |
Federal National Mortgage Association (FNMA) REMIC,2013-124, SB, IO(-1.000 x 1 mo. USD LIBOR + 5.950%) | | | 3.444 | % | | | 12/25/43 | | | | 17,319,325 | | | | 3,062,008 | (c) |
Federal National Mortgage Association (FNMA) REMIC,2013-14, IG, IO | | | 4.000 | % | | | 3/25/43 | | | | 8,698,168 | | | | 1,659,107 | |
Federal National Mortgage Association (FNMA) REMIC,2013-26, HI, IO | | | 3.000 | % | | | 4/25/32 | | | | 5,179,683 | | | | 396,192 | |
Federal National Mortgage Association (FNMA) REMIC,2013-29, QI, IO | | | 4.000 | % | | | 4/25/43 | | | | 8,476,135 | | | | 1,634,304 | |
Federal National Mortgage Association (FNMA) REMIC,2013-54, BS, IO(-1.000 x 1 mo. USD LIBOR + 6.150%) | | | 3.644 | % | | | 6/25/43 | | | | 8,561,177 | | | | 1,566,505 | (c) |
Federal National Mortgage Association (FNMA) REMIC,2013-9 BC | | | 6.500 | % | | | 7/25/42 | | | | 6,407,926 | | | | 7,271,193 | |
Federal National Mortgage Association (FNMA) REMIC,2013-9 CB | | | 5.500 | % | | | 4/25/42 | | | | 17,830,399 | | | | 19,412,396 | |
Federal National Mortgage Association (FNMA) REMIC,2013-9, SA, IO(-1.000 x 1 mo. LIBOR + 6.150%) | | | 3.644 | % | | | 3/25/42 | | | | 5,873,114 | | | | 708,824 | (c) |
Federal National Mortgage Association (FNMA) REMIC,2014-47 AI, IO | | | 1.692 | % | | | 8/25/44 | | | | 7,940,854 | | | | 421,258 | (c) |
Federal National Mortgage Association (FNMA) REMIC,2015-55 IO, IO | | | 1.342 | % | | | 8/25/55 | | | | 15,820,092 | | | | 758,600 | (c) |
See Notes to Financial Statements.
| | |
| 46 | | Western Asset Core Plus Bond Fund 2018 Annual Report |
Western Asset Core Plus Bond Fund
| | | | | | | | | | | | | | | | |
| Security | | Rate | | | Maturity
Date | | | Face
Amount† | | | Value | |
| Collateralized Mortgage Obligations (j) — continued | | | | | | | | | | | | | | | | |
Federal National Mortgage Association (FNMA) REMIC,2015-56, AS, IO(-1.000 x 1 mo. USD LIBOR + 6.150%) | | | 3.644 | % | | | 8/25/45 | | | | 3,768,876 | | | $ | 748,893 | (c) |
Federal National Mortgage Association (FNMA) REMIC,2016-23, ST, IO(-1.000 x 1 mo. LIBOR + 6.000%) | | | 3.494 | % | | | 11/25/45 | | | | 22,055,777 | | | | 3,826,587 | (c) |
Federal National Mortgage Association (FNMA) REMIC,2016-60 QS, IO(-1.000 x 1 mo. USD LIBOR + 6.100%) | | | 3.594 | % | | | 9/25/46 | | | | 24,185,813 | | | | 3,280,155 | (c) |
Federal National Mortgage Association (FNMA) REMIC,2016-61, BS, IO(-1.000 x 1 mo. LIBOR + 6.100%) | | | 3.594 | % | | | 9/25/46 | | | | 10,987,963 | | | | 1,437,032 | (c) |
Federal National Mortgage Association (FNMA) REMIC,2017-76, SB, IO(-1.000 x 1 mo. USD LIBOR + 6.100%) | | | 3.594 | % | | | 10/25/57 | | | | 45,159,556 | | | | 7,797,276 | (c) |
Federal National Mortgage Association (FNMA) REMIC,2017-85, SC, IO(-1.000 x 1 mo. USD LIBOR + 6.200%) | | | 3.694 | % | | | 11/25/47 | | | | 15,224,652 | | | | 2,269,448 | (c) |
Federal National Mortgage Association (FNMA) REMIC,2011-59 NZ | | | 5.500 | % | | | 7/25/41 | | | | 1,178,042 | | | | 1,288,682 | |
Federal National Mortgage Association (FNMA) REMIC,2012-28 B | | | 6.500 | % | | | 6/25/39 | | | | 1,694,501 | | | | 1,808,839 | |
Federal National Mortgage Association (FNMA) REMIC,2012-51 B | | | 7.000 | % | | | 5/25/42 | | | | 7,182,982 | | | | 8,352,452 | |
Federal National Mortgage Association (FNMA) REMIC,2012-75 NS, IO(-1.000 x 1 mo. USD LIBOR + 6.600%) | | | 4.094 | % | | | 7/25/42 | | | | 751,357 | | | | 126,710 | (c) |
Federal National Mortgage Association (FNMA) STRIPS, 20384, 14, IO | | | 5.500 | % | | | 1/25/40 | | | | 691,253 | | | | 151,428 | |
Federal National Mortgage Association (FNMA) STRIPS, 20409, C1, IO | | | 3.000 | % | | | 11/25/26 | | | | 5,265,982 | | | | 390,767 | |
Federal National Mortgage Association (FNMA) STRIPS, 20409, C13, IO | | | 3.500 | % | | | 11/25/41 | | | | 5,905,639 | | | | 1,146,077 | |
Federal National Mortgage Association (FNMA) STRIPS, 20409, C18, IO | | | 4.000 | % | | | 4/25/42 | | | | 4,068,008 | | | | 799,691 | |
Federal National Mortgage Association (FNMA) STRIPS, 20409, C22, IO | | | 4.500 | % | | | 11/25/39 | | | | 1,757,899 | | | | 390,844 | |
Federal National Mortgage Association (FNMA) STRIPS, 390, C3, IO | | | 6.000 | % | | | 7/25/38 | | | | 1,307,239 | | | | 276,138 | |
Federal National Mortgage Association (FNMA) STRIPS, 407 41, IO | | | 6.000 | % | | | 1/25/38 | | | | 1,630,463 | | | | 379,260 | |
Federal National Mortgage Association (FNMA) STRIPS, 407, 22, IO | | | 5.000 | % | | | 1/25/39 | | | | 584,489 | | | | 121,528 | |
Federal National Mortgage Association (FNMA) STRIPS, 407, 23, IO | | | 5.000 | % | | | 1/25/39 | | | | 309,725 | | | | 71,721 | (c) |
Federal National Mortgage Association (FNMA) STRIPS, 407, 27, IO | | | 5.500 | % | | | 1/25/39 | | | | 265,877 | | | | 51,225 | (c) |
Federal National Mortgage Association (FNMA) STRIPS, 407, 34, IO | | | 5.000 | % | | | 1/25/38 | | | | 375,802 | | | | 73,460 | |
See Notes to Financial Statements.
| | |
| Western Asset Core Plus Bond Fund 2018 Annual Report | | 47 |
Schedule of investments (cont’d)
December 31, 2018
Western Asset Core Plus Bond Fund
| | | | | | | | | | | | | | | | |
| Security | | Rate | | | Maturity
Date | | | Face
Amount† | | | Value | |
| Collateralized Mortgage Obligations (j) — continued | | | | | | | | | | | | | | | | |
Federal National Mortgage Association (FNMA) STRIPS, 409, C2, IO | | | 3.000 | % | | | 4/25/27 | | | | 263,516 | | | $ | 20,720 | |
First Horizon Alternative Mortgage Securities Trust,2007-FA3, A1 (1 mo. USD LIBOR + 0.330%) | | | 2.836 | % | | | 6/25/37 | | | | 10,961,481 | | | | 6,181,028 | (c) |
Flagstar Mortgage Trust,2018-2 A4 | | | 3.500 | % | | | 4/25/48 | | | | 88,315,544 | | | | 86,831,039 | (a)(c) |
FREMF Mortgage Trust,2012-K20, X2A, IO | | | 0.200 | % | | | 5/25/45 | | | | 186,764,969 | | | | 1,041,495 | (a) |
GE Business Loan Trust,2007-1A, A (1 mo. USD LIBOR + 0.170%) | | | 2.625 | % | | | 4/15/35 | | | | 3,641,001 | | | | 3,573,802 | (a)(c) |
GE Capital Commercial Mortgage Corp.,2007-C1 AJ | | | 5.677 | % | | | 12/10/49 | | | | 34,897,000 | | | | 9,160,463 | (c) |
Government National Mortgage Association (GNMA),2001-36, FC (1 mo. LIBOR + 0.400%) | | | 2.870 | % | | | 8/20/31 | | | | 544 | | | | 544 | (c) |
Government National Mortgage Association (GNMA),2006-16, GS, IO(-1.000 x 1 mo. LIBOR + 6.990%) | | | 4.520 | % | | | 4/20/36 | | | | 761,288 | | | | 98,604 | (c) |
Government National Mortgage Association (GNMA),2007-51, SG, IO(-1.000 x 1 mo. LIBOR + 6.580%) | | | 4.110 | % | | | 8/20/37 | | | | 2,951,678 | | | | 477,423 | (c) |
Government National Mortgage Association (GNMA),2010-116, MH | | | 5.000 | % | | | 7/20/40 | | | | 27,967,485 | | | | 30,514,872 | |
Government National Mortgage Association (GNMA),2010-118, IO | | | 0.103 | % | | | 4/16/53 | | | | 2,864,898 | | | | 11,406 | (c) |
Government National Mortgage Association (GNMA),2010-42, PC, PAC | | | 5.000 | % | | | 7/20/39 | | | | 7,100,000 | | | | 7,443,991 | |
Government National Mortgage Association (GNMA),2010-86, PB, PAC | | | 4.500 | % | | | 10/20/39 | | | | 17,716,278 | | | | 18,268,119 | |
Government National Mortgage Association (GNMA),2010-H10 FC (1 mo. USD LIBOR + 1.000%) | | | 3.322 | % | | | 5/20/60 | | | | 639,706 | | | | 648,293 | (c) |
Government National Mortgage Association (GNMA),2010-H26, LF (1 mo. USD LIBOR + 0.350%) | | | 2.664 | % | | | 8/20/58 | | | | 1,657,496 | | | | 1,656,083 | (c) |
Government National Mortgage Association (GNMA),2010-H27, FA (1 mo. USD LIBOR + 0.380%) | | | 2.694 | % | | | 12/20/60 | | | | 356,545 | | | | 356,450 | (c) |
Government National Mortgage Association (GNMA),2010-H28, FE (1 mo. USD LIBOR + 0.400%) | | | 2.714 | % | | | 12/20/60 | | | | 7,404,277 | | | | 7,405,648 | (c) |
Government National Mortgage Association (GNMA),2011-140, AI, IO | | | 4.000 | % | | | 10/16/26 | | | | 305,798 | | | | 26,208 | |
Government National Mortgage Association (GNMA),2011-H06 FA (1 mo. USD LIBOR + 0.450%) | | | 2.764 | % | | | 2/20/61 | | | | 2,247,075 | | | | 2,250,565 | (c) |
Government National Mortgage Association (GNMA),2011-H08, FG (1 mo. USD LIBOR + 0.480%) | | | 2.794 | % | | | 3/20/61 | | | | 7,882,871 | | | | 7,899,121 | (c) |
Government National Mortgage Association (GNMA),2011-H09 AF (1 mo. USD LIBOR + 0.500%) | | | 2.814 | % | | | 3/20/61 | | | | 7,061,823 | | | | 7,079,014 | (c) |
Government National Mortgage Association (GNMA),2012-152, IO | | | 0.781 | % | | | 1/16/54 | | | | 73,906,236 | | | | 3,784,997 | (c) |
Government National Mortgage Association (GNMA),2012-34 SA, IO(-1.000 x 1 mo. USD LIBOR + 6.050%) | | | 3.580 | % | | | 3/20/42 | | | | 2,027,195 | | | | 282,406 | (c) |
See Notes to Financial Statements.
| | |
| 48 | | Western Asset Core Plus Bond Fund 2018 Annual Report |
Western Asset Core Plus Bond Fund
| | | | | | | | | | | | | | | | |
| Security | | Rate | | | Maturity
Date | | | Face
Amount† | | | Value | |
| Collateralized Mortgage Obligations (j) — continued | | | | | | | | | | | | | | | | |
Government National Mortgage Association (GNMA),2012-66, CI, IO | | | 3.500 | % | | | 2/20/38 | | | | 5,204,358 | | | $ | 387,975 | |
Government National Mortgage Association (GNMA),2012-81, AI, IO | | | 3.500 | % | | | 4/20/27 | | | | 2,204,201 | | | | 142,780 | |
Government National Mortgage Association (GNMA),2012-98, SA, IO(-1.000 x 1 mo. USD LIBOR + 6.100%) | | | 3.645 | % | | | 8/16/42 | | | | 3,832,957 | | | | 602,988 | (c) |
Government National Mortgage Association (GNMA),2013-150, IA, IO | | | 0.658 | % | | | 11/20/42 | | | | 2,566,636 | | | | 84,132 | (c) |
Government National Mortgage Association (GNMA),2014-117, SJ, IO, PAC(-1.000 x 1 mo. LIBOR + 5.600%) | | | 3.130 | % | | | 8/20/44 | | | | 780,883 | | | | 93,230 | (c) |
Government National Mortgage Association (GNMA),2014-160, EI, IO | | | 4.000 | % | | | 7/16/26 | | | | 6,294,001 | | | | 534,835 | |
Government National Mortgage Association (GNMA),2014-176, IA, IO | | | 4.000 | % | | | 11/20/44 | | | | 1,016,111 | | | | 204,820 | |
Government National Mortgage Association (GNMA),2016-135 SB, IO(-1.000 x 1 mo. USD LIBOR + 6.100%) | | | 3.645 | % | | | 10/16/46 | | | | 8,038,947 | | | | 1,504,493 | (c) |
Government National Mortgage Association (GNMA),2016-21, ST, IO(-1.000 x 1 mo. LIBOR + 6.150%) | | | 3.680 | % | | | 2/20/46 | | | | 28,922,613 | | | | 4,872,136 | (c) |
Government National Mortgage Association (GNMA),2016-84 IG, IO, PAC | | | 4.500 | % | | | 11/16/45 | | | | 6,265,061 | | | | 1,347,413 | |
Government National Mortgage Association (GNMA),2017-H15, KI, IO | | | 2.223 | % | | | 7/20/67 | | | | 38,646,410 | | | | 5,517,896 | (c) |
Government National Mortgage Association (GNMA),2017-H18, BI, IO | | | 1.577 | % | | | 9/20/67 | | | | 30,363,423 | | | | 2,836,557 | (c) |
Government National Mortgage Association (GNMA),2017-H20, IB, IO | | | 1.999 | % | | | 10/20/67 | | | | 15,189,546 | | | | 1,743,760 | (c)(f) |
Government National Mortgage Association (GNMA),2017-H22, IC, IO | | | 2.012 | % | | | 11/20/67 | | | | 4,703,471 | | | | 574,458 | (c)(f) |
Government National Mortgage Association (GNMA),2018-108 A | | | 3.250 | % | | | 5/16/59 | | | | 19,221,768 | | | | 19,094,547 | (c) |
Government National Mortgage Association (GNMA),2018-123 AH | | | 3.250 | % | | | 9/16/52 | | | | 558,258 | | | | 553,228 | |
Government National Mortgage Association (GNMA),2018-129 AG | | | 3.100 | % | | | 5/16/59 | | | | 2,352,740 | | | | 2,322,883 | |
Government National Mortgage Association (GNMA),2018-37, QA | | | 2.750 | % | | | 3/20/48 | | | | 11,826,772 | | | | 11,630,529 | |
Government National Mortgage Association (GNMA),2018-98 A | | | 3.000 | % | | | 10/16/50 | | | | 1,687,594 | | | | 1,659,546 | |
Government National Mortgage Association (GNMA),2018-99 A | | | 3.200 | % | | | 1/16/52 | | | | 2,892,853 | | | | 2,871,478 | |
Government National Mortgage Association (GNMA),2018-H06, PF (1 mo. USD LIBOR + 0.300%) | | | 2.614 | % | | | 2/20/68 | | | | 21,121,432 | | | | 21,069,978 | (c) |
Government National Mortgage Association (GNMA),2018-H07, FD (1 mo. USD LIBOR + 0.300%) | | | 2.614 | % | | | 5/20/68 | | | | 36,315,918 | | | | 36,223,301 | (c) |
See Notes to Financial Statements.
| | |
| Western Asset Core Plus Bond Fund 2018 Annual Report | | 49 |
Schedule of investments (cont’d)
December 31, 2018
Western Asset Core Plus Bond Fund
| | | | | | | | | | | | | | | | |
| Security | | Rate | | | Maturity
Date | | | Face
Amount† | | | Value | |
| Collateralized Mortgage Obligations (j) — continued | | | | | | | | | | | | | | | | |
Government National Mortgage Association (GNMA),2018-H08, KF (1 mo. USD LIBOR + 0.300%) | | | 2.614 | % | | | 5/20/68 | | | | 17,539,131 | | | $ | 17,487,377 | (c) |
Government National Mortgage Association (GNMA),2018-H13 FC (1 mo. USD LIBOR + 0.300%) | | | 2.614 | % | | | 7/20/68 | | | | 10,997,653 | | | | 10,962,695 | (c) |
Government National Mortgage Association (GNMA),2018-H17 FG (12 mo. USD LIBOR + 0.250%) | | | 3.250 | % | | | 10/20/68 | | | | 7,456,623 | | | | 7,497,448 | (c) |
Government National Mortgage Association (GNMA),2010-31 GS, IO,PAC-1(-1.000 x 1 mo. USD LIBOR + 6.500%) | | | 4.030 | % | | | 3/20/39 | | | | 477,750 | | | | 14,538 | (c) |
Government National Mortgage Association (GNMA),2010-42 BS, IO(-1.000 x 1 mo. USD LIBOR + 6.480%) | | | 4.010 | % | | | 4/20/40 | | | | 569,410 | | | | 86,510 | (c) |
Government National Mortgage Association (GNMA),2010-85 HS, IO, PAC(-1.000 x 1 mo. USD LIBOR + 6.650%) | | | 4.180 | % | | | 1/20/40 | | | | 323,471 | | | | 28,106 | (c) |
GreenPoint Mortgage Funding Trust,2005-AR4, 1A2A (1 mo. USD LIBOR + 0.640%) | | | 3.146 | % | | | 10/25/45 | | | | 2,692,137 | | | | 2,678,782 | (c) |
GreenPoint Mortgage Funding Trust,2005-AR5, 2A1 | | | 3.066 | % | | | 11/25/45 | | | | 17,240,464 | | | | 12,153,198 | (c) |
GreenPoint Mortgage Funding Trust,2006-AR3, 3A1
(1 mo. USD LIBOR + 0.230%) | | | 2.736 | % | | | 4/25/36 | | | | 840,976 | | | | 1,066,254 | (c) |
GS Mortgage Securities Corp. II, 2018-SRP5 A (1 mo. USD LIBOR + 1.300%) | | | 3.755 | % | | | 9/15/31 | | | | 139,880,000 | | | | 140,348,039 | (a)(c) |
GS Mortgage Securities Trust, 2007-GG10, AM | | | 5.780 | % | | | 8/10/45 | | | | 1,048,885 | | | | 1,067,697 | (c) |
GS Mortgage Securities Trust, 2013-GC16, B | | | 5.161 | % | | | 11/10/46 | | | | 4,302,000 | | | | 4,555,554 | (c) |
GS Mortgage Securities Trust, 2015-GC30, B | | | 4.013 | % | | | 5/10/50 | | | | 16,340,000 | | | | 16,368,502 | (c) |
GS Mortgage Securities Trust,2017-GS8, A4 | | | 3.469 | % | | | 11/10/50 | | | | 5,490,000 | | | | 5,398,449 | |
GSR Mortgage Loan Trust,2005-AR7, 1A1 | | | 4.592 | % | | | 11/25/35 | | | | 875,504 | | | | 715,546 | (c) |
HarborView Mortgage Loan Trust,2005-3, 2A1A (1 mo. USD LIBOR + 0.480%) | | | 2.950 | % | | | 6/19/35 | | | | 4,544,084 | | | | 4,498,699 | (c) |
HarborView Mortgage Loan Trust,2005-7, 1A1 (11th District Cost of Funds + 1.850%) | | | 2.929 | % | | | 6/19/45 | | | | 2,456,023 | | | | 1,584,762 | (c) |
HarborView Mortgage Loan Trust,2006-13, A (1 mo. USD LIBOR + 0.180%) | | | 2.650 | % | | | 11/19/46 | | | | 226,431 | | | | 190,769 | (c) |
HarborView Mortgage Loan Trust,2006-2 1A | | | 4.597 | % | | | 2/25/36 | | | | 902,864 | | | | 618,350 | (c) |
Impac CMB Trust,2005-7, A1 (1 mo. USD LIBOR + 0.520%) | | | 3.026 | % | | | 11/25/35 | | | | 3,691,250 | | | | 3,329,418 | (c) |
Impac CMB Trust,2007-A A (1 mo. USD LIBOR + 0.500%) | | | 3.006 | % | | | 5/25/37 | | | | 8,758,296 | | | | 8,687,572 | (a)(c) |
IndyMac INDX Mortgage Loan Trust, 2005-AR13, 1A1 | | | 3.978 | % | | | 8/25/35 | | | | 192,122 | | | | 160,320 | (c) |
IndyMac INDX Mortgage Loan Trust,2006-AR2, 1A1B
(1 mo. USD LIBOR + 0.210%) | | | 2.716 | % | | | 4/25/46 | | | | 5,994,172 | | | | 5,454,628 | (c) |
Jefferies Resecuritization Trust,2015-R1, A2 (1 mo. USD LIBOR + 0.140%) | | | 2.455 | % | | | 12/26/36 | | | | 18,386,177 | | | | 11,419,029 | (a)(c) |
JPMBB Commercial Mortgage Securities Trust,2013-C17, B | | | 4.891 | % | | | 1/15/47 | | | | 1,602,000 | | | | 1,661,167 | (c) |
JPMBB Commercial Mortgage Securities Trust,2014-C25, AS | | | 4.065 | % | | | 11/15/47 | | | | 5,930,000 | | | | 5,982,642 | |
See Notes to Financial Statements.
| | |
| 50 | | Western Asset Core Plus Bond Fund 2018 Annual Report |
Western Asset Core Plus Bond Fund
| | | | | | | | | | | | | | | | |
| Security | | Rate | | | Maturity
Date | | | Face
Amount† | | | Value | |
| Collateralized Mortgage Obligations (j) — continued | | | | | | | | | | | | | | | | |
JPMBB Commercial Mortgage Securities Trust,2015-C30, B | | | 4.297 | % | | | 7/15/48 | | | | 19,921,000 | | | $ | 19,964,264 | (c) |
JPMBB Commercial Mortgage Securities Trust,2015-C31, B | | | 4.617 | % | | | 8/15/48 | | | | 10,543,000 | | | | 10,774,836 | (c) |
JPMDB Commercial Mortgage Securities Trust,2017-C5, A5 | | | 3.694 | % | | | 3/15/50 | | | | 620,000 | | | | 624,294 | |
JPMorgan Chase Commercial Mortgage Securities Trust, 2006-LDP7 AJ | | | 6.055 | % | | | 4/17/45 | | | | 6,166,970 | | | | 4,525,264 | (c) |
JPMorgan Chase Commercial Mortgage Securities Trust, 2007-CB18 AJ | | | 5.502 | % | | | 6/12/47 | | | | 22,881,841 | | | | 18,918,397 | (c) |
JPMorgan Chase Commercial Mortgage Securities Trust, 2007-CB19 AJ | | | 5.818 | % | | | 2/12/49 | | | | 16,493,229 | | | | 12,349,859 | (c) |
JPMorgan Chase Commercial Mortgage Securities Trust, 2007-LD12 AJ | | | 6.206 | % | | | 2/15/51 | | | | 1,950,195 | | | | 1,816,546 | (c) |
JPMorgan Chase Commercial Mortgage Securities Trust, 2007-LDPX AJFX | | | 5.438 | % | | | 1/15/49 | | | | 47,100,000 | | | | 10,144,210 | (a) |
JPMorgan Chase Commercial Mortgage Securities Trust,2015-FL7 D (1 mo. USD LIBOR + 3.750%) | | | 6.205 | % | | | 5/15/28 | | | | 17,708,248 | | | | 17,452,775 | (a)(c) |
JPMorgan Mortgage Trust,2018-3 A1 | | | 3.500 | % | | | 9/25/48 | | | | 109,528,486 | | | | 108,698,151 | (a)(c) |
JPMorgan Mortgage Trust,2018-4 A1 | | | 3.500 | % | | | 10/25/48 | | | | 43,402,429 | | | | 42,695,659 | (a)(c) |
JPMorgan Mortgage Trust,2018-5 A1 | | | 3.500 | % | | | 10/25/48 | | | | 149,933,821 | | | | 147,061,539 | (a)(c) |
JPMorgan Resecuritization Trust,2015-1, 4A1 (1 mo. USD LIBOR + 0.300%) | | | 2.770 | % | | | 9/27/36 | | | | 11,342,265 | | | | 11,016,040 | (a)(c) |
JPMorgan Resecuritization Trust,2015-1, 4A2 | | | 2.417 | % | | | 9/27/36 | | | | 13,846,932 | | | | 10,136,235 | (a) |
Lehman Mortgage Trust,2006-7, 3A4, IO(-1.000 x 1 mo. USD LIBOR + 7.150%) | | | 4.644 | % | | | 11/25/36 | | | | 8,124,189 | | | | 2,082,374 | (c) |
Lone Star Portfolio Trust, 2015-LSMZ M (1 mo. LIBOR + 7.218%) | | | 9.673 | % | | | 9/15/20 | | | | 7,356,021 | | | | 7,311,988 | (a)(c) |
Lone Star Portfolio Trust,2015-LSP F (1 mo. LIBOR + 6.900%) | | | 9.605 | % | | | 9/15/28 | | | | 13,844,281 | | | | 13,934,990 | (a)(c) |
Lone Star Portfolio Trust,2015-LSP, E (1 mo. USD LIBOR + 5.600%) | | | 8.305 | % | | | 9/15/28 | | | | 38,778,969 | | | | 39,146,516 | (a)(c) |
LSTAR Securities Investment Ltd.,2017-8R, A (1 mo. USD LIBOR + 2.500%) | | | 5.007 | % | | | 11/5/22 | | | | 9,641,969 | | | | 9,610,401 | (a)(c) |
MASTR Adjustable Rate Mortgages Trust,2004-6, 5A1 | | | 4.639 | % | | | 7/25/34 | | | | 319,207 | | | | 301,180 | (c) |
MASTR Adjustable Rate Mortgages Trust,2006-OA1 1A1 (1 mo. USD LIBOR + 0.210%) | | | 2.716 | % | | | 4/25/46 | | | | 192,518 | | | | 173,218 | (c) |
MASTR Reperforming Loan Trust,2005-1, 1A1 | | | 6.000 | % | | | 8/25/34 | | | | 1,682,109 | | | | 1,563,461 | (a) |
MASTR Reperforming Loan Trust,2005-2 1A1F (1 mo. USD LIBOR + 0.350%) | | | 2.856 | % | | | 5/25/35 | | | | 2,499,782 | | | | 1,993,709 | (a)(c) |
MASTR Reperforming Loan Trust,2005-1 1A3 | | | 7.000 | % | | | 8/25/34 | | | | 2,486,721 | | | | 2,485,057 | (a) |
ML-CFC Commercial Mortgage Trust,2007-5 AJ | | | 5.450 | % | | | 8/12/48 | | | | 5,524,998 | | | | 4,074,756 | (c) |
ML-CFC Commercial Mortgage Trust,2007-5 AJFL | | | 5.450 | % | | | 8/12/48 | | | | 872,452 | | | | 643,444 | (a)(c) |
See Notes to Financial Statements.
| | |
| Western Asset Core Plus Bond Fund 2018 Annual Report | | 51 |
Schedule of investments (cont’d)
December 31, 2018
Western Asset Core Plus Bond Fund
| | | | | | | | | | | | | | | | |
| Security | | Rate | | | Maturity
Date | | | Face
Amount† | | | Value | |
| Collateralized Mortgage Obligations (j) — continued | | | | | | | | | | | | | | | | |
ML-CFC Commercial Mortgage Trust,2007-9 AJ | | | 6.086 | % | | | 9/12/49 | | | | 6,139,280 | | | $ | 4,761,512 | (c) |
Morgan Stanley Bank of America Merrill Lynch Trust,2013-C10, A4 | | | 4.082 | % | | | 7/15/46 | | | | 110,000 | | | | 113,703 | (c) |
Morgan Stanley Capital I Trust, 2007-IQ13 AJ | | | 5.438 | % | | | 3/15/44 | | | | 580,670 | | | | 583,723 | |
Morgan Stanley Mortgage Loan Trust,2004-5AR, 2A | | | 4.246 | % | | | 7/25/34 | | | | 19,927 | | | | 19,479 | (c) |
Morgan Stanley Mortgage Loan Trust,2005-3AR, 2A2 | | | 3.683 | % | | | 7/25/35 | | | | 1,476,706 | | | | 1,300,460 | (c) |
Morgan Stanley Resecuritization Trust,2015-R3 7A1 (Federal Reserve U.S. 12 mo. Cumulative Avg 1 Year CMT + 0.770%) | | | 2.823 | % | | | 4/26/47 | | | | 17,180,881 | | | | 16,919,955 | (a)(c) |
Mortgage Loan Resecuritization Trust,2009-RS1, A85 (1 mo. USD LIBOR + 0.340%) | | | 2.689 | % | | | 4/16/36 | | | | 56,559,677 | | | | 49,836,547 | (a)(c) |
Multifamily Trust,2016-1 B | | | 10.442 | % | | | 4/25/46 | | | | 5,356,329 | | | | 5,643,220 | (a)(c) |
Nomura Asset Acceptance Corp. Alternative Loan Trust Series,2005-AP2, A5 | | | 5.476 | % | | | 5/25/35 | | | | 79,470 | | | | 58,110 | |
Nomura Resecuritization Trust,2015-5R, 3A5 (1 mo. USD LIBOR + 0.260%) | | | 2.575 | % | | | 2/26/46 | | | | 10,170,195 | | | | 9,030,328 | (a)(c) |
Prime Mortgage Trust,2006-1, 3A2(-1.000 x 1 mo. USD LIBOR + 7.150%), IO | | | 4.644 | % | | | 6/25/36 | | | | 14,003,006 | | | | 2,339,396 | (c) |
Prime Mortgage Trust,2006-DR1 2A2 | | | 6.000 | % | | | 5/25/35 | | | | 32,763,120 | | | | 26,173,159 | (a) |
RALI Series Trust,2007-QS4, 3A9 | | | 6.000 | % | | | 3/25/37 | | | | 2,782,379 | | | | 2,529,213 | |
RAMP Series Trust,2004-SL4, A5 | | | 7.500 | % | | | 7/25/32 | | | | 589,831 | | | | 445,194 | |
RAMP Series Trust,2005-SL1, A7 | | | 8.000 | % | | | 5/25/32 | | | | 292,688 | | | | 235,426 | |
RBSGC Mortgage Loan Trust,2007-B, 1A4 (1 mo. USD LIBOR + 0.450%) | | | 2.956 | % | | | 1/25/37 | | | | 9,108,743 | | | | 6,017,672 | (c) |
RBSSP Resecuritization Trust,2009-12, 9A2 | | | 3.853 | % | | | 3/25/36 | | | | 10,976,947 | | | | 9,953,624 | (a) |
Reperforming Loan REMIC Trust,2006-R2, AS, IO | | | 3.389 | % | | | 7/25/36 | | | | 17,142,295 | | | | 1,871,966 | (a)(c) |
Residential Asset Securitization Trust,2003-A14, A1 | | | 4.750 | % | | | 2/25/19 | | | | 13,796 | | | | 12,297 | |
Residential Asset Securitization Trust,2004-A2, 1A3, PAC (1 mo. USD LIBOR + 0.400%) | | | 2.906 | % | | | 5/25/34 | | | | 13,096 | | | | 12,787 | (c) |
Rosslyn Portfolio Trust, 2017-ROSS, A (1 mo. USD LIBOR + 0.950%) | | | 3.405 | % | | | 6/15/33 | | | | 31,270,000 | | | | 31,311,183 | (a)(c) |
Shops at Crystals Trust, 2016-CSTL, A | | | 3.126 | % | | | 7/5/36 | | | | 11,160,000 | | | | 10,716,881 | (a) |
Structured Adjustable Rate Mortgage Loan Trust,2004-8, 1A1 | | | 4.373 | % | | | 7/25/34 | | | | 1,209 | | | | 1,212 | (c) |
Structured Adjustable Rate Mortgage Loan Trust,2004-9XS A (1 mo. USD LIBOR + 0.370%) | | | 2.876 | % | | | 7/25/34 | | | | 33,406 | | | | 33,327 | (c) |
Structured Asset Mortgage Investments II Trust,2006-AR6 1A1 (1 mo. USD LIBOR + 0.180%) | | | 2.686 | % | | | 7/25/46 | | | | 150,051 | | | | 138,936 | (c) |
Structured Asset Mortgage Investments Trust,2003-AR1, A1 (1 mo. USD LIBOR + 0.740%) | | | 3.210 | % | | | 10/19/33 | | | | 105,025 | | | | 99,843 | (c) |
|
Structured Asset Securities Corp. Mortgage Loan Trust,2002-9, A2 (1 mo. USD LIBOR + 0.600%) | | | 3.106 | % | | | 10/25/27 | | | | 17,711 | | | | 17,513 | (c) |
|
See Notes to Financial Statements.
| | |
| 52 | | Western Asset Core Plus Bond Fund 2018 Annual Report |
Western Asset Core Plus Bond Fund
| | | | | | | | | | | | | | | | |
| Security | | Rate | | | Maturity
Date | | | Face
Amount† | | | Value | |
| Collateralized Mortgage Obligations (j) — continued | | | | | | | | | | | | | | | | |
SunTrust Alternative Loan Trust,2006-1F, 3A (1 mo. USD LIBOR + 0.350%) | | | 2.856 | % | | | 4/25/36 | | | | 19,255,985 | | | $ | 5,806,149 | (c) |
|
UBS Commercial Mortgage Trust,2017-C1, A4 | | | 3.460 | % | | | 6/15/50 | | | | 5,440,000 | | | | 5,365,789 | |
|
UBS Commercial Mortgage Trust,2017-C3, A4 | | | 3.426 | % | | | 8/15/50 | | | | 6,000,000 | | | | 5,893,260 | |
|
Wachovia Bank Commercial Mortgage Trust,2007-C33 AJ | | | 5.773 | % | | | 2/15/51 | | | | 25,271,528 | | | | 24,998,825 | (c) |
|
WaMu Mortgage Pass-Through Certificates Series Trust,2003-AR9, 1A7 (1 year Treasury Constant Maturity Rate + 2.330%) | | | 4.331 | % | | | 9/25/33 | | | | 10,024 | | | | 10,302 | (c) |
|
WaMu Mortgage Pass-Through Certificates Trust, 2005-AR15 A1C3 (1 mo. USD LIBOR + 0.480%) | | | 2.986 | % | | | 11/25/45 | | | | 37,532,900 | | | | 27,493,194 | (c) |
|
Waterfall Commercial Mortgage Trust, 2015-SBC5, A | | | 4.104 | % | | | 9/14/22 | | | | 13,966,012 | | | | 14,043,980 | (a)(c) |
|
Wells Fargo Alternative Loan Trust,2007-PA1 A12, IO(-1.000 x 1 mo. USD LIBOR + 5.460%) | | | 2.954 | % | | | 3/25/37 | | | | 16,218,473 | | | | 1,347,270 | (c) |
|
Wells Fargo Alternative Loan Trust,2007-PA2, 2A1 (1 mo. USD LIBOR + 0.430%) | | | 2.936 | % | | | 6/25/37 | | | | 6,094,315 | | | | 5,039,702 | (c) |
|
Wells Fargo Commercial Mortgage Trust, 2013-LC12, B | | | 4.287 | % | | | 7/15/46 | | | | 450,000 | | | | 456,728 | (c) |
|
Wells Fargo Commercial Mortgage Trust, 2014-LC18, AS | | | 3.808 | % | | | 12/15/47 | | | | 5,630,000 | | | | 5,616,129 | |
|
Wells Fargo Commercial Mortgage Trust,2015-NXS1, A5 | | | 3.148 | % | | | 5/15/48 | | | | 8,530,000 | | | | 8,388,778 | |
|
Wells Fargo Commercial Mortgage Trust,2017-C41, XA, IO | | | 1.232 | % | | | 11/15/50 | | | | 32,161,913 | | | | 2,637,566 | (c) |
|
Wells Fargo Commercial Mortgage Trust,2018-C44, A5 | | | 4.212 | % | | | 5/15/51 | | | | 7,530,000 | | | | 7,801,660 | |
Wells Fargo Mortgage Backed Securities Trust,2004-Y, 1A2 (1 year Treasury Constant Maturity Rate + 2.490%) | | | 4.918 | % | | | 11/25/34 | | | | 31,024 | | | | 31,899 | (c) |
Wells Fargo Mortgage Backed Securities Trust,2006-AR2, 1A1 | | | 4.595 | % | | | 3/25/36 | | | | 41,559,019 | | | | 42,039,674 | (c) |
Wells Fargo Mortgage Loan Trust,2010-RR4, 2A1 | | | 4.603 | % | | | 8/27/35 | | | | 10,889 | | | | 10,895 | (a)(c) |
WFRBS Commercial Mortgage Trust,2012-C7, XA, IO | | | 1.405 | % | | | 6/15/45 | | | | 184,246 | | | | 6,698 | (a)(c) |
WFRBS Commercial Mortgage Trust,2013-C14, D | | | 3.979 | % | | | 6/15/46 | | | | 3,030,000 | | | | 2,757,855 | (a)(c) |
WFRBS Commercial Mortgage Trust,2014-C19, B | | | 4.723 | % | | | 3/15/47 | | | | 270,000 | | | | 279,280 | (c) |
WFRBS Commercial Mortgage Trust,2014-C19, XA, IO | | | 1.083 | % | | | 3/15/47 | | | | 48,028,803 | | | | 1,906,508 | (c) |
Total Collateralized Mortgage Obligations (Cost — $2,820,422,884) | | | | | | | | 2,758,437,783 | |
| Sovereign Bonds — 6.4% | | | | | | | | | | | | | | | | |
Argentina — 0.5% | | | | | | | | | | | | | | | | |
Argentina POM Politica Monetaria, Bonds (Argentina Central Bank 7 Day Repo Reference Rate) | | | 59.031 | % | | | 6/21/20 | | | | 67,940,000 | ARS | | | 1,930,555 | (c) |
Argentine Bonos del Tesoro | | | 18.200 | % | | | 10/3/21 | | | | 626,050,000 | ARS | | | 12,791,967 | |
Argentine Republic Government International Bond, Senior Notes | | | 6.875 | % | | | 4/22/21 | | | | 5,430,000 | | | | 4,926,422 | |
Argentine Republic Government International Bond, Senior Notes | | | 5.625 | % | | | 1/26/22 | | | | 50,540,000 | | | | 42,832,650 | |
See Notes to Financial Statements.
| | |
| Western Asset Core Plus Bond Fund 2018 Annual Report | | 53 |
Schedule of investments (cont’d)
December 31, 2018
Western Asset Core Plus Bond Fund
| | | | | | | | | | | | | | | | |
| Security | | Rate | | | Maturity
Date | | | Face
Amount† | | | Value | |
Argentina — continued | | | | | | | | | | | | | | | | |
Argentine Republic Government International Bond, Senior Notes | | | 7.500 | % | | | 4/22/26 | | | | 11,600,000 | | | $ | 9,330,750 | |
Argentine Republic Government International Bond, Senior Notes | | | 5.875 | % | | | 1/11/28 | | | | 1,390,000 | | | | 1,004,275 | |
Argentine Republic Government International Bond, Senior Notes | | | 7.125 | % | | | 7/6/36 | | | | 3,600,000 | | | | 2,594,250 | |
Argentine Republic Government International Bond, Senior Notes | | | 7.625 | % | | | 4/22/46 | | | | 5,450,000 | | | | 3,972,368 | |
Argentine Republic Government International Bond, Senior Notes | | | 6.875 | % | | | 1/11/48 | | | | 49,940,000 | | | | 35,020,425 | |
Provincia de Buenos Aires, Senior Notes | | | 6.500 | % | | | 2/15/23 | | | | 9,210,000 | | | | 7,460,100 | (a) |
|
Provincia de Buenos Aires, Senior Notes | | | 7.875 | % | | | 6/15/27 | | | | 7,890,000 | | | | 5,720,329 | (a) |
|
Total Argentina | | | | | | | | | | | | | | | 127,584,091 | |
Brazil — 1.4% | | | | | | | | | | | | | | | | |
Brazil Notas do Tesouro Nacional Serie F, Notes | | | 10.000 | % | | | 1/1/21 | | | | 430,023,000 | BRL | | | 116,053,621 | |
|
Brazil Notas do Tesouro Nacional Serie F, Notes | | | 10.000 | % | | | 1/1/23 | | | | 270,145,000 | BRL | | | 73,024,606 | |
|
Brazil Notas do Tesouro Nacional Serie F, Notes | | | 10.000 | % | | | 1/1/27 | | | | 34,396,000 | BRL | | | 9,278,276 | |
|
Brazilian Government International Bond, Senior Notes | | | 2.625 | % | | | 1/5/23 | | | | 4,490,000 | | | | 4,234,115 | |
|
Brazilian Government International Bond, Senior Notes | | | 4.625 | % | | | 1/13/28 | | | | 18,440,000 | | | | 17,762,514 | |
|
Brazilian Government International Bond, Senior Notes | | | 5.625 | % | | | 1/7/41 | | | | 25,970,000 | | | | 25,028,588 | |
|
Brazilian Government International Bond, Senior Notes | | | 5.000 | % | | | 1/27/45 | | | | 34,140,000 | | | | 29,928,319 | |
|
Brazilian Government International Bond, Senior Notes | | | 5.625 | % | | | 2/21/47 | | | | 50,990,000 | | | | 48,268,919 | |
|
Total Brazil | | | | | | | | | | | | | | | 323,578,958 | |
China — 0.3% | | | | | | | | | | | | | | | | |
China Government Bond, Senior Notes | | | 3.380 | % | | | 11/21/24 | | | | 115,500,000 | CNH | | | 16,511,675 | (k) |
|
China Government Bond, Senior Notes | | | 3.390 | % | | | 5/21/25 | | | | 59,000,000 | CNH | | | 8,427,792 | (k) |
|
China Government Bond, Senior Notes | | | 3.310 | % | | | 11/30/25 | | | | 273,500,000 | CNH | | | 38,821,327 | (k) |
|
Total China | | | | | | | | | | | | | | | 63,760,794 | |
Colombia — 0.1% | | | | | | | | | | | | | | | | |
Colombia Government International Bond, Senior Notes | | | 5.625 | % | | | 2/26/44 | | | | 19,220,000 | | | | 19,863,870 | |
|
Ecuador — 0.0% | | | | | | | | | | | | | | | | |
Ecuador Government International Bond, Senior Notes | | | 7.875 | % | | | 1/23/28 | | | | 14,140,000 | | | | 11,550,613 | (a) |
|
Egypt — 0.1% | | | | | | | | | | | | | | | | |
Egypt Government International Bond, Senior Notes | | | 5.577 | % | | | 2/21/23 | | | | 15,630,000 | | | | 14,853,908 | (a) |
Indonesia — 0.5% | | | | | | | | | | | | | | | | |
Indonesia Government International Bond, Senior Notes | | | 5.875 | % | | | 3/13/20 | | | | 310,000 | | | | 319,137 | (k) |
|
Indonesia Government International Bond, Senior Notes | | | 4.875 | % | | | 5/5/21 | | | | 510,000 | | | | 521,914 | (k) |
|
Indonesia Government International Bond, Senior Notes | | | 3.750 | % | | | 4/25/22 | | | | 24,750,000 | | | | 24,547,718 | (k) |
|
Indonesia Government International Bond, Senior Notes | | | 3.750 | % | | | 4/25/22 | | | | 370,000 | | | | 366,976 | (a) |
|
See Notes to Financial Statements.
| | |
| 54 | | Western Asset Core Plus Bond Fund 2018 Annual Report |
Western Asset Core Plus Bond Fund
| | | | | | | | | | | | | | | | |
| Security | | Rate | | | Maturity
Date | | | Face
Amount† | | | Value | |
Indonesia — continued | | | | | | | | | | | | | | | | |
Indonesia Government International Bond, Senior Notes | | | 5.375 | % | | | 10/17/23 | | | | 7,620,000 | | | $ | 7,971,427 | (k) |
|
Indonesia Government International Bond, Senior Notes | | | 3.850 | % | | | 7/18/27 | | | | 10,410,000 | | | | 9,908,311 | (a) |
|
Indonesia Government International Bond, Senior Notes | | | 3.500 | % | | | 1/11/28 | | | | 3,010,000 | | | | 2,791,185 | |
|
Indonesia Government International Bond, Senior Notes | | | 4.625 | % | | | 4/15/43 | | | | 5,050,000 | | | | 4,677,507 | (k) |
|
Indonesia Government International Bond, Senior Notes | | | 5.125 | % | | | 1/15/45 | | | | 22,340,000 | | | | 22,075,450 | (a) |
|
Indonesia Government International Bond, Senior Notes | | | 5.125 | % | | | 1/15/45 | | | | 3,610,000 | | | | 3,567,250 | (k) |
|
Indonesia Government International Bond, Senior Notes | | | 5.250 | % | | | 1/8/47 | | | | 23,930,000 | | | | 24,076,882 | (a) |
|
Indonesia Government International Bond, Senior Notes | | | 4.750 | % | | | 7/18/47 | | | | 3,900,000 | | | | 3,676,241 | (a) |
|
Indonesia Government International Bond, Senior Notes | | | 4.350 | % | | | 1/11/48 | | | | 28,860,000 | | | | 26,410,421 | |
|
Total Indonesia | | | | | | | | | | | | | | | 130,910,419 | |
Kenya — 0.1% | | | | | | | | | | | | | | | | |
Kenya Government International Bond, Senior Notes | | | 6.875 | % | | | 6/24/24 | | | | 7,780,000 | | | | 7,332,456 | (k) |
|
Kenya Government International Bond, Senior Notes | | | 7.250 | % | | | 2/28/28 | | | | 8,110,000 | | | | 7,270,793 | (a) |
|
Total Kenya | | | | | | | | | | | | | | | 14,603,249 | |
Kuwait — 0.1% | | | | | | | | | | | | | | | | |
Kuwait International Government Bond, Senior Notes | | | 3.500 | % | | | 3/20/27 | | | | 24,270,000 | | | | 24,201,365 | (a) |
|
Mexico — 2.1% | | | | | | | | | | | | | | | | |
Mexican Bonos, Bonds | | | 6.500 | % | | | 6/9/22 | | | | 2,253,009,800 | MXN | | | 107,708,354 | |
Mexican Bonos, Bonds | | | 10.000 | % | | | 12/5/24 | | | | 324,780,000 | MXN | | | 17,569,777 | |
Mexican Bonos, Bonds | | | 8.000 | % | | | 11/7/47 | | | | 4,039,060,000 | MXN | | | 185,820,910 | |
Mexican Bonos, Senior Notes | | | 7.750 | % | | | 11/23/34 | | | | 381,940,000 | MXN | | | 17,645,223 | |
Mexican Bonos, Senior Notes | | | 7.750 | % | | | 11/13/42 | | | | 2,668,886,200 | MXN | | | 120,052,516 | |
Mexico Government International Bond, Senior Notes | | | 4.350 | % | | | 1/15/47 | | | | 11,650,000 | | | | 10,027,737 | |
Mexico Government International Bond, Senior Notes | | | 4.600 | % | | | 2/10/48 | | | | 38,120,000 | | | | 33,950,625 | |
Total Mexico | | | | | | | | | | | | | | | 492,775,142 | |
Nigeria — 0.1% | | | | | | | | | | | | | | | | |
Nigeria Government International Bond, Senior Notes | | | 6.500 | % | | | 11/28/27 | | | | 8,130,000 | | | | 7,213,098 | (a) |
Nigeria Government International Bond, Senior Notes | | | 7.143 | % | | | 2/23/30 | | | | 9,270,000 | | | | 8,227,496 | (a) |
Total Nigeria | | | | | | | | | | | | | | | 15,440,594 | |
Peru — 0.1% | | | | | | | | | | | | | | | | |
Peruvian Government International Bond, Senior Notes | | | 6.550 | % | | | 3/14/37 | | | | 2,330,000 | | | | 2,953,275 | |
Peruvian Government International Bond, Senior Notes | | | 5.625 | % | | | 11/18/50 | | | | 14,180,000 | | | | 16,682,770 | |
Total Peru | | | | | | | | | | | | | | | 19,636,045 | |
Poland — 0.1% | | | | | | | | | | | | | | | | |
Republic of Poland Government International Bond, Senior Notes | | | 4.000 | % | | | 1/22/24 | | | | 34,880,000 | | | | 35,760,023 | |
Russia — 0.8% | | | | | | | | | | | | | | | | |
Russian Federal Bond - OFZ, Bonds | | | 7.000 | % | | | 1/25/23 | | | | 1,326,230,000 | RUB | | | 18,275,230 | |
See Notes to Financial Statements.
| | |
| Western Asset Core Plus Bond Fund 2018 Annual Report | | 55 |
Schedule of investments (cont’d)
December 31, 2018
Western Asset Core Plus Bond Fund
| | | | | | | | | | | | | | | | |
| Security | | Rate | | | Maturity
Date | | | Face
Amount† | | | Value | |
Russia — continued | | | | | | | | | | | | | | | | |
Russian Federal Bond - OFZ, Bonds | | | 7.000 | % | | | 8/16/23 | | | | 3,299,070,000 | RUB | | $ | 45,099,364 | |
Russian Federal Bond - OFZ, Bonds | | | 7.750 | % | | | 9/16/26 | | | | 256,110,000 | RUB | | | 3,534,263 | |
Russian Federal Bond - OFZ, Bonds | | | 8.150 | % | | | 2/3/27 | | | | 2,696,040,000 | RUB | | | 37,938,033 | |
Russian Federal Bond - OFZ, Bonds | | | 7.050 | % | | | 1/19/28 | | | | 6,370,818,000 | RUB | | | 83,202,380 | |
Total Russia | | | | | | | | | | | | | | | 188,049,270 | |
United Arab Emirates — 0.1% | | | | | | | | | | | | | | | | |
Abu Dhabi Government International Bond, Senior Notes | | | 2.500 | % | | | 10/11/22 | | | | 26,930,000 | | | | 26,191,310 | (a) |
Uruguay — 0.0% | | | | | | | | | | | | | | | | |
Uruguay Government International Bond, Senior Notes | | | 7.875 | % | | | 1/15/33 | | | | 1 | | | | 1 | |
Total Sovereign Bonds (Cost — $1,778,436,611) | | | | | | | | 1,508,759,652 | |
| | | | |
| | | | | | | | | Face
Amount†/Units | | | | |
| Asset-Backed Securities — 3.6% | | | | | | | | | | | | | | | | |
Airspeed Ltd.,2007-1A, G1W (1 mo. USD LIBOR + 0.270%) | | | 2.725 | % | | | 4/15/24 | | | | 6,564,931 | | | | 5,830,447 | (a)(c) |
Bear Stearns Asset Backed Securities I Trust,2005-CL1 A1 (1 mo. USD LIBOR + 0.500%) | | | 2.222 | % | | | 9/25/34 | | | | 1,620,696 | | | | 1,564,558 | (c) |
Bear Stearns Asset Backed Securities Trust,2004-SD3, A3 (1 mo. USD LIBOR + 1.140%) | | | 3.455 | % | | | 9/25/34 | | | | 2,183 | | | | 2,189 | (c) |
Brazos Student Finance Corp.,2009-1, AS (3 mo. USD LIBOR + 2.500%) | | | 5.322 | % | | | 12/27/39 | | | | 7,100,000 | | | | 7,371,483 | (c) |
CIT Mortgage Loan Trust,2007-1, 1M1 (1 mo. USD LIBOR + 1.500%) | | | 4.006 | % | | | 10/25/37 | | | | 47,370,000 | | | | 47,043,649 | (a)(c) |
CIT Mortgage Loan Trust,2007-1, 1M2 (1 mo. USD LIBOR + 1.750%) | | | 4.256 | % | | | 10/25/37 | | | | 108,930,000 | | | | 94,666,935 | (a)(c) |
Community Funding CLO,2015-1A A | | | 5.750 | % | | | 11/1/27 | | | | 36,638,237 | | | | 37,602,518 | (a) |
Conseco Finance Corp.,201999-3, A9 | | | 6.530 | % | | | 2/1/31 | | | | 14,778,441 | | | | 14,255,928 | (c) |
ContiMortgage Home Equity Loan Trust,201997-4, B1F | | | 7.330 | % | | | 10/15/28 | | | | 79,204 | | | | 168,626 | (c) |
Countrywide Asset-Backed Certificates,2003-BC3, A2 (1 mo. USD LIBOR + 0.620%) | | | 3.126 | % | | | 9/25/33 | | | | 433,005 | | | | 424,269 | (c) |
Countrywide Asset-Backed Certificates,2006-SD4, A1 (1 mo. USD LIBOR + 0.340%) | | | 2.846 | % | | | 12/25/36 | | | | 63,245 | | | | 33,746 | (a)(c) |
Countrywide Home Equity Loan Trust,2006-E 2A (1 mo. USD LIBOR + 0.140%) | | | 2.595 | % | | | 7/15/36 | | | | 48,559 | | | | 46,267 | (c) |
Countrywide Home Equity Loan Trust,2006-HW 2A1B (1 mo. USD LIBOR + 0.150%) | | | 2.605 | % | | | 11/15/36 | | | | 556,884 | | | | 489,111 | (c) |
Countrywide Home Equity Loan Trust,2006-I, 2A (1 mo. USD LIBOR + 0.140%) | | | 2.595 | % | | | 1/15/37 | | | | 5,755,728 | | | | 5,460,522 | (c) |
Countrywide Home Equity Loan Trust,2007-B, A (1 mo. USD LIBOR + 0.150%) | | | 2.605 | % | | | 2/15/37 | | | | 7,367,378 | | | | 7,087,847 | (c) |
See Notes to Financial Statements.
| | |
| 56 | | Western Asset Core Plus Bond Fund 2018 Annual Report |
Western Asset Core Plus Bond Fund
| | | | | | | | | | | | | | | | |
| Security | | Rate | | | Maturity
Date | | | Face
Amount†/Units | | | Value | |
| Asset-Backed Securities — continued | | | | | | | | | | | | | | | | |
Ford Credit Floorplan Master Owner Trust,2018-4 A | | | 4.060 | % | | | 11/15/30 | | | | 49,670,000 | | | $ | 49,713,938 | |
GMAC Mortgage Corp. Loan Trust,2004-HE3, A2VN (1 mo. USD LIBOR + 0.500%) | | | 3.006 | % | | | 10/25/34 | | | | 3,765,032 | | | | 3,784,736 | (a)(c) |
Green Tree Home Improvement Loan Trust,201996-A, B2 | | | 7.400 | % | | | 2/15/26 | | | | 2,628 | | | | 2,687 | |
Greenpoint Manufactured Housing Contract Pass-Through Certificates Trust,2001-2 IA2 (Auction Rate Security) | | | 5.777 | % | | | 2/20/32 | | | | 1,550,000 | | | | 1,559,013 | (c) |
GSRPM Mortgage Loan Trust,2007-1 A (1 mo. USD LIBOR + 0.400%) | | | 2.906 | % | | | 10/25/46 | | | | 6,791,721 | | | | 6,435,096 | (a)(c) |
Hertz Vehicle Financing II LP,2015-1A, C | | | 4.350 | % | | | 3/25/21 | | | | 14,481,000 | | | | 14,439,867 | (a) |
Hertz Vehicle Financing II LP,2016-1A, D | | | 5.730 | % | | | 3/25/20 | | | | 18,584,000 | | | | 18,616,838 | (a) |
Hertz Vehicle Financing II LP,2016-2A, D | | | 5.970 | % | | | 3/25/22 | | | | 10,226,000 | | | | 10,282,570 | (a) |
Hertz Vehicle Financing II LP,2017-1A A | | | 2.960 | % | | | 10/25/21 | | | | 16,630,000 | | | | 16,492,304 | (a) |
Hertz Vehicle Financing II LP,2017-1A, D | | | 6.490 | % | | | 10/25/21 | | | | 24,750,000 | | | | 25,200,698 | (a) |
HSI Asset Securitization Corp. Trust, 2007-OPT1, 1A
(1 mo. USD LIBOR + 0.140%) | | | 2.646 | % | | | 12/25/36 | | | | 96,604,290 | | | | 81,074,928 | (c) |
Long Beach Mortgage Loan Trust,2006-9, 2A3 (1 mo. USD LIBOR + 0.160%) | | | 2.666 | % | | | 10/25/36 | | | | 3,861,922 | | | | 1,690,527 | (c) |
Morgan Stanley ABS Capital I Inc. Trust,2003-HE3, M1 (1 mo. USD LIBOR + 1.020%) | | | 3.526 | % | | | 10/25/33 | | | | 321,297 | | | | 320,828 | (c) |
Morgan Stanley Resecuritization Trust,2015-R7, 1BXA | | | 9.094 | % | | | 2/26/29 | | | | 18,137,842 | | | | 19,742,932 | (a)(c) |
Nelnet Student Loan Trust,2006-2, A6 (3 mo. USD LIBOR + 0.380%) | | | 2.870 | % | | | 4/25/31 | | | | 4,180,000 | | | | 4,174,937 | (a)(c) |
Option One Mortgage Loan Trust, 2007-FXD2, 1A1 | | | 5.820 | % | | | 3/25/37 | | | | 36,663,197 | | | | 36,043,057 | |
Origen Manufactured Housing Contract Trust,2006-A A2 | | | 4.043 | % | | | 10/15/37 | | | | 13,165,828 | | | | 12,383,331 | (c) |
Origen Manufactured Housing Contract Trust,2007-A A2 | | | 4.755 | % | | | 4/15/37 | | | | 16,621,948 | | | | 16,167,620 | (c) |
Ownit Mortgage Loan Asset-Backed Certificates,2004-1, M2 (1 mo. USD LIBOR + 1.800%) | | | 4.306 | % | | | 7/25/35 | | | | 3,586,160 | | | | 3,617,635 | (c) |
RAMP Series Trust,2006-RZ4, M1 (1 mo. USD LIBOR + 0.350%) | | | 2.856 | % | | | 10/25/36 | | | | 17,250,000 | | | | 15,721,167 | (c) |
RAMP Trust,2003-RS7 MII1 (1 mo. USD LIBOR + 1.125%) | | | 3.631 | % | | | 8/25/33 | | | | 1,449,222 | | | | 1,425,675 | (c) |
Ratchet Trading Ltd.,2018-1 A | | | 15.190 | % | | | 1/26/27 | | | | 8,150,035 | | | | 8,253,304 | (a)(c) |
Renaissance Home Equity Loan Trust,2003-4, A3
(1 mo. USD LIBOR + 0.620%) | | | 3.126 | % | | | 3/25/34 | | | | 5,925,990 | | | | 5,842,122 | (c) |
Renaissance Home Equity Loan Trust,2006-1 AF5 | | | 6.166 | % | | | 5/25/36 | | | | 14,451,469 | | | | 10,581,288 | |
Residential Funding Securities Corp.,2002-RP2, A1
(1 mo. USD LIBOR + 1.500%) | | | 4.006 | % | | | 10/25/32 | | | | 1,449,316 | | | | 1,377,862 | (a)(c) |
SACO I Trust,2006-3 A3 (1 mo. USD LIBOR + 0.460%) | | | 2.966 | % | | | 4/25/36 | | | | 325,974 | | | | 321,051 | (c) |
SBA Small Business Investment Cos,2018-10B 1 | | | 3.548 | % | | | 9/11/28 | | | | 10,060,000 | | | | 10,362,615 | |
See Notes to Financial Statements.
| | |
| Western Asset Core Plus Bond Fund 2018 Annual Report | | 57 |
Schedule of investments (cont’d)
December 31, 2018
Western Asset Core Plus Bond Fund
| | | | | | | | | | | | | | | | |
| Security | | Rate | | | Maturity
Date | | | Face
Amount†/Units | | | Value | |
| Asset-Backed Securities — continued | | | | | | | | | | | | | | | | |
Securitized Asset Backed Receivables LLC Trust,2006-WM3, A1 (1 mo. USD LIBOR + 0.050%) | | | 2.556 | % | | | 10/25/36 | | | | 29,553,036 | | | $ | 12,775,302 | (c) |
Securitized Asset Backed Receivables LLC Trust,2006-WM3, A2 (1 mo. USD LIBOR + 0.160%) | | | 2.666 | % | | | 10/25/36 | | | | 80,552,959 | | | | 35,269,855 | (c) |
Securitized Asset Backed Receivables LLC Trust,2006-WM3, A3 (1 mo. USD LIBOR + 0.220%) | | | 2.726 | % | | | 10/25/36 | | | | 40,833,367 | | | | 17,980,263 | (c) |
SLM Student Loan Trust,2013-M1, M1 | | | 3.500 | % | | | 10/28/29 | | | | 2,173,452 | | | | 2,134,056 | (a)(f) |
SMB Private Education Loan Trust,2015-C R | | | 0.000 | % | | | 9/18/46 | | | | 49,649 | | | | 59,250,089 | (a) |
SoFi Professional Loan Program LLC,2015-C R | | | 0.000 | % | | | 8/25/36 | | | | 4,200 | | | | 9,007,369 | (a) |
Southern Pacific Secured Asset Corp.,201998-2, A1 (1 mo. USD LIBOR + 0.340%) | | | 2.846 | % | | | 7/25/29 | | | | 568 | | | | 559 | (c) |
Structured Asset Securities Corp. Mortgage Loan Trust, 2006-ARS1 A1 (1 mo. USD LIBOR + 0.220%) | | | 2.726 | % | | | 2/25/36 | | | | 1,103,934 | | | | 56,032 | (a)(c) |
Structured Asset Securities Corp. Mortgage Loan Trust,2007-BC2, A4 (1 mo. USD LIBOR + 0.150%) | | | 2.656 | % | | | 3/25/37 | | | | 28,682,756 | | | | 22,943,090 | (c) |
Structured Asset Securities Corp. Trust,2005-SC1, 1A2 | | | 7.127 | % | | | 5/25/31 | | | | 6,273,681 | | | | 6,065,883 | (a)(c) |
Upgrade Pass-Through Trust,2018-3 A | | | 15.498 | % | | | 6/15/24 | | | | 14,852,890 | | | | 15,045,235 | (a) |
Upgrade Pass-Through Trust I,2017-1 CERT | | | 14.960 | % | | | 12/27/27 | | | | 16,196,731 | | | | 16,385,617 | (a)(c) |
Upgrade Pass-Through Trust I,2018-2 A | | | 16.537 | % | | | 5/15/24 | | | | 12,832,300 | | | | 12,998,183 | (a) |
Upgrade Pass-Through Trust I,2018-5 A | | | 12.075 | % | | | 9/15/24 | | | | 14,623,118 | | | | 14,812,912 | (a) |
Upgrade Pass-Through Trust I,2018-6 A | | | 5.339 | % | | | 10/15/24 | | | | 12,841,993 | | | | 12,980,070 | (a) |
Upgrade Pass-Through Trust IV,2018-4 A | | | 15.308 | % | | | 8/15/24 | | | | 15,157,929 | | | | 15,354,588 | (a) |
Total Asset-Backed Securities (Cost — $834,809,344) | | | | | | | | | | | | 850,735,824 | |
| | | | |
| | | | | | | | | Face Amount† | | | | |
| Senior Loans — 2.3% | | | | | | | | | | | | | | | | |
| Communication Services — 0.4% | | | | | | | | | | | | | | | | |
Diversified Telecommunication Services — 0.1% | | | | | | | | | | | | | | | | |
Level 3 Financing Inc., 2024 Term Loan B (1 mo. LIBOR + 2.250%) | | | 4.754 | % | | | 2/22/24 | | | | 17,132,000 | | | | 16,232,570 | (c)(l)(m) |
Unitymedia Finance LLC, First Lien Term Loan D (1 mo. LIBOR + 2.250%) | | | 4.705 | % | | | 1/15/26 | | | | 210,000 | | | | 203,288 | (c)(l)(m) |
UnityMedia Hessen GmbH & Co. KG, Term Loan Senior Facility B (1 mo. LIBOR + 2.250%) | | | 4.705 | % | | | 9/30/25 | | | | 4,305,296 | | | | 4,166,717 | (c)(l)(m) |
Virgin Media Bristol LLC, Term Loan Facility K (1 mo. LIBOR + 2.500%) | | | 4.955 | % | | | 1/15/26 | | | | 3,680,120 | | | | 3,498,874 | (c)(l)(m) |
Total Diversified Telecommunication Services | | | | | | | | | | | | | | | 24,101,449 | |
See Notes to Financial Statements.
| | |
| 58 | | Western Asset Core Plus Bond Fund 2018 Annual Report |
Western Asset Core Plus Bond Fund
| | | | | | | | | | | | | | | | |
| Security | | Rate | | | Maturity
Date | | | Face
Amount† | | | Value | |
Media — 0.3% | | | | | | | | | | | | | | | | |
CBS Radio Inc., Term Loan B1 (1 mo. LIBOR + 2.750%) | | | 5.256 | % | | | 11/18/24 | | | | 7,765,392 | | | $ | 7,309,175 | (c)(f)(l)(m) |
Charter Communications Operating LLC, Term B Loan (1 mo. LIBOR + 2.000%) | | | 4.530 | % | | | 4/30/25 | | | | 9,964,189 | | | | 9,580,568 | (c)(l)(m) |
Numericable U.S. LLC, Term Loan B12 (1 mo. LIBOR + 3.688%) | | | 6.143 | % | | | 1/31/26 | | | | 12,761,206 | | | | 11,855,951 | (c)(l)(m) |
Univision Communications Inc., 2017 Replacement Term Loan (1 mo. LIBOR + 2.750%) | | | 5.272 | % | | | 3/15/24 | | | | 17,722,669 | | | | 16,109,906 | (c)(l)(m) |
UPC Financing Partnership, Term Loan Facility AR
(1 mo. LIBOR + 2.500%) | | | 4.955 | % | | | 1/15/26 | | | | 8,076,605 | | | | 7,708,110 | (c)(l)(m) |
Ziggo Secured Finance Partnership, Term Loan E
(1 mo. LIBOR + 2.500%) | | | 4.955 | % | | | 4/15/25 | | | | 8,238,250 | | | | 7,790,295 | (c)(l)(m) |
Total Media | | | | | | | | | | | | | | | 60,354,005 | |
Wireless Telecommunication Services — 0.0% | | | | | | | | | | | | | | | | |
Sprint Communications Inc., Term Loan (1 mo. LIBOR + 2.500%) | | | 5.063 | % | | | 2/2/24 | | | | 5,867,243 | | | | 5,617,885 | (c)(l)(m) |
Total Communication Services | | | | | | | | | | | | | | | 90,073,339 | |
| Consumer Discretionary — 0.7% | | | | | | | | | | | | | | | | |
Auto Components — 0.1% | | | | | | | | | | | | | | | | |
American Axle & Manufacturing Inc., Tranche B Term Loan | | | 4.740-4.760 | % | | | 4/6/24 | | | | 11,512,481 | | | | 10,962,760 | (c)(l)(m) |
Commercial Services & Supplies — 0.0% | | | | | | | | | | | | | | | | |
Atlantic Aviation FBO Inc., Term Loan (1 mo. LIBOR + 3.750%) | | | 6.130 | % | | | 12/6/25 | | | | 3,750,000 | | | | 3,726,563 | (c)(f)(l)(m) |
Diversified Consumer Services — 0.0% | | | | | | | | | | | | | | | | |
Prime Security Services Borrower LLC, Term Loan B1 (1 mo. LIBOR + 2.750%) | | | 5.272 | % | | | 5/2/22 | | | | 6,473,542 | | | | 6,222,692 | (c)(l)(m) |
Hotels, Restaurants & Leisure — 0.4% | | | | | | | | | | | | | | | | |
1011778 BC Unlimited Liability Co., Term Loan B3
(1 mo. LIBOR + 2.250%) | | | 4.772 | % | | | 2/16/24 | | | | 7,855,766 | | | | 7,495,642 | (c)(l)(m) |
Aramark Services Inc., Term Loan B3 (1 mo. LIBOR + 1.750%) | | | 4.272 | % | | | 3/11/25 | | | | 14,934,742 | | | | 14,499,021 | (c)(l)(m) |
Boyd Gaming Corp., Refinancing Term Loan B (1 week LIBOR + 2.250%) | | | 4.666 | % | | | 9/15/23 | | | | 5,622,064 | | | | 5,383,126 | (c)(l)(m) |
Caesars Resort Collection LLC, Term Loan B (1 mo. LIBOR + 2.750%) | | | 5.272 | % | | | 12/23/24 | | | | 13,006,013 | | | | 12,485,772 | (c)(l)(m) |
Four Seasons Hotels Ltd., Restated Term Loan (1 mo. LIBOR + 2.000%) | | | 4.522 | % | | | 11/30/23 | | | | 5,761,872 | | | | 5,524,195 | (c)(l)(m) |
Golden Nugget Inc., Term Loan B (3 mo. LIBOR + 2.750%) | | | 5.186-5.277 | % | | | 10/4/23 | | | | 7,066,117 | | | | 6,769,340 | (c)(l)(m) |
Hilton Worldwide Finance LLC, Term Loan B2 (1 mo. LIBOR + 1.750%) | | | 4.256 | % | | | 10/25/23 | | | | 11,054,713 | | | | 10,667,798 | (c)(l)(m) |
See Notes to Financial Statements.
| | |
| Western Asset Core Plus Bond Fund 2018 Annual Report | | 59 |
Schedule of investments (cont’d)
December 31, 2018
Western Asset Core Plus Bond Fund
| | | | | | | | | | | | | | | | |
| Security | | Rate | | | Maturity
Date | | | Face
Amount† | | | Value | |
Hotels, Restaurants & Leisure — continued | | | | | | | | | | | | | | | | |
Scientific Games International Inc., Initial Term Loan B5 | | | 5.245-5.272 | % | | | 8/14/24 | | | | 15,900,594 | | | $ | 14,970,410 | (c)(l)(m) |
Station Casinos LLC, Term Loan Facility B (1 mo. LIBOR + 2.500%) | | | 5.030 | % | | | 6/8/23 | | | | 11,485,553 | | | | 11,112,272 | (c)(l)(m) |
Wyndham Hotels & Resorts Inc., Term Loan B (1 mo. LIBOR + 1.750%) | | | 4.272 | % | | | 5/30/25 | | | | 4,249,350 | | | | 4,095,311 | (c)(l)(m) |
Total Hotels, Restaurants & Leisure | | | | | | | | | | | | | | | 93,002,887 | |
Specialty Retail — 0.2% | | | | | | | | | | | | | | | | |
Academy Ltd., Initial Term Loan (1 mo. LIBOR + 4.000%) | | | 6.349 | % | | | 7/1/22 | | | | 15,767,239 | | | | 10,623,177 | (c)(l)(m) |
CWGS Group LLC, Term Loan (1 mo. LIBOR + 2.750%) | | | 5.129-5.272 | % | | | 11/8/23 | | | | 3,209,974 | | | | 2,911,045 | (c)(l)(m) |
Michaels Stores Inc., 2018 New Replacement Term Loan B (1 mo. LIBOR + 2.500%) | | | 4.970-5.022 | % | | | 1/30/23 | | | | 6,101,370 | | | | 5,862,398 | (c)(l)(m) |
Party City Holdings Inc., 2018 Replacement Term Loan (1 mo. LIBOR + 2.500%) | | | 5.030 | % | | | 8/19/22 | | | | 10,258,873 | | | | 9,969,060 | (c)(l)(m) |
PetSmart Inc., Term Loan B2 (1 mo. LIBOR + 3.000%) | | | 5.380 | % | | | 3/11/22 | | | | 19,060,973 | | | | 15,105,821 | (c)(l)(m) |
Total Specialty Retail | | | | | | | | | | | | | | | 44,471,501 | |
Total Consumer Discretionary | | | | | | | | | | | | | | | 158,386,403 | |
| Consumer Staples — 0.1% | | | | | | | | | | | | | | | | |
Food & Staples Retailing — 0.1% | | | | | | | | | | | | | | | | |
Albertson’s LLC, 2018 Term Loan B7 (1 mo. LIBOR + 3.000%) | | | 5.522 | % | | | 11/17/25 | | | | 4,905,850 | | | | 4,642,161 | (c)(l)(m) |
Albertson’s LLC, Replacement2017-1 Term Loan B6 (3 mo. LIBOR + 3.000%) | | | 5.691 | % | | | 6/22/23 | | | | 10,475,730 | | | | 10,012,179 | (c)(l)(m) |
Total Food & Staples Retailing | | | | | | | | | | | | | | | 14,654,340 | |
Food Products — 0.0% | | | | | | | | | | | | | | | | |
Post Holdings Inc., Term Loan A (1 mo. LIBOR + 2.000%) | | | 4.510 | % | | | 5/24/24 | | | | 7,019,589 | | | | 6,800,227 | (c)(l)(m) |
Total Consumer Staples | | | | | | | | | | | | | | | 21,454,567 | |
| Energy — 0.0% | | | | | | | | | | | | | | | | |
Electric Utilities — 0.0% | | | | | | | | | | | | | | | | |
Vistra Operations Co. LLC, 2016 Term Loan B2 | | | — | | | | 12/14/23 | | | | 927,633 | | | | 897,485 | (n) |
Vistra Operations Co. LLC, 2018 Term Loan | | | — | | | | 12/1/25 | | | | 1,137,143 | | | | 1,100,186 | (n) |
Vistra Operations Co. LLC, Initial Term Loan B1 | | | — | | | | 8/4/23 | | | | 2,353,995 | | | | 2,266,897 | (n) |
Total Energy | | | | | | | | | | | | | | | 4,264,568 | |
| Financials — 0.0% | | | | | | | | | | | | | | | | |
Capital Markets — 0.0% | | | | | | | | | | | | | | | | |
RPI Finance Trust, Initial Term Loan B6 (1 mo. LIBOR + 2.000%) | | | 4.522 | % | | | 3/27/23 | | | | 4,080,274 | | | | 3,961,265 | (c)(l)(m) |
See Notes to Financial Statements.
| | |
| 60 | | Western Asset Core Plus Bond Fund 2018 Annual Report |
Western Asset Core Plus Bond Fund
| | | | | | | | | | | | | | | | |
| Security | | Rate | | | Maturity
Date | | | Face
Amount† | | | Value | |
| Health Care — 0.4% | | | | | | | | | | | | | | | | |
Health Care Equipment & Supplies — 0.1% | | | | | | | | | | | | | |
Envision Healthcare Corp., Initial Term Loan (1 mo. LIBOR + 3.750%) | | | 6.272 | % | | | 10/10/25 | | | | 20,940,000 | | | $ | 19,607,986 | (c)(l)(m) |
Health Care Providers & Services — 0.2% | | | | | | | | | | | | | |
Air Medical Group Holdings Inc., 2018 Term Loan (1 mo. LIBOR + 3.250%) | | | 5.682 | % | | | 4/28/22 | | | | 7,518,459 | | | | 7,016,331 | (c)(l)(m) |
HCA Inc., Term Loan B10 (1 mo. LIBOR + 2.000%) | | | 4.522 | % | | | 3/13/25 | | | | 8,096,920 | | | | 7,953,774 | (c)(l)(m) |
Jaguar Holding Co. II, 2018 Term Loan (1 mo. LIBOR + 2.500%) | | | 5.022 | % | | | 8/18/22 | | | | 10,314,050 | | | | 9,822,699 | (c)(l)(m) |
LifePoint Health Inc., First Lien Term B Loan | | | — | | | | 11/14/25 | | | | 10,520,000 | | | | 9,985,237 | (n) |
MPH Acquisition Holdings LLC, Initial Term Loan (3 mo. LIBOR + 2.750%) | | | 5.553 | % | | | 6/7/23 | | | | 14,194,425 | | | | 13,424,377 | (c)(l)(m) |
Total Health Care Providers & Services | | | | | | | | | | | | 48,202,418 | |
Health Care Technology — 0.0% | | | | | | | | | | | | | | | | |
Change Healthcare Holdings LLC, Closing Date Term Loan (1 mo. LIBOR + 2.750%) | | | 5.272 | % | | | 3/1/24 | | | | 7,296,427 | | | | 6,951,365 | (c)(l)(m) |
Pharmaceuticals — 0.1% | | | | | | | | | | | | | | | | |
Akorn Inc., Term Loan (1 mo. LIBOR + 5.500%) | | | 8.063 | % | | | 4/16/21 | | | | 3,184,450 | | | | 2,584,713 | (c)(l)(m) |
Bausch Health Co. Inc., Initial Term Loan (1 mo. LIBOR + 3.000%) | | | 5.379 | % | | | 6/2/25 | | | | 11,161,525 | | | | 10,715,064 | (c)(l)(m) |
Catalent Pharma Solutions Inc., Dollar Term Loan (1 mo. LIBOR + 2.250%) | | | 4.772 | % | | | 5/20/24 | | | | 4,872,876 | | | | 4,744,963 | (c)(l)(m) |
|
Total Pharmaceuticals | | | | | | | | | | | | | | | 18,044,740 | |
Total Health Care | | | | | | | | | | | | | | | 92,806,509 | |
| Industrials — 0.3% | | | | | | | | | | | | | | | | |
Air Freight & Logistics — 0.1% | | | | | | | | | | | | | | | | |
Avolon TLB Borrower 1 (US) LLC, Term Loan B3 (1 mo. LIBOR + 2.000%) | | | 4.470 | % | | | 1/15/25 | | | | 10,797,676 | | | | 10,422,208 | (c)(l)(m) |
|
XPO Logistics Inc., Refinancing Term Loan (3 mo. LIBOR + 2.000%) | | | 4.509 | % | | | 2/24/25 | | | | 6,774,389 | | | | 6,511,882 | (c)(l)(m) |
|
Total Air Freight & Logistics | | | | | | | | | | | | | | | 16,934,090 | |
Building Products — 0.1% | | | | | | | | | | | | | | | | |
Quikrete Holdings Inc., Initial First Lien Term Loan (1 mo. LIBOR + 2.750%) | | | 5.272 | % | | | 11/15/23 | | | | 11,046,208 | | | | 10,542,224 | (c)(l)(m) |
|
Commercial Services & Supplies — 0.0% | | | | | | | | | | | | | | | | |
ServiceMaster Co. LLC, Term Loan C (1 mo. LIBOR + 2.500%) | | | 5.022 | % | | | 11/8/23 | | | | 4,767,285 | | | | 4,677,899 | (c)(l)(m) |
|
Professional Services — 0.0% | | | | | | | | | | | | | | | | |
Trans Union LLC, Replacement 2017 Term Loan B3 (1 mo. LIBOR + 2.000%) | | | 4.522 | % | | | 4/9/23 | | | | 8,550,177 | | | | 8,257,333 | (c)(l)(m) |
|
See Notes to Financial Statements.
| | |
| Western Asset Core Plus Bond Fund 2018 Annual Report | | 61 |
Schedule of investments (cont’d)
December 31, 2018
Western Asset Core Plus Bond Fund
| | | | | | | | | | | | | | | | |
| Security | | Rate | | | Maturity
Date | | | Face
Amount† | | | Value | |
Trading Companies & Distributors — 0.1% | | | | | | | | | | | | | | | | |
Beacon Roofing Supply Inc., Initial Term Loan
(1 mo. LIBOR + 2.250%) | | | 4.682 | % | | | 1/2/25 | | | | 14,043,517 | | | $ | 13,394,004 | (c)(l)(m) |
|
BrightView Landscapes LLC, Initial Term Loan (1 mo. LIBOR + 2.500%) | | | 5.000-5.063 | % | | | 8/15/25 | | | | 9,522,150 | | | | 9,117,459 | (c)(f)(l)(m) |
Delos Finance SARL, 2018 Term Loan B (3 mo. LIBOR + 1.750%) | | | 4.553 | % | | | 10/6/23 | | | | 1,720,000 | | | | 1,677,860 | (c)(l)(m) |
|
Total Trading Companies & Distributors | | | | | | | | | | | | 24,189,323 | |
Transportation Infrastructure — 0.0% | | | | | | | | | | | | | | | | |
Flying Fortress Holdings LLC, Refinancing Term Loan (3 mo. LIBOR + 1.750%) | | | 4.553 | % | | | 10/30/22 | | | | 5,333,140 | | | | 5,239,810 | (c)(l)(m) |
|
Total Industrials | | | | | | | | | | | | | | | 69,840,679 | |
| Information Technology — 0.2% | | | | | | | | | | | | | | | | |
IT Services — 0.1% | | | | | | | | | | | | | | | | |
First Data Corp., 2024A New Dollar Term Loan (1 mo. LIBOR + 2.000%) | | | 4.504 | % | | | 4/26/24 | | | | 11,116,608 | | | | 10,651,100 | (c)(l)(m) |
Semiconductors & Semiconductor Equipment — 0.0% | | | | | | | | | | | | | |
ON Semiconductor Corp., 2018 New Replacement Term Loan B3 (1 mo. LIBOR + 1.750%) | | | 4.272 | % | | | 3/31/23 | | | | 6,386,611 | | | | 6,181,039 | (c)(l)(m) |
Software — 0.0% | | | | | | | | | | | | | | | | |
Dell International LLC, Refinancing Term Loan B (1 mo. LIBOR + 2.000%) | | | 4.530 | % | | | 9/7/23 | | | | 7,597,628 | | | | 7,316,409 | (c)(l)(m) |
MA Financeco LLC, Term Loan B3 (1 mo. LIBOR + 2.500%) | | | 5.022 | % | | | 6/21/24 | | | | 363,167 | | | | 339,561 | (c)(l)(m) |
Seattle Escrow Borrower LLC, Initial Term Loan (1 mo. LIBOR + 2.500%) | | | 5.022 | % | | | 6/21/24 | | | | 2,452,555 | | | | 2,293,140 | (c)(l)(m) |
Total Software | | | | | | | | | | | | | | | 9,949,110 | |
Technology Hardware, Storage & Peripherals — 0.1% | | | | | | | | | | | | | |
Western Digital Corp., New Term Loan B4 (1 mo. LIBOR + 1.750%) | | | 4.256 | % | | | 4/29/23 | | | | 15,195,504 | | | | 14,537,037 | (c)(l)(m) |
Total Information Technology | | | | | | | | | | | | | | | 41,318,286 | |
| Materials — 0.1% | | | | | | | | | | | | | | | | |
Construction Materials — 0.0% | | | | | | | | | | | | | | | | |
American Builders & Contractors Supply Co. Inc., Term Loan B2 (1 mo. LIBOR + 2.000%) | | | 4.522 | % | | | 10/31/23 | | | | 11,033,251 | | | | 10,528,878 | (c)(l)(m) |
Containers & Packaging — 0.1% | | | | | | | | | | | | | | | | |
Berry Global Inc., Term Loan Q (1 mo. LIBOR + 2.000%) | | | 4.387 | % | | | 10/1/22 | | | | 9,071,845 | | | | 8,850,718 | (c)(l)(m) |
Reynolds Group Holdings Inc., Incremental U.S. Term Loan (1 mo. LIBOR + 2.750%) | | | 5.272 | % | | | 2/5/23 | | | | 8,801,723 | | | | 8,427,650 | (c)(l)(m) |
Total Containers & Packaging | | | | | | | | | | | | | | | 17,278,368 | |
Total Materials | | | | | | | | | | | | | | | 27,807,246 | |
See Notes to Financial Statements.
| | |
| 62 | | Western Asset Core Plus Bond Fund 2018 Annual Report |
Western Asset Core Plus Bond Fund
| | | | | | | | | | | | | | | | |
| Security | | Rate | | | Maturity
Date | | | Face
Amount† | | | Value | |
| Real Estate — 0.1% | | | | | | | | | | | | | | | | |
Equity Real Estate Investment Trusts (REITs) — 0.0% | | | | | | | | | |
MGM Growth Properties Operating Partnership LP, Term Loan B (1 mo. LIBOR + 2.000%) | | | 4.522 | % | | | 3/21/25 | | | | 11,360,409 | | | $ | 10,884,692 | (c)(l)(m) |
|
VICI Properties 1 LLC, Term Loan B (1 mo. LIBOR + 2.000%) | | | 4.504 | % | | | 12/20/24 | | | | 3,488,182 | | | | 3,351,271 | (c)(l)(m) |
|
Total Equity Real Estate Investment Trusts (REITs) | | | | | | | | 14,235,963 | |
Real Estate Management & Development — 0.1% | | | | | | | | | | | | | |
CityCenter Holdings LLC, Refinancing Term Loan (1 mo. LIBOR + 2.250%) | | | 4.772 | % | | | 4/18/24 | | | | 13,392,795 | | | | 12,731,526 | (c)(l)(m) |
|
Realogy Group LLC, Extended 2025 Term Loan (1 mo. LIBOR + 2.250%) | | | 4.705 | % | | | 2/7/25 | | | | 4,250,498 | | | | 4,027,346 | (c)(l)(m) |
|
Total Real Estate Management & Development | | | | | | | | 16,758,872 | |
Total Real Estate | | | | | | | | | | | | | | | 30,994,835 | |
Total Senior Loans (Cost — $574,590,979) | | | | | | | | | | | | 540,907,697 | |
| U.S. Treasury Inflation Protected Securities — 1.7% | | | | | | | | | |
U.S. Treasury Bonds, Inflation Indexed | | | 2.125 | % | | | 2/15/40 | | | | 11,969,202 | | | | 14,097,788 | |
|
U.S. Treasury Bonds, Inflation Indexed | | | 2.125 | % | | | 2/15/41 | | | | 18,961,324 | | | | 22,438,924 | |
|
U.S. Treasury Bonds, Inflation Indexed | | | 0.750 | % | | | 2/15/42 | | | | 74,703,930 | | | | 67,942,641 | |
|
U.S. Treasury Bonds, Inflation Indexed | | | 0.875 | % | | | 2/15/47 | | | | 3,708,539 | | | | 3,411,566 | |
|
U.S. Treasury Notes, Inflation Indexed | | | 0.625 | % | | | 4/15/23 | | | | 291,570,795 | | | | 286,840,362 | |
|
Total U.S. Treasury Inflation Protected Securities
(Cost — $398,308,503) | | | | | | | | | | | | 394,731,281 | |
| Non-U.S. Treasury Inflation Protected Securities — 0.4% | | | | | | | | | |
Japan — 0.4% | | | | | | | | | | | | | | | | |
Japanese Government CPI Linked Bond, Senior Notes (Cost — $94,181,991) | | | 0.100 | % | | | 3/10/26 | | | | 9,434,688,525 | JPY | | | 88,962,644 | |
|
| | | | |
| | | Expiration
Date | | | Contracts | | | Notional
Amount† | | | | |
| Purchased Options — 0.1% | | | | | | | | | | | | | | | | |
| Exchange-Traded Purchased Options — 0.0% | | | | | | | | | | | | | |
Australian Dollar Futures, Call @ $73.00 | | | 1/4/19 | | | | 265 | | | | 265,000 | | | | 1,325 | |
Australian Dollar Futures, Call @ $75.00 | | | 1/4/19 | | | | 190 | | | | 190,000 | | | | 950 | |
|
Euro Bund Futures, Call @ 175.00 EUR | | | 2/22/19 | | | | 7,861 | | | | 786,100,000 | | | | 90,067 | |
|
Euro Bund Futures, Call @ 172.00 EUR | | | 2/22/19 | | | | 10,920 | | | | 1,092,000,000 | | | | 375,348 | |
|
Japanese Yen Futures, Call @ $89.00 | | | 3/8/19 | | | | 133 | | | | 166,250 | | | | 498,750 | |
|
U.S. Treasury5-Year Notes Futures, Put @ $103.50 | | | 2/22/19 | | | | 55,906 | | | | 55,906,000 | | | | 0 | (g) |
|
U.S. Treasury5-Year Notes Futures, Put @ $106.50 | | | 2/22/19 | | | | 5,937 | | | | 5,937,000 | | | | 0 | (g) |
|
See Notes to Financial Statements.
| | |
| Western Asset Core Plus Bond Fund 2018 Annual Report | | 63 |
Schedule of investments (cont’d)
December 31, 2018
Western Asset Core Plus Bond Fund
| | | | | | | | | | | | | | | | | | |
| Security | | | | Expiration
Date | | | Contracts | | | Notional
Amount† | | | Value | |
| Exchange-Traded Purchased Options — continued | | | | | | | | | | | | | |
U.S. Treasury5-Year Notes Futures, Put @ $107.00 | | | 2/22/19 | | | | 75 | | | | 75,000 | | | $ | 0 | (g) |
U.S. Treasury5-Year Notes Futures, Put @ $109.25 | | | 2/22/19 | | | | 10,200 | | | | 10,200,000 | | | | 79,693 | |
U.S. Treasury10-Year Notes Futures, Call @ $130.50 | | | 2/22/19 | | | | 7,000 | | | | 7,000,000 | | | | 218,750 | |
U.S. Treasury10-Year Notes Futures, Call @ $133.00 | | | 2/22/19 | | | | 10,183 | | | | 10,183,000 | | | | 159,109 | |
U.S. Treasury10-Year Notes Futures, Put @ $117.00 | | | 1/25/19 | | | | 400 | | | | 400,000 | | | | 0 | (g) |
U.S. Treasury10-Year Notes Futures, Put @ $117.50 | | | 1/25/19 | | | | 400 | | | | 400,000 | | | | 0 | (g) |
U.S. Treasury Long-Term Bonds Futures, Call @ $170.00 | | | 2/22/19 | | | | 370 | | | | 370,000 | | | | 11,563 | |
U.S. Treasury Long-Term Bonds Futures, Call @ $171.00 | | | 2/22/19 | | | | 630 | | | | 630,000 | | | | 9,844 | |
Total Exchange-Traded Purchased Options | | | | | | | | | | | | 1,445,399 | |
| | | | | |
| | | Counterparty | | | | | | | | | | | | |
| OTC Purchased Options — 0.1% | | | | | | | | | | | | | | | | |
Credit default swaption with Bank of America N.A. to sell protection on Markit CDX.NA.IG.31 Index, Call @ 90.00 bps | | Bank of America N.A. | | | 3/20/19 | | | | 233,810,000 | | | | 233,810,000 | | | | 892,144 | |
Credit default swaption with Bank of America N.A. to sell protection on Markit CDX.NA.IG.31 Index, Call @ 80.00 bps | | Bank of America N.A. | | | 2/20/19 | | | | 115,330,000 | | | | 115,330,000 | | | | 134,128 | |
|
Credit default swaption with BNP Paribas SA to sell protection on Markit CDX.NA.IG.31 Index, Call @ 80.00 bps | | BNP Paribas SA | | | 2/20/19 | | | | 121,880,000 | | | | 121,880,000 | | | | 141,745 | |
|
U.S. Dollar/Canadian Dollar, Put @ 1.29 CAD | | Goldman Sachs Group Inc. | | | 1/11/19 | | | | 185,708,000 | | | | 185,708,000 | | | | 131 | |
|
U.S. Dollar/Euro, Call @ $1.14 | | Citibank N.A. | | | 11/4/19 | | | | 539,176,464 | | | | 539,176,464 | | | | 8,703,123 | |
|
U.S. Dollar/Mexican Peso, Put @ 19.92 MXN | | Citibank N.A. | | | 2/12/19 | | | | 717,400,000 | | | | 717,400,000 | | | | 16,484,196 | |
|
Total OTC Purchased Options | | | | | | | | | | | | | | | 26,355,467 | |
Total Purchased Options (Cost — $27,238,495) | | | | | | | | 27,800,866 | |
See Notes to Financial Statements.
| | |
| 64 | | Western Asset Core Plus Bond Fund 2018 Annual Report |
Western Asset Core Plus Bond Fund
| | | | | | | | | | | | | | | | |
| Security | | Rate | | | | | | Shares | | | Value | |
| Preferred Stocks — 0.0% | | | | | | | | | | | | | |
| Financials — 0.0% | | | | | | | | | | | | | | | | |
Banks — 0.0% | | | | | | | | | | | | | | | | |
GMAC Capital Trust I (3 mo. USD LIBOR + 5.785%) | | | 8.401 | % | | | | | | | 431,316 | | | $ | 10,933,860 | (c) |
Diversified Financial Services — 0.0% | | | | | | | | | |
Citigroup Capital XIII (3 mo. USD LIBOR + 6.370%) | | | 8.890 | % | | | | | | | 63,425 | | | | 1,676,323 | (c) |
Total Preferred Stocks (Cost — $12,150,259) | | | | | | | | 12,610,183 | |
Total Investments before Short-Term Investments (Cost — $24,413,081,610) | | | | 23,850,464,558 | |
| | | | |
| | | | | | Maturity
Date | | | Face
Amount† | | | | |
| Short-Term Investments — 9.0% | | | | | | | | | | | | | | | | |
| Commercial Paper — 4.9% | | | | | | | | | | | | | | | | |
Banco Santander SA | | | 2.628 | % | | | 2/1/19 | | | $ | 257,090,000 | | | | 256,505,891 | (p) |
BPCE SA | | | 2.641 | % | | | 3/7/19 | | | | 134,430,000 | | | | 133,797,843 | (o)(p) |
JPMorgan Securities LLC | | | 2.656 | % | | | 2/1/19 | | | | 202,960,000 | | | | 202,494,184 | (p) |
Mizuho Bank Ltd. | | | 2.581 | % | | | 1/29/19 | | | | 261,250,000 | | | | 260,721,557 | (o)(p) |
Sumitomo Mitsui Trust Bank | | | 2.606 | % | | | 1/30/19 | | | | 297,570,000 | | | | 296,941,383 | (o)(p) |
Total Commercial Paper (Cost — $1,150,510,288) | | | | | | | | | | | | | | | 1,150,460,858 | |
| Certificates of Deposit — 0.5% | | | | | | | | | | | | | | | | |
Sumitomo Mitsui Trust NY (Cost — $109,120,000) | | | 2.810 | % | | | 3/25/19 | | | | 109,120,000 | | | | 109,118,415 | |
| Sovereign Bonds — 0.0% | | | | | | | | | | | | | | | | |
Argentina Treasury Bill | | | (80.169 | )% | | | 1/31/19 | | | | 100,000,000 | ARS | | | 3,046,468 | (p) |
Argentina Treasury Bill | | | (36.214 | )% | | | 3/29/19 | | | | 39,972,000 | ARS | | | 1,182,921 | (p) |
Total Sovereign Bonds (Cost — $3,681,246) | | | | | | | | | | | | | | | 4,229,389 | |
| | | | |
| | | | | | | | | Shares | | | | |
| Money Market Funds — 3.6% | | | | | | | | | | | | | | | | |
Western Asset Government Cash Management Portfolio LLC (Cost — $845,554,311) | | | 2.390 | % | | | | | | | 845,554,311 | | | | 845,554,311 | (q) |
Total Short-Term Investments (Cost — $2,108,865,845) | | | | | | | | 2,109,362,973 | |
Total Investments — 110.3% (Cost — $26,521,947,455) | | | | | | | | 25,959,827,531 | |
Liabilities in Excess of Other Assets — (10.3)% | | | | | | | | | | | | | | | (2,423,675,073 | ) |
Total Net Assets — 100.0% | | | | | | | | | | | | | | $ | 23,536,152,458 | |
| † | Face amount/notional amount denominated in U.S. dollars, unless otherwise noted. |
| * | Non-income producing security. |
| (a) | Security is exempt from registration under Rule 144A of the Securities Act of 1933. This security may be resold in transactions that are exempt from registration, normally to qualified institutional buyers. This security has been deemed liquid pursuant to guidelines approved by the Board of Directors. |
| (b) | Security has no maturity date. The date shown represents the next call date. |
See Notes to Financial Statements.
| | |
| Western Asset Core Plus Bond Fund 2018 Annual Report | | 65 |
Schedule of investments (cont’d)
December 31, 2018
Western Asset Core Plus Bond Fund
| (c) | Variable rate security. Interest rate disclosed is as of the most recent information available. Certain variable rate securities are not based on a published reference rate and spread but are determined by the issuer or agent and are based on current market conditions. These securities do not indicate a reference rate and spread in their description above. |
| (d) | The coupon payment on these securities is currently in default as of December 31, 2018. |
| (e) | Security is valued in good faith in accordance with procedures approved by the Board of Directors (Note 1). |
| (f) | Security is valued using significant unobservable inputs (Note 1). |
| (g) | Value is less than $1. |
| (h) | The maturity principal is currently in default as of December 31, 2018. |
| (i) | This security is traded on ato-be-announced (“TBA”) basis. At December 31, 2018, the Fund held TBA securities with a total cost of $2,726,784,675. |
| (j) | Collateralized mortgage obligations are secured by an underlying pool of mortgages or mortgage pass-through certificates that are structured to direct payments on underlying collateral to different series or classes of the obligations. The interest rate may change positively or inversely in relation to one or more interest rates, financial indices or other financial indicators and may be subject to an upper and/or lower limit. |
| (k) | Security is exempt from registration under Regulation S of the Securities Act of 1933. Regulation S applies to securities offerings that are made outside of the United States and do not involve direct selling efforts in the United States. This security has been deemed liquid pursuant to guidelines approved by the Board of Directors. |
| (l) | Interest rates disclosed represent the effective rates on senior loans. Ranges in interest rates are attributable to multiple contracts under the same loan. |
| (m) | Senior loans may be considered restricted in that the Fund ordinarily is contractually obligated to receive approval from the agent bank and/or borrower prior to the disposition of a senior loan. |
| (n) | All or a portion of this loan is unfunded as of December 31, 2018. The interest rate for fully unfunded term loans is to be determined. |
| (o) | Commercial paper exempt from registration under Section 4(2) of the Securities Act of 1933. This security may be resold in transactions that are exempt from registration, normally to qualified institutional buyers. This security has been deemed liquid pursuant to guidelines approved by the Board of Directors. |
| (p) | Rate shown representsyield-to-maturity. |
| (q) | In this instance, as defined in the Investment Company Act of 1940, an “Affiliated Company” represents Fund ownership of at least 5% of the outstanding voting securities of an issuer, or a company which is under common ownership or control. At December 31, 2018, the total market value of investments in Affiliated Companies was $845,554,311 and the cost was $845,554,311 (Note 8). |
| | |
Abbreviations used in this schedule: |
| |
| ARS | | — Argentine Peso |
| |
| bps | | — basis point spread. 100 basis points = 1.00% |
| |
| BRL | | — Brazilian Real |
| |
| CAD | | — Canadian Dollar |
| |
| CAS | | — Connecticut Avenue Securities |
| |
| CLO | | — Collateral Loan Obligation |
| |
| CMT | | — Constant Maturity Treasury |
| |
| CNH | | — Chinese Offshore Yuan |
| |
| EDC | | — Economic Development Corporation |
| |
| EUR | | — Euro |
| |
| GBP | | — British Pound |
See Notes to Financial Statements.
| | |
| 66 | | Western Asset Core Plus Bond Fund 2018 Annual Report |
Western Asset Core Plus Bond Fund
| | |
Abbreviations used in this schedule(cont’d): |
| |
| GTD | | — Guaranteed |
| |
| ICE | | — Intercontinental Exchange |
| |
| IO | | — Interest Only |
| |
| JPY | | — Japanese Yen |
| |
| JSC | | — Joint Stock Company |
| |
| LIBOR | | — London Interbank Offered Rate |
| |
| MXN | | — Mexican Peso |
| |
| PAC | | — Planned Amortization Class |
| |
| PO | | — Principal Only |
| |
| REMIC | | — Real Estate Mortgage Investment Conduit |
| |
| RUB | | — Russian Ruble |
| |
| STRIPS | | — Separate Trading of Registered Interest and Principal Securities |
| |
| USD | | — United States Dollar |
| | | | | | | | | | | | | | | | | | | | |
| Schedule of Written Options | | | | | | | | | | | | | | | |
| Exchange-Traded Written Options | | | | | |
| Security | | Expiration
Date | | | Strike
Price | | | Contracts | | | Notional
Amount† | | | Value | |
| Euro Futures, Call | | | 1/4/19 | | | $ | 1.15 | | | | 187 | | | | 23,375,000 | | | $ | 114,537 | |
| U.S. Treasury5-Year Notes Futures, Call | | | 1/25/19 | | | | 114.00 | | | | 2,066 | | | | 2,066,000 | | | | 1,614,062 | |
| U.S. Treasury5-Year Notes Futures, Put | | | 1/25/19 | | | | 113.00 | | | | 1,241 | | | | 1,241,000 | | | | 29,087 | |
| U.S. Treasury5-Year Notes Futures, Call | | | 1/25/19 | | | | 114.25 | | | | 1,031 | | | | 1,031,000 | | | | 612,156 | |
| U.S. Treasury5-Year Notes Futures, Put | | | 1/25/19 | | | | 113.50 | | | | 620 | | | | 620,000 | | | | 24,219 | |
| U.S. Treasury10-Year Notes Futures, Call | | | 1/25/19 | | | | 122.00 | | | | 4,175 | | | | 4,175,000 | | | | 2,217,969 | |
| U.S. Treasury10-Year Notes Futures, Put | | | 1/25/19 | | | | 120.75 | | | | 2,734 | | | | 2,734,000 | | | | 341,750 | |
| U.S. Treasury10-Year Notes Futures, Call | | | 1/25/19 | | | | 121.00 | | | | 2,060 | | | | 2,060,000 | | | | 2,446,250 | |
| U.S. Treasury10-Year Notes Futures, Call | | | 1/25/19 | | | | 121.75 | | | | 1,988 | | | | 1,988,000 | | | | 1,304,625 | |
| U.S. Treasury10-Year Notes Futures, Call | | | 1/25/19 | | | | 120.00 | | | | 1,920 | | | | 1,920,000 | | | | 3,960,000 | |
| U.S. Treasury10-Year Notes Futures, Put | | | 1/25/19 | | | | 120.00 | | | | 1,441 | | | | 1,441,000 | | | | 67,547 | |
| U.S. Treasury10-Year Notes Futures, Call | | | 1/25/19 | | | | 120.50 | | | | 1,198 | | | | 1,208,782 | | | | 1,928,031 | |
| U.S. Treasury10-Year Notes Futures, Put | | | 1/25/19 | | | | 120.50 | | | | 1,000 | | | | 1,000,000 | | | | 93,750 | |
| U.S. Treasury10-Year Notes Futures, Put | | | 1/25/19 | | | | 119.50 | | | | 651 | | | | 651,000 | | | | 20,344 | |
| U.S. Treasury10-Year Notes Futures, Call | | | 1/25/19 | | | | 121.50 | | | | 405 | | | | 405,000 | | | | 329,062 | |
| U.S. Treasury10-Year Notes Futures, Put | | | 1/25/19 | | | | 119.00 | | | | 352 | | | | 352,000 | | | | 11,000 | |
| U.S. Treasury10-Year Notes Futures, Call | | | 1/25/19 | | | | 122.50 | | | | 5 | | | | 5,000 | | | | 1,641 | |
| U.S. Treasury10-Year Notes Futures, Put | | | 2/22/19 | | | | 119.00 | | | | 1,810 | | | | 1,810,000 | | | | 141,406 | |
| U.S. Treasury10-Year Notes Futures, Call | | | 2/22/19 | | | | 122.00 | | | | 1,489 | | | | 1,489,000 | | | | 1,140,016 | |
| U.S. Treasury10-Year Notes Futures, Call | | | 2/22/19 | | | | 121.00 | | | | 598 | | | | 598,000 | | | | 812,906 | |
| U.S. Treasury10-Year Notes Futures, Put | | | 2/22/19 | | | | 119.50 | | | | 597 | | | | 597,000 | | | | 65,297 | |
| U.S. Treasury10-Year Notes Futures, Put | | | 2/22/19 | | | | 120.50 | | | | 298 | | | | 298,000 | | | | 69,844 | |
| U.S. Treasury Long-Term Bonds Futures, Put | | | 1/25/19 | | | | 143.00 | | | | 1,665 | | | | 1,665,000 | | | | 416,250 | |
| U.S. Treasury Long-Term Bonds Futures, Call | | | 1/25/19 | | | | 146.00 | | | | 698 | | | | 698,000 | | | | 807,062 | |
See Notes to Financial Statements.
| | |
| Western Asset Core Plus Bond Fund 2018 Annual Report | | 67 |
Schedule of investments (cont’d)
December 31, 2018
Western Asset Core Plus Bond Fund
| | | | | | | | | | | | | | | | | | | | |
| Schedule of Written Options(cont’d) | | | | | | | | | | | | | | | |
| Exchange-Traded Written Options — continued | | | | | |
| Security | | Expiration
Date | | | Strike
Price | | | Contracts | | | Notional
Amount† | | | Value | |
| U.S. Treasury Long-Term Bonds Futures, Put | | | 1/25/19 | | | $ | 140.00 | | | | 504 | | | | 504,000 | | | $ | 31,500 | |
| U.S. Treasury Long-Term Bonds Futures, Put | | | 1/25/19 | | | | 144.00 | | | | 503 | | | | 503,000 | | | | 220,062 | |
| U.S. Treasury Long-Term Bonds Futures, Call | | | 1/25/19 | | | | 148.00 | | | | 313 | | | | 313,000 | | | | 141,828 | |
| U.S. Treasury Long-Term Bonds Futures, Call | | | 1/25/19 | | | | 141.00 | | | | 300 | | | | 300,000 | | | | 1,528,125 | |
| U.S. Treasury Long-Term Bonds Futures, Put | | | 1/25/19 | | | | 142.00 | | | | 299 | | | | 299,000 | | | | 46,719 | |
| U.S. Treasury Long-Term Bonds Futures, Call | | | 1/25/19 | | | | 144.00 | | | | 200 | | | | 200,000 | | | | 487,500 | |
| U.S. Treasury Long-Term Bonds Futures, Call | | | 1/25/19 | | | | 145.00 | | | | 100 | | | | 100,000 | | | | 171,875 | |
| U.S. Treasury Long-Term Bonds Futures, Call | | | 1/25/19 | | | | 146.50 | | | | 99 | | | | 99,000 | | | | 91,266 | |
| U.S. Treasury Long-Term Bonds Futures, Put | | | 1/25/19 | | | | 142.50 | | | | 99 | | | | 99,000 | | | | 20,109 | |
| U.S. Treasury Long-Term Bonds Futures, Put | | | 1/25/19 | | | | 144.50 | | | | 99 | | | | 99,000 | | | | 55,688 | |
| U.S. Treasury Long-Term Bonds Futures, Call | | | 2/22/19 | | | | 145.00 | | | | 703 | | | | 703,000 | | | | 1,570,766 | |
| U.S. Treasury Long-Term Bonds Futures, Call | | | 2/22/19 | | | | 143.00 | | | | 400 | | | | 400,000 | | | | 1,443,750 | |
| U.S. Treasury Long-Term Bonds Futures, Call | | | 2/22/19 | | | | 147.00 | | | | 299 | | | | 299,000 | | | | 373,750 | |
| Total Exchange-Traded Written Options (Premiums received — $13,102,871) | | | | | | | $ | 24,751,749 | |
| | | | | | | | | | | | | | | | | | | | | | | | |
| OTC Written Options | |
| Security | | Counterparty | | | Expiration
Date | | | Strike
Price | | | Contracts | | | Notional
Amount† | | | Value | |
| Credit default swaption with BNP Paribas SA to sell protection on Markit CDX.NA.IG.31 Index, Put | |
| BNP
Paribas SA |
| | | 2/20/19 | | | | 100.00 | bps | | | 121,880,000 | | | | 121,880,000 | ‡ | | $ | 260,634 | |
| Credit default swaption with Bank of America N.A. to sell protection on Markit CDX.NA.IG.31 Index, Put | |
| Bank of
America N.A. |
| | | 2/20/19 | | | | 100.00 | bps | | | 115,330,000 | | | | 115,330,000 | ‡ | | | 246,627 | |
| Credit default swaption with Bank of America N.A. to sell protection on Markit CDX.NA.IG.31 Index, Put | |
| Bank of
America N.A. |
| | | 3/20/19 | | | | 120.00 | bps | | | 233,810,000 | | | | 233,810,000 | ‡ | | | 392,737 | |
| U.S. Dollar/Mexican Peso, Put | | | Citibank N.A. | | | | 1/30/19 | | | | 19.50 | MXN | | | 113,763,000 | | | | 113,763,000 | | | | 1,131,282 | |
| Total OTC Written Options (Premiums received — $2,514,393) | | | | | | | | | | | $ | 2,031,280 | |
| Total Written Options (Premiums received — $15,617,264) | | | | | | | | | | | $ | 26,783,029 | |
| † | Notional amount denominated in U.S. dollars, unless otherwise noted. |
| ‡ | In the event an option is exercised and a credit event occurs as defined under the terms of the swap agreement, the notional amount is the maximum potential amount that could be required to be paid as a seller of credit protection or received as a buyer of credit protection. |
| | |
Abbreviations used in this schedule: |
| |
| bps | | — basis point spread. 100 basis points = 1.00% |
| |
| MXN | | — Mexican Peso |
See Notes to Financial Statements.
| | |
| 68 | | Western Asset Core Plus Bond Fund 2018 Annual Report |
Western Asset Core Plus Bond Fund
At December 31, 2018, the Fund had the following open futures contracts:
| | | | | | | | | | | | | | | | | | | | |
| | | Number of
Contracts | | | Expiration
Date | | | Notional Amount | | | Market Value | | | Unrealized
Appreciation
(Depreciation) | |
| Contracts to Buy: | | | | | | | | | | | | | | | | | | | | |
| 90-Day Eurodollar | | | 36,373 | | | | 12/19 | | | $ | 8,819,611,605 | | | $ | 8,852,278,875 | | | $ | 32,667,270 | |
| 90-Day Eurodollar | | | 402 | | | | 3/20 | | | | 98,184,199 | | | | 97,932,225 | | | | (251,974) | |
| 90-Day Eurodollar | | | 18,714 | | | | 6/20 | | | | 4,550,325,723 | | | | 4,561,771,425 | | | | 11,445,702 | |
| 90-Day Eurodollar | | | 3,783 | | | | 3/21 | | | | 922,748,234 | | | | 922,673,700 | | | | (74,534) | |
| Australian Dollar | | | 1,813 | | | | 3/19 | | | | 130,931,400 | | | | 127,852,760 | | | | (3,078,640) | |
| British Pound | | | 3,337 | | | | 3/19 | | | | 262,378,049 | | | | 266,751,438 | | | | 4,373,389 | |
| Canadian Dollar | | | 7,386 | | | | 3/19 | | | | 552,433,545 | | | | 542,944,860 | | | | (9,488,685) | |
| Euro | | | 5,585 | | | | 3/19 | | | | 799,989,825 | | | | 804,414,531 | | | | 4,424,706 | |
| Euro-Bobl | | | 237 | | | | 3/19 | | | | 35,912,072 | | | | 35,984,845 | | | | 72,773 | |
| Euro-BTP | | | 3,973 | | | | 3/19 | | | | 542,986,974 | | | | 581,844,916 | | | | 38,857,942 | |
| Japanese Yen | | | 2,027 | | | | 3/19 | | | | 225,648,174 | | | | 232,370,213 | | | | 6,722,039 | |
| Mexican Peso | | | 14,231 | | | | 3/19 | | | | 349,717,444 | | | | 357,625,030 | | | | 7,907,586 | |
| Russian Ruble | | | 1,000 | | | | 3/19 | | | | 37,413,937 | | | | 35,662,500 | | | | (1,751,437) | |
| Swiss Franc | | | 344 | | | | 3/19 | | | | 43,738,723 | | | | 44,049,200 | | | | 310,477 | |
| U.S. Treasury2-Year Notes | | | 9,760 | | | | 3/19 | | | | 2,058,764,732 | | | | 2,072,170,000 | | | | 13,405,268 | |
| U.S. Treasury5-Year Notes | | | 73,120 | | | | 3/19 | | | | 8,266,877,950 | | | | 8,385,950,000 | | | | 119,072,050 | |
| U.S. Treasury Ultra Long-Term Bonds | | | 11,032 | | | | 3/19 | | | | 1,708,947,624 | | | | 1,772,359,750 | | | | 63,412,126 | |
| | | | | | | | | | | | | | | | | | | | 288,026,058 | |
| Contracts to Sell: | | | | | | | | | | | | | | | | | | | | |
| Australian10-Year Bonds | | | 295 | | | | 3/19 | | | | 27,295,582 | | | | 27,567,635 | | | | (272,053) | |
| Euro-Bund | | | 18,761 | | | | 3/19 | | | | 3,468,661,283 | | | | 3,515,360,292 | | | | (46,699,009) | |
| Euro-Buxl | | | 653 | | | | 3/19 | | | | 133,249,025 | | | | 135,135,323 | | | | (1,886,298) | |
| Euro-Oat | | | 132 | | | | 3/19 | | | | 22,670,545 | | | | 22,806,841 | | | | (136,296) | |
| Japanese10-Year Bonds | | | 328 | | | | 3/19 | | | | 454,331,098 | | | | 456,306,190 | | | | (1,975,092) | |
| United Kingdom Long Gilt Bonds | | | 131 | | | | 3/19 | | | | 20,383,835 | | | | 20,566,015 | | | | (182,180) | |
| U.S. Treasury10-Year Notes | | | 41,448 | | | | 3/19 | | | | 4,960,507,028 | | | | 5,057,303,832 | | | | (96,796,804) | |
| U.S. Treasury Long-Term Bonds | | | 8,269 | | | | 3/19 | | | | 1,177,280,678 | | | | 1,207,274,000 | | | | (29,993,322) | |
| U.S. Treasury Ultra10-Year Notes | | | 5,791 | | | | 3/19 | | | | 729,181,312 | | | | 753,282,451 | | | | (24,101,139) | |
| | | | | | | | | | | | | | | | | | | | (202,042,193) | |
| Net unrealized appreciation on open futures contracts | | | | | | | $ | 85,983,865 | |
See Notes to Financial Statements.
| | |
| Western Asset Core Plus Bond Fund 2018 Annual Report | | 69 |
Schedule of investments (cont’d)
December 31, 2018
Western Asset Core Plus Bond Fund
At December 31, 2018, the Fund had the following open forward foreign currency contracts:
| | | | | | | | | | | | | | | | | | | | |
Currency
Purchased | | | Currency
Sold | | | Counterparty | | Settlement
Date | | | Unrealized
Appreciation
(Depreciation) | |
| BRL | | | 237,623,700 | | | USD | | | 63,243,207 | | | Barclays Bank PLC | | | 1/18/19 | | | $ | (2,005,344) | |
| BRL | | | 770,530,000 | | | USD | | | 203,463,901 | | | Barclays Bank PLC | | | 1/18/19 | | | | (4,891,074) | |
| COP | | | 32,817,550,000 | | | USD | | | 10,586,306 | | | Barclays Bank PLC | | | 1/18/19 | | | | (490,369) | |
| COP | | | 77,799,175,700 | | | USD | | | 25,095,699 | | | Barclays Bank PLC | | | 1/18/19 | | | | (1,161,687) | |
| IDR | | | 2,086,674,380,000 | | | USD | | | 137,028,788 | | | Barclays Bank PLC | | | 1/18/19 | | | | 7,809,586 | |
| INR | | | 10,772,820,000 | | | USD | | | 144,537,587 | | | Barclays Bank PLC | | | 1/18/19 | | | | 9,449,209 | |
| TWD | | | 52,474,000 | | | USD | | | 1,701,933 | | | Barclays Bank PLC | | | 1/18/19 | | | | 8,260 | |
| USD | | | 71,078 | | | AUD | | | 100,000 | | | Barclays Bank PLC | | | 1/18/19 | | | | 616 | |
| USD | | | 94,361,139 | | | CNH | | | 657,980,221 | | | Barclays Bank PLC | | | 1/18/19 | | | | (1,435,908) | |
| USD | | | 11,610,830 | | | EUR | | | 10,000,000 | | | Barclays Bank PLC | | | 1/18/19 | | | | 135,742 | |
| USD | | | 90,060,000 | | | MXN | | | 1,856,275,292 | | | Barclays Bank PLC | | | 1/18/19 | | | | (4,136,331) | |
| USD | | | 71,207 | | | PHP | | | 3,909,000 | | | Barclays Bank PLC | | | 1/18/19 | | | | (3,002) | |
| CAD | | | 506,289,687 | | | USD | | | 390,610,413 | | | Citibank N.A. | | | 1/18/19 | | | | (19,577,521) | |
| EUR | | | 12,000,000 | | | USD | | | 13,789,219 | | | Citibank N.A. | | | 1/18/19 | | | | (19,114) | |
| EUR | | | 12,000,000 | | | USD | | | 13,749,150 | | | Citibank N.A. | | | 1/18/19 | | | | 20,955 | |
| EUR | | | 28,372,138 | | | USD | | | 32,515,179 | | | Citibank N.A. | | | 1/18/19 | | | | 42,097 | |
| EUR | | | 52,619,679 | | | USD | | | 59,956,283 | | | Citibank N.A. | | | 1/18/19 | | | | 425,259 | |
| EUR | | | 127,674,612 | | | USD | | | 146,322,766 | | | Citibank N.A. | | | 1/18/19 | | | | 184,969 | |
| IDR | | | 616,081,610,000 | | | USD | | | 39,703,655 | | | Citibank N.A. | | | 1/18/19 | | | | 3,059,250 | |
| MXN | | | 1,374,280,000 | | | USD | | | 68,048,823 | | | Citibank N.A. | | | 1/18/19 | | | | 1,688,751 | |
| MXN | | | 1,378,720,000 | | | USD | | | 68,355,660 | | | Citibank N.A. | | | 1/18/19 | | | | 1,607,220 | |
| MXN | | | 1,843,059,888 | | | USD | | | 90,362,462 | | | Citibank N.A. | | | 1/18/19 | | | | 3,163,256 | |
| MXN | | | 4,474,391,637 | | | USD | | | 234,574,518 | | | Citibank N.A. | | | 1/18/19 | | | | (7,522,378) | |
| RUB | | | 8,002,374,774 | | | USD | | | 121,204,028 | | | Citibank N.A. | | | 1/18/19 | | | | (6,650,133) | |
| USD | | | 144,538 | | | AUD | | | 200,000 | | | Citibank N.A. | | | 1/18/19 | | | | 3,614 | |
| USD | | | 15,139,871 | | | BRL | | | 56,935,000 | | | Citibank N.A. | | | 1/18/19 | | | | 467,186 | |
| USD | | | 225,658,982 | | | CNY | | | 1,574,197,056 | | | Citibank N.A. | | | 1/18/19 | | | | (3,636,789) | |
| USD | | | 6,867,006 | | | EUR | | | 6,000,000 | | | Citibank N.A. | | | 1/18/19 | | | | (18,046) | |
| USD | | | 11,483,039 | | | EUR | | | 10,000,000 | | | Citibank N.A. | | | 1/18/19 | | | | 7,951 | |
| USD | | | 11,551,928 | | | EUR | | | 10,000,000 | | | Citibank N.A. | | | 1/18/19 | | | | 76,840 | |
| USD | | | 17,289,225 | | | EUR | | | 15,000,000 | | | Citibank N.A. | | | 1/18/19 | | | | 76,594 | |
| USD | | | 479,802,811 | | | EUR | | | 411,590,000 | | | Citibank N.A. | | | 1/18/19 | | | | 7,499,683 | |
| USD | | | 54,036,082 | | | GBP | | | 40,703,000 | | | Citibank N.A. | | | 1/18/19 | | | | 2,108,673 | |
| USD | | | 1,077,779 | | | JPY | | | 120,000,000 | | | Citibank N.A. | | | 1/18/19 | | | | (18,680) | |
| USD | | | 1,341,170 | | | JPY | | | 150,000,000 | | | Citibank N.A. | | | 1/18/19 | | | | (29,404) | |
| USD | | | 2,225,793 | | | JPY | | | 250,000,000 | | | Citibank N.A. | | | 1/18/19 | | | | (58,497) | |
See Notes to Financial Statements.
| | |
| 70 | | Western Asset Core Plus Bond Fund 2018 Annual Report |
Western Asset Core Plus Bond Fund
| | | | | | | | | | | | | | | | | | | | |
Currency
Purchased | | | Currency
Sold | | | Counterparty | | Settlement
Date | | | Unrealized
Appreciation
(Depreciation) | |
| USD | | | 2,682,895 | | | JPY | | | 300,000,000 | | | Citibank N.A. | | | 1/18/19 | | | $ | (58,254) | |
| USD | | | 33,165,789 | | | JPY | | | 3,689,501,688 | | | Citibank N.A. | | | 1/18/19 | | | | (545,788) | |
| ZAR | | | 728,620,000 | | | USD | | | 48,663,884 | | | Citibank N.A. | | | 1/18/19 | | | | 1,869,005 | |
| IDR | | | 1,222,383,200,000 | | | USD | | | 83,240,259 | | | Goldman Sachs Group Inc. | | | 1/18/19 | | | | 1,606,709 | |
| USD | | | 111,280,385 | | | AUD | | | 156,696,521 | | | Goldman Sachs Group Inc. | | | 1/18/19 | | | | 868,824 | |
| BRL | | | 433,500,000 | | | USD | | | 114,425,234 | | | JPMorgan Chase & Co. | | | 1/18/19 | | | | (2,708,208) | |
| BRL | | | 896,263,000 | | | USD | | | 237,722,933 | | | JPMorgan Chase & Co. | | | 1/18/19 | | | | (6,747,529) | |
| IDR | | | 1,698,712,470,000 | | | USD | | | 115,858,169 | | | JPMorgan Chase & Co. | | | 1/18/19 | | | | 2,051,340 | |
| USD | | | 37,748,419 | | | COP 120,587,324,000 | | | JPMorgan Chase & Co. | | | 1/18/19 | | | | 651,131 | |
| USD | | | 15,944,026 | | | EUR | | | 14,000,000 | | | JPMorgan Chase & Co. | | | 1/18/19 | | | | (121,097) | |
| USD | | | 812,945,244 | | | EUR | | | 695,240,059 | | | JPMorgan Chase & Co. | | | 1/18/19 | | | | 15,151,190 | |
| USD | | | 49,103,131 | | | MXN | | | 1,000,000,000 | | | JPMorgan Chase & Co. | | | 1/18/19 | | | | (1,641,676) | |
| USD | | | 232,315,098 | | | MXN | | | 4,790,105,000 | | | JPMorgan Chase & Co. | | | 1/18/19 | | | | (10,757,856) | |
| USD | | | 265,080,000 | | | MXN | | | 5,455,611,480 | | | Citibank N.A. | | | 2/14/19 | | | | (10,555,816) | |
| USD | | | 37,935,397 | | | PHP | | | 2,071,272,654 | | | Deutsche Bank AG | | | 2/15/19 | | | | (1,283,835) | |
| USD | | | 38,381,849 | | | PHP | | | 2,092,194,600 | | | Deutsche Bank AG | | | 2/15/19 | | | | (1,233,536) | |
| USD | | | 38,438,262 | | | PHP | | | 2,092,194,600 | | | Deutsche Bank AG | | | 2/15/19 | | | | (1,177,123) | |
| USD | | | 77,420,926 | | | PHP | | | 4,205,311,146 | | | Deutsche Bank AG | | | 2/15/19 | | | | (2,205,998) | |
| ARS | | | 286,782,000 | | | USD | | | 6,215,205 | | | Citibank N.A. | | | 3/26/19 | | | | 620,071 | |
| ARS | | | 438,300,000 | | | USD | | | 9,896,139 | | | Citibank N.A. | | | 3/26/19 | | | | 550,477 | |
| ARS | | | 146,840,000 | | | USD | | | 3,113,656 | | | JPMorgan Chase & Co. | | | 3/26/19 | | | | 386,187 | |
| ARS | | | 237,958,000 | | | USD | | | 5,071,028 | | | JPMorgan Chase & Co. | | | 3/26/19 | | | | 600,557 | |
| Total | | | | | | | | | | | | | | | $ | (28,499,791) | |
| | |
Abbreviations used in this table: |
| |
| ARS | | — Argentine Peso |
| |
| AUD | | — Australian Dollar |
| |
| BRL | | — Brazilian Real |
| |
| CAD | | — Canadian Dollar |
| |
| CNH | | — Chinese Offshore Yuan |
| |
| CNY | | — Chinese Yuan Renminbi |
| |
| COP | | — Colombian Peso |
| |
| EUR | | — Euro |
| |
| GBP | | — British Pound |
| |
| IDR | | — Indonesian Rupiah |
| |
| INR | | — Indian Rupee |
| |
| JPY | | — Japanese Yen |
| |
| MXN | | — Mexican Peso |
| |
| PHP | | — Philippine Peso |
See Notes to Financial Statements.
| | |
| Western Asset Core Plus Bond Fund 2018 Annual Report | | 71 |
Schedule of investments (cont’d)
December 31, 2018
Western Asset Core Plus Bond Fund
| | |
Abbreviations used in this table(cont’d): |
| |
| RUB | | — Russian Ruble |
| |
| TWD | | — Taiwan Dollar |
| |
| USD | | — United States Dollar |
| |
| ZAR | | — South African Rand |
At December 31, 2018, the Fund had the following open swap contracts:
| | | | | | | | | | | | | | | | | | | | | | | | | | |
| OTC CREDIT DEFAULT SWAPS ON CORPORATE ISSUES — SELL PROTECTION1 | |
Swap Counterparty
(Reference Entity) | | Notional
Amount2 | | | Termination
Date | | | Implied
Credit
Spread at
December 31,
20183 | | Periodic
Payments
Received by
the Fund† | | | Market
Value | | | Upfront
Premiums
Paid
(Received) | | | Unrealized
Appreciation | |
| JPMorgan Chase & Co. (Berkshire Hathaway Inc., 2.750%, due 3/15/23) | | $ | 21,430,000 | | | | 3/20/24 | | | 0.910% | | | 1.000% quarterly | | | $ | 92,668 | | | $ | (239,118) | | | $ | 331,786 | |
| | | | | | | | | | | | | | | | | | |
|
| CENTRALLY CLEARED INTEREST RATE SWAPS | |
Notional Amount* | | | Termination
Date | | | Payments Made by the Fund† | | Payments Received by
the Fund† | | Upfront
Premiums Paid
(Received) | | | Unrealized
Appreciation
(Depreciation) | |
| | 295,460,000 | | | | 3/29/19 | | | 3-Month LIBOR quarterly | | 1.597% semi-annually | | | — | | | $ | (850,404 | ) |
| | 195,170,000 | | | | 9/28/19 | | | 3-Month LIBOR quarterly | | 1.705% semi-annually | | | — | | | | (1,526,771 | ) |
| | 404,740,000 | | | | 10/17/19 | | | 3-Month LIBOR quarterly | | 1.138% semi-annually | | | — | | | | (5,106,730 | ) |
| | 483,220,000 | | | | 6/14/20 | | | 3-Month LIBOR quarterly | | 1.671% semi-annually | | $ | (67,345 | ) | | | (7,095,944 | ) |
| | 17,816,530,000 | MXN | | | 4/5/21 | | | 28-Day TIIE - Banxico every 28 days | | 7.351% every 28 days | | | (119,284 | ) | | | (23,537,375 | ) |
| | 248,962,000 | GBP | | | 10/26/21 | | | 1.271% semi-annually | | 6-Month GBP LIBORsemi-annually | | | 120,857 | | | | (150,649 | ) |
| | 1,218,648,000 | GBP | | | 10/30/21 | | | 1.385% annually | | 3-Month GBP LIBOR annually | | | (437,018 | ) | | | (1,403,670 | ) |
| | 204,100,000 | | | | 12/18/21 | | | 3-Month LIBOR quarterly | | 2.851%semi-annually | | | — | | | | 1,432,804 | |
| | 2,311,724,000 | | | | 12/18/21 | | | 3-Month LIBOR quarterly | | 3.230%semi-annually | | | 3,601,262 | | | | 27,126,076 | |
| | 11,722,600,000 | MXN | | | 4/6/22 | | | 28-Day TIIE - Banxico every 28 days | | 7.330% every 28 days | | | (226,258 | ) | | | (21,234,329 | ) |
| | 1,213,994,000 | | | | 8/31/22 | | | 3-Month LIBOR quarterly | | 2.850%semi-annually | | | (454,512 | ) | | | 12,005,628 | |
| | 119,020,000 | | | | 12/1/22 | | | 3-Month LIBOR quarterly | | 2.169%semi-annually | | | — | | | | (1,814,819 | ) |
| | 2,576,998,000 | | | | 3/20/24 | | | 3-Month LIBOR quarterly | | Daily Federal Funds Effective Rate + 0.310% quarterly | | | 79,958 | | | | 4,384,355 | |
| | 509,925,000 | | | | 12/18/29 | | | 3.300% semi-annually | | 3-Month LIBOR quarterly | | | (2,623,111 | ) | | | (20,967,721 | ) |
| | 434,265,000 | | | | 2/15/36 | | | 3-Month LIBOR quarterly | | 3.000% semi-annually | | | 250,574 | | | | 8,415,186 | |
| | 335,439,000 | | | | 2/15/44 | | | 3.330% semi-annually | | 3-Month LIBOR quarterly | | | (14,508 | ) | | | (28,371,138 | ) |
| | 322,196,000 | | | | 5/15/44 | | | 3.000% semi-annually | | 3-Month LIBOR quarterly | | | 251,182 | | | | (7,998,556 | ) |
See Notes to Financial Statements.
| | |
| 72 | | Western Asset Core Plus Bond Fund 2018 Annual Report |
Western Asset Core Plus Bond Fund
| | | | | | | | | | | | | | | | | | |
| CENTRALLY CLEARED INTEREST RATE SWAPS | |
Notional Amount* | | | Termination
Date | | | Payments Made by the Fund† | | Payments Received by
the Fund† | | Upfront
Premiums Paid
(Received) | | | Unrealized
Appreciation
(Depreciation) | |
| | 12,221,800,000 | JPY | | | 5/9/46 | | | 0.641%semi-annually | | 6-Month JPY LIBORsemi-annually | | | — | | | $ | 1,517,784 | |
| | 25,980,000 | EUR | | | 8/23/47 | | | 1.498% annually | | 6-Month EURIBORsemi-annually | | | (28,595 | ) | | | (812,973 | ) |
| | Total | | | | | | | | | | | $ | 333,202 | | | $ | (65,989,246 | ) |
| | | | | | | | | | | | | | | | | | | | | | |
| OTC INTEREST RATE SWAPS | |
| Swap Counterparty | | Notional Amount* | | | Termination
Date | | | Payments
Made by
the Fund† | | Payments
Received by
the Fund† | | | Upfront
Premiums
Paid
(Received) | | | Unrealized
Appreciation | |
| Citibank N.A. | | | 1,838,341,000 | BRL | | | 1/2/20 | | | BRL - CDI** | | | 8.410%** | | | | — | | | $ | 11,807,506 | |
| Citibank N.A. | | | 374,400,000 | BRL | | | 1/2/20 | | | BRL - CDI** | | | 8.410%** | | | $ | 61,007 | | | | 2,346,260 | |
| Citibank N.A. | | | 637,200,000 | BRL | | | 1/2/20 | | | BRL - CDI** | | | 8.410%** | | | | 391,462 | | | | 3,885,543 | |
| Citibank N.A. | | | 359,599,996 | BRL | | | 1/2/20 | | | BRL - CDI** | | | 8.410%** | | | | 137,601 | | | | 2,266,588 | |
| Citibank N.A. | | | 241,219,004 | BRL | | | 1/2/20 | | | BRL - CDI** | | | 8.410%** | | | | 174,209 | | | | 1,438,516 | |
| Total | | | | | | | | | $ | 764,279 | | | $ | 21,744,413 | |
| | | | | | | | | | | | | | | | | | | | | | |
| CENTRALLY CLEARED CREDIT DEFAULT SWAPS ON CREDIT INDICES — SELL PROTECTION1 | |
| Reference Entity | | Notional Amount2 | | | Termination
Date | | | Periodic
Payments
Received by
the Fund† | | Market Value4 | | | Upfront
Premiums Paid (Received) | | | Unrealized
Depreciation | |
| Markit CDX.NA.IG. 23 Index | | $ | 193,240,000 | | | | 12/20/19 | | | 1.000% quarterly | | $ | 969,678 | | | $ | 1,350,445 | | | $ | (380,767) | |
| Markit CDX.NA.IG. 25 Index | | | 138,520,000 | | | | 12/20/20 | | | 1.000% quarterly | | | 1,217,868 | | | | 1,779,522 | | | | (561,654) | |
| Markit CDX.NA.IG.31 Index | | | 3,939,986,876 | | | | 12/20/23 | | | 1.000% quarterly | | | 21,870,867 | | | | 52,402,307 | | | | (30,531,440) | |
| Total | | $ | 4,271,746,876 | | | | | | | | | $ | 24,058,413 | | | $ | 55,532,274 | | | $ | (31,473,861) | |
| | | | | | | | | | | | | | | | | | | | | | |
| CENTRALLY CLEARED CREDIT DEFAULT SWAPS ON CREDIT INDICES — BUY PROTECTION5 | |
| Reference Entity | | Notional Amount2 | | | Termination
Date | | | Periodic
Payments
Made by
the Fund† | | Market
Value4 | | | Upfront
Premiums Paid (Received) | | | Unrealized
Appreciation | |
| Markit CDX.NA.HY.29 Index | | $ | 94,040,000 | | | | 12/20/22 | | | 5.000% quarterly | | $ | (3,102,379) | | | $ | (5,210,447) | | | $ | 2,108,068 | |
| Markit CDX.NA.HY.31 Index | | | 53,040,000 | | | | 12/20/23 | | | 5.000% quarterly | | | (1,057,246) | | | | (3,663,515) | | | | 2,606,269 | |
| Total | | $ | 147,080,000 | | | | | | | | | $ | (4,159,625) | | | $ | (8,873,962) | | | $ | 4,714,337 | |
| 1 | If the Fund is a seller of protection and a credit event occurs, as defined under the terms of that particular swap agreement, the Fund will either (i) pay to the buyer of protection an amount equal to the notional amount of the swap and take delivery of the referenced obligation or underlying securities comprising the referenced index or (ii) pay a net settlement amount in the |
See Notes to Financial Statements.
| | |
| Western Asset Core Plus Bond Fund 2018 Annual Report | | 73 |
Schedule of investments (cont’d)
December 31, 2018
Western Asset Core Plus Bond Fund
| form of cash or securities equal to the notional amount of the swap less the recovery value of the referenced obligation or underlying securities comprising the referenced index. |
| 2 | The maximum potential amount the Fund could be required to pay as a seller of credit protection or receive as a buyer of credit protection if a credit event occurs as defined under the terms of that particular swap agreement. |
| 3 | Implied credit spreads, utilized in determining the market value of credit default swap agreements on corporate or sovereign issues as of period end, serve as an indicator of the current status of the payment/performance risk and represent the likelihood or risk of default for the credit derivative. The implied credit spread of a particular referenced entity reflects the cost of buying/selling protection and may include upfront payments required to be made to enter into the agreement. Wider credit spreads represent a deterioration of the referenced entity’s credit soundness and a greater likelihood or risk of default or other credit event occurring as defined under the terms of the agreement. A credit spread identified as “Defaulted” indicates a credit event has occurred for the referenced entity or obligation. |
| 4 | The quoted market prices and resulting values for credit default swap agreements on asset-backed securities and credit indices serve as an indicator of the current status of the payment/performance risk and represent the likelihood of an expected loss (or profit) for the credit derivative had the notional amount of the swap agreement been closed/sold as of the period end. Decreasing market values (sell protection) or increasing market values (buy protection) when compared to the notional amount of the swap, represent a deterioration of the referenced entity’s credit soundness and a greater likelihood or risk of default or other credit event occurring as defined under the terms of the agreement. |
| 5 | If the Fund is a buyer of protection and a credit event occurs, as defined under the terms of that particular swap agreement, the Fund will either (i) receive from the seller of protection an amount equal to the notional amount of the swap and deliver the referenced obligation or the underlying securities comprising the referenced index or (ii) receive a net settlement amount in the form of cash or securities equal to the notional amount of the swap less the recovery value of the referenced obligation or the underlying securities comprising the referenced index. |
| † | Percentage shown is an annual percentage rate. |
| * | Notional amount denominated in U.S. dollars, unless otherwise noted. |
| ** | One time payment made at termination date. |
| | |
Abbreviations used in this table: |
| |
| BRL | | — Brazilian Real |
| |
| EUR | | — Euro |
| |
| EURIBOR | | — Euro Interbank Offered Rate |
| |
| GBP | | — British Pound |
| |
| JPY | | — Japanese Yen |
| |
| LIBOR | | — London Interbank Offered Rate |
| |
| MXN | | — Mexican Peso |
| |
| TIIE | | — Equilibrium Interbanking Interest Rate (Tasa de Intere’s Interbancaria de Equilibrio) |
See Notes to Financial Statements.
| | |
| 74 | | Western Asset Core Plus Bond Fund 2018 Annual Report |
Statement of assets and liabilities
December 31, 2018
| | | | |
| |
| Assets: | | | | |
Investments in unaffiliated securities, at value (Cost — $25,676,393,144) | | $ | 25,114,273,220 | |
Investments in affiliated securities, at value (Cost — $845,554,311) | | | 845,554,311 | |
Cash | | | 30,616,804 | |
Foreign currency, at value (Cost — $128,655,960) | | | 129,789,621 | |
Receivable for securities sold | | | 395,764,829 | |
Interest receivable | | | 168,822,369 | |
Deposits with brokers for centrally cleared swap contracts | | | 142,156,466 | |
Deposits with brokers for open futures contracts and exchange traded options | | | 121,423,507 | |
Foreign currency collateral for open futures contracts, at value (Cost — $84,943,480) | | | 85,800,916 | |
Unrealized appreciation on forward foreign currency contracts | | | 62,191,202 | |
Receivable for Fund shares sold | | | 35,725,056 | |
OTC swaps, at value (net premiums paid — $525,161) | | | 22,601,360 | |
Deposits with brokers for OTC derivatives | | | 12,440,000 | |
Receivable from broker — variation margin on open futures contracts | | | 9,940,543 | |
Receivable for open OTC swap contracts | | | 7,143 | |
Prepaid expenses | | | 652,692 | |
Total Assets | | | 27,177,760,039 | |
| |
| Liabilities: | | | | |
Payable for securities purchased | | | 3,347,391,822 | |
Payable for Fund shares repurchased | | | 95,190,579 | |
Unrealized depreciation on forward foreign currency contracts | | | 90,690,993 | |
Payable to broker — variation margin on centrally cleared swaps | | | 57,816,456 | |
Written options, at value (premiums received — $15,617,264) | | | 26,783,029 | |
Distributions payable | | | 10,230,128 | |
Investment management fee payable | | | 6,768,253 | |
Service and/or distribution fees payable | | | 580,731 | |
Directors’ fees payable | | | 110,516 | |
Accrued expenses | | | 6,045,074 | |
Total Liabilities | | | 3,641,607,581 | |
| Total Net Assets | | $ | 23,536,152,458 | |
| |
| Net Assets: | | | | |
Par value (Note 7) | | $ | 2,100,813 | |
Paid-in capital in excess of par value | | | 24,571,686,435 | |
Total distributable earnings (loss) | | | (1,037,634,790) | |
| Total Net Assets | | $ | 23,536,152,458 | |
See Notes to Financial Statements.
| | |
| Western Asset Core Plus Bond Fund 2018 Annual Report | | 75 |
Statement of assets and liabilities (cont’d)
December 31, 2018
| | | | |
| |
| Net Assets: | | | | |
Class A | | | $1,031,760,594 | |
Class C | | | $198,632,365 | |
Class C1 | | | $14,201,797 | |
Class FI | | | $359,293,878 | |
Class R | | | $244,710,110 | |
Class I | | | $15,351,069,348 | |
Class IS | | | $6,336,484,366 | |
| |
| Shares Outstanding: | | | | |
Class A | | | 92,173,222 | |
Class C | | | 17,719,998 | |
Class C1 | | | 1,268,176 | |
Class FI | | | 32,069,173 | |
Class R | | | 21,874,144 | |
Class I | | | 1,370,035,014 | |
Class IS | | | 565,673,199 | |
| |
| Net Asset Value: | | | | |
Class A (and redemption price) | | | $11.19 | |
Class C* | | | $11.21 | |
Class C1* | | | $11.20 | |
Class FI (and redemption price) | | | $11.20 | |
Class R (and redemption price) | | | $11.19 | |
Class I (and redemption price) | | | $11.20 | |
Class IS (and redemption price) | | | $11.20 | |
| Maximum Public Offering Price Per Share: | | | | |
Class A (based on maximum initial sales charge of 4.25%) | | | $11.69 | |
| * | Redemption price per share is NAV of Class C and Class C1 shares reduced by a 1.00% CDSC if shares are |
redeemed within one year from purchase payment (Note 2).
See Notes to Financial Statements.
| | |
| 76 | | Western Asset Core Plus Bond Fund 2018 Annual Report |
Statement of operations
For the Year Ended December 31, 2018
| | | | |
| |
| Investment Income: | | | | |
Dividends | | $ | 18,866,120 | |
Interest from unaffiliated investments | | | 878,275,515 | |
Interest from affiliated investments | | | 34,467,777 | |
Total Investment Income | | | 931,609,412 | |
| |
| Expenses: | | | | |
Investment management fee (Note 2) | | | 93,890,094 | |
Transfer agent fees (Note 5) | | | 18,788,628 | |
Service and/or distribution fees (Notes 2 and 5) | | | 7,102,952 | |
Registration fees | | | 886,993 | |
Fund accounting fees | | | 767,963 | |
Legal fees | | | 755,387 | |
Directors’ fees | | | 575,258 | |
Insurance | | | 220,549 | |
Commitment fees (Note 9) | | | 166,772 | |
Shareholder reports | | | 159,205 | |
Custody fees | | | 119,017 | |
Audit and tax fees | | | 94,144 | |
Interest expense | | | 40,006 | |
Miscellaneous expenses | | | 283,506 | |
Total Expenses | | | 123,850,474 | |
Less: Fee waivers and/or expense reimbursements (Notes 2 and 5) | | | (10,902,563) | |
Net Expenses | | | 112,947,911 | |
| Net Investment Income | | | 818,661,501 | |
| |
Realized and Unrealized Gain (Loss) on Investments, Futures Contracts,
Written Options, Swap Contracts, Forward Foreign Currency Contracts and Foreign Currency Transactions (Notes 1, 3 and 4): | | | | |
Net Realized Gain (Loss) From: | | | | |
Investment transactions in unaffiliated securities | | | (326,911,398) | |
Futures contracts | | | (248,120,100) | |
Written options | | | 143,433,094 | |
Swap contracts | | | 111,030,935 | |
Forward foreign currency contracts | | | (23,066,230) | |
Foreign currency transactions | | | 40,099,352 | |
Net Realized Loss | | | (303,534,347) | |
Change in Net Unrealized Appreciation (Depreciation) From: | | | | |
Investments in unaffiliated securities | | | (861,211,086) | |
Futures contracts | | | 93,377,492 | |
Written options | | | (12,763,027) | |
Swap contracts | | | (78,268,417) | |
Forward foreign currency contracts | | | (7,582,478) | |
Foreign currencies | | | 3,788,190 | |
Change in Net Unrealized Appreciation (Depreciation) | | | (862,659,326) | |
| Net Loss on Investments, Futures Contracts, Written Options, Swap Contracts, Forward Foreign Currency Contracts and Foreign Currency Transactions | | | (1,166,193,673) | |
| Decrease in Net Assets From Operations | | $ | (347,532,172) | |
See Notes to Financial Statements.
| | |
| Western Asset Core Plus Bond Fund 2018 Annual Report | | 77 |
Statements of changes in net assets
| | | | | | | | |
| For the Years Ended December 31, | | 2018 | | | 2017 | |
| | |
| Operations: | | | | | | | | |
Net investment income | | $ | 818,661,501 | | | $ | 578,404,811 | |
Net realized gain (loss) | | | (303,534,347) | | | | 193,690,141 | |
Change in net unrealized appreciation (depreciation) | | | (862,659,326) | | | | 483,400,571 | |
Increase (Decrease) in Net Assets From Operations | | | (347,532,172) | | | | 1,255,495,523 | |
| | |
| Distributions to Shareholders From (Notes 1 and 6): | | | | | | | | |
Total distributable earnings(a) | | | (923,585,439) | | | | (618,247,243) | |
Decrease in Net Assets From Distributions to Shareholders | | | (923,585,439) | | | | (618,247,243) | |
| | |
| Fund Share Transactions (Note 7): | | | | | | | | |
Net proceeds from sale of shares | | | 9,782,620,710 | | | | 9,191,583,035 | |
Reinvestment of distributions | | | 799,750,505 | | | | 548,217,276 | |
Cost of shares repurchased | | | (7,870,220,490) | | | | (6,000,635,672) | |
Increase in Net Assets From Fund Share Transactions | | | 2,712,150,725 | | | | 3,739,164,639 | |
Increase in Net Assets | | | 1,441,033,114 | | | | 4,376,412,919 | |
| | |
| Net Assets: | | | | | | | | |
Beginning of year | | | 22,095,119,344 | | | | 17,718,706,425 | |
End of year(b) | | $ | 23,536,152,458 | | | $ | 22,095,119,344 | |
| (a) | Distributions from net investment income and from realized gains are no longer required to be separately disclosed. See Note 11. For the year ended December 31, 2017, distributions from net investment income and net realized gains were $588,947,116 and $29,300,127, respectively. |
| (b) | Parenthetical disclosure of undistributed net investment income is no longer required. See Note 11. For the year ended December 31, 2017, end of year net assets included overdistributed net investment income of $(8,710,332). |
See Notes to Financial Statements.
| | |
| 78 | | Western Asset Core Plus Bond Fund 2018 Annual Report |
Financial highlights
| | | | | | | | | | | | | | | | | | | | |
| For a share of each class of capital stock outstanding throughout each year ended December 31: | |
| Class A Shares1 | | 2018 | | | 2017 | | | 2016 | | | 2015 | | | 2014 | |
| | | | | |
| Net asset value, beginning of year | | | $11.83 | | | | $11.42 | | | | $11.42 | | | | $11.63 | | | | $11.19 | |
| | | | | |
| Income (loss) from operations: | | | | | | | | | | | | | | | | | | | | |
Net investment income | | | 0.36 | | | | 0.31 | | | | 0.33 | | | | 0.30 | | | | 0.35 | |
Net realized and unrealized gain (loss) | | | (0.60) | | | | 0.44 | | | | 0.18 | | | | (0.20) | | | | 0.46 | |
Total income (loss) from operations | | | (0.24) | | | | 0.75 | | | | 0.51 | | | | 0.10 | | | | 0.81 | |
| | | | | |
| Less distributions from: | | | | | | | | | | | | | | | | | | | | |
Net investment income | | | (0.35) | | | | (0.32) | | | | (0.40) | | | | (0.31) | | | | (0.37) | |
Net realized gains | | | (0.05) | | | | (0.02) | | | | (0.11) | | | | — | | | | — | |
Total distributions | | | (0.40) | | | | (0.34) | | | | (0.51) | | | | (0.31) | | | | (0.37) | |
| | | | | |
| Net asset value, end of year | | | $11.19 | | | | $11.83 | | | | $11.42 | | | | $11.42 | | | | $11.63 | |
Total return2 | | | (1.86) | % | | | 6.57 | % | | | 4.42 | % | | | 0.76 | % | | | 7.36 | % |
| | | | | |
| Net assets, end of year (millions) | | | $1,032 | | | | $992 | | | | $825 | | | | $492 | | | | $277 | |
| | | | | |
| Ratios to average net assets: | | | | | | | | | | | | | | | | | | | | |
Gross expenses | | | 0.84 | % | | | 0.85 | %3 | | | 0.82 | % | | | 0.89 | % | | | 0.78 | % |
Net expenses4 | | | 0.82 | 5 | | | 0.82 | 3,5 | | | 0.81 | 5 | | | 0.89 | | | | 0.78 | |
Net investment income | | | 3.16 | | | | 2.66 | | | | 2.85 | | | | 2.58 | | | | 2.99 | |
| | | | | |
| Portfolio turnover rate6 | | | 105 | % | | | 94 | % | | | 97 | % | | | 93 | % | | | 78 | % |
| 1 | Per share amounts have been calculated using the average shares method. |
| 2 | Performance figures, exclusive of sales charges, may reflect compensating balance arrangements, fee waivers and/or expense reimbursements. In the absence of compensating balance arrangements, fee waivers and/or expense reimbursements, the total return would have been lower. Past performance is no guarantee of future results. |
| 3 | Reflects recapture of expenses waived/reimbursed from prior fiscal years. |
| 4 | As a result of an expense limitation arrangement, the ratio of total annual fund operating expenses, other than interest, brokerage commissions, taxes, extraordinary expenses, deferred organizational expenses and acquired fund fees and expenses, to average net assets of Class A shares did not exceed 0.82%. This expense limitation arrangement cannot be terminated prior to December 31, 2020 without the Board of Directors’ consent. Prior to May 1, 2016, the expense limitation was 0.90%. |
| 5 | Reflects fee waivers and/or expense reimbursements. |
| 6 | Excluding mortgage dollar roll transactions. If mortgage dollar roll transactions had been included, the portfolio turnover rate would have been 274%, 264%, 201%, 244% and 229% for the years ended December 31, 2018, 2017, 2016, 2015 and 2014, respectively. |
See Notes to Financial Statements.
| | |
| Western Asset Core Plus Bond Fund 2018 Annual Report | | 79 |
Financial highlights (cont’d)
| | | | | | | | | | | | | | | | | | | | |
| For a share of each class of capital stock outstanding throughout each year ended December 31: | |
| Class C Shares1 | | 2018 | | | 2017 | | | 2016 | | | 2015 | | | 2014 | |
| | | | | |
| Net asset value, beginning of year | | | $11.84 | | | | $11.43 | | | | $11.44 | | | | $11.65 | | | | $11.20 | |
| | | | | |
| Income (loss) from operations: | | | | | | | | | | | | | | | | | | | | |
Net investment income | | | 0.28 | | | | 0.23 | | | | 0.25 | | | | 0.23 | | | | 0.26 | |
Net realized and unrealized gain (loss) | | | (0.58) | | | | 0.43 | | | | 0.16 | | | | (0.20) | | | | 0.47 | |
Total income (loss) from operations | | | (0.30) | | | | 0.66 | | | | 0.41 | | | | 0.03 | | | | 0.73 | |
| | | | | |
| Less distributions from: | | | | | | | | | | | | | | | | | | | | |
Net investment income | | | (0.28) | | | | (0.23) | | | | (0.31) | | | | (0.24) | | | | (0.28) | |
Net realized gains | | | (0.05) | | | | (0.02) | | | | (0.11) | | | | — | | | | — | |
Total distributions | | | (0.33) | | | | (0.25) | | | | (0.42) | | | | (0.24) | | | | (0.28) | |
| | | | | |
| Net asset value, end of year | | | $11.21 | | | | $11.84 | | | | $11.43 | | | | $11.44 | | | | $11.65 | |
Total return2 | | | (2.53) | % | | | 5.82 | % | | | 3.59 | % | | | 0.22 | % | | | 6.53 | % |
| | | | | |
| Net assets, end of year (millions) | | | $199 | | | | $219 | | | | $186 | | | | $121 | | | | $53 | |
| | | | | |
| Ratios to average net assets: | | | | | | | | | | | | | | | | | | | | |
Gross expenses | | | 1.52 | % | | | 1.52 | % | | | 1.52 | % | | | 1.52 | % | | | 1.53 | %3 |
Net expenses4 | | | 1.52 | 5 | | | 1.52 | 5 | | | 1.52 | | | | 1.52 | | | | 1.53 | 3,5 |
Net investment income | | | 2.45 | | | | 1.95 | | | | 2.13 | | | | 1.99 | | | | 2.26 | |
| | | | | |
| Portfolio turnover rate6 | | | 105 | % | | | 94 | % | | | 97 | % | | | 93 | % | | | 78 | % |
| 1 | Per share amounts have been calculated using the average shares method. |
| 2 | Performance figures, exclusive of CDSC, may reflect compensating balance arrangements, fee waivers and/or expense reimbursements. In the absence of compensating balance arrangements, fee waivers and/or expense reimbursements, the total return would have been lower. Past performance is no guarantee of future results. |
| 3 | Reflects recapture of expenses waived/reimbursed from prior fiscal years. |
| 4 | As a result of an expense limitation arrangement, the ratio of total annual fund operating expenses, other than interest, brokerage commissions, taxes, extraordinary expenses, deferred organizational expenses and acquired fund fees and expenses, to average net assets of Class C shares did not exceed 1.65%. This expense limitation arrangement cannot be terminated prior to December 31, 2020 without the Board of Directors’ consent. |
| 5 | Reflects fee waivers and/or expense reimbursements. |
| 6 | Excluding mortgage dollar roll transactions. If mortgage dollar roll transactions had been included, the portfolio turnover rate would have been 274%, 264%, 201%, 244% and 229% for the years ended December 31, 2018, 2017, 2016, 2015 and 2014, respectively. |
See Notes to Financial Statements.
| | |
| 80 | | Western Asset Core Plus Bond Fund 2018 Annual Report |
| | | | | | | | | | | | | | | | | | | | |
| For a share of each class of capital stock outstanding throughout each year ended December 31: | |
| Class C1 Shares1 | | 2018 | | | 2017 | | | 2016 | | | 2015 | | | 2014 | |
| | | | | |
| Net asset value, beginning of year | | | $11.83 | | | | $11.42 | | | | $11.43 | | | | $11.63 | | | | $11.18 | |
| | | | | |
| Income (loss) from operations: | | | | | | | | | | | | | | | | | | | | |
Net investment income | | | 0.31 | | | | 0.27 | | | | 0.29 | | | | 0.27 | | | | 0.31 | |
Net realized and unrealized gain (loss) | | | (0.58) | | | | 0.43 | | | | 0.16 | | | | (0.20) | | | | 0.45 | |
Total income (loss) from operations | | | (0.27) | | | | 0.70 | | | | 0.45 | | | | 0.07 | | | | 0.76 | |
| | | | | |
| Less distributions from: | | | | | | | | | | | | | | | | | | | | |
Net investment income | | | (0.31) | | | | (0.27) | | | | (0.35) | | | | (0.27) | | | | (0.31) | |
Net realized gains | | | (0.05) | | | | (0.02) | | | | (0.11) | | | | — | | | | — | |
Total distributions | | | (0.36) | | | | (0.29) | | | | (0.46) | | | | (0.27) | | | | (0.31) | |
| | | | | |
| Net asset value, end of year | | | $11.20 | | | | $11.83 | | | | $11.42 | | | | $11.43 | | | | $11.63 | |
Total return2 | | | (2.22) | % | | | 6.16 | % | | | 3.92 | % | | | 0.63 | % | | | 6.89 | % |
| | | | | |
| Net assets, end of year (000s) | | | $14,202 | | | | $22,192 | | | | $25,069 | | | | $27,662 | | | | $30,785 | |
| | | | | |
| Ratios to average net assets: | | | | | | | | | | | | | | | | | | | | |
Gross expenses | | | 1.19 | % | | | 1.21 | % | | | 1.21 | % | | | 1.20 | % | | | 1.24 | % |
Net expenses3 | | | 1.19 | 4 | | | 1.21 | 4 | | | 1.21 | | | | 1.20 | | | | 1.24 | |
Net investment income | | | 2.75 | | | | 2.27 | | | | 2.46 | | | | 2.29 | | | | 2.65 | |
| | | | | |
| Portfolio turnover rate5 | | | 105 | % | | | 94 | % | | | 97 | % | | | 93 | % | | | 78 | % |
| 1 | Per share amounts have been calculated using the average shares method. |
| 2 | Performance figures, exclusive of CDSC, may reflect compensating balance arrangements, fee waivers and/or expense reimbursements. In the absence of compensating balance arrangements, fee waivers and/or expense reimbursements, the total return would have been lower. Past performance is no guarantee of future results. |
| 3 | As a result of an expense limitation arrangement, the ratio of total annual fund operating expenses, other than interest, brokerage commissions, taxes, extraordinary expenses, deferred organizational expenses and acquired fund fees and expenses, to average net assets of Class C1 shares did not exceed 1.51%. This expense limitation arrangement cannot be terminated prior to December 31, 2020 without the Board of Directors’ consent. |
| 4 | Reflects fee waivers and/or expense reimbursements. |
| 5 | Excluding mortgage dollar roll transactions. If mortgage dollar roll transactions had been included, the portfolio turnover rate would have been 274%, 264%, 201%, 244% and 229% for the years ended December 31, 2018, 2017, 2016, 2015 and 2014, respectively. |
See Notes to Financial Statements.
| | |
| Western Asset Core Plus Bond Fund 2018 Annual Report | | 81 |
Financial highlights (cont’d)
| | | | | | | | | | | | | | | | | | | | |
| For a share of each class of capital stock outstanding throughout each year ended December 31: | |
| Class FI Shares1 | | 2018 | | | 2017 | | | 2016 | | | 2015 | | | 2014 | |
| | | | | |
| Net asset value, beginning of year | | | $11.84 | | | | $11.43 | | | | $11.44 | | | | $11.64 | | | | $11.19 | |
| | | | | |
| Income (loss) from operations: | | | | | | | | | | | | | | | | | | | | |
Net investment income | | | 0.36 | | | | 0.31 | | | | 0.34 | | | | 0.31 | | | | 0.36 | |
Net realized and unrealized gain (loss) | | | (0.60) | | | | 0.44 | | | | 0.15 | | | | (0.19) | | | | 0.45 | |
Total income (loss) from operations | | | (0.24) | | | | 0.75 | | | | 0.49 | | | | 0.12 | | | | 0.81 | |
| | | | | |
| Less distributions from: | | | | | | | | | | | | | | | | | | | | |
Net investment income | | | (0.35) | | | �� | (0.32) | | | | (0.39) | | | | (0.32) | | | | (0.36) | |
Net realized gains | | | (0.05) | | | | (0.02) | | | | (0.11) | | | | — | | | | — | |
Total distributions | | | (0.40) | | | | (0.34) | | | | (0.50) | | | | (0.32) | | | | (0.36) | |
| | | | | |
| Net asset value, end of year | | | $11.20 | | | | $11.84 | | | | $11.43 | | | | $11.44 | | | | $11.64 | |
Total return2 | | | (1.87) | % | | | 6.65 | % | | | 4.21 | % | | | 0.99 | % | | | 7.35 | % |
| | | | | |
| Net assets, end of year (millions) | | | $359 | | | | $444 | | | | $406 | | | | $1,542 | | | | $1,853 | |
| | | | | |
| Ratios to average net assets: | | | | | | | | | | | | | | | | | | | | |
Gross expenses | | | 0.83 | % | | | 0.83 | % | | | 0.83 | % | | | 0.84 | % | | | 0.81 | % |
Net expenses3 | | | 0.83 | 4 | | | 0.83 | 4 | | | 0.83 | | | | 0.84 | | | | 0.80 | 4 |
Net investment income | | | 3.13 | | | | 2.65 | | | | 2.88 | | | | 2.64 | | | | 3.12 | |
| | | | | |
| Portfolio turnover rate5 | | | 105 | % | | | 94 | % | | | 97 | % | | | 93 | % | | | 78 | % |
| 1 | Per share amounts have been calculated using the average shares method. |
| 2 | Performance figures may reflect compensating balance arrangements, fee waivers and/or expense reimbursements. In the absence of compensating balance arrangements, fee waivers and/or expense reimbursements, the total return would have been lower. Past performance is no guarantee of future results. |
| 3 | As a result of an expense limitation arrangement, the ratio of total annual fund operating expenses, other than interest, brokerage commissions, taxes, extraordinary expenses, deferred organizational expenses and acquired fund fees and expenses, to average net assets of Class FI shares did not exceed 0.85%. This expense limitation arrangement cannot be terminated prior to December 31, 2020 without the Board of Directors’ consent. Prior to May 1, 2014, the manager voluntarily waived fees and/or reimbursed operating expenses so that total annual operating expenses did not exceed 0.78%. This expense limitation did not include interest, brokerage commissions, taxes, extraordinary expenses and deferred organizational expenses. |
| 4 | Reflects fee waivers and/or expense reimbursements. |
| 5 | Excluding mortgage dollar roll transactions. If mortgage dollar roll transactions had been included, the portfolio turnover rate would have been 274%, 264%, 201%, 244% and 229% for the years ended December 31, 2018, 2017, 2016, 2015 and 2014, respectively. |
See Notes to Financial Statements.
| | |
| 82 | | Western Asset Core Plus Bond Fund 2018 Annual Report |
| | | | | | | | | | | | | | | | | | | | |
| For a share of each class of capital stock outstanding throughout each year ended December 31: | |
| Class R Shares1 | | 2018 | | | 2017 | | | 2016 | | | 2015 | | | 2014 | |
| | | | | |
| Net asset value, beginning of year | | | $11.82 | | | | $11.41 | | | | $11.41 | | | | $11.62 | | | | $11.18 | |
| | | | | |
| Income (loss) from operations: | | | | | | | | | | | | | | | | | | | | |
Net investment income | | | 0.32 | | | | 0.28 | | | | 0.29 | | | | 0.28 | | | | 0.31 | |
Net realized and unrealized gain (loss) | | | (0.58) | | | | 0.43 | | | | 0.18 | | | | (0.21) | | | | 0.45 | |
Total income (loss) from operations | | | (0.26) | | | | 0.71 | | | | 0.47 | | | | 0.07 | | | | 0.76 | |
| | | | | |
| Less distributions from: | | | | | | | | | | | | | | | | | | | | |
Net investment income | | | (0.32) | | | | (0.28) | | | | (0.36) | | | | (0.28) | | | | (0.32) | |
Net realized gains | | | (0.05) | | | | (0.02) | | | | (0.11) | | | | — | | | | — | |
Total distributions | | | (0.37) | | | | (0.30) | | | | (0.47) | | | | (0.28) | | | | (0.32) | |
| | | | | |
| Net asset value, end of year | | | $11.19 | | | | $11.82 | | | | $11.41 | | | | $11.41 | | | | $11.62 | |
Total return2 | | | (2.16) | % | | | 6.25 | % | | | 4.11 | % | | | 0.62 | % | | | 6.89 | % |
| | | | | |
| Net assets, end of year (millions) | | | $245 | | | | $215 | | | | $130 | | | | $53 | | | | $11 | |
| | | | | |
| Ratios to average net assets: | | | | | | | | | | | | | | | | | | | | |
Gross expenses | | | 1.12 | % | | | 1.13 | % | | | 1.12 | % | | | 1.14 | %3 | | | 1.27 | %3 |
Net expenses4 | | | 1.12 | | | | 1.13 | 5 | | | 1.12 | | | | 1.14 | 3 | | | 1.15 | 3,5 |
Net investment income | | | 2.87 | | | | 2.35 | | | | 2.53 | | | | 2.42 | | | | 2.71 | |
| | | | | |
| Portfolio turnover rate6 | | | 105 | % | | | 94 | % | | | 97 | % | | | 93 | % | | | 78 | % |
| 1 | Per share amounts have been calculated using the average shares method. |
| 2 | Performance figures may reflect compensating balance arrangements, fee waivers and/or expense reimbursements. In the absence of compensating balance arrangements, fee waivers and/or expense reimbursements, the total return would have been lower. Past performance is no guarantee of future results. |
| 3 | Reflects recapture of expenses waived/reimbursed from prior fiscal years. |
| 4 | As a result of an expense limitation arrangement, the ratio of total annual fund operating expenses, other than interest, brokerage commissions, taxes, extraordinary expenses, deferred organizational expenses and acquired fund fees and expenses, to average net assets of Class R shares did not exceed 1.15%. This expense limitation arrangement cannot be terminated prior to December 31, 2020 without the Board of Directors’ consent. |
| 5 | Reflects fee waivers and/or expense reimbursements. |
| 6 | Excluding mortgage dollar roll transactions. If mortgage dollar roll transactions had been included, the portfolio turnover rate would have been 274%, 264%, 201%, 244% and 229% for the years ended December 31, 2018, 2017, 2016, 2015 and 2014, respectively. |
See Notes to Financial Statements.
| | |
| Western Asset Core Plus Bond Fund 2018 Annual Report | | 83 |
Financial highlights (cont’d)
| | | | | | | | | | | | | | | | | | | | |
| For a share of each class of capital stock outstanding throughout each year ended December 31: | |
| Class I Shares1 | | 2018 | | | 2017 | | | 2016 | | | 2015 | | | 2014 | |
| | | | | |
| Net asset value, beginning of year | | | $11.84 | | | | $11.43 | | | | $11.43 | | | | $11.64 | | | | $11.19 | |
| | | | | |
| Income (loss) from operations: | | | | | | | | | | | | | | | | | | | | |
Net investment income | | | 0.40 | | | | 0.35 | | | | 0.38 | | | | 0.35 | | | | 0.39 | |
Net realized and unrealized gain (loss) | | | (0.59) | | | | 0.44 | | | | 0.17 | | | | (0.20) | | | | 0.46 | |
Total income (loss) from operations | | | (0.19) | | | | 0.79 | | | | 0.55 | | | | 0.15 | | | | 0.85 | |
| | | | | |
| Less distributions from: | | | | | | | | | | | | | | | | | | | | |
Net investment income | | | (0.40) | | | | (0.36) | | | | (0.44) | | | | (0.36) | | | | (0.40) | |
Net realized gains | | | (0.05) | | | | (0.02) | | | | (0.11) | | | | — | | | | — | |
Total distributions | | | (0.45) | | | | (0.38) | | | | (0.55) | | | | (0.36) | | | | (0.40) | |
| | | | | |
| Net asset value, end of year | | | $11.20 | | | | $11.84 | | | | $11.43 | | | | $11.43 | | | | $11.64 | |
Total return2 | | | (1.49) | % | | | 6.96 | % | | | 4.79 | % | | | 1.29 | % | | | 7.68 | % |
| | | | | |
| Net assets, end of year (millions) | | | $15,351 | | | | $14,721 | | | | $12,191 | | | | $9,649 | | | | $7,499 | |
| | | | | |
| Ratios to average net assets: | | | | | | | | | | | | | | | | | | | | |
Gross expenses | | | 0.52 | % | | | 0.52 | % | | | 0.52 | % | | | 0.52 | % | | | 0.49 | % |
Net expenses4 | | | 0.45 | 3 | | | 0.45 | 3 | | | 0.45 | 3 | | | 0.45 | 3 | | | 0.49 | 3 |
Net investment income | | | 3.53 | | | | 3.03 | | | | 3.21 | | | | 3.05 | | | | 3.39 | |
| | | | | |
| Portfolio turnover rate5 | | | 105 | % | | | 94 | % | | | 97 | % | | | 93 | % | | | 78 | % |
| 1 | Per share amounts have been calculated using the average shares method. |
| 2 | Performance figures may reflect compensating balance arrangements, fee waivers and/or expense reimbursements. In the absence of compensating balance arrangements, fee waivers and/or expense reimbursements, the total return would have been lower. Past performance is no guarantee of future results. |
| 3 | Reflects fee waivers and/or expense reimbursements. |
| 4 | As a result of an expense limitation arrangement, effective November 7, 2014, the ratio of total annual fund operating expenses, other than interest, brokerage commissions, taxes, extraordinary expenses, deferred organizational expenses and acquired fund fees and expenses, to average net assets of Class I shares did not exceed 0.45%. This expense limitation arrangement cannot be terminated prior to December 31, 2020 without the Board of Directors’ consent. |
| 5 | Excluding mortgage dollar roll transactions. If mortgage dollar roll transactions had been included, the portfolio turnover rate would have been 274%, 264%, 201%, 244% and 229% for the years ended December 31, 2018, 2017, 2016, 2015 and 2014, respectively. |
See Notes to Financial Statements.
| | |
| 84 | | Western Asset Core Plus Bond Fund 2018 Annual Report |
| | | | | | | | | | | | | | | | | | | | |
| For a share of each class of capital stock outstanding throughout each year ended December 31: | |
| Class IS Shares1 | | 2018 | | | 2017 | | | 2016 | | | 2015 | | | 2014 | |
| | | | | |
| Net asset value, beginning of year | | | $11.83 | | | | $11.42 | | | | $11.43 | | | | $11.64 | | | | $11.19 | |
| | | | | |
| Income (loss) from operations: | | | | | | | | | | | | | | | | | | | | |
Net investment income | | | 0.40 | | | | 0.36 | | | | 0.38 | | | | 0.36 | | | | 0.40 | |
Net realized and unrealized gain (loss) | | | (0.58) | | | | 0.43 | | | | 0.16 | | | | (0.21) | | | | 0.46 | |
Total income (loss) from operations | | | (0.18) | | | | 0.79 | | | | 0.54 | | | | 0.15 | | | | 0.86 | |
| | | | | |
| Less distributions from: | | | | | | | | | | | | | | | | | | | | |
Net investment income | | | (0.40) | | | | (0.36) | | | | (0.44) | | | | (0.36) | | | | (0.41) | |
Net realized gains | | | (0.05) | | | | (0.02) | | | | (0.11) | | | | — | | | | — | |
Total distributions | | | (0.45) | | | | (0.38) | | | | (0.55) | | | | (0.36) | | | | (0.41) | |
| | | | | |
| Net asset value, end of year | | | $11.20 | | | | $11.83 | | | | $11.42 | | | | $11.43 | | | | $11.64 | |
Total return2 | | | (1.47) | % | | | 6.99 | % | | | 4.73 | % | | | 1.32 | % | | | 7.75 | % |
| | | | | |
| Net assets, end of year (millions) | | | $6,336 | | | | $5,482 | | | | $3,955 | | | | $3,330 | | | | $3,170 | |
| | | | | |
| Ratios to average net assets: | | | | | | | | | | | | | | | | | | | | |
Gross expenses | | | 0.42 | % | | | 0.43 | % | | | 0.42 | % | | | 0.42 | %3 | | | 0.43 | % |
Net expenses4 | | | 0.42 | | | | 0.43 | | | | 0.42 | | | | 0.42 | 3 | | | 0.43 | 5 |
Net investment income | | | 3.57 | | | | 3.05 | | | | 3.24 | | | | 3.07 | | | | 3.45 | |
| | | | | |
| Portfolio turnover rate6 | | | 105 | % | | | 94 | % | | | 97 | % | | | 93 | % | | | 78 | % |
| 1 | Per share amounts have been calculated using the average shares method. |
| 2 | Performance figures may reflect compensating balance arrangements, fee waivers and/or expense reimbursements. In the absence of compensating balance arrangements, fee waivers and/or expense reimbursements, the total return would have been lower. Past performance is no guarantee of future results. |
| 3 | Reflects recapture of expenses waived/reimbursed from prior fiscal years. |
| 4 | As a result of an expense limitation arrangement, the ratio of total annual fund operating expenses, other than interest, brokerage commissions, taxes, extraordinary expenses, deferred organizational expenses and acquired fund fees and expenses, to average net assets of Class IS shares did not exceed 0.45%. In addition, the ratio of total annual fund operating expenses for Class IS shares did not exceed the ratio of total annual fund operating expenses for Class I shares. These expense limitation arrangements cannot be terminated prior to December 31, 2020 without the Board of Directors’ consent. |
| 5 | Reflects fee waivers and/or expense reimbursements. |
| 6 | Excluding mortgage dollar roll transactions. If mortgage dollar roll transactions had been included, the portfolio turnover rate would have been 274%, 264%, 201%, 244% and 229% for the years ended December 31, 2018, 2017, 2016, 2015 and 2014, respectively. |
See Notes to Financial Statements.
| | |
| Western Asset Core Plus Bond Fund 2018 Annual Report | | 85 |
Notes to financial statements
1. Organization and significant accounting policies
Western Asset Core Plus Bond Fund (the “Fund”) is a separate diversified investment series of Western Asset Funds, Inc. (the “Corporation”). The Corporation, a Maryland Corporation, is registered under the Investment Company Act of 1940, as amended (the “1940 Act”), as anopen-end management investment company.
The following are significant accounting policies consistently followed by the Fund and are in conformity with U.S. generally accepted accounting principles (“GAAP”). Estimates and assumptions are required to be made regarding assets, liabilities and changes in net assets resulting from operations when financial statements are prepared. Changes in the economic environment, financial markets and any other parameters used in determining these estimates could cause actual results to differ. Subsequent events have been evaluated through the date the financial statements were issued.
(a) Investment valuation. The valuations for fixed income securities (which may include,but are not limited to, corporate, government, municipal, mortgage-backed, collateralized mortgage obligations and asset-backed securities) and certain derivative instruments are typically the prices supplied by independent third party pricing services, which may use market prices or broker/dealer quotations or a variety of valuation techniques and methodologies. The independent third party pricing services use inputs that are observable such as issuer details, interest rates, yield curves, prepayment speeds, credit risks/spreads, default rates and quoted prices for similar securities. Investments inopen-end funds are valued at the closing net asset value per share of each fund on the day of valuation. Futures contracts are valued daily at the settlement price established by the board of trade or exchange on which they are traded. Equity securities for which market quotations are available are valued at the last reported sales price or official closing price on the primary market or exchange on which they trade. When the Fund holds securities or other assets that are denominated in a foreign currency, the Fund will normally use the currency exchange rates as of 4:00 p.m. (Eastern Time). If independent third party pricing services are unable to supply prices for a portfolio investment, or if the prices supplied are deemed by the manager to be unreliable, the market price may be determined by the manager using quotations from one or more broker/dealers or at the transaction price if the security has recently been purchased and no value has yet been obtained from a pricing service or pricing broker. When reliable prices are not readily available, such as when the value of a security has been significantly affected by events after the close of the exchange or market on which the security is principally traded, but before the Fund calculates its net asset value, the Fund values these securities as determined in accordance with procedures approved by the Fund’s Board of Directors.
The Board of Directors is responsible for the valuation process and has delegated the supervision of the daily valuation process to the Legg Mason North Atlantic Fund Valuation Committee (the “Valuation Committee”). The Valuation Committee, pursuant to the policies adopted by the Board of Directors, is responsible for making fair value determinations, evaluating the effectiveness of the Fund’s pricing policies, and reporting to the Board of
| | |
| 86 | | Western Asset Core Plus Bond Fund 2018 Annual Report |
Directors. When determining the reliability of third party pricing information for investments owned by the Fund, the Valuation Committee, among other things, conducts due diligence reviews of pricing vendors, monitors the daily change in prices and reviews transactions among market participants.
The Valuation Committee will consider pricing methodologies it deems relevant and appropriate when making fair value determinations. Examples of possible methodologies include, but are not limited to, multiple of earnings; discount from market of a similar freely traded security; discounted cash-flow analysis; book value or a multiple thereof; risk premium/yield analysis; yield to maturity; and/or fundamental investment analysis. The Valuation Committee will also consider factors it deems relevant and appropriate in light of the facts and circumstances. Examples of possible factors include, but are not limited to, the type of security; the issuer’s financial statements; the purchase price of the security; the discount from market value of unrestricted securities of the same class at the time of purchase; analysts’ research and observations from financial institutions; information regarding any transactions or offers with respect to the security; the existence of merger proposals or tender offers affecting the security; the price and extent of public trading in similar securities of the issuer or comparable companies; and the existence of a shelf registration for restricted securities.
For each portfolio security that has been fair valued pursuant to the policies adopted by the Board of Directors, the fair value price is compared against the last available and next avail-able market quotations. The Valuation Committee reviews the results of such back testing monthly and fair valuation occurrences are reported to the Board of Directors quarterly.
The Fund uses valuation techniques to measure fair value that are consistent with the market approach and/or income approach, depending on the type of security and the particular circumstance. The market approach uses prices and other relevant information generated by market transactions involving identical or comparable securities. The income approach uses valuation techniques to discount estimated future cash flows to present value.
GAAP establishes a disclosure hierarchy that categorizes the inputs to valuation techniques used to value assets and liabilities at measurement date. These inputs are summarized in the three broad levels listed below:
| • | | Level 1 — quoted prices in active markets for identical investments |
| • | | Level 2 — other significant observable inputs (including quoted prices for similar investments, interest rates, prepayment speeds, credit risk, etc.) |
| • | | Level 3 — significant unobservable inputs (including the Fund’s own assumptions in determining the fair value of investments) |
The inputs or methodologies used to value securities are not necessarily an indication of the risk associated with investing in those securities.
| | |
| Western Asset Core Plus Bond Fund 2018 Annual Report | | 87 |
Notes to financial statements (cont’d)
The following is a summary of the inputs used in valuing the Fund’s assets and liabilities carried at fair value:
| | | | | | | | | | | | | | | | |
| ASSETS | |
| Description | | Quoted Prices
(Level 1) | | | Other Significant
Observable Inputs
(Level 2) | | | Significant
Unobservable
Inputs
(Level 3) | | | Total | |
| Long-term investments†: | | | | | | | | | | | | | | | | |
Corporate bonds & notes: | | | | | | | | | | | | | | | | |
Financials | | | — | | | $ | 2,517,824,479 | | | $ | 72,030,115 | | | $ | 2,589,854,594 | |
Industrials | | | — | | | | 375,692,363 | | | | 6,852,247 | | | | 382,544,610 | |
Other corporate bonds & notes | | | — | | | | 4,114,755,151 | | | | — | | | | 4,114,755,151 | |
Mortgage-backed securities | | | — | | | | 6,186,755,412 | | | | 67,467,802 | | | | 6,254,223,214 | |
U.S. government & agency obligations | | | — | | | | 4,326,141,059 | | | | — | | | | 4,326,141,059 | |
Collateralized mortgage obligations | | | — | | | | 2,756,119,565 | | | | 2,318,218 | | | | 2,758,437,783 | |
Sovereign bonds | | | — | | | | 1,508,759,652 | | | | — | | | | 1,508,759,652 | |
Asset-backed securities | | | — | | | | 848,601,768 | | | | 2,134,056 | | | | 850,735,824 | |
Senior loans: | | | | | | | | | | | | | | | | |
Communication services | | | — | | | | 82,764,164 | | | | 7,309,175 | | | | 90,073,339 | |
Consumer discretionary | | | — | | | | 154,659,840 | | | | 3,726,563 | | | | 158,386,403 | |
Industrials | | | — | | | | 60,723,220 | | | | 9,117,459 | | | | 69,840,679 | |
Other senior loans | | | — | | | | 222,607,276 | | | | — | | | | 222,607,276 | |
U.S. Treasury inflation protected securities | | | — | | | | 394,731,281 | | | | — | | | | 394,731,281 | |
Non-U.S. Treasury inflation protected securities | | | — | | | | 88,962,644 | | | | — | | | | 88,962,644 | |
Purchased options: | | | | | | | | | | | | | | | | |
Exchange-traded purchased options | | $ | 1,445,399 | | | | — | | | | — | | | | 1,445,399 | |
OTC purchased options | | | — | | | | 26,355,467 | | | | — | | | | 26,355,467 | |
Preferred stocks | | | 12,610,183 | | | | — | | | | — | | | | 12,610,183 | |
| Total long-term investments | | | 14,055,582 | | | | 23,665,453,341 | | | | 170,955,635 | | | | 23,850,464,558 | |
| Short-term investments†: | | | | | | | | | | | | | | | | |
Commercial paper | | | — | | | | 1,150,460,858 | | | | — | | | | 1,150,460,858 | |
Certificates of deposit | | | — | | | | 109,118,415 | | | | — | | | | 109,118,415 | |
Sovereign bonds | | | — | | | | 4,229,389 | | | | — | | | | 4,229,389 | |
Money market funds | | | — | | | | 845,554,311 | | | | — | | | | 845,554,311 | |
| Total short-term investments | | | — | | | | 2,109,362,973 | | | | — | | | | 2,109,362,973 | |
| Total investments | | $ | 14,055,582 | | | $ | 25,774,816,314 | | | $ | 170,955,635 | | | $ | 25,959,827,531 | |
| Other financial instruments: | | | | | | | | | | | | | | | | |
Futures contracts | | $ | 302,671,328 | | | | — | | | | — | | | $ | 302,671,328 | |
Forward foreign currency contracts | | | — | | | $ | 62,191,202 | | | | — | | | | 62,191,202 | |
OTC credit default swaps on corporate issues — sell protection‡ | | | — | | | | 92,668 | | | | — | | | | 92,668 | |
Centrally cleared interest rate swaps | | | — | | | | 54,881,833 | | | | — | | | | 54,881,833 | |
Centrally cleared credit default swaps on credit indices — buy protection | | | — | | | | 4,714,337 | | | | — | | | | 4,714,337 | |
| | |
| 88 | | Western Asset Core Plus Bond Fund 2018 Annual Report |
| | | | | | | | | | | | | | | | |
| ASSETS | |
| Description | | Quoted Prices
(Level 1) | | | Other Significant
Observable Inputs
(Level 2) | | | Significant
Unobservable
Inputs
(Level 3) | | | Total | |
OTC interest rate swaps‡ | | | — | | | $ | 22,508,692 | | | | — | | | $ | 22,508,692 | |
| Total other financial instruments | | $ | 302,671,328 | | | $ | 144,388,732 | | | | — | | | $ | 447,060,060 | |
| Total | | $ | 316,726,910 | | | $ | 25,915,235,675 | | | $ | 174,925,006 | | | $ | 26,406,887,591 | |
|
| LIABILITIES | |
| Description | | Quoted Prices
(Level 1) | | | Other Significant
Observable Inputs
(Level 2) | | | Significant
Unobservable
Inputs
(Level 3) | | | Total | |
| Other financial instruments: | | | | | | | | | | | | | | | | |
Written options: | | | | | | | | | | | | | | | | |
Exchange-traded written options | | $ | 24,751,749 | | | | — | | | | — | | | $ | 24,751,749 | |
OTC written options | | | — | | | $ | 2,031,280 | | | | — | | | | 2,031,280 | |
Futures contracts | | | 216,687,463 | | | | — | | | | — | | | | 216,687,463 | |
Forward foreign currency contracts | | | — | | | | 90,690,993 | | | | — | | | | 90,690,993 | |
Centrally cleared interest rate swaps | | | — | | | | 120,871,079 | | | | — | | | | 120,871,079 | |
Centrally cleared credit default swaps on credit indices — sell protection | | | — | | | | 31,473,861 | | | | — | | | | 31,473,861 | |
| Total | | $ | 241,439,212 | | | $ | 245,067,213 | | | | — | | | $ | 486,506,425 | |
| † | See Schedule of Investments for additional detailed categorizations. |
| ‡ | Value includes any premium paid or received with respect to swap contracts. |
(b) Purchased options. When the Fund purchases an option, an amount equal to thepremium paid by the Fund is recorded as an investment on the Statement of Assets and Liabilities, the value of which ismarked-to-market to reflect the current market value of the option purchased. If the purchased option expires, the Fund realizes a loss equal to the amount of premium paid. When an instrument is purchased or sold through the exercise of an option, the related premium paid is added to the basis of the instrument acquired or deducted from the proceeds of the instrument sold. The risk associated with purchasing put and call options is limited to the premium paid.
(c) Written options. When the Fund writes an option, an amount equal to the premiumreceived by the Fund is recorded as a liability, the value of which ismarked-to-market daily to reflect the current market value of the option written. If the option expires, the premium received is recorded as a realized gain. When a written call option is exercised, the difference between the premium received plus the option exercise price and the Fund’s basis in the underlying security (in the case of a covered written call option), or the cost to purchase the underlying security (in the case of an uncovered written call option), including brokerage commission, is recognized as a realized gain or loss. When a written put option is exercised, the amount of the premium received is subtracted from the cost of the security purchased by the Fund from the exercise of the written put option to form the Fund’s basis in the underlying security purchased. The writer or buyer of an option traded on an
| | |
| Western Asset Core Plus Bond Fund 2018 Annual Report | | 89 |
Notes to financial statements (cont’d)
exchange can liquidate the position before the exercise of the option by entering into a closing transaction. The cost of a closing transaction is deducted from the original premium received resulting in a realized gain or loss to the Fund.
The risk in writing a covered call option is that the Fund may forego the opportunity of profit if the market price of the underlying security increases and the option is exercised. The risk in writing a put option is that the Fund may incur a loss if the market price of the underlying security decreases and the option is exercised. The risk in writing an uncovered call option is that the Fund is exposed to the risk of loss if the market price of the underlying security increases. In addition, there is the risk that the Fund may not be able to enter into a closing transaction because of an illiquid secondary market.
(d) Options on futures contracts. An option on a futures contract gives the purchaser theright, in return for the premium paid, to assume a position in the underlying futures contract at the specified option exercise price at any time prior to the expiration date of the option.Upon exercise of an option, the delivery of the futures position by the writer of the option to the holder of the option will be accompanied by delivery of the accumulated balance in the writer’s futures margin account that represents the amount by which the market price of the futures contract exceeds (in the case of a call) or is less than (in the case of a put) the exercise price of the option on the futures contract. The potential for loss related to the purchase of an option on a futures contract is limited to the premium paid for the option plus transaction costs. Because the value of the option is fixed at the point of purchase, there are no daily cash payments by the purchaser to reflect changes in the value of the underlying contract; however, the value of the option changes daily and that change would be reflected in the net asset value of the Fund. The potential for loss related to writing call options is unlimited. The potential for loss related to writing put options is limited only by the aggregate strike price of the put option less the premium received.
(e) Futures contracts. The Fund uses futures contracts generally to gain exposure to, orhedge against, changes in interest rates or gain exposure to, or hedge against, changes in certain asset classes. A futures contract represents a commitment for the future purchase or sale of an asset at a specified price on a specified date.
Upon entering into a futures contract, the Fund is required to deposit cash or cash equivalents with a broker in an amount equal to a certain percentage of the contract amount. This is known as the ‘‘initial margin’’ and subsequent payments (‘‘variation margin’’) are made or received by the Fund each day, depending on the daily fluctuation in the value of the contract. For certain futures, including foreign denominated futures, variation margin is not settled daily, but is recorded as a net variation margin payable or receivable. The daily changes in contract value are recorded as unrealized gains or losses in the Statement of Operations and the Fund recognizes a realized gain or loss when the contract is closed.
Futures contracts involve, to varying degrees, risk of loss in excess of the amounts reflected in the financial statements. In addition, there is the risk that the Fund may not be able to enter into a closing transaction because of an illiquid secondary market.
| | |
| 90 | | Western Asset Core Plus Bond Fund 2018 Annual Report |
(f) Forward foreign currency contracts. The Fund enters into a forward foreign currencycontract to hedge against foreign currency exchange rate risk on itsnon-U.S. dollar denominated securities or to facilitate settlement of a foreign currency denominated portfolio transaction. A forward foreign currency contract is an agreement between two parties to buy and sell a currency at a set price with delivery and settlement at a future date. The contract ismarked-to-market daily and the change in value is recorded by the Fund as an unrealized gain or loss. When a forward foreign currency contract is closed, through either delivery or offset by entering into another forward foreign currency contract, the Fund recognizes a realized gain or loss equal to the difference between the value of the contract at the time it was opened and the value of the contract at the time it is closed.
Non-deliverable forward foreign currency exchange contracts are settled with the counterparty in cash without the delivery of foreign currency.
Forward foreign currency contracts involve elements of market risk in excess of the amounts reflected on the Statement of Assets and Liabilities. The Fund bears the risk of an unfavorable change in the foreign exchange rate underlying the forward foreign currency contract. Risks may also arise upon entering into these contracts from the potential inability of the counterparties to meet the terms of their contracts.
(g) Swap agreements. The Fund invests in swaps for the purpose of managing its exposure to interest rate, credit or market risk, or for other purposes. The use of swaps involves risks that are different from those associated with other portfolio transactions. Swap agreements are privately negotiated in theover-the-counter market and may be entered into as a bilateral contract (“OTC Swaps”) or centrally cleared (“Centrally Cleared Swaps”). Unlike Centrally Cleared Swaps, the Fund has credit exposure to the counterparties of OTC Swaps.
In a Centrally Cleared Swap, immediately following execution of the swap, the swap agreement is submitted to a clearinghouse or central counterparty (the “CCP”) and the CCP becomes the ultimate counterparty of the swap agreement. The Fund is required to interface with the CCP through a broker, acting in an agency capacity. All payments are settled with the CCP through the broker. Upon entering into a Centrally Cleared Swap, the Fund is required to deposit initial margin with the broker in the form of cash or securities.
Swap contracts aremarked-to-market daily and changes in value are recorded as unrealized appreciation (depreciation). The daily change in valuation of Centrally Cleared Swaps, if any, is recorded as a receivable or payable for variation margin on the Statement of Assets and Liabilities. Gains or losses are realized upon termination of the swap agreement. Collateral, in the form of restricted cash or securities, may be required to be held in segregated accounts with the Fund’s custodian in compliance with the terms of the swap contracts. Securities posted as collateral for swap contracts are identified in the Schedule of Investments and restricted cash, if any, is identified on the Statement of Assets and Liabilities. Risks may exceed amounts recorded in the Statement of Assets and Liabilities. These risks include changes in the returns of the underlying instruments, failure of the counterparties to perform under the contracts’ terms, and the possible lack of liquidity with respect to the swap agreements.
| | |
| Western Asset Core Plus Bond Fund 2018 Annual Report | | 91 |
Notes to financial statements (cont’d)
OTC swap payments received or made at the beginning of the measurement period are reflected as a premium or deposit, respectively, on the Statement of Assets and Liabilities. These upfront payments are amortized over the life of the swap and are recognized as realized gain or loss in the Statement of Operations. Net periodic payments received or paid by the Fund are recognized as a realized gain or loss in the Statement of Operations.
The Fund’s maximum exposure in the event of a defined credit event on a credit default swap to sell protection is the notional amount. As of December 31, 2018, the total notional value of all credit default swaps to sell protection was $4,293,176,876. This amount would be offset by the value of the swap’s reference entity, upfront premiums received on the swap and any amounts received from the settlement of a credit default swap where the Fund bought protection for the same referenced security/entity.
For average notional amounts of swaps held during the year ended December 31, 2018, see Note 4.
Credit default swaps
The Fund enters into credit default swap (“CDS”) contracts for investment purposes, to manage its credit risk or to add leverage. CDS agreements involve one party making a stream of payments to another party in exchange for the right to receive a specified return in the event of a default by a third party, typically corporate or sovereign issuers, on a specified obligation, or in the event of a write-down, principal shortfall, interest shortfall or default of all or part of the referenced entities comprising a credit index. The Fund may use a CDS to provide protection against defaults of the issuers (i.e., to reduce risk where the Fund has exposure to an issuer) or to take an active long or short position with respect to the likelihood of a particular issuer’s default. As a seller of protection, the Fund generally receives an upfront payment or a stream of payments throughout the term of the swap provided that there is no credit event. If the Fund is a seller of protection and a credit event occurs, as defined under the terms of that particular swap agreement, the maximum potential amount of future payments (undiscounted) that the Fund could be required to make under a credit default swap agreement would be an amount equal to the notional amount of the agreement. These amounts of potential payments will be partially offset by any recovery of values from the respective referenced obligations. As a seller of protection, the Fund effectively adds leverage to its portfolio because, in addition to its total net assets, the Fund is subject to investment exposure on the notional amount of the swap. As a buyer of protection, the Fund generally receives an amount up to the notional value of the swap if a credit event occurs.
Implied spreads are the theoretical prices a lender receives for credit default protection. When spreads rise, market perceived credit risk rises and when spreads fall, market perceived credit risk falls. The implied credit spread of a particular referenced entity reflects the cost of buying/selling protection and may include upfront payments required to enter into the agreement. Wider credit spreads and decreasing market values, when compared to the notional amount of the swap, represent a deterioration of the referenced entity’s credit soundness and a greater likelihood or risk of default or other credit event occurring as defined under the terms of the agreement. Credit spreads utilized in determining the period
| | |
| 92 | | Western Asset Core Plus Bond Fund 2018 Annual Report |
end market value of credit default swap agreements on corporate or sovereign issues are disclosed in the Schedule of Investments and serve as an indicator of the current status of the payment/performance risk and represent the likelihood or risk of default for credit derivatives. For credit default swap agreements on asset-backed securities and credit indices, the quoted market prices and resulting values, particularly in relation to the notional amount of the contract as well as the annual payment rate, serve as an indication of the current status of the payment/performance risk.
The Fund’s maximum risk of loss from counterparty risk, as the protection buyer, is the fair value of the contract (this risk is mitigated by the posting of collateral by the counterparty to the Fund to cover the Fund’s exposure to the counterparty). As the protection seller, the Fund’s maximum risk is the notional amount of the contract. Credit default swaps are considered to have credit risk-related contingent features since they require payment by the protection seller to the protection buyer upon the occurrence of a defined credit event.
Entering into a CDS agreement involves, to varying degrees, elements of credit, market and documentation risk in excess of the related amounts recognized on the Statement of Assets and Liabilities. Such risks involve the possibility that there will be no liquid market for these agreements, that the counterparty to the agreement may default on its obligation to perform or disagree as to the meaning of the contractual terms in the agreement, and that there will be unfavorable changes in net interest rates.
Interest rate swaps
The Fund enters into interest rate swap contracts to manage its exposure to interest rate risk. Interest rate swaps are agreements between two parties to exchange cash flows based on a notional principal amount. The Fund may elect to pay a fixed rate and receive a floating rate, receive a fixed rate and pay a floating rate, or receive and pay a floating rate, on a notional principal amount. Interest rate swaps aremarked-to-market daily based upon quotations from market makers and the change, if any, is recorded as an unrealized gain or loss in the Statement of Operations. When a swap contract is terminated early, the Fund records a realized gain or loss equal to the difference between the original cost and the settlement amount of the closing transaction.
The risks of interest rate swaps include changes in market conditions that will affect the value of the contract or changes in the present value of the future cash flow streams and the possible inability of the counterparty to fulfill its obligations under the agreement. The Fund’s maximum risk of loss from counterparty credit risk is the discounted net value of the cash flows to be received from the counterparty over the contract’s remaining life, to the extent that amount is positive. This risk is mitigated by the posting of collateral by the counterparty to the Fund to cover the Fund’s exposure to the counterparty.
Total return swaps
The Fund enters into total return swaps for investment purposes. Total return swaps are agreements to exchange the return generated by one instrument for the return generated by another instrument. For example, the agreement to pay a predetermined or fixed interest
| | |
| Western Asset Core Plus Bond Fund 2018 Annual Report | | 93 |
Notes to financial statements (cont’d)
rate in exchange for a market-linked return based on a notional amount. To the extent the total return of a referenced index or instrument exceeds the offsetting interest obligation, the Fund will receive a payment from the counterparty. To the extent it is less, the Fund will make a payment to the counterparty.
(h) Swaptions. The Fund may purchase or write swaption contracts to manage exposureto fluctuations in interest rates or to enhance yield. The Fund may also purchase and write swaption contracts to manage exposure to an underlying instrument. Swaption contracts written by the Fund represent an option that gives the purchaser the right, but not the obligation, to enter into a previously agreed upon swap contract at a future date. Swaption contracts purchased by the Fund represent an option that gives the Fund the right, but not the obligation, to enter into a previously agreed upon swap contract at a future date.
When the Fund writes a swaption, an amount equal to the premium received by the Fund is recorded as a liability, the value of which ismarked-to-market daily to reflect the current market value of the swaption written. If the swaption expires, the Fund realizes a gain equal to the amount of the premium received.
When the Fund purchases a swaption, an amount equal to the premium paid by the Fund is recorded as an investment on the Statement of Assets and Liabilities, the value of which ismarked-to-market daily to reflect the current market value of the swaption purchased. If the swaption expires, the Fund realizes a loss equal to the amount of the premium paid.
Swaptions aremarked-to-market daily based upon quotations from market makers. Changes in the value of the swaption are reported as unrealized gains or losses in the Statement of Operations.
(i) Loan participations. The Fund may invest in loans arranged through private negotiation between one or more financial institutions. The Fund’s investment in any such loan may be in the form of a participation in or an assignment of the loan. In connection with purchasing participations, the Fund generally will have no right to enforce compliance by the borrower with the terms of the loan agreement related to the loan, or any rights ofoff-set against the borrower and the Fund may not benefit directly from any collateral supporting the loan in which it has purchased the participation.
The Fund assumes the credit risk of the borrower, the lender that is selling the participation and any other persons interpositioned between the Fund and the borrower. In the event of the insolvency of the lender selling the participation, the Fund may be treated as a general creditor of the lender and may not benefit from anyoff-set between the lender and the borrower.
(j) Unfunded loan commitments. The Fund may enter into certain credit agreementswhere all or a portion of which may be unfunded. The Fund is obligated to fund these commitments at the borrower’s discretion. The commitments are disclosed in the accompanying Schedule of Investments. At December 31, 2018, the Fund had sufficient cash and/or securities to cover these commitments.
| | |
| 94 | | Western Asset Core Plus Bond Fund 2018 Annual Report |
(k) Stripped securities. The Fund may invest in ‘‘Stripped Securities,’’ a term used collectively for components, or strips, of fixed income securities. Stripped Securities can be principal only securities (“PO”), which are debt obligations that have been stripped of unmatured interest coupons, or interest only securities (“IO”), which are unmatured interest coupons that have been stripped from debt obligations. The market value of Stripped Securities will fluctuate in response to changes in economic conditions, rates of prepayment, interest rates and the market’s perception of the securities. However, fluctuations in response to interest rates may be greater in Stripped Securities than for debt obligations of comparable maturities that pay interest currently. The amount of fluctuation may increase with a longer period of maturity.
The yield to maturity on IO’s is sensitive to the rate of principal repayments (including prepayments) on the related underlying debt obligation and principal payments may have a material effect on yield to maturity. If the underlying debt obligation experiences greater than anticipated prepayments of principal, the Fund may not fully recoup its initial investment in IO’s.
(l) Securities traded on a to-be-announced basis. The Fund may trade securities on a to-be-announced (“TBA”) basis. In a TBA transaction, the Fund commits to purchasing or selling securities which have not yet been issued by the issuer and for which specific information, such as the face amount, maturity date and underlying pool of investments in U.S. government agency mortgage pass-through securities, is not announced. Securities purchased on a TBA basis are not settled until they are delivered to the Fund. Beginning on the date the Fund enters into a TBA transaction, cash, U.S. government securities or other liquid high-grade debt obligations are segregated in an amount equal in value to the purchase price of the TBA security. These securities are subject to market fluctuations and their current value is determined in the same manner as for other securities. At December 31, 2018, the Fund held non-cash collateral for TBA securities from Bank of America N.A., Goldman Sachs Group Inc., Morgan Stanley & Co. Inc. and Nomura in the amount $432,190, $45,419, $2,446,560 and $43,909, respectively.
(m) Mortgage dollar rolls. The Fund may enter into mortgage dollar rolls in which theFund sells mortgage-backed securities for delivery in the current month, realizing a gain or loss, and simultaneously contracts to repurchase substantially similar (same type, coupon and maturity) securities to settle on a specified future date.
The Fund executes its mortgage dollar rolls entirely in the TBA market, whereby the Fund makes a forward commitment to purchase a security and, instead of accepting delivery, the position is offset by a sale of the security with a simultaneous agreement to repurchase at a future date. The Fund accounts for mortgage dollar rolls as purchases and sales.
The risk of entering into mortgage dollar rolls is that the market value of the securities the Fund is obligated to repurchase under the agreement may decline below the repurchase price. In the event the buyer of securities under a mortgage dollar roll files for bankruptcy or becomes insolvent, the Fund’s use of the proceeds of the mortgage dollar roll may be restricted pending a determination by the counterparty, or its trustee or receiver, whether to enforce the Fund’s obligation to repurchase the securities.
| | |
| Western Asset Core Plus Bond Fund 2018 Annual Report | | 95 |
Notes to financial statements (cont’d)
(n) Inflation-indexed bonds. Inflation-indexed bonds are fixed-income securities whoseprincipal value or interest rate is periodically adjusted according to the rate of inflation. As the index measuring inflation changes, the principal value or interest rate of inflation-indexed bonds will be adjusted accordingly. Inflation adjustments to the principal amount of inflation-indexed bonds are reflected as an increase or decrease to investment income on the Statement of Operations. Repayment of the original bond principal upon maturity (as adjusted for inflation) is guaranteed in the case of U.S. Treasury inflation-indexed bonds. For bonds that do not provide a similar guarantee, the adjusted principal value of the bond repaid at maturity may be less than the original principal.
(o) Foreign currency translation. Investment securities and other assets and liabilitiesdenominated in foreign currencies are translated into U.S. dollar amounts based upon prevailing exchange rates on the date of valuation. Purchases and sales of investment securities and income and expense items denominated in foreign currencies are translated into U.S. dollar amounts based upon prevailing exchange rates on the respective dates of such transactions.
The Fund does not isolate that portion of the results of operations resulting from fluctuations in foreign exchange rates on investments from the fluctuations arising from changes in market prices of securities held. Such fluctuations are included with the net realized and unrealized gain or loss on investments.
Net realized foreign exchange gains or losses arise from sales of foreign currencies, including gains and losses on forward foreign currency contracts, currency gains or losses realized between the trade and settlement dates on securities transactions, and the difference between the amounts of dividends, interest, and foreign withholding taxes recorded on the Fund’s books and the U.S. dollar equivalent of the amounts actually received or paid. Net unrealized foreign exchange gains and losses arise from changes in the values of assets and liabilities, other than investments in securities, on the date of valuation, resulting from changes in exchange rates.
Foreign security and currency transactions may involve certain considerations and risks not typically associated with those of U.S. dollar denominated transactions as a result of, among other factors, the possibility of lower levels of governmental supervision and regulation of foreign securities markets and the possibility of political or economic instability.
(p) Credit and market risk. The Fund invests in high-yield and emerging market instruments that are subject to certain credit and market risks. The yields of high-yield and emerging market debt obligations reflect, among other things, perceived credit and market risks. The Fund’s investments in securities rated below investment grade typically involve risks not associated with higher rated securities including, among others, greater risk related to timely and ultimate payment of interest and principal, greater market price volatility and less liquid secondary market trading. The consequences of political, social, economic or diplomatic changes may have disruptive effects on the market prices of investments held by the Fund. The Fund’s investments innon-U.S. dollar denominated securities may also result in foreign currency losses caused by devaluations and exchange rate fluctuations.
| | |
| 96 | | Western Asset Core Plus Bond Fund 2018 Annual Report |
Investments in securities that are collateralized by real estate mortgages are subject to certain credit and liquidity risks. When market conditions result in an increase in default rates of the underlying mortgages and the foreclosure values of underlying real estate properties are materially below the outstanding amount of these underlying mortgages, collection of the full amount of accrued interest and principal on these investments may be doubtful. Such market conditions may significantly impair the value and liquidity of these investments and may result in a lack of correlation between their credit ratings and values.
(q) Foreign investment risks. The Fund’s investments in foreign securities may involverisks not present in domestic investments. Since securities may be denominated in foreign currencies, may require settlement in foreign currencies or pay interest or dividends in foreign currencies, changes in the relationship of these foreign currencies to the U.S. dollar can significantly affect the value of the investments and earnings of the Fund. Foreign investments may also subject the Fund to foreign government exchange restrictions, expropriation, taxation or other political, social or economic developments, all of which affect the market and/or credit risk of the investments.
(r) Counterparty risk and credit-risk-related contingent features of derivative instruments. The Fund may invest in certain securities or engage in other transactions,where the Fund is exposed to counterparty credit risk in addition to broader market risks. The Fund may invest in securities of issuers, which may also be considered counterparties as trading partners in other transactions. This may increase the risk of loss in the event of default or bankruptcy by the counterparty or if the counterparty otherwise fails to meet its contractual obligations. The Fund’s subadviser attempts to mitigate counterparty risk by (i) periodically assessing the creditworthiness of its trading partners, (ii) monitoring and/or limiting the amount of its net exposure to each individual counterparty based on its assessment and (iii) requiring collateral from the counterparty for certain transactions. Market events and changes in overall economic conditions may impact the assessment of such counterparty risk by the subadviser. In addition, declines in the values of underlying collateral received may expose the Fund to increased risk of loss.
With exchange traded and centrally cleared derivatives, there is less counterparty risk to the Fund since the exchange or clearinghouse, as counterparty to such instruments, guarantees against a possible default. The clearinghouse stands between the buyer and the seller of the contract; therefore, the credit risk is limited to failure of the clearinghouse. While offset rights may exist under applicable law, the Fund does not have a contractual right of offset against a clearing broker or clearinghouse in the event of a default of the clearing broker or clearinghouse.
The Fund has entered into master agreements, such as an International Swaps and Derivatives Association, Inc. Master Agreement (“ISDA Master Agreement”) or similar agreement, with certain of its derivative counterparties that governover-the-counter derivatives and provide for general obligations, representations, agreements, collateral posting terms, netting provisions in the event of default or termination and credit related contingent features. The credit related contingent features include, but are not limited to, a
| | |
| Western Asset Core Plus Bond Fund 2018 Annual Report | | 97 |
Notes to financial statements (cont’d)
percentage decrease in the Fund’s net assets or NAV over a specified period of time. If these credit related contingent features were triggered, the derivatives counterparty could terminate the positions and demand payment or require additional collateral.
Under an ISDA Master Agreement, the Fund may, under certain circumstances, offset with the counterparty certain derivative financial instruments’ payables and/or receivables with collateral held and/or posted and create one single net payment. However, absent an event of default by the counterparty or a termination of the agreement, the terms of the ISDA Master Agreements do not result in an offset of reported amounts of financial assets and financial liabilities in the Statement of Assets and Liabilities across transactions between the Fund and the applicable counterparty. The enforceability of the right to offset may vary by jurisdiction.
Collateral requirements differ by type of derivative. Collateral or margin requirements are set by the broker or exchange clearinghouse for exchange traded derivatives while collateral terms are contract specific for over-the-counter traded derivatives. Cash collateral that has been pledged to cover obligations of the Fund under derivative contracts, if any, will be reported separately in the Statement of Assets and Liabilities. Securities pledged as collateral, if any, for the same purpose are noted in the Schedule of Investments.
As of December 31, 2018, the Fund held OTC written options and forward foreign currency contracts with credit related contingent features which had a liability position of $92,722,273. If a contingent feature in the master agreements would have been triggered, the Fund would have been required to pay this amount to its derivatives counterparties. As of December 31, 2018, the Fund had posted with its counterparties cash and/or securities as collateral to cover the net liability of these derivatives amounting to $12,440,000, which could be used to reduce the required payment.
At December 31, 2018, the Fund held collateral from Barclays Bank PLC, Citibank N.A. and Goldman Sachs Group Inc. in the amount of $6,228,369, $42,850,636 and $531,475, respectively. These amounts could be used to reduce the Fund’s exposure to the counterparty in the event of default.
(s) Security transactions and investment income. Security transactions are accountedfor on a trade date basis. Interest income (including interest income frompayment-in-kind securities), adjusted for amortization of premium and accretion of discount, is recorded on the accrual basis. Paydown gains and losses on mortgage- and asset-backed securities are recorded as adjustments to interest income. Dividend income is recorded on theex-dividend date for dividends received in cash and/or securities. Foreign dividend income is recorded on theex-dividend date or as soon as practicable after the Fund determines the existence of a dividend declaration after exercising reasonable due diligence. The cost of investments sold is determined by use of the specific identification method. To the extent any issuer defaults or a credit event occurs that impacts the issuer, the Fund may halt any additional interest income accruals and consider the realizability of interest accrued up to the date of default or credit event.
| | |
| 98 | | Western Asset Core Plus Bond Fund 2018 Annual Report |
(t) Distributions to shareholders. Distributions from net investment income of the Fundare declared each business day to shareholders of record and are paid monthly. Distributions of net realized gains, if any, are declared at least annually. Distributions to shareholders of the Fund are recorded on theex-dividend date and are determined in accordance with income tax regulations, which may differ from GAAP.
(u) Share class accounting. Investment income, common expenses and realized/unrealized gains (losses) on investments are allocated to the various classes of the Fund on the basis of daily net assets of each class. Fees relating to a specific class are charged directly to that share class.
(v) Compensating balance arrangements. The Fund has an arrangement with its custodian bank whereby a portion of the custodian’s fees is paid indirectly by credits earned on the Fund’s cash on deposit with the bank.
(w) Federal and other taxes. It is the Fund’s policy to comply with the federal income and excise tax requirements of the Internal Revenue Code of 1986 (the “Code”), as amended, applicable to regulated investment companies. Accordingly, the Fund intends to distribute its taxable income and net realized gains, if any, to shareholders in accordance with timing requirements imposed by the Code. Therefore, no federal or state income tax provision is required in the Fund’s financial statements.
Management has analyzed the Fund’s tax positions taken on income tax returns for all open tax years and has concluded that as of December 31, 2018, no provision for income tax is required in the Fund’s financial statements. The Fund’s federal and state income and federal excise tax returns for tax years for which the applicable statutes of limitations have not expired are subject to examination by the Internal Revenue Service and state departments of revenue.
(x) Reclassification. GAAP requires that certain components of net assets be reclassified to reflect permanent differences between financial and tax reporting. These reclassifications have no effect on net assets or net asset value per share. During the current year, the Fund had no reclassifications.
2. Investment management agreement and other transactions with affiliates
Legg Mason Partners Fund Advisor, LLC (“LMPFA”) is the Fund’s investment manager. Western Asset Management Company, LLC (formerly Western Asset Management Company) (“Western Asset”), Western Asset Management Company Limited in London (“Western Asset London”), Western Asset Management Company Pte. Ltd. in Singapore (“Western Asset Singapore”) and Western Asset Management Company Ltd in Japan (“Western Asset Japan”) are the Fund’s subadvisers. LMPFA, Western Asset, Western Asset London, Western Asset Singapore and Western Asset Japan are wholly-owned subsidiaries of Legg Mason, Inc. (“Legg Mason”).
LMPFA provides the Fund with management and administrative services for which the Fund pays a fee calculated daily and paid monthly, at an annual rate of 0.450% of the Fund’s
| | |
| Western Asset Core Plus Bond Fund 2018 Annual Report | | 99 |
Notes to financial statements (cont’d)
average daily net assets up to $500 million, 0.425% of the average daily net assets of the next $500 million and 0.400% of the Fund’s average daily net assets in excess of $1 billion. For their services, LMPFA pays Western Asset, Western Asset London, Western Asset Singapore and Western Asset Japan monthly all of the management fee that it receives from the Fund.
LMPFA has agreed to waive fees and/or reimburse operating expenses, other than interest, brokerage commissions, taxes, extraordinary expenses, deferred organizational expenses and acquired fund fees and expenses, so that the ratio of total annual fund operating expenses did not exceed 0.82%, 1.65%, 1.51%, 0.85%, 1.15%, 0.45% and 0.45% for Class A, Class C, Class C1, Class FI, Class R, Class I and Class IS shares, respectively. In addition, the ratio of total annual fund operating expenses for Class IS shares did not exceed the ratio of total annual fund operating expenses for Class I shares. These arrangements cannot be terminated prior to December 31, 2020 without the Board of Directors’ consent.
During the year ended December 31, 2018, fees waived and/or expenses reimbursed amounted to $10,902,563.
LMPFA is permitted to recapture amounts waived and/or reimbursed to a class within two years after the fiscal year in which LMPFA earned the fee or incurred the expense if the class’ total annual operating expenses have fallen to a level below the expense limitation (“expense cap”) in effect at the time the fees were earned or the expenses incurred. In no case will LMPFA recapture any amount that would result, on any particular business day of the Fund, in the class’ total annual operating expenses exceeding the expense cap or any other lower limit then in effect.
Pursuant to these arrangements, at December 31, 2018, the Fund had remaining fee waivers and/or expense reimbursements subject to recapture by LMPFA and respective dates of expiration as follows:
| | | | | | | | |
| | | Class A | | | Class I | |
| Expires December 31, 2019 | | $ | 240,090 | | | $ | 9,227,382 | |
| Expires December 31, 2020 | | | 171,998 | | | | 10,730,006 | |
| Total fee waivers/expense reimbursements subject to recapture | | $ | 412,088 | | | $ | 19,957,388 | |
For the year ended December 31, 2018, LMPFA did not recapture any fees.
Legg Mason Investor Services, LLC (‘‘LMIS’’), a wholly-owned broker-dealer subsidiary of Legg Mason, serves as the Fund’s sole and exclusive distributor.
There is a maximum initial sales charge of 4.25% for Class A shares. There is a contingent deferred sales charge (“CDSC”) of 1.00% on Class C and Class C1 shares which applies if redemption occurs within 12 months from purchase payment. In certain cases, Class A shares have a 1.00% CDSC, which applies if redemption occurs within 18 months from purchase payment. This CDSC only applies to those purchases of Class A shares, which, when combined with current holdings of other shares of funds sold by LMIS, equal or exceed $1,000,000 in the aggregate. These purchases do not incur an initial sales charge.
| | |
| 100 | | Western Asset Core Plus Bond Fund 2018 Annual Report |
For the year ended December 31, 2018, sales charges retained by and CDSCs paid to LMIS and its affiliates, if any, were as follows:
| | | | | | | | | | | | |
| | | Class A | | | Class C | | | Class C1 | |
| Sales charges | | $ | 183,010 | | | | — | | | | — | |
| CDSCs | | | 12,391 | | | $ | 50,248 | | | | — | |
All officers of the Corporation are employees of Legg Mason or its affiliates and do not receive compensation from the Corporation.
3. Investments
During the year ended December 31, 2018, the aggregate cost of purchases and proceeds from sales of investments (excluding short-term investments) and U.S. Government & Agency Obligations were as follows:
| | | | | | | | |
| | | Investments | | | U.S. Government &
Agency Obligations | |
| Purchases | | $ | 6,005,168,830 | | | $ | 61,052,275,971 | |
| Sales | | | 3,808,918,788 | | | | 60,312,890,130 | |
At December 31, 2018, the aggregate cost of investments and the aggregate gross unrealized appreciation and depreciation of investments for federal income tax purposes were as follows:
| | | | | | | | | | | | | | | | |
| | | Cost/Premiums Paid (Received) | | | Gross Unrealized
Appreciation | | | Gross Unrealized
Depreciation | | | Net Unrealized
Appreciation
(Depreciation) | |
| Securities | | $ | 26,579,305,313 | | | $ | 202,029,742 | | | $ | (821,507,524) | | | $ | (619,477,782) | |
| Swap contracts | | | 47,516,675 | | | | 81,672,369 | | | | (152,344,940) | | | | (70,672,571) | |
| Written options | | | (15,617,264) | | | | 3,410,047 | | | | (14,575,812) | | | | (11,165,765) | |
| Futures contracts | | | — | | | | 302,671,328 | | | | (216,687,463) | | | | 85,983,865 | |
| Forward foreign currency contracts | | | — | | | | 62,191,202 | | | | (90,690,993) | | | | (28,499,791) | |
4. Derivative instruments and hedging activities
Below is a table, grouped by derivative type, that provides information about the fair value and the location of derivatives within the Statement of Assets and Liabilities at December 31, 2018.
| | | | | | | | | | | | | | | | |
| ASSET DERIVATIVES1 | |
| | | Interest Rate
Risk | | | Foreign
Exchange Risk | | | Credit Risk | | | Total | |
| Purchased options2 | | $ | 944,374 | | | $ | 25,688,475 | | | $ | 1,168,017 | | | $ | 27,800,866 | |
| Futures contracts3 | | | 278,933,131 | | | | 23,738,197 | | | | — | | | | 302,671,328 | |
| OTC swap contracts4 | | | 22,508,692 | | | | — | | | | 92,668 | | | | 22,601,360 | |
| Centrally cleared swap contracts5 | | | 54,881,833 | | | | — | | | | 4,714,337 | | | | 59,596,170 | |
| Forward foreign currency contracts | | | — | | | | 62,191,202 | | | | — | | | | 62,191,202 | |
| Total | | $ | 357,268,030 | | | $ | 111,617,874 | | | $ | 5,975,022 | | | $ | 474,860,926 | |
| | |
| Western Asset Core Plus Bond Fund 2018 Annual Report | | 101 |
Notes to financial statements (cont’d)
| | | | | | | | | | | | | | | | |
| LIABILITY DERIVATIVES1 | |
| | | Interest Rate
Risk | | | Foreign
Exchange Risk | | | Credit Risk | | | Total | |
| Written options | | $ | 24,637,212 | | | $ | 1,245,819 | | | $ | 899,998 | | | $ | 26,783,029 | |
| Futures contracts3 | | | 202,368,701 | | | | 14,318,762 | | | | — | | | | 216,687,463 | |
| Centrally cleared swap contracts5 | | | 120,871,079 | | | | — | | | | 31,473,861 | | | | 152,344,940 | |
| Forward foreign currency contracts | | | — | | | | 90,690,993 | | | | — | | | | 90,690,993 | |
| Total | | $ | 347,876,992 | | | $ | 106,255,574 | | | $ | 32,373,859 | | | $ | 486,506,425 | |
| 1 | Generally, the balance sheet location for asset derivatives is receivables/net unrealized appreciation (depreciation) and for liability derivatives is payables/net unrealized appreciation (depreciation). |
| 2 | Market value of purchased options is reported in Investments in unaffiliated securities at value in the Statement of Assets and Liabilities. |
| 3 | Includes cumulative appreciation (depreciation) of futures contracts as reported in the Schedule of Investments. Only variation margin is reported within the receivables and/or payables on the Statement of Assets and Liabilities. |
| 4 | Values include premiums paid (received) on swap contracts which are shown separately in the Statement of Assets and Liabilities. |
| 5 | Includes cumulative appreciation (depreciation) of centrally cleared swap contracts as reported in the Schedule of Investments. Only variation margin is reported within the receivables and/or payables on the Statement of Assets and Liabilities. |
The following tables provide information about the effect of derivatives and hedging activities on the Fund’s Statement of Operations for the year ended December 31, 2018. The first table provides additional detail about the amounts and sources of gains (losses) realized on derivatives during the period. The second table provides additional information about the change in unrealized appreciation (depreciation) resulting from the Fund’s derivatives and hedging activities during the period.
| | | | | | | | | | | | | | | | |
| AMOUNT OF REALIZED GAIN (LOSS) ON DERIVATIVES RECOGNIZED | |
| | | Interest Rate Risk | | | Foreign
Exchange Risk | | | Credit Risk | | | Total | |
| Purchased options1 | | $ | (62,264,345) | | | $ | (37,895,893) | | | $ | (466,370) | | | $ | (100,626,608) | |
| Written options | | | 124,750,690 | | | | 18,207,657 | | | | 474,747 | | | | 143,433,094 | |
| Futures contracts | | | (182,444,270) | | | | (65,675,830) | | | | — | | | | (248,120,100) | |
| Swap contracts | | | 83,917,228 | | | | — | | | | 27,113,707 | | | | 111,030,935 | |
| Forward foreign currency contracts | | | — | | | | (23,066,230) | | | | — | | | | (23,066,230) | |
| Total | | $ | (36,040,697) | | | $ | (108,430,296) | | | $ | 27,122,084 | | | $ | (117,348,909) | |
| 1 | Net realized gain (loss) from purchased options is reported in net realized gain (loss) from investment transactions in the Statement of Operations. |
| | | | | | | | | | | | | | | | |
| CHANGE IN UNREALIZED APPRECIATION (DEPRECIATION) ON DERIVATIVES RECOGNIZED | |
| | | Interest Rate Risk | | | Foreign
Exchange Risk | | | Credit Risk | | | Total | |
| Purchased options1 | | $ | (4,236,131) | | | $ | 650,678 | | | $ | 50,412 | | | $ | (3,535,041) | |
| Written options | | | (13,285,411) | | | | 325,476 | | | | 196,908 | | | | (12,763,027) | |
| Futures contracts | | | 79,177,335 | | | | 14,200,157 | | | | — | | | | 93,377,492 | |
| Swap contracts | | | (40,422,572) | | | | — | | | | (37,845,845) | | | | (78,268,417) | |
| Forward foreign currency contracts | | | — | | | | (7,582,478) | | | | — | | | | (7,582,478) | |
| Total | | $ | 21,233,221 | | | $ | 7,593,833 | | | $ | (37,598,525) | | | $ | (8,771,471) | |
| 1 | The change in unrealized appreciation (depreciation) from purchased options is reported in the change in net unrealized appreciation (depreciation) from investments in unaffiliated securities in the Statement of Operations. |
| | |
| 102 | | Western Asset Core Plus Bond Fund 2018 Annual Report |
During the year ended December 31, 2018, the volume of derivative activity for the Fund was as follows:
| | | | |
| | | Average Market
Value | |
| Purchased options | | $ | 16,636,703 | |
| Written options | | | 14,265,694 | |
| Futures contracts (to buy) | | | 25,805,350,214 | |
| Futures contracts (to sell) | | | 12,229,853,720 | |
| Forward foreign currency contracts (to buy) | | | 1,800,073,947 | |
| Forward foreign currency contracts (to sell) | | | 2,229,048,612 | |
| |
| | | Average Notional
Balance | |
| Interest rate swap contracts | | $ | 7,497,250,790 | |
| Credit default swap contracts (to buy protection) | | | 321,726,923 | |
| Credit default swap contracts (to sell protection) | | | 2,828,670,452 | |
| Total return swap contracts† | | | 6,890,736 | |
| † | At December 31, 2018, there were no open positions held in this derivative. |
The following table presents the Fund’s OTC derivative assets and liabilities by counterparty net of amounts available for offset under an ISDA Master Agreement and net of the related collateral pledged (received) by the Fund as of December 31, 2018.
| | | | | | | | | | | | | | | | | | | | |
| Counterparty | | Gross Assets
Subject to Master
Agreements1 | | | Gross Liabilities
Subject to
Master
Agreements1 | | | Net Assets
(Liabilities)
Subject to
Master
Agreements | | | Collateral
Pledged
(Received)2, 3 | | | Net Amount4, 5 | |
| Bank of America N.A. | | $ | 1,026,272 | | | $ | (639,364) | | | $ | 386,908 | | | | — | | | $ | 386,908 | |
| Barclays Bank PLC | | | 17,403,413 | | | | (14,123,715) | | | | 3,279,698 | | | $ | (6,228,369) | | | | (2,948,671) | |
| BNP Paribas SA | | | 141,745 | | | | (260,634) | | | | (118,889) | | | | — | | | | (118,889) | |
| Citibank N.A. | | | 71,167,862 | | | | (49,821,702) | | | | 21,346,160 | | | | (42,850,636) | | | | (21,504,476) | |
| Deutsche Bank AG | | | — | | | | (5,900,492) | | | | (5,900,492) | | | | 5,690,000 | | | | (210,492) | |
| Goldman Sachs Group Inc. | | | 2,475,664 | | | | — | | | | 2,475,664 | | | | (531,475) | | | | 1,944,189 | |
| JPMorgan Chase & Co. | | | 18,933,073 | | | | (21,976,366) | | | | (3,043,293) | | | | 6,580,000 | | | | 3,536,707 | |
| Total | | $ | 111,148,029 | | | $ | (92,722,273) | | | $ | 18,425,756 | | | $ | (37,340,480) | | | $ | (18,914,724) | |
| 1 | Absent an event of default or early termination, derivative assets and liabilities are presented gross and not offset in the Statement of Assets and Liabilities. |
| 2 | Gross amounts are not offset in the Statement of Assets and Liabilities. |
| 3 | In some instances, the actual collateral received and/or pledged may be more than the amount shown here due to overcollateralization. |
| 4 | Net amount may also include forward foreign currency exchange contracts that are not required to be collateralized. |
| 5 | Represents the net amount receivable (payable) from (to) the counterparty in the event of default. |
5. Class specific expenses, waivers and/or expense reimbursements
The Fund has adopted a Rule12b-1 shareholder services and distribution plan and under that plan the Fund pays service and/or distribution fees with respect to its Class A, Class C,
| | |
| Western Asset Core Plus Bond Fund 2018 Annual Report | | 103 |
Notes to financial statements (cont’d)
Class C1, Class FI and Class R shares calculated at the annual rate of 0.25%, 1.00%, 0.70%, 0.25% and 0.50% of the average daily net assets of each class, respectively. Service and/or distribution fees are accrued daily and paid monthly.
For the year ended December 31, 2018, class specific expenses were as follows:
| | | | | | | | |
| | | Service and/or Distribution Fees | | | Transfer Agent
Fees | |
| Class A | | $ | 2,591,610 | † | | $ | 1,739,597 | |
| Class C | | | 2,170,476 | † | | | 216,647 | |
| Class C1 | | | 124,613 | † | | | 13,114 | |
| Class FI | | | 1,062,780 | † | | | 692,866 | |
| Class R | | | 1,153,473 | | | | 474,468 | |
| Class I | | | — | | | | 15,564,657 | |
| Class IS | | | — | | | | 87,279 | |
| Total | | $ | 7,102,952 | | | $ | 18,788,628 | |
| † | Amounts shown are exclusive of expense reimbursements. For the year ended December 31, 2018, the service and/or distribution fees reimbursed amounted to $203, $309, $2, and $45 for Class A, Class C, Class C1 and Class FI shares, respectively. |
For the year ended December 31, 2018, waivers and/or expense reimbursements by class were as follows:
| | | | |
| | | Waivers/Expense
Reimbursements | |
| Class A | | $ | 172,201 | |
| Class C | | | 309 | |
| Class C1 | | | 2 | |
| Class FI | | | 45 | |
| Class R | | | — | |
| Class I | | | 10,730,006 | |
| Class IS | | | — | |
| Total | | $ | 10,902,563 | |
6. Distributions to shareholders by class
| | | | | | | | |
| | | Year Ended
December 31, 2018 | | | Year Ended
December 31, 2017 | |
| Net Investment Income: | | | | | |
| Class A | | $ | 32,594,313 | | | $ | 24,824,376 | |
| Class C | | | 5,278,842 | | | | 3,877,713 | |
| Class C1 | | | 486,386 | | | | 547,013 | |
| Class FI | | | 13,233,645 | | | | 11,265,646 | |
| Class R | | | 6,556,069 | | | | 4,183,705 | |
| Class I | | | 543,699,756 | | | | 392,265,021 | |
| Class IS | | | 212,788,415 | | | | 151,983,642 | |
| Total | | $ | 814,637,426 | | | $ | 588,947,116 | |
| | |
| 104 | | Western Asset Core Plus Bond Fund 2018 Annual Report |
| | | | | | | | |
| | | Year Ended
December 31, 2018 | | | Year Ended
December 31, 2017 | |
| Net Realized Gains: | | | | | |
| Class A | | $ | 4,960,005 | | | $ | 1,334,603 | |
| Class C | | | 1,028,494 | | | | 288,218 | |
| Class C1 | | | 84,696 | | | | 29,574 | |
| Class FI | | | 2,034,129 | | | | 585,977 | |
| Class R | | | 1,064,801 | | | | 286,536 | |
| Class I | | | 72,533,084 | | | | 19,481,332 | |
| Class IS | | | 27,242,804 | | | | 7,293,887 | |
| Total | | $ | 108,948,013 | | | $ | 29,300,127 | |
7. Capital Shares
At December 31, 2018, the Corporation had 42.7 billion shares of capital stock authorized with a par value of $0.001 per share. Transactions in shares of each class were as follows:
| | | | | | | | | | | | | | | | |
| | | Year Ended
December 31, 2018 | | | Year Ended
December 31, 2017 | |
| | | Shares | | | Amount | | | Shares | | | Amount | |
| Class A | | | | | | | | | | | | | | | | |
| Shares sold | | | 38,615,336 | | | $ | 439,567,825 | | | | 39,382,925 | | | $ | 460,526,649 | |
| Shares issued on reinvestment | | | 2,457,480 | | | | 27,772,857 | | | | 1,594,072 | | | | 18,709,228 | |
| Shares repurchased | | | (32,773,031) | | | | (370,658,684) | | | | (29,391,420) | | | | (342,655,357) | |
| Net increase | | | 8,299,785 | | | $ | 96,681,998 | | | | 11,585,577 | | | $ | 136,580,520 | |
| | | | |
| Class C | | | | | | | | | | | | | | | | |
| Shares sold | | | 5,085,468 | | | $ | 58,147,327 | | | | 7,182,229 | | | $ | 84,537,642 | |
| Shares issued on reinvestment | | | 425,468 | | | | 4,816,139 | | | | 251,839 | | | | 2,960,911 | |
| Shares repurchased | | | (6,253,809) | | | | (70,658,444) | | | | (5,278,418) | | | | (61,774,608) | |
| Net increase (decrease) | | | (742,873) | | | $ | (7,694,978) | | | | 2,155,650 | | | $ | 25,723,945 | |
| | | | |
| Class C1 | | | | | | | | | | | | | | | | |
| Shares sold | | | 80,212 | | | $ | 897,928 | | | | 48,403 | | | $ | 570,239 | |
| Shares issued on reinvestment | | | 49,222 | | | | 557,714 | | | | 47,401 | | | | 556,089 | |
| Shares repurchased | | | (737,049) | | | | (8,338,247) | | | | (415,108) | | | | (4,861,549) | |
| Net decrease | | | (607,615) | | | $ | (6,882,605) | | | | (319,304) | | | $ | (3,735,221) | |
| | | | |
| Class FI | | | | | | | | | | | | | | | | |
| Shares sold | | | 11,413,961 | | | $ | 130,365,716 | | | | 14,828,028 | | | $ | 174,129,804 | |
| Shares issued on reinvestment | | | 1,337,820 | | | | 15,149,672 | | | | 1,000,827 | | | | 11,752,405 | |
| Shares repurchased | | | (18,219,797) | | | | (205,651,254) | | | | (13,818,638) | | | | (161,717,646) | |
| Net increase (decrease) | | | (5,468,016) | | | $ | (60,135,866) | | | | 2,010,217 | | | $ | 24,164,563 | |
| | | | |
| Class R | | | | | | | | | | | | | | | | |
| Shares sold | | | 6,575,693 | | | $ | 74,707,665 | | | | 8,923,448 | | | $ | 104,471,540 | |
| Shares issued on reinvestment | | | 637,538 | | | | 7,196,264 | | | | 342,083 | | | | 4,016,169 | |
| Shares repurchased | | | (3,528,335) | | | | (39,898,014) | | | | (2,483,440) | | | | (29,123,735) | |
| Net increase | | | 3,684,896 | | | $ | 42,005,915 | | | | 6,782,091 | | | $ | 79,363,974 | |
| | |
| Western Asset Core Plus Bond Fund 2018 Annual Report | | 105 |
Notes to financial statements (cont’d)
| | | | | | | | | | | | | | | | |
| | | Year Ended
December 31, 2018 | | | Year Ended
December 31, 2017 | |
| | | Shares | | | Amount | | | Shares | | | Amount | |
| Class I | | | | | | | | | | | | | | | | |
| Shares sold | | | 592,864,725 | | | $ | 6,740,991,507 | | | | 518,654,831 | | | $ | 6,085,001,449 | |
| Shares issued on reinvestment | | | 46,980,763 | | | | 531,525,916 | | | | 31,309,282 | | | | 367,933,554 | |
| Shares repurchased | | | (513,386,605) | | | | (5,797,832,906) | | | | (373,204,638) | | | | (4,336,469,230) | |
| Net increase | | | 126,458,883 | | | $ | 1,474,684,517 | | | | 176,759,475 | | | $ | 2,116,465,773 | |
| | | | |
| Class IS | | | | | | | | | | | | | | | | |
| Shares sold | | | 205,891,595 | | | $ | 2,337,942,742 | | | | 195,577,943 | | | $ | 2,282,345,712 | |
| Shares issued on reinvestment | | | 18,814,668 | | | | 212,731,943 | | | | 12,106,012 | | | | 142,288,920 | |
| Shares repurchased | | | (122,278,177) | | | | (1,377,182,941) | | | | (90,649,269) | | | | (1,064,033,547) | |
| Net increase | | | 102,428,086 | | | $ | 1,173,491,744 | | | | 117,034,686 | | | $ | 1,360,601,085 | |
8. Transactions with affiliated companies
As defined by the 1940 Act, an affiliated company is one in which the Fund owns 5% or more of the outstanding voting securities, or a company which is under common ownership or control. The Fund may invest in Western Asset Government Cash Management Portfolio, LLC (“Cash Management Portfolio”), an affiliated private money market fund managed by Western Asset, the Fund’s subadviser. Cash Management Portfolio is available as a cash management vehicle for certain proprietary investment companies affiliated with Legg Mason. While Cash Management Portfolio is not a registered money market fund, it conducts all of its investment activities in accordance with the requirements of Rule 2a-7 under the 1940 Act. Based on the Fund’s relative ownership, the following companies were considered affiliated companies for all or some portion of the year ended December 31, 2018. The following transactions were effected in shares of such companies for the year ended December 31, 2018.
| | | | | | | | | | | | | | | | | | | | | | | | | | | | | | | | | | | | |
| | | Affiliate
Value at
December 31,
2017 | | | Purchased | | | Sold | | | Realized
Gain (Loss) | | | Interest
Income | | | Net Increase
(Decrease) in
Unrealized
Appreciation
(Depreciation) | | | Affiliate
Value at
December 31,
2018 | |
| | Cost | | | Shares | | | Cost | | | Shares | |
| Western Asset Government Cash Management Portfolio LLC | | $ | 2,207,737,972 | | | $ | 11,665,316,339 | | | | 11,665,316,339 | | | $ | 13,027,500,000 | | | | 13,027,500,000 | | | | — | | | $ | 34,467,777 | | | | — | | | $ | 845,554,311 | |
9. Redemption facility
The Fund and certain other participating funds within the Corporation (the “Participating Funds”), have available an unsecured revolving credit facility (the “Redemption Facility”) from the lenders and The Bank of New York Mellon (“BNY Mellon”), as administrative agent for the lenders. The Redemption Facility is to be used for temporary or emergency purposes as an additional source of liquidity to fund redemptions of shares. Under the agreement, BNY Mellon provides a364-day revolving credit facility, in the aggregate amount of $265 million. Unless renewed, the agreement will terminate on November 18, 2019. Any borrowings under the Redemption Facility will bear interest at current market
| | |
| 106 | | Western Asset Core Plus Bond Fund 2018 Annual Report |
rates as set forth in the credit agreement. The annual commitment fee to maintain the Redemption Facility is 0.10% and is incurred on the unused portion of the facility and is allocated to all Participating Funds pro rata based on net assets. For the year ended December 31, 2018, the Fund incurred a commitment fee in the amount of $166,772. The Fund did not utilize the Redemption Facility during the year ended December 31, 2018.
10. Income tax information and distributions to shareholders
The tax character of distributions paid during the fiscal years ended December 31, was as follows:
| | | | | | | | |
| | | 2018 | | | 2017 | |
| Distributions paid from: | | | | | | | | |
| Ordinary income | | $ | 834,658,093 | | | $ | 606,190,111 | |
| Net long-term capital gains | | | 88,927,346 | | | | 12,057,132 | |
| Total distributions paid | | $ | 923,585,439 | | | $ | 618,247,243 | |
As of December 31, 2018, the components of accumulated earnings (losses) on a tax basis were as follows:
| | | | |
| Undistributed ordinary income — net | | $ | 5,856,803 | |
| Deferred capital losses* | | | (318,659,766) | |
| Other book/tax temporary differences(a) | | | (84,485,460) | |
| Unrealized appreciation/(depreciation)(b) | | | (640,346,367) | |
| Total accumulated earnings/(losses) — net | | $ | (1,037,634,790) | |
| * | These capital losses have been deferred in the current year as either short-term or long-term losses. The losses will be deemed to occur on the first day of the next taxable year in the same character as they were originally deferred and will be available to offset future taxable capital gains. |
| (a) | Other book/tax temporary differences are attributable to the tax deferral of losses on straddles, the realization for tax purposes of unrealized gains (losses) on certain futures and foreign currency contracts, book/tax differences in the accrual of interest income on securities in default, book/tax differences in the treatment of swap contracts and book/tax differences in the timing of the deductibility of various expenses. |
| (b) | The difference between book-basis and tax-basis unrealized appreciation (depreciation) is attributable to the tax deferral of losses on wash sales, book/tax differences in the treatment of partnership investments and other book/tax basis adjustments. |
11. Recent accounting pronouncement
In August 2018, the Securities and Exchange Commission released its Final Rule on Disclosure Update and Simplification (the “Final Rule”) which is intended to simplify an issuer’s disclosure compliance efforts by removing redundant or outdated disclosure requirements without significantly altering the mix of information provided to investors. Effective with the current reporting period, the Fund adopted the Final Rule with the most notable impacts being that the Fund is no longer required to present the components of distributable earnings on the Statement of Assets and Liabilities or the sources of distributions to shareholders and the amount of undistributed net investment income on the Statements of Changes in Net Assets. The tax components of distributable earnings and distributions to shareholders continue to be disclosed within the Notes to Financial Statements.
| | |
| Western Asset Core Plus Bond Fund 2018 Annual Report | | 107 |
Report of independent registered public accounting firm
To the Board of Directors of Western Asset Funds, Inc. and
Shareholders of Western Asset Core Plus Bond Fund
Opinion on the financial statements
We have audited the accompanying statement of assets and liabilities, including the schedule of investments, of Western Asset Core Plus Bond Fund (one of the funds constituting Western Asset Funds, Inc., referred to hereafter as the “Fund”) as of December 31, 2018, the related statement of operations for the year ended December 31, 2018, the statement of changes in net assets for each of the two years in the period ended December 31, 2018, including the related notes, and the financial highlights for each of the five years in the period ended December 31, 2018 (collectively referred to as the “financial statements”). In our opinion, the financial statements present fairly, in all material respects, the financial position of the Fund as of December 31, 2018, the results of its operations for the year then ended, the changes in its net assets for each of the two years in the period ended December 31, 2018 and the financial highlights for each of the five years in the period ended December 31, 2018 in conformity with accounting principles generally accepted in the United States of America.
Basis for opinion
These financial statements are the responsibility of the Fund’s management. Our responsibility is to express an opinion on the Fund’s financial statements based on our audits. We are a public accounting firm registered with the Public Company Accounting Oversight Board (United States) (“PCAOB”) and are required to be independent with respect to the Fund in accordance with the U.S. federal securities laws and the applicable rules and regulations of the Securities and Exchange Commission and the PCAOB.
We conducted our audits of these financial statements in accordance with the standards of the PCAOB. Those standards require that we plan and perform the audit to obtain reasonable assurance about whether the financial statements are free of material misstatement, whether due to error or fraud.
Our audits included performing procedures to assess the risks of material misstatement of the financial statements, whether due to error or fraud, and performing procedures that respond to those risks. Such procedures included examining, on a test basis, evidence regarding the amounts and disclosures in the financial statements. Our audits also included evaluating the accounting principles used and significant estimates made by management, as well as evaluating the overall presentation of the financial statements. Our procedures included confirmation of securities owned as of December 31, 2018 by correspondence with the custodian, agent banks, brokers and transfer agent of the investee fund; when replies were not received, we performed other auditing procedures. We believe that our audits provide a reasonable basis for our opinion.
/s/PricewaterhouseCoopers LLP
Baltimore, Maryland
February 22, 2019
We have served as the auditor of one or more investment companies in Legg Mason investment company group since at least 1973. We have not been able to determine the specific year we began serving as auditor.
| | |
| 108 | | Western Asset Core Plus Bond Fund 2018 Annual Report |
Board approval of management and subadvisory agreements(unaudited)
The Executive and Contracts Committee of the Board of Directors considered the Investment Management Agreement between the Corporation and LMPFA with respect to the Fund and the Investment Advisory Agreements between LMPFA and Western Asset Management Company, LLC (“Western Asset”), Western Asset Management Company Limited in London (“WAML”), Western Asset Management Company Pte. Ltd. in Singapore (“Western Asset Singapore”) and Western Asset Management Company Ltd in Japan (“Western Asset Japan,” and together with Western Asset Singapore and WAML, the“Non-U.S. Subadvisers”, and together with Western Asset, the “Subadvisers”) (collectively, the “Agreements”) with respect to the Fund at meetings held on September 11, 2018 and October 29, 2018. At a meeting held on November 13, 2018, the Executive and Contracts Committee reported to the full Board of Directors its considerations and recommendation with respect to the Agreements, and the Board of Directors, including a majority of the Independent Directors, considered and approved renewal of the Agreements.
The Directors noted that although Western Asset’s business is operated through separate legal entities, such as theNon-U.S. Subadvisers, its business is highly integrated and senior investment personnel at Western Asset have supervisory oversight responsibility over the investment decisions made by theNon-U.S. Subadvisers. Therefore, in connection with their deliberations noted below, the Directors primarily focused on the information provided by Western Asset when considering the approval of the Investment Advisory Agreements between LMPFA and theNon-U.S. Subadvisers with respect to the Fund. The Directors also noted that the Fund does not pay any management fees directly to Western Asset or to any of theNon-U.S. Subadvisers because LMPFA pays the Subadvisers for services provided to the Fund out of the management fee LMPFA receives from the Fund.
In arriving at their decision to renew the Agreements, the Directors met with representatives of Western Asset, including relevant investment advisory personnel, as well as representatives of LMPFA; reviewed a variety of information prepared by LMPFA and Western Asset and materials provided by Broadridge and counsel to the Independent Directors; reviewed performance and expense information for the Fund’s peer group of comparable funds selected and prepared by Broadridge and for certain other comparable products available from Western Asset, including separate accounts managed by Western Asset; and requested and reviewed additional information as necessary. These reviews were in addition to information obtained by the Directors at their regular quarterly meetings with respect to the Fund’s performance and other relevant matters, and related discussions with Western Asset’s personnel.
As part of their review, the Directors examined LMPFA’s ability to provide high quality oversight and administrative and shareholder support services to the Fund, and the Subadvisers’ ability to provide high quality investment management services to the Fund. The Directors considered the experience of LMPFA’s personnel in providing the types of services that LMPFA is responsible for providing to the Fund; the ability of LMPFA to attract and retain capable personnel; the capability and integrity of LMPFA’s senior management and staff;
| | |
| Western Asset Core Plus Bond Fund | | 109 |
Board approval of management and subadvisory agreements(unaudited) (cont’d)
and the level of skill required to provide such services to the Fund. The Directors considered the investment philosophy and research and decision-making processes of the Subadvisers; the experience of their key advisory personnel responsible for management of the Fund; the ability of the Subadvisers to attract and retain capable research and advisory personnel; the capability and integrity of the Subadvisers’ senior management and staff; and the level of skill required to manage the Fund. In addition, the Directors reviewed the quality of LMPFA’s and the Subadvisers’ services with respect to regulatory compliance and compliance with the investment policies of the Fund and conditions that might affect LMPFA’s or a Subadviser’s ability to provide high quality services to the Fund in the future under the Agreements, including its business reputation, financial condition and operational stability. Based on the foregoing, the Directors concluded that the Subadvisers’ investment process, research capabilities and philosophy were well suited to the Fund given the Fund’s investment objectives and policies, and that LMPFA and each of the Subadvisers would be able to meet any reasonably foreseeable obligations under the Agreements.
In reviewing the quality of the services provided to the Fund, the Directors also reviewed comparisons of the performance of the Fund to the performance of certain comparable funds in its peer group and to its investment benchmark over theone-, three-, five- andten-year periods ended June 30, 2018. In that connection, the Directors noted that the performance of the Fund exceeded its peer group’s average performance for the three-, five-, andten-year periods and was lower than its peer group’s average performance for theone-year period. With respect to the Fund, the Directors considered the factors involved in its performance relative to the performance of its investment benchmark and peer group.
The Directors also considered the management fee payable by the Fund to LMPFA, the total expenses payable by the Fund and the fact that LMPFA pays to the Subadvisers the entire management fee it receives from the Fund. They reviewed information concerning management fees paid to investment advisers of similarly managed funds, as well as fees paid by the Subadvisers’ other clients, including separate accounts managed by the Subadvisers. The Directors observed that the contractual management fee paid by the Fund to LMPFA was higher than the average contractual management fee rate paid by funds in its peer group, while the actual management fee rate paid by the Fund to LMPFA was lower than the average actual management fee rate paid by funds in its peer group and that total expenses for the Fund were lower than the average of the funds in its peer group. The Directors noted that the management fee paid by the Fund was generally higher than the management fees paid by other clients of the Subadvisers for accounts with similar investment strategies, but that the administrative and operational responsibilities for the Subadvisers with respect to the Fund were also relatively higher. In light of this difference, the Directors concluded that the management fee paid by the Fund relative to the fees paid by the Subadvisers’ other clients was reasonable.
The Directors further evaluated the benefits of the advisory relationship to LMPFA and the Subadvisers, including, among others, the profitability of the relationship to LMPFA and the
| | |
| 110 | | Western Asset Core Plus Bond Fund |
Subadvisers; the direct and indirect benefits that LMPFA and each Subadviser may receive from its relationship with the Fund, including any “fallout benefits,” such as reputational value derived from serving as investment manager or adviser to the Fund; and the affiliations between LMPFA, the Subadvisers and certain service providers for the Fund. In that connection, the Directors concluded that LMPFA and each Subadviser’s profitability was consistent with levels of profitability that had been determined by courts not to be excessive. The Directors noted that Western Asset does not have soft dollar arrangements.
Finally, the Directors considered, in light of the profitability information provided by LMPFA and Western Asset, the extent to which economies of scale would be realized by the Subadvisers as the assets of the Fund grow. They further concluded that the Fund’s assets were currently at a level at which the Subadvisers potentially may realize economies of scale from any future growth in the Fund, and noted that fee breakpoints had been implemented to capture a portion of any economies of scale for the benefit of the Fund’s shareholders. The Directors determined that the management fee structure for the Fund is reasonable.
In their deliberations with respect to these matters, the Independent Directors were advised by their independent counsel, who is independent, within the meaning of Securities and Exchange Commission rules regarding the independence of counsel, of LMPFA and the Subadvisers. The Independent Directors weighed each of the foregoing matters in light of the advice given to them by their independent counsel as to the law applicable to the review of investment advisory contracts. In arriving at a decision, the Directors, including the Independent Directors, did not identify any single matter as all-important or controlling, and the foregoing summary does not detail all the matters considered. The Directors judged the terms and conditions of the Agreements, including the investment advisory fees, in light of all of the surrounding circumstances.
Based upon their review, the Directors, including all of the Independent Directors, determined, in the exercise of their business judgment, that they were generally satisfied with the quality of services being provided by LMPFA and the Subadvisers, but they would continue to closely monitor the performance of LMPFA and the Subadvisers; that the fees to be paid to the Subadvisers and LMPFA under the relevant Agreements were fair and reasonable, given the scope and quality of the services rendered by the Subadvisers and LMPFA; and that approval of the Agreements was in the best interest of the Fund and its shareholders.
| | |
| Western Asset Core Plus Bond Fund | | 111 |
Additional information(unaudited)
Information about Directors and Officers
The business and affairs of Western Asset Core Plus Bond Fund (the “Fund”) are conducted by management under the supervision and subject to the direction of its Board of Directors. The business address of each Director is c/o Jane Trust, Legg Mason, 100 International Drive, 11th Floor, Baltimore, Maryland 21202. Information pertaining to the Directors and officers of the Fund is set forth below.
The Statement of Additional Information includes additional information about Directors and is available, without charge, upon request by calling the Fund at1-877-721-1926.
| | |
| Independent Directors† | | |
| |
| Robert Abeles, Jr. | | |
| |
| Year of birth | | 1945 |
| Position(s) held with Fund | | Director |
| Term of office1 and length of time served2 | | Since 2013 |
| Principal occupation(s) during the past five years | | Senior Vice President Emeritus (since 2016) and formerly, Senior Vice President, Finance and Chief Financial Officer (2009 to 2016) at University of Southern California |
| Number of portfolios in fund complex overseen3 | | 9 |
| Other directorships held during the past five years | | None |
| |
| Anita L. DeFrantz | | |
| |
| Year of birth | | 1952 |
| Position(s) held with Fund | | Director |
| Term of office1 and length of time served2 | | Since 1998 |
| Principal occupation(s) during the past five years | | President of Tubman Truth Corp. (since 2015); President Emeritus (since 2015) and formerly, President (1987 to 2015) and Director (1990 to 2015) of LA84 (formerly Amateur Athletic Foundation of Los Angeles); Member (since 1986) Member of Executive Board (since 2013) and Vice President (since 2017) of the International Olympic Committee |
| Number of portfolios in fund complex overseen3 | | 9 |
| Other directorships held during the past five years | | None |
| |
| Avedick B. Poladian | | |
| |
| Year of birth | | 1951 |
| Position(s) held with Fund | | Director |
| Term of office1 and length of time served2 | | Since 2007 |
| Principal occupation(s) during the past five years | | Director and Advisor (since 2017) and former Executive Vice President and Chief Operating Officer (2002 to 2016) of Lowe Enterprises, Inc. (privately held real estate and hospitality firm); formerly, Partner, Arthur Andersen, LLP (1974 to 2002) |
| Number of portfolios in fund complex overseen3 | | 9 |
| Other directorships held during the past five years | | Occidental Petroleum Corporation, California Resources Corporation and Public Storage |
| | |
| 112 | | Western Asset Core Plus Bond Fund |
| | |
| Independent Directors† cont’d | | |
| |
| William E. B. Siart | | |
| |
| Year of birth | | 1946 |
| Position(s) held with Fund | | Director and Chairman |
| Term of office1 and length of time served2 | | Since 1997 |
| Principal occupation(s) during the past five years | | Chairman of Great Public Schools Now (since 2015); Chairman of Excellent Education Development (since 2000); formerly, Trustee of The Getty Trust (since 2005 to 2017); Chairman of Walt Disney Concert Hall, Inc. (1998 to 2006) |
| Number of portfolios in fund complex overseen3 | | 9 |
| Other directorships held during the past five years | | None |
| |
| Jaynie Miller Studenmund | | |
| |
| Year of birth | | 1954 |
| Position(s) held with Fund | | Director |
| Term of office1 and length of time served2 | | Since 2004 |
| Principal occupation(s) during the past five years | | Director of EXL (operations management and analytics company) (since 2018); Director of CoreLogic, Inc. (information, analytics and business services company) (since 2012); formerly, Director of Pinnacle Entertainment, Inc. (gaming and hospitality company) (2012 to 2018); Director of LifeLock, Inc. (identity theft protection company) (2015 to 2017); Director of Orbitz Worldwide, Inc. (online travel company) (2007 to 2014) |
| Number of portfolios in fund complex overseen3 | | 9 |
| Other directorship held during the past five years | | None |
| | |
| Interested Director | | |
| |
| Ronald L. Olson4 | | |
| |
| Year of birth | | 1941 |
| Position(s) held with Fund | | Director |
| Term of office1 and length of time served2 | | Since 2005 |
| Principal occupation(s) during the past five years | | Partner of Munger, Tolles & Olson LLP (law partnership) (since 1968) |
| Number of portfolios in fund complex overseen3 | | 9 |
| Other directorships held during the past five years | | Berkshire Hathaway, Inc. formerly, Graham Holdings Company (formerly, The Washington Post Company) (2001 to 2017) |
| | |
| | |
| Western Asset Core Plus Bond Fund | | 113 |
Additional information(unaudited) (cont’d)
Information about Directors and Officers
| | |
| Officers5 | | |
| |
Jane Trust, CFA Legg Mason 100 International Drive, 11th Floor, Baltimore, MD 21202 | | |
| |
| Year of birth | | 1962 |
| Position(s) held with Fund | | President and Chief Executive Officer |
| Term of office1 and length of time served2 | | Since 2015 |
| Principal occupation(s) during the past five years | | Senior Managing Director of Legg Mason & Co., LLC (“Legg Mason & Co.”) (since 2018); Managing Director of Legg Mason & Co. (2016 to 2018); Officer and/or Trustee/Director of 146 funds associated with Legg Mason Partners Fund Advisor, LLC (“LMPFA”) or its affiliates (since 2015); President and Chief Executive Officer of LMPFA (since 2015); formerly, Senior Vice President of LMPFA (2015); Director of ClearBridge, LLC (formerly, Legg Mason Capital Management, LLC) (2007 to 2014);Managing Director of Legg Mason Investment Counsel & Trust Co. (2000 to 2007) |
| |
Richard F. Sennett Legg Mason 100 International Drive, Baltimore, MD 21202 | | |
| |
| Year of birth | | 1970 |
| Position(s) held with Fund | | Principal Financial Officer and Treasurer |
| Term of office1 and length of time served2 | | Since 2011 and since 2013 |
| Principal occupation(s) during the past five years | | Principal Financial Officer and Treasurer of certain mutual funds associated with Legg Mason & Co. or its affiliates (since 2011 and since 2013); Managing Director of Legg Mason & Co. and Senior Manager of the Treasury Policy group for Legg Mason & Co.’s Global Fiduciary Platform (since 2011); formerly, Chief Accountant within the SEC’s Division of Investment Management (2007 to 2011); Assistant Chief Accountant within the SEC’s Division of Investment Management (2002 to 2007) |
| |
Todd F. Kuehl Legg Mason 100 International Drive, 9th Floor, Baltimore, MD 21202 | | |
| |
| Year of birth | | 1969 |
| Position(s) held with Fund | | Chief Compliance Officer |
| Term of office1 and length of time served2 | | Since 2007 |
| Principal occupation(s) during the past five years | | Managing Director of Legg Mason & Co. (since 2011); Chief Compliance Officer of certain mutual funds associated with Legg Mason & Co. or its affiliates (since 2006); formerly, Chief Compliance Officer of Legg Mason Private Portfolio Group (prior to 2010); formerly, Branch Chief, Division of Investment Management, U.S. Securities and Exchange Commission (2002 to 2006) |
| | |
| 114 | | Western Asset Core Plus Bond Fund |
| | |
| Additional Officers5 | | |
| |
Robert I. Frenkel Legg Mason 100 First Stamford Place, 6th Floor, Stamford, CT 06902 | | |
| |
| Year of birth | | 1954 |
| Position(s) held with Fund | | Secretary and Chief Legal Officer |
| Term of office1 and length of time served2 | | Since 2007 |
| Principal occupation(s) during the past five years | | Vice President and Deputy General Counsel of Legg Mason, Inc. (since 2006); Managing Director and General Counsel — U.S. Mutual Funds for Legg Mason & Co. (since 2006) and Legg Mason & Co. predecessors (since 1994); Secretary and Chief Legal Officer of certain mutual funds associated with Legg Mason & Co. or its affiliates (since 2006) and Legg Mason & Co. predecessors (prior to 2006) |
| |
Thomas C. Mandia Legg Mason 100 First Stamford Place, 6th Floor, Stamford, CT 06902 | | |
| |
| Year of Birth | | 1962 |
| Position(s) held with Fund | | Assistant Secretary |
| Term of office1 and length of time served2 | | Since 2007 |
| Principal occupation(s) during the past five years | | Managing Director and Deputy General Counsel of Legg Mason & Co. (since 2005) and Legg Mason & Co. predecessors (prior to 2005); Secretary of LMPFA (since 2006); Assistant Secretary of certain mutual funds associated with Legg Mason & Co. or its affiliates (since 2006) and Legg Mason & Co. predecessors (prior to 2006); Secretary of LMAsset Services, LLC (“LMAS”) (since 2002) and Legg Mason Fund Asset Management, Inc. (“LMFAM”) (since 2013) (formerly registered investment advisers) |
| |
Susan Kerr Legg Mason 620 Eighth Avenue, 49th Floor ,New York, NY 10018 | | |
| |
| Year of birth | | 1949 |
| Position(s) held with Fund | | Chief Anti-Money Laundering Compliance Officer |
| Term of office1 and length of time served2 | | Since 2013 |
| Principal occupation(s) during the past five years | | Assistant Vice President of Legg Mason & Co. and Legg Mason Investor Services, LLC (“LMIS”) (since 2010); Chief Anti-Money Laundering Compliance Officer of certain mutual funds associated with Legg Mason & Co. or its affiliates (since 2013) and Anti-Money Laundering Compliance Officer of LMIS (since 2012); Senior Compliance Officer of LMIS (since 2011); formerly, AML Consultant, DTCC (2010); AML Consultant, Rabobank Netherlands, (2009); First Vice President, Director of Marketing & Advertising Compliance and Manager of Communications Review Group at Citigroup Inc. (1996 to 2008) |
| | |
| Western Asset Core Plus Bond Fund | | 115 |
Additional information(unaudited) (cont’d)
Information about Directors and Officers
| | |
| Additional Officers5 cont’d | | |
| |
Jenna Bailey Legg Mason 100 First Stamford Place, 5th Floor, Stamford, CT 06902 | | |
| |
| Year of birth | | 1978 |
| Position(s) held with Fund | | Identity Theft Prevention Officer |
| Term of office1 and length of time served2 | | Since 2015 |
| Principal occupation(s) during the past five years | | Identity Theft Prevention Officer of certain mutual funds associated with Legg Mason & Co. or its affiliates (since 2015); Compliance Officer of Legg Mason & Co. (since 2013); Assistant Vice President of Legg Mason & Co. (since 2011); formerly, Associate Compliance Officer of Legg Mason & Co. (2011 to 2013) |
| |
Jeanne M. Kelly Legg Mason 620 Eighth Avenue, 49th Floor, New York, NY 10018 | | |
| |
| Year of birth | | 1951 |
| Position(s) held with Fund | | Senior Vice President |
| Term of office1 and length of time served2 | | Since 2007 |
| Principal occupation(s) during the past five years | | Senior Vice President of certain mutual funds associated with Legg Mason & Co. or its affiliates (since 2007); Senior Vice President of LMPFA (since 2006); President and Chief Executive Officer of LMAS and LMFAM (since 2015); Managing Director of Legg Mason & Co. (since 2005) and Legg Mason & Co. predecessors (prior to 2005); formerly, Senior Vice President of LMFAM (2013 to 2015) |
| † | Directors who are not “interested persons” of the Fund within the meaning of section 2(a)(19) of the Investment Company Act of 1940, as amended (the “1940 Act”). |
| 1 | Each Director and officer serves until his or her respective successor has been duly elected and qualified or until his or her earlier death, resignation, retirement or removal. |
| 2 | Indicates the earliest year in which the Director became a board member for a fund in the Legg Mason fund complex or the officer took such office. |
| 3 | In addition to overseeing the 7 funds of the Corporation, each Director also serves as a Director of Western Asset Investment Grade Income Fund Inc. and a Trustee of Western Asset Premier Bond Fund(closed-end investment companies), which are considered part of the same fund complex as the Corporation. |
| 4 | Mr. Olson is an “interested person” (as defined above) of the Fund because his law firm has provided legal services to WAM. |
| 5 | Each officer of the Fund is an “interested person” (as defined above) of the Fund. |
| | |
| 116 | | Western Asset Core Plus Bond Fund |
Important tax information(unaudited)
The following information is provided with respect to the distributions paid during the taxable year ended December 31, 2018:
| | | | | | | | | | | | |
| Record date | | | Daily | | | | 6/18/2018 | | | | Daily | |
| Payable date | | | 1/31/2018 | | | | 6/19/2018 | | |
| February 2018 -
December 2018 |
|
| Ordinary income: | | | | | | | | | | | | |
Qualified dividend income for individuals | | | 0.52 | % | | | — | | | | 1.00 | % |
Dividends qualifying for the dividends | | | | | | | | | | | | |
received deduction for corporations | | | 0.41 | % | | | — | | | | 0.78 | % |
| Interest from Federal Obligations | | | 15.40 | % | | | 15.40 | % | | | 15.40 | % |
| Long-term capital gain dividend | | | — | | | | $ 0.043187 | | | | — | |
The law varies in each state as to whether and what percentage of dividend income attributable to Federal obligations is exempt from state income tax. We recommend that you consult with your tax adviser to determine if any portion of the dividends you received is exempt from state income taxes.
The following information is applicable tonon-U.S. resident shareholders:
The following ordinary income distributions paid monthly by the Fund represent Qualified Net Investment Income and Qualified Short-Term Capital Gains eligible for exemption from U.S. withholding tax for nonresident aliens and foreign corporations.
| | | | | | |
| Record date: | | Daily | | 6/18/2018 | | Daily |
| Payable date: | | 1/31/2018 | | 6/19/2018 | | February 2018 -
December 2018 |
| Qualified net investment income | | 60.00% | | — | | 60.00% |
| Qualified short-term capital gains | | — | | $0.009723 | | — |
Please retain this information for your records.
| | |
| Western Asset Core Plus Bond Fund | | 117 |
Western Asset
Core Plus Bond Fund
Directors
Robert Abeles, Jr
Anita L. DeFrantz
Ronald L. Olson
Avedick B. Poladian
William E.B. Siart
Chairman
Jaynie M. Studenmund
Investment manager
Legg Mason Partners Fund Advisor, LLC
Subadvisers
Western Asset Management Company, LLC*
Western Asset Management Company Limited
Western Asset Management Company Ltd
Western Asset Management Company Pte. Ltd.
Distributor
Legg Mason Investor Services, LLC
| * | Prior to May 2, 2018, known as Western Asset Management Company. |
Transfer Agent
BNY Mellon Investment Servicing (US) Inc.
4400 Computer Drive
Westborough, MA 01581
Custodian
The Bank of New York Mellon (“BNY”)**
Independent registered public accounting firm
Pricewaterhouse Coopers LLP Baltimore, MD
| ** | Effective May 7, 2018, BNY became custodian. |
Western Asset Core Plus Bond Fund
The Fund is a separate investment series of Western Asset Funds, Inc.
Western Asset Core Plus Bond Fund
Legg Mason Funds
620 Eighth Avenue, 49th Floor
New York, NY 10018
The Fund files its complete schedule of portfolio holdings with the Securities and Exchange Commission (“SEC”) for the first and third quarters of each fiscal year on FormN-Q. The Fund’s FormsN-Q are available on the SEC’s website at www.sec.gov. To obtain information on FormN-Q, shareholders can call the Fund at1-877-721-1926.
Information on how the Fund voted proxies relating to portfolio securities during the prior12-month period ended June 30th of each year and a description of the policies and procedures that the Fund uses to determine how to vote proxies related to portfolio transactions are available (1) without charge, upon request, by calling the Fund at1-877-721-1926, (2) at www.leggmason.com/mutualfunds and (3) on the SEC’s website at www.sec.gov.
This report is submitted for the general information of the shareholders of Western Asset Core Plus Bond Fund. This report is not authorized for distribution to prospective investors in the Fund unless preceded or accompanied by a current prospectus.
Investors should consider the Fund’s investment objectives, risks, charges and expenses carefully before investing. The prospectus contains this and other important information about the Fund. Please read the prospectus carefully before investing.
www.leggmason.com
© 2019 Legg Mason Investors Services, LLC
Member FINRA, SIPC
Legg Mason Funds Privacy and Security Notice
Your Privacy and the Security of Your Personal Information is Very Important to the Legg Mason Funds
This Privacy and Security Notice (the “Privacy Notice”) addresses the Legg Mason Funds’ privacy and data protection practices with respect to nonpublic personal information the Funds receive. The Legg Mason Funds include any funds sold by the Funds’ distributor, Legg Mason Investor Services, LLC, as well as Legg Mason-sponsoredclosed-end funds. The provisions of this Privacy Notice apply to your information both while you are a shareholder and after you are no longer invested with the Funds.
The Type of Nonpublic Personal Information the Funds Collect About You
The Funds collect and maintain nonpublic personal information about you in connection with your shareholder account. Such information may include, but is not limited to:
| • | | Personal information included on applications or other forms; |
| • | | Account balances, transactions, and mutual fund holdings and positions; |
| • | | Bank account information, legal documents, and identify verification documentation; |
| • | | Online account access user IDs, passwords, security challenge question responses; and |
| • | | Information received from consumer reporting agencies regarding credit history and creditworthiness (such as the amount of an individual’s total debt, payment history, etc.). |
How the Funds Use Nonpublic Personal Information About You
The Funds do not sell or share your nonpublic personal information with third parties or with affiliates for their marketing purposes, or with other financial institutions or affiliates for joint marketing purposes, unless you have authorized the Funds to do so. The Funds do not disclose any nonpublic personal information about you except as may be required to perform transactions or services you have authorized or as permitted or required by law. The Funds may disclose information about you to:
| • | | Employees, agents, and affiliates on a “need to know” basis to enable the Funds to conduct ordinary business or to comply with obligations to government regulators; |
| • | | Service providers, including the Funds’ affiliates, who assist the Funds as part of the ordinary course of business (such as printing, mailing services, or processing or servicing your account with us) or otherwise perform services on the Funds’ behalf, including companies that may perform statistical analysis, market research and marketing services solely for the Funds; |
| • | | Permit access to transfer, whether in the United States or countries outside of the United States to such Funds’ employees, agents and affiliates and service providers as required to enable the Funds to conduct ordinary business, or to comply with obligations to government regulators; |
| • | | The Funds’ representatives such as legal counsel, accountants and auditors to enable the Funds to conduct ordinary business, or to comply with obligations to government regulators; |
|
| NOT PART OF THE ANNUAL REPORT |
Legg Mason Funds Privacy and Security Notice (cont’d)
| • | | Fiduciaries or representatives acting on your behalf, such as an IRA custodian or trustee of a grantor trust. |
Except as otherwise permitted by applicable law, companies acting on the Funds’ behalf, including those outside the United States, are contractually obligated to keep nonpublic personal information the Funds provide to them confidential and to use the information the Funds share only to provide the services the Funds ask them to perform.
The Funds may disclose nonpublic personal information about you when necessary to enforce their rights or protect against fraud, or as permitted or required by applicable law, such as in connection with a law enforcement or regulatory request, subpoena, or similar legal process. In the event of a corporate action or in the event a Fund service provider changes, the Funds may be required to disclose your nonpublic personal information to third parties. While it is the Funds’ practice to obtain protections for disclosed information in these types of transactions, the Funds cannot guarantee their privacy policy will remain unchanged.
Keeping You Informed of the Funds’ Privacy and Security Practices
The Funds will notify you annually of their privacy policy as required by federal law. While the Funds reserve the right to modify this policy at any time they will notify you promptly if this privacy policy changes.
The Funds’ Security Practices
The Funds maintain appropriate physical, electronic and procedural safeguards designed to guard your nonpublic personal information. The Funds’ internal data security policies restrict access to your nonpublic personal information to authorized employees, who may use your nonpublic personal information for Fund business purposes only.
Although the Funds strive to protect your nonpublic personal information, they cannot ensure or warrant the security of any information you provide or transmit to them, and you do so at your own risk. In the event of a breach of the confidentiality or security of your nonpublic personal information, the Funds will attempt to notify you as necessary so you can take appropriate protective steps. If you have consented to the Funds using electronic communications or electronic delivery of statements, they may notify you under such circumstances using the most current email address you have on record with them.
In order for the Funds to provide effective service to you, keeping your account information accurate is very important. If you believe that your account information is incomplete, not accurate or not current, if you have questions about the Funds’ privacy practices, or our use of your nonpublic personal information, write the Funds using the contact information on your account statements, email the Funds by clicking on the Contact Us section of the Funds’ website at www.leggmason.com, or contact the Funds at1-877-721-1926.
Revised April 2018
|
| NOT PART OF THE ANNUAL REPORT |
Western Asset Management Company, LLC
Legg Mason, Inc. Subsidiaries
www.leggmason.com
© 2019 Legg Mason Investor Services, LLC Member FINRA, SIPC
WASX013139 2/19 SR19-3560
The registrant has adopted a code of ethics that applies to the registrant’s principal executive officer, principal financial officer, principal accounting officer or controller.
| ITEM 3. | AUDIT COMMITTEE FINANCIAL EXPERT. |
The Board of Directors of the registrant has determined that Mr. Robert Abeles, Jr., possesses the technical attributes identified in Instruction 2(b) of Item 3 to FormN-CSR to qualify as “audit committee financial expert,” and have designated Mr. Abeles as the Audit Committee’s financial expert. Mr. Abeles is an “independent” Director pursuant to paragraph (a) (2) of Item 3 to FormN-CSR.
| ITEM 4. | PRINCIPAL ACCOUNTANT FEES AND SERVICES |
a)Audit Fees. The aggregate fees billed in the last two fiscal years ending December 31, 2017 and December 31, 2018 (the “Reporting Periods”) for professional services rendered by the Registrant’s principal accountant (the “Auditor”) for the audit of the Registrant’s annual financial statements, or services that are normally provided by the Auditor in connection with the statutory and regulatory filings or engagements for the Reporting Periods, were $74,510 in December 31, 2017 and in $383,790 in December 31, 2018.
b)Audit-Related Fees. The aggregate fees billed in the Reporting Period for assurance and related services by the Auditor that are reasonably related to the performance of the Registrant’s financial statements were $0 in December 31, 2017 and $0 in December 31, 2018.
(c)Tax Fees. The aggregate fees billed in the Reporting Periods for professional services rendered by the Auditor for tax compliance, tax advice and tax planning (“Tax Services”) were $20,806 in December 31, 2017 and $0 in December 31, 2018. These services consisted of (i) review or preparation of U.S. federal, state, local and excise tax returns; (ii) U.S. federal, state and local tax planning, advice and assistance regarding statutory, regulatory or administrative developments, and (iii) tax advice regarding tax qualification matters and/or treatment of various financial instruments held or proposed to be acquired or held.
There were no fees billed for tax services by the Auditors to service affiliates during the Reporting Periods that requiredpre-approval by the Audit Committee.
d)All Other Fees. The aggregate other fees billed in the Reporting Periods for products and services provided by the Auditor were $0 in December 31, 2017 and $9,000 in December 31, 2018, other than the services reported in paragraphs (a) through (c) for the Item for the Western Asset Funds, Inc.
All Other Fees. There were no othernon-audit services rendered by the Auditor to Legg Mason Partners Fund Advisors, LLC (“LMPFA”), and any entity controlling, controlled by or under common control with LMPFA that provided ongoing services to Western Asset Funds, Inc. requiringpre-approval by the Audit Committee in the Reporting Period.
(e) Audit Committee’s pre–approval policies and procedures described in paragraph (c)(7) of Rule2-01 of RegulationS-X.
(1) The Charter for the Audit Committee (the “Committee”) of the Board of each registered investment company (the “Fund”) advised by LMPFA or one of their affiliates (each, an “Adviser”) requires that the Committee shall approve (a) all audit and permissiblenon-audit services to be provided to the Fund and (b) all permissiblenon-audit services to be provided by the Fund’s independent auditors to the Adviser and any Covered Service Providers if the engagement relates directly to the operations and financial reporting of the Fund. The Committee may implement policies and procedures by which such services are approved other than by the full Committee.
The Committee shall not approvenon-audit services that the Committee believes may impair the independence of the auditors. As of the date of the approval of this Audit Committee Charter, permissiblenon-audit services include any professional services (including tax services), that are not prohibited services as described below, provided to the Fund by the independent auditors, other than those provided to the Fund in connection with an audit or a review of the financial statements of the Fund. Permissiblenon-audit services may not include: (i) bookkeeping or other services related to the accounting records or financial statements of the Fund; (ii) financial information systems design and implementation; (iii) appraisal or valuation services, fairness opinions orcontribution-in-kind reports; (iv) actuarial services; (v) internal audit outsourcing services; (vi) management functions or human resources; (vii) broker or dealer, investment adviser or investment banking services; (viii) legal services and expert services unrelated to the audit; and (ix) any other service the Public Company Accounting Oversight Board determines, by regulation, is impermissible.
Pre-approval by the Committee of any permissiblenon-audit services is not required so long as: (i) the aggregate amount of all such permissiblenon-audit services provided to the Fund, the Adviser and any service providers controlling, controlled by or under common control with the Adviser that provide ongoing services to the Fund (“Covered Service Providers”) constitutes not more than 5% of the total amount of revenues paid to the independent auditors during the fiscal year in which the permissiblenon-audit services are provided to (a) the Fund, (b) the Adviser and (c) any entity controlling, controlled by or under common control with the Adviser that provides ongoing services to the Fund during the fiscal year in which the services are provided that would have to be approved by the Committee; (ii) the permissiblenon-audit services were not recognized by the Fund at the time of the engagement to benon-audit services; and (iii) such services are promptly brought to the attention of the Committee and approved by the Committee (or its delegate(s)) prior to the completion of the audit.
(2) For the Western Asset Funds, Inc., the percentage of fees that were approved by the audit committee, with respect to: Audit-Related Fees were 100% and 100% for December 31, 2017 and December 31, 2018; Tax Fees were 100% and 100% for December 31, 2017 and December 31, 2018; and Other Fees were 100% and 100% for December 31, 2017 and December 31, 2018.
(f) N/A
(g)Non-audit fees billed by the Auditor for services rendered to Western Asset Funds, Inc., LMPFA and any entity controlling, controlled by, or under common control with LMPFA that provides ongoing services to Western Asset Funds, Inc. during the reporting period were $269,356 in December 31, 2017 and $678,000 in December 31, 2018.
(h) Yes. Western Asset Funds, Inc.’s Audit Committee has considered whether the provision ofnon-audit services that were rendered to Service Affiliates, which were notpre-approved (not requiringpre-approval), is compatible with maintaining the Accountant’s independence. All services provided by the Auditor to the Western Asset Funds, Inc. or to Service Affiliates, which were required to bepre-approved, werepre-approved as required.
| ITEM 5. | AUDIT COMMITTEE OF LISTED REGISTRANTS. |
| | a) | The independent board members are acting as the registrant’s audit committee as specified in Section 3(a)(58)(B) of the Exchange Act. The Audit Committee consists of the following Board members: |
Robert Abeles, Jr
Anita L. DeFrantz
Ronald L. Olson
Avedick B. Poladian
William E.B. Siart
Jaynie M. Studenmund
| ITEM 6. | SCHEDULE OF INVESTMENTS. |
Included herein under Item 1.
| ITEM 7. | DISCLOSURE OF PROXY VOTING POLICIES AND PROCEDURES FORCLOSED-END MANAGEMENT INVESTMENT COMPANIES. |
Not applicable.
| ITEM 8. | PORTFOLIO MANAGERS OFCLOSED-END MANAGEMENT INVESTMENT COMPANIES. |
Not applicable.
| ITEM 9. | PURCHASES OF EQUITY SECURITIES BYCLOSED-END MANAGEMENT INVESTMENT COMPANY AND AFFILIATED PURCHASERS. |
Not applicable.
| ITEM 10. | SUBMISSION OF MATTERS TO A VOTE OF SECURITY HOLDERS. |
Not applicable.
| ITEM 11. | CONTROLS AND PROCEDURES. |
| | (a) | The registrant’s principal executive officer and principal financial officer have concluded that the registrant’s disclosure controls and procedures (as defined in Rule30a- 3(c) under the Investment Company Act of 1940, as amended (the “1940 Act”)) are effective as of a date within 90 days of the filing date of this report that includes the disclosure required by this paragraph, based on their evaluation of the disclosure controls and procedures required by Rule30a-3(b) under the 1940 Act and15d-15(b) under the Securities Exchange Act of 1934. |
| | (b) | There were no changes in the registrant’s internal control over financial reporting (as defined in Rule30a-3(d) under the 1940 Act) that occurred during the second fiscal quarter of the period covered by this report that have materially affected, or are likely to materially affect the registrant’s internal control over financial reporting. |
(a) (1) Code of Ethics attached hereto.
Exhibit 99.CODE ETH
(a) (2) Certifications pursuant to section 302 of the Sarbanes-Oxley Act of 2002 attached hereto.
Exhibit 99.CERT
(b) Certifications pursuant to Section 906 of the Sarbanes-Oxley Act of 2002 attached hereto.
Exhibit 99.906CERT
SIGNATURES
Pursuant to the requirements of the Securities Exchange Act of 1934 and the Investment Company Act of 1940, the registrant has duly caused this Report to be signed on its behalf by the undersigned, there unto duly authorized.
Western Asset Funds, Inc.
| | |
By: | | /s/ Jane Trust |
| | Jane Trust |
| | Chief Executive Officer |
Date: February 25, 2019
Pursuant to the requirements of the Securities Exchange Act of 1934 and the Investment Company Act of 1940, this report has been signed below by the following persons on behalf of the registrant and in the capacities and on the dates indicated.
| | |
| By: | | /s/ Jane Trust |
| | Jane Trust |
| | Chief Executive Officer |
Date: February 25, 2019
| | |
| By: | | /s/ Richard F. Sennett |
| | Richard F. Sennett |
| | Principal Financial Officer |
Date: February 25, 2019