UNITED STATES
SECURITIES AND EXCHANGE COMMISSION
Washington, D.C. 20549
FORMN-CSR
CERTIFIED SHAREHOLDER REPORT OF REGISTERED
MANAGEMENT INVESTMENT COMPANIES
Investment Company Act file number811-06110
Western Asset Funds, Inc.
(Exact name of registrant as specified in charter)
620 Eighth Avenue, 49th Floor, New York, NY 10018
(Address of principal executive offices) (Zip code)
Robert I. Frenkel, Esq.
Legg Mason & Co., LLC
100 First Stamford Place
Stamford, CT 06902
(Name and address of agent for service)
Registrant’s telephone number, including area code:1-877-721-1926
Date of fiscal year end: May 31
Date of reporting period: May 31, 2019
ITEM 1. REPORT TO STOCKHOLDERS.
TheAnnual Report to Stockholders is filed herewith.

| | |
| Annual Report | | May 31, 2019 |
WESTERN ASSET
TOTAL RETURN UNCONSTRAINED FUND
Beginning in January 2021, as permitted by regulations adopted by the Securities and Exchange Commission, the Fund intends to no longer mail paper copies of the Fund’s shareholder reports like this one, unless you specifically request paper copies of the reports from the Fund or from your Service Agent or financial intermediary (such as a broker-dealer or bank). Instead, the reports will be made available on a website, and you will be notified by mail each time a report is posted and provided with a website link to access the report.
If you already elected to receive shareholder reports electronically(“e-delivery”), you will not be affected by this change and you need not take any action. If you have not already electede-delivery, you may elect to receive shareholder reports and other communications from the Fund electronically by contacting your Service Agent or, if you are a direct shareholder with the Fund, by calling1-877-721-1926.
You may elect to receive all future reports in paper free of charge. If you invest through a Service Agent, you can contact your Service Agent to request that you continue to receive paper copies of your shareholder reports. That election will apply to all Legg Mason funds held in your account at that Service Agent. If you are a direct shareholder with the Fund, you can call the Fund at1-877-721-1926, or write to the Fund by regular mail at Legg Mason Funds, P.O. Box 9699, Providence, RI 02940-9699 or by express, certified or registered mail to Legg Mason Funds, 4400 Computer Drive, Westborough, MA 01581 to let the Fund know you wish to continue receiving paper copies of your shareholder reports. That election will apply to all Legg Mason Funds held in your account held directly with the fund complex.

|
| INVESTMENT PRODUCTS: NOT FDIC INSURED • NO BANK GUARANTEE • MAY LOSE VALUE |
Fund objective
The Fund seeks to maximize long-term total return.
Letter from the president

Dear Shareholder,
We are pleased to provide the annual report of Western Asset Total Return Unconstrained Fund for the twelve-month reporting period ended May 31, 2019. Please read on for a detailed look at prevailing economic and market conditions during the Fund’s reporting period and to learn how those conditions have affected Fund performance.
As always, we remain committed to providing you with excellent service and a full spectrum of investment choices. We also remain committed to supplementing the support you receive from your financial advisor. One way we accomplish this is through our website, www.leggmason.com. Here you can gain immediate access to market and investment information, including:
| • | | Fund prices and performance, |
| • | | Market insights and commentaries from our portfolio managers, and |
| • | | A host of educational resources. |
We look forward to helping you meet your financial goals.
Sincerely,

Jane Trust, CFA
President and Chief Executive Officer
June 28, 2019
| | |
II | | Western Asset Total Return Unconstrained Fund |
Fund overview
Q. What is the Fund’s investment strategy?
A.The Fund’s investment objective is to maximize long-term total return. The Fund has a flexible investment strategy and will invest in a variety of securities and instruments and use a variety of investment techniques in pursuing its objective. Under normal market conditions, the Fund will invest at least 50% of its net assets in debt and fixed-income securities rated at least in the Baa or BBB categories (“investment grade” securities) at the time of purchase by one or more Nationally Recognized Statistical Rating Organizations (“NRSROs”) or unrated securities that we determined to be of comparable quality at the time of purchase. The Fund intends to invest a substantial portion of its assets in mortgage-backed and asset-backed securities.
The Fund may also enter into various exchange-traded andover-the-counter derivative transactions for both hedging andnon-hedging purposes, including for purposes of enhancing returns. These derivative transactions include, but are not limited to, bond and interest rate futures, options on bonds, options on bond and interest rate futures, swaps, foreign currency futures, forwards and options, options on swaps, options on forwards and commodity and commodity index futures, options, swaps and structured notes.
In particular, the Fund may use certain derivatives, including interest rate swaps, credit default swaps (including buying and selling credit default swaps on individual securities and/or baskets of securities), options (including options on credit default swaps) and/or futures contracts (including options on futures contracts) to a significant extent, although the amounts invested in these instruments may change from time to time. Other derivative instruments may also be used to a significant extent from time to time.
The Fund may use currency related transactions involving options and futures contracts, indexed securities and other derivatives instruments (collectively, “Financial Instruments”). These Financial Instruments may be used without limit, for either hedging purposes or to implement a currency investment strategy.
We use fundamental investment techniques to select issues. In deciding among the securities and instruments in which the Fund may invest, we may take into account the credit quality, country of issue, interest rate, liquidity, maturity and yield of a security or instrument as well as other factors, including the Fund’s dollar-weighted average effective durationi and prevailing or anticipated market conditions. Although the Fund may invest in securities of any maturity, the Fund will normally maintain a dollar-weighted average effective duration, (including futures positions), as estimated by Western Asset Management Company, LLC (“Western Asset”), the Fund’s primary subadviser, within the range of-3 to 8 years. Although the Fund may invest in debt and fixed-income securities of any credit quality, including securities that are in default, under normal market conditions it is expected that the Fund will maintain a dollar-weighted average credit quality of portfolio holdings of at least the Baa/BBB categories or their equivalent (as determined by Western Asset).
| | |
| Western Asset Total Return Unconstrained Fund 2019 Annual Report | | 1 |
Fund overview (cont’d)
At Western Asset, we utilize a fixed-income team approach, with decisions derived from interaction among various investment management sector specialists. The sector teams are comprised of Western Asset’s senior portfolio management personnel, research analysts and anin-house economist. Under this team approach, management of client fixed-income portfolios will reflect a consensus of interdisciplinary views within the Western Asset organization.
Q. What were the overall market conditions during the Fund’s reporting period?
A.Fixed income markets generally posted positive results over the twelve-month reporting period ended May 31, 2019. The spread sectors(non-Treasuries) experienced periods of volatility as they were impacted by a number of factors, including overall solid economic growth in the U.S., moderating growth overseas, monetary policy tightening and then a “dovish pivot” by the Federal Reserve Board (the “Fed”)ii, concerns over a global trade war and numerous geopolitical issues.
Both short- and long-term U.S. Treasury yields declined during the reporting period. The yield for thetwo-year Treasury note began the period at 2.40% and ended the period at 1.95% — the low for the reporting period. The high for the period of 2.98% occurred on November 8, 2018. The yield for theten-year Treasury began the reporting period at 2.83% and ended the period at 2.14% — the low for the reporting period. The peak for the period of 3.24% took place on November 8, 2018.
Inflation was generally well contained during the reporting period. For the twelve months ended May 31, 2019, the seasonally unadjusted rate of inflation, as measured by the Consumer Price Index for All Urban Consumers(“CPI-U”)iii, was 1.8%. TheCPI-U less food and energy was 2.0% over the same time frame. Against this backdrop, U.S. Treasury Inflation-Protected Securities (“TIPS”)iv, as measured by the Bloomberg Barclays U.S. Treasury Inflation-Linked Bond Indexv, gained 4.36% during the reporting period.
Q. How did we respond to these changing market conditions?
A.A number of adjustments were made to the Fund during the reporting period. We increased the Fund’s allocations to TIPS, emerging market debt (mostlynon-U.S. dollar denominated sovereigns) and high-yield corporate bonds. In contrast we decreased the Fund’s exposures to U.S. Treasuries, investment-grade corporate bonds, bank loans, commercial mortgage-backed securities (“MBS”),non-agency residential MBS and asset-backed securities (“ABS”). We also reduced the Fund’s allocation to cash.
During the reporting period, index futures, Eurodollar futures and options, U.S. Treasury futures and options, interest rate swaps and foreign interest rate derivatives were used to manage the Fund’s durationvi and yield curvevii positioning. Single name credit default swaps, as well as high-yield and investment-grade index swaps (CDX), were used to manage the Fund’s high-yield and investment-grade corporate bond exposures. In aggregate they detracted from results. Finally, currency forwards and options on currencies, which were utilized to adjust the
| | |
2 | | Western Asset Total Return Unconstrained Fund 2019 Annual Report |
Fund’s currency exposure, were negative for performance. In aggregate, the overall use of derivatives was negative for performance.
Performance review
For the twelve months ended May 31, 2019, Class I shares of Western Asset Total Return Unconstrained Fund returned 3.43%. The Fund’s unmanaged benchmarks, the Bloomberg Barclays U.S. Aggregate Indexviii and the ICE BofAML USD LIBOR3-Month Constant Maturity Indexix, returned 6.40% and 2.54%, respectively, for the same period. The Lipper Absolute Return Bond Funds Category Averagex returned 2.98% over the same time frame.
| | | | | | | | |
| Performance Snapshotas of May 31, 2019 (unaudited) | |
| (excluding sales charges) | | 6 months | | | 12 months | |
| Western Asset Total Return Unconstrained Fund: | | | | | | | | |
Class A | | | 5.49 | % | | | 3.05 | % |
Class A2 | | | 5.36 | % | | | 2.85 | % |
Class C | | | 5.15 | % | | | 2.36 | % |
Class FI | | | 5.53 | % | | | 3.10 | % |
Class R | | | 5.36 | % | | | 2.80 | % |
Class I | | | 5.69 | % | | | 3.43 | % |
Class IS | | | 5.74 | % | | | 3.52 | % |
| Bloomberg Barclays U.S. Aggregate Index | | | 6.72 | % | | | 6.40 | % |
| ICE BofAML USD LIBOR3-Month Constant Maturity Index | | | 1.40 | % | | | 2.54 | % |
| Lipper Absolute Return Bond Funds Category Average | | | 2.90 | % | | | 2.98 | % |
The performance shown represents past performance. Past performance is no guarantee of future results and current performance may be higher or lower than the performance shown above. Principal value, investment returns and yields will fluctuate and investors’ shares, when redeemed, may be worth more or less than their original cost. To obtain performance data current to the most recentmonth-end, please visit our website at www.leggmason.com/mutualfunds.
All share class returns assume the reinvestment of all distributions, including returns of capital, at net asset value and the deduction of all Fund expenses. Returns have not been adjusted to include sales charges that may apply or the deduction of taxes that a shareholder would pay on Fund distributions. If sales charges were reflected, the performance quoted would be lower. Performance figures for periods shorter than one year represent cumulative figures and are not annualized.
Fund performance figures reflect fee waivers and/or expense reimbursements, without which the performance would have been lower.
The30-Day SEC Yields for the period ended May 31, 2019 for Class A, Class A2, Class C, Class FI, Class R, Class I and Class IS shares were 3.98%, 3.80%, 3.39%, 4.17%, 3.83%, 4.50% and 4.48%, respectively. Absent fee waivers and/or expense reimbursements, the30-Day SEC Yield for Class A shares would have been 3.62%. The30-Day SEC Yield, calculated pursuant to the standard SEC formula, is based on a Fund’s investments over an annualized trailing30-day period, and not on the distributions paid by the Fund, which may differ.
| | | | |
| Total Annual Operating Expenses(unaudited) |
As of the Fund’s current prospectus dated September 28, 2018, the gross total annual fund operating expense ratios for Class A, Class A2, Class C, Class FI, Class R, Class I and Class IS shares were 1.18%, 1.15%, 1.75%, 1.01%, 1.31%, 0.75% and 0.66%, respectively.
Actual expenses may be higher. For example, expenses may be higher than those shown if average net assets decrease.
| | |
| Western Asset Total Return Unconstrained Fund 2019 Annual Report | | 3 |
Fund overview (cont’d)
Net assets are more likely to decrease and Fund expense ratios are more likely to increase when markets are volatile.
As a result of expense limitation arrangements, the ratio of total annual fund operating expenses, other than interest, brokerage commissions, taxes, extraordinary expenses, deferred organizational expenses and acquired fund fees and expenses, to average net assets will not exceed 1.10% for Class A shares, 1.30% for Class A2 shares, 1.80% for Class C shares, 1.10% for Class FI shares, 1.35% for Class R shares, 0.75% for Class I shares and 0.65% for Class IS shares. In addition, the ratio of total annual fund operating expenses for Class IS shares will not exceed the ratio of total annual fund operating expenses for Class I shares. These expense limitation arrangements cannot be terminated prior to December 31, 2020 without the Board of Directors’ consent.
The manager is permitted to recapture amounts waived and/or reimbursed to a class within two years after the fiscal year in which the manager earned the fee or incurred the expense if the class’ total annual operating expenses have fallen to a level below the expense limitation (“expense cap”) in effect at the time the fees were earned or the expenses incurred. In no case will the manager recapture any amount that would result, on any particular business day of the Fund, in the class’ total annual operating expenses exceeding the expense cap or any other lower limit then in effect.
Q. What were the leading contributors to performance?
A.The largest contributor to the Fund’s absolute performance during the reporting period was its duration positioning, as rates moved lower across the yield curve during the period.
The Fund’s structured product exposure, namely its overweight positions in commercial MBS, ABS andnon-agency residential MBS, was additive for returns as their spreads narrowed.
The Fund’s allocations to bank loans, high-yield corporate bonds and investment-grade corporate bonds were positive for performance as their spreads narrowed over the reporting period. Individual high-yield corporate bonds that were additive for results included positions in Petrobras Global Finance BV and PetSmart Inc. Examples of investment grade corporate bonds that contributed to returns included positions in Anheuser-Busch Cos. LLC, Wells Fargo & Co. and CVS Health Corp.
Q. What were the leading detractors from performance?
A.The largest detractor from the Fund’s absolute performance during the reporting period was its position in corporate bonds. Individual high-yield corporate bonds that detracted from results included positions in PG&E Corp. and Adient Global Holdings Ltd. Examples of investment-grade corporate bonds that were headwinds for returns included positions in Rockies Express Pipeline LLC and Kroger Co.
| | |
4 | | Western Asset Total Return Unconstrained Fund 2019 Annual Report |
Thank you for your investment in Western Asset Total Return Unconstrained Fund. As always, we appreciate that you have chosen us to manage your assets and we remain focused on achieving the Fund’s investment goals.
Sincerely,
Western Asset Management Company, LLC
June 18, 2019
RISKS: Fixed-income securities involve interest rate, credit, inflation and reinvestment risks. As interest rates rise, the value of fixed-income securities falls. High-yield securities, commonly known as “junk bonds,” include greater price volatility, illiquidity and possibility of default. International investments are subject to special risks including currency fluctuations and social, economic and political uncertainties, which could increase volatility. These risks are magnified in emerging markets. The use of leverage may increase volatility and possibility of loss. Potential active and frequent trading may result in higher transaction costs and increased investor liability. Asset-backed, mortgage-backed or mortgage-related securities are subject to prepayment and extension risks. Derivatives, such as options, futures and swaps, can be illiquid, may disproportionately increase losses, and have a potentially large impact on Fund performance. Please see the Fund’s prospectus for a more complete discussion of these and other risks and the Fund’s investment strategies.
Portfolio holdings and breakdowns are as of May 31, 2019 and are subject to change and may not be representative of the portfolio managers’ current or future investments. Please refer to pages 14 through 59 for a list and percentage breakdown of the Fund’s holdings.
The mention of sector breakdowns is for informational purposes only and should not be construed as a recommendation to purchase or sell any securities. The information provided regarding such sectors is not a sufficient basis upon which to make an investment decision. Investors seeking financial advice regarding the appropriateness of investing in any securities or investment strategies discussed should consult their financial professional. Portfolio holdings are subject to change at any time and may not be representative of the portfolio managers’ current or future investments. The Fund’s top five sector holdings (as a percentage of net assets) as of May 31, 2019 were: U.S. Government & Agency Obligations (25.3%), Corporate Bonds (22.6%), Sovereign Bonds (13.7%), Collateralized Mortgage Obligations (10.2%) and Asset-Backed Securities (5.4%). The Fund’s portfolio composition is subject to change at any time.
All investments are subject to risk including the possible loss of principal. Past performance is no guarantee of future results. All index performance reflects no deduction for fees, expenses or taxes. Please note that an investor cannot invest directly in an index.
The information provided is not intended to be a forecast of future events, a guarantee of future results or investment advice. Views expressed may differ from those of the firm as a whole.
| | |
| Western Asset Total Return Unconstrained Fund 2019 Annual Report | | 5 |
Fund overview (cont’d)
| i | Effective duration is a duration calculation for bonds with embedded options. Effective duration takes into account that expected cash flows will fluctuate as interest rates change. Please note, duration measures the sensitivity of price (the value of principal) of a fixed-income investment to a change in interest rates. |
| ii | The Federal Reserve Board (the “Fed”) is responsible for the formulation of U.S. policies designed to promote economic growth, full employment, stable prices, and a sustainable pattern of international trade and payments. |
| iii | The Consumer Price Index for All Urban Consumers(“CPI-U”) is a measure of the average change in prices over time of goods and services purchased by households, which covers approximately 87% of the total population and includes, in addition to wage earners and clerical worker households, groups such as professional, managerial and technical workers, the self-employed, short-term workers, the unemployed and retirees and others not in the labor force. |
| iv | U.S. Treasury Inflation-Protected Securities (“TIPS”) are inflation-indexed securities issued by the U.S. Treasury in five-year,ten-year and twenty-year maturities. The principal is adjusted to the Consumer Price Index, the commonly used measure of inflation. The coupon rate is constant, but generates a different amount of interest when multiplied by the inflation-adjusted principal. |
| v | The Bloomberg Barclays U.S. Treasury Inflation-Linked Bond Index represents an unmanaged market index made up of U.S. Treasury Inflation-Linked Index securities. |
| vi | Duration is the measure of the price sensitivity of a fixed-income security to an interest rate change of 100 basis points. Calculation is based on the weighted average of the present values for all cash flows. |
| vii | The yield curve is the graphical depiction of the relationship between the yield on bonds of the same credit quality but different maturities. |
| viii | The Bloomberg Barclays U.S. Aggregate Index is a broad-based bond index comprised of government, corporate, mortgage- and asset-backed issues, rated investment grade or higher, and having at least one year to maturity. |
| ix | The ICE BofAML USD LIBOR3-Month Constant Maturity Index is based on the assumed purchase of a synthetic instrument having three months to maturity and with a coupon equal to the closing quote for three-month LIBOR. That issue is sold the following day (priced at a yield equal to the current day closing three-month LIBOR rate) and is rolled into a new three-month instrument. The Index, therefore, will always have a constant maturity equal to exactly three months. |
| x | Lipper, Inc., a wholly-owned subsidiary of Reuters, provides independent insight on global collective investments. Returns are based on the period ended May 31, 2019, including the reinvestment of all distributions, including returns of capital, if any, calculated among the 101 funds for thesix-month period and among the 101 funds for the twelve-month period in the Fund’s Lipper category, and excluding sales charges, if any. |
| | |
6 | | Western Asset Total Return Unconstrained Fund 2019 Annual Report |
Fund at a glance†(unaudited)
Investment breakdown(%) as a percent of total investments
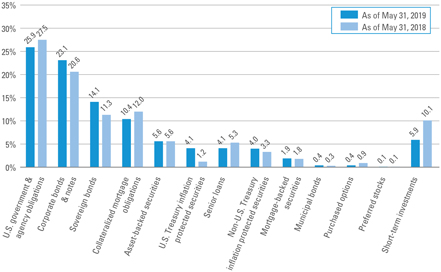
| † | The bar graph above represents the composition of the Fund’s investments as of May 31, 2019 and May 31, 2018 and does not include derivatives, such as written options, futures contracts, forward foreign currency contracts and swap contracts. The Fund is actively managed. As a result, the composition of the Fund’s investments is subject to change at any time. |
| | |
| Western Asset Total Return Unconstrained Fund 2019 Annual Report | | 7 |
Fund expenses(unaudited)
Example
As a shareholder of the Fund, you may incur two types of costs: (1) transaction costs, includingfront-end andback-end sales charges (loads) on purchase payments; and (2) ongoing costs, including management fees; service and/or distribution(12b-1) fees; and other Fund expenses. This example is intended to help you understand your ongoing costs (in dollars) of investing in the Fund and to compare these costs with the ongoing costs of investing in other mutual funds.
This example is based on an investment of $1,000 invested on December 1, 2018 and held for the six months ended May 31, 2019.
Actual expenses
The table below titled “Based on Actual Total Return” provides information about actual account values and actual expenses. You may use the information provided in this table, together with the amount you invested, to estimate the expenses that you paid over the period. To estimate the expenses you paid on your account, divide your ending account value by $1,000 (for example, an $8,600 ending account value divided by $1,000 = 8.6), then multiply the result by the number under the heading entitled “Expenses Paid During the Period”.
Hypothetical example for comparison purposes
The table below titled “Based on Hypothetical Total Return” provides information about hypothetical account values and hypothetical expenses based on the actual expense ratio and an assumed rate of return of 5.00% per year before expenses, which is not the Fund’s actual return. The hypothetical account values and expenses may not be used to estimate the actual ending account balance or expenses you paid for the period. You may use the information provided in this table to compare the ongoing costs of investing in the Fund and other funds. To do so, compare the 5.00% hypothetical example relating to the Fund with the 5.00% hypothetical examples that appear in the shareholder reports of the other funds.
Please note that the expenses shown in the table below are meant to highlight your ongoing costs only and do not reflect any transactional costs, such as front-end or back-end sales charges (loads). Therefore, the table is useful in comparing ongoing costs only, and will not help you determine the relative total costs of owning different funds. In addition, if these transaction costs were included, your costs would have been higher.
| | | | | | | | | | | | | | | | | | | | | | | | | | | | | | | | | | | | | | | | | | | | | | |
| | | |
| Based on actual total return1 | | | | | | | | | Based on hypothetical total return1 | |
| | | Actual
Total Return
Without
Sales
Charge2 | | | Beginning
Account
Value | | | Ending
Account
Value | | | Annualized Expense
Ratio | | | Expenses
Paid
During
the
Period3 | | | | | | | | Hypothetical
Annualized
Total Return | | | Beginning
Account
Value | | | Ending
Account
Value | | | Annualized
Expense
Ratio | | | Expenses
Paid
During
the
Period3 | |
| Class A | | | 5.49 | % | | $ | 1,000.00 | | | $ | 1,054.90 | | | | 1.10 | % | | $ | 5.64 | | | | | | | Class A | | | 5.00 | % | | $ | 1,000.00 | | | $ | 1,019.45 | | | | 1.10 | % | | $ | 5.54 | |
| Class A2 | | | 5.36 | | | | 1,000.00 | | | | 1,053.60 | | | | 1.13 | | | | 5.79 | | | | | | | Class A2 | | | 5.00 | | | | 1,000.00 | | | | 1,019.30 | | | | 1.13 | | | | 5.69 | |
| Class C | | | 5.15 | | | | 1,000.00 | | | | 1,051.50 | | | | 1.80 | | | | 9.21 | | | | | | | Class C | | | 5.00 | | | | 1,000.00 | | | | 1,015.96 | | | | 1.80 | | | | 9.05 | |
| Class FI | | | 5.53 | | | | 1,000.00 | | | | 1,055.30 | | | | 1.10 | | | | 5.64 | | | | | | | Class FI | | | 5.00 | | | | 1,000.00 | | | | 1,019.45 | | | | 1.10 | | | | 5.54 | |
| Class R | | | 5.36 | | | | 1,000.00 | | | | 1,053.60 | | | | 1.35 | | | | 6.91 | | | | | | | Class R | | | 5.00 | | | | 1,000.00 | | | | 1,018.20 | | | | 1.35 | | | | 6.79 | |
| Class I | | | 5.69 | | | | 1,000.00 | | | | 1,056.90 | | | | 0.75 | | | | 3.85 | | | | | | | Class I | | | 5.00 | | | | 1,000.00 | | | | 1,021.19 | | | | 0.75 | | | | 3.78 | |
| Class IS | | | 5.74 | | | | 1,000.00 | | | | 1,057.40 | | | | 0.65 | | | | 3.33 | | | | | | | Class IS | | | 5.00 | | | | 1,000.00 | | | | 1,021.69 | | | | 0.65 | | | | 3.28 | |
| | |
8 | | Western Asset Total Return Unconstrained Fund 2019 Annual Report |
| 1 | For the six months ended May 31, 2019. |
| 2 | Assumes the reinvestment of all distributions, including returns of capital, if any, at net asset value and does not reflect the deduction of the applicable sales charge with respect to Class A and Class A2 shares or the applicable contingent deferred sales charge (“CDSC”) with respect to Class C shares. Total return is not annualized, as it may not be representative of the total return for the year. Performance figures may reflect compensating balance arrangements, fee waivers and/or expense reimbursements. In the absence of compensating balance arrangements, fee waivers and/or expense reimbursements, the total return would have been lower. Past performance is no guarantee of future results. |
| 3 | Expenses (net of compensating balance arrangements, fee waivers and/or expense reimbursements) are equal to each class’ respective annualized expense ratio multiplied by the average account value over the period, multiplied by the number of days in the most recent fiscal half-year (182), then divided by 365. |
| | |
| Western Asset Total Return Unconstrained Fund 2019 Annual Report | | 9 |
Fund performance(unaudited)
| | | | | | | | | | | | | | | | | | | | | | | | | | | | |
| Average annual total returns | | | | | | | | | | | | | | | | | | | | | |
| Without sales charges1 | | Class A | | | Class A2 | | | Class C | | | Class FI | | | Class R | | | Class I | | | Class IS | |
| Twelve Months Ended 5/31/19 | | | 3.05 | % | | | 2.85 | % | | | 2.36 | % | | | 3.10 | % | | | 2.80 | % | | | 3.43 | % | | | 3.52 | % |
| Five Years Ended 5/31/19 | | | 2.42 | | | | 2.24 | | | | 1.73 | | | | 2.46 | | | | 2.19 | | | | 2.75 | | | | 2.84 | |
| Ten Years Ended 5/31/19 | | | N/A | | | | N/A | | | | N/A | | | | 5.07 | | | | N/A | | | | 5.36 | | | | 5.40 | |
| Inception* through 5/31/19 | | | 2.81 | | | | 2.28 | | | | 2.07 | | | | — | | | | 2.55 | | | | — | | | | — | |
| | | | | | | |
| With sales charges2 | | Class A | | | Class A2 | | | Class C | | | Class FI | | | Class R | | | Class I | | | Class IS | |
| Twelve Months Ended 5/31/19 | | | -1.33 | % | | | -1.53 | % | | | 1.37 | % | | | 3.10 | % | | | 2.80 | % | | | 3.43 | % | | | 3.52 | % |
| Five Years Ended 5/31/19 | | | 1.53 | | | | 1.35 | | | | 1.73 | | | | 2.46 | | | | 2.19 | | | | 2.75 | | | | 2.84 | |
| Ten Years Ended 5/31/19 | | | N/A | | | | N/A | | | | N/A | | | | 5.07 | | | | N/A | | | | 5.36 | | | | 5.40 | |
| Inception* through 5/31/19 | | | 2.19 | | | | 1.40 | | | | 2.07 | | | | — | | | | 2.55 | | | | — | | | | — | |
| | | | |
| Cumulative total returns | |
| Without sales charges1 | | | |
| Class A (Inception date of 4/30/12 through 5/31/19) | | | 21.74 | % |
| Class A2 (Inception date of 5/1/14 through 5/31/19) | | | 12.15 | |
| Class C (Inception date of 4/30/12 through 5/31/19) | | | 15.59 | |
| Class FI (5/31/09 through 5/31/19) | | | 63.99 | |
| Class R (Inception date of 4/30/12 through 5/31/19) | | | 19.57 | |
| Class I (5/31/09 through 5/31/19) | | | 68.52 | |
| Class IS (5/31/09 through 5/31/19) | | | 69.21 | |
All figures represent past performance and are not a guarantee of future results. Investment return and principal value of an investment will fluctuate so that an investor’s shares, when redeemed, may be worth more or less than their original cost. The returns shown do not reflect the deduction of taxes that a shareholder would pay on Fund distributions or the redemption of Fund shares. Performance figures may reflect compensating balance arrangements, fee waivers and/or expense reimbursements. In the absence of compensating balance arrangements, fee waivers and/or expense reimbursements, the total return would have been lower.
| 1 | Assumes the reinvestment of all distributions, including returns of capital, if any, at net asset value and does not reflect the deduction of the applicable sales charge with respect to Class A shares and Class A2 shares or the applicable contingent deferred sales charge (“CDSC”) with respect to Class C shares. |
| 2 | Assumes the reinvestment of all distributions, including returns of capital, if any, at net asset value. In addition, Class A shares and Class A2 shares reflect the deduction of the maximum initial sales charge of 4.25%. Class C shares reflect the deduction of a 1.00% CDSC, which applies if shares are redeemed within one year from purchase payment. |
| * | Inception dates for Class A, A2, C, FI, R, I and IS shares are April 30, 2012, May 1, 2014, April 30, 2012, September 6, 2006, April 30, 2012, July 6, 2006 and August 4, 2008, respectively. |
| | |
10 | | Western Asset Total Return Unconstrained Fund 2019 Annual Report |
Historical performance
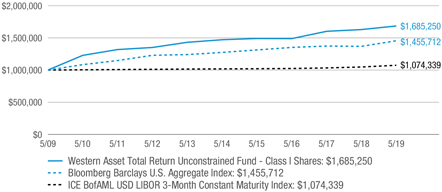
Value of $1,000,000 invested in
Class I Shares of Western Asset Total Return Unconstrained Fund vs. Bloomberg Barclays U.S. Aggregate Index and ICE BofAML USD LIBOR 3-Month Constant Maturity Index† — May 2009 - May 2019
All figures represent past performance and are not a guarantee of future results. Investment return and principal value of an investment will fluctuate so that an investor’s shares, when redeemed, may be worth more or less than their original cost. The returns shown do not reflect the deduction of taxes that a shareholder would pay on Fund distributions or the redemption of Fund shares. Performance figures may reflect compensating balance arrangements, fee waivers and/or expense reimbursements. In the absence of compensating balance arrangements, fee waivers and/or expense reimbursements, the total return would have been lower.
| † | Hypothetical illustration of $1,000,000 invested in Class I shares of Western Asset Total Return Unconstrained Fund on May 31, 2009, assuming the reinvestment of all distributions, including returns of capital, if any, at net asset value through May 31, 2019. The hypothetical illustration also assumes a $1,000,000 investment in the Bloomberg Barclays U.S. Aggregate Index and the ICE BofAML USD LIBOR3-Month Constant Maturity Index. The Bloomberg Barclays U.S. Aggregate Index is a broad-based bond index comprised of government, corporate, mortgage- and asset-backed issues, rated investment grade or higher, and having at least one year to maturity. The ICE BofAML USD LIBOR3-Month Constant Maturity Index is based on the assumed purchase of a synthetic instrument having three months to maturity and with a coupon equal to the closing quote for three-month LIBOR. That issue is sold the following day (priced at a yield equal to the current day closing three-month LIBOR rate) and is rolled into a new three-month instrument. The index, therefore, will always have a constant maturity equal to exactly three months. The indices are unmanaged and are not subject to the same management and trading expenses as a mutual fund. Please note that an investor cannot invest directly in an index. The performance of the Fund’s other classes may be greater or less than the performance of Class I shares indicated on this chart, depending on whether greater or lesser sales charges and fees were incurred by shareholders investing in the other classes. |
| | |
| Western Asset Total Return Unconstrained Fund 2019 Annual Report | | 11 |
Spread duration(unaudited)
Economic exposure— May 31, 2019
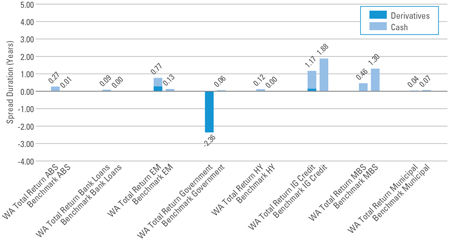
Spread duration measures the sensitivity to changes in spreads. The spread over Treasuries is the annual risk-premium demanded by investors to holdnon-Treasury securities. Spread duration is quantified as the % change in price resulting from a 100 basis points change in spreads. For a security with positive spread duration, an increase in spreads would result in a price decline and a decline in spreads would result in a price increase. This chart highlights the market sector exposure of the Fund’s sectors relative to the selected benchmark sectors as of the end of the reporting period.
| | |
| |
| ABS | | — Asset-Backed Securities |
| |
| Benchmark | | — Bloomberg Barclays U.S. Aggregate Index |
| |
| EM | | — Emerging Markets |
| |
| HY | | — High Yield |
| |
| IG Credit | | — Investment Grade Credit |
| |
| MBS | | — Mortgage-Backed Securities |
| |
| WA Total Return | | — Western Asset Total Return Unconstrained Fund |
| | |
12 | | Western Asset Total Return Unconstrained Fund 2019 Annual Report |
Effective duration(unaudited)
Interest rate exposure — May 31, 2019
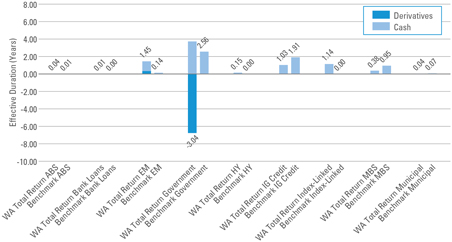
Effective duration measures the sensitivity to changes in relevant interest rates. Effective duration is quantified as the % change in price resulting from a 100 basis points change in interest rates. For a security with positive effective duration, an increase in interest rates would result in a price decline and a decline in interest rates would result in a price increase. This chart highlights the interest rate exposure of the Fund’s sectors relative to the selected benchmark sectors as of the end of the reporting period.
| | |
| |
| ABS | | — Asset-Backed Securities |
| |
| Benchmark | | — Bloomberg Barclays U.S. Aggregate Index |
| |
| EM | | — Emerging Markets |
| |
| HY | | — High Yield |
| |
| IG Credit | | — Investment Grade Credit |
| |
| MBS | | — Mortgage-Backed Securities |
| |
| WA Total Return | | — Western Asset Total Return Unconstrained Fund |
| | |
| Western Asset Total Return Unconstrained Fund 2019 Annual Report | | 13 |
Schedule of investments
May 31, 2019
Western Asset Total Return Unconstrained Fund
| | | | | | | | | | | | | | | | |
| Security | | Rate | | | Maturity
Date | | | Face
Amount† | | | Value | |
| U.S. Government & Agency Obligations — 25.3% | | | | | | | | | | | | | | | | |
U.S. Government Agencies — 0.1% | | | | | | | | | | | | | | | | |
Federal National Mortgage Association (FNMA), Subordinated Notes | | | 0.000 | % | | | 10/9/19 | | | | 2,000,000 | | | $ | 1,982,507 | |
U.S. Government Obligations — 25.2% | | | | | | | | | | | | | | | | |
U.S. Treasury Bonds | | | 3.750 | % | | | 11/15/43 | | | | 74,120,000 | | | | 90,339,540 | |
U.S. Treasury Bonds | | | 2.500 | % | | | 2/15/45 | | | | 11,210,000 | | | | 11,057,614 | |
U.S. Treasury Bonds | | | 3.000 | % | | | 5/15/45 | | | | 11,260,000 | | | | 12,195,548 | |
U.S. Treasury Bonds | | | 2.875 | % | | | 8/15/45 | | | | 37,020,000 | | | | 39,180,464 | |
U.S. Treasury Bonds | | | 2.750 | % | | | 8/15/47 | | | | 31,360,000 | | | | 32,396,350 | |
U.S. Treasury Bonds | | | 2.750 | % | | | 11/15/47 | | | | 11,130,000 | | | | 11,495,203 | |
U.S. Treasury Bonds | | | 3.000 | % | | | 2/15/48 | | | | 27,310,000 | | | | 29,589,212 | |
U.S. Treasury Bonds | | | 3.125 | % | | | 5/15/48 | | | | 4,070,000 | | | | 4,516,667 | |
U.S. Treasury Bonds | | | 3.000 | % | | | 8/15/48 | | | | 18,670,000 | | | | 20,250,751 | |
U.S. Treasury Bonds | | | 3.000 | % | | | 2/15/49 | | | | 4,120,000 | | | | 4,476,879 | |
U.S. Treasury Notes | | | 1.375 | % | | | 2/15/20 | | | | 900,000 | | | | 894,059 | |
U.S. Treasury Notes | | | 1.625 | % | | | 6/30/20 | | | | 650,000 | | | | 645,938 | |
U.S. Treasury Notes | | | 1.375 | % | | | 5/31/21 | | | | 8,800,000 | | | | 8,700,484 | |
U.S. Treasury Notes | | | 1.125 | % | | | 6/30/21 | | | | 1,680,000 | | | | 1,652,995 | |
U.S. Treasury Notes | | | 2.875 | % | | | 10/15/21 | | | | 970,000 | | | | 991,238 | |
U.S. Treasury Notes | | | 1.875 | % | | | 1/31/22 | | | | 6,140,000 | | | | 6,133,284 | |
U.S. Treasury Notes | | | 1.875 | % | | | 4/30/22 | | | | 1,910,000 | | | | 1,908,209 | |
U.S. Treasury Notes | | | 2.250 | % | | | 11/15/24 | | | | 21,360,000 | | | | 21,665,381 | |
U.S. Treasury Notes | | | 2.125 | % | | | 11/30/24 | | | | 17,410,000 | | | | 17,552,816 | |
U.S. Treasury Notes | | | 2.000 | % | | | 2/15/25 | | | | 19,010,000 | | | | 19,030,050 | |
U.S. Treasury Notes | | | 2.875 | % | | | 5/31/25 | | | | 16,650,000 | | | | 17,478,923 | |
U.S. Treasury Notes | | | 3.125 | % | | | 11/15/28 | | | | 1,760,000 | | | | 1,908,363 | |
U.S. Treasury Notes | | | 2.625 | % | | | 2/15/29 | | | | 2,250,000 | | | | 2,344,834 | |
Total U.S. Government Obligations | | | | | | | | | | | | | | | 356,404,802 | |
Total U.S. Government & Agency Obligations (Cost — $338,990,095) | | | | | | | | 358,387,309 | |
| Corporate Bonds & Notes — 22.6% | | | | | | | | | | | �� | | | | | |
| Communication Services — 2.2% | | | | | | | | | | | | | | | | |
Diversified Telecommunication Services — 0.4% | | | | | | | | | | | | | | | | |
British Telecommunications PLC, Senior Notes | | | 9.625 | % | | | 12/15/30 | | | | 1,710,000 | | | | 2,486,188 | |
Telecom Italia SpA, Senior Notes | | | 5.303 | % | | | 5/30/24 | | | | 2,450,000 | | | | 2,431,502 | (a) |
UPCB Finance IV Ltd., Senior Secured Notes | | | 5.375 | % | | | 1/15/25 | | | | 930,000 | | | | 943,950 | (a) |
Total Diversified Telecommunication Services | | | | | | | | | | | | | | | 5,861,640 | |
See Notes to Financial Statements.
| | |
14 | | Western Asset Total Return Unconstrained Fund 2019 Annual Report |
Western Asset Total Return Unconstrained Fund
| | | | | | | | | | | | | | | | |
| Security | | Rate | | | Maturity
Date | | | Face
Amount† | | | Value | |
Entertainment — 0.0% | | | | | | | | | | | | | | | | |
Walt Disney Co., Senior Notes | | | 8.450 | % | | | 8/1/34 | | | | 440,000 | | | $ | 673,036 | (a) |
Media — 1.4% | | | | | | | | | | | | | | | | |
Altice France SA, Senior Secured Notes | | | 7.375 | % | | | 5/1/26 | | | | 2,030,000 | | | | 1,988,131 | (a) |
CCO Holdings LLC/CCO Holdings Capital Corp., Senior Notes | | | 5.250 | % | | | 9/30/22 | | | | 70,000 | | | | 71,020 | |
CCO Holdings LLC/CCO Holdings Capital Corp., Senior Notes | | | 5.125 | % | | | 5/1/27 | | | | 770,000 | | | | 772,406 | (a) |
CCO Holdings LLC/CCO Holdings Capital Corp., Senior Notes | | | 5.000 | % | | | 2/1/28 | | | | 60,000 | | | | 59,550 | (a) |
Charter Communications Operating LLC/Charter Communications Operating Capital Corp., Senior Secured Notes | | | 5.375 | % | | | 4/1/38 | | | | 1,010,000 | | | | 1,035,023 | |
Comcast Corp., Senior Notes | | | 4.700 | % | | | 10/15/48 | | | | 4,640,000 | | | | 5,165,795 | |
DISH DBS Corp., Senior Notes | | | 7.875 | % | | | 9/1/19 | | | | 350,000 | | | | 353,188 | |
DISH DBS Corp., Senior Notes | | | 5.875 | % | | | 11/15/24 | | | | 970,000 | | | | 875,716 | |
DISH DBS Corp., Senior Notes | | | 7.750 | % | | | 7/1/26 | | | | 850,000 | | | | 782,000 | |
Fox Corp., Senior Notes | | | 4.709 | % | | | 1/25/29 | | | | 1,390,000 | | | | 1,519,225 | (a) |
Fox Corp., Senior Notes | | | 5.476 | % | | | 1/25/39 | | | | 430,000 | | | | 490,314 | (a) |
Myriad International Holdings BV, Senior Notes | | | 5.500 | % | | | 7/21/25 | | | | 2,460,000 | | | | 2,655,558 | (a) |
Myriad International Holdings BV, Senior Notes | | | 4.850 | % | | | 7/6/27 | | | | 1,660,000 | | | | 1,724,508 | (a) |
Time Warner Cable LLC, Senior Secured Notes | | | 7.300 | % | | | 7/1/38 | | | | 650,000 | | | | 766,076 | |
UBM PLC, Senior Notes | | | 5.750 | % | | | 11/3/20 | | | | 920,000 | | | | 952,634 | (a) |
Virgin Media Secured Finance PLC, Senior Secured Notes | | | 5.250 | % | | | 1/15/26 | | | | 200,000 | | | | 199,750 | (a) |
Total Media | | | | | | | | | | | | | | | 19,410,894 | |
Wireless Telecommunication Services — 0.4% | | | | | | | | | | | | | | | | |
CSC Holdings LLC, Secured Notes | | | 5.375 | % | | | 7/15/23 | | | | 400,000 | | | | 407,000 | (a) |
Millicom International Cellular SA, Senior Notes | | | 6.625 | % | | | 10/15/26 | | | | 1,950,000 | | | | 2,110,875 | (a) |
Millicom International Cellular SA, Senior Notes | | | 6.250 | % | | | 3/25/29 | | | | 700,000 | | | | 734,412 | (a) |
Vodafone Group PLC, Senior Notes | | | 4.375 | % | | | 5/30/28 | | | | 2,580,000 | | | | 2,692,497 | |
Total Wireless Telecommunication Services | | | | | | | | | | | | | | | 5,944,784 | |
Total Communication Services | | | | | | | | | | | | 31,890,354 | |
See Notes to Financial Statements.
| | |
| Western Asset Total Return Unconstrained Fund 2019 Annual Report | | 15 |
Schedule of investments (cont’d)
May 31, 2019
Western Asset Total Return Unconstrained Fund
| | | | | | | | | | | | | | | | |
| Security | | Rate | | | Maturity
Date | | | Face
Amount† | | | Value | |
| Consumer Discretionary — 1.2% | | | | | | | | | | | | | | | | |
Auto Components — 0.3% | | | | | | | | | | | | | | | | |
American Axle & Manufacturing Inc., Senior Notes | | | 6.625 | % | | | 10/15/22 | | | | 286,000 | | | $ | 289,933 | |
IHO Verwaltungs GmbH, Senior Secured Notes, (4.500% Cash or 5.250% PIK) | | | 4.500 | % | | | 9/15/23 | | | | 2,030,000 | | | | 2,082,272 | (a)(b) |
ZF North America Capital Inc., Senior Notes | | | 4.500 | % | | | 4/29/22 | | | | 866,000 | | | | 875,439 | (a) |
ZF North America Capital Inc., Senior Notes | | | 4.750 | % | | | 4/29/25 | | | | 1,050,000 | | | | 1,047,574 | (a) |
Total Auto Components | | | | | | | | | | | | | | | 4,295,218 | |
Automobiles — 0.1% | | | | | | | | | | | | | | | | |
General Motors Financial Co. Inc., Senior Notes | | | 4.375 | % | | | 9/25/21 | | | | 500,000 | | | | 512,419 | |
General Motors Financial Co. Inc., Senior Notes | | | 3.450 | % | | | 4/10/22 | | | | 120,000 | | | | 120,194 | |
General Motors Financial Co. Inc., Senior Notes | | | 4.250 | % | | | 5/15/23 | | | | 800,000 | | | | 814,079 | |
Total Automobiles | | | | | | | | | | | | | | | 1,446,692 | |
Diversified Consumer Services — 0.0% | | | | | | | | | | | | | | | | |
Service Corp. International, Senior Notes | | | 7.500 | % | | | 4/1/27 | | | | 230,000 | | | | 269,100 | |
Hotels, Restaurants & Leisure — 0.4% | | | | | | | | | | | | | | | | |
1011778 BC ULC/New Red Finance Inc., Senior Secured Notes | | | 4.250 | % | | | 5/15/24 | | | | 80,000 | | | | 79,300 | (a) |
Aramark Services Inc., Senior Notes | | | 5.000 | % | | | 4/1/25 | | | | 1,020,000 | | | | 1,017,450 | (a) |
GLP Capital LP/GLP Financing II Inc., Senior Notes | | | 5.250 | % | | | 6/1/25 | | | | 20,000 | | | | 21,169 | |
GLP Capital LP/GLP Financing II Inc., Senior Notes | | | 5.375 | % | | | 4/15/26 | | | | 260,000 | | | | 275,522 | |
Hilton Domestic Operating Co. Inc., Senior Notes | | | 5.125 | % | | | 5/1/26 | | | | 200,000 | | | | 202,500 | |
Hilton Worldwide Finance LLC/ Hilton Worldwide Finance Corp., Senior Notes | | | 4.625 | % | | | 4/1/25 | | | | 40,000 | | | | 40,250 | |
Hilton Worldwide Finance LLC/ Hilton Worldwide Finance Corp., Senior Notes | | | 4.875 | % | | | 4/1/27 | | | | 720,000 | | | | 726,869 | |
Sands China Ltd., Senior Notes | | | 4.600 | % | | | 8/8/23 | | | | 520,000 | | | | 542,032 | |
See Notes to Financial Statements.
| | |
16 | | Western Asset Total Return Unconstrained Fund 2019 Annual Report |
Western Asset Total Return Unconstrained Fund
| | | | | | | | | | | | | | | | |
| Security | | Rate | | | Maturity
Date | | | Face
Amount† | | | Value | |
Hotels, Restaurants & Leisure — continued | | | | | | | | | | | | | | | | |
Sands China Ltd., Senior Notes | | | 5.125 | % | | | 8/8/25 | | | | 730,000 | | | $ | 766,411 | |
VOC Escrow Ltd., Senior Secured Notes | | | 5.000 | % | | | 2/15/28 | | | | 1,760,000 | | | | 1,720,400 | (a) |
Total Hotels, Restaurants & Leisure | | | | | | | | | | | | | | | 5,391,903 | |
Household Durables — 0.1% | | | | | | | | | | | | | | | | |
Lennar Corp., Senior Notes | | | 4.750 | % | | | 11/15/22 | | | | 500,000 | | | | 516,250 | |
Lennar Corp., Senior Notes | | | 4.500 | % | | | 4/30/24 | | | | 380,000 | | | | 384,750 | |
Lennar Corp., Senior Notes | | | 4.750 | % | | | 5/30/25 | | | | 110,000 | | | | 111,650 | |
Lennar Corp., Senior Notes | | | 5.000 | % | | | 6/15/27 | | | | 60,000 | | | | 60,675 | |
Toll Brothers Finance Corp., Senior Notes | | | 5.875 | % | | | 2/15/22 | | | | 440,000 | | | | 463,100 | |
Total Household Durables | | | | | | | | | | | | | | | 1,536,425 | |
Textiles, Apparel & Luxury Goods — 0.3% | | | | | | | | | | | | | | | | |
Hanesbrands Inc., Senior Notes | | | 4.625 | % | | | 5/15/24 | | | | 2,540,000 | | | | 2,533,650 | (a) |
Hanesbrands Inc., Senior Notes | | | 4.875 | % | | | 5/15/26 | | | | 130,000 | | | | 128,313 | (a) |
Levi Strauss & Co., Senior Notes | | | 5.000 | % | | | 5/1/25 | | | | 1,120,000 | | | | 1,148,000 | |
Total Textiles, Apparel & Luxury Goods | | | | | | | | | | | | | | | 3,809,963 | |
Total Consumer Discretionary | | | | | | | | 16,749,301 | |
| Consumer Staples — 1.3% | | | | | | | | | | | | | | | | |
Beverages — 0.6% | | | | | | | | | | | | | | | | |
Anheuser-Busch Cos. LLC/ Anheuser-Busch InBev World-wide Inc., Senior Notes | | | 4.900 | % | | | 2/1/46 | | | | 660,000 | | | | 684,030 | |
Anheuser-Busch InBev World-wide Inc., Senior Notes | | | 5.550 | % | | | 1/23/49 | | | | 6,040,000 | | | | 6,841,027 | |
Anheuser-Busch InBev World-wide Inc., Senior Notes | | | 5.800 | % | | | 1/23/59 | | | | 440,000 | | | | 511,435 | |
Total Beverages | | | | | | | | | | | | | | | 8,036,492 | |
Food & Staples Retailing — 0.0% | | | | | | | | | | | | | | | | |
CVS Pass-Through Trust, Senior | | | | | | | | | | | | | | | | |
Secured Trust | | | 5.298 | % | | | 1/11/27 | | | | 15,532 | | | | 16,084 | (a) |
CVS Pass-Through Trust, Senior | | | | | | | | | | | | | | | | |
Secured Trust | | | 6.036 | % | | | 12/10/28 | | | | 55,190 | | | | 61,090 | |
Total Food & Staples Retailing | | | | | | | | | | | | | | | 77,174 | |
Food Products — 0.1% | | | | | | | | | | | | | | | | |
Kraft Heinz Foods Co., Senior Notes | | | 5.200 | % | | | 7/15/45 | | | | 1,020,000 | | | | 1,003,376 | |
Tobacco — 0.6% | | | | | | | | | | | | | | | | |
Altria Group Inc., Senior Notes | | | 4.400 | % | | | 2/14/26 | | | | 440,000 | | | | 457,309 | |
Altria Group Inc., Senior Notes | | | 4.800 | % | | | 2/14/29 | | | | 1,520,000 | | | | 1,590,099 | |
Altria Group Inc., Senior Notes | | | 6.200 | % | | | 2/14/59 | | | | 1,080,000 | | | | 1,197,050 | |
See Notes to Financial Statements.
| | |
| Western Asset Total Return Unconstrained Fund 2019 Annual Report | | 17 |
Schedule of investments (cont’d)
May 31, 2019
Western Asset Total Return Unconstrained Fund
| | | | | | | | | | | | | | | | |
| Security | | Rate | | | Maturity
Date | | | Face
Amount† | | | Value | |
Tobacco — continued | | | | | | | | | | | | | | | | |
BAT Capital Corp., Senior Notes | | | 3.557 | % | | | 8/15/27 | | | | 2,230,000 | | | $ | 2,145,474 | |
BAT Capital Corp., Senior Notes | | | 4.540 | % | | | 8/15/47 | | | | 2,090,000 | | | | 1,880,996 | |
Philip Morris International Inc., Senior Notes | | | 2.900 | % | | | 11/15/21 | | | | 600,000 | | | | 605,260 | |
Reynolds American Inc., Senior Notes | | | 8.125 | % | | | 6/23/19 | | | | 810,000 | | | | 812,498 | |
Total Tobacco | | | | | | | | | | | | | | | 8,688,686 | |
Total Consumer Staples | | | | | | | | 17,805,728 | |
| Energy — 4.8% | | | | | | | | | | | | | | | | |
Energy Equipment & Services — 0.1% | | | | | | | | | | | | | | | | |
Halliburton Co., Senior Notes | | | 4.850 | % | | | 11/15/35 | | | | 910,000 | | | | 974,692 | |
Oil, Gas & Consumable Fuels — 4.7% | | | | | | | | | | | | | | | | |
Anadarko Petroleum Corp., Senior Notes | | | 4.850 | % | | | 3/15/21 | | | | 2,302,000 | | | | 2,378,159 | |
Anadarko Petroleum Corp., Senior Notes | | | 7.950 | % | | | 6/15/39 | | | | 2,330,000 | | | | 3,237,228 | |
Anadarko Petroleum Corp., Senior Notes | | | 6.200 | % | | | 3/15/40 | | | | 1,000,000 | | | | 1,200,947 | |
Antero Resources Corp., Senior Notes | | | 5.000 | % | | | 3/1/25 | | | | 830,000 | | | | 791,613 | |
BP Capital Markets America Inc., Senior Notes | | | 3.216 | % | | | 11/28/23 | | | | 1,070,000 | | | | 1,091,272 | |
Cheniere Corpus Christi Holdings LLC, Senior Secured Notes | | | 5.125 | % | | | 6/30/27 | | | | 450,000 | | | | 466,884 | |
Chesapeake Energy Corp., Senior Notes | | | 8.000 | % | | | 6/15/27 | | | | 100,000 | | | | 89,000 | |
CNOOC Finance 2015 USA LLC, Senior Notes | | | 3.500 | % | | | 5/5/25 | | | | 3,230,000 | | | | 3,280,633 | |
Continental Resources Inc., Senior Notes | | | 3.800 | % | | | 6/1/24 | | | | 190,000 | | | | 191,049 | |
Continental Resources Inc., Senior Notes | | | 4.375 | % | | | 1/15/28 | | | | 160,000 | | | | 164,726 | |
DCP Midstream Operating LP, Senior Notes | | | 6.750 | % | | | 9/15/37 | | | | 1,340,000 | | | | 1,386,900 | (a) |
Devon Energy Corp., Senior Notes | | | 5.850 | % | | | 12/15/25 | | | | 210,000 | | | | 243,045 | |
Devon Energy Corp., Senior Notes | | | 5.600 | % | | | 7/15/41 | | | | 40,000 | | | | 45,573 | |
Diamondback Energy Inc., Senior Notes | | | 5.375 | % | | | 5/31/25 | | | | 290,000 | | | | 302,325 | |
Ecopetrol SA, Senior Notes | | | 5.875 | % | | | 9/18/23 | | | | 1,730,000 | | | | 1,888,122 | |
Ecopetrol SA, Senior Notes | | | 4.125 | % | | | 1/16/25 | | | | 720,000 | | | | 724,507 | |
See Notes to Financial Statements.
| | |
18 | | Western Asset Total Return Unconstrained Fund 2019 Annual Report |
Western Asset Total Return Unconstrained Fund
| | | | | | | | | | | | | | | | |
| Security | | Rate | | | Maturity
Date | | | Face
Amount† | | | Value | |
Oil, Gas & Consumable Fuels — continued | | | | | | | | | | | | | | | | |
Ecopetrol SA, Senior Notes | | | 5.375 | % | | | 6/26/26 | | | | 350,000 | | | $ | 373,695 | |
Ecopetrol SA, Senior Notes | | | 5.875 | % | | | 5/28/45 | | | | 1,620,000 | | | | 1,669,313 | |
Energy Transfer Partners LP/Regency Energy Finance Corp., Senior Notes | | | 5.875 | % | | | 3/1/22 | | | | 1,960,000 | | | | 2,092,121 | |
KazMunayGas National Co. JSC, Senior Notes | | | 4.750 | % | | | 4/19/27 | | | | 4,170,000 | | | | 4,380,189 | (a) |
KazMunayGas National Co. JSC, Senior Notes | | | 5.375 | % | | | 4/24/30 | | | | 200,000 | | | | 215,985 | (a) |
KazMunayGas National Co. JSC, Senior Notes | | | 6.375 | % | | | 10/24/48 | | | | 530,000 | | | | 600,177 | (a) |
Kerr-McGee Corp., Senior Notes | | | 6.950 | % | | | 7/1/24 | | | | 380,000 | | | | 447,133 | |
Kinder Morgan Energy Partners LP, Senior Notes | | | 3.950 | % | | | 9/1/22 | | | | 360,000 | | | | 371,755 | |
Kinder Morgan Inc., Senior Notes | | | 5.000 | % | | | 2/15/21 | | | | 160,000 | | | | 165,588 | (a) |
Kinder Morgan Inc., Senior Notes | | | 7.750 | % | | | 1/15/32 | | | | 1,220,000 | | | | 1,600,203 | |
Lukoil International Finance BV, Senior Notes | | | 6.125 | % | | | 11/9/20 | | | | 1,400,000 | | | | 1,454,674 | (a) |
Lukoil International Finance BV, Senior Notes | | | 6.656 | % | | | 6/7/22 | | | | 2,360,000 | | | | 2,565,759 | (c) |
MPLX LP, Senior Notes | | | 4.875 | % | | | 6/1/25 | | | | 550,000 | | | | 588,928 | |
NGPL PipeCo LLC, Senior Notes | | | 4.875 | % | | | 8/15/27 | | | | 2,930,000 | | | | 3,021,563 | (a) |
Oasis Petroleum Inc., Senior Notes | | | 6.875 | % | | | 1/15/23 | | | | 171,000 | | | | 164,588 | |
Petrobras Global Finance BV, Senior Notes | | | 6.250 | % | | | 3/17/24 | | | | 2,170,000 | | | | 2,358,660 | |
Petrobras Global Finance BV, Senior Notes | | | 6.900 | % | | | 3/19/49 | | | | 2,580,000 | | | | 2,582,580 | |
Petrobras Global Finance BV, Senior Notes | | | 6.850 | % | | | 6/5/2115 | | | | 4,340,000 | | | | 4,266,220 | |
Petroleos Mexicanos, Senior Notes | | | 6.875 | % | | | 8/4/26 | | | | 130,000 | | | | 135,395 | |
Petroleos Mexicanos, Senior Notes | | | 5.500 | % | | | 6/27/44 | | | | 1,430,000 | | | | 1,160,459 | |
QEP Resources Inc., Senior Notes | | | 6.875 | % | | | 3/1/21 | | | | 1,200,000 | | | | 1,224,000 | |
Range Resources Corp., Senior Notes | | | 5.875 | % | | | 7/1/22 | | | | 200,000 | | | | 197,000 | |
Range Resources Corp., Senior Notes | | | 5.000 | % | | | 3/15/23 | | | | 170,000 | | | | 159,375 | |
Range Resources Corp., Senior Notes | | | 4.875 | % | | | 5/15/25 | | | | 420,000 | | | | 367,500 | |
Reliance Holding USA Inc., Senior Notes | | | 5.400 | % | | | 2/14/22 | | | | 1,990,000 | | | | 2,106,928 | (a) |
See Notes to Financial Statements.
| | |
| Western Asset Total Return Unconstrained Fund 2019 Annual Report | | 19 |
Schedule of investments (cont’d)
May 31, 2019
Western Asset Total Return Unconstrained Fund
| | | | | | | | | | | | | | | | |
| Security | | Rate | | | Maturity
Date | | | Face
Amount† | | | Value | |
Oil, Gas & Consumable Fuels — continued | | | | | | | | | | | | | | | | |
Rockies Express Pipeline LLC, Senior Notes | | | 6.875 | % | | | 4/15/40 | | | | 2,540,000 | | | $ | 2,750,947 | (a) |
Targa Resources Partners LP/Targa Resources Partners Finance Corp., Senior Notes | | | 4.250 | % | | | 11/15/23 | | | | 230,000 | | | | 226,550 | |
Targa Resources Partners LP/Targa Resources Partners Finance Corp., Senior Notes | | | 5.875 | % | | | 4/15/26 | | | | 180,000 | | | | 186,525 | |
Targa Resources Partners LP/Targa Resources Partners Finance Corp., Senior Notes | | | 6.500 | % | | | 7/15/27 | | | | 210,000 | | | | 219,230 | (a) |
Targa Resources Partners LP/Targa Resources Partners Finance Corp., Senior Notes | | | 6.875 | % | | | 1/15/29 | | | | 260,000 | | | | 277,713 | (a) |
Ultrapar International SA, Senior Notes | | | 5.250 | % | | | 10/6/26 | | | | 2,730,000 | | | | 2,818,752 | (a) |
Williams Cos. Inc., Senior Notes | | | 5.750 | % | | | 6/24/44 | | | | 220,000 | | | | 240,214 | |
WPX Energy Inc., Senior Notes | | | 6.000 | % | | | 1/15/22 | | | | 20,000 | | | | 20,394 | |
WPX Energy Inc., Senior Notes | | | 8.250 | % | | | 8/1/23 | | | | 2,660,000 | | | | 2,945,950 | |
YPF SA, Senior Notes | | | 8.500 | % | | | 3/23/21 | | | | 3,690,000 | | | | 3,630,037 | (a) |
YPF SA, Senior Notes | | | 8.750 | % | | | 4/4/24 | | | | 1,320,000 | | | | 1,294,260 | (a) |
YPF SA, Senior Notes | | | 6.950 | % | | | 7/21/27 | | | | 580,000 | | | | 500,192 | (a) |
Total Oil, Gas & Consumable Fuels | | | | | | | | | | | | | | | 66,862,535 | |
Total Energy | | | | | | | | 67,837,227 | |
| Financials — 6.1% | | | | | | | | | | | | | | | | |
Banks — 4.4% | | | | | | | | | | | | | | | | |
BAC Capital Trust XIV, Junior Subordinated Notes (the greater of 3 mo. USD LIBOR + 0.400% or 4.000%) | | | 4.000 | % | | | 6/17/19 | | | | 370,000 | | | | 298,484 | (d)(e) |
Banco Mercantil del Norte SA, Junior Subordinated Notes (7.625% to 1/10/28 then 10 year Treasury Constant Maturity Rate + 5.353%) | | | 7.625 | % | | | 1/10/28 | | | | 260,000 | | | | 267,800 | (a)(d)(e) |
Banco Mercantil del Norte SA, Junior Subordinated Notes (6.875% to 7/6/22 then 5 year Treasury Constant Maturity Rate + 5.035%) | | | 6.875 | % | | | 7/6/22 | | | | 260,000 | | | | 266,438 | (a)(d)(e) |
See Notes to Financial Statements.
| | |
20 | | Western Asset Total Return Unconstrained Fund 2019 Annual Report |
Western Asset Total Return Unconstrained Fund
| | | | | | | | | | | | | | | | |
| Security | | Rate | | | Maturity
Date | | | Face
Amount† | | | Value | |
Banks — continued | | | | | | | | | | | | | | | | |
Bank of America Corp., Senior Notes (3.419% to 12/20/27 then 3 mo. USD LIBOR + 1.040%) | | | 3.419 | % | | | 12/20/28 | | | | 631,000 | | | $ | 630,450 | (e) |
Bank of America Corp., Senior Notes (3.593% to 7/21/27 then 3 mo. USD LIBOR + 1.370%) | | | 3.593 | % | | | 7/21/28 | | | | 300,000 | | | | 303,178 | (e) |
Bank of America Corp., Subordinated Notes | | | 4.000 | % | | | 1/22/25 | | | | 1,220,000 | | | | 1,260,029 | |
Bank of America Corp., Subordinated Notes | | | 4.250 | % | | | 10/22/26 | | | | 1,930,000 | | | | 2,011,891 | |
Barclays Bank PLC, Subordinated Notes | | | 10.179 | % | | | 6/12/21 | | | | 1,120,000 | | | | 1,263,616 | (a) |
BNP Paribas SA, Junior Subordinated Notes (7.375% to 8/19/25 then USD 5 year ICE Swap Rate + 5.150%) | | | 7.375 | % | | | 8/19/25 | | | | 950,000 | | | | 1,020,894 | (a)(d)(e) |
BPCE SA, Junior Subordinated Notes (12.500% to 9/30/19 then 3 mo. USD LIBOR + 12.980%) | | | 12.500 | % | | | 9/30/19 | | | | 1,022,000 | | | | 1,053,743 | (a)(d)(e) |
BPCE SA, Subordinated Notes | | | 5.150 | % | | | 7/21/24 | | | | 2,680,000 | | | | 2,837,271 | (a) |
CIT Group Inc., Senior Notes | | | 5.000 | % | | | 8/15/22 | | | | 824,000 | | | | 856,564 | |
CIT Group Inc., Senior Notes | | | 4.750 | % | | | 2/16/24 | | | | 100,000 | | | | 102,949 | |
Citigroup Inc., Junior Subordinated Notes (5.950% to 5/15/25 then 3 mo. USD LIBOR + 3.905%) | | | 5.950 | % | | | 5/15/25 | | | | 1,310,000 | | | | 1,355,359 | (d)(e) |
Citigroup Inc., Senior Notes | | | 4.650 | % | | | 7/30/45 | | | | 1,308,000 | | | | 1,437,554 | |
Citigroup Inc., Subordinated Notes | | | 5.500 | % | | | 9/13/25 | | | | 1,680,000 | | | | 1,866,214 | |
Citigroup Inc., Subordinated Notes | | | 4.450 | % | | | 9/29/27 | | | | 2,610,000 | | | | 2,731,594 | |
Cooperatieve Rabobank UA, Junior Subordinated Notes (4.625% to 12/29/25 then EUR 5 year Swap Rate + 4.098%) | | | 4.625 | % | | | 12/29/25 | | | | 2,200,000 | EUR | | | 2,538,921 | (c)(d)(e) |
Cooperatieve Rabobank UA, Senior Notes | | | 4.625 | % | | | 12/1/23 | | | | 2,150,000 | | | | 2,262,933 | |
Cooperatieve Rabobank UA, Senior Notes | | | 4.375 | % | | | 8/4/25 | | | | 300,000 | | | | 312,924 | |
Credit Agricole SA, Junior Subordinated Notes (8.125% to 12/23/25 then USD 5 year ICE Swap Rate + 6.185%) | | | 8.125 | % | | | 12/23/25 | | | | 1,650,000 | | | | 1,843,545 | (a)(d)(e) |
See Notes to Financial Statements.
| | |
| Western Asset Total Return Unconstrained Fund 2019 Annual Report | | 21 |
Schedule of investments (cont’d)
May 31, 2019
Western Asset Total Return Unconstrained Fund
| | | | | | | | | | | | | | | | |
| Security | | Rate | | | Maturity
Date | | | Face
Amount† | | | Value | |
Banks — continued | | | | | | | | | | | | | | | | |
Credit Agricole SA, Junior Subordinated Notes (8.375% to 10/13/19 then 3 mo. USD LIBOR + 6.982%) | | | 8.375 | % | | | 10/13/19 | | | | 1,300,000 | | | $ | 1,326,000 | (a)(d)(e) |
HSBC Holdings PLC, Junior Subordinated Notes (5.250% to 9/16/22 then EUR 5 year Swap Rate + 4.383%) | | | 5.250 | % | | | 9/16/22 | | | | 1,330,000 | EUR | | | 1,572,677 | (c)(d)(e) |
HSBC Holdings PLC, Junior Subordinated Notes (6.000% to 5/22/27 then USD 5 year ICE Swap Rate + 3.746%) | | | 6.000 | % | | | 5/22/27 | | | | 780,000 | | | | 769,833 | (d)(e) |
HSBC Holdings PLC, Junior Subordinated Notes (6.250% to 3/23/23 then USD 5 year ICE Swap Rate + 3.453%) | | | 6.250 | % | | | 3/23/23 | | | | 1,830,000 | | | | 1,828,975 | (d)(e) |
HSBC Holdings PLC, Junior Subordinated Notes (6.375% to 9/17/24 then USD 5 year ICE Swap Rate + 3.705%) | | | 6.375 | % | | | 9/17/24 | | | | 300,000 | | | | 300,567 | (d)(e) |
HSBC Holdings PLC, Junior Subordinated Notes (6.500% to 3/23/28 then USD 5 year ICE Swap Rate + 3.606%) | | | 6.500 | % | | | 3/23/28 | | | | 1,830,000 | | | | 1,833,916 | (d)(e) |
HSBC Holdings PLC, Subordinated Notes | | | 4.250 | % | | | 8/18/25 | | | | 450,000 | | | | 462,889 | |
ING Bank NV, Subordinated Notes | | | 5.800 | % | | | 9/25/23 | | | | 1,300,000 | | | | 1,417,202 | (a) |
Intesa Sanpaolo SpA, Senior Notes | | | 3.375 | % | | | 1/12/23 | | | | 530,000 | | | | 517,869 | (a) |
Intesa Sanpaolo SpA, Subordinated Notes | | | 5.017 | % | | | 6/26/24 | | | | 1,230,000 | | | | 1,166,528 | (a) |
Lloyds Banking Group PLC, Junior Subordinated Notes (6.375% to 6/27/20 then EUR 5 year Swap Rate + 5.290%) | | | 6.375 | % | | | 6/27/20 | | | | 1,312,000 | EUR | | | 1,507,631 | (c)(d)(e) |
Lloyds Banking Group PLC, Subordinated Notes | | | 4.500 | % | | | 11/4/24 | | | | 1,230,000 | | | | 1,258,044 | |
Nordea Bank ABP, Subordinated Notes | | | 4.875 | % | | | 5/13/21 | | | | 910,000 | | | | 943,347 | (a) |
Royal Bank of Scotland Group PLC, Subordinated Notes | | | 6.000 | % | | | 12/19/23 | | | | 1,200,000 | | | | 1,280,684 | |
Royal Bank of Scotland Group PLC, Subordinated Notes | | | 5.125 | % | | | 5/28/24 | | | | 7,320,000 | | | | 7,536,367 | |
See Notes to Financial Statements.
| | |
22 | | Western Asset Total Return Unconstrained Fund 2019 Annual Report |
Western Asset Total Return Unconstrained Fund
| | | | | | | | | | | | | | | | |
| Security | | Rate | | | Maturity
Date | | | Face
Amount† | | | Value | |
Banks — continued | | | | | | | | | | | | | | | | |
Santander UK Group Holdings PLC, Subordinated Notes | | | 4.750 | % | | | 9/15/25 | | | | 900,000 | | | $ | 909,099 | (a) |
Standard Chartered PLC, Subordinated Notes | | | 5.700 | % | | | 3/26/44 | | | | 780,000 | | | | 868,353 | (a) |
Wachovia Capital Trust III Ltd., Junior Subordinated Bonds (the greater of 3 mo. USD LIBOR + 0.930% or 5.570%) | | | 5.570 | % | | | 7/1/19 | | | | 130,000 | | | | 129,313 | (d)(e) |
Wells Fargo & Co., Subordinated Notes | | | 4.480 | % | | | 1/16/24 | | | | 3,768,000 | | | | 3,990,645 | |
Wells Fargo & Co., Subordinated Notes | | | 4.100 | % | | | 6/3/26 | | | | 820,000 | | | | 850,191 | |
Wells Fargo & Co., Subordinated Notes | | | 4.300 | % | | | 7/22/27 | | | | 3,740,000 | | | | 3,926,554 | |
Wells Fargo & Co., Subordinated Notes | | | 5.375 | % | | | 11/2/43 | | | | 460,000 | | | | 535,090 | |
Total Banks | | | | | | | | | | | | | | | 61,454,125 | |
Capital Markets — 1.0% | | | | | | | | | |
Credit Suisse Group Funding Guernsey Ltd., Senior Notes | | | 4.550 | % | | | 4/17/26 | | | | 310,000 | | | | 328,672 | |
Goldman Sachs Capital II Ltd. (3 mo. USD LIBOR + 0.768%, 4.000% floor) | | | 4.000 | % | | | 7/1/19 | | | | 75,000 | | | | 59,041 | (d)(e) |
Goldman Sachs Group Inc., Senior Notes | | | 5.750 | % | | | 1/24/22 | | | | 600,000 | | | | 645,261 | |
Goldman Sachs Group Inc., Senior Notes | | | 6.250 | % | | | 2/1/41 | | | | 1,910,000 | | | | 2,450,883 | |
Goldman Sachs Group Inc., Senior Notes | | | 4.750 | % | | | 10/21/45 | | | | 740,000 | | | | 807,393 | |
Goldman Sachs Group Inc., Subordinated Notes | | | 4.250 | % | | | 10/21/25 | | | | 1,610,000 | | | | 1,668,826 | |
Goldman Sachs Group Inc., Subordinated Notes | | | 5.150 | % | | | 5/22/45 | | | | 530,000 | | | | 578,105 | |
Lehman Brothers Holdings Capital Trust VII, Junior Subordinated Notes | | | 5.857 | % | | | 7/12/19 | | | | 100,000 | | | | 0 | *(d)(f)(g)(h)(i) |
See Notes to Financial Statements.
| | |
| Western Asset Total Return Unconstrained Fund 2019 Annual Report | | 23 |
Schedule of investments (cont’d)
May 31, 2019
Western Asset Total Return Unconstrained Fund
| | | | | | | | | | | | | | | | |
| Security | | Rate | | | Maturity
Date | | | Face
Amount† | | | Value | |
Capital Markets — continued | | | | | | | | | | | | | | | | |
Lehman Brothers Holdings Inc., Subordinated Notes | | | 6.750 | % | | | 12/28/17 | | | | 2,350,000 | | | $ | 0 | *(g)(h)(i)(j) |
UBS Group Funding Switzerland AG, Senior Notes (7.000% to 1/31/24 then USD 5 year ICE Swap Rate + 4.344%) | | | 7.000 | % | | | 1/31/24 | | | | 7,810,000 | | | | 8,029,773 | (a)(d)(e) |
Total Capital Markets | | | | | | | | | | | | | | | 14,567,954 | |
Diversified Financial Services — 0.6% | | | | | | | | | | | | | | | | |
AerCap Ireland Capital DAC/ AerCap Global Aviation Trust, Senior Notes | | | 4.500 | % | | | 5/15/21 | | | | 1,150,000 | | | | 1,181,421 | |
AerCap Ireland Capital DAC/ AerCap Global Aviation Trust, Senior Notes | | | 4.625 | % | | | 7/1/22 | | | | 1,350,000 | | | | 1,403,504 | |
DAE Funding LLC, Senior Notes | | | 5.750 | % | | | 11/15/23 | | | | 320,000 | | | | 331,600 | (a) |
Indian Railway Finance Corp. Ltd., Senior Secured Notes | | | 7.270 | % | | | 6/15/27 | | | | 100,000,000 | INR | | | 1,371,585 | |
Park Aerospace Holdings Ltd., Senior Notes | | | 5.250 | % | | | 8/15/22 | | | | 1,890,000 | | | | 1,970,325 | (a) |
Park Aerospace Holdings Ltd., Senior Notes | | | 4.500 | % | | | 3/15/23 | | | | 370,000 | | | | 375,058 | (a) |
Park Aerospace Holdings Ltd., Senior Notes | | | 5.500 | % | | | 2/15/24 | | | | 880,000 | | | | 923,613 | (a) |
Power Finance Corp. Ltd., Senior Notes | | | 7.280 | % | | | 6/10/22 | | | | 100,000,000 | INR | | | 1,409,620 | |
Total Diversified Financial Services | | | | | | | | | | | | | | | 8,966,726 | |
Insurance — 0.1% | | | | | | | | | | | | | | | | |
MetLife Inc., Junior Subordinated Notes (6.400% to 12/15/36 then 3 mo. USD LIBOR + 2.205%) | | | 6.400 | % | | | 12/15/36 | | | | 830,000 | | | | 918,553 | (e) |
Total Financials | | | | | | | | | | | | | | | 85,907,358 | |
| Health Care — 2.7% | | | | | | | | | | | | | | | | |
Biotechnology — 0.0% | | | | | | | | | | | | | | | | |
Celgene Corp., Senior Notes | | | 3.625 | % | | | 5/15/24 | | | | 160,000 | | | | 165,954 | |
Celgene Corp., Senior Notes | | | 5.000 | % | | | 8/15/45 | | | | 460,000 | | | | 535,811 | |
Total Biotechnology | | | | | | | | | | | | | | | 701,765 | |
Health Care Equipment & Supplies — 0.2% | | | | | | | | | | | | | | | | |
Becton Dickinson and Co., Senior Notes | | | 3.700 | % | | | 6/6/27 | | | | 3,080,000 | | | | 3,155,271 | |
See Notes to Financial Statements.
| | |
24 | | Western Asset Total Return Unconstrained Fund 2019 Annual Report |
Western Asset Total Return Unconstrained Fund
| | | | | | | | | | | | | | | | |
| Security | | Rate | | | Maturity
Date | | | Face
Amount† | | | Value | |
Health Care Providers & Services — 2.1% | | | | | | | | | | | | | |
Aetna Inc., Senior Notes | | | 2.800 | % | | | 6/15/23 | | | | 170,000 | | | $ | 169,009 | |
BioScrip Inc., Senior Notes | | | 8.875 | % | | | 2/15/21 | | | | 1,120,000 | | | | 1,122,800 | |
Centene Corp., Senior Notes | | | 5.625 | % | | | 2/15/21 | | | | 90,000 | | | | 91,125 | |
Centene Corp., Senior Notes | | | 4.750 | % | | | 5/15/22 | | | | 160,000 | | | | 162,154 | |
Centene Corp., Senior Notes | | | 6.125 | % | | | 2/15/24 | | | | 370,000 | | | | 386,698 | |
Centene Corp., Senior Notes | | | 4.750 | % | | | 1/15/25 | | | | 2,080,000 | | | | 2,111,200 | |
Cigna Corp., Senior Notes | | | 4.125 | % | | | 11/15/25 | | | | 460,000 | | | | 479,940 | (a) |
Cigna Corp., Senior Notes | | | 4.375 | % | | | 10/15/28 | | | | 1,140,000 | | | | 1,195,916 | (a) |
CommonSpirit Health, Secured Notes | | | 4.350 | % | | | 11/1/42 | | | | 3,750,000 | | | | 3,775,145 | |
CVS Health Corp., Senior Notes | | | 2.750 | % | | | 12/1/22 | | | | 600,000 | | | | 596,322 | |
CVS Health Corp., Senior Notes | | | 4.000 | % | | | 12/5/23 | | | | 620,000 | | | | 641,309 | |
CVS Health Corp., Senior Notes | | | 4.100 | % | | | 3/25/25 | | | | 3,630,000 | | | | 3,758,877 | |
CVS Health Corp., Senior Notes | | | 4.300 | % | | | 3/25/28 | | | | 3,900,000 | | | | 4,020,136 | |
CVS Health Corp., Senior Notes | | | 5.050 | % | | | 3/25/48 | | | | 1,660,000 | | | | 1,691,114 | |
Dignity Health, Secured Notes | | | 5.267 | % | | | 11/1/64 | | | | 860,000 | | | | 953,129 | |
Fresenius Medical Care U.S. Finance II Inc., Senior Notes | | | 4.125 | % | | | 10/15/20 | | | | 430,000 | | | | 435,592 | (a) |
Hackensack Meridian Health Inc., Secured Notes | | | 4.211 | % | | | 7/1/48 | | | | 1,060,000 | | | | 1,162,488 | |
HCA Inc., Senior Notes | | | 5.875 | % | | | 5/1/23 | | | | 450,000 | | | | 478,971 | |
HCA Inc., Senior Notes | | | 5.875 | % | | | 2/15/26 | | | | 540,000 | | | | 573,755 | |
HCA Inc., Senior Secured Notes | | | 5.000 | % | | | 3/15/24 | | | | 720,000 | | | | 765,669 | |
HCA Inc., Senior Secured Notes | | | 5.250 | % | | | 6/15/26 | | | | 10,000 | | | | 10,755 | |
HCA Inc., Senior Secured Notes | | | 5.500 | % | | | 6/15/47 | | | | 740,000 | | | | 778,824 | |
Humana Inc., Senior Notes | | | 3.150 | % | | | 12/1/22 | | | | 1,160,000 | | | | 1,172,322 | |
Humana Inc., Senior Notes | | | 8.150 | % | | | 6/15/38 | | | | 480,000 | | | | 662,734 | |
Humana Inc., Senior Notes | | | 4.625 | % | | | 12/1/42 | | | | 180,000 | | | | 182,735 | |
UnitedHealth Group Inc., Senior Notes | | | 4.625 | % | | | 7/15/35 | | | | 1,200,000 | | | | 1,341,768 | |
Willis-Knighton Medical Center, Secured Notes | | | 4.813 | % | | | 9/1/48 | | | | 770,000 | | | | 909,494 | |
Total Health Care Providers & Services | | | | | | | | | | | | 29,629,981 | |
Pharmaceuticals — 0.4% | | | | | | | | | | | | | | | | |
Bausch Health Americas Inc., Senior Notes | | | 9.250 | % | | | 4/1/26 | | | | 330,000 | | | | 358,153 | (a) |
Bausch Health Cos. Inc., Senior Notes | | | 9.000 | % | | | 12/15/25 | | | | 380,000 | | | | 410,400 | (a) |
Bristol-Myers Squibb Co., Senior Notes | | | 4.250 | % | | | 10/26/49 | | | | 1,400,000 | | | | 1,482,002 | (a) |
See Notes to Financial Statements.
| | |
| Western Asset Total Return Unconstrained Fund 2019 Annual Report | | 25 |
Schedule of investments (cont’d)
May 31, 2019
Western Asset Total Return Unconstrained Fund
| | | | | | | | | | | | | | | | |
| Security | | Rate | | | Maturity
Date | | | Face
Amount† | | | Value | |
Pharmaceuticals — continued | | | | | | | | | | | | | | | | |
Teva Pharmaceutical Finance Co. BV, Senior Notes | | | 3.650 | % | | | 11/10/21 | | | | 2,300,000 | | | $ | 2,159,125 | |
Teva Pharmaceutical Finance IV BV, Senior Notes | | | 3.650 | % | | | 11/10/21 | | | | 50,000 | | | | 46,938 | |
Teva Pharmaceutical Finance Netherlands III BV, Senior Notes | | | 2.200 | % | | | 7/21/21 | | | | 740,000 | | | | 685,573 | |
Total Pharmaceuticals | | | | | | | | | | | | | | | 5,142,191 | |
Total Health Care | | | | | | | | | | | | | | | 38,629,208 | |
| Industrials — 0.5% | | | | | | | | | | | | | | | | |
Airlines — 0.1% | | | | | | | | | | | | | | | | |
Air 2 U.S. Pass-Through Certificates | | | 8.027 | % | | | 10/1/19 | | | | 4,444 | | | | 4,455 | (a) |
Continental Airlines Pass-Through Trust | | | 7.250 | % | | | 11/10/19 | | | | 520,641 | | | | 529,179 | |
Continental Airlines Pass-Through Trust | | | 6.703 | % | | | 6/15/21 | | | | 5,004 | | | | 5,250 | |
Total Airlines | | | | | | | | | | | | | | | 538,884 | |
Commercial Services & Supplies — 0.2% | | | | | | | | | | | | | |
Republic Services Inc., Senior Notes | | | 5.500 | % | | | 9/15/19 | | | | 290,000 | | | | 292,037 | |
United Rentals North America Inc., Senior Notes | | | 6.500 | % | | | 12/15/26 | | | | 40,000 | | | | 42,500 | |
United Rentals North America Inc., Senior Notes | | | 5.500 | % | | | 5/15/27 | | | | 580,000 | | | | 586,525 | |
United Rentals North America Inc., Senior Notes | | | 5.250 | % | | | 1/15/30 | | | | 1,970,000 | | | | 1,935,525 | |
Total Commercial Services & Supplies | | | | | | | | | | | | 2,856,587 | |
Industrial Conglomerates — 0.2% | | | | | | | | | | | | | | | | |
Alfa SAB de CV, Senior Notes | | | 5.250 | % | | | 3/25/24 | | | | 700,000 | | | | 732,382 | (a) |
General Electric Co., Senior Notes | | | 5.875 | % | | | 1/14/38 | | | | 1,320,000 | | | | 1,450,578 | |
General Electric Co., Senior Notes | | | 6.875 | % | | | 1/10/39 | | | | 670,000 | | | | 813,758 | |
Total Industrial Conglomerates | | | | | | | | | | | | | | | 2,996,718 | |
Trading Companies & Distributors — 0.0% | | | | | | | | | | | | | |
Beacon Roofing Supply Inc., Senior Notes | | | 4.875 | % | | | 11/1/25 | | | | 260,000 | | | | 246,758 | (a) |
Total Industrials | | | | | | | | | | | | | | | 6,638,947 | |
| Information Technology — 0.2% | | | | | | | | | | | | | | | | |
IT Services — 0.1% | | | | | | | | | | | | | | | | |
First Data Corp., Senior Secured Notes | | | 5.000 | % | | | 1/15/24 | | | | 1,800,000 | | | | 1,840,500 | (a) |
See Notes to Financial Statements.
| | |
26 | | Western Asset Total Return Unconstrained Fund 2019 Annual Report |
Western Asset Total Return Unconstrained Fund
| | | | | | | | | | | | | | | | |
| Security | | Rate | | | Maturity
Date | | | Face
Amount† | | | Value | |
Technology Hardware, Storage & Peripherals — 0.1% | | | | | | | | | |
Dell International LLC/EMC Corp., Senior Secured Notes | | | 4.420 | % | | | 6/15/21 | | | | 1,145,000 | | | $ | 1,173,543 | (a) |
Total Information Technology | | | | | | | | | | | | | | | 3,014,043 | |
| Materials — 2.6% | | | | | | | | | | | | | | | | |
Chemicals — 0.7% | | | | | | | | | | | | | | | | |
Braskem America Finance Co., Senior Notes | | | 7.125 | % | | | 7/22/41 | | | | 5,560,000 | | | | 6,324,500 | (c) |
OCP SA, Senior Notes | | | 5.625 | % | | | 4/25/24 | | | | 3,220,000 | | | | 3,449,019 | (a) |
Total Chemicals | | | | | | | | | | | | | | | 9,773,519 | |
Construction Materials — 0.0% | | | | | | | | | | | | | | | | |
Cemex SAB de CV, Senior Secured Notes | | | 5.700 | % | | | 1/11/25 | | | | 250,000 | | | | 255,237 | (a) |
Containers & Packaging — 0.4% | | | | | | | | | | | | | | | | |
Ardagh Packaging Finance PLC/ Ardagh Holdings USA Inc., Senior Notes | | | 6.000 | % | | | 2/15/25 | | | | 1,430,000 | | | | 1,419,561 | (a) |
Reynolds Group Issuer Inc./Reynolds Group Issuer LLC/Reynolds Group Issuer (Luxembourg) SA, Senior Secured Notes | | | 5.750 | % | | | 10/15/20 | | | | 639,611 | | | | 641,402 | |
Suzano Austria GmbH, Senior Notes | | | 7.000 | % | | | 3/16/47 | | | | 3,060,000 | | | | 3,325,302 | (a) |
WestRock RKT LLC, Senior Notes | | | 3.500 | % | | | 3/1/20 | | | | 70,000 | | | | 70,466 | |
Total Containers & Packaging | | | | | | | | | | | | | | | 5,456,731 | |
Metals & Mining — 1.5% | | | | | | | | | | | | | | | | |
Alcoa Nederland Holding BV, Senior Notes | | | 6.750 | % | | | 9/30/24 | | | | 2,750,000 | | | | 2,818,750 | (a) |
Alcoa Nederland Holding BV, Senior Notes | | | 7.000 | % | | | 9/30/26 | | | | 1,790,000 | | | | 1,883,975 | (a) |
Alcoa Nederland Holding BV, Senior Notes | | | 6.125 | % | | | 5/15/28 | | | | 250,000 | | | | 251,875 | (a) |
Anglo American Capital PLC, Senior Notes | | | 3.625 | % | | | 9/11/24 | | | | 1,850,000 | | | | 1,857,953 | (a) |
Anglo American Capital PLC, Senior Notes | | | 4.000 | % | | | 9/11/27 | | | | 290,000 | | | | 284,618 | (a) |
ArcelorMittal, Senior Notes | | | 7.000 | % | | | 10/15/39 | | | | 1,520,000 | | | | 1,734,973 | |
ArcelorMittal, Senior Notes | | | 6.750 | % | | | 3/1/41 | | | | 840,000 | | | | 936,053 | |
Arconic Inc., Senior Notes | | | 5.870 | % | | | 2/23/22 | | | | 1,170,000 | | | | 1,220,257 | |
Barrick North America Finance LLC, Senior Notes | | | 5.700 | % | | | 5/30/41 | | | | 380,000 | | | | 431,621 | |
See Notes to Financial Statements.
| | |
| Western Asset Total Return Unconstrained Fund 2019 Annual Report | | 27 |
Schedule of investments (cont’d)
May 31, 2019
Western Asset Total Return Unconstrained Fund
| | | | | | | | | | | | | | | | |
| Security | | Rate | | | Maturity
Date | | | Face
Amount† | | | Value | |
Metals & Mining — continued | | | | | | | | | | | | | | | | |
BHP Billiton Finance USA Ltd., Senior Notes (6.750% to 10/19/25 then USD 5 year ICE Swap Rate + 5.093% to 10/19/45 then USD 5 year ICE Swap Rate + 5.843%) | | | 6.750 | % | | | 10/19/75 | | | | 1,330,000 | | | $ | 1,494,634 | (a)(e) |
First Quantum Minerals Ltd., Senior Notes | | | 7.250 | % | | | 4/1/23 | | | | 320,000 | | | | 293,200 | (a) |
First Quantum Minerals Ltd., Senior Notes | | | 6.875 | % | | | 3/1/26 | | | | 260,000 | | | | 222,937 | (a) |
Freeport-McMoRan Inc., Senior Notes | | | 6.875 | % | | | 2/15/23 | | | | 380,000 | | | | 398,525 | |
Freeport-McMoRan Inc., Senior Notes | | | 5.450 | % | | | 3/15/43 | | | | 3,190,000 | | | | 2,737,020 | |
Glencore Funding LLC, Senior Notes | | | 4.125 | % | | | 5/30/23 | | | | 120,000 | | | | 122,583 | (a) |
Glencore Funding LLC, Senior Notes | | | 4.000 | % | | | 3/27/27 | | | | 1,490,000 | | | | 1,454,714 | (a) |
Vale Overseas Ltd., Senior Notes | | | 6.875 | % | | | 11/21/36 | | | | 2,880,000 | | | | 3,240,000 | |
Total Metals & Mining | | | | | | | | | | | | | | | 21,383,688 | |
Total Materials | | | | | | | | | | | | | | | 36,869,175 | |
| Real Estate — 0.2% | | | | | | | | | | | | | | | | |
Equity Real Estate Investment Trusts (REITs) — 0.1% | | | | | | | | | |
MPT Operating Partnership LP/MPT Finance Corp., Senior Notes | | | 5.000 | % | | | 10/15/27 | | | | 1,240,000 | | | | 1,227,600 | |
Real Estate Management & Development — 0.1% | | | | | | | | | | | | | |
Country Garden Holdings Co. Ltd., Senior Secured Notes | | | 7.250 | % | | | 4/4/21 | | | | 2,340,000 | | | | 2,378,277 | (c) |
Total Real Estate | | | | | | | | | | | | | | | 3,605,877 | |
| Utilities — 0.8% | | | | | | | | | | | | | | | | |
Electric Utilities — 0.7% | | | | | | | | | | | | | | | | |
FirstEnergy Corp., Senior Notes | | | 3.900 | % | | | 7/15/27 | | | | 2,490,000 | | | | 2,554,525 | |
FirstEnergy Corp., Senior Notes | | | 7.375 | % | | | 11/15/31 | | | | 3,186,000 | | | | 4,278,406 | |
Perusahaan Listrik Negara PT, Senior Notes | | | 5.500 | % | | | 11/22/21 | | | | 3,160,000 | | | | 3,325,900 | (c) |
Total Electric Utilities | | | | | | | | | | | | | | | 10,158,831 | |
Independent Power and Renewable Electricity Producers — 0.1% | | | | | | | | | |
NTPC Ltd., Senior Secured Notes | | | 6.720 | % | | | 11/24/21 | | | | 50,000,000 | INR | | | 704,071 | |
Total Utilities | | | | | | | | | | | | | | | 10,862,902 | |
Total Corporate Bonds & Notes (Cost — $310,961,870) | | | | | | | | 319,810,120 | |
See Notes to Financial Statements.
| | |
28 | | Western Asset Total Return Unconstrained Fund 2019 Annual Report |
Western Asset Total Return Unconstrained Fund
| | | | | | | | | | | | | | | | |
| Security | | Rate | | | Maturity
Date | | | Face
Amount† | | | Value | |
| Sovereign Bonds — 13.7% | | | | | | | | | | | | | | | | |
Argentina — 1.0% | | | | | | | | | | | | | | | | |
Argentina POM Politica Monetaria, Bonds (Argentina Central Bank 7 Day Repo Reference Rate) | | | 68.804 | % | | | 6/21/20 | | | | 129,420,000 | ARS | | $ | 2,887,132 | (e) |
Argentine Bonos del Tesoro, Bonds | | | 18.200 | % | | | 10/3/21 | | | | 56,970,000 | ARS | | | 770,738 | |
Argentine Republic Government International Bond, Senior Notes | | | 5.625 | % | | | 1/26/22 | | | | 2,730,000 | | | | 2,114,385 | |
Argentine Republic Government International Bond, Senior Notes | | | 7.500 | % | | | 4/22/26 | | | | 2,160,000 | | | | 1,623,510 | |
Argentine Republic Government International Bond, Senior Notes | | | 5.875 | % | | | 1/11/28 | | | | 250,000 | | | | 173,281 | |
Argentine Republic Government International Bond, Senior Notes | | | 7.125 | % | | | 7/6/36 | | | | 340,000 | | | | 233,113 | |
Argentine Republic Government International Bond, Senior Notes | | | 7.625 | % | | | 4/22/46 | | | | 360,000 | | | | 253,170 | |
Argentine Republic Government International Bond, Senior Notes, Step Bond | | | 3.750 | % | | | 12/31/38 | | | | 3,240,000 | | | | 1,753,682 | |
Provincia de Buenos Aires, Senior Notes | | | 6.500 | % | | | 2/15/23 | | | | 1,720,000 | | | | 1,298,600 | (a) |
Provincia de Buenos Aires, Senior Notes | | | 9.125 | % | | | 3/16/24 | | | | 1,750,000 | | | | 1,327,830 | (a) |
Provincia de Buenos Aires, Senior Notes | | | 7.875 | % | | | 6/15/27 | | | | 1,770,000 | | | | 1,241,230 | (a) |
Total Argentina | | | | | | | | | | | | | | | 13,676,671 | |
Brazil — 3.2% | | | | | | | | | | | | | | | | |
Brazil Letras do Tesouro Nacional Serie F | | | 0.000 | % | | | 1/1/20 | | | | 17,162,000 | BRL | | | 4,218,520 | |
Brazil Notas do Tesouro Nacional Serie F, Notes | | | 10.000 | % | | | 1/1/21 | | | | 51,904,000 | BRL | | | 13,889,522 | |
Brazil Notas do Tesouro Nacional Serie F, Notes | | | 10.000 | % | | | 1/1/23 | | | | 13,490,000 | BRL | | | 3,692,111 | |
Brazil Notas do Tesouro Nacional Serie F, Notes | | | 10.000 | % | | | 1/1/25 | | | | 5,000,000 | BRL | | | 1,382,405 | |
Brazil Notas do Tesouro Nacional Serie F, Notes | | | 10.000 | % | | | 1/1/27 | | | | 82,532,000 | BRL | | | 22,918,536 | |
Total Brazil | | | | | | | | | | | | | | | 46,101,094 | |
Ecuador — 0.5% | | | | | | | | | | | | | | | | |
Ecuador Government International Bond, Senior Notes | | | 7.950 | % | | | 6/20/24 | | | | 200,000 | | | | 202,752 | (c) |
See Notes to Financial Statements.
| | |
| Western Asset Total Return Unconstrained Fund 2019 Annual Report | | 29 |
Schedule of investments (cont’d)
May 31, 2019
Western Asset Total Return Unconstrained Fund
| | | | | | | | | | | | | | | | |
| Security | | Rate | | | Maturity
Date | | | Face Amount† | | | Value | |
Ecuador — continued | | | | | | | | | | | | | | | | |
Ecuador Government International Bond, Senior Notes | | | 9.650 | % | | | 12/13/26 | | | | 730,000 | | | $ | 768,332 | (a) |
Ecuador Government International Bond, Senior Notes | | | 9.625 | % | | | 6/2/27 | | | | 1,650,000 | | | | 1,728,392 | (a) |
Ecuador Government International Bond, Senior Notes | | | 8.875 | % | | | 10/23/27 | | | | 4,140,000 | | | | 4,178,336 | (a) |
Total Ecuador | | | | | | | | | | | | | | | 6,877,812 | |
Ghana — 0.5% | | | | | | | | | | | | | | | | |
Ghana Government International Bond, Senior Notes | | | 10.750 | % | | | 10/14/30 | | | | 5,450,000 | | | | 6,660,238 | (a) |
India — 2.7% | | | | | | | | | | | | | | | | |
India Government Bond, Senior Notes | | | 6.840 | % | | | 12/19/22 | | | | 580,000,000 | INR | | | 8,366,531 | |
India Government Bond, Senior Notes | | | 7.350 | % | | | 6/22/24 | | | | 750,000,000 | INR | | | 10,951,160 | |
India Government Bond, Senior Notes | | | 7.590 | % | | | 1/11/26 | | | | 620,000,000 | INR | | | 9,127,243 | |
India Government Bond, Senior Notes | | | 7.590 | % | | | 3/20/29 | | | | 700,000,000 | INR | | | 10,311,712 | |
Total India | | | | | | | | | | | | | | | 38,756,646 | |
Indonesia — 1.4% | | | | | | | | | | | | | | | | |
Indonesia Government International Bond, Senior Notes | | | 3.500 | % | | | 1/11/28 | | | | 490,000 | | | | 483,818 | |
Indonesia Government International Bond, Senior Notes | | | 4.625 | % | | | 4/15/43 | | | | 1,310,000 | | | | 1,334,669 | (c) |
Indonesia Government International Bond, Senior Notes | | | 5.125 | % | | | 1/15/45 | | | | 930,000 | | | | 1,009,788 | (c) |
Indonesia Government International Bond, Senior Notes | | | 4.350 | % | | | 1/11/48 | | | | 550,000 | | | | 554,557 | |
Indonesia Treasury Bond, Senior Notes | | | 7.000 | % | | | 5/15/27 | | | | 240,796,000,000 | IDR | | | 15,972,231 | |
Total Indonesia | | | | | | | | | | | | | | | 19,355,063 | |
Kenya — 0.2% | | | | | | | | | | | | | | | | |
Kenya Government International Bond, Senior Notes | | | 7.000 | % | | | 5/22/27 | | | | 3,400,000 | | | | 3,350,224 | (a) |
Mexico — 2.8% | | | | | | | | | | | | | | | | |
Mexican Bonos, Bonds | | | 6.500 | % | | | 6/9/22 | | | | 338,026,900 | MXN | | | 16,631,294 | |
Mexican Bonos, Bonds | | | 10.000 | % | | | 12/5/24 | | | | 19,150,000 | MXN | | | 1,070,648 | |
Mexican Bonos, Bonds | | | 7.500 | % | | | 6/3/27 | | | | 146,140,000 | MXN | | | 7,248,634 | |
See Notes to Financial Statements.
| | |
30 | | Western Asset Total Return Unconstrained Fund 2019 Annual Report |
Western Asset Total Return Unconstrained Fund
| | | | | | | | | | | | | | | | |
| Security | | Rate | | | Maturity
Date | | | Face
Amount† | | | Value | |
Mexico — continued | | | | | | | | | | | | | | | | |
Mexican Bonos, Senior Notes | | | 7.750 | % | | | 11/13/42 | | | | 140,691,900 | MXN | | $ | 6,698,115 | |
Mexican Bonos, Senior Notes | | | 8.000 | % | | | 11/7/47 | | | | 179,210,000 | MXN | | | 8,710,838 | |
Total Mexico | | | | | | | | | | | | | | | 40,359,529 | |
Russia — 1.1% | | | | | | | | | | | | | | | | |
Russian Federal Bond — OFZ | | | 8.150 | % | | | 2/3/27 | | | | 52,000,000 | RUB | | | 816,020 | |
Russian Federal Bond — OFZ | | | 7.050 | % | | | 1/19/28 | | | | 871,231,000 | RUB | | | 12,785,891 | |
Russian Foreign Bond — Eurobond, Senior Notes | | | 4.875 | % | | | 9/16/23 | | | | 1,400,000 | | | | 1,487,793 | (a) |
Total Russia | | | | | | | | | | | | | | | 15,089,704 | |
Uruguay — 0.3% | | | | | | | | | | | | | | | | |
Uruguay Government International Bond, Senior Notes | | | 9.875 | % | | | 6/20/22 | | | | 61,530,000 | UYU | | | 1,714,112 | (a) |
Uruguay Government International Bond, Senior Notes | | | 8.500 | % | | | 3/15/28 | | | | 124,280,000 | UYU | | | 2,966,476 | (a) |
Total Uruguay | | | | | | | | | | | | | | | 4,680,588 | |
Total Sovereign Bonds (Cost — $225,902,271) | | | | | | | | | | | | | | | 194,907,569 | |
| Collateralized Mortgage Obligations (k)— 10.2% | | | | | | | | | | | | | | | | |
Banc of America Funding Trust,2014-R2 2A2 (1 mo. USD
LIBOR + 0.210%) | | | 2.638 | % | | | 5/26/37 | | | | 5,052,161 | | | | 4,459,601 | (a)(e) |
Banc of America Funding Trust,2015-R2 4A1 (1 mo. USD
LIBOR + 0.165%) | | | 2.595 | % | | | 9/29/36 | | | | 1,234,501 | | | | 1,217,680 | (a)(e) |
Banc of America Funding Trust,2015-R2 4A2 (1 mo. USD
LIBOR + 0.165%) | | | 3.804 | % | | | 9/29/36 | | | | 15,075,331 | | | | 12,758,253 | (a)(e) |
Banc of America Funding Trust,2015-R2 9A2 | | | 3.116 | % | | | 3/27/36 | | | | 5,623,271 | | | | 5,003,969 | (a)(e) |
Banc of America Funding Trust,2015-R2 10A1 (1 mo. USD
LIBOR + 0.190%) | | | 2.620 | % | | | 6/29/37 | | | | 475,436 | | | | 476,341 | (a)(e) |
Banc of America Funding Trust,2015-R4 6A1 (1 mo. USD
LIBOR + 0.140%) | | | 2.617 | % | | | 8/27/36 | | | | 1,108,084 | | | | 1,109,107 | (a)(e) |
Banc of America Mortgage Trust,2004-A 1A1 | | | 4.913 | % | | | 2/25/34 | | | | 7,962 | | | | 8,172 | (e) |
BBCCRE Trust,2015-GTP E | | | 4.563 | % | | | 8/10/33 | | | | 6,700,000 | | | | 6,103,707 | (a)(e) |
Bear StearnsAlt-A Trust,2004-11 1A2 (1 mo. USD
LIBOR + 0.840%) | | | 3.270 | % | | | 11/25/34 | | | | 1,890 | | | | 1,894 | (e) |
See Notes to Financial Statements.
| | |
| Western Asset Total Return Unconstrained Fund 2019 Annual Report | | 31 |
Schedule of investments (cont’d)
May 31, 2019
Western Asset Total Return Unconstrained Fund
| | | | | | | | | | | | | | | | |
| Security | | Rate | | | Maturity
Date | | | Face
Amount† | | | Value | |
| Collateralized Mortgage Obligations (k)— continued | | | | | | | | | | | | | | | | |
Bear Stearns Mortgage Funding Trust,2007-AR1 1A1 (1 mo. USD
LIBOR + 0.160%) | | | 2.590 | % | | | 1/25/37 | | | | 2,441,558 | | | $ | 2,369,731 | (e) |
BX Trust, 2018-GWMZ MC (1 mo. USD LIBOR + 5.488%) | | | 7.927 | % | | | 5/15/37 | | | | 4,900,000 | | | | 4,906,641 | (a)(e) |
CHL Mortgage Pass-Through Trust, 2001-HYB1 1A1 | | | 3.808 | % | | | 6/19/31 | | | | 5,626 | | | | 5,730 | (e) |
CHL Mortgage Pass-Through Trust,2003-60 1A1 | | | 4.880 | % | | | 2/25/34 | | | | 63,235 | | | | 64,770 | (e) |
Citigroup Mortgage Loan Trust Inc.,2005-9 1A1 (1 mo. USD
LIBOR + 0.260%) | | | 2.690 | % | | | 11/25/35 | | | | 151,336 | | | | 124,998 | (e) |
Countrywide Alternative Loan Trust, 2005-28CB 2A3 | | | 5.750 | % | | | 8/25/35 | | | | 1,352,796 | | | | 1,248,102 | |
Countrywide Alternative Loan Trust, 2005-52CB 1A2, IO(-1.000 x 1 mo. USD LIBOR + 5.100%) | | | 2.670 | % | | | 11/25/35 | | | | 6,160,678 | | | | 637,919 | (e) |
Countrywide Alternative Loan Trust,2005-76 3A1 (1 mo. USD
LIBOR + 0.260%) | | | 2.690 | % | | | 1/25/46 | | | | 102,298 | | | | 99,412 | (e) |
Countrywide Alternative Loan Trust,2006-4CB 1A4, IO(-1.000 x 1 mo. USD LIBOR + 5.300%) | | | 2.870 | % | | | 4/25/36 | | | | 8,705,427 | | | | 1,505,263 | (e) |
Countrywide Alternative Loan Trust,2006-8T1 1A2, IO(-1.000 x 1 mo. USD LIBOR + 5.500%) | | | 3.070 | % | | | 4/25/36 | | | | 4,872,839 | | | | 792,231 | (e) |
Countrywide Alternative Loan Trust, 2006-21CB A6, IO(-1.000 x 1 mo. USD LIBOR + 5.600%) | | | 3.170 | % | | | 7/25/36 | | | | 2,686,064 | | | | 371,263 | (e) |
Credit Suisse Commercial Mortgage Securities Corp.,2018-TOP G (1 mo. USD LIBOR + 3.250%) | | | 5.690 | % | | | 8/15/35 | | | | 6,000,000 | | | | 5,871,116 | (a)(e) |
Credit Suisse Commercial Mortgage Trust,2006-C3 AJ | | | 6.484 | % | | | 6/15/38 | | | | 124,482 | | | | 70,562 | (e) |
Credit Suisse Commercial Mortgage Trust,2006-C5 AJ | | | 5.373 | % | | | 12/15/39 | | | | 4,101,219 | | | | 2,782,144 | |
Credit Suisse Commercial Mortgage Trust,2007-C5 AM | | | 5.869 | % | | | 9/15/40 | | | | 2,759,418 | | | | 2,101,673 | (e) |
CSMC Trust,2014-USA E | | | 4.373 | % | | | 9/15/37 | | | | 2,170,000 | | | | 2,032,457 | (a) |
CSMC Trust,2014-USA F | | | 4.373 | % | | | 9/15/37 | | | | 4,280,000 | | | | 3,825,944 | (a) |
CSMC Trust,2015-2R 3A1 | | | 2.687 | % | | | 4/27/36 | | | | 1,151,161 | | | | 1,146,756 | (a)(e) |
See Notes to Financial Statements.
| | |
32 | | Western Asset Total Return Unconstrained Fund 2019 Annual Report |
Western Asset Total Return Unconstrained Fund
| | | | | | | | | | | | | | | | |
| Security | | Rate | | | Maturity
Date | | | Face
Amount† | | | Value | |
| Collateralized Mortgage Obligations(k)— continued | | | | | | | | | | | | | | | | |
CSMC Trust,2015-2R 7A1 | | | 3.722 | % | | | 8/27/36 | | | | 935,526 | | | $ | 950,716 | (a)(e) |
CSMC Trust,2015-2R 7A2 | | | 3.722 | % | | | 8/27/36 | | | | 3,860,789 | | | | 3,311,525 | (a)(e) |
CSMC Trust, 2017-CHOP H (1 mo. USD LIBOR + 7.620%) | | | 10.060 | % | | | 7/15/32 | | | | 9,800,000 | | | | 9,798,403 | (a)(e) |
Deutsche Mortgage Securities Inc. Mortgage Loan Trust,2004-4 7AR2 (1 mo. USD LIBOR + 0.450%) | | | 2.880 | % | | | 6/25/34 | | | | 28,042 | | | | 26,658 | (e) |
Federal Home Loan Mortgage Corp. (FHLMC) Multifamily Structured Pass-Through Certificates, K015 X1, IO | | | 1.564 | % | | | 7/25/21 | | | | 1,489,401 | | | | 41,713 | (e) |
Federal Home Loan Mortgage Corp. (FHLMC) Structured Agency Credit Risk Debt Notes,2013-DN1 M2 (1 mo. USD LIBOR + 7.150%) | | | 9.580 | % | | | 7/25/23 | | | | 1,001,296 | | | | 1,166,453 | (e) |
Federal Home Loan Mortgage Corp. (FHLMC) Structured Agency Credit Risk Debt Notes,2015-HQ1 B (1 mo. USD LIBOR + 10.750%) | | | 13.180 | % | | | 3/25/25 | | | | 3,884,474 | | | | 5,265,986 | (e) |
Federal Home Loan Mortgage Corp. (FHLMC) Structured Agency Credit Risk Debt Notes, 2016-DNA4 M2 (1 mo. USD LIBOR + 1.300%) | | | 3.730 | % | | | 3/25/29 | | | | 2,605,055 | | | | 2,617,030 | (e) |
Federal Home Loan Mortgage Corp. (FHLMC) Structured Agency Credit Risk Debt Notes, 2017-HRP1 M2 (1 mo. USD LIBOR + 2.450%) | | | 4.880 | % | | | 12/25/42 | | | | 1,880,000 | | | | 1,916,849 | (e) |
Federal National Mortgage Association (FNMA) REMIC,2012-51 B | | | 7.000 | % | | | 5/25/42 | | | | 63,033 | | | | 74,872 | |
Federal National Mortgage Association (FNMA) REMIC,2012-118 CI, IO | | | 3.500 | % | | | 12/25/39 | | | | 856,426 | | | | 72,235 | |
First Horizon Alternative Mortgage Securities Trust,2005-AA12 1A1 | | | 4.177 | % | | | 2/25/36 | | | | 57,025 | | | | 48,100 | (e) |
Flagstar Mortgage Trust,2018-2 A4 | | | 3.500 | % | | | 4/25/48 | | | | 6,029,059 | | | | 6,081,041 | (a)(e) |
FREMF Mortgage Trust,2012-K20 X2A, IO | | | 0.200 | % | | | 5/25/45 | | | | 14,064,702 | | | | 69,352 | (a) |
GE Business Loan Trust,2006-1A C (1 mo. USD LIBOR + 0.420%) | | | 2.860 | % | | | 5/15/34 | | | | 317,322 | | | | 298,050 | (a)(e) |
GMAC Commercial Mortgage Securities Inc.,2006-C1 AJ | | | 5.349 | % | | | 11/10/45 | | | | 393,556 | | | | 281,393 | (e) |
See Notes to Financial Statements.
| | |
| Western Asset Total Return Unconstrained Fund 2019 Annual Report | | 33 |
Schedule of investments (cont’d)
May 31, 2019
Western Asset Total Return Unconstrained Fund
| | | | | | | | | | | | | | | | |
| Security | | Rate | | | Maturity
Date | | | Face
Amount† | | | Value | |
| Collateralized Mortgage Obligations(k)— continued | | | | | | | | | |
Government National Mortgage Association (GNMA),2011-142 IO, IO | | | 0.229 | % | | | 9/16/46 | | | | 6,460,348 | | | $ | 52,222 | (e) |
Government National Mortgage Association (GNMA),2012-112 IO, IO | | | 0.278 | % | | | 2/16/53 | | | | 3,434,841 | | | | 66,147 | (e) |
Government National Mortgage Association (GNMA),2014-47 IA, IO | | | 0.126 | % | | | 2/16/48 | | | | 959,267 | | | | 19,008 | (e) |
Government National Mortgage Association (GNMA),2014-50 IO, IO | | | 0.836 | % | | | 9/16/55 | | | | 2,694,085 | | | | 144,485 | (e) |
Government National Mortgage Association (GNMA),2014-134 IA, IO | | | 0.588 | % | | | 1/16/55 | | | | 60,179,645 | | | | 1,410,340 | (e) |
Government National Mortgage Association (GNMA),2017-21 IO | | | 0.795 | % | | | 10/16/58 | | | | 6,287,680 | | | | 445,110 | (e) |
GreenPoint Mortgage Funding Trust,2006-AR3 3A1 (1 mo. USD LIBOR + 0.230%) | | | 2.660 | % | | | 4/25/36 | | | | 104,003 | | | | 135,543 | (e) |
HarborView Mortgage Loan Trust,2006-13 A (1 mo. USD LIBOR + 0.180%) | | | 2.621 | % | | | 11/19/46 | | | | 160,418 | | | | 138,134 | (e) |
JPMorgan Chase Commercial Mortgage Securities Trust, 2006- LDP7 AJ | | | 6.080 | % | | | 4/17/45 | | | | 740,603 | | | | 407,139 | (e) |
JPMorgan Chase Commercial Mortgage Securities Trust, 2007- CB19 AJ | | | 5.816 | % | | | 2/12/49 | | | | 5,252,474 | | | | 3,809,723 | (e) |
JPMorgan Chase Commercial Mortgage Securities Trust, 2007- LD12 AJ | | | 6.232 | % | | | 2/15/51 | | | | 113,244 | | | | 108,557 | (e) |
JPMorgan Chase Commercial Mortgage Securities Trust, 2018- PHMZ M (1 mo. USD LIBOR + 8.208%) | | | 10.647 | % | | | 6/15/35 | | | | 10,150,000 | | | | 10,118,281 | (a)(e) |
JPMorgan Resecuritization Trust,2014-6 3A1 (1 mo. USD LIBOR + 0.210%) | | | 2.687 | % | | | 7/27/46 | | | | 1,230,784 | | | | 1,235,474 | (a)(e) |
Merrill Lynch Mortgage Investors Trust,2004-A3 4A3 | | | 4.802 | % | | | 5/25/34 | | | | 42,544 | | | | 42,995 | (e) |
See Notes to Financial Statements.
| | |
34 | | Western Asset Total Return Unconstrained Fund 2019 Annual Report |
Western Asset Total Return Unconstrained Fund
| | | | | | | | | | | | | | | | |
| Security | | Rate | | | Maturity
Date | | | Face
Amount† | | | Value | |
| Collateralized Mortgage Obligations(k)— continued | | | | | | | | | |
ML-CFC Commercial Mortgage Trust,2007-5 AJ | | | 5.450 | % | | | 8/12/48 | | | | 972,125 | | | $ | 644,520 | (e) |
ML-CFC Commercial Mortgage Trust,2007-5 AJFL | | | 5.450 | % | | | 8/12/48 | | | | 1,253,584 | | | | 831,126 | (a)(e) |
ML-CFC Commercial Mortgage Trust,2007-9 AJ | | | 6.070 | % | | | 9/12/49 | | | | 376,197 | | | | 242,639 | (e) |
Morgan Stanley Capital I Trust, 2006-IQ12 AJ | | | 5.399 | % | | | 12/15/43 | | | | 340,091 | | | | 257,287 | |
New Residential Mortgage Loan Trust,2019-2A A1 | | | 4.250 | % | | | 12/25/57 | | | | 3,284,304 | | | | 3,428,366 | (a)(e) |
Nomura Asset Acceptance Corp. Alternative Loan Trust,2006-AF2 4A | | | 4.628 | % | | | 8/25/36 | | | | 145,476 | | | | 118,558 | (e) |
Residential Asset Securitization Trust,2005-A15 2A11, IO(-1.000 x 1 mo. USD LIBOR + 5.550%) | | | 3.120 | % | | | 2/25/36 | | | | 9,924,629 | | | | 1,679,481 | (e) |
Starwood Retail Property Trust, 2014-STAR E (1 mo. USD LIBOR + 4.150%) | | | 6.590 | % | | | 11/15/27 | | | | 7,530,000 | | | | 5,832,017 | (a)(e) |
Structured Adjustable Rate Mortgage Loan Trust,2004-4 3A2 | | | 4.715 | % | | | 4/25/34 | | | | 150,151 | | | | 156,342 | (e) |
Tharaldson Hotel Portfolio Trust,2018-THL G (1 mo. USD LIBOR + 6.350%) | | | 8.817 | % | | | 11/11/34 | | | | 4,050,401 | | | | 4,011,310 | (a)(e) |
Tharaldson Hotel Portfolio Trust,2018-THL H (1 mo. USD LIBOR + 9.800%) | | | 12.267 | % | | | 11/11/34 | | | | 4,050,401 | | | | 4,021,024 | (a)(e) |
UBS-Barclays Commercial Mortgage Trust,2012-C2 G | | | 4.891 | % | | | 5/10/63 | | | | 2,080,000 | | | | 1,396,639 | (a)(e) |
UBS-Barclays Commercial Mortgage Trust,2012-C2 H | | | 4.891 | % | | | 5/10/63 | | | | 3,650,000 | | | | 1,568,139 | (a)(e) |
Wachovia Bank Commercial Mortgage Trust,2007-C33 AJ | | | 5.655 | % | | | 2/15/51 | | | | 2,481,013 | | | | 2,162,823 | (e) |
WaMu Mortgage Pass-Through Certificates Trust, 2004-AR13 A1A (1 mo. USD LIBOR + 0.720%) | | | 3.150 | % | | | 11/25/34 | | | | 3,215,476 | | | | 3,277,339 | (e) |
WaMu Mortgage Pass-Through Certificates Trust,2006-AR3 A1B (Federal Reserve US 12 mo. Cumulative Avg 1 Year CMT + 1.000%) | | | 3.481 | % | | | 2/25/46 | | | | 2,782,791 | | | | 2,606,686 | (e) |
See Notes to Financial Statements.
| | |
| Western Asset Total Return Unconstrained Fund 2019 Annual Report | | 35 |
Schedule of investments (cont’d)
May 31, 2019
Western Asset Total Return Unconstrained Fund
| | | | | | | | | | | | | | | | |
| Security | | Rate | | | Maturity
Date | | | Face
Amount† | | | Value | |
| Collateralized Mortgage Obligations(k)— continued | | | | | | | | | |
Waterfall Commercial Mortgage Trust, 2015-SBC5 A | | | 4.104 | % | | | 9/14/22 | | | | 534,727 | | | $ | 547,694 | (a)(e) |
Wells Fargo Mortgage-Backed Securities Trust,2005-AR9 4A1 | | | 4.927 | % | | | 5/25/35 | | | | 44,361 | | | | 45,397 | (e) |
Total Collateralized Mortgage Obligations (Cost — $143,688,640) | | | | 144,076,357 | |
| Asset-Backed Securities — 5.4% | | | | | | | | | | | | | | | | |
AccessLex Institute,2004-A B1 (28 day Auction Rate Security) | | | 0.000 | % | | | 7/1/39 | | | | 7,400,000 | | | | 7,013,446 | (e) |
American Money Management Corp. CLO 20 Ltd.,2017-20A E (3 mo. USD LIBOR + 5.810%) | | | 8.398 | % | | | 4/17/29 | | | | 2,300,000 | | | | 2,214,396 | (a)(e) |
Amortizing Residential Collateral Trust,2002-BC5 M1 (1 mo. USD LIBOR + 1.035%) | | | 3.465 | % | | | 7/25/32 | | | | 112,382 | | | | 112,123 | (e) |
Applebee’s Funding LLC/IHOP Funding LLC,2014-1 A2 | | | 4.277 | % | | | 9/5/44 | | | | 3,456,250 | | | | 3,473,067 | (a) |
Ares XLIV CLO Ltd.,2017-44A D (3 mo. USD LIBOR + 6.550%) | | | 9.147 | % | | | 10/15/29 | | | | 3,700,000 | | | | 3,699,515 | (a)(e) |
Asset-Backed Securities Corp. Home Equity Loan Trust,2005-HE3 M4 (1 mo. USD LIBOR + 0.945%) | | | 3.375 | % | | | 4/25/35 | | | | 779,216 | | | | 783,276 | (e) |
Avery Point VI CLO Ltd.,2015-6A E1 (3 mo. USD LIBOR + 5.500%) | | | 8.065 | % | | | 8/5/27 | | | | 750,000 | | | | 727,043 | (a)(e) |
Avis Budget Rental Car Funding Aesop LLC,2019-1A C | | | 4.530 | % | | | 3/20/23 | | | | 2,200,000 | | | | 2,255,703 | (a) |
Ballyrock CLO Ltd.,2018-1A C (3 mo. USD LIBOR + 3.150%) | | | 5.742 | % | | | 4/20/31 | | | | 1,400,000 | | | | 1,386,232 | (a)(e) |
Barings CLO Ltd.,2017-1A F (3 mo. USD LIBOR + 7.450%) | | | 10.051 | % | | | 7/18/29 | | | | 730,000 | | | | 665,857 | (a)(e) |
Benefit Street Partners CLO IV Ltd.,2014-IVA CRR (3 mo. USD LIBOR + 3.800%) | | | 6.392 | % | | | 1/20/29 | | | | 1,570,000 | | | | 1,578,140 | (a)(e) |
California Street CLO IX LP,2012-9A ER (3 mo. USD LIBOR + 7.180%) | | | 9.781 | % | | | 10/16/28 | | | | 750,000 | | | | 751,099 | (a)(e) |
Carlyle US CLO Ltd.,2017-2A C (3 mo. USD LIBOR + 3.700%) | | | 6.292 | % | | | 7/20/31 | | | | 3,250,000 | | | | 3,273,592 | (a)(e) |
Catskill Park CLO Ltd.,2017-1A D (3 mo. USD LIBOR + 6.000%) | | | 8.592 | % | | | 4/20/29 | | | | 3,600,000 | | | | 3,539,394 | (a)(e) |
Cent CLO 24 Ltd.,2015-24A CR (3 mo. USD LIBOR + 3.150%) | | | 5.747 | % | | | 10/15/26 | | | | 1,980,000 | | | | 1,994,684 | (a)(e) |
See Notes to Financial Statements.
| | |
36 | | Western Asset Total Return Unconstrained Fund 2019 Annual Report |
Western Asset Total Return Unconstrained Fund
| | | | | | | | | | | | | | | | |
| Security | | Rate | | | Maturity
Date | | | Face
Amount† | | | Value | |
| Asset-Backed Securities — continued | | | | | | | | | | | | | |
Community Funding CLO,2015-1A A | | | 5.750 | % | | | 11/1/27 | | | | 2,451,739 | | | $ | 2,505,165 | (a) |
Cook Park CLO Ltd.,2018-1A E (3 mo. USD LIBOR + 5.400%) | | | 7.988 | % | | | 4/17/30 | | | | 250,000 | | | | 235,511 | (a)(e) |
Countrywide Home Equity Loan Trust,2007-A A (1 mo. USD LIBOR + 0.120%) | | | 2.560 | % | | | 4/15/37 | | | | 1,792,317 | | | | 1,641,460 | (e) |
Cumberland Park CLO Ltd.,2015-2A ER (3 mo. USD LIBOR + 5.650%) | | | 8.242 | % | | | 7/20/28 | | | | 2,000,000 | | | | 1,989,567 | (a)(e) |
Dividend Solar Loans LLC,2018-1 C | | | 5.140 | % | | | 7/20/38 | | | | 4,060,324 | | | | 4,160,443 | (a) |
Fremont Home Loan Trust,2006-B 2A2 (1 mo. USD LIBOR + 0.100%) | | | 2.530 | % | | | 8/25/36 | | | | 384,271 | | | | 168,074 | (e) |
GoldenTree Loan Opportunities IX Ltd.,2014-9A DR2 (3 mo. USD LIBOR + 3.000%) | | | 5.582 | % | | | 10/29/29 | | | | 1,550,000 | | | | 1,549,927 | (a)(e) |
Greenwood Park CLO Ltd.,2018-1A E (3 mo. USD LIBOR + 4.950%) | | | 7.547 | % | | | 4/15/31 | | | | 2,000,000 | | | | 1,859,584 | (a)(e) |
Greywolf CLO IV Ltd.,2019-1A C (3 mo. USD LIBOR + 3.950%) | | | 6.538 | % | | | 4/17/30 | | | | 2,020,000 | | | | 2,019,580 | (a)(e) |
Jamestown CLO VIII Ltd.,2015-8A D2 (3 mo. USD LIBOR + 6.750%) | | | 9.347 | % | | | 1/15/28 | | | | 1,500,000 | | | | 1,501,251 | (a)(e) |
LCM XIV LP, 14A ER (3 mo. USD LIBOR + 5.500%) | | | 8.092 | % | | | 7/20/31 | | | | 400,000 | | | | 383,904 | (a)(e) |
Lehman XS Trust,2006-16N A4B (1 mo. USD LIBOR + 0.240%) | | | 2.670 | % | | | 11/25/46 | | | | 15,039 | | | | 1,226 | (e) |
Lehman XS Trust,2006-GP3 2A2 (1 mo. USD LIBOR + 0.220%) | | | 2.650 | % | | | 6/25/46 | | | | 11,924 | | | | 13,348 | (e) |
Madison Park Funding XV Ltd.,2014-15A DR (3 mo. USD LIBOR + 5.440%) | | | 8.022 | % | | | 1/27/26 | | | | 750,000 | | | | 751,568 | (a)(e) |
MASTR Specialized Loan Trust,2006-3 A (1 mo. USD LIBOR + 0.260%) | | | 2.690 | % | | | 6/25/46 | | | | 160,851 | | | | 153,933 | (a)(e) |
Midocean Credit CLO VII,2017-7A D (3 mo. USD LIBOR + 3.880%) | | | 6.477 | % | | | 7/15/29 | | | | 1,000,000 | | | | 1,005,360 | (a)(e) |
Neuberger Berman CLO XVII Ltd.,2014-17A ER (3 mo. USD LIBOR + 6.550%) | | | 9.142 | % | | | 4/22/29 | | | | 500,000 | | | | 495,230 | (a)(e) |
Oaktree CLO Ltd.,2015-1A DR (3 mo. USD LIBOR + 5.200%) | | | 7.792 | % | | | 10/20/27 | | | | 1,250,000 | | | | 1,249,880 | (a)(e) |
See Notes to Financial Statements.
| | |
| Western Asset Total Return Unconstrained Fund 2019 Annual Report | | 37 |
Schedule of investments (cont’d)
May 31, 2019
Western Asset Total Return Unconstrained Fund
| | | | | | | | | | | | | | | | |
| Security | | Rate | | | Maturity
Date | | | Face
Amount† | | | Value | |
| Asset-Backed Securities — continued | | | | | | | | | | | | | |
Oaktree CLO Ltd.,2019-1A D (3 mo. USD LIBOR + 3.800%) | | | 6.375 | % | | | 4/22/30 | | | | 2,600,000 | | | $ | 2,599,844 | (a)(e) |
Ocean Trails CLO VI,2016-6A E (3 mo. USD LIBOR + 7.750%) | | | 10.347 | % | | | 7/15/28 | | | | 750,000 | | | | 750,817 | (a)(e) |
Octagon Investment Partners XXIII Ltd.,2015-1A ER (3 mo. USD LIBOR + 5.750%) | | | 8.347 | % | | | 7/15/27 | | | | 1,870,000 | | | | 1,870,712 | (a)(e) |
Saranac CLO III Ltd.,2014-3A DR (3 mo. USD LIBOR + 3.250%) | | | 5.857 | % | | | 6/22/30 | | | | 3,344,000 | | | | 3,304,865 | (a)(e) |
Sound Point CLOIII-R Ltd., 2013-2RA E (3 mo. USD LIBOR + 6.000%) | | | 8.597 | % | | | 4/15/29 | | | | 750,000 | | | | 728,891 | (a)(e) |
Symphony CLO XIV Ltd.,2014-14A D2 (3 mo. USD LIBOR + 3.600%) | | | 6.197 | % | | | 7/14/26 | | | | 1,500,000 | | | | 1,501,194 | (a)(e) |
Thayer Park CLO Ltd.,2017-1A C (3 mo. USD LIBOR + 3.700%) | | | 6.292 | % | | | 4/20/29 | | | | 1,750,000 | | | | 1,750,940 | (a)(e) |
THL Credit Wind River CLO Ltd.,2016-1A ER (3 mo. USD LIBOR + 5.550%) | | | 8.147 | % | | | 7/15/28 | | | | 1,000,000 | | | | 978,502 | (a)(e) |
UCFC Manufactured Housing Contract,1997-3 M | | | 7.115 | % | | | 1/15/29 | | | | 2,273,485 | | | | 2,275,137 | |
Venture XVII CLO Ltd.,2014-17A ERR (3 mo. USD LIBOR + 5.740%) | | | 8.337 | % | | | 4/15/27 | | | | 2,600,000 | | | | 2,566,871 | (a)(e) |
VOYA CLO,2017-2A D (3 mo. USD LIBOR + 6.020%) | | | 8.617 | % | | | 6/7/30 | | | | 800,000 | | | | 787,153 | (a)(e) |
Whitehorse XII Ltd.,2018-12A D (3 mo. USD LIBOR + 3.650%) | | | 6.247 | % | | | 10/15/31 | | | | 2,260,000 | | | | 2,243,036 | (a)(e) |
Total Asset-Backed Securities (Cost — $75,547,218) | | | | | | | | 76,510,540 | |
| U.S. Treasury Inflation Protected Securities — 4.0% | | | | | | | | | |
U.S. Treasury Bonds, Inflation Indexed | | | 0.125 | % | | | 7/15/26 | | | | 1,569,525 | | | | 1,549,141 | |
U.S. Treasury Bonds, Inflation Indexed | | | 1.375 | % | | | 2/15/44 | | | | 19,305,744 | | | | 22,053,478 | |
U.S. Treasury Bonds, Inflation Indexed | | | 0.750 | % | | | 2/15/45 | | | | 7,049,135 | | | | 7,028,988 | |
U.S. Treasury Bonds, Inflation Indexed | | | 1.000 | % | | | 2/15/46 | | | | 5,975,663 | | | | 6,318,347 | |
U.S. Treasury Bonds, Inflation Indexed | | | 0.875 | % | | | 2/15/47 | | | | 4,475,548 | | | | 4,603,833 | |
U.S. Treasury Bonds, Inflation Indexed | | | 1.000 | % | | | 2/15/49 | | | | 14,466,064 | | | | 15,433,905 | |
Total U.S. Treasury Inflation Protected Securities (Cost — $53,420,444) | | | | 56,987,692 | |
See Notes to Financial Statements.
| | |
38 | | Western Asset Total Return Unconstrained Fund 2019 Annual Report |
Western Asset Total Return Unconstrained Fund
| | | | | | | | | | | | | | | | |
| Security | | Rate | | | Maturity
Date | | | Face
Amount† | | | Value | |
| Senior Loans — 4.0% | | | | | | | | | | | | | | | | |
| Communication Services — 0.7% | | | | | | | | | | | | | | | | |
Diversified Telecommunication Services — 0.3% | | | | | | | | | | | | | |
Level 3 Financing Inc., 2024 Term Loan B (1 mo. USD LIBOR + 2.250%) | | | 4.689 | % | | | 2/22/24 | | | | 1,730,000 | | | $ | 1,706,861 | (e)(l)(m) |
Securus Technologies Holdings Inc., First Lien Initial Term Loan (1 mo. USD LIBOR + 4.500%) | | | 6.939 | % | | | 11/1/24 | | | | 1,350,000 | | | | 1,302,750 | (e)(l)(m) |
UnityMedia Hessen GmbH & Co. KG, Term Loan Senior Facility B (1 mo. USD LIBOR + 2.250%) | | | 4.690 | % | | | 9/30/25 | | | | 620,000 | | | | 617,223 | (e)(l)(m) |
Virgin Media Bristol LLC, Term Loan Facility K (1 mo. USD LIBOR + 2.500%) | | | 4.940 | % | | | 1/15/26 | | | | 640,000 | | | | 635,556 | (e)(l)(m)(n) |
Total Diversified Telecommunication Services | | | | | | | | | | | | 4,262,390 | |
Media — 0.3% | | | | | | | | | | | | | | | | |
Charter Communications Operating LLC, Term Loan B (1 mo. USD LIBOR + 2.000%) | | | 4.440 | % | | | 4/30/25 | | | | 811,278 | | | | 810,541 | (e)(l)(m)(n) |
iHeartCommunications Inc., Term Loan | | | — | | | | 5/4/26 | | | | 240,000 | | | | 240,550 | (n) |
Meredith Corp., Term Loan B1 (1 mo. USD LIBOR + 2.750%) | | | 5.189 | % | | | 1/31/25 | | | | 1,239,665 | | | | 1,240,107 | (e)(l)(m) |
Numericable U.S. LLC, USD Term Loan B12 (1 mo. USD LIBOR + 3.688%) | | | 6.127 | % | | | 1/31/26 | | | | 743,787 | | | | 717,888 | (e)(l)(m) |
Univision Communications Inc., 2017 Replacement Term Loan (1 mo. USD LIBOR + 2.750%) | | | 5.189 | % | | | 3/15/24 | | | | 1,445,647 | | | | 1,374,268 | (e)(l)(m) |
Total Media | | | | | | | | | | | | | | | 4,383,354 | |
Wireless Telecommunication Services — 0.1% | | | | | | | | | | | | | |
Sprint Communications Inc., Initial Term Loan (1 mo. USD LIBOR + 2.500%) | | | 5.000 | % | | | 2/2/24 | | | | 610,203 | | | | 596,469 | (e)(l)(m) |
Total Communication Services | | | | | | | | | | | | | | | 9,242,213 | |
| Consumer Discretionary — 1.0% | | | | | | | | | | | | | | | | |
Diversified Consumer Services — 0.1% | | | | | | | | | | | | | |
Prime Security Services Borrower LLC, Term Loan B1 (1 mo. USD LIBOR + 2.750%) | | | 5.189 | % | | | 5/2/22 | | | | 1,498,338 | | | | 1,488,705 | (e)(l)(m)(n) |
See Notes to Financial Statements.
| | |
| Western Asset Total Return Unconstrained Fund 2019 Annual Report | | 39 |
Schedule of investments (cont’d)
May 31, 2019
Western Asset Total Return Unconstrained Fund
| | | | | | | | | | | | | | | | |
| Security | | Rate | | | Maturity
Date | | | Face
Amount† | | | Value | |
Hotels, Restaurants & Leisure — 0.6% | | | | | | | | | | | | | |
1011778 BC Unlimited Liability Co., Term Loan B3 (1 mo. USD LIBOR + 2.250%) | | | 4.689 | % | | | 2/16/24 | | | | 321,048 | | | $ | 318,239 | (e)(l)(m) |
Alterra Mountain Co., Initial Term Loan (1 mo. USD LIBOR + 3.000%) | | | 5.439 | % | | | 7/31/24 | | | | 360,000 | | | | 359,660 | (e)(l)(m) |
Boyd Gaming Corp., Refinancing Term Loan B (1 week USD LIBOR + 2.250%) | | | 4.641 | % | | | 9/15/23 | | | | 215,763 | | | | 214,937 | (e)(l)(m) |
Caesars Resort Collection LLC, Term Loan B (1 mo. USD LIBOR + 2.750%) | | | 5.189 | % | | | 12/23/24 | | | | 1,366,550 | | | | 1,360,327 | (e)(l)(m) |
Four Seasons Hotels Ltd., Restated Term Loan (1 mo. USD LIBOR + 2.000%) | | | 4.439 | % | | | 11/30/23 | | | | 583,997 | | | | 582,172 | (e)(l)(m) |
Golden Nugget Inc., Term Loan B (1 mo. USD LIBOR + 2.750%) | | | 5.189-5.190 | % | | | 10/4/23 | | | | 611,389 | | | | 609,287 | (e)(l)(m) |
Hilton Worldwide Finance LLC, Term Loan B2 (1 mo. USD LIBOR + 1.750%) | | | 4.180 | % | | | 10/25/23 | | | | 1,049,736 | | | | 1,048,603 | (e)(l)(m) |
PCI Gaming Authority, Term Loan Facility B | | | — | | | | 5/15/26 | | | | 700,000 | | | | 701,187 | (n) |
Scientific Games International Inc., Initial Term Loan B5 (1 mo. USD LIBOR + 2.750%) | | | 5.189-5.231 | % | | | 8/14/24 | | | | 2,055,049 | | | | 2,027,649 | (e)(l)(m) |
Station Casinos LLC, Term Loan Facility B (1 mo. USD LIBOR + 2.500%) | | | 4.940 | % | | | 6/8/23 | | | | 1,122,520 | | | | 1,116,322 | (e)(l)(m) |
Total Hotels, Restaurants & Leisure | | | | | | | | | | | | 8,338,383 | |
Specialty Retail — 0.3% | | | | | | | | | | | | | | | | |
Academy Ltd., Initial Term Loan (1 mo. USD LIBOR + 4.000%) | | | 6.439-6.483 | % | | | 7/1/22 | | | | 1,647,573 | | | | 1,210,966 | (e)(l)(m) |
CWGS Group LLC, Term Loan (1 mo. USD LIBOR + 2.750%) | | | 5.189-5.233 | % | | | 11/8/23 | | | | 1,114,350 | | | | 1,015,452 | (e)(l)(m) |
Michaels Stores Inc., 2018 New Replacement Term Loan B (1 mo. USD LIBOR + 2.500%) | | | 4.929-4.930 | % | | | 1/30/23 | | | | 641,785 | | | | 634,962 | (e)(l)(m) |
See Notes to Financial Statements.
| | |
40 | | Western Asset Total Return Unconstrained Fund 2019 Annual Report |
Western Asset Total Return Unconstrained Fund
| | | | | | | | | | | | | | | | |
| Security | | Rate | | | Maturity
Date | | | Face
Amount† | | | Value | |
Specialty Retail — continued | | | | | | | | | | | | | | | | |
Party City Holdings Inc., 2018 Replacement Term Loan (1 mo. USD LIBOR + 2.500%) | | | 4.940 | % | | | 8/19/22 | | | | 832,526 | | | $ | 828,104 | (e)(l)(m) |
PetSmart Inc., Term Loan B2 (1 mo. USD LIBOR + 4.250%) | | | 6.720 | % | | | 3/11/22 | | | | 839,351 | | | | 812,072 | (e)(l)(m) |
Total Specialty Retail | | | | | | | | | | | | | | | 4,501,556 | |
Total Consumer Discretionary | | | | | | | | | | | | | | | 14,328,644 | |
| Consumer Staples — 0.2% | | | | | | | | | | | | | | | | |
Food & Staples Retailing — 0.1% | | | | | | | | | | | | | | | | |
Albertson’s LLC, 2017 Replacement Term Loan B6 (1 mo. USD LIBOR + 3.000%) | | | 5.439 | % | | | 6/22/23 | | | | 1,576,531 | | | | 1,571,932 | (e)(l)(m) |
Food Products — 0.1% | | | | | | | | | | | | | | | | |
Post Holdings Inc., Replacement Incremental Term Loan A (1 mo. USD LIBOR + 2.000%) | | | 4.440 | % | | | 5/24/24 | | | | 938,756 | | | | 937,500 | (e)(l)(m) |
Total Consumer Staples | | | | | | | | | | | | | | | 2,509,432 | |
| Financials — 0.4% | | | | | | | | | | | | | | | | |
Capital Markets — 0.1% | | | | | | | | | | | | | | | | |
First Eagle Holdings Inc., Initial Term Loan (3 mo. USD LIBOR + 2.750%) | | | 5.351 | % | | | 12/2/24 | | | | 420,000 | | | | 418,950 | (e)(l)(m) |
RPI Finance Trust, Initial Term Loan B6 (1 mo. USD LIBOR + 2.000%) | | | 4.439 | % | | | 3/27/23 | | | | 546,370 | | | | 546,858 | (e)(l)(m) |
Total Capital Markets | | | | | | | | | | | | | | | 965,808 | |
Diversified Financial Services — 0.2% | | | | | | | | | | | | | | | | |
Finco I LLC, 2018 Replacement Term Loan B | | | — | | | | 12/27/22 | | | | 765,849 | | | | 766,806 | (n) |
Jane Street Group LLC, New Term Loan (1 mo. USD LIBOR + 3.000%) | | | 5.439 | % | | | 8/25/22 | | | | 800,000 | | | | 796,980 | (e)(h)(l)(m) |
Stars Group Holdings BV, USD Term Loan (3 mo. USD LIBOR + 3.500%) | | | 6.101 | % | | | 7/10/25 | | | | 55,650 | | | | 55,733 | (e)(l)(m) |
TKC Holdings Inc., First Lien Initial Term Loan (1 mo. USD LIBOR + 3.750%) | | | 6.190 | % | | | 2/1/23 | | | | 1,685,000 | | | | 1,670,959 | (e)(l)(m)(n) |
UFC Holdings LLC, Term Loan B (1 mo. USD LIBOR + 3.250%) | | | 5.690 | % | | | 4/29/26 | | | | 320,000 | | | | 320,240 | (e)(l)(m) |
Total Diversified Financial Services | | | | | | | | | | | | 3,610,718 | |
See Notes to Financial Statements.
| | |
| Western Asset Total Return Unconstrained Fund 2019 Annual Report | | 41 |
Schedule of investments (cont’d)
May 31, 2019
Western Asset Total Return Unconstrained Fund
| | | | | | | | | | | | | | | | |
| Security | | Rate | | | Maturity
Date | | | Face
Amount† | | | Value | |
Insurance — 0.1% | | | | | | | | | | | | | | | | |
Asurion LLC, New Term Loan B7 (1 mo. USD LIBOR + 3.000%) | | | 5.439 | % | | | 11/3/24 | | | | 1,835,377 | | | $ | 1,829,641 | (e)(l)(m) |
Total Financials | | | | | | | | | | | | | | | 6,406,167 | |
| Health Care — 0.7% | | | | | | | | | | | | | | | | |
Health Care Providers & Services — 0.5% | | | | | | | | | | | | | |
Air Medical Group Holdings Inc., 2018 Term Loan (1 mo. USD LIBOR + 3.250%) | | | 5.690 | % | | | 4/28/22 | | | | 1,332,295 | | | | 1,301,485 | (e)(l)(m) |
HCA Inc., Term Loan B10 (1 mo. USD LIBOR + 2.000%) | | | 4.439 | % | | | 3/13/25 | | | | 600,097 | | | | 600,753 | (e)(l)(m) |
Jaguar Holding Co. II, 2018 Term Loan (1 mo. USD LIBOR + 2.500%) | | | 4.939 | % | | | 8/18/22 | | | | 790,019 | | | | 782,036 | (e)(l)(m) |
LifePoint Health Inc., First Lien Term Loan B (1 mo. USD LIBOR + 4.500%) | | | 6.930 | % | | | 11/16/25 | | | | 1,400,000 | | | | 1,398,687 | (e)(l)(m)(n) |
MPH Acquisition Holdings LLC, Initial Term Loan (3 mo. USD LIBOR + 2.750%) | | | 5.351 | % | | | 6/7/23 | | | | 1,673,060 | | | | 1,640,297 | (e)(l)(m) |
Phoenix Guarantor Inc., First Lien Initial Term Loan | | | 6.923-6.967 | % | | | 3/5/26 | | | | 850,000 | | | | 849,150 | (e)(l)(m)(n) |
Radnet Management Inc., First Lien Term Loan B1 | | | 6.110-8.000 | % | | | 6/30/23 | | | | 772,642 | | | | 772,160 | (e)(l)(m) |
Total Health Care Providers & Services | | | | | | | | | | | | 7,344,568 | |
Health Care Technology — 0.2% | | | | | | | | | | | | | | | | |
AthenaHealth Inc., First Lien Term Loan B | | | 6.951-7.045 | % | | | 2/11/26 | | | | 1,100,000 | | | | 1,101,375 | (e)(l)(m) |
Change Healthcare Holdings LLC, Closing Date Term Loan (1 mo. USD LIBOR + 2.750%) | | | 5.189 | % | | | 3/1/24 | | | | 1,229,886 | | | | 1,214,609 | (e)(l)(m) |
Total Health Care Technology | | | | | | | | | | | | | | | 2,315,984 | |
Pharmaceuticals — 0.0% | | | | | | | | | | | | | | | | |
Bausch Health Cos. Inc., Initial Term Loan (1 mo. USD LIBOR + 3.000%) | | | 5.467 | % | | | 6/2/25 | | | | 380,000 | | | | 378,724 | (e)(l)(m) |
Total Health Care | | | | | | | | | | | | | | | 10,039,276 | |
| Industrials — 0.3% | | | | | | | | | | | | | | | | |
Air Freight & Logistics — 0.0% | | | | | | | | | | | | | | | | |
Avolon TLB Borrower 1 (US) LLC, Term Loan B3 (1 mo. USD LIBOR + 2.000%) | | | 4.191 | % | | | 1/15/25 | | | | 797,378 | | | | 796,481 | (e)(l)(m) |
See Notes to Financial Statements.
| | |
42 | | Western Asset Total Return Unconstrained Fund 2019 Annual Report |
Western Asset Total Return Unconstrained Fund
| | | | | | | | | | | | | | | | |
| Security | | Rate | | | Maturity
Date | | | Face
Amount† | | | Value | |
Electrical Equipment — 0.0% | | | | | | | | | | | | | | | | |
Brookfield WEC Holdings Inc., First Lien Initial Term Loan (1 mo. USD LIBOR + 3.500%) | | | 5.939 | % | | | 8/1/25 | | | | 40,000 | | | $ | 39,990 | (e)(l)(m) |
Trading Companies & Distributors — 0.2% | | | | | | | | | | | | | | | | |
BrightView Landscapes LLC, Initial Term Loan (1 mo. USD LIBOR + 2.500%) | | | 5.000 | % | | | 8/15/25 | | | | 1,548,300 | | | | 1,548,282 | (e)(l)(m) |
Delos Finance SARL, 2018 Term Loan (3 mo. USD LIBOR + 1.750%) | | | 4.351 | % | | | 10/6/23 | | | | 810,000 | | | | 810,126 | (e)(l)(m) |
Total Trading Companies & Distributors | | | | | | | | | | | | | | | 2,358,408 | |
Transportation Infrastructure — 0.1% | | | | | | | | | | | | | | | | |
Flying Fortress Holdings LLC, Refinancing Term Loan (3 mo. USD LIBOR + 1.750%) | | | 4.351 | % | | | 10/31/22 | | | | 1,210,000 | | | | 1,210,000 | (e)(l)(m) |
Total Industrials | | | | | | | | | | | | | | | 4,404,879 | |
| Information Technology — 0.4% | | | | | | | | | | | | | | | | |
Communications Equipment — 0.0% | | | | | | | | | | | | | | | | |
Global Tel Link Corp., First Lien Term Loan (1 mo. USD LIBOR + 4.250%) | | | 6.689 | % | | | 11/29/25 | | | | 640,000 | | | | 640,500 | (e)(l)(m) |
IT Services — 0.1% | | | | | | | | | | | | | | | | |
First Data Corp., 2022 New Dollar Term Loan D (1 mo. USD LIBOR + 2.000%) | | | 4.437 | % | | | 7/8/22 | | | | 72,556 | | | | 72,539 | (e)(l)(m) |
First Data Corp., 2024 New Dollar Term Loan A (1 mo. USD LIBOR + 2.000%) | | | 4.437 | % | | | 4/26/24 | | | | 580,693 | | | | 580,366 | (e)(l)(m) |
McAfee LLC, USD Term Loan B (1 mo. USD LIBOR + 3.750%) | | | 6.178 | % | | | 9/30/24 | | | | 469,073 | | | | 469,366 | (e)(l)(m) |
Total IT Services | | | | | | | | | | | | | | | 1,122,271 | |
Semiconductors & Semiconductor Equipment — 0.0% | | | | | | | | | | | | | | | | |
ON Semiconductor Corp., 2018 New Replacement Term Loan B3 (1 mo. USD LIBOR + 1.750%) | | | 4.189 | % | | | 3/31/23 | | | | 734,512 | | | | 727,429 | (e)(l)(m) |
Software — 0.3% | | | | | | | | | | | | | | | | |
Dell International LLC, Refinancing Term Loan B (1 mo. USD LIBOR + 2.000%) | | | 4.440 | % | | | 9/7/23 | | | | 730,554 | | | | 728,552 | (e)(l)(m) |
See Notes to Financial Statements.
| | |
| Western Asset Total Return Unconstrained Fund 2019 Annual Report | | 43 |
Schedule of investments (cont’d)
May 31, 2019
Western Asset Total Return Unconstrained Fund
| | | | | | | | | | | | | | | | |
| Security | | Rate | | | Maturity
Date | | | Face
Amount† | | | Value | |
Software — continued | | | | | | | | | | | | | | | | |
DigiCert Holdings Inc., First Lien Term Loan (1 mo. USD LIBOR + 4.000%) | | | 6.439 | % | | | 10/31/24 | | | | 959,750 | | | $ | 958,910 | (e)(l)(m)(n) |
Ultimate Software Group Inc., First Lien Initial Term Loan (3 mo. USD LIBOR + 3.750%) | | | 6.274 | % | | | 5/4/26 | | | | 2,070,000 | | | | 2,075,821 | (e)(l)(m) |
Total Software | | | | | | | | | | | | | | | 3,763,283 | |
Total Information Technology | | | | | | | | | | | | | | | 6,253,483 | |
| Materials — 0.2% | | | | | | | | | | | | | | | | |
Containers & Packaging — 0.2% | | | | | | | | | | | | | | | | |
Berry Global Inc., Term Loan Q (1 mo. USD LIBOR + 2.000%) | | | 4.451 | % | | | 10/3/22 | | | | 487,640 | | | | 486,726 | (e)(l)(m) |
Reynolds Group Holdings Inc., Incremental Term Loan (1 mo. USD LIBOR + 2.750%) | | | 5.189 | % | | | 2/6/23 | | | | 1,704,111 | | | | 1,694,235 | (e)(l)(m) |
Total Materials | | | | | | | | | | | | | | | 2,180,961 | |
| Real Estate — 0.1% | | | | | | | | | | | | | | | | |
Real Estate Management & Development — 0.1% | | | | | | | | | | | | | |
CityCenter Holdings LLC, Refinancing Term Loan (1 mo. USD LIBOR + 2.250%) | | | 4.689 | % | | | 4/18/24 | | | | 900,570 | | | | 893,253 | (e)(l)(m) |
Total Senior Loans (Cost — $57,054,206) | | | | | | | | | | | | | | | 56,258,308 | |
| Non-U.S. Treasury Inflation Protected Securities — 3.8% | | | | | |
Argentina — 0.3% | | | | | | | | | | | | | |
Bonos de la Nacion Argentina con Ajuste por CER, Bonds | | | 4.000 | % | | | 3/6/20 | | | | 214,494,774 | ARS | | | 4,034,474 | |
Germany — 0.5% | | | | | | | | | | | | | |
Deutsche Bundesrepublik Inflation Linked Bond, Bonds | | | 0.100 | % | | | 4/15/26 | | | | 5,840,307 | EUR | | | 7,190,135 | (c) |
Japan — 3.0% | | | | | | | | | | | | | |
Japanese Government CPI Linked Bond, Senior Notes | | | 0.100 | % | | | 9/10/23 | | | | 104,700,000 | JPY | | | 988,401 | |
Japanese Government CPI Linked Bond, Senior Notes | | | 0.100 | % | | | 3/10/24 | | | | 1,134,690,000 | JPY | | | 10,738,011 | |
Japanese Government CPI Linked Bond, Senior Notes | | | 0.100 | % | | | 9/10/24 | | | | 1,720,400,000 | JPY | | | 16,360,192 | |
See Notes to Financial Statements.
| | |
44 | | Western Asset Total Return Unconstrained Fund 2019 Annual Report |
Western Asset Total Return Unconstrained Fund
| | | | | | | | | | | | | | | | |
| Security | | Rate | | | Maturity Date | | | Face
Amount† | | | Value | |
Japan — continued | | | | | | | | | | | | | | | | |
Japanese Government CPI Linked Bond, Senior Notes | | | 0.100 | % | | | 3/10/25 | | | | 1,014,000,000 | JPY | | $ | 9,661,376 | |
Japanese Government CPI Linked Bond, Senior Notes | | | 0.100 | % | | | 3/10/26 | | | | 597,619,671 | JPY | | | 5,724,994 | |
Total Japan | | | | | | | | | | | | | | | 43,472,974 | |
TotalNon-U.S. Treasury Inflation Protected Securities
(Cost — $55,543,868) | | | | | | | | 54,697,583 | |
| Mortgage-Backed Securities — 1.9% | | | | | | | | | | | | | |
FHLMC — 0.0% | | | | | | | | | | | | | | | | |
Federal Home Loan Mortgage Corp. (FHLMC) Gold | | | 4.000 | % | | | 5/1/43-7/1/43 | | | | 382,253 | | | | 402,949 | |
FNMA — 1.5% | | | | | | | | | | | | | | | | |
Federal National Mortgage Association (FNMA) | | | 5.000 | % | | | 1/1/39-7/1/39 | | | | 431,516 | | | | 462,944 | |
Federal National Mortgage Association (FNMA) | | | 5.500 | % | | | 5/1/40 | | | | 349,594 | | | | 376,054 | |
Federal National Mortgage Association (FNMA) | | | 3.500 | % | | | 4/1/43-10/1/43 | | | | 11,049,981 | | | | 11,468,405 | |
Federal National Mortgage Association (FNMA) | | | 4.000 | % | | | 4/1/43-7/1/43 | | | | 1,083,781 | | | | 1,139,689 | |
Federal National Mortgage Association (FNMA) | | | 3.000 | % | | | 7/1/46-11/1/48 | | | | 6,825,940 | | | | 6,871,679 | |
Total FNMA | | | | | | | | | | | | | | | 20,318,771 | |
GNMA — 0.4% | | | | | | | | | | | | | | | | |
Government National Mortgage Association (GNMA) | | | 3.000 | % | | | 6/20/49-7/20/49 | | | | 2,200,000 | | | | 2,231,148 | (o) |
Government National Mortgage Association (GNMA) | | | 3.500 | % | | | 6/20/49 | | | | 100,000 | | | | 102,793 | (o) |
Government National Mortgage Association (GNMA) | | | 4.000 | % | | | 6/20/49 | | | | 100,000 | | | | 103,438 | (o) |
Government National Mortgage Association (GNMA) II | | | 4.500 | % | | | 4/20/41 | | | | 108,282 | | | | 115,026 | |
Government National Mortgage Association (GNMA) II | | | 3.000 | % | | | 9/20/47-2/20/48 | | | | 3,099,229 | | | | 3,147,505 | |
Government National Mortgage Association (GNMA) II | | | 5.000 | % | | | 12/20/48-1/20/49 | | | | 197,144 | | | | 206,741 | |
Total GNMA | | | | | | | | | | | | | | | 5,906,651 | |
Total Mortgage-Backed Securities (Cost — $25,876,124) | | | | | | | | 26,628,371 | |
See Notes to Financial Statements.
| | |
| Western Asset Total Return Unconstrained Fund 2019 Annual Report | | 45 |
Schedule of investments (cont’d)
May 31, 2019
Western Asset Total Return Unconstrained Fund
| | | | | | | | | | | | | | | | |
| Security | | Rate | | | Maturity
Date | | | Face
Amount† | | | Value | |
| Municipal Bonds — 0.4% | | | | | | | | | | | | | | | | |
California — 0.0% | | | | | | | | | | | | | | | | |
Morongo Band of Mission Indians, CA, Revenue, Tribal Economic Development, Series A | | | 7.000 | % | | | 10/1/39 | | | | 360,000 | | | $ | 392,749 | (a) |
Illinois — 0.3% | | | | | | | | | | | | | | | | |
Chicago, IL, GO, Taxable Project, Series B, Refunding | | | 6.314 | % | | | 1/1/44 | | | | 1,470,000 | | | | 1,550,732 | |
State of Illinois, GO | | | 5.100 | % | | | 6/1/33 | | | | 3,100,000 | | | | 3,201,060 | |
Total Illinois | | | | | | | | | | | | | | | 4,751,792 | |
Michigan — 0.1% | | | | | | | | | | | | | | | | |
Detroit, MI, GO, Financial Recovery, Series B1 | | | 4.000 | % | | | 4/1/44 | | | | 790,000 | | | | 689,844 | |
Total Municipal Bonds (Cost — $5,512,162) | | | | | | | | | | | | 5,834,385 | |
| | | | |
| | | Expiration
Date | | | Contracts | | | Notional
Amount† | | | | |
| Purchased Options — 0.4% | | | | | | | | | | | | | | | | |
| Exchange-Traded Purchased Options — 0.2% | | | | | | | | | | | | | |
Euro-Bund Futures, Call @ 178.00 EUR | | | 7/26/19 | | | | 1,991 | | | | 199,100,000 | | | | 66,727 | |
Eurodollar Futures, Call @ $98.00 | | | 3/16/20 | | | | 1,161 | | | | 2,902,500 | | | | 885,263 | |
Eurodollar Futures, Call @ $100.00 | | | 9/14/20 | | | | 1,265 | | | | 3,162,500 | | | | 39,531 | |
Eurodollar Futures, Put @ $97.38 | | | 9/16/19 | | | | 959 | | | | 2,397,500 | | | | 5,994 | |
U.S. Treasury2-Year Notes Futures, Put @ $106.38 | | | 6/21/19 | | | | 2,460 | | | | 4,920,000 | | | | 38,440 | |
U.S. Treasury2-Year Notes Futures, Put @ $105.50 | | | 7/26/19 | | | | 744 | | | | 1,488,000 | | | | 23,250 | |
U.S. Treasury5-Year Notes Futures, Call @ $117.00 | | | 6/21/19 | | | | 828 | | | | 828,000 | | | | 517,500 | |
U.S. Treasury5-Year Notes Futures, Call @ $122.50 | | | 7/26/19 | | | | 2,600 | | | | 2,600,000 | | | | 81,250 | |
U.S. Treasury5-Year Notes Futures, Put @ $116.00 | | | 6/21/19 | | | | 1,087 | | | | 1,087,000 | | | | 42,461 | |
U.S. Treasury5-Year Notes Futures, Put @ $116.50 | | | 6/21/19 | | | | 804 | | | | 804,000 | | | | 81,657 | |
U.S. Treasury5-Year Notes Futures, Put @ $113.50 | | | 7/26/19 | | | | 3,172 | | | | 3,172,000 | | | | 74,345 | |
U.S. Treasury10-Year Notes Futures, Call @ $134.50 | | | 7/26/19 | | | | 281 | | | | 281,000 | | | | 13,172 | |
U.S. Treasury10-Year Notes Futures, Put @ $123.50 | | | 6/21/19 | | | | 231 | | | | 231,000 | | | | 3,609 | |
See Notes to Financial Statements.
| | |
46 | | Western Asset Total Return Unconstrained Fund 2019 Annual Report |
Western Asset Total Return Unconstrained Fund
| | | | | | | | | | | | | | | | | | |
| Security | | | | Expiration
Date | | | Contracts | | | Notional
Amount† | | | Value | |
| Exchange-Traded Purchased Options — continued | | | | | | | | | |
U.S. Treasury10-Year Notes Futures, Put @ $124.50 | | | 6/21/19 | | | | 842 | | | | 842,000 | | | $ | 52,625 | |
U.S. Treasury10-Year Notes Futures, Put @ $125.00 | | | 6/21/19 | | | | 2,718 | | | | 2,718,000 | | | | 297,281 | |
U.S. Treasury10-Year Notes Futures, Put @ $125.25 | | | 6/21/19 | | | | 640 | | | | 640,000 | | | | 90,000 | |
U.S. Treasury Long-Term Bonds Futures, Call @ $152.00 | | | 6/21/19 | | | | 219 | | | | 219,000 | | | | 499,594 | |
U.S. Treasury Long-Term Bonds Futures, Call @ $153.00 | | | 6/21/19 | | | | 115 | | | | 115,000 | | | | 190,469 | |
U.S. Treasury Long-Term Bonds Futures, Call @ $154.00 | | | 6/21/19 | | | | 116 | | | | 116,000 | | | | 134,125 | |
U.S. Treasury Long-Term Bonds Futures, Put @ $145.00 | | | 6/21/19 | | | | 39 | | | | 39,000 | | | | 609 | |
U.S. Treasury Long-Term Bonds Futures, Put @ $149.00 | | | 6/21/19 | | | | 248 | | | | 248,000 | | | | 19,375 | |
U.S. Treasury Long-Term Bonds Futures, Put @ $150.50 | | | 6/21/19 | | | | 207 | | | | 207,000 | | | | 48,516 | |
U.S. Treasury Long-Term Bonds Futures, Put @ $135.00 | | | 7/26/19 | | | | 428 | | | | 428,000 | | | | 13,375 | |
U.S. Treasury Long-Term Bonds Futures, Put @ $136.00 | | | 7/26/19 | | | | 250 | | | | 250,000 | | | | 7,813 | |
Total Exchange-Traded Purchased Options | | | | | | | | | | | | 3,226,981 | |
| | | | | |
| | | Counterparty | | | | | | | | | | | | |
| OTC Purchased Options — 0.2% | | | | | | | | | | | | | | | | |
Credit default swaption with Bank of America N.A. to sell protection on Markit CDX.NA.HY.32 Index, Call @ $105.25 | | Bank of America
N.A. | | | 9/18/19 | | | | 14,080,000 | | | | 14,080,000 | | | | 60,309 | |
Credit default swaption with Bank of America N.A. to sell protection on Markit CDX.NA.HY.32 Index, Call @ $106.50 | | Bank of America
N.A. | | | 9/18/19 | | | | 15,047,000 | | | | 15,047,000 | | | | 19,548 | |
See Notes to Financial Statements.
| | |
| Western Asset Total Return Unconstrained Fund 2019 Annual Report | | 47 |
Schedule of investments (cont’d)
May 31, 2019
Western Asset Total Return Unconstrained Fund
| | | | | | | | | | | | | | | | | | |
| Security | | Counterparty | | Expiration
Date | | | Contracts | | | Notional
Amount† | | | Value | |
| OTC Purchased Options — continued | | | | | | | | | | | | | |
Credit default swaption with Bank of America N.A. to sell protection on Markit CDX.NA.IG.32 Index, Call @ 67.50 bps | | Bank of America
N.A. | | | 9/18/19 | | | | 28,260,000 | | | | 28,260,000 | | | $ | 53,694 | |
Credit default swaption with Goldman Sachs Group Inc. to sell protection on Markit CDX.NA.IG.32 Index, Call @ 62.50 bps | | Goldman Sachs
Group Inc. | | | 9/18/19 | | | | 139,070,000 | | | | 139,070,000 | | | | 126,979 | |
U.S. Dollar/Brazilian Real, Put @ 4.11 BRL | | Goldman Sachs
Group Inc. | | | 8/19/19 | | | | 28,490,000 | | | | 28,490,000 | | | | 1,489,747 | |
U.S. Dollar/British Pound, Put @ $1.27 | | Citibank N.A. | | | 7/22/19 | | | | 13,313,520 | | | | 13,313,520 | | | | 138,286 | |
U.S. Dollar/Chinese Offshore Yuan, Call @ 6.94 CNH | | BNP Paribas SA | | | 8/30/19 | | | | 7,070,000 | | | | 7,070,000 | | | | 76,770 | |
U.S. Dollar/Euro, Put @ $1.16 | | JPMorgan
Chase & Co. | | | 6/18/19 | | | | 14,100,000 | | | | 14,100,000 | | | | 1,023 | |
U.S. Dollar/Euro, Put @ $1.16 | | Goldman Sachs
Group Inc. | | | 6/21/19 | | | | 13,980,000 | | | | 13,980,000 | | | | 1,213 | |
U.S. Dollar/Euro, Put @ $1.14 | | Citibank N.A. | | | 7/3/19 | | | | 12,090,000 | | | | 12,090,000 | | | | 11,044 | |
U.S. Dollar/Euro, Put @ $1.12 | | Barclays Bank
PLC | | | 7/24/19 | | | | 8,980,000 | | | | 8,980,000 | | | | 48,646 | |
U.S. Dollar/Euro, Put @ $1.13 | | BNP Paribas SA | | | 7/24/19 | | | | 18,560,000 | | | | 18,560,000 | | | | 100,542 | |
U.S. Dollar/Mexican Peso, Put @ 19.38 MXN | | Goldman Sachs
Group Inc. | | | 8/16/19 | | | | 20,350,000 | | | | 20,350,000 | | | | 187,822 | |
Total OTC Purchased Options | | | | | | | | | | | | | | | 2,315,623 | |
Total Purchased Options (Cost — $4,827,570) | | | | | | | | | | | | 5,542,604 | |
See Notes to Financial Statements.
| | |
48 | | Western Asset Total Return Unconstrained Fund 2019 Annual Report |
Western Asset Total Return Unconstrained Fund
| | | | | | | | | | | | | | | | |
| | | | |
| Security | | Rate | | | | | | Shares | | | Value | |
| Preferred Stocks — 0.1% | | | | | | | | | | | | | | | | |
| Financials — 0.1% | | | | | | | | | | | | | | | | |
Banks — 0.1% | | | | | | | | | | | | | | | | |
GMAC Capital Trust I (3 mo. USD LIBOR + 5.785%) (Cost — $1,171,775) | | | 8.303 | % | | | | | | | 47,249 | | | $ | 1,219,969 | (e) |
Total Investments before Short-Term Investments (Cost — $1,298,496,243) | | | | 1,300,860,807 | |
| | | | |
| | | | | | Maturity
Date | | | Face
Amount† | | | | |
| Short-Term Investments — 5.8% | | | | | | | | | | | | | | | | |
| Commercial Paper — 1.8% | | | | | | | | | | | | | | | | |
Mizuho Bank Ltd. | | | 2.513 | % | | | 6/13/19 | | | | 14,200,000 | | | | 14,187,452 | (p)(q) |
Standard Chartered Bank | | | 2.473 | % | | | 7/24/19 | | | | 2,910,000 | | | | 2,899,502 | (p)(q) |
Toronto-Dominion Bank | | | 2.523 | % | | | 7/25/19 | | | | 7,780,000 | | | | 7,750,844 | (p)(q) |
Total Commercial Paper (Cost — $24,837,488) | | | | | | | | | | | | | | | 24,837,798 | |
| | | | |
| | | | | | | | | Shares | | | | |
| Money Market Funds — 4.0% | | | | | | | | | | | | | | | | |
Western Asset Government Cash Management Portfolio LLC (Cost — $57,276,616) | | | 2.400 | % | | | | | | | 57,276,616 | | | | 57,276,616 | (r) |
Total Short-Term Investments (Cost — $82,114,104) | | | | | | | | | | | | | | | 82,114,414 | |
Total Investments — 97.6% (Cost — $1,380,610,347) | | | | | | | | | | | | | | | 1,382,975,221 | |
Other Assets in Excess of Liabilities — 2.4% | | | | | | | | | | | | | | | 33,735,322 | |
Total Net Assets — 100.0% | | | | | | | | | | | | | | $ | 1,416,710,543 | |
See Notes to Financial Statements.
| | |
| Western Asset Total Return Unconstrained Fund 2019 Annual Report | | 49 |
Schedule of investments (cont’d)
May 31, 2019
Western Asset Total Return Unconstrained Fund
| † | Face amount/notional amount denominated in U.S. dollars, unless otherwise noted. |
| * | Non-income producing security. |
| (a) | Security is exempt from registration under Rule 144A of the Securities Act of 1933. This security may be resold in transactions that are exempt from registration, normally to qualified institutional buyers. This security has been deemed liquid pursuant to guidelines approved by the Board of Directors. |
| (b) | Payment-in-kind security for which the issuer has the option at each interest payment date of making interest payments in cash or additional debt securities. |
| (c) | Security is exempt from registration under Regulation S of the Securities Act of 1933. Regulation S applies to securities offerings that are made outside of the United States and do not involve direct selling efforts in the United States. This security has been deemed liquid pursuant to guidelines approved by the Board of Directors. |
| (d) | Security has no maturity date. The date shown represents the next call date. |
| (e) | Variable rate security. Interest rate disclosed is as of the most recent information available. Certain variable rate securities are not based on a published reference rate and spread but are determined by the issuer or agent and are based on current market conditions. These securities do not indicate a reference rate and spread in their description above. |
| (f) | The coupon payment on these securities is currently in default as of May 31, 2019. |
| (g) | Security is valued in good faith in accordance with procedures approved by the Board of Directors (Note 1). |
| (h) | Security is valued using significant unobservable inputs (Note 1). |
| (i) | Value is less than $1. |
| (j) | The maturity principal is currently in default as of May 31, 2019. |
| (k) | Collateralized mortgage obligations are secured by an underlying pool of mortgages or mortgage pass-through certificates that are structured to direct payments on underlying collateral to different series or classes of the obligations. The interest rate may change positively or inversely in relation to one or more interest rates, financial indices or other financial indicators and may be subject to an upper and/or lower limit. |
| (l) | Senior loans may be considered restricted in that the Fund ordinarily is contractually obligated to receive approval from the agent bank and/or borrower prior to the disposition of a senior loan. |
| (m) | Interest rates disclosed represent the effective rates on senior loans. Ranges in interest rates are attributable to multiple contracts under the same loan. |
| (n) | All or a portion of this loan is unfunded as of May 31, 2019. The interest rate for fully unfunded term loans is to be determined. |
| (o) | This security is traded on ato-be-announced (“TBA”) basis. At May 31, 2019, the Fund held TBA securities with a total cost of $2,409,543. |
| (p) | Commercial paper exempt from registration under Section 4(2) of the Securities Act of 1933. This security may be resold in transactions that are exempt from registration, normally to qualified institutional buyers. This security has been deemed liquid pursuant to guidelines approved by the Board of Directors. |
| (q) | Rate shown representsyield-to-maturity. |
| (r) | In this instance, as defined in the Investment Company Act of 1940, an “Affiliated Company” represents Fund ownership of at least 5% of the outstanding voting securities of an issuer or a company which is under common ownership or control. At May 31, 2019, the total market value of investments in Affiliated Companies was $57,276,616 and the cost was $57,276,616 (Note 8). |
See Notes to Financial Statements.
| | |
50 | | Western Asset Total Return Unconstrained Fund 2019 Annual Report |
Western Asset Total Return Unconstrained Fund
| | |
Abbreviations used in this schedule: |
| |
| ARS | | — Argentine Peso |
| |
| bps | | — basis point spread. 100 basis points = 1.00% |
| |
| BRL | | — Brazilian Real |
| |
| CER | | — Coeficente de Establilzacion de Referencia |
| |
| CLO | | — Collateral Loan Obligation |
| |
| CMT | | — Constant Maturity Treasury |
| |
| CNH | | — Chinese Offshore Yuan |
| |
| CPI | | — Consumer Price Index |
| |
| EUR | | — Euro |
| |
| GO | | — General Obligation |
| |
| ICE | | — Intercontinental Exchange |
| |
| IDR | | — Indonesian Rupiah |
| |
| INR | | — Indian Rupee |
| |
| IO | | — Interest Only |
| |
| JPY | | — Japanese Yen |
| |
| JSC | | — Joint Stock Company |
| |
| LIBOR | | — London Interbank Offered Rate |
| |
| MXN | | — Mexican Peso |
| |
| PIK | | —Payment-In-Kind |
| |
| REMIC | | — Real Estate Mortgage Investment Conduit |
| |
| RUB | | — Russian Ruble |
| |
| USD | | — United States Dollar |
| |
| UYU | | — Uruguayan Peso |
| | | | | | | | | | | | | | | | | | | | |
| Schedule of Written Options | | | | | | | |
| Exchange-Traded Written Options | | | | | | | | | |
| Security | | Expiration
Date | | | Strike
Price | | | Contracts | | | Notional
Amount† | | | Value | |
| Eurodollar Futures, Call | | | 9/14/20 | | | $ | 98.00 | | | | 581 | | | | 1,452,500 | | | $ | (718,987) | |
| U.S. Treasury5-Year Notes Futures, Call | | | 7/26/19 | | | | 117.00 | | | | 415 | | | | 415,000 | | | | (337,188) | |
| U.S. Treasury5-Year Notes Futures, Put | | | 7/26/19 | | | | 116.00 | | | | 869 | | | | 869,000 | | | | (122,203) | |
| U.S. Treasury5-Year Notes Futures, Put | | | 8/23/19 | | | | 114.75 | | | | 1,918 | | | | 1,918,000 | | | | (119,875) | |
| U.S. Treasury10-Year Notes Futures, Call | | | 6/21/19 | | | | 126.00 | | | | 231 | | | | 231,000 | | | | (249,047) | |
| U.S. Treasury10-Year Notes Futures, Put | | | 6/21/19 | | | | 122.50 | | | | 231 | | | | 231,000 | | | | 0 | (a) |
| U.S. Treasury10-Year Notes Futures, Put | | | 6/21/19 | | | | 126.00 | | | | 906 | | | | 906,000 | | | | (297,281) | |
| U.S. Treasury10-Year Notes Futures, Put | | | 7/26/19 | | | | 124.50 | | | | 621 | | | | 621,000 | | | | (126,141) | |
| U.S. Treasury10-Year Notes Futures, Put | | | 8/23/19 | | | | 122.50 | | | | 1,764 | | | | 1,764,000 | | | | (165,375) | |
| U.S. Treasury Long-Term Bonds Futures, Put | | | 6/21/19 | | | | 147.00 | | | | 13 | | | | 13,000 | | | | (406) | |
| U.S. Treasury Long-Term Bonds Futures, Put | | | 7/26/19 | | | | 149.00 | | | | 331 | | | | 331,000 | | | | (124,125) | |
| Total Exchange-Traded Written Options (Premiums received — $2,466,913) | | | | | | | $ | (2,260,628) | |
See Notes to Financial Statements.
| | |
| Western Asset Total Return Unconstrained Fund 2019 Annual Report | | 51 |
Schedule of investments (cont’d)
May 31, 2019
Western Asset Total Return Unconstrained Fund
| | | | | | | | | | | | | | | | | | | | | | |
| Schedule of Written Options (cont’d) | |
| OTC Written Options | |
| Security | | Counterparty | | Expiration
Date | | | Strike
Price | | | Contracts | | | Notional
Amount† | | | Value | |
| Credit default swaption with Bank of America N.A. to sell protection on Markit CDX.NA.HY.32 Index, Put | | Bank of
America
N.A. | | | 9/18/19 | | | $ | 100.38 | | | | 14,080,000 | | | | 14,080,000 | ‡ | | $ | (119,595) | |
| Credit default swaption with Bank of America N.A. to sell protection on Markit CDX.NA.HY.32 Index, Put | | Bank of
America
N.A. | | | 9/18/19 | | | | 101.50 | | | | 15,047,000 | | | | 15,047,000 | ‡ | | | (162,235) | |
| Credit default swaption with Bank of America N.A. to sell protection on Markit CDX.NA.IG.32 Index, Put | | Bank of
America
N.A. | | | 9/18/19 | | | | 95.00 | bps | | | 28,260,000 | | | | 28,260,000 | ‡ | | | (43,803) | |
| Credit default swaption with Goldman Sachs Group Inc. to sell protection on Markit CDX.NA.IG.32 Index, Put | | Goldman
Sachs
Group
Inc. | | | 9/18/19 | | | | 85.00 | bps | | | 139,070,000 | | | | 139,070,000 | ‡ | | | (350,177) | |
| U.S. Dollar/Canadian Dollar, Call | | Citibank
N.A. | | | 6/27/19 | | | | 1.37 | CAD | | | 4,100,000 | | | | 4,100,000 | | | | (5,903) | |
| U.S. Dollar/Chinese Offshore Yuan, Call | | BNP
Paribas
SA | | | 8/30/19 | | | | 7.13 | CNH | | | 14,140,000 | | | | 14,140,000 | | | | (51,606) | |
| U.S. Dollar/Euro, Call | | Citibank
N.A. | | | 7/3/19 | | | | 1.12 | | | | 12,090,000 | | | | 12,090,000 | | | | (48,861) | |
| Total OTC Written Options (Premiums received — $624,201) | | | $ | (782,180) | |
| Total Written Options (Premiums received — $3,091,114) | | | $ | (3,042,808) | |
| † | Notional amount denominated in U.S. dollars, unless otherwise noted. |
| (a) | Value is less than $1. |
| ‡ | In the event an option is exercised and a credit event occurs as defined under the terms of the swap agreement, the notional amount is the maximum potential amount that could be required to be paid as a seller of credit protection or received as a buyer of credit protection. |
See Notes to Financial Statements.
| | |
52 | | Western Asset Total Return Unconstrained Fund 2019 Annual Report |
Western Asset Total Return Unconstrained Fund
| | | | |
Abbreviations used in this schedule: |
| |
| bps | | — basis point spread. 100 basis points = 1.00% |
| |
| CAD | | — Canadian Dollar |
| |
| CNH | | — Chinese Offshore Yuan |
At May 31, 2019, the Fund had the following open futures contracts:
| | | | | | | | | | | | | | | | | | | | |
| | | Number of
Contracts | | | Expiration
Date | | | Notional
Amount | | | Market
Value | | | Unrealized
Appreciation
(Depreciation) | |
| Contracts to Buy: | | | | | | | | | | | | | | | | | | | | |
| 90-Day Eurodollar | | | 840 | | | | 12/19 | | | $ | 204,458,014 | | | $ | 205,600,500 | | | $ | 1,142,486 | |
| 90-Day Eurodollar | | | 1,088 | | | | 6/20 | | | | 263,818,019 | | | | 267,185,600 | | | | 3,367,581 | |
| Australian10-Year Bonds | | | 1 | | | | 6/19 | | | | 97,124 | | | | 98,495 | | | | 1,371 | |
| Euro-BTP | | | 193 | | | | 6/19 | | | | 27,245,480 | | | | 28,046,542 | | | | 801,062 | |
| U.S. Treasury2-Year Notes | | | 2,488 | | | | 9/19 | | | | 532,214,875 | | | | 534,103,625 | | | | 1,888,750 | |
| U.S. Treasury Long-Term Bonds | | | 1,475 | | | | 9/19 | | | | 222,314,577 | | | | 226,735,156 | | | | 4,420,579 | |
| U.S. Treasury Ultra10-Year Notes | | | 21 | | | | 9/19 | | | | 2,846,749 | | | | 2,867,485 | | | | 20,736 | |
| | | | | | | | | | | | | | | | | | | | 11,642,565 | |
| Contracts to Sell: | | | | | | | | | | | | | | | | | | | | |
| 30-Day Federal Funds | | | 457 | | | | 7/19 | | | | 185,927,317 | | | | 185,955,605 | | | | (28,288) | |
| 30-Day Federal Funds | | | 346 | | | | 1/20 | | | | 141,162,718 | | | | 141,490,055 | | | | (327,337) | |
| 90-Day Eurodollar | | | 1,400 | | | | 6/21 | | | | 339,479,980 | | | | 344,032,500 | | | | (4,552,520) | |
| Canadian10-Year Bonds | | | 452 | | | | 9/19 | | | | 47,345,946 | | | | 47,771,678 | | | | (425,732) | |
| Euro-Bund | | | 232 | | | | 6/19 | | | | 42,551,664 | | | | 43,630,159 | | | | (1,078,495) | |
| Euro-Bund | | | 2,576 | | | | 9/19 | | | | 489,992,937 | | | | 491,466,995 | | | | (1,474,058) | |
| Euro-Buxl | | | 59 | | | | 6/19 | | | | 12,018,757 | | | | 13,014,954 | | | | (996,197) | |
| Euro-Schatz | | | 323 | | | | 9/19 | | | | 40,429,823 | | | | 40,450,102 | | | | (20,279) | |
| U.S. Treasury5-Year Notes | | | 3,623 | | | | 9/19 | | | | 422,284,467 | | | | 425,221,330 | | | | (2,936,863) | |
| U.S. Treasury10-Year Notes | | | 397 | | | | 9/19 | | | | 50,171,189 | | | | 50,319,750 | | | | (148,561) | |
| U.S. Treasury Ultra Long- Term Bonds | | | 703 | | | | 9/19 | | | | 120,436,962 | | | | 123,574,219 | | | | (3,137,257) | |
| United Kingdom Long Gilt Bonds | | | 247 | | | | 9/19 | | | | 40,226,904 | | | | 40,485,773 | | | | (258,869) | |
| | | | | | | | | | | | | | | | | | | | (15,384,456) | |
| Net unrealized depreciation on open futures contracts | | | | | | | $ | (3,741,891) | |
See Notes to Financial Statements.
| | |
| Western Asset Total Return Unconstrained Fund 2019 Annual Report | | 53 |
Schedule of investments (cont’d)
May 31, 2019
Western Asset Total Return Unconstrained Fund
At May 31, 2019, the Fund had the following open forward foreign currency contracts:
| | | | | | | | | | | | | | | | | | | | |
Currency Purchased | | | Currency Sold | | | Counterparty | | Settlement
Date | | | Unrealized
Appreciation
(Depreciation) | |
| BRL | | | 17,010,000 | | | USD | | | 4,311,678 | | | Barclays Bank PLC | | | 7/17/19 | | | $ | 5,431 | |
| CAD | | | 57,001,288 | | | USD | | | 42,918,132 | | | Barclays Bank PLC | | | 7/17/19 | | | | (693,866) | |
| EUR | | | 2,000,000 | | | USD | | | 2,257,306 | | | Barclays Bank PLC | | | 7/17/19 | | | | (13,984) | |
| GBP | | | 11,151,977 | | | USD | | | 14,660,724 | | | Barclays Bank PLC | | | 7/17/19 | | | | (527,475) | |
| MXN | | | 2,000,000 | | | USD | | | 103,604 | | | Barclays Bank PLC | | | 7/17/19 | | | | (2,387) | |
| MXN | | | 2,000,000 | | | USD | | | 103,719 | | | Barclays Bank PLC | | | 7/17/19 | | | | (2,502) | |
| MXN | | | 3,000,000 | | | USD | | | 155,697 | | | Barclays Bank PLC | | | 7/17/19 | | | | (3,871) | |
| NOK | | | 62,360,000 | | | USD | | | 7,285,302 | | | Barclays Bank PLC | | | 7/17/19 | | | | (147,674) | |
| USD | | | 967,393 | | | CAD | | | 1,300,000 | | | Barclays Bank PLC | | | 7/17/19 | | | | 4,405 | |
| USD | | | 2,446,497 | | | CNY | | | 16,449,512 | | | Barclays Bank PLC | | | 7/17/19 | | | | 63,765 | |
| USD | | | 1,342,808 | | | EUR | | | 1,200,000 | | | Barclays Bank PLC | | | 7/17/19 | | | | (3,185) | |
| USD | | | 2,831,040 | | | EUR | | | 2,494,906 | | | Barclays Bank PLC | | | 7/17/19 | | | | 32,601 | |
| USD | | | 25,158,403 | | | EUR | | | 22,176,594 | | | Barclays Bank PLC | | | 7/17/19 | | | | 283,780 | |
| USD | | | 13,806,217 | | | INR | | | 973,504,012 | | | Barclays Bank PLC | | | 7/17/19 | | | | (90,808) | |
| USD | | | 276,531 | | | JPY | | | 30,000,000 | | | Barclays Bank PLC | | | 7/17/19 | | | | (1,368) | |
| USD | | | 9,998,814 | | | RUB | | | 664,566,199 | | | Barclays Bank PLC | | | 7/17/19 | | | | (90,595) | |
| USD | | | 423,864 | | | SEK | | | 3,904,000 | | | Barclays Bank PLC | | | 7/17/19 | | | | 10,832 | |
| MXN | | | 5,000,000 | | | USD | | | 260,224 | | | BNP Paribas SA | | | 7/17/19 | | | | (7,181) | |
| USD | | | 148,247 | | | CAD | | | 200,000 | | | BNP Paribas SA | | | 7/17/19 | | | | 95 | |
| AUD | | | 3,901,267 | | | USD | | | 2,780,259 | | | Citibank N.A. | | | 7/17/19 | | | | (70,028) | |
| BRL | | | 140,000 | | | USD | | | 35,875 | | | Citibank N.A. | | | 7/17/19 | | | | (344) | |
| BRL | | | 10,574,189 | | | USD | | | 2,709,663 | | | Citibank N.A. | | | 7/17/19 | | | | (25,952) | |
| BRL | | | 27,480,000 | | | USD | | | 7,043,986 | | | Citibank N.A. | | | 7/17/19 | | | | (69,610) | |
| EUR | | | 3,100,000 | | | USD | | | 3,522,574 | | | Citibank N.A. | | | 7/17/19 | | | | (45,424) | |
| IDR | | | 139,417,416,039 | | | USD | | | 9,646,929 | | | Citibank N.A. | | | 7/17/19 | | | | 63,550 | |
| MXN | | | 2,000,000 | | | USD | | | 104,054 | | | Citibank N.A. | | | 7/17/19 | | | | (2,837) | |
| MXN | | | 2,000,000 | | | USD | | | 103,775 | | | Citibank N.A. | | | 7/17/19 | | | | (2,558) | |
| MXN | | | 233,700,000 | | | USD | | | 12,217,691 | | | Citibank N.A. | | | 7/17/19 | | | | (390,464) | |
| TRY | | | 43,943,810 | | | USD | | | 7,257,442 | | | Citibank N.A. | | | 7/17/19 | | | | 73,627 | |
| USD | | | 185,876 | | | CAD | | | 250,000 | | | Citibank N.A. | | | 7/17/19 | | | | 686 | |
| USD | | | 208,597 | | | COP | | | 659,689,200 | | | Citibank N.A. | | | 7/17/19 | | | | 13,846 | |
| USD | | | 912,385 | | | EUR | | | 800,000 | | | Citibank N.A. | | | 7/17/19 | | | | 15,056 | |
| USD | | | 1,458,931 | | | EUR | | | 1,300,000 | | | Citibank N.A. | | | 7/17/19 | | | | 772 | |
| USD | | | 1,691,391 | | | EUR | | | 1,500,000 | | | Citibank N.A. | | | 7/17/19 | | | | 8,899 | |
| USD | | | 1,797,290 | | | EUR | | | 1,600,000 | | | Citibank N.A. | | | 7/17/19 | | | | 2,632 | |
| USD | | | 2,236,130 | | | EUR | | | 2,000,000 | | | Citibank N.A. | | | 7/17/19 | | | | (7,192) | |
| USD | | | 46,129,980 | | | JPY | | | 5,105,666,140 | | | Citibank N.A. | | | 7/17/19 | | | | (1,165,412) | |
| USD | | | 886,867 | | | MXN | | | 17,000,000 | | | Citibank N.A. | | | 7/17/19 | | | | 26,521 | |
See Notes to Financial Statements.
| | |
54 | | Western Asset Total Return Unconstrained Fund 2019 Annual Report |
Western Asset Total Return Unconstrained Fund
| | | | | | | | | | | | | | | | | | | | |
Currency
Purchased | | | Currency Sold | | | Counterparty | | Settlement
Date | | | Unrealized
Appreciation
(Depreciation) | |
| USD | | | 926,779 | | | MXN | | | 18,000,000 | | | Citibank N.A. | | | 7/17/19 | | | $ | 15,825 | |
| USD | | | 4,615,990 | | | MXN | | | 90,009,507 | | | Citibank N.A. | | | 7/17/19 | | | | 60,736 | |
| USD | | | 5,367,886 | | | MXN | | | 102,886,334 | | | Citibank N.A. | | | 7/17/19 | | | | 160,953 | |
| ZAR | | | 170,000,000 | | | USD | | | 11,867,530 | | | Goldman Sachs Group Inc. | | | 7/17/19 | | | | (265,099) | |
| BRL | | | 5,410,000 | | | USD | | | 1,386,415 | | | JPMorgan Chase & Co. | | | 7/17/19 | | | | (13,366) | |
| EUR | | | 10,789,474 | | | USD | | | 12,305,880 | | | JPMorgan Chase & Co. | | | 7/17/19 | | | | (203,747) | |
| TWD | | | 14,840,500 | | | USD | | | 482,587 | | | JPMorgan Chase & Co. | | | 7/17/19 | | | | (11,841) | |
| USD | | | 17,388,030 | | | KRW | | | 19,711,940,000 | | | JPMorgan Chase & Co. | | | 7/17/19 | | | | 806,789 | |
| USD | | | 7,250,422 | | | PHP | | | 386,520,000 | | | JPMorgan Chase & Co. | | | 7/17/19 | | | | (133,314) | |
| USD | | | 4,689,290 | | | EUR | | | 4,170,000 | | | Barclays Bank PLC | | | 7/26/19 | | | | 8,509 | |
| USD | | | 9,371,769 | | | EUR | | | 8,310,000 | | | BNP Paribas SA | | | 7/26/19 | | | | 43,882 | |
| USD | | | 11,396,000 | | | MXN | | | 220,854,480 | | | Goldman Sachs Group Inc. | | | 8/20/19 | | | | 279,878 | |
| USD | | | 16,280,000 | | | BRL | | | 66,910,800 | | | Goldman Sachs Group Inc. | | | 8/21/19 | | | | (652,163) | |
| CNH | | | 7,247,980 | | | USD | | | 1,045,131 | | | BNP Paribas SA | | | 9/3/19 | | | | (1,246) | |
| USD | | | 1,045,311 | | | CNH | | | 7,247,980 | | | Citibank N.A. | | | 9/3/19 | | | | 1,427 | |
| ARS | | | 116,470,000 | | | USD | | | 2,368,962 | | | JPMorgan Chase & Co. | | | 9/23/19 | | | | (192,051) | |
| Total | | | | | | | | | | | | | | | $ | (2,853,047) | |
| | |
Abbreviations used in this table: |
| |
| ARS | | — Argentine Peso |
| |
| AUD | | — Australian Dollar |
| |
| BRL | | — Brazilian Real |
| |
| CAD | | — Canadian Dollar |
| |
| CNH | | — Chinese Offshore Yuan |
| |
| CNY | | — Chinese Yuan Renminbi |
| |
| COP | | — Colombian Peso |
| |
| EUR | | — Euro |
| |
| GBP | | — British Pound |
| |
| IDR | | — Indonesian Rupiah |
| |
| INR | | — Indian Rupee |
| |
| JPY | | — Japanese Yen |
| |
| KRW | | — South Korean Won |
| |
| MXN | | — Mexican Peso |
| |
| NOK | | — Norwegian Krone |
| |
| PHP | | — Philippine Peso |
| |
| RUB | | — Russian Ruble |
| |
| SEK | | — Swedish Krona |
| |
| TRY | | — Turkish Lira |
| |
| TWD | | — Taiwan Dollar |
| |
| USD | | — United States Dollar |
| |
| ZAR | | — South African Rand |
.
See Notes to Financial Statements.
| | |
| Western Asset Total Return Unconstrained Fund 2019 Annual Report | | 55 |
Schedule of investments (cont’d)
May 31, 2019
Western Asset Total Return Unconstrained Fund
At May 31, 2019, the Fund had the following open swap contracts:
| | | | | | | | | | | | | | | | | | | | | | | | | | |
OTC CREDIT DEFAULT SWAPS ON SOVEREIGN ISSUES — BUY PROTECTION1 | | | | |
Swap Counterparty
(Reference Entity) | | Notional
Amount2 | | | Termination Date | | | Implied
Credit
Spread at May 31,
20193 | | Periodic
Payments
Made by the
Fund† | | | Market
Value | | | Upfront
Premiums
Paid (Received) | | | Unrealized Appreciation Depreciation | |
| Barclays Bank PLC (Republic of Korea, 2.750%, due 1/19/27) | | $ | 16,138,000 | | | | 6/20/24 | | | 0.374% | | | 1.000% quarterly | | | $ | (487,220) | | | $ | (493,997) | | | $ | 6,777 | |
| Deutsche Bank AG (Australia Government, 4.750%, due 4/21/27) | | | 8,260,000 | | | | 6/20/23 | | | 0.176% | | | 1.000% quarterly | | | | (267,183) | | | | (258,815) | | | | (8,368) | |
| Total | | $ | 24,398,000 | | | | | | | | | | | | | $ | (754,403) | | | $ | (752,812) | | | $ | (1,591) | |
| | | | | | | | | | | | | | | | | | | | |
| CENTRALLY CLEARED INTEREST RATE SWAPS | |
| | | Notional
Amount* | | | Termination
Date | | | Payments
Made by
the Fund† | | Payments
Received by
the Fund† | | Upfront
Premiums
Paid (Received) | | | Unrealized Appreciation (Depreciation) | |
| | | | 2,540,640,000 | MXN | | | 4/5/21 | | | 28-Day TIIE - Banxico every 28 days | | 7.351% every 28 days | | $ | (12,830) | | | $ | (1,694,666) | |
| | | | 29,396,000 | GBP | | | 10/26/21 | | | 1.271% semi-annually | | 6-Month GBP LIBOR semi-annually | | | 14,270 | | | | (298,079) | |
| | | | 36,061,000 | GBP | | | 10/30/21 | | | 1.385% annually | | 3-Month GBP LIBOR annually | | | — | | | | (247,604) | |
| | | | 1,742,000,000 | MXN | | | 4/6/22 | | | 28-Day TIIE - Banxico every 28 days | | 7.330% every 28 days | | | (30,777) | | | | (1,325,228) | |
| | | | 159,407,000 | | | | 4/26/22 | | | 3-Month LIBOR quarterly | | 2.250% semi-annually | | | 35,620 | | | | 700,511 | |
| | | | 162,396,000 | | | | 4/26/23 | | | 2.300% semi-annually | | 3-Month LIBOR quarterly | | | 10,959 | | | | (660,645) | |
| | | | 32,466,000 | | | | 6/19/24 | | | 3-Month LIBOR quarterly | | Daily U.S. Federal Funds Intraday Effective Rate + 0.254% quarterly | | | — | | | | 59,955 | |
| | | | 35,712,000 | | | | 12/31/25 | | | 2.250% semi-annually | | 3-Month LIBOR quarterly | | | 182,989 | | | | (774,538) | |
See Notes to Financial Statements.
| | |
56 | | Western Asset Total Return Unconstrained Fund 2019 Annual Report |
Western Asset Total Return Unconstrained Fund
| | | | | | | | | | | | | | | | | | | | |
| CENTRALLY CLEARED INTEREST RATE SWAPS (cont’d) | |
| | | Notional
Amount* | | | Termination
Date | | | Payments
Made by
the Fund† | | Payments
Received by
the Fund† | | Upfront
Premiums
Paid
(Received) | | | Unrealized
Appreciation (Depreciation) | |
| | | | 50,672,000 | | | | 12/31/25 | | | 2.250% annually | | Daily U.S. Federal Funds Intraday Effective Rate annually | | $ | (308,231) | | | $ | (1,282,339) | |
| | | | 135,101,000 | | | | 1/31/26 | | | 2.500% semi-annually | | 3-Month LIBOR quarterly | | | (1,917,497) | | | | (2,443,592) | |
| | | | 12,838,000 | | | | 2/15/36 | | | 3-Month LIBOR quarterly | | 3.000% semi-annually | | | 5,941 | | | | 1,333,446 | |
| | | | 16,576,000 | | | | 5/15/44 | | | 2.875% semi-annually | | 3-Month LIBOR quarterly | | | 82,280 | | | | (1,880,378) | |
| | | | 9,472,000 | | | | 5/15/44 | | | 3.000% semi-annually | | 3-Month LIBOR quarterly | | | 6,067 | | | | (1,265,209) | |
| | | | 19,584,000 | | | | 8/15/44 | | | 2.750% semi-annually | | 3-Month LIBOR quarterly | | | (91,113) | | | | (1,561,690) | |
| | | | 6,054,600,000 | JPY | | | 4/19/47 | | | 0.785% semi-annually | | 6-Month JPY LIBOR semi-annually | | | 3,232,546 | | | | (8,035,663) | |
| Total | | | | | | | | | | | | | | $ | 1,210,224 | | | $ | (19,375,719) | |
| | | | | | | | | | | | | | | | | | | | | | |
| OTC INTEREST RATE SWAPS | |
| Swap Counterparty | | Notional
Amount* | | | Termination
Date | | Payments Made by
the Fund† | | | Payments Received by
the Fund† | | | Upfront Premiums Paid (Received) | | | Unrealized
Appreciation Depreciation | |
| Citibank N.A. | | | 117,723,000 | BRL | | 1/2/20 | | | BRL-CDI ** | | | | 8.410% ** | | | | — | | | $ | 819,895 | |
| Citibank N.A. | | | 24,000,000 | BRL | | 1/2/20 | | | BRL-CDI ** | | | | 8.410% ** | | | $ | 2,284 | | | | 165,042 | |
| Citibank N.A. | | | 40,800,000 | BRL | | 1/2/20 | | | BRL-CDI ** | | | | 8.410% ** | | | | 14,600 | | | | 282,497 | |
| Citibank N.A. | | | 26,600,000 | BRL | | 1/2/20 | | | BRL-CDI ** | | | | 8.410% ** | | | | 5,923 | | | | 187,009 | |
| Citibank N.A. | | | 12,497,000 | BRL | | 1/2/20 | | | BRL-CDI ** | | | | 8.410% ** | | | | 5,308 | | | | 85,334 | |
| Barclays Bank PLC | | | 151,270,000 | | | 4/15/20 | | | 2.015% ** | | | | CPURNSA ** | | | | — | | | | (99,317) | |
| Barclays Bank PLC | | | 75,630,000 | | | 4/18/20 | | | 2.060% ** | | | | CPURNSA ** | | | | — | | | | (86,156) | |
| Barclays Bank PLC | | | 75,630,000 | | | 4/23/20 | | | 2.060% ** | | | | CPURNSA ** | | | | — | | | | (108,436) | |
| Total | | | | | | | | | | | | | | | | $ | 28,115 | | | $ | 1,245,868 | |
See Notes to Financial Statements.
| | |
| Western Asset Total Return Unconstrained Fund 2019 Annual Report | | 57 |
Schedule of investments (cont’d)
May 31, 2019
Western Asset Total Return Unconstrained Fund
| | | | | | | | | | | | | | | | | | | | | | |
| CENTRALLY CLEARED CREDIT DEFAULT SWAPS ON CREDIT INDICES — BUY PROTECTION1 | |
| Reference Entity | | Notional
Amount2 | | | Termination
Date | | | Periodic
Payments
Made by the
Fund† | | Market Value4 | | | Upfront Premiums Paid (Received) | | | Unrealized Appreciation | |
| Markit CDX.NA.HY.32 Index | | $ | 24,515,000 | | | | 6/20/24 | | | 5.000% quarterly | | $ | (1,112,049) | | | $ | (1,520,751) | | | $ | 408,702 | |
| Markit CDX.NA.IG.32 Index | | | 46,250,000 | | | | 6/20/24 | | | 1.000% quarterly | | | (648,749) | | | | (909,585) | | | | 260,836 | |
| Total | | $ | 70,765,000 | | | | | | | | | $ | (1,760,798) | | | $ | (2,430,336) | | | $ | 669,538 | |
| 1 | If the Fund is a buyer of protection and a credit event occurs, as defined under the terms of that particular swap agreement, the Fund will either (i) receive from the seller of protection an amount equal to the notional amount of the swap and deliver the referenced obligation or the underlying securities comprising the referenced index or (ii) receive a net settlement amount in the form of cash or securities equal to the notional amount of the swap less the recovery value of the referenced obligation or the underlying securities comprising the referenced index. |
| 2 | The maximum potential amount the Fund could be required to pay as a seller of credit protection or receive as a buyer of credit protection if a credit event occurs as defined under the terms of that particular swap agreement. |
| 3 | Implied credit spreads, utilized in determining the market value of credit default swap agreements on corporate or sovereign issues as of period end, serve as an indicator of the current status of the payment/performance risk and represent the likelihood or risk of default for the credit derivative. The implied credit spread of a particular referenced entity reflects the cost of buying/selling protection and may include upfront payments required to be made to enter into the agreement. Wider credit spreads represent a deterioration of the referenced entity’s credit soundness and a greater likelihood or risk of default or other credit event occurring as defined under the terms of the agreement. A credit spread identified as “Defaulted” indicates a credit event has occurred for the referenced entity or obligation. |
| 4 | The quoted market prices and resulting values for credit default swap agreements on asset-backed securities and credit indices serve as an indicator of the current status of the payment/performance risk and represent the likelihood of an expected loss (or profit) for the credit derivative had the notional amount of the swap agreement been closed/sold as of the period end. Decreasing market values (sell protection) or increasing market values (buy protection) when compared to the notional amount of the swap, represent a deterioration of the referenced entity’s credit soundness and a greater likelihood or risk of default or other credit event occurring as defined under the terms of the agreement. |
| † | Percentage shown is an annual percentage rate. |
| * | Notional amount denominated in U.S. dollars, unless otherwise noted. |
| ** | One time payment made at termination date. |
See Notes to Financial Statements.
| | |
58 | | Western Asset Total Return Unconstrained Fund 2019 Annual Report |
Western Asset Total Return Unconstrained Fund
| | |
Abbreviations used in this table: |
| |
| BRL | | — Brazilian Real |
| |
| BRL-CDI | | — Brazil Cetip InterBank Deposit Rate |
| |
| CPURNSA | | — U.S. CPI Urban Consumers NSA Index |
| |
| GBP | | — British Pound |
| |
| JPY | | — Japanese Yen |
| |
| LIBOR | | — London Interbank Offered Rate |
| |
| MXN | | — Mexican Peso |
| |
| TIIE | | — Equilibrium Interbanking Interest Rate (Tasa de Intere’s Interbancaria de Equilibrio) |
See Notes to Financial Statements.
| | |
| Western Asset Total Return Unconstrained Fund 2019 Annual Report | | 59 |
Statement of assets and liabilities
May 31, 2019
| | | | |
| |
| Assets: | | | | |
Investments in unaffiliated securities, at value (Cost — $1,323,333,731) | | $ | 1,325,698,605 | |
Investments in affiliated securities, at value (Cost — $57,276,616) | | | 57,276,616 | |
Cash | | | 1,777,931 | |
Foreign currency, at value (Cost — $13,409,985) | | | 13,166,710 | |
Interest receivable | | | 12,875,004 | |
Foreign currency collateral for open futures contracts and exchange traded options, at value (Cost — $11,691,706) | | | 11,708,435 | |
Deposits with brokers for centrally cleared swap contracts | | | 7,966,950 | |
Receivable for securities sold | | | 3,778,126 | |
Receivable for Fund shares sold | | | 2,680,896 | |
Deposits with brokers for open futures contracts and exchange-traded options | | | 2,254,271 | |
Unrealized appreciation on forward foreign currency contracts | | | 1,984,497 | |
OTC swaps, at value (premiums paid — $28,115) | | | 1,567,892 | |
Deposits with brokers for OTC derivatives | | | 1,250,000 | |
Foreign currency collateral for centrally cleared swap contracts, at value (Cost — $47,504) | | | 47,038 | |
Receivable for open OTC swap contracts | | | 22,513 | |
Other receivables | | | 22,242 | |
Prepaid expenses | | | 52,186 | |
Total Assets | | | 1,444,129,912 | |
| |
| Liabilities: | | | | |
Payable for securities purchased | | | 10,343,749 | |
Unrealized depreciation on forward foreign currency contracts | | | 4,837,544 | |
Payable for Fund shares repurchased | | | 3,262,994 | |
Written options, at value (premiums received — $3,091,114) | | | 3,042,808 | |
Payable to broker — variation margin on centrally cleared swap contracts | | | 2,272,797 | |
Payable to broker — variation margin on open futures contracts | | | 1,065,002 | |
OTC swaps, at value (premiums received — $752,812) | | | 1,048,312 | |
Investment management fee payable | | | 869,002 | |
Distributions payable | | | 415,525 | |
Service and/or distribution fees payable | | | 24,659 | |
Directors’ fees payable | | | 6,114 | |
Accrued expenses | | | 230,863 | |
Total Liabilities | | | 27,419,369 | |
| Total Net Assets | | $ | 1,416,710,543 | |
| |
| Net Assets: | | | | |
Par value (Note 7) | | $ | 137,860 | |
Paid-in capital in excess of par value | | | 1,469,811,198 | |
Total distributable earnings (loss) | | | (53,238,515) | |
| Total Net Assets | | $ | 1,416,710,543 | |
See Notes to Financial Statements.
| | |
60 | | Western Asset Total Return Unconstrained Fund 2019 Annual Report |
| | | | |
| |
| Net Assets: | | | | |
Class A | | | $13,085,890 | |
Class A2 | | | $1,202,898 | |
Class C | | | $11,858,144 | |
Class FI | | | $52,649,591 | |
Class R | | | $457,487 | |
Class I | | | $1,131,615,964 | |
Class IS | | | $205,840,569 | |
| |
| Shares Outstanding: | | | | |
Class A | | | 1,272,877 | |
Class A2 | | | 117,065 | |
Class C | | | 1,154,032 | |
Class FI | | | 5,127,828 | |
Class R | | | 44,492 | |
Class I | | | 110,089,127 | |
Class IS | | | 20,054,751 | |
| |
| Net Asset Value: | | | | |
Class A (and redemption price) | | | $10.28 | |
Class A2 (and redemption price) | | | $10.28 | |
Class C* | | | $10.28 | |
Class FI (and redemption price) | | | $10.27 | |
Class R (and redemption price) | | | $10.28 | |
Class I (and redemption price) | | | $10.28 | |
Class IS (and redemption price) | | | $10.26 | |
| Maximum Public Offering Price Per Share: | | | | |
Class A (based on maximum initial sales charge of 4.25%) | | | $10.74 | |
Class A2 (based on maximum initial sales charge of 4.25%) | | | $10.74 | |
| * | Redemption price per share is NAV of Class C shares reduced by a 1.00% CDSC if shares are redeemed within one year from purchase payment (Note 2). |
See Notes to Financial Statements.
| | |
| Western Asset Total Return Unconstrained Fund 2019 Annual Report | | 61 |
Statement of operations
For the Year Ended May 31, 2019
| | | | |
| |
| Investment Income: | | | | |
Interest from unaffiliated investments | | $ | 68,434,928 | |
Interest from affiliated investments | | | 1,050,237 | |
Dividends | | | 93,433 | |
Less: Foreign taxes withheld | | | (437,055) | |
Total Investment Income | | | 69,141,543 | |
| |
| Expenses: | | | | |
Investment management fee (Note 2) | | | 8,616,331 | |
Transfer agent fees (Note 5) | | | 1,072,024 | |
Fees recaptured by investment manager (Note 2) | | | 461,686 | |
Service and/or distribution fees (Notes 2 and 5) | | | 375,497 | |
Registration fees | | | 252,598 | |
Fund accounting fees | | | 91,535 | |
Custody fees | | | 81,459 | |
Audit and tax fees | | | 69,511 | |
Legal fees | | | 48,001 | |
Shareholder reports | | | 45,198 | |
Directors’ fees | | | 42,124 | |
Insurance | | | 19,402 | |
Commitment fees (Note 9) | | | 10,555 | |
Interest expense | | | 2,965 | |
Miscellaneous expenses | | | 31,979 | |
Total Expenses | | | 11,220,865 | |
Less: Fee waivers and/or expense reimbursements (Notes 2 and 5) | | | (150,394) | |
Net Expenses | | | 11,070,471 | |
| Net Investment Income | | | 58,071,072 | |
| |
Realized and Unrealized Gain (Loss) on Investments, Futures Contracts,
Written Options, Swap Contracts, Forward Foreign Currency Contracts and Foreign Currency Transactions (Notes 1, 3 and 4): | | | | |
Net Realized Gain (Loss) From: | | | | |
Investment transactions in unaffiliated securities | | | (29,411,540) | † |
Futures contracts | | | (27,372,159) | |
Written options | | | 21,061,374 | |
Swap contracts | | | 5,014,982 | |
Forward foreign currency contracts | | | (3,036,633) | |
Foreign currency transactions | | | (1,435,228) | |
Net Realized Loss | | | (35,179,204) | |
Change in Net Unrealized Appreciation (Depreciation) From: | | | | |
Investments in unaffiliated securities | | | 28,443,300 | |
Futures contracts | | | (22,590) | |
Written options | | | 2,047,187 | |
Swap contracts | | | (12,988,561) | |
See Notes to Financial Statements.
| | |
62 | | Western Asset Total Return Unconstrained Fund 2019 Annual Report |
| | | | |
Forward foreign currency contracts | | | (1,729,267) | |
Foreign currencies | | | 649,137 | |
Change in Net Unrealized Appreciation (Depreciation) | | | 16,399,206 | |
| Net Loss on Investments, Futures Contracts, Written Options, Swap Contracts, Forward Foreign Currency Contracts and Foreign Currency Transactions | | | (18,779,998) | |
| Increase in Net Assets From Operations | | $ | 39,291,074 | |
| † | Net of foreign capital gains tax of $(23,546). |
See Notes to Financial Statements.
| | |
| Western Asset Total Return Unconstrained Fund 2019 Annual Report | | 63 |
Statements of changes in net assets
| | | | | | | | |
| For the Years Ended May 31, | | 2019 | | | 2018 | |
| | |
| Operations: | | | | | | | | |
Net investment income | | $ | 58,071,072 | | | $ | 51,458,060 | |
Net realized gain (loss) | | | (35,179,204) | | | | 18,991,134 | |
Change in net unrealized appreciation (depreciation) | | | 16,399,206 | | | | (55,384,245) | |
Increase in Net Assets From Operations | | | 39,291,074 | | | | 15,064,949 | |
| | |
| Distributions to Shareholders From (Notes 1 and 6): | | | | | | | | |
Total distributable earnings(a) | | | (46,632,989) | | | | (58,589,093) | |
Return of capital | | | (11,293,113) | | | | — | |
Decrease in Net Assets From Distributions to Shareholders | | | (57,926,102) | | | | (58,589,093) | |
| | |
| Fund Share Transactions (Note 7): | | | | | | | | |
Net proceeds from sale of shares | | | 503,862,054 | | | | 913,508,532 | |
Reinvestment of distributions | | | 53,338,906 | | | | 52,829,493 | |
Cost of shares repurchased | | | (739,528,533) | | | | (593,981,419) | |
Increase (Decrease) in Net Assets From Fund Share Transactions | | | (182,327,573) | | | | 372,356,606 | |
Increase (Decrease) in Net Assets | | | (200,962,601) | | | | 328,832,462 | |
| | |
| Net Assets: | | | | | | | | |
Beginning of year | | | 1,617,673,144 | | | | 1,288,840,682 | |
End of year(b) | | $ | 1,416,710,543 | | | $ | 1,617,673,144 | |
| (a) | Distributions from net investment income and from realized gains are no longer required to be separately disclosed (Note 11). For the year ended May 31, 2018, distributions from net investment income were $58,589,093. |
| (b) | Parenthetical disclosure of undistributed net investment income is no longer required (Note 11). For the year ended May 31, 2018, end of year net assets included overdistributed net investment income of $(3,365,464). |
See Notes to Financial Statements.
| | |
64 | | Western Asset Total Return Unconstrained Fund 2019 Annual Report |
Financial highlights
| | | | | | | | | | | | | | | | | | | | |
| For a share of each class of capital stock outstanding throughout each year ended May 31: | |
| Class A Shares1 | | 2019 | | | 2018 | | | 2017 | | | 2016 | | | 2015 | |
| | | | | |
| Net asset value, beginning of year | | | $10.36 | | | | $10.59 | | | | $10.14 | | | | $10.49 | | | | $10.74 | |
| | | | | |
| Income (loss) from operations: | | | | | | | | | | | | | | | | | | | | |
Net investment income | | | 0.38 | | | | 0.31 | | | | 0.31 | | | | 0.31 | | | | 0.31 | |
Net realized and unrealized gain (loss) | | | (0.08) | | | | (0.16) | | | | 0.42 | | | | (0.36) | | | | (0.20) | |
Total income (loss) from operations | | | 0.30 | | | | 0.15 | | | | 0.73 | | | | (0.05) | | | | 0.11 | |
| | | | | |
| Less distributions from: | | | | | | | | | | | | | | | | | | | | |
Net investment income | | | (0.30) | | | | (0.38) | | | | (0.28) | | | | (0.23) | | | | (0.36) | |
Return of capital | | | (0.08) | | | | — | | | | — | | | | (0.07) | | | | — | |
Total distributions | | | (0.38) | | | | (0.38) | | | | (0.28) | | | | (0.30) | | | | (0.36) | |
| | | | | |
| Net asset value, end of year | | | $10.28 | | | | $10.36 | | | | $10.59 | | | | $10.14 | | | | $10.49 | |
Total return2 | | | 3.05 | % | | | 1.34 | % | | | 7.24 | % | | | (0.41) | % | | | 1.03 | % |
| | | | | |
| Net assets, end of year (000s) | | | $13,086 | | | | $27,536 | | | | $165,033 | | | | $226,970 | | | | $54,767 | |
| | | | | |
| Ratios to average net assets: | | | | | | | | | | | | | | | | | | | | |
Gross expenses | | | 1.50 | %3 | | | 1.31 | %3 | | | 1.30 | %3 | | | 1.40 | % | | | 1.18 | %3 |
Net expenses4 | | | 1.10 | 3,5 | | | 1.10 | 3,5 | | | 1.23 | 3,5 | | | 1.25 | 5 | | | 1.18 | 3 |
Net investment income | | | 3.70 | | | | 2.92 | | | | 2.96 | | | | 3.06 | | | | 2.92 | |
| | | | | |
| Portfolio turnover rate6 | | | 49 | % | | | 49 | % | | | 56 | % | | | 59 | % | | | 62 | % |
| 1 | Per share amounts have been calculated using the average shares method. |
| 2 | Performance figures, exclusive of sales charges, may reflect compensating balance arrangements, fee waivers and/or expense reimbursements. In the absence of compensating balance arrangements, fee waivers and/or expense reimbursements, the total return would have been lower. Past performance is no guarantee of future results. |
| 3 | Reflects recapture of expenses waived/reimbursed from prior fiscal years. |
| 4 | As a result of an expense limitation arrangement, effective March 31, 2017, the ratio of total annual fund operating expenses, other than interest, brokerage commissions, taxes, extraordinary expenses, deferred organizational expenses and acquired fund fees and expenses, to average net assets of Class A shares did not exceed 1.10%. This expense limitation arrangement cannot be terminated prior to December 31, 2020 without the Board of Directors’ consent. Prior to March 31, 2017, as a result of an expense limitation arrangement, the ratio of total annual fund operating expenses to average net assets of Class A shares did not exceed 1.25%. |
| 5 | Reflects fee waivers and/or expense reimbursements. |
| 6 | Excluding mortgage dollar roll transactions. If mortgage dollar roll transactions had been included, the portfolio turnover rate would have been 51%, 67%, 70%, 71% and 64% for the years ended May 31, 2019, 2018, 2017, 2016 and 2015, respectively. |
See Notes to Financial Statements.
| | |
| Western Asset Total Return Unconstrained Fund 2019 Annual Report | | 65 |
Financial highlights (cont’d)
| | | | | | | | | | | | | | | | | | | | |
| For a share of each class of capital stock outstanding throughout each year ended May 31: | |
| Class A2 Shares1 | | 2019 | | | 2018 | | | 2017 | | | 2016 | | | 2015 | |
| | | | | |
| Net asset value, beginning of year | | | $10.35 | | | | $10.59 | | | | $10.13 | | | | $10.49 | | | | $10.74 | |
| | | | | |
| Income (loss) from operations: | | | | | | | | | | | | | | | | | | | | |
Net investment income | | | 0.37 | | | | 0.32 | | | | 0.29 | | | | 0.29 | | | | 0.28 | |
Net realized and unrealized gain (loss) | | | (0.07) | | | | (0.19) | | | | 0.42 | | | | (0.37) | | | | (0.19) | |
Total income (loss) from operations | | | 0.30 | | | | 0.13 | | | | 0.71 | | | | (0.08) | | | | 0.09 | |
| | | | | |
| Less distributions from: | | | | | | | | | | | | | | | | | | | | |
Net investment income | | | (0.29) | | | | (0.37) | | | | (0.25) | | | | (0.21) | | | | (0.34) | |
Return of capital | | | (0.08) | | | | — | | | | — | | | | (0.07) | | | | — | |
Total distributions | | | (0.37) | | | | (0.37) | | | | (0.25) | | | | (0.28) | | | | (0.34) | |
| | | | | |
| Net asset value, end of year | | | $10.28 | | | | $10.35 | | | | $10.59 | | | | $10.13 | | | | $10.49 | |
Total return2 | | | 2.85 | % | | | 1.13 | % | | | 7.14 | % | | | (0.64) | % | | | 0.90 | % |
| | | | | |
| Net assets, end of year (000s) | | | $1,203 | | | | $1,253 | | | | $1,351 | | | | $1,172 | | | | $1,062 | |
| | | | | |
| Ratios to average net assets: | | | | | | | | | | | | | | | | | | | | |
Gross expenses | | | 1.21 | %3 | | | 1.29 | %3 | | | 1.44 | %3 | | | 1.54 | % | | | 1.41 | % |
Net expenses4 | | | 1.21 | 3 | | | 1.22 | 3,5 | | | 1.40 | 3,5 | | | 1.45 | 5 | | | 1.41 | |
Net investment income | | | 3.63 | | | | 2.96 | | | | 2.78 | | | | 2.86 | | | | 2.69 | |
| | | | | |
| Portfolio turnover rate6 | | | 49 | % | | | 49 | % | | | 56 | % | | | 59 | % | | | 62 | % |
| 1 | Per share amounts have been calculated using the average shares method. |
| 2 | Performance figures, exclusive of sales charges, may reflect compensating balance arrangements, fee waivers and/or expense reimbursements. In the absence of compensating balance arrangements, fee waivers and/or expense reimbursements, the total return would have been lower. Past performance is no guarantee of future results. |
| 3 | Reflects recapture of expenses waived/reimbursed from prior fiscal years. |
| 4 | As a result of an expense limitation arrangement, effective March 31, 2017, the ratio of total annual fund operating expenses, other than interest, brokerage commissions, taxes, extraordinary expenses, deferred organizational expenses and acquired fund fees and expenses, to average net assets of Class A2 shares did not exceed 1.30%. This expense limitation arrangement cannot be terminated prior to December 31, 2020 without the Board of Directors’ consent. Prior to March 31, 2017, as a result of an expense limitation arrangement, the ratio of total annual fund operating expenses to average net assets of Class A2 shares did not exceed 1.45%. |
| 5 | Reflects fee waivers and/or expense reimbursements. |
| 6 | Excluding mortgage dollar roll transactions. If mortgage dollar roll transactions had been included, the portfolio turnover rate would have been 51%, 67%, 70%, 71% and 64% for the years ended May 31, 2019, 2018, 2017, 2016 and 2015, respectively. |
See Notes to Financial Statements.
| | |
66 | | Western Asset Total Return Unconstrained Fund 2019 Annual Report |
| | | | | | | | | | | | | | | | | | | | |
| For a share of each class of capital stock outstanding throughout each year ended May 31: | |
| Class C Shares1 | | 2019 | | | 2018 | | | 2017 | | | 2016 | | | 2015 | |
| | | | | |
| Net asset value, beginning of year | | | $10.35 | | | | $10.59 | | | | $10.14 | | | | $10.49 | | | | $10.74 | |
| | | | | |
| Income (loss) from operations: | | | | | | | | | | | | | | | | | | | | |
Net investment income | | | 0.31 | | | | 0.26 | | | | 0.24 | | | | 0.25 | | | | 0.23 | |
Net realized and unrealized gain (loss) | | | (0.07) | | | | (0.19) | | | | 0.42 | | | | (0.36) | | | | (0.20) | |
Total income (loss) from operations | | | 0.24 | | | | 0.07 | | | | 0.66 | | | | (0.11) | | | | 0.03 | |
| | | | | |
| Less distributions from: | | | | | | | | | | | | | | | | | | | | |
Net investment income | | | (0.24) | | | | (0.31) | | | | (0.21) | | | | (0.18) | | | | (0.28) | |
Return of capital | | | (0.07) | | | | — | | | | — | | | | (0.06) | | | | — | |
Total distributions | | | (0.31) | | | | (0.31) | | | | (0.21) | | | | (0.24) | | | | (0.28) | |
| | | | | |
| Net asset value, end of year | | | $10.28 | | | | $10.35 | | | | $10.59 | | | | $10.14 | | | | $10.49 | |
Total return2 | | | 2.36 | % | | | 0.59 | % | | | 6.56 | % | | | (1.07) | % | | | 0.37 | % |
| | | | | |
| Net assets, end of year (000s) | | | $11,858 | | | | $16,966 | | | | $17,250 | | | | $17,034 | | | | $19,606 | |
| | | | | |
| Ratios to average net assets: | | | | | | | | | | | | | | | | | | | | |
Gross expenses | | | 1.81 | %3 | | | 1.84 | %3 | | | 1.88 | % | | | 1.88 | % | | | 1.91 | %3 |
Net expenses4 | | | 1.80 | 3,5 | | | 1.76 | 3,5 | | | 1.85 | 5 | | | 1.88 | | | | 1.91 | 3 |
Net investment income | | | 3.01 | | | | 2.41 | | | | 2.33 | | | | 2.42 | | | | 2.18 | |
| | | | | |
| Portfolio turnover rate6 | | | 49 | % | | | 49 | % | | | 56 | % | | | 59 | % | | | 62 | % |
| 1 | Per share amounts have been calculated using the average shares method. |
| 2 | Performance figures, exclusive of CDSC, may reflect compensating balance arrangements, fee waivers and/or expense reimbursements. In the absence of compensating balance arrangements, fee waivers and/or expense reimbursements, the total return would have been lower. Past performance is no guarantee of future results. |
| 3 | Reflects recapture of expenses waived/reimbursed from prior fiscal years. |
| 4 | As a result of an expense limitation arrangement, effective March 31, 2017, the ratio of total annual fund operating expenses, other than interest, brokerage commissions, taxes, extraordinary expenses, deferred organizational expenses and acquired fund fees and expenses, to average net assets of Class C shares did not exceed 1.80%. This expense limitation arrangement cannot be terminated prior to December 31, 2020 without the Board of Directors’ consent. Prior to March 31, 2017, as a result of an expense limitation arrangement, the ratio of total annual fund operating expenses to average net assets of Class C shares did not exceed 2.00%. |
| 5 | Reflects fee waivers and/or expense reimbursements. |
| 6 | Excluding mortgage dollar roll transactions. If mortgage dollar roll transactions had been included, the portfolio turnover rate would have been 51%, 67%, 70%, 71% and 64% for the years ended May 31, 2019, 2018, 2017, 2016 and 2015, respectively. |
See Notes to Financial Statements.
| | |
| Western Asset Total Return Unconstrained Fund 2019 Annual Report | | 67 |
Financial highlights (cont’d)
| | | | | | | | | | | | | | | | | | | | |
| For a share of each class of capital stock outstanding throughout each year ended May 31: | |
| Class FI Shares1 | | 2019 | | | 2018 | | | 2017 | | | 2016 | | | 2015 | |
| | | | | |
| Net asset value, beginning of year | | | $10.35 | | | | $10.58 | | | | $10.13 | | | | $10.48 | | | | $10.73 | |
| | | | | |
| Income (loss) from operations: | | | | | | | | | | | | | | | | | | | | |
Net investment income | | | 0.38 | | | | 0.33 | | | | 0.32 | | | | 0.32 | | | | 0.31 | |
Net realized and unrealized gain (loss) | | | (0.08) | | | | (0.18) | | | | 0.41 | | | | (0.36) | | | | (0.20) | |
Total income (loss) from operations | | | 0.30 | | | | 0.15 | | | | 0.73 | | | | (0.04) | | | | 0.11 | |
| | | | | |
| Less distributions from: | | | | | | | | | | | | | | | | | | | | |
Net investment income | | | (0.30) | | | | (0.38) | | | | (0.28) | | | | (0.23) | | | | (0.36) | |
Return of capital | | | (0.08) | | | | — | | | | — | | | | (0.08) | | | | — | |
Total distributions | | | (0.38) | | | | (0.38) | | | | (0.28) | | | | (0.31) | | | | (0.36) | |
| | | | | |
| Net asset value, end of year | | | $10.27 | | | | $10.35 | | | | $10.58 | | | | $10.13 | | | | $10.48 | |
Total return2 | | | 3.10 | % | | | 1.39 | % | | | 7.33 | % | | | (0.36) | % | | | 1.02 | % |
| | | | | |
| Net assets, end of year (000s) | | | $52,650 | | | | $90,923 | | | | $175,304 | | | | $195,266 | | | | $226,485 | |
| | | | | |
| Ratios to average net assets: | | | | | | | | | | | | | | | | | | | | |
Gross expenses | | | 1.11 | %3 | | | 1.12 | %3 | | | 1.16 | % | | | 1.16 | % | | | 1.18 | %3 |
Net expenses4 | | | 1.10 | 3,5 | | | 1.05 | 3,5 | | | 1.14 | 5 | | | 1.16 | | | | 1.18 | 3,5 |
Net investment income | | | 3.70 | | | | 3.10 | | | | 3.05 | | | | 3.15 | | | | 2.91 | |
| | | | | |
| Portfolio turnover rate6 | | | 49 | % | | | 49 | % | | | 56 | % | | | 59 | % | | | 62 | % |
| 1 | Per share amounts have been calculated using the average shares method. |
| 2 | Performance figures may reflect compensating balance arrangements, fee waivers and/or expense reimbursements. In the absence of compensating balance arrangements, fee waivers and/or expense reimbursements, the total return would have been lower. Past performance is no guarantee of future results. |
| 3 | Reflects recapture of expenses waived/reimbursed from prior fiscal years. |
| 4 | As a result of an expense limitation arrangement, effective March 31, 2017, the ratio of total annual fund operating expenses, other than interest, brokerage commissions, taxes, extraordinary expenses, deferred organizational expenses and acquired fund fees and expenses, to average net assets of Class FI shares did not exceed 1.10%. This expense limitation arrangement cannot be terminated prior to December 31, 2020 without the Board of Directors’ consent. Prior to March 31, 2017, as a result of an expense limitation arrangement, the ratio of total annual fund operating expenses to average net assets of Class FI shares did not exceed 1.20%. |
| 5 | Reflects fee waivers and/or expense reimbursements. |
| 6 | Excluding mortgage dollar roll transactions. If mortgage dollar roll transactions had been included, the portfolio turnover rate would have been 51%, 67%, 70%, 71% and 64% for the years ended May 31, 2019, 2018, 2017, 2016 and 2015, respectively. |
See Notes to Financial Statements.
| | |
68 | | Western Asset Total Return Unconstrained Fund 2019 Annual Report |
| | | | | | | | | | | | | | | | | | | | |
| For a share of each class of capital stock outstanding throughout each year ended May 31: | |
| Class R Shares1 | | 2019 | | | 2018 | | | 2017 | | | 2016 | | | 2015 | |
| | | | | |
| Net asset value, beginning of year | | | $10.36 | | | | $10.59 | | | | $10.14 | | | | $10.50 | | | | $10.74 | |
| | | | | |
| Income (loss) from operations: | | | | | | | | | | | | | | | | | | | | |
Net investment income | | | 0.36 | | | | 0.31 | | | | 0.30 | | | | 0.29 | | | | 0.28 | |
Net realized and unrealized gain (loss) | | | (0.09) | | | | (0.19) | | | | 0.41 | | | | (0.37) | | | | (0.19) | |
Total income (loss) from operations | | | 0.27 | | | | 0.12 | | | | 0.71 | | | | (0.08) | | | | 0.09 | |
| | | | | |
| Less distributions from: | | | | | | | | | | | | | | | | | | | | |
Net investment income | | | (0.28) | | | | (0.35) | | | | (0.26) | | | | (0.21) | | | | (0.33) | |
Return of capital | | | (0.07) | | | | — | | | | — | | | | (0.07) | | | | — | |
Total distributions | | | (0.35) | | | | (0.35) | | | | (0.26) | | | | (0.28) | | | | (0.33) | |
| | | | | |
| Net asset value, end of year | | | $10.28 | | | | $10.36 | | | | $10.59 | | | | $10.14 | | | | $10.50 | |
Total return2 | | | 2.80 | % | | | 1.11 | % | | | 7.10 | % | | | (0.72) | % | | | 0.83 | % |
| | | | | |
| Net assets, end of year (000s) | | | $457 | | | | $356 | | | | $335 | | | | $568 | | | | $586 | |
| | | | | |
| Ratios to average net assets: | | | | | | | | | | | | | | | | | | | | |
Gross expenses | | | 1.37 | %3 | | | 1.40 | %3 | | | 1.37 | % | | | 1.42 | % | | | 1.47 | %3 |
Net expenses4 | | | 1.35 | 3,5 | | | 1.34 | 3,5 | | | 1.35 | 5 | | | 1.42 | | | | 1.47 | 3 |
Net investment income | | | 3.50 | | | | 2.87 | | | | 2.86 | | | | 2.89 | | | | 2.71 | |
| | | | | |
| Portfolio turnover rate6 | | | 49 | % | | | 49 | % | | | 56 | % | | | 59 | % | | | 62 | % |
| 1 | Per share amounts have been calculated using the average shares method. |
| 2 | Performance figures may reflect compensating balance arrangements, fee waivers and/or expense reimbursements. In the absence of compensating balance arrangements, fee waivers and/or expense reimbursements, the total return would have been lower. Past performance is no guarantee of future results. |
| 3 | Reflects recapture of expenses waived/reimbursed from prior fiscal years. |
| 4 | As a result of an expense limitation arrangement, effective March 31, 2017, the ratio of total annual fund operating expenses, other than interest, brokerage commissions, taxes, extraordinary expenses, deferred organizational expenses and acquired fund fees and expenses, to average net assets of Class R shares did not exceed 1.35%. This expense limitation arrangement cannot be terminated prior to December 31, 2020 without the Board of Directors’ consent. Prior to March 31, 2017, as a result of an expense limitation arrangement, the ratio of total annual fund operating expenses to average net assets of Class R shares did not exceed 1.50%. |
| 5 | Reflects fee waivers and/or expense reimbursements. |
| 6 | Excluding mortgage dollar roll transactions. If mortgage dollar roll transactions had been included, the portfolio turnover rate would have been 51%, 67%, 70%, 71% and 64% for the years ended May 31, 2019, 2018, 2017, 2016 and 2015, respectively. |
See Notes to Financial Statements.
| | |
| Western Asset Total Return Unconstrained Fund 2019 Annual Report | | 69 |
Financial highlights (cont’d)
| | | | | | | | | | | | | | | | | | | | |
| For a share of each class of capital stock outstanding throughout each year ended May 31: | |
| Class I Shares1 | | 2019 | | | 2018 | | | 2017 | | | 2016 | | | 2015 | |
| | | | | |
| Net asset value, beginning of year | | | $10.36 | | | | $10.59 | | | | $10.14 | | | | $10.49 | | | | $10.74 | |
| | | | | |
| Income (loss) from operations: | | | | | | | | | | | | | | | | | | | | |
Net investment income | | | 0.41 | | | | 0.37 | | | | 0.34 | | | | 0.35 | | | | 0.33 | |
Net realized and unrealized gain (loss) | | | (0.08) | | | | (0.18) | | | | 0.42 | | | | (0.36) | | | | (0.19) | |
Total income (loss) from operations | | | 0.33 | | | | 0.19 | | | | 0.76 | | | | (0.01) | | | | 0.14 | |
| | | | | |
| Less distributions from: | | | | | | | | | | | | | | | | | | | | |
Net investment income | | | (0.32) | | | | (0.42) | | | | (0.31) | | | | (0.25) | | | | (0.39) | |
Return of capital | | | (0.09) | | | | — | | | | — | | | | (0.09) | | | | — | |
Total distributions | | | (0.41) | | | | (0.42) | | | | (0.31) | | | | (0.34) | | | | (0.39) | |
| | | | | |
| Net asset value, end of year | | | $10.28 | | | | $10.36 | | | | $10.59 | | | | $10.14 | | | | $10.49 | |
Total return2 | | | 3.43 | % | | | 1.70 | % | | | 7.61 | % | | | (0.11) | % | | | 1.30 | % |
| | | | | |
| Net assets, end of year (millions) | | | $1,132 | | | | $1,321 | | | | $835 | | | | $597 | | | | $535 | |
| | | | | |
| Ratios to average net assets: | | | | | | | | | | | | | | | | | | | | |
Gross expenses | | | 0.76 | %3 | | | 0.83 | %3 | | | 0.91 | % | | | 0.91 | % | | | 0.91 | %3 |
Net expenses4 | | | 0.75 | 3,5 | | | 0.75 | 3,5 | | | 0.88 | 5 | | | 0.91 | | | | 0.91 | 3 |
Net investment income | | | 4.06 | | | | 3.44 | | | | 3.29 | | | | 3.40 | | | | 3.16 | |
| | | | | |
| Portfolio turnover rate6 | | | 49 | % | | | 49 | % | | | 56 | % | | | 59 | % | | | 62 | % |
| 1 | Per share amounts have been calculated using the average shares method. |
| 2 | Performance figures may reflect compensating balance arrangements, fee waivers and/or expense reimbursements. In the absence of compensating balance arrangements, fee waivers and/or expense reimbursements, the total return would have been lower. Past performance is no guarantee of future results. |
| 3 | Reflects recapture of expenses waived/reimbursed from prior fiscal years. |
| 4 | As a result of an expense limitation arrangement, effective March 31, 2017, the ratio of total annual fund operating expenses, other than interest, brokerage commissions, taxes, extraordinary expenses, deferred organizational expenses and acquired fund fees and expenses, to average net assets of Class I shares did not exceed 0.75%. This expense limitation arrangement cannot be terminated prior to December 31, 2020 without the Board of Directors’ consent. Prior to March 31, 2017, as a result of an expense limitation arrangement, the ratio of total annual fund operating expenses to average net assets of Class I did not exceed 0.95%. |
| 5 | Reflects fee waivers and/or expense reimbursements. |
| 6 | Excluding mortgage dollar roll transactions. If mortgage dollar roll transactions had been included, the portfolio turnover rate would have been 51%, 67%, 70%, 71% and 64% for the years ended May 31, 2019, 2018, 2017, 2016 and 2015, respectively. |
See Notes to Financial Statements.
| | |
70 | | Western Asset Total Return Unconstrained Fund 2019 Annual Report |
| | | | | | | | | | | | | | | | | | | | |
| For a share of each class of capital stock outstanding throughout each year ended May 31: | |
| Class IS Shares1 | | 2019 | | | 2018 | | | 2017 | | | 2016 | | | 2015 | |
| | | | | |
| Net asset value, beginning of year | | | $10.34 | | | | $10.57 | | | | $10.12 | | | | $10.48 | | | | $10.73 | |
| | | | | |
| Income (loss) from operations: | | | | | | | | | | | | | | | | | | | | |
Net investment income | | | 0.43 | | | | 0.38 | | | | 0.35 | | | | 0.36 | | | | 0.35 | |
Net realized and unrealized gain (loss) | | | (0.09) | | | | (0.18) | | | | 0.42 | | | | (0.37) | | | | (0.20) | |
Total income (loss) from operations | | | 0.34 | | | | 0.20 | | | | 0.77 | | | | (0.01) | | | | 0.15 | |
| | | | | |
| Less distributions from: | | | | | | | | | | | | | | | | | | | | |
Net investment income | | | (0.33) | | | | (0.43) | | | | (0.32) | | | | (0.26) | | | | (0.40) | |
Return of capital | | | (0.09) | | | | — | | | | — | | | | (0.09) | | | | — | |
Total distributions | | | (0.42) | | | | (0.43) | | | | (0.32) | | | | (0.35) | | | | (0.40) | |
| | | | | |
| Net asset value, end of year | | | $10.26 | | | | $10.34 | | | | $10.57 | | | | $10.12 | | | | $10.48 | |
Total return2 | | | 3.52 | % | | | 1.79 | % | | | 7.73 | % | | | (0.10) | % | | | 1.40 | % |
| | | | | |
| Net assets, end of year (000s) | | | $205,841 | | | | $160,055 | | | | $94,352 | | | | $116,990 | | | | $278,387 | |
| | | | | |
| Ratios to average net assets: | | | | | | | | | | | | | | | | | | | | |
Gross expenses | | | 0.66 | %3 | | | 0.72 | %3 | | | 0.80 | % | | | 0.80 | % | | | 0.81 | %3 |
Net expenses4 | | | 0.65 | 3,5 | | | 0.65 | 3,5 | | | 0.78 | 5 | | | 0.80 | | | | 0.81 | 3 |
Net investment income | | | 4.21 | | | | 3.54 | | | | 3.41 | | | | 3.51 | | | | 3.28 | |
| | | | | |
| Portfolio turnover rate6 | | | 49 | % | | | 49 | % | | | 56 | % | | | 59 | % | | | 62 | % |
| 1 | Per share amounts have been calculated using the average shares method. |
| 2 | Performance figures may reflect compensating balance arrangements, fee waivers and/or expense reimbursements. In the absence of compensating balance arrangements, fee waivers and/or expense reimbursements, the total return would have been lower. Past performance is no guarantee of future results. |
| 3 | Reflects recapture of expenses waived/reimbursed from prior fiscal years. |
| 4 | As a result of an expense limitation arrangement, effective March 31, 2017, the ratio of total annual fund operating expenses, other than interest, brokerage commissions, taxes, extraordinary expenses, deferred organizational expenses and acquired fund fees and expenses, to average net assets of Class IS shares did not exceed 0.65%. In addition, the ratio of total annual fund operating expenses for Class IS shares did not exceed the ratio of total annual fund operating expenses for Class I shares. These expense limitation arrangements cannot be terminated prior to December 31, 2020 without the Board of Directors’ consent. Prior to March 31, 2017, as a result of an expense limitation arrangement, the ratio of total annual fund operating expenses for Class IS shares did not exceed 0.85%. In addition, the ratio of total annual fund operating expenses for Class IS shares did not exceed the ratio of total annual fund operating expenses for Class I shares. |
| 5 | Reflects fee waivers and/or expense reimbursements. |
| 6 | Excluding mortgage dollar roll transactions. If mortgage dollar roll transactions had been included, the portfolio turnover rate would have been 51%, 67%, 70%, 71% and 64% for the years ended May 31, 2019, 2018, 2017, 2016 and 2015, respectively. |
See Notes to Financial Statements.
| | |
| Western Asset Total Return Unconstrained Fund 2019 Annual Report | | 71 |
Notes to financial statements
1. Organization and significant accounting policies
Western Asset Total Return Unconstrained Fund (the “Fund”) is a separate diversified investment series of Western Asset Funds, Inc. (the “Corporation”). The Corporation, a Maryland corporation, is registered under the Investment Company Act of 1940, as amended (the “1940 Act”), as anopen-end management investment company.
The following are significant accounting policies consistently followed by the Fund and are in conformity with U.S. generally accepted accounting principles (“GAAP”). Estimates and assumptions are required to be made regarding assets, liabilities and changes in net assets resulting from operations when financial statements are prepared. Changes in the economic environment, financial markets and any other parameters used in determining these estimates could cause actual results to differ. Subsequent events have been evaluated through the date the financial statements were issued.
(a) Investment valuation.The valuations for fixed income securities (which may include, but are not limited to, corporate, government, municipal, mortgage-backed, collateralized mortgage obligations and asset-backed securities) and certain derivative instruments are typically the prices supplied by independent third party pricing services, which may use market prices or broker/dealer quotations or a variety of valuation techniques and methodologies. The independent third party pricing services use inputs that are observable such as issuer details, interest rates, yield curves, prepayment speeds, credit risks/spreads, default rates and quoted prices for similar securities. Investments inopen-end funds are valued at the closing net asset value per share of each fund on the day of valuation. Futures contracts are valued daily at the settlement price established by the board of trade or exchange on which they are traded. Equity securities for which market quotations are available are valued at the last reported sales price or official closing price on the primary market or exchange on which they trade. When the Fund holds securities or other assets that are denominated in a foreign currency, the Fund will normally use the currency exchange rates as of 4:00 p.m. (Eastern Time). If independent third party pricing services are unable to supply prices for a portfolio investment, or if the prices supplied are deemed by the manager to be unreliable, the market price may be determined by the manager using quotations from one or more broker/dealers or at the transaction price if the security has recently been purchased and no value has yet been obtained from a pricing service or pricing broker. When reliable prices are not readily available, such as when the value of a security has been significantly affected by events after the close of the exchange or market on which the security is principally traded, but before the Fund calculates its net asset value, the Fund values these securities as determined in accordance with procedures approved by the Fund’s Board of Directors.
The Board of Directors is responsible for the valuation process and has delegated the supervision of the daily valuation process to the Legg Mason North Atlantic Fund Valuation Committee (the “Valuation Committee”). The Valuation Committee, pursuant to the policies adopted by the Board of Directors, is responsible for making fair value determinations,
| | |
72 | | Western Asset Total Return Unconstrained Fund 2019 Annual Report |
evaluating the effectiveness of the Fund’s pricing policies, and reporting to the Board of Directors. When determining the reliability of third party pricing information for investments owned by the Fund, the Valuation Committee, among other things, conducts due diligence reviews of pricing vendors, monitors the daily change in prices and reviews transactions among market participants.
The Valuation Committee will consider pricing methodologies it deems relevant and appropriate when making fair value determinations. Examples of possible methodologies include, but are not limited to, multiple of earnings; discount from market of a similar freely traded security; discounted cash-flow analysis; book value or a multiple thereof; risk premium/yield analysis; yield to maturity; and/or fundamental investment analysis. The Valuation Committee will also consider factors it deems relevant and appropriate in light of the facts and circumstances. Examples of possible factors include, but are not limited to, the type of security; the issuer’s financial statements; the purchase price of the security; the discount from market value of unrestricted securities of the same class at the time of purchase; analysts’ research and observations from financial institutions; information regarding any transactions or offers with respect to the security; the existence of merger proposals or tender offers affecting the security; the price and extent of public trading in similar securities of the issuer or comparable companies; and the existence of a shelf registration for restricted securities.
For each portfolio security that has been fair valued pursuant to the policies adopted by the Board of Directors, the fair value price is compared against the last available and next available market quotations. The Valuation Committee reviews the results of such back testing monthly and fair valuation occurrences are reported to the Board of Directors quarterly.
The Fund uses valuation techniques to measure fair value that are consistent with the market approach and/or income approach, depending on the type of security and the particular circumstance. The market approach uses prices and other relevant information generated by market transactions involving identical or comparable securities. The income approach uses valuation techniques to discount estimated future cash flows to present value.
GAAP establishes a disclosure hierarchy that categorizes the inputs to valuation techniques used to value assets and liabilities at measurement date. These inputs are summarized in the three broad levels listed below:
| • | | Level 1 — quoted prices in active markets for identical investments |
| • | | Level 2 — other significant observable inputs (including quoted prices for similar investments, interest rates, prepayment speeds, credit risk, etc.) |
| • | | Level 3 — significant unobservable inputs (including the Fund’s own assumptions in determining the fair value of investments) |
The inputs or methodologies used to value securities are not necessarily an indication of the risk associated with investing in those securities.
| | |
| Western Asset Total Return Unconstrained Fund 2019 Annual Report | | 73 |
Notes to financial statements (cont’d)
The following is a summary of the inputs used in valuing the Fund’s assets and liabilities carried at fair value:
| | | | | | | | | | | | | | | | |
| ASSETS | |
| Description | | Quoted Prices
(Level 1) | | | Other Significant
Observable Inputs
(Level 2) | | | Significant
Unobservable
Inputs
(Level 3) | | | Total | |
| Long-Term Investments†: | | | | | | | | | | | | | | | | |
U.S. Government & Agency Obligations | | | — | | | $ | 358,387,309 | | | | — | | | $ | 358,387,309 | |
Corporate Bonds & Notes: | | | | | | | | | | | | | | | | |
Financials | | | — | | | | 85,907,358 | | | $ | 0 | * | | | 85,907,358 | |
Other Corporate Bonds & Notes | | | — | | | | 233,902,762 | | | | — | | | | 233,902,762 | |
Sovereign Bonds | | | — | | | | 194,907,569 | | | | — | | | | 194,907,569 | |
Collateralized Mortgage Obligations | | | — | | | | 144,076,357 | | | | — | | | | 144,076,357 | |
Asset-Backed Securities | | | — | | | | 76,510,540 | | | | — | | | | 76,510,540 | |
U.S. Treasury Inflation Protected Securities | | | — | | | | 56,987,692 | | | | — | | | | 56,987,692 | |
Senior Loans: | | | | | | | | | | | | | | | | |
Financials | | | — | | | | 5,609,187 | | | | 796,980 | | | | 6,406,167 | |
Other Senior Loans | | | — | | | | 49,852,141 | | | | — | | | | 49,852,141 | |
Non-U.S. Treasury Inflation Protected Securities | | | — | | | | 54,697,583 | | | | — | | | | 54,697,583 | |
Mortgage-Backed Securities | | | — | | | | 26,628,371 | | | | — | | | | 26,628,371 | |
Municipal Bonds | | | — | | | | 5,834,385 | | | | — | | | | 5,834,385 | |
Purchased Options: | | | | | | | | | | | | | | | | |
Exchange-Traded Purchased Options | | $ | 3,226,981 | | | | — | | | | — | | | | 3,226,981 | |
OTC Purchased Options | | | — | | | | 2,315,623 | | | | — | | | | 2,315,623 | |
Preferred Stocks | | | 1,219,969 | | | | — | | | | — | | | | 1,219,969 | |
| Total Long-Term Investments | | | 4,446,950 | | | | 1,295,616,877 | | | | 796,980 | | | | 1,300,860,807 | |
| Short-Term Investments†: | | | | | | | | | | | | | | | | |
Commercial Paper | | | — | | | | 24,837,798 | | | | — | | | | 24,837,798 | |
Money Market Funds | | | — | | | | 57,276,616 | | | | — | | | | 57,276,616 | |
| Total Short-Term Investments | | | — | | | | 82,114,414 | | | | — | | | | 82,114,414 | |
| Total Investments | | $ | 4,446,950 | | | $ | 1,377,731,291 | | | $ | 796,980 | | | $ | 1,382,975,221 | |
| | |
74 | | Western Asset Total Return Unconstrained Fund 2019 Annual Report |
| | | | | | | | | | | | | | | | |
| ASSETS | |
| Description | | Quoted Prices
(Level 1) | | | Other Significant
Observable Inputs
(Level 2) | | | Significant
Unobservable
Inputs
(Level 3) | | | Total | |
| Other Financial Instruments: | | | | | | | | | | | | | | | | |
Futures Contracts | | $ | 11,642,565 | | | | — | | | | — | | | $ | 11,642,565 | |
Forward Foreign Currency Contracts | | | — | | | $ | 1,984,497 | | | | — | | | | 1,984,497 | |
Centrally Cleared Interest Rate Swaps | | | — | | | | 2,093,912 | | | | — | | | | 2,093,912 | |
OTC Interest Rate Swaps‡ | | | — | | | | 1,567,892 | | | | — | | | | 1,567,892 | |
Centrally Cleared Credit Default Swaps on Credit Indices — Buy Protection | | | — | | | | 669,538 | | | | — | | | | 669,538 | |
| Total Other Financial Instruments | | $ | 11,642,565 | | | $ | 6,315,839 | | | | — | | | $ | 17,958,404 | |
| Total | | $ | 16,089,515 | | | $ | 1,384,047,130 | | | $ | 796,980 | | | $ | 1,400,933,625 | |
|
| LIABILITIES | |
| Description | | Quoted Prices
(Level 1) | | | Other Significant
Observable Inputs
(Level 2) | | | Significant
Unobservable
Inputs
(Level 3) | | | Total | |
| Other Financial Instruments: | | | | | | | | | | | | | | | | |
Written Options: | | | | | | | | | | | | | | | | |
Exchange-Traded Written Options | | $ | 2,260,628 | | | | — | | | | — | | | $ | 2,260,628 | |
OTC Written Options | | | — | | | $ | 782,180 | | | | — | | | | 782,180 | |
Futures Contracts | | | 15,384,456 | | | | — | | | | — | | | | 15,384,456 | |
Forward Foreign Currency Contracts | | | — | | | | 4,837,544 | | | | — | | | | 4,837,544 | |
OTC Credit Default Swaps on Sovereign Issues — Buy Protection‡ | | | — | | | | 754,403 | | | | — | | | | 754,403 | |
Centrally Cleared Interest Rate Swaps | | | — | | | | 21,469,631 | | | | — | | | | 21,469,631 | |
OTC Interest Rate Swaps‡ | | | — | | | | 293,909 | | | | — | | | | 293,909 | |
| Total | | $ | 17,645,084 | | | $ | 28,137,667 | | | | — | | | $ | 45,782,751 | |
| † | See Schedule of Investments for additional detailed categorizations. |
| * | Amount represents less than $1. |
| ‡ | Value includes any premiums paid or received with respect to swap contracts. |
(b) Purchased options. When the Fund purchases an option, an amount equal to the premium paid by the Fund is recorded as an investment on the Statement of Assets and Liabilities, the value of which ismarked-to-market to reflect the current market value of the option purchased. If the purchased option expires, the Fund realizes a loss equal to the amount of premium paid. When an instrument is purchased or sold through the exercise of
| | |
| Western Asset Total Return Unconstrained Fund 2019 Annual Report | | 75 |
Notes to financial statements (cont’d)
an option, the related premium paid is added to the basis of the instrument acquired or deducted from the proceeds of the instrument sold. The risk associated with purchasing put and call options is limited to the premium paid.
(c) Written options. When the Fund writes an option, an amount equal to the premium received by the Fund is recorded as a liability, the value of which ismarked-to-market daily to reflect the current market value of the option written. If the option expires, the premium received is recorded as a realized gain. When a written call option is exercised, the difference between the premium received plus the option exercise price and the Fund’s basis in the underlying security (in the case of a covered written call option), or the cost to purchase the underlying security (in the case of an uncovered written call option), including brokerage commission, is recognized as a realized gain or loss. When a written put option is exercised, the amount of the premium received is subtracted from the cost of the security purchased by the Fund from the exercise of the written put option to form the Fund’s basis in the underlying security purchased. The writer or buyer of an option traded on an exchange can liquidate the position before the exercise of the option by entering into a closing transaction. The cost of a closing transaction is deducted from the original premium received resulting in a realized gain or loss to the Fund.
The risk in writing a covered call option is that the Fund may forego the opportunity of profit if the market price of the underlying security increases and the option is exercised. The risk in writing a put option is that the Fund may incur a loss if the market price of the underlying security decreases and the option is exercised. The risk in writing an uncovered call option is that the Fund is exposed to the risk of loss if the market price of the underlying security increases. In addition, there is the risk that the Fund may not be able to enter into a closing transaction because of an illiquid secondary market.
(d) Options on futures contracts. An option on a futures contract gives the purchaser the right, in return for the premium paid, to assume a position in the underlying futures contract at the specified option exercise price at any time prior to the expiration date of the option. Upon exercise of an option, the delivery of the futures position by the writer of the option to the holder of the option will be accompanied by delivery of the accumulated balance in the writer’s futures margin account that represents the amount by which the market price of the futures contract exceeds (in the case of a call) or is less than (in the case of a put) the exercise price of the option on the futures contract. The potential for loss related to the purchase of an option on a futures contract is limited to the premium paid for the option plus transaction costs. Because the value of the option is fixed at the point of purchase, there are no daily cash payments by the purchaser to reflect changes in the value of the underlying contract; however, the value of the option changes daily and that change would be reflected in the net asset value of the Fund. The potential for loss related to writing call options is unlimited. The potential for loss related to writing put options is limited only by the aggregate strike price of the put option less the premium received.
| | |
76 | | Western Asset Total Return Unconstrained Fund 2019 Annual Report |
(e) Futures contracts. The Fund uses futures contracts generally to gain exposure to, or hedge against, changes in interest rates or gain exposure to, or hedge against, changes in certain asset classes. A futures contract represents a commitment for the future purchase or sale of an asset at a specified price on a specified date.
Upon entering into a futures contract, the Fund is required to deposit cash or securities with a broker in an amount equal to a certain percentage of the contract amount. This is known as the ‘‘initial margin’’ and subsequent payments (‘‘variation margin’’) are made or received by the Fund each day, depending on the daily fluctuation in the value of the contract. For certain futures, including foreign denominated futures, variation margin is not settled daily, but is recorded as a net variation margin payable or receivable. The daily changes in contract value are recorded as unrealized gains or losses in the Statement of Operations and the Fund recognizes a realized gain or loss when the contract is closed.
Futures contracts involve, to varying degrees, risk of loss in excess of the amounts reflected in the financial statements. In addition, there is the risk that the Fund may not be able to enter into a closing transaction because of an illiquid secondary market.
(f) Forward foreign currency contracts.The Fund enters into a forward foreign currency contract to hedge exposure of bond positions or in an attempt to increase the Fund’s return. A forward foreign currency contract is an agreement between two parties to buy and sell a currency at a set price with delivery and settlement at a future date. The contract ismarked-to-market daily and the change in value is recorded by the Fund as an unrealized gain or loss. When a forward foreign currency contract is closed, through either delivery or offset by entering into another forward foreign currency contract, the Fund recognizes a realized gain or loss equal to the difference between the value of the contract at the time it was opened and the value of the contract at the time it is closed.
Non-deliverable forward foreign currency exchange contracts are settled with the counterparty in cash without the delivery of foreign currency.
Forward foreign currency contracts involve elements of market risk in excess of the amounts reflected on the Statement of Assets and Liabilities. The Fund bears the risk of an unfavorable change in the foreign exchange rate underlying the forward foreign currency contract. Risks may also arise upon entering into these contracts from the potential inability of the counterparties to meet the terms of their contracts.
(g) Swap agreements.The Fund invests in swaps for the purpose of managing its exposure to interest rate, credit or market risk, or for other purposes. The use of swaps involves risks that are different from those associated with other portfolio transactions. Swap agreements are privately negotiated in theover-the-counter market and may be entered into as a bilateral contract (“OTC Swaps”) or centrally cleared (“Centrally Cleared Swaps”). Unlike Centrally Cleared Swaps, the Fund has credit exposure to the counterparties of OTC Swaps.
| | |
| Western Asset Total Return Unconstrained Fund 2019 Annual Report | | 77 |
Notes to financial statements (cont’d)
In a Centrally Cleared Swap, immediately following execution of the swap, the swap agreement is submitted to a clearinghouse or central counterparty (the “CCP”) and the CCP becomes the ultimate counterparty of the swap agreement. The Fund is required to interface with the CCP through a broker, acting in an agency capacity. All payments are settled with the CCP through the broker. Upon entering into a Centrally Cleared Swap, the Fund is required to deposit initial margin with the broker in the form of cash or securities.
Swap contracts aremarked-to-market daily and changes in value are recorded as unrealized appreciation (depreciation). The daily change in valuation of Centrally Cleared Swaps, if any, is recorded as a receivable or payable for variation margin on the Statement of Assets and Liabilities. Gains or losses are realized upon termination of the swap agreement. Collateral, in the form of restricted cash or securities, may be required to be held in segregated accounts with the Fund’s custodian in compliance with the terms of the swap contracts. Securities posted as collateral for swap contracts are identified in the Schedule of Investments and restricted cash, if any, is identified on the Statement of Assets and Liabilities. Risks may exceed amounts recorded in the Statement of Assets and Liabilities. These risks include changes in the returns of the underlying instruments, failure of the counterparties to perform under the contracts’ terms, and the possible lack of liquidity with respect to the swap agreements.
OTC swap payments received or made at the beginning of the measurement period are reflected as a premium or deposit, respectively, on the Statement of Assets and Liabilities. These upfront payments are amortized over the life of the swap and are recognized as realized gain or loss in the Statement of Operations. Net periodic payments received or paid by the Fund are recognized as a realized gain or loss in the Statement of Operations.
The Fund’s maximum exposure in the event of a defined credit event on a credit default swap to sell protection is the notional amount. As of May 31, 2019, the Fund did not hold any credit default swaps to sell protection.
For average notional amounts of swaps held during the year ended May 31, 2019, see Note 4.
Credit default swaps
The Fund enters into credit default swap (“CDS”) contracts for investment purposes, to manage its credit risk or to add leverage. CDS agreements involve one party making a stream of payments to another party in exchange for the right to receive a specified return in the event of a default by a third party, typically corporate or sovereign issuers, on a specified obligation, or in the event of a write-down, principal shortfall, interest shortfall or default of all or part of the referenced entities comprising a credit index. The Fund may use a CDS to provide protection against defaults of the issuers (i.e., to reduce risk where the Fund has exposure to an issuer) or to take an active long or short position with respect to the likelihood of a particular issuer’s default. As a seller of protection, the Fund generally
| | |
78 | | Western Asset Total Return Unconstrained Fund 2019 Annual Report |
receives an upfront payment or a stream of payments throughout the term of the swap provided that there is no credit event. If the Fund is a seller of protection and a credit event occurs, as defined under the terms of that particular swap agreement, the maximum potential amount of future payments (undiscounted) that the Fund could be required to make under a credit default swap agreement would be an amount equal to the notional amount of the agreement. These amounts of potential payments will be partially offset by any recovery of values from the respective referenced obligations. As a seller of protection, the Fund effectively adds leverage to its portfolio because, in addition to its total net assets, the Fund is subject to investment exposure on the notional amount of the swap. As a buyer of protection, the Fund generally receives an amount up to the notional value of the swap if a credit event occurs.
Implied spreads are the theoretical prices a lender receives for credit default protection. When spreads rise, market perceived credit risk rises and when spreads fall, market perceived credit risk falls. The implied credit spread of a particular referenced entity reflects the cost of buying/selling protection and may include upfront payments required to enter into the agreement. Wider credit spreads and decreasing market values, when compared to the notional amount of the swap, represent a deterioration of the referenced entity’s credit soundness and a greater likelihood or risk of default or other credit event occurring as defined under the terms of the agreement. Credit spreads utilized in determining the period end market value of credit default swap agreements on corporate or sovereign issues are disclosed in the Schedule of Investments and serve as an indicator of the current status of the payment/performance risk and represent the likelihood or risk of default for credit derivatives. For credit default swap agreements on asset-backed securities and credit indices, the quoted market prices and resulting values, particularly in relation to the notional amount of the contract as well as the annual payment rate, serve as an indication of the current status of the payment/performance risk.
The Fund’s maximum risk of loss from counterparty risk, as the protection buyer, is the fair value of the contract (this risk is mitigated by the posting of collateral by the counterparty to the Fund to cover the Fund’s exposure to the counterparty). As the protection seller, the Fund’s maximum risk is the notional amount of the contract. Credit default swaps are considered to have credit risk-related contingent features since they require payment by the protection seller to the protection buyer upon the occurrence of a defined credit event.
Entering into a CDS agreement involves, to varying degrees, elements of credit, market and documentation risk in excess of the related amounts recognized on the Statement of Assets and Liabilities. Such risks involve the possibility that there will be no liquid market for these agreements, that the counterparty to the agreement may default on its obligation to perform or disagree as to the meaning of the contractual terms in the agreement, and that there will be unfavorable changes in net interest rates.
| | |
| Western Asset Total Return Unconstrained Fund 2019 Annual Report | | 79 |
Notes to financial statements (cont’d)
Interest rate swaps
The Fund enters into interest rate swap contracts to manage its exposure to interest rate risk. Interest rate swaps are agreements between two parties to exchange cash flows based on a notional principal amount. The Fund may elect to pay a fixed rate and receive a floating rate, receive a fixed rate and pay a floating rate, or pay and receive a floating rate, on a notional principal amount. Interest rate swaps aremarked-to-market daily based upon quotations from market makers and the change, if any, is recorded as an unrealized gain or loss in the Statement of Operations. When a swap contract is terminated early, the Fund records a realized gain or loss equal to the difference between the original cost and the settlement amount of the closing transaction.
The risks of interest rate swaps include changes in market conditions that will affect the value of the contract or changes in the present value of the future cash flow streams and the possible inability of the counterparty to fulfill its obligations under the agreement. The Fund’s maximum risk of loss from counterparty credit risk is the discounted net value of the cash flows to be received from the counterparty over the contract’s remaining life, to the extent that amount is positive. This risk is mitigated by the posting of collateral by the counterparty to the Fund to cover the Fund’s exposure to the counterparty.
(h) Swaptions. The Fund may purchase or write swaption contracts to manage exposure to fluctuations in interest rates or to enhance yield. The Fund may also purchase and write swaption contracts to manage exposure to an underlying instrument. Swaption contracts written by the Fund represent an option that gives the purchaser the right, but not the obligation, to enter into a previously agreed upon swap contract at a future date. Swaption contracts purchased by the Fund represent an option that gives the Fund the right, but not the obligation, to enter into a previously agreed upon swap contract at a future date.
When the Fund writes a swaption, an amount equal to the premium received by the Fund is recorded as a liability, the value of which ismarked-to-market daily to reflect the current market value of the swaption written. If the swaption expires, the Fund realizes a gain equal to the amount of the premium received.
When the Fund purchases a swaption, an amount equal to the premium paid by the Fund is recorded as an investment on the Statement of Assets and Liabilities, the value of which ismarked-to-market daily to reflect the current market value of the swaption purchased. If the swaption expires, the Fund realizes a loss equal to the amount of the premium paid.
Swaptions aremarked-to-market daily based upon quotations from market makers. Changes in the value of the swaption are reported as unrealized gains or losses in the Statement of Operations.
(i) Loan participations.The Fund may invest in loans arranged through private negotiation between one or more financial institutions. The Fund’s investment in any such loan may be in the form of a participation in or an assignment of the loan. In connection with purchasing participations, the Fund generally will have no right to enforce compliance by the borrower
| | |
80 | | Western Asset Total Return Unconstrained Fund 2019 Annual Report |
with the terms of the loan agreement related to the loan, or any rights ofoff-set against the borrower and the Fund may not benefit directly from any collateral supporting the loan in which it has purchased the participation.
The Fund assumes the credit risk of the borrower, the lender that is selling the participation and any other persons interpositioned between the Fund and the borrower. In the event of the insolvency of the lender selling the participation, the Fund may be treated as a general creditor of the lender and may not benefit from anyoff-set between the lender and the borrower.
(j) Unfunded loan commitments. The Fund may enter into certain credit agreements where all or a portion of which may be unfunded. The Fund is obligated to fund these commitments at the borrower’s discretion. The commitments are disclosed in the accompanying Schedule of Investments. At May 31, 2019, the Fund had sufficient cash and/or securities to cover these commitments.
(k) Stripped securities. The Fund may invest in ‘‘Stripped Securities,’’ a term used collectively for components, or strips, of fixed income securities. Stripped Securities can be principal only securities (“PO”), which are debt obligations that have been stripped of unmatured interest coupons, or interest only securities (“IO”), which are unmatured interest coupons that have been stripped from debt obligations. The market value of Stripped Securities will fluctuate in response to changes in economic conditions, rates ofpre-payment, interest rates and the market’s perception of the securities. However, fluctuations in response to interest rates may be greater in Stripped Securities than for debt obligations of comparable maturities that pay interest currently. The amount of fluctuation may increase with a longer period of maturity.
The yield to maturity on IO’s is sensitive to the rate of principal repayments (including prepayments) on the related underlying debt obligation and principal payments may have a material effect on yield to maturity. If the underlying debt obligation experiences greater than anticipated prepayments of principal, the Fund may not fully recoup its initial investment in IO’s.
(l) Securities traded on a to-be-announced basis. The Fund may trade securities on ato-be-announced (“TBA”) basis. In a TBA transaction, the Fund commits to purchasing or selling securities which have not yet been issued by the issuer and for which specific information, such as the face amount, maturity date and underlying pool of investments in U.S. government agency mortgage pass-through securities, is not announced. Securities purchased on a TBA basis are not settled until they are delivered to the Fund. Beginning on the date the Fund enters into a TBA transaction, cash, U.S. government securities or other liquid high-grade debt obligations are segregated in an amount equal in value to the purchase price of the TBA security. These securities are subject to market fluctuations and their current value is determined in the same manner as for other securities.
| | |
| Western Asset Total Return Unconstrained Fund 2019 Annual Report | | 81 |
Notes to financial statements (cont’d)
(m) Mortgage dollar rolls. The Fund may enter into mortgage dollar rolls in which the Fund sells mortgage-backed securities for delivery in the current month, realizing a gain or loss, and simultaneously contracts to repurchase substantially similar (same type, coupon and maturity) securities to settle on a specified future date.
The Fund executes its mortgage dollar rolls entirely in the TBA market, whereby the Fund makes a forward commitment to purchase a security and, instead of accepting delivery, the position is offset by a sale of the security with a simultaneous agreement to repurchase at a future date. The Fund accounts for mortgage dollar rolls as purchases and sales.
The risk of entering into mortgage dollar rolls is that the market value of the securities the Fund is obligated to repurchase under the agreement may decline below the repurchase price. In the event the buyer of securities under a mortgage dollar roll files for bankruptcy or becomes insolvent, the Fund’s use of the proceeds of the mortgage dollar roll may be restricted pending a determination by the counterparty, or its trustee or receiver, whether to enforce the Fund’s obligation to repurchase the securities.
(n) Inflation-indexed bonds. Inflation-indexed bonds are fixed-income securities whose principal value or interest rate is periodically adjusted according to the rate of inflation. As the index measuring inflation changes, the principal value or interest rate of inflation-indexed bonds will be adjusted accordingly. Inflation adjustments to the principal amount of inflation-indexed bonds are reflected as an increase or decrease to investment income on the Statement of Operations. Repayment of the original bond principal upon maturity (as adjusted for inflation) is guaranteed in the case of U.S. Treasury inflation-indexed bonds. For bonds that do not provide a similar guarantee, the adjusted principal value of the bond repaid at maturity may be less than the original principal.
(o) Foreign currency translation. Investment securities and other assets and liabilities denominated in foreign currencies are translated into U.S. dollar amounts based upon prevailing exchange rates on the date of valuation. Purchases and sales of investment securities and income and expense items denominated in foreign currencies are translated into U.S. dollar amounts based upon prevailing exchange rates on the respective dates of such transactions.
The Fund does not isolate that portion of the results of operations resulting from fluctuations in foreign exchange rates on investments from the fluctuations arising from changes in market prices of securities held. Such fluctuations are included with the net realized and unrealized gain or loss on investments.
Net realized foreign exchange gains or losses arise from sales of foreign currencies, including gains and losses on forward foreign currency contracts, currency gains or losses realized between the trade and settlement dates on securities transactions, and the difference between the amounts of dividends, interest, and foreign withholding taxes recorded on the Fund’s books and the U.S. dollar equivalent of the amounts actually received or paid. Net unrealized foreign exchange gains and losses arise from changes in the values of assets
| | |
82 | | Western Asset Total Return Unconstrained Fund 2019 Annual Report |
and liabilities, other than investments in securities, on the date of valuation, resulting from changes in exchange rates.
Foreign security and currency transactions may involve certain considerations and risks not typically associated with those of U.S. dollar denominated transactions as a result of, among other factors, the possibility of lower levels of governmental supervision and regulation of foreign securities markets and the possibility of political or economic instability.
(p) Credit and market risk. The Fund invests in high-yield and emerging market instruments that are subject to certain credit and market risks. The yields of high-yield and emerging market debt obligations reflect, among other things, perceived credit and market risks. The Fund’s investments in securities rated below investment grade typically involve risks not associated with higher rated securities including, among others, greater risk related to timely and ultimate payment of interest and principal, greater market price volatility and less liquid secondary market trading. The consequences of political, social, economic or diplomatic changes may have disruptive effects on the market prices of investments held by the Fund. The Fund’s investments innon-U.S. dollar denominated securities may also result in foreign currency losses caused by devaluations and exchange rate fluctuations.
Investments in securities that are collateralized by real estate mortgages are subject to certain credit and liquidity risks. When market conditions result in an increase in default rates of the underlying mortgages and the foreclosure values of underlying real estate properties are materially below the outstanding amount of these underlying mortgages, collection of the full amount of accrued interest and principal on these investments may be doubtful. Such market conditions may significantly impair the value and liquidity of these investments and may result in a lack of correlation between their credit ratings and values.
(q) Foreign investment risks. The Fund’s investments in foreign securities may involve risks not present in domestic investments. Since securities may be denominated in foreign currencies, may require settlement in foreign currencies or pay interest or dividends in foreign currencies, changes in the relationship of these foreign currencies to the U.S. dollar can significantly affect the value of the investments and earnings of the Fund. Foreign investments may also subject the Fund to foreign government exchange restrictions, expropriation, taxation or other political, social or economic developments, all of which affect the market and/or credit risk of the investments.
(r) Counterparty risk and credit-risk-related contingent features of derivative instruments. The Fund may invest in certain securities or engage in other transactions, where the Fund is exposed to counterparty credit risk in addition to broader market risks. The Fund may invest in securities of issuers, which may also be considered counterparties as trading partners in other transactions. This may increase the risk of loss in the event of default or bankruptcy by the counterparty or if the counterparty otherwise fails to meet its contractual obligations. The Fund’s subadviser attempts to mitigate counterparty risk by (i)
| | |
| Western Asset Total Return Unconstrained Fund 2019 Annual Report | | 83 |
Notes to financial statements (cont’d)
periodically assessing the creditworthiness of its trading partners, (ii) monitoring and/or limiting the amount of its net exposure to each individual counterparty based on its assessment and (iii) requiring collateral from the counterparty for certain transactions. Market events and changes in overall economic conditions may impact the assessment of such counterparty risk by the subadviser. In addition, declines in the values of underlying collateral received may expose the Fund to increased risk of loss.
With exchange traded and centrally cleared derivatives, there is less counterparty risk to the Fund since the exchange or clearinghouse, as counterparty to such instruments, guarantees against a possible default. The clearinghouse stands between the buyer and the seller of the contract; therefore, the credit risk is limited to failure of the clearinghouse. While offset rights may exist under applicable law, the Fund does not have a contractual right of offset against a clearing broker or clearinghouse in the event of a default of the clearing broker or clearinghouse.
The Fund has entered into master agreements, such as an International Swaps and Derivatives Association, Inc. Master Agreement (“ISDA Master Agreement”) or similar agreement, with certain of its derivative counterparties that governover-the-counter derivatives and provide for general obligations, representations, agreements, collateral posting terms, netting provisions in the event of default or termination and credit related contingent features. The credit related contingent features include, but are not limited to, a percentage decrease in the Fund’s net assets or NAV over a specified period of time. If these credit related contingent features were triggered, the derivatives counterparty could terminate the positions and demand payment or require additional collateral.
Under an ISDA Master Agreement, the Fund may, under certain circumstances, offset with the counterparty certain derivative financial instruments’ payables and/or receivables with collateral held and/or posted and create one single net payment. However, absent an event of default by the counterparty or a termination of the agreement, the terms of the ISDA Master Agreements do not result in an offset of reported amounts of financial assets and financial liabilities in the Statement of Assets and Liabilities across transactions between the Fund and the applicable counterparty. The enforceability of the right to offset may vary by jurisdiction.
Collateral requirements differ by type of derivative. Collateral or margin requirements are set by the broker or exchange clearinghouse for exchange traded derivatives while collateral terms are contract specific forover-the-counter traded derivatives. Cash collateral that has been pledged to cover obligations of the Fund under derivative contracts, if any, will be reported separately in the Statement of Assets and Liabilities. Securities pledged as collateral, if any, for the same purpose are noted in the Schedule of Investments.
As of May 31, 2019, the Fund held OTC written options, forward foreign currency contracts, OTC credit default swaps and OTC interest rate swaps with credit related contingent features which had a liability position of $6,668,036. If a contingent feature in the master
| | |
84 | | Western Asset Total Return Unconstrained Fund 2019 Annual Report |
agreements would have been triggered, the Fund would have been required to pay this amount to its derivatives counterparties. As of May 31, 2019, the Fund had posted with its counterparties cash and/or securities as collateral to cover the net liability of these derivatives amounting to $1,250,000, which could be used to reduce the required payment.
At May 31, 2019, the Fund heldnon-cash collateral from BNP Paribas SA, Citibank N.A., Goldman Sachs Group Inc. and JPMorgan Chase & Co. in the amounts of $112,916, $1,349,316, $487,425 and $462,113 respectively. These amounts could be used to reduce the Fund’s exposure to the counterparty in the event of default.
(s) Security transactions and investment income. Security transactions are accounted for on a trade date basis. Interest income (including interest income frompayment-in-kind securities), adjusted for amortization of premium and accretion of discount, is recorded on the accrual basis. Paydown gains and losses on mortgage- and asset-backed securities are recorded as adjustments to interest income. Dividend income is recorded on theex-dividend date for dividends received in cash and/or securities. Foreign dividend income is recorded on theex-dividend date or as soon as practicable after the Fund determines the existence of a dividend declaration after exercising reasonable due diligence. The cost of investments sold is determined by use of the specific identification method. To the extent any issuer defaults or a credit event occurs that impacts the issuer, the Fund may halt any additional interest income accruals and consider the realizability of interest accrued up to the date of default or credit event.
(t) Distributions to shareholders. Distributions from net investment income of the Fund are declared each business day to shareholders of record and are paid monthly. Distributions of net realized gains, if any, are declared at least annually. Distributions to shareholders of the Fund are recorded on theex-dividend date and are determined in accordance with income tax regulations, which may differ from GAAP.
(u) Share class accounting. Investment income, common expenses and realized/ unrealized gains (losses) on investments are allocated to the various classes of the Fund on the basis of daily net assets of each class. Fees relating to a specific class are charged directly to that share class.
(v) Compensating balance arrangements. The Fund has an arrangement with its custodian bank whereby a portion of the custodian’s fees is paid indirectly by credits earned on the Fund’s cash on deposit with the bank.
(w) Federal and other taxes. It is the Fund’s policy to comply with the federal income and excise tax requirements of the Internal Revenue Code of 1986 (the “Code”), as amended, applicable to regulated investment companies. Accordingly, the Fund intends to distribute its taxable income and net realized gains, if any, to shareholders in accordance with timing requirements imposed by the Code. Therefore, no federal or state income tax provision is required in the Fund’s financial statements.
| | |
| Western Asset Total Return Unconstrained Fund 2019 Annual Report | | 85 |
Notes to financial statements (cont’d)
Management has analyzed the Fund’s tax positions taken on income tax returns for all open tax years and has concluded that as of May 31, 2019, no provision for income tax is required in the Fund’s financial statements. The Fund’s federal and state income and federal excise tax returns for tax years for which the applicable statutes of limitations have not expired are subject to examination by the Internal Revenue Service and state departments of revenue.
Under the applicable foreign tax laws, a withholding tax may be imposed on interest, dividends and capital gains at various rates.
(x) Reclassification. GAAP requires that certain components of net assets be reclassified to reflect permanent differences between financial and tax reporting. These reclassifications have no effect on net assets or net asset value per share. During the current year, the Fund had no reclassifications.
2. Investment management agreement and other transactions with affiliates
Legg Mason Partners Fund Advisor, LLC (“LMPFA”) is the Fund’s investment manager. Western Asset Management Company, LLC (“Western Asset”), Western Asset Management Company Pte. Ltd. in Singapore (“Western Asset Singapore”), Western Asset Management Company Ltd in Japan (“Western Asset Japan”) and Western Asset Management Company Limited in London (“Western Asset London”) are the Fund’s subadvisers. LMPFA, Western Asset, Western Asset Singapore, Western Asset Japan and Western Asset London are wholly-owned subsidiaries of Legg Mason, Inc. (“Legg Mason”).
LMPFA provides the Fund with management and administrative services for which the Fund pays a fee calculated daily and paid monthly, at an annual rate of 0.60% of the Fund’s average daily net assets. For their services, LMPFA pays Western Asset, Western Asset Singapore, Western Asset Japan and Western Asset London monthly all of the management fee that it receives from the Fund.
As a result of expense limitation arrangements between the Fund and LMPFA, the ratio of total annual fund operating expenses, other than interest, brokerage commissions, taxes, extraordinary expenses, deferred organizational expenses and acquired fund fees and expenses, to average net assets of Class A, Class A2, Class C, Class FI, Class R, Class I and Class IS shares did not exceed 1.10%, 1.30%, 1.80%, 1.10%, 1.35%, 0.75% and 0.65%, respectively. In addition, the ratio of total annual fund operating expenses for Class IS shares did not exceed the ratio of total annual fund operating expenses for Class I shares. These expense limitation arrangements cannot be terminated prior to December 31, 2020 without the Board of Directors’ consent.
During the year ended May 31, 2019, fees waived and/or expenses reimbursed amounted to $150,394.
LMPFA is permitted to recapture amounts waived and/or reimbursed to a class within two years after the fiscal year in which LMPFA earned the fee or incurred the expense if the
| | |
86 | | Western Asset Total Return Unconstrained Fund 2019 Annual Report |
class’ total annual operating expenses have fallen to a level below the expense limitation (“expense cap”) in effect at the time the fees were earned or the expenses incurred. In no case will LMPFA recapture any amount that would result, on any particular business day of the Fund, in the class’ total annual operating expenses exceeding the expense cap or any other lower limit then in effect.
Pursuant to these arrangements, at May 31, 2019, the Fund had remaining fee waivers and/or expense reimbursements subject to recapture by LMPFA and respective dates of expiration as follows:
| | | | | | | | | | | | | | | | | | | | | | | | |
| | | Class A | | | Class C | | | Class FI | | | Class R | | | Class I | | | Class IS | |
| Expires May 31, 2020 | | $ | 151,178 | | | $ | 6,417 | | | $ | 41,693 | | | $ | 4 | | | $ | 729,633 | | | $ | 82,068 | |
| Expires May 31, 2021 | | | 62,818 | | | | 1,082 | | | | 9,095 | | | | 95 | | | | 64,941 | | | | 11,967 | |
| Total fee waivers/expense reimbursements subject to recapture | | $ | 213,996 | | | $ | 7,499 | | | $ | 50,788 | | | $ | 99 | | | $ | 794,574 | | | $ | 94,035 | |
For the year ended May 31, 2019, fee waivers and/or expense reimbursements recaptured by LMPFA, if any, were as follows:
| | | | | | | | | | | | | | | | | | | | | | | | | | | | |
| | | Class A | | | Class A2 | | | Class C | | | Class FI | | | Class R | | | Class I | | | Class IS | |
| LMPFA recaptured | | $ | 900 | | | $ | 904 | | | $ | 7,343 | | | $ | 73,333 | | | $ | 171 | | | $ | 368,875 | | | $ | 10,160 | |
Legg Mason Investor Services, LLC (“LMIS”), a wholly-owned broker-dealer subsidiary of Legg Mason, serves as the Fund’s sole and exclusive distributor.
There is a maximum initial sales charge of 4.25% for Class A and Class A2 shares. There is a contingent deferred sales charge (“CDSC”) of 1.00% on Class C shares, which applies if redemption occurs within 12 months from purchase payment. In certain cases, Class A and Class A2 shares have a 1.00% CDSC, which applies if redemption occurs within 18 months from purchase payment. This CDSC only applies to those purchases of Class A and Class A2 shares, which, when combined with current holdings of other shares of funds sold by LMIS, equal or exceed $1,000,000 in the aggregate. These purchases do not incur an initial sales charge.
For the year ended May 31, 2019, sales charges retained by and CDSCs paid to LMIS and its affiliates, if any, were as follows:
| | | | | | | | | | | | |
| | | Class A | | | Class A2 | | | Class C | |
| Sales charges | | $ | 1,387 | | | $ | 340 | | | | — | |
| CDSCs | | | — | | | | — | | | $ | 2,044 | |
All officers of the Corporation are employees of Legg Mason or its affiliates and do not receive compensation from the Corporation.
| | |
| Western Asset Total Return Unconstrained Fund 2019 Annual Report | | 87 |
Notes to financial statements (cont’d)
3. Investments
During the year ended May 31, 2019, the aggregate cost of purchases and proceeds from sales of investments (excluding short-term investments) and U.S. Government & Agency Obligations were as follows:
| | | | | | | | |
| | | Investments | | | U.S. Government &
Agency Obligations | |
| Purchases | | $ | 219,616,529 | | | $ | 433,377,487 | |
| Sales | | | 228,625,529 | | | | 457,650,459 | |
At May 31, 2019, the aggregate cost of investments and the aggregate gross unrealized appreciation and depreciation of investments for federal income tax purposes were as follows:
| | | | | | | | | | | | | | | | |
| | | Cost/Premiums Paid (Received) | | | Gross
Unrealized
Appreciation | | | Gross Unrealized
Depreciation | | | Net Unrealized
Appreciation
(Depreciation) | |
| Securities | | $ | 1,381,971,913 | | | $ | 55,433,621 | | | $ | (54,430,313) | | | $ | 1,003,308 | |
| Swap contracts | | | (1,944,809) | | | | 4,310,004 | | | | (21,771,908) | | | | (17,461,904) | |
| Written options | | | (3,091,114) | | | | 1,185,512 | | | | (1,137,206) | | | | 48,306 | |
| Futures contracts | | | — | | | | 11,642,565 | | | | (15,384,456) | | | | (3,741,891) | |
| Forward foreign currency contracts | | | — | | | | 1,984,497 | | | | (4,837,544) | | | | (2,853,047) | |
4. Derivative instruments and hedging activities
Below is a table, grouped by derivative type, that provides information about the fair value and the location of derivatives within the Statement of Assets and Liabilities at May 31, 2019.
| | | | | | | | | | | | | | | | |
| ASSET DERIVATIVES1 | |
| | | Interest Rate Risk | | | Foreign
Exchange Risk | | | Credit Risk | | | Total | |
| Purchased options2 | | $ | 3,226,981 | | | $ | 2,055,093 | | | $ | 260,530 | | | $ | 5,542,604 | |
| Futures contracts3 | | | 11,642,565 | | | | — | | | | — | | | | 11,642,565 | |
| OTC swap contracts4 | | | 1,567,892 | | | | — | | | | — | | | | 1,567,892 | |
| Centrally cleared swap contracts5 | | | 2,093,912 | | | | — | | | | 669,538 | | | | 2,763,450 | |
| Forward foreign currency contracts | | | — | | | | 1,984,497 | | | | — | | | | 1,984,497 | |
| Total | | $ | 18,531,350 | | | $ | 4,039,590 | | | $ | 930,068 | | | $ | 23,501,008 | |
| | |
88 | | Western Asset Total Return Unconstrained Fund 2019 Annual Report |
| | | | | | | | | | | | | | | | |
| LIABILITY DERIVATIVES1 | |
| | | Interest
Rate Risk | | | Foreign
Exchange Risk | | | Credit Risk | | | Total | |
| Written options | | $ | 2,260,628 | | | $ | 106,370 | | | $ | 675,810 | | | $ | 3,042,808 | |
| Futures contracts3 | | | 15,384,456 | | | | — | | | | — | | | | 15,384,456 | |
| OTC swap contracts4 | | | 293,909 | | | | — | | | | 754,403 | | | | 1,048,312 | |
| Centrally cleared swap contracts5 | | | 21,469,631 | | | | — | | | | — | | | | 21,469,631 | |
| Forward foreign currency contracts | | | — | | | | 4,837,544 | | | | — | | | | 4,837,544 | |
| Total | | $ | 39,408,624 | | | $ | 4,943,914 | | | $ | 1,430,213 | | | $ | 45,782,751 | |
| 1 | Generally, the balance sheet location for asset derivatives is receivables/net unrealized appreciation (depreciation) and for liability derivatives is payables/net unrealized appreciation (depreciation). |
| 2 | Market value of purchased options is reported in Investments in unaffiliated securities at value in the Statement of Assets and Liabilities. |
| 3 | Includes cumulative appreciation (depreciation) of futures contracts as reported in the Schedule of Investments. Only variation margin is reported within the receivables and/or payables on the Statement of Assets and Liabilities. |
| 4 | Values include premiums paid (received) on swap contracts which are shown separately in the Statement of Assets and Liabilities. |
| 5 | Includes cumulative appreciation (depreciation) of centrally cleared swap contracts as reported in the Schedule of Investments. Only variation margin is reported within the receivables and/or payables on the Statement of Assets and Liabilities. |
The following tables provide information about the effect of derivatives and hedging activities on the Fund’s Statement of Operations for the year ended May 31, 2019. The first table provides additional detail about the amounts and sources of gains (losses) realized on derivatives during the period. The second table provides additional information about the change in unrealized appreciation (depreciation) resulting from the Fund’s derivatives and hedging activities during the period.
| | | | | | | | | | | | | | | | | | | | |
| AMOUNT OF REALIZED GAIN (LOSS) ON DERIVATIVES RECOGNIZED | |
| | | Interest Rate Risk | | | Foreign
Exchange Risk | | | Credit Risk | | | Equity Risk | | | Total | |
| Purchased options1 | | $ | (16,623,584) | | | $ | (3,090,730) | | | $ | (2,972,544) | | | $ | (282,176) | | | $ | (22,969,034) | |
| Written options | | | 18,473,274 | | | | 2,145,742 | | | | 196,988 | | | | 245,370 | | | | 21,061,374 | |
| Futures contracts | | | (27,372,159) | | | | — | | | | — | | | | — | | | | (27,372,159) | |
| Swap contracts | | | 6,535,547 | | | | — | | | | (1,520,565) | | | | — | | | | 5,014,982 | |
| Forward foreign currency contracts | | | — | | | | (3,036,633) | | | | — | | | | — | | | | (3,036,633) | |
| Total | | $ | (18,986,922) | | | $ | (3,981,621) | | | $ | (4,296,121) | | | $ | (36,806) | | | $ | (27,301,470) | |
| 1 | Net realized gain (loss) from purchased options is reported in net realized gain (loss) from investment transactions in unaffiliated securities in the Statement of Operations. |
| | |
| Western Asset Total Return Unconstrained Fund 2019 Annual Report | | 89 |
Notes to financial statements (cont’d)
| | | | | | | | | | | | | | | | | | | | |
| CHANGE IN UNREALIZED APPRECIATION (DEPRECIATION) ON DERIVATIVES RECOGNIZED | |
| | | Interest Rate Risk | | | Foreign
Exchange Risk | | | Credit Risk | | | Equity Risk | | | Total | |
| Purchased options1 | | $ | (1,057,236) | | | $ | 577,066 | | | $ | (167,426) | | | $ | 43,940 | | | $ | (603,656) | |
| Written options | | | 2,285,766 | | | | 46,155 | | | | (255,438) | | | | (29,296) | | | | 2,047,187 | |
| Futures contracts | | | (22,590) | | | | — | | | | — | | | | — | | | | (22,590) | |
| Swap contracts | | | (13,906,189) | | | | — | | | | 917,628 | | | | — | | | | (12,988,561) | |
| Forward foreign currency contracts | | | — | | | | (1,729,267) | | | | — | | | | — | | | | (1,729,267) | |
| Total | | $ | (12,700,249) | | | $ | (1,106,046) | | | $ | 494,764 | | | $ | 14,644 | | | $ | (13,296,887) | |
| 1 | The change in unrealized appreciation (depreciation) from purchased options is reported in the change in net unrealized appreciation (depreciation) from investments in unaffiliated securities in the Statement of Operations. |
During the year ended May 31, 2019, the volume of derivative activity for the Fund was as follows:
| | | | |
| | | Average Market
Value | |
| Purchased options | | $ | 9,119,370 | |
| Written options | | | 2,792,424 | |
| Futures contracts (to buy) | | | 2,278,388,641 | |
| Futures contracts (to sell) | | | 1,275,596,995 | |
| Forward foreign currency contracts (to buy) | | | 194,403,761 | |
| Forward foreign currency contracts (to sell) | | | 195,964,211 | |
| |
| | | Average Notional
Balance | |
| Interest rate swap contracts | | $ | 1,261,834,894 | |
| Credit default swap contracts (to buy protection) | | | 105,587,338 | |
| Credit default swap contracts (to sell protection) | | | 31,324,615 | |
The following table presents the Fund’s OTC derivative assets and liabilities by counterparty net of amounts available for offset under an ISDA Master Agreement and net of the related collateral pledged (received) by the Fund as of May 31, 2019.
| | | | | | | | | | | | | | | | | | | | |
| Counterparty | | Gross Assets
Subject to
Master
Agreements1 | | | Gross
Liabilities
Subject to
Master
Agreements1 | | | Net Assets
(Liabilities)
Subject to
Master Agreements | | | Collateral
Pledged
(Received)2,3 | | | Net
Amount4,5 | |
| Bank of America N.A. | | $ | 133,551 | | | $ | (325,633) | | | $ | (192,082) | | | $ | 325,633 | | | $ | 133,551 | |
| Barclays Bank PLC | | | 457,969 | | | | (2,358,844) | | | | (1,900,875) | | | | 450,000 | | | | (1,450,875) | |
| BNP Paribas SA | | | 221,289 | | | | (60,033) | | | | 161,256 | | | | (112,916) | | | | 48,340 | |
| Citibank N.A. | | | 2,161,752 | | | | (1,834,585) | | | | 327,167 | | | | (1,349,316) | | | | (1,022,149) | |
| Deutsche Bank AG | | | — | | | | (267,183) | | | | (267,183) | | | | 267,183 | | | | — | |
| | |
90 | | Western Asset Total Return Unconstrained Fund 2019 Annual Report |
| | | | | | | | | | | | | | | | | | | | |
| Counterparty | | Gross Assets
Subject to
Master
Agreements1 | | | Gross Liabilities
Subject to
Master
Agreements1 | | | Net Assets
(Liabilities)
Subject to
Master
Agreements | | | Collateral
Pledged
(Received)2,3 | | | Net Amount4,5 | |
| Goldman Sachs Group Inc. | | $ | 2,085,639 | | | $ | (1,267,439) | | | $ | 818,200 | | | $ | (487,425) | | | $ | 330,775 | |
| JPMorgan Chase & Co. | | | 807,812 | | | | (554,319) | | | | 253,493 | | | | (462,113) | | | | (208,620) | |
| Total | | $ | 5,868,012 | | | $ | (6,668,036) | | | $ | (800,024) | | | $ | (1,368,954) | | | $ | (2,168,978) | |
| 1 | Absent an event of default or early termination, derivative assets and liabilities are presented gross and not offset in the Statement of Assets and Liabilities. |
| 2 | Gross amounts are not offset in the Statement of Assets and Liabilities. |
| 3 | In some instances, the actual collateral received and/or pledged may be more than the amount shown here due to overcollateralization. |
| 4 | Net amount may also include forward foreign currency exchange contracts that are not required to be collateralized. |
| 5 | Represents the net amount receivable (payable) from (to) the counterparty in the event of default. |
5. Class specific expenses, waivers and/or expense reimbursements
The Fund has adopted a Rule12b-1 shareholder services and distribution plan and under that plan the Fund pays service and/or distribution fees with respect to its Class A, Class A2, Class C, Class FI and Class R shares calculated at the annual rate of 0.25%, 0.25%, 1.00%, 0.25% and 0.50% of the average daily net assets of each class, respectively. Service and/or distribution fees are accrued daily and paid monthly.
For the year ended May 31, 2019, class specific expenses were as follows:
| | | | | | | | |
| | | Service and/or
Distribution Fees | | | Transfer Agent
Fees | |
| Class A | | $ | 38,904 | | | $ | 93,225 | |
| Class A2 | | | 3,137 | | | | 2,989 | |
| Class C | | | 136,957 | | | | 14,493 | |
| Class FI | | | 194,285 | † | | | 93,306 | |
| Class R | | | 2,214 | | | | 817 | |
| Class I | | | — | | | | 863,877 | |
| Class IS | | | — | | | | 3,317 | |
| Total | | $ | 375,497 | | | $ | 1,072,024 | |
| † | Amount shown is exclusive of expense reimbursements. For the year ended May 31, 2019, the service and/or distribution fees reimbursed amounted to $396 for Class FI shares. |
| | |
| Western Asset Total Return Unconstrained Fund 2019 Annual Report | | 91 |
Notes to financial statements (cont’d)
For the year ended May 31, 2019, waivers and/or expense reimbursements by class were as follows:
| | | | |
| | | Waivers/Expense
Reimbursements | |
| Class A | | $ | 62,818 | |
| Class A2 | | | — | |
| Class C | | | 1,082 | |
| Class FI | | | 9,491 | |
| Class R | | | 95 | |
| Class I | | | 64,941 | |
| Class IS | | | 11,967 | |
| Total | | $ | 150,394 | |
6. Distributions to shareholders by class
| | | | | | | | |
| | | Year Ended
May 31, 2019 | | | Year Ended
May 31, 2018 | |
| Net Investment Income: | | | | | | | | |
| Class A | | $ | 468,728 | | | $ | 2,158,033 | |
| Class A2 | | | 35,739 | | | | 46,154 | |
| Class C | | | 331,357 | | | | 497,509 | |
| Class FI | | | 2,356,472 | | | | 5,696,275 | |
| Class R | | | 12,219 | | | | 9,715 | |
| Class I | | | 37,465,867 | | | | 45,353,949 | |
| Class IS | | | 5,962,607 | | | | 4,827,458 | |
| Total | | $ | 46,632,989 | | | $ | 58,589,093 | |
| | |
| Return of Capital: | | | | | | | | |
| Class A | | $ | 99,428 | | | | — | |
| Class A2 | | | 9,499 | | | | — | |
| Class C | | | 77,845 | | | | — | |
| Class FI | | | 512,045 | | | | — | |
| Class R | | | 3,187 | | | | — | |
| Class I | | | 8,930,913 | | | | — | |
| Class IS | | | 1,660,196 | | | | — | |
| Total | | $ | 11,293,113 | | | | — | |
7. Capital Shares
At May 31, 2019, the Corporation had 42.7 billion shares of capital stock authorized with a par value of $0.001 per share.
| | |
92 | | Western Asset Total Return Unconstrained Fund 2019 Annual Report |
Transactions in shares of each class were as follows:
| | | | | | | | | | | | | | | | |
| | | Year Ended
May 31, 2019 | | | Year Ended
May 31, 2018 | |
| | | Shares | | | Amount | | | Shares | | | Amount | |
| Class A | | | | | | | | | | | | | | | | |
| Shares sold | | | 244,442 | | | $ | 2,480,833 | | | | 972,450 | | | $ | 10,424,389 | |
| Shares issued on reinvestment | | | 50,089 | | | | 509,403 | | | | 137,691 | | | | 1,475,753 | |
| Shares repurchased | | | (1,680,371) | | | | (17,165,859) | | | | (14,035,060) | | | | (152,002,331) | |
| Net decrease | | | (1,385,840) | | | $ | (14,175,623) | | | | (12,924,919) | | | $ | (140,102,189) | |
| | | | |
| Class A2 | | | | | | | | | | | | | | | | |
| Shares sold | | | 15,820 | | | $ | 161,507 | | | | 24,602 | | | $ | 263,620 | |
| Shares issued on reinvestment | | | 4,450 | | | | 45,238 | | | | 4,319 | | | | 46,154 | |
| Shares repurchased | | | (24,235) | | | | (246,642) | | | | (35,497) | | | | (379,692) | |
| Net decrease | | | (3,965) | | | $ | (39,897) | | | | (6,576) | | | $ | (69,918) | |
| | | | |
| Class C | | | | | | | | | | | | | | | | |
| Shares sold | | | 221,249 | | | $ | 2,239,541 | | | | 500,557 | | | $ | 5,347,937 | |
| Shares issued on reinvestment | | | 39,263 | | | | 399,232 | | | | 45,099 | | | | 481,876 | |
| Shares repurchased | | | (745,107) | | | | (7,552,266) | | | | (536,271) | | | | (5,711,358) | |
| Net increase (decrease) | | | (484,595) | | | $ | (4,913,493) | | | | 9,385 | | | $ | 118,455 | |
| | | | |
| Class FI | | | | | | | | | | | | | | | | |
| Shares sold | | | 909,032 | | | $ | 9,232,455 | | | | 2,578,853 | | | $ | 27,604,018 | |
| Shares issued on reinvestment | | | 282,142 | | | | 2,865,305 | | | | 531,767 | | | | 5,692,518 | |
| Shares repurchased | | | (4,848,878) | | | | (49,265,356) | | | | (10,891,321) | | | | (115,546,700) | |
| Net decrease | | | (3,657,704) | | | $ | (37,167,596) | | | | (7,780,701) | | | $ | (82,250,164) | |
| | | | |
| Class R | | | | | | | | | | | | | | | | |
| Shares sold | | | 17,136 | | | $ | 175,777 | | | | 43,306 | | | $ | 459,844 | |
| Shares issued on reinvestment | | | 1,254 | | | | 12,758 | | | | 684 | | | | 7,292 | |
| Shares repurchased | | | (8,251) | | | | (84,224) | | | | (41,262) | | | | (437,172) | |
| Net increase | | | 10,139 | | | $ | 104,311 | | | | 2,728 | | | $ | 29,964 | |
| | | | |
| Class I | | | | | | | | | | | | | | | | |
| Shares sold | | | 41,164,920 | | | $ | 420,031,192 | | | | 74,370,335 | | | $ | 796,853,373 | |
| Shares issued on reinvestment | | | 4,197,719 | | | | 42,699,229 | | | | 3,793,428 | | | | 40,488,769 | |
| Shares repurchased | | | (62,786,042) | | | | (635,339,891) | | | | (29,520,046) | | | | (312,399,650) | |
| Net increase (decrease) | | | (17,423,403) | | | $ | (172,609,470) | | | | 48,643,717 | | | $ | 524,942,492 | |
| | | | |
| Class IS | | | | | | | | | | | | | | | | |
| Shares sold | | | 6,855,953 | | | $ | 69,540,749 | | | | 6,829,663 | | | $ | 72,555,351 | |
| Shares issued on reinvestment | | | 669,821 | | | | 6,807,741 | | | | 435,035 | | | | 4,637,131 | |
| Shares repurchased | | | (2,949,313) | | | | (29,874,295) | | | | (709,743) | | | | (7,504,516) | |
| Net increase | | | 4,576,461 | | | $ | 46,474,195 | | | | 6,554,955 | | | $ | 69,687,966 | |
8. Transactions with affiliated companies
As defined by the 1940 Act, an affiliated company is one in which the Fund owns 5% or more of the outstanding voting securities, or a company which is under common ownership
| | |
| Western Asset Total Return Unconstrained Fund 2019 Annual Report | | 93 |
Notes to financial statements (cont’d)
or control. The Fund may invest in Western Asset Government Cash Management Portfolio, LLC (“Cash Management Portfolio”), an affiliated private money market fund managed by Western Asset, the Fund’s subadviser. Cash Management Portfolio is available as a cash management vehicle for certain proprietary investment companies affiliated with Legg Mason. While Cash Management Portfolio is not a registered money market fund, it conducts all of its investment activities in accordance with the requirements of Rule2a-7 under the 1940 Act. Based on the Fund’s relative ownership, the following companies were considered affiliated companies for all or some portion of the year ended May 31, 2019. The following transactions were effected in shares of such companies for the year ended May 31, 2019.
| | | | | | | | | | | | | | | | | | | | |
| | | Affiliate
Value at
May 31,
2018 | | | Purchased | | | Sold | |
| | | Cost | | | Shares | | | Cost | | | Shares | |
| Western Asset Government Cash Management Portfolio LLC | | | — | | | $ | 710,766,741 | | | | 710,766,741 | | | $ | 653,490,125 | | | | 653,490,125 | |
| | | | | | | | | | | | | | | | |
| (cont’d) | | Realized
Gain (Loss) | | | Interest
Income | | | Net Increase
(Decrease) in
Unrealized
Appreciation
(Depreciation) | | | Affiliate
Value at
May 31, 2019 | |
| Western Asset Government Cash Management Portfolio LLC | | | — | | | $ | 1,050,237 | | | | — | | | $ | 57,276,616 | |
9. Redemption facility
The Fund and certain other participating funds within the Corporation (the “Participating Funds”) have available an unsecured revolving credit facility (the “Redemption Facility”) from the lenders and The Bank of New York Mellon (“BNY Mellon”), as administrative agent for the lenders. The Redemption Facility is to be used for temporary or emergency purposes as an additional source of liquidity to fund redemptions of shares. Under the agreement, BNY Mellon provides a364-day revolving credit facility, in the aggregate amount of $265 million. Unless renewed, the agreement will terminate on November 18, 2019. Any borrowings under the Redemption Facility will bear interest at current market rates as set forth in the credit agreement. The annual commitment fee to maintain the Redemption Facility is 0.10% and is incurred on the unused portion of the facility and is allocated to all Participating Funds pro rata based on net assets. For the year ended May 31, 2019, the Fund incurred a commitment fee in the amount of $10,555. The Fund did not utilize the Redemption Facility during the year ended May 31, 2019.
| | |
94 | | Western Asset Total Return Unconstrained Fund 2019 Annual Report |
10. Income tax information and distributions to shareholders
The tax character of distributions paid during the fiscal years ended May 31, was as follows:
| | | | | | | | |
| | | 2019 | | | 2018 | |
| Distributions paid from: | | | | | | | | |
| Ordinary income | | $ | 46,632,989 | | | $ | 58,589,093 | |
| Tax return of capital | | | 11,293,113 | | | | — | |
| Total distributions paid | | $ | 57,926,102 | | | $ | 58,589,093 | |
As of May 31, 2019, the components of accumulated earnings (losses) on a tax basis were as follows:
| | | | |
| Deferred capital losses* | | $ | (8,272,360) | |
| Other book/tax temporary differences(a) | | | (21,804,250) | |
| Unrealized appreciation (depreciation)(b) | | | (23,161,905) | |
| Total accumulated earnings (losses) — net | | $ | (53,238,515) | |
| * | These capital losses have been deferred in the current year as either short-term or long-term losses. The losses will be deemed to occur on the first day of the next taxable year in the same character as they were originally deferred and will be available to offset future taxable capital gains. |
| (a) | Other book/tax temporary differences are attributable to the realization for tax purposes of unrealized gains (losses) on certain futures, options and foreign currency contracts, book/tax differences in the accrual of interest income on securities in default, the tax deferral of losses on straddles and book/tax differences in the timing of the deductibility of various expenses. |
| (b) | The difference between book-basis andtax-basis unrealized appreciation (depreciation) is attributable to the tax deferral of losses on wash sales, book/tax differences on partnership investments and inflation-indexed bonds. |
11. Recent accounting pronouncements
In August 2018, the Securities and Exchange Commission released its Final Rule on Disclosure Update and Simplification (the “Final Rule”) which is intended to simplify an issuer’s disclosure compliance efforts by removing redundant or outdated disclosure requirements without significantly altering the mix of information provided to investors. Effective with the current reporting period, the Fund adopted the Final Rule with the most notable impacts being that the Fund is no longer required to present the components of distributable earnings on the Statement of Assets and Liabilities or the sources of distributions to shareholders and the amount of undistributed net investment income on the Statements of Changes in Net Assets. The tax components of distributable earnings and distributions to shareholders continue to be disclosed within the Notes to Financial Statements.
The Fund has adopted the disclosure provisions of the Financial Accounting Standards Board Accounting Standards UpdateNo. 2018-13,Fair Value Measurement (Topic 820)— Disclosure Framework—Changes to the Disclosure Requirements for Fair Value Measurement(“ASU2018-13”) which introduces new fair value disclosure requirements as well as eliminates and modifies certain existing fair value disclosure requirements. ASU2018-13 would be effective for fiscal years beginning after December 15, 2019, and interim periods within those fiscal years; however, management has elected to early adopt ASU2018-13.
| | |
| Western Asset Total Return Unconstrained Fund 2019 Annual Report | | 95 |
Notes to financial statements (cont’d)
The impact of the Fund’s adoption was limited to changes in the Fund’s financial statement disclosures regarding fair value, primarily those disclosures related to transfers between levels of the fair value hierarchy.
| | |
96 | | Western Asset Total Return Unconstrained Fund 2019 Annual Report |
Report of independent registered public accounting firm
To the Board of Directors of Western Asset Funds, Inc. and Shareholders of Western Asset Total Return Unconstrained Fund
Opinion on the financial statements
We have audited the accompanying statement of assets and liabilities, including the schedule of investments, of Western Asset Total Return Unconstrained Fund (one of the funds constituting Western Asset Funds, Inc., referred to hereafter as the “Fund”) as of May 31, 2019, the related statement of operations for the year ended May 31, 2019, the statement of changes in net assets for each of the two years in the period ended May 31, 2019, including the related notes, and the financial highlights for each of the five years in the period ended May 31, 2019 (collectively referred to as the “financial statements”). In our opinion, the financial statements present fairly, in all material respects, the financial position of the Fund as of May 31, 2019, the results of its operations for the year then ended, the changes in its net assets for each of the two years in the period ended May 31, 2019 and the financial highlights for each of the five years in the period ended May 31, 2019 in conformity with accounting principles generally accepted in the United States of America.
Basis for opinion
These financial statements are the responsibility of the Fund’s management. Our responsibility is to express an opinion on the Fund’s financial statements based on our audits. We are a public accounting firm registered with the Public Company Accounting Oversight Board (United States) (PCAOB) and are required to be independent with respect to the Fund in accordance with the U.S. federal securities laws and the applicable rules and regulations of the Securities and Exchange Commission and the PCAOB.
We conducted our audits of these financial statements in accordance with the standards of the PCAOB. Those standards require that we plan and perform the audit to obtain reasonable assurance about whether the financial statements are free of material misstatement, whether due to error or fraud.
Our audits included performing procedures to assess the risks of material misstatement of the financial statements, whether due to error or fraud, and performing procedures that respond to those risks. Such procedures included examining, on a test basis, evidence regarding the amounts and disclosures in the financial statements. Our audits also included evaluating the accounting principles used and significant estimates made by management, as well as evaluating the overall presentation of the financial statements. Our procedures included confirmation of securities owned as of May 31, 2019 by correspondence with the custodian, agent banks, brokers and transfer agent of the investee fund; when replies were not received, we performed other auditing procedures. We believe that our audits provide a reasonable basis for our opinion.
/s/PricewaterhouseCoopers LLP
Baltimore, Maryland
July 18, 2019
We have served as the auditor of one or more investment companies in Legg Mason investment company group since at least 1973. We have not been able to determine the specific year we began serving as auditor.
| | |
| Western Asset Total Return Unconstrained Fund 2019 Annual Report | | 97 |
Additional information(unaudited)
Information about Directors and Officers
The business and affairs of Western Asset Total Return Unconstrained Fund (the “Fund”) are conducted by management under the supervision and subject to the direction of its Board of Directors. The business address of each Director is c/o Jane Trust, Legg Mason, 100 International Drive, 11th Floor, Baltimore, Maryland 21202. Information pertaining to the Directors and officers of the Fund is set forth below.
The Statement of Additional Information includes additional information about Directors and is available, without charge, upon request by calling the Fund at1-877-721-1926.
| | |
| Independent Directors† | | |
| |
| Robert Abeles, Jr. | | |
| |
| Year of birth | | 1945 |
| Position(s) held with Fund | | Director |
| Term of office1and length of time served2 | | Since 2013 |
| Principal occupation(s) during the past five years | | Senior Vice President Emeritus (since 2016) and formerly, Senior Vice President, Finance and Chief Financial Officer (2009 to 2016) at University of Southern California |
| Number of portfolios in fund complex overseen3 | | 9 |
| Other directorships held during the past five years | | None |
|
| Anita L. DeFrantz |
| |
| Year of birth | | 1952 |
| Position(s) held with Fund | | Director |
| Term of office1and length of time served2 | | Since 1998 |
| Principal occupation(s) during the past five years | | President of Tubman Truth Corp. (since 2015); President Emeritus (since 2015) and formerly, President (1987 to 2015) and Director (1990 to 2015) of LA84 (formerly Amateur Athletic Foundation of Los Angeles); Member (since 1986), Member of the Executive Board (since 2013) and Vice President (since 2017) of the International Olympic Committee |
| Number of portfolios in fund complex overseen3 | | 9 |
| Other directorships held during the past five years | | None |
|
| Avedick B. Poladian |
| |
| Year of birth | | 1951 |
| Position(s) held with Fund | | Director |
| Term of office1and length of time served2 | | Since 2007 |
| Principal occupation(s) during the past five years | | Director and Advisor (since 2017) and former Executive Vice President and Chief Operating Officer (2002 to 2016) of Lowe Enterprises, Inc. (privately held real estate and hospitality firm); formerly, Partner, Arthur Andersen, LLP (1974 to 2002) |
| Number of portfolios in fund complex overseen3 | | 9 |
| Other directorships held during the past five years | | Occidental Petroleum Corporation (since 2008); California Resources Corporation (since 2014); and Public Storage (since 2010) |
| | |
98 | | Western Asset Total Return Unconstrained Fund |
| | |
| Independent Directors†(cont’d) | | |
| |
| William E. B. Siart | | |
| |
| Year of birth | | 1946 |
| Position(s) held with Fund | | Director and Chairman of the Board |
| Term of office1and length of time served2 | | Since 1997 |
| Principal occupation(s) during the past five years | | Chairman of Great Public Schools Now (since 2015); Chairman of Excellent Education Development (since 2000); formerly, Trustee of The Getty Trust (since 2005 to 2017); Chairman of Walt Disney Concert Hall, Inc. (1998 to 2006) |
| Number of portfolios in fund complex overseen3 | | 9 |
| Other directorships held during the past five years | | Member of Board of United States Golf Association, Executive Committee Member (since 2018) |
| |
| Jaynie Miller Studenmund | | |
| |
| Year of birth | | 1954 |
| Position(s) held with Fund | | Director |
| Term of office1and length of time served2 | | Since 2004 |
| Principal occupation(s) during the past five years | | Director of Pacific Premier Bancorp Inc. (“PPBI”) (a publicly traded bank) (since 2019); Director of Pacific Premier Bank (a wholly-owned bank subsidiary of PPBI) (since 2019); Director of EXL (operations management and analytics company) (since 2018); Director of CoreLogic, Inc. (information, analytics and business services company) (since 2012); formerly, Director of Pinnacle Entertainment, Inc. (gaming and hospitality company) (2012 to 2018); Director of LifeLock, Inc. (identity theft protection company) (2015 to 2017); Director of Orbitz Worldwide, Inc. (online travel company) (2007 to 2014) |
| Number of portfolios in fund complex overseen3 | | 9 |
| Other directorships held during the past five years | | None |
| | |
| Interested Director | | |
| | |
| |
| Ronald L. Olson4 | | |
| |
| Year of birth | | 1941 |
| Position(s) held with Fund | | Director |
| Term of office1and length of time served2 | | Since 2005 |
| Principal occupation(s) during the past five years | | Partner of Munger, Tolles & Olson LLP (law partnership) (since 1968) |
| Number of portfolios in fund complex overseen3 | | 9 |
| Other directorships held during the past five years | | Berkshire Hathaway, Inc.; formerly, Graham Holdings Company (formerly, The Washington Post Company) (2003 to 2017) |
| | |
| Western Asset Total Return Unconstrained Fund | | 99 |
Additional information(unaudited) (cont’d)
Information about Directors and Officers
| | |
| Officers5 | | |
| |
Jane Trust, CFA Legg Mason 100 International Drive, 11th Floor, Baltimore, MD 21202 | | |
| |
| Year of birth | | 1962 |
| Position(s) held with Fund | | President and Chief Executive Officer |
| Term of office1and length of time served2 | | Since 2015 |
| Principal occupation(s) during the past five years | | Senior Managing Director of Legg Mason & Co., LLC (“Legg Mason & Co.”) (since 2018); Managing Director of Legg Mason & Co. (2016 to 2018); Officer and/or Trustee/Director of 132 funds associated with Legg Mason Partners Fund Advisor, LLC (“LMPFA”) or its affiliates (since 2015); President and Chief Executive Officer of LMPFA (since 2015); formerly, Senior Vice President of LMPFA (2015); Director of ClearBridge, LLC (formerly, Legg Mason Capital Management, LLC) (2007 to 2014); Managing Director of Legg Mason Investment Counsel & Trust Co. (2000 to 2007) |
| |
Richard F. Sennett Legg Mason 100 International Drive, Baltimore, MD 21202 | | |
| |
| Year of birth | | 1970 |
| Position(s) held with Fund | | Principal Financial Officer and Treasurer |
| Term of office1and length of time served2 | | Since 2011 and since 2013 |
| Principal occupation(s) during the past five years | | Principal Financial Officer and Treasurer of certain mutual funds associated with Legg Mason & Co. or its affiliates (since 2011 and since 2013); Managing Director of Legg Mason & Co. and Senior Manager of the Treasury Policy group for Legg Mason & Co.’s Global Fiduciary Platform (since 2011); formerly, Chief Accountant within the SEC’s Division of Investment Management (2007 to 2011); Assistant Chief Accountant within the SEC’s Division of Investment Management (2002 to 2007) |
| |
Todd F. Kuehl Legg Mason 100 International Drive, 9th Floor, Baltimore, MD 21202 | | |
| |
| Year of birth | | 1969 |
| Position(s) held with Fund | | Chief Compliance Officer |
| Term of office1and length of time served2 | | Since 2007 |
| Principal occupation(s) during the past five years | | Managing Director of Legg Mason & Co. (since 2011); Chief Compliance Officer of certain mutual funds associated with Legg Mason & Co. or its affiliates (since 2006); formerly, Chief Compliance Officer of Legg Mason Private Portfolio Group (prior to 2010); formerly, Branch Chief, Division of Investment Management, U.S. Securities and Exchange Commission (2002 to 2006) |
| | |
100 | | Western Asset Total Return Unconstrained Fund |
| | |
| Officers5(cont’d) | | |
| |
Robert I. Frenkel Legg Mason 100 First Stamford Place, 6th Floor, Stamford, CT 06902 | | |
| |
| Year of birth | | 1954 |
| Position(s) held with Fund | | Secretary and Chief Legal Officer |
| Term of office1and length of time served2 | | Since 2007 |
| Principal occupation(s) during the past five years | | Vice President and Deputy General Counsel of Legg Mason, Inc. (since 2006); Managing Director and General Counsel — U.S. Mutual Funds for Legg Mason & Co. (since 2006) and Legg Mason & Co. predecessors (since 1994); Secretary and Chief Legal Officer of certain mutual funds associated with Legg Mason & Co. or its affiliates (since 2006) and Legg Mason & Co. predecessors (prior to 2006) |
| |
Thomas C. Mandia Legg Mason 100 First Stamford Place, 6th Floor, Stamford, CT 06902 | | |
| |
| Year of Birth | | 1962 |
| Position(s) held with Fund | | Assistant Secretary |
| Term of office1and length of time served2 | | Since 2007 |
| Principal occupation(s) during the past five years | | Managing Director and Deputy General Counsel of Legg Mason & Co. (since 2005) and Legg Mason & Co. predecessors (prior to 2005); Secretary of LMPFA (since 2006); Assistant Secretary of certain mutual funds associated with Legg Mason & Co. or its affiliates (since 2006) and Legg Mason & Co. predecessors (prior to 2006); Secretary of LMAsset Services, LLC (“LMAS”) (since 2002) and Legg Mason Fund Asset Management, Inc. (“LMFAM”) (since 2013) (formerly registered investment advisers) |
| |
Susan Kerr Legg Mason 620 Eighth Avenue, 49th Floor, New York, NY 10018 | | |
| |
| Year of birth | | 1949 |
| Position(s) held with Fund | | Chief Anti-Money Laundering Compliance Officer |
| Term of office1and length of time served2 | | Since 2013 |
| Principal occupation(s) during the past five years | | Assistant Vice President of Legg Mason & Co. and Legg Mason Investor Services, LLC (“LMIS”) (since 2010); Chief Anti-Money Laundering Compliance Officer of certain mutual funds associated with Legg Mason & Co. or its affiliates (since 2013) and Anti-Money Laundering Compliance Officer of LMIS (since 2012); Senior Compliance Officer of LMIS (since 2011); formerly, AML Consultant, DTCC (2010); AML Consultant, Rabobank Netherlands, (2009); First Vice President, Director of Marketing & Advertising Compliance and Manager of Communications Review Group at Citigroup Inc. (1996 to 2008) |
| | |
| Western Asset Total Return Unconstrained Fund | | 101 |
Additional information(unaudited) (cont’d)
Information about Directors and Officers
| | |
| Officers5(cont’d) | | |
| |
Jenna Bailey Legg Mason 100 First Stamford Place, 5th Floor, Stamford, CT 06902 | | |
| |
| Year of birth | | 1978 |
| Position(s) held with Fund | | Identity Theft Prevention Officer |
| Term of office1and length of time served2 | | Since 2015 |
| Principal occupation(s) during the past five years | | Identity Theft Prevention Officer of certain mutual funds associated with Legg Mason & Co. or its affiliates (since 2015); Compliance Officer of Legg Mason & Co. (since 2013); Assistant Vice President of Legg Mason & Co. (since 2011); formerly, Associate Compliance Officer of Legg Mason & Co. (2011 to 2013) |
| |
Jeanne M. Kelly Legg Mason 620 Eighth Avenue, 49th Floor, New York, NY 10018 | | |
| |
| Year of birth | | 1951 |
| Position(s) held with Fund | | Senior Vice President |
| Term of office1and length of time served2 | | Since 2007 |
| Principal occupation(s) during the past five years | | Senior Vice President of certain mutual funds associated with Legg Mason & Co. or its affiliates (since 2007); Senior Vice President of LMPFA (since 2006); President and Chief Executive Officer of LMAS and LMFAM (since 2015); Managing Director of Legg Mason & Co. (since 2005) and Legg Mason & Co. predecessors (prior to 2005); formerly, Senior Vice President of LMFAM (2013 to 2015) |
| † | Directors who are not “interested persons” of the Fund within the meaning of section 2(a)(19) of the Investment Company Act of 1940, as amended (the “1940 Act”). |
| 1 | Each Director and officer serves until his or her respective successor has been duly elected and qualified or until his or her earlier death, resignation, retirement or removal. |
| 2 | Indicates the earliest year in which the Director became a board member for a fund in the Legg Mason fund complex or the officer took such office. |
| 3 | In addition to overseeing the 7 funds of the Corporation, each Director also serves as a Director of Western Asset Investment Grade Income Fund Inc. and a Trustee of Western Asset Premier Bond Fund(closed-end investment companies), which are considered part of the same fund complex as the Corporation. |
| 4 | Mr. Olson is an “interested person” (as defined above) of the Fund because his law firm has provided legal services to WAM. |
| 5 | Each officer of the Fund is an “interested person” (as defined above) of the Fund. |
| | |
102 | | Western Asset Total Return Unconstrained Fund |
Important tax information(unaudited)
The following information is provided with respect to the distributions paid during the taxable year ended May 31, 2019:
| | | | |
| Record date: | | Daily | | Daily |
| Payable date: | | June 2018 to
December 2018 | | January 2019 to
May 2019 |
| Interest from Federal Obligations | | 15.10% | | 27.07% |
| Tax Return of Capital | | — | | 46.44% |
The law varies in each state as to whether and what percentage of dividend income attributable to Federal obligations is exempt from state income tax. We recommend that you consult with your tax adviser to determine if any portion of the dividends you received is exempt from state income taxes.
Please retain this information for your records.
| | |
| Western Asset Total Return Unconstrained Fund | | 103 |
(This page intentionally left blank.)
(This page intentionally left blank.)
(This page intentionally left blank.)
Western Asset
Total Return Unconstrained Fund
Directors
Robert Abeles, Jr
Anita L. DeFrantz
Ronald L. Olson
Avedick B. Poladian
William E.B. Siart
Chairman
Jaynie M. Studenmund
Investment manager
Legg Mason Partners Fund Advisor, LLC
Subadvisers
Western Asset Management Company, LLC
Western Asset Management Company Limited
Western Asset Management Company Ltd
Western Asset Management Company Pte. Ltd.
Distributor
Legg Mason Investor Services, LLC
Transfer Agent
BNY Mellon Investment Servicing (US) Inc.
4400 Computer Drive Westborough, MA 01581
Custodian
The Bank of New York Mellon
Independent registered public accounting firm
Pricewaterhouse Coopers LLP
Baltimore, MD
Western Asset Total Return Unconstrained Fund
The Fund is a separate investment series of Western Asset Funds, Inc.
Western Asset Total Return Unconstrained Fund
Legg Mason Funds
620 Eighth Avenue, 49th Floor
New York, NY 10018
The Fund files its complete schedule of portfolio holdings with the Securities and Exchange Commission (“SEC”) for the first and third quarters of each fiscal year as an exhibit to its reports on FormN-PORT. Previously, the Fund filed a complete schedule of portfolio holdings with the SEC for the first and third quarters of each fiscal year on FormN-Q. The Fund’s FormsN-PORT andN-Q are available on the SEC’s website at www.sec.gov. To obtain information on FormsN-PORT andN-Q, shareholders can call the Fund at1-877-721-1926.
Information on how the Fund voted proxies relating to portfolio securities during the prior12-month period ended June 30th of each year and a description of the policies and procedures that the Fund uses to determine how to vote proxies related to portfolio transactions are available (1) without charge, upon request, by calling the Fund at1-877-721-1926, (2) at www.leggmason.com/mutualfunds and (3) on the SEC’s website at www.sec.gov.
This report is submitted for the general information of the shareholders of Western Asset Total Return Unconstrained Fund. This report is not authorized for distribution to prospective investors in the Fund unless preceded or accompanied by a current prospectus.
Investors should consider the Fund’s investment objectives, risks, charges and expenses carefully before investing. The prospectus contains this and other important information about the Fund. Please read the prospectus carefully before investing.
www.leggmason.com
© 2019 Legg Mason Investor Services, LLC
Member FINRA, SIPC
Legg Mason Funds Privacy and Security Notice
Your Privacy and the Security of Your Personal Information is Very Important to the Legg Mason Funds
This Privacy and Security Notice (the “Privacy Notice”) addresses the Legg Mason Funds’ privacy and data protection practices with respect to nonpublic personal information the Funds receive. The Legg Mason Funds include any funds sold by the Funds’ distributor, Legg Mason Investor Services, LLC, as well as Legg Mason-sponsoredclosed-end funds. The provisions of this Privacy Notice apply to your information both while you are a shareholder and after you are no longer invested with the Funds.
The Type of Nonpublic Personal Information the Funds Collect About You
The Funds collect and maintain nonpublic personal information about you in connection with your shareholder account. Such information may include, but is not limited to:
| • | | Personal information included on applications or other forms; |
| • | | Account balances, transactions, and mutual fund holdings and positions; |
| • | | Bank account information, legal documents, and identity verification documentation; |
| • | | Online account access user IDs, passwords, security challenge question responses; and |
| • | | Information received from consumer reporting agencies regarding credit history and creditworthiness (such as the amount of an individual’s total debt, payment history, etc.). |
How the Funds Use Nonpublic Personal Information About You
The Funds do not sell or share your nonpublic personal information with third parties or with affiliates for their marketing purposes, or with other financial institutions or affiliates for joint marketing purposes, unless you have authorized the Funds to do so. The Funds do not disclose any nonpublic personal information about you except as may be required to perform transactions or services you have authorized or as permitted or required by law. The Funds may disclose information about you to:
| • | | Employees, agents, and affiliates on a “need to know” basis to enable the Funds to conduct ordinary business or to comply with obligations to government regulators; |
| • | | Service providers, including the Funds’ affiliates, who assist the Funds as part of the ordinary course of business (such as printing, mailing services, or processing or servicing your account with us) or otherwise perform services on the Funds’ behalf, including companies that may perform statistical analysis, market research and marketing services solely for the Funds; |
| • | | Permit access to transfer, whether in the United States or countries outside of the United States to such Funds’ employees, agents and affiliates and service providers as required to enable the Funds to conduct ordinary business, or to comply with obligations to government regulators; |
| • | | The Funds’ representatives such as legal counsel, accountants and auditors to enable the Funds to conduct ordinary business, or to comply with obligations to government regulators; |
| • | | Fiduciaries or representatives acting on your behalf, such as an IRA custodian or trustee of a grantor trust. |
|
| NOT PART OF THE ANNUAL REPORT |
Legg Mason Funds Privacy and Security Notice (cont’d)
Except as otherwise permitted by applicable law, companies acting on the Funds’ behalf, including those outside the United States, are contractually obligated to keep nonpublic personal information the Funds provide to them confidential and to use the information the Funds share only to provide the services the Funds ask them to perform.
The Funds may disclose nonpublic personal information about you when necessary to enforce their rights or protect against fraud, or as permitted or required by applicable law, such as in connection with a law enforcement or regulatory request, subpoena, or similar legal process. In the event of a corporate action or in the event a Fund service provider changes, the Funds may be required to disclose your nonpublic personal information to third parties. While it is the Funds’ practice to obtain protections for disclosed information in these types of transactions, the Funds cannot guarantee their privacy policy will remain unchanged.
Keeping You Informed of the Funds’ Privacy and Security Practices
The Funds will notify you annually of their privacy policy as required by federal law. While the Funds reserve the right to modify this policy at any time they will notify you promptly if this privacy policy changes.
The Funds’ Security Practices
The Funds maintain appropriate physical, electronic and procedural safeguards designed to guard your nonpublic personal information. The Funds’ internal data security policies restrict access to your nonpublic personal information to authorized employees, who may use your nonpublic personal information for Fund business purposes only.
Although the Funds strive to protect your nonpublic personal information, they cannot ensure or warrant the security of any information you provide or transmit to them, and you do so at your own risk. In the event of a breach of the confidentiality or security of your nonpublic personal information, the Funds will attempt to notify you as necessary so you can take appropriate protective steps. If you have consented to the Funds using electronic communications or electronic delivery of statements, they may notify you under such circumstances using the most current email address you have on record with them.
In order for the Funds to provide effective service to you, keeping your account information accurate is very important. If you believe that your account information is incomplete, not accurate or not current, if you have questions about the Funds’ privacy practices, or our use of your nonpublic personal information, write the Funds using the contact information on your account statements, email the Funds by clicking on the Contact Us section of the Funds’ website at www.leggmason.com, or contact the Funds at1-877-721-1926.
Revised April 2018
|
| NOT PART OF THE ANNUAL REPORT |
Western Asset Management Company, LLC
Legg Mason, Inc. Subsidiaries
www.leggmason.com
© 2019 Legg Mason Investor Services, LLC Member FINRA, SIPC
WASX013140 7/19 SR19-3662
The registrant has adopted a code of ethics that applies to the registrant’s principal executive officer, principal financial officer, principal accounting officer or controller.
| ITEM 3. | AUDIT COMMITTEE FINANCIAL EXPERT. |
The Board of Directors of the registrant has determined that Mr. Robert Abeles, Jr., possesses the technical attributes identified in Instruction 2(b) of Item 3 to FormN-CSR to qualify as “audit committee financial expert,” and have designated Mr. Abeles as the Audit Committee’s financial expert. Mr. Abeles is an “independent” Director pursuant to paragraph (a) (2) of Item 3 to FormN-CSR.
| ITEM 4. | PRINCIPAL ACCOUNTANT FEES AND SERVICES |
a)Audit Fees. The aggregate fees billed in the last two fiscal years ending May 31, 2018 and May 31, 2019 (the “Reporting Periods”) for professional services rendered by the Registrant’s principal accountant (the “Auditor”) for the audit of the Registrant’s annual financial statements, or services that are normally provided by the Auditor in connection with the statutory and regulatory filings or engagements for the Reporting Periods, were $254,060 in May 31, 2018 and in $228,275 in May 31, 2019.
b)Audit-Related Fees. The aggregate fees billed in the Reporting Period for assurance and related services by the Auditor that are reasonably related to the performance of the Registrant’s financial statements were $0 in May 31, 2018 and $9,000 in May 31, 2019.
In addition, there were no Audit-Related Fees billed in the Reporting Period for assurance and related services by the Auditor to the Registrant’s investment adviser (not including anysub-adviser whose role is primarily portfolio management and is subcontracted with or overseen by another investment adviser), and any entity controlling, controlled by or under common control with the investment adviser that provides ongoing services to the Western Asset Funds, Inc. (“service affiliates”), that were reasonably related to the performance of the annual audit of the service affiliates. Accordingly, there were no such fees that requiredpre-approval by the Audit Committee for the Reporting Period.
(c)Tax Fees. The aggregate fees billed in the Reporting Periods for professional services rendered by the Auditor for tax compliance, tax advice and tax planning (“Tax Services”) were $18,952 in May 31, 2018 and $0 in May 31, 2019. These services consisted of (i) review or preparation of U.S. federal, state, local and excise tax returns; (ii) U.S. federal, state and local tax planning, advice and assistance regarding statutory, regulatory or administrative developments, and (iii) tax advice regarding tax qualification matters and/or treatment of various financial instruments held or proposed to be acquired or held.
There were no fees billed for tax services by the Auditors to service affiliates during the Reporting Periods that requiredpre-approval by the Audit Committee.
d)All Other Fees. The aggregate other fees billed in the Reporting Periods for products and services provided by the Auditor were $0 in May 31, 2018 and $0 in May 31, 2019, other than the services reported in paragraphs (a) through (c) for the Item for the Western Asset Funds, Inc.
All Other Fees. There were no othernon-audit services rendered by the Auditor to Legg Mason Partners Fund Advisors, LLC (“LMPFA”), and any entity controlling, controlled by or under common control with LMPFA that provided ongoing services to Western Asset Funds, Inc. requiringpre-approval by the Audit Committee in the Reporting Period.
(e) Audit Committee’s pre–approval policies and procedures described in paragraph (c)(7) of Rule2-01 of RegulationS-X.
(1) The Charter for the Audit Committee (the “Committee”) of the Board of each registered investment company (the “Fund”) advised by LMPFA or one of their affiliates (each, an “Adviser”) requires that the Committee shall approve (a) all audit and permissiblenon-audit services to be
provided to the Fund and (b) all permissiblenon-audit services to be provided by the Fund’s independent auditors to the Adviser and any Covered Service Providers if the engagement relates directly to the operations and financial reporting of the Fund. The Committee may implement policies and procedures by which such services are approved other than by the full Committee.
The Committee shall not approvenon-audit services that the Committee believes may impair the independence of the auditors. As of the date of the approval of this Audit Committee Charter, permissiblenon-audit services include any professional services (including tax services), that are not prohibited services as described below, provided to the Fund by the independent auditors, other than those provided to the Fund in connection with an audit or a review of the financial statements of the Fund. Permissiblenon-audit services may not include: (i) bookkeeping or other services related to the accounting records or financial statements of the Fund; (ii) financial information systems design and implementation; (iii) appraisal or valuation services, fairness opinions orcontribution-in-kind reports; (iv) actuarial services; (v) internal audit outsourcing services; (vi) management functions or human resources; (vii) broker or dealer, investment adviser or investment banking services; (viii) legal services and expert services unrelated to the audit; and (ix) any other service the Public Company Accounting Oversight Board determines, by regulation, is impermissible.
Pre-approval by the Committee of any permissiblenon-audit services is not required so long as: (i) the aggregate amount of all such permissiblenon-audit services provided to the Fund, the Adviser and any service providers controlling, controlled by or under common control with the Adviser that provide ongoing services to the Fund (“Covered Service Providers”) constitutes not more than 5% of the total amount of revenues paid to the independent auditors during the fiscal year in which the permissiblenon-audit services are provided to (a) the Fund, (b) the Adviser and (c) any entity controlling, controlled by or under common control with the Adviser that provides ongoing services to the Fund during the fiscal year in which the services are provided that would have to be approved by the Committee; (ii) the permissiblenon-audit services were not recognized by the Fund at the time of the engagement to benon-audit services; and (iii) such services are promptly brought to the attention of the Committee and approved by the Committee (or its delegate(s)) prior to the completion of the audit.
(2) For the Western Asset Funds, Inc., the percentage of fees that were approved by the audit committee, with respect to: Audit-Related Fees were 100% and 100% for May 31, 2018 and May 31, 2019; Tax Fees were 100% and 100% for May 31, 2018 and May 31, 2019; and Other Fees were 100% and 100% for May 31, 2018 and May 31, 2019.
(f) N/A
(g)Non-audit fees billed by the Auditor for services rendered to Western Asset Funds, Inc., LMPFA and any entity controlling, controlled by, or under common control with LMPFA that provides ongoing services to Western Asset Funds, Inc. during the reporting period were $562,403 in May 31, 2018 and $678,000 in May 31, 2019.
(h) Yes. Western Asset Funds, Inc.’s Audit Committee has considered whether the provision ofnon-audit services that were rendered to Service Affiliates, which were notpre-approved (not requiringpre-approval), is compatible with maintaining the Accountant’s independence. All services provided by the Auditor to the Western Asset Funds, Inc. or to Service Affiliates, which were required to bepre-approved, werepre-approved as required.
| ITEM 5. | AUDIT COMMITTEE OF LISTED REGISTRANTS. |
| | a) | The independent board members are acting as the registrant’s audit committee as specified in Section 3(a)(58)(B) of the Exchange Act. The Audit Committee consists of the following Board members: |
Robert Abeles, Jr
Anita L. DeFrantz
Ronald L. Olson
Avedick B. Poladian
William E.B. Siart
Jaynie M. Studenmund
| ITEM 6. | SCHEDULE OF INVESTMENTS. |
Included herein under Item 1.
| ITEM 7. | DISCLOSURE OF PROXY VOTING POLICIES AND PROCEDURES FORCLOSED-END MANAGEMENT INVESTMENT COMPANIES. |
Not applicable.
| ITEM 8. | PORTFOLIO MANAGERS OFCLOSED-END MANAGEMENT INVESTMENT COMPANIES. |
Not applicable.
| ITEM 9. | PURCHASES OF EQUITY SECURITIES BYCLOSED-END MANAGEMENT INVESTMENT COMPANY AND AFFILIATED PURCHASERS. |
Not applicable.
| ITEM 10. | SUBMISSION OF MATTERS TO A VOTE OF SECURITY HOLDERS. |
Not applicable.
| ITEM 11. | CONTROLS AND PROCEDURES. |
| | (a) | The registrant’s principal executive officer and principal financial officer have concluded that the registrant’s disclosure controls and procedures (as defined in Rule30a- 3(c) under the Investment Company Act of 1940, as amended (the “1940 Act”)) are effective as of a date within 90 days of the filing date of this report that includes the disclosure required by this paragraph, based on their evaluation of the disclosure controls and procedures required by Rule30a-3(b) under the 1940 Act and15d-15(b) under the Securities Exchange Act of 1934. |
| | (b) | There were no changes in the registrant’s internal control over financial reporting (as defined in Rule30a-3(d) under the 1940 Act) that occurred during the second fiscal quarter of the period covered by this report that have materially affected, or are likely to materially affect the registrant’s internal control over financial reporting. |
| ITEM 12. | DISCLOSURE OF SECURITIES LENDING ACTIVITIES FORCLOSED-END MANAGEMENT INVESTMENT COMPANIES. |
Not applicable.
(a) (1) Code of Ethics attached hereto.
Exhibit 99.CODE ETH
(a) (2) Certifications pursuant to section 302 of the Sarbanes-Oxley Act of 2002 attached hereto.
Exhibit 99.CERT
(b) Certifications pursuant to Section 906 of the Sarbanes-Oxley Act of 2002 attached hereto.
Exhibit 99.906CERT
SIGNATURES
Pursuant to the requirements of the Securities Exchange Act of 1934 and the Investment Company Act of 1940, the registrant has duly caused this Report to be signed on its behalf by the undersigned, there unto duly authorized.
| | |
Western Asset Funds, Inc. |
| |
| By: | | /s/ Jane Trust |
| | Jane Trust |
| | Chief Executive Officer |
|
| Date: July 24, 2019 |
Pursuant to the requirements of the Securities Exchange Act of 1934 and the Investment Company Act of 1940, this report has been signed below by the following persons on behalf of the registrant and in the capacities and on the dates indicated.
| | |
| By: | | /s/ Jane Trust |
| | Jane Trust |
| | Chief Executive Officer |
|
| Date: July 24, 2019 |
| |
| By: | | /s/ Richard F. Sennett |
| | Richard F. Sennett |
| | Principal Financial Officer |
|
| Date: July 24, 2019 |