UNITED STATES
SECURITIES AND EXCHANGE COMMISSION
Washington, D.C. 20549
FORM N-CSR
CERTIFIED SHAREHOLDER REPORT OF REGISTERED
MANAGEMENT INVESTMENT COMPANIES
Investment Company Act file number 811-06110
Western Asset Funds, Inc.
(Exact name of registrant as specified in charter)
100 International Drive, Baltimore, MD, 21202
(Address of principal executive offices) (Zip code)
Marc A. De Oliveira
Franklin Templeton
100 First Stamford Place
Stamford, CT 06902
(Name and address of agent for service)
Registrant’s telephone number, including area code: 877-6LM-FUND/656-3863
Date of fiscal year end: October 31
Date of reporting period: April 30, 2024
| ITEM 1. | REPORT TO STOCKHOLDERS. |
The Semi-Annual Report to Stockholders is filed herewith.

| Semi-Annual Report | April 30, 2024 |
WESTERN ASSET
MACRO OPPORTUNITIES FUND
The Securities and Exchange Commission has adopted new regulations that will result in changes to the design and delivery of annual and semi-annual shareholder reports beginning in July 2024.
If you have previously elected to receive shareholder reports electronically, you will continue to do so and need not take any action.
Otherwise, paper copies of the Fund’s shareholder reports will be mailed to you beginning in July 2024. If you would like to receive shareholder reports and other communications from the Fund electronically instead of by mail, you may make that request at any time by contacting your financial intermediary (such as a broker-dealer or bank) or, if you are a direct investor, enrolling at franklintempleton.com.
You may access franklintempleton.com by scanning the code below.


| INVESTMENT PRODUCTS: NOT FDIC INSURED • NO BANK GUARANTEE • MAY LOSE VALUE |
Fund objective
The Fund seeks to maximize total return.

Dear Shareholder,
We are pleased to provide the semi-annual report of Western Asset Macro Opportunities Fund for the six-month reporting period ended April 30, 2024. Please read on for Fund performance information during the Fund’s reporting period.
Special shareholder notice
Effective March 1, 2024, Gordon Brown, Michael C. Buchanan, Amit Chopra, and Mark S. Lindbloom joined the Fund’s portfolio management team.
As always, we remain committed to providing you with excellent service and a full spectrum of investment choices. We also remain committed to supplementing the support you receive from your financial advisor. One way we accomplish this is through our website, www.franklintempleton.com. Here you can gain immediate access to market and investment information, including:
| • | Fund prices and performance, |
| • | Market insights and commentaries from our portfolio managers, and |
| • | A host of educational resources. |
We look forward to helping you meet your financial goals.
Sincerely,

Jane Trust, CFA
President and Chief Executive Officer
May 31, 2024
II | Western Asset Macro Opportunities Fund |
For the six months ended April 30, 2024, Class A shares of Western Asset Macro Opportunities Fund, excluding sales charges, returned 9.05%. The Fund’s unmanaged benchmark, the ICE BofA 3-Month U.S. Treasury Bill Indexi, returned 2.66% for the same period.
| Performance Snapshot as of April 30, 2024 (unaudited) | ||||
| (excluding sales charges) | 6 months | |||
| Western Asset Macro Opportunities Fund: | ||||
Class A | 9.05% | |||
Class C | 8.74% | |||
Class FI | 8.96% | |||
Class I | 9.17% | |||
Class IS | 9.22% | |||
| ICE BofA 3-Month U.S. Treasury Bill Index | 2.66% | |||
The performance shown represents past performance. Past performance is no guarantee of future results and current performance may be higher or lower than the performance shown above. Principal value, investment returns and yields will fluctuate and investors’ shares, when redeemed, may be worth more or less than their original cost. To obtain performance data current to the most recent month-end, please visit our website at www.franklintempleton.com.
All share class returns assume the reinvestment of all distributions, including returns of capital, if any, at net asset value and the deduction of all Fund expenses. Returns have not been adjusted to include sales charges that may apply or the deduction of taxes that a shareholder would pay on Fund distributions. If sales charges were reflected, the performance quoted would be lower. Performance figures for periods shorter than one year represent cumulative figures and are not annualized.
Fund performance figures reflect fee waivers and/or expense reimbursements, without which the performance would have been lower.
The 30-Day SEC Yields for the period ended April 30, 2024 for Class A, Class C, Class FI, Class I and Class IS shares were 6.17%, 5.64%, 6.25%, 6.66% and 6.76%, respectively. Absent fee waivers and/or expense reimbursements, the 30-Day SEC Yields for Class A, Class C, Class FI, Class I and Class IS shares would have been 6.10%, 5.60%, 6.13%, 6.61% and 6.69%, respectively. The 30-Day SEC Yield, calculated pursuant to the standard SEC formula, is based on the Fund’s investments over an annualized trailing 30-day period, and not on the distributions paid by the Fund, which may differ.
| Total Annual Operating Expenses (unaudited) |
As of the Fund’s current prospectus dated March 1, 2024, the gross total annual fund operating expense ratios for Class A, Class C, Class FI, Class I and Class IS shares were 1.57%, 2.30%, 1.62%, 1.32% and 1.24%, respectively.
Actual expenses may be higher. For example, expenses may be higher than those shown if average net assets decrease. Net assets are more likely to decrease and Fund expense ratios are more likely to increase when markets are volatile.
| Western Asset Macro Opportunities Fund |
III |
Performance review (cont’d)
As always, thank you for your confidence in our stewardship of your assets.
Sincerely,
Jane Trust, CFA
President and Chief Executive Officer
May 31, 2024
RISKS: Fixed income securities involve interest rate, credit, inflation and reinvestment risks. As interest rates rise, the value of fixed income securities falls. High yield (“junk”) bonds possess greater price volatility, illiquidity, and possibility of default. Asset-backed, mortgage-backed or mortgage related securities are subject to prepayment and extension risks. International investments are subject to special risks, including currency fluctuations, as well as social, economic and political uncertainties, which could increase volatility. These risks are magnified in emerging markets. Emerging market countries tend to have economic, political and legal systems that are less developed and are less stable than those of more developed countries. Derivatives, such as options and futures, can be illiquid, may disproportionately increase losses and have a potentially large impact on Fund performance. The Fund may use derivatives to a significant extent, which could result in substantial losses and greater volatility in the Fund’s net assets. Potential active and frequent trading may result in higher transaction costs and increased investor liability. The use of leverage may increase volatility and the possibility of loss. The manager’s investment style may become out of favor and/or the manager’s selection process may prove incorrect, which may have a negative impact on the Fund’s performance. The Fund is non-diversified, which means it may invest its assets in a larger percentage of its assets in a smaller number of issuers than a diversified fund. The market values of securities or other assets will fluctuate, sometimes sharply and unpredictably, due to changes in general market conditions, overall economic trends or events, governmental actions or intervention, actions taken by the U.S. Federal Reserve or foreign central banks, market disruptions caused by trade disputes or other factors, political developments, armed conflicts, economic sanctions and countermeasures in response to sanctions, major cybersecurity events, investor sentiment, the global and domestic effects of a pandemic, and other factors that may or may not be related to the issuer of the security or other asset. Please see the Fund’s prospectus for a more complete discussion of these and other risks and the Fund’s investment strategies.
All investments are subject to risk including the possible loss of principal. Past performance is no guarantee of future results. All index performance reflects no deduction for fees, expenses or taxes. Please note that an investor cannot invest directly in an index.
| i | The ICE BofA 3-Month U.S. Treasury Bill Index is an unmanaged index that comprises a single U.S. Treasury issue with approximately three months to final maturity, purchased at the beginning of each month and held for one full month. |
IV | Western Asset Macro Opportunities Fund |
Investment breakdown (%) as a percent of total investments
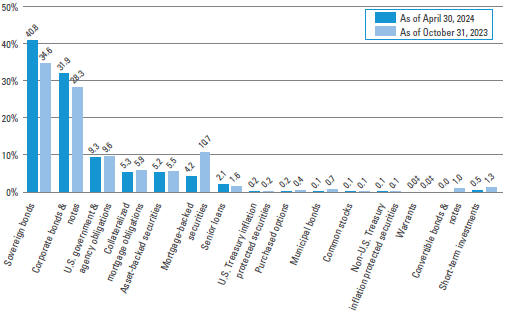
| † | The bar graph above represents the composition of the Fund’s investments as of April 30, 2024 and October 31, 2023 and does not include derivatives, such as written options, futures contracts, forward foreign currency contracts and swap contracts. The Fund is actively managed. As a result, the composition of the Fund’s investments is subject to change at any time. |
| ‡ | Represents less than 0.1%. |
| Western Asset Macro Opportunities Fund 2024 Semi-Annual Report |
1 |
Example
As a shareholder of the Fund, you may incur two types of costs: (1) transaction costs, including front-end and back-end sales charges (loads) on purchase payments; and (2) ongoing costs, including management fees; service and/or distribution (12b-1) fees; and other Fund expenses. This example is intended to help you understand your ongoing costs (in dollars) of investing in the Fund and to compare these costs with the ongoing costs of investing in other mutual funds.
This example is based on an investment of $1,000 invested on November 1, 2023 and held for the six months ended April 30, 2024.
Actual expenses
The table below titled “Based on actual total return” provides information about actual account values and actual expenses. You may use the information provided in this table, together with the amount you invested, to estimate the expenses that you paid over the period. To estimate the expenses you paid on your account, divide your ending account value by $1,000 (for example, an $8,600 ending account value divided by $1,000 = 8.6), then multiply the result by the number under the heading entitled “Expenses Paid During the Period”.
Hypothetical example for comparison purposes
The table below titled “Based on hypothetical total return” provides information about hypothetical account values and hypothetical expenses based on the actual expense ratio and an assumed rate of return of 5.00% per year before expenses, which is not the Fund’s actual return. The hypothetical account values and expenses may not be used to estimate the actual ending account balance or expenses you paid for the period. You may use the information provided in this table to compare the ongoing costs of investing in the Fund and other funds. To do so, compare the 5.00% hypothetical example relating to the Fund with the 5.00% hypothetical examples that appear in the shareholder reports of the other funds.
Please note that the expenses shown in the table below are meant to highlight your ongoing costs only and do not reflect any transactional costs, such as front-end or back-end sales charges (loads). Therefore, the table is useful in comparing ongoing costs only, and will not help you determine the relative total costs of owning different funds. In addition, if these transaction costs were included, your costs would have been higher.
| Based on actual total return1 | Based on hypothetical total return1 | |||||||||||||||||||||||||||||||||||||||||||||
Actual Total Return Without Sales Charge2 | Beginning Account Value | Ending Account Value | Annualized Ratio | Expenses Paid During the Period3 | Hypothetical Annualized Total Return | Beginning Value | Ending Account Value | Annualized Expense Ratio | Expenses Paid During the Period3 | |||||||||||||||||||||||||||||||||||||
| Class A | 9.05 | % | $ | 1,000.00 | $ | 1,090.50 | 1.58 | % | $ | 8.21 | Class A | 5.00 | % | $ | 1,000.00 | $ | 1,017.01 | 1.58 | % | $ | 7.92 | |||||||||||||||||||||||||
| Class C | 8.74 | 1,000.00 | 1,087.40 | 2.33 | 12.09 | Class C | 5.00 | 1,000.00 | 1,013.28 | 2.33 | 11.66 | |||||||||||||||||||||||||||||||||||
| Class FI | 8.96 | 1,000.00 | 1,089.60 | 1.65 | 8.57 | Class FI | 5.00 | 1,000.00 | 1,016.66 | 1.65 | 8.27 | |||||||||||||||||||||||||||||||||||
| Class I | 9.17 | 1,000.00 | 1,091.70 | 1.35 | 7.02 | Class I | 5.00 | 1,000.00 | 1,018.15 | 1.35 | 6.77 | |||||||||||||||||||||||||||||||||||
| Class IS | 9.22 | 1,000.00 | 1,092.20 | 1.25 | 6.50 | Class IS | 5.00 | 1,000.00 | 1,018.65 | 1.25 | 6.27 | |||||||||||||||||||||||||||||||||||
2 | Western Asset Macro Opportunities Fund 2024 Semi-Annual Report |
| 1 | For the six months ended April 30, 2024. |
| 2 | Assumes the reinvestment of all distributions, including returns of capital, if any, at net asset value and does not reflect the deduction of the applicable sales charge with respect to Class A shares or the applicable contingent deferred sales charge (“CDSC”) with respect to Class C shares. Total return is not annualized, as it may not be representative of the total return for the year. Performance figures may reflect compensating balance arrangements, fee waivers and/or expense reimbursements. In the absence of compensating balance arrangements, fee waivers and/or expense reimbursements, the total return would have been lower. Past performance is no guarantee of future results. |
| 3 | Expenses (net of compensating balance arrangements, fee waivers and/or expense reimbursements) are equal to each class’ respective annualized expense ratio multiplied by the average account value over the period, multiplied by the number of days in the most recent fiscal half-year (182), then divided by 366. |
| Western Asset Macro Opportunities Fund 2024 Semi-Annual Report |
3 |
Schedule of investments (unaudited)
April 30, 2024
Western Asset Macro Opportunities Fund
(Percentages shown based on Fund net assets)
| Security | Rate | Maturity Date | Face Amount† | Value | ||||||||||||
| Sovereign Bonds — 40.9% | ||||||||||||||||
Angola — 0.4% | ||||||||||||||||
Angolan Government International Bond, Senior Notes | 8.250 | % | 5/9/28 | 700,000 | $ | 661,860 | (a) | |||||||||
Angolan Government International Bond, Senior Notes | 8.750 | % | 4/14/32 | 400,000 | 362,819 | (b) | ||||||||||
Total Angola | 1,024,679 | |||||||||||||||
Argentina — 2.6% | ||||||||||||||||
Argentine Republic Government International Bond, Senior Notes, Step bond (0.750% to 7/9/27 then 1.750%) | 0.750 | % | 7/9/30 | 3,087,393 | 1,793,806 | |||||||||||
Argentine Republic Government International Bond, Senior Notes, Step bond (4.250% to 7/9/24 then 5.000%) | 4.250 | % | 1/9/38 | 2,874,178 | 1,471,794 | |||||||||||
Provincia de Buenos Aires, Senior Notes, Step bond (6.375% to 9/1/24 then 6.625%) | 6.375 | % | 9/1/37 | 4,684,792 | 2,078,877 | (b) | ||||||||||
Provincia de Buenos Aires, Senior Notes, Step bond (6.375% to 9/1/24 then 6.625%) | 6.375 | % | 9/1/37 | 549,752 | 243,952 | (a) | ||||||||||
Provincia de Cordoba, Senior Notes | 6.990 | % | 6/1/27 | 650,000 | 520,000 | (b) | ||||||||||
Provincia de Cordoba, Senior Notes | 6.875 | % | 2/1/29 | 1,034,131 | 767,842 | (b) | ||||||||||
Total Argentina | 6,876,271 | |||||||||||||||
Brazil — 1.5% | ||||||||||||||||
Brazil Notas do Tesouro Nacional Serie F, Notes | 10.000 | % | 1/1/27 | 13,552,000 | BRL | 2,555,713 | ||||||||||
Brazil Notas do Tesouro Nacional Serie F, Notes | 10.000 | % | 1/1/31 | 8,024,000 | BRL | 1,429,767 | ||||||||||
Total Brazil | 3,985,480 | |||||||||||||||
Dominican Republic — 0.8% | ||||||||||||||||
Dominican Republic International Bond, Senior Notes | 11.250 | % | 9/15/35 | 57,000,000 | DOP | 1,029,516 | (b) | |||||||||
Dominican Republic International Bond, Senior Notes | 5.875 | % | 1/30/60 | 1,270,000 | 1,038,303 | (b) | ||||||||||
Total Dominican Republic | 2,067,819 | |||||||||||||||
Egypt — 0.4% | ||||||||||||||||
Egypt Government Bond | 18.400 | % | 5/30/24 | 3,500,000 | EGP | 72,972 | ||||||||||
Egypt Government International Bond, Senior Notes | 5.250 | % | 10/6/25 | 960,000 | 911,947 | (a) | ||||||||||
Total Egypt | 984,919 | |||||||||||||||
See Notes to Financial Statements.
4 | Western Asset Macro Opportunities Fund 2024 Semi-Annual Report |
Western Asset Macro Opportunities Fund
(Percentages shown based on Fund net assets)
| Security | Rate | Maturity Date | Face Amount† | Value | ||||||||||||
Indonesia — 6.7% | ||||||||||||||||
Indonesia Treasury Bond | 8.250 | % | 5/15/29 | 95,863,000,000 | IDR | $ | 6,163,230 | |||||||||
Indonesia Treasury Bond | 6.500 | % | 2/15/31 | 134,566,000,000 | IDR | 7,918,069 | ||||||||||
Indonesia Treasury Bond | 7.000 | % | 2/15/33 | 56,584,000,000 | IDR | 3,475,027 | ||||||||||
Total Indonesia | 17,556,326 | |||||||||||||||
Israel — 0.5% | ||||||||||||||||
Israel Government International Bond, Senior Notes | 5.500 | % | 3/12/34 | 1,500,000 | 1,426,875 | |||||||||||
Ivory Coast — 1.5% | ||||||||||||||||
Ivory Coast Government International Bond, Senior Notes | 4.875 | % | 1/30/32 | 2,150,000 | EUR | 1,918,965 | (b) | |||||||||
Ivory Coast Government International Bond, Senior Notes | 5.750 | % | 12/31/32 | 220,148 | 205,059 | (a) | ||||||||||
Ivory Coast Government International Bond, Senior Notes | 6.125 | % | 6/15/33 | 1,420,000 | 1,234,227 | (a) | ||||||||||
Ivory Coast Government International Bond, Senior Notes | 6.125 | % | 6/15/33 | 650,000 | 564,963 | (b) | ||||||||||
Total Ivory Coast | 3,923,214 | |||||||||||||||
Jamaica — 0.1% | ||||||||||||||||
Jamaica Government International Bond, Senior Notes | 9.625 | % | 11/3/30 | 35,500,000 | JMD | 240,108 | ||||||||||
Kenya — 0.6% | ||||||||||||||||
Republic of Kenya Government International Bond, Senior Notes | 7.250 | % | 2/28/28 | 1,600,000 | 1,510,915 | (a) | ||||||||||
Mexico — 8.5% | ||||||||||||||||
Mexican Bonos, Bonds | 8.000 | % | 11/7/47 | 112,720,000 | MXN | 5,392,492 | ||||||||||
Mexican Bonos, Senior Notes | 7.750 | % | 11/13/42 | 357,935,400 | MXN | 16,878,015 | ||||||||||
Total Mexico | 22,270,507 | |||||||||||||||
Nigeria — 0.4% | ||||||||||||||||
Nigeria Government International Bond, Senior Notes | 6.125 | % | 9/28/28 | 1,080,000 | 954,450 | (a) | ||||||||||
Poland — 4.9% | ||||||||||||||||
Republic of Poland Government Bond | 1.750 | % | 4/25/32 | 68,550,000 | PLN | 12,720,111 | ||||||||||
South Africa — 4.0% | ||||||||||||||||
Republic of South Africa Government Bond, Senior Notes | 6.250 | % | 3/31/36 | 255,430,000 | ZAR | 8,550,637 | ||||||||||
Republic of South Africa Government Bond, Senior Notes | 6.500 | % | 2/28/41 | 59,640,000 | ZAR | 1,839,147 | ||||||||||
Total South Africa | 10,389,784 | |||||||||||||||
See Notes to Financial Statements.
| Western Asset Macro Opportunities Fund 2024 Semi-Annual Report |
5 |
Schedule of investments (unaudited) (cont’d)
April 30, 2024
Western Asset Macro Opportunities Fund
(Percentages shown based on Fund net assets)
| Security | Rate | Maturity Date | Face Amount† | Value | ||||||||||||
Supranational — 7.9% | ||||||||||||||||
European Bank for Reconstruction & Development, Senior Notes | 5.000 | % | 10/6/26 | 38,012,000,000 | IDR | $ | 2,249,979 | |||||||||
European Bank for Reconstruction & Development, Senior Notes | 7.050 | % | 8/10/33 | 484,700,000 | INR | 5,740,067 | ||||||||||
Inter-American Development Bank, Senior Notes | 7.000 | % | 4/17/33 | 1,078,000,000 | INR | 12,708,109 | ||||||||||
Total Supranational | 20,698,155 | |||||||||||||||
Zambia — 0.1% | ||||||||||||||||
Zambia Government International Bond, Senior Notes | — | 4/14/24 | 550,000 | 405,331 | *(b)(c) | |||||||||||
Total Sovereign Bonds (Cost — $110,036,650) |
| 107,034,944 | ||||||||||||||
| Corporate Bonds & Notes — 32.0% | ||||||||||||||||
| Communication Services — 1.3% | ||||||||||||||||
Diversified Telecommunication Services — 0.2% |
| |||||||||||||||
Altice Financing SA, Senior Secured Notes | 5.750 | % | 8/15/29 | 220,000 | 163,736 | (b) | ||||||||||
Altice France SA, Senior Secured Notes | 5.500 | % | 1/15/28 | 580,000 | 392,422 | (b) | ||||||||||
Total Diversified Telecommunication Services |
| 556,158 | ||||||||||||||
Media — 0.4% | ||||||||||||||||
CCO Holdings LLC/CCO Holdings Capital Corp., Senior Notes | 4.250 | % | 1/15/34 | 810,000 | 587,615 | (b) | ||||||||||
DISH DBS Corp., Senior Notes | 5.125 | % | 6/1/29 | 420,000 | 169,072 | |||||||||||
DISH DBS Corp., Senior Secured Notes | 5.250 | % | 12/1/26 | 240,000 | 189,182 | (b) | ||||||||||
DISH DBS Corp., Senior Secured Notes | 5.750 | % | 12/1/28 | 30,000 | 20,315 | (b) | ||||||||||
Time Warner Cable LLC, Senior Secured Notes | 7.300 | % | 7/1/38 | 190,000 | 184,746 | |||||||||||
Total Media | 1,150,930 | |||||||||||||||
Wireless Telecommunication Services — 0.7% |
| |||||||||||||||
CSC Holdings LLC, Senior Notes | 5.750 | % | 1/15/30 | 2,210,000 | 971,041 | (b) | ||||||||||
CSC Holdings LLC, Senior Notes | 4.125 | % | 12/1/30 | 320,000 | 203,565 | (b) | ||||||||||
Vmed O2 UK Financing I PLC, Senior Secured Notes | 4.750 | % | 7/15/31 | 670,000 | 559,798 | (b) | ||||||||||
Total Wireless Telecommunication Services |
| 1,734,404 | ||||||||||||||
Total Communication Services | 3,441,492 | |||||||||||||||
| Consumer Discretionary — 5.3% | ||||||||||||||||
Automobiles — 0.4% | ||||||||||||||||
Ford Motor Co., Senior Notes | 6.100 | % | 8/19/32 | 960,000 | 942,045 | |||||||||||
Ford Motor Credit Co. LLC, Senior Notes | 2.900 | % | 2/10/29 | 200,000 | 172,735 | |||||||||||
Total Automobiles | 1,114,780 | |||||||||||||||
See Notes to Financial Statements.
6 | Western Asset Macro Opportunities Fund 2024 Semi-Annual Report |
Western Asset Macro Opportunities Fund
(Percentages shown based on Fund net assets)
| Security | Rate | Maturity Date | Face Amount† | Value | ||||||||||||
Broadline Retail — 1.6% | ||||||||||||||||
Amazon.com Inc., Senior Notes | 4.050 | % | 8/22/47 | 3,980,000 | $ | 3,253,427 | (d) | |||||||||
Prosus NV, Senior Notes | 4.027 | % | 8/3/50 | 1,290,000 | 817,039 | (b) | ||||||||||
Total Broadline Retail | 4,070,466 | |||||||||||||||
Hotels, Restaurants & Leisure — 3.3% | ||||||||||||||||
Carnival Corp., Senior Notes | 10.500 | % | 6/1/30 | 1,900,000 | 2,064,632 | (b) | ||||||||||
Las Vegas Sands Corp., Senior Notes | 2.900 | % | 6/25/25 | 50,000 | 48,131 | |||||||||||
Las Vegas Sands Corp., Senior Notes | 3.500 | % | 8/18/26 | 30,000 | 28,285 | |||||||||||
Royal Caribbean Cruises Ltd., Senior Notes | 5.375 | % | 7/15/27 | 1,970,000 | 1,918,455 | (b) | ||||||||||
Royal Caribbean Cruises Ltd., Senior Notes | 6.250 | % | 3/15/32 | 120,000 | 118,376 | (b) | ||||||||||
Sands China Ltd., Senior Notes | 5.125 | % | 8/8/25 | 1,210,000 | 1,197,412 | |||||||||||
Sands China Ltd., Senior Notes | 2.300 | % | 3/8/27 | 960,000 | 863,864 | |||||||||||
Sands China Ltd., Senior Notes | 2.850 | % | 3/8/29 | 630,000 | 541,760 | |||||||||||
VOC Escrow Ltd., Senior Secured Notes | 5.000 | % | 2/15/28 | 670,000 | 639,446 | (b) | ||||||||||
Wynn Macau Ltd., Senior Notes | 5.500 | % | 1/15/26 | 1,320,000 | 1,282,141 | (b) | ||||||||||
Total Hotels, Restaurants & Leisure | 8,702,502 | |||||||||||||||
Total Consumer Discretionary | 13,887,748 | |||||||||||||||
| Energy — 11.3% | ||||||||||||||||
Oil, Gas & Consumable Fuels — 11.3% | ||||||||||||||||
Apache Corp., Senior Notes | 7.750 | % | 12/15/29 | 190,000 | 204,425 | |||||||||||
Apache Corp., Senior Notes | 6.000 | % | 1/15/37 | 410,000 | 398,156 | |||||||||||
Apache Corp., Senior Notes | 5.250 | % | 2/1/42 | 1,210,000 | 1,006,719 | |||||||||||
Apache Corp., Senior Notes | 7.375 | % | 8/15/47 | 100,000 | 99,873 | |||||||||||
Apache Corp., Senior Notes | 5.350 | % | 7/1/49 | 940,000 | 765,269 | |||||||||||
Berry Petroleum Co. LLC, Senior Notes | 7.000 | % | 2/15/26 | 780,000 | 773,847 | (b) | ||||||||||
Blue Racer Midstream LLC/Blue Racer Finance Corp., Senior Notes | 7.625 | % | 12/15/25 | 580,000 | 583,044 | (b) | ||||||||||
Continental Resources Inc., Senior Notes | 4.900 | % | 6/1/44 | 240,000 | 193,774 | |||||||||||
DCP Midstream Operating LP, Senior Notes | 6.450 | % | 11/3/36 | 660,000 | 677,875 | (b) | ||||||||||
DCP Midstream Operating LP, Senior Notes | 6.750 | % | 9/15/37 | 620,000 | 649,924 | (b) | ||||||||||
Devon Energy Corp., Senior Notes | 7.875 | % | 9/30/31 | 220,000 | 245,849 | |||||||||||
Devon Energy Corp., Senior Notes | 7.950 | % | 4/15/32 | 340,000 | 382,842 | |||||||||||
Ecopetrol SA, Senior Notes | 5.375 | % | 6/26/26 | 1,300,000 | 1,268,349 | |||||||||||
Ecopetrol SA, Senior Notes | 8.875 | % | 1/13/33 | 10,000 | 10,241 | |||||||||||
Ecopetrol SA, Senior Notes | 8.375 | % | 1/19/36 | 820,000 | 797,673 | |||||||||||
See Notes to Financial Statements.
| Western Asset Macro Opportunities Fund 2024 Semi-Annual Report |
7 |
Schedule of investments (unaudited) (cont’d)
April 30, 2024
Western Asset Macro Opportunities Fund
(Percentages shown based on Fund net assets)
| Security | Rate | Maturity Date | Face Amount† | Value | ||||||||||||
Oil, Gas & Consumable Fuels — continued | ||||||||||||||||
Energy Transfer LP, Junior Subordinated Notes (6.625% to 2/15/28 then 3 mo. USD LIBOR + 4.155%) | 6.625 | % | 2/15/28 | 3,450,000 | $ | 3,182,013 | (e)(f) | |||||||||
Energy Transfer LP, Junior Subordinated Notes (6.750% to 5/15/25 then 5 year Treasury Constant Maturity Rate + 5.134%) | 6.750 | % | 5/15/25 | 1,370,000 | 1,342,228 | (e)(f) | ||||||||||
Energy Transfer LP, Junior Subordinated Notes (7.125% to 5/15/30 then 5 year Treasury Constant Maturity Rate + 5.306%) | 7.125 | % | 5/15/30 | 325,000 | 312,850 | (e)(f) | ||||||||||
Energy Transfer LP, Senior Notes | 6.850 | % | 2/15/40 | 400,000 | 405,283 | |||||||||||
Kinder Morgan Energy Partners LP, Senior Notes | 6.950 | % | 1/15/38 | 70,000 | 74,656 | |||||||||||
Occidental Petroleum Corp., Senior Notes | 6.200 | % | 3/15/40 | 920,000 | 913,485 | |||||||||||
Occidental Petroleum Corp., Senior Notes | 4.500 | % | 7/15/44 | 180,000 | 136,294 | |||||||||||
Occidental Petroleum Corp., Senior Notes | 6.600 | % | 3/15/46 | 540,000 | 556,379 | |||||||||||
Occidental Petroleum Corp., Senior Notes | 4.400 | % | 4/15/46 | 1,050,000 | 812,010 | |||||||||||
Occidental Petroleum Corp., Senior Notes | 4.200 | % | 3/15/48 | 4,450,000 | 3,284,836 | |||||||||||
Occidental Petroleum Corp., Senior Notes | 4.400 | % | 8/15/49 | 604,000 | 435,160 | |||||||||||
Petrobras Global Finance BV, Senior Notes | 5.999 | % | 1/27/28 | 150,000 | 149,823 | |||||||||||
Petrobras Global Finance BV, Senior Notes | 6.850 | % | 6/5/2115 | 1,070,000 | 930,159 | |||||||||||
Plains All American Pipeline LP, Junior Subordinated Notes (3 mo. Term SOFR + 4.372%) | 9.679 | % | 5/31/24 | 800,000 | 794,958 | (e)(f) | ||||||||||
Plains All American Pipeline LP/PAA Finance Corp., Senior Notes | 6.700 | % | 5/15/36 | 560,000 | 573,686 | |||||||||||
Rockies Express Pipeline LLC, Senior Notes | 6.875 | % | 4/15/40 | 1,180,000 | 1,122,619 | (b) | ||||||||||
Southwestern Energy Co., Senior Notes | 4.750 | % | 2/1/32 | 1,560,000 | 1,405,982 | |||||||||||
Western Midstream Operating LP, Senior Notes | 5.450 | % | 4/1/44 | 2,130,000 | 1,870,463 | |||||||||||
See Notes to Financial Statements.
8 | Western Asset Macro Opportunities Fund 2024 Semi-Annual Report |
Western Asset Macro Opportunities Fund
(Percentages shown based on Fund net assets)
| Security | Rate | Maturity Date | Face Amount† | Value | ||||||||||||
Oil, Gas & Consumable Fuels — continued | ||||||||||||||||
Western Midstream Operating LP, Senior Notes | 5.300 | % | 3/1/48 | 550,000 | $ | 460,369 | ||||||||||
Western Midstream Operating LP, Senior Notes | 5.500 | % | 8/15/48 | 890,000 | 754,686 | |||||||||||
Williams Cos. Inc., Senior Notes | 8.750 | % | 3/15/32 | 1,090,000 | 1,273,608 | |||||||||||
YPF SA, Senior Notes | 8.500 | % | 7/28/25 | 610,000 | 594,510 | (b) | ||||||||||
Total Energy | 29,443,917 | |||||||||||||||
| Financials — 7.8% | ||||||||||||||||
Banks — 5.9% | ||||||||||||||||
BAC Capital Trust XIV, Ltd. GTD (3 mo. Term SOFR + 0.662%) | 5.991 | % | 5/16/24 | 610,000 | 504,137 | (e)(f) | ||||||||||
Banco Mercantil del Norte SA, Junior Subordinated Notes (7.625% to 1/10/28 then 10 year Treasury Constant Maturity Rate + 5.353%) | 7.625 | % | 1/10/28 | 1,430,000 | 1,395,353 | (b)(e)(f) | ||||||||||
Bank of America Corp., Junior Subordinated Notes (5.875% to 3/15/28 then 3 mo. Term SOFR + 3.193%) | 5.875 | % | 3/15/28 | 2,400,000 | 2,304,877 | (e)(f) | ||||||||||
Bank of Nova Scotia, Junior Subordinated Notes (8.000% to 1/27/29 then 5 year Treasury Constant Maturity Rate + 4.017%) | 8.000 | % | 1/27/84 | 630,000 | 634,920 | (f) | ||||||||||
BNP Paribas SA, Junior Subordinated Notes (7.000% to 8/16/28 then USD 5 year ICE Swap Rate + 3.980%) | 7.000 | % | 8/16/28 | 200,000 | 196,390 | (b)(e)(f) | ||||||||||
BNP Paribas SA, Junior Subordinated Notes (8.000% to 8/22/31 then 5 year Treasury Constant Maturity Rate + 3.727%) | 8.000 | % | 8/22/31 | 300,000 | 298,868 | (b)(e)(f) | ||||||||||
BNP Paribas SA, Junior Subordinated Notes (9.250% to 11/17/27 then 5 year Treasury Constant Maturity Rate + 4.969%) | 9.250 | % | 11/17/27 | 200,000 | 212,377 | (b)(e)(f) | ||||||||||
Citigroup Inc., Junior Subordinated Notes (5.950% to 5/15/25 then 3 mo. Term SOFR + 4.167%) | 5.950 | % | 5/15/25 | 4,970,000 | 4,951,501 | (e)(f) | ||||||||||
Credit Agricole SA, Junior Subordinated Notes (7.500% to 6/23/26 then GBP 5 year Swap Rate + 4.812%) | 7.500 | % | 6/23/26 | 1,680,000 | GBP | 2,087,261 | (b)(e)(f) | |||||||||
See Notes to Financial Statements.
| Western Asset Macro Opportunities Fund 2024 Semi-Annual Report |
9 |
Schedule of investments (unaudited) (cont’d)
April 30, 2024
Western Asset Macro Opportunities Fund
(Percentages shown based on Fund net assets)
| Security | Rate | Maturity Date | Face Amount† | Value | ||||||||||||
Banks — continued | ||||||||||||||||
Credit Agricole SA, Junior Subordinated Notes (8.125% to 12/23/25 then USD 5 year ICE Swap Rate + 6.185%) | 8.125 | % | 12/23/25 | 1,050,000 | $ | 1,065,844 | (b)(e)(f) | |||||||||
HSBC Holdings PLC, Junior Subordinated Notes (6.375% to 3/30/25 then USD 5 year ICE Swap Rate + 4.368%) | 6.375 | % | 3/30/25 | 660,000 | 653,073 | (e)(f) | ||||||||||
Intesa Sanpaolo SpA, Subordinated Notes | 5.017 | % | 6/26/24 | 200,000 | 199,450 | (b) | ||||||||||
Intesa Sanpaolo SpA, Subordinated Notes | 5.710 | % | 1/15/26 | 210,000 | 206,999 | (b) | ||||||||||
Toronto-Dominion Bank, Junior Subordinated Notes (8.125% to 10/31/27 then 5 year Treasury Constant Maturity Rate + 4.075%) | 8.125 | % | 10/31/82 | 210,000 | 216,469 | (f) | ||||||||||
Wells Fargo & Co., Junior Subordinated Notes | 5.875 | % | 6/15/25 | 497,000 | 494,841 | (e)(f) | ||||||||||
Total Banks | 15,422,360 | |||||||||||||||
Capital Markets — 0.9% | ||||||||||||||||
Credit Suisse AG AT1 Claim | — | — | 10,610,000 | 1,220,150 | *(g) | |||||||||||
Goldman Sachs Capital II, Ltd. GTD (3 mo. Term SOFR + 1.029%) | 6.370 | % | 5/31/24 | 109,000 | 92,783 | (e)(f) | ||||||||||
UBS Group AG, Junior Subordinated Notes (7.750% to 4/12/31 then USD 5 year SOFR ICE Swap Rate + 4.160%) | 7.750 | % | 4/12/31 | 280,000 | 282,916 | (b)(e)(f) | ||||||||||
UBS Group AG, Junior Subordinated Notes (9.250% to 11/13/28 then 5 year Treasury Constant Maturity Rate + 4.745%) | 9.250 | % | 11/13/28 | 500,000 | 534,864 | (b)(e)(f) | ||||||||||
UBS Group AG, Junior Subordinated Notes (9.250% to 11/13/33 then 5 year Treasury Constant Maturity Rate + 4.758%) | 9.250 | % | 11/13/33 | 250,000 | 274,997 | (b)(e)(f) | ||||||||||
Total Capital Markets | 2,405,710 | |||||||||||||||
Financial Services — 0.2% | ||||||||||||||||
ILFC E-Capital Trust I, Ltd. GTD (3 mo. Term SOFR + 1.812%) | 7.145 | % | 12/21/65 | 740,000 | 585,969 | (b)(f) | ||||||||||
Toll Road Investors Partnership II LP | 0.000 | % | 2/15/38 | 200,000 | 64,245 | (b) | ||||||||||
Total Financial Services | 650,214 | |||||||||||||||
See Notes to Financial Statements.
10 | Western Asset Macro Opportunities Fund 2024 Semi-Annual Report |
Western Asset Macro Opportunities Fund
(Percentages shown based on Fund net assets)
| Security | Rate | Maturity Date | Face Amount† | Value | ||||||||||||
Insurance — 0.8% | ||||||||||||||||
Highlands Holdings Bond Issuer Ltd./ Highlands Holdings Bond Co-Issuer Inc., Senior Secured Notes (7.625% Cash or 8.375% PIK) | 7.625 | % | 10/15/25 | 2,070,000 | $ | 2,070,333 | (b)(h) | |||||||||
Total Financials | 20,548,617 | |||||||||||||||
| Health Care — 3.9% | ||||||||||||||||
Health Care Providers & Services — 0.8% | ||||||||||||||||
Dignity Health, Secured Notes | 5.267 | % | 11/1/64 | 760,000 | 673,520 | |||||||||||
HCA Inc., Senior Notes | 7.500 | % | 11/15/95 | 1,250,000 | 1,339,909 | |||||||||||
Total Health Care Providers & Services | 2,013,429 | |||||||||||||||
Pharmaceuticals — 3.1% | ||||||||||||||||
Bausch Health Cos. Inc., Senior Notes | 6.250 | % | 2/15/29 | 6,030,000 | 2,638,125 | (b) | ||||||||||
Bausch Health Cos. Inc., Senior Notes | 7.250 | % | 5/30/29 | 470,000 | 213,692 | (b) | ||||||||||
Teva Pharmaceutical Finance Co. LLC, Senior Notes | 6.150 | % | 2/1/36 | 856,000 | 813,934 | |||||||||||
Teva Pharmaceutical Finance Netherlands III BV, Senior Notes | 4.100 | % | 10/1/46 | 6,917,000 | 4,617,469 | |||||||||||
Total Pharmaceuticals | 8,283,220 | |||||||||||||||
Total Health Care | 10,296,649 | |||||||||||||||
| Industrials — 1.1% | ||||||||||||||||
Ground Transportation — 0.5% | ||||||||||||||||
XPO CNW Inc., Senior Notes | 6.700 | % | 5/1/34 | 1,350,000 | 1,374,524 | |||||||||||
Passenger Airlines — 0.3% | ||||||||||||||||
American Airlines Inc., Senior Secured Notes | 8.500 | % | 5/15/29 | 140,000 | 145,922 | (b) | ||||||||||
United Airlines Inc., Senior Secured Notes | 4.625 | % | 4/15/29 | 720,000 | 664,300 | (b) | ||||||||||
Total Passenger Airlines | 810,222 | |||||||||||||||
Trading Companies & Distributors — 0.3% | ||||||||||||||||
United Rentals North America Inc., Senior Notes | 5.250 | % | 1/15/30 | 320,000 | 307,275 | |||||||||||
United Rentals North America Inc., Senior Notes | 3.875 | % | 2/15/31 | 310,000 | 272,080 | |||||||||||
United Rentals North America Inc., Senior Notes | 6.125 | % | 3/15/34 | 20,000 | 19,553 | (b) | ||||||||||
Total Trading Companies & Distributors | 598,908 | |||||||||||||||
Total Industrials | 2,783,654 | |||||||||||||||
See Notes to Financial Statements.
| Western Asset Macro Opportunities Fund 2024 Semi-Annual Report |
11 |
Schedule of investments (unaudited) (cont’d)
April 30, 2024
Western Asset Macro Opportunities Fund
(Percentages shown based on Fund net assets)
| Security | Rate | Maturity Date | Face Amount† | Value | ||||||||||||
| Materials — 0.6% | ||||||||||||||||
Containers & Packaging — 0.2% | ||||||||||||||||
Ardagh Metal Packaging Finance USA LLC/Ardagh Metal Packaging Finance PLC, Senior Notes | 4.000 | % | 9/1/29 | 200,000 | $ | 165,048 | (b) | |||||||||
Ardagh Packaging Finance PLC/Ardagh Holdings USA Inc., Senior Notes | 5.250 | % | 8/15/27 | 660,000 | 337,286 | (b) | ||||||||||
Total Containers & Packaging | 502,334 | |||||||||||||||
Metals & Mining — 0.4% | ||||||||||||||||
First Quantum Minerals Ltd., Secured Notes | 9.375 | % | 3/1/29 | 200,000 | 206,885 | (b) | ||||||||||
First Quantum Minerals Ltd., Senior Notes | 6.875 | % | 10/15/27 | 400,000 | 385,166 | (b) | ||||||||||
Yamana Gold Inc., Senior Notes | 4.625 | % | 12/15/27 | 380,000 | 364,290 | |||||||||||
Total Metals & Mining | 956,341 | |||||||||||||||
Total Materials | 1,458,675 | |||||||||||||||
| Utilities — 0.7% | ||||||||||||||||
Electric Utilities — 0.7% | ||||||||||||||||
Enel Finance International NV, Senior Notes | 6.000 | % | 10/7/39 | 1,680,000 | 1,631,162 | (b) | ||||||||||
Pacific Gas and Electric Co., First Mortgage Bonds | 3.300 | % | 8/1/40 | 200,000 | 139,479 | |||||||||||
Total Utilities | 1,770,641 | |||||||||||||||
Total Corporate Bonds & Notes (Cost — $90,966,878) | 83,631,393 | |||||||||||||||
| U.S. Government & Agency Obligations — 9.4% | ||||||||||||||||
U.S. Government Obligations — 9.4% | ||||||||||||||||
U.S. Treasury Bonds | 2.000 | % | 2/15/50 | 70,000 | 40,759 | |||||||||||
U.S. Treasury Bonds | 1.250 | % | 5/15/50 | 250,000 | 118,174 | |||||||||||
U.S. Treasury Bonds | 4.000 | % | 11/15/52 | 50,000 | 43,824 | |||||||||||
U.S. Treasury Bonds | 3.625 | % | 5/15/53 | 2,000,000 | 1,635,156 | (d) | ||||||||||
U.S. Treasury Bonds | 4.125 | % | 8/15/53 | 3,580,000 | 3,206,897 | (d) | ||||||||||
U.S. Treasury Notes | 4.000 | % | 2/29/28 | 7,090,000 | 6,891,840 | (i) | ||||||||||
U.S. Treasury Notes | 3.375 | % | 3/31/28 | 13,100,000 | 12,557,066 | (d) | ||||||||||
Total U.S. Government & Agency Obligations (Cost — $25,304,855) | 24,493,716 | |||||||||||||||
| Collateralized Mortgage Obligations (j) — 5.4% | ||||||||||||||||
AREIT Trust, 2021-CRE5 B (1 mo. Term SOFR + 1.934%) | 7.251 | % | 11/17/38 | 807,000 | 787,908 | (b)(f) | ||||||||||
Benchmark Mortgage Trust, 2020-IG3 C | 3.390 | % | 9/15/48 | 1,190,000 | 613,891 | (b)(f) | ||||||||||
BX Trust, 2018-GWMZ MC (1 mo. Term SOFR + 5.785%) | 11.106 | % | 5/15/37 | 1,390,000 | 1,382,391 | (b)(f) | ||||||||||
See Notes to Financial Statements.
12 | Western Asset Macro Opportunities Fund 2024 Semi-Annual Report |
Western Asset Macro Opportunities Fund
(Percentages shown based on Fund net assets)
| Security | Rate | Maturity Date | Face Amount† | Value | ||||||||||||
| Collateralized Mortgage Obligations (j) — continued |
| |||||||||||||||
BX Trust, 2021-ARIA G (1 mo. Term SOFR + 3.257%) | 8.578 | % | 10/15/36 | 2,570,000 | $ | 2,476,838 | (b)(f) | |||||||||
Federal Home Loan Mortgage Corp. (FHLMC) REMIC, Structured Agency Credit Risk Debt Notes, 2022-DNA3 B1 (30 Day Average SOFR + 5.650%) | 10.980 | % | 4/25/42 | 780,000 | 847,404 | (b)(f) | ||||||||||
Federal Home Loan Mortgage Corp. (FHLMC) Structured Agency Credit Risk Debt Notes, 2015-HQ2 B (30 Day Average SOFR + 8.064%) | 13.395 | % | 5/25/25 | 1,525,430 | 1,608,885 | (f) | ||||||||||
GS Mortgage Securities Corp. Trust, 2018-LUAU G (1 mo. Term SOFR + 4.747%) | 10.068 | % | 11/15/32 | 1,032,000 | 1,016,212 | (b)(f) | ||||||||||
GS Mortgage Securities Corp. Trust, 2018-SRP5 C (1 mo. Term SOFR + 4.297%) | 9.618 | % | 9/15/31 | 6,607,481 | 1,137,877 | (b)(f) | ||||||||||
IMPAC Secured Assets Corp., 2006-3 A7 (1 mo. Term SOFR + 0.654%) | 5.971 | % | 11/25/36 | 1,382,035 | 1,137,701 | (f) | ||||||||||
JPMorgan Chase Commercial Mortgage Securities Trust, 2018-PHMZ M (1 mo. Term SOFR + 8.622%) | 13.943 | % | 6/15/35 | 10,570,000 | 1,057 | (b)(f) | ||||||||||
MHC Trust, 2021-MHC2 E (1 mo. Term SOFR + 2.064%) | 7.385 | % | 5/15/38 | 680,000 | 671,503 | (b)(f) | ||||||||||
Morgan Stanley Capital Trust, 2021-L7 XA, IO | 1.205 | % | 10/15/54 | 7,208,734 | 368,118 | (f) | ||||||||||
Residential Asset Securitization Trust, 2005-A15 1A4 | 5.750 | % | 2/25/36 | 60,688 | 54,994 | |||||||||||
Residential Asset Securitization Trust, 2005-A15 2A11, IO (-1.000 x 1 mo. Term SOFR + 5.436%) | 0.119 | % | 2/25/36 | 1,667,633 | 95,362 | (f) | ||||||||||
SFO Commercial Mortgage Trust, 2021-555 D (1 mo. Term SOFR + 2.514%) | 7.835 | % | 5/15/38 | 1,000,000 | 909,076 | (b)(f) | ||||||||||
Starwood Retail Property Trust, 2014- STAR E | 8.500 | % | 11/15/27 | 5,070,000 | 24,001 | (b)(f) | ||||||||||
WaMu Mortgage Pass-Through Certificates Trust, 2005-AR17 A1C3 (1 mo. Term SOFR + 1.074%) | 6.391 | % | 12/25/45 | 1,188,090 | 882,851 | (f) | ||||||||||
Total Collateralized Mortgage Obligations (Cost — $35,951,098) |
| 14,016,069 | ||||||||||||||
| Asset-Backed Securities — 5.2% | ||||||||||||||||
Aegis Asset Backed Securities Trust, 2003-3 M2 (1 mo. Term SOFR + 2.589%) | 7.906 | % | 1/25/34 | 157,931 | 143,985 | (f) | ||||||||||
See Notes to Financial Statements.
| Western Asset Macro Opportunities Fund 2024 Semi-Annual Report |
13 |
Schedule of investments (unaudited) (cont’d)
April 30, 2024
Western Asset Macro Opportunities Fund
(Percentages shown based on Fund net assets)
| Security | Rate | Maturity Date | Face Amount† | Value | ||||||||||||
| Asset-Backed Securities — continued | ||||||||||||||||
Bayview Financial Mortgage Pass- Through Trust, 2006-C 2A3 (1 mo. Term SOFR + 0.549%) | 5.868 | % | 11/28/36 | 1,399,932 | $ | 1,204,916 | (f) | |||||||||
BlueMountain CLO Ltd., 2020-29A ER (3 mo. Term SOFR + 7.122%) | 12.445 | % | 7/25/34 | 4,390,000 | 4,306,194 | (b)(f) | ||||||||||
Dryden CLO Ltd., 2021-95A SUB | 0.000 | % | 8/20/34 | 3,420,000 | 2,020,133 | (b)(f) | ||||||||||
Elmwood CLO Ltd., 2019-2A SUB | 0.000 | % | 4/20/34 | 6,250,000 | 4,603,831 | (b)(f) | ||||||||||
SMB Private Education Loan Trust, 2021-A D2 | 3.860 | % | 1/15/53 | 1,486,789 | 1,262,100 | (b) | ||||||||||
Total Asset-Backed Securities (Cost — $16,158,747) |
| 13,541,159 | ||||||||||||||
| Mortgage-Backed Securities — 4.2% |
| |||||||||||||||
FNMA — 0.2% | ||||||||||||||||
Federal National Mortgage Association (FNMA) | 3.000 | % | 5/1/54 | 100,000 | 82,582 | (k) | ||||||||||
Federal National Mortgage Association (FNMA) | 6.000 | % | 5/1/54 | 200,000 | 198,172 | (k) | ||||||||||
Federal National Mortgage Association (FNMA) | 6.500 | % | 5/1/54 | 200,000 | 201,540 | (k) | ||||||||||
Total FNMA | 482,294 | |||||||||||||||
GNMA — 4.0% | ||||||||||||||||
Government National Mortgage Association (GNMA) II | 3.000 | % | 5/20/54 | 200,000 | 170,164 | (k) | ||||||||||
Government National Mortgage Association (GNMA) II | 4.500 | % | 5/20/54 | 600,000 | 558,838 | (k) | ||||||||||
Government National Mortgage Association (GNMA) II | 5.000 | % | 5/20/54 | 3,200,000 | 3,063,493 | (k) | ||||||||||
Government National Mortgage Association (GNMA) II | 5.500 | % | 5/20/54 | 3,800,000 | 3,725,822 | (k) | ||||||||||
Government National Mortgage Association (GNMA) II | 6.000 | % | 5/20/54 | 1,900,000 | 1,905,085 | (k) | ||||||||||
Government National Mortgage Association (GNMA) II | 6.500 | % | 5/20/54 | 1,000,000 | 1,012,635 | (k) | ||||||||||
Total GNMA | 10,436,037 | |||||||||||||||
Total Mortgage-Backed Securities (Cost — $10,995,824) |
| 10,918,331 | ||||||||||||||
See Notes to Financial Statements.
14 | Western Asset Macro Opportunities Fund 2024 Semi-Annual Report |
Western Asset Macro Opportunities Fund
(Percentages shown based on Fund net assets)
| Security | Rate | Maturity Date | Face Amount† | Value | ||||||||||||
| Senior Loans — 2.1% |
| |||||||||||||||
| Communication Services — 0.6% |
| |||||||||||||||
Media — 0.6% | ||||||||||||||||
Charter Communications Operating LLC, Term Loan B4 (3 mo. Term SOFR + 2.000%) | 7.302% | 12/7/30 | 1,335,990 | $ | 1,318,983 | (f)(l)(m) | ||||||||||
Virgin Media Bristol LLC, Term Loan Facility N (1 mo. Term SOFR + 2.614%) | 7.935% | 1/31/28 | 360,000 | 353,835 | (f)(l)(m) | |||||||||||
Total Communication Services |
| 1,672,818 | ||||||||||||||
| Consumer Discretionary — 0.5% |
| |||||||||||||||
Hotels, Restaurants & Leisure — 0.5% | ||||||||||||||||
1011778 BC Unlimited Liability Co., Term Loan B5 (1 mo. Term SOFR + 2.250%) | 7.566% | 9/20/30 | 737,943 | 739,984 | (f)(l)(m) | |||||||||||
Alterra Mountain Co., Term Loan B4 (1 mo. Term SOFR + 3.250%) | 8.577% | 8/17/28 | 276,308 | 277,862 | (f)(l)(m) | |||||||||||
Flutter Entertainment Public Ltd. Co., Term Loan B (3 mo. Term SOFR + 2.250%) | 7.559% | 11/25/30 | 389,025 | 390,206 | (f)(l)(m) | |||||||||||
Total Consumer Discretionary |
| 1,408,052 | ||||||||||||||
| Financials — 0.6% |
| |||||||||||||||
Financial Services — 0.4% | ||||||||||||||||
Boost Newco Borrower LLC, Initial USD Term Loan (3 mo. Term SOFR + 3.000%) | 8.309% | 1/31/31 | 600,000 | 602,814 | (f)(l)(m) | |||||||||||
Jane Street Group LLC, 2021 Term Loan (1 mo. Term SOFR + 2.614%) | 7.930% | 1/26/28 | 323,206 | 323,849 | (f)(l)(m) | |||||||||||
Total Financial Services | 926,663 | |||||||||||||||
Insurance — 0.2% | ||||||||||||||||
Asurion LLC, New Term Loan B11 (1 mo. Term SOFR + 4.350%) | 9.666% | 8/21/28 | 542,979 | 530,933 | (f)(l)(m) | |||||||||||
Total Financials |
| 1,457,596 | ||||||||||||||
| Health Care — 0.4% |
| |||||||||||||||
Health Care Providers & Services — 0.4% | ||||||||||||||||
LifePoint Health Inc., 2024 Repricing | ||||||||||||||||
Term Loan B (2 mo. Term SOFR + 4.750%) | 10.056% | 11/16/28 | 628,219 | 631,573 | (f)(l)(m) | |||||||||||
Phoenix Guarantor Inc., Term Loan B4 (1 mo. Term SOFR + 3.250%) | 8.566% | 2/21/31 | 267,456 | 265,889 | (f)(l)(m) | |||||||||||
Total Health Care |
| 897,462 | ||||||||||||||
Total Senior Loans (Cost — $5,427,329) |
| 5,435,928 | ||||||||||||||
See Notes to Financial Statements.
| Western Asset Macro Opportunities Fund 2024 Semi-Annual Report |
15 |
Schedule of investments (unaudited) (cont’d)
April 30, 2024
Western Asset Macro Opportunities Fund
(Percentages shown based on Fund net assets)
| Security | Rate | Maturity Date | Face Amount† | Value | ||||||||||||||||
| U.S. Treasury Inflation Protected Securities — 0.2% |
| |||||||||||||||||||
U.S. Treasury Bonds, Inflation Indexed (Cost — $717,689) | 1.500 | % | 2/15/53 | 814,304 | $ | 660,181 | ||||||||||||||
| Expiration Date | Contracts | Notional Amount† | ||||||||||||||||||
| Purchased Options — 0.2% |
| |||||||||||||||||||
| Exchange-Traded Purchased Options — 0.2% |
| |||||||||||||||||||
Euro Futures, Call @ $1.070 | 5/3/24 | 30 | 3,750,000 | 13,500 | ||||||||||||||||
Euro Futures, Call @ $1.085 | 5/3/24 | 28 | 3,500,000 | 875 | ||||||||||||||||
Euro Futures, Call @ $1.070 | 6/7/24 | 30 | 3,750,000 | 31,125 | ||||||||||||||||
Euro Futures, Put @ $1.085 | 5/3/24 | 22 | 2,750,000 | 42,350 | ||||||||||||||||
Japanese Yen Futures, Call @ $65.500 | 5/3/24 | 60 | 75,000 | 3,750 | ||||||||||||||||
Japanese Yen Futures, Call @ $66.000 | 5/3/24 | 30 | 37,500 | 1,125 | ||||||||||||||||
Japanese Yen Futures, Call @ $66.750 | 5/3/24 | 17 | 21,250 | 319 | ||||||||||||||||
Japanese Yen Futures, Call @ $67.000 | 5/3/24 | 17 | 21,250 | 319 | ||||||||||||||||
U.S. Treasury 10-Year Notes Futures, Call @ $107.500 | 5/24/24 | 60 | 60,000 | 45,000 | ||||||||||||||||
U.S. Treasury 10-Year Notes Futures, Call @ $108.500 | 5/24/24 | 111 | 111,000 | 41,625 | ||||||||||||||||
U.S. Treasury Long-Term Bonds Futures, Call @ $114.000 | 5/24/24 | 184 | 184,000 | 255,875 | ||||||||||||||||
Total Exchange-Traded Purchased Options (Cost — $570,443) |
| 435,863 | ||||||||||||||||||
| Counterparty | ||||||||||||||||||||
| OTC Purchased Options — 0.0%†† |
| |||||||||||||||||||
Credit default swaption to sell protection on Markit CDX.NA.HY.42 Index, Call @ 106.000bps, 500.000bps quarterly payments received by the Fund, maturing on 6/20/29 | | Bank of America N.A. | | 6/20/24 | 5,390,000 | 5,390,000 | 24,007 | |||||||||||||
U.S. Dollar/Brazilian Real, Put @ 5.118BRL | | Goldman Sachs Group Inc. | | 6/13/24 | 1,028,000 | 1,028,000 | 7,031 | |||||||||||||
U.S. Dollar/Mexican Peso, Put @ 16.758MXN | | Bank of America N.A. | | 6/4/24 | 2,900,000 | 2,900,000 | 8,975 | |||||||||||||
Total OTC Purchased Options (Cost — $47,141) |
| 40,013 | ||||||||||||||||||
Total Purchased Options (Cost — $617,584) |
| 475,876 | ||||||||||||||||||
See Notes to Financial Statements.
16 | Western Asset Macro Opportunities Fund 2024 Semi-Annual Report |
Western Asset Macro Opportunities Fund
(Percentages shown based on Fund net assets)
| Security | Rate | Maturity Date | Face Amount† | Value | ||||||||||||
| Municipal Bonds — 0.1% |
| |||||||||||||||
California — 0.1% | ||||||||||||||||
Morongo Band of Mission Indians, CA, Revenue, Tribal Economic Development, Series A (Cost — $360,000) | 7.000 | % | 10/1/39 | 360,000 | $ | 366,171 | (b) | |||||||||
| Shares | ||||||||||||||||
| Common Stocks — 0.1% |
| |||||||||||||||
| Energy — 0.1% |
| |||||||||||||||
Oil, Gas & Consumable Fuels — 0.1% | ||||||||||||||||
Berry Corp. (Cost — $432,213) | 40,182 | 341,145 | ||||||||||||||
| Rate | Maturity Date | Face Amount† | ||||||||||||||
| Non-U.S. Treasury Inflation Protected Securities — 0.1% |
| |||||||||||||||
Uruguay — 0.1% | ||||||||||||||||
Uruguay Government International Bond, Senior Notes (Cost — $199,518) | 3.875 | % | 7/2/40 | 7,761,912 | UYU | 218,875 | ||||||||||
| Expiration Date | Warrants | |||||||||||||||
| Warrants — 0.0%†† |
| |||||||||||||||
| Industrials — 0.0%†† |
| |||||||||||||||
Passenger Airlines — 0.0%†† | ||||||||||||||||
flyExclusive Inc. (Cost — $58,936) | 5/28/28 | 61,553 | 25,852 | * | ||||||||||||
Total Investments before Short-Term Investments (Cost —$297,227,321) |
| 261,159,640 | ||||||||||||||
| Rate | Maturity Date | Face Amount† | ||||||||||||||
| Short-Term Investments — 0.5% |
| |||||||||||||||
| Sovereign Bonds — 0.3% |
| |||||||||||||||
Egypt Treasury Bills (Cost — $741,251) | 25.736 | % | 3/18/25 | 44,600,000 | EGP | 761,989 | (n) | |||||||||
| Shares | ||||||||||||||||
| Money Market Funds — 0.2% |
| |||||||||||||||
Western Asset Premier Institutional Government Reserves, Premium Shares (Cost — $624,899) | 5.265 | % | 624,899 | 624,899 | (o)(p) | |||||||||||
Total Short-Term Investments (Cost — $1,366,150) |
| 1,386,888 | ||||||||||||||
Total Investments — 100.4% (Cost — $298,593,471) |
| 262,546,528 | ||||||||||||||
Liabilities in Excess of Other Assets — (0.4)% | (1,010,091) | |||||||||||||||
Total Net Assets — 100.0% |
| $ | 261,536,437 | |||||||||||||
See Notes to Financial Statements.
| Western Asset Macro Opportunities Fund 2024 Semi-Annual Report |
17 |
Schedule of investments (unaudited) (cont’d)
April 30, 2024
Western Asset Macro Opportunities Fund
| † | Face amount/notional amount denominated in U.S. dollars, unless otherwise noted. |
| †† | Represents less than 0.1%. |
| * | Non-income producing security. |
| (a) | Security is exempt from registration under Regulation S of the Securities Act of 1933. Regulation S applies to securities offerings that are made outside of the United States and do not involve direct selling efforts in the United States. This security has been deemed liquid pursuant to guidelines approved by the Board of Directors. |
| (b) | Security is exempt from registration under Rule 144A of the Securities Act of 1933. This security may be resold in transactions that are exempt from registration, normally to qualified institutional buyers. This security has been deemed liquid pursuant to guidelines approved by the Board of Directors. |
| (c) | The maturity principal is currently in default as of April 30, 2024. |
| (d) | All or a portion of this security is held at the broker as collateral for open centrally cleared swap contracts. |
| (e) | Security has no maturity date. The date shown represents the next call date. |
| (f) | Variable rate security. Interest rate disclosed is as of the most recent information available. Certain variable rate securities are not based on a published reference rate and spread but are determined by the issuer or agent and are based on current market conditions. These securities do not indicate a reference rate and spread in their description above. |
| (g) | Security is fair valued in accordance with procedures approved by the Board of Directors (Note 1). |
| (h) | Payment-in-kind security for which the issuer has the option at each interest payment date of making interest payments in cash or additional securities. |
| (i) | All or a portion of this security is held at the broker as collateral for open futures contracts and exchange-traded options. |
| (j) | Collateralized mortgage obligations are secured by an underlying pool of mortgages or mortgage pass-through certificates that are structured to direct payments on underlying collateral to different series or classes of the obligations. The interest rate may change positively or inversely in relation to one or more interest rates, financial indices or other financial indicators and may be subject to an upper and/or lower limit. |
| (k) | This security is traded on a to-be-announced (“TBA”) basis. At April 30, 2024, the Fund held TBA securities with a total cost of $10,995,824. |
| (l) | Interest rates disclosed represent the effective rates on senior loans. Ranges in interest rates are attributable to multiple contracts under the same loan. |
| (m) | Senior loans may be considered restricted in that the Fund ordinarily is contractually obligated to receive approval from the agent bank and/or borrower prior to the disposition of a senior loan. |
| (n) | Rate shown represents yield-to-maturity. |
| (o) | Rate shown is one-day yield as of the end of the reporting period. |
| (p) | In this instance, as defined in the Investment Company Act of 1940, an “Affiliated Company” represents Fund ownership of at least 5% of the outstanding voting securities of an issuer, or a company which is under common ownership or control with the Fund. At April 30, 2024, the total market value of investments in Affiliated Companies was $624,899 and the cost was $624,899 (Note 8). |
See Notes to Financial Statements.
18 | Western Asset Macro Opportunities Fund 2024 Semi-Annual Report |
Western Asset Macro Opportunities Fund
Abbreviation(s) used in this schedule: | ||
| bps | — basis point spread (100 basis points = 1.00%) | |
| BRL | — Brazilian Real | |
| CLO | — Collateralized Loan Obligation | |
| DOP | — Dominican Peso | |
| EGP | — Egyptian Pound | |
| EUR | — Euro | |
| GBP | — British Pound | |
| GTD | — Guaranteed | |
| ICE | — Intercontinental Exchange | |
| IDR | — Indonesian Rupiah | |
| INR | — Indian Rupee | |
| IO | — Interest Only | |
| JMD | — Jamaican Dollar | |
| LIBOR | — London Interbank Offered Rate | |
| MXN | — Mexican Peso | |
| PIK | — Payment-In-Kind | |
| PLN | — Polish Zloty | |
| REMIC | — Real Estate Mortgage Investment Conduit | |
| SOFR | — Secured Overnight Financing Rate | |
| USD | — United States Dollar | |
| UYU | — Uruguayan Peso | |
| ZAR | — South African Rand | |
At April 30, 2024, the Fund had the following written options contracts:
| Exchange-Traded Written Options | ||||||||||||||||||||
| Security | Expiration Date | Strike Price | Contracts | Notional Amount† | Value | |||||||||||||||
| 3-Month SOFR Futures, Call | 12/13/24 | $ | 96.250 | 322 | 805,000 | $ | (44,275) | |||||||||||||
| Euro-Bund Futures, Call | 5/24/24 | 131.000 | EUR | 61 | 6,100,000 | EUR | (36,456) | |||||||||||||
| Euro-Bund Futures, Call | 5/24/24 | 134.000 | EUR | 88 | 8,800,000 | EUR | (10,331) | |||||||||||||
| U.S. Treasury 5-Year Notes Futures, Call | 5/3/24 | 105.250 | 90 | 90,000 | (10,547) | |||||||||||||||
| U.S. Treasury 5-Year Notes Futures, Call | 5/24/24 | 105.750 | 177 | 177,000 | (35,953) | |||||||||||||||
| U.S. Treasury 5-Year Notes Futures, Call | 5/24/24 | 106.000 | 118 | 118,000 | (17,516) | |||||||||||||||
| U.S. Treasury 6 to 7-Year Notes Futures, Call | 5/3/24 | 107.750 | 120 | 120,000 | (31,875) | |||||||||||||||
| U.S. Treasury 6 to 7-Year Notes Futures, Call | 5/3/24 | 109.000 | 89 | 89,000 | (2,781) | |||||||||||||||
| U.S. Treasury 10-Year Notes Futures, Call | 5/24/24 | 108.000 | 60 | 60,000 | (31,875) | |||||||||||||||
| U.S. Treasury 10-Year Notes Futures, Call | 5/24/24 | 109.000 | 120 | 120,000 | (30,000) | |||||||||||||||
| U.S. Treasury 10-Year Notes Futures, Call | 5/24/24 | 110.000 | 111 | 111,000 | (12,141) | |||||||||||||||
| U.S. Treasury 10-Year Notes Futures, Call | 5/24/24 | 111.000 | 84 | 84,000 | (3,938) | |||||||||||||||
| U.S. Treasury 10-Year Notes Futures, Call | 5/24/24 | 113.000 | 227 | 227,000 | (3,547) | |||||||||||||||
| U.S. Treasury Long-Term Bonds Futures, Call | 5/24/24 | 115.000 | 60 | 60,000 | (57,187) | |||||||||||||||
See Notes to Financial Statements.
| Western Asset Macro Opportunities Fund 2024 Semi-Annual Report |
19 |
Schedule of investments (unaudited) (cont’d)
April 30, 2024
Western Asset Macro Opportunities Fund
| Security | Expiration Date | Strike Price | Contracts | Notional Amount† | Value | |||||||||||||||||
| U.S. Treasury Long-Term Bonds Futures, Call | 5/24/24 | $ | 116.000 | 220 | 220,000 | (137,500) | ||||||||||||||||
| U.S. Treasury Long-Term Bonds Futures, Call | 5/24/24 | 117.000 | 29 | 29,000 | (11,781) | |||||||||||||||||
| U.S. Treasury Long-Term Bonds Futures, Call | 5/24/24 | 122.000 | 308 | 308,000 | (19,250) | |||||||||||||||||
| U.S. Treasury Long-Term Bonds Futures, Put | 5/24/24 | 112.000 | 60 | 60,000 | (46,875) | |||||||||||||||||
| U.S. Treasury Long-Term Bonds Futures, Put | 5/24/24 | 113.000 | 60 | 60,000 | (67,500) | |||||||||||||||||
| U.S. Treasury Long-Term Bonds Futures, Put | 7/26/24 | 112.000 | 114 | 114,000 | (224,437) | |||||||||||||||||
| Total Exchange-Traded Written Options (Premiums received — $1,624,028) |
| (835,765) | ||||||||||||||||||||
| OTC Written Options |
| |||||||||||||||||||||
| Counterparty | ||||||||||||||||||||||
| Credit default swaption to sell protection on Markit CDX.NA.HY.42 Index, Put, 500.000bps quarterly payments received by the Fund, maturing on 6/20/29 | Bank of America N.A. | 6/20/24 | 100.000 | bps | 5,390,000 | 5,390,000 | ‡ | (6,726) | ||||||||||||||
| U.S. Dollar/Brazilian Real, Call | Goldman Sachs Group Inc. | 5/23/24 | 5.035 | BRL | 3,456,040 | 3,456,040 | (112,400) | |||||||||||||||
| Total OTC Written Options (Premiums received — $86,832) |
| (119,126) | ||||||||||||||||||||
| Total Written Options (Premiums received — $1,710,860) |
| $ | (954,891) | |||||||||||||||||||
| † | Notional amount denominated in U.S. dollars, unless otherwise noted. |
| ‡ | In the event an option is exercised and a credit event occurs as defined under the terms of the swap agreement, the notional amount is the maximum potential amount that could be required to be paid as a seller of credit protection or received as a buyer of credit protection. |
Abbreviation(s) used in this schedule: | ||
| bps | — basis point spread (100 basis points = 1.00%) | |
| BRL | — Brazilian Real | |
| EUR | — Euro | |
| SOFR | — Secured Overnight Financing Rate | |
At April 30, 2024, the Fund had the following open futures contracts:
| Number of Contracts | Expiration Date | Notional Amount | Market Value | Unrealized Appreciation (Depreciation) | ||||||||||||||||
| Contracts to Buy: | ||||||||||||||||||||
| 3-Month SOFR | 358 | 6/25 | $ | 85,206,989 | $ | 85,123,450 | $ | (83,539) | ||||||||||||
| 3-Month SOFR | 255 | 12/25 | 61,199,936 | 60,846,188 | (353,748) | |||||||||||||||
| 3-Month SOFR | 670 | 3/26 | 161,613,241 | 160,079,750 | (1,533,491) | |||||||||||||||
See Notes to Financial Statements.
20 | Western Asset Macro Opportunities Fund 2024 Semi-Annual Report |
Western Asset Macro Opportunities Fund
| Number of Contracts | Expiration Date | Notional Amount | Market Value | Unrealized Appreciation (Depreciation) | ||||||||||||||||
| Contracts to Buy continued | ||||||||||||||||||||
| Euro-Bund | 309 | 6/24 | $ | 43,516,912 | $ | 42,895,805 | $ | (621,107) | ||||||||||||
| Euro-Buxl | 62 | 6/24 | 8,783,007 | 8,530,172 | (252,835) | |||||||||||||||
| Japanese Yen | 267 | 6/24 | 23,058,454 | 21,321,619 | (1,736,835) | |||||||||||||||
| Mexican Peso | 768 | 6/24 | 22,561,785 | 22,268,160 | (293,625) | |||||||||||||||
| U.S. Treasury 2-Year Notes | 2,817 | 6/24 | 575,655,385 | 570,882,656 | (4,772,729) | |||||||||||||||
| U.S. Treasury 5-Year Notes | 3,083 | 6/24 | 328,283,706 | 322,920,172 | (5,363,534) | |||||||||||||||
| U.S. Treasury Long-Term Bonds | 1,751 | 6/24 | 207,296,512 | 199,285,687 | (8,010,825) | |||||||||||||||
| U.S. Treasury Ultra Long- Term Bonds | 503 | 6/24 | 64,206,111 | 60,139,937 | (4,066,174) | |||||||||||||||
| United Kingdom Long Gilt Bonds | 152 | 6/24 | 18,642,324 | 18,191,649 | (450,675) | |||||||||||||||
| (27,539,117) | ||||||||||||||||||||
| Contracts to Sell: | ||||||||||||||||||||
| 30-Day Federal Funds | 227 | 5/24 | 89,572,422 | 89,551,570 | 20,852 | |||||||||||||||
| 3-Month EURIBOR | 230 | 6/24 | 59,099,374 | 59,087,396 | 11,978 | |||||||||||||||
| 3-Month EURIBOR | 108 | 12/24 | 28,120,555 | 27,857,762 | 262,793 | |||||||||||||||
| 3-Month SOFR | 1,786 | 6/24 | 422,680,287 | 422,634,575 | 45,712 | |||||||||||||||
| Australian Dollar | 136 | 6/24 | 8,976,136 | 8,829,120 | 147,016 | |||||||||||||||
| British Pound | 43 | 6/24 | 3,423,130 | 3,361,256 | 61,874 | |||||||||||||||
| Euro | 195 | 6/24 | 26,631,464 | 26,077,593 | 553,871 | |||||||||||||||
| Euro-BTP | 164 | 6/24 | 20,727,695 | 20,475,683 | 252,012 | |||||||||||||||
| Japanese 10-Year Bonds | 144 | 6/24 | 132,897,535 | 131,934,185 | 963,350 | |||||||||||||||
| U.S. Treasury 10-Year Notes | 1,510 | 6/24 | 166,383,349 | 162,230,625 | 4,152,724 | |||||||||||||||
| U.S. Treasury Ultra 10-Year Notes | 2,228 | 6/24 | 253,341,725 | 245,567,375 | 7,774,350 | |||||||||||||||
| 14,246,532 | ||||||||||||||||||||
| Net unrealized depreciation on open futures contracts |
| $ | (13,292,585) | |||||||||||||||||
Abbreviation(s) used in this table: | ||
| BTP | — Buoni del Tesoro Poliennali (Italian Treasury Bonds) | |
| Buxl | — Ultra Long German Bond | |
| EURIBOR | — Euro Interbank Offered Rate | |
| SOFR | — Secured Overnight Financing Rate | |
See Notes to Financial Statements.
| Western Asset Macro Opportunities Fund 2024 Semi-Annual Report |
21 |
Schedule of investments (unaudited) (cont’d)
April 30, 2024
Western Asset Macro Opportunities Fund
At April 30, 2024, the Fund had the following open forward foreign currency contracts:
Currency Purchased | Currency Sold | Counterparty | Settlement Date | Unrealized Appreciation (Depreciation) | ||||||||||||||||
| BRL | 2,056,533 | USD | 396,547 | Morgan Stanley & Co. Inc. | 5/3/24 | $ | (642) | |||||||||||||
| BRL | 2,056,533 | USD | 397,644 | Morgan Stanley & Co. Inc. | 5/3/24 | (1,738) | ||||||||||||||
| USD | 397,644 | BRL | 2,056,533 | Morgan Stanley & Co. Inc. | 5/3/24 | 1,738 | ||||||||||||||
| USD | 401,941 | BRL | 2,056,533 | Morgan Stanley & Co. Inc. | 5/3/24 | 6,036 | ||||||||||||||
| USD | 810,000 | MXN | 13,945,770 | Bank of America N.A. | 6/6/24 | 702 | ||||||||||||||
| USD | 396,000 | BRL | 2,063,754 | Goldman Sachs Group Inc. | 6/17/24 | 372 | ||||||||||||||
| EUR | 750,809 | USD | 802,320 | Bank of America N.A. | 7/19/24 | 1,753 | ||||||||||||||
| USD | 8,080,620 | JPY | 1,208,080,924 | BNP Paribas SA | 7/19/24 | 327,413 | ||||||||||||||
| AUD | 32,481,154 | USD | 21,225,265 | Citibank N.A. | 7/19/24 | (135,087) | ||||||||||||||
| JPY | 212,315,000 | USD | 1,388,395 | Citibank N.A. | 7/19/24 | (25,802) | ||||||||||||||
| USD | 377,799 | GBP | 303,000 | Citibank N.A. | 7/19/24 | (982) | ||||||||||||||
| USD | 11,357,343 | GBP | 9,053,153 | Citibank N.A. | 7/19/24 | 39,973 | ||||||||||||||
| USD | 14,729,694 | INR | 1,230,341,845 | Citibank N.A. | 7/19/24 | 25,714 | ||||||||||||||
| PLN | 1,199,625 | USD | 296,650 | Goldman Sachs Group Inc. | 7/19/24 | (1,194) | ||||||||||||||
| USD | 13,521,260 | PLN | 53,529,317 | Goldman Sachs Group Inc. | 7/19/24 | 337,470 | ||||||||||||||
| MXN | 2,545,000 | USD | 147,562 | JPMorgan Chase & Co. | 7/19/24 | (902) | ||||||||||||||
| MXN | 4,363,000 | USD | 249,736 | JPMorgan Chase & Co. | 7/19/24 | 1,689 | ||||||||||||||
| USD | 799,444 | CNH | 5,774,381 | JPMorgan Chase & Co. | 7/19/24 | 75 | ||||||||||||||
| USD | 1,940,724 | CNH | 14,030,000 | JPMorgan Chase & Co. | 7/19/24 | (1,500) | ||||||||||||||
| USD | 17,166,271 | IDR | 280,891,692,335 | JPMorgan Chase & Co. | 7/19/24 | (74,554) | ||||||||||||||
| USD | 774,545 | MXN | 13,419,000 | JPMorgan Chase & Co. | 7/19/24 | 1,254 | ||||||||||||||
| USD | 7,256,237 | MXN | 121,121,102 | JPMorgan Chase & Co. | 7/19/24 | 276,437 | ||||||||||||||
| USD | 16,642,898 | MXN | 276,580,000 | JPMorgan Chase & Co. | 7/19/24 | 704,528 | ||||||||||||||
| BRL | 2,056,533 | USD | 398,854 | Morgan Stanley & Co. Inc. | 7/19/24 | (5,924) | ||||||||||||||
| BRL | 39,501,394 | USD | 7,732,030 | Morgan Stanley & Co. Inc. | 7/19/24 | (184,715) | ||||||||||||||
| USD | 1,472 | CAD | 2,013 | Morgan Stanley & Co. Inc. | 7/19/24 | 8 | ||||||||||||||
| USD | 5,657,743 | ZAR | 106,650,712 | Morgan Stanley & Co. Inc. | 7/19/24 | 28,121 | ||||||||||||||
| Net unrealized appreciation on open forward foreign currency contracts |
| $ | 1,320,243 | |||||||||||||||||
See Notes to Financial Statements.
22 | Western Asset Macro Opportunities Fund 2024 Semi-Annual Report |
Western Asset Macro Opportunities Fund
Abbreviation(s) used in this table: | ||
| AUD | — Australian Dollar | |
| BRL | — Brazilian Real | |
| CAD | — Canadian Dollar | |
| CNH | — Chinese Offshore Yuan | |
| EUR | — Euro | |
| GBP | — British Pound | |
| IDR | — Indonesian Rupiah | |
| INR | — Indian Rupee | |
| JPY | — Japanese Yen | |
| MXN | — Mexican Peso | |
| PLN | — Polish Zloty | |
| USD | — United States Dollar | |
| ZAR | — South African Rand | |
At April 30, 2024, the Fund had the following open swap contracts:
| OTC INTEREST RATE SWAPS | ||||||||||||||||||||||||||
Swap Counterparty | Notional Amount* | Termination Date | Payments Made by the Fund† | Payments Received by the Fund† | Market Value | Upfront Premiums Paid (Received) | Unrealized Appreciation | |||||||||||||||||||
| Bank of America N.A. | 122,898,368 | BRL | 1/4/27 | BRL-CDI** | 11.993 | %** | $ | 210,325 | — | $ | 210,325 | |||||||||||||||
| BNP Paribas SA | 142,015,300 | BRL | 1/2/29 | BRL-CDI** | 12.610 | %** | 908,147 | — | 908,147 | |||||||||||||||||
| JPMorgan Chase & Co. | 4,588,200 | BRL | 1/2/29 | BRL-CDI** | 12.893 | %** | 37,188 | — | 37,188 | |||||||||||||||||
| Total | $ | 1,155,660 | — | $ | 1,155,660 | |||||||||||||||||||||
| CENTRALLY CLEARED INTEREST RATE SWAPS | ||||||||||||||||||||
| Notional Amount* | Termination Date | Payments Made by the Fund† | Payments Received by the Fund† | Market Value | Upfront Premiums Paid (Received) | Unrealized Appreciation (Depreciation) | ||||||||||||||
| 144,900,000 | 6/4/24 | Daily SOFR Compound** | 4.600%** | $ | (132,851 | ) | $ | 314 | $ | (133,165 | ) | |||||||||
| 170,428,000 | 10/13/25 | Daily SOFR Compound** | 1.396%** | (5,778,580 | ) | — | (5,778,580 | ) | ||||||||||||
| 189,528,000 | 3/15/26 | Daily SOFR Compound annually | 4.450% annually | (1,654,438 | ) | 21,236 | (1,675,674 | ) | ||||||||||||
See Notes to Financial Statements.
| Western Asset Macro Opportunities Fund 2024 Semi-Annual Report |
23 |
Schedule of investments (unaudited) (cont’d)
April 30, 2024
Western Asset Macro Opportunities Fund
| CENTRALLY CLEARED INTEREST RATE SWAPS (cont’d) | ||||||||||||||||||||||||||
| Notional Amount* | Termination Date | Payments Made by the Fund† | Payments the Fund† | Market Value | Upfront Premiums Paid (Received) | Unrealized (Depreciation) | ||||||||||||||||||||
| 12,670,000 | 3/18/30 | | Daily SOFR Compound annually | | 3.650% annually | $ | (326,719 | ) | $ | (339,071 | ) | $ | 12,352 | |||||||||||||
| 40,896,000 | 2/28/31 | 3.870% annually | | Daily SOFR Compound annually | | 1,167,007 | (114,771 | ) | 1,281,778 | |||||||||||||||||
| 54,546,000 | 5/15/32 | 3.220% annually | | Daily SOFR Compound annually | | 4,132,515 | 1,327,229 | 2,805,286 | ||||||||||||||||||
| 228,101,667MXN | 10/25/32 | | 28-Day MXN TIIE - Banxico every 28 days | | | 9.260% every 28 days |
| (231,059 | ) | — | (231,059 | ) | ||||||||||||||
| 165,225,000MXN | 3/1/33 | | 28-Day MXN TIIE - Banxico every 28 days | | | 8.450% every 28 days |
| (641,162 | ) | — | (641,162 | ) | ||||||||||||||
| 44,601,000 | 2/15/48 | 2.600% annually | | Daily SOFR Compound annually | | 10,394,519 | 4,198,146 | 6,196,373 | ||||||||||||||||||
| 6,113,000 | 2/15/48 | 3.050% annually | | Daily SOFR Compound annually | | 1,015,479 | 111,622 | 903,857 | ||||||||||||||||||
| 20,162,000 | 5/15/48 | 3.150% annually | | Daily SOFR Compound annually | | 3,050,036 | (1,745,168 | ) | 4,795,204 | |||||||||||||||||
| 3,378,000 | 3/18/55 | 3.510% annually | | Daily SOFR Compound annually | | 242,365 | 252,466 | (10,101 | ) | |||||||||||||||||
| Total | $ | 11,237,112 | $ | 3,712,003 | $ | 7,525,109 | ||||||||||||||||||||
See Notes to Financial Statements.
24 | Western Asset Macro Opportunities Fund 2024 Semi-Annual Report |
Western Asset Macro Opportunities Fund
| CENTRALLY CLEARED CREDIT DEFAULT SWAPS ON CORPORATE ISSUES — SELL PROTECTION1 | ||||||||||||||||||||||||
| Reference Entity | Notional Amount2 | Termination Date | Implied Credit Spread at April 30, 20243 | Periodic the Fund† | Market Value | Upfront Premiums Paid (Received) | Unrealized Appreciation | |||||||||||||||||
| Teva Pharmaceutical Finance Netherlands III BV, 3.150%, due 10/1/26 | $ | 3,270,000 | 6/20/26 | 0.549% | 1.000% quarterly | $ | 29,935 | $ | (137,793) | $ | 167,728 | |||||||||||||
| CENTRALLY CLEARED CREDIT DEFAULT SWAPS ON CREDIT INDICES — BUY PROTECTION4 | ||||||||||||||||||||||
| Reference Entity | Notional Amount2 | Termination Date | Periodic Made by the Fund† | Market Value5 | Upfront Premiums Paid (Received) | Unrealized Appreciation | ||||||||||||||||
| Markit CDX.NA.HY.42 Index | $ | 10,870,700 | 6/20/29 | 5.000% quarterly | $ | (638,736) | $ | (733,519) | $ | 94,783 | ||||||||||||
| OTC TOTAL RETURN SWAPS | ||||||||||||||||||||||||
| Swap Counterparty | Notional Amount | Termination Date | Periodic Payments Made by the Fund‡ | Periodic Payments Received by the Fund† | Market Value | Upfront Premiums Paid (Received) | Unrealized Depreciation | |||||||||||||||||
| JPMorgan Chase & Co. | $ | 19,708 | 8/1/24 | Daily SOFR Compound + 1.100% quarterly | JPEIFNTR quarterly^ | $ | (56,482) | — | $ | (56,482) | ||||||||||||||
See Notes to Financial Statements.
| Western Asset Macro Opportunities Fund 2024 Semi-Annual Report |
25 |
Schedule of investments (unaudited) (cont’d)
April 30, 2024
Western Asset Macro Opportunities Fund
| 1 | If the Fund is a seller of protection and a credit event occurs, as defined under the terms of that particular swap agreement, the Fund will either (i) pay to the buyer of protection an amount equal to the notional amount of the swap and take delivery of the referenced obligation or underlying securities comprising the referenced index or (ii) pay a net settlement amount in the form of cash or securities equal to the notional amount of the swap less the recovery value of the referenced obligation or underlying securities comprising the referenced index. |
| 2 | The maximum potential amount the Fund could be required to pay as a seller of credit protection or receive as a buyer of credit protection if a credit event occurs as defined under the terms of that particular swap agreement. |
| 3 | Implied credit spreads, utilized in determining the market value of credit default swap agreements on corporate or sovereign issues as of period end, serve as an indicator of the current status of the payment/performance risk and represent the likelihood or risk of default for the credit derivative. The implied credit spread of a particular referenced entity reflects the cost of buying/selling protection and may include upfront payments required to be made to enter into the agreement. Wider credit spreads represent a deterioration of the referenced entity’s credit soundness and a greater likelihood or risk of default or other credit event occurring as defined under the terms of the agreement. A credit spread identified as “Defaulted” indicates a credit event has occurred for the referenced entity or obligation. |
| 4 | If the Fund is a buyer of protection and a credit event occurs, as defined under the terms of that particular swap agreement, the Fund will either (i) receive from the seller of protection an amount equal to the notional amount of the swap and deliver the referenced obligation or the underlying securities comprising the referenced index or (ii) receive a net settlement amount in the form of cash or securities equal to the notional amount of the swap less the recovery value of the referenced obligation or the underlying securities comprising the referenced index. |
| 5 | The quoted market prices and resulting values for credit default swap agreements on asset-backed securities and credit indices serve as an indicator of the current status of the payment/performance risk and represent the likelihood of an expected loss (or profit) for the credit derivative had the notional amount of the swap agreement been closed/sold as of the period end. Decreasing market values (sell protection) or increasing market values (buy protection) when compared to the notional amount of the swap, represent a deterioration of the referenced entity’s credit soundness and a greater likelihood or risk of default or other credit event occurring as defined under the terms of the agreement. |
| † | Percentage shown is an annual percentage rate. |
| ‡ | Periodic payments made/received by the Fund are based on the total return of the referenced entity. |
| ^ | Custom emerging markets debt basket is comprised of 32 bonds in the Sovereign Frontier sector. |
| * | Notional amount denominated in U.S. dollars, unless otherwise noted. |
| ** | One time payment made at termination date. |
Reference rate(s) and their value(s) as of period end used in this table:
| Reference Index | Reference Rate | |||
| 28-Day MXN TIIE - Banxico | 11.240 | % | ||
| BRL-CDI | 10.650 | % | ||
| Daily SOFR Compound | 5.340 | % | ||
See Notes to Financial Statements.
26 | Western Asset Macro Opportunities Fund 2024 Semi-Annual Report |
Western Asset Macro Opportunities Fund
Abbreviation(s) used in this table: | ||
| BRL | — Brazilian Real | |
| BRL-CDI | — Brazilian Cetip InterBank Deposit Rate | |
| MXN | — Mexican Peso | |
| SOFR | — Secured Overnight Financing Rate | |
| TIIE | — Tasa de Intere’s Interbancaria de Equilibrio (Equilibrium Interbanking Interest Rate) | |
See Notes to Financial Statements.
| Western Asset Macro Opportunities Fund 2024 Semi-Annual Report |
27 |
Statement of assets and liabilities (unaudited)
April 30, 2024
| Assets: | ||||
Investments in unaffiliated securities, at value (Cost — $297,968,572) | $ | 261,921,629 | ||
Investments in affiliated securities, at value (Cost — $624,899) | 624,899 | |||
Foreign currency, at value (Cost — $1,599,240) | 1,581,103 | |||
Cash | 1,000,000 | |||
Deposits with brokers for centrally cleared swap contracts | 9,101,598 | |||
Receivable for securities sold | 3,933,102 | |||
Foreign currency collateral for open futures contracts and exchange-traded options, at value (Cost — $3,887,382) | 3,870,780 | |||
Interest receivable | 3,792,898 | |||
Unrealized appreciation on forward foreign currency contracts | 1,753,283 | |||
OTC swaps, at value (premiums paid — $0) | 1,155,660 | |||
Deposits with brokers for OTC derivatives | 240,000 | |||
Receivable for net premiums on written options | 166,866 | |||
Deposits with brokers for open futures contracts and exchange-traded options | 123,777 | |||
Receivable for Fund shares sold | 104,963 | |||
Dividends receivable from affiliated investments | 888 | |||
Principal paydown receivable | 652 | |||
Prepaid expenses | 22,888 | |||
Total Assets | 289,394,986 | |||
| Liabilities: | ||||
Payable for securities purchased | 15,065,293 | |||
Payable to brokers — net variation margin on centrally cleared swap contracts | 7,730,935 | |||
Payable to brokers — net variation margin on open futures contracts | 2,815,243 | |||
Written options, at value (premiums received — $1,710,860) | 954,891 | |||
Unrealized depreciation on forward foreign currency contracts | 433,040 | |||
Payable for Fund shares repurchased | 320,009 | |||
Investment management fee payable | 245,508 | |||
OTC swaps, at value (premiums received — $0) | 56,482 | |||
Deposits from brokers for OTC derivatives | 20,000 | |||
Service and/or distribution fees payable | 7,242 | |||
Directors’ fees payable | 5,233 | |||
Accrued expenses | 204,673 | |||
Total Liabilities | 27,858,549 | |||
| Total Net Assets | $ | 261,536,437 | ||
| Net Assets: | ||||
Par value (Note 7) | $ | 27,803 | ||
Paid-in capital in excess of par value | 547,453,324 | |||
Total distributable earnings (loss) | (285,944,690) | |||
| Total Net Assets | $ | 261,536,437 | ||
See Notes to Financial Statements.
28 | Western Asset Macro Opportunities Fund 2024 Semi-Annual Report |
| Net Assets: | ||||
Class A | $12,096,618 | |||
Class C | $4,680,377 | |||
Class FI | $2,882,552 | |||
Class I | $201,147,117 | |||
Class IS | $40,729,773 | |||
| Shares Outstanding: | ||||
Class A | 1,291,269 | |||
Class C | 515,703 | |||
Class FI | 308,029 | |||
Class I | 21,376,529 | |||
Class IS | 4,311,321 | |||
| Net Asset Value: | ||||
Class A (and redemption price) | $9.37 | |||
Class C* | $9.08 | |||
Class FI (and redemption price) | $9.36 | |||
Class I (and redemption price) | $9.41 | |||
Class IS (and redemption price) | $9.45 | |||
| Maximum Public Offering Price Per Share: | ||||
Class A (based on maximum initial sales charge of 3.75%) | $9.74 | |||
| * | Redemption price per share is NAV of Class C shares reduced by a 1.00% CDSC if shares are redeemed within one year from purchase payment (Note 2). |
See Notes to Financial Statements.
| Western Asset Macro Opportunities Fund 2024 Semi-Annual Report |
29 |
Statement of operations (unaudited)
For the Six Months Ended April 30, 2024
| Investment Income: | ||||
Interest | $ | 12,181,725 | ||
Dividends from affiliated investments | 112,062 | |||
Dividends from unaffiliated investments | 18,886 | |||
Less: Foreign taxes withheld | (90,080) | |||
Total Investment Income | 12,222,593 | |||
| Expenses: | ||||
Investment management fee (Note 2) | 1,806,702 | |||
Transfer agent fees (Notes 2 and 5) | 146,226 | |||
Service and/or distribution fees (Notes 2 and 5) | 51,960 | |||
Registration fees | 46,389 | |||
Fund accounting fees | 43,691 | |||
Audit and tax fees | 34,627 | |||
Custody fees | 17,404 | |||
Shareholder reports | 15,333 | |||
Legal fees | 8,201 | |||
Commodity pool reports | 5,967 | |||
Directors’ fees | 5,649 | |||
Interest expense | 1,898 | |||
Commitment fees (Note 9) | 1,635 | |||
Insurance | 1,361 | |||
Miscellaneous expenses | 8,002 | |||
Total Expenses | 2,195,045 | |||
Less: Fee waivers and/or expense reimbursements (Notes 2 and 5) | (50,287) | |||
Net Expenses | 2,144,758 | |||
| Net Investment Income | 10,077,835 | |||
| Realized and Unrealized Gain (Loss) on Investments, Futures Contracts, Written Options, Swap Contracts, Forward Foreign Currency Contracts and Foreign Currency Transactions (Notes 1, 3 and 4): |
| |||
Net Realized Gain (Loss) From: | ||||
Investment transactions in unaffiliated securities | (20,243,602) | † | ||
Futures contracts | (6,576,672) | |||
Written options | 17,728,192 | |||
Swap contracts | 8,436,995 | |||
Forward foreign currency contracts | (1,638,913) | |||
Foreign currency transactions | (108,001) | |||
Net Realized Loss | (2,402,001) | |||
Change in Net Unrealized Appreciation (Depreciation) From: | ||||
Investments in unaffiliated securities | 20,764,837 | |||
Futures contracts | 18,533,267 | |||
Written options | (2,662,521) | |||
Swap contracts | (12,475,512) | |||
Forward foreign currency contracts | 1,391,745 | |||
Foreign currencies | 42,271 | |||
Change in Net Unrealized Appreciation (Depreciation) | 25,594,087 | |||
| Net Gain on Investments, Futures Contracts, Written Options, Swap Contracts, Forward Foreign Currency Contracts and Foreign Currency Transactions | 23,192,086 | |||
| Increase in Net Assets From Operations | $ | 33,269,921 | ||
| † | Net of foreign capital gains tax of $9,926. |
See Notes to Financial Statements.
30 | Western Asset Macro Opportunities Fund 2024 Semi-Annual Report |
Statements of changes in net assets
| For the Six Months Ended April 30, 2024 (unaudited) and the Year Ended October 31, 2023 | 2024 | 2023 | ||||||
| Operations: | ||||||||
Net investment income | $ | 10,077,835 | $ | 26,239,937 | ||||
Net realized loss | (2,402,001) | (96,289,544) | ||||||
Change in net unrealized appreciation (depreciation) | 25,594,087 | 104,984,322 | ||||||
Increase in Net Assets From Operations | 33,269,921 | 34,934,715 | ||||||
| Distributions to Shareholders From (Notes 1 and 6): | ||||||||
Total distributable earnings | (1,200,005) | — | ||||||
Decrease in Net Assets From Distributions to Shareholders | (1,200,005) | — | ||||||
| Fund Share Transactions (Note 7): | ||||||||
Net proceeds from sale of shares | 37,812,104 | 148,567,603 | ||||||
Reinvestment of distributions | 925,165 | — | ||||||
Cost of shares repurchased | (131,213,595) | (439,100,081) | ||||||
Decrease in Net Assets From Fund Share Transactions | (92,476,326) | (290,532,478) | ||||||
Decrease in Net Assets | (60,406,410) | (255,597,763) | ||||||
| Net Assets: | ||||||||
Beginning of period | 321,942,847 | 577,540,610 | ||||||
End of period | $ | 261,536,437 | $ | 321,942,847 | ||||
See Notes to Financial Statements.
| Western Asset Macro Opportunities Fund 2024 Semi-Annual Report |
31 |
| For a share of each class of capital stock outstanding throughout each year ended October 31, unless otherwise noted: | ||||||||||||||||||||||||
| Class A Shares1 | 20242 | 2023 | 2022 | 2021 | 2020 | 2019 | ||||||||||||||||||
| Net asset value, beginning of period | $8.60 | $8.36 | $11.69 | $11.00 | $11.94 | $10.36 | ||||||||||||||||||
| Income (loss) from operations: | ||||||||||||||||||||||||
Net investment income | 0.30 | 0.52 | 0.31 | 0.28 | 0.33 | 0.46 | ||||||||||||||||||
Net realized and unrealized gain (loss) | 0.48 | (0.28) | 3 | (3.37) | 0.41 | (0.11) | 1.37 | |||||||||||||||||
Total income (loss) from operations | 0.78 | 0.24 | (3.06) | 0.69 | 0.22 | 1.83 | ||||||||||||||||||
| Less distributions from: | ||||||||||||||||||||||||
Net investment income | (0.01) | — | (0.27) | (0.00) | 4 | (0.57) | (0.25) | |||||||||||||||||
Net realized gains | — | — | — | — | (0.59) | — | ||||||||||||||||||
Total distributions | (0.01) | — | (0.27) | (0.00) | 4 | (1.16) | (0.25) | |||||||||||||||||
| Net asset value, end of period | $9.37 | $8.60 | $8.36 | $11.69 | $11.00 | $11.94 | ||||||||||||||||||
Total return5 | 9.05 | % | 2.87 | % | (26.70) | % | 6.19 | % | 1.86 | % | 17.98 | % | ||||||||||||
| Net assets, end of period (000s) | $12,097 | $14,985 | $21,926 | $43,398 | $46,762 | $44,655 | ||||||||||||||||||
| Ratios to average net assets: | ||||||||||||||||||||||||
Gross expenses | 1.61 | %6 | 1.56 | %7 | 1.59 | % | 1.57 | % | 1.59 | % | 1.57 | % | ||||||||||||
Net expenses8 | 1.58 | 6,9 | 1.56 | 7,9 | 1.58 | 9 | 1.57 | 9 | 1.59 | 9 | 1.57 | |||||||||||||
Net investment income | 6.20 | 6 | 5.55 | 3.17 | 2.47 | 3.04 | 4.13 | |||||||||||||||||
| Portfolio turnover rate | 14 | %10 | 117 | %10 | 67 | % | 70 | % | 138 | % | 165 | % | ||||||||||||
| 1 | Per share amounts have been calculated using the average shares method. |
| 2 | For the six months ended April 30, 2024 (unaudited). |
| 3 | Calculation of the net loss per share (both realized and unrealized) does not correlate to the aggregate realized and unrealized losses gain presented in the Statement of Operations due to the timing of the sales and repurchases of Fund shares in relation to fluctuating market values of the investments of the Fund. |
| 4 | Amount represents less than $0.005 or greater than $(0.005) per share. |
| 5 | Performance figures, exclusive of sales charges, may reflect compensating balance arrangements, fee waivers and/or expense reimbursements. In the absence of compensating balance arrangements, fee waivers and/or expense reimbursements, the total return would have been lower. Past performance is no guarantee of future results. Total returns for periods of less than one year are not annualized. |
| 6 | Annualized. |
| 7 | Reflects recapture of fees waived and/or expenses reimbursed from prior fiscal years. |
| 8 | As a result of an expense limitation arrangement, effective May 21, 2021, the ratio of total annual fund operating expenses, other than interest, brokerage commissions, taxes, extraordinary expenses, deferred organizational expenses and acquired fund fees and expenses, to average net assets of Class A shares did not exceed 1.58%. This expense limitation arrangement cannot be terminated prior to December 31, 2025 without the Board of Directors’ consent. In addition, the manager has agreed to waive the Fund’s management fee to an extent sufficient to offset the net management fee payable in connection with any investment in an affiliated money market fund. Prior to May 21, 2021, the expense limitation was 1.65%. |
| 9 | Reflects fee waivers and/or expense reimbursements. |
| 10 | Excluding mortgage dollar roll transactions. If mortgage dollar roll transactions had been included, the portfolio turnover rates for the respective years/periods presented would have been 26% and 149%. |
See Notes to Financial Statements.
32 | Western Asset Macro Opportunities Fund 2024 Semi-Annual Report |
| For a share of each class of capital stock outstanding throughout each year ended October 31, unless otherwise noted: | ||||||||||||||||||||||||
| Class C Shares1 | 20242 | 2023 | 2022 | 2021 | 2020 | 2019 | ||||||||||||||||||
| Net asset value, beginning of period | $8.36 | $8.18 | $11.44 | $10.84 | $11.78 | $10.20 | ||||||||||||||||||
| Income (loss) from operations: | ||||||||||||||||||||||||
Net investment income | 0.26 | 0.44 | 0.24 | 0.20 | 0.26 | 0.38 | ||||||||||||||||||
Net realized and unrealized gain (loss) | 0.46 | (0.26) | 3 | (3.30) | 0.40 | (0.13) | 1.35 | |||||||||||||||||
Total income (loss) from operations | 0.72 | 0.18 | (3.06) | 0.60 | 0.13 | 1.73 | ||||||||||||||||||
| Less distributions from: | ||||||||||||||||||||||||
Net investment income | — | — | (0.20) | — | (0.48) | (0.15) | ||||||||||||||||||
Net realized gains | — | — | — | — | (0.59) | — | ||||||||||||||||||
Total distributions | — | — | (0.20) | — | (1.07) | (0.15) | ||||||||||||||||||
| Net asset value, end of period | $9.08 | $8.36 | $8.18 | $11.44 | $10.84 | $11.78 | ||||||||||||||||||
Total return4 | 8.74 | % | 2.08 | % | (27.24) | % | 5.54 | % | 1.09 | % | 17.13 | % | ||||||||||||
| Net assets, end of period (000s) | $4,680 | $5,480 | $9,169 | $18,154 | $21,515 | $28,583 | ||||||||||||||||||
| Ratios to average net assets: | ||||||||||||||||||||||||
Gross expenses | 2.35 | %5 | 2.28 | % | 2.30 | % | 2.27 | % | 2.31 | % | 2.29 | % | ||||||||||||
Net expenses6 | 2.33 | 5,7 | 2.28 | 7 | 2.30 | 7 | 2.27 | 7 | 2.30 | 7 | 2.29 | |||||||||||||
Net investment income | 5.46 | 5 | 4.84 | 2.44 | 1.77 | 2.37 | 3.43 | |||||||||||||||||
| Portfolio turnover rate | 14 | %8 | 117 | %8 | 67 | % | 70 | % | 138 | % | 165 | % | ||||||||||||
| 1 | Per share amounts have been calculated using the average shares method. |
| 2 | For the six months ended April 30, 2024 (unaudited). |
| 3 | Calculation of the net loss per share (both realized and unrealized) does not correlate to the aggregate realized and unrealized losses gain presented in the Statement of Operations due to the timing of the sales and repurchases of Fund shares in relation to fluctuating market values of the investments of the Fund. |
| 4 | Performance figures, exclusive of CDSC, may reflect compensating balance arrangements, fee waivers and/or expense reimbursements. In the absence of compensating balance arrangements, fee waivers and/or expense reimbursements, the total return would have been lower. Past performance is no guarantee of future results. Total returns for periods of less than one year are not annualized. |
| 5 | Annualized. |
| 6 | As a result of an expense limitation arrangement, the ratio of total annual fund operating expenses, other than interest, brokerage commissions, taxes, extraordinary expenses, deferred organizational expenses and acquired fund fees and expenses, to average net assets of Class C shares did not exceed 2.40%. This expense limitation arrangement cannot be terminated prior to December 31, 2025 without the Board of Directors’ consent. In addition, the manager has agreed to waive the Fund’s management fee to an extent sufficient to offset the net management fee payable in connection with any investment in an affiliated money market fund. |
| 7 | Reflects fee waivers and/or expense reimbursements. |
| 8 | Excluding mortgage dollar roll transactions. If mortgage dollar roll transactions had been included, the portfolio turnover rates for the respective years/periods presented would have been 26% and 149%. |
See Notes to Financial Statements.
| Western Asset Macro Opportunities Fund 2024 Semi-Annual Report |
33 |
Financial highlights (cont’d)
| For a share of each class of capital stock outstanding throughout each year ended October 31, unless otherwise noted: | ||||||||||||||||||||||||
| Class FI Shares1 | 20242 | 2023 | 2022 | 2021 | 2020 | 2019 | ||||||||||||||||||
| Net asset value, beginning of period | $8.59 | $8.35 | $11.68 | $10.99 | $11.94 | $10.34 | ||||||||||||||||||
| Income (loss) from operations: | ||||||||||||||||||||||||
Net investment income | 0.30 | 0.51 | 0.31 | 0.28 | 0.34 | 0.45 | ||||||||||||||||||
Net realized and unrealized gain (loss) | 0.47 | (0.27) | 3 | (3.36) | 0.41 | (0.14) | 1.38 | |||||||||||||||||
Total income (loss) from operations | 0.77 | 0.24 | (3.05) | 0.69 | 0.20 | 1.83 | ||||||||||||||||||
| Less distributions from: | ||||||||||||||||||||||||
Net investment income | — | — | (0.28) | — | (0.56) | (0.23) | ||||||||||||||||||
Net realized gains | — | — | — | — | (0.59) | — | ||||||||||||||||||
Total distributions | — | — | (0.28) | — | (1.15) | (0.23) | ||||||||||||||||||
| Net asset value, end of period | $9.36 | $8.59 | $8.35 | $11.68 | $10.99 | $11.94 | ||||||||||||||||||
Total return4 | 8.96 | % | 2.87 | % | (26.71) | % | 6.19 | % | 1.82 | % | 17.93 | % | ||||||||||||
| Net assets, end of period (000s) | $2,883 | $6,872 | $8,304 | $40,542 | $37,935 | $55,388 | ||||||||||||||||||
| Ratios to average net assets: | ||||||||||||||||||||||||
Gross expenses | 1.69 | %5 | 1.60 | % | 1.61 | % | 1.60 | % | 1.62 | % | 1.61 | %6 | ||||||||||||
Net expenses7 | 1.65 | 5,8 | 1.59 | 8 | 1.61 | 8 | 1.60 | 8 | 1.62 | 8 | 1.61 | 6 | ||||||||||||
Net investment income | 6.05 | 5 | 5.48 | 3.04 | 2.44 | 3.10 | 4.03 | |||||||||||||||||
| Portfolio turnover rate | 14 | %9 | 117 | %9 | 67 | % | 70 | % | 138 | % | 165 | % | ||||||||||||
| 1 | Per share amounts have been calculated using the average shares method. |
| 2 | For the six months ended April 30, 2024 (unaudited). |
| 3 | Calculation of the net loss per share (both realized and unrealized) does not correlate to the aggregate realized and unrealized losses gain presented in the Statement of Operations due to the timing of the sales and repurchases of Fund shares in relation to fluctuating market values of the investments of the Fund. |
| 4 | Performance figures may reflect compensating balance arrangements, fee waivers and/or expense reimbursements. In the absence of compensating balance arrangements, fee waivers and/or expense reimbursements, the total return would have been lower. Past performance is no guarantee of future results. Total returns for periods of less than one year are not annualized. |
| 5 | Annualized. |
| 6 | Reflects recapture of fees waived and/or expenses reimbursed from prior fiscal years. |
| 7 | As a result of an expense limitation arrangement, the ratio of total annual fund operating expenses, other than interest, brokerage commissions, taxes, extraordinary expenses, deferred organizational expenses and acquired fund fees and expenses, to average net assets of Class FI shares did not exceed 1.65%. This expense limitation arrangement cannot be terminated prior to December 31, 2025 without the Board of Directors’ consent. In addition, the manager has agreed to waive the Fund’s management fee to an extent sufficient to offset the net management fee payable in connection with any investment in an affiliated money market fund. |
| 8 | Reflects fee waivers and/or expense reimbursements. |
| 9 | Excluding mortgage dollar roll transactions. If mortgage dollar roll transactions had been included, the portfolio turnover rates for the respective years/periods presented would have been 26% and 149%. |
See Notes to Financial Statements.
34 | Western Asset Macro Opportunities Fund 2024 Semi-Annual Report |
| For a share of each class of capital stock outstanding throughout each year ended October 31, unless otherwise noted: | ||||||||||||||||||||||||
| Class I Shares1 | 20242 | 2023 | 2022 | 2021 | 2020 | 2019 | ||||||||||||||||||
| Net asset value, beginning of period | $8.65 | $8.39 | $11.72 | $11.01 | $11.95 | $10.37 | ||||||||||||||||||
| Income (loss) from operations: | ||||||||||||||||||||||||
Net investment income | 0.32 | 0.55 | 0.33 | 0.32 | 0.36 | 0.49 | ||||||||||||||||||
Net realized and unrealized gain (loss) | 0.48 | (0.29) | 3 | (3.35) | 0.40 | (0.11) | 1.38 | |||||||||||||||||
Total income (loss) from operations | 0.80 | 0.26 | (3.02) | 0.72 | 0.25 | 1.87 | ||||||||||||||||||
| Less distributions from: | ||||||||||||||||||||||||
Net investment income | (0.04) | — | (0.31) | (0.01) | (0.60) | (0.29) | ||||||||||||||||||
Net realized gains | — | — | — | — | (0.59) | — | ||||||||||||||||||
Total distributions | (0.04) | — | (0.31) | (0.01) | (1.19) | (0.29) | ||||||||||||||||||
| Net asset value, end of period | $9.41 | $8.65 | $8.39 | $11.72 | $11.01 | $11.95 | ||||||||||||||||||
Total return4 | 9.17 | % | 3.10 | % | (26.50) | % | 6.60 | % | 2.13 | % | 18.26 | % | ||||||||||||
| Net assets, end of period (millions) | $201 | $240 | $365 | $1,187 | $1,225 | $1,275 | ||||||||||||||||||
| Ratios to average net assets: | ||||||||||||||||||||||||
Gross expenses | 1.38 | %5 | 1.30 | % | 1.31 | % | 1.30 | % | 1.32 | % | 1.30 | % | ||||||||||||
Net expenses6 | 1.35 | 5,7 | 1.29 | 7 | 1.31 | 7 | 1.30 | 7 | 1.32 | 7 | 1.30 | |||||||||||||
Net investment income | 6.44 | 5 | 5.83 | 3.32 | 2.74 | 3.34 | 4.39 | |||||||||||||||||
| Portfolio turnover rate | 14 | %8 | 117 | %8 | 67 | % | 70 | % | 138 | % | 165 | % | ||||||||||||
| 1 | Per share amounts have been calculated using the average shares method. |
| 2 | For the six months ended April 30, 2024 (unaudited). |
| 3 | Calculation of the net loss per share (both realized and unrealized) does not correlate to the aggregate realized and unrealized losses gain presented in the Statement of Operations due to the timing of the sales and repurchases of Fund shares in relation to fluctuating market values of the investments of the Fund. |
| 4 | Performance figures may reflect compensating balance arrangements, fee waivers and/or expense reimbursements. In the absence of compensating balance arrangements, fee waivers and/or expense reimbursements, the total return would have been lower. Past performance is no guarantee of future results. Total returns for periods of less than one year are not annualized. |
| 5 | Annualized. |
| 6 | As a result of an expense limitation arrangement, the ratio of total annual fund operating expenses, other than interest, brokerage commissions, taxes, extraordinary expenses, deferred organizational expenses and acquired fund fees and expenses, to average net assets of Class I shares did not exceed 1.35%. This expense limitation arrangement cannot be terminated prior to December 31, 2025 without the Board of Directors’ consent. In addition, the manager has agreed to waive the Fund’s management fee to an extent sufficient to offset the net management fee payable in connection with any investment in an affiliated money market fund. |
| 7 | Reflects fee waivers and/or expense reimbursements. |
| 8 | Excluding mortgage dollar roll transactions. If mortgage dollar roll transactions had been included, the portfolio turnover rates for the respective years/periods presented would have been 26% and 149%. |
See Notes to Financial Statements.
| Western Asset Macro Opportunities Fund 2024 Semi-Annual Report |
35 |
Financial highlights (cont’d)
| For a share of each class of capital stock outstanding throughout each year ended October 31, unless otherwise noted: | ||||||||||||||||||||||||
| Class IS Shares1 | 20242 | 2023 | 2022 | 2021 | 2020 | 2019 | ||||||||||||||||||
| Net asset value, beginning of period | $8.69 | $8.42 | $11.76 | $11.04 | $11.98 | $10.39 | ||||||||||||||||||
| Income (loss) from operations: | ||||||||||||||||||||||||
Net investment income | 0.32 | 0.54 | 0.35 | 0.32 | 0.37 | 0.50 | ||||||||||||||||||
Net realized and unrealized gain (loss) | 0.48 | (0.27) | 3 | (3.37) | 0.41 | (0.11) | 1.39 | |||||||||||||||||
Total income (loss) from operations | 0.80 | 0.27 | (3.02) | 0.73 | 0.26 | 1.89 | ||||||||||||||||||
| Less distributions from: | ||||||||||||||||||||||||
Net investment income | (0.04) | — | (0.32) | (0.01) | (0.61) | (0.30) | ||||||||||||||||||
Net realized gains | — | — | — | — | (0.59) | — | ||||||||||||||||||
Total distributions | (0.04) | — | (0.32) | (0.01) | (1.20) | (0.30) | ||||||||||||||||||
| Net asset value, end of period | $9.45 | $8.69 | $8.42 | $11.76 | $11.04 | $11.98 | ||||||||||||||||||
Total return4 | 9.22 | % | 3.21 | % | (26.43) | % | 6.59 | % | 2.30 | % | 18.45 | % | ||||||||||||
| Net assets, end of period (000s) | $40,730 | $54,860 | $173,628 | $420,234 | $237,988 | $231,003 | ||||||||||||||||||
| Ratios to average net assets: | ||||||||||||||||||||||||
Gross expenses | 1.29 | %5 | 1.22 | % | 1.24 | % | 1.21 | % | 1.22 | % | 1.21 | % | ||||||||||||
Net expenses6 | 1.25 | 5,7 | 1.22 | 7 | 1.24 | 7 | 1.21 | 7 | 1.22 | 7 | 1.21 | |||||||||||||
Net investment income | 6.51 | 5 | 5.78 | 3.47 | 2.81 | 3.42 | 4.46 | |||||||||||||||||
| Portfolio turnover rate | 14 | %8 | 117 | %8 | 67 | % | 70 | % | 138 | % | 165 | % | ||||||||||||
| 1 | Per share amounts have been calculated using the average shares method. |
| 2 | For the six months ended April 30, 2024 (unaudited). |
| 3 | Calculation of the net loss per share (both realized and unrealized) does not correlate to the aggregate realized and unrealized losses gain presented in the Statement of Operations due to the timing of the sales and repurchases of Fund shares in relation to fluctuating market values of the investments of the Fund. |
| 4 | Performance figures may reflect compensating balance arrangements, fee waivers and/or expense reimbursements. In the absence of compensating balance arrangements, fee waivers and/or expense reimbursements, the total return would have been lower. Past performance is no guarantee of future results. Total returns for periods of less than one year are not annualized. |
| 5 | Annualized. |
| 6 | As a result of an expense limitation arrangement, the ratio of total annual fund operating expenses, other than interest, brokerage commissions, taxes, extraordinary expenses, deferred organizational expenses and acquired fund fees and expenses, to average net assets of Class IS shares did not exceed 1.25%. In addition, the ratio of total annual fund operating expenses for Class IS shares did not exceed the ratio of total annual fund operating expenses for Class I shares. These expense limitation arrangements cannot be terminated prior to December 31, 2025 without the Board of Directors’ consent. In addition, the manager has agreed to waive the Fund’s management fee to an extent sufficient to offset the net management fee payable in connection with any investment in an affiliated money market fund. |
| 7 | Reflects fee waivers and/or expense reimbursements. |
| 8 | Excluding mortgage dollar roll transactions. If mortgage dollar roll transactions had been included, the portfolio turnover rates for the respective years/periods presented would have been 26% and 149%. |
See Notes to Financial Statements.
36 | Western Asset Macro Opportunities Fund 2024 Semi-Annual Report |
Notes to financial statements (unaudited)
1. Organization and significant accounting policies
Western Asset Macro Opportunities Fund (the “Fund”) is a separate non-diversified investment series of Western Asset Funds, Inc. (the “Corporation”). The Corporation, a Maryland corporation, is registered under the Investment Company Act of 1940, as amended (the “1940 Act”), as an open-end management investment company.
The Fund follows the accounting and reporting guidance in Financial Accounting Standards Board (“FASB”) Accounting Standards Codification Topic 946, Financial Services –Investment Companies (“ASC 946”). The following are significant accounting policies consistently followed by the Fund and are in conformity with U.S. generally accepted accounting principles (“GAAP”), including, but not limited to, ASC 946. Estimates and assumptions are required to be made regarding assets, liabilities and changes in net assets resulting from operations when financial statements are prepared. Changes in the economic environment, financial markets and any other parameters used in determining these estimates could cause actual results to differ. Subsequent events have been evaluated through the date the financial statements were issued.
(a) Investment valuation. The valuations for fixed income securities (which may include, but are not limited to, corporate, government, municipal, mortgage-backed, collateralized mortgage obligations and asset-backed securities) and certain derivative instruments are typically the prices supplied by independent third party pricing services, which may use market prices or broker/dealer quotations or a variety of valuation techniques and methodologies. The independent third party pricing services typically use inputs that are observable such as issuer details, interest rates, yield curves, prepayment speeds, credit risks/spreads, default rates and quoted prices for similar securities. Investments in open-end funds are valued at the closing net asset value per share of each fund on the day of valuation. Futures contracts are valued daily at the settlement price established by the board of trade or exchange on which they are traded. Equity securities for which market quotations are available are valued at the last reported sales price or official closing price on the primary market or exchange on which they trade. When the Fund holds securities or other assets that are denominated in a foreign currency, the Fund will normally use the currency exchange rates as of 4:00 p.m. (Eastern Time). If independent third party pricing services are unable to supply prices for a portfolio investment, or if the prices supplied are deemed by the manager to be unreliable, the market price may be determined by the manager using quotations from one or more broker/dealers or at the transaction price if the security has recently been purchased and no value has yet been obtained from a pricing service or pricing broker. When reliable prices are not readily available, such as when the value of a security has been significantly affected by events after the close of the exchange or market on which the security is principally traded, but before the Fund calculates its net asset value, the Fund values these securities as determined in accordance with procedures approved by the Fund’s Board of Directors.
Pursuant to policies adopted by the Board of Directors, the Fund’s manager has been designated as the valuation designee and is responsible for the oversight of the daily valuation process. The Fund’s manager is assisted by the Global Fund Valuation Committee (the “Valuation Committee”). The Valuation Committee is responsible for making fair value determinations, evaluating the effectiveness of the Fund’s pricing policies, and reporting to the Fund’s manager and the Board of Directors. When determining the reliability of third party pricing information for investments owned by the Fund, the Valuation Committee,
| Western Asset Macro Opportunities Fund 2024 Semi-Annual Report |
37 |
Notes to financial statements (unaudited) (cont’d)
among other things, conducts due diligence reviews of pricing vendors, monitors the daily change in prices and reviews transactions among market participants.
The Valuation Committee will consider pricing methodologies it deems relevant and appropriate when making fair value determinations. Examples of possible methodologies include, but are not limited to, multiple of earnings; discount from market of a similar freely traded security; discounted cash-flow analysis; book value or a multiple thereof; risk premium/yield analysis; yield to maturity; and/or fundamental investment analysis. The Valuation Committee will also consider factors it deems relevant and appropriate in light of the facts and circumstances. Examples of possible factors include, but are not limited to, the type of security; the issuer’s financial statements; the purchase price of the security; the discount from market value of unrestricted securities of the same class at the time of purchase; analysts’ research and observations from financial institutions; information regarding any transactions or offers with respect to the security; the existence of merger proposals or tender offers affecting the security; the price and extent of public trading in similar securities of the issuer or comparable companies; and the existence of a shelf registration for restricted securities.
For each portfolio security that has been fair valued pursuant to the policies adopted by the Board of Directors, the fair value price is compared against the last available and next available market quotations. The Valuation Committee reviews the results of such back testing monthly and fair valuation occurrences are reported to the Board of Directors quarterly.
The Fund uses valuation techniques to measure fair value that are consistent with the market approach and/or income approach, depending on the type of security and the particular circumstance. The market approach uses prices and other relevant information generated by market transactions involving identical or comparable securities. The income approach uses valuation techniques to discount estimated future cash flows to present value.
GAAP establishes a disclosure hierarchy that categorizes the inputs to valuation techniques used to value assets and liabilities at measurement date. These inputs are summarized in the three broad levels listed below:
| • | Level 1 — unadjusted quoted prices in active markets for identical investments |
| • | Level 2 — other significant observable inputs (including quoted prices for similar investments, interest rates, prepayment speeds, credit risk, etc.) |
| • | Level 3 — significant unobservable inputs (including the Fund’s own assumptions in determining the fair value of investments) |
The inputs or methodologies used to value securities are not necessarily an indication of the risk associated with investing in those securities.
38 | Western Asset Macro Opportunities Fund 2024 Semi-Annual Report |
The following is a summary of the inputs used in valuing the Fund’s assets and liabilities carried at fair value:
| ASSETS | ||||||||||||||||
| Description | Quoted Prices (Level 1) | Other Significant Observable Inputs (Level 2) | Significant Unobservable Inputs (Level 3) | Total | ||||||||||||
| Long-Term Investments†: | ||||||||||||||||
Sovereign Bonds | — | $ | 107,034,944 | — | $ | 107,034,944 | ||||||||||
Corporate Bonds & Notes | — | 83,631,393 | — | 83,631,393 | ||||||||||||
U.S. Government & Agency Obligations | — | 24,493,716 | — | 24,493,716 | ||||||||||||
Collateralized Mortgage Obligations | — | 14,016,069 | — | 14,016,069 | ||||||||||||
Asset-Backed Securities | — | 13,541,159 | — | 13,541,159 | ||||||||||||
Mortgage-Backed Securities | — | 10,918,331 | — | 10,918,331 | ||||||||||||
Senior Loans | — | 5,435,928 | — | 5,435,928 | ||||||||||||
U.S. Treasury Inflation Protected Securities | — | 660,181 | — | 660,181 | ||||||||||||
Purchased Options: | ||||||||||||||||
Exchange-Traded Purchased Options | $ | 435,863 | — | — | 435,863 | |||||||||||
OTC Purchased Options | — | 40,013 | — | 40,013 | ||||||||||||
Municipal Bonds | — | 366,171 | — | 366,171 | ||||||||||||
Common Stocks | 341,145 | — | — | 341,145 | ||||||||||||
Non-U.S. Treasury Inflation Protected Securities | — | 218,875 | — | 218,875 | ||||||||||||
Warrants | — | 25,852 | — | 25,852 | ||||||||||||
| Total Long-Term Investments | 777,008 | 260,382,632 | — | 261,159,640 | ||||||||||||
| Short-Term Investments†: | ||||||||||||||||
Sovereign Bonds | — | 761,989 | — | 761,989 | ||||||||||||
Money Market Funds | 624,899 | — | — | 624,899 | ||||||||||||
| Total Short-Term Investments | 624,899 | 761,989 | — | 1,386,888 | ||||||||||||
| Total Investments | $ | 1,401,907 | $ | 261,144,621 | — | $ | 262,546,528 | |||||||||
| Western Asset Macro Opportunities Fund 2024 Semi-Annual Report |
39 |
Notes to financial statements (unaudited) (cont’d)
| ASSETS (cont’d) | ||||||||||||||||
| Description | Quoted Prices (Level 1) | Other Significant Observable Inputs (Level 2) | Significant Unobservable Inputs (Level 3) | Total | ||||||||||||
| Other Financial Instruments: | ||||||||||||||||
Futures Contracts†† | $ | 14,246,532 | — | — | $ | 14,246,532 | ||||||||||
Forward Foreign Currency Contracts†† | — | $ | 1,753,283 | — | 1,753,283 | |||||||||||
OTC Interest Rate Swaps | — | 1,155,660 | — | 1,155,660 | ||||||||||||
Centrally Cleared Interest Rate Swaps†† | — | 15,994,850 | — | 15,994,850 | ||||||||||||
Centrally Cleared Credit Default Swaps on Corporate | — | 167,728 | — | 167,728 | ||||||||||||
Centrally Cleared Credit Default Swaps on Credit | — | 94,783 | — | 94,783 | ||||||||||||
| Total Other Financial Instruments | $ | 14,246,532 | $ | 19,166,304 | — | $ | 33,412,836 | |||||||||
| Total | $ | 15,648,439 | $ | 280,310,925 | — | $ | 295,959,364 | |||||||||
| LIABILITIES | ||||||||||||||||
| Description | Quoted Prices (Level 1) | Other Significant Observable Inputs (Level 2) | Significant Unobservable Inputs (Level 3) | Total | ||||||||||||
| Other Financial Instruments: | ||||||||||||||||
Written Options: | ||||||||||||||||
Exchange-Traded Written Options | $ | 835,765 | — | — | $ | 835,765 | ||||||||||
OTC Written Options | — | $ | 119,126 | — | 119,126 | |||||||||||
Futures Contracts†† | 27,539,117 | — | — | 27,539,117 | ||||||||||||
Forward Foreign Currency Contracts†† | — | 433,040 | — | 433,040 | ||||||||||||
Centrally Cleared Interest Rate Swaps†† | — | 8,469,741 | — | 8,469,741 | ||||||||||||
OTC Total Return Swaps | — | 56,482 | — | 56,482 | ||||||||||||
| Total | $ | 28,374,882 | $ | 9,078,389 | — | $ | 37,453,271 | |||||||||
| † | See Schedule of Investments for additional detailed categorizations. |
| †† | Reflects the unrealized appreciation (depreciation) of the instruments. |
(b) Purchased options. The Fund may purchase option contracts generally to gain or reduce exposure to certain types of investments or market factors or as a means of attempting to enhance returns. When the Fund purchases an option, an amount equal to the premium paid by the Fund is recorded as an investment on the Statement of Assets and Liabilities, the value of which is marked-to-market to reflect the current market value of the option purchased. If the purchased option expires, the Fund realizes a loss equal to the
40 | Western Asset Macro Opportunities Fund 2024 Semi-Annual Report |
amount of premium paid. When an instrument is purchased or sold through the exercise of an option, the related premium paid is added to the basis of the instrument acquired or deducted from the proceeds of the instrument sold. The risk associated with purchasing put and call options is limited to the premium paid.
(c) Written options. The Fund may write option contracts generally to gain or reduce exposure to certain types of investments or market factors or as a means of attempting to enhance returns. When the Fund writes an option, an amount equal to the premium received by the Fund is recorded as a liability, the value of which is marked-to-market daily to reflect the current market value of the option written. If the option expires, the premium received is recorded as a realized gain. When a written call option is exercised, the difference between the premium received plus the option exercise price and the Fund’s basis in the underlying security (in the case of a covered written call option), or the cost to purchase the underlying security (in the case of an uncovered written call option), including brokerage commission, is recognized as a realized gain or loss. When a written put option is exercised, the amount of the premium received is subtracted from the cost of the security purchased by the Fund from the exercise of the written put option to form the Fund’s basis in the underlying security purchased. The writer or buyer of an option traded on an exchange can liquidate the position before the exercise of the option by entering into a closing transaction. The cost of a closing transaction is deducted from the original premium received resulting in a realized gain or loss to the Fund.
The risk in writing a covered call option is that the Fund may forego the opportunity of profit if the market price of the underlying security increases and the option is exercised. The risk in writing a put option is that the Fund may incur a loss if the market price of the underlying security decreases and the option is exercised. The risk in writing an uncovered call option is that the Fund is exposed to the risk of loss if the market price of the underlying security increases. In addition, there is the risk that the Fund may not be able to enter into a closing transaction because of an illiquid secondary market.
(d) Options on futures contracts. The Fund may purchase or write option contracts generally to gain or reduce exposure to types of investments or market factors or as a means of attempting to enhance returns. An option on a futures contract gives the purchaser the right, in return for the premium paid, to assume a position in the underlying futures contract at the specified option exercise price at any time prior to the expiration date of the option. Upon exercise of an option, the delivery of the futures position by the writer of the option to the holder of the option will be accompanied by delivery of the accumulated balance in the writer’s futures margin account that represents the amount by which the market price of the futures contract exceeds (in the case of a call) or is less than (in the case of a put) the exercise price of the option on the futures contract. The potential for loss related to the purchase of an option on a futures contract is limited to the premium paid for the option plus transaction costs. Because the value of the option is fixed at the point of purchase, there are no daily cash payments by the purchaser to reflect changes in the value of the underlying contract; however, the value of the option changes daily and that change would be reflected in the net asset value of the Fund. The potential for loss related to writing call options is unlimited. The potential for loss related to writing put options is limited only by the aggregate strike price of the put option less the premium received.
| Western Asset Macro Opportunities Fund 2024 Semi-Annual Report |
41 |
Notes to financial statements (unaudited) (cont’d)
(e) Futures contracts. The Fund uses futures contracts generally to gain exposure to, or hedge against, changes in interest rates or gain exposure to, or hedge against, changes in certain asset classes. A futures contract represents a commitment for the future purchase or sale of an asset at a specified price on a specified date.
Upon entering into a futures contract, the Fund is required to deposit cash or securities with a broker in an amount equal to a certain percentage of the contract amount. This is known as the ‘‘initial margin’’ and subsequent payments (‘‘variation margin’’) are made or received by the Fund each day, depending on the daily fluctuation in the value of the contract. For certain futures, including foreign denominated futures, variation margin is not settled daily, but is recorded as a net variation margin payable or receivable. The daily changes in contract value are recorded as unrealized appreciation or depreciation in the Statement of Operations and the Fund recognizes a realized gain or loss when the contract is closed.
Futures contracts involve, to varying degrees, risk of loss in excess of the amounts reflected in the financial statements. In addition, there is the risk that the Fund may not be able to enter into a closing transaction because of an illiquid secondary market.
(f) Forward foreign currency contracts. The Fund enters into a forward foreign currency contract to hedge against foreign currency exchange rate risk on its non-U.S. dollar denominated securities or to facilitate settlement of a foreign currency denominated portfolio transaction. A forward foreign currency contract is an agreement between two parties to buy and sell a currency at a set price with delivery and settlement at a future date. The contract is marked-to-market daily and the change in value is recorded by the Fund as an unrealized gain or loss. When a forward foreign currency contract is closed, through either delivery or offset by entering into another forward foreign currency contract, the Fund recognizes a realized gain or loss equal to the difference between the value of the contract at the time it was opened and the value of the contract at the time it is closed.
Non-deliverable forward foreign currency exchange contracts are settled with the counterparty in cash without the delivery of foreign currency.
Forward foreign currency contracts involve elements of market risk in excess of the amounts reflected on the Statement of Assets and Liabilities. The Fund bears the risk of an unfavorable change in the foreign exchange rate underlying the forward foreign currency contract. Risks may also arise upon entering into these contracts from the potential inability of the counterparties to meet the terms of their contracts.
(g) Swap agreements. The Fund invests in swaps for the purpose of managing its exposure to interest rate, credit or market risk, or for other purposes, including to increase the Fund’s return. The use of swaps involves risks that are different from those associated with other portfolio transactions. Swap agreements are privately negotiated in the over-the-counter market and may be entered into as a bilateral contract (“OTC Swaps”) or centrally cleared (“Centrally Cleared Swaps”). Unlike Centrally Cleared Swaps, the Fund has credit exposure to the counterparties of OTC Swaps.
In a Centrally Cleared Swap, immediately following execution of the swap, the swap agreement is submitted to a clearinghouse or central counterparty (the “CCP”) and the CCP becomes the ultimate counterparty of the swap agreement. The Fund is required to interface with the CCP through a broker, acting in an agency capacity. All payments are
42 | Western Asset Macro Opportunities Fund 2024 Semi-Annual Report |
settled with the CCP through the broker. Upon entering into a Centrally Cleared Swap, the Fund is required to deposit initial margin with the broker in the form of cash or securities.
Swap contracts are marked-to-market daily and changes in value are recorded as unrealized appreciation (depreciation). The daily change in valuation of Centrally Cleared Swaps, if any, is recorded as a net receivable or payable for variation margin on the Statement of Assets and Liabilities. Gains or losses are realized upon termination of the swap agreement. Collateral, in the form of restricted cash or securities, may be required to be held in segregated accounts with the Fund’s custodian in compliance with the terms of the swap contracts. Securities posted as collateral for swap contracts are identified in the Schedule of Investments and restricted cash, if any, is identified on the Statement of Assets and Liabilities. Risks may exceed amounts recorded in the Statement of Assets and Liabilities. These risks include changes in the returns of the underlying instruments, failure of the counterparties to perform under the contracts’ terms, and the possible lack of liquidity with respect to the swap agreements.
OTC Swap payments received or made at the beginning of the measurement period are reflected as a premium or deposit, respectively, on the Statement of Assets and Liabilities. These upfront payments are amortized over the life of the swap and are recognized as realized gain or loss in the Statement of Operations. Net periodic payments received or paid by the Fund are recognized as a realized gain or loss in the Statement of Operations.
The Fund’s maximum exposure in the event of a defined credit event on a credit default swap to sell protection is the notional amount. As of April 30, 2024, the total notional value of all credit default swaps to sell protection was $3,270,000. This amount would be offset by the value of the swap’s reference entity, upfront premiums received on the swap and any amounts received from the settlement of a credit default swap where the Fund bought protection for the same referenced security/entity.
For average notional amounts of swaps held during the six months ended April 30, 2024, see Note 4.
Credit default swaps
The Fund enters into credit default swap (“CDS”) contracts for investment purposes, to manage its credit risk or to add leverage. CDS agreements involve one party making a stream of payments to another party in exchange for the right to receive a specified return in the event of a default by a third party, typically corporate or sovereign issuers, on a specified obligation, or in the event of a write-down, principal shortfall, interest shortfall or default of all or part of the referenced entities comprising a credit index. The Fund may use a CDS to provide protection against defaults of the issuers (i.e., to reduce risk where the Fund has exposure to an issuer) or to take an active long or short position with respect to the likelihood of a particular issuer’s default. As a seller of protection, the Fund generally receives an upfront payment or a stream of payments throughout the term of the swap provided that there is no credit event. If the Fund is a seller of protection and a credit event occurs, as defined under the terms of that particular swap agreement, the maximum potential amount of future payments (undiscounted) that the Fund could be required to make under a CDS agreement would be an amount equal to the notional amount of the agreement. These amounts of potential payments will be partially offset by any recovery of values from the respective referenced obligations. As a seller of protection, the Fund
| Western Asset Macro Opportunities Fund 2024 Semi-Annual Report |
43 |
Notes to financial statements (unaudited) (cont’d)
effectively adds leverage to its portfolio because, in addition to its total net assets, the Fund is subject to investment exposure on the notional amount of the swap. As a buyer of protection, the Fund generally receives an amount up to the notional value of the swap if a credit event occurs.
Implied spreads are the theoretical prices a lender receives for credit default protection. When spreads rise, market perceived credit risk rises and when spreads fall, market perceived credit risk falls. The implied credit spread of a particular referenced entity reflects the cost of buying/selling protection and may include upfront payments required to enter into the agreement. Wider credit spreads and decreasing market values, when compared to the notional amount of the swap, represent a deterioration of the referenced entity’s credit soundness and a greater likelihood or risk of default or other credit event occurring as defined under the terms of the agreement. Credit spreads utilized in determining the period end market value of CDS agreements on corporate or sovereign issues are disclosed in the Schedule of Investments and serve as an indicator of the current status of the payment/ performance risk and represent the likelihood or risk of default for credit derivatives. For CDS agreements on asset-backed securities and credit indices, the quoted market prices and resulting values, particularly in relation to the notional amount of the contract as well as the annual payment rate, serve as an indication of the current status of the payment/ performance risk.
The Fund’s maximum risk of loss from counterparty risk, as the protection buyer, is the fair value of the contract (this risk is mitigated by the posting of collateral by the counterparty to the Fund to cover the Fund’s exposure to the counterparty). As the protection seller, the Fund’s maximum risk is the notional amount of the contract. CDS are considered to have credit risk-related contingent features since they require payment by the protection seller to the protection buyer upon the occurrence of a defined credit event.
Entering into a CDS agreement involves, to varying degrees, elements of credit, market and documentation risk in excess of the related amounts recognized on the Statement of Assets and Liabilities. Such risks involve the possibility that there will be no liquid market for these agreements, that the counterparty to the agreement may default on its obligation to perform or disagree as to the meaning of the contractual terms in the agreement, and that there will be unfavorable changes in net interest rates.
Interest rate swaps
The Fund enters into interest rate swap contracts to manage its exposure to interest rate risk. Interest rate swaps are agreements between two parties to exchange cash flows based on a notional principal amount. The Fund may elect to pay a fixed rate and receive a floating rate, receive a fixed rate and pay a floating rate, or pay and receive a floating rate, on a notional principal amount. Interest rate swaps are marked-to-market daily based upon quotations from market makers and the change, if any, is recorded as an unrealized appreciation or depreciation in the Statement of Operations. When a swap contract is terminated early, the Fund records a realized gain or loss equal to the difference between the original cost and the settlement amount of the closing transaction.
The risks of interest rate swaps include changes in market conditions that will affect the value of the contract or changes in the present value of the future cash flow streams and the possible inability of the counterparty to fulfill its obligations under the agreement. The
44 | Western Asset Macro Opportunities Fund 2024 Semi-Annual Report |
Fund’s maximum risk of loss from counterparty credit risk is the discounted net value of the cash flows to be received from the counterparty over the contract’s remaining life, to the extent that amount is positive. This risk is mitigated by the posting of collateral by the counterparty to the Fund to cover the Fund’s exposure to the counterparty.
Total return swaps
The Fund enters into total return swaps for investment purposes. Total return swaps are agreements to exchange the return generated by one instrument for the return generated by another instrument. For example, the agreement to pay a predetermined or fixed interest rate in exchange for a market-linked return based on a notional amount. To the extent the total return of a referenced index or instrument exceeds the offsetting interest obligation, the Fund will receive a payment from the counterparty. To the extent it is less, the Fund will make a payment to the counterparty.
(h) Swaptions. The Fund may purchase or write swaption contracts to manage exposure to fluctuations in interest rates or to enhance yield. The Fund may also purchase and write swaption contracts to manage exposure to an underlying instrument. Swaption contracts written by the Fund represent an option that gives the purchaser the right, but not the obligation, to enter into a previously agreed upon swap contract at a future date. Swaption contracts purchased by the Fund represent an option that gives the Fund the right, but not the obligation, to enter into a previously agreed upon swap contract at a future date.
When the Fund writes a swaption, an amount equal to the premium received by the Fund is recorded as a liability, the value of which is marked-to-market daily to reflect the current market value of the swaption written. If the swaption expires, the Fund realizes a gain equal to the amount of the premium received.
When the Fund purchases a swaption, an amount equal to the premium paid by the Fund is recorded as an investment on the Statement of Assets and Liabilities, the value of which is marked-to-market daily to reflect the current market value of the swaption purchased. If the swaption expires, the Fund realizes a loss equal to the amount of the premium paid.
Swaptions are marked-to-market daily based upon quotations from market makers. Changes in the value of the swaption are reported as unrealized gains or losses in the Statement of Operations.
(i) Loan participations. The Fund may invest in loans arranged through private negotiation between one or more financial institutions. The Fund’s investment in any such loan may be in the form of a participation in or an assignment of the loan. In connection with purchasing participations, the Fund generally will have no right to enforce compliance by the borrower with the terms of the loan agreement related to the loan, or any rights of offset against the borrower and the Fund may not benefit directly from any collateral supporting the loan in which it has purchased the participation.
The Fund assumes the credit risk of the borrower, the lender that is selling the participation and any other persons interpositioned between the Fund and the borrower. In the event of the insolvency of the lender selling the participation, the Fund may be treated as a general creditor of the lender and may not benefit from any offset between the lender and the borrower.
| Western Asset Macro Opportunities Fund 2024 Semi-Annual Report |
45 |
Notes to financial statements (unaudited) (cont’d)
(j) Stripped securities. The Fund may invest in ‘‘Stripped Securities,’’ a term used collectively for components, or strips, of fixed income securities. Stripped Securities can be principal only securities (“PO”), which are debt obligations that have been stripped of unmatured interest coupons, or interest only securities (“IO”), which are unmatured interest coupons that have been stripped from debt obligations. The market value of Stripped Securities will fluctuate in response to changes in economic conditions, rates of prepayment, interest rates and the market’s perception of the securities. However, fluctuations in response to interest rates may be greater in Stripped Securities than for debt obligations of comparable maturities that pay interest currently. The amount of fluctuation may increase with a longer period of maturity.
The yield to maturity on IO’s is sensitive to the rate of principal repayments (including prepayments) on the related underlying debt obligation and principal payments may have a material effect on yield to maturity. If the underlying debt obligation experiences greater than anticipated prepayments of principal, the Fund may not fully recoup its initial investment in IO’s.
(k) Securities traded on a to-be-announced basis. The Fund may trade securities on a to-be-announced (“TBA”) basis. In a TBA transaction, the Fund commits to purchasing or selling securities which have not yet been issued by the issuer and for which specific information, such as the face amount, maturity date and underlying pool of investments in U.S. government agency mortgage pass-through securities, is not announced. Securities purchased on a TBA basis are not settled until they are delivered to the Fund. Beginning on the date the Fund enters into a TBA transaction, cash, U.S. government securities or other liquid high-grade debt obligations are segregated in an amount equal in value to the purchase price of the TBA security. These securities are subject to market fluctuations and their current value is determined in the same manner as for other securities.
(l) Mortgage dollar rolls. The Fund may enter into mortgage dollar rolls in which the Fund sells mortgage-backed securities for delivery in the current month, realizing a gain or loss, and simultaneously entering into contracts to repurchase substantially similar (same type, coupon and maturity) securities to settle on a specified future date.
The Fund executes its mortgage dollar rolls entirely in the TBA market, whereby the Fund makes a forward commitment to purchase a security and, instead of accepting delivery, the position is offset by a sale of the security with a simultaneous agreement to repurchase at a future date. The Fund accounts for mortgage dollar rolls as purchases and sales.
The risk of entering into mortgage dollar rolls is that the market value of the securities the Fund is obligated to repurchase under the agreement may decline below the repurchase price. In the event the buyer of securities under a mortgage dollar roll files for bankruptcy or becomes insolvent, the Fund’s use of the proceeds of the mortgage dollar roll may be restricted pending a determination by the counterparty, or its trustee or receiver, whether to enforce the Fund’s obligation to repurchase the securities.
(m) Inflation-indexed bonds. Inflation-indexed bonds are fixed income securities whose principal value or interest rate is periodically adjusted according to the rate of inflation. As the index measuring inflation changes, the principal value or interest rate of inflation-indexed bonds will be adjusted accordingly. Inflation adjustments to the principal amount of
46 | Western Asset Macro Opportunities Fund 2024 Semi-Annual Report |
inflation-indexed bonds are reflected as an increase or decrease to investment income on the Statement of Operations. Repayment of the original bond principal upon maturity (as adjusted for inflation) is guaranteed in the case of U.S. Treasury inflation-indexed bonds. For bonds that do not provide a similar guarantee, the adjusted principal value of the bond repaid at maturity may be less than the original principal.
(n) Foreign currency translation. Investment securities and other assets and liabilities denominated in foreign currencies are translated into U.S. dollar amounts based upon prevailing exchange rates on the date of valuation. Purchases and sales of investment securities and income and expense items denominated in foreign currencies are translated into U.S. dollar amounts based upon prevailing exchange rates on the respective dates of such transactions.
The Fund does not isolate that portion of the results of operations resulting from fluctuations in foreign exchange rates on investments from the fluctuations arising from changes in market prices of securities held. Such fluctuations are included with the net realized and unrealized gain or loss on investments.
Net realized foreign exchange gains or losses arise from sales of foreign currencies, including gains and losses on forward foreign currency contracts, currency gains or losses realized between the trade and settlement dates on securities transactions, and the difference between the amounts of dividends, interest, and foreign withholding taxes recorded on the Fund’s books and the U.S. dollar equivalent of the amounts actually received or paid. Net unrealized foreign exchange gains and losses arise from changes in the values of assets and liabilities, other than investments in securities, on the date of valuation, resulting from changes in exchange rates.
Foreign security and currency transactions may involve certain considerations and risks not typically associated with those of U.S. dollar denominated transactions as a result of, among other factors, the possibility of lower levels of governmental supervision and regulation of foreign securities markets and the possibility of political or economic instability.
(o) Credit and market risk. The Fund invests in high-yield and emerging market instruments that are subject to certain credit and market risks. The yields of high-yield and emerging market debt obligations reflect, among other things, perceived credit and market risks. The Fund’s investments in securities rated below investment grade typically involve risks not associated with higher rated securities including, among others, greater risk related to timely and ultimate payment of interest and principal, greater market price volatility and less liquid secondary market trading. The consequences of political, social, economic or diplomatic changes may have disruptive effects on the market prices of investments held by the Fund. The Fund’s investments in non-U.S. dollar denominated securities may also result in foreign currency losses caused by devaluations and exchange rate fluctuations.
Investments in securities that are collateralized by real estate mortgages are subject to certain credit and liquidity risks. When market conditions result in an increase in default rates of the underlying mortgages and the foreclosure values of underlying real estate properties are materially below the outstanding amount of these underlying mortgages,
| Western Asset Macro Opportunities Fund 2024 Semi-Annual Report |
47 |
Notes to financial statements (unaudited) (cont’d)
collection of the full amount of accrued interest and principal on these investments may be doubtful. Such market conditions may significantly impair the value and liquidity of these investments and may result in a lack of correlation between their credit ratings and values.
(p) Foreign investment risks. The Fund’s investments in foreign securities may involve risks not present in domestic investments. Since securities may be denominated in foreign currencies, may require settlement in foreign currencies or may pay interest or dividends in foreign currencies, changes in the relationship of these foreign currencies to the U.S. dollar can significantly affect the value of the investments and earnings of the Fund. Foreign investments may also subject the Fund to foreign government exchange restrictions, expropriation, taxation or other political, social or economic developments, all of which affect the market and/or credit risk of the investments.
(q) Counterparty risk and credit-risk-related contingent features of derivative instruments. The Fund may invest in certain securities or engage in other transactions where the Fund is exposed to counterparty credit risk in addition to broader market risks. The Fund may invest in securities of issuers, which may also be considered counterparties as trading partners in other transactions. This may increase the risk of loss in the event of default or bankruptcy by the counterparty or if the counterparty otherwise fails to meet its contractual obligations. The Fund’s subadviser attempts to mitigate counterparty risk by (i) periodically assessing the creditworthiness of its trading partners, (ii) monitoring and/or limiting the amount of its net exposure to each individual counterparty based on its assessment and (iii) requiring collateral from the counterparty for certain transactions. Market events and changes in overall economic conditions may impact the assessment of such counterparty risk by the subadviser. In addition, declines in the values of underlying collateral received may expose the Fund to increased risk of loss.
With exchange traded and centrally cleared derivatives, there is less counterparty risk to the Fund since the exchange or clearinghouse, as counterparty to such instruments, guarantees against a possible default. The clearinghouse stands between the buyer and the seller of the contract; therefore, the credit risk is limited to failure of the clearinghouse. While offset rights may exist under applicable law, the Fund does not have a contractual right of offset against a clearing broker or clearinghouse in the event of a default of the clearing broker or clearinghouse.
The Fund has entered into master agreements, such as an International Swaps and Derivatives Association, Inc. Master Agreement (“ISDA Master Agreement”) or similar agreement, with certain of its derivative counterparties that govern over-the-counter (“OTC”) derivatives and provide for general obligations, representations, agreements, collateral posting terms, netting provisions in the event of default or termination and credit related contingent features. The credit related contingent features include, but are not limited to, a percentage decrease in the Fund’s net assets or net asset value per share over a specified period of time. If these credit related contingent features were triggered, the derivatives counterparty could terminate the positions and demand payment or require additional collateral.
Under an ISDA Master Agreement, the Fund may, under certain circumstances, offset with the counterparty certain derivative financial instruments’ payables and/or receivables with collateral held and/or posted and create one single net payment. However, absent an event
48 | Western Asset Macro Opportunities Fund 2024 Semi-Annual Report |
of default by the counterparty or a termination of the agreement, the terms of the ISDA Master Agreements do not result in an offset of reported amounts of financial assets and financial liabilities in the Statement of Assets and Liabilities across transactions between the Fund and the applicable counterparty. The enforceability of the right to offset may vary by jurisdiction.
Collateral requirements differ by type of derivative. Collateral or margin requirements are set by the broker or exchange clearinghouse for exchange traded derivatives while collateral terms are contract specific for OTC traded derivatives. Cash collateral that has been pledged to cover obligations of the Fund under derivative contracts, if any, will be reported separately in the Statement of Assets and Liabilities. Securities pledged as collateral, if any, for the same purpose are noted in the Schedule of Investments.
As of April 30, 2024, the Fund held OTC written options, forward foreign currency contracts and OTC total return swaps with credit related contingent features which had a liability position of $608,648. If a contingent feature in the master agreements would have been triggered, the Fund would have been required to pay this amount to its derivatives counterparties. As of April 30, 2024, the Fund had posted with its counterparties cash and/or securities as collateral to cover the net liability of these derivatives amounting to $240,000 which could be used to reduce the required payment.
At April 30, 2024, the Fund held cash collateral from Citibank N.A. in the amount of $20,000 and non-cash collateral from Bank of America N.A. and BNP Paribas SA in the amounts of $368,124 and $1,020,502, respectively. These amounts could be used to reduce the Fund’s exposure to the counterparty in the event of default.
(r) Security transactions and investment income. Security transactions are accounted for on a trade date basis. Interest income (including interest income from payment-in-kind securities) is recorded on the accrual basis. Amortization of premiums and accretion of discounts on debt securities are recorded to interest income over the lives of the respective securities, except for premiums on certain callable debt securities, which are amortized to the earliest call date. Paydown gains and losses on mortgage- and asset-backed securities are recorded as adjustments to interest income. Dividend income is recorded on the ex-dividend date for dividends received in cash and/or securities. Foreign dividend income is recorded on the ex-dividend date or as soon as practicable after the Fund determines the existence of a dividend declaration after exercising reasonable due diligence. The cost of investments sold is determined by use of the specific identification method. To the extent any issuer defaults or a credit event occurs that impacts the issuer, the Fund may halt any additional interest income accruals and consider the realizability of interest accrued up to the date of default or credit event.
(s) Distributions to shareholders. Distributions from net investment income and distributions of net realized gains, if any, are declared at least annually. Distributions to shareholders of the Fund are recorded on the ex-dividend date and are determined in accordance with income tax regulations, which may differ from GAAP.
(t) Share class accounting. Investment income, common expenses and realized/ unrealized gains (losses) on investments are allocated to the various classes of the Fund on
| Western Asset Macro Opportunities Fund 2024 Semi-Annual Report |
49 |
Notes to financial statements (unaudited) (cont’d)
the basis of daily net assets of each class. Fees relating to a specific class are charged directly to that share class.
(u) Compensating balance arrangements. The Fund has an arrangement with its custodian bank whereby a portion of the custodian’s fees is paid indirectly by credits earned on the Fund’s cash on deposit with the bank.
(v) Federal and other taxes. It is the Fund’s policy to comply with the federal income and excise tax requirements of the Internal Revenue Code of 1986 (the “Code”), as amended, applicable to regulated investment companies. Accordingly, the Fund intends to distribute its taxable income and net realized gains, if any, to shareholders in accordance with timing requirements imposed by the Code. Therefore, no federal or state income tax provision is required in the Fund’s financial statements.
Management has analyzed the Fund’s tax positions taken on income tax returns for all open tax years and has concluded that as of October 31, 2023, no provision for income tax is required in the Fund’s financial statements. The Fund’s federal and state income and federal excise tax returns for tax years for which the applicable statutes of limitations have not expired are subject to examination by the Internal Revenue Service and state departments of revenue.
Under the applicable foreign tax laws, a withholding tax may be imposed on interest, dividends and capital gains at various rates. Realized gains upon the disposition of securities issued in or by certain foreign countries are subject to capital gains tax imposed by those countries.
(w) Reclassification. GAAP requires that certain components of net assets be reclassified to reflect permanent differences between financial and tax reporting. These reclassifications have no effect on net assets or net asset value per share.
2. Investment management agreement and other transactions with affiliates
Franklin Templeton Fund Adviser, LLC (“FTFA”) is the Fund’s investment manager. Western Asset Management Company, LLC (“Western Asset”), Western Asset Management Company Pte. Ltd. in Singapore (“Western Asset Singapore”), Western Asset Management Company Ltd in Japan (“Western Asset Japan”) and Western Asset Management Company Limited (“Western Asset London”) are the Fund’s subadvisers. FTFA, Western Asset, Western Asset Singapore, Western Asset Japan and Western Asset London are indirect, wholly-owned subsidiaries of Franklin Resources, Inc. (“Franklin Resources”).
FTFA provides administrative and certain oversight services to the Fund. The Fund pays FTFA an investment management fee, calculated daily and paid monthly, at an annual rate of 1.15% of the Fund’s average daily net assets.
As a result of expense limitation arrangements between the Fund and FTFA, the ratio of total annual fund operating expenses, other than interest, brokerage commissions, taxes, extraordinary expenses, deferred organizational expenses and acquired fund fees and expenses, to average net assets of Class A, Class C, Class FI, Class I and Class IS shares did not exceed 1.58%, 2.40%, 1.65%, 1.35% and 1.25%, respectively. In addition, the ratio of total annual fund operating expenses for Class IS shares did not exceed the ratio of total annual fund operating expenses for Class I shares. These expense limitation arrangements
50 | Western Asset Macro Opportunities Fund 2024 Semi-Annual Report |
cannot be terminated prior to December 31, 2025 without the Board of Directors’ consent. In addition, the manager has agreed to waive the Fund’s management fee to an extent sufficient to offset the net management fee payable in connection with any investment in an affiliated money market fund (the “affiliated money market fund waiver”). The affiliated money market fund waiver is not subject to the recapture provision discussed below.
During the six months ended April 30, 2024, fees waived and/or expenses reimbursed amounted to $50,287, which included an affiliated money market fund waiver of $1,658.
FTFA is permitted to recapture amounts waived and/or reimbursed to a class within two years after the fiscal year in which FTFA earned the fee or incurred the expense if the class’ total annual fund operating expenses have fallen to a level below the expense limitation (“expense cap”) in effect at the time the fees were earned or the expenses incurred. In no case will FTFA recapture any amount that would result, on any particular business day of the Fund, in the class’ total annual fund operating expenses exceeding the expense cap or any other lower limit then in effect.
Pursuant to these arrangements, at April 30, 2024, the Fund had remaining fee waivers and/or expense reimbursements subject to recapture by FTFA and respective dates of expiration as follows:
| Class A | Class C | Class FI | Class I | Class IS | ||||||||||||||||
| Expires October 31, 2024 | — | — | — | — | — | |||||||||||||||
| Expires October 31, 2025 | — | — | — | — | — | |||||||||||||||
| Expires October 31, 2026 | $ | 2,458 | $ | 510 | $ | 932 | $ | 34,138 | $ | 10,591 | ||||||||||
| Total fee waivers/expense reimbursements subject to recapture | $ | 2,458 | $ | 510 | $ | 932 | $ | 34,138 | $ | 10,591 | ||||||||||
For the six months ended April 30, 2024, FTFA did not recapture any fees.
Franklin Distributors, LLC (“Franklin Distributors”) serves as the Fund’s sole and exclusive distributor. Franklin Distributors is an indirect, wholly-owned broker-dealer subsidiary of Franklin Resources. Franklin Templeton Investor Services, LLC (“Investor Services”) serves as the Fund’s shareholder servicing agent and acts as the Fund’s transfer agent and dividend-paying agent. Investor Services is an indirect, wholly-owned subsidiary of Franklin Resources. Each class of shares of the Fund pays transfer agent fees to Investor Services for its performance of shareholder servicing obligations. Investor Services charges account-based fees based on the number of individual shareholder accounts, as well as a fixed percentage fee based on the total account-based fees charged. In addition, each class reimburses Investor Services for out of pocket expenses incurred. For the six months ended April 30, 2024, the Fund incurred transfer agent fees as reported on the Statement of Operations, of which $5,987 was earned by Investor Services.
There is a maximum initial sales charge of 3.75% for Class A shares. There is a contingent deferred sales charge (“CDSC”) of 1.00% on Class C shares, which applies if redemption occurs within 12 months from purchase payment. In certain cases, Class A shares have a 1.00% CDSC, which applies if redemption occurs within 18 months from purchase payment. This CDSC only applies to those purchases of Class A shares, which, when combined with
| Western Asset Macro Opportunities Fund 2024 Semi-Annual Report |
51 |
Notes to financial statements (unaudited) (cont’d)
current holdings of other shares of funds sold by Franklin Distributors, equal or exceed $500,000 in the aggregate. These purchases do not incur an initial sales charge.
For the six months ended April 30, 2024, sales charges retained by and CDSCs paid to Franklin Distributors and its affiliates, if any, were as follows:
| Class A | ||||
| Sales charges | $ | 8 | ||
| CDSCs | — | |||
All officers and one Director of the Corporation are employees of Franklin Resources or its affiliates and do not receive compensation from the Corporation.
3. Investments
During the six months ended April 30, 2024, the aggregate cost of purchases and proceeds from sales of investments (excluding short-term investments) and U.S. Government & Agency Obligations were as follows:
| Investments | U.S. Government & Agency Obligations | |||||||
| Purchases | $ | 9,674,587 | $ | 75,196,913 | ||||
| Sales | 60,164,591 | 110,156,409 | ||||||
At April 30, 2024, the aggregate cost of investments and the aggregate gross unrealized appreciation and depreciation of investments for federal income tax purposes were substantially as follows:
| Cost/Premiums Paid (Received) | Gross Unrealized Appreciation | Gross Unrealized Depreciation | Net Unrealized Appreciation (Depreciation) | |||||||||||||
| Securities | $ | 298,593,471 | $ | 5,542,471 | $ | (41,589,414) | $ | (36,046,943) | ||||||||
| Written options | (1,710,860) | 902,214 | (146,245) | 755,969 | ||||||||||||
| Futures contracts | — | 14,246,532 | (27,539,117) | (13,292,585) | ||||||||||||
| Forward foreign currency contracts | — | 1,753,283 | (433,040) | 1,320,243 | ||||||||||||
Swap contracts | 2,840,691 | 17,413,021 | (8,526,223) | 8,886,798 | ||||||||||||
52 | Western Asset Macro Opportunities Fund 2024 Semi-Annual Report |
4. Derivative instruments and hedging activities
Below is a table, grouped by derivative type, that provides information about the fair value and the location of derivatives within the Statement of Assets and Liabilities at April 30, 2024.
| ASSET DERIVATIVES1 | ||||||||||||||||
| Interest Rate Risk | Foreign Exchange Risk | Credit Risk | Total | |||||||||||||
| Purchased options2 | $ | 342,500 | $ | 109,369 | $ | 24,007 | $ | 475,876 | ||||||||
| Futures contracts3 | 13,483,771 | 762,761 | — | 14,246,532 | ||||||||||||
| Forward foreign currency contracts | — | 1,753,283 | — | 1,753,283 | ||||||||||||
| OTC swap contracts4 | 1,155,660 | — | — | 1,155,660 | ||||||||||||
| Centrally cleared swap contracts5 | 15,994,850 | — | 262,511 | 16,257,361 | ||||||||||||
| Total | $ | 30,976,781 | $ | 2,625,413 | $ | 286,518 | $ | 33,888,712 | ||||||||
| LIABILITY DERIVATIVES1 | ||||||||||||||||
| Interest Rate Risk | Foreign Exchange Risk | Credit Risk | Total | |||||||||||||
| Written options | $ | 835,765 | $ | 112,400 | $ | 6,726 | $ | 954,891 | ||||||||
| Futures contracts3 | 25,508,657 | 2,030,460 | — | 27,539,117 | ||||||||||||
| Forward foreign currency contracts | — | 433,040 | — | 433,040 | ||||||||||||
| OTC swap contracts4 | 56,482 | — | — | 56,482 | ||||||||||||
| Centrally cleared swap contracts5 | 8,469,741 | — | — | 8,469,741 | ||||||||||||
| Total | $ | 34,870,645 | $ | 2,575,900 | $ | 6,726 | $ | 37,453,271 | ||||||||
| 1 | Generally, the balance sheet location for asset derivatives is receivables/net unrealized appreciation and for liability derivatives is payables/net unrealized depreciation. |
| 2 | Market value of purchased options is reported in Investments in unaffiliated securities at value in the Statement of Assets and Liabilities. |
| 3 | Includes cumulative unrealized appreciation (depreciation) of futures contracts as reported in the Schedule of Investments. Only net variation margin is reported within the receivables and/or payables on the Statement of Assets and Liabilities. |
| 4 | Values include premiums paid (received) on swap contracts which are shown separately in the Statement of Assets and Liabilities. |
| 5 | Includes cumulative unrealized appreciation (depreciation) of centrally cleared swap contracts as reported in the Schedule of Investments. Only net variation margin is reported within the receivables and/or payables on the Statement of Assets and Liabilities. |
| Western Asset Macro Opportunities Fund 2024 Semi-Annual Report |
53 |
Notes to financial statements (unaudited) (cont’d)
The following tables provide information about the effect of derivatives and hedging activities on the Fund’s Statement of Operations for the six months ended April 30, 2024. The first table provides additional detail about the amounts and sources of gains (losses) realized on derivatives during the period. The second table provides additional information about the change in net unrealized appreciation (depreciation) resulting from the Fund’s derivatives and hedging activities during the period.
| AMOUNT OF NET REALIZED GAIN (LOSS) ON DERIVATIVES RECOGNIZED | ||||||||||||||||
| Interest Rate Risk | Foreign Exchange Risk | Credit Risk | Total | |||||||||||||
| Purchased options1 | $ | (14,201,867) | $ | (789,641) | — | $ | (14,991,508) | |||||||||
| Futures contracts | (7,910,757) | 1,334,085 | — | (6,576,672) | ||||||||||||
| Written options | 17,047,343 | 680,849 | — | 17,728,192 | ||||||||||||
| Swap contracts | 8,816,760 | — | $ | (379,765) | 8,436,995 | |||||||||||
| Forward foreign currency contracts | — | (1,638,913) | — | (1,638,913) | ||||||||||||
| Total | $ | 3,751,479 | $ | (413,620) | $ | (379,765) | $ | 2,958,094 | ||||||||
| 1 | Net realized gain (loss) from purchased options is reported in Net Realized Gain (Loss) From Investment transactions in unaffiliated securities in the Statement of Operations. |
| CHANGE IN NET UNREALIZED APPRECIATION (DEPRECIATION) ON DERIVATIVES RECOGNIZED | ||||||||||||||||
| Interest Rate Risk | Foreign Exchange Risk | Credit Risk | Total | |||||||||||||
| Purchased options1 | $ | 1,659,815 | $ | 71,743 | $ | 4,603 | $ | 1,736,161 | ||||||||
| Futures contracts | 18,886,914 | (353,647) | — | 18,533,267 | ||||||||||||
| Written options | (2,650,814) | (23,038) | 11,331 | (2,662,521) | ||||||||||||
| Swap contracts | (12,755,836) | — | 280,324 | (12,475,512) | ||||||||||||
| Forward foreign currency contracts | — | 1,391,745 | — | 1,391,745 | ||||||||||||
| Total | $ | 5,140,079 | $ | 1,086,803 | $ | 296,258 | $ | 6,523,140 | ||||||||
| 1 | The change in net unrealized appreciation (depreciation) from purchased options is reported in the Change in Net Unrealized Appreciation (Depreciation) From Investments in unaffiliated securities in the Statement of Operations. |
During the six months ended April 30, 2024, the volume of derivative activity for the Fund was as follows:
| Average Market Value | ||||
| Purchased options | $ | 2,201,994 | ||
| Written options | 2,378,663 | |||
| Futures contracts (to buy) | 1,628,905,823 | |||
| Futures contracts (to sell) | 1,932,830,861 | |||
| Forward foreign currency contracts (to buy) | 62,232,903 | |||
| Forward foreign currency contracts (to sell) | 129,086,191 | |||
54 | Western Asset Macro Opportunities Fund 2024 Semi-Annual Report |
| Average Notional Balance | ||||
| Interest rate swap contracts | $ | 688,953,546 | ||
| Credit default swap contracts (buy protection) | 20,932,808 | |||
| Credit default swap contracts (sell protection) | 82,996,571 | |||
| Total return swap contracts | 2,815 | |||
The following table presents the Fund’s OTC derivative assets and liabilities by counterparty net of amounts available for offset under an ISDA Master Agreement and net of the related collateral pledged (received) by the Fund as of April 30, 2024.
| Counterparty | Gross Assets Subject to Master Agreements1 | Gross Liabilities Subject to Master Agreements1 | Net Assets (Liabilities) Subject to Master Agreements | Collateral Pledged (Received)2,3 | Net Amount4,5 | |||||||||||||||
| Bank of America N.A. | $ | 245,762 | $ | (6,726) | $ | 239,036 | $ | (245,762) | $ | (6,726) | ||||||||||
| BNP Paribas SA | 1,235,560 | — | 1,235,560 | (1,020,502) | 215,058 | |||||||||||||||
| Citibank N.A. | 65,687 | (161,871) | (96,184) | (20,000) | (116,184) | |||||||||||||||
| Goldman Sachs Group Inc. | 344,873 | (113,594) | 231,279 | 80,000 | 311,279 | |||||||||||||||
| JPMorgan Chase & Co. | 1,021,171 | (133,438) | 887,733 | 70,000 | 957,733 | |||||||||||||||
| Morgan Stanley & Co. Inc. | 35,903 | (193,019) | (157,116) | 90,000 | (67,116) | |||||||||||||||
| Total | $ | 2,948,956 | $ | (608,648) | $ | 2,340,308 | $ | (1,046,264) | $ | 1,294,044 | ||||||||||
| 1 | Absent an event of default or early termination, derivative assets and liabilities are presented gross and not offset in the Statement of Assets and Liabilities. |
| 2 | Gross amounts are not offset in the Statement of Assets and Liabilities. |
| 3 | In some instances, the actual collateral received and/or pledged may be more than the amount shown here due to overcollateralization. |
| 4 | Net amount may also include forward foreign currency exchange contracts that are not required to be collateralized. |
| 5 | Represents the net amount receivable (payable) from (to) the counterparty in the event of default. |
5. Class specific expenses, waivers and/or expense reimbursements
The Fund has adopted a Rule 12b-1 shareholder services and distribution plan and under that plan the Fund pays service and/or distribution fees with respect to its Class A, Class C and Class FI shares calculated at the annual rate of 0.25%, 1.00% and 0.25% of the average daily net assets of each class, respectively. Service and/or distribution fees are accrued daily and paid monthly.
| Western Asset Macro Opportunities Fund 2024 Semi-Annual Report |
55 |
Notes to financial statements (unaudited) (cont’d)
For the six months ended April 30, 2024, class specific expenses were as follows:
| Service and/or Distribution Fees | Transfer Agent Fees | |||||||
| Class A | $ | 17,795 | $ | 6,845 | ||||
| Class C | 27,603 | 2,123 | ||||||
| Class FI | 6,562 | 4,610 | ||||||
| Class I | — | 126,693 | ||||||
| Class IS | — | 5,955 | ||||||
| Total | $ | 51,960 | $ | 146,226 | ||||
For the six months ended April 30, 2024, waivers and/or expense reimbursements by class were as follows:
| Waivers/Expense Reimbursements | ||||
| Class A | $ | 2,532 | ||
| Class C | 539 | |||
| Class FI | 963 | |||
| Class I | 35,392 | |||
| Class IS | 10,861 | |||
| Total | $ | 50,287 | ||
6. Distributions to shareholders by class
| Six Months Ended April 30, 2024 | Year Ended October 31, 2023 | |||||||
| Net Investment Income: | ||||||||
| Class A | $ | 15,349 | — | |||||
| Class C | — | — | ||||||
| Class FI | — | — | ||||||
| Class I | 931,072 | — | ||||||
| Class IS | 253,584 | — | ||||||
| Total | $ | 1,200,005 | — | |||||
7. Capital shares
At April 30, 2024, the Corporation had 42.7 billion shares of capital stock authorized with a par value of $0.001 per share. Transactions in shares of each class were as follows:
| Six Months Ended April 30, 2024 | Year Ended October 31, 2023 | |||||||||||||||
| Shares | Amount | Shares | Amount | |||||||||||||
| Class A | ||||||||||||||||
| Shares sold | 154,496 | $ | 1,525,150 | 271,552 | $ | 2,489,393 | ||||||||||
| Shares issued on reinvestment | 1,045 | 10,759 | — | — | ||||||||||||
| Shares repurchased | (606,062) | (6,161,640) | (1,152,165) | (10,709,236) | ||||||||||||
| Net decrease | (450,521) | $ | (4,625,731) | (880,613) | $ | (8,219,843) | ||||||||||
56 | Western Asset Macro Opportunities Fund 2024 Semi-Annual Report |
| Six Months Ended April 30, 2024 | Year Ended October 31, 2023 | |||||||||||||||
| Shares | Amount | Shares | Amount | |||||||||||||
| Class C | ||||||||||||||||
| Shares sold | 1,251 | $ | 12,351 | 39,586 | $ | 347,283 | ||||||||||
| Shares issued on reinvestment | — | — | — | — | ||||||||||||
| Shares repurchased | (141,174) | (1,335,350) | (504,675) | (4,461,836) | ||||||||||||
| Net decrease | (139,923) | $ | (1,322,999) | (465,089) | $ | (4,114,553) | ||||||||||
| Class FI | ||||||||||||||||
| Shares sold | 7,218 | $ | 72,149 | 1,354,954 | $ | 13,212,563 | ||||||||||
| Shares issued on reinvestment | — | — | — | — | ||||||||||||
| Shares repurchased | (499,137) | (4,981,363) | (1,549,331) | (13,907,939) | ||||||||||||
| Net decrease | (491,919) | $ | (4,909,214) | (194,377) | $ | (695,376) | ||||||||||
| Class I | ||||||||||||||||
| Shares sold | 2,113,351 | $ | 20,834,842 | 12,853,046 | $ | 120,939,374 | ||||||||||
| Shares issued on reinvestment | 74,770 | 772,376 | — | — | ||||||||||||
| Shares repurchased | (8,516,107) | (83,749,816) | (28,608,164) | (266,337,051) | ||||||||||||
| Net decrease | (6,327,986) | $ | (62,142,598) | (15,755,118) | $ | (145,397,677) | ||||||||||
| Class IS | ||||||||||||||||
| Shares sold | 1,536,630 | $ | 15,367,612 | 1,207,303 | $ | 11,578,990 | ||||||||||
| Shares issued on reinvestment | 13,696 | 142,030 | — | — | ||||||||||||
| Shares repurchased | (3,550,843) | (34,985,426) | (15,524,209) | (143,684,019) | ||||||||||||
| Net decrease | (2,000,517) | $ | (19,475,784) | (14,316,906) | $ | (132,105,029) | ||||||||||
8. Transactions with affiliated company
As defined by the 1940 Act, an affiliated company is one in which the Fund owns 5% or more of the outstanding voting securities, or a company which is under common ownership or control with the Fund. The following company was considered an affiliated company for all or some portion of the six months ended April 30, 2024. The following transactions were effected in such company for the six months ended April 30, 2024.
| Affiliate Value at October 31, 2023 | Purchased | Sold | ||||||||||||||||||
| Cost | Shares | Proceeds | Shares | |||||||||||||||||
| Western Asset Premier Institutional Government Reserves, Premium Shares | $ | 4,478,088 | $ | 93,649,781 | 93,649,781 | $ | 97,502,970 | 97,502,970 | ||||||||||||
| Western Asset Macro Opportunities Fund 2024 Semi-Annual Report |
57 |
Notes to financial statements (unaudited) (cont’d)
| (cont’d) | Realized Gain (Loss) | Dividend Income | Net Increase (Decrease) in Unrealized Appreciation (Depreciation) | Affiliate Value at April 30, 2024 | ||||
| Western Asset Premier Institutional Government Reserves, Premium Shares | — | $112,062 | — | $624,899 |
9. Redemption facility
The Fund, together with other U.S. registered and foreign investment funds (collectively, the “Borrowers”) managed by Franklin Resources or its affiliates, is a borrower in a joint syndicated senior unsecured credit facility totaling $2.675 billion (the “Global Credit Facility”). The Global Credit Facility provides a source of funds to the Borrowers for temporary and emergency purposes, including the ability to meet future unanticipated or unusually large redemption requests. Unless renewed, the Global Credit Facility will terminate on January 31, 2025.
Under the terms of the Global Credit Facility, the Fund shall, in addition to interest charged on any borrowings made by the Fund and other costs incurred by the Fund, pay its share of fees and expenses incurred in connection with the implementation and maintenance of the Global Credit Facility, based upon its relative share of the aggregate net assets of all the Borrowers, including an annual commitment fee of 0.15% based upon the unused portion of the Global Credit Facility. These fees are reflected in the Statement of Operations. The Fund did not utilize the Global Credit Facility during the six months ended April 30, 2024.
10. Deferred capital losses
As of October 31, 2023, the Fund had deferred capital losses of $284,914,665, which have no expiration date, that will be available to offset future taxable capital gains.
11. Recent accounting pronouncement
In March 2020, the Financial Accounting Standards Board (FASB) issued Accounting Standards Update (ASU) No. 2020-04, Reference Rate Reform (Topic 848) – Facilitation of the Effects of Reference Rate Reform on Financial Reporting. In January 2021 and December 2022, the FASB issued ASU No. 2021-01 and ASU No. 2022-06, with further amendments to Topic 848. The amendments in the ASUs provide optional temporary accounting recognition and financial reporting relief from the effect of certain types of contract modifications due to the planned discontinuation of the London Interbank Offered Rate (LIBOR) and other interbank-offered based reference rates as of the end of 2021 for certain LIBOR settings and 2023 for the remainder. The ASUs are effective for certain reference rate-related contract modifications that occur during the period March 12, 2020 through December 31, 2024. Management has reviewed the requirements and believes the adoption of these ASUs will not have a material impact on the financial statements.
58 | Western Asset Macro Opportunities Fund 2024 Semi-Annual Report |
Western Asset
Macro Opportunities Fund
Directors
Robert Abeles, Jr.
Jane F. Dasher
Anita L. DeFrantz
Susan B. Kerley
Michael Larson
Ronald L. Olson
Avedick B. Poladian
William E.B. Siart
Chairman
Jaynie M. Studenmund
Peter J. Taylor
Jane Trust
Investment manager
Franklin Templeton Fund Adviser, LLC
Subadvisers
Western Asset Management Company, LLC
Western Asset Management Company Limited
Western Asset Management Company Ltd
Western Asset Management Company Pte. Ltd.
Distributor
Franklin Distributors, LLC
Custodian
The Bank of New York Mellon
Transfer agent
Franklin Templeton Investor Services, LLC
3344 Quality Drive
Rancho Cordova, CA 95670-7313
Independent registered public accounting firm
PricewaterhouseCoopers LLP Baltimore, MD
Western Asset Macro Opportunities Fund
The Fund is a separate investment series of Western Asset Funds, Inc.
Western Asset Macro Opportunities Fund
Legg Mason Funds
100 International Drive
Baltimore, MD 21202
The Fund files its complete schedule of portfolio holdings with the Securities and Exchange Commission (“SEC”) for the first and third quarters of each fiscal year as an exhibit to its reports on Form N-PORT. The Fund’s Forms N-PORT are available on the SEC’s website at www.sec.gov. To obtain information on Form N-PORT, shareholders can call the Fund at 877-6LM-FUND/656-3863.
Information on how the Fund voted proxies relating to portfolio securities during the prior 12-month period ended June 30th of each year and a description of the policies and procedures that the Fund uses to determine how to vote proxies related to portfolio transactions are available (1) without charge, upon request, by calling the Fund at 877-6LM-FUND/656-3863, (2) at www.franklintempleton.com and (3) on the SEC’s website at www.sec.gov.
This report is submitted for the general information of the shareholders of Western Asset Macro Opportunities Fund. This report is not authorized for distribution to prospective investors in the Fund unless preceded or accompanied by a current prospectus.
Investors should consider the Fund’s investment objectives, risks, charges and expenses carefully before investing. The prospectus contains this and other important information about the Fund. Please read the prospectus carefully before investing.
www.franklintempleton.com
© 2024 Franklin Distributors, LLC, Member FINRA/SIPC. All rights reserved.
Franklin Templeton Funds Privacy and Security Notice
Your Privacy Is Our Priority
Franklin Templeton* is committed to safeguarding your personal information. This notice is designed to provide you with a summary of the non-public personal information Franklin Templeton may collect and maintain about current or former individual investors; our policy regarding the use of that information; and the measures we take to safeguard the information. We do not sell individual investors’ non-public personal information to anyone and only share it as described in this notice.
Information We Collect
When you invest with us, you provide us with your non-public personal information. We collect and use this information to service your accounts and respond to your requests. The non-public personal information we may collect falls into the following categories:
| • | Information we receive from you or your financial intermediary on applications or other forms, whether we receive the form in writing or electronically. For example, this information may include your name, address, tax identification number, birth date, investment selection, beneficiary information, and your personal bank account information and/or email address if you have provided that information. |
| • | Information about your transactions and account history with us, or with other companies that are part of Franklin Templeton, including transactions you request on our website or in our app. This category also includes your communications to us concerning your investments. |
| • | Information we receive from third parties (for example, to update your address if you move, obtain or verify your email address or obtain additional information to verify your identity). |
| • | Information collected from you online, such as your IP address or device ID and data gathered from your browsing activity and location. (For example, we may use cookies to collect device and browser information so our website recognizes your online preferences and device information.) Our website contains more information about cookies and similar technologies and ways you may limit them. |
| • | Other general information that we may obtain about you such as demographic information. |
Disclosure Policy
To better service your accounts and process transactions or services you requested, we may share non-public personal information with other Franklin Templeton companies. From time to time we may also send you information about products/services offered by other Franklin Templeton companies although we will not share your non-public personal information with these companies without first offering you the opportunity to prevent that sharing.
We will only share non-public personal information with outside parties in the limited circumstances permitted by law. For example, this includes situations where we need to share information with companies who work on our behalf to service or maintain your account or
| NOT PART OF THE SEMI-ANNUAL REPORT |
Franklin Templeton Funds Privacy and Security Notice (cont’d)
process transactions you requested, when the disclosure is to companies assisting us with our own marketing efforts, when the disclosure is to a party representing you, or when required by law (for example, in response to legal process). Additionally, we will ensure that any outside companies working on our behalf, or with whom we have joint marketing agreements, are under contractual obligations to protect the confidentiality of your information, and to use it only to provide the services we asked them to perform.
Confidentiality and Security
Our employees are required to follow procedures with respect to maintaining the confidentiality of our investors’ non-public personal information. Additionally, we maintain physical, electronic and procedural safeguards to protect the information. This includes performing ongoing evaluations of our systems containing investor information and making changes when appropriate.
At all times, you may view our current privacy notice on our website at
https://www.franklintempleton.com/help/privacy-policy or contact us for a copy at (800) 632-2301.
*For purposes of this privacy notice Franklin Templeton shall refer to the following entities:
Fiduciary Trust International of the South (FTIOS), as custodian for individual retirement plans
Franklin Advisers, Inc.
Franklin Distributors, LLC, including as program manager of the Franklin Templeton 529 College Savings Plan and the NJBEST 529 College Savings Plan
Franklin Mutual Advisers, LLC
Franklin, Templeton and Mutual Series Funds
Franklin Templeton Institutional, LLC
Franklin Templeton Investments Corp., Canada
Franklin Templeton Investments Management, Limited UK
Legg Mason Funds
Templeton Asset Management, Limited
Templeton Global Advisors, Limited
Templeton Investment Counsel, LLC
If you are a customer of other Franklin Templeton affiliates and you receive notices from them, you will need to read those notices separately.
| NOT PART OF THE SEMI-ANNUAL REPORT |
Western Asset Management Company, LLC
Legg Mason, Inc. Subsidiaries
www.franklintempleton.com
© 2024 Franklin Distributors, LLC, Member FINRA/SIPC. All rights reserved.
WASX016460 6/24 SR24-4881
| ITEM 2. | CODE OF ETHICS. |
Not applicable.
| ITEM 3. | AUDIT COMMITTEE FINANCIAL EXPERT. |
Not applicable.
| ITEM 4. | PRINCIPAL ACCOUNTANT FEES AND SERVICES. |
Not applicable.
| ITEM 5. | AUDIT COMMITTEE OF LISTED REGISTRANTS. |
Not applicable.
| ITEM 6. | SCHEDULE OF INVESTMENTS. |
Included herein under Item 1.
| ITEM 7. | DISCLOSURE OF PROXY VOTING POLICIES AND PROCEDURES FOR CLOSED-END MANAGEMENT INVESTMENT COMPANIES. |
Not applicable.
| ITEM 8. | PORTFOLIO MANAGERS OF CLOSED-END MANAGEMENT INVESTMENT COMPANIES. |
Not applicable.
| ITEM 9. | PURCHASES OF SECURITIES BY CLOSED-END MANAGEMENT INVESTMENT COMPANY AND AFFILIATED PURCHASERS. |
Not applicable.
| ITEM 10. | SUBMISSION OF MATTERS TO A VOTE OF SECURITY HOLDERS. |
Not applicable.
| ITEM 11. | CONTROLS AND PROCEDURES. |
| (a) | The registrant’s principal executive officer and principal financial officer have concluded that the registrant’s disclosure controls and procedures (as defined in Rule 30a- 3(c) under the Investment Company Act of 1940, as amended (the “1940 Act”)) are effective as of a date within 90 days of the filing date of this report that includes the disclosure required by this paragraph, based on their evaluation of the disclosure controls and procedures required by Rule 30a-3(b) under the 1940 Act and 15d-15(b) under the Securities Exchange Act of 1934. |
| (b) | There were no changes in the registrant’s internal control over financial reporting (as defined in Rule 30a-3(d) under the 1940 Act) that occurred during the period covered by this report that have materially affected, or are likely to materially affect the registrant’s internal control over financial reporting. |
| ITEM 12. | DISCLOSURE OF SECURITIES LENDING ACTIVITIES FOR CLOSED-END MANAGEMENT INVESTMENT COMPANIES. |
Not applicable.
| ITEM 13. | RECOVERY OF ERRONEOUSLY AWARDED COMPENSATION. |
(a) Not applicable.
(b) Not applicable.
| ITEM 14. | EXHIBITS. |
(a) (1) Not applicable.
Exhibit 99.CODE ETH
(a) (2) Certifications pursuant to section 302 of the Sarbanes-Oxley Act of 2002 attached hereto.
(b) Certifications pursuant to Section 906 of the Sarbanes-Oxley Act of 2002 attached hereto.
SIGNATURES
Pursuant to the requirements of the Securities Exchange Act of 1934 and the Investment Company Act of 1940, the registrant has duly caused this Report to be signed on its behalf by the undersigned, there unto duly authorized.
Western Asset Funds, Inc.
| By: | /s/ Jane Trust | |
| Jane Trust | ||
| Chief Executive Officer | ||
| Date: | June 26, 2024 | |
Pursuant to the requirements of the Securities Exchange Act of 1934 and the Investment Company Act of 1940, this report has been signed below by the following persons on behalf of the registrant and in the capacities and on the dates indicated.
| By: | /s/ Jane Trust | |
| Jane Trust | ||
| Chief Executive Officer | ||
| Date: | June 26, 2024 | |
| By: | /s/ Christopher Berarducci | |
| Christopher Berarducci | ||
| Principal Financial Officer | ||
| Date: | June 26, 2024 | |