UNITED STATES
SECURITIES AND EXCHANGE COMMISSION
Washington, D.C. 20549
FORM N-CSR
CERTIFIED SHAREHOLDER REPORT OF REGISTERED
MANAGEMENT INVESTMENT COMPANIES
Investment Company Act file number: (811- 06128 )
Exact name of registrant as specified in charter: Putnam New Opportunities Fund
Address of principal executive offices: One Post Office Square, Boston, Massachusetts 02109
| Name and address of agent for service: | Beth S. Mazor, Vice President |
| | One Post Office Square |
| | Boston, Massachusetts 02109 |
| |
| Copy to: | John W. Gerstmayr, Esq. |
| | Ropes & Gray LLP |
| | One International Place |
| | Boston, Massachusetts 02110 |
Registrant’s telephone number, including area code: (617) 292-1000
Date of fiscal year end: June 30, 2007
Date of reporting period: July 1, 2006— December 31, 2006
Item 1. Report to Stockholders:
The following is a copy of the report transmitted to stockholders pursuant
to Rule 30e-1 under the Investment Company Act of 1940:
What makes Putnam different?

In 1830, Massachusetts Supreme Judicial Court Justice Samuel Putnam established The Prudent Man Rule, a legal foundation for responsible money management.
THE PRUDENT MAN RULE
All that can be required of a trustee to invest is that he shall conduct himself faithfully and exercise a sound discretion. He is to observe how men of prudence, discretion, and intelligence manage their own affairs, not in regard to speculation, but in regard to the permanent disposition of their funds, considering the probable income, as well as the probable safety of the capital to be invested.

A time-honored tradition in money management
Since 1937, our values have been rooted in a profound sense of responsibility for the money entrusted to us.
A prudent approach to investing
We use a research-driven team approach to seek consistent, dependable, superior investment results over time, although there is no guarantee a fund will meet its objectives.
Funds for every investment goal
We offer a broad range of mutual funds and other financial products so investors and their financial representatives can build diversified portfolios.
A commitment to doing what’s right for investors
We have below-average expenses and stringent investor protections, and provide a wealth of information about the Putnam funds.
Industry-leading service
We help investors, along with their financial representatives, make informed investment decisions with confidence.
Putnam
New Opportunities
Fund
12| 31| 06
Semiannual Report
| Message from the Trustees | 2 |
| About the fund | 4 |
| Report from the fund managers | 7 |
| Performance | 13 |
| Expenses | 15 |
| Portfolio turnover | 17 |
| Risk | 18 |
| Your fund’s management | 19 |
| Terms and definitions | 22 |
| Trustee approval of management contract | 24 |
| Other information for shareholders | 29 |
| Financial statements | 30 |
| Brokerage commissions | 56 |
Cover photograph: Vineyard, Napa County, California © Charles O’Rear
Message from the Trustees
Dear Fellow Shareholder
Although the global economy continues to move forward, it has become apparent over the past few months that certain sectors of the U.S. economy may have slowed somewhat. We consequently consider slower job growth and perhaps a rise in the unemployment rate as possible developments for 2007. On the other hand, since the Federal Reserve (the Fed) stopped raising interest rates, stock prices have moved higher, bond yields have remained relatively low, and the weaker dollar appears to be making U.S. exports more competitive. With the benefit of this financial cushion, we believe 2007 may hold the potential for a renewed economic expansion.
As you may have heard, Putnam has announced that it will be acquired by a subsidiary of Power Financial Corporation, one of Canada’s largest financial services firms. The transaction is expected to close by the middle of the year. Putnam’s team of investment and business professionals will continue to be led by Putnam President and Chief Executive Officer Ed Haldeman. Your Trustees have been actively involved through every step of the discussions, and recommend approval of the transaction by Putnam’s fund shareholders. Proxy statements soliciting your approval of new management contracts for the funds will be mailed in the coming weeks. We believe the transaction is good for investors because it will provide for stability and continuity in Putnam’s investment approach and in the management team’s focus on performance. We will also continue in our role of overseeing the Putnam funds on your behalf.
We would like to take this opportunity to announce that a new independent Trustee, Kenneth R. Leibler, has joined your fund’s Board of Trustees. Mr. Leibler has had a distinguished career as a leader in the investment management industry. He is the founding Chairman of the
2
Boston Options Exchange and currently serves as a Trustee of Beth Israel Deaconess Hospital in Boston; a lead director of Ruder Finn Group, a global communications and advertising firm; and a director of Northeast Utilities.
In the following pages, members of your fund’s management team discuss the fund’s performance and strategies for the fiscal period ended December 31, 2006, and provide their outlook for the months ahead. As always, we thank you for your support of the Putnam funds.
Putnam New Opportunities Fund: investing
through 16 years of unprecedented innovation
Long before most Americans could conceive of the Internet, digital music files, or a cell phone small enough to fit in their pockets, Putnam New Opportunities Fund was seeking growth potential in emerging, cutting-edge companies. The fund was also targeting stocks in more traditional industries, such as restaurants, retail stores, health care, and broadcasting, which can also offer strong growth potential.
For example, among the holdings in the fund’s portfolio shortly after the fund was introduced in 1990 was the stock of Symantec, then a 9-year-old emerging software company. Today, Symantec is a leading maker of antivirus software, which has seen explosive demand as the Internet and computer networks have become an essential component of everyday life.

The managers of the fund focus on bottom-up stock selection in seeking above-average growth for investors. Putnam’s in-house research organization, whose dedicated analysts work in teams, helps the management team find growth stocks that other investors may have overlooked. The specialized expertise of these Putnam analysts, who visit with the managements of thousands of companies each year, is critical to the success of the fund’s growth strategy.
An important benefit of the fund’s strategy is its flexibility — it diversifies across a range of industries and capitalizations. The fund can invest in smaller companies that are in their emerging- or expansionary-growth phases, and these companies can remain in the fund’s portfolio until they grow to become market leaders.
Of course, historically, markets have been volatile at times for growing companies; the growth potential offered by these stocks comes with the risk of greater price fluctuations. Combining small-cap stocks with the stocks of larger, well-established companies provides a more diversified approach to help manage those risks.
While it seems likely that the next decade will bring as many innovative changes as the last one, the teams managing Putnam New Opportunities Fund will continue to focus on capturing growth potential for investors.
The fund invests some or all of its assets in small and/or midsize companies. Such investments increase the risk of price fluctuations. Stocks with above-average earnings growth may be more volatile, especially if earnings do not continue to grow.
In-depth analysis is key to
successful stock selection.
Drawing on the expertise of a dedicated team of stock analysts, the fund’s management team seeks attractive growth stocks. Once a stock is selected for the portfolio, it is regularly assessed by the members of the team to ensure that it continues to meet their criteria, including:
Growth They examine each company’s financials, including its sales and earnings, and target those believed to offer growth potential.
Quality They look for high-quality companies, seeking characteristics such as solid management teams, sound business models, a record of strong performance, and high levels of free-cash flow.
Valuation They carefully consider how each stock is valued, seeking stocks whose valuations are attractive relative to the company’s growth potential.
Putnam New Opportunities Fund’s holdings have spanned many
sectors and industries over time.

Putnam New Opportunities Fund has a multi-cap strategy, seeking to invest in the highest-quality large-cap companies as well as small- and mid-cap growth companies. The fund’s management team seeks to identify dynamic companies that are positioned in sectors believed to offer above-average growth potential. The fund may be appropriate for investors who are seeking long-term capital appreciation potential from stocks of small, midsize, and large companies.
Highlights
• For the six months ended December 31, 2006, Putnam New Opportunities Fund’s class A shares returned 8.53% without sales charges.
• Over the same period, the fund’s benchmark, the Russell 3000 Growth Index, returned 9.81% .
• The average return for the fund’s Lipper category, Multi-Cap Growth Funds, was 8.14% .
• Additional fund performance, comparative performance, and Lipper data can be found in the performance section beginning on page 13.
Performance
Total return for class A shares for periods ended 12/31/06
Since the fund's inception (8/31/90), average annual return is 13.90% at NAV and 13.52% at POP.
| | Average annual return | Cumulative return | |
| | NAV | POP | | NAV | POP | | |
|
| 10 years | 4.92% | 4.36% | | 61.65% | 53.17% | |
|
| 5 years | 3.90 | 2.79 | | 21.08 | 14.73 | |
|
| 3 years | 9.58 | 7.63 | | 31.58 | 24.68 | |
|
| 1 year | 8.67 | 2.97 | | 8.67 | 2.97 | |
|
| 6 months | — | — | | 8.53 | 2.84 | |
|
Data is historical. Past performance does not guarantee future results. More recent returns may be less or more than those shown. Investment return and principal value will fluctuate, and you may have a gain or a loss when you sell your shares. Performance assumes reinvestment of distributions and does not account for taxes. Returns at POP reflect a sales charge of 5.25% . For a portion of the period, this fund had limited expenses, without which returns would have been lower. For the most recent month-end performance, visit www.putnam.com. A 1% short-term trading fee may apply.
6
Report from the fund managers
The period in review
Although your fund began its 2007 fiscal year in the midst of a significant market correction, growth stocks rallied in mid-August and continued to advance over the balance of the period. Fund performance benefited from the rally, and our emphasis on consumer cyclical stocks enabled the fund to outperform the average for its Lipper peer group, based on results at net asset value (NAV, or without sales charges). The technology sector also rebounded during the period; its strength is reflected in the fund’s total return. However, because the fund’s weighting in this sector was smaller than that of its benchmark index, the Russell 3000 Growth Index, the portion of fund results attributable to gains in this sector was correspondingly less — in other words, the fund’s technology weighting detracted from the fund’s performance relative to the benchmark. Holdings in the health-care sector had a similar effect, but in this case it was due to unrewarded stock se lection rather than a sector weighting decision.
Market overview
At the beginning of the six-month period ended December 31, 2006, growth stock prices were depressed by prospects of higher inflation, higher interest rates, and rising oil prices. Later in the period, the concern shifted to whether consumers would spend enough to keep the economy from running out of steam. Due in part to an unusually warm winter, oil prices backed off from their mid-summer highs, and did not have a significant negative impact on the economy. Inflation fears eased considerably. After two years of rate hikes, the Fed suspended its credit-tightening program in August. Furthermore, as market watchers had hoped, consumer spending remained relatively strong through the back-to-school and holiday seasons. Against this backdrop, and following a significant midyear correction, growth stocks climbed the proverbial “wall of worry,” rebounding in August and rising steadily through December.
7
Although value stocks — as measured by the Russell 3000 Value Index — outperformed growth stocks for the period, growth-stock performance — as measured by the Russell 3000 Growth Index — actually surpassed that of value stocks in three of the six months of the period (August through October), and performed approximately in line with value stocks in one other month (November). Large-company growth stocks — as represented by the Russell 1000 Growth Index — were the star performers, surpassing the returns of midsize and small-company growth stocks for the period overall.
Strategy overview
Our goal is to invest in a limited number of stocks in order to better focus our research and analysis on what we consider to be the most attractive opportunities in the growth-stock universe. Specifically, we look for high-quality growth companies with favorable valuations. As such, our stock-selection strategy is based on three fundamental criteria: quality of the company, near-term growth prospects, and a valuation forecast that meets our parameters. The ability to rotate among these criteria gives the fund the advantage of potentially favorable market positioning whether the market is rewarding one, two, or all three of these factors.
Although it is not a key consideration for many growth managers, valuation is a central component of our investment process. Our approach to valuing
Market sector performance
These indexes provide an overview of performance in different market sectors for the six months ended 12/31/06.
| Equities | |
|
| Russell 3000 Growth Index (multi-cap growth stocks) | 9.81% |
|
| Russell Midcap Growth Index (midsize-company growth stocks) | 7.90% |
|
| S&P 500/Citigroup Value Index (large-company value stocks) | 13.41% |
|
| MSCI EAFE Index (international stocks) | 14.69% |
|
| Bonds | |
|
| Lehman Aggregate Bond Index (broad bond market) | 5.09% |
|
| Lehman Government Bond Index (U.S. Treasury and agency securities) | 4.41% |
|
| Citigroup World Government Bond Index (global government bonds) | 3.28% |
|
8
companies combines a review of historical financial data with forward-looking scenario analysis that enables us to examine a range of possible outcomes. One of the key elements that we consider when valuing companies is the price-to-free-cash-flow ratio, which indicates a company’s ability to generate cash flow relative to its current market price. We also examine operating profit margins and look for companies that have the potential to expand their margins. We then break companies down into 21 distinct market sectors and rank them in comparison to other companies with similar growth potential, operating margins, competitive environments, and capital requirements. Finally, in order to gauge current market sentiment toward a company, we will consider indicators such as analysts’ earnings forecasts.
Your fund’s holdings
During the period, the fund derived the greatest benefit from its emphasis on consumer cyclical stocks. The consumer cyclicals sector was among the top-performing sectors in the index, and the combination of an overweight position there (relative to its benchmark index) and our successful stock selections, particularly among specialty retailers, bolstered fund results considerably. Holdings such as American Eagle Outfitters and Guess consistently posted stronger-than-expected sales and earnings during the six-month period, and their stocks were rewarded
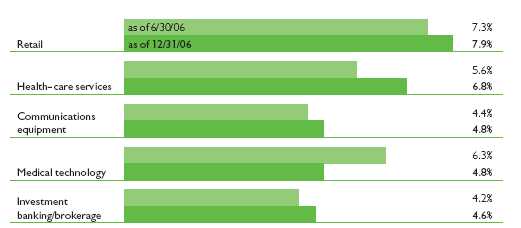
Comparison of top industry weightings
This chart shows how the fund’s top weightings have changed over the last six months.
Weightings are shown as a percentage of net assets. Holdings will vary over time.
9
accordingly. In addition, same-store sales — a key indicator of retail performance that measures the sales of stores open for at least one year — grew at much faster rates for these retailers than those of many larger, broad-based retailers such as Wal-Mart.
Diversified financial and media company McGraw-Hill was also a top contributor to returns during the period. Much of McGraw-Hill’s solid performance was due, in turn, to the strength of Standard & Poor’s (S&P), one of its business units. As one of just a few major credit rating firms, S&P benefited from increasing demand for its corporate/government bond-rating services, as well as its structured finance services.
Goldman Sachs was another top performer that gained value as a result of increased capital markets activities. As a leading investment bank, Goldman’s business grew amidst record levels of corporate mergers and acquisitions, and increased levels of initial public stock offerings.
The stock of Accenture, a global provider of management and technology consulting services, rounded out the top contributors to fund performance. Revenues in the company’s consulting and outsourcing businesses grew at a healthy clip, and profitability was helped by expense reductions.
In sector terms, the fund’s health-care holdings were the biggest disappointment during the period. Sierra Health
Top holdings
This table shows the fund's top holdings, and the percentage of the fund's net assets that each
represented, as of 12/31/06. The fund's holdings will change over time.
| Holding (percent of fund's net assets) | Industry |
|
| Cisco Systems, Inc. (2.3%) | Communications equipment |
|
| Goldman Sachs Group, Inc. (The) (1.8%) | Investment banking/brokerage |
|
| Amgen, Inc. (1.8%) | Biotechnology |
|
| Qualcomm, Inc. (1.8%) | Communications equipment |
|
| PepsiCo, Inc. (1.7%) | Beverage |
|
| Microsoft Corp. (1.7%) | Software |
|
| McGraw-Hill Cos., Inc. (The) (1.6%) | Publishing |
|
| Becton, Dickinson and Co. (1.5%) | Medical technology |
|
| Raytheon Co. (1.5%) | Aerospace and defense |
|
| Exxon Mobil Corp. (1.4%) | Oil and gas |
|
10
Services, a managed-care provider, saw its stock decline from the mid-$40 range at the beginning of the period, to the mid-$30 range by the end. Although the demographics of an aging population are certainly in Sierra’s favor, the firm has struggled with managing its growth. In addition, an ongoing contract dispute with a major hospital provider created an air of uncertainty regarding Sierra’s profitability and drove down the company’s stock price. The fund continues to hold shares of Sierra, because its valuation remains compelling.
The fund’s position in Kinetic Concepts (KCI) declined in value precipitously in August when the outcome of a patent dispute was announced. KCI derives most of its revenues from the manufacturing and marketing of wound-care devices. Its leading product is a system called Vacuum Assisted Closure (VAC). In early August, a jury found that patents on the VAC system were valid and enforceable, but also announced that a competing wound-care device from a company operated by a former KCI employee did not infringe on the patents. KCI’s stock price fell by more than 40%, reflecting fears that the decision would create significant pricing pressures for the company and, over the longer term, would open the market to increased competition. However, by the end of the period, the stock had regained most of its lost value. Consequently, it remains in the portfolio, and we believe the market’s reaction to the court decision may have been overblown.
Lastly, the fund’s investment in former top performer WESCO International detracted from results during the period. A wholesale distributor of electrical construction products and other industrial supplies, WESCO is heavily exposed to the residential and commercial construction marketplaces. We believed the stock would be protected by the fact that WESCO receives a substantial portion of its revenues from the commercial real-estate sector and is diversified into non-U.S. markets. However, WESCO announced disappointing earnings late in the period, and sentiment toward the stock turned negative. We continue to monitor the firm to see how well it can respond to a changing construction-industry cycle.
Please note that the holdings discussed in this report may not have been held by the fund for the entire period. Portfolio composition is subject to review in accordance with the fund’s investment strategy and may vary in the future.
11
The outlook for your fund
The following commentary reflects anticipated developments that could affect your fund over the next six months, as well as your management team’s plans for responding to them.
While certain sectors of the economy, such as housing, have slowed, other sectors continue to perform well and have kept broad-based economic growth intact. Trends in consumer and business spending are a key consideration in the team’s economic outlook for the rest of the fiscal year. Business capital spending has been healthy, as evidenced by the solid results registered by many industrial companies. If this trend continues, we believe it is likely that, while the economy may decelerate overall, a moderate rate of growth is likely to persist.
In light of multi-year outperformance by most value-stock categories, we believe that as investors rebalance their portfolios, it is possible that more money may flow into growth stocks in 2007. Moreover, it appears that investors are waking up to the compelling values that we believe exist among many large-company growth stocks, particularly in the technology sector. If our expectations prove well-founded, these developments may further strengthen the environment for growth investing. Furthermore, should this occur, we believe the fund’s three-pronged approach to seeking out high-quality growth companies at reasonable valuations and its flexibility to invest in large-, mid-, and small-company stocks should enable it to take full advantage of the opportunities such an environment can offer.
The views expressed in this report are exclusively those of Putnam Management. They are not meant as investment advice.
The fund invests some or all of its assets in small and/or midsize companies. Such investments increase the risk of greater price fluctuations. Stocks with above-average earnings growth may be more volatile, especially if earnings do not continue to grow.
12
Your fund’s performance
This section shows your fund’s performance for periods ended December 31, 2006, the end of the first half of its current fiscal year. Performance should always be considered in light of a fund’s investment strategy. Data represents past performance. Past performance does not guarantee future results. More recent returns may be less or more than those shown. Investment return and principal value will fluctuate, and you may have a gain or a loss when you sell your shares. For the most recent month-end performance, please visit www.putnam.com or call Putnam at 1-800-225-1581. Class Y shares are generally only available to corporate and institutional clients. See the Terms and Definitions section in this report for definitions of the share classes offered by your fund.
Fund performance
Total return for periods ended 12/31/06
| | Class A | | Class B | | Class C | | Class M | | Class R | Class Y |
| (inception dates) | (8/31/90) | | (3/1/93) | | (7/26/99) | | (12/1/94) | | (1/21/03) | (7/19/94) |
| | NAV | POP | NAV | CDSC | NAV | CDSC | NAV | POP | NAV | NAV |
|
| Annual average | | | | | | | | | | |
| (life of fund) | 13.90% | 13.52% | 13.06% | 13.06% | 13.05% | 13.05% | 13.31% | 13.08% | 13.62% | 14.12% |
|
| 10 years | 61.65 | 53.17 | 50.43 | 50.43 | 49.99 | 49.99 | 53.77 | 48.77 | 57.78 | 65.76 |
| Annual average | 4.92 | 4.36 | 4.17 | 4.17 | 4.14 | 4.14 | 4.40 | 4.05 | 4.67 | 5.18 |
|
| 5 years | 21.08 | 14.73 | 16.64 | 14.64 | 16.63 | 16.63 | 18.10 | 14.25 | 19.67 | 22.59 |
| Annual average | 3.90 | 2.79 | 3.13 | 2.77 | 3.12 | 3.12 | 3.38 | 2.70 | 3.66 | 4.16 |
|
| 3 years | 31.58 | 24.68 | 28.66 | 25.66 | 28.63 | 28.63 | 29.63 | 25.42 | 30.60 | 32.58 |
| Annual average | 9.58 | 7.63 | 8.76 | 7.91 | 8.75 | 8.75 | 9.04 | 7.84 | 9.31 | 9.86 |
|
| 1 year | 8.67 | 2.97 | 7.89 | 2.89 | 7.87 | 6.87 | 8.15 | 4.63 | 8.40 | 8.96 |
|
| 6 months | 8.53 | 2.84 | 8.13 | 3.13 | 8.12 | 7.12 | 8.27 | 4.75 | 8.38 | 8.66 |
|
Performance assumes reinvestment of distributions and does not account for taxes. Returns at public offering price (POP) for class A and M shares reflect a sales charge of 5.25% and 3.25%, respectively. Class B share returns reflect the applicable contingent deferred sales charge (CDSC), which is 5% in the first year, declining to 1% in the sixth year, and is eliminated thereafter. Class C shares reflect a 1% CDSC for the first year and is eliminated thereafter. Class R and Y shares have no initial sales charge or CDSC. Performance for class B, C, M, R, and Y shares before their inception is derived from the historical performance of class A shares, adjusted for the applicable sales charge (or CDSC) and, except for class Y shares, the higher operating expenses for such shares. For a portion of the period, this fund had limited expenses, without which returns would have been lower.
A 1% short-term trading fee may be applied to shares exchanged or sold within 7 days of purchase.
13
Comparative index returns
For periods ended 12/31/06
| | | Lipper Multi-Cap |
| | | Russell 3000 | Growth Funds |
| | | Growth Index | category average* |
|
| Annual average | | |
| (life of fund) | | 9.83% | 11.70% |
|
| 10 years | | 68.29 | 117.60 |
| Annual average | | 5.34 | 7.52 |
|
| 5 years | | 16.02 | 27.84 |
| Annual average | | 3.02 | 4.78 |
|
| 3 years | | 23.09 | 31.62 |
| Annual average | | 7.17 | 9.49 |
|
| 1 year | | 9.46 | 8.19 |
|
| 6 months | | 9.81 | 8.14 |
|
Index and Lipper results should be compared to fund performance at net asset value.
* Over the 6-month and 1-, 3-, 5-, and 10-year periods ended 12/31/06, there were 521, 492, 397, 310, and 118 funds, respectively, in this Lipper category.
Fund price and distribution* information
For the six-month period ended 12/31/06
| | Class A | Class B | Class C | Class M | Class R | Class Y |
|
| Share value: | NAV | POP | NAV | NAV | NAV | POP | NAV | NAV |
|
| 6/30/06 | $45.72 | $48.25 | $40.85 | $43.34 | $42.79 | $44.23 | $45.37 | $47.34 |
|
| 12/31/06 | 49.62 | 52.37 | 44.17 | 46.86 | 46.33 | 47.89 | 49.17 | 51.44 |
|
*The fund made no distributions during the period.
14
Your fund’s expenses
As a mutual fund investor, you pay ongoing expenses, such as management fees, distribution fees (12b-1 fees), and other expenses. In the most recent six-month period, your fund limited these expenses; had it not done so, expenses would have been higher. Using the information below, you can estimate how these expenses affect your investment and compare them with the expenses of other funds. You may also pay one-time transaction expenses, including sales charges (loads) and redemption fees, which are not shown in this section and would have resulted in higher total expenses. For more information, see your fund’s prospectus or talk to your financial advisor.
Review your fund’s expenses
The table below shows the expenses you would have paid on a $1,000 investment in Putnam New Opportunities Fund from July 1, 2006, to December 31, 2006. It also shows how much a $1,000 investment would be worth at the close of the period, assuming actual returns and expenses.
| | Class A | Class B | Class C | Class M | Class R | Class Y |
|
| Expenses paid per $1,000* | | $ 5.99 | | $ 9.91 | | $ 9.91 | | $ 8.61 | $ 7.30 | $ 4.68 |
|
| Ending value (after expenses) | | $1,085.30 | | $1,081.30 | | $1,081.20 | | $1,082.70 | $1,083.80 | $1,086.60 |
|
* Expenses for each share class are calculated using the fund’s annualized expense ratio for each class, which represents the ongoing expenses as a percentage of average net assets for the six months ended 12/31/06. The expense ratio may differ for each share class (see the last table in this section). Expenses are calculated by multiplying the expense ratio by the average account value for the period; then multiplying the result by the number of days in the period; and then dividing that result by the number of days in the year.
Estimate the expenses you paid
To estimate the ongoing expenses you paid for the six months ended December 31, 2006, use the calculation method below. To find the value of your investment on July 1, 2006, go to www.putnam.com and log on to your account. Click on the “Transaction History” tab in your Daily Statement and enter 07/01/2006 in both the “from” and “to” fields. Alternatively, call Putnam at 1-800-225-1581.

15
Compare expenses using the SEC’s method
The Securities and Exchange Commission (SEC) has established guidelines to help investors assess fund expenses. Per these guidelines, the table below shows your fund’s expenses based on a $1,000 investment, assuming a hypothetical 5% annualized return. You can use this information to compare the ongoing expenses (but not transaction expenses or total costs) of investing in the fund with those of other funds. All mutual fund shareholder reports will provide this information to help you make this comparison. Please note that you cannot use this information to estimate your actual ending account balance and expenses paid during the period.
| | Class A | Class B | Class C | Class M | Class R | Class Y |
|
| Expenses paid per $1,000* | $ 5.80 | $ 9.60 | $ 9.60 | $ 8.34 | $ 7.07 | $ 4.53 |
|
| Ending value (after expenses) | $1,019.46 | $1,015.68 | $1,015.68 | $1,016.94 | $1,018.20 | $1,020.72 |
|
* Expenses for each share class are calculated using the fund’s annualized expense ratio for each class, which represents the ongoing expenses as a percentage of average net assets for the six months ended 12/31/06. The expense ratio may differ for each share class (see the last table in this section). Expenses are calculated by multiplying the expense ratio by the average account value for the period; then multiplying the result by the number of days in the period; and then dividing that result by the number of days in the year.
Compare expenses using industry averages
You can also compare your fund’s expenses with the average of its peer group, as defined by Lipper, an independent fund-rating agency that ranks funds relative to others that Lipper considers to have similar investment styles or objectives. The expense ratio for each share class shown below indicates how much of your fund’s average net assets have been used to pay ongoing expenses during the period.
| | Class A | Class B | Class C | Class M | Class R | Class Y |
|
| Your fund’s annualized | | | | | | |
| expense ratio | 1.14% | 1.89% | 1.89% | 1.64% | 1.39% | 0.89% |
|
| Average annualized expense | | | | | | |
| ratio for Lipper peer group* | 1.41% | 2.16% | 2.16% | 1.91% | 1.66% | 1.16% |
|
* Simple average of the expenses of all front-end load funds in the fund’s Lipper peer group, calculated in accordance with Lipper’s standard method for comparing fund expenses (excluding 12b-1 fees and without giving effect to any expense offset and brokerage service arrangements that may reduce fund expenses). This average reflects each fund’s expenses for its most recent fiscal year available to Lipper as of 12/31/06. To facilitate comparison, Putnam has adjusted this average to reflect the 12b-1 fees carried by each class of shares other than class Y shares, which do not incur 12b-1 fees. The peer group may include funds that are significantly smaller or larger than the fund, which may limit the comparability of the fund’s expenses to the simple average, which typically is higher than the asset-weighted average.
16
Your fund’s
portfolio turnover
Putnam funds are actively managed by teams of experts who buy and sell securities based on intensive analysis of companies, industries, economies, and markets. Portfolio turnover is a measure of how often a fund’s managers buy and sell securities for your fund. A portfolio turnover of 100%, for example, means that the managers sold and replaced securities valued at 100% of a fund’s assets within a one-year period. Funds with high turnover may be more likely to generate capital gains and dividends that must be distributed to shareholders as taxable income. High turnover may also cause a fund to pay more brokerage commissions and other transaction costs, which may detract from performance.
Turnover comparisons
Percentage of holdings that change every year
| | 2006 | 2005 | 2004 | 2003 | 2002 |
|
| Putnam New Opportunities Fund | 84% | 97% | 61% | 42% | 77% |
|
| Lipper Multi-Cap Growth Funds | | | | | |
| category average | 108% | 117% | 125% | 142% | 153% |
|
Turnover data for the fund is calculated based on the fund's fiscal-year period, which ends on June 30. Turnover data for the fund's Lipper category is calculated based on the average of the turnover of each fund in the category for its fiscal year ended during the indicated year. Fiscal years vary across funds in the Lipper category, which may limit the comparability of the fund's portfolio turnover rate to the Lipper average. Comparative data for 2006 is based on information available as of 12/31/06.
17
Your fund’s risk
This risk comparison is designed to help you understand how your fund compares with other funds. The comparison utilizes a risk measure developed by Morningstar, an independent fund-rating agency. This risk measure is referred to as the fund’s Morningstar Risk.
Your fund’s Morningstar® Risk
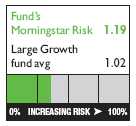
Your fund’s Morningstar Risk is shown alongside that of the average fund in its Morningstar category. The risk bar broadens the comparison by translating the fund’s Morningstar Risk into a percentile, which is based on the fund’s ranking among all funds rated by Morningstar as of December 31, 2006. A higher Morningstar Risk generally indicates that a fund’s monthly returns have varied more widely.
Morningstar determines a fund’s Morningstar Risk by assessing variations in the fund’s monthly returns — with an emphasis on downside variations — over a 3-year period, if available. Those measures are weighted and averaged to produce the fund’s Morningstar Risk. The information shown is provided for the fund’s class A shares only; information for other classes may vary. Morningstar Risk is based on historical data and does not indicate future results. Morningstar does not purport to measure the risk associated with a current investment in a fund, either on an absolute basis or on a relative basis. Low Morningstar Risk does not mean that you cannot lose money on an investment in a fund. Copyright 2007 Morningstar, Inc. All Rights Reserved. The information contained herein (1) is proprietary to Morningstar and/or its content providers; (2) may not be copied or distributed; and (3) is not warranted to be accurate, complete, or timely. Neither Morningstar nor its content providers are responsible for any damages or losses arising from any use of this information.
18
Your fund’s management
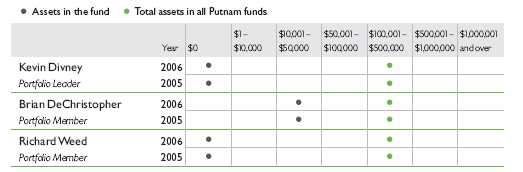
Your fund is managed by the members of the Putnam Mid-Cap Growth and Small and Emerging Growth teams. Kevin Divney is the Portfolio Leader and Brian DeChristopher and Richard Weed are Portfolio Members of your fund. The Portfolio Leader and Portfolio Members coordinate the teams’ management of the fund.
For a complete listing of the members of the Putnam Mid-Cap Growth and Small and Emerging Growth teams, including those who are not Portfolio Leaders or Portfolio Members of your fund, visit Putnam’s Individual Investor Web site at www.putnam.com.
Investment team fund ownership
The table below shows how much the fund’s current Portfolio Leader and Portfolio Members have invested in the fund and in all Putnam mutual funds (in dollar ranges). Information shown is as of December 31, 2006, and December 31, 2005.
Trustee and Putnam employee fund ownership
As of December 31, 2006, all of the Trustees on the Board of the Putnam funds owned fund shares. The table below shows the approximate value of investments in the fund and all Putnam funds as of that date by the Trustees and Putnam employees. These amounts include investments by the Trustees’ and employees’ immediate family members and investments through retirement and deferred compensation plans.
| | | Total assets in |
| | Assets in the fund | all Putnam funds |
|
| Trustees | | $ 583,000 | | $100,000,000 |
|
| Putnam employees | | $14,734,000 | | $438,000,000 |
|
19
Fund manager compensation
The total 2005 fund manager compensation that is attributable to your fund is approximately $2,500,000. This amount includes a portion of 2005 compensation paid by Putnam Management to the fund managers listed in this section for their portfolio management responsibilities, calculated based on the fund assets they manage taken as a percentage of the total assets they manage. The compensation amount also includes a portion of the 2005 compensation paid to the Chief Investment Officer of the team and the Group Chief Investment Officer of the fund’s broader investment category for their oversight responsibilities, calculated based on the fund assets they oversee taken as a percentage of the total assets they oversee. This amount does not include compensation of other personnel involved in research, trading, administration, systems, compliance, or fund operations; nor does it include non-compensation costs. These percentages are determined as of the fund’s fiscal period-end. For personnel who joined Putnam Management during or after 2005, the calculation reflects annualized 2005 compensation or an estimate of 2006 compensation, as applicable.
Other Putnam funds managed by the Portfolio Leader and Portfolio Members
Kevin Divney is also a Portfolio Leader of Putnam Vista Fund.
Brian DeChristopher is also a Portfolio Member of Putnam Vista Fund.
Richard Weed is also a Portfolio Leader of Putnam Discovery Growth Fund, Putnam OTC & Emerging Growth Fund, and Putnam Small Cap Growth Fund.
Kevin Divney, Brian DeChristopher, and Richard Weed may also manage other accounts and variable trust funds advised by Putnam Management or an affiliate.
Changes in your fund’s Portfolio Leader and Portfolio Members
Your fund’s Portfolio Leader and Portfolio Members did not change during the year ended December 31, 2006.
20
Putnam fund ownership by Putnam’s Executive Board
The table below shows how much the members of Putnam’s Executive Board have invested in all Putnam mutual funds (in dollar ranges). Information shown is as of December 31, 2006, and December 31, 2005.
| | | $1 – | $10,001 – | $50,001 – | $100,001 – | $500,001 – | $1,000,001 |
| | Year | $0 | $10,000 | $50,000 | $100,000 | $500,000 | $1,000,000 | and over |
|
| Philippe Bibi | 2006 | | | | | | • |
|
|
| Chief Technology Officer | 2005 | | | | | | • |
|
| Joshua Brooks | 2006 | | | | | | • |
|
|
| Deputy Head of Investments | 2005 | | | | | | • |
|
| William Connolly | 2006 | | | | | | • |
|
|
| Head of Retail Management | 2005 | | | | | | • |
|
| Kevin Cronin | 2006 | | | | | | • |
|
|
| Head of Investments | 2005 | | | | | | • |
|
| Charles Haldeman, Jr. | 2006 | | | | | | • |
|
|
| President and CEO | 2005 | | | | | | • |
|
| Amrit Kanwal | 2006 | | | | | • |
|
|
| Chief Financial Officer | 2005 | | | | | • |
|
| Steven Krichmar | 2006 | | | | | | • |
|
|
| Chief of Operations | 2005 | | | | | • |
|
| Francis McNamara, III | 2006 | | | | | | • |
|
|
| General Counsel | 2005 | | | | | | • |
|
| Jeffrey Peters | 2006 | | | | | | • |
|
|
| Head of International Business | N/A | | | | | | |
| |
|
| Richard Robie, III | 2006 | | | | | • | |
|
|
| Chief Administrative Officer | 2005 | | | | | • | |
|
| Edward Shadek | 2006 | | | | | | • |
|
|
| Deputy Head of Investments | 2005 | | | | | | • |
|
| Sandra Whiston | 2006 | | | | | • |
|
|
| Head of Institutional Management | 2005 | | | | | • |
|
N/A indicates the individual was not a member of Putnam’s Executive Board as of 12/31/05.
21
Terms and definitions
Important terms
Total return shows how the value of the fund’s shares changed over time, assuming you held the shares through the entire period and reinvested all distributions in the fund.
Net asset value (NAV) is the price, or value, of one share of a mutual fund, without a sales charge. NAVs fluctuate with market conditions. NAV is calculated by dividing the net assets of each class of shares by the number of outstanding shares in the class.
Public offering price (POP) is the price of a mutual fund share plus the maximum sales charge levied at the time of purchase. POP performance figures shown here assume the 5.25% maximum sales charge for class A shares and 3.25% for class M shares.
Contingent deferred sales charge (CDSC) is generally a charge applied at the time of the redemption of class B or C shares and assumes redemption at the end of the period. Your fund’s class B CDSC declines from a 5% maximum during the first year to 1% during the sixth year. After the sixth year, the CDSC no longer applies. The CDSC for class C shares is 1% for one year after purchase.
Share classes
Class A shares are generally subject to an initial sales charge and no CDSC (except on certain redemptions of shares bought without an initial sales charge).
Class B shares are not subject to an initial sales charge. They may be subject to a CDSC.
Class C shares are not subject to an initial sales charge and are subject to a CDSC only if the shares are redeemed during the first year.
Class M shares have a lower initial sales charge and a higher 12b-1 fee than class A shares and no CDSC (except on certain redemptions of shares bought without an initial sales charge).
Class R shares are not subject to an initial sales charge or CDSC and are available only to certain defined contribution plans.
Class Y shares are not subject to an initial sales charge or CDSC, and carry no 12b-1 fee. They are only available to eligible purchasers, including eligible defined contribution plans or corporate IRAs.
22
Comparative indexes
Citigroup World Government Bond Index is an unmanaged index of global investment-grade fixed-income securities.
Lehman Aggregate Bond Index is an unmanaged index of U.S. investment-grade fixed-income securities.
Lehman Government Bond Index is an unmanaged index of U.S. Treasury and agency securities.
Morgan Stanley Capital International (MSCI) EAFE Index is an unmanaged index of equity securities from developed countries in Western Europe, the Far East, and Australasia.
Russell Midcap Growth Index is an unmanaged index of those companies in the Russell Midcap Index chosen for their growth orientation.
Russell 3000 Growth Index is an unmanaged index of those companies in the broad-market Russell 3000 Index chosen for their growth orientation.
S&P 500/Citigroup Value Index is an unmanaged capitalization-weighted index of large-cap stocks chosen for their value orientation.
Indexes assume reinvestment of all distributions and do not account for fees. Securities and performance of a fund and an index will differ. You cannot invest directly in an index.
Lipper is a third-party industry-ranking entity that ranks mutual funds. Its rankings do not reflect sales charges. Lipper rankings are based on total return at net asset value relative to other funds that have similar current investment styles or objectives as determined by Lipper. Lipper may change a fund’s category assignment at its discretion. Lipper category averages reflect performance trends for funds within a category.
23
Trustee approval of
management contract
General conclusions
The Board of Trustees of the Putnam funds oversees the management of each fund and, as required by law, determines annually whether to approve the continuance of your fund’s management contract with Putnam Management. In this regard, the Board of Trustees, with the assistance of its Contract Committee consisting solely of Trustees who are not “interested persons” (as such term is defined in the Investment Company Act of 1940, as amended) of the Putnam funds (the “Independent Trustees”), requests and evaluates all information it deems reasonably necessary under the circumstances. Over the course of several months ending in June 2006, the Contract Committee met four times to consider the information provided by Putnam Management and other information developed with the assistance of the Board’s independent counsel and independent staff. The Contract Committee reviewed and discussed key aspects of this information with all of the Independe nt Trustees. Upon completion of this review, the Contract Committee recommended, and the Independent Trustees approved, the continuance of your fund’s management contract, effective July 1, 2006.
This approval was based on the following conclusions:
• That the fee schedule in effect for your fund represents reasonable compensation in light of the nature and quality of the services being provided to the fund, the fees paid by competitive funds and the costs incurred by Putnam Management in providing such services, and
• That such fee schedule represents an appropriate sharing between fund shareholders and Putnam Management of such economies of scale as may exist in the management of the fund at current asset levels.
These conclusions were based on a comprehensive consideration of all information provided to the Trustees and were not the result of any single factor. Some of the factors that figured particularly in the Trustees’ deliberations and how the Trustees considered these factors are described below, although individual Trustees may have evaluated the information presented differently, giving different weights to various factors. It is also important to recognize that the fee arrangements for your fund and the other Putnam funds are the result of many years of review and discussion between the Independent Trustees and Putnam Management, that certain aspects of such arrangements may receive greater scrutiny in some years than others, and that the Trustees’ conclusions may be based, in part, on their consideration of these same arrangements in prior years.
24
Management fee schedules and categories; total expenses
The Trustees reviewed the management fee schedules in effect for all Putnam funds, including fee levels and breakpoints, and the assignment of funds to particular fee categories. In reviewing fees and expenses, the Trustees generally focused their attention on material changes in circumstances — for example, changes in a fund’s size or investment style, changes in Putnam Management’s operating costs, or changes in competitive practices in the mutual fund industry — that suggest that consideration of fee changes might be warranted. The Trustees concluded that the circumstances did not warrant changes to the management fee structure of your fund, which had been carefully developed over the years, re-examined on many occasions, and adjusted where appropriate. The Trustees focused on two areas of particular interest, as discussed further below:
• Competitiveness. The Trustees reviewed comparative fee and expense information for competitive funds, which indicated that, in a custom peer group of competitive funds selected by Lipper Inc., your fund ranked in the 3rd percentile in management fees and in the 3rd percentile in total expenses (less any applicable 12b-1 fees) as of December 31, 2005 (the first percentile being the least expensive funds and the 100th percentile being the most expensive funds). (Because the fund’s custom peer group is smaller than the fund’s broad Lipper Inc. peer group, this expense information may differ from the Lipper peer expense information found elsewhere in this report.) The Trustees noted that expense ratios for a number of Putnam funds, which show the percentage of fund assets used to pay for management and administrative services, distribution (12b-1) fees and other expenses, had been increasing recently as a result of declining net assets and the natural operation of fee breakpoints.
The Trustees noted that the expense ratio increases described above were currently being controlled by expense limitations implemented in January 2004 and which Putnam Management, in consultation with the Contract Committee, has committed to maintain at least through 2007. These expense limitations give effect to a commitment by Putnam Management that the expense ratio of each open-end fund would be no higher than the average expense ratio of the competitive funds included in the fund’s relevant Lipper universe (exclusive of any applicable 12b-1 charges in each case). The Trustees observed that this commitment to limit fund expenses has served shareholders well since its inception. In order to ensure that the expenses of the Putnam funds continue to meet evolving competitive standards, the Trustees requested, and Putnam Management agreed, to implement an additional expense limitation for certain funds for the twelve months beginning January 1, 2007 equal to the average expense ratio (exclusive of 12b-1 charges) of a custom peer group of competitive funds selected by Lipper based on the size of the fund. This additional expense limitation will be applied to those open-end funds that had above-average expense ratios (exclusive of 12b-1 charges) based on the Lipper custom peer group data for the period ended December 31, 2005. This additional expense limitation will not be applied to your fund.
25
• Economies of scale. Your fund currently has the benefit of breakpoints in its management fee that provide shareholders with significant economies of scale, which means that the effective management fee rate of a fund (as a percentage of fund assets) declines as a fund grows in size and crosses specified asset thresholds. Conversely, as a fund shrinks in size — as has been the case for many Putnam funds in recent years — these breakpoints result in increasing fee levels. In recent years, the Trustees have examined the operation of the existing breakpoint structure during periods of both growth and decline in asset levels. The Trustees concluded that the fee schedules in effect for the funds represented an appropriate sharing of economies of scale at current asset levels. In reaching this conclusion, the Trustees considered the Contract Committee’s stated intent to continue t o work with Putnam Management to plan for an eventual resumption in the growth of assets, including a study of potential economies that might be produced under various growth assumptions.
In connection with their review of the management fees and total expenses of the Putnam funds, the Trustees also reviewed the costs of the services to be provided and profits to be realized by Putnam Management and its affiliates from the relationship with the funds. This information included trends in revenues, expenses and profitability of Putnam Management and its affiliates relating to the investment management and distribution services provided to the funds. In this regard, the Trustees also reviewed an analysis of Putnam Management’s revenues, expenses, and profitability with respect to the funds’ management contracts, allocated on a fund-by-fund basis. Because many of the costs incurred by Putnam Management in managing the funds are not readily identifiable to particular funds, the Trustees observed that the methodology for allocating costs is an important factor in evaluating Putnam Management’s costs and profitability, both as to the Putnam f unds in the aggregate and as to individual funds. The Trustees reviewed Putnam Management’s cost allocation methodology with the assistance of independent consultants and concluded that this methodology was reasonable and well considered.
Investment performance
The quality of the investment process provided by Putnam Management represented a major factor in the Trustees’ evaluation of the quality of services provided by Putnam Management under your fund’s management contract. The Trustees were assisted in their review of the Putnam funds’ investment process and performance by the work of the Investment Process Committee of the Trustees and the Investment Oversight Committee of the Trustees, which meet on a regular monthly basis with the funds’ portfolio teams throughout the year. The Trustees concluded that Putnam Management generally provides a high-quality investment process — as measured by the experience and skills of the individuals assigned to the management of fund portfolios, the resources made available to such personnel, and in general the ability of Putnam Management to attract and retain high-quality personnel — but also recognize that this does not guarantee favorable investment r esults for every fund in every time period.
26
The Trustees considered the investment performance of each fund over multiple time periods and considered information comparing each fund’s performance with various benchmarks and with the performance of competitive funds.
The Trustees noted the satisfactory investment performance of many Putnam funds. They also noted the disappointing investment performance of certain funds in recent years and discussed with senior management of Putnam Management the factors contributing to such underperformance and actions being taken to improve performance. The Trustees recognized that, in recent years, Putnam Management has made significant changes in its investment personnel and processes and in the fund product line to address areas of underperformance. In particular, they noted the important contributions of Putnam Management’s leadership in attracting, retaining, and supporting high-quality investment professionals and in systematically implementing an investment process that seeks to merge the best features of fundamental and quantitative analysis. The Trustees indicated their intention to continue to monitor performance trends to assess the effectiveness of these changes and to evaluate whether additional changes to address areas of underperformance are warranted.
In the case of your fund, the Trustees considered that your fund’s class A share cumulative total return performance at net asset value was in the following percentiles of its Lipper peer group (Lipper Multi-Cap Growth Funds) for the one-, three- and five-year periods ended March 31, 2006 (the first percentile being the best-performing funds and the 100th percentile being the worst-performing funds):
| One-year period | Three-year period | Five-year period |
|
| 51st | 48th | 66th |
(Because of the passage of time, these performance results may differ from the performance results for more recent periods shown elsewhere in this report. Over the one-, three- and five-year periods ended March 31, 2006, there were 418, 359, and 288 funds, respectively, in your fund’s Lipper peer group.* Past performance is no guarantee of future performance.)
As a general matter, the Trustees concluded that cooperative efforts between the Trustees and Putnam Management represent the most effective way to address investment performance problems. The Trustees noted that investors in the Putnam funds have, in effect, placed their trust in the Putnam organization, under the oversight of the funds’ Trustees, to make appropriate decisions regarding the management of the funds. Based on the responsiveness of Putnam Management in the recent past to Trustee concerns about investment performance, the Trustees concluded that it is preferable to seek change within Putnam Management to address performance shortcomings. In the Trustees’ view, the alternative of terminating a
* The percentile rankings for your fund’s class A share annualized total return performance in the Lipper Multi-Cap Growth Funds category for the one-, five- and ten-year periods ended December 31, 2006 , were 41%, 57%, and 70%, respectively. Over the one-, five- and ten-year periods ended December 31, 2006, the fund ranked 198 out of 489, 177 out of 310, and 83 out of 118 funds, respectively. Note that this more recent information was not available when the Trustees approved the continuance of your fund’s management contract.
27
management contract and engaging a new investment adviser for an underperforming fund would entail significant disruptions and would not provide any greater assurance of improved investment performance.
Brokerage and soft-dollar allocations; other benefits
The Trustees considered various potential benefits that Putnam Management may receive in connection with the services it provides under the management contract with your fund. These include benefits related to brokerage and soft-dollar allocations, whereby a portion of the commissions paid by a fund for brokerage may be used to acquire research services that may be useful to Putnam Management in managing the assets of the fund and of other clients. The Trustees indicated their continued intent to monitor the potential benefits associated with the allocation of fund brokerage to ensure that the principle of seeking “best price and execution” remains paramount in the portfolio trading process.
The Trustees’ annual review of your fund’s management contract also included the review of its distributor’s contract and distribution plan with Putnam Retail Management Limited Partnership and the custodian agreement and investor servicing agreement with Putnam Fiduciary Trust Company, all of which provide benefits to affiliates of Putnam Management.
Comparison of retail and institutional fee schedules
The information examined by the Trustees as part of their annual contract review has included for many years information regarding fees charged by Putnam Management and its affiliates to institutional clients such as defined benefit pension plans, college endowments, etc. This information included comparison of such fees with fees charged to the funds, as well as a detailed assessment of the differences in the services provided to these two types of clients. The Trustees observed, in this regard, that the differences in fee rates between institutional clients and the mutual funds are by no means uniform when examined by individual asset sectors, suggesting that differences in the pricing of investment management services to these types of clients reflect to a substantial degree historical competitive forces operating in separate market places. The Trustees considered the fact that fee rates across all asset sectors are higher on average for mutual funds than for institutional clients, as well as the differences between the services that Putnam Management provides to the Putnam funds and those that it provides to institutional clients of the firm, but did not rely on such comparisons to any significant extent in concluding that the management fees paid by your fund are reasonable.
28
Other information
for shareholders
Important notice regarding delivery of shareholder documents
In accordance with SEC regulations, Putnam sends a single copy of annual and semiannual shareholder reports, prospectuses, and proxy statements to Putnam shareholders who share the same address, unless a shareholder requests otherwise. If you prefer to receive your own copy of these documents, please call Putnam at 1-800-225-1581, and Putnam will begin sending individual copies within 30 days.
Proxy voting
Putnam is committed to managing our mutual funds in the best interests of our shareholders. The Putnam funds’ proxy voting guidelines and procedures, as well as information regarding how your fund voted proxies relating to portfolio securities during the 12-month period ended June 30, 2006, are available on the Putnam Individual Investor Web site, www.putnam.com/individual, and on the SEC’s Web site, www.sec.gov. If you have questions about finding forms on the SEC’s Web site, you may call the SEC at 1-800-SEC-0330. You may also obtain the Putnam funds’ proxy voting guidelines and procedures at no charge by calling Putnam’s Shareholder Services at 1-800-225-1581.
Fund portfolio holdings
The fund will file a complete schedule of its portfolio holdings with the SEC for the first and third quarters of each fiscal year on Form N-Q. Shareholders may obtain the fund’s Forms N-Q on the SEC’s Web site at www.sec.gov. In addition, the fund’s Forms N-Q may be reviewed and copied at the SEC’s Public Reference Room in Washington, D.C. You may call the SEC at 1-800-SEC-0330 for information about the SEC’s Web site or the operation of the Public Reference Room.
29
Financial statements
A guide to financial statements
These sections of the report, as well as the accompanying Notes, constitute the fund’s financial statements.
The fund’s portfolio lists all the fund’s investments and their values as of the last day of the reporting period. Holdings are organized by asset type and industry sector, country, or state to show areas of concentration and diversification.
Statement of assets and liabilities shows how the fund’s net assets and share price are determined. All investment and noninvestment assets are added together. Any unpaid expenses and other liabilities are subtracted from this total. The result is divided by the number of shares to determine the net asset value per share, which is calculated separately for each class of shares. (For funds with preferred shares, the amount subtracted from total assets includes the liquidation preference of preferred shares.)
Statement of operations shows the fund’s net investment gain or loss. This is done by first adding up all the fund’s earnings — from dividends and interest income — and subtracting its operating expenses to determine net investment income (or loss). Then, any net gain or loss the fund realized on the sales of its holdings — as well as any unrealized gains or losses over the period — is added to or subtracted from the net investment result to determine the fund’s net gain or loss for the fiscal period.
Statement of changes in net assets shows how the fund’s net assets were affected by the fund’s net investment gain or loss, by distributions to shareholders, and by changes in the number of the fund’s shares. It lists distributions and their sources (net investment income or realized capital gains) over the current reporting period and the most recent fiscal year-end. The distributions listed here may not match the sources listed in the Statement of operations because the distributions are determined on a tax basis and may be paid in a different period from the one in which they were earned. Dividend sources are estimated at the time of declaration. Actual results may vary. Any non-taxable return of capital cannot be determined until final tax calculations are completed after the end of the fund’s fiscal year.
Financial highlights provide an overview of the fund’s investment results, per-share distributions, expense ratios, net investment income ratios, and portfolio turnover in one summary table, reflecting the five most recent reporting periods. In a semiannual report, the highlight table also includes the current reporting period.
30
| The fund’s portfolio 12/31/06 (Unaudited) | | | |
|
| |
| COMMON STOCKS (99.6%)* | | | |
|
| | Shares | | Value |
|
| Advertising and Marketing Services (0.2%) | | | |
| inVentiv Health, Inc. † | 227,800 | $ | 8,052,730 |
|
| |
| Aerospace and Defense (4.6%) | | | |
| Boeing Co. (The) | 686,700 | | 61,006,428 |
| General Dynamics Corp. | 449,300 | | 33,405,455 |
| L-3 Communications Holdings, Inc. | 392,000 | | 32,057,760 |
| Raytheon Co. | 1,333,500 | | 70,408,800 |
| Rockwell Collins, Inc. | 271,400 | | 17,176,906 |
| | | | 214,055,349 |
|
| |
| Airlines (0.6%) | | | |
| Southwest Airlines Co. | 1,798,700 | | 27,556,084 |
|
| |
| Automotive (1.4%) | | | |
| Harley-Davidson, Inc. | 929,500 | | 65,501,865 |
|
| |
| Banking (0.6%) | | | |
| Commerce Bancorp, Inc. | 408,100 | | 14,393,687 |
| UnionBanCal Corp. | 238,900 | | 14,632,625 |
| | | | 29,026,312 |
|
| |
| Beverage (2.9%) | | | |
| Coca-Cola Co. (The) | 685,100 | | 33,056,075 |
| Fomento Economico Mexicano SA de CV ADR (Mexico) | 210,300 | | 24,344,328 |
| PepsiCo, Inc. | 1,273,300 | | 79,644,915 |
| | | | 137,045,318 |
|
| |
| Biotechnology (4.5%) | | | |
| Amgen, Inc. † | 1,210,400 | | 82,682,424 |
| Applera Corp. - Applied Biosystems Group | 386,500 | | 14,180,685 |
| Biogen Idec, Inc. † | 1,179,400 | | 58,014,686 |
| Celgene Corp. † | 277,083 | | 15,940,585 |
| Genzyme Corp. † | 524,900 | | 32,323,342 |
| Invitrogen Corp. † | 161,500 | | 9,139,285 |
| | | | 212,281,007 |
|
| |
| Building Materials (0.6%) | | | |
| Genlyte Group, Inc. (The) † | 201,600 | | 15,746,976 |
| Sherwin-Williams Co. (The) | 182,300 | | 11,590,634 |
| | | | 27,337,610 |
|
| |
| Chemicals (0.8%) | | | |
| Airgas, Inc. | 291,500 | | 11,811,580 |
| Monsanto Co. | 505,100 | | 26,532,903 |
| | | | 38,344,483 |
31
| COMMON STOCKS (99.6%)* continued | | | |
|
| | Shares | | Value |
|
| Commercial and Consumer Services (2.8%) | | | |
| Alliance Data Systems Corp. † | 208,400 | $ | 13,018,748 |
| Corporate Executive Board Co. (The) | 482,700 | | 42,332,790 |
| Dun & Bradstreet Corp. (The) † | 140,800 | | 11,656,832 |
| IAC/InterActiveCorp. † | 451,800 | | 16,788,888 |
| Manpower, Inc. | 154,100 | | 11,546,713 |
| Paychex, Inc. | 757,600 | | 29,955,504 |
| Pre-Paid Legal Services, Inc. | 186,600 | | 7,301,658 |
| | | | 132,601,133 |
|
| |
| Communications Equipment (4.8%) | | | |
| Avaya, Inc. † | 1,366,500 | | 19,103,670 |
| Cisco Systems, Inc. † | 3,867,200 | | 105,690,578 |
| Harris Corp. | 414,400 | | 19,004,384 |
| Qualcomm, Inc. | 2,182,800 | | 82,488,012 |
| | | | 226,286,644 |
|
| |
| Computers (3.8%) | | | |
| Anixter International, Inc. † | 225,000 | | 12,217,500 |
| Brocade Communications Systems, Inc. † | 4,143,500 | | 34,018,135 |
| Emulex Corp. † | 753,500 | | 14,700,785 |
| Hewlett-Packard Co. | 329,400 | | 13,567,986 |
| Jack Henry & Associates, Inc. | 501,200 | | 10,725,680 |
| Lexmark International, Inc. Class A † | 240,400 | | 17,597,280 |
| NCR Corp. † | 254,400 | | 10,878,144 |
| Network Appliance, Inc. † | 1,021,600 | | 40,128,448 |
| Red Hat, Inc. † | 984,600 | | 22,645,800 |
| | | | 176,479,758 |
|
| |
| Conglomerates (0.4%) | | | |
| Danaher Corp. | 258,900 | | 18,754,716 |
|
| |
| Construction (0.3%) | | | |
| Eagle Materials, Inc. | 286,800 | | 12,398,364 |
|
| |
| Consumer (1.2%) | | | |
| Black & Decker Manufacturing Co. | 192,800 | | 15,418,216 |
| Harman International Industries, Inc. | 225,300 | | 22,509,723 |
| Tupperware Brands Corp. | 741,700 | | 16,769,837 |
| | | | 54,697,776 |
|
| |
| Consumer Finance (0.7%) | | | |
| Accredited Home Lenders Holding Co. † | 151,600 | | 4,135,648 |
| AmeriCredit Corp. † | 381,700 | | 9,607,389 |
| First Marblehead Corp. (The) | 331,800 | | 18,132,870 |
| | | | 31,875,907 |
|
| |
| Consumer Goods (2.6%) | | | |
| Chattem, Inc. �� | 311,200 | | 15,584,896 |
| Colgate-Palmolive Co. | 938,600 | | 61,234,264 |
| Newell Rubbermaid, Inc. | 1,552,700 | | 44,950,665 |
| | | 121,769,825 |
32
| COMMON STOCKS (99.6%)* continued | | | |
|
| | Shares | | Value |
|
| Containers (0.3%) | | | |
| Pactiv Corp. † | 367,000 | $ | 13,098,230 |
|
| |
| Electric Utilities (0.6%) | | | |
| TXU Corp. | 501,300 | | 27,175,473 |
|
| |
| Electrical Equipment (1.1%) | | | |
| WESCO International, Inc. † | 871,500 | | 51,252,915 |
|
| |
| Electronics (3.7%) | | | |
| Amphenol Corp. Class A | 281,400 | | 17,469,312 |
| General Cable Corp. † | 349,000 | | 15,254,790 |
| Komag, Inc. † | 419,447 | | 15,888,652 |
| MEMC Electronic Materials, Inc. † | 228,765 | | 8,953,862 |
| Motorola, Inc. | 2,874,600 | | 59,101,776 |
| National Semiconductor Corp. | 360,800 | | 8,190,160 |
| NVIDIA Corp. † | 408,100 | | 15,103,781 |
| QLogic Corp. † | 535,900 | | 11,746,928 |
| RF Micro Devices, Inc. † | 1,928,000 | | 13,091,120 |
| Texas Instruments, Inc. | 231,500 | | 6,667,200 |
| | | | 171,467,581 |
|
| |
| Energy (1.8%) | | | |
| Cameron International Corp. † | 601,900 | | 31,930,795 |
| Grey Wolf, Inc. † | 1,804,100 | | 12,376,126 |
| Pride International, Inc. † | 486,000 | | 14,584,860 |
| Rowan Cos., Inc. | 395,200 | | 13,120,640 |
| Superior Energy Services † | 446,800 | | 14,601,424 |
| | | | 86,613,845 |
|
| |
| Engineering & Construction (0.6%) | | | |
| Jacobs Engineering Group, Inc. † | 172,600 | | 14,073,804 |
| McDermott International, Inc. † | 266,000 | | 13,528,760 |
| | | | 27,602,564 |
|
| |
| Financial (2.2%) | | | |
| Assurant, Inc. | 222,700 | | 12,304,175 |
| JPMorgan Chase & Co. | 961,300 | | 46,430,790 |
| Moody’s Corp. | 666,500 | | 46,028,490 |
| | | | 104,763,455 |
|
| |
| Food (0.2%) | | | |
| Campbell Soup Co. | 255,700 | | 9,944,173 |
| McCormick & Co., Inc. | 53,700 | | 2,070,672 |
| | | | 12,014,845 |
33
| COMMON STOCKS (99.6%)* continued | | | |
|
| | Shares | | Value |
|
| Health Care Services (6.8%) | | | |
| AMERIGROUP Corp. † | 440,900 | $ | 15,823,901 |
| Apria Healthcare Group, Inc. † | 304,000 | | 8,101,600 |
| Caremark Rx, Inc. | 513,600 | | 29,331,696 |
| Charles River Laboratories International, Inc. † | 273,600 | | 11,833,200 |
| Coventry Health Care, Inc. † | 387,700 | | 19,404,385 |
| Humana, Inc. † | 389,600 | | 21,548,776 |
| Laboratory Corp. of America Holdings † | 172,500 | | 12,673,575 |
| McKesson Corp. | 1,175,200 | | 59,582,640 |
| Sierra Health Services, Inc. † | 596,900 | | 21,512,276 |
| UnitedHealth Group, Inc. | 1,213,600 | | 65,206,728 |
| WellCare Health Plans, Inc. † | 311,800 | | 21,483,020 |
| WellPoint, Inc. † | 436,400 | | 34,340,316 |
| | | | 320,842,113 |
|
| |
| Homebuilding (0.8%) | | | |
| NVR, Inc. † | 60,300 | | 38,893,500 |
|
| |
| Insurance (1.0%) | | | |
| Safety Insurance Group, Inc. | 149,300 | | 7,571,003 |
| Selective Insurance Group | 210,800 | | 12,076,732 |
| W.R. Berkley Corp. | 750,900 | | 25,913,559 |
| | | | 45,561,294 |
|
| |
| Investment Banking/Brokerage (4.6%) | | | |
| Bear Stearns Cos., Inc. (The) | 195,800 | | 31,872,324 |
| Calamos Asset Management, Inc. Class A | 407,300 | | 10,927,859 |
| Goldman Sachs Group, Inc. (The) | 421,900 | | 84,105,765 |
| Lazard, Ltd. Class A (Bermuda) | 334,900 | | 15,854,166 |
| Lehman Brothers Holdings, Inc. | 717,400 | | 56,043,288 |
| State Street Corp. | 262,300 | | 17,689,512 |
| | | | 216,492,914 |
|
| |
| Leisure (0.3%) | | | |
| Thor Industries, Inc. | 341,900 | | 15,040,181 |
|
| |
| Lodging/Tourism (0.3%) | | | |
| Choice Hotels International, Inc. | 357,400 | | 15,046,540 |
|
| |
| Machinery (2.3%) | | | |
| Cummins, Inc. | 267,000 | | 31,554,060 |
| MSC Industrial Direct Co., Inc. Class A | 350,600 | | 13,725,990 |
| Terex Corp. † | 618,090 | | 39,916,252 |
| Timken Co. | 495,100 | | 14,447,018 |
| Wabtec Corp. | 326,100 | | 9,906,918 |
| | | | 109,550,238 |
34
| COMMON STOCKS (99.6%)* continued | | | |
|
| | Shares | | Value |
|
| Manufacturing (1.6%) | | | |
| Dover Corp. | 547,502 | $ | 26,838,548 |
| Freightcar America, Inc. | 188,700 | | 10,463,415 |
| Mettler-Toledo International, Inc. (Switzerland) † | 237,800 | | 18,750,530 |
| Roper Industries, Inc. | 385,100 | | 19,347,424 |
| | | | 75,399,917 |
|
| |
| Medical Technology (4.8%) | | | |
| Becton, Dickinson and Co. | 1,017,100 | | 71,349,565 |
| C.R. Bard, Inc. | 406,400 | | 33,719,008 |
| Edwards Lifesciences Corp. † | 311,200 | | 14,638,848 |
| Hologic, Inc. † | 229,337 | | 10,843,053 |
| Kinetic Concepts, Inc. † | 936,600 | | 37,042,530 |
| Millipore Corp. † | 219,500 | | 14,618,700 |
| Respironics, Inc. † | 62,100 | | 2,344,275 |
| Techne Corp. † | 260,200 | | 14,428,090 |
| Zimmer Holdings, Inc. † | 336,700 | | 26,390,546 |
| | | | 225,374,615 |
|
| |
| Metals (1.9%) | | | |
| Agnico-Eagle Mines, Ltd. (Canada) | 322,700 | | 13,308,148 |
| Cameco Corp. (Canada) | 326,300 | | 13,198,835 |
| Freeport-McMoRan Copper & Gold, Inc. Class B | 495,300 | | 27,603,069 |
| Rio Tinto PLC (United Kingdom) | 409,975 | | 21,786,462 |
| Steel Dynamics, Inc. | 363,000 | | 11,779,350 |
| | | | 87,675,864 |
|
| |
| Natural Gas Utilities (0.1%) | | | |
| Dynegy, Inc. Class A † | 381,581 | | 2,762,646 |
|
| |
| Oil & Gas (4.1%) | | | |
| EOG Resources, Inc. | 155,100 | | 9,685,995 |
| Exxon Mobil Corp. | 861,300 | | 66,001,419 |
| Frontier Oil Corp. | 1,214,000 | | 34,890,360 |
| Marathon Oil Corp. | 89,400 | | 8,269,500 |
| Noble Energy, Inc. | 292,200 | | 14,338,254 |
| Penn West Energy Trust (Unit) (Canada) | 289,300 | | 8,841,008 |
| Sunoco, Inc. | 224,100 | | 13,974,876 |
| Tesoro Corp. | 219,700 | | 14,449,669 |
| Unit Corp. † | 229,000 | | 11,095,050 |
| Western Refining, Inc. | 339,600 | | 8,646,216 |
| | | | 190,192,347 |
|
| |
| Pharmaceuticals (1.4%) | | | |
| Barr Pharmaceuticals, Inc. † | 412,700 | | 20,684,524 |
| Cephalon, Inc. † | 209,900 | | 14,779,059 |
| Medicis Pharmaceutical Corp. Class A | 373,200 | | 13,110,516 |
| Mylan Laboratories, Inc. | 465,800 | | 9,297,368 |
| Salix Pharmaceuticals, Ltd. † | 773,200 | | 9,409,844 |
| | | | 67,281,311 |
35
| COMMON STOCKS (99.6%)* continued | | | |
|
| | Shares | | Value |
|
| Power Producers (0.9%) | | | |
| AES Corp. (The) † # | 1,918,000 | $ | 42,272,720 |
|
| |
| Publishing (1.8%) | | | |
| Marvel Entertainment, Inc. † | 328,429 | | 8,838,024 |
| McGraw-Hill Cos., Inc. (The) | 1,112,800 | | 75,692,656 |
| | | | 84,530,680 |
|
| |
| Railroads (0.4%) | | | |
| Canadian National Railway Co. (Canada) | 392,600 | | 16,893,578 |
|
| |
| Real Estate (0.7%) | | | |
| CB Richard Ellis Group, Inc. Class A † | 593,300 | | 19,697,560 |
| Jones Lang LaSalle, Inc. | 126,700 | | 11,677,939 |
| | | | 31,375,499 |
|
| |
| Restaurants (1.3%) | | | |
| Brinker International, Inc. | 427,811 | | 12,902,780 |
| Darden Restaurants, Inc. | 656,800 | | 26,383,656 |
| Domino’s Pizza, Inc. | 422,700 | | 11,835,600 |
| Jack in the Box, Inc. † | 184,000 | | 11,231,360 |
| | | | 62,353,396 |
|
| |
| Retail (7.9%) | | | |
| American Eagle Outfitters, Inc. | 2,012,700 | | 62,816,367 |
| AnnTaylor Stores Corp. † | 482,000 | | 15,828,880 |
| Bed Bath & Beyond, Inc. † | 793,500 | | 30,232,350 |
| Best Buy Co., Inc. | 575,701 | | 28,318,732 |
| Big Lots, Inc. † | 698,200 | | 16,002,744 |
| Claire’s Stores, Inc. | 456,000 | | 15,111,840 |
| Dollar Tree Stores, Inc. † | 451,500 | | 13,590,150 |
| Dress Barn, Inc. † | 567,800 | | 13,246,774 |
| EZCORP, Inc. Class A † | 278,692 | | 4,528,745 |
| Family Dollar Stores, Inc. | 490,200 | | 14,377,566 |
| Guess ?, Inc. † | 622,200 | | 39,466,146 |
| Lowe’s Cos., Inc. | 1,326,400 | | 41,317,360 |
| NBTY, Inc. † | 348,600 | | 14,491,302 |
| OfficeMax, Inc. | 313,600 | | 15,570,240 |
| Pantry, Inc. (The) † | 287,300 | | 13,457,132 |
| Staples, Inc. | 1,203,450 | | 32,132,115 |
| | | | 370,488,443 |
|
| |
| Semiconductor (1.6%) | | | |
| Formfactor, Inc. † | 254,000 | | 9,461,500 |
| Lam Research Corp. † | 1,255,500 | | 63,553,410 |
| | | | 73,014,910 |
36
| COMMON STOCKS (99.6%)* continued | | | |
|
| | Shares | | Value |
|
| Software (4.6%) | | | |
| Autodesk, Inc. † | 736,200 | $ | 29,786,652 |
| BMC Software, Inc. † | 579,700 | | 18,666,340 |
| Citrix Systems, Inc. † | 482,300 | | 13,046,215 |
| Hyperion Solutions Corp. † | 390,700 | | 14,041,758 |
| Mantech International Corp. Class A † | 207,600 | | 7,645,908 |
| McAfee, Inc. † | 1,132,567 | | 32,142,251 |
| Microsoft Corp. # | 2,656,600 | | 79,326,076 |
| Oracle Corp. † | 1,206,300 | | 20,675,982 |
| | | | 215,331,182 |
|
| |
| Staffing (0.3%) | | | |
| Administaff, Inc. | 375,700 | | 16,068,689 |
|
| |
| Technology (0.3%) | | | |
| ON Semiconductor Corp. † | 1,794,400 | | 13,583,608 |
|
| |
| Technology Services (2.9%) | | | |
| Accenture, Ltd. Class A (Bermuda) | 1,674,800 | | 61,850,364 |
| Acxiom Corp. | 673,300 | | 17,270,145 |
| Convergys Corp. † | 749,100 | | 17,813,598 |
| Fair Isaac Corp. | 88,100 | | 3,581,265 |
| Global Payments, Inc. | 501,300 | | 23,210,190 |
| Ingram Micro, Inc. Class A † | 545,400 | | 11,131,614 |
| | | | 134,857,176 |
|
| |
| Telecommunications (1.2%) | | | |
| Brightpoint, Inc. † | 852,260 | | 11,462,897 |
| InterDigital Communications Corp. † | 350,000 | | 11,742,500 |
| j2 Global Communications, Inc. † | 528,000 | | 14,388,000 |
| NII Holdings, Inc. † | 290,000 | | 18,687,600 |
| | | | 56,280,997 |
|
| |
| Textiles (1.4%) | | | |
| NIKE, Inc. Class B | 390,400 | | 38,661,312 |
| Phillips-Van Heusen Corp. | 295,800 | | 14,840,286 |
| Polo Ralph Lauren Corp. | 146,100 | | 11,346,126 |
| | | | 64,847,724 |
|
| |
| Tobacco (0.9%) | | | |
| Reynolds American, Inc. | 455,000 | | 29,788,850 |
| UST, Inc. | 229,700 | | 13,368,540 |
| | | | 43,157,390 |
|
| |
| Transportation Services (0.1%) | | | |
| C.H. Robinson Worldwide, Inc. | 40,500 | | 1,656,045 |
| Expeditors International of Washington, Inc. | 77,600 | | 3,142,800 |
| | | | 4,798,845 |
|
| |
| Total common stocks (cost $4,128,837,495) | | $4,668,022,106 |
37
| PURCHASED OPTIONS OUTSTANDING (—%)* (cost $532,432) | | | |
|
| | Expiration date/strike price | Contract amount | | Value |
|
| WESCO International, Inc. (Call) | Jan 07/$65.00 | $73,830 | $ | 20,672 |
|
| |
| SHORT-TERM INVESTMENTS (0.8%)* (cost $38,636,619) | | | |
|
| | | Shares | | Value |
|
| Putnam Prime Money Market Fund (e) | | 38,636,619 | $ | 38,636,619 |
|
| |
| TOTAL INVESTMENTS | | | | |
| Total investments (cost $4,168,006,546) | | $ | 4,706,679,397 |
* Percentages indicated are based on net assets of $4,688,149,530.
† Non-income-producing security.
# A portion of these securities were pledged and segregated with the custodian to cover margin requirements for futures contracts at December 31, 2006.
(e) See Note 5 to the financial statements regarding investments in Putnam Prime Money Market Fund.
At December 31, 2006, liquid assets totaling $16,356,120 have been designated as collateral for open options and futures contracts.
ADR after the name of a foreign holding stands for American Depository Receipts, representing ownership of foreign securities on deposit with a custodian bank.
| FUTURES CONTRACTS OUTSTANDING at 12/31/06 (Unaudited) | | |
|
| | | | | Unrealized |
| | Number of | | Expiration | appreciation/ |
| | contracts | Value | | date | (depreciation) |
|
| NASDAQ 100 Index E-Mini (Long) | 27 | $ 958,500 | | Mar-07 | $(17,836) |
| Russell 2000 Index Mini (Long) | 21 | 1,669,290 | | Mar-07 | (15,857) |
| S&P 500 Index (Long) | 7 | 2,499,700 | | Mar-07 | 9,999 |
| S&P MidCap 400 Index E-Mini (Long) | 11 | 892,430 | | Mar-07 | (19,162) |
|
| Total | | | | $(42,856) |
| WRITTEN OPTIONS OUTSTANDING at 12/31/06 (premiums received $647,903) (Unaudited) | |
|
| | Contract | Expiration date/ | |
| | amount | strike price | Value |
|
| WESCO International, Inc. (Call) | $147,660 | Jan 07/$70.00 | $21,854 |
The accompanying notes are an integral part of these financial statements.
38
| Statement of assets and liabilities 12/31/06 (Unaudited) | |
|
| |
| ASSETS | |
|
| Investment in securities, at value (Note 1): | |
| Unaffiliated issuers (identified cost $4,129,369,927) | $ 4,668,042,778 |
| Affiliated issuers (identified cost $38,636,619) (Note 5) | 38,636,619 |
|
| Cash | 46,519 |
|
| Dividends, interest and other receivables | 4,227,418 |
|
| Receivable for shares of the fund sold | 703,358 |
|
| Receivable for securities sold | 4,707,718 |
|
| Total assets | 4,716,364,410 |
|
| |
| LIABILITIES | |
|
| Payable to subcustodian (Note 2) | 12,669 |
|
| Payable for variation margin (Note 1) | 21,700 |
|
| Payable for shares of the fund repurchased | 16,110,728 |
|
| Payable for compensation of Manager (Notes 2 and 5) | 6,411,139 |
|
| Payable for investor servicing and custodian fees (Note 2) | 1,112,573 |
|
| Payable for Trustee compensation and expenses (Note 2) | 1,041,217 |
|
| Payable for administrative services (Note 2) | 9,985 |
|
| Payable for distribution fees (Note 2) | 2,852,211 |
|
| Written options outstanding, at value (premiums received $647,903) (Notes 1 and 3) | 21,854 |
|
| Other accrued expenses | 620,804 |
|
| Total liabilities | 28,214,880 |
|
| Net assets | $ 4,688,149,530 |
|
| |
| REPRESENTED BY | |
|
| Paid-in capital (Unlimited shares authorized) (Notes 1 and 4) | $ 7,769,529,607 |
|
| Accumulated net investment loss (Note 1) | (6,704,631) |
|
| Accumulated net realized loss on investments | |
| and foreign currency transactions (Note 1) | (3,613,929,309) |
|
| Net unrealized appreciation of investments | |
| and assets and liabilities in foreign currencies | 539,253,863 |
|
| Total — Representing net assets applicable to capital shares outstanding | $ 4,688,149,530 |
| |
| (Continued on next page) | |
39
Statement of assets and liabilities (Continued)
| COMPUTATION OF NET ASSET VALUE AND OFFERING PRICE | |
|
| Net asset value and redemption price per class A share | |
| ($3,600,398,518 divided by 72,554,477 shares) | $49.62 |
|
| Offering price per class A share | |
| (100/94.75 of $49.62)* | $52.37 |
|
| Net asset value and offering price per class B share | |
| ($548,351,394 divided by 12,415,623 shares)** | $44.17 |
|
| Net asset value and offering price per class C share | |
| ($38,101,024 divided by 813,027 shares)** | $46.86 |
|
| Net asset value and redemption price per class M share | |
| ($74,767,650 divided by 1,613,798 shares) | $46.33 |
|
| Offering price per class M share | |
| (100/96.75 of $46.33)* | $47.89 |
|
| Net asset value, offering price and redemption price per class R share | |
| ($1,215,025 divided by 24,709 shares) | $49.17 |
|
| Net asset value, offering price and redemption price per class Y share | |
| ($425,315,919 divided by 8,267,777 shares) | $51.44 |
* On single retail sales of less than $50,000. On sales of $50,000 or more the offering price is reduced.
** Redemption price per share is equal to net asset value less any applicable contingent deferred sales charge.
The accompanying notes are an integral part of these financial statements.
40
| Statement of operations Six months ended 12/31/06 (Unaudited) | |
|
| |
| INVESTMENT INCOME | |
|
| Dividends (net of foreign tax of $98,895) | $ 19,824,009 |
|
| Interest (including interest income of $975,985 | |
| from investments in affiliated issuers) (Note 5) | 1,491,296 |
|
| Total investment income | 21,315,305 |
|
| |
| EXPENSES | |
|
| Compensation of Manager (Note 2) | 12,699,703 |
|
| Investor servicing fees (Note 2) | 7,508,731 |
|
| Custodian fees (Note 2) | 129,967 |
|
| Trustee compensation and expenses (Note 2) | 64,856 |
|
| Administrative services (Note 2) | 28,411 |
|
| Distribution fees — Class A (Note 2) | 4,524,073 |
|
| Distribution fees — Class B (Note 2) | 2,871,969 |
|
| Distribution fees — Class C (Note 2) | 192,070 |
|
| Distribution fees — Class M (Note 2) | 284,332 |
|
| Distribution fees — Class R (Note 2) | 2,101 |
|
| Other | 555,993 |
|
| Non-recurring costs (Notes 2 and 6) | 18,980 |
|
| Costs assumed by Manager (Notes 2 and 6) | (18,980) |
|
| Fees waived and reimbursed by Manager (Note 5) | (20,899) |
|
| Total expenses | 28,841,307 |
|
| Expense reduction (Note 2) | (821,371) |
|
| Net expenses | 28,019,936 |
|
| Net investment loss | (6,704,631) |
|
| Net realized gain on investments (Notes 1 and 3) | 150,310,009 |
|
| Net realized gain on futures contracts (Note 1) | 2,635,611 |
|
| Net realized loss on foreign currency transactions (Note 1) | (5,446) |
|
| Net realized gain on written options (Notes 1 and 3) | 312,394 |
|
| Net unrealized depreciation of assets and liabilities | |
| in foreign currencies during the period | (2,181) |
|
| Net unrealized appreciation of investments, futures | |
| contracts and written options during the period | 233,169,869 |
|
| Net gain on investments | 386,420,256 |
|
| Net increase in net assets resulting from operations | $379,715,625 |
The accompanying notes are an integral part of these financial statements.
41
| Statement of changes in net assets | |
|
| |
| DECREASE IN NET ASSETS | | |
|
| | Six months ended | Year ended |
| | 12/31/06* | 6/30/06 |
|
| Operations: | | |
| Net investment loss | $ (6,704,631) | $ (16,304,610) |
|
| Net realized gain on investments and foreign | | |
| currency transactions | 153,252,568 | 944,402,173 |
|
| Net unrealized appreciation (depreciation) of investments | | |
| and assets and liabilities in foreign currencies | 233,167,688 | (347,818,003) |
|
| Net increase in net assets resulting from operations | 379,715,625 | 580,279,560 |
|
| Redemption fees (Note 1) | 1,126 | 12,783 |
|
| Decrease from capital share transactions (Note 4) | (523,223,966) | (1,736,185,398) |
|
| Total decrease in net assets | (143,507,215) | (1,155,893,055) |
|
| |
| NET ASSETS | | |
|
| Beginning of period | 4,831,656,745 | 5,987,549,800 |
|
| End of period (including accumulated net investment | | |
| loss of $6,704,631 and $—, respectively) | $4,688,149,530 | $ 4,831,656,745 |
* Unaudited | | |
The accompanying notes are an integral part of these financial statements.
42
This page left blank intentionally.
43
| Financial highlights | (For a common share outstanding throughout the period) | | | | | |
|
| |
| INVESTMENT OPERATIONS: | | | | | | | RATIOS AND SUPPLEMENTAL DATA: | |
|
| | | | Net | | | | Total | | | Ratio of net | |
| | Net asset | | realized and | Total | | Net asset | return | Net | Ratio of | investment | |
| | value, | Net | unrealized | from | | value, | at net | assets, | expenses to | income (loss) | Portfolio |
| | beginning | investment | gain (loss) on | investment | Redemption | end | asset | end of period | average net | to average | turnover |
| Period ended | of period | income (loss)(a) | investments | operations | fees | of period | value (%)(b) | (in thousands) | assets (%)(c) | net assets (%) | (%) |
|
| CLASS A | | | | | | | | | | | |
| December 31, 2006** | $45.72 | (.05)(d) | 3.95 | 3.90 | —(e) | $49.62 | 8.53* | $3,600,399 | .57*(d) | (.10)*(d) | 30.95* |
| June 30, 2006 | 41.60 | (.09)(d,h) | 4.21 | 4.12 | —(e) | 45.72 | 9.90(h) | 3,688,423 | 1.08(d,h) | (.19)(d,h) | 83.63 |
| June 30, 2005 | 38.96 | .03(d,f,g) | 2.61 | 2.64 | —(e) | 41.60 | 6.78(g) | 4,650,755 | 1.12(d) | .07(d,f,g) | 97.25 |
| June 30, 2004 | 32.79 | (.19)(d) | 6.36 | 6.17 | —(e) | 38.96 | 18.82 | 5,075,005 | 1.09(d) | (.52)(d) | 60.86 |
| June 30, 2003 | 32.28 | (.17) | .68 | .51 | — | 32.79 | 1.58 | 6,262,164 | 1.09 | (.57) | 42.43 |
| June 30, 2002 | 47.97 | (.22) | (15.47) | (15.69) | — | 32.28 | (32.71) | 7,683,016 | .98 | (.57) | 76.67 |
|
| |
| CLASS B | | | | | | | | | | | |
| December 31, 2006** | $40.85 | (.20)(d) | 3.52 | 3.32 | —(e) | $44.17 | 8.13* | $548,351 | .95*(d) | (.48)*(d) | 30.95* |
| June 30, 2006 | 37.45 | (.38)(d,h) | 3.78 | 3.40 | —(e) | 40.85 | 9.08(h) | 610,991 | 1.83(d,h) | (.94)(d,h) | 83.63 |
| June 30, 2005 | 35.34 | (.24)(d,f,g) | 2.35 | 2.11 | —(e) | 37.45 | 5.97(g) | 784,295 | 1.87(d) | (.68)(d,f,g) | 97.25 |
| June 30, 2004 | 29.96 | (.43)(d) | 5.81 | 5.38 | —(e) | 35.34 | 17.96 | 1,674,238 | 1.84(d) | (1.27)(d) | 60.86 |
| June 30, 2003 | 29.72 | (.36) | .60 | .24 | — | 29.96 | .81 | 1,850,775 | 1.84 | (1.33) | 42.43 |
| June 30, 2002 | 44.50 | (.48) | (14.30) | (14.78) | — | 29.72 | (33.21) | 2,739,100 | 1.73 | (1.32) | 76.67 |
|
| |
| CLASS C | | | | | | | | | | | |
| December 31, 2006** | $43.34 | (.21)(d) | 3.73 | 3.52 | —(e) | $46.86 | 8.12* | $38,101 | .95*(d) | (.48)*(d) | 30.95* |
| June 30, 2006 | 39.73 | (.41)(d,h) | 4.02 | 3.61 | —(e) | 43.34 | 9.09(h) | 39,825 | 1.83(d,h) | (.94)(d,h) | 83.63 |
| June 30, 2005 | 37.49 | (.25)(d,f,g) | 2.49 | 2.24 | —(e) | 39.73 | 5.98(g) | 42,827 | 1.87(d) | (.68)(d,f,g) | 97.25 |
| June 30, 2004 | 31.79 | (.45)(d) | 6.15 | 5.70 | —(e) | 37.49 | 17.93 | 55,005 | 1.84(d) | (1.27)(d) | 60.86 |
| June 30, 2003 | 31.53 | (.37) | .63 | .26 | — | 31.79 | .83 | 64,015 | 1.84 | (1.32) | 42.43 |
| June 30, 2002 | 47.21 | (.50) | (15.18) | (15.68) | — | 31.53 | (33.21) | 79,149 | 1.73 | (1.32) | 76.67 |
|
| |
| CLASS M | | | | | | | | | | | |
| December 31, 2006** | $42.79 | (.15)(d) | 3.69 | 3.54 | —(e) | $46.33 | 8.27* | $74,768 | .83*(d) | (.35)*(d) | 30.95* |
| June 30, 2006 | 39.14 | (.29)(d,h) | 3.94 | 3.65 | —(e) | 42.79 | 9.32(h) | 78,230 | 1.58(d,h) | (.69)(d,h) | 83.63 |
| June 30, 2005 | 36.83 | (.16)(d,f,g) | 2.47 | 2.31 | —(e) | 39.14 | 6.27(g) | 104,545 | 1.62(d) | (.43)(d,f,g) | 97.25 |
| June 30, 2004 | 31.15 | (.36)(d) | 6.04 | 5.68 | —(e) | 36.83 | 18.24 | 134,157 | 1.59(d) | (1.02)(d) | 60.86 |
| June 30, 2003 | 30.82 | (.30) | .63 | .33 | — | 31.15 | 1.07 | 171,675 | 1.59 | (1.07) | 42.43 |
| June 30, 2002 | 46.03 | (.40) | (14.81) | (15.21) | — | 30.82 | (33.04) | 223,964 | 1.48 | (1.07) | 76.67 |
|
| |
| CLASS R | | | | | | | | | | | |
| December 31, 2006** | $45.37 | (.10)(d) | 3.90 | 3.80 | —(e) | $49.17 | 8.38* | $1,215 | .70*(d) | (.21)*(d) | 30.95* |
| June 30, 2006 | 41.38 | (.19)(d,h) | 4.18 | 3.99 | —(e) | 45.37 | 9.64(h) | 517 | 1.33(d,h) | (.40)(d,h) | 83.63 |
| June 30, 2005 | 38.85 | (.09)(d,f,g) | 2.62 | 2.53 | —(e) | 41.38 | 6.51(g) | 184 | 1.37(d) | (.23)(d,f,g) | 97.25 |
| June 30, 2004 | 32.76 | (.27)(d) | 6.36 | 6.09 | —(e) | 38.85 | 18.59 | 25 | 1.34(d) | (.76)(d) | 60.86 |
| June 30, 2003† | 28.90 | (.10) | 3.96 | 3.86 | — | 32.76 | 13.36* | 1 | .59* | (.36)* | 42.43 |
|
| |
| CLASS Y | | | | | | | | | | | |
| December 31, 2006** | $47.34 | .01(d) | 4.09 | 4.10 | —(e) | $51.44 | 8.66* | $425,316 | .45*(d) | .03*(d) | 30.95* |
| June 30, 2006 | 42.97 | .03(d,h) | 4.34 | 4.37 | —(e) | 47.34 | 10.17(h) | 413,670 | .83(d,h) | .06(d,h) | 83.63 |
| June 30, 2005 | 40.14 | .13(d,f,g) | 2.70 | 2.83 | —(e) | 42.97 | 7.05(g) | 404,943 | .87(d) | .34(d,f,g) | 97.25 |
| June 30, 2004 | 33.70 | (.10)(d) | 6.54 | 6.44 | —(e) | 40.14 | 19.11 | 851,430 | .84(d) | (.27)(d) | 60.86 |
| June 30, 2003 | 33.09 | (.10) | .71 | .61 | — | 33.70 | 1.85 | 930,912 | .84 | (.33) | 42.43 |
| June 30, 2002 | 49.05 | (.13) | (15.83) | (15.96) | — | 33.09 | (32.54) | 1,170,852 | .73 | (.32) | 76.67 |
|
See notes to financial highlights at the end of this section.
The accompanying notes are an integral part of these financial statements.
Financial highlights (Continued)
* Not annualized.
** Unaudited.
† For the period January 21, 2003 (commencement of operations) to June 30, 2003.
(a) Per share net investment income (loss) has been determined on the basis of the weighted average number of shares outstanding during the period.
(b) Total return assumes dividend reinvestment and does not reflect the effect of sales charges.
(c) Includes amounts paid through expense offset and brokerage service arrangements (Note 2).
(d) Reflects waivers of certain fund expenses in connection with investments in Putnam Prime Money Market Fund during the period. As a result of such waivers, the expenses of each class, as a percentage of its average net assets, reflect a reduction of the following amounts (Note 5):
| | 12/31/06 | 6/30/06 | 6/30/05 | 6/30/04 |
|
| Class A | <0.01% | <0.01% | <0.01% | <0.01% |
|
| Class B | <0.01 | <0.01 | <0.01 | <0.01 |
|
| Class C | <0.01 | <0.01 | <0.01 | <0.01 |
|
| Class M | <0.01 | <0.01 | <0.01 | <0.01 |
|
| Class R | <0.01 | <0.01 | <0.01 | <0.01 |
|
| Class Y | <0.01 | <0.01 | <0.01 | <0.01 |
|
(e) Amount represents less than $0.01 per share.
(f) Net investment income (loss) per share and ratio of net investment income (loss) to average net assets reflect a special dividend received by the fund which amounted to the following amounts:
| | | Percentage |
| | | of average |
| | Per share | net assets |
|
| Class A | $0.15 | 0.39% |
|
| Class B | 0.15 | 0.42 |
|
| Class C | 0.15 | 0.40 |
|
| Class M | 0.15 | 0.40 |
|
| Class R | 0.12 | 0. 31 |
|
| Class Y | 0.17 | 0.43 |
|
(g) Reflects a non-recurring accrual related to Putnam Management’s settlement with the SEC regarding brokerage allocation practices, which amounted to the following amounts:
| | | Percentage |
| | | of average |
| | Per share | net assets |
|
| Class A | $0.02 | 0.05% |
|
| Class B | 0.01 | 0.04 |
|
| Class C | 0.02 | 0.05 |
|
| Class M | 0.02 | 0.05 |
|
| Class R | 0.03 | 0.08 |
|
| Class Y | 0.01 | 0.04 |
|
(h) Reflects a non-recurring reimbursement from Putnam Investments relating to the calculation of certain amounts paid by the fund to Putnam in previous years for transfer agent services, which amounted to $0.03 per share and 0.06% of average net assets for the period ended June 30, 2006 (Note 6).
The accompanying notes are an integral part of these financial statements.
46
Notes to financial statements 12/31/06 (Unaudited)
Note 1: Significant accounting policies
Putnam New Opportunities Fund (the “fund”), a Massachusetts business trust, is registered under the Investment Company Act of 1940, as amended, as a diversified, open-end management investment company. The fund seeks capital appreciation by investing principally in common stocks of companies in sectors of the economy which, in the judgment of Putnam Investment Management, LLC (“Putnam Management”), the fund’s manager, an indirect wholly-owned subsidiary of Putnam, LLC, possess above-average, long-term growth potential.
The fund offers class A, class B, class C, class M, class R and class Y shares. Class A and class M shares are sold with a maximum front-end sales charge of 5.25% and 3.25%, respectively, and generally do not pay a contingent deferred sales charge. Class B shares, which convert to class A shares after approximately eight years, do not pay a front-end sales charge and are subject to a contingent deferred sales charge, if those shares are redeemed within six years of purchase. Class C shares have a one-year 1.00% contingent deferred sales charge and do not convert to class A shares. Class R shares, which are offered to qualified employee-benefit plans, are sold without a front-end sales charge or a contingent deferred sales charge. The expenses for class A, class B, class C, class M and class R shares may differ based on the distribution fee of each class, which is identified in Note 2. Class Y shares, which are sold at net asset value, are generally subject to the sa me expenses as class A, class B, class C, class M and class R shares, but do not bear a distribution fee. Class Y shares are sold to certain eligible purchasers including certain defined contribution plans (including corporate IRAs), bank trust departments, trust companies and certain college savings plans.
Effective October 2, 2006, a 1.00% redemption fee may apply on any shares purchased on or after such date that are redeemed (either by selling or exchanging into another fund) within 7 days of purchase. The redemption fee is accounted for as an addition to paid-in-capital. Prior to October 2, 2006, a 2.00% redemption fee applied to any shares that were redeemed (either by selling or exchanging into another fund) within 5 days of purchase.
Investment income, realized and unrealized gains and losses and expenses of the fund are borne pro-rata based on the relative net assets of each class to the total net assets of the fund, except that each class bears expenses unique to that class (including the distribution fees applicable to such classes). Each class votes as a class only with respect to its own distribution plan or other matters on which a class vote is required by law or determined by the Trustees. Shares of each class would receive their pro-rata share of the net assets of the fund, if the fund were liquidated. In addition, the Trustees declare separate dividends on each class of shares.
In the normal course of business, the fund enters into contracts that may include agreements to indemnify another party under given circumstances. The fund’s maximum exposure under these arrangements is unknown as this would involve future claims that may be, but have not yet been, made against the fund. However, the fund expects the risk of material loss to be remote.
The following is a summary of significant accounting policies consistently followed by the fund in the preparation of its financial statements. The preparation of financial statements is in conformity with accounting principles generally accepted in the United States of America and requires management to make estimates and assumptions that affect the reported amounts of assets and liabilities in the financial statements and the reported amounts of increases and decreases in net assets from operations during the reporting period. Actual results could differ from those estimates.
A) Security valuation Investments for which market quotations are readily available are valued at the last reported sales price on their principal exchange, or official closing price for certain markets. If no sales are reported — as in the case
47
of some securities traded over-the-counter — a security is valued at its last reported bid price. Many securities markets and exchanges outside the U.S. close prior to the close of the New York Stock Exchange and therefore the closing prices for securities in such markets or on such exchanges may not fully reflect events that occur after such close but before the close of the New York Stock Exchange. Accordingly, on certain days, the fund will fair value foreign equity securities taking into account multiple factors, including movements in the U.S. securities markets. The number of days on which fair value prices will be used will depend on market activity and it is possible that fair value prices will be used by the fund to a significant extent. At December 31, 2006, fair value pricing was used for certain foreign securities in the portfolio. Securities quoted in foreign currencies, if any, are translated into U.S. dollars at the current exchange rate. Certain investments, including certain restricted securities, are also valued at fair value following procedures approved by the Trustees. Such valuations and procedures are reviewed periodically by the Trustees. The fair value of securities is generally determined as the amount that the fund could reasonably expect to realize from an orderly disposition of such securities over a reasonable period of time. By its nature, a fair value price is a good faith estimate of the value of a security at a given point in time and does not reflect an actual market price, which may be different by a material amount.
B) Joint trading account Pursuant to an exemptive order from the Securities and Exchange Commission, the fund may transfer uninvested cash balances, including cash collateral received under security lending arrangements, into a joint trading account along with the cash of other registered investment companies and certain other accounts managed by Putnam Management. These balances may be invested in issues of high-grade, short-term investments having maturities of up to 397 days for collateral received under security lending arrangements and up to 90 days for other cash investments.
C) Repurchase agreements The fund, or any joint trading account, through its custodian, receives delivery of the underlying securities, the market value of which at the time of purchase is required to be in an amount at least equal to the resale price, including accrued interest. Collateral for certain tri-party repurchase agreements is held at the counterparty’s custodian in a segregated account for the benefit of the fund and the coun-terparty. Putnam Management is responsible for determining that the value of these underlying securities is at all times at least equal to the resale price, including accrued interest.
D) Security transactions and related investment income Security transactions are recorded on the trade date (the date the order to buy or sell is executed). Gains or losses on securities sold are determined on the identified cost basis.
Interest income is recorded on the accrual basis. Dividend income, net of applicable withholding taxes, is recognized on the ex-dividend date except that certain dividends from foreign securities, if any, are recognized as soon as the fund is informed of the ex-dividend date. Non-cash dividends, if any, are recorded at the fair market value of the securities received. Dividends representing a return of capital or capital gains, if any, are reflected as a reduction of cost and/or as a realized gain.
E) Foreign currency translation The accounting records of the fund are maintained in U.S. dollars. The market value of foreign securities, currency holdings, and other assets and liabilities are recorded in the books and records of the fund after translation to U.S. dollars based on the exchange rates on that day. The cost of each security is determined using historical exchange rates. Income and withholding taxes are translated at prevailing exchange rates when earned or incurred. The fund does not isolate that portion of realized or unrealized gains or losses resulting from changes in the foreign exchange rate on investments from fluctuations arising from changes in the market prices of the securities. Such gains and losses are included with the net
48
realized and unrealized gain or loss on investments. Net realized gains and losses on foreign currency transactions represent net realized exchange gains or losses on closed forward currency contracts, disposition of foreign currencies, currency gains and losses realized between the trade and settlement dates on securities transactions and the difference between the amount of investment income and foreign withholding taxes recorded on the fund’s books and the U.S. dollar equivalent amounts actually received or paid. Net unrealized appreciation and depreciation of assets and liabilities in foreign currencies arise from changes in the value of open forward currency contracts and assets and liabilities other than investments at the period end, resulting from changes in the exchange rate. Investments in foreign securities involve certain risks, including those related to economic instability, unfavorable political developments, and currency fluctuations, not presen t with domestic investments.
F) Futures and options contracts The fund may use futures and options contracts to hedge against changes in the values of securities the fund owns or expects to purchase, or for other investment purposes. The fund may also write options on swaps or securities it owns or in which it may invest to increase its current returns.
The potential risk to the fund is that the change in value of futures and options contracts may not correspond to the change in value of the hedged instruments. In addition, losses may arise from changes in the value of the underlying instruments, if there is an illiquid secondary market for the contracts, or if the counterparty to the contract is unable to perform. Risks may exceed amounts recognized on the statement of assets and liabilities. When the contract is closed, the fund records a realized gain or loss equal to the difference between the value of the contract at the time it was opened and the value at the time it was closed. Realized gains and losses on purchased options are included in realized gains and losses on investment securities. If a written call option is exercised, the premium originally received is recorded as an addition to sales proceeds. If a written put option is exercised, the premium originally receive d is recorded as a reduction to the cost of investments.
Futures contracts are valued at the quoted daily settlement prices established by the exchange on which they trade. The fund and the broker agree to exchange an amount of cash equal to the daily fluctuation in the value of the futures contract. Such receipts or payments are known as “variation margin.” Exchange traded options are valued at the last sale price or, if no sales are reported, the last bid price for purchased options and the last ask price for written options. Options traded over-the-counter are valued using prices supplied by dealers. Futures and written option contracts outstanding at period end, if any, are listed after the fund’s portfolio.
G) Federal taxes It is the policy of the fund to distribute all of its taxable income within the prescribed time and otherwise comply with the provisions of the Internal Revenue Code of 1986 (the “Code”) applicable to regulated investment companies. It is also the intention of the fund to distribute an amount sufficient to avoid imposition of any excise tax under Section 4982 of the Code, as amended. Therefore, no provision has been made for federal taxes on income, capital gains or unrealized appreciation on securities held nor for excise tax on income and capital gains.
At June 30, 2006, the fund had a capital loss carryover of $3,761,597,037 available to the extent allowed by the Code to offset future net capital gain, if any. The amount of the carryover and the expiration dates are:
| Loss Carryover | Expiration |
|
| $1,985,109,119 | June 30, 2010 |
|
| 1,776,487,918 | June 30, 2011 |
|
The aggregate identified cost on a tax basis is $4,172,175,560, resulting in gross unrealized appreciation and depreciation of $682,118,196 and $147,614,359, respectively, or net unrealized appreciation of $534,503,837.
49
H) Distributions to shareholders Distributions to shareholders from net investment income are recorded by the fund on the ex-dividend date. Distributions from capital gains, if any, are recorded on the ex-dividend date and paid at least annually. The amount and character of income and gains to be distributed are determined in accordance with income tax regulations, which may differ from generally accepted accounting principles. Dividend sources are estimated at the time of declaration. Actual results may vary. Any non-taxable return of capital cannot be determined until final tax calculations are completed after the end of the fund’s fiscal year. Reclassifications are made to the fund’s capital accounts to reflect income and gains available for distribution (or available capital loss carryovers) under income tax regulations.
Note 2: Management fee, administrative services and other transactions
Putnam Management is paid for management and investment advisory services quarterly based on the average net assets of the fund. Such fee is based on the following annual rates: 0.70% of the first $500 million of average net assets, 0.60% of the next $500 million, 0.55% of the next $500 million, 0.50% of the next $5 billion, 0.475% of the next $5 billion, 0.455% of the next $5 billion, 0.44% of the next $5 billion, 0.43% of the next $5 billion, 0.42% of the next $5 billion, 0.41% of the next $5 billion, 0.40% of the next $5 billion, 0.39% of the next $5 billion, 0.38% of the next $8.5 billion and 0.37% thereafter.
Putnam Management has agreed to waive fees and reimburse expenses of the fund through June 30, 2007, to the extent necessary to ensure that the fund’s expenses do not exceed the simple average of the expenses of all front-end load funds viewed by Lipper, Inc. as having the same investment classification or objective as the fund. The expense reimbursement is based on a comparison of the fund’s expenses with the average annualized operating expenses of the funds in its Lipper peer group for each calendar quarter during the fund’s last fiscal year, excluding 12b-1 fees and without giving effect to any expense offset and brokerage service arrangements that may reduce fund expenses. For the period ended December 31, 2006, Putnam Management did not waive any of its management fee from the fund.
For the period ended December 31, 2006, Putnam Management has assumed $18,980 of legal, shareholder servicing and communication, audit and Trustee fees incurred by the fund in connection with certain legal and regulatory matters (including those described in Note 6).
The fund reimburses Putnam Management an allocated amount for the compensation and related expenses of certain officers of the fund and their staff who provide administrative services to the fund. The aggregate amount of all such reimbursements is determined annually by the Trustees.
Custodial functions for the fund’s assets were provided by Putnam Fiduciary Trust Company (“PFTC”), a subsidiary of Putnam, LLC. PFTC received fees for custody services based on the fund’s asset level, the number of its security holdings and transaction volumes. Putnam Investor Services, a division of PFTC, provided investor servicing agent functions to the fund. Putnam Investor Services received fees for investor servicing based on the number of shareholder accounts in the fund and the level of defined contribution plan assets in the fund. During the period ended December 31, 2006, the fund incurred $7,638,698 for these services. State Street Bank and Trust Company will begin providing custodial functions for the fund’s assets in the subsequent period.
Under the subcustodian contract between the subcustodian bank and PFTC, the subcustodian bank has a lien on the securities of the fund to the extent permitted by the fund’s investment restrictions to cover any advances made by the subcustodian bank for the settlement of securities purchased by the fund. At December 31, 2006, the payable to the subcustodian bank represents the
50
amount due for cash advanced for the settlement of securities purchased.
The fund has entered into an arrangement with PFTC whereby credits realized as a result of uninvested cash balances are used to reduce a portion of the fund’s expenses. The fund also reduced expenses through brokerage service arrangements. For the six months ended December 31, 2006, the fund’s expenses were reduced by $821,371 under these arrangements.
Each independent Trustee of the fund receives an annual Trustee fee, of which $1,163, as a quarterly retainer, has been allocated to the fund, and an additional fee for each Trustees meeting attended. Trustees receive additional fees for attendance at certain committee meetings, industry seminars and for certain compliance-related matters. Trustees also are reimbursed for expenses they incur relating to their services as Trustees. George Putnam, III, who is not an independent Trustee, also receives the foregoing fees for his services as Trustee.
The fund has adopted a Trustee Fee Deferral Plan (the “Deferral Plan”) which allows the Trustees to defer the receipt of all or a portion of Trustees fees payable on or after July 1, 1995. The deferred fees remain invested in certain Putnam funds until distribution in accordance with the Deferral Plan.
The fund has adopted an unfunded noncontributory defined benefit pension plan (the “Pension Plan”) covering all Trustees of the fund who have served as a Trustee for at least five years and were first elected prior to 2004. Benefits under the Pension Plan are equal to 50% of the Trustee’s average annual attendance and retainer fees for the three years ended December 31, 2005. The retirement benefit is payable during a Trustee’s lifetime, beginning the year following retirement, for the number of years of service through December 31, 2006. Pension expense for the fund is included in Trustee compensation and expenses in the statement of operations. Accrued pension liability is included in Payable for Trustee compensation and expenses in the statement of assets and liabilities. The Trustees have terminated the Pension Plan with respect to any Trustee first elected after 2003.
The fund has adopted distribution plans (the “Plans”) with respect to its class A, class B, class C, class M and class R shares pursuant to Rule 12b-1 under the Investment Company Act of 1940. The purpose of the Plans is to compensate Putnam Retail Management, a wholly-owned subsidiary of Putnam, LLC and Putnam Retail Management GP, Inc., for services provided and expenses incurred in distributing shares of the fund. The Plans provide for payments by the fund to Putnam Retail Management at an annual rate of up to 0.35%, 1.00%, 1.00%, 1.00% and 1.00% of the average net assets attributable to class A, class B, class C, class M and class R shares, respectively. The Trustees have approved payment by the fund at an annual rate of 0.25%, 1.00%, 1.00%, 0.75% and 0.50% of the average net assets attributable to class A, class B, class C, class M and class R shares, respectively.
For the six months ended December 31, 2006, Putnam Retail Management, acting as underwriter, received net commissions of $136,215 and $2,267 from the sale of class A and class M shares, respectively, and received $376,022 and $3,316 in contingent deferred sales charges from redemptions of class B and class C shares, respectively. A deferred sales charge of up to 1.00% and 0.65% is assessed on certain redemptions of class A and class M shares, respectively. For the six months ended December 31, 2006, Putnam Retail Management, acting as underwriter, received $57 and no monies on class A and class M redemptions, respectively.
Note 3: Purchases and sales of securities
During the six months ended December 31, 2006, cost of purchases and proceeds from sales of investment securities other than short-term investments aggregated $1,438,296,419 and $1,844,143,523, respectively. There were no purchases or sales of U.S. government securities.
51
Written option transactions during the period ended December 31, 2006 are summarized as follows:
| | Contract | Premiums |
| | Amounts | Received |
|
| Written options | | |
| outstanding at | | |
| beginning of period | $ 28,800 | $ 24,549 |
|
| Options opened | 571,079 | 938,214 |
| Options exercised | — | — |
| Options expired | (336,295) | (228,238) |
| Options closed | (115,924) | (86,622) |
|
| Written options | | |
| outstanding at | | |
| end of period | $ 147,660 | $ 647,903 |
Note 4: Capital shares
At December 31, 2006, there was an unlimited number of shares of beneficial interest authorized. In certain circumstances shares may be purchased or redeemed through the delivery to the fund or receipt by the shareholders, respectively, of securities, the fair value of which is used to determine the number of shares issued or redeemed. Transactions in capital shares were as follows:
| CLASS A | Shares | | Amount |
|
| Six months ended 12/31/06: | | |
| Shares sold | 2,357,763 | | | $ 110,101,321 |
|
| Shares issued | | | |
| in connection | | | |
| with reinvestment | | | |
| of distributions | — | | — |
|
| | 2,357,763 | | 110,101,321 |
|
| Shares | | | |
| repurchased | (10,476,412) | | (491,002,504) |
|
| Net decrease | (8,118,649) | | | $ (380,901,183) |
| |
| Year ended 6/30/06: | | | |
| Shares sold | 7,090,831 | | | $ 323,578,415 |
|
| Shares issued | | | |
| in connection | | | |
| with reinvestment | | | |
| of distributions | — | | — |
|
| | 7,090,831 | | 323,578,415 |
|
| Shares | | | |
| repurchased | (26,760,549) | (1,213,365,048) |
|
| Redemptions | | | |
| in kind | (11,442,046) | | (529,080,227) |
|
| Net decrease | (31,111,764) | $(1,418,866,860) |
52
| CLASS B | Shares | Amount |
|
| Six months ended 12/31/06: | |
| Shares sold | 315,457 | $ 13,148,611 |
|
| Shares issued | | |
| in connection | | |
| with reinvestment | | |
| of distributions | — | — |
|
| | 315,457 | 13,148,611 |
|
| Shares | | |
| repurchased | (2,858,101) | (118,851,446) |
|
| Net decrease | (2,542,644) | $(105,702,835) |
| |
| Year ended 6/30/06: | | |
| Shares sold | 1,098,871 | $ 44,859,067 |
|
| Shares issued | | |
| in connection | | |
| with reinvestment | | |
| of distributions | — | — |
|
| | 1,098,871 | 44,859,067 |
|
| Shares | | |
| repurchased | (7,083,792) | (288,129,279) |
|
| Net decrease | (5,984,921) | $(243,270,212) |
|
| |
| CLASS C | Shares | Amount |
|
| Six months ended 12/31/06: | |
| Shares sold | 40,659 | $ 1,816,067 |
|
| Shares issued | | |
| in connection | | |
| with reinvestment | | |
| of distributions | — | — |
|
| | 40,659 | 1,816,067 |
|
| Shares | | |
| repurchased | (146,507) | (6,466,220) |
|
| Net decrease | (105,848) | $ (4,650,153) |
| |
| Year ended 6/30/06: | | |
| Shares sold | 130,754 | $ 5,654,158 |
|
| Shares issued | | |
| in connection | | |
| with reinvestment | | |
| of distributions | — | — |
|
| | 130,754 | 5,654,158 |
|
| Shares | | |
| repurchased | (289,685) | (12,509,194) |
|
| Net decrease | (158,931) | $ (6,855,036) |
| CLASS M | Shares | Amount |
|
| Six months ended 12/31/06: | |
| Shares sold | 43,548 | $ 1,908,744 |
|
| Shares issued | | |
| in connection | | |
| with reinvestment | | |
| of distributions | — | — |
|
| | 43,548 | 1,908,744 |
|
| Shares | | |
| repurchased | (257,808) | (11,255,199) |
|
| Net decrease | (214,260) | $ (9,346,455) |
| |
| Year ended 6/30/06: | | |
| Shares sold | 181,349 | $ 7,716,906 |
|
| Shares issued | | |
| in connection | | |
| with reinvestment | | |
| of distributions | — | — |
|
| | 181,349 | 7,716,906 |
|
| Shares | | |
| repurchased | (1,024,641) | (43,488,871) |
|
| Net decrease | (843,292) | $(35,771,965) |
|
| |
| CLASS R | Shares | Amount |
|
| Six months ended 12/31/06: | |
| Shares sold | 18,469 | $ 862,074 |
|
| Shares issued | | |
| in connection | | |
| with reinvestment | | |
| of distributions | — | — |
|
| | 18,469 | 862,074 |
|
| Shares | | |
| repurchased | (5,155) | (242,312) |
|
| Net increase | 13,314 | $ 619,762 |
| |
| Year ended 6/30/06: | | |
| Shares sold | 16,608 | $ 757,250 |
|
| Shares issued | | |
| in connection | | |
| with reinvestment | | |
| of distributions | — | — |
|
| | 16,608 | 757,250 |
|
| Shares | | |
| repurchased | (9,669) | (466,245) |
|
| Net increase | 6,939 | $ 291,005 |
53
| CLASS Y | Shares | Amount |
|
| Six months ended 12/31/06: | |
| Shares sold | 503,506 | $ 24,352,592 |
|
| Shares issued | | |
| in connection | | |
| with reinvestment | | |
| of distributions | — | — |
|
| | 503,506 | 24,352,592 |
|
| Shares | | |
| repurchased | (974,696) | (47,595,694) |
|
| Net decrease | (471,190) | $(23,243,102) |
| |
| Year ended 6/30/06: | | |
| Shares sold | 1,292,228 | $ 61,098,068 |
|
| Shares issued | | |
| in connection | | |
| with reinvestment | | |
| of distributions | — | — |
|
| | 1,292,228 | 61,098,068 |
|
| Shares | | |
| repurchased | (1,977,874) | (92,810,398) |
|
| Net decrease | (685,646) | $(31,712,330) |
Note 5: Investment in Putnam Prime Money Market Fund
The fund invests in Putnam Prime Money Market Fund, an open-end management investment company managed by Putnam Management. Investments in Putnam Prime Money Market Fund are valued at its closing net asset value each business day. Management fees paid by the fund are reduced by an amount equal to the management and administrative services fees paid by Putnam Prime Money Market Fund with respect to assets invested by the fund in Putnam Prime Money Market Fund. For the period ended December 31, 2006, management fees paid were reduced by $20,899 relating to the fund’s investment in Putnam Prime Money Market Fund. Income distributions earned by the fund are recorded as income in the statement of operations and totaled $975,985 for the period ended December 31, 2006. During the period ended December 31, 2006, cost of purchases and proceeds of sales of investments in Putnam Prime Money Market Fund aggregated $390,905,363 and $383,9 54,404, respectively.
Note 6: Regulatory matters and litigation
In late 2003 and 2004, Putnam Management settled charges brought by the Securities and Exchange Commission (“SEC”) and the Massachusetts Securities Division (“MSD”) in connection with excessive short-term trading by certain former Putnam employees and, in the case of charges brought by the MSD, excessive short-term trading by participants in some Putnam-administered 401(k) plans. Putnam Management agreed to pay $193.5 million in penalties and restitution, of which $153.5 million will be distributed to certain open-end Putnam funds and their shareholders after the SEC and MSD approve a distribution plan being developed by an independent consultant. The allegations of the SEC and MSD and related matters have served as the general basis for certain lawsuits, including purported class action lawsuits filed against Putnam Management and, in a limited number of cases, against some Putnam funds. Putnam Management believes that these lawsuits will have n o material adverse effect on the funds or on Putnam Management’s ability to provide investment management services. In addition, Putnam Management has agreed to bear any costs incurred by the Putnam funds as a result of these matters.
In connection with a settlement between Putnam and the fund’s Trustees in September 2006, the fund received $3,605,432 from Putnam to address issues relating to the calculation of certain amounts paid by the Putnam mutual funds to Putnam for transfer agent services.
Putnam Management and Putnam Retail Management are named as defendants in a civil suit in which the plaintiffs allege that the management and distribution fees paid by certain Putnam funds were excessive and seek recovery under the Investment Company Act of 1940. Putnam Management and Putnam Retail Management have contested the plaintiffs’ claims and the matter is currently pending in the U.S. District
54
Court for the District of Massachusetts. Based on currently available information, Putnam Management believes that this action is without merit and that it is unlikely to have a material effect on Putnam Management’s and Putnam Retail Management’s ability to provide services to their clients, including the fund.
Note 7: New accounting pronouncements
In June 2006, the Financial Accounting Standards Board (“FASB”) issued Interpretation No. 48, Accounting for Uncertainty in Income Taxes (the “Interpretation”). The Interpretation prescribes a minimum threshold for financial statement recognition of the benefit of a tax position taken or expected to be taken by a filer in the filer’s tax return. The Interpretation will become effective for fiscal years beginning after December 15, 2006 but will also apply to tax positions reflected in the fund’s financial statements as of that date. No determination has been made whether the adoption of the Interpretation will require the fund to make any adjustments to its net assets or have any other effect on the fund’s financial statements. The effects of implementing this pronouncement, if any, will be noted in the fund’s next semiannual financial statements.
In September 2006, the FASB issued Statement of Financial Accounting Standards No. 157, Fair Value Measurements (the “Standard”). The Standard defines fair value, sets out a framework for measuring fair value and requires additional disclosures about fair value measurements. The Standard applies to fair value measurements already required or permitted by existing standards. The Standard is effective for financial statements issued for fiscal years beginning after November 15, 2007 and interim periods within those fiscal years. Putnam Management is currently evaluating what impact the adoption of the Standard will have on the fund’s financial statements.
55
Brokerage commissions
(Unaudited)
Brokerage commissions are paid to firms that execute trades on behalf of your fund. When choosing these firms, Putnam is required by law to seek the best execution of the trades, taking all relevant factors into consideration, including expected quality of execution and commission rate. Listed below are the largest relationships based upon brokerage commissions for your fund and the other funds in Putnam’s U.S. Small- and Mid-Cap group for the year ended December 31, 2006. The other Putnam mutual funds in this group are Putnam Capital Opportunities Fund, Putnam Discovery Growth Fund, Putnam Mid Cap Value Fund, Putnam OTC & Emerging Growth Fund, Putnam Small Cap Growth Fund, Putnam Small Cap Value Fund, Putnam Vista Fund, Putnam VT Capital Opportunities Fund, Putnam VT Discovery Growth Fund, Putnam VT Mid Cap Value Fund, Putnam VT New Opportunities Fund, Putnam VT OTC & Emerging Growth Fund, Putnam VT Small Cap Value Fund, and Putnam VT Vista Fund.
The top five firms that received brokerage commissions for trades executed for the U.S. Small-and Mid-Cap group are (in descending order) Citigroup Global Markets, Goldman Sachs, Credit Suisse First Boston, Merrill Lynch, and Lehman Brothers. Commissions paid to these firms together represented approximately 38% of the total brokerage commissions paid for the year ended December 31, 2006.
Commissions paid to the next 10 firms together represented approximately 39% of the total brokerage commissions paid during the period. These firms are (in alphabetical order) Bank of America, Bear Stearns & Company, CIBC World Markets, Deutsche Bank Securities, JPMorgan Clearing, Morgan Stanley Dean Witter, RBC Capital Markets, SG Cowen, UBS Warburg, and Wachovia Securities.
Additional information about brokerage commissions is available on the Securities and Exchange Commission (SEC) Web site at www.sec.gov. Putnam funds disclose commissions by firm to the SEC in semiannual filings on Form N-SAR.
56
Putnam puts your
interests first
In January 2004, Putnam began introducing a number of voluntary initiatives designed to reduce fund expenses, provide investors with more useful information, and help safeguard the interests of all Putnam investors. Visit www.putnam.com for details.
Cost-cutting initiatives
Reduced sales charges The maximum sales charge for class A shares has been reduced to 5.25% for equity funds (formerly 5.75%) and 3.75% for most income funds (formerly 4.50%) . The maximum sales charge for class M shares has been reduced to 3.25% for equity funds (formerly 3.50%) .
* Lower class B purchase limit To help ensure that investors are in the most cost-effective share class, the maximum amount that can be invested in class B shares has been reduced to $100,000. (Larger trades or accumulated amounts will be refused.)
Ongoing expenses will be limited Through calendar 2007, total ongoing expenses, including management fees for all funds, will be maintained at or below the average of each fund’s industry peers in its Lipper load-fund universe. For more information, please see the Statement of Additional information.
Improved disclosure
Putnam fund prospectuses and shareholder reports have been revised to disclose additional information that will help shareholders compare funds and weigh their costs and risks along with their potential benefits. Shareholders will find easy-to-understand information about fund expense ratios, portfolio manager compensation, risk comparisons, turnover comparisons, brokerage commissions, and employee and trustee ownership of Putnam funds. Disclosure of breakpoint discounts has also been enhanced to alert investors to potential cost savings.
Protecting investors’ interests
Short-term trading fee introduced To discourage short-term trading, which can interfere with a fund’s long-term strategy, a 1% short-term trading fee may be imposed on any Putnam fund shares (other than money market funds) redeemed or exchanged within seven calendar days of purchase (for certain funds, this fee applies for 90 days).
* The maximum sales charge for class A shares of Putnam Limited Duration Government Income Fund and Putnam Floating Rate Income Fund remains 3.25% .
57
The Putnam
family of funds
The following is a list of Putnam’s open-end mutual funds offered to the public. Investors should carefully consider the investment objective, risks, charges, and expenses of a fund before investing. For a prospectus containing this and other information for any Putnam fund or product, call your financial advisor at 1-800-225-1581 and ask for a prospectus. Please read the prospectus carefully before investing.
| Growth funds | Value funds |
| Discovery Growth Fund | Classic Equity Fund |
| Growth Opportunities Fund | Convertible Income-Growth Trust |
| Health Sciences Trust | Equity Income Fund |
| International New Opportunities Fund* | The George Putnam Fund of Boston |
| New Opportunities Fund | The Putnam Fund for Growth |
| OTC & Emerging Growth Fund | and Income |
| Small Cap Growth Fund* | International Growth and Income Fund* |
| Vista Fund | Mid Cap Value Fund |
| Voyager Fund | New Value Fund |
| | Small Cap Value Fund* |
| |
| Blend funds | Income funds |
| Capital Appreciation Fund | American Government Income Fund |
| Capital Opportunities Fund* | Diversified Income Trust |
| Europe Equity Fund* | Floating Rate Income Fund |
| Global Equity Fund* | Global Income Trust* |
| Global Natural Resources Fund* | High Yield Advantage Fund* |
| International Capital | High Yield Trust* |
| Opportunities Fund* | Income Fund |
| International Equity Fund* | Limited Duration Government |
| Investors Fund | Income Fund |
| Research Fund | Money Market Fund† |
| Tax Smart Equity Fund® | U.S. Government Income Trust |
| Utilities Growth and Income Fund | |
* A 1% redemption fee on total assets redeemed or exchanged within 90 days of purchase may be imposed for all share classes of these funds.
† An investment in a money market fund is not insured or guaranteed by the Federal Deposit Insurance Corporation or any other government agency. Although the fund seeks to preserve your investment at $1.00 per share, it is possible to lose money by investing in the fund.
58
Tax-free income funds
AMT-Free Insured Municipal Fund
Tax Exempt Income Fund
Tax Exempt Money Market Fund§
Tax-Free High Yield Fund
State tax-free income funds:
Arizona, California, Florida, Massachusetts,
Michigan, Minnesota, New Jersey, New York,
Ohio, and Pennsylvania
Asset allocation funds
Income Strategies Fund
Putnam Asset Allocation Funds — three
investment portfolios that spread your
money across a variety of stocks, bonds,
and money market investments.
The three portfolios:
Asset Allocation: Balanced Portfolio
Asset Allocation: Conservative Portfolio
Asset Allocation: Growth Portfolio
Putnam RetirementReady® Funds
Putnam RetirementReady Funds — ten
investment portfolios that offer diversification
among stocks, bonds, and money
market instruments and adjust to become
more conservative over time based on a
target date for withdrawing assets.
The ten funds:
Putnam RetirementReady 2050 Fund
Putnam RetirementReady 2045 Fund
Putnam RetirementReady 2040 Fund
Putnam RetirementReady 2035 Fund
Putnam RetirementReady 2030 Fund
Putnam RetirementReady 2025 Fund
Putnam RetirementReady 2020 Fund
Putnam RetirementReady 2015 Fund
Putnam RetirementReady 2010 Fund
Putnam RetirementReady Maturity Fund
With the exception of money market funds, a 1% redemption fee may be applied to shares exchanged or sold within 7 days of purchase (90 days, for certain funds).
Check your account balances and the most recent month-end performance at www.putnam.com.
59
Services for shareholders
Investor services
Help your investment grow Set up a program for systematic investing from a Putnam fund or from your own savings or checking account. (Regular investing does not guarantee a profit or protect against loss in a declining market.)
Switch funds easily* You can move money from one Putnam fund to another within the same class of shares without a service charge.
Access your money easily You can have checks sent regularly or redeem shares any business day at the then-current net asset value, which may be more or less than the original cost of the shares. Class B and class C shares carry a sales charge that is applied to certain withdrawals.
How to buy additional shares You may buy shares through your financial advisor or directly from Putnam. To open an account by mail, send a check made payable to the name of the fund along with a completed fund application. To add to an existing account, complete the investment slip found at the top of your Confirmation of Activity statement and return it with a check payable to your fund.
For more information
Visit www.putnam.com A secure section of our Web site contains complete information on your account, including balances and transactions, updated daily. You may also conduct transactions, such as exchanges, additional investments, and address changes. Log on today to get your password.
Call us toll free at 1-800-225-1581 Ask a helpful Putnam representative or your financial advisor for details about any of these or other services, or see your prospectus.
*This privilege is subject to change or termination. An exchange of funds may result in a taxable event. In addition, a 1% redemption fee will be applied to shares exchanged or sold within 7 days of purchase, and, for certain funds, this fee applies on total assets redeemed or exchanged within 90 days of purchase.
60
Fund information
Founded over 65 years ago, Putnam Investments was built around the concept that a balance between risk and reward is the hallmark of a well-rounded financial program. We manage over 100 mutual funds in growth, value, blend, fixed income, and international.
| Investment Manager | Officers | Francis J. McNamara, III |
| Putnam Investment | George Putnam, III | Vice President and Chief |
| Management, LLC | President | Legal Officer |
| One Post Office Square | | |
| Boston, MA 02109 | Charles E. Porter | Charles A. Ruys de Perez |
| Executive Vice President, | Vice President and Chief |
Marketing Services | Principal Executive Officer, | Compliance Officer |
| Putnam Retail Management | Associate Treasurer and | |
| One Post Office Square | Compliance Liaison | |
| Boston, MA 02109 | | Mark C. Trenchard |
| Jonathan S. Horwitz | Vice President and |
| Custodians | Senior Vice President and | BSA Compliance Officer |
| Putnam Fiduciary | Treasurer | |
| Trust Company, State Street | | Judith Cohen |
| Bank and Trust Company | Steven D. Krichmar | Vice President, Clerk and |
| | Vice President and Principal | Assistant Treasurer |
| Legal Counsel | Financial Officer | |
| Ropes & Gray LLP | | Wanda M. McManus |
| Janet C. Smith | Vice President, Senior Associate |
| Trustees | Vice President, Principal | Treasurer and Assistant Clerk |
| John A. Hill, Chairman | Accounting Officer and | |
| Jameson Adkins Baxter, | Assistant Treasurer | Nancy E. Florek |
| Vice Chairman | | Vice President, Assistant Clerk, |
| Charles B. Curtis | Susan G. Malloy | Assistant Treasurer and |
| Myra R. Drucker | Vice President and | Proxy Manager |
| Charles E. Haldeman, Jr. | Assistant Treasurer | |
| Paul L. Joskow | | |
| Elizabeth T. Kennan | Beth S. Mazor | |
| Kenneth R. Leibler | Vice President | |
| Robert E. Patterson | | |
| George Putnam, III | James P. Pappas | |
| W. Thomas Stephens | Vice President | |
| Richard B. Worley | | |
| Richard S. Robie, III | |
| Vice President | |
| | |
| | |
This report is for the information of shareholders of Putnam New Opportunities Fund. It may also be used as sales literature when preceded or accompanied by the current prospectus, the most recent copy of Putnam’s Quarterly Performance Summary, and Putnam’s Quarterly Ranking Summary. For more recent performance, please visit www.putnam.com. Investors should carefully consider the investment objective, risks, charges, and expenses of a fund, which are described in its prospectus. For this and other information or to request a prospectus, call 1-800-225-1581 toll free. Please read the prospectus carefully before investing. The fund’s Statement of Additional Information contains additional information about the fund’s Trustees and is available without charge upon request by calling 1-800-225-1581.

Item 2. Code of Ethics:
Not applicable
Item 3. Audit Committee Financial Expert:
Not applicable
Item 4. Principal Accountant Fees and Services:
Not applicable
Item 5. Audit Committee of Listed Registrants
Not applicable
Item 6. Schedule of Investments:
The registrant’s schedule of investments in unaffiliated issuers is included in the report to shareholders in Item 1 above.
Item 7. Disclosure of Proxy Voting Policies and Procedures For Closed-End Management Investment Companies:
Not applicable
Item 8. Portfolio Managers of Closed-End Investment Companies
Not Applicable
Item 9. Purchases of Equity Securities by Closed-End Management Investment Companies and Affiliated Purchasers:
Not applicable
Item 10. Submission of Matters to a Vote of Security Holders:
Not applicable
Item 11. Controls and Procedures:
(a) The registrant's principal executive officer and principal financial officer have concluded, based on their evaluation of the effectiveness of the design and operation of the registrant's disclosure controls and procedures as of a date within 90 days of the filing date of this report, that the design and operation of such procedures are generally effective to provide reasonable assurance that information required to be disclosed by the registrant in this report is recorded, processed, summarized and reported within the time periods specified in the Commission's rules and forms.
(b) Changes in internal control over financial reporting: Not applicable
Item 12. Exhibits:
(a)(1) Not applicable
(a)(2) Separate certifications for the principal executive officer and principal financial officer of the registrant as required by Rule 30a-2(a) under the Investment Company Act of 1940, as amended, are filed herewith.
(b) The certifications required by Rule 30a-2(b) under the Investment Company Act of 1940, as amended, are filed herewith.
SIGNATURES
Pursuant to the requirements of the Securities Exchange Act of 1934 and the Investment Company Act of 1940, the registrant has duly caused this report to be signed on its behalf by the undersigned, thereunto duly authorized.
Putnam New Opportunities Fund
By (Signature and Title):
/s/Janet C. Smith
Janet C. Smith
Principal Accounting Officer
Date: February 28, 2007
Pursuant to the requirements of the Securities Exchange Act of 1934 and the Investment Company Act of 1940, this report has been signed below by the following persons on behalf of the registrant and in the capacities and on the dates indicated.
By (Signature and Title):
/s/Charles E. Porter
Charles E. Porter
Principal Executive Officer
Date: February 28, 2007
By (Signature and Title):
/s/Steven D. Krichmar
Steven D. Krichmar
Principal Financial Officer
Date: February 28, 2007