| | | |
| | |
| UNITED STATES |
| SECURITIES AND EXCHANGE COMMISSION |
| Washington, D.C. 20549 |
| |
| FORM N-CSR |
| |
| CERTIFIED SHAREHOLDER REPORT OF REGISTERED |
| MANAGEMENT INVESTMENT COMPANIES |
| |
| Investment Company Act file number: (811- 06128) |
| | |
| Exact name of registrant as specified in charter: | Putnam New Opportunities Fund |
| |
| Address of principal executive offices: One Post Office Square, Boston, Massachusetts 02109 |
| | | |
| Name and address of agent for service: | | Beth S. Mazor, Vice President |
| | One Post Office Square |
| | Boston, Massachusetts 02109 |
| | | |
| Copy to: | | John W. Gerstmayr, Esq. |
| | Ropes & Gray LLP |
| | One International Place |
| | Boston, Massachusetts 02110 |
| | |
| Registrant’s telephone number, including area code: | (617) 292-1000 |
| | | |
| Date of fiscal year end: June 30, 2009 | | |
| |
| Date of reporting period: July 1, 2008 — December 31, 2008 |
Item 1. Report to Stockholders:
The following is a copy of the report transmitted to stockholders pursuant to Rule 30e-1 under the Investment Company Act of 1940:

Since 1937, when George Putnam created a prudent mix of stocks and bonds in a single, professionally managed portfolio, we have championed the wisdom of the balanced approach. Today, we offer investors a world of equity, fixed-income, multi-asset, and absolute-return portfolios so investors can pursue a range of financial goals. Our seasoned portfolio managers seek superior results over time, backed by original, fundamental research on a global scale. We believe in service excellence, in the value of experienced financial advice, and in putting clients first in everything we do.
Not FDIC insured
May lose value
No bank guarantee
In 1830, Massachusetts Supreme Judicial Court Justice Samuel Putnam established The Prudent Man Rule, a legal foundation for responsible money management.

THE PRUDENT MAN RULE
All that can be required of a trustee to invest is that he shall conduct himself faithfully and exercise a sound discretion. He is to observe how men of prudence, discretion, and intelligence manage their own affairs, not in regard to speculation, but in regard to the permanent disposition of their funds, considering the probable income, as well as the probable safety of the capital to be invested.

Putnam
New Opportunities
Fund
12 | 31 | 08
Semiannual Report
| |
| Message from the Trustees | 2 |
| About the fund | 4 |
| Performance snapshot | 6 |
| Interview with your fund’s Portfolio Manager | 7 |
| Performance in depth. | 12 |
| Expenses | 13 |
| Portfolio turnover | 15 |
| Your fund’s management. | 16 |
| Terms and definitions | 17 |
| Trustee approval of management contract | 18 |
| Other information for shareholders. | 23 |
| Financial statements | 24 |
| Brokerage commissions | 48 |
Cover photograph: Vineyard, Napa County, California © Charles O’Rear
1
Message from the Trustees
Dear Fellow Shareholder:
For more than a year now, financial markets have experienced significant upheaval. Ongoing and coordinated responses by governmental and financial authorities around the world have provided a sense of optimism that stability will be restored, but investors should not expect a reduction in volatility in the near term.
Putnam Investments, meanwhile, is making several important changes to its equity fund lineup and portfolio management under President and Chief Executive Officer Robert L. Reynolds. Key among them is replacing the team management structure of Putnam equity funds with a more nimble decision-making process that vests full authority and responsibility with individual fund managers.
The portfolio manager of Putnam New Opportunities Fund is Gerald Moore, who joined the company in 1997 and has 17 years of investment industry experience. In other moves aimed at achieving performance excellence, Putnam has bolstered its ranks of seasoned equity analysts with several important hires in recent months.
2
We would like to take this opportunity to welcome new shareholders to the fund and to thank all of our investors for your continued confidence in Putnam. Although the financial markets have recently presented investors with extraordinary challenges, it is Putnam’s belief that the seeds of opportunity are often sown during difficult times like these.

About the fund
Seeking growth in innovative companies

Long before most Americans could conceive of the Internet, digital music files, or a cell phone small enough to fit in their pockets, Putnam New Opportunities Fund was seeking growth potential in emerging, cutting-edge companies. The fund was also targeting stocks in more traditional industries, such as restaurants, retail stores, health care, and broadcasting, which can also offer strong growth potential.
For example, among the holdings in the fund’s portfolio shortly after the fund was introduced in 1990 was the stock of Symantec, then a 9-year-old emerging software company. Today, Symantec is a leading maker of antivirus software, which has seen explosive demand as the Internet and computer networks have become an essential component of everyday life.
The portfolio manager focuses on bottom-up stock selection in seeking above-average growth for investors. Putnam’s in-house research organization, whose dedicated analysts work in teams, helps identify growth stocks that other investors may have overlooked. The specialized expertise of these Putnam analysts, who visit regularly with company managements, is critical to the fund’s growth strategy.
An important benefit of the fund’s strategy is its flexibility — it diversifies across a range of industries and capitalizations. The fund can invest in smaller companies that are in their emerging- or expansionary-growth phases, and these companies can remain in the fund’s portfolio until they grow to become market leaders.
Of course, historically, the growth potential offered by stocks of growing companies comes with the risk of greater price fluctuations. Combining small-cap stocks with the stocks of larger, well-established companies provides a more diversified approach to help manage those risks.
With growth opportunities continuing to emerge across industries and market capitalizations, Putnam New Opportunities Fund will continue to focus on capturing growth potential for investors.
The fund invests some or all of its assets in small and/or midsize companies. Such investments increase the risk of greater price fluctuations. Stocks with above-average earnings growth may be more volatile, especially if earnings do not continue to grow.
In-depth analysis is key to
successful stock selection.
Drawing on the expertise of a dedicated team of stock analysts, the fund’s manager seeks attractive growth stocks. Once a stock is selected for the portfolio, it is regularly assessed to ensure that it continues to meet certain criteria, including:
Growth Examining each company’s financials, including its sales and earnings, and targeting those believed to offer growth potential.
Quality Looking for high-quality companies, seeking characteristics such as solid management teams, sound business models, a record of strong performance, and high levels of free-cash flow.
Valuation Carefully considering how each stock is valued, seeking stocks whose valuations are attractive relative to the company’s growth potential.
Putnam New Opportunities Fund’s holdings have spanned
many sectors and industries over time.

Performance snapshot
Average annual total return (%) comparison as of 12/31/08
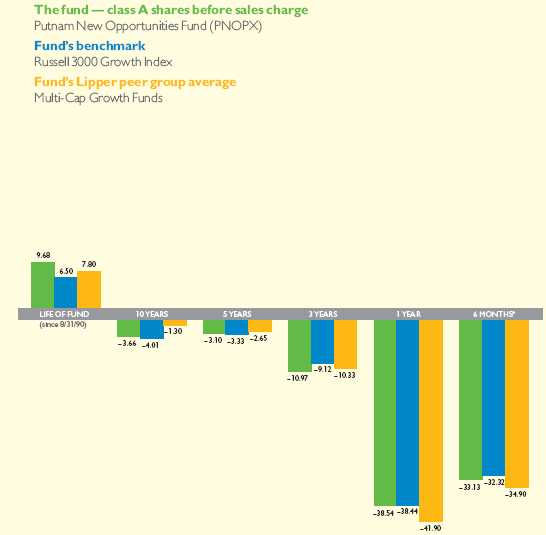
Current performance may be lower or higher than the quoted past performance, which cannot guarantee future results. Share price, principal value, and return will fluctuate, and you may have a gain or a loss when you sell your shares. Performance of class A shares assumes reinvestment of distributions and does not account for taxes. Fund returns in the bar chart do not reflect a sales charge of 5.75%; had they, returns would have been lower.
See pages 7 and 12–13 for additional performance information. For a portion of the periods, this fund may have limited expenses, without which returns would have been lower. A 1% short-term trading fee may apply. To obtain the most recent month-end performance, visit www.putnam.com.
* Returns for the six-month period are not annualized, but cumulative.
6
Interview with your
fund’s Portfolio Manager
Gerald Moore
Thanks for taking the time to speak with us today, Gerry. How did the fund perform during the period?
In terms of absolute performance, results for Putnam New Opportunities Fund reflected the difficult period for equity markets overall. For the six months ended December 31, 2008, the fund declined 33.13%, and lagged its benchmark — the Russell 3000 Growth Index — by a small margin. The average of its peer group, Lipper Multi-Cap Growth Funds, fell 34.90% . [Fund performance benefitted from receipt of an Enron Class Action Settlement pertaining to investments made prior to 2002. See “Of special interest” on page 11 for more details.]
How would you characterize the market environment during the period?
The effects of the liquidity crisis that grew out of the subprime mortgage melt-down were felt throughout the period, in both the United States and capital markets around the world. Prices for a wide range of commodities — including oil, coal, copper, and many others — fell
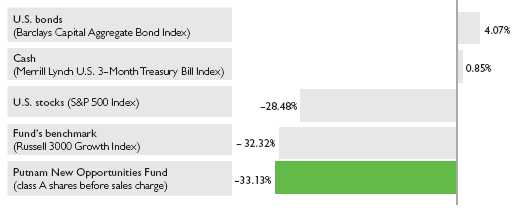
Broad market index and fund performance
This comparison shows your fund’s performance in the context of broad market indexes for the six months ended 12/31/08. See page 6 and pages 12–13 for additional fund performance information. Index descriptions can be found on page 17.
7
sharply, reflecting rapidly deteriorating economic conditions in the United States and abroad. Intensifying weakness in many emerging economies particularly affected commodity prices since these countries had been a robust source of demand for many of these raw materials.
Against this backdrop, energy and basic materials were the worst-performing market sectors, while consumer staples and health care were the best-performing sectors. Value stocks outperformed growth stocks across all market-capitalization tiers. Small-cap value stocks did best during the first half of the period, while large-cap value stocks led during the second half.
How did you position the fund in light of this market environment?
Reflecting our concerns about weakening global economies, I kept the fund positioned defensively. I maintained an overweight position in health-care stocks and an underweight position in financial stocks. In addition, I reduced the fund’s exposure to technology and industrial companies on concerns that corporate capital spending and information technology budgets would be cut.
Which specific holdings helped the fund’s relative results the most over the period?
The fund’s investment in managed-care provider AMERIGROUP was the top overall contributor to performance. The company focuses on the Medicaid
Top 10 holdings
This table shows the fund’s top 10 holdings and the percentage of the fund’s net assets that each represented as of 12/31/08. Also shown is each holding’s market sector and the specific industry within that sector. Holdings will vary over time.
| | |
| HOLDING (percentage of fund’s net assets) | SECTOR | INDUSTRY |
|
| IBM Corp. (2.8%) | Technology | Computers |
| Philip Morris International, Inc. (2.5%) | Consumer staples | Tobacco |
| Wal-Mart Stores, Inc. (2.5%) | Consumer cyclicals | Retail |
| Microsoft Corp. (2.3%) | Technology | Software |
| Abbott Laboratories (2.3%) | Health care | Pharmaceuticals |
| Hewlett-Packard Co. (2.2%) | Technology | Computers |
| Apple, Inc. (2.1%) | Technology | Computers |
| McDonald’s Corp. (1.9%) | Consumer staples | Restaurants |
| Occidental Petroleum Corp. (1.8%) | Energy | Oil and gas |
| Oracle Corp. (1.8%) | Technology | Software |
8
market, serving a constituency that is poor and uninsured. Amerigroup renegotiated a contract with the state of Tennessee that improved the firm’s profitability on business conducted in the state. This, in turn, provided a significant boost to the company’s stock price.
While I maintained a lower-than-benchmark position in consumer discretionary stocks, the fund benefited from several selections in the category, such as Apollo Group, AutoZone, and McDonald’s. Apollo Group owns and operates the University of Phoenix, which is the largest online university. When unemployment rises — as it did during the period — online universities experience increased enrollment as people pursue education for new job opportunities. In the case of AutoZone, although most of the company’s business comes from do-it-yourself customers, increased commercial demand for parts from auto repair shops helped to push the stock higher. Lastly, McDonald’s enjoyed increased sales as cost-conscious consumers tr aded sit-down restaurants for fast food.
Various information technology (IT) holdings also helped performance. Most notably, Affiliated Computer Services and Accenture, both of which provide outsourced IT services and consulting, were among the fund’s leading contributors relative to its benchmark.
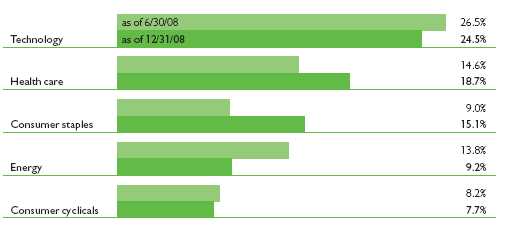
Comparison of top sector weightings
This chart shows how the fund’s top weightings have changed over the past six months. Weightings are shown as a percentage of net assets. Holdings will vary over time.
9
Which holdings detracted from performance?
Many of the fund’s detractors were grouped in the basic materials sector. The top overall detractor from relative results was Freeport-McMoRan, the world’s largest copper-mining company. Copper prices fell by more than 50% during the period, primarily because of the slowdown in residential construction, hurting Freeport-McMoRan’s bottom line and its stock price. Agricultural chemicals and fertilizer companies such as The Mosaic Company, Potash, and Terra Industries also underperformed as the prices for corn, soybeans, and many other crops declined in step with commodity prices generally. Lastly, coal producers Massey Energy and Walter Industries also held back results, as did steel maker United States Steel.
Many industrial companies among the fund’s holdings were also affected by the across-the-board decline in commodity prices. For example, Joy Global, which makes machinery and equipment for coal mining, struggled as its customers, the mine operators, lost pricing power. Similarly, AGCO, a maker of tractors, combines, and other farming equipment, saw a downturn in its business due to the sell-off in commodities.
By the end of the period, I had eliminated the fund’s positions in United States Steel, Mosaic, and Terra Industries.
I N T H E N E W S
The U.S. Treasury and the Federal Reserve have taken well-publicized steps in response to the credit crisis. What may be less known are actions by European and Asian authorities.The Bank of England has made dramatic reductions in interest rates. In October, short-term rates stood at 5%, but after a series of cuts, they had fallen to 1.5% by January 8.This marked the first time rates had dropped below 2% in the Bank of England’s history, which dates to 1694. Similarly, China has instituted several interest-rate reductions since September. In November, China unveiled a $586 billion economic stimulus program. In a more unconventional move, the government of Ireland during January nationalized Anglo-Irish Banks, a weakened financial institution.
Gerry, what is your outlook for the economy and the fund?
I believe it’s likely that a severe global recession will persist throughout 2009, characterized by increased unemployment, reduced consumer spending, and reduced spending by businesses for capital equipment and new technology. As a consequence, I
10
believe the equity markets are likely to remain weak during the first half of 2009. However, if market participants conclude that the economy will begin to recover by early 2010, equity markets could begin a sustained rebound during the second half of 2009.
Given this forecast, I currently plan to maintain the fund’s lower-than-benchmark positions in industrial and consumer-discretionary stocks. I also plan to maintain the fund’s overweight position in the health-care sector, a traditional defensive haven in times of market uncertainty. If the equity markets begin to show signs of a durable recovery later in 2009, I would at that point begin to shift the fund from a defensive posture to one that would be better positioned to benefit in a strengthening economy.
Thanks, Gerry, for your time and insights today.
The views expressed in this report are exclusively those of Putnam Management. They are not meant as investment advice.
Please note that the holdings discussed in this report may not have been held by the fund for the entire period. Portfolio composition is subject to review in accordance with the fund’s investment strategy and may vary in the future.
Of special interest
We are pleased to report that the fund benefited during the period as a result of a court-ordered settlement distribution made to eligible holders of Enron Corporation common stock. Enron’s stock became worthless in 2001 when it was determined that the company had defrauded shareholders by conspiring to conceal losses and inflate profits. The company declared bankruptcy in December 2001, and its assets were later sold off to repay creditors. Shareholders who purchased Enron stock between September 9, 1997, and December 2, 2001, were eligible to participate in the settlement. The fund received $21,548,904, which represents 0.93% of net assets at December 31, 2008.
11
Your fund’s performance
This section shows your fund’s performance, price, and distribution information for periods ended December 31, 2008, the end of the first half of its current fiscal year. In accordance with regulatory requirements for mutual funds, we also include expense information taken from the fund’s current prospectus. Performance should always be considered in light of a fund’s investment strategy. Data represents past performance. Past performance does not guarantee future results. More recent returns may be less or more than those shown. Investment return and principal value will fluctuate, and you may have a gain or a loss when you sell your shares. Performance information does not reflect any deduction for taxes a shareholder may owe on fund distributions or on the redemption of fund shares. For the most recent month-end performance, please visit the Individual Investors section of www.putnam.com or call Putnam at 1-800-225-1581. Class Y shares are generally onl y available to corporate and institutional clients and clients in other approved programs. See the Terms and Definitions section in this report for definitions of the share classes offered by your fund.
Fund performance Total return for periods ended 12/31/08
| | | | | | | | | | |
| | Class A | Class B | Class C | Class M | Class R | Class Y |
| (inception dates) | (8/31/90) | (3/1/93) | (7/26/99) | (12/1/94) | (1/21/03) (7/19/94) |
| | NAV | POP | NAV | CDSC | NAV | CDSC | NAV | POP | NAV | NAV |
|
| Annual average | | | | | | | | | | |
| (life of fund) | 9.68% | 9.32% | 8.87% | 8.87% | 8.86% | 8.86% | 9.11% | 8.90% | 9.41% | 9.90% |
|
| 10 years | –31.13 | –35.08 | –35.92 | –35.92 | –36.10 | –36.10 | –34.46 | –36.75 | –32.77 | –29.37 |
| Annual average | –3.66 | –4.23 | –4.35 | –4.35 | –4.38 | –4.38 | –4.14 | –4.48 | –3.89 | –3.42 |
|
| 5 years | –14.56 | –19.47 | –17.71 | –19.36 | –17.73 | –17.73 | –16.65 | –19.57 | –15.62 | –13.48 |
| Annual average | –3.10 | –4.24 | –3.82 | –4.21 | –3.83 | –3.83 | –3.58 | –4.26 | –3.34 | –2.85 |
|
| 3 years | –29.44 | –33.50 | –31.00 | –33.07 | –31.01 | –31.01 | –30.46 | –32.89 | –29.96 | –28.89 |
| Annual average | –10.97 | –12.71 | –11.63 | –12.53 | –11.64 | –11.64 | –11.40 | –12.45 | –11.19 | –10.74 |
|
| 1 year | –38.54 | –42.07 | –39.00 | –42.05 | –39.01 | –39.62 | –38.83 | –40.97 | –38.69 | –38.38 |
|
| 6 months | –33.13 | –36.97 | –33.37 | –36.70 | –33.39 | –34.05 | –33.28 | –35.62 | –33.20 | –33.03 |
|
Current performance may be lower or higher than the quoted past performance, which cannot guarantee future results. After-sales-charge returns (public offering price, or POP) for class A and M shares reflect a maximum 5.75% and 3.50% load, respectively. Class B share returns reflect the applicable contingent deferred sales charge (CDSC), which is 5% in the first year, declining to 1% in the sixth year, and is eliminated thereafter. Class C shares reflect a 1% CDSC for the first year that is eliminated thereafter. Class R and Y shares have no initial sales charge or CDSC. Performance for class B, C, M, R, and Y shares before their inception is derived from the historical performance of class A shares, adjusted for the applicable sales charge (or CDSC) and, except for class Y shares, the higher operating expenses for such shares.
Recent performance benefitted from receipt of an Enron Class Action Settlement pertaining to investments made prior to 2002.
For a portion of the periods, this fund may have limited expenses, without which returns would have been lower.
A 1% short-term trading fee may be applied to shares exchanged or sold within 7 days of purchase.
12
Comparative index returns For period ended 12/31/08
| | |
| | | Lipper Multi-Cap Growth Funds |
| | Russell 3000 Growth Index | category average* |
|
| Annual average (life of fund) | 6.50% | 7.80% |
|
| 10 years | –33.61 | –7.72 |
| Annual average | –4.01 | –1.30 |
|
| 5 years | –15.59 | –11.97 |
| Annual average | –3.33 | –2.65 |
|
| 3 years | –24.94 | –27.60 |
| Annual average | –9.12 | –10.33 |
|
| 1 year | –38.44 | –41.90 |
|
| 6 months | –32.32 | –34.90 |
|
Index and Lipper results should be compared to fund performance at net asset value.
* Over the 6-month, 1-year, 3-year, 5-year, 10-year, and life-of-fund periods ended 12/31/08, there were 526, 506, 386, 320, 144, and 29 funds, respectively, in this Lipper category.
Fund price and distribution information For the six-month period ended 12/31/08
| | | | | | | | |
| | Class A | Class B | Class C | Class M | Class R | Class Y |
|
| Share value | NAV | POP | NAV | NAV | NAV | POP | NAV | NAV |
|
| 6/30/08 | $48.18 | $51.12 | $42.40 | $44.99 | $44.65 | $46.27 | $47.56 | $50.13 |
|
| 12/31/08 | 32.22 | 34.19 | 28.25 | 29.97 | 29.79 | 30.87 | 31.77 | 33.57 |
|
The fund made no distributions during the period.
Fund’s annual operating expenses For the fiscal year ended 6/30/08
| | | | | | |
| | Class A | Class B | Class C | Class M | Class R | Class Y |
|
| Total annual fund operating expenses | 1.21% | 1.96% | 1.96% | 1.71% | 1.46% | 0.96% |
|
Expense information in this table is taken from the most recent prospectus, is subject to change, and may differ from that shown in the next section and in the financial highlights of this report. Expenses are shown as a percentage of average net assets.
Your fund’s expenses
As a mutual fund investor, you pay ongoing expenses, such as management fees, distribution fees (12b-1 fees), and other expenses. In the most recent six-month period, your fund limited these expenses; had it not done so, expenses would have been higher. Using the following information, you can estimate how these expenses affect your investment and compare them with the expenses of other funds. You may also pay one-time transaction expenses, including sales charges (loads) and redemption fees, which are not shown in this section and would have resulted in higher total expenses. For more information, see your fund’s prospectus or talk to your financial representative.
13
Review your fund’s expenses
The following table shows the expenses you would have paid on a $1,000 investment in Putnam New Opportunities Fund from July 1, 2008, to December 31, 2008. It also shows how much a $1,000 investment would be worth at the close of the period, assuming actual returns and expenses.
| | | | | | |
| | Class A | Class B | Class C | Class M | Class R | Class Y |
|
| Expenses paid per $1,000* | $5.30 | $8.44 | $8.44 | $7.40 | $6.35 | $4.25 |
|
| Ending value (after expenses) | $668.70 | $666.30 | $666.10 | $667.20 | $668.00 | $669.70 |
|
* Expenses for each share class are calculated using the fund’s annualized expense ratio for each class, which represents the ongoing expenses as a percentage of average net assets for the six months ended 12/31/08. The expense ratio may differ for each share class (see the last table in this section). Expenses are calculated by multiplying the expense ratio by the average account value for the period; then multiplying the result by the number of days in the period; and then dividing that result by the number of days in the year.
Estimate the expenses you paid
To estimate the ongoing expenses you paid for the six months ended December 31, 2008, use the following calculation method. To find the value of your investment on July 1, 2008, call Putnam at 1-800-225-1581.

Compare expenses using the SEC’s method
The Securities and Exchange Commission (SEC) has established guidelines to help investors assess fund expenses. Per these guidelines, the following table shows your fund’s expenses based on a $1,000 investment, assuming a hypothetical 5% annualized return. You can use this information to compare the ongoing expenses (but not transaction expenses or total costs) of investing in the fund with those of other funds. All mutual fund shareholder reports will provide this information to help you make this comparison. Please note that you cannot use this information to estimate your actual ending account balance and expenses paid during the period.
| | | | | | |
| | Class A | Class B | Class C | Class M | Class R | Class Y |
|
| Expenses paid per $1,000* | $6.41 | $10.21 | $10.21 | $8.94 | $7.68 | $5.14 |
|
| Ending value (after expenses) | $1,018.85 | $1,015.07 | $1,015.07 | $1,016.33 | $1,017.59 | $1,020.11 |
|
* Expenses for each share class are calculated using the fund’s annualized expense ratio for each class, which represents the ongoing expenses as a percentage of average net assets for the six months ended 12/31/08. The expense ratio may differ for each share class (see the last table in this section). Expenses are calculated by multiplying the expense ratio by the average account value for the period; then multiplying the result by the number of days in the period; and then dividing that result by the number of days in the year.
14
Compare expenses using industry averages
You can also compare your fund’s expenses with the average of its peer group, as defined by Lipper, an independent fund-rating agency that ranks funds relative to others that Lipper considers to have similar investment styles or objectives. The expense ratio for each share class shown indicates how much of your fund’s average net assets have been used to pay ongoing expenses during the period.
| | | | | | |
| | Class A | Class B | Class C | Class M | Class R | Class Y |
|
| Your fund’s annualized | | | | | | |
| expense ratio | 1.26% | 2.01% | 2.01% | 1.76% | 1.51% | 1.01% |
|
| Average annualized expense | | | | | | |
| ratio for Lipper peer group* | 1.34% | 2.09% | 2.09% | 1.84% | 1.59% | 1.09% |
|
* Putnam keeps fund expenses below the Lipper peer group average expense ratio by limiting our fund expenses if they exceed the Lipper average. The Lipper average is a simple average of front-end load funds in the peer group that excludes 12b-1 fees as well as any expense offset and brokerage/service arrangements that may reduce fund expenses. To facilitate the comparison in this presentation, Putnam has adjusted the Lipper average to reflect 12b-1 fees. Investors should note that the other funds in the peer group may be significantly smaller or larger than the fund, and that an asset-weighted average would likely be lower than the simple average. Also, the fund and Lipper report expense data at different times; the fund’s expense ratio shown here is annualized data for the most recent six-month period, while the quarterly updated Lipper average is based on the most recent fiscal year-end data available for the peer group funds as of 12/31/08.
Your fund’s portfolio turnover
Putnam funds are actively managed by experts who buy and sell securities based on intensive analysis of companies, industries, economies, and markets. Portfolio turnover is a measure of how often a fund’s managers buy and sell securities for your fund. A portfolio turnover of 100%, for example, means that the managers sold and replaced securities valued at 100% of a fund’s assets within a one-year period. Funds with high turnover may be more likely to generate capital gains that must be distributed to shareholders as taxable income. High turnover may also cause a fund to pay more brokerage commissions and other transaction costs, which may detract from performance.
You can use the following table to compare your fund’s turnover with the average turnover for funds in its Lipper category.
Turnover comparisons Percentage of holdings that change every year
| | | | | |
| | 2008 | 2007 | 2006 | 2005 | 2004 |
|
| Putnam New Opportunities Fund | 126% | 91% | 84% | 97% | 61% |
|
| Lipper Multi-Cap Growth Funds | | | | | |
| category average | 105% | 108% | 108% | 117% | 125% |
|
Turnover data for the fund is calculated based on the fund’s fiscal-year period, which ends on June 30. Turnover data for the fund’s Lipper category is calculated based on the average of the turnover of each fund in the category for its fiscal year ended during the indicated year. Fiscal years vary across funds in the Lipper category, which may limit the comparability of the fund’s portfolio turnover rate to the Lipper average. Comparative data for 2008 is based on information available as of 12/31/08.
15
Your fund’s management
Your fund’s Portfolio Manager is Gerald Moore.
Investment team fund ownership
The following table shows how much the fund’s current Portfolio Manager has invested in the fund and in all Putnam mutual funds (in dollar ranges). Information shown is as of December 31, 2008, and December 31, 2007.

Trustee and Putnam employee fund ownership
As of December 31, 2008, all of the Trustees of the Putnam funds owned fund shares. The following table shows the approximate value of investments in the fund and all Putnam funds as of that date by the Trustees and Putnam employees. These amounts include investments by the Trustees’ and employees’ immediate family members and investments through retirement and deferred compensation plans.
| | |
| | Assets in the fund | Total assets in all Putnam funds |
|
| Trustees | $530,000 | $32,000,000 |
|
| Putnam employees | $9,841,000 | $332,000,000 |
|
Other Putnam funds managed by the Portfolio Manager
Gerald Moore does not manage any other Putnam mutual funds. He may also manage other accounts and variable trust funds advised by Putnam Management or an affiliate.
16
Terms and definitions
Important terms
Total return shows how the value of the fund’s shares changed over time, assuming you held the shares through the entire period and reinvested all distributions in the fund.
Net asset value (NAV) is the price, or value, of one share of a mutual fund, without a sales charge. NAVs fluctuate with market conditions. NAV is calculated by dividing the net assets of each class of shares by the number of outstanding shares in the class.
Public offering price (POP) is the price of a mutual fund share plus the maximum sales charge levied at the time of purchase. POP performance figures shown here assume the 5.75% maximum sales charge for class A shares and 3.50% for class M shares.
Contingent deferred sales charge (CDSC) is generally a charge applied at the time of the redemption of class B or C shares and assumes redemption at the end of the period. Your fund’s class B CDSC declines from a 5% maximum during the first year to 1% during the sixth year. After the sixth year, the CDSC no longer applies. The CDSC for class C shares is 1% for one year after purchase.
Share classes
Class A shares are generally subject to an initial sales charge and no CDSC (except on certain redemptions of shares bought without an initial sales charge).
Class B shares are not subject to an initial sales charge. They may be subject to a CDSC.
Class C shares are not subject to an initial sales charge and are subject to a CDSC only if the shares are redeemed during the first year.
Class M shares have a lower initial sales charge and a higher 12b-1 fee than class A shares and no CDSC (except on certain redemptions of shares bought without an initial sales charge).
Class R shares are not subject to an initial sales charge or CDSC and are available only to certain defined contribution plans.
Class Y shares are not subject to an initial sales charge or CDSC, and carry no 12b-1 fee. They are generally only available to corporate and institutional clients and clients in other approved programs.
Comparative indexes
Barclays Capital Aggregate Bond Index is an unmanaged index of U.S. investment-grade fixed-income securities.
Merrill Lynch U.S. 3-Month Treasury Bill Index is an unmanaged index that seeks to measure the performance of U.S. Treasury bills available in the marketplace.
Russell 3000 Growth Index is an unmanaged index of those companies in the broad-market Russell 3000 Index chosen for their growth orientation.
S&P 500 Index is an unmanaged index of common stock performance.
Indexes assume reinvestment of all distributions and do not account for fees. Securities and performance of a fund and an index will differ. You cannot invest directly in an index.
Lipper is a third-party industry-ranking entity that ranks mutual funds. Its rankings do not reflect sales charges. Lipper rankings are based on total return at net asset value relative to other funds that have similar current investment styles or objectives as determined by Lipper. Lipper may change a fund’s category assignment at its discretion. Lipper category averages reflect performance trends for funds within a category.
17
Trustee approval of management contract
General conclusions
The Board of Trustees of the Putnam funds oversees the management of each fund and, as required by law, determines annually whether to approve the continuance of your fund’s management contract with Putnam Investment Management (“Putnam Management”). In this regard, the Board of Trustees, with the assistance of its Contract Committee consisting solely of Trustees who are not “interested persons” (as such term is defined in the Investment Company Act of 1940, as amended) of the Putnam funds (the “Independent Trustees”), requests and evaluates all information it deems reasonably necessary under the circumstances. Over the course of several months ending in June 2008, the Contract Committee met several times to consider the information provided by Putnam Management and other information developed with the assistance of the Board’s independent counsel and independent staff. The Contract Committee reviewed and discussed key aspects of t his information with all of the Independent Trustees. The Contract Committee recommended, and the Independent Trustees approved, the continuance of your fund’s management contract, effective July 1, 2008.
The Independent Trustees’ approval was based on the following conclusions:
• That the fee schedule in effect for your fund represented reasonable compensation in light of the nature and quality of the services being provided to the fund, the fees paid by competitive funds and the costs incurred by Putnam Management in providing such services, and
• That this fee schedule represented an appropriate sharing between fund shareholders and Putnam Management of such economies of scale as may exist in the management of the fund at current asset levels.
These conclusions were based on a comprehensive consideration of all information provided to the Trustees, were subject to the continued application of certain expense reductions and waivers and other considerations noted below, and were not the result of any single factor. Some of the factors that figured particularly in the Trustees’ deliberations and how the Trustees considered these factors are described below, although individual Trustees may have evaluated the information presented differently, giving different weights to various factors. It is also important to recognize that the fee arrangements for your fund and the other Putnam funds are the result of many years of review and discussion between the Independent Trustees and Putnam Management, that certain aspects of such arrangements may receive greater scrutiny in some years than others, and that the Trustees’ conclusions may be based, in part, on their consideration of these same arrangements in prio r years.
Management fee schedules and categories; total expenses
The Trustees reviewed the management fee schedules in effect for all Putnam funds, including fee levels and breakpoints, and the assignment of funds to particular fee categories. In reviewing fees and expenses, the Trustees generally focused their attention on material changes in circumstances — for example, changes in a fund’s size or investment style, changes in Putnam Management’s operating costs or responsibilities, or changes in competitive practices in the mutual fund industry — that suggest that consideration of fee changes might be warranted. The Trustees concluded that the circumstances
18
did not warrant changes to the management fee structure of your fund, which had been carefully developed over the years, re-examined on many occasions and adjusted where appropriate. In this regard, the Trustees also noted that shareholders of your fund voted in 2007 to approve new management contracts containing an identical fee structure. The Trustees focused on two areas of particular interest, as discussed further below:
• Competitiveness. The Trustees reviewed comparative fee and expense information for competitive funds, which indicated that, in a custom peer group of competitive funds selected by Lipper Inc., your fund ranked in the 10th percentile in management fees and in the 14th percentile in total expenses (less any applicable 12b-1 fees) as of December 31, 2007 (the first percentile being the least expensive funds and the 100th percentile being the most expensive funds). (Because the fund’s custom peer group is smaller than the fund’s broad Lipper Inc. peer group, this expense information may differ from the Lipper peer expense information found elsewhere in this report.) The Trustees noted that expense ratios for a number of Putnam funds, which show the percentage of fund assets used to pay for management and administrative services, distribution (12b-1) fees and other expenses, had been increas ing recently as a result of declining net assets and the natural operation of fee breakpoints.
The Trustees noted that the expense ratio increases described above were currently being controlled by expense limitations initially implemented in January 2004. The Trustees have received a commitment from Putnam Management and its parent company to continue this program through at least June 30, 2009. These expense limitations give effect to a commitment by Putnam Management that the expense ratio of each open-end fund would be no higher than the average expense ratio of the competitive funds included in the fund’s relevant Lipper universe (exclusive of any applicable 12b-1 charges in each case). The Trustees observed that this commitment to limit fund expenses has served shareholders well since its inception.
In order to ensure that the expenses of the Putnam funds continue to meet evolving competitive standards, the Trustees requested, and Putnam Management agreed, to extend for the twelve months beginning July 1, 2008, an additional expense limitation for certain funds at an amount equal to the average expense ratio (exclusive of 12b-1 charges) of a custom peer group of competitive funds selected by Lipper to correspond to the size of the fund. This additional expense limitation will be applied to those open-end funds that had above-average expense ratios (exclusive of 12b-1 charges) based on the custom peer group data for the period ended December 31, 2007. This additional expense limitation will not be applied to your fund because it had a below-average expense ratio relative to its custom peer group.
In addition, the Trustees devoted particular attention to analyzing the Putnam funds’ fees and expenses relative to those of competitors in fund complexes of comparable size and with a comparable mix of asset categories. The Trustees concluded that this analysis did not reveal any matters requiring further attention at the current time.
• Economies of scale. Your fund currently has the benefit of breakpoints in its management fee that provide shareholders with significant economies of scale, which means that the effective management fee rate of the fund (as a percentage of fund assets) declines as the fund grows in size and crosses specified asset thresholds. Conversely, if the fund shrinks in size — as has been the case for many Putnam funds in recent years — these breakpoints
19
result in increasing fee levels. In recent years, the Trustees have examined the operation of the existing breakpoint structure during periods of both growth and decline in asset levels. The Trustees concluded that the fee schedule in effect for your fund represented an appropriate sharing of economies of scale at current asset levels.
In connection with their review of the management fees and total expenses of the Putnam funds, the Trustees also reviewed the costs of the services to be provided and profits to be realized by Putnam Management and its affiliates from the relationship with the funds. This information included trends in revenues, expenses and profitability of Putnam Management and its affiliates relating to the investment management and distribution services provided to the funds. In this regard, the Trustees also reviewed an analysis of Putnam Management’s revenues, expenses and profitability with respect to the funds’ management contracts, allocated on a fund-by-fund basis.
Investment performance
The quality of the investment process provided by Putnam Management represented a major factor in the Trustees’ evaluation of the quality of services provided by Putnam Management under your fund’s management contract. The Trustees were assisted in their review of the Putnam funds’ investment process and performance by the work of the Investment Oversight Coordinating Committee of the Trustees and the Investment Oversight Committees of the Trustees, which had met on a regular monthly basis with the funds’ portfolio teams throughout the year. The Trustees concluded that Putnam Management generally provides a high-quality investment process — as measured by the experience and skills of the individuals assigned to the management of fund portfolios, the resources made available to such personnel, and in general the ability of Putnam Management to attract and retain high-quality personnel — but also recognized that this does not guarantee favorable investment results for every fund in every time period. The Trustees considered the investment performance of each fund over multiple time periods and considered information comparing each fund’s performance with various benchmarks and with the performance of competitive funds.
While the Trustees noted the satisfactory investment performance of certain Putnam funds, they considered the disappointing investment performance of many funds in recent periods, particularly over periods in 2007 and 2008. They discussed with senior management of Putnam Management the factors contributing to such underperformance and actions being taken to improve performance. The Trustees recognized that, in recent years, Putnam Management has taken steps to strengthen its investment personnel and processes to address areas of underperformance, including recent efforts to further centralize Putnam Management’s equity research function. In this regard, the Trustees took into consideration efforts by Putnam Management to improve its ability to assess and mitigate investment risk in individual funds, across asset classes, and across the complex as a whole. The Trustees indicated their intention to continue to monitor performance trends to assess the effectiveness of these efforts and to evaluate whether additional changes to address areas of underperformance are warranted.
In the case of your fund, the Trustees considered that your fund’s class A share cumulative total return performance at net asset value was in the following percentiles of its Lipper Inc. peer group (Lipper Multi-Cap Growth Funds) for the one-year, three-year and five-year periods ended December 31, 2007 (the first percentile
20
being the best-performing funds and the 100th percentile being the worst-performing funds):
| | | |
| One-year period | 89th | | |
| | |
| Three-year period | 77th | | |
| | |
| Five-year period | 75th | | |
| | |
(Because of the passage of time, these performance results may differ from the performance results for more recent periods shown elsewhere in this report.) Over the one-year, three-year and five-year periods ended December 31, 2007, there were 518, 399, and 339 funds, respectively, in your fund’s Lipper peer group.* Past performance is no guarantee of future returns.
The Trustees noted the disappointing performance for your fund for the one-year and three-year periods ended December 31, 2007. In this regard, the Trustees considered that, similar to the experience of certain other Putnam Funds with exposure to the large-cap equity space, your fund’s performance would have been materially better over these periods but for the performance of a limited number of portfolio choices in the financial sector that experienced extreme distress in the market turmoil that began in the summer of 2007. In addition, following leadership and portfolio management team changes, Putnam Management continues to make efforts to enhance the strength of the Large Cap Equities team, and Putnam Management has centralized the equity research structure. These changes were made to strengthen the investment process, which focuses on a blend of quantitative techniques and fundamental analysis, and to enhance the performance potential for Putnam funds with expo sure to the large-cap equity space.
As a general matter, the Trustees believe that cooperative efforts between the Trustees and Putnam Management represent the most effective way to address investment performance problems. The Trustees noted that investors in the Putnam funds have, in effect, placed their trust in the Putnam organization, under the oversight of the funds’ Trustees, to make appropriate decisions regarding the management of the funds. Based on the responsiveness of Putnam Management in the recent past to Trustee concerns about investment performance, the Trustees concluded that it is preferable to seek change within Putnam Management to address performance shortcomings. In the Trustees’ view, the alternative of engaging a new investment adviser for an underperforming fund would entail significant disruptions and would not provide any greater assurance of improved investment performance.
Brokerage and soft-dollar allocations; other benefits
The Trustees considered various potential benefits that Putnam Management may receive in connection with the services it provides under the management contract with your fund. These include benefits related to brokerage and soft-dollar allocations, whereby a portion of the commissions paid by a fund for brokerage may be used to acquire research services that may be useful to Putnam Management in managing the assets of the fund and of other clients. The Trustees considered changes made in 2008, at Putnam Management’s request, to the Putnam funds’ brokerage allocation policy, which expanded the permitted categories of brokerage and
* The percentile rankings for your fund’s class A share annualized total return performance in the Lipper Multi-Cap Growth Funds category for the one-year, five-year, and ten-year periods ended December 31, 2008, were 23%, 57%, and 73%, respectively. Over the one-year, five-year, and ten-year periods ended December 31, 2008, your fund ranked 115th out of 506, 181st out of 320, and 105th out of 144 funds, respectively. Note that this more recent information was not available when theTrustees approved the continuance of your fund’s management contract.
21
research services payable with soft dollars and increased the permitted soft dollar allocation to third-party services over what had been authorized in previous years. The Trustees indicated their continued intent to monitor the potential benefits associated with the allocation of fund brokerage and trends in industry practice to ensure that the principle of seeking “best price and execution” remains paramount in the portfolio trading process.
The Trustees’ annual review of your fund’s management contract arrangements also included the review of its distributor’s contract and distribution plan with Putnam Retail Management Limited Partnership and the investor servicing agreement with Putnam Fiduciary Trust Company (“PFTC”), each of which provides benefits to affiliates of Putnam Management. In the case of the investor servicing agreement, the Trustees considered that certain shareholder servicing functions were shifted to a third-party service provider by PFTC in 2007.
Comparison of retail and institutional fee schedules
The information examined by the Trustees as part of their annual contract review has included for many years information regarding fees charged by Putnam Management and its affiliates to institutional clients such as defined benefit pension plans, college endowments, etc. This information included comparisons of such fees with fees charged to the funds, as well as a detailed assessment of the differences in the services provided to these two types of clients. The Trustees observed, in this regard, that the differences in fee rates between institutional clients and mutual funds are by no means uniform when examined by individual asset sectors, suggesting that differences in the pricing of investment management services to these types of clients reflect to a substantial degree historical competitive forces operating in separate market places. The Trustees considered the fact that fee rates across different asset classes are typically higher o n average for mutual funds than for institutional clients, as well as the differences between the services that Putnam Management provides to the Putnam funds and those that it provides to institutional clients of the firm, but did not rely on such comparisons to any significant extent in concluding that the management fees paid by your fund are reasonable.
22
Other information for shareholders
Important notice regarding delivery of shareholder documents
In accordance with SEC regulations, Putnam sends a single copy of annual and semiannual shareholder reports, prospectuses, and proxy statements to Putnam shareholders who share the same address, unless a shareholder requests otherwise. If you prefer to receive your own copy of these documents, please call Putnam at 1-800-225-1581, and Putnam will begin sending individual copies within 30 days.
Proxy voting
Putnam is committed to managing our mutual funds in the best interests of our shareholders. The Putnam funds’ proxy voting guidelines and procedures, as well as information regarding how your fund voted proxies relating to portfolio securities during the 12-month period ended June 30, 2008, are available in the Individual Investors section of www.putnam.com, and on the SEC’s Web site, www.sec.gov. If you have questions about finding forms on the SEC’s Web site, you may call the SEC at 1-800-SEC-0330. You may also obtain the Putnam funds’ proxy voting guidelines and procedures at no charge by calling Putnam’s Shareholder Services at 1-800-225-1581.
Fund portfolio holdings
The fund will file a complete schedule of its portfolio holdings with the SEC for the first and third quarters of each fiscal year on Form N-Q. Shareholders may obtain the fund’s Forms N-Q on the SEC’s Web site at www.sec.gov. In addition, the fund’s Forms N-Q may be reviewed and copied at the SEC’s Public Reference Room in Washington, D.C. You may call the SEC at 1-800-SEC-0330 for information about the SEC’s Web site or the operation of the Public Reference Room.
23
Financial statements
A guide to financial statements
These sections of the report, as well as the accompanying Notes, constitute the fund’s financial statements.
The fund’s portfolio lists all the fund’s investments and their values as of the last day of the reporting period. Holdings are organized by asset type and industry sector, country, or state to show areas of concentration and diversification.
Statement of assets and liabilities shows how the fund’s net assets and share price are determined. All investment and noninvestment assets are added together. Any unpaid expenses and other liabilities are subtracted from this total. The result is divided by the number of shares to determine the net asset value per share, which is calculated separately for each class of shares. (For funds with preferred shares, the amount subtracted from total assets includes the liquidation preference of preferred shares.)
Statement of operations shows the fund’s net investment gain or loss. This is done by first adding up all the fund’s earnings —from dividends and interest income — and subtracting its operating expenses to determine net investment income (or loss). Then, any net gain or loss the fund realized on the sales of its holdings — as well as any unrealized gains or losses over the period — is added to or subtracted from the net investment result to determine the fund’s net gain or loss for the fiscal period.
Statement of changes in net assets shows how the fund’s net assets were affected by the fund’s net investment gain or loss, by distributions to shareholders, and by changes in the number of the fund’s shares. It lists distributions and their sources (net investment income or realized capital gains) over the current reporting period and the most recent fiscal year-end. The distributions listed here may not match the sources listed in the Statement of operations because the distributions are determined on a tax basis and may be paid in a different period from the one in which they were earned. Dividend sources are estimated at the time of declaration. Actual results may vary. Any non-taxable return of capital cannot be determined until final tax calculations are completed after the end of the fund’s fiscal year.
Financial highlights provide an overview of the fund’s investment results, per-share distributions, expense ratios, net investment income ratios, and portfolio turnover in one summary table, reflecting the five most recent reporting periods. In a semiannual report, the highlight table also includes the current reporting period.
24
The fund’s portfolio 12/31/08 (Unaudited)
| | |
| COMMON STOCKS (96.7%)* | Shares | Value |
|
| Aerospace and defense (2.3%) | | |
| Alliant Techsystems, Inc. † | 85,600 | $7,341,056 |
|
| General Dynamics Corp. | 107,800 | 6,208,202 |
|
| L-3 Communications Holdings, Inc. | 168,400 | 12,424,552 |
|
| Orbital Sciences Corp. † | 202,300 | 3,950,919 |
|
| Precision Castparts Corp. | 183,200 | 10,896,736 |
|
| Raytheon Co. | 256,600 | 13,096,864 |
|
| | | 53,918,329 |
| Banking (1.0%) | | |
| Bank of the Ozarks, Inc. | 59,700 | 1,769,508 |
|
| BOK Financial Corp. | 32,223 | 1,301,809 |
|
| City National Corp. | 65,300 | 3,180,110 |
|
| Commerce Bancshares, Inc. | 27,510 | 1,209,065 |
|
| First Citizens BancShares, Inc. Class A | 21,900 | 3,346,320 |
|
| Northern Trust Corp. | 234,600 | 12,232,044 |
|
| | | 23,038,856 |
| Beverage (1.5%) | | |
| Coca-Cola Co. (The) | 286,600 | 12,974,382 |
|
| Heckmann Corp. † | 264,900 | 1,496,685 |
|
| PepsiCo, Inc. | 366,516 | 20,074,081 |
|
| | | 34,545,148 |
| Biotechnology (4.7%) | | |
| American Oriental Bioengineering, Inc. (China) † | 729,900 | 4,956,021 |
|
| Amgen, Inc. † | 235,500 | 13,600,125 |
|
| Genentech, Inc. † | 279,000 | 23,131,890 |
|
| Genzyme Corp. † | 248,359 | 16,483,587 |
|
| Gilead Sciences, Inc. † | 747,000 | 38,201,580 |
|
| Life Technologies Corp. † | 236,143 | 5,504,493 |
|
| Martek Biosciences Corp. † | 116,000 | 3,515,960 |
|
| Medicines Co. † | 178,500 | 2,629,305 |
|
| | | 108,022,961 |
| Chemicals (2.5%) | | |
| Airgas, Inc. | 239,500 | 9,338,105 |
|
| FMC Corp. | 144,300 | 6,454,539 |
|
| Monsanto Co. | 366,124 | 25,756,823 |
|
| Potash Corp. of Saskatchewan (Canada) | 99,900 | 7,314,678 |
|
| Sigma-Adrich Corp. | 236,118 | 9,973,624 |
|
| | | 58,837,769 |
| Coal (0.3%) | | |
| Massey Energy Co. | 464,182 | 6,401,070 |
|
| | | 6,401,070 |
| Commercial and consumer services (1.4%) | | |
| EZCORP, Inc. Class A † | 308,692 | 4,695,205 |
|
| H&R Block, Inc. | 476,700 | 10,830,624 |
|
| Navigant Consulting, Inc. † | 268,900 | 4,267,443 |
|
| Priceline.com, Inc. † | 141,090 | 10,391,279 |
|
| Watson Wyatt Worldwide, Inc. Class A | 63,700 | 3,046,134 |
|
| | | 33,230,685 |
| Communications equipment (4.0%) | | |
| Cisco Systems, Inc. † | 2,130,255 | 34,723,157 |
|
| Comtech Telecommunications Corp. † | 58,200 | 2,666,724 |
|
25
| | |
| COMMON STOCKS (96.7%)* cont. | Shares | Value |
|
| Communications equipment cont. | | |
| F5 Networks, Inc. † | 450,524 | $10,298,979 |
|
| Juniper Networks, Inc. † | 848,100 | 14,850,231 |
|
| Qualcomm, Inc. | 872,000 | 31,243,760 |
|
| | | 93,782,851 |
| Computers (7.6%) | | |
| Actuate Corp. † | 209,772 | 620,925 |
|
| Apple, Inc. † | 579,129 | 49,428,660 |
|
| Hewlett-Packard Co. | 1,434,283 | 52,050,130 |
|
| IBM Corp. | 759,844 | 63,948,471 |
|
| TeleCommunication Systems, Inc. Class A † | 370,000 | 3,178,300 |
|
| Teradata Corp. † | 410,600 | 6,089,198 |
|
| | | 175,315,684 |
| Conglomerates (0.3%) | | |
| Walter Industries, Inc. | 354,490 | 6,207,120 |
|
| | | 6,207,120 |
| Consumer goods (3.9%) | | |
| Church & Dwight Co., Inc. | 302,900 | 16,998,748 |
|
| Colgate-Palmolive Co. | 433,700 | 29,725,798 |
|
| Prestige Brands Holdings, Inc. † | 421,400 | 4,445,770 |
|
| Procter & Gamble Co. (The) | 640,102 | 39,571,106 |
|
| | | 90,741,422 |
| Consumer services (0.1%) | | |
| Sapient Corp. † | 643,800 | 2,858,472 |
|
| | | 2,858,472 |
| Distribution (0.2%) | | |
| Spartan Stores, Inc. | 173,400 | 4,031,550 |
|
| | | 4,031,550 |
| Electric utilities (1.4%) | | |
| DPL, Inc. | 202,700 | 4,629,668 |
|
| Edison International | 289,800 | 9,308,376 |
|
| Exelon Corp. | 333,156 | 18,526,805 |
|
| | | 32,464,849 |
| Electrical equipment (1.7%) | | |
| Emerson Electric Co. | 655,300 | 23,990,533 |
|
| GrafTech International, Ltd. † | 370,400 | 3,081,728 |
|
| Insteel Industries, Inc. | 244,400 | 2,759,276 |
|
| Vestas Wind Systems A/S (Denmark) † | 147,740 | 8,819,386 |
|
| | | 38,650,923 |
| Electronics (2.5%) | | |
| Altera Corp. | 713,113 | 11,916,118 |
|
| Analog Devices, Inc. | 437,500 | 8,321,250 |
|
| Intel Corp. | 1,529,663 | 22,424,860 |
|
| Intermec, Inc. † | 296,300 | 3,934,864 |
|
| Marvell Technology Group, Ltd. (Bermuda) † | 768,400 | 5,125,228 |
|
| Thermo Electron Corp. † | 198,700 | 6,769,709 |
|
| | | 58,492,029 |
| Energy (oil field) (1.9%) | | |
| FMC Technologies, Inc. † | 385,500 | 9,186,465 |
|
| National-Oilwell Varco, Inc. † | 490,717 | 11,993,123 |
|
| Noble Corp. | 433,000 | 9,564,970 |
|
| Schlumberger, Ltd. | 297,411 | 12,589,408 |
|
| | | 43,333,966 |
26
| | |
| COMMON STOCKS (96.7%)* cont. | Shares | Value |
|
| Energy (other) (0.8%) | | |
| Covanta Holding Corp. † | 318,600 | $6,996,456 |
|
| First Solar, Inc. † | 72,600 | 10,015,896 |
|
| Optisolar, Inc. (acquired 7/30/08, cost $617,098) (Private) F ‡ † | 99,532 | 617,098 |
|
| | | 17,629,450 |
| Engineering and construction (1.1%) | | |
| EMCOR Group, Inc. † | 241,100 | 5,407,873 |
|
| ENGlobal Corp. † | 859,100 | 2,792,075 |
|
| Fluor Corp. | 232,638 | 10,438,467 |
|
| Michael Baker Corp. † | 168,600 | 6,223,026 |
|
| | | 24,861,441 |
| Financial (0.3%) | | |
| Assurant, Inc. | 200,100 | 6,003,000 |
|
| Credit Acceptance Corp. † | 8,378 | 114,779 |
|
| | | 6,117,779 |
| Food (1.0%) | | |
| Del Monte Foods Co. | 523,800 | 3,739,932 |
|
| General Mills, Inc. | 180,900 | 10,989,675 |
|
| Ralcorp Holdings, Inc. † | 137,300 | 8,018,320 |
|
| | | 22,747,927 |
| Health-care services (3.0%) | | |
| AMERIGROUP Corp. † | 589,226 | 17,393,952 |
|
| Express Scripts, Inc. † | 304,800 | 16,757,904 |
|
| Genoptix, Inc. † | 65,000 | 2,215,200 |
|
| Healthsouth Corp. † | 304,600 | 3,338,416 |
|
| Hooper Holmes, Inc. † | 2,079,695 | 519,924 |
|
| LHC Group, Inc. † | 115,100 | 4,143,600 |
|
| Omnicare, Inc. | 242,600 | 6,734,576 |
|
| Quest Diagnostics, Inc. | 289,500 | 15,027,945 |
|
| Questcor Pharmaceuticals, Inc. † | 488,300 | 4,546,073 |
|
| | | 70,677,590 |
| Insurance (0.8%) | | |
| AON Corp. | 190,500 | 8,702,040 |
|
| Fidelity National Title Group, Inc. Class A | 489,200 | 8,683,300 |
|
| Transatlantic Holdings, Inc. | 53,400 | 2,139,204 |
|
| | | 19,524,544 |
| Investment banking/Brokerage (1.4%) | | |
| Eaton Vance Corp. | 609,200 | 12,799,292 |
|
| Goldman Sachs Group, Inc. (The) | 116,050 | 9,793,460 |
|
| TD Ameritrade Holding Corp. † | 703,300 | 10,022,025 |
|
| | | 32,614,777 |
| Machinery (1.3%) | | |
| AGCO Corp. † | 338,336 | 7,981,346 |
|
| Chart Industries, Inc. † | 215,300 | 2,288,639 |
|
| Joy Global, Inc. | 356,800 | 8,167,152 |
|
| Parker-Hannifin Corp. | 251,300 | 10,690,302 |
|
| | | 29,127,439 |
| Manufacturing (0.8%) | | |
| Dover Corp. | 231,800 | 7,630,856 |
|
| Flowserve Corp. | 96,900 | 4,990,350 |
|
| Matthews International Corp. Class A | 9,154 | 335,769 |
|
| Shaw Group, Inc. † | 265,000 | 5,424,550 |
|
| | | 18,381,525 |
27
| | |
| COMMON STOCKS (96.7%)* cont. | Shares | Value |
|
| Medical technology (5.1%) | | |
| Baxter International, Inc. | 553,558 | $29,665,173 |
|
| Becton, Dickinson and Co. | 347,562 | 23,769,765 |
|
| Covidien, Ltd. | 233,700 | 8,469,288 |
|
| Datascope Corp. | 61,500 | 3,212,760 |
|
| Luminex Corp. † | 109,800 | 2,345,328 |
|
| Masimo Corp. † | 71,928 | 2,145,612 |
|
| St. Jude Medical, Inc. † | 535,500 | 17,650,080 |
|
| Steris Corp. | 83,872 | 2,003,702 |
|
| Varian Medical Systems, Inc. † | 320,800 | 11,240,832 |
|
| Waters Corp. † | 383,700 | 14,062,605 |
|
| Zoll Medical Corp. † | 180,000 | 3,400,200 |
|
| | | 117,965,345 |
| Metals (1.8%) | | |
| Barrick Gold Corp. (Canada) | 178,600 | 6,567,122 |
|
| Freeport-McMoRan Copper & Gold, Inc. Class B | 306,100 | 7,481,084 |
|
| Newmont Mining Corp. | 371,443 | 15,117,730 |
|
| Nucor Corp. | 236,800 | 10,940,160 |
|
| Steel Dynamics, Inc. | 242,000 | 2,705,560 |
|
| | | 42,811,656 |
| Natural gas utilities (0.4%) | | |
| Southwestern Energy Co. † | 333,300 | 9,655,701 |
|
| | | 9,655,701 |
| Oil and gas (6.3%) | | |
| Comstock Resources, Inc. † | 226,841 | 10,718,237 |
|
| Devon Energy Corp. | 138,000 | 9,067,980 |
|
| Exxon Mobil Corp. | 351,066 | 28,025,599 |
|
| Hess Corp. | 337,800 | 18,119,592 |
|
| McMoRan Exploration Co. † | 405,444 | 3,973,351 |
|
| Noble Energy, Inc. | 192,200 | 9,460,084 |
|
| Occidental Petroleum Corp. | 701,300 | 42,070,987 |
|
| Petroleo Brasileiro SA ADR (Brazil) | 608,172 | 14,894,132 |
|
| Ultra Petroleum Corp. † | 131,800 | 4,548,418 |
|
| Whiting Petroleum Corp. † | 169,100 | 5,658,086 |
|
| | | 146,536,466 |
| Pharmaceuticals (5.9%) | | |
| Abbott Laboratories | 1,007,000 | 53,743,590 |
|
| Cephalon, Inc. † | 246,000 | 18,951,840 |
|
| Emergent Biosolutions, Inc. † | 133,119 | 3,475,737 |
|
| Johnson & Johnson | 446,935 | 26,740,121 |
|
| Owens & Minor, Inc. | 389,400 | 14,660,910 |
|
| Perrigo Co. | 190,300 | 6,148,593 |
|
| Valeant Pharmaceuticals International † | 175,200 | 4,012,080 |
|
| Wyeth | 221,500 | 8,308,465 |
|
| | | 136,041,336 |
| Power producers (0.4%) | | |
| AES Corp. (The) † | 1,079,000 | 8,890,960 |
|
| | | 8,890,960 |
| Publishing (0.4%) | | |
| Marvel Entertainment, Inc. † | 281,300 | 8,649,975 |
|
| | | 8,649,975 |
28
| | |
| COMMON STOCKS (96.7%)* cont. | Shares | Value |
|
| Railroads (1.7%) | | |
| Burlington Northern Santa Fe Corp. | 266,700 | $20,191,857 |
|
| Union Pacific Corp. | 388,200 | 18,555,960 |
|
| | | 38,747,817 |
| Real estate (0.4%) | | |
| Simon Property Group, Inc. R | 190,300 | 10,110,639 |
|
| | | 10,110,639 |
| Regional Bells (0.4%) | | |
| Verizon Communications, Inc. | 297,438 | 10,083,148 |
|
| | | 10,083,148 |
| Restaurants (2.8%) | | |
| CEC Entertainment, Inc. † | 194,900 | 4,726,325 |
|
| McDonald’s Corp. | 692,400 | 43,060,356 |
|
| Yum! Brands, Inc. | 528,619 | 16,651,499 |
|
| | | 64,438,180 |
| Retail (5.8%) | | |
| Advance Auto Parts, Inc. | 275,900 | 9,284,035 |
|
| AutoZone, Inc. † | 123,044 | 17,160,947 |
|
| BJ’s Wholesale Club, Inc. † | 369,923 | 12,673,562 |
|
| Jo-Ann Stores, Inc. † | 215,100 | 3,331,899 |
|
| Kroger Co. | 521,100 | 13,762,251 |
|
| Rent-A-Center, Inc. † | 210,100 | 3,708,265 |
|
| TJX Cos., Inc. (The) | 783,471 | 16,115,998 |
|
| Wal-Mart Stores, Inc. | 1,049,000 | 58,806,940 |
|
| | | 134,843,897 |
| Schools (1.3%) | | |
| Apollo Group, Inc. Class A † | 286,100 | 21,920,982 |
|
| Career Education Corp. † | 499,800 | 8,966,412 |
|
| | | 30,887,394 |
| Semiconductor (0.1%) | | |
| Hittite Microwave Corp. † | 115,700 | 3,408,522 |
|
| | | 3,408,522 |
| Shipping (0.4%) | | |
| Frontline, Ltd. (Bermuda) | 73,600 | 2,179,296 |
|
| Kirby Corp. † | 284,300 | 7,778,448 |
|
| | | 9,957,744 |
| Software (6.2%) | | |
| Activision Blizzard, Inc. † | 851,700 | 7,358,688 |
|
| Adobe Systems, Inc. † | 724,381 | 15,422,071 |
|
| JDA Software Group, Inc. † | 193,893 | 2,545,815 |
|
| Mantech International Corp. Class A † | 131,100 | 7,104,309 |
|
| Microsoft Corp. | 2,779,473 | 54,032,955 |
|
| Oracle Corp. † | 2,324,000 | 41,204,520 |
|
| Red Hat, Inc. † | 506,200 | 6,691,964 |
|
| Symantec Corp. † | 489,300 | 6,615,336 |
|
| Websense, Inc. † | 105,729 | 1,582,763 |
|
| | | 142,558,421 |
| Staffing (0.2%) | | |
| Hewitt Associates, Inc. Class A † | 127,400 | 3,615,612 |
|
| | | 3,615,612 |
| Technology (0.7%) | | |
| Affiliated Computer Services, Inc. Class A † | 336,800 | 15,475,960 |
|
| | | 15,475,960 |
29
| | |
| COMMON STOCKS (96.7%)* cont. | Shares | Value |
|
| Technology services (3.4%) | | |
| Accenture, Ltd. Class A (Bermuda) | 741,695 | $24,320,179 |
|
| CSG Systems International, Inc. † | 335,800 | 5,866,426 |
|
| Google, Inc. Class A † | 70,867 | 21,802,233 |
|
| NetEase.com ADR (China) † | 170,300 | 3,763,630 |
|
| SAIC, Inc. † | 507,100 | 9,878,308 |
|
| Western Union Co. (The) | 909,300 | 13,039,362 |
|
| | | 78,670,138 |
| Telecommunications (0.9%) | | |
| NeuStar, Inc. Class A † | 551,560 | 10,551,343 |
|
| NII Holdings, Inc. † | 238,400 | 4,334,112 |
|
| Premiere Global Services, Inc. † | 590,700 | 5,085,927 |
|
| | | 19,971,382 |
| Textiles (0.7%) | | |
| NIKE, Inc. Class B | 329,300 | 16,794,300 |
|
| | | 16,794,300 |
| Tobacco (3.0%) | | |
| Lorillard, Inc. | 205,300 | 11,568,655 |
|
| Philip Morris International, Inc. | 1,356,600 | 59,025,666 |
|
| | | 70,594,321 |
| Toys (0.5%) | | |
| Hasbro, Inc. | 364,900 | 10,644,133 |
|
| | | 10,644,133 |
| Trucks and parts (0.1%) | | |
| Fuel Systems Solutions, Inc. † | 71,300 | 2,335,788 |
|
| | | 2,335,788 |
| Total common stocks (cost $2,839,679,658) | | $2,239,244,991 |
| |
| |
| CONVERTIBLE PREFERRED STOCKS (—%)* | Shares | Value |
|
| Totality Corp. Ser. D, $0.346 cum. cv. pfd. | | |
| (acquired 7/27/00, cost $311,442) (Private) F ‡ † | 122,060 | $12 |
|
| Total convertible preferred stocks (cost $311,442) | | $12 |
| |
| |
| SHORT-TERM INVESTMENTS (5.0%)* | Principal amount/shares | Value |
|
| U.S. Treasury Cash Management Bills for an effective yield | | |
| of 0.883%, May 15, 2009 # | $1,605,000 | $1,600,193 |
|
| U.S. Treasury Bills for an effective yield of 0.472%, | | |
| November 19, 2009 # | 15,765,000 | 15,718,141 |
|
| Federated Prime Obligations Fund | 98,869,827 | 98,869,827 |
|
| Total short-term investments (cost $116,188,161) | | $116,188,161 |
|
| |
| TOTAL INVESTMENTS | | |
| Total investments (cost $2,956,179,261) | | $2,355,433,164 |
* Percentages indicated are based on net assets of $2,316,417,488.
† Non-income-producing security.
‡ Restricted, excluding 144A securities, as to public resale. The total market value of restricted securities held at December 31, 2008 was $617,110 or less than 0.1% of net assets.
# These securities were pledged and segregated with the custodian to cover margin requirements for futures contracts at December 31, 2008.
30
F Is valued at fair value following procedures approved by the Trustees. Securities may be classified as a Level 2 or Level 3 for FASB 157 disclosures based on the securities valuation inputs. On December 31, 2008, fair value pricing was also used for certain foreign securities in the portfolio (Note 1).
R Real Estate Investment Trust.
ADR after the name of a foreign holding stands for American Depository Receipts, representing ownership of foreign securities on deposit with a custodian bank.
| | | | | |
| FUTURES CONTRACTS OUTSTANDING at 12/31/08 (Unaudited) | | | |
| |
| | Number of | | | Expiration | Unrealized |
| | contracts | Value | | date | appreciation |
|
| NASDAQ 100 Index E-Mini (Long) | 505 | $12,246,250 | | Mar-09 | $68,359 |
|
| Russell 2000 Index Mini (Long) | 57 | 2,814,090 | | Mar-09 | 89,593 |
|
| S&P 500 Index (Long) | 166 | 37,354,150 | | Mar-09 | 879,051 |
|
| S&P Mid Cap 400 Index E-Mini (Long) | 63 | 3,384,360 | | Mar-09 | 124,567 |
|
| Total | | | | | $1,161,570 |
In September 2006, the FASB issued Statement of Financial Accounting Standards No. 157, Fair Value Measurements (SFAS 157). SFAS 157 is effective for financial statements issued for fiscal years beginning after November 15, 2007 and interim periods within those fiscal years. While the adoption of SFAS 157 does not have a material effect on the fund’s net asset value, it does require additional disclosures about fair value measurements. The Standard establishes a three-level hierarchy for disclosure of fair value measurements. The valuation hierarchy is based upon the transparency of inputs to the valuation of the fund’s investments. The three levels are defined as follows:
Level 1 – Valuations based on quoted prices for identical securities in active markets.
Level 2 – Valuations based on quoted prices in markets that are not active or for which all significant inputs are observable, either directly or indirectly.
Level 3 – Valuations based on inputs that are unobservable and significant to the fair value measurement.
The following is a summary of the inputs used to value the fund’s net assets as of December 31, 2008:
| | |
| Valuation inputs | Investments in securities | Other financial instruments |
|
| Level 1 | $2,328,678,334 | $1,161,570 |
|
| Level 2 | 26,137,720 | — |
|
| Level 3 | 617,110 | — |
|
| Total | $2,355,433,164 | $1,161,570 |
Other financial instruments include futures, written options, TBA sale commitments, swaps and forward contracts which are valued at the unrealized appreciation/(depreciation) on the instrument.
The following is a reconciliation of Level 3 assets as of December 31, 2008:
| | |
| | Investment in securities | Other financial instruments |
|
| Balance as of June 30, 2008 | $— | $— |
|
| Accrued discounts/premiums | — | — |
|
| Realized gain/loss | — | — |
|
| Change in net unrealized appreciation (depreciation) | — | — |
|
| Net purchases/sales | — | — |
|
| Net transfers in and/or out of Level 3 1 | 617,110 | — |
|
| Balance as of December 31, 2008 | $617,110 | $— |
Other financial instruments include futures, written options, TBA sale commitments, swaps and forward contracts which are valued at the unrealized appreciation/(depreciation) on the instrument.
1 Represents Level 3 securities acquired in merger with Putnam Discovery Growth Fund.
The accompanying notes are an integral part of these financial statements.
31
Statement of assets and liabilities 12/31/08 (Unaudited)
| |
| ASSETS | |
|
| |
| Investment in securities, at value (Note 1): | |
| Unaffiliated issuers (identified cost $2,956,179,261) | $2,355,433,164 |
|
| Cash | 34,091,875 |
|
| Dividends, interest and other receivables | 26,173,362 |
|
| Receivable for shares of the fund sold | 1,654,086 |
|
| Receivable for securities sold | 1,190,448 |
|
| Receivable for variation margin (Note 1) | 2,068,453 |
|
| Total assets | 2,420,611,388 |
|
| |
| LIABILITIES | |
|
| Payable for securities purchased | 84,329,455 |
|
| Payable for shares of the fund repurchased | 12,519,421 |
|
| Payable for compensation of Manager (Note 2) | 3,569,170 |
|
| Payable for investor servicing fees (Note 2) | 764,554 |
|
| Payable for custodian fees (Note 2) | 37,173 |
|
| Payable for Trustee compensation and expenses (Note 2) | 988,705 |
|
| Payable for administrative services (Note 2) | 7,353 |
|
| Payable for distribution fees (Note 2) | 1,389,608 |
|
| Other accrued expenses | 588,461 |
|
| Total liabilities | 104,193,900 |
| |
| Net assets | $2,316,417,488 |
| |
| |
| REPRESENTED BY | |
|
| Paid-in capital (Unlimited shares authorized) (Notes 1, 4 and 6) | $7,600,617,458 |
|
| Undistributed net investment income (Notes 1 and 6) | 391,708 |
|
| Accumulated net realized loss on investments and foreign currency transactions (Notes 1 and 6) | (4,685,007,154) |
|
| Net unrealized depreciation of investments and assets and liabilities in foreign currencies (Note 6) | (599,584,524) |
|
| Total — Representing net assets applicable to capital shares outstanding | $2,316,417,488 |
|
| |
| COMPUTATION OF NET ASSET VALUE AND OFFERING PRICE | |
| Net asset value and redemption price per class A share ($1,834,743,750 divided by 56,936,242 shares) | $32.22 |
|
| Offering price per class A share (100/94.25 of $32.22)* | $34.19 |
|
| Net asset value and offering price per class B share ($182,777,563 divided by 6,471,021 shares)** | $28.25 |
|
| Net asset value and offering price per class C share ($29,048,726 divided by 969,311 shares)** | $29.97 |
|
| Net asset value and redemption price per class M share ($38,441,592 divided by 1,290,611 shares) | $29.79 |
|
| Offering price per class M share (100/96.50 of $29.79)* | $30.87 |
|
| Net asset value, offering price and redemption price per class R share | |
| ($2,203,634 divided by 69,359 shares) | $31.77 |
|
| Net asset value, offering price and redemption price per class Y share | |
| ($229,202,223 divided by 6,827,027 shares) | $33.57 |
|
* On single retail sales of less than $50,000. On sales of $50,000 or more the offering price is reduced.
** Redemption price per share is equal to net asset value less any applicable contingent deferred sales charge.
The accompanying notes are an integral part of these financial statements.
32
Statement of operations Six months ended 12/31/08 (Unaudited)
| |
| INVESTMENT INCOME | |
|
| Dividends (net of foreign tax of $98,184) | $17,674,190 |
|
| Interest (including interest income of $60,903 from investments in affiliated issuers) (Note 5) | 291,878 |
|
| Securities lending | 886,729 |
|
| Total investment income | 18,852,797 |
|
| |
| EXPENSES | |
|
| Compensation of Manager (Note 2) | 7,342,960 |
|
| Investor servicing fees (Note 2) | 5,211,066 |
|
| Custodian fees (Note 2) | 14,671 |
|
| Trustee compensation and expenses (Note 2) | 56,669 |
|
| Administrative services (Note 2) | 30,304 |
|
| Distribution fees — Class A (Note 2) | 2,545,867 |
|
| Distribution fees — Class B (Note 2) | 1,000,982 |
|
| Distribution fees — Class C (Note 2) | 104,728 |
|
| Distribution fees — Class M (Note 2) | 147,415 |
|
| Distribution fees — Class R (Note 2) | 5,514 |
|
| Other | 456,256 |
|
| Fees waived and reimbursed by Manager (Note 5) | (2,368) |
|
| Total expenses | 16,914,064 |
| Expense reduction (Note 2) | (236,998) |
|
| Net expenses | 16,677,066 |
| |
| Net investment income | 2,175,731 |
|
| |
| Net realized loss on investments (Notes 1 and 3) | (424,408,531) |
|
| Net realized loss on futures contracts (Note 1) | (9,662,348) |
|
| Net realized loss on foreign currency transactions (Note 1) | (3,230) |
|
| Net realized gain on written options (Notes 1 and 3) | 158,968 |
|
| Net unrealized appreciation of assets and liabilities in foreign currencies during the period | 425 |
|
| Net unrealized depreciation of investments, futures contracts | |
| and written options during the period | (602,855,664) |
|
| Net loss on investments | (1,036,770,380) |
| |
| Net decrease in net assets resulting from operations | $(1,034,594,649) |
|
The accompanying notes are an integral part of these financial statements.
33
Statement of changes in net assets
| | |
| DECREASE IN NET ASSETS | Six months ended 12/31/08* | Year ended 6/30/08 |
|
| Operations: | | |
| Net investment income (loss) | $2,175,731 | $(12,243,838) |
|
| Net realized loss on investments | | |
| and foreign currency transactions | (433,915,141) | (10,990,791) |
|
| Net unrealized depreciation of investments | | |
| and assets and liabilities in foreign currencies | (602,855,239) | (363,594,428) |
|
| Net decrease in net assets resulting from operations | (1,034,594,649) | (386,829,057) |
|
| Redemption fees (Note 1) | 6,690 | 3,799 |
|
| Increase (decrease) from capital share transactions | | |
| (Notes 4 and 6) | 54,842,382 | (741,274,788) |
|
| Total decrease in net assets | (979,745,577) | (1,128,100,046) |
|
| |
| NET ASSETS | | |
|
| Beginning of period | 3,296,163,065 | 4,424,263,111 |
|
| End of period (including undistributed net investment | | |
| income of $391,708 and accumulated net investment | | |
| loss of $11,439, respectively) | $2,316,417,488 | $3,296,163,065 |
|
* Unaudited
The accompanying notes are an integral part of these financial statements.
34
| |
| |
| |
| This page left blank intentionally. |
| |
| |
| |
35
Financial highlights (For a common share outstanding throughout the period)
| | | | | | | | | | | |
| INVESTMENT OPERATIONS: | RATIOS AND SUPPLEMENTAL DATA: | |
|
| |
| | | Net | Net realized | | | | | | | Ratio of net | |
| | Net asset value, | investment | and unrealized | Total from | | | | Net assets, | Ratio of expenses | investment income | |
| | beginning | income | gain (loss) on | investment | | Net asset value, | Total return at net | end of period | to average net assets | (loss) to average | Portfolio |
| Period ended | of period | (loss) a ,d | investments | operations | Redemption fees e | end of period | asset value (%) b | (in thousands) | (%) c,d | net assets (%) d | turnover (%) |
|
| Class A | | | | | | | | | | | |
| December 31, 2008 ** | $48.18 | .04 | (16.00) k | (15.96) | — | $32.22 | (33.13)* k | $1,834,744 | .64 * | .11 * | 39.73 * |
| June 30, 2008 | 53.15 | (.13) | (4.84) j | (4.97) | — | 48.18 | (9.35) | 2,585,412 | 1.21 | (.25) | 126.21 |
| June 30, 2007 | 45.72 | (.08) | 7.51 | 7.43 | — | 53.15 | 16.25 | 3,418,392 | 1.17 | (.15) | 91.32 |
| June 30, 2006 | 41.60 | (.09) h | 4.21 | 4.12 | — | 45.72 | 9.90 h | 3,688,423 | 1.08 h | (.19) h | 83.63 |
| June 30, 2005 | 38.96 | .03 f,g | 2.61 | 2.64 | — | 41.60 | 6.78 g | 4,650,755 | 1.12 | .07 f,g | 97.25 |
| June 30, 2004 | 32.79 | (.19) | 6.36 | 6.17 | — | 38.96 | 18.82 | 5,075,005 | 1.09 | (.52) | 60.86 |
|
| Class B | | | | | | | | | | | |
| December 31, 2008 ** | $42.40 | (.09) | (14.06) k | (14.15) | — | $28.25 | (33.37)* k | $182,778 | 1.02 * | (.28) * | 39.73 * |
| June 30, 2008 | 47.13 | (.45) | (4.28) j | (4.73) | — | 42.40 | (10.04) | 278,414 | 1.96 | (1.01) | 126.21 |
| June 30, 2007 | 40.85 | (.40) | 6.68 | 6.28 | — | 47.13 | 15.37 | 482,812 | 1.92 | (.91) | 91.32 |
| June 30, 2006 | 37.45 | (.38) h | 3.78 | 3.40 | — | 40.85 | 9.08 h | 610,991 | 1.83 h | (.94) h | 83.63 |
| June 30, 2005 | 35.34 | (.24) f,g | 2.35 | 2.11 | — | 37.45 | 5.97 g | 784,295 | 1.87 | (.68) f,g | 97.25 |
| June 30, 2004 | 29.96 | (.43) | 5.81 | 5.38 | — | 35.34 | 17.96 | 1,674,238 | 1.84 | (1.27) | 60.86 |
|
| Class C | | | | | | | | | | | |
| December 31, 2008 ** | $44.99 | (.09) | (14.93) k | (15.02) | — | $29.97 | (33.39)* k | $29,049 | 1.02 * | (.27) * | 39.73 * |
| June 30, 2008 | 50.01 | (.48) | (4.54) j | (5.02) | — | 44.99 | (10.04) | 27,355 | 1.96 | (1.00) | 126.21 |
| June 30, 2007 | 43.34 | (.42) | 7.09 | 6.67 | — | 50.01 | 15.39 | 35,776 | 1.92 | (.91) | 91.32 |
| June 30, 2006 | 39.73 | (.41) h | 4.02 | 3.61 | — | 43.34 | 9.09 h | 39,825 | 1.83 h | (.94) h | 83.63 |
| June 30, 2005 | 37.49 | (.25) f,g | 2.49 | 2.24 | — | 39.73 | 5.98 g | 42,827 | 1.87 | (.68) f,g | 97.25 |
| June 30, 2004 | 31.79 | (.45) | 6.15 | 5.70 | — | 37.49 | 17.93 | 55,005 | 1.84 | (1.27) | 60.86 |
|
| Class M | | | | | | | | | | | |
| December 31, 2008 ** | $44.65 | (.05) | (14.81) k | (14.86) | — | $29.79 | (33.28)* k | $38,442 | .89 * | (.14) * | 39.73 * |
| June 30, 2008 | 49.50 | (.36) | (4.49) j | (4.85) | — | 44.65 | (9.80) | 50,256 | 1.71 | (.76) | 126.21 |
| June 30, 2007 | 42.79 | (.30) | 7.01 | 6.71 | — | 49.50 | 15.68 | 70,140 | 1.67 | (.66) | 91.32 |
| June 30, 2006 | 39.14 | (.29) h | 3.94 | 3.65 | — | 42.79 | 9.32 h | 78,230 | 1.58 h | (.69) h | 83.63 |
| June 30, 2005 | 36.83 | (.16) f,g | 2.47 | 2.31 | — | 39.14 | 6.27 g | 104,545 | 1.62 | (.43) f,g | 97.25 |
| June 30, 2004 | 31.15 | (.36) | 6.04 | 5.68 | — | 36.83 | 18.24 | 134,157 | 1.59 | (1.02) | 60.86 |
|
| Class R | | | | | | | | | | | |
| December 31, 2008 ** | $47.56 | (.01) | (15.78) k | (15.79) | — | $31.77 | (33.20)* k | $2,204 | .76 * | (.02) * | 39.73 * |
| June 30, 2008 | 52.60 | (.23) | (4.81) j | (5.04) | — | 47.56 | (9.58) | 3,215 | 1.46 | (.47) | 126.21 |
| June 30, 2007 | 45.37 | (.18) | 7.41 | 7.23 | — | 52.60 | 15.94 | 1,257 | 1.42 | (.36) | 91.32 |
| June 30, 2006 | 41.38 | (.19) h | 4.18 | 3.99 | — | 45.37 | 9.64 h | 517 | 1.33 h | (.40) h | 83.63 |
| June 30, 2005 | 38.85 | (.09) f,g | 2.62 | 2.53 | — | 41.38 | 6.51 g | 184 | 1.37 | (.23) f,g | 97.25 |
| June 30, 2004 | 32.76 | (.27) | 6.36 | 6.09 | — | 38.85 | 18.59 | 25 | 1.34 | (.76) | 60.86 |
|
| Class Y | | | | | | | | | | | |
| December 31, 2008 ** | $50.13 | .09 | (16.65) k | (16.56) | — | $33.57 | (33.03)* k | $229,202 | .51 * | .23 * | 39.73 * |
| June 30, 2008 | 55.17 | — e | (5.04) j | (5.04) | — | 50.13 | (9.13) | 351,511 | .96 | — i | 126.21 |
| June 30, 2007 | 47.34 | .05 | 7.78 | 7.83 | — | 55.17 | 16.54 | 415,886 | .92 | .10 | 91.32 |
| June 30, 2006 | 42.97 | .03 h | 4.34 | 4.37 | — | 47.34 | 10.17 h | 413,670 | .83 h | .06 h | 83.63 |
| June 30, 2005 | 40.14 | .13 f,g | 2.70 | 2.83 | — | 42.97 | 7.05 g | 404,943 | .87 | .34 f,g | 97.25 |
| June 30, 2004 | 33.70 | (.10) | 6.54 | 6.44 | — | 40.14 | 19.11 | 851,430 | .84 | (.27) | 60.86 |
|
See notes to financial highlights at the end of this section.
The accompanying notes are an integral part of these financial statements.
Financial highlights (Continued)
* Not annualized.
**Unaudited.
a Per share net investment income (loss) has been determined on the basis of the weighted average number of shares outstanding during the period.
b Total return assumes dividend reinvestment and does not reflect the effect of sales charges.
c Includes amounts paid through expense offset and brokerage service arrangements (Note 2).
d Reflects an involuntary contractual expense limitation and/or waivers of certain fund expenses in connection with investments in Putnam Prime Money Market Fund in effect during the period. As a result of such limitation and/or waivers, the expenses of each class reflect a reduction of the following amounts (Notes 2 and 5):
| | |
| | | Percentage of |
| | | average net assets |
|
| December 31, 2008 | | <0.01% |
|
| June 30, 2008 | | <0.01 |
|
| June 30, 2007 | | <0.01 |
|
| June 30, 2006 | | <0.01 |
|
| June 30, 2005 | | <0.01 |
|
| June 30, 2004 | | <0.01 |
|
e Amount represents less than $0.01 per share.
f Net investment income (loss) per share and ratio of net investment income (loss) to average net assets reflect a special dividend received by the fund which amounted to the following amounts:
| | |
| | | Percentage of |
| | Per share | average net assets |
|
| Class A | $0.15 | 0.39% |
|
| Class B | 0.15 | 0.42 |
|
| Class C | 0.15 | 0.40 |
|
| Class M | 0.15 | 0.40 |
|
| Class R | 0.12 | 0.31 |
|
| Class Y | 0.17 | 0.43 |
|
g Reflects a non-recurring accrual related to Putnam Management’s settlement with the SEC regarding brokerage allocation practices, which amounted to the following amounts:
| | |
| | | Percentage of |
| | Per share | average net assets |
|
| Class A | $0.02 | 0.05% |
|
| Class B | 0.01 | 0.04 |
|
| Class C | 0.02 | 0.05 |
|
| Class M | 0.02 | 0.05 |
|
| Class R | 0.03 | 0.08 |
|
| Class Y | 0.01 | 0.04 |
|
h Reflects a non-recurring reimbursement from Putnam Investments relating to the calculation of certain amounts paid by the fund to Putnam in previous years for transfer agent services, which amounted to $0.03 per share and 0.06% of average net assets for the period ended June 30, 2006.
The accompanying notes are an integral part of these financial statements.
38
Financial highlights (Continued)
i Amount represents less than 0.01% .
j Reflects a non-recurring reimbursement pursuant to a settlement between the Securities and Exchange Commission and Knight Securities, L.P. which amounted to $0.06 per share.
k Reflects a non-recurring litigation payment from Enron Corporation which amounted to the following amounts per share outstanding as of December 29, 2008.
| | |
| | Per share | |
| Class A | $0.30 | |
| |
| Class B | 0.26 | |
| |
| Class C | 0.28 | |
| |
| Class M | 0.28 | |
| |
| Class R | 0.29 | |
| |
| Class Y | 0.31 | |
| |
Without this payment, total returns for each class, for the year ended December 31, 2008 would have been as follows:
| | |
| | Total Return | |
| Class A | –33.75% | |
| |
| Class B | –34.01 | |
| |
| Class C | –34.01�� | |
| |
| Class M | –33.91 | |
| |
| Class R | –33.81 | |
| |
| Class Y | –33.61 | |
| |
The accompanying notes are an integral part of these financial statements.
39
Notes to financial statements 12/31/08 (Unaudited)
Note 1: Significant accounting policies
Putnam New Opportunities Fund (the “fund”), a Massachusetts business trust, is registered under the Investment Company Act of 1940, as amended, as a diversified, open-end management investment company. The fund seeks capital appreciation by investing principally in common stocks of companies that, in the judgment of Putnam Investment Management, LLC (“Putnam Management”), the fund’s manager, a wholly owned subsidiary of Putnam Investments, LLC, possess above-average, long-term growth potential.
The fund offers class A, class B, class C, class M, class R and class Y shares. Class A and class M shares are sold with a maximum front-end sales charge of 5.75% and 3.50%, respectively, and generally do not pay a contingent deferred sales charge. Class B shares, which convert to class A shares after approximately eight years, do not pay a front-end sales charge and are subject to a contingent deferred sales charge, if those shares are redeemed within six years of purchase. Class C shares have a one-year 1.00% contingent deferred sales charge and do not convert to class A shares. Class R shares, which are offered to qualified employee-benefit plans, are sold at net asset value. The expenses for class A, class B, class C, class M and class R shares may differ based on the distribution fee of each class, which is identified in Note 2. Class Y shares, which are sold at net asset value, are generally subject to the same expenses as class A, class B, class C, class M an d class R shares, but do not bear a distribution fee. Class Y shares are generally only available to corporate and institutional clients and clients in other approved programs.
A 1.00% redemption fee may apply on any shares that are redeemed (either by selling or exchanging into another fund) within 7 days of purchase. The redemption fee is accounted for as an addition to paid-in-capital.
Investment income, realized and unrealized gains and losses and expenses of the fund are borne pro-rata based on the relative net assets of each class to the total net assets of the fund, except that each class bears expenses unique to that class (including the distribution fees applicable to such classes). Each class votes as a class only with respect to its own distribution plan or other matters on which a class vote is required by law or determined by the Trustees. If the fund were liquidated, shares of each class would receive their pro-rata share of the net assets of the fund. In addition, the Trustees declare separate dividends on each class of shares.
In the normal course of business, the fund enters into contracts that may include agreements to indemnify another party under given circumstances. The fund’s maximum exposure under these arrangements is unknown as this would involve future claims that may be, but have not yet been, made against the fund. However, the fund’s management team expects the risk of material loss to be remote.
The following is a summary of significant accounting policies consistently followed by the fund in the preparation of its financial statements. The preparation of financial statements is in conformity with accounting principles generally accepted in the United States of America and requires management to make estimates and assumptions that affect the reported amounts of assets and liabilities in the financial statements and the reported amounts of increases and decreases in net assets from operations during the reporting period. Actual results could differ from those estimates.
A) Security valuation Investments for which market quotations are readily available are valued at the last reported sales price on their principal exchange, or official closing price for certain markets. If no sales are reported — as in the case of some securities traded over-the-counter — a security is valued at its last reported bid price. Many securities markets and exchanges outside the U.S. close prior to the close of the New York Stock Exchange and therefore the closing prices for securities in such markets or on such exchanges may not fully reflect events that occur after such close but before the close of the New York Stock Exchange. Accordingly, on certain days, the fund will fair value foreign equity securities taking into account multiple factors, including movements in the U.S. securities markets. The number of days on which fair value prices will be used will depend on market activity and it is possib le that fair value prices will be used by the fund to a significant extent. At December 31, 2008, fair value pricing was used for certain foreign securities in the portfolio. Securities quoted in foreign currencies, if any, are translated into U.S. dollars at the current exchange rate. To the extent a pricing service or dealer is unable to value a security or provides a valuation which Putnam Management does not believe accurately reflects the security’s fair value, the security will be valued at fair value by Putnam Management. Certain
40
investments, including certain restricted and illiquid securities and derivatives, are also valued at fair value following procedures approved by the Trustees. Such valuations and procedures are reviewed periodically by the Trustees. The fair value of securities is generally determined as the amount that the fund could reasonably expect to realize from an orderly disposition of such securities over a reasonable period of time. By its nature, a fair value price is a good faith estimate of the value of a security at a given point in time and does not reflect an actual market price, which may be different by a material amount.
B) Joint trading account Pursuant to an exemptive order from the Securities and Exchange Commission (the “SEC”), the fund may transfer uninvested cash balances, including cash collateral received under security lending arrangements, into a joint trading account along with the cash of other registered investment companies and certain other accounts managed by Putnam Management. These balances may be invested in issues of short-term investments having maturities of up to 397 days for collateral received under security lending arrangements and up to 90 days for other cash investments.
C) Repurchase agreements The fund, or any joint trading account, through its custodian, receives delivery of the underlying securities, the market value of which at the time of purchase is required to be in an amount at least equal to the resale price, including accrued interest. Collateral for certain tri-party repurchase agreements is held at the counterparty’s custodian in a segregated account for the benefit of the fund and the counterparty. Putnam Management is responsible for determining that the value of these underlying securities is at all times at least equal to the resale price, including accrued interest.
D) Security transactions and related investment income Security transactions are recorded on the trade date (the date the order to buy or sell is executed). Gains or losses on securities sold are determined on the identified cost basis.
Interest income is recorded on the accrual basis. Dividend income, net of applicable withholding taxes, is recognized on the ex-dividend date except that certain dividends from foreign securities, if any, are recognized as soon as the fund is informed of the ex-dividend date. Non-cash dividends, if any, are recorded at the fair market value of the securities received. Dividends representing a return of capital or capital gains, if any, are reflected as a reduction of cost and/or as a realized gain. All premiums/discounts are amortized/accreted on a yield-to-maturity basis.
E) Foreign currency translation The accounting records of the fund are maintained in U.S. dollars. The market value of foreign securities, currency holdings, and other assets and liabilities is recorded in the books and records of the fund after translation to U.S. dollars based on the exchange rates on that day. The cost of each security is determined using historical exchange rates. Income and withholding taxes are translated at prevailing exchange rates when earned or incurred. The fund does not isolate that portion of realized or unrealized gains or losses resulting from changes in the foreign exchange rate on investments from fluctuations arising from changes in the market prices of the securities. Such gains and losses are included with the net realized and unrealized gain or loss on investments. Net realized gains and losses on foreign currency transactions represent net realized exchange gains or losses on closed fo rward currency contracts, disposition of foreign currencies, currency gains and losses realized between the trade and settlement dates on securities transactions and the difference between the amount of investment income and foreign withholding taxes recorded on the fund’s books and the U.S. dollar equivalent amounts actually received or paid. Net unrealized appreciation and depreciation of assets and liabilities in foreign currencies arise from changes in the value of open forward currency contracts and assets and liabilities other than investments at the period end, resulting from changes in the exchange rate. Investments in foreign securities involve certain risks, including those related to economic instability, unfavorable political developments, and currency fluctuations, not present with domestic investments.
F) Futures and options contracts The fund may use futures and options contracts to hedge against changes in the values of securities the fund owns, owned or expects to purchase, or for other investment purposes. The fund may also write options on swaps or securities it owns or in which it may invest to increase its current returns.
The potential risk to the fund is that the change in value of futures and options contracts may not correspond to the change in value of the hedged instruments. In addition, losses may arise from changes in the value of the underlying instruments, if there is an illiquid secondary market for the contracts, or if the counterparty to the contract is unable to perform. Risks may exceed amounts recognized on the Statement of assets and liabilities.When the contract is closed, the fund records a realized gain or loss equal to the difference between
41
the value of the contract at the time it was opened and the value at the time it was closed. Realized gains and losses on purchased options are included in realized gains and losses on investment securities. If a written call option is exercised, the premium originally received is recorded as an addition to sales proceeds. If a written put option is exercised, the premium originally received is recorded as a reduction to the cost of investments.
Futures contracts are valued at the quoted daily settlement prices established by the exchange on which they trade. The fund and the broker agree to exchange an amount of cash equal to the daily fluctuation in the value of the futures contract. Such receipts or payments are known as “variation margin.” Exchange traded options are valued at the last sale price or, if no sales are reported, the last bid price for purchased options and the last ask price for written options. Options traded over-the-counter are valued using prices supplied by dealers. Futures and written option contracts outstanding at period end, if any, are listed after the fund’s portfolio.
G) Securities lending The fund may lend securities, through its agents, to qualified borrowers in order to earn additional income. The loans are collateralized by cash and/or securities in an amount at least equal to the market value of the securities loaned. The market value of securities loaned is determined daily and any additional required collateral is allocated to the fund on the next business day. The risk of borrower default will be borne by the fund’s agents; the fund will bear the risk of loss with respect to the investment of the cash collateral. Income from securities lending is included in investment income on the Statement of operations. At December 31, 2008, the fund had no securities out on loan.
H) Federal taxes It is the policy of the fund to distribute all of its income within the prescribed time and otherwise comply with the provisions of the Internal Revenue Code of 1986, as amended (the “Code”), applicable to regulated investment companies. It is also the intention of the fund to distribute an amount sufficient to avoid imposition of any excise tax under Section 4982 of the Code. The fund is subject to the provisions of FASB Interpretation No. 48, Accounting for Uncertainties in Income Taxes (FIN 48). FIN 48 sets forth a minimum threshold for financial statement recognition of the benefit of a tax position taken or expected to be taken in a tax return. The fund did not have any unrecognized tax benefits in the accompanying financial statements. Therefore, no provision has been made for federal taxes on income, capital gains or unrealized appreciation on securities held nor for excise tax on income and capital gains. Each of the fund’s federal tax returns for the prior three fiscal years remains subject to examination by the Internal Revenue Service.
At June 30, 2008, the fund had a capital loss carryover of $3,079,545,286 available to the extent allowed by the Code to offset future net capital gain, if any. The amount of the carryover and the expiration dates are:
| | | |
| Loss Carryover | Expiration | | |
| | |
| $1,303,057,368 | June 30, 2010 | | |
| | |
| 1,776,487,918 | June 30, 2011 | | |
| | |
As a result of the December 26, 2008 merger of Putnam Discovery Growth Fund into the fund, the fund acquired $953,987,337 in capital loss carryovers which are subject to limitations imposed by the Code. The acquired capital loss carryovers and the expiration dates are:
| | | |
| Loss Carryover | Expiration | | |
| | |
| $470,949,460 | June 30, 2009 | | |
| | |
| 372,597,779 | June 30, 2010 | | |
| | |
| 9,712,905 | June 30, 2011 | | |
| | |
| 154,110 | June 30, 2013 | | |
| | |
| 100,573,083 | June 30, 2016 | | |
| | |
Pursuant to federal income tax regulations applicable to regulated investment companies, the fund has elected to defer to its fiscal year ending June 30, 2009 $103,367,567 of losses recognized during the period November 1, 2007 to June 30, 2008.
The aggregate identified cost on a tax basis is $2,956,179,276, resulting in gross unrealized appreciation and depreciation of $72,910,104 and $673,656,216, respectively, or net unrealized depreciation of $600,746,112.
I) Distributions to shareholders Distributions to shareholders from net investment income are recorded by the fund on the ex-dividend date. Distributions from capital gains, if any, are recorded on the ex-dividend date and paid at least annually. The amount and character of income and gains to be distributed are determined in accordance with income tax regulations, which may differ from generally accepted accounting principles. Dividend sources are estimated at the time of declaration. Actual results may vary. Any non-taxable return of capital cannot be determined until final tax calculations are completed after the end of the fund’s fiscal year. Reclassifications are made to the fund’s
42
capital accounts to reflect income and gains available for distribution (or available capital loss carryovers) under income tax regulations.
Note 2: Management fee, administrative services and other transactions
The fund pays Putnam Management for management and investment advisory services quarterly based on the average net assets of the fund. Such fee is based on the following annual rates: 0.70% of the first $500 million of average net assets, 0.60% of the next $500 million, 0.55% of the next $500 million, 0.50% of the next $5 billion, 0.475% of the next $5 billion, 0.455% of the next $5 billion, 0.44% of the next $5 billion, 0.43% of the next $5 billion, 0.42% of the next $5 billion, 0.41% of the next $5 billion, 0.40% of the next $5 billion, 0.39% of the next $5 billion, 0.38% of the next $8.5 billion and 0.37% thereafter.
Putnam Management has agreed to waive fees and reimburse expenses of the fund through June 30, 2009 to the extent necessary to ensure that the fund’s expenses do not exceed the simple average of the expenses of all front-end load funds viewed by Lipper, Inc. as having the same investment classification or objective as the fund. The expense reimbursement is based on a comparison of the fund’s expenses with the average annualized operating expenses of the funds in its Lipper peer group for each calendar quarter during the fund’s last fiscal year, excluding 12b-1 fees and without giving effect to any expense offset and brokerage/service arrangements that may reduce fund expenses. For the period ended December 31, 2008, Putnam Management did not waive any of its management fee from the fund.
The fund reimburses Putnam Management an allocated amount for the compensation and related expenses of certain officers of the fund and their staff who provide administrative services to the fund. The aggregate amount of all such reimbursements is determined annually by the Trustees.
Custodial functions for the fund’s assets were provided by State Street Bank and Trust Company (“State Street”). Custody fees are based on the fund’s asset level, the number of its security holdings and transaction volumes.
Putnam Investor Services, a division of Putnam Fiduciary Trust Company (“PFTC”), which is an affiliate of Putnam Management, provided investor servicing agent functions to the fund through December 31, 2008. Subsequent to December 31, 2008, these services were provided by Putnam Investor Services, Inc., another affiliate of Putnam Management. Putnam Investor Services received fees for investor servicing, subject to certain limitations, based on the number of shareholder accounts in the fund and the level of defined contribution plan assets in the fund. During the period ended December 31, 2008, the amounts incurred for investor servicing agent functions provided by PFTC are included in Investor servicing fees in the Statement of operations.
The fund has entered into expense offset arrangements with PFTC and State Street whereby PFTC’s and State Street’s fees are reduced by credits allowed on cash balances. The fund also reduced expenses through brokerage/service arrangements. For the six months ended December 31, 2008, the fund’s expenses were reduced by $30,425 under the expense offset arrangements and by $206,573 under the brokerage/service arrangements.
Each independent Trustee of the fund receives an annual Trustee fee, of which $1,142, as a quarterly retainer, has been allocated to the fund, and an additional fee for each Trustees meeting attended. Trustees receive additional fees for attendance at certain committee meetings and industry seminars and for certain compliance-related matters. Trustees also are reimbursed for expenses they incur relating to their services as Trustees.
The fund has adopted a Trustee Fee Deferral Plan (the “Deferral Plan”) which allows the Trustees to defer the receipt of all or a portion of Trustees fees payable on or after July 1, 1995. The deferred fees remain invested in certain Putnam funds until distribution in accordance with the Deferral Plan.
The fund has adopted an unfunded noncontribu-tory defined benefit pension plan (the “Pension Plan”) covering all Trustees of the fund who have served as a Trustee for at least five years and were first elected prior to 2004. Benefits under the Pension Plan are equal to 50% of the Trustee’s average annual attendance and retainer fees for the three years ended December 31, 2005. The retirement benefit is payable during a Trustee’s lifetime, beginning the year following retirement, for the number of years of service through December 31, 2006. Pension expense for the fund is included in Trustee compensation and expenses in the Statement of operations. Accrued pension liability is included in Payable for Trustee compensation and expenses in the Statement of assets and liabilities. The Trustees have terminated the Pension Plan with respect to any Trustee first elected after 2003.
43
The fund has adopted distribution plans (the “Plans”) with respect to its class A, class B, class C, class M and class R shares pursuant to Rule 12b-1 under the Investment Company Act of 1940. The purpose of the Plans is to compensate Putnam Retail Management Limited Partnership, a wholly-owned subsidiary of Putnam Investments, LLC and Putnam Retail Management GP, Inc., for services provided and expenses incurred in distributing shares of the fund. The Plans provide for payments by the fund to Putnam Retail Management Limited Partnership at an annual rate of up to 0.35%, 1.00%, 1.00%, 1.00% and 1.00% of the average net assets attributable to class A, class B, class C, class M and class R shares, respectively. The Trustees have approved payment by the fund at an annual rate of 0.25%, 1.00%, 1.00%, 0.75% and 0.50% of the average net assets attributable to class A, class B, class C, class M and class R shares, respectively.
For the six months ended December 31, 2008, Putnam Retail Management Limited Partnership, acting as underwriter, received net commissions of $65,589 and $1,250 from the sale of class A and class M shares, respectively, and received $116,875 and $798 in contingent deferred sales charges from redemptions of class B and class C shares, respectively. A deferred sales charge of up to 1.00% and 0.65% is assessed on certain redemptions of class A and class M shares, respectively. For the six months ended December 31, 2008, Putnam Retail Management Limited Partnership, acting as underwriter, received $475 and no monies on class A and class M redemptions, respectively.
Note 3: Purchases and sales of securities
During the six months ended December 31, 2008, cost of purchases and proceeds from sales of investment securities other than short-term investments aggregated $1,056,440,668 and $1,266,603,288, respectively. There were no purchases or sales of U.S. government securities.
Written option transactions during the period ended December 31, 2008 are summarized as follows:
| | |
| | Contract | Premiums |
| | Amounts | Received |
|
| Written options | | |
| outstanding at | | |
| beginning of period | $33,330 | $67,793 |
|
| Options opened | 23,637 | 91,175 |
| Options exercised | — | — |
| Options expired | (56,967) | (158,968) |
| Options closed | — | — |
|
| Written options | | |
| outstanding at | | |
| end of period | — | $— |
|
Note 4: Capital shares
At December 31, 2008, there was an unlimited number of shares of beneficial interest authorized. Transactions in capital shares were as follows:
| | | | |
| | Six months ended 12/31/08 | Year ended 6/30/08 |
| Class A | Shares | Amount | Shares | Amount |
|
| Shares sold | 1,924,084 | $74,035,240 | 3,615,459 | $182,625,716 |
|
| Shares issued in connection with | — | — | — | — |
| reinvestment of distributions | | | | |
|
| Shares issued in connection with the | 8,404,068 | 259,758,824 | — | — |
| merger of Putnam Discovery Growth Fund | | | | |
|
| | 10,328,152 | 333,794,064 | 3,615,459 | 182,625,716 |
|
| Shares repurchased | (7,052,088) | (267,799,584) | (14,267,503) | (717,675,825) |
|
| Net increase (decrease) | 3,276,064 | $65,994,480 | (10,652,044) | $(535,050,109) |
|
44
| | | | |
| | Six months ended 12/31/08 | Year ended 6/30/08 |
|
| Class B | Shares | Amount | Shares | Amount |
|
| Shares sold | 183,733 | $5,957,826 | 364,005 | $16,290,714 |
|
| Shares issued in connection with | — | — | — | — |
| reinvestment of distributions | | | | |
|
| Shares issued in connection with the | 1,543,617 | 41,832,935 | — | — |
| merger of Putnam Discovery Growth Fund | | | | |
|
| | 1,727,350 | 47,790,761 | 364,005 | 16,290,714 |
|
| Shares repurchased | (1,822,280) | (62,902,912) | (4,041,878) | (179,204,098) |
|
| Net decrease | (94,930) | $(15,112,151) | (3,677,873) | $(162,913,384) |
|
| |
| | Six months ended 12/31/08 | Year ended 6/30/08 |
|
| Class C | Shares | Amount | Shares | Amount |
|
| Shares sold | 47,591 | $1,545,789 | 81,658 | $3,859,486 |
|
| Shares issued in connection with | — | — | — | — |
| reinvestment of distributions | | | | |
|
| Shares issued in connection with the | 437,859 | 12,591,678 | — | — |
| merger of Putnam Discovery Growth Fund | | | | |
|
| | 485,450 | 14,137,467 | 81,658 | 3,859,486 |
|
| Shares repurchased | (124,159) | (4,538,636) | (189,035) | (8,881,796) |
|
| Net increase (decrease) | 361,291 | $9,598,831 | (107,377) | $(5,022,310) |
|
| |
| | Six months ended 12/31/08 | Year ended 6/30/08 |
|
| Class M | Shares | Amount | Shares | Amount |
|
| Shares sold | 50,973 | $1,698,383 | 57,536 | $2,706,369 |
|
| Shares issued in connection with | — | — | — | — |
| reinvestment of distributions | | | | |
|
| Shares issued in connection with the | 266,186 | 7,605,451 | — | — |
| merger of Putnam Discovery Growth Fund | | | | |
|
| | 317,159 | 9,303,834 | 57,536 | 2,706,369 |
|
| Shares repurchased | (152,162) | (5,425,434) | (348,822) | (16,300,261) |
|
| Net increase (decrease) | 164,997 | $3,878,400 | (291,286) | $(13,593,892) |
|
| |
| | Six months ended 12/31/08 | Year ended 6/30/08 |
|
| Class R | Shares | Amount | Shares | Amount |
|
| Shares sold | 19,549 | $645,696 | 63,581 | $3,175,081 |
|
| Shares issued in connection with | — | — | — | — |
| reinvestment of distributions | | | | |
|
| Shares issued in connection with the | 3,098 | 94,402 | — | — |
| merger of Putnam Discovery Growth Fund | | | | |
|
| | 22,647 | 740,098 | 63,581 | 3,175,081 |
|
| Shares repurchased | (20,884) | (939,509) | (19,877) | (1,008,065) |
|
| Net increase (decrease) | 1,763 | $(199,411) | 43,704 | $2,167,016 |
|
45
| | | | |
| | Six months ended 12/31/08 | Year ended 6/30/08 |
| Class Y | Shares | Amount | Shares | Amount |
|
| Shares sold | 940,160 | $34,679,389 | 1,102,727 | $57,910,629 |
|
| Shares issued in connection with | — | — | — | — |
| reinvestment of distributions | | | | |
|
| Shares issued in connection with the | 178,445 | 5,746,193 | — | — |
| merger of Putnam Discovery Growth Fund | | | | |
|
| | 1,118,605 | 40,425,582 | 1,102,727 | 57,910,629 |
|
| Shares repurchased | (1,302,916) | (49,743,349) | (1,629,687) | (84,772,738) |
|
| Net decrease | (184,311) | $(9,317,767) | (526,960) | $(26,862,109) |
|
Note 5: Investment in Putnam Prime Money Market Fund
The fund invested in Putnam Prime Money Market Fund, an open-end management investment company managed by Putnam Management. Investments in Putnam Prime Money Market Fund were valued at its closing net asset value each business day. Management fees paid by the fund were reduced by an amount equal to the management fees paid by Putnam Prime Money Market Fund with respect to assets invested by the fund in Putnam Prime Money Market Fund. For the period ended December 31, 2008, management fees paid were reduced by $2,368 relating to the fund’s investment in Putnam Prime Money Market Fund. Income distributions earned by the fund were recorded as interest income in the Statement of operations and totaled $60,903 for the period December 31, 2008. During the period ended December 31, 2008, cost of purchases and proceeds of sales of investments in Putnam Prime Money Market Fund aggregated $99,178,099 and $118,048,184, respectively.
On September 17, 2008, the Trustees of the Putnam Prime Money Market Fund voted to close that fund effective September 17, 2008. On September 24, 2008, the fund received shares of Federated Prime Obligations Fund, an unaffiliated management investment company registered under the Investment Company Act of 1940, in liquidation of its shares of Putnam Prime Money Market Fund.
Note 6: Acquisition of Putnam Discovery Growth Fund
On December 29, 2008, the fund issued 8,404,068, 1,543,617, 437,859, 266,186, 3,098 and 178,445 class A, class B, class C, class M, class R and class Y shares, respectively, for 21,193,853, 3,790,207, 1,105,892, 664,552, 7,797 and 460,961 class A, class B, class C, class M, class R and class Y shares, respectively, of Putnam Discovery Growth Fund to acquire that fund’s net assets in a tax-free exchange approved by the Trustees. The net assets of the fund and Putnam Discovery Growth Fund on December 26, 2008, were $1,907,579,272 and $327,629,483, respectively. On December 26, 2008, Putnam Discovery Growth Fund had accumulated net investment loss of $1,772,584, accumulated net realized loss of $1,068,190,584 and unrealized depreciation of $50,280,614. The aggregate net assets of the fund immediately following the acquisition were $2,235,208,755.
Information presented in the Statement of operations and changes in net assets reflect only operations of Putnam New Opportunities Fund.
Note 7: Regulatory matters and litigation
In late 2003 and 2004, Putnam Management settled charges brought by the Securities and Exchange Commission (the “SEC”) and the Massachusetts Securities Division in connection with excessive short-term trading in Putnam funds. Distribution of payments from Putnam Management to certain open-end Putnam funds and their shareholders is expected to be completed in the next several months. These allegations and related matters have served as the general basis for certain lawsuits, including purported class action lawsuits against Putnam Management and, in a limited number of cases, some Putnam funds. Putnam Management believes that these lawsuits will have no material adverse effect on the funds or on Putnam Management’s ability to provide investment management services. In addition, Putnam Management has agreed to bear any costs incurred by the Putnam funds as a result of these matters.
Note 8: New accounting pronouncement
In March 2008, Statement of Financial Accounting Standards No. 161, Disclosures about Derivative Instruments and Hedging Activities (“SFAS 161”) —an amendment of FASB Statement No. 133, was issued and is effective for fiscal years and interim periods beginning after November 15, 2008.
46
SFAS 161 requires enhanced disclosures about how and why an entity uses derivative instruments and how derivative instruments affect an entity’s financial position. Putnam Management is currently evaluating the impact the adoption of SFAS 161 will have on the fund’s financial statement disclosures.
Note 9: Market conditions
In the normal course of business the fund trades financial instruments and enters into financial transactions where risk of potential loss exists due to changes in the market (market risk) or failure of the contracting party to the transaction to perform (credit risk). The fund may be exposed to additional credit risk that an institution or other entity with which the funds have unsettled or open transactions will default.
47
Brokerage commissions (unaudited)
Brokerage commissions are paid to firms that execute trades on behalf of your fund. When choosing these firms, Putnam is required by law to seek the best execution of the trades, taking all relevant factors into consideration, including expected quality of execution and commission rate. Listed below are the largest relationships based upon brokerage commissions for your fund and the other funds in Putnam’s U.S. Small- and Mid-Cap group for the year ended December 31, 2008. The Putnam mutual funds in this group are Putnam Capital Opportunities Fund, Putnam Discovery Growth Fund, Putnam Mid Cap Value Fund, Putnam New Opportunities Fund, Putnam OTC & Emerging Growth Fund, Putnam Small Cap Growth Fund, Putnam Small Cap Value Fund, Putnam Vista Fund, Putnam VT Capital Opportunities Fund, Putnam VT Discovery Growth Fund, Putnam VT Mid Cap Value Fund, Putnam VT New Opportunities Fund, Putnam VT OTC & Emerging Growth Fund, Putnam VT Small Cap Value Fund, and Putn am VT Vista Fund.
The top five firms that received brokerage commissions for trades executed for the U.S. Small- and Mid-Cap group are (in descending order) Morgan Stanley & Co., UBS Securities, Citigroup Global Markets, Credit Suisse First Boston, and Merrill Lynch, Pierce, Fenner and Smith. Commissions paid to these firms together represented approximately 42% of the total brokerage commissions paid for the year ended December 31, 2008.
Commissions paid to the next 10 firms together represented approximately 34% of the total brokerage commissions paid during the period. These firms are Barclays Capital, Cowen & Company, Goldman, Sachs & Co., Lehman Brothers, J.P.Morgan Securities, Oppenheimer & Co., Piper Jaffray & Co., RBC Capital Markets, Wachovia Securities, and Weeden & Co.
Commission amounts do not include “mark-ups” paid on bond or derivative trades made directly with a dealer. Additional information about brokerage commissions is available on the Securities and Exchange Commission (SEC) Web site at www.sec.gov. Putnam funds disclose commissions by firm to the SEC in semiannual filings on Form N-SAR.
48
Putnam puts your interests first
Putnam has introduced a number of voluntary initiatives designed to reduce fund expenses, provide investors with more useful information, and help safeguard the interests of all Putnam investors. Visit the Individual Investors section at www.putnam.com for details.
Cost-cutting initiatives
Ongoing expenses will be limited Through calendar 2008, total ongoing expenses, including management fees for all funds, will be maintained at or below the average of each fund’s industry peers in its Lipper load-fund universe. For more information, please see the Statement of Additional information.
Lower class B purchase limit To help ensure that investors are in the most cost-effective share class, the maximum amount that can be invested in class B shares has been reduced to $100,000. (Larger trades or accumulated amounts will be refused.)
Improved disclosure
Putnam fund prospectuses and shareholder reports have been revised to disclose additional information that will help shareholders compare funds and weigh their costs and risks along with their potential benefits. Shareholders will find easy-to-understand information about fund expense ratios, portfolio manager compensation, risk comparisons, turnover comparisons, brokerage commissions, and employee and trustee ownership of Putnam funds. Disclosure of breakpoint discounts has also been enhanced to alert investors to potential cost savings.
Protecting investors’ interests
Short-term trading fee introduced To discourage short-term trading, which can interfere with a fund’s long-term strategy, a 1% short-term trading fee may be imposed on any Putnam fund shares (other than money market funds) redeemed or exchanged within 7 calendar days of purchase (for certain funds, this fee applies for 90 days).
49
The Putnam family of funds
The following is a list of Putnam’s open-end mutual funds offered to the public. Investors should carefully consider the investment objective, risks, charges, and expenses of a fund before investing. For a prospectus containing this and other information for any Putnam fund or product, call your financial advisor at 1-800-225-1581 and ask for a prospectus. Please read the prospectus carefully before investing.
| |
| Growth | Value |
| Growth Opportunities Fund | Convertible Income-Growth Trust |
| International New Opportunities Fund* | Equity Income Fund |
| New Opportunities Fund | The George Putnam Fund of Boston |
| Small Cap Growth Fund* | The Putnam Fund for Growth and Income |
| Vista Fund | International Growth and Income Fund* |
| Voyager Fund | Mid Cap Value Fund |
| Small Cap Value Fund* |
| Blend | |
| Capital Opportunities Fund* | Income |
| Europe Equity Fund* | American Government Income Fund |
| Global Equity Fund* | Diversified Income Trust |
| Global Natural Resources Fund* | Floating Rate Income Fund |
| International Capital Opportunities Fund* | Global Income Trust* |
| International Equity Fund* | High Yield Advantage Fund* |
| Investors Fund | High Yield Trust* |
| Research Fund | Income Fund |
| | Money Market Fund† |
| | U.S. Government Income Trust |
* A 1% redemption fee on total assets redeemed or exchanged within 90 days of purchase may be imposed for all share classes of these funds.
† An investment in a money market fund is not insured or guaranteed by the Federal Deposit Insurance Corporation or any other government agency. Although the fund seeks to preserve the value of your investment at $1.00 per share, it is possible to lose money by investing in the fund.
50
Tax-free income
AMT-Free Municipal Fund‡
Tax Exempt Income Fund
Tax Exempt Money Market Fund†
Tax-Free High Yield Fund
State tax-free income funds:
Arizona, California, Massachusetts, Michigan, Minnesota, New Jersey, New York, Ohio, and Pennsylvania
Absolute Return
Absolute Return 100 Fund
Absolute Return 300 Fund
Absolute Return 500 Fund
Absolute Return 700 Fund
Global Sector
Global Consumer Fund
Global Energy Fund
Global Financials Fund
Global Health Care Fund**
Global Industrials Fund
Global Natural Resources Fund
Global Technology Fund
Global Telecommunications Fund
Global Utilities Fund††
Asset allocation
Income Strategies Fund
Putnam Asset Allocation Funds — three investment portfolios that spread your money across a variety of stocks, bonds, and money market investments.
The three portfolios:
Asset Allocation: Balanced Portfolio
Asset Allocation: Conservative Portfolio
Asset Allocation: Growth Portfolio
Putnam RetirementReady®
Putnam RetirementReady Funds — 10 investment portfolios that offer diversification among stocks, bonds, and money market instruments and adjust to become more conservative over time based on a target date for withdrawing assets.
The 10 funds:
Putnam RetirementReady 2050 Fund
Putnam RetirementReady 2045 Fund
Putnam RetirementReady 2040 Fund
Putnam RetirementReady 2035 Fund
Putnam RetirementReady 2030 Fund
Putnam RetirementReady 2025 Fund
Putnam RetirementReady 2020 Fund
Putnam RetirementReady 2015 Fund
Putnam RetirementReady 2010 Fund
Putnam RetirementReady Maturity Fund
‡ Prior to November 30, 2008, the fund was known as Putnam AMT-Free Insured Municipal Fund.
** Prior to January 2, 2009, the fund was known as Putnam Health Sciences Trust.
†† Prior to January 2, 2009, the fund was known as Putnam Utilities Growth and Income Fund.
With the exception of money market funds, a 1% redemption fee may be applied to shares exchanged or sold within 7 days of purchase (90 days, for certain funds).
Check your account balances and the most recent month-end performance in the Individual Investors section at www.putnam.com.
51
Services for shareholders
Investor services
Systematic investment plan Tell us how much you wish to invest regularly — weekly, semimonthly, or monthly — and the amount you choose will be transferred automatically from your checking or savings account. There’s no additional fee for this service, and you can suspend it at any time. This plan may be a great way to save for college expenses or to plan for your retirement.
Please note that regular investing does not guarantee a profit or protect against loss in a declining market. Before arranging a systematic investment plan, consider your financial ability to continue making purchases in periods when prices are low.
Systematic exchange You can make regular transfers from one Putnam fund to another Putnam fund. There are no additional fees for this service, and you can cancel or change your options at any time.
Dividends PLUS You can choose to have the dividend distributions from one of your Putnam funds automatically reinvested in another Putnam fund at no additional charge.
Free exchange privilege You can exchange money between Putnam funds free of charge, as long as they are the same class of shares. A signature guarantee is required if you are exchanging more than $500,000.
Reinstatement privilege If you’ve sold Putnam shares or received a check for a dividend or capital gain, you may reinvest the proceeds with Putnam within 90 days of the transaction and they will be reinvested at the fund’s current net asset value — with no sales charge. However, reinstatement of class B shares may have special tax consequences. Ask your financial or tax representative for details.
Check-writing service You have ready access to many Putnam accounts. It’s as simple as writing a check, and there are no special fees or service charges. For more information about the check-writing service, call Putnam or visit our Web site.
Dollar cost averaging When you’re investing for long-term goals, it’s time, not timing, that counts. Investing on a systematic basis is a better strategy than trying to figure out when the markets will go up or down. This means investing the same amount of money regularly over a long period. This method of investing is called dollar cost averaging. When a fund’s share price declines, your investment dollars buy more shares at lower prices. When it increases, they buy fewer shares. Over time, you will pay a lower average price per share.
For more information
Visit the Individual Investors section at www.putnam.com A secure section of our Web site contains complete information on your account, including balances and transactions, updated daily. You may also conduct transactions, such as exchanges, additional investments, and address changes. Log on today to get your password.
Call us toll free at 1-800-225-1581 Ask a helpful Putnam representative or your financial advisor for details about any of these or other services, or see your prospectus.
52
Fund information
Founded over 70 years ago, Putnam Investments was built around the concept that a balance between risk and reward is the hallmark of a well-rounded financial program. We manage over 100 mutual funds across income, value, blend, growth, asset allocation, absolute return, and global sector categories.
| | |
| Investment Manager | George Putnam, III | Beth S. Mazor |
| Putnam Investment | Robert L. Reynolds | Vice President |
| Management, LLC | Richard B. Worley | |
| One Post Office Square | | James P. Pappas |
| Boston, MA 02109 | Officers | Vice President |
| | Charles E. Haldeman, Jr. | |
| Marketing Services | President | Francis J. McNamara, III |
| Putnam Retail Management | | Vice President and |
| One Post Office Square | Charles E. Porter | Chief Legal Officer |
| Boston, MA 02109 | Executive Vice President, | |
| | Principal Executive Officer, | Robert R. Leveille |
| Custodian | Associate Treasurer and | Vice President and |
| State Street Bank | Compliance Liaison | Chief Compliance Officer |
| and Trust Company | | |
| | Jonathan S. Horwitz | Mark C. Trenchard |
| Legal Counsel | Senior Vice President | Vice President and |
| Ropes & Gray LLP | and Treasurer | BSA Compliance Officer |
| | | |
| Trustees | Steven D. Krichmar | Judith Cohen |
| John A. Hill, Chairman | Vice President and | Vice President, Clerk and |
| Jameson A. Baxter, | Principal Financial Officer | Assistant Treasurer |
| Vice Chairman |
| Charles B. Curtis | Janet C. Smith | Wanda M. McManus |
| Robert J. Darretta | Vice President, Principal | Vice President, Senior Associate |
| Myra R. Drucker | Accounting Officer and | Treasurer and Assistant Clerk |
| Charles E. Haldeman, Jr. | Assistant Treasurer | |
| Paul L. Joskow | | Nancy E. Florek |
| Elizabeth T. Kennan | Susan G. Malloy | Vice President, Assistant Clerk, |
| Kenneth R. Leibler | Vice President and | Assistant Treasurer and |
| Robert E. Patterson | Assistant Treasurer | Proxy Manager |
| | |
| | | |
This report is for the information of shareholders of Putnam New Opportunities Fund. It may also be used as sales literature when preceded or accompanied by the current prospectus, the most recent copy of Putnam’s Quarterly Performance Summary, and Putnam’s Quarterly Ranking Summary. For more recent performance, please visit www.putnam.com. Investors should carefully consider the investment objective, risks, charges, and expenses of a fund, which are described in its prospectus. For this and other information or to request a prospectus, call 1-800-225-1581 toll free. Please read the prospectus carefully before investing. The fund’s Statement of Additional Information contains additional information about the fund’s Trustees and is available without charge upon request by calling 1-800-225-1581.

One Post Office Square
Boston, MA 02109
putnam.com
1-800-225-1581
Forwarding service requested
PRSRT STD
U.S. POSTAGE PAID
PUTNAM
INVESTMENTS
SA013 254951 2/09
Item 2. Code of Ethics:
Not applicable
Item 3. Audit Committee Financial Expert:
Not applicable
Item 4. Principal Accountant Fees and Services:
Not applicable
Item 5. Audit Committee of Listed Registrants
Not applicable
Item 6. Schedule of Investments:
The registrant’s schedule of investments in unaffiliated issuers is included in the report to shareholders in Item 1 above.
Item 7. Disclosure of Proxy Voting Policies and Procedures For Closed-End Management Investment Companies:
Not applicable
Item 8. Portfolio Managers of Closed-End Investment Companies
Not Applicable
Item 9. Purchases of Equity Securities by Closed-End Management Investment Companies and Affiliated Purchasers:
Not applicable
Item 10. Submission of Matters to a Vote of Security Holders:
Not applicable
Item 11. Controls and Procedures:
(a) The registrant's principal executive officer and principal financial officer have concluded, based on their evaluation of the effectiveness of the design and operation of the registrant's disclosure controls and procedures as of a date within 90 days of the filing date of this report, that the design and operation of such procedures are generally effective to provide reasonable assurance that information required to be disclosed by the registrant in this report is recorded, processed, summarized and reported within the time periods specified in the Commission's rules and forms.
(b) Changes in internal control over financial reporting: Not applicable
Item 12. Exhibits:
(a)(1) Not applicable
(a)(2) Separate certifications for the principal executive officer and principal financial officer of the registrant as required by Rule 30a-2(a) under the Investment Company Act of 1940, as amended, are filed herewith.
(b) The certifications required by Rule 30a-2(b) under the Investment Company Act of 1940, as amended, are filed herewith.
SIGNATURES
Pursuant to the requirements of the Securities Exchange Act of 1934 and the Investment Company Act of 1940, the registrant has duly caused this report to be signed on its behalf by the undersigned, thereunto duly authorized.
Putnam New Opportunities Fund
By (Signature and Title):
/s/Janet C. Smith
Janet C. Smith
Principal Accounting Officer
Date: February 27, 2009
Pursuant to the requirements of the Securities Exchange Act of 1934 and the Investment Company Act of 1940, this report has been signed below by the following persons on behalf of the registrant and in the capacities and on the dates indicated.
By (Signature and Title):
/s/Charles E. Porter
Charles E. Porter
Principal Executive Officer
Date: February 27, 2009
By (Signature and Title):
/s/Steven D. Krichmar
Steven D. Krichmar
Principal Financial Officer
Date: February 27, 2009