| | |
| UNITED STATES
SECURITIES AND EXCHANGE COMMISSION |
| | |
| CERTIFIED SHAREHOLDER REPORT OF REGISTERED
MANAGEMENT INVESTMENT COMPANIES
|
| | |
| Investment Company Act file number: | (811-06128) |
| | |
| Exact name of registrant as specified in charter: | Putnam Multi-Cap Growth Fund |
| | |
| Address of principal executive offices: | One Post Office Square, Boston, Massachusetts 02109 |
| | |
| Name and address of agent for service: | Robert T. Burns, Vice President
One Post Office Square
Boston, Massachusetts 02109 |
| | |
| Copy to: | John W. Gerstmayr, Esq.
Ropes & Gray LLP
800 Boylston Street
Boston, Massachusetts 02199-3600 |
| | |
| Registrant’s telephone number, including area code: | (617) 292-1000 |
| | |
| Date of fiscal year end: | June 30, 2012 |
| | |
| Date of reporting period: | July 1, 2011 — December 31, 2011 |
| | |
|
Item 1. Report to Stockholders: | |
| | |
| The following is a copy of the report transmitted to stockholders pursuant to Rule 30e-1 under the Investment Company Act of 1940: | |
Putnam
Multi-Cap Growth
Fund
Semiannual report
12 | 31 | 11
| | |
| Message from the Trustees | 1 | |
| |
| About the fund | 2 | |
| |
| Performance snapshot | 4 | |
| |
| Interview with your fund’s portfolio manager | 5 | |
| |
| Your fund’s performance | 10 | |
| |
| Your fund’s expenses | 12 | |
| |
| Terms and definitions | 14 | |
| |
| Other information for shareholders | 15 | |
| |
| Financial statements | 16 | |
| |
Message from the Trustees
Dear Fellow Shareholder:
Global financial uncertainty and the European debt crisis continue to contribute to risk aversion and volatility within markets around the world. While we have experienced some positive trends in recent months, stock markets ended 2011 essentially where they began.
Until a lasting and meaningful solution is found for the European debt problem and the U.S. economy establishes a solid footing, it is our belief that this volatility and uncertainty will persist, at least over the near term. In this kind of market, Putnam’s portfolio managers and analysts are dedicated to uncovering opportunities, while seeking to guard against downside risk.
During periods of market uncertainty, it is especially important to rely on the counsel and expertise of your financial advisor, who can help you maintain a long-term focus and a balanced investment approach suitable to your goals.
In other developments, please join us in welcoming the return of Elizabeth T. Kennan to the Board of Trustees. Dr. Kennan, who served as a Trustee from 1992 until 2010, has rejoined the Board, effective January 1, 2012. Dr. Kennan is a Partner of Cambus-Kenneth Farm (thoroughbred horse breeding and general farming), and is also President Emeritus of Mount Holyoke College.
We would also like to take this opportunity to welcome new shareholders to the fund and to thank all of our investors for your continued confidence in Putnam.

About the fund
A flexible approach to investing in growing companies
Long before most Americans could conceive of the Internet or interactive mobile devices small enough to fit in their pockets, Putnam Multi-Cap Growth Fund was seeking investment opportunities in emerging, cutting-edge companies. The fund was also targeting stocks in more traditional industries, such as restaurants, retail stores, health care, and broadcasting, that could offer strong growth potential.
Introduced in 1990, the fund invests in stocks of companies that are believed to offer above-average growth potential. An important benefit of the fund’s strategy is its flexibility — it diversifies across a range of industries and companies. In addition to large companies, the fund can invest in smaller companies that are in their emerging- or expansionary-growth phase, and these companies can remain in the fund’s portfolio until they grow to become market leaders.
Historically, the growth potential offered by stocks of growing companies comes with the risk of greater price fluctuations. Combining small-cap stocks with those of larger, more established companies provides a more diversified approach to help manage those risks.
Supported by a team of dedicated research analysts, the fund’s portfolio manager uses his stock-picking expertise and multiple resources to identify opportunities and manage risk.
With opportunities continuing to emerge across industries and companies of all sizes, Putnam Multi-Cap Growth Fund will continue to focus on capturing growth potential for investors.
Consider these risks before investing: Investments in small and/or midsize companies increase the risk of greater price fluctuations. Growth stocks may be more susceptible to earnings disappointments, and the market may not favor growth-style investing.
Multi-cap investing at Putnam
Putnam’s suite of multi-cap equity funds is designed to provide a simple, streamlined approach to investing across the broad universe of U.S. stocks. Each fund invests with a specific style and has the flexibility to invest in companies of all sizes.
The fund managers can select from all companies within their style universe, regardless of company size. The managers can own stocks throughout a company’s entire growth cycle, without capitalization restraints that might force them to sell holdings that get too large, or that would prevent them from taking advantage of certain attractively priced stocks.
Supported by a strong research team, the managers use their stock-picking expertise to identify opportunities and manage risk.
Putnam Multi-Cap Growth Fund targets stocks of companies that are believed to offer above-average growth potential.
Putnam Multi-Cap Value Fund targets companies whose stocks are priced below their long-term potential, and where there may be a catalyst for positive change.
Putnam Multi-Cap Core Fund uses a blend strategy, investing in both growth stocks and value stocks, seeking capital appreciation for investors.

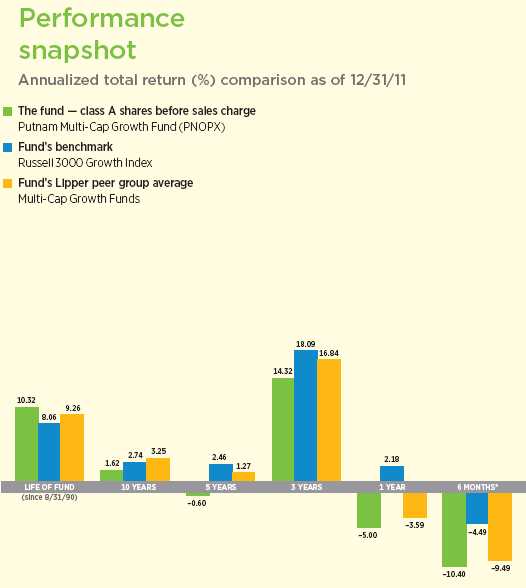
Current performance may be lower or higher than the quoted past performance, which cannot guarantee future results. Share price, principal value, and return will fluctuate, and you may have a gain or a loss when you sell your shares. Performance of class A shares assumes reinvestment of distributions and does not account for taxes. Fund returns in the bar chart do not reflect a sales charge of 5.75%; had they, returns would have been lower. See pages 5 and 10–11 for additional performance information. For a portion of the periods, the fund had expense limitations, without which returns would have been lower. To obtain the most recent month-end performance, visit putnam.com.
* Returns for the six-month period are not annualized, but cumulative.
4
Interview with your fund’s portfolio manager

Rob, the six months ended December 31, 2011, marked a difficult period for the stock market. What can you tell us about the investing environment and the fund’s performance?
As a whole, 2011 was tumultuous for stock investors, and the second half was particularly challenging. The financial markets endured a series of setbacks that were quite destabilizing to investor confidence and brought about renewed uncertainty regarding the strength of the U.S. economic recovery. Shortly after the period began in July, worsening sovereign credit woes in Europe and a generally dismal outlook for global economic growth resulted in sharp declines across world stock markets. Debt issues in the United States added to the pressure as lawmakers struggled to reach an agreement over the federal debt ceiling, and in August, Standard & Poor’s unprecedented downgrade of U.S. sovereign debt to AA+ from AAA sent stocks plunging again. Despite a dramatic recovery for the stock market in October, high levels of volatility continued through the close of the year. For the six-month period, the fund underperformed both its benchmark index and the average return for funds in its Lipper peer group.
Within the fund’s portfolio, what strategies or stocks held back performance for the period?
The market environment I just described was especially difficult for cyclical stocks — those
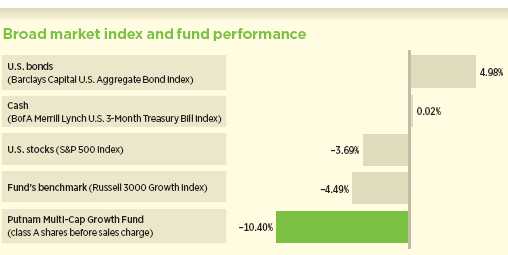
This comparison shows your fund’s performance in the context of broad market indexes for the six months ended 12/31/11. See pages 4 and 10–11 for additional fund performance information. Index descriptions can be found on page 14.
5
of companies and sectors that tend to do well in a recovering economy. As investor hopes dimmed for a solid, sustainable recovery, a number of cyclical stocks struggled. One example in the portfolio was Thermo Fisher Scientific, a company that provides analytical instruments, equipment, and services for businesses and institutions that conduct research. Thermo Fisher’s business is dependent on capital spending by its clients, and investors were concerned that pressure on capital budgets would hurt the company’s revenues. Most notable is Thermo Fisher’s exposure to government spending through clients such as the National Institutes of Health. Although we have not seen evidence of it yet, the market was projecting a substantial slowdown in capital spending, and we believe this caused declines in Thermo Fisher’s stock price.
We believe the same issue has affected Polycom, which also detracted from fund performance for the six-month period. One of the fund’s top-performing holdings for the previous fiscal year, Polycom specializes in video conferencing, which allows people to meet face-to-face from different physical locations worldwide. While Polycom has benefited from increasing demand for advanced technology that can boost productivity, investors became concerned that spending by businesses on video conferencing could slow substantially.
Fund returns were also dampened by our decision to avoid the stock of Exxon Mobil, which performed strongly. Despite the fact that the company is well managed, we believed it did not offer adequate organic growth potential. In my view, this industry giant will struggle to consistently replace the oil it is producing through exploration, and therefore I have focused on other oil companies that I believe are well managed and offer considerably stronger growth potential. In fact, two of those companies — Brigham Exploration and Noble Energy — were
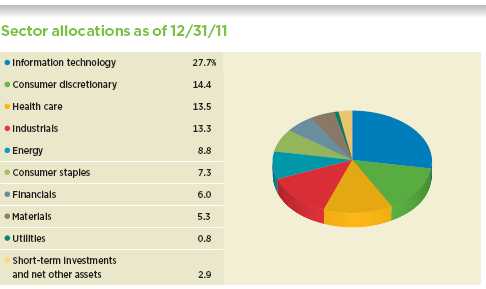
Allocations are represented as a percentage of the fund’s net assets. Summary information may differ from the portfolio schedule included in the financial statements due to the inclusion of derivative securities and the exclusion of as-of trades, if any, and the use of different classifications of securities for presentation purposes. Holdings and allocations may vary over time.
6
among the fund’s top performers for the period. The fund’s position in Brigham Exploration was sold by period-end.

Could you highlight some other stocks that helped performance?
Among the top contributors was SanDisk, which provides flash memory for products such as smartphones, tablet computers, and laptops. Accelerating demand for mobile computing devices has been a rewarding trend for SanDisk’s profitability.
Another key contributor to performance was our investment in Elan, a biotechnology company that specializes in treatments for neurodegenerative and autoimmune diseases. The company has benefited from highly successful sales of Tysabri, its treatment for multiple sclerosis. As demand for the drug continued to grow, Elan’s stock price climbed significantly. Fund performance also benefited from our investment in Goodrich, a maker of aircraft components whose stock performed well, primarily after the company was acquired by conglomerate United Technologies. Another portfolio highlight was MasterCard. This stock had been pressured by uncertainty about how new credit card regulations —specifically card interchange fees — might affect the revenues and business models of card companies. As investors have gained more clarity on the issue, and it appeared the impact would be minimal, MasterCard stock rebounded. In addition, we have seen a steady improvement in U.S. consumer spending, which boosts credit card use.
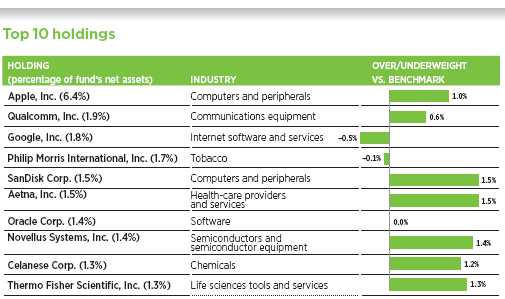
This table shows the fund’s top 10 holdings by percentage of the fund’s net assets as of 12/31/11. Short-term holdings are excluded. Holdings will vary over time.
7
What is your outlook for the markets and the fund?
I continue to believe that the U.S. economic recovery is moving forward, despite market volatility and sometimes mixed economic data. Toward the close of 2011, we began to see improvement in areas such as housing and job creation, and overall, the data appears to point to a strengthening economy. Of course, much skepticism remains as to whether the recovery is durable and sustainable, particularly in light of the challenges in Europe. The potential for a deep recession or a financial system freeze in Europe continues to be a risk.
In terms of the fund, I believe today’s market offers many attractive long-term investment opportunities. I believe the outlook for U.S.-centric companies in particular is brightening. In addition to improving U.S. housing data, we’re seeing increasing strength in industries such as restaurants and travel. The corporate earnings picture also remains positive, in my view. Earnings have been consistently better than investors expected, businesses continue to focus on costs, productivity growth has been solid, and revenues have improved.
A key benefit of our investment process is our thematic approach. As every investor should, we maintain a long-term perspective, and we identify what we believe are the big-picture, thematic trends that will drive global growth over the next several years. Of course, there will be cyclical downturns in any industry, but we look for durable growth trends, and then target companies whose products and services can benefit from these trends. As always, when positioning the portfolio, I am mindful of the potential macroeconomic headwinds. I seek to capitalize on improving conditions, but I don’t want to expose the fund’s investors to too much risk. We continue to strive for a careful balance of stocks with high growth potential and those with more defensive characteristics.
Thank you, Rob, for your time and insight.
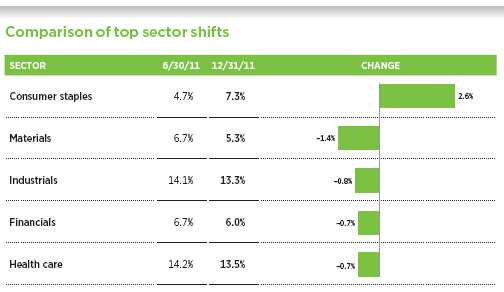
This chart shows the fund’s largest allocation shifts, by percentage, over the past six months. Weightings are shown as a percentage of net assets. Summary information may differ from the portfolio schedule included in the financial statements due to the inclusion of derivative securities and the exclusion of as-of trades, if any, and the use of different classifications of securities for presentation purposes. Holdings will vary over time.
8
The views expressed in this report are exclusively those of Putnam Management and are subject to change. They are not meant as investment advice.
Please note that the holdings discussed in this report may not have been held by the fund for the entire period. Portfolio composition is subject to review in accordance with the fund’s investment strategy and may vary in the future. Current and future portfolio holdings are subject to risk.
Portfolio Manager Robert M. Brookby has an M.B.A. from Harvard Business School and a B.A. from Northwestern University. Rob joined Putnam in 2008 and has been in the investment industry since 1999.
IN THE NEWS
Governments of the world’s top economies have more than $7.6 trillion of debt maturing in 2012, up from $7.4 trillion one year ago, according to data compiled by Bloomberg. With Japan’s $3 trillion and the United States’ $2.8 trillion of debt at the head of the list, most of the Group of Seven nations, as well as Brazil, Russia, India, and China, will inevitably confront an increase in borrowing costs. As the global economy decelerates, surveys show that investors may seek a higher return to lend to countries seeking to finance higher debt burdens. Meanwhile the International Monetary Fund (IMF) reduced its 2012 global growth forecast from 4.5% to 4%, as Europe’s debt contagion spreads and the United States seeks to cut its $1 trillion-plus budget deficit.
9
Your fund’s performance
This section shows your fund’s performance, price, and distribution information for periods ended December 31, 2011, the end of the first half of its current fiscal year. In accordance with regulatory requirements for mutual funds, we also include expense information taken from the fund’s current prospectus. Performance should always be considered in light of a fund’s investment strategy. Data represent past performance. Past performance does not guarantee future results. More recent returns may be less or more than those shown. Investment return and principal value will fluctuate, and you may have a gain or a loss when you sell your shares. Performance information does not reflect any deduction for taxes a shareholder may owe on fund distributions or on the redemption of fund shares. For the most recent month-end performance, please visit the Individual Investors section at putnam.com or call Putnam at 1-800-225-1581. Class R and class Y shares are not available to all investors. See the Terms and Definitions section in this report for definitions of the share classes offered by your fund.
Fund performance Total return for periods ended 12/31/11
| | | | | | | | | | |
| | Class A | Class B | Class C | Class M | Class R | Class Y |
| (inception dates) | (8/31/90) | (3/1/93) | (7/26/99) | (12/1/94) | (1/21/03) | (7/19/94) |
|
| | Before | After | | | | | Before | After | Net | Net |
| sales | sales | Before | After | Before | After | sales | sales | asset | asset |
| charge | charge | CDSC | CDSC | CDSC | CDSC | charge | charge | value | value |
|
| Annual average | | | | | | | | | | |
| (life of fund) | 10.32% | 10.01% | 9.51% | 9.51% | 9.50% | 9.50% | 9.75% | 9.57% | 10.05% | 10.55% |
|
| 10 years | 17.48 | 10.72 | 9.00 | 9.00 | 9.03 | 9.03 | 11.75 | 7.85 | 14.65 | 20.44 |
| Annual average | 1.62 | 1.02 | 0.87 | 0.87 | 0.87 | 0.87 | 1.12 | 0.76 | 1.38 | 1.88 |
|
| 5 years | –2.98 | –8.56 | –6.54 | –8.41 | –6.51 | –6.51 | –5.38 | –8.69 | –4.19 | –1.75 |
| Annual average | –0.60 | –1.77 | –1.34 | –1.74 | –1.34 | –1.34 | –1.10 | –1.80 | –0.85 | –0.35 |
|
| 3 years | 49.41 | 40.80 | 46.12 | 43.12 | 46.18 | 46.18 | 47.16 | 42.02 | 48.28 | 50.54 |
| Annual average | 14.32 | 12.08 | 13.48 | 12.69 | 13.49 | 13.49 | 13.74 | 12.40 | 14.03 | 14.61 |
|
| 1 year | –5.00 | –10.47 | –5.69 | –10.40 | –5.68 | –6.63 | –5.46 | –8.76 | –5.23 | –4.75 |
|
| 6 months | –10.40 | –15.55 | –10.73 | –15.19 | –10.72 | –11.61 | –10.62 | –13.75 | –10.51 | –10.28 |
|
Current performance may be lower or higher than the quoted past performance, which cannot guarantee future results. After-sales-charge returns for class A and M shares reflect the deduction of the maximum 5.75% and 3.50% sales charge, respectively, levied at the time of purchase. Class B share returns after contingent deferred sales charge (CDSC) reflect the applicable CDSC, which is 5% in the first year, declining over time to 1% in the sixth year, and is eliminated thereafter. Class C share returns after CDSC reflect a 1% CDSC for the first year that is eliminated thereafter. Class R and Y shares have no initial sales charge or CDSC. Performance for class B, C, M, R, and Y shares before their inception is derived from the historical performance of class A shares, adjusted for the applicable sales charge (or CDSC) and the higher operating expenses for such shares, except for class Y shares, for which 12b-1 fees are not applicable.
Recent performance may have benefited from one or more legal settlements.
For a portion of the periods, the fund had expense limitations, without which returns would have been lower.
Class B share performance does not reflect conversion to class A shares.
10
Comparative index returns For periods ended 12/31/11
| | |
| | Russell 3000 | Lipper Multi-Cap Growth Funds |
| | Growth Index | category average* |
|
| Annual average (life of fund) | 8.06% | 9.26% |
|
| 10 years | 31.02 | 40.17 |
| Annual average | 2.74 | 3.25 |
|
| 5 years | 12.93 | 7.33 |
| Annual average | 2.46 | 1.27 |
|
| 3 years | 64.69 | 60.39 |
| Annual average | 18.09 | 16.84 |
|
| 1 year | 2.18 | –3.59 |
|
| 6 months | –4.49 | –9.49 |
|
Index and Lipper results should be compared with fund performance before sales charge, before CDSC, or at net asset value.
* Over the 6-month, 1-year, 3-year, 5-year, 10-year, and life-of-fund periods ended 12/31/11, there were 534, 506, 425, 347, 236, and 37 funds, respectively, in this Lipper category.
Fund price and distribution information For the six-month period ended 12/31/11
| | | | | | | | |
| | Class A | Class B | Class C | Class M | Class R | Class Y |
|
| | Before | After | Net | Net | Before | After | Net | Net |
| | sales | sales | asset | asset | sales | sales | asset | asset |
| Share value | charge | charge | value | value | charge | charge | value | value |
|
| 6/30/11 | $53.66 | $56.93 | $46.24 | $49.07 | $49.05 | $50.83 | $52.64 | $56.14 |
|
| 12/31/11 | 48.08 | 51.01 | 41.28 | 43.81 | 43.84 | 45.43 | 47.11 | 50.37 |
|
The classification of distributions, if any, is an estimate. Before-sales-charge share value and current dividend rate for class A and M shares, if applicable, do not take into account any sales charge levied at the time of purchase. After-sales-charge share value, current dividend rate, and current 30-day SEC yield, if applicable, are calculated assuming that the maximum sales charge (5.75% for class A shares and 3.50% for class M shares) was levied at the time of purchase. Final distribution information will appear on your year-end tax forms.
The fund made no distributions during the period.
11
Your fund’s expenses
As a mutual fund investor, you pay ongoing expenses, such as management fees, distribution fees (12b-1 fees), and other expenses. Using the following information, you can estimate how these expenses affect your investment and compare them with the expenses of other funds. You may also pay one-time transaction expenses, including sales charges (loads) and redemption fees, which are not shown in this section and would have resulted in higher total expenses. For more information, see your fund’s prospectus or talk to your financial representative.
Expense ratios
| | | | | | |
| | Class A | Class B | Class C | Class M | Class R | Class Y |
|
| Total annual fund operating expenses for the fiscal | | | | | | |
| year ended 6/30/11 | 1.22% | 1.97% | 1.97% | 1.72% | 1.47% | 0.97% |
|
| Annualized expense ratio for the six-month period | | | | | | |
| ended 12/31/11* | 1.15% | 1.90% | 1.90% | 1.65% | 1.40% | 0.90% |
|
Fiscal-year expense information in this table is taken from the most recent prospectus, is subject to change, and may differ from that shown for the annualized expense ratio and in the financial highlights of this report. Expenses are shown as a percentage of average net assets.
* Includes a decrease of 0.05% from annualizing the performance fee adjustment for the six months ended 12/31/11.
Expenses per $1,000
The following table shows the expenses you would have paid on a $1,000 investment in the fund from July 1, 2011, to December 31, 2011. It also shows how much a $1,000 investment would be worth at the close of the period, assuming actual returns and expenses.
| | | | | | |
| | Class A | Class B | Class C | Class M | Class R | Class Y |
|
| Expenses paid per $1,000*† | $5.48 | $9.04 | $9.04 | $7.85 | $6.67 | $4.29 |
|
| Ending value (after expenses) | $896.00 | $892.70 | $892.80 | $893.80 | $894.90 | $897.20 |
|
* Expenses for each share class are calculated using the fund’s annualized expense ratio for each class, which represents the ongoing expenses as a percentage of average net assets for the six months ended 12/31/11. The expense ratio may differ for each share class.
† Expenses are calculated by multiplying the expense ratio by the average account value for the period; then multiplying the result by the number of days in the period; and then dividing that result by the number of days in the year.
12
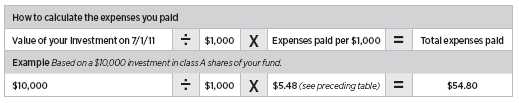
Estimate the expenses you paid
To estimate the ongoing expenses you paid for the six months ended December 31, 2011, use the following calculation method. To find the value of your investment on July 1, 2011, call Putnam at 1-800-225-1581.
Compare expenses using the SEC’s method
The Securities and Exchange Commission (SEC) has established guidelines to help investors assess fund expenses. Per these guidelines, the following table shows your fund’s expenses based on a $1,000 investment, assuming a hypothetical 5% annualized return. You can use this information to compare the ongoing expenses (but not transaction expenses or total costs) of investing in the fund with those of other funds. All mutual fund shareholder reports will provide this information to help you make this comparison. Please note that you cannot use this information to estimate your actual ending account balance and expenses paid during the period.
| | | | | | |
| | Class A | Class B | Class C | Class M | Class R | Class Y |
|
| Expenses paid per $1,000*† | $5.84 | $9.63 | $9.63 | $8.36 | $7.10 | $4.57 |
|
| Ending value (after expenses) | $1,019.36 | $1,015.58 | $1,015.58 | $1,016.84 | $1,018.10 | $1,020.61 |
|
* Expenses for each share class are calculated using the fund’s annualized expense ratio for each class, which represents the ongoing expenses as a percentage of average net assets for the six months ended 12/31/11. The expense ratio may differ for each share class.
† Expenses are calculated by multiplying the expense ratio by the average account value for the period; then multiplying the result by the number of days in the period; and then dividing that result by the number of days in the year.
13
Terms and definitions
Important terms
Total return shows how the value of the fund’s shares changed over time, assuming you held the shares through the entire period and reinvested all distributions in the fund.
Before sales charge, or net asset value, is the price, or value, of one share of a mutual fund, without a sales charge. Before-sales-charge figures fluctuate with market conditions, and are calculated by dividing the net assets of each class of shares by the number of outstanding shares in the class.
After sales charge is the price of a mutual fund share plus the maximum sales charge levied at the time of purchase. After-sales-charge performance figures shown here assume the 5.75% maximum sales charge for class A shares and 3.50% for class M shares.
Contingent deferred sales charge (CDSC) is generally a charge applied at the time of the redemption of class B or C shares and assumes redemption at the end of the period. Your fund’s class B CDSC declines over time from a 5% maximum during the first year to 1% during the sixth year. After the sixth year, the CDSC no longer applies. The CDSC for class C shares is 1% for one year after purchase.
Share classes
Class A shares are generally subject to an initial sales charge and no CDSC (except on certain redemptions of shares bought without an initial sales charge).
Class B shares are not subject to an initial sales charge. They may be subject to a CDSC.
Class C shares are not subject to an initial sales charge and are subject to a CDSC only if the shares are redeemed during the first year.
Class M shares have a lower initial sales charge and a higher 12b-1 fee than class A shares and no CDSC (except on certain redemptions of shares bought without an initial sales charge).
Class R shares are not subject to an initial sales charge or CDSC and are available only to certain defined contribution plans.
Class Y shares are not subject to an initial sales charge or CDSC, and carry no 12b-1 fee. They are generally only available to corporate and institutional clients and clients in other approved programs.
Comparative indexes
Barclays Capital U.S. Aggregate Bond Index is an unmanaged index of U.S. investment-grade fixed-income securities.
BofA (Bank of America) Merrill Lynch U.S. 3-Month Treasury Bill Index is an unmanaged index that seeks to measure the performance of U.S. Treasury bills available in the marketplace.
Russell 3000 Growth Index is an unmanaged index of those companies in the broad-market Russell 3000 Index chosen for their growth orientation.
S&P 500 Index is an unmanaged index of common stock performance.
Indexes assume reinvestment of all distributions and do not account for fees. Securities and performance of a fund and an index will differ. You cannot invest directly in an index.
Lipper is a third-party industry-ranking entity that ranks mutual funds. Its rankings do not reflect sales charges. Lipper rankings are based on total return at net asset value relative to other funds that have similar current investment styles or objectives as determined by Lipper. Lipper may change a fund’s category assignment at its discretion. Lipper category averages reflect performance trends for funds within a category.
14
Other information for shareholders
Important notice regarding delivery of shareholder documents
In accordance with SEC regulations, Putnam sends a single copy of annual and semiannual shareholder reports, prospectuses, and proxy statements to Putnam shareholders who share the same address, unless a shareholder requests otherwise. If you prefer to receive your own copy of these documents, please call Putnam at 1-800-225-1581, and Putnam will begin sending individual copies within 30 days.
Proxy voting
Putnam is committed to managing our mutual funds in the best interests of our shareholders. The Putnam funds’ proxy voting guidelines and procedures, as well as information regarding how your fund voted proxies relating to portfolio securities during the 12-month period ended June 30, 2011, are available in the Individual Investors section of putnam.com, and on the SEC’s website, www.sec.gov. If you have questions about finding forms on the SEC’s website, you may call the SEC at 1-800-SEC-0330. You may also obtain the Putnam funds’ proxy voting guidelines and procedures at no charge by calling Putnam’s Shareholder Services at 1-800-225-1581.
Fund portfolio holdings
The fund will file a complete schedule of its portfolio holdings with the SEC for the first and third quarters of each fiscal year on Form N-Q. Shareholders may obtain the fund’s Forms N-Q on the SEC’s website at www.sec.gov. In addition, the fund’s Forms N-Q may be reviewed and copied at the SEC’s Public Reference Room in Washington, D.C. You may call the SEC at 1-800-SEC-0330 for information about the SEC’s website or the operation of the Public Reference Room.
Trustee and employee fund ownership
Putnam employees and members of the Board of Trustees place their faith, confidence, and, most importantly, investment dollars in Putnam mutual funds. As of December 31, 2011, Putnam employees had approximately $321,000,000 and the Trustees had approximately $70,000,000 invested in Putnam mutual funds. These amounts include investments by the Trustees’ and employees’ immediate family members as well as investments through retirement and deferred compensation plans.
15
Financial statements
A guide to financial statements
These sections of the report, as well as the accompanying Notes, constitute the fund’s financial statements.
The fund’s portfolio lists all the fund’s investments and their values as of the last day of the reporting period. Holdings are organized by asset type and industry sector, country, or state to show areas of concentration and diversification.
Statement of assets and liabilities shows how the fund’s net assets and share price are determined. All investment and non-investment assets are added together. Any unpaid expenses and other liabilities are subtracted from this total. The result is divided by the number of shares to determine the net asset value per share, which is calculated separately for each class of shares. (For funds with preferred shares, the amount subtracted from total assets includes the liquidation preference of preferred shares.)
Statement of operations shows the fund’s net investment gain or loss. This is done by first adding up all the fund’s earnings — from dividends and interest income — and subtracting its operating expenses to determine net investment income (or loss). Then, any net gain or loss the fund realized on the sales of its holdings — as well as any unrealized gains or losses over the period — is added to or subtracted from the net investment result to determine the fund’s net gain or loss for the fiscal period.
Statement of changes in net assets shows how the fund’s net assets were affected by the fund’s net investment gain or loss, by distributions to shareholders, and by changes in the number of the fund’s shares. It lists distributions and their sources (net investment income or realized capital gains) over the current reporting period and the most recent fiscal year-end. The distributions listed here may not match the sources listed in the Statement of operations because the distributions are determined on a tax basis and may be paid in a different period from the one in which they were earned. Dividend sources are estimated at the time of declaration. Actual results may vary. Any non-taxable return of capital cannot be determined until final tax calculations are completed after the end of the fund’s fiscal year.
Financial highlights provide an overview of the fund’s investment results, per-share distributions, expense ratios, net investment income ratios, and portfolio turnover in one summary table, reflecting the five most recent reporting periods. In a semiannual report, the highlights table also includes the current reporting period.
16
The fund’s portfolio 12/31/11 (Unaudited)
| | |
| COMMON STOCKS (98.3%)* | Shares | Value |
|
| Aerospace and defense (4.6%) | | |
| BE Aerospace, Inc. † | 245,500 | $9,503,305 |
|
| Embraer SA ADR (Brazil) | 743,400 | 18,748,548 |
|
| Honeywell International, Inc. | 482,100 | 26,202,135 |
|
| Northrop Grumman Corp. S | 140,200 | 8,198,896 |
|
| Precision Castparts Corp. | 236,061 | 38,900,492 |
|
| Safran SA (France) | 469,455 | 14,032,251 |
|
| United Technologies Corp. | 358,300 | 26,188,147 |
|
| | | 141,773,774 |
| Air freight and logistics (0.7%) | | |
| United Parcel Service, Inc. Class B | 314,200 | 22,996,298 |
|
| | | 22,996,298 |
| Airlines (0.4%) | | |
| Delta Air Lines, Inc. † | 1,625,900 | 13,153,531 |
|
| | | 13,153,531 |
| Auto components (0.8%) | | |
| Autoliv, Inc. (Sweden) S | 212,000 | 11,339,880 |
|
| Lear Corp. | 342,800 | 13,643,440 |
|
| | | 24,983,320 |
| Automobiles (0.5%) | | |
| Ford Motor Co. † S | 1,406,800 | 15,137,168 |
|
| | | 15,137,168 |
| Beverages (2.3%) | | |
| Beam, Inc. | 239,404 | 12,264,667 |
|
| Coca-Cola Co. (The) | 167,800 | 11,740,966 |
|
| Coca-Cola Enterprises, Inc. S | 1,353,900 | 34,903,542 |
|
| PepsiCo, Inc. | 175,200 | 11,624,520 |
|
| | | 70,533,695 |
| Biotechnology (1.9%) | | |
| Affymax, Inc. † | 624,200 | 4,125,962 |
|
| Amarin Corp. PLC ADR (Ireland) † | 300,000 | 2,247,000 |
|
| BioMarin Pharmaceuticals, Inc. † S | 423,700 | 14,566,806 |
|
| Celgene Corp. † | 224,800 | 15,196,480 |
|
| Cubist Pharmaceuticals, Inc. † S | 429,511 | 17,017,226 |
|
| Dendreon Corp. † S | 428,364 | 3,255,566 |
|
| Human Genome Sciences, Inc. † S | 485,358 | 3,586,796 |
|
| | | 59,995,836 |
| Building products (0.3%) | | |
| Owens Corning, Inc. † | 283,900 | 8,153,608 |
|
| | | 8,153,608 |
| Capital markets (1.5%) | | |
| Apollo Global Management, LLC. Class A S | 393,316 | 4,881,052 |
|
| Invesco, Ltd. | 662,500 | 13,309,625 |
|
| Morgan Stanley | 364,000 | 5,507,320 |
|
| State Street Corp. | 556,500 | 22,432,515 |
|
| | | 46,130,512 |
| Chemicals (3.5%) | | |
| Agrium, Inc. (Canada) | 182,756 | 12,264,755 |
|
| Albemarle Corp. | 293,600 | 15,123,336 |
|
| Celanese Corp. Ser. A | 941,599 | 41,684,588 |
|
17
| | |
| COMMON STOCKS (98.3%)* cont. | Shares | Value |
|
| Chemicals cont. | | |
| LyondellBasell Industries NV Class A (Netherlands) | 656,627 | $21,333,811 |
|
| Monsanto Co. | 239,100 | 16,753,737 |
|
| | | 107,160,227 |
| Commercial banks (0.7%) | | |
| SVB Financial Group † S | 186,900 | 8,913,261 |
|
| Wells Fargo & Co. | 480,607 | 13,245,529 |
|
| | | 22,158,790 |
| Communications equipment (4.4%) | | |
| ADTRAN, Inc. S | 373,500 | 11,264,760 |
|
| Aruba Networks, Inc. † S | 138,594 | 2,566,761 |
|
| Cisco Systems, Inc. | 1,137,355 | 20,563,378 |
|
| F5 Networks, Inc. † | 56,400 | 5,985,168 |
|
| Juniper Networks, Inc. † | 614,803 | 12,548,129 |
|
| Polycom, Inc. † | 1,423,598 | 23,204,647 |
|
| Qualcomm, Inc. | 1,082,335 | 59,203,723 |
|
| | | 135,336,566 |
| Computers and peripherals (9.0%) | | |
| Apple, Inc. † | 485,229 | 196,517,745 |
|
| EMC Corp. † | 1,074,500 | 23,144,730 |
|
| Hewlett-Packard Co. | 402,883 | 10,378,266 |
|
| SanDisk Corp. † | 959,012 | 47,192,981 |
|
| | | 277,233,722 |
| Diversified financial services (1.1%) | | |
| CME Group, Inc. | 85,800 | 20,906,886 |
|
| IntercontinentalExchange, Inc. † | 111,100 | 13,393,105 |
|
| | | 34,299,991 |
| Diversified telecommunication services (0.3%) | | |
| Iridium Communications, Inc. † S | 1,032,606 | 7,961,392 |
|
| | | 7,961,392 |
| Electrical equipment (1.1%) | | |
| Cooper Industries PLC S | 385,500 | 20,874,825 |
|
| GrafTech International, Ltd. † S | 981,700 | 13,400,205 |
|
| Thermon Group Holdings, Inc. † | 58,468 | 1,030,206 |
|
| | | 35,305,236 |
| Electronic equipment, instruments, and components (1.2%) | | |
| Jabil Circuit, Inc. | 309,800 | 6,090,668 |
|
| TE Connectivity, Ltd. (Switzerland) | 677,000 | 20,858,370 |
|
| Trimble Navigation, Ltd. † | 221,000 | 9,591,400 |
|
| | | 36,540,438 |
| Energy equipment and services (4.4%) | | |
| Cameron International Corp. † | 533,600 | 26,247,784 |
|
| Key Energy Services, Inc. † | 938,500 | 14,518,595 |
|
| National Oilwell Varco, Inc. | 423,300 | 28,780,167 |
|
| Oil States International, Inc. † | 364,956 | 27,871,690 |
|
| Schlumberger, Ltd. S | 374,600 | 25,588,926 |
|
| Technip SA (France) | 128,313 | 11,992,515 |
|
| | | 134,999,677 |
| Food products (1.0%) | | |
| Mead Johnson Nutrition Co. Class A | 239,000 | 16,426,470 |
|
| Sara Lee Corp. | 835,500 | 15,807,660 |
|
| | | 32,234,130 |
18
| | |
| COMMON STOCKS (98.3%)* cont. | Shares | Value |
|
| Health-care equipment and supplies (3.3%) | | |
| Baxter International, Inc. | 791,958 | $39,186,082 |
|
| Covidien PLC (Ireland) | 748,000 | 33,667,480 |
|
| OraSure Technologies, Inc. † | 768,200 | 6,998,302 |
|
| St. Jude Medical, Inc. | 363,100 | 12,454,330 |
|
| Stryker Corp. | 200,300 | 9,956,913 |
|
| | | 102,263,107 |
| Health-care providers and services (3.7%) | | |
| Aetna, Inc. | 1,065,600 | 44,957,664 |
|
| CIGNA Corp. | 367,685 | 15,442,770 |
|
| Express Scripts, Inc. † | 513,500 | 22,948,315 |
|
| Lincare Holdings, Inc. S | 554,300 | 14,251,053 |
|
| Quest Diagnostics, Inc. S | 275,664 | 16,005,052 |
|
| | | 113,604,854 |
| Health-care technology (0.4%) | | |
| SXC Health Solutions Corp. (Canada) † | 214,800 | 12,131,904 |
|
| | | 12,131,904 |
| Hotels, restaurants, and leisure (2.4%) | | |
| Carnival Corp. | 494,400 | 16,137,216 |
|
| Las Vegas Sands Corp. † | 497,155 | 21,243,433 |
|
| Starbucks Corp. | 535,700 | 24,647,557 |
|
| Wyndham Worldwide Corp. | 314,769 | 11,907,711 |
|
| | | 73,935,917 |
| Household durables (0.4%) | | |
| Newell Rubbermaid, Inc. | 402,800 | 6,505,220 |
|
| NVR, Inc. † | 7,200 | 4,939,200 |
|
| | | 11,444,420 |
| Household products (1.6%) | | |
| Colgate-Palmolive Co. S | 202,800 | 18,736,692 |
|
| Procter & Gamble Co. (The) | 469,800 | 31,340,358 |
|
| | | 50,077,050 |
| Independent power producers and energy traders (0.8%) | | |
| AES Corp. (The) † | 2,143,300 | 25,376,672 |
|
| | | 25,376,672 |
| Industrial conglomerates (0.6%) | | |
| Tyco International, Ltd. | 433,600 | 20,253,456 |
|
| | | 20,253,456 |
| Insurance (1.5%) | | |
| Aflac, Inc. | 331,800 | 14,353,668 |
|
| AON Corp. | 395,600 | 18,514,080 |
|
| Hartford Financial Services Group, Inc. (The) | 760,500 | 12,358,125 |
|
| | | 45,225,873 |
| Internet and catalog retail (2.2%) | | |
| Amazon.com, Inc. † | 223,500 | 38,687,850 |
|
| Priceline.com, Inc. † S | 64,290 | 30,069,076 |
|
| | | 68,756,926 |
| Internet software and services (2.4%) | | |
| Baidu, Inc. ADR (China) † | 159,187 | 18,540,510 |
|
| Google, Inc. Class A † | 84,580 | 54,630,222 |
|
| | | 73,170,732 |
| IT Services (2.3%) | | |
| Accenture PLC Class A S | 251,500 | 13,387,345 |
|
| Cognizant Technology Solutions Corp. † | 232,700 | 14,964,937 |
|
19
| | |
| COMMON STOCKS (98.3%)* cont. | Shares | Value |
|
| IT Services cont. | | |
| MasterCard, Inc. Class A S | 73,800 | $27,514,116 |
|
| Western Union Co. (The) | 898,100 | 16,399,306 |
|
| | | 72,265,704 |
| Leisure equipment and products (0.5%) | | |
| Hasbro, Inc. | 515,800 | 16,448,862 |
|
| | | 16,448,862 |
| Life sciences tools and services (2.4%) | | |
| Agilent Technologies, Inc. † | 476,700 | 16,651,131 |
|
| Bruker Corp. † | 1,313,298 | 16,311,161 |
|
| Thermo Fisher Scientific, Inc. † | 891,500 | 40,090,755 |
|
| | | 73,053,047 |
| Machinery (3.3%) | | |
| Cummins, Inc. | 263,700 | 23,210,874 |
|
| Eaton Corp. | 556,146 | 24,209,035 |
|
| Lincoln Electric Holdings, Inc. | 46,761 | 1,829,290 |
|
| Parker Hannifin Corp. S | 371,094 | 28,295,918 |
|
| Timken Co. | 671,730 | 26,002,668 |
|
| | | 103,547,785 |
| Media (2.6%) | | |
| Interpublic Group of Companies, Inc. (The) | 2,775,700 | 27,007,561 |
|
| Time Warner, Inc. S | 706,800 | 25,543,752 |
|
| Walt Disney Co. (The) | 782,200 | 29,332,500 |
|
| | | 81,883,813 |
| Metals and mining (1.8%) | | |
| Carpenter Technology Corp. | 183,529 | 9,448,073 |
|
| Cliffs Natural Resources, Inc. S | 230,398 | 14,365,315 |
|
| Rio Tinto PLC (United Kingdom) | 283,158 | 13,703,287 |
|
| Teck Resources Limited Class B (Canada) | 284,300 | 10,004,517 |
|
| Walter Energy, Inc. | 126,990 | 7,690,514 |
|
| | | 55,211,706 |
| Multiline retail (1.2%) | | |
| Dollar General Corp. † S | 392,373 | 16,142,225 |
|
| Nordstrom, Inc. | 452,471 | 22,492,333 |
|
| | | 38,634,558 |
| Office electronics (0.3%) | | |
| Xerox Corp. | 1,087,577 | 8,657,113 |
|
| | | 8,657,113 |
| Oil, gas, and consumable fuels (4.5%) | | |
| Alpha Natural Resources, Inc. † | 614,500 | 12,554,235 |
|
| Anadarko Petroleum Corp. | 358,400 | 27,356,672 |
|
| Cabot Oil & Gas Corp. Class A | 124,700 | 9,464,730 |
|
| Hess Corp. | 220,900 | 12,547,120 |
|
| Kosmos Energy, Ltd. † | 472,518 | 5,793,071 |
|
| Linn Energy, LLC (Units) | 427,718 | 16,214,789 |
|
| Noble Energy, Inc. S | 352,600 | 33,281,914 |
|
| Occidental Petroleum Corp. | 224,400 | 21,026,280 |
|
| | | 138,238,811 |
| Personal products (0.7%) | | |
| Avon Products, Inc. | 284,500 | 4,970,215 |
|
| Estee Lauder Cos., Inc. (The) Class A | 144,800 | 16,263,936 |
|
| | | 21,234,151 |
20
| | |
| COMMON STOCKS (98.3%)* cont. | Shares | Value |
|
| Pharmaceuticals (1.9%) | | |
| Elan Corp. PLC ADR (Ireland) † S | 1,657,994 | $22,780,838 |
|
| Merck & Co., Inc. | 412,700 | 15,558,790 |
|
| Teva Pharmaceutical Industries, Ltd. ADR (Israel) | 214,000 | 8,637,040 |
|
| ViroPharma, Inc. † S | 389,700 | 10,673,883 |
|
| | | 57,650,551 |
| Real estate investment trusts (REITs) (0.3%) | | |
| American Tower REIT, Inc. Class A R | 163,902 | 9,835,759 |
|
| | | 9,835,759 |
| Real estate management and development (0.9%) | | |
| BR Malls Participacoes SA (Brazil) | 713,360 | 6,929,947 |
|
| CBRE Group, Inc. † | 1,301,800 | 19,813,396 |
|
| | | 26,743,343 |
| Road and rail (1.6%) | | |
| Hertz Global Holdings, Inc. † S | 1,345,000 | 15,763,400 |
|
| Kansas City Southern † | 322,554 | 21,936,898 |
|
| Swift Transportation Co. † | 1,348,046 | 11,107,899 |
|
| | | 48,808,197 |
| Semiconductors and semiconductor equipment (3.4%) | | |
| Advanced Micro Devices, Inc. † S | 2,935,919 | 15,853,963 |
|
| Cymer, Inc. † S | 227,711 | 11,330,899 |
|
| Intel Corp. | 388,963 | 9,432,353 |
|
| KLA-Tencor Corp. S | 129,500 | 6,248,375 |
|
| Novellus Systems, Inc. † S | 966,142 | 39,892,003 |
|
| Texas Instruments, Inc. | 816,100 | 23,756,671 |
|
| | | 106,514,264 |
| Software (5.1%) | | |
| Adobe Systems, Inc. † | 460,700 | 13,023,989 |
|
| Check Point Software Technologies, Ltd. (Israel) † S | 288,000 | 15,131,520 |
|
| Informatica Corp. † | 140,400 | 5,184,972 |
|
| Microsoft Corp. | 535,863 | 13,911,003 |
|
| Oracle Corp. | 1,719,900 | 44,115,435 |
|
| Red Hat, Inc. † | 196,766 | 8,124,468 |
|
| Salesforce.com, Inc. † S | 243,996 | 24,755,834 |
|
| SS&C Technologies Holdings, Inc. † | 124,078 | 2,240,849 |
|
| Synchronoss Technologies, Inc. † S | 255,800 | 7,727,718 |
|
| Synopsys, Inc. † | 431,600 | 11,739,520 |
|
| VMware, Inc. Class A † | 140,250 | 11,667,398 |
|
| | | 157,622,706 |
| Specialty retail (2.2%) | | |
| Bed Bath & Beyond, Inc. † S | 285,787 | 16,567,072 |
|
| Dick’s Sporting Goods, Inc. S | 251,700 | 9,282,696 |
|
| Signet Jewelers, Ltd. (Bermuda) | 148,300 | 6,519,268 |
|
| TJX Cos., Inc. (The) | 231,372 | 14,935,063 |
|
| Williams-Sonoma, Inc. | 523,500 | 20,154,750 |
|
| | | 67,458,849 |
| Textiles, apparel, and luxury goods (1.5%) | | |
| Coach, Inc. | 200,800 | 12,256,832 |
|
| Crocs, Inc. † S | 296,900 | 4,385,213 |
|
| Iconix Brand Group, Inc. † | 830,868 | 13,534,840 |
|
21
| | |
| COMMON STOCKS (98.3%)* cont. | Shares | Value |
|
| Textiles, apparel, and luxury goods cont. | | |
| PVH Corp. | 114,251 | $8,053,553 |
|
| Steven Madden, Ltd. † | 230,864 | 7,964,808 |
|
| | | 46,195,246 |
| Tobacco (1.7%) | | |
| Philip Morris International, Inc. | 671,000 | 52,660,080 |
|
| | | 52,660,080 |
| Trading companies and distributors (0.7%) | | |
| United Rentals, Inc. † S | 196,600 | 5,809,530 |
|
| WESCO International, Inc. † S | 277,067 | 14,687,322 |
|
| | | 20,496,852 |
| Wireless telecommunication services (0.4%) | | |
| NII Holdings, Inc. † | 622,500 | 13,259,250 |
|
| | | 13,259,250 |
| Total common stocks (cost $2,824,673,669) | | $3,038,749,469 |
| |
| CONVERTIBLE BONDS AND NOTES (0.1%)* | Principal amount | Value |
|
| Novellus Systems, Inc. 144A cv. sr. notes 2 5/8s, 2041 | $2,475,000 | $2,964,308 |
|
| Total convertible bonds and notes (cost $2,475,000) | | $2,964,308 |
| | | |
| | | | |
| WARRANTS (—%)* † | Expiration | Strike | | |
| | date | price | Warrants | Value |
|
| Citigroup, Inc. | 1/4/19 | $106.10 | 1,682,858 | $488,029 |
|
| Total warrants (cost $1,699,687) | | | | $488,029 |
| | | |
| | | |
| PURCHASED OPTIONS | Expiration date/ | Contract | |
| OUTSTANDING (—%)* | strike price | amount | Value |
|
| JPMorgan Chase & Co. (Call) | Jan-12/$45.00 | 269,705 | $186 |
|
| JPMorgan Chase & Co. (Call) | Jan-12/50.00 | 396,820 | 4 |
|
| Total purchased options outstanding (cost $1,746,497) | | $190 |
| | | |
| | |
| CONVERTIBLE PREFERRED STOCKS (—%)* | Shares | Value |
|
| UNEXT.com, LLC zero % cv. pfd. (acquired 4/14/00, | | |
| cost $10,451,238) (Private) † ‡ F | 125,000 | $— |
|
| Total convertible preferred stocks (cost $10,451,238) | | $— |
|
| |
| SHORT-TERM INVESTMENTS (12.0%)* | Principal amount/shares | Value |
|
| U.S. Treasury Bills with effective yields ranging | | |
| from 0.084% to 0.100%, October 18, 2012 # | $1,351,000 | $1,350,079 |
|
| U.S. Treasury Bills with effective yields ranging | | |
| from 0.089% to 0.097%, August 23, 2012 # | 2,467,000 | 2,465,882 |
|
| U.S. Treasury Bills with an effective yield of 0.074%, | | |
| June 28, 2012 # | 513,000 | 512,849 |
|
| Putnam Cash Collateral Pool, LLC 0.14% d | 302,455,920 | 302,455,920 |
|
| Putnam Money Market Liquidity Fund 0.05% e | 63,609,912 | 63,609,912 |
|
| Total short-term investments (cost $370,394,139) | | $370,394,642 |
| |
| TOTAL INVESTMENTS | | |
|
| Total investments (cost $3,211,440,230) | | $3,412,596,638 |
22
|
| Key to holding’s abbreviations |
| |
| ADR American Depository Receipts |
Notes to the fund’s portfolioUnless noted otherwise, the notes to the fund’s portfolio are for the close of the fund’s reporting period, which ran from July 1, 2011 through December 31, 2011 (the reporting period).
* Percentages indicated are based on net assets of $3,092,552,420.
† Non-income-producing security.
‡ Restricted, excluding 144A securities, as to public resale. The total market value of restricted securities held at the close of the reporting period was $0.
# This security, in part or in entirety, was pledged and segregated with the broker to cover margin requirements for futures contracts at the close of the reporting period.
d See Note 1 to the financial statements regarding securities lending. The rate quoted in the security description is the annualized 7-day yield of the fund at the close of the reporting period.
e See Note 6 to the financial statements regarding investments in Putnam Money Market Liquidity Fund. The rate quoted in the security description is the annualized 7-day yield of the fund at the close of the reporting period.
F Is valued at fair value following procedures approved by the Trustees. Securities may be classified as Level 2 or Level 3 for Accounting Standards Codification ASC 820 Fair Value Measurements and Disclosures (ASC 820) based on the securities’ valuation inputs. At the close of the reporting period, fair value pricing was also used for certain foreign securities in the portfolio (Note 1).
R Real Estate Investment Trust.
S Security on loan, in part or in entirety, at the close of the reporting period.
At the close of the reporting period, the fund maintained liquid assets totaling $60,013 to cover certain derivatives contracts.
Debt obligations are considered secured unless otherwise indicated.
144A after the name of an issuer represents securities exempt from registration under Rule 144A under the Securities Act of 1933, as amended. These securities may be resold in transactions exempt from registration, normally to qualified institutional buyers.
ADR after the name of a foreign holding represents ownership of foreign securities on deposit with a custodian bank.
The dates shown on debt obligations are the original maturity dates.
FORWARD CURRENCY CONTRACTS at 12/31/11 (aggregate face value $34,773,722) (Unaudited)
| | | | | | |
| | | Contract | Delivery | | Aggregate | Unrealized |
| Counterparty | Currency | type | date | Value | face value | appreciation |
|
| UBS AG | | | | | | |
|
| | Euro | Sell | 1/18/12 | $33,368,231 | $34,773,722 | $1,405,491 |
|
| Total | | | | | | $1,405,491 |
| | | |
FUTURES CONTRACTS OUTSTANDING at 12/31/11 (Unaudited)
| | | | | |
| | | | | | Unrealized |
| | Number of | | | Expiration | appreciation/ |
| | contracts | Value | | date | (depreciation) |
|
| NASDAQ 100 Index | | | | | |
| E-Mini (Long) | 112 | $5,094,880 | | Mar-12 | $(30,812) |
|
| Russell 2000 Index Mini (Long) | 17 | 1,255,960 | | Mar-12 | 10,091 |
|
| S&P 500 Index (Long) | 49 | 15,344,350 | | Mar-12 | 213,204 |
|
| S&P Mid Cap 400 Index | | | | | |
| E-Mini (Long) | 43 | 3,772,390 | | Mar-12 | 23,019 |
|
| Total | | | | | $215,502 |
23
| | | | | | |
| TOTAL RETURN SWAP CONTRACTS OUTSTANDING at 12/31/11 (Unaudited) | | |
| |
| | | | | Fixed payments | Total return | |
| Swap counterparty / | Termination | | received (paid) by | received by | Unrealized |
| Notional amount | date | | fund per annum | or paid by fund | depreciation |
|
| Goldman Sachs International | | | | | |
| baskets | 80,413 | 9/26/12 | | (1 month USD- | A basket | $(60,013) |
| | | | | LIBOR-BBA plus | (GSCBPBNK) | |
| | | | | 35 bp) | of common stocks | |
|
| Total | | | | | | $(60,013) |
ASC 820 establishes a three-level hierarchy for disclosure of fair value measurements. The valuation hierarchy is based upon the transparency of inputs to the valuation of the fund’s investments. The three levels are defined as follows:
Level 1: Valuations based on quoted prices for identical securities in active markets.
Level 2: Valuations based on quoted prices in markets that are not active or for which all significant inputs are observable, either directly or indirectly.
Level 3: Valuations based on inputs that are unobservable and significant to the fair value measurement.
The following is a summary of the inputs used to value the fund’s net assets as of the close of the reporting period:
| | | |
| | | Valuation inputs | |
|
| Investments in securities: | Level 1 | Level 2 | Level 3 |
|
| Common stocks: | | | |
|
| Consumer discretionary | $444,879,079 | $— | $— |
|
| Consumer staples | 226,739,106 | — | — |
|
| Energy | 261,245,973 | 11,992,515 | — |
|
| Financials | 184,394,268 | — | — |
|
| Health care | 418,699,299 | — | — |
|
| Industrials | 400,456,486 | 14,032,251 | — |
|
| Information technology | 867,341,245 | — | — |
|
| Materials | 148,668,646 | 13,703,287 | — |
|
| Telecommunication services | 21,220,642 | — | — |
|
| Utilities | 25,376,672 | — | — |
|
| Total common stocks | 2,999,021,416 | 39,728,053 | — |
| Convertible bonds and notes | — | 2,964,308 | — |
|
| Convertible preferred stocks | — | — | — |
|
| Purchased options outstanding | — | 190 | |
|
| Warrants | 488,029 | — | — |
|
| Short-term investments | 63,609,912 | 306,784,730 | — |
|
| Totals by level | $3,063,119,357 | $349,477,281 | $— |
| | | | |
| | | Valuation inputs | |
|
| Other financial instruments: | Level 1 | Level 2 | Level 3 |
|
| Forward currency contracts | $— | $1,405,491 | $— |
|
| Futures contracts | 215,502 | — | — |
|
| Total return swap contracts | — | (60,013) | — |
|
| Totals by level | $215,502 | $1,345,478 | $— |
At the start and/or close of the reporting period, Level 3 investments in securities were not considered a significant portion of the fund’s portfolio.
The accompanying notes are an integral part of these financial statements.
24
Statement of assets and liabilities 12/31/11 (Unaudited)
| |
| ASSETS | |
|
| Investment in securities, at value, including $294,053,911 of securities on loan (Note 1): | |
| Unaffiliated issuers (identified cost $2,845,374,398) | $3,046,530,806 |
| Affiliated issuers (identified cost $366,065,832) (Notes 1 and 6) | 366,065,832 |
|
| Cash | 962,119 |
|
| Dividends, interest and other receivables | 4,262,445 |
|
| Receivable for shares of the fund sold | 686,541 |
|
| Receivable for investments sold | 22,260,525 |
|
| Unrealized appreciation on forward currency contracts (Note 1) | 1,405,491 |
|
| Total assets | 3,442,173,759 |
| |
| LIABILITIES | |
|
| Payable for variation margin (Note 1) | 84,340 |
|
| Payable for investments purchased | 36,616,157 |
|
| Payable for shares of the fund repurchased | 4,174,807 |
|
| Payable for compensation of Manager (Note 2) | 1,282,828 |
|
| Payable for investor servicing fees (Note 2) | 737,280 |
|
| Payable for custodian fees (Note 2) | 17,375 |
|
| Payable for Trustee compensation and expenses (Note 2) | 1,828,947 |
|
| Payable for administrative services (Note 2) | 7,941 |
|
| Payable for distribution fees (Note 2) | 1,934,895 |
|
| Unrealized depreciation on swap contracts (Note 1) | 60,013 |
|
| Collateral on securities loaned, at value (Note 1) | 302,455,920 |
|
| Other accrued expenses | 420,836 |
|
| Total liabilities | 349,621,339 |
| | |
| Net assets | $3,092,552,420 |
|
| |
| REPRESENTED BY | |
|
| Paid-in capital (Unlimited shares authorized) (Notes 1, 4 and 7) | $3,843,968,065 |
|
| Undistributed net investment income (Note 1) | 3,031,813 |
|
| Accumulated net realized loss on investments and foreign currency transactions (Note 1) | (957,141,658) |
|
| Net unrealized appreciation of investments and assets and liabilities in foreign currencies | 202,694,200 |
|
| Total — Representing net assets applicable to capital shares outstanding | $3,092,552,420 |
| |
| (Continued on next page) | |
25
Statement of assets and liabilities (Continued)
| |
| COMPUTATION OF NET ASSET VALUE AND OFFERING PRICE | |
|
| Net asset value and redemption price per class A share | |
| ($2,768,712,943 divided by 57,580,778 shares) | $48.08 |
|
| Offering price per class A share (100/94.25 of $48.08)* | $51.01 |
|
| Net asset value and offering price per class B share ($114,376,524 divided by 2,771,017 shares)** | $41.28 |
|
| Net asset value and offering price per class C share ($46,324,547 divided by 1,057,506 shares)** | $43.81 |
|
| Net asset value and redemption price per class M share ($48,154,208 divided by 1,098,484 shares) | $43.84 |
|
| Offering price per class M share (100/96.50 of $43.84)* | $45.43 |
|
| Net asset value, offering price and redemption price per class R share | |
| ($6,132,485 divided by 130,161 shares) | $47.11 |
|
| Net asset value, offering price and redemption price per class Y share | |
| ($108,851,713 divided by 2,160,976 shares) | $50.37 |
|
* On single retail sales of less than $50,000. On sales of $50,000 or more the offering price is reduced.
** Redemption price per share is equal to net asset value less any applicable contingent deferred sales charge.
The accompanying notes are an integral part of these financial statements.
26
Statement of operations Six months ended 12/31/11 (Unaudited)
| |
| INVESTMENT INCOME | |
|
| Dividends (net of foreign tax of $572,710) | $21,179,658 |
|
| Interest (including interest income of $11,023 from investments in affiliated issuers) (Note 6) | 44,649 |
|
| Securities lending (Note 1) | 530,988 |
|
| Total investment income | 21,755,295 |
| |
| EXPENSES | |
|
| Compensation of Manager (Note 2) | 8,251,239 |
|
| Investor servicing fees (Note 2) | 5,506,263 |
|
| Custodian fees (Note 2) | 11,566 |
|
| Trustee compensation and expenses (Note 2) | 140,190 |
|
| Administrative services (Note 2) | 46,252 |
|
| Distribution fees — Class A (Note 2) | 3,602,930 |
|
| Distribution fees — Class B (Note 2) | 629,921 |
|
| Distribution fees — Class C (Note 2) | 243,149 |
|
| Distribution fees — Class M (Note 2) | 192,745 |
|
| Distribution fees — Class R (Note 2) | 14,975 |
|
| Other | 583,774 |
|
| Total expenses | 19,223,004 |
| | |
| Expense reduction (Note 2) | (197,106) |
|
| Net expenses | 19,025,898 |
| | |
| Net investment income | 2,729,397 |
|
| |
| Net realized gain on investments (Notes 1 and 3) | 49,583,830 |
|
| Net realized loss on swap contracts (Note 1) | (414,572) |
|
| Net realized loss on futures contracts (Note 1) | (72,651) |
|
| Net realized gain on foreign currency transactions (Note 1) | 1,920,447 |
|
| Net realized gain on written options (Notes 1 and 3) | 437,882 |
|
| Net unrealized appreciation of assets and liabilities in foreign currencies during the period | 2,023,664 |
|
| Net unrealized depreciation of investments, futures contracts, written options and swap | |
| contracts during the period | (444,539,869) |
|
| Net loss on investments | (391,061,269) |
| | |
| Net decrease in net assets resulting from operations | $(388,331,872) |
|
The accompanying notes are an integral part of these financial statements.
27
Statement of changes in net assets
| | |
| INCREASE (DECREASE) IN NET ASSETS | Six months ended 12/31/11* | Year ended 6/30/11 |
|
| Operations: | | |
| Net investment income (loss) | $2,729,397 | $(5,695,226) |
|
| Net realized gain on investments | | |
| and foreign currency transactions | 51,454,936 | 301,948,572 |
|
| Net unrealized appreciation (depreciation) of investments | | |
| and assets and liabilities in foreign currencies | (442,516,205) | 664,969,405 |
|
| Net increase (decrease) in net assets resulting | | |
| from operations | (388,331,872) | 961,222,751 |
|
| Increase in capital from settlement payments (Note 7) | 6,058,769 | 1,049,949 |
|
| Redemption fees (Note 1) | — | 279 |
|
| Increase (decrease) from capital share transactions | | |
| (Notes 4 and 8) | (204,691,957) | 591,568,850 |
|
| Total increase (decrease) in net assets | (586,965,060) | 1,553,841,829 |
| |
| NET ASSETS | | |
|
| Beginning of period | 3,679,517,480 | 2,125,675,651 |
|
| End of period (including undistributed net investment | | |
| income of $3,031,813 and $302,416, respectively) | $3,092,552,420 | $3,679,517,480 |
| |
| *Unaudited | | |
The accompanying notes are an integral part of these financial statements.
28
|
| This page left blank intentionally. |
29
Financial highlights (For a common share outstanding throughout the period)
| | | | | | | | | | | | | | |
| INVESTMENT OPERATIONS: | | | | LESS DISTRIBUTIONS: | | | | | RATIOS AND SUPPLEMENTAL DATA: | |
|
| | | | | | | | | | | | | Ratio | Ratio | |
| | | | Net realized | | | | | | | | | of expenses | of net investment | |
| | Net asset value, | | and unrealized | Total from | From | | | | | Total return | Net assets, | to average | income (loss) | Portfolio |
| | beginning | Net investment | gain (loss) | investment | net investment | Total | Redemption | Non-recurring | Net asset value, | at net asset | end of period | net assets | to average | turnover |
| Period ended | of period | income (loss) a | on investments | operations | income | distributions | fees | reimbursements | end of period | value (%) b | (in thousands) | (%) c | net assets (%) | (%) |
|
| Class A | | | | | | | | | | | | | | |
| December 31, 2011** | $53.66 | .05 | (5.72) | (5.67) | — | — | — | .09 m,n,o | $48.08 | (10.40)* | $2,768,713 | .58* | .11* | 20* |
| June 30, 2011 | 39.22 | (.06) | 14.49 | 14.43 | — | — | — e | .01 j,k,l | 53.66 | 36.82 | 3,283,602 | 1.22 | (.13) | 69 |
| June 30, 2010 | 35.33 | (.03) | 3.97 | 3.94 | (.05) | (.05) | — e | — | 39.22 | 11.15 | 1,835,862 | 1.29 d | (.06) d | 71 |
| June 30, 2009 | 48.18 | .07 | (12.92) h | (12.85) | — | — | — e | — e,i | 35.33 | (26.67) h | 1,882,896 | 1.30 d | .19 d | 72 |
| June 30, 2008 | 53.15 | (.13) | (4.84) g | (4.97) | — | — | — e | — | 48.18 | (9.35) | 2,585,412 | 1.21 d | (.25) d | 126 |
| June 30, 2007 | 45.72 | (.08) | 7.51 | 7.43 | — | — | — e | — | 53.15 | 16.25 | 3,418,392 | 1.17 d | (.15) d | 91 |
|
| Class B | | | | | | | | | | | | | | |
| December 31, 2011** | $46.24 | (.12) | (4.92) | (5.04) | — | — | — | .08 m,n,o | $41.28 | (10.73)* | $114,377 | .96* | (.28)* | 20* |
| June 30, 2011 | 34.05 | (.38) | 12.56 | 12.18 | — | — | — e | .01 j,k,l | 46.24 | 35.80 | 152,335 | 1.97 | (.88) | 69 |
| June 30, 2010 | 30.87 | (.29) | 3.47 | 3.18 | — | — | — e | — | 34.05 | 10.30 | 110,983 | 2.04 d | (.80) d | 71 |
| June 30, 2009 | 42.40 | (.19) | (11.34) h | (11.53) | — | — | — e | — e,i | 30.87 | (27.19) h | 152,758 | 2.05 d | (.57) d | 72 |
| June 30, 2008 | 47.13 | (.45) | (4.28) g | (4.73) | — | — | — e | — | 42.40 | (10.04) | 278,414 | 1.96 d | (1.01) d | 126 |
| June 30, 2007 | 40.85 | (.40) | 6.68 | 6.28 | — | — | — e | — | 47.13 | 15.37 | 482,812 | 1.92 d | (.91) d | 91 |
|
| Class C | | | | | | | | | | | | | | |
| December 31, 2011** | $49.07 | (.12) | (5.22) | (5.34) | — | — | — | .08 m,n,o | $43.81 | (10.72)* | $46,325 | .96* | (.27)* | 20* |
| June 30, 2011 | 36.13 | (.39) | 13.32 | 12.93 | — | — | — e | .01 j,k,l | 49.07 | 35.81 | 55,393 | 1.97 | (.88) | 69 |
| June 30, 2010 | 32.76 | (.31) | 3.68 | 3.37 | — | — | — e | — | 36.13 | 10.29 | 28,220 | 2.04 d | (.81) d | 71 |
| June 30, 2009 | 44.99 | (.14) | (12.09) h | (12.23) | — | — | — e | — e,i | 32.76 | (27.18) h | 29,060 | 2.05 d | (.55) d | 72 |
| June 30, 2008 | 50.01 | (.48) | (4.54) g | (5.02) | — | — | — e | — | 44.99 | (10.04) | 27,355 | 1.96 d | (1.00) d | 126 |
| June 30, 2007 | 43.34 | (.42) | 7.09 | 6.67 | — | — | — e | — | 50.01 | 15.39 | 35,776 | 1.92 d | (.91) d | 91 |
|
| Class M | | | | | | | | | | | | | | |
| December 31, 2011** | $49.05 | (.06) | (5.23) | (5.29) | — | — | — | .08 m,n,o | $43.84 | (10.62)* | $48,154 | .83* | (.14)* | 20* |
| June 30, 2011 | 36.02 | (.28) | 13.30 | 13.02 | — | — | — e | .01 j,k,l | 49.05 | 36.17 | 58,016 | 1.72 | (.63) | 69 |
| June 30, 2010 | 32.58 | (.21) | 3.65 | 3.44 | — | — | — e | — | 36.02 | 10.56 | 37,163 | 1.79 d | (.56) d | 71 |
| June 30, 2009 | 44.65 | (.09) | (11.98) h | (12.07) | — | — | — e | — e,i | 32.58 | (27.03) h | 38,379 | 1.80 d | (.31) d | 72 |
| June 30, 2008 | 49.50 | (.36) | (4.49) g | (4.85) | — | — | — e | — | 44.65 | (9.80) | 50,256 | 1.71 d | (.76) d | 126 |
| June 30, 2007 | 42.79 | (.30) | 7.01 | 6.71 | — | — | — e | — | 49.50 | 15.68 | 70,140 | 1.67 d | (.66) d | 91 |
|
| Class R | | | | | | | | | | | | | | |
| December 31, 2011** | $52.64 | (.01) | (5.61) | (5.62) | — | — | — | .09 m,n,o | $47.11 | (10.51)* | $6,132 | .71* | (.01)* | 20* |
| June 30, 2011 | 38.57 | (.17) | 14.23 | 14.06 | — | — | — e | .01 j,k,l | 52.64 | 36.48 | 6,553 | 1.47 | (.38) | 69 |
| June 30, 2010 | 34.79 | (.14) | 3.92 | 3.78 | — | — | — e | — | 38.57 | 10.87 | 3,039 | 1.54 d | (.33) d | 71 |
| June 30, 2009 | 47.56 | (.02) | (12.75) h | (12.77) | — | — | — e | — e,i | 34.79 | (26.85) h | 2,026 | 1.55 d | (.06) d | 72 |
| June 30, 2008 | 52.60 | (.23) | (4.81) g | (5.04) | — | — | — e | — | 47.56 | (9.58) | 3,215 | 1.46 d | (.47) d | 126 |
| June 30, 2007 | 45.37 | (.18) | 7.41 | 7.23 | — | — | — e | — | 52.60 | 15.94 | 1,257 | 1.42 d | (.36) d | 91 |
|
| Class Y | | | | | | | | | | | | | | |
| December 31, 2011** | $56.14 | .12 | (5.98) | (5.86) | — | — | — | .09 m,n,o | $50.37 | (10.28)* | $108,852 | .45* | .23* | 20* |
| June 30, 2011 | 40.93 | .04 | 15.16 | 15.20 | — | — | — e | .01 j,k,l | 56.14 | 37.16 | 123,618 | .97 | .14 | 69 |
| June 30, 2010 | 36.86 | .09 | 4.12 | 4.21 | (.14) | (.14) | — e | — | 40.93 | 11.41 | 110,409 | 1.04 d | .21 d | 71 |
| June 30, 2009 | 50.13 | .16 | (13.43) h | (13.27) | — | — | — e | — e,i | 36.86 | (26.47) h | 249,218 | 1.05 d | .44 d | 72 |
| June 30, 2008 | 55.17 | — e | (5.04) g | (5.04) | — | — | — e | — | 50.13 | (9.13) | 351,511 | .96 d | — d,f | 126 |
| June 30, 2007 | 47.34 | .05 | 7.78 | 7.83 | — | — | — e | — | 55.17 | 16.54 | 415,886 | .92 d | .10 d | 91 |
|
See notes to financial highlights at the end of this section.
The accompanying notes are an integral part of these financial statements.
Financial highlights (Continued)
* Not annualized.
** Unaudited.
a Per share net investment income (loss) has been determined on the basis of the weighted average number of shares outstanding during the period.
b Total return assumes dividend reinvestment and does not reflect the effect of sales charges.
c Includes amounts paid through expense offset and/or brokerage/service arrangements (Note 2).
d Reflects an involuntary contractual expense limitation in effect during the period. For periods prior to June 30, 2010 certain fund expenses were waived in connection with the fund’s investment in Putnam Prime Money Market Fund. As a result of such limitation and/or waivers, the expenses of each class reflect a reduction of the following amounts:
| |
| | Percentage of |
| | average net assets |
|
| June 30, 2010 | <0.01% |
|
| June 30, 2009 | 0.01 |
|
| June 30, 2008 | <0.01 |
|
| June 30, 2007 | <0.01 |
|
e Amount represents less than $0.01 per share.
f Amount represents less than 0.01%.
g Reflects a non-recurring reimbursement pursuant to a settlement between the Securities and Exchange Commission (the SEC) and Knight Securities, L.P. which amounted to $0.06 per share.
h Reflects a non-recurring litigation payment received by the fund from Enron Corporation which amounted to the following amounts per share outstanding on December 29, 2008:
| |
| | Per share |
|
| Class A | $0.30 |
|
| Class B | 0.26 |
|
| Class C | 0.28 |
|
| Class M | 0.28 |
|
| Class R | 0.29 |
|
| Class Y | 0.31 |
|
This payment resulted in an increase to total returns of 0.62% for the year ended June 30, 2009.
i Reflects a non-recurring reimbursement pursuant to a settlement between the SEC and Millennium Partners, L.P., Millennium Management, L.L.C., and Millennium International Management, L.L.C., which amounted to less than $0.01 per share outstanding as of June 23, 2009.
j Reflects a non-recurring reimbursement pursuant to a settlement between the SEC and Zurich Capital Markets, Inc. which amounted to less than $0.01 per share outstanding on December 21, 2010.
k Reflects a non-recurring reimbursement pursuant to a settlement between the SEC and Prudential Securities, Inc. which amounted to $0.01 per share outstanding on May 16, 2011.
l Reflects a non-recurring reimbursement related to short-term trading related lawsuits, which amounted to less than $0.01 per share outstanding on May 11, 2011 (Note 7).
The accompanying notes are an integral part of these financial statements.
32
Financial highlights (Continued)
m Reflects a non-recurring reimbursement related to restitution amounts in connection with a distribution plan approved by the SEC which amounted to the following amounts per share outstanding on July 21, 2011 (Note 7):
| |
| | Per share |
|
| Class A | $0.09 |
|
| Class B | 0.07 |
|
| Class C | 0.08 |
|
| Class M | 0.08 |
|
| Class R | 0.08 |
|
| Class Y | 0.09 |
|
n Reflects a non-recurring reimbursement pursuant to a settlement between the SEC and Southwest Securities, Inc. which amounted to less than $0.01 per share outstanding on August 22, 2011.
o Reflects a non-recurring reimbursement pursuant to a settlement between the SEC and Canadian Imperial Holdings, Inc./CIBC World Markets Corp. which amounted to less than $0.01 per share outstanding on November 29, 2011.
The accompanying notes are an integral part of these financial statements.
33
Notes to financial statements 12/31/11 (Unaudited)
Note 1: Significant accounting policies
Putnam Multi-Cap Growth Fund (the fund) is a Massachusetts business trust, which is registered under the Investment Company Act of 1940, as amended, as a diversified open-end management investment company. The fund seeks long-term capital appreciation by investing mainly in common stocks of U. S. companies of any size, with a focus on growth stocks. Growth stocks are issued by companies whose earnings are expected to grow faster than those of similar firms, and whose business growth and other characteristics may lead to an increase in stock price.
The fund offers class A, class B, class C, class M, class R and class Y shares. Class A and class M shares are sold with a maximum front-end sales charge of 5.75% and 3.50%, respectively, and generally do not pay a contingent deferred sales charge. Class B shares, which convert to class A shares after approximately eight years, do not pay a front-end sales charge and are subject to a contingent deferred sales charge if those shares are redeemed within six years of purchase. Class C shares have a one-year 1.00% contingent deferred sales charge and do not convert to class A shares. Class R shares, which are not available to all investors, are sold at net asset value. The expenses for class A, class B, class C, class M and class R shares may differ based on the distribution fee of each class, which is identified in Note 2. Class Y shares, which are sold at net asset value, are generally subject to the same expenses as class A, class B, class C, class M and class R shares, but do not bear a distribution fee. Class Y shares are not available to all investors.
Prior to August 2, 2010, a 1.00% redemption fee applied to certain shares that were redeemed (either by selling or exchanging into another fund) within 7 days of purchase. The redemption fee was accounted for as an addition to paid-in-capital. Effective August 2, 2010, this redemption fee no longer applies to shares redeemed.
Investment income, realized and unrealized gains and losses and expenses of the fund are borne pro-rata based on the relative net assets of each class to the total net assets of the fund, except that each class bears expenses unique to that class (including the distribution fees applicable to such classes). Each class votes as a class only with respect to its own distribution plan or other matters on which a class vote is required by law or determined by the Trustees. If the fund were liquidated, shares of each class would receive their pro-rata share of the net assets of the fund. In addition, the Trustees declare separate dividends on each class of shares.
In the normal course of business, the fund enters into contracts that may include agreements to indemnify another party under given circumstances. The fund’s maximum exposure under these arrangements is unknown as this would involve future claims that may be, but have not yet been, made against the fund. However, the fund’s management team expects the risk of material loss to be remote.
The following is a summary of significant accounting policies consistently followed by the fund in the preparation of its financial statements. The preparation of financial statements is in conformity with accounting principles generally accepted in the United States of America and requires management to make estimates and assumptions that affect the reported amounts of assets and liabilities in the financial statements and the reported amounts of increases and decreases in net assets from operations. Actual results could differ from those estimates. Subsequent events after the Statement of assets and liabilities date through the date that the financial statements were issued have been evaluated in the preparation of the financial statements. Unless otherwise noted, the “reporting period” represents the period from July 1, 2011 through December 31, 2011.
A) Security valuation Investments for which market quotations are readily available are valued at the last reported sales price on their principal exchange, or official closing price for certain markets, and are classified as Level 1 securities. If no sales are reported, as in the case of some securities traded over-the-counter, a security is valued at its last reported bid price and is generally categorized as a Level 2 security.
Investments in other open-end investment companies, which are classified as Level 1 securities, are based on their net asset value (NAV). The NAV of an investment company equals the total value of its assets less its liabilities and divided by the number of its outstanding shares. Shares are only valued as of the close of regular trading on the New York Stock Exchange each day that the exchange is open.
Many securities markets and exchanges outside the U.S. close prior to the close of the New York Stock Exchange and therefore the closing prices for securities in such markets or on such exchanges may not fully reflect events that occur after such close but before the close of the New York Stock Exchange. Accordingly, on certain days, the fund will fair value foreign equity securities taking into account multiple factors including movements in the
34
U.S. securities markets, currency valuations and comparisons to the valuation of American Depository Receipts, exchange-traded funds and futures contracts. These securities, which will generally represent a transfer from a Level 1 to a Level 2 security, will be classified as Level 2. The number of days on which fair value prices will be used will depend on market activity and it is possible that fair value prices will be used by the fund to a significant extent. At the close of the reporting period, fair value pricing was used for certain foreign securities in the portfolio. Securities quoted in foreign currencies, if any, are translated into U.S. dollars at the current exchange rate.
To the extent a pricing service or dealer is unable to value a security or provides a valuation that Putnam Investment Management, LLC (Putnam Management), the fund’s manager, an indirect wholly-owned subsidiary of Putnam Investments, LLC, does not believe accurately reflects the security’s fair value, the security will be valued at fair value by Putnam Management. Certain investments, including certain restricted and illiquid securities and derivatives, are also valued at fair value following procedures approved by the Trustees. These valuations consider such factors as significant market or specific security events such as interest rate or credit quality changes, various relationships with other securities, discount rates, U.S. Treasury, U.S. swap and credit yields, index levels, convexity exposures and recovery rates. These securities are classified as Level 2 or as Level 3 depending on the priority of the significant inputs.
Such valuations and procedures are reviewed periodically by the Trustees. The fair value of securities is generally determined as the amount that the fund could reasonably expect to realize from an orderly disposition of such securities over a reasonable period of time. By its nature, a fair value price is a good faith estimate of the value of a security in a current sale and does not reflect an actual market price, which may be different by a material amount.
B) Security transactions and related investment income Security transactions are recorded on the trade date (the date the order to buy or sell is executed). Gains or losses on securities sold are determined on the identified cost basis.
Interest income is recorded on the accrual basis. Dividend income, net of applicable withholding taxes, is recognized on the ex-dividend date except that certain dividends from foreign securities, if any, are recognized as soon as the fund is informed of the ex-dividend date. Non-cash dividends, if any, are recorded at the fair market value of the securities received. Dividends representing a return of capital or capital gains, if any, are reflected as a reduction of cost and/or as a realized gain.
All premiums/discounts are amortized/accreted on a yield-to-maturity basis.
C) Foreign currency translation The accounting records of the fund are maintained in U.S. dollars. The market value of foreign securities, currency holdings, and other assets and liabilities is recorded in the books and records of the fund after translation to U.S. dollars based on the exchange rates on that day. The cost of each security is determined using historical exchange rates. Income and withholding taxes are translated at prevailing exchange rates when earned or incurred. The fund does not isolate that portion of realized or unrealized gains or losses resulting from changes in the foreign exchange rate on investments from fluctuations arising from changes in the market prices of the securities. Such gains and losses are included with the net realized and unrealized gain or loss on investments. Net realized gains and losses on foreign currency transactions represent net realized exchange gains or losses on closed forward currency contracts, disposition of foreign currencies, currency gains and losses realized between the trade and settlement dates on securities transactions and the difference between the amount of investment income and foreign withholding taxes recorded on the fund’s books and the U.S. dollar equivalent amounts actually received or paid. Net unrealized appreciation and depreciation of assets and liabilities in foreign currencies arise from changes in the value of open forward currency contracts and assets and liabilities other than investments at the period end, resulting from changes in the exchange rate. Investments in foreign securities involve certain risks, including those related to economic instability, unfavorable political developments, and currency fluctuations, not present with domestic investments. The fund may be subject to taxes imposed by governments of countries in which it invests. Such taxes are generally based on either income or gains earned or repatriated. The fund accrues and applies such taxes to net investment income, net realized gains and net unrealized gains as income and/or capital gains are earned. In some cases, the fund may be entitled to reclaim all or a portion of such taxes, and such reclaim amounts, if any, are reflected as an asset on the fund’s books. In many cases, however, the fund may not receive such amounts for an extended period of time, depending on the country of investment.
D) Futures contracts The fund uses futures contracts to equitize cash.
The potential risk to the fund is that the change in value of futures contracts may not correspond to the change in value of the hedged instruments. In addition, losses may arise from changes in the value of the underlying instruments if there is an illiquid secondary market for the contracts, if interest or exchange rates move unexpectedly
35
or if the counterparty to the contract is unable to perform. With futures, there is minimal counterparty credit risk to the fund since futures are exchange traded and the exchange’s clearinghouse, as counterparty to all exchange traded futures, guarantees the futures against default. Risks may exceed amounts recognized on the Statement of assets and liabilities. When the contract is closed, the fund records a realized gain or loss equal to the difference between the value of the contract at the time it was opened and the value at the time it was closed.
Futures contracts are valued at the quoted daily settlement prices established by the exchange on which they trade. The fund and the broker agree to exchange an amount of cash equal to the daily fluctuation in the value of the futures contract. Such receipts or payments are known as “variation margin.”
Futures contracts outstanding at period end, if any, are listed after the fund’s portfolio. The fund had an average number of contracts of approximately 90 on futures contracts for the reporting period.
E) Options contracts The fund uses options contracts to enhance the return on a security owned.
The potential risk to the fund is that the change in value of options contracts may not correspond to the change in value of the hedged instruments. In addition, losses may arise from changes in the value of the underlying instruments if there is an illiquid secondary market for the contracts, if interest or exchange rates move unexpectedly or if the counterparty to the contract is unable to perform. Realized gains and losses on purchased options are included in realized gains and losses on investment securities. If a written call option is exercised, the premium originally received is recorded as an addition to sales proceeds. If a written put option is exercised, the premium originally received is recorded as a reduction to the cost of investments.
Exchange traded options are valued at the last sale price or, if no sales are reported, the last bid price for purchased options and the last ask price for written options. Options traded over-the-counter are valued using prices supplied by dealers.
Written option contracts outstanding at period end, if any, are listed after the fund’s portfolio. See Note 3 for the volume of written options contracts activity for the reporting period. The fund had an average contract amount of approximately 1,200,000 on purchased options contracts for the reporting period.
F) Forward currency contracts The fund buys and sells forward currency contracts, which are agreements between two parties to buy and sell currencies at a set price on a future date. These contracts are used to hedge foreign exchange risk.
The U.S. dollar value of forward currency contracts is determined using current forward currency exchange rates supplied by a quotation service. The market value of the contract will fluctuate with changes in currency exchange rates. The contract is marked to market daily and the change in market value is recorded as an unrealized gain or loss. The fund records a realized gain or loss equal to the difference between the value of the contract at the time it was opened and the value at the time it was closed when the contract matures or by delivery of the currency. The fund could be exposed to risk if the value of the currency changes unfavorably, if the counterparties to the contracts are unable to meet the terms of their contracts or if the fund is unable to enter into a closing position. Risks may exceed amounts recognized on the Statement of assets and liabilities.
Forward currency contracts outstanding at period end, if any, are listed after the fund’s portfolio. Outstanding forward currency contracts at the close of the reporting period are indicative of the volume of activity during the reporting period.
G) Total return swap contracts The fund entered into total return swap contracts, which are arrangements to exchange a market linked return for a periodic payment, both based on a notional principal amount to gain exposure to specific sectors/industries.
To the extent that the total return of the security, index or other financial measure underlying the transaction exceeds or falls short of the offsetting interest rate obligation, the fund will receive a payment from or make a payment to the counterparty. Total return swap contracts are marked to market daily based upon quotations from an independent pricing service or market makers and the change, if any, is recorded as an unrealized gain or loss. Payments received or made are recorded as realized gains or losses. Certain total return swap contracts may include extended effective dates. Payments related to these swap contracts are accrued based on the terms of the contract. The fund could be exposed to credit or market risk due to unfavorable changes in the fluctuation of interest rates or in the price of the underlying security or index, the possibility that there is no liquid market for these agreements or that the counterparty may default on its obligation to perform. The fund’s maximum risk of loss from counterparty risk is the fair value of the contract. This risk may be mitigated by having a master
36
netting arrangement between the fund and the counterparty. Risk of loss may exceed amounts recognized on the Statement of assets and liabilities.
Total return swap contracts outstanding at period end, if any, are listed after the fund’s portfolio. The fund had an average notional amount of approximately $7,400,000 on total return swap contracts for the reporting period.
H) Master agreements The fund is a party to ISDA (International Swaps and Derivatives Association, Inc.) Master Agreements (Master Agreements) with certain counterparties that govern over-the-counter derivative and foreign exchange contracts entered into from time to time. The Master Agreements may contain provisions regarding, among other things, the parties’ general obligations, representations, agreements, collateral requirements, events of default and early termination. With respect to certain counterparties, in accordance with the terms of the Master Agreements, collateral posted to the fund is held in a segregated account by the fund’s custodian and with respect to those amounts which can be sold or repledged, are presented in the fund’s portfolio. Collateral posted to the fund which cannot be sold or repledged totaled $2,223,587 at the close of the reporting period.
Collateral pledged by the fund is segregated by the fund’s custodian and identified in the fund’s portfolio. Collateral can be in the form of cash or debt securities issued by the U.S. Government or related agencies or other securities as agreed to by the fund and the applicable counterparty. Collateral requirements are determined based on the fund’s net position with each counterparty.
Termination events applicable to the fund may occur upon a decline in the fund’s net assets below a specified threshold over a certain period of time. Termination events applicable to counterparties may occur upon a decline in the counterparty’s long-term and short-term credit ratings below a specified level. In each case, upon occurrence, the other party may elect to terminate early and cause settlement of all derivative and foreign exchange contracts outstanding, including the payment of any losses and costs resulting from such early termination, as reasonably determined by the terminating party. Any decision by one or more of the fund’s counterparties to elect early termination could impact the fund’s future derivative activity.
At the close of the reporting period, the fund had a net liability position of $60,013 on derivative contracts subject to the Master Agreements. There was no collateral posted by the fund.
I) Securities lending The fund may lend securities, through its agent, to qualified borrowers in order to earn additional income. The loans are collateralized by cash in an amount at least equal to the market value of the securities loaned. The market value of securities loaned is determined daily and any additional required collateral is allocated to the fund on the next business day. The risk of borrower default will be borne by the fund’s agent; the fund will bear the risk of loss with respect to the investment of the cash collateral. Income from securities lending is included in investment income on the Statement of operations. Cash collateral is invested in Putnam Cash Collateral Pool, LLC, a limited liability company managed by an affiliate of Putnam Management. Investments in Putnam Cash Collateral Pool, LLC are valued at its closing net asset value each business day. There are no management fees charged to Putnam Cash Collateral Pool, LLC. At the close of the reporting period, the value of securities loaned amounted to $294,084,583. Certain of these securities were sold prior to the close of the reporting period and are included in Receivable for investments sold on the Statement of assets and liabilities. The fund received cash collateral of $302,455,920.
J) Interfund lending The fund, along with other Putnam funds, may participate in an interfund lending program pursuant to an exemptive order issued by the Securities and Exchange Commission (the SEC). This program allows the fund to borrow from or lend to other Putnam funds that permit such transactions. Interfund lending transactions are subject to each fund’s investment policies and borrowing and lending limits. Interest earned or paid on the interfund lending transaction will be based on the average of certain current market rates. During the reporting period, the fund did not utilize the program.
K) Line of credit The fund participates, along with other Putnam funds, in a $325 million unsecured committed line of credit and a $185 million unsecured uncommitted line of credit, both provided by State Street Bank and Trust Company (State Street). Borrowings may be made for temporary or emergency purposes, including the funding of shareholder redemption requests and trade settlements. Interest is charged to the fund based on the fund’s borrowing at a rate equal to the Federal Funds rate plus 1.25% for the committed line of credit and the Federal Funds rate plus 1.30% for the uncommitted line of credit. A closing fee equal to 0.02% of the committed line of credit and $50,000 for the uncommitted line of credit has been paid by the participating funds. In addition, a commitment fee of 0.13% per annum on any unutilized portion of the committed line of credit is allocated to the participating funds based on their relative net assets and paid quarterly. During the reporting period, the fund had no borrowings against these arrangements.
37
L) Federal taxes It is the policy of the fund to distribute all of its taxable income within the prescribed time period and otherwise comply with the provisions of the Internal Revenue Code of 1986, as amended (the Code), applicable to regulated investment companies. It is also the intention of the fund to distribute an amount sufficient to avoid imposition of any excise tax under Section 4982 of the Code. The fund is subject to the provisions of Accounting Standards Codification ASC 740 Income Taxes (ASC 740). ASC 740 sets forth a minimum threshold for financial statement recognition of the benefit of a tax position taken or expected to be taken in a tax return. The fund did not have a liability to record for any unrecognized tax benefits in the accompanying financial statements. No provision has been made for federal taxes on income, capital gains or unrealized appreciation on securities held nor for excise tax on income and capital gains. Each of the fund’s federal tax returns for the prior three fiscal years remains subject to examination by the Internal Revenue Service.
At June 30, 2011, the fund had a capital loss carryover of $1,006,960,326 available to the extent allowed by the Code to offset future net capital gain, if any. The amounts of the combined carryovers and the expiration dates are:
| | | |
| Loss carryover |
| Short-term | Long-term | Total | Expiration |
| $154,110 | $— | $154,110 | June 30, 2013 |
|
| 12,395,807 | — | 12,395,807 | June 30, 2015 |
|
| 371,652,411 | — | 371,652,411 | June 30, 2016 |
|
| 231,246,246 | — | 231,246,246 | June 30, 2017 |
|
| 391,511,752 | — | 391,511,752 | June 30, 2018 |
|
Under the recently enacted Regulated Investment Company Modernization Act of 2010, the fund will be permitted to carry forward capital losses incurred in taxable years beginning after December 22, 2010 for an unlimited period. However, any losses incurred during those future years will be required to be utilized prior to the losses incurred in pre-enactment tax years. As a result of this ordering rule, pre-enactment capital loss carryforwards may be more likely to expire unused. Additionally, post-enactment capital losses that are carried forward will retain their character as either short-term or long-term capital losses rather than being considered all short-term as under previous law.
The aggregate identified cost on a tax basis is $3,212,412,279, resulting in gross unrealized appreciation and depreciation of $454,544,038 and $254,359,679, respectively, or net unrealized appreciation of $200,184,359.
M) Distributions to shareholders Distributions to shareholders from net investment income are recorded by the fund on the ex-dividend date. Distributions from capital gains, if any, are recorded on the ex-dividend date and paid at least annually. The amount and character of income and gains to be distributed are determined in accordance with income tax regulations, which may differ from generally accepted accounting principles. Dividend sources are estimated at the time of declaration. Actual results may vary. Any non-taxable return of capital cannot be determined until final tax calculations are completed after the end of the fund’s fiscal year. Reclassifications are made to the fund’s capital accounts to reflect income and gains available for distribution (or available capital loss carryovers) under income tax regulations.
Note 2: Management fee, administrative services and other transactions
The fund pays Putnam Management a management fee (base fee) (based on the fund’s average net assets and computed and paid monthly) at annual rates that may vary based on the average of the aggregate net assets of most open-end funds, as defined in the fund’s management contract, sponsored by Putnam Management. Such annual rates may vary as follows:
| |
| 0.710% | of the first $5 billion, |
| 0.660% | of the next $5 billion, |
| 0.610% | of the next $10 billion, |
| 0.560% | of the next $10 billion, |
| 0.510% | of the next $50 billion, |
| 0.490% | of the next $50 billion, |
| 0.480% | of the next $100 billion and |
| 0.475% | of any excess thereafter. |
38
In addition, beginning with the fund’s thirteenth complete calendar month of operation under the management contract (February 2011), the monthly management fee consists of the monthly base fee plus or minus a performance adjustment for the month. The performance adjustment is determined based on performance over the thirty-six month period then ended or, if the management contract has not yet been effective for thirty-six complete calendar months, the period from the date the management contract became effective to the end of the month for which the fee adjustment is being computed. Each month, the performance adjustment is calculated by multiplying the performance adjustment rate and the fund’s average net assets over the performance period and the result is divided by twelve. The resulting dollar amount is added to, or subtracted from the base fee for that month. The performance adjustment rate is equal to 0.03 multiplied by the difference between the fund’s annualized performance (measured by the fund’s class A shares) and the annualized performance of the Russell 3000 Growth Index, each measured over the performance period. The maximum annualized performance adjustment rates are +/–0.12%. The monthly base fee is determined based on the fund’s average net assets for the month, while the performance adjustment is determined based on the fund’s average net assets over the performance period of up to thirty-six months. This means it is possible that, if the fund underperforms significantly over the performance period, and the fund’s assets have declined significantly over that period, the negative performance adjustment may exceed the base fee. In this event, Putnam Management would make a payment to the fund.
Because the performance adjustment is based on the fund’s performance relative to its applicable benchmark index, and not its absolute performance, the performance adjustment could increase Putnam Management’s fee even if the fund’s shares lose value during the performance period provided that the fund outperformed its benchmark index, and could decrease Putnam Management’s fee even if the fund’s shares increase in value during the performance period provided that the fund underperformed its benchmark index.
For the reporting period, the base fee represented an effective rate (excluding the impact from any expense waivers in effect) of 0.29% of the fund’s average net assets before a decrease of $864,190 (0.03% of the fund’s average net assets) based on performance.
Putnam Management has contractually agreed, through June 30, 2012, to waive fees or reimburse the fund’s expenses to the extent necessary to limit the cumulative expenses of the fund, exclusive of brokerage, interest, taxes, investment-related expenses, extraordinary expenses and payments under the fund’s investor servicing contract, investment management contract and distribution plans, on a fiscal year-to-date basis to an annual rate of 0.20% of the fund’s average net assets over such fiscal year-to-date period. During the reporting period, the fund’s expenses were not reduced as a result of this limit.
Putnam Investments Limited (PIL), an affiliate of Putnam Management, is authorized by the Trustees to manage a separate portion of the assets of the fund as determined by Putnam Management from time to time. Putnam Management pays a quarterly sub-management fee to PIL for its services at an annual rate of 0.35% of the average net assets of the portion of the fund managed by PIL.
The fund reimburses Putnam Management an allocated amount for the compensation and related expenses of certain officers of the fund and their staff who provide administrative services to the fund. The aggregate amount of all such reimbursements is determined annually by the Trustees.
Custodial functions for the fund’s assets are provided by State Street. Custody fees are based on the fund’s asset level, the number of its security holdings and transaction volumes.
Putnam Investor Services, Inc., an affiliate of Putnam Management, provides investor servicing agent functions to the fund. Putnam Investor Services, Inc. received fees for investor servicing based on the fund’s retail asset level, the number of shareholder accounts in the fund and the level of defined contribution plan assets in the fund. Investor servicing fees will not exceed an annual rate of 0.375% of the fund’s average net assets. The amounts incurred for investor servicing agent functions during the reporting period are included in Investor servicing fees in the Statement of operations.
The fund has entered into expense offset arrangements with Putnam Investor Services, Inc. and State Street whereby Putnam Investor Services, Inc.’s and State Street’s fees are reduced by credits allowed on cash balances. The fund also reduced expenses through brokerage/service arrangements. For the reporting period, the fund’s expenses were reduced by $3,971 under the expense offset arrangements and by $193,135 under the brokerage/service arrangements.
Each independent Trustee of the fund receives an annual Trustee fee, of which $2,383, as a quarterly retainer, has been allocated to the fund, and an additional fee for each Trustees meeting attended. Trustees also are reimbursed for expenses they incur relating to their services as Trustees.
39
The fund has adopted a Trustee Fee Deferral Plan (the Deferral Plan) which allows the Trustees to defer the receipt of all or a portion of Trustees fees payable on or after July 1, 1995. The deferred fees remain invested in certain Putnam funds until distribution in accordance with the Deferral Plan.
The fund has adopted an unfunded noncontributory defined benefit pension plan (the Pension Plan) covering all Trustees of the fund who have served as a Trustee for at least five years and were first elected prior to 2004. Benefits under the Pension Plan are equal to 50% of the Trustee’s average annual attendance and retainer fees for the three years ended December 31, 2005. The retirement benefit is payable during a Trustee’s lifetime, beginning the year following retirement, for the number of years of service through December 31, 2006. Pension expense for the fund is included in Trustee compensation and expenses in the Statement of operations. Accrued pension liability is included in Payable for Trustee compensation and expenses in the Statement of assets and liabilities. The Trustees have terminated the Pension Plan with respect to any Trustee first elected after 2003.
The fund has adopted distribution plans (the Plans) with respect to its class A, class B, class C, class M and class R shares pursuant to Rule 12b–1 under the Investment Company Act of 1940. The purpose of the Plans is to compensate Putnam Retail Management Limited Partnership, a wholly-owned subsidiary of Putnam Investments, LLC and Putnam Retail Management GP, Inc., for services provided and expenses incurred in distributing shares of the fund. The Plans provide for payments by the fund to Putnam Retail Management Limited Partnership at an annual rate of up to 0.35%, 1.00%, 1.00%, 1.00% and 1.00% of the average net assets attributable to class A, class B, class C, class M and class R shares, respectively. The Trustees have approved payment by the fund at an annual rate of 0.25%, 1.00%, 1.00%, 0.75% and 0.50% of the average net assets attributable to class A, class B, class C, class M and class R shares, respectively.
For the reporting period, Putnam Retail Management Limited Partnership, acting as underwriter, received net commissions of $65,563 and $1,361 from the sale of class A and class M shares, respectively, and received $61,348 and $771 in contingent deferred sales charges from redemptions of class B and class C shares, respectively.
A deferred sales charge of up to 1.00% and 0.65% is assessed on certain redemptions of class A and class M shares, respectively. For the reporting period, Putnam Retail Management Limited Partnership, acting as underwriter, received $39 and no monies on class A and class M redemptions, respectively.
Note 3: Purchases and sales of securities
During the reporting period, cost of purchases and proceeds from sales of investment securities other than short-term investments aggregated $651,056,054 and $881,623,389, respectively. There were no purchases or proceeds from sales of long-term U.S. government securities.
Written option transactions during the reporting period are summarized as follows:
| | |
| | Written equity option | Written equity option |
| | contract amounts | premiums received |
|
| Written options outstanding at the | | |
| beginning of the reporting period | 913,624 | $429,403 |
|
| Options opened | 23,487 | 58,718 |
|
| Options exercised | — | — |
|
| Options expired | — | — |
|
| Options closed | (937,111) | (488,121) |
|
| Written options outstanding at the | | |
| end of the reporting period | — | $— |
|
40
Note 4: Capital shares
At the close of the reporting period, there was an unlimited number of shares of beneficial interest authorized. Transactions in capital shares were as follows:
| | | | |
| | Six months ended 12/31/11 | Year ended 6/30/11 |
|
| Class A | Shares | Amount | Shares | Amount |
|
| Shares sold | 922,920 | $44,803,097 | 2,365,480 | $117,385,826 |
|
| Shares issued in connection with | | | | |
| reinvestment of distributions | — | — | — | — |
|
| Shares issued in connection with the | | | | |
| merger of Putnam Vista Fund | — | — | 21,970,683 | 981,498,528 |
|
| | 922,920 | 44,803,097 | 24,336,163 | 1,098,884,354 |
|
| Shares repurchased | (4,533,895) | (219,252,355) | (9,957,238) | (493,000,787) |
|
| Net increase (decrease) | (3,610,975) | $(174,449,258) | 14,378,925 | $605,883,567 |
|
| |
| | Six months ended 12/31/11 | Year ended 6/30/11 |
|
| Class B | Shares | Amount | Shares | Amount |
|
| Shares sold | 90,608 | $3,734,732 | 227,402 | $9,671,410 |
|
| Shares issued in connection with | | | | |
| reinvestment of distributions | — | — | — | — |
|
| Shares issued in connection with the | | | | |
| merger of Putnam Vista Fund | — | — | 1,494,855 | 57,871,961 |
|
| | 90,608 | 3,734,732 | 1,722,257 | 67,543,371 |
|
| Shares repurchased | (614,141) | (25,871,602) | (1,687,508) | (71,847,388) |
|
| Net increase (decrease) | (523,533) | $(22,136,870) | 34,749 | $(4,304,017) |
|
| |
| | Six months ended 12/31/11 | Year ended 6/30/11 |
|
| Class C | Shares | Amount | Shares | Amount |
|
| Shares sold | 25,453 | $1,134,569 | 64,565 | $2,921,624 |
|
| Shares issued in connection with | | | | |
| reinvestment of distributions | — | — | — | — |
|
| Shares issued in connection with the | | | | |
| merger of Putnam Vista Fund | — | — | 488,294 | 20,063,359 |
|
| | 25,453 | 1,134,569 | 552,859 | 22,984,983 |
|
| Shares repurchased | (96,753) | (4,241,439) | (205,016) | (9,265,892) |
|
| Net increase (decrease) | (71,300) | $(3,106,870) | 347,843 | $13,719,091 |
|
| |
| | Six months ended 12/31/11 | Year ended 6/30/11 |
|
| Class M | Shares | Amount | Shares | Amount |
|
| Shares sold | 60,604 | $2,629,209 | 64,474 | $2,854,426 |
|
| Shares issued in connection with | | | | |
| reinvestment of distributions | — | — | — | — |
|
| Shares issued in connection with the | | | | |
| merger of Putnam Vista Fund | — | — | 397,127 | 16,277,012 |
|
| | 60,604 | 2,629,209 | 461,601 | 19,131,438 |
|
| Shares repurchased | (145,041) | (6,335,801) | (310,296) | (14,208,414) |
|
| Net increase (decrease) | (84,437) | $(3,706,592) | 151,305 | $4,923,024 |
|
41
| | | | |
| | Six months ended 12/31/11 | Year ended 6/30/11 |
|
| Class R | Shares | Amount | Shares | Amount |
|
| Shares sold | 18,452 | $820,305 | 22,655 | $1,107,144 |
|
| Shares issued in connection with | | | | |
| reinvestment of distributions | — | — | — | — |
|
| Shares issued in connection with the | | | | |
| merger of Putnam Vista Fund | — | — | 54,165 | 2,378,405 |
|
| | 18,452 | 820,305 | 76,820 | 3,485,549 |
|
| Shares repurchased | (12,763) | (608,199) | (31,150) | (1,521,273) |
|
| Net increase | 5,689 | $212,106 | 45,670 | $1,964,276 |
|
| |
| | Six months ended 12/31/11 | Year ended 6/30/11 |
|
| Class Y | Shares | Amount | Shares | Amount |
|
| Shares sold | 180,588 | $9,646,584 | 308,142 | $16,005,411 |
|
| Shares issued in connection with | | | | |
| reinvestment of distributions | — | — | — | — |
|
| Shares issued in connection with the | | | | |
| merger of Putnam Vista Fund | — | — | 861,908 | 40,207,331 |
|
| | 180,588 | 9,646,584 | 1,170,050 | 56,212,742 |
|
| Shares repurchased | (221,456) | (11,151,057) | (1,655,850) | (86,829,833) |
|
| Net decrease | (40,868) | $(1,504,473) | (485,800) | $(30,617,091) |
|
Note 5: Summary of derivative activity
The following is a summary of the market values of derivative instruments as of the close of the reporting period:
| | | | |
| Market values of derivative instruments as of the close of the reporting period | |
|
| |
| | Asset derivatives | Liability derivatives |
|
| Derivatives not | | | | |
| accounted for as | Statement of | | Statement of | |
| hedging instruments | assets and | | assets and | |
| under ASC 815 | liabilities location | Market value | liabilities location | Market value |
|
| Foreign exchange | | | | |
| contracts | Receivables | $1,405,491 | Payables | $— |
|
| | Investments, | | | |
| | Receivables, Net | | Payables, Net | |
| | assets — Unrealized | | assets — Unrealized | |
| | appreciation/ | | appreciation/ | |
| Equity contracts | (depreciation) | 734,533* | (depreciation) | 90,825* |
|
| Total | | $2,140,024 | | $90,825 |
|
* Includes cumulative appreciation/depreciation of futures contracts as reported in the fund’s portfolio. Only current day’s variation margin is reported within the Statement of assets and liabilities.
42
The following is a summary of realized and change in unrealized gains or losses of derivative instruments on the Statement of operations for the reporting period (see Note 1):
Amount of realized gain or (loss) on derivatives recognized in net gain or (loss) on investments
| | | | | |
| Derivatives not | | | | | |
| accounted for as | | | Forward | | |
| hedging instruments | | | currency | | |
| under ASC 815 | Options | Futures | contracts | Swaps | Total |
|
| Foreign exchange | | | | | |
| contracts | $— | $— | $1,924,285 | $— | $1,924,285 |
|
| Equity contracts | (640,194) | (72,651) | — | (414,572) | $(1,127,417) |
|
| Total | $(640,194) | $(72,651) | $1,924,285 | $(414,572) | $796,868 |
|
Change in unrealized appreciation or (depreciation) on derivatives recognized in net gain or (loss) on investments
| | | | | | |
| Derivatives not | | | | | | |
| accounted for as | | | | Forward | | |
| hedging instruments | | | | currency | | |
| under ASC 815 | Options | Warrants† | Futures | contracts | Swaps | Total |
|
| Foreign exchange | | | | | | |
| contracts | $— | $— | $— | $2,047,901 | $— | $2,047,901 |
|
| Equity contracts | (735,587) | (674,826) | 215,502 | — | (400,007) | $(1,594,918) |
|
| Total | $(735,587) | $(674,826) | $215,502 | $2,047,901 | $(400,007) | $452,983 |
|
��� For the reporting period, the transaction volume for warrants was minimal.
Note 6: Investment in Putnam Money Market Liquidity Fund
The fund invested in Putnam Money Market Liquidity Fund, an open-end management investment company managed by Putnam Management. Investments in Putnam Money Market Liquidity Fund are valued at its closing net asset value each business day. Income distributions earned by the fund are recorded as interest income in the Statement of operations and totaled $11,023 for the reporting period. During the reporting period, cost of purchases and proceeds of sales of investments in Putnam Money Market Liquidity Fund aggregated $295,585,438 and $242,759,452, respectively. Management fees charged to Putnam Money Market Liquidity Fund have been waived by Putnam Management.
Note 7: Regulatory matters and litigation
In late 2003 and 2004, Putnam Management settled charges brought by the Securities and Exchange Commission (the SEC) and the Massachusetts Securities Division in connection with excessive short-term trading in Putnam funds. In July 2011, the fund recorded a receivable of $5,864,257 related to restitution amounts in connection with a distribution plan approved by the SEC. This amount, which was received by the fund in December 2011, is reported as part of Increase in capital from settlement payments on the Statement of changes in net assets. These allegations and related matters have served as the general basis for certain lawsuits, including purported class action lawsuits against Putnam Management and, in a limited number of cases, some Putnam funds. In May 2011, the fund received a payment of $157,666 related to settlement of those lawsuits. This amount is reported as a part of Increase in capital from settlement payments on the Statement of changes in net assets. Putnam Management has agreed to bear any costs incurred by the Putnam funds as a result of these matters.
Note 8: Acquisition of Putnam Vista Fund
On September 27, 2010, the fund issued 21,970,683, 1,494,855, 488,294, 397,127, 54,165 and 861,908 class A, class B, class C, class M, class R and class Y shares, respectively, for 96,718,304, 6,785,681, 2,156,292, 1,769,923, 238,471 and 3,764,946 class A, class B, class C, class M, class R and class Y shares of Putnam Vista Fund to acquire that fund’s net assets in a tax-free exchange. Putnam Management recommended, and the Board of Trustees approved, the merger transaction because it believed that it was in the best interests of shareholders of Putnam Vista Fund to be invested in a fund with more flexibility to invest in attractive companies regardless of capitalization size. Putnam Management believed that this flexibility would increase the likelihood of delivering strong investment performance over the long-term. In addition, after the merger, Putnam Vista Fund shareholders would be invested
43
in a larger fund with a lower expense ratio. The investment portfolio of Putnam Vista Fund, with a fair value of $931,784,799 and an identified cost of $870,278,890 at September 24, 2010, was the principal asset acquired by the fund. The net assets of the fund and Putnam Vista Fund on September 24, 2010, were $2,348,440,346 and $1,118,296,596, respectively. On September 24, 2010, Putnam Vista Fund had accumulated net investment loss of $1,279,092, accumulated net realized loss of $1,846,121,583 and unrealized appreciation of $65,891,595. The aggregate net assets of the fund immediately following the acquisition were $3,466,736,942.
Assuming the acquisition had been completed on July 1, 2010, the fund’s pro forma results of operations for the reporting period are as follows:
| |
| Net investment loss | $(6,981,864) |
| Net gain on investments | $1,132,847,222 |
| Net increase in net assets resulting from operations | $1,125,865,358 |
Information presented in the Statement of changes in net assets reflect only the operations of Putnam Multi-Cap Growth Fund.
Note 9: Market and credit risk
In the normal course of business, the fund trades financial instruments and enters into financial transactions where risk of potential loss exists due to changes in the market (market risk) or failure of the contracting party to the transaction to perform (credit risk). The fund may be exposed to additional credit risk that an institution or other entity with which the fund has unsettled or open transactions will default.
Note 10: New accounting pronouncement
In May 2011, the Financial Accounting Standards Board (FASB) issued Accounting Standards Update (ASU) 2011-04 “Fair Value Measurements and Disclosures (Topic 820) - Amendments to Achieve Common Fair Value Measurement and Disclosure Requirements in U.S. GAAP and IFRS”. ASU 2011-04 amends FASB Topic 820 “Fair Value Measurement” and seeks to develop common requirements for measuring fair value and for disclosing information about fair value measurements in accordance with GAAP. ASU 2011-04 is effective for fiscal years and interim periods beginning after December 15, 2011. Putnam Management is currently evaluating the application of ASU 2011-04 and its impact, if any, on the fund’s financial statements.
44
Fund information
Founded over 70 years ago, Putnam Investments was built around the concept that a balance between risk and reward is the hallmark of a well-rounded financial program. We manage over 100 funds across income, value, blend, growth, asset allocation, absolute return, and global sector categories.
| | |
| Investment Manager | Paul L. Joskow | Mark C. Trenchard |
| Putnam Investment | Elizabeth T. Kennan | Vice President and |
| Management, LLC | Kenneth R. Leibler | BSA Compliance Officer |
| One Post Office Square | Robert E. Patterson | |
| Boston, MA 02109 | George Putnam, III | Robert T. Burns |
| | Robert L. Reynolds | Vice President and |
| Investment Sub-Manager | W. Thomas Stephens | Chief Legal Officer |
| Putnam Investments Limited | | |
| 57–59 St James’s Street | Officers | James P. Pappas |
| London, England SW1A 1LD | Robert L. Reynolds | Vice President |
| | President | |
| Marketing Services | | Judith Cohen |
| Putnam Retail Management | Jonathan S. Horwitz | Vice President, Clerk and |
| One Post Office Square | Executive Vice President, | Assistant Treasurer |
| Boston, MA 02109 | Principal Executive | |
| | Officer, Treasurer and | Michael Higgins |
| Custodian | Compliance Liaison | Vice President, Senior Associate |
| State Street Bank | | Treasurer and Assistant Clerk |
| and Trust Company | Steven D. Krichmar | |
| | Vice President and | Nancy E. Florek |
| Legal Counsel | Principal Financial Officer | Vice President, Assistant Clerk, |
| Ropes & Gray LLP | | Assistant Treasurer and |
| | Janet C. Smith | Proxy Manager |
| Trustees | Vice President, Assistant | |
| Jameson A. Baxter, Chair | Treasurer and Principal | Susan G. Malloy |
| Ravi Akhoury | Accounting Officer | Vice President and |
| Barbara M. Baumann | | Assistant Treasurer |
| Charles B. Curtis | Robert R. Leveille | |
| Robert J. Darretta | Vice President and | |
| John A. Hill | Chief Compliance Officer | |
| | | |
This report is for the information of shareholders of Putnam Multi-Cap Growth Fund. It may also be used as sales literature when preceded or accompanied by the current prospectus, the most recent copy of Putnam’s Quarterly Performance Summary, and Putnam’s Quarterly Ranking Summary. For more recent performance, please visit putnam.com. Investors should carefully consider the investment objectives, risks, charges, and expenses of a fund, which are described in its prospectus. For this and other information or to request a prospectus or summary prospectus, call 1-800-225-1581 toll free. Please read the prospectus carefully before investing. The fund’s Statement of Additional Information contains additional information about the fund’s Trustees and is available without charge upon request by calling 1-800-225-1581.
| |
| Item 3. Audit Committee Financial Expert: |
| |
| Item 4. Principal Accountant Fees and Services: |
| |
| Item 5. Audit Committee of Listed Registrants |
| |
| Item 6. Schedule of Investments: |
| |
| The registrant’s schedule of investments in unaffiliated issuers is included in the report to shareholders in Item 1 above. |
| |
| Item 7. Disclosure of Proxy Voting Policies and Procedures For Closed-End Management Investment Companies: |
| |
| Item 8. Portfolio Managers of Closed-End Investment Companies |
| |
| Item 9. Purchases of Equity Securities by Closed-End Management Investment Companies and Affiliated Purchasers: |
| |
| Item 10. Submission of Matters to a Vote of Security Holders: |
| |
| Item 11. Controls and Procedures: |
| |
| (a) The registrant’s principal executive officer and principal financial officer have concluded, based on their evaluation of the effectiveness of the design and operation of the registrant’s disclosure controls and procedures as of a date within 90 days of the filing date of this report, that the design and operation of such procedures are generally effective to provide reasonable assurance that information required to be disclosed by the registrant in this report is recorded, processed, summarized and reported within the time periods specified in the Commission’s rules and forms. |
| |
| (b) Changes in internal control over financial reporting: Not applicable |
| |
| (a)(2) Separate certifications for the principal executive officer and principal financial officer of the registrant as required by Rule 30a-2(a) under the Investment Company Act of 1940, as amended, are filed herewith. |
| |
| (b) The certifications required by Rule 30a-2(b) under the Investment Company Act of 1940, as amended, are filed herewith. |
| |
| Putnam Multi-Cap Growth Fund |
| |
| By (Signature and Title): |
| |
| /s/Janet C. Smith
Janet C. Smith
Principal Accounting Officer
|
| |
| Pursuant to the requirements of the Securities Exchange Act of 1934 and the Investment Company Act of 1940, this report has been signed below by the following persons on behalf of the registrant and in the capacities and on the dates indicated. |
| |
| By (Signature and Title): |
| |
| /s/Jonathan S. Horwitz
Jonathan S. Horwitz
Principal Executive Officer
|
| |
| By (Signature and Title): |
| |
| /s/Steven D. Krichmar
Steven D. Krichmar
Principal Financial Officer
|