CERTIFIED SHAREHOLDER REPORT OF REGISTERED MANAGEMENT INVESTMENT COMPANIES
Investment Company Act file number:
(811-06128)
Exact name of registrant as specified in charter:
Putnam Multi-Cap Growth Fund
Address of principal executive offices:
One Post Office Square, Boston, Massachusetts 02109
Name and address of agent for service:
Robert T. Burns, Vice President One Post Office Square Boston, Massachusetts 02109
Copy to:
Bryan Chegwidden, Esq. Ropes & Gray LLP 1211 Avenue of the Americas New York, New York 10036
Registrant’s telephone number, including area code:
(617) 292-1000
Date of fiscal year end:
June 30, 2015
Date of reporting period:
July 1, 2014 – December 31, 2014
Item 1. Report to Stockholders:
The following is a copy of the report transmitted to stockholders pursuant to Rule 30e-1 under the Investment Company Act of 1940:
Putnam Multi-Cap Growth Fund
Semiannual report 12 | 31 | 14
Message from the Trustees
1
About the fund
2
Performance snapshot
4
Interview with your fund’s portfolio manager
5
Your fund’s performance
10
Your fund’s expenses
12
Terms and definitions
14
Other information for shareholders
15
Financial statements
16
Consider these risks before investing: Investments in small and/or midsize companies increase the risk of greater price fluctuations. Growth stocks may be more susceptible to earnings disappointments, and the market may not favor growth-style investing. Stock prices may fall or fail to rise over time for several reasons, including general financial market conditions and factors related to a specific issuer or industry. You can lose money by investing in the fund.
Message from the Trustees
Dear Fellow Shareholder:
The falling price of oil has captured headlines in recent months and is having a sustained effect on markets and economies worldwide. Cheaper oil allows many consumers and businesses to shift spending to other priorities. At the same time, the decline reflects greater pessimism about global growth, and it is having a negative impact on the energy sector — not just in the United States, but wherever energy is a key export.
This change in the investing environment has contributed to an increase in market volatility. Although the U.S. economy continues to grow, economic challenges in Europe, China, and Japan are causing uncertainty.
Compared with recent years, we may see more tempered returns from equity and fixed-income markets. While a number of positive trends continue, including an improving housing market and a brighter employment situation, investors should also be alert to a possible increase in short-term interest rates that is widely expected to occur in 2015. History suggests that rising rates could generate headwinds for markets.
In all types of market conditions, Putnam offers a wide range of flexible strategies. Our experienced investment teams employ new ways of thinking about building portfolios for both the opportunities and risks in today’s markets. In this dynamic environment, it may be an opportune time for you to meet with your financial advisor to ensure that your portfolio is properly aligned with your goals and tolerance for risk.
As always, thank you for investing with Putnam.
Respectfully yours,
Robert L. Reynolds President and Chief Executive Officer Putnam Investments
Jameson A. Baxter Chair, Board of Trustees
February 9, 2015
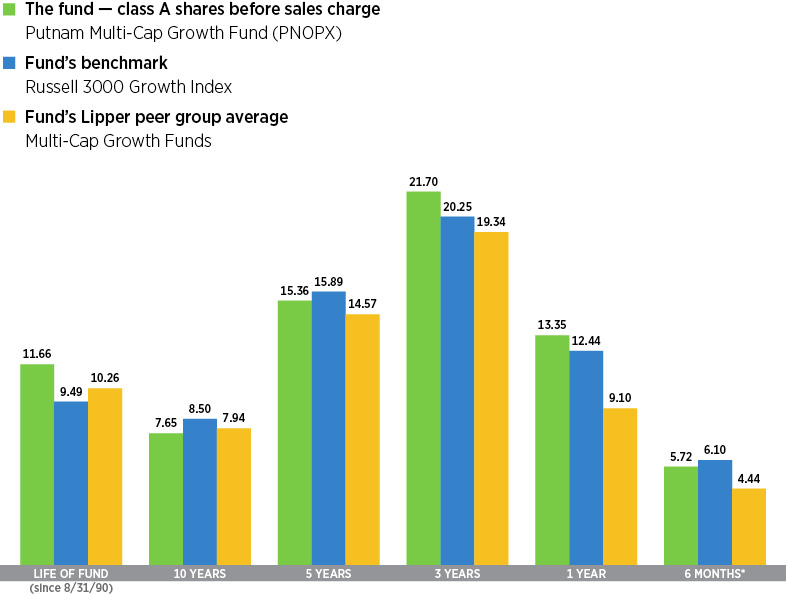
Performance snapshot
Annualized total return (%) comparison as of 12/31/14
Current performance may be lower or higher than the quoted past performance, which cannot guarantee future results. Share price, principal value, and return will fluctuate, and you may have a gain or a loss when you sell your shares. Performance of class A shares assumes reinvestment of distributions and does not account for taxes. Fund returns in the bar chart do not reflect a sales charge of 5.75%; had they, returns would have been lower. See pages 5 and 10–11 for additional performance information. For a portion of the periods, the fund had expense limitations, without which returns would have been lower. To obtain the most recent month-end performance, visit putnam.com.
* Returns for the six-month period are not annualized, but cumulative.
4 Multi-Cap Growth Fund
Interview with your fund’s portfolio manager
Robert M. Brookby
Rob, could you tell us about the investing environment for the six-month reporting period ended December 31, 2014?
After an extended period of relative tranquility for the U.S. stock market, volatility returned during this six-month period. The turbulence was most pronounced in October, when stocks declined nearly 10% in response to global geopolitical tensions, slowing growth in Europe and China, and falling oil prices. Stocks recovered by the end of October, but experienced declines again in December. The market quickly rebounded from those losses as well, and stocks ended the year in positive territory. At the close of 2014, the S&P 500 Index, a broad measure of U.S. stock performance, posted its third consecutive double-digit annual return.
The dominant theme for the period was energy — plummeting oil prices, severe weakness in energy stocks that are closely tied to the price of oil, and the resurgence of volatility in the broader market in response to these declines. The price of oil dropped more than 40% from June to December, when it hit a five-year low. The declines were largely in response to greater oil supplies combined with reduced energy demand.
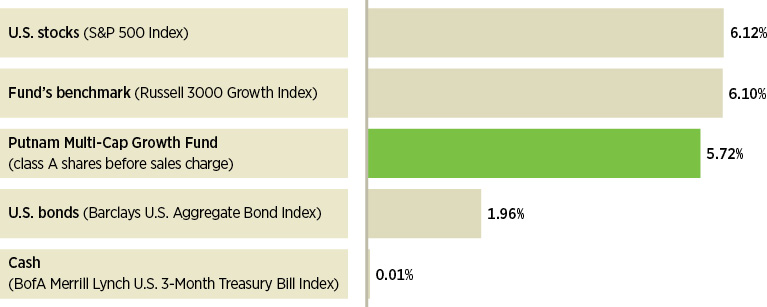
Broad market index and fund performance
This comparison shows your fund’s performance in the context of broad market indexes for the six months ended 12/31/14. See pages 4 and 10–11 for additional fund performance information. Index descriptions can be found on page 14.
Multi-Cap Growth Fund 5
How did the fund perform during the reporting period?
The fund delivered a positive return for the period but underperformed its benchmark, the Russell 3000 Growth Index. I am pleased to report that the fund outperformed the average return for funds in its Lipper peer group, Multi-Cap Growth Funds.
Can you provide examples of stocks or strategies that helped fund performance for the period?
One highlight in the fund’s portfolio was the stock of Alibaba Group Holding, the China-based e-commerce company whose $25 billion initial public offering [IPO] was the largest in history. We had been researching and following Alibaba for a while, and our analysts’ extensive knowledge of the company in advance of the IPO proved beneficial. While the IPO was certainly profitable, we also remain optimistic about the company’s long-term growth potential. As with any technology company, we will need to monitor it closely, but Alibaba appeared to have a commanding position in the marketplace at the close of 2014. It is one of a handful of Internet leaders in China, with a diverse business model that appears poised to capitalize on the growth potential in a population of 1.3 billion people.
Fund performance also benefited from our decision to not hold a position in technology giant IBM, a stock that underperformed as investors responded to its seemingly anemic growth prospects. I chose not to include IBM in the portfolio because I didn’t believe it offered the long-term growth potential I seek. Instead, among the large companies in the technology sector, I focused on those that I believe offer more promising revenue growth potential.
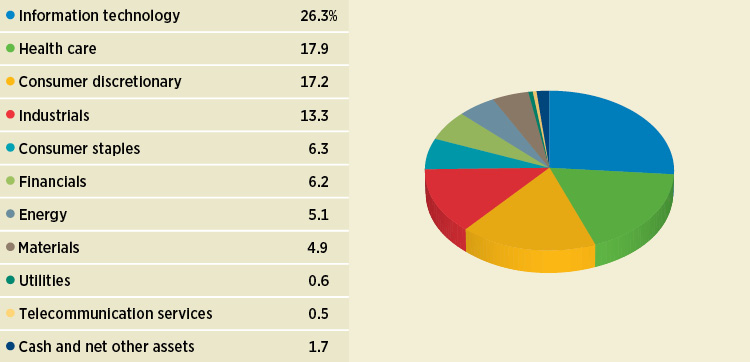
Sector allocations
Allocations are shown as a percentage of the fund’s net assets as of 12/31/14. Cash and net other assets, if any, represent the market value weights of cash, derivatives, short-term securities, and other unclassified assets in the portfolio. Summary information may differ from the portfolio schedule included in the financial statements due to the inclusion of derivative securities, any interest accruals, the exclusion of as-of trades, if any, and the use of different classifications of securities for presentation purposes. Holdings and allocations may vary over time.
6 Multi-Cap Growth Fund
“Volatility returned to the U.S. stock market after an extended period of relative tranquility.”
Rob Brookby
Another top performer for the period was the stock of Cubist Pharmaceuticals, a company that specializes in developing antibacterial drugs for use in hospitals. The stock advanced during the period, particularly after the announcement that Cubist was being acquired by Merck, the second-largest U.S. pharmaceutical company. We added Cubist to the portfolio because of the company’s expertise with products that are considered to be “scarce assets” — that is, few companies specialize in anti-infective treatments, giving Cubist an attractive growth profile, in our view. Cubist was no longer a holding in the portfolio at the close of the period.
What are some holdings that detracted from relative fund returns?
The top detractor for the period was the stock of technology giant Google, which declined in large part due to decelerating top-line growth. Also, the company’s profit margins have been pressured, particularly in areas outside of its search engine business. Google remained in the portfolio at the close of the period, as we believe it has an attractive valuation and continues to offer solid growth prospects over the longer term.
The stock of Melco Crown Entertainment, a casino developer and operator in Macao, China, also detracted from performance for the period. The gaming industry in China struggled considerably throughout 2014, as casino traffic slowed. Slowing economic growth and a crackdown on corruption in China discouraged many from visiting casinos throughout the year.
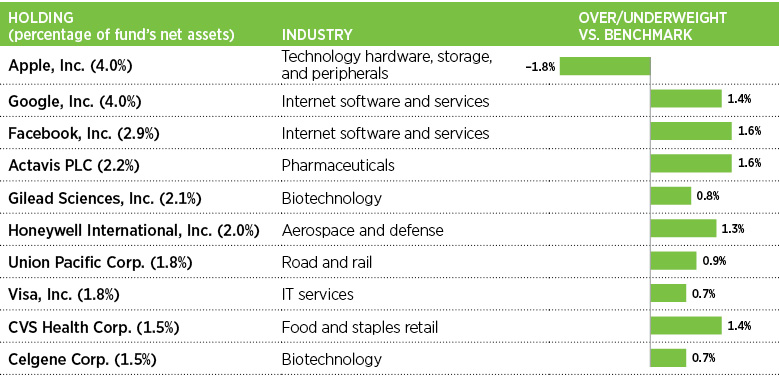
Top 10 holdings
This table shows the fund’s top 10 holdings by percentage of the fund’s net assets as of 12/31/14. Short-term holdings and derivatives, if any, are excluded. Holdings may vary over time.
Multi-Cap Growth Fund 7
Plunging oil prices took their toll on Halliburton and QEP Resources, two gas and oil exploration and production companies in the fund’s portfolio. Halliburton had been sold from the portfolio by the close of the period.
What role did derivatives play in the portfolio?
Although derivative investments were not a significant part of the portfolio, they did modestly affect performance during the period. Forward currency contracts, designed to hedge foreign exchange risk, had a positive impact on the portfolio’s performance. However, these gains were offset by total return swaps, which were designed to gain exposure to specific markets, countries, sectors, or industries.
As the fund enters the second half of its fiscal year, what is your outlook for the markets and the economy?
Heading into 2015, I believe one of the most significant issues is the relative performance of economies around the world. While it appears that the United States has achieved a self-sustaining recovery in its economy, weakness in other regions could have a negative effect on global financial markets in the year ahead.
In the United States, I believe a healing housing market, a brighter employment picture, and improving investor sentiment could contribute to the performance of U.S. stocks in the coming months. Overseas, however, the outlook is not as optimistic. China’s economic growth has been undeniably weaker than expected, while Europe’s economy has flatlined and is flirting with a recession and deflation. These conditions
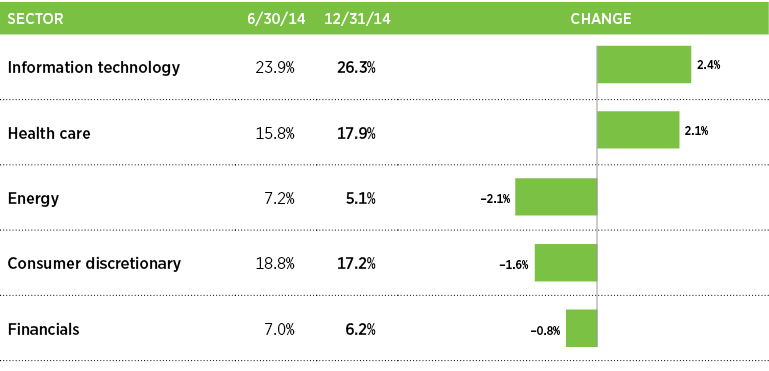
Comparison of top sector shifts
This chart shows the fund’s largest allocation shifts, by percentage, over the past six months. Allocations are shown as a percentage of the fund’s net assets. Current period summary information may differ from the portfolio schedule included in the financial statements due to the inclusion of derivative securities, any interest accruals, the exclusion of as-of trades, if any, and the use of different classifications of securities for presentation purposes. Holdings and allocations may vary over time.
8 Multi-Cap Growth Fund
bear monitoring, along with the likelihood of a hike in short-term interest rates in the United States sometime in 2015.
It is also important to consider the potential impact of weakened energy prices on U.S. financial markets. From the perspective of the U.S. consumer, plunging oil prices could have a positive effect. According to some estimates, today’s lower gasoline prices could save the average American household approximately $1,200 a year. I believe this bodes well for consumer spending and industries such as retail. At the same time, however, if oil prices stay low, I believe we will see a massive slowdown in oil production, which could have a negative impact on many businesses, particularly oil exploration and production companies and the firms that provide equipment to them.
As always, the key to my investment strategy is to employ disciplined fundamental research and analysis to find companies with fundamental strength, a competitive edge, and the potential to produce strong profits.
Thank you, Rob, for this fund update.
The views expressed in this report are exclusively those of Putnam Management and are subject to change. They are not meant as investment advice.
Please note that the holdings discussed in this report may not have been held by the fund for the entire period. Portfolio composition is subject to review in accordance with the fund’s investment strategy and may vary in the future. Current and future portfolio holdings are subject to risk.
Portfolio Manager Robert M. Brookby has an M.B.A. from Harvard Business School and a B.A. from Northwestern University. Rob joined Putnam in 2008 and has been in the investment industry since 1999.
IN THE NEWS
Citing deteriorating economic conditions in the eurozone and emerging markets, the World Bank recently reduced its outlook for global economic growth. The Washington-based institution expects the global growth rate to rise moderately, by 3.0% in 2015, below its earlier forecast of 3.4%. World Bank economists see plummeting oil prices, down more than 50% since June 2014, as having a mixed effect around the world. For the United States, the drop in oil prices has boosted consumer spending. As such, the bank increased its U.S. growth estimate by 0.2%, to 3.2%. Meanwhile, the bank’s economists noted that the oil price plunge was failing to generate growth in Europe and Japan, while moving major oil-exporting countries toward recession.
Multi-Cap Growth Fund 9
Your fund’s performance
This section shows your fund’s performance, price, and distribution information for periods ended December 31, 2014, the end of the first half of its current fiscal year. In accordance with regulatory requirements for mutual funds, we also include expense information taken from the fund’s current prospectus. Performance should always be considered in light of a fund’s investment strategy. Data represent past performance. Past performance does not guarantee future results. More recent returns may be less or more than those shown. Investment return and principal value will fluctuate, and you may have a gain or a loss when you sell your shares. Performance information does not reflect any deduction for taxes a shareholder may owe on fund distributions or on the redemption of fund shares. For the most recent month-end performance, please visit the Individual Investors section at putnam.com or call Putnam at 1-800-225-1581. Class R and Y shares are not available to all investors. See the Terms and Definitions section in this report for definitions of the share classes offered by your fund.
Fund performance Total return for periods ended 12/31/14
Class A
Class B
Class C
Class M
Class R
Class Y
(inception dates)
(8/31/90)
(3/1/93)
(7/26/99)
(12/1/94)
(1/21/03)
(7/19/94)
Before sales charge
After sales charge
Before CDSC
After CDSC
Before CDSC
After CDSC
Before sales charge
After sales charge
Net asset value
Net asset value
Annual average
(life of fund)
11.66%
11.39%
11.38%
11.38%
10.83%
10.83%
11.09%
10.93%
11.39%
11.90%
10 years
108.96
96.94
96.79
96.79
93.92
93.92
98.78
91.82
103.77
114.32
Annual average
7.65
7.01
7.00
7.00
6.85
6.85
7.11
6.73
7.38
7.92
5 years
104.32
92.57
96.84
94.84
96.79
96.79
99.29
92.32
101.77
106.94
Annual average
15.36
14.00
14.50
14.27
14.50
14.50
14.79
13.97
15.07
15.66
3 years
80.27
69.90
76.24
73.24
76.22
76.22
77.56
71.35
78.90
81.64
Annual average
21.70
19.32
20.79
20.10
20.79
20.79
21.09
19.66
21.39
22.01
1 year
13.35
6.83
12.51
7.63
12.50
11.52
12.80
8.85
13.08
13.64
6 months
5.72
–0.36
5.33
0.75
5.32
4.40
5.46
1.77
5.60
5.85
Current performance may be lower or higher than the quoted past performance, which cannot guarantee future results. After-sales-charge returns for class A and M shares reflect the deduction of the maximum 5.75% and 3.50% sales charge, respectively, levied at the time of purchase. Class B share returns after contingent deferred sales charge (CDSC) reflect the applicable CDSC, which is 5% in the first year, declining over time to 1% in the sixth year, and is eliminated thereafter. Class C share returns after CDSC reflect a 1% CDSC for the first year that is eliminated thereafter. Class R and Y shares have no initial sales charge or CDSC. Performance for class B, C, M, R, and Y shares before their inception is derived from the historical performance of class A shares, adjusted for the applicable sales charge (or CDSC) and the higher operating expenses for such shares, except for class Y shares, for which 12b-1 fees are not applicable.
Recent performance may have benefited from one or more legal settlements.
For a portion of the periods, the fund had expense limitations, without which returns would have been lower.
Class B share performance reflects conversion to class A shares after eight years.
10 Multi-Cap Growth Fund
Comparative index returns For periods ended 12/31/14
Russell 3000 Growth Index
Lipper Multi-Cap Growth Funds category average*
Annual average (life of fund)
9.49%
10.26%
10 years
126.05
116.90
Annual average
8.50
7.94
5 years
109.01
98.16
Annual average
15.89
14.57
3 years
73.88
70.30
Annual average
20.25
19.34
1 year
12.44
9.10
6 months
6.10
4.44
Index and Lipper results should be compared with fund performance before sales charge, before CDSC, or at net asset value.
* Over the 6-month, 1-year, 3-year, 5-year, 10-year, and life-of-fund periods ended 12/31/14, there were 575, 557, 474, 417, 269, and 42 funds, respectively, in this Lipper category.
Fund price and distribution information For the six-month period ended 12/31/14
Distributions
Class A
Class B
Class C
Class M
Class R
Class Y
Number
1
1
1
1
1
1
Income
$0.237
—
—
—
$0.005
$0.442
Capital gains — Long-term
8.500
$8.500
$8.500
$8.500
8.500
8.500
Capital gains — Short-term
1.123
1.123
1.123
1.123
1.123
1.123
Total
$9.860
$9.623
$9.623
$9.623
$9.628
$10.065
Share value
Before sales charge
After sales charge
Net asset value
Net asset value
Before sales charge
After sales charge
Net asset value
Net asset value
6/30/14
$81.46
$86.43
$69.07
$73.30
$73.81
$76.49
$79.65
$85.51
12/31/14
76.32
80.98
63.19
67.64
68.28
70.76
74.54
80.51
The classification of distributions, if any, is an estimate. Before-sales-charge share value and current dividend rate for class A and M shares, if applicable, do not take into account any sales charge levied at the time of purchase. After-sales-charge share value, current dividend rate, and current 30-day SEC yield, if applicable, are calculated assuming that the maximum sales charge (5.75% for class A shares and 3.50% for class M shares) was levied at the time of purchase. Final distribution information will appear on your year-end tax forms.
Multi-Cap Growth Fund 11
Your fund’s expenses
As a mutual fund investor, you pay ongoing expenses, such as management fees, distribution fees (12b-1 fees), and other expenses. Using the following information, you can estimate how these expenses affect your investment and compare them with the expenses of other funds. You may also pay one-time transaction expenses, including sales charges (loads) and redemption fees, which are not shown in this section and would have resulted in higher total expenses. For more information, see your fund’s prospectus or talk to your financial representative.
Expense ratios
Class A
Class B
Class C
Class M
Class R
Class Y
Total annual operating expenses for the fiscal year ended 6/30/14
1.04%
1.79%
1.79%
1.54%
1.29%
0.79%
Annualized expense ratio for the six-month period ended 12/31/14*
1.05%
1.80%
1.80%
1.55%
1.30%
0.80%
Fiscal-year expense information in this table is taken from the most recent prospectus, is subject to change, and may differ from that shown for the annualized expense ratio and in the financial highlights of this report.
Expenses are shown as a percentage of average net assets.
* Includes an increase of 0.02% from annualizing the performance fee adjustment for the six months ended 12/31/14.
Expenses per $1,000
The following table shows the expenses you would have paid on a $1,000 investment in the fund from July 1, 2014, to December 31, 2014. It also shows how much a $1,000 investment would be worth at the close of the period, assuming actual returns and expenses.
Class A
Class B
Class C
Class M
Class R
Class Y
Expenses paid per $1,000*†
$5.44
$9.32
$9.32
$8.03
$6.74
$4.15
Ending value (after expenses)
$1,057.20
$1,053.30
$1,053.20
$1,054.60
$1,056.00
$1,058.50
* Expenses for each share class are calculated using the fund’s annualized expense ratio for each class, which represents the ongoing expenses as a percentage of average net assets for the six months ended 12/31/14. The expense ratio may differ for each share class.
† Expenses are calculated by multiplying the expense ratio by the average account value for the period; then multiplying the result by the number of days in the period; and then dividing that result by the number of days in the year.
12 Multi-Cap Growth Fund
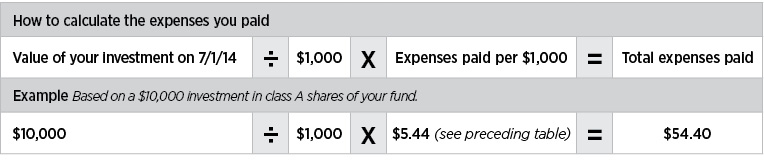
Estimate the expenses you paid
To estimate the ongoing expenses you paid for the six months ended December 31, 2014, use the following calculation method. To find the value of your investment on July 1, 2014, call Putnam at 1-800-225-1581.
Compare expenses using the SEC’s method
The Securities and Exchange Commission (SEC) has established guidelines to help investors assess fund expenses. Per these guidelines, the following table shows your fund’s expenses based on a $1,000 investment, assuming a hypothetical 5% annualized return. You can use this information to compare the ongoing expenses (but not transaction expenses or total costs) of investing in the fund with those of other funds. All mutual fund shareholder reports will provide this information to help you make this comparison. Please note that you cannot use this information to estimate your actual ending account balance and expenses paid during the period.
Class A
Class B
Class C
Class M
Class R
Class Y
Expenses paid per $1,000*†
$5.35
$9.15
$9.15
$7.88
$6.61
$4.08
Ending value (after expenses)
$1,019.91
$1,016.13
$1,016.13
$1,017.39
$1,018.65
$1,021.17
* Expenses for each share class are calculated using the fund’s annualized expense ratio for each class, which represents the ongoing expenses as a percentage of average net assets for the six months ended 12/31/14. The expense ratio may differ for each share class.
† Expenses are calculated by multiplying the expense ratio by the average account value for the six-month period; then multiplying the result by the number of days in the six-month period; and then dividing that result by the number of days in the year.
Multi-Cap Growth Fund 13
Terms and definitions
Important terms
Total return shows how the value of the fund’s shares changed over time, assuming you held the shares through the entire period and reinvested all distributions in the fund.
Before sales charge, or net asset value, is the price, or value, of one share of a mutual fund, without a sales charge. Before-sales-charge figures fluctuate with market conditions, and are calculated by dividing the net assets of each class of shares by the number of outstanding shares in the class.
After sales charge is the price of a mutual fund share plus the maximum sales charge levied at the time of purchase. After-sales-charge performance figures shown here assume the 5.75% maximum sales charge for class A shares and 3.50% for class M shares.
Contingent deferred sales charge (CDSC) is generally a charge applied at the time of the redemption of class B or C shares and assumes redemption at the end of the period. Your fund’s class B CDSC declines over time from a 5% maximum during the first year to 1% during the sixth year. After the sixth year, the CDSC no longer applies. The CDSC for class C shares is 1% for one year after purchase.
Share classes
Class A shares are generally subject to an initial sales charge and no CDSC (except on certain redemptions of shares bought without an initial sales charge).
Class B shares are not subject to an initial sales charge and may be subject to a CDSC.
Class C shares are not subject to an initial sales charge and are subject to a CDSC only if the shares are redeemed during the first year.
Class M shares have a lower initial sales charge and a higher 12b-1 fee than class A shares and no CDSC (except on certain redemptions of shares bought without an initial sales charge).
Class R shares are not subject to an initial sales charge or CDSC and are available only to certain employer-sponsored retirement plans.
Class Y shares are not subject to an initial sales charge or CDSC, and carry no 12b-1 fee. They are generally only available to corporate and institutional clients and clients in other approved programs.
Comparative indexes
Barclays U.S. Aggregate Bond Index is an unmanaged index of U.S. investment-grade fixed-income securities.
BofA Merrill Lynch U.S. 3-Month Treasury Bill Index is an unmanaged index that seeks to measure the performance of U.S. Treasury bills available in the marketplace.
Russell 3000 Growth Index is an unmanaged index of those companies in the broad-market Russell 3000 Index chosen for their growth orientation.
S&P 500 Index is an unmanaged index of common stock performance.
Indexes assume reinvestment of all distributions and do not account for fees. Securities and performance of a fund and an index will differ. You cannot invest directly in an index.
Lipper is a third-party industry-ranking entity that ranks mutual funds. Its rankings do not reflect sales charges. Lipper rankings are based on total return at net asset value relative to other funds that have similar current investment styles or objectives as determined by Lipper. Lipper may change a fund’s category assignment at its discretion. Lipper category averages reflect performance trends for funds within a category.
14 Multi-Cap Growth Fund
Other information for shareholders
Important notice regarding delivery of shareholder documents
In accordance with Securities and Exchange Commission (SEC) regulations, Putnam sends a single copy of annual and semiannual shareholder reports, prospectuses, and proxy statements to Putnam shareholders who share the same address, unless a shareholder requests otherwise. If you prefer to receive your own copy of these documents, please call Putnam at 1-800-225-1581, and Putnam will begin sending individual copies within 30 days.
Proxy voting
Putnam is committed to managing our mutual funds in the best interests of our shareholders. The Putnam funds’ proxy voting guidelines and procedures, as well as information regarding how your fund voted proxies relating to portfolio securities during the 12-month period ended June 30, 2014, are available in the Individual Investors section of putnam.com, and on the SEC’s website, www.sec.gov. If you have questions about finding forms on the SEC’s website, you may call the SEC at 1-800-SEC-0330. You may also obtain the Putnam funds’ proxy voting guidelines and procedures at no charge by calling Putnam’s Shareholder Services at 1-800-225-1581.
Fund portfolio holdings
The fund will file a complete schedule of its portfolio holdings with the SEC for the first and third quarters of each fiscal year on Form N-Q. Shareholders may obtain the fund’s Form N-Q on the SEC’s website at www.sec.gov. In addition, the fund’s Form N-Q may be reviewed and copied at the SEC’s Public Reference Room in Washington, D.C. You may call the SEC at 1-800-SEC-0330 for information about the SEC’s website or the operation of the Public Reference Room.
Trustee and employee fund ownership
Putnam employees and members of the Board of Trustees place their faith, confidence, and, most importantly, investment dollars in Putnam mutual funds. As of December 31, 2014, Putnam employees had approximately $483,000,000 and the Trustees had approximately $140,000,000 invested in Putnam mutual funds. These amounts include investments by the Trustees’ and employees’ immediate family members as well as investments through retirement and deferred compensation plans.
Multi-Cap Growth Fund 15
Financial statements
A guide to financial statements
These sections of the report, as well as the accompanying Notes, constitute the fund’s financial statements.
The fund’s portfolio lists all the fund’s investments and their values as of the last day of the reporting period. Holdings are organized by asset type and industry sector, country, or state to show areas of concentration and diversification.
Statement of assets and liabilities shows how the fund’s net assets and share price are determined. All investment and non-investment assets are added together. Any unpaid expenses and other liabilities are subtracted from this total. The result is divided by the number of shares to determine the net asset value per share, which is calculated separately for each class of shares. (For funds with preferred shares, the amount subtracted from total assets includes the liquidation preference of preferred shares.)
Statement of operations shows the fund’s net investment gain or loss. This is done by first adding up all the fund’s earnings — from dividends and interest income — and subtracting its operating expenses to determine net investment income (or loss). Then, any net gain or loss the fund realized on the sales of its holdings — as well as any unrealized gains or losses over the period — is added to or subtracted from the net investment result to determine the fund’s net gain or loss for the fiscal period.
Statement of changes in net assets shows how the fund’s net assets were affected by the fund’s net investment gain or loss, by distributions to shareholders, and by changes in the number of the fund’s shares. It lists distributions and their sources (net investment income or realized capital gains) over the current reporting period and the most recent fiscal year-end. The distributions listed here may not match the sources listed in the Statement of operations because the distributions are determined on a tax basis and may be paid in a different period from the one in which they were earned. Dividend sources are estimated at the time of declaration. Actual results may vary. Any non-taxable return of capital cannot be determined until final tax calculations are completed after the end of the fund’s fiscal year.
Financial highlights provide an overview of the fund’s investment results, per-share distributions, expense ratios, net investment income ratios, and portfolio turnover in one summary table, reflecting the five most recent reporting periods. In a semiannual report, the highlights table also includes the current reporting period.
16 Multi-Cap Growth Fund
The fund’s portfolio 12/31/14 (Unaudited)
COMMON STOCKS (98.3%)*
Shares
Value
Aerospace and defense (4.5%)
General Dynamics Corp.
288,600
$39,717,132
Honeywell International, Inc.
787,400
78,677,008
Rockwell Collins, Inc.
237,600
20,072,448
United Technologies Corp.
386,500
44,447,500
182,914,088
Air freight and logistics (0.4%)
United Parcel Service, Inc. Class B
126,500
14,063,005
14,063,005
Airlines (0.9%)
Spirit Airlines, Inc. †
501,600
37,910,928
37,910,928
Banks (1.4%)
Bank of America Corp.
1,230,600
22,015,434
Bank of Ireland (Ireland) †
22,361,337
8,337,459
PacWest Bancorp
541,600
24,621,136
54,974,029
Beverages (1.1%)
Monster Beverage Corp. †
100,900
10,932,515
PepsiCo, Inc.
358,200
33,871,392
44,803,907
Biotechnology (6.3%)
Alkermes PLC †
292,200
17,111,232
AMAG Pharmaceuticals, Inc. †
342,425
14,594,154
Biogen Idec, Inc. †
100,800
34,216,560
BioMarin Pharmaceutical, Inc. †
175,800
15,892,320
Celgene Corp. †
543,168
60,758,772
Dynavax Technologies Corp. †
391,790
6,605,579
Gilead Sciences, Inc. †
901,533
84,978,501
Inovio Pharmaceuticals, Inc. † S
407,100
3,737,178
Neuralstem, Inc. † S
2,527,211
6,874,014
Vertex Pharmaceuticals, Inc. †
68,679
8,159,065
252,927,375
Building products (0.6%)
Assa Abloy AB Class B (Sweden)
304,985
16,117,512
Fortune Brands Home & Security, Inc.
132,900
6,016,383
22,133,895
Capital markets (1.4%)
Charles Schwab Corp. (The)
1,252,600
37,815,994
KKR & Co. LP
744,800
17,286,808
55,102,802
Chemicals (3.7%)
Air Products & Chemicals, Inc.
69,800
10,067,254
Axalta Coating Systems, Ltd. †
327,500
8,521,550
Axiall Corp.
502,600
21,345,422
Chemtura Corp. †
930,700
23,016,211
Huntsman Corp.
822,700
18,741,106
Monsanto Co.
244,100
29,162,627
Symrise AG (Germany)
364,535
22,106,832
W.R. Grace & Co. †
149,200
14,232,188
147,193,190
Multi-Cap Growth Fund 17
COMMON STOCKS (98.3%)* cont.
Shares
Value
Commercial services and supplies (1.0%)
KAR Auction Services, Inc.
513,174
$17,781,479
MiX Telematics, Ltd. ADR (South Africa) †
290,613
1,888,985
Tyco International PLC
468,290
20,539,199
40,209,663
Communications equipment (0.3%)
Qualcomm, Inc.
157,635
11,717,010
11,717,010
Consumer finance (0.7%)
American Express Co.
320,300
29,800,712
29,800,712
Containers and packaging (0.8%)
Packaging Corp. of America
211,700
16,523,185
Sealed Air Corp.
410,079
17,399,652
33,922,837
Diversified consumer services (0.2%)
Bright Horizons Family Solutions, Inc. †
186,151
8,750,959
8,750,959
Diversified financial services (0.7%)
CME Group, Inc.
307,400
27,251,010
27,251,010
Diversified telecommunication services (0.1%)
Iridium Communications, Inc. † S
437,490
4,265,528
4,265,528
Electrical equipment (0.7%)
AMETEK, Inc.
270,100
14,215,363
Eaton Corp PLC
212,500
14,441,500
28,656,863
Electronic equipment, instruments, and components (1.8%)
Anixter International, Inc.
267,218
23,638,104
Hollysys Automation Technologies, Ltd. (China) †
670,600
16,382,758
Keysight Technologies, Inc. †
410,600
13,865,962
SYNNEX Corp.
253,400
19,805,744
73,692,568
Energy equipment and services (1.5%)
Baker Hughes, Inc.
383,200
21,486,024
Dril-Quip, Inc. †
165,600
12,706,488
Oceaneering International, Inc.
102,900
6,051,549
Schlumberger, Ltd.
165,200
14,109,732
Weatherford International PLC †
417,700
4,782,665
59,136,458
Food and staples retail (2.3%)
Costco Wholesale Corp.
159,300
22,580,775
CVS Health Corp.
647,500
62,360,725
Diplomat Pharmacy, Inc. †
261,303
7,151,863
92,093,363
Food products (1.2%)
Freshpet, Inc. † S
289,658
4,941,565
Keurig Green Mountain, Inc.
117,300
15,529,934
Mead Johnson Nutrition Co.
220,971
22,216,424
Pinnacle Foods, Inc.
182,625
6,446,663
49,134,586
18 Multi-Cap Growth Fund
COMMON STOCKS (98.3%)* cont.
Shares
Value
Health-care equipment and supplies (4.0%)
AtriCure, Inc. †
253,576
$5,061,377
Becton Dickinson and Co.
146,900
20,442,604
Boston Scientific Corp. †
1,226,800
16,255,100
Cooper Cos., Inc. (The)
126,200
20,455,758
GenMark Diagnostics, Inc. † S
920,982
12,534,565
Medtronic, Inc.
548,200
39,580,040
Spectranetics Corp. (The) † S
574,000
19,848,920
Zimmer Holdings, Inc.
228,200
25,882,444
160,060,808
Health-care providers and services (0.9%)
AAC Holdings, Inc. †
559,965
17,314,118
Premier, Inc. Class A †
536,679
17,994,847
35,308,965
Health-care technology (0.2%)
Castlight Health, Inc. Class B † S
256,100
2,996,370
Medidata Solutions, Inc. †
145,900
6,966,725
9,963,095
Hotels, restaurants, and leisure (4.2%)
Bloomin’ Brands, Inc. †
750,299
18,577,403
Dunkin’ Brands Group, Inc.
277,900
11,852,435
Hilton Worldwide Holdings, Inc. †
2,033,903
53,064,529
Intrawest Resorts Holdings, Inc. †
393,229
4,695,154
Melco Crown Entertainment, Ltd. ADR (Hong Kong)
1,197,000
30,403,800
Wyndham Worldwide Corp.
587,269
50,364,189
168,957,510
Household durables (2.3%)
Panasonic Corp. (Japan)
1,727,300
20,293,483
PulteGroup, Inc.
1,655,200
35,520,592
Whirlpool Corp.
186,700
36,171,258
91,985,333
Household products (0.3%)
Colgate-Palmolive Co.
145,100
10,039,469
10,039,469
Independent power and renewable electricity producers (0.6%)
Global Fashion Holding SA (acquired 8/2/13, cost $3,488,697) (Private) (Brazil) † ΔΔ F
82,353
2,070,143
Groupon, Inc. †
1,075,600
8,884,456
HSN, Inc.
20,042
1,523,192
Multi-Cap Growth Fund 19
COMMON STOCKS (98.3%)* cont.
Shares
Value
Internet and catalog retail cont.
New Bigfoot Other Assets GmbH (acquired 8/2/13, cost $69) (Private) (Brazil) † ΔΔ F
52
$47
New Middle East Other Assets GmbH (acquired 8/2/13, cost $29) (Private) (Brazil) † ΔΔ F
22
20
Priceline Group, Inc. (The) †
49,490
56,428,993
Zalando SE (acquired 9/30/13, cost $6,098,442) (Private) (Germany) † ΔΔ F
254,320
7,062,632
114,042,337
Internet software and services (8.7%)
Alibaba Group Holding, Ltd. ADR (China) †
277,152
28,807,179
AOL, Inc. †
225,700
10,420,569
Baidu, Inc. ADR (China) †
108,700
24,780,339
Facebook, Inc. Class A †
1,495,000
116,639,900
Google, Inc. Class A †
146,348
77,661,030
Google, Inc. Class C †
158,748
83,564,947
Twitter, Inc. †
252,200
9,046,414
350,920,378
IT Services (1.8%)
Visa, Inc. Class A
276,700
72,550,740
72,550,740
Life sciences tools and services (0.9%)
Agilent Technologies, Inc.
545,200
22,320,488
Thermo Fisher Scientific, Inc.
115,453
14,465,106
36,785,594
Machinery (1.5%)
KION Group AG (Germany)
62,971
2,417,372
Middleby Corp. (The) †
239,400
23,724,540
Pall Corp.
218,800
22,144,748
Wabtec Corp.
138,000
11,990,820
60,277,480
Marine (0.3%)
Kirby Corp. †
166,100
13,410,914
13,410,914
Media (3.4%)
Charter Communications, Inc. Class A †
99,100
16,512,042
Comcast Corp. Class A
736,327
42,714,329
DISH Network Corp. Class A †
185,100
13,491,939
Liberty Global PLC Ser. C (United Kingdom)
232,300
11,222,413
Liberty Global PLC Ser. A (United Kingdom) †
222,900
11,190,695
Live Nation Entertainment, Inc. †
1,604,600
41,896,106
137,027,524
Metals and mining (0.4%)
Constellium NV Class A (Netherlands) †
506,734
8,325,640
Reliance Steel & Aluminum Co.
137,200
8,406,244
16,731,884
Oil, gas, and consumable fuels (3.6%)
Cabot Oil & Gas Corp.
575,800
17,049,438
EOG Resources, Inc.
332,600
30,622,482
EP Energy Corp. Class A † S
826,000
8,623,440
Gaztransport Et Technigaz SA (France)
340,787
20,126,428
Gulfport Energy Corp. †
374,400
15,627,456
20 Multi-Cap Growth Fund
COMMON STOCKS (98.3%)* cont.
Shares
Value
Oil, gas, and consumable fuels cont.
JP Energy Partners LP †
488,766
$5,977,608
QEP Resources, Inc.
726,100
14,681,742
Scorpio Tankers, Inc.
1,179,470
10,249,594
Suncor Energy, Inc. (Canada)
523,577
16,629,361
Whiting Petroleum Corp. †
220,267
7,268,811
146,856,360
Personal products (1.4%)
Coty, Inc. Class A †
1,118,000
23,097,880
Estee Lauder Cos., Inc. (The) Class A
433,200
33,009,840
56,107,720
Pharmaceuticals (5.6%)
AbbVie, Inc.
395,300
25,868,432
Actavis PLC †
348,900
89,810,349
AstraZeneca PLC ADR (United Kingdom)
189,500
13,337,010
Bristol-Myers Squibb Co.
532,700
31,445,281
Cardiome Pharma Corp. (Canada) †
665,400
6,154,950
Jazz Pharmaceuticals PLC †
215,367
35,262,039
Mylan, Inc. †
353,500
19,926,795
Salix Pharmaceuticals, Ltd. †
40,200
4,620,588
226,425,444
Professional services (0.2%)
TrueBlue, Inc. †
374,500
8,332,625
8,332,625
Real estate investment trusts (REITs) (0.3%)
American Tower Corp. R
136,502
13,493,223
13,493,223
Real estate management and development (0.5%)
RE/MAX Holdings, Inc. Class A
558,179
19,117,631
19,117,631
Road and rail (2.5%)
Genesee & Wyoming, Inc. Class A †
127,725
11,485,032
Old Dominion Freight Line, Inc. †
211,000
16,382,040
Union Pacific Corp.
618,600
73,693,818
101,560,890
Semiconductors and semiconductor equipment (3.4%)
Broadcom Corp. Class A
238,700
10,342,871
Freescale Semiconductor, Ltd. † S
406,395
10,253,346
Lam Research Corp.
357,366
28,353,418
Maxim Integrated Products, Inc.
633,200
20,180,084
Micron Technology, Inc. †
1,530,173
53,571,357
Skyworks Solutions, Inc.
187,200
13,611,312
136,312,388
Software (4.8%)
Activision Blizzard, Inc.
1,033,100
20,816,965
Cadence Design Systems, Inc. † S
834,000
15,820,980
Microsoft Corp.
980,300
45,534,935
Oracle Corp.
678,100
30,494,157
Red Hat, Inc. †
492,000
34,016,880
SS&C Technologies Holdings, Inc.
283,620
16,588,934
TiVo, Inc. †
2,416,219
28,608,033
191,880,884
Multi-Cap Growth Fund 21
COMMON STOCKS (98.3%)* cont.
Shares
Value
Specialty retail (2.3%)
Five Below, Inc. † S
383,993
$15,678,434
Gap, Inc. (The)
329,900
13,892,089
Home Depot, Inc. (The)
331,400
34,787,058
TJX Cos., Inc. (The)
396,444
27,188,130
91,545,711
Technology hardware, storage, and peripherals (5.5%)
Apple, Inc.
1,466,432
161,864,764
EMC Corp.
532,700
15,842,498
SanDisk Corp.
309,155
30,291,007
Western Digital Corp.
110,700
12,254,490
220,252,759
Textiles, apparel, and luxury goods (2.0%)
Michael Kors Holdings, Ltd. †
281,000
21,103,100
NIKE, Inc. Class B
391,000
37,594,650
Tumi Holdings, Inc. † S
943,000
22,377,390
81,075,140
Wireless telecommunication services (0.4%)
Vodafone Group PLC ADR (United Kingdom)
424,727
14,512,920
14,512,920
Total common stocks (cost $3,185,474,475)
$3,956,761,589
WARRANTS (—%)* †
Expiration date
Strike price
Warrants
Value
Citigroup, Inc.
1/4/19
$106.10
1,682,858
$1,464,086
Neuralstem, Inc. Ser. J (acquired 1/3/14, cost $—) ΔΔ F
1/3/19
3.64
721,455
—
Total warrants (cost $1,699,687)
$1,464,086
U.S. TREASURY OBLIGATIONS (—%)*
Principal amount
Value
U.S. Treasury Inflation Protected Securities 2 1/8s, February 15, 2041 i
$133,380
$175,816
U.S. Treasury Notes
5/8s, November 30, 2017 i
568,000
560,820
3/4s, February 28, 2018 i
391,000
386,562
Total U.S. Treasury obligations (cost $1,123,198)
$1,123,198
CONVERTIBLE PREFERRED STOCKS (—%)*
Shares
Value
UNEXT.com, LLC zero % cv. pfd. (acquired 4/14/00, cost $10,451,238) (Private) † ΔΔ F
125,000
$—
Total convertible preferred stocks (cost $10,451,238)
$—
SHORT-TERM INVESTMENTS (3.6%)*
Principal amount/shares
Value
Putnam Cash Collateral Pool, LLC 0.20% d
Shares 81,196,500
$81,196,500
Putnam Short Term Investment Fund 0.10% L
Shares 58,159,766
58,159,766
U.S. Treasury Bills with an effective yield of 0.09%, June 11, 2015 Δ
$182,000
181,947
22 Multi-Cap Growth Fund
SHORT-TERM INVESTMENTS (3.6%)* cont.
Principal amount/shares
Value
U.S. Treasury Bills with an effective yield of 0.01%, January 22, 2015 Δ
$1,080,000
$1,079,994
U.S. Treasury Bills with an effective yield of 0.10%, January 8, 2015 Δ
3,998,000
3,997,922
Total short-term investments (cost $144,616,111)
$144,616,129
TOTAL INVESTMENTS
Total investments (cost $3,343,364,709)
$4,103,965,002
Key to holding’s abbreviations
ADR
American Depository Receipts: represents ownership of foreign securities on deposit with a custodian bank
Notes to the fund’s portfolio
Unless noted otherwise, the notes to the fund’s portfolio are for the close of the fund’s reporting period, which ran from July 1, 2014 through December 31, 2014 (the reporting period). Within the following notes to the portfolio, references to “ASC 820” represent Accounting Standards Codification 820 Fair Value Measurements and Disclosures and references to “OTC”, if any, represent over-the-counter.
*
Percentages indicated are based on net assets of $4,027,140,565.
†
Non-income-producing security.
ΔΔ
Security is restricted with regard to public resale. The total fair value of this security and any other restricted securities (excluding 144A securities), if any, held at the close of the reporting period was $9,132,889, or 0.2% of net assets.
Δ
This security, in part or in entirety, was pledged and segregated with the custodian for collateral on certain derivative contracts at the close of the reporting period.
d
Affiliated company. See Note 1 to the financial statements regarding securities lending. The rate quoted in the security description is the annualized 7-day yield of the fund at the close of the reporting period.
F
Security is valued at fair value following procedures approved by the Trustees. Securities may be classified as Level 2 or Level 3 for ASC 820 based on the securities’ valuation inputs. At the close of the reporting period, fair value pricing was also used for certain foreign securities in the portfolio (Note 1).
i
Security was pledged, or purchased with cash that was pledged, to the fund for collateral on certain derivatives contracts (Note 1).
L
Affiliated company (Note 5). The rate quoted in the security description is the annualized 7-day yield of the fund at the close of the reporting period.
R
Real Estate Investment Trust.
S
Security on loan, in part or in entirety, at the close of the reporting period (Note 1).
At the close of the reporting period, the fund maintained liquid assets totaling $2,509,704 to cover certain derivatives contracts and the settlement of certain securities.
Debt obligations are considered secured unless otherwise indicated.
The dates shown on debt obligations are the original maturity dates.
Multi-Cap Growth Fund 23
FORWARD CURRENCY CONTRACTS at 12/31/14 (aggregate face value $121,160,444) (Unaudited)
Counterparty
Currency
Contract type
Delivery date
Value
Aggregate face value
Unrealized appreciation/ (depreciation)
Barclays Bank PLC
Japanese Yen
Sell
2/13/15
$18,080,981
$19,042,553
$961,572
JPMorgan Chase Bank N.A.
Euro
Sell
3/18/15
52,778,901
53,724,157
945,256
State Street Bank and Trust Co.
Japanese Yen
Sell
2/13/15
2,970,978
2,949,600
(21,378)
UBS AG
Euro
Sell
3/18/15
44,022,273
45,444,134
1,421,861
Total
$3,307,311
OTC TOTAL RETURN SWAP CONTRACTS OUTSTANDING at 12/31/14 (Unaudited)
Swap counterparty/ Notional amount
Upfront premium received (paid)
Termination date
Payments received (paid) by fund per annum
Total return received by or paid by fund
Unrealized appreciation/ (depreciation)
JPMorgan Chase Bank N.A.
baskets
96,185
$—
7/16/15
(3 month USD-LIBOR-BBA plus 30 bp)
A basket (JPCMPTMD) of common stocks
$488,312
baskets
384,843
—
8/13/15
(3 month USD-LIBOR-BBA plus 38 bp)
A basket (JPCMPNET) of common stocks
(3,955,347)
Total
$—
$(3,467,035)
24 Multi-Cap Growth Fund
ASC 820 establishes a three-level hierarchy for disclosure of fair value measurements. The valuation hierarchy is based upon the transparency of inputs to the valuation of the fund’s investments. The three levels are defined as follows:
Level 1: Valuations based on quoted prices for identical securities in active markets.
Level 2: Valuations based on quoted prices in markets that are not active or for which all significant inputs are observable, either directly or indirectly.
Level 3: Valuations based on inputs that are unobservable and significant to the fair value measurement.
The following is a summary of the inputs used to value the fund’s net assets as of the close of the reporting period:
Valuation inputs
Investments in securities:
Level 1
Level 2
Level 3
Common stocks*:
Consumer discretionary
$663,958,142
$20,293,483
$9,132,889
Consumer staples
252,179,045
—
—
Energy
185,866,390
20,126,428
—
Financials
225,343,785
24,041,852
—
Health care
721,471,281
—
—
Industrials
490,935,467
46,492,430
—
Information technology
1,057,326,727
—
—
Materials
175,741,079
22,106,832
—
Telecommunication services
18,778,448
—
—
Utilities
22,967,311
—
—
Total common stocks
3,814,567,675
133,061,025
9,132,889
Convertible preferred stocks
—
—
—**
U.S. Treasury obligations
—
1,123,198
—
Warrants
1,464,086
—
—
Short-term investments
58,159,766
86,456,363
—
Totals by level
$3,874,191,527
$220,640,586
$9,132,889
Valuation inputs
Other financial instruments:
Level 1
Level 2
Level 3
Forward currency contracts
$—
$3,307,311
$—
Total return swap contracts
—
(3,467,035)
—
Totals by level
$—
$(159,724)
$—
* Common stock classifications are presented at the sector level, which may differ from the fund’s portfolio presentation.
** Value of level 3 security is $—.
During the reporting period, transfers within the fair value hierarchy, if any, (other than certain transfers involving non-U.S. equity securities as described in Note 1) did not represent, in the aggregate, more than 1% of the fund’s net assets measured as of the end of the period.
At the start and close of the reporting period, Level 3 investments in securities represented less than 1% of the fund’s net assets and were not considered a significant portion of the fund’s portfolio.
The accompanying notes are an integral part of these financial statements.
Multi-Cap Growth Fund 25
Statement of assets and liabilities 12/31/14 (Unaudited)
ASSETS
Investment in securities, at value, including $78,896,049 of securities on loan (Note 1):
Affiliated issuers (identified cost $139,356,266) (Notes 1 and 5)
139,356,266
Foreign currency (cost $26) (Note 1)
26
Dividends, interest and other receivables
4,499,196
Receivable for shares of the fund sold
700,836
Receivable for investments sold
10,678,932
Unrealized appreciation on forward currency contracts (Note 1)
3,328,689
Unrealized appreciation on OTC swap contracts (Note 1)
488,312
Prepaid assets
46,458
Total assets
4,123,707,451
LIABILITIES
Payable for investments purchased
172,943
Payable for shares of the fund repurchased
2,290,877
Payable for compensation of Manager (Note 2)
2,014,714
Payable for custodian fees (Note 2)
16,820
Payable for investor servicing fees (Note 2)
557,696
Payable for Trustee compensation and expenses (Note 2)
2,286,531
Payable for administrative services (Note 2)
27,221
Payable for distribution fees (Note 2)
2,447,246
Unrealized depreciation on OTC swap contracts (Note 1)
3,955,347
Unrealized depreciation on forward currency contracts (Note 1)
21,378
Collateral on securities loaned, at value (Note 1)
81,196,500
Collateral on certain derivative contracts, at value (Note 1)
1,123,198
Other accrued expenses
456,415
Total liabilities
96,566,886
Net assets
$4,027,140,565
REPRESENTED BY
Paid-in capital (Unlimited shares authorized) (Notes 1 and 4)
$3,220,162,931
Distributions in excess of net investment income (Note 1)
(2,260,383)
Accumulated net realized gain on investments and foreign currency transactions (Note 1)
48,797,761
Net unrealized appreciation of investments and assets and liabilities in foreign currencies
760,440,256
Total — Representing net assets applicable to capital shares outstanding
$4,027,140,565
(Continued on next page)
The accompanying notes are an integral part of these financial statements.
26 Multi-Cap Growth Fund
Statement of assets and liabilities (Continued)
COMPUTATION OF NET ASSET VALUE AND OFFERING PRICE
Net asset value and redemption price per class A share ($3,660,222,371 divided by 47,959,058 shares)
$76.32
Offering price per class A share (100/94.25 of $76.32)*
$80.98
Net asset value and offering price per class B share ($90,190,537 divided by 1,427,377 shares)**
$63.19
Net asset value and offering price per class C share ($64,628,292 divided by 955,452 shares)**
$67.64
Net asset value and redemption price per class M share ($58,575,253 divided by 857,914 shares)
$68.28
Offering price per class M share (100/96.50 of $68.28)*
$70.76
Net asset value, offering price and redemption price per class R share ($8,768,689 divided by 117,642 shares)
$74.54
Net asset value, offering price and redemption price per class Y share ($144,755,423 divided by 1,798,061 shares)
$80.51
*
On single retail sales of less than $50,000. On sales of $50,000 or more the offering price is reduced.
**
Redemption price per share is equal to net asset value less any applicable contingent deferred sales charge.
The accompanying notes are an integral part of these financial statements.
Multi-Cap Growth Fund 27
Statement of operations Six months ended 12/31/14 (Unaudited)
INVESTMENT INCOME
Dividends (net of foreign tax of $166,899)
$19,427,581
Interest (including interest income of $20,946 from investments in affiliated issuers) (Note 5)
21,539
Securities lending (Note 1)
844,974
Total investment income
20,294,094
EXPENSES
Compensation of Manager (Note 2)
11,454,472
Investor servicing fees (Note 2)
4,014,278
Custodian fees (Note 2)
48,288
Trustee compensation and expenses (Note 2)
23,654
Distribution fees (Note 2)
5,552,989
Administrative services (Note 2)
59,950
Other
569,866
Total expenses
21,723,497
Expense reduction (Note 2)
(147,793)
Net expenses
21,575,704
Net investment loss
(1,281,610)
Net realized gain on investments (Notes 1 and 3)
259,343,720
Net realized loss on swap contracts (Note 1)
(7,160,557)
Net realized gain on foreign currency transactions (Note 1)
8,384,073
Net realized gain on written options (Notes 1 and 3)
1,462,405
Net unrealized appreciation of assets and liabilities in foreign currencies during the period
4,196,094
Net unrealized depreciation of investments and swap contracts during the period
(41,596,073)
Net gain on investments
224,629,662
Net increase in net assets resulting from operations
$223,348,052
The accompanying notes are an integral part of these financial statements.
28 Multi-Cap Growth Fund
Statement of changes in net assets
INCREASE IN NET ASSETS
Six months ended 12/31/14*
Year ended 6/30/14
Operations:
Net investment income (loss)
$(1,281,610)
$12,698,753
Net realized gain on investments and foreign currency transactions
262,029,641
695,506,142
Net unrealized appreciation (depreciation) of investments and assets and liabilities in foreign currencies
(37,399,979)
289,585,324
Net increase in net assets resulting from operations
223,348,052
997,790,219
Distributions to shareholders (Note 1):
From ordinary income
Net investment income
Class A
(10,185,773)
(7,663,055)
Class R
(517)
(2,283)
Class Y
(917,835)
(675,961)
Net realized short-term gain on investments
Class A
(48,281,440)
—
Class B
(1,413,162)
—
Class C
(951,221)
—
Class M
(850,087)
—
Class R
(116,077)
—
Class Y
(2,331,966)
—
From net realized long-term gain on investments
Class A
(365,442,782)
—
Class B
(10,696,236)
—
Class C
(7,199,804)
—
Class M
(6,434,316)
—
Class R
(878,592)
—
Class Y
(17,650,674)
—
Increase (decrease) from capital share transactions (Note 4)
255,152,889
(306,047,496)
Total increase in net assets
5,150,459
683,401,424
NET ASSETS
Beginning of period
4,021,990,106
3,338,588,682
End of period (including distributions in excess of net investment income of $2,260,383 and undistributed net investment income of $10,125,352, respectively)
$4,027,140,565
$4,021,990,106
*
Unaudited.
The accompanying notes are an integral part of these financial statements.
Multi-Cap Growth Fund 29
Financial highlights (For a common share outstanding throughout the period)
INVESTMENT OPERATIONS:
LESS DISTRIBUTIONS:
RATIOS AND SUPPLEMENTAL DATA:
Period ended
Net asset value, beginning of period
Net investment income (loss)a
Net realized and unrealized gain (loss) on investments
Total from investment operations
From net investment income
From net realized gain on investments
Total distributions
Redemption fees
Non-recurring reimbursements
Net asset value, end of period
Total return at net asset value (%)b
Net assets, end of period (in thousands)
Ratio of expenses to average net assets (%)c
Ratio of net investment income (loss) to average net assets (%)
Portfolio turnover (%)
Class A
December 31, 2014**
$81.46
(.02)
4.74
4.72
(.24)
(9.62)
(9.86)
—
—
$76.32
5.72*
$3,660,222
.53*
(.02)*
32*
June 30, 2014
62.31
.27
19.05
19.32
(.17)
—
(.17)
—
—
81.46
31.03
3,622,814
1.04
.37
88
June 30, 2013
52.15
.19
10.20
10.39
(.23)
—
(.23)
—
—
62.31
19.98
3,004,507
1.08
.32
78
June 30, 2012
53.66
.10
(1.71)
(1.61)
—
—
—
—
.10f,g,h,i
52.15
(2.81)
2,822,270
1.15
.20
57
June 30, 2011
39.22
(.06)
14.49
14.43
—
—
—
—e
.01j,k,l
53.66
36.82
3,283,602
1.22
(.13)
69
June 30, 2010
35.33
(.03)
3.97
3.94
(.05)
—
(.05)
—e
—
39.22
11.15
1,835,862
1.29d
(.06)d
71
Class B
December 31, 2014**
$69.07
(.27)
4.01
3.74
—
(9.62)
(9.62)
—
—
$63.19
5.33*
$90,191
.91*
(.40)*
32*
June 30, 2014
53.11
(.24)
16.20
15.96
—
—
—
—
—
69.07
30.05
95,550
1.79
(.39)
88
June 30, 2013
44.60
(.21)
8.72
8.51
—
—
—
—
—
53.11
19.08
93,740
1.83
(.43)
78
June 30, 2012
46.24
(.24)
(1.49)
(1.73)
—
—
—
—
.09f,g,h,i
44.60
(3.55)
103,691
1.90
(.56)
57
June 30, 2011
34.05
(.38)
12.56
12.18
—
—
—
—e
.01j,k,l
46.24
35.80
152,335
1.97
(.88)
69
June 30, 2010
30.87
(.29)
3.47
3.18
—
—
—
—e
—
34.05
10.30
110,983
2.04d
(.80)d
71
Class C
December 31, 2014**
$73.30
(.29)
4.25
3.96
—
(9.62)
(9.62)
—
—
$67.64
5.32*
$64,628
.91*
(.40)*
32*
June 30, 2014
56.37
(.25)
17.18
16.93
—
—
—
—
—
73.30
30.03
63,105
1.79
(.38)
88
June 30, 2013
47.33
(.22)
9.26
9.04
—
—
—
—
—
56.37
19.10
50,514
1.83
(.43)
78
June 30, 2012
49.07
(.26)
(1.57)
(1.83)
—
—
—
—
.09f,g,h,i
47.33
(3.55)
47,333
1.90
(.55)
57
June 30, 2011
36.13
(.39)
13.32
12.93
—
—
—
—e
.01j,k,l
49.07
35.81
55,393
1.97
(.88)
69
June 30, 2010
32.76
(.31)
3.68
3.37
—
—
—
—e
—
36.13
10.29
28,220
2.04d
(.81)d
71
Class M
December 31, 2014**
$73.81
(.20)
4.29
4.09
—
(9.62)
(9.62)
—
—
$68.28
5.46*
$58,575
.78*
(.27)*
32*
June 30, 2014
56.62
(.09)
17.28
17.19
—
—
—
—
—
73.81
30.36
57,211
1.54
(.14)
88
June 30, 2013
47.42
(.09)
9.29
9.20
—
—
—
—
—
56.62
19.40
47,819
1.58
(.18)
78
June 30, 2012
49.05
(.14)
(1.58)
(1.72)
—
—
—
—
.09f,g,h,i
47.42
(3.32)
46,932
1.65
(.30)
57
June 30, 2011
36.02
(.28)
13.30
13.02
—
—
—
—e
.01j,k,l
49.05
36.17
58,016
1.72
(.63)
69
June 30, 2010
32.58
(.21)
3.65
3.44
—
—
—
—e
—
36.02
10.56
37,163
1.79d
(.56)d
71
Class R
December 31, 2014**
$79.65
(.12)
4.64
4.52
(.01)
(9.62)
(9.63)
—
—
$74.54
5.60*
$8,769
.66*
(.15)*
32*
June 30, 2014
60.96
.09
18.62
18.71
(.02)
—
(.02)
—
—
79.65
30.69
9,313
1.29
.13
88
June 30, 2013
51.03
.05
9.97
10.02
(.09)
—
(.09)
—
—
60.96
19.67
7,381
1.33
.08
78
June 30, 2012
52.64
(.02)
(1.69)
(1.71)
—
—
—
—
.10f,g,h,i
51.03
(3.06)
7,457
1.40
(.05)
57
June 30, 2011
38.57
(.17)
14.23
14.06
—
—
—
—e
.01j,k,l
52.64
36.48
6,553
1.47
(.38)
69
June 30, 2010
34.79
(.14)
3.92
3.78
—
—
—
—e
—
38.57
10.87
3,039
1.54d
(.33)d
71
Class Y
December 31, 2014**
$85.51
.09
4.97
5.06
(.44)
(9.62)
(10.06)
—
—
$80.51
5.85*
$144,755
.40*
.11*
32*
June 30, 2014
65.37
.47
20.00
20.47
(.33)
—
(.33)
—
—
85.51
31.37
173,998
.79
.62
88
June 30, 2013
54.70
.35
10.69
11.04
(.37)
—
(.37)
—
—
65.37
20.27
134,628
.83
.57
78
June 30, 2012
56.14
.24
(1.79)
(1.55)
—
—
—
—
.11f,g,h,i
54.70
(2.56)
115,279
.90
.45
57
June 30, 2011
40.93
.04
15.16
15.20
—
—
—
—e
.01j,k,l
56.14
37.16
123,618
.97
.14
69
June 30, 2010
36.86
.09
4.12
4.21
(.14)
—
(.14)
—e
—
40.93
11.41
110,409
1.04d
.21d
71
See notes to financial highlights at the end of this section.
The accompanying notes are an integral part of these financial statements.
30
Multi-Cap Growth Fund
Multi-Cap Growth Fund
31
Financial highlights (Continued)
* Not annualized.
** Unaudited.
a Per share net investment income (loss) has been determined on the basis of the weighted average number of shares outstanding during the period.
b Total return assumes dividend reinvestment and does not reflect the effect of sales charges.
c Includes amounts paid through expense offset and/or brokerage/service arrangements, if any (Note 2). Also excludes acquired fund fees and expenses, if any.
d Reflects an involuntary contractual expense limitation in effect during the period. As a result of such limitation, the expenses of each class reflect a reduction of less than 0.01% of average net assets for the period ended June 30, 2010.
e Amount represents less than $0.01 per share.
f Reflects a non-recurring reimbursement pursuant to a settlement between the Securities and Exchange Commission (SEC) and Canadian Imperial Holdings, Inc./CIBC World Markets Corp. which amounted to $0.01 per share outstanding on February 24, 2012.
g Reflects a non-recurring reimbursement pursuant to a settlement between the SEC and Canadian Imperial Holdings, Inc./CIBC World Markets Corp. which amounted to less than $0.01 per share outstanding on November 29, 2011.
h Reflects a non-recurring reimbursement related to restitution amounts in connection with a distribution plan approved by the SEC which amounted to the following amounts per share outstanding on July 21, 2011:
Per share
Class A
$0.09
Class B
0.07
Class C
0.08
Class M
0.08
Class R
0.08
Class Y
0.09
i Reflects a non-recurring reimbursement pursuant to a settlement between the SEC and Southwest Securities, Inc. which amounted to less than $0.01 per share outstanding on August 22, 2011.
j Reflects a non-recurring reimbursement pursuant to a settlement between the SEC and Zurich Capital Markets, Inc. which amounted to less than $0.01 per share outstanding on December 21, 2010.
k Reflects a non-recurring reimbursement pursuant to a settlement between the SEC and Prudential Securities, Inc. which amounted to $0.01 per share outstanding on May 16, 2011.
l Reflects a non-recurring reimbursement related to short-term trading related lawsuits, which amounted to less than $0.01 per share outstanding on May 11, 2011.
The accompanying notes are an integral part of these financial statements.
32 Multi-Cap Growth Fund
Notes to financial statements 12/31/14 (Unaudited)
Within the following Notes to financial statements, references to “State Street” represent State Street Bank and Trust Company, references to “the SEC” represent the Securities and Exchange Commission, references to “Putnam Management” represent Putnam Investment Management, LLC, the fund’s manager, an indirect wholly-owned subsidiary of Putnam Investments, LLC and references to “OTC”, if any, represent over-the-counter. Unless otherwise noted, the “reporting period” represents the period from July 1, 2014 through December 31, 2014.
Putnam Multi-Cap Growth Fund (the fund) is a Massachusetts business trust, which is registered under the Investment Company Act of 1940, as amended, as a diversified, open-end management investment company. The goal of the fund is to seek long-term capital appreciation. The fund invests mainly in common stocks of U.S. companies of any size, with a focus on growth stocks. Growth stocks are issued by companies whose earnings are expected to grow faster than those of similar firms, and whose business growth and other characteristics may lead to an increase in stock price. Putnam Management may consider, among other factors, a company’s valuation, financial strength, growth potential, competitive position in its industry, projected future earnings, cash flows and dividends when deciding whether to buy or sell investments.
The fund offers class A, class B, class C, class M, class R and class Y shares. Class A and class M shares are sold with a maximum front-end sales charge of 5.75% and 3.50%, respectively, and generally do not pay a contingent deferred sales charge. Class B shares, which convert to class A shares after approximately eight years, do not pay a front-end sales charge and are subject to a contingent deferred sales charge if those shares are redeemed within six years of purchase. Class C shares have a one-year 1.00% contingent deferred sales charge and do not convert to class A shares. Class R shares, which are not available to all investors, are sold at net asset value. The expenses for class A, class B, class C, class M and class R shares may differ based on the distribution fee of each class, which is identified in Note 2. Class Y shares, which are sold at net asset value, are generally subject to the same expenses as class A, class B, class C, class M and class R shares, but do not bear a distribution fee. Class Y shares are not available to all investors.
In the normal course of business, the fund enters into contracts that may include agreements to indemnify another party under given circumstances. The fund’s maximum exposure under these arrangements is unknown as this would involve future claims that may be, but have not yet been, made against the fund. However, the fund’s management team expects the risk of material loss to be remote.
Note 1: Significant accounting policies
The following is a summary of significant accounting policies consistently followed by the fund in the preparation of its financial statements. The preparation of financial statements is in conformity with accounting principles generally accepted in the United States of America and requires management to make estimates and assumptions that affect the reported amounts of assets and liabilities in the financial statements and the reported amounts of increases and decreases in net assets from operations. Actual results could differ from those estimates. Subsequent events after the Statement of assets and liabilities date through the date that the financial statements were issued have been evaluated in the preparation of the financial statements.
Investment income, realized and unrealized gains and losses and expenses of the fund are borne pro-rata based on the relative net assets of each class to the total net assets of the fund, except that each class bears expenses unique to that class (including the distribution fees applicable to such classes). Each class votes as a class only with respect to its own distribution plan or other matters on which a class vote is required by law or determined by the Trustees. If the fund were liquidated, shares of each class would receive their pro-rata share of the net assets of the fund. In addition, the Trustees declare separate dividends on each class of shares.
Security valuation Portfolio securities and other investments are valued using policies and procedures adopted by the Board of Trustees. The Trustees have formed a Pricing Committee to oversee the implementation of these procedures and has delegated responsibility for valuing the fund’s assets in accordance with these procedures to Putnam Management. Putnam Management has established an internal Valuation Committee that is responsible for making fair value determinations, evaluating the effectiveness of the pricing policies of the fund and reporting to the Pricing Committee.
Investments for which market quotations are readily available are valued at the last reported sales price on their principal exchange, or official closing price for certain markets, and are classified as Level 1 securities under Accounting Standards Codification 820 Fair Value Measurements and Disclosures (ASC 820). If no sales are
Multi-Cap Growth Fund 33
reported, as in the case of some securities that are traded OTC, a security is valued at its last reported bid price and is generally categorized as a Level 2 security.
Investments in open-end investment companies (excluding exchange traded funds), if any, which can be classified as Level 1 or Level 2 securities, are valued based on their net asset value. The net asset value of such investment companies equals the total value of their assets less their liabilities and divided by the number of their outstanding shares.
Market quotations are not considered to be readily available for certain debt obligations and other investments; such investments are valued on the basis of valuations furnished by an independent pricing service approved by the Trustees or dealers selected by Putnam Management. Such services or dealers determine valuations for normal institutional-size trading units of such securities using methods based on market transactions for comparable securities and various relationships, generally recognized by institutional traders, between securities (which consider such factors as security prices, yields, maturities and ratings). These securities will generally be categorized as Level 2. Short-term securities with remaining maturities of 60 days or less may be valued at amortized cost, which approximates fair value and are classified as Level 2 securities.
Many securities markets and exchanges outside the U.S. close prior to the close of the New York Stock Exchange and therefore the closing prices for securities in such markets or on such exchanges may not fully reflect events that occur after such close but before the close of the New York Stock Exchange. Accordingly, on certain days, the fund will fair value foreign equity securities taking into account multiple factors including movements in the U.S. securities markets, currency valuations and comparisons to the valuation of American Depository Receipts, exchange-traded funds and futures contracts. These securities, which would generally be classified as Level 1 securities, will be transferred to Level 2 of the fair value hierarchy when they are valued at fair value. The number of days on which fair value prices will be used will depend on market activity and it is possible that fair value prices will be used by the fund to a significant extent. At the close of the reporting period, fair value pricing was used for certain foreign securities in the portfolio. Securities quoted in foreign currencies, if any, are translated into U.S. dollars at the current exchange rate.
To the extent a pricing service or dealer is unable to value a security or provides a valuation that Putnam Management does not believe accurately reflects the security’s fair value, the security will be valued at fair value by Putnam Management in accordance with policies and procedures approved by the Trustees. Certain investments, including certain restricted and illiquid securities and derivatives, are also valued at fair value following procedures approved by the Trustees. These valuations consider such factors as significant market or specific security events such as interest rate or credit quality changes, various relationships with other securities, discount rates, U.S. Treasury, U.S. swap and credit yields, index levels, convexity exposures and recovery rates, sales and other multiples and resale restrictions. These securities are classified as Level 2 or as Level 3 depending on the priority of the significant inputs.
To assess the continuing appropriateness of fair valuations, the Valuation Committee reviews and affirms the reasonableness of such valuations on a regular basis after considering all relevant information that is reasonably available. Such valuations and procedures are reviewed periodically by the Trustees. The fair value of securities is generally determined as the amount that the fund could reasonably expect to realize from an orderly disposition of such securities over a reasonable period of time. By its nature, a fair value price is a good faith estimate of the value of a security in a current sale and does not reflect an actual market price, which may be different by a material amount.
Security transactions and related investment income Security transactions are recorded on the trade date (the date the order to buy or sell is executed). Gains or losses on securities sold are determined on the identified cost basis.
Interest income, net of any applicable withholding taxes, is recorded on the accrual basis. Dividend income, net of any applicable withholding taxes, is recognized on the ex-dividend date except that certain dividends from foreign securities, if any, are recognized as soon as the fund is informed of the ex-dividend date. Non-cash dividends, if any, are recorded at the fair value of the securities received. Dividends representing a return of capital or capital gains, if any, are reflected as a reduction of cost and/or as a realized gain.
All premiums/discounts are amortized/accreted on a yield-to-maturity basis.
Foreign currency translation The accounting records of the fund are maintained in U.S. dollars. The fair value of foreign securities, currency holdings, and other assets and liabilities is recorded in the books and records of the fund after translation to U.S. dollars based on the exchange rates on that day. The cost of each security is determined using historical exchange rates. Income and withholding taxes are translated at prevailing exchange rates when earned or incurred. The fund does not isolate that portion of realized or unrealized gains or losses resulting
34 Multi-Cap Growth Fund
from changes in the foreign exchange rate on investments from fluctuations arising from changes in the market prices of the securities. Such gains and losses are included with the net realized and unrealized gain or loss on investments. Net realized gains and losses on foreign currency transactions represent net realized exchange gains or losses on closed forward currency contracts, disposition of foreign currencies, currency gains and losses realized between the trade and settlement dates on securities transactions and the difference between the amount of investment income and foreign withholding taxes recorded on the fund’s books and the U.S. dollar equivalent amounts actually received or paid. Net unrealized appreciation and depreciation of assets and liabilities in foreign currencies arise from changes in the value of open forward currency contracts and assets and liabilities other than investments at the period end, resulting from changes in the exchange rate.
Options contracts The fund uses options contracts to manage downside risks.
The potential risk to the fund is that the change in value of options contracts may not correspond to the change in value of the hedged instruments. In addition, losses may arise from changes in the value of the underlying instruments if there is an illiquid secondary market for the contracts, if interest or exchange rates move unexpectedly or if the counterparty to the contract is unable to perform. Realized gains and losses on purchased options are included in realized gains and losses on investment securities. If a written call option is exercised, the premium originally received is recorded as an addition to sales proceeds. If a written put option is exercised, the premium originally received is recorded as a reduction to the cost of investments.
Exchange traded options are valued at the last sale price or, if no sales are reported, the last bid price for purchased options and the last ask price for written options. OTC traded options are valued using prices supplied by dealers.
Options on swaps are similar to options on securities except that the premium paid or received is to buy or grant the right to enter into a previously agreed upon interest rate or credit default contract. Forward premium swap option contracts include premiums that have extended settlement dates. The delayed settlement of the premiums is factored into the daily valuation of the option contracts. In the case of interest rate cap and floor contracts, in return for a premium, ongoing payments between two parties are based on interest rates exceeding a specified rate, in the case of a cap contract, or falling below a specified rate in the case of a floor contract.
Written option contracts outstanding at period end, if any, are listed after the fund’s portfolio.
Forward currency contracts The fund buys and sells forward currency contracts, which are agreements between two parties to buy and sell currencies at a set price on a future date. These contracts are used to hedge foreign exchange risk.
The U.S. dollar value of forward currency contracts is determined using current forward currency exchange rates supplied by a quotation service. The fair value of the contract will fluctuate with changes in currency exchange rates. The contract is marked to market daily and the change in fair value is recorded as an unrealized gain or loss. The fund records a realized gain or loss equal to the difference between the value of the contract at the time it was opened and the value at the time it was closed when the contract matures or by delivery of the currency. The fund could be exposed to risk if the value of the currency changes unfavorably, if the counterparties to the contracts are unable to meet the terms of their contracts or if the fund is unable to enter into a closing position. Risks may exceed amounts recognized on the Statement of assets and liabilities.
Forward currency contracts outstanding at period end, if any, are listed after the fund’s portfolio.
Total return swap contracts The fund entered into OTC total return swap contracts, which are arrangements to exchange a market linked return for a periodic payment, both based on a notional principal amount, to gain exposure to specific markets or countries and to gain exposure to specific sectors or industries.
To the extent that the total return of the security, index or other financial measure underlying the transaction exceeds or falls short of the offsetting interest rate obligation, the fund will receive a payment from or make a payment to the counterparty. OTC total return swap contracts are marked to market daily based upon quotations from an independent pricing service or market makers and the change, if any, is recorded as an unrealized gain or loss. Payments received or made are recorded as realized gains or losses. Certain OTC total return swap contracts may include extended effective dates. Payments related to these swap contracts are accrued based on the terms of the contract. The fund could be exposed to credit or market risk due to unfavorable changes in the fluctuation of interest rates or in the price of the underlying security or index, the possibility that there is no liquid market for these agreements or that the counterparty may default on its obligation to perform. The fund’s maximum risk of loss from counterparty risk is the fair value of the contract. This risk may be mitigated by having a master netting arrangement between the fund and the counterparty. Risk of loss may exceed amounts recognized on the Statement of assets and liabilities.
Multi-Cap Growth Fund 35
OTC total return swap contracts outstanding, including their respective notional amounts at period end, if any, are listed after the fund’s portfolio.
Master agreements The fund is a party to ISDA (International Swaps and Derivatives Association, Inc.) Master Agreements (Master Agreements) with certain counterparties that govern OTC derivative and foreign exchange contracts entered into from time to time. The Master Agreements may contain provisions regarding, among other things, the parties’ general obligations, representations, agreements, collateral requirements, events of default and early termination. With respect to certain counterparties, in accordance with the terms of the Master Agreements, collateral posted to the fund is held in a segregated account by the fund’s custodian and with respect to those amounts which can be sold or repledged, is presented in the fund’s portfolio. Collateral posted to the fund which cannot be sold or repledged totaled $1,166,328 at the close of the reporting period.
Collateral pledged by the fund is segregated by the fund’s custodian and identified in the fund’s portfolio. Collateral can be in the form of cash or debt securities issued by the U.S. Government or related agencies or other securities as agreed to by the fund and the applicable counterparty. Collateral requirements are determined based on the fund’s net position with each counterparty.
Termination events applicable to the fund may occur upon a decline in the fund’s net assets below a specified threshold over a certain period of time. Termination events applicable to counterparties may occur upon a decline in the counterparty’s long-term and short-term credit ratings below a specified level. In each case, upon occurrence, the other party may elect to terminate early and cause settlement of all derivative and foreign exchange contracts outstanding, including the payment of any losses and costs resulting from such early termination, as reasonably determined by the terminating party. Any decision by one or more of the fund’s counterparties to elect early termination could impact the fund’s future derivative activity.
At the close of the reporting period, the fund had a net liability position of $2,543,157 on open derivative contracts subject to the Master Agreements. Collateral posted by the fund at period end for these agreements totaled $2,559,939 and may include amounts related to unsettled agreements.
Securities lending The fund may lend securities, through its agent, to qualified borrowers in order to earn additional income. The loans are collateralized by cash in an amount at least equal to the fair value of the securities loaned. The fair value of securities loaned is determined daily and any additional required collateral is allocated to the fund on the next business day. The risk of borrower default will be borne by the fund’s agent; the fund will bear the risk of loss with respect to the investment of the cash collateral. Income from securities lending is included in investment income on the Statement of operations. Cash collateral is invested in Putnam Cash Collateral Pool, LLC, a limited liability company managed by an affiliate of Putnam Management. Investments in Putnam Cash Collateral Pool, LLC are valued at its closing net asset value each business day. There are no management fees charged to Putnam Cash Collateral Pool, LLC. At the close of the reporting period, the fund received cash collateral of $81,196,500 and the value of securities loaned amounted to $78,896,049.
Interfund lending The fund, along with other Putnam funds, may participate in an interfund lending program pursuant to an exemptive order issued by the SEC. This program allows the fund to borrow from or lend to other Putnam funds that permit such transactions. Interfund lending transactions are subject to each fund’s investment policies and borrowing and lending limits. Interest earned or paid on the interfund lending transaction will be based on the average of certain current market rates. During the reporting period, the fund did not utilize the program.
Lines of credit The fund participates, along with other Putnam funds, in a $392.5 million unsecured committed line of credit and a $235.5 million unsecured uncommitted line of credit, both provided by State Street. Borrowings may be made for temporary or emergency purposes, including the funding of shareholder redemption requests and trade settlements. Interest is charged to the fund based on the fund’s borrowing at a rate equal to the Federal Funds rate plus 1.25% for the committed line of credit and the Federal Funds rate plus 1.30% for the uncommitted line of credit. A closing fee equal to 0.04% of the committed line of credit and 0.04% of the uncommitted line of credit has been paid by the participating funds. In addition, a commitment fee of 0.11% per annum on any unutilized portion of the committed line of credit is allocated to the participating funds based on their relative net assets and paid quarterly. During the reporting period, the fund had no borrowings against these arrangements.
Federal taxes It is the policy of the fund to distribute all of its taxable income within the prescribed time period and otherwise comply with the provisions of the Internal Revenue Code of 1986, as amended (the Code), applicable to regulated investment companies. It is also the intention of the fund to distribute an amount sufficient to avoid imposition of any excise tax under Section 4982 of the Code.
36 Multi-Cap Growth Fund
The fund is subject to the provisions of Accounting Standards Codification 740 Income Taxes (ASC 740). ASC 740 sets forth a minimum threshold for financial statement recognition of the benefit of a tax position taken or expected to be taken in a tax return. The fund did not have a liability to record for any unrecognized tax benefits in the accompanying financial statements. No provision has been made for federal taxes on income, capital gains or unrealized appreciation on securities held nor for excise tax on income and capital gains. Each of the fund’s federal tax returns for the prior three fiscal years remains subject to examination by the Internal Revenue Service.
The fund may also be subject to taxes imposed by governments of countries in which it invests. Such taxes are generally based on either income or gains earned or repatriated. The fund accrues and applies such taxes to net investment income, net realized gains and net unrealized gains as income and/or capital gains are earned. In some cases, the fund may be entitled to reclaim all or a portion of such taxes, and such reclaim amounts, if any, are reflected as an asset on the fund’s books. In many cases, however, the fund may not receive such amounts for an extended period of time, depending on the country of investment.
At June 30, 2014 the fund had a capital loss carryover of $204,628,070 available to the extent allowed by the Code to offset future net capital gain, if any. The amounts of the carryovers and the expiration dates are:
Loss carryover
Short-term
Long-term
Total
Expiration
$96,315,793
N/A
$96,315,793
June 30, 2016
44,620,034
N/A
44,620,034
June 30, 2017
63,692,243
N/A
63,692,243
June 30, 2018
Under the Regulated Investment Company Modernization Act of 2010, the fund will be permitted to carry forward capital losses incurred in taxable years beginning after December 22, 2010 for an unlimited period. However, any losses incurred will be required to be utilized prior to the losses incurred in pre-enactment tax years. As a result of this ordering rule, pre-enactment capital loss carryforwards may be more likely to expire unused. Additionally, post-enactment capital losses that are carried forward will retain their character as either short-term or long-term capital losses rather than being considered all short-term as under previous law.
The aggregate identified cost on a tax basis is $3,343,189,177, resulting in gross unrealized appreciation and depreciation of $876,123,378 and $115,347,553, respectively, or net unrealized appreciation of $760,775,825.
Distributions to shareholders Distributions to shareholders from net investment income are recorded by the fund on the ex-dividend date. Distributions from capital gains, if any, are recorded on the ex-dividend date and paid at least annually. The amount and character of income and gains to be distributed are determined in accordance with income tax regulations, which may differ from generally accepted accounting principles. Dividend sources are estimated at the time of declaration. Actual results may vary. Any non-taxable return of capital cannot be determined until final tax calculations are completed after the end of the fund’s fiscal year. Reclassifications are made to the fund’s capital accounts to reflect income and gains available for distribution (or available capital loss carryovers) under income tax regulations.
Note 2: Management fee, administrative services and other transactions
The fund pays Putnam Management a management fee (base fee) (based on the fund’s average net assets and computed and paid monthly) at annual rates that may vary based on the average of the aggregate net assets of most open-end funds, as defined in the fund’s management contract, sponsored by Putnam Management. Such annual rates may vary as follows:
0.710%
of the first $5 billion,
0.660%
of the next $5 billion,
0.610%
of the next $10 billion,
0.560%
of the next $10 billion,
0.510%
of the next $50 billion,
0.490%
of the next $50 billion,
0.480%
of the next $100 billion and
0.475%
of any excess thereafter.
In addition, the monthly management fee consists of the monthly base fee plus or minus a performance adjustment for the month. The performance adjustment is determined based on performance over the thirty-six month period then ended. Each month, the performance adjustment is calculated by multiplying the performance adjustment rate and the fund’s average net assets over the performance period and the result is divided by twelve.
Multi-Cap Growth Fund 37
The resulting dollar amount is added to, or subtracted from the base fee for that month. The performance adjustment rate is equal to 0.03 multiplied by the difference between the fund’s annualized performance (measured by the fund’s class A shares) and the annualized performance of the Russell 3000 Growth Index, each measured over the performance period. The maximum annualized performance adjustment rates are +/– 0.12%. The monthly base fee is determined based on the fund’s average net assets for the month, while the performance adjustment is determined based on the fund’s average net assets over the performance period of up to thirty-six months. This means it is possible that, if the fund underperforms significantly over the performance period, and the fund’s assets have declined significantly over that period, the negative performance adjustment may exceed the base fee. In this event, Putnam Management would make a payment to the fund.
Because the performance adjustment is based on the fund’s performance relative to its applicable benchmark index, and not its absolute performance, the performance adjustment could increase Putnam Management’s fee even if the fund’s shares lose value during the performance period provided that the fund outperformed its benchmark index, and could decrease Putnam Management’s fee even if the fund’s shares increase in value during the performance period provided that the fund underperformed its benchmark index.
For the reporting period, the base fee represented an effective rate (excluding the impact from any expense waivers in effect) of 0.277% of the fund’s average net assets before an increase of $394,752 (0.010% of the fund’s average net assets) based on performance.
Putnam Management has contractually agreed, through June 30, 2015, to waive fees or reimburse the fund’s expenses to the extent necessary to limit the cumulative expenses of the fund, exclusive of brokerage, interest, taxes, investment-related expenses, extraordinary expenses, acquired fund fees and expenses and payments under the fund’s investor servicing contract, investment management contract and distribution plans, on a fiscal year-to-date basis to an annual rate of 0.20% of the fund’s average net assets over such fiscal year-to-date period. During the reporting period, the fund’s expenses were not reduced as a result of this limit.
Putnam Investments Limited (PIL), an affiliate of Putnam Management, is authorized by the Trustees to manage a separate portion of the assets of the fund as determined by Putnam Management from time to time. Putnam Management pays a quarterly sub-management fee to PIL for its services at an annual rate of 0.35% of the average net assets of the portion of the fund managed by PIL.
The fund reimburses Putnam Management an allocated amount for the compensation and related expenses of certain officers of the fund and their staff who provide administrative services to the fund. The aggregate amount of all such reimbursements is determined annually by the Trustees.
Custodial functions for the fund’s assets are provided by State Street. Custody fees are based on the fund’s asset level, the number of its security holdings and transaction volumes.
Putnam Investor Services, Inc., an affiliate of Putnam Management, provides investor servicing agent functions to the fund. Putnam Investor Services, Inc. received fees for investor servicing based on the fund’s retail asset level, the number of shareholder accounts in the fund and the level of defined contribution plan assets in the fund. Investor servicing fees will not exceed an annual rate of 0.32% of the fund’s average net assets. During the reporting period, the expenses for each class of shares related to investor servicing fees were as follows:
Class A
$3,615,903
Class B
91,481
Class C
63,424
Class M
57,398
Class R
9,082
Class Y
176,990
Total
$4,014,278
The fund has entered into expense offset arrangements with Putnam Investor Services, Inc. and State Street whereby Putnam Investor Services, Inc.’s and State Street’s fees are reduced by credits allowed on cash balances. The fund also reduced expenses through brokerage/service arrangements. For the reporting period, the fund’s expenses were reduced by $2,929 under the expense offset arrangements and by $144,864 under the brokerage/service arrangements.
Each Independent Trustee of the fund receives an annual Trustee fee, of which $2,285, as a quarterly retainer, has been allocated to the fund, and an additional fee for each Trustees meeting attended. Trustees also are reimbursed for expenses they incur relating to their services as Trustees.
38 Multi-Cap Growth Fund
The fund has adopted a Trustee Fee Deferral Plan (the Deferral Plan) which allows the Trustees to defer the receipt of all or a portion of Trustees fees payable on or after July 1, 1995. The deferred fees remain invested in certain Putnam funds until distribution in accordance with the Deferral Plan.
The fund has adopted an unfunded noncontributory defined benefit pension plan (the Pension Plan) covering all Trustees of the fund who have served as a Trustee for at least five years and were first elected prior to 2004. Benefits under the Pension Plan are equal to 50% of the Trustee’s average annual attendance and retainer fees for the three years ended December 31, 2005. The retirement benefit is payable during a Trustee’s lifetime, beginning the year following retirement, for the number of years of service through December 31, 2006. Pension expense for the fund is included in Trustee compensation and expenses in the Statement of operations. Accrued pension liability is included in Payable for Trustee compensation and expenses in the Statement of assets and liabilities. The Trustees have terminated the Pension Plan with respect to any Trustee first elected after 2003.
The fund has adopted distribution plans (the Plans) with respect to its class A, class B, class C, class M and class R shares pursuant to Rule 12b–1 under the Investment Company Act of 1940. The purpose of the Plans is to compensate Putnam Retail Management Limited Partnership, an indirect wholly-owned subsidiary of Putnam Investments, LLC, for services provided and expenses incurred in distributing shares of the fund. The Plans provide for payments by the fund to Putnam Retail Management Limited Partnership at an annual rate of up to 0.35%, 1.00%, 1.00%, 1.00% and 1.00% of the average net assets attributable to class A, class B, class C, class M and class R shares, respectively. The Trustees have approved payment by the fund at an annual rate of 0.25%, 1.00%, 1.00%, 0.75% and 0.50% of the average net assets attributable to class A, class B, class C, class M and class R shares, respectively. During the reporting period, the class specific expenses related to distribution fees were as follows:
Class A
$4,536,196
Class B
459,422
Class C
318,438
Class M
216,138
Class R
22,795
Total
$5,552,989
For the reporting period, Putnam Retail Management Limited Partnership, acting as underwriter, received net commissions of $96,993 and $1,557 from the sale of class A and class M shares, respectively, and received $28,016 and $805 in contingent deferred sales charges from redemptions of class B and class C shares, respectively.
A deferred sales charge of up to 1.00% and 0.65% is assessed on certain redemptions of class A and class M shares, respectively. For the reporting period, Putnam Retail Management Limited Partnership, acting as underwriter, received $162 and no monies on class A and class M redemptions, respectively.
Note 3: Purchases and sales of securities
During the reporting period, cost of purchases and proceeds from sales, excluding short-term investments were as follows:
Cost of purchases
Proceeds from sales
Investments in securities (Long-term)
$1,269,747,567
$1,485,587,238
U.S. government securities (Long-term)
—
—
Total
$1,269,747,567
$1,485,587,238
Written option transactions during the reporting period are summarized as follows:
Written option contract amounts
Written option premiums
Written options outstanding at the beginning of the reporting period
$—
$—
Options opened
1,874,878
1,462,405
Options exercised
—
—
Options expired
(1,874,878)
(1,462,405)
Options closed
—
—
Written options outstanding at the end of the reporting period
$—
$—
Multi-Cap Growth Fund 39
Note 4: Capital shares
At the close of the reporting period, there were an unlimited number of shares of beneficial interest authorized. Transactions in capital shares were as follows:
Six months ended 12/31/14
Year ended 6/30/14
Class A
Shares
Amount
Shares
Amount
Shares sold
698,638
$55,765,885
1,017,089
$74,276,005
Shares issued in connection with reinvestment of distributions
5,182,117
397,882,946
98,060
7,171,099
5,880,755
453,648,831
1,115,149
81,447,104
Shares repurchased
(2,395,262)
(193,671,166)
(4,857,919)
(354,732,700)
Net increase (decrease)
3,485,493
$259,977,665
(3,742,770)
$(273,285,596)
Six months ended 12/31/14
Year ended 6/30/14
Class B
Shares
Amount
Shares
Amount
Shares sold
41,268
$2,802,175
100,387
$6,186,854
Shares issued in connection with reinvestment of distributions
184,990
11,765,345
—
—
226,258
14,567,520
100,387
6,186,854
Shares repurchased
(182,322)
(12,432,612)
(481,880)
(29,844,415)
Net increase (decrease)
43,936
$2,134,908
(381,493)
$(23,657,561)
Six months ended 12/31/14
Year ended 6/30/14
Class C
Shares
Amount
Shares
Amount
Shares sold
40,853
$2,958,077
69,125
$4,561,327
Shares issued in connection with reinvestment of distributions
111,803
7,611,530
—
—
152,656
10,569,607
69,125
4,561,327
Shares repurchased
(58,116)
(4,213,366)
(104,363)
(6,956,111)
Net increase (decrease)
94,540
$6,356,241
(35,238)
$(2,394,784)
Six months ended 12/31/14
Year ended 6/30/14
Class M
Shares
Amount
Shares
Amount
Shares sold
9,947
$719,210
20,202
$1,344,102
Shares issued in connection with reinvestment of distributions
103,829
7,134,071
—
—
113,776
7,853,281
20,202
1,344,102
Shares repurchased
(30,971)
(2,261,356)
(89,698)
(5,898,688)
Net increase (decrease)
82,805
$5,591,925
(69,496)
$(4,554,586)
Six months ended 12/31/14
Year ended 6/30/14
Class R
Shares
Amount
Shares
Amount
Shares sold
9,128
$722,475
20,365
$1,454,342
Shares issued in connection with reinvestment of distributions
13,260
994,520
32
2,283
22,388
1,716,995
20,397
1,456,625
Shares repurchased
(21,662)
(1,754,341)
(24,548)
(1,777,647)
Net increase (decrease)
726
$(37,346)
(4,151)
$(321,022)
40 Multi-Cap Growth Fund
Six months ended 12/31/14
Year ended 6/30/14
Class Y
Shares
Amount
Shares
Amount
Shares sold
211,618
$18,114,965
328,557
$25,337,233
Shares issued in connection with reinvestment of distributions
250,078
20,251,294
8,626
661,157
461,696
38,366,259
337,183
25,998,390
Shares repurchased
(698,515)
(57,236,763)
(361,658)
(27,832,337)
Net decrease
(236,819)
$(18,870,504)
(24,475)
$(1,833,947)
Note 5: Affiliated transactions
Transactions during the reporting period with Putnam Short Term Investment Fund, which is under common ownership and control, were as follows:
Name of affiliate
Fair value at the beginning of the reporting period
Purchase cost
Sale proceeds
Investment income
Fair value at the end of the reporting period
Putnam Short Term Investment Fund*
$53,391,813
$435,417,702
$430,649,749
$20,946
$58,159,766
* Management fees charged to Putnam Short Term Investment Fund have been waived by Putnam Management.
Note 6: Market, credit and other risks
In the normal course of business, the fund trades financial instruments and enters into financial transactions where risk of potential loss exists due to changes in the market (market risk) or failure of the contracting party to the transaction to perform (credit risk). The fund may be exposed to additional credit risk that an institution or other entity with which the fund has unsettled or open transactions will default. Investments in foreign securities involve certain risks, including those related to economic instability, unfavorable political developments, and currency fluctuations.
Note 7: Summary of derivative activity
The volume of activity for the reporting period for any derivative type that was held during the period is listed below and was as follows based on an average of the holdings at the end of each fiscal quarter:
Written equity option contracts (contract amount) (Note 3)
$—*
Forward currency contracts (contract amount)
$116,800,000
OTC total return swap contracts (notional)
$42,500,000
Warrants (number of warrants)
2,400,000
* For the reporting period there were no holdings at the end of each fiscal quarter and the transactions were considered minimal.
Multi-Cap Growth Fund 41
The following is a summary of the fair value of derivative instruments as of the close of the reporting period:
Fair value of derivative instruments as of the close of the reporting period
Asset derivatives
Liability derivatives
Derivatives not accounted for as hedging instruments under ASC 815
Statement of assets and liabilities location
Fair value
Statement of assets and liabilities location
Fair value
Foreign exchange contracts
Receivables
$3,328,689
Payables
$21,378
Equity contracts
Investments, Receivables
1,952,398
Payables
3,955,347
Total
$5,281,087
$3,976,725
The following is a summary of realized and change in unrealized gains or losses of derivative instruments on the Statement of operations for the reporting period (see Note 1):
Amount of realized gain or (loss) on derivatives recognized in net gain or (loss) on investments
Derivatives not accounted for as hedging instruments under ASC 815
Options
Forward currency contracts
Swaps
Total
Foreign exchange contracts
$—
$8,405,597
$—
$8,405,597
Equity contracts
(412,473)
—
(7,160,557)
$(7,573,030)
Total
$(412,473)
$8,405,597
$(7,160,557)
$832,567
Change in unrealized appreciation or (depreciation) on derivatives recognized in net gain or (loss) on investments
Derivatives not accounted for as hedging instruments under ASC 815
Warrants
Forward currency contracts
Swaps
Total
Foreign exchange contracts
$—
$4,198,808
$—
$4,198,808
Equity contracts
19,267
—
(5,140,187)
$(5,120,920)
Total
$19,267
$4,198,808
$(5,140,187)
$(922,112)
42 Multi-Cap Growth Fund
Note 8: Offsetting of financial and derivative assets and liabilities
The following table summarizes any derivatives, repurchase agreements and reverse repurchase agreements, at the end of the reporting period, that are subject to an enforceable master netting agreement or similar agreement. For securities lending transactions or borrowing transactions associated with securities sold short, if any, see Note 1. For financial reporting purposes, the fund does not offset financial assets and financial liabilities that are subject to the master netting agreements in the Statement of assets and liabilities.
Barclays Bank PLC
JPMorgan Chase Bank N.A.
State Street Bank and Trust Co.
UBS AG
Total
Assets:
OTC Total return swap contracts*#
$—
$488,312
$—
$—
$488,312
Forward currency contracts#
961,572
945,256
—
1,421,861
3,328,689
Total Assets
$961,572
$1,433,568
$—
$1,421,861
$3,817,001
Liabilities:
OTC Total return swap contracts*#
—
3,955,347
—
—
3,955,347
Forward currency contracts#
—
—
21,378
—
21,378
Total Liabilities
$—
$3,955,347
$21,378
$—
$3,976,725
Total Financial and Derivative Net Assets
$961,572
$(2,521,779)
$(21,378)
$1,421,861
$(159,724)
Total collateral received (pledged)†##
$961,572
$(2,521,779)
$—
$1,166,328
Net amount
$—
$—
$(21,378)
$255,533
*
Excludes premiums, if any. Included in unrealized appreciation and depreciation on OTC swap contracts on the Statement of assets and liabilities.
†
Additional collateral may be required from certain brokers based on individual agreements.
#
Covered by master netting agreement (Note 1).
##
Any over-collateralization of total financial and derivative net assets is not shown. Collateral may include amounts related to unsettled agreements.
Multi-Cap Growth Fund 43
Services for shareholders
Investor services
Systematic investment plan Tell us how much you wish to invest regularly — weekly, semimonthly, or monthly — and the amount you choose will be transferred automatically from your checking or savings account. There’s no additional fee for this service, and you can suspend it at any time. This plan may be a great way to save for college expenses or to plan for your retirement.
Please note that regular investing does not guarantee a profit or protect against loss in a declining market. Before arranging a systematic investment plan, consider your financial ability to continue making purchases in periods when prices are low.
Systematic exchange You can make regular transfers from one Putnam fund to another Putnam fund. There are no additional fees for this service, and you can cancel or change your options at any time.
Dividends PLUS You can choose to have the dividend distributions from one of your Putnam funds automatically reinvested in another Putnam fund at no additional charge.
Free exchange privilege You can exchange money between Putnam funds free of charge, as long as they are the same class of shares. A signature guarantee is required if you are exchanging more than $500,000. The fund reserves the right to revise or terminate the exchange privilege.
Reinstatement privilege If you’ve sold Putnam shares or received a check for a dividend or capital gain, you may reinvest the proceeds with Putnam within 90 days of the transaction and they will be reinvested at the fund’s current net asset value — with no sales charge. However, reinstatement of class B shares may have special tax consequences. Ask your financial or tax representative for details.
Check-writing service You have ready access to many Putnam accounts. It’s as simple as writing a check, and there are no special fees or service charges. For more information about the check-writing service, call Putnam or visit our website.
Dollar cost averaging When you’re investing for long-term goals, it’s time, not timing, that counts. Investing on a systematic basis is a better strategy than trying to figure out when the markets will go up or down. This means investing the same amount of money regularly over a long period. This method of investing is called dollar cost averaging. When a fund’s share price declines, your investment dollars buy more shares at lower prices. When it increases, they buy fewer shares. Over time, you will pay a lower average price per share.
For more information
Visit the Individual Investors section at putnam.com A secure section of our website contains complete information on your account, including balances and transactions, updated daily. You may also conduct transactions, such as exchanges, additional investments, and address changes. Log on today to get your password.
Call us toll free at 1-800-225-1581 Ask a helpful Putnam representative or your financial advisor for details about any of these or other services, or see your prospectus.
44 Multi-Cap Growth Fund
Fund information
Founded over 75 years ago, Putnam Investments was built around the concept that a balance between risk and reward is the hallmark of a well-rounded financial program. We manage over 100 funds across income, value, blend, growth, asset allocation, absolute return, and global sector categories.
Investment Manager
Putnam Investment Management, LLC One Post Office Square Boston, MA 02109
Investment Sub-Manager
Putnam Investments Limited 57–59 St James’s Street London, England SW1A 1LD
Marketing Services
Putnam Retail Management One Post Office Square Boston, MA 02109
Custodian
State Street Bank and Trust Company
Legal Counsel
Ropes & Gray LLP
Trustees
Jameson A. Baxter, Chair Liaquat Ahamed Ravi Akhoury Barbara M. Baumann Charles B. Curtis Robert J. Darretta Katinka Domotorffy John A. Hill Paul L. Joskow Kenneth R. Leibler Robert E. Patterson George Putnam, III Robert L. Reynolds W. Thomas Stephens
Officers
Robert L. Reynolds President
Jonathan S. Horwitz Executive Vice President, Principal Executive Officer, and Compliance Liaison
Steven D. Krichmar Vice President and Principal Financial Officer
Robert T. Burns Vice President and Chief Legal Officer
Robert R. Leveille Vice President and Chief Compliance Officer
Michael J. Higgins Vice President, Treasurer, and Clerk
Janet C. Smith Vice President, Principal Accounting Officer, and Assistant Treasurer
Susan G. Malloy Vice President and Assistant Treasurer
James P. Pappas Vice President
Mark C. Trenchard Vice President and BSA Compliance Officer
Nancy E. Florek Vice President, Director of Proxy Voting and Corporate Governance, Assistant Clerk, and Associate Treasurer
This report is for the information of shareholders of Putnam Multi-Cap Growth Fund. It may also be used as sales literature when preceded or accompanied by the current prospectus, the most recent copy of Putnam’s Quarterly Performance Summary, and Putnam’s Quarterly Ranking Summary. For more recent performance, please visit putnam.com. Investors should carefully consider the investment objectives, risks, charges, and expenses of a fund, which are described in its prospectus. For this and other information or to request a prospectus or summary prospectus, call 1-800-225-1581 toll free. Please read the prospectus carefully before investing. The fund’s Statement of Additional Information contains additional information about the fund’s Trustees and is available without charge upon request by calling 1-800-225-1581.
Item 2. Code of Ethics:
Not applicable
Item 3. Audit Committee Financial Expert:
Not applicable
Item 4. Principal Accountant Fees and Services:
Not applicable
Item 5. Audit Committee of Listed Registrants
Not applicable
Item 6. Schedule of Investments:
The registrant’s schedule of investments in unaffiliated issuers is included in the report to shareholders in Item 1 above.
Item 7. Disclosure of Proxy Voting Policies and Procedures For Closed-End Management Investment Companies:
Not applicable
Item 8. Portfolio Managers of Closed-End Investment Companies
Not Applicable
Item 9. Purchases of Equity Securities by Closed-End Management Investment Companies and Affiliated Purchasers:
Not applicable
Item 10. Submission of Matters to a Vote of Security Holders:
Not applicable
Item 11. Controls and Procedures:
(a) The registrant’s principal executive officer and principal financial officer have concluded, based on their evaluation of the effectiveness of the design and operation of the registrant’s disclosure controls and procedures as of a date within 90 days of the filing date of this report, that the design and operation of such procedures are generally effective to provide reasonable assurance that information required to be disclosed by the registrant in this report is recorded, processed, summarized and reported within the time periods specified in the Commission’s rules and forms.
(b) Changes in internal control over financial reporting: Not applicable
Item 12. Exhibits:
(a)(1) Not applicable
(a)(2) Separate certifications for the principal executive officer and principal financial officer of the registrant as required by Rule 30a-2(a) under the Investment Company Act of 1940, as amended, are filed herewith.
(b) The certifications required by Rule 30a-2(b) under the Investment Company Act of 1940, as amended, are filed herewith.
Putnam Multi-Cap Growth Fund
By (Signature and Title):
/s/ Janet C. Smith Janet C. Smith Principal Accounting Officer
Date: February 27, 2015
Pursuant to the requirements of the Securities Exchange Act of 1934 and the Investment Company Act of 1940, this report has been signed below by the following persons on behalf of the registrant and in the capacities and on the dates indicated.
By (Signature and Title):
/s/ Jonathan S. Horwitz Jonathan S. Horwitz Principal Executive Officer
Date: February 27, 2015
By (Signature and Title):
/s/ Steven D. Krichmar Steven D. Krichmar Principal Financial Officer
Date: February 27, 2015
We use cookies on this site to provide a more responsive and personalized service. Continuing to browse, clicking I Agree, or closing this banner indicates agreement. See our Cookie Policy for more information.