Economic and Market Overview
During the year under review, equities advanced against a backdrop of heightened volatility and uneven global economic recovery. Emerging market regions primarily led growth, as they were generally unconstrained by the debt overhang burdening western economies and benefited from strong intrinsic demand and significant capital inflows. Policymakers in these regions began raising interest rates toward period-end to combat inflation and speculative investment. Developed economies grew at a more subdued pace, with demand recovery and asset price reflation heavily underpinned by government-sponsored, liquidity-enhancing measures. The U.S. Federal Reserve Board (Fed), having already brought official interest rates close to zero, began directly purchasing government securities as part of an extreme policy measure known as quantitative easing. Further promoting the U.S. recovery, the traditionally pro-business Republican Party gained control of the House of Representatives in mid-term elections and President Obama extended Bush-era tax cuts. In Europe, ballooning fiscal deficits took their toll on peripheral nations and growing concerns of potential sovereign defaults significantly roiled equity markets on several occasions during the period. The European Central Bank responded by pledging 750 billion euros in the spring with the intent to forestall defaults, stabilize markets and restore confidence in the euro currency, followed by further backstops in the autumn as Ireland and the rest of the periphery came under renewed duress.
NOT FDIC INSURED | MAY LOSE VALUE | NO BANK GUARANTEE
Annual Report | 1
The combination of intrinsic growth drivers in emerging markets and stimulus-induced support in the developed world encouraged the global economic recovery, and equity markets responded favorably. By the end of 2010, global equity markets recouped all losses suffered since Lehman Brothers Holdings’ 2008 bankruptcy. Commodities surged in the second half of 2010 due to near-term supply constraints and emerging market demand increases, as well as longer-term fears that overly accommodative monetary policies would ultimately have negative inflationary consequences. The dollar strengthened relative to the euro, which bore the burden of the region’s fiscal crisis, but weakened against the yen, which hit multi-decade highs amid persistent deflationary pressures. Meanwhile, U.S. Treasuries and corporate bonds finished the year with gains, though Treasury prices declined considerably in the final quarter as Fed policies appeared to improve growth ex pectations. Although market conditions remained accommodative and corporate profitability improved, critical economic fundamentals such as employment, home prices and credit creation remained substantially depressed at period-end, leading many investors to question the true health of the global economy and the sustainability of the recovery.
The foregoing information reflects our analysis and opinions as of December 31, 2010. The information is not a complete analysis of every aspect of any market, country, industry or fund. Statements of fact are from sources considered reliable.
2 | Annual Report

We thank you for your continued participation in the Fund and look forward to serving your future investment needs.


| | Mark Mobius
Executive Chairman
Templeton Emerging Markets Group |
The foregoing information reflects our analysis, opinions and portfolio holdings as of December 31, 2010, the end of the reporting period. The way we implement our main investment strategies and the resulting portfolio holdings may change depending on factors such as market and economic conditions. These opinions may not be relied upon as investment advice or an offer for a particular security. The information is not a complete analysis of every aspect of any market, country, industry, security or the Fund. Statements of fact are from sources considered reliable, but the investment manager makes no representation or warranty as to their completeness or accuracy. Although historical performance is no guarantee of future results, these insights may help you understand our investment management philosophy.
6 | Annual Report
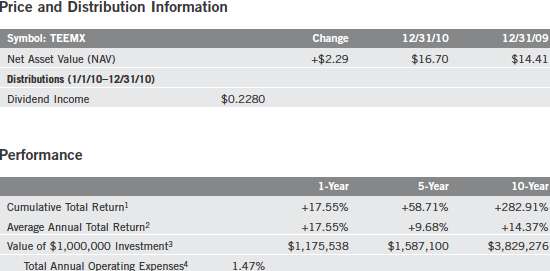
Performance Summary as of 12/31/10
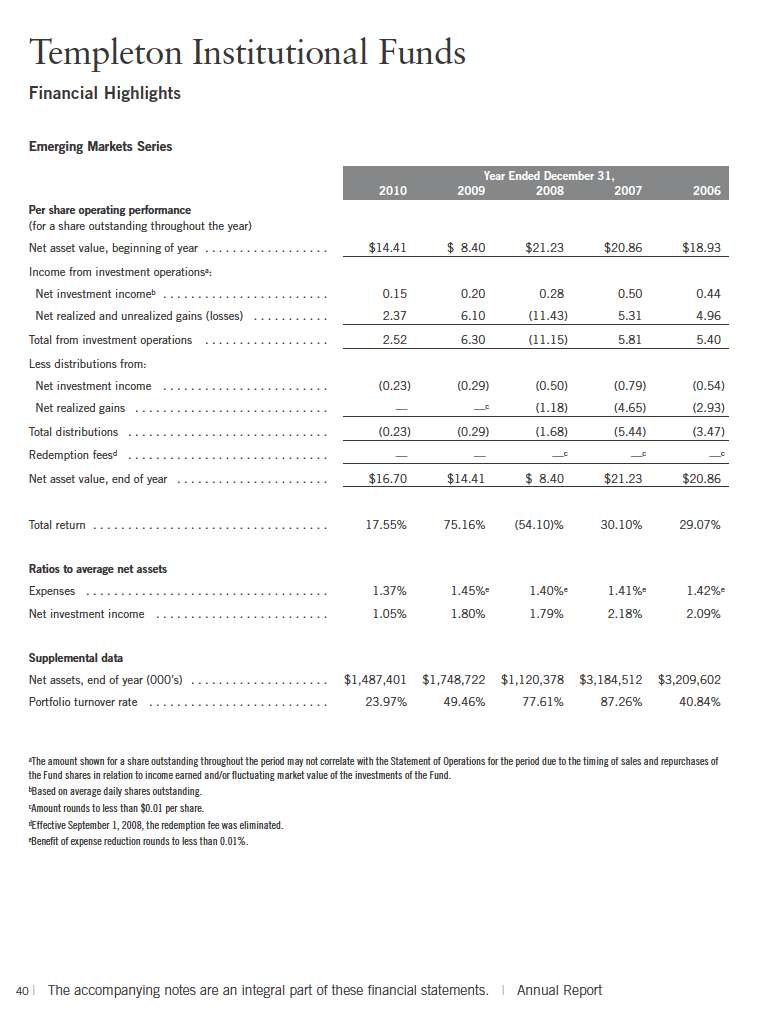
Emerging Markets Series
Your dividend income will vary depending on dividends or interest paid by securities in the Fund’s portfolio, adjusted for operating expenses. Capital gain distributions are net profits realized from the sale of portfolio securities. The performance table and graph do not reflect any taxes that a shareholder would pay on Fund dividends, capital gain distributions, if any, or any realized gains on the sale of Fund shares. Total return reflects reinvestment of the Fund’s dividends and capital gain distributions, if any, and any unrealized gains or losses on the sale of Fund shares.
Performance data represent past performance, which does not guarantee future results. Investment return and principal value will fluctuate, and you may have a gain or loss when you sell your shares. Current performance may differ from figures shown. For most recent month-end performance, visit ftinstitutional.com or call a Franklin Templeton Institutional Services representative at (800) 321-8563.
Annual Report | 7

Your Fund’s Expenses
Emerging Markets Series
As a Fund shareholder, you can incur two types of costs:
Transaction costs, including sales charges (loads) on Fund purchases; and
Ongoing Fund costs, including management fees, distribution and service (12b-1) fees, if applicable, and other Fund expenses. All mutual funds have ongoing costs, sometimes referred to as operating expenses.
The following table shows ongoing costs of investing in the Fund and can help you understand these costs and compare them with those of other mutual funds. The table assumes a $1,000 investment held for the six months indicated.
Actual Fund Expenses
The first line (Actual) of the table provides actual account values and expenses. The “Ending Account Value” is derived from the Fund’s actual return, which includes the effect of Fund expenses.
You can estimate the expenses you paid during the period, by following these steps. Of course, your account value and expenses will differ from those in this illustration:
| 1. | Divide your account value by $1,000. |
| | If an account had an $8,600 value, then $8,600 ÷ $1,000 = 8.6. |
| 2. | Multiply the result by the number under the heading “Expenses Paid During Period.” |
| | If Expenses Paid During Period were $7.50, then 8.6 x $7.50 = $64.50. |
In this illustration, the estimated expenses paid this period are $64.50.
Hypothetical Example for Comparison with Other Funds
Information in the second line (Hypothetical) of the table can help you compare ongoing costs of investing in the Fund with those of other mutual funds. This information may not be used to estimate the actual ending account balance or expenses you paid during the period. The hypothetical “Ending Account Value” is based on the Fund’s actual expense and an assumed 5% annual rate of return before expenses, which does not represent the Fund’s actual return. The figure under the heading “Expenses Paid During Period” shows the hypothetical expenses your account would have incurred under this scenario. You can compare this figure with the 5% hypothetical examples that appear in shareholder reports of other funds.
Annual Report | 9
Your Fund’s Expenses (continued)
Please note that expenses shown in the table are meant to highlight ongoing costs and do not reflect any transaction costs, such as sales charges. Therefore, the second line of the table is useful in comparing ongoing costs only, and will not help you compare total costs of owning different funds. In addition, if transaction costs were included, your total costs would have been higher. Please refer to the Fund prospectus for additional information on operating expenses.
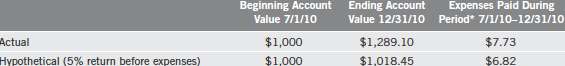
*Expenses are calculated using the most recent six-month annualized expense ratio of 1.34%, multiplied by the average account value over the period, multiplied by 184/365 to reflect the one-half year period.
10 | Annual Report
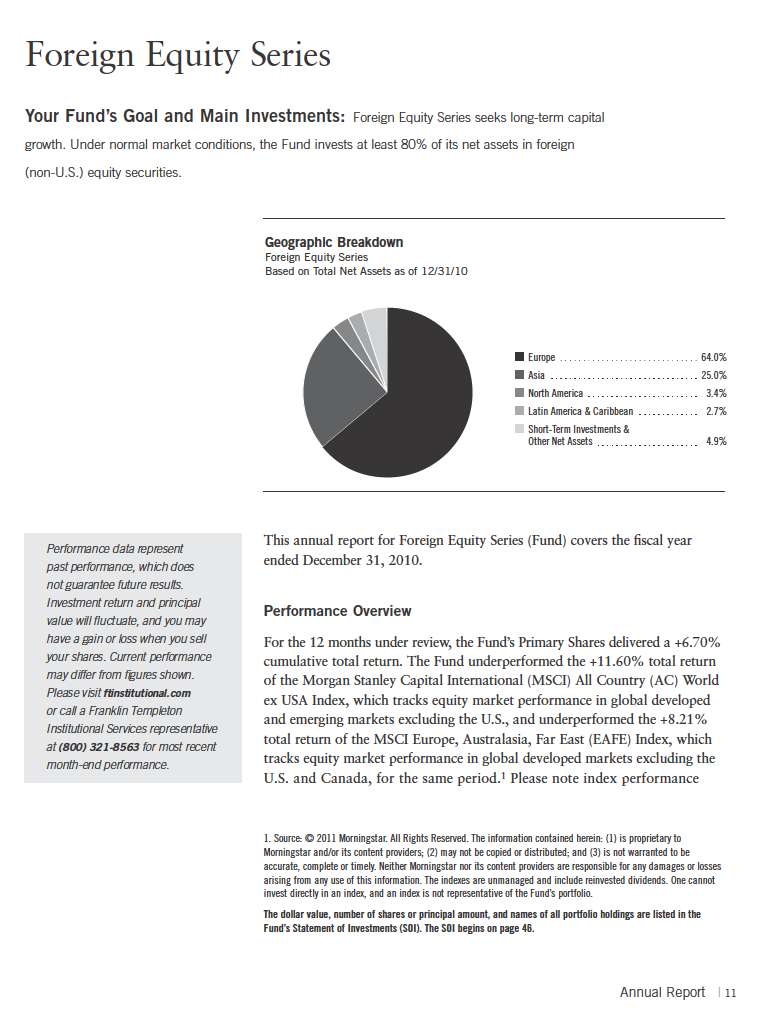
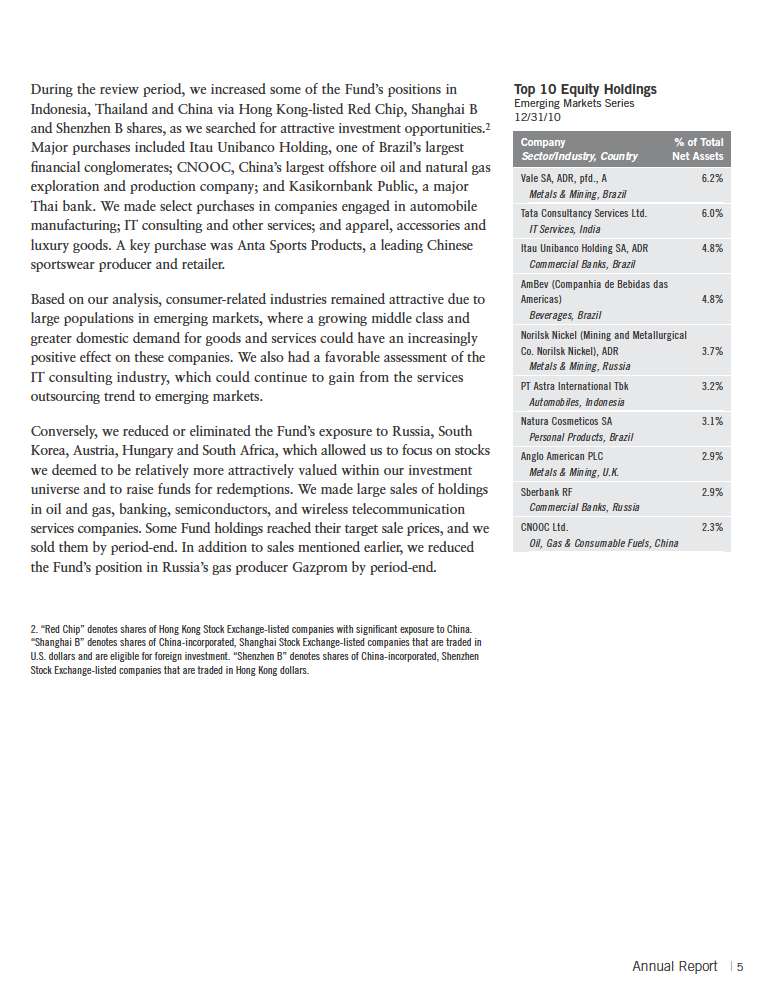
information is provided for reference and we do not attempt to track an index but rather undertake investments on the basis of fundamental research. You can find the Fund’s long-term performance data in the Performance Summary on page 17.
Investment Strategy
We employ a bottom-up, value-oriented, long-term investment strategy. Our in-depth, fundamental, internal research evaluates a company’s potential to grow earnings, asset value and/or cash flow. We also consider a company’s price/earnings ratio, profit margins and liquidation value.
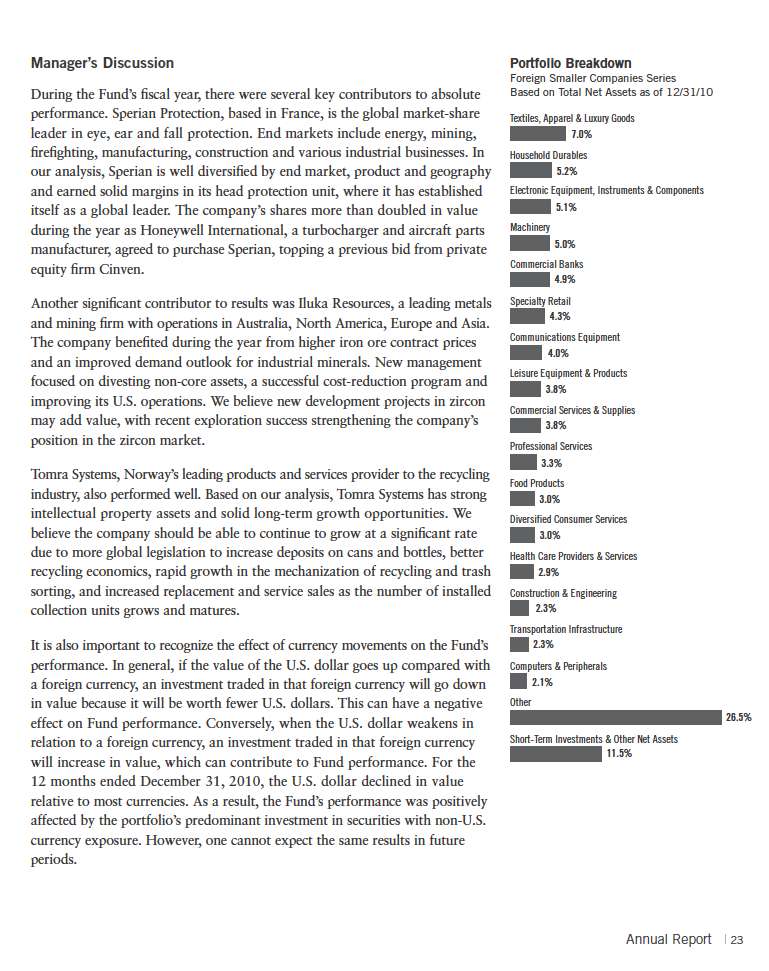
Manager’s Discussion
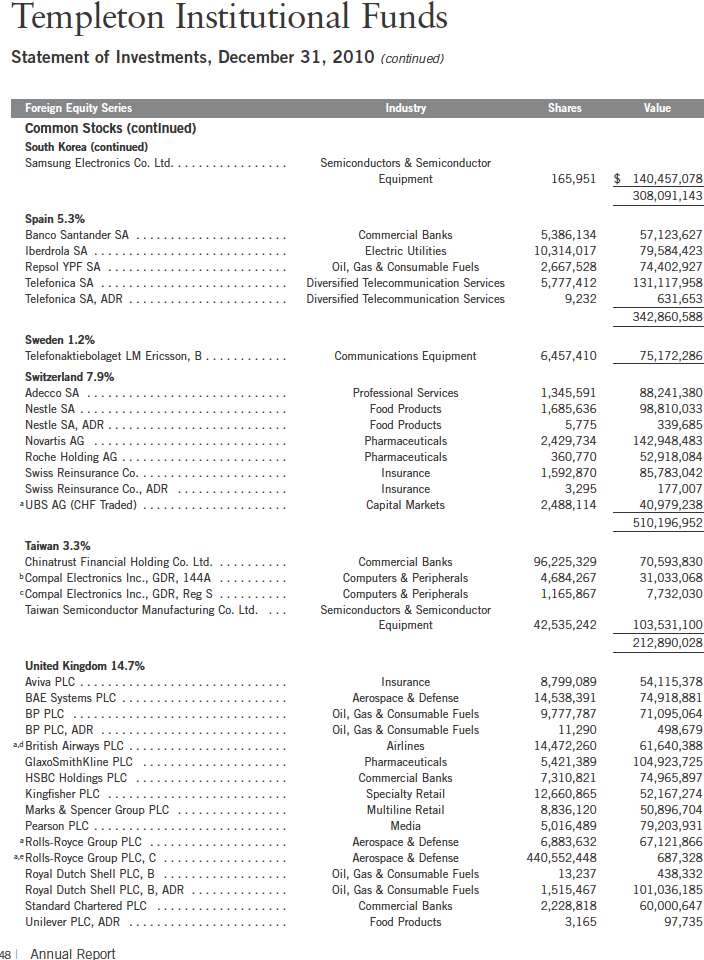
As the economic recovery progressed during the year, the Fund benefited from overweighted allocations to certain traditionally cyclical sectors, while it suffered from underweighted allocations to some other cyclical sectors. Our information technology holdings were among the Fund’s top absolute and relative contributors, led by semiconductor manufacturers like Germany’s Infineon Technologies and Taiwan’s Taiwan Semiconductor Manufacturing, which benefited from the companies’ high sensitivity to global economic growth.2 In our analysis, the Fund’s select information technology stocks remained modestly valued, offered good exposure to fast-growing emerging market regions and featured strong balance sheets that benefited from abundant cash-flow generation. Hardware demand improved as eco nomic growth rebounded, while software manufacturers began to benefit from a recovery in corporate technology spending after a protracted period of underinvestment. These cyclical tailwinds, along with fundamental strengths and undemanding valuations at the security level, could help support the performance of the Fund’s select technology holdings over the long term.
The industrials sector also benefited from the economic recovery, and the Fund’s overweighted position outperformed the benchmark index during the reporting period.3 Companies throughout the global supply chain, including capital goods manufacturers like Siemens and Atlas Copco, transportation companies like British Airways and Embraer, and infrastructure equipment developers like Shanghai Electric Group, gained from widespread infrastructure
2. The information technology sector comprises communications equipment; computers and peripherals; electronic equipment, instruments and components; semiconductors and semiconductor equipment; and software in the SOI.
3. The industrials sector comprises aerospace and defense, air freight and logistics, electrical equipment, industrial conglomerates, professional services, and trading companies and distributors in the SOI.
12 | Annual Report
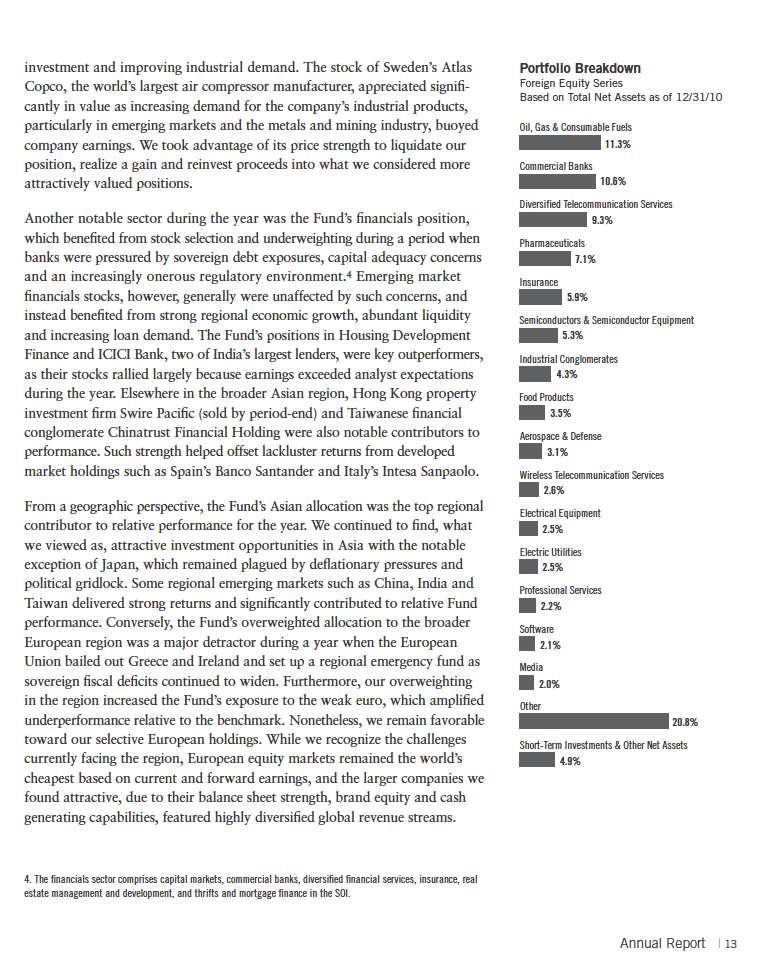

Horizon tragedy in the Gulf of Mexico.7 Unfortunately, stock-specific pressures negatively affected our energy allocation, along with our position in BP, which weighed on relative Fund performance. We conducted an exhaustive review of our investment in light of the Gulf of Mexico spill and its possible legal, regulatory, and financial implications for the company. While we recognized that the final cost of the disaster to BP could exceed the $20 billion escrowed for spill victims, the stock was nonetheless trading at levels during the year that valued the entire company at less than half the $195 billion known value of just its reserves. We concluded that significant investment value remained and we continued to hold our position, which recovered substantially toward the end of the year once BP confirm ed it had permanently sealed off the leaking Macondo well.
It is important to recognize the effect of currency movements on the Fund’s performance. In general, if the value of the U.S. dollar goes up compared with a foreign currency, an investment traded in that foreign currency will go down in value because it will be worth fewer U.S. dollars. This can have a negative effect on Fund performance. Conversely, when the U.S. dollar weakens in relation to a foreign currency, an investment traded in that foreign currency will increase in value, which can contribute to Fund performance. For the 12 months ended December 31, 2010, the U.S. dollar rose in value relative to many of the foreign currencies in which the Fund’s holdings were denominated. As a result, the Fund’s performance was negatively affected by the portfolio’s investment in securities with those currency exposures.
In general, we continue to find attractive the combination of long-term potential and near-term pessimism in sectors and regions around the world, though most notably in larger cap, globally diversified businesses in the health care, telecommunications, information technology and consumer discretionary sectors. In our view, select opportunities have begun to emerge elsewhere as well, notably among well-positioned and cash-generative companies in the financials, industrials and energy sectors. Although the market’s current focus on economic trends created a difficult performance environment for bottom-up, value-oriented equity investors in the near term, we think it revealed attractive long-term opportunities at the security level. A market that ignores fundamentals also can misprice them, allowing investors to purchase critical variables like balance sheet strength, cash flow generation, revenue diversification and
7. The energy sector comprises energy equipment and services; and oil, gas and consumable fuels in the SOI.
Annual Report | 15
earnings growth at considerable discounts. At Templeton, we seek to take advantage of this market condition by buying stakes in high-quality companies at prices we believe significantly understate the long-term intrinsic worth of their underlying businesses.
Thank you for your continued participation in Foreign Equity Series. We look forward to serving your future investment needs.


Gary P. Motyl, CFA Chief Investment Officer —Templeton Global Equity Group
President – Templeton Investment Counsel, LLC
CFA® is a trademark owned by CFA Institute.
The foregoing information reflects our analysis, opinions and portfolio holdings as of December 31, 2010, the end of the reporting period. The way we implement our main investment strategies and the resulting portfolio holdings may change depending on factors such as market and economic conditions. These opinions may not be relied upon as investment advice or an offer for a particular security. The information is not a complete analysis of every aspect of any market, country, industry, security or the Fund. Statements of fact are from sources considered reliable, but the investment manager makes no representation or warranty as to their completeness or accuracy. Although historical performance is no guarantee of future results, these insights may help you understand our investment management philosophy.
16 | Annual Report
Performance Summary as of 12/31/10
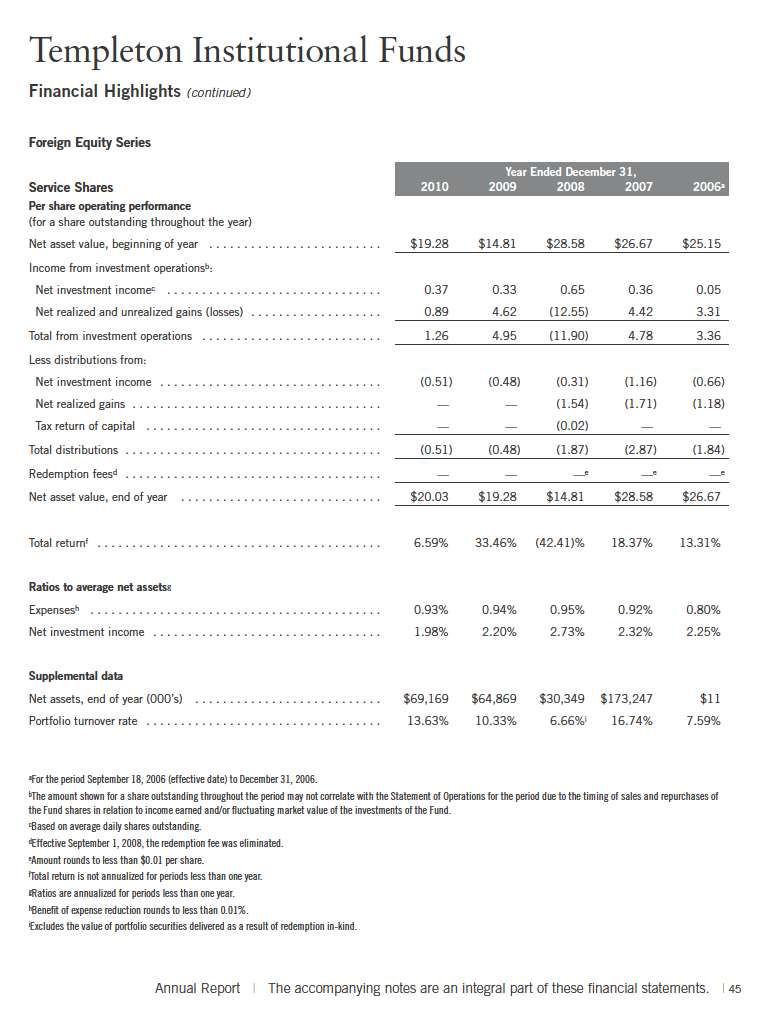
Foreign Equity Series
Your dividend income will vary depending on dividends or interest paid by securities in the Fund’s portfolio, adjusted for operating expenses of each class. Capital gain distributions are net profits realized from the sale of portfolio securities. The performance table and graphs do not reflect any taxes that a shareholder would pay on Fund dividends, capital gain distributions, if any, or any realized gains on the sale of Fund shares. Total return reflects reinvestment of the Fund’s dividends and capital gain distributions, if any, and any unrealized gains or losses on the sale of Fund shares.

Performance data represent past performance, which does not guarantee future results. Investment return and principal value will fluctuate, and you may have a gain or loss when you sell your shares. Current performance may differ from figures shown. For most recent month-end performance, visit ftinstitutional.com or call a Franklin Templeton Institutional Services representative at (800) 321-8563.
Annual Report | 17
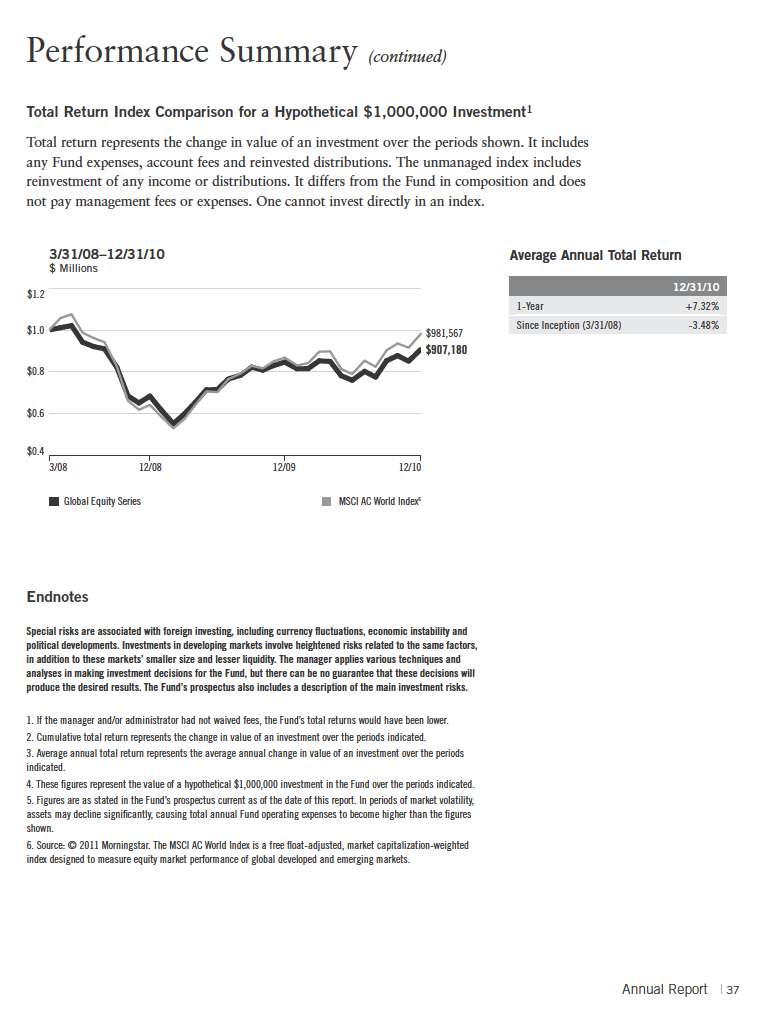
Performance Summary (continued)
Total Return Index Comparison for a Hypothetical $1,000,000 Investment
Total return represents the change in value of an investment over the periods shown. It includes any Fund expenses, account fees and reinvested distributions. The unmanaged indexes include reinvestment of any income or distributions. They differ from the Fund in composition and do not pay management fees or expenses. One cannot invest directly in an index.

18 | Annual Report
Performance Summary (continued)
Endnotes
Special risks are associated with foreign investing, including currency fluctuations, economic instability and political developments. Investments in developing markets involve heightened risks related to the same factors, in addition to those associated with these markets’ smaller size and lesser liquidity. The manager applies various techniques and analyses in making investment decisions for the Fund, but there can be no guarantee that these decisions will produce the desired results. The Fund’s prospectus also includes a description of the main investment risks.
1. Cumulative total return represents the change in value of an investment over the periods indicated.
2. Average annual total return represents the average annual change in value of an investment over the periods indicated. 3. These figures represent the value of a hypothetical $1,000,000 investment in the Fund over the periods indicated.
4. Figures are as stated in the Fund’s prospectus current as of the date of this report. In periods of market volatility, assets may decline significantly, causing total annual Fund operating expenses to become higher than the figures shown.
5. Source: © 2011 Morningstar. The MSCI AC World ex USA Index is a free float-adjusted, market capitalization-weighted index designed to measure equity market performance of global developed and emerging markets, excluding the U.S. The MSCI EAFE Index is a free float-adjusted, market capitalization-weighted index designed to measure equity market performance of global developed markets excluding the U.S. and Canada. The Consumer Price Index (CPI), calculated by the U.S. Bureau of Labor Statistics, is a commonly used measure of the inflation rate.
Annual Report | 19
Your Fund’s Expenses
Foreign Equity Series
As a Fund shareholder, you can incur two types of costs:
Transaction costs, including sales charges (loads) on Fund purchases; and
Ongoing Fund costs, including management fees, distribution and service (12b-1) fees, if applicable, and other Fund expenses. All mutual funds have ongoing costs, sometimes referred to as operating expenses.
The following table shows ongoing costs of investing in the Fund and can help you understand these costs and compare them with those of other mutual funds. The table assumes a $1,000 investment held for the six months indicated.
Actual Fund Expenses
The first line (Actual) for each share class listed in the table provides actual account values and expenses. The “Ending Account Value” is derived from the Fund’s actual return, which includes the effect of Fund expenses.
You can estimate the expenses you paid during the period, by following these steps. Of course, your account value and expenses will differ from those in this illustration:
| 1. | Divide your account value by $1,000. |
| | If an account had an $8,600 value, then $8,600 ÷ $1,000 = 8.6. |
| 2. | Multiply the result by the number under the heading “Expenses Paid During Period.” |
| | If Expenses Paid During Period were $7.50, then 8.6 x $7.50 = $64.50. |
In this illustration, the estimated expenses paid this period are $64.50.
Hypothetical Example for Comparison with Other Funds
Information in the second line (Hypothetical) for each class in the table can help you compare ongoing costs of investing in the Fund with those of other mutual funds. This information may not be used to estimate the actual ending account balance or expenses you paid during the period. The hypothetical “Ending Account Value” is based on the actual expense for each class and an assumed 5% annual rate of return before expenses, which does not represent the Fund’s actual return. The figure under the heading “Expenses Paid During Period” shows the hypothetical expenses your account would have incurred under this scenario. You can compare this figure with the 5% hypothetical examples that appear in shareholder reports of other funds.
20 | Annual Report
Your Fund’s Expenses (continued)
Please note that expenses shown in the table are meant to highlight ongoing costs and do not reflect any transaction costs, such as sales charges. Therefore, the second line for each class is useful in comparing ongoing costs only, and will not help you compare total costs of owning different funds. In addition, if transaction costs were included, your total costs would have been higher. Please refer to the Fund prospectus for additional information on operating expenses.
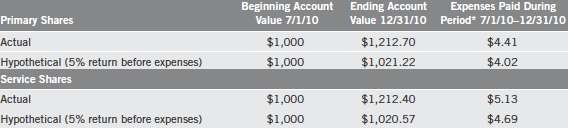
*Expenses are calculated using the most recent six-month expense ratio, annualized for each class (Primary Shares: 0.79% and Service Shares: 0.92%), multiplied by the average account value over the period, multiplied by 184/365 for to reflect the one-half year period.
Annual Report | 21

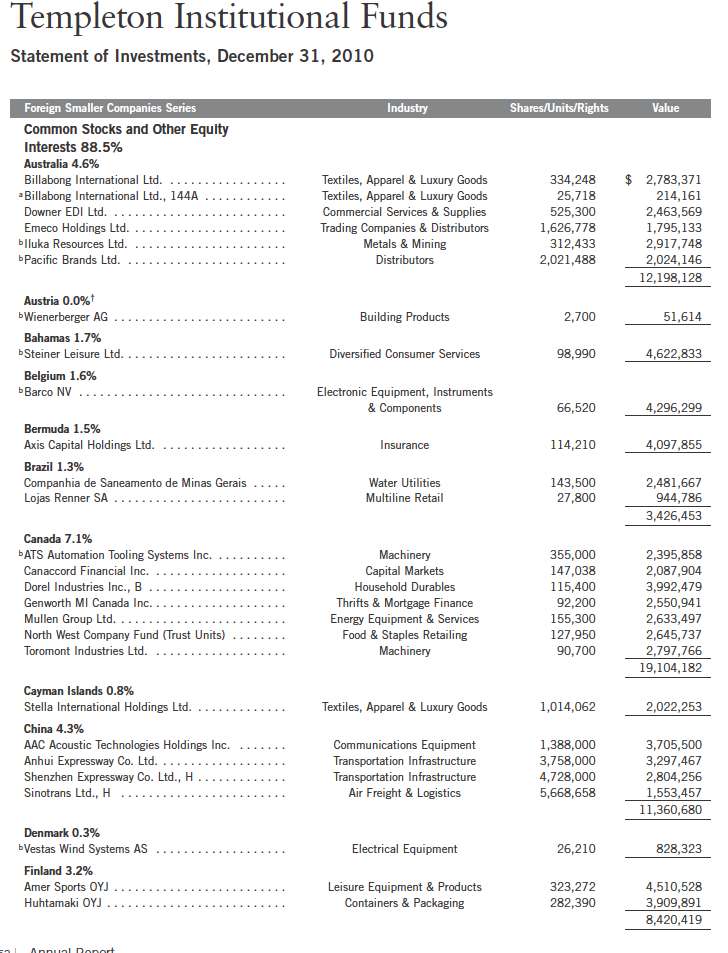
Thank you for your continued participation in Foreign Smaller Companies Series. We look forward to serving your future investment needs.


| | Cindy L. Sweeting, CFA
Portfolio Management Team
Foreign Smaller Companies Series |
The foregoing information reflects our analysis, opinions and portfolio holdings as of December 31, 2010, the end of the reporting period. The way we implement our main investment strategies and the resulting portfolio holdings may change depending on factors such as market and economic conditions. These opinions may not be relied upon as investment advice or an offer for a particular security. The information is not a complete analysis of every aspect of any market, country, industry, security or the Fund. Statements of fact are from sources considered reliable, but the investment manager makes no representation or warranty as to their completeness or accuracy. Although historical performance is no guarantee of future results, these insights may help you understand our investment management philosophy.
Annual Report | 25
Performance Summary as of 12/31/10
Foreign Smaller Company Series
Your dividend income will vary depending on dividends or interest paid by securities in the Fund’s portfolio, adjusted for operating expenses. Capital gain distributions are net profits realized from the sale of portfolio securities. The performance table and graph do not reflect any taxes that a shareholder would pay on Fund dividends, capital gain distributions, if any, or any realized gains on the sale of Fund shares. Total return reflects reinvestment of the Fund’s dividends and capital gain distributions, if any, and any unrealized gains or losses on the sale of Fund shares.

Performance data represent past performance, which does not guarantee future results. Investment return and principal value will fluctuate, and you may have a gain or loss when you sell your shares. Current performance may differ from figures shown. For most recent month-end performance, call a Franklin Templeton Institutional Services representative at (800) 321-8563.
The investment manager and/or administrator have contractually agreed to waive or assume certain expenses so that common expenses (excluding acquired fund fees and expenses) do not exceed 0.95% (other than certain nonroutine expenses) until 4/30/11.
26 | Annual Report
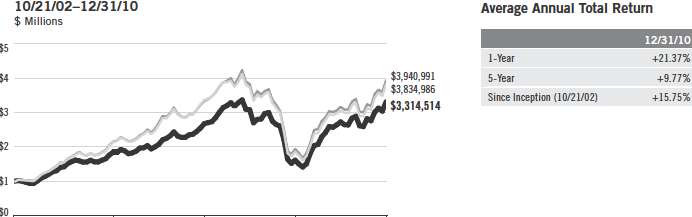
Performance Summary (continued)
Total Return Index Comparison for a Hypothetical $1,000,000 Investment1
Total return represents the change in value of an investment over the periods shown. It includes any Fund expenses, account fees and reinvested distributions. The unmanaged indexes include reinvestment of any income or distributions. They differ from the Fund in composition and do not pay management fees or expenses. One cannot invest directly in an index.
Endnotes
The Fund invests in foreign securities, which can involve exposure to currency volatility and political, economic and regulatory uncertainty. Emerging markets involve heightened risks related to the same factors, in addition to those associated with their relatively small size and lesser liquidity. The Fund’s investments in smaller company stocks carry special risks as such stocks have historically exhibited greater price volatility than large company stocks, particularly over the short term. Additionally, smaller companies often have relatively small revenues, limited product lines and small market share. The manager applies various techniques and analyses in making investment decisions for the Fund, but there can be no guarantee that these decisions will produce the desired results. The Fund’s prospectus also includes a description of the main investment risks.
1. If the manager and/or administrator had not waived fees, the Fund’s total returns would have been lower.
2. Cumulative total return represents the change in value of an investment over the periods indicated.
3. Average annual total return represents the average annual change in value of an investment over the periods indicated.
4. These figures represent the value of a hypothetical $1,000,000 investment in the Fund over the periods indicated.
5. Figures are as stated in the Fund’s prospectus current as of the date of this report. In periods of market volatility, assets may decline significantly, causing total annual Fund operating expenses to become higher than the figures shown.
6. Source: © 2011 Morningstar. The MSCI AC World Index ex USA Small Cap Index is a free float-adjusted, market capitalization-weighted index designed to measure performance of small cap equity securities of global developed and emerging markets, excluding the U.S. The S&P Global ex-U.S. less than $2 Billion Index is a free float-adjusted, market capitalization-weighted index designed to measure performance of global developed and emerging market securities excluding the U.S. with market capitalizations less than $2 billion.
Your Fund’s Expenses
Foreign Smaller Companies Series
As a Fund shareholder, you can incur two types of costs:
Transaction costs, including sales charges (loads) on Fund purchases, if applicable; and
Ongoing Fund costs, including management fees, distribution and service (12b-1) fees, if applicable, and other Fund expenses. All mutual funds have ongoing costs, sometimes referred to as operating expenses.
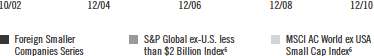
The following table shows ongoing costs of investing in the Fund and can help you understand these costs and compare them with those of other mutual funds. The table assumes a $1,000 investment held for the six months indicated.
Actual Fund Expenses
The first line (Actual) of the table provides actual account values and expenses. The “Ending Account Value” is derived from the Fund’s actual return, which includes the effect of Fund expenses.
You can estimate the expenses you paid during the period by following these steps. Of course, your account value and expenses will differ from those in this illustration:
| 1. | Divide your account value by $1,000. |
| | If an account had an $8,600 value, then $8,600 ÷ $1,000 = 8.6. |
| 2. | Multiply the result by the number under the heading “Expenses Paid During Period.” |
| | If Expenses Paid During Period were $7.50, then 8.6 x $7.50 = $64.50. |
In this illustration, the estimated expenses paid this period are $64.50.
Hypothetical Example for Comparison with Other Funds
Information in the second line (Hypothetical) of the table can help you compare ongoing costs of investing in the Fund with those of other mutual funds. This information may not be used to estimate the actual ending account balance or expenses you paid during the period. The hypothetical “Ending Account Value” is based on the Fund’s actual expense and an assumed 5% annual rate of return before expenses, which does not represent the Fund’s actual return. The figure under the heading “Expenses Paid During Period” shows the hypothetical expenses your account would have incurred under this scenario. You can compare this figure with the 5% hypothetical examples that appear in shareholder reports of other funds.
28 | Annual Report
Your Fund’s Expenses (continued)
Please note that expenses shown in the table are meant to highlight ongoing costs and do not reflect any transaction costs, such as sales charges. Therefore, the second line of the table is useful in comparing ongoing costs only, and will not help you compare total costs of owning different funds. In addition, if transaction costs were included, your total costs would have been higher. Please refer to the Fund prospectus for additional information on operating expenses.
*Expenses are calculated using the most recent six-month annualized expense ratio, net of expense waivers, of 0.95%, multiplied by the average account value over the period, multiplied by 184/365 to reflect the one-half year period.
Annual Report | 29
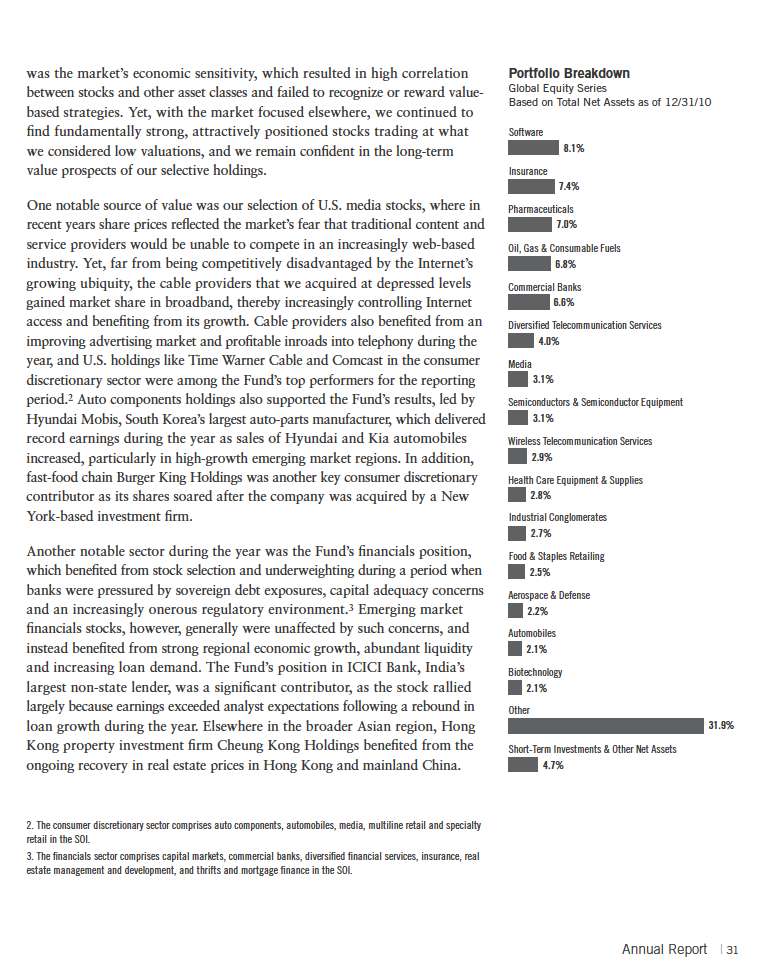
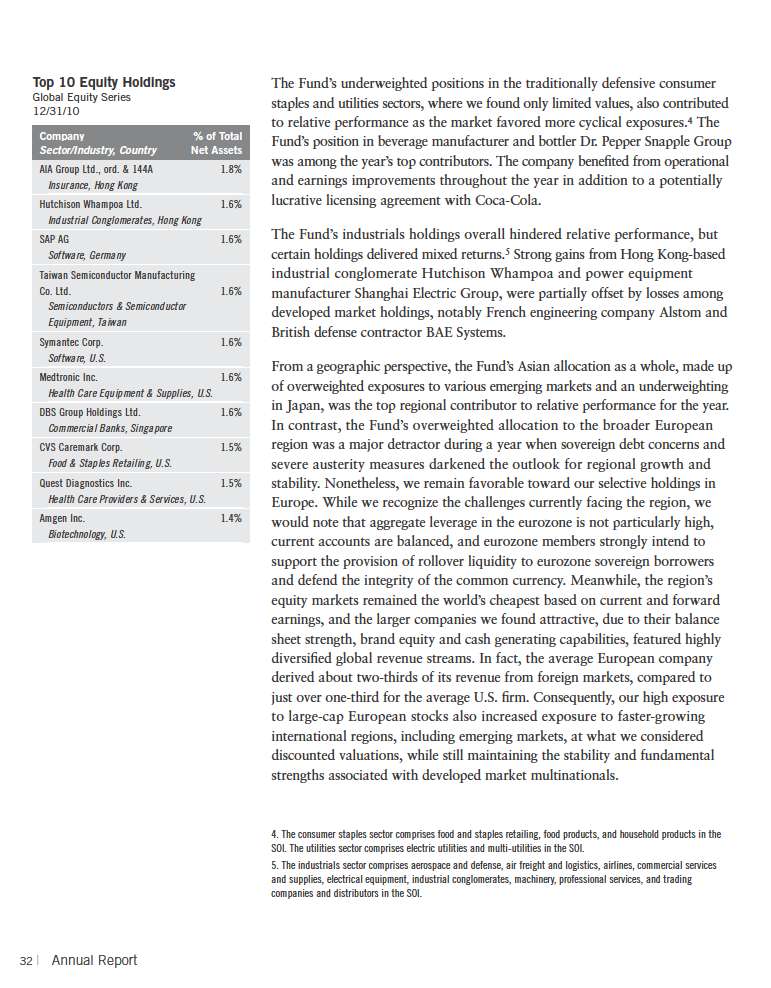
Select stocks in the global health care sector also offered improving fundamentals in their business mix and cost structure and substantial regional growth opportunities in spite of the lowest valuations in more than a decade and severely depressed expectations.6 However, our overweighted position in pharmaceuticals was one of the largest detractors from relative performance during a year when European governments undertaking fiscal austerity measures considered reducing pharmaceuticals industry reimbursements and U.S. politicians debated sweeping health care reforms. French pharmaceuticals manufacturer Sanofi-Aventis was a major detractor despite delivering strong earnings and an upbeat outlook as investors focused instead on impending patent expirations and the company’s hostile bid for biotechnology fi rm Genzyme. Although Sanofi’s track record has left much to be desired over the last decade, a new management team seems to us to be pursuing a sensible strategy of cost-cutting, merger and acquisition, and pipeline rationalization, and we believe the company is attractively positioned in emerging markets and higher-growth industry segments such as vaccines, diabetes and animal health. In our view, recent valuations ignored these investment positives and reflected the market’s negative bias, and we remain holders of the stock. The stock of German specialty pharmaceuticals manufacturer Merck Kgaa also detracted from relative performance and fell in value after European regulators rejected a promising multiple sclerosis drug, while the share price of U.S.-based Medtronic, the world’s largest maker of heart devices, declined after a lower sales forecast. Despite such pressures, we still favorably view select opportunities in the broader health care sector, which we consider among the world’s cheapest equity sectors despite strong cash flow generation, strengthening corporate fundamentals, significant restructuring potential and global demographic advantages.
We found fewer values in the materials sector and our consequently low exposure to metals and mining stocks was another relative detractor during a period when near-term demand increases and longer-term inflation concerns boosted commodity prices.7 Although economic momentum supported commodities’ stocks in the near term, we believe recent sector valuations leave little room for outperformance over Templeton’s long-term investment horizon, and we maintained our underweighted position at period-end. However, we did increase portfolio exposure to the commodity price-sensitive energy sector during the period as our analysis began to uncover increasing value
6. The health care sector comprises biotechnology, health care equipment and supplies, health care providers and services, and pharmaceuticals in the SOI.
7. The materials sector comprises chemicals, containers and packaging, and metals and mining in the SOI.
Annual Report | 33
opportunities amid the sector-wide sell-off that followed the Deepwater Horizon tragedy in the Gulf of Mexico.8 Unfortunately, stock-specific pressures negatively affected our energy allocation, which weighed on relative Fund performance. French oil producer Total was one of the Fund’s largest detractors, with its shares declining as earnings growth lagged behind its peers and industrial action resulted in the temporary closure of French refineries. We believe, however, the stock remains attractively valued and Total continues to expand production through promising emerging market investments, and we remain positive on this holding’s longer-term prospects. The Fund’s position in BP weighed on absolute returns. We conducted an exhaustive review of our investment in light of the Gulf of Mexico spi ll and its possible legal, regulatory, and financial implications for the company. While we recognized that the final cost of the disaster to BP could exceed the $20 billion escrowed for spill victims, the stock was nonetheless trading at levels during the year that valued the entire company at less than half the $195 billion known value of just its reserves. We concluded that significant investment value remained and we continued to hold our position, which recovered substantially toward the end of the year once BP confirmed it had permanently sealed off the leaking Macondo well.
In general, we continue to find attractive the combination of long-term potential and near-term pessimism in sectors and regions around the world, though most notably in larger cap, globally diversified businesses in the health care, telecommunications, information technology and consumer discretionary sectors. In our view, select opportunities have begun to emerge elsewhere as well, notably among well-positioned and cash-generative companies in the financials, industrials and energy sectors. Although the market’s current focus on economic trends created a difficult performance environment for bottom-up, value-oriented equity investors in the near term, we think it revealed attractive long-term opportunities at the security level. A market that ignores fundamentals also can misprice them, allowing investors to purchase critical variables like balance sheet strength, cash flow generation, revenue diversification and earnings growth at considerabl e discounts. At
8. The energy sector comprises energy equipment and services; and oil, gas and consumable fuels in the SOI.
34 | Annual Report
Templeton, we seek to take advantage of this market condition by buying stakes in high-quality companies at prices we believe significantly understate the long-term intrinsic worth of their underlying businesses.
Thank you for your continued participation in Global Equity Series. We look forward to serving your future investment needs.


| | Neil Devlin, CFA
Portfolio Manager
Global Equity Series |
The foregoing information reflects our analysis, opinions and portfolio holdings as of December 31, 2010, the end of the reporting period. The way we implement our main investment strategies and the resulting portfolio holdings may change depending on factors such as market and economic conditions. These opinions may not be relied upon as investment advice or an offer for a particular security. The information is not a complete analysis of every aspect of any market, country, industry, security or the Fund. Statements of fact are from sources considered reliable, but the investment manager makes no representation or warranty as to their completeness or accuracy. Although historical performance is no guarantee of future results, these insights may help you understand our investment management philosophy.
Annual Report | 35
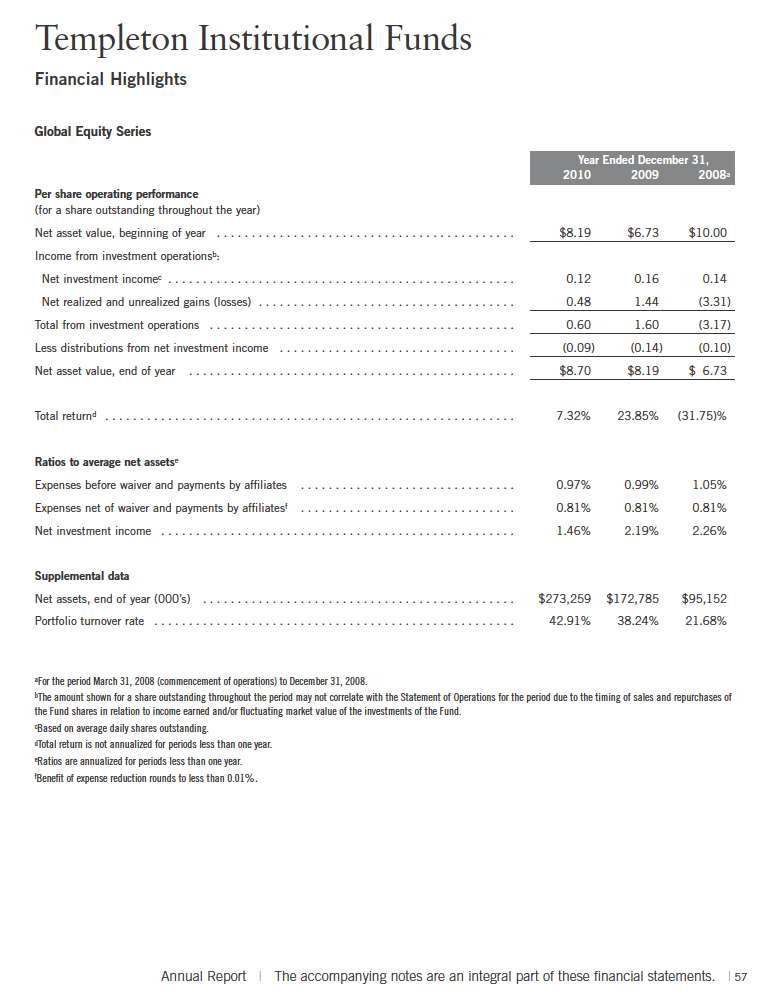
Performance Summary as of 12/31/10
Global Equity Series
Your dividend income will vary depending on dividends or interest paid by securities in the Fund’s portfolio, adjusted for operating expenses. Capital gain distributions are net profits realized from the sale of portfolio securities. The performance table and graph do not reflect any taxes that a shareholder would pay on Fund dividends, capital gain distributions, if any, or any realized gains on the sale of Fund shares. Total return reflects reinvestment of the Fund’s dividends and capital gain distributions, if any, and any unrealized gains or losses on the sale of Fund shares.
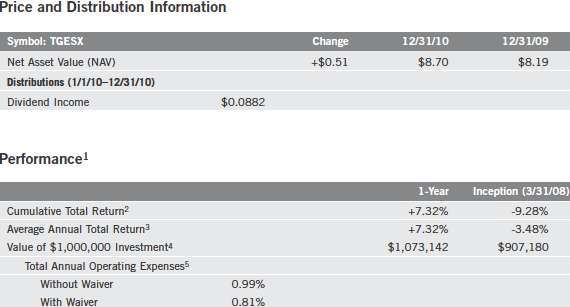
Performance data represent past performance, which does not guarantee future results. Investment return and principal value will fluctuate, and you may have a gain or loss when you sell your shares. Current performance may differ from figures shown. For most recent month-end performance, visit ftinstitutional.com or call a Franklin Templeton Institutional Services representative at (800) 321-8563.
The investment manager and/or administrator have contractually agreed to waive or assume certain expenses so that common expenses (excluding acquired fund fees and expenses) do not exceed 0.81% (other than certain nonroutine expenses) until 4/30/11.
36 | Annual Report
Your Fund’s Expenses
Global Equity Series
As a Fund shareholder, you can incur two types of costs:
Transaction costs, including sales charges (loads) on Fund purchases; and
Ongoing Fund costs, including management fees, distribution and service (12b-1) fees, and other Fund expenses. All mutual funds have ongoing costs, sometimes referred to as operating expenses.
The following table shows ongoing costs of investing in the Fund and can help you understand these costs and compare them with those of other mutual funds. The table assumes a $1,000 investment held for the six months indicated.
Actual Fund Expenses
The first line (Actual) of the table provides actual account values and expenses. The “Ending Account Value” is derived from the Fund’s actual return, which includes the effect of Fund expenses.
You can estimate the expenses you paid during the period by following these steps. Of course, your account value and expenses will differ from those in this illustration:
| 1. | Divide your account value by $1,000. |
| | If an account had an $8,600 value, then $8,600 ÷ $1,000 = 8.6. |
| 2. | Multiply the result by the number under the heading “Expenses Paid During Period.” |
| | If Expenses Paid During Period were $7.50, then 8.6 x $7.50 = $64.50. |
In this illustration, the estimated expenses paid this period are $64.50.
Hypothetical Example for Comparison with Other Funds
Information in the second line (Hypothetical) of the table can help you compare ongoing costs of investing in the Fund with those of other mutual funds. This information may not be used to estimate the actual ending account balance or expenses you paid during the period. The hypothetical “Ending Account Value” is based on the Fund’s actual expense ratio and an assumed 5% annual rate of return before expenses, which does not represent the Fund’s actual return. The figure under the heading “Expenses Paid During Period” shows the hypothetical expenses your account would have incurred under this scenario. You can compare this figure with the 5% hypothetical examples that appear in shareholder reports of other funds.
38 | Annual Report
Your Fund’s Expenses (continued)
Please note that expenses shown in the table are meant to highlight ongoing costs and do not reflect any transaction costs, such as sales charges. Therefore, the second line of the table is useful in comparing ongoing costs only, and will not help you compare total costs of owning different funds. In addition, if transaction costs were included, your total costs would have been higher. Please refer to the Fund prospectus for additional information on operating expenses.

*Expenses are calculated using the most recent six-month annualized expense ratio, net of expense waivers, of 0.81%, multiplied by the average account value over the period, multiplied by 184/365 to reflect the one-half year period.
Annual Report | 39

Annual Report | 41
42 | Annual Report
Annual Report | 53
54 | Annual Report
Annual Report | 55

58 | Annual Report
Annual Report | 59
Annual Report | 61
64 | The accompanying notes are an integral part of these financial statements. | Annual Report

Annual Report | The accompanying notes are an integral part of these financial statements. | 65
66 | The accompanying notes are an integral part of these financial statements. | Annual Report
Annual Report | The accompanying notes are an integral part of these financial statements. | 67
68 | The accompanying notes are an integral part of these financial statements. | Annual Report
Templeton Institutional Funds
Notes to Financial Statements
1. ORGANIZATION AND SIGNIFICANT ACCOUNTING POLICIES
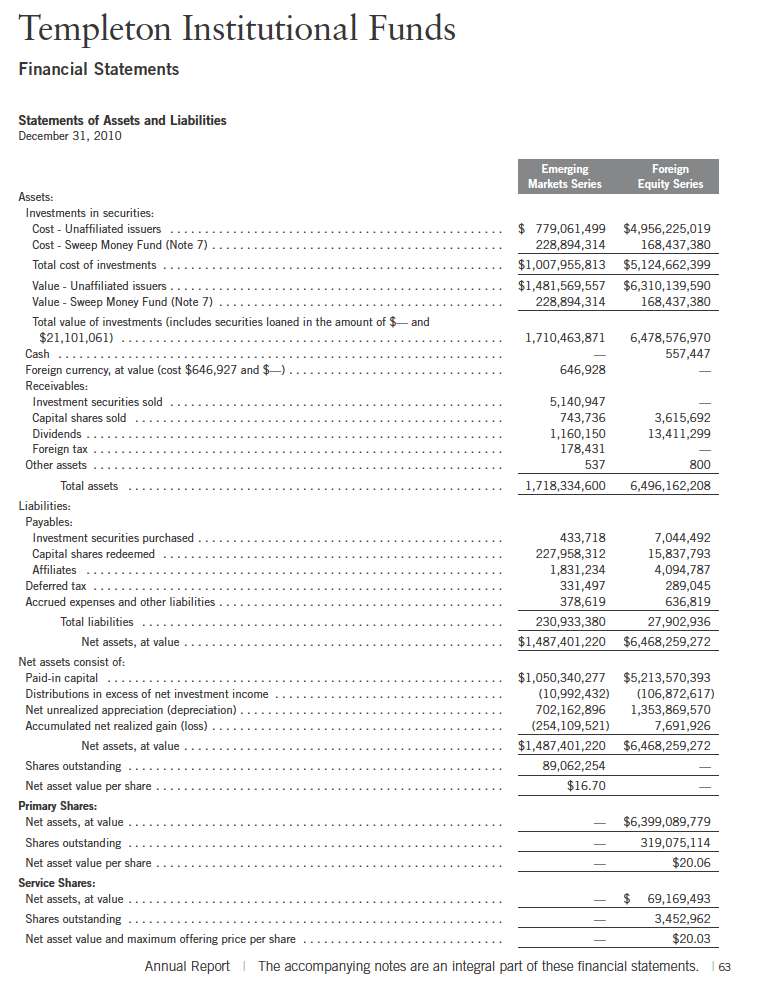
Templeton Institutional Funds (Trust) is registered under the Investment Company Act of 1940, as amended, (1940 Act) as an open-end investment company, consisting of four funds (Funds). The Foreign Equity Series offers Primary and Service Shares. Each class of shares differs by its transfer agent fees and voting rights on matters affecting a single class.
The following summarizes the Funds’ significant accounting policies.
a. Financial Instrument Valuation
The Funds value their investments in securities and other assets and liabilities carried at fair value daily. Fair value is the price that would be received to sell an asset or paid to transfer a liability in an orderly transaction between market participants on the measurement date. Under procedures approved by the Trust’s Board of Trustees, the Funds may utilize independent pricing services, quotations from securities and financial instrument dealers, and other market sources to determine fair value.
Equity securities listed on an exchange or on the NASDAQ National Market System are valued at the last quoted sale price or the official closing price of the day, respectively. Foreign equity securities are valued as of the close of trading on the foreign stock exchange on which the security is primarily traded, or the NYSE, whichever is earlier. The value is then converted into its U.S. dollar equivalent at the foreign exchange rate in effect at the close of the NYSE on the day that the value of the security is determined. Over-the-counter securities are valued within the range of the most recent quoted bid and ask prices. Securities that trade in multiple markets or on multiple exchanges are valued according to the broadest and most representative market. Certain equity securities are valued based upon fundamental characteristics or relationships to similar securities. Investments in open-end mutual funds are valued at the closing net asset value. Time deposits are valued at cost, which approximates market value.
Debt securities generally trade in the over-the-counter market rather than on a securities exchange. The Funds’ pricing services use multiple valuation techniques to determine fair value. In instances where sufficient market activity exists, the pricing services may utilize a market-based approach through which quotes from market makers are used to determine fair value. In instances where sufficient market activity may not exist or is limited, the pricing services also utilize proprietary valuation models which may consider market characteristics such as benchmark yield curves, option-adjusted spreads, credit spreads, estimated default rates, coupon rates, anticipated timing of principal repayments, underlying collateral, and other unique security features in order to estimate the relevant cash flows, which are then discounted to calculate the fair value.
Annual Report | 69
Templeton Institutional Funds
Notes to Financial Statements (continued)
| 1. | ORGANIZATION AND SIGNIFICANT ACCOUNTING POLICIES (continued) |
| a. | Financial Instrument Valuation (continued) |
The Funds have procedures to determine the fair value of securities and other financial instruments for which market prices are not readily available or which may not be reliably priced. Under these procedures, the Funds primarily employ a market-based approach which may use related or comparable assets or liabilities, recent transactions, market multiples, book values, and other relevant information for the investment to determine the fair value of the investment. The Funds may also use an income-based valuation approach in which the anticipated future cash flows of the investment are discounted to calculate fair value. Discounts may also be applied due to the nature or duration of any restrictions on the disposition of the investments. Due to the inherent uncertainty of valuations of such investments, the fair values may differ significantly from the values that would have been used had an active market existed.
Trading in securities on foreign exchanges and over-the-counter markets may be completed before the daily close of business on the NYSE. Occasionally, events occur between the time at which trading in a foreign security is completed and the close of the NYSE that might call into question the reliability of the value of a portfolio security held by the Fund. As a result, differences may arise between the value of the Funds’ portfolio securities as determined at the foreign market close and the latest indications of value at the close of the NYSE. In order to minimize the potential for these differences, the investment manager monitors price movements following the close of trading in foreign stock markets through a series of country specific market proxies (such as baskets of American Depository Receipts, futures contracts and exchange traded funds). These price movements are measured against established trigger thresholds for each specific marke t proxy to assist in determining if an event has occurred that may call into question the reliability of the values of the foreign securities held by the Funds. If such an event occurs, the securities may be valued using fair value procedures, which may include the use of independent pricing services.
b. Foreign Currency Translation
Portfolio securities and other assets and liabilities denominated in foreign currencies are translated into U.S. dollars based on the exchange rate of such currencies against U.S. dollars on the date of valuation. The Funds may enter into foreign currency exchange contracts to facilitate transactions denominated in a foreign currency. Purchases and sales of securities, income and expense items denominated in foreign currencies are translated into U.S. dollars at the exchange rate in effect on the transaction date. Portfolio securities and assets and liabilities denominated in foreign currencies contain risks that those currencies will decline in value relative to the U.S. dollar. Occasionally, events may impact the availability or reliability of foreign exchange rates used to convert the U.S. dollar equivalent value. If such an event occurs, the foreign exchange rate will be valued at fair value using procedures established and approved by the Trust& #146;s Board of Trustees.
70 | Annual Report
Templeton Institutional Funds
Notes to Financial Statements (continued)
| 1. | ORGANIZATION AND SIGNIFICANT ACCOUNTING POLICIES (continued) |
| b. | Foreign Currency Translation (continued) |
The Funds do not separately report the effect of changes in foreign exchange rates from changes in market prices on securities held. Such changes are included in net realized and unrealized gain or loss from investments on the Statement of Operations.
Realized foreign exchange gains or losses arise from sales of foreign currencies, currency gains or losses realized between the trade and settlement dates on securities transactions and the difference between the recorded amounts of dividends, interest, and foreign withholding taxes and the U.S. dollar equivalent of the amounts actually received or paid. Net unrealized foreign exchange gains and losses arise from changes in foreign exchange rates on foreign denominated assets and liabilities other than investments in securities held at the end of the reporting period.
c. Securities Lending
The Foreign Equity Series participates in an agency based security lending program. The fund receives collateral against the loaned securities in an amount equal to at least 105% of the market value of the loaned securities. Collateral is maintained over the life of the loan in an amount not less than 103.5% of the market value of loaned securities, as determined at the close of fund business each day; any additional collateral required due to changes in security values is delivered to the fund on the next business day. The fund receives income from lending fees and rebates paid by the borrower. The fund bears the market risk with respect to the collateral investment, securities loaned, and the risk that the agent may default on its obligations to the fund. The securities lending agent has agreed to indemnify the fund in the event of default by a third party borrower.
d. Income and Deferred Taxes
It is each Fund’s policy to qualify as a regulated investment company under the Internal Revenue Code. Each Fund intends to distribute to shareholders substantially all of its taxable income and net realized gains to relieve it from federal income and excise taxes. As a result, no provision for U.S. federal income taxes is required. The Funds file U.S. income tax returns as well as tax returns in certain other jurisdictions. The Fund’s application of those tax rules is subject to its understanding. The Funds record a provision for taxes in its financial statements including penalties and interest, if any, for a tax position taken on a tax return (or expected to be taken) when it fails to meet the more likely than not (a greater than 50% probability) threshold and based on the technical merits, the tax position may not be sustained upon examination by the tax authorities. As of December 31, 2010, and for all open tax years the Funds have det ermined that no provision for income tax is required in the Funds’ financial statements. Open tax years are those that remain subject to examination and are based on each tax jurisdiction statute of limitation. The Funds are not aware of any tax position for which it is reasonably possible that the total amounts of unrecognized tax effects will significantly change in the next twelve months.
Annual Report | 71
Templeton Institutional Funds
Notes to Financial Statements (continued)
| 1. | ORGANIZATION AND SIGNIFICANT ACCOUNTING POLICIES (continued) |
| d. | Income and Deferred Taxes (continued) |
The Funds may be subject to foreign taxation related to income received, capital gains on the sale of securities and certain foreign currency transactions in the foreign jurisdictions in which it invests. Foreign taxes, if any, are recorded based on the tax regulations and rates that exist in the foreign markets in which the Funds invest. When a capital gain tax is determined to apply the Funds record an estimated deferred tax liability for net unrealized gains on these securities in an amount that would be payable if the securities were disposed of on the valuation date.
e. Security Transactions, Investment Income, Expenses and Distributions
Security transactions are accounted for on trade date. Realized gains and losses on security transactions are determined on a specific identification basis. Interest income and estimated expenses are accrued daily. Amortization of premium and accretion of discount on debt securities are included in interest income. Dividend income is recorded on the ex-dividend date except that certain dividends from foreign securities are recognized as soon as the Funds are notified of the ex-dividend date. Distributions to shareholders are recorded on the ex-dividend date and are determined according to income tax regulations (tax basis). Distributable earnings determined on a tax basis may differ from earnings recorded in accordance with accounting principles generally accepted in the United States of America. These differences may be permanent or temporary. Permanent differences are reclassified among capital accounts to reflect their tax character. These reclass ifications have no impact on net assets or the results of operations. Temporary differences are not reclassified, as they may reverse in subsequent periods.
Common expenses incurred by the Trust are allocated among the Funds based on the ratio of net assets of each fund to the combined net assets of the Trust. Fund specific expenses are charged directly to the fund that incurred the expense.
Realized and unrealized gains and losses and net investment income, not including class specific expenses, are allocated daily to each class of shares based upon the relative proportion of net assets of each class. Differences in per share distributions, by class, are generally due to differences in class specific expenses.
f. Accounting Estimates
The preparation of financial statements in accordance with accounting principles generally accepted in the United States of America requires management to make estimates and assumptions that affect the reported amounts of assets and liabilities at the date of the financial statements and the amounts of income and expenses during the reporting period. Actual results could differ from those estimates.
72 | Annual Report
Templeton Institutional Funds
Notes to Financial Statements (continued)
| 1. | ORGANIZATION AND SIGNIFICANT ACCOUNTING POLICIES (continued) |
| g. | Guarantees and Indemnifications |
Under the Trust’s organizational documents, its officers and trustees are indemnified by the Trust against certain liabilities arising out of the performance of their duties to the Trust. Additionally, in the normal course of business, the Trust, on behalf of the Funds, enters into contracts with service providers that contain general indemnification clauses. The Trust’s maximum exposure under these arrangements is unknown as this would involve future claims that may be made against the Trust that have not yet occurred. Currently, the Trust expects the risk of loss to be remote.
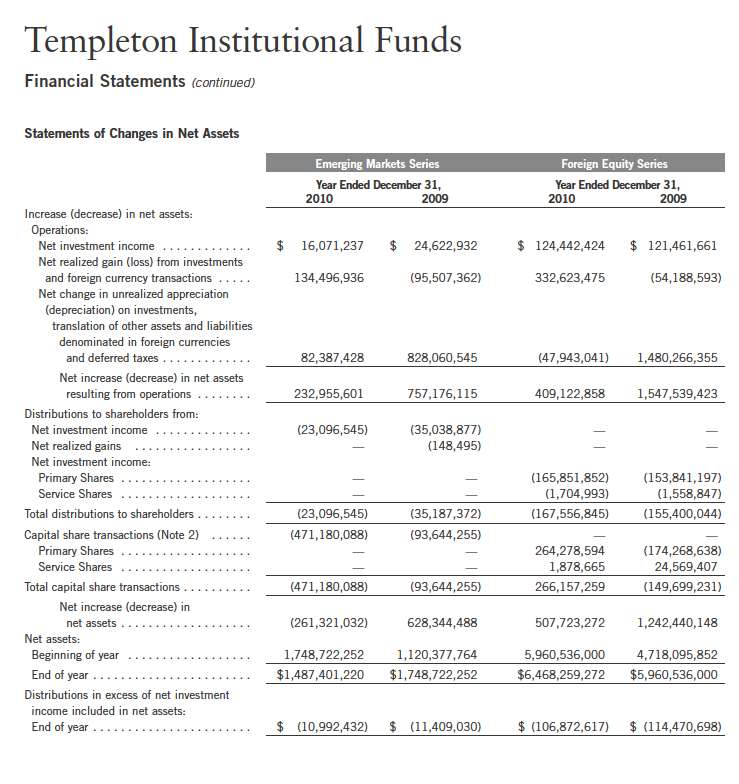
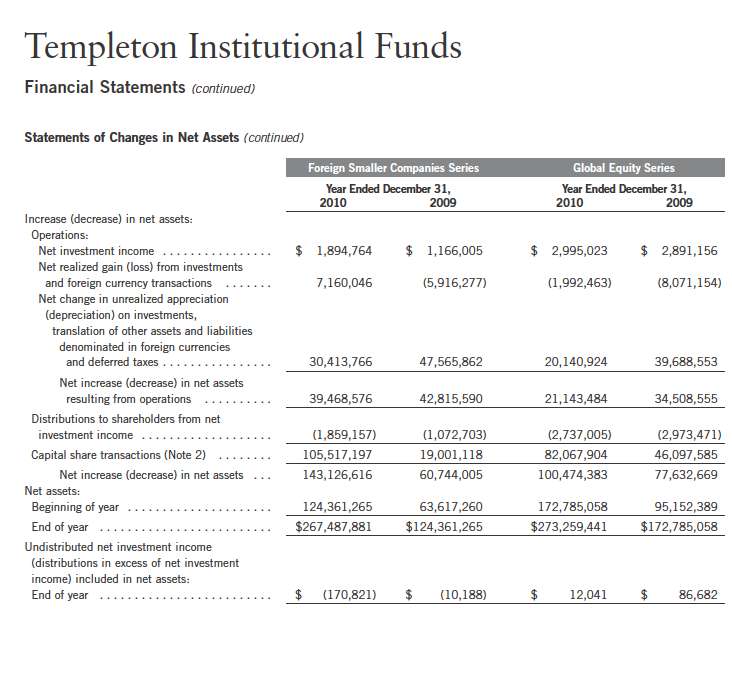
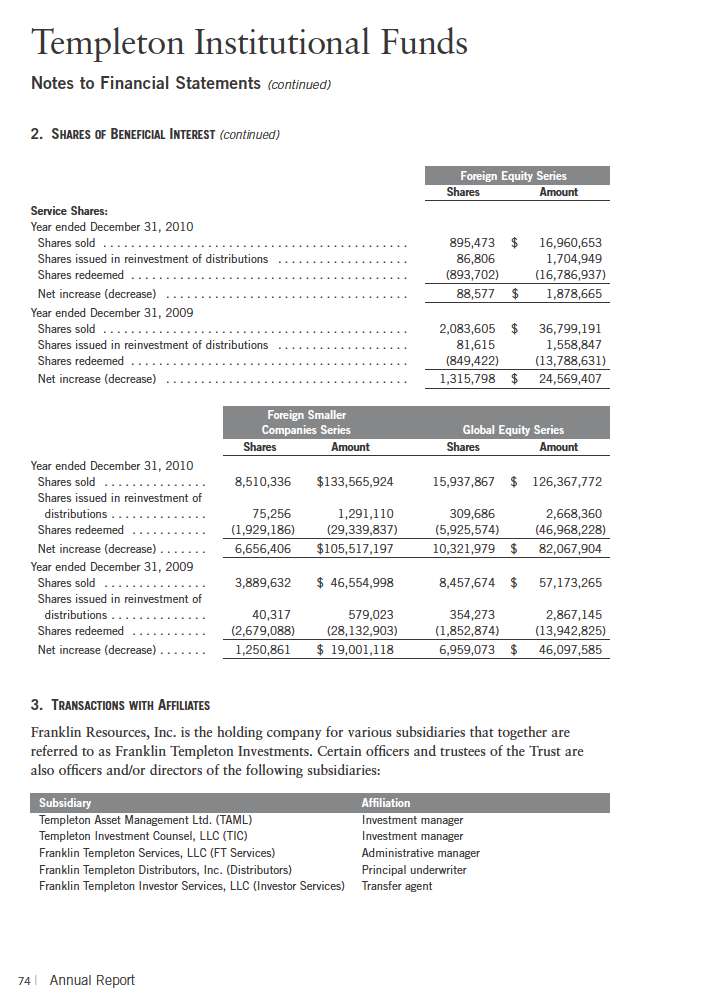
2. SHARES OF BENEFICIAL INTEREST
At December 31, 2010, there were an unlimited number of shares authorized (without par value). Transactions in the Funds’ shares were as follows:

Annual Report | 73
Templeton Institutional Funds
Notes to Financial Statements (continued)
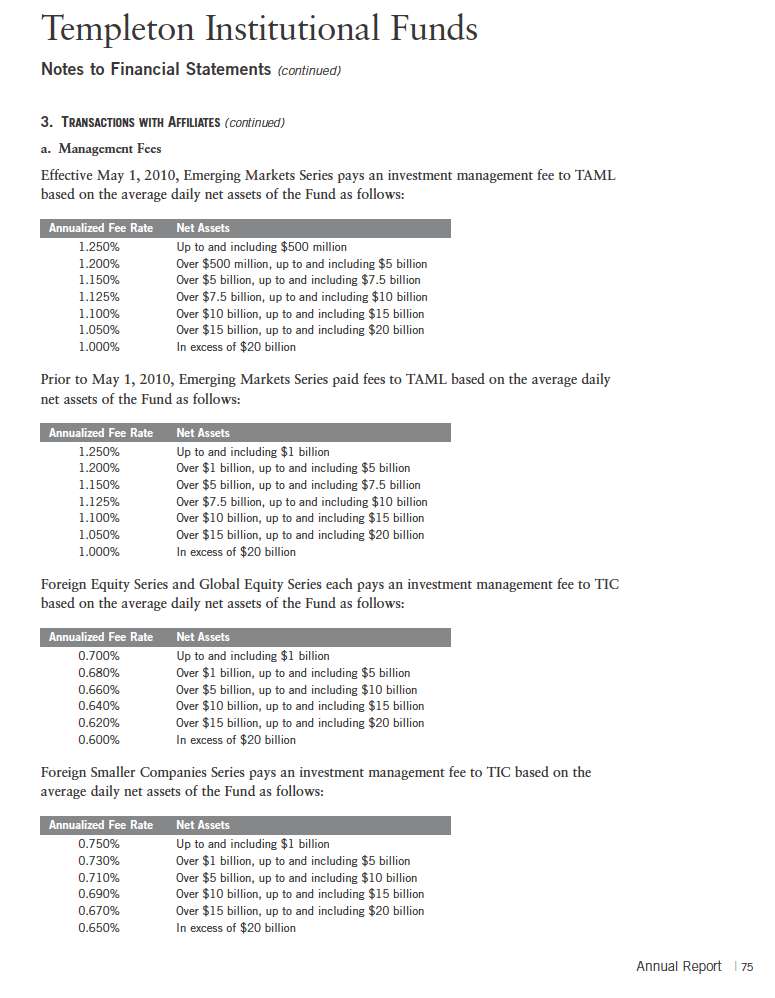
| 3. | TRANSACTIONS WITH AFFILIATES (continued) |
| b. | Administrative Fees |
Foreign Smaller Companies Series and Global Equity Series each pay an administrative fee to FT Services of 0.20% per year of the average daily net assets of the fund.
Emerging Markets Series and Foreign Equity Series each pay their allocated share of an administrative fee to FT Services based on the aggregate average net assets as follows:

c. Transfer Agent Fees
For the year ended December 31, 2010, the Funds paid transfer agent fees as noted in the Statement of Operations at which the following amounts were retained by Investor Services.

Foreign Equity Series’ Service Shares may pay up to 0.15% of average daily net assets for sub-transfer agency fees as noted in the Statements of Operations.
d. Waiver and Expense Reimbursements
FT Services and TIC have contractually agreed in advance to waive or limit their respective fees and to assume as their own expense certain expenses otherwise payable by the Foreign Smaller Companies Series and Global Equity Series so that the common expenses (i.e. a combination of management fees, administrative fees, and other expenses) do not exceed 0.95% and 0.81%, respectively (other than certain non-routine expenses or costs, including those relating to litigation, indemnification, reorganizations, and liquidations) until April 30, 2011.
4. EXPENSE OFFSET ARRANGEMENT
The Funds have entered into an arrangement with their custodian whereby credits realized as a result of uninvested cash balances are used to reduce a portion of the Funds’ custodian expenses. During the year ended December 31, 2010, the custodian fees were reduced as noted in the Statements of Operations.
76 | Annual Report

Templeton Institutional Funds
Notes to Financial Statements (continued)
7. INVESTMENTS IN INSTITUTIONAL FIDUCIARY TRUST MONEY MARKET PORTFOLIO
Emerging Markets Series and Foreign Equity Series may invest in the Institutional Fiduciary Trust Money Market Portfolio (Sweep Money Fund), an open-end investment company managed by Franklin Advisers, Inc. (an affiliate of the investment manager). Management fees paid by the Funds are reduced on assets invested in the Sweep Money Fund, in an amount not to exceed the management and administrative fees paid by the Sweep Money Fund.
8. SHAREHOLDER CONCENTRATIONS
The Funds have a concentration of shareholders holding a significant percentage of shares outstanding. Investment activities of these shareholders could have a material impact on the Funds. At December 31, 2010, Emerging Markets Series had one unaffiliated shareholder holding 53.2% of the fund’s outstanding shares.
9. CONCENTRATION OF RISK
Investing in foreign securities may include certain risks and considerations not typically associated with investing in U.S. securities, such as fluctuating currency values and changing local and regional economic, political and social conditions, which may result in greater market volatility. In addition, certain foreign securities may not be as liquid as U.S. securities.
10. CREDIT FACILITY
The Funds, together with other U.S. registered and foreign investment funds (collectively “Borrowers”), managed by Franklin Templeton Investments, are borrowers in a joint syndicated senior unsecured credit facility totaling $750 million (Global Credit Facility) which matures on January 21, 2011. This Global Credit Facility provides a source of funds to the Borrowers for temporary and emergency purposes, including the ability to meet future unanticipated or unusually large redemption requests.
Under the terms of the Global Credit Facility, the Funds shall, in addition to interest charged on any borrowings made by the Funds and other costs incurred by the Funds, pay their share of fees and expenses incurred in connection with the implementation and maintenance of the Global Credit Facility, based upon its relative share of the aggregate net assets of all of the Borrowers, including an annual commitment fee of 0.10% based upon the unused portion of the Global Credit Facility, which is reflected in other expenses on the Statements of Operations. During the year ended December 31, 2010, the Funds did not use the Global Credit Facility.
Effective January 21, 2011, the Borrowers renewed the Global Credit Facility for a total of $750 million, maturing January 20, 2012.
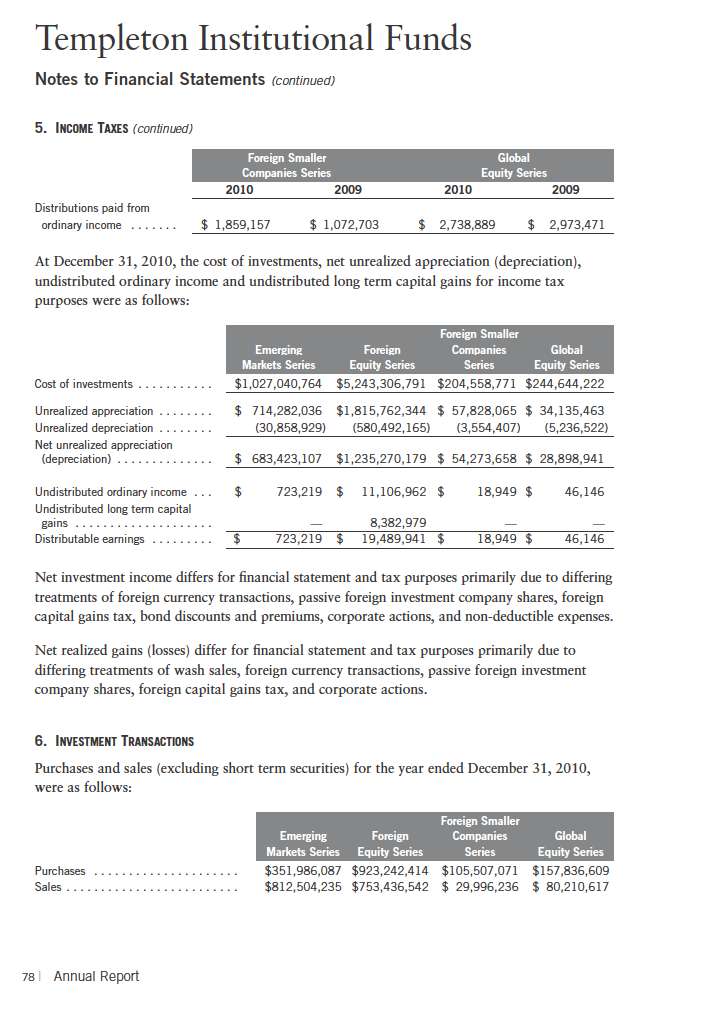
Annual Report | 79
Templeton Institutional Funds
Notes to Financial Statements (continued)
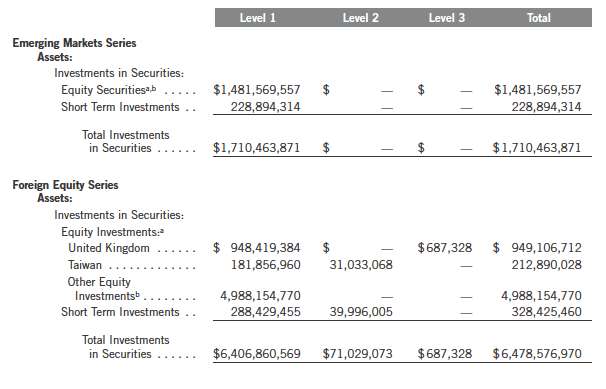
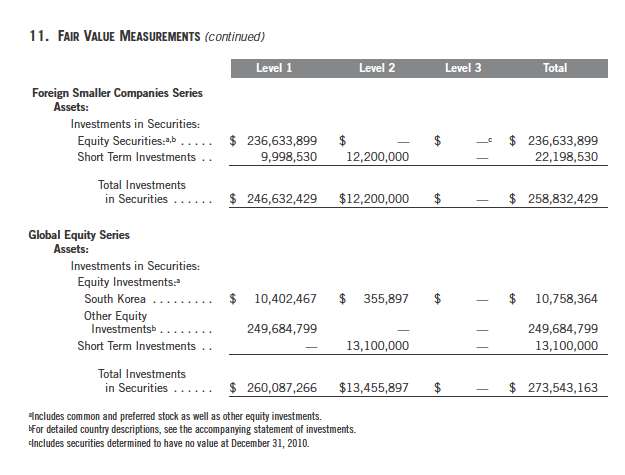
11. FAIR VALUE MEASUREMENTS
The Funds follow a fair value hierarchy that distinguishes between market data obtained from independent sources (observable inputs) and the Funds’ own market assumptions (unobservable inputs). These inputs are used in determining the value of the Funds’ investments and are summarized in the following fair value hierarchy:
Level 1 – quoted prices in active markets for identical securities
Level 2 – other significant observable inputs (including quoted prices for similar securities, interest rates, prepayment speed, credit risk, etc.)
Level 3 – significant unobservable inputs (including the Fund’s own assumptions in deter- mining the fair value of investments)
The inputs or methodology used for valuing securities are not an indication of the risk associated with investing in those securities.
For movements between the levels within the fair value hierarchy, the Funds have adopted a policy of recognizing the transfers as of the date of the underlying event which caused the movement.
The following is a summary of the inputs used as of December 31, 2010, in valuing the Funds’ assets and liabilities carried at fair value:
80 | Annual Report
Templeton Institutional Funds
Notes to Financial Statements (continued)
12. SUBSEQUENT EVENTS
The Funds have evaluated subsequent events through the issuance of the financial statements and determined that no events have occurred that require disclosure other than those already disclosed in the financial statements.
Annual Report | 81
Templeton Institutional Funds
Report of Independent Registered Public Accounting Firm
To the Board of Trustees and Shareholders of Templeton Institutional Funds
In our opinion, the accompanying statements of assets and liabilities, including the statements of investments, and the related statements of operations and of changes in net assets and the financial highlights present fairly, in all material respects, the financial position of Emerging Markets Series, Foreign Equity Series, Foreign Smaller Companies Series and Global Equity Series (the “Funds”) at December 31, 2010, the results of each of their operations for the year then ended, the changes in each of their net assets for each of the two years in the period then ended and the financial highlights for each of the periods presented, in conformity with accounting principles generally accepted in the United States of America. These financial statements and financial highlights (hereafter referred to as “financial statements”) are the responsibility of the Funds’ management. Our responsibility is to express an opinion on these f inancial statements based on our audits. We conducted our audits of these financial statements in accordance with the standards of the Public Company Accounting Oversight Board (United States). Those standards require that we plan and perform the audit to obtain reasonable assurance about whether the financial statements are free of material misstatement. An audit includes examining, on a test basis, evidence supporting the amounts and disclosures in the financial statements, assessing the accounting principles used and significant estimates made by management, and evaluating the overall financial statement presentation. We believe that our audits, which included confirmation of securities at December 31, 2010 by correspondence with the custodian and brokers, provide a reasonable basis for our opinion.
PricewaterhouseCoopers LLP
San Francisco, California
February 17, 2011 |
82 | Annual Report
Templeton Institutional Funds
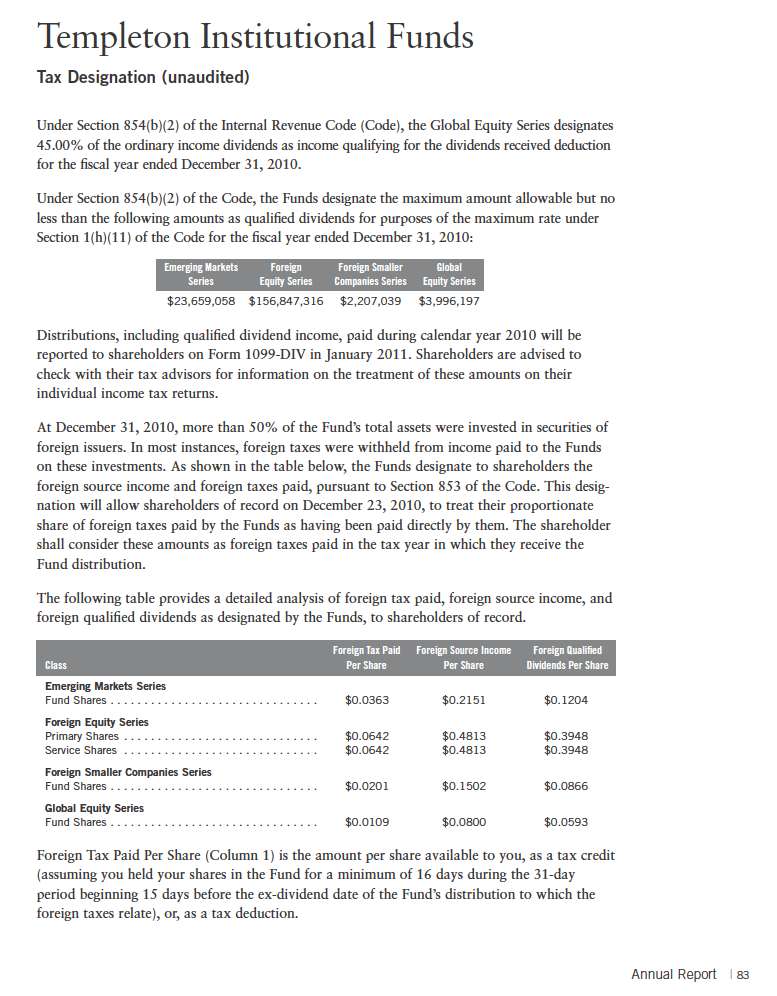
Tax Designation (unaudited) (continued)
Foreign Source Income Per Share (Column 2) is the amount per share of income dividends attributable to foreign securities held by the Fund, plus any foreign taxes withheld on these dividends. The amounts reported include foreign source qualified dividends that have not been adjusted for the rate differential applicable to such dividend income.1
Foreign Qualified Dividends Per Share (Column 3) is the amount per share of foreign source qualified dividends plus any foreign taxes withheld on these dividends. These amounts represent the portion of the Foreign Source Income reported to you in column 2 that were derived from qualified foreign securities held by the Fund.1
In January 2011, shareholders will receive Form 1099-DIV which will include their share of taxes paid and foreign source income distributed during the calendar year 2010. The Foreign Source Income reported on Form 1099-DIV has not been adjusted for the rate differential on foreign source qualified dividend income. Shareholders are advised to check with their tax advisors for information on the treatment of these amounts on their 2010 individual income tax returns.
1Qualified dividends are taxed at reduced long term capital gains tax rates. In determining the amount of foreign tax credit that may be applied against the U.S. tax liability of individuals receiving foreign source qualified dividends, adjustments may be required to the foreign tax credit limitation calculation to reflect the rate differential applicable to such dividend income. The rules however permit certain individuals to elect not to apply the rate differential adjustments for capital gains and/or dividends for any taxable year. Please consult your tax advisor and the instructions to Form 1116 for more information.
84 | Annual Report

Templeton Institutional Funds
Shareholder Information
Proxy Voting Policies and Procedures
The Funds’ investment managers have established Proxy Voting Policies and Procedures (Policies) that the Funds use to determine how to vote proxies relating to portfolio securities. Shareholders may view the Funds’ complete Policies online at franklintempleton.com. Alternatively, shareholders may request copies of the Policies free of charge by calling the Proxy Group collect at (954) 527-7678 or by sending a written request to: Franklin Templeton Companies, LLC, 500 East Broward Boulevard, Suite 1500, Fort Lauderdale, FL 33394, Attention: Proxy Group. Copies of the Funds’ proxy voting records are also made available online at franklintempleton.com and posted on the U.S. Securities and Exchange Commission’s website at sec.gov and reflect the most recent 12-month period ended June 30.
Quarterly Statement of Investments
The Funds file a complete statement of investments with the U.S. Securities and Exchange Commission for the first and third quarters for each fiscal year on Form N-Q. Shareholders may view the filed Form N-Q by visiting the Commission’s website at sec.gov. The filed form may also be viewed and copied at the Commission’s Public Reference Room in Washington, DC. Information regarding the operations of the Public Reference Room may be obtained by calling (800) SEC-0330.
Householding of Reports and Prospectuses
You will receive each Fund’s financial reports every six months as well as an annual updated summary prospectus (prospectus available upon request). To reduce Fund expenses, we try to identify related shareholders in a household and send only one copy of the financial reports and summary prospectus. This process, called “householding,” will continue indefinitely unless you instruct us otherwise. If you prefer not to have these documents householded, please call us at (800) 321-8563. At any time you may view current prospectuses/summary prospectuses and financial reports on our website. If you choose, you may receive these documents through electronic delivery.
90 | Annual Report
This page intentionally left blank.
This page intentionally left blank.
Item 2. Code of Ethics.
(a) The Registrant has adopted a code of ethics that applies to its principal executive officers and principal financial and accounting officer.
(c) N/A
(d) N/A
(f) Pursuant to Item 12(a)(1), the Registrant is attaching as an exhibit a copy of its code of ethics that applies to its principal executive officers and principal financial and accounting officer.
Item 3. Audit Committee Financial Expert.
(a)(1) The Registrant has an audit committee financial expert serving on its audit committee.
(2) The audit committee financial expert is David W. Niemiec and he is "independent" as defined under the relevant Securities and Exchange Commission Rules and Releases.
Item 4. Principal Accountant Fees and Services.
(a) Audit Fees
The aggregate fees paid to the principal accountant for professional services rendered by the principal accountant for the audit of the registrant’s annual financial statements or for services that are normally provided by the principal accountant in connection with statutory and regulatory filings or engagements were $159,771 for the fiscal year ended December 31, 2010 and $158,933 for the fiscal year ended December 31, 2009.
(b) Audit-Related Fees
The aggregate fees paid to the principal accountant for assurance and related services rendered by the principal accountant to the registrant that are reasonably related to the performance of the audit of the registrant's financial statements and are not reported under paragraph (a) of Item 4 were $2,769 for the fiscal year ended December 31, 2010 and $2,650 for the fiscal year ended December 31, 2009. The services for which these fees were paid included attestation services.
There were no fees paid to the principal accountant for assurance and related services rendered by the principal accountant to the registrant's investment adviser and any entity controlling, controlled by or under common control with the investment adviser that provides ongoing services to the registrant that are reasonably related to the performance of the audit of their financial statements.
(c) Tax Fees
The aggregate fees paid to the principal accountant for professional services rendered by the principal accountant to the registrant for tax compliance, tax advice and tax planning were $1,290 for the fiscal year ended December 31, 2010 and $1,250 for the fiscal year ended December
31, 2009. The services for which these fees were paid included preparation of tax returns for foreign governments.
The aggregate fees paid to the principal accountant for professional services rendered by the principal accountant to the registrant’s investment adviser and any entity controlling, controlled by or under common control with the investment adviser that provides ongoing services to the registrant for tax compliance, tax advice and tax planning were $35,000 for the fiscal year ended December 31, 2010 and $2,000 for the fiscal year ended December 31, 2009. The services for which these fees were paid included technical tax consultation for capital gain tax reporting to foreign governments and derivative instruments.
(d) All Other Fees
The aggregate fees paid to the principal accountant for products and services rendered by the principal accountant to the registrant not reported in paragraphs (a)-(c) of Item 4 were $3,032 for the fiscal year ended December 31, 2010 and $0 for the fiscal year ended December 31, 2009. The services for which these fees were paid include review of materials provided to the fund Board in connection with the investment management contract renewal process.
The aggregate fees paid to the principal accountant for products and services rendered by the principal accountant to the registrant’s investment adviser and any entity controlling, controlled by or under common control with the investment adviser that provides ongoing services to the registrant other than services reported in paragraphs (a)-(c) of Item 4 were $141,768 for the fiscal year ended December 31, 2010 and $0 for the fiscal year ended December 31, 2009. The services for which these fees were paid include review of materials provided to the fund Board in connection with the investment management contract renewal process.
(e) (1) The registrant’s audit committee is directly responsible for approving the services to be provided by the auditors, including:
| (i) | pre-approval of all audit and audit related services; |
| (ii) | pre-approval of all non-audit related services to be |
provided to the Fund by the auditors;
(iii) pre-approval of all non-audit related services to be provided to the registrant by the auditors to the registrant’s investment adviser or to any entity that controls, is controlled by or is under common control with the registrant’s investment adviser and that provides ongoing services to the registrant where the non-audit services relate directly to the operations or financial reporting of the registrant; and
(iv) establishment by the audit committee, if deemed necessary or appropriate, as an alternative to committee pre-approval of services to be provided by the auditors, as required by paragraphs (ii) and (iii) above, of policies and procedures to permit such services to be pre-approved by other means, such as through establishment of guidelines or by action of a designated member or members of the committee; provided the policies and procedures are detailed as to the
particular service and the committee is informed of each service and such policies and procedures do not include delegation of audit committee responsibilities, as contemplated under the Securities Exchange Act of 1934, to management; subject, in the case of (ii) through (iv), to any waivers, exceptions or exemptions that may be available under applicable law or rules.
(e) (2) None of the services provided to the registrant described in paragraphs (b)-(d) of Item 4 were approved by the audit committee pursuant to paragraph (c)(7)(i)(C) of Rule 2-01 of regulation S-X.
| (f) | No disclosures are required by this Item 4(f). |
| (g) | The aggregate non-audit fees paid to the principal accountant for |
services rendered by the principal accountant to the registrant and the registrant’s investment adviser and any entity controlling, controlled by or under common control with the investment adviser that provides ongoing services to the registrant were $183,859 for the fiscal year ended December 31, 2010 and $5,900 for the fiscal year ended December 31, 2009.
(h) The registrant’s audit committee of the board has considered whether the provision of non-audit services that were rendered to the registrant’s investment adviser (not including any sub-adviser whose role is primarily portfolio management and is subcontracted with or overseen by another investment adviser), and any entity controlling, controlled by, or under common control with the investment adviser that provides ongoing services to the registrant that were not pre-approved pursuant to paragraph (c)(7)(ii) of Rule 2-01 of Regulation S-X is compatible with maintaining the principal accountant’s independence.
Item 5. Audit Committee of Listed Registrants. N/A
Item 6. Schedule of Investments. N/A
Item 7. Disclosure of Proxy Voting Policies and Procedures for Closed-End Management Investment Companies. N/A
Item 8. Portfolio Managers of Closed-End Management Investment Companies. N/A
Item 9. Purchases of Equity Securities by Closed-End Management Investment Company and Affiliated Purchasers. N/A
Item 10. Submission of Matters to a Vote of Security Holders.
There have been no changes to the procedures by which shareholders may recommend nominees to the Registrant's Board of Directors that would require disclosure herein.
Item 11. Controls and Procedures.
(a) Evaluation of Disclosure Controls and Procedures. The Registrant maintains disclosure controls and procedures that are designed to ensure that information required to be disclosed in the Registrant’s filings under the Securities Exchange Act of 1934 and the Investment Company Act of 1940 is recorded, processed, summarized and reported within the periods specified in the rules and forms of the Securities and Exchange Commission. Such information is accumulated and communicated to the Registrant’s management, including its principal executive officer and principal financial officer, as appropriate, to allow timely decisions regarding required disclosure. The Registrant’s management, including the principal executive officer and the principal financial officer, recogni zes that any set of controls and procedures, no matter how well designed and operated, can provide only reasonable assurance of achieving the desired control objectives.
Within 90 days prior to the filing date of this Shareholder Report on Form N-CSR, the Registrant had carried out an evaluation, under the supervision and with the participation of the Registrant’s management, including the Registrant’s principal executive officer and the Registrant’s principal financial officer, of the effectiveness of the design and operation of the Registrant’s disclosure controls and procedures. Based on such evaluation, the Registrant’s principal executive officer and principal financial officer concluded that the Registrant’s disclosure controls and procedures are effective.
(b) Changes in Internal Controls. There have been no significant changes in the Registrant’s internal controls or in other factors that could significantly affect the internal controls subsequent to the date of their evaluation in connection with the preparation of this Shareholder Report on Form N-CSR.
Item 12. Exhibits.
(a)(1) Code of Ethics |
(a)(2) Certifications pursuant to Section 302 of the Sarbanes-Oxley Act of 2002 of Laura F. Fergerson, Chief Executive Officer - Finance and Administration, and Mark H. Otani, Chief Financial Officer and Chief Accounting Officer (b) Certifications pursuant to Section 906 of the Sarbanes-Oxley Act of 2002 of Laura F. Fergerson, Chief Executive Officer - Finance and Administration, and Mark H. Otani, Chief Financial Officer and Chief Accounting Officer
Pursuant to the requirements of the Securities Exchange Act of 1934 and the Investment Company Act of 1940, the registrant has duly caused this report to be signed on its behalf by the undersigned, thereunto duly authorized.
TEMPLETON INSTITUTIONAL FUNDS
By /s/ LAURA F. FERGERSON
Laura F. Fergerson
Chief Executive Officer –
Finance and Administration
Date February 25, 2011 |
Pursuant to the requirements of the Securities Exchange Act of 1934 and the Investment Company Act of 1940, this report has been signed below by the following persons on behalf of the registrant and in the capacities and on the dates indicated.
By /s/ LAURA F. FERGERSON
Laura F. Fergerson
Chief Executive Officer –
Finance and Administration
Date February 25, 2011 |
By /s/ MARK H. OTANI
Mark H. Otani
Chief Financial Officer and
Chief Accounting Officer
Date February 25, 2011 |