of quantitative easing in little more than a decade, and India announced a series of reforms to boost investment confidence. In Latin America, Brazil aggressively cut interest rates and announced a stimulus package plan. Headwinds to growth negatively affected most world regions during 2012, including recently resilient emerging markets, and the International Monetary Fund lowered its global growth outlook. However, the slowdown appeared less severe than expected in developed markets such as Germany and the U.S. and in emerging markets such as China, India and Brazil. In the latter half of 2012, policy measures seemed to take hold and supported global economic recovery, contributing to expansion in many emerging market countries as well as a slowing rate of contraction in Europe. Toward year-end, investor focus shifted to the U.S., where policymakers sought to avert automatic spending cuts and tax hikes, commonly known as the “fiscal cliff.” Just after year-end, Congress passed compromise legislation that preserved lower income tax rates for most U.S. households and delayed far-reaching federal spending cuts. Despite adversity and uncertainty throughout the 12-month period, virtually all major asset classes, as well as all developed and emerging market regions, finished 2012 with positive returns.
The foregoing information reflects our analysis and opinions as of December 31, 2012. The information is not a complete analysis of every aspect of any market, country, industry or fund. Statements of fact are from sources considered reliable.
2 | Annual Report
4 | Annual Report
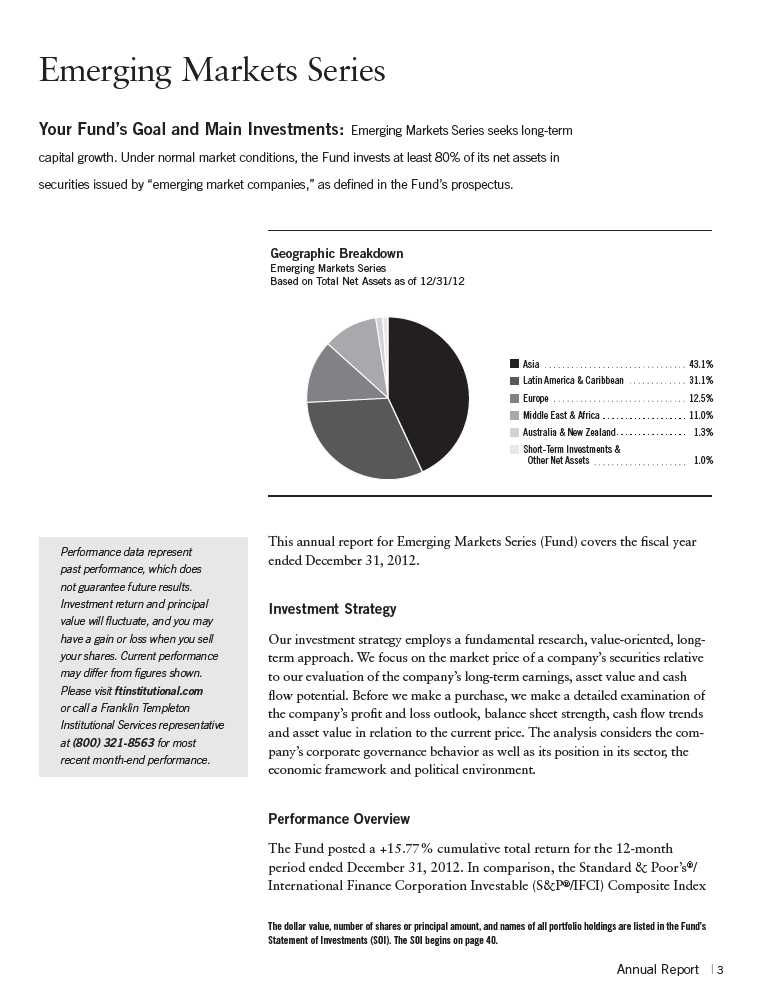
and the MSCI Emerging Markets (EM) Index, which track global emerging market stock performance, generated total returns of +18.89% and +18.63% during the same period.1 Please note index performance information is provided for reference and we do not attempt to track an index but rather undertake investments on the basis of fundamental research. The Fund’s return reflects the effect of fees and expenses for professional management, while an index does not have such costs. In addition, an index is not subject to investment flows while the Fund is subject to purchases and redemptions that could impact performance. You can find the Fund’s long-term performance data in the Performance Summary beginning on page 7.
Manager’s Discussion
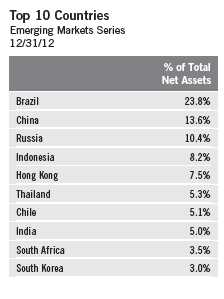
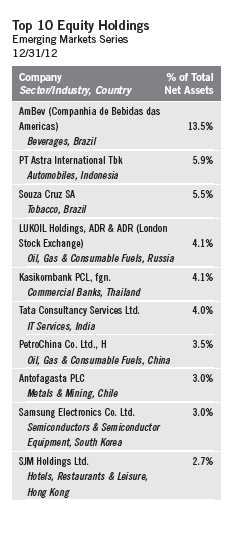
During the 12 months under review, major contributors to the Fund’s absolute performance included Brazil-based AmBev (Companhia de Bebidas das Americas), one of the world’s largest beer and soft drink producers; Souza Cruz, a major Brazilian cigarette company; and Kasikornbank, a leading commercial bank in Thailand. The strong market positions of AmBev and Souza Cruz have allowed their businesses to achieve robust returns and build market share as consumers become wealthier and more discerning. The companies’ strong operations, high profit margins and popular brands make them attractive investments in our view. Delays to beer tax increases and indications that AmBev’s product price increases and higher margin product mix were protecting earnings drove the company’s share price higher in the latter part of the reporting period. Souza Cruz’s share price also rebounded in the final quarter of 2012 from weakness in the third quarter, aided by the company’s imposition of higher product prices ahead of expected tax increases. We believe Kasikornbank is well positioned to benefit from Thailand’s potentially strong economic growth as the country continues to recover from the 2011 floods and the government’s fiscal stimulus measures, including minimum wage increases, work through the economy. Investor sentiment further improved as signs that European banks’ deleveraging in Thailand has been working to the advantage of local lenders during the recovery phase.
In contrast, key detractors from absolute performance included Itau Unibanco Holding, one of Brazil’s largest financial conglomerates; Yantai Changyu Pioneer Wine, a leading wine manufacturer in China; and Exxaro Resources, a South Africa-based mining group with key interests in iron ore, coal and mineral sands. Itau Unibanco’s share price weakened as the Central Bank of
1. Source: © 2013 Morningstar. All Rights Reserved. The information contained herein: (1) is proprietary to Morningstar and/or its content providers; (2) may not be copied or distributed; and (3) is not warranted to be accurate, complete or timely. Neither Morningstar nor its content providers are responsible for any damages or losses arising from any use of this information. STANDARD & POOR’S®, S&P® and S&P 500® are registered trademarks of Standard & Poor’s Financial Services LLC. The indexes are unmanaged and include reinvested dividends. One cannot invest directly in an index, and an index is not representative of the Fund’s portfolio.
Brazil’s interest rate cuts throughout most of 2012 threatened to affect the bank’s margins. In our view, cost-cutting initiatives undertaken by the bank could help offset lower spreads in the future. In the long term, we believe the bank could potentially benefit from its strong market position as the Brazilian economy grows and consumer wealth increases. Concerns of fierce competition from existing and emerging domestic wineries, as well as foreign wineries, and the availability of opportunities we considered more attractive within the Fund’s investment universe led us to divest our investment in Yantai Changyu Pioneer Wine. We sold the Fund’s small position in Exxaro Resources during the reporting period to streamline the Fund’s exposure to the mining industry and focus on companies we considered to have stronger fundamentals.
It is important to recognize the effect of currency movements on the Fund’s performance. In general, if the value of the U.S. dollar goes up compared with a foreign currency, an investment traded in that foreign currency will go down in value because it will be worth fewer U.S. dollars. This can have a negative effect on Fund performance. Conversely, when the U.S. dollar weakens in relation to a foreign currency, an investment traded in that foreign currency will increase in value, which can contribute to Fund performance. For the 12 months ended December 31, 2012, the U.S. dollar rose in value relative to many currencies in which the Fund’s investments were traded. As a result, the Fund’s performance was negatively affected by the portfolio’s investment predominantly in securities with non-U.S. currency exposure.
In the past 12 months, our continued search for investments we considered to be attractive led us to increase the Fund’s holdings in Hong Kong, South Korea and China via Hong Kong-listed China H and Red Chip shares, and to initiate investments in Colombia.2 We also added to the Fund’s investments in faster growing frontier markets by initiating positions in Saudi Arabia, Turkmenistan and Kenya and by increasing the Fund’s holdings in Nigeria and Qatar as we identified stocks with fundamentals we considered to be attractive. We increased the Fund’s investments in wireless telecommunication services, specialty and catalog retail, casinos and gaming, and electronic products companies. Key purchases included new positions in China Mobile, the country’s leading mobile services provider, and Dragon Oil, an independent oil company operating oilfields in the Caspian Sea off the shores of Turkmenistan, as well as an additional investment in Yanzhou Coal Mining, one of China’s largest coal producers.
2. “China H” denotes shares of China-incorporated, Hong Kong Stock Exchange-listed companies with most businesses in China. “Red Chip” denotes shares of Hong Kong Stock Exchange-listed companies with significant exposure to China.
Annual Report | 5
Conversely, we reduced the Fund’s investments in India, Brazil, Russia and
Indonesia to focus on stocks we considered to be more attractively valued
within our investment universe. We reduced the Fund’s holdings largely in
diversified metals and mining, food retailing, oil and gas, and diversified bank-
ing companies. Key sales included elimination of our position in President
Chain Store, the operator of 7-Eleven stores in Taiwan, as well as reductions
of our investments in Brazil-based Vale, the world’s largest iron ore producer
and exporter, and Bank Central Asia, a major Indonesian bank.
Thank you for your continued participation in Emerging Markets Series.
We look forward to serving your future investment needs.
The foregoing information reflects our analysis, opinions and portfolio holdings as of December 31, 2012, the end
of the reporting period. The way we implement our main investment strategies and the resulting portfolio holdings
may change depending on factors such as market and economic conditions. These opinions may not be relied upon
as investment advice or an offer for a particular security. The information is not a complete analysis of every
aspect of any market, country, industry, security or the Fund. Statements of fact are from sources considered reli-
able, but the investment manager makes no representation or warranty as to their completeness or accuracy.
Although historical performance is no guarantee of future results, these insights may help you understand our
investment management philosophy.
6 | Annual Report
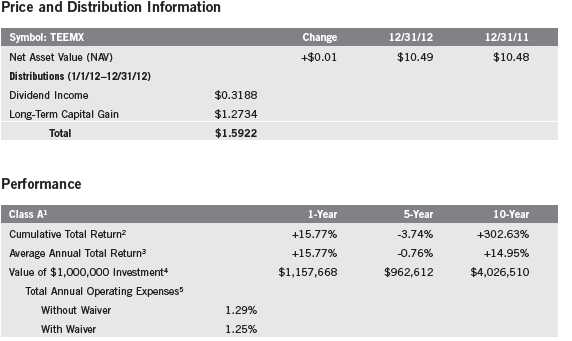
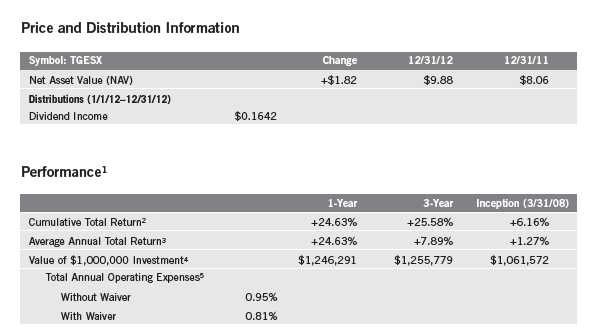
Performance Summary as of 12/31/12
Emerging Markets Series
Your dividend income will vary depending on dividends or interest paid by securities in the Fund’s
portfolio, adjusted for operating expenses. Capital gain distributions are net profits realized from
the sale of portfolio securities. The performance table and graph do not reflect any taxes that a
shareholder would pay on Fund dividends, capital gain distributions, if any, or any realized gains
on the sale of Fund shares. Total return reflects reinvestment of the Fund’s dividends and capital
gain distributions, if any, and any unrealized gains or losses on the sale of Fund shares.
Performance data represent past performance, which does not guarantee future results. Investment return and principal
value will fluctuate, and you may have a gain or loss when you sell your shares. Current performance may differ from
figures shown. For most recent month-end performance, visit ftinstitutional.com or call a Franklin Templeton Institutional
Services representative at (800) 321-8563.
The investment manager and administrator have contractually agreed to waive or assume certain expenses so that common
expenses (excluding acquired fund fees and expenses) do not exceed 1.24% (other than certain nonroutine expenses) until
4/30/13.
Annual Report | 7
Performance Summary (continued)
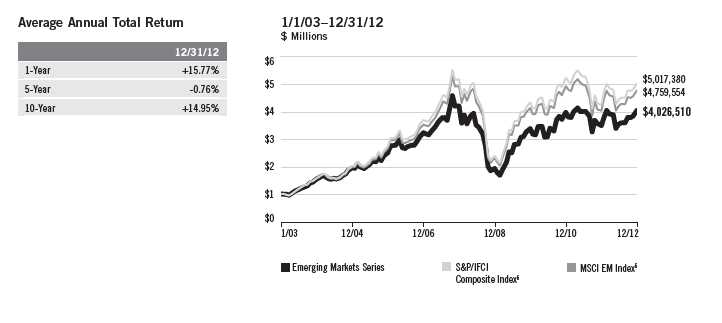
Total Return Index Comparison for a Hypothetical $1,000,000 Investment1
Total return represents the change in value of an investment over the periods shown. It includes
any Fund expenses, account fees and reinvested distributions. The unmanaged indexes include
reinvestment of any income or distributions. They differ from the Fund in composition and do
not pay management fees or expenses. One cannot invest directly in an index.
Endnotes
All investments involve risks, including possible loss of principal. The Fund invests in foreign securities, which
can involve exposure to currency fluctuations, economic instability and political developments. Emerging mar-
kets involve heightened risks related to the same factors, in addition to those associated with their relatively
small size and lesser liquidity. The Fund is actively managed but there is no guarantee that the manager’s
investment decisions will produce the desired results. The Fund’s prospectus also includes a description of the
main investment risks.
1. Fund investment results reflect the expense reduction, without which the results would have been lower.
2. Cumulative total return represents the change in value of an investment over the periods indicated.
3. Average annual total return represents the average annual change in value of an investment over the periods
indicated.
4. These figures represent the value of a hypothetical $1,000,000 investment in the Fund over the periods indicated.
5. Figures are as stated in the Fund’s prospectus current as of the date of this report. In periods of market volatility,
assets may decline significantly, causing total annual Fund operating expenses to become higher than the figures
shown.
6. Source: © 2013 Morningstar. The S&P/IFCI Composite Index is a free float-adjusted, market capitalization-
weighted index designed to measure equity performance of global emerging markets. The MSCI EM Index is a free
float-adjusted, market capitalization-weighted index designed to measure equity market performance of global
emerging markets.
8 | Annual Report
Your Fund’s Expenses
Emerging Markets Series
As a Fund shareholder, you can incur two types of costs:
- Transaction costs, including sales charges (loads) on Fund purchases, if applicable; and
- Ongoing Fund costs, including management fees, distribution and service (12b-1) fees, if applicable, and other Fund expenses. All mutual funds have ongoing costs, sometimes referred to as operating expenses
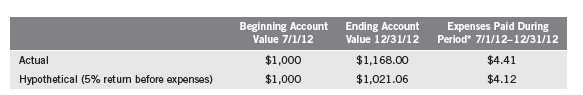
The following table shows ongoing costs of investing in the Fund and can help you understand these costs and compare them with those of other mutual funds. The table assumes a $1,000 investment held for the six months indicated.
Actual Fund Expenses
The first line (Actual) of the table provides actual account values and expenses. The “Ending Account Value” is derived from the Fund’s actual return, which includes the effect of Fund expenses.
You can estimate the expenses you paid during the period by following these steps. Of course, your account value and expenses will differ from those in this illustration:
| 1. | Divide your account value by $1,000. |
| | If an account had an $8,600 value, then $8,600 ÷ $1,000 = 8.6. |
| 2. | Multiply the result by the number under the heading “Expenses Paid During Period.” |
| | If Expenses Paid During Period were $7.50, then 8.6 x $7.50 = $64.50. |
In this illustration, the estimated expenses paid this period are $64.50.
Hypothetical Example for Comparison with Other Funds
Information in the second line (Hypothetical) of the table can help you compare ongoing costs of investing in the Fund with those of other mutual funds. This information may not be used to estimate the actual ending account balance or expenses you paid during the period. The hypothetical “Ending Account Value” is based on the Fund’s actual expense ratio and an assumed 5% annual rate of return before expenses, which does not represent the Fund’s actual return. The figure under the heading “Expenses Paid During Period” shows the hypothetical expenses your account would have incurred under this scenario. You can compare this figure with the 5% hypothetical examples that appear in shareholder reports of other funds.
Annual Report | 9
Your Fund’s Expenses (continued)
Please note that expenses shown in the table are meant to highlight ongoing costs and do not reflect
any transaction costs, such as sales charges, if applicable. Therefore, the second line of the table is
useful in comparing ongoing costs only, and will not help you compare total costs of owning differ-
ent funds. In addition, if transaction costs were included, your total costs would have been higher.
Please refer to the Fund prospectus for additional information on operating expenses.
*Expenses are calculated using the most recent six-month annualized expense ratio, net of expense waivers, of 1.24% multiplied by the average
account value over the period, multiplied by 184/366 to reflect the one-half year period.
10 | Annual Report
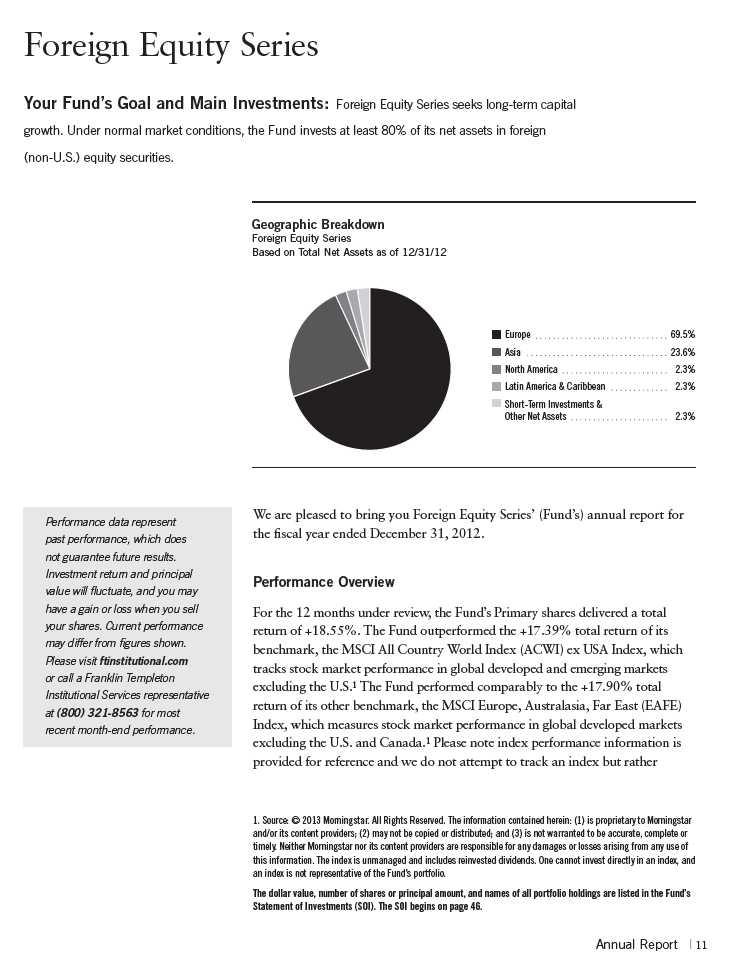
undertake investments on the basis of fundamental research. You can find the Fund’s long-term performance data in the Performance Summary beginning on page 17.
Investment Strategy
We employ a bottom-up, value-oriented, long-term investment strategy. We focus on the market price of a company’s securities relative to our evaluation of the company’s long-term earnings, asset value and cash flow potential. We also consider a company’s price/earnings ratio, profit margins and liquidation value.
Manager’s Discussion
Although weak sentiment in early 2012 left many investors ill-prepared for the stock market rally, the three biggest macro concerns of the year —European debt, Chinese growth and U.S. fiscal politics — all failed to derail equities, and many of Wall Street’s dour forecasts for 2012 proved inaccurate. Despite these forecasts, we remained focused on identifying those stocks with what we viewed as the greatest potential for appreciation. We believe our disciplined adherence to fundamental value principles served our clients well in 2012, with stock selection driving relative performance. However, for us the year will be remembered most for the sad loss of our friend and Chief Investment Officer, Gary Motyl. Gary was one of the first investment professionals hired by Sir John Templeton and had been lead manager of Foreign Equity Series since 1996. A much-respected colleague and talented analyst, Gary instilled Sir John’s investment principles in a new generation of security analysts, and his steady leadership helped navigate diverse market cycles and a period of rapid growth for our organization. Gary is deeply missed, but his legacy lives on in the work of Templeton’s portfolio managers and analysts around the world.
This work proved successful in 2012 as muted volatility and falling interstock correlations in the latter half of the year mitigated the short-term macro forces that we believe had been excessively influencing market performance, allowing many of the Fund’s bottom-up value holdings to be recognized and rewarded. Accordingly, stock selection was the main driver of relative performance at the sector level. Stock selection was particularly beneficial in the resurgent finan-cials sector, where holdings highlighted the Fund’s diverse exposure.2 Two of the Fund’s top financials holdings during the period — DBS Group Holdings, a large Southeast Asian lender, and ICICI Bank, a leading Indian bank —
2. The financials sector comprises capital markets, commercial banks, diversified financial services, insurance, real estate management and development, and thrifts and mortgage finance in the SOI.
12 | Annual Report
represented opportunities we found attractive, dominant franchises serving underleveraged consumers in high organic growth markets. Meanwhile, exposure to reinsurance giants Muenchener Rueckversicherungs-Gesellschaft (Munich Reinsurance; Germany) and Swiss Re (Switzerland) provided healthy gains, and we believe could yield additional returns as the industry considers paying excess capital to shareholders following 2012’s lower-than-expected catastrophe levels. Finally, traditional European lending franchises like Lloyds Banking Group (U.K.) and BNP Paribas (France) also contributed to performance following the European Central Bank’s implicit backing of the regional banking system and company-specific restructuring measures that have delever aged balance sheets and improved sector capital ratios. We remained favorable toward select holdings in the global financials sector, in particular European banks. Even after robust gains in 2012, European bank stock performance has still lagged that of U.S. banks since 2009 and remained near two-decade low valuations, suggesting to us further appreciation potential for a sector that has undergone intensive fundamental repair and recapitalization.
We were also encouraged to see some of the Fund’s long-term, high-conviction holdings contribute meaningfully to performance in 2012. Information technology, for example, was one of the top sector performers and a long-standing Fund overweighting.3 We gradually increased exposure to the sector several years after the bursting of the technology, media and telecommunications bub ble in the early 2000s, when market attrition weeded out unviable businesses and, in our opinion, forced the survivors to repair their balance sheets and reassess business models. Some of the industry’s leading companies emerged from this bubble with strengthened fundamentals and a renewed focus on core operations generating recurring revenues. South Korean semiconductor and consumer electronics manufacturer Samsung Electronics and German enterprise software developer SAP are two excellent examples, with both increasing market share and improving innovation and profitability in lucrative segments like consumer devices (Samsung) and enterprise application software (SAP). Our analysis identified what we regarded as tremendous cash-flow generating capabilities and the cleanest balance sheets of any global sector for certain technology companies, which prospered as customers targeting cost efficien-cies prioritized productivity-enhancing investments over capacity-enhancing capital expenditures. Although we remained favorable on our technology holdings, the sector overall has become more fully valued in our view, and we selectively reduced exposure in recent quarters.
Health care, another long-standing Fund overweighting, also performed strongly in 2012, although valuations remained compelling to us.4 Within the
3. The information technology sector comprises communications equipment, computers and peripherals, semiconductors and semiconductor equipment, and software in the SOI.
4. The health care sector comprises health care equipment and supplies, and pharmaceuticals in the SOI.
Annual Report | 13
sector, we incrementally extended our focus beyond pharmaceutical manufacturers in favor of opportunities we saw as compelling in higher growth companies, often with emerging market exposure. French and German drug-makers Sanofi and Bayer are excellent examples; both companies have high emerging market exposure and, in our view, strong franchises outside of traditional branded pharmaceuticals. Following a period of anemic returns in anticipation of an industry-wide patent cliff that peaked in 2012, we believe our disciplined search for undervalued pharmaceuticals companies actively addressing their competitive and pipeline challenges has begun to pay off.
As important as knowing what stocks to buy is determining what stocks to avoid. The Fund’s underweighting in the materials sector, including our preference for what we viewed as undervalued chemicals firms over expensive metals and mining stocks, positively contributed to performance.5 Netherlands-based Akzo Nobel, one of the world’s largest paint makers, benefited from falling input costs and the disposal of the firm’s troubled U.S. decorative paints business. In general, global economic growth concerns delayed capacity increases and resulted in aggressive cost-cutting in the chemicals industry, boosting operating margins and shoring up balance sheets at companies we believe may be well positioned for an eventual cyclical recovery. Our analysis determined capital discipline was far less judicious in the metals and mining industry, where the capital expenditures-to-depreciation ratio level is near a record high. In addition, valuations based on our normalized earnings forecasts remained largely unattractive and the industry’s reliance on China as the primary source of marginal commodity demand looked precarious given the country’s unsustainably high investment and infrastructure spending.
Among cyclical sectors, we found selectively better opportunities in industrials, and our stock selection aided relative performance.6 German freight and logistics firm Deutsche Post was a leading Fund performer as successful restructuring initiatives led to upgraded earnings guidance, and stock sentiment improved.
The Fund’s overweighted positions in energy and telecommunication services, two of the market’s biggest sector laggards in 2012, were primary relative detractors.7 Spanish oil producer Repsol, which had its YPF assets nationalized by the Argentine government, and Dutch oilfield services firm SBM Offshore, which experienced complications at a legacy project in the North Sea, weighed on relative performance. Despite these isolated issues, we believe
5. The materials sector comprises chemicals, construction materials, and metals and mining in the SOI.
6. The industrials sector comprises aerospace and defense, air freight and logistics, airlines, electrical equipment, industrial conglomerates, professional services, and trading companies and distributors in the SOI.
7. The energy sector comprises energy equipment and services; and oil, gas and consumable fuels in the SOI. The telecommunication services sector comprises diversified telecommunication services and wireless telecommunication services in the SOI.
14 | Annual Report
some exploration and production companies and oil services firms with advanced technology, sound capital discipline and operational flexibility can gain market share as hydrocarbon extraction moves to increasingly challenging and remote locations. In the telecommunication services sector, France Telecom and Spain’s Telefonica were two of the biggest detractors from performance. Although regulatory and competitive issues and anemic revenue growth kept the telecommunication services sector out of favor, this allowed us to buy what we regarded as highly profitable companies with healthy dividend yields at depressed valuations.
From a geographic perspective, Asian stocks benefited relative performance, led by stock selection and an underweighted allocation, particularly in Japan. However, a beneficial overweighting in the resurgent eurozone was offset by stock-specific losses, leading our European exposure to slightly hamper relative returns. At period-end, Europe remained the Fund’s biggest relative and absolute allocation. Despite producing some leading market returns in 2012, developed Europe was still home to eight of the world’s 10 cheapest markets based on cyclically adjusted price-to-earnings ratios at period-end. The region’s dramatic policy progress has made European stocks more attractive to many investors, mainly through the European Central Bank’s efforts to neutralize tail risks with unconventional monetary tools to repair sovereign balance sheets via fiscal austerity. Although challenges remain, we are still favorable toward Europe in light of the region’s fundamental stabilization and many stocks we view as inexpensive and potentially high yielding with global revenue streams.
It is important to recognize the effect of currency movements on the Fund’s performance. In general, if the value of the U.S. dollar goes up compared with a foreign currency, an investment traded in that foreign currency will go down in value because it will be worth fewer U.S. dollars. This can have a negative effect on Fund performance. Conversely, when the U.S. dollar weakens in relation to a foreign currency, an investment traded in that foreign currency will increase in value, which can contribute to Fund performance. For the 12 months ended December 31, 2012, the U.S. dollar declined in value relative to most currencies. As a result, the Fund’s performance was positively affected by the portfolio’s investment predominantly in securities with non-U.S. currency exposure. However, one cannot expect the same result in future periods.
We believe the balance between risk and reward in the global financial system changed dramatically over the past several years. Through increasingly powerful and creative means of market intervention, most governments took great steps to ensure ample liquidity, competitive currencies, and economic and asset reflation. Such measures transferred massive liabilities to the public sector,
Annual Report | 15
which we feel altered traditional safe-haven asset risk profiles and competi-
tively devalued the world’s reserve currencies. Some ratings agencies have
based downgrades at least partially on the inability of elected officials to
address these liabilities. In this environment of negative real interest rates and
impaired government credibility, we believe equities are the best positioned
asset class to potentially provide yield, inflation protection and long-term
appreciation potential. In contrast to the public sector, we believe corporate
fundamentals generally remain strong and investors can still acquire stakes
in productive enterprises at what we consider to be reasonable valuations.
Furthermore, we see lower volatility and falling stock correlations as poten-
tially helping mitigate the macro factors that have unduly influenced stocks
in recent years, which we believe could benefit the Fund’s bottom-up stock
selection approach.
Thank you for your continued participation in Foreign Equity Series. We look
forward to serving your future investment needs.

The foregoing information reflects our analysis, opinions and portfolio holdings as of December 31, 2012, the end
of the reporting period. The way we implement our main investment strategies and the resulting portfolio holdings
may change depending on factors such as market and economic conditions. These opinions may not be relied
upon as investment advice or an offer for a particular security. The information is not a complete analysis of
every aspect of any market, country, industry, security or the Fund. Statements of fact are from sources consid-
ered reliable, but the investment manager makes no representation or warranty as to their completeness or
accuracy. Although historical performance is no guarantee of future results, these insights may help you under-
stand our investment management philosophy.
16 | Annual Report
Performance Summary as of 12/31/12
Foreign Equity Series
Your dividend income will vary depending on dividends or interest paid by securities in the Fund’s portfolio, adjusted for operating expenses of each class. Capital gain distributions are net profits realized from the sale of portfolio securities. The performance table and graphs do not reflect any taxes that a shareholder would pay on Fund dividends, capital gain distributions, if any, or any realized gains on the sale of Fund shares. Total return reflects reinvestment of the Fund’s dividends and capital gain distributions, if any, and any unrealized gains or losses on the sale of Fund shares.
Performance data represent past performance, which does not guarantee future results. Investment return and principal value will fluctuate, and you may have a gain or loss when you sell your shares. Current performance may differ from figures shown. For most recent month-end performance, visit ftinstitutional.com or call a Franklin Templeton Institutional Services representative at (800) 321-8563.
Annual Report | 17
Performance Summary (continued)
Total Return Index Comparison for a Hypothetical $1,000,000 Investment
Total return represents the change in value of an investment over the periods shown. It includes
any Fund expenses, account fees and reinvested distributions. The unmanaged indexes include
reinvestment of any income or distributions. They differ from the Fund in composition and do
not pay management fees or expenses. One cannot invest directly in an index.
18 | Annual Report
Performance Summary (continued)
Endnotes
All investments involve risks, including possible loss of principal. Special risks are associated with foreign investing, including currency fluctua-
tions, economic instability and political developments; investments in emerging markets involve heightened risks related to the same factors. To
the extent the Fund focuses on particular countries, regions, industries, sectors or types of investment from time to time, it may be subject to
greater risks of adverse developments in such areas of focus than a fund that invests in a wider variety of countries, regions, industries, sectors
or investments. Current political uncertainty surrounding the European Union (EU) and its membership may increase market volatility. The
financial instability of some countries in the EU, including Greece, Italy and Spain, together with the risk of that impacting other more stable
countries. may increase the economic risk of investing in companies in Europe. The Fund is actively managed but there is no guarantee that the
manager’s investment decisions will produce the desired results. The Fund’s prospectus also includes a description of the main investment risks.
1. Cumulative total return represents the change in value of an investment over the periods indicated.
2. Average annual total return represents the average annual change in value of an investment over the periods indicated.
3. These figures represent the value of a hypothetical $1,000,000 investment in the Fund over the periods indicated.
4. Figures are as stated in the Fund’s prospectus current as of the date of this report. In periods of market volatility, assets may decline significantly,
causing total annual Fund operating expenses to become higher than the figures shown.
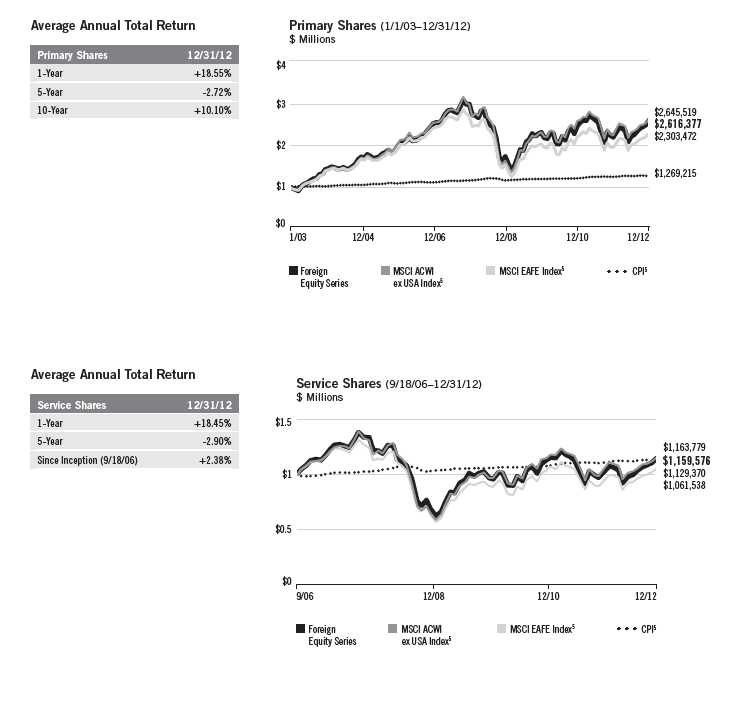
5. Source: © 2013 Morningstar. The MSCI ACWI ex USA Index is a free float-adjusted, market capitalization-weighted index designed to measure
equity market performance of global developed and emerging markets, excluding the U.S. The MSCI EAFE Index is a free float-adjusted, market
capitalization-weighted index designed to measure equity market performance of global developed markets excluding the U.S. and Canada. The
Consumer Price Index (CPI), calculated by the Bureau of Labor Statistics, is a commonly used measure of the inflation rate.
Annual Report | 19
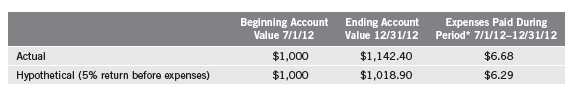
Your Fund’s Expenses
Foreign Equity Series
As a Fund shareholder, you can incur two types of costs:
- Transaction costs, including sales charges (loads) on Fund purchases, if applicable; and
- Ongoing Fund costs, including management fees, distribution and service (12b-1) fees, if applicable, and other Fund expenses. All mutual funds have ongoing costs, sometimes referred to as operating expenses.
The following table shows ongoing costs of investing in the Fund and can help you understand these costs and compare them with those of other mutual funds. The table assumes a $1,000 investment held for the six months indicated.
Actual Fund Expenses
The first line (Actual) for each share class listed in the table provides actual account values and expenses. The “Ending Account Value” is derived from the Fund’s actual return, which includes the effect of Fund expenses.
You can estimate the expenses you paid during the period by following these steps. Of course, your account value and expenses will differ from those in this illustration:
| 1. | Divide your account value by $1,000. |
| | If an account had an $8,600 value, then $8,600 ÷ $1,000 = 8.6. |
| 2. | Multiply the result by the number under the heading “Expenses Paid During Period.” |
| | If Expenses Paid During Period were $7.50, then 8.6 x $7.50 = $64.50. |
In this illustration, the estimated expenses paid this period are $64.50.
Hypothetical Example for Comparison with Other Funds
Information in the second line (Hypothetical) for each class in the table can help you compare ongoing costs of investing in the Fund with those of other mutual funds. This information may not be used to estimate the actual ending account balance or expenses you paid during the period. The hypothetical “Ending Account Value” is based on the actual expense for each class and an assumed 5% annual rate of return before expenses, which does not represent the Fund’s actual return. The figure under the heading “Expenses Paid During Period” shows the hypothetical expenses your account would have incurred under this scenario. You can compare this figure with the 5% hypothetical examples that appear in shareholder reports of other funds.
20 | Annual Report
Your Fund’s Expenses (continued)
Please note that expenses shown in the table are meant to highlight ongoing costs and do not reflect
any transaction costs, such as sales charges, if applicable. Therefore, the second line for each class is
useful in comparing ongoing costs only, and will not help you compare total costs of owning differ-
ent funds. In addition, if transaction costs were included, your total costs would have been higher.
Please refer to the Fund prospectus for additional information on operating expenses.
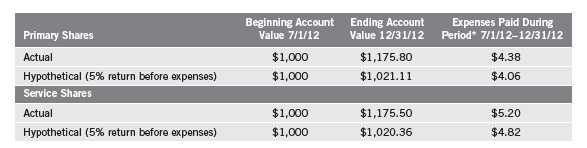
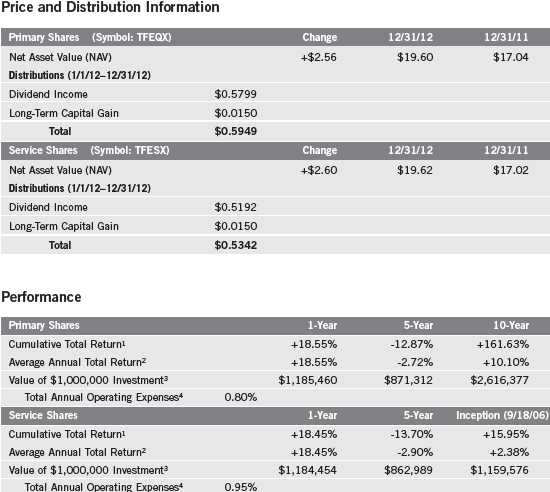
*Expenses are calculated using the most recent six-month expense ratio, annualized for each class (Primary Shares: 0.80% and Service Shares: 0.95%),
multiplied by the average account value over the period, multiplied by 184/366 to reflect the one-half year period.
Annual Report | 21
Investment Strategy
When choosing equity investments, we apply a bottom-up, value-oriented, long-term approach, focusing on the market price of a company’s securities relative to our evaluation of the company’s long-term (typically five years) earnings, asset value and cash flow potential. We also consider a company’s price/earnings ratio, profit margins, liquidation value and other factors.
Manager’s Discussion
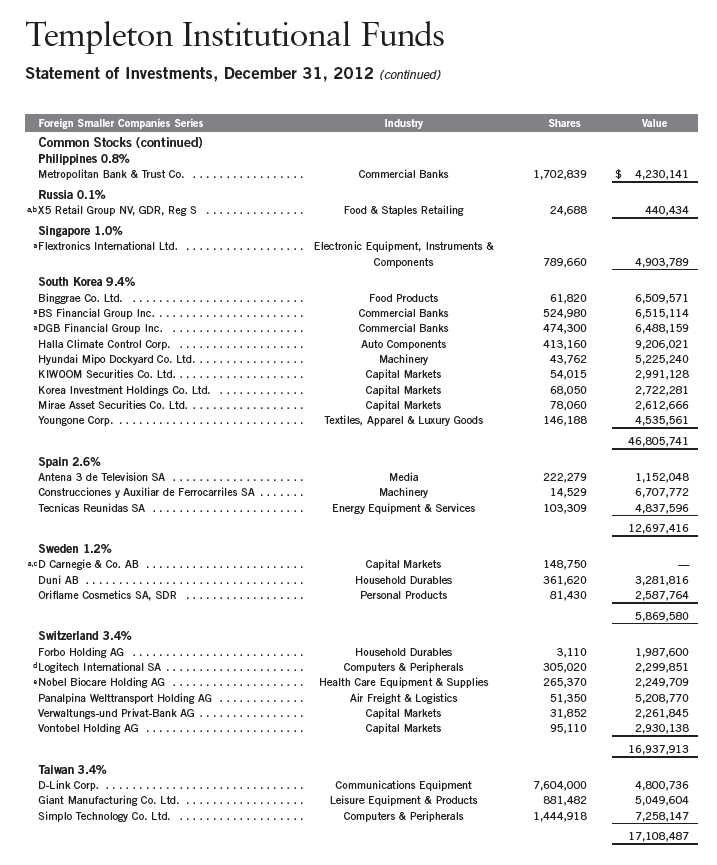
During the 12 months under review, several holdings contributed to Fund performance. Hong Kong-based Techtronic Industries is a brand leader in power tools recognized for product innovation and product extension. The company has continued to gain market share through better innovation than its competitors, in our view, and its shares benefited during the period from the announcements of solid 2011 and first-half 2012 financial results. With restructuring efforts coming to an end, the company has the potential to generate a sharp increase in margins, in our assessment, despite the prospect of higher costs.
South Korea-based Binggrae manufactures dairy food, including ice cream, snacks and beverages. Binggrae has strong brand power in the flavored milk and ice cream markets, and its market share has risen steadily, driven by strong banana-flavored milk sales growth. Although banana-flavored milk is not a novel product, it has benefited from consumers’ growing interest in flavored milk. The company’s balance sheet and profitability have improved significantly over the past several years, resulting in stronger share-price performance.
U.K.-based Laird is a leading supplier of technology solutions for electronic devices needing antennae or shielding from electromagnetic interference or heat. The company maintained a strong balance sheet and cut costs to protect margins. Furthermore, our analysis indicated cost reductions and stabilization in handset products could lead Laird to return to a strong growth path. We believe the company’s measures to broaden its technical and customer base could also improve future performance. During the period, Laird announced a notable profit increase, a sign to us that restructuring efforts gained traction.
Annual Report | 23
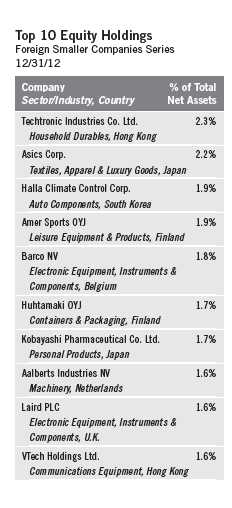
In contrast, several holdings detracted from Fund performance during the reporting period. Despite short-term underperformance, we believe Japanese pharmaceuticals, medical devices and personal products company Kobayashi Pharmaceutical operates in stable businesses with relatively few cyclical or foreign currency exchange elements, which made it attractive to us in a risk-averse market environment. The company’s ability to create new product categories through unique developments has driven above-average sales growth, high market share and impressive margins, in our view. Kobayashi has also displayed a sensible approach to the economic environment by reducing new product launches during difficult times to restore earnings and then accelerating capital investments to potentially benefit from the improving market outlook.
The share price of Asahi, Japan’s largest specialty bicycle retail chain, lagged during the period due to global economic concerns and their potential impact on consumers. From our long-term perspective, we believe Asahi distinguishes itself from the competition, which includes general merchandise stores, home improvement stores and typical mom-and-pop bicycle shops, by providing high-quality in-store services and developing competitively priced private brand products.
Emeco Holdings is the leading supplier of heavy earthmoving rental equipment to the Australian mining industry. The company’s focus is on coal and gold, with a growing presence in iron ore. Shares underperformed during the period as the company was affected by generally lower commodity prices. Over the longer term, we believe the trend for mining production volumes, which drives the utilization level of Emeco’s fleet, looks positive, and the company’s conservative balance sheet positions it well for potentially solid long-term growth.
24 | Annual Report
Thank you for your continued participation in Foreign Smaller Companies
Series. We look forward to serving your future investment needs.

The foregoing information reflects our analysis, opinions and portfolio holdings as of December 31, 2012, the end
of the reporting period. The way we implement our main investment strategies and the resulting portfolio holdings
may change depending on factors such as market and economic conditions. These opinions may not be relied
upon as investment advice or an offer for a particular security. The information is not a complete analysis of
every aspect of any market, country, industry, security or the Fund. Statements of fact are from sources consid-
ered reliable, but the investment manager makes no representation or warranty as to their completeness or
accuracy. Although historical performance is no guarantee of future results, these insights may help you under-
stand our investment management philosophy.
Annual Report | 25
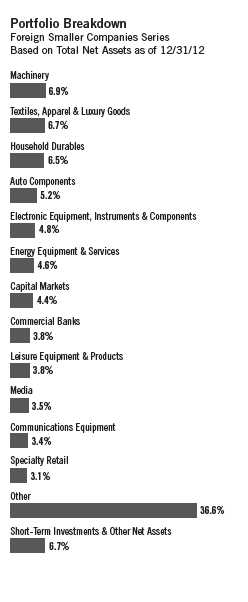
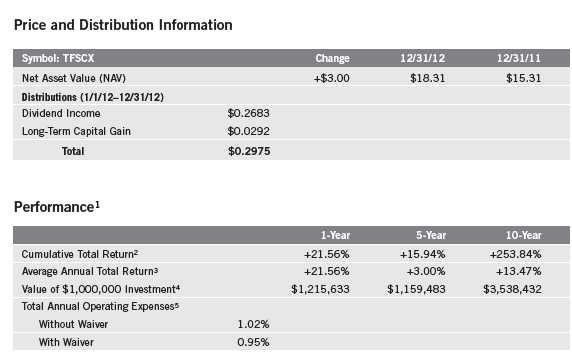
Performance Summary as of 12/31/12
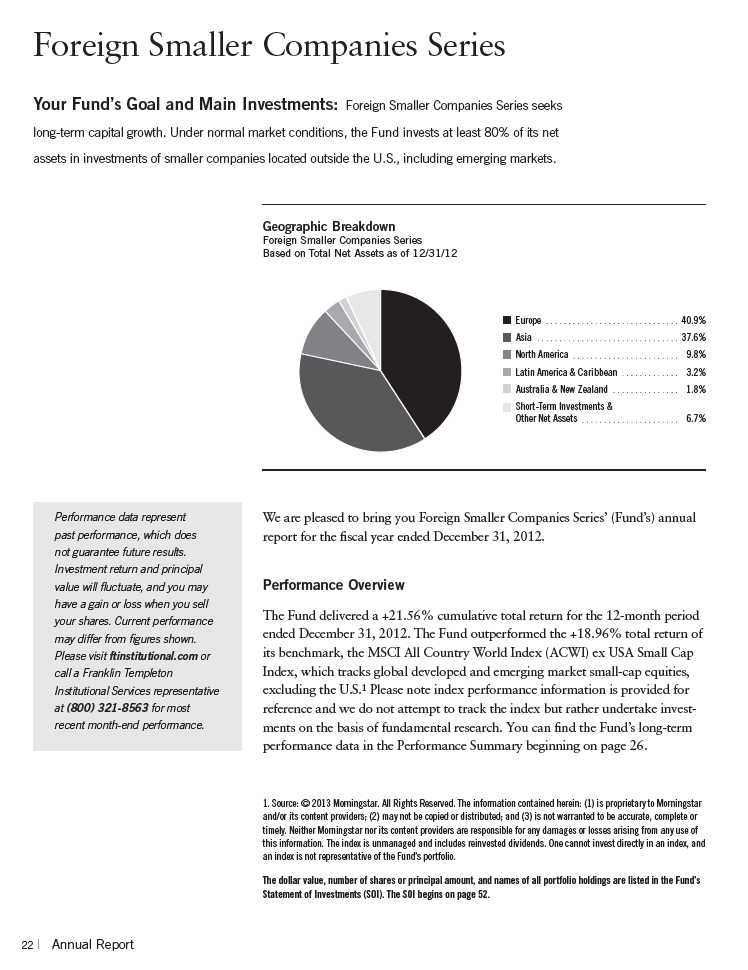
Foreign Smaller Companies Series
Your dividend income will vary depending on dividends or interest paid by securities in the Fund’s
portfolio, adjusted for operating expenses. Capital gain distributions are net profits realized from
the sale of portfolio securities. The performance table and graph do not reflect any taxes that a
shareholder would pay on Fund dividends, capital gain distributions, if any, or any realized gains
on the sale of Fund shares. Total return reflects reinvestment of the Fund’s dividends and capital
gain distributions, if any, and any unrealized gains or losses on the sale of Fund shares.
Performance data represent past performance, which does not guarantee future results. Investment return and principal
value will fluctuate, and you may have a gain or loss when you sell your shares. Current performance may differ from
figures shown. For most recent month-end performance, visit ftinstitutional.com or call a Franklin Templeton Institutional
Services representative at (800) 321-8563.
The investment manager and/or administrator have contractually agreed to waive or assume certain expenses so that
common expenses (excluding acquired fund fees and expenses) do not exceed 0.95% (other than certain nonroutine
expenses) until 4/30/13.
26 | Annual Report
Performance Summary (continued)
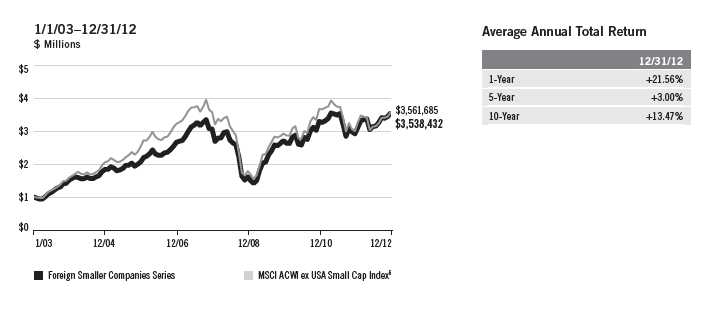
Total Return Index Comparison for a Hypothetical $1,000,000 Investment1
Total return represents the change in value of an investment over the periods shown. It includes
any Fund expenses, account fees and reinvested distributions. The unmanaged index includes
reinvestment of any income or distributions. It differs from the Fund in composition and does
not pay management fees or expenses. One cannot invest directly in an index.
Endnotes
All investments involve risks, including possible loss of principal. The Fund invests in foreign securities, which
can involve exposure to currency volatility and political, economic and regulatory uncertainty. Emerging mar-
kets involve heightened risks related to the same factors, in addition to those associated with their relatively
small size and lesser liquidity. The Fund’s investments in smaller company stocks carry special risks as such
stocks have historically exhibited greater price volatility than large company stocks, particularly over the short
term. Additionally, smaller companies often have relatively small revenues, limited product lines and small mar-
ket share. The Fund is actively managed but there is no guarantee that the manager’s investment decisions will
produce the desired results. The Fund’s prospectus also includes a description of the main investment risks.
1. Fund investment results reflect the expense reduction, without which the results would have been lower.
2. Cumulative total return represents the change in value of an investment over the periods indicated.
3. Average annual total return represents the average annual change in value of an investment over the periods
indicated.
4. These figures represent the value of a hypothetical $1,000,000 investment in the Fund over the periods indicated.
5. Figures are as stated in the Fund’s prospectus current as of the date of this report. In periods of market volatility,
assets may decline significantly, causing total annual Fund operating expenses to become higher than the figures
shown.
6. Source: © 2013 Morningstar. The MSCI ACWI ex USA Small Cap Index is a free float-adjusted, market capitalization-
weighted index designed to measure performance of small cap equity securities of global developed and emerging
markets, excluding the U.S.
Annual Report | 27
Your Fund’s Expenses
Foreign Smaller Companies Series
As a Fund shareholder, you can incur two types of costs:
- Transaction costs, including sales charges (loads) on Fund purchases, if applicable; and
- Ongoing Fund costs, including management fees, distribution and service (12b-1) fees, if appli- cable, and other Fund expenses. All mutual funds have ongoing costs, sometimes referred to as operating expenses.
The following table shows ongoing costs of investing in the Fund and can help you understand these costs and compare them with those of other mutual funds. The table assumes a $1,000 investment held for the six months indicated.
Actual Fund Expenses
The first line (Actual) of the table provides actual account values and expenses. The “Ending Account Value” is derived from the Fund’s actual return, which includes the effect of Fund expenses.
You can estimate the expenses you paid during the period by following these steps. Of course, your account value and expenses will differ from those in this illustration:
| 1. | Divide your account value by $1,000. |
| | If an account had an $8,600 value, then $8,600 ÷ $1,000 = 8.6. |
| 2. | Multiply the result by the number under the heading “Expenses Paid During Period.” |
| | If Expenses Paid During Period were $7.50, then 8.6 x $7.50 = $64.50. |
In this illustration, the estimated expenses paid this period are $64.50.
Hypothetical Example for Comparison with Other Funds
Information in the second line (Hypothetical) of the table can help you compare ongoing costs of investing in the Fund with those of other mutual funds. This information may not be used to estimate the actual ending account balance or expenses you paid during the period. The hypothetical “Ending Account Value” is based on the Fund’s actual expense ratio and an assumed 5% annual rate of return before expenses, which does not represent the Fund’s actual return. The figure under the heading “Expenses Paid During Period” shows the hypothetical expenses your account would have incurred under this scenario. You can compare this figure with the 5% hypothetical examples that appear in shareholder reports of other funds.
28 | Annual Report
Your Fund’s Expenses (continued)
Please note that expenses shown in the table are meant to highlight ongoing costs and do not reflect
any transaction costs, such as sales charges, if applicable. Therefore, the second line of the table is
useful in comparing ongoing costs only, and will not help you compare total costs of owning differ-
ent funds. In addition, if transaction costs were included, your total costs would have been higher.
Please refer to the Fund prospectus for additional information on operating expenses.

*Expenses are calculated using the most recent six-month annualized expense ratio, net of expense waivers, of 0.95% multiplied by the average
account value over the period, multiplied by 184/366 to reflect the one-half year period.
Annual Report | 29
financials sector, positions in what we viewed as undervalued European banks and global services firms operating in attractive growth markets contributed to relative performance.2 Performance for the Fund’s commercial banks holdings was more than double the benchmark’s bank position performance during the year. For example, shares of U.K. lender Lloyds Banking Group nearly doubled in value in 2012 after the firm reported higher earnings and lower-than-expected loan losses and provisioning reserves, and French lender BNP Paribas rallied after doubling third-quarter profits and raising capital levels. We remained favorable toward the global financials sector, especially European banks. Even after robust gains in 2012, European bank stock performance has still notably lagged that of U.S. banks since 2009 and remained near two-decade low valuations, suggesting to us further appreciation potential for a sector that has undergone intensive fundamental repair and recapitalization.
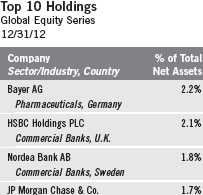
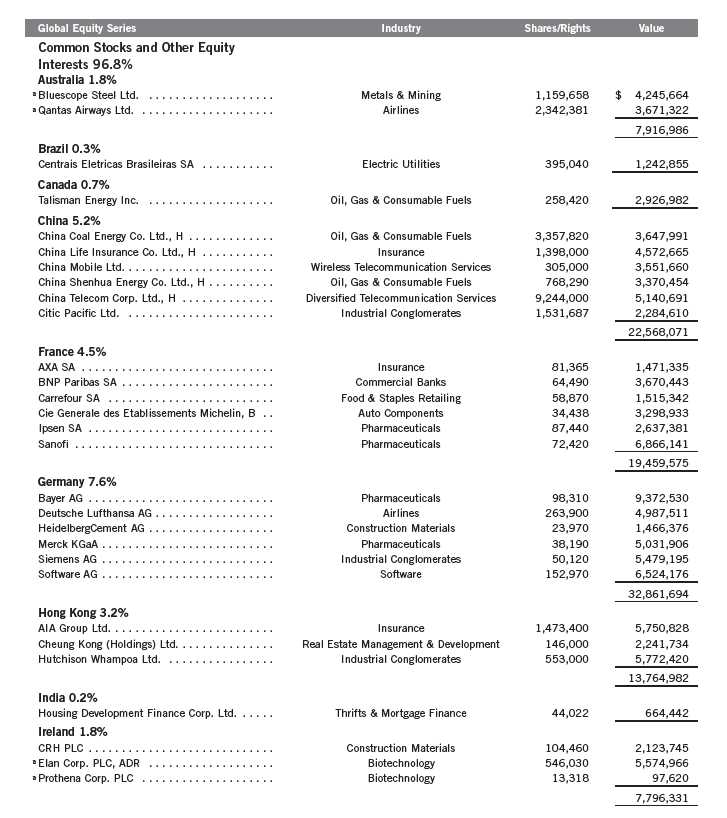
We were also encouraged by relative performance from some of our highest conviction sector allocations such as health care, the Fund’s largest sector overweighting and one of its top absolute and relative performers in 2012.3 We increased sector exposure in the mid-2000s, when an impending patent cliff and potential regulatory headwinds left pharmaceuticals stocks deeply unpopular. We sought to identify companies actively addressing their patent challenges through improved research and development (R&D) productivity, increased emerging market exposure and investment in longer duration assets. Because health care has the highest sales, general and administrative expenses among global sectors, we also recognized significant potential for cost-cutting and consolidation. We believe the worst of the patent cliff’s effects are behind most health care companies and see our expectations largely realized, as managements have been refocusing R&D efforts, reducing overhead and compounding value by returning excess cash flow to shareholders through dividends and buy-backs. Although we remained significantly overweighted in the sector, we have incrementally shifted our focus to higher growth companies, often with emerging market exposure. Drug makers Bayer (Germany) and Gilead Sciences (U.S.), two of the Fund’s largest health care holdings, are excellent examples; the former has high emerging market exposure and strong franchises outside of traditional branded pharmaceuticals, while the latter owns what we view as one of the world’s most innovative biotechnology pipelines.
2. The financials sector comprises capital markets, commercial banks, consumer finance, diversified financial services, insurance, real estate management and development, and thrifts and mortgage finance in the SOI.
3. The health care sector comprises biotechnology, health care equipment and supplies, and pharmaceuticals in the SOI.
Annual Report | 31
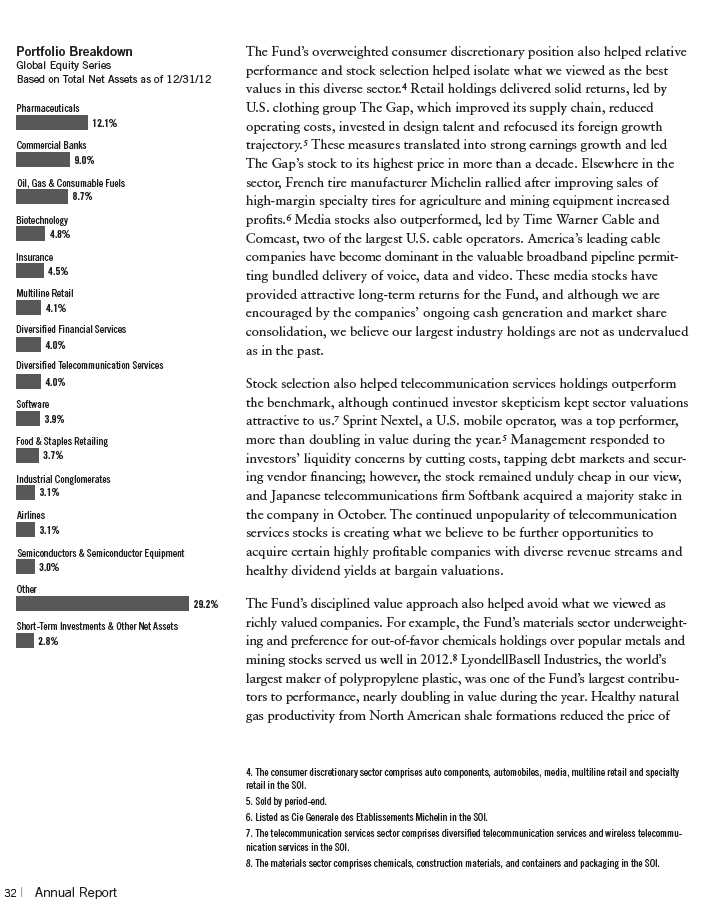
the carbon-based liquids used to make resins for bottle caps, car parts and textiles, boosting the company’s profits and enhancing shareholder returns through a series of special dividends. Global economic growth concerns delayed capacity increases and resulted in aggressive cost cutting in the chemicals industry, raising operating margins and strengthening balance sheets at some companies we considered to be best positioned for a likely cyclical recovery. From our perspective, mining valuations remained unattractive to us as we believe many firms demonstrated poor capital discipline. Furthermore, the industry’s reliance on China as the primary source of marginal commodity demand was potentially destabilizing given the country’s unsustainable investment and infrastructure spending.
Among cyclical sectors, we sought to identify selectively better opportunities in industrials, although we also remained slightly underweighted here.9 Industrials, the only sector to meaningfully hinder relative performance during 2012, was pressured by isolated weakness at the stock level. U.S. truck maker Navistar International, the sector’s biggest laggard, declined amid difficulties getting a truck engine certified by the U.S. Environmental Protection Agency. However, the company revised its strategy to address the problem, and we believe the shares offer appreciation potential given their wide valuation discount relative to industry peers.
From a geographic perspective, all major regions in the Fund outperformed the index in 2012, led primarily by stock picking in the U.S. Stock selection and a favorably overweighted allocation to Europe and an underweighting in Japan also contributed. At period-end, Europe remained the Fund’s biggest relative and absolute region allocation. Despite leading developed market returns in 2012, Europe remained home to eight of the world’s 10 cheapest markets on a cyclically adjusted price-to-earnings ratio. The region’s dramatic policy progress made European stocks even more attractive to us, with the European Central Bank seeking to neutralize risks through unconventional monetary tools and repairing sovereign balance sheets via fiscal austerity. While acknowledged challenges remain, we have stayed positive on Europe in light of the region’s fundamental stabilization and preponderance of what we consider to be inexpensive, high yielding stocks with global revenue streams.
We believe the balance between risk and reward in the global financial system changed dramatically over the past several years. Through increasingly powerful and creative means of market intervention, most governments took great steps to ensure ample liquidity, competitive currencies, and economic
9. The industrials sector comprises air freight and logistics, airlines, commercial services and supplies, machinery, professional services, and trading companies and distributors in the SOI.
Annual Report | 33
and asset reflation. Such measures transferred massive liabilities to the public sector, which we feel altered traditional safe-haven asset risk profiles and competitively devalued the world’s reserve currencies. Some ratings agencies have based downgrades at least partially on the inability of elected officials to address these liabilities. In this environment of negative real interest rates and impaired government credibility, we believe equities are the best positioned asset class to provide yield, inflation protection and long-term appreciation potential. In contrast to the public sector, corporate fundamentals in many cases remain strong and investors can still acquire stakes in productive enterprises at reasonable valuations, in our view. Furthermore, we see lower volatility and falling stock correlations as helping mitigate the macro factors that have unduly influenced stocks in recent years, which we believe is likely to benefit the Fund’s bottom-up stock selection approach.
Thank you for your continued participation in Global Equity Series. We look forward to serving your future investment needs.

Antonio T. Docal, CFA
Cindy L. Sweeting, CFA
Peter A. Nori, CFA
Portfolio Management Team
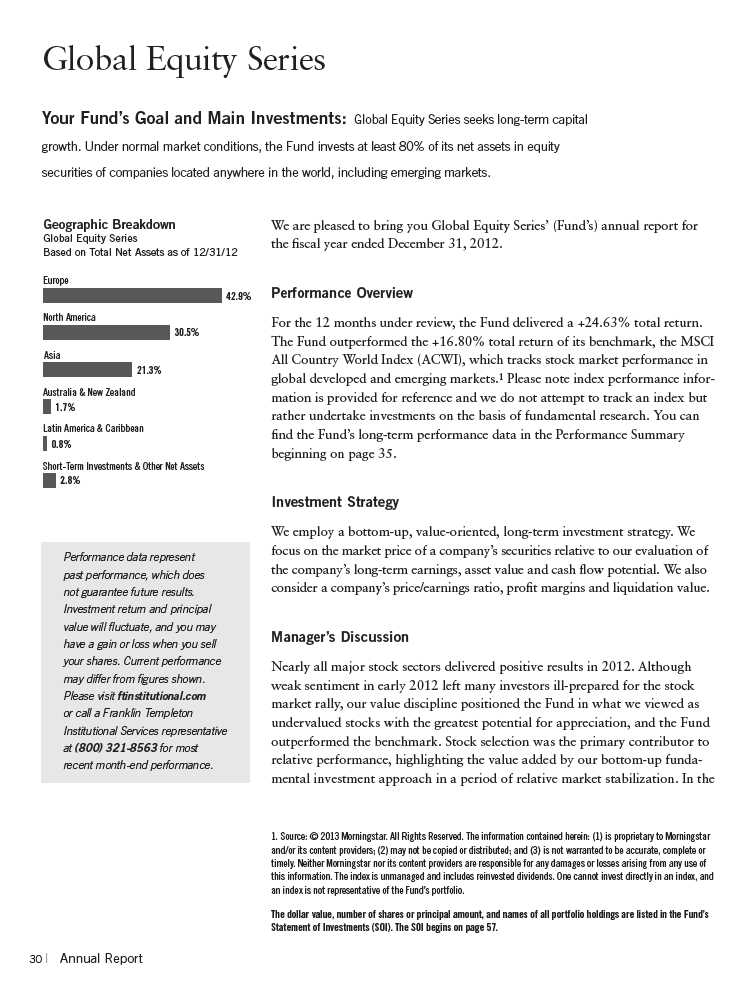
Global Equity Series
The foregoing information reflects our analysis, opinions and portfolio holdings as of December 31, 2012, the end of the reporting period. The way we implement our main investment strategies and the resulting portfolio holdings may change depending on factors such as market and economic conditions. These opinions may not be relied upon as investment advice or an offer for a particular security. The information is not a complete analysis of every aspect of any market, country, industry, security or the Fund. Statements of fact are from sources considered reliable, but the investment manager makes no representation or warranty as to their completeness or accuracy. Although historical performance is no guarantee of future results, these insights may help you understand our investment management philosophy.
34 | Annual Report
Performance Summary as of 12/31/12
Global Equity Series
Your dividend income will vary depending on dividends or interest paid by securities in the Fund’s
portfolio, adjusted for operating expenses. Capital gain distributions are net profits realized from
the sale of portfolio securities. The performance table and graph do not reflect any taxes that a
shareholder would pay on Fund dividends, capital gain distributions, if any, or any realized gains
on the sale of Fund shares. Total return reflects reinvestment of the Fund’s dividends and capital
gain distributions, if any, and any unrealized gains or losses on the sale of Fund shares.
Performance data represent past performance, which does not guarantee future results. Investment return and principal
value will fluctuate, and you may have a gain or loss when you sell your shares. Current performance may differ from
figures shown. For most recent month-end performance, visit ftinstitutional.com or call a Franklin Templeton Institutional
Services representative at (800) 321-8563.
The investment manager and/or administrator have contractually agreed to waive or assume certain expenses so that
common expenses (excluding acquired fund fees and expenses) do not exceed 0.81% (other than certain nonroutine
expenses) until 4/30/13.
Annual Report | 35
Performance Summary (continued)
Total Return Index Comparison for a Hypothetical $1,000,000 Investment1
Total return represents the change in value of an investment over the periods shown. It includes
any Fund expenses, account fees and reinvested distributions. The unmanaged index includes
reinvestment of any income or distributions. It differs from the Fund in composition and does not
pay management fees or expenses. One cannot invest directly in an index.

Endnotes
All investments involve risks, including possible loss of principal. Special risks are associated with foreign
investing, including currency fluctuations, economic instability and political developments; investments in
emerging markets involve heightened risks related to the same factors. To the extent the Fund focuses on par-
ticular countries, regions, industries, sectors or types of investment from time to time, it may be subject to
greater risks of adverse developments in such areas of focus than a fund that invests in a wider variety of coun-
tries, regions, industries, sectors or investments. Current political uncertainty surrounding the European Union
(EU) and its membership may increase market volatility. The financial instability of some countries in the EU,
including Greece, Italy and Spain, together with the risk of that impacting other more stable countries may
increase the economic risk of investing in companies in Europe. The Fund is actively managed but there is no
guarantee that the manager’s investment decisions will produce the desired results. The Fund’s prospectus also
includes a description of the main investment risks.
1. Fund investment results reflect the expense reduction, without which the results would have been lower.
2. Cumulative total return represents the change in value of an investment over the periods indicated.
3. Average annual total return represents the average annual change in value of an investment over the periods
indicated.
4. These figures represent the value of a hypothetical $1,000,000 investment in the Fund over the periods indicated.
5. Figures are as stated in the Fund’s prospectus current as of the date of this report. In periods of market volatility,
assets may decline significantly, causing total annual Fund operating expenses to become higher than the figures
shown.
6. Source: © 2013 Morningstar. The MSCI ACWI is a free float-adjusted, market capitalization-weighted index
designed to measure equity market performance of global developed and emerging markets.
36 | Annual Report
Your Fund’s Expenses
Global Equity Series
As a Fund shareholder, you can incur two types of costs:
- Transaction costs, including sales charges (loads) on Fund purchases, if applicable; and
- Ongoing Fund costs, including management fees, distribution and service (12b-1) fees, if appli- cable, and other Fund expenses. All mutual funds have ongoing costs, sometimes referred to as operating expenses.
The following table shows ongoing costs of investing in the Fund and can help you understand these costs and compare them with those of other mutual funds. The table assumes a $1,000 investment held for the six months indicated.
Actual Fund Expenses
The first line (Actual) of the table provides actual account values and expenses. The “Ending Account Value” is derived from the Fund’s actual return, which includes the effect of Fund expenses.
You can estimate the expenses you paid during the period by following these steps. Of course, your account value and expenses will differ from those in this illustration:
| 1. | Divide your account value by $1,000. |
| | If an account had an $8,600 value, then $8,600 ÷ $1,000 = 8.6. |
| 2. | Multiply the result by the number under the heading “Expenses Paid During Period.” |
| | If Expenses Paid During Period were $7.50, then 8.6 x $7.50 = $64.50. |
In this illustration, the estimated expenses paid this period are $64.50.
Hypothetical Example for Comparison with Other Funds
Information in the second line (Hypothetical) of the table can help you compare ongoing costs of investing in the Fund with those of other mutual funds. This information may not be used to estimate the actual ending account balance or expenses you paid during the period. The hypothetical “Ending Account Value” is based on the Fund’s actual expense ratio and an assumed 5% annual rate of return before expenses, which does not represent the Fund’s actual return. The figure under the heading “Expenses Paid During Period” shows the hypothetical expenses your account would have incurred under this scenario. You can compare this figure with the 5% hypothetical examples that appear in shareholder reports of other funds.
Annual Report | 37
Your Fund’s Expenses (continued)
Please note that expenses shown in the table are meant to highlight ongoing costs and do not
reflect any transaction costs, such as sales charges, if applicable. Therefore, the second line of the
table is useful in comparing ongoing costs only, and will not help you compare total costs of owning
different funds. In addition, if transaction costs were included, your total costs would have been
higher. Please refer to the Fund prospectus for additional information on operating expenses.
*Expenses are calculated using the most recent six-month annualized expense ratio, net of expense waivers, of 0.81% multiplied by the average
account value over the period, multiplied by 184/366 to reflect the one-half year period.
38 | Annual Report
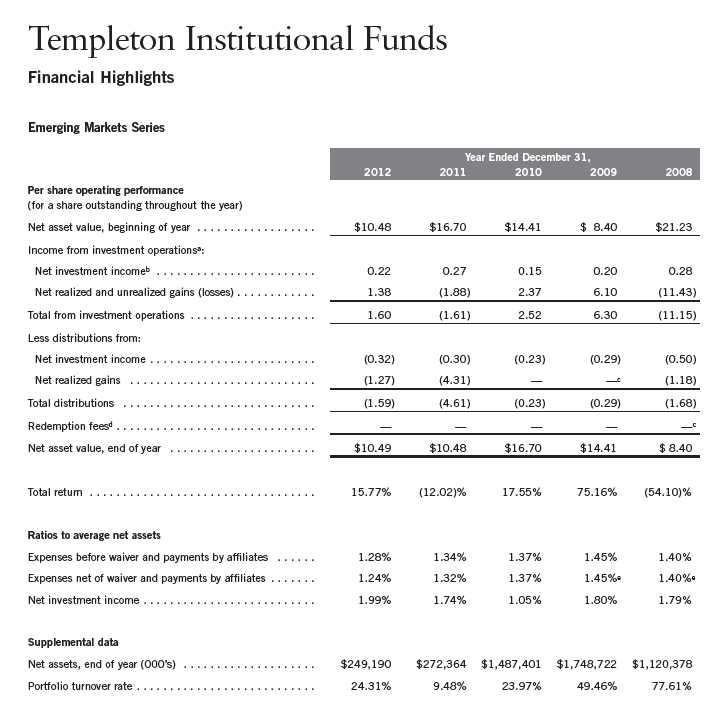
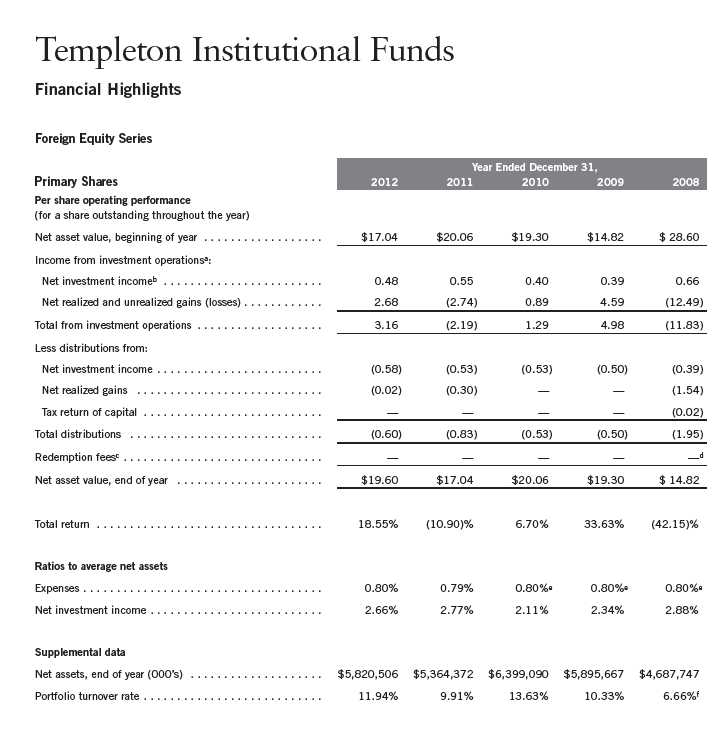
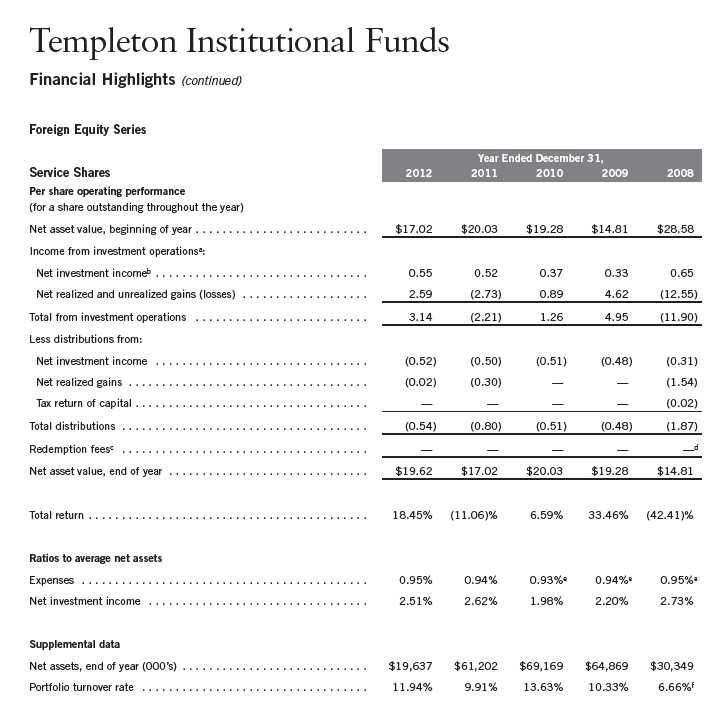
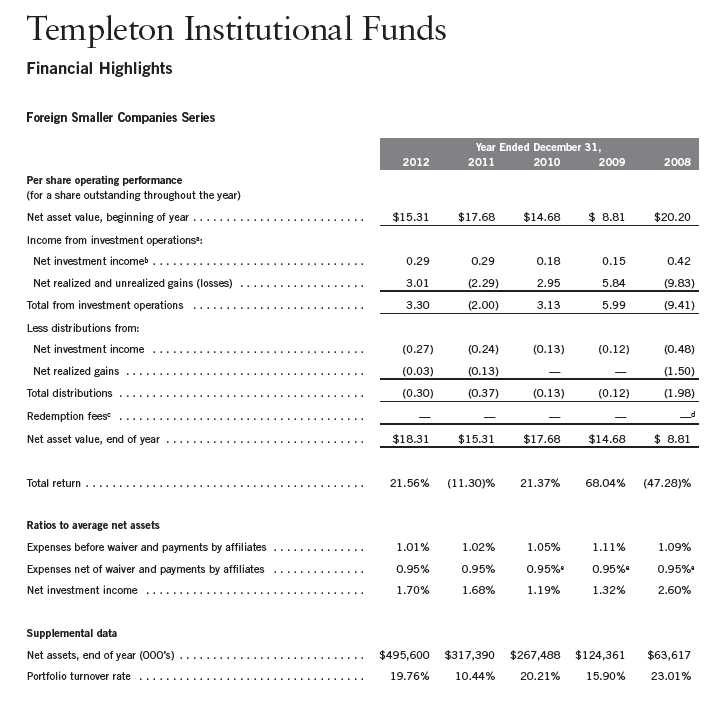
aThe amount shown for a share outstanding throughout the period may not correlate with the Statement of Operations for the period due to the timing of sales and repurchases of
the Fund shares in relation to income earned and/or fluctuating market value of the investments of the Fund.
bBased on average daily shares outstanding.
cAmount rounds to less than $0.01 per share.
dEffective September 1, 2008, the redemption fee was eliminated.
eBenefit of expense reduction rounds to less than 0.01%.
Annual Report | The accompanying notes are an integral part of these financial statements. | 39
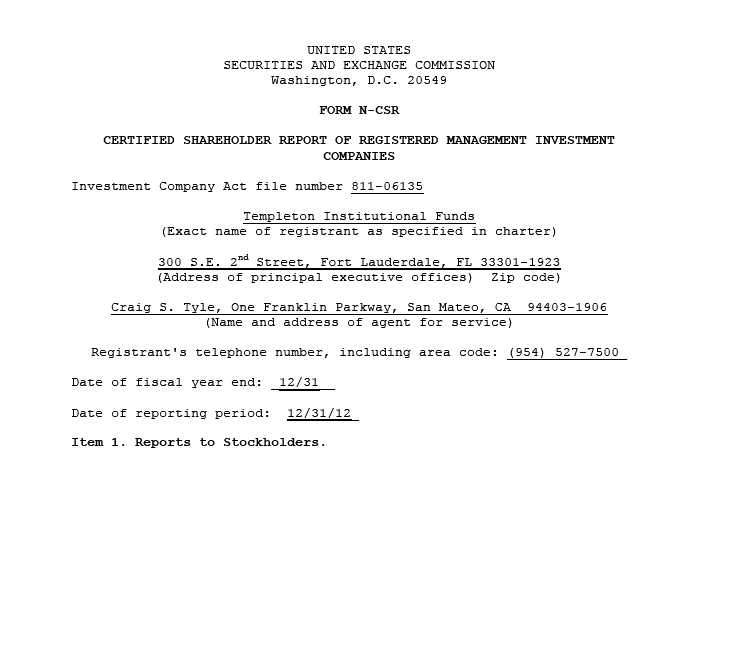
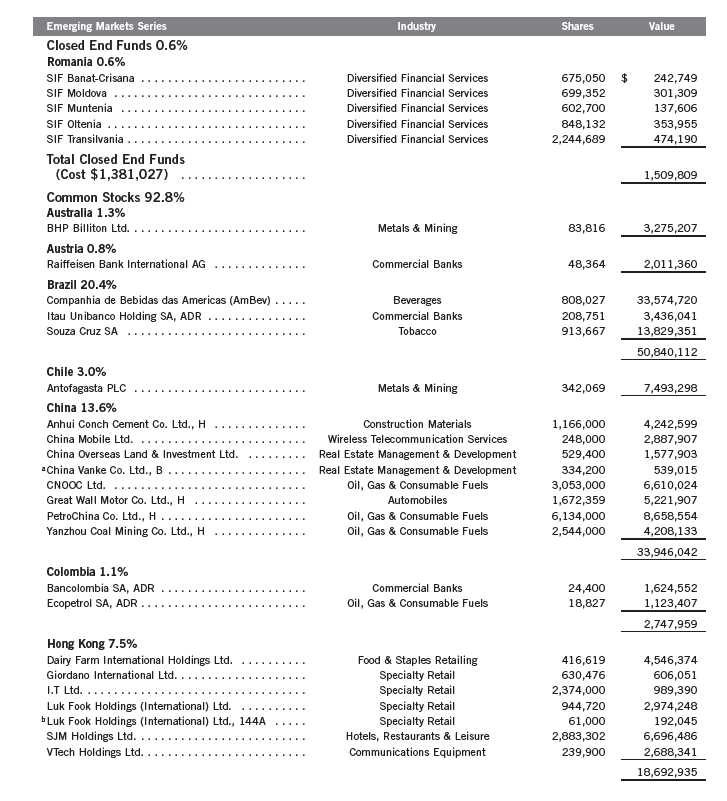
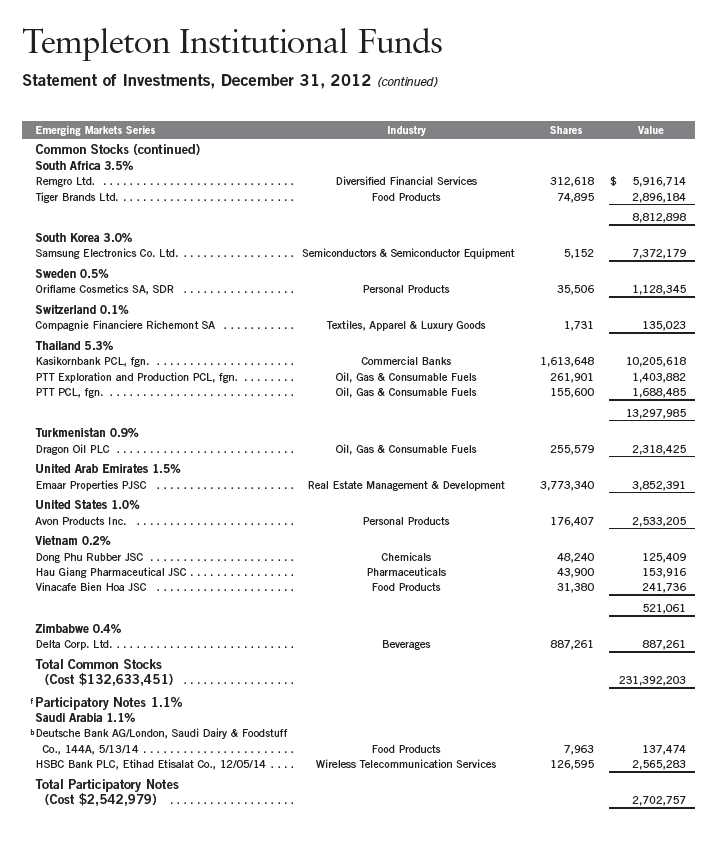
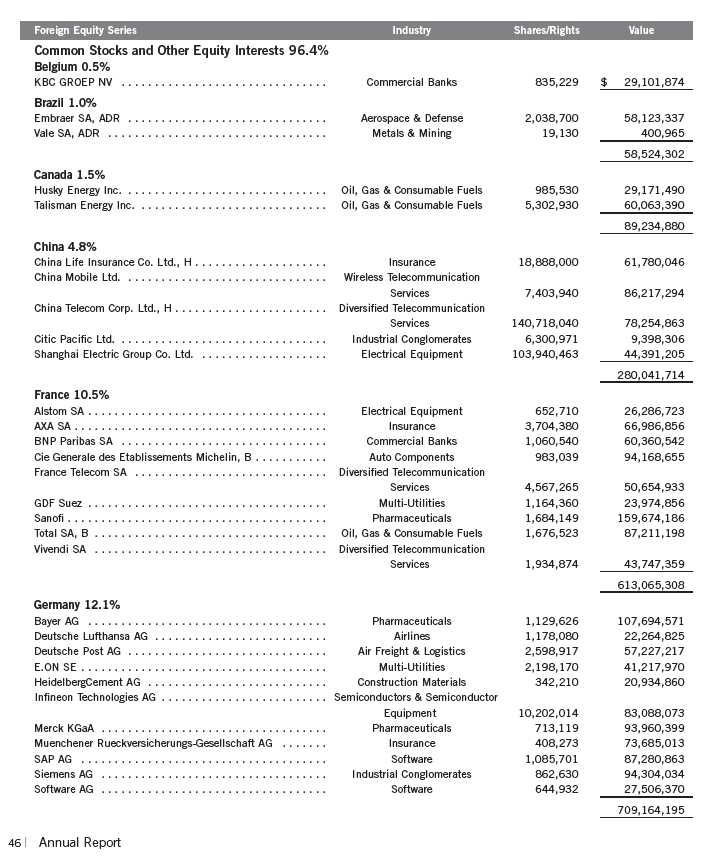
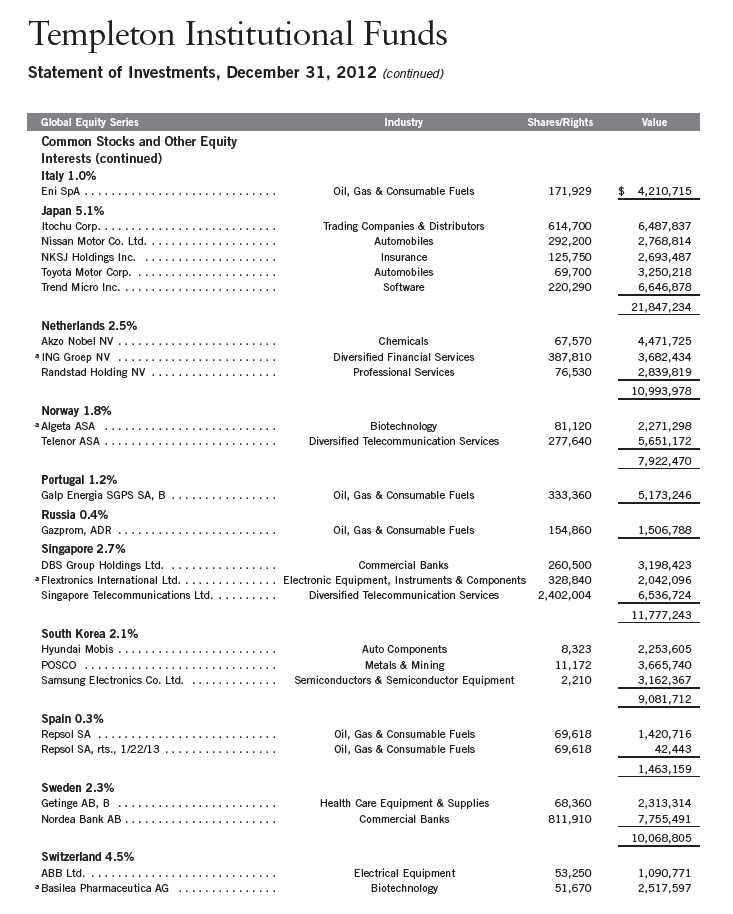
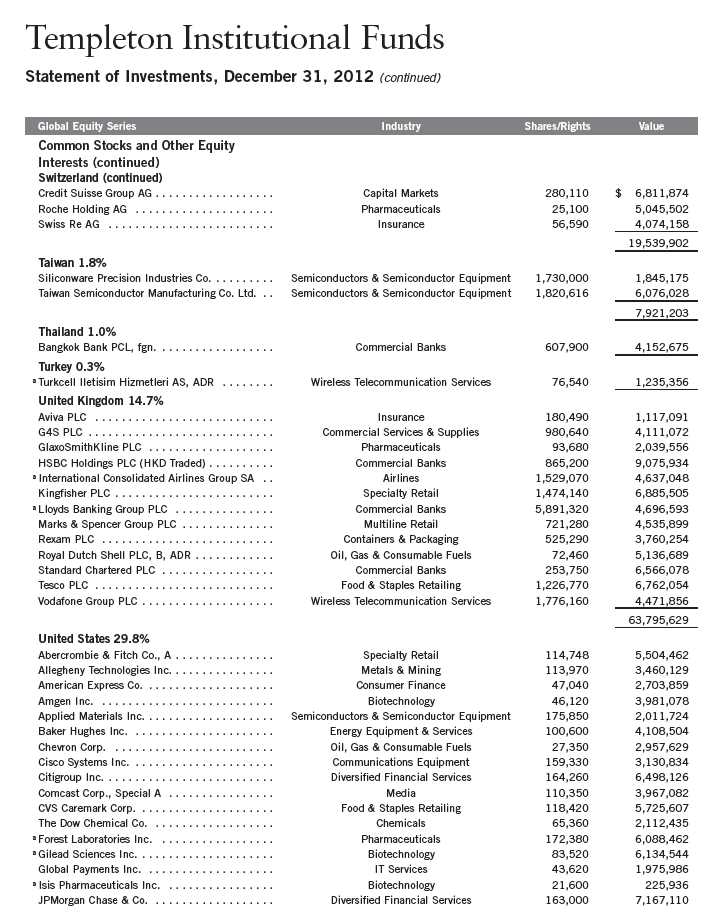
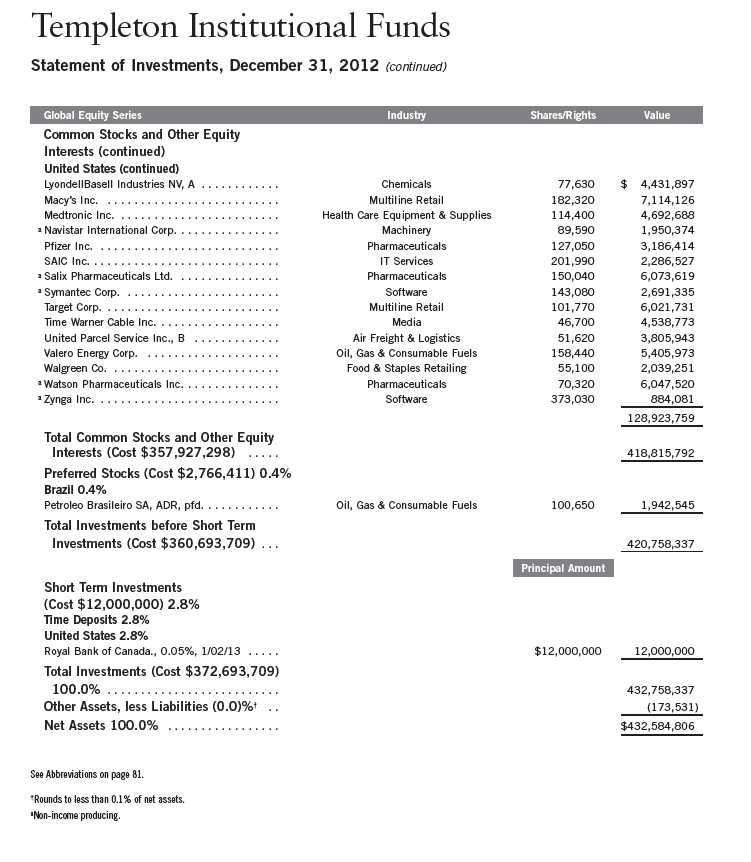
Templeton Institutional Funds
Statement of Investments, December 31, 2012
40 | Annual Report

Annual Report | 41
42 | Annual Report
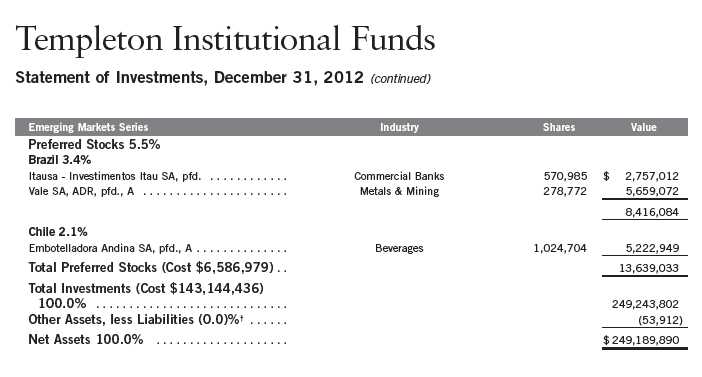
See Abbreviations on page 81.
†Rounds to less than 0.1% of net assets.
aSecurity has been deemed illiquid because it may not be able to be sold within seven days. At December 31, 2012, the value of this security was $539,015, representing 0.22%
of net assets.
bSecurity was purchased pursuant to Rule 144A under the Securities Act of 1933 and may be sold in transactions exempt from registration only to qualified institutional buyers or in
a public offering registered under the Securities Act of 1933. These securities have been deemed liquid under guidelines approved by the Trust’s Board of Trustees. At December 31,
2012, the aggregate value of these securities was $816,394, representing 0.33% of net assets.
cNon-income producing.
dAt December 31, 2012, pursuant to the Fund’s policies and the requirements of applicable securities law, the Fund may be restricted from trading these securities for a limited or
extended period of time due to ownership limits and/or potential possession of material non-public information.
eSecurity was purchased pursuant to Regulation S under the Securities Act of 1933, which exempts from registration securities offered and sold outside of the United States. Such
a security cannot be sold in the United States without either an effective registration statement filed pursuant to the Securities Act of 1933, or pursuant to an exemption from
registration. This security has been deemed liquid under guidelines approved by the Trust’s Board of Trustees. At December 31, 2012, the value of this security was $2,475,865,
representing 0.99% of net assets.
fSee Note 1(d) regarding Participatory Notes.
Annual Report | The accompanying notes are an integral part of these financial statements. | 43
aThe amount shown for a share outstanding throughout the period may not correlate with the Statement of Operations for the period due to the timing of sales and repurchases of
the Fund shares in relation to income earned and/or fluctuating market value of the investments of the Fund.
bBased on average daily shares outstanding.
cEffective September 1, 2008, the redemption fee was eliminated.
dAmount rounds to less than $0.01 per share.
eBenefit of expense reduction rounds to less than 0.01%.
fExcludes the value of portfolio securities delivered as a result of a redemption in-kind.
44 | The accompanying notes are an integral part of these financial statements. | Annual Report
aThe amount shown for a share outstanding throughout the period may not correlate with the Statement of Operations for the period due to the timing of sales and repurchases of
the Fund shares in relation to income earned and/or fluctuating market value of the investments of the Fund.
bBased on average daily shares outstanding.
cEffective September 1, 2008, the redemption fee was eliminated.
dAmount rounds to less than $0.01 per share.
eBenefit of expense reduction rounds to less than 0.01%.
fExcludes the value of portfolio securities delivered as a result of a redemption in-kind.
Annual Report | The accompanying notes are an integral part of these financial statements. | 45
Templeton Institutional Funds
Statement of Investments, December 31, 2012
Annual Report | 49
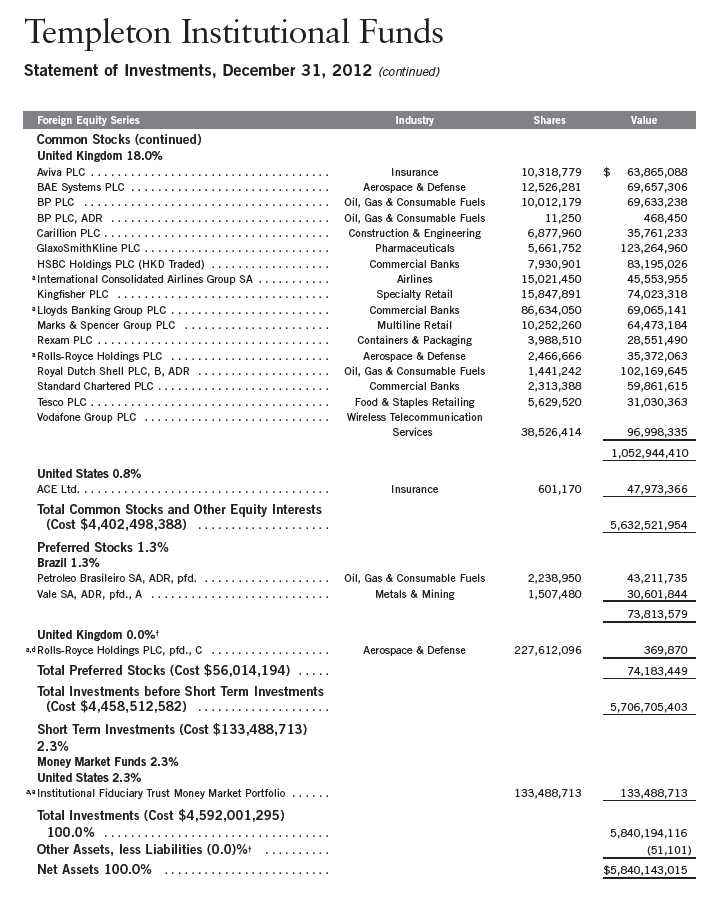
Templeton Institutional Funds
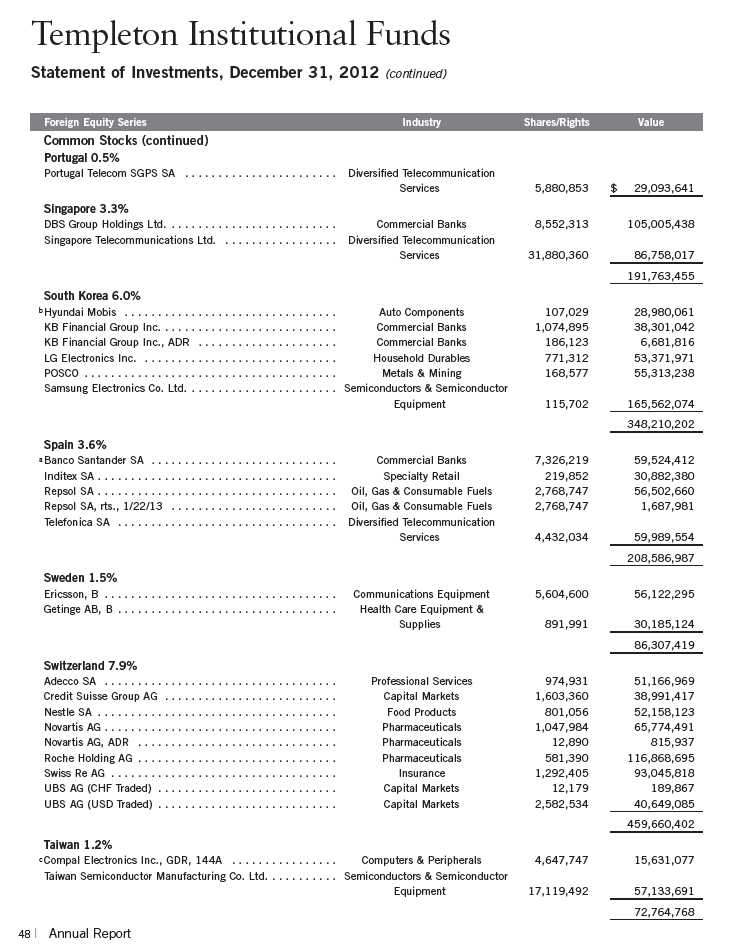
Statement of Investments, December 31, 2012 (continued)
Foreign Equity Series
See Abbreviations on page 81.
†Rounds to less than 0.1% of net assets.
aNon-income producing.
bA portion or all of the security purchased on a delayed delivery basis. See Note 1(c).
cSecurity was purchased pursuant to Rule 144A under the Securities Act of 1933 and may be sold in transactions exempt from registration only to qualified institutional buyers or
in a public offering registered under the Securities Act of 1933. This security has been deemed liquid under guidelines approved by the Trust’s Board of Trustees. At December 31,
2012, the value of this security was $15,631,077, representing 0.27% of net assets.
dSecurity has been deemed illiquid because it may not be able to be sold within seven days.
eSee Note 7 regarding investments in the Institutional Fiduciary Trust Money Market Portfolio.
50 | The accompanying notes are an integral part of these financial statements. | Annual Report
aThe amount shown for a share outstanding throughout the period may not correlate with the Statement of Operations for the period due to the timing of sales and repurchases of
the Fund shares in relation to income earned and/or fluctuating market value of the investments of the Fund.
bBased on average daily shares outstanding.
cEffective September 1, 2008, the redemption fee was eliminated.
dAmount rounds to less than $0.01 per share.
eBenefit of expense reduction rounds to less than 0.01%.
Annual Report | The accompanying notes are an integral part of these financial statements. | 51
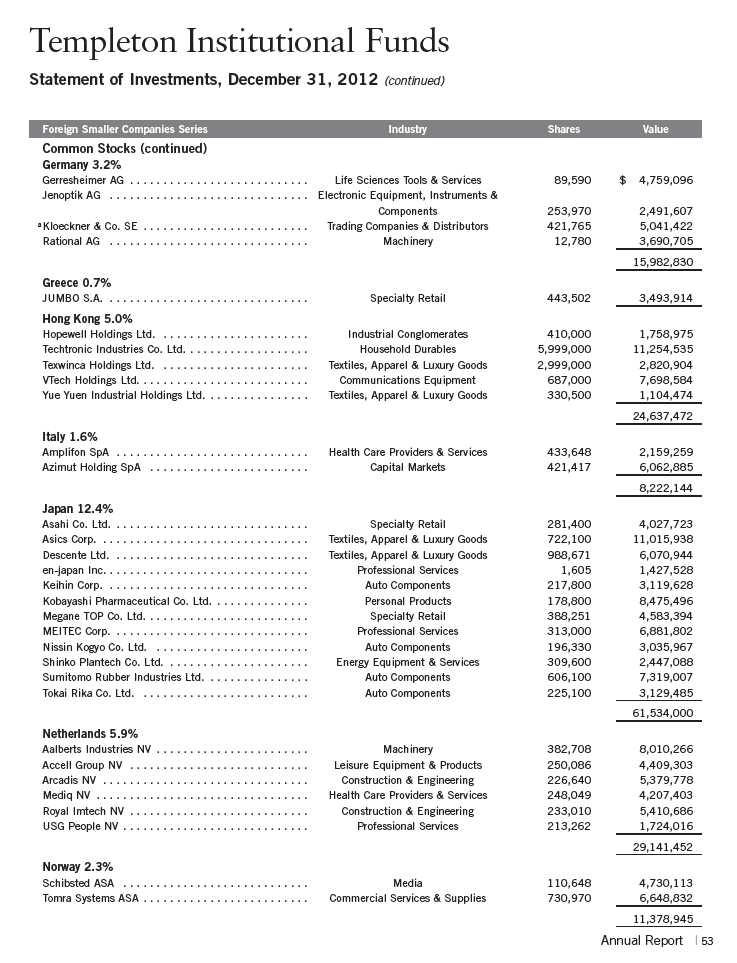
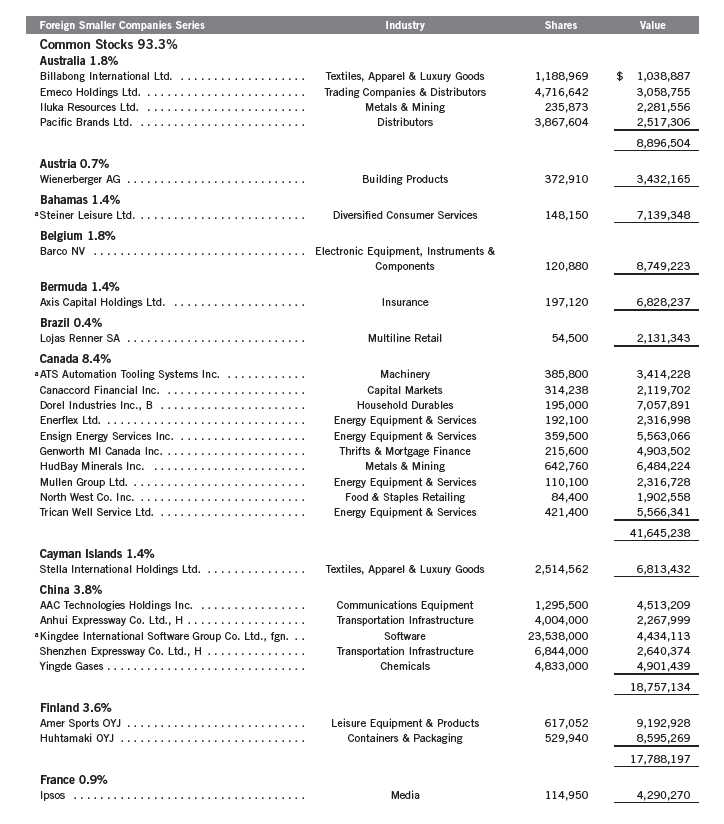
Templeton Institutional Funds
Statement of Investments, December 31, 2012
52 | Annual Report
54 | Annual Report
aNon-income producing.
bSecurity was purchased pursuant to Regulation S under the Securities Act of 1933, which exempts from registration securities offered and sold outside of the United States. Such
a security cannot be sold in the United States without either an effective registration statement filed pursuant to the Securities Act of 1933, or pursuant to an exemption from
registration. This security has been deemed liquid under guidelines approved by the Trust’s Board of Trustees.
cSecurity has been deemed illiquid because it may not be able to be sold within seven days.
dA portion or all of the security is on loan at December 31, 2012. See Note 1(e).
eA portion or all of the security purchased on a delayed delivery basis. See Note 1(c).
fSee Note 1(e) regarding securities on loan.
gThe rate shown is the annualized seven-day yield at period end.
Annual Report | The accompanying notes are an integral part of these financial statements. | 55
aFor the period March 31, 2008 (commencement of operations) to December 31, 2008.
bThe amount shown for a share outstanding throughout the period may not correlate with the Statement of Operations for the period due to the timing of sales and repurchases of
the Fund shares in relation to income earned and/or fluctuating market value of the investments of the Fund.
cBased on average daily shares outstanding.
dTotal return is not annualized for periods less than one year.
eRatios are annualized for periods less than one year.
fBenefit of expense reduction rounds to less than 0.01%.
56 | The accompanying notes are an integral part of these financial statements. | Annual Report
Templeton Institutional Funds
Statement of Investments, December 31, 2012
Annual Report | 57
58 | Annual Report
Annual Report | 59
60 | The accompanying notes are an integral part of these financial statements. | Annual Report
Annual Report | The accompanying notes are an integral part of these financial statements. | 61
62 | The accompanying notes are an integral part of these financial statements. | Annual Report
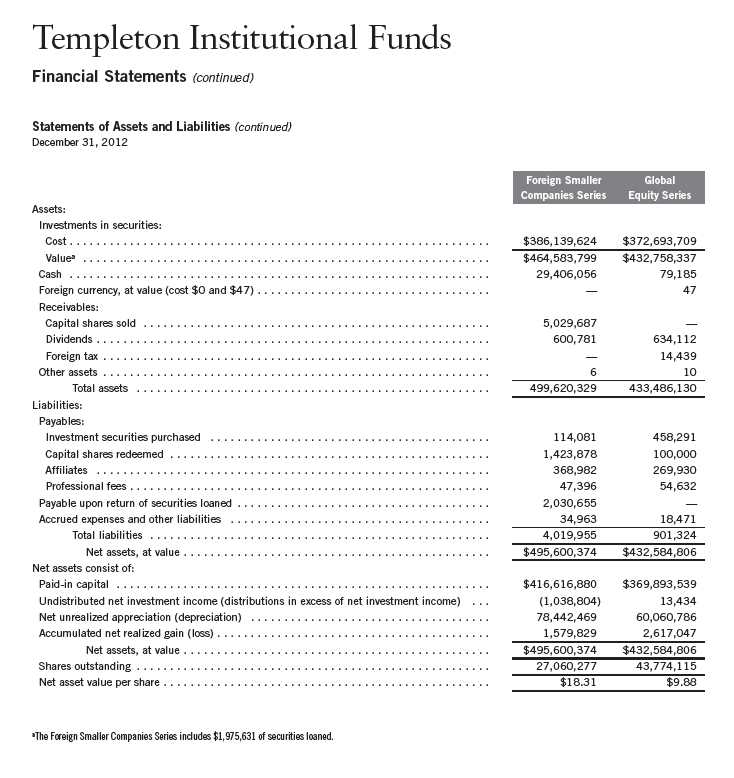
Templeton Institutional Funds
Financial Statements (continued)
Statements of Operations
for the year ended December 31, 2012

Annual Report | The accompanying notes are an integral part of these financial statements. | 63

64 | The accompanying notes are an integral part of these financial statements. | Annual Report
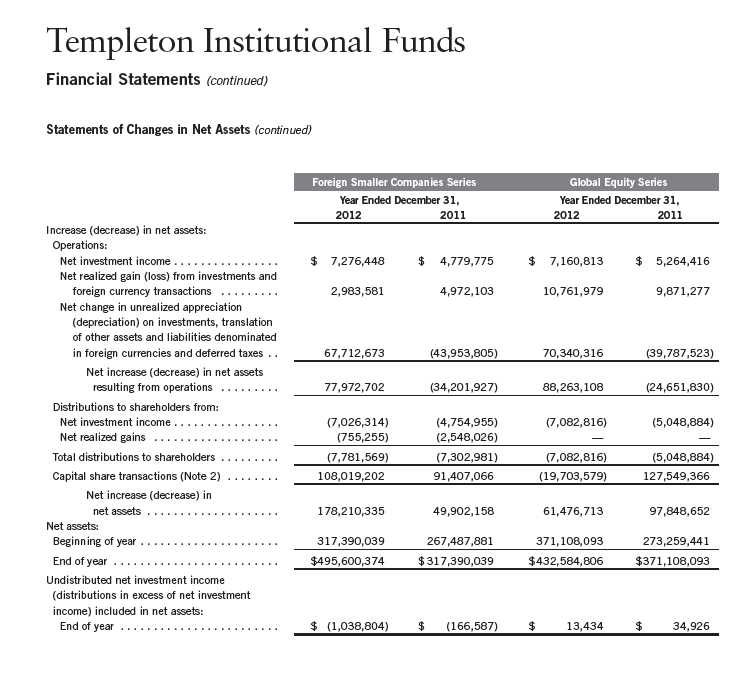
Templeton Institutional Funds
Financial Statements (continued)
Annual Report | The accompanying notes are an integral part of these financial statements. | 65
66 | The accompanying notes are an integral part of these financial statements. | Annual Report
Templeton Institutional Funds
Notes to Financial Statements
1. ORGANIZATION AND SIGNIFICANT ACCOUNTING POLICIES
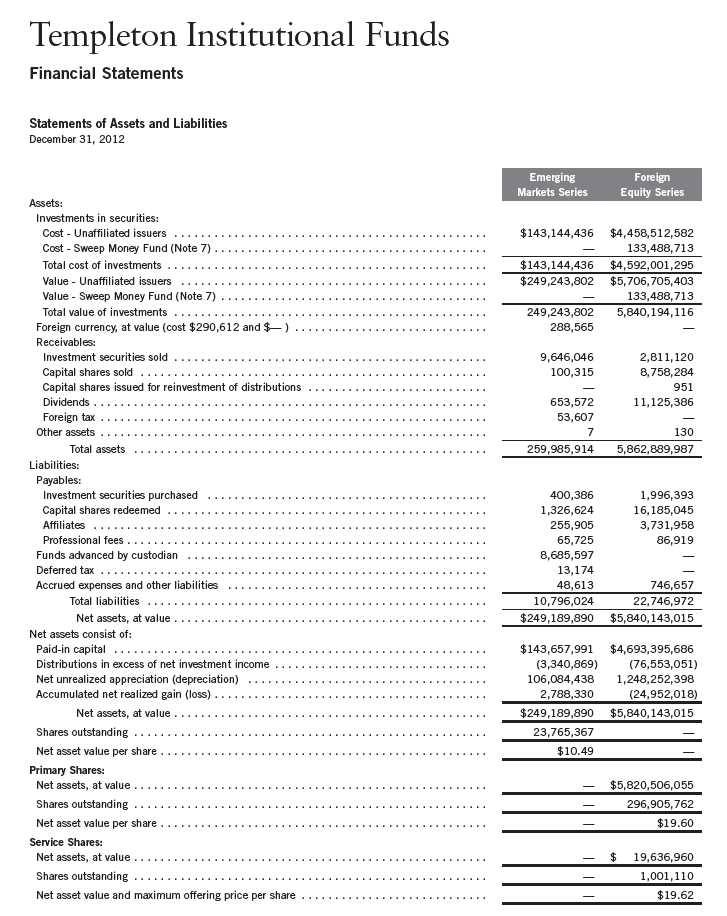
Templeton Institutional Funds (Trust) is registered under the Investment Company Act of 1940, as amended, (1940 Act) as an open-end investment company, consisting of four funds (Funds). The Foreign Equity Series offers Primary and Service Shares. Each class of shares differs by its transfer agent fees and voting rights on matters affecting a single class.
The following summarizes the Funds’ significant accounting policies.
a. Financial Instrument Valuation
The Funds’ investments in financial instruments are carried at fair value daily. Fair value is the price that would be received to sell an asset or paid to transfer a liability in an orderly transaction between market participants on the measurement date. Under procedures approved by the Trust’s Board of Trustees (the Board), the Funds’ administrator, investment manager and other affiliates have formed the Valuation and Liquidity Oversight Committee (VLOC). The VLOC provides administration and oversight of the Funds’ valuation policies and procedures, which are approved annually by the Board. Among other things, these procedures allow the Funds to utilize independent pricing services, quotations from securities and financial instrument dealers, and other market sources to determine fair value.
Equity securities listed on an exchange or on the NASDAQ National Market System are valued at the last quoted sale price or the official closing price of the day, respectively. Foreign equity securities are valued as of the close of trading on the foreign stock exchange on which the security is primarily traded, or the NYSE, whichever is earlier. The value is then converted into its U.S. dollar equivalent at the foreign exchange rate in effect at the close of the NYSE on the day that the value of the security is determined. Over-the-counter (OTC) securities are valued within the range of the most recent quoted bid and ask prices. Securities that trade in multiple markets or on multiple exchanges are valued according to the broadest and most representative market. Certain equity securities are valued based upon fundamental characteristics or relationships to similar securities. Investments in open-end mutual funds and non-registered money market funds are valued at the closing net asset value.
Debt securities generally trade in the OTC market rather than on a securities exchange. The Funds’ pricing services use multiple valuation techniques to determine fair value. In instances where sufficient market activity exists, the pricing services may utilize a market-based approach through which quotes from market makers are used to determine fair value. In instances where sufficient market activity may not exist or is limited, the pricing services also utilize proprietary valuation models which may consider market characteristics such as benchmark yield curves, credit spreads, estimated default rates, anticipated market interest rate volatility, coupon rates, anticipated timing of principal repayments, underlying collateral, and other unique security features in order to estimate the relevant cash flows, which are then discounted to calculate the fair value. Time deposits are valued at cost, which approximates market value.
Annual Report | 67
Templeton Institutional Funds
Notes to Financial Statements (continued)
| 1. | ORGANIZATION AND SIGNIFICANT ACCOUNTING POLICIES (continued) |
| a. | Financial Instrument Valuation (continued) |
The Funds have procedures to determine the fair value of financial instruments for which market prices are not reliable or readily available. Under these procedures, the VLOC convenes on a regular basis to review such financial instruments and considers a number of factors, including significant unobservable valuation inputs, when arriving at fair value. The VLOC primarily employs a market-based approach which may use related or comparable assets or liabilities, recent transactions, market multiples, book values, and other relevant information for the investment to determine the fair value of the investment. An income-based valuation approach may also be used in which the anticipated future cash flows of the investment are discounted to calculate fair value. Discounts may also be applied due to the nature or duration of any restrictions on the disposition of the investments. Due to the inherent uncertainty of valuations of such investments, the fair values may differ significantly from the values that would have been used had an active market existed. The VLOC employs various methods for calibrating these valuation approaches including a regular review of key inputs and assumptions, transactional back-testing or disposition analysis, and reviews of any related market activity.
Trading in securities on foreign securities stock exchanges and OTC markets may be completed before the daily close of business on the NYSE. Occasionally, events occur between the time at which trading in a foreign security is completed and the close of the NYSE that might call into question the reliability of the value of a portfolio security held by the fund. As a result, differences may arise between the value of the Funds’ portfolio securities as determined at the foreign market close and the latest indications of value at the close of the NYSE. In order to minimize the potential for these differences, the VLOC monitors price movements following the close of trading in foreign stock markets through a series of country specific market proxies (such as baskets of American Depositary Receipts, futures contracts and exchange traded funds). These price movements are measured against established trigger thresholds for each specific market proxy to assist in determining if an event has occurred that may call into question the reliability of the values of the foreign securities held by the Funds. If such an event occurs, the securities may be valued using fair value procedures, which may include the use of independent pricing services. At December 31, 2012, a market event occurred resulting in a portion of the securities held by the Funds being valued using fair value procedures.
b. Foreign Currency Translation
Portfolio securities and other assets and liabilities denominated in foreign currencies are translated into U.S. dollars based on the exchange rate of such currencies against U.S. dollars on the date of valuation. The Funds may enter into foreign currency exchange contracts to facilitate transactions denominated in a foreign currency. Purchases and sales of securities, income and expense items denominated in foreign currencies are translated into U.S. dollars at the exchange rate in effect on the transaction date. Portfolio securities and assets and liabilities denominated in foreign currencies contain risks that those currencies will decline in value relative to the U.S. dollar. Occasionally, events may impact the availability or reliability of foreign exchange rates
68 | Annual Report
Templeton Institutional Funds
Notes to Financial Statements (continued)
| 1. | ORGANIZATION AND SIGNIFICANT ACCOUNTING POLICIES (continued) |
| b. | Foreign Currency Translation (continued) |
used to convert the U.S. dollar equivalent value. If such an event occurs, the foreign exchange rate will be valued at fair value using procedures established and approved by the Board.
The Funds do not separately report the effect of changes in foreign exchange rates from changes in market prices on securities held. Such changes are included in net realized and unrealized gain or loss from investments on the Statements of Operations.
Realized foreign exchange gains or losses arise from sales of foreign currencies, currency gains or losses realized between the trade and settlement dates on securities transactions and the difference between the recorded amounts of dividends, interest, and foreign withholding taxes and the U.S. dollar equivalent of the amounts actually received or paid. Net unrealized foreign exchange gains and losses arise from changes in foreign exchange rates on foreign denominated assets and liabilities other than investments in securities held at the end of the reporting period.
c. Securities Purchased on a Delayed Delivery Basis
Certain funds purchase securities on a delayed delivery basis, with payment and delivery scheduled for a future date. These transactions are subject to market fluctuations and are subject to the risk that the value at delivery may be more or less than the trade date purchase price. Although the Funds will generally purchase these securities with the intention of holding the securities, they may sell the securities before the settlement date. Sufficient assets have been segregated for these securities.
d. Participatory Notes
Certain funds invest in Participatory Notes (P-Notes). P-notes are promissory notes that are designed to offer a return linked to the performance of a particular underlying equity security or market. P-Notes are issued by banks or broker-dealers and allow the fund to gain exposure to common stocks in markets where direct investment is not allowed. Income received from P-Notes is recorded as dividend income in the Statement of Operations. P-Notes may contain various risks including the potential inability of the counterparty to fulfill their obligations under the terms of the contract. These securities may be more volatile and less liquid than other investments held by the Fund.
e. Securities Lending
Certain funds participate in an agency based security lending program. The fund receives cash collateral against the loaned securities in an amount equal to at least 102% of the market value of the loaned securities. Collateral is maintained over the life of the loan in an amount not less than 100% of the market value of loaned securities, as determined at the close of fund business each day; any additional collateral required due to changes in security values is delivered to the fund on the next business day. The collateral is invested in a non-registered money fund as indicated on the Statements of Investments. The fund receives income from the investment of cash
Annual Report | 69
Templeton Institutional Funds
Notes to Financial Statements (continued)
| 1. | ORGANIZATION AND SIGNIFICANT ACCOUNTING POLICIES (continued) |
| e. | Securities Lending (continued) |
collateral, in addition to lending fees and rebates paid by the borrower. The fund bears the market risk with respect to the collateral investment, securities loaned, and the risk that the agent may default on its obligations to the fund. The securities lending agent has agreed to indemnify the fund in the event of default by a third party borrower.
f. Income and Deferred Taxes
It is each fund’s policy to qualify as a regulated investment company under the Internal Revenue Code. Each fund intends to distribute to shareholders substantially all of its taxable income and net realized gains to relieve it from federal income and excise taxes.
During the year ended December 31, 2012, a security was identified as a Passive Foreign Investment Company (PFIC) subsequent to the filing of the Foreign Equity Series’ Federal tax return, resulting in the recognition of income on which the Foreign Equity Series incurred federal income taxes of $400,470 as noted in the Statements of Operations. No further provision for U.S. federal income taxes is required.
The Funds may be subject to foreign taxation related to income received, capital gains on the sale of securities and certain foreign currency transactions in the foreign jurisdictions in which it invests. Foreign taxes, if any, are recorded based on the tax regulations and rates that exist in the foreign markets in which the Funds invest. When a capital gain tax is determined to apply the Funds record an estimated deferred tax liability in an amount that would be payable if the securities were disposed of on the valuation date.
Each fund recognizes the tax benefits of uncertain tax provisions only when the position is “more likely than not” to be sustained upon examination by the tax authorities based on the technical merits of the tax position. As of December 31, 2012, and for all open tax years, each fund has determined that no liability for unrecognized tax benefits is required in each fund’s financial statements related to uncertain tax positions taken on a tax return (or expected to be taken future tax returns). Open tax years are those that remain subject to examinations and are based on each tax jurisdiction statute of limitation.
g. Security Transactions, Investment Income, Expenses and Distributions
Security transactions are accounted for on trade date. Realized gains and losses on security transactions are determined on a specific identification basis. Interest income and estimated expenses are accrued daily. Amortization of premium and accretion of discount on debt securities are included in interest income. Dividend income recorded on the ex-dividend date except that certain dividends from foreign securities are recognized as soon as the Funds are notified of the ex-dividend date. Distributions to shareholders are recorded on the ex-dividend date and are determined according to income tax regulations (tax basis). Distributable earnings determined on a tax basis may differ from earnings recorded in accordance with accounting principles generally accepted in the United States of America. These differences may be permanent or temporary. Permanent differences are reclassified among capital accounts to reflect their tax character. These reclassifications have no
70 | Annual Report
Templeton Institutional Funds
Notes to Financial Statements (continued)
| 1. | ORGANIZATION AND SIGNIFICANT ACCOUNTING POLICIES (continued) |
| g. | Security Transactions, Investment Income, Expenses and Distributions (continued) |
impact on net assets or the results of operations. Temporary differences are not reclassified, as they may reverse in subsequent periods.
Common expenses incurred by the Trust are allocated among the Funds based on the ratio of net assets of each fund to the combined net assets of the Trust. Fund specific expenses are charged directly to the fund that incurred the expense.
Realized and unrealized gains and losses and net investment income, not including class specific expenses, are allocated daily to each class of shares based upon the relative proportion of net assets of each class. Differences in per share distributions, by class, are generally due to differences in class specific expenses.
h. Accounting Estimates
The preparation of financial statements in accordance with accounting principles generally accepted in the United States of America requires management to make estimates and assumptions that affect the reported amounts of assets and liabilities at the date of the financial statements and the amounts of income and expenses during the reporting period. Actual results could differ from those estimates.
i. Guarantees and Indemnifications
Under the Trust’s organizational documents, its officers and trustees are indemnified by the Trust against certain liabilities arising out of the performance of their duties to the Trust. Additionally, in the normal course of business, the Trust, on behalf of the Funds, enters into contracts with service providers that contain general indemnification clauses. The Trust’s maximum exposure under these arrangements is unknown as this would involve future claims that may be made against the Trust that have not yet occurred. Currently, the Trust expects the risk of loss to be remote.
2. SHARES OF BENEFICIAL INTEREST
At December 31, 2012, there were an unlimited number of shares authorized (without par value).
Transactions in the Funds’ shares were as follows:
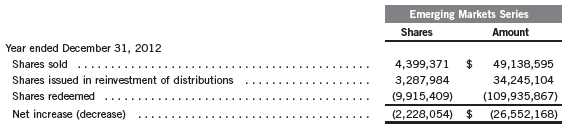
Annual Report | 71
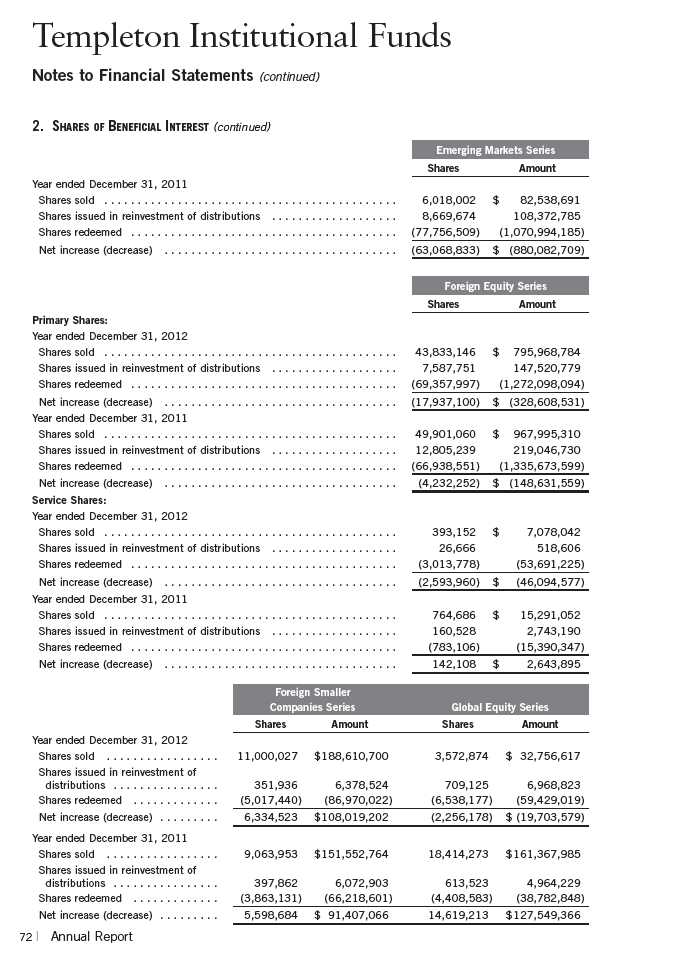
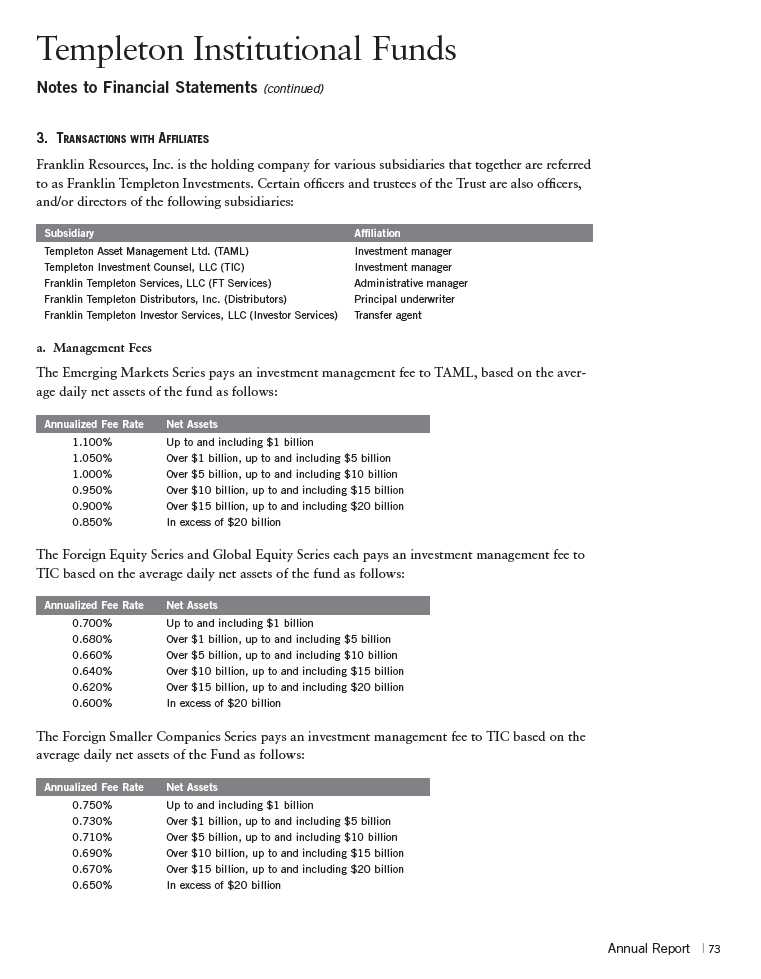
Templeton Institutional Funds
Notes to Financial Statements (continued)
| 3. | TRANSACTIONS WITH AFFILIATES (continued) |
| b. | Administrative Fees |
The Foreign Smaller Companies Series and Global Equity Series each pays an administrative fee to FT Services of 0.20% per year of the average daily net assets of the fund.
The Emerging Markets Series and Foreign Equity Series each pay their allocated share of an administrative fee to FT Services based on the aggregate average net assets as follows:
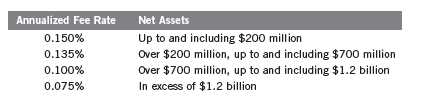
c. Transfer Agent Fees
For the year ended December 31, 2012, the Funds paid transfer agent fees as noted in the Statements of Operations of which the following amounts were retained by Investor Services:
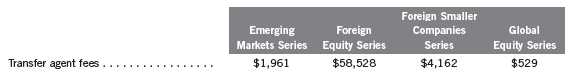
Foreign Equity Series’ Service shares may pay up to 0.15% of average daily net assets for sub-transfer agency fees as noted in the Statements of Operations.
d. Waiver and Expense Reimbursements
TIC and FT Services have contractually agreed in advance to waive or limit their respective fees and to assume as their own expense certain expenses otherwise payable by the Foreign Smaller Companies Series and Global Equity Series so that the common expenses (i.e. a combination of management fees, administrative fees, and other expenses) do not exceed 0.95% and 0.81%, respectively (other than certain non-routine expenses or costs, including those relating to litigation, indemnification, reorganizations, and liquidations) until April 30, 2013.
TAML and FT Services have contractually agreed in advance to waive or limit their respective fees and to assume as their own expense certain expenses otherwise payable by the Emerging Markets Series so that the common expenses do not exceed 1.24% (other than certain non-routine expenses or costs, including those relating to litigation, indemnification, reorganizations, and liquidations) until April 30, 2013.
74 | Annual Report
Templeton Institutional Funds
Notes to Financial Statements (continued)
4. EXPENSE OFFSET ARRANGEMENT
The Funds have entered into an arrangement with their custodian whereby credits realized as a result of uninvested cash balances are used to reduce a portion of the Funds’ custodian expenses. During the year ended December 31, 2012, the custodian fees were reduced as noted in the Statements of Operations.
5. INCOME TAXES
For tax purposes, capital losses may be carried over to offset future capital gains, if any. Capital loss carryforwards with no expiration, if any, must be fully utilized before those losses with expiration dates.
During the year ended December 31, 2012, the Global Equity Series utilized $5,266,547 of capital loss carryforwards.
The tax character of distributions paid during the years ended December 31, 2012 and 2011, was as follows:
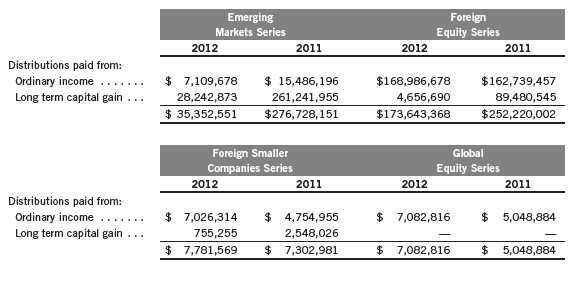
Annual Report | 75
Templeton Institutional Funds
Notes to Financial Statements (continued)
5. INCOME TAXES (continued)
At December 31, 2012, the cost of investments, net unrealized appreciation (depreciation), undistributed ordinary income and undistributed long term capital gains for income tax purposes were as follows:
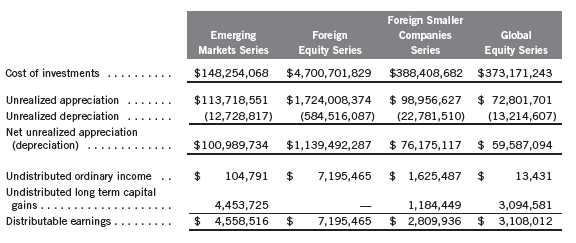
Differences between income and/or capital gains as determined on a book basis and a tax basis are primarily due to differing treatments of passive foreign investments company shares, foreign capital gains tax, corporate actions and wash sales.
6. INVESTMENT TRANSACTIONS
Purchases and sales of investments (excluding short term securities) for the year ended December 31, 2012, were as follows:
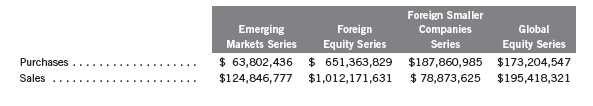
7. INVESTMENTS IN INSTITUTIONAL FIDUCIARY TRUST MONEY MARKET PORTFOLIO
The Foreign Equity Series invests in the Institutional Fiduciary Trust Money Market Portfolio (Sweep Money Fund), an open-end investment company managed by Franklin Advisers, Inc. (an affiliate of the investment manager). Management fees paid by the Funds are reduced on assets invested in the Sweep Money Fund, in an amount not to exceed the management and administrative fees paid by the Sweep Money Fund.
76 | Annual Report
Templeton Institutional Funds
Notes to Financial Statements (continued)
8. SHAREHOLDER CONCENTRATIONS
The Emerging Markets Series has a concentration of shareholders holding a significant percentage of shares outstanding. Investment activities of these shareholders could have a material impact on the Funds. At December 31, 2012, there was one shareholder holding 62% of the Emerging Markets Series’ outstanding shares. Subsequent to December 31, 2012, the fund received net redemptions from this shareholder, reducing it’s holdings to approximately 45% of the fund’s shares outstanding.
9. CONCENTRATION OF RISK
Investing in foreign securities may include certain risks and considerations not typically associated with investing in U.S. securities, such as fluctuating currency values and changing local and regional economic, political and social conditions, which may result in greater market volatility. In addition, certain foreign securities may not be as liquid as U.S. securities.
10. CREDIT FACILITY
The Funds, together with other U.S. registered and foreign investment funds (collectively, Borrowers), managed by Franklin Templeton Investments, are borrowers in a joint syndicated senior unsecured credit facility totaling $1.5 billion (Global Credit Facility) which matures on January 17, 2014. This Global Credit Facility provides a source of funds to the Borrowers for temporary and emergency purposes, including the ability to meet future unanticipated or unusually large redemption requests. Effective January 18, 2013, the Borrowers renewed the Global Credit Facility, maturing January 17, 2014.
Under the terms of the Global Credit Facility, the Funds shall, in addition to interest charged on any borrowings made by the Funds and other costs incurred by the Funds, pay their share of fees and expenses incurred in connection with the implementation and maintenance of the Global Credit Facility, based upon their relative share of the aggregate net assets of all of the Borrowers, including an annual commitment fee of 0.07% based upon the unused portion of the Global Credit Facility, which is reflected in other expenses on the Statements of Operations. During the year ended December 31, 2012, the Funds did not use the Global Credit Facility.
Annual Report | 77
Templeton Institutional Funds
Notes to Financial Statements (continued)
11. FAIR VALUE MEASUREMENTS
The Funds follow a fair value hierarchy that distinguishes between market data obtained from independent sources (observable inputs) and the Funds’ own market assumptions (unobservable inputs). These inputs are used in determining the value of the Funds’ investments and are summarized in the following fair value hierarchy:
- Level 1 – quoted prices in active markets for identical financial instruments
- Level 2 – other significant observable inputs (including quoted prices for similar financial instruments, interest rates, prepayment speed, credit risk, etc.)
- Level 3 – significant unobservable inputs (including the Funds’ own assumptions in determining the fair value of financial instruments)
The inputs or methodology used for valuing financial instruments are not an indication of the risk associated with investing in those financial instruments.
For movements between the levels within the fair value hierarchy, the Funds have adopted a policy of recognizing the transfers as of the date of the underlying event which caused the movement. Additionally, at December 31, 2012, due to market events and temporary trading halts, the Funds employed fair value procedures to value a portion of their holdings, resulting in a temporary transfer of these financial instruments from Level 1 to Level 2 within the fair value hierarchy.
The values of such transfers were as follow:

A summary of inputs used as of December 31, 2012, in valuing the Funds’ assets carried at fair value, is as follows:

78 | Annual Report
Templeton Institutional Funds
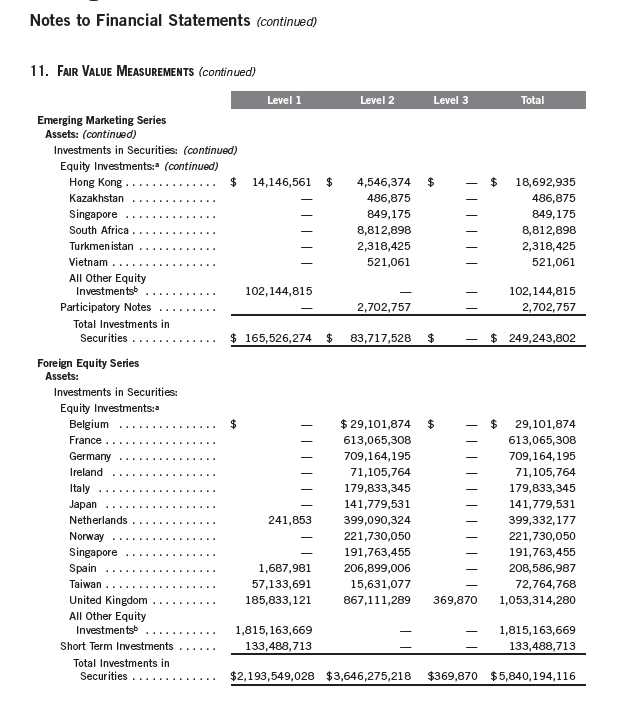
Annual Report | 79
Templeton Institutional Funds

80 | Annual Report

Templeton Institutional Funds
Report of Independent Registered Public Accounting Firm
To the Board of Trustees and Shareholders of Templeton Institutional Funds
In our opinion, the accompanying statements of assets and liabilities, including the statements of investments, and the related statements of operations and of changes in net assets and the financial highlights present fairly, in all material respects, the financial position of Emerging Markets Series, Foreign Equity Series, Foreign Smaller Companies Series and Global Equity Series (separate portfolios of Templeton Institutional Funds, hereafter referred to as the “Funds”) at December 31, 2012, the results of each of their operations for the year then ended, the changes in each of their net assets for each of the two years in the period then ended and the financial highlights for each of the periods presented, in conformity with accounting principles generally accepted in the United States of America. These financial statements and financial highlights (hereafter referred to as “financial statements”) are the responsibility of the Funds’ management. Our responsibility is to express an opinion on these financial statements based on our audits. We conducted our audits of these financial statements in accordance with the standards of the Public Company Accounting Oversight Board (United States). Those standards require that we plan and perform the audit to obtain reasonable assurance about whether the financial statements are free of material misstatement. An audit includes examining, on a test basis, evidence supporting the amounts and disclosures in the financial statements, assessing the accounting principles used and significant estimates made by management, and evaluating the overall financial statement presentation. We believe that our audits, which included confirmation of securities at December 31, 2012 by correspondence with the custodian, transfer agent and brokers, provide a reasonable basis for our opinion.
PricewaterhouseCoopers LLP
San Francisco, California
February 19, 2013
82 | Annual Report

Distributions, including qualified dividend income, paid during calendar year 2012 will be
reported to shareholders on Form 1099-DIV by mid-February 2013. Shareholders are advised to
check with their tax advisors for information on the treatment of these amounts on their individual
income tax returns.
At December 31, 2012, more than 50% of the Funds’ total assets were invested in securities of
foreign issuers. In most instances, foreign taxes were withheld from income paid to the Funds on
these investments. As shown in the table below, the Funds hereby report to shareholders the for-
eign source income and foreign taxes paid, pursuant to Section 853 of the Code. This written
statement will allow shareholders of record on December 21, 2012, to treat their proportionate
share of foreign taxes paid by the Funds as having been paid directly by them. The shareholder
shall consider these amounts as foreign taxes paid in the tax year in which they receive the Fund
distribution.
Annual Report | 83
Templeton Institutional Funds
Tax Information (unaudited) (continued)
The following table provides a detailed analysis of foreign tax paid, foreign source income, and foreign qualified dividends as reported by the Funds, to shareholders of record.
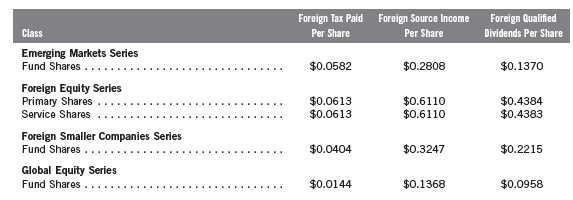
Foreign Tax Paid Per Share (Column 1) is the amount per share available to you, as a tax credit (assuming you held your shares in the Fund for a minimum of 16 days during the 31-day period beginning 15 days before the ex-dividend date of the Fund’s distribution to which the foreign taxes relate), or, as a tax deduction.
Foreign Source Income Per Share (Column 2) is the amount per share of income dividends attributable to foreign securities held by the Fund, plus any foreign taxes withheld on these dividends. The amounts reported include foreign source qualified dividends that have not been adjusted for the rate differential applicable to such dividend income.1
Foreign Qualified Dividends Per Share (Column 3) is the amount per share of foreign source qualified dividends, plus any foreign taxes withheld on these dividends. These amounts represent the portion of the Foreign Source Income reported to you in column 2 that were derived from qualified foreign securities held by the Fund.1
By mid-February 2013, shareholders will receive Form 1099-DIV which will include their share of taxes paid and foreign source income distributed during the calendar year 2012. The Foreign Source Income reported on Form 1099-DIV has not been adjusted for the rate differential on foreign source qualified dividend income. Shareholders are advised to check with their tax advisors for information on the treatment of these amounts on their 2012 individual income tax returns.
1Qualified dividends are taxed at reduced long term capital gains tax rates. In determining the amount of foreign tax credit that may be applied against the U.S. tax liability of individuals receiving foreign source qualified dividends, adjustments may be required to the foreign tax credit limitation calculation to reflect the rate differential applicable to such dividend income. The rules however permit certain individuals to elect not to apply the rate differential adjustments for capital gains and/or dividends for any taxable year. Please consult your tax advisor and the instructions to Form 1116 for more information.
84 | Annual Report
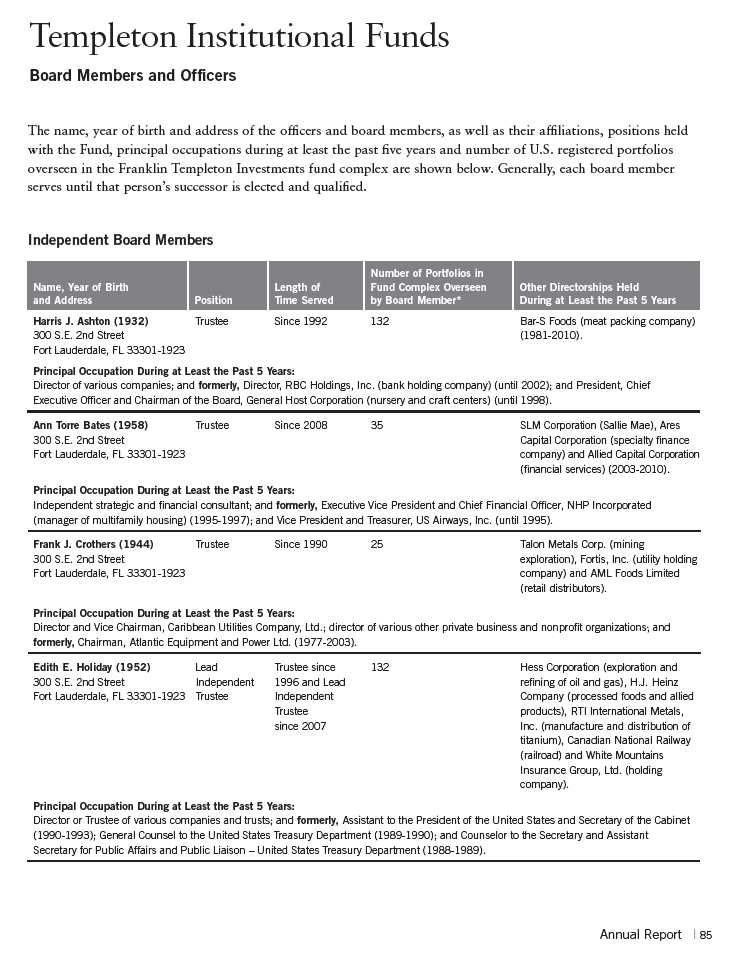
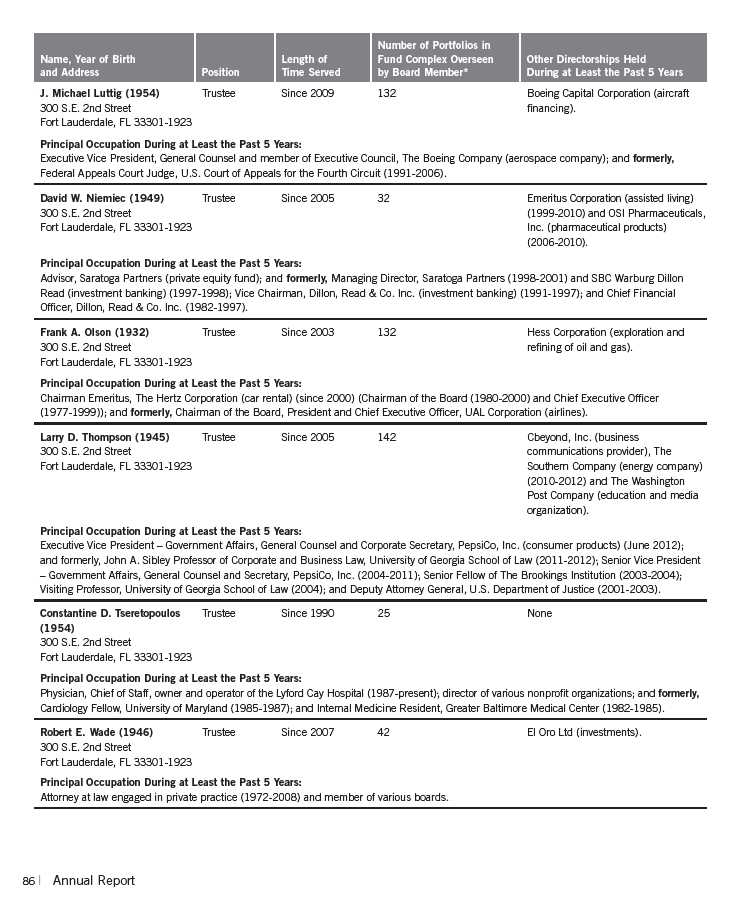
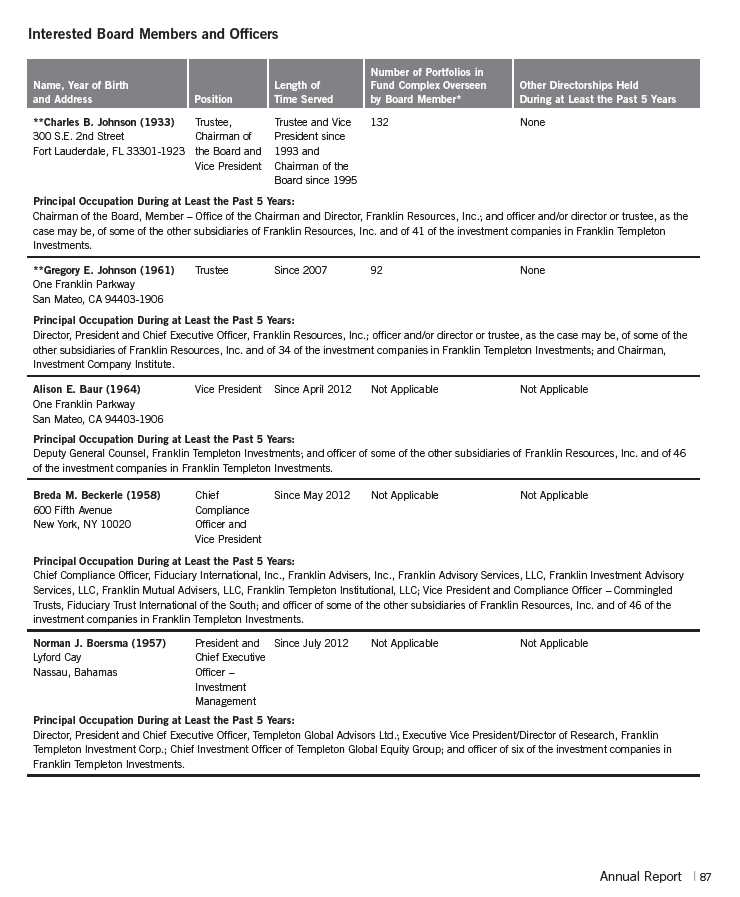
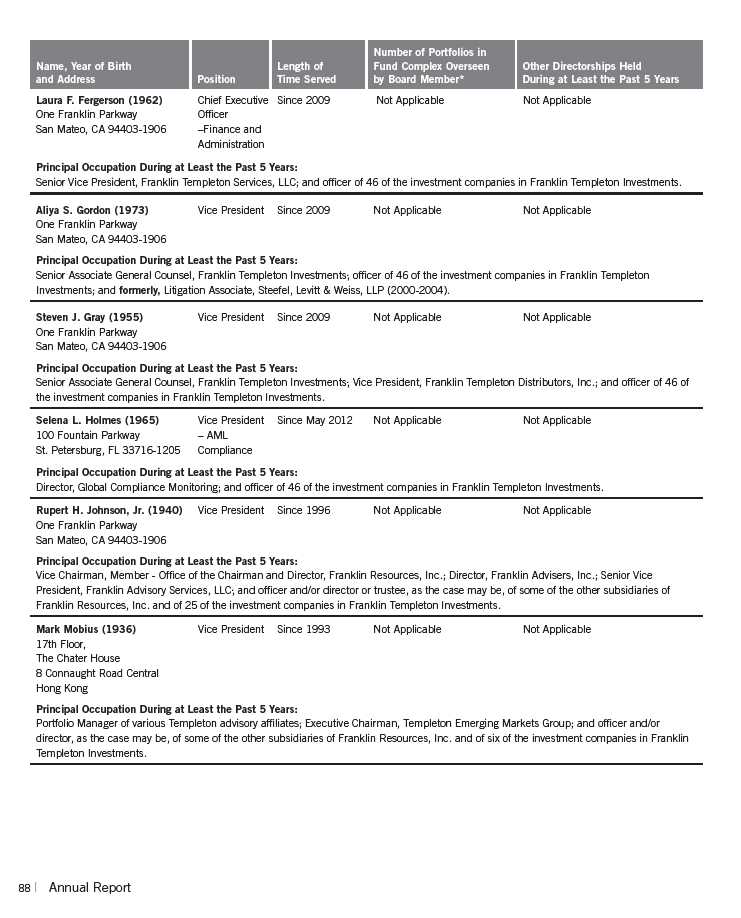
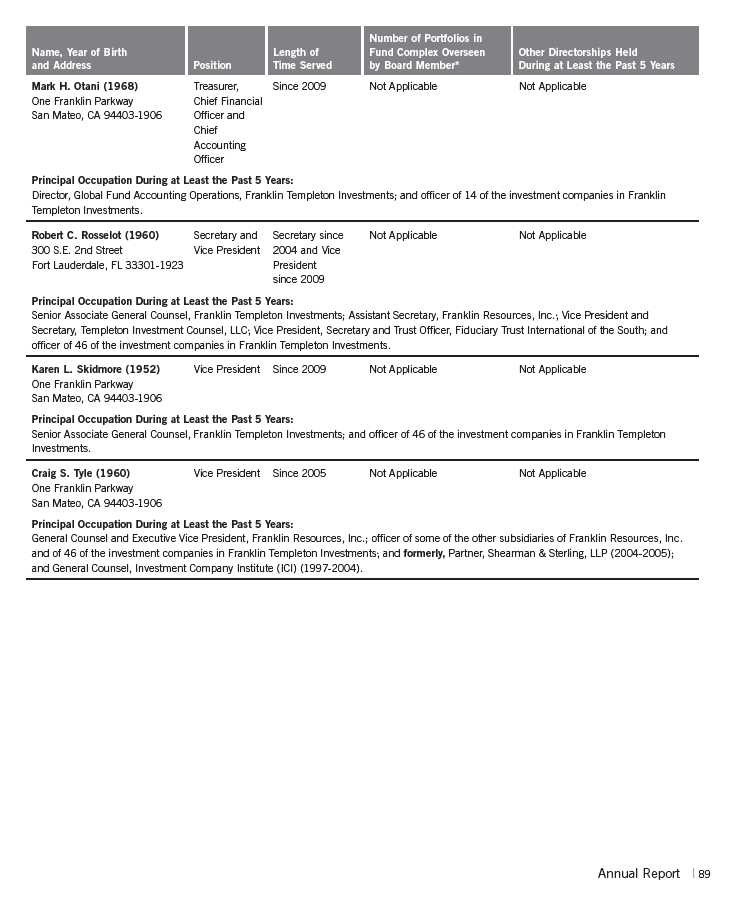
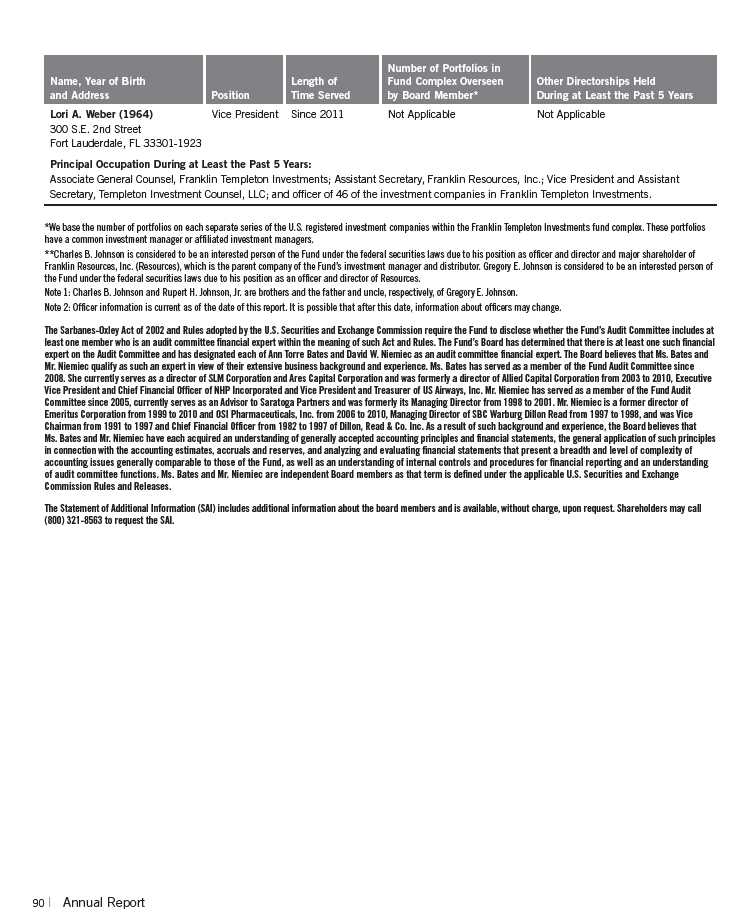
Templeton Institutional Funds
Shareholder Information
Proxy Voting Policies and Procedures
The Funds’ investment managers have established Proxy Voting Policies and Procedures (Policies) that the Funds use to determine how to vote proxies relating to portfolio securities. Shareholders may view the Funds’ complete Policies online at franklintempleton.com. Alternatively, shareholders may request copies of the Policies free of charge by calling the Proxy Group collect at (954) 527-7678 or by sending a written request to: Franklin Templeton Companies, LLC, 300 S.E. 2nd Street, Fort Lauderdale, FL 33301, Attention: Proxy Group. Copies of the Funds’ proxy voting records are also made available online at franklintempleton.com and posted on the U.S. Securities and Exchange Commission’s website at sec.gov and reflect the most recent 12-month period ended June 30.
Quarterly Statement of Investments
The Funds file a complete statement of investments with the U.S. Securities and Exchange Commission for the first and third quarters for each fiscal year on Form N-Q. Shareholders may view the filed Form N-Q by visiting the Commission’s website at sec.gov. The filed form may also be viewed and copied at the Commission’s Public Reference Room in Washington, DC. Information regarding the operations of the Public Reference Room may be obtained by calling (800) SEC-0330.
Householding of Reports and Prospectuses
You will receive each Fund’s financial reports every six months as well as an annual updated summary prospectus (prospectus available upon request). To reduce Fund expenses, we try to identify related shareholders in a household and send only one copy of the financial reports and summary prospectus. This process, called “householding,” will continue indefinitely unless you instruct us otherwise. If you prefer not to have these documents householded, please call us at (800) 321-8563. At any time you may view current prospectuses/summary prospectuses and financial reports on our website. If you choose, you may receive these documents through electronic delivery.
Annual Report | 91
This page intentionally left blank.

Item 2. Code of Ethics.
(a) The Registrant has adopted a code of ethics that applies to its
principal executive officers and principal financial and accounting
officer.
(c) N/A
(d) N/A
(f) Pursuant to Item 12(a)(1), the Registrant is attaching as an
exhibit a copy of its code of ethics that applies to its principal
executive officers and principal financial and accounting officer.
Item 3. Audit Committee Financial Expert.
(a)(1) The Registrant has an audit committee financial expert serving
on its audit committee.
(2) The audit committee financial expert is David W. Niemiec and he is
"independent" as defined under the relevant Securities and Exchange
Commission Rules and Releases.
Item 4. Principal Accountant Fees and Services.
(a) Audit Fees
The aggregate fees paid to the principal accountant for professional
services rendered by the principal accountant for the audit of the
registrant’s annual financial statements or for services that are
normally provided by the principal accountant in connection with
statutory and regulatory filings or engagements were $179,782 for the
fiscal year ended December 31, 2012 and $166,066 for the fiscal year
ended December 31, 2011.
(b) Audit-Related Fees
The aggregate fees paid to the principal accountant for assurance and
related services rendered by the principal accountant to the registrant
that are reasonably related to the performance of the audit of the
registrant's financial statements and are not reported under paragraph
(a) of Item 4 were $2,894 for the fiscal year ended December 31, 2012
and $2,894 for the fiscal year ended December 31, 2011. The services
for which these fees were paid included attestation services.
There were no fees paid to the principal accountant for assurance and
related services rendered by the principal accountant to the
registrant's investment adviser and any entity controlling, controlled
by or under common control with the investment adviser that provides
ongoing services to the registrant that are reasonably related to the
performance of the audit of their financial statements.
(c) Tax Fees
The aggregate fees paid to the principal accountant for professional
services rendered by the principal accountant to the registrant for tax
compliance, tax advice and tax planning were $2,040 for the fiscal year
ended December 31, 2012 and $1,300 for the fiscal year ended December
31, 2011. The services for which these fees were paid included
preparation of tax returns for foreign governments.
The aggregate fees paid to the principal accountant for professional
services rendered by the principal accountant to the registrant’s
investment adviser and any entity controlling, controlled by or under
common control with the investment adviser that provides ongoing
services to the registrant for tax compliance, tax advice and tax
planning were $4,600 for the fiscal year ended December 31, 2012 and
$100,000 for the fiscal year ended December 31, 2011. The services for
which these fees were paid included technical tax consultation for
capital gain tax reporting to foreign governments, application of local
country tax laws to investments and licensing securities with local
country offices.
(d) All Other Fees
The aggregate fees paid to the principal accountant for products and
services rendered by the principal accountant to the registrant not
reported in paragraphs (a)-(c) of Item 4 were $2,433 for the fiscal
year ended December 31, 2012 and $0 for the fiscal year ended December
31, 2011. The services for which these fees were paid include review
of materials provided to the fund Board in connection with the
investment management contract renewal process.
The aggregate fees paid to the principal accountant for products and
services rendered by the principal accountant to the registrant’s
investment adviser and any entity controlling, controlled by or under
common control with the investment adviser that provides ongoing
services to the registrant other than services reported in paragraphs
(a)-(c) of Item 4 were $150,017 for the fiscal year ended December 31,
2012 and $0 for the fiscal year ended December 31, 2011. The services
for which these fees were paid include review of materials provided to
the fund Board in connection with the investment management contract
renewal process.
(e) (1) The registrant’s audit committee is directly responsible for
approving the services to be provided by the auditors, including:
(i) pre-approval of all audit and audit related services;
(ii) pre-approval of all non-audit related services to be
provided to the Fund by the auditors;
(iii) pre-approval of all non-audit related services to be
provided to the registrant by the auditors to the registrant’s
investment adviser or to any entity that controls, is controlled by or
is under common control with the registrant’s investment adviser and
that provides ongoing services to the registrant where the non-audit
services relate directly to the operations or financial reporting of
the registrant; and
(iv) establishment by the audit committee, if deemed necessary
or appropriate, as an alternative to committee pre-approval of services
to be provided by the auditors, as required by paragraphs (ii) and
(iii) above, of policies and procedures to permit such services to be
pre-approved by other means, such as through establishment of
guidelines or by action of a designated member or members of the
committee; provided the policies and procedures are detailed as to the
particular service and the committee is informed of each service and
such policies and procedures do not include delegation of audit
committee responsibilities, as contemplated under the Securities
Exchange Act of 1934, to management; subject, in the case of (ii)
through (iv), to any waivers, exceptions or exemptions that may be
available under applicable law or rules.
(e) (2) None of the services provided to the registrant described in
paragraphs (b)-(d) of Item 4 were approved by the audit committee
pursuant to paragraph (c)(7)(i)(C) of Rule 2-01 of regulation S-X.
(f) No disclosures are required by this Item 4(f).
(g) The aggregate non-audit fees paid to the principal accountant for
services rendered by the principal accountant to the registrant and the
registrant’s investment adviser and any entity controlling, controlled
by or under common control with the investment adviser that provides
ongoing services to the registrant were $161,984 for the fiscal year
ended December 31, 2012 and $104,194 for the fiscal year ended December
31, 2011.
(h) The registrant’s audit committee of the board has considered
whether the provision of non-audit services that were rendered to the
registrant’s investment adviser (not including any sub-adviser whose
role is primarily portfolio management and is subcontracted with or
overseen by another investment adviser), and any entity controlling,
controlled by, or under common control with the investment adviser that
provides ongoing services to the registrant that were not pre-approved
pursuant to paragraph (c)(7)(ii) of Rule 2-01 of Regulation S-X is
compatible with maintaining the principal accountant’s independence.
Item 5. Audit Committee of Listed Registrants. N/A
Item 6. Schedule of Investments. N/A
Item 7. Disclosure of Proxy Voting Policies and Procedures for
Closed-End Management Investment Companies. N/A
Item 8. Portfolio Managers of Closed-End Management Investment
Companies. N/A
Item 9. Purchases of Equity Securities by Closed-End Management
Investment Company and Affiliated Purchasers. N/A
Item 10. Submission of Matters to a Vote of Security Holders.
There have been no changes to the procedures by which shareholders may
recommend nominees to the Registrant's Board of Directors that would
require disclosure herein.
Item 11. Controls and Procedures.
(a) Evaluation of Disclosure Controls and Procedures. The Registrant
maintains disclosure controls and procedures that are designed to
ensure that information required to be disclosed in the Registrant’s
filings under the Securities Exchange Act of 1934 and the Investment
Company Act of 1940 is recorded, processed, summarized and reported
within the periods specified in the rules and forms of the Securities
and Exchange Commission. Such information is accumulated and
communicated to the Registrant’s management, including its principal
executive officer and principal financial officer, as appropriate, to
allow timely decisions regarding required disclosure. The Registrant’s
management, including the principal executive officer and the principal
financial officer, recognizes that any set of controls and procedures,
no matter how well designed and operated, can provide only reasonable
assurance of achieving the desired control objectives.
Within 90 days prior to the filing date of this Shareholder Report on
Form N-CSR, the Registrant had carried out an evaluation, under the
supervision and with the participation of the Registrant’s management,
including the Registrant’s principal executive officer and the
Registrant’s principal financial officer, of the effectiveness of the
design and operation of the Registrant’s disclosure controls and
procedures. Based on such evaluation, the Registrant’s principal
executive officer and principal financial officer concluded that the
Registrant’s disclosure controls and procedures are effective.
(b) Changes in Internal Controls. There have been no changes in the
Registrant’s internal controls or in other factors that could
materially affect the internal controls over financial reporting
subsequent to the date of their evaluation in connection with the
preparation of this Shareholder Report on Form N-CSR.
Item 12. Exhibits.
(a)(1) Code of Ethics
(a)(2) Certifications pursuant to Section 302 of the Sarbanes-Oxley Act
of 2002 of Laura F. Fergerson, Chief Executive Officer - Finance and
Administration, and Mark H. Otani, Chief Financial Officer and Chief
Accounting Officer
(b) Certifications pursuant to Section 906 of the Sarbanes-Oxley Act of
2002 of Laura F. Fergerson, Chief Executive Officer - Finance and
Administration, and Mark H. Otani, Chief Financial Officer and Chief
Accounting Officer