UNITED STATES
SECURITIES AND EXCHANGE COMMISSION
Washington, DC 20549
FORM N-CSRS
CERTIFIED SHAREHOLDER REPORT OF REGISTERED
MANAGEMENT INVESTMENT COMPANIES
Investment Company Act file number 811-06135
Templeton Institutional Funds
(Exact name of registrant as specified in charter)
300 S.E. 2nd Street, Fort Lauderdale, FL 33301-1923
(Address of principal executive offices) (Zip code)
Craig S. Tyle, One Franklin Parkway, San Mateo, CA 94403-1906
(Name and address of agent for service)
Registrant’s telephone number, including area code: (954) 527-7500
Date of fiscal year end: 12/31
Date of reporting period: 6/30/17
| Item 1. | Reports to Stockholders. |
| | |

| | Semiannual Report June 30, 2017 |
Templeton Institutional Funds
Emerging Markets Series
Foreign Smaller Companies Series
Global Equity Series
International Equity Series

Franklin Templeton Investments
Gain From Our Perspective®
At Franklin Templeton Investments, we’re dedicated to one goal: delivering exceptional asset management for our clients. By bringing together multiple, world-class investment teams in a single firm, we’re able to offer specialized expertise across styles and asset classes, all supported by the strength and resources of one of the world’s largest asset managers. This has helped us to become a trusted partner to individual and institutional investors across the globe.
Contents
Semiannual Report
Visit ftinstitutional.com for fund updates, to access your account, or to find investment insights.
|
| Not FDIC Insured | May Lose Value | No Bank Guarantee |
| | | | | | |
| | | |
| ftinstitutional.com | | Not part of the semiannual report | | | 1 | |
Semiannual Report
Economic and Market Overview
The global economy generally expanded during the period under review. In this environment, global developed and emerging market stocks rose, as measured by the MSCI All Country World Index. Global markets were aided by improved industrial commodity prices at certain points during the period, generally upbeat economic data across regions, investor optimism about pro-growth and pro-business policies in the U.S., hopes of tax reforms under the Trump administration, Emmanuel Macron’s election as France’s president and encouraging corporate earnings reports.
However, investors expressed concerns about the timing and economic effects of the U.K.’s exit from the European Union (also known as “Brexit”) and the U.S. executive order banning entry from some Muslim-majority countries. Other headwinds included the health of European banks, concerns about political uncertainty in the U.S. and European Union, geopolitical tensions in certain regions, worries about global oversupply in oil production despite a pact to extend cuts, and hawkish comments from key central bankers around the world toward period-end.
U.S. economic growth decelerated in 2017’s first quarter, largely due to slower growth in consumer spending and declines in private inventory investment and government spending. However, growth accelerated in the second quarter due to increases in consumer spending, business investment and federal government spending. The unemployment rate decreased from 4.7% in December 2016 to 4.4% at period-end.1 Annual inflation, as measured by the Consumer Price Index, decreased from 2.1% to 1.6% during the period. After increasing its benchmark interest rate in March, the U.S. Federal Reserve (Fed), at its June meeting, made the widely anticipated increase to its target range for the federal funds rate from 0.75%–1.00% to 1.00%–1.25%, amid signs of a growing U.S. economy, a strengthening labor market and an improvement in business spending.
In Europe, the U.K.’s economy grew at a slower rate in 2017’s first quarter over the previous quarter, largely due to slower growth in household spending. The eurozone’s growth increased in the first quarter over the previous quarter. The bloc’s annual inflation rate fluctuated during the reporting period and ended slightly higher from where it began. During the period, the European Central Bank kept its key policy rates unchanged.
In Asia, Japan’s quarterly gross domestic product (GDP) remained unchanged in 2017’s first quarter compared to 2016’s fourth quarter. In April 2017, the Bank of Japan (BOJ) slightly increased its GDP forecasts for the 2017–2018 fiscal year. However, the BOJ lowered its inflation forecast.
In emerging markets, Brazil’s quarterly GDP grew for the first time in two years, as its first-quarter 2017 GDP grew compared to the previous quarter. The country’s central bank cut its benchmark interest rate four times between January and June 2017 to spur economic growth. Russia’s GDP grew in 2017’s first quarter compared to the prior-year period. The Bank of Russia reduced its key interest rate in March, April and June 2017 to try to revive its economy. China’s economy grew faster in the first half of 2017 compared to the first half of 2016, driven by solid growth in industrial production, services, fixed-asset investment, retail sales, and imports and exports. The People’s Bank of China left its benchmark interest rate unchanged during the period. Overall, emerging market stocks, as measured by the MSCI Emerging Markets Index, rose during the period.
The foregoing information reflects our analysis and opinions as of June 30, 2017. The information is not a complete analysis of every aspect of any market, country, industry, security or fund. Statements of fact are from sources considered reliable.
1. Source: Bureau of Labor Statistics.
| | | | |
| | | |
| 2 | | Semiannual Report | | ftinstitutional.com |
Emerging Markets Series
We are pleased to bring you Emerging Markets Series’ (Fund’s) semiannual report for the period ended June 30, 2017.
Your Fund’s Goal and Main Investments
The Fund seeks long-term capital growth. Under normal market conditions, the Fund invests at least 80% of its net assets in securities issued by “emerging market companies,” as defined in the Fund’s prospectus.
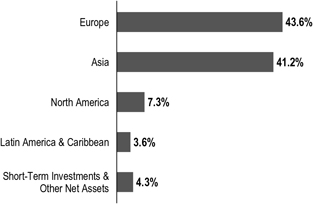
Geographic Composition
Based on Total Net Assets as of 6/30/17

Performance Overview
The Fund delivered a +22.66% cumulative total return for the six months under review. In comparison, the Standard & Poor’s®/International Finance Corporation Investable Composite Index generated a +18.74% total return, and the MSCI Emerging Markets (EM) Index posted a total return of +18.60% during the same period.1 The indexes measure global emerging market stock performance. Please note, index performance information is provided for reference and we do not attempt to track an index but rather undertake investments on the basis of fundamental research. The Fund’s return reflects the effect of fees and expenses for professional management, while an index does not have such costs. In addition, an index is not subject to investment flows while the Fund is subject to purchases and redemptions that could impact performance. You can find the Fund’s long-term performance data in the Performance Summary beginning on page 7.
Performance data represent past performance, which does not guarantee future results. Investment return and principal value will fluctuate, and you may have a gain or loss when you sell your shares. Current performance may differ from figures shown. For most recent month-end performance, go to ftinstitutional.com or call a Franklin Templeton Institutional Services representative at (800) 321-8563.
Investment Strategy
Our investment strategy employs a fundamental research, value-oriented, long-term approach. We focus on the market price of a company’s securities relative to our evaluation of the company’s long-term earnings, asset value and cash flow potential. We also consider a company’s profit and loss outlook, balance sheet strength, cash flow trends and asset value in relation to the current price. Our analysis considers the company’s corporate governance behavior as well as its position in its sector, the economic framework and political environment.
Manager’s Discussion
During the six months under review, key contributors to the Fund’s absolute performance included investments in Samsung Electronics, Tencent Holdings and Brilliance China Automotive Holdings.
Samsung Electronics is a major South Korea-based manufacturer of consumer electronics. It is one of the world’s largest manufacturers of mobile phones, smartphones, tablets and televisions. The company is also a leading supplier of memory chips for high-end phones and is a key provider of organic light-emitting diodes (OLED) displays. Key drivers of the stock price included strong first-quarter 2017 corporate results, robust second-quarter earnings guidance, proposed share buybacks and announcement of a cancelation of all existing Treasury shares. Strong demand for Samsung’s new high-end smartphone, the Galaxy S8, which was released in March 2017, also supported sentiment.
Tencent is one of the world’s largest and most widely used Internet service portals. The company provides value-added Internet, mobile and telecommunication services and online advertising under the strategic goal of providing users with “one-stop online lifestyle services.” Over the last decade,
1. Source: Morningstar.
The indexes are unmanaged and include reinvestment of any income or distributions. They do not reflect any fees, expenses or sales charges. One cannot invest directly in an index, and an index is not representative of the Fund’s portfolio.
The dollar value, number of shares or principal amount, and names of all portfolio holdings are listed in the Fund’s Statement of Investments (SOI). The SOI begins on page 33.
| | | | | | |
| | | |
| ftinstitutional.com | | Semiannual Report | | | 3 | |
EMERGING MARKETS SERIES
Tencent has maintained steady growth under its user-oriented operating strategies. Internet stocks in China rebounded in the first half of 2017 following pressure in the fourth quarter of 2016. Tencent’s shares further benefited from a better-than-expected double-digit increase in first-quarter revenues, driven by the online gaming, online advertising and social networking segments.
| | | | |
| Top 10 Countries | | | |
| 6/30/17 | | | |
| | | % of Total
Net Assets | |
| China | | | 18.1% | |
| South Korea | | | 17.8% | |
| Taiwan | | | 13.3% | |
| India | | | 7.9% | |
| South Africa | | | 7.4% | |
| Russia | | | 6.0% | |
| Brazil | | | 4.5% | |
| Indonesia | | | 4.0% | |
| Thailand | | | 3.7% | |
| U.K. | | | 3.3% | |
Brilliance China Automotive manufactures and sells automobiles to the Chinese domestic market, predominantly through its joint venture with German luxury car manufacturer BMW. The company announced an in-line set of figures for 2016, and better-than-expected first-quarter 2017 earnings growth driven by strong sales growth. Expectations for a continuation of strong sales momentum in the second half of 2017, supported by resilient luxury car demand and the continued rise of China’s upper middle class, also drove share price performance over the period. An encouraging outlook based upon new vehicle launches, increased financing revenues, a supportive macroeconomic environment and attractive valuations further supported investor sentiment in the stock.
In contrast, key detractors included positions in IMAX, LUKOIL and Glenmark Pharmaceuticals.
IMAX is one of the world’s leading entertainment technology companies, specializing in immersive motion picture technologies. The company combines proprietary software, theater architecture and equipment to create high-quality motion picture experiences. Its systems are used globally, including a notable market position in China. Gross profit margin for first-quarter 2017 was down from first-quarter 2016, when box-office figures were helped by a stronger movie slate. In June, the company announced a cost-cutting program and proposed further share buybacks.
| | | | |
| Top 10 Holdings | | | |
6/30/17 | | | |
Company Sector/Industry, Country | | % of Total
Net Assets | |
| Samsung Electronics Co. Ltd. | | | 7.5% | |
Technology Hardware, Storage & Peripherals, South Korea | | | | |
Brilliance China Automotive Holdings Ltd.
Automobiles, China | | | 6.8% | |
Taiwan Semiconductor Manufacturing Co. Ltd.
Semiconductors & Semiconductor Equipment, Taiwan | | | 6.6% | |
Naspers Ltd.
Media, South Africa | | | 6.2% | |
Unilever PLC
Personal Products, U.K. | | | 3.3% | |
Hon Hai Precision Industry Co. Ltd.
Electronic Equipment, Instruments & Components, Taiwan | | | 3.3% | |
Tencent Holdings Ltd.
Internet Software & Services, China | | | 3.0% | |
ICICI Bank Ltd.
Banks, India | | | 2.5% | |
Astra International Tbk PT
Automobiles, Indonesia | | | 2.3% | |
Alibaba Group Holding Ltd.
Internet Software & Services, China | | | 1.9% | |
LUKOIL is a Russia-based energy company primarily involved in the exploration, production, marketing and refining of oil and oil-related products. The company is one of the world’s largest oil companies in terms of reserves. Although the company delivered first-quarter 2017 results that beat expectations, its shares underperformed due to weak investor sentiment in the Russian market in general and a decline in crude oil prices. After surging 55.93% in U.S. dollar terms in 2016, the Russian market gave back some of those gains in the first half of 2017, with the MSCI Russia Index declining 13.96%.1 Key reasons for the correction were a decline in oil prices and geopolitical worries, including additional U.S. sanctions.
Glenmark Pharmaceuticals is an Indian manufacturer of generic drugs and pharmaceutical ingredients. Glenmark produces formulation products in areas such as oncology, respiratory and cardiac. It also researches and develops its own chemical and biological entities. In addition to India, the U.S. is its main market. Its share price declined significantly in May as the company announced weaker-than-expected first-quarter 2017 operating performance with disappointing revenue growth. Sales in India were impacted by the government’s demonetization program to recall large-denominated currency
| | | | |
| | | |
| 4 | | Semiannual Report | | ftinstitutional.com |
EMERGING MARKETS SERIES
notes, while price declines and lower sales for a cholesterol-lowering drug pressured sales in the U.S.
It is important to recognize the effect of currency movements on the Fund’s performance. In general, if the value of the U.S. dollar goes up compared with a foreign currency, an investment traded in that foreign currency will go down in value because it will be worth fewer U.S. dollars. This can have a negative effect on Fund performance. Conversely, when the U.S. dollar weakens in relation to a foreign currency, an investment traded in that foreign currency will increase in value, which can contribute to Fund performance. For the six months ended June 30, 2017, the U.S. dollar declined in value relative to most currencies. As a result, the Fund’s performance was positively affected by the portfolio’s investment predominantly in securities with non-U.S. currency exposure. However, one cannot expect the same result in future periods.
During the past six months, we increased the Fund’s holdings in Russia, South Korea, Peru and the Czech Republic as we continued to invest in opportunities we considered to be attractive. In sector terms, we added to the Fund’s holdings in financials and materials and made some purchases in health care.2 Key purchases included new positions in Sberbank of Russia, the country’s leading bank, and POSCO in South Korea, one of the world’s largest steel producers. We also increased the Fund’s holding in Alibaba Group Holding, China’s largest e-commerce company.
Conversely, we reduced the Fund’s investments in China, Hong Kong, South Africa and the U.K. to focus on stocks we considered to be more attractively valued within our investment universe. In sector terms, we reduced holdings in industrials and consumer discretionary and conducted some sales in information technology (IT).3 Key sales included reducing holdings in the aforementioned Tencent and in Brazilian financial conglomerate Itau Unibanco Holding. We also closed the Fund’s position in Remgro, a South African holding company with interests in food, finance and health care.
Thank you for your continued participation in Emerging Markets Series. We look forward to serving your future investment needs.
| | |
 | | 
Chetan Sehgal, CFA Portfolio Manager |
The foregoing information reflects our analysis, opinions and portfolio holdings as of June 30, 2017, the end of the reporting period. The way we implement our main investment strategies and the resulting portfolio holdings may change depending on factors such as market and economic conditions. These opinions may not be relied upon as investment advice or an offer for a particular security. The information is not a complete analysis of every aspect of any market, country, industry, security or the Fund. Statements of fact are from sources considered reliable, but the investment manager makes no representation or warranty as to their completeness or accuracy. Although historical performance is no guarantee of future results, these insights may help you understand our investment management philosophy.
CFA® is a trademark owned by CFA Institute.
2. The financials sector comprises banks, capital markets, diversified financial services and insurance in the SOI. The materials sector comprises chemicals, construction materials, and metals and mining in the SOI. The health care sector comprises biotechnology and pharmaceuticals in the SOI.
3. The industrials sector comprises construction and engineering, trading companies and distributors, and transportation infrastructure in the SOI. The consumer discretionary sector comprises auto components; automobiles; Internet and direct marketing retail; media; hotels, restaurants and leisure; and textiles, apparel and luxury goods in the SOI. The IT sector comprises electronic equipment, instruments and components; Internet software and services; IT services; semiconductors and semiconductor equipment; software; and technology hardware, storage and peripherals in the SOI.
| | | | | | |
| | | |
| ftinstitutional.com | | Semiannual Report | | | 5 | |
EMERGING MARKETS SERIES
|
Chetan Sehgal is an executive vice president and the Director of Global Emerging Markets/Small Cap Strategies for the Templeton Emerging Markets Group. In this capacity, he is responsible for strengthening the overall Global Emerging Markets and Small Cap strategies, providing guidance and thought leadership, coordinating appropriate resources and coverage, and leveraging the group’s expertise to add value across products within the strategies. Prior to joining Franklin Templeton in 1995, Mr. Sehgal was a senior ratings analyst for the Credit Rating Information Services of India, Ltd. Mr. Sehgal earned a B.E. mechanical (honors) from the University of Bombay and a post-graduate diploma in management from the Indian Institute of Management in Bangalore, where he specialized in finance and business policy and graduated as an institute scholar. Mr. Sehgal speaks English and Hindi and is a Chartered Financial Analyst (CFA) charterholder. |
| | | | |
| | | |
| 6 | | Semiannual Report | | ftinstitutional.com |
EMERGING MARKETS SERIES
Performance Summary as of June 30, 2017
The performance table does not reflect any taxes that a shareholder would pay on Fund dividends, capital gain distributions, if any, or any realized gains on the sale of Fund shares. Total return reflects reinvestment of the Fund’s dividends and capital gain distributions, if any, and any unrealized gains or losses. Your dividend income will vary depending on dividends or interest paid by securities in the Fund’s portfolio, adjusted for operating expenses. Capital gain distributions are net profits realized from the sale of portfolio securities.
Performance as of 6/30/171
| | | | | | | | |
| | | Cumulative
Total Return2 | | | Average Annual
Total Return3 | |
6-Month | | | +22.66% | | | | +22.66% | |
1-Year | | | +31.73% | | | | +31.73% | |
5-Year | | | +25.81% | | | | +4.70% | |
10-Year | | | +19.90% | | | | +1.83% | |
Performance data represent past performance, which does not guarantee future results. Investment return and principal value will fluctuate, and you may have a gain or loss when you sell your shares. Current performance may differ from figures shown. For most recent month-end performance, go to ftinstitutional.com or call a Franklin Templeton Institutional Services representative at (800) 321-8563.
See page 8 for Performance Summary footnotes.
| | | | | | |
| | | |
| ftinstitutional.com | | Semiannual Report | | | 7 | |
EMERGING MARKETS SERIES
PERFORMANCE SUMMARY
Total Annual Operating Expenses4
| | | | |
| | | With Waiver | | Without Waiver |
| | | 1.31% | | 1.44% |
All investments involve risks, including possible loss of principal. Special risks are associated with foreign investing, including currency fluctuations, economic instability and political developments. Investments in emerging markets, of which frontier markets are a subset, involve heightened risks related to the same factors, in addition to those associated with these markets’ smaller size, lesser liquidity and lack of established legal, political, business and social frameworks to support securities markets. Because these frameworks are typically even less developed in frontier markets, as well as various factors including the increased potential for extreme price volatility, illiquidity, trade barriers and exchange controls, the risks associated with emerging markets are magnified in frontier markets. The Fund’s ability to invest in smaller company securities that may have limited liquidity involves additional risks, such as relatively small revenues, limited product lines and small market share. Historically, these stocks have exhibited greater price volatility than larger company stocks, especially over the short term. The Fund is actively managed but there is no guarantee that the manager’s investment decisions will produce the desired results. The Fund’s prospectus also includes a description of the main investment risks.
1. The Fund has an expense reduction contractually guaranteed through 4/30/18. Fund investment results reflect the expense reduction; without this reduction, the results would have been lower.
2. Cumulative total return represents the change in value of an investment over the periods indicated.
3. Average annual total return represents the average annual change in value of an investment over the periods indicated. Return for less than one year, if any, has not been annualized.
4. Figures are as stated in the Fund’s current prospectus and may differ from the expense ratios disclosed in the Your Fund’s Expenses and Financial Highlights sections in this report. In periods of market volatility, assets may decline significantly, causing total annual Fund operating expenses to become higher than the figures shown.
| | | | |
| | | |
| 8 | | Semiannual Report | | ftinstitutional.com |
EMERGING MARKETS SERIES
Your Fund’s Expenses
As a Fund shareholder, you can incur two types of costs: (1) transaction costs, including sales charges (loads) on Fund purchases and redemptions, if applicable; and (2) ongoing Fund costs, including management fees, distribution and service (12b-1) fees, if applicable, and other Fund expenses. All mutual funds have ongoing costs, sometimes referred to as operating expenses. The table below shows ongoing costs of investing in the Fund and can help you understand these costs and compare them with those of other mutual funds. The table assumes a $1,000 investment held for the six months indicated.
Actual Fund Expenses
The table below provides information about actual account values and actual expenses in the columns under the heading “Actual.” In these columns the Fund’s actual return, which includes the effect of Fund expenses, is used to calculate the “Ending Account Value.” You can estimate the expenses you paid during the period by following these steps (of course, your account value and expenses will differ from those in this illustration): Divide your account value by $1,000 (if your account had an $8,600 value, then $8,600 ÷ $1,000 = 8.6). Then multiply the result by the number in the row for your class of shares under the headings “Actual” and “Expenses Paid During Period” (if Actual Expenses Paid During Period were $7.50, then 8.6 x $7.50 = $64.50). In this illustration, the actual expenses paid this period are $64.50.
Hypothetical Example for Comparison with Other Funds
Under the heading “Hypothetical” in the table, information is provided about hypothetical account values and hypothetical expenses based on the Fund’s actual expense ratio and an assumed rate of return of 5% per year before expenses, which is not the Fund’s actual return. This information may not be used to estimate the actual ending account balance or expenses you paid for the period, but it can help you compare ongoing costs of investing in the Fund with those of other funds. To do so, compare this 5% hypothetical example for the class of shares you hold with the 5% hypothetical examples that appear in the shareholder reports of other funds.
Please note that expenses shown in the table are meant to highlight ongoing costs and do not reflect any transactional costs. Therefore, information under the heading “Hypothetical” is useful in comparing ongoing costs only, and will not help you compare total costs of owning different funds. In addition, if transactional costs were included, your total costs would have been higher.
| | | | | | | | | | | | | | | | |
| | | | | Actual (actual return after expenses) | | | | Hypothetical (5% annual return before expenses) | | | | |
Beginning
Account
Value 1/1/17 | | | | Ending
Account
Value 6/30/17 | | Expenses
Paid During
Period
1/1/17–6/30/171,2 | | | | Ending
Account
Value 6/30/17 | | Expenses
Paid During
Period
1/1/17–6/30/171,2 | | | | Net
Annualized
Expense
Ratio2 |
| $1,000 | | | | $1,226.60 | | $7.40 | | | | $1,018.15 | | $6.71 | | | | 1.34% |
1. Expenses are equal to the annualized expense ratio for the six-month period as indicated above—in the far right column—multiplied by the simple average account value over the period indicated, and then multiplied by 181/365 to reflect the one-half year period.
2. Reflects expenses after fee waivers and expense reimbursements.
| | | | | | |
| | | |
| ftinstitutional.com | | Semiannual Report | | | 9 | |
Foreign Smaller Companies Series
We are pleased to bring you Foreign Smaller Companies Series’ (Fund’s) semiannual report for the period ended June 30, 2017. Effective at the market close on December 10, 2013, the Fund closed to new investors. Existing shareholders may add to their accounts. We believe this closure will help us manage the inflow of assets and allow us to effectively manage our current level of assets.
Your Fund’s Goal and Main Investments
The Fund seeks long-term capital growth. Under normal market conditions, the Fund invests at least 80% of its net assets in investments of smaller companies located outside the U.S., including emerging markets.
Performance Overview
The Fund delivered a +20.12% cumulative total return for the six months under review. In comparison, the MSCI All Country World Index ex USA Small Cap Index, which measures performance of global developed and emerging market small-cap equities, excluding the U.S., posted a +15.83% total return.1 Please note, index performance information is provided for reference and we do not attempt to track the index but rather undertake investments on the basis of fundamental research. You can find the Fund’s long-term performance data in the Performance Summary beginning on page 13.
Performance data represent past performance, which does not guarantee future results. Investment return and principal value will fluctuate, and you may have a gain or loss when you sell your shares. Current performance may differ from figures shown. For most recent month-end performance, go to ftinstitutional.com or call a Franklin Templeton Institutional Services representative at (800) 321-8563.
Investment Strategy
When choosing equity investments, we apply a bottom-up, value-oriented, long-term approach, focusing on the market price of a company’s securities relative to our evaluation of the company’s long-term earnings, asset value and cash flow potential. We also consider a company’s price/earnings ratio, profit margins and liquidation value.
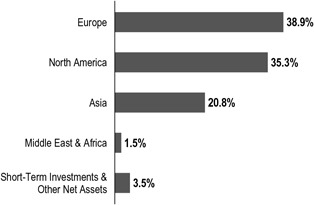
Geographic Composition
Based on Total Net Assets as of 6/30/17
Manager’s Discussion
Several holdings performed well during the six months under review. Italy-based Interpump Group manufactures piston pumps and hydraulic products. Historically, about two-thirds of earnings growth has been driven by mergers and acquisitions (M&A) done at what we considered attractive valuation multiples and with related synergies. After doubling its revenues over the last five years, we feel Interpump’s M&A engine has remained well in place, with several options under scrutiny. Exposure to end markets such as trucks, agriculture and construction equipment and earth-moving machines, particularly in the U.S. (a geographical market that accounts for a significant portion of the group’s revenues), also helped drive growth.
Italy-based Technogym is the world’s second-largest gym equipment manufacturer. The company has a solid global market share, and recent efforts to expand revenue in the U.S. looked promising to us. Technogym’s shares were supported by the company’s advanced technology and recently announced partnership with IBM Watson (not a Fund holding).
India-based Dewan Housing Finance benefited from its low valuation, a positive shift in investor sentiment and growth opportunities in the mortgage finance industry. Despite the recent share price appreciation, Dewan has continued to trade at a sizable discount to many of its peers. This is partially due to Dewan’s relatively low return on equity, a measure of profitability that is mainly a function of the company’s
1. Source: Morningstar.
The index is unmanaged and includes reinvestment of any income or distributions. It does not reflect any fees, expenses or sales charges. One cannot invest directly in an index, and an index is not representative of the Fund’s portfolio.
See www.franklintempletondatasources.com for additional data provider information.
The dollar value, number of shares or principal amount, and names of all portfolio holdings are listed in the Fund’s Statement of Investments (SOI). The SOI begins on page 38.
| | | | |
| | | |
| 10 | | Semiannual Report | | ftinstitutional.com |
FOREIGN SMALLER COMPANIES SERIES
extensive branch network relative to other firms. Over time, we believe Dewan could see the benefits of its branch network, including higher asset density and better operating leverage.
| | | | |
| Portfolio Composition | | | |
| 6/30/17 | | | |
| Sector/Industry | | % of Total
Net Assets | |
Machinery | | | 11.5% | |
Leisure Products | | | 7.4% | |
Capital Markets | | | 6.3% | |
Electronic Equipment, Instruments & Components | | | 6.1% | |
Textiles, Apparel & Luxury Goods | | | 6.0% | |
Banks | | | 4.0% | |
Household Durables | | | 3.7% | |
Real Estate Management & Development | | | 3.4% | |
Specialty Retail | | | 3.0% | |
Pharmaceuticals | | | 2.7% | |
Construction & Engineering | | | 2.6% | |
Thrifts & Mortgage Finance | | | 2.6% | |
Professional Services | | | 2.5% | |
Personal Products | | | 2.4% | |
Food Products | | | 2.4% | |
Containers & Packaging | | | 2.4% | |
Life Sciences Tools & Services | | | 2.2% | |
Auto Components | | | 2.1% | |
Other | | | 22.4% | |
Short-Term Investments & Other Net Assets | | | 4.3% | |
In contrast, the Fund had some underperformers during the six months under review. Mullen Group is a Canadian oil services company that owns a network of independently operated businesses. Weakness in energy markets impacted its share price during the period. However, Mullen has a diversified business mix and a strong track record for generating attractive returns on capital. The company’s strategy is to be the dominant player in select niche markets with favorable competitive dynamics, such as better pricing power and higher barriers to entry. Mullen typically navigates through business cycles strategically, which includes maintaining a balance sheet that allows for making opportunistic acquisitions. We believe the company is in good shape to capitalize on a recovery in energy markets.
Shares of Badger Daylighting, North America’s largest operator of specialized hydro-excavation trucks for the utility and petroleum sectors, fell after the Canada-based company announced disappointing quarterly results. In our longer-term perspective, we believe Badger’s key technology, the Badger Hydrovac excavator used primarily for digging trenches in
| | | | |
| Top 10 Holdings | | | |
6/30/17 | | | |
Company Sector/Industry, Country | | % of Total
Net Assets | |
Tsumura & Co.
Pharmaceuticals, Japan | | | 2.0% | |
Dewan Housing Finance Corp. Ltd.
Thrifts & Mortgage Finance, India | | | 1.9% | |
Kobayashi Pharmaceutical Co. Ltd.
Personal Products, Japan | | | 1.9% | |
Bucher Industries AG
Machinery, Switzerland | | | 1.9% | |
Techtronic Industries Co. Ltd.
Household Durables, Hong Kong | | | 1.9% | |
Interpump Group SpA
Machinery, Italy | | | 1.8% | |
The Thule Group AB
Leisure Products, Sweden | | | 1.8% | |
Rational AG
Machinery, Germany | | | 1.7% | |
Huhtamaki OYJ
Containers & Packaging, Finland | | | 1.7% | |
Gerresheimer AG
Life Sciences Tools & Services, Germany | | | 1.6% | |
congested grounds, will continue to provide the company with a competitive edge.
Despite its shares’ short-term underperformance, we have still seen substantial further potential for Japan-based sportswear exporter Asics to expand its sales channels and take full advantage of its untapped brand value. The global popularity of fitness and running and a growing recognition of Asics products’ high performance should, in our view, also remain a growth driver for the company.
It is important to recognize the effect of currency movements on the Fund’s performance. In general, if the value of the U.S. dollar goes up compared with a foreign currency, an investment traded in that foreign currency will go down in value because it will be worth fewer U.S. dollars. This can have a negative effect on Fund performance. Conversely, when the U.S. dollar weakens in relation to a foreign currency, an investment traded in that foreign currency will increase in value, which can contribute to Fund performance. For the six months ended June 30, 2017, the U.S. dollar declined in value relative to most currencies. As a result, the Fund’s performance was positively affected by the portfolio’s investment predominantly in securities with non-U.S. currency exposure. However, one cannot expect the same result in future periods.
| | | | | | |
| | | |
| ftinstitutional.com | | Semiannual Report | | | 11 | |
FOREIGN SMALLER COMPANIES SERIES
Thank you for your continued participation in Foreign Smaller Companies Series. We look forward to serving your future investment needs.
| | |
 | | 
Harlan B. Hodes, CPA Portfolio Manager |
The foregoing information reflects our analysis, opinions and portfolio holdings as of June 30, 2017, the end of the reporting period. The way we implement our main investment strategies and the resulting portfolio holdings may change depending on factors such as market and economic conditions. These opinions may not be relied upon as investment advice or an offer for a particular security. The information is not a complete analysis of every aspect of any market, country, industry, security or the Fund. Statements of fact are from sources considered reliable, but the investment manager makes no representation or warranty as to their completeness or accuracy. Although historical performance is no guarantee of future results, these insights may help you understand our investment management philosophy.
| | | | |
| | | |
| 12 | | Semiannual Report | | ftinstitutional.com |
FOREIGN SMALLER COMPANIES SERIES
Performance Summary as of June 30, 2017
The performance table does not reflect any taxes that a shareholder would pay on Fund dividends, capital gain distributions, if any, or any realized gains on the sale of Fund shares. Total return reflects reinvestment of the Fund’s dividends and capital gain distributions, if any, and any unrealized gains or losses. Your dividend income will vary depending on dividends or interest paid by securities in the Fund’s portfolio, adjusted for operating expenses. Capital gain distributions are net profits realized from the sale of portfolio securities.
Performance as of 6/30/171
| | | | | | | | |
| | | Cumulative
Total Return2 | | | Average Annual
Total Return3 | |
| | |
6-Month | | | +20.12% | | | | +20.12% | |
| | |
1-Year | | | +25.08% | | | | +25.08% | |
| | |
5-Year | | | +62.34% | | | | +10.18% | |
| | |
10-Year | | | +59.91% | | | | +4.81% | |
Performance data represent past performance, which does not guarantee future results. Investment return and principal value will fluctuate, and you may have a gain or loss when you sell your shares. Current performance may differ from figures shown. For most recent month-end performance, go to ftinstitutional.com or call a Franklin Templeton Institutional Services representative at (800) 321-8563.
See page 14 for Performance Summary footnotes.
| | | | | | |
| | | |
| ftinstitutional.com | | Semiannual Report | | | 13 | |
FOREIGN SMALLER COMPANIES SERIES
PERFORMANCE SUMMARY
Total Annual Operating Expenses4
| | | | |
| | | With Waiver | | Without Waiver |
| | | 0.98% | | 0.99% |
All investments involve risks, including possible loss of principal. The Fund invests in foreign securities, which can involve exposure to currency volatility and political, economic and regulatory uncertainty. Emerging markets involve heightened risks related to the same factors, in addition to those associated with their relatively small size and lesser liquidity. The Fund’s investments in smaller company stocks carry special risks as such stocks have historically exhibited greater price volatility than large company stocks, particularly over the short term. Additionally, smaller companies often have relatively small revenues, limited product lines and small market share. The Fund is actively managed but there is no guarantee that the manager’s investment decisions will produce the desired results. The Fund’s prospectus also includes a description of the main investment risks.
1. The Fund has a fee waiver associated with any investment it makes in a Franklin Templeton money fund and/or other Franklin Templeton fund, contractually guaranteed through 4/30/18. Fund investment results reflect the fee waiver; without this waiver, the results would have been lower.
2. Cumulative total return represents the change in value of an investment over the periods indicated.
3. Average annual total return represents the average annual change in value of an investment over the periods indicated. Return for less than one year, if any, has not been annualized.
4. Figures are as stated in the Fund’s current prospectus and may differ from the expense ratios disclosed in the Your Fund’s Expenses and Financial Highlights sections in this report. In periods of market volatility, assets may decline significantly, causing total annual Fund operating expenses to become higher than the figures shown.
| | | | |
| | | |
| 14 | | Semiannual Report | | ftinstitutional.com |
FOREIGN SMALLER COMPANIES SERIES
Your Fund’s Expenses
As a Fund shareholder, you can incur two types of costs: (1) transaction costs, including sales charges (loads) on Fund purchases and redemptions, if applicable; and (2) ongoing Fund costs, including management fees, distribution and service (12b-1) fees, if applicable, and other Fund expenses. All mutual funds have ongoing costs, sometimes referred to as operating expenses. The table below shows ongoing costs of investing in the Fund and can help you understand these costs and compare them with those of other mutual funds. The table assumes a $1,000 investment held for the six months indicated.
Actual Fund Expenses
The table below provides information about actual account values and actual expenses in the columns under the heading “Actual.” In these columns the Fund’s actual return, which includes the effect of Fund expenses, is used to calculate the “Ending Account Value.” You can estimate the expenses you paid during the period by following these steps (of course, your account value and expenses will differ from those in this illustration): Divide your account value by $1,000 (if your account had an $8,600 value, then $8,600 ÷ $1,000 = 8.6). Then multiply the result by the number in the row for your class of shares under the headings “Actual” and “Expenses Paid During Period” (if Actual Expenses Paid During Period were $7.50, then 8.6 x $7.50 = $64.50). In this illustration, the actual expenses paid this period are $64.50.
Hypothetical Example for Comparison with Other Funds
Under the heading “Hypothetical” in the table, information is provided about hypothetical account values and hypothetical expenses based on the Fund’s actual expense ratio and an assumed rate of return of 5% per year before expenses, which is not the Fund’s actual return. This information may not be used to estimate the actual ending account balance or expenses you paid for the period, but it can help you compare ongoing costs of investing in the Fund with those of other funds. To do so, compare this 5% hypothetical example for the class of shares you hold with the 5% hypothetical examples that appear in the shareholder reports of other funds.
Please note that expenses shown in the table are meant to highlight ongoing costs and do not reflect any transactional costs. Therefore, information under the heading “Hypothetical” is useful in comparing ongoing costs only, and will not help you compare total costs of owning different funds. In addition, if transactional costs were included, your total costs would have been higher.
| | | | | | | | | | | | | | | | |
| | | | | Actual (actual return after expenses) | | | | Hypothetical (5% annual return before
expenses) | | | | |
Beginning
Account
Value 1/1/17 | | | | Ending
Account
Value 6/30/17 | | Expenses
Paid During
Period
1/1/17–6/30/171,2 | | | | Ending
Account
Value 6/30/17 | | Expenses
Paid During
Period
1/1/17–6/30/171,2 | | | | Net
Annualized
Expense
Ratio2 |
| $1,000 | | | | $1,201.20 | | $5.29 | | | | $1,019.98 | | $4.86 | | | | 0.97% |
1. Expenses are equal to the annualized expense ratio for the six-month period as indicated above—in the far right column—multiplied by the simple average account value over the period indicated, and then multiplied by 181/365 to reflect the one-half year period.
2. Reflects expenses after fee waivers and expense reimbursements.
| | | | | | |
| | | |
| ftinstitutional.com | | Semiannual Report | | | 15 | |
Global Equity Series
This semiannual report for Global Equity Series (Fund) covers the period ended June 30, 2017.
Your Fund’s Goal and Main Investments
The Fund seeks long-term capital growth. Under normal market conditions, the Fund invests at least 80% of its net assets in equity securities of companies located anywhere in the world, including developing markets.
Performance Overview
The Fund delivered a +11.40% cumulative total return for the six months under review. For comparison, the Fund’s benchmark, the MSCI All Country World Index (ACWI), which measures stock market performance in global developed and emerging markets, generated a +11.82% total return.1 Please note, index performance information is provided for reference and we do not attempt to track an index but rather undertake investments on the basis of fundamental research. You can find the Fund’s long-term performance data in the Performance Summary beginning on page 21.
Performance data represent past performance, which does not guarantee future results. Investment return and principal value will fluctuate, and you may have a gain or loss when you sell your shares. Current performance may differ from figures shown. For most recent month-end performance, go to ftinstitutional.com or call a Franklin Templeton Institutional Services representative at (800) 321-8563.
Investment Strategy
We employ a bottom-up, value-oriented, long-term investment strategy. Our in-depth fundamental research evaluates a company’s potential to grow earnings, asset value and/or cash flow. We also consider a company’s price/earnings ratio, profit margins and liquidation value.
Manager’s Discussion
The Fund delivered double-digit absolute gains, but slightly trailed its benchmark, the MSCI ACWI, during the reporting period. In general, stock selection buoyed Fund performance, but was largely offset by unfavorable sector allocations during the period. Although stocks sustained upward momentum through the bulk of the period, market leadership transitioned
Geographic Composition
Based on Total Net Assets as of 6/30/17
from cyclical, value-oriented stocks back to defensive, growth-oriented issues as the period progressed. The market’s increasingly defensive posture was consistent with mixed global economic and political newsflow. Growth slowed in the world’s two largest economies (the U.S. and China), major central banks incrementally tightened policy and political tensions in key markets such as the U.S., Japan and the U.K remained elevated. Yet, investors focused more on positive factors: continued corporate earnings strength, still abundant liquidity and a favorable election outcome in France, which creates a window of opportunity for structural change and further European reform and integration. We, too, have been encouraged by positive political and economic developments in Europe, which rewarded our long-standing overweighted allocation to the region.
At the sector level, energy holdings were largely responsible for the modest relative underperformance.2 Although the Fund actually benefited from stock selection in the sector, our significant overweighting proved challenging during a period when oil fell briefly into bear market territory amid the worst start to a year since 1997. Yet, we believe consensus pessimism in oil markets is misplaced, and we believe concerns about rising North American supply are overblown as global stockpiles paint a tighter overall inventory picture. There are even nascent signs of improvement in the U.S., where the last week of June had one of the largest inventory drawdowns on record. As inventories slowly turn, we could begin to see production come under pressure if persistently low prices
1. Source: Morningstar.
The index is unmanaged and includes reinvestment of any income or distributions. It does not reflect any fees, expenses or sales charges. One cannot invest directly in an index, and an index is not representative of the Fund’s portfolio.
2. The energy sector comprises energy equipment and services and oil, gas and consumable fuels in the SOI.
The dollar value, number of shares or principal amount, and names of all portfolio holdings are listed in the Fund’s Statement of Investments (SOI). The SOI begins on page 44.
| | | | |
| | | |
| 16 | | Semiannual Report | | ftinstitutional.com |
GLOBAL EQUITY SERIES
discourage investment in future production. Financial speculation has further pressured oil, with net positioning in futures markets revealing one of the highest levels of short trades on record, a potential contrarian indicator. Finally, geopolitical relations among the world’s largest oil producers are mostly stable, compliance to the production cuts by the Organization of the Petroleum Exporting Countries is high, and firmer oil price benefits Saudi Arabia as it prepares to conduct an initial public offering of Saudi Arabian Oil Co. (commonly known as Aramco), one of the world’s largest companies. Despite such encouraging underpinnings for an eventual oil price recovery, energy stocks continue to trade near 90-year lows based on relative price-to-book value, offering a number of what we consider to be compelling bargains for long-term value investors.
At the stock level, our positions in U.K.-based oilfield services firm Petrofac3 and U.S. exploration and production company Apache were among the Fund’s biggest individual laggards. Petrofac’s shares declined sharply after the U.K.’s Serious Fraud Office (SFO) launched an investigation into bribery allegations related to the firm’s past relationship with controversial Monaco-based consultancy Unaoil. Although we had been constructive on the stock given the company’s healthy pipeline of outstanding bids, strategic refocus on core assets and prudent balance sheet deleveraging, the escalating fraud investigation seems to us a thesis changer. Over the past three years, nearly all of the SFO’s investigations have led to charges being filed. Of particular concern, the executives currently running Petrofac also ran the company when the alleged improprieties occurred. Any legal action against these individuals could materially impact Petrofac’s ability to win new business, without which we believe the company’s financial situation is tenuous. A change in circumstances requires a reassessment of the new reality, and we decided to liquidate our stake in Petrofac given the rising risk profile. Meanwhile, Apache’s shares lagged after the firm reported an unexpected loss and disappointing 2017 production guidance. We continue to like Apache’s longer term prospects, given the strong cash-flow generating capabilities of its low-cost international assets (in Egypt and the North Sea) and an attractive growth pipeline in U.S. shale, including a potential major new discovery in the Permian Basin. We initially invested in Apache on the premise that its attractive growth pipeline was deeply undervalued by a short-term-oriented
| | | | |
| Portfolio Composition | |
| 6/30/17 | | | |
| Sector/Industry | | % of Total
Net Assets | |
Banks | | | 11.8% | |
Oil, Gas & Consumable Fuels | | | 10.5% | |
Pharmaceuticals | | | 9.9% | |
Technology Hardware, Storage & Peripherals | | | 5.3% | |
Insurance | | | 4.5% | |
Software | | | 4.2% | |
Media | | | 4.0% | |
Biotechnology | | | 3.6% | |
Wireless Telecommunication Services | | | 3.2% | |
Chemicals | | | 2.9% | |
Metals & Mining | | | 2.8% | |
Internet Software & Services | | | 2.8% | |
Aerospace & Defense | | | 2.7% | |
Diversified Telecommunication Services | | | 2.6% | |
Other | | | 25.7% | |
Short-Term Investments & Other Net Assets | | | 3.5% | |
market; the market now ascribes a higher value to these assets, and while the stock is no longer an outright bargain in our view, it remains a core holding with potential for future appreciation as value materializes.
An underweighted position in consumer staples also notably detracted during a period when the defensive sector came back into favor.4 We continue to believe that the historic valuation premium commanded by consumer staples stocks is likely to limit long-term investment returns in a commoditized sector subject to extreme pricing pressure and deteriorating earnings trends. For exposure to quality stocks with defensive characteristics, we continue to prefer health care to consumer staples given, among other things, the near-record valuation gap between the two sectors.
Even-weighted information technology (IT) holdings also detracted, pressured by Japanese electronics firm Konica Minolta.5 Its shares declined after the firm reported disappointing quarterly results and projected declining earnings for its current fiscal year amid higher restructuring costs and expenditures. Although many market participants remain skeptical about the firm’s near-term product transitions and strategic initiatives, we believe the stock is attractive on a longer term horizon. We believe many investors continue to
3. No longer held by period-end.
4. The consumer staples sector comprises beverages, food and staples retailing, and personal products in the SOI.
5. The IT sector comprises communications equipment; electronic equipment, instruments and components; Internet software and services; IT services; semiconductors and semiconductor equipment; software; and technology hardware, storage and peripherals in the SOI.
| | | | | | |
| | | |
| ftinstitutional.com | | Semiannual Report | | | 17 | |
GLOBAL EQUITY SERIES
underappreciate the company’s success in gradually lowering dependency on its still-profitable office equipment business, while it is increasing focus on more attractive growth segments such as commercial printing, medical and various industrials businesses. The company’s ability to consistently return its high free cash flow to shareholders also remains undervalued, in our analysis. We continue to find selective value opportunities within the IT sector more broadly, and note that three of the Fund’s absolute contributors during the period were from the sector: South Korean semiconductor and consumer electronics manufacturer Samsung Electronics, U.S. enterprise software firm Oracle, and consumer technology giant Apple. Samsung was a significant relative contributor, benefiting from a more stable South Korean political environment, the cancelation of billions of U.S. dollars’ worth of its Treasury shares and a raft of earnings upgrades from Wall Street analysts. Although sentiment on the stock is beginning to improve as results highlight operational progress, our analysis indicates to us that the market continues to undervalue the sustainability of Samsung’s dominant, low-cost position in core markets due to excessive focus on problem areas of lesser business impact. Trading at what we considered low valuation multiples and with the company holding a large net cash position, Samsung’s improving business mix shift and increasing focus on shareholder returns remain significantly undervalued, in our analysis.
Turning to contributors, stock selection and an overweighted allocation in telecommunication services led the sector to deliver the best relative sector returns during the review period.6 Japanese mobile operator and technology conglomerate SoftBank Group led sector outperformance. Its shares rose to the highest levels in nearly two decades after the firm’s majority-owned U.S. telecommunications subsidiary, Sprint,7 reported better-than-expected sales and subscriber growth. The higher share price also reflected rising optimism that SoftBank might be able to execute a long-desired merger between Sprint and another U.S. major mobile operator, T-Mobile U.S.,7 under a new Republican administration. SoftBank Chairman Masayoshi Son recently met with President Donald Trump and pledged to invest US$50 billion and create 50,000 jobs in the U.S., an indication that SoftBank is working to curry favor with the new administration to facilitate a deal that, if executed, we believe could represent a potential share price catalyst. Elsewhere at SoftBank, the core Japanese telecommunications business is providing strong, stable free
| | | | |
| Top 10 Holdings | | | |
| 6/30/17 | | | |
Company Sector/Industry, Country | | % of Total
Net Assets | |
Samsung Electronics Co. Ltd. Technology Hardware, Storage & Peripherals, South Korea | | | 2.5% | |
Oracle Corp. Software, U.S. | | | 2.2% | |
BP PLC Oil, Gas & Consumable Fuels, U.K. | | | 2.1% | |
Microsoft Corp. Software, U.S. | | | 2.0% | |
Apple Inc. Technology Hardware, Storage & Peripherals, U.S. | | | 1.9% | |
Alphabet Inc. Internet Software & Services, U.S. | | | 1.9% | |
Citigroup Inc. Banks, U.S. | | | 1.8% | |
Comcast Corp. Media, U.S. | | | 1.7% | |
HSBC Holdings PLC Banks, U.K. | | | 1.7% | |
JPMorgan Chase & Co. Banks, U.S. | | | 1.6% | |
cash flow; Chinese technology subsidiary Alibaba Group Holding7 continues to realize outsized growth; and the newly acquired U.K. semiconductor manufacturer ARM Holdings,7 while expensive and value-destructive in the near-term, in our view, offers another exciting long-term growth driver. SoftBank’s stock remains excessively cheap on a sum-of-the-parts basis, in our analysis.
We were also encouraged by the outperformance of the Fund’s overweighted financials holdings, led by a mix of European and Asian banks.8 Conditions continue to generally improve in the European banking sector, where earnings revisions have returned to a positive trajectory, regulatory capital has been largely rebuilt and the bulk of post-crisis re-regulation efforts are now complete. As economic data have picked up and certain risky political events have been favorably resolved, demand for credit has increased. Indeed, private loan growth is steadily rising in Europe, with favorable implications for bank earnings. Yet, little of this good news has made it into the price of European bank shares, which continue to look undervalued to us based on price-to-earnings, price-to-book value and dividend yields, relative to both their own history and to their
6. The telecommunication services sector comprises diversified telecommunication services and wireless telecommunication services in the SOI.
7. Not a Fund holding.
8. The financials sector comprises banks, capital markets, consumer finance, diversified financial services, insurance, and thrifts and mortgage finance in the SOI.
| | | | |
| | | |
| 18 | | Semiannual Report | | ftinstitutional.com |
GLOBAL EQUITY SERIES
U.S. peers. In Asia, the lowly valued South Korean market has offered some of the best financials sector opportunities, in our analysis. Shares of South Korean lender Hana Financial Group finished among the Fund’s top contributors during the period, rallying amid signs that a new government in South Korea could deliver fiscal stimulus, reform the rigid corporate chaebol structure (large, mostly family-owned conglomerates) and normalize economic ties with China. Prospects for improving corporate governance and political stability have combined with rising interest rates and genuine economic growth to benefit the banking sector in emerging Asia more generally.
Stock selection also drove outperformance in the underweighted industrials sectors, led by German airline Deutsche Lufthansa.9 Its shares rose to a three-year high after the company reported solid first-quarter 2017 earnings attributable to successes at its maintenance and logistics businesses. Following a difficult several years, Lufthansa has more recently begun to report encouraging progress on a number of fronts. Pricing is improving, fuel costs remain low, the pension deficit has fallen significantly from its 2016 highs and a recent favorable accord with the pilots’ union reduces the risk of further industrial actions. Wall Street analysts, who were almost uniformly negative on Lufthansa in recent years, have issued a number of upgrades recently and the stock has appreciated and improved on a number of key valuation metrics.
Encouragingly, the Fund’s overweighted health care holdings outperformed during the period.10 Pharmaceuticals stocks have steadily rebounded in the first half of 2017 after a difficult 2016 marked by election cycle political rhetoric. We argued that the political threat to drugmakers was overdone and added to our holdings during 2016’s weakness. Recent signs from Washington suggest to us that health care reform initiatives may indeed be less punitive to pharmaceuticals earnings than initially feared. Within the sector, we continue to favor innovative companies we feel have portfolios of high-margin, long-duration products and think are facing little competition or have demonstrable advantages over existing therapies.
From a regional standpoint, all major geographic regions benefited from favorable allocations (underweighting in North America and overweightings in Europe and Asia), although stock-specific weakness in Europe offset stock-level performance. Nevertheless, we were encouraged by positive
developments in Europe during the period and continue to find what we consider attractive bottom-up bargains in the region. Although economic indicators in the U.S. are softening and the political environment remains hostile, Europe is experiencing an encouraging combination of genuine economic momentum and a political climate now conducive to structural reform. To the first point, unemployment in Europe recently hit an eight-year low, gross domestic product growth has outpaced the U.S. in 2016 for the first time since the global financial crisis, and corporate profits are solidly accelerating. Encouragingly, European equity markets attracted record weekly investment inflows during 2017’s second quarter. On the political front, Emmanuel Macron’s victory in the French presidential election (and subsequent success in parliamentary votes) creates a historic opportunity for genuine reform and closer European integration.
It is important to recognize the effect of currency movements on the Fund’s performance. In general, if the value of the U.S. dollar goes up compared with a foreign currency, an investment traded in that foreign currency will go down in value because it will be worth fewer U.S. dollars. This can have a negative effect on Fund performance. Conversely, when the U.S. dollar weakens in relation to a foreign currency, an investment traded in that foreign currency will increase in value, which can contribute to Fund performance. For the six months ended June 30, 2017, the U.S. dollar declined in value relative to most currencies. As a result, the Fund’s performance was positively affected by the portfolio’s substantial investment in securities with non-U.S. currency exposure. However, one cannot expect the same result in future periods.
More broadly, we continue to stress the value of fundamental investing, active stock picking and disciplined risk management in the current environment. Overall, we assess that equities offer selectively attractive opportunities, and should continue to generate investor interest in a lower-yield, lower-return environment in which asset owners are under pressure to meet challenging return targets. However, in our opinion, this is not the point in the cycle to buy equities indiscriminately. We believe monetary policy has never been so loose and experimental, artificially depressing the price of money and skewing the risk-free rate (and therefore the assets that are priced off of it). Global debt levels have never been so high, generating a flood of liquidity that has saturated many financial
9. The industrials sector comprises aerospace and defense, airlines, building products, industrial conglomerates and machinery in the SOI.
10. The health care sector comprises biotechnology, health care equipment and supplies, health care providers and services, life sciences tools and services, and pharmaceuticals in the SOI.
See www.franklintempletondatasources.com for additional data provider information.
| | | | | | |
| | | |
| ftinstitutional.com | | Semiannual Report | | | 19 | |
GLOBAL EQUITY SERIES
assets. Political tensions remain elevated, and policymakers may struggle to turn pro-growth campaign promises into actual legislation. Meanwhile, we believe stocks have become commoditized into “factor buckets,” and are thought of today not as ownership stakes in long-term, cash-generating businesses, but instead as high-or-low-beta, high-or-low-quality, defensive-or-aggressive, risk-on-or-off, etc. These are all unusual conditions that create additional challenges for fundamentally oriented security analysts. Yet, it is our belief that all of these trends are temporary, as price eventually converges with value over time and a healthy market needs investors with the ability to facilitate price discovery. After a long, fallow period for active value investors, we were encouraged by 2016’s value rally and, despite the more recent pull-back, we anticipate a supportive environment for value investing over our long-term horizon.
Thank you for your continued participation in Global Equity Series. We look forward to serving your future investment needs.
| | | | |
| | Peter A. Nori, CFA |
| | Antonio T. Docal, CFA |
| | Cindy L. Sweeting, CFA |
| |
| | Portfolio Management Team |
The foregoing information reflects our analysis, opinions and portfolio holdings as of June 30, 2017, the end of the reporting period. The way we implement our main investment strategies and the resulting portfolio holdings may change depending on factors such as market and economic conditions. These opinions may not be relied upon as investment advice or an offer for a particular security. The information is not a complete analysis of every aspect of any market, country, industry, security or the Fund. Statements of fact are from sources considered reliable, but the investment manager makes no representation or warranty as to their completeness or accuracy. Although historical performance is no guarantee of future results, these insights may help you understand our investment management philosophy.
| | | | |
| | | |
| 20 | | Semiannual Report | | ftinstitutional.com |
GLOBAL EQUITY SERIES
Performance Summary as of June 30, 2017
The performance table does not reflect any taxes that a shareholder would pay on Fund dividends, capital gain distributions, if any, or any realized gains on the sale of Fund shares. Total return reflects reinvestment of the Fund’s dividends and capital gain distributions, if any, and any unrealized gains or losses. Your dividend income will vary depending on dividends or interest paid by securities in the Fund’s portfolio, adjusted for operating expenses. Capital gain distributions are net profits realized from the sale of portfolio securities.
Performance as of 6/30/17
| | | | | | | | |
| | | Cumulative
Total Return1 | | | Average Annual
Total Return2 | |
6-Month | | | +11.40% | | | | +11.40% | |
1-Year | | | +25.20% | | | | +25.20% | |
5-Year | | | +68.09% | | | | +10.94% | |
Since Inception (3/31/08) | | | +52.77% | | | | +4.69% | |
Performance data represent past performance, which does not guarantee future results. Investment return and principal value will fluctuate, and you may have a gain or loss when you sell your shares. Current performance may differ from figures shown. For most recent month-end performance, go to ftinstitutional.com or call a Franklin Templeton Institutional Services representative at (800) 321-8563.
See page 22 for Performance Summary footnotes.
| | | | | | |
| | | |
| ftinstitutional.com | | Semiannual Report | | | 21 | |
GLOBAL EQUITY SERIES
PERFORMANCE SUMMARY
Total Annual Operating Expenses3
All investments involve risks, including possible loss of principal. Special risks are associated with foreign investing, including currency fluctuations, economic instability and political developments; investments in emerging markets involve heightened risks related to the same factors. To the extent the Fund focuses on particular countries, regions, industries, sectors or types of investment from time to time, it may be subject to greater risks of adverse developments in such areas of focus than a fund that invests in a wider variety of countries, regions, industries, sectors or investments. The Fund is actively managed but there is no guarantee that the manager’s investment decisions will produce the desired results. The Fund’s prospectus also includes a description of the main investment risks.
1. Cumulative total return represents the change in value of an investment over the periods indicated.
2. Average annual total return represents the average annual change in value of an investment over the periods indicated. Return for less than one year, if any, has not been annualized.
3. Figures are as stated in the Fund’s current prospectus and may differ from the expense ratios disclosed in the Your Fund’s Expenses and Financial Highlights sections in this report. In periods of market volatility, assets may decline significantly, causing total annual Fund operating expenses to become higher than the figures shown.
| | | | |
| | | |
| 22 | | Semiannual Report | | ftinstitutional.com |
GLOBAL EQUITY SERIES
Your Fund’s Expenses
As a Fund shareholder, you can incur two types of costs: (1) transaction costs, including sales charges (loads) on Fund purchases and redemptions, if applicable; and (2) ongoing Fund costs, including management fees, distribution and service (12b-1) fees, if applicable, and other Fund expenses. All mutual funds have ongoing costs, sometimes referred to as operating expenses. The table below shows ongoing costs of investing in the Fund and can help you understand these costs and compare them with those of other mutual funds. The table assumes a $1,000 investment held for the six months indicated.
Actual Fund Expenses
The table below provides information about actual account values and actual expenses in the columns under the heading “Actual.” In these columns the Fund’s actual return, which includes the effect of Fund expenses, is used to calculate the “Ending Account Value.” You can estimate the expenses you paid during the period by following these steps (of course, your account value and expenses will differ from those in this illustration): Divide your account value by $1,000 (if your account had an $8,600 value, then $8,600 ÷ $1,000 = 8.6). Then multiply the result by the number in the row for your class of shares under the headings “Actual” and “Expenses Paid During Period” (if Actual Expenses Paid During Period were $7.50, then 8.6 x $7.50 = $64.50). In this illustration, the actual expenses paid this period are $64.50.
Hypothetical Example for Comparison with Other Funds
Under the heading “Hypothetical” in the table, information is provided about hypothetical account values and hypothetical expenses based on the Fund’s actual expense ratio and an assumed rate of return of 5% per year before expenses, which is not the Fund’s actual return. This information may not be used to estimate the actual ending account balance or expenses you paid for the period, but it can help you compare ongoing costs of investing in the Fund with those of other funds. To do so, compare this 5% hypothetical example for the class of shares you hold with the 5% hypothetical examples that appear in the shareholder reports of other funds.
Please note that expenses shown in the table are meant to highlight ongoing costs and do not reflect any transactional costs. Therefore, information under the heading “Hypothetical” is useful in comparing ongoing costs only, and will not help you compare total costs of owning different funds. In addition, if transactional costs were included, your total costs would have been higher.
| | | | | | | | | | | | | | | | |
| | | | | Actual (actual return after expenses) | | | | Hypothetical (5% annual return before expenses) | | | | |
Beginning
Account
Value 1/1/17 | | | | Ending
Account
Value 6/30/17 | | Expenses
Paid During
Period
1/1/17–6/30/171 | | | | Ending
Account
Value 6/30/17 | | Expenses
Paid During
Period
1/1/17–6/30/171 | | | | Annualized
Expense
Ratio |
| $1,000 | | | | $1,114.00 | | $4.30 | | | | $1,020.73 | | $4.11 | | | | 0.82% |
1. Expenses are equal to the annualized expense ratio for the six-month period as indicated above—in the far right column—multiplied by the simple average account value over the period indicated, and then multiplied by 181/365 to reflect the one-half year period.
| | | | | | |
| | | |
| ftinstitutional.com | | Semiannual Report | | | 23 | |
International Equity Series
This semiannual report for International Equity Series (Fund) covers the period ended June 30, 2017.
Your Fund’s Goal and Main Investments
The Fund seeks long-term capital growth. Under normal market conditions, the Fund invests at least 80% of its net assets in foreign (non-U.S.) equity securities.
Performance Overview
The Fund’s Primary shares delivered a +13.24% cumulative total return for the six months under review. For comparison, the Fund’s benchmark, the MSCI All Country World Index (ACWI) ex USA Index, which measures stock market performance in global developed and emerging markets excluding the U.S., generated a +14.45% total return for the period under review.1 The Fund’s other benchmark, the MSCI Europe, Australasia, Far East Index, which measures stock market performance in global developed markets excluding the U.S. and Canada, posted a +14.23% total return.1 Please note, index performance information is provided for reference and we do not attempt to track an index but rather undertake investments on the basis of fundamental research. You can find the Fund’s long-term performance data in the Performance Summary beginning on page 29.
Performance data represent past performance, which does not guarantee future results. Investment return and principal value will fluctuate, and you may have a gain or loss when you sell your shares. Current performance may differ from figures shown. For most recent month-end performance, go to ftinstitutional.com or call a Franklin Templeton Institutional Services representative at (800) 321-8563.
Investment Strategy
We employ a bottom-up, value-oriented, long-term investment strategy. We focus on the market price of a company’s securities relative to our evaluation of the company’s long-term earnings, asset value and cash flow potential. We also consider a company’s price/earnings ratio, profit margins and liquidation value.
Geographic Composition
Based on Total Net Assets as of 6/30/17

Manager’s Discussion
The Fund delivered double-digit absolute gains, but slightly trailed its benchmark, the MSCI ACWI ex USA Index, during the reporting period. In general, stock selection buoyed Fund performance, but was largely offset by unfavorable sector allocations during the period. Although stocks sustained upward momentum through the bulk of the period, market leadership transitioned from cyclical, value-oriented stocks back to defensive, growth-oriented issues as the period progressed. The market’s increasingly defensive posture was consistent with mixed global economic and political newsflow. Growth slowed in the world’s two largest economies (the U.S. and China), major central banks incrementally tightened policy and political tensions in key markets such as the U.S., Japan and the U.K remained elevated. Yet, investors focused more on positive factors: continued corporate earnings strength, still-abundant liquidity and a favorable election outcome in France, which creates a window of opportunity for structural change and further European reform and integration. We, too, have been encouraged by positive political and economic developments in Europe, which rewarded our long-standing overweighted allocation to the region.
At the sector level, energy holdings were largely responsible for the modest relative underperformance.2 Our significant overweighting proved challenging during a period when oil fell
1. Source: Morningstar.
The indexes are unmanaged and include reinvested dividends. They do not reflect any fees, expenses or sales charges. One cannot invest directly in an index, and an index is not representative of the Fund’s portfolio.
2. The energy sector comprises energy equipment and services and oil, gas and consumable fuels in the SOI.
The dollar value, number of shares or principal amount, and names of all portfolio holdings are listed in the Fund’s Statement of Investments (SOI). The SOI begins on page 50.
| | | | |
| | | |
| 24 | | Semiannual Report | | ftinstitutional.com |
INTERNATIONAL EQUITY SERIES
briefly into bear market territory amid the worst start to a year since 1997. Yet, we believe consensus pessimism in oil markets is misplaced, and we believe concerns about rising North American supply are overblown as global stockpiles paint a tighter overall inventory picture. There are even nascent signs of improvement in the U.S., where the last week of June had one of the largest inventory drawdowns on record. As inventories slowly turn, we could begin to see production come under pressure if persistently low prices discourage investment in future production. Financial speculation has further pressured oil, with net positioning in futures markets revealing one of the highest levels of short trades on record, a potential contrarian indicator. Finally, geopolitical relations among the world’s largest oil producers are mostly stable, compliance to the production cuts by the Organization of the Petroleum Exporting Countries is high, and a firmer oil price benefits Saudi Arabia as it prepares to conduct an initial public offering of Saudi Arabian Oil Co. (commonly known as Aramco), one of the world’s largest companies. Despite such encouraging underpinnings for an eventual oil price recovery, energy stocks continue to trade near 90-year lows based on relative price-to-book value, offering a number of what we consider to be compelling bargains for long-term value investors.
At the stock level, a position in U.K.-based oilfield services firm Petrofac was the Fund’s biggest laggard.3 Its shares declined sharply after the U.K.’s Serious Fraud Office (SFO) launched an investigation into bribery allegations related to the firm’s past relationship with controversial Monaco-based consultancy Unaoil. Although we had been constructive on the stock given the company’s healthy pipeline of outstanding bids, strategic refocus on core assets, and prudent balance sheet deleveraging, the escalating fraud investigation seems to us a thesis changer. Over the past three years, nearly all of the SFO’s investigations have led to charges being filed. Of particular concern, the executives currently running Petrofac also ran the company when the alleged improprieties occurred. Any legal action against these individuals could materially impact Petrofac’s ability to win new business, without which we believe the company’s financial situation is tenuous. A change in circumstances requires a reassessment of the new reality, and we decided to liquidate our stake in Petrofac given the rising risk profile.
Nearly even-weighted information technology (IT) holdings detracted, pressured by Japanese electronics firm Konica
| | | | |
| Portfolio Composition | | | |
| 6/30/17 | | | |
| Sector/Industry | | % of Total
Net Assets | |
Banks | | | 13.1% | |
Pharmaceuticals | | | 10.0% | |
Oil, Gas & Consumable Fuels | | | 9.6% | |
Insurance | | | 7.4% | |
Technology Hardware, Storage & Peripherals | | | 5.7% | |
Diversified Telecommunication Services | | | 5.1% | |
Chemicals | | | 3.7% | |
Wireless Telecommunication Services | | | 3.5% | |
Aerospace & Defense | | | 3.1% | |
Auto Components | | | 2.9% | |
Metals & Mining | | | 2.7% | |
Industrial Conglomerates | | | 2.6% | |
Construction Materials | | | 2.2% | |
Other | | | 25.4% | |
Short-Term Investments & Other Net Assets | | | 3.0% | |
Minolta.4 Its shares declined after the firm reported disappointing quarterly results and projected declining earnings for its current fiscal year amid higher restructuring costs and expenditures. Although many market participants remain skeptical about near-term product transitions and strategic initiatives, we believe the stock is attractive on a longer term horizon. We believe many investors continue to underappreciate the company’s success in gradually lowering dependency on its still-profitable office equipment business, while it is increasing focus on more attractive growth segments such as commercial printing, medical and various industrials businesses. The company’s ability to consistently return its high free cash flow to shareholders also remains undervalued, in our analysis. We continue to find selective value opportunities within the IT sector more broadly, and note that the sector also delivered one of the Fund’s top contributors during the period: South Korean semiconductor and consumer electronics manufacturer Samsung Electronics. Its shares benefited from a more stable South Korean political environment, the cancelation of billions of U.S. dollars’ worth of its Treasury shares and a raft of earnings upgrades from Wall Street analysts. Although sentiment on the stock is beginning to improve as results highlight operational progress, our analysis indicates to us that the market continues to undervalue the sustainability of Samsung’s dominant, low-cost position in core markets due to excessive focus on problem areas of lesser
3. No longer held by period-end.
4. The IT sector comprises electronic equipment, instruments and components; Internet software and services; semiconductors and semiconductor equipment; software; and technology hardware, storage and peripherals in the SOI.
| | | | | | |
| | | |
| ftinstitutional.com | | Semiannual Report | | | 25 | |
INTERNATIONAL EQUITY SERIES
business impact. Trading at what we considered low valuation multiples and with the company holding a large net cash position, Samsung’s improving business mix shift and increasing focus on shareholder returns remain significantly undervalued, in our analysis.
An underweighted position and stock selection in consumer staples also notably detracted during a period when the defensive sector came back into favor.5 We continue to believe that the historic valuation premium commanded by consumer staples stocks is likely to limit long-term investment returns in a commoditized sector subject to extreme pricing pressure and deteriorating earnings trends. For exposure to quality stocks with defensive characteristics, we continue to prefer health care to consumer staples given, among other things, the near-record valuation gap between the two sectors.
We were also encouraged by the outperformance of the Fund’s financials holdings.6 Sector outperformance during the period was led by European and Asian lenders, which offered more exposure to tailwinds associated with the French election outcome than the headwinds stemming from doubts about the viability of the global reflation trade. The European banking sector has continued to make promising progress. Earnings revisions have returned to a positive trajectory, regulatory capital has been largely rebuilt and the bulk of post-crisis re-regulation efforts are now complete. As economic data have picked up and certain political risks have been largely favorably resolved, demand for credit has increased. While the Euro Stoxx Banks Index is up notably over the six-month period and the past 12 months, we still believe the improving conditions aren’t fully reflected in European banks shares that continue to trade at what we considered material discounts to both their own history and U.S. peers based on price-to-earnings, price-to-book value and dividend yields. In Asia, prospects for improving corporate governance and political stability have combined with rising interest rates and genuine economic growth to benefit the regional banking sector. South Korea, in particular, is an excellent example of a banking market subject to all of these cyclical and structural tailwinds, but still trading at what we considered low valuation multiples, and select exposure to South Korean banks positively contributed during the period.
| | | | |
| Top 10 Holdings | | | |
6/30/17 | | | |
Company
Sector/Industry, Country | | % of Total
Net Assets | |
Samsung Electronics Co. Ltd.
Technology Hardware, Storage & Peripherals, South Korea | | | 3.3% | |
BP PLC
Oil, Gas & Consumable Fuels, U.K. | | | 2.4% | |
Royal Dutch Shell PLC
Oil, Gas & Consumable Fuels, U.K. | | | 2.1% | |
Roche Holding AG
Pharmaceuticals, Switzerland | | | 2.0% | |
BNP Paribas SA
Banks, France | | | 2.0% | |
ING Groep NV
Banks, Netherlands | | | 1.8% | |
Bayer AG
Pharmaceuticals, Germany | | | 1.7% | |
HSBC Holdings PLC
Banks, U.K. | | | 1.7% | |
Sanofi
Pharmaceuticals, France | | | 1.7% | |
Merck KGaA
Pharmaceuticals, Germany | | | 1.6% | |
Encouragingly, the Fund’s overweighted health care holdings outperformed during the period.7 Pharmaceuticals stocks have steadily rebounded in the first half of 2017 after a difficult 2016 marked by election cycle political rhetoric. We argued that the political threat to drugmakers was overdone and added to our holdings during 2016’s weakness. Recent signs from Washington suggest to us that health care reform initiatives may indeed be less punitive to pharmaceuticals earnings than initially feared. Within the sector, we continue to favor innovative companies we feel have portfolios of high-margin, long-duration products and think are facing little competition or have demonstrable advantages over existing therapies.
The Fund’s telecommunication services holdings also outperformed as stock selection overcame a detractive overweighted allocation.8 Japanese mobile operator and technology conglomerate SoftBank Group notably contributed to sector performance. Its shares rose to the highest levels in nearly two decades after the firm’s majority-owned U.S.
5. The consumer staples sector comprises beverages and food and staples retailing in the SOI.
6. The financials sector comprises banks, capital markets, diversified financial services, insurance, and thrifts and mortgage finance in the SOI.
7. The health care sector comprises health care equipment and supplies, health care providers and services, life sciences tools and services, and pharmaceuticals in the SOI.
8. The telecommunication services sector comprises diversified telecommunication services and wireless telecommunication services in the SOI.
| | | | |
| | | |
| 26 | | Semiannual Report | | ftinstitutional.com |
INTERNATIONAL EQUITY SERIES
telecommunications subsidiary, Sprint,9 reported better-than-expected sales and subscriber growth. The higher share price also reflected rising optimism that SoftBank might be able to execute a long-desired merger between Sprint and another major U.S. mobile operator, T-Mobile U.S.,9 under a new Republican administration. SoftBank Chairman Masayoshi Son recently met with President Donald Trump and pledged to invest US$50 billion and create 50,000 jobs in the U.S., an indication that SoftBank is working to curry favor with the new administration to facilitate a deal that, if executed, we believe could represent a potential share price catalyst. Elsewhere at SoftBank, the core Japanese telecommunications business is providing strong, stable free cash flow; Chinese technology subsidiary Alibaba Group Holding9 continues to realize outsized growth; and the newly acquired U.K. semiconductor manufacturer, ARM Holdings,9 while expensive and value-destructive in the near-term, in our view, offers another exciting long-term growth driver. SoftBank’s stock remains excessively cheap on a sum-of-the-parts basis, in our analysis.
From a regional standpoint, stock selection in Asia overcame a detractive underweighted allocation, while European holdings lagged as stock-specific weakness offset a favorable overweighted allocation to the region. Europe delivered a number of positive political and economic developments during the second quarter, and we continue to find what we consider attractive bottom-up bargains in the region. Europe is experiencing an encouraging combination of genuine economic momentum and a political climate now increasingly conducive to structural reform. Unemployment in Europe recently hit an eight-year low, gross domestic growth has outpaced the U.S. in 2016 for the first time since the global financial crisis, and corporate profits are solidly accelerating. After long being out of favor, European equity markets attracted record weekly investment inflows during the second quarter. On the political front, Emmanuel Macron’s victory in the French presidential election (and subsequent success in parliamentary votes) creates a historic opportunity for genuine structural reform, including labor and fiscal measures, and for working more closely with Germany to enhance European integration.
It is important to recognize the effect of currency movements on the Fund’s performance. In general, if the value of the U.S. dollar goes up compared with a foreign currency, an investment traded in that foreign currency will go down in value because it will be worth fewer U.S. dollars. This can have a negative effect on Fund performance. Conversely, when the U.S. dollar weakens in relation to a foreign currency, an investment traded
in that foreign currency will increase in value, which can contribute to Fund performance. For the six months ended June 30, 2017, the U.S. dollar declined in value relative to most currencies. As a result, the Fund’s performance was positively affected by the portfolio’s investment predominantly in securities with non-U.S. currency exposure. However, one cannot expect the same result in future periods.
More broadly, we continue to stress the value of fundamental investing, active stock picking and disciplined risk management in the current environment. Overall, we assess that equities offer selectively attractive opportunities, and should continue to generate investor interest in a lower-yield, lower-return environment in which asset owners are under pressure to meet challenging return targets. However, in our opinion, this is not the point in the cycle to buy equities indiscriminately. We believe monetary policy has never been so loose and experimental, artificially depressing the price of money and skewing the risk-free rate (and therefore the assets that are priced off of it). Global debt levels have never been so high, generating a flood of liquidity that has saturated many financial assets. Political tensions remain elevated, and policymakers may struggle to turn pro-growth campaign promises into actual legislation. Meanwhile, we believe stocks have become commoditized into “factor buckets,” and are thought of today not as ownership stakes in long-term, cash-generating businesses, but instead as high-or-low-beta, high-or-low-quality, defensive-or-aggressive, risk-on-or-off, etc. These are all unusual conditions that create additional challenges for fundamentally oriented security analysts. Yet, it is our belief that all of these trends are temporary, as price eventually converges with value over time and a healthy market needs investors with the ability to facilitate price discovery. After a long fallow period for active value investors, we were encouraged by 2016’s value rally and, despite the more recent pull-back, we anticipate a supportive environment for value investing over our long-term horizon.
9. Not a Fund holding.
See www.franklintempletondatasources.com for additional data provider information.
| | | | | | |
| | | |
| ftinstitutional.com | | Semiannual Report | | | 27 | |
INTERNATIONAL EQUITY SERIES
Thank you for your continued participation in International Equity Series. We look forward to serving your future investment needs.
| | |
 | | 
Cindy L. Sweeting, CFA Director of Portfolio Management – Templeton Global Equity Group President – Templeton Investment Counsel, LLC Peter A. Nori, CFA Antonio T. Docal, CFA Portfolio Management Team |
The foregoing information reflects our analysis, opinions and portfolio holdings as of June 30, 2017, the end of the reporting period. The way we implement our main investment strategies and the resulting portfolio holdings may change depending on factors such as market and economic conditions. These opinions may not be relied upon as investment advice or an offer for a particular security. The information is not a complete analysis of every aspect of any market, country, industry, security or the Fund. Statements of fact are from sources considered reliable, but the investment manager makes no representation or warranty as to their completeness or accuracy. Although historical performance is no guarantee of future results, these insights may help you understand our investment management philosophy.
| | | | |
| | | |
| 28 | | Semiannual Report | | ftinstitutional.com |
INTERNATIONAL EQUITY SERIES
Performance Summary as of June 30, 2017
The performance table does not reflect any taxes that a shareholder would pay on Fund dividends, capital gain distributions, if any, or any realized gains on the sale of Fund shares. Total return reflects reinvestment of the Fund’s dividends and capital gain distributions, if any, and any unrealized gains or losses. Your dividend income will vary depending on dividends or interest paid by securities in the Fund’s portfolio, adjusted for operating expenses of each class. Capital gain distributions are net profits realized from the sale of portfolio securities.
Performance as of 6/30/17
| | | | | | | | |
| Share Class | | Cumulative Total Return1 | | | Average Annual Total Return2 | |
| | |
| Primary | | | | | | | | |
| | |
6-Month | | | +13.24% | | | | +13.24% | |
| | |
1-Year | | | +22.63% | | | | +22.63% | |
| | |
5-Year | | | +46.26% | | | | +7.90% | |
| | |
10-Year | | | +13.63% | | | | +1.29% | |
| | |
| Service | | | | | | | | |
| | |
6-Month | | | +13.14% | | | | +13.14% | |
| | |
1-Year | | | +22.46% | | | | +22.46% | |
| | |
5-Year | | | +45.17% | | | | +7.74% | |
| | |
10-Year | | | +11.77% | | | | +1.12% | |
Performance data represent past performance, which does not guarantee future results. Investment return and principal value will fluctuate, and you may have a gain or loss when you sell your shares. Current performance may differ from figures shown. For most recent month-end performance, go to ftinstitutional.com or call a Franklin Templeton Institutional Services representative at (800) 321-8563.
See page 30 for Performance Summary footnotes.
| | | | | | |
| | | |
| ftinstitutional.com | | Semiannual Report | | | 29 | |
INTERNATIONAL EQUITY SERIES
PERFORMANCE SUMMARY
Total Annual Operating Expenses3
| | | | |
| Share Class | | | |
Primary | | | 0.78% | |
Service | | | 0.93% | |
Each class of shares is available to certain eligible investors and has different annual fees and expenses, as described in the prospectus.
All investments involve risks, including possible loss of principal. Special risks are associated with foreign investing, including currency fluctuations, economic instability and political developments; investments in emerging markets involve heightened risks related to the same factors. To the extent the Fund focuses on particular countries, regions, industries, sectors or types of investment from time to time, it may be subject to greater risks of adverse developments in such areas of focus than a fund that invests in a wider variety of countries, regions, industries, sectors or investments. The Fund is actively managed but there is no guarantee that the manager’s investment decisions will produce the desired results. The Fund’s prospectus also includes a description of the main investment risks.
1. Cumulative total return represents the change in value of an investment over the periods indicated.
2. Average annual total return represents the average annual change in value of an investment over the periods indicated. Return for less then one year, if any, has not been annualized.
3. Figures are as stated in the Fund’s current prospectus and may differ from the expense ratios disclosed in the Your Fund’s Expenses and Financial Highlights sections in this report. In periods of market volatility, assets may decline significantly, causing total annual Fund operating expenses to become higher than the figures shown.
| | | | |
| | | |
| 30 | | Semiannual Report | | ftinstitutional.com |
INTERNATIONAL EQUITY SERIES
Your Fund’s Expenses
As a Fund shareholder, you can incur two types of costs: (1) transaction costs, including sales charges (loads) on Fund purchases and redemptions, if applicable; and (2) ongoing Fund costs, including management fees, distribution and service (12b-1) fees, if applicable, and other Fund expenses. All mutual funds have ongoing costs, sometimes referred to as operating expenses. The table below shows ongoing costs of investing in the Fund and can help you understand these costs and compare them with those of other mutual funds. The table assumes a $1,000 investment held for the six months indicated.
Actual Fund Expenses
The table below provides information about actual account values and actual expenses in the columns under the heading “Actual.” In these columns the Fund’s actual return, which includes the effect of Fund expenses, is used to calculate the “Ending Account Value” for each class of shares. You can estimate the expenses you paid during the period by following these steps (of course, your account value and expenses will differ from those in this illustration): Divide your account value by $1,000 (if your account had an $8,600 value, then $8,600 ÷ $1,000 = 8.6). Then multiply the result by the number in the row for your class of shares under the headings “Actual” and “Expenses Paid During Period” (if Actual Expenses Paid During Period were $7.50, then 8.6 x $7.50 = $64.50). In this illustration, the actual expenses paid this period are $64.50.
Hypothetical Example for Comparison with Other Funds
Under the heading “Hypothetical” in the table, information is provided about hypothetical account values and hypothetical expenses based on the Fund’s actual expense ratio and an assumed rate of return of 5% per year before expenses, which is not the Fund’s actual return. This information may not be used to estimate the actual ending account balance or expenses you paid for the period, but it can help you compare ongoing costs of investing in the Fund with those of other funds. To do so, compare this 5% hypothetical example for the class of shares you hold with the 5% hypothetical examples that appear in the shareholder reports of other funds.
Please note that expenses shown in the table are meant to highlight ongoing costs and do not reflect any transactional costs. Therefore, information under the heading “Hypothetical” is useful in comparing ongoing costs only, and will not help you compare total costs of owning different funds. In addition, if transactional costs were included, your total costs would have been higher.
| | | | | | | | | | | | | | | | | | |
| | | | | | | Actual (actual return after expenses) | | | | Hypothetical (5% annual return before expenses) | | | | |
Share
Class | | Beginning
Account
Value 1/1/17 | | | | Ending
Account
Value 6/30/17 | | Expenses
Paid During
Period
1/1/17–6/30/171 | | | | Ending
Account
Value 6/30/17 | | Expenses
Paid During
Period
1/1/17–6/30/171 | | | | Annualized
Expense
Ratio |
Primary Shares | | $1,000 | | | | $1,132.40 | | $4.12 | | | | $1,020.93 | | $3.91 | | | | 0.78% |
Service Shares | | $1,000 | | | | $1,131.40 | | $4.91 | | | | $1,020.18 | | $4.66 | | | | 0.93% |
1. Expenses are equal to the annualized expense ratio for the six-month period as indicated above—in the far right column—multiplied by the simple average account value over the period indicated, and then multiplied by 181/365 to reflect the one-half year period.
| | | | | | |
| | | |
| ftinstitutional.com | | Semiannual Report | | | 31 | |
TEMPLETON INSTITUTIONAL FUNDS
Financial Highlights
Emerging Markets Series
| | | | | | | | | | | | | | | | | | | | | | | | |
| | | Six Months Ended
June 30, 2017 | | | Year Ended December 31, | |
| | | (unaudited) | | | 2016 | | | 2015 | | | 2014 | | | 2013 | | | 2012 | |
| | | | | | |
Per share operating performance
(for a share outstanding throughout the period) | | | | | | | | | | | | | | | | | | | | | | | | |
| | | | | | |
Net asset value, beginning of period | | | $4.28 | | | | $3.65 | | | | $4.59 | | | | $7.31 | | | | $10.49 | | | | $10.48 | |
| | | | |
| | | | | | |
| Income from investment operationsa: | | | | | | | | | | | | | | | | | | | | | | | | |
| | | | | | |
Net investment incomeb | | | 0.02 | | | | 0.03 | | | | 0.04 | | | | 0.12 | c | | | 0.13 | | | | 0.22 | |
| | | | | | |
Net realized and unrealized gains (losses) | | | 0.95 | | | | 0.68 | | | | (0.90 | ) | | | (0.70 | ) | | | (0.13 | ) | | | 1.38 | |
| | | | |
| | | | | | |
Total from investment operations | | | 0.97 | | | | 0.71 | | | | (0.86 | ) | | | (0.58 | ) | | | — | | | | 1.60 | |
| | | | |
| | | | | | |
| Less distributions from: | | | | | | | | | | | | | | | | | | | | | | | | |
| | | | | | |
Net investment income | | | — | | | | (0.08 | ) | | | (0.06 | ) | | | (0.19 | ) | | | (0.13 | ) | | | (0.32 | ) |
| | | | | | |
Net realized gains | | | — | | | | — | | | | (0.02 | ) | | | (1.95 | ) | | | (3.05 | ) | | | (1.27 | ) |
| | | | |
| | | | | | |
Total distributions | | | — | | | | (0.08 | ) | | | (0.08 | ) | | | (2.14 | ) | | | (3.18 | ) | | | (1.59 | ) |
| | | | |
| | | | | | |
Net asset value, end of period | | | $5.25 | | | | $4.28 | | | | $3.65 | | | | $4.59 | | | | $7.31 | | | | $10.49 | |
| | | | |
| | | | | | |
Total returnd | | | 22.66% | | | | 19.45% | | | | (18.88)% | | | | (8.01)% | | | | 0.72% | | | | 15.77% | |
| | | | | | |
| Ratios to average net assetse | | | | | | | | | | | | | | | | | | | | | | | | |
| | | | | | |
Expenses before waiver and payments by affiliates | | | 1.47% | | | | 1.44% | | | | 1.33% | | | | 1.32% | | | | 1.32% | | | | 1.28% | |
| | | | | | |
Expenses net of waiver and payments by affiliates | | | 1.34% | f | | | 1.33% | | | | 1.32% | | | | 1.32% | | | | 1.29% | | | | 1.24% | |
| | | | | | |
Net investment income | | | 0.78% | | | | 0.79% | | | | 0.83% | | | | 1.74% | c | | | 1.23% | | | | 1.99% | |
| | | | | | |
| Supplemental data | | | | | | | | | | | | | | | | | | | | | | | | |
| | | | | | |
Net assets, end of period (000’s) | | | $49,883 | | | | $40,879 | | | | $71,434 | | | | $101,861 | | | | $165,216 | | | | $249,190 | |
| | | | | | |
Portfolio turnover rate | | | 10.04% | | | | 17.55% | | | | 69.65% | | | | 78.18% | | | | 52.07% | | | | 24.31% | |
aThe amount shown for a share outstanding throughout the period may not correlate with the Statement of Operations for the period due to the timing of sales and repurchases of the Fund’s shares in relation to income earned and/or fluctuating fair value of the investments of the Fund.
bBased on average daily shares outstanding.
cNet investment income per share includes approximately $0.03 per share related to income received in the form of special dividends in connection with certain Fund holdings. Excluding this amount, the ratio of net investment income to average net assets would have been 1.33%.
dTotal return is not annualized for periods less than one year.
eRatios are annualized for periods less than one year.
fBenefit of expense reduction rounds to less than 0.01%.
| | | | |
| | | |
| 32 | | Semiannual Report | The accompanying notes are an integral part of these financial statements. | | ftinstitutional.com |
TEMPLETON INSTITUTIONAL FUNDS
Statement of Investments, June 30, 2017 (unaudited)
| | | | | | | | | | | | | | |
| Emerging Markets Series | | | | | | | | | |
| | | | | Industry | | | Shares | | | Value | |
| | | Common Stocks 91.9% | | | | | | | | | |
| | | Argentina 0.1% | | | | | | | | | |
| a | | Grupo Clarin SA, B, GDR, Reg S | | | Media | | | | 2,037 | | | $ | 57,953 | |
| | | | | | | | | | | | | | |
| | | Belgium 0.6% | | | | | | | | | |
| | Anheuser-Busch InBev SA/NV | | | Beverages | | | | 2,739 | | | | 302,569 | |
| | | | | | | | | | | | | | |
| | | Brazil 1.4% | | | | | | | | | |
| b | | B2W Cia Digital. | | | Internet & Direct Marketing Retail | | | | 28,200 | | | | 99,552 | |
| | B3 SA - Brasil Bolsa Balcao | | | Capital Markets | | | | 38,100 | | | | 227,042 | |
| | M Dias Branco SA | | | Food Products | | | | 600 | | | | 8,925 | |
| | Mahle-Metal Leve SA. | | | Auto Components | | | | 20,500 | | | | 120,306 | |
| | Totvs SA | | | Software | | | | 24,600 | | | | 223,863 | |
| | | | | | | | | | | | | | |
| | | | | | | | | | | | | 679,688 | |
| | | | | | | | | | | | | | |
| | | Cambodia 0.6% | | | | | | | | | |
| | NagaCorp Ltd. | | | Hotels, Restaurants & Leisure | | | | 576,000 | | | | 302,469 | |
| | | | | | | | | | | | | | |
| | | China 18.1% | | | | | | | | | |
| b | | Alibaba Group Holding Ltd., ADR | | | Internet Software & Services | | | | 6,870 | | | | 967,983 | |
| b | | Baidu Inc., ADR | | | Internet Software & Services | | | | 1,835 | | | | 328,208 | |
| | Bloomage Biotechnology Corp. Ltd. | | | Chemicals | | | | 57,000 | | | | 109,507 | |
| | Brilliance China Automotive Holdings Ltd. | | | Automobiles | | | | 1,855,800 | | | | 3,379,908 | |
| | China Life Insurance Co. Ltd., H | | | Insurance | | | | 28,000 | | | | 85,531 | |
| | China Petroleum & Chemical Corp., H | | | Oil, Gas & Consumable Fuels | | | | 824,500 | | | | 643,105 | |
| | CNOOC Ltd. | | | Oil, Gas & Consumable Fuels | | | | 324,600 | | | | 355,458 | |
| | COSCO Shipping Ports Ltd. | | | Transportation Infrastructure | | | | 169,057 | | | | 198,337 | |
| | Inner Mongolia Yitai Coal Co. Ltd., B | | | Oil, Gas & Consumable Fuels | | | | 68,700 | | | | 70,761 | |
| | NetEase Inc., ADR | | | Internet Software & Services | | | | 345 | | | | 103,717 | |
| | Ping An Insurance Group Co. of China Ltd., A | | | Insurance | | | | 101,862 | | | | 745,086 | |
| | Poly Culture Group Corp. Ltd., H | | | Media | | | | 57,500 | | | | 136,096 | |
| | Tencent Holdings Ltd. | | | Internet Software & Services | | | | 42,100 | | | | 1,505,468 | |
| | Uni-President China Holdings Ltd. | | | Food Products | | | | 294,800 | | | | 238,249 | |
| | Weifu High-Technology Co. Ltd., B | | | Auto Components | | | | 66,986 | | | | 158,376 | |
| | | | | | | | | | | | | | |
| | | | | | | | | | | | | 9,025,790 | |
| | | | | | | | | | | | | | |
| | | Czech Republic 0.5% | | | | | | | | | |
| | Moneta Money Bank AS. | | | Banks | | | | 68,210 | | | | 228,540 | |
| | | | | | | | | | | | | | |
| | | Hong Kong 2.4% | | | | | | | | | |
| | Dairy Farm International Holdings Ltd. | | | Food & Staples Retailing | | | | 10,119 | | | | 79,737 | |
| | MGM China Holdings Ltd. | | | Hotels, Restaurants & Leisure | | | | 235,400 | | | | 523,396 | |
| | Sands China Ltd. | | | Hotels, Restaurants & Leisure | | | | 126,000 | | | | 576,927 | |
| | | | | | | | | | | | | | |
| | | | | | | | | | | | | 1,180,060 | |
| | | | | | | | | | | | | | |
| | | Hungary 1.2% | | | | | | | | | |
| | Richter Gedeon Nyrt | | | Pharmaceuticals | | | | 22,261 | | | | 581,939 | |
| | | | | | | | | | | | | | |
| | India 7.9% | | | | | | | | | | | | |
| | Bajaj Holdings & Investment Ltd. | | | Diversified Financial Services | | | | 3,924 | | | | 128,301 | |
| | Biocon Ltd. | | | Biotechnology | | | | 123,528 | | | | 632,837 | |
| | Glenmark Pharmaceuticals Ltd. | | | Pharmaceuticals | | | | 40,694 | | | | 398,502 | |
| | ICICI Bank Ltd. | | | Banks | | | | 274,857 | | | | 1,234,135 | |
| | Infosys Ltd. | | | IT Services | | | | 40,960 | | | | 593,007 | |
| | Reliance Industries Ltd. | | | Oil, Gas & Consumable Fuels | | | | 16,200 | | | | 345,961 | |
| | Tata Chemicals Ltd. | | | Chemicals | | | | 38,000 | | | | 356,919 | |
| | Tata Motors Ltd., A | | | Automobiles | | | | 55,668 | | | | 226,824 | |
| | | | | | | | | | | | | | |
| | | | | | | | | | | | | 3,916,486 | |
| | | | | | | | | | | | | | |
| | | | | | |
| | | |
| ftinstitutional.com | | Semiannual Report | | | 33 | |
TEMPLETON INSTITUTIONAL FUNDS
STATEMENT OF INVESTMENTS (UNAUDITED)
| | | | | | | | | | | | | | |
| Emerging Markets Series (continued) | | | | | | | |
| | | | | Industry | | | Shares | | | Value | |
| | | Common Stocks (continued) | | | | | | | | | |
| | | Indonesia 4.0% | | | | | | | | | |
| | Astra International Tbk PT | | | Automobiles | | | | 1,719,600 | | | $ | 1,151,561 | |
| | Bank Danamon Indonesia Tbk PT | | | Banks | | | | 891,700 | | | | 342,897 | |
| | Perusahaan Gas Negara (Persero) Tbk PT | | | Gas Utilities | | | | 797,500 | | | | 134,637 | |
| | Semen Indonesia (Persero) Tbk PT | | | Construction Materials | | | | 519,100 | | | | 389,496 | |
| | | | | | | | | | | | | | |
| | | | | | | | | | | | | 2,018,591 | |
| | | | | | | | | | | | | | |
| | | Kenya 0.4% | | | | | | | | | |
| | Equity Group Holdings Ltd. | | | Banks | | | | 579,300 | | | | 210,883 | |
| | | | | | | | | | | | | | |
| | | Mexico 1.2% | | | | | | | | | |
| | Grupo Financiero Santander Mexico SAB de CV, B, ADR | | | Banks | | | | 49,881 | | | | 480,853 | |
| | Nemak SAB de CV | | | Auto Components | | | | 137,500 | | | | 131,908 | |
| | | | | | | | | | | | | | |
| | | | | | | | | | | | | 612,761 | |
| | | | | | | | | | | | | | |
| | | Nigeria 0.0%† | | | | | | | | | |
| | Nigerian Breweries PLC | | | Beverages | | | | 38,224 | | | | 16,483 | |
| | | | | | | | | | | | | | |
| | | Pakistan 0.9% | | | | | | | | | |
| | Habib Bank Ltd. | | | Banks | | | | 171,400 | | | | 441,102 | |
| | | | | | | | | | | | | | |
| | | Peru 0.2% | | | | | | | | | |
| | Compania de Minas Buenaventura SA, ADR | | | Metals & Mining | | | | 9,690 | | | | 111,435 | |
| | | | | | | | | | | | | | |
| | | Russia 6.0% | | | | | | | | | |
| | Gazprom PAO, ADR | | | Oil, Gas & Consumable Fuels | | | | 44,300 | | | | 175,339 | |
| | LUKOIL PJSC, ADR (London Stock Exchange) | | | Oil, Gas & Consumable Fuels | | | | 200 | | | | 9,740 | |
| | LUKOIL PJSC, ADR | | | Oil, Gas & Consumable Fuels | | | | 10,450 | | | | 508,915 | |
| a,b | | Mail.Ru Group Ltd., GDR, Reg S. | | | Internet Software & Services | | | | 20,854 | | | | 549,503 | |
| | MMC Norilsk Nickel PJSC, ADR | | | Metals & Mining | | | | 16,400 | | | | 226,320 | |
| | Sberbank of Russia PJSC, ADR | | | Banks | | | | 63,151 | | | | 653,613 | |
| b | | Yandex NV, A | | | Internet Software & Services | | | | 32,204 | | | | 845,033 | |
| | | | | | | | | | | | | | |
| | | | | | | | | | | | | 2,968,463 | |
| | | | | | | | | | | | | | |
| | | Singapore 0.2% | | | | | | | | | |
| | DBS Group Holdings Ltd. | | | Banks | | | | 6,452 | | | | 97,192 | |
| | | | | | | | | | | | | | |
| | | South Africa 7.4% | | | | | | | | | |
| | Massmart Holdings Ltd. | | | Food & Staples Retailing | | | | 51,057 | | | | 411,326 | |
| | MTN Group Ltd. | | | Wireless Telecommunication Services | | | | 20,188 | | | | 175,896 | |
| | Naspers Ltd., N | | | Media | | | | 15,915 | | | | 3,092,946 | |
| | | | | | | | | | | | | | |
| | | | | | | | | | | | | 3,680,168 | |
| | | | | | | | | | | | | | |
| | | South Korea 17.8% | | | | | | | | | |
| | Daelim Industrial Co. Ltd. | | | Construction & Engineering | | | | 8,526 | | | | 662,760 | |
| | Fila Korea Ltd. | | | Textiles, Apparel & Luxury Goods | | | | 8,416 | | | | 628,482 | |
| | Hankook Tire Co. Ltd. | | | Auto Components | | | | 3,598 | | | | 199,866 | |
| | Hanon Systems | | | Auto Components | | | | 38,655 | | | | 347,747 | |
| | Hite Jinro Co. Ltd. | | | Beverages | | | | 8,080 | | | | 164,433 | |
| | Hyundai Development Co-Engineering & Construction | | | Construction & Engineering | | | | 18,150 | | | | 744,275 | |
| | iMarketkorea Inc. | | | Trading Companies & Distributors | | | | 15,123 | | | | 179,638 | |
| | Interpark Holdings Corp. | | | Internet & Direct Marketing Retail | | | | 9,693 | | | | 51,219 | |
| | KT Skylife Co. Ltd. | | | Media | | | | 35,290 | | | | 503,954 | |
| | POSCO | | | Metals & Mining | | | | 2,804 | | | | 702,880 | |
| | Samsung Electronics Co. Ltd. | | | Technology Hardware, Storage & Peripherals | | | | 1,802 | | | | 3,741,149 | |
| | SK Hynix Inc. | | | Semiconductors & Semiconductor Equipment | | | | 16,340 | | | | 961,907 | |
| | | | | | | | | | | | | | |
| | | | | | | | | | | | | 8,888,310 | |
| | | | | | | | | | | | | | |
| | | | |
| | | |
| 34 | | Semiannual Report | | ftinstitutional.com |
TEMPLETON INSTITUTIONAL FUNDS
STATEMENT OF INVESTMENTS (UNAUDITED)
| | | | | | | | | | | | | | |
| Emerging Markets Series (continued) | | | | | | | | | |
| | | | | Industry | | | Shares | | | Value | |
| | | Common Stocks (continued) | | | | | | | | | |
| | | Taiwan 13.3% | | | | | | | | | |
| | Catcher Technology Co. Ltd. | | | Technology Hardware, Storage & Peripherals | | | | 65,000 | | | $ | 777,374 | |
| | Hon Hai Precision Industry Co. Ltd. | |
| Electronic Equipment, Instruments &
Components |
| | | 425,920 | | | | 1,639,555 | |
| | Largan Precision Co. Ltd. | |
| Electronic Equipment, Instruments &
Components |
| | | 3,000 | | | | 478,713 | |
| | Pegatron Corp. | | | Technology Hardware, Storage & Peripherals | | | | 146,000 | | | | 457,781 | |
| | Taiwan Semiconductor Manufacturing Co. Ltd. | | | Semiconductors & Semiconductor Equipment | | | | 481,000 | | | | 3,299,615 | |
| | | | | | | | | | | | | | |
| | | | | | | | | | | | | 6,653,038 | |
| | | | | | | | | | | | | | |
| | | Thailand 3.7% | | | | | | | | | |
| | Kasikornbank PCL, fgn. | | | Banks | | | | 111,900 | | | | 658,138 | |
| | Land and Houses PCL, fgn. | | | Real Estate Management & Development | | | | 1,107,300 | | | | 332,974 | |
| | PTT Exploration and Production PCL, fgn. | | | Oil, Gas & Consumable Fuels | | | | 89,900 | | | | 228,593 | |
| | Siam Commercial Bank PCL, fgn. | | | Banks | | | | 43,100 | | | | 197,584 | |
| | Thai Beverage PCL, fgn. | | | Beverages | | | | 654,000 | | | | 427,513 | |
| | | | | | | | | | | | | | |
| | | | | | | | | | | | | 1,844,802 | |
| | | | | | | | | | | | | | |
| | | United Kingdom 3.3% | | | | | | | | | |
| | Unilever PLC. | | | Personal Products | | | | 30,419 | | | | 1,646,305 | |
| | | | | | | | | | | | | | |
| | | United States 0.7% | | | | | | | | | |
| b | | IMAX Corp. | | | Media | | | | 16,027 | | | | 352,594 | |
| | | | | | | | | | | | | | |
| | Total Common Stocks (Cost $33,608,918) | | | | | | | | 45,817,621 | |
| | | | | | | | | | | | | | |
| c | | Participatory Notes (Cost $364,195) 0.9% | | | | | | | | | |
| | | Saudi Arabia 0.9% | | | | | | | | | |
| | HSBC Bank PLC, Saudi Basic Industries Corp., 1/22/18 | | | Chemicals | | | | 16,459 | | | | 447,667 | |
| | | | | | | | | | | | | | |
| | | Preferred Stocks 3.1% | | | | | | | | | |
| | | Brazil 3.1% | | | | | | | | | |
| d | | Banco Bradesco SA, 4.12%, ADR, pfd. | | | Banks | | | | 99,232 | | | | 843,472 | |
| d | | Itau Unibanco Holding SA, 5.137%, ADR, pfd. | | | Banks | | | | 64,746 | | | | 715,444 | |
| | | | | | | | | | | | | | |
| | Total Preferred Stocks (Cost $802,379) | | | | | | | | | | | 1,558,916 | |
| | | | | | | | | | | | | | |
| | Total Investments before Short Term Investments (Cost $34,775,492) | | | | | | | | | | | 47,824,204 | |
| | | | | | | | | | | | | | |
| | | Short Term Investments (Cost $2,018,434) 4.0% | | | | | | | |
| | | Money Market Funds 4.0% | | | | | | | | | |
| | | United States 4.0% | | | | | | | | | |
| e,f | | Institutional Fiduciary Trust Money Market Portfolio, 0.58% | | | | | | | 2,018,434 | | | | 2,018,434 | |
| | | | | | | | | | | | | | |
| | Total Investments (Cost $36,793,926) 99.9% | | | | | | | | 49,842,638 | |
| | Other Assets, less Liabilities 0.1% | | | | | | | | 39,979 | |
| | | | | | | | | | | | | | |
| | Net Assets 100.0% | | | | | | | $ | 49,882,617 | |
| | | | | | | | | | | | | | |
| | | | | | |
| | | |
| ftinstitutional.com | | Semiannual Report | | | 35 | |
TEMPLETON INSTITUTIONAL FUNDS
STATEMENT OF INVESTMENTS (UNAUDITED)
Emerging Markets Series (continued)
See Abbreviations on page 71.
†Rounds to less than 0.1% of net assets.
aSecurity was purchased pursuant to Regulation S under the Securities Act of 1933, which exempts from registration securities offered and sold outside of the United States. Such a security cannot be sold in the United States without either an effective registration statement filed pursuant to the Securities Act of 1933, or pursuant to an exemption from registration. These securities have been deemed liquid under guidelines approved by the Trust’s Board of Trustees. At June 30, 2017, the aggregate value of these securities was $607,456, representing 1.2% of net assets.
bNon-income producing.
cSee Note 1(c) regarding Participatory Notes.
dVariable rate security. The rate shown represents the yield at period end.
eSee Note 3(d) regarding investments in affiliated management investment companies.
f The rate shown is the annualized seven-day yield at period end.
| | | | |
| | | |
| 36 | | Semiannual Report | The accompanying notes are an integral part of these financial statements. | | ftinstitutional.com |
TEMPLETON INSTITUTIONAL FUNDS
Financial Highlights
Foreign Smaller Companies Series
| | | | | | | | | | | | | | | | | | | | | | | | |
| | | Six Months Ended
June 30, 2017 | | | Year Ended December 31, | |
| | | (unaudited) | | | 2016 | | | 2015 | | | 2014 | | | 2013 | | | 2012 | |
| | | | | | |
Per share operating performance
(for a share outstanding throughout the period) | | | | | | | | | | | | | | | | | | | | | | | | |
| | | | | | |
Net asset value, beginning of period | | | $19.93 | | | | $20.90 | | | | $20.80 | | | | $21.96 | | | | $18.31 | | | | $15.31 | |
| | | | |
| | | | | | |
| Income from investment operationsa: | | | | | | | | | | | | | | | | | | | | | | | | |
| | | | | | |
Net investment incomeb | | | 0.20 | | | | 0.29 | | | | 0.28 | | | | 0.25 | | | | 0.24 | | | | 0.29 | |
| | | | | | |
Net realized and unrealized gains (losses) | | | 3.81 | | | | (0.48 | ) | | | 0.12 | | | | (0.98 | ) | | | 3.82 | | | | 3.01 | |
| | | | |
| | | | | | |
Total from investment operations | | | 4.01 | | | | (0.19 | ) | | | 0.40 | | | | (0.73 | ) | | | 4.06 | | | | 3.30 | |
| | | | |
| | | | | | |
| Less distributions from: | | | | | | | | | | | | | | | | | | | | | | | | |
| | | | | | |
Net investment income | | | — | | | | (0.41 | ) | | | (0.28 | ) | | | (0.16 | ) | | | (0.30 | ) | | | (0.27 | ) |
| | | | | | |
Net realized gains | | | — | | | | (0.37 | ) | | | (0.02 | ) | | | (0.27 | ) | | | (0.11 | ) | | | (0.03 | ) |
| | | | |
| | | | | | |
Total distributions | | | — | | | | (0.78 | ) | | | (0.30 | ) | | | (0.43 | ) | | | (0.41 | ) | | | (0.30 | ) |
| | | | |
| | | | | | |
Net asset value, end of period | | | $23.94 | | | | $19.93 | | | | $20.90 | | | | $20.80 | | | | $21.96 | | | | $18.31 | |
| | | | |
| | | | | | |
Total returnc | | | 20.12% | | | | (0.85)% | | | | 1.88% | | | | (3.32)% | | | | 22.24% | | | | 21.56% | |
| | | | | | |
| Ratios to average net assetsd | | | | | | | | | | | | | | | | | | | | | | | | |
| | | | | | |
Expenses before waiver and payments by affiliates and expense reduction | | | 0.99% | | | | 0.99% | | | | 0.98% | | | | 0.98% | | | | 0.99% | | | | 1.01% | |
| | | | | | |
Expenses before waiver and payments by affiliates | | | 0.98% | | | | 0.98% | e | | | 0.98%e | | | | 0.98% | | | | 0.98% | e | | | 0.95% | |
| | | | | | |
Expenses net of waiver and payments by affiliates and expense reduction | | | 0.97% | | | | 0.98% | e | | | 0.98% | e,f | | | 0.98% | | | | 0.98% | e | | | 0.95% | |
| | | | | | |
Net investment income | | | 1.82% | | | | 1.44% | | | | 1.28% | | | | 1.15% | | | | 1.16% | | | | 1.70% | |
| | | | | | |
| Supplemental data | | | | | | | | | | | | | | | | | | | | | | | | |
| | | | | | |
Net assets, end of period (000’s) | | | $1,031,942 | | | | $931,879 | | | | $1,260,407 | | | | $1,281,733 | | | | $1,252,797 | | | | $495,600 | |
| | | | | | |
Portfolio turnover rate | | | 12.78% | | | | 21.36% | | | | 29.11% | | | | 21.36% | | | | 23.84% | | | | 19.76% | |
aThe amount shown for a share outstanding throughout the period may not correlate with the Statement of Operations for the period due to the timing of sales and repurchases of the Fund’s shares in relation to income earned and/or fluctuating fair value of the investments of the Fund.
bBased on average daily shares outstanding.
cTotal return is not annualized for periods less than one year.
dRatios are annualized for periods less than one year.
eBenefit of expense reduction rounds to less than 0.01%.
fBenefit of waiver and payments by affiliates rounds to less than 0.01%.
| | | | | | |
| | | |
| ftinstitutional.com | | The accompanying notes are an integral part of these financial statements. | Semiannual Report | | | 37 | |
TEMPLETON INSTITUTIONAL FUNDS
Statement of Investments, June 30, 2017 (unaudited)
| | | | | | | | | | | | | | |
| Foreign Smaller Companies Series | | | | | | | | | |
| | | | | Industry | | | Shares | | | Value | |
| | | Common Stocks 95.1% | | | | | | | | | |
| | | Belgium 2.0% | | | | | | | | | |
| | Barco NV | | | Electronic Equipment, Instruments & Components | | | | 151,240 | | | $ | 15,532,302 | |
| | Ontex Group NV | | | Personal Products | | | | 154,340 | | | | 5,484,533 | |
| | | | | | | | | | | | | | |
| | | | | | | | | | | | | 21,016,835 | |
| | | | | | | | | | | | | | |
| | | Bermuda 0.9% | | | | | | | | | |
| | Axis Capital Holdings Ltd. | | | Insurance | | | | 145,450 | | | | 9,404,797 | |
| | | | | | | | | | | | | | |
| | | Brazil 1.5% | | | | | | | | | |
| | Grendene SA | | | Textiles, Apparel & Luxury Goods | | | | 806,700 | | | | 6,238,431 | |
| | M Dias Branco SA | | | Food Products | | | | 618,700 | | | | 9,203,262 | |
| | | | | | | | | | | | | | |
| | | | | | | | | | | | | 15,441,693 | |
| | | | | | | | | | | | | | |
| | | Canada 7.3% | | | | | | | | | |
| | Alamos Gold Inc., A. | | | Metals & Mining | | | | 777,700 | | | | 5,583,886 | |
| a | | Badger Daylighting Ltd. | | | Construction & Engineering | | | | 627,200 | | | | 12,881,275 | |
| | Canaccord Genuity Group Inc. | | | Capital Markets | | | | 1,973,638 | | | | 8,115,951 | |
| b | | Canada Goose Holdings Inc. | | | Textiles, Apparel & Luxury Goods | | | | 82,700 | | | | 1,634,667 | |
| | Canadian Western Bank | | | Banks | | | | 460,272 | | | | 9,722,831 | |
| | Enerflex Ltd. | | | Energy Equipment & Services | | | | 364,700 | | | | 5,295,416 | |
| a | | Genworth MI Canada Inc. | | | Thrifts & Mortgage Finance | | | | 247,000 | | | | 6,799,337 | |
| | Laurentian Bank of Canada | | | Banks | | | | 94,500 | | | | 3,949,439 | |
| | Mullen Group Ltd. | | | Energy Equipment & Services | | | | 726,800 | | | | 8,971,801 | |
| | Russel Metals Inc. | | | Trading Companies & Distributors | | | | 305,800 | | | | 6,124,729 | |
| | Shawcor Ltd. | | | Energy Equipment & Services | | | | 317,600 | | | | 6,488,484 | |
| | | | | | | | | | | | | | |
| | | | | | | | | | | | | 75,567,816 | |
| | | | | | | | | | | | | | |
| | | China 3.1% | | | | | | | | | |
| | China ZhengTong Auto Services Holdings Ltd. | | | Specialty Retail | | | | 10,754,500 | | | | 8,608,834 | |
| | Goodbaby International Holdings Ltd. | | | Household Products | | | | 15,882,600 | | | | 6,570,497 | |
| | Greatview Aseptic Packaging Co. Ltd. | | | Containers & Packaging | | | | 11,348,300 | | | | 7,078,380 | |
| | Shanghai Haohai Biological Technology Co. Ltd., H | | | Biotechnology | | | | 1,121,900 | | | | 6,099,664 | |
| | Xtep International Holdings Ltd. | | | Textiles, Apparel & Luxury Goods | | | | 10,137,800 | | | | 3,908,268 | |
| | | | | | | | | | | | | | |
| | | | | | | | | | | | | 32,265,643 | |
| | | | | | | | | | | | | | |
| | Colombia 0.6% | | | | | | | | | | | | |
| b | | Gran Tierra Energy Inc. (CAD Traded) | | | Oil, Gas & Consumable Fuels | | | | 2,487,900 | | | | 5,528,027 | |
| b | | Gran Tierra Energy Inc. (USD Traded) | | | Oil, Gas & Consumable Fuels | | | | 424,190 | | | | 950,186 | |
| | | | | | | | | | | | | | |
| | | | | | | | | | | | | 6,478,213 | |
| | | | | | | | | | | | | | |
| | | Finland 3.2% | | | | | | | | | |
| | Amer Sports OYJ | | | Leisure Products | | | | 639,882 | | | | 16,006,824 | |
| | Huhtamaki OYJ | | | Containers & Packaging | | | | 439,350 | | | | 17,313,740 | |
| | | | | | | | | | | | | | |
| | | | | | | | | | | | | 33,320,564 | |
| | | | | | | | | | | | | | |
| | | France 0.4% | | | | | | | | | |
| | Beneteau SA | | | Leisure Products | | | | 262,753 | | | | 4,545,463 | |
| | | | | | | | | | | | | | |
| | | Germany 7.4% | | | | | | | | | |
| | Gerresheimer AG | | | Life Sciences Tools & Services | | | | 209,510 | | | | 16,854,800 | |
| | Grand City Properties SA | | | Real Estate Management & Development | | | | 563,890 | | | | 11,300,793 | |
| | Jenoptik AG | | | Electronic Equipment, Instruments & Components | | | | 581,057 | | | | 15,242,154 | |
| | Rational AG | | | Machinery | | | | 32,770 | | | | 17,443,094 | |
| | Stabilus SA | | | Machinery | | | | 205,450 | | | | 15,955,571 | |
| | | | | | | | | | | | | | |
| | | | | | | | | | | | | 76,796,412 | |
| | | | | | | | | | | | | | |
| | | | |
| | | |
| 38 | | Semiannual Report | | ftinstitutional.com |
TEMPLETON INSTITUTIONAL FUNDS
STATEMENT OF INVESTMENTS (UNAUDITED)
| | | | | | | | | | | | | | |
| Foreign Smaller Companies Series (continued) | | | | | | | | | |
| | | | | Industry | | | Shares | | | Value | |
| | | Common Stocks (continued) | | | | | | | | | |
| | | Hong Kong 6.0% | | | | | | | | | |
| | Luk Fook Holdings (International) Ltd. | | | Specialty Retail | | | | 1,536,000 | | | $ | 5,252,627 | |
| | Stella International Holdings Ltd. | | | Textiles, Apparel & Luxury Goods | | | | 2,965,062 | | | | 5,316,624 | |
| | Techtronic Industries Co. Ltd. | | | Household Durables | | | | 4,218,500 | | | | 19,396,644 | |
| | Value Partners Group Ltd. | | | Capital Markets | | | | 12,630,000 | | | | 11,501,303 | |
| | Vinda International Holdings Ltd. | | | Household Products | | | | 2,137,700 | | | | 4,325,915 | |
| | VTech Holdings Ltd. | | | Communications Equipment | | | | 1,005,200 | | | | 15,925,618 | |
| | | | | | | | | | | | | | |
| | | | | | | | | | | | | 61,718,731 | |
| | | | | | | | | | | | | | |
| | | India 2.5% | | | | | | | | | |
| | Dewan Housing Finance Corp. Ltd. | | | Thrifts & Mortgage Finance | | | | 2,917,809 | | | | 19,741,041 | |
| | Jain Irrigation Systems Ltd. | | | Machinery | | | | 3,629,196 | | | | 5,770,658 | |
| | | | | | | | | | | | | | |
| | | | | | | | | | | | | 25,511,699 | |
| | | | | | | | | | | | | | |
| | | Italy 4.5% | | | | | | | | | |
| | Azimut Holding SpA | | | Capital Markets | | | | 278,263 | | | | 5,578,196 | |
| | Interpump Group SpA | | | Machinery | | | | 695,238 | | | | 19,011,606 | |
| | Technogym SpA | | | Leisure Products | | | | 2,111,040 | | | | 16,264,458 | |
| a | | Tod’s SpA | | | Textiles, Apparel & Luxury Goods | | | | 88,814 | | | | 5,539,049 | |
| | | | | | | | | | | | | | |
| | | | | | | | | | | | | 46,393,309 | |
| | | | | | | | | | | | | | |
| | | Japan 19.6% | | | | | | | | | |
| | Anicom Holdings Inc. | | | Insurance | | | | 284,000 | | | | 6,218,536 | |
| | Asahi Co. Ltd. | | | Specialty Retail | | | | 357,700 | | | | 4,172,133 | |
| | Asics Corp. | | | Textiles, Apparel & Luxury Goods | | | | 773,600 | | | | 14,318,666 | |
| | Bunka Shutter Co. Ltd. | | | Building Products | | | | 755,900 | | | | 5,785,926 | |
| | Capcom Co. Ltd. | | | Software | | | | 445,600 | | | | 10,549,254 | |
| | Daibiru Corp. | | | Real Estate Management & Development | | | | 978,900 | | | | 10,164,513 | |
| | Descente Ltd. | | | Textiles, Apparel & Luxury Goods | | | | 588,571 | | | | 7,953,309 | |
| | Dowa Holdings Co. Ltd. | | | Metals & Mining | | | | 1,658,000 | | | | 12,543,521 | |
| | Fuji Oil Holdings Inc. | | | Food Products | | | | 414,400 | | | | 9,571,153 | |
| | IDOM Inc. | | | Specialty Retail | | | | 1,129,800 | | | | 7,784,105 | |
| | Kobayashi Pharmaceutical Co. Ltd. | | | Personal Products | | | | 328,900 | | | | 19,502,716 | |
| | KYB Corp. | | | Auto Components | | | | 922,000 | | | | 4,713,073 | |
| | MEITEC Corp. | | | Professional Services | | | | 390,500 | | | | 16,611,481 | |
| | Nachi-Fujikoshi Corp. | | | Machinery | | | | 1,407,000 | | | | 7,967,809 | |
| | Nihon Parkerizing Co. Ltd. | | | Chemicals | | | | 765,600 | | | | 11,386,841 | |
| | Square Enix Holdings Co. Ltd. | | | Software | | | | 161,800 | | | | 5,293,364 | |
| | Sumitomo Rubber Industries Ltd. | | | Auto Components | | | | 725,400 | | | | 12,227,038 | |
| | TechnoPro Holdings Inc. | | | Professional Services | | | | 221,000 | | | | 8,880,473 | |
| | Tsumura & Co. | | | Pharmaceuticals | | | | 501,800 | | | | 20,342,339 | |
| | Ushio Inc. | | | Electrical Equipment | | | | 466,600 | | | | 5,857,129 | |
| | | | | | | | | | | | | | |
| | | | | | | | | | | | | 201,843,379 | |
| | | | | | | | | | | | | | |
| | | Netherlands 5.6% | | | | | | | | | |
| | Aalberts Industries NV | | | Machinery | | | | 386,858 | | | | 15,404,235 | |
| | Accell Group NV | | | Leisure Products | | | | 229,265 | | | | 7,511,969 | |
| | Arcadis NV | | | Construction & Engineering | | | | 762,969 | | | | 13,791,508 | |
| | Beter Bed Holding NV | | | Specialty Retail | | | | 278,730 | | | | 5,022,434 | |
| c | | Refresco Group NV, Reg S | | | Beverages | | | | 795,712 | | | | 16,242,079 | |
| | | | | | | | | | | | | | |
| | | | | | | | | | | | | 57,972,225 | |
| | | | | | | | | | | | | | |
| | | Norway 0.6% | | | | | | | | | |
| | Tomra Systems ASA | | | Commercial Services & Supplies | | | | 467,060 | | | | 5,707,659 | |
| | | | | | | | | | | | | | |
| | | | | | |
| | | |
| ftinstitutional.com | | Semiannual Report | | | 39 | |
TEMPLETON INSTITUTIONAL FUNDS
STATEMENT OF INVESTMENTS (UNAUDITED)
| | | | | | | | | | | | | | |
| Foreign Smaller Companies Series (continued) | | | | | | | |
| | | | | Industry | | | Shares | | | Value | |
| | | Common Stocks (continued) | | | | | | | | | |
| | | Philippines 0.9% | | | | | | | | | |
| | Metropolitan Bank & Trust Co. | | | Banks | | | | 1,981,336 | | | $ | 3,438,421 | |
| | Vista Land & Lifescapes Inc. | | | Real Estate Management & Development | | | | 54,228,200 | | | | 6,248,765 | |
| | | | | | | | | | | | | | |
| | | | | | | | | | | | | 9,687,186 | |
| | | | | | | | | | | | | | |
| | | Poland 0.8% | | | | | | | | | |
| | CCC SA. | | | Textiles, Apparel & Luxury Goods | | | | 131,440 | | | | 7,981,648 | |
| | | | | | | | | | | | | | |
| | | South Korea 4.0% | | | | | | | | | |
| | BNK Financial Group Inc. | | | Banks | | | | 863,508 | | | | 8,258,507 | |
| | DGB Financial Group Inc. | | | Banks | | | | 1,310,001 | | | | 13,501,273 | |
| b | | Hyundai Mipo Dockyard Co. Ltd | | | Machinery | | | | 64,943 | | | | 6,182,725 | |
| | Korea Investment Holdings Co. Ltd | | | Capital Markets | | | | 222,805 | | | | 13,641,559 | |
| | | | | | | | | | | | | | |
| | | | | | | | | | | | | 41,584,064 | |
| | | | | | | | | | | | | | |
| | | Spain 1.1% | | | | | | | | | |
| | Construcciones y Auxiliar de Ferrocarriles SA | | | Machinery | | | | 276,330 | | | | 11,350,340 | |
| | | | | | | | | | | | | | |
| | | Sweden 3.9% | | | | | | | | | |
| | Bulten AB. | | | Auto Components | | | | 351,615 | | | | 5,010,248 | |
| | Cloetta AB, B | | | Food Products | | | | 1,439,820 | | | | 5,932,643 | |
| | Duni AB | | | Household Durables | | | | 340,920 | | | | 4,989,419 | |
| | Tethys Oil AB | | | Oil, Gas & Consumable Fuels | | | | 790,900 | | | | 5,493,991 | |
| c | | The Thule Group AB, Reg S | | | Leisure Products | | | | 991,900 | | | | 18,621,313 | |
| | | | | | | | | | | | | | |
| | | | | | | | | | | | | 40,047,614 | |
| | | | | | | | | | | | | | |
| | | Switzerland 5.3% | | | | | | | | | |
| b | | Basilea Pharmaceutica AG | | | Biotechnology | | | | 54,180 | | | | 4,566,095 | |
| | Bucher Industries AG | | | Machinery | | | | 61,870 | | | | 19,472,514 | |
| | Logitech International SA | | | Technology Hardware, Storage & Peripherals | | | | 304,800 | | | | 11,173,968 | |
| | Tecan Group AG | | | Life Sciences Tools & Services | | | | 31,520 | | | | 5,927,568 | |
| | Vontobel Holding AG | | | Capital Markets | | | | 212,225 | | | | 13,790,475 | |
| | | | | | | | | | | | | | |
| | | | | | | | | | | | | 54,930,620 | |
| | | | | | | | | | | | | | |
| | | Taiwan 4.5% | | | | | | | | | |
| | Chicony Electronics Co. Ltd. | | | Technology Hardware, Storage & Peripherals | | | | 3,801,503 | | | | 9,643,215 | |
| | Giant Manufacturing Co. Ltd. | | | Leisure Products | | | | 1,245,482 | | | | 7,130,153 | |
| | King Yuan Electronics Co. Ltd. | | | Semiconductors & Semiconductor Equipment | | | | 7,745,000 | | | | 7,937,644 | |
| | Merida Industry Co. Ltd. | | | Leisure Products | | | | 1,161,000 | | | | 6,226,327 | |
| | Tripod Technology Corp. | | | Electronic Equipment, Instruments & Components | | | | 4,888,000 | | | | 15,583,576 | |
| | | | | | | | | | | | | | |
| | | | | | | | | | | | | 46,520,915 | |
| | | | | | | | | | | | | | |
| | | Thailand 0.6% | | | | | | | | | |
| | L.P.N. Development PCL, fgn. | | | Real Estate Management & Development | | | | 8,912,700 | | | | 3,126,802 | |
| | TISCO Financial Group PCL, fgn. | | | Banks | | | | 1,149,200 | | | | 2,574,859 | |
| | | | | | | | | | | | | | |
| | | | | | | | | | | | | 5,701,661 | |
| | | | | | | | | | | | | | |
| | | Turkey 0.3% | | | | | | | | | |
| b,c | | Mavi Giyim Sanayi Ve Ticaret AS, B, Reg S | | | Textiles, Apparel & Luxury Goods | | | | 242,200 | | | | 2,957,653 | |
| | | | | | | | | | | | | | |
| | | United Kingdom 8.5% | | | | | | | | | |
| | Bellway PLC | | | Household Durables | | | | 129,940 | | | | 5,035,287 | |
| | Bovis Homes Group PLC | | | Household Durables | | | | 301,350 | | | | 3,750,562 | |
| | DFS Furniture PLC | | | Household Durables | | | | 2,031,290 | | | | 5,437,236 | |
| | Foxtons Group PLC | | | Real Estate Management & Development | | | | 3,219,953 | | | | 3,973,957 | |
| | Greggs PLC | | | Hotels, Restaurants & Leisure | | | | 938,140 | | | | 13,197,323 | |
| | | | |
| | | |
| 40 | | Semiannual Report | | ftinstitutional.com |
TEMPLETON INSTITUTIONAL FUNDS
STATEMENT OF INVESTMENTS (UNAUDITED)
Foreign Smaller Companies Series (continued)
| | | | | | | | | | | | | | |
| | | Industry | | | Shares | | | Value | |
| | | Common Stocks (continued) | | | | | | | | | |
| | | United Kingdom (continued) | | | | | | | | | |
| | Laird PLC | |
| Electronic Equipment, Instruments
& Components |
| | | 4,146,264 | | | $ | 7,479,992 | |
| b | | LivaNova PLC | | | Health Care Equipment & Supplies | | | | 145,051 | | | | 8,878,572 | |
| | Man Group PLC | | | Capital Markets | | | | 6,379,271 | | | | 12,862,827 | |
| | Oxford Instruments PLC | |
| Electronic Equipment, Instruments
& Components |
| | | 706,421 | | | | 9,643,159 | |
| | SIG PLC | | | Trading Companies & Distributors | | | | 4,846,543 | | | | 9,380,917 | |
| b | | Vectura Group PLC | | | Pharmaceuticals | | | | 5,214,172 | | | | 7,599,935 | |
| | | | | | | | | | | | | | |
| | | | | | | | | | | | | 87,239,767 | |
| | | | | | | | | | | | | | |
| | Total Common Stocks (Cost $719,040,231) | | | | | | | | | | | 981,985,906 | |
| | | | | | | | | | | | | | |
| | | Preferred Stocks (Cost $4,070,004) 0.6% | | | | | | | | | |
| | | Brazil 0.6% | | | | | | | | | |
| d | | Alpargatas SA, 2.783%, pfd | | | Textiles, Apparel & Luxury Goods | | | | 1,427,900 | | | | 5,906,769 | |
| | | | | | | | | | | | | | |
| | Total Investments before Short Term Investments (Cost $723,110,235) | | | | | | | | | | | 987,892,675 | |
| | | | | | | | | | | | | | |
| | | | |
| | | | | | | | Principal
Amount | | | | |
| | | Short Term Investments 6.4% | | | | | | | | | |
| | U.S. Government and Agency Securities (Cost $43,797,627) 4.3% | | | | | | | | | | | | |
| | | United States 4.3% | | | | | | | | | |
| e | | FHLB, 7/03/17 | | | | | | $ | 43,800,000 | | | | 43,800,000 | |
| | | | | | | | | | | | | | |
| | | | |
| | | | | | | | Shares | | | | |
| f | | Investments from Cash Collateral Received
for Loaned Securities (Cost $21,603,092) 2.1% | | | | | | | |
| | | Money Market Funds 2.1% | | | | | | | | | |
| | | United States 2.1% | | | | | | | | | |
| g,h | | Institutional Fiduciary Trust Money Market Portfolio, 0.58% | | | | | | | 21,603,092 | | | | 21,603,092 | |
| | | | | | | | | | | | | | |
| | Total Investments (Cost $788,510,954) 102.1% | | | | | | | | 1,053,295,767 | |
| | Other Assets, less Liabilities (2.1)% | | | | | | | | | | | (21,353,998 | ) |
| | | | | | | | | | | | | | |
| | Net Assets 100.0% | | | | | | | | | | $ | 1,031,941,769 | |
| | | | | | | | | | | | | | |
| | | | | | |
| | | |
| ftinstitutional.com | | Semiannual Report | | | 41 | |
TEMPLETON INSTITUTIONAL FUNDS
STATEMENT OF INVESTMENTS (UNAUDITED)
Foreign Smaller Companies Series (continued)
See Abbreviations on page 71.
aA portion or all of the security is on loan at June 30, 2017. See Note 1(d).
bNon-income producing.
cSecurity was purchased pursuant to Regulation S under the Securities Act of 1933, which exempts from registration securities offered and sold outside of the United States. Such a security cannot be sold in the United States without either an effective registration statement filed pursuant to the Securities Act of 1933, or pursuant to an exemption from registration. These securities have been deemed liquid under guidelines approved by the Trust’s Board of Trustees. At June 30, 2017, the aggregate value of these securities was $37,821,045, representing 3.7% of net assets.
dVariable rate security. The rate shown represents the yield at period end.
eThe security was issued on a discount basis with no stated coupon rate.
fSee Note 1(d) regarding securities on loan.
gSee Note 3(d) regarding investments in affiliated management investment companies.
hThe rate shown is the annualized seven-day yield at period end.
| | | | |
| | | |
| 42 | | Semiannual Report | The accompanying notes are an integral part of these financial statements. | | ftinstitutional.com |
TEMPLETON INSTITUTIONAL FUNDS
Financial Highlights
Global Equity Series
| | | | | | | | | | | | | | | | | | | | | | | | |
| | | Six Months Ended
June 30, 2017 | | | Year Ended December 31, | |
| | | (unaudited) | | | 2016 | | | 2015 | | | 2014 | | | 2013 | | | 2012 | |
| | | | | | |
Per share operating performance
(for a share outstanding throughout the period) | | | | | | | | | | | | | | | | | | | | | | | | |
| | | | | | |
Net asset value, beginning of period | | | $8.95 | | | | $8.73 | | | | $9.64 | | | | $11.53 | | | | $9.88 | | | | $8.06 | |
| | | | |
| | | | | | |
| Income from investment operationsa: | | | | | | | | | | | | | | | | | | | | | | | | |
| | | | | | |
Net investment incomeb | | | 0.11 | | | | 0.16 | | | | 0.14 | | | | 0.25 | c | | | 0.14 | | | | 0.16 | |
| | | | | | |
Net realized and unrealized gains (losses) | | | 0.91 | | | | 0.25 | | | | (0.43 | ) | | | (0.46 | ) | | | 2.84 | | | | 1.82 | |
| | | | |
| | | | | | |
Total from investment operations | | | 1.02 | | | | 0.41 | | | | (0.29 | ) | | | (0.21 | ) | | | 2.98 | | | | 1.98 | |
| | | | |
| | | | | | |
| Less distributions from: | | | | | | | | | | | | | | | | | | | | | | | | |
| | | | | | |
Net investment income | | | — | | | | (0.15 | ) | | | (0.16 | ) | | | (0.26 | ) | | | (0.13 | ) | | | (0.16 | ) |
| | | | | | |
Net realized gains | | | — | | | | (0.04 | ) | | | (0.46 | ) | | | (1.42 | ) | | | (1.20 | ) | | | — | |
| | | | |
| | | | | | |
Total distributions | | | — | | | | (0.19 | ) | | | (0.62 | ) | | | (1.68 | ) | | | (1.33 | ) | | | (0.16 | ) |
| | | | |
| | | | | | |
Net asset value, end of period | | | $9.97 | | | | $8.95 | | | | $8.73 | | | | $9.64 | | | | $11.53 | | | | $9.88 | |
| | | | |
| | | | | | |
Total returnd | | | 11.40% | | | | 4.67% | | | | (3.43)% | | | | (2.01)% | | | | 30.43% | | | | 24.63% | |
| | | | | | |
| Ratios to average net assetse | | | | | | | | | | | | | | | | | | | | | | | | |
| | | | | | |
Expenses before waiver and payments by affiliates and expense reduction | | | 0.83% | | | | 0.84% | | | | 0.81% | | | | 0.92% | | | | 0.94% | | | | 0.94% | |
| | | | | | |
Expenses net of waiver and payments by affiliates and expense reduction | | | 0.82% | f | | | 0.84% | | | | 0.81% | f,g | | | 0.92% | | | | 0.90% | g | | | 0.81% | g |
| | | | | | |
Net investment income | | | 2.25% | | | | 1.82% | | | | 1.47% | | | | 2.21% | c | | | 1.26% | | | | 1.80% | |
| | | | | | |
| Supplemental data | | | | | | | | | | | | | | | | | | | | | | | | |
| | | | | | |
Net assets, end of period (000’s) | | | $303,826 | | | | $280,709 | | | | $282,830 | | | | $467,375 | | | | $491,602 | | | | $432,585 | |
| | | | | | |
Portfolio turnover rate | | | 11.83% | | | | 27.91% | | | | 36.88% | | | | 35.50% | | | | 42.66% | | | | 45.23% | |
aThe amount shown for a share outstanding throughout the period may not correlate with the Statement of Operations for the period due to the timing of sales and repurchases of the Fund’s shares in relation to income earned and/or fluctuating fair value of the investments of the Fund.
bBased on average daily shares outstanding.
cNet investment income per share includes approximately $0.09 per share related to income received in the form of special dividends in connection with certain Fund holdings. Excluding this amount, the ratio of net investment income to average net assets would have been 1.43%.
dTotal return is not annualized for periods less than one year.
eRatios are annualized for periods less than one year.
fBenefit of waiver and payments by affiliates rounds to less than 0.01%.
gBenefit of expense reduction rounds to less than 0.01%.
| | | | | | |
| | | |
| ftinstitutional.com | | The accompanying notes are an integral part of these financial statements. | Semiannual Report | | | 43 | |
TEMPLETON INSTITUTIONAL FUNDS
Statement of Investments, June 30, 2017 (unaudited)
| | | | | | | | | | | | | | |
| Global Equity Series | | | | | | | | | |
| | | | | Industry | | | Shares | | | Value | |
| | | | | | | | | | | | | | |
| | | Common Stocks 96.0% | | | | | | | | | |
| | | Austria 0.6% | | | | | | | | | |
| | UNIQA Insurance Group AG | | | Insurance | | | | 195,108 | | | $ | 1,818,555 | |
| | | | | | | | | | | | | | |
| | | Belgium 0.4% | | | | | | | | | |
| | UCB SA | | | Pharmaceuticals | | | | 15,470 | | | | 1,064,301 | |
| | | | | | | | | | | | | | |
| | | Canada 2.5% | | | | | | | | | |
| | Alamos Gold Inc., A | | | Metals & Mining | | | | 288,330 | | | | 2,070,209 | |
| a | | Husky Energy Inc. | | | Oil, Gas & Consumable Fuels | | | | 183,900 | | | | 2,088,499 | |
| | Tahoe Resources Inc. | | | Metals & Mining | | | | 170,700 | | | | 1,472,381 | |
| | Wheaton Precious Metals Corp | | | Metals & Mining | | | | 99,900 | | | | 1,985,437 | |
| | | | | | | | | | | | | | |
| | | | | | | | | | | | | 7,616,526 | |
| | | | | | | | | | | | | | |
| | | China 4.9% | | | | | | | | | |
| a | | Baidu Inc., ADR | | | Internet Software & Services | | | | 15,660 | | | | 2,800,948 | |
| | China Life Insurance Co. Ltd., H. | | | Insurance | | | | 730,000 | | | | 2,229,900 | |
| | China Mobile Ltd. | | | Wireless Telecommunication Services | | | | 65,500 | | | | 695,037 | |
| | China Telecom Corp. Ltd., H | | | Diversified Telecommunication Services | | | | 6,472,000 | | | | 3,075,293 | |
| | Haier Electronics Group Co. Ltd. | | | Household Durables | | | | 721,000 | | | | 1,874,586 | |
| | Kunlun Energy Co. Ltd. | | | Oil, Gas & Consumable Fuels | | | | 1,570,000 | | | | 1,331,164 | |
| | Shanghai Pharmaceuticals Holding Co. Ltd., H | | | Health Care Providers & Services | | | | 509,200 | | | | 1,516,301 | |
| | Sinopharm Group Co. Ltd. | | | Health Care Providers & Services | | | | 311,600 | | | | 1,408,790 | |
| | | | | | | | | | | | | | |
| | | | | | | | | | | | | 14,932,019 | |
| | | | | | | | | | | | | | |
| | | France 7.4% | | | | | | | | | |
| | AXA SA | | | Insurance | | | | 130,035 | | | | 3,557,353 | |
| | BNP Paribas SA. | | | Banks | | | | 64,264 | | | | 4,628,954 | |
| | Cie Generale des Etablissements Michelin, B | | | Auto Components | | | | 16,888 | | | | 2,245,393 | |
| | Compagnie de Saint-Gobain | | | Building Products | | | | 55,516 | | | | 2,966,467 | |
| | Credit Agricole SA | | | Banks | | | | 144,231 | | | | 2,320,473 | |
| | Sanofi | | | Pharmaceuticals | | | | 32,210 | | | | 3,081,687 | |
| | Total SA | | | Oil, Gas & Consumable Fuels | | | | 47,170 | | | | 2,332,193 | |
| | Zodiac Aerospace | | | Aerospace & Defense | | | | 55,090 | | | | 1,494,506 | |
| | | | | | | | | | | | | | |
| | | | | | | | | | | | | 22,627,026 | |
| | | | | | | | | | | | | | |
| | | Germany 6.6% | | | | | | | | | |
| | Bayer AG | | | Pharmaceuticals | | | | 29,510 | | | | 3,815,723 | |
| | Deutsche Lufthansa AG | | | Airlines | | | | 82,100 | | | | 1,868,541 | |
| | HeidelbergCement AG | | | Construction Materials | | | | 13,410 | | | | 1,296,633 | |
| | innogy SE | | | Multi-Utilities | | | | 40,680 | | | | 1,601,476 | |
| | Lanxess AG | | | Chemicals | | | | 59,640 | | | | 4,515,926 | |
| | Merck KGaA | | | Pharmaceuticals | | | | 25,730 | | | | 3,108,002 | |
| a | | MorphoSys AG | | | Life Sciences Tools & Services | | | | 25,980 | | | | 1,842,858 | |
| | Siemens AG, ADR | | | Industrial Conglomerates | | | | 27,580 | | | | 1,907,157 | |
| | | | | | | | | | | | | | |
| | | | | | | | | | | | | 19,956,316 | |
| | | | | | | | | | | | | | |
| | | Hong Kong 0.7% | | | | | | | | | |
| | CK Hutchison Holdings Ltd. | | | Industrial Conglomerates | | | | 180,040 | | | | 2,259,796 | |
| | | | | | | | | | | | | | |
| | | India 0.2% | | | | | | | | | |
| | Housing Development Finance Corp. Ltd. | | | Thrifts & Mortgage Finance | | | | 21,285 | | | | 531,944 | |
| | | | | | | | | | | | | | |
| | | Ireland 0.7% | | | | | | | | | |
| | CRH PLC | | | Construction Materials | | | | 60,390 | | | | 2,136,670 | |
| | | | | | | | | | | | | | |
| | | Israel 1.5% | | | | | | | | | |
| | Teva Pharmaceutical Industries Ltd., ADR | | | Pharmaceuticals | | | | 138,627 | | | | 4,605,189 | |
| | | | | | | | | | | | | | |
| | | Italy 1.2% | | | | | | | | | |
| | Eni SpA | | | Oil, Gas & Consumable Fuels | | | | 233,799 | | | | 3,514,469 | |
| | | | | | | | | | | | | | |
| | | | |
| | | |
| 44 | | Semiannual Report | | ftinstitutional.com |
TEMPLETON INSTITUTIONAL FUNDS
STATEMENT OF INVESTMENTS (UNAUDITED)
| | | | | | | | | | | | | | |
| Global Equity Series (continued) | | | | | | | | | |
| | | | | Industry | | | Shares | | | Value | |
| | | | | | | | | | | | | | |
| | | Common Stocks (continued) | | | | | | | | | |
| | | Japan 8.9% | | | | | | | | | |
| a | | IHI Corp. | | | Machinery | | | | 496,000 | | | $ | 1,684,420 | |
| | INPEX Corp. | | | Oil, Gas & Consumable Fuels | | | | 158,200 | | | | 1,520,329 | |
| | Konica Minolta Inc. | | | Technology Hardware, Storage & Peripherals | | | | 342,700 | | | | 2,839,458 | |
| | Nissan Motor Co. Ltd. | | | Automobiles | | | | 154,600 | | | | 1,536,585 | |
| | Omron Corp. | |
| Electronic Equipment, Instruments &
Components |
| | | 70,300 | | | | 3,046,740 | |
| | Panasonic Corp. | | | Household Durables | | | | 311,500 | | | | 4,220,349 | |
| | Ryohin Keikaku Co. Ltd. | | | Multiline Retail | | | | 6,500 | | | | 1,622,039 | |
| | SoftBank Group Corp. | | | Wireless Telecommunication Services | | | | 57,000 | | | | 4,609,761 | |
| | Sumitomo Metal Mining Co. Ltd. | | | Metals & Mining | | | | 147,000 | | | | 1,960,915 | |
| | Suntory Beverage & Food Ltd. | | | Beverages | | | | 84,700 | | | | 3,930,604 | |
| | | | | | | | | | | | | | |
| | | | | | | | | | | | | 26,971,200 | |
| | | | | | | | | | | | | | |
| | | Luxembourg 0.7% | | | | | | | | | |
| | SES SA, IDR | | | Media | | | | 95,350 | | | | 2,235,450 | |
| | | | | | | | | | | | | | |
| | | Netherlands 2.4% | | | | | | | | | |
| | Akzo Nobel NV | | | Chemicals | | | | 17,502 | | | | 1,521,165 | |
| | ING Groep NV | | | Banks | | | | 135,218 | | | | 2,332,237 | |
| | NN Group NV | | | Insurance | | | | 42,340 | | | | 1,505,052 | |
| | QIAGEN NV | | | Life Sciences Tools & Services | | | | 57,575 | | | | 1,915,407 | |
| | | | | | | | | | | | | | |
| | | | | | | | | | | | | 7,273,861 | |
| | | | | | | | | | | | | | |
| | | Norway 1.5% | | | | | | | | | |
| | Telenor ASA | | | Diversified Telecommunication Services | | | | 185,116 | | | | 3,071,701 | |
| | Yara International ASA | | | Chemicals | | | | 37,320 | | | | 1,402,177 | |
| | | | | | | | | | | | | | |
| | | | | | | | | | | | | 4,473,878 | |
| | | | | | | | | | | | | | |
| | | Portugal 1.2% | | | | | | | | | |
| | Galp Energia SGPS SA, B. | | | Oil, Gas & Consumable Fuels | | | | 242,940 | | | | 3,678,239 | |
| | | | | | | | | | | | | | |
| | | Singapore 0.6% | | | | | | | | | |
| | Singapore Telecommunications Ltd. | | | Diversified Telecommunication Services | | | | 627,204 | | | | 1,772,097 | |
| | | | | | | | | | | | | | |
| | | South Korea 3.7% | | | | | | | | | |
| | Hana Financial Group Inc | | | Banks | | | | 60,590 | | | | 2,394,642 | |
| | Hyundai Mobis Co. Ltd. | | | Auto Components | | | | 6,165 | | | | 1,346,152 | |
| | Samsung Electronics Co. Ltd. | | | Technology Hardware, Storage & Peripherals | | | | 3,591 | | | | 7,455,309 | |
| | | | | | | | | | | | | | |
| | | | | | | | | | | | | 11,196,103 | |
| | | | | | | | | | | | | | |
| | | Switzerland 2.4% | | | | | | | | | |
| | Roche Holding AG | | | Pharmaceuticals | | | | 14,360 | | | | 3,657,587 | |
| | UBS Group AG | | | Capital Markets | | | | 220,250 | | | | 3,730,754 | |
| | | | | | | | | | | | | | |
| | | | | | | | | | | | | 7,388,341 | |
| | | | | | | | | | | | | | |
| | | Taiwan 1.0% | | | | | | | | | |
| | Taiwan Semiconductor Manufacturing Co. Ltd., ADR | | | Semiconductors & Semiconductor Equipment | | | | 90,240 | | | | 3,154,790 | |
| | | | | | | | | | | | | | |
| | | Thailand 0.8% | | | | | | | | | |
| | Bangkok Bank PCL, NVDR | | | Banks | | | | 430,400 | | | | 2,347,406 | |
| | | | | | | | | | | | | | |
| | | United Kingdom 13.3% | | | | | | | | | |
| | Aviva PLC | | | Insurance | | | | 248,300 | | | | 1,701,206 | |
| | BAE Systems PLC | | | Aerospace & Defense | | | | 277,640 | | | | 2,290,989 | |
| | Barclays PLC | | | Banks | | | | 1,013,040 | | | | 2,675,358 | |
| | BP PLC | | | Oil, Gas & Consumable Fuels | | | | 1,095,713 | | | | 6,319,735 | |
| | GlaxoSmithKline PLC | | | Pharmaceuticals | | | | 74,600 | | | | 1,589,219 | |
| | HSBC Holdings PLC | | | Banks | | | | 552,800 | | | | 5,143,725 | |
| | | | | | |
| | | |
| ftinstitutional.com | | Semiannual Report | | | 45 | |
TEMPLETON INSTITUTIONAL FUNDS
STATEMENT OF INVESTMENTS (UNAUDITED)
| | | | | | | | | | | | | | |
| Global Equity Series (continued) | | | | | | | | | |
| | | | | Industry | | | Shares | | | Value | |
| | | | | | | | | | | | | | |
| | | Common Stocks (continued) | | | | | | | | | |
| | | United Kingdom (continued) | | | | | | | | | |
| | Kingfisher PLC | | | Specialty Retail | | | | 386,087 | | | $ | 1,512,213 | |
| a | | LivaNova PLC | | | Health Care Equipment & Supplies | | | | 37,100 | | | | 2,270,891 | |
| a | | Rolls-Royce Holdings PLC | | | Aerospace & Defense | | | | 145,920 | | | | 1,693,507 | |
| | Royal Dutch Shell PLC, B | | | Oil, Gas & Consumable Fuels | | | | 166,850 | | | | 4,482,441 | |
| | Sky PLC | | | Media | | | | 205,010 | | | | 2,654,336 | |
| a | | Standard Chartered PLC | | | Banks | | | | 353,208 | | | | 3,575,673 | |
| | Vodafone Group PLC | | | Wireless Telecommunication Services | | | | 1,574,482 | | | | 4,465,708 | |
| | | | | | | | | | | | | | |
| | | | | | | | | | | | | 40,375,001 | |
| | | | | | | | | | | | | | |
| | | United States 32.8% | | | | | | | | | |
| | Allegheny Technologies Inc. | | | Metals & Mining | | | | 65,450 | | | | 1,113,304 | |
| | Allergan PLC | | | Pharmaceuticals | | | | 18,040 | | | | 4,385,344 | |
| a | | Alphabet Inc., A | | | Internet Software & Services | | | | 6,180 | | | | 5,745,422 | |
| | American International Group Inc. | | | Insurance | | | | 47,690 | | | | 2,981,579 | |
| | Amgen Inc. | | | Biotechnology | | | | 24,000 | | | | 4,133,520 | |
| | Apache Corp. | | | Oil, Gas & Consumable Fuels | | | | 40,050 | | | | 1,919,596 | |
| | Apple Inc. | | | Technology Hardware, Storage & Peripherals | | | | 41,090 | | | | 5,917,782 | |
| | Applied Materials Inc. | | | Semiconductors & Semiconductor Equipment | | | | 35,920 | | | | 1,483,855 | |
| | Baker Hughes Inc. | | | Energy Equipment & Services | | | | 21,290 | | | | 1,160,518 | |
| | Capital One Financial Corp. | | | Consumer Finance | | | | 47,340 | | | | 3,911,231 | |
| a | | Celgene Corp. | | | Biotechnology | | | | 25,660 | | | | 3,332,464 | |
| | Citigroup Inc. | | | Banks | | | | 81,620 | | | | 5,458,746 | |
| | Comcast Corp., A | | | Media | | | | 134,640 | | | | 5,240,189 | |
| a | | CommScope Holding Co. Inc. | | | Communications Equipment | | | | 40,500 | | | | 1,540,215 | |
| | ConocoPhillips | | | Oil, Gas & Consumable Fuels | | | | 73,370 | | | | 3,225,345 | |
| | Coty Inc., A | | | Personal Products | | | | 19,700 | | | | 369,572 | |
| | Devon Energy Corp. | | | Oil, Gas & Consumable Fuels | | | | 46,820 | | | | 1,496,835 | |
| | DXC Technology Co. | | | IT Services | | | | 23,130 | | | | 1,774,534 | |
| | Eastman Chemical Co. | | | Chemicals | | | | 17,570 | | | | 1,475,704 | |
| | Eli Lilly & Co. | | | Pharmaceuticals | | | | 41,070 | | | | 3,380,061 | |
| | Gilead Sciences Inc. | | | Biotechnology | | | | 46,910 | | | | 3,320,290 | |
| | JPMorgan Chase & Co. | | | Banks | | | | 53,760 | | | | 4,913,664 | |
| a | | Knowles Corp. | |
| Electronic Equipment, Instruments &
Components |
| | | 106,380 | | | | 1,799,950 | |
| | Medtronic PLC | | | Health Care Equipment & Supplies | | | | 18,580 | | | | 1,648,975 | |
| | Microsoft Corp. | | | Software | | | | 88,280 | | | | 6,085,140 | |
| | Oracle Corp. | | | Software | | | | 133,710 | | | | 6,704,219 | |
| | Pfizer Inc. | | | Pharmaceuticals | | | | 38,800 | | | | 1,303,292 | |
| | Rockwell Collins Inc. | | | Aerospace & Defense | | | | 25,150 | | | | 2,642,762 | |
| | Stanley Black & Decker Inc. | | | Machinery | | | | 20,920 | | | | 2,944,072 | |
| | Twenty-First Century Fox Inc., A. | | | Media | | | | 68,120 | | | | 1,930,521 | |
| | Voya Financial Inc. | | | Diversified Financial Services | | | | 80,670 | | | | 2,975,916 | |
| | Walgreens Boots Alliance Inc. | | | Food & Staples Retailing | | | | 43,790 | | | | 3,429,195 | |
| | | | | | | | | | | | | | |
| | | | | | | | | | | | | 99,743,812 | |
| | | | | | | | | | | | | | |
| | Total Common Stocks (Cost $236,075,349) | | | | | | | | 291,672,989 | |
| | | | | | | | | | | | | | |
| | Preferred Stocks (Cost $1,775,191) 0.5% | | | | | | | | | |
| | | Germany 0.5% | | | | | | | | | |
| b | | Draegerwerk AG & Co. KGAA, 0.206%, pfd. | | | Health Care Equipment & Supplies | | | | 14,500 | | | | 1,525,583 | |
| | | | | | | | | | | | | | |
| | Total Investments before Short Term Investments (Cost $237,850,540) | | | | | | | | | | | 293,198,572 | |
| | | | | | | | | | | | | | |
| | | | |
| | | |
| 46 | | Semiannual Report | | ftinstitutional.com |
TEMPLETON INSTITUTIONAL FUNDS
STATEMENT OF INVESTMENTS (UNAUDITED)
| | | | | | | | | | |
| Global Equity Series (continued) | | | | | | |
| | | | | Principal
Amount | | | Value | |
| | | | | | | | | | |
| | | Short Term Investments 3.1% | | | | | | |
| | | Time Deposits 3.1% | | | | | | |
| | | United States 3.1% | | | | | | |
| | Bank of Montreal, 1.00%, 7/03/17 | | $ | 4,000,000 | | | $ | 4,000,000 | |
| | Royal Bank of Canada, 1.02%, 7/03/17 | | | 5,300,000 | | | | 5,300,000 | |
| | | | | | | | | | |
| | Total Time Deposits (Cost $9,300,000) | | | | | | | 9,300,000 | |
| | | | | | | | | | |
| | Total Investments (Cost $247,150,540) 99.6% | | | | | | | 302,498,572 | |
| | Other Assets, less Liabilities 0.4% | | | | | | | 1,327,696 | |
| | | | | | | | | | |
| | Net Assets 100.0% | | | | | | $ | 303,826,268 | |
| | | | | | | | | | |
See Abbreviations on page 71.
aNon-income producing.
bVariable rate security. The rate shown represents the yield at period end.
| | | | | | |
| | | |
| ftinstitutional.com | | The accompanying notes are an integral part of these financial statements. | Semiannual Report | | | 47 | |
TEMPLETON INSTITUTIONAL FUNDS
Financial Highlights
International Equity Series
| | | | | | | | | | | | | | | | | | | | | | | | |
| | | Six Months Ended
June 30, 2017 | | | Year Ended December 31, | |
| | | (unaudited) | | | 2016 | | | 2015 | | | 2014 | | | 2013 | | | 2012 | |
| | | | | | |
| Primary Shares | | | | | | | | | | | | | | | | | | | | | | | | |
| | | | | | |
Per share operating performance
(for a share outstanding throughout the period) | | | | | | | | | | | | | | | | | | | | | | | | |
| | | | | | |
Net asset value, beginning of period | | | $18.65 | | | | $19.05 | | | | $20.05 | | | | $22.72 | | | | $19.60 | | | | $17.04 | |
| | | | |
| | | | | | |
| Income from investment operationsa: | | | | | | | | | | | | | | | | | | | | | | | | |
| | | | | | |
Net investment incomeb | | | 0.31 | | | | 0.45 | | | | 0.45 | | | | 0.74 | c | | | 0.45 | | | | 0.48 | |
| | | | | | |
Net realized and unrealized gains (losses) | | | 2.16 | | | | (0.20 | ) | | | (0.98 | ) | | | (2.27 | ) | | | 3.36 | | | | 2.68 | |
| | | | |
| | | | | | |
Total from investment operations | | | 2.47 | | | | 0.25 | | | | (0.53 | ) | | | (1.53 | ) | | | 3.81 | | | | 3.16 | |
| | | | |
| | | | | | |
| Less distributions from: | | | | | | | | | | | | | | | | | | | | | | | | |
| | | | | | |
Net investment income | | | — | | | | (0.46 | ) | | | (0.47 | ) | | | (0.79 | ) | | | (0.44 | ) | | | (0.58 | ) |
| | | | | | |
Net realized gains | | | — | | | | (0.19 | ) | | | — | | | | (0.35 | ) | | | (0.25 | ) | | | (0.02 | ) |
| | | | |
| | | | | | |
Total distributions | | | — | | | | (0.65 | ) | | | (0.47 | ) | | | (1.14 | ) | | | (0.69 | ) | | | (0.60 | ) |
| | | | |
| | | | | | |
Net asset value, end of period | | | $21.12 | | | | $18.65 | | | | $19.05 | | | | $20.05 | | | | $22.72 | | | | $19.60 | |
| | | | |
| | | | | | |
Total returnd | | | 13.24% | | | | 1.30% | | | | (2.67)% | | | | (6.78)% | | | | 19.51% | | | | 18.55% | |
| | | | | | |
| Ratios to average net assetse | | | | | | | | | | | | | | | | | | | | | | | | |
| | | | | | |
Expenses | | | 0.78% | f | | | 0.78% | f | | | 0.78% | f | | | 0.78% | f | | | 0.79% | | | | 0.80% | |
| | | | | | |
Net investment income | | | 3.16% | | | | 2.44% | | | | 2.16% | | | | 3.27% | c | | | 2.12% | | | | 2.66% | |
| | | | | | |
| Supplemental data | | | | | | | | | | | | | | | | | | | | | | | | |
| | | | | | |
Net assets, end of period (000’s) | | | $4,961,818 | | | | $4,539,205 | | | | $5,077,937 | | | | $6,210,850 | | | | $6,815,920 | | | | $5,820,506 | |
| | | | | | |
Portfolio turnover rate | | | 8.39% | | | | 14.88% | | | | 16.16% | | | | 14.97% | | | | 15.89% | | | | 11.94% | |
aThe amount shown for a share outstanding throughout the period may not correlate with the Statement of Operations for the period due to the timing of sales and repurchases of the Fund’s shares in relation to income earned and/or fluctuating fair value of the investments of the Fund.
bBased on average daily shares outstanding.
cNet investment income per share includes approximately $0.29 per share related to income received in the form of special dividends in connection with certain Fund holdings. Excluding this amount, the ratio of net investment income to average net assets would have been 2.00%.
dTotal return does not reflect sales commissions or contingent deferred sales charges, if applicable, and is not annualized for periods less than one year.
eRatios are annualized for periods less than one year.
fBenefit of waiver and payments by affiliates rounds to less than 0.01%.
| | | | |
| | | |
| 48 | | Semiannual Report | The accompanying notes are an integral part of these financial statements. | | ftinstitutional.com |
TEMPLETON INSTITUTIONAL FUNDS
FINANCIAL HIGHLIGHTS
International Equity Series (continued)
| | | | | | | | | | | | | | | | | | | | | | | | |
| | | Six Months Ended
June 30, 2017 | | | Year Ended December 31, | |
| | | (unaudited) | | | 2016 | | | 2015 | | | 2014 | | | 2013 | | | 2012 | |
| | | | | | |
| Service Shares | | | | | | | | | | | | | | | | | | | | | | | | |
| | | | | | |
Per share operating performance
(for a share outstanding throughout the period) | | | | | | | | | | | | | | | | | | | | | | | | |
| | | | | | |
Net asset value, beginning of period | | | $18.72 | | | | $19.11 | | | | $20.11 | | | | $22.79 | | | | $19.62 | | | | $17.02 | |
| | | | |
| | | | | | |
| Income from investment operationsa: | | | | | | | | | | | | | | | | | | | | | | | | |
| | | | | | |
Net investment incomeb | | | 0.31 | | | | 0.42 | | | | 0.36 | | | | 0.71 | c | | | 0.48 | | | | 0.55 | |
| | | | | | |
Net realized and unrealized gains (losses) | | | 2.15 | | | | (0.20 | ) | | | (0.92 | ) | | | (2.28 | ) | | | 3.30 | | | | 2.59 | |
| | | | |
| | | | | | |
Total from investment operations | | | 2.46 | | | | 0.22 | | | | (0.56 | ) | | | (1.57 | ) | | | 3.78 | | | | 3.14 | |
| | | | |
| | | | | | |
| Less distributions from: | | | | | | | | | | | | | | | | | | | | | | | | |
| | | | | | |
Net investment income | | | — | | | | (0.42 | ) | | | (0.44 | ) | | | (0.76 | ) | | | (0.36 | ) | | | (0.52 | ) |
| | | | | | |
Net realized gains | | | — | | | | (0.19 | ) | | | — | | | | (0.35 | ) | | | (0.25 | ) | | | (0.02 | ) |
| | | | |
| | | | | | |
Total distributions | | | — | | | | (0.61 | ) | | | (0.44 | ) | | | (1.11 | ) | | | (0.61 | ) | | | (0.54 | ) |
| | | | |
| | | | | | |
Net asset value, end of period | | | $21.18 | | | | $18.72 | | | | $19.11 | | | | $20.11 | | | | $22.79 | | | | $19.62 | |
| | | | |
| | | | | | |
Total returnd | | | 13.14% | | | | 1.15% | | | | (2.80)% | | | | (6.95)% | | | | 19.31% | | | | 18.45% | |
| | | | | | |
| Ratios to average net assetse | | | | | | | | | | | | | | | | | | | | | | | | |
| | | | | | |
Expenses | | | 0.93% | f | | | 0.93% | f | | | 0.93% | f | | | 0.93% | f | | | 0.94% | | | | 0.95% | |
| | | | | | |
Net investment income | | | 3.01% | | | | 2.29% | | | | 2.01% | | | | 3.12% | c | | | 1.97% | | | | 2.51% | |
| | | | | | |
| Supplemental data | | | | | | | | | | | | | | | | | | | | | | | | |
| | | | | | |
Net assets, end of period (000’s) | | | $13,531 | | | | $8,624 | | | | $12,525 | | | | $6,985 | | | | $7,705 | | | | $19,637 | |
| | | | | | |
Portfolio turnover rate | | | 8.39% | | | | 14.88% | | | | 16.16% | | | | 14.97% | | | | 15.89% | | | | 11.94% | |
aThe amount shown for a share outstanding throughout the period may not correlate with the Statement of Operations for the period due to the timing of sales and repurchases of the Fund’s shares in relation to income earned and/or fluctuating fair value of the investments of the Fund.
bBased on average daily shares outstanding.
cNet investment income per share includes approximately $0.29 per share related to income received in the form of special dividends in connection with certain Fund holdings. Excluding this amount, the ratio of net investment income to average net assets would have been 1.85%.
dTotal return does not reflect sales commissions or contingent deferred sales charges, if applicable, and is not annualized for periods less than one year.
eRatios are annualized for periods less than one year.
fBenefit of waiver and payments by affiliates rounds to less than 0.01%.
| | | | | | |
| | | |
| ftinstitutional.com | | The accompanying notes are an integral part of these financial statements. | Semiannual Report | | | 49 | |
TEMPLETON INSTITUTIONAL FUNDS
Statement of Investments, June 30, 2017 (unaudited)
| | | | | | | | | | | | | | |
| International Equity Series | |
| | | | | Industry | | | Shares | | | Value | |
| | | Common Stocks 97.0% | | | | | | | | | |
| | | Brazil 0.4% | | | | | | | | | |
| | Embraer SA, ADR | | | Aerospace & Defense | | | | 1,223,882 | | | $ | 22,311,369 | |
| | | | | | | | | | | | | | |
| | | Canada 2.8% | | | | | | | | | |
| a | | Husky Energy Inc. | | | Oil, Gas & Consumable Fuels | | | | 2,065,400 | | | | 23,456,150 | |
| | Suncor Energy Inc. | | | Oil, Gas & Consumable Fuels | | | | 1,519,060 | | | | 44,406,267 | |
| | Tahoe Resources Inc. | | | Metals & Mining | | | | 3,218,968 | | | | 27,765,353 | |
| | Wheaton Precious Metals Corp. | | | Metals & Mining | | | | 2,204,200 | | | | 43,806,806 | |
| | | | | | | | | | | | | | |
| | | | | | | | | | | | | 139,434,576 | |
| | | | | | | | | | | | | | |
| | | China 5.8% | | | | | | | | | |
| a | | Baidu Inc., ADR | | | Internet Software & Services | | | | 255,090 | | | | 45,625,397 | |
| | China Life Insurance Co. Ltd., H | | | Insurance | | | | 12,715,000 | | | | 38,839,967 | |
| | China Mobile Ltd. | | | Wireless Telecommunication Services | | | | 4,409,440 | | | | 46,789,677 | |
| | China Telecom Corp. Ltd., H | | | Diversified Telecommunication Services | | | | 116,918,040 | | | | 55,555,817 | |
| | Haier Electronics Group Co. Ltd. | | | Household Durables | | | | 19,577,700 | | | | 50,901,644 | |
| | Sinopharm Group Co. Ltd. | | | Health Care Providers & Services | | | | 11,080,400 | | | | 50,096,138 | |
| | | | | | | | | | | | | | |
| | | | | | | | | | | | | 287,808,640 | |
| | | | | | | | | | | | | | |
| | | France 10.0% | | | | | | | | | |
| | AXA SA | | | Insurance | | | | 2,492,600 | | | | 68,189,777 | |
| | BNP Paribas SA | | | Banks | | | | 1,352,940 | | | | 97,452,653 | |
| | Cie Generale des Etablissements Michelin, B | | | Auto Components | | | | 462,179 | | | | 61,450,349 | |
| | Compagnie de Saint-Gobain | | | Building Products | | | | 1,025,330 | | | | 54,787,949 | |
| | Sanofi | | | Pharmaceuticals | | | | 864,789 | | | | 82,738,566 | |
| | Total SA | | | Oil, Gas & Consumable Fuels | | | | 1,325,773 | | | | 65,549,254 | |
| | Veolia Environnement SA | | | Multi-Utilities | | | | 1,549,120 | | | | 32,735,422 | |
| | Zodiac Aerospace | | | Aerospace & Defense | | | | 1,337,470 | | | | 36,283,471 | |
| | | | | | | | | | | | | | |
| | | | | | | | | | | | | 499,187,441 | |
| | | | | | | | | | | | | | |
| | | Germany 11.5% | | | | | | | | | |
| | Bayer AG | | | Pharmaceuticals | | | | 671,726 | | | | 86,855,984 | |
| | Deutsche Lufthansa AG | | | Airlines | | | | 2,006,750 | | | | 45,672,287 | |
| | HeidelbergCement AG | | | Construction Materials | | | | 473,190 | | | | 45,753,433 | |
| | Infineon Technologies AG | | | Semiconductors & Semiconductor Equipment | | | | 2,354,534 | | | | 49,714,787 | |
| | innogy SE | | | Multi-Utilities | | | | 1,285,850 | | | | 50,620,887 | |
| | Lanxess AG | | | Chemicals | | | | 710,490 | | | | 53,798,126 | |
| | Merck KGaA | | | Pharmaceuticals | | | | 673,538 | | | | 81,358,633 | |
| | Metro AG | | | Food & Staples Retailing | | | | 760,370 | | | | 25,669,482 | |
| | SAP SE | | | Software | | | | 478,021 | | | | 49,933,482 | |
| | Siemens AG | | | Industrial Conglomerates | | | | 429,650 | | | | 59,063,894 | |
| | Telefonica Deutschland Holding AG | | | Diversified Telecommunication Services | | | | 4,503,722 | | | | 22,496,358 | |
| | | | | | | | | | | | | | |
| | | | | | | | | | | | | 570,937,353 | |
| | | | | | | | | | | | | | |
| | | Hong Kong 2.7% | | | | | | | | | |
| | AIA Group Ltd. | | | Insurance | | | | 4,975,110 | | | | 36,352,345 | |
| | Cheung Kong Property Holdings Ltd. | | | Real Estate Management & Development | | | | 3,338,743 | | | | 26,148,908 | |
| | CK Hutchison Holdings Ltd. | | | Industrial Conglomerates | | | | 5,604,743 | | | | 70,348,668 | |
| | | | | | | | | | | | | | |
| | | | | | | | | | | | | 132,849,921 | |
| | | | | | | | | | | | | | |
| | | India 1.2% | | | | | | | | | |
| | Housing Development Finance Corp. Ltd. | | | Thrifts & Mortgage Finance | | | | 2,309,793 | | | | 57,725,166 | |
| | | | | | | | | | | | | | |
| | | Ireland 1.3% | | | | | | | | | |
| | CRH PLC | | | Construction Materials | | | | 1,839,312 | | | | 65,501,062 | |
| | | | | | | | | | | | | | |
| | | Israel 1.2% | | | | | | | | | |
| | Teva Pharmaceutical Industries Ltd., ADR | | | Pharmaceuticals | | | | 1,835,119 | | | | 60,962,653 | |
| | | | | | | | | | | | | | |
| | | | |
| | | |
| 50 | | Semiannual Report | | ftinstitutional.com |
TEMPLETON INSTITUTIONAL FUNDS
STATEMENT OF INVESTMENTS (UNAUDITED)
International Equity Series (continued)
| | | | | | | | | | | | | | |
| | | | | Industry | | | Shares | | | Value | |
| | | Common Stocks (continued) | | | | | | | | | |
| | | Italy 2.1% | | | | | | | | | |
| | Eni SpA | | | Oil, Gas & Consumable Fuels | | | | 2,971,985 | | | $ | 44,674,908 | |
| | Intesa Sanpaolo SpA | | | Banks | | | | 8,109,523 | | | | 25,714,372 | |
| | Tenaris SA | | | Energy Equipment & Services | | | | 2,338,200 | | | | 36,456,542 | |
| | | | | | | | | | | | | | |
| | | | | | | | | | | | | 106,845,822 | |
| | | | | | | | | | | | | | |
| | | Japan 10.1% | | | | | | | | | |
| | INPEX Corp. | | | Oil, Gas & Consumable Fuels | | | | 4,241,600 | | | | 40,762,498 | |
| | Konica Minolta Inc. | | | Technology Hardware, Storage & Peripherals | | | | 3,564,200 | | | | 29,531,354 | |
| | Mitsui Fudosan Co. Ltd. | | | Real Estate Management & Development | | | | 1,618,500 | | | | 38,568,603 | |
| | Nissan Motor Co. Ltd. | | | Automobiles | | | | 5,948,100 | | | | 59,118,779 | |
| | Omron Corp. | | | Electronic Equipment, Instruments & Components | | | | 1,041,900 | | | | 45,155,021 | |
| | Panasonic Corp. | | | Household Durables | | �� | | 2,397,100 | | | | 32,477,045 | |
| | Ryohin Keikaku Co. Ltd. | | | Multiline Retail | | | | 154,900 | | | | 38,654,425 | |
| | SoftBank Group Corp. | | | Wireless Telecommunication Services | | | | 900,100 | | | | 72,793,792 | |
| | Sumitomo Metal Mining Co. Ltd. | | | Metals & Mining | | | | 3,153,000 | | | | 42,059,621 | |
| | Sumitomo Rubber Industries Ltd. | | | Auto Components | | | | 1,993,400 | | | | 33,599,915 | |
| | Suntory Beverage & Food Ltd. | | | Beverages | | | | 1,497,600 | | | | 69,497,906 | |
| | | | | | | | | | | | | | |
| | | | | | | | | | | | | 502,218,959 | |
| | | | | | | | | | | | | | |
| | | Netherlands 7.3% | | | | | | | | | |
| | Akzo Nobel NV | | | Chemicals | | | | 912,330 | | | | 79,294,068 | |
| | ASR Nederland NV | | | Insurance | | | | 1,895,890 | | | | 63,938,759 | |
| | ING Groep NV | | | Banks | | | | 5,062,550 | | | | 87,318,735 | |
| | NN Group NV | | | Insurance | | | | 1,040,520 | | | | 36,987,177 | |
| | QIAGEN NV | | | Life Sciences Tools & Services | | | | 1,455,690 | | | | 48,427,940 | |
| | SBM Offshore NV | | | Energy Equipment & Services | | | | 2,907,857 | | | | 46,600,640 | |
| | | | | | | | | | | | | | |
| | | | | | | | | | | | | 362,567,319 | |
| | | | | | | | | | | | | | |
| | | Norway 1.9% | | | | | | | | | |
| | Telenor ASA | | | Diversified Telecommunication Services | | | | 3,920,078 | | | | 65,047,361 | |
| | Yara International ASA | | | Chemicals | | | | 842,216 | | | | 31,643,516 | |
| | | | | | | | | | | | | | |
| | | | | | | | | | | | | 96,690,877 | |
| | | | | | | | | | | | | | |
| | | Portugal 0.7% | | | | | | | | | |
| | Galp Energia SGPS SA, B | | | Oil, Gas & Consumable Fuels | | | | 2,358,660 | | | | 35,711,347 | |
| | | | | | | | | | | | | | |
| | | Singapore 3.4% | | | | | | | | | |
| | DBS Group Holdings Ltd. | | | Banks | | | | 4,011,113 | | | | 60,423,071 | |
| | Singapore Telecommunications Ltd. | | | Diversified Telecommunication Services | | | | 23,205,260 | | | | 65,563,961 | |
| | United Overseas Bank Ltd. | | | Banks | | | | 2,418,800 | | | | 40,617,850 | |
| | | | | | | | | | | | | | |
| | | | | | | | | | | | | 166,604,882 | |
| | | | | | | | | | | | | | |
| | | South Korea 6.4% | | | | | | | | | |
| | Hana Financial Group Inc. | | | Banks | | | | 835,043 | | | | 33,002,625 | |
| | Hyundai Mobis Co. Ltd. | | | Auto Components | | | | 220,719 | | | | 48,194,868 | |
| | Hyundai Motor Co. | | | Automobiles | | | | 175,174 | | | | 24,403,459 | |
| | KB Financial Group Inc. | | | Banks | | | | 991,974 | | | | 49,991,615 | |
| | Samsung Electronics Co. Ltd. | | | Technology Hardware, Storage & Peripherals | | | | 79,408 | | | | 164,859,700 | |
| | | | | | | | | | | | | | |
| | | | | | | | | | | | | 320,452,267 | |
| | | | | | | | | | | | | | |
| | | Spain 0.9% | | | | | | | | | |
| | Telefonica SA | | | Diversified Telecommunication Services | | | | 4,136,643 | | | | 42,705,277 | |
| | | | | | | | | | | | | | |
| | | Sweden 0.8% | | | | | | | | | |
| | Getinge AB, B | | | Health Care Equipment & Supplies | | | | 1,945,231 | | | | 38,089,247 | |
| | | | | | | | | | | | | | |
| | | | | | |
| | | |
| ftinstitutional.com | | Semiannual Report | | | 51 | |
TEMPLETON INSTITUTIONAL FUNDS
STATEMENT OF INVESTMENTS (UNAUDITED)
International Equity Series (continued)
| | | | | | | | | | | | | | |
| | | | | Industry | | | Shares | | | Value | |
| | | Common Stocks (continued) | | | | | | | | | |
| | | Switzerland 5.3% | | | | | | | | | |
| | Glencore PLC | | | Metals & Mining | | | | 5,392,280 | | | $ | 20,172,109 | |
| | Novartis AG | | | Pharmaceuticals | | | | 566,274 | | | | 47,132,897 | |
| | Roche Holding AG | | | Pharmaceuticals | | | | 397,640 | | | | 101,281,552 | |
| | Swiss Re AG | | | Insurance | | | | 414,905 | | | | 37,931,080 | |
| | UBS Group AG | | | Capital Markets | | | | 3,421,340 | | | | 57,953,128 | |
| | | | | | | | | | | | | | |
| | | | | | | | | | | | | 264,470,766 | |
| | | | | | | | | | | | | | |
| | | Taiwan 2.7% | | | | | | | | | |
| | Catcher Technology Co. Ltd. | | | Technology Hardware, Storage & Peripherals | | | | 4,568,000 | | | | 54,631,440 | |
| | Pegatron Corp. | | | Technology Hardware, Storage & Peripherals | | | | 10,897,000 | | | | 34,167,405 | |
| | Taiwan Semiconductor Manufacturing Co. Ltd. | | | Semiconductors & Semiconductor Equipment | | | | 6,754,492 | | | | 46,335,184 | |
| | | | | | | | | | | | | | |
| | | | | | | | | | | | | 135,134,029 | |
| | | | | | | | | | | | | | |
| | | Thailand 1.0% | | | | | | | | | |
| | Bangkok Bank PCL, fgn | | | Banks | | | | 209,100 | | | | 1,214,407 | |
| | Bangkok Bank PCL, NVDR | | | Banks | | | | 9,163,600 | | | | 49,978,361 | |
| | | | | | | | | | | | | | |
| | | | | | | | | | | | | 51,192,768 | |
| | | | | | | | | | | | | | |
| | | United Kingdom 16.5% | | | | | | | | | |
| | Aviva PLC | | | Insurance | | | | 4,948,179 | | | | 33,902,020 | |
| | BAE Systems PLC | | | Aerospace & Defense | | | | 7,880,361 | | | | 65,026,018 | |
| | Barclays PLC | | | Banks | | | | 19,101,850 | | | | 50,446,463 | |
| | BP PLC | | | Oil, Gas & Consumable Fuels | | | | 20,474,911 | | | | 118,092,976 | |
| | GlaxoSmithKline PLC | | | Pharmaceuticals | | | | 1,750,912 | | | | 37,300,040 | |
| | HSBC Holdings PLC | | | Banks | | | | 9,094,103 | | | | 84,619,331 | |
| | Johnson Matthey PLC | | | Chemicals | | | | 552,365 | | | | 20,656,359 | |
| | Kingfisher PLC | | | Specialty Retail | | | | 8,515,147 | | | | 33,351,856 | |
| a | | LivaNova PLC | | | Health Care Equipment & Supplies | | | | 689,590 | | | | 42,209,804 | |
| | London Stock Exchange Group PLC | | | Capital Markets | | | | 553,700 | | | | 26,295,753 | |
| a | | Rolls-Royce Holdings PLC | | | Aerospace & Defense | | | | 2,533,640 | | | | 29,404,720 | |
| | Royal Dutch Shell PLC, B | | | Oil, Gas & Consumable Fuels | | | | 1,474,388 | | | | 39,609,574 | |
| | Royal Dutch Shell PLC, B, ADR | | | Oil, Gas & Consumable Fuels | | | | 1,218,811 | | | | 66,339,883 | |
| | Sky PLC | | | Media | | | | 1,864,320 | | | | 24,137,999 | |
| a | | Standard Chartered PLC | | | Banks | | | | 7,068,831 | | | | 71,560,740 | |
| | Travis Perkins PLC | | | Trading Companies & Distributors | | | | 1,174,860 | | | | 22,266,069 | |
| | Vodafone Group PLC | | | Wireless Telecommunication Services | | | | 19,365,878 | | | | 54,927,494 | |
| | | | | | | | | | | | | | |
| | | | | | | | | | | | | 820,147,099 | |
| | | | | | | | | | | | | | |
| | | United States 1.0% | | | | | | | | | |
| | Chubb Ltd. | | | Insurance | | | | 345,010 | | | | 50,157,554 | |
| | | | | | | | | | | | | | |
| | Total Common Stocks
(Cost $3,382,461,679) | | | | | | | | 4,829,706,394 | |
| | | | | | | | | | | | | | |
| | | | |
| | | |
| 52 | | Semiannual Report | | ftinstitutional.com |
TEMPLETON INSTITUTIONAL FUNDS
STATEMENT OF INVESTMENTS (UNAUDITED)
International Equity Series (continued)
| | | | | | | | | | |
| | | | | Shares | | | Value | |
| | | Short Term Investments (Cost $123,123,322) 2.5% | | | | | | |
| | | Money Market Funds 2.5% | | | | | | |
| | | United States 2.5% | | | | | | |
| b,c | | Institutional Fiduciary Trust Money Market Portfolio, 0.58% | | | 123,123,322 | | | $ | 123,123,322 | |
| | | | | | | | | | |
| | Total Investments (Cost $3,505,585,001) 99.5% | | | | | | | 4,952,829,716 | |
| | Other Assets, less Liabilities 0.5% | | | | | | | 22,519,270 | |
| | | | | | | | | | |
| | Net Assets 100.0% | | | | | | $ | 4,975,348,986 | |
| | | | | | | | | | |
See Abbreviations on page 71.
aNon-income producing.
bSee Note 3(d) regarding investments in affiliated management investment companies.
cThe rate shown is the annualized seven-day yield at period end.
| | | | | | |
| | | |
| ftinstitutional.com | | The accompanying notes are an integral part of these financial statements. | Semiannual Report | | | 53 | |
TEMPLETON INSTITUTIONAL FUNDS
Financial Statements
Statements of Assets and Liabilities
June 30, 2017 (unaudited)
| | | | | | | | |
| | | Emerging
Markets Series | | | Foreign Smaller
Companies Series | |
Assets: | | | | | | | | |
Investments in securities: | | | | | | | | |
Cost - Unaffiliated issuers | | | $34,775,492 | | | | $766,907,862 | |
Cost - Non-controlled affiliates (Note 3d) | | | 2,018,434 | | | | 21,603,092 | |
| | | | |
Total cost of investments | | | $36,793,926 | | | | $788,510,954 | |
| | | | |
Value - Unaffiliated issuers | | | $47,824,204 | | | | $1,031,692,675 | |
Value - Non-controlled affiliates (Note 3d) | | | 2,018,434 | | | | 21,603,092 | |
| | | | |
Total value of investments* | | | 49,842,638 | | | | 1,053,295,767 | |
Cash | | | — | | | | 2,621,296 | |
Foreign currency, at value (cost $298 and $—, respectively) | | | 297 | | | | — | |
Receivables: | | | | | | | | |
Investment securities sold | | | 14,590 | | | | 544,583 | |
Capital shares sold | | | 25,012 | | | | 372,294 | |
Dividends | | | 209,439 | | | | 3,499,086 | |
European Union tax reclaims | | | — | | | | 794,699 | |
Other assets | | | 28 | | | | 624 | |
| | | | |
Total assets | | | 50,092,004 | | | | 1,061,128,349 | |
| | | | |
Liabilities: | | | | | | | | |
Payables: | | | | | | | | |
Investment securities purchased | | | 89,463 | | | | — | |
Capital shares redeemed | | | 1,442 | | | | 6,154,616 | |
Management fees | | | 41,862 | | | | 806,327 | |
Transfer agent fees | | | 63 | | | | 951 | |
Trustees’ fees and expenses | | | 370 | | | | 1,860 | |
Professional fees | | | 16,414 | | | | 33,569 | |
Payable upon return of securities loaned | | | — | | | | 21,603,092 | |
Deferred tax | | | 47,300 | | | | 492,126 | |
Accrued expenses and other liabilities | | | 12,473 | | | | 94,039 | |
| | | | |
Total liabilities | | | 209,387 | | | | 29,186,580 | |
| | | | |
Net assets, at value | | | $49,882,617 | | | | $1,031,941,769 | |
| | | | |
Net assets consist of: | | | | | | | | |
Paid-in capital | | | $46,029,491 | | | | $740,178,282 | |
Undistributed net investment income | | | — | | | | 4,674,051 | |
Distributions in excess of net investment income | | | (236,551 | ) | | | — | |
Net unrealized appreciation (depreciation) | | | 12,991,040 | | | | 264,335,045 | |
Accumulated net realized gain (loss) | | | (8,901,363 | ) | | | 22,754,391 | |
| | | | |
Net assets, at value | | | $49,882,617 | | | | $1,031,941,769 | |
| | | | |
Shares outstanding | | | 9,507,277 | | | | 43,108,963 | |
| | | | |
Net asset value per share | | | $5.25 | | | | $23.94 | |
| | | | |
| | | | | | | | |
*Includes securities loaned | | $ | — | | | $ | 20,804,255 | |
| | | | |
| | | |
| 54 | | Semiannual Report | The accompanying notes are an integral part of these financial statements. | | ftinstitutional.com |
TEMPLETON INSTITUTIONAL FUNDS
FINANCIAL STATEMENTS
Statements of Assets and Liabilities (continued)
June 30, 2017 (unaudited)
| | | | | | | | |
| | | Global
Equity Series | | | International
Equity Series | |
Assets: | | | | | | | | |
Investments in securities: | | | | | | | | |
Cost - Unaffiliated issuers | | $ | 247,150,540 | | | $ | 3,382,461,679 | |
Cost - Non-controlled affiliates (Note 3d) | | | — | | | | 123,123,322 | |
| | | | |
Total cost of investments | | $ | 247,150,540 | | | $ | 3,505,585,001 | |
| | | | |
Value - Unaffiliated issuers | | $ | 302,498,572 | | | $ | 4,829,706,394 | |
Value - Non-controlled affiliates (Note 3d) | | | — | | | | 123,123,322 | |
| | | | |
Total value of investments | | | 302,498,572 | | | | 4,952,829,716 | |
Cash | | | 268,887 | | | | — | |
Receivables: | | | | | | | | |
Investment securities sold | | | 394,241 | | | | 114,084 | |
Capital shares sold | | | 6,060 | | | | 3,146,947 | |
Dividends | | | 1,151,967 | | | | 21,373,504 | |
Foreign tax | | | 14,286 | | | | — | |
European Union tax reclaims | | | 54,052 | | | | 7,830,033 | |
Other assets | | | 183 | | | | 3,048 | |
| | | | |
Total assets | | | 304,388,248 | | | | 4,985,297,332 | |
| | | | |
Liabilities: | | | | | | | | |
Payables: | | | | | | | | |
Investment securities purchased | | | 330,752 | | | | — | |
Capital shares redeemed | | | 433 | | | | 6,450,964 | |
Management fees | | | 192,402 | | | | 3,079,073 | |
Transfer agent fees | | | — | | | | 32,855 | |
Professional fees | | | 23,367 | | | | 14,074 | |
Accrued expenses and other liabilities | | | 15,026 | | | | 371,380 | |
| | | | |
Total liabilities | | | 561,980 | | | | 9,948,346 | |
| | | | |
Net assets, at value | | $ | 303,826,268 | | | $ | 4,975,348,986 | |
| | | | |
Net assets consist of: | | | | | | | | |
Paid-in capital | | $ | 243,205,450 | | | $ | 3,505,772,395 | |
Undistributed net investment income | | | 3,300,608 | | | | 40,449,255 | |
Net unrealized appreciation (depreciation) | | | 55,346,072 | | | | 1,447,381,363 | |
Accumulated net realized gain (loss) | | | 1,974,138 | | | | (18,254,027 | ) |
| | | | |
Net assets, at value | | $ | 303,826,268 | | | $ | 4,975,348,986 | |
| | | | |
Shares outstanding | | | 30,461,871 | | | | | |
| | | | | | | | |
Net asset value per share | | | $9.97 | | | | | |
| | | | | | | | |
| | |
| Primary Shares: | | | | | | | | |
Net assets, at value | | | | | | $ | 4,961,818,328 | |
| | | | | | | | |
Shares outstanding | | | | | | | 234,929,585 | |
| | | | | | | | |
Net asset value per share | | | | | | | $21.12 | |
| | | | | | | | |
| | |
| Service Shares: | | | | | | | | |
Net assets, at value | | | | | | $ | 13,530,658 | |
| | | | | | | | |
Shares outstanding | | | | | | | 638,782 | |
| | | | | | | | |
Net asset value per share | | | | | | | $21.18 | |
| | | | | | | | |
| | | | | | |
| | | |
| ftinstitutional.com | | The accompanying notes are an integral part of these financial statements. | Semiannual Report | | | 55 | |
TEMPLETON INSTITUTIONAL FUNDS
FINANCIAL STATEMENTS
Statements of Operations
for the six months ended June 30, 2017 (unaudited)
| | | | | | | | |
| | | Emerging
Markets Series | | | Foreign Smaller
Companies Series | |
Investment income: | | | | | | | | |
Dividends: (net of foreign taxes)a | | | | | | | | |
Unaffiliated issuers | | | $474,818 | | | | $13,225,905 | |
Non-controlled affiliates (Note 3d) | | | 1,442 | | | | — | |
Interest | | | — | | | | 142,335 | |
Income from securities loaned (net of fees and rebates) | | | — | | | | 445,400 | |
| | | | |
Total investment income | | | 476,260 | | | | 13,813,640 | |
| | | | |
Expenses: | | | | | | | | |
Management fees (Note 3a) | | | 263,934 | | | | 4,692,677 | |
Transfer agent fees (Note 3c) | | | 674 | | | | 4,130 | |
Custodian fees (Note 4) | | | 7,813 | | | | 73,199 | |
Reports to shareholders | | | 2,417 | | | | 13,479 | |
Registration and filing fees | | | 10,199 | | | | 22,724 | |
Professional fees | | | 32,715 | | | | 54,773 | |
Trustees’ fees and expenses | | | 371 | | | | 20,375 | |
Other | | | 12,521 | | | | 18,349 | |
| | | | |
Total expenses | | | 330,644 | | | | 4,899,706 | |
Expense reductions (Note 4) | | | (76 | ) | | | (49,111 | ) |
Expenses waived/paid by affiliates (Note 3d and 3e) | | | (29,402 | ) | | | (37,831 | ) |
| | | | |
Net expenses | | | 301,166 | | | | 4,812,764 | |
| | | | |
Net investment income | | | 175,094 | | | | 9,000,876 | |
| | | | |
Realized and unrealized gains (losses): | | | | | | | | |
Net realized gain (loss) from: | | | | | | | | |
Investments (net of foreign taxes)b | | | 1,653,630 | | | | 24,975,976 | |
Foreign currency transactions | | | 8,232 | | | | (150,820 | ) |
| | | | |
Net realized gain (loss) | | | 1,661,862 | | | | 24,825,156 | |
| | | | |
Net change in unrealized appreciation (depreciation) on: | | | | | | | | |
Investments | | | 7,151,316 | | | | 148,142,697 | |
Translation of other assets and liabilities
denominated in foreign currencies | | | 9,929 | | | | 178,766 | |
Change in deferred taxes on unrealized appreciation | | | 34,023 | | | | (492,126 | ) |
| | | | |
Net change in unrealized appreciation (depreciation) | | | 7,195,268 | | | | 147,829,337 | |
| | | | |
Net realized and unrealized gain (loss) | | | 8,857,130 | | | | 172,654,493 | |
| | | | |
Net increase (decrease) in net assets resulting from operations | | | $9,032,224 | | | | $181,655,369 | |
| | | | |
| | | | | | | | |
| | | | | | | | |
| | | | | | | | |
| | | | | | | | |
| | | | | | | | |
| | | | | | | | |
| | | | | | | | |
| | | | | | | | |
| | | | | | | | |
| | | | | | | | |
| | | | | | | | |
| | | | | | | | |
| | | | | | | | |
| | | | | | | | |
aForeign taxes withheld on dividends | | | $105,889 | | | | $1,786,269 | |
bNet of foreign taxes | | | 6,216 | | | | — | |
| | | | |
| | | |
| 56 | | Semiannual Report | The accompanying notes are an integral part of these financial statements. | | ftinstitutional.com |
TEMPLETON INSTITUTIONAL FUNDS
FINANCIAL STATEMENTS
Statements of Operations (continued)
for the six months ended June 30, 2017 (unaudited)
| | | | | | | | |
| | | Global
Equity Series | | | International
Equity Series | |
Investment income: | | | | | | | | |
Dividends: (net of foreign taxes)a | | | | | | | | |
Unaffiliated issuers | | | $4,413,989 | | | | $92,533,586 | |
Non-controlled affiliates (Note 3d) | | | — | | | | 127,499 | |
Interest | | | 34,611 | | | | 104,111 | |
Income from securities loaned (net of fees and rebates) | | | 8,360 | | | | 75,312 | |
Other income (Note 1e) | | | — | | | | 404,227 | |
| | | | |
Total investment income | | | 4,456,960 | | | | 93,244,735 | |
| | | | |
Expenses: | | | | | | | | |
Management fees (Note 3a) | | | 1,123,229 | | | | 17,990,646 | |
Transfer agent fees (Note 3c) | | | 363 | | | | 19,689 | |
Sub-transfer agent fees - Service Shares (Note 3c) | | | — | | | | 7,607 | |
Custodian fees (Note 4) | | | 10,407 | | | | 273,047 | |
Reports to shareholders | | | 2,844 | | | | 36,353 | |
Registration and filing fees | | | 15,010 | | | | 48,361 | |
Professional fees | | | 37,989 | | | | 75,116 | |
Trustees’ fees and expenses | | | 4,875 | | | | 88,077 | |
Other | | | 14,040 | | | | 51,583 | |
| | | | |
Total expenses | | | 1,208,757 | | | | 18,590,479 | |
Expense reductions (Note 4) | | | (6,812 | ) | | | (9,077 | ) |
Expenses waived/paid by affiliates (Note 3d) | | | (902 | ) | | | (154,745 | ) |
| | | | |
Net expenses | | | 1,201,043 | | | | 18,426,657 | |
| | | | |
Net investment income | | | 3,255,917 | | | | 74,818,078 | |
| | | | |
Realized and unrealized gains (losses): | | | | | | | | |
Net realized gain (loss) from: | | | | | | | | |
Investments | | | 6,633,308 | | | | 42,859,760 | |
Foreign currency transactions | | | (12,207 | ) | | | 604,690 | |
| | | | |
Net realized gain (loss) | | | 6,621,101 | | | | 43,464,450 | |
| | | | |
Net change in unrealized appreciation (depreciation) on: | | | | | | | | |
Investments | | | 21,566,048 | | | | 468,483,611 | |
Translation of other assets and liabilities
denominated in foreign currencies | | | 43,632 | | | | 1,289,596 | |
| | | | |
Net change in unrealized appreciation (depreciation) | | | 21,609,680 | | | | 469,773,207 | |
| | | | |
Net realized and unrealized gain (loss) | | | 28,230,781 | | | | 513,237,657 | |
| | | | |
Net increase (decrease) in net assets resulting from operations | | | $31,486,698 | | | | $588,055,735 | |
| | | | |
| | | | | | | | |
| | | | | | | | |
| | | | | | | | |
| | | | | | | | |
| | | | | | | | |
| | | | | | | | |
| | | | | | | | |
| | | | | | | | |
| | | | | | | | |
| | | | | | | | |
| | | | | | | | |
| | | | | | | | |
| | | | | | | | |
| | | | | | | | |
| | | | | | | | |
aForeign taxes withheld on dividends | | | $428,580 | | | | $10,232,317 | |
| | | | | | |
| | | |
| ftinstitutional.com | | The accompanying notes are an integral part of these financial statements. | Semiannual Report | | | 57 | |
TEMPLETON INSTITUTIONAL FUNDS
FINANCIAL STATEMENTS
Statements of Changes in Net Assets
| | | | | | | | | | | | | | | | |
| | | Emerging
Markets Series | | | Foreign Smaller
Companies Series | |
| | | Six Months Ended
June 30, 2017
(unaudited) | | | Year Ended
December 31, 2016 | | | Six Months Ended
June 30, 2017
(unaudited) | | | Year Ended
December 31, 2016 | |
Increase (decrease) in net assets: | | | | | | | | | | | | | | | | |
Operations: | | | | | | | | | | | | | | | | |
Net investment income | | | $175,094 | | | | $408,811 | | | | $9,000,876 | | | | $15,365,001 | |
Net realized gain (loss) | | | 1,661,862 | | | | 2,205,680 | | | | 24,825,156 | | | | 13,765,470 | |
Net change in unrealized appreciation (depreciation) | | | 7,195,268 | | | | 6,574,324 | | | | 147,829,337 | | | | (46,825,711 | ) |
| | | | |
Net increase (decrease) in net
assets resulting from operations . | | | 9,032,224 | | | | 9,188,815 | | | | 181,655,369 | | | | (17,695,240 | ) |
| | | | |
Distributions to shareholders from: | | | | | | | | | | | | | | | | |
Net investment income | | | — | | | | (765,866 | ) | | | — | | | | (18,779,194 | ) |
Net realized gains | | | — | | | | — | | | | — | | | | (16,947,519 | ) |
| | | | |
Total distributions to shareholders | | | — | | | | (765,866 | ) | | | — | | | | (35,726,713 | ) |
| | | | |
Capital share transactions (Note 2) | | | (28,876 | ) | | | (38,977,606 | ) | | | (81,592,357 | ) | | | (275,106,684 | ) |
| | | | |
Net increase (decrease) in net
assets | | | 9,003,348 | | | | (30,554,657 | ) | | | 100,063,012 | | | | (328,528,637 | ) |
Net assets: | | | | | | | | | | | | | | | | |
Beginning of period | | | 40,879,269 | | | | 71,433,926 | | | | 931,878,757 | | | | 1,260,407,394 | |
| | | | |
End of period | | $ | 49,882,617 | | | $ | 40,879,269 | | | $ | 1,031,941,769 | | | $ | 931,878,757 | |
| | | | |
Undistributed net investment income
included in net assets: | | | | | | | | | | | | | | | | |
End of period | | | $— | | | | $— | | | | $4,674,051 | | | | $— | |
| | | | |
Distributions in excess of net investment
income included in net assets: | | | | | | | | | | | | | | | | |
End of period | | | $(236,551 | ) | | | $(411,645 | ) | | | $— | | | | $(4,326,825 | ) |
| | | | |
| | | | |
| | | |
| 58 | | Semiannual Report | The accompanying notes are an integral part of these financial statements. | | ftinstitutional.com |
TEMPLETON INSTITUTIONAL FUNDS
FINANCIAL STATEMENTS
Statements of Changes in Net Assets (continued)
| | | | | | | | | | | | | | | | |
| | | Global
Equity Series | | | International
Equity Series | |
| | | Six Months Ended
June 30, 2017
(unaudited) | | | Year Ended
December 31, 2016 | | | Six Months Ended
June 30, 2017
(unaudited) | | | Year Ended
December 31, 2016 | |
Increase (decrease) in net assets: | | | | | | | | | | | | | | | | |
Operations: | | | | | | | | | | | | | | | | |
Net investment income | | | $3,255,917 | | | | $4,912,198 | | | | $74,818,078 | | | | $114,710,465 | |
Net realized gain (loss) | | | 6,621,101 | | | | (3,325,690 | ) | | | 43,464,450 | | | | (24,309,851 | ) |
Net change in unrealized appreciation (depreciation) | | | 21,609,680 | | | | 10,998,974 | | | | 469,773,207 | | | | (38,429,032 | ) |
| | | | |
Net increase (decrease) in net assets resulting from operations | | | 31,486,698 | | | | 12,585,482 | | | | 588,055,735 | | | | 51,971,582 | |
| | | | |
Distributions to shareholders from: | | | | | | | | | | | | | | | | |
Net investment income | | | — | | | | (4,598,697 | ) | | | — | | | | — | |
Net realized gains | | | — | | | | (1,102,505 | ) | | | — | | | | — | |
Primary Shares | | | — | | | | — | | | | — | | | | (111,420,196 | ) |
Service Shares | | | — | | | | — | | | | — | | | | (199,913 | ) |
Net realized gains: | | | | | | | | | | | | | | | | |
Primary Shares | | | — | | | | — | | | | — | | | | (47,078,491 | ) |
Service Shares | | | — | | | | — | | | | — | | | | (118,885 | ) |
| | | | |
Total distributions to shareholders | | | — | | | | (5,701,202 | ) | | | — | | | | (158,817,485 | ) |
| | | | |
Capital share transactions (Note 2) | | | (8,369,799 | ) | | | (9,004,806 | ) | | | — | | | | — | |
Primary Shares | | | — | | | | — | | | | (164,269,451 | ) | | | (432,190,251 | ) |
Service Shares | | | — | | | | — | | | | 3,734,040 | | | | (3,597,374 | ) |
| | | | |
Total capital share transactions | | | (8,369,799 | ) | | | (9,004,806 | ) | | | (160,535,411 | ) | | | (435,787,625 | ) |
| | | | |
Net increase (decrease) in net assets | | | 23,116,899 | | | | (2,120,526 | ) | | | 427,520,324 | | | | (542,633,528 | ) |
Net assets: | | | | | | | | | | | | | | | | |
Beginning of period | | | 280,709,369 | | | | 282,829,895 | | | | 4,547,828,662 | | | | 5,090,462,190 | |
| | | | |
End of period | | | $303,826,268 | | | | $280,709,369 | | | | $4,975,348,986 | | | | $4,547,828,662 | |
| | | | |
Undistributed net investment income included in net assets: | | | | | | | | | | | | | | | | |
End of period | | | $3,300,608 | | | | $44,691 | | | | $40,449,255 | | | | $— | |
| | | | |
Distributions in excess of net investment income included in net assets: | | | | | | | | | | | | | | | | |
End of period | | | $— | | | | $— | | | | $— | | | | $(34,368,823 | ) |
| | | | |
| | | | | | |
| | | |
| ftinstitutional.com | | The accompanying notes are an integral part of these financial statements. | Semiannual Report | | | 59 | |
TEMPLETON INSTITUTIONAL FUNDS
Notes to Financial Statements (unaudited)
1. Organization and Significant Accounting Policies
Templeton Institutional Funds (Trust) is registered under the Investment Company Act of 1940 (1940 Act) as an open-end management investment company, consisting of four separate funds (Funds) and applies the specialized accounting and reporting guidance in U.S. Generally Accepted Accounting Principles (U.S. GAAP). International Equity Series offers Primary and Service Shares. Each class of shares differs by its voting rights on matters affecting a single class and transfer agent fees. Foreign Smaller Companies Series was closed to new investors with limited exceptions effective at the close of market on December 10, 2013.
The following summarizes the Funds’ significant accounting policies.
a. Financial Instrument Valuation
The Funds’ investments in financial instruments are carried at fair value daily. Fair value is the price that would be received to sell an asset or paid to transfer a liability in an orderly transaction between market participants on the measurement date. The Funds calculate the net asset value (NAV) per share as of 4 p.m. Eastern time each day the New York Stock Exchange (NYSE) is open for trading. Under compliance policies and procedures approved by the Trust’s Board of Trustees (the Board), the Funds’ administrator has responsibility for oversight of valuation, including leading the cross-functional Valuation Committee (VC). The VC provides administration and oversight of the Funds’ valuation policies and procedures, which are approved annually by the Board. Among other things, these procedures allow the Funds to utilize independent pricing services, quotations from securities and financial instrument dealers, and other market sources to determine fair value.
Equity securities listed on an exchange or on the NASDAQ National Market System are valued at the last quoted sale price or the official closing price of the day, respectively. Foreign equity securities are valued as of the close of trading on the foreign stock exchange on which the security is primarily traded, or as of 4 p.m. Eastern time. The value is then converted into its U.S. dollar equivalent at the foreign exchange rate in effect at 4 p.m. Eastern time on the day that the value of the security is determined. Over-the-counter (OTC) securities are valued within the range of the most recent quoted bid and ask prices. Securities that trade in multiple markets or on multiple
exchanges are valued according to the broadest and most representative market. Certain equity securities are valued based upon fundamental characteristics or relationships to similar securities.
Debt securities generally trade in the OTC market rather than on a securities exchange. The Funds’ pricing services use multiple valuation techniques to determine fair value. In instances where sufficient market activity exists, the pricing services may utilize a market-based approach through which quotes from market makers are used to determine fair value. In instances where sufficient market activity may not exist or is limited, the pricing services also utilize proprietary valuation models which may consider market characteristics such as benchmark yield curves, credit spreads, estimated default rates, anticipated market interest rate volatility, coupon rates, anticipated timing of principal repayments, underlying collateral, and other unique security features in order to estimate the relevant cash flows, which are then discounted to calculate the fair value.
Investments in open-end mutual funds are valued at the closing NAV. Time deposits are valued at cost, which approximates fair value.
The Funds have procedures to determine the fair value of financial instruments for which market prices are not reliable or readily available. Under these procedures, the VC convenes on a regular basis to review such financial instruments and considers a number of factors, including significant unobservable valuation inputs, when arriving at fair value. The VC primarily employs a market-based approach which may use related or comparable assets or liabilities, recent transactions, market multiples, book values, and other relevant information for the investment to determine the fair value of the investment. An income-based valuation approach may also be used in which the anticipated future cash flows of the investment are discounted to calculate fair value. Discounts may also be applied due to the nature or duration of any restrictions on the disposition of the investments. Due to the inherent uncertainty of valuations of such investments, the fair values may differ significantly from the values that would have been used had an active market existed. The VC employs various methods for calibrating these valuation approaches including a regular review of key inputs and assumptions, transactional back-testing or disposition analysis, and reviews of any related market activity.
| | | | |
| | | |
| 60 | | Semiannual Report | | ftinstitutional.com |
TEMPLETON INSTITUTIONAL FUNDS
NOTES TO FINANCIAL STATEMENTS (UNAUDITED)
Trading in securities on foreign securities stock exchanges and OTC markets may be completed before 4 p.m. Eastern time. In addition, trading in certain foreign markets may not take place on every Funds’ business day. Occasionally, events occur between the time at which trading in a foreign security is completed and 4 p.m. Eastern time that might call into question the reliability of the value of a portfolio security held by the Fund. As a result, differences may arise between the value of the Funds’ portfolio securities as determined at the foreign market close and the latest indications of value at 4 p.m. Eastern time. In order to minimize the potential for these differences, the VC monitors price movements following the close of trading in foreign stock markets through a series of country specific market proxies (such as baskets of American Depositary Receipts, futures contracts and exchange traded funds). These price movements are measured against established trigger thresholds for each specific market proxy to assist in determining if an event has occurred that may call into question the reliability of the values of the foreign securities held by the Funds. If such an event occurs, the securities may be valued using fair value procedures, which may include the use of independent pricing services.
When the last day of the reporting period is a non-business day, certain foreign markets may be open on those days that the Funds’ NAV is not calculated, which could result in differences between the value of the Funds’ portfolio securities on the last business day and the last calendar day of the reporting period. Any significant security valuation changes due to an open foreign market are adjusted and reflected by the Funds for financial reporting purposes.
b. Foreign Currency Translation
Portfolio securities and other assets and liabilities denominated in foreign currencies are translated into U.S. dollars based on the exchange rate of such currencies against U.S. dollars on the date of valuation. The Funds may enter into foreign currency exchange contracts to facilitate transactions denominated in a foreign currency. Purchases and sales of securities, income and expense items denominated in foreign currencies are translated into U.S. dollars at the exchange rate in effect on the transaction date. Portfolio securities and assets and liabilities denominated in foreign currencies contain risks that those currencies will decline in value relative to the U.S. dollar. Occasionally, events may impact the availability or reliability of foreign exchange
rates used to convert the U.S. dollar equivalent value. If such an event occurs, the foreign exchange rate will be valued at fair value using procedures established and approved by the Board.
The Funds do not separately report the effect of changes in foreign exchange rates from changes in market prices on securities held. Such changes are included in net realized and unrealized gain or loss from investments in the Statements of Operations.
Realized foreign exchange gains or losses arise from sales of foreign currencies, currency gains or losses realized between the trade and settlement dates on securities transactions and the difference between the recorded amounts of dividends, interest, and foreign withholding taxes and the U.S. dollar equivalent of the amounts actually received or paid. Net unrealized foreign exchange gains and losses arise from changes in foreign exchange rates on foreign denominated assets and liabilities other than investments in securities held at the end of the reporting period.
c. Participatory Notes
Certain or all Funds invest in Participatory Notes (P-Notes). P-Notes are promissory notes that are designed to offer a return linked to the performance of a particular underlying equity security or market. P-Notes are issued by banks or broker-dealers and allow the Fund to gain exposure to common stocks in markets where direct investment is not allowed. Income received from P-Notes is recorded as dividend income in the Statement of Operations. P-Notes may contain various risks including the potential inability of the counterparty to fulfill their obligations under the terms of the contract. These securities may be more volatile and less liquid than other investments held by the Fund.
d. Securities Lending
Certain or all Funds participate in an agency based securities lending program to earn additional income. The Fund receives cash collateral against the loaned securities in an amount equal to at least 102% of the fair value of the loaned securities. Collateral is maintained over the life of the loan in an amount not less than 100% of the fair value of loaned securities, as determined at the close of Fund business each day; any additional collateral required due to changes in security values is delivered to the Fund on the next business day. The collateral is deposited into a joint cash account with other funds and is used to invest in a money market fund managed by Franklin
| | | | | | |
| | | |
| ftinstitutional.com | | Semiannual Report | | | 61 | |
TEMPLETON INSTITUTIONAL FUNDS
NOTES TO FINANCIAL STATEMENTS (UNAUDITED)
1. Organization and Significant Accounting Policies (continued)
d. Securities Lending (continued)
Advisers, Inc., an affiliate of the Funds. The Fund may receive income from the investment of cash collateral, in addition to lending fees and rebates paid by the borrower. Income from securities loaned, net of fees paid to the securities lending agent and/or third-party vendor, is reported separately in the Statements of Operations. The Fund bears the market risk with respect to the collateral investment, securities loaned, and the risk that the may default on its obligations to the Fund. If the borrower defaults on its obligation to return the securities loaned, the Fund has the right to repurchase the securities in the open market using the collateral received. The securities lending agent has agreed to indemnify the Fund in the event of default by a third party borrower.
e. Income and Deferred Taxes
It is each Fund’s policy to qualify as a regulated investment company under the Internal Revenue Code. Each Fund intends to distribute to shareholders substantially all of its taxable income and net realized gains to relieve it from federal income and excise taxes. As a result, no provision for U.S. federal income taxes is required.
The Funds may be subject to foreign taxation related to income received, capital gains on the sale of securities and certain foreign currency transactions in the foreign jurisdictions in which the Funds invest. Foreign taxes, if any, are recorded based on the tax regulations and rates that exist in the foreign markets in which the Funds invest. When a capital gain tax is determined to apply, certain or all Funds record an estimated deferred tax liability in an amount that would be payable if the securities were disposed of on the valuation date. As a result of several court cases, in certain countries across the European Union, certain or all Funds filed additional tax reclaims for previously withheld taxes on dividends earned in those countries (EU reclaims). These additional filings are subject to various administrative proceedings by the local jurisdictions’ tax authorities within the European Union, as well as a number of related judicial proceedings. Income recognized, if any, for EU reclaims is reflected as other income in the Statements of Operations and any related receivable, if any, is reflected as European Union tax reclaims in the Statements of Assets and Liabilities. When uncertainty exists as to the ultimate resolution of these proceedings, the likelihood of receipt of these EU
reclaims, and the potential timing of payment, no amounts are reflected in the financial statements. For U.S. income tax purposes, EU reclaims received by the Funds, if any, reduce the amounts of foreign taxes Fund shareholders can use as tax credits in their individual income tax returns.
Each Fund may recognize an income tax liability related to its uncertain tax positions under U.S. GAAP when the uncertain tax position has a less than 50% probability that it will be sustained upon examination by the tax authorities based on its technical merits. As of June 30, 2017, each Fund has determined that no tax liability is required in its financial statements related to uncertain tax positions for any open tax years (or expected to be taken in future tax years). Open tax years are those that remain subject to examination and are based on each tax jurisdiction’s statute of limitation.
f. Security Transactions, Investment Income, Expenses and Distributions
Security transactions are accounted for on trade date. Realized gains and losses on security transactions are determined on a specific identification basis. Interest income and estimated expenses are accrued daily. Amortization of premium and accretion of discount on debt securities are included in interest income. Dividend income is recorded on the ex-dividend date except for certain dividends from securities where the dividend rate is not available. In such cases, the dividend is recorded as soon as the information is received by the Funds. Distributions to shareholders are recorded on the ex-dividend date. Distributable earnings are determined according to income tax regulations (tax basis) and may differ from earnings recorded in accordance with U.S. GAAP. These differences may be permanent or temporary. Permanent differences are reclassified among capital accounts to reflect their tax character. These reclassifications have no impact on net assets or the results of operations. Temporary differences are not reclassified, as they may reverse in subsequent periods.
Common expenses incurred by the Trust are allocated among the Funds based on the ratio of net assets of each Fund to the combined net assets of the Trust. Fund specific expenses are charged directly to the Fund that incurred the expense.
Realized and unrealized gains and losses and net investment income, not including class specific expenses, are allocated daily to each class of shares based upon the relative proportion
| | | | |
| | | |
| 62 | | Semiannual Report | | ftinstitutional.com |
TEMPLETON INSTITUTIONAL FUNDS
NOTES TO FINANCIAL STATEMENTS (UNAUDITED)
of net assets of each class. Differences in per share distributions, by class, are generally due to differences in class specific expenses.
g. Accounting Estimates
The preparation of financial statements in accordance with U.S. GAAP requires management to make estimates and assumptions that affect the reported amounts of assets and liabilities at the date of the financial statements and the amounts of income and expenses during the reporting period. Actual results could differ from those estimates.
h. Guarantees and Indemnifications
Under the Trust’s organizational documents, its officers and trustees are indemnified by the Trust against certain liabilities arising out of the performance of their duties to the Trust.
Additionally, in the normal course of business, the Trust, on behalf of the Funds, enters into contracts with service providers that contain general indemnification clauses. The Trust’s maximum exposure under these arrangements is unknown as this would involve future claims that may be made against the Trust that have not yet occurred. Currently, the Trust expects the risk of loss to be remote.
2. Shares of Beneficial Interest
At June 30, 2017, there were an unlimited number of shares authorized (without par value). Transactions in the Funds’ shares were as follows:
| | | | | | | | | | | | | | | | | | | | |
| | | Emerging
Markets Series | | | | | | Foreign Smaller
Companies Series | |
| | | Shares | | | Amount | | | | | | Shares | | | Amount | |
Six Months ended June 30, 2017 | | | | | | | | | | | | | | | | | | | | |
Shares sold | | | 1,101,728 | | | $ | 5,407,920 | | | | | | | | 2,685,241 | | | $ | 58,992,690 | |
Shares redeemed | | | (1,140,285 | ) | | | (5,436,796 | ) | | | | | | | (6,332,394 | ) | | | (140,585,047 | ) |
| | | | |
Net increase (decrease) | | | (38,557 | ) | | $ | (28,876 | ) | | | | | | | (3,647,153 | ) | | $ | (81,592,357 | ) |
| | | | |
| Year ended December 31, 2016 | | | | | | | | | | | | | | | | | | | | |
Shares sold | | | 1,610,965 | | | $ | 6,302,919 | | | | | | | | 4,833,974 | | | $ | 97,234,695 | |
Shares issued in reinvestment of distributions | | | 125,828 | | | | 532,907 | | | | | | | | 1,628,813 | | | | 32,442,291 | |
Shares redeemed | | | (11,753,686 | ) | | | (45,813,432 | ) | | | | | | | (20,026,557 | ) | | | (404,783,670 | ) |
| | | | |
Net increase (decrease) | | | (10,016,893 | ) | | $ | (38,977,606 | ) | | | | | | | (13,563,770 | ) | | $ | (275,106,684 | ) |
| | | | |
| | | | | | | | |
| | | Global
Equity Series | |
| | | Shares | | | Amount | |
Six Months ended June 30, 2017 | | | | | | | | |
Shares sold | | | 113,435 | | | $ | 1,074,262 | |
Shares redeemed | | | (1,009,510 | ) | | | (9,444,061 | ) |
| | | | |
Net increase (decrease) | | | (896,075 | ) | | $ | (8,369,799 | ) |
| | | | |
| Year ended December 31, 2016 | | | | | | | | |
Shares sold | | | 5,904,348 | | | $ | 50,777,649 | |
Shares issued in reinvestment of distributions | | | 622,766 | | | | 5,571,015 | |
Shares redeemed | | | (7,569,735 | ) | | | (65,353,470 | ) |
| | | | |
Net increase (decrease) | | | (1,042,621 | ) | | $ | (9,004,806 | ) |
| | | | |
| | | | | | |
| | | |
| ftinstitutional.com | | Semiannual Report | | | 63 | |
TEMPLETON INSTITUTIONAL FUNDS
NOTES TO FINANCIAL STATEMENTS (UNAUDITED)
2. Shares of Beneficial Interest (continued)
| | | | | | | | |
| | | International
Equity Series | |
| | | Shares | | | Amount | |
| | |
| Primary Shares: | | | | | | | | |
| Six Months ended June 30, 2017 | | | | | | | | |
| Shares sold | | | 16,242,169 | | | $ | 324,976,959 | |
| Shares redeemed. | | | (24,667,999 | ) | | | (489,246,410 | ) |
| | | | |
| Net increase (decrease) | | | (8,425,830 | ) | | $ | (164,269,451 | ) |
| | | | |
| Year ended December 31, 2016 | | | | | | | | |
| Shares sold | | | 33,190,087 | | | $ | 605,288,189 | |
| Shares issued in reinvestment of distributions | | | 7,502,120 | | | | 140,569,227 | |
| Shares redeemed. | | | (63,963,402 | ) | | | (1,178,047,667 | ) |
| | | | |
| Net increase (decrease) | | | (23,271,195 | ) | | $ | (432,190,251 | ) |
| | | | |
| Service Shares: | | | | | | | | |
| Six Months ended June 30, 2017 | | | | | | | | |
Shares sold | | | 206,203 | | | $ | 4,303,077 | |
Shares redeemed. | | | (28,087 | ) | | | (569,037 | ) |
| | | | |
Net increase (decrease) | | | 178,116 | | | $ | 3,734,040 | |
| | | | |
| Year ended December 31, 2016 | | | | | | | | |
Shares sold | | | 356,445 | | | $ | 6,374,901 | |
Shares issued in reinvestment of distributions | | | 16,838 | | | | 316,996 | |
Shares redeemed. | | | (568,197 | ) | | | (10,289,271 | ) |
| | | | |
Net increase (decrease) | | | (194,914 | ) | | $ | (3,597,374 | ) |
| | | | |
3. Transactions with Affiliates
Franklin Resources, Inc. is the holding company for various subsidiaries that together are referred to as Franklin Templeton Investments. Certain officers and trustees of the Trust are also officers, and/or directors of the following subsidiaries:
| | |
| Subsidiary | | Affiliation |
Templeton Asset Management Ltd. (TAML) | | Investment manager |
Templeton Investment Counsel, LLC (TIC) | | Investment manager |
Franklin Templeton Services, LLC (FT Services) | | Administrative manager |
Franklin Templeton Distributors, Inc. (Distributors) | | Principal underwriter |
Franklin Templeton Investor Services, LLC (Investor Services) | | Transfer agent |
| | | | |
| | | |
| 64 | | Semiannual Report | | ftinstitutional.com |
TEMPLETON INSTITUTIONAL FUNDS
NOTES TO FINANCIAL STATEMENTS (UNAUDITED)
a. Management Fees
Emerging Markets Series pays an investment management fee to TAML based on the average daily net assets of the Fund as follows:
| | |
| Annualized Fee Rate | | Net Assets |
1.175% | | Up to and including $1 billion |
1.125% | | Over $1 billion, up to and including $5 billion |
1.075% | | Over $5 billion, up to and including $10 billion |
1.025% | | Over $10 billion, up to and including $15 billion |
0.975% | | Over $15 billion, up to and including $20 billion |
0.925% | | In excess of $20 billion |
Foreign Smaller Companies Series pays an investment management fee to TIC based on the average daily net assets of the Fund as follows:
| | |
| Annualized Fee Rate | | Net Assets |
0.950% | | Up to and including $1 billion |
0.930% | | Over $1 billion, up to and including $5 billion |
0.910% | | Over $5 billion, up to and including $10 billion |
0.890% | | Over $10 billion, up to and including $15 billion |
0.870% | | Over $15 billion, up to and including $20 billion |
0.850% | | In excess of $20 billion |
Global Equity Series pays an investment management fee to TIC based on the average daily net assets of the Fund as follows:
| | |
| Annualized Fee Rate | | Net Assets |
0.780% | | Up to and including $200 million |
0.765% | | Over $200 million, up to and including $700 million |
0.730% | | Over $700 million, up to and including $1 billion |
0.715% | | Over $1 billion, up to and including $1.2 billion |
0.690% | | Over $1.2 billion, up to and including $5 billion |
0.675% | | Over $5 billion, up to and including $10 billion |
0.655% | | Over $10 billion, up to and including $15 billion |
0.635% | | Over $15 billion, up to and including $20 billion |
0.615% | | Over $20 billion, up to and including $25 billion |
0.605% | | Over $25 billion, up to and including $30 billion |
0.595% | | Over $30 billion, up to and including $35 billion |
0.585% | | Over $35 billion, up to and including $40 billion |
0.575% | | Over $40 billion, up to and including $45 billion |
0.565% | | In excess of $45 billion |
| | | | | | |
| | | |
| ftinstitutional.com | | Semiannual Report | | | 65 | |
TEMPLETON INSTITUTIONAL FUNDS
NOTES TO FINANCIAL STATEMENTS (UNAUDITED)
3. Transactions with Affiliates (continued)
a. Management Fees (continued)
International Equity Series pays an investment management fee to TIC based on the average daily net assets of the Fund as follows:
| | |
| Annualized Fee Rate | | Net Assets |
0.775% | | Up to and including $1 billion |
0.755% | | Over $1 billion, up to and including $5 billion |
0.735% | | Over $5 billion, up to and including $10 billion |
0.715% | | Over $10 billion, up to and including $15 billion |
0.695% | | Over $15 billion, up to and including $20 billion |
0.675% | | In excess of $20 billion |
For the period ended June 30, 2017, each Fund’s annualized effective investment management fee rate based on average daily net assets was as follows:
| | | | | | | | | | | | | | |
Emerging
Markets Series | | | Foreign Smaller
Companies Series | | | Global
Equity Series | | | International
Equity Series | |
| | 1.174% | | | | 0.949% | | | | 0.775% | | | | 0.759% | |
b. Administrative Fees
Under an agreement with TAML, FT Services provides administrative services to Emerging Markets Series. The fee is paid by TAML based on the Fund’s average daily net assets, and is not an additional expense of the Fund.
Under agreements with TIC, FT Services provides administrative services to Foreign Smaller Companies Series, Global Equity Series, and International Equity Series. The fee is paid by TIC based on each of the Funds’ average daily net assets, and is not an additional expense of the Funds.
c. Transfer Agent Fees
Each class of shares pays transfer agent fees to Investor Services for its performance of shareholder servicing obligations and reimburses Investor Services for out of pocket expenses incurred, including shareholder servicing fees paid to third parties. These fees are allocated daily based upon their relative proportion of such classes’ aggregate net assets.
For the period ended June 30, 2017, the Funds paid transfer agent fees as noted in the Statements of Operations, of which the following amounts were retained by Investor Services:
| | | | | | | | | | | | | | | | |
| | | Emerging
Markets Series | | | Foreign Smaller
Companies Series | | | Global
Equity Series | | | International
Equity Series | |
Transfer agent fees | | | $512 | | | | $2,667 | | | | $228 | | | | $13,145 | |
International Equity Series Service shares may pay up to 0.15% of average daily net assets for sub-transfer agency fees as noted in the Statements of Operations.
| | | | |
| | | |
| 66 | | Semiannual Report | | ftinstitutional.com |
TEMPLETON INSTITUTIONAL FUNDS
NOTES TO FINANCIAL STATEMENTS (UNAUDITED)
d. Investments in Affiliated Management Investment Companies
Certain or all Funds invest in one or more affiliated management investment companies for purposes other than exercising a controlling influence over the management or policies. Management fees paid by the Funds are waived on assets invested in the affiliated management investment companies, as noted in the Statements of Operations, in an amount not to exceed the management and administrative fees paid directly or indirectly by each affiliate. Prior to January 1, 2014, the waiver was accounted for as a reduction to management fees. During the period ended June 30, 2017, certain or all Funds held investments in affiliated management investment companies as follows:
| | | | | | | | | | | | | | | | | | | | | | | | | | | | | | | | |
| | | Number of
Shares Held
at Beginning
of Period | | | Gross
Additions | | | Gross
Reductions | | | Number of
Shares
Held at End
of Period | | | Value
at End
of Period | | | Investment
Income | | | Realized
Gain (Loss) | | | % of
Affiliated
Fund Shares
Outstanding
Held at End
of Period | |
| Emerging Markets Series | | | | | | | | | | | | | | | | | | | | | | | | | | | | | | | | |
| Non-Controlled Affiliates | | | | | | | | | | | | | | | | | | | | | | | | | | | | | | | | |
Institutional Fiduciary Trust Money Market Portfolio, 0.58% | | | 234,539 | | | | 5,949,559 | | | | (4,165,664 | ) | | | 2,018,434 | | | $ | 2,018,434 | | | $ | 1,442 | | | $ | — | | | | –%a | |
| | | | | | | | | | | | | | | | | | | | | | | | |
| Foreign Smaller Companies Series | | | | | | | | | | | | | | | | | | | | | | | | | | | | | | | | |
| Non-Controlled Affiliates | | | | | | | | | | | | | | | | | | | | | | | | | | | | | | | | |
Institutional Fiduciary Trust Money Market Portfolio, 0.58% | | | 22,128,772 | | | | 45,623,227 | | | | (46,148,907 | ) | | | 21,603,092 | | | $ | 21,603,092 | | | $ | — | | | $ | — | | | | 0.1% | |
| | | | | | | | | | | | | | | | | | | | | | | | |
| Global Equity Series | | | | | | | | | | | | | | | | | | | | | | | | | | | | | | | | |
| Non-Controlled Affiliates | | | | | | | | | | | | | | | | | | | | | | | | | | | | | | | | |
Institutional Fiduciary Trust Money Market Portfolio, 0.58% | | | — | | | | 9,161,613 | | | | (9,161,613 | ) | | | — | | | $ | — | | | $ | — | | | $ | — | | | | — | |
| | | | | | | | | | | | | | | | | | | | | | | | |
| International Equity Series | | | | | | | | | | | | | | | | | | | | | | | | | | | | | | | | |
| Non-Controlled Affiliates | | | | | | | | | | | | | | | | | | | | | | | | | | | | | | | | |
Institutional Fiduciary Trust Money Market Portfolio, 0.58% | | | 55,224,352 | | | | 634,643,345 | | | | (566,744,375 | ) | | | 123,123,322 | | | $ | 123,123,322 | | | $ | 127,499 | | | $ | — | | | | 0.6% | |
| | | | | | | | | | | | | | | | | | | | | | | | |
aRounds to less than 0.1%.
e. Waiver and Expense Reimbursements
TAML has contractually agreed in advance to limit the investment management fees for Emerging Markets Series to 1.05% of the average daily net assets of the Fund until April 30, 2018.
4. Expense Offset Arrangement
The Funds have entered into an arrangement with their custodian whereby credits realized as a result of uninvested cash balances are used to reduce a portion of the Funds’ custodian expenses. During the period ended June 30, 2017, the custodian fees were reduced as noted in the Statements of Operations.
| | | | | | |
| | | |
| ftinstitutional.com | | Semiannual Report | | | 67 | |
TEMPLETON INSTITUTIONAL FUNDS
NOTES TO FINANCIAL STATEMENTS (UNAUDITED)
5. Income Taxes
For tax purposes, capital losses may be carried over to offset future capital gains, if any. At December 31, 2016, the capital loss carryforwards were as follows:
| | | | | | | | | | | | |
| | | Emerging
Markets Series | | | Global Equity Series | | | International
Equity Series | |
| Capital loss carryforwards not subject to expiration: | | | | | | | | | | | | |
Short term | | | $5,552,161 | | | | $1,380,563 | | | | $ 969,274 | |
Long term | | | 4,154,972 | | | | 728,478 | | | | 26,673,318 | |
| | | | |
Total capital loss carryforwards | | | $9,707,133 | | | | $2,109,041 | | | | $27,642,592 | |
| | | | |
At June 30, 2017, the cost of investments and net unrealized appreciation (depreciation) for income tax purposes were as follows:
| | | | | | | | | | | | | | | | |
| | | Emerging
Markets Series | | | Foreign Smaller
Companies Series | | | Global
Equity Series | | | International
Equity Series | |
Cost of investments | | | $38,171,627 | | | | $791,376,329 | | | | $250,198,995 | | | | $3,590,537,239 | |
| | | | |
Unrealized appreciation | | | $14,283,067 | | | | $299,248,450 | | | | $65,299,829 | | | | $1,583,152,747 | |
Unrealized depreciation | | | (2,612,056 | ) | | | (37,329,012 | ) | | | (13,000,252 | ) | | | (220,860,270 | ) |
| | | | |
Net unrealized appreciation (depreciation) | | | $11,671,011 | | | | $261,919,438 | | | | $52,299,577 | | | | $1,362,292,477 | |
| | | | |
Differences between income and/or capital gains as determined on a book basis and a tax basis are primarily due to differing treatments of corporate actions, foreign tax reclaims, and wash sales.
6. Investment Transactions
Purchases and sales of investments (excluding short term securities) for the period ended June 30, 2017, were as follows:
| | | | | | | | | | | | | | | | |
| | | Emerging
Markets Series | | | Foreign Smaller
Companies Series | | | Global
Equity Series | | | International
Equity Series | |
Purchases | | | $4,446,776 | | | | $120,466,174 | | | | $33,280,982 | | | | $390,925,098 | |
Sales | | | $6,032,769 | | | | $202,116,105 | | | | $40,065,894 | | | | $506,169,026 | |
At June 30, 2017, in connection with securities lending transactions, certain or all Funds loaned investments and received cash collateral as follows:
| | | | |
| | | Foreign Smaller
Companies Series | |
| Securities lending transactionsa: | | | | |
Equity investmentsb | | | $21,603,092 | |
aThe agreements can be terminated at any time.
bThe gross amount of recognized liability for such transactions is included in payable upon return of securities loaned in the Statements of Assets and Liabilities.
7. Concentration of Risk
Investing in foreign securities may include certain risks and considerations not typically associated with investing in U.S. securities, such as fluctuating currency values and changing local and regional economic, political and social conditions, which may result in greater market volatility. In addition, certain foreign securities may not be as liquid as U.S. securities.
| | | | |
| | | |
| 68 | | Semiannual Report | | ftinstitutional.com |
TEMPLETON INSTITUTIONAL FUNDS
NOTES TO FINANCIAL STATEMENTS (UNAUDITED)
The United States and other nations have imposed and could impose additional sanctions on certain issuers in Russia due to regional conflicts. These sanctions could result in the devaluation of Russia’s currency, a downgrade in Russian issuers’ credit ratings, or a decline in the value and liquidity of Russian stocks or other securities. Such sanctions could also adversely affect Russia’s economy, possibly forcing the economy into a recession. The Fund may be prohibited from investing in securities issued by companies subject to such sanctions. In addition, if the Fund holds the securities of an issuer that is subject to such sanctions, an immediate freeze of that issuer’s securities could result, impairing the ability of the Fund to buy, sell, receive or deliver those securities. There is also the risk that countermeasures could be taken by Russia’s government, which could involve the seizure of the Fund’s assets. These risks could affect the value of the Funds’ portfolio. While the Funds hold securities of certain companies impacted by the sanctions, the restrictions do not impact the existing investments in those issuers. At June 30, 2017, Emerging Markets Series had 6.0% of its net assets invested in Russia.
8. Credit Facility
Certain or all Funds, together with other U.S. registered and foreign investment funds (collectively, Borrowers), managed by Franklin Templeton Investments, are borrowers in a joint syndicated senior unsecured credit facility totaling $2 billion (Global Credit Facility) which matures on February 9, 2018. This Global Credit Facility provides a source of funds to the Borrowers for temporary and emergency purposes, including the ability to meet future unanticipated or unusually large redemption requests.
Under the terms of the Global Credit Facility, the Funds shall, in addition to interest charged on any borrowings made by the Funds and other costs incurred by the Funds, pay their share of fees and expenses incurred in connection with the implementation and maintenance of the Global Credit Facility, based upon their relative share of the aggregate net assets of all of the Borrowers, including an annual commitment fee of 0.15% based upon the unused portion of the Global Credit Facility. These fees are reflected in other expenses in the Statements of Operations. During the period ended June 30, 2017, the Funds did not use the Global Credit Facility.
9. Fair Value Measurements
The Funds follow a fair value hierarchy that distinguishes between market data obtained from independent sources (observable inputs) and the Funds’ own market assumptions (unobservable inputs). These inputs are used in determining the value of the Funds’ financial instruments and are summarized in the following fair value hierarchy:
| | • | | Level 1 – quoted prices in active markets for identical financial instruments |
| | • | | Level 2 – other significant observable inputs (including quoted prices for similar financial instruments, interest rates, prepayment speed, credit risk, etc.) |
| | • | | Level 3 – significant unobservable inputs (including the Funds’ own assumptions in determining the fair value of financial instruments) |
The input levels are not necessarily an indication of the risk or liquidity associated with financial instruments at that level.
For movements between the levels within the fair value hierarchy, the Funds have adopted a policy of recognizing the transfers as of the date of the underlying event which caused the movement.
| | | | | | |
| | | |
| ftinstitutional.com | | Semiannual Report | | | 69 | |
TEMPLETON INSTITUTIONAL FUNDS
NOTES TO FINANCIAL STATEMENTS (UNAUDITED)
9. Fair Value Measurements (continued)
A summary of inputs used as of June 30, 2017, in valuing the Funds’ assets carried at fair value, is as follows:
| | | | | | | | | | | | | | | | |
| | | Level 1 | | | Level 2 | | | Level 3 | | | Total | |
| | | | |
| Emerging Markets Series | | | | | | | | | | | | | | | | |
Assets: | | | | | | | | | | | | | | | | |
Investments in Securities: | | | | | | | | | | | | | | | | |
Equity Investmentsa,b | | $ | 47,376,537 | | | $ | — | | | $ | — | | | $ | 47,376,537 | |
Participatory Notes | | | — | | | | 447,667 | | | | — | | | | 447,667 | |
Short Term Investments | | | 2,018,434 | | | | — | | | | — | | | | 2,018,434 | |
| | | | |
Total Investments in Securities | | $ | 49,394,971 | | | $ | 447,667 | | | $ | — | | | $ | 49,842,638 | |
| | | | |
| | | | |
| Foreign Smaller Companies Series | | | | | | | | | | | | | | | | |
Assets: | | | | | | | | | | | | | | | | |
Investments in Securities: | | | | | | | | | | | | | | | | |
Equity Investmentsa,b | | $ | 987,892,675 | | | $ | — | | | $ | — | | | $ | 987,892,675 | |
Short Term Investments | | | 21,603,092 | | | | 43,800,000 | | | | — | | | | 65,403,092 | |
| | | | |
Total Investments in Securities | | $ | 1,009,495,767 | | | $ | 43,800,000 | | | $ | — | | | $ | 1,053,295,767 | |
| | | | |
| | | | |
| Global Equity Series | | | | | | | | | | | | | | | | |
Assets: | | | | | | | | | | | | | | | | |
Investments in Securities: | | | | | | | | | | | | | | | | |
Equity Investmentsa,b | | $ | 293,198,572 | | | $ | — | | | $ | — | | | $ | 293,198,572 | |
Short Term Investments | | | — | | | | 9,300,000 | | | | — | | | | 9,300,000 | |
| | | | |
Total Investments in Securities | | $ | 293,198,572 | | | $ | 9,300,000 | | | $ | — | | | $ | 302,498,572 | |
| | | | |
| | | | |
| International Equity Series | | | | | | | | | | | | | | | | |
Assets: | | | | | | | | | | | | | | | | |
Investments in Securities: | | | | | | | | | | | | | | | | |
Equity Investmentsa,b | | $ | 4,829,706,394 | | | $ | — | | | $ | — | | | $ | 4,829,706,394 | |
Short Term Investments | | | 123,123,322 | | | | — | | | | — | | | | 123,123,322 | |
| | | | |
Total Investments in Securities | | $ | 4,952,829,716 | | | $ | — | | | $ | — | | | $ | 4,952,829,716 | |
| | | | |
aIncludes common and preferred stocks as well as other equity investments.
bFor detailed categories, see the accompanying Statement of Investments.
10. Investment Company Reporting Modernization
In October 2016, the U.S. Securities and Exchange Commission adopted new rules and amended existing rules (together, final rules) intended to modernize the reporting and disclosure of information by registered investment companies. In part, the final rules amend Regulation S-X and require standardized, enhanced disclosures about derivatives in investment company financial statements, as well as other amendments. The compliance date for the amendments to Regulation S-X is August 1, 2017. Management has reviewed the requirements and believes the adoption of the amendments to Regulation S-X will not have a material impact on the Funds’ financial statements and related disclosures.
11. Subsequent Events
The Funds have evaluated subsequent events through the issuance of the financial statements and determined that no events have occurred that require disclosure.
| | | | |
| | | |
| 70 | | Semiannual Report | | ftinstitutional.com |
TEMPLETON INSTITUTIONAL FUNDS
NOTES TO FINANCIAL STATEMENTS (UNAUDITED)
Abbreviations
| | | | | | |
| Currency | | Selected Portfolio |
| CAD | | Canadian Dollar | | ADR | | American Depositary Receipt |
| USD | | United States Dollar | | FHLB | | Federal Home Loan Bank |
| | | | GDR | | Global Depositary Receipt |
| | | | IDR | | International Depositary Receipt |
| | | | NVDR | | Non-Voting Depositary Receipt |
| | | | | | |
| | | |
| ftinstitutional.com | | Semiannual Report | | | 71 | |
TEMPLETON INSTITUTIONAL FUNDS
Shareholder Information
Board Approval of Investment Management Agreements
TEMPLETON INSTITUTIONAL FUNDS
Emerging Markets Series
Foreign Smaller Companies Series
Global Equity Series
International Equity Series
(each a Fund)
At an in-person meeting held on February 28, 2017 (Meeting), the Board of Trustees (Board) of Templeton Institutional Funds, including a majority of the trustees who are not “interested persons” as defined in the Investment Company Act of 1940 (Independent Trustees), reviewed and approved the continuance of the investment management agreement between Templeton Investment Counsel, LLC (TIC) and each Fund, except for Emerging Markets Series, and between Templeton Asset Management, Ltd. (TAML) and Emerging Markets Series (each a Management Agreement) for an additional one-year period. The Independent Trustees received advice from and met separately with Independent Trustee counsel in considering whether to approve the continuation of each Management Agreement. Although the Management Agreements for the Funds were considered at the same Board meeting, the Board considered the information provided to it about the Funds together and with respect to each Fund separately as the Board deemed appropriate. TIC and TAML are each referred to herein as a Manager.
In considering the continuation of each Management Agreement, the Board reviewed and considered information provided by the respective Manager at the Meeting and throughout the year at meetings of the Board and its committees. The Board also reviewed and considered information provided in response to a detailed set of requests for information submitted to each Manager by Independent Trustee counsel on behalf of the Independent Trustees in connection with the annual contract renewal process. In addition, prior to the Meeting, the Independent Trustees held a telephonic contract renewal meeting at which the Independent Trustees conferred amongst themselves and Independent Trustee counsel about contract renewal matters. The Board reviewed and considered all of the factors it deemed relevant in approving the continuance of each Management Agreement, including, but not limited to: (i) the nature, extent, and quality of the services provided by the respective Manager; (ii) the investment performance of each Fund; (iii) the costs of the services provided and profits realized by the respective
Manager and its affiliates from the relationship with each Fund; (iv) the extent to which economies of scale are realized as each Fund grows; and (v) whether fee levels reflect these economies of scale for the benefit of Fund investors.
In approving the continuance of each Management Agreement, the Board, including a majority of the Independent Trustees, determined that the existing management fees are fair and reasonable and that the continuance of such Management Agreement is in the interests of the applicable Fund and its shareholders. While attention was given to all information furnished, the following discusses some primary factors relevant to the Board’s determination.
Nature, Extent and Quality of Services
The Board reviewed and considered information regarding the nature, extent and quality of investment management services provided by each Manager and its affiliates to the Funds and their shareholders. This information included, among other things, the qualifications, background and experience of the senior management and investment personnel of each Manager; the structure of investment personnel compensation; oversight of third-party service providers; investment performance reports and related financial information for each Fund; reports on expenses, shareholder services, marketing support payments made to financial intermediaries and third party servicing arrangements; legal and compliance matters; risk controls; pricing and other services provided by each Manager and its affiliates; and management fees charged by each Manager and its affiliates to U.S. funds and other accounts, including management’s explanation of differences among accounts where relevant. The Board noted management’s continual efforts and expenditures in establishing effective business continuity plans and developing strategies to address areas of heightened concern in the mutual fund industry, such as cybersecurity, derivatives and liquidity risk management.
The Board also reviewed and considered the benefits provided to Fund shareholders of investing in a fund that is part of the Franklin Templeton family of funds. The Board noted the financial position of Franklin Resources, Inc. (FRI), the Managers’ parent, and its commitment to the mutual fund business as evidenced by its continued introduction of new funds, reassessment of the fund offerings in response to the market environment and project initiatives and capital investments relating to the services provided to the Funds by the Franklin Templeton Investments (FTI) organization.
Following consideration of such information, the Board was satisfied with the nature, extent and quality of services provided
| | | | |
| | | |
| 72 | | Semiannual Report | | ftinstitutional.com |
TEMPLETON INSTITUTIONAL FUNDS
SHAREHOLDER INFORMATION
by each Manager and its affiliates to the Funds and their shareholders.
Fund Performance
The Board reviewed and considered the performance results of each Fund over various time periods ended December 31, 2016. The Board considered the performance returns for each Fund in comparison to the performance returns of mutual funds deemed comparable to the Fund included in a universe (Performance Universe) selected by Broadridge Financial Solutions, Inc. (Broadridge), an independent provider of investment company data. The Board received a description of the methodology used by Broadridge to select the mutual funds included in a Performance Universe. The Board also reviewed and considered Fund performance reports provided and discussions that occurred with portfolio managers at Board meetings throughout the year. A summary of each Fund’s performance results is below.
Emerging Markets Series and Foreign Smaller Companies Series - The Performance Universe for the Emerging Markets Series included the Fund and all retail and institutional emerging markets funds. The Performance Universe for the Foreign Smaller Companies Series included the Fund and all retail and institutional international small-/mid-cap growth funds. The Board noted that the Funds’ annualized total returns for the one- and 10-year periods were above the medians of their respective Performance Universes, but for the three- and five-year periods were below the medians of their respective Performance Universes. The Board concluded that the Funds’ performance was satisfactory. In doing so, the Board noted that Emerging Markets Series’ annualized total return for the one-year period was 19.45%. The Board also noted that management was proposing some changes to the Emerging Markets Series’ portfolio management team to be effective April 2017. The Board further noted that effective December 11, 2013, the Foreign Smaller Companies Series is closed to new investors.
Global Equity Series - The Performance Universe for this Fund included the Fund and all retail and institutional global multi-cap value funds. The Board noted that the Fund’s annualized total return for the one- and three-year periods was below the median of its Performance Universe, but for the five-year period was above the median of its Performance Universe. The Board concluded that the Fund’s performance was acceptable. In doing so, the Board noted management’s explanation that the Fund’s shorter term performance has been impacted by its underweight position to the U.S. market, a
strong U.S. dollar given the Fund’s overweight position to Europe and mixed performance from the healthcare and consumer discretionary sectors. The Board also noted that the Fund’s annualized total return for the one-year period, while below the median, exceeded 4.6%.
International Equity Series - The Performance Universe for this Fund included the Fund and all retail and institutional international large-cap value funds. The Board noted that the Fund’s annualized total return for the one-year period was below the median of its Performance Universe, but for the three-, five- and 10-year periods was above the median of its Performance Universe. The Board concluded that the Funds’ performance was satisfactory, noting its positive longer-term performance.
Comparative Fees and Expenses
The Board reviewed and considered information regarding each Fund’s actual total expense ratio and its various components, including, as applicable, management fees; transfer agent expenses; underlying fund expenses; Rule 12b-1 and non-Rule 12b-1 service fees; and other non-management fees. The Board also noted that at its February meeting each year, it receives an annual report on all marketing support payments made by FTI to financial intermediaries. The Board considered the actual total expense ratio and, separately, the contractual management fee rate, without the effect of fee waivers, if any (Management Rate) of each Fund in comparison to the median ratio and median Management Rate, respectively, of other mutual funds deemed comparable to and with a similar expense structure as the Fund selected by Broadridge (Expense Group). Broadridge fee and expense data is based upon information taken from each fund’s most recent annual report, which reflects historical asset levels that may be quite different from those currently existing, particularly in a period of market volatility. While recognizing such inherent limitation and the fact that expense ratios and Management Rates generally increase as assets decline and decrease as assets grow, the Board believed the independent analysis conducted by Broadridge to be an appropriate measure of comparative fees and expenses. The Broadridge Management Rate includes administrative charges, and the actual total expense ratio, for comparative consistency, was shown for Primary shares for the International Equity Series and for Institutional Class shares and F Class shares for certain other funds in the Expense Group. The Board received a description of the methodology used by Broadridge to select the mutual funds included in an Expense Group.
| | | | | | |
| | | |
| ftinstitutional.com | | Semiannual Report | | | 73 | |
TEMPLETON INSTITUTIONAL FUNDS
SHAREHOLDER INFORMATION
Emerging Markets Series - The Expense Group for this Fund included the Fund and fifteen other emerging markets funds. The Board noted that the Management Rate and actual total expense ratio for the Fund were above the medians of its Expense Group. The Board concluded that the Management Rate charged to the Fund is fair and reasonable. In doing so, the Board noted that the actual total expense ratio for the Fund was only 1.8 basis points above the median of its Expense Group. The Board also noted that, effective March 1, 2016, management contractually agreed to waive the Management Rate so that it does not exceed 1.05%.
Foreign Smaller Companies Series - The Expense Group for this Fund included the Fund, four other international small-/mid-cap growth funds and three international small-/mid-cap core funds. The Board noted that the Management Rate for the Fund was above the median of its Expense Group, but its actual total expense ratio was below the median of its Expense Group. The Board concluded that the Management Rate charged to the Fund is fair and reasonable.
Global Equity Series and International Equity Series - The Expense Group for the Global Equity Series included the Fund and seven other global multi-cap value funds. The Expense Group for the International Equity Series included the fund and two other international large-cap value funds and four international large-cap core funds. The Board noted that the Management Rates and actual total expense ratios for the Funds were below the medians of their respective Expense Groups. The Board concluded that the Management Rates charged to these Funds are fair and reasonable.
Profitability
The Board reviewed and considered information regarding the profits realized by each Manager and its affiliates in connection with the operation of each Fund. In this respect, the Board considered the Fund profitability analysis provided by each Manager that addresses the overall profitability of FTI’s U.S. fund business, as well as its profits in providing investment management and other services to each of the individual funds during the 12-month period ended September 30, 2016, being the most recent fiscal year-end for FRI. The Board noted that although management continually makes refinements to its methodologies used in calculating profitability in response to organizational and product-related changes, the overall methodology has remained consistent with that used in the Funds’ profitability report presentations from prior years. Additionally, the Funds’ independent registered public accounting firm has been engaged by each Manager to
periodically review the reasonableness of the allocation methodologies to be used solely by the Funds’ Board with respect to the profitability analysis.
The Board noted management’s belief that costs incurred in establishing the infrastructure necessary for the type of mutual fund operations conducted by each Manager and its affiliates may not be fully reflected in the expenses allocated to each Fund in determining its profitability, as well as the fact that the level of profits, to a certain extent, reflected operational cost savings and efficiencies initiated by management. The Board also noted management’s expenditures in improving shareholder services provided to the Funds, as well as the need to implement systems and meet additional regulatory and compliance requirements resulting from recent SEC and other regulatory requirements.
The Board also considered the extent to which each Manager and its affiliates might derive ancillary benefits from fund operations, including revenues generated from transfer agent services, potential benefits resulting from personnel and systems enhancements necessitated by fund growth, as well as increased leverage with service providers and counterparties. Based upon its consideration of all these factors, the Board concluded that the level of profits realized by each Manager and its affiliates from providing services to each Fund was not excessive in view of the nature, quality and extent of services provided to each Fund.
Economies of Scale
The Board reviewed and considered the extent to which each Manager may realize economies of scale, if any, as each Fund grows larger and whether the Fund’s management fee structure reflects any economies of scale for the benefit of shareholders. With respect to possible economies of scale, the Board noted the existence of management fee breakpoints, which operate generally to share any economies of scale with a Fund’s shareholders by reducing the Fund’s effective management fees as the Fund grows in size. The Board considered each Manager’s view that any analyses of potential economies of scale in managing a particular fund are inherently limited in light of the joint and common costs and investments the Manager incurs across the Franklin Templeton family of funds as a whole. The Board concluded that to the extent economies of scale may be realized by each Manager and its affiliates, each Fund’s management fee structure provided a sharing of benefits with the Fund and its shareholders as the Fund grows.
Conclusion
Based on its review, consideration and evaluation of all factors
| | | | |
| | | |
| 74 | | Semiannual Report | | ftinstitutional.com |
TEMPLETON INSTITUTIONAL FUNDS
SHAREHOLDER INFORMATION
it believed relevant, including the above-described factors and conclusions, the Board unanimously approved the continuation of each Management Agreement for an additional one-year period.
Board Approval of Investment Management Agreements
TEMPLETON INSTITUTIONAL FUNDS
Emerging Markets Series
(Fund)
At an in-person meeting held on May 23, 2017 (Meeting), the Board of Trustees (Board) of Templeton Institutional Funds, including a majority of the trustees who are not “interested persons” as defined in the Investment Company Act of 1940 (Independent Trustees), reviewed and approved, and recommended shareholder approval of, a new investment sub-advisory agreement between Templeton Asset Management Ltd. (Manager), the Fund’s investment manager, and Franklin Templeton Investment Management Limited (Sub-Adviser), an affiliate of the Manager, on behalf of the Fund (Sub-Advisory Agreement) for an initial two year period. The Independent Trustees received advice from and met separately with Independent Trustee counsel in considering whether to approve the Sub-Advisory Agreement.
The Board reviewed and considered information provided by the Manager at the Meeting with respect to the Sub-Advisory Agreement. The Board reviewed and considered the factors it deemed relevant in approving the Sub-Advisory Agreement, including, but not limited to: (i) the nature, extent, and quality of the services to be provided by the Sub-Adviser; and (ii) the costs of the services to be provided by the Sub-Adviser. The Board considered that management proposed that the Board approve the Sub-Advisory Agreement in order to facilitate certain portfolio management team enhancements.
In approving the Sub-Advisory Agreement, the Board, including a majority of the Independent Trustees, determined that the proposed investment sub-advisory fees are fair and reasonable and that the approval of such Sub-Advisory Agreement is in the interests of the Fund and its shareholders. While attention was given to all information furnished, the following discusses some primary factors relevant to the Board’s determination.
Nature, Extent and Quality of Services
The Board reviewed and considered information regarding the nature, extent and quality of investment management services
to be provided by the Sub-Adviser and currently being provided by the Manager and its affiliates to the Fund and its shareholders. In particular, with respect to the Sub-Adviser, the Board took into account that the Sub-Advisory Agreement would not affect how the Fund is managed or the Fund’s investment goal, principal investment strategies or principal risks associated with an investment in the Fund. The Board reviewed and considered information regarding the nature, quality and extent of investment sub-advisory services to be provided by the Sub-Adviser to the Fund and its shareholders under the Sub-Advisory Agreement; the Sub-Adviser’s experience as manager of other funds and accounts, including those within the Franklin Templeton Investments (FTI) organization; the personnel, operations, financial condition, and investment management capabilities, methodologies and resources of the Sub-Adviser and the Sub-Adviser’s capabilities, as demonstrated by, among other things, its policies and procedures designed to prevent violations of the Federal securities laws, which had previously been approved by the Board in connection with its oversight of other funds in the FTI organization.
The Board also reviewed and considered the benefits provided to Fund shareholders of investing in a fund that is part of the Franklin Templeton family of funds. The Board noted the financial position of Franklin Resources, Inc. (FRI), the Manager’s and the Sub-Adviser’s parent, and its commitment to the mutual fund business as evidenced by its continued introduction of new funds, reassessment of the fund offerings in response to the market environment and project initiatives and capital investments relating to the services provided to the Fund by the (FTI) organization.
Following consideration of such information, the Board was satisfied with the nature, extent and quality of services to be provided by the Sub-Adviser to the Fund and its shareholders.
Fund Performance
The Board noted its review and consideration of the performance results of the Fund in connection with the February 2017 annual contract renewal. The Board recalled its conclusion at that time that the Fund’s performance was satisfactory. The Board further recalled recent and expected portfolio management team changes for the Fund.
Comparative Fees and Expenses
The Board reviewed and considered information regarding the investment sub-advisory fee to be charged by the Sub-Adviser. The Board noted that the addition of the Sub-Adviser will have no impact on the amount of management fees that are currently
| | | | | | |
| | | |
| ftinstitutional.com | | Semiannual Report | | | 75 | |
TEMPLETON INSTITUTIONAL FUNDS
SHAREHOLDER INFORMATION
paid by the Fund as the Sub-Adviser will be paid by the Manager out of the management fee that the Manager receives from the Fund. The Board further noted that the allocation of the fee between the Manager and the Sub-Adviser reflected the services to be provided by each. The Board concluded that the proposed investment sub-advisory fee is fair and reasonable.
Management Profitability and Economies of Scale
The Board determined that its conclusions regarding profitability and economies of scale reached in connection with the February 2017 annual contract renewal of the existing investment management agreement with the Manager had not changed as a result of the proposal to approve the Sub-Advisory Agreement.
Conclusion
Based on its review, consideration and evaluation of all factors it believed relevant, including the above-described factors and conclusions, the Board unanimously approved the Sub-Advisory Agreement for an initial two year period.
Proxy Voting Policies and Procedures
The Funds’ investment manager has established Proxy Voting Policies and Procedures (Policies) that the Funds use to determine how to vote proxies relating to portfolio securities. Shareholders may view the Funds’ complete Policies online at franklintempleton.com. Alternatively, shareholders may request copies of the Policies free of charge by calling the Proxy Group collect at (954) 527-7678 or by sending a written request to: Franklin Templeton Companies, LLC, 300 S.E. 2nd Street, Fort Lauderdale, FL 33301, Attention: Proxy Group. Copies of the Funds’ proxy voting records are also made available online at franklintempleton.com and posted on the U.S. Securities and Exchange Commission’s website at sec.gov and reflect the most recent 12-month period ended June 30.
Quarterly Statement of Investments
The Funds file a complete statement of investments with the U.S. Securities and Exchange Commission for the first and third quarters for each fiscal year on Form N-Q. Shareholders may view the filed Form N-Q by visiting the Commission’s website at sec.gov. The filed form may also be viewed and copied at the Commission’s Public Reference Room in Washington, DC. Information regarding the operations of the Public Reference Room may be obtained by calling (800) SEC-0330.
| | | | |
| | | |
| 76 | | Semiannual Report | | ftinstitutional.com |
Semiannual Report
Templeton Institutional Funds
Investment Managers
Templeton Asset Management Ltd.
Templeton Investment Counsel, LLC
Distributor
Franklin Templeton Distributors, Inc.
Shareholder Services
(800) 321-8563
ftinstitutional.com
Authorized for distribution only when accompanied or preceded by a summary prospectus and/or prospectus. Investors should carefully consider a fund’s investment goals, risks, charges and expenses before investing. A prospectus contains this and other information; please read it carefully before investing.
To help ensure we provide you with quality service, all calls to and from our service areas are monitored and/or recorded.
| | |
| © 2017 Franklin Templeton Investments. All rights reserved. | | ZTIF S 08/17 |
(a) The Registrant has adopted a code of ethics that applies to its principal executive officers and principal financial and accounting officer.
(c) N/A
(d) N/A
(f) Pursuant to Item 12(a)(1), the Registrant is attaching as an exhibit a copy of its code of ethics that applies to its principal executive officers and principal financial and accounting officer.
| Item 3. | Audit Committee Financial Expert. |
(a)(1) The Registrant has an audit committee financial expert serving on its audit committee.
(2) The audit committee financial expert is David W. Niemiec and he is “independent” as defined under the relevant Securities and Exchange Commission Rules and Releases.
| Item 4. | Principal Accountant Fees and Services. N/A |
| Item 5. | Audit Committee of Listed Registrants. N/A |
| Item 6. | Schedule of Investments. N/A |
| Item 7. | Disclosure of Proxy Voting Policies and Procedures for Closed-End Management Investment Companies. N/A |
| Item 8. | Portfolio Managers of Closed-End Management Investment Companies. N/A |
| Item 9. | Purchases of Equity Securities by Closed-End Management Investment Company and Affiliated Purchasers. N/A |
| Item 10. | Submission of Matters to a Vote of Security Holders. |
There have been no changes to the procedures by which shareholders may recommend nominees to the Registrant’s Board of Trustees that would require disclosure herein.
| Item 11. | Controls and Procedures. |
(a) Evaluation of Disclosure Controls and Procedures. The Registrant maintains disclosure controls and procedures that are designed to
ensure that information required to be disclosed in the Registrant’s filings under the Securities Exchange Act of 1934 and the Investment Company Act of 1940, is recorded, processed, summarized and reported within the periods specified in the rules and forms of the Securities and Exchange Commission. Such information is accumulated and communicated to the Registrant’s management, including its principal executive officer and principal financial officer, as appropriate, to allow timely decisions regarding required disclosure. The Registrant’s management, including the principal executive officer and the principal financial officer, recognizes that any set of controls and procedures, no matter how well designed and operated, can provide only reasonable assurance of achieving the desired control objectives.
Within 90 days prior to the filing date of this Shareholder Report on Form N-CSR, the Registrant had carried out an evaluation, under the supervision and with the participation of the Registrant’s management, including the Registrant’s principal executive officer and the Registrant’s principal financial officer, of the effectiveness of the design and operation of the Registrant’s disclosure controls and procedures. Based on such evaluation, the Registrant’s principal executive officer and principal financial officer concluded that the Registrant’s disclosure controls and procedures are effective.
(b) Changes in Internal Controls. There have been no changes in the Registrant’s internal controls or in other factors that could materially affect the internal controls over financial reporting subsequent to the date of their evaluation in connection with the preparation of this Shareholder Report on Form N-CSR.
(a)(1) Code of Ethics
(a)(2) Certifications pursuant to Section 302 of the Sarbanes-Oxley Act of 2002 of Matthew T. Hinkle, Chief Executive Officer - Finance and Administration, and Robert G. Kubilis, Chief Financial Officer and Chief Accounting Officer
(b) Certifications pursuant to Section 906 of the Sarbanes-Oxley Act of 2002 of Matthew T. Hinkle, Chief Executive Officer - Finance and Administration, and Robert G. Kubilis, Chief Financial Officer and Chief Accounting Officer
SIGNATURES
Pursuant to the requirements of the Securities Exchange Act of 1934 and the Investment Company Act of 1940, the registrant has duly caused this report to be signed on its behalf by the undersigned, thereunto duly authorized.
TEMPLETON INSTITUTIONAL FUNDS
| | |
| By | | /s/ Matthew T. Hinkle |
| | Matthew T. Hinkle |
| | Chief Executive Officer – |
| | Finance and Administration |
| Date August 25, 2017 |
Pursuant to the requirements of the Securities Exchange Act of 1934 and the Investment Company Act of 1940, this report has been signed below by the following persons on behalf of the registrant and in the capacities and on the dates indicated.
| | |
| By | | /s/ Matthew T. Hinkle |
| | Matthew T. Hinkle |
| | Chief Executive Officer – |
| | Finance and Administration |
| Date August 25, 2017 |
| |
| By | | /s/ Robert G. Kubilis |
| | Robert G. Kubilis |
| | Chief Financial Officer and |
| | Chief Accounting Officer |
| Date August 25, 2017 |
