UNITED STATES
SECURITIES AND EXCHANGE COMMISSION
Washington, DC 20549
FORM N-CSRS
CERTIFIED SHAREHOLDER REPORT OF REGISTERED
MANAGEMENT INVESTMENT COMPANIES
Investment Company Act file number 811-06135
Templeton Institutional Funds
(Exact name of registrant as specified in charter)
300 S.E. 2nd Street, Fort Lauderdale, FL 33301-1923
(Address of principal executive offices) (Zip code)
Craig S. Tyle, One Franklin Parkway, San Mateo, CA 94403-1906
(Name and address of agent for service)
Registrant’s telephone number, including area code: (954) 527-7500
Date of fiscal year end: 12/31
Date of reporting period: 6/30/18
| Item 1. | Reports to Stockholders. |
Franklin Templeton Investments
Why choose Franklin Templeton Investments?
Successful investing begins with ambition. And achievement only comes when you reach for it. That’s why we continually strive to deliver better outcomes for investors. No matter what your goals are, our deep, global investment expertise allows us to offer solutions that can help.
During our more than 70 years of experience, we’ve managed through all kinds of markets—up, down and those in between. We’re always preparing for what may come next. It’s because of this, combined with our strength as one of the world’s largest asset managers that we’ve earned the trust of millions of investors around the world.
Contents
Visit ftinstitutional.com for fund updates, to access your account, or to find investment insights.
|
Not FDIC Insured | May Lose Value | No Bank Guarantee |
| | | | | | |
| | | |
| ftinstitutional.com | | Not part of the semiannual report | | | 1 | |
Semiannual Report
Economic and Market Overview
The global economy expanded during the six-month period under review amid generally upbeat economic data across regions. In this environment, global developed and emerging market stocks reached a new all-time high in January 2018, as measured by the MSCI All Country World Index (ACWI). During the period, global markets were aided by price gains in oil and other commodities, encouraging corporate earnings reports and investor optimism about global economic growth. However, global stocks had a -0.13% total return for the six-month period, as measured by the MSCI ACWI, largely due to an overall decline in emerging market stocks.1
Global markets reflected investor concerns about tensions in the Korean peninsula and political uncertainties in the US and the European Union, as well as worries that strong economic growth and rising inflation in some parts of the world, particularly in the US, would lead central banks to increase interest rates sooner than expected. Markets were further pressured by the Trump administration’s protectionist trade policies, uncertainty surrounding the US-China trade relationship, and a broad sell-off in information technology stocks in March due to a potential for tighter regulation in the sector arising from concerns about consumer data privacy. An overall easing of tensions in the Korean peninsula and intermittent US-China trade negotiations partially offset some of these concerns. However, US trade disputes with its allies and China near period-end dampened investor sentiment.
The US economy continued to grow during the six months under review. After moderating for three consecutive quarters, the economy grew faster in 2018’s second quarter, driven by consumer spending, exports, business investment and government spending. The unemployment rate declined from 4.1% in December 2017, as reported at the beginning of the six-month period, to 4.0% at period-end.2 Annual inflation, as measured by the Consumer Price Index, increased from 2.1% in December 2017, as reported at the beginning of the period, to 2.9% at period-end.2 The US Federal Reserve raised its target range for the federal funds rate in March and June 2018 and continued reducing its balance sheet as part of its ongoing plan to normalize monetary policy.
In Europe, the UK’s quarterly economic growth moderated in 2018’s first quarter amid a decline in construction output. The Bank of England kept its key policy rate unchanged during the
period. The eurozone’s quarterly growth moderated in 2018’s first quarter due to a decline in external demand. The bloc’s annual inflation rate ended the period higher than in December 2017. The European Central Bank (ECB) kept its benchmark interest rate unchanged during the period. However, at its June meeting, the ECB announced it would further reduce its monthly bond purchases beginning in October 2018 and indicated it would conclude the program at the end of 2018 while continuing to keep interest rates unchanged through at least the summer of 2019.
In Asia, Japan’s quarterly gross domestic product (GDP) growth in 2018’s first quarter declined, the country’s first contraction since 2015’s fourth quarter, mainly due to a decline in private residential investment and household consumption. The Bank of Japan left its benchmark interest rate unchanged during the period and continued its monetary stimulus measures.
In emerging markets, Brazil’s quarterly GDP accelerated in 2018’s first quarter compared to the previous quarter. The country’s central bank cut its benchmark interest rate twice during the period to spur economic growth. Russia’s annual GDP grew in 2018’s first quarter compared to the prior-year period, amid the Bank of Russia’s continued policy support. China’s annual GDP moderated in 2018’s first quarter compared to the prior-year period. The People’s Bank of China left its benchmark interest rate unchanged during the period. Overall, emerging market stocks, as measured by the MSCI Emerging Markets Index, declined during the period.
The foregoing information reflects our analysis and opinions as of June 30, 2018. The information is not a complete analysis of every aspect of any market, country, industry, security or fund. Statements of fact are from sources considered reliable.
1. Source: Morningstar.
2. Source: US Bureau of Labor Statistics
See www.franklintempletondatasources.com for additional data provider information.
| | | | |
| | | |
| 2 | | Semiannual Report | | ftinstitutional.com |
Foreign Smaller Companies Series
This semiannual report for Foreign Smaller Companies Series (Fund) covers the period ended June 30, 2018. Effective at the market close on December 10, 2013, the Fund closed to new investors; existing shareholders may add to their accounts. Effective June 25, 2018, the Fund reopened to new investors.
Your Fund’s Goal and Main Investments
The Fund seeks long-term capital growth. Under normal market conditions, the Fund invests at least 80% of its net assets in investments of smaller companies located outside the US, including emerging markets.
Performance Overview
The Fund had a -2.03% cumulative total return for the six months under review. In comparison, the MSCI All Country World Index ex USA Small Cap Index, which measures performance of global developed and emerging market small-cap equities, excluding the US, had a -2.71% total return.1 Please note, index performance information is provided for reference and we do not attempt to track the index but rather undertake investments on the basis of fundamental research. You can find the Fund’s long-term performance data in the Performance Summary beginning on page 6.
Performance data represent past performance, which does not guarantee future results. Investment return and principal value will fluctuate, and you may have a gain or loss when you sell your shares. Current performance may differ from figures shown. For most recent month-end performance, go to ftinstitutional.com or call a Franklin Templeton Institutional Services representative at (800) 321-8563.
Investment Strategy
When choosing equity investments, we apply a bottom-up, value-oriented, long-term approach, focusing on the market price of a company’s securities relative to our evaluation of the company’s long-term earnings, asset value and cash flow potential. We also consider a company’s price/earnings ratio, profit margins and liquidation value.
Manager’s Discussion
Several holdings performed well during the period under review. Kobayashi Pharmaceutical is a Japanese
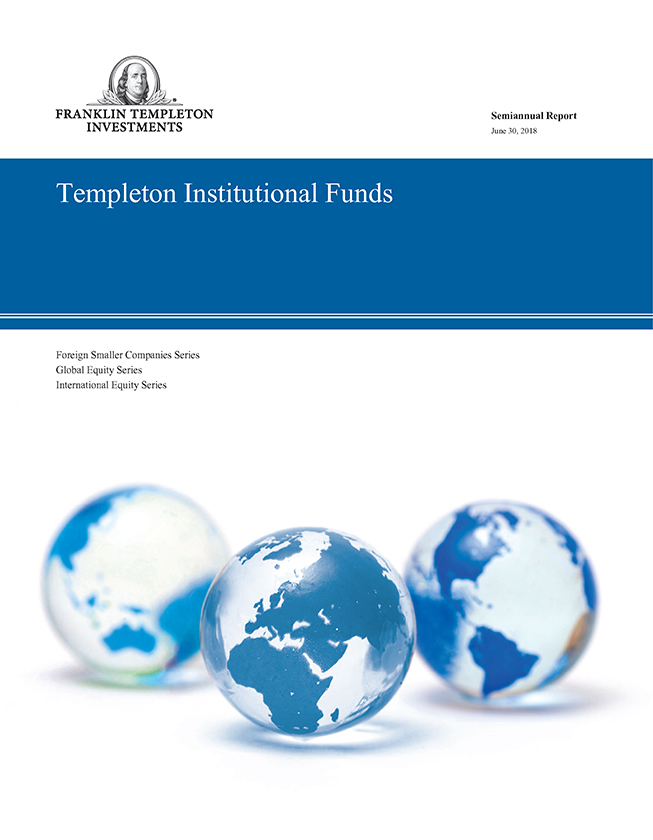
Geographic Composition
Based on Total Net Assets as of 6/30/18
pharmaceutical/household product company. We believe Kobayashi is structurally well positioned for continued organic domestic growth and high global demand for its products. Given the perception of superior quality relative to global competitors, new products in the skincare and household segments have seen strong growth internationally. Kobayashi also has been benefiting from growing tourist spending in Japan. We believe margin expansion should continue based on a shift to higher margin consumer products and higher capacity utilization due to new product launches. We have continued to like Kobayashi based on its strong balance sheet, growth drivers and favorable shareholder policies.
Capcom is a small-capitalization game software developer based in Japan. Sales of packaged games, downloadable games for consoles, PC games and mobile games are its main earnings drivers. The company has continued to develop popular game franchises such as “Monster Hunter: World,” a major hit in the US, Japan and Europe. Management plans to actively seek partnerships in mobile to leverage its intellectual property, and this is a key component of our investment thesis.
Laird is a UK-based supplier of products such as “shark-fin” antennae for wireless connections and electromagnetic interference shielding for Apple’s iPhone and iPad. The firm’s shares (not held at period-end) surged during the period after the company agreed to a takeover by US private equity firm Advent International.
1. Source: Morningstar.
The index is unmanaged and includes reinvestment of any income or distributions. It does not reflect any fees, expenses or sales charges. One cannot invest directly in an index, and an index is not representative of the Fund’s portfolio.
See www.franklintempletondatasources.com for additional data provider information.
The dollar value, number of shares or principal amount, and names of all portfolio holdings are listed in the Fund’s Statement of Investments (SOI). The SOI begins on page 24.
| | | | | | |
| | | |
| ftinstitutional.com | | Semiannual Report | | | 3 | |
FOREIGN SMALLER COMPANIES SERIES
Portfolio Composition
6/30/18
| | | | |
| |
| Sector/Industry | | % of Total Net Assets | |
| |
| Machinery | | | 10.5% | |
| |
| Leisure Products | | | 8.0% | |
| |
| Textiles, Apparel & Luxury Goods | | | 7.4% | |
| |
| Electronic Equipment, Instruments & Components | | | 6.6% | |
| |
| Capital Markets | | | 4.5% | |
| |
| Food Products | | | 3.7% | |
| |
| Banks | | | 3.7% | |
| |
| Household Durables | | | 3.3% | |
| |
| Professional Services | | | 3.1% | |
| |
| Specialty Retail | | | 2.9% | |
| |
| Personal Products | | | 2.9% | |
| |
| Construction & Engineering | | | 2.6% | |
| |
| Real Estate Management & Development | | | 2.6% | |
| |
| Containers & Packaging | | | 2.4% | |
| Metals & Mining | | | 2.4% | |
| |
| Life Sciences Tools & Services | | | 2.3% | |
| |
| Insurance | | | 2.3% | |
| |
| Other | | | 23.8% | |
| |
| Short-Term Investments & Other Net Assets | | | 5.0% | |
| |
In contrast, the Fund had some underperformers in the period under review. Shares of UK sandwich retailer Greggs declined after the company announced that it had suffered sluggish spring sales due to bad weather and remained cautious about its sales outlook for the rest of the year. Looking at the longer term, Greggs is a leading player in the UK take-away sandwich and savories market, with growth opportunities from new products and organic store expansion.
Shares of Belgian hygiene products firm Ontex Group declined after management forecasted low single-digit percentage sales growth in the “broadly flat” hygiene markets and said it is taking measures to restore profitability in its Brazilian business. Ultimately, we believe the market wants to see the firm successfully integrate its emerging market acquisitions and improve its cornerstone private label business in Europe to develop a sustainable long-term growth profile. A setback like this casts doubt on Ontex’s progress and strategy, and Wall Street analysts downgraded the company’s stock. However, our analysis of Ontex’s corporate strategy and market opportunities suggests that its goal of improving and fortifying its growth profile is well within reach. We view the recent disappointments as temporary setbacks, and we continue to believe that the period-end valuations understate Ontex’s long-term business prospects.
Top 10 Holdings
6/30/18
| | | | |
| |
Company Sector/Industry, Country | | % of Total
Net Assets | |
| |
The Thule Group AB Leisure Products, Sweden | | | 2.0% | |
| |
Dewan Housing Finance Corp. Ltd. Thrifts & Mortgage Finance, India | | | 2.0% | |
| |
Amer Sports OYJ Leisure Products, Finland | | | 2.0% | |
| |
Kobayashi Pharmaceutical Co. Ltd. Personal Products, Japan | | | 1.9% | |
| |
Technogym SpA Leisure Products, Italy | | | 1.9% | |
| |
Tsumura & Co. Pharmaceuticals, Japan | | | 1.8% | |
| |
Interpump Group SpA Machinery, Italy | | | 1.7% | |
| |
Gerresheimer AG Life Sciences Tools & Services, Germany | | | 1.6% | |
| |
Huhtamaki OYJ Containers & Packaging, Finland | | | 1.6% | |
| |
Anicom Holdings Inc. Insurance, Japan | | | 1.6% | |
| |
M. Dias Branco is Brazil’s market leader in cookies and crackers. Despite its stock’s short-term underperformance, we believe the company’s market-leading brands and the significant competitive advantages it has developed by vertically integrating and slowly developing distribution across Brazil could lead to strong share-price performance over our long-term investment horizon.
It is important to recognize the effect of currency movements on the Fund’s performance. In general, if the value of the US dollar goes up compared with a foreign currency, an investment traded in that foreign currency will go down in value because it will be worth fewer US dollars. This can have a negative effect on Fund performance. Conversely, when the US dollar weakens in relation to a foreign currency, an investment traded in that foreign currency will increase in value, which can contribute to Fund performance. For the six months ended June 30, 2018, the US dollar rose in value relative to most currencies. As a result, the Fund’s performance was negatively affected by the portfolio’s investment predominantly in securities with non-US currency exposure.
| | | | |
| | | |
| 4 | | Semiannual Report | | ftinstitutional.com |
FOREIGN SMALLER COMPANIES SERIES
Thank you for your continued participation in Foreign Smaller Companies Series. We look forward to serving your future investment needs.
| | |
 | | 
Harlan B. Hodes, CPA Portfolio Manager |
The foregoing information reflects our analysis, opinions and portfolio holdings as of June 30, 2018, the end of the reporting period. The way we implement our main investment strategies and the resulting portfolio holdings may change depending on factors such as market and economic conditions. These opinions may not be relied upon as investment advice or an offer for a particular security. The information is not a complete analysis of every aspect of any market, country, industry, security or the Fund. Statements of fact are from sources considered reliable, but the investment manager makes no representation or warranty as to their completeness or accuracy. Although historical performance is no guarantee of future results, these insights may help you understand our investment management philosophy.
| | | | | | |
| | | |
| ftinstitutional.com | | Semiannual Report | | | 5 | |
FOREIGN SMALLER COMPANIES SERIES
Performance Summary as of June 30, 2018
The performance table does not reflect any taxes that a shareholder would pay on Fund dividends, capital gain distributions, if any, or any realized gains on the sale of Fund shares. Total return reflects reinvestment of the Fund’s dividends and capital gain distributions, if any, and any unrealized gains or losses. Your dividend income will vary depending on dividends or interest paid by securities in the Fund’s portfolio, adjusted for operating expenses. Capital gain distributions are net profits realized from the sale of portfolio securities.
Performance as of 6/30/181
| | | | | | | | |
| | | Cumulative Total Return2 | | | Average Annual Total Return3 | |
| |
6-Month | | | -2.03% | | | | -2.03% | |
| |
1-Year | | | +9.43% | | | | +9.43% | |
| |
5-Year | | | +47.73% | | | | +8.12% | |
| |
10-Year | | | +103.85% | | | | +7.38% | |
| |
Performance data represent past performance, which does not guarantee future results. Investment return and principal value will fluctuate, and you may have a gain or loss when you sell your shares. Current performance may differ from figures shown. For most recent month-end performance, go to ftinstitutional.com or call a Franklin Templeton Institutional Services representative at (800) 321-8563.
See page 7 for Performance Summary footnotes.
| | | | |
| | | |
| 6 | | Semiannual Report | | ftinstitutional.com |
FOREIGN SMALLER COMPANIES SERIES
PERFORMANCE SUMMARY
Total Annual Operating Expenses4
| | | | |
| | | With Waiver | | Without Waiver |
|
| | 0.99% | | 1.00% |
|
All investments involve risks, including possible loss of principal. Smaller, midsized and relatively new or unseasoned companies can be particularly sensitive to changing economic conditions, and their prospectus for growth are less certain than those of larger, more established companies. Historically, these securities have exhibited greater price volatility than large company stocks, particularly over the short term. Special risks are associated with foreign investing, including currency fluctuations, economic instability and political developments. Investments in emerging markets involve heightened risks related to the same factors, in addition to those associated with these markets’ smaller size and lesser liquidity. Because the Fund may invest its assets in companies in a specific region, including Europe, it is subject to greater risks of adverse developments in that region and/or the surrounding regions than a fund that is more broadly diversified geographically. Political, social or economic disruptions in the region, even in countries in which the Fund is not invested, may adversely affect the value of securities held by the Fund. Current political and financial uncertainty surrounding the European Union may increase market volatility and the economic risk of investing in companies in Europe. The Fund is actively managed but there is no guarantee that the manager’s investment decisions will produce the desired results. The Fund’s prospectus also includes a description of the main investment risks.
1. The Fund has a fee waiver associated with any investment it makes in a Franklin Templeton money fund and/or other Franklin Templeton fund, contractually guaranteed through 4/30/19. Fund investment results reflect the fee waiver; without this waiver, the results would have been lower.
2. Cumulative total return represents the change in value of an investment over the periods indicated.
3. Average annual total return represents the average annual change in value of an investment over the periods indicated. Return for less than one year, if any, has not been annualized.
4. Figures are as stated in the Fund’s current prospectus and may differ from the expense ratios disclosed in the Your Fund’s Expenses and Financial Highlights sections in this report. In periods of market volatility, assets may decline significantly, causing total annual Fund operating expenses to become higher than the figures shown.
| | | | | | |
| | | |
| ftinstitutional.com | | Semiannual Report | | | 7 | |
FOREIGN SMALLER COMPANIES SERIES
Your Fund’s Expenses
As a Fund shareholder, you can incur two types of costs: (1) transaction costs, including sales charges (loads) on Fund purchases and redemptions, if applicable; and (2) ongoing Fund costs, including management fees, distribution and service (12b-1) fees, if applicable, and other Fund expenses. All mutual funds have ongoing costs, sometimes referred to as operating expenses. The table below shows ongoing costs of investing in the Fund and can help you understand these costs and compare them with those of other mutual funds. The table assumes a $1,000 investment held for the six months indicated.
Actual Fund Expenses
The table below provides information about actual account values and actual expenses in the columns under the heading “Actual.” In these columns the Fund’s actual return, which includes the effect of Fund expenses, is used to calculate the “Ending Account Value.” You can estimate the expenses you paid during the period by following these steps (of course, your account value and expenses will differ from those in this illustration): Divide your account value by $1,000 (if your account had an $8,600 value, then $8,600 ÷ $1,000 = 8.6). Then multiply the result by the number in the row for your class of shares under the headings “Actual” and “Expenses Paid During Period” (if Actual Expenses Paid During Period were $7.50, then 8.6 x $7.50 = $64.50). In this illustration, the actual expenses paid this period are $64.50.
Hypothetical Example for Comparison with Other Funds
Under the heading “Hypothetical” in the table, information is provided about hypothetical account values and hypothetical expenses based on the Fund’s actual expense ratio and an assumed rate of return of 5% per year before expenses, which is not the Fund’s actual return. This information may not be used to estimate the actual ending account balance or expenses you paid for the period, but it can help you compare ongoing costs of investing in the Fund with those of other funds. To do so, compare this 5% hypothetical example for the class of shares you hold with the 5% hypothetical examples that appear in the shareholder reports of other funds.
Please note that expenses shown in the table are meant to highlight ongoing costs and do not reflect any transactional costs. Therefore, information under the heading “Hypothetical” is useful in comparing ongoing costs only, and will not help you compare total costs of owning different funds. In addition, if transactional costs were included, your total costs would have been higher.
| | | | | | | | | | | | | | | | |
| | | | | Actual (actual return after expenses) | | | | Hypothetical (5% annual return before expenses) | | | | |
Beginning
Account
Value 1/1/18 | | | | Ending
Account
Value 6/30/18 | | Paid During
Period
1/1/18–6/30/181,2 | | | | Ending
Account
Value 6/30/18 | | Paid During
Period
1/1/18–6/30/181,2 | | | | Net
Annualized
Expense
Ratio2 |
| $1,000 | | | | $979.70 | | $4.91 | | | | $1,019.84 | | $5.01 | | | | 1.00% |
1. Expenses are equal to the annualized expense ratio for the six-month period as indicated above—in the far right column—multiplied by the simple average account value over the period indicated, and then multiplied by 181/365 to reflect the one-half year period.
2. Reflects expenses after fee waivers and expense reimbursements. Does not include acquired fund fees and expenses.
| | | | |
| | | |
| 8 | | Semiannual Report | | ftinstitutional.com |
Global Equity Series
This semiannual report for Global Equity Series (Fund) covers the period ended June 30, 2018.
Your Fund’s Goal and Main Investments
The Fund seeks long-term capital growth. Under normal market conditions, the Fund invests at least 80% of its net assets in equity securities of companies located anywhere in the world, including developing markets.
Performance Overview
The Fund had a -2.17% cumulative total return for the six months under review. For comparison, the Fund’s benchmark, the MSCI All Country World Index, which measures stock market performance in global developed and emerging markets, had a -0.13% total return.1 Please note, index performance information is provided for reference and we do not attempt to track an index but rather undertake investments on the basis of fundamental research. You can find the Fund’s long-term performance data in the Performance Summary beginning on page 13.
Performance data represent past performance, which does not guarantee future results. Investment return and principal value will fluctuate, and you may have a gain or loss when you sell your shares. Current performance may differ from figures shown. For most recent month-end performance, go to ftinstitutional.com or call a Franklin Templeton Institutional Services representative at (800) 321-8563.
Investment Strategy
We employ a bottom-up, value-oriented, long-term investment strategy. We focus on the market price of a company’s securities relative to our evaluation of the company’s long-term earnings, asset value and cash flow potential. We also consider a company’s price/earnings ratio, profit margins and liquidation value. We attempt to identify those companies that offer above-average opportunities for capital appreciation in various countries and industries where economic and political factors, including currency movements, are favorable to capital growth.
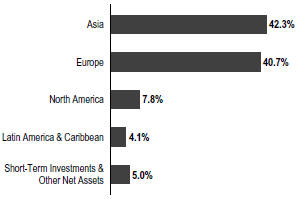
Geographic Composition
Based on Total Net Assets as of 6/30/18
Manager’s Discussion
Global equities modestly retreated during the first half of 2018 amid concerns about escalating trade tensions and the impact of a stronger US dollar and tighter monetary policy on emerging markets. The performance trends dominant during this market cycle remained largely intact, with a few exceptions. Information technology (IT) and other growth-oriented sectors maintained their long-running leadership, while energy extended more recent gains as supply concerns and solid demand supported the price of crude. Among new developments during the period, health care stocks rebounded while financials underperformance deepened.
The Fund’s stock selection and underweighted allocation in IT detracted significantly from the Fund’s performance relative to its benchmark during the period.2 US communications equipment firm CommScope Holding was the sector’s biggest laggard, declining after pricing pressures negatively impacted the company’s margins. Although aggressive pricing from US telecom carriers embarking on large-scale projects has remained a threat to CommScope’s profitability, the resulting single-digit hit to near-term free cash flow guidance did not justify the significant share-price selloff, in our view. CommScope has remained a leading global franchise in the solidly growing wireless equipment space (with leading positions in most product areas), and recent pricing concessions are likely necessary to win new long-term business. We remain skeptical about the sustainability of the IT sectors’s
1. Source: Morningstar.
The index is unmanaged and includes reinvestment of any income or distributions. It does not reflect any fees, expenses or sales charges. One cannot invest directly in an index, and an index is not representative of the Fund’s portfolio.
2. The IT sector comprises communications equipment; electronic equipment, instruments and components; internet software and services; IT services; semiconductors and semiconductor equipment; software; and technology hardware, storage and peripherals in the SOI.
The dollar value, number of shares or principal amount, and names of all portfolio holdings are listed in the Fund’s Statement of Investments (SOI). The SOI begins on page 29.
| | | | | | |
| | | |
| ftinstitutional.com | | Semiannual Report | | | 9 | |
GLOBAL EQUITY SERIES
outperformance given that recent strength has been driven primarily by valuation multiples expansion, not earnings growth. Indeed, the price/sales ratio for the Standard & Poor’s® 500 IT Index has almost doubled over the past five years, while the earnings growth trend has stagnated. We cannot explain why flat growth is being rewarded with an expanding multiple, and we continue to underweight the sector amid what appears to be the biggest divergence between IT valuations and fundamentals since the late 1990s.
The Fund’s stock selection and overweighted allocation in financials also detracted, led lower by European-domiciled firms Standard Chartered (UK), BNP Paribas (France) and UBS Group (Switzerland).3 European banks were negatively impacted by flagging regional growth and Italian political turmoil during the first half of 2018. We believe investor concerns about Italy are overblown. Italy certainly has its challenges, including high public debt, rigid labor markets, low productivity, high unit labor costs, a fragmented banking system, inefficient tax base, political fragility and so on. But, by any objective assessment, we believe the country is far better off in the EU than it would be outside of it. Were Italy to leave, we think its banks would be insolvent, its government would default on its obligations, and the purchasing power of household savings would be vastly diminished once redenominated into lira. In all likelihood, the recent Italian crisis has done little more than postpone ECB interest rate hikes a few months and take some air out of the euro—not necessarily adverse developments for an export-oriented trading bloc accustomed to expansive monetary policy. The largest one-day spike in Italian bond yields since 1993 may also be a helpful warning—much like the one experienced by Greece in 2015—that financial markets remain vigilant. After reducing exposure to European financials amid last year’s strength, we have viewed more recent volatility as a selective buying opportunity.
A significant overweighting in telecommunication services also detracted in the first half, as the sector was led lower by UK-based Vodafone Group.4 Its shares declined amid concerns about the firm’s bid for some of the assets of international media group Liberty Global (not a Fund holding). Yet, the deal was struck at a materially lower-than-expected price and creates significant opportunities for growth and convergence in the Vodafone portfolio. With an attractive dividend yield
Portfolio Composition
6/30/18
| | | | |
| Sector/Industry | | % of Total
Net Assets | |
| |
Banks | | | 12.0% | |
| |
Oil, Gas & Consumable Fuels | | | 10.3% | |
| |
Pharmaceuticals | | | 9.8% | |
| |
Biotechnology | | | 5.6% | |
| |
Wireless Telecommunication Services | | | 3.8% | |
| |
Technology Hardware, Storage & Peripherals | | | 3.5% | |
| |
Media | | | 3.4% | |
| |
Chemicals | | | 3.3% | |
| |
Specialty Retail | | | 2.8% | |
| |
Software | | | 2.8% | |
| |
Industrial Conglomerates | | | 2.7% | |
| |
Diversified Telecommunication Services | | | 2.3% | |
| |
Internet Software & Services | | | 2.2% | |
| |
Multi-Utilities | | | 2.2% | |
| |
Other | | | 30.0% | |
| |
Short-Term Investments & Other Net Assets | | | 3.3% | |
| |
backed by solid free cash flow and a robust and diversified operating portfolio, Vodafone remains a hold at current levels, in our analysis. Elsewhere in the sector, shares of Singapore Telecommunications (Singtel) declined after reporting a drop in net income. Although currency fluctuations and a new 4G mobile entry in Australia and Singapore may pressure profits in the near term, we believe consolidation in the promising Indian market should help earnings recover over our investment horizon. Recently trading at what we consider a relatively cheap valuation multiple and featuring a strong balance sheet, attractive dividend yield and compelling emerging market growth prospects, we believe Singtel remains significantly undervalued relative to its long-term fundamentals.
Turning to contributors, the Fund’s two largest overweighted sector allocations—health care and energy—benefited relative performance as did stock selection in both sectors.5 From the health care sector, Israel’s Teva Pharmaceutical Industries was the Fund’s top stock contributor during the review period. We have been encouraged by the progress Teva is making under its new chief executive officer’s restructuring plan, which seeks to refinance and pay down debt, renew the focus on profitability and deliver substantial savings by 2019. The stock could find additional support following a major vote of confidence from
3. The financials sector comprises banks, capital markets, consumer finance, diversified financial services, insurance, and thrifts and mortgage finance in the SOI.
4. The telecommunication services sector comprises diversified telecommunication services and wireless telecommunication services in the SOI.
5. The health care sector comprises biotechnology, health care equipment and supplies, life sciences tools and services, and pharmaceuticals in the SOI. The energy sector comprises oil, gas and consumable fuels in the SOI.
| | | | |
| | | |
| 10 | | Semiannual Report | | ftinstitutional.com |
GLOBAL EQUITY SERIES
Warren Buffett’s Berkshire Hathaway (not a Fund holding), which initiated a stake in Teva during the period. Within the sector, we believe we have assembled a balanced portfolio of stocks that discounts well-known macroeconomic headwinds and presents unique catalysts for sustainable outperformance. Pharmaceuticals stocks at period-end offered free cash flow yields well in excess of the broader market and even the IT sector. These companies have been generating returns on equity above 20%, yet are still discounting low single-digit percentage earnings growth, on average. Furthermore, the health care sector in general may prove relatively immune to escalating trade wars given largely domestic supply chains and government incentives to keep costs down.
Stock selection and an overweighted allocation in the energy sector aided Fund performance. Oil prices surged to a multi-year high during the period due to a combination of geopolitical output risks, coordinated supply management and stronger-than-expected global demand. Shares of US exploration and production firm ConocoPhillips advanced as management maintained capital discipline, returning excess cash flows from higher oil prices to shareholders through dividends and share buybacks. UK-based integrated energy firm BP also contributed. We believe BP should be able to generate substantial free cash flow that will likely be returned to shareholders through improved dividends and share repurchases. In the integrated oil segment more generally, production growth is finally coming through as operating and capital expenditures come down and oil prices normalize higher. As a result, the integrated oil segment looks set to generate more free cash flow this year than it did when oil traded at US$100 per barrel, in our view, and much of that cash could be returned to shareholders in the form of dividends and share buybacks. As the commodity cycle matures, we have begun to take profits on higher volatility oil services holdings and focus instead on more stable and cash-generative integrated energy firms.
Stock selection and an underweighting in industrials contributed to relative performance, led by UK defense firm BAE Systems.6 In the overseas segment where the company makes most of its sales, BAE continues to report solid progress amid a gradually strengthening global defense spending environment. In March, the UK government signed a deal with Saudi Arabia for the purchase of several Typhoon aircraft, and BAE is the prime contractor for the program. The deal helps give visibility to the program until the middle of the next
Top 10 Holdings
6/30/18
| | | | |
Company Sector/Industry, Country | | % of Total
Net Assets | |
| |
BP PLC Oil, Gas & Consumable Fuels, U.K. | | | 2.5% | |
| |
Royal Dutch Shell PLC Oil, Gas & Consumable Fuels, U.K. | | | 2.1% | |
| |
Samsung Electronics Co. Ltd. Technology Hardware, Storage & Peripherals,
South Korea | | | 2.0% | |
| |
Oracle Corp. Software, U.S. | | | 2.0% | |
| |
Citigroup Inc. Banks, U.S. | | | 1.8% | |
| |
Shire PLC Biotechnology, U.K. | | | 1.8% | |
| |
Teva Pharmaceutical Industries Ltd. Pharmaceuticals, Israel | | | 1.8% | |
| |
Siemens AG Industrial Conglomerates, Germany | | | 1.6% | |
| |
Advance Auto Parts Inc. Specialty Retail, U.S. | | | 1.6% | |
| |
Standard Chartered PLC Banks, U.K. | | | 1.5% | |
| |
decade, and we believe it will likely come with a long tail of higher margin after-market revenue.
From a regional standpoint, stock selection and an underweighted position in the resilient US market detracted, as did stock selection and an overweighting in Asia. European holdings benefited from stock selection, but were pressured by an overweighted position during a period of relative weakness. In the Middle East and Africa region, an overweighting in Israel contributed.
It is important to recognize the effect of currency movements on the Fund’s performance. In general, if the value of the US dollar goes up compared with a foreign currency, an investment traded in that foreign currency will go down in value because it will be worth fewer U.S. dollars. This can have a negative effect on Fund performance. Conversely, when the US dollar weakens in relation to a foreign currency, an investment traded in that foreign currency will increase in value, which can contribute to Fund performance. For the six months ended June 30, 2018, the US dollar rose in value relative to most currencies. As a result, the Fund’s performance was negatively
6. The industrials sector comprises aerospace and defense, air freight and logistics, building products, electrical equipment, industrial conglomerates and machinery in the SOI.
See www.franklintempletondatasources.com for additional data provider information.
| | | | | | |
| | | |
| ftinstitutional.com | | Semiannual Report | | | 11 | |
GLOBAL EQUITY SERIES
affected by the portfolio’s substantial investment in securities with non-US currency exposure.
At the end of the first half of 2018, we remained optimistic about the prospects for value, and we maintained the belief that companies whose fundamentals are underappreciated by a short-term market are well positioned for outperformance over time. Global valuation spreads (the gap between the market’s cheapest and most expensive stocks) at the end of the period were the widest they have been in at least 30 years. Put another way, value globally has only been this cheap a very small percentage of the time in the past three decades. Though it may not feel like it, we believe this could be a uniquely great opportunity for value investors. Yet, despite our conviction on value’s long-term prospects, we are not sitting idly by waiting for the cycle to turn. We have worked hard to continuously refine and improve our process, with recent initiatives including improved risk management strategies and the integration of environmental, social and governance analysis into our investment framework. The goal in these efforts is to ensure that our investment process remains true to Templeton’s time-tested fundamental value approach, while also evolving to best address client goals and market conditions.
Thank you for your continued participation in Global Equity Series. We look forward to serving your future investment needs.
Peter A. Nori, CFA
Antonio T. Docal, CFA
Matthew R. Nagle, CFA
Portfolio Management Team
The foregoing information reflects our analysis, opinions and portfolio holdings as of June 30, 2018, the end of the reporting period. The way we implement our main investment strategies and the resulting portfolio holdings may change depending on factors such as market and economic conditions. These opinions may not be relied upon as investment advice or an offer for a particular security. The information is not a complete analysis of every aspect of any market, country, industry, security or the Fund. Statements of fact are from sources considered reliable, but the investment manager makes no representation or warranty as to their completeness or accuracy. Although historical performance is no guarantee of future results, these insights may help you understand our investment management philosophy.
Matthew R. Nagle is an executive vice president, portfolio manager and research analyst in the Templeton Global Equity Group, responsible for managing institutional portfolios. He also has global research responsibilities for the US banks sector, electronic manufacturing services and component manufacturer companies. Prior to joining Franklin Templeton in 2003, Mr. Nagle was an associate sell-side analyst for Sanford C. Bernstein & Co., a research associate with ABN AMRO, and an auditor for financial services companies at Coopers & Lybrand. He entered the financial services industry in 1998. Mr. Nagle holds a B.B.A. in accounting from Siena College and an M.B.A. in finance from New York University. He is a Chartered Financial Analyst (CFA) charterholder and a Certified Public Accountant (CPA).
CFA® is a trademark owned by CFA Institute.
| | | | |
| | | |
| 12 | | Semiannual Report | | ftinstitutional.com |
GLOBAL EQUITY SERIES
Performance Summary as of June 30, 2018
The performance table does not reflect any taxes that a shareholder would pay on Fund dividends, capital gain distributions, if any, or any realized gains on the sale of Fund shares. Total return reflects reinvestment of the Fund’s dividends and capital gain distributions, if any, and any unrealized gains or losses. Your dividend income will vary depending on dividends or interest paid by securities in the Fund’s portfolio, adjusted for operating expenses. Capital gain distributions are net profits realized from the sale of portfolio securities.
Performance as of 6/30/181
| | | | | | | | |
| | | Cumulative
Total Return2 | | | Average Annual
Total Return3 | |
| |
| | |
6-Month | | | -2.17% | | | | -2.17% | |
| |
1-Year | | | +6.15% | | | | +6.15% | |
| |
5-Year | | | +40.14% | | | | +6.98% | |
| |
10-Year | | | +72.34% | | | | +5.59% | |
| |
Performance data represent past performance, which does not guarantee future results. Investment return and principal value will fluctuate, and you may have a gain or loss when you sell your shares. Current performance may differ from figures shown. For most recent month-end performance, go to ftinstitutional.com or call a Franklin Templeton Institutional Services representative at (800) 321-8563.
See page 14 for Performance Summary footnotes.
| | | | | | |
| | | |
| ftinstitutional.com | | Semiannual Report | | | 13 | |
GLOBAL EQUITY SERIES
PERFORMANCE SUMMARY
Total Annual Operating Expenses4
All investments involve risks, including possible loss of principal. Special risks are associated with foreign investing, including currency fluctuations, economic instability and political developments; investments in emerging markets involve heightened risks related to the same factors. Because the Fund may invest its assets in companies in a specific region, including Europe, it is subject to greater risks of adverse developments in that region and/or the surrounding regions than a fund that is more broadly diversified geographically. Political, social or economic disruptions in the region, even in countries in which the Fund is not invested, may adversely affect the value of securities held by the Fund. Current political and financial uncertainty surrounding the European Union may increase market volatility and the economic risk of investing in companies in Europe. In addition, smaller company stocks have historically experienced more price volatility than larger company stocks, especially over the short term. The Fund is actively managed but there is no guarantee that the manager’s investment decisions will produce the desired results. The Fund’s prospectus also includes a description of the main investment risks.
1. The Fund has a fee waiver associated with any investment it makes in a Franklin Templeton money fund and/or other Franklin Templeton fund, contractually guaranteed through 4/30/19. Fund investment results reflect the fee waiver; without this waiver, the results would have been lower.
2. Cumulative total return represents the change in value of an investment over the periods indicated.
3. Average annual total return represents the average annual change in value of an investment over the periods indicated. Return for less than one year, if any, has not been annualized.
4. Figures are as stated in the Fund’s current prospectus and may differ from the expense ratios disclosed in the Your Fund’s Expenses and Financial Highlights sections in this report. In periods of market volatility, assets may decline significantly, causing total annual Fund operating expenses to become higher than the figures shown.
| | | | |
| | | |
| 14 | | Semiannual Report | | ftinstitutional.com |
GLOBAL EQUITY SERIES
Your Fund’s Expenses
As a Fund shareholder, you can incur two types of costs: (1) transaction costs, including sales charges (loads) on Fund purchases and redemptions, if applicable; and (2) ongoing Fund costs, including management fees, distribution and service (12b-1) fees, if applicable, and other Fund expenses. All mutual funds have ongoing costs, sometimes referred to as operating expenses. The table below shows ongoing costs of investing in the Fund and can help you understand these costs and compare them with those of other mutual funds. The table assumes a $1,000 investment held for the six months indicated.
Actual Fund Expenses
The table below provides information about actual account values and actual expenses in the columns under the heading “Actual.” In these columns the Fund’s actual return, which includes the effect of Fund expenses, is used to calculate the “Ending Account Value.” You can estimate the expenses you paid during the period by following these steps (of course, your account value and expenses will differ from those in this illustration): Divide your account value by $1,000 (if your account had an $8,600 value, then $8,600 ÷ $1,000 = 8.6). Then multiply the result by the number in the row for your class of shares under the headings “Actual” and “Expenses Paid During Period” (if Actual Expenses Paid During Period were $7.50, then 8.6 x $7.50 = $64.50). In this illustration, the actual expenses paid this period are $64.50.
Hypothetical Example for Comparison with Other Funds
Under the heading “Hypothetical” in the table, information is provided about hypothetical account values and hypothetical expenses based on the Fund’s actual expense ratio and an assumed rate of return of 5% per year before expenses, which is not the Fund’s actual return. This information may not be used to estimate the actual ending account balance or expenses you paid for the period, but it can help you compare ongoing costs of investing in the Fund with those of other funds. To do so, compare this 5% hypothetical example for the class of shares you hold with the 5% hypothetical examples that appear in the shareholder reports of other funds.
Please note that expenses shown in the table are meant to highlight ongoing costs and do not reflect any transactional costs. Therefore, information under the heading “Hypothetical” is useful in comparing ongoing costs only, and will not help you compare total costs of owning different funds. In addition, if transactional costs were included, your total costs would have been higher.
| | | | | | | | | | | | | | | | |
| | | | | Actual (actual return after expenses) | | | | Hypothetical (5% annual return before expenses) | | | | |
Beginning
Account
Value 1/1/18 | | | | Ending
Account
Value 6/30/18 | | Paid During
Period
1/1/18–6/30/181,2 | | | | Ending
Account
Value 6/30/18 | | Paid During
Period
1/1/18–6/30/181,2 | | | | Net
Annualized
Expense
Ratio2 |
| $1,000 | | | | $978.30 | | $4.12 | | | | $1,020.63 | | $4.21 | | | | 0.84% |
1. Expenses are equal to the annualized expense ratio for the six-month period as indicated above—in the far right column—multiplied by the simple average account value over the period indicated, and then multiplied by 181/365 to reflect the one-half year period.
2. Reflects expenses after fee waivers and expense reimbursements. Does not include acquired fund fees and expenses.
| | | | | | |
| | | |
| ftinstitutional.com | | Semiannual Report | | | 15 | |
International Equity Series
This semiannual report for International Equity Series (Fund) covers the period ended June 30, 2018.
Your Fund’s Goal and Main Investments
The Fund seeks long-term capital growth. Under normal market conditions, the Fund invests at least 80% of its net assets in foreign (non-US) equity securities. The Fund predominantly invests in companies located outside the US including companies located in developing markets countries.
Performance Overview
The Fund’s Primary shares had a -3.50% cumulative total return for the six months under review. For comparison, the Fund’s benchmark, the MSCI All Country World Index ex USA Index, which measures stock market performance in global developed and emerging markets excluding the US, had a -3.44% total return for the period under review.1 The Fund’s other benchmark, the MSCI Europe, Australasia, Far East Index, which measures stock market performance in global developed markets excluding the US and Canada, had a -2.37% total return.1 Please note, index performance information is provided for reference and we do not attempt to track an index but rather undertake investments on the basis of fundamental research. You can find the Fund’s long-term performance data in the Performance Summary beginning on page 20.
Performance data represent past performance, which does not guarantee future results. Investment return and principal value will fluctuate, and you may have a gain or loss when you sell your shares. Current performance may differ from figures shown. For most recent month-end performance, go to ftinstitutional.com or call a Franklin Templeton Institutional Services representative at (800) 321-8563.
Investment Strategy
We employ a bottom-up, value-oriented, long-term investment strategy. We focus on the market price of a company’s securities relative to our evaluation of the company’s long-term earnings, asset value and cash flow potential. We also consider a company’s price/earnings ratio, profit margins and liquidation value. We attempt to identify those companies that offer above-average opportunities for capital appreciation in various
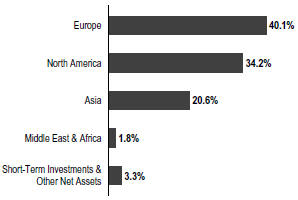
Geographic Composition
Based on Total Net Assets as of 6/30/18
countries and industries where economic and political factors, including currency movements, are favorable to capital growth.
Manager’s Discussion
International equities declined during the first half of 2018 amid concerns about escalating trade tensions and the impact of a stronger US dollar and tighter monetary policy on emerging markets. The performance trends dominant during this market cycle remained largely intact, with a few exceptions. Information technology (IT) and other growth-oriented sectors maintained their long-running leadership, while energy extended more recent gains as supply concerns and solid demand supported the price of crude. Among new developments during the period, health care stocks rebounded, while financials underperformance deepened.
The Fund’s two largest overweighted sector allocations—health care and energy—benefited relative performance as did stock selection in both sectors.2 From the health care sector, Teva Pharmaceutical Industries was the Fund’s top stock contributor during the review period. We have been encouraged by the progress Teva is making under its new chief executive officer’s restructuring plan, which seeks to refinance and pay down debt, renew the focus on profitability and deliver substantial savings by 2019. The stock could find additional support following a major vote of confidence from Warren Buffett’s Berkshire Hathaway (not a Fund holding), which initiated a stake in Teva during the period. Within the health care sector more broadly,
1. Source: Morningstar.
The indexes are unmanaged and include reinvested dividends. They do not reflect any fees, expenses or sales charges. One cannot invest directly in an index, and an index is not representative of the Fund’s portfolio.
2. The health care sector comprises biotechnology, health care equipment and supplies, health care providers and services, life sciences tools and services, and pharmaceuticals in the SOI. The energy sector comprises energy equipment and services and oil, gas and consumable fuels in the SOI.
The dollar value, number of shares or principal amount, and names of all portfolio holdings are listed in the Fund’s Statement of Investments (SOI). The SOI begins on page 35.
| | | | |
| | | |
| 16 | | Semiannual Report | | ftinstitutional.com |
INTERNATIONAL EQUITY SERIES
we believe we have assembled a balanced portfolio of stocks that discounts well-known macroeconomic headwinds and presents unique catalysts for sustainable outperformance. Pharmaceuticals stocks at period-end offered free cash flow yields well in excess of the broader market and even the IT sector. These companies have been generating returns on equity above 20%, yet are still discounting low single-digit percentage earnings growth, on average. Furthermore, the health care sector in general may prove relatively immune to escalating trade wars given largely domestic supply chains and government incentives to keep costs down.
An overweighted allocation and stock selection in the energy sector aided relative performance. Oil prices surged to a multi-year high during the period due to a combination of geopolitical output risks, coordinated supply management and stronger-than-expected global demand. UK-based integrated energy firm BP also positively contributed. We believe BP should be able to generate substantial free cash flow that will likely be returned to shareholders through improved dividends and share repurchases. In the integrated oil segment more generally, production growth is finally coming through as operating and capital expenditures come down and oil prices normalize higher. As a result, the integrated oil segment looks set to generate more free cash flow this year than it did when oil traded at US$100 per barrel, in our view, and much of that cash could be returned to shareholders in the form of dividends and share buybacks. As the commodity cycle matures, we have begun to take profits on higher volatility oil services holdings and focus instead on more stable and cash-generative integrated energy firms.
Stock selection and an underweighted allocation in consumer discretionary also benefited relative performance, led by Luxembourg-based satellite specialist SES.3 The stock has been under pressure recently from one-off issues and delays associated with its transition to a value-added full service model. A strong earnings report in April, highlighted by lower-than-expected restructuring charges and better-than-expected results from its video business, has helped improve sentiment. We continue to believe that SES’s new management team is executing a sensible turnaround plan and the company should benefit over our long-term horizon from the structural growth in global data demand given the high barriers to entry associated with its difficult-to-replicate orbital slots.
| | | | |
| Portfolio Composition | | | |
6/30/18 | | | |
| Sector/Industry | | % of Total Net Assets | |
| |
Pharmaceuticals | | | 13.7% | |
| |
Banks | | | 12.8% | |
| |
Oil, Gas & Consumable Fuels | | | 11.5% | |
| |
Wireless Telecommunication Services | | | 4.0% | |
| |
Insurance | | | 3.9% | |
| |
Chemicals | | | 3.7% | |
| |
Diversified Telecommunication Services | | | 3.7% | |
| |
Technology Hardware, Storage & Peripherals | | | 3.5% | |
| |
Industrial Conglomerates | | | 3.1% | |
| |
Capital Markets | | | 2.5% | |
| |
Construction Materials | | | 2.4% | |
| |
Aerospace & Defense | | | 2.3% | |
| |
Health Care Equipment & Supplies | | | 2.1% | |
| |
Other | | | 28.4% | |
| |
Short-Term Investments & Other Net Assets | | | 2.4% | |
| |
Turning to detractors, stock selection in the IT sector hurt relative results.4 Shares of Japanese automation equipment firm Omron declined after investors parsed through a solid earnings report and took issue with moderate weakness in one operating division. Overall, management’s guidance has been realistic and the sell-off seems overdone as the company’s strategy should yield structural margin improvements over time, in our view. We remain skeptical about the sustainability of the IT sector’s outperformance given that recent strength has been driven primarily by valuation multiples expansion, not earnings growth. Indeed, the price/sales ratio for the Standard & Poor’s® 500 IT index has almost doubled over the past five years, while the earnings growth trend has stagnated. We cannot explain why flat growth is being rewarded with an expanding multiple, and we continue to underweight the sector amid what appears to be the biggest divergence between IT valuations and fundamentals since the late 1990s.
A significant overweighting in telecommunication services also detracted during the period, as the sector was led lower by UK-based Vodafone Group.5 Its shares declined amid concerns about the firm’s bid for some of the assets of international media group Liberty Global (not a Fund holding). Yet, the deal was struck at a materially lower-than-expected price and creates significant opportunities for growth and convergence in
3. The consumer discretionary sector comprises auto components, household durables, media, multiline retail and specialty retail in the SOI.
4. The IT sector comprises electronic equipment, instruments and components; internet software and services; semiconductors and semiconductor equipment; and technology hardware, storage and peripherals in the SOI.
5. The telecommunication services sector comprises diversified telecommunication services and wireless telecommunication services in the SOI.
See www.franklintempletondatasources.com for additional data provider information.
| | | | | | |
| | | |
| ftinstitutional.com | | Semiannual Report | | | 17 | |
INTERNATIONAL EQUITY SERIES
the Vodafone portfolio. With an attractive dividend yield backed by solid free cash flow and a robust and diversified operating portfolio, Vodafone remains a hold at current levels, in our analysis. Elsewhere in the sector, shares of Singapore Telecommunications (Singtel) declined after reporting a drop in net income. While currency fluctuations and a new 4G mobile entry in Australia and Singapore may pressure profits in the near term, consolidation in the promising Indian market should help earnings recover over our investment horizon. Recently trading at a relatively cheap valuation multiple and featuring a strong balance sheet, attractive dividend yield and compelling emerging market growth prospects, we believe Singtel remains significantly undervalued relative to its long-term fundamentals.
From a regional standpoint, stock selection and an overweighting in Europe notably contributed, as did an overweighting and stock selection in Israel, due to the aforementioned Teva. In contrast, stock selection in Asia ultimately offset the benefit of an underweighting in the region.
It is important to recognize the effect of currency movements on the Fund’s performance. In general, if the value of the US dollar goes up compared with a foreign currency, an investment traded in that foreign currency will go down in value because it will be worth fewer US dollars. This can have a negative effect on Fund performance. Conversely, when the US dollar weakens in relation to a foreign currency, an investment traded in that foreign currency will increase in value, which can contribute to Fund performance. For the six months ended June 30, 2018, the US dollar rose in value relative to most currencies. As a result, the Fund’s performance was negatively affected by the portfolio’s investment predominantly in securities with non-US currency exposure.
At the end of the first half of 2018, we remained optimistic about the prospects for value, and we maintained the belief that companies whose fundamentals are underappreciated by a short-term market are well positioned for outperformance over time. Global valuation spreads (the gap between the market’s cheapest and most expensive stocks) at the end of the period were the widest they have been in at least 30 years. Put another way, value globally has only been this cheap a very small percentage of the time in the past three decades. Though it may not feel like it, we believe this could be a uniquely great opportunity for value investors. Yet, despite our conviction on value’s long-term prospects, we are not sitting idly by waiting for the cycle to turn. We have worked hard to continuously refine and improve our process, with recent initiatives including improved risk management strategies and the integration of environmental, social and governance analysis
| | | | |
| Top 10 Holdings | | | |
6/30/18 | | | |
Company
Sector/Industry, Country | | % of Total
Net Assets | |
| |
Royal Dutch Shell PLC | | | 3.3% | |
Oil, Gas & Consumable Fuels, U.K. | | | | |
| |
BP PLC | | | 3.2% | |
Oil, Gas & Consumable Fuels, U.K. | | | | |
| |
Teva Pharmaceutical Industries Ltd. | | | 2.4% | |
Pharmaceuticals, Israel | | | | |
| |
Samsung Electronics Co. Ltd. | | | 2.4% | |
Technology Hardware, Storage & Peripherals, | | | | |
South Korea | | | | |
| |
Roche Holding AG | | | 2.0% | |
Pharmaceuticals, Switzerland | | | | |
| |
Total SA | | | 1.9% | |
Oil, Gas & Consumable Fuels, France | | | | |
| |
Sanofi | | | 1.9% | |
Pharmaceuticals, France | | | | |
| |
Standard Chartered PLC | | | 1.9% | |
Banks, U.K. | | | | |
| |
HSBC Holdings PLC | | | 1.9% | |
Banks, U.K. | | | | |
| |
BNP Paribas SA | | | 1.8% | |
Banks, France | | | | |
| |
into our investment framework. The goal in these efforts is to ensure that our investment process remains true to Templeton’s time-tested fundamental value approach, while also evolving to best address client goals and market conditions.
Thank you for your continued participation in International Equity Series. We look forward to serving your future investment needs.
| | |
 | | 
Antonio T. Docal, CFA Peter A. Nori, CFA Matthew R. Nagle, CFA Portfolio Management Team |
| | | | |
| | | |
| 18 | | Semiannual Report | | ftinstitutional.com |
INTERNATIONAL EQUITY SERIES
The foregoing information reflects our analysis, opinions and portfolio holdings as of June 30, 2018, the end of the reporting period. The way we implement our main investment strategies and the resulting portfolio holdings may change depending on factors such as market and economic conditions. These opinions may not be relied upon as investment advice or an offer for a particular security. The information is not a complete analysis of every aspect of any market, country, industry, security or the Fund. Statements of fact are from sources considered reliable, but the investment manager makes no representation or warranty as to their completeness or accuracy. Although historical performance is no guarantee of future results, these insights may help you understand our investment management philosophy.
Matthew R. Nagle is an executive vice president, portfolio manager and research analyst in the Templeton Global Equity Group, responsible for managing institutional portfolios. He also has global research responsibilities for the US banks sector, electronic manufacturing services and component manufacturer companies. Prior to joining Franklin Templeton in 2003, Mr. Nagle was an associate sell-side analyst for Sanford C. Bernstein & Co., a research associate with ABN AMRO, and an auditor for financial services companies at Coopers & Lybrand. He entered the financial services industry in 1998. Mr. Nagle holds a B.B.A. in accounting from Siena College and an M.B.A. in finance from New York University. He is a Chartered Financial Analyst (CFA) charterholder and a Certified Public Accountant (CPA).
| | | | | | |
| | | |
| ftinstitutional.com | | Semiannual Report | | | 19 | |
INTERNATIONAL EQUITY SERIES
Performance Summary as of June 30, 2018
The performance table does not reflect any taxes that a shareholder would pay on Fund dividends, capital gain distributions, if any, or any realized gains on the sale of Fund shares. Total return reflects reinvestment of the Fund’s dividends and capital gain distributions, if any, and any unrealized gains or losses. Your dividend income will vary depending on dividends or interest paid by securities in the Fund’s portfolio, adjusted for operating expenses of each class. Capital gain distributions are net profits realized from the sale of portfolio securities.
Performance as of 6/30/181
| | | | | | | | |
| Share Class | | Cumulative Total Return2 | | | Average Annual
Total Return3 | |
| | |
Primary | | | | | | | | |
6-Month | | | -3.50% | | | | -3.50% | |
1-Year | | | +4.74% | | | | +4.74% | |
5-Year | | | +28.58% | | | | +5.16% | |
10-Year | | | +32.84% | | | | +2.88% | |
| | |
Service | | | | | | | | |
6-Month | | | -3.58% | | | | -3.58% | |
1-Year | | | +4.59% | | | | +4.59% | |
5-Year | | | +27.60% | | | | +5.00% | |
10-Year | | | +30.92% | | | | +2.73% | |
Performance data represent past performance, which does not guarantee future results. Investment return and principal value will fluctuate, and you may have a gain or loss when you sell your shares. Current performance may differ from figures shown. For most recent month-end performance, go to ftinstitutional.com or call a Franklin Templeton Institutional Services representative at (800) 321-8563.
See page 21 for Performance Summary footnotes.
| | | | |
| | | |
| 20 | | Semiannual Report | | ftinstitutional.com |
INTERNATIONAL EQUITY SERIES
PERFORMANCE SUMMARY
Total Annual Operating Expenses4
| | | | |
| Share Class | | | |
Primary | | | 0.79% | |
Service | | | 0.94% | |
Each class of shares is available to certain eligible investors and has different annual fees and expenses, as described in the prospectus.
All investments involve risks, including possible loss of principal. Foreign investing involves special risks, including currency fluctuations, economic instability and political developments. Investments in developing markets involve heightened risks related to the same factors, in addition to those associated with these markets’ small or midcap size and lesser liquidity. Because the Fund may invest in companies in a specific region, including Europe, it is subject to greater risks of adverse developments in that region and/or the surrounding regions than a fund that is more broadly diversified geographically. Political, social or economic disruptions in the region, even in countries in which the Fund is not invested, may adversely affect the value of securities held by the Fund. Current political uncertainty surrounding the European Union (EU) and the financial instability of some countries in the EU may increase market volatility and the economic risk of investing in companies in Europe. Value securities may not increase in price as anticipated or may decline further in value. The Fund is actively managed but there is no guarantee that the manager’s investment decisions will produce the desired results. The Fund’s prospectus also includes a description of the main investment risks.
1. The Fund has a fee waiver associated with any investment it makes in a Franklin Templeton money fund and/or other Franklin Templeton fund, contractually guaranteed through 4/30/19. Fund investment results reflect the fee waiver; without this waiver, the results would have been lower.
2. Cumulative total return represents the change in value of an investment over the periods indicated.
3. Average annual total return represents the average annual change in value of an investment over the periods indicated. Return for less then one year, if any, has not been annualized.
4. Figures are as stated in the Fund’s current prospectus and may differ from the expense ratios disclosed in the Your Fund’s Expenses and Financial Highlights sections in this report. In periods of market volatility, assets may decline significantly, causing total annual Fund operating expenses to become higher than the figures shown.
| | | | | | |
| | | |
| ftinstitutional.com | | Semiannual Report | | | 21 | |
INTERNATIONAL EQUITY SERIES
Your Fund’s Expenses
As a Fund shareholder, you can incur two types of costs: (1) transaction costs, including sales charges (loads) on Fund purchases and redemptions, if applicable; and (2) ongoing Fund costs, including management fees, distribution and service (12b-1) fees, if applicable, and other Fund expenses. All mutual funds have ongoing costs, sometimes referred to as operating expenses. The table below shows ongoing costs of investing in the Fund and can help you understand these costs and compare them with those of other mutual funds. The table assumes a $1,000 investment held for the six months indicated.
Actual Fund Expenses
The table below provides information about actual account values and actual expenses in the columns under the heading “Actual.” In these columns the Fund’s actual return, which includes the effect of Fund expenses, is used to calculate the “Ending Account Value” for each class of shares. You can estimate the expenses you paid during the period by following these steps (of course, your account value and expenses will differ from those in this illustration): Divide your account value by $1,000 (if your account had an $8,600 value, then $8,600 ÷ $1,000 = 8.6). Then multiply the result by the number in the row for your class of shares under the headings “Actual” and “Expenses Paid During Period” (if Actual Expenses Paid During Period were $7.50, then 8.6 x $7.50 = $64.50). In this illustration, the actual expenses paid this period are $64.50.
Hypothetical Example for Comparison with Other Funds
Under the heading “Hypothetical” in the table, information is provided about hypothetical account values and hypothetical expenses based on the Fund’s actual expense ratio and an assumed rate of return of 5% per year before expenses, which is not the Fund’s actual return. This information may not be used to estimate the actual ending account balance or expenses you paid for the period, but it can help you compare ongoing costs of investing in the Fund with those of other funds. To do so, compare this 5% hypothetical example for the class of shares you hold with the 5% hypothetical examples that appear in the shareholder reports of other funds.
Please note that expenses shown in the table are meant to highlight ongoing costs and do not reflect any transactional costs. Therefore, information under the heading “Hypothetical” is useful in comparing ongoing costs only, and will not help you compare total costs of owning different funds. In addition, if transactional costs were included, your total costs would have been higher.
| | | | | | | | | | | | | | | | | | |
| | | | | | | Actual
(actual return after expenses) | | | | Hypothetical (5% annual return before expenses) | | | | |
Share Class | | Beginning
Account
Value 1/1/18 | | | | Ending
Account
Value 6/30/18 | | Expenses Paid During Period 1/1/18–6/30/181,2 | | | | Ending
Account
Value 6/30/18 | | Expenses Paid During Period 1/1/18–6/30/181,2 | | | | Net
Annualized
Expense
Ratio2 |
| Primary Shares | | $1,000 | | | | $965.00 | | $3.92 | | | | $1,020.94 | | $4.03 | | | | 0.80% |
Service Shares | | $1,000 | | | | $964.20 | | $4.65 | | | | $1,020.19 | | $4.78 | | | | 0.95% |
1. Expenses are equal to the annualized expense ratio for the six-month period as indicated above—in the far right column—multiplied by the simple average account value over the period indicated, and then multiplied by 181/365 to reflect the one-half year period.
2. Reflects expenses after fee waivers and expense reimbursements. Does not include acquired fund fees and expenses.
| | | | |
| | | |
| 22 | | Semiannual Report | | ftinstitutional.com |
TEMPLETON INSTITUTIONAL FUNDS
Financial Highlights
Foreign Smaller Companies Series
| | | | | | | | | | | | | | | | | | | | | | | | |
| | | Six Months Ended June 30, 2018 (unaudited) | | | | |
| | | Year Ended December 31, | |
| | | 2017 | | | 2016 | | | 2015 | | | 2014 | | | 2013 | |
| |
| | | | | | |
Per share operating performance
(for a share outstanding throughout the period) | | | | | | | | | | | | | | | | | | | | | | | | |
| | | | | | |
Net asset value, beginning of period | | | $25.08 | | | | $19.93 | | | | $20.90 | | | | $20.80 | | | | $21.96 | | | | $18.31 | |
| | | | |
| | | | | | |
| Income from investment operationsa: | | | | | | | | | | | | | | | | | | | | | | | | |
| | | | | | |
Net investment incomeb | | | 0.23 | | | | 0.30 | | | | 0.29 | | | | 0.28 | | | | 0.25 | | | | 0.24 | |
| | | | | | |
Net realized and unrealized gains (losses) | | | (0.74 | ) | | | 6.49 | | | | (0.48 | ) | | | 0.12 | | | | (0.98 | ) | | | 3.82 | |
| | | | |
| | | | | | |
Total from investment operations | | | (0.51 | ) | | | 6.79 | | | | (0.19 | ) | | | 0.40 | | | | (0.73 | ) | | | 4.06 | |
| | | | |
| | | | | | |
| Less distributions from: | | | | | | | | | | | | | | | | | | | | | | | | |
| | | | | | |
Net investment income | | | — | | | | (0.68 | ) | | | (0.41 | ) | | | (0.28 | ) | | | (0.16 | ) | | | (0.30) | |
| | | | | | |
Net realized gains | | | — | | | | (0.96 | ) | | | (0.37 | ) | | | (0.02 | ) | | | (0.27 | ) | | | (0.11) | |
| | | | |
| | | | | | |
Total distributions | | | — | | | | (1.64 | ) | | | (0.78 | ) | | | (0.30 | ) | | | (0.43 | ) | | | (0.41) | |
| | | | |
| | | | | | |
Net asset value, end of period | | | $24.57 | | | | $25.08 | | | | $19.93 | | | | $20.90 | | | | $20.80 | | | | $21.96 | |
| | | | |
| | | | | | |
Total returnc | | | (2.03)% | | | | 34.18% | | | | (0.85)% | | | | 1.88% | | | | (3.32)% | | | | 22.24% | |
| | | | | | |
| Ratios to average net assetsd | | | | | | | | | | | | | | | | | | | | | | | | |
| | | | | | |
Expenses before waiver and payments by affiliates | | | 1.00% | | | | 0.99% | | | | 0.99% | | | | 0.98% | | | | 0.98% | | | | 0.99% | |
| | | | | | |
Expenses net of waiver and payments by affiliates | | | 1.00% | e,f | | | 0.98% | e | | | 0.98% | e | | | 0.98% | e,f | | | 0.98% | | | | 0.98% | e |
| | | | | | | |
Net investment income | | | 1.84% | | | | 1.28% | | | | 1.44% | | | | 1.28% | | | | 1.15% | | | | 1.16% | |
| | | | | | |
| Supplemental data | | | | | | | | | | | | | | | | | | | | | | | | |
| | | | | | |
Net assets, end of period (000’s) | | | $997,859 | | | | $1,040,180 | | | | $931,879 | | | | $1,260,407 | | | | $1,281,733 | | | | $1,252,797 | |
| | | | | | |
Portfolio turnover rate | | | 20.51% | | | | 25.97% | | | | 21.36% | | | | 29.11% | | | | 21.36% | | | | 23.84% | |
aThe amount shown for a share outstanding throughout the period may not correlate with the Statement of Operations for the period due to the timing of sales and repurchases of the Fund’s shares in relation to income earned and/or fluctuating fair value of the investments of the Fund.
bBased on average daily shares outstanding.
cTotal return is not annualized for periods less than one year.
dRatios are annualized for periods less than one year.
eBenefit of expense reduction rounds to less than 0.01%.
fBenefit of waiver and payments by affiliates rounds to less than 0.01%.
| | | | |
| | | |
| ftinstitutional.com | | The accompanying notes are an integral part of these financial statements. | Semiannual Report | | 23 |
TEMPLETON INSTITUTIONAL FUNDS
Statement of Investments, June 30, 2018 (unaudited)
Foreign Smaller Companies Series
| | | | | | | | | | |
| | | Industry | | Shares | | | Value | |
Common Stocks 94.5% | | | | | | | | | | |
Belgium 2.4% | | | | | | | | | | |
Barco NV | | Electronic Equipment, Instruments | | | | | | | | |
| | & Components | | | 116,686 | | | $ | 14,260,127 | |
Ontex Group NV | | Personal Products | | | 448,570 | | | | 9,858,072 | |
| | | | | | | | | | |
| | | | | | | | | 24,118,199 | |
| | | | | | | | | | |
Bermuda 0.7% | | | | | | | | | | |
Axis Capital Holdings Ltd. | | Insurance | | | 120,750 | | | | 6,716,115 | |
| | | | | | | | | | |
Brazil 2.2% | | | | | | | | | | |
Camil Alimentos SA | | Food Products | | | 5,827,500 | | | | 9,925,420 | |
Grendene SA | | Textiles, Apparel & Luxury Goods | | | 2,905,500 | | | | 5,938,391 | |
M. Dias Branco SA | | Food Products | | | 585,100 | | | | 5,647,086 | |
| | | | | | | | | | |
| | | | | | | | | 21,510,897 | |
| | | | | | | | | | |
Canada 7.8% | | | | | | | | | | |
Alamos Gold Inc., A | | Metals & Mining | | | 1,013,900 | | | | 5,769,091 | |
a Badger Daylighting Ltd. | | Construction & Engineering | | | 588,700 | | | | 14,186,675 | |
Canaccord Genuity Group Inc. | | Capital Markets | | | 2,003,338 | | | | 11,066,987 | |
b Canada Goose Holdings Inc. | | Textiles, Apparel & Luxury Goods | | | 101,300 | | | | 5,959,912 | |
Canadian Western Bank | | Banks | | | 493,481 | | | | 13,011,046 | |
Mullen Group Ltd. | | Energy Equipment & Services | | | 734,500 | | | | 8,657,286 | |
The North West Co. Inc. | | Food & Staples Retailing | | | 288,700 | | | | 6,440,940 | |
Russel Metals Inc. | | Trading Companies & Distributors | | | 223,900 | | | | 4,577,837 | |
Shawcor Ltd. | | Energy Equipment & Services | | | 397,900 | | | | 7,726,684 | |
| | | | | | | | | | |
| | | | | | | | | 77,396,458 | |
| | | | | | | | | | |
| | | |
China 5.5% | | | | | | | | | | |
China ZhengTong Auto Services Holdings Ltd. | | Specialty Retail | | | 10,462,000 | | | | 6,973,733 | |
Goodbaby International Holdings Ltd. | | Household Products | | | 19,747,600 | | | | 11,955,201 | |
Greatview Aseptic Packaging Co. Ltd. | | Containers & Packaging | | | 13,180,300 | | | | 7,861,765 | |
Hollysys Automation Technologies Ltd. | | Electronic Equipment, Instruments | | | | | | | | |
| | & Components | | | 272,600 | | | | 6,035,364 | |
Shanghai Haohai Biological Technology Co. Ltd., H | | Biotechnology | | | 1,102,800 | | | | 6,887,185 | |
Xtep International Holdings Ltd. | | Textiles, Apparel & Luxury Goods | | | 21,776,800 | | | | 14,904,496 | |
| | | | | | | | | | |
| | | | | | | | | 54,617,744 | |
| | | | | | | | | | |
| | | |
Colombia 0.9% | | | | | | | | | | |
b Gran Tierra Energy Inc. | | Oil, Gas & Consumable Fuels | | | 2,545,200 | | | | 8,811,946 | |
| | | | | | | | | | |
Denmark 1.0% | | | | | | | | | | |
b Nilfisk Holding AS | | Machinery | | | 195,744 | | | | 9,561,739 | |
| | | | | | | | | | |
Finland 4.0% | | | | | | | | | | |
Amer Sports OYJ | | Leisure Products | | | 617,228 | | | | 19,485,158 | |
Huhtamaki OYJ | | Containers & Packaging | | | 431,877 | | | | 15,990,251 | |
b Outotec OYJ | | Machinery | | | 610,597 | | | | 4,865,327 | |
| | | | | | | | | | |
| | | | | | | | | 40,340,736 | |
| | | | | | | | | | |
| | | |
Germany 8.7% | | | | | | | | | | |
Gerresheimer AG | | Life Sciences Tools & Services | | | 197,167 | | | | 16,010,025 | |
Grand City Properties SA | | Real Estate Management & Development | | | 489,231 | | | | 12,712,229 | |
Jenoptik AG | | Electronic Equipment, Instruments | | | | | | | | |
| | & Components | | | 374,336 | | | | 14,686,397 | |
Rational AG | | Machinery | | | 23,172 | | | | 15,133,810 | |
Stabilus SA | | Machinery | | | 143,471 | | | | 12,915,456 | |
b zooplus AG | | Internet & Direct Marketing Retail | | | 81,247 | | | | 15,187,989 | |
| | | | | | | | | | |
| | | | | | | | | 86,645,906 | |
| | | | | | | | | | |
| | | | |
| | | |
| 24 | | Semiannual Report | | ftinstitutional.com |
TEMPLETON INSTITUTIONAL FUNDS
STATEMENT OF INVESTMENTS (UNAUDITED)
Foreign Smaller Companies Series (continued)
| | | | | | | | | | |
| | | Industry | | Shares | | | Value | |
Common Stocks (continued) | | | | | | | | | | |
Hong Kong 4.7% | | | | | | | | | | |
PAX Global Technology Ltd. | | Electronic Equipment, Instruments | | | | | | | | |
| | | & Components | | 17,591,000 | | | $ 8,676,617 | |
Stella International Holdings Ltd. | | Textiles, Apparel & Luxury Goods | | | 2,793,062 | | | | 3,449,477 | |
Techtronic Industries Co. Ltd. | | Household Durables | | | 2,463,500 | | | | 13,736,609 | |
Value Partners Group Ltd. | | Capital Markets | | | 12,630,000 | | | | 9,980,309 | |
VTech Holdings Ltd. | | Communications Equipment | | | 959,200 | | | | 11,069,973 | |
| | | | | | | | | | |
| | | | | | | | | 46,912,985 | |
| | | | | | | | | | |
| | | |
India 2.0% | | | | | | | | | | |
Dewan Housing Finance Corp. Ltd. | | Thrifts & Mortgage Finance | | | 2,132,227 | | | | 19,856,870 | |
| | | | | | | | | | |
Italy 4.8% | | | | | | | | | | |
Azimut Holding SpA | | Capital Markets | | | 443,051 | | | | 6,861,300 | |
Interpump Group SpA | | Machinery | | | 536,935 | | | | 16,712,018 | |
Technogym SpA | | Leisure Products | | | 1,624,276 | | | | 19,261,887 | |
a Tod’s SpA | | Textiles, Apparel & Luxury Goods | | | 88,814 | | | | 5,535,908 | |
| | | | | | | | | | |
| | | | | | | | 48,371,113 | |
| | | | | | | | | | |
| | | |
Japan 21.4% | | | | | | | | | | |
Anicom Holdings Inc. | | Insurance | | | 418,500 | | | | 15,765,346 | |
Asahi Co. Ltd. | | Specialty Retail | | | 351,600 | | | | 4,961,373 | |
Asics Corp. | | Textiles, Apparel & Luxury Goods | | | 813,600 | | | | 13,766,410 | |
Bunka Shutter Co. Ltd. | | Building Products | | | 1,045,400 | | | | 8,877,330 | |
Capcom Co. Ltd. | | Software | | | 315,500 | | | | 7,780,975 | |
Daibiru Corp. | | Real Estate Management & Development | | | 818,200 | | | | 8,330,199 | |
Descente Ltd. | | Textiles, Apparel & Luxury Goods | | | 582,371 | | | | 10,322,164 | |
Dowa Holdings Co. Ltd. | | Metals & Mining | | | 333,500 | | | | 10,288,653 | |
Fuji Oil Holdings Inc. | | Food Products | | | 430,200 | | | | 15,467,690 | |
Idec Corp. | | Electrical Equipment | | | 320,600 | | | | 7,515,759 | |
IDOM Inc. | | Specialty Retail | | | 1,607,200 | | | | 8,900,254 | |
Kobayashi Pharmaceutical Co. Ltd. | | Personal Products | | | 222,800 | | | | 19,261,900 | |
MEITEC Corp. | | Professional Services | | | 260,000 | | | | 12,495,597 | |
Morita Holdings Corp. | | Machinery | | | 411,500 | | | | 8,312,155 | |
N Field Co. Ltd. | | Health Care Providers & Services | | | 525,700 | | | | 8,301,401 | |
Nihon Parkerizing Co. Ltd. | | Chemicals | | | 539,800 | | | | 7,782,834 | |
Square Enix Holdings Co. Ltd. | | Software | | | 71,200 | | | | 3,499,056 | |
Sumitomo Rubber Industries Ltd. | | Auto Components | | | 235,300 | | | | 3,741,163 | |
TechnoPro Holdings Inc. | | Professional Services | | | 205,900 | | | | 12,667,049 | |
Tsumura & Co. | | Pharmaceuticals | | | 563,100 | | | | 18,211,283 | |
Ushio Inc. | | Electrical Equipment | | | 155,100 | | | | 1,974,217 | |
Zojirushi Corp. | | Household Durables | | | 456,700 | | | | 5,586,267 | |
| | | | | | | | | | |
| | | | | | | | | 213,809,075 | |
| | | | | | | | | | |
| | | |
Netherlands 3.5% | | | | | | | | | | |
Aalberts Industries NV | | Machinery | | | 61,385 | | | | 2,941,920 | |
Accell Group NV | | Leisure Products | | | 261,475 | | | | 5,590,546 | |
Arcadis NV | | Construction & Engineering | | | 676,106 | | | | 12,212,294 | |
Beter Bed Holding NV | | Specialty Retail | | | 246,995 | | | | 1,996,950 | |
Intertrust NV | | Professional Services | | | 277,910 | | | | 4,941,875 | |
PostNL NV | | Air Freight & Logistics | | | 2,030,078 | | | | 7,625,471 | |
| | | | | | | | | | |
| | | | | | | | | 35,309,056 | |
| | | | | | | | | | |
| | | |
Norway 0.6% | | | | | | | | | | |
XXL ASA | | Specialty Retail | | | 792,433 | | | | 6,421,188 | |
| | | | | | | | | | |
| | | | | | |
| | | |
| ftinstitutional.com | | Semiannual Report | | | 25 | |
TEMPLETON INSTITUTIONAL FUNDS
STATEMENT OF INVESTMENTS (UNAUDITED)
Foreign Smaller Companies Series (continued)
| | | | | | | | | | |
| | | Industry | | Shares | | | Value | |
Common Stocks (continued) | | | | | | | | | | |
Poland 0.7% | | | | | | | | | | |
CCC SA | | Textiles, Apparel & Luxury Goods | | | 135,034 | | | $ | 7,467,118 | |
| | | | | | | | | | |
South Korea 3.0% | | | | | | | | | | |
BNK Financial Group Inc. | | Banks | | | 1,117,857 | | | | 9,370,596 | |
DGB Financial Group Inc. | | Banks | | | 1,533,277 | | | | 14,090,093 | |
b Hyundai Mipo Dockyard Co. Ltd. | | Machinery | | | 55,560 | | | | 4,273,846 | |
Korea Investment Holdings Co. Ltd. | | Capital Markets | | | 23,867 | | | | 1,799,547 | |
| | | | | | | | | | |
| | | | | | | | 29,534,082 | |
| | | | | | | | | | |
| | | |
Spain 1.5% | | | | | | | | | | |
Construcciones y Auxiliar de Ferrocarriles SA | | Machinery | | | 309,069 | | | | 14,841,242 | |
| | | | | | | | | | |
Sweden 4.6% | | | | | | | | | | |
Cloetta AB, B | | Food Products | | | 2,082,697 | | | | 6,323,399 | |
Duni AB | | Household Durables | | | 321,708 | | | | 4,607,072 | |
Granges AB | | Metals & Mining | | | 579,543 | | | | 7,593,793 | |
Tethys Oil AB | | Oil, Gas & Consumable Fuels | | | 669,086 | | | | 7,578,705 | |
c The Thule Group AB, Reg S | | Leisure Products | | | 802,990 | | | | 19,984,827 | |
| | | | | | | | | | |
| | | | | | | | 46,087,796 | |
| | | | | | | | | | |
| | | |
Switzerland 3.1% | | | | | | | | | | |
Bucher Industries AG | | Machinery | | | 43,136 | | | | 14,477,389 | |
Logitech International SA | | Technology Hardware, Storage & Peripherals | | | 214,900 | | | | 9,434,110 | |
Tecan Group AG | | Life Sciences Tools & Services | | | 29,767 | | | | 7,243,384 | |
| | | | | | | | | | |
| | | | | | | | 31,154,883 | |
| | | | | | | | | | |
| | | |
Taiwan 5.3% | | | | | | | | | | |
Chicony Electronics Co. Ltd. | | Technology Hardware, Storage & Peripherals | | | 4,105,510 | | | | 9,259,029 | |
Giant Manufacturing Co. Ltd. | | Leisure Products | | | 2,180,482 | | | | 9,233,871 | |
King Yuan Electronics Co. Ltd. | | Semiconductors & Semiconductor Equipment | | | 16,118,400 | | | | 14,683,396 | |
Merida Industry Co. Ltd. | | Leisure Products | | | 1,485,000 | | | | 7,434,262 | |
Tripod Technology Corp. | | Electronic Equipment, Instruments | | | | | | | | |
| | | & Components | | 4,502,000 | | | 12,384,860 | |
| | | | | | | | | | |
| | | |
| | | | | | | | 52,995,418 | |
| | | | | | | | | | |
| | | |
Thailand 0.5% | | | | | | | | | | |
L.P.N. Development PCL, fgn | | Real Estate Management & Development | | | 15,384,300 | | | | 4,661,909 | |
| | | | | | | | | | |
Turkey 0.3% | | | | | | | | | | |
Mavi Giyim Sanayi Ve Ticaret AS, B | | Textiles, Apparel & Luxury Goods | | | 351,370 | | | | 2,986,737 | |
| | | | | | | | | | |
United Kingdom 5.3% | | | | | | | | | | |
Bellway PLC | | Household Durables | | | 105,459 | | | | 4,183,645 | |
Bovis Homes Group PLC | | Household Durables | | | 284,563 | | | | 4,304,719 | |
Greggs PLC | | Hotels, Restaurants & Leisure | | | 861,993 | | | | 11,332,253 | |
Man Group PLC | | Capital Markets | | | 6,572,499 | | | | 15,328,247 | |
Oxford Instruments PLC | | Electronic Equipment, Instruments | | | | | | | | |
| | & Components | | | 713,228 | | | | 9,418,889 | |
SIG PLC | | Trading Companies & Distributors | | | 4,609,621 | | | | 8,504,189 | |
| | | | | | | | | | |
| | | | | | | | 53,071,942 | |
| | | | | | | | | | |
| | | |
Total Common Stocks (Cost $707,252,434) | | | | | | | | | 943,201,154 | |
| | | | | | | | | | |
Preferred Stocks (Cost $3,871,900) 0.5% | | | | | | | | | | |
Brazil 0.5% | | | | | | | | | | |
d Alpargatas SA, 4.612%, pfd | | Textiles, Apparel & Luxury Goods | | | 1,363,700 | | | | 4,258,208 | |
| | | | | | | | | | |
Total Investments before Short Term | | | | | | | | | | |
Investments (Cost $711,124,334) | | | | | | | | | 947,459,362 | |
| | | | | | | | | | |
| | | | |
| | | |
| 26 | | Semiannual Report | | ftinstitutional.com |
TEMPLETON INSTITUTIONAL FUNDS
STATEMENT OF INVESTMENTS (UNAUDITED)
Foreign Smaller Companies Series (continued)
| | | | | | | | |
| | | Principal
Amount | | | Value | |
Short Term Investments 6.3% | | | | | | | | |
| | |
U.S. Government and Agency Securities (Cost | | | | | | | | |
$44,895,995) 4.5% | | | | | | | | |
| United States 4.5% | | | | | | |
e FHLB, 7/02/18 | | $ | 44,900,000 | | | $ | 44,900,000 | |
| | | | | | | | |
| | |
| | | Shares | | | | | |
| | |
fInvestments from Cash Collateral Received for Loaned | | | | | | | | |
Securities (Cost $18,183,968) 1.8% | | | | | | | | |
Money Market Funds 1.8% | | | | | | | | |
United States 1.8% | | | | | | | | |
| g,h Institutional Fiduciary Trust Money Market Portfolio, 1.51% | | | 18,183,968 | | | | 18,183,968 | |
| | | | | | | | |
| | | | | | | | |
Total Investments (Cost $774,204,297) 101.3% | | | | | | | 1,010,543,330 | |
Other Assets, less Liabilities (1.3)% | | | | | | | (12,684,706 | ) |
| | | | | | | | |
Net Assets 100.0% | | | | | | $ | 997,858,624 | |
| | | | | | | | |
See Abbreviations on page 54.
aA portion or all of the security is on loan at June 30, 2018. See Note 1(c).
bNon-income producing.
cSecurity was purchased pursuant to Regulation S under the Securities Act of 1933, which exempts from registration securities offered and sold outside of the United States. Such a security cannot be sold in the United States without either an effective registration statement filed pursuant to the Securities Act of 1933, or pursuant to an exemption from registration. This security has been deemed liquid under guidelines approved by the Trust’s Board of Trustees. At June 30, 2018, the value of this security was $19,984,827, representing 2.0% of net assets.
dVariable rate security. The rate shown represents the yield at period end.
eThe security was issued on a discount basis with no stated coupon rate.
fSee Note 1(c) regarding securities on loan.
gSee Note 3(d) regarding investments in affiliated management investment companies.
hThe rate shown is the annualized seven-day effective yield at period end.
| | | | |
| | | |
| ftinstitutional.com | | The accompanying notes are an integral part of these financial statements. | Semiannual Report | | 27 |
TEMPLETON INSTITUTIONAL FUNDS
Financial Highlights
Global Equity Series
| | | | | | | | | | | | | | | | | | | | | | | | |
| | | Six Months Ended
June 30, 2018 | | | Year Ended December 31, | |
| | | (unaudited) | | | 2017 | | | 2016 | | | 2015 | | | 2014 | | | 2013 | |
| |
| | | | | | |
Per share operating performance
(for a share outstanding throughout the period) | | | | | | | | | | | | | | | | | | | | | | | | |
| | | | | | |
Net asset value, beginning of period | | | $10.59 | | | | $8.95 | | | | $8.73 | | | | $9.64 | | | | $11.53 | | | | $9.88 | |
| | | | |
| | | | | | |
| Income from investment operationsa: | | | | | | | | | | | | | | | | | | | | | | | | |
| | | | | | |
Net investment incomeb | | | 0.11 | | | | 0.16 | | | | 0.16 | | | | 0.14 | | | | 0.25 | c | | | 0.14 | |
| | | | | | |
Net realized and unrealized gains (losses) | | | (0.34 | ) | | | 1.71 | | | | 0.25 | | | | (0.43 | ) | | | (0.46 | ) | | | 2.84 | |
| | | | |
| | | | | | |
Total from investment operations | | | (0.23 | ) | | | 1.87 | | | | 0.41 | | | | (0.29 | ) | | | (0.21 | ) | | | 2.98 | |
| | | | |
| | | | | | |
| Less distributions from: | | | | | | | | | | | | | | | | | | | | | | | | |
| | | | | | |
Net investment income | | | — | | | | (0.19 | ) | | | (0.15 | ) | | | (0.16 | ) | | | (0.26 | ) | | | (0.13) | |
| | | | | | |
Net realized gains | | | — | | | | (0.04 | ) | | | (0.04 | ) | | | (0.46 | ) | | | (1.42 | ) | | | (1.20) | |
| | | | |
| | | | | | |
Total distributions | | | — | | | | (0.23 | ) | | | (0.19 | ) | | | (0.62 | ) | | | (1.68 | ) | | | (1.33) | |
| | | | |
| | | | | | |
Net asset value, end of period | | | $10.36 | | | | $10.59 | | | | $8.95 | | | | $8.73 | | | | $9.64 | | | | $11.53 | |
| | | | |
| | | | | | |
Total returnd | | | (2.17)% | | | | 20.88% | | | | 4.67% | | | | (3.43)% | | | | (2.01)% | | | | 30.43% | |
| | | | | | |
| Ratios to average net assetse | | | | | | | | | | | | | | | | | | | | | | | | |
| | | | | | |
Expenses before waiver and payments by affiliates and expense reduction | | | 0.84% | | | | 0.82% | | | | 0.84% | | | | 0.81% | | | | 0.92% | | | | 0.94% | |
| | | | | | |
Expenses net of waiver and payments by affiliates and expense reduction | | | 0.84% | f | | | 0.82% | f,g | | | 0.84% | f | | | 0.81% | f,g | | | 0.92% | | | | 0.90%g | |
| | | | | | |
Net investment income | | | 2.11% | | | | 1.65% | | | | 1.82% | | | | 1.47% | | | | 2.21% | c | | | 1.26% | |
| | | | | | |
| Supplemental data | | | | | | | | | | | | | | | | | | | | | | | | |
| | | | | | |
Net assets, end of period (000’s) | | | $297,207 | | | | $327,015 | | | | $280,709 | | | | $282,830 | | | | $467,375 | | | | $491,602 | |
| | | | | | |
Portfolio turnover rate | | | 17.74% | | | | 25.27% | | | | 27.91% | | | | 36.88% | | | | 35.50% | | | | 42.66% | |
aThe amount shown for a share outstanding throughout the period may not correlate with the Statement of Operations for the period due to the timing of sales and repurchases of the Fund’s shares in relation to income earned and/or fluctuating fair value of the investments of the Fund.
bBased on average daily shares outstanding.
cNet investment income per share includes approximately $0.09 per share related to income received in the form of special dividends in connection with certain Fund holdings. Excluding this amount, the ratio of net investment income to average net assets would have been 1.43%.
dTotal return is not annualized for periods less than one year.
eRatios are annualized for periods less than one year.
fBenefit of waiver and payments by affiliates rounds to less than 0.01%.
gBenefit of expense reduction rounds to less than 0.01%.
| | | | |
| | | |
| 28 | | Semiannual Report | The accompanying notes are an integral part of these financial statements. | | ftinstitutional.com |
TEMPLETON INSTITUTIONAL FUNDS
Statement of Investments, June 30, 2018 (unaudited)
Global Equity Series
| | | | | | | | | | |
| | | Industry | | Shares | | | Value | |
| |
Common Stocks 96.3% | | | | | | | | | | |
Canada 2.5% | | | | | | | | | | |
Alamos Gold Inc., A | | Metals & Mining | | | 288,330 | | | $ | 1,640,598 | |
Husky Energy Inc. | | Oil, Gas & Consumable Fuels | | | 226,500 | | | | 3,531,415 | |
Wheaton Precious Metals Corp. | | Metals & Mining | | | 99,900 | | | | 2,205,979 | |
| | | | | | | | | | |
| | | |
| | | | | | | | | 7,377,992 | |
| | | | | | | | | | |
China 4.5% | | | | | | | | | | |
a Baidu Inc., ADR | | Internet Software & Services | | | 10,260 | | | | 2,493,180 | |
China Life Insurance Co. Ltd., H | | Insurance | | | 1,082,000 | | | | 2,792,552 | |
China Mobile Ltd. | | Wireless Telecommunication Services | | | 362,000 | | | | 3,215,809 | |
China Telecom Corp. Ltd., H | | Diversified Telecommunication Services | | | 7,412,000 | | | | 3,466,972 | |
Kunlun Energy Co. Ltd. | | Oil, Gas & Consumable Fuels | | | 1,570,000 | | | | 1,374,692 | |
| | | | | | | | | | |
| | | |
| | | | | | | | | 13,343,205 | |
| | | | | | | | | | |
Denmark 0.6% | | | | | | | | | | |
Vestas Wind Systems AS | | Electrical Equipment | | | 29,315 | | | | 1,815,839 | |
| | | | | | | | | | |
France 7.0% | | | | | | | | | | |
AXA SA | | Insurance | | | 130,035 | | | | 3,192,733 | |
BNP Paribas SA | | Banks | | | 64,264 | | | | 3,993,657 | |
Cie Generale des Etablissements Michelin SCA | | Auto Components | | | 24,592 | | | | 2,996,754 | |
Compagnie de Saint-Gobain | | Building Products | | | 55,516 | | | | 2,482,273 | |
Sanofi | | Pharmaceuticals | | | 55,961 | | | | 4,488,477 | |
Veolia Environnement SA | | Multi-Utilities | | | 166,767 | | | | 3,571,458 | |
| | | | | | | | | | |
| | | |
| | | | | | | | | 20,725,352 | |
| | | | | | | | | | |
Germany 6.4% | | | | | | | | | | |
Bayer AG | | Pharmaceuticals | | | 39,769 | | | | 4,383,889 | |
E.ON SE | | Multi-Utilities | | | 282,126 | | | | 3,017,359 | |
HeidelbergCement AG | | Construction Materials | | | 13,410 | | | | 1,129,318 | |
Lanxess AG | | Chemicals | | | 41,593 | | | | 3,246,158 | |
Merck KGaA | | Pharmaceuticals | | | 25,730 | | | | 2,513,755 | |
Siemens AG, ADR | | Industrial Conglomerates | | | 71,437 | | | | 4,706,627 | |
| | | | | | | | | | |
| | | |
| | | | | | | | | 18,997,106 | |
| | | | | | | | | | |
Hong Kong 1.1% | | | | | | | | | | |
CK Hutchison Holdings Ltd. | | Industrial Conglomerates | | | 314,040 | | | | 3,330,100 | |
| | | | | | | | | | |
India 0.2% | | | | | | | | | | |
Housing Development Finance Corp. Ltd. | | Thrifts & Mortgage Finance | | | 21,285 | | | | 593,250 | |
| | | | | | | | | | |
Ireland 2.2% | | | | | | | | | | |
Bank of Ireland Group PLC | | Banks | | | 396,345 | | | | 3,095,621 | |
CRH PLC | | Construction Materials | | | 95,060 | | | | 3,370,773 | |
| | | | | | | | | | |
| | | |
| | | | | | | | | 6,466,394 | |
| | | | | | | | | | |
Israel 1.8% | | | | | | | | | | |
Teva Pharmaceutical Industries Ltd., ADR | | Pharmaceuticals | | | 222,363 | | | | 5,407,868 | |
| | | | | | | | | | |
Italy 1.1% | | | | | | | | | | |
Eni SpA | | Oil, Gas & Consumable Fuels | | | 179,243 | | | | 3,331,012 | |
| | | | | | | | | | |
Japan 8.7% | | | | | | | | | | |
IHI Corp. | | Machinery | | | 49,600 | | | | 1,729,581 | |
INPEX Corp. | | Oil, Gas & Consumable Fuels | | | 132,800 | | | | 1,379,047 | |
Mitsui Fudosan Co. Ltd. | | Real Estate Management & Development | | | 131,600 | | | | 3,178,991 | |
Omron Corp. | | Electronic Equipment, Instruments & Components | | | 49,800 | | | | 2,325,904 | |
Panasonic Corp. | | Household Durables | | | 276,600 | | | | 3,731,895 | |
| | | | | | |
| | | |
| ftinstitutional.com | | Semiannual Report | | | 29 | |
TEMPLETON INSTITUTIONAL FUNDS
STATEMENT OF INVESTMENTS (UNAUDITED)
Global Equity Series (continued)
| | | | | | | | | | |
| | | Industry | | Shares | | | Value | |
| |
Common Stocks (continued) | | | | | | | | | | |
Japan (continued) | | | | | | | | | | |
Ryohin Keikaku Co. Ltd. | | Multiline Retail | | | 4,100 | | | $ | 1,444,510 | |
Seven & i Holdings Co. Ltd. | | Food & Staples Retailing | | | 79,700 | | | | 3,478,302 | |
SoftBank Group Corp. | | Wireless Telecommunication Services | | | 50,700 | | | | 3,651,756 | |
Sumitomo Metal Mining Co. Ltd. | | Metals & Mining | | | 35,300 | | | | 1,351,474 | |
Suntory Beverage & Food Ltd. | | Beverages | | | 84,700 | | | | 3,619,233 | |
| | | | | | | | | | |
| | | |
| | | | | | | | | 25,890,693 | |
| | | | | | | | | | |
Luxembourg 0.8% | | | | | | | | | | |
SES SA, IDR | | Media | | | 122,893 | | | | 2,252,802 | |
| | | | | | | | | | |
Netherlands 1.2% | | | | | | | | | | |
ING Groep NV | | Banks | | | 135,218 | | | | 1,947,602 | |
a QIAGEN NV | | Life Sciences Tools & Services | | | 41,532 | | | | 1,513,946 | |
| | | | | | | | | | |
| | | |
| | | | | | | | | 3,461,548 | |
| | | | | | | | | | |
Norway 1.1% | | | | | | | | | | |
Yara International ASA | | Chemicals | | | 75,205 | | | | 3,120,846 | |
| | | | | | | | | | |
Portugal 0.6% | | | | | | | | | | |
Galp Energia SGPS SA, B | | Oil, Gas & Consumable Fuels | | | 90,560 | | | | 1,728,337 | |
| | | | | | | | | | |
Singapore 1.1% | | | | | | | | | | |
Singapore Telecommunications Ltd. | | Diversified Telecommunication Services | | | 1,487,104 | | | | 3,361,797 | |
| | | | | | | | | | |
South Korea 2.8% | | | | | | | | | | |
Hana Financial Group Inc. | | Banks | | | 60,590 | | | | 2,327,668 | |
Samsung Electronics Co. Ltd. | | Technology Hardware, Storage & Peripherals | | | 144,272 | | | | 6,033,969 | |
| | | | | | | | | | |
| | | |
| | | | | | | | | 8,361,637 | |
| | | | | | | | | | |
Switzerland 2.3% | | | | | | | | | | |
Roche Holding AG | | Pharmaceuticals | | | 14,360 | | | | 3,197,797 | |
UBS Group AG | | Capital Markets | | | 237,165 | | | | 3,669,783 | |
| | | | | | | | | | |
| | | |
| | | | | | | | | 6,867,580 | |
| | | | | | | | | | |
Taiwan 1.1% | | | | | | | | | | |
Taiwan Semiconductor Manufacturing Co. Ltd., ADR | | Semiconductors & Semiconductor Equipment | | | 90,240 | | | | 3,299,174 | |
| | | | | | | | | | |
Thailand 1.1% | | | | | | | | | | |
Bangkok Bank PCL, NVDR | | Banks | | | 566,300 | | | | 3,354,899 | |
| | | | | | | | | | |
United Kingdom 16.4% | | | | | | | | | | |
BAE Systems PLC | | Aerospace & Defense | | | 361,813 | | | | 3,090,477 | |
Barclays PLC | | Banks | | | 1,349,848 | | | | 3,369,131 | |
BP PLC | | Oil, Gas & Consumable Fuels | | | 986,319 | | | | 7,532,547 | |
GlaxoSmithKline PLC | | Pharmaceuticals | | | 74,600 | | | | 1,507,109 | |
HSBC Holdings PLC | | Banks | | | 474,000 | | | | 4,446,365 | |
Kingfisher PLC | | Specialty Retail | | | 893,933 | | | | 3,506,168 | |
a LivaNova PLC | | Health Care Equipment & Supplies | | | 27,500 | | | | 2,745,050 | |
Rolls-Royce Holdings PLC | | Aerospace & Defense | | | 145,920 | | | | 1,904,281 | |
Royal Dutch Shell PLC, B | | Oil, Gas & Consumable Fuels | | | 176,566 | | | | 6,327,151 | |
Shire PLC | | Biotechnology | | | 96,250 | | | | 5,421,145 | |
Standard Chartered PLC | | Banks | | | 497,691 | | | | 4,552,118 | |
Vodafone Group PLC | | Wireless Telecommunication Services | | | 1,789,378 | | | | 4,343,763 | |
| | | | | | | | | | |
| | | |
| | | | | | | | | 48,745,305 | |
| | | | | | | | | | |
United States 31.7% | | | | | | | | | | |
Advance Auto Parts Inc. | | Specialty Retail | | | 34,600 | | | | 4,695,220 | |
Allergan PLC | | Pharmaceuticals | | | 24,640 | | | | 4,107,981 | |
a Alphabet Inc., A | | Internet Software & Services | | | 3,780 | | | | 4,268,338 | |
| | | | |
| | | |
| 30 | | Semiannual Report | | ftinstitutional.com |
TEMPLETON INSTITUTIONAL FUNDS
STATEMENT OF INVESTMENTS (UNAUDITED)
Global Equity Series (continued)
| | | | | | | | | | |
| | | Industry | | Shares | | | Value | |
| |
Common Stocks (continued) | | | | | | | | | | |
United States (continued) | | | | | | | | | | |
Amgen Inc. | | Biotechnology | | | 24,000 | | | $ | 4,430,160 | |
Apache Corp. | | Oil, Gas & Consumable Fuels | | | 40,050 | | | | 1,872,338 | |
Apple Inc. | | Technology Hardware, Storage & Peripherals | | | 24,490 | | | | 4,533,344 | |
Capital One Financial Corp. | | Consumer Finance | | | 47,340 | | | | 4,350,546 | |
a Celgene Corp. | | Biotechnology | | | 35,860 | | | | 2,848,001 | |
Citigroup Inc. | | Banks | | | 81,620 | | | | 5,462,010 | |
Comcast Corp., A. | | Media | | | 134,640 | | | | 4,417,538 | |
a CommScope Holding Co. Inc. | | Communications Equipment | | | 77,900 | | | | 2,275,070 | |
ConocoPhillips | | Oil, Gas & Consumable Fuels | | | 22,970 | | | | 1,599,171 | |
Coty Inc., A | | Personal Products | | | 216,300 | | | | 3,049,830 | |
Devon Energy Corp. | | Oil, Gas & Consumable Fuels | | | 46,820 | | | | 2,058,207 | |
DXC Technology Co. | | IT Services | | | 6,330 | | | | 510,261 | |
Eastman Chemical Co. | | Chemicals | | | 17,570 | | | | 1,756,297 | |
Eli Lilly & Co. | | Pharmaceuticals | | | 41,070 | | | | 3,504,503 | |
Gilead Sciences Inc. | | Biotechnology | | | 55,110 | | | | 3,903,992 | |
JPMorgan Chase & Co. | | Banks | | | 28,060 | | | | 2,923,852 | |
Kellogg Co. | | Food Products | | | 22,400 | | | | 1,565,088 | |
a Knowles Corp. | | Electronic Equipment, Instruments | | | | | | | | |
| | & Components | | | 148,000 | | | | 2,264,400 | |
LyondellBasell Industries NV, A | | Chemicals | | | 14,700 | | | | 1,614,795 | |
Mattel Inc. | | Leisure Products | | | 177,900 | | | | 2,921,118 | |
Medtronic PLC | | Health Care Equipment & Supplies | | | 18,580 | | | | 1,590,634 | |
Microsoft Corp. | | Software | | | 22,480 | | | | 2,216,753 | |
Oracle Corp. | | Software | | | 133,710 | | | | 5,891,263 | |
Perspecta Inc. | | IT Services | | | 3,165 | | | | 65,041 | |
Tapestry Inc. | | Textiles, Apparel & Luxury Goods | | | 66,200 | | | | 3,092,202 | |
Twenty-First Century Fox Inc., A | | Media | | | 68,120 | | | | 3,384,883 | |
United Parcel Service Inc., B | | Air Freight & Logistics | | | 30,900 | | | | 3,282,507 | |
Voya Financial Inc. | | Diversified Financial Services | | | 82,070 | | | | 3,857,290 | |
| | | | | | | | | | |
| | | |
| | | | | | | | | 94,312,633 | |
| | | | | | | | | | |
Total Common Stocks (Cost $239,839,518) | | | | | | | | | 286,145,369 | |
| | | | | | | | | | |
Preferred Stocks 0.4% | | | | | | | | | | |
Germany 0.4% | | | | | | | | | | |
b Draegerwerk AG & Co. KGaA, 0.748%, pfd | | Health Care Equipment & Supplies | | | 14,500 | | | | 1,041,876 | |
| | | | | | | | | | |
United Kingdom 0.0%† | | | | | | | | | | |
a Rolls-Royce Holdings PLC, pfd | | Aerospace & Defense | | | 10,360,320 | | | | 13,682 | |
| | | | | | | | | | |
Total Preferred Stocks (Cost $1,789,618) | | | | | | | | | 1,055,558 | |
| | | | | | | | | | |
Total Investments before Short Term | | | | | | | | | | |
Investments (Cost $241,629,136) | | | | | | | | | 287,200,927 | |
| | | | | | | | | | |
| | | | | | |
| | | |
| ftinstitutional.com | | Semiannual Report | | | 31 | |
TEMPLETON INSTITUTIONAL FUNDS
STATEMENT OF INVESTMENTS (UNAUDITED)
Global Equity Series (continued)
| | | | | | | | |
| | | | | Principal
Amount | | Value | |
| |
Short Term Investments (Cost $8,700,000) 2.9% | | | | | | |
| | | |
Time Deposits 2.9% | | | | | | | | |
United States 2.9% | | | | | | | | |
Royal Bank of Canada, 1.85%, 7/02/18 | | | | $8,700,000 | | $ | 8,700,000 | |
| | | | | | | | |
Total Investments (Cost $250,329,136) 99.6% | | | | | | | 295,900,927 | |
Other Assets, less Liabilities 0.4% | | | | | | | 1,305,763 | |
| | | | | | | | |
Net Assets 100.0% | | | | | | $ | 297,206,690 | |
| | | | | | | | |
See Abbreviations on page 54.
†Rounds to less than 0.1% of net assets.
aNon-income producing.
bVariable rate security. The rate shown represents the yield at period end.
| | | | |
| | | |
| 32 | | Semiannual Report | The accompanying notes are an integral part of these financial statements. | | ftinstitutional.com |
TEMPLETON INSTITUTIONAL FUNDS
Financial Highlights
International Equity Series
| | | | | | | | | | | | | | | | | | | | | | | | |
| | | Six Months Ended
June 30, 2018 | | | Year Ended December 31, | |
| | | (unaudited) | | | 2017 | | | 2016 | | | 2015 | | | 2014 | | | 2013 | |
| |
| | | | | | |
| Primary Shares | | | | | | | | | | | | | | | | | | | | | | | | |
| | | | | | |
Per share operating performance
(for a share outstanding throughout the period) | | | | | | | | | | | | | | | | | | | | | | | | |
| | | | | | |
Net asset value, beginning of period | | | $21.99 | | | | $18.65 | | | | $19.05 | | | | $20.05 | | | | $22.72 | | | | $19.60 | |
| | | | |
| | | | | | |
| Income from investment operationsa: | | | | | | | | | | | | | | | | | | | | | | | | |
| | | | | | |
Net investment incomeb | | | 0.31 | | | | 0.45 | | | | 0.45 | | | | 0.45 | | | | 0.74 | c | | | 0.45 | |
| | | | | | |
Net realized and unrealized gains (losses) | | | (1.08 | ) | | | 3.81 | | �� | | (0.20 | ) | | | (0.98 | ) | | | (2.27 | ) | | | 3.36 | |
| | | | |
| | | | | | |
Total from investment operations | | | (0.77 | ) | | | 4.26 | | | | 0.25 | | | | (0.53 | ) | | | (1.53 | ) | | | 3.81 | |
| | | | |
| | | | | | |
| Less distributions from: | | | | | | | | | | | | | | | | | | | | | | | | |
| | | | | | |
Net investment income | | | — | | | | (0.64 | ) | | | (0.46 | ) | | | (0.47 | ) | | | (0.79 | ) | | | (0.44) | |
| | | | | | |
Net realized gains | | | — | | | | (0.28 | ) | | | (0.19 | ) | | | — | | | | (0.35 | ) | | | (0.25) | |
| | | | |
| | | | | | |
Total distributions | | | — | | | | (0.92 | ) | | | (0.65 | ) | | | (0.47 | ) | | | (1.14 | ) | | | (0.69) | |
| | | | |
| | | | | | |
Net asset value, end of period | | | $21.22 | | | | $21.99 | | | | $18.65 | | | | $19.05 | | | | $20.05 | | | | $22.72 | |
| | | | |
| | | | | | |
Total returnd | | | (3.50)% | | | | 22.92% | | | | 1.30% | | | | (2.67)% | | | | (6.78)% | | | | 19.51% | |
| | | | | | |
| Ratios to average net assetse | | | | | | | | | | | | | | | | | | | | | | | | |
| | | | | | |
Expenses before waiver and payments by affiliates | | | 0.81% | | | | 0.78% | | | | 0.78% | | | | 0.78% | | | | 0.78% | | | | 0.79% | |
| | | | | | |
Expenses net of waiver and payments by affiliates | | | 0.80%f | | | | 0.78%g | | | | 0.78%g | | | | 0.78%g | | | | 0.78%g | | | | 0.79% | |
| | | | | | |
Net investment income | | | 2.88% | | | | 2.13% | | | | 2.44% | | | | 2.16% | | | | 3.27%c | | | | 2.12% | |
| | | | | | |
| Supplemental data | | | | | | | | | | | | | | | | | | | | | | | | |
| | | | | | |
Net assets, end of period (000’s) | | | $3,807,000 | | | | $4,412,494 | | | | $4,539,205 | | | | $5,077,937 | | | | $6,210,850 | | | | $6,815,920 | |
| | | | | | |
Portfolio turnover rate | | | 11.80% | | | | 16.39% | h | | | 14.88% | | | | 16.16% | | | | 14.97% | | | | 15.89% | |
aThe amount shown for a share outstanding throughout the period may not correlate with the Statement of Operations for the period due to the timing of sales and repurchases of the Fund’s shares in relation to income earned and/or fluctuating fair value of the investments of the Fund.
bBased on average daily shares outstanding.
cNet investment income per share includes approximately $0.29 per share related to income received in the form of special dividends in connection with certain Fund holdings. Excluding this amount, the ratio of net investment income to average net assets would have been 2.00%.
dTotal return is not annualized for periods less than one year.
eRatios are annualized for periods less than one year.
fBenefit of expense reduction rounds to less than 0.01%.
gBenefit of waiver and payments by affiliates rounds to less than 0.01%.
hExcludes the value of portfolio securities delivered as a result of a redemption in-kind. See Note 9.
| | | | | | |
| | | |
| ftinstitutional.com | | The accompanying notes are an integral part of these financial statements. | Semiannual Report | | | 33 | |
TEMPLETON INSTITUTIONAL FUNDS
FINANCIAL HIGHLIGHTS
International Equity Series (continued)
| | | | | | | | | | | | | | | | | | | | | | | | |
| | | Six Months Ended
June 30, 2018 | | | Year Ended December 31, | |
| | | (unaudited) | | | 2017 | | | 2016 | | | 2015 | | | 2014 | | | 2013 | |
| |
| | | | | | |
| Service Shares | | | | | | | | | | | | | | | | | | | | | | | | |
| | | | | | |
Per share operating performance (for a share outstanding throughout the period) | | | | | | | | | | | | | | | | | | | | | | | | |
| | | | | | |
Net asset value, beginning of period | | | $22.07 | | | | $18.72 | | | | $19.11 | | | | $20.11 | | | | $22.79 | | | | $19.62 | |
| | | | |
| | | | | | |
| Income from investment operationsa: | | | | | | | | | | | | | | | | | | | | | | | | |
| | | | | | |
Net investment incomeb | | | 0.31 | | | | 0.39 | | | | 0.42 | | | | 0.36 | | | | 0.71 | c | | | 0.48 | |
| | | | | | |
Net realized and unrealized gains (losses) | | | (1.10 | ) | | | 3.85 | | | | (0.20 | ) | | | (0.92 | ) | | | (2.28 | ) | | | 3.30 | |
| | | | |
| | | | | | |
Total from investment operations | | | (0.79 | ) | | | 4.24 | | | | 0.22 | | | | (0.56 | ) | | | (1.57 | ) | | | 3.78 | |
| | | | |
| | | | | | |
| Less distributions from: | | | | | | | | | | | | | | | | | | | | | | | | |
| | | | | | |
Net investment income | | | — | | | | (0.61 | ) | | | (0.42 | ) | | | (0.44 | ) | | | (0.76 | ) | | | (0.36) | |
| | | | | | |
Net realized gains | | | — | | | | (0.28 | ) | | | (0.19 | ) | | | — | | | | (0.35 | ) | | | (0.25) | |
| | | | |
| | | | | | |
Total distributions | | | — | | | | (0.89 | ) | | | (0.61 | ) | | | (0.44 | ) | | | (1.11 | ) | | | (0.61) | |
| | | | |
| | | | | | |
Net asset value, end of period | | | $21.28 | | | | $22.07 | | | | $18.72 | | | | $19.11 | | | | $20.11 | | | | $22.79 | |
| | | | |
| | | | | | |
Total returnd | | | (3.58)% | | | | 22.73% | | | | 1.15% | | | | (2.80)% | | | | (6.95)% | | | | 19.31% | |
| | | | | | |
| Ratios to average net assetse | | | | | | | | | | | | | | | | | | | | | | | | |
| | | | | | |
Expenses before waiver and payments by affiliates | | | 0.96% | | | | 0.93% | | | | 0.93% | | | | 0.93% | | | | 0.93% | | | | 0.94% | |
| | | | | | |
Expenses net of waiver and payments by affiliates | | | 0.95%f | | | | 0.93%g | | | | 0.93%g | | | | 0.93%g | | | | 0.93%g | | | | 0.94% | |
| | | | | | |
Net investment income | | | 2.73% | | | | 1.98% | | | | 2.29% | | | | 2.01% | | | | 3.12%c | | | | 1.97% | |
| | | | | | |
| Supplemental data | | | | | | | | | | | | | | | | | | | | | | | | |
| | | | | | |
Net assets, end of period (000’s) | | | $13,548 | | | | $14,164 | | | | $8,624 | | | | $12,525 | | | | $6,985 | | | | $7,705 | |
| | | | | | |
Portfolio turnover rate | | | 11.80% | | | | 16.39% | h | | | 14.88% | | | | 16.16% | | | | 14.97% | | | | 15.89% | |
aThe amount shown for a share outstanding throughout the period may not correlate with the Statement of Operations for the period due to the timing of sales and repurchases of the Fund’s shares in relation to income earned and/or fluctuating fair value of the investments of the Fund.
bBased on average daily shares outstanding.
cNet investment income per share includes approximately $0.29 per share related to income received in the form of special dividends in connection with certain Fund holdings. Excluding this amount, the ratio of net investment income to average net assets would have been 1.85%.
dTotal return is not annualized for periods less than one year.
eRatios are annualized for periods less than one year.
fBenefit of expense reduction rounds to less than 0.01%.
gBenefit of waiver and payments by affiliates rounds to less than 0.01%.
hExcludes the value of portfolio securities delivered as a result of a redemption in-kind. See Note 9.
| | | | |
| | | |
| 34 | | Semiannual Report | The accompanying notes are an integral part of these financial statements. | | ftinstitutional.com |
TEMPLETON INSTITUTIONAL FUNDS
Statement of Investments, June 30, 2018 (unaudited)
International Equity Series
| | | | | | | | | | |
| | | Industry | | Shares | | | Value | |
| |
Common Stocks 97.6% | | | | | | | | | | |
Belgium 0.4% | | | | | | | | | | |
UCB SA | | Pharmaceuticals | | | 213,324 | | | $ | 16,783,626 | |
| | | | | | | | | | |
Canada 2.3% | | | | | | | | | | |
Goldcorp Inc. | | Metals & Mining | | | 1,224,300 | | | | 16,815,260 | |
Husky Energy Inc. | | Oil, Gas & Consumable Fuels | | | 1,888,903 | | | | 29,450,329 | |
Wheaton Precious Metals Corp. | | Metals & Mining | | | 1,954,332 | | | | 43,155,315 | |
| | | | | | | | | | |
| | | |
| | | | | | | | | 89,420,904 | |
| | | | | | | | | | |
China 6.0% | | | | | | | | | | |
a Baidu Inc., ADR | | Internet Software & Services | | | 176,817 | | | | 42,966,531 | |
China Life Insurance Co. Ltd., H | | Insurance | | | 14,004,448 | | | | 36,144,311 | |
China Mobile Ltd. | | Wireless Telecommunication Services | | | 5,388,264 | | | | 47,866,379 | |
China Telecom Corp. Ltd., H | | Diversified Telecommunication Services | | | 115,218,881 | | | | 53,893,780 | |
NetEase Inc., ADR | | Internet Software & Services | | | 81,300 | | | | 20,542,071 | |
Sinopharm Group Co. Ltd., H | | Health Care Providers & Services | | | 7,110,776 | | | | 28,593,367 | |
| | | | | | | | | | |
| | | |
| | | | | | | | | 230,006,439 | |
| | | | | | | | | | |
Denmark 1.6% | | | | | | | | | | |
A.P. Moeller-Maersk AS, B | | Marine | | | 19,508 | | | | 24,314,257 | |
Vestas Wind Systems AS | | Electrical Equipment | | | 582,218 | | | | 36,063,935 | |
| | | | | | | | | | |
| | | |
| | | | | | | | | 60,378,192 | |
| | | | | | | | | | |
France 10.3% | | | | | | | | | | |
AXA SA | | Insurance | | | 2,221,330 | | | | 54,540,039 | |
BNP Paribas SA | | Banks | | | 1,125,022 | | | | 69,913,971 | |
Cie Generale des Etablissements Michelin SCA | | Auto Components | | | 378,513 | | | | 46,125,180 | |
Compagnie de Saint-Gobain | | Building Products | | | 926,315 | | | | 41,418,095 | |
Sanofi | | Pharmaceuticals | | | 908,551 | | | | 72,872,357 | |
Total SA | | Oil, Gas & Consumable Fuels | | | 1,197,744 | | | | 73,061,850 | |
Veolia Environnement SA | | Multi-Utilities | | | 1,560,832 | | | | 33,426,553 | |
| | | | | | | | | | |
| | | |
| | | | | | | | | 391,358,045 | |
| | | | | | | | | | |
Germany 10.1% | | | | | | | | | | |
Bayer AG | | Pharmaceuticals | | | 631,734 | | | | 69,638,454 | |
E.ON SE | | Multi-Utilities | | | 2,209,575 | | | | 23,631,572 | |
Fresenius Medical Care AG & Co. KGaA | | Health Care Providers & Services | | | 207,965 | | | | 20,988,259 | |
HeidelbergCement AG | | Construction Materials | | | 427,495 | | | | 36,001,350 | |
Infineon Technologies AG | | Semiconductors & Semiconductor Equipment | | | 1,100,804 | | | | 28,076,095 | |
Lanxess AG | | Chemicals | | | 641,879 | | | | 50,095,948 | |
Merck KGaA | | Pharmaceuticals | | | 576,692 | | | | 56,341,325 | |
Siemens AG | | Industrial Conglomerates | | | 448,143 | | | | 59,280,619 | |
Telefonica Deutschland Holding AG | | Diversified Telecommunication Services | | | 10,397,198 | | | | 41,010,184 | |
| | | | | | | | | | |
| | | |
| | | | | | | | | 385,063,806 | |
| | | | | | | | | | |
Hong Kong 2.7% | | | | | | | | | | |
AIA Group Ltd. | | Insurance | | | 2,418,202 | | | | 21,142,952 | |
CK Asset Holdings Ltd. | | Real Estate Management & Development | | | 3,016,394 | | | | 23,951,077 | |
CK Hutchison Holdings Ltd. | | Industrial Conglomerates | | | 5,377,294 | | | | 57,021,158 | |
| | | | | | | | | | |
| | | |
| | | | | | | | | 102,115,187 | |
| | | | | | | | | | |
India 1.6% | | | | | | | | | | |
Housing Development Finance Corp. Ltd. | | Thrifts & Mortgage Finance | | | 2,247,128 | | | | 62,631,390 | |
| | | | | | | | | | |
| | | | | | |
| | | |
| ftinstitutional.com | | Semiannual Report | | | 35 | |
TEMPLETON INSTITUTIONAL FUNDS
STATEMENT OF INVESTMENTS (UNAUDITED)
International Equity Series (continued)
| | | | | | | | | | |
| | | Industry | | Shares | | | Value | |
| |
Common Stocks (continued) | | | | | | | | | | |
Ireland 2.6% | | | | | | | | | | |
Bank of Ireland Group PLC | | Banks | | | 5,371,221 | | | $ | 41,951,491 | |
CRH PLC | | Construction Materials | | | 1,573,158 | | | | 55,573,455 | |
| | | | | | | | | | |
| | | |
| | | | | | | | | 97,524,946 | |
| | | | | | | | | | |
Israel 2.4% | | | | | | | | | | |
Teva Pharmaceutical Industries Ltd., ADR | | Pharmaceuticals | | | 3,770,984 | | | | 91,710,331 | |
| | | | | | | | | | |
Italy 1.3% | | | | | | | | | | |
Eni SpA | | Oil, Gas & Consumable Fuels | | | 2,684,985 | | | | 49,897,158 | |
| | | | | | | | | | |
Japan 11.0% | | | | | | | | | | |
Astellas Pharma Inc. | | Pharmaceuticals | | | 4,135,100 | | | | 63,093,942 | |
Ezaki Glico Co. Ltd. | | Food Products | | | 228,600 | | | | 10,986,513 | |
INPEX Corp. | | Oil, Gas & Consumable Fuels | | | 3,832,038 | | | | 39,793,375 | |
Mitsui Fudosan Co. Ltd. | | Real Estate Management & Development | | | 1,777,090 | | | | 42,928,214 | |
Omron Corp. | | Electronic Equipment, Instruments | | | | | | | | |
| | & Components | | | 941,251 | | | | 43,961,043 | |
Panasonic Corp. | | Household Durables | | | 3,010,745 | | | | 40,621,055 | |
Ryohin Keikaku Co. Ltd. | | Multiline Retail | | | 33,594 | | | | 11,835,819 | |
Seven & i Holdings Co. Ltd. | | Food & Staples Retailing | | | 922,600 | | | | 40,264,516 | |
SoftBank Group Corp. | | Wireless Telecommunication Services | | | 764,914 | | | | 55,094,262 | |
Sumitomo Rubber Industries Ltd. | | Auto Components | | | 1,647,554 | | | | 26,195,357 | |
Suntory Beverage & Food Ltd. | | Beverages | | | 1,069,379 | | | | 45,694,590 | |
| | | | | | | | | | |
| | | |
| | | | | | | | | 420,468,686 | |
| | | | | | | | | | |
Luxembourg 1.7% | | | | | | | | | | |
SES SA, IDR | | Media | | | 3,451,223 | | | | 63,265,789 | |
| | | | | | | | | | |
Netherlands 5.3% | | | | | | | | | | |
Akzo Nobel NV | | Chemicals | | | 448,185 | | | | 38,393,061 | |
ING Groep NV | | Banks | | | 3,254,830 | | | | 46,880,680 | |
NN Group NV | | Insurance | | | 940,038 | | | | 38,264,542 | |
a QIAGEN NV | | Life Sciences Tools & Services | | | 1,315,116 | | | | 47,939,292 | |
SBM Offshore NV | | Energy Equipment & Services | | | 1,948,047 | | | | 30,327,710 | |
| | | | | | | | | | |
| | | |
| | | | | | | | | 201,805,285 | |
| | | | | | | | | | |
Norway 0.8% | | | | | | | | | | |
Yara International ASA | | Chemicals | | | 760,884 | | | | 31,575,051 | |
| | | | | | | | | | |
Singapore 1.2% | | | | | | | | | | |
Singapore Telecommunications Ltd. | | Diversified Telecommunication Services | | | 20,964,276 | | | | 47,392,543 | |
| | | | | | | | | | |
South Korea 4.3% | | | | | | | | | | |
Hana Financial Group Inc. | | Banks | | | 758,840 | | | | 29,152,137 | |
KB Financial Group Inc. | | Banks | | | 901,450 | | | | 42,672,189 | |
Samsung Electronics Co. Ltd. | | Technology Hardware, Storage & Peripherals | | | 2,186,550 | | | | 91,449,308 | |
| | | | | | | | | | |
| | | |
| | | | | | | | | 163,273,634 | |
| | | | | | | | | | |
Sweden 0.5% | | | | | | | | | | |
Getinge AB, B | | Health Care Equipment & Supplies | | | 2,011,526 | | | | 18,312,951 | |
| | | | | | | | | | |
Switzerland 4.9% | | | | | | | | | | |
Novartis AG | | Pharmaceuticals | | | 586,263 | | | | 44,561,671 | |
Roche Holding AG | | Pharmaceuticals | | | 350,283 | | | | 78,003,751 | |
UBS Group AG | | Capital Markets | | | 4,158,871 | | | | 64,352,482 | |
| | | | | | | | | | |
| | | |
| | | | | | | | | 186,917,904 | |
| | | | | | | | | | |
| | | | |
| | | |
| 36 | | Semiannual Report | | ftinstitutional.com |
TEMPLETON INSTITUTIONAL FUNDS
STATEMENT OF INVESTMENTS (UNAUDITED)
International Equity Series (continued)
| | | | | | | | | | |
| | | Industry | | Shares | | | Value | |
| |
Common Stocks (continued) | | | | | | | | | | |
Taiwan 2.1% | | | | | | | | | | |
Catcher Technology Co. Ltd. | | Technology Hardware, Storage & Peripherals | | | 2,925,000 | | | $ | 32,743,254 | |
Pegatron Corp. | | Technology Hardware, Storage & Peripherals | | | 4,439,000 | | | | 9,136,803 | |
Taiwan Semiconductor Manufacturing Co. Ltd. | | Semiconductors & Semiconductor Equipment | | | 5,410,492 | | | | 38,453,533 | |
| | | | | | | | | | |
| | | |
| | | | | | | | | 80,333,590 | |
| | | | | | | | | | |
Thailand 1.3% | | | | | | | | | | |
Bangkok Bank PCL, fgn | | Banks | | | 191,232 | | | | 1,150,290 | |
Bangkok Bank PCL, NVDR | | Banks | | | 8,380,531 | | | | 49,648,297 | |
| | | | | | | | | | |
| | | |
| | | | | | | | | 50,798,587 | |
| | | | | | | | | | |
United Kingdom 23.2% | | | | | | | | | | |
BAE Systems PLC | | Aerospace & Defense | | | 6,304,194 | | | | 53,848,158 | |
Barclays PLC | | Banks | | | 23,931,750 | | | | 59,732,065 | |
BP PLC | | Oil, Gas & Consumable Fuels | | | 15,977,811 | | | | 122,023,013 | |
GlaxoSmithKline PLC | | Pharmaceuticals | | | 1,528,323 | | | | 30,876,003 | |
HSBC Holdings PLC | | Banks | | | 7,716,315 | | | | 72,383,019 | |
Johnson Matthey PLC | | Chemicals | | | 499,024 | | | | 23,849,610 | |
Kingfisher PLC | | Specialty Retail | | | 12,865,424 | | | | 50,460,532 | |
a LivaNova PLC | | Health Care Equipment & Supplies | | | 606,362 | | | | 60,527,055 | |
London Stock Exchange Group PLC | | Capital Markets | | | 500,232 | | | | 29,535,710 | |
Rolls-Royce Holdings PLC | | Aerospace & Defense | | | 2,687,511 | | | | 35,072,471 | |
Royal Dutch Shell PLC, B | | Oil, Gas & Consumable Fuels | | | 1,332,009 | | | | 47,731,849 | |
Royal Dutch Shell PLC, B, ADR | | Oil, Gas & Consumable Fuels | | | 1,101,123 | | | | 79,996,586 | |
Shire PLC | | Biotechnology | | | 1,062,976 | | | | 59,870,621 | |
Standard Chartered PLC | | Banks | | | 7,962,233 | | | | 72,826,366 | |
Travis Perkins PLC | | Trading Companies & Distributors | | | 2,034,696 | | | | 38,222,851 | |
Vodafone Group PLC | | Wireless Telecommunication Services | | | 20,965,068 | | | | 50,893,264 | |
| | | | | | | | | | |
| | | |
| | | | | | | | | 887,849,173 | |
| | | | | | | | | | |
Total Common Stocks | | | | | | | | | | |
(Cost $2,793,385,781) | | | | | | | | | 3,728,883,217 | |
| | | | | | | | | | |
Preferred Stocks (Cost $265,727) 0.0%† | | | | | | | | | | |
United Kingdom 0.0%† | | | | | | | | | | |
a Rolls-Royce Holdings PLC, pfd | | Aerospace & Defense | | | 190,813,281 | | | | 251,988 | |
| | | | | | | | | | |
Total Investments before Short Term | | | | | | | | | | |
Investments (Cost $2,793,651,508) | | | | | | | | | 3,729,135,205 | |
| | | | | | | | | | |
| | |
Short Term Investments (Cost $65,741,417) 1.7% | | | | | | | | |
| | | |
Money Market Funds 1.7% | | | | | | | | | | |
United States 1.7% | | | | | | | | | | |
b,c Institutional Fiduciary Trust Money Market Portfolio, | | | | | | | | | | |
1.51% | | | | | 65,741,417 | | | | 65,741,417 | |
| | | | | | | | | | |
Total Investments (Cost $2,859,392,925) | | | | | | | | | | |
99.3% | | | | | | | | | 3,794,876,622 | |
Other Assets, less Liabilities 0.7% | | | | | | | | | 25,671,038 | |
| | | | | | | | | | |
Net Assets 100.0% | | | | | | | | $ | 3,820,547,660 | |
| | | | | | | | | | |
| | | | | | |
| | | |
| ftinstitutional.com | | Semiannual Report | | | 37 | |
TEMPLETON INSTITUTIONAL FUNDS
STATEMENT OF INVESTMENTS (UNAUDITED)
International Equity Series (continued)
See Abbreviations on page 54.
†Rounds to less than 0.1% of net assets.
aNon-income producing.
bSee Note 3(d) regarding investments in affiliated management investment companies.
cThe rate shown is the annualized seven-day effective yield at period end.
| | | | |
| | | |
| 38 | | Semiannual Report | The accompanying notes are an integral part of these financial statements. | | ftinstitutional.com |
TEMPLETON INSTITUTIONAL FUNDS
Financial Statements
Statements of Assets and Liabilities
June 30, 2018 (unaudited)
| | | | | | | | |
| | | Foreign Smaller
Companies Series | | | Global Equity Series | |
| |
Assets: | | | | | | | | |
Investments in securities: | | | | | | | | |
Cost - Unaffiliated issuers | | | $ 756,020,329 | | | | $250,329,136 | |
Cost - Non-controlled affiliates (Note 3d) | | | 18,183,968 | | | | — | |
| | | | |
| | |
Value - Unaffiliated issuers + | | | $ 992,359,362 | | | | $295,900,927 | |
Value - Non-controlled affiliates (Note 3d) | | | 18,183,968 | | | | — | |
Cash | | | 376,386 | | | | 151,775 | |
Foreign currency, at value (cost $148,454 and $—, respectively) | | | 148,407 | | | | — | |
Receivables: | | | | | | | | |
Investment securities sold | | | 3,368,210 | | | | — | |
Capital shares sold | | | 435,878 | | | | 9,559 | |
Dividends | | | 3,788,176 | | | | 1,316,449 | |
Foreign tax refund | | | — | | | | 9,865 | |
European Union tax reclaims | | | 461,413 | | | | 51,224 | |
Other assets | | | 705 | | | | 220 | |
| | | | |
| | |
Total assets | | | 1,019,122,505 | | | | 297,440,019 | |
| | | | |
Liabilities: | | | | | | | | |
Payables: | | | | | | | | |
Investment securities purchased | | | 2,069,870 | | | | — | |
Capital shares redeemed | | | 103,203 | | | | — | |
Management fees | | | 792,530 | | | | 194,415 | |
Transfer agent fees | | | 10,801 | | | | 5,406 | |
Professional fees | | | 30,907 | | | | 29,746 | |
Payable upon return of securities loaned | | | 18,183,968 | | | | — | |
Accrued expenses and other liabilities | | | 72,602 | | | | 3,762 | |
| | | | |
| | |
Total liabilities | | | 21,263,881 | | | | 233,329 | |
| | | | |
| | |
Net assets, at value | | | $ 997,858,624 | | | | $297,206,690 | |
| | | | |
Net assets consist of: | | | | | | | | |
Paid-in capital | | | $ 684,557,647 | | | | $224,845,705 | |
Undistributed net investment income | | | — | | | | 2,710,681 | |
Distributions in excess of net investment income | | | (2,236,816 | ) | | | — | |
Net unrealized appreciation (depreciation) | | | 236,325,116 | | | | 45,568,890 | |
Accumulated net realized gain (loss) | | | 79,212,677 | | | | 24,081,414 | |
| | | | |
| | |
Net assets, at value | | | $ 997,858,624 | | | | $297,206,690 | |
| | | | |
| | |
Shares outstanding | | | 40,605,385 | | | | 28,693,543 | |
| | | | |
| | |
Net asset value per share | | | $24.57 | | | | $10.36 | |
| | | | |
| | |
+Includes securities loaned | | | $ 17,375,096 | | | | $ — | |
| | | | |
| | | |
| ftinstitutional.com | | The accompanying notes are an integral part of these financial statements. | Semiannual Report | | 39 |
TEMPLETON INSTITUTIONAL FUNDS
FINANCIAL STATEMENTS
Statements of Assets and Liabilities (continued)
June 30, 2018 (unaudited)
| | | | |
| | | International
Equity Series | |
| |
Assets: | | | | |
Investments in securities: | | | | |
Cost - Unaffiliated issuers | | $ | 2,793,651,508 | |
Cost - Non-controlled affiliates (Note 3d) | | | 65,741,417 | |
| | | | |
| |
Value - Unaffiliated issuers | | $ | 3,729,135,205 | |
Value - Non-controlled affiliates (Note 3d) | | | 65,741,417 | |
Receivables: | | | | |
Capital shares sold | | | 3,945,673 | |
Dividends | | | 19,987,643 | |
European Union tax reclaims | | | 7,460,894 | |
Other assets | | | 2,977 | |
| | | | |
| |
Total assets | | | 3,826,273,809 | |
| | | | |
Liabilities: | | | | |
Payables: | | | | |
Capital shares redeemed | | | 2,872,200 | |
Management fees | | | 2,420,555 | |
Transfer agent fees | | | 69,380 | |
Professional fees | | | 25,800 | |
Accrued expenses and other liabilities | | | 338,214 | |
| | | | |
| |
Total liabilities | | | 5,726,149 | |
| | | | |
| |
Net assets, at value | | $ | 3,820,547,660 | |
| | | | |
Net assets consist of: | | | | |
Paid-in capital | | $ | 2,435,939,406 | |
Undistributed net investment income | | | 3,352,792 | |
Net unrealized appreciation (depreciation) | | | 935,014,379 | |
Accumulated net realized gain (loss) | | | 446,241,083 | |
| | | | |
| |
Net assets, at value | | $ | 3,820,547,660 | |
| | | | |
| |
| Primary Shares: | | | | |
Net assets, at value | | $ | 3,806,999,670 | |
| | | | |
Shares outstanding | | | 179,418,193 | |
| | | | |
Net asset value per share | | | $21.22 | |
| | | | |
| |
| Service Shares: | | | | |
Net assets, at value | | $ | 13,547,990 | |
| | | | |
Shares outstanding | | | 636,695 | |
| | | | |
Net asset value per share | | | $21.28 | |
| | | | |
| | | | |
| | | |
| 40 | | Semiannual Report | The accompanying notes are an integral part of these financial statements. | | ftinstitutional.com |
TEMPLETON INSTITUTIONAL FUNDS
FINANCIAL STATEMENTS
Statements of Operations
for the six months ended June 30, 2018 (unaudited)
| | | | | | | | |
| | | Foreign Smaller
Companies Series | | | Global
Equity Series | |
| |
Investment income: | | | | | | | | |
Dividends: (net of foreign taxes)* | | | | | | | | |
Unaffiliated issuers | | | $13,530,121 | | | | $ 4,619,732 | |
Interest: | | | | | | | | |
Unaffiliated issuers | | | 338,446 | | | | 77,902 | |
Income from securities loaned (net of fees and rebates) | | | 851,498 | | | | 850 | |
| | | | |
| | |
Total investment income | | | 14,720,065 | | | | 4,698,484 | |
| | | | |
Expenses: | | | | | | | | |
Management fees (Note 3a) | | | 4,929,329 | | | | 1,231,763 | |
Transfer agent fees (Note 3c) | | | 129,645 | | | | 33,228 | |
Custodian fees (Note 4) | | | 75,328 | | | | 10,876 | |
Reports to shareholders | | | 7,870 | | | | 2,157 | |
Registration and filing fees | | | 16,228 | | | | 11,467 | |
Professional fees | | | 38,832 | | | | 36,779 | |
Trustees’ fees and expenses | | | 20,897 | | | | 6,315 | |
Other | | | 15,107 | | | | 11,493 | |
| | | | |
| | |
Total expenses | | | 5,233,236 | | | | 1,344,078 | |
Expense reductions (Note 4) | | | (1,932 | ) | | | — | |
Expenses waived/paid by affiliates (Note 3d) | | | (37,578 | ) | | | (185 | ) |
| | | | |
| | |
Net expenses | | | 5,193,726 | | | | 1,343,893 | |
| | | | |
| | |
Net investment income | | | 9,526,339 | | | | 3,354,591 | |
| | | | |
Realized and unrealized gains (losses): | | | | | | | | |
Net realized gain (loss) from: | | | | | | | | |
Investments: | | | | | | | | |
Unaffiliated issuers | | | 61,355,881 | | | | 23,444,140 | |
Foreign currency transactions | | | (157,991 | ) | | | (1,913 | ) |
| | | | |
| | |
Net realized gain (loss) | | | 61,197,890 | | | | 23,442,227 | |
| | | | |
Net change in unrealized appreciation (depreciation) on: | | | | | | | | |
Investments: | | | | | | | | |
Unaffiliated issuers | | | (90,274,490 | ) | | | (33,528,321 | ) |
Translation of other assets and liabilities denominated in foreign currencies | | | (128,509 | ) | | | (25,482 | ) |
Change in deferred taxes on unrealized appreciation | | | 120,033 | | | | — | |
| | | | |
| | |
Net change in unrealized appreciation (depreciation) | | | (90,282,966 | ) | | | (33,553,803 | ) |
| | | | |
| | |
Net realized and unrealized gain (loss) | | | (29,085,076 | ) | | | (10,111,576 | ) |
| | | | |
| | |
Net increase (decrease) in net assets resulting from operations | | | $(19,558,737 | ) | | | $ (6,756,985 | ) |
| | | | |
| | | | | | | | |
| | | | | | | | |
| | | | | | | | |
| | | | | | | | |
| | | | | | | | |
| | | | | | | | |
| | | | | | | | |
| | | | | | | | |
| | | | | | | | |
| | | | | | | | |
| | | | | | | | |
| | | | | | | | |
| | | | | | | | |
| | | | | | | | |
| | | | | | | | |
*Foreign taxes withheld on dividends | | | $ 1,679,023 | | | | $ 414,930 | |
| | | | | | |
| | | |
| ftinstitutional.com | | The accompanying notes are an integral part of these financial statements. | Semiannual Report | | | 41 | |
TEMPLETON INSTITUTIONAL FUNDS
FINANCIAL STATEMENTS
Statements of Operations (continued)
for the six months ended June 30, 2018 (unaudited)
| | | | |
| | | International
Equity Series | |
| |
Investment income: | | | | |
Dividends: (net of foreign taxes)* | | | | |
Unaffiliated issuers | | | $76,176,255 | |
Non-controlled affiliates (Note 3d) | | | 398,268 | |
Interest: | | | | |
Unaffiliated issuers | | | 334,287 | |
Income from securities loaned (net of fees and rebates) | | | 14,610 | |
| | | | |
| |
Total investment income | | | 76,923,420 | |
| | | | |
Expenses: | | | | |
Management fees (Note 3a) | | | 15,910,707 | |
Transfer agent fees: (Note 3c) | | | | |
Primary Shares | | | 472,893 | |
Service Shares | | | 1,417 | |
Sub-transfer agent fees - Service Shares (Note 3c) | | | 10,619 | |
Custodian fees (Note 4) | | | 276,602 | |
Reports to shareholders | | | 30,624 | |
Registration and filing fees | | | 37,611 | |
Professional fees | | | 60,751 | |
Trustees’ fees and expenses | | | 96,988 | |
Other | | | 48,833 | |
| | | | |
| |
Total expenses | | | 16,947,045 | |
Expense reductions (Note 4) | | | (1,514 | ) |
Expenses waived/paid by affiliates (Note 3d) | | | (129,455 | ) |
| | | | |
| |
Net expenses | | | 16,816,076 | |
| | | | |
| |
Net investment income | | | 60,107,344 | |
| | | | |
Realized and unrealized gains (losses): | | | | |
Net realized gain (loss) from: | | | | |
Investments: | | | | |
Unaffiliated issuers | | | 366,025,838 | |
Foreign currency transactions. | | | (557,478 | ) |
| | | | |
| |
Net realized gain (loss) | | | 365,468,360 | |
| | | | |
Net change in unrealized appreciation (depreciation) on: | | | | |
Investments: | | | | |
Unaffiliated issuers | | | (565,393,987 | ) |
Translation of other assets and liabilities denominated in foreign currencies | | | (1,180,204 | ) |
| | | | |
| |
Net change in unrealized appreciation (depreciation) | | | (566,574,191 | ) |
| | | | |
| |
Net realized and unrealized gain (loss) | | | (201,105,831 | ) |
| | | | |
| |
Net increase (decrease) in net assets resulting from operations | | | $(140,998,487 | ) |
| | | | |
| | | | |
| | | | |
| | | | |
| | | | |
| | | | |
| | | | |
| | | | |
| | | | |
| | | | |
| | | | |
| | | | |
| | | | |
| | | | |
| | | | |
| | | | |
*Foreign taxes withheld on dividends | | | $ 7,883,861 | |
| | | | |
| | | |
| 42 | | Semiannual Report | The accompanying notes are an integral part of these financial statements. | | ftinstitutional.com |
TEMPLETON INSTITUTIONAL FUNDS
FINANCIAL STATEMENTS
Statements of Changes in Net Assets
| | | | | | | | | | | | | | | | |
| | | Foreign Smaller Companies Series | | | Global Equity Series | |
| | | Six Months Ended
June 30, 2018
(unaudited) | | | Year Ended
December 31, 2017 | | | Six Months Ended
June 30, 2018
(unaudited) | | | Year Ended
December 31, 2017 | |
| |
Increase (decrease) in net assets: | | | | | | | | | | | | | | | | |
Operations: | | | | | | | | | | | | | | | | |
Net investment income | | | $ 9,526,339 | | | | $ 13,021,091 | | | | $ 3,354,591 | | | | $ 5,016,840 | |
Net realized gain (loss) | | | 61,197,890 | | | | 73,589,228 | | | | 23,442,227 | | | | 6,669,126 | |
Net change in unrealized appreciation (depreciation) | | | (90,282,966 | ) | | | 210,102,374 | | | | (33,553,803 | ) | | | 45,386,301 | |
| | | | |
Net increase (decrease) in net assets resulting from operations | | | (19,558,737 | ) | | | 296,712,693 | | | | (6,756,985 | ) | | | 57,072,267 | |
| | | | |
Distributions to shareholders from: | | | | | | | | | | | | | | | | |
Net investment income | | | — | | | | (26,684,552 | ) | | | — | | | | (5,755,645 | ) |
Net realized gains | | | — | | | | (37,723,593 | ) | | | — | | | | (1,123,692 | ) |
| | | | |
Total distributions to shareholders | | | — | | | | (64,408,145 | ) | | | — | | | | (6,879,337 | ) |
| | | | |
| | | | |
Capital share transactions (Note 2) | | | (22,762,403 | ) | | | (124,003,541 | ) | | | (23,051,799 | ) | | | (3,886,825 | ) |
| | | | |
Net increase (decrease) in net assets | | | (42,321,140 | ) | | | 108,301,007 | | | | (29,808,784 | ) | | | 46,306,105 | |
Net assets: | | | | | | | | | | | | | | | | |
Beginning of period | | | 1,040,179,764 | | | | 931,878,757 | | | | 327,015,474 | | | | 280,709,369 | |
| | | | |
| | | | |
End of period | | | $ 997,858,624 | | | | $1,040,179,764 | | | | $297,206,690 | | | | $327,015,474 | |
| | | | |
Undistributed net investment income included in net assets: | | | | | | | | | | | | | | | | |
End of period | | | $ — | | | | $ — | | | | $ 2,710,681 | | | | $ — | |
| | | | |
Distributions in excess of net investment income included in net assets: | | | | | | | | | | | | | | | | |
End of period | | | $ (2,236,816 | ) | | | $ (11,763,155 | ) | | | $ — | | | | $ (643,910 | ) |
| | | | |
| | | | | | |
| | | |
| ftinstitutional.com | | The accompanying notes are an integral part of these financial statements. | Semiannual Report | | | 43 | |
TEMPLETON INSTITUTIONAL FUNDS
FINANCIAL STATEMENTS
Statements of Changes in Net Assets (continued)
| | | | | | | | |
| | | International Equity Series | |
| | | Six Months Ended
June 30, 2018
(unaudited) | | | Year Ended
December 31, 2017 | |
| |
Increase (decrease) in net assets: | | | | | | | | |
Operations: | | | | | | | | |
Net investment income | | | $ 60,107,344 | | | | $ 100,855,422 | |
Net realized gain (loss) | | | 365,468,360 | | | | 353,346,497 | |
Net change in unrealized appreciation (depreciation) | | | (566,574,191 | ) | | | 523,980,414 | |
| | | | |
| | |
Net increase (decrease) in net assets resulting from operations | | | (140,998,487 | ) | | | 978,182,333 | |
| | | | |
Distributions to shareholders from: | | | | | | | | |
Net investment income: | | | | | | | | |
Primary Shares | | | — | | | | (127,842,638 | ) |
Service Shares | | | — | | | | (382,337 | ) |
Net realized gains: | | | | | | | | |
Primary Shares | | | — | | | | (56,164,739 | ) |
Service Shares | | | — | | | | (178,539 | ) |
| | | | |
| | |
Total distributions to shareholders | | | — | | | | (184,568,253 | ) |
| | | | |
Capital share transactions: (Note 2) | | | | | | | | |
Primary Shares | | | (465,013,786 | ) | | | (918,597,405 | ) |
Service Shares | | | (98,394 | ) | | | 3,812,990 | |
| | | | |
| | |
Total capital share transactions | | | (465,112,180 | ) | | | (914,784,415 | ) |
| | | | |
Net increase (decrease) in net assets | | | (606,110,667 | ) | | | (121,170,335 | ) |
Net assets: | | | | | | | | |
Beginning of period | | | 4,426,658,327 | | | | 4,547,828,662 | |
| | | | |
| | |
End of period | | | $3,820,547,660 | | | | $4,426,658,327 | |
| | | | |
Undistributed net investment income included in net assets: | | | | | | | | |
End of period | | | $ 3,352,792 | | | | $ — | |
| | | | |
Distributions in excess of net investment income included in net assets: | | | | | | | | |
End of period | | | $ — | | | | $ (56,754,552 | ) |
| | | | |
| | | | |
| | | |
| 44 | | Semiannual Report | The accompanying notes are an integral part of these financial statements. | | ftinstitutional.com |
TEMPLETON INSTITUTIONAL FUNDS
Notes to Financial Statements (unaudited)
1. Organization and Significant Accounting Policies
Templeton Institutional Funds (Trust) is registered under the Investment Company Act of 1940 (1940 Act) as an open-end management investment company, consisting of three separate funds (Funds) and applies the specialized accounting and reporting guidance in U.S. Generally Accepted Accounting Principles (U.S. GAAP). International Equity Series offers Primary and Service Shares. Each class of shares differs by its voting rights on matters affecting a single class and transfer agent fees. Foreign Smaller Companies Series was closed to new investors with limited exceptions effective at the close of market on December 10, 2013. Effective June 25, 2018, Foreign Smaller Companies Series reopened to new investors.
The following summarizes the Funds’ significant accounting policies.
a. Financial Instrument Valuation
The Funds’ investments in financial instruments are carried at fair value daily. Fair value is the price that would be received to sell an asset or paid to transfer a liability in an orderly transaction between market participants on the measurement date. The Funds calculate the net asset value (NAV) per share each business day as of 4 p.m. Eastern time or the regularly scheduled close of the New York Stock Exchange (NYSE), whichever is earlier. Under compliance policies and procedures approved by the Trust’s Board of Trustees (the Board), the Funds’ administrator has responsibility for oversight of valuation, including leading the cross-functional Valuation Committee (VC). The VC provides administration and oversight of the Funds’ valuation policies and procedures, which are approved annually by the Board. Among other things, these procedures allow the Funds to utilize independent pricing services, quotations from securities and financial instrument dealers, and other market sources to determine fair value.
Equity securities listed on an exchange or on the NASDAQ National Market System are valued at the last quoted sale price or the official closing price of the day, respectively. Foreign equity securities are valued as of the close of trading on the foreign stock exchange on which the security is primarily traded, or as of 4 p.m. Eastern time. The value is then converted into its U.S. dollar equivalent at the foreign exchange rate in effect at 4 p.m. Eastern time on the day that the value of the security is determined. Over-the-counter (OTC) securities are valued within the range of the most recent quoted bid and ask
prices. Securities that trade in multiple markets or on multiple exchanges are valued according to the broadest and most representative market. Certain equity securities are valued based upon fundamental characteristics or relationships to similar securities.
Debt securities generally trade in the OTC market rather than on a securities exchange. The Funds’ pricing services use multiple valuation techniques to determine fair value. In instances where sufficient market activity exists, the pricing services may utilize a market-based approach through which quotes from market makers are used to determine fair value. In instances where sufficient market activity may not exist or is limited, the pricing services also utilize proprietary valuation models which may consider market characteristics such as benchmark yield curves, credit spreads, estimated default rates, anticipated market interest rate volatility, coupon rates, anticipated timing of principal repayments, underlying collateral, and other unique security features in order to estimate the relevant cash flows, which are then discounted to calculate the fair value.
Investments in open-end mutual funds are valued at the closing NAV. Time deposits are valued at cost, which approximates fair value.
The Funds have procedures to determine the fair value of financial instruments for which market prices are not reliable or readily available. Under these procedures, the VC convenes on a regular basis to review such financial instruments and considers a number of factors, including significant unobservable valuation inputs, when arriving at fair value. The VC primarily employs a market-based approach which may use related or comparable assets or liabilities, recent transactions, market multiples, book values, and other relevant information for the investment to determine the fair value of the investment. An income-based valuation approach may also be used in which the anticipated future cash flows of the investment are discounted to calculate fair value. Discounts may also be applied due to the nature or duration of any restrictions on the disposition of the investments. Due to the inherent uncertainty of valuations of such investments, the fair values may differ significantly from the values that would have been used had an active market existed. The VC employs various methods for calibrating these valuation approaches including a regular review of key inputs and assumptions, transactional back-testing or disposition analysis, and reviews of any related market activity.
| | | | | | |
| | | |
| ftinstitutional.com | | Semiannual Report | | | 45 | |
TEMPLETON INSTITUTIONAL FUNDS
NOTES TO FINANCIAL STATEMENTS (UNAUDITED)
1. Organization and Significant Accounting
Policies (continued)
a. Financial Instrument Valuation (continued)
Trading in securities on foreign securities stock exchanges and OTC markets may be completed before 4 p.m. Eastern time. In addition, trading in certain foreign markets may not take place on every Funds’ business day. Occasionally, events occur between the time at which trading in a foreign security is completed and 4 p.m. Eastern time that might call into question the reliability of the value of a portfolio security held by the Fund. As a result, differences may arise between the value of the Funds’ portfolio securities as determined at the foreign market close and the latest indications of value at 4 p.m. Eastern time. In order to minimize the potential for these differences, the VC monitors price movements following the close of trading in foreign stock markets through a series of country specific market proxies (such as baskets of American Depositary Receipts, futures contracts and exchange traded funds). These price movements are measured against established trigger thresholds for each specific market proxy to assist in determining if an event has occurred that may call into question the reliability of the values of the foreign securities held by the Funds. If such an event occurs, the securities may be valued using fair value procedures, which may include the use of independent pricing services.
When the last day of the reporting period is a non-business day, certain foreign markets may be open on those days that the Funds’ NAV is not calculated, which could result in differences between the value of the Funds’ portfolio securities on the last business day and the last calendar day of the reporting period. Any significant security valuation changes due to an open foreign market are adjusted and reflected by the Funds for financial reporting purposes.
b. Foreign Currency Translation
Portfolio securities and other assets and liabilities denominated in foreign currencies are translated into U.S. dollars based on the exchange rate of such currencies against U.S. dollars on the date of valuation. The Funds may enter into foreign currency exchange contracts to facilitate transactions denominated in a foreign currency. Purchases and sales of securities, income and expense items denominated in foreign currencies are translated into U.S. dollars at the exchange rate in effect on the transaction date. Portfolio securities and assets and liabilities denominated in foreign currencies contain risks that those currencies will
decline in value relative to the U.S. dollar. Occasionally, events may impact the availability or reliability of foreign exchange rates used to convert the U.S. dollar equivalent value. If such an event occurs, the foreign exchange rate will be valued at fair value using procedures established and approved by the Board.
The Funds do not separately report the effect of changes in foreign exchange rates from changes in market prices on securities held. Such changes are included in net realized and unrealized gain or loss from investments in the Statements of Operations.
Realized foreign exchange gains or losses arise from sales of foreign currencies, currency gains or losses realized between the trade and settlement dates on securities transactions and the difference between the recorded amounts of dividends, interest, and foreign withholding taxes and the U.S. dollar equivalent of the amounts actually received or paid. Net unrealized foreign exchange gains and losses arise from changes in foreign exchange rates on foreign denominated assets and liabilities other than investments in securities held at the end of the reporting period.
c. Securities Lending
Certain or all Funds participate in an agency based securities lending program to earn additional income. The Fund receives cash collateral against the loaned securities in an amount equal to at least 102% of the fair value of the loaned securities. Collateral is maintained over the life of the loan in an amount not less than 100% of the fair value of loaned securities, as determined at the close of Fund business each day; any additional collateral required due to changes in security values is delivered to the Fund on the next business day. The collateral is deposited into a joint cash account with other funds and is used to invest in a money market fund managed by Franklin Advisers, Inc., an affiliate of the Funds. The Fund may receive income from the investment of cash collateral, in addition to lending fees and rebates paid by the borrower. Income from securities loaned, net of fees paid to the securities lending agent and/or third-party vendor, is reported separately in the Statements of Operations. The Fund bears the market risk with respect to the collateral investment, securities loaned, and the risk that the agent may default on its obligations to the Fund. If the borrower defaults on its obligation to return the securities loaned, the Fund has the right to repurchase the securities in the open market using the collateral received. The securities lending
| | | | |
| | | |
| 46 | | Semiannual Report | | ftinstitutional.com |
TEMPLETON INSTITUTIONAL FUNDS
NOTES TO FINANCIAL STATEMENTS (UNAUDITED)
agent has agreed to indemnify the Fund in the event of default by a third party borrower. At June 30, 2018, Global Equity Series and International Equity Series had no securities on loan.
d. Income and Deferred Taxes
It is each Fund’s policy to qualify as a regulated investment company under the Internal Revenue Code. Each Fund intends to distribute to shareholders substantially all of its taxable income and net realized gains to relieve it from federal income and excise taxes. As a result, no provision for U.S. federal income taxes is required.
The Funds may be subject to foreign taxation related to income received, capital gains on the sale of securities and certain foreign currency transactions in the foreign jurisdictions in which the Funds invest. Foreign taxes, if any, are recorded based on the tax regulations and rates that exist in the foreign markets in which the Funds invest. When a capital gain tax is determined to apply, certain or all Funds record an estimated deferred tax liability in an amount that would be payable if the securities were disposed of on the valuation date.
As a result of several court cases, in certain countries across the European Union, certain or all Funds filed additional tax reclaims for previously withheld taxes on dividends earned in those countries (EU reclaims). These additional filings are subject to various administrative proceedings by the local jurisdictions’ tax authorities within the European Union, as well as a number of related judicial proceedings. Income recognized, if any, for EU reclaims is reflected as other income in the Statements of Operations and any related receivable, if any, is reflected as European Union tax reclaims in the Statements of Assets and Liabilities. When uncertainty exists as to the ultimate resolution of these proceedings, the likelihood of receipt of these EU reclaims, and the potential timing of payment, no amounts are reflected in the financial statements. For U.S. income tax purposes, EU reclaims received by the Funds, if any, reduce the amounts of foreign taxes Fund shareholders can use as tax credits in their individual income tax returns.
Each Fund may recognize an income tax liability related to its uncertain tax positions under U.S. GAAP when the uncertain tax position has a less than 50% probability that it will be sustained upon examination by the tax authorities based on its technical merits. As of June 30, 2018, each Fund has determined that no tax liability is required in its financial
statements related to uncertain tax positions for any open tax years (or expected to be taken in future tax years). Open tax years are those that remain subject to examination and are based on the statute of limitations in each jurisdiction in which the Fund invests.
e. Security Transactions, Investment Income, Expenses and Distributions
Security transactions are accounted for on trade date. Realized gains and losses on security transactions are determined on a specific identification basis. Interest income and estimated expenses are accrued daily. Amortization of premium and accretion of discount on debt securities are included in interest income. Dividend income is recorded on the ex-dividend date except for certain dividends from securities where the dividend rate is not available. In such cases, the dividend is recorded as soon as the information is received by the Funds. Distributions to shareholders are recorded on the ex-dividend date. Distributable earnings are determined according to income tax regulations (tax basis) and may differ from earnings recorded in accordance with U.S. GAAP. These differences may be permanent or temporary. Permanent differences are reclassified among capital accounts to reflect their tax character. These reclassifications have no impact on net assets or the results of operations. Temporary differences are not reclassified, as they may reverse in subsequent periods.
Common expenses incurred by the Trust are allocated among the Funds based on the ratio of net assets of each Fund to the combined net assets of the Trust or based on the ratio of number of shareholders of each Fund to the combined number of shareholders of the Trust. Fund specific expenses are charged directly to the Fund that incurred the expense.
Realized and unrealized gains and losses and net investment income, excluding class specific expenses, are allocated daily to each class of shares based upon the relative proportion of net assets of each class. Differences in per share distributions by class are generally due to differences in class specific expenses.
f. Accounting Estimates
The preparation of financial statements in accordance with U.S. GAAP requires management to make estimates and assumptions that affect the reported amounts of assets and liabilities at the date of the financial statements and the amounts of income and expenses during the reporting period. Actual results could differ from those estimates.
| | | | | | |
| | | |
| ftinstitutional.com | | Semiannual Report | | | 47 | |
TEMPLETON INSTITUTIONAL FUNDS
NOTES TO FINANCIAL STATEMENTS (UNAUDITED)
1. Organization and Significant Accounting
Policies (continued)
g. Guarantees and Indemnifications
Under the Trust’s organizational documents, its officers and trustees are indemnified by the Trust against certain liabilities arising out of the performance of their duties to the Trust. Additionally, in the normal course of business, the Trust, on
behalf of the Funds, enters into contracts with service providers that contain general indemnification clauses. The Trust’s maximum exposure under these arrangements is unknown as this would involve future claims that may be made against the Trust that have not yet occurred. Currently, the Trust expects the risk of loss to be remote.
2. Shares of Beneficial Interest
At June 30, 2018, there were an unlimited number of shares authorized (without par value). Transactions in the Funds’ shares were as follows:
| | | | | | | | | | | | | | | | | | | | |
| | | Foreign Smaller Companies Series | | | | | | Global Equity Series | |
| | | | |
| | | Shares | | | Amount | | | | | | Shares | | | Amount | |
| |
Six Months ended June 30, 2018 | | | | | | | | | | | | | | | | | | | | |
Shares sold | | | 3,892,986 | | | $ | 98,418,896 | | | | | | | | 41,863 | | | $ | 445,603 | |
Shares redeemed | | | (4,765,978 | ) | | | (121,181,299 | ) | | | | | | | (2,230,868 | ) | | | (23,497,402) | |
| | | | |
| | | | | |
Net increase (decrease) | | | (872,992 | ) | | $ | (22,762,403 | ) | | | | | | | (2,189,005 | ) | | $ | (23,051,799) | |
| | | | |
Year ended December 31, 2017 | | | | | | | | | | | | | | | | | | | | |
Shares sold | | | 4,597,046 | | | $ | 107,028,602 | | | | | | | | 1,172,155 | | | $ | 11,992,491 | |
Shares issued in reinvestment of distributions | | | 2,304,062 | | | | 57,025,539 | | | | | | | | 652,710 | | | | 6,879,337 | |
Shares redeemed | | | (12,178,847 | ) | | | (288,057,682 | ) | | | | | | | (2,300,263 | ) | | | (22,758,653) | |
| | | | |
| | | | | |
Net increase (decrease) | | | (5,277,739 | ) | | $ | (124,003,541 | ) | | | | | | | (475,398 | ) | | $ | (3,886,825) | |
| | | | |
| | | | | | | | |
| | | International
Equity Series | |
| | |
| | | Shares | | | Amount | |
| |
| Primary Shares: | | | | | | | | |
Six Months ended June 30, 2018 | | | | | | | | |
Shares sold | | | 8,399,735 | | | $ | 186,192,862 | |
Shares redeemed | | | (29,604,688 | ) | | | (651,206,648) | |
| | | | |
| | |
Net increase (decrease) | | | (21,204,953 | ) | | $ | (465,013,786) | |
| | | | |
Year ended December 31, 2017 | | | | | | | | |
Shares sold | | | 25,057,295 | | | $ | 517,786,830 | |
Shares issued in reinvestment of distributions | | | 7,303,655 | | | | 159,119,329 | |
Shares redeemed in-kind (Note 9) | | | (19,099,929 | ) | | | (421,197,360) | |
Shares redeemed | | | (55,993,290 | ) | | | (1,174,306,204) | |
| | | | |
| | |
Net increase (decrease) | | | (42,732,269 | ) | | $ | (918,597,405) | |
| | | | |
| | | | |
| | | |
| 48 | | Semiannual Report | | ftinstitutional.com |
TEMPLETON INSTITUTIONAL FUNDS
NOTES TO FINANCIAL STATEMENTS (UNAUDITED)
| | | | | | | | |
| | | International
Equity Series | |
| | |
| | | Shares | | | Amount | |
| |
| Service Shares: | | | | | | | | |
Six Months ended June 30, 2018 | | | | | | | | |
Shares sold | | | 67,101 | | | $ | 1,485,811 | |
Shares redeemed | | | (72,132 | ) | | | (1,584,205) | |
| | | | |
| | |
Net increase (decrease) | | | (5,031 | ) | | $ | (98,394) | |
| | | | |
Year ended December 31, 2017 | | | | | | | | |
Shares sold | | | 272,954 | | | $ | 5,774,008 | |
Shares issued in reinvestment of distributions | | | 25,407 | | | | 555,560 | |
Shares redeemed | | | (117,301 | ) | | | (2,516,578) | |
| | | | |
| | |
Net increase (decrease) | | | 181,060 | | | $ | 3,812,990 | |
| | | | |
3. Transactions with Affiliates
Franklin Resources, Inc. is the holding company for various subsidiaries that together are referred to as Franklin Templeton Investments. Certain officers and trustees of the Trust are also officers and/or directors of the following subsidiaries:
| | |
| Subsidiary | | Affiliation |
Templeton Investment Counsel, LLC (TIC) | | Investment manager |
Franklin Templeton Services, LLC (FT Services) | | Administrative manager |
Franklin Templeton Distributors, Inc. (Distributors) | | Principal underwriter |
Franklin Templeton Investor Services, LLC (Investor Services) | | Transfer agent |
a. Management Fees
Foreign Smaller Companies Series pays an investment management fee to TIC based on the average daily net assets of the Fund as follows:
| | |
| Annualized Fee Rate | | Net Assets |
| 0.950% | | Up to and including $1 billion |
| 0.930% | | Over $1 billion, up to and including $5 billion |
| 0.910% | | Over $5 billion, up to and including $10 billion |
| 0.890% | | Over $10 billion, up to and including $15 billion |
| 0.870% | | Over $15 billion, up to and including $20 billion |
| 0.850% | | In excess of $20 billion |
| | | | | | |
| | | |
| ftinstitutional.com | | Semiannual Report | | | 49 | |
TEMPLETON INSTITUTIONAL FUNDS
NOTES TO FINANCIAL STATEMENTS (UNAUDITED)
3. Transactions with Affiliates (continued)
a. Management Fees (continued)
Global Equity Series pays an investment management fee to TIC based on the average daily net assets of the Fund as follows:
| | |
| Annualized Fee Rate | | Net Assets |
| 0.780% | | Up to and including $200 million |
| 0.765% | | Over $200 million, up to and including $700 million |
| 0.730% | | Over $700 million, up to and including $1 billion |
| 0.715% | | Over $1 billion, up to and including $1.2 billion |
| 0.690% | | Over $1.2 billion, up to and including $5 billion |
| 0.675% | | Over $5 billion, up to and including $10 billion |
| 0.655% | | Over $10 billion, up to and including $15 billion |
| 0.635% | | Over $15 billion, up to and including $20 billion |
| 0.615% | | Over $20 billion, up to and including $25 billion |
| 0.605% | | Over $25 billion, up to and including $30 billion |
| 0.595% | | Over $30 billion, up to and including $35 billion |
| 0.585% | | Over $35 billion, up to and including $40 billion |
| 0.575% | | Over $40 billion, up to and including $45 billion |
| 0.565% | | In excess of $45 billion |
International Equity Series pays an investment management fee to TIC based on the average daily net assets of the Fund as follows:
| | |
| Annualized Fee Rate | | Net Assets |
| 0.775% | | Up to and including $1 billion |
| 0.755% | | Over $1 billion, up to and including $5 billion |
| 0.735% | | Over $5 billion, up to and including $10 billion |
| 0.715% | | Over $10 billion, up to and including $15 billion |
| 0.695% | | Over $15 billion, up to and including $20 billion |
| 0.675% | | In excess of $20 billion |
For the period ended June 30, 2018, each Fund’s annualized gross effective investment management fee rate based on average daily net assets was as follows:
| | | | | | | | |
Foreign Smaller
Companies Series | | | Global
Equity Series | | | International
Equity Series |
| | |
| | 0.949% | | | | 0.775% | | | 0.760% |
b. Administrative Fees
Under agreements with TIC, FT Services provides administrative services to the Funds. The fee is paid by TIC based on each of the Funds’ average daily net assets, and is not an additional expense of the Funds.
| | | | |
| | | |
| 50 | | Semiannual Report | | ftinstitutional.com |
TEMPLETON INSTITUTIONAL FUNDS
NOTES TO FINANCIAL STATEMENTS (UNAUDITED)
c. Transfer Agent Fees
Each class of shares pays transfer agent fees to Investor Services for its performance of shareholder servicing obligations. Effective November 1, 2017, the fees are based on an annualized asset based fee of 0.02% plus a transaction based fee. Prior to November 1, 2017, the fees were account based fees that varied based on fund or account type. In addition, each class reimburses Investor Services for out of pocket expenses incurred and reimburses shareholder servicing fees paid to third parties. These fees are allocated daily based upon their relative proportion of such classes’ aggregate net assets.
For the period ended June 30, 2018, the Funds paid transfer agent fees as noted in the Statements of Operations of which the following amounts were retained by Investor Services:
| | | | | | | | | | | | |
| | | Foreign Smaller
Companies Series | | | Global
Equity Series | | | International
Equity Series | |
| |
Transfer agent fees | | | $139,173 | | | | $33,421 | | | | $502,487 | |
International Equity Series’ Service shares may pay up to 0.15% of average daily net assets for sub-transfer agency fees as noted in the Statements of Operations.
d. Investments in Affiliated Management Investment Companies
Certain or all Funds invest in one or more affiliated management investment companies for purposes other than exercising a controlling influence over the management or policies. Management fees paid by the Funds are waived on assets invested in the affiliated management investment companies, as noted in the Statements of Operations, in an amount not to exceed the management and administrative fees paid directly or indirectly by each affiliate. Prior to January 1, 2014, the waiver was accounted for as a reduction to management fees. During the period ended June 30, 2018, investments in affiliated management investment companies were as follows:
| | | | | | | | | | | | | | | | | | | | | | | | | | | | | | | | |
| | | Number of | | | | | | | | | Number of | | | | | | | | | | | | Net Change in | |
| | | Shares Held | | | | | | | | | Shares | | | Value | | | | | | Realized | | | Unrealized | |
| | | at Beginning | | | Gross | | | Gross | | | Held at End | | | at End | | | Dividend | | | Gain | | | Appreciation | |
| | | of Period | | | Additions | | | Reductions | | | of Period | | | of Period | | | Income | | | (Loss) | | | (Depreciation) | |
| |
| Foreign Smaller Companies Series | | | | | | | | | | | | | | | | | | | | | | | | | | | | | |
| Non-Controlled Affiliates | | | | | | | | | | | | | | | | | | | | | | | | | | | | | | | | |
Institutional Fiduciary Trust Money Market Portfolio, 1.51% | | | 27,923,489 | | | | 36,134,472 | | | | (45,873,993 | ) | | | 18,183,968 | | | | $ 18,183,968 | | | | $ — | | | | $ — | | | | $ — | |
| | | | | | | | | | | | | | | | | | | | |
| Global Equity Series | | | | | | | | | | | | | | | | | | | | | | | | | | | | | | | | |
| Non-Controlled Affiliates | | | | | | | | | | | | | | | | | | | | | | | | | | | | | | | | |
Institutional Fiduciary Trust Money Market Portfolio, 1.51% | | | — | | | | 4,894,761 | | | | (4,894,761 | ) | | | — | | | | $ — | | | | $ — | | | | $ — | | | | $ — | |
| | | | | | | | | | | | | | | | | | | | |
| International Equity Series | | | | | | | | | | | | | | | | | | | | | | | | | | | | | | | | |
| Non-Controlled Affiliates | | | | | | | | | | | | | | | | | | | | | | | | | | | | | | | | |
Institutional Fiduciary Trust Money Market Portfolio, 1.51% | | | 136,672,218 | | | | 652,506,299 | | | | (723,437,100 | ) | | | 65,741,417 | | | | $ 65,741,417 | | | | $ 398,268 | | | | $ — | | | | $ — | |
| | | | | | | | | | | | | | | | | | | | |
e. Interfund Transactions
Certain or all Funds engaged in purchases and sales of investments with funds or other accounts that have common investment managers (or affiliated investment managers), directors, trustees or officers. These purchases and sales for the period ended June 30, 2018, were as follows:
| | | | |
| |
| Foreign Smaller
Companies Series |
|
| |
Purchases | | | $1,012,970 | |
Sales | | | $ — | |
| | | | | | |
| | | |
| ftinstitutional.com | | Semiannual Report | | | 51 | |
TEMPLETON INSTITUTIONAL FUNDS
NOTES TO FINANCIAL STATEMENTS (UNAUDITED)
4. Expense Offset Arrangement
The Funds have entered into an arrangement with their custodian whereby credits realized as a result of uninvested cash balances are used to reduce a portion of the Funds’ custodian expenses. During the period ended June 30, 2018, the custodian fees were reduced as noted in the Statements of Operations.
5. Income Taxes
For tax purposes, the Funds may elect to defer any portion of a late-year ordinary loss to the first day of the following fiscal year. At December 31, 2017, Foreign Smaller Companies Series deferred late-year ordinary losses of $153,742.
At June 30, 2018, the cost of investments and net unrealized appreciation (depreciation) for income tax purposes were as follows:
| | | | | | | | | | | | |
| | | Foreign Smaller | | | Global | | | International | |
| | | Companies Series | | | Equity Series | | | Equity Series | |
| |
Cost of investments | | | $789,805,832 | | | | $253,082,859 | | | | $2,956,546,560 | |
| | | | |
| | | |
Unrealized appreciation | | | $284,041,459 | | | | $ 57,822,479 | | | | $1,062,412,205 | |
Unrealized depreciation | | | (63,303,961 | ) | | | (15,004,411 | ) | | | (224,082,143) | |
| | | | |
Net unrealized appreciation (depreciation) | | | $220,737,498 | | | | $ 42,818,068 | | | | $ 838,330,062 | |
| | | | |
Differences between income and/or capital gains as determined on a book basis and a tax basis are primarily due to differing treatments of passive foreign investment company shares, corporate actions, wash sales and gains realized on in-kind shareholder redemptions.
6. Investment Transactions
Purchases and sales of investments (excluding short term securities) for the period ended June 30, 2018, were as follows:
| | | | | | | | | | | | |
| | | Foreign Smaller
Companies Series | | | Global
Equity Series | | | International Equity Series | |
| |
Purchases | | | $203,457,398 | | | | $54,430,073 | | | | $483,730,994 | |
Sales | | | $223,600,660 | | | | $74,214,495 | | | | $861,379,287 | |
At June 30, 2018, in connection with securities lending transactions, certain or all Funds loaned investments and received cash collateral as follows:
| | | | |
| | | Foreign Smaller | |
| | | Companies Series | |
| |
| Securities lending transactionsa: | | | | |
Equity investmentsb | | | $18,183,968 | |
aThe agreements can be terminated at any time.
bThe gross amount of recognized liability for such transactions is included in payable upon return of securities loaned in the Statements of Assets and Liabilities.
7. Concentration of Risk
Investing in foreign securities may include certain risks and considerations not typically associated with investing in U.S. securities, such as fluctuating currency values and changing local and regional economic, political and social conditions, which may result in greater market volatility. In addition, certain foreign securities may not be as liquid as U.S. securities.
| | | | |
| | | |
| 52 | | Semiannual Report | | ftinstitutional.com |
TEMPLETON INSTITUTIONAL FUNDS
NOTES TO FINANCIAL STATEMENTS (UNAUDITED)
8. Credit Facility
The Funds, together with other U.S. registered and foreign investment funds (collectively, Borrowers), managed by Franklin Templeton Investments, are borrowers in a joint syndicated senior unsecured credit facility totaling $2 billion (Global Credit Facility) which matures on February 8, 2019. This Global Credit Facility provides a source of funds to the Borrowers for temporary and emergency purposes, including the ability to meet future unanticipated or unusually large redemption requests.
Under the terms of the Global Credit Facility, the Funds shall, in addition to interest charged on any borrowings made by the Funds and other costs incurred by the Funds, pay their share of fees and expenses incurred in connection with the implementation and maintenance of the Global Credit Facility, based upon their relative share of the aggregate net assets of all of the Borrowers, including an annual commitment fee of 0.15% based upon the unused portion of the Global Credit Facility. These fees are reflected in other expenses in the Statements of Operations. During the period ended June 30, 2018, the Funds did not use the Global Credit Facility.
9. Redemption In-Kind
During the year ended December 31, 2017, International Equity Series realized $116,160,039 of net gains resulting from a redemption in-kind in which a shareholder redeemed fund shares for cash and securities held by the Fund. Because such gains are not taxable to the Fund, and are not distributed to remaining shareholders, they have been reclassified from accumulated net realized gains to paid-in capital.
10. Fair Value Measurements
The Funds follow a fair value hierarchy that distinguishes between market data obtained from independent sources (observable inputs) and the Funds’ own market assumptions (unobservable inputs). These inputs are used in determining the value of the Funds’ financial instruments and are summarized in the following fair value hierarchy:
| | • | | Level 1 – quoted prices in active markets for identical financial instruments |
| | • | | Level 2 – other significant observable inputs (including quoted prices for similar financial instruments, interest rates, prepayment speed, credit risk, etc.) |
| | • | | Level 3 – significant unobservable inputs (including the Funds’ own assumptions in determining the fair value of financial instruments) |
The input levels are not necessarily an indication of the risk or liquidity associated with financial instruments at that level.
For movements between the levels within the fair value hierarchy, the Funds have adopted a policy of recognizing the transfers as of the date of the underlying event which caused the movement.
A summary of inputs used as of June 30, 2018, in valuing the Funds’ assets carried at fair value, is as follows:
| | | | | | | | | | | | | | | | |
| | | Level 1 | | | Level 2 | | | Level 3 | | | Total | |
| |
| Foreign Smaller Companies Series | | | | | | | | | | | | | | | | |
Assets: | | | | | | | | | | | | | | | | |
Investments in Securities:a | | | | | | | | | | | | | | | | |
Equity Investmentsb | | $ | 947,459,362 | | | $ | — | | | $ | — | | | $ | 947,459,362 | |
Short Term Investments | | | 18,183,968 | | | | 44,900,000 | | | | — | | | | 63,083,968 | |
| | | | |
| | | | |
Total Investments in Securities | | $ | 965,643,330 | | | $ | 44,900,000 | | | $ | — | | | $ | 1,010,543,330 | |
| | | | |
| | | | | | |
| | | |
| ftinstitutional.com | | Semiannual Report | | | 53 | |
TEMPLETON INSTITUTIONAL FUNDS
NOTES TO FINANCIAL STATEMENTS (UNAUDITED)
10. Fair Value Measurements (continued)
| | | | | | | | | | | | | | | | |
| | | Level 1 | | | Level 2 | | | Level 3 | | | Total | |
| |
| Global Equity Series | | | | | | | | | | | | | | | | |
Assets: | | | | | | | | | | | | | | | | |
Investments in Securities:a | | | | | | | | | | | | | | | | |
Equity Investments:b | | | | | | | | | | | | | | | | |
Aerospace & Defense | | $ | 4,994,758 | | | $ | 13,682 | | | $ | — | | | $ | 5,008,440 | |
All Other Equity Investments | | | 282,192,487 | | | | — | | | | — | | | | 282,192,487 | |
Short Term Investments | | | — | | | | 8,700,000 | | | | — | | | | 8,700,000 | |
| | | | |
Total Investments in Securities | | $ | 287,187,245 | | | $ | 8,713,682 | | | $ | — | | | $ | 295,900,927 | |
| | | | |
| International Equity Series | | | | | | | | | | | | | | | | |
Assets: | | | | | | | | | | | | | | | | |
Investments in Securities:a | | | | | | | | | | | | | | | | |
Equity Investments:b | | | | | | | | | | | | | | | | |
Aerospace & Defense | | $ | 88,920,629 | | | $ | 251,988 | | | $ | — | | | $ | 89,172,617 | |
All Other Equity Investments | | | 3,639,962,588 | | | | — | | | | — | | | | 3,639,962,588 | |
Short Term Investments | | | 65,741,417 | | | | — | | | | — | | | | 65,741,417 | |
| | | | |
Total Investments in Securities | | $ | 3,794,624,634 | | | $ | 251,988 | | | $ | — | | | $ | 3,794,876,622 | |
| | | | |
aFor detailed categories, see the accompanying Statement of Investments.
bIncludes common and preferred stocks.
11. Subsequent Events
The Funds have evaluated subsequent events through the issuance of the financial statements and determined that no events have occurred that require disclosure.
Abbreviations
| | | | |
| Selected Portfolio | | |
| | |
ADR | | American Depositary Receipt | | |
FHLB | | Federal Home Loan Bank | | |
IDR | | International Depositary Receipt | | |
NVDR | | Non-Voting Depositary Receipt | | |
| | | | |
| | | |
| 54 | | Semiannual Report | | ftinstitutional.com |
TEMPLETON INSTITUTIONAL FUNDS
Shareholder Information
Board Approval of Investment Management Agreements
TEMPLETON INSTITUTIONAL FUNDS
Foreign Smaller Companies Series
Global Equity Series
International Equity Series
(each a Fund)
At an in-person meeting held on February 27, 2018 (Meeting), the Board of Trustees (Board) of Templeton Institutional Funds (Trust), including a majority of the trustees who are not “interested persons” as defined in the Investment Company Act of 1940 (Independent Trustees), reviewed and approved the continuance of the investment management agreement between Templeton Investment Counsel, LLC (Manager) and the Trust, on behalf of each Fund (each a Management Agreement) for an additional one-year period. The Independent Trustees received advice from and met separately with Independent Trustee counsel in considering whether to approve the continuation of each Management Agreement. Although the Management Agreements for the Funds were considered at the same Board meeting, the Board considered the information provided to it about the Funds together and with respect to each Fund separately as the Board deemed appropriate.
In considering the continuation of each Management Agreement, the Board reviewed and considered information provided by the Manager at the Meeting and throughout the year at meetings of the Board and its committees. The Board also reviewed and considered information provided in response to a detailed set of requests for information submitted to the Manager by Independent Trustee counsel on behalf of the Independent Trustees in connection with the annual contract renewal process. In addition, prior to the Meeting, the Independent Trustees held a telephonic contract renewal meeting at which the Independent Trustees conferred amongst themselves and Independent Trustee counsel about contract renewal matters. The Board reviewed and considered all of the factors it deemed relevant in approving the continuance of each Management Agreement, including, but not limited to: (i) the nature, extent and quality of the services provided by the Manager; (ii) the investment performance of each Fund; (iii) the costs of the services provided and profits realized by the Manager and its affiliates from the relationship with each Fund; (iv) the extent to which economies of scale are realized as each Fund grows; and (v) whether fee levels reflect these economies of scale for the benefit of Fund investors.
In approving the continuance of each Management Agreement, the Board, including a majority of the Independent Trustees, determined that the terms of the Management Agreement are fair and reasonable and that the continuance of such Management Agreement is in the interests of the applicable Fund and its shareholders. While attention was given to all information furnished, the following discusses some primary factors relevant to the Board’s determination.
Nature, Extent and Quality of Services
The Board reviewed and considered information regarding the nature, extent and quality of investment management services provided by the Manager and its affiliates to the Funds and their shareholders. This information included, among other things, the qualifications, background and experience of the senior management and investment personnel of the Manager; the structure of investment personnel compensation; oversight of third-party service providers; investment performance reports and related financial information for each Fund; reports on expenses, shareholder services, marketing support payments made to financial intermediaries and third party servicing arrangements; legal and compliance matters; risk controls; pricing and other services provided by the Manager and its affiliates; and management fees charged by the Manager and its affiliates to U.S. funds and other accounts, including management’s explanation of differences among accounts where relevant. The Board also reviewed and considered an annual report on payments made by Franklin Templeton Investments (FTI) or the Funds to financial intermediaries, as well as a memorandum relating to third-party servicing arrangements in response to a guidance update in 2016 from the U.S. Securities and Exchange Commission (SEC) relating to mutual fund distribution and sub-accounting fees. The Board noted management’s continuing efforts and expenditures in establishing effective business continuity plans and developing strategies to address areas of heightened concern in the mutual fund industry, such as cybersecurity and liquidity risk management. The Board also recognized management’s commitment to facilitating Board oversight of particular areas, including derivatives and payments to intermediaries, by enhanced reporting.
The Board also reviewed and considered the benefits provided to Fund shareholders of investing in a fund that is part of the Franklin Templeton family of funds. The Board noted the financial position of Franklin Resources, Inc. (FRI), the Manager’s parent, and its commitment to the mutual fund business as evidenced by its continued introduction of new funds, reassessment of the fund offerings in response to the
| | | | | | |
| | | |
| ftinstitutional.com | | Semiannual Report | | | 55 | |
TEMPLETON INSTITUTIONAL FUNDS
SHAREHOLDER INFORMATION
market environment and project initiatives and capital investments relating to the services provided to the Funds by the FTI organization.
Following consideration of such information, the Board was satisfied with the nature, extent and quality of services provided by the Manager and its affiliates to the Funds and their shareholders.
Fund Performance
The Board reviewed and considered the performance results of each Fund over various time periods ended December 31, 2017. The Board considered the performance returns for each Fund in comparison to the performance returns of mutual funds deemed comparable to the Fund included in a universe (Performance Universe) selected by Broadridge Financial Solutions, Inc. (Broadridge), an independent provider of investment company data. The Board received a description of the methodology used by Broadridge to select the mutual funds included in a Performance Universe. The Board also reviewed and considered Fund performance reports provided and discussions that occurred with portfolio managers at Board meetings throughout the year. A summary of each Fund’s performance results is below.
Foreign Smaller Companies Series - The Performance Universe for this Fund included the Fund and all retail and institutional international small-/mid-cap growth funds. The Board noted that the Fund’s annualized total return for the one-, three- and five-year periods was below the median of its Performance Universe, but for the 10-year period was above the median of its Performance Universe. The Board also noted management’s explanation that comparing the Fund to the Performance Universe is not an apt comparison as the funds that comprise the Performance Universe can invest in securities of companies with market capitalizations in excess of $10 billion, whereas the Fund is limited to purchasing securities of companies with market capitalizations of $2 billion or less at the time of initial purchase. The Board concluded that the Fund’s performance was acceptable, noting its positive longer-term performance. The Board also noted that the Fund’s annualized total return for the one-year period, while below the median, exceeded 34%. The Board further noted that the Fund is closed to new investors at this time.
Global Equity Series - The Performance Universe for this Fund included the Fund and all retail and institutional global multi-cap value funds. The Board noted that the Fund’s annualized total return for the one- and five-year periods was above the median of its Performance Universe, but for the
three-year period was below the median of its Performance Universe. The Board concluded that the Fund’s performance was satisfactory. In doing so, the Board noted that the Fund’s annualized total return for the one-year period exceeded 20%.
International Equity Series - The Performance Universe for this Fund included the Fund and all retail and institutional international multi-cap value funds. The Board noted that the Fund’s annualized total return for the one-, three- and five-year periods was below the median of its Performance Universe, but for the 10-year period was above the median of its Performance Universe. The Board also noted management’s explanation that security selection detracted from shorter-term performance. The Board concluded that the Fund’s performance was acceptable, noting its positive longer-term performance. The Board also noted that the Fund’s annualized total return for the one-year period was only 7 basis points below the median and exceeded 22%. The Board further noted management’s continued attention to the portfolio management team.
Comparative Fees and Expenses
The Board reviewed and considered information regarding each Fund’s actual total expense ratio and its various components, including, as applicable, management fees; transfer agent expenses; underlying fund expenses; Rule 12b-1 and non-Rule 12b-1 service fees; and other non-management fees. The Board also noted the quarterly and annual reports it receives on all marketing support payments made by FTI to financial intermediaries. The Board considered the actual total expense ratio and, separately, the contractual management fee rate, without the effect of fee waivers (Management Rate), if any, of each Fund in comparison to the median expense ratio and median Management Rate, respectively, of other mutual funds deemed comparable to and with a similar expense structure as the Fund selected by Broadridge (Expense Group). Broadridge fee and expense data is based upon information taken from each fund’s most recent annual report, which reflects historical asset levels that may be quite different from those currently existing, particularly in a period of market volatility. While recognizing such inherent limitation and the fact that expense ratios and Management Rates generally increase as assets decline and decrease as assets grow, the Board believed the independent analysis conducted by Broadridge to be an appropriate measure of comparative fees and expenses. The Broadridge Management Rate includes administrative charges, and the actual total expense ratio, for comparative consistency, was shown for: (i) Primary shares for the International Equity Series and for Institutional Class, Class I and Investor Class shares for certain other funds in the
| | | | |
| | | |
| 56 | | Semiannual Report | | ftinstitutional.com |
TEMPLETON INSTITUTIONAL FUNDS
SHAREHOLDER INFORMATION
Expense Group, (ii) Institutional Class, Class I and Class I2 shares for certain funds in the Foreign Smaller Companies Series Expense Group and (iii) Institutional Class and Class I shares for certain funds in the Global Equity Series Expense Group. The Board received a description of the methodology used by Broadridge to select the mutual funds included in an Expense Group.
Foreign Smaller Companies Series and International Equity Series - The Expense Group for the Foreign Smaller Companies Series included the Fund and 13 other international small-/mid-cap growth funds. The Expense Group for the International Equity Series included the Fund and six other international multi-cap value funds. The Board noted that the Management Rates and actual total expense ratios for the Funds were below the medians of their respective Expense Groups. The Board concluded that the Management Rates charged to these Funds are reasonable.
Global Equity Series - The Expense Group for the Global Equity Series included the Fund and six other global multi-cap value funds. The Board noted that the Management Rate for the Fund was equal to the median of its Expense Group, but its actual total expense ratio was below the median of its Expense Group. The Board concluded that the Management Rate charged to the Fund is reasonable.
Profitability
The Board reviewed and considered information regarding the profits realized by the Manager and its affiliates in connection with the operation of each Fund. In this respect, the Board considered the Fund profitability analysis provided by the Manager that addresses the overall profitability of FTI’s U.S. fund business, as well as its profits in providing investment management and other services to each of the individual funds during the 12-month period ended September 30, 2017, being the most recent fiscal year-end for FRI. The Board noted that although management continually makes refinements to its methodologies used in calculating profitability in response to organizational and product-related changes, the overall methodology has remained consistent with that used in the Funds’ profitability report presentations from prior years. Additionally, PricewaterhouseCoopers LLP, auditor to Franklin Resources, Inc. and certain Franklin Templeton funds, has been engaged by the Manager to periodically review and assess the allocation methodologies to be used solely by the Funds’ Board with respect to the profitability analysis.
The Board noted management’s belief that costs incurred in establishing the infrastructure necessary for the type of mutual
fund operations conducted by the Manager and its affiliates may not be fully reflected in the expenses allocated to each Fund in determining its profitability, as well as the fact that the level of profits, to a certain extent, reflected operational cost savings and efficiencies initiated by management. The Board also noted management’s expenditures in improving shareholder services provided to the Funds, as well as the need to implement systems and meet additional regulatory and compliance requirements resulting from recent SEC and other regulatory requirements.
The Board also considered the extent to which the Manager and its affiliates might derive ancillary benefits from fund operations, including revenues generated from transfer agent services, potential benefits resulting from personnel and systems enhancements necessitated by fund growth, as well as increased leverage with service providers and counterparties. Based upon its consideration of all these factors, the Board concluded that the level of profits realized by the Manager and its affiliates from providing services to each Fund was not excessive in view of the nature, extent and quality of services provided to each Fund.
Economies of Scale
The Board reviewed and considered the extent to which the Manager may realize economies of scale, if any, as each Fund grows larger and whether the Fund’s management fee structure reflects any economies of scale for the benefit of shareholders. With respect to possible economies of scale, the Board noted the existence of management fee breakpoints, which operate generally to share any economies of scale with a Fund’s shareholders by reducing the Fund’s effective management fees as the Fund grows in size. The Board considered the Manager’s view that any analyses of potential economies of scale in managing a particular fund are inherently limited in light of the joint and common costs and investments the Manager incurs across the Franklin Templeton family of funds as a whole. The Board concluded that to the extent economies of scale may be realized by the Manager and its affiliates, each Fund’s management fee structure provided a sharing of benefits with the Fund and its shareholders as the Fund grows.
Conclusion
Based on its review, consideration and evaluation of all factors it believed relevant, including the above-described factors and conclusions, the Board unanimously approved the continuation of each Management Agreement for an additional one-year period.
| | | | | | |
| | | |
| ftinstitutional.com | | Semiannual Report | | | 57 | |
TEMPLETON INSTITUTIONAL FUNDS
SHAREHOLDER INFORMATION
Proxy Voting Policies and Procedures
The Funds’ investment manager has established Proxy Voting Policies and Procedures (Policies) that the Funds use to determine how to vote proxies relating to portfolio securities. Shareholders may view the Funds’ complete Policies online at franklintempleton.com. Alternatively, shareholders may request copies of the Policies free of charge by calling the Proxy Group collect at (954) 527-7678 or by sending a written request to: Franklin Templeton Companies, LLC, 300 S.E. 2nd Street, Fort Lauderdale, FL 33301, Attention: Proxy Group. Copies of the Funds’ proxy voting records are also made available online at franklintempleton.com and posted on the US Securities and Exchange Commission’s website at sec.gov and reflect the most recent 12-month period ended June 30.
Quarterly Statement of Investments
The Trust files a complete statement of investments with the US Securities and Exchange Commission for the first and third quarters for each fiscal year on Form N-Q. Shareholders may view the filed Form N-Q by visiting the Commission’s website at sec.gov. The filed form may also be viewed and copied at the Commission’s Public Reference Room in Washington, DC. Information regarding the operations of the Public Reference Room may be obtained by calling (800) SEC-0330.
| | | | |
| | | |
| 58 | | Semiannual Report | | ftinstitutional.com |
This page intentionally left blank.
This page intentionally left blank.
| | |
| |

| | Semiannual Report |
| | Templeton Institutional Funds |
| | Investment Manager |
| | Templeton Investment Counsel, LLC |
| | Distributor |
| | Franklin Templeton Distributors, Inc. |
| | Shareholder Services |
| | (800) 321-8563 ftinstitutional.com |
Authorized for distribution only when accompanied or preceded by a summary prospectus and/or prospectus. Investors should carefully consider a fund’s investment goals, risks, charges and expenses before investing. A prospectus contains this and other information; please read it carefully before investing.
To help ensure we provide you with quality service, all calls to and from our service areas are monitored and/or recorded.
| | |
| © 2018 Franklin Templeton Investments. All rights reserved. | | ZTIF S 08/18 |
(a) The Registrant has adopted a code of ethics that applies to its principal executive officers and principal financial and accounting officer.
(c) N/A
(d) N/A
(f) Pursuant to Item 12(a)(1), the Registrant is attaching as an exhibit a copy of its code of ethics that applies to its principal executive officers and principal financial and accounting officer.
| Item 3. | Audit Committee Financial Expert. |
(a)(1) The Registrant has an audit committee financial expert serving on its audit committee.
(2) The audit committee financial expert is David W. Niemiec and he is “independent” as defined under the relevant Securities and Exchange Commission Rules and Releases.
| Item 4. | Principal Accountant Fees and Services. N/A |
| Item 5. | Audit Committee of Listed Registrants. N/A |
| Item 6. | Schedule of Investments. N/A |
| Item 7. | Disclosure of Proxy Voting Policies and Procedures for Closed-End Management Investment Companies. N/A |
| Item 8. | Portfolio Managers of Closed-End Management Investment Companies. N/A |
| Item 9. | Purchases of Equity Securities by Closed-End Management Investment Company and Affiliated Purchasers. N/A |
| Item 10. | Submission of Matters to a Vote of Security Holders. |
There have been no changes to the procedures by which shareholders may recommend nominees to the Registrant’s Board of Trustees that would require disclosure herein.
| Item 11. | Controls and Procedures. |
(a) Evaluation of Disclosure Controls and Procedures. The Registrant maintains disclosure controls and procedures that are designed to
ensure that information required to be disclosed in the Registrant’s filings under the Securities Exchange Act of 1934 and the Investment Company Act of 1940, is recorded, processed, summarized and reported within the periods specified in the rules and forms of the Securities and Exchange Commission. Such information is accumulated and communicated to the Registrant’s management, including its principal executive officer and principal financial officer, as appropriate, to allow timely decisions regarding required disclosure. The Registrant’s management, including the principal executive officer and the principal financial officer, recognizes that any set of controls and procedures, no matter how well designed and operated, can provide only reasonable assurance of achieving the desired control objectives.
Within 90 days prior to the filing date of this Shareholder Report on Form N-CSR, the Registrant had carried out an evaluation, under the supervision and with the participation of the Registrant’s management, including the Registrant’s principal executive officer and the Registrant’s principal financial officer, of the effectiveness of the design and operation of the Registrant’s disclosure controls and procedures. Based on such evaluation, the Registrant’s principal executive officer and principal financial officer concluded that the Registrant’s disclosure controls and procedures are effective.
(b) Changes in Internal Controls. There have been no changes in the Registrant’s internal controls or in other factors that could materially affect the internal controls over financial reporting subsequent to the date of their evaluation in connection with the preparation of this Shareholder Report on Form N-CSR.
| Item 12. | Disclosure of Securities Lending Activities for Closed-End Management Investment Company. N/A |
(a)(1) Code of Ethics
(a)(2) Certifications pursuant to Section 302 of the Sarbanes-Oxley Act of 2002 of Matthew T. Hinkle, Chief Executive Officer - Finance and Administration, and Robert G. Kubilis, Chief Financial Officer and Chief Accounting Officer
(b) Certifications pursuant to Section 906 of the Sarbanes-Oxley Act of 2002 of Matthew T. Hinkle, Chief Executive Officer - Finance and Administration, and Robert G. Kubilis, Chief Financial Officer and Chief Accounting Officer
SIGNATURES
Pursuant to the requirements of the Securities Exchange Act of 1934 and the Investment Company Act of 1940, the registrant has duly caused this report to be signed on its behalf by the undersigned, thereunto duly authorized.
| | |
| TEMPLETON INSTITUTIONAL FUNDS |
| |
| By | | /s/ MATTHEW T. HINKLE |
| | Matthew T. Hinkle |
| | Chief Executive Officer – |
| | Finance and Administration |
| Date | | August 24, 2018 |
Pursuant to the requirements of the Securities Exchange Act of 1934 and the Investment Company Act of 1940, this report has been signed below by the following persons on behalf of the registrant and in the capacities and on the dates indicated.
| | |
| By | | /s/ MATTHEW T. HINKLE |
| | Matthew T. Hinkle |
| | Chief Executive Officer – |
| | Finance and Administration |
| Date | | August 24, 2018 |
| | |
| By | | /s/ ROBERT G. KUBILIS |
| | Robert G. Kubilis |
| | Chief Financial Officer and |
| | Chief Accounting Officer |
| Date | | August 24, 2018 |