UNITED STATES
SECURITIES AND EXCHANGE COMMISSION
Washington, D.C. 20549
FORM N-CSR
CERTIFIED SHAREHOLDER REPORT OF REGISTERED
MANAGEMENT INVESTMENT COMPANIES
Investment Company Act File number: 811-06136
HOMESTEAD FUNDS, INC.
��
(Exact name of registrant as specified in charter)
4301 Wilson Boulevard
Arlington, VA 22203
(Address of principal executive office – Zip code)
Kelly Whetstone, Esq.
Homestead Funds, Inc.
4301 Wilson Boulevard
Arlington, VA 22203
(Name and address of agent for service)
Copies to:
Bibb L. Strench, Esq.
Seward & Kissel LLP
901 K Street, NW
Washington, DC 20001
(Name and addresses of agent for service)
Registrant’s telephone number, including area code: (703) 907-5953
Date of fiscal year end: December 31
Date of reporting period: June 30, 2015
Item 1. Reports to Stockholders.

Semi-Annual Report
June 30, 2015
Our Funds
Daily Income Fund (HDIXX)
Short-Term Government Securities Fund (HOSGX)
Short-Term Bond Fund (HOSBX)
Stock Index Fund (HSTIX)
Value Fund (HOVLX)
Growth Fund (HNASX)
Small-Company Stock Fund (HSCSX)
International Value Fund (HISIX)

Table of Contents
The investment commentaries on the following pages were prepared for each fund by its portfolio manager(s). The views expressed are those of the portfolio manager(s) for each fund as of June 30, 2015; since that date, those views might have changed. The opinions stated might contain forward-looking statements and discuss the impact of domestic and foreign markets, industry and economic trends, and governmental regulations on the funds and their holdings. Such statements are subject to uncertainty, and the impact on the funds might be materially different from what is described here.
Past performance does not guarantee future results.
Investments in fixed-income funds are subject to interest rate, credit and inflation risk. Equity funds, in general, are subject to style risk, the chance that returns on stocks within the style category in which the fund invests will trail returns of stocks representing other style categories or the market overall.

Homestead Funds
2015 Semi-Annual Report
August 19, 2015
Dear Shareholders:
As Homestead Funds approaches the anniversary of its 25th year in business, I want to say how pleased I am to be part of an organization helping to fulfill NRECA’s mission of service to the cooperative community. The vision that inspired the launch of the fund company—to deliver top-notch and affordable money management services to the employees of NRECA member systems and their families—is a core focus of our business objectives and strategic planning decisions today.
Since joining the firm in January of this year, I have had the opportunity to hear from a number of our customers and get a better sense of their needs and what we can do to align our business to best meet them. Company management has also engaged with your board of directors on a number of changes that we believe to be in the best interests of shareholders.
Following management’s recommendation, Homestead Funds’ board of directors recently approved a change to the Daily Income Fund that was described in a supplement to the prospectus. As explained, on or before October 14, 2016, the fund will become a government money market fund and assets will be invested almost entirely in government securities, rather than a mix of government securities, commercial paper and short-term corporate securities, as is the case now.
This transition means that we will not have to impose the liquidity fees or redemption gates that were part of the Securities and Exchange Commission’s new rules governing money market funds. Further, we can preserve the fund’s stable net asset value. The Daily Income Fund is now and will continue to be managed to maintain a constant $1.00 share price. Shareholders with check-writing privileges will continue be able to redeem shares by check.
The board of directors, also based on a recommendation from company management, voted to terminate the contract of the sub-advisor to the International Value Fund. RE Advisers and the board of directors regularly review sub-advisory contracts, evaluating performance, fees and services. Management and the board believe shareholder interests are best served by the change and are actively engaged in the search for a new sub-advisor.
Both of these changes are described in more detail in the prospectus, which is available on the Homestead Funds’ website.
As we chart a course for the company’s next quarter century of growth, RE Advisers will continue to focus on stewardship, working with your board of directors to provide attractive investment options that seek to deliver competitive long-term performance for a prudent level of risk and at a reasonable cost.
I hope you will take a few minutes to read how your portfolio managers directed fund assets in the first half of 2015, the performance results and their outlook for the coming months.
Sincerely,

Stephen Kaszynski, CFA
Director, President and CEO
Homestead Funds and RE Advisers

Stephen Kaszynski, CFA
Director, President and CEO
An investment in the Daily Income Fund is not insured or guaranteed by the Federal Deposit Insurance Corporation (FDIC) or any other government agency. While this fund seeks to preserve the value of your investment at $1.00 per share, it is possible to lose money by investing in this fund.
Daily Income Fund
Performance Evaluation | Prepared by the Fund’s Investment Advisor, RE Advisers Corporation
Fund Performance
The Daily Income Fund earned a total return of 0.01 percent for the first half of 2015. The seven-day current annualized yield was 0.01 percent on June 30, 2015, unchanged from the end of 2014. Interest income for the fund is netted against operating expenses. With interest income at historic lows, RE Advisers continues to waive fees and/or reimburse expenses to assist the fund in maintaining a positive yield. As long as the Federal Reserve (the Fed) continues to maintain a federal funds rate close to zero, the Daily Income Fund will continue to earn very little interest income, which is the only component of return in a money market fund.
Market Conditions
The U.S. economy regained its footing in the later part of the first half of 2015 and looks to be on more solid ground as we enter the second half of the year. An unusually tough winter for much of the country was said to be the major cause for an unexpected decline in gross domestic product (GDP) of 0.2 percent in the first quarter of 2015. However, as was the case with 2014, a negative GDP in the first quarter was then followed by a second quarter of much greater strength. At this time, the general consensus among economists is that GDP rose at an annual rate of 2.8 percent in the second quarter of 2015.
The Fed, under the leadership of Chairwoman Janet Yellen, continued its policy of maintaining historically low short-term interest rates—a policy that was initially established in December 2008. The Fed’s policy is designed to accomplish its dual mandate of fostering maximum employment and price stability. The Federal Open Market Committee (FOMC, the Fed’s policy making body) has not revised its target for the federal funds rate—still set at 0.00 percent to 0.25 percent—since this policy was established.
An analysis of the data by the Fed suggests a moderately expanding economy, improved labor market, growth in household spending and a stronger housing sector. However, business fixed investment and net exports remained relatively soft. In addition, inflation remained below the FOMC’s long-term objective of 2 percent. This partly reflects earlier declines in energy prices and decreasing prices of non-energy imports. Therefore, with an official unemployment rate under 6 percent, an economy growing between 2 percent and 4 percent, improved labor markets (where weekly initial jobless claims remained under 300,000) and an improving housing sector, a rise in interest rates to more normalized levels should be expected this year. As far as timing, Fed policy makers have said repeatedly that they will be both patient and data driven in their efforts to normalize monetary policy.
| | |
| Investment Advisor: RE Advisers |
| |
 | | Marc Johnston, CFP, ChFC, CAIA Money Market Portfolio Manager BA, General Arts, Villanova University; MBA, Northeastern University |
| |
| | |
Outlook
Barring any unusual events that interrupt economic growth or roil global political stability, 2015 may be the year in which the Fed finally thinks conditions are right to support a normalization of interest rates. In such an environment, short-term, risk-free rates should approximate the rate of inflation, and longer term rates should reflect a term premium.
In closing, we’d like to remind shareholders about some recently announced fund changes. On June 17, 2015, in response to the Securities and Exchange Commission’s adoption of the final amendments to Rule 2a-7 of the Investment Company Act of 1940, which governs money market funds, Homestead Funds’ board of directors, after carefully reviewing the money market funds options available, unanimously approved the conversion of the Daily Income Fund to a government money market fund. Accordingly, the fund, on or before October 14, 2016, will change its principal investment strategy to invest at least 99.5% of its total assets in U.S. government securities, repurchase agreements fully collateralized by U.S. government securities and cash.
The Rule also requires that the board of directors consider whether the imposition of liquidity fees on redemptions and/or redemption gates (fees and gates) in the event the fund’s liquid weekly assets were to fall below a designated threshold are in the best interest of the fund. Liquidity fees and redemption gates are optional for government money market funds. The board determined that fees and gates were not in the best interest of the fund, and as such, no fees and gates will be applied to the fund.
The fund’s name and fundamental investment objective of earning current income and maintaining a stable net asset value of $1.00 per share will not change.
Daily Income Fund
| | | | | | | | | | | | |
| Average Annual Total Returns (periods ended 06/30/15) | | | | | | | | | |
| | | |
| | | 1 YR % | | | 5 YR % | | | 10 YR % | |
Daily Income Fund | | | 0.01 | | | | 0.01 | | | | 1.28 | |
| | | | |
| Yield | | | |
Annualized 7-day current yield quoted 06/30/15 | | | 0.01% | |
| | | | | | | | |
| Security Diversification | | | |
| |
| | | % of Total Investments | |
| | | as of 12/31/14 | | | as of 06/30/15 | |
Commercial paper | | | 71.7 | | | | 62.7 | |
U.S. Government obligations | | | 17.8 | | | | 20.5 | |
Corporate bonds | | | 0.9 | | | | 7.0 | |
Short-term and other assets | | | 9.6 | | | | 9.8 | |
Total | | | 100.0% | | | | 100.0% | |
| | | | | | | | |
| Maturity | | | | | | |
| | |
| | | as of 12/31/14 | | | as of 06/30/15 | |
Average Weighted Maturity | | | 42 days | | | | 50 days | |
The returns quoted in the above table represent past performance, which is no guarantee of future results. Current performance may be higher or lower than that shown above. Returns and the principal value of your investment may be worth more or less than its original cost. An investment in the Daily Income Fund is not insured or guaranteed by the Federal Deposit Insurance Corporation (FDIC) or any other government agency. While the Daily Income Fund seeks to maintain a constant $1.00 per share price, it is possible to lose money investing in the fund. The Daily Income Fund’s average annual total returns are net of any fee waivers and reimbursements. Returns do no reflect taxes that the shareholder may pay on fund distributions or the redemption of fund shares.
Short-Term Government Securities
and Short-Term Bond Funds
Performance Evaluation | Prepared by the Funds’ Investment Advisor, RE Advisers Corporation
Fund Performance
The Short-Term Government Securities Fund had a total return of 0.68 percent for the first half of 2015, trailing its benchmark’s return of 0.94 percent. While all of the fund’s sectors generated positive returns, the corporate sector was the standout performer as the various financing issues guaranteed by the Export-Import Bank benefitted from a relatively stable yield curve and robust demand for higher yielding government guaranteed paper. The U.S. government and agency obligations sector also benefitted from the same factors. The fund’s cash position was the largest relative drag on performance.
Positions were added in the corporate sector, utilizing FDIC-guaranteed certificates of deposit and Export-Import Bank guaranteed issues. We also added to positions in the government and agency sector using U.S. Treasuries and issuance from the U.S. Department of Housing and Urban Development. There were no additional investments into the mortgage-backed, asset-backed or municipal sectors.
The Short-Term Bond Fund had a total of return of 0.31 percent for the first half of 2015, trailing its benchmark’s return of 1.01 percent. While all but one of the fund’s sectors generated positive returns, the U.S. government and agency sector was the standout performer. The municipal sector was an drag on performance as debt obligations of the Puerto Rico Sales Tax Financing Corporation accounted for nearly two-thirds of the sector underperformance (see note below).
Positions were added in all sectors with the exception of mortgages. In general, yield spreads widened modestly during the period.
A Note about the Fund’s Puerto Rico Holdings: With the exception of the sales tax bonds, 100 percent of the remaining Puerto Rico positions are insured by strongly capitalized financial entities, with ratings recently affirmed by Standard & Poor’s of at least AA-. At the July 13, 2015 bondholder meeting hosted by the Puerto Rico Government Development Bank, it was made clear in the Q&A that not all Puerto Rico debt obligations are “unpayable”. The sales tax bonds are special revenue bonds that are serviced by a pledged percentage of the Commonwealth’s sales tax receipts, with a collection mechanism that segregates those monies from the General Fund. There is a non-impairment covenant by the Commonwealth and multiple legal opinions that the pledged sales tax revenues are not available to its General Fund.
Market Conditions
As we entered 2015, market participants’ discussions continued to revolve around Federal Reserve monetary policy, with the question becoming, not “will they hike” but “when will they hike.” The fervent prognostication ended with a thud at midyear given worries about the rapid meltdown in Chinese equities, the potential for Greece not reaching a deal with its European creditors and being forced out of the Euro, and the Governor of Puerto Rico stating that the Commonwealth’s debts are “unpayable” and must be restructured. While Treasury yields inside of five years were sharply lower in January (compared with year-end levels) due to the plunge in crude oil prices and slowdown in economic activity, by June yields were sharply higher as the economic slump (which was at least in part weather related) ended, crude oil prices rebounded and eurozone economic activity at the margin was stronger than expected; therefore, the discussion shifted to domestic monetary policy revolving around the initial “lift-off” date for the Fed’s first rate hike since 2006. By the end of June, rates had declined to levels modestly below year-end 2014 levels on the aforementioned market worries.
While Chinese GDP has risen 7 percent through the fiscal year that ended March 31, 2015, its stock market, as measured by the Shanghai Stock Exchange Composite Index, dropped 17 percent from its recent peak in June through month-end and an astonishing 32 percent through July 9, 2015, stoking fears about an imminent economic slowdown. Greece has failed to win a financing package and risks a total economic and financial collapse as the Greek government and people have rejected further austerity as a condition to additional bailout funding, which so far has resulted in a growing shortage of goods and bank lines at ATMs to retrieve what little cash is left. The economic damage appears to be contained to Greece itself, but the markets are still wary. While the Puerto Rico situation is obviously of importance to holders of Puerto Rican debt issues, the damage has seemingly not spread to the rest of the municipal market.
Domestic GDP declined 0.2 percent in the first quarter yet rose a respectable 2.9 percent for the year ended March 31, 2015, as compared with 1.9 percent for the same period in 2014. West Texas crude oil, which ended the year just above $53 per barrel, averaged over $56 per barrel for the first half of 2015 and ended the quarter at over $59 but now sits little changed for the year as the Chinese market meltdown hit the broad commodities markets hard. The June unemployment rate stands at 5.3 percent versus 5.6 percent at year-end, while the broader U-6 unemployment rate fell to 10.5 percent from 11.2 percent during the same time period. So far in 2015, monthly job gains have averaged 208,000 per month, somewhat lower than the 239,000 during last year’s same time period. The Consumer Price Index (CPI) was flat for the fiscal year that ended May 31, 2015, due primarily to the plunge in oil. This is compared with a 2.1 percent rise for the same period in 2014. Core CPI (excludes food and energy) rose 1.7 percent for the same time period in 2015 versus 2.0 percent in 2014.
Performance Evaluation | Prepared by the Funds’ Investment Advisor, RE Advisers Corporation (Continued)
The ISM Manufacturing Index averaged 52.6 in the first half of 2015 as compared with 54.5 in 2014’s first half. Industrial production rose a modest 1.4 percent for the fiscal year that ended May 31, 2015, compared with 4.3 percent one year earlier. U.S. auto sales continue to be strong, averaging 16.8 million in annual sales compared with 16.1 million in the previous year period. Total retail sales for the fiscal year that ended May 31, 2015, rose 2.7 percent as compared with 4.3 percent in the previous time period. Housing starts have averaged 1.04 million at an annual rate so far in 2015, modestly higher than the .97 million in 2014. Existing home sales are averaging 5.07 million so far this year versus 4.76 million a year ago. The University of Michigan Consumer sentiment for the first half of 2015 averaged 94.9, significantly stronger than the 81.9 reading a year earlier.
The Federal Open Market Committee (the Fed’s policymaking body) continues to maintain a federal funds target in a range of 0.00 percent to 0.25 percent. At the June FOMC meeting, officials “…saw economic conditions as continuing to approach those consistent with warranting a start…” to interest rate increases at some point. The FOMC indicated it was likely to raise rates twice in 2015, assuming economic conditions continue to improve with additional employment gains and progress toward their 2 percent inflation goal. The FOMC also mentioned risks revolving around both China and Greece, and both situations have, in general, deteriorated further since the meeting. In a July 10, 2015, speech Fed Chairperson Janet Yellen reiterated the June FOMC view that the Fed is on track to raise interest rates later this year but remains cautious over various headwinds such as weak wage growth, the low labor participation rate and lack of a strong business capital spending cycle. She added that it would be wrong for the markets to overemphasize the Fed’s first rate hike, since rate increases are likely to be gradual going forward, suggesting that interest rates will stay at low levels for some time.
Outlook
Over the weekend of July 11, 2015, Greece capitulated to its European creditors’ demands for immediate action to qualify for up to €86 billion of aid, the amount needed to avoid a chaotic exit from the euro. Given that this deal is worse than the one the Greek citizenry voted down in a referendum held July 5, 2015, average citizens will understandably not feel very enthusiastic about their and their country’s plight.
As this is being written, world equity markets are giving a big thumbs up to improved sentiment regarding China. The previously mentioned Shanghai Index is up 7 percent off of its July 9 bottom and the flight to safety into U.S. Treasuries has dissipated somewhat. Assuming that the Greek deal gets done and Chinese worries continue to fade, we expect Federal Reserve monetary policy will again move to center stage.
It is clear that the Fed wants to move short-term interest rates away from emergency levels to a range that is still very
| | |
| Investment Advisor: RE Advisers |
| |
 | | Doug Kern, CFA Senior Fixed Income Portfolio Manager BS, Business Administration; MBA Finance, Pennsylvania State University |
| |
| | |
accommodative, but policymakers are having a hard time thinking through the increased market volatility that will almost certainly accompany the initial hike. Given the length of the time rates have spent close to 0.00 percent, the Fed is likely to communicate its intentions as never before. The good news for the Fed is that its “dot plot” (a chart showing each committee member’s projection for the federal funds rate at various different future dates) has, in general, moved closer to the market’s consensus view. This alignment of expectations should help to limit volatility somewhat. It may be that the initial hike will be the most problematic for the market; the worse the reaction, the less tightening the Fed may ultimately end up doing.
We believe that the first rate hike is likely to be in September or possibly October of this year, while the market’s best guess is December. We doubt the first hike would come in December because 1) the psychological damage before the Christmas holiday could dampen holiday spending and 2) it could have a possible negative effect on year-end bank funding. In a best-case scenario, the markets are looking at early 2016. Until the road map is clearer, we will continue to maintain both funds’ durations well below their respective benchmarks.
Short-Term Government Securities Fund
| | | | | | | | | | | | |
| Average Annual Total Returns (periods ended 06/30/15) | | | | | | | | | |
| | | |
| | | 1 YR % | | | 5 YR % | | | 10 YR % | |
Short-Term Government Securities Fund | | | 0.97 | | | | 1.06 | | | | 2.48 | |
BofA Merrill Lynch 1-5 Year U.S. Treasury Index | | | 1.38 | | | | 1.37 | | | | 3.08 | |
| | | | | | | | |
| Security Diversification | | | | | | |
| |
| | | % of Total Investments | |
| | | as of 12/31/14 | | | as of 06/30/15 | |
Government-guaranteed agencies | | | 52.9 | | | | 39.6 | |
Corporate bonds | | | 18.7 | | | | 21.0 | |
U.S. Treasuries | | | 13.1 | | | | 18.0 | |
Mortgage-backed securities | | | 4.6 | | | | 4.0 | |
Municipal bonds | | | 4.4 | | | | 2.9 | |
Asset-backed securities | | | 0.4 | | | | 0.3 | |
Short-term and other assets | | | 5.9 | | | | 14.2 | |
Total | | | 100.0% | | | | 100.0% | |
| | | | | | | | |
| Maturity | | | | | | |
| | |
| | | as of 12/31/14 | | | as of 06/30/15 | |
Average Weighted Maturity | | | 2.09 | | | | 2.16 | |
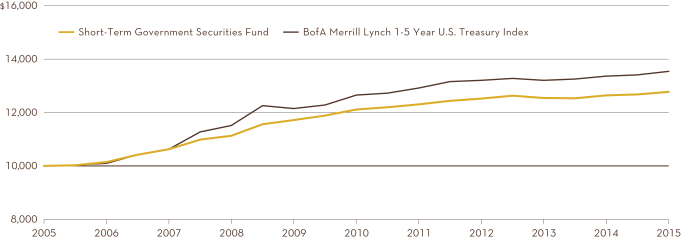
Comparison of the change in value of a $10,000 investment in the fund and the BofA Merrill Lynch 1-5 Year U.S. Treasury Index made on June 30, 2005.
The returns quoted in the above table and chart represent past performance, which is no guarantee of future results. Current performance may be higher or lower than that shown above. Returns and the principal value of your investment will fluctuate such that shares, when redeemed, may be worth more or less than their original cost. The Short-Term Government Securities Fund’s average annual total returns are net of any fee waivers and reimbursements. Returns do not reflect taxes that the shareholder may pay on fund distributions or the redemption of fund shares.
Short-Term Bond Fund
| | | | | | | | | | | | |
| Average Annual Total Returns (periods ended 06/30/15) | | | | | | | | | |
| | | |
| | | 1 YR % | | | 5 YR % | | | 10 YR % | |
Short-Term Bond Fund | | | 0.61 | | | | 2.35 | | | | 3.75 | |
BofA Merrill Lynch 1-5 Year Corp./Gov. Index | | | 1.34 | | | | 1.91 | | | | 3.39 | |
| | | | | | | | |
| Security Diversification | | | |
| |
| | | % of Total Investments | |
| | | as of 12/31/14 | | | as of 06/30/15 | |
Corporate bonds | | | 25.9 | | | | 30.3 | |
Asset-backed securities | | | 24.8 | | | | 24.8 | |
Municipal bonds | | | 24.8 | | | | 22.7 | |
Yankee bonds | | | 9.1 | | | | 9.9 | |
U.S. Government obligations | | | 7.9 | | | | 6.5 | |
Mortgage-backed securities | | | 3.7 | | | | 3.4 | |
Short-term and other assets | | | 3.8 | | | | 2.4 | |
Total | | | 100.0% | | | | 100.0% | |
| | | | | | | | |
| Maturity | | | | | | |
| | |
| | | as of 12/31/14 | | | as of 06/30/15 | |
Average Weighted Maturity | | | 2.37 | | | | 2.28 | |

Comparison of the change in value of a $10,000 investment in the fund and the BofA Merrill Lynch 1-5 Year Corp./Gov. Index made on June 30, 2005.
The returns quoted in the above table and chart represent past performance, which is no guarantee of future results. Current performance may be higher or lower than that shown above. Returns and the principal value of your investment will fluctuate such that shares, when redeemed, may be worth more or less than their original cost. The Short-Term Bond Fund’s average annual total returns are net of any fee waivers and reimbursements. Returns do not reflect taxes that the shareholder may pay on fund distributions or the redemption of fund shares.
Stock Index Fund
Performance Evaluation | Prepared by the Fund’s Investment Advisor, BlackRock Fund Advisors
Index and Fund Performance
For the six months ended June 30, 2015, the U.S. large cap market metric and the Stock Index Fund’s benchmark, the Standard & Poor’s (S&P) 500 Index, advanced 1.23 percent, compared to the fund’s return of 0.91 percent. The S&P 500 Index is a market capitalization-weighted index composed of 500 common stocks issued by large-capitalization companies in a wide range of industries. The stocks included in this index collectively represent a substantial portion of all common stocks publicly traded in the United States.
From a sector perspective, health care stocks (+9.56 percent) generated the strongest returns in the S&P 500 Index, followed by consumer discretionary (+6.81 percent) and telecommunication services (+3.19 percent). Information technology (+0.72 percent) and materials (+0.50 percent) posted slight gains for the first half of the year. Conversely, financials (-0.33 percent) and consumer staples (-0.77 percent) edged down. Negative results came from the industrials (-3.06 percent) and energy (-4.68 percent) sectors. Utilities stocks (-10.67 percent) were the worst performers in the index.
During the six-month period, as changes were made to the composition of the S&P 500 Index, the Master Portfolio in which the fund invests purchased and sold securities to maintain its objective of replicating the risks and return of the benchmark index.
Market Conditions
The year started with U.S. stock prices falling as lower oil prices punished the energy sector and the negative impact of a stronger dollar began to show in the earnings of large global exporting companies. High valuations in U.S. stocks drove equity investors toward more appealing opportunities overseas. U.S. stocks rebounded in February thanks to increased merger and acquisition activity and strong earnings reports from cyclical technology companies. However, stock prices came under pressure again in March as an improving labor market furthered the appreciation of the U.S. dollar and raised investors’ focus on the timing of an expected Federal Reserve move toward tightening policy. U.S. equities came back into favor in April, after a powerful rally in European equities left valuations in the United States looking more appealing by comparison. U.S. stocks continued to outperform international markets in the following months as increasing turmoil around Greece’s debt troubles drove investors to the relative stability of U.S. markets.
A clear sign of strength has yet to emerge from the blurry U.S. economic picture, as uptrends in the housing and labor markets stand in contrast with consumer caution and productivity languor. This economic unevenness together with still quiescent inflation has kept the Federal Reserve tentative on when to start raising short-term interest rates. However, hiring strength and a modest but concrete pickup in wage growth point to a possible acceleration in the second half of 2015. More investors are now penciling in an autumn rate hike—a significant event that could push market volatility beyond the unusually low levels of the past few years, but we think most of the ups and downs will be short-lived for stocks.
Stock Index Fund
| | | | | | | | | | | | |
| Average Annual Total Returns (periods ended 06/30/15) | | | | | | | | | |
| | | |
| | | 1 YR % | | | 5 YR % | | | 10 YR % | |
Stock Index Fund | | | 6.87 | | | | 16.70 | | | | 7.29 | |
Standard & Poor’s 500 Stock Index | | | 7.42 | | | | 17.34 | | | | 7.89 | |
| | | | |
| Industry Diversification* | | | |
| |
| | | % of Total Long Term Investments
as of 06/30/15 | |
Information technology | | | 19.6 | |
Financials | | | 16.6 | |
Health Care | | | 15.4 | |
Consumer discretionary | | | 12.8 | |
Industrials | | | 10.1 | |
Consumer staples | | | 9.4 | |
Energy | | | 7.8 | |
Materials | | | 3.2 | |
Utilities | | | 2.8 | |
Telecommunication services | | | 2.3 | |
Total | | | 100.0% | |
| | | | |
| Top Ten Equity Holdings* | | | |
| |
| | | % of Total Long Term Investments
as of 06/30/15 | |
Apple, Inc. | | | 4.0 | |
Microsoft Corp. | | | 2.0 | |
Exxon Mobil Corp. | | | 1.9 | |
Johnson & Johnson | | | 1.5 | |
General Electric Co. | | | 1.5 | |
Wells Fargo & Co. | | | 1.4 | |
JPMorgan Chase & Co. | | | 1.4 | |
Berkshire Hathaway, Inc. | | | 1.4 | |
Procter & Gamble Co. | | | 1.2 | |
Pfizer, Inc. | | | 1.1 | |
Total | | | 17.4% | |

Comparison of the change in value of a $10,000 investment in the fund and the Standard & Poor’s 500 Stock Index made on June 30, 2005.
The returns quoted in the above table and chart represent past performance, which is no guarantee of future results. Current performance may be higher or lower than that shown above. Returns and the principal value of your investment will fluctuate such that shares, when redeemed, may be worth more or less than their original cost. The Stock Index Fund’s average annual total returns are net of any fee waivers and reimbursements. Returns do not reflect taxes that the shareholder may pay on fund distributions or the redemption of fund shares.
| * | Industry diversification and top holdings information is for the S&P 500 Index Master Portfolio, managed by BlackRock Fund Advisors, the portfolio in which the Stock Index Fund invests all of its investable assets. Please refer to the Appendix for the complete annual report of the S&P 500 Index Master Portfolio. |
Value Fund
Performance Evaluation | Prepared by the Fund’s Investment Advisor, RE Advisers Corporation
Fund Performance
The Value Fund decreased -0.21 percent for the first half of 2015, and its benchmark index, the unmanaged S&P 500 Index, increased 1.23 percent. The fund’s lower-than-index results were due primarily to the results in its consumer discretionary, information technology and industrials sector holdings.
Results in the consumer discretionary positions detracted from relative results, with Genuine Parts Company and Dillard’s being the notable laggards. These two stocks did very well in 2014 as investors expected better results from lower oil prices. This reversed itself somewhat in the first half of 2015.
The fund’s information technology holdings did not fare well compared with the index in the first half of 2015. The fund was underweight in the information technology sector, and the fund’s sector holdings depreciated while the index’s sector position recorded a slight increase. Within information technology, Intel Corporation, Hewlett-Packard and Cisco Systems were the stocks that detracted the most from relative results.
The fund’s industrials results were below those of the sector and the overall index. The bulk of the poor results were due to the depreciation in the stock of Southwest Airlines Co. and Parker-Hannifin Corp. The impact of falling oil prices benefited Southwest’s stock price in the second half of 2014, while the rebound of oil prices in the first half of 2015 had a negative impact on the stock.
The performance of the fund’s health care positions made the greatest positive contribution to first-half results. These stocks as a group generated a return above the sector and the overall index. The announced acquisition of Hospira by Pfizer—both companies are represented in the fund’s portfolio—was also positive for performance as share prices for both companies moved higher on the news. The proposed merger is expected to close by the end of 2015. Also, Bristol-Meyers Squibb received a second-use FDA approval for its immuno-oncology compound Opdivo two and a half months after its first-use approval, and this development was positively received by investors.
The materials sector recovered from a weak second half 2014, led by Avery Dennison and Dow Chemical. The fund’s materials stocks collectively outpaced the sector and the overall index results.
The fund’s consumer staples positions fared well against the sector and well above that of the overall index. The index’s consumer staples sector decreased slightly during the first half of the year, while the fund’s Consumer Discretionary positions increased 8 percent. WhiteWave Foods and J.M. Smuckers led this sector’s results.
A new name added to the fund during the first half of the year was American International Group. American International Group provides property/casualty insurance, life insurance and retirement services in both domestic and international markets.
Outlook
U.S. GDP is projected to exceed 3 percent growth in the second half of 2015. Another factor supportive of economic growth is that the impact of lower oil prices has yet to fully play out.
| | |
| Investment Advisor: RE Advisers |
| |

| | Mark Ashton, CFA Senior Equity Portfolio Manager BS, Finance, University of Utah; MBA, Marketing Research, University of Southern California |
| |

| | Prabha Carpenter, CFA Senior Equity Portfolio Manager BA, Economics, University of Madras; MBA with distinction in Finance and BS in Business Economics, The American University |
| |

| | Gregory Halter, CFA Senior Equity Portfolio Manager BBA, Finance, Cleveland State University |
The U. S. economy has shown positive indications in employment, housing and manufacturing. Energy companies and related industries are working through the effects of lower oil and gas prices. However, there will be changes in the economy as all businesses and the global economy adjust to the United States’ incrementally declining dependence upon imported oil.
Recent Fed commentary about increasing interest rates indicates that action may happen in September. However, any interest rate increases will depend on the strength of the economy in the second half of the 2015. Historically, rising interest rates early in an economic expansion—as long as they are not extreme—have been positive for equities as an indication of an improving business environment. We would expect past experience would continue this next time around.
The markets have gone through an extended period where company managements have returned capital to shareholders via share repurchases and increased dividends. Some of this has come as the result of “activist” shareholders. We have also seen an increase in mergers and acquisitions. Perhaps this reflects company managements’ decisions to deploy capital in a slightly more aggressive manner or an expectation of rising borrowing costs in the near future.
We continue to search for companies with attractive prospects, strong financials and reasonable valuations.
| | | | |
| 10 | | Performance Evaluation | | |
Value Fund
| | | | | | | | | | | | |
| Average Annual Total Returns (periods ended 06/30/15) | | | | | | | | | |
| | | |
| | | 1 YR % | | | 5 YR % | | | 10 YR % | |
Value Fund | | | 4.73 | | | | 16.34 | | | | 7.76 | |
Standard & Poor’s 500 Stock Index | | | 7.42 | | | | 17.34 | | | | 7.89 | |
| | | | |
| Industry Diversification | | | |
| |
| | | % of Total Investments
as of 06/30/15 | |
Health care | | | 22.9 | |
Industrials | | | 16.0 | |
Energy | | | 14.7 | |
Information technology | | | 13.6 | |
Financials | | | 11.4 | |
Materials | | | 9.4 | |
Consumer discretionary | | | 6.7 | |
Consumer staples | | | 2.9 | |
Utilities | | | 0.4 | |
Short-term and other assets | | | 2.0 | |
Total | | | 100.0% | |
| | | | |
| Top Ten Equity Holdings | | | |
| |
| | | % of Total Investments
as of 06/30/15 | |
Bristol-Myers Squibb Co. | | | 5.2 | |
Pfizer, Inc. | | | 4.0 | |
Cisco Systems, Inc. | | | 4.0 | |
Dow Chemical Co. (The) | | | 3.9 | |
General Electric Co. | | | 3.9 | |
Intel Corp. | | | 3.9 | |
JPMorgan Chase & Co. | | | 3.8 | |
Hospira, Inc. | | | 3.6 | |
Avery Dennison Corp. | | | 3.4 | |
Honeywell International Inc. | | | 3.1 | |
Total | | | 38.8% | |
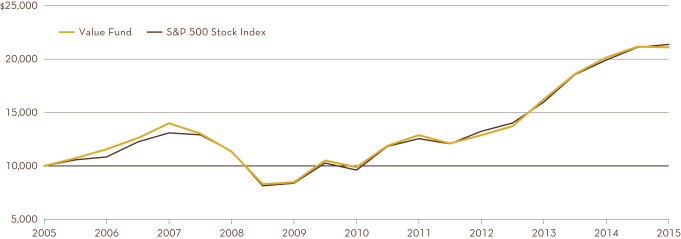
Comparison of the change in value of a $10,000 investment in the fund and the Standard & Poor’s 500 Stock Index made on June 30, 2005.
The returns quoted in the above table and chart represent past performance, which is no guarantee of future results. Current performance may be higher or lower than that shown above. Returns and the principal value of your investment will fluctuate such that shares, when redeemed, may be worth more or less than their original cost. The Value Fund’s average annual total returns are net of any fee waivers and reimbursements. Returns do not reflect taxes that the shareholder may pay on fund distributions or the redemption of fund shares.
| | | | | | |
| | Performance Evaluation | | | 11 | |
Growth Fund
Performance Evaluation | Prepared by the Fund’s Subadvisor, T. Rowe Price Associates
Fund Performance
The Growth Fund returned 5.93 percent for the first half of 2015 and outperformed the Russell 1000 Growth Index, which returned 3.96 percent. Stock selection, especially in health care and consumer discretionary, boosted the fund’s performance relative to the index. Overall, sector allocation contributed as well.
Portfolio Review
In addition to positive stock selection, an overweight position to health care—the best-performing sector within the index over the time period—contributed to relative performance. Our out-of-benchmark position in Valeant Pharmaceuticals was a notable contributor. The company continued to make value-enhancing acquisitions with its purchase of Salix Pharmaceuticals in February, which helped shares advance. Management subsequently indicated that it expects Salix, which develops treatments for gastrointestinal disorders, to contribute $1 billion in revenue this year. Valeant also benefited from gains in Asia and Mexico as well as in its contact lens and dermatology businesses.
Stock selection in the consumer discretionary sector was also a significant factor in the portfolio’s outperformance of the index. An overweight allocation to Amazon.com proved beneficial. The company’s shares soared after it announced strong Amazon Prime membership growth and that it would begin breaking out financial results for its Amazon Web Services unit. The stock rose further after the profitability of Amazon Web Services reported by the firm was much higher than expected.
An area of relative weakness was information technology, where stock selection and group weighting proved detrimental. An underweight allocation to Apple hurt relative performance as strong iPhone sales persisted. We remain underweight in Apple as we believe that a decelerating product cycle will eventually hamper iPhone growth. Despite the additional products and services that the company has launched or is preparing to launch, it is unclear how durable these launches will be in contributing to Apple’s growth beyond the iPhone 6 upgrade cycle.
Baidu, a non-index position, was also a detractor for the information technology sector. Shares struggled during the period as management provided second-quarter guidance that suggested more modest growth acceleration than expected. Heavy investments in mobile products have weighed on profits but are beginning to positively affect the company as traffic and monetization on mobile are growing and should continue to improve as more products are introduced. Baidu’s online to offline business also continues to gain traction.
| | |
| Subadvisor: T. Rowe Price Associates |
| |

| | Robert Sharps, CFA Lead Portfolio Manager BS, Accounting, Towson University; MBA, Finance, the Wharton School, University of Pennsylvania |
| |
| | |
Outlook
As we look ahead to the second half of 2015, our key concerns are the events unfolding in Greece and China. While Greece captured most of the headlines toward the end of the first half of the year, China’s situation is potentially more worrisome, considering it is the world’s second-largest economy. A continued deterioration of the Chinese economy could produce far greater ripple effects to global economic growth than Greece.
Aside from these macroeconomic headwinds, equity market strength during the past five years has made it more challenging to unearth attractive investment opportunities outside of a few key sectors. We are focused heavily in health care stocks, where the fundamentals remain sound and valuations are generally attractive. The sector has also benefited from merger and acquisition activity, which we expect to continue. We also have significant exposure to consumer discretionary and business services stocks. Moving forward, we will focus on identifying all-seasons growth companies with the ability to increase earnings even in a volatile macro environment.
| | | | |
| 12 | | Performance Evaluation | | |
Growth Fund
| | | | | | | | | | | | |
| Average Annual Total Returns (periods ended 06/30/15) | | | | | | | | | |
| | | |
| | | 1 YR % | | | 5 YR % | | | 10 YR % | |
Growth Fund* | | | 11.16 | | | | 19.34 | | | | 10.26 | |
Russell 1000 Growth Index | | | 10.56 | | | | 18.59 | | | | 9.10 | |
Standard & Poor’s 500 Stock Index | | | 7.42 | | | | 17.34 | | | | 7.89 | |
| | | | |
| Industry Diversification | | | |
| |
| | | % of Total Investments
as of 06/30/15 | |
Health care | | | 29.2 | |
Information technology | | | 23.9 | |
Consumer discretionary | | | 19.1 | |
Industrials | | | 14.6 | |
Financials | | | 6.1 | |
Energy | | | 2.8 | |
Materials | | | 1.9 | |
Consumer staples | | | 0.7 | |
Short-term and other assets | | | 1.7 | |
Total | | | 100.0% | |
| | | | |
| Top Ten Equity Holdings | | | |
| |
| | | % of Total Investments
as of 06/30/15 | |
Amazon.com, Inc. | | | 4.9 | |
Visa Inc. (Class A) | | | 4.0 | |
Boeing Co. (The) | | | 3.9 | |
Priceline Group, Inc. (The) | | | 3.6 | |
Danaher Corp. | | | 3.3 | |
Alexion Pharmaceuticals Inc. | | | 3.1 | |
McKesson Corp. | | | 3.1 | |
Google Inc. (Class A) | | | 2.9 | |
Morgan Stanley | | | 2.7 | |
Valeant Pharmaceuticals International, Inc. | | | 2.7 | |
Total | | | 34.2% | |
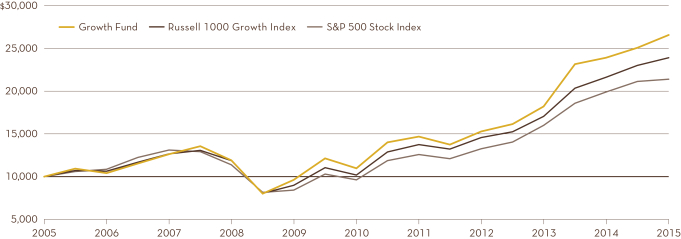
Comparison of the change in value of a $10,000 investment in the fund and its benchmark indices made on June 30, 2005.
The returns quoted in the above table and chart represent past performance, which is no guarantee of future results. Current performance may be higher or lower than that shown above. Returns and the principal value of your investment will fluctuate such that shares, when redeemed, may be worth more or less than their original cost. The Growth Fund’s average annual total returns are net of any fee waivers and reimbursements. Returns do not reflect taxes that the shareholder may pay on fund distributions or the redemption of fund shares.
| * | Performance information for the Growth Fund (formerly the Nasdaq-100 Index Tracking StockSM Fund) reflects its previous investment strategy from inception through December 5, 2008, of matching, as closely as possible, before expenses, the performance of the Nasdaq-100 Stock Index. |
| | | | | | |
| | Performance Evaluation | | | 13 | |
Small-Company Stock Fund
Performance Evaluation | Prepared by the Fund’s Investment Advisor, RE Advisers Corporation
Fund Performance
The Small-Company Stock Fund increased 3.11 percent in the first half of 2015 trailing its benchmark index the Russell 2000, which increased 4.75 percent. The fund’s returns in information technology and industrials detracted from results, while the returns in the materials, financials and consumer staples sectors aided overall results.
The fund’s information technology positions, while underweight relative to the index’s sector positions, delivered a negative return for the first six months. The index’s information technology sector and overall index generated positive results. Western Digital and Rofin-Sinar were the primary detractors to the fund’s results in 2015’s first half.
The fund had a large position in the industrials sector. The fund’s industrial positions generated a return less than that of the index’s industrials sector and that of the overall index. Knight Transportation, Werner Enterprises, Applied Industrial Technologies, Orion Marine Group and Gorman Rupp detracted from the portfolio’s industrial sector results. Positive contributions came from Dycom Industries and Polypore International. Polypore accepted a buyout agreement with Asahi Kasei and 3M Corporation in the first half of 2015. The acquisition is expected to close in the third quarter of 2015.
Materials made a positive contribution to the fund’s first half returns, outpacing the sector and the overall index. Positive results came from Olin Corporation and Westlake Chemical Corp. After an extended period of underperformance, financials came to life in the first half with help from Texas Capital Bancshares, National Penn Bancshares and Cardinal Bank. The fund’s financial holdings appreciated more than the sector and almost as much as the overall index.
The fund’s returns in consumer staples exceeded those for the sector and those of the overall index. Cal-Maine Foods and WhiteWave Foods led this sector’s results for the fund.
New names added to the fund during the first half of the year included 1) Burke & Herbert Bank & Trust, a commercial bank serving consumers and businesses through offices in northern Virginia; 2) Cal-Maine Foods, which produces, cleans, grades, packs and sells fresh eggs; 3) Glacier Bancorp, a holding company for a commercial bank serving consumers and businesses in six states in the northern Rocky Mountain area of the U.S.; 4) Libbey, which designs, manufactures and markets glass tableware used by foodservice, industrial, premium and retail customers; 5) NeuStar, a provider of real-time information and analysis to the Internet, telecommunications, technology, financial services, retail and media sectors; 6) Primoris Services Corporation, a provider of a wide range of engineering, construction and fabrication services to municipalities, utilities and energy-related companies; 7) Rentrak Corporation, a generator of audience viewership measurement for the entertainment industry and also a developer of a database currency for the television and digital media market; and 8) State Bank Financial Corporation, a bank holding company serving Atlanta and counties in central Georgia.
| | |
| Investment Advisor: RE Advisers |
| |
| | Mark Ashton, CFA Senior Equity Portfolio Manager BS, Finance, University of Utah; MBA, Marketing Research, University of Southern California |
| |
| | Prabha Carpenter, CFA Senior Equity Portfolio Manager BA, Economics, University of Madras; MBA with distinction in Finance and BS in Business Economics, The American University |
| |
| | Gregory Halter, CFA Senior Equity Portfolio Manager BBA, Finance, Cleveland State University |
Names eliminated from the fund in the first half of 2015 were Matthews International Corporation, Southcoast Financial Corporation and Cal-Maine Foods. The fund’s uncharacteristically short holding period for Cal-Maine Foods was the result of significant appreciation in share price shortly after its initial purchase and a substantial alteration to the original investment thesis. The uncertainty about the business greatly increased with the outbreak of avian flu within the egg-laying bird inventory. As a result, the shares were sold.
Outlook
As 2015 rounds the mid-year mark, our general feeling is for the economy to be stronger in the second half than it was in the first half of 2015. Economic indicators are encouraging in the areas of employment, housing and manufacturing. In total, this has led to forecasts of U.S. GDP to exceed 3 percent growth in the second half of 2015.
Recent events have brought to the forefront significant volatility with the Chinese stock market and weakness in its economy. This comes on the heels of Greece’s debt repayment uncertainty. It would seem that while the U.S. economic backdrop continues to be positive, the outlook for some overseas markets has become less certain, at least for the present.
Regardless of the economic environment, we continue to search for and uncover attractive investment opportunities. While valuations remain somewhat elevated, some of the price volatility in the first half of the year has provided values that are compelling. We continue to find companies with attractive business models and better prospects for the future that we believe will benefit investors over the longer-term.
We appreciate your continued trust and investment.
| | | | |
| 14 | | Performance Evaluation | | |
Small-Company Stock Fund
| | | | | | | | | | | | |
| Average Annual Total Returns (periods ended 06/30/15) | | | | | | | | | |
| | | |
| | | 1 YR % | | | 5 YR % | | | 10 YR % | |
Small-Company Stock Fund | | | 8.56 | | | | 19.00 | | | | 11.45 | |
Russell 2000 Index | | | 6.49 | | | | 17.08 | | | | 8.40 | |
| | | | |
| Industry Diversification | | | |
| |
| | | % of Total Investments
as of 06/30/15 | |
Industrials | | | 25.7 | |
Consumer discretionary | | | 22.1 | |
Financials | | | 16.3 | |
Information technology | | | 11.1 | |
Materials | | | 8.4 | |
Consumer staples | | | 2.4 | |
Health care | | | 1.8 | |
Energy | | | 0.9 | |
Short-term and other assets | | | 11.3 | |
Total | | | 100.0% | |
| | | | |
| Top Ten Equity Holdings | | | |
| |
| | | % of Total Investments
as of 06/30/15 | |
Dycom Industries, Inc. | | | 5.4 | |
iShares Core S&P Small-Cap | | | 3.8 | |
iShares Russell 2000 Value | | | 3.8 | |
Encore Capital Group, Inc. | | | 3.7 | |
Knight Transportation, Inc. | | | 2.9 | |
Werner Enterprises, Inc. | | | 2.7 | |
Rofin-Sinar Technologies, Inc. | | | 2.7 | |
Cooper Tire & Rubber Co. | | | 2.7 | |
Fred’s, Inc. (Class A) | | | 2.6 | |
BJ’s Restaurants, Inc. | | | 2.6 | |
Total | | | 32.9% | |
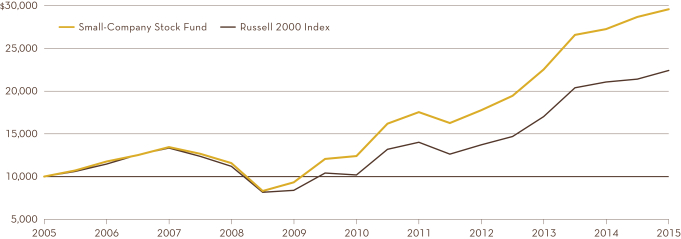
Comparison of the change in value of a $10,000 investment in the fund and the Russell 2000 Index made on June 30, 2005.
The returns quoted in the above table and chart represent past performance, which is no guarantee of future results. Current performance may be higher or lower than that shown above. Returns and the principal value of your investment will fluctuate such that shares, when redeemed, may be worth more or less than their original cost. The Small-Company Stock Fund’s average annual total returns are net of any fee waivers and reimbursements. Returns do not reflect taxes that the shareholder may pay on fund distributions or the redemption of fund shares.
| | | | | | |
| | Performance Evaluation | | | 15 | |
International Value Fund
Performance Evaluation | Prepared by the Fund’s Subadvisor, Mercator Asset Management, L.P.
Fund Performance
For the six-month period ending June 30, 2015, the International Value Fund returned 5.16 percent versus the MSCI EAFE Index, which returned 5.52 percent.
Portfolio Review
International equities throughout the first half of the year were characterized by heightened volatility, yet finished the period roughly flat. Mixed macroeconomic news flow was prevalent throughout the six-month period and investors were confronted with continued U.S. dollar strength and geopolitical uncertainty. Despite these factors, your portfolio registered solid gains during the first half of the year. The fund’s European holdings continued to perform strongly as the economic recovery gained pace. Several of the fund’s Japanese holdings performed well throughout the six-month period; however, holdings in Southeast Asia detracted performance as the region suffered from concerns over slow growth. Since the beginning of the year, our value investment style has continued to underperform growth investment style—a trend that has been in place for much of the past decade.
The best performing sectors over the six-month period were energy, industrials and information technology, while financials, utilities and health care detracted. Specific stocks that contributed to performance were Intesa, MS & AD Insurance and Mitsui Chemicals, while Krung Thai Bank, Hyundai Motor Company and Posco detracted. From a country standpoint, the best performers included Australia, the U.K. and Germany, while South Korea, Thailand and the Netherlands detracted.
We continue to find many undervalued opportunities across the globe, with five new purchases initiated during the six-month period: Leopalace21, Georg Fischer, BAM Group, Societe Generale and Marine Harvest. We also sold out of five positions: Guangzhou Auto, Lixil Group, Bangkok Bank, Hyundai Motor and Givaudan.
Outlook
Global economic growth continues to improve with the U.S. leading the rest of the world. The eurozone also continues to improve; bank lending has started to grow, business confidence is rebounding and consumer prices are moving back into positive territory. Early signs of a normalization of interest rates in Europe can be seen, likely ending the deflationary scare of recent months. In this regard, rising bond yields should not be seen as a negative. The weak Euro continues to act as a tailwind for the economy as a whole and for many export-oriented companies.
In spite of the uncertainty created by ongoing negotiations between Greece and the rest of the eurozone, with Greece representing less than 2 percent of the eurozone economy, its
| | |
| Subadvisor, Mercator Asset Management, L.P. |
| |
 | | James Chaney Portfolio Manager BS, University of Massachusetts; MS, Northeastern University; MBA, Columbia University Graduate School of Business |
| |
| | |
effect on European economic activity should be limited. Of greater concern is the impact on politics in the region. While not an immediate risk, it does point to the necessity for the eurozone to further its efforts in moving toward a true monetary, fiscal and political union.
We remain overweight in equities in continental Europe. While earnings are beginning to recover, they are still almost 40 percent below prior peak levels. Profit margins have significant room to expand and balance sheets are sound. With interest rates likely to remain low for an extended period, a highly competitive currency, and an economy that is finally starting to grow, we believe Europe is the most attractive region globally and should offer substantial returns over the coming quarters.
The Japanese market should continue to be supported by stronger earnings. Prime Minister Shinzo Abe’s ambitious goal ending Japan’s deflationary spiral is starting to work. Structural reforms are impacting corporate behavior, where the emphasis on improving returns on equity and better governance is driving profit growth. With household ownership of Japanese equities well below the rest of the developed world and a plan to increase allocation to equities in large government-related pension funds, demand for equities in Japan should be well supported.
Emerging markets continue to underperform as an asset class. While it’s difficult to generalize about such a diverse group of economies, they have suffered from a slowdown in growth and fears of rising interest rates in the developed world. Valuations are becoming more attractive with emerging market equities trading at close to a 30 percent discount to the developed world, and trading at an 18 percent discount relative to their historical price-to-book value. However, in the near term, we expect earnings growth to be stronger in regions such as Europe and Japan where economic growth is accelerating. We continue to look at the emerging market asset class opportunistically.
In spite of our style being out of favor, emerging markets underperforming as an asset class and our early positioning in Europe, we believe that as the economic cycle gathers pace, particularly in Europe, as interest rates normalize globally and as risk appetite returns to pre-crisis norms, our investment style should produce strong relative performance for a multiyear period.
| | | | |
| 16 | | Performance Evaluation | | |
International Value Fund
| | | | | | | | | | | | |
| Average Annual Total Returns (periods ended 06/30/15) | | | | | | | | | |
| | | |
| | | 1 YR % | | | 5 YR % | | | 10 YR % | |
International Value Fund* | | | -7.71 | | | | 7.16 | | | | 4.68 | |
MSCI® EAFE® Index | | | -4.22 | | | | 9.54 | | | | 5.12 | |
| | | | |
| Country Diversification | | | |
| | | % of Total Investments
as of 06/30/15 | |
Japan | | | 18.9 | |
France | | | 14.0 | |
Switzerland | | | 12.0 | |
Netherlands | | | 7.2 | |
Italy | | | 6.5 | |
Britain | | | 6.4 | |
Spain | | | 5.6 | |
Hong Kong | | | 5.1 | |
Germany | | | 4.8 | |
Thailand | | | 2.7 | |
Republic of South Korea | | | 2.5 | |
Sweden | | | 2.4 | |
Singapore | | | 2.1 | |
Denmark | | | 1.5 | |
Australia | | | 1.4 | |
Israel | | | 1.2 | |
Norway | | | 0.7 | |
Short-term and other assets | | | 5.0 | |
Total | | | 100.0% | |
| | | | |
| Top Ten Equity Holdings | | | |
| | | % of Total Investments
as of 06/30/15 | |
Intesa Sanpaolo SpA | | | 3.7 | |
AEGON NV | | | 2.8 | |
WPP Group plc | | | 2.8 | |
Daimler AG REG | | | 2.8 | |
MS & AD Insurance Group Holdings, Inc. | | | 2.6 | |
Compagnie de Saint-Gobain SA | | | 2.6 | |
Mitsui Chemicals, Inc. | | | 2.6 | |
Nissan Motor Co., Ltd. | | | 2.6 | |
Sumitomo Mitsui Trust Holdings, Inc. | | | 2.6 | |
DSM NV | | | 2.4 | |
Total | | | 27.5% | |
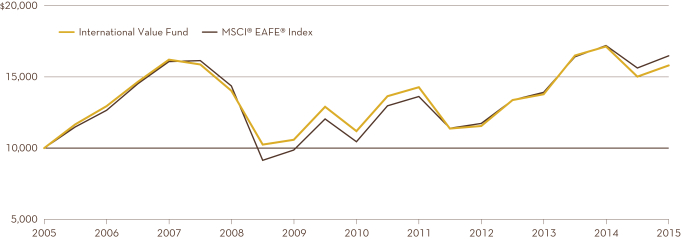
Comparison of the change in value of a $10,000 investment in the fund and the MSCI® EAFE® Index made on June 30, 2005.
The returns quoted in the above table and chart represent past performance, which is no guarantee of future results. Current performance may be higher or lower than that shown above. Returns and the principal value of your investment will fluctuate such that shares, when redeemed, may be worth more or less than their original cost. The International Value Fund’s average annual total returns are net of any fee waivers and reimbursements. Returns do not reflect taxes that the shareholder may pay on fund distributions or the redemption of fund shares.
| * | The performance information for the International Value Fund (formerly the International Stock Index Fund) reflects its investment experience in the State Street MSCI® EAFE® Index Portfolio from inception through October 16, 2005, and in the Vanguard Developed Markets Index Fund from October 17, 2005 to June 9, 2006. Mercator Asset Management, L.P.‘s role as subadvisor began June 12, 2006. |
| | | | | | |
| | Performance Evaluation | | | 17 | |
Expense Example
As a shareholder, you incur two types of costs: (1) transaction costs; and (2) ongoing costs, including management fees, service fees, and other fund expenses. This example is intended to help you understand your ongoing costs (in dollars) of investing in each of the Homestead Funds and to compare these costs with the ongoing costs of investing in other mutual funds.
The example is based on an investment of $1,000 invested at January 1, 2015 and held through June 30, 2015.
Actual Expenses
The first line for each Fund in the table on the following page provides information about actual account values and actual expenses. You may use the information in this line, together with the amount you invested, to estimate the expenses that you paid over the period. Simply divide your account value by $1,000 (for example, an $8,600 account value divided by $1,000 = 8.6), then multiply the result by the number in the first line under the heading entitled “Expenses Paid During the Period” to estimate the expenses you paid on your account during this period.
Individual Retirement Arrangements (IRAs) and Educational Savings Accounts (ESAs) are charged a $15.00 annual custodial fee. The charge is automatically deducted from your account in the fourth quarter of each year or, if you close your account, at the time of redemption. A fee is collected for each IRA or ESA, as distinguished by account type (Traditional IRA, Roth IRA, or ESA) and Social Security Number. For example, if you have both a Traditional IRA and a Roth IRA account, each would be charged a fee. But only one fee would be collected for each account type, regardless of the number of Funds held by each account type. These fees are not included in the example below. If included, the costs shown would be higher.
Hypothetical Example for Comparison Purposes
The second line for each Fund in the table on the following page provides information about hypothetical account values and hypothetical expenses based on the Fund’s actual expense ratio and an assumed rate of return of 5% per year before expenses, which is not the Fund’s actual return. The hypothetical account values and expenses may not be used to estimate the actual ending account balance or expenses you paid for the period. You may use this information to compare the ongoing costs of investing in the Funds and other funds. To do so, compare this 5% hypothetical example with the 5% hypothetical examples that appear in the shareholder reports of the other funds.
Please note that the expenses shown in the table are meant to highlight your ongoing costs only and do not reflect the custodial account fee. Therefore, the hypothetical information in the example is useful in comparing your ongoing costs only, and will not help you determine the relative total costs of owning different funds. In addition, if the custodial account fee was included, your costs would have been higher.
Expense Example (Continued)
| | | | | | | | | | | | | | | | |
| Daily Income Fund | | Beginning
Account Value
January 1, 2015 | | | Ending
Account Value
June 30, 2015 | | | Expenses Paid
During the Perioda | | | Annualized Expense
Ratio for the
Six Month Period
Ended June 30, 2015 | |
Actual Return | | $ | 1,000.00 | | | $ | 1,000.05 | | | $ | 0.56 | | | | 0.11% | |
Hypothetical (5% return before expenses) | | $ | 1,000.00 | | | $ | 1,024.48 | | | $ | 0.57 | | | | 0.11% | |
| | |
| Short-Term Government Securities Fund | | | | | | | | |
Actual Return | | $ | 1,000.00 | | | $ | 1,006.82 | | | $ | 3.61 | | | | 0.73% | |
Hypothetical (5% return before expenses) | | $ | 1,000.00 | | | $ | 1,021.39 | | | $ | 3.64 | | | | 0.73% | |
| | |
| Short-Term Bond Fund | | | | | | | | |
Actual Return | | $ | 1,000.00 | | | $ | 1,003.20 | | | $ | 3.68 | | | | 0.74% | |
Hypothetical (5% return before expenses) | | $ | 1,000.00 | | | $ | 1,021.31 | | | $ | 3.71 | | | | 0.74% | |
| | |
| Stock Index Fundb | | | | | | | | |
Actual Return | | $ | 1,000.00 | | | $ | 1,011.66 | | | $ | 2.87 | | | | 0.57% | |
Hypothetical (5% return before expenses) | | $ | 1,000.00 | | | $ | 1,022.15 | | | $ | 2.88 | | | | 0.57% | |
| | |
| Value Fund | | | | | | | | |
Actual Return | | $ | 1,000.00 | | | $ | 1,001.40 | | | $ | 2.99 | | | | 0.60% | |
Hypothetical (5% return before expenses) | | $ | 1,000.00 | | | $ | 1,022.00 | | | $ | 3.02 | | | | 0.60% | |
| | |
| Growth Fund | | | | | | | | |
Actual Return | | $ | 1,000.00 | | | $ | 1,061.42 | | | $ | 4.75 | | | | 0.93% | |
Hypothetical (5% return before expenses) | | $ | 1,000.00 | | | $ | 1,020.36 | | | $ | 4.65 | | | | 0.93% | |
| | |
| Small-Company Stock Fund | | | | | | | | |
Actual Return | | $ | 1,000.00 | | | $ | 1,037.88 | | | $ | 4.38 | | | | 0.87% | |
Hypothetical (5% return before expenses) | | $ | 1,000.00 | | | $ | 1,020.67 | | | $ | 4.34 | | | | 0.87% | |
| | |
| International Value Fund | | | | | | | | |
Actual Return | | $ | 1,000.00 | | | $ | 1,054.60 | | | $ | 4.96 | | | | 0.97% | |
Hypothetical (5% return before expenses) | | $ | 1,000.00 | | | $ | 1,020.13 | | | $ | 4.88 | | | | 0.97% | |
| a. | The dollar amounts shown as “Expenses Paid During the Period” are equal to each Fund’s annualized expense ratio multiplied by the average account value over the period, multiplied by 181, then divided by 365. |
| b. | The Stock Index Fund is a feeder fund that invests substantially all of its assets in a Master Portfolio. The example reflects the expenses of both the feeder fund and the Master Portfolio. |
Regulatory and Shareholder Matters
Proxy Voting Policies and Procedures
The policies and procedures used to determine how to vote proxies relating to the Funds’ portfolio securities are available online at homesteadfunds.com and, without charge, upon request by calling 800-258-3030. This information is also available on the Securities and Exchange Commission’s website at sec.gov.
Proxy Voting Record
For the most recent twelve-month period ended June 30, information regarding how proxies relating to portfolio securities were voted on behalf of each of the Funds is available, without charge, upon request by calling 800-258-3030 and on the Securities and Exchange Commission’s website at sec.gov.
Quarterly Disclosure of Portfolio Holdings
The Funds file complete schedules of portfolio holdings with the Securities and Exchange Commission for the first and third quarters of each fiscal year on Form N-Q. Portfolio holdings for the second and fourth quarters of each fiscal year are filed as part of the Funds’ semi-annual and annual reports. The Funds’ Form N-Q, semi-annual and annual reports are available on the Commission’s website at sec.gov, and may be reviewed and copied at the Commission’s Public Reference Room in Washington, DC. Information on the operation of the Public Reference Room may be obtained by calling 800-SEC-0330. The most recent quarterly portfolio holdings and semi-annual and annual report also can be accessed on the Funds’ website at homesteadfunds.com.
| | | | |
| 20 | | Regulatory and Shareholder Matters | | |
Portfolio of Investments
Daily Income Fund | June 30, 2015 | (Unaudited)
| | | | | | | | | | | | | | |
Corporate Bonds | 7.0% of portfolio | | | | | | | | | | | | | | |
| | | | |
| | | Interest Rate | | | Maturity Date | | Face Amount | | | Value | |
PACCAR Financial Corp. | | | 0.75 | % | | 08/14/15 | | $ | 3,500,000 | | | $ | 3,502,229 | |
Toyota Motor Credit Corp. | | | 0.88 | | | 07/17/15 | | | 1,400,000 | | | | 1,400,445 | |
Wal-Mart Stores, Inc. | | | 2.25 | | | 07/08/15 | | | 508,000 | | | | 508,205 | |
Wal-Mart Stores, Inc. | | | 1.50 | | | 10/25/15 | | | 2,000,000 | | | | 2,008,003 | |
Wells Fargo & Co. | | | 1.50 | | | 07/01/15 | | | 5,526,000 | | | | 5,526,000 | |
Total Corporate Bonds (Cost $12,944,882) | | | | | | | | | | | | | 12,944,882 | |
Commercial Paper | 62.7% of portfolio | | | | | | | | | | | | | | |
Abbott Laboratories (a) | | | 0.12 | | | 07/20/15 | | | 3,100,000 | | | | 3,099,804 | |
Abbott Laboratories (a) | | | 0.15 | | | 07/27/15 | | | 420,000 | | | | 419,955 | |
Air Liquide US LLC (a) | | | 0.15 | | | 07/17/15 | | | 2,200,000 | | | | 2,199,853 | |
Air Liquide US LLC (a) | | | 0.16 | | | 07/23/15 | | | 5,000,000 | | | | 4,999,511 | |
Air Products & Chemicals Inc. (a) | | | 0.11 | | | 07/02/15 | | | 1,000,000 | | | | 999,997 | |
Air Products & Chemicals Inc. (a) | | | 0.11 | | | 07/31/15 | | | 3,000,000 | | | | 2,999,725 | |
American Honda Finance Corp. | | | 0.12 | | | 07/06/15 | | | 3,000,000 | | | | 2,999,950 | |
American Honda Finance Corp. | | | 0.12 | | | 07/07/15 | | | 3,000,000 | | | | 2,999,940 | |
American Honda Finance Corp. | | | 0.11 | | | 08/07/15 | | | 2,000,000 | | | | 1,999,774 | |
Apple, Inc. (a) | | | 0.09 | | | 08/18/15 | | | 5,000,000 | | | | 4,999,400 | |
BMW US Capital LLC (a) | | | 0.12 | | | 07/27/15 | | | 2,150,000 | | | | 2,149,814 | |
BMW US Capital LLC (a) | | | 0.12 | | | 08/05/15 | | | 3,500,000 | | | | 3,499,592 | |
BMW US Capital LLC (a) | | | 0.12 | | | 08/11/15 | | | 2,000,000 | | | | 1,999,727 | |
Chevron Corp. (a) | | | 0.10 | | | 07/13/15 | | | 2,000,000 | | | | 1,999,933 | |
Chevron Corp. (a) | | | 0.12 | | | 09/21/15 | | | 2,000,000 | | | | 1,999,453 | |
Chevron Corp. (a) | | | 0.12 | | | 09/25/15 | | | 4,000,000 | | | | 3,998,853 | |
Coca-Cola Co. (a) | | | 0.10 | | | 07/29/15 | | | 1,000,000 | | | | 999,922 | |
Coca-Cola Co. (a) | | | 0.10 | | | 08/11/15 | | | 1,000,000 | | | | 999,886 | |
Coca-Cola Co. (a) | | | 0.13 | | | 08/28/15 | | | 1,000,000 | | | | 999,791 | |
Conocophillips Qatar Funding Ltd. (a) | | | 0.12 | | | 08/21/15 | | | 2,000,000 | | | | 1,999,660 | |
Conocophillips Qatar Funding Ltd. (a) | | | 0.14 | | | 09/14/15 | | | 1,500,000 | | | | 1,499,562 | |
Conocophillips Qatar Funding Ltd. (a) | | | 0.14 | | | 09/22/15 | | | 2,000,000 | | | | 1,999,354 | |
Emerson Electric Co. (a) | | | 0.12 | | | 08/19/15 | | | 2,000,000 | | | | 1,999,673 | |
Emerson Electric Co. (a) | | | 0.12 | | | 08/20/15 | | | 2,000,000 | | | | 1,999,667 | |
Emerson Electric Co. (a) | | | 0.12 | | | 09/09/15 | | | 3,000,000 | | | | 2,999,300 | |
Essilor International SA (a) | | | 0.12 | | | 07/16/15 | | | 2,000,000 | | | | 1,999,900 | |
Essilor International SA (a) | | | 0.10 | | | 07/24/15 | | | 2,000,000 | | | | 1,999,872 | |
Essilor International SA (a) | | | 0.16 | | | 08/04/15 | | | 2,000,000 | | | | 1,999,698 | |
Essilor International SA (a) | | | 0.15 | | | 08/07/15 | | | 2,750,000 | | | | 2,749,576 | |
Exxon Mobil Corp. | | | 0.11 | | | 08/03/15 | | | 5,000,000 | | | | 4,999,496 | |
General Electric Capital Corp. | | | 0.12 | | | 08/10/15 | | | 3,000,000 | | | | 2,999,600 | |
General Electric Capital Corp. | | | 0.15 | | | 09/08/15 | | | 3,000,000 | | | | 2,999,138 | |
Honeywell International (a) | | | 0.14 | | | 08/27/15 | | | 750,000 | | | | 749,834 | |
Honeywell International (a) | | | 0.15 | | | 09/01/15 | | | 874,000 | | | | 873,774 | |
Honeywell International (a) | | | 0.21 | | | 09/24/15 | | | 1,000,000 | | | | 999,504 | |
Honeywell International (a) | | | 0.20 | | | 10/05/15 | | | 2,000,000 | | | | 1,998,933 | |
John Deere Bank SA (a) | | | 0.10 | | | 07/07/15 | | | 4,000,000 | | | | 3,999,933 | |
Nestle Capital Corp. (a) | | | 0.11 | | | 07/09/15 | | | 3,500,000 | | | | 3,499,915 | |
Nestle Capital Corp. (a) | | | 0.11 | | | 09/23/15 | | | 4,000,000 | | | | 3,998,973 | |
PACCAR Financial Corp. | | | 0.14 | | | 07/27/15 | | | 2,500,000 | | | | 2,499,747 | |
Siemans Capital Co. LLC (a) | | | 0.18 | | | 09/25/15 | | | 2,500,000 | | | | 2,498,925 | |
Toyota Motor Credit Corp. | | | 0.10 | | | 07/10/15 | | | 5,000,000 | | | | 4,999,875 | |
Toyota Motor Credit Corp. | | | 0.11 | | | 07/22/15 | | | 2,275,000 | | | | 2,274,854 | |
United Technologies Corp. (a) | | | 0.12 | | | 07/31/15 | | | 4,200,000 | | | | 4,199,580 | |
Walt Disney Co. (The) (a) | | | 0.10 | | | 07/15/15 | | | 1,500,000 | | | | 1,499,942 | |
Walt Disney Co. (The) (a) | | | 0.11 | | | 09/24/15 | | | 4,100,000 | | | | 4,098,935 | |
Total Commercial Paper (Cost $116,802,100) | | | | | | | | | | | | | 116,802,100 | |
| | | | | | |
| The accompanying notes are an integral part of these financial statements. | | Portfolio of Investments | | | 21 | |
Portfolio of Investments | Daily Income Fund | June 30, 2015 | (Unaudited) (Continued)
| | | | | | | | | | | | | | |
| U.S. Government Obligations | 20.5% of portfolio | | | | | | | | | | | |
| | | | |
| | | Interest Rate | | | Maturity Date | | Face Amount | | | Value | |
U.S. Treasury Note | | | 0.25 | % | | 07/15/15 | | $ | 4,000,000 | | | $ | 4,000,282 | |
U.S. Treasury Note | | | 4.25 | | | 08/15/15 | | | 2,000,000 | | | | 2,010,409 | |
U.S. Treasury Note | | | 1.25 | | | 08/31/15 | | | 3,000,000 | | | | 3,005,813 | |
U.S. Treasury Note | | | 0.25 | | | 09/15/15 | | | 2,000,000 | | | | 2,000,943 | |
U.S. Treasury Note | | | 1.25 | | | 09/30/15 | | | 3,000,000 | | | | 3,008,602 | |
U.S. Treasury Note | | | 0.25 | | | 09/30/15 | | | 2,000,000 | | | | 2,001,023 | |
U.S. Treasury Note | | | 0.25 | | | 10/15/15 | | | 5,000,000 | | | | 5,002,706 | |
U.S. Treasury Note | | | 1.25 | | | 10/31/15 | | | 4,000,000 | | | | 4,014,431 | |
U.S. Treasury Note | | | 4.50 | | | 11/15/15 | | | 6,000,000 | | | | 6,098,264 | |
U.S. Treasury Note | | | 1.38 | | | 11/30/15 | | | 4,000,000 | | | | 4,021,271 | |
U.S. Treasury Note | | | 0.25 | | | 12/15/15 | | | 3,000,000 | | | | 3,002,679 | |
Total U.S. Government Obligations (Cost $38,166,423) | | | | | | | | | | | | | 38,166,423 | |
Money Market Fund | 9.8% of portfolio | | | | | | | | | | | | | | |
| | | | |
| | | | | | | | Shares | | | | |
State Street Institutional Liquid Reserves Fund (Premier Class) | | | 0.11 | (b) | | | | | 18,276,690 | | | | 18,276,690 | |
Total Money Market Fund (Cost $18,276,690) | | | | | | | | | | | | | 18,276,690 | |
| | | | | |
Total Investments in Securities (Cost $186,190,095) | 100% | | | | | | | | | | | | $ | 186,190,095 | |
| (a) | Security was purchased pursuant to Rule 144A under the Securities Act of 1933 and may be resold in transactions exempt from registration normally to qualified institutional buyers. The security has been determined to be liquid under criteria established by the Fund’s Board of Directors. The total of such securities at period-end amounts to $88,029,726 and represents 47.3% of total investments. |
| (b) | 7-day yield at June 30, 2015. |
| LLC | – Limited Liability Company |
| | | | |
| 22 | | Portfolio of Investments | | The accompanying notes are an integral part of these financial statements. |
Portfolio of Investments
Short-Term Government Securities Fund | June 30, 2015 | (Unaudited)
| | | | | | | | | | | | | | |
Corporate Bonds | 21.0% of portfolio | | | | | | | | | | |
| | | | |
| | | Interest Rate | | | Maturity Date | | Face Amount | | | Value | |
Ally Bank | | | 0.95 | % | | 09/25/15 | | $ | 250,000 | | | $ | 250,392 | |
Altitude Investments 17 LLC | | | 2.68 | | | 11/08/25 | | | 888,672 | | | | 874,951 | |
American Express Bank FSB | | | 1.55 | | | 10/23/17 | | | 250,000 | | | | 250,394 | |
American Express Centurion Bank | | | 1.45 | | | 06/04/18 | | | 250,000 | | | | 248,287 | |
Banco Bilbao Vizcaya Argentaria Puerto Rico | | | 1.50 | | | 04/20/17 | | | 150,000 | | | | 150,078 | |
Capital One Bank USA NA | | | 1.65 | | | 07/09/18 | | | 250,000 | | | | 249,853 | |
Comenity Capital Bank | | | 0.75 | | | 02/25/16 | | | 250,000 | | | | 250,513 | |
Discover Bank | | | 1.05 | | | 09/26/16 | | | 250,000 | | | | 250,068 | |
Ethiopian Leasing (2012) LLC | | | 2.68 | | | 07/30/25 | | | 176,445 | | | | 180,147 | |
FirstBank Puerto Rico | | | 0.70 | | | 11/30/15 | | | 250,000 | | | | 250,368 | |
GE Capital Bank | | | 1.50 | | | 10/17/17 | | | 250,000 | | | | 250,811 | |
Goldman Sachs Bank USA | | | 1.00 | | | 01/30/17 | | | 200,000 | | | | 200,640 | |
Lulwa Ltd. | | | 1.83 | | | 03/26/25 | | | 829,059 | | | | 813,481 | |
Mexican Aircraft Finance IV | | | 2.54 | | | 07/13/25 | | | 436,404 | | | | 442,640 | |
Mexican Aircraft Finance V | | | 2.33 | | | 01/14/27 | | | 489,583 | | | | 488,805 | |
Micron Semiconductor Asia PTE LTD | | | 1.26 | | | 01/15/19 | | | 2,796,800 | | | | 2,797,575 | |
Petroleos Mexicanos | | | 2.00 | | | 12/20/22 | | | 750,000 | | | | 751,306 | |
Safina LTD | | | 1.55 | | | 01/15/22 | | | 721,570 | | | | 716,534 | |
Safina LTD | | | 2.00 | | | 12/30/23 | | | 1,522,635 | | | | 1,517,567 | |
Sallie Mae Bank | | | 1.50 | | | 10/16/17 | | | 250,000 | | | | 250,399 | |
Salmon River Export LLC | | | 2.19 | | | 09/15/26 | | | 240,106 | | | | 238,425 | |
Sandalwood 2013 LLC | | | 2.82 | | | 02/12/26 | | | 589,566 | | | | 604,863 | |
Sayarra LTD | | | 2.77 | | | 10/29/21 | | | 31,512 | | | | 32,511 | |
Tagua Leasing LLC | | | 1.90 | | | 07/12/24 | | | 790,496 | | | | 782,937 | |
Tagua Leasing LLC | | | 1.73 | | | 09/18/24 | | | 789,991 | | | | 774,598 | |
Union 11 Leasing LLC | | | 2.41 | | | 01/23/24 | | | 756,405 | | | | 767,137 | |
Union 16 Leasing LLC | | | 1.86 | | | 01/22/25 | | | 828,104 | | | | 815,833 | |
VRG Linhas Aéreas SA | | | 0.62 | | | 02/14/16 | | | 375,000 | | | | 375,240 | |
Wells Fargo Bank | | | 0.78 | (a) | | 04/29/16 | | | 100,000 | | | | 98,750 | |
Worlds Foremost Bank | | | 1.50 | | | 06/11/18 | | | 200,000 | | | | 198,633 | |
Total Corporate Bonds (Cost $15,896,448) | | | | | | | | | 15,873,736 | |
Mortgage-Backed Securities | 4.0% of portfolio | | | | | | | | | | |
FDIC Structured Sale Guaranteed Notes 2010-S3 (b) | | | 2.74 | | | 12/03/20 | | | 308,492 | | | | 313,324 | |
GNMA #2602 | | | 6.00 | | | 06/20/28 | | | 26,625 | | | | 30,601 | |
GNMA #8004 | | | 1.63 | (a) | | 07/20/22 | | | 14,434 | | | | 14,975 | |
GNMA #8006 | | | 1.63 | (a) | | 07/20/22 | | | 12,455 | | | | 12,743 | |
GNMA #8038 | | | 1.63 | (a) | | 08/20/22 | | | 7,849 | | | | 8,161 | |
GNMA #8040 | | | 2.00 | (a) | | 08/20/22 | | | 21,357 | | | | 22,214 | |
GNMA #8054 | | | 1.63 | (a) | | 10/20/22 | | | 4,870 | | | | 4,886 | |
GNMA #8076 | | | 1.63 | (a) | | 11/20/22 | | | 7,916 | | | | 8,148 | |
GNMA #8102 | | | 4.00 | (a) | | 02/20/16 | | | 250 | | | | 251 | |
GNMA #8103 | | | 4.00 | (a) | | 02/20/16 | | | 1,021 | | | | 1,032 | |
GNMA #8157 | | | 1.75 | (a) | | 03/20/23 | | | 12,911 | | | | 13,380 | |
GNMA #8191 | | | 1.63 | (a) | | 05/20/23 | | | 24,802 | | | | 25,769 | |
GNMA #8215 | | | 2.00 | (a) | | 04/20/17 | | | 697 | | | | 707 | |
GNMA #8259 | | | 1.63 | (a) | | 08/20/23 | | | 6,731 | | | | 6,999 | |
GNMA #8297 | | | 4.00 | (a) | | 12/20/17 | | | 3,180 | | | | 3,303 | |
GNMA #8332 | | | 3.50 | (a) | | 03/20/18 | | | 1,826 | | | | 1,879 | |
GNMA #8344 | | | 3.50 | (a) | | 04/20/18 | | | 6,599 | | | | 6,751 | |
GNMA #8384 | | | 1.75 | (a) | | 03/20/24 | | | 3,717 | | | | 3,861 | |
GNMA #8393 | | | 4.00 | (a) | | 08/20/18 | | | 2,923 | | | | 3,015 | |
GNMA #8400 | | | 2.00 | (a) | | 08/20/18 | | | 4,440 | | | | 4,543 | |
GNMA #8405 | | | 4.00 | (a) | | 09/20/18 | | | 3,808 | | | | 3,944 | |
GNMA #8423 | | | 1.63 | (a) | | 05/20/24 | | | 4,542 | | | | 4,726 | |
GNMA #8429 | | | 4.00 | (a) | | 11/20/18 | | | 4,279 | | | | 4,415 | |
| | | | | | |
| The accompanying notes are an integral part of these financial statements. | | Portfolio of Investments | | | 23 | |
Portfolio of Investments | Short-Term Government Securities Fund | June 30, 2015 | (Unaudited) (Continued)
| | | | | | | | | | | | | | |
Mortgage-Backed Securities | 4.0% of portfolio (Continued) | | | | | | | |
| | | | |
| | | Interest Rate | | | Maturity Date | | Face Amount | | | Value | |
GNMA #8459 | | | 1.63 | %(a) | | 07/20/24 | | $ | 7,148 | | | $ | 7,431 | |
GNMA #8499 | | | 3.00 | (a) | | 05/20/19 | | | 4,369 | | | | 4,402 | |
GNMA #8518 | | | 1.63 | (a) | | 10/20/24 | | | 7,514 | | | | 7,794 | |
GNMA #8532 | | | 2.50 | (a) | | 10/20/24 | | | 9,809 | | | | 10,141 | |
GNMA #8591 | | | 1.75 | (a) | | 02/20/25 | | | 20,222 | | | | 20,837 | |
GNMA #8638 | | | 1.63 | (a) | | 06/20/25 | | | 9,127 | | | | 9,497 | |
GNMA #8648 | | | 1.63 | (a) | | 07/20/25 | | | 16,936 | | | | 16,989 | |
GNMA #8663 | | | 2.00 | (a) | | 07/20/25 | | | 11,643 | | | | 12,044 | |
GNMA #8680 | | | 3.50 | (a) | | 08/20/20 | | | 6,954 | | | | 7,183 | |
GNMA #8687 | | | 2.50 | (a) | | 08/20/25 | | | 3,196 | | | | 3,328 | |
GNMA #8702 | | | 3.00 | (a) | | 10/20/20 | | | 3,569 | | | | 3,691 | |
GNMA #8747 | | | 1.63 | (a) | | 11/20/25 | | | 7,174 | | | | 7,453 | |
GNMA #8807 | | | 1.63 | (a) | | 07/20/21 | | | 7,753 | | | | 8,199 | |
GNMA #8836 | | | 1.63 | (a) | | 09/20/21 | | | 7,605 | | | | 7,858 | |
GNMA #8847 | | | 1.63 | (a) | | 04/20/26 | | | 9,492 | | | | 9,875 | |
GNMA #8869 | | | 1.63 | (a) | | 11/20/21 | | | 23,754 | | | | 24,576 | |
GNMA #8873 | | | 2.50 | (a) | | 11/20/21 | | | 12,059 | | | | 12,346 | |
GNMA #8877 | | | 1.63 | (a) | | 05/20/26 | | | 2,265 | | | | 2,338 | |
GNMA #8883 | | | 1.63 | (a) | | 12/20/21 | | | 7,978 | | | | 8,172 | |
GNMA #8915 | | | 1.75 | (a) | | 02/20/22 | | | 7,998 | | | | 8,294 | |
GNMA #8934 | | | 1.75 | (a) | | 03/20/22 | | | 14,001 | | | | 14,521 | |
GNMA #8978 | | | 1.63 | (a) | | 05/20/22 | | | 31,631 | | | | 32,908 | |
GNMA #80053 | | | 1.75 | (a) | | 03/20/27 | | | 2,095 | | | | 2,178 | |
GNMA #80058 | | | 1.63 | (a) | | 04/20/27 | | | 1,962 | | | | 2,041 | |
GNMA #80185 | | | 1.63 | (a) | | 04/20/28 | | | 18,972 | | | | 19,749 | |
GNMA #80264 | | | 1.75 | (a) | | 03/20/29 | | | 14,446 | | | | 15,004 | |
GNMA #80283 | | | 1.63 | (a) | | 05/20/29 | | | 13,525 | | | | 14,040 | |
GNMA #80300 | | | 1.63 | (a) | | 07/20/29 | | | 11,293 | | | | 11,759 | |
GNMA #80309 | | | 1.63 | (a) | | 08/20/29 | | | 5,982 | | | | 6,229 | |
GNMA #80363 | | | 1.75 | (a) | | 01/20/30 | | | 42,535 | | | | 44,212 | |
GNMA #80426 | | | 1.63 | (a) | | 07/20/30 | | | 1,607 | | | | 1,670 | |
GNMA #80452 | | | 1.63 | (a) | | 09/20/30 | | | 12,466 | | | | 12,946 | |
GNMA #80475 | | | 1.63 | (a) | | 12/20/30 | | | 15,539 | | | | 15,931 | |
GNMA #80577 | | | 1.75 | (a) | | 02/20/32 | | | 2,279 | | | | 2,372 | |
GNMA #80684 | | | 1.63 | (a) | | 04/20/33 | | | 9,013 | | | | 9,264 | |
GNMA #81129 | | | 2.13 | (a) | | 10/20/34 | | | 200,420 | | | | 206,348 | |
GNMA #583189 | | | 4.50 | | | 02/20/17 | | | 10,454 | | | | 10,991 | |
GNMA #607494 | | | 5.00 | | | 04/15/19 | | | 11,027 | | | | 11,712 | |
GNMA #616274 | | | 5.00 | | | 02/15/19 | | | 8,578 | | | | 9,105 | |
GNMA 2001-53 | | | 5.50 | | | 10/20/31 | | | 893 | | | | 896 | |
GNMA 2001-53 | | | 0.54 | (a) | | 10/20/31 | | | 165 | | | | 165 | |
GNMA 2002-15 | | | 5.50 | | | 11/20/31 | | | 1,567 | | | | 1,568 | |
GNMA 2002-20 | | | 4.50 | | | 03/20/32 | | | 13,689 | | | | 14,936 | |
GNMA 2003-11 | | | 4.00 | | | 10/17/29 | | | 19,762 | | | | 21,011 | |
GNMA 2003-12 | | | 4.50 | | | 02/20/32 | | | 2,398 | | | | 2,423 | |
GNMA 2003-26 | | | 0.63 | (a) | | 04/16/33 | | | 5,444 | | | | 5,477 | |
GNMA 2003-97 | | | 4.50 | | | 03/20/33 | | | 18,038 | | | | 18,877 | |
GNMA 2004-17 | | | 4.50 | | | 12/20/33 | | | 50,224 | | | | 53,823 | |
GNMA 2004-102 | | | 5.50 | | | 04/20/34 | | | 36,798 | | | | 39,404 | |
GNMA 2010-113 | | | 2.50 | | | 02/16/40 | | | 317,073 | | | | 320,082 | |
GNMA 2012-143 | | | 1.50 | | | 12/16/27 | | | 723,181 | | | | 707,685 | |
GNMA 2013-131 | | | 0.53 | (a) | | 09/16/43 | | | 365,492 | | | | 367,166 | |
GNMA #MA0668 | | | 2.00 | | | 12/20/27 | | | 209,494 | | | | 208,078 | |
NCUA Guaranteed Notes 2010-C1 | | | 1.60 | | | 10/29/20 | | | 129,184 | | | | 129,224 | |
Total Mortgage-Backed Securities (Cost $2,972,080) | | | | | | | | | 3,025,870 | |
| | | | |
| 24 | | Portfolio of Investments | | The accompanying notes are an integral part of these financial statements. |
Portfolio of Investments | Short-Term Government Securities Fund | June 30, 2015 | (Unaudited) (Continued)
| | | | | | | | | | | | | | |
Asset-Backed Securities | 0.3% of portfolio | | | | | | | | | | |
| | | | |
| | | Interest Rate | | | Maturity Date | | Face Amount | | | Value | |
Small Business Administration 98-20D | | | 6.15 | % | | 04/01/18 | | $ | 4,687 | | | $ | 4,982 | |
Small Business Administration 98-20E | | | 6.30 | | | 05/01/18 | | | 4,730 | | | | 5,058 | |
Small Business Administration 98-20H | | | 6.15 | | | 08/01/18 | | | 2,923 | | | | 3,106 | |
Small Business Administration 99-20D | | | 6.15 | | | 04/01/19 | | | 8,389 | | | | 8,883 | |
Small Business Administration 04-20B | | | 4.72 | | | 02/01/24 | | | 32,628 | | | | 34,700 | |
Small Business Administration 04-20C | | | 4.34 | | | 03/01/24 | | | 49,311 | | | | 51,725 | |
Small Business Administration 05-10E | | | 4.54 | | | 09/01/15 | | | 2,114 | | | | 2,127 | |
Small Business Administration Pool # 100075 | | | 3.50 | | | 05/25/19 | | | 13,906 | | | | 14,149 | |
Small Business Administration Pool # 502261 | | | 1.38 | (a) | | 10/25/17 | | | 5,321 | | | | 5,310 | |
Small Business Administration Pool # 502684 | | | 1.25 | (a) | | 07/25/19 | | | 1,685 | | | | 1,700 | |
Small Business Administration Pool # 503278 | | | 0.88 | (a) | | 02/25/21 | | | 15,402 | | | | 15,447 | |
Small Business Administration Pool # 503463 | | | 1.13 | (a) | | 09/25/21 | | | 3,480 | | | | 3,447 | |
Small Business Administration Pool # 504305 | | | 0.88 | (a) | | 10/25/23 | | | 582 | | | | 580 | |
Small Business Investment Companies 02-20K | | | 5.08 | | | 11/01/22 | | | 10,291 | | | | 11,040 | |
Small Business Investment Companies 05-10B | | | 4.94 | | | 09/10/15 | | | 32,231 | | | | 32,449 | |
Small Business Investment Companies 07-10A | | | 5.38 | | | 03/10/17 | | | 7,306 | | | | 7,715 | |
Total Asset-Backed Securities
(Cost $192,144) | | | | | | | | | | | | | 202,418 | |
Municipal Bonds | 2.9% of portfolio | | | | | | | | | | | | | | |
Carmel, Indiana Redevelopment District | | | 7.80 | | | 01/15/29 | | | 500,000 | | | | 540,095 | |
Cook County, Illinois Community Consolidated School District | | | 0.00 | (c) | | 12/01/15 | | | 1,050,000 | | | | 1,048,603 | |
DuPage & Cook County Illinois Community School District | | | 5.25 | | | 01/01/26 | | | 110,000 | | | | 112,660 | |
Illinois Housing Development Authority, Illinois | | | 4.13 | | | 10/20/16 | | | 305,000 | | | | 310,161 | |
Jefferson County Colorado | | | 0.00 | (c) | | 03/01/16 | | | 200,000 | | | | 199,518 | |
Total Municipal Bonds (Cost $2,258,425) | | | | | | | | | | | | | 2,211,037 | |
U. S. Government and Agency Obligations | 57.6% of portfolio | | | | | | | | | | | |
National Archives Facility Trust | | | 8.50 | | | 09/01/19 | | | 26,472 | | | | 30,473 | |
Overseas Private Investment Corp. | | | 3.56 | (d) | | 04/23/17 | | | 3,000,000 | | | | 3,723,750 | |
Overseas Private Investment Corp. | | | 1.50 | (e) | | 11/17/17 | | | 1,000,000 | | | | 1,060,223 | |
Overseas Private Investment Corp. | | | 1.32 | (d) | | 02/19/18 | | | 2,533,926 | | | | 2,621,447 | |
Overseas Private Investment Corp. | | | 1.14 | (e) | | 06/10/18 | | | 4,000,000 | | | | 4,145,672 | |
Overseas Private Investment Corp. | | | 1.30 | | | 06/15/19 | | | 571,429 | | | | 571,318 | |
Overseas Private Investment Corp. | | | 0.78 | (e) | | 07/07/19 | | | 1,000,000 | | | | 1,022,087 | |
Overseas Private Investment Corp. | | | 2.53 | (e) | | 07/07/19 | | | 1,000,000 | | | | 1,133,010 | |
Overseas Private Investment Corp. | | | 0.83 | (e) | | 11/08/19 | | | 2,000,000 | | | | 2,000,798 | |
Overseas Private Investment Corp. | | | 1.50 | (e) | | 11/15/20 | | | 1,000,000 | | | | 1,047,840 | |
Overseas Private Investment Corp. | | | 3.37 | | | 05/15/21 | | | 653,267 | | | | 688,533 | |
Overseas Private Investment Corp. | | | 2.07 | | | 05/15/21 | | | 681,685 | | | | 683,900 | |
Overseas Private Investment Corp. | | | 2.52 | | | 09/15/22 | | | 1,000,000 | | | | 1,010,758 | |
Overseas Private Investment Corp. | | | 2.51 | | | 05/15/25 | | | 2,239,153 | | | | 2,260,013 | |
Philippine Power Trust I (b) | | | 5.40 | | | 09/26/18 | | | 208,333 | | | | 220,930 | |
Private Export Funding Corp. | | | 2.53 | | | 07/15/16 | | | 500,000 | | | | 508,050 | |
The Financing Corp. | | | 0.00 | (c) | | 10/06/17 | | | 500,000 | | | | 487,875 | |
The Financing Corp. | | | 0.00 | (c) | | 02/08/18 | | | 500,000 | | | | 485,195 | |
U.S. Department of Housing and Urban Development | | | 7.91 | | | 08/01/17 | | | 37,000 | | | | 37,020 | |
U.S. Department of Housing and Urban Development | | | 5.77 | | | 08/01/17 | | | 560,000 | | | | 560,619 | |
U.S. Department of Housing and Urban Development | | | 2.91 | | | 08/01/17 | | | 1,000,000 | | | | 1,044,023 | |
U.S. Department of Housing and Urban Development | | | 7.93 | | | 08/01/18 | | | 80,000 | | | | 80,088 | |
U.S. Department of Housing and Urban Development | | | 1.88 | | | 08/01/19 | | | 2,000,000 | | | | 1,998,540 | |
U.S. Department of Housing and Urban Development | | | 5.45 | | | 08/01/19 | | | 800,000 | | | | 839,658 | |
U.S. Department of Housing and Urban Development | | | 6.07 | | | 08/01/21 | | | 345,000 | | | | 345,754 | |
U.S. Department of Housing and Urban Development | | | 6.12 | | | 08/01/22 | | | 776,000 | | | | 778,087 | |
| | | | | | |
| The accompanying notes are an integral part of these financial statements. | | Portfolio of Investments | | | 25 | |
Portfolio of Investments | Short-Term Government Securities Fund | June 30, 2015 | (Unaudited) (Continued)
| | | | | | | | | | | | | | |
U. S. Government and Agency Obligations | 57.6% of portfolio (Continued) | | | | | | | | |
| | | | |
| | | Interest Rate | | | Maturity Date | | Face Amount | | | Value | |
U.S. Department of Housing and Urban Development | | | 5.77 | % | | 08/01/26 | | $ | 500,000 | | | $ | 524,738 | |
United States Treasury Note | | | 1.50 | | | 06/30/16 | | | 1,000,000 | | | | 1,011,406 | |
United States Treasury Note | | | 1.00 | | | 08/31/16 | | | 1,000,000 | | | | 1,006,797 | |
United States Treasury Note | | | 0.75 | | | 01/15/17 | | | 500,000 | | | | 501,641 | |
United States Treasury Note | | | 0.75 | | | 03/15/17 | | | 1,000,000 | | | | 1,003,281 | |
United States Treasury Note | | | 0.88 | | | 06/15/17 | | | 1,000,000 | | | | 1,004,375 | |
United States Treasury Note | | | 1.88 | | | 08/31/17 | | | 1,500,000 | | | | 1,537,383 | |
United States Treasury Note | | | 1.00 | | | 09/15/17 | | | 1,000,000 | | | | 1,005,547 | |
United States Treasury Note | | | 0.88 | | | 01/15/18 | | | 1,000,000 | | | | 999,844 | |
United States Treasury Note | | | 0.75 | | | 04/15/18 | | | 4,000,000 | | | | 3,976,564 | |
United States Treasury Note | | | 1.38 | | | 09/30/18 | | | 1,000,000 | | | | 1,007,578 | |
United States Treasury Note | | | 1.63 | | | 04/30/19 | | | 500,000 | | | | 505,274 | |
Total U.S. Government and Agency Obligations (Cost $43,144,837) | | | | | | | | | | | | | 43,470,089 | |
| Commercial Paper | 14.2% of portfolio | | | | | | | | | | | |
Empire District Electric Co. (The) (b) | | | 0.49 | | | 07/14/15 | | | 439,000 | | | | 438,923 | |
Empire District Electric Co. (The) (b) | | | 0.49 | | | 07/17/15 | | | 3,291,000 | | | | 3,290,283 | |
KCP&L Greater Missouri Operations Co. (b) | | | 0.37 | | | 07/01/15 | | | 3,767,000 | | | | 3,767,000 | |
NextEra Energy Capital Holdings, Inc. (b) | | | 0.43 | | | 07/08/15 | | | 1,172,000 | | | | 1,171,902 | |
Westar Energy Inc. (b) | | | 0.42 | | | 07/22/15 | | | 2,016,000 | | | | 2,015,506 | |
Total Commercial Paper (Cost $10,683,614) | | | | | | | | | | | | | 10,683,614 | |
Money Market Fund | Less than 0.1% of portfolio | | | | | | | | | | | | | | |
| | | | |
| | | | | | | | Shares | | | | |
State Street Institutional Liquid Reserves Fund (Premier Class) | | | 0.11 | (f) | | | | | 737 | | | | 737 | |
Total Money Market Fund (Cost $737) | | | | | | | | | | | | | 737 | |
| | | | | |
Total Investment in Securities (Cost $75,148,285) | 100% | | | | | | | | | | | | $ | 75,467,501 | |
| (a) | Variable coupon rate as of June 30, 2015. |
| (b) | Security was purchased pursuant to Rule 144A under the Securities Act of 1933 and may be resold in transactions exempt from registration, normally to qualified institutional buyers. The security has been determined to be liquid under criteria established by the Fund’s Board of Directors. The total of such securities at period-end amounts to $11,217,868 and represents 14.9% of total investments. |
| (d) | Interest is paid at maturity. |
| (e) | Interest is paid at put date. |
| (f) | 7-day yield at June 30, 2015. |
| | | | |
| 26 | | Portfolio of Investments | | The accompanying notes are an integral part of these financial statements. |
Portfolio of Investments
Short-Term Bond Fund | June 30, 2015 | (Unaudited)
| | | | | | | | | | | | | | |
Corporate Bonds | 30.3% of portfolio | | | | | | | | | | |
| | | | |
| Consumer Discretionary | 0.2% | | Interest Rate | | | Maturity Date | | Face Amount | | | Value | |
| Media | | | | | | | | | | | | | | |
ABC Inc. | | | 8.75 | % | | 08/15/21 | | $ | 810,000 | | | $ | 1,060,178 | |
| Total Consumer Discretionary | | | | | | | | | | | | | 1,060,178 | |
| | | | |
| Consumer Staples | 1.1% | | | | | | | | | | | | | | |
| Beverages | | | | | | | | | | | | | | |
Pepsico Inc. | | | 0.70 | | | 02/26/16 | | | 525,000 | | | | 525,293 | |
Pepsico Inc. | | | 0.49 | (a) | | 02/26/16 | | | 525,000 | | | | 525,659 | |
| Food and Staples Retailing | | | | | | | | | | | | | | |
Sysco Corp. | | | 1.45 | | | 10/02/17 | | | 165,000 | | | | 166,650 | |
Wal-Mart Stores Inc. | | | 1.95 | | | 12/15/18 | | | 1,175,000 | | | | 1,192,481 | |
| Personal Products | | | | | | | | | | | | | | |
Colgate-Palmolive Co. | | | 0.90 | | | 05/01/18 | | | 550,000 | | | | 545,669 | |
Colgate-Palmolive Co. | | | 1.75 | | | 03/15/19 | | | 1,025,000 | | | | 1,022,727 | |
Procter & Gamble Co. (The) | | | 1.90 | | | 11/01/19 | | | 1,625,000 | | | | 1,627,582 | |
| Tobacco | | | | | | | | | | | | | | |
Phillip Morris International Inc. | | | 1.25 | | | 11/09/17 | | | 500,000 | | | | 499,220 | |
| Total Consumer Staples | | | | | | | | | | | | | 6,105,281 | |
| | | | |
| Energy | 2.4% | | | | | | | | | | | | | | |
| Oil, Gas, & Consumable Fuels | | | | | | | | | | | | | | |
ANR Pipeline Co. | | | 9.63 | | | 11/01/21 | | | 1,025,000 | | | | 1,349,458 | |
Chevron Corp. | | | 0.89 | | | 06/24/16 | | | 2,075,000 | | | | 2,080,810 | |
Chevron Corp. | | | 1.35 | | | 11/15/17 | | | 500,000 | | | | 501,942 | |
Chevron Corp. | | | 1.10 | | | 12/05/17 | | | 475,000 | | | | 472,876 | |
Chevron Corp. | | | 1.37 | | | 03/02/18 | | | 1,400,000 | | | | 1,396,732 | |
Chevron Corp. | | | 1.72 | | | 06/24/18 | | | 975,000 | | | | 980,024 | |
Chevron Corp. | | | 2.19 | | | 11/15/19 | | | 375,000 | | | | 376,780 | |
ConocoPhillips Co. | | | 1.50 | | | 05/15/18 | | | 965,000 | | | | 963,794 | |
Colonial Pipeline Co. (b) | | | 3.50 | | | 10/15/20 | | | 875,000 | | | | 902,603 | |
Exxon Mobil Corp. | | | 1.82 | | | 03/15/19 | | | 1,050,000 | | | | 1,050,644 | |
Exxon Mobil Corp. | | | 1.31 | | | 03/06/18 | | | 3,300,000 | | | | 3,295,271 | |
| Total Energy | | | | | | | | | | | | | 13,370,934 | |
| | | | |
| Financials | 7.9% | | | | | | | | | | | | | | |
| Banks | | | | | | | | | | | | | | |
Agricultural Bank of China NY | | | 1.19 | (a) | | 05/21/18 | | | 665,000 | | | | 664,808 | |
Agricultural Bank of China NY | | | 2.00 | | | 05/21/18 | | | 915,000 | | | | 912,004 | |
American Express Bank FSB | | | 1.65 | | | 07/09/18 | | | 250,000 | | | | 249,853 | |
American Express Centurion Bank | | | 1.60 | | | 06/25/18 | | | 250,000 | | | | 248,704 | |
Bank of America NA | | | 0.57 | (a) | | 06/15/16 | | | 2,025,000 | | | | 2,018,694 | |
Bank of America NA | | | 0.59 | (a) | | 06/15/17 | | | 1,550,000 | | | | 1,538,307 | |
Bank of America NA | | | 1.75 | | | 06/05/18 | | | 1,250,000 | | | | 1,246,650 | |
Capital One Bank USA NA | | | 1.65 | | | 07/09/18 | | | 250,000 | | | | 249,853 | |
Credit Suisse New York | | | 1.29 | (a) | | 09/13/16 | | | 1,980,000 | | | | 1,982,218 | |
Discover Bank | | | 1.65 | | | 07/09/18 | | | 250,000 | | | | 249,853 | |
Industrial & Commercial Bank of China NY | | | 1.47 | (a) | | 11/13/17 | | | 250,000 | | | | 251,146 | |
Industrial & Commercial Bank of China NY | | | 2.35 | | | 11/13/17 | | | 250,000 | | | | 251,778 | |
JP Morgan Chase Bank NA | | | 0.62 | (a) | | 06/13/16 | | | 14,300,000 | | | | 14,266,323 | |
Landesbank Baden-Wuerttemberg NY | | | 5.05 | | | 12/30/15 | | | 7,650,000 | | | | 7,804,607 | |
Union Bank NA | | | 5.95 | | | 05/11/16 | | | 525,000 | | | | 546,692 | |
Sallie Mae Bank | | | 1.50 | | | 10/30/17 | | | 250,000 | | | | 250,275 | |
State Bank of India NY | | | 1.60 | | | 12/05/17 | | | 250,000 | | | | 249,761 | |
UBS AG, Stamford CT | | | 1.80 | | | 03/26/18 | | | 1,675,000 | | | | 1,671,677 | |
WestLB AG, NY | | | 4.80 | | | 07/15/15 | | | 275,000 | | | | 275,009 | |
| | | | | | |
| The accompanying notes are an integral part of these financial statements. | | Portfolio of Investments | | | 27 | |
Portfolio of Investments | Short-Term Bond Fund | June 30, 2015 | (Unaudited) (Continued)
| | | | | | | | | | | | | | |
Corporate Bonds | 30.3% of portfolio (Continued) | | | | | | | | | | |
| | | | |
| Financials | 7.9% (Continued) | | Interest Rate | | | Maturity Date | | Face Amount | | | Value | |
| Capital Markets | | | | | | | | | | | | | | |
Vesey Street Investment Trust I | | | 4.40 | % | | 09/01/16 | | $ | 2,275,000 | | | $ | 2,356,156 | |
| Consumer Finance | | | | | | | | | | | | | | |
General Electric Capital Corp. | | | 1.09 | (a) | | 12/20/17 | | | 1,100,000 | | | | 1,109,889 | |
| Diversified Financial Services | | | | | | | | | | | | | | |
Xtra Finance Corp. | | | 5.15 | | | 04/01/17 | | | 4,650,000 | | | | 4,958,588 | |
| Real Estate Management & Development | | | | | | | | | | | | | | |
Fishers Lane LLC (b) | | | 2.03 | | | 04/05/17 | | | 750,000 | | | | 751,275 | |
| Total Financials | | | | | | | | | | | | | 44,104,120 | |
| | | | |
| Health Care | 1.9% | | | | | | | | | | | | | | |
| Health Care Equipment & Supplies | | | | | | | | | | | | | | |
Baxter International Inc. | | | 0.95 | | | 06/01/16 | | | 825,000 | | | | 823,411 | |
Baxter International Inc. | | | 1.85 | | | 01/15/17 | | | 2,250,000 | | | | 2,264,792 | |
| Health Care Providers & Services | | | | | | | | | | | | | | |
UnitedHealth Group Inc. | | | 0.85 | | | 10/15/15 | | | 550,000 | | | | 550,431 | |
UnitedHealth Group Inc. | | | 1.40 | | | 12/15/17 | | | 825,000 | | | | 823,370 | |
| Pharmaceuticals | | | | | | | | | | | | | | |
Bristol-Myers Squibb Co. | | | 0.88 | | | 08/01/17 | | | 4,125,000 | | | | 4,107,069 | |
Johnson & Johnson | | | 1.13 | | | 11/21/17 | | | 750,000 | | | | 749,777 | |
Johnson & Johnson | | | 1.88 | | | 12/05/19 | | | 775,000 | | | | 776,097 | |
Merck & Co., Inc. | | | 1.85 | | | 02/10/20 | | | 475,000 | | | | 470,619 | |
| Total Health Care | | | | | | | | | | | | | 10,565,566 | |
| | | | |
| Industrials | 2.1% | | | | | | | | | | | | | | |
| Aerospace & Defense | | | | | | | | | | | | | | |
Rockwell Collins Inc. | | | 0.64 | (a) | | 12/15/16 | | | 1,175,000 | | | | 1,174,558 | |
United Technologies Corp. | | | 1.78 | | | 05/04/18 | | | 1,000,000 | | | | 1,002,558 | |
| Industrial Conglomerates | | | | | | | | | | | | | | |
General Electric Co. | | | 0.85 | | | 10/09/15 | | | 550,000 | | | | 550,805 | |
General Electric Co. | | | 5.25 | | | 12/06/17 | | | 3,900,000 | | | | 4,247,474 | |
| Machinery | | | | | | | | | | | | | | |
Caterpillar Inc. | | | 1.50 | | | 06/26/17 | | | 500,000 | | | | 504,697 | |
| Road & Rail | | | | | | | | | | | | | | |
Burlington Northern & Santa Fe Railway Co. | | | 4.58 | | | 01/15/21 | | | 547,621 | | | | 581,847 | |
Burlington Northern & Santa Fe Railway Co. | | | 4.83 | | | 01/15/23 | | | 95,734 | | | | 103,280 | |
Skyway Concession Co. LLC (b) | | | 0.56 | (a) | | 06/30/17 | | | 3,825,000 | | | | 3,686,344 | |
Union Pacific Railroad Co. | | | 6.85 | | | 01/02/19 | | | 31,004 | | | | 33,652 | |
| Total Industrials | | | | | | | | | | | | | 11,885,215 | |
| | | | |
| Information Technology | 4.0% | | | | | | | | | | | | | | |
| Communications Equipment | | | | | | | | | | | | | | |
Cisco Systems Inc. | | | 0.56 | (a) | | 03/03/17 | | | 1,650,000 | | | | 1,652,318 | |
Cisco Systems Inc. | | | 1.10 | | | 03/03/17 | | | 600,000 | | | | 601,648 | |
| IT Services | | | | | | | | | | | | | | |
Dun & Bradstreet Corp. | | | 2.88 | | | 11/15/15 | | | 990,000 | | | | 997,783 | |
| Software | | | | | | | | | | | | | | |
Microsoft Corp. | | | 0.88 | | | 11/15/17 | | | 250,000 | | | | 249,402 | |
Microsoft Corp. | | | 1.00 | | | 05/01/18 | | | 900,000 | | | | 894,409 | |
Microsoft Corp. | | | 1.63 | | | 12/06/18 | | | 675,000 | | | | 679,941 | |
Oracle Corp. | | | 0.47 | (a) | | 07/07/17 | | | 4,600,000 | | | | 4,599,048 | |
| Technology Hardware, Storage & Peripherals | | | | | | | | | | | | | | |
Intel Corp. | | | 1.35 | | | 12/15/17 | | | 950,000 | | | | 949,711 | |
Apple Inc. | | | 1.00 | | | 05/03/18 | | | 8,150,000 | | | | 8,058,924 | |
Apple Inc. | | | 1.05 | | | 05/05/17 | | | 1,650,000 | | | | 1,654,701 | |
Apple Inc. | | | 2.10 | | | 05/06/19 | | | 2,100,000 | | | | 2,120,389 | |
| Total Information Technology | | | | | | | | | | | | | 22,458,274 | |
| | | | |
| 28 | | Portfolio of Investments | | The accompanying notes are an integral part of these financial statements. |
Portfolio of Investments | Short-Term Bond Fund | June 30, 2015 | (Unaudited) (Continued)
| | | | | | | | | | | | | | |
Corporate Bonds | 30.3% of portfolio (Continued) | | | | | | | | | | |
| | | | |
| Materials | 1.8% | | Interest Rate | | | Maturity Date | | Face Amount | | | Value | |
| Chemicals | | | | | | | | | | | | | | |
PetroLogistics LP | | | 6.25 | % | | 04/01/20 | | $ | 9,680,000 | | | $ | 10,349,759 | |
| Total Materials | | | | | | | | | | | | | 10,349,759 | |
| | | | |
| Utilities | 7.3% | | | | | | | | | | | | | | |
| Electric Utilities | | | | | | | | | | | | | | |
Ameren Illinois Co. | | | 6.25 | | | 04/01/18 | | | 450,000 | | �� | | 504,316 | |
Ameren Illinois Co. | | | 6.20 | | | 06/15/16 | | | 5,000,000 | | | | 5,242,750 | |
Atlantic City Electric Co. | | | 4.35 | | | 04/01/21 | | | 1,625,000 | | | | 1,748,299 | |
Connecticut Light & Power Co. | | | 5.75 | | | 09/01/17 | | | 325,000 | | | | 353,658 | |
Duke Energy Indiana Inc. | | | 0.63 | (a) | | 07/11/16 | | | 1,450,000 | | | | 1,451,030 | |
Georgia Power Co. | | | 0.61 | (a) | | 03/15/16 | | | 850,000 | | | | 849,165 | |
Georgia Power Co. | | | 0.67 | (a) | | 08/15/16 | | | 4,100,000 | | | | 4,092,911 | |
Gulf Power Co. | | | 5.90 | | | 06/15/17 | | | 9,250,000 | | | | 10,043,539 | |
Public Service Co. of New Hampshire | | | 4.50 | | | 12/01/19 | | | 2,575,000 | | | | 2,812,685 | |
Southern California Edison Co. | | | 1.13 | | | 05/01/17 | | | 325,000 | | | | 324,604 | |
Southern California Edison Co. | | | 1.25 | | | 11/01/17 | | | 870,000 | | | | 869,052 | |
Southern California Edison Co. | | | 1.85 | | | 02/01/22 | | | 6,525,000 | | | | 6,514,638 | |
| Gas Utillities | | | | | | | | | | | | | | |
Questar Corp. | | | 2.75 | | | 02/01/16 | | | 2,825,000 | | | | 2,857,120 | |
Southern Natural Gas Company, LLC | | | 4.40 | | | 06/15/21 | | | 1,100,000 | | | | 1,134,597 | |
WGL Holdings Inc. | | | 2.25 | | | 11/01/19 | | | 2,125,000 | | | | 2,116,519 | |
| Total Utilities | | | | | | | | | | | | | 40,914,883 | |
| | | | |
| Telecomunication Services | 1.6% | | | | | | | | | | | | | | |
| Diversified Telecommunication Services | | | | | | | | | | | | | | |
AT&T Inc. | | | 0.80 | | | 12/01/15 | | | 675,000 | | | | 674,979 | |
AT&T Inc. | | | 0.90 | | | 02/12/16 | | | 6,425,000 | | | | 6,425,000 | |
Southwestern Bell Telephone Co. | | | 7.00 | | | 07/01/15 | | | 525,000 | | | | 525,000 | |
| Wireless Telecommunication Services | | | | | | | | | | | | | | |
Ameritech Capital Funding Corp. | | | 6.45 | | | 01/15/18 | | | 1,200,000 | | | | 1,331,362 | |
| Total Telecommunication Services | | | | | | | | | | | | | 8,956,341 | |
Total Corporate Bonds (Cost $169,025,720) | | | | | | | | | | | | | 169,770,551 | |
Yankee Bonds | 9.9% of portfolio | | | | | | | | | | |
Alibaba Group Holding Ltd. (b) | | | 2.50 | | | 11/28/19 | | | 1,275,000 | | | | 1,260,061 | |
African Development Bank | | | 6.88 | | | 10/15/15 | | | 4,825,000 | | | | 4,902,634 | |
Bayer US Finance LLC (b) | | | 1.50 | | | 10/06/17 | | | 350,000 | | | | 351,447 | |
Canadian National Railway Co. | | | 7.20 | | | 01/02/16 | | | 1,945,355 | | | | 2,000,942 | |
CNOOC Finance (2013) Ltd. | | | 1.13 | | | 05/09/16 | | | 2,680,000 | | | | 2,677,674 | |
CNOOC Nexen Finance (2014) ULC | | | 1.63 | | | 04/30/17 | | | 3,460,000 | | | | 3,464,446 | |
CNOOC Nexen Finance (2015) Australia Pty Ltd. | | | 2.63 | | | 05/05/20 | | | 425,000 | | | | 419,074 | |
Commonwealth Bank of Australia (b) | | | 1.53 | (a) | | 03/31/17 | | | 800,000 | | | | 801,374 | |
Compagnie de Financement Foncier | | | 0.23 | (a) | | 03/22/17 | | �� | 2,100,000 | | | | 2,070,625 | |
Daimler Finance NA LLC (b) | | | 1.25 | | | 01/11/16 | | | 1,175,000 | | | | 1,178,402 | |
Daimler Finance NA LLC (b) | | | 1.38 | | | 08/01/17 | | | 400,000 | | | | 399,368 | |
Daimler Finance NA LLC (b) | | | 0.62 | (a) | | 08/01/17 | | | 775,000 | | | | 774,010 | |
DEPFA ACS Bank (b) | | | 4.88 | | | 10/28/15 | | | 500,000 | | | | 506,593 | |
Dexia Municipal Agency | | | 5.25 | | | 02/16/17 | | | 1,100,000 | | | | 1,173,970 | |
Diageo Capital plc | | | 0.63 | | | 04/29/16 | | | 1,375,000 | | | | 1,373,050 | |
Eni Coordination Center SA | | | 4.80 | | | 08/10/15 | | | 1,775,000 | | | | 1,782,011 | |
Export-Import Bank of Korea | | | 0.98 | (a) | | 11/26/16 | | | 1,000,000 | | | | 1,000,547 | |
France Telecom | | | 2.13 | | | 09/16/15 | | | 825,000 | | | | 826,950 | |
GlaxoSmithKline Capital Corp. | | | 0.70 | | | 03/18/16 | | | 925,000 | | | | 926,384 | |
Hydro-Quebec | | | 6.27 | | | 01/03/26 | | | 80,000 | | | | 99,078 | |
| | | | | | |
| The accompanying notes are an integral part of these financial statements. | | Portfolio of Investments | | | 29 | |
Portfolio of Investments | Short-Term Bond Fund | June 30, 2015 | (Unaudited) (Continued)
| | | | | | | | | | | | | | |
Yankee Bonds | 9.9% of portfolio (Continued) | | | | | | | | | | |
| | | | |
| | | Interest Rate | | | Maturity Date | | Face Amount | | | Value | |
Hypothekenbank Frankfurt International SA | | | 0.22 | %(a) | | 07/12/16 | | $ | 930,000 | | | $ | 913,313 | |
ING Bank NV (b) | | | 2.00 | | | 09/25/15 | | | 2,625,000 | | | | 2,631,943 | |
International Bank for Reconstruction and Development | | | 0.00 | (d) | | 05/01/18 | | | 295,000 | | | | 280,111 | |
Mitsubishi Corp. | | | 2.75 | | | 09/16/15 | | | 300,000 | | | | 301,233 | |
Nexen Energy ULC | | | 5.65 | | | 05/15/17 | | | 220,000 | | | | 233,936 | |
NRAM plc (b) | | | 5.63 | | | 06/22/17 | | | 1,100,000 | | | | 1,191,933 | |
Shell International Finance BV | | | 1.90 | | | 08/10/18 | | | 3,175,000 | | | | 3,204,134 | |
Shell International Finance BV | | | 2.13 | | | 05/11/20 | | | 665,000 | | | | 663,432 | |
Sinopec Group Overseas Development (2014) Ltd.(b) | | | 1.75 | | | 04/10/17 | | | 1,075,000 | | | | 1,075,391 | |
Sinopec Group Overseas Development (2015) Ltd.(b) | | | 2.50 | | | 04/28/20 | | | 1,075,000 | | | | 1,062,646 | |
Statoil ASA | | | 1.25 | | | 11/09/17 | | | 2,500,000 | | | | 2,494,845 | |
Statoil ASA | | | 1.95 | | | 11/08/18 | | | 325,000 | | | | 326,520 | |
Total Capital Canada Ltd. | | | 0.66 | (a) | | 01/15/16 | | | 1,175,000 | | | | 1,177,136 | |
Total Capital International SA | | | 1.00 | | | 08/12/16 | | | 2,000,000 | | | | 2,003,452 | |
TransCanada PipeLines Ltd. | | | 0.75 | | | 01/15/16 | | | 3,575,000 | | | | 3,573,130 | |
TransCanada PipeLines Ltd. | | | 1.88 | | | 01/12/18 | | | 775,000 | | | | 779,763 | |
TransCanada PipeLines Ltd. | | | 1.07 | (a) | | 01/12/18 | | | 2,350,000 | | | | 2,355,248 | |
Vodafone Group plc | | | 0.66 | (a) | | 02/19/16 | | | 850,000 | | | | 849,561 | |
Volkswagen Group of America Finance LLC (b) | | | 1.25 | | | 05/23/17 | | | 1,650,000 | | | | 1,651,673 | |
Volkswagen International Finance NV (b) | | | 1.15 | | | 11/20/15 | | | 650,000 | | | | 651,463 | |
Total Yankee Bonds
(Cost $55,239,200) | | | | | | | | | | | | | 55,409,503 | |
Asset Backed Securities | 24.8% of portfolio | | | | | | | | | | |
Access Group Inc. 01 | | | 0.64 | (a) | | 05/25/29 | | | 1,177,553 | | | | 1,116,115 | |
Access Group Inc. 04-A | | | 0.54 | (a) | | 04/25/29 | | | 568,674 | | | | 560,109 | |
Access Group Inc. 05-B | | | 0.51 | (a) | | 07/25/22 | | | 175,938 | | | | 174,931 | |
Ally Master Owner Trust 13-1 | | | 0.64 | (a) | | 02/15/18 | | | 925,000 | | | | 925,181 | |
Ally Master Owner Trust 13-1 | | | 1.00 | | | 02/15/18 | | | 925,000 | | | | 926,175 | |
Ally Master Owner Trust 14-1 | | | 0.66 | (a) | | 01/15/19 | | | 1,450,000 | | | | 1,449,711 | |
Ally Master Owner Trust 14-1 | | | 1.29 | | | 01/15/19 | | | 1,725,000 | | | | 1,727,917 | |
Ally Master Owner Trust 14-2 | | | 0.56 | (a) | | 01/16/18 | | | 2,325,000 | | | | 2,322,691 | |
Ally Master Owner Trust 14-3 | | | 1.33 | | | 03/15/19 | | | 1,500,000 | | | | 1,503,335 | |
Ally Master Owner Trust 14-4 | | | 0.59 | (a) | | 06/17/19 | | | 4,025,000 | | | | 4,015,759 | |
Ally Master Owner Trust 14-4 | | | 1.43 | | | 06/17/19 | | | 4,075,000 | | | | 4,084,572 | |
Ally Master Owner Trust 14-5 | | | 0.68 | (a) | | 10/15/19 | | | 4,500,000 | | | | 4,509,374 | |
Ally Master Owner Trust 14-5 | | | 1.60 | | | 10/15/19 | | | 4,000,000 | | | | 4,016,220 | |
Ally Master Owner Trust 15-2 | | | 1.83 | | | 01/15/21 | | | 725,000 | | | | 721,772 | |
American Credit Acceptance Receivable 13-1 (b) | | | 1.45 | | | 04/16/18 | | | 131,720 | | | | 131,733 | |
Axis Equipment Finance Receivables LLC 13-1 (b) | | | 1.75 | | | 03/20/17 | | | 440,399 | | | | 440,447 | |
Axis Equipment Finance Receivables LLC 15-1A (b) | | | 1.90 | | | 03/20/20 | | | 1,500,000 | | | | 1,500,087 | |
Capital Auto Receivables Asset Trust 14-2 | | | 0.91 | | | 04/20/17 | | | 7,600,000 | | | | 7,600,464 | |
CCR Inc. MT-100 Payment Rights Master Trust 12-C (b) | | | 4.75 | | | 07/10/22 | | | 1,750,000 | | | | 1,736,401 | |
College Loan Corp Trust 07-2 | | | 0.53 | (a) | | 01/25/24 | | | 19,395,000 | | | | 18,682,292 | |
CPS Auto Trust 11-B (b) | | | 3.68 | | | 09/17/18 | | | 73,706 | | | | 74,391 | |
CPS Auto Trust 11-C (b) | | | 4.21 | | | 03/15/19 | | | 132,904 | | | | 135,010 | |
CPS Auto Trust 12-A (b) | | | 2.78 | | | 06/17/19 | | | 119,323 | | | | 120,688 | |
CPS Auto Trust 13-A (b) | | | 1.31 | | | 06/15/20 | | | 920,036 | | | | 917,588 | |
CPS Auto Trust 13-B (b) | | | 1.82 | | | 09/15/20 | | | 911,899 | | | | 912,213 | |
CPS Auto Trust 13-C (b) | | | 1.64 | | | 04/16/18 | | | 1,235,335 | | | | 1,237,875 | |
CPS Auto Trust 13-D (b) | | | 1.54 | | | 07/16/18 | | | 279,969 | | | | 280,381 | |
CPS Auto Trust 14-C (b) | | | 1.31 | | | 02/15/19 | | | 2,474,891 | | | | 2,474,429 | |
CPS Auto Trust 15-A (b) | | | 1.53 | | | 07/15/19 | | | 2,429,947 | | | | 2,439,971 | |
Credit Acceptance Auto Loan Trust 12-2 (b) | | | 2.21 | | | 09/15/20 | | | 550,000 | | | | 552,431 | |
Edlinc Student Loan Funding Trust 12-A (b) | | | 3.19 | (a) | | 10/01/25 | | | 4,149,081 | | | | 4,088,015 | |
Education Loan Asset Backed Trust 13-1 (b) | | | 1.19 | (a) | | 11/25/33 | | | 6,243,038 | | | | 5,832,983 | |
Element Rail Leasing I LLC 14-1 (b) | | | 2.30 | | | 04/19/44 | | | 3,115,452 | | | | 3,095,859 | |
Element Rail Leasing I LLC 15-1 (b) | | | 2.71 | | | 02/19/45 | | | 1,083,926 | | | | 1,084,478 | |
| | | | |
| 30 | | Portfolio of Investments | | The accompanying notes are an integral part of these financial statements. |
Portfolio of Investments | Short-Term Bond Fund | June 30, 2015 | (Unaudited) (Continued)
| | | | | | | | | | | | | | |
Asset Backed Securities | 24.8% of portfolio (Continued) | | | | | | | |
| | | | |
| | | Interest Rate | | | Maturity Date | | Face Amount | | | Value | |
Flagship Credit Auto Trust 13-2 (b) | | | 1.94 | % | | 01/15/19 | | $ | 751,919 | | | $ | 755,677 | |
Ford Credit Floorplan Master Owner Trust 13-5 | | | 1.50 | | | 09/15/18 | | | 3,325,000 | | | | 3,348,644 | |
Ford Credit Floorplan Master Owner Trust 13-5 | | | 0.66 | (a) | | 09/15/18 | | | 3,325,000 | | | | 3,330,300 | |
Ford Credit Floorplan Master Owner Trust 14-1 | | | 1.20 | | | 02/15/19 | | | 1,750,000 | | | | 1,749,958 | |
Ford Credit Floorplan Master Owner Trust 14-1 | | | 0.59 | (a) | | 02/15/19 | | | 1,750,000 | | | | 1,750,058 | |
FRS I LLC 13-1 (b) | | | 1.80 | | | 04/15/43 | | | 237,630 | | | | 235,376 | |
Goal Capital Funding Trust 06-1 | | | 0.40 | (a) | | 11/25/26 | | | 2,493,491 | | | | 2,476,715 | |
HLSS Servicer Advance Receivable 13-T5 (b) | | | 1.98 | | | 08/15/46 | | | 1,375,000 | | | | 1,373,625 | |
HLSS Servicer Advance Receivable 13-T7 (b) | | | 1.98 | | | 11/15/46 | | | 1,300,000 | | | | 1,293,500 | |
KeyCorp Student Loan Trust 00-A | | | 0.60 | (a) | | 05/25/29 | | | 902,106 | | | | 875,588 | |
KeyCorp Student Loan Trust 00-B | | | 0.59 | (a) | | 07/25/29 | | | 959,391 | | | | 910,890 | |
KeyCorp Student Loan Trust 04-A | | | 0.58 | (a) | | 10/28/41 | | | 885,789 | | | | 878,475 | |
KeyCorp Student Loan Trust 04-A | | | 0.71 | (a) | | 01/27/43 | | | 653,074 | | | | 574,623 | |
KeyCorp Student Loan Trust 05-A | | | 0.68 | (a) | | 09/27/40 | | | 543,405 | | | | 472,707 | |
KeyCorp Student Loan Trust 06-A | | | 0.47 | (a) | | 06/27/29 | | | 667,484 | | | | 665,684 | |
KeyCorp Student Loan Trust 06-A | | | 0.59 | (a) | | 09/27/35 | | | 1,300,000 | | | | 1,263,623 | |
Longtrain Leasing III LLC 2015-1A (b) | | | 2.98 | | | 01/15/45 | | | 765,618 | | | | 762,223 | |
Marriott Vacation Club Owners Trust 08-1A (b) | | | 7.20 | | | 05/20/30 | | | 101,176 | | | | 103,207 | |
National Collegiate Student Loan Trust 04-1 | | | 0.54 | (a) | | 06/25/27 | | | 922,800 | | | | 915,028 | |
National Collegiate Student Loan Trust 05-3 | | | 0.43 | (a) | | 07/25/28 | | | 64,985 | | | | 64,792 | |
National Collegiate Student Loan Trust 06-1 | | | 0.38 | (a) | | 05/25/26 | | | 88,687 | | | | 88,397 | |
One Main Financial Issuance Trust 14-2 (b) | | | 2.47 | | | 09/18/24 | | | 2,300,000 | | | | 2,312,213 | |
One Main Financial Issuance Trust 15-2A (b) | | | 2.57 | | | 07/18/25 | | | 500,000 | | | | 500,380 | |
SLC Student Loan Trust 06-A | | | 0.58 | (a) | | 07/15/36 | | | 3,275,000 | | | | 3,191,677 | |
SLC Student Loan Trust 06-A | | | 0.73 | (a) | | 07/15/36 | | | 6,250,000 | | | | 5,535,731 | |
SLM Student Loan Trust 03-A | | | 0.73 | (a) | | 09/15/20 | | | 2,158,833 | | | | 2,138,352 | |
SLM Student Loan Trust 03-B | | | 0.69 | (a) | | 03/15/22 | | | 3,858,393 | | | | 3,831,284 | |
SLM Student Loan Trust 04-A | | | 0.49 | (a) | | 03/16/20 | | | 150,195 | | | | 150,088 | |
SLM Student Loan Trust 04-B | | | 0.49 | (a) | | 06/15/21 | | | 477,100 | | | | 474,547 | |
SLM Student Loan Trust 04-B | | | 0.62 | (a) | | 03/15/24 | | | 5,275,000 | | | | 5,058,134 | |
SLM Student Loan Trust 05-A | | | 0.49 | (a) | | 06/15/23 | | | 3,359,422 | | | | 3,271,344 | |
SLM Student Loan Trust 06-A | | | 0.48 | (a) | | 12/15/23 | | | 1,635,153 | | | | 1,617,742 | |
SLM Student Loan Trust 07-A | | | 0.41 | (a) | | 09/15/25 | | | 1,441,026 | | | | 1,426,407 | |
Small Business Administration 02-20K | | | 5.08 | | | 11/01/22 | | | 36,019 | | | | 38,641 | |
Small Business Administration 05-10E | | | 4.54 | | | 09/01/15 | | | 5,285 | | | | 5,317 | |
Springcastle Funding Asset-Backed Notes 14-A (b) | | | 2.70 | | | 05/25/23 | | | 2,311,088 | | | | 2,325,230 | |
World Financial Network Credit Card Trust 13-B | | | 0.91 | | | 03/16/20 | | | 2,075,000 | | | | 2,075,556 | |
Total Asset Backed Securities (Cost $136,984,080) | | | | | | | | | | | | | 139,233,331 | |
Mortgage Backed Securities | 3.4% of portfolio | | | | | | | | | | |
Accredited Mortgage Loan Trust 03-1 | | | 4.33 | (a) | | 06/25/33 | | | 132,630 | | | | 126,031 | |
ACE Securities Corp. 06-ASL1 | | | 0.46 | (a) | | 02/25/36 | | | 385,684 | | | | 226,886 | |
ACE Securities Corp. 06-GP1 | | | 0.45 | (a) | | 02/25/31 | | | 41,659 | | | | 40,354 | |
ACE Securities Corp. 06-SL1 | | | 0.50 | (a) | | 09/25/35 | | | 139,462 | | | | 84,266 | |
Adjustable Rate Mortgage Trust 05-10 | | | 2.66 | (a) | | 01/25/36 | | | 84,980 | | | | 72,576 | |
American Business Financial Services 02-1 | | | 7.01 | | | 12/15/32 | | | 70,741 | | | | 68,814 | |
American Home Mortgage Investment Trust 05-01 | | | 2.42 | (a) | | 06/25/45 | | | 161,415 | | | | 159,290 | |
American Home Mortgage Investment Trust 05-03 | | | 4.97 | | | 09/25/35 | | | 20,038 | | | | 20,243 | |
Amresco Residential Securities 98-1 | | | 7.57 | | | 10/25/27 | | | 54,779 | | | | 62,683 | |
Banc of America Alternative Loan Trust Inc. 07-2 | | | 5.75 | | | 06/25/37 | | | 138,742 | | | | 108,294 | |
Banc of America Funding Corp. 04-A | | | 2.62 | (a) | | 09/20/34 | | | 14,713 | | | | 14,583 | |
Banc of America Funding Corp. 05-G | | | 4.72 | (a) | | 10/20/35 | | | 318,457 | | | | 302,077 | |
Banc of America Funding Corp. 07-5 | | | 6.50 | | | 07/25/37 | | | 42,132 | | | | 43,356 | |
Banc of America Mortgage Securities Inc. 02-J | | | 3.58 | (a) | | 09/25/32 | | | 2,886 | | | | 2,783 | |
Banc of America Mortgage Securities Inc. 05-1 | | | 5.00 | | | 02/25/20 | | | 12,784 | | | | 13,113 | |
Banc of America Mortgage Securities Inc. 05-C | | | 2.66 | (a) | | 04/25/35 | | | 33,074 | | | | 30,498 | |
Bayview Financial Acquisition Trust 06-D | | | 5.93 | | | 12/28/36 | | | 4,450,000 | | | | 4,339,102 | |
| | | | | | |
| The accompanying notes are an integral part of these financial statements. | | Portfolio of Investments | | | 31 | |
Portfolio of Investments | Short-Term Bond Fund | June 30, 2015 | (Unaudited) (Continued)
| | | | | | | | | | | | | | |
Mortgage Backed Securities | 3.4% of portfolio (Continued) | | | | | | | |
| | | | |
| | | Interest Rate | | | Maturity Date | | Face Amount | | | Value | |
Bayview Financial Asset Trust 07-SR1A (b) | | | 0.64 | %(a) | | 03/25/37 | | $ | 200,203 | | | $ | 173,502 | |
Bear Stearns Adjustable Rate Mortgage Trust 04-10 | | | 2.73 | (a) | | 01/25/35 | | | 275,562 | | | | 273,256 | |
Bear Stearns Adjustable Rate Mortgage Trust 05-12 | | | 5.39 | (a) | | 02/25/36 | | | 41,386 | | | | 38,596 | |
Bear Stearns ALT-A Trust 04-11 | | | 2.66 | (a) | | 11/25/34 | | | 18,474 | | | | 15,740 | |
Bear Stearns ALT-A Trust 05-4 | | | 2.58 | (a) | | 05/25/35 | | | 109,723 | | | | 106,142 | |
Bear Stearns ALT-A Trust 05-9 | | | 4.87 | (a) | | 11/25/35 | | | 56,131 | | | | 42,275 | |
Bear Stearns ALT-A Trust 06-6 | | | 2.72 | (a) | | 11/25/36 | | | 192,379 | | | | 147,578 | |
Bear Stearns Asset Backed Securities Trust 03-3 | | | 1.36 | (a) | | 06/25/43 | | | 55,432 | | | | 52,746 | |
Bear Stearns Asset Backed Securities Trust 04-HE5 | | | 2.06 | (a) | | 07/25/34 | | | 194,012 | | | | 181,273 | |
Bear Stearns Structured Products Inc., 00-1 (b) | | | 7.25 | (a) | | 08/28/33 | | | 2,941 | | | | 2,638 | |
CDC Mortgage Capital Trust 02-HE1 | | | 0.81 | (a) | | 01/25/33 | | | 318,992 | | | | 298,593 | |
Chase Mortgage Finance Corp. 05-A1 | | | 4.66 | (a) | | 12/25/35 | | | 12,489 | | | | 11,923 | |
Chaseflex Trust 05-2 | | | 6.00 | | | 06/25/35 | | | 112,843 | | | | 102,897 | |
CITICORP Mortgage Securities, Inc. 07-1 | | | 5.50 | | | 01/25/22 | | | 15,773 | | | | 15,842 | |
CITICORP Mortgage Securities, Inc. 07-1 | | | 5.89 | (c) | | 03/25/37 | | | 237,993 | | | | 252,229 | |
Citigroup Mortgage Loan Trust, Inc. 05-7 | | | 2.27 | (a) | | 09/25/35 | | | 266,416 | | | | 203,104 | |
Cityscape Home Equity Loan Trust 96-2 | | | 8.10 | | | 08/25/26 | | | 69,547 | | | | 69,713 | |
CMO Trust 17 | | | 7.25 | | | 04/20/18 | | | 39 | | | | 39 | |
Conseco Finance Securitizations Corp. 01-2 | | | 6.60 | | | 02/01/33 | | | 146,982 | | | | 152,628 | |
Contimortgage Home Equity Loan Trust 95-2 | | | 8.10 | | | 08/15/25 | | | 27,057 | | | | 25,804 | |
Countrywide Alternative Loan Trust 04-24CB | | | 6.00 | | | 11/25/34 | | | 55,131 | | | | 56,127 | |
Countrywide Alternative Loan Trust 05-11CB | | | 5.50 | | | 06/25/35 | | | 128,310 | | | | 128,588 | |
Countrywide Alternative Loan Trust 05-43 | | | 5.07 | (a) | | 10/25/35 | | | 37,574 | | | | 34,135 | |
Countrywide Asset Backed Certificate 02-S2 | | | 5.98 | | | 01/25/17 | | | 100,789 | | | | 101,349 | |
Countrywide Asset Backed Certificate 02-S4 | | | 5.22 | (a) | | 10/25/17 | | | 137,704 | | | | 137,565 | |
Countrywide Asset Backed Certificate 04-S1 | | | 5.12 | | | 02/25/35 | | | 40,708 | | | | 41,456 | |
Countrywide Asset Backed Certificate 06-S7 | | | 5.71 | (a) | | 11/25/35 | | | 109,671 | | | | 106,937 | |
Countrywide Asset Backed Certificate 07-S1 | | | 5.69 | | | 11/25/36 | | | 75,268 | | | | 72,546 | |
Countrywide Home Loans 03-49 | | | 2.43 | (a) | | 12/19/33 | | | 31,369 | | | | 31,932 | |
Countrywide Home Loans 05-HYB8 | | | 4.26 | (a) | | 12/20/35 | | | 108,711 | | | | 96,611 | |
Countrywide Home Loans 06-HYB5 | | | 2.40 | (a) | | 09/20/36 | | | 64,255 | | | | 56,711 | |
Credit Suisse First Boston Mortgage 03-21 | | | 4.75 | | | 08/25/18 | | | 23,159 | | | | 23,416 | |
Credit Suisse First Boston Mortgage 03-AR24 | | | 2.56 | (a) | | 10/25/33 | | | 219,796 | | | | 216,842 | |
Credit Suisse First Boston Mortgage 03-FFA | | | 5.91 | (a) | | 02/25/33 | | | 48,148 | | | | 47,797 | |
Credit Suisse First Boston Mortgage 04-AR3 | | | 2.51 | (a) | | 04/25/34 | | | 64,175 | | | | 65,432 | |
Credit Suisse First Boston Mortgage 05-10 | | | 5.25 | | | 11/25/20 | | | 71,335 | | | | 71,927 | |
Credit Suisse First Boston Mortgage 06-2 | | | 5.91 | (a) | | 07/25/36 | | | 1,120,000 | | | | 117,060 | |
DLJ Mortgage Acceptance Corp. 91-3 | | | 1.96 | (a) | | 01/25/21 | | | 7,066 | | | | 7,128 | |
Encore Credit Receivables Trust 05-3 | | | 0.67 | (a) | | 10/25/35 | | | 675,000 | | | | 659,600 | |
FHLMC 2419 | | | 5.50 | | | 03/15/17 | | | 1,629 | | | | 1,662 | |
FHLMC 2649 | | | 4.50 | | | 07/15/18 | | | 78,724 | | | | 81,867 | |
FHLMC 780754 | | | 2.38 | (a) | | 08/01/33 | | | 4,306 | | | | 4,590 | |
First Alliance Mortgage Loan Trust 94-1 | | | 5.85 | | | 04/25/25 | | | 15,591 | | | | 15,628 | |
First Alliance Mortgage Loan Trust 94-2 | | | 7.63 | | | 07/25/25 | | | 622 | | | | 621 | |
First Horizon Mortgage Alternative Mortgage Securities 04-AA3 | | | 2.20 | (a) | | 09/25/34 | | | 26,473 | | | | 25,859 | |
First Horizon Mortgage Pass-Through Trust 05-AR2 | | | 2.95 | (a) | | 05/25/35 | | | 134,588 | | | | 124,926 | |
FNMA 03-38 | | | 5.00 | | | 03/25/23 | | | 10,172 | | | | 10,421 | |
FNMA 03-86 | | | 4.50 | | | 09/25/18 | | | 49,911 | | | | 50,896 | |
FNMA 813842 | | | 1.84 | (a) | | 01/01/35 | | | 18,558 | | | | 19,507 | |
GMAC Mortgage Corp. Loan Trust 06-HE3 | | | 5.75 | | | 10/25/36 | | | 42,409 | | | | 41,416 | |
GMAC Mortgage Corp. Loan Trust 07-HE1 | | | 5.95 | | | 08/25/37 | | | 1,100,000 | | | | 1,014,240 | |
GNMA 02-15 | | | 5.50 | | | 11/20/31 | | | 1,160 | | | | 1,161 | |
GNMA 03-11 | | | 4.00 | | | 10/17/29 | | | 102,611 | | | | 109,095 | |
GNMA 03-12 | | | 4.50 | | | 02/20/32 | | | 4,797 | | | | 4,847 | |
GNMA 03-26 | | | 0.63 | (a) | | 04/16/33 | | | 12,250 | | | | 12,323 | |
GNMA 04-17 | | | 4.50 | | | 12/20/33 | | | 21,042 | | | | 22,549 | |
GNMA 583189 | | | 4.50 | | | 02/20/17 | | | 6,272 | | | | 6,595 | |
Green Tree Financial Corp. 98-5 | | | 6.22 | | | 03/01/30 | | | 101,939 | | | | 108,033 | |
GS Mortgage Loan Trust 03-10 | | | 2.36 | (a) | | 10/25/33 | | | 118,705 | | | | 118,445 | |
GS Mortgage Loan Trust 05-8F | | | 5.50 | | | 10/25/20 | | | 26,400 | | | | 26,964 | |
| | | | |
| 32 | | Portfolio of Investments | | The accompanying notes are an integral part of these financial statements. |
Portfolio of Investments | Short-Term Bond Fund | June 30, 2015 | (Unaudited) (Continued)
| | | | | | | | | | | | | | |
Mortgage Backed Securities | 3.4% of portfolio (Continued) | | | | | | | |
| | | | |
| | | Interest Rate | | | Maturity Date | | Face Amount | | | Value | |
GS Mortgage Loan Trust 05-AR3 | | | 2.63 | %(a) | | 05/25/35 | | $ | 72,535 | | | $ | 67,079 | |
GS Mortgage Loan Trust 05-AR6 | | | 2.73 | (a) | | 09/25/35 | | | 48,559 | | | | 48,771 | |
Home Equity Mortgage Trust 06-1 | | | 5.80 | | | 05/25/36 | | | 1,016,124 | | | | 802,856 | |
Home Savings of America 9 | | | 3.75 | (a) | | 11/25/17 | | | 38,494 | | | | 38,851 | |
Home Savings of America 11 | | | 4.80 | (a) | | 01/25/18 | | | 39,016 | | | | 39,323 | |
IMPAC Secured Assets Corp. 03-3 | | | 5.08 | (a) | | 08/25/33 | | | 129,241 | | | | 135,472 | |
Indymac Indx Mortgage Loan Trust 04-AR6 | | | 2.65 | (a) | | 10/25/34 | | | 7,501 | | | | 7,319 | |
Indymac Indx Mortgage Loan Trust 05-AR15 | | | 4.53 | (a) | | 09/25/35 | | | 37,185 | | | | 31,689 | |
Indymac Residential Mortgage-Backed Trust 05-L1 (g) | | | 0.59 | (a) | | 07/25/13 | | | 191,221 | | | | 110,210 | |
JP Morgan Mortgage Trust 05-A2 | | | 2.14 | (a) | | 04/25/35 | | | 212,926 | | | | 207,837 | |
Lehman ABS Manufactured Housing Contract 01-B | | | 4.35 | | | 04/15/40 | | | 54,830 | | | | 56,404 | |
Master Adjustable Rate Mortgages Trust 04-13 | | | 2.67 | (a) | | 04/21/34 | | | 23,694 | | | | 23,848 | |
Master Adjustable Rate Mortgages Trust 05-1 | | | 2.86 | (a) | | 01/25/35 | | | 18,339 | | | | 18,260 | |
Master Alternative Loans Trust 03-5 | | | 6.00 | | | 08/25/33 | | | 46,077 | | | | 49,082 | |
Master Asset Backed Securities Trust 07-NCW (b) | | | 0.48 | (a) | | 05/25/37 | | | 442,220 | | | | 395,060 | |
Master Asset Securitization Trust 03-6 | | | 5.00 | | | 07/25/18 | | | 5,397 | | | | 5,511 | |
Master Asset Securitization Trust 07-1 | | | 6.00 | | | 10/25/22 | | | 16,197 | | | | 15,934 | |
Merrill Lynch Mortgage Investors Trust 03-A2 | | | 1.91 | (a) | | 02/25/33 | | | 39,324 | | | | 37,860 | |
Merrill Lynch Mortgage Investors Trust 06-SL1 | | | 0.54 | (a) | | 09/25/36 | | | 165,521 | | | | 159,019 | |
Morgan Stanley Capital Inc. 04-1 | | | 5.00 | | | 11/25/18 | | | 27,033 | | | | 27,318 | |
Morgan Stanley Mortgage Loan Trust 05-5AR | | | 4.94 | (a) | | 09/25/35 | | | 37,228 | | | | 27,987 | |
Morgan Stanley Mortgage Loan Trust 06-1AR | | | 2.85 | (a) | | 02/25/36 | | | 124,547 | | | | 97,644 | |
Morgan Stanley Mortgage Loan Trust 07-10XS | | | 6.00 | | | 07/25/47 | | | 611,578 | | | | 200,309 | |
New Century Home Equity Loan Trust 97-NC5 | | | 6.35 | (a) | | 10/25/28 | | | 10 | | | | 10 | |
Nomura Asset Acceptance Corporation 06-AF2 | | | 0.28 | (a) | | 08/25/36 | | | 173,815 | | | | 69,907 | |
Nomura Asset Acceptance Corporation 07-1 | | | 5.96 | | | 03/25/47 | | | 194,659 | | | | 196,749 | |
Oakwood Mortgage Investors, Inc. 99-D | | | 7.84 | | | 11/15/29 | | | 260,482 | | | | 268,088 | |
Oakwood Mortgage Investors, Inc. 02-A (g) | | | 0.44 | (a) | | 09/15/14 | | | 129,726 | | | | 114,477 | |
Option One Mortgage Loan Trust 07-FXD2 | | | 5.90 | | | 03/25/37 | | | 15,076 | | | | 13,851 | |
Ownit Mortgage Loan Asset Backed Certificate 05-5 | | | 0.47 | (a) | | 10/25/36 | | | 202,059 | | | | 200,562 | |
Prime Mortgage Trust 05-2 | | | 5.00 | | | 07/25/20 | | | 19,734 | | | | 19,993 | |
Residential Accredit Loans, Inc. 02-QS9 | | | 0.79 | (a) | | 07/25/32 | | | 3,725 | | | | 3,395 | |
Residential Accredit Loans, Inc. 05-QS5 | | | 5.70 | | | 04/25/35 | | | 34,564 | | | | 32,556 | |
Residential Accredit Loans, Inc. 06-QS4 | | | 6.00 | | | 04/25/36 | | | 303,909 | | | | 262,337 | |
Residential Asset Mortgage Products Inc. 02-RS5 | | | 4.75 | | | 09/25/32 | | | 117,324 | | | | 117,831 | |
Residential Asset Mortgage Products Inc. 03-RZ3 | | | 4.62 | | | 06/25/33 | | | 99,130 | | | | 95,404 | |
Residential Asset Securitization Trust 04-A3 | | | 5.25 | | | 06/25/34 | | | 31,382 | | | | 32,352 | |
Residential Asset Securitization Trust 05-A14 | | | 5.50 | | | 12/25/35 | | | 139,367 | | | | 120,228 | |
Residential Funding Mortgage Securities 00-HI5 | | | 7.98 | | | 12/25/25 | | | 124,439 | | | | 123,796 | |
Residential Funding Mortgage Securities I 03-S15 | | | 4.50 | | | 08/25/18 | | | 13,611 | | | | 13,833 | |
Residential Funding Mortgage Securities I 05-SA2 | | | 2.86 | (a) | | 06/25/35 | | | 35,185 | | | | 29,831 | |
Residential Funding Mortgage Securities I 06-SA1 | | | 3.78 | (a) | | 02/25/36 | | | 36,996 | | | | 33,212 | |
Ryland Acceptance Corp. 64 E | | | 3.50 | (a) | | 04/01/18 | | | 14,926 | | | | 14,984 | |
SACO I Trust 05-6 | | | 0.76 | (a) | | 09/25/35 | | | 73,156 | | | | 72,793 | |
Salomon Brothers Mortgage Securities 97-LB6 | | | 6.82 | | | 12/25/27 | | | 8 | | | | 8 | |
Structured Adjustable Rate Mortgage Loan Trust 04-3AC | | | 2.40 | (a) | | 03/25/34 | | | 18,160 | | | | 18,211 | |
Structured Adjustable Rate Mortgage Loan Trust 04-4 | | | 2.39 | (a) | | 04/25/34 | | | 462,985 | | | | 456,100 | |
Structured Adjustable Rate Mortgage Loan Trust 04-11 | | | 2.52 | (a) | | 08/25/34 | | | 35,582 | | | | 35,395 | |
Structured Adjustable Rate Mortgage Loan Trust 04-18 | | | 2.60 | (a) | | 12/25/34 | | | 75,043 | | | | 54,158 | |
Structured Adjustable Rate Mortgage Loan Trust 05-11 | | | 2.54 | (a) | | 05/25/35 | | | 313,187 | | | | 290,068 | |
Structured Adjustable Rate Mortgage Loan Trust 06-1 | | | 2.43 | (a) | | 02/25/36 | | | 28,609 | | | | 25,123 | |
Structured Adjustable Rate Mortgage Loan Trust 06-4 | | | 4.50 | (a) | | 05/25/36 | | | 74,582 | | | | 58,078 | |
Structured Adjustable Rate Mortgage Loan Trust 06-4 | | | 5.08 | (a) | | 05/25/36 | | | 79,517 | | | | 68,614 | |
Structured Asset Mortgage Investments 04-AR5 | | | 2.18 | (a) | | 10/19/34 | | | 26,231 | | | | 25,729 | |
Structured Asset Securities Corp. 98-RF1 (b) | | | 6.60 | (a) | | 04/15/27 | | | 25,571 | | | | 25,650 | |
Structured Asset Securities Corp. 03-37A | | | 2.46 | (a) | | 12/25/33 | | | 163,039 | | �� | | 159,538 | |
Structured Asset Securities Corp. 04-3 | | | 5.22 | (a) | | 03/25/24 | | | 119,803 | | | | 123,055 | |
Terwin Mortgage Trust 04-5HE | | | 1.07 | (a) | | 06/25/35 | | | 471,910 | | | | 445,552 | |
Vanderbilt Mortgage & Finance 03-A | | | 0.83 | (a) | | 05/07/26 | | | 63,269 | | | | 62,332 | |
Wachovia Mortgage Loan Trust 06-A | | | 2.70 | (a) | | 05/20/36 | | | 116,516 | | | | 111,195 | |
| | | | | | |
| The accompanying notes are an integral part of these financial statements. | | Portfolio of Investments | | | 33 | |
Portfolio of Investments | Short-Term Bond Fund | June 30, 2015 | (Unaudited) (Continued)
| | | | | | | | | | | | | | |
Mortgage Backed Securities | 3.4% of portfolio (Continued) | | | | | | | |
| | | | |
| | | Interest Rate | | | Maturity Date | | Face Amount | | | Value | |
Washington Mutual Mortgage Securities Corp. 04-AR3 | | | 2.46 | %(a) | | 06/25/34 | | $ | 46,716 | | | $ | 47,202 | |
Washington Mutual Mortgage Securities Corp. 04-AR14 | | | 2.39 | (a) | | 01/25/35 | | | 81,823 | | | | 82,446 | |
Washington Mutual MSC Mortgage Pass-Through Certificates 03-MS2 | | | 5.00 | | | 03/25/18 | | | 13,490 | | | | 13,678 | |
Wells Fargo Mortgage Backed Securities Trust 04-B | | | 2.49 | (a) | | 02/25/34 | | | 13,154 | | | | 13,126 | |
Wells Fargo Mortgage Backed Securities Trust 04-E | | | 2.75 | (a) | | 05/25/34 | | | 18,408 | | | | 18,400 | |
Wells Fargo Mortgage Backed Securities Trust 04-EE | | | 2.60 | (a) | | 12/25/34 | | | 16,016 | | | | 16,134 | |
Wells Fargo Mortgage Backed Securities Trust 04-F | | | 2.60 | (a) | | 06/25/34 | | | 56,473 | | | | 57,297 | |
Wells Fargo Mortgage Backed Securities Trust 04-I | | | 2.61 | (a) | | 07/25/34 | | | 3,665 | | | | 3,697 | |
Wells Fargo Mortgage Backed Securities Trust 04-K | | | 2.74 | (a) | | 07/25/34 | | | 76,306 | | | | 76,468 | |
Wells Fargo Mortgage Backed Securities Trust 04-K | | | 2.73 | (a) | | 07/25/34 | | | 30,979 | | | | 31,225 | |
Wells Fargo Mortgage Backed Securities Trust 04-K | | | 2.73 | (a) | | 07/25/34 | | | 34,463 | | | | 34,660 | |
Wells Fargo Mortgage Backed Securities Trust 04-R | | | 2.62 | (a) | | 09/25/34 | | | 40,375 | | | | 40,881 | |
Wells Fargo Mortgage Backed Securities Trust 05-AR14 | | | 4.89 | (a) | | 08/25/35 | | | 18,786 | | | | 18,596 | |
Wells Fargo Mortgage Backed Securities Trust 05-AR15 | | | 2.62 | (a) | | 09/25/35 | | | 162,210 | | | | 160,391 | |
Wells Fargo Mortgage Backed Securities Trust 05-AR16 | | | 5.23 | (a) | | 10/25/35 | | | 36,240 | | | | 35,654 | |
Wells Fargo Mortgage Backed Securities Trust 06-AR4 | | | 5.68 | (a) | | 04/25/36 | | | 30,800 | | | | 30,527 | |
Wells Fargo Mortgage Backed Securities Trust 06-AR19 | | | 5.59 | (a) | | 12/25/36 | | | 20,234 | | | | 19,539 | |
Total Mortgage Backed Securities
(Cost $20,159,180) | | | | | | | | | | | | | 18,854,830 | |
Municipal Bonds | 22.7% of portfolio | | | | | | | | | | | |
Alaska Housing Finance Corp. | | | 2.80 | | | 12/01/26 | | | 270,000 | | | | 274,644 | |
Alaska Housing Finance Corp. | | | 0.98 | (a) | | 06/01/43 | | | 5,150,000 | | | | 5,165,914 | |
Alaska Student Loan Corp. | | | 0.69 | (a) | | 08/25/31 | | | 1,058,540 | | | | 1,057,354 | |
Atlantic City NJ | | | 4.00 | | | 11/01/16 | | | 400,000 | | | | 366,604 | |
Austin TX | | | 1.58 | | | 09/01/17 | | | 3,250,000 | | | | 3,273,043 | |
California, State of | | | 1.05 | | | 02/01/16 | | | 925,000 | | | | 927,710 | |
Colorado Housing & Finance Authority | | | 1.17 | | | 05/01/17 | | | 1,625,000 | | | | 1,619,410 | |
Colorado Housing & Finance Authority | | | 1.69 | | | 05/01/18 | | | 1,605,000 | | | | 1,601,164 | |
Colorado State Department of Corrections | | | 2.26 | | | 09/01/17 | | | 3,375,000 | | | | 3,437,471 | |
Desert Sands California Unified School District | | | 2.28 | | | 06/01/19 | | | 375,000 | | | | 373,283 | |
Energy Northwest, WA | | | 1.06 | | | 07/01/15 | | | 350,000 | | | | 350,000 | |
Energy Northwest, WA | | | 2.15 | | | 07/01/18 | | | 850,000 | | | | 867,230 | |
Florida Hurricane Catastrophe Fund Finance Corp. | | | 1.30 | | | 07/01/16 | | | 1,750,000 | | | | 1,758,453 | |
Illinois Housing Development Authority | | | 1.14 | | | 01/01/16 | | | 305,000 | | | | 304,854 | |
Illinois, State of Sales Tax Revenue | | | 1.36 | | | 06/15/16 | | | 2,200,000 | | | | 2,210,142 | |
Illinois, State of Sales Tax Revenue | | | 2.23 | | | 06/15/19 | | | 3,625,000 | | | | 3,589,983 | |
Indiana Bond Bank | | | 1.48 | | | 01/15/17 | | | 1,285,000 | | | | 1,294,933 | |
Indiana Bond Bank | | | 2.08 | | | 01/15/19 | | | 300,000 | | | | 301,107 | |
Indianapolis, Indiana Local Public Improvement Bond Bank | | | 1.58 | | | 06/01/16 | | | 600,000 | | | | 602,802 | |
Jackson Tennessee Energy Authority | | | 1.15 | | | 04/01/16 | | | 400,000 | | | | 401,176 | |
Jersey City, NJ | | | 1.51 | | | 09/01/16 | | | 950,000 | | | | 952,451 | |
Jobsohio Beverage System, OH | | | 1.57 | | | 01/01/17 | | | 925,000 | | | | 933,057 | |
Lehigh County Authority PA | | | 3.44 | | | 12/01/18 | | | 3,825,000 | | | | 3,935,275 | |
Massachusetts Housing Finance Agency | | | 1.17 | | | 12/01/15 | | | 230,000 | | | | 230,301 | |
Massachusetts Housing Finance Agency | | | 1.31 | | | 06/01/16 | | | 145,000 | | | | 145,394 | |
Mississippi, State of | | | 2.40 | | | 10/01/22 | | | 225,000 | | | | 222,318 | |
Monroe County, NY Industrial Development Corp. | | | 2.60 | | | 01/15/16 | | | 265,000 | | | | 265,024 | |
New Jersey Economic Development Authority | | | 0.00 | (d) | | 02/15/16 | | | 6,675,000 | | | | 6,584,354 | |
New Jersey Economic Development Authority | | | 1.06 | | | 03/01/16 | | | 1,400,000 | | | | 1,395,506 | |
New Jersey Economic Development Authority | | | 0.00 | (d) | | 02/15/17 | | | 950,000 | | | | 912,637 | |
New Jersey Economic Development Authority | | | 0.00 | (d) | | 02/15/18 | | | 3,125,000 | | | | 2,877,406 | |
New Jersey Economic Development Authority | | | 0.00 | (d) | | 02/15/19 | | | 1,290,000 | | | | 1,133,368 | |
New Jersey Economic Development Authority | | | 0.00 | (d) | | 02/15/20 | | | 10,450,000 | | | | 8,680,502 | |
New Jersey Economic Development Authority | | | 0.00 | (d) | | 02/15/21 | | | 1,350,000 | | | | 1,053,945 | |
New Jersey Economic Development Authority | | | 0.00 | % | | 02/15/22 | | | 755,000 | | | | 562,973 | |
New Orleans Louisiana | | | 2.12 | | | 09/01/17 | | | 825,000 | | | | 828,473 | |
| | | | |
| 34 | | Portfolio of Investments | | The accompanying notes are an integral part of these financial statements. |
Portfolio of Investments | Short-Term Bond Fund | June 30, 2015 | (Unaudited) (Continued)
| | | | | | | | | | | | | | |
Municipal Bonds | 22.7% of portfolio (Continued) | | | | | | | | | | | |
| | | | |
| | | Interest Rate | | | Maturity Date | | Face Amount | | | Value | |
New Orleans Louisiana | | | 2.80 | % | | 09/01/19 | | $ | 1,725,000 | | | $ | 1,739,990 | |
New York City, NY Transitional Finance Authority | | | 1.80 | | | 08/01/18 | | | 1,475,000 | | | | 1,484,809 | |
New York City, NY Transitional Finance Authority | | | 1.85 | | | 05/01/19 | | | 2,025,000 | | | | 2,012,972 | |
New York City, NY Transitional Finance Authority | | | 2.45 | | | 08/01/20 | | | 1,000,000 | | | | 1,014,560 | |
New York City, NY Transitional Finance Authority | | | 2.75 | | | 11/01/20 | | | 2,695,000 | | | | 2,750,760 | |
New York City, NY Transitional Finance Authority | | | 2.85 | | | 02/01/21 | | | 2,775,000 | | | | 2,845,402 | |
New York State Urban Development Corp. | | | 2.35 | | | 03/15/20 | | | 4,350,000 | | | | 4,385,366 | |
North Carolina Housing Finance Agency | | | 4.00 | | | 01/01/30 | | | 1,535,000 | | | | 1,554,694 | |
North Carolina State Education Assistance Authority | | | 0.99 | (a) | | 07/25/39 | | | 915,915 | | | | 918,810 | |
Oakland California Redevelopment Agency | | | 7.25 | | | 09/01/15 | | | 400,000 | | | | 403,348 | |
Oklahoma Student Loan Authority | | | 0.69 | (a) | | 02/25/32 | | | 875,272 | | | | 875,298 | |
Pennsylvania Higher Education Assistance Agency (b) | | | 0.74 | (a) | | 05/25/27 | | | 363,563 | | | | 364,904 | |
Philadelphia Pennsylvania Authority for Industrial Development | | | 0.00 | (d) | | 04/15/18 | | | 9,400,000 | | | | 8,799,810 | |
Philadelphia Pennsylvania Authority for Industrial Development | | | 0.00 | (d) | | 04/15/19 | | | 2,500,000 | | | | 2,254,075 | |
Philadelphia Pennsylvania Authority for Industrial Development | | | 0.00 | (d) | | 04/15/20 | | | 5,285,000 | | | | 4,544,043 | |
Puerto Rico, Commonwealth of | | | 5.00 | | | 07/01/15 | | | 1,325,000 | | | | 1,325,000 | |
Puerto Rico, Commonwealth of | | | 5.65 | | | 07/01/15 | | | 250,000 | | | | 250,000 | |
Puerto Rico, Commonwealth of | | | 5.50 | | | 07/01/16 | | | 1,250,000 | | | | 1,269,012 | |
Puerto Rico, Commonwealth of | | | 5.50 | | | 07/01/17 | | | 320,000 | | | | 321,302 | |
Puerto Rico, Commonwealth of | | | 5.50 | | | 07/01/17 | | | 230,000 | | | | 237,900 | |
Puerto Rico, Commonwealth of | | | 5.50 | | | 07/01/18 | | | 340,000 | | | | 341,234 | |
Puerto Rico, Commonwealth of | | | 5.25 | | | 07/01/18 | | | 390,000 | | | | 405,374 | |
Puerto Rico Electric Power Authority | | | 5.00 | | | 07/01/15 | | | 375,000 | | | | 375,000 | |
Puerto Rico Electric Power Authority | | | 5.00 | | | 07/01/17 | | | 330,000 | | | | 334,349 | |
Puerto Rico Electric Power Authority | | | 5.50 | | | 07/01/17 | | | 500,000 | | | | 511,300 | |
Puerto Rico Government Development Bank | | | 4.75 | | | 12/01/15 | | | 330,000 | | | | 330,000 | |
Puerto Rico Highway & Transportation Authority | | | 5.50 | | | 07/01/16 | | | 875,000 | | | | 899,972 | |
Puerto Rico Highway & Transportation Authority | | | 5.50 | | | 07/01/17 | | | 725,000 | | | | 758,973 | |
Puerto Rico Highway & Transportation Authority | | | 6.00 | | | 07/01/18 | | | 420,000 | | | | 441,609 | |
Puerto Rico Highway & Transportation Authority | | | 5.50 | | | 07/01/19 | | | 475,000 | | | | 501,011 | |
Puerto Rico Highway & Transportation Authority | | | 6.25 | | | 07/01/21 | | | 2,400,000 | | | | 2,620,560 | |
Puerto Rico Sales Tax Financing Corp. | | | 5.25 | | | 08/01/19 | | | 3,175,000 | | | | 2,026,507 | |
Puerto Rico Sales Tax Financing Corp. | | | 4.38 | | | 08/01/20 | | | 905,000 | | | | 548,249 | |
Puerto Rico Sales Tax Financing Corp. | | | 3.38 | | | 08/01/16 | | | 575,000 | | | | 444,044 | |
South Carolina Student Loan Corp. | | | 0.40 | (a) | | 12/01/20 | | | 146,674 | | | | 146,134 | |
Stockton California Pension Obligation | | | 5.14 | | | 09/01/17 | | | 1,125,000 | | | | 1,130,917 | |
Utah Infrastructure Agency | | | 3.20 | | | 10/15/16 | | | 345,000 | | | | 349,323 | |
University of California | | | 2.85 | | | 05/15/20 | | | 540,000 | | | | 554,661 | |
Utility Debt Securitization Authority, NY | | | 2.04 | | | 06/15/21 | | | 250,000 | | | | 251,302 | |
Vermont Student Assistance Corp. | | | 0.89 | (a) | | 07/28/34 | | | 1,228,943 | | | | 1,236,820 | |
Village of Rosemont Illinois | | | 2.14 | | | 12/01/16 | | | 1,375,000 | | | | 1,387,485 | |
Village of Rosemont Illinois | | | 2.77 | | | 12/01/18 | | | 1,375,000 | | | | 1,390,785 | |
Virginia Housing Development Authority | | | 1.11 | | | 10/01/16 | | | 550,000 | | | | 551,397 | |
Washington Economic Development Finance Authority | | | 3.20 | | | 10/01/15 | | | 2,350,000 | | | | 2,357,543 | |
Wayne County Michigan | | | 3.25 | | | 12/01/15 | | | 5,075,000 | | | | 5,080,481 | |
Wayne County Michigan | | | 4.25 | | | 12/01/16 | | | 1,138,000 | | | | 1,159,759 | |
Wayne County Michigan Building Authority | | | 6.82 | | | 12/01/15 | | | 730,000 | | | | 725,715 | |
Wayne County Michigan Building Authority | | | 7.33 | | | 12/01/16 | | | 740,000 | | | | 724,978 | |
Total Municipal Bonds
(Cost $128,204,273) | | | | | | | | | | | | | 127,427,798 | |
U.S. Government and Agency Obligations | 6.5% of portfolio | | | | | | | | | | | |
Overseas Private Investment Corp. | | | 3.56 | (e) | | 04/23/17 | | | 1,000,000 | | | | 1,241,250 | |
Overseas Private Investment Corp. | | | 1.50 | (f) | | 11/17/17 | | | 1,100,000 | | | | 1,166,245 | |
Overseas Private Investment Corp. | | | 1.30 | | | 06/15/19 | | | 685,714 | | | | 685,582 | |
| | | | | | |
| The accompanying notes are an integral part of these financial statements. | | Portfolio of Investments | | | 35 | |
Portfolio of Investments | Short-Term Bond Fund | June 30, 2015 | (Unaudited) (Continued)
| | | | | | | | | | | | | | |
U.S. Government and Agency Obligations | 6.5% of portfolio (Continued) | | | | | | | | |
| | | | |
| | | Interest Rate | | | Maturity Date | | Face Amount | | | Value | |
Overseas Private Investment Corp. | | | 0.83 | (f)% | | 11/08/19 | | $ | 1,375,000 | | | $ | 1,375,549 | |
Overseas Private Investment Corp. | | | 1.50 | (f) | | 11/15/20 | | | 1,075,000 | | | | 1,126,428 | |
Overseas Private Investment Corp. | | | 2.52 | | | 09/15/22 | | | 1,750,000 | | | | 1,768,826 | |
Tennessee Valley Authority | | | 0.00 | (d) | | 06/15/21 | | | 595,000 | | | | 514,438 | |
U.S. Department of Housing & Urban Development | | | 1.88 | | | 08/01/19 | | | 950,000 | | | | 949,306 | |
U.S. Department of Housing & Urban Development | | | 6.07 | | | 08/01/21 | | | 80,000 | | | | 80,175 | |
U.S. Department of Housing & Urban Development | | | 6.12 | | | 08/01/22 | | | 525,000 | | | | 526,412 | |
U.S. Treasury Notes | | | 0.75 | | | 01/15/17 | | | 5,225,000 | | | | 5,242,143 | |
U.S. Treasury Notes | | | 0.75 | | | 03/15/17 | | | 2,950,000 | | | | 2,959,679 | |
U.S. Treasury Notes | | | 1.00 | | | 03/31/17 | | | 10,000,000 | | | | 10,071,880 | |
U.S. Treasury Notes | | | 0.88 | | | 06/15/17 | | | 2,900,000 | | | | 2,912,688 | |
U.S. Treasury Notes | | | 1.88 | | | 08/31/17 | | | 1,925,000 | | | | 1,972,975 | |
U.S. Treasury Notes | | | 1.00 | | | 09/15/17 | | | 1,700,000 | | | | 1,709,430 | |
U.S. Treasury Notes | | | 1.63 | | | 04/30/19 | | | 1,975,000 | | | | 1,995,830 | |
Total U.S. Government and Agency Obligations
(Cost $36,082,785) | | | | | | | | | | | | | 36,298,836 | |
Commercial Paper | 2.4% of portfolio | | | | | | | | | | | |
Bunge Asset Funding Corp. (b) | | | 0.35 | | | 07/01/15 | | | 13,563,000 | | | | 13,563,000 | |
Total Commercial Paper
(Cost $13,563,000) | | | | | | | | | | | | | 13,563,000 | |
Money Market Fund | less than 0.1% of portfolio | | | | | | | | | | | |
| | | | |
| | | | | | | | Shares | | | | |
State Street Institutional Liquid Reserves Fund (Premier Class) | | | 0.11 | (h) | | | | | 762 | | | | 762 | |
Total Money Market Fund
(Cost $762) | | | | | | | | | | | | | 762 | |
| | | | | |
Total Investment in Securities | 100%
(Cost $559,259,000) | | | | | | | | | | | | $ | 560,558,611 | |
| (a) | Variable coupon rate as of June 30, 2015. |
| (b) | Security was purchased pursuant to Rule 144A under the Securities Act of 1933 and may be resold in transactions exempt from registration, normally to qualified institutional buyers. The securities have been determined to be liquid under criteria established by the Fund’s Board of Directors. The total of such securities at period-end amounts to $70,117,691 and represents 12.5% of total investments. |
| (c) | Step coupon security, the current rate may be adjusted upwards before maturity date. |
| (d) | Zero coupon security, purchased at a discount. |
| (e) | Interest is paid at maturity. |
| (f) | Interest is paid at put date. |
| (g) | Security did not mature on maturity date. While additional principal and interest have been received past the maturity date, the amount and timing of future payments is uncertain. |
| (h) | 7-day yield at June 30, 2015. |
| LLC | – Limited Liablity Company |
| NV | – Naamloze Vennottschap |
| SA | – Sociedad Anónima or Société Anonyme |
| plc | – Public Limited Company |
| BV | – Besloten Vennootschap |
| ULC | – Unlimited Liability Corporation |
| | | | |
| 36 | | Portfolio of Investments | | The accompanying notes are an integral part of these financial statements. |
Portfolio of Investments
Stock Index Fund | June 30, 2015 | (Unaudited)
| | | | | | | | |
| | | Cost | | | Value | |
| Investment in S&P 500 Index Master Portfolio | | $ | 51,763,849 | | | $ | 116,024,271 | |
| | | | | | | |
Substantially all the assets of the Stock Index Fund are invested in the S&P 500 Index Master Portfolio managed by BlackRock Fund Advisors. As of June 30, 2015, the Stock Index Fund’s ownership interest in the S&P 500 Index Master Portfolio was 1.70%. See the Appendix for the S&P 500 Index Master Portfolio for holdings information.
| | | | | | |
| The accompanying notes are an integral part of these financial statements. | | Portfolio of Investments | | | 37 | |
Portfolio of Investments
Value Fund | June 30, 2015 | (Unaudited)
| | | | | | | | |
| Common Stocks | 98.0% of portfolio | |
| | |
| Consumer Discretionary | 6.7% | | Shares | | | Value | |
| Auto Components | | | | | | | | |
Cooper Tire & Rubber Co. | | | 440,000 | | | $ | 14,885,200 | |
| Distributors | | | | | | | | |
Genuine Parts Co. | | | 315,400 | | | | 28,237,762 | |
| Multiline Retail | | | | | | | | |
Dillard’s, Inc. (Class A) | | | 182,700 | | | | 19,218,213 | |
| Total Consumer Discretionary | | | | | | | 62,341,175 | |
| | |
| Consumer Staples | 2.9% | | | | | | | | |
| Food Products | | | | | | | | |
Dean Foods Co. | | | 349,449 | | | | 5,650,590 | |
J.M. Smucker Co. (The) | | | 148,853 | | | | 16,137,154 | |
WhiteWave Foods Co. (The) (Class A) (a) | | | 113,627 | | | | 5,554,088 | |
| Total Consumer Staples | | | | | | | 27,341,832 | |
| | |
| Energy | 14.7% | | | | | | | | |
| Energy Equipment & Services | | | | | | | | |
Baker Hughes Inc. | | | 187,000 | | | | 11,537,900 | |
Helmerich & Payne, Inc. | | | 110,000 | | | | 7,746,200 | |
| Oil, Gas, & Consumable Fuels | | | | | | | | |
Chevron Corp. | | | 295,000 | | | | 28,458,650 | |
ConocoPhillips | | | 452,400 | | | | 27,781,884 | |
Marathon Oil Corp. | | | 663,100 | | | | 17,598,674 | |
Marathon Petroleum Corp. | | | 378,000 | | | | 19,773,180 | |
Phillips 66 | | | 159,500 | | | | 12,849,320 | |
QEP Resources, Inc. | | | 552,400 | | | | 10,224,924 | |
| Total Energy | | | | | | | 135,970,732 | |
| | |
| Financials | 11.4% | | | | | | | | |
| Banks | | | | | | | | |
Bank of America Corp. | | | 475,200 | | | | 8,087,904 | |
Commerce Bancshares, Inc. | | | 34,698 | | | | 1,622,825 | |
JPMorgan Chase & Co. | | | 517,600 | | | | 35,072,576 | |
Wells Fargo & Co. | | | 221,000 | | | | 12,429,040 | |
| Insurance | | | | | | | | |
Allstate Corp. (The) | | | 369,000 | | | | 23,937,030 | |
American International Group, Inc. | | | 180,000 | | | | 11,127,600 | |
Chubb Corp. (The) | | | 142,000 | | | | 13,509,880 | |
| Total Financials | | | | | | | 105,786,855 | |
| | |
| Health Care | 22.9% | | | | | | | | |
| Health Care Equipment & Supplies | | | | | | | | |
Abbott Laboratories | | | 399,000 | | | | 19,582,920 | |
Medtronic, plc | | | 198,465 | | | | 14,706,257 | |
| Pharmaceuticals | | | | | | | | |
AbbVie Inc. | | | 399,000 | | | | 26,808,810 | |
Bristol-Myers Squibb Co. | | | 719,700 | | | | 47,888,838 | |
GlaxoSmithKline plc ADR | | | 454,000 | | | | 18,909,100 | |
Hospira, Inc. (a) | | | 379,400 | | | | 33,656,574 | |
Mallinckrodt plc (a) | | | 25,950 | | | | 3,054,834 | |
Merck & Co., Inc. | | | 193,194 | | | | 10,998,534 | |
Pfizer Inc. | | | 1,107,000 | | | | 37,117,710 | |
| Total Health Care | | | | | | | 212,723,577 | |
| | | | | | | | |
| | |
| Industrials | 16.0% | | Shares | | | Value | |
| Aerospace & Defense | | | | | | | | |
Honeywell International Inc. | | | 281,100 | | | $ | 28,663,767 | |
| Airlines | | | | | | | | |
Southwest Airlines Co. | | | 844,100 | | | | 27,931,269 | |
| Commercial Services & Supplies | | | | | | | | |
Tyco International plc | | | 164,850 | | | | 6,343,428 | |
| Industrial Conglomerates | | | | | | | | |
General Electric Co. | | | 1,364,000 | | | | 36,241,480 | |
| Machinery | | | | | | | | |
Flowserve Corp. | | | 285,900 | | | | 15,055,494 | |
Parker-Hannifin Corp. | | | 246,400 | | | | 28,663,712 | |
| Trading Companies & Distributors | | | | | | | | |
Applied Industrial Technologies, Inc. | | | 130,500 | | | | 5,174,325 | |
| Total Industrials | | | | | | | 148,073,475 | |
| | |
| Information Technology | 13.6% | | | | | | | | |
| Communications Equipment | | | | | | | | |
Cisco Systems, Inc. | | | 1,343,500 | | | | 36,892,510 | |
| Electronic Equipment, Instruments & Components | | | | | | | | |
TE Connectivity Ltd. | | | 262,850 | | | | 16,901,255 | |
| IT Services | | | | | | | | |
Leidos Holdings Inc. | | | 150,750 | | | | 6,085,778 | |
Science Applications International Corp. | | | 66,142 | | | | 3,495,605 | |
| Semiconductors & Semiconductor Equipment | | | | | | | | |
Intel Corp. | | | 1,185,000 | | | | 36,041,775 | |
| Technology Hardware, Storage & Peripherals | | | | | | | | |
Hewlett-Packard Co. | | | 876,900 | | | | 26,315,769 | |
| Total Information Technology | | | | | | | 125,732,692 | |
| | |
| Materials | 9.4% | | | | | | | | |
| Chemicals | | | | | | | | |
Dow Chemical Co. (The) | | | 711,900 | | | | 36,427,923 | |
| Containers & Packaging | | | | | | | | |
Avery Dennison Corp. | | | 520,000 | | | | 31,688,800 | |
Bemis Co., Inc. | | | 433,600 | | | | 19,516,336 | |
| Total Materials | | | | | | | 87,633,059 | |
| | |
| Utilities | 0.4% | | | | | | | | |
| Gas Utilities | | | | | | | | |
Questar Corp. | | | 169,814 | | | | 3,550,811 | |
| Total Utilities | | | | | | | 3,550,811 | |
Total Common Stocks (Cost $472,527,322) | | | | | | | 909,154,208 | |
| | | | |
| 38 | | Portfolio of Investments | | The accompanying notes are an integral part of these financial statements. |
Portfolio of Investments | Value Fund | June 30, 2015 | (Unaudited) (Continued)
| | | | | | | | |
Commercial Paper | 2.0% | | | | | | | | |
| | |
| | | Face Amount | | | Value | |
KCP&L Greater Missouri Operations Co., 0.37%, 07/01/15 (b) | | | 18,593,000 | | | $ | 18,593,000 | |
Total Commercial Paper (Cost $18,593,000) | | | | | | | 18,593,000 | |
Money Market Fund | Less than 0.1% of portfolio | |
| | |
| | | Shares | | | | |
State Street Institutional Liquid Reserves Fund (Premier Class),
0.11% (c) | | | 564 | | | | 564 | |
Total Money Market Fund
(Cost $564) | | | | | | | 564 | |
| | | |
Total Investments in Securities
(Cost $491,120,886) | 100% | | | | | | $ | 927,747,772 | |
| (b) | Security was purchased pursuant to Rule 144A under the Securities Act of 1933 and may be resold in transactions exempt from registration normally to qualified institutional buyers. The security has been determined to be liquid under criteria established by the Fund’s Board of Directors. The total of such securities at period-end amounts to $18,593,000 and represents 2.0% of total investments. |
| (c) | 7-day yield at June 30, 2015. |
| plc | – Public Limited Company |
| ADR | – American Depositary Receipt |
| | | | | | |
| The accompanying notes are an integral part of these financial statements. | | Portfolio of Investments | | | 39 | |
Portfolio of Investments
Growth Fund | June 30, 2015 | (Unaudited)
| | | | | | | | |
| Common Stocks | 98.3% of portfolio | |
| | |
| Consumer Discretionary | 19.1% | | Shares | | | Value | |
| Automobiles | | | | | | | | |
Tesla Motors, Inc. (a) | | | 4,000 | | | $ | 1,073,040 | |
| Hotels, Restaurants & Leisure | | | | | | | | |
Chipotle Mexican Grill Inc. (a) | | | 800 | | | | 483,992 | |
Hilton Worldwide Holdings Inc. (a) | | | 45,013 | | | | 1,240,108 | |
MGM Resorts International (a) | | | 69,997 | | | | 1,277,445 | |
Starbucks Corp. | | | 27,400 | | | | 1,469,051 | |
Wynn Resorts, Ltd. | | | 6,800 | | | | 670,956 | |
| Internet & Catalog Retail | | | | | | | | |
Amazon.com, Inc. (a) | | | 12,200 | | | | 5,295,898 | |
Netflix, Inc. (a) | | | 800 | | | | 525,552 | |
Priceline Group, Inc. (The) (a) | | | 3,400 | | | | 3,914,658 | |
Vipshop Holdings, Ltd. ADR (a) | | | 24,100 | | | | 536,225 | |
| Specialty Retail | | | | | | | | |
CarMax, Inc. (a) | | | 10,400 | | | | 688,584 | |
Lowe’s Cos., Inc. | | | 19,800 | | | | 1,326,006 | |
Tractor Supply Co. | | | 14,100 | | | | 1,268,154 | |
| Textiles, Apparel & Luxury Goods | | | | | | | | |
Hanesbrands Inc. | | | 24,300 | | | | 809,676 | |
| Total Consumer Discretionary | | | | | | | 20,579,345 | |
| | |
| Consumer Staples | 0.7% | | | | | | | | |
| Personal Products | | | | | | | | |
Estee Lauder Cos., Inc. (The) (Class A) | | | 9,400 | | | | 814,604 | |
| Total Consumer Staples | | | | | | | 814,604 | |
| | |
| Energy | 2.8% | | | | | | | | |
| Oil, Gas, & Consumable Fuels | | | | | | | | |
EQT Corp. | | | 11,400 | | | | 927,276 | |
Cimarex Energy Co. | | | 3,600 | | | | 397,116 | |
Pioneer Natural Resources Co. | | | 4,000 | | | | 554,760 | |
Range Resources Corp. | | | 22,054 | | | | 1,089,027 | |
| Total Energy | | | | | | | 2,968,179 | |
| | |
| Financials | 6.1% | | | | | | | | |
| Capital Markets | | | | | | | | |
Morgan Stanley | | | 76,100 | | | | 2,951,919 | |
State Street Corp. | | | 17,600 | | | | 1,355,200 | |
TD Ameritrade Holding Corp. | | | 32,000 | | | | 1,178,240 | |
| Diversified Financial Services | | | | | | | | |
Intercontinental Exchange, Inc. | | | 4,900 | | | | 1,095,689 | |
| Total Financials | | | | | | | 6,581,048 | |
| | |
| Health Care | 29.2% | | | | | | | | |
| Biotechnology | | | | | | | | |
Alexion Pharmaceuticals Inc. (a) | | | 18,700 | | | | 3,380,399 | |
Biogen Inc. (a) | | | 5,950 | | | | 2,403,443 | |
BioMarin Pharmaceutical Inc. (a) | | | 5,700 | | | | 779,646 | |
Celgene Corp. (a) | | | 18,100 | | | | 2,094,803 | |
Gilead Sciences, Inc. | | | 19,200 | | | | 2,247,936 | |
Incyte Corp. (a) | | | 5,500 | | | | 573,155 | |
Regeneron Pharmaceuticals, Inc. (a) | | | 1,600 | | | | 816,208 | |
Vertex Pharmaceuticals, Inc. (a) | | | 5,900 | | | | 728,532 | |
| Health Care Equipment & Supplies | | | | | | | | |
Becton, Dickinson and Co. | | | 3,800 | | | | 538,270 | |
Intuitive Surgical, Inc. (a) | | | 4,150 | | | | 2,010,675 | |
| | | | | | | | |
| | |
| Health Care | 29.2% (Continued) | | Shares | | | Value | |
| Health Care Providers & Services | | | | | | | | |
Anthem, Inc. | | | 8,000 | | | $ | 1,313,120 | |
Cigna Corp. | | | 5,000 | | | | 810,000 | |
Humana Inc. | | | 5,700 | | | | 1,090,296 | |
McKesson Corp. | | | 14,800 | | | | 3,327,188 | |
Unitedhealth Group Inc. | | | 16,300 | | | | 1,988,600 | |
| Pharmaceuticals | | | | | | | | |
Allergan, Inc. (a) | | | 7,946 | | | | 2,411,293 | |
Bristol-Myers Squibb Co. | | | 11,500 | | | | 765,210 | |
Eli Lilly and Co. | | | 14,200 | | | | 1,185,558 | |
Valeant Pharmaceuticals International, Inc. (a) | | | 13,200 | | | | 2,932,380 | |
| Total Health Care | | | | | | | 31,396,712 | |
| | |
| Industrials | 14.6% | | | | | | | | |
| Aerospace & Defense | | | | | | | | |
Boeing Co. (The) | | | 29,900 | | | | 4,147,728 | |
Precision Castparts Corp. | | | 3,900 | | | | 779,493 | |
Textron Inc. | | | 19,900 | | | | 888,137 | |
| Airlines | | | | | | | | |
American Airlines Group Inc. | | | 49,700 | | | | 1,984,770 | |
United Continental Holdings Inc. (a) | | | 10,300 | | | | 546,003 | |
| Air Freight & Logistics | | | | | | | | |
FedEx Corp. | | | 7,400 | | | | 1,260,960 | |
| Machinery | | | | | | | | |
Flowserve Corp. | | | 14,700 | | | | 774,102 | |
Wabtec Corp. | | | 11,800 | | | | 1,112,032 | |
| Industrial Conglomerates | | | | | | | | |
Danaher Corp. | | | 40,900 | | | | 3,500,631 | |
| Road & Rail | | | | | | | | |
Canadian Pacific Railway Ltd. | | | 3,100 | | | | 496,713 | |
J.B. Hunt Transport Services, Inc. | | | 2,300 | | | | 188,807 | |
| Total Industrials | | | | | | | 15,679,376 | |
| | |
| Information Technology | 23.9% | | | | | | | | |
| Communications Equipment | | | | | | | | |
Palo Alto Networks, Inc. (a) | | | 2,100 | | | | 366,870 | |
| Internet Software & Services | | | | | | | | |
Akamai Technologies, Inc. (a) | | | 2,900 | | | | 202,478 | |
Alibaba Group Holding Ltd. ADR (a) | | | 13,299 | | | | 1,094,109 | |
Baidu, Inc. ADR (a) | | | 7,100 | | | | 1,413,468 | |
Facebook, Inc. (a) | | | 30,800 | | | | 2,641,562 | |
Google Inc. (Class A) (a) | | | 5,700 | | | | 3,078,228 | |
Google Inc. (Class C) (a) | | | 4,712 | | | | 2,452,643 | |
LinkedIn Corp. (a) | | | 4,400 | | | | 909,172 | |
| IT Services | | | | | | | | |
Vantiv, Inc. (Class A) (a) | | | 4,600 | | | | 175,674 | |
Visa Inc. (Class A) | | | 64,500 | | | | 4,331,175 | |
| Software | | | | | | | | |
Microsoft Corp. | | | 37,500 | | | | 1,655,625 | |
Mobileye NV ADR (a) | | | 7,600 | | | | 404,092 | |
NetSuite Inc. (a) | | | 7,400 | | | | 678,950 | |
Red Hat, Inc. (a) | | | 14,800 | | | | 1,123,764 | |
salesforce.com, Inc. (a) | | | 28,900 | | | | 2,012,307 | |
ServiceNow, Inc. (a) | | | 12,200 | | | | 906,582 | |
Workday, Inc. (a) | | | 6,700 | | | | 511,813 | |
| Technology Hardware, Storage, & Peripherals | | | | | | | | |
Apple Inc. | | | 14,200 | | | | 1,781,035 | |
| Total Information Technology | | | | | | | 25,739,547 | |
| | | | |
| 40 | | Portfolio of Investments | | The accompanying notes are an integral part of these financial statements. |
Portfolio of Investments | Growth Fund | June 30, 2015 | (Unaudited) (Continued)
| | | | | | | | |
| Common Stocks | 98.3% of portfolio (Continued) | |
| | |
| Materials | 1.9% | | | Shares | | | | Value | |
| Chemicals | | | | | | | | |
Sherwin-Williams Co. | | | 1,950 | | | $ | 536,289 | |
| Construction Materials | | | | | | | | |
Vulcan Materials Co. | | | 18,300 | | | | 1,535,919 | |
| Total Materials | | | | | | | 2,072,208 | |
Total Common Stocks
(Cost $83,694,501) | | | | | | | 105,831,019 | |
Money Market Fund | 1.7% of portfolio | |
State Street Institutional Liquid Reserves Fund (Premier Class),
0.11% (b) | | | 1,810,955 | | | | 1,810,955 | |
Total Money Market Fund
(Cost $1,810,955) | | | | | | | 1,810,955 | |
| | | |
| Total Investments in Securities (Cost $85,505,456) | 100% | | | | | | $ | 107,641,974 | |
| (b) | 7-day yield at June 30, 2015. |
| ADR | – American Depositary Receipt |
| plc | – Public Limited Company |
| NV | – Naamloze Vennottschap |
| | | | | | |
| The accompanying notes are an integral part of these financial statements. | | Portfolio of Investments | | | 41 | |
Portfolio of Investments
Small-Company Stock Fund | June 30, 2015 | (Unaudited)
| | | | | | | | |
| Common Stocks | 88.7% of portfolio | |
| | |
| Consumer Discretionary | 22.1% | | Shares | | | Value | |
| Auto Components | | | | | | | | |
Cooper Tire & Rubber Co. | | | 985,350 | | | $ | 33,334,391 | |
| Distributors | | | | | | | | |
Core-Mark Holding Company, Inc. | | | 369,796 | | | | 21,910,413 | |
| Hotels, Restaurants, & Leisure | | | | | | | | |
BJ’s Restuarants, Inc. (a) | | | 657,427 | | | | 31,852,338 | |
Brinker International, Inc. | | | 200,000 | | | | 11,530,000 | |
Cracker Barrel Old Country Store, Inc. | | | 210,209 | | | | 31,354,774 | |
Wendy’s Co. (The) | | | 2,040,260 | | | | 23,014,133 | |
| Household Durables | | | | | | | | |
Libbey Inc. | | | 637,134 | | | | 26,332,748 | |
| Media | | | | | | | | |
Rentrak Corp. (a) | | | 425,668 | | | | 29,711,626 | |
| Multiline Retail | | | | | | | | |
Fred’s, Inc. (Class A) | | | 1,685,683 | | | | 32,516,825 | |
| Specialty Retail | | | | | | | | |
Francesca’s Holdings Corp. (a) | | | 1,851,106 | | | | 24,934,398 | |
Sally Beauty Holdings, Inc. (a) | | | 114,000 | | | | 3,600,120 | |
| Textiles, Apparel, & Luxury Goods | | | | | | | | |
G-III Apparel Group, Ltd. (a) | | | 25,000 | | | | 1,758,750 | |
| Total Consumer Discretionary | | | | | | | 271,850,516 | |
| | |
| Consumer Staples | 2.4% | | | | | | | | |
| Food & Staples Retailing | | | | | | | | |
United Natural Foods, Inc. (a) | | | 159,600 | | | | 10,163,328 | |
| Food Products | | | | | | | | |
Dean Foods Co. | | | 487,500 | | | | 7,882,875 | |
J.M. Smucker Co. (The) | | | 40,868 | | | | 4,430,500 | |
WhiteWave Foods Co. (The) (Class A) (a) | | | 143,159 | | | | 6,997,612 | |
| Total Consumer Staples | | | | | | | 29,474,315 | |
| | |
| Energy | 0.9% | | | | | | | | |
| Energy Equipment & Services | | | | | | | | |
Helmerich & Payne, Inc. | | | 35,000 | | | | 2,464,700 | |
| Oil, Gas, & Consumable Fuels | | | | | | | | |
Cimarex Energy Co. | | | 59,400 | | | | 6,552,414 | |
SM Energy Co. | | | 49,000 | | | | 2,259,880 | |
| Total Energy | | | | | | | 11,276,994 | |
| | |
| Financials | 16.3% | | | | | | | | |
| Banks | | | | | | | | |
Burke & Herbert Bank & Trust Co. | | | 160 | | | | 352,000 | |
Cardinal Financial Corp. | | | 1,048,441 | | | | 22,845,529 | |
Glacier Bancorp, Inc. | | | 52,500 | | | | 1,544,550 | |
Middleburg Financial Corp. | | | 104,400 | | | | 1,879,200 | |
National Bankshares, Inc. (Virginia) | | | 448,702 | | | | 13,129,020 | |
National Penn Bancshares, Inc. | | | 2,376,015 | | | | 26,801,449 | |
State Bank Financial Corp. | | | 1,217,750 | | | | 26,425,175 | |
Texas Capital Bancshares, Inc. (a) | | | 483,917 | | | | 30,118,994 | |
UMB Financial Corp. | | | 343,244 | | | | 19,571,773 | |
Valley National Bancorp | | | 1,225,799 | | | | 12,637,988 | |
| Consumer Finance | | | | | | | | |
Encore Capital Group, Inc. (a) | | | 1,071,289 | | | | 45,786,892 | |
| Total Financials | | | | | | | 201,092,570 | |
| | | | | | | | |
| | |
| Health Care | 1.8% | | Shares | | | Value | |
| Health Care Equipment & Supplies | | | | | |
STERIS Corp. | | | 342,112 | | | $ | 22,045,697 | |
| Total Health Care | | | | | | | 22,045,697 | |
| | |
| Industrials | 25.7% | | | | | | | | |
| Aerospace & Defense | | | | | | | | |
Huntington Ingalls Industries, Inc. | | | 157,208 | | | | 17,700,049 | |
Triumph Group, Inc. | | | 136,800 | | | | 9,027,432 | |
| Construction & Engineering | | | | | | | | |
Dycom Industries, Inc. (a) | | | 1,135,299 | | | | 66,812,346 | |
Orion Marine Group, Inc. (a) | | | 1,833,794 | | | | 13,239,993 | |
Primoris Services Corp. | | | 1,092,400 | | | | 21,629,520 | |
| Electrical Equipment | | | | | | | | |
Polypore International, Inc. (a) | | | 247,826 | | | | 14,839,821 | |
Regal Beloit Corp. | | | 58,500 | | | | 4,246,515 | |
| Industrial Conglomerates | | | | | | | | |
Carlisle Companies Inc. | | | 125,600 | | | | 12,575,072 | |
| Machinery | | | | | | | | |
CLARCOR Inc. | | | 87,100 | | | | 5,421,104 | |
Flowserve Corp. | | | 43,500 | | | | 2,290,710 | |
Gorman-Rupp Co. (The) | | | 644,775 | | | | 18,105,282 | |
Manitowoc Co., Inc. (The) | | | 759,400 | | | | 14,884,240 | |
Standex International Corp. | | | 214,200 | | | | 17,121,006 | |
| Road & Rail | | | | | | | | |
Knight Transportation, Inc. | | | 1,352,732 | | | | 36,172,054 | |
Werner Enterprises, Inc. | | | 1,274,181 | | | | 33,447,251 | |
| Trading Companies & Distributors | | | | | | | | |
Applied Industrial Technologies, Inc. | | | 738,374 | | | | 29,276,529 | |
| Total Industrials | | | | | | | 316,788,924 | |
| | |
| Information Technology | 11.1% | | | | | | | | |
| Electronic Equipment, Instruments, & Components | | | | | | | | |
Belden Inc. | | | 292,585 | | | | 23,766,680 | |
Rofin-Sinar Technologies Inc. (a) | | | 1,210,473 | | | | 33,409,055 | |
| IT Services | | | | | | | | |
Cass Information Systems, Inc. | | | 104,921 | | | | 5,898,659 | |
Computer Services, Inc. | | | 546,243 | | | | 24,171,253 | |
ManTech International Corp. | | | 984,370 | | | | 28,546,730 | |
NeuStar, Inc. (a) | | | 530,000 | | | | 15,481,300 | |
| Technology Hardware, Storage, & Peripherals | | | | | | | | |
Western Digital Corp. | | | 70,000 | | | | 5,489,400 | |
| Total Information Technology | | | | | | | 136,763,077 | |
| | |
| Materials | 8.4% | | | | | | | | |
| Chemicals | | | | | | | | |
American Vanguard Corp. | | | 941,165 | | | | 12,988,077 | |
Olin Corp. | | | 1,133,231 | | | | 30,540,575 | |
PolyOne Corp. | | | 629,000 | | | | 24,637,930 | |
Westlake Chemical Corp. | | | 231,400 | | | | 15,871,726 | |
| Containers & Packaging | | | | | | | | |
Myers Industries, Inc. | | | 1,055,473 | | | | 20,053,987 | |
| Total Materials | | | | | | | 104,092,295 | |
Total Common Stocks
(Cost $773,947,139) | | | | | | | 1,093,384,388 | |
| | | | |
| 42 | | Portfolio of Investments | | The accompanying notes are an integral part of these financial statements. |
Portfolio of Investments | Small-Company Stock Fund | June 30, 2015 | (Unaudited) (Continued)
| | | | | | | | |
| Exchange Traded Funds | 7.6% of portfolio | |
| | |
| | | Shares | | | Value | |
iShares Russell 2000 Value | | | 459,600 | | | $ | 46,860,816 | |
iShares Core S&P Small-Cap | | | 402,000 | | | | 47,387,760 | |
Total Exchange Traded Funds (Cost $69,694,950) | | | | | | | 94,248,576 | |
| Commercial Paper | 3.7% of portfolio | |
| | |
| | | Face Amount | | | | |
Diamond Offshore Drilling, Inc., 0.45%, 07/06/15 (b) | | | 20,000,000 | | | | 19,998,750 | |
KCP&L Greater Missouri Operations Co., 0.37%, 07/01/15 (b) | | | 20,390,000 | | | | 20,390,000 | |
TransCanada American Investments Ltd., 0.40%, 07/06/15 (b) | | | 4,606,000 | | | | 4,605,744 | |
Total Commercial Paper (Cost $44,994,494) | | | | | | | 44,994,494 | |
Money Market Fund | Less than 0.1% of portfolio | |
| | |
| | | Shares | | | | |
State Street Institutional Liquid Reserves Fund (Premier Class), 0.11% (c) | | | 168 | | | | 168 | |
Total Money Market Fund
(Cost $168) | | | | | | | 168 | |
| | | |
Total Investments in Securities
(Cost $888,636,751) | 100% | | | | | | $ | 1,232,627,626 | |
| (b) | Security was purchased pursuant to Rule 144A under the Securities Act of 1933 and may be resold in transactions exempt from registration normally to qualified institutional buyers. The security has been determined to be liquid under criteria established by the Fund’s Board of Directors. The total of such securities at period-end amounts to $44,994,494 and represents 3.7% of total investments. |
| (c) | 7-day yield at June 30, 2015. |
| | | | | | |
| The accompanying notes are an integral part of these financial statements. | | Portfolio of Investments | | | 43 | |
Portfolio of Investments
International Value Fund | June 30, 2015 | (Unaudited)
| | | | | | | | |
| Common Stocks | 95.0% of portfolio | |
| | |
| Australia | 1.4% | | Shares | | | Value | |
Incitec Pivot Ltd. | | | 1,000,571 | | | $ | 2,966,434 | |
| Total Australia | | | | | | | 2,966,434 | |
| | |
| Britain | 6.4% | | | | | | | | |
BAE Systems plc | | | 634,314 | | | | 4,494,384 | |
HSBC Holdings plc ADR | | | 78,393 | | | | 3,512,790 | |
WPP Group plc | | | 271,480 | | | | 6,093,687 | |
| Total Britain | | | | | | | 14,100,861 | |
| | |
| Denmark | 1.5% | | | | | | | | |
Danske Bank Group | | | 109,043 | | | | 3,205,535 | |
| Total Denmark | | | | | | | 3,205,535 | |
| | |
| France | 14.0% | | | | | | | | |
AXA SA | | | 188,766 | | | | 4,785,565 | |
Cap Gemini SA | | | 52,712 | | | | 4,676,422 | |
Christian Dior SE | | | 23,450 | | | | 4,590,779 | |
Compagnie de Saint-Gobain SA | | | 126,266 | | | | 5,699,821 | |
GDF SUEZ SA | | | 172,306 | | | | 3,208,052 | |
Société Générale SA | | | 91,029 | | | | 4,271,424 | |
Total SA | | | 69,264 | | | | 3,397,465 | |
| Total France | | | | | | | 30,629,528 | |
| | |
| Germany | 4.8% | | | | | | | | |
Daimler AG REG | | | 66,675 | | | | 6,073,799 | |
ThyssenKrupp AG | | | 167,946 | | | | 4,369,017 | |
| Total Germany | | | | | | | 10,442,816 | |
| | |
| Hong Kong | 5.1% | | | | | | | | |
CK Hutchison Holdings Ltd. | | | 305,912 | | | | 4,517,254 | |
Lenovo Group Ltd. | | | 3,115,185 | | | | 4,306,943 | |
New World Development Co. Ltd. | | | 1,738,938 | | | | 2,281,142 | |
| Total Hong Kong | | | | | | | 11,105,339 | |
| | |
| Israel | 1.2% | | | | | | | | |
Israel Chemicals, Ltd. | | | 380,091 | | | | 2,654,722 | |
| Total Israel | | | | | | | 2,654,722 | |
| | |
| Italy | 6.5% | | | | | | | | |
Assicurazioni Generali SpA | | | 220,813 | | | | 3,979,883 | |
Eni SpA | | | 126,673 | | | | 2,249,916 | |
Intesa Sanpaolo SpA | | | 2,219,017 | | | | 8,058,323 | |
| Total Italy | | | | | | | 14,288,122 | |
| | |
| Japan | 18.9% | | | | | | | | |
Daiwa Securities Group Inc. | | | 462,528 | | | | 3,460,036 | |
Leopalace21 Corp. (a) | | | 479,377 | | | | 2,937,991 | |
Mitsui Chemicals, Inc. | | | 1,532,811 | | | | 5,694,813 | |
MS & AD Insurance Group Holdings, Inc. | | | 183,920 | | | | 5,725,111 | |
Nippon Sheet Glass Co. Ltd. | | | 3,223,422 | | | | 3,422,537 | |
Nippon Yusen KK | | | 1,496,566 | | | | 4,166,521 | |
Nissan Motor Co., Ltd. | | | 542,301 | | | | 5,665,390 | |
| | | | | | | | |
| | |
| Japan | 18.9% (Continued) | | Shares | | | Value | |
Sumitomo Corp. | | | 417,917 | | | $ | 4,864,310 | |
Sumitomo Mitsui Trust Holdings, Inc. | | | 1,222,939 | | | | 5,594,455 | |
| Total Japan | | | | | | | 41,531,164 | |
| | |
| Norway | 0.7% | | | | | | | | |
Marine Harvest ASA | | | 142,578 | | | | 1,632,886 | |
| Total Norway | | | | | | | 1,632,886 | |
| | |
| Netherlands | 7.2% | | | | | | | | |
AEGON NV | | | 827,950 | | | | 6,108,773 | |
ASML Holding NV | | | 31,395 | | | | 3,265,625 | |
DSM NV | | | 91,390 | | | | 5,306,120 | |
Royal BAM Group NV | | | 264,330 | | | | 1,123,614 | |
| Total Netherlands | | | | | | | 15,804,132 | |
| | |
| Portugal | 0.0% | | | | | | | | |
Banco Espirito Santo SA (a) | | | 2,678,100 | | | | — | |
| Total Portugal | | | | | | | — | |
| | |
| Republic of South Korea | 2.5% | | | | | | | | |
KB Financial Group Inc. | | | 83,895 | | | | 2,770,875 | |
Posco | | | 14,064 | | | | 2,816,171 | |
| Total Republic of South Korea | | | | | | | 5,587,046 | |
| | |
| Singapore | 2.1% | | | | | | | | |
Jardine Matheson Holdings Ltd. | | | 81,370 | | | | 4,613,056 | |
| Total Singapore | | | | | | | 4,613,056 | |
| | |
| Spain | 5.6% | | | | | | | | |
Banco Popular Espanol SA | | | 913,256 | | | | 4,443,553 | |
Banco Santander SA | | | 584,151 | | | | 4,108,925 | |
IBERDROLA SA (a) | | | 545,662 | | | | 3,684,059 | |
| Total Spain | | | | | | | 12,236,537 | |
| | |
| Sweden | 2.4% | | | | | | | | |
Volvo AB (Class B) | | | 423,443 | | | | 5,258,114 | |
| Total Sweden | | | | | | | 5,258,114 | |
| | |
| Switzerland | 12.0% | | | | | | | | |
Adecco SA REG | | | 57,937 | | | | 4,702,018 | |
Credit Suisse Group AG | | | 173,407 | | | | 4,783,860 | |
Georg Fischer Ltd. | | | 5,753 | | | | 3,954,959 | |
Holcim Ltd. | | | 65,214 | | | | 4,811,850 | |
Novartis AG REG (a) | | | 40,752 | | | | 4,008,385 | |
Roche Holding AG | | | 14,679 | | | | 4,115,866 | |
| Total Switzerland | | | | | | | 26,376,938 | |
| | | | |
| 44 | | Portfolio of Investments | | The accompanying notes are an integral part of these financial statements. |
Portfolio of Investments | International Value Fund | June 30, 2015 (Unaudited) (Continued)
| | | | | | | | |
| Common Stocks | 95.0% of portfolio (Continued) | |
| | |
| Thailand | 2.7% | | | Shares | | | | Value | |
Krung Thai Bank Public Company, Ltd. | | | 7,481,331 | | | $ | 3,779,583 | |
PTT Public Company Ltd. | | | 204,427 | | | | 2,166,796 | |
| Total Thailand | | | | | | | 5,946,379 | |
Total Common Stocks
(Cost $190,488,739) | | | | | | | 208,379,609 | |
Money Market Fund | 5.0% of portfolio | |
State Street Institutional Liquid Reserves Fund (Premier Class), 0.11% (b) | | | 10,926,077 | | | | 10,926,077 | |
Total Money Market Fund
(Cost $10,926,077) | | | | | | | 10,926,077 | |
| | | |
Total Investments in Securities (Cost $201,414,816) | 100% | | | | | | $ | 219,305,686 | |
| (b) | 7-day yield at June 30, 2015. |
| plc – | Public Limited Company |
| ADR | – American Depositary Receipt |
| SA | – Sociedad Anónima or Société Anonyme |
| NV | – Naamloze Vennottschap |
| | | | | | |
| The accompanying notes are an integral part of these financial statements. | | Portfolio of Investments | | | 45 | |
Statements of Assets and Liabilities
June 30, 2015 | (Unaudited)
| | | | | | | | |
| Assets | | Daily Income Fund | | | Short-Term Government Securities Fund | |
| Investments in securities, at value (cost: $186,190,095; $75,148,285; $559,259,000; $51,763,849; $491,120,886; $85,505,456; $888,636,751; $201,414,816) | | $ | 186,190,095 | | | $ | 75,467,501 | |
| Cash | | | — | | | | — | |
| Foreign currency (cost $106,338) | | | — | | | | — | |
| Receivables | | | | | | | | |
Investment securities sold | | | — | | | | — | |
Dividends, interest, and tax reclaims | | | 181,326 | | | | 228,197 | |
Capital shares sold | | | 237,618 | | | | 428 | |
| Prepaid expenses | | | 33,371 | | | | 26,045 | |
| | | | | | | |
Total Assets | | | 186,642,410 | | | | 75,722,171 | |
| | |
| Liabilities | | | | | | | | |
| | | | | | | |
| Payables | | | | | | | | |
Investment securities purchased | | | — | | | | 250,000 | |
Accrued expenses | | | 58,968 | | | | 25,236 | |
Independent Director’s deferred compensation | | | 54,760 | | | | 21,883 | |
Due to RE Advisers | | | 5,652 | | | | 35,126 | |
Capital shares redeemed | | | 207,053 | | | | 2,080 | |
Dividends | | | 11 | | | | 1,057 | |
| | | | | | | |
Total Liabilities | | | 326,444 | | | | 335,382 | |
| | | | | | | |
| Net Assets | | $ | 186,315,966 | | | $ | 75,386,789 | |
| | |
| Net Assets Consist Of: | | | | | | | | |
| | | | | | | |
| Unrealized appreciation of investments | | $ | — | | | $ | 319,216 | |
| | | | | | | |
| Undistributed (over distributed) net investment income | | | (54,760 | ) | | | (21,905 | ) |
| | | | | | | |
| Undistributed net realized gain (loss) from investments and futures transactions | | | — | | | | 2,229 | |
| | | | | | | |
| Paid-in-capital applicable to outstanding shares of 186,370,685 of Daily Income Fund, 14,483,461 of Short-Term Government Securities Fund, 107,690,861 of Short-Term Bond Fund, 7,495,161 of Stock Index Fund, 18,479,570 of Value Fund, 13,148,717 of Growth Fund, 30,362,873 of Small- Company Stock Fund, and 29,268,109 of International Value Fund | | | 186,370,726 | | | | 75,087,249 | |
| | |
| | | | | | | | |
| | | | | | | |
| Net Assets | | $ | 186,315,966 | | | $ | 75,386,789 | |
| | | | | | | |
Net Asset Value Per Share | | | $1.00 | | | | $5.21 | |
| | | | |
| 46 | | Statements of Assets and Liabilities | | The accompanying notes are an integral part of these financial statements. |
| | | | | | | | | | | | | | | | | | | | | | |
Short-Term Bond Fund | | | Stock Index Fund | | | Value Fund | | | Growth Fund | | | Small- Company Stock Fund | | | International Value Fund | |
| | | | | |
| $ | 560,558,611 | | | $ | 116,024,271 | | | $ | 927,747,772 | | | $ | 107,641,974 | | | $ | 1,232,627,626 | | | $ | 219,305,686 | |
| | 5,405 | | | | — | | | | — | | | | — | | | | — | | | | — | |
| | — | | | | — | | | | — | | | | — | | | | — | | | | 106,095 | |
| | | | | | | | | | | | | | | | | | | | | | |
| | — | | | | — | | | | — | | | | 373,064 | | | | 3,059,803 | | | | 567,497 | |
| | 2,132,996 | | | | — | | | | 1,639,352 | | | | 22,492 | | | | 541,708 | | | | 738,159 | |
| | 160,211 | | | | 95,912 | | | | 1,047,995 | | | | 16,598 | | | | 3,049,646 | | | | 1,323,129 | |
| | 74,898 | | | | 27,145 | | | | 126,901 | | | | 27,422 | | | | 158,707 | | | | 37,290 | |
| | | | | | | | | | | | | | | | | |
| | 562,932,121 | | | | 116,147,328 | | | | 930,562,020 | | | | 108,081,550 | | | | 1,239,437,490 | | | | 222,077,856 | |
| | | | | |
| | | | | | | | | | | | | | | | | | | | | | |
| | | | | | | | | | | | | | | | | |
| | | | | | | | | | | | | | | | | | | | | | |
| | 750,000 | | | | — | | | | — | | | | 556,005 | | | | 7,361,770 | | | | 1,134,427 | |
| | 123,168 | | | | 83,021 | | | | 276,539 | | | | 56,386 | | | | 185,788 | | | | 88,119 | |
| | 107,833 | | | | 20,471 | | | | 177,821 | | | | 12,043 | | | | 106,406 | | | | 45,080 | |
| | 310,023 | | | | 38,010 | | | | 429,109 | | | | 70,110 | | | | 838,121 | | | | 154,060 | |
| | 461,340 | | | | 23,637 | | | | 1,198,935 | | | | 75,531 | | | | 1,106,226 | | | | 77,417 | |
| | 14,411 | | | | — | | | | 111,396 | | | | 5,245 | | | | — | | | | — | |
| | | | | | | | | | | | | | | | | |
| | 1,766,775 | | | | 165,139 | | | | 2,193,800 | | | | 775,320 | | | | 9,598,311 | | | | 1,499,103 | |
| | | | | | | | | | | | | | | | | |
| $ | 561,165,346 | | | $ | 115,982,189 | | | $ | 928,368,220 | | | $ | 107,306,230 | | | $ | 1,229,839,179 | | | $ | 220,578,753 | |
| | | | | |
| | | | | | | | | | | | | | | | | | | | | | |
| | | | | | | | | | | | | | | | | |
| $ | 1,299,611 | | | $ | 64,260,422 | | | $ | 436,626,886 | | | $ | 22,136,518 | | | $ | 343,990,875 | | | $ | 17,863,861 | |
| | | | | | | | | | | | | | | | | |
| | (122,404 | ) | | | 788,981 | | | | (182,800 | ) | | | (182,750 | ) | | | 1,803,079 | | | | 2,746,139 | |
| | | | | | | | | | | | | | | | | |
| | (345,140 | ) | | | (5,029,180 | ) | | | 19,156,092 | | | | 3,841,815 | | | | 18,773,212 | | | | (25,082,066 | ) |
| | | | | | | | | | | | | | | | | |
| | | | | |
| | 560,333,279 | | | | 55,961,966 | | | | 472,768,042 | | | | 81,510,647 | | | | 865,272,013 | | | | 225,050,819 | |
| | | | | |
| | | | | | | | | | | | | | | | | | | | | | |
| | | | | | | | | | | | | | | | | |
| $ | 561,165,346 | | | $ | 115,982,189 | | | $ | 928,368,220 | | | $ | 107,306,230 | | | $ | 1,229,839,179 | | | $ | 220,578,753 | |
| | | | | | | | | | | | | | | | | |
| | $5.21 | | | | $15.47 | | | | $50.24 | | | | $8.16 | | | | $40.50 | | | | $7.54 | |
| | | | | | |
| The accompanying notes are an integral part of these financial statements. | | Statements of Assets and Liabilities | | | 47 | |
Statements of Operations
For the Period Ended June 30, 2015 | (Unaudited)
| | | | | | | | |
| Investment Income | | Daily Income Fund | | | Short-Term
Government
Securities Fund | |
| Interest | | $ | 111,265 | | | $ | 638,140 | |
| Dividends | | | — | | | | — | |
| Allocated from Master Portfolio | | | | | | | | |
Income | | | — | | | | — | |
Expense | | | — | | | | — | |
| | | | | | | |
Total Investment Income | | | 111,265 | | | | 638,140 | |
| | |
| Expenses | | | | | | | | |
| | | | | | | |
| Management fees | | | 466,594 | | | | 169,373 | |
| Shareholder servicing fees | | | 77,920 | | | | 38,727 | |
| Custodian and accounting fees | | | 18,527 | | | | 29,575 | |
| Director and Board meeting expenses | | | 22,042 | | | | 8,086 | |
| Legal and audit fees | | | 13,069 | | | | 5,496 | |
| Registration fees | | | 19,085 | | | | 10,879 | |
| Insurance | | | 4,051 | | | | 1,392 | |
| Printing | | | 8,627 | | | | 4,096 | |
| Communication | | | 2,747 | | | | 1,309 | |
| Other expenses | | | 2,715 | | | | 4,074 | |
| Administration fees | | | — | | | | — | |
| | | | | | | |
Total Expenses | | | 635,377 | | | | 273,007 | |
| | | | | | | | |
| Less fees waived and expenses reimbursed by RE Advisers | | | (529,647 | ) | | | — | |
| | | | | | | |
Net Expenses | | | 105,730 | | | | 273,007 | |
| | | | | | | |
| Net Investment Income (Loss) | | | 5,535 | | | | 365,133 | |
| | |
| Realized And Unrealized Gain (Loss) On Investments | | | | | | | | |
| | | | | | | |
| Net realized gain on investments | | | — | | | | 2,229 | |
| | | | | | | |
| Net change in unrealized appreciation (depreciation) | | | — | | | | 137,122 | |
| | | | | | | |
| Net Gain (Loss) On Investments | | | — | | | | 139,351 | |
| | |
| | | | | | | | |
| | | | | | | |
| Net Increase (Decrease) In Net Assets From Operations | | $ | 5,535 | | | $ | 504,484 | |
| | | | | | | |
| (a) | Represents realized and unrealized gain on investments allocated from the Master Portfolio. |
| (b) | Includes foreign tax witholding expense of $633 in Growth Fund and $425,736 in International Value Fund. |
| | | | |
| 48 | | Statements of Operations | | The accompanying notes are an integral part of these financial statements. |
| | | | | | | | | | | | | | | | | | | | | | |
Short-Term Bond Fund | | | Stock Index
Fund | | | Value Fund | | | Growth
Fund | | | Small-
Company
Stock Fund | | | International
Value Fund | |
| $ | 6,008,830 | | | $ | — | | | $ | 37,178 | | | $ | 883 | | | $ | 88,214 | | | $ | 4,556 | |
| | — | | | | — | | | | 10,900,189 | | | | 298,106 | (b) | | | 6,730,953 | | | | 3,897,936 | (b) |
| | | | | | | | | | | | | | | | | | | | | | |
| | — | | | | 1,142,267 | | | | — | | | | — | | | | — | | | | — | |
| | — | | | | (25,800 | ) | | | — | | | | — | | | | — | | | | — | |
| | | | | | | | | | | | | | | | | |
| | 6,008,830 | | | | 1,116,467 | | | | 10,937,367 | | | | 298,989 | | | | 6,819,167 | | | | 3,902,492 | |
| | | | | |
| | | | | | | | | | | | | | | | | | | | | | |
| | | | | | | | | | | | | | | | | |
| | 1,691,465 | | | | — | | | | 2,241,349 | | | | 330,045 | | | | 4,364,054 | | | | 820,068 | |
| | 105,594 | | | | 81,775 | | | | 219,920 | | | | 63,079 | | | | 164,019 | | | | 66,564 | |
| | 105,799 | | | | 12,067 | | | | 87,825 | | | | 24,213 | | | | 92,050 | | | | 92,329 | |
| | 70,426 | | | | 13,513 | | | | 128,104 | | | | 11,170 | | | | 128,969 | | | | 26,161 | |
| | 37,261 | | | | 20,165 | | | | 65,703 | | | | 15,187 | | | | 66,808 | | | | 23,968 | |
| | 30,187 | | | | 12,105 | | | | 33,586 | | | | 12,345 | | | | 51,151 | | | | 16,611 | |
| | 12,367 | | | | 2,805 | | | | 21,784 | | | | 1,788 | | | | 20,532 | | | | 4,436 | |
| | 13,970 | | | | 13,471 | | | | 34,242 | | | | 8,061 | | | | 24,364 | | | | 8,835 | |
| | 5,163 | | | | 1,314 | | | | 12,612 | | | | 3,007 | | | | 9,125 | | | | 3,313 | |
| | 14,222 | | | | 6,441 | | | | 12,519 | | | | 2,827 | | | | 8,542 | | | | 3,192 | |
| | — | | | | 145,742 | | | | — | | | | — | | | | — | | | | — | |
| | | | | | | | | | | | | | | | | |
| | 2,086,454 | | | | 309,398 | | | | 2,857,644 | | | | 471,722 | | | | 4,929,614 | | | | 1,065,477 | |
| | | | | | | | | | | | | | | | | | | | | | |
| | — | | | | — | | | | — | | | | — | | | | — | | | | — | |
| | | | | | | | | | | | | | | | | |
| | 2,086,454 | | | | 309,398 | | | | 2,857,644 | | | | 471,722 | | | | 4,929,614 | | | | 1,065,477 | |
| | | | | | | | | | | | | | | | | |
| | 3,922,376 | | | | 807,069 | | | | 8,079,723 | | | | (172,733 | ) | | | 1,889,553 | | | | 2,837,015 | |
| | | | | |
| | | | | | | | | | | | | | | | | | | | | | |
| | | | | | | | | | | | | | | | | |
| | 75,969 | | | | 1,331,090 | (a) | | | 19,157,190 | | | | 3,920,609 | | | | 18,780,389 | | | | 2,367,832 | |
| | | | | | | | | | | | | | | | | |
| | (2,508,950 | ) | | | (983,951 | )(a) | | | (28,704,678 | ) | | | 1,851,933 | | | | 14,924,179 | | | | 5,564,782 | |
| | | | | | | | | | | | | | | | | |
| | (2,432,981 | ) | | | 347,139 | | | | (9,547,488 | ) | | | 5,772,542 | | | | 33,704,568 | | | | 7,932,614 | |
| | | | | |
| | | | | | | | | | | | | | | | | | | | | | |
| | | | | | | | | | | | | | | | | |
| $ | 1,489,395 | | | $ | 1,154,208 | | | $ | (1,467,765 | ) | | $ | 5,599,809 | | | $ | 35,594,121 | | | $ | 10,769,629 | |
| | | | | | | | | | | | | | | | | |
| | | | | | |
| The accompanying notes are an integral part of these financial statements. | | Statements of Operations | | | 49 | |
Statements of Changes in Net Assets
| | | | | | | | |
| | |
Daily Income Fund | |
| | | Six Months Ended June 30,
2015 (Unaudited) | | | Year Ended December 31, 2014 | |
| Increase (Decrease) In Net Assets | | | | | | | | |
| | |
| Operations | | | | | | | | |
| | | | | | | |
| Net investment income | | $ | 5,535 | | | $ | 14,070 | |
| Net realized gain (loss) on investments | | | — | | | | — | |
| Net change in unrealized appreciation (depreciation) | | | — | | | | — | |
| | | | | | | |
Increase (decrease) in net assets from operations | | | 5,535 | | | | 14,070 | |
| | |
| Distributions to Shareholders | | | | | | | | |
| | | | | | | |
| Net investment income | | | (9,334 | ) | | | (20,921 | ) |
| Net realized gain on investments | | | — | | | | — | |
| | | | | | | |
Total distributions to shareholders | | | (9,334 | ) | | | (20,921 | ) |
| | |
| Capital Share Transactions | | | | | | | | |
| | | | | | | |
| Net capital share transactions | | | (10,451,030 | ) | | | (15,530,338 | ) |
| | | | | | | |
Total increase (decrease) in net assets from capital transactions | | | (10,451,030 | ) | | | (15,530,338 | ) |
| | | | | | | |
| Total Increase (Decrease) In Net Assets | | | (10,454,829 | ) | | | (15,537,189 | ) |
| | |
| Net Assets | | | | | | | | |
| | | | | | | |
| Beginning of period | | | 196,770,795 | | | | 212,307,984 | |
End of Period | | $ | 186,315,966 | | | $ | 196,770,795 | |
| | | | | | | |
| | | | | | | | |
| Under (over) distributed net investment income | | $ | (54,760 | ) | | $ | (50,961 | ) |
| | | | |
| 50 | | Statements of Changes in Net Assets | | The accompanying notes are an integral part of these financial statements. |
| | | | | | | | | | | | | | | | | | | | | | |
Short-Term Government Securities Fund | | | Short-Term Bond Fund | | | Stock Index Fund | |
Six Months Ended June 30, 2015 (Unaudited) | | | Year Ended December 31, 2014 | | | Six Months Ended June 30, 2015 (Unaudited) | | | Year Ended December 31, 2014 | | | Six Months Ended June 30, 2015 (Unaudited) | | | Year Ended December 31, 2014 | |
| | | | | | | | | | | | | | | | | | | | | | |
| | | | | |
| | | | | | | | | | | | | | | | | | | | | | |
| | | | | | | | | | | | | | | | | |
| $ | 365,133 | | | $ | 780,900 | | | $ | 3,922,376 | | | $ | 7,511,934 | | | $ | 807,069 | | | $ | 1,617,325 | |
| | 2,229 | | | | 5,615 | | | | 75,969 | | | | 45,590 | | | | 1,331,090 | | | | 1,104,473 | |
| | 137,122 | | | | 33,202 | | | | (2,508,950 | ) | | | 1,538,440 | | | | (983,951 | ) | | | 10,763,126 | |
| | | | | | | | | | | | | | | | | |
| | 504,484 | | | | 819,717 | | | | 1,489,395 | | | | 9,095,964 | | | | 1,154,208 | | | | 13,484,924 | |
| | | | | |
| | | | | | | | | | | | | | | | | | | | | | |
| | | | | | | | | | | | | | | | | |
| | (366,680 | ) | | | (783,717 | ) | | | (3,948,763 | ) | | | (7,533,719 | ) | | | — | | | | (1,621,036 | ) |
| | — | | | | (7,372 | ) | | | — | | | | — | | | | — | | | | — | |
| | | | | | | | | | | | | | | | | |
| | (366,680 | ) | | | (791,089 | ) | | | (3,948,763 | ) | | | (7,533,719 | ) | | | — | | | | (1,621,036 | ) |
| | | | | |
| | | | | | | | | | | | | | | | | | | | | | |
| | | | | | | | | | | | | | | | | |
| | (1,412,231 | ) | | | (9,497,916 | ) | | | (8,070,716 | ) | | | 33,830,112 | | | | (1,335,221 | ) | | | 1,038,944 | |
| | | | | | | | | | | | | | | | | |
| | (1,412,231 | ) | | | (9,497,916 | ) | | | (8,070,716 | ) | | | 33,830,112 | | | | (1,335,221 | ) | | | 1,038,944 | |
| | | | | | | | | | | | | | | | | |
| | (1,274,427 | ) | | | (9,469,288 | ) | | | (10,530,084 | ) | | | 35,392,357 | | | | (181,013 | ) | | | 12,902,832 | |
| | | | | |
| | | | | | | | | | | | | | | | | | | | | | |
| | | | | | | | | | | | | | | | | |
| | 76,661,216 | | | | 86,130,504 | | | | 571,695,430 | | | | 536,303,073 | | | | 116,163,192 | | | | 103,260,360 | |
| $ | 75,386,789 | | | $ | 76,661,216 | | | $ | 561,165,346 | | | $ | 571,695,430 | | | $ | 115,982,179 | | | $ | 116,163,192 | |
| | | | | | | | | | | | | | | | | |
| | | | | | | | | | | | | | | | | | | | | | |
| $ | (21,905 | ) | | $ | (20,358 | ) | | $ | (122,404 | ) | | $ | (96,017 | ) | | $ | 788,981 | | | $ | (18,088 | ) |
| | | | | | |
| The accompanying notes are an integral part of these financial statements. | | Statements of Changes in Net Assets | | | 51 | |
Statements of Changes in Net Assets (Continued)
| | | | | | | | |
| | |
Value Fund | |
| | | Six Months Ended June 30, 2015 (Unaudited) | | | Year Ended December 31, 2014 | |
| Increase (Decrease) In Net Assets | | | | | | | | |
| | |
| Operations | | | | | | | | |
| | | | | | | |
| Net investment income | | $ | 8,079,723 | | | $ | 14,289,549 | |
| Net realized gain (loss) on investments | | | 19,157,190 | | | | 6,154,536 | |
| Net change in unrealized appreciation (depreciation) | | | (28,704,678 | ) | | | 92,481,055 | |
| | | | | | | |
Increase (decrease) in net assets from operations | | | (1,467,765 | ) | | | 112,925,140 | |
| | |
| Distributions to Shareholders | | | | | | | | |
| | | | | | | |
| Net investment income | | | (8,100,648 | ) | | | (14,318,699 | ) |
| Net realized gain on investments | | | — | | | | (1,464,223 | ) |
| | | | | | | |
Total distributions to shareholders | | | (8,100,648 | ) | | | (15,782,922 | ) |
| | |
| Capital Share Transactions | | | | | | | | |
| | | | | | | |
| Net capital share transactions | | | (920,787 | ) | | | 25,244,114 | |
| | | | | | | |
Total increase (decrease) in net assets from capital transactions | | | (920,787 | ) | | | 25,244,114 | |
| | | | | | | |
| Total Increase (Decrease) In Net Assets | | | (10,489,200 | ) | | | 122,386,332 | |
| | |
| Net Assets | | | | | | | | |
| | | | | | | |
| Beginning of period | | | 938,857,420 | | | | 816,471,088 | |
End of Period | | $ | 928,368,220 | | | $ | 938,857,420 | |
| | | | | | | |
| | | | | | | | |
| | $ | (182,800 | ) | | $ | (161,875 | ) |
| | | | |
| 52 | | Statements of Changes in Net Assets | | The accompanying notes are an integral part of these financial statements. |
| | | | | | | | | | | | | | | | | | | | | | |
Growth Fund | | | Small- Company Stock Fund | | | International Value Fund | |
Six Months Ended June 30, 2015 (Unaudited) | | | Year Ended December 31, 2014 | | | Six Months Ended June 30, 2015 (Unaudited) | | | Year Ended December 31, 2014 | | | Six Months Ended June 30, 2015 (Unaudited) | | | Year Ended December 31, 2014 | |
| | | | | | | | | | | | | | | | | | | | | | |
| | | | | |
| | | | | | | | | | | | | | | | | | | | | | |
| | | | | | | | | | | | | | | | | |
| $ | (172,733 | ) | | $ | (270,843 | ) | | $ | 1,889,553 | | | $ | 3,604,635 | | | $ | 2,837,015 | | | $ | 6,667,120 | |
| | 3,920,609 | | | | 9,400,268 | | | | 18,780,389 | | | | 10,199,698 | | | | 2,367,832 | | | | 2,722,042 | |
| | 1,851,933 | | | | (2,080,242 | ) | | | 14,924,179 | | | | 63,236,859 | | | | 5,564,782 | | | | (29,730,070 | ) |
| | | | | | | | | | | | | | | | | |
| | 5,599,809 | | | | 7,049,183 | | | | 35,594,121 | | | | 77,041,192 | | | | 10,769,629 | | | | (20,340,908 | ) |
| | | | | |
| | | | | | | | | | | | | | | | | | | | | | |
| | | | | | | | | | | | | | | | | |
| | — | | | | — | | | | — | | | | (3,635,031 | ) | | | — | | | | (6,614,230 | ) |
| | (1,197,030 | ) | | | (8,679,354 | ) | | | — | | | | (10,204,210 | ) | | | — | | | | — | |
| | | | | | | | | | | | | | | | | |
| | (1,197,030 | ) | | | (8,679,354 | ) | | | — | | | | (13,839,241 | ) | | | — | | | | (6,614,230 | ) |
| | | | | |
| | | | | | | | | | | | | | | | | | | | | | |
| | | | | | | | | | | | | | | | | |
| | 9,186,722 | | | | 20,320,275 | | | | 134,444,626 | | | | 151,541,063 | | | | 2,035,421 | | | | 19,680,685 | |
| | | | | | | | | | | | | | | | | |
| | 9,186,722 | | | | 20,320,275 | | | | 134,444,626 | | | | 151,541,063 | | | | 2,035,421 | | | | 19,680,685 | |
| | | | | | | | | | | | | | | | | |
| | 13,589,501 | | | | 18,690,104 | | | | 170,038,747 | | | | 214,743,014 | | | | 12,805,050 | | | | (7,274,453 | ) |
| | | | | |
| | | | | | | | | | | | | | | | | | | | | | |
| | | | | | | | | | | | | | | | | |
| | 93,716,729 | | | | 75,026,625 | | | | 1,059,800,432 | | | | 845,057,418 | | | | 207,773,703 | | | | 215,048,156 | |
| $ | 107,306,230 | | | $ | 93,716,729 | | | $ | 1,229,839,179 | | | $ | 1,059,800,432 | | | $ | 220,578,753 | | | $ | 207,773,703 | |
| | | | | | | | | | | | | | | | | |
| | | | | | | | | | | | | | | | | | | | | | |
| $ | (182,750 | ) | | $ | (10,017 | ) | | $ | 1,803,079 | | | $ | (86,474 | ) | | $ | 2,746,139 | | | $ | (90,876 | ) |
| | | | | | |
| The accompanying notes are an integral part of these financial statements. | | Statements of Changes in Net Assets | | | 53 | |
Financial Highlights
Daily Income Fund
| | | | | | | | | | | | | | | | | | | | | | | | |
| | | Six Months Ended
June 30, 2015, (Unaudited) | | | Year Ended December 31, | |
| For a Share Outstanding Throughout Each Period | | | 2014 | | | 2013 | | | 2012 | | | 2011 | | | 2010 | |
Net Asset Value, Beginning of Period | | $ | 1.00 | | | $ | 1.00 | | | $ | 1.00 | | | $ | 1.00 | | | $ | 1.00 | | | $ | 1.00 | |
| Income from investment operations | | | | | | | | | | | | | | | | | | | | | | | | |
Net investment income | | | — | (a,b,c) | | | — | (a,b,c) | | | — | (a,b,c) | | | — | (a,b,c) | | | — | (a,b,c) | | | — | (a,b,c) |
Net realized and unrealized gain (loss) on investments | | | — | | | | — | | | | — | | | | — | | | | — | | | | — | |
Total from investment operations | | | — | | | | — | | | | — | | | | — | | | | — | | | | — | |
| | | | | | |
| Distributions | | | | | | | | | | | | | | | | | | | | | | | | |
Net investment income | | | — | (b) | | | — | (b) | | | — | (b) | | | — | (b) | | | — | (b) | | | — | (b) |
Net realized gain | | | — | | | | — | | | | — | | | | — | | | | — | | | | — | |
Total distributions | | | — | | | | — | | | | — | | | | — | | | | — | | | | — | |
Redemption fee (d) | | | — | | | | — | | | | — | | | | — | | | | — | | | | — | |
Net Asset Value, End of Period | | $ | 1.00 | | | $ | 1.00 | | | $ | 1.00 | | | $ | 1.00 | | | $ | 1.00 | | | $ | 1.00 | |
| | | | | | |
| Total Return | | | 0.01 | %(f) | | | 0.01 | % | | | 0.01 | % | | | 0.01 | % | | | 0.01 | % | | | 0.01 | % |
Ratios/Supplemental Data | | | | | | | | | | | | | | | | | | | | | | | | |
Net assets, end of period (thousands) | | $ | 186,316 | | | $ | 196,771 | | | $ | 212,308 | | | $ | 208,527 | | | $ | 195,173 | | | $ | 187,089 | |
Ratio of net investment income to average net assets | | | 0.01% | (a,c,g) | | | 0.00% | (a,c,e) | | | 0.00% | (a,c,e) | | | 0.00% | (a,c,e) | | | 0.01% | (a,c) | | | 0.01% | (a,c) |
Ratio of gross expenses before voluntary expense limitation to average net assets | | | 0.68% | (g) | | | 0.66% | | | | 0.66% | | | | 0.67% | | | | 0.68% | | | | 0.69% | |
Ratio of expenses to average net assets | | | 0.11% | (a,c,g) | | | 0.09% | (a,c) | | | 0.11% | (a,c) | | | 0.15% | (a,c) | | | 0.14% | (a,c) | | | 0.24% | (a,c) |
| (a) | Excludes excess investment management fees and other expenses voluntarily waived and reimbursed by RE Advisers. |
| (b) | Less than $0.01 per share. |
| (c) | On January 27, 2009, RE Advisers voluntarily and temporarily reduced the amount of the expense limitation from 0.80% to 0.50%. Additionally, effective August 14, 2009, RE Advisers agreed to further waive fees or reimburse expenses to the extent necessary to assist the Fund in attempting to maintain a positive yield. The temporary waiver continued throughout 2010, 2011, 2012, 2013, 2014, and through the date of this report. |
| (d) | The Daily Income Fund does not charge a redemption fee. |
| (f) | Aggregate total return for the period. |
| | | | |
| 54 | | Financial Highlights | | The accompanying notes are an integral part of these financial statements. |
Financial Highlights
Short-Term Government Securities Fund
| | | | | | | | | | | | | | | | | | | | | | | | |
| | | Six Months
Ended
June 30, 2015,
(Unaudited) | | | Year Ended December 31, | |
| For a Share Outstanding Throughout Each Period | | | 2014 | | | 2013 | | | 2012 | | | 2011 | | | 2010 | |
Net Asset Value, Beginning of Period | | $ | 5.20 | | | $ | 5.19 | | | $ | 5.28 | | | $ | 5.27 | | | $ | 5.26 | | | $ | 5.25 | |
| Income from investment operations | | | | | | | | | | | | | | | | | | | | | | | | |
Net investment income | | | 0.03 | | | | 0.05 | | | | 0.05 | | | | 0.06 | | | | 0.09 | | | | 0.12 | |
Net realized and unrealized gain (loss) on investments | | | 0.01 | | | | 0.01 | | | | (0.09 | ) | | | 0.02 | | | | 0.01 | | | | 0.01 | |
Total from investment operations | | | 0.04 | | | | 0.06 | | | | (0.04 | ) | | | 0.08 | | | | 0.10 | | | | 0.13 | |
| | | | | | |
| Distributions | | | | | | | | | | | | | | | | | | | | | | | | |
Net investment income | | | (0.03 | ) | | | (0.05 | ) | | | (0.05 | ) | | | (0.06 | ) | | | (0.09 | ) | | | (0.12 | ) |
Net realized gain | | | — | (a) | | | — | (a) | | | — | (a) | | | (0.01 | ) | | | — | (a) | | | — | (a) |
Total distributions | | | (0.03 | ) | | | (0.05 | ) | | | (0.05 | ) | | | (0.07 | ) | | | (0.09 | ) | | | (0.12 | ) |
Redemption fee (b) | | | — | | | | — | | | | — | | | | — | | | | — | | | | — | |
Net Asset Value, End of Period | | $ | 5.21 | | | $ | 5.20 | | | $ | 5.19 | | | $ | 5.28 | | | $ | 5.27 | | | $ | 5.26 | |
| | | | | | |
| Total Return | | | 0.68 | %(c) | | | 1.16 | % | | | (0.72 | )% | | | 1.50 | % | | | 2.03 | % | | | 2.57 | % |
Ratios/Supplemental Data | | | | | | | | | | | | | | | | | | | | | | | | |
Net assets, end of period (thousands) | | $ | 75,387 | | | $ | 76,661 | | | $ | 86,131 | | | $ | 94,130 | | | $ | 84,559 | | | $ | 76,137 | |
Ratio of net investment income to average net assets | | | 0.97% | (d) | | | 0.95% | | | | 0.96% | | | | 1.19% | | | | 1.76% | | | | 2.27% | |
Ratio of expenses to average net assets | | | 0.73% | (d) | | | 0.71% | | | | 0.69% | | | | 0.69% | | | | 0.71% | | | | 0.75% | |
Portfolio turnover rate | | | 14% | | | | 12% | | | | 20% | | | | 36% | | | | 32% | | | | 26% | |
| (a) | Less than $0.01 per share. |
| (b) | The Short-Term Government Securities Fund does not charge a redemption fee. |
| (c) | Aggregate total return for the period. |
| | | | | | |
| The accompanying notes are an integral part of these financial statements. | | Financial Highlights | | | 55 | |
Financial Highlights
Short-Term Bond Fund
| | | | | | | | | | | | | | | | | | | | | | | | |
| | | Six Months
Ended
June 30, 2015,
(Unaudited) | | | Year Ended December 31, | |
| For a Share Outstanding Throughout Each Period | | | 2014 | | | 2013 | | | 2012 | | | 2011 | | | 2010 | |
Net Asset Value, Beginning of Period | | $ | 5.23 | | | $ | 5.22 | | | $ | 5.22 | | | $ | 5.12 | | | $ | 5.19 | | | $ | 5.13 | |
| Income from investment operations | | | | | | | | | | | | | | | | | | | | | | | | |
Net investment income | | | 0.04 | | | | 0.07 | | | | 0.08 | | | | 0.13 | | | | 0.17 | | | | 0.23 | |
Net realized and unrealized gain (loss) on investments | | | (0.02 | ) | | | 0.01 | | | | — | (a) | | | 0.10 | | | | (0.07 | ) | | | 0.06 | |
Total from investment operations | | | 0.02 | | | | 0.08 | | | | 0.08 | | | | 0.23 | | | | 0.10 | | | | 0.29 | |
| | | | | | |
| Distributions | | | | | | | | | | | | | | | | | | | | | | | | |
Net investment income | | | (0.04 | ) | | | (0.07 | ) | | | (0.08 | ) | | | (0.13 | ) | | | (0.17 | ) | | | (0.23 | ) |
Net realized gain | | | — | | | | — | | | | — | | | | — | | | | — | | | | — | |
Total distributions | | | (0.04 | ) | | | (0.07 | ) | | | (0.08 | ) | | | (0.13 | ) | | | (0.17 | ) | | | (0.23 | ) |
Redemption fee (b) | | | — | | | | — | | | | — | | | | — | | | | — | | | | — | |
Net Asset Value, End of Period | | $ | 5.21 | | | $ | 5.23 | | | $ | 5.22 | | | $ | 5.22 | | | $ | 5.12 | | | $ | 5.19 | |
| | | | | | |
| Total Return | | | 0.31 | %(c) | | | 1.56 | % | | | 1.64 | % | | | 4.58 | % | | | 1.90 | % | | | 5.73 | % |
Ratios/Supplemental Data | | | | | | | | | | | | | | | | | | | | | | | | |
Net assets, end of period (thousands) | | $ | 561,165 | | | $ | 571,695 | | | $ | 536,303 | | | $ | 426,481 | | | $ | 374,557 | | | $ | 309,006 | |
Ratio of net investment income to average net assets | | | 1.39% | (d) | | | 1.35% | | | | 1.61% | | | | 2.53% | | | | 3.22% | | | | 4.38% | |
Ratio of expenses to average net assets | | | 0.74% | (d) | | | 0.73% | | | | 0.74% | | | | 0.76% | | | | 0.77% | | | | 0.80% | |
Portfolio turnover rate | | | 11% | | | | 26% | | | | 32% | | | | 44% | | | | 31% | | | | 38% | |
| (a) | Less than $0.01 per share. |
| (b) | The Short-Term Bond Fund does not charge a redemption fee. |
| (c) | Aggregate total return for the period. |
| | | | |
| 56 | | Financial Highlights | | The accompanying notes are an integral part of these financial statements. |
Financial Highlights
Stock Index Fund
| | | | | | | | | | | | | | | | | | | | | | | | |
| | | Six Months
Ended
June 30, 2015,
(Unaudited) | | | Year Ended December 31, | |
| For a Share Outstanding Throughout Each Period | | | 2014 | | | 2013 | | | 2012 | | | 2011 | | | 2010 | |
Net Asset Value, Beginning of Period | | $ | 15.33 | | | $ | 13.74 | | | $ | 10.57 | | | $ | 9.32 | | | $ | 9.31 | | | $ | 8.24 | |
| Income from investment operations | | | | | | | | | | | | | | | | | | | | | | | | |
Net investment income | | | 0.11 | | | | 0.22 | | | | 0.18 | | | | 0.18 | | | | 0.14 | | | | 0.12 | |
Net realized and unrealized gain (loss) on investments | | | 0.03 | | | | 1.59 | | | | 3.17 | | | | 1.25 | | | | 0.01 | | | | 1.07 | |
Total from investment operations | | | 0.14 | | | | 1.81 | | | | 3.35 | | | | 1.43 | | | | 0.15 | | | | 1.19 | |
| | | | | | |
| Distributions | | | | | | | | | | | | | | | | | | | | | | | | |
Net investment income | | | — | | | | (0.22 | ) | | | (0.18 | ) | | | (0.18 | ) | | | (0.14 | ) | | | (0.12 | ) |
Net realized gain | | | — | | | | — | | | | — | | | | — | | | | — | | | | — | |
Total distributions | | | — | | | | (0.22 | ) | | | (0.18 | ) | | | (0.18 | ) | | | (0.14 | ) | | | (0.12 | ) |
Redemption fee | | | — | | | | — | | | | — | (a,b) | | | — | | | | — | (a) | | | — | (a) |
Net Asset Value, End of Period | | $ | 15.47 | | | $ | 15.33 | | | $ | 13.74 | | | $ | 10.57 | | | $ | 9.32 | | | $ | 9.31 | |
| | | | | | |
| Total Return | | | 0.91 | %(d) | | | 13.15 | % | | | 31.72 | % | | | 15.30 | % | | | 1.65 | % | | | 14.47 | % |
Ratios/Supplemental Data | | | | | | | | | | | | | | | | | | | | | | | | |
Net assets, end of period (thousands) | | $ | 115,982 | | | $ | 116,163 | | | $ | 103,260 | | | $ | 71,514 | | | $ | 61,844 | | | $ | 60,624 | |
Ratio of net investment income to average net assets | | | 1.38% | (e) | | | 1.49% | | | | 1.55% | | | | 1.74% | | | | 1.52% | | | | 1.45% | |
Ratio of expenses to average net assets | | | 0.57% | (e) | | | 0.54% | | | | 0.56% | | | | 0.60% | | | | 0.61% | | | | 0.62% | |
Portfolio turnover rate (c) | | | N/A | | | | N/A | | | | N/A | | | | N/A | | | | N/A | | | | N/A | |
| (a) | Less than $0.01 per share. |
| (b) | Effective May 1, 2013, the redemption fee was eliminated. |
| (c) | See Appendix for the portfolio turnover of the S&P 500 Index Master Portfolio. |
| (d) | Aggregate total return for the period. |
| | | | | | |
| The accompanying notes are an integral part of these financial statements. | | Financial Highlights | | | 57 | |
Financial Highlights
Value Fund
| | | | | | | | | | | | | | | | | | | | | | | | |
| | | Six Months Ended June 30, 2015, (Unaudited) | | | Year Ended December 31, | |
| For a Share Outstanding Throughout Each Period | | | 2014 | | | 2013 | | | 2012 | | | 2011 | | | 2010 | |
Net Asset Value, Beginning of Period | | $ | 50.79 | | | $ | 45.46 | | | $ | 34.09 | | | $ | 30.71 | | | $ | 30.70 | | | $ | 27.52 | |
| Income from investment operations | | | | | | | | | | | | | | | | | | | | | | | | |
Net investment income | | | 0.44 | | | | 0.78 | | | | 0.76 | | | | 0.71 | | | | 0.50 | | | | 0.38 | |
Net realized and unrealized gain (loss) on investments | | | (0.55 | ) | | | 5.41 | | | | 11.37 | | | | 3.38 | | | | — | (b) | | | 3.18 | |
Total from investment operations | | | (0.11 | ) | | | 6.19 | | | | 12.13 | | | | 4.09 | | | | 0.50 | | | | 3.56 | |
| | | | | | |
| Distributions | | | | | | | | | | | | | | | | | | | | | | | | |
Net investment income | | | (0.44 | ) | | | (0.78 | ) | | | (0.76 | ) | | | (0.71 | ) | | | (0.49 | ) | | | (0.38 | ) |
Net realized gain | | | 0.00 | | | | (0.08 | ) | | | — | | | | — | | | | — | | | | — | |
Total distributions | | | (0.44 | ) | | | (0.86 | ) | | | (0.76 | ) | | | (0.71 | ) | | | (0.49 | ) | | | (0.38 | ) |
Redemption fee | | | — | | | | — | | | | — | (a,b) | | | — | (b) | | | — | (b) | | | — | (b) |
Net Asset Value, End of Period | | $ | 50.24 | | | $ | 50.79 | | | $ | 45.46 | | | $ | 34.09 | | | $ | 30.71 | | | $ | 30.70 | |
| | | | | | |
| Total Return | | | (0.21 | )%(c) | | | 13.66 | % | | | 35.74 | % | | | 13.38 | % | | | 1.60 | % | | | 13.05 | % |
Ratios/Supplemental Data | | | | | | | | | | | | | | | | | | | | | | | | |
Net assets, end of period (thousands) | | $ | 928,368 | | | $ | 938,857 | | | $ | 816,471 | | | $ | 600,544 | | | $ | 540,772 | | | $ | 547,616 | |
Ratio of net investment income to average net assets | | | 1.71% | (d) | | | 1.64% | | | | 1.86% | | | | 2.13% | | | | 1.59% | | | | 1.32% | |
Ratio of expenses to average net assets | | | 0.60% | (d) | | | 0.61% | | | | 0.64% | | | | 0.68% | | | | 0.70% | | | | 0.73% | |
Portfolio turnover rate | | | 3% | | | | 2% | | | | 2% | | | | 2% | | | | 6% | | | | 4% | |
| (a) | Effective May 1, 2013, the redemption fee was eliminated. |
| (b) | Less than $0.01 per share. |
| (c) | Aggregate total return for the period. |
| | | | |
| 58 | | Financial Highlights | | The accompanying notes are an integral part of these financial statements. |
Financial Highlights
Growth Fund
| | | | | | | | | | | | | | | | | | | | | | | | |
| | | Six Months Ended June 30, 2015, (Unaudited) | | | Year Ended December 31, | |
| For a Share Outstanding Throughout Each Period | | | 2014 | | | 2013 | | | 2012 | | | 2011 | | | 2010 | |
Net Asset Value, Beginning of Period | | $ | 7.79 | | | $ | 7.92 | | | $ | 5.71 | | | $ | 5.17 | | | $ | 5.80 | | | $ | 5.02 | |
| Income from investment operations | | | | | | | | | | | | | | | | | | | | | | | | |
Net investment loss | | | (0.01 | ) | | | — | | | | — | | | | — | (b) | | | (0.01 | ) | | | (0.01 | ) |
Net realized and unrealized gain (loss) on investments | | | 0.47 | | | | 0.66 | | | | 2.48 | | | | 0.91 | | | | (0.11 | ) | | | 0.79 | |
Total from investment operations | | | 0.46 | | | | 0.66 | | | | 2.48 | | | | 0.91 | | | | (0.12 | ) | | | 0.78 | |
| | | | | | |
| Distributions | | | | | | | | | | | | | | | | | | | | | | | | |
Net investment income | | | — | | | | — | | | | — | | | | — | (b) | | | — | | | | — | |
Net realized gain | | | (0.09 | ) | | | (0.79 | ) | | | (0.27 | ) | | | (0.37 | ) | | | (0.51 | ) | | | — | |
Total distributions | | | (0.09 | ) | | | (0.79 | ) | | | (0.27 | ) | | | (0.37 | ) | | | (0.51 | ) | | | — | |
Redemption fee | | | — | | | | — | | | | — | (a,b) | | | — | (b) | | | — | (b) | | | — | (b) |
Net Asset Value, End of Period | | $ | 8.16 | | | $ | 7.79 | | | $ | 7.92 | | | $ | 5.71 | | | $ | 5.17 | | | $ | 5.80 | |
| | | | | | |
| Total Return | | | 5.93 | %(d) | | | 8.38 | % | | | 43.40 | % | | | 17.57 | % | | | (2.09 | )% | | | 15.54 | % |
Ratios/Supplemental Data | | | | | | | | | | | | | | | | | | | | | | | | |
Net assets, end of period (thousands) | | $ | 107,306 | | | $ | 93,717 | | | $ | 75,027 | | | $ | 41,836 | | | $ | 32,434 | | | $ | 29,051 | |
Ratio of net investment income (loss) to average net assets | | | 0.34% | (e) | | | (0.32)% | (c) | | | (0.32)% | (c) | | | 0.00% | (c) | | | (0.19)% | (c) | | | (0.17)% | (c) |
Ratio of gross expenses before expense limitation to average net assets | | | 0.93% | (e) | | | 0.97% | | | | 1.04% | | | | 1.11% | | | | 1.14% | | | | 1.23% | |
Ratio of expenses to average net assets | | | 0.93% | (e) | | | 0.95% | (c) | | | 0.95% | (c) | | | 0.95% | (c) | | | 0.95% | (c) | | | 0.95% | (c) |
Portfolio turnover rate | | | 20% | | | | 49% | | | | 39% | | | | 51% | | | | 67% | | | | 67% | |
| (a) | Effective May 1, 2013, the redemption fee was eliminated. |
| (b) | Less than $0.01 per share. |
| (c) | Excludes expenses in excess of a 0.95% contractual expense limitation with RE Advisers, in effect through April 30, 2016. |
| (d) | Aggregate total return for the period. |
| | | | | | |
| The accompanying notes are an integral part of these financial statements. | | Financial Highlights | | | 59 | |
Financial Highlights
Small-Company Stock Fund
| | | | | | | | | | | | | | | | | | | | | | | | |
| | | Six Months
Ended
June 30, 2015,
(Unaudited) | | | Year Ended December 31, | |
| For a Share Outstanding Throughout Each Period | | | 2014 | | | 2013 | | | 2012 | | | 2011 | | | 2010 | |
Net Asset Value, Beginning of Period | | $ | 39.28 | | | $ | 36.86 | | | $ | 27.10 | | | $ | 22.89 | | | $ | 22.79 | | | $ | 17.04 | |
| Income from investment operations | | | | | | | | | | | | | | | | | | | | | | | | |
Net investment income (loss) | | | 0.06 | | | | 0.14 | | | | 0.12 | | | | 0.22 | | | | 0.03 | | | | 0.03 | |
Net realized and unrealized gain (loss) on investments | | | 1.16 | | | | 2.80 | | | | 9.79 | | | | 4.27 | | | | 0.10 | | | | 5.75 | |
Total from investment operations | | | 1.22 | | | | 2.94 | | | | 9.91 | | | | 4.49 | | | | 0.13 | | | | 5.78 | |
| | | | | | |
| Distributions | | | | | | | | | | | | | | | | | | | | | | | | |
Net investment income | | | — | | | | (0.14 | ) | | | (0.12 | ) | | | (0.22 | ) | | | (0.03 | ) | | | (0.03 | ) |
Net realized gain | | | — | | | | (0.38 | ) | | | (0.03 | ) | | | (0.06 | ) | | | — | | | | — | |
Total distributions | | | — | | | | (0.52 | ) | | | (0.15 | ) | | | (0.28 | ) | | | (0.03 | ) | | | (0.03 | ) |
Redemption fee | | | — | | | | — | | | | — | (a,b) | | | — | (b) | | | — | (b) | | | — | (b) |
Net Asset Value, End of Period | | $ | 40.50 | | | $ | 39.28 | | | $ | 36.86 | | | $ | 27.10 | | | $ | 22.89 | | | $ | 22.79 | |
| | | | | | |
| Total Return | | | 3.11 | %(c) | | | 7.97 | % | | | 36.58 | % | | | 19.63 | % | | | 0.58 | % | | | 33.94 | % |
Ratios/Supplemental Data | | | | | | | | | | | | | | | | | | | | | | | | |
Net assets, end of period (thousands) | | $ | 1,229,839 | | | $ | 1,059,800 | | | $ | 845,057 | | | $ | 390,373 | | | $ | 190,426 | | | $ | 114,159 | |
Ratio of net investment income (loss) to average net assets | | | 0.33% | (d) | | | 0.38% | | | | 0.44% | | | | 1.05% | | | | 0.17% | | | | 0.20% | |
Ratio of expenses to average net assets | | | 0.87% | (d) | | | 0.89% | | | | 0.91% | | | | 1.00% | | | | 1.06% | | | | 1.17% | |
Portfolio turnover rate | | | 5% | | | | 3% | | | | 1% | | | | 1% | | | | 2% | | | | 4% | |
| (a) | Effective May 1, 2013, the redemption fee was eliminated. |
| (b) | Less than $0.01 per share. |
| (c) | Aggregate total return for the period. |
| | | | |
| 60 | | Financial Highlights | | The accompanying notes are an integral part of these financial statements. |
Financial Highlights
International Value Fund
| | | | | | | | | | | | | | | | | | | | | | | | |
| | | Six Months
Ended
June 30, 2015,
(Unaudited) | | | Year Ended December 31, | |
| | | | 2014 | | | 2013 | | | 2012 | | | 2011 | | | 2010 | |
Net Asset Value, Beginning of Period | | $ | 7.17 | | | $ | 8.13 | | | $ | 6.70 | | | $ | 5.96 | | | $ | 7.57 | | | $ | 7.27 | |
| Income from investment operations | | | | | | | | | | | | | | | | | | | | | | | | |
Net investment income | | | 0.09 | | | | 0.24 | | | | 0.14 | | | | 0.16 | | | | 0.16 | (a) | | | 0.14 | (a) |
Net realized and unrealized gain (loss) on investments | | | 0.28 | | | | (0.96 | ) | | | 1.43 | | | | 0.87 | | | | (1.40 | ) | | | 0.27 | |
Total from investment operations | | | 0.37 | | | | (0.72 | ) | | | 1.57 | | | | 1.03 | | | | (1.24 | ) | | | 0.41 | |
| | | | | | |
| Distributions | | | | | | | | | | | | | | | | | | | | | | | | |
Net investment income | | | — | | | | (0.24 | ) | | | (0.14 | ) | | | (0.16 | ) | | | (0.27 | )(b) | | | (0.11 | ) |
Net realized gain | | | — | | | | — | | | | — | | | | — | | | | — | | | | — | |
Return of Capital | | | — | | | | — | | | | — | | | | (0.13 | ) | | | (0.10 | )(b) | | | — | |
Total distributions | | | — | | | | (0.24 | ) | | | (0.14 | ) | | | (0.29 | ) | | | (0.37 | ) | | | (0.11 | ) |
Redemption fee | | | — | | | | — | | | | — | (c,d) | | | — | (d) | | | — | (d) | | | — | (d) |
Net Asset Value, End of Period | | $ | 7.54 | | | $ | 7.17 | | | $ | 8.13 | | | $ | 6.70 | | | $ | 5.96 | | | $ | 7.57 | |
| | | | | | |
| Total Return | | | 5.16 | %(e) | | | (8.90 | )% | | | 23.44 | % | | | 17.41 | % | | | (16.55 | )% | | | 5.73 | % |
Ratios/Supplemental Data | | | | | | | | | | | | | | | | | | | | | | | | |
Net assets, end of period (thousands) | | $ | 220,579 | | | $ | 207,774 | | | $ | 215,048 | | | $ | 169,382 | | | $ | 144,421 | | | $ | 135,455 | |
Ratio of net investment income to average net assets | | | 2.59% | (f) | | | 3.04% | | | | 1.95% | | | | 2.47% | | | | 2.44% | (a) | | | 2.08% | (a) |
Ratio of gross expenses before voluntary expense limitation to average net assets | | | 0.97% | (f) | | | 0.97% | | | | 0.96% | | | | 0.99% | | | | 1.00% | | | | 1.02% | |
Ratio of expenses to average net assets | | | 0.97% | (f) | | | 0.97% | | | | 0.96% | | | | 0.99% | | | | 0.99% | (a) | | | 0.99% | (a) |
Portfolio turnover rate | | | 14% | | | | 24% | | | | 19% | | | | 23% | | | | 34% | | | | 44% | |
| (a) | Excludes expenses in excess of a 0.99% contractual expense limitation with RE Advisers, in effect through April 30, 2016. |
| (b) | Revised to reflect distributions from return of capital per share which were previously reported as distributions from net investment income per share. Previously reported amounts were distributions from net investment income per share of 0.37. This revision did not impact net assets, total distributions or total return. Refer to Note 2 of the Financial Statements for further details. |
| (c) | Effective May 1, 2013, the redemption fee was eliminated. |
| (d) | Less than $0.01 per share. |
| (e) | Aggregate total return for the period. |
| | | | | | |
| The accompanying notes are an integral part of these financial statements. | | Financial Highlights | | | 61 | |
Notes to Financial Statements (Unaudited)
1. Organization
Homestead Funds, Inc. (“Homestead Funds”) is a Maryland corporation registered with the Securities and Exchange Commission under the Investment Company Act of 1940, as amended (the “Act”), as an open-end management investment company. Homestead Funds currently consists of eight funds: Daily Income Fund, Short-Term Government Securities Fund, Short-Term Bond Fund, Stock Index Fund, Value Fund, Growth Fund, Small-Company Stock Fund, and International Value Fund (each a “Fund” and collectively the “Funds”).
Each Fund is a separate investment portfolio with distinct investment objectives, investment programs, policies and restrictions. The investment objectives of the Funds, as well as the nature and risks of the investment activities of each Fund, are set forth more fully in Homestead Funds’ Prospectus and Statement of Additional Information. All of the portfolios except for the Growth Fund are diversified for purposes of the federal securities laws.
The Stock Index Fund seeks to achieve its investment objective by investing substantially all of its investable assets in one or more securities that are designed to track the performance of the S&P 500 Index. At June 30, 2015, the Stock Index Fund was operating as a feeder fund, whereby substantially all of its assets are invested in the S&P 500 Index Master Portfolio (“Master Portfolio”), an open-end investment company managed by BlackRock Fund Advisors. At June 30, 2015, the Stock Index Fund’s investment constituted 1.70% of the Master Portfolio. The financial statements of the Master Portfolio are contained in the Appendix of this report and should be read in conjunction with the financial statements for the Stock Index Fund.
2. Summary of Significant Accounting Policies
Security Valuation: Each Fund’s net asset value per share is determined as of the close of the New York Stock Exchange (“NYSE”) (usually 4:00 p.m. ET), each day that the NYSE is open for business. The Funds use independent pricing services approved by the Funds’ Board of Directors (“Board”) to value the investments. In the event a pricing service is unable to provide a price for a particular security or the price is deemed unreliable, the security is priced at fair value by RE Advisers (“Adviser”) or the Funds’ sub-advisor, as determined in good faith in accordance with policies approved by the Board.
The Board has adopted Portfolio Securities Valuation Policies and Procedures (“Valuation Procedures”) to determine the fair value of securities for which the market prices are not readily available or if the price is deemed unreliable. The Board has delegated the day-to-day responsibility for determining the fair value of securities to the Adviser and the Funds’ sub-advisors. RE Advisers has chartered an internal Valuation Committee to oversee the implementation of the Valuation Procedures, oversee the fair valuation decisions of the sub-advisors, monitor the valuation process, and provide quarterly reports to the Board. The Valuation Committee reports all instances of fair valuation to the Board at each quarterly Board meeting, as applicable.
Accounting principles generally accepted in the United States (GAAP) establish a disclosure hierarchy that categorizes the inputs used to value assets and liabilities at measurement date. These inputs are summarized into three broad levels as follows:
| • | | Level 1—quoted prices in active markets for identical investments; |
| • | | Level 2—other significant observable inputs (including quoted prices for similar investments, interest rates, prepayment speeds, credit risk, etc.); and |
| • | | Level 3—significant unobservable inputs (including the Fund’s own assumptions in determining the fair valuation of investments). |
The inputs or methodologies used to value securities are not necessarily an indication of the risk associated with investing in those securities. Changes in valuation techniques may result in transfers in or out of an investment’s assigned level within the hierarchy during the period.
The Funds use the following valuation techniques to value securities by major category:
Registered investment companies are valued at the net asset value determined by the registered investment company after the close of the NYSE. The Funds invest in regulated investment companies that seek to maintain a share price of $1.00 and are categorized as Level 1 in the hierarchy.
Domestic equity securities and exchange traded funds for which market quotations are readily available are valued at the closing price as reported by an independent pricing service from the primary market in which the securities trade and are categorized as Level 1.
Foreign equity securities are valued based on the closing price from the principal market in which such securities are normally traded. An independent pricing service is utilized to fair value foreign equity securities based on the impact of market events between the close of the foreign exchange and the time the net asset value is calculated. Foreign equity securities that are fair valued are categorized as Level 2 in the hierarchy and foreign equity securities not fair valued are categorized as Level 1.
| | | | |
| 62 | | Notes to Financial Statements | | |
Notes to Financial Statements | (Unaudited) (Continued)
The valuations for fixed income securities, including corporate, government, municipal, mortgage-backed and asset-backed are typically the prices provided by independent third party pricing services, which may use market prices, broker/dealer quotations or a variety of valuation techniques and methodologies, such as benchmark yields, monthly payment information and issuer spreads.
Fixed income securities utilizing these methods are generally categorized as Level 2. Fixed income securities that are valued using only a broker quote, absent corroborating observable inputs are categorized as Level 3.
Fixed income securities and commercial paper held in the Daily Income Fund are valued at amortized cost and are categorized as Level 2 in the hierarchy. Short-term fixed income securities held in portfolios other than the Daily Income Fund and that mature in 60 days or less at time of purchase are valued at amortized cost, unless it is determined that using this method would not reflect the security’s fair value and are categorized as Level 2 in the hierarchy. Under the amortized cost method, discounts and premiums on securities purchased are amortized over the lives of the respective securities.
In the event an independent pricing service is unable to provide a security price, RE Advisers values the fixed income security using a matrix, model or other available market information. Pricing methodologies include, but are not limited to: estimates of securities fair values by independent parties, book value or a multiple thereof, multiple of earnings, yield to maturity, ratings, analytical data relating to the security, and the nature and duration of restrictions on disposition of the security. RE Advisers also will consider factors it deems relevant and appropriate in light of the facts and circumstances. Examples of possible factors include, but are not limited to: the type of security, issuer’s financial statements, cost at purchase, information regarding recent transactions with respect to the security, the nature and duration of restrictions on disposition of the security, the existence of merger proposals affecting the security, the price of public trading in similar securities of the issuer or comparable companies, news events, analyst reports or government actions, corporate action, and the forces that influence the market in which the security is traded. These securities are generally categorized as Level 2 or Level 3 in the hierarchy, depending on the observability of market inputs.
If a market value cannot be determined for a security using the methodologies described above, or if, in the good faith opinion of the Adviser or Funds’ sub-advisor, the market value does not constitute a readily available market quotation, or if a significant event has occurred that would impact a security’s valuation, the security will be fair valued as determined in good faith by the Funds’ Adviser or sub-advisor Funds’ based on the Valuation Procedures approved by the Board. Examples of additional considerations for a significant event include: nature and duration of the event and the forces influencing the operation of the financial markets; factors that preceded the event; whether the event is likely to reoccur; and whether the event affects the entire market, region or country. As fair valuation determinations involve a significant amount of judgment, there is a degree of subjectivity inherent in such pricing decisions. Such securities are generally categorized as Level 3 in the hierarchy.
The Stock Index Fund records its investment in the Master Portfolio at the market value of its proportionate interest in the net assets of the Master Portfolio. The Board of Trustees of the Master Portfolio has adopted valuation policies and procedures. The policies and procedures are discussed in the notes to the Master Portfolio’s financial statements, included in the Appendix of this report.
The following table summarizes each Fund’s investments, based on the inputs used to determine their values on June 30, 2015 (other than Stock Index Fund). The level classifications of the Master Portfolio as of June 30, 2015 are included in the Appendix.
| | | | | | | | | | | | | | | | |
| Daily Income Fund | | Level 1 | | | Level 2 | | | Level 3 | | | Total | |
Commercial Paper | | $ | — | | | $ | 116,802,100 | | | $ | — | | | $ | 116,802,100 | |
U.S. Government Obligations | | | — | | | | 38,166,423 | | | | — | | | | 38,166,423 | |
Corporate Bonds | | | — | | | | 12,944,882 | | | | — | | | | 12,944,882 | |
Cash Equivalents | | | 18,276,690 | | | | — | | | | — | | | | 18,276,690 | |
| | | | | | | | | | | | | |
Total | | $ | 18,276,690 | | | $ | 167,913,405 | | | $ | — | | | $ | 186,190,095 | |
| | | | |
| Short-Term Government Securities Fund | | | | | | | | | | | | |
U.S. Government Obligations | | $ | — | | | $ | 43,470,089 | | | $ | — | | | $ | 43,470,089 | |
Corporate Bonds | | | — | | | | 15,873,736 | | | | — | | | | 15,873,736 | |
Commercial Paper | | | — | | | | 10,683,614 | | | | — | | | | 10,683,614 | |
Mortgage Backed Securities | | | — | | | | 3,025,870 | | | | — | | | | 3,025,870 | |
Municipal Bonds | | | — | | | | 2,211,037 | | | | — | | | | 2,211,037 | |
Asset Backed Securities | | | — | | | | 202,418 | | | | — | | | | 202,418 | |
Cash Equivalents | | | 737 | | | | — | | | | — | | | | 737 | |
| | | | | | | | | | | | | |
Total | | $ | 737 | | | $ | 75,466,764 | | | $ | — | | | $ | 75,467,501 | |
| | | | | | |
| | Notes to Financial Statements | | | 63 | |
Notes to Financial Statements | (Unaudited) (Continued)
| | | | | | | | | | | | | | | | |
| Short-Term Bond Fund | | Level 1 | | | Level 2 | | | Level 3 | | | Total | |
Corporate Bonds | | $ | — | | | $ | 169,770,551 | | | $ | — | | | $ | 169,770,551 | |
Asset Backed Securities | | | — | | | | 135,145,316 | | | | 4,088,015 | | | | 139,233,331 | |
Municipal Bonds | | | — | | | | 127,427,798 | | | | — | | | | 127,427,798 | |
Yankee Bonds | | | — | | | | 55,409,503 | | | | — | | | | 55,409,503 | |
U.S. Government Obligations | | | — | | | | 36,298,836 | | | | — | | | | 36,298,836 | |
Mortgage Backed Securities | | | — | | | | 18,744,620 | | | | 110,210 | | | | 18,854,830 | |
Commercial Paper | | | — | | | | 13,563,000 | | | | — | | | | 13,563,000 | |
Cash Equivalents | | | 762 | | | | — | | | | — | | | | 762 | |
| | | | | | | | | | | | | |
Total | | $ | 762 | | | $ | 556,359,624 | | | $ | 4,198,225 | | | $ | 560,558,611 | |
| | | | |
| Value Fund | | | | | | | | | | | | |
Common Stocks | | $ | 909,154,208 | | | $ | — | | | $ | — | | | $ | 909,154,208 | |
Commercial Paper | | | — | | | | 18,593,000 | | | | — | | | | 18,593,000 | |
Cash Equivalents | | | 564 | | | | — | | | | — | | | | 564 | |
| | | | | | | | | | | | | |
Total | | $ | 909,154,772 | | | $ | 18,593,000 | | | $ | — | | | $ | 927,747,772 | |
| | | | |
| Growth Fund | | | | | | | | | | | | |
Common Stocks | | $ | 105,831,019 | | | $ | — | | | $ | — | | | $ | 105,831,019 | |
Cash Equivalents | | | 1,810,955 | | | | — | | | | — | | | | 1,810,955 | |
| | | | | | | | | | | | | |
Total | | $ | 107,641,974 | | | $ | — | | | $ | — | | | $ | 107,641,974 | |
| | | | |
| Small-Company Stock Fund | | | | | | | | | | | | |
Common Stocks | | $ | 1,093,384,388 | | | $ | — | | | $ | — | | | $ | 1,093,384,388 | |
Exchange Traded Funds | | | 94,248,576 | | | | — | | | | — | | | | 94,248,576 | |
Commercial Paper | | | — | | | | 44,994,494 | | | | — | | | | 44,994,494 | |
Cash Equivalents | | | 168 | | | | — | | | | — | | | | 168 | |
| | | | | | | | | | | | | |
Total | | $ | 1,187,633,132 | | | $ | 44,994,494 | | | $ | — | | | $ | 1,232,627,626 | |
| | | | |
| International Value | | | | | | | | | | | | |
Common Stocks | | | | | | | | | | | | | | | | |
Foreign Equities | | $ | — | | | $ | 204,866,819 | | | $ | — | | | $ | 204,866,819 | |
American Depository Receipts | | | 3,512,790 | | | | — | | | | — | | | | 3,512,790 | |
Cash Equivalents | | | 10,926,077 | | | | — | | | | — | | | | 10,926,077 | |
| | | | | | | | | | | | | |
Total | | $ | 14,438,867 | | | $ | 204,866,819 | | | $ | — | | | $ | 219,305,686 | |
| | | | |
| Short Term Bond Fund - Level 3 | | | | | Asset Backed Securities | | | Mortgage Backed Securities | | | Total | |
Balance as of December 31, 2014 | | | | | | $ | 12,742 | | | $ | 68,516 | | | $ | 81,258 | |
Purchase at cost | | | | | | | — | | | | — | | | | — | |
Sales at proceeds | | | | | | | (12,822 | ) | | | (8,636 | ) | | | (21,458 | ) |
Realized gain/(loss) | | | | | | | 1,309 | | | | — | | | | 1,309 | |
Change in unrealized appreciation/(depreciation) | | | | | | | (1,243 | ) | | | 50,330 | | | | 49,087 | |
Accretion/(amortization) | | | | | | | 14 | | | | — | | | | 14 | |
Transfer into Level 3 | | | | | | | 4,088,015 | | | | — | | | | 4,088,015 | |
Transfer out of Level 3 | | | | | | | — | | | | — | | | | — | |
| | | | | | | | | | | | | |
Balance as of June 30, 2015 | | | | | | $ | 4,088,015 | | | $ | 110,210 | | | $ | 4,198,225 | |
There was one security transferred from Level 2 to Level 3, due to pricing by third party with no visibility into assumptions, in addition to lack of recent trade activity. There were no other transfers between levels. Transfers are reported using values at the end of the reporting period.
At June 30, 2015, the Short-Term Bond Fund held two securities with a fair value of $4,198,225 classified as Level 3 in the fair value hierarchy. Both securities were valued by external pricing services and observable inputs were not available.
Foreign currency: The International Value Fund may use foreign currency contracts to facilitate transactions in foreign-denominated securities. Losses from these transactions may arise from changes in the value of the foreign currency or if the counterparties do not perform under the contract’s terms. Foreign-denominated assets, including investment securities and liabilities are translated into
| | | | |
| 64 | | Notes to Financial Statements | | |
Notes to Financial Statements | (Unaudited) (Continued)
U.S. dollars at the exchange rate at the end of the period. Purchases and sales of investment securities and income and dividends received are translated into U.S. dollars at the exchange rate in effect on the transaction date. Currency gains and losses and the effects of exchange rate fluctuations on investments are included with the realized and unrealized gain (loss) on investment securities.
Revisions: The tax character of certain distributions from the International Value Fund for the fiscal year 2011 was revised to correct the allocation between net investment income, net realized gain on investments, and return of capital. Distributions from return of capital increased and distributions from net investment income decreased by $2,295,839. This revision impacts the Financial Highlights. This revision did not impact net assets, total distributions or total return. Management does not believe this revision is material to the financial statements.
Distributions to shareholders: Dividends to shareholders are recorded on the ex-dividend date. Ordinary income dividends for the Daily Income, Short-Term Government Securities and Short-Term Bond Funds are declared daily and paid monthly. Ordinary income dividends for Value Fund are declared and paid semi-annually. Ordinary income dividends for the Stock Index, Growth, Small-Company Stock and International Value Funds are declared and paid annually. Capital gains dividends, if any, are declared and paid at the end of each fiscal year, or more frequently, if necessary.
Use of estimates in the preparation of financial statements: The preparation of financial statements in conformity with GAAP requires management to make estimates and assumptions that affect the reported amounts of assets and liabilities and disclosure of contingent assets and liabilities at the date of the financial statements and the reported amounts of revenues and expenses during the reporting period. Actual results could differ from those estimates.
Other: Dividend income is recorded on the ex-dividend date. Interest income, including amortization of premium and accretion of discount, and expenses are recorded on the accrual basis. Investment transactions are recorded as of the trade date. Realized gains and losses from investment transactions are reported on the identified cost basis.
The Stock Index Fund records a pro rata share of the Master Portfolio’s income, expenses, and realized and unrealized gains and losses in addition to the Fund’s own expenses, which are accrued daily.
In the normal course of business, the Funds enter into contracts that provide general indemnifications. The Funds’ maximum exposure under these arrangements is dependent on claims that may be made against the Funds in the future and therefore cannot be estimated; however, based on experience, the risk of material loss from claims is considered remote.
Management considered events occurring between the date of this report, June 30, 2015, and the date of issuance of this report in determining adjustments to the financial statements or necessary disclosures in this report.
3. Federal Income Tax Information
The Funds intend to comply with the provisions of the Internal Revenue Code applicable to regulated investment companies and will distribute all net investment income to its shareholders. Therefore, no provision for Federal income taxes is required.
Management has analyzed the Funds’ tax positions and has concluded that no provision for income tax is required in the Funds’ financial statements. The Funds are not aware of any tax positions for which it is reasonably possible that the total amounts of unrecognized tax benefits will significantly change in the next twelve months. However, management’s conclusions may be subject to review and adjustment at a later date based on factors including, but not limited to new tax laws, regulations and administrative interpretations.
Each Fund files U.S. federal, state, and local tax returns as required. Each Fund’s tax returns are subject to examination by the relevant tax authorities until expiration of the applicable statute of limitations, which is generally three years after filing of the tax return but could be longer in certain circumstances.
Income and capital gain distributions are determined in accordance with federal income tax regulations, which may differ from GAAP. These differences are primarily due to differing treatments of the following: futures and options transactions, foreign currency transactions, losses deferred due to wash sales, losses deferred due to post-October losses return of capital distributions, partnership investments, deferred Director’s fees and REIT transactions.
| | | | | | |
| | Notes to Financial Statements | | | 65 | |
Notes to Financial Statements | (Unaudited) (Continued)
At June 30, 2015, the cost of securities for federal income tax purposes, the aggregate gross unrealized gain for all securities for which there was an excess of value over tax cost and the aggregate gross unrealized loss for all securities for which there was an excess of tax cost over value was as follows:
| | | | | | | | | | | | | | | | |
| | | Tax Cost | | | Tax Unrealized Gain | | | Tax
Unrealized
(Loss) | | | Net
Unrealized
Gain (Loss) | |
Daily Income Fund | | $ | 186,190,095 | | | $ | — | | | $ | — | | | $ | — | |
Short-Term Government Securities Fund | | $ | 75,148,285 | | | $ | 494,106 | | | $ | (174,890 | ) | | $ | 319,216 | |
Short-Term Bond Fund | | $ | 559,259,000 | | | $ | 6,719,558 | | | $ | (5,419,947 | ) | | $ | 1,299,611 | |
Value Fund | | $ | 491,120,886 | | | $ | 443,804,019 | | | $ | (7,177,133 | ) | | $ | 436,626,886 | |
Growth Fund | | $ | 85,583,360 | | | $ | 24,348,352 | | | $ | (2,289,744 | ) | | $ | 22,058,608 | |
Small-Company Stock Fund | | $ | 888,636,751 | | | $ | 366,609,755 | | | $ | (22,618,880 | ) | | $ | 343,990,875 | |
International Value Fund | | $ | 202,268,042 | | | $ | 33,624,006 | | | $ | (16,586,362 | ) | | $ | 17,037,644 | |
Net unrealized appreciation/(depreciation) of Stock Index Fund in the Master Portfolio consists of an allocated portion of the portfolio’s unrealized appreciation/(depreciation). For information pertaining to the unrealized appreciation/(depreciation) for the Master Portfolio, please refer to the Appendix of this report.
4. Investment Transactions
Purchases and proceeds from sales of securities, other than short-term and U.S. Government securities, for the period ended June 30, 2015, were as follows:
| | | | | | | | |
| | | Purchases | | | Proceeds from Sale | |
Short-Term Government Securities Fund | | $ | 2,527,600 | | | $ | 2,857,941 | |
Short-Term Bond Fund | | $ | 60,697,899 | | | $ | 50,044,077 | |
Value Fund | | $ | 26,106,498 | | | $ | 24,675,323 | |
Growth Fund | | $ | 27,490,573 | | | $ | 20,073,248 | |
Small-Company Stock Fund | | $ | 191,693,177 | | | $ | 58,815,672 | |
International Value Fund | | $ | 29,353,593 | | | $ | 30,105,710 | |
Purchases and proceeds from sales of long-term U.S. Government securities, for the period ended June 30, 2015, were as follows:
| | | | | | | | |
| | | Purchases | | | Proceeds from Sale | |
Short-Term Government Securities Fund | | $ | 6,977,500 | | | $ | 14,134,072 | |
Short-Term Bond Fund | | $ | 4,550,000 | | | $ | 13,414,501 | |
5. Related Parties
The investment management agreements between Homestead Funds, with respect to each Fund (other than the Stock Index Fund), and RE Advisers Corporation (“RE Advisers”), an indirect, wholly-owned subsidiary of the National Rural Electric Cooperative Association (“NRECA”), provide for an annual investment management fee, that also provides for certain administrative services to the Funds, which is computed daily and paid monthly, based on each Fund’s average daily net assets. The annualized management fee rates for the Funds are 0.50% of average daily net assets for Daily Income Fund; 0.45% of average daily net assets for Short-Term Government Securities Fund; 0.60% of average daily net assets for Short-Term Bond Fund; 0.65% of average daily net assets up to $200 million, 0.50% of average daily net assets up to the next $200 million, 0.40% of average daily net assets in excess of $400 million for Value Fund; 0.65% of average daily net assets up to $250 million and 0.60% of average daily net assets in excess of $250 million for the Growth Fund; 0.85% of average daily net assets up to $200 million and 0.75% of average daily net assets in excess of $200 million for Small-Company Stock Fund; and 0.75% of average daily net assets up to $300 million, 0.65% of average daily net assets up to the next $100 million, 0.55% of average daily net assets up to the next $100 million, and 0.50% of average daily net assets in excess of $500 million for International Value Fund.
T. Rowe Price Associates, Inc. (“T. Rowe”) is the subadvisor for the Growth Fund and Mercator Asset Management, L.P. (“Mercator”) is the subadvisor for the International Value Fund. The subadvisors select, buy, and sell securities under the oversight of RE Advisers and the Board of Directors. RE Advisers pays the subadvisors from the fees it receives from the Funds.
| | | | |
| 66 | | Notes to Financial Statements | | |
Notes to Financial Statements | (Unaudited) (Continued)
The Homestead Funds’ Board of Directors, based on a recommendation from RE Advisers, voted to terminate the contract with Mercator effective September 7, 2015. The Board has appointed SSGA Funds Management, Inc. (“SSGA FM”) as subadviser to the Fund until the earlier of (a) a permanent subadviser is selected and approved by a shareholder vote or (b) 150 days following the date of termination of the Mercator contract (the “Interim Period”). During the Interim Period, RE Advisers will waive, pursuant to a contractual waiver, from its investment management fee due to it from the International Value Fund an amount equal to the sub-advisory fee it would have paid Mercator under the existing sub-advisory agreement less the amount paid to SSGA FM.
With respect to the Stock Index Fund, an Administrative Service Agreement with RE Advisers has been contracted, under which RE Advisers provides certain administrative services to the Fund. Pursuant to this agreement, RE Advisers receives a fee of 0.25% of the Fund’s average daily net assets. In addition, the Stock Index Fund is allocated a management fee from the Master Portfolio, calculated daily at an annual rate of 0.04% of its average daily net assets. This fee includes advisory, custody, and administrative fees provided by the Master Portfolio on behalf of its investors. The financial information for the Master Portfolio is included in the Appendix.
RE Advisers has agreed, as part of the Expense Limitation Agreement entered into with Homestead Funds, with respect to each Fund, to waive its management fee and/or reimburse all Fund operating expenses, excluding certain non-recurring expenses, which in any year exceed 0.80% of the average daily net assets of the Daily Income Fund and Short-Term Bond Fund, 0.75% of the average daily net assets of the Short-Term Government Securities Fund and Stock Index Fund, 1.25% of the average daily net assets of Value Fund, 0.95% of the average daily net assets of Growth Fund, 1.50% of the average daily net assets of Small-Company Stock Fund and 0.99% of the average daily net assets of the International Value Fund.
On August 14, 2009, RE Advisers agreed to waive fees and/or reimburse expenses, if necessary, in order to assist the Daily Income Fund in maintaining a minimum yield. The temporary waiver continued from 2010 through the date of issuance of this report.
Pursuant to the Expense Limitation Agreement, management fees waived for the period ended June 30, 2015, amounted to $466,594 for Daily Income Fund. Additionally, RE Advisers paid the Daily Income Fund $63,053 during the period for expense reimbursements.
Through April 30, 2013, the Stock Index, Value, Growth, Small-Company Stock, and International Value Funds each received a 2% redemption fee on shares sold within 30 days of purchase. Effective May 1, 2013, this redemption fee was eliminated. None of the Funds currently assess a redemption fee.
Under a Deferred Compensation Plan (the “Plan”), Independent Directors of the Funds may elect to defer receipt of all or a specified portion of their compensation. Deferred amounts are credited with the earnings and losses equal to those made as if the deferred amounts were invested in one or more of the Funds, as designated by each participating Independent Director. Deferred amounts remain in the Fund until distributed in accordance with the Plan. The liability is reflected as Independent Director’s deferred compensation on the Statement of Assets and Liabilities and the expense is included in Director and Board meeting expenses on the Statement of Operations.
The Funds’ shares are sold through channels including financial intermediaries that may establish a single, omnibus account with the beneficial owners being individual accounts within the financial intermediary. As of June 30, 2015, there was one such account in the Value Fund, accounting for 19% of the outstanding shares and four such accounts in the Small-Company Stock Fund, accounting for 30%, 16%, 14% and 13% of the outstanding shares, respectively. Additionally, 72% of the outstanding shares of the International Value Fund are held in a retirement plan account for the benefit of its participants. 6% of the outstanding shares of the Daily Income Fund are owned by RE Advisers, the investment adviser to the Fund.
| | | | | | |
| | Notes to Financial Statements | | | 67 | |
Notes to Financial Statements | (Unaudited) (Continued)
6. Capital Share Transactions
As of June 30, 2015, 500 million shares of $.01 par value capital shares are authorized for Daily Income Fund, 200 million shares for Short-Term Bond Fund, and 100 million shares for Short-Term Government Securities Fund, Stock Index Fund, Value Fund, Growth Fund, Small-Company Stock Fund, and International Value Fund. Transactions in capital shares were as follows:
| | | | | | | | | | | | | | | | | | | | | | | | | | | | |
| | | Shares Sold | | | | | Shares Issued
In Reinvestment
of Dividends | | | | | Total Shares
Issued | | | | | Total Shares
Redeemed | | | | | Net Increase
(Decrease) | |
Period Ended June 30, 2015 | | | | | | | | | | | | | | | | | | | | | | | | | | | | |
| In Dollars | | | | | | | | | | | | | | | | | | | | | | | | | | | | |
Daily Income Fund | | $ | 51,718,360 | | | | | $ | 5,139 | | | | | $ | 51,723,499 | | | | | $ | (62,174,529 | ) | | | | $ | (10,451,030 | ) |
Short-Term Government Securities Fund | | $ | 4,940,097 | | | | | $ | 358,663 | | | | | $ | 5,298,760 | | | | | $ | (6,710,991 | ) | | | | $ | (1,412,231 | ) |
Short-Term Bond Fund | | $ | 53,249,431 | | | | | $ | 3,868,413 | | | | | $ | 57,117,844 | | | | | $ | (65,188,560 | ) | | | | $ | (8,070,716 | ) |
Stock Index Fund | | $ | 7,546,883 | | | | | $ | — | | | | | $ | 7,546,883 | | | | | $ | (8,882,104 | ) | | | | $ | (1,335,221 | ) |
Value Fund | | $ | 61,892,107 | | | | | $ | 7,989,329 | | | | | $ | 69,881,436 | | | | | $ | (70,802,223 | ) | | | | $ | (920,787 | ) |
Growth Fund | | $ | 15,185,282 | | | | | $ | 1,191,853 | | | | | $ | 16,377,135 | | | | | $ | (7,190,413 | ) | | | | $ | 9,186,722 | |
Small-Company Stock Fund | | $ | 264,142,540 | | | | | $ | — | | | | | $ | 264,142,540 | | | | | $ | (129,697,914 | ) | | | | $ | 134,444,626 | |
International Value Fund | | $ | 20,359,666 | | | | | $ | — | | | | | $ | 20,359,666 | | | | | $ | (18,324,245 | ) | | | | $ | 2,035,421 | |
| In Shares | | | | | | | | | | | | | | | | | | | | | | | | | | | | |
Daily Income Fund | | | 51,718,360 | | | | | | 5,139 | | | | | | 51,723,499 | | | | | | (62,174,529 | ) | | | | | (10,451,030 | ) |
Short-Term Government Securities Fund | | | 948,143 | | | | | | 68,728 | | | | | | 1,016,871 | | | | | | (1,287,826 | ) | | | | | (270,955 | ) |
Short-Term Bond Fund | | | 10,172,492 | | | | | | 739,188 | | | | | | 10,911,680 | | | | | | (12,455,940 | ) | | | | | (1,544,260 | ) |
Stock Index Fund | | | 486,869 | | | | | | — | | | | | | 486,869 | | | | | | (571,431 | ) | | | | | (84,562 | ) |
Value Fund | | | 1,203,654 | | | | | | 159,023 | | | | | | 1,362,677 | | | | | | (1,368,676 | ) | | | | | (5,999 | ) |
Growth Fund | | | 1,856,456 | | | | | | 146,058 | | | | | | 2,002,514 | | | | | | (881,725 | ) | | | | | 1,120,789 | |
Small-Company Stock Fund | | | 6,649,003 | | | | | | — | | | | | | 6,649,003 | | | | | | (3,266,946 | ) | | | | | 3,382,057 | |
International Value Fund | | | 2,697,329 | | | | | | — | | | | | | 2,697,329 | | | | | | (2,422,384 | ) | | | | | 274,945 | |
| | | | | | | | | |
Year Ended December 31, 2014 | | | | | | | | | | | | | | | | | | | | | | | | | | | | |
| In Dollars | | | | | | | | | | | | | | | | | | | | | | | | | | | | |
Daily Income Fund | | $ | 107,567,680 | | | | | $ | 20,305 | | | | | $ | 107,587,985 | | | | | $ | (123,118,323 | ) | | | | $ | (15,530,338 | ) |
Short-Term Government Securities Fund | | $ | 10,130,485 | | | | | $ | 770,184 | | | | | $ | 10,900,669 | | | | | $ | (20,398,585 | ) | | | | $ | (9,497,916 | ) |
Short-Term Bond Fund | | $ | 132,512,687 | | | | | $ | 7,388,128 | | | | | $ | 139,900,815 | | | | | $ | (106,070,703 | ) | | | | $ | 33,830,112 | |
Stock Index Fund | | $ | 16,184,681 | | | | | $ | 1,609,483 | | | | | $ | 17,794,164 | | | | | $ | (16,755,220 | ) | | | | $ | 1,038,944 | |
Value Fund | | $ | 116,770,643 | | | | | $ | 15,540,554 | | | | | $ | 132,311,197 | | | | | $ | (107,067,083 | ) | | | | $ | 25,244,114 | |
Growth Fund | | $ | 28,753,850 | | | | | $ | 8,624,694 | | | | | $ | 37,378,544 | | | | | $ | (17,058,269 | ) | | | | $ | 20,320,275 | |
Small-Company Stock Fund | | $ | 367,210,570 | | | | | $ | 13,351,705 | | | | | $ | 380,562,275 | | | | | $ | (229,021,212 | ) | | | | $ | 151,541,063 | |
International Value Fund | | $ | 42,195,331 | | | | | $ | 6,607,729 | | | | | $ | 48,803,060 | | | | | $ | (29,122,375 | ) | | | | $ | 19,680,685 | |
| In Shares | | | | | | | | | | | | | | | | | | | | | | | | | | | | |
Daily Income Fund | | | 107,567,680 | | | | | | 20,305 | | | | | | 107,587,985 | | | | | | (123,118,323 | ) | | | | | (15,530,338 | ) |
Short-Term Government Securities Fund | | | 1,946,519 | | | | | | 147,970 | | | | | | 2,094,489 | | | | | | (3,922,846 | ) | | | | | (1,828,357 | ) |
Short-Term Bond Fund | | | 25,272,096 | | | | | | 1,408,893 | | | | | | 26,680,989 | | | | | | (20,235,879 | ) | | | | | 6,445,110 | |
Stock Index Fund | | | 1,127,870 | | | | | | 104,991 | | | | | | 1,232,861 | | | | | | (1,166,911 | ) | | | | | 65,950 | |
Value Fund | | | 2,451,657 | | | | | | 311,019 | | | | | | 2,762,676 | | | | | | (2,237,043 | ) | | | | | 525,633 | |
Growth Fund | | | 3,555,344 | | | | | | 1,103,253 | | | | | | 4,658,597 | | | | | | (2,101,288 | ) | | | | | 2,557,309 | |
Small-Company Stock Fund | | | 9,918,888 | | | | | | 339,911 | | | | | | 10,258,799 | | | | | | (6,207,162 | ) | | | | | 4,051,637 | |
International Value Fund | | | 5,297,414 | | | | | | 921,578 | | | | | | 6,218,992 | | | | | | (3,662,175 | ) | | | | | 2,556,817 | |
| | | | |
| 68 | | Notes to Financial Statements | | |
Directors and Officers
James F. Perna, Director and Chairman of the Board
Stephen J. Kaszynski, Director, President and Chief Executive Officer
Douglas W. Johnson, Director and Chairman of the Audit Committee
Kenneth R. Meyer, Director and Chairman of the Compensation Committee
Anthony M. Marinello, Director
Sheldon C. Petersen, Director
Mark Rose, Director
Peter J. Tonetti, Director
Anthony C. Williams, Director
Cynthia L. Dove, Vice President and Chief Operations Officer
Amy M. DiMauro, Treasurer
Danielle C. Sieverling, Chief Compliance Officer
Kelly B. Whetstone, Secretary
| | | | | | |
| | Directors and Officers | | | 69 | |
Portfolio of Investments
S&P 500 Index Master Portfolio | June 30, 2015 | (Unaudited)
| | | | | | | | |
| Common Stocks | 96.8% of net assets | |
| | |
| Aerospace & Defense | 2.5% | | Shares | | | Value | |
The Boeing Co. | | | 231,310 | | | $ | 32,087,323 | |
General Dynamics Corp. | | | 112,325 | | | | 15,915,329 | |
Honeywell International, Inc. | | | 281,159 | | | | 28,669,783 | |
L-3 Communications Holdings, Inc. | | | 29,623 | | | | 3,358,656 | |
Lockheed Martin Corp. | | | 96,230 | | | | 17,889,157 | |
Northrop Grumman Corp. | | | 69,718 | | | | 11,059,366 | |
Precision Castparts Corp. | | | 49,843 | | | | 9,962,121 | |
Raytheon Co. | | | 109,752 | | | | 10,501,071 | |
Rockwell Collins, Inc. | | | 47,574 | | | | 4,393,459 | |
Textron, Inc. | | | 99,861 | | | | 4,456,797 | |
United Technologies Corp. | | | 297,769 | | | | 33,031,515 | |
| Total Aerospace & Defense | | | | | | | 171,324,577 | |
|
| Air Freight & Logistics | 0.7% | |
C.H. Robinson Worldwide, Inc. | | | 52,454 | | | | 3,272,605 | |
Expeditors International of
Washington, Inc. | | | 68,797 | | | | 3,171,886 | |
FedEx Corp. | | | 94,816 | | | | 16,156,646 | |
United Parcel Service, Inc., Class B | | | 249,599 | | | | 24,188,639 | |
| Total Air Freight & Logistics | | | | | | | 46,789,776 | |
|
| Airlines | 0.4% | |
American Airlines Group, Inc. | | | 250,542 | | | | 10,005,395 | |
Delta Air Lines, Inc. | | | 295,404 | | | | 12,135,196 | |
Southwest Airlines Co. | | | 240,369 | | | | 7,953,810 | |
| Total Airlines | | | | | | | 30,094,401 | |
|
| Auto Components | 0.4% | |
BorgWarner, Inc. | | | 81,382 | | | | 4,625,753 | |
Delphi Automotive PLC | | | 103,852 | | | | 8,836,767 | |
The Goodyear Tire & Rubber Co. | | | 97,027 | | | | 2,925,364 | |
Johnson Controls, Inc. | | | 235,525 | | | | 11,665,553 | |
| Total Auto Components | | | | | | | 28,053,437 | |
|
| Automobiles | 0.6% | |
Ford Motor Co. | | | 1,429,828 | | | | 21,461,718 | |
General Motors Co. | | | 485,578 | | | | 16,184,315 | |
Harley-Davidson, Inc. | | | 75,192 | | | | 4,237,069 | |
| Total Automobiles | | | | | | | 41,883,102 | |
|
| Banks | 6.0% | |
Bank of America Corp. | | | 3,777,320 | | | | 64,289,986 | |
BB&T Corp. | | | 262,903 | | | | 10,597,620 | |
Citigroup, Inc. | | | 1,091,298 | | | | 60,283,302 | |
Comerica, Inc. | | | 64,025 | | | | 3,285,763 | |
Fifth Third Bancorp | | | 291,312 | | | | 6,065,116 | |
Huntington Bancshares, Inc. | | | 290,806 | | | | 3,289,016 | |
JPMorgan Chase & Co. | | | 1,334,777 | | | | 90,444,490 | |
KeyCorp | | | 305,113 | | | | 4,582,797 | |
M&T Bank Corp. | | | 47,826 | | | | 5,974,902 | |
The PNC Financial Services Group,
Inc. (a) | | | 186,281 | | | | 17,817,778 | |
Regions Financial Corp. | | | 482,090 | | | | 4,994,452 | |
SunTrust Banks, Inc. | | | 185,670 | | | | 7,987,523 | |
| | | | | | | | |
| | |
| Banks | 6.0% (Continued) | | Shares | | | Value | |
US Bancorp | | | 637,713 | | | $ | 27,676,744 | |
Wells Fargo & Co. | | | 1,685,347 | | | | 94,783,915 | |
Zions Bancorporation | | | 73,089 | | | | 2,319,480 | |
| Total Banks | | | | | | | 404,392,884 | |
|
| Beverages | 2.0% | |
Brown-Forman Corp., Class B | | | 56,047 | | | | 5,614,788 | |
The Coca-Cola Co. | | | 1,410,936 | | | | 55,351,019 | |
Coca-Cola Enterprises, Inc. | | | 77,352 | | | | 3,360,171 | |
Constellation Brands, Inc., Class A | | | 60,939 | | | | 7,070,143 | |
Dr Pepper Snapple Group, Inc. | | | 68,961 | | | | 5,027,257 | |
Molson Coors Brewing Co., Class B | | | 57,422 | | | | 4,008,630 | |
Monster Beverage Corp. (b) | | | 52,880 | | | | 7,086,977 | |
PepsiCo, Inc. | | | 530,896 | | | | 49,553,833 | |
| Total Beverages | | | | | | | 137,072,818 | |
|
| Biotechnology | 3.1% | |
Alexion Pharmaceuticals, Inc. (b) | | | 80,531 | | | | 14,557,589 | |
Amgen, Inc. | | | 273,468 | | | | 41,982,807 | |
Biogen, Inc. (b)(c) | | | 84,606 | | | | 34,175,748 | |
Celgene Corp. (b) | | | 285,273 | | | | 33,016,071 | |
Gilead Sciences, Inc. | | | 528,578 | | | | 61,885,912 | |
Regeneron Pharmaceuticals, Inc. (b) | | | 27,117 | | | | 13,833,195 | |
Vertex Pharmaceuticals, Inc. (b) | | | 87,671 | | | | 10,825,615 | |
| Total Biotechnology | | | | | | | 210,276,937 | |
|
| Building Products | 0.1% | |
Allegion PLC | | | 34,669 | | | | 2,084,994 | |
Masco Corp. | | | 125,021 | | | | 3,334,310 | |
| Total Building Products | | | | | | | 5,419,304 | |
|
| Capital Markets | 2.3% | |
Affiliated Managers Group, Inc. (b) | | | 19,683 | | | | 4,302,704 | |
Ameriprise Financial, Inc. | | | 65,238 | | | | 8,150,183 | |
The Bank of New York Mellon Corp. | | | 403,378 | | | | 16,929,775 | |
BlackRock, Inc. (a) | | | 45,672 | | | | 15,801,599 | |
The Charles Schwab Corp. | | | 415,745 | | | | 13,574,074 | |
E*Trade Financial Corp. (b) | | | 104,265 | | | | 3,122,737 | |
Franklin Resources, Inc. | | | 140,285 | | | | 6,878,174 | |
The Goldman Sachs Group, Inc. | | | 144,508 | | | | 30,171,825 | |
Invesco Ltd. | | | 154,914 | | | | 5,807,726 | |
Legg Mason, Inc. | | | 34,629 | | | | 1,784,432 | |
Morgan Stanley | | | 552,681 | | | | 21,438,496 | |
Northern Trust Corp. | | | 78,901 | | | | 6,032,770 | |
State Street Corp. | | | 148,071 | | | | 11,401,467 | |
T. Rowe Price Group, Inc. | | | 94,502 | | | | 7,345,640 | |
| Total Capital Markets | | | | | | | 152,741,602 | |
|
| Chemicals | 2.3% | |
Air Products & Chemicals, Inc. | | | 69,521 | | | | 9,512,558 | |
Airgas, Inc. | | | 24,445 | | | | 2,585,792 | |
CF Industries Holdings, Inc. | | | 84,764 | | | | 5,448,630 | |
The Dow Chemical Co. | | | 389,781 | | | | 19,945,094 | |
| | | | |
| 70 | | Appendix | | The accompanying notes are an integral part of these financial statements. |
Portfolio of Investments | S&P 500 Index Master Portfolio | June 30, 2015 | (Unaudited) (Continued)
| | | | | | | | |
| Common Stocks | 96.8% of net assets (Continued) | |
| | |
| Chemicals | 2.3% (Continued) | | Shares | | | Value | |
E.I. du Pont de Nemours & Co. | | | 325,590 | | | $ | 20,821,481 | |
Eastman Chemical Co. | | | 53,583 | | | | 4,384,161 | |
Ecolab, Inc. | | | 96,387 | | | | 10,898,478 | |
FMC Corp. | | | 48,029 | | | | 2,523,924 | |
International Flavors & Fragrances, Inc. | | | 29,093 | | | | 3,179,574 | |
LyondellBasell Industries NV, Class A | | | 141,294 | | | | 14,626,755 | |
Monsanto Co. | | | 171,242 | | | | 18,252,685 | |
The Mosaic Co. | | | 111,627 | | | | 5,229,725 | |
PPG Industries, Inc. | | | 97,778 | | | | 11,217,092 | |
Praxair, Inc. | | | 103,698 | | | | 12,397,096 | |
The Sherwin-Williams Co. | | | 28,489 | | | | 7,835,045 | |
Sigma-Aldrich Corp. | | | 42,955 | | | | 5,985,779 | |
| Total Chemicals | | | | | | | 154,843,869 | |
|
| Commercial Services & Supplies | 0.4% | |
The ADT Corp. (c) | | | 62,000 | | | | 2,081,340 | |
Cintas Corp. | | | 34,045 | | | | 2,879,867 | |
Iron Mountain, Inc. | | | 67,453 | | | | 2,091,043 | |
Pitney Bowes, Inc. | | | 73,611 | | | | 1,531,845 | |
Republic Services, Inc. | | | 89,723 | | | | 3,514,450 | |
Stericycle, Inc. (b) | | | 30,590 | | | | 4,096,307 | |
Tyco International PLC | | | 151,434 | | | | 5,827,180 | |
Waste Management, Inc. | | | 153,140 | | | | 7,098,039 | |
| Total Commercial Services & Supplies | | | | | | | 29,120,071 | |
|
| Communications Equipment | 1.5% | |
Cisco Systems, Inc. | | | 1,829,256 | | | | 50,231,370 | |
F5 Networks, Inc. (b) | | | 25,872 | | | | 3,113,695 | |
Harris Corp. | | | 44,324 | | | | 3,408,959 | |
Juniper Networks, Inc. | | | 126,623 | | | | 3,288,399 | |
Motorola Solutions, Inc. | | | 66,634 | | | | 3,820,794 | |
QUALCOMM, Inc. | | | 586,112 | | | | 36,708,194 | |
| Total Communications Equipment | | | | | | | 100,571,411 | |
|
| Construction & Engineering | 0.1% | |
Fluor Corp. | | | 53,026 | | | | 2,810,908 | |
Jacobs Engineering Group, Inc. (b) | | | 45,022 | | | | 1,828,794 | |
Quanta Services, Inc. (b) | | | 76,190 | | | | 2,195,796 | |
| Total Construction & Engineering | | | | | | | 6,835,498 | |
|
| Construction Materials | 0.1% | |
Martin Marietta Materials, Inc. | | | 22,330 | | | | 3,159,918 | |
Vulcan Materials Co. | | | 47,715 | | | | 4,004,720 | |
| Total Construction Materials | | | | | | | 7,164,638 | |
|
| Consumer Finance | 0.8% | |
American Express Co. | | | 314,205 | | | | 24,420,013 | |
Capital One Financial Corp. | | | 196,534 | | | | 17,289,096 | |
Discover Financial Services | | | 159,157 | | | | 9,170,626 | |
Navient Corp. | | | 140,345 | | | | 2,555,682 | |
| Total Consumer Finance | | | | | | | 53,435,417 | |
| | | | | | | | |
| | |
| Containers & Packaging | 0.2% | | Shares | | | Value | |
Avery Dennison Corp. | | | 32,739 | | | $ | 1,995,115 | |
Ball Corp. | | | 49,584 | | | | 3,478,318 | |
MeadWestvaco Corp. | | | 120,177 | | | | 5,671,153 | |
Owens-Illinois, Inc. (b)(c) | | | 57,477 | | | | 1,318,522 | |
Sealed Air Corp. | | | 75,591 | | | | 3,883,865 | |
| Total Containers & Packaging | | | | | | | 16,346,973 | |
|
| Distributors | 0.1% | |
Genuine Parts Co. | | | 54,743 | | | | 4,901,141 | |
| Total Distributors | | | | | | | 4,901,141 | |
|
| Diversified Consumer Services | 0.0% | |
H&R Block, Inc. | | | 99,000 | | | | 2,935,350 | |
| Total Diversified Consumer Services | | | | | | | 2,935,350 | |
|
| Diversified Financial Services | 1.9% | |
Berkshire Hathaway, Inc., Class B (b) | | | 655,959 | | | | 89,282,579 | |
CME Group, Inc. | | | 114,126 | | | | 10,620,566 | |
IntercontinentalExchange Group, Inc. | | | 40,195 | | | | 8,988,004 | |
Leucadia National Corp. | | | 113,415 | | | | 2,753,716 | |
McGraw-Hill Financial, Inc. | | | 98,443 | | | | 9,888,599 | |
Moody’s Corp. | | | 63,989 | | | | 6,908,252 | |
The NASDAQ OMX Group, Inc. | | | 42,638 | | | | 2,081,161 | |
| Total Diversified Financial Services | | | | | | | 130,522,877 | |
|
| Diversified Telecommunication Services | 2.2% | |
AT&T, Inc. | | | 1,867,781 | | | | 66,343,581 | |
CenturyLink, Inc. | | | 202,766 | | | | 5,957,265 | |
Frontier Communications Corp. | | | 414,814 | | | | 2,053,329 | |
Level 3 Communications, Inc. (b) | | | 105,817 | | | | 5,573,382 | |
Verizon Communications, Inc. | | | 1,466,921 | | | | 68,373,188 | |
| Total Diversified Telecommunication Services | | | | | | | 148,300,745 | |
|
| Electric Utilities | 1.5% | |
American Electric Power Co., Inc. | | | 176,219 | | | | 9,334,321 | |
Duke Energy Corp. | | | 248,728 | | | | 17,565,171 | |
Edison International | | | 117,186 | | | | 6,513,198 | |
Entergy Corp. | | | 64,570 | | | | 4,552,185 | |
Eversource Energy | | | 114,250 | | | | 5,188,093 | |
Exelon Corp. | | | 309,766 | | | | 9,732,848 | |
FirstEnergy Corp. | | | 151,792 | | | | 4,940,830 | |
NextEra Energy, Inc. | | | 159,740 | | | | 15,659,312 | |
Pepco Holdings, Inc. | | | 90,931 | | | | 2,449,681 | |
Pinnacle West Capital Corp. | | | 39,834 | | | | 2,266,156 | |
PPL Corp. | | | 240,300 | | | | 7,081,641 | |
The Southern Co. | | | 326,677 | | | | 13,687,766 | |
Xcel Energy, Inc. | | | 182,324 | | | | 5,867,186 | |
| Total Electric Utilities | | | | | | | 104,838,388 | |
|
| Electrical Equipment | 0.5% | |
AMETEK, Inc. | | | 86,869 | | | | 4,758,684 | |
Eaton Corp. PLC | | | 168,004 | | | | 11,338,590 | |
| | | | | | |
| The accompanying notes are an integral part of these financial statements. | | Appendix | | | 71 | |
Portfolio of Investments | S&P 500 Index Master Portfolio | June 30, 2015 | (Unaudited) (Continued)
| | | | | | | | |
| Common Stocks | 96.8% of net assets (Continued) | |
| | |
Electrical Equipment | 0.5%
(Continued) | | Shares | | | Value | |
Emerson Electric Co. | | | 240,488 | | | $ | 13,330,250 | |
Rockwell Automation, Inc. | | | 48,412 | | | | 6,034,071 | |
| Total Electrical Equipment | | | | | | | 35,461,595 | |
|
| Electronic Equipment, Instruments & Components | 0.4% | |
Amphenol Corp., Class A | | | 111,111 | | | | 6,441,105 | |
Corning, Inc. | | | 452,668 | | | | 8,931,139 | |
FLIR Systems, Inc. | | | 51,061 | | | | 1,573,700 | |
TE Connectivity Ltd. | | | 146,240 | | | | 9,403,232 | |
| Total Electronic Equipment, Instruments & Components | | | | | | | 26,349,176 | |
|
| Energy Equipment & Services | 1.3% | |
Baker Hughes, Inc. | | | 156,342 | | | | 9,646,301 | |
Cameron International Corp. (b) | | | 69,316 | | | | 3,630,079 | |
Diamond Offshore Drilling, Inc. (c) | | | 23,577 | | | | 608,522 | |
Ensco PLC, Class A | | | 84,813 | | | | 1,888,785 | |
FMC Technologies, Inc. (b) | | | 83,053 | | | | 3,445,869 | |
Halliburton Co. | | | 306,037 | | | | 13,181,014 | |
Helmerich & Payne, Inc. | | | 38,721 | | | | 2,726,733 | |
National Oilwell Varco, Inc. | | | 139,506 | | | | 6,735,350 | |
Noble Corp. PLC | | | 86,909 | | | | 1,337,529 | |
Schlumberger Ltd. | | | 456,687 | | | | 39,361,853 | |
Transocean Ltd. (c) | | | 122,948 | | | | 1,981,922 | |
| Total Energy Equipment & Services | | | | | | | 84,543,957 | |
|
| Food & Staples Retailing | 2.3% | |
Costco Wholesale Corp. | | | 158,072 | | | | 21,349,204 | |
CVS Health Corp. | | | 405,830 | | | | 42,563,451 | |
The Kroger Co. | | | 176,313 | | | | 12,784,456 | |
Sysco Corp. | | | 213,561 | | | | 7,709,552 | |
Wal-Mart Stores, Inc. | | | 567,589 | | | | 40,259,088 | |
Walgreens Boots Alliance, Inc. | | | 313,853 | | | | 26,501,747 | |
Whole Foods Market, Inc. | | | 128,864 | | | | 5,082,396 | |
| Total Food & Staples Retailing | | | | | | | 156,249,894 | |
|
| Food Products | 1.6% | |
Archer-Daniels-Midland Co. | | | 223,132 | | | | 10,759,425 | |
Campbell Soup Co. | | | 63,922 | | | | 3,045,883 | |
ConAgra Foods, Inc. | | | 153,599 | | | | 6,715,348 | |
General Mills, Inc. | | | 214,398 | | | | 11,946,257 | |
The Hershey Co. | | | 52,786 | | | | 4,688,980 | |
Hormel Foods Corp. | | | 48,477 | | | | 2,732,649 | |
The J.M. Smucker Co. | | | 34,860 | | | | 3,779,173 | |
Kellogg Co. | | | 90,119 | | | | 5,650,461 | |
Keurig Green Mountain, Inc. | | | 41,534 | | | | 3,182,750 | |
Kraft Foods Group, Inc. | | | 213,027 | | | | 18,137,119 | |
McCormick & Co., Inc. | | | 45,961 | | | | 3,720,543 | |
Mead Johnson Nutrition Co. | | | 72,847 | | | | 6,572,256 | |
Mondelez International, Inc., Class A | | | 585,052 | | | | 24,069,039 | |
Tyson Foods, Inc., Class A | | | 104,928 | | | | 4,473,081 | |
| Total Food Products | | | | | | | 109,472,964 | |
| | | | | | | | |
| | |
| Gas Utilities | 0.0% | | Shares | | | Value | |
AGL Resources, Inc. | | | 43,231 | | | $ | 2,012,835 | |
| Total Gas Utilities | | | | | | | 2,012,835 | |
|
| Health Care Equipment & Supplies | 2.1% | |
Abbott Laboratories | | | 535,466 | | | | 26,280,671 | |
Baxter International, Inc. | | | 195,754 | | | | 13,689,077 | |
Becton Dickinson & Co. | | | 75,311 | | | | 10,667,803 | |
Boston Scientific Corp. (b) | | | 482,205 | | | | 8,535,028 | |
C.R. Bard, Inc. | | | 26,705 | | | | 4,558,544 | |
DENTSPLY International, Inc. | | | 50,340 | | | | 2,595,027 | |
Edwards Lifesciences Corp. (b) | | | 38,686 | | | | 5,510,047 | |
Intuitive Surgical, Inc. (b) | | | 13,257 | | | | 6,423,017 | |
Medtronic PLC | | | 512,558 | | | | 37,980,548 | |
St. Jude Medical, Inc. | | | 100,753 | | | | 7,362,022 | |
Stryker Corp. | | | 107,522 | | | | 10,275,878 | |
Varian Medical Systems, Inc. (b)(c) | | | 35,895 | | | | 3,027,025 | |
Zimmer Biomet Holdings, Inc. | | | 61,289 | | | | 6,694,597 | |
| Total Health Care Equipment & Supplies | | | | | | | 143,599,284 | |
| |
| Health Care Providers & Services | 2.9% | | | | | |
Aetna, Inc. | | | 125,598 | | | | 16,008,721 | |
AmerisourceBergen Corp. | | | 75,065 | | | | 7,982,412 | |
Anthem, Inc. | | | 95,147 | | | | 15,617,429 | |
Cardinal Health, Inc. | | | 118,992 | | | | 9,953,681 | |
Cigna Corp. | | | 92,568 | | | | 14,996,016 | |
DaVita HealthCare Partners, Inc. (b) | | | 61,847 | | | | 4,914,981 | |
Express Scripts Holding Co. (b) | | | 262,307 | | | | 23,329,584 | |
HCA Holdings, Inc. (b)(c) | | | 104,314 | | | | 9,463,366 | |
Henry Schein, Inc. (b) | | | 30,076 | | | | 4,274,401 | |
Humana, Inc. | | | 53,872 | | | | 10,304,636 | |
Laboratory Corp. of America Holdings (b) | | | 36,112 | | | | 4,377,497 | |
McKesson Corp. | | | 83,284 | | | | 18,723,076 | |
Patterson Cos., Inc. | | | 31,346 | | | | 1,524,983 | |
Quest Diagnostics, Inc. | | | 51,662 | | | | 3,746,528 | |
Tenet Healthcare Corp. (b) | | | 35,744 | | | | 2,068,863 | |
UnitedHealth Group, Inc. | | | 342,374 | | | | 41,769,628 | |
Universal Health Services, Inc., Class B | | | 32,787 | | | | 4,659,033 | |
| Total Health Care Providers & Services | | | | | | | 193,714,835 | |
|
| Health Care Technology | 0.1% | |
Cerner Corp. (b) | | | 110,143 | | | | 7,606,476 | |
| Total Health Care Technology | | | | | | | 7,606,476 | |
|
| Hotels, Restaurants & Leisure | 1.7% | |
Carnival Corp. | | | 162,215 | | | | 8,011,799 | |
Chipotle Mexican Grill, Inc. (b) | | | 11,167 | | | | 6,755,923 | |
Darden Restaurants, Inc. | | | 45,244 | | | | 3,215,943 | |
Marriott International, Inc., Class A | | | 74,170 | | | | 5,517,506 | |
McDonald’s Corp. | | | 344,752 | | | | 32,775,573 | |
Royal Caribbean Cruises Ltd. | | | 59,322 | | | | 4,668,048 | |
Starbucks Corp. | | | 539,689 | | | | 28,935,426 | |
Starwood Hotels & Resorts Worldwide, Inc. | | | 61,464 | | | | 4,984,116 | |
Wyndham Worldwide Corp. | | | 43,177 | | | | 3,536,628 | |
| | | | |
| 72 | | Appendix | | The accompanying notes are an integral part of these financial statements. |
Portfolio of Investments | S&P 500 Index Master Portfolio | June 30, 2015 | (Unaudited) (Continued)
| | | | | | | | |
| Common Stocks | 96.8% of net assets (Continued) | |
| | |
Hotels, Restaurants &
Leisure | 1.7% (Continued) | | Shares | | | Value | |
Wynn Resorts Ltd. | | | 29,325 | | | $ | 2,893,498 | |
Yum! Brands, Inc. | | | 155,523 | | | | 14,009,512 | |
| Total Hotels, Restaurants & Leisure | | | | | | | 115,303,972 | |
|
| Household Durables | 0.4% | |
D.R. Horton, Inc. | | | 119,998 | | | | 3,283,145 | |
Garmin Ltd. | | | 43,738 | | | | 1,921,410 | |
Harman International Industries, Inc. | | | 25,592 | | | | 3,043,913 | |
Leggett & Platt, Inc. | | | 49,755 | | | | 2,422,073 | |
Lennar Corp., Class A | | | 64,212 | | | | 3,277,381 | |
Mohawk Industries, Inc. (b) | | | 22,346 | | | | 4,265,851 | |
Newell Rubbermaid, Inc. | | | 96,645 | | | | 3,973,076 | |
PulteGroup, Inc. | | | 119,290 | | | | 2,403,694 | |
Whirlpool Corp. | | | 28,287 | | | | 4,895,065 | |
| Total Household Durables | | | | | | | 29,485,608 | |
|
| Household Products | 1.7% | |
The Clorox Co. | | | 47,182 | | | | 4,907,872 | |
Colgate-Palmolive Co. | | | 305,829 | | | | 20,004,275 | |
Kimberly-Clark Corp. | | | 130,957 | | | | 13,877,513 | |
The Procter & Gamble Co. | | | 975,791 | | | | 76,345,888 | |
| Total Household Products | | | | | | | 115,135,548 | |
|
| Independent Power & Renewable Electricity Producers | 0.1% | |
The AES Corp. | | | 245,456 | | | | 3,254,747 | |
NRG Energy, Inc. | | | 120,782 | | | | 2,763,492 | |
| Total Independent Power & Renewable Electricity Producers | | | | | | | 6,018,239 | |
|
| Industrial Conglomerates | 2.3% | |
3M Co. | | | 228,156 | | | | 35,204,471 | |
Danaher Corp. | | | 221,491 | | | | 18,957,415 | |
General Electric Co. | | | 3,624,038 | | | | 96,290,689 | |
Roper Industries, Inc. | | | 36,155 | | | | 6,235,291 | |
| Total Industrial Conglomerates | | | | | | | 156,687,866 | |
| | |
| Insurance | 2.7% | | | | | | | | |
ACE Ltd. | | | 117,467 | | | | 11,944,044 | |
Aflac, Inc. | | | 156,057 | | | | 9,706,745 | |
The Allstate Corp. | | | 147,111 | | | | 9,543,090 | |
American International Group, Inc. | | | 479,346 | | | | 29,633,170 | |
Aon PLC | | | 101,333 | | | | 10,100,873 | |
Assurant, Inc. | | | 24,234 | | | | 1,623,678 | |
The Chubb Corp. | | | 82,636 | | | | 7,861,989 | |
Cincinnati Financial Corp. | | | 53,204 | | | | 2,669,777 | |
Genworth Financial, Inc., Class A (b) | | | 182,289 | | | | 1,379,928 | |
Hartford Financial Services Group, Inc. | | | 151,038 | | | | 6,278,650 | |
Lincoln National Corp. | | | 91,006 | | | | 5,389,375 | |
Loews Corp. | | | 106,860 | | | | 4,115,179 | |
Marsh & McLennan Cos., Inc. | | | 193,651 | | | | 10,980,012 | |
MetLife, Inc. | | | 401,330 | | | | 22,470,467 | |
| | | | | | | | |
| | |
| Insurance | 2.7% (Continued) | | Shares | | | Value | |
Principal Financial Group, Inc. | | | 98,570 | | | $ | 5,055,655 | |
The Progressive Corp. | | | 192,029 | | | | 5,344,167 | |
Prudential Financial, Inc. | | | 162,932 | | | | 14,259,809 | |
Torchmark Corp. | | | 45,499 | | | | 2,648,952 | |
The Travelers Cos., Inc. | | | 114,627 | | | | 11,079,846 | |
Unum Group | | | 89,743 | | | | 3,208,312 | |
XL Group PLC | | | 110,289 | | | | 4,102,751 | |
| Total Insurance | | | | | | | 179,396,469 | |
|
| Internet & Catalog Retail | 1.5% | |
Amazon.com, Inc. (b) | | | 137,345 | | | | 59,620,091 | |
Expedia, Inc. | | | 35,862 | | | | 3,921,510 | |
Netflix, Inc. (b) | | | 21,805 | | | | 14,324,577 | |
The Priceline Group, Inc. (b) | | | 18,645 | | | | 21,467,294 | |
TripAdvisor, Inc. (b) | | | 40,261 | | | | 3,508,343 | |
| Total Internet & Catalog Retail | | | | | | | 102,841,815 | |
|
| Internet Software & Services | 3.3% | |
Akamai Technologies, Inc. (b) | | | 64,223 | | | | 4,484,050 | |
eBay, Inc. (b) | | | 397,614 | | | | 23,952,267 | |
Equinix, Inc. (c) | | | 20,474 | | | | 5,200,396 | |
Facebook, Inc., Class A (b) | | | 757,535 | | | | 64,969,989 | |
Google, Inc., Class A (b) | | | 102,940 | | | | 55,591,718 | |
Google, Inc., Class C (b) | | | 103,234 | | | | 53,734,329 | |
VeriSign, Inc. (b)(c) | | | 37,835 | | | | 2,335,176 | |
Yahoo!, Inc. (b) | | | 313,906 | | | | 12,333,367 | |
| Total Internet Software & Services | | | | | | | 222,601,292 | |
|
| IT Services | 3.3% | |
Accenture PLC, Class A | | | 225,247 | | | | 21,799,405 | |
Alliance Data Systems Corp. (b) | | | 22,318 | | | | 6,515,517 | |
Automatic Data Processing, Inc. | | | 168,875 | | | | 13,548,841 | |
Cognizant Technology Solutions Corp., Class A (b) | | | 219,587 | | | | 13,414,570 | |
Computer Sciences Corp. | | | 49,302 | | | | 3,236,183 | |
Fidelity National Information Services, Inc. | | | 101,955 | | | | 6,300,819 | |
Fiserv, Inc. (b) | | | 85,167 | | | | 7,054,383 | |
International Business Machines Corp. | | | 329,390 | | | | 53,578,577 | |
Mastercard, Inc., Class A | | | 348,596 | | | | 32,586,754 | |
Paychex, Inc. | | | 117,579 | | | | 5,512,103 | |
Teradata Corp. (b)(c) | | | 50,758 | | | | 1,878,046 | |
Total System Services, Inc. | | | 59,192 | | | | 2,472,450 | |
Visa, Inc., Class A | | | 695,267 | | | | 46,687,179 | |
The Western Union Co. | | | 185,703 | | | | 3,775,342 | |
Xerox Corp. | | | 373,236 | | | | 3,971,231 | |
| Total IT Services | | | | | | | 222,331,400 | |
|
| Leisure Products | 0.1% | |
Hasbro, Inc. | | | 40,295 | | | | 3,013,663 | |
Mattel, Inc. | | | 121,692 | | | | 3,126,268 | |
| Total Leisure Products | | | | | | | 6,139,931 | |
| | | | | | |
| The accompanying notes are an integral part of these financial statements. | | Appendix | | | 73 | |
Portfolio of Investments | S&P 500 Index Master Portfolio | June 30, 2015 | (Unaudited) (Continued)
| | | | | | | | |
| Common Stocks | 96.8% of net assets (Continued) | |
| | |
| Life Sciences Tools & Services | 0.4% | | Shares | | | Value | |
Agilent Technologies, Inc. | | | 119,841 | | | $ | 4,623,466 | |
PerkinElmer, Inc. | | | 40,789 | | | | 2,147,133 | |
Thermo Fisher Scientific, Inc. | | | 143,171 | | | | 18,577,869 | |
Waters Corp. (b) | | | 29,743 | | | | 3,818,406 | |
| Total Life Sciences Tools & Services | | | | | | | 29,166,874 | |
|
| Machinery | 1.5% | |
Caterpillar, Inc. | | | 217,115 | | | | 18,415,694 | |
Cummins, Inc. | | | 60,310 | | | | 7,912,069 | |
Deere & Co. | | | 120,085 | | | | 11,654,249 | |
Dover Corp. | | | 57,919 | | | | 4,064,755 | |
Flowserve Corp. | | | 48,445 | | | | 2,551,114 | |
Illinois Tool Works, Inc. | | | 121,942 | | | | 11,193,056 | |
Ingersoll-Rand PLC | | | 95,213 | | | | 6,419,261 | |
Joy Global, Inc. | | | 34,113 | | | | 1,234,891 | |
PACCAR, Inc. | | | 127,611 | | | | 8,142,858 | |
Pall Corp. | | | 38,424 | | | | 4,781,867 | |
Parker Hannifin Corp. | | | 49,774 | | | | 5,790,209 | |
Pentair PLC | | | 64,849 | | | | 4,458,369 | |
Snap-on, Inc. | | | 20,977 | | | | 3,340,587 | |
Stanley Black & Decker, Inc. | | | 55,001 | | | | 5,788,305 | |
Xylem, Inc. | | | 65,584 | | | | 2,431,199 | |
| Total Machinery | | | | | | | 98,178,483 | |
|
| Media | 3.6% | |
Cablevision Systems Corp., New York Group, Class A | | | 79,517 | | | | 1,903,637 | |
CBS Corp., Class B | | | 162,850 | | | | 9,038,175 | |
Comcast Corp., Class A | | | 904,053 | | | | 54,369,747 | |
DIRECTV (b) | | | 180,844 | | | | 16,780,515 | |
Discovery Communications, Inc., Class A (b)(c) | | | 51,909 | | | | 1,726,493 | |
Discovery Communications, Inc., Class C (b) | | | 94,536 | | | | 2,938,179 | |
The Interpublic Group of Cos., Inc. | | | 148,523 | | | | 2,862,038 | |
News Corp., Class A (b) | | | 180,100 | | | | 2,627,659 | |
Omnicom Group, Inc. | | | 87,873 | | | | 6,106,295 | |
Scripps Networks Interactive, Inc., Class A | | | 34,067 | | | | 2,226,960 | |
TEGNA, Inc. | | | 81,594 | | | | 2,616,720 | |
Time Warner Cable, Inc. | | | 101,675 | | | | 18,115,435 | |
Time Warner, Inc. | | | 296,587 | | | | 25,924,670 | |
Twenty-First Century Fox, Inc., Class A | | | 636,411 | | | | 20,711,996 | |
Viacom, Inc., Class B | | | 128,574 | | | | 8,311,023 | |
The Walt Disney Co. | | | 561,457 | | | | 64,084,702 | |
| Total Media | | | | | | | 240,344,244 | |
|
| Metals & Mining | 0.3% | |
Alcoa, Inc. | | | 439,658 | | | | 4,902,187 | �� |
Allegheny Technologies, Inc. | | | 40,097 | | | | 1,210,930 | |
Freeport-McMoRan Copper & Gold, Inc. | | | 374,076 | | | | 6,965,295 | |
Newmont Mining Corp. | | | 190,212 | | | | 4,443,352 | |
Nucor Corp. | | | 114,785 | | | | 5,058,575 | |
| Total Metals & Mining | | | | | | | 22,580,339 | |
| | | | | | | | |
| | |
| Multi-Utilities | 1.1% | | Shares | | | Value | |
Ameren Corp. | | | 87,270 | | | $ | 3,288,334 | |
CenterPoint Energy, Inc. | | | 154,734 | | | | 2,944,588 | |
CMS Energy Corp. | | | 99,268 | | | | 3,160,693 | |
Consolidated Edison, Inc. | | | 105,340 | | | | 6,097,079 | |
Dominion Resources, Inc. | | | 213,457 | | | | 14,273,870 | |
DTE Energy Co. | | | 64,501 | | | | 4,814,355 | |
NiSource, Inc. | | | 114,153 | | | | 5,204,235 | |
PG&E Corp. | | | 172,692 | | | | 8,479,177 | |
Public Service Enterprise Group, Inc. | | | 181,946 | | | | 7,146,839 | |
SCANA Corp. | | | 51,404 | | | | 2,603,613 | |
Sempra Energy | | | 83,708 | | | | 8,282,069 | |
TECO Energy, Inc. | | | 86,116 | | | | 1,520,809 | |
WEC Energy Group, Inc. | | | 113,546 | | | | 5,106,170 | |
| Total Multi-Utilities | | | | | | | 72,921,831 | |
|
| Multiline Retail | 0.8% | |
Dollar General Corp. | | | 106,863 | | | | 8,307,530 | |
Dollar Tree, Inc. (b) | | | 74,162 | | | | 5,858,056 | |
Family Dollar Stores, Inc. | | | 34,578 | | | | 2,725,092 | |
Kohl’s Corp. | | | 70,586 | | | | 4,419,389 | |
Macy’s, Inc. | | | 120,998 | | | | 8,163,735 | |
Nordstrom, Inc. | | | 50,713 | | | | 3,778,119 | |
Target Corp. | | | 229,649 | | | | 18,746,248 | |
| Total Multiline Retail | | | | | | | 51,998,169 | |
|
| Oil, Gas & Consumable Fuels | 6.3% | |
Anadarko Petroleum Corp. | | | 182,691 | | | | 14,260,860 | |
Apache Corp. | | | 135,631 | | | | 7,816,415 | |
Cabot Oil & Gas Corp. | | | 148,763 | | | | 4,691,985 | |
Chesapeake Energy Corp. (c) | | | 186,426 | | | | 2,082,378 | |
Chevron Corp. | | | 676,357 | | | | 65,248,160 | |
Cimarex Energy Co. | | | 33,691 | | | | 3,716,454 | |
ConocoPhillips | | | 443,458 | | | | 27,232,756 | |
CONSOL Energy, Inc. | | | 83,199 | | | | 1,808,746 | |
Devon Energy Corp. | | | 138,990 | | | | 8,268,515 | |
EOG Resources, Inc. | | | 197,437 | | | | 17,285,609 | |
EQT Corp. | | | 54,795 | | | | 4,457,025 | |
Exxon Mobil Corp. | | | 1,503,831 | | | | 125,118,739 | |
Hess Corp. | | | 87,859 | | | | 5,876,010 | |
Kinder Morgan, Inc. | | | 623,862 | | | | 23,950,062 | |
Marathon Oil Corp. | | | 242,763 | | | | 6,442,930 | |
Marathon Petroleum Corp. | | | 195,401 | | | | 10,221,426 | |
Murphy Oil Corp. | | | 60,170 | | | | 2,501,267 | |
Newfield Exploration Co. (b) | | | 58,556 | | | | 2,115,043 | |
Noble Energy, Inc. | | | 139,196 | | | | 5,940,885 | |
Occidental Petroleum Corp. | | | 276,272 | | | | 21,485,674 | |
ONEOK, Inc. | | | 75,086 | | | | 2,964,395 | |
Phillips 66 | | | 195,061 | | | | 15,714,114 | |
Pioneer Natural Resources Co. | | | 53,699 | | | | 7,447,514 | |
Range Resources Corp. | | | 59,891 | | | | 2,957,418 | |
Southwestern Energy Co. (b)(c) | | | 139,190 | | | | 3,163,789 | |
Spectra Energy Corp. | | | 241,459 | | | | 7,871,563 | |
Tesoro Corp. | | | 45,294 | | | | 3,823,267 | |
Valero Energy Corp. | | | 182,938 | | | | 11,451,919 | |
The Williams Cos., Inc. | | | 242,460 | | | | 13,914,779 | |
| Total Oil, Gas & Consumable Fuels | | | | | | | 429,829,697 | |
| | | | |
| 74 | | Appendix | | The accompanying notes are an integral part of these financial statements. |
Portfolio of Investments | S&P 500 Index Master Portfolio | June 30, 2015 | (Unaudited) (Continued)
| | | | | | | | |
| Common Stocks | 96.8% of net assets (Continued) | |
| | |
| Paper & Forest Products | 0.1% | | Shares | | | Value | |
International Paper Co. | | | 152,094 | | | $ | 7,238,153 | |
| Total Paper & Forest Products | | | | | | | 7,238,153 | |
|
| Personal Products | 0.1% | |
The Estee Lauder Cos., Inc., Class A | | | 80,299 | | | | 6,958,711 | |
| Total Personal Products | | | | | | | 6,958,711 | |
|
| Pharmaceuticals | 6.3% | |
AbbVie, Inc. | | | 618,480 | | | | 41,555,671 | |
Allergan PLC (b) | | | 141,152 | | | | 42,833,986 | |
Bristol-Myers Squibb Co. | | | 599,566 | | | | 39,895,122 | |
Eli Lilly & Co. | | | 351,247 | | | | 29,325,612 | |
Endo International PLC (b) | | | 72,931 | | | | 5,808,954 | |
Hospira, Inc. (b) | | | 62,144 | | | | 5,512,794 | |
Johnson & Johnson | | | 997,389 | | | | 97,205,532 | |
Mallinckrodt PLC (b) | | | 42,073 | | | | 4,952,834 | |
Merck & Co., Inc. | | | 1,016,156 | | | | 57,849,761 | |
Mylan NV (b) | | | 148,052 | | | | 10,046,809 | |
Perrigo Co. PLC | | | 52,607 | | | | 9,723,352 | |
Pfizer, Inc. | | | 2,214,747 | | | | 74,260,467 | |
Zoetis, Inc. | | | 179,824 | | | | 8,671,113 | |
| Total Pharmaceuticals | | | | | | | 427,642,007 | |
|
| Professional Services | 0.2% | |
The Dun & Bradstreet Corp. | | | 13,110 | | | | 1,599,420 | |
Equifax, Inc. | | | 42,804 | | | | 4,155,840 | |
Nielsen NV. | | | 132,757 | | | | 5,943,531 | |
Robert Half International, Inc. | | | 48,584 | | | | 2,696,412 | |
| Total Professional Services | | | | | | | 14,395,203 | |
|
| Real Estate Investment Trusts (REITs) | 2.2% | |
American Tower Corp. | | | 152,174 | | | | 14,196,312 | |
Apartment Investment & Management Co., Class A | | | 56,410 | | | | 2,083,221 | |
AvalonBay Communities, Inc. | | | 47,545 | | | | 7,601,019 | |
Boston Properties, Inc. | | | 55,177 | | | | 6,678,624 | |
Crown Castle International Corp. | | | 121,384 | | | | 9,747,135 | |
Equity Residential | | | 130,917 | | | | 9,186,446 | |
Essex Property Trust, Inc. | | | 23,506 | | | | 4,995,025 | |
General Growth Properties, Inc. | | | 226,312 | | | | 5,807,166 | |
HCP, Inc. | | | 166,053 | | | | 6,055,953 | |
Health Care REIT, Inc. | | | 126,257 | | | | 8,286,247 | |
Host Hotels & Resorts, Inc. | | | 272,516 | | | | 5,403,992 | |
Kimco Realty Corp. | | | 148,457 | | | | 3,346,221 | |
The Macerich Co. | | | 50,662 | | | | 3,779,385 | |
Plum Creek Timber Co., Inc. | | | 63,168 | | | | 2,562,726 | |
Prologis, Inc. | | | 188,486 | | | | 6,992,831 | |
Public Storage | | | 52,237 | | | | 9,630,936 | |
Realty Income Corp. (c) | | | 83,638 | | | | 3,712,691 | |
Simon Property Group, Inc. | | | 111,955 | | | | 19,370,454 | |
SL Green Realty Corp. | | | 35,818 | | | | 3,936,040 | |
Ventas, Inc. (c) | | | 111,891 | | | | 6,947,312 | |
Vornado Realty Trust | | | 62,977 | | | | 5,978,407 | |
Weyerhaeuser Co. | | | 186,219 | | | | 5,865,898 | |
| Total Real Estate Investment Trusts (REITs) | | | | | | | 152,164,041 | |
| | | | | | | | |
| | |
Real Estate Management &
Development | 0.1% | | Shares | | | Value | |
CBRE Group, Inc., Class A (b) | | | 100,602 | | | $ | 3,722,274 | |
| Total Real Estate Management & Development | | | | | | | 3,722,274 | |
| | |
| Road & Rail | 0.9% | | | | | | | | |
CSX Corp. | | | 355,350 | | | | 11,602,177 | |
JB Hunt Transport Services, Inc. | | | 33,102 | | | | 2,717,343 | |
Kansas City Southern | | | 39,761 | | | | 3,626,203 | |
Norfolk Southern Corp. | | | 109,646 | | | | 9,578,675 | |
Ryder System, Inc. | | | 19,261 | | | | 1,682,834 | |
Union Pacific Corp. | | | 314,927 | | | | 30,034,588 | |
| Total Road & Rail | | | | | | | 59,241,820 | |
| | |
| Semiconductors & Semiconductor Equipment | 2.3% | | | | | | | | |
Altera Corp. | | | 108,294 | | | | 5,544,653 | |
Analog Devices, Inc. | | | 112,773 | | | | 7,238,335 | |
Applied Materials, Inc. | | | 442,973 | | | | 8,513,941 | |
Avago Technologies Ltd. (c) | | | 92,288 | | | | 12,267,844 | |
Broadcom Corp., Class A | | | 195,604 | | | | 10,071,650 | |
First Solar, Inc. (b) | | | 27,607 | | | | 1,296,977 | |
Intel Corp. | | | 1,706,288 | | | | 51,896,750 | |
KLA-Tencor Corp. | | | 58,026 | | | | 3,261,641 | |
Lam Research Corp. | | | 56,946 | | | | 4,632,557 | |
Linear Technology Corp. | | | 86,130 | | | | 3,809,530 | |
Microchip Technology, Inc. | | | 72,771 | | | | 3,451,165 | |
Micron Technology, Inc. (b) | | | 387,481 | | | | 7,300,142 | |
NVIDIA Corp. | | | 183,829 | | | | 3,696,801 | |
Qorvo, Inc. (b) | | | 53,748 | | | | 4,314,352 | |
Skyworks Solutions, Inc. | | | 68,733 | | | | 7,155,105 | |
Texas Instruments, Inc. | | | 374,191 | | | | 19,274,578 | |
Xilinx, Inc. | | | 93,010 | | | | 4,107,322 | |
| Total Semiconductors & Semiconductor Equipment | | | | | | | 157,833,343 | |
| | |
| Software | 3.6% | | | | | | | | |
Adobe Systems, Inc. (b) | | | 170,937 | | | | 13,847,606 | |
Autodesk, Inc. (b) | | | 81,881 | | | | 4,100,191 | |
CA, Inc. | | | 113,861 | | | | 3,334,989 | |
Citrix Systems, Inc. (b) | | | 57,652 | | | | 4,044,864 | |
Electronic Arts, Inc. (b) | | | 111,836 | | | | 7,437,094 | |
Intuit, Inc. | | | 99,151 | | | | 9,991,446 | |
Microsoft Corp. | | | 2,909,600 | | | | 128,458,840 | |
Oracle Corp. | | | 1,146,623 | | | | 46,208,907 | |
Red Hat, Inc. (b) | | | 65,935 | | | | 5,006,445 | |
Salesforce.com, Inc. (b) | | | 219,281 | | | | 15,268,536 | |
Symantec Corp. | | | 244,840 | | | | 5,692,530 | |
| Total Software | | | | | | | 243,391,448 | |
| | |
| Specialty Retail | 2.3% | | | | | | | | |
AutoNation, Inc. (b) | | | 27,276 | | | | 1,717,842 | |
AutoZone, Inc. (b)(c) | | | 11,410 | | | | 7,609,329 | |
Bed Bath & Beyond, Inc. (b) | | | 61,616 | | | | 4,250,272 | |
Best Buy Co., Inc. | | | 105,313 | | | | 3,434,257 | |
| | | | | | |
| The accompanying notes are an integral part of these financial statements. | | Appendix | | | 75 | |
Portfolio of Investments | S&P 500 Index Master Portfolio | June 30, 2015 | (Unaudited) (Continued)
| | | | | | | | |
| Common Stocks | 96.8% of net assets (Continued) | |
| | |
Specialty Retail | 2.3%
(Continued) | | Shares | | | Value | |
CarMax, Inc. (b)(c) | | | 75,254 | | | $ | 4,982,567 | |
GameStop Corp., Class A (c) | | | 37,969 | | | | 1,631,148 | |
The Gap, Inc. | | | 94,571 | | | | 3,609,775 | |
The Home Depot, Inc. | | | 467,207 | | | | 51,920,714 | |
L Brands, Inc. | | | 88,210 | | | | 7,562,243 | |
Lowe’s Cos., Inc. | | | 335,462 | | | | 22,465,890 | |
O’Reilly Automotive, Inc. (b) | | | 36,324 | | | | 8,208,498 | |
Ross Stores, Inc. | | | 148,830 | | | | 7,234,626 | |
Staples, Inc. | | | 230,426 | | | | 3,527,822 | |
Tiffany & Co. | | | 40,416 | | | | 3,710,189 | |
TJX Cos., Inc. | | | 244,716 | | | | 16,192,858 | |
Tractor Supply Co. | | | 49,070 | | | | 4,413,356 | |
Urban Outfitters, Inc. (b) | | | 35,003 | | | | 1,225,105 | |
| Total Specialty Retail | | | | | | | 153,696,491 | |
|
| Technology Hardware, Storage & Peripherals | 4.7% | |
Apple, Inc. | | | 2,072,086 | | | | 259,891,387 | |
EMC Corp. | | | 698,507 | | | | 18,433,600 | |
Hewlett-Packard Co. | | | 649,719 | | | | 19,498,067 | |
NetApp, Inc. | | | 112,143 | | | | 3,539,233 | |
SanDisk Corp. | | | 74,425 | | | | 4,333,024 | |
Seagate Technology PLC | | | 114,717 | | | | 5,449,057 | |
Western Digital Corp. | | | 78,070 | | | | 6,122,249 | |
| Total Technology Hardware, Storage & Peripherals | | | | | | | 317,266,617 | |
|
| Textiles, Apparel & Luxury Goods | 0.9% | |
Coach, Inc. | | | 99,373 | | | | 3,439,300 | |
Fossil Group, Inc. (b)(c) | | | 15,506 | | | | 1,075,496 | |
Hanesbrands, Inc. | | | 144,469 | | | | 4,813,707 | |
Michael Kors Holdings Ltd. (b) | | | 71,592 | | | | 3,013,307 | |
NIKE, Inc., Class B | | | 250,475 | | | | 27,056,309 | |
PVH Corp. | | | 29,743 | | | | 3,426,394 | |
Ralph Lauren Corp. | | | 21,736 | | | | 2,876,977 | |
Under Armour, Inc., Class A (b) | | | 60,468 | | | | 5,045,450 | |
VF Corp. | | | 122,282 | | | | 8,527,947 | |
| Total Textiles, Apparel & Luxury Goods | | | | | | | 59,274,887 | |
| | |
| Thrifts & Mortgage Finance | 0.1% | | | | | | | | |
Hudson City Bancorp, Inc. | | | 175,105 | | | | 1,730,038 | |
People’s United Financial, Inc. | | | 112,010 | | | | 1,815,682 | |
| Total Thrifts & Mortgage Finance | | | | | | | 3,545,720 | |
| | |
| Tobacco | 1.3% | | | | | | | | |
Altria Group, Inc. | | | 707,318 | | | | 34,594,923 | |
Philip Morris International, Inc. | | | 557,186 | | | | 44,669,602 | |
Reynolds American, Inc. | | | 149,506 | | | | 11,162,118 | |
| Total Tobacco | | | | | | | 90,426,643 | |
| | | | | | | | |
| | |
Trading Companies &
Distributors | 0.2% | | Shares | | | Value | |
Fastenal Co. | | | 97,779 | | | $ | 4,124,318 | |
United Rentals, Inc. (b)(c) | | | 34,878 | | | | 3,056,011 | |
W.W. Grainger, Inc. | | | 21,422 | | | | 5,069,516 | |
| Total Trading Companies & Distributors | | | | 12,249,845 | |
| Total Long-Term Investments (Cost $3,928,129,254) | | | | | | | 6,556,885,212 | |
Short-Term Securities | 3.3% of net assets | | | | | |
BlackRock Cash Funds: | | | | | | | | |
Institutional, SL Agency Shares, 0.18% (a)(d) | | | 176,986,191 | | | | 176,986,191 | |
Prime, SL Agency Shares,
0.16% (a)(d)(e) | | | 47,201,629 | | | | 47,201,629 | |
Total Short-Term Securities
(Cost $224,187,820) | | | | | | | 224,187,820 | |
| | |
Total Investments
Before Investments Sold Short
(Cost $4,152,317,074) | 100.1% | | | | 6,781,073,032 | |
Investments Sold Short (f) | 0.0% of net assets | |
| | |
| Chemicals | | | | | | | | |
The Chemours Co. (b) | | | (65,118 | ) | | | (1,041,888 | ) |
| | |
| Household Durables | | | | | | | | |
TopBuild Corp. (b) | | | (12,502 | ) | | | (362,558 | ) |
| Total Investments Sold Short (Proceeds $1,404,110) | | | | | | | (1,404,446 | ) |
| | |
Total Investments, Net of Investment Sold Short
(Cost $4,150,912,964) | 100.1% | | | | 6,779,668,586 | |
| | |
| Liabilities in Excess of Other Assets | (0.1%) | | | | (8,490,162 | ) |
| | |
| Net Assets | 100.0% | | | $ | 6,771,178,424 | |
| | | | |
| 76 | | Appendix | | The accompanying notes are an integral part of these financial statements. |
Portfolio of Investments | S&P 500 Index Master Portfolio | June 30, 2015 | (Unaudited) (Continued)
| (a) | During the six months ended June 30, 2015, investments in issuers considered to be affiliates of the Master Portfolio for purposes of Section 2(a)(3) of the Investment Company Act of 1940, as amended, were as follows: |
| | | | | | | | | | | | | | | | | | | | | | | | | | | | |
| | | Shares Held at
December 31,
2014 | | | Shares
Purchased | | | Shares
Sold | | | Shares Held at
June 30,
2015 | | | Value at
June 30,
2015 | | | Income | | | Realized
Gain | |
BlackRock Inc | | | 39,755 | | | | 6,071 | | | | (154 | ) | | | 45,672 | | | $ | 15,801,599 | | | $ | 192,267 | | | $ | 9,903 | |
BlackRock Cash Funds: Institutional, SL Agency Shares | | | 76,063,771 | | | | 100,922,420 | 1 | | | — | | | | 176,986,191 | | | $ | 176,981,191 | | | $ | 186,462 | | | | — | |
BlackRock Cash Funds: Prime, SL Agency Shares | | | 6,710,893 | | | | 40,490,736 | 1 | | | — | | | | 47,201,629 | | | $ | 47,201,629 | | | $ | 173,537 | 2 | | | — | |
The PNC Financial Services Group, Inc | | | 164,243 | | | | 23,833 | | | | (1,795 | ) | | | 186,281 | | | $ | 17,817,778 | | | $ | 171,575 | | | | 54,146 | |
| 1 | Represents net shares purchased. |
| 2 | Represents securities lending income earned from the reinvestment of cash collateral from loaned securities, net of fees, and other payments to and from borrowers of securities, and less the collateral investment expenses. |
| (b) | Non-income producing security. |
| (c) | Security, or a portion of security, is on loan. |
| (d) | Represents the curent yield as of report date. |
| (e) | All or a portion of security was purchased with the cash collateral from loaned securities. |
| (f) | In order to track the performance of its benchmark index, the Master Portfolio sold non-index securities that it subsequently received in corporate action occurring on the opening of market trading on the following business day. |
| • | | As of June 30, 2015, financial futures contracts outstanding were as follows: |
| | | | | | | | | | |
| Contracts Long | | Issue | | Exchange | | Expiration | | Notional Value | | Unrealized Depreciation |
1,818 | | S&P 500 E-Mini Index | | Chicago Mercantile | | September 2015 | | $186,744,960 | | $(3,507,526) |
| • | | For Master Portfolio compliance purposes, the Master Portfolio’s sector and industry classifications refer to one or more of the sector and industry subclassifications used by one or more widely recognized market indexes or rating group indexes, and/or as defined by the investment advisor. These definitions may not apply for purposes of this report, which may combine such sector and industry sub-classifications for reporting ease. |
| • | | Fair Value Measurements — Various inputs are used in determining the fair value of investments and derivative financial instruments. These inputs to valuation techniques are categorized into a disclosure hierarchy consisting of three broad levels for financial statement purposes. The hierarchy gives the highest priority to unadjusted quoted prices in active markets for identical assets or liabilities (Level 1 measurements) and the lowest priority to unobservable inputs (Level 3 measurements). Accordingly, the degree of judgment exercised in determining fair value is greatest for instruments categorized in Level 3. The inputs used to measure fair value may fall into different levels of the fair value hierarchy. In such cases, for disclosure purposes, the fair value hierarchy classification is determined based on the lowest level input that is significant to the fair value measurement in its entirety. The categorization of a value determined for investments and derivative financial instruments is based on the pricing transparency of the investments and derivative financial instruments and is not necessarily an indication of the risks associated with investing in those securities. The three levels of the fair value hierarchy are as follows: |
| | • | | Level 1—unadjusted quoted prices in active markets/exchanges for identical assets or liabilities that the Master Portfolio has the ability to access |
| | • | | Level 2—other observable inputs (including, but not limited to, quoted prices for similar assets or liabilities in markets that are active, quoted prices for identical or similar assets or liabilities in markets that are not active, inputs other than quoted prices that are observable for the assets or liabilities (such as interest rates, yield curves, volatilities, prepayment speeds, loss severities, credit risks and default rates) or other market-corroborated inputs) |
| | • | | Level 3—unobservable inputs based on the best information available in the circumstances, to the extent observable inputs are not available (including the Master Portfolio’s own assumptions used in determining the fair value of investments and derivative financial instruments) |
Changes in valuation techniques may result in transfers into or out of an assigned level within the disclosure hierarchy. In accordance with the Master Portfolio’s policy, transfers between different levels of the fair value disclosure hierarchy are deemed to have occurred as of the beginning of the reporting period. For information about the Master Portfolio’s policy regarding valuation of investments and derivative financial instruments, refer to Note 2 of the Notes to Financial Statements.
As of June 30, 2015, the following tables summarize the Master Portfolio’s investments and derivative financial instruments categorized in the disclosure hierarchy:
| | | | | | | | | | | | | | | | |
| | | Level 1 | | | Level 2 | | | Level 3 | | | Total | |
Assets: | | | | | | | | | | | | | | | | |
| Investments: | | | | | | | | | | | | | | | | |
| Long-Term Investments: | | | | | | | | | | | | | | | | |
Common Stocks1 | | $ | 6,556,885,212 | | | | — | | | | — | | | $ | 6,556,885,212 | |
| Short-Term Securities: | | | | | | | | | | | | | | | | |
Money Market Funds | | | 224,187,820 | | | | — | | | | — | | | | 224,187,820 | |
Liabilities: | | | | | | | | | | | | | | | | |
Investments Sold Short | | | (1,404,446 | ) | | | | | | | | | | | (1,404,446 | ) |
| | | | | | | | | | | | | | | | |
Total | | $ | 6,779,668,586 | | | | — | | | | — | | | $ | 6,779,668,586 | |
| | | | | | | | | | | | | | | | |
| 1 | See above Schedule of Investments for values in each industry. |
| | | | | | |
| The accompanying notes are an integral part of these financial statements. | | Appendix | | | 77 | |
Portfolio of Investments | S&P 500 Index Master Portfolio | June 30, 2015 | (Unaudited) (Continued)
| | | | | | | | | | | | | | | | |
| | | Level 1 | | | Level 2 | | | Level 3 | | | Total | |
| Derivative Financial Instruments2 | | | | | | | | | | | | | | | | |
Liabilities: | | | | | | | | | | | | | | | | |
Equity contracts | | $ | (3,507,526 | ) | | $ | — | | | $ | — | | | $ | (3,507,526 | ) |
| 2 | Derivative financial instruments are financial futures contracts, which are valued at the unrealized appreciation (depreciation) on the instrument. |
The Master Portfolio may hold assets and/or liabilities in which the fair value approximates the carrying amount for financial statement purposes. As of June 30, 2015, such assets and/or liabilities are categorized within the disclosure hierarchy as follows:
| | | | | | | | | | | | | | | | |
| | | Level 1 | | | Level 2 | | | Level 3 | | | Total | |
Assets: | | | | | |
Cash pledged for financial futures contracts | | $ | 7,962,600 | | | | — | | | | — | | | $ | 7,962,600 | |
Liabilities: | | | | | | | | | | | | | | | | |
Collateral on securities loaned at value | | | — | | | | (47,201,629 | ) | | | — | | | | (47,201,629 | ) |
| | | | | | | | | | | | | | | | |
Total | | $ | 7,962,600 | | | $ | (47,201,629 | ) | | $ | — | | | $ | (39,239,029 | ) |
| | | | | | | | | | | | | | | | |
During the period ended June 30, 2015, there were no transfers between levels.
| | | | |
| 78 | | Appendix | | The accompanying notes are an integral part of these financial statements. |
Statement of Assets and Liabilities
S&P 500 Index Master Portfolio | June 30, 2015 | (Unaudited)
| | | | |
| Assets | | | |
| Investments at value—unaffiliated (including securities loaned of $46,306,043) (cost—$3,907,632,181) | | $ | 6,523,265,835 | |
| Investments at value—affiliated (cost—$244,684,893) | | | 257,807,197 | |
| Cash pledged for financial futures contracts | | | 7,962,600 | |
| Receivables: | | | | |
Contributions from investors | | | 25,691,440 | |
Dividends | | | 7,455,085 | |
Investments sold | | | 3,070,050 | |
Securities lending income—affiliated | | | 21,429 | |
| Variation margin receivable on financial futures contracts | | | 335,924 | |
| | | | |
Total assets | | | 6,825,609,560 | |
| |
| Liabilities | | | | |
| | | | |
| Collateral on securities loaned at value | | | 47,201,629 | |
| Investments sold short at value (proceeds—$1,404,110) | | | 1,404,446 | |
| Payables: | | | | |
Investments purchased | | | 5,574,125 | |
Investment advisory fees | | | 190,515 | |
Professional fees | | | 25,673 | |
Officer’s and Trustees’ fees | | | 23,593 | |
Withdrawals to investors | | | 11,155 | |
| | | | |
Total liabilities | | | 54,431,136 | |
| | | | |
| Net Assets | | $ | 6,771,178,424 | |
| |
| Net Assets Consist Of | | | | |
| | | | |
| Investors’ capital | | | 4,145,930,328 | |
| Net unrealized appreciation (depreciation) | | | 2,625,248,096 | |
| | | | |
| Net Assets | | $ | 6,771,178,424 | |
| | | | |
| | | | | | |
| The accompanying notes are an integral part of these financial statements. | | Appendix | | | 79 | |
Statement of Operations
S&P 500 Index Master Portfolio | Six Months Ended June 30, 2015 | (Unaudited)
| | | | |
| Investment Income | | | |
| Dividends—unaffiliated | | $ | 62,201,697 | |
| Dividends—affiliated | | | 363,842 | |
| Interest—affiliated | | | 186,462 | |
| Securities lending—affiliated—net | | | 173,537 | |
| Foreign taxes withheld | | | (12,996 | ) |
| | | | |
Total Income | | | 62,912,542 | |
| |
| Expenses | | | | |
| | | | |
| Investment advisory | | | 1,492,644 | |
| Officer and Trustees | | | 81,105 | |
| Professional | | | 23,626 | |
| | | | |
Total Expenses | | | 1,597,375 | |
| | | | |
| Less fees waived by the Manager | | | (179,447 | ) |
| | | | |
Total Expenses after fees waived | | | 1,417,928 | |
| | | | |
| Net Investment Income | | | 61,494,614 | |
| |
| Realized And Unrealized Gain (Loss) | | | | |
| | | | |
| Net realized gain from: | | | | |
| Investments—unaffiliated | | | 56,744,520 | |
| Investments—affiliated | | | 64,049 | |
| Financial futures contracts | | | 9,822,347 | |
| | | | |
Net Realized Gain | | | 66,630,916 | |
| Net change in unrealized appreciation (depreciation) on: | | | | |
| Investments—unaffiliated | | | (59,167,319 | ) |
| Investments—affiliated | | | 77,472 | |
| Financial futures contracts | | | (4,117,513 | ) |
| Short sales | | | 336 | |
| | | | |
| Net Change In Unrealized Appreciation (Depreciation) | | | (63,207,024 | ) |
| | | | |
| Net Realized And Unrealized Gain | | | 3,423,892 | |
| | | | |
| Net Increase In Net Assets Resulting From Operations | | $ | 64,918,506 | |
| | | | |
| | | | |
| 80 | | Appendix | | The accompanying notes are an integral part of these financial statements. |
Statements of Changes in Net Assets
S&P 500 Index Master Portfolio
| | | | | | | | |
| | | Six Months Ended June 30, 2015
(Unaudited) | | | Year Ended
December 31,
2014 | |
| Increase (Decrease) In Net Assets | | | | | | | | |
| | |
| Operations | | | | | | | | |
| | | | | | | |
| Net investment income | | $ | 61,494,614 | | | $ | 108,892,318 | |
| Net realized gain | | | 66,630,916 | | | | 76,733,344 | |
| Net change in unrealized appreciation (depreciation) | | | (63,207,024 | ) | | | 527,569,116 | |
| | | | | | | |
Net increase in net assets resulting from operations | | | 64,918,506 | | | | 713,194,778 | |
| | |
| Capital Transactions | | | | | | | | |
| | | | | | | |
| Proceeds from contributions | | | 2,008,992,597 | | | | 539,481,303 | |
| Value of withdrawals | | | (1,051,310,965 | ) | | | (775,228,002 | ) |
| | | | | | | |
Net increase (decrease) in net assets derived from capital transactions | | | 957,681,632 | | | | (235,746,699 | ) |
| | |
| Net Assets | | | | | | | | |
| | | | | | | |
| Total increase in net assets | | | 1,022,600,138 | | | | 477,448,079 | |
| Beginning of period | | | 5,748,578,286 | | | | 5,271,130,207 | |
| | | | | | | |
End of period | | $ | 6,771,178,424 | | | $ | 5,748,578,286 | |
| | | | | | | |
| | | | | | |
| The accompanying notes are an integral part of these financial statements. | | Appendix | | | 81 | |
Financial Highlights
S&P 500 Index Master Portfolio
| | | | | | | | | | | | | | | | | | | | | | | | |
| | | Six Months Ended June 30, 2015
(Unaudited) | | | For Year Ended December 31, | |
| | | | 2014 | | | 2013 | | | 2012 | | | 2011 | | | 2010 | |
Total Return | | | 1.23 | %1 | | | 13.63 | % | | | 32.33 | % | | | 15.98 | % | | | 2.13 | % | | | 15.06 | % |
| | | | | | |
| Ratio to Average Net Assets | | | | | | | | | | | | | | | | | | | | | | | | |
| | | | | | | | | | | | | | | | | | | |
| Total expenses | | | 0.05 | %2 | | | 0.05 | % | | | 0.05 | % | | | 0.06 | % | | | 0.06 | % | | | 0.05 | % |
| | | | | | | | | | | | | | | | | | | |
| Total expenses after fees waived and paid indirectly | | | 0.04 | %2 | | | 0.05 | % | | | 0.05 | % | | | 0.05 | % | | | 0.05 | % | | | 0.05 | % |
| | | | | | | | | | | | | | | | | | | |
| Net investment income | | | 1.91 | %2 | | | 1.98 | % | | | 2.08 | % | | | 2.22 | % | | | 2.08 | % | | | 2.01 | % |
Supplemental Data | | | | | | | | | | | | | | | | | | | | | | | | |
| Net assets, end of period (000) | | $ | 6,771,178 | | | $ | 5,748,578 | | | $ | 5,271,130 | | | $ | 1,717,932 | | | $ | 2,108,316 | | | $ | 2,158,717 | |
| | | | | | | | | | | | | | | | | | | |
| Portfolio turnover rate | | | 1 | % | | | 3 | % | | | 2 | % | | | 10 | % | | | 5 | % | | | 9 | % |
| | | | | | | | | | | | | | | | | | | |
| 1 | Aggregate total return. |
| | | | |
| 82 | | Appendix | | The accompanying notes are an integral part of these financial statements. |
Notes to Financial Statements
S&P 500 Index Master Portfolio | (Unaudited)
1. Organization
S&P 500 Index Master Portfolio (the “Master Portfolio”) (formerly known as S&P 500 Stock Master Portfolio), a series of Master Investment Portfolio (“MIP”), is registered under the Investment Company Act of 1940, as amended (the “1940 Act”), as a diversified, open-end management investment company. MIP is organized as a Delaware statutory trust.
The Master Portfolio, together with certain other registered investment companies advised by BlackRock Advisor, LLC (“the Manager”) or its affiliates, is included in a complex of open-end funds referred to as the Equity-Liquidity Complex.
2. Significant Accounting Policies
The Master Portfolio’s financial statements are prepared in conformity with accounting principles generally accepted in the United States of America (“U.S. GAAP”), which may require management to make estimates and assumptions that affect the reported amounts of assets and liabilities in the financial statements and the reported amounts of increases and decreases in net assets from operations during the reporting period. Actual results could differ from those estimates. Master Portfolio is considered an investment company under U.S. GAAP and follows the accounting and reporting guidance applicable to investment companies. The following is a summary of significant accounting policies followed by the Master Portfolio:
Valuation: The Master Portfolio’s investments are valued at fair value as of the close of trading on the New York Stock Exchange (“NYSE”) (generally 4:00 p.m., Eastern time). U.S. GAAP defines fair value as the price the Master Portfolio would receive to sell an asset or pay to transfer a liability in an orderly transaction between market participants at the measurement date. The Master Portfolio determines the fair values of its financial instruments at market value using independent dealers or pricing services under policies approved by the Board of Trustees of MIP (the “Board”). The BlackRock Global Valuation Methodologies Committee (the “Global Valuation Committee”) is the committee formed by management to develop global pricing policies and procedures and to provide oversight of the pricing function for the Master Portfolio for all financial instruments. Investments in open-end registered investment companies are valued at NAV each business day. Equity investments traded on a recognized securities exchange are valued at the official close price each day, if available. For equity investments traded on more than one exchange, the official close price on the exchange where the stock is primarily traded is used. Equity investments traded on a recognized exchange for which there were no sales on that day may be valued at the last available bid (long positions) or ask (short positions) price. Financial futures contracts traded on exchanges are valued at their last sale price.
In the event that the application of these methods of valuation results in a price for an investment that is deemed not to be representative of the market value of such investment, or if a price is not available, the investment will be valued by the Global Valuation Committee, or its delegate, in accordance with a policy approved by the Board as reflecting fair value (“Fair Value Investments”). When determining the price for Fair Value Investments, the Global Valuation Committee, or its delegate, seeks to determine the price that the Master Portfolio might reasonably expect to receive or pay from the current sale or purchase of that asset or liability in an arm’s-length transaction. Fair value determinations shall be based upon all available factors that the Global Valuation Committee, or its delegate, deems relevant consistent with the principles of fair value measurement. The pricing of all Fair Value Investments is subsequently reported to the Board or a committee thereof on a quarterly basis.
Segregation and Collateralization: In cases where a Master Portfolio enters into certain investments (e.g., financial futures contracts and short sales that would be “senior securities” for 1940 Act purposes, the Master Portfolio may segregate or designate on its books and records cash or liquid securities having a market value at least equal to the amount of the Master Portfolio’s future obligations under such investments. Doing so allows the investment to be excluded from treatment as a “senior security.” Furthermore, if required by an exchange or counterparty agreement, the Master Portfolio may be required to deliver/deposit cash and/or securities to/with an exchange, or broker-dealer or custodian as collateral for certain investments or obligations.
Investment Transactions and Investment Income: For financial reporting purposes, investment transactions are recorded on the dates the transactions are entered into (the trade dates). Realized gains and losses on investment transactions are determined on the identified cost basis. Dividend income is recorded on the ex-dividend date. Dividends from foreign securities where the ex-dividend date may have passed are subsequently recorded when the Master Portfolio is informed of the ex-dividend date. Under the applicable foreign tax laws, a withholding tax at various rates may be imposed on capital gains, dividends and interest. Upon notification from issuers, some of the dividend income received from a real estate investment trust may be redesignated as a reduction of cost of the related investment and/or realized gain. Interest income, including amortization and accretion of premiums and discounts on debt securities, is recognized on the accrual basis.
Other: Expenses directly related to the Master Portfolio are charged to the Master Portfolio. Other operating expenses shared by several funds are prorated among those funds on the basis of relative net assets or other appropriate methods.
| | | | | | |
| Notes to Financial Statements | | Appendix | | | 83 | |
Notes to Financial Statements | S&P 500 Index Master Portfolio | (Unaudited) (Continued)
The Master Portfolio an arrangement with the custodian whereby fees may be reduced by credits earned on uninvested cash balances, which, if applicable, are shown as fees paid indirectly in the Statement of Operations. The custodian imposes fees on overdrawn cash balances, which can be offset by accumulated credits earned or may result in additional custody charges.
3. Securities and Other Investments
Preferred Stock: The Master Portfolio may invest in preferred stock. Preferred stock has a preference over common stock in liquidation (and generally in receiving dividends as well) but is subordinated to the liabilities of the issuer in all respects. As a general rule, the market value of preferred stock with a fixed dividend rate and no conversion element varies inversely with interest rates and perceived credit risk, while the market price of convertible preferred stock generally also reflects some element of conversion value. Because preferred stock is junior to debt securities and other obligations of the issuer, deterioration in the credit quality of the issuer will cause greater changes in the value of a preferred stock than in a more senior debt security with similar stated yield characteristics. Unlike interest payments on debt securities, preferred stock dividends are payable only if declared by the issuer’s board of directors. Preferred stock also may be subject to optional or mandatory redemption provisions.
Securities Lending: The Master Portfolio may lend its securities to approved borrowers, such as brokers, dealers and other financial institutions. The borrower pledges and maintains with the Master Portfolio collateral consisting of cash, an irrevocable letter of credit issued by a bank, or securities issued or guaranteed by the U.S. Government. The initial collateral received by the Master Portfolio is required to have a value of at least 102% of the current value of the loaned securities for securities traded on U.S. exchanges and a value of at least 105% for all other securities. The collateral is maintained thereafter, at a value equal to at least 100% of the current market value of the securities on loan. The market value of the loaned securities is determined at the close of each business day of the Master Portfolio and any additional required collateral is delivered to the Master Portfolio, or excess collateral returned by the Master Portfolio, on the next business day. During the term of the loan, the Master Portfolio is entitled to all distributions made on or in respect of the loaned securities. Loans of securities are terminable at any time and the borrower, after notice, is required to return borrowed securities within the standard time period for settlement of securities transactions.
The market value of securities on loan, all of which were classified as common stocks in the Master Portfolio’s Schedule of Investments, and the value of the related collateral are shown separately in the Statement of Assets and Liabilities as a component of investments at value—unaffiliated, and collateral on securities loaned at value, respectively. As of June 30, 2015, any securities on loan were collateralized by cash. The cash collateral invested by the securities lending agent, BlackRock Institutional Trust Company, N.A. (“BTC”), if any, is disclosed in the Schedule of Investments.
Securities lending transactions are entered into by the Master Portfolio under Master Securities Lending Agreements (each, an “MSLA”) which provide the right, in the event of default (including bankruptcy or insolvency), for the non-defaulting party to liquidate the collateral and calculate a net exposure to the defaulting party or request additional collateral. In the event that a borrower defaults, the Master Portfolio, as lender, would offset the market value of the collateral received against the market value of the securities loaned. When the value of the collateral is greater than that of the market value of the securities loaned, the lender is left with a net amount payable to the defaulting party. However, bankruptcy or insolvency laws of a particular jurisdiction may impose restrictions on or prohibitions against such a right of offset in the event of an MSLA counterparty’s bankruptcy or insolvency. Under the MSLA, the borrower can resell or re-pledge the loaned securities, and the Master Portfolio can reinvest cash collateral, or, upon an event of default, resell or re-pledge the collateral.
As of June 30, 2015, the following table is a summary of the Master Portfolio’s securities lending agreements by counterparty, which are subject to offset under an MSLA:
| | | | | | | | | | | | |
| Counterparty | | Securities
Loaned at
Value | | | Cash
Collateral
Received1 | | | Net
Amount | |
| Barclays Capital, Inc. | | $ | 61,530 | | | $ | (61,530 | ) | | | — | |
| Citigroup Global Markets, Inc. | | | 1,601,215 | | | | (1,601,215 | ) | | | — | |
| Credit Suisse Securities (USA) LLC | | | 16,485,265 | | | | (16,485,265 | ) | | | — | |
| Deutsche Bank Securities Inc. | | | 1,182,861 | | | | (1,182,861 | ) | | | — | |
| Goldman Sachs & Co. | | | 8,023,119 | | | | (8,023,119 | ) | | | — | |
| HSBC Bank PLC | | | 15,606 | | | | (15,606 | ) | | | — | |
| Jefferies LLC | | | 353,328 | | | | (353,328 | ) | | | — | |
| JP Morgan Securities LLC | | | 13,245,643 | | | | (13,245,643 | ) | | | — | |
| Merrill Lynch, Pierce, Fenner & Smith, Inc. | | | 3,281,812 | | | | (3,281,812 | ) | | | — | |
| Morgan Stanley | | | 25,110 | | | | (25,110 | ) | | | — | |
| National Financial Services LLC | | | 166,300 | | | | (166,300 | ) | | | — | |
| SG Americas Securities LLC | | | 677,081 | | | | (677,081 | ) | | | — | |
| State Street Bank & Trust Co. | | | 1,063,559 | | | | (1,063,559 | ) | | | — | |
| UBS Securities LLC | | | 123,614 | | | | (123,614 | ) | | | — | |
| | | | | | | | | | | | |
| Total | | $ | 46,306,043 | | | $ | (46,306,043 | ) | | | — | |
| | | | | | | | | | | | |
| 1 | Collateral with a value of $47,201,629 has been received in connection with securities lending agreements. Collateral received in excess of the value of securities loaned from the individual counterparty is not shown for financial reporting purposes. |
The risks of securities lending include the risk that the borrower may not provide additional collateral when required or may not return the securities when due. To mitigate these risks, the Master Portfolio benefits from a borrower default indemnity provided by BlackRock, Inc. (“BlackRock”). BlackRock’s indemnity allows for full replacement of the securities loaned if the collateral received does not cover the value on the securities loaned in the event of borrower default. The Master Portfolio could suffer a loss if the value of an investment purchased with cash collateral falls below the market value of loaned securities
| | | | |
| 84 | | Appendix | | Notes to Financial Statements |
Notes to Financial Statements | S&P 500 Index Master Portfolio | (Unaudited) (Continued)
or if the value of an investment purchased with cash collateral falls below the value of the original cash collateral received.
Short Sales: The Master Portfolio may enter into short sale transactions in which the Master Portfolio sells a security it does not hold in anticipation of a decline in the market price of that security. When the Master Portfolio makes a short sale, it will borrow the security sold short from a broker/counterparty and deliver the security to the purchaser. To close out a short position, the Master Portfolio delivers the same security to the broker and records a liability to reflect the obligation to return the security to the broker. The amount of the liability is subsequently marked-to-market to reflect the market value of the short sale. The Master Portfolio maintains a segregated account of securities or deposits cash with the broker-dealer as collateral for the short sales. Cash deposited with the broker is recorded as an asset in the Statement of Assets and Liabilities. Securities segregated as collateral are denoted in the Schedule of Investments. The Master Portfolio may pay a financing fee for the difference between the market value of the short position and the cash collateral deposited with the broker which would be recorded as interest expense. The Master Portfolio is required to repay the counterparty any dividends received on the security sold short, which, if applicable, is shown as dividend expense in the Statement of Operations. The Master Portfolio may pay a fee on the assets borrowed from the counterparty, which, if applicable, is shown as stock loan fees in the Statement of Operations. The Master Portfolio is exposed to market risk based on the amount, if any, that the market value of the security increases beyond the market value at which the position was sold. Thus, a short sale of a security involves the risk that instead of declining, the price of the security sold short will rise. The short sale of securities involves the possibility of a theoretically unlimited loss since there is a theoretically unlimited potential for the market price of the security sold short to increase. A gain, limited to the price at which the Master Portfolio sold the security short, or a loss, unlimited as to the dollar amount, will be recognized upon the termination of a short sale if the market price is either less than or greater than the proceeds originally received. There is no = assurance the Master Portfolio will be able to close out a short position at a particular time or at an acceptable price.
4. Derivative Financial Instruments
The Master Portfolio engages in various portfolio investment strategies using derivative contracts both to increase the returns of the Master Portfolio and/or to manage economically its exposure to certain risks such as equity risk. These contracts may be transacted on an exchange or over-the-counter (“OTC”).
Financial Futures Contracts: The Master Portfolio invests in long and/or short positions in financial futures contracts and options on financial futures contracts and options on financial futures contracts to gain exposure to, or economically hedge against, changes in the value of equity securities (equity risk). Financial futures contracts are agreements between the Master Portfolio and a counterparty to buy or sell a specific quantity of an underlying instrument at a specified price and at a specified date. Depending on the terms of the particular contract, financial futures contracts are settled either through physical delivery of the underlying instrument on the settlement date or by payment of a cash settlement amount on the settlement date.
Upon entering into a financial futures contract, the Master Portfolio is required to deposit initial margin with the broker in the form of cash or securities in an amount that varies depending on a contract’s size and risk profile. The initial margin deposit must then be maintained at an established level over the life of the contract. Securities deposited as initial margin are designated on the Schedule of Investments and cash deposited, if any, is recorded on the Statement of Assets and Liabilities as cash pledged for financial futures contracts. Pursuant to the contract, the Master Portfolio agrees to receive from or pay to the broker an amount of cash equal to the daily fluctuation in value of the contract. Such receipts or payments are known as variation margin. Variation margin is recorded by the Master Portfolio as unrealized appreciation (depreciation) and, if applicable, as a receivable or payable for variation margin in the Statement of Assets and Liabilities.
When the contract is closed, the Master Portfolio records a realized gain or loss equal to the difference between the value of the contract at the time it was opened and the value at the time it was closed. The use of financial futures contracts involves the risk of an imperfect correlation in the movements in the price of financial futures contracts, interest and the underlying assets.
The following is a summary of the Master Portfolio’s derivative financial instruments categorized by risk exposure:
| | | | | | |
| Fair Values of Derivative Financial Instruments as of June 30, 2015 | |
| | | Derivative Liabilities | |
| | | Statement of Assets and
Liabilities Location | | Value | |
| Equity contracts | | Net unrealized depreciation1 | | $ | (3,507,526 | ) |
| 1 | Includes cumulative appreciation (depreciation) on financial futures contracts as reported in the Schedule of Investments. Only current day’s variation margin is reported within the Statement of Assets and Liabilities. |
| | | | |
The Effect of Derivative Financial Instruments in the Statement of Operations
Six Months Ended June 30, 2015 | |
| Net Realized Gain From | |
| Equity contracts: | | | | |
Financial futures contracts | | $ | 9,822,347 | |
| | | | |
| Net Change in Unrealized Appreciation (Depreciation) on | |
| Equity contracts: | | | | |
Financial futures contracts | | $ | (4,117,513 | ) |
For the six months ended June 30, 2015, the average quarterly balances of outstanding derivative financial instruments were as follows:
| | | | |
Financial futures contracts: | | | | |
Average notional value of contracts—long | | $ | 202,491,840 | |
| | | | | | |
| Notes to Financial Statements | | Appendix | | | 85 | |
Notes to Financial Statements | S&P 500 Index Master Portfolio | (Unaudited) (Continued)
Counterparty Credit Risk: A derivative contract may suffer a mark-to-market loss if the value of the contract decreases due to an unfavorable change in the market rates or values of the underlying instrument. Losses can also occur if the counterparty does not perform under the contract.
The Master Portfolio’s risk of loss from counterparty credit risk on OTC derivatives is generally limited to the aggregate unrealized gain less the value of any collateral held by such Master Portfolio.
With exchange-traded futures, there is less counterparty credit risk to the Master Portfolio since the exchange or clearinghouse, as counterparty to such instruments, guarantees against a possible default. The clearinghouse stands between the buyer and the seller of the contract; therefore, credit risk is limited to failure of the clearinghouse. While offset rights may exist under applicable law, the Master Portfolio does not have a contractual right of offset against a clearing broker or clearinghouse in the event of a default (including the bankruptcy or insolvency) of the clearing broker or clearinghouse. Additionally, credit risk exists in exchange-traded futures with respect to initial and variation margin that is held in a clearing broker’s customer accounts. While clearing brokers are required to segregate customer margin from their own assets, in the event that a clearing broker becomes insolvent or goes into bankruptcy and at that time there is a shortfall in the aggregate amount of margin held by the clearing broker for all its clients, typically the shortfall would be allocated on a pro rata basis across all the clearing broker’s customers, potentially resulting in losses to the Master Portfolio.
5. Investment Advisory Agreement and Other Transactions with Affiliates
The PNC Financial Services Group, Inc. is the largest stockholder and an affiliate of BlackRock, for 1940 Act purposes.
MIP, on behalf of the Master Portfolio, entered into an Investment Advisory Agreement (the “Investment Advisory Agreement”) with BFA, the Master Portfolio’s investment advisor, an indirect, wholly owned subsidiary of BlackRock, to provide investment advisory services. BFA is responsible for the management of the Master Portfolio’s investments and provides the necessary personnel, facilities, equipment and certain other services to the operations of the Master Portfolio. For such services, the Master Portfolio pays BFA a monthly fee based on a percentage of the Master Portfolio’s average daily net assets at an annual rate of 0.04%. Prior to April 30, 2015, the annual rates as a percentage of average daily net assets was 0.05%.
MIP entered into an Administration Agreement with BlackRock Advisors, LLC (“BAL”), which has agreed to provide general administration services (other than investment advice and related portfolio activities). BAL may delegate certain of its administration duties to sub-administrators.
BAL, in consideration thereof, has agreed to bear all of the Master Portfolio’s and MIP’s ordinary operating expenses, excluding, generally, investment advisory fees, distribution fees, brokerage and other expenses related to the execution of portfolio transactions, extraordinary expenses and certain other expenses and certain other expenses which are borne by the Master Portfolio.
BAL is not entitled to compensation for providing administration services to the Master Portfolio, for so long as BAL is entitled to compensation for providing administration services to corresponding feeder funds that invest substantially all of their assets in the Master Portfolio, or BAL (or an affiliate) receives investment advisory fees from the Master Portfolio.
The Manager voluntarily agreed to waive its investment advisory fees by the amount of investment advisory fees the Master Portfolio pays to the Manager indirectly through its investment in affiliated money market funds. This amount is included in fees waived by Manager in the Statement of Operations. However, the Manager does not waive its investment advisory fees by the amount of investment advisory fees paid in connection with the Master Portfolio’s investment in other affiliated investment companies, if any. For six months ended June 30, 2015, the amount waived was $74,716.
The fees and expenses of the MIP’s trustees who are not “interested persons” of MIP, as defined in the 1940 Act (“Independent Trustees”), counsel to the Independent Trustees and MIP’s independent registered public accounting firm (together, the “independent expenses”) are paid directly by the Master Portfolio. BFA has contractually agreed to cap the expenses of the Master Portfolio at the rate at which the Master Portfolio pays an advisory fee to BFA by providing an offsetting credit against the investment advisory fees paid by the Master Portfolio in an amount equal to the independent expenses. This contractual waiver is effective through April 30, 2016. The amount of the waiver, if any, is shown as fees reimbursed in the Statement of Operations.
The U.S. Securities and Exchange Commission has issued an exemptive order which permits BTC, an affiliate of the Manager, to serve as securities lending agent for the Master Portfolio, subject to applicable conditions. As securities lending agent, BTC bears all operational costs directly related to securities lending. The Master Portfolio is responsible for fees in connection with the investment of cash collateral received for securities on loan in a money market fund managed by the Manager or its affiliates, however, BTC has agreed to reduce the amount of securities lending income it receives in order to effectively limit the collateral investment fees the Master Portfolio bears to an annual rate of 0.04% (the “collateral investment fees”).
Securities lending income is equal to the total of income earned from the reinvestment of cash collateral, net of fees and other payments to and from borrowers of securities, and less the collateral investment fees. The Master Portfolio retains a portion
| | | | |
| 86 | | Appendix | | Notes to Financial Statements |
Notes to Financial Statements | S&P 500 Index Master Portfolio | (Unaudited) (Continued)
of securities lending income and remits a remaining portion to BTC as compensation for its services as securities lending agent.
Pursuant to a securities lending agreement, BTC may lend securities only when the difference between the borrower rebate rate and the risk free rate exceeds a certain level (such securities, the “specials only securities”).
Pursuant to a securities lending agreement effective March 9, 2015, the Master Portfolio retains 71.5% of securities lending income, and this amount retained can never be less than 65% of the total of securities lending income plus the collateral investment fees. In addition, commencing the business day following the date that the aggregate securities lending income earned across certain funds in the Equity-Liquidity Complex in a calendar year exceeds a specified threshold, the Master Portfolio, pursuant to the securities lending agreement, will retain for the remainder of the calendar year securities lending income in an amount equal to 75% of securities lending income, and this amount retained can never be less than 65% of the total of securities lending income plus the collateral investment fees. For the period January 1, 2015 through March 8, 2015, BTC could lend securities with respect to the Master Portfolio only when the difference between the borrower rebate rate and the risk free rate exceeded a certain level, and the Master Portfolio retained 80% (85% commencing on the business day following the date that the aggregate securities lending income earned across the Equity-Liquidity Complex in the calendar year 2014 exceeded a specified threshold and for the remainder of that calendar year) of securities lending income.
Certain officers and/or trustees of MIP are officers and/or directors of BlackRock or its affiliates.
The share of securities lending income earned by the Master Portfolio is shown as securities lending—affiliated—net in the Statement of Operations. For the six months ended June 30, 2015, the Master Portfolio paid BTC $59,400 in total for securities lending agent services and collateral investment fees.
The Master Portfolio may purchase securities from, or sell securities to, an affiliated fund provided the affiliation is due solely to having a common investment advisor, common officers, or common trustees. For the six months ended June 30, 2015, the purchase and sale transactions with an affiliated fund in compliance with Rule 17a-7 under the 1940 Act were $123,951,582 and $10,591,711, respectively.
6. Purchases and Sales
For the six months ended June 30, 2015, purchases and sales of investments, excluding short-term securities were $945,541,698 and $50,022,682, respectively.
7. Income Tax Information
The Master Portfolio is classified as a partnership for federal income tax purposes. As such, each investor in the Master Portfolio is treated as the owner of its proportionate share of net assets, income, expenses and realized and unrealized gains and losses of the Master Portfolio. Therefore, no federal income tax provision is required. It is intended that the Master Portfolio’s assets will be managed so an investor in the Master Portfolio can satisfy the requirements of Subchapter M of the Internal Revenue Code of 1986, as amended.
The Master Portfolio files U.S. federal and various state and local tax returns. No income tax returns are currently under examination. The statute of limitations on the Master Portfolio’s U.S. federal tax returns remains open for each of the four years ended December 31, 2014. The statutes of limitations on the Master Portfolio’s state and local tax returns may remain open for an additional year depending upon the jurisdiction.
Management has analyzed tax laws and regulations and their application to the Master Portfolio as of June 30, 2015, inclusive of the open tax return years, and does not believe there are any uncertain tax positions that require recognition of a tax liability in the Master Portfolio’s financial statements.
As of June 30, 2015, gross unrealized appreciation and depreciation based on cost for federal income tax purposes were as follows:
| | | | |
Tax Cost | | $ | 3,806,423,172 | |
Gross unrealized appreciation | | $ | 3,081,075,880 | |
Gross unrealized depreciation | | $ | (106,426,020 | ) |
Net unrealized appreciation | | $ | 2,974,649,860 | |
8. Bank Borrowings
MIP, on behalf of the Master Portfolio, along with certain other funds managed by the Manager and its affiliates (“Participating Funds”), is a party to a 364-day, $2.1 billion credit agreement with a group of lenders, under which the Master Portfolio may borrow to fund shareholder redemptions. Excluding commitments designated for certain individual funds, the Participating Funds, including the Master Portfolio, can borrow up to an aggregate commitment amount of $1.6 billion, subject to asset coverage and other limitations as specified in the agreement. The credit agreement has the following terms: a fee of 0.06% per annum on unused commitment amounts and interest at a rate equal to the higher of (a) one-month LIBOR (but, in any event, not less than 0.00%) on the date the loan is made plus 0.80% per annum or (b) the Fed Funds rate (but in any event, not less than 0.00%) in effect from time to time plus 0.80% per annum on amounts borrowed. The agreement expires in April 2016 unless extended or renewed. Participating Funds paid administration, legal and arrangement fees, which, if applicable, are included in miscellaneous expenses in the Statement of Operations, and along with commitment fees, were allocated among such funds based upon portions of the aggregate commitment available to them and relative net assets
| | | | | | |
| Notes to Financial Statements | | Appendix | | | 87 | |
Notes to Financial Statements | S&P 500 Index Master Portfolio | (Unaudited) (Continued)
of Participating Funds. During the six months ended June 30, 2015, the Master Portfolio did not borrow under the credit agreement. During the six months ended June 30, 2015, the Master Portfolio did not borrow under the credit agreement. During the six months ended June 30, 2015, the Master Portfolio did not borrow under the credit agreement.
9. Principal Risks
In the normal course of business, the Master Portfolio invests in securities and enter into transactions where risks exist due to fluctuations in the market (market risk) or failure of the issuer of a security to meet all its obligations, including to pay principal and interest when due (issuer credit risk). The value of securities held by the Master Portfolio may decline in response to certain events, including those directly involving the issuers whose securities are owned by the Master Portfolio; conditions affecting the general economy; overall market changes; local, regional or global political, social or economic instability; and currency, interest rate and price fluctuations. Similar to issuer credit risk, the Master Portfolio may be exposed to counterparty credit risk, or the risk that an entity with which the Master Portfolio has unsettled or open transactions may fail to or be unable to perform on its commitments. The Master Portfolio manages counterparty credit risk by entering into transactions only with counterparties that the Manager believes have the financial resources to honor their obligations and by monitoring the financial stability of those counterparties. Financial assets, which potentially expose the Master Portfolio to market, issuer and counterparty credit risks, consist principally of financial instruments and receivables due from counterparties. The extent of the Master Portfolio’s exposure to market, issuer and counterparty credit risks, consist principally of financial instruments and receivables due from counterparties. The extent of the Master Portfolio’s exposure to market, issuer and counterparty credit risks with respect to these financial assets is generally approximated by their value recorded in the Statement of Assets and Liabilities, less any collateral held by the Master Portfolio.
10. Subsequent Events
Management has evaluated the impact of all subsequent events on the Master Portfolio through the date the financial statements were issued and has determined that there were no subsequent events requiring adjustment or additional disclosure in the financial statements.
| | | | |
| 88 | | Appendix | | Notes to Financial Statements |
Disclosure of Investment Advisory Agreement
S&P 500 Index Master Portfolio
The Board of Trustees of Master Investment Portfolio (the “Master Fund”) met in person on April 21, 2015 (the “April Meeting”) and May 18-20, 2015 (the “May Meeting”) to consider the approval of the investment advisory agreement (the “Agreement”) between the Master Fund, on behalf of S&P 500 Index Master Portfolio (the “Master Portfolio”), a series of the Master Fund, and BlackRock Fund Advisors (the “Manager” or “BlackRock”), the Master Fund’s investment advisor. BlackRock S&P 500 Index Fund (the “Portfolio”), a series of BlackRock Funds III (the “Fund”), is a “feeder” fund that invests all of its investable assets in the Master Portfolio. Accordingly, the Board of Trustees of the Fund also considered the approval of the Agreement with respect to the Master Portfolio. For simplicity: (a) the Board of Trustees of the Master Fund and the Board of Trustees of the Fund are referred to herein collectively as the “Board,” and the members are referred to as “Board Members;” and (b) the shareholders of the Portfolio and the interest holders of the Master Portfolio are referred to as “shareholders.”
Activities and Composition of the Board
On the date of the May Meeting, the Board consisted of fourteen individuals, thirteen of whom were not “interested persons” of the Master Fund or the Fund as defined in the Investment Company Act of 1940, as amended (the “1940 Act”) (the “Independent Board Members”). The Board Members are responsible for the oversight of the operations of the Master Fund or the Fund, as pertinent, and perform the various duties imposed on the directors of investment companies by the 1940 Act. The Independent Board Members have retained independent legal counsel to assist them in connection with their duties. The Chair of the Board is an Independent Board Member. The Board has established five standing committees: an Audit Committee, a Governance and Nominating Committee, a Compliance Committee, a Performance Oversight and Contract Committee and an Executive Committee, each of which is chaired by an Independent Board Member and composed of Independent Board Members (except for the Executive Committee, which also has one interested Board Member).
The Agreement
Pursuant to the 1940 Act, the Board is required to consider the continuation of the Agreement on an annual basis. The Board has four quarterly meetings per year, each extending over two days, a fifth one-day meeting to consider specific information surrounding the consideration of renewing the Agreement, and additional in-person and telephonic meetings as needed. In connection with this year-long deliberative process, the Board assessed, among other things, the nature, extent and quality of the services provided to the Master Portfolio and the Portfolio by BlackRock, BlackRock’s personnel and affiliates, including (as applicable) investment management services; administrative and shareholder services; the oversight of fund service providers; marketing services; risk oversight; compliance; and ability to meet applicable legal and regulatory requirements.
The Board, acting directly and through its committees, considers at each of its meetings, and from time to time as appropriate, factors that are relevant to its annual consideration of the renewal of the Agreement, including the services and support provided by BlackRock to the Master Portfolio, the Portfolio and their shareholders. Among the matters the Board considered were: (a) investment performance for one-year, three-year, five-year and/or since inception periods, as applicable, against peer funds, applicable benchmark, and performance metrics, as applicable, as well as senior management’s and portfolio managers’ analysis of the reasons for any over performance or underperformance relative to its peers, benchmark, and other performance metrics, as applicable; (b) fees, including advisory, administration, if applicable, and other amounts paid to BlackRock and its affiliates by the Master Portfolio and/or the Portfolio for services, such as marketing and distribution, call center and fund accounting; (c) the Master Portfolio’s and /or the Portfolio’s operating expenses and how BlackRock allocates expenses to the Master Portfolio and the Portfolio; (d) the resources devoted to, risk oversight of, and compliance reports relating to, implementation of the Master Portfolio’s and the Portfolio’s investment objective(s), policies and restrictions, and meeting new regulatory requirements; (e) the Master Fund’s and the Fund’s compliance with its respective compliance policies and procedures; (f) the nature, cost and character of non-investment management services provided by BlackRock and its affiliates; (g) BlackRock’s and other service providers’ internal controls and risk and compliance oversight mechanisms; (h) BlackRock’s implementation of the proxy voting policies approved by the Board; (i) the use of brokerage commissions and execution quality of portfolio transactions; (j) BlackRock’s implementation of the Master Fund’s and/or the Fund’s valuation and liquidity procedures; (k) an analysis of management fees for products with similar investment mandates across the open-end fund, exchange-traded fund (“ETF”), closed-end fund and institutional account product channels, as applicable, and the similarities and differences between these products and the services provided as compared to the Master Portfolio and/or the Portfolio; (l) BlackRock’s compensation methodology for its investment professionals and the incentives it creates, along with investment professionals’ investments in the fund(s) they manage; and (m) periodic updates on BlackRock’s business.
The Board has engaged in an ongoing strategic review with BlackRock of opportunities to consolidate funds and of BlackRock’s commitment to investment performance. BlackRock also furnished information to the Board in response to specific questions. These questions covered issues such as: BlackRock’s profitability; investment performance; sub-advisory and advisory relationships with other clients (including mutual funds sponsored by third parties); the viability of specific funds; fund size and manager capacity; BlackRock’s research capabilities; portfolio managers’ investments in funds they
Disclosure of Investment Advisory Agreement | S&P 500 Index Master Portfolio (Continued)
manage; funds’ portfolio risk targets; and management fee levels and breakpoints. The Board further discussed with BlackRock: BlackRock’s management structure; portfolio turnover, execution quality and use of soft dollars; BlackRock’s portfolio manager compensation and performance accountability; marketing support for the funds; services provided to the funds by BlackRock affiliates; and BlackRock’s oversight of relationships with third party service providers.
Board Considerations in Approving the Agreement
The Approval Process: Prior to the April Meeting, the Board requested and received materials specifically relating to the Agreement. The Board is continuously engaged in a process with its independent legal counsel and BlackRock to review the nature and scope of the information provided to better assist its deliberations. The materials provided in connection with the April Meeting included (a) information independently compiled and prepared by Lipper, Inc. (“Lipper”) on fees and expenses of the Master Portfolio and the Portfolio, as applicable, as compared with a peer group of funds as determined by Lipper (“Expense Peers”) and the investment performance of the Portfolio as compared with a peer group of funds as determined by Lipper1, as well as the gross investment performance of the Portfolio as compared with its benchmark; (b) information on the profits realized by BlackRock and its affiliates pursuant to the Agreement and a discussion of fall-out benefits to BlackRock and its affiliates; (c) a general analysis provided by BlackRock concerning investment management fees charged to other clients, such as institutional clients, sub-advised mutual funds, ETFs and closed-end funds, under similar investment mandates, as well as the performance of such other clients, as applicable; (d) review of non-management fees; (e) the existence, impact and sharing of potential economies of scale; (f) a summary of aggregate amounts paid by the Master Portfolio and/or the Portfolio to BlackRock; (g) sales and redemption data regarding the Portfolio’s shares; and (h) if applicable, a comparison of management fees to similar BlackRock open-end funds, as classified by Lipper.
At the April Meeting, the Board reviewed materials relating to its consideration of the Agreement. As a result of the discussions that occurred during the April Meeting, and as a culmination of the Board’s year-long deliberative process, the Board presented BlackRock with questions and requests for additional information. BlackRock responded to these requests with additional written information in advance of the May Meeting.
At the May Meeting, the Board of the Master Fund, including the Independent Board Members, approved the continuation of the Agreement between the Manager and the Master Fund with respect to the Master Portfolio for a one-year term ending June 30, 2016. The Board of the Fund, including the Independent Board
| 1 | Funds are ranked by Lipper in quartiles, ranging from first to fourth, where first is the most desirable quartile position and fourth is the least desirable. |
Members, also considered the continuation of the Agreement with respect to the Master Portfolio and found the Agreement to be satisfactory. In approving the continuation of the Agreement, the Board of the Master Fund considered: (a) the nature, extent and quality of the services provided by BlackRock; (b) the investment performance of the Master Portfolio, the Portfolio and BlackRock; (c) the advisory fee and the cost of the services and profits to be realized by BlackRock and its affiliates from their relationship with the Master Portfolio and the Portfolio; (d) the Portfolio’s costs to investors compared to the costs of Expense Peers and performance compared to the relevant performance comparison as previously discussed; (e) the sharing of potential economies of scale; (f) fall-out benefits to BlackRock and its affiliates as a result of its relationship with the Master Portfolio and the Portfolio; and (g) other factors deemed relevant by the Board Members.
The Board also considered other matters it deemed important to the approval process, such as payments made to BlackRock or its affiliates relating to the distribution of Portfolio shares, securities lending and cash management, services related to the valuation and pricing of portfolio holdings of the Master Portfolio, direct and indirect benefits to BlackRock and its affiliates from their relationship with the Master Portfolio and the Portfolio and advice from independent legal counsel with respect to the review process and materials submitted for the Board’s review. The Board noted the willingness of BlackRock personnel to engage in open, candid discussions with the Board. The Board did not identify any particular information as determinative, and each Board Member may have attributed different weights to the various items considered.
A. Nature, Extent and Quality of the Services Provided by BlackRock: The Board, including the Independent Board Members, reviewed the nature, extent and quality of services provided by BlackRock, including the investment advisory services and the resulting performance of the Portfolio. Throughout the year, the Board compared the Portfolio’s performance to the performance of a comparable group of mutual funds, relevant benchmark, and performance metrics, as applicable. The Board met with BlackRock’s senior management personnel responsible for investment activities, including the senior investment officers. The Board also reviewed the materials provided by the Master Portfolio’s portfolio management team discussing the Master Portfolio’s performance and the Master Portfolio’s investment objective(s), strategies and outlook.
The Board considered, among other factors, with respect to BlackRock: the number, education and experience of investment personnel generally and the Master Portfolio’s portfolio management team; BlackRock’s research capabilities; investments by portfolio managers in the funds they manage; portfolio trading capabilities; use of technology; commitment to compliance; credit analysis capabilities; risk analysis and oversight capabilities; and the approach to training and retaining portfolio managers and other research, advisory and
Disclosure of Investment Advisory Agreement | S&P 500 Index Master Portfolio (Continued)
management personnel. The Board engaged in a review of BlackRock’s compensation structure with respect to the Master Portfolio’s portfolio management team and BlackRock’s ability to attract and retain high-quality talent and create performance incentives.
In addition to advisory services, the Board considered the quality of the administrative and other non-investment advisory services provided to the Master Portfolio and the Portfolio. BlackRock and its affiliates provide the Master Portfolio and the Portfolio with certain administrative, shareholder and other services (in addition to any such services provided to the Master Portfolio and the Portfolio by third parties) and officers and other personnel as are necessary for the operations of the Master Portfolio and the Portfolio. In particular, BlackRock and its affiliates provide the Master Portfolio and the Portfolio with the following administrative services, including, among others: (i) preparing disclosure documents, such as the prospectus, the summary prospectus (as applicable), the statement of additional information and periodic shareholder reports; (ii) oversight of daily accounting and pricing; (iii) overseeing and coordinating the activities of other service providers; (iv) organizing Board meetings and preparing the materials for such Board meetings; (v) providing legal and compliance support; (vi) furnishing analytical and other support to assist the Board in its consideration of strategic issues such as the merger, consolidation or repurposing of certain open-end funds; and (vii) performing other administrative functions necessary for the operation of the Master Portfolio and the Portfolio, such as tax reporting, fulfilling regulatory filing requirements and call center services. The Board reviewed the structure and duties of BlackRock’s fund administration, shareholder services, legal and compliance departments and considered BlackRock’s policies and procedures for assuring compliance with applicable laws and regulations.
B. The Investment Performance of the Master Portfolio, the Portfolio and BlackRock: The Board, including the Independent Board Members, also reviewed and considered the performance history of the Master Portfolio and the Portfolio, as applicable. The Board noted that the Portfolio’s investment results correspond directly to the investment results of the Master Portfolio. In preparation for the April Meeting, the Board worked with its independent legal counsel, BlackRock and Lipper to develop a template for, and was provided with, reports independently prepared by Lipper, which included a comprehensive analysis of the Portfolio’s performance. The Board also reviewed a narrative and statistical analysis of the Lipper data that was prepared by BlackRock. In connection with its review, the Board received and reviewed information regarding the investment performance of the Portfolio as compared to other funds in its applicable Lipper category and the gross investment performance of the Portfolio as compared with its benchmark. The Board was provided with a description of the methodology used by Lipper to select peer funds and periodically meets with Lipper representatives to review its methodology. The Board and its Performance Oversight and Contract Committee regularly review, and meet with Master Portfolio management to discuss, the performance of the Master Portfolio and the Portfolio, as applicable, throughout the year.
In evaluating performance, the Board recognized that the performance data reflects a snapshot of a period or as of a particular date and that selecting a different performance period could produce significantly different results. Further, the Board recognized that it is possible that long-term performance can be adversely affected by even one period of significant underperformance so that a single investment decision or theme has the ability to affect long-term performance disproportionately.
The Board noted that for the one-, three- and five-year periods reported, the Portfolio’s gross performance (before expenses and fees), as agreed upon by the Board, was out of tolerance, within tolerance and within tolerance of its benchmark, respectively. BlackRock believes that gross performance relative to the benchmark is an appropriate performance metric for the Portfolio.
C. Consideration of the Advisory/Management Fees and the Cost of the Services and Profits to be Realized by BlackRock and its Affiliates from their Relationship with the Master Portfolio and the Portfolio: The Board, including the Independent Board Members, reviewed the Master Portfolio’s contractual advisory fee rate compared with the other funds in the Portfolio’s Lipper category. The contractual advisory fee rate is shown before taking into account any reimbursements or fee waivers. The Board also compared the Portfolio’s total expense ratio, as well as the Master Portfolio’s actual advisory fee rate, to those of other funds in the Portfolio’s Lipper category. The total expense ratio represents a fund’s total net operating expenses, including any 12b-1 or non-12b-1 service fees. The total expense ratio gives effect to any expense reimbursements or fee waivers that benefit a fund, and the actual advisory fee rate gives effect to any advisory fee reimbursements or waivers that benefit a fund. The Board considered the services provided and the fees charged by BlackRock and its affiliates to other types of clients with similar investment mandates, as applicable, including institutional accounts and sub-advised mutual funds.
The Board received and reviewed statements relating to BlackRock’s financial condition. The Board reviewed BlackRock’s profitability methodology and was also provided with a profitability analysis that detailed the revenues earned and the expenses incurred by BlackRock for services provided to the Master Portfolio and the Portfolio. The Board reviewed BlackRock’s profitability with respect to the Master Portfolio and the Portfolio, as applicable, and other funds the Board currently oversees for the year ended December 31, 2014 compared to available aggregate profitability data provided for the two prior years. The Board reviewed BlackRock’s profitability
Disclosure of Investment Advisory Agreement | S&P 500 Index Master Portfolio (Continued)
with respect to certain other U.S. fund complexes managed by the Manager and/or its affiliates. The Board reviewed BlackRock’s assumptions and methodology of allocating expenses in the profitability analysis, noting the inherent limitations in allocating costs among various advisory products. The Board recognized that profitability may be affected by numerous factors including, among other things, fee waivers and expense reimbursements by the Manager, the types of funds managed, precision of expense allocations and business mix. As a result, calculating and comparing profitability at individual fund levels is difficult.
The Board noted that, in general, individual fund or product line profitability of other advisors is not publicly available. The Board reviewed BlackRock’s overall operating margin, in general, compared to that of certain other publicly-traded asset management firms. The Board considered the differences between BlackRock and these other firms, including the contribution of technology at BlackRock, BlackRock’s expense management, and the relative product mix.
In addition, the Board considered the cost of the services provided to the Master Portfolio and the Portfolio by BlackRock, and BlackRock’s and its affiliates’ profits relating to the management and distribution of the Master Portfolio and the Portfolio and the other funds advised by BlackRock and its affiliates. As part of its analysis, the Board reviewed BlackRock’s methodology in allocating its costs to the management of the Master Portfolio and the Portfolio. The Board also considered whether BlackRock has the financial resources necessary to attract and retain high quality investment management personnel to perform its obligations under the Agreement and to continue to provide the high quality of services that is expected by the Board. The Board further considered factors including but not limited to BlackRock’s commitment of time, assumption of risk and liability profile in servicing the Master Portfolio and the Portfolio in contrast to what is required of BlackRock with respect to other products with similar investment mandates across the open-end fund, ETF, closed-end fund, sub-advised mutual fund and institutional account product channels, as applicable.
The Board noted that the Master Portfolio’s contractual advisory fee rate ranked in the first quartile, and that the actual advisory fee rate and the Portfolio’s total expense ratio each ranked in the first quartile, relative to the Portfolio’s Expense Peers. The Board noted that BlackRock proposed, and the Board agreed to, a contractual reduction of the Master Portfolio’s advisory fee. This advisory fee reduction was implemented on April 30, 2015. The Board also noted that BlackRock and its affiliates have contractually agreed to reimburse or otherwise compensate the Master Portfolio/ Portfolio for the fees and expenses of the Independent Board Members, counsel to the Independent Board Members and the Master Portfolio’s/ Portfolio’s independent registered public accounting firm.
D. Economies of Scale: The Board, including the Independent Board Members, considered the extent to which economies of scale might be realized as the assets of the Master Portfolio and the Portfolio increase, as well as the existence of expense caps, as applicable. The Board also considered the extent to which the Master Portfolio and the Portfolio benefit from such economies and whether there should be changes in the advisory fee rate or breakpoint structure in order to enable the Master Portfolio and the Portfolio to participate in these economies of scale, for example through the use of breakpoints in the advisory fee based upon the asset level of the Master Portfolio. In their consideration, the Board Members took into account the existence of any expense caps and further considered the continuation and/or implementation, as applicable, of such caps.
E. Other Factors Deemed Relevant by the Board Members: The Board, including the Independent Board Members, also took into account other ancillary or “fall-out” benefits that BlackRock or its affiliates may derive from their respective relationships with the Master Portfolio and the Portfolio, both tangible and intangible, such as BlackRock’s ability to leverage its investment professionals who manage other portfolios and risk management personnel, an increase in BlackRock’s profile in the investment advisory community, and the engagement of BlackRock’s affiliates as service providers to the Master Portfolio and the Portfolio, including for administrative, distribution, securities lending and cash management services. The Board also considered BlackRock’s overall operations and its efforts to expand the scale of, and improve the quality of, its operations. The Board also noted that BlackRock may use and benefit from third party research obtained by soft dollars generated by certain registered fund transactions to assist in managing all or a number of its other client accounts. The Board further noted that it had considered the investment by BlackRock’s funds in affiliated ETFs without any offset against the management fees payable by the funds to BlackRock.
In connection with its consideration of the Agreement, the Board also received information regarding BlackRock’s brokerage and soft dollar practices. The Board received reports from BlackRock which included information on brokerage commissions and trade execution practices throughout the year.
The Board noted the competitive nature of the open-end fund marketplace, and that shareholders are able to redeem their Portfolio shares if they believe that the Portfolio’s and/or the Master Portfolio’s fees and expenses are too high or if they are dissatisfied with the performance of the Portfolio.
Conclusion
The Board of the Master Fund, including the Independent Board Members, approved the continuation of the Agreement between the Manager and the Master Fund, with respect to the Master Portfolio, for a one-year term ending June 30, 2016. Based upon its evaluation of all of the aforementioned factors in
Disclosure of Investment Advisory Agreement | S&P 500 Index Master Portfolio (Continued)
their totality, the Board of the Master Fund, including the Independent Board Members, was satisfied that the terms of the Agreement were fair and reasonable and in the best interest of the Master Portfolio and its shareholders. The Board of the Fund, including the Independent Board Members, also considered the continuation of the Agreement with respect to the Master Portfolio and found the Agreement to be satisfactory. In arriving at its decision to approve the Agreement, the Board of the Master Fund did not identify any single factor or group of factors as all-important or controlling, but considered all factors together, and different Board Members may have attributed different weights to the various factors considered. The Independent Board Members were also assisted by the advice of independent legal counsel in making this determination. The contractual fee arrangements for the Master Portfolio reflect the results of several years of review by the Board Members and predecessor Board Members, and discussions between such Board Members (and predecessor Board Members) and BlackRock. As a result, the Board Members’ conclusions may be based in part on their consideration of these arrangements in prior years.
Officers and Trustees
S&P 500 Index Master Portfolio
Rodney D. Johnson, Chair of the Board and Trustee
David O. Beim, Trustee
Collette Chilton, Trustee
Frank J. Fabozzi, Trustee
Dr. Matina S. Horner, Trustee
Herbert I. London, Trustee
Cynthia A. Montgomery, Trustee
Barbara G. Novick, Trustee
Joseph P. Platt, Trustee
Robert C. Robb, Jr., Trustee
Toby Rosenblatt, Trustee
Mark Stalnecker, Trustee
Kenneth L. Urish, Trustee
Frederick W. Winter, Trustee
John M. Perlowski, President and Chief Executive Officer
Richard Hoerner, CFA, Vice President
Fernanda Piedra, Anti-Money Laundering Compliance Officer
Jennifer McGovern, Vice President
Neal Andrews, Chief Financial Officer
Jay Fife, Treasurer
Charles Park, Chief Compliance Officer
Fernanda Piedra, Anti-Money Laundering Compliance Officer
Benjamin Archibald, Secretary
Effective March 1, 2015, Charles Park resigned as Anti-Money Laundering Compliance Officer of the Trust/MIP and Fernanda Piedra became Anti-Money Laundering Compliance Officer of the Trust/MIP.
Effective May 18, 2015, Ian MacKinnon resigned as a Trustee of the Trust/MIP.

PRSRT STD
U.S. POSTAGE
PAID
LANCASTER, PA
PERMIT NO. 1793
homesteadfunds.com | 800.258.3030 | 4301 Wilson Blvd. | Arlington, VA | 22203
This report is authorized for distribution to shareholders and others who have received a copy of the prospectus.
Distributor: RE Investment Corporation.
Item 2. Code of Ethics.
Not required in this filing.
Item 3. Audit Committee Financial Expert.
Not required in this filing.
Item 4. Principal Accountant Fees and Services.
Not required in this filing.
Item 5. Audit Committee of Listed Registrants.
Not applicable.
Item 6. Investments.
| (a) | The registrant’s schedule of investments in unaffiliated issuers is included in the report to shareholders under Item 1 of this Form N-CSR. |
Item 7. Disclosure of Proxy Voting Policies and Procedures for Closed-End Management Investment Companies.
Not applicable.
Item 8. Portfolio Managers of Closed-End Management Investment Companies.
Not applicable.
Item 9. Purchases of Equity Securities by Closed-End Management Investment Company and Affiliated Purchasers.
Not applicable.
Item 10. Submission of Matters to a Vote of Security Holders.
Not applicable.
Item 11. Controls and Procedures.
| (a) | Disclosure Controls and Procedures. The registrant’s principal executive officer and principal financial officer concluded that the registrant’s Disclosure Controls and Procedures are effective based on their evaluation of the Disclosure Controls and Procedures as of a date within 90 days of the filing date of this report. |
| (b) | Internal Control. There were no changes in registrant’s internal control over financial reporting that occurred during the registrant’s second fiscal quarter of the period covered by this report that have materially affected, or are reasonably likely to materially affect, the registrant’s internal control over financial reporting. |
Item 12. Exhibits.
| (a)(1) | Not required with this filing. |
| (a)(2) | A separate certification for the principal executive officer and principal financial officer of the registrant, as required by Rule 30a-2(a) under the Investment Company Act of 1940, is filed herewith. |
| (b) | A certification by the registrant’s principal executive officer and principal financial officer, as required by Section 906 of the Sarbanes-Oxley Act of 2002 and Rule 30a-2(b) under the Investment Company Act of 1940, is attached hereto. |
SIGNATURES
Pursuant to the requirements of the Securities Exchange Act of 1934 and the Investment Company Act of 1940, the registrant has duly caused this report to be signed on its behalf by the undersigned, thereunto duly authorized.
| | |
| HOMESTEAD FUNDS, INC. |
| |
| By: | | /s/ Stephen J. Kaszynski |
| | Stephen J. Kaszynski |
| | President, Chief Executive Officer and Director |
| |
| Date: | | September 3, 2015 |
Pursuant to the requirements of the Securities Exchange Act of 1934 and the Investment Company Act of 1940, this report has been signed below by the following persons on behalf of the registrant and in the capacities and on the dates indicated.
| | |
| By: | | /s/ Stephen J. Kaszynski |
| | Stephen J. Kaszynski |
| | President, Chief Executive Officer and Director |
| |
| Date | | September 3, 2015 |
| |
| By: | | /s/ Amy M. DiMauro |
| | Amy M. DiMauro |
| | Treasurer |
| |
| Date: | | September 3, 2015 |