UNITED STATES
SECURITIES AND EXCHANGE COMMISSION
Washington, D.C. 20549
FORM N-CSR
CERTIFIED SHAREHOLDER REPORT OF REGISTERED
MANAGEMENT INVESTMENT COMPANIES
Investment Company Act File number: 811-06136
HOMESTEAD FUNDS, INC.
(Exact name of registrant as specified in charter)
4301 Wilson Boulevard
Arlington, VA 22203
(Address of principal executive office – Zip code)
Danielle Sieverling
Homestead Funds, Inc.
4301 Wilson Boulevard
Arlington, VA 22203
(Name and address of agent for service)
Copies to:
Bryan Chegwidden, Esq.
Ropes & Gray LLP
1211 Avenue of the Americas
New York, NY 10036-8704
(Name and addresses of agent for service)
Registrant’s telephone number, including area code: (703) 907-5993
Date of fiscal year end: December 31
Date of reporting period: June 30, 2018
Item 1. Reports to Stockholders.

Semi-Annual Report
June 30, 2018
Our Funds
Daily Income Fund (HDIXX)
Short-Term Government Securities Fund (HOSGX)
Short-Term Bond Fund (HOSBX)
Stock Index Fund (HSTIX)
Value Fund (HOVLX)
Growth Fund (HNASX)
Small-Company Stock Fund (HSCSX)
International Equity Fund (HISIX)
The investment commentaries on the following pages were prepared for each fund by its portfolio manager(s). The views expressed are those of the portfolio manager(s) on July 17, 2018, for each fund as of June 30, 2018. Since that date, those views might have changed. The opinions stated might contain forward-looking statements and discuss the impact of domestic and foreign markets, industry and economic trends, and governmental regulations on the funds and their holdings. Such statements are subject to uncertainty, and the impact on the funds might be materially different from what is described here.
Past performance does not guarantee future results.
Investors are advised to consider fund objectives, risks, charges and expenses before investing. The prospectus contains this and other information and should be read carefully before you invest. To obtain a prospectus, call 800.258.3030 or download a PDF at homesteadfunds.com.

President's Letter
2018 Semi-Annual Report
July 17, 2018
Dear Shareholders,
I’m very pleased to introduce myself to you as the CEO and president of Homestead Funds. In the months that I have spent learning about the fund company — its origin and purpose — and now as I get to know our staff of tenured professionals, I continue to be impressed by who we are as a company. We have a truly unique mission that remains at the heart of what we do today and is very much in our sights as we look to the future.
Writing to you at the midpoint of 2018, the financial markets have exhibited higher levels of volatility this year as stocks have reached peak levels and the Federal Reserve has continued on a path to normalize interest rates. Reaching peak levels does not imply that stocks are about to come tumbling down. In fact, economic activity and company profits could continue in this zone for quite some time. But at these elevated valuation levels, we are cautious of market risks. In particular, we are watching the developments around global trade tensions, an issue that continues to escalate, particularly between the U.S. and China.
Against this difficult market backdrop, five of our six active equity and bond funds generated a total return above their benchmark index for the six months ending June 30, 2018. In the letters that follow, portfolio managers detail their strategies and the impacts on fund performance. I also invite you to visit homesteadfunds.com for the latest management commentary and other resources that can help you understand how your investment is performing and set reasonable expectations for returns and volatility.
In closing, it’s an honor to lead a company that exists to do well for investors — to add value as money managers — but also to be true to our heritage and roots in the rural electric cooperative community. This is something that differentiates Homestead Funds from any other mutual fund company, and it lends passion and commitment to our work every day. I thank you for your continued support of the funds and look forward to communicating regularly with you in the future.
Thank you for your investment with Homestead Funds.
Sincerely,
Mark D. Santero
Director, President and CEO
Homestead Funds
Mark Santero
Director, President and CEO
Daily Income Fund
Performance Evaluation | Prepared by the Fund's Investment Advisor, RE Advisers Corporation
Performance
The Daily Income Fund earned an annualized return of 0.41 percent for the first half of 2018. The seven-day current annualized yield was 1.10 percent as of June 30, 2018, much changed from the 0.45 percent as of December 31, 2017. Interest income for the fund is netted against operating expenses. With the Federal Reserve raising the federal funds rate band two times in the first half of 2018 (the last being to between 1.75 percent and 2.00 percent in June 2018), the fund earned enough interest income (which is the only component of return in a money market fund) to cover all of its expenses and provide income to its shareholders.
Market Conditions
The U.S. economy continued to improve in 2018 as the year progressed. After a fairly soft 2.0 percent rise in gross domestic product (GDP) in the first quarter of 2018, the economy showed strength in the second quarter with an estimated GDP increase of 3.4 percent. The general consensus among economists is for GDP to rise by an annual rate of approximately 2.8 percent in the second half of 2018. In addition, despite changes to the political, regulatory and tax law landscapes, Fed forecasts still only indicate a relatively modest 2.4 percent gain in GDP for all of 2019.
Although the Fed’s analysis of the data suggests continued overall economic expansion since the beginning of 2018, specific issues remain. On the positive side, household spending has expanded at a moderate pace, while business fixed investment has continued to grow strongly. Several labor market measurements during the first half of 2018 continued to show strong growth: Initial jobless claims fell below 250,000, continuing claims trended below 1.9 million and the unemployment rate declined to 4.0 percent. However, wage gains were still relatively mild at approximately 2.7 percent, largely influenced by the lack of strong growth in labor productivity. Although there were signs of improvement this year, we believe a sustained improvement in productivity will be essential to economic growth in general and to wage gains in particular for the rest of 2018 and beyond. On a 12-month basis, overall inflation (even that which excludes food and energy prices) has moved closer to 2 percent with indicators of longer-term inflation expectations little changed.
Outlook
After the Federal Open Market Committee (FOMC), the Fed’s policy-making committee, revised its target for the federal funds rate to between 1.75 percent and 2.00 percent in June 2018, the question usually is how many rate hikes seem likely for the rest of 2018 given the Fed’s leadership and possibly more robust economic environment. Forecasts by the Fed after the rate hike in June 2018 indicated two more hikes in
| Investment Advisor: RE Advisers Corporation |
 | Marc Johnston, CFP, ChFC, CAIAMoney Market Portfolio ManagerBA, General Arts, Villanova University;
MBA, Northeastern University |
2018. However, with the FOMC being the very cautious decision maker that it is, the timing and size of interest rate increases and the portfolio unwinding process remain very much dependent upon the data and the stability of the situation at the time, in our view. Assuming continued growth in the U.S. economy, continued improvement in labor markets, stability in financial markets and a steepening (as opposed to flattening) yield curve, we believe that we are most likely to see a continued, gradual normalization of interest rates for the rest of this year into next year. In addition, with inflation on a 12-month basis expected to remain somewhat near the FOMC’s 2 percent objective in the medium term, we believe monetary policy is likely to remain accommodative to support a strong labor market and a sustained return to 2 percent inflation. The risks to the economic outlook appear roughly balanced.
The timing of this continued interest rate normalization process notwithstanding, we believe that investors in money market funds such as the Daily Income Fund will continue to see income on their investment in 2018 as the Fed raises short-term rates to higher levels. In our view, this trend is likely to continue into 2019; therefore, we must be prepared to operate in that type of environment going forward. We will prudently take advantage of higher yielding investments as they become available, and consistent with our management of the fund as a government money market fund.
| Average Annual Total Returns (periods ended 06/30/18) | | | |
| | 1 YR % | 5 YR % | 10 YR % |
| Daily Income Fund | 0.57 | 0.12 | 0.18 |
| Yield | |
| Annualized 7-day current yield quoted 6/30/18 | 1.10% |
| Security Diversification |
| | % of Total Investments |
| | as of 12/31/17 | as of 6/30/18 |
| U.S. government & agency obligations | 89.5 | 89.5 |
| Short-term and other assets | 10.5 | 10.5 |
| Total | 100.0% | 100.0% |
| Maturity | | |
| | as of 12/31/17 | as of 06/30/18 |
| Average Weighted Maturity | 38 days | 40 days |
The returns quoted in the above table represent past performance, which is no guarantee of future results. Current performance may be higher or lower than that shown above. To obtain the most recent month-end returns please call 800-258-3030 or visit homesteadfunds.com. Returns and the principal value of your investment will fluctuate such that shares, when redeemed, may be worth more or less than their original cost. You could lose money by investing in the Daily Income Fund. Although the fund seeks to preserve the value of your investment at $1.00 per share, it cannot guarantee it will do so. An investment in the Daily Income Fund is not insured or guaranteed by the Federal Deposit Insurance Corporation (FDIC) or any other government agency. The fund’s sponsor has no legal obligation to provide financial support to the fund, and you should not expect that the sponsor will provide financial support to the fund at any time.
The Daily Income Fund’s average annual total returns are net of any fee waivers and reimbursements. The fund’s advisor waived a portion of its management fee and/or reimbursed fund expenses during the five- and 10-year periods. Had the advisor not done so, the fund’s total returns would have been lower. The expenses used are as of the most recent period-end and may fluctuate over time. Returns include the reinvestment of dividends. Returns do not reflect taxes that the shareholder may pay on fund distributions or the redemption of fund shares.
Short-Term Government Securities Fund
Performance Evaluation | Prepared by the Fund's Investment Advisor, RE Advisers Corporation
Performance
The Short-Term Government Securities Fund returned 0.04 percent for the first half of 2018, outperforming its benchmark index, the ICE BofA Merrill Lynch 1-5 Year U.S. Treasury Index, which returned –0.25 percent.
The fund benefited from overall lower interest rate exposure relative to the benchmark throughout the period. Additionally, the fund’s allocation to out-of-benchmark issuers in the corporate sector through issuers guaranteed by the Export-Import Bank of the United States and Federal Deposit Insurance Corporation guaranteed certificates of deposit contributed positively during the period.
The fund gradually added holdings in U.S. Treasuries, short-term amortizing asset-backed securities and the corporate sector through high-quality issuers with a preference for one- to three-year maturities. We believe that the front-end part of the curve offers a compelling risk/reward profile in the current Federal Reserve rate hike cycle.
Market Conditions
The Federal Open Market Committee (FOMC), the Fed’s policy-making committee, continued the gradual pace of rate increases, delivering two rate hikes during the period. The labor market has made steady progress with the unemployment rate improving to 4.0 percent at the end of June from 4.1 percent at the end of 2017. Economic activity, as measured by real gross domestic product, continues to grow modestly around 2.8 percent on the back of tax legislation passed by Congress at the end of 2017. Monetary policy remained accommodative, supporting strong labor market conditions and price stability. Inflation has risen closer to the Fed’s long-term goal of 2 percent. The May 2018 reading on core personal consumption expenditures (PCE) stood at 1.96 percent from 1.52 percent at the end of 2017. The FOMC expects that further gradual increases in the target range for the federal funds rate will be warranted over the coming periods.
Treasury yields rose during the period in anticipation of stronger economic conditions and the increased probability that the FOMC would raise the federal funds rate one more time this year than was previously expected. Three-month LIBOR and two-year, three-year and five-year Treasury yields rose 64, 64, 65 and 53 basis points respectively. The steeper rise in short rates brought about a flattening of the yield curve, with the closely watched two-year versus 10-year spread finishing at 32.8 basis points at midyear from 51.8 at the end of 2017.
The first half of 2018 experienced the return of volatility to the markets. The Chicago Board Options Exchange Volatility Index (VIX) rose above 20 multiple times after remaining
| Investment Advisor: RE Advisers Corporation |
 | Mauricio Agudelo, CFASenior Fixed Income Portfolio ManagerBS, Finance, The University of Maryland,
Robert H. Smith School of Business |
fairly muted during 2017. Geopolitical concerns and the risk of escalation to a global trade war due to tariffs imposed by the Trump administration contributed to the increase in volatility. The U.S. has imposed tariffs on imported goods with the intention of narrowing the trade deficit with multiple countries, most notably China.
Outlook
The economy continues to deliver solid and stable growth and, in our view, should continue to expand at a moderate pace. While global growth has pulled back a bit, we believe that overall the environment remains healthy with the U.S. Purchasing Managers’ Index, an indicator of economic strength, still in the mid-50s. Consumer confidence indices appear solid with retail sales showing signs of strength. The Fed’s outlook for the labor market remains positive with the unemployment rate below 4 percent and wages increasing 2.7 percent on a year-over-year basis. In our view, consumer price inflation, as measured by the 12-month percentage change in the price index for PCE, should remain near or slightly above the 2 percent goal. According to its June 2018 statement, the FOMC expects that determining the timing and size of future adjustments to the target range for the federal funds rate will depend on the assessment of realized and expected economic conditions relative to its maximum employment objective and its symmetric 2 percent inflation objective.
On the fiscal side, we expect President Trump’s administration to continue imposing tariffs on goods produced by global trade partners with the ultimate goal of negotiating better trade agreements that will be beneficial to the U.S. economy. Nevertheless, there could be downside risks to any significant escalation of tariffs as other countries could respond in kind, potentially triggering a global economic slowdown. We continue to maintain the fund’s duration below the benchmark’s as we believe interest rates will likely continue their gradual upward course, assuming the economy continues to perform at a stable pace.
Short-Term Government Securities Fund
| Average Annual Total Returns (periods ended 06/30/18) | | | |
| | 1 YR % | 5 YR % | 10 YR % |
| Short-Term Government Securities Fund | 0.19 | 0.58 | 1.50 |
| ICE BofAML 1-5 Year U.S. Treasury Index | -0.35 | 0.81 | 1.79 |
| Security Diversification |
| | % of Total Investments |
| | as of 12/31/17 | as of 6/30/18 |
| U.S. government & agency obligations | 49.0 | 52.0 |
| Corporate bonds-government guaranteed | 28.4 | 24.1 |
| Corporate bonds-other | 4.7 | 9.7 |
| Certificates of deposit | 3.8 | 3.8 |
| Mortgage-backed securities | 2.9 | 2.4 |
| Asset-backed securities | 2.7 | 2.3 |
| Municipal bonds | 0.3 | 0.3 |
| Short-term and other assets | 8.2 | 5.4 |
| Total | 100.0% | 100.0% |
| Maturity | | |
| | as of 12/31/17 | as of 06/30/18 |
| Average Weighted Maturity | 1.76 | 1.89 |
Performance Comparison
Comparison of the change in value of a $10,000 investment in the fund and the ICE BofAML 1-5 Year U.S. Treasury Index made on June 30, 2008.
The returns quoted in the above table and chart represent past performance, which is no guarantee of future results. Current performance may be higher or lower than that shown above. To obtain the most recent month-end returns please call 800-258-3030 or visit homesteadfunds.com. Returns and the principal value of your investment will fluctuate such that shares, when redeemed, may be worth more or less than their original cost. The Short-Term Government Securities Fund’s average annual total returns are net of any fee waivers and reimbursements. The fund’s advisor waived a portion of its management fee during the periods shown. Had the advisor not done so, the fund's total returns would have been lower. The expenses used are as of the most recent period-end and may fluctuate over time. Returns include the reinvestment of dividends and capital gains. Returns do not reflect taxes that the shareholder may pay on fund distributions or the redemption of fund shares.
Short-Term Bond Fund
Performance Evaluation | Prepared by the Fund's Investment Advisor, RE Advisers Corporation
Performance
The Short-Term Bond Fund returned 0.59 percent for the first half of 2018, outperforming its benchmark index, the ICE BofA Merrill Lynch 1-5 Year Corporate/Government Index, which returned –0.32 percent. The fund’s defensive positioning relative to the benchmark, as measured by effective duration, was the primary contributor to outperformance.
The fund benefited from overall lower interest rate exposure relative to the benchmark in a period where rates gradually increased. The fund’s allocation to the asset-backed sector was also positive for performance. Additionally, the fund benefitted from a strong recovery in its two municipal positions in the Puerto Rico Sales Tax Financing Corp.
The fund gradually added holdings in U.S. Treasuries, short-term asset-backed securities and the corporate sector through high-quality issuers with a preference for one- to three-year maturities. We believe that the front-end part of the credit curve offers an attractive risk/reward profile in the current economic cycle.
Market Conditions
The Federal Open Market Committee (FOMC), the Federal Reserve’s policy-making committee, continued the gradual pace of rate increases, delivering two rate hikes during the period. The labor market has made steady progress with the unemployment rate improving to 4.0 percent at the end of June from 4.1 percent at the end of 2017. Economic activity, real gross domestic product, continues to grow modestly around 2.8 percent on the back of tax legislation passed by Congress at the end of 2017. Monetary policy remained accommodative, supporting strong labor market conditions and price stability. Inflation has risen closer to the Fed’s long-term goal of 2 percent. The May 2018 reading on core personal consumption expenditures (PCE) stood at 1.96 percent from 1.52 percent at the end of 2017. The FOMC expects that further gradual increases in the target range for the federal funds rate will be warranted over the coming periods.
Treasury yields rose during the period in anticipation of stronger economic conditions and the increased probability that the FOMC would raise the federal funds rate one more time this year than was previously expected. Three-month LIBOR and two-year, three-year and five-year Treasury yields rose 64, 64, 65 and 53 basis points respectively. The steeper rise in short rates brought about a flattening of the yield curve, with the closely watched two-year versus 10-year spread finishing at 32.8 basis points at midyear from 51.8 at the end of 2017.
The first half of 2018 experienced the return of volatility to the markets. Corporate credit spreads widened by more than 20 bps during the period, as measured by the Bloomberg Barclays U.S. Credit Index. The risk of escalation to a global
| Investment Advisor: RE Advisers Corporation |
| Mauricio Agudelo, CFASenior Fixed Income Portfolio ManagerBS, Finance, The University of Maryland,
Robert H. Smith School of Business |
trade war due to tariffs imposed by the Trump administration contributed to the increase in volatility. Emerging market currencies have shown notable depreciation relative to the U.S. dollar. In Europe, concerns about the political situation in Italy and its potential economic implications for the eurozone prompted a significant widening in risk spreads on debt issuance of Italian and other Yankee banks.
Outlook
The economy continues to deliver solid and stable growth and, in our view, should continue to expand at a moderate pace. While global growth has pulled back a bit, we believe that overall the environment remains healthy with the U.S. Purchasing Managers’ Index, an indicator of economic strength, still in the mid-50s. Consumer confidence indices appear solid with retail sales showing signs of strength. The Fed’s outlook for the labor market remains positive with the unemployment rate below 4 percent and wages increasing 2.7 percent on a year-over-year basis. In our view, consumer price inflation, as measured by the 12-month percentage change in the price index for PCE should remain near or slightly above the 2 percent goal. According to its June 2018 statement, the FOMC expects that determining the timing and size of future adjustments to the target range for the federal funds rate will depend on the assessment of realized and expected economic conditions relative to its maximum employment objective and its symmetric 2 percent inflation objective.
On the fiscal side, we expect President Trump’s administration to continue imposing tariffs on goods produced by global trade partners with the ultimate goal of negotiating better trade agreements that will be beneficial to the U.S. economy. Nevertheless, there could be downside risks to any significant escalation of tariffs as other countries could respond in kind, potentially triggering a global economic slowdown. We continue to maintain the fund’s duration below the benchmark’s as we believe interest rates will likely continue their gradual upward course, assuming the economy continues to perform at a stable pace.
| Average Annual Total Returns (periods ended 06/30/18) | | | |
| | 1 YR % | 5 YR % | 10 YR % |
| Short-Term Bond Fund | 1.04 | 1.34 | 3.15 |
| ICE BofAML 1-5 Year Corp./Gov. Index | -0.16 | 1.19 | 2.28 |
| Security Diversification |
| | % of Total Investments |
| | as of 12/31/17 | as of 6/30/18 |
| Corporate bonds-other | 29.2 | 34.3 |
| Asset-backed securities | 20.4 | 22.3 |
| Municipal bonds | 20.1 | 17.5 |
| Yankee bonds | 11.6 | 11.4 |
| U.S. government & agency obligations | 6.0 | 10.7 |
| Mortgage-backed securities | 1.9 | 1.1 |
| Certificates of deposit | 0.4 | 0.3 |
| Corporate bonds-government guaranteed | 0.1 | 0.1 |
| Short-term and other assets | 10.3 | 2.3 |
| Total | 100.0% | 100.0% |
| Maturity | | |
| | as of 12/31/17 | as of 06/30/18 |
| Average Weighted Maturity | 1.72 | 1.70 |
Performance Comparison
Comparison of the change in value of a $10,000 investment in the fund and the ICE BofAML 1-5 Year Corp./Gov. Index made on June 30, 2008.
The returns quoted in the above table and chart represent past performance, which is no guarantee of future results. Current performance may be higher or lower than that shown above. To obtain the most recent month-end returns please call 800-258-3030 or visit homesteadfunds.com. Returns and the principal value of your investment will fluctuate such that shares, when redeemed, may be worth more or less than their original cost. The Short-Term Bond Fund’s average annual total returns are net of any fee waivers and reimbursements. The expenses used are as of the most recent period-end and may fluctuate over time. Returns include the reinvestment of dividends and capital gains. Returns do not reflect taxes that the shareholder may pay on fund distributions or the redemption of fund shares.
Stock Index Fund
Performance Evaluation | Prepared by the Master Portfolio’s Investment Advisor, BlackRock Fund Advisors
Performance
For the six-month period ended June 30, 2018, the U.S. large cap market metric and the fund’s benchmark, the Standard & Poor’s 500 Index (the S&P 500), gained 2.65 percent. The Stock Index Fund followed closely behind with a 2.39 percent return. The S&P 500 is a market capitalization-weighted index composed of 500 common stocks issued by large-capitalization companies in a wide range of industries. The stocks included in this index collectively represent a substantial portion of all common stocks publicly traded in the United States.
During the six-month period, as changes were made to the composition of the S&P 500, the master portfolio in which the fund invests purchased and sold securities to maintain its objective of replicating the risks and return of the index.
Market Conditions
In the beginning of 2018, the low volatility regime that helped global equity markets reach record highs in 2017 continued to support U.S. markets. Further fueled by tax-reform optimism, January saw markets rally, led higher by momentum and information technology names. However, as the first quarter of 2018 progressed, a combination of economic over-heating concerns, the return of volatility, rising yields and the specter of trade wars weighed on markets.
From a sector standpoint, technology and consumer discretionary stocks outperformed, due to their impressive early-quarter runs. Later in the first quarter of 2018, negative headlines regarding regulation of tech stocks (considered after the breach of consumer data by Facebook), artificial intelligence and Facebook’s usage of user data weighed on the sector. Although the first quarter of 2018 was plagued with volatility, the defensive sectors of telecommunications and consumer staples were the worst performing in the S&P 500.
Contrary to what the U.S. equity market’s lackluster performance would suggest, the U.S. economy remained healthy in the first quarter of 2018. The unemployment rate remained at multi-decade lows and consumer confidence was high by historical standards. This supported the Federal Reserve’s decision to increase interest rates in March and to revise higher their rate hike expectations for 2019. The combination of increased interest rate expectations, a strong economic backdrop and technical issues regarding the deficit drove selling in U.S. Treasuries. The 10-year U.S. Treasury yield increased by 0.33 percent in the first quarter of 2018 to 2.75 percent.
Despite the fluid headlines and ongoing threats regarding the topic of U.S. protectionism in the second quarter of 2018, investors found confidence in strong U.S. economic data and
earnings growth. On the macroeconomic front, the U.S. unemployment rate struck 3.8 percent, the lowest level since 1975. Economic reports throughout the second quarter of 2018 also indicated strong economic conditions. Additionally, the core personal consumption expenditure hit the Fed’s target rate of 2 percent, supporting its decision to raise rates in June. The central bank has also signaled the likelihood of two additional hikes this year. On the earnings front, the aggregate earnings growth of S&P 500 constituents was 26.6 percent based on Thomson Reuters IBES estimates. Both of these factors were supportive for the index broadly and pushed volatility lower in the second quarter of 2018. The average level of the Chicago Board Options Exchange Volatility Index was 15.3 in the second quarter, lower than the 17.4 experienced in the first quarter of 2018.
From a sector standpoint, energy outperformed as a prolonged period of higher crude oil prices increased the attractiveness of energy company shares. In addition to the fact that West Texas Intermediate crude appreciated throughout the second quarter of 2018 and reached $77 per barrel in June, the exercising of cost discipline by U.S. producers, evident from low levels of capital expenditure from first-quarter earnings reports, was supportive for investor sentiment given uncertainty over OPEC production plans.
Elsewhere, financials underperformed all other sectors, led lower by shares of diversified financial services companies. While deregulation provided a tailwind for regional banks, investor sentiment on the broader sector was fraught by the narrowing term structure of the U.S. Treasury curve, uncertainty ahead of the Comprehensive Capital Analysis and Review stress tests (an annual exercise by the Fed to assess the largest bank holding companies operating in the United States), and global protectionism.
For the six-month period ended June 30, 2018, the strongest returns in the S&P 500 Index came from consumer discretionary (11.47 percent) and information technology (10.87 percent). Negative returns were found in consumer staples (–8.92 percent), telecommunication services (–8.35 percent), industrials (–4.70 percent), financials (–4.09 percent), materials (–3.08 percent) and telecommunication services (–0.94 percent). All remaining sectors had positive returns.
| Average Annual Total Returns (periods ended 06/30/18) | | | |
| | 1 YR % | 5 YR % | 10 YR % |
| Stock Index Fund | 13.75 | 12.82 | 9.57 |
| Standard & Poor's 500 Stock Index | 14.37 | 13.42 | 10.17 |
| Sector Diversification* | |
| | % of Total Investments
as of 6/30/18 |
| Information technology | 25.2 |
| Health care | 13.8 |
| Financials | 13.4 |
| Consumer discretionary | 12.6 |
| Industrials | 9.4 |
| Consumer staples | 6.8 |
| Energy | 6.2 |
| Utilities | 2.9 |
| Real estate | 2.8 |
| Materials | 2.5 |
| Telecommunication services | 1.9 |
| Short-term and other assets | 2.5 |
| Total | 100.0% |
| Top Ten Equity Holdings* | |
| | % of Total Investments
as of 6/30/18 |
| Apple, Inc. | 3.8 |
| Microsoft Corp. | 3.2 |
| Amazon.com, Inc. | 2.9 |
| Alphabet, Inc., Class A & C | 2.8 |
| Facebook, Inc., Class A | 2.0 |
| Berkshire Hathaway, Inc., Class B | 1.5 |
| JPMorgan Chase & Co. | 1.5 |
| Exxon Mobil Corp. | 1.5 |
| Johnson & Johnson | 1.4 |
| Bank of America Corp. | 1.1 |
| Total | 21.7% |
Performance Comparison
Comparison of the change in value of a $10,000 investment in the fund and the Standard & Poor's 500 Stock Index made on June 30, 2008.
The returns quoted in the above table and chart represent past performance, which is no guarantee of future results. Current performance may be higher or lower than that shown above. To obtain the most recent month-end returns please call 800-258-3030 or visit homesteadfunds.com. Returns and the principal value of your investment will fluctuate such that shares, when redeemed, may be worth more or less than their original cost. The Stock Index Fund’s average annual total returns are net of any fee waivers and reimbursements. The expenses used are as of the most recent period-end and may fluctuate over time. Returns include the reinvestment of dividends and capital gains. Returns do not reflect taxes that the shareholder may pay on fund distributions or the redemption of fund shares.
* Sector diversification and top holdings information is for the S&P 500 Index Master Portfolio, managed by BlackRock Fund Advisors, the portfolio in which the Stock Index Fund invests all of its investable assets. Please refer to the Appendix for the complete annual report of the S&P 500 Index Master Portfolio.
Value Fund
Performance Evaluation | Prepared by the Fund's Investment Advisor, RE Advisers Corporation
Performance
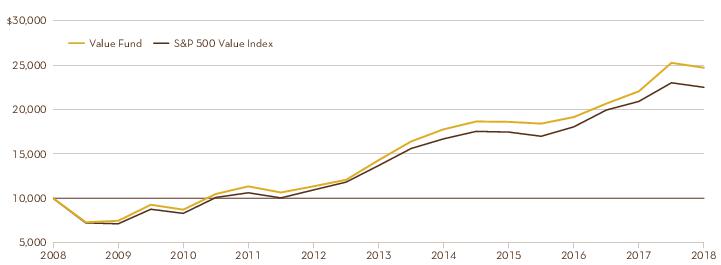
The Value Fund posted a –2.17 percent return for the first six months of 2018 while its benchmark index, the Standard & Poor’s 500 Value Index, returned –2.22 percent. The fund’s slightly higher than index performance results were due primarily to strength in the fund’s information technology holdings. Materials stocks, consumer discretionary equities and industrials positions detracted from results during the period.
Portfolio Review
The fund was overweight information technology issues versus the index, and the fund’s information technology holdings outperformed the index’s sector returns. Stocks contributing to the favorable results included Cisco, Microsoft, Visa, Intel and Alphabet.
Lack of exposure to consumer staples stocks was a positive for fund performance as this group was among the index’s worst-performing sectors.
The telecommunications services sector added to results. Verizon was the fund’s single holding in this grouping.
The fund’s energy holdings outperformed the benchmark’s energy sector results, though the fund was slightly underweight the sector versus the index. Conoco Phillips, Marathon Oil and Royal Dutch Shell led performance in this sector.
Health care stocks contributed to the fund’s performance. The fund was overweight in the sector compared with the index. The fund’s holdings exhibited positive performance during the period, while the benchmark’s holdings were down marginally for the first six months of the year.
Generally speaking, large-cap financial stocks were down for the first half of 2018. The fund being underweight the sector versus the benchmark benefitted in terms of relative performance.
The fund’s above-index weighting to materials stocks detracted from results. One of the holdings, DowDupont, will be discussed in more detail later in this report.
The fund’s consumer discretionary sector positions declined during the period. The fund’s exposure to auto-related stocks and limited exposure to internet/direct marketing/specialty retail impacted sector performance. The auto parts provider LKQ detracted from performance during the first half.
The fund’s industrials position detracted from results. The fund had an above-index allocation to this sector, and the fund’s stocks underperformed the index’s. Detractors included Parker Hannifin and Southwest Airlines.
| Investment Advisor: RE Advisers Corporation |
 | Prabha Carpenter, CFASenior Equity Portfolio ManagerBA, Economics, University of Madras; MBA with distinction in Finance and BS in Business Economics, The American University |
Outlook
For the second half of 2018, the economic backdrop looks to be supportive of further growth. The synchronized global growth gathering momentum in the first quarter appeared less robust in the second. However, the U.S. economy remains on solid footing with real gross domestic product (GDP) expected to grow 2.9 percent for the year. Consumer confidence measures have also remained strong. The employment backdrop is strengthening: Payrolls are up, participation rates are increasing and wage gains are moderate. Earnings for the S&P 500 are expected to exhibit double-digit, high-teens growth in coming quarters as they have in the first half of the year. The tailwinds of strong macro variables and favorable tax policies have been offset by headwinds of trade wars, tariffs and protectionism. These pronouncements shift constantly. The full effect of these policy shifts and the impact on companies and industries are being discerned.
The Federal Reserve is expected to raise rates two more times in this calendar year if economic growth remains strong. We believe that trade issues could add to inflationary pressures and diminish GDP growth.
We continue to search for opportunities that will reward shareholders over the long haul. The fund has benefited in the past from spin-offs and divestitures. One name in the materials sector that we believe is poised to benefit from such an event is DowDupont, with related financial filings anticipated in the second half of 2018. The spin into a specialty chemicals company, a materials company and an agriculture entity is being engineered by Ed Breen, who successfully orchestrated the division of Tyco a few years ago. Fund shareholders benefitted from his stewardship of Tyco in the early 2000s, and we anticipate similar success with Breen’s leadership of DowDupont. In our view, the present stock price does not reflect the returns-based valuation that will eventually be accorded the new entities.
| Average Annual Total Returns (periods ended 06/30/18) | | | |
| | 1 YR % | 5 YR % | 10 YR % |
| Value Fund | 12.05 | 11.57 | 9.46 |
| Standard & Poor's 500 Value Index | 7.58 | 10.45 | 8.44 |
| Sector Diversification | |
| | % of Total Investments
as of 6/30/18 |
| Information technology | 25.7 |
| Health care | 17.4 |
| Financials | 16.1 |
| Industrials | 12.7 |
| Energy | 11.3 |
| Materials | 11.1 |
| Consumer discretionary | 3.3 |
| Telecommunication services | 1.1 |
| Short-term and other assets | 1.3 |
| Total | 100.0% |
| Top Ten Equity Holdings | |
| | % of Total Investments
as of 6/30/18 |
| Cisco Systems, Inc. | 4.8 |
| Avery Dennison Corp. | 4.7 |
| Intel Corp. | 4.7 |
| Visa Inc., Class A | 4.6 |
| DowDuPont, Inc. | 4.6 |
| JPMorgan Chase & Co. | 4.3 |
| Southwest Airlines Co. | 4.2 |
| Microsoft Corp. | 4.1 |
| Pfizer, Inc. | 3.9 |
| Bristol-Myers Squibb Co. | 3.9 |
| Total | 43.8% |
Performance Comparison
Comparison of the change in value of a $10,000 investment in the fund and its benchmark indices made on June 30, 2008.
The returns quoted in the above table and chart represent past performance, which is no guarantee of future results. Current performance may be higher or lower than that shown above. To obtain the most recent month-end returns please call 800-258-3030 or visit homesteadfunds.com. Returns and the principal value of your investment will fluctuate such that shares, when redeemed, may be worth more or less than their original cost. The Value Fund’s average annual total returns are net of any fee waivers and reimbursements. The expenses used are as of the most recent period-end and may fluctuate over time. Returns include the reinvestment of dividends and capital gains. Returns do not reflect taxes that the shareholder may pay on fund distributions or the redemption of fund shares.
Performance Evaluation
11
Growth Fund
Performance Evaluation | Prepared by the Fund's Subadvisor, T. Rowe Price Associates
Performance
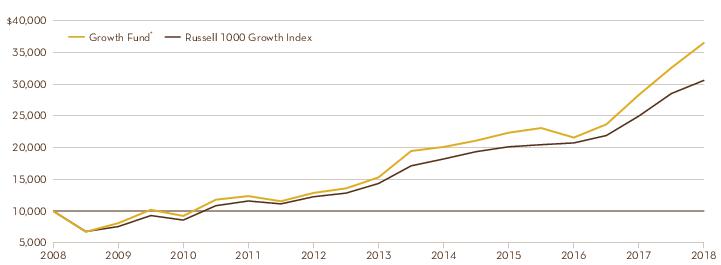
The Growth Fund posted a 12.02 percent return in the first half of 2018 and outperformed the 7.25 percent advance for the Russell 1000 Growth Index, the fund’s benchmark. Broadly speaking, both stock selection and sector allocation contributed to relative performance.
Portfolio Review
An overweight allocation and stock choices like Amazon.com and Netflix led the consumer discretionary sector to be the top contributor to relative performance during the period. At Amazon.com, core retail strength in North America, accelerating revenue and margin expansion within Amazon Web Services, and growth of ad revenue drove above-consensus top-line and bottom-line results. In addition to its dominant e-commerce and cloud-computing businesses, both of which we believe still have substantial growth runways, the company continues to reinvest profits into such other business segments as devices and video. In our view, such initiatives bode well for future growth and enhance the overall value proposition of its expanding ecosystem. The company’s push into advertising also continues to gain traction as more consumers begin their product search on Amazon’s platform. Netflix shares traded upward as both domestic and international subscription growth continues to outpace expectations, driven by strong content lineup and growth of bundling deals. As viewership builds on an aggregate and per-subscriber basis, we anticipate that Netflix will continue to improve the viewing experience, thereby increasing the company’s negotiating leverage with content suppliers globally and increasing its competitive positioning against regional companies.
Stock selection in industrials and business services was beneficial, and underweighting the sector also helped. Boeing was one of the strong positions. Shares of Boeing rose as operating margins continued to expand thanks to favorable delivery volume and mix within commercial aircraft, and better-than-expected revenue growth from defense and services. We continue to believe that the company is well positioned for several years of healthy earnings and free cash flow growth, supported by its robust backlog of orders and tailwinds from secular growth in global air traffic as the middle class in emerging markets continues to expand.
Stock selection in information technology was mainly responsible for excess returns, while overweighting the sector also had a positive impact. Salesforce.com and Intuit were key areas of strength. Large deal activity; strong international growth; and the accelerating growth of service, marketing and commerce cloud computing drove above-consensus top-line results, causing shares of Salesforce to climb. In our view, Salesforce.com is an outstanding business for its leadership in cloud computing, specifically software- as-a-service, and boasts a highly recurring subscription
| Subadvisor: T. Rowe Price Associates |
 | Taymour Tamaddon, CFAPortfolio ManagerBS, Applied Physics, Cornell University;
MBA, Finance, Dartmouth |
business model. The consumer tax segment benefited from a shift to a high-end product mix and an increase in customer purchases of secondary products, which helped to lift Intuit shares. We believe Intuit’s dominant market position and transition to software-as-a-service will expand the company’s addressable market, leading to above-average earnings growth in the long term.
Underweighting the materials sector had a positive impact on relative performance as the sector underperformed the broader benchmark.
In contrast, the financials sector was the largest detractor from relative performance due primarily to adverse stock selection. Morgan Stanley shares came under pressure due to several news items including investor concerns over European instability due to political unrest in Italy and news that transaction revenue from retail clients had slowed significantly in the second quarter, weighing on results of the company's wealth management division. Nevertheless, we believe that the company's shift away from fixed income, currency and commodity trading toward higher margin, less capital-intensive asset management should bolster earnings growth over time.
Outlook
We are encouraged by the solid performance of U.S. large-cap growth stocks, which posted solid second-quarter gains and ended the first half of 2018 with positive returns. However, investor sentiment has deteriorated somewhat due to geopolitical issues, including the tide of protectionism, new tariffs and rising U.S. interest rates. We are expecting and positioned for a potentially challenging stock market environment that delivers only moderate returns. This more guarded stance stems from uncertainties related to the sustainability of profit margins. As a result, large-cap growth stock valuations appear relatively expensive; we are uncovering fewer durable growth companies that offer compelling value. Nevertheless, we believe that good stock selection can continue to drive outperformance. We remain constructive on many individual companies in the information technology and health care sectors, where we are finding stocks that offer attractive relative value.
| Average Annual Total Returns (periods ended 06/30/18) | | | |
| | 1 YR % | 5 YR % | 10 YR % |
| Growth Fund* | 28.93 | 18.98 | 13.82 |
| Russell 1000 Growth Index | 22.51 | 16.36 | 11.83 |
| Sector Diversification | |
| | % of Total Investments
as of 6/30/18 |
| Information technology | 41.1 |
| Consumer discretionary | 23.1 |
| Health care | 18.6 |
| Industrials | 7.5 |
| Financials | 4.5 |
| Real estate | 1.2 |
| Consumer staples | 1.1 |
| Utilities | 1.1 |
| Short-term and other assets | 1.8 |
| Total | 100.0% |
| Top Ten Equity Holdings | |
| | % of Total Investments
as of 6/30/18 |
| Amazon.com, Inc. | 8.5 |
| Microsoft Corp. | 5.5 |
| Booking Holdings, Inc. | 4.9 |
| Facebook, Inc., Class A | 4.8 |
| Boeing Co. | 4.6 |
| Visa Inc., Class A | 4.5 |
| Alphabet, Inc., Class A | 4.2 |
| UnitedHealth Group, Inc. | 2.9 |
| Alibaba Group Holding Ltd. ADR | 2.5 |
| Alphabet, Inc., Class C | 2.4 |
| Total | 44.8% |
Performance Comparison
Comparison of the change in value of a $10,000 investment in the fund and its benchmark indices made on June 30, 2008.
The returns quoted in the above table and chart represent past performance, which is no guarantee of future results. Current performance may be higher or lower than that shown above. To obtain the most recent month-end returns please call 800-258-3030 or visit homesteadfunds.com. Returns and the principal value of your investment will fluctuate such that shares, when redeemed, may be worth more or less than their original cost. The Growth Fund’s average annual total returns are net of any fee waivers and reimbursements. The fund's advisor waived a portion of its management fee during the five- and 10-year periods. Had the advisor not done so, the fund's total returns would have been lower. The expenses used are as of the most recent period-end and may fluctuate over time. Returns include the reinvestment of dividends and capital gains. Returns do not reflect taxes that the shareholder may pay on fund distributions or the redemption of fund shares.
* Performance information for the Growth Fund (formerly the Nasdaq-100 Index Tracking StockSM Fund) reflects its previous investment strategy from inception through December 5, 2008, of matching, as closely as possible, before expenses, the performance of the Nasdaq-100 Stock Index.
Performance Evaluation
13
Small-Company Stock Fund
Performance Evaluation | Prepared by the Fund's Investment Advisor, RE Advisers Corporation
Performance
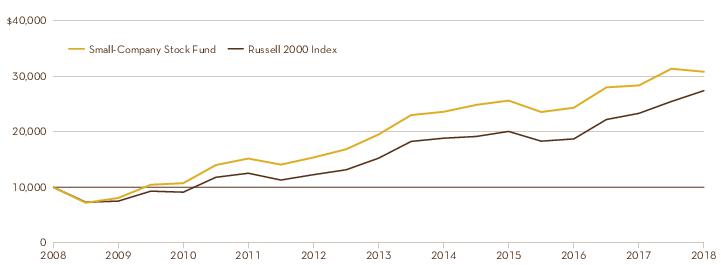
The Small-Company Stock Fund returned –1.73 percent for the first six months of 2018, versus a return of 7.66 percent for the Russell 2000, the fund’s benchmark. Generally speaking, the fund’s holdings did not receive favorable market attention during this time. The fund has historically been underweight in health care, especially biotechnology, due to its binary outcome profiles and associated risk. During this period, biotechnology stocks comprised the index’s largest sector position, and these holdings generated double-digit returns. The second area of fund relative underperformance versus the benchmark was in the information technology sector. Although the fund’s information technology services holdings performed well during the period, its electronic equipment holdings and internet software and services holdings detracted from sector results. Industrials, an overweight sector for the fund, also performed poorly.
Portfolio Review
A number of the fund’s consumer discretionary holdings performed well in the first half of 2018. BJ’s Restaurants reported strong traffic trends and sales growth. G-III Apparel reported strength in sales, earnings and progress on business initiatives.
The fund’s financial sector holdings slightly outperformed the benchmark. Encore Capital detracted from results. Encore’s acquisition of Cabot Credit Management, completed in July 2018, weighed on the stock. In insurance holdings, an overweight sector position relative to the benchmark, both Kinsale and National General Holdings were strong performers. In banking, one of the fund’s holdings, State Bank Financial, received a takeover offer from a larger Texas bank for a premium multiple to tangible book value.
The fund’s health care holdings performed well during the period. Specifically, Steris benefitted from both a favorable competitive landscape as a competitor’s sterilization division was disrupted by a transaction during the period as well as introduction of consolidated sterile processing locations to U.S. hospitals.
Names added to the fund during the period included Interface, a manufacturer of modular carpets for institutional markets and luxury vinyl tiles. Interface’s new management is focused on growth, greater operational efficiencies and newer products utilizing research and development.
| Investment Advisor: RE Advisers Corporation |
| Prabha Carpenter, CFASenior Equity Portfolio ManagerBA, Economics, University of Madras; MBA with distinction in Finance and BS in Business Economics, The American University |
Outlook
Small business optimism was strong as reported by the National Federation of Independent Business in its June report. And the economic backdrop, in our view, remains supportive of continued domestic and global growth.
For the first half of 2018, small capitalization stocks, represented by the Russell 2000, have outpaced larger capitalization stocks, represented by the Standard & Poor’s 500 Index. Lower tax rates and the perception that smaller companies are less exposed to the vicissitudes of trade wars have favored this group. However, the first-half performance of the Russell 2000 was concentrated in a few sectors. Industrials as a sector did not really contribute to the benchmark’s performance. We anticipate that investors will recognize some of the fund’s “overlooked” holdings in the industrials sector in future periods. For example, as broadband infrastructure is built out, and the need for high-speed constant connection is met, Dycom, a fund holding of long standing, stands to realize stronger earnings growth. As investors, we are patient with fund holdings that are in the midst of transformations from prosaic, low-margin businesses to higher-margin, higher-valuation enterprises. In this category is NN, Inc. NN, Inc. has sold its bearing components business, purchased health care-related operations, paid off some high-cost debt, and stated that there may be further refinement of its portfolio offerings and deleveraging — which we believe are all attainable goals. We do not believe that the current valuation reflects the changes made or prospects for NN, Inc.’s future.
Benchmark comparisons periodically obscure our long-term focus and success over longer time periods. We continue to manage the portfolio with a focus on fundamentals, seeking to identify “values” overlooked by the market. We do not seek to replicate the benchmark’s sector weightings, as evidenced by the fund’s high active share.
| Average Annual Total Returns (periods ended 06/30/18) | | | |
| | 1 YR % | 5 YR % | 10 YR % |
| Small-Company Stock Fund | 8.71 | 9.57 | 11.90 |
| Russell 2000 Index | 17.57 | 12.46 | 10.60 |
| Sector Diversification | |
| | % of Total Investments
as of 6/30/18 |
| Industrials | 33.6 |
| Financials | 22.4 |
| Information technology | 14.7 |
| Consumer discretionary | 12.2 |
| Materials | 9.1 |
| Health care | 4.4 |
| Energy | 0.8 |
| Short-term and other assets | 2.8 |
| Total | 100.0% |
| Top Ten Equity Holdings | |
| | % of Total Investments
as of 6/30/18 |
| Dycom Industries, Inc. | 6.6 |
| Encore Capital Group, Inc. | 4.8 |
| PolyOne Corp. | 4.7 |
| Applied Industrial Technologies, Inc. | 4.3 |
| State Bank Financial Corp. | 4.2 |
| BJ’s Restaurants, Inc. | 4.2 |
| Kinsale Capital Group, Inc. | 3.8 |
| STERIS PLC | 3.8 |
| Cracker Barrel Old Country Store, Inc. | 3.5 |
| Werner Enterprises, Inc. | 3.2 |
| Total | 43.1% |
Performance Comparison
Comparison of the change in value of a $10,000 investment in the fund and the Russell 2000 Index made on June 30, 2008.
The returns quoted in the above table and chart represent past performance, which is no guarantee of future results. Current performance may be higher or lower than that shown above. To obtain the most recent month-end returns please call 800-258-3030 or visit homesteadfunds.com. Returns and the principal value of your investment will fluctuate such that shares, when redeemed, may be worth more or less than their original cost. The Small-Company Stock Fund’s average annual total returns are net of any fee waivers and reimbursements. The expenses used are as of the most recent period-end and may fluctuate over time. Returns include the reinvestment of dividends and capital gains. Returns do not reflect taxes that the shareholder may pay on fund distributions or the redemption of fund shares.
Performance Evaluation
15
International Equity Fund
Performance Evaluation | Prepared by the Fund's Subadvisor, Harding Loevner LP
Performance
For the six-month period ending June 30, 2018, the International Equity Fund outperformed its benchmark, the MSCI EAFE Index, increasing 0.82 percent versus the –2.75 percent return for the index.
Portfolio Review
The positive relative performance derived primarily from good stock selection, although the fund’s overweight in information technology (IT), one of the strongest-performing sectors, also worked in its favor. Within IT, 3D-design software developer Dassault Systèmes and banking software provider Temenos were both additive, particularly as the latter had high earnings growth and accelerating software licensing growth. Health care was led by blood plasma specialist CSL Limited and medical information provider M3. M3 rose on the news that the company acquired an American clinical trials firm, signaling entry into the large and profitable U.S. market. In financials, DBS Group of Singapore led as the bank signaled larger distributions of capital to shareholders with a surprising increase in the company’s regular dividend plus a special dividend. DBS Group’s strong performance, alongside gains from GF Banorte, HDFC, and AIA Group, were enough to offset the losses associated with our holdings in Spain’s BBVA and Brazil’s Itaú Unibanco.
Viewed by region, our stock selection was strong in Europe, both in and out of the eurozone. In France, all of the fund’s five holdings gained, led by Dassault Systèmes. In Germany the fund benefitted from gains in Symrise, Linde and enterprise software developer SAP. Outside of the eurozone, Switzerland was boosted by good results from hearing-aid maker Sonova and Temenos. The fund’s holdings in Japan also added to relative performance from a regional perspective, led by M3 and Sysmex, the clinical-testing equipment manufacturer. On the other side of the ledger, industrial robot manufacturer Fanuc dragged on stock selection in Japan after management cautioned that declining smartphone demand, rising foreign exchange rates and global trade friction could threaten the company’s profitability in coming years.
Outlook
The suggestion that we are in an environment of rising interest rates will likely not surprise even casual readers of the financial press. In the U.S., the 0.25 percent hike in June 2018 by the Federal Reserve was the seventh such increase in the past three years.
Rising interest rates can have an impact on corporate profits, stock valuations, and more generally economic growth and capital flows. We believe that higher interest rates are likely to hurt corporate profits as the costs of capital rise. In our view,
| Subadvisor: Harding Loevner LP |
 | Ferrill D. Roll, CFACo-Lead Portfolio ManagerBA, Economics, Stanford University |
 | Alexander T. Walsh, CFACo-Lead Portfolio ManagerBA, North American Studies, McGill University |
reduced capital expenditures can decelerate economic growth. Rising rates are also viewed as negative for stock valuations, as company share prices should reflect the discounted value of their future cash flows. Over time, higher rates do the job central banks ask them to do: reduce liquidity and slow spending. The nature of economic cycles portends that this could result in economic recession.
The impact of rising rates also affects global capital flows. U.S. rates have oversized influence because of the U.S. dollar’s role as a reserve currency: Many companies and countries, particularly in emerging markets, raise debt in U.S. dollars. Globally, low nominal interest rates and easy monetary policies have papered over many financial vulnerabilities, including the rise in debt in emerging markets.
Our investment philosophy features three components: quality, growth and valuation. All three will play their roles in more challenging economic times. In an environment of rising interest rates, we’ve found that our requirement of a strong balance sheet and cash flow has protected our investments when liquidity tightens. While we hope to own many secular growth businesses, we believe that many of our businesses will be impacted if global growth slows (or, in recessions, declines), and we must be skeptical about forecasts, anticipating ways in which we could be wrong-footed.
The final pillar of our investment philosophy, valuation, is potentially the most problematic for us and for growth investors generally. For years, while share prices have been rising, we have talked about how we found market valuations challenging, but noted that, with growth scarce in a slow-to-heal world, we would be more tolerant of higher valuations than in other circumstances. With growth now under threat cyclically but the prices of the fastest-growing companies still rising, market valuations remain a fraught issue.
International Equity Fund
| Average Annual Total Returns (periods ended 06/30/18) | | | |
| | 1 YR % | 5 YR % | 10 YR % |
| International Equity Fund* | 10.76 | 7.35 | 3.43 |
| MSCI®EAFE®Index | 6.84 | 6.44 | 2.84 |
| Country Diversification | |
| | % of Total Investments
as of 6/30/18 |
| Germany | 18.2 |
| Japan | 17.1 |
| France | 11.0 |
| Switzerland | 9.6 |
| Britain | 9.1 |
| Hong Kong | 4.7 |
| Sweden | 3.9 |
| Spain | 3.4 |
| Singapore | 2.9 |
| Israel | 2.7 |
| Canada | 2.1 |
| United States of America | 1.9 |
| South Africa | 1.5 |
| Australia | 1.3 |
| Italy | 1.3 |
| China | 1.2 |
| Denmark | 1.0 |
| Republic of South Korea | 1.0 |
| Taiwan, India, Brazil & Mexico | 2.3 |
| Short-term and other assets | 3.8 |
| Total | 100.0% |
| Top Ten Equity Holdings | |
| | % of Total Investments
as of 6/30/18 |
| AIA Group Ltd. | 4.7 |
| Dassault Systèmes SE | 3.7 |
| Bayer AG REG | 3.7 |
| Royal Dutch Shell PLC, Class B | 3.7 |
| Allianz SE REG | 3.5 |
| Nestlé SA ADR | 3.3 |
| M3, Inc. | 3.1 |
| L’Oréal SA | 3.0 |
| FANUC Corp. | 2.9 |
| DBS Group Holdings Ltd. | 2.9 |
| Total | 34.5% |
Performance Comparison
Comparison of the change in value of a $10,000 investment in the fund and the MSCI®EAFE®Index made on June 30, 2008.
The returns quoted in the above table and chart represent past performance, which is no guarantee of future results. Current performance may be higher or lower than that shown above. To obtain the most recent month-end returns please call 800-258-3030 or visit homesteadfunds.com. Returns and the principal value of your investment will fluctuate such that shares, when redeemed, may be worth more or less than their original cost. The International Equity Fund’s average annual total returns are net of any fee waivers and reimbursements. The fund’s advisor waived a portion of its management fee during the periods shown. Had the advisor not done so, the fund's total returns would have been lower. The expenses used are as of the most recent period-end and may fluctuate over time. Returns include the reinvestment of dividends and capital gains. Returns do not reflect taxes that the shareholder may pay on fund distributions or the redemption of fund shares.
* Performance information for the International Equity Fund (formerly the International Value Fund) reflects its performance as an actively managed fund subadvised by Mercator Asset Management from June 30, 2008 to September 14, 2015, as a passively managed portfolio directed by SSGA Funds Management Inc. from September 15, 2015 to January 8, 2016 and, after a transition, as an actively managed fund subadvised by Harding Loevner LP from January 15, 2016 to period end.
Performance Evaluation
17
As a shareholder, you incur two types of costs: (1) transaction costs; and (2) ongoing costs, including management fees, service fees, and other fund expenses. This example is intended to help you understand your ongoing costs (in dollars) of investing in each of the Homestead Funds and to compare these costs with the ongoing costs of investing in other mutual funds.
The example is based on an investment of $1,000 invested at January 1, 2018 and held through June 30, 2018.
Actual Expenses
The first line for each Fund in the table on the following page provides information about actual account values and actual expenses. You may use the information in this line, together with the amount you invested, to estimate the expenses that you paid over the period. Simply divide your account value by $1,000 (for example, an $8,600 account value divided by $1,000 = 8.6), then multiply the result by the number in the first line under the heading entitled “Expenses Paid During the Period” to estimate the expenses you paid on your account during this period.
Individual Retirement Arrangements (IRAs) and Educational Savings Accounts (ESAs) are charged a $15.00 annual custodial fee. The charge is automatically deducted from your account in the fourth quarter of each year or, if you close your account, at the time of redemption. A fee is collected for each IRA or ESA, as distinguished by account type (Traditional IRA, Roth IRA, or ESA) and Social Security Number. For example, if you have both a Traditional IRA and a Roth IRA account, each would be charged a fee. But only one fee would be collected for each account type, regardless of the number of Funds held by each account type. These fees are not included in the example below. If included, the costs shown would be higher.
Hypothetical Example for Comparison Purposes
The second line for each Fund in the table on the following page provides information about hypothetical account values and hypothetical expenses based on the Fund’s actual expense ratio and an assumed rate of return of 5% per year before expenses, which is not the Fund’s actual return. The hypothetical account values and expenses may not be used to estimate the actual ending account balance or expenses you paid for the period.
You may use this information to compare the ongoing costs of investing in the Funds and other funds. To do so, compare this 5% hypothetical example with the 5% hypothetical examples that appear in the shareholder reports of the other funds.
Please note that the expenses shown in the table are meant to highlight your ongoing costs only and do not reflect the custodial account fee. Therefore, the hypothetical information in the example is useful in comparing your ongoing costs only, and will not help you determine the
relative total costs of owning different funds. In addition, if the custodial account fee was included, your costs would have been higher.
Expense Example (Continued)
| Daily Income Fund | Beginning Account Value
January 1, 2018 | Ending Account Value
June 30, 2018 | Expenses Paid During the Perioda | Annualized Expense Ratio for the Six Month Period Ended
June 30, 2018 |
| Actual Return | $1,000.00 | $1,004.10 | $3.60 | 0.72% |
| Hypothetical Return (5% return before expenses) | $1,000.00 | $1,021.41 | $3.63 | 0.72% |
| Short-Term Government Securities Fundb | | | | |
| Actual Return | $1,000.00 | $1,000.40 | $3.72 | 0.75% |
| Hypothetical Return (5% return before expenses) | $1,000.00 | $1,021.28 | $3.76 | 0.75% |
| Short-Term Bond Fund | | | | |
| Actual Return | $1,000.00 | $1,005.90 | $3.78 | 0.76% |
| Hypothetical Return (5% return before expenses) | $1,000.00 | $1,021.23 | $3.81 | 0.76% |
| Stock Index Fundc | | | | |
| Actual Return | $1,000.00 | $1,023.90 | $2.74 | 0.55% |
| Hypothetical Return (5% return before expenses) | $1,000.00 | $1,022.29 | $2.74 | 0.55% |
| Value Fund | | | | |
| Actual Return | $1,000.00 | $978.30 | $2.91 | 0.59% |
| Hypothetical Return (5% return before expenses) | $1,000.00 | $1,022.06 | $2.98 | 0.59% |
| Growth Fund | | | | |
| Actual Return | $1,000.00 | $1,120.20 | $4.60 | 0.87% |
| Hypothetical Return (5% return before expenses) | $1,000.00 | $1,020.66 | $4.38 | 0.87% |
| Small-Company Stock Fund | | | | |
| Actual Return | $1,000.00 | $982.70 | $4.34 | 0.88% |
| Hypothetical Return (5% return before expenses) | $1,000.00 | $1,020.62 | $4.42 | 0.88% |
| International Equity Fundb | | | | |
| Actual Return | $1,000.00 | $1,008.20 | $4.93 | 0.99% |
| Hypothetical Return (5% return before expenses) | $1,000.00 | $1,020.09 | $4.95 | 0.99% |
| a. | The dollar amounts shown as “Expenses Paid During the Period” are equal to each Fund’s annualized expense ratio multiplied by the average account value over the period, multiplied by 181, then divided by 365 (to reflect the half-year period). |
| b. | Reflects fee waiver and expense limitation agreements in effect during the period. |
| c. | The Stock Index Fund is a feeder fund that invests substantially all of its assets in a Master Portfolio. The example reflects the expenses of both the feeder fund and the Master Portfolio. |
Regulatory and Shareholder Matters
Proxy Voting Policies and Procedures
The policies and procedures used to determine how to vote proxies relating to the Funds’ portfolio securities are available online at homesteadfunds.com and, without charge, upon request by calling 800-258-3030. This information is also available on the Securities and Exchange Commission’s website at sec.gov.
Proxy Voting Record
For the most recent twelve-month period ended June 30, information regarding how proxies relating to portfolio securities were voted on behalf of each of the Funds is available, without charge, upon request by calling 800-258-3030. This information is also available online at homesteadfunds.com and on the Securities and Exchange Commission’s website at sec.gov.
Quarterly Disclosure of Portfolio Holdings
The Funds file complete schedules of portfolio holdings with the Securities and Exchange Commission for the first and third quarters of each fiscal year on Form N-Q. Portfolio holdings for the second and fourth quarters of each fiscal year are filed as part of the Funds’ semi-annual and annual reports. The Funds’ Form N-Q, semi-annual and annual reports are available on the Commission’s website at sec.gov, and may be reviewed and copied at the Commission’s Public Reference Room in Washington, DC. Information on the operation of the Public Reference Room may be obtained by calling 800-SEC-0330. The most recent quarterly portfolio holdings and semi-annual and annual report also can be accessed on the Funds’ website at homesteadfunds.com.
Principal Risks
You may lose money by investing in the Funds. Below are summaries of some, but not all, of the principal risks of investing in one or more of the Funds, each of which could adversely affect a Fund’s NAV, yield and total return. Each risk listed below does not necessarily apply to each Fund, and you should read each Fund’s prospectus carefully for a description of the principal risks associated with investing in a particular Fund.
• Asset-Backed and Mortgage-Backed Securities Risk The risk that defaults, or perceived increases in the risk of defaults, on the obligations underlying asset-backed and mortgage-backed securities, including mortgage pass-through securities and collateralized mortgage obligations (“CMOs”), significant credit downgrades and illiquidity may impair the value of the securities. These securities also present a higher degree of prepayment risk (when repayment of principal occurs before scheduled maturity resulting in the Fund having to reinvest proceeds at a lower interest rate) and extension risk (when rates of repayment of principal are slower than expected, which may lock in a below-market interest rate, increase the security’s duration, and reduce the value of the security) than do other types of fixed income securities. Enforcing
rights against the underlying assets or collateral may be difficult, and the underlying assets or collateral may be insufficient if the issuer defaults.
• Commercial Paper Risk Investments in commercial paper are subject to the risk that the issuer cannot issue enough new commercial paper to satisfy its obligations with respect to its outstanding commercial paper, also known as rollover risk. Commercial paper is generally unsecured, which increases the credit risk associated with this type of investment. The value of commercial paper may be affected by changes in the credit rating or financial condition of the issuing entities. The value of commercial paper will tend to fall when interest rates rise and rise when interest rates fall.
• Concentration Risk To the extent the fund concentrates in a particular industry, it may be more susceptible to economic conditions and risks affecting that industry.
• Corporate Bond Risk Corporate debt securities are subject to the risk of the issuer’s inability to meet principal and interest payments on the obligations and may also be subject to price volatility due to factors such as interest rates, market perception of the creditworthiness of the issuer and general market liquidity.
• Currency Risk Foreign currencies may experience steady or sudden devaluation relative to the U.S. dollar or other currencies, adversely affecting the value of the Fund’s investments. The value of the Fund’s assets may be affected favorably or unfavorably by currency exchange rates, currency exchange control regulations, and restrictions or prohibitions on the repatriation of foreign currencies. Because the Fund’s net asset value is determined on the basis of U.S. dollars, if the local currency of a foreign market depreciates against the U.S. dollar, you may lose money even if the foreign market prices of the Fund’s holdings rise.
• Debt Securities Risks
Credit Risk The risk that an issuer or counterparty will fail to pay its obligations to the Fund when they are due. As a result, the Fund’s income might be reduced, the value of the Fund’s investment might fall, and/or the Fund could lose the entire amount of its investment. Changes in the financial condition of an issuer or counterparty, changes in specific economic, social or political conditions that affect a particular type of security or other instrument or an issuer, and changes in economic, social or political conditions generally can increase the risk of default by an issuer or counterparty, which can affect a security’s or other instrument’s credit quality or value and an issuer’s or counterparty’s ability to pay interest and principal when due. The values of securities also may decline for a number of other reasons that relate directly to the issuer, such as management performance, financial leverage and reduced demand for the issuer’s goods and services, as well as the historical and prospective earnings of the issuer and the value of its assets.
Regulatory and Shareholder Matters
Regulatory and Shareholder Matters (Continued)
Extension Risk The risk that if interest rates rise, repayments of principal on certain debt securities, including, but not limited to, floating rate loans and mortgage-related securities, may occur at a slower rate than expected and the expected maturity of those securities could lengthen as a result. Securities that are subject to extension risk generally have a greater potential for loss when prevailing interest rates rise, which could cause their values to fall sharply.
Interest Rate Risk The risk that debt instruments will change in value because of changes in interest rates. The value of an instrument with a longer duration (whether positive or negative) will be more sensitive to changes in interest rates than a similar instrument with a shorter duration. Bonds and other debt instruments typically have a positive duration. The value of a debt instrument with positive duration will generally decline if interest rates increase.
• Depositary Receipts Risk Depositary receipts in which the Fund may invest are receipts listed on U.S. exchanges that are issued by banks or trust companies that entitle the holder to all dividends and capital gains that are paid out on the underlying foreign shares. Investments in depositary receipts may be less liquid than the underlying shares in their primary trading market.
• Derivatives Risk The risk that an investment in derivatives will not perform as anticipated by the Adviser, cannot be closed out at a favorable time or price, or will increase the Fund’s volatility; that derivatives may create investment leverage; that, when a derivative is used as a substitute for or alternative to a direct cash investment, the transaction may not provide a return that corresponds precisely with that of the cash investment; or that, when used for hedging purposes, derivatives will not provide the anticipated protection, causing the Fund to lose money on both the derivatives transaction and the exposure the Fund sought to hedge. The counterparty to a derivatives contract may be unable or unwilling to make timely settlement payments, return the Fund’s margin, or otherwise honor its obligations. Changes in regulation relating to a mutual fund’s use of derivatives and related instruments could potentially limit or impact the Fund’s ability to invest in derivatives, limit a Fund’s ability to employ certain strategies that use derivatives and adversely affect the value or performance of derivatives and the Fund.
• Emerging and Frontier Market Risk The risk that investing in emerging and frontier markets will be subject to greater political and economic instability, greater volatility in currency exchange rates, less developed securities markets, possible trade barriers, currency transfer restrictions, a more limited number of potential buyers and issuers, an emerging market country’s dependence on revenue from particular commodities or international aid, less governmental supervision and regulation, unavailability of currency hedging techniques,
differences in auditing and financial reporting standards, thinner trading markets, different clearing and settlement procedures and custodial services, and less developed legal systems than in many more developed countries. The securities of emerging market companies may trade less frequently and in smaller volumes than more widely held securities. These risks are generally greater for investments in frontier market countries, which typically have smaller economies or less developed capital markets than traditional emerging market countries.
• Equity Securities Risk Equity securities generally have greater price volatility than fixed-income securities. The market price of equity securities owned by the Fund may go up or down, sometimes rapidly or unpredictably. Equity securities may decline in value due to factors affecting the issuer, equity securities markets generally, particular industries represented in those markets or the issuer itself.
• Focused Investment Risk A fund that invests a substantial portion of its assets in a particular market, industry, sector, group of industries or sectors, country, region, group of countries or asset class is subject to greater risk than a fund that invests in a more diverse investment portfolio. In addition, the value of such a fund is more susceptible to any single economic, market, political or regulatory or other occurrence affecting, for example, the particular markets, industries, regions, sectors or asset classes in which the fund is invested. This is because, for example, issuers in a particular market, industry, region, sector or asset class may react similarly to specific economic, market, regulatory, political or other developments. The particular markets, industries, regions, sectors or asset classes in which the Fund may focus its investments may change over time and the Fund may alter its focus at inopportune times.
• Foreign Risk Foreign securities are subject to political, regulatory, and economic risks not present in domestic investments and may exhibit more extreme changes in value than securities of U.S. companies. The securities markets of many foreign countries are relatively small, with a limited number of companies representing a small number of industries. In addition, foreign companies often are not subject to the same degree of regulation as U.S. companies. Reporting, legal, accounting and auditing standards of foreign countries differ, in some cases significantly, from U.S. standards. Nationalization, expropriation or confiscatory taxation, currency blockage, political changes or diplomatic developments could adversely affect the Fund’s investments in a foreign country. In the event of nationalization, expropriation or other confiscation, the Fund could lose its entire investment. Investments in emerging market countries are likely to involve significant risks. These countries are generally more likely to experience political and economic instability.
Regulatory and Shareholder Matters
21
Regulatory and Shareholder Matters (Continued)
• Growth Style Risk The risk that returns on stocks within the growth style in which the Fund invests will trail returns of stocks representing other styles or the market overall over any period of time and may shift in and out of favor with investors generally, sometimes rapidly, depending on changes in market, economic, and other factors. Growth stocks can be volatile, as these companies usually invest a high portion of earnings in their business and therefore may lack the dividends of value stocks that can cushion stock prices in a falling market. Also, earnings disappointments often lead to sharply falling prices because investors buy growth stocks in anticipation of superior earnings growth.
• Income Risk The Fund’s income may decline due to falling interest rates or other factors. Issuers of securities held by the Fund may call or redeem the securities during periods of falling interest rates, and the Fund would likely be required to reinvest in securities paying lower interest rates. If an obligation held by the Fund is prepaid, the Fund may have to reinvest the prepayment in other obligations paying income at lower rates.
• Index Fund Risk An index fund has operating and other expenses while an index does not. As a result, while a fund will attempt to track its underlying index as closely as possible, it will tend to underperform the index to some degree over time. If an index fund is properly correlated to its stated index, the fund will perform poorly when the index performs poorly.
• Index-Related Risk There is no assurance that the index provider will compile the underlying index accurately, or that the underlying index will be determined, composed or calculated accurately. Gains, losses or costs associated with index provider errors will be borne by the Stock Index Fund and its shareholders.
• Investments in Other Investment Companies Risk The risk that an investment company or other pooled investment vehicle in which the Fund invests will not achieve its investment objective or execute its investment strategies effectively or that significant purchase or redemption activity by shareholders of such an investment company might negatively affect the value of the investment company’s shares. The Fund must pay its pro rata portion of an investment company’s fees and expenses.
• Investments in Small- and Mid-Size Companies Securities of small and medium-sized companies tend to be more volatile and less liquid than securities of large companies. Compared to large companies, small and medium-sized companies may face greater business risks because they lack the management depth or experience, financial resources, product diversification or competitive strengths of larger companies, and they may be more adversely affected by poor economic conditions. There may be less publicly available information about smaller
companies than larger companies. In addition, these companies may have been recently organized and may have little or no track record of success.
• Issuer Risk The risk that the value of a security may decline because of adverse events or circumstances that directly relate to the issuer.
• Manager Risk The risk that the manager’s decisions, including security selection, will cause the Fund to underperform relative to the Fund’s peers. There can be no assurance that the manager’s investment techniques and decisions will produce the desired results. The Fund’s ability to achieve its investment objective is dependent upon the manager’s ability to identify profitable investment opportunities for the Fund. The past experience of the portfolio manager, including with other strategies and funds, does not guarantee future results for the Fund.
• Market Capitalization Risk Investing primarily in issuers within the same market capitalization category carries the risk that the category may be out of favor due to current market conditions or investor sentiment. Securities issued by large-cap companies tend to be less volatile than securities issued by smaller companies. However, larger companies may not be able to attain the high growth rates of successful smaller companies, especially during strong economic periods, and may be unable to respond as quickly to competitive challenges.
• Market Risk The risk that markets will perform poorly or that the returns from the securities in which the Fund invests will underperform returns from the general securities markets or other types of investments. Securities markets may, in response to governmental actions or intervention, economic or market developments, geopolitical events or other external factors, experience periods of high volatility and reduced liquidity. During those periods, the Fund may experience high levels of shareholder redemptions, and may have to sell securities at times when the Fund would otherwise not do so, and potentially at unfavorable prices. Certain securities may be difficult to value during such periods. These risks may be heightened for fixed income securities due to the current low interest rate environment.
• Master/Feeder Structure Risk The Stock Index Fund pursues its objective by investing substantially all of its assets in another pooled investment vehicle (a “master fund”). The ability of the Stock Index Fund to meet its investment objective is directly related to the ability of the master fund to meet its investment objective. The Stock Index Fund will bear its pro rata portion of the expenses incurred by the master fund. Substantial redemptions by other investors in a master fund may affect the master fund’s investment program adversely and limit the ability of the master fund to achieve its objective.
Regulatory and Shareholder Matters
Regulatory and Shareholder Matters (Continued)
• Money Market Securities Risk The value of a money market instrument typically will decline during periods of rising interest rates, and can also decline in response to changes in the financial condition of the issuer, borrower, counterparty or underlying collateral assets, or changes in market, economic, industry, political, and regulatory conditions affecting a particular type of security or issuer or fixed income securities generally. Money market funds are not designed to offer capital appreciation. Effective October 14, 2016, amendments to money market fund regulations could affect a money market fund’s operations and possibly negatively affect its return. In addition, certain money market funds may impose a fee upon the sale of shares or may temporarily suspend the ability of investors to redeem shares if such fund’s liquidity falls below required minimums, which may adversely affect the Fund’s returns or liquidity.
• Municipal Bond Risk Factors unique to the municipal bond market may negatively affect the value of the Fund’s investment in municipal bonds. The Fund may invest in a group of municipal obligations that are related in such a way that an economic, business, or political development affecting one would also affect the others. In addition, the municipal bond market, or portions thereof, may experience substantial volatility or become distressed, and individual bonds may go into default, which would lead to heightened risks of investing in municipal bonds generally. The ability of municipalities to meet their obligations will depend on the availability of tax and other revenues, economic, political and other conditions within the state and municipality, and the underlying fiscal condition of the state and municipality.
• Passive Investment Risk Because BlackRock Investment Advisors does not select the individual companies in the Index that the Master Portfolio tracks, the Master Portfolio may hold securities of companies that present risks that an investment adviser researching individual securities might otherwise seek to avoid.
• Repurchase Agreements Risk The Fund’s investment return on repurchase agreements will depend on the counterparty’s willingness and ability to perform its obligations under a repurchase agreement. If the Fund’s counterparty should default on its obligations, becomes subject to a bankruptcy or other insolvency proceeding or if the value of the collateral is insufficient, the Fund could (i) experience delays in recovering cash or the securities sold (and during such delay the value of the underlying securities may change in a manner adverse to the fund) and/or (ii) lose all or part of the income, proceeds or rights in the securities to which the Fund would otherwise be entitled.
• Tracking Error Risk Tracking error is the divergence of an index fund’s performance from that of the underlying index. Tracking error may occur because of differences between the securities and other instruments held in the Stock Index Fund’s portfolio and those included in the S&P
500 Index, pricing differences, transaction costs, the fund’s holding of cash, differences in timing of the accrual of dividends or interest, tax gains or losses, changes to the Index or the need to meet various new or existing regulatory requirements. This risk may be heightened during times of increased market volatility or other unusual market conditions. Tracking error also may result because the Stock Index Fund incurs fees and expenses, while the S&P 500 Index does not.
• U.S. Government Securities Risk The risk that the value of U.S. Government securities can decrease due to changes in interest rates or changes to the financial condition or credit rating of the U.S. Government.
• Value Style Risk The risk that returns on stocks within the value style in which the Fund invests will trail returns of stocks representing other styles or the market overall over any period of time and may shift in and out of favor with investors generally, sometimes rapidly, depending on changes in market, economic, and other factors. Investments in value securities may be subject to risks that (1) the issuer’s potential business prospects will not be realized; (2) their potential values will never be recognized by the market; and (3) their value was appropriately priced when acquired and they do not perform as anticipated.
• Variable and Floating-Rate Securities Risk The value of these securities may decline if their interest rates do not rise as much, or as quickly, as other interest rates. Conversely, these securities will not generally increase in value to the same extent as other fixed income securities, or at all, if interest rates decline.
Regulatory and Shareholder Matters
23
Portfolio of Investments
Daily Income Fund | June 30, 2018 | (Unaudited)
| U.S. Government & Agency Obligations | 89.5% of portfolio |
| | Interest Rate /
Yield | Maturity Date | Face Amount | Value |
| Federal Agricultural Mortgage Corp. | 1.73% | 07/03/18 | $1,447,000 | $1,446,861 |
| Federal Agricultural Mortgage Corp. | 1.94 | 09/28/18 | 5,000,000 | 4,976,143 |
| Federal Farm Credit Bank | 2.18 | 12/24/18 | 507,000 | 501,671 |
| Federal Farm Credit Bank | 2.04 | 01/02/19 | 300,000 | 296,886 |
| Federal Home Loan Bank | 1.73 | 07/06/18 | 5,500,000 | 5,498,686 |
| Federal Home Loan Bank | 1.74 | 07/09/18 | 4,100,000 | 4,098,419 |
| Federal Home Loan Bank | 1.73 | 07/13/18 | 4,000,000 | 3,997,700 |
| Federal Home Loan Bank | 1.78 | 07/16/18 | 1,900,000 | 1,898,595 |
| Federal Home Loan Bank | 1.84 | 07/18/18 | 4,000,000 | 3,996,543 |
| Federal Home Loan Bank | 1.85 | 07/20/18 | 1,285,000 | 1,283,757 |
| Federal Home Loan Bank | 1.82 | 07/20/18 | 900,000 | 899,130 |
| Federal Home Loan Bank | 1.82 | 07/25/18 | 1,800,000 | 1,797,828 |
| Federal Home Loan Bank | 1.82 | 07/26/18 | 1,100,000 | 1,098,617 |
| Federal Home Loan Bank | 1.84 | 08/03/18 | 2,000,000 | 1,996,636 |
| Federal Home Loan Bank | 1.88 | 08/07/18 | 4,000,000 | 3,992,312 |
| Federal Home Loan Bank | 1.88 | 08/08/18 | 3,500,000 | 3,493,073 |
| Federal Home Loan Bank | 1.87 | 08/10/18 | 2,500,000 | 2,494,833 |
| Federal Home Loan Bank | 1.86 | 08/14/18 | 3,500,000 | 3,492,086 |
| Federal Home Loan Bank | 1.90 | 08/17/18 | 3,500,000 | 3,491,364 |
| Federal Home Loan Bank | 1.88 | 08/30/18 | 1,000,000 | 996,883 |
| Federal Home Loan Bank | 1.92 | 09/11/18 | 6,589,000 | 6,563,830 |
| Federal Home Loan Bank | 1.91 | 09/17/18 | 4,000,000 | 3,983,533 |
| Federal Home Loan Bank | 1.95 | 09/24/18 | 3,000,000 | 2,986,294 |
| Federal Home Loan Mortgage Corp. | 1.76 | 07/23/18 | 4,000,000 | 3,995,710 |
| Federal Home Loan Mortgage Corp. | 1.81 | 08/02/18 | 5,000,000 | 4,992,000 |
| Federal Home Loan Mortgage Corp. | 1.89 | 08/21/18 | 3,250,000 | 3,241,321 |
| Federal Home Loan Mortgage Corp. | 1.89 | 09/04/18 | 1,500,000 | 1,494,908 |
| Federal National Mortgage Assoc. | 1.75 | 07/10/18 | 2,000,000 | 1,999,130 |
| U.S. Treasury Bill | 1.68 | 07/05/18 | 4,000,000 | 3,999,253 |
| U.S. Treasury Bill | 1.72 | 07/12/18 | 3,750,000 | 3,748,026 |
| U.S. Treasury Bill | 1.79 | 07/19/18 | 3,500,000 | 3,496,876 |
| U.S. Treasury Bill | 1.79 | 07/26/18 | 1,750,000 | 1,747,829 |
| U.S. Treasury Bill | 1.82 | 08/09/18 | 3,500,000 | 3,493,099 |
| U.S. Treasury Bill | 1.87 | 08/16/18 | 3,250,000 | 3,242,227 |
| U.S. Treasury Bill | 1.89 | 08/23/18 | 4,000,000 | 3,988,888 |
| U.S. Treasury Bill | 1.88 | 08/30/18 | 4,000,000 | 3,987,494 |
| U.S. Treasury Bill | 1.90 | 09/06/18 | 3,500,000 | 3,487,627 |
| U.S. Treasury Bill | 1.90 | 09/13/18 | 4,000,000 | 3,984,384 |
| U.S. Treasury Bill | 1.89 | 09/20/18 | 4,750,000 | 4,729,786 |
| U.S. Treasury Bill | 1.88 | 09/27/18 | 5,000,000 | 4,976,962 |
| U.S. Treasury Note | 0.88 | 07/15/18 | 4,000,000 | 3,998,583 |
| U.S. Treasury Note | 0.75 | 07/31/18 | 5,000,000 | 4,995,443 |
| U.S. Treasury Note | 1.00 | 08/15/18 | 3,250,000 | 3,246,538 |
| U.S. Treasury Note | 0.75 | 08/31/18 | 1,500,000 | 1,497,076 |
| U.S. Treasury Note | 1.00 | 09/15/18 | 1,750,000 | 1,746,635 |
| Total U.S. Government & Agency Obligations | | | | |
| (Cost $141,371,475) | | | | 141,371,475 |
| Portfolio of Investments | The accompanying notes are an integral part of these financial statements. |
Portfolio of Investments | Daily Income Fund | June 30, 2018 | (Unaudited) | (Continued)
| Money Market Fund | 10.5% of portfolio |
| | Interest Rate /Yield | | Shares | Value |
| State Street Institutional U.S. Government Money Market Fund, Premier Class | 1.82%(a) | | 16,533,535 | $16,533,535 |
| Total Money Market Fund | | | | |
| (Cost $16,533,535) | | | | 16,533,535 |
| Total Investments in Securities | | | | |
| (Cost $157,905,010) | 100.0% | | | | $157,905,010 |
| (a) | 7-day yield at June 30, 2018. |
| The accompanying notes are an integral part of these financial statements. | Portfolio of Investments |
25
Portfolio of Investments
Short-Term Government Securities Fund | June 30, 2018 | (Unaudited)
| U.S. Government & Agency Obligations | 52.0% of portfolio |
| | Interest Rate /
Yield | Maturity Date | Face Amount | Value |
| AID-Tunisia | 1.42% | 08/05/21 | $1,000,000 | $960,700 |
| AID-Ukraine | 1.47 | 09/29/21 | 2,000,000 | 1,919,966 |
| Government Trust Certificate (Israel Trust) | 0.00(a) | 04/01/21 | 639,000 | 592,138 |
| National Archives Facility Trust | 8.50(b) | 09/01/19 | 9,946 | 10,316 |
| Overseas Private Investment Corp. | 1.77 | 11/20/18 | 1,000,000 | 1,008,076 |
| Overseas Private Investment Corp. | 1.30 | 06/15/19 | 142,857 | 141,540 |
| Overseas Private Investment Corp. | 2.26(b) | 02/11/20 | 2,000,000 | 2,011,800 |
| Overseas Private Investment Corp. | 3.37 | 05/15/21 | 234,964 | 236,354 |
| Overseas Private Investment Corp. | 2.07 | 05/15/21 | 244,860 | 243,342 |
| Overseas Private Investment Corp. | 2.52 | 09/15/22 | 1,118,182 | 1,105,069 |
| Overseas Private Investment Corp. | 2.51 | 05/15/25 | 1,892,592 | 1,853,663 |
| Overseas Private Investment Corp. | 1.96(c) | 06/15/25 | 2,000,000 | 2,000,000 |
| Philippine Power Trust I (d) | 5.40 | 09/26/18 | 29,762 | 29,811 |
| Private Export Funding Corp. | 1.45 | 08/15/19 | 974,000 | 962,700 |
| U.S. Department of Housing & Urban Development | 7.93 | 08/01/18 | 30,000 | 30,154 |
| U.S. Department of Housing & Urban Development | 5.45 | 08/01/19 | 655,000 | 656,678 |
| U.S. Department of Housing & Urban Development | 1.88 | 08/01/19 | 2,000,000 | 1,987,052 |
| U.S. Department of Housing & Urban Development | 6.07 | 08/01/21 | 40,000 | 40,128 |
| U.S. Department of Housing & Urban Development | 6.12 | 08/01/22 | 29,000 | 29,095 |
| U.S. Department of Housing & Urban Development | 5.77 | 08/01/26 | 220,000 | 220,644 |
| U.S. Treasury Note | 1.38 | 09/30/18 | 1,000,000 | 998,480 |
| U.S. Treasury Note | 0.88 | 10/15/18 | 2,000,000 | 1,993,561 |
| U.S. Treasury Note | 1.50 | 12/31/18 | 2,000,000 | 1,993,359 |
| U.S. Treasury Note | 0.75 | 02/15/19 | 2,000,000 | 1,981,875 |
| U.S. Treasury Note | 1.63 | 04/30/19 | 2,000,000 | 1,988,750 |
| U.S. Treasury Note | 1.50 | 05/31/19 | 4,000,000 | 3,969,375 |
| U.S. Treasury Note | 1.00 | 06/30/19 | 2,000,000 | 1,973,281 |
| U.S. Treasury Note | 1.00 | 08/31/19 | 1,000,000 | 983,789 |
| U.S. Treasury Note | 1.75 | 09/30/19 | 2,000,000 | 1,983,203 |
| U.S. Treasury Note | 1.88 | 12/31/19 | 500,000 | 495,547 |
| U.S. Treasury Note | 1.25 | 01/31/20 | 1,440,000 | 1,412,381 |
| U.S. Treasury Note | 1.38 | 09/15/20 | 500,000 | 487,324 |
| U.S. Treasury Note | 1.63 | 10/15/20 | 500,000 | 489,434 |
| U.S. Treasury Note | 1.75 | 11/15/20 | 500,000 | 490,430 |
| U.S. Treasury Note | 1.88 | 12/15/20 | 500,000 | 491,582 |
| U.S. Treasury Note | 2.00 | 01/15/21 | 500,000 | 492,637 |
| U.S. Treasury Note | 2.25 | 02/15/21 | 500,000 | 495,566 |
| U.S. Treasury Note | 2.38 | 04/15/21 | 1,000,000 | 993,516 |
| Total U.S. Government & Agency Obligations | | | | |
| (Cost $40,051,638) | | | | 39,753,316 |
| Corporate Bonds Guaranteed by Export-Import Bank of the United States | 24.1% of portfolio |
| | | | |
| Consumer Discretionary | 0.2% | | |
| Ethiopian Leasing (2012) LLC | 2.68 | 07/30/25 | 129,738 | 127,943 |
| Total Consumer Discretionary | | | | 127,943 |
| Energy | 7.6% | | |
| Petroleos Mexicanos | 2.00 | 12/20/22 | 450,000 | 439,996 |
| Petroleos Mexicanos | 1.95 | 12/20/22 | 450,000 | 439,466 |
| Petroleos Mexicanos | 2.38 | 04/15/25 | 854,700 | 834,921 |
| Petroleos Mexicanos | 2.46 | 12/15/25 | 750,000 | 732,676 |
| Reliance Industries Ltd. | 2.06 | 01/15/26 | 126,400 | 122,002 |
| Reliance Industries Ltd. | 1.87 | 01/15/26 | 1,684,211 | 1,613,241 |
| Portfolio of Investments | The accompanying notes are an integral part of these financial statements. |
Portfolio of Investments | Short-Term Government Securities Fund | June 30, 2018 | (Unaudited) | (Continued)
| Corporate Bonds Guaranteed by Export-Import Bank of the United States | 24.1% of portfolio (Continued) |
| | Interest Rate /Yield | Maturity Date | Face Amount | Value |
| Energy | 7.6% (Continued) | | |
| Reliance Industries Ltd. | 2.44% | 01/15/26 | $1,684,210 | $1,649,004 |
| Total Energy | | | | 5,831,306 |
| Financials | 14.1% | | |
| Altitude Investments 17 LLC | 2.68 | 11/08/25 | 654,928 | 639,163 |
| Export Leasing 2009 LLC | 1.86 | 08/28/21 | 246,062 | 242,212 |
| Lulwa Ltd. | 1.83 | 03/26/25 | 589,746 | 565,313 |
| Mexican Aircraft Finance IV | 2.54 | 07/13/25 | 320,441 | 315,135 |
| Mexican Aircraft Finance V | 2.33 | 01/14/27 | 393,750 | 381,821 |
| MSN 41079 and 41084 Ltd. | 1.63 | 12/14/24 | 1,127,796 | 1,076,547 |
| Penta Aircraft Leasing 2013 LLC | 1.69 | 04/29/25 | 1,201,596 | 1,148,074 |
| Safina Ltd. | 1.55 | 01/15/22 | 808,019 | 789,573 |
| Safina Ltd. | 2.00 | 12/30/23 | 1,587,947 | 1,543,635 |
| Salmon River Export LLC | 2.19 | 09/15/26 | 178,187 | 172,181 |
| Sandalwood 2013 LLC | 2.82 | 02/12/26 | 442,756 | 438,359 |
| Santa Rosa Leasing LLC | 1.69 | 08/15/24 | 54,048 | 51,918 |
| Santa Rosa Leasing LLC | 1.47 | 11/03/24 | 565,562 | 538,000 |
| Tagua Leasing LLC | 1.90 | 07/12/24 | 1,276,753 | 1,234,237 |
| Tagua Leasing LLC | 1.73 | 09/18/24 | 548,401 | 526,283 |
| Union 11 Leasing LLC | 2.41 | 01/23/24 | 514,443 | 505,369 |
| Union 16 Leasing LLC | 1.86 | 01/22/25 | 588,148 | 565,659 |
| VCK Lease SA | 2.59 | 07/24/26 | 90,062 | 88,308 |
| Total Financials | | | | 10,821,787 |
| Industrials | 0.2% | | |
| Sayarra Ltd. | 2.77 | 10/29/21 | 188,486 | 188,089 |
| Total Industrials | | | | 188,089 |
| Information Technology | 2.0% | | |
| Micron Semiconductor Asia PTE Ltd. | 1.26 | 01/15/19 | 1,518,200 | 1,512,196 |
| Total Information Technology | | | | 1,512,196 |
| Total Corporate Bonds Guaranteed by Export-Import Bank of the United States | | | | |
| (Cost $18,990,147) | | | | 18,481,321 |
| Corporate Bonds - Other | 9.7% of portfolio |
| | | | |
| Financials | 5.5% | | |
| Athene Global Funding (d) | 2.88 | 10/23/18 | 545,000 | 544,904 |
| Athene Global Funding (d) | 3.50(c) | 04/20/20 | 300,000 | 303,817 |
| Bank of Amercia Corp. | 2.96(c) | 10/01/21 | 250,000 | 250,885 |
| Bank of America Corp. | 6.88 | 11/15/18 | 388,000 | 394,029 |
| Capital One Financial Co. | 3.12(c) | 05/12/20 | 250,000 | 251,050 |
| Citibank N.A. | 2.83(c) | 06/12/20 | 250,000 | 250,729 |
| Citigroup Inc. | 3.32(c) | 04/25/22 | 150,000 | 151,334 |
| Fifth Third Bank | 2.30 | 03/15/19 | 250,000 | 249,153 |
| Goldman Sach Group, Inc. | 3.20 | 06/05/20 | 150,000 | 150,546 |
| Jackson National Life Global Funding (d) | 2.20 | 01/30/20 | 175,000 | 172,600 |
| JP Morgan Chase Bank NA | 3.09(c) | 04/26/21 | 250,000 | 249,405 |
| MetLife Global Funding I (d) | 1.75 | 09/19/19 | 500,000 | 492,676 |
| Morgan Stanley & Co. LLC | 2.90(c) | 02/10/21 | 250,000 | 250,490 |
| Protective Life Global Funding (d) | 1.56 | 09/13/19 | 250,000 | 245,934 |
| The accompanying notes are an integral part of these financial statements. | Portfolio of Investments |
27
Portfolio of Investments | Short-Term Government Securities Fund | June 30, 2018 | (Unaudited) | (Continued)
| Corporate Bonds - Other | 9.7% of portfolio (Continued) |
| | Interest Rate /Yield | Maturity Date | Face Amount | Value |
| Financials | 5.5% (Continued) | | |
| Wells Fargo Bank NA | 2.40% | 01/15/20 | $250,000 | $247,588 |
| Total Financials | | | | 4,205,140 |
| Health Care | 0.4% | | |
| CVS Health Corp. | 2.96(c) | 03/09/20 | 150,000 | 150,578 |
| CVS Health Corp. | 3.05(c) | 03/09/21 | 150,000 | 150,756 |
| Total Health Care | | | | 301,334 |
| Information Technology | 0.6% | | |
| Apple Inc. | 1.55 | 02/08/19 | 500,000 | 497,382 |
| Total Information Technology | | | | 497,382 |
| Utilities | 3.2% | | |
| Duke Energy Florida, LLC | 2.10 | 12/15/19 | 375,000 | 372,765 |
| Laclede Gas Co. | 2.00 | 08/15/18 | 300,000 | 299,773 |
| Oncor Electric Delivery Co. LLC (d) | 2.15 | 06/01/19 | 300,000 | 297,599 |
| ONE Gas, Inc. (d) | 2.07 | 02/01/19 | 250,000 | 249,125 |
| Sempra Energy, Inc. | 2.85(c) | 01/15/21 | 300,000 | 300,151 |
| Southwest Gas Corp. | 4.45 | 12/01/20 | 125,000 | 126,763 |
| Spire Inc. | 2.55 | 08/15/19 | 110,000 | 108,875 |
| Union Electric Co. | 5.10 | 10/01/19 | 250,000 | 256,350 |
| WEC Energy Group Inc. | 3.38 | 06/15/21 | 150,000 | 150,415 |
| WGL Holdings Inc. | 2.72(c) | 11/29/19 | 250,000 | 250,147 |
| Total Utilities | | | | 2,411,963 |
| Total Corporate Bonds - Other | | | | |
| (Cost $7,426,717) | | | | 7,415,819 |
| Mortgage-Backed Securities | 2.4% of portfolio |
| | | | |
| FDIC Structured Sale Guaranteed Notes 2010-S3 (d) | 2.74 | 12/03/20 | 112,644 | 110,991 |
| GNMA #2602 | 6.00 | 06/20/28 | 15,254 | 16,757 |
| GNMA #607494 | 5.00 | 04/15/19 | 108 | 109 |
| GNMA #616274 | 5.00 | 02/15/19 | 429 | 434 |
| GNMA #8004 | 2.75(c) | 07/20/22 | 7,049 | 7,208 |
| GNMA #80053 | 3.38(c) | 03/20/27 | 1,320 | 1,358 |
| GNMA #80058 | 2.63(c) | 04/20/27 | 1,139 | 1,174 |
| GNMA #8006 | 2.75(c) | 07/20/22 | 5,771 | 5,856 |
| GNMA #80185 | 2.63(c) | 04/20/28 | 11,960 | 12,343 |
| GNMA #80264 | 3.38(c) | 03/20/29 | 7,877 | 7,896 |
| GNMA #80283 | 2.63(c) | 05/20/29 | 8,744 | 9,039 |
| GNMA #80300 | 2.75(c) | 07/20/29 | 7,863 | 8,110 |
| GNMA #80309 | 2.75(c) | 08/20/29 | 4,080 | 4,215 |
| GNMA #80363 | 3.38(c) | 01/20/30 | 23,441 | 24,213 |
| GNMA #8038 | 2.75(c) | 08/20/22 | 3,707 | 3,763 |
| GNMA #8040 | 2.75(c) | 08/20/22 | 9,354 | 9,585 |
| GNMA #80426 | 2.75(c) | 07/20/30 | 911 | 942 |
| GNMA #80452 | 2.75(c) | 09/20/30 | 7,907 | 8,146 |
| GNMA #80475 | 3.13(c) | 12/20/30 | 6,629 | 6,660 |
| GNMA #8054 | 3.13(c) | 10/20/22 | 647 | 644 |
| GNMA #80577 | 3.38(c) | 02/20/32 | 1,245 | 1,289 |
| GNMA #80684 | 2.63(c) | 04/20/33 | 4,071 | 4,144 |
| GNMA #8076 | 3.13(c) | 11/20/22 | 3,826 | 3,853 |
| GNMA #81129 | 3.63(c) | 10/20/34 | 72,290 | 73,561 |
| Portfolio of Investments | The accompanying notes are an integral part of these financial statements. |
Portfolio of Investments | Short-Term Government Securities Fund | June 30, 2018 | (Unaudited) | (Continued)
| Mortgage-Backed Securities | 2.4% of portfolio (Continued) |
| | Interest Rate /Yield | Maturity Date | Face Amount | Value |
| GNMA #8157 | 3.38%(c) | 03/20/23 | $6,359 | $6,470 |
| GNMA #8191 | 2.63(c) | 05/20/23 | 10,740 | 10,946 |
| GNMA #8259 | 2.75(c) | 08/20/23 | 3,146 | 3,205 |
| GNMA #8384 | 3.38(c) | 03/20/24 | 1,622 | 1,634 |
| GNMA #8393 | 4.00(c) | 08/20/18 | 53 | 53 |
| GNMA #8400 | 2.75(c) | 08/20/18 | 18 | 18 |
| GNMA #8405 | 4.00(c) | 09/20/18 | 54 | 54 |
| GNMA #8423 | 2.63(c) | 05/20/24 | 2,430 | 2,485 |
| GNMA #8429 | 4.00(c) | 11/20/18 | 233 | 233 |
| GNMA #8459 | 2.75(c) | 07/20/24 | 3,780 | 3,863 |
| GNMA #8499 | 3.13(c) | 05/20/19 | 682 | 680 |
| GNMA #8518 | 3.13(c) | 10/20/24 | 4,245 | 4,291 |
| GNMA #8532 | 3.13(c) | 10/20/24 | 5,070 | 5,181 |
| GNMA #8591 | 3.38(c) | 02/20/25 | 9,991 | 10,023 |
| GNMA #8638 | 2.63(c) | 06/20/25 | 5,056 | 5,125 |
| GNMA #8648 | 2.75(c) | 07/20/25 | 12,442 | 12,388 |
| GNMA #8663 | 2.75(c) | 07/20/25 | 7,033 | 7,211 |
| GNMA #8680 | 3.50(c) | 08/20/20 | 1,981 | 1,972 |
| GNMA #8687 | 2.75(c) | 08/20/25 | 2,196 | 2,243 |
| GNMA #8702 | 3.13(c) | 10/20/20 | 1,248 | 1,252 |
| GNMA #8747 | 3.13(c) | 11/20/25 | 4,297 | 4,369 |
| GNMA #8807 | 2.75(c) | 07/20/21 | 2,423 | 2,459 |
| GNMA #8836 | 2.75(c) | 09/20/21 | 3,579 | 3,650 |
| GNMA #8847 | 2.63(c) | 04/20/26 | 5,612 | 5,770 |
| GNMA #8869 | 3.13(c) | 11/20/21 | 9,434 | 9,479 |
| GNMA #8873 | 3.13(c) | 11/20/21 | 3,542 | 3,531 |
| GNMA #8877 | 2.63(c) | 05/20/26 | 1,224 | 1,253 |
| GNMA #8883 | 3.13(c) | 12/20/21 | 3,135 | 3,160 |
| GNMA #8915 | 3.38(c) | 02/20/22 | 3,207 | 3,251 |
| GNMA #8934 | 3.38(c) | 03/20/22 | 5,259 | 5,275 |
| GNMA #8978 | 2.63(c) | 05/20/22 | 14,223 | 14,611 |
| GNMA #MA0668 | 2.00 | 12/20/27 | 64,217 | 61,645 |
| GNMA 2002-20 | 4.50 | 03/20/32 | 8,403 | 8,815 |
| GNMA 2003-11 | 4.00 | 10/17/29 | 11,027 | 11,265 |
| GNMA 2003-26 | 2.54(c) | 04/16/33 | 2,506 | 2,518 |
| GNMA 2003-97 | 4.50 | 03/20/33 | 3,069 | 3,098 |
| GNMA 2004-102 | 5.50 | 04/20/34 | 816 | 815 |
| GNMA 2004-17 | 4.50 | 12/20/33 | 23,378 | 24,108 |
| GNMA 2010-113 | 2.50 | 02/16/40 | 168,300 | 164,154 |
| GNMA 2012-143 | 1.50 | 12/16/27 | 393,157 | 370,509 |
| GNMA 2013-131 | 2.44(c) | 09/16/43 | 177,202 | 177,959 |
| NCUA Guaranteed Notes 2011-C1 | 2.62(c) | 03/09/21 | 577,724 | 576,755 |
| Total Mortgage-Backed Securities | | | | |
| (Cost $1,873,492) | | | | 1,860,066 |
| Asset-Backed Securities | 2.3% of portfolio |
| | | | |
| Ally Master Owner Trust 17-3 | 2.50(c) | 06/15/22 | 250,000 | 250,728 |
| American Credit Acceptance Receivables Trust 18-1 (d) | 2.72 | 03/10/21 | 203,802 | 203,703 |
| Avant Loans Funding Trust 17-B (d) | 2.29 | 06/15/20 | 50,191 | 50,144 |
| Avant Loans Funding Trust 18-A (d) | 3.09 | 06/15/21 | 150,000 | 149,982 |
| Exeter Automobile Receivables Trust 17-2 (d) | 2.11 | 06/15/21 | 100,481 | 100,220 |
| Flagship Credit Auto Trust 17-1 (d) | 1.93 | 12/15/21 | 77,928 | 77,661 |
| Foursight Capital Automobile Receivables Trust 17-1 (d) | 2.37 | 04/15/22 | 69,180 | 68,785 |
| GLS Auto Receivables Trust 17-1 (d) | 2.67 | 04/15/21 | 139,736 | 139,377 |
| Prosper Marketplace Issuance Trust 17-1 (d) | 2.56 | 06/15/23 | 31,410 | 31,410 |
| Prosper Marketplace Issuance Trust 17-2 (d) | 2.41 | 09/15/23 | 54,059 | 53,963 |
| Small Business Administration 02-20K | 5.08 | 11/01/22 | 3,355 | 3,431 |
| The accompanying notes are an integral part of these financial statements. | Portfolio of Investments |
29
Portfolio of Investments | Short-Term Government Securities Fund | June 30, 2018 | (Unaudited) | (Continued)
| Asset-Backed Securities | 2.3% of portfolio (Continued) |
| | Interest Rate /Yield | Maturity Date | Face Amount | Value |
| Small Business Administration 04-20B | 4.72% | 02/01/24 | $11,327 | $11,596 |
| Small Business Administration 04-20C | 4.34 | 03/01/24 | 20,630 | 20,977 |
| Small Business Administration 16-10E | 1.80 | 09/01/26 | 411,674 | 397,560 |
| Small Business Administration 16-10F | 2.17 | 11/01/26 | 180,591 | 175,536 |
| Small Business Administration 98-20H | 6.15 | 08/01/18 | 282 | 282 |
| Small Business Administration 99-20D | 6.15 | 04/01/19 | 1,124 | 1,129 |
| Small Business Administration Pool # 100075 | 3.50 | 05/25/19 | 1,708 | 1,706 |
| Small Business Administration Pool # 503278 | 2.38(c) | 02/25/21 | 7,278 | 7,233 |
| Small Business Administration Pool # 503463 | 2.63(c) | 09/25/21 | 184 | 181 |
| United Auto Credit Securitization Trust 17-1 (d) | 1.89 | 05/10/19 | 6,518 | 6,517 |
| Total Asset-Backed Securities | | | | |
| (Cost $1,770,663) | | | | 1,752,121 |
| Municipal Bond | 0.3% of portfolio |
| | | | |
| Wisconsin | 0.3% | | |
| Wisconsin, Public Finance Authority | 2.75 | 06/01/20 | 225,000 | 220,621 |
| Total Wisconsin | | | | 220,621 |
| Total Municipal Bond | | | | |
| (Cost $225,000) | | | | 220,621 |
| Certificates of Deposit | 3.8% of portfolio |
| | | | |
| BB&T Corp. | 1.62 | 10/19/18 | 250,000 | 249,506 |
| Capital One Bank USA NA | 1.65 | 07/09/18 | 250,000 | 249,973 |
| Capital One NA | 1.60 | 07/16/18 | 250,000 | 249,954 |
| First Republic Bank | 2.30 | 07/12/18 | 250,000 | 249,984 |
| HSBC Bank USA NA | 3.10(c) | 11/17/20 | 246,000 | 246,703 |
| JP Morgan Chase Bank, NA | 1.50(c) | 04/22/21 | 200,000 | 196,330 |
| Morgan Stanley Bank NA | 1.95 | 12/09/19 | 250,000 | 247,787 |
| Northern Bank & Trust Co. | 1.05 | 11/28/18 | 240,000 | 238,972 |
| U.S. Bankcorp | 1.88 | 07/23/18 | 250,000 | 250,001 |
| Wells Fargo Bank NA | 1.60 | 07/27/18 | 200,000 | 199,929 |
| Wells Fargo Bank NA | 2.70 | 04/16/19 | 500,000 | 500,276 |
| Total Certificates of Deposit | | | | |
| (Cost $2,883,471) | | | | 2,879,415 |
| Commercial Paper | 5.4% of portfolio |
| | | | |
| Kansas City Power and Light Co. (d) | 2.25 | 07/02/18 | 3,493,000 | 3,492,351 |
| PPL Capital Funding, Inc. (d) | 2.40 | 07/02/18 | 646,000 | 645,880 |
| Total Commercial Paper | | | | |
| (Cost $4,138,739) | | | | 4,138,231 |
| Money Market Fund | less than 0.1% of portfolio |
| | | | Shares | |
| State Street Institutional U.S. Government Money Market Fund, Premier Class | 1.82(e) | | 733 | 733 |
| Total Money Market Fund | | | | |
| (Cost $733) | | | | 733 |
| Total Investments in Securities | | | | |
| (Cost $77,360,600) | 100.0% | | | | $76,501,643 |
| (a) | Zero coupon rate, purchased at a discount. |
| Portfolio of Investments | The accompanying notes are an integral part of these financial statements. |
Portfolio of Investments | Short-Term Government Securities Fund | June 30, 2018 | (Unaudited) | (Continued)
| (b) | Interest is paid at maturity. |
| (c) | Variable coupon rate as of June 30, 2018. |
| (d) | Security was purchased pursuant to Rule 144A under the Securities Act of 1933 and may be resold in transactions exempt from registration, normally to qualified institutional buyers. The securities have been determined to be liquid under criteria established by the Fund's Board of Directors. The total of such securities at period-end amounts to $7,467,450 and represents 9.8% of total investments. |
| (e) | 7-day yield at June 30, 2018. |
LLC - Limited Liability Company
SA - Sociedad Anonima or Societe Anonyme
NA - National Association
| The accompanying notes are an integral part of these financial statements. | Portfolio of Investments |
31
Portfolio of Investments
Short-Term Bond Fund | June 30, 2018 | (Unaudited)
| Corporate Bonds - Other | 34.3% of portfolio |
| | Interest Rate /
Yield | Maturity Date | Face Amount | Value |
| Consumer Discretionary | 1.3% | | |
| ABC Inc. | 8.75% | 08/15/21 | $810,000 | $937,695 |
| McDonald’s Corp. | 2.10 | 12/07/18 | 350,000 | 349,333 |
| Philip Morris International Inc. | 1.38 | 02/25/19 | 3,275,000 | 3,250,890 |
| Philip Morris International Inc. | 1.88 | 11/01/19 | 2,200,000 | 2,171,512 |
| Stanley Black & Decker Inc. | 2.45 | 11/17/18 | 250,000 | 249,679 |
| Stanley Black & Decker Inc. | 1.62 | 11/17/18 | 425,000 | 423,313 |
| Total Consumer Discretionary | | | | 7,382,422 |
| Consumer Staples | 2.9% | | |
| Alberto-Culver Co. | 5.15 | 06/01/20 | 375,000 | 388,464 |
| Coca-Cola Co. (The) | 1.55 | 09/01/21 | 475,000 | 454,410 |
| Coca-Cola Co. (The) | 2.20 | 05/25/22 | 420,000 | 407,539 |
| Colgate-Palmolive Co. | 1.75 | 03/15/19 | 1,025,000 | 1,019,497 |
| Hershey Co. (The) | 2.90 | 05/15/20 | 875,000 | 873,877 |
| Mead Johnson Nutrition Co. | 3.00 | 11/15/20 | 4,125,000 | 4,107,634 |
| PepsiCo Inc. | 1.50 | 02/22/19 | 350,000 | 347,777 |
| PepsiCo Inc. | 1.35 | 10/04/19 | 875,000 | 860,465 |
| Procter & Gamble Co. (The) | 1.90 | 11/01/19 | 1,625,000 | 1,608,001 |
| Procter & Gamble Co. (The) | 1.85 | 02/02/21 | 350,000 | 341,176 |
| Procter & Gamble Co. (The) | 1.70 | 11/03/21 | 475,000 | 457,025 |
| Procter & Gamble Co. (The) | 2.15 | 08/11/22 | 1,150,000 | 1,109,660 |
| Unilever Capital Corp. | 2.75 | 03/22/21 | 2,625,000 | 2,604,162 |
| Wal-Mart Stores Inc. | 1.95 | 12/15/18 | 1,175,000 | 1,171,649 |
| Total Consumer Staples | | | | 15,751,336 |
| Energy | 2.4% | | |
| ANR Pipeline Co. | 9.63 | 11/01/21 | 3,175,000 | 3,842,377 |
| Cameron International Corp. | 6.38 | 07/15/18 | 2,500,000 | 2,502,940 |
| Chevron Corp. | 2.75(a) | 11/15/19 | 2,175,000 | 2,188,018 |
| Chevron Corp. | 2.19 | 11/15/19 | 375,000 | 372,405 |
| Chevron Corp. | 2.42 | 11/17/20 | 700,000 | 692,263 |
| Colonial Pipeline Co. (b) | 3.50 | 10/15/20 | 875,000 | 880,654 |
| Exxon Mobil Corp. | 1.82 | 03/15/19 | 1,050,000 | 1,044,720 |
| Marathon Oil Corp. | 2.70 | 06/01/20 | 550,000 | 541,658 |
| Phillips 66 | 2.92(a) | 02/26/21 | 975,000 | 976,515 |
| Total Energy | | | | 13,041,550 |
| Financials | 9.3% | | |
| AMBAC Assurance Corp. (b) | 5.10 | 06/07/20 | 2,871 | 3,847 |
| AMBAC LSNI LLC (b) | 7.34(a) | 02/12/23 | 13,803 | 14,011 |
| Ares Capital Corp. | 3.50 | 02/10/23 | 1,175,000 | 1,119,592 |
| Athene Global Funding (b) | 2.88 | 10/23/18 | 3,050,000 | 3,049,462 |
| Athene Global Funding (b) | 2.75 | 04/20/20 | 575,000 | 568,002 |
| Athene Global Funding (b) | 3.50(a) | 04/20/20 | 1,200,000 | 1,215,268 |
| Athene Global Funding (b) | 4.00 | 01/25/22 | 1,400,000 | 1,409,678 |
| Berkshire Hathaway Inc. | 1.15 | 08/15/18 | 400,000 | 399,463 |
| Citibank, N.A. | 3.05 | 05/01/20 | 2,175,000 | 2,174,126 |
| Citibank, N.A. | 2.85 | 02/12/21 | 1,650,000 | 1,630,883 |
| Fifth Third Bank | 2.30 | 03/15/19 | 1,200,000 | 1,195,935 |
| Flagstar Bancorp Inc. | 6.13 | 07/15/21 | 2,975,000 | 3,116,340 |
| HSBC Bank USA NA | 4.88 | 08/24/20 | 2,575,000 | 2,651,848 |
| Hyundai Capital America, Inc. (b) | 2.55 | 04/03/20 | 1,325,000 | 1,302,079 |
| Portfolio of Investments | The accompanying notes are an integral part of these financial statements. |
Portfolio of Investments | Short-Term Bond Fund | June 30, 2018 | (Unaudited) ��| (Continued)
| Corporate Bonds - Other | 34.3% of portfolio (Continued) |
| | Interest Rate /
Yield | Maturity Date | Face Amount | Value |
| Financials | 9.3% (Continued) | | |
| Hyundai Capital America, Inc. (b) | 3.11%(a) | 04/03/20 | $875,000 | $876,928 |
| Hyundai Capital America, Inc. (b) | 3.33(a) | 09/18/20 | 2,275,000 | 2,288,889 |
| Hyundai Capital America, Inc. (b) | 2.75 | 09/18/20 | 975,000 | 958,754 |
| IBM Credit LLC | 1.63 | 09/06/19 | 1,300,000 | 1,283,544 |
| Industrial And Commercial Bank of China Ltd. NY | 3.23 | 11/13/19 | 1,600,000 | 1,595,499 |
| Jackson National Life Global Funding (b) | 1.88 | 10/15/18 | 775,000 | 773,675 |
| Jackson National Life Global Funding (b) | 2.20 | 01/30/20 | 1,250,000 | 1,232,855 |
| Main Street Capital Corp. | 4.50 | 12/01/22 | 4,945,000 | 4,880,660 |
| Met Life Global Funding I (b) | 1.35 | 09/14/18 | 250,000 | 249,466 |
| Met Life Global Funding I (b) | 1.75 | 12/19/18 | 875,000 | 871,999 |
| New York Life Global Funding (b) | 2.00 | 04/09/20 | 1,300,000 | 1,276,372 |
| Prospect Capital Corp. | 5.88 | 03/15/23 | 2,050,000 | 2,084,703 |
| Protective Life Global Funding (b) | 1.56 | 09/13/19 | 2,075,000 | 2,041,249 |
| Reliance Standard Life Global Funding II (b) | 2.50 | 01/15/20 | 5,550,000 | 5,491,614 |
| Reliance Standard Life Global Funding II (b) | 2.38 | 05/04/20 | 5,650,000 | 5,547,262 |
| Total Financials | | | | 51,304,003 |
| Health Care | 1.8% | | |
| Bayer US Finance II LLC (b) | 3.50 | 06/25/21 | 1,325,000 | 1,327,535 |
| Bayer US Finance II LLC (b) | 2.97(a) | 06/25/21 | 1,325,000 | 1,327,623 |
| Bristol-Myers Squibb Co. | 1.60 | 02/27/19 | 1,000,000 | 993,990 |
| CVS Health Corp. | 3.13 | 03/09/20 | 875,000 | 873,840 |
| CVS Health Corp. | 2.96(a) | 03/09/20 | 1,250,000 | 1,254,817 |
| CVS Health Corp. | 3.35 | 03/09/21 | 1,300,000 | 1,298,479 |
| Johnson & Johnson | 1.88 | 12/05/19 | 775,000 | 767,746 |
| Merck & Co., Inc. | 1.85 | 02/10/20 | 475,000 | 467,890 |
| Pfizer Inc. | 2.20 | 12/15/21 | 1,250,000 | 1,216,194 |
| UnitedHealth Group Inc. | 1.90 | 07/16/18 | 250,000 | 249,955 |
| Total Health Care | | | | 9,778,069 |
| Industrials | 2.0% | | |
| BNSF Railway Co. | 3.80 | 01/01/20 | 330,000 | 329,186 |
| Burlington Northern & Santa Fe Railway Co. | 4.58 | 01/15/21 | 185,490 | 187,489 |
| Burlington Northern & Santa Fe Railway Co. | 4.83 | 01/15/23 | 53,852 | 55,321 |
| General Dynamics Corp. | 2.88 | 05/11/20 | 3,075,000 | 3,077,284 |
| General Electric Co. | 2.50 | 03/28/20 | 6,930,000 | 6,837,887 |
| Johnson Controls Inc. (b) | 5.00 | 03/30/20 | 831,000 | 854,858 |
| Total Industrials | | | | 11,342,025 |
| Information Technology | 3.3% | | |
| Amazon.com, Inc. (b) | 1.90 | 08/21/20 | 975,000 | 954,918 |
| Apple Inc. | 1.70 | 02/22/19 | 1,250,000 | 1,244,322 |
| Apple Inc. | 2.10 | 05/06/19 | 2,100,000 | 2,093,584 |
| Apple Inc. | 1.10 | 08/02/19 | 3,075,000 | 3,031,427 |
| Apple Inc. | 1.50 | 09/12/19 | 3,050,000 | 3,012,045 |
| Apple Inc. | 2.50 | 02/09/22 | 975,000 | 955,969 |
| International Business Machines Corp. | 2.50 | 01/27/22 | 700,000 | 683,880 |
| Microsoft Corp. | 1.63 | 12/06/18 | 675,000 | 673,203 |
| Microsoft Corp. | 1.10 | 08/08/19 | 3,100,000 | 3,051,896 |
| Microsoft Corp. | 2.00 | 11/03/20 | 950,000 | 934,265 |
| Microsoft Corp. | 2.40 | 02/06/22 | 1,675,000 | 1,640,306 |
| Total Information Technology | | | | 18,275,815 |
| The accompanying notes are an integral part of these financial statements. | Portfolio of Investments |
33
Portfolio of Investments | Short-Term Bond Fund | June 30, 2018 | (Unaudited) | (Continued)
| Corporate Bonds - Other | 34.3% of portfolio (Continued) |
| | Interest Rate /
Yield | Maturity Date | Face Amount | Value |
| Materials | 0.5% | | |
| 3M Co. | 1.63% | 09/19/21 | $450,000 | $430,507 |
| PPG Industries, Inc. | 2.30 | 11/15/19 | 2,200,000 | 2,180,896 |
| Total Materials | | | | 2,611,403 |
| Utilities | 10.8% | | |
| Alabama Power Co. | 5.13 | 02/15/19 | 700,000 | 710,210 |
| Atlantic City Electric Co. | 4.35 | 04/01/21 | 3,150,000 | 3,217,059 |
| California Water Service Co. | 5.88 | 05/01/19 | 1,725,000 | 1,765,375 |
| Dominion Energy Inc. | 2.58 | 07/01/20 | 325,000 | 320,154 |
| Duke Energy Florida Project Finance, LLC | 1.20 | 03/01/22 | 3,493,290 | 3,441,293 |
| Duke Energy Florida, LLC | 2.10 | 12/15/19 | 2,831,250 | 2,814,378 |
| Empire District Electric Co. | 4.65 | 06/01/20 | 5,225,000 | 5,357,301 |
| Entergy Louisiana LLC | 4.80 | 05/01/21 | 1,175,000 | 1,205,208 |
| Laclede Gas Co. | 2.00 | 08/15/18 | 2,200,000 | 2,198,331 |
| Nevada Power Co. | 2.75 | 04/15/20 | 1,300,000 | 1,298,216 |
| Northern Natural Gas Co. (b) | 4.25 | 06/01/21 | 475,000 | 483,760 |
| Oncor Electric Delivery Co. LLC (b) | 2.15 | 06/01/19 | 2,940,000 | 2,916,473 |
| ONE Gas, Inc. (b) | 2.07 | 02/01/19 | 2,475,000 | 2,466,341 |
| PacifiCorp | 5.65 | 07/15/18 | 1,025,000 | 1,026,071 |
| Public Service Co. of New Hampshire | 4.50 | 12/01/19 | 2,575,000 | 2,625,167 |
| SanDiego Gas & Electric Co. | 1.91 | 02/01/22 | 2,212,585 | 2,158,826 |
| Southern California Edison Co. | 5.50 | 08/15/18 | 2,200,000 | 2,207,238 |
| Southern California Edison Co. | 1.85 | 02/01/22 | 4,680,000 | 4,564,293 |
| Southern Natural Gas Company, LLC | 4.40 | 06/15/21 | 1,100,000 | 1,123,611 |
| Southwest Gas Corp. | 4.45 | 12/01/20 | 825,000 | 836,637 |
| Spire Inc. | 2.55 | 08/15/19 | 830,000 | 821,513 |
| Toledo Edison Co. | 7.25 | 05/01/20 | 250,000 | 266,764 |
| Union Electric Co. | 5.10 | 08/01/18 | 975,000 | 976,930 |
| Union Electric Co. | 5.10 | 10/01/19 | 4,150,000 | 4,255,410 |
| WEC Energy Group Inc. | 3.38 | 06/15/21 | 825,000 | 827,283 |
| Westar Energy Inc. | 5.10 | 07/15/20 | 1,275,000 | 1,320,352 |
| Western Massachusetts Electric Co. | 3.50 | 09/15/21 | 250,000 | 250,742 |
| WGL Holdings Inc. | 2.25 | 11/01/19 | 2,125,000 | 2,096,832 |
| WGL Holdings Inc. | 2.72(a) | 11/29/19 | 1,875,000 | 1,876,100 |
| WGL Holdings Inc. | 2.88(a) | 03/12/20 | 3,500,000 | 3,505,607 |
| Wisconsin Power and Light Co. | 5.00 | 07/15/19 | 560,000 | 573,512 |
| Total Utilities | | | | 59,506,987 |
| Total Corporate Bonds - Other | | | | |
| (Cost $190,237,694) | | | | 188,993,610 |
| Asset-Backed Securities | 22.3% of portfolio |
| | | | |
| ACC Trust 18-1 (b) | 3.70 | 12/21/20 | 1,014,458 | 1,014,765 |
| Access Group Inc. 01 | 2.69(a) | 05/25/29 | 558,993 | 552,410 |
| Access Group Inc. 05-B | 2.12(a) | 07/25/35 | 1,308,696 | 1,292,075 |
| Ally Master Owner Trust 15-2 | 1.83 | 01/15/21 | 725,000 | 721,919 |
| Ally Master Owner Trust 17-3 | 2.50(a) | 06/15/22 | 750,000 | 752,183 |
| Ally Master Owner Trust 17-3 | 2.04 | 06/15/22 | 900,000 | 882,370 |
| American Credit Acceptance Receivables Trust 18-1 (b) | 2.72 | 03/10/21 | 3,546,154 | 3,544,436 |
| Avant Loans Funding Trust 17-B (b) | 2.29 | 06/15/20 | 451,722 | 451,296 |
| Avant Loans Funding Trust 18-A (b) | 3.09 | 06/15/21 | 1,900,000 | 1,899,777 |
| Axis Equipment Finance Receivables LLC 16-A (b) | 2.21 | 11/20/21 | 565,423 | 562,062 |
| California Republic Auto Receivable Trust 15-3 | 2.13 | 05/17/21 | 1,762,451 | 1,756,173 |
| CCR Inc. MT-100 Payment Rights Master Trust 12-C (b) | 4.75 | 07/10/22 | 1,020,833 | 1,019,719 |
| Portfolio of Investments | The accompanying notes are an integral part of these financial statements. |
Portfolio of Investments | Short-Term Bond Fund | June 30, 2018 | (Unaudited) | (Continued)
| Asset-Backed Securities | 22.3% of portfolio (Continued) |
| | Interest Rate /Yield | Maturity Date | Face Amount | Value |
| College Loan Corp Trust 07-2 | 2.61%(a) | 01/25/24 | $19,395,000 | $19,171,649 |
| Consumer Loan Underlying Bond 17-NP2 (b) | 2.55 | 01/16/24 | 449,689 | 449,179 |
| Consumer Loan Underlying Bond 17-P1 (b) | 2.42 | 09/15/23 | 1,033,223 | 1,030,739 |
| Consumer Loan Underlying Bond 17-P2 (b) | 2.61 | 01/15/24 | 1,144,304 | 1,139,978 |
| Consumer Loan Underlying Bond 18-NP1 (b) | 2.99 | 05/15/24 | 487,471 | 487,355 |
| CPS Auto Trust 17-A (b) | 1.68 | 08/17/20 | 254,186 | 253,516 |
| Credit Acceptance Auto Loan Trust 17-1 (b) | 2.56 | 10/15/25 | 1,100,000 | 1,093,840 |
| Credit Acceptance Auto Loan Trust 17-2 (b) | 2.55 | 02/17/26 | 1,525,000 | 1,508,548 |
| Credit Acceptance Auto Loan Trust 17-3 (b) | 2.65 | 06/15/26 | 1,025,000 | 1,012,620 |
| Credit Acceptance Auto Loan Trust 18-1 (b) | 3.01 | 02/16/27 | 1,525,000 | 1,510,370 |
| Credit Acceptance Auto Loan Trust 18-2 (b) | 3.47 | 05/17/27 | 2,200,000 | 2,204,820 |
| Credit Suisse ABS Trust 18-LD1 (b) | 3.42 | 07/25/24 | 1,950,000 | 1,950,156 |
| Edlinc Student Loan Funding Trust 12-A (b) | 4.54(a) | 10/01/25 | 1,645,487 | 1,668,246 |
| Education Loan Asset Backed Trust 13-1 (b) | 2.96(a) | 11/25/33 | 6,195,464 | 6,012,830 |
| Element Rail Leasing I LLC 14-1 (b) | 2.30 | 04/19/44 | 1,477,859 | 1,468,847 |
| Element Rail Leasing I LLC 15-1 (b) | 2.71 | 02/19/45 | 586,758 | 579,050 |
| Element Rail Leasing I LLC 16-1 (b) | 3.97 | 03/19/46 | 345,935 | 348,927 |
| Entergy New Orleans Storm Recovery Fund 15-1 | 2.67 | 06/01/27 | 722,835 | 706,543 |
| Exeter Automobile Receivables Trust 16-3 (b) | 1.84 | 11/16/20 | 192,610 | 192,234 |
| Exeter Automobile Receivables Trust 17-1 (b) | 1.96 | 03/15/21 | 291,097 | 290,434 |
| Exeter Automobile Receivables Trust 17-2 (b) | 2.11 | 06/15/21 | 586,137 | 584,618 |
| Exeter Automobile Receivables Trust 17-3 (b) | 2.05 | 12/15/21 | 524,416 | 521,579 |
| Flagship Credit Auto Trust 15-3 (b) | 2.38 | 10/15/20 | 159,920 | 159,723 |
| Flagship Credit Auto Trust 17-1 (b) | 1.93 | 12/15/21 | 597,451 | 595,400 |
| Ford Credit Floorplan Master Owner Trust 16-1 | 1.76 | 02/15/21 | 1,250,000 | 1,243,386 |
| Ford Credit Floorplan Master Owner Trust 16-1 | 2.97(a) | 02/15/21 | 1,250,000 | 1,256,106 |
| Foursight Capital Automobile Receivables Trust 16-1 (b) | 2.87 | 10/15/21 | 389,905 | 389,317 |
| Foursight Capital Automobile Receivables Trust 17-1 (b) | 2.37 | 04/15/22 | 498,093 | 495,254 |
| Foursight Capital Automobile Receivables Trust 18-1 (b) | 2.85 | 08/16/21 | 1,300,000 | 1,297,651 |
| Freedom Financial 18-1 (b) | 3.61 | 07/18/24 | 2,950,000 | 2,949,752 |
| FRS I LLC 13-1 (b) | 1.80 | 04/15/43 | 409,741 | 407,062 |
| GLS Auto Receivables Trust 17-1 (b) | 2.67 | 04/15/21 | 1,103,917 | 1,101,082 |
| GLS Auto Receivables Trust 18-1 (b) | 2.82 | 07/15/22 | 2,531,960 | 2,517,364 |
| Gracie Point International Premium Financing 18-A (b) | 3.61(a) | 03/01/20 | 5,160,000 | 5,159,794 |
| Gracie Point Premium Financing 17-A (b) | 3.51(a) | 03/01/19 | 7,665,089 | 7,663,862 |
| KeyCorp Student Loan Trust 00-A | 2.26(a) | 05/25/29 | 296,218 | 295,091 |
| KeyCorp Student Loan Trust 00-B | 2.06(a) | 07/25/29 | 452,310 | 448,709 |
| KeyCorp Student Loan Trust 04-A | 2.19(a) | 01/27/43 | 463,797 | 425,083 |
| KeyCorp Student Loan Trust 05-A | 2.69(a) | 09/27/40 | 374,094 | 342,097 |
| KeyCorp Student Loan Trust 06-A | 2.60(a) | 09/27/35 | 1,106,724 | 1,106,901 |
| Longtrain Leasing III LLC 2015-1 (b) | 2.98 | 01/15/45 | 518,964 | 511,416 |
| Marlette Funding Trust 18-2 (b) | 3.06 | 07/17/28 | 2,275,000 | 2,276,137 |
| Navistar Financial Dealer Note Master Trust 16-1 (b) | 3.44(a) | 09/27/21 | 1,900,000 | 1,904,698 |
| Nelnet Private Education Loan Trust 16-A (b) | 3.60 | 12/26/40 | 1,784,692 | 1,723,466 |
| NP SPE II LLC 17-1 (b) | 3.37 | 10/21/47 | 524,452 | 512,911 |
| One Main Direct Auto Receivables Trust 16-1 (b) | 2.04 | 01/15/21 | 1,355 | 1,355 |
| One Main Financial Issuance Trust 15-2 (b) | 2.57 | 07/18/25 | 115,460 | 115,432 |
| Oscar US Funding Trust 16-2 (b) | 2.31 | 11/15/19 | 170,630 | 170,340 |
| Oscar US Funding Trust 17-2 (b) | 2.45 | 12/10/21 | 730,000 | 721,458 |
| Oscar US Funding Trust 18-1 (b) | 2.91 | 04/12/21 | 1,950,000 | 1,946,724 |
| Prosper Marketplace Issuance Trust 17-1 (b) | 2.56 | 06/15/23 | 198,929 | 198,931 |
| Prosper Marketplace Issuance Trust 17-2 (b) | 2.41 | 09/15/23 | 1,279,390 | 1,277,121 |
| Sierra Auto Receivables Securities Trust 16-1 (b) | 2.85 | 01/18/22 | 112,272 | 112,253 |
| SLC Student Loan Trust 05-1 | 2.04(a) | 02/15/45 | 1,052,797 | 991,898 |
| SLC Student Loan Trust 06-A | 2.02(a) | 07/15/36 | 2,576,906 | 2,572,215 |
| SLC Student Loan Trust 06-A | 2.17(a) | 07/15/36 | 6,250,000 | 6,011,515 |
| SLM Student Loan Trust 03-11 | 2.77(a) | 12/15/38 | 537,189 | 511,441 |
| SLM Student Loan Trust 04-A | 2.52(a) | 06/15/33 | 2,089,397 | 2,068,568 |
| The accompanying notes are an integral part of these financial statements. | Portfolio of Investments |
35
Portfolio of Investments | Short-Term Bond Fund | June 30, 2018 | (Unaudited) | (Continued)
| Asset-Backed Securities | 22.3% of portfolio (Continued) |
| | Interest Rate /Yield | Maturity Date | Face Amount | Value |
| SLM Student Loan Trust 04-B | 2.45%(a) | 03/15/24 | $3,806,060 | $3,795,965 |
| SLM Student Loan Trust 05-A | 2.32(a) | 06/15/23 | 1,282,421 | 1,280,281 |
| SLM Student Loan Trust 06-A | 2.41(a) | 06/15/39 | 1,376,375 | 1,348,780 |
| Small Business Administration 02-20K | 5.08 | 11/01/22 | 11,742 | 12,007 |
| SoFi Consumer Loan Program Trust 17-1 (b) | 3.28 | 01/26/26 | 800,435 | 799,785 |
| SoFi Consumer Loan Program Trust 17-3 (b) | 2.77 | 05/25/26 | 384,479 | 381,405 |
| SoFi Consumer Loan Program Trust 17-4 (b) | 2.50 | 05/26/26 | 817,613 | 807,299 |
| ThunderRoad Motorcycle Trust 16-1 (b) | 4.00 | 09/15/22 | 387,093 | 387,518 |
| United Auto Credit Securitization Trust 17-1 (b) | 1.89 | 05/10/19 | 66,483 | 66,470 |
| Veros Autos Receivable Trust 17-1 (b) | 2.84 | 04/17/23 | 402,362 | 400,718 |
| World Financial Network Credit Card Master Note Trust 17-B | 1.98 | 06/15/23 | 3,500,000 | 3,466,205 |
| Total Asset-Backed Securities | | | | |
| (Cost $120,338,113) | | | | 122,863,209 |
| Municipal Bonds | 17.5% of portfolio |
| | | | |
| Alaska | 0.1% | | |
| Alaska Student Loan Corp. | 2.46(a) | 08/25/31 | 575,458 | 575,619 |
| Total Alaska | | | | 575,619 |
| California | 0.5% | | |
| Adelanto California Public Utility Authority | 3.25 | 07/01/21 | 750,000 | 748,170 |
| Adelanto California Public Utility Authority | 3.63 | 07/01/23 | 795,000 | 797,186 |
| Desert Sands California Unified School District | 2.28 | 06/01/19 | 375,000 | 373,695 |
| Fresno County CA Pension Obligation | 0.00(c) | 08/15/22 | 650,000 | 553,995 |
| University of California | 2.85 | 05/15/20 | 540,000 | 540,708 |
| Total California | | | | 3,013,754 |
| Florida | 0.8% | | |
| Florida State Board of Administration Finance Corp. | 2.16 | 07/01/19 | 4,375,000 | 4,347,919 |
| Total Florida | | | | 4,347,919 |
| Illinois | 0.9% | | |
| Illinois, State of Sales Tax Revenue | 2.23 | 06/15/19 | 3,625,000 | 3,600,495 |
| Village of Rosemont Illinois | 2.77 | 12/01/18 | 1,375,000 | 1,374,491 |
| Total Illinois | | | | 4,974,986 |
| Indiana | 0.1% | | |
| Indiana Bond Bank | 2.08 | 01/15/19 | 300,000 | 299,574 |
| Total Indiana | | | | 299,574 |
| Louisiana | 0.3% | | |
| New Orleans Louisiana | 2.80 | 09/01/19 | 1,725,000 | 1,722,309 |
| Total Louisiana | | | | 1,722,309 |
| Mississippi | Less than 0.1% | | |
| Mississippi, State of | 2.40 | 10/01/22 | 225,000 | 219,112 |
| Total Mississippi | | | | 219,112 |
| Portfolio of Investments | The accompanying notes are an integral part of these financial statements. |
Portfolio of Investments | Short-Term Bond Fund | June 30, 2018 | (Unaudited) | (Continued)
| Municipal Bonds | 17.5% of portfolio (Continued) |
| | Interest Rate /Yield | Maturity Date | Face Amount | Value |
| Missouri | Less than 0.1% | | |
| Missouri Higher Education Loan Authority | 2.79%(a) | 01/26/26 | $205,973 | $205,328 |
| Total Missouri | | | | 205,328 |
| New Jersey | 3.9% | | |
| New Jersey Economic Development Authority | 0.00(c) | 02/15/19 | 4,990,000 | 4,910,459 |
| New Jersey Economic Development Authority | 0.00(c) | 02/15/20 | 12,575,000 | 11,936,693 |
| New Jersey Economic Development Authority | 0.00(c) | 02/15/21 | 1,350,000 | 1,236,276 |
| New Jersey Economic Development Authority | 0.00(c) | 02/15/22 | 1,005,000 | 885,425 |
| New Jersey Economic Development Authority | 0.00(c) | 02/15/24 | 3,200,000 | 2,562,496 |
| Total New Jersey | | | | 21,531,349 |
| New York | 4.5% | | |
| New York City, NY Transitional Finance Authority | 1.80 | 08/01/18 | 1,475,000 | 1,474,572 |
| New York City, NY Transitional Finance Authority | 1.85 | 05/01/19 | 2,025,000 | 2,015,462 |
| New York City, NY Transitional Finance Authority | 2.45 | 08/01/20 | 1,000,000 | 990,790 |
| New York City, NY Transitional Finance Authority | 2.75 | 11/01/20 | 2,695,000 | 2,685,487 |
| New York City, NY Transitional Finance Authority | 2.85 | 02/01/21 | 2,775,000 | 2,766,203 |
| New York City, NY Transitional Finance Authority | 2.15 | 02/01/21 | 2,100,000 | 2,057,118 |
| New York State Urban Development Corp. | 2.35 | 03/15/20 | 4,350,000 | 4,323,857 |
| New York State Urban Development Corp. | 2.38 | 03/15/21 | 4,375,000 | 4,325,562 |
| New York State Urban Development Corp. | 2.10 | 03/15/22 | 3,975,000 | 3,905,994 |
| Utility Debt Securitization Authority, NY | 2.04 | 06/15/21 | 263,000 | 262,077 |
| Total New York | | | | 24,807,122 |
| North Carolina | 0.3% | | |
| North Carolina Housing Finance Agency | 4.00 | 01/01/30 | 885,000 | 894,930 |
| North Carolina State Education Assistance Authority | 2.76(a) | 07/25/39 | 545,667 | 550,332 |
| Total North Carolina | | | | 1,445,262 |
| Oklahoma | 0.1% | | |
| Oklahoma Student Loan Authority | 2.46(a) | 02/25/32 | 423,079 | 418,125 |
| Total Oklahoma | | | | 418,125 |
| Pennsylvania | 2.9% | | |
| Lehigh County Authority PA | 3.44 | 12/01/18 | 3,825,000 | 3,829,896 |
| Pennsylvania Higher Education Assistance Agency (b) | 2.51(a) | 05/25/57 | 174,296 | 174,489 |
| Philadelphia Pennsylvania Authority for Industrial Development | 0.00(c) | 04/15/19 | 2,500,000 | 2,433,675 |
| Philadelphia Pennsylvania Authority for Industrial Development | 0.00(c) | 04/15/20 | 5,285,000 | 4,936,877 |
| Philadelphia Pennsylvania Authority for Industrial Development | 0.00(c) | 04/15/20 | 3,380,000 | 3,164,018 |
| Philadelphia Pennsylvania Authority for Industrial Development | 0.00(c) | 04/15/22 | 1,400,000 | 1,206,870 |
| Total Pennsylvania | | | | 15,745,825 |
| Puerto Rico | 1.5% | | |
| Puerto Rico Electric Power Authority | 5.00 | 07/01/18 | 300,000 | 300,000 |
| Puerto Rico Highway & Transportation Authority | 6.00 | 07/01/18 | 420,000 | 420,000 |
| Puerto Rico Highway & Transportation Authority | 5.50 | 07/01/19 | 1,800,000 | 1,850,022 |
| The accompanying notes are an integral part of these financial statements. | Portfolio of Investments |
37
Portfolio of Investments | Short-Term Bond Fund | June 30, 2018 | (Unaudited) | (Continued)
| Municipal Bonds | 17.5% of portfolio (Continued) |
| | Interest Rate /Yield | Maturity Date | Face Amount | Value |
| Puerto Rico | 1.5% (Continued) | | |
| Puerto Rico Highway & Transportation Authority | 6.25% | 07/01/21 | $2,400,000 | $2,555,376 |
| Puerto Rico Sales Tax Financing Corp. | 5.25 | 08/01/19 | 3,175,000 | 1,420,812 |
| Puerto Rico Sales Tax Financing Corp. | 4.38 | 08/01/20 | 905,000 | 404,988 |
| Puerto Rico, Commonwealth of | 5.50 | 07/01/18 | 340,000 | 340,000 |
| Puerto Rico, Commonwealth of | 5.25 | 07/01/18 | 390,000 | 390,000 |
| Puerto Rico, Commonwealth of | 5.25 | 07/01/18 | 325,000 | 325,000 |
| Puerto Rico, Commonwealth of | 5.50 | 07/01/19 | 250,000 | 256,948 |
| Total Puerto Rico | | | | 8,263,146 |
| Vermont | 0.1% | | |
| Vermont Student Assistance Corp. | 2.67(a) | 07/28/34 | 707,051 | 709,497 |
| Total Vermont | | | | 709,497 |
| Washington | 0.2% | | |
| Energy Northwest,WA | 2.15 | 07/01/18 | 850,000 | 850,000 |
| Total Washington | | | | 850,000 |
| Wisconsin | 1.3% | | |
| Wisconsin, Public Finance Authority | 2.50 | 09/01/18 | 2,250,000 | 2,248,335 |
| Wisconsin, Public Finance Authority | 2.63 | 11/01/19 | 2,375,000 | 2,339,327 |
| Wisconsin, Public Finance Authority | 2.82 | 03/01/20 | 910,000 | 904,267 |
| Wisconsin, Public Finance Authority | 2.75 | 06/01/20 | 1,575,000 | 1,544,351 |
| Total Wisconsin | | | | 7,036,280 |
| Total Municipal Bonds | | | | |
| (Cost $98,328,359) | | | | 96,165,207 |
| Yankee Bonds | 11.4% of portfolio |
| | | | |
| ABN AMRO Bank N.V. (b) | 2.10 | 01/18/19 | 650,000 | 647,634 |
| ABN AMRO Bank N.V. (b) | 3.00(a) | 01/18/19 | 900,000 | 902,421 |
| African Development Bank | 8.80 | 09/01/19 | 1,960,000 | 2,086,150 |
| Alibaba Group Holding Ltd. | 2.50 | 11/28/19 | 1,275,000 | 1,266,454 |
| BAT Capital Corp. (b) | 2.30 | 08/14/20 | 875,000 | 856,093 |
| BAT Capital Corp. (b) | 2.95(a) | 08/14/20 | 2,175,000 | 2,182,250 |
| Bayerische Landesbank | 1.38 | 08/09/19 | 4,400,000 | 4,329,142 |
| CNOOC Nexen Finance (2015) Australia Pty Ltd. | 2.63 | 05/05/20 | 425,000 | 419,481 |
| Daimler Finance North America LLC (b) | 3.10 | 05/04/20 | 650,000 | 648,659 |
| Daimler Finance North America LLC (b) | 2.75(a) | 05/04/20 | 450,000 | 449,842 |
| Daimler Finance North America LLC (b) | 2.30 | 02/12/21 | 1,650,000 | 1,602,640 |
| Daimler Finance North America LLC (b) | 2.79(a) | 02/12/21 | 1,650,000 | 1,650,219 |
| Daimler Finance North America LLC (b) | 3.35 | 05/04/21 | 875,000 | 871,297 |
| Daimler Finance North America LLC (b) | 2.91(a) | 05/04/21 | 425,000 | 426,068 |
| Deutsche Bank AG | 2.85 | 05/10/19 | 1,250,000 | 1,239,034 |
| Deutsche Bank AG | 4.26(a) | 05/10/19 | 750,000 | 753,555 |
| Hydro-Quebec | 6.27 | 01/03/26 | 80,000 | 93,323 |
| Landesbank Baden-Wuerttemberg | 2.13 | 01/31/20 | 3,000,000 | 2,962,005 |
| Landesbank Baden-Wuerttemberg | 7.63 | 02/01/23 | 1,175,000 | 1,385,920 |
| Mizuho Bank Ltd. (b) | 2.15 | 10/20/18 | 325,000 | 324,438 |
| Mizuho Bank Ltd. (b) | 2.65 | 09/25/19 | 250,000 | 248,686 |
| Petróleos Mexicanos S.A. de C.V. (b) | 5.98(a) | 03/11/22 | 160,000 | 170,800 |
| Reckitt Benckiser Treasury Services plc. (b) | 2.13 | 09/21/18 | 975,000 | 974,073 |
| Santander UK plc | 2.50 | 03/14/19 | 250,000 | 249,499 |
| Santander UK plc | 3.82(a) | 03/14/19 | 250,000 | 252,054 |
| Portfolio of Investments | The accompanying notes are an integral part of these financial statements. |
Portfolio of Investments | Short-Term Bond Fund | June 30, 2018 | (Unaudited) | (Continued)
| Yankee Bonds | 11.4% of portfolio (Continued) |
| | Interest Rate /Yield | Maturity Date | Face Amount | Value |
| Shell International Finance BV | 1.90% | 08/10/18 | $3,175,000 | $3,173,394 |
| Shell International Finance BV | 1.63 | 11/10/18 | 2,125,000 | 2,117,793 |
| Shell International Finance BV | 1.38 | 09/12/19 | 3,000,000 | 2,951,401 |
| Shell International Finance BV | 2.68(a) | 09/12/19 | 3,000,000 | 3,010,693 |
| Shell International Finance BV | 2.13 | 05/11/20 | 665,000 | 657,004 |
| Sinopec Group Overseas Development (2015) Ltd. (b) | 2.50 | 04/28/20 | 1,075,000 | 1,059,209 |
| Sinopec Group Overseas Development (2016) Ltd. (b) | 1.75 | 09/29/19 | 2,200,000 | 2,159,278 |
| Sinopec Group Overseas Development (2017) Ltd. (b) | 2.38 | 04/12/20 | 2,175,000 | 2,139,169 |
| Standard Chartered Bank plc. (b) | 2.10 | 08/19/19 | 700,000 | 690,492 |
| Standard Chartered Bank plc. (b) | 3.46(a) | 08/19/19 | 450,000 | 454,052 |
| Sumitomo Mitsui Banking Corp. | 1.76 | 10/19/18 | 2,225,000 | 2,219,694 |
| Sumitomo Mitsui Banking Corp. | 1.97 | 01/11/19 | 1,350,000 | 1,344,333 |
| Sumitomo Mitsui Banking Corp. | 2.09 | 10/18/19 | 1,300,000 | 1,283,628 |
| Sumitomo Mitsui Banking Corp. | 2.51 | 01/17/20 | 1,300,000 | 1,286,243 |
| Sumitomo Mitsui Banking Corp. | 2.70(a) | 01/17/20 | 875,000 | 874,982 |
| Syngenta Finance N.V. (b) | 3.70 | 04/24/20 | 1,300,000 | 1,295,233 |
| Syngenta Finance N.V. (b) | 3.93 | 04/23/21 | 425,000 | 423,892 |
| Toronto Dominion Bank | 1.45 | 09/06/18 | 4,400,000 | 4,391,867 |
| TransCanada PipeLines Ltd. | 7.13 | 01/15/19 | 2,045,000 | 2,092,317 |
| Volkswagen International Finance N.V. (b) | 2.13 | 11/20/18 | 2,300,000 | 2,294,498 |
| Total Yankee Bonds | | | | |
| (Cost $63,231,672) | | | | 62,910,909 |
| U.S. Government & Agency Obligations | 10.7% of portfolio |
| | | | |
| Overseas Private Investment Corp. | 1.30 | 06/15/19 | 171,429 | 169,848 |
| Overseas Private Investment Corp. | 2.52 | 09/15/22 | 1,630,682 | 1,611,559 |
| Private Export Funding Corp. (b) | 2.10 | 12/19/19 | 875,000 | 867,774 |
| Private Export Funding Corp. (b) | 2.65 | 02/16/21 | 1,825,000 | 1,815,516 |
| Tennessee Valley Authority | 0.00(c) | 06/15/21 | 595,000 | 545,964 |
| U.S. Department of Housing & Urban Development | 1.88 | 08/01/19 | 950,000 | 943,850 |
| U.S. Department of Housing & Urban Development | 6.07 | 08/01/21 | 10,000 | 10,032 |
| U.S. Department of Housing & Urban Development | 6.12 | 08/01/22 | 19,000 | 19,062 |
| U.S. Treasury Note | 1.63 | 04/30/19 | 1,975,000 | 1,963,891 |
| U.S. Treasury Note | 1.38 | 09/30/19 | 2,175,000 | 2,146,878 |
| U.S. Treasury Note | 1.50 | 10/31/19 | 13,100,000 | 12,937,273 |
| U.S. Treasury Note | 1.25 | 01/31/20 | 2,175,000 | 2,133,284 |
| U.S. Treasury Note | 2.25 | 03/31/20 | 2,175,000 | 2,165,060 |
| U.S. Treasury Note | 1.50 | 06/15/20 | 4,800,000 | 4,705,500 |
| U.S. Treasury Note | 1.63 | 10/15/20 | 12,225,000 | 11,966,651 |
| U.S. Treasury Note | 1.38 | 10/31/20 | 2,175,000 | 2,115,612 |
| U.S. Treasury Note | 2.00 | 01/15/21 | 7,850,000 | 7,734,397 |
| U.S. Treasury Note | 2.38 | 04/15/21 | 4,800,000 | 4,768,875 |
| Total U.S. Government & Agency Obligations | | | | |
| (Cost $59,179,976) | | | | 58,621,026 |
| Mortgage-Backed Securities | 1.1% of portfolio |
| | | | |
| ACE Securities Corp. 06-ASL1 | 2.24(a) | 02/25/36 | 234,673 | 128,288 |
| Adjustable Rate Mortgage Trust 05-10 | 3.82(a) | 01/25/36 | 44,729 | 41,771 |
| American Business Financial Services 02-1 | 7.01 | 12/15/32 | 46,929 | 31,994 |
| American Home Mortgage Investment Trust 05-01 | 4.50(a) | 06/25/45 | 7,020 | 7,018 |
| American Home Mortgage Investment Trust 05-03 | 5.47 | 09/25/35 | 5,355 | 5,322 |
| Amresco Residential Securities 98-1 | 7.03(a) | 10/25/27 | 32,888 | 35,749 |
| Banc of America Alternative Loan Trust Inc. 07-2 | 5.75 | 06/25/37 | 61,992 | 56,499 |
| Banc of America Funding Corp. 04-A | 3.60(a) | 09/20/34 | 5,113 | 5,228 |
| Banc of America Funding Corp. 05-G | 3.31(a) | 10/20/35 | 134,377 | 134,130 |
| The accompanying notes are an integral part of these financial statements. | Portfolio of Investments |
39
Portfolio of Investments | Short-Term Bond Fund | June 30, 2018 | (Unaudited) | (Continued)
| Mortgage-Backed Securities | 1.1% of portfolio (Continued) |
| | Interest Rate /Yield | Maturity Date | Face Amount | Value |
| Banc of America Funding Corp. 07-5 | 6.50% | 07/25/37 | $20,440 | $17,823 |
| Banc of America Mortgage Securities Inc. 02-J | 4.26(a) | 09/25/32 | 2,491 | 2,441 |
| Bayview Financial Acquisition Trust 06-D | 5.93 | 12/28/36 | 1,784,571 | 1,804,111 |
| Bear Stearns Adjustable Rate Mortgage Trust 04-10 | 3.60(a) | 01/25/35 | 134,182 | 135,329 |
| Bear Stearns Adjustable Rate Mortgage Trust 05-12 | 4.00(a) | 02/25/36 | 18,305 | 17,116 |
| Bear Stearns ALT-A Trust 04-11 | 4.07(a) | 11/25/34 | 8,344 | 8,218 |
| Bear Stearns ALT-A Trust 05-4 | 3.78(a) | 05/25/35 | 57,905 | 58,365 |
| Bear Stearns ALT-A Trust 05-9 | 3.50(a) | 11/25/35 | 30,960 | 25,370 |
| Bear Stearns ALT-A Trust 06-6 | 3.67(a) | 11/25/36 | 125,687 | 116,608 |
| Bear Stearns Asset Backed Securities Trust 03-3 | 3.14(a) | 06/25/43 | 33,147 | 32,774 |
| Bear Stearns Asset Backed Securities Trust 04-HE5 | 3.97(a) | 07/25/34 | 40,714 | 40,527 |
| Bear Stearns Structured Products Inc., 00-1 (b) | 7.33(a) | 08/28/33 | 100 | 97 |
| CDC Mortgage Capital Trust 02-HE1 | 2.58(a) | 01/25/33 | 203,159 | 200,098 |
| Chase Mortgage Finance Corp. 05-A1 | 3.48(a) | 12/25/35 | 4,888 | 4,707 |
| Chaseflex Trust 05-2 | 6.00 | 06/25/35 | 74,567 | 71,677 |
| CITICORP Mortgage Securities, Inc. 07-1 | 5.50 | 01/25/22 | 117 | 117 |
| CITICORP Mortgage Securities, Inc. 07-1 | 5.45(d) | 03/25/37 | 82,138 | 84,308 |
| Cityscape Home Equity Loan Trust 96-2 | 8.10 | 08/25/26 | 44,514 | 44,360 |
| Conseco Finance Securitizations Corp. 01-2 | 7.10 | 02/01/33 | 96,221 | 100,105 |
| Contimortgage Home Equity Loan Trust 95-2 | 8.10 | 08/15/25 | 21,286 | 13,872 |
| Countrywide Alternative Loan Trust 04-24CB | 6.00 | 11/25/34 | 30,825 | 31,084 |
| Countrywide Alternative Loan Trust 05-43 | 3.31(a) | 10/25/35 | 18,701 | 16,450 |
| Countrywide Asset Backed Certificate 02-S2 (e) | 5.98 | 01/25/17 | 1,688 | 1,687 |
| Countrywide Asset Backed Certificate 02-S4 (e) | 4.59(a) | 10/25/17 | 8,060 | 8,076 |
| Countrywide Asset Backed Certificate 04-S1 | 5.12 | 02/25/35 | 14,742 | 14,838 |
| Countrywide Asset Backed Certificate 06-S7 | 5.71(a) | 11/25/35 | 5,978 | 5,955 |
| Countrywide Asset Backed Certificate 07-S1 | 5.69 | 11/25/36 | 7,430 | 7,563 |
| Countrywide Home Loans 03-49 | 3.54(a) | 12/19/33 | 13,590 | 13,827 |
| Countrywide Home Loans 05-HYB8 | 3.42(a) | 12/20/35 | 58,755 | 56,631 |
| Countrywide Home Loans 06-HYB5 | 3.47(a) | 09/20/36 | 36,274 | 31,296 |
| Credit Suisse First Boston Mortgage 03-21 | 4.75 | 08/25/18 | 56 | 56 |
| Credit Suisse First Boston Mortgage 03-AR24 | 3.91(a) | 10/25/33 | 98,020 | 97,842 |
| Credit Suisse First Boston Mortgage 04-AR3 | 3.72(a) | 04/25/34 | 28,790 | 29,389 |
| Credit Suisse First Boston Mortgage 05-10 | 5.25 | 11/25/20 | 26,422 | 24,965 |
| Encore Credit Receivables Trust 05-3 | 2.69(a) | 10/25/35 | 123,684 | 123,855 |
| FHLMC 780754 | 3.32(a) | 08/01/33 | 1,229 | 1,294 |
| First Alliance Mortgage Loan Trust 94-1 | 5.85 | 04/25/25 | 4,002 | 3,995 |
| First Horizon Mortgage Alternative Mortgage Securities 04-AA3 | 3.42(a) | 09/25/34 | 10,963 | 10,873 |
| FNMA 813842 | 3.15(a) | 01/01/35 | 6,163 | 6,355 |
| GMAC Mortgage Corp. Loan Trust 06-HE3 | 5.75 | 10/25/36 | 19,097 | 19,309 |
| GMAC Mortgage Corp. Loan Trust 07-HE1 | 6.48(a) | 08/25/37 | 817,559 | 825,708 |
| GNMA 2003-11 | 4.00 | 10/17/29 | 57,254 | 58,492 |
| GNMA 2003-26 | 2.54(a) | 04/16/33 | 5,638 | 5,666 |
| GNMA 2004-17 | 4.50 | 12/20/33 | 9,794 | 10,100 |
| Green Tree Financial Corp. 98-5 | 6.22 | 03/01/30 | 44,288 | 46,725 |
| GS Mortgage Loan Trust 03-10 | 3.44(a) | 10/25/33 | 73,619 | 72,441 |
| GS Mortgage Loan Trust 05-8F | 5.50 | 10/25/20 | 7,818 | 7,812 |
| GS Mortgage Loan Trust 05-AR6 | 3.98(a) | 09/25/35 | 20,399 | 20,499 |
| IMPAC Secured Assets Corp. 03-3 | 5.20(a) | 08/25/33 | 65,192 | 66,642 |
| Indymac Indx Mortgage Loan Trust 05-AR15 | 3.50(a) | 09/25/35 | 21,080 | 19,736 |
| JP Morgan Mortgage Trust 05-A2 | 3.47(a) | 04/25/35 | 119,607 | 118,966 |
| Lehman ABS Manufactured Housing Contract 01-B | 4.35 | 04/15/40 | 9,336 | 9,390 |
| Master Adjustable Rate Mortgages Trust 04-13 | 3.81(a) | 04/21/34 | 9,332 | 9,576 |
| Master Adjustable Rate Mortgages Trust 05-1 | 3.62(a) | 01/25/35 | 7,417 | 7,347 |
| Master Alternative Loans Trust 03-5 | 6.00 | 08/25/33 | 24,822 | 25,118 |
| Master Asset Backed Securities Trust 07-NCW (b) | 2.26(a) | 05/25/37 | 289,959 | 271,531 |
| Master Asset Securitization Trust 07-1 | 6.00 | 10/25/22 | 8,648 | 8,557 |
| Merrill Lynch Mortgage Investors Trust 03-A2 | 3.77(a) | 02/25/33 | 14,361 | 14,122 |
| Portfolio of Investments | The accompanying notes are an integral part of these financial statements. |
Portfolio of Investments | Short-Term Bond Fund | June 30, 2018 | (Unaudited) | (Continued)
| Mortgage-Backed Securities | 1.1% of portfolio (Continued) |
| | Interest Rate /Yield | Maturity Date | Face Amount | Value |
| Morgan Stanley Mortgage Loan Trust 05-5AR | 3.67%(a) | 09/25/35 | $19,896 | $17,363 |
| Nomura Asset Acceptance Corporation 07-1 | 5.96 | 03/25/47 | 128,546 | 129,666 |
| Option One Mortgage Loan Trust 07-FXD2 | 5.90 | 03/25/37 | 10,084 | 9,482 |
| Prime Mortgage Trust 05-2 | 5.00 | 07/25/20 | 4,125 | 4,139 |
| Residential Asset Securitization Trust 04-A3 | 5.25 | 06/25/34 | 5,711 | 5,735 |
| Residential Asset Securitization Trust 05-A14 | 5.50 | 12/25/35 | 99,265 | 84,664 |
| Residential Funding Mortgage Securities I 03-S15 | 4.50 | 08/25/18 | 129 | 129 |
| Residential Funding Mortgage Securities I 05-SA2 | 3.94(a) | 06/25/35 | 17,242 | 14,291 |
| Ryland Acceptance Corp. 64 E (e) | 3.50(a) | 04/01/18 | 5,326 | 0 |
| Salomon Brothers Mortgage Securities 97-LB6 | 6.82 | 12/25/27 | 5 | 5 |
| Structured Adjustable Rate Mortgage Loan Trust 04-11 | 3.79(a) | 08/25/34 | 19,544 | 19,133 |
| Structured Adjustable Rate Mortgage Loan Trust 04-4 | 3.80(a) | 04/25/34 | 142,098 | 145,785 |
| Structured Adjustable Rate Mortgage Loan Trust 06-1 | 3.55(a) | 02/25/36 | 10,747 | 10,875 |
| Structured Adjustable Rate Mortgage Loan Trust 06-4 | 3.75(a) | 05/25/36 | 46,303 | 43,443 |
| Structured Asset Mortgage Investments 04-AR5 | 3.34(a) | 10/19/34 | 19,548 | 19,217 |
| Structured Asset Securities Corp. 03-37A | 4.15(a) | 12/25/33 | 80,135 | 79,601 |
| Structured Asset Securities Corp. 98-RF1 (b) | 5.12(a) | 04/15/27 | 13,810 | 13,766 |
| Washington Mutual Mortgage Securities Corp. 04-AR14 | 3.48(a) | 01/25/35 | 41,794 | 42,747 |
| Washington Mutual Mortgage Securities Corp. 04-AR3 | 3.95(a) | 06/25/34 | 23,687 | 24,155 |
| Wells Fargo Mortgage Backed Securities Trust 04-B | 3.77(a) | 02/25/34 | 7,336 | 7,388 |
| Wells Fargo Mortgage Backed Securities Trust 04-E | 4.35(a) | 05/25/34 | 9,838 | 10,044 |
| Wells Fargo Mortgage Backed Securities Trust 04-EE | 4.16(a) | 12/25/34 | 7,904 | 8,209 |
| Wells Fargo Mortgage Backed Securities Trust 04-F | 4.19(a) | 06/25/34 | 23,409 | 23,431 |
| Wells Fargo Mortgage Backed Securities Trust 04-I | 3.75(a) | 07/25/34 | 1,898 | 1,943 |
| Wells Fargo Mortgage Backed Securities Trust 04-K | 4.49(a) | 07/25/34 | 28,889 | 29,442 |
| Wells Fargo Mortgage Backed Securities Trust 04-K | 4.40(a) | 07/25/34 | 12,535 | 13,111 |
| Wells Fargo Mortgage Backed Securities Trust 04-K | 4.40(a) | 07/25/34 | 13,945 | 14,327 |
| Wells Fargo Mortgage Backed Securities Trust 04-R | 3.60(a) | 09/25/34 | 14,321 | 14,802 |
| Wells Fargo Mortgage Backed Securities Trust 05-AR14 | 3.66(a) | 08/25/35 | 7,526 | 7,636 |
| Wells Fargo Mortgage Backed Securities Trust 05-AR15 | 3.61(a) | 09/25/35 | 60,588 | 60,457 |
| Wells Fargo Mortgage Backed Securities Trust 05-AR16 | 3.65(a) | 10/25/35 | 16,757 | 16,397 |
| Wells Fargo Mortgage Backed Securities Trust 06-AR19 | 3.71(a) | 12/25/36 | 9,965 | 9,287 |
| Total Mortgage-Backed Securities | | | | |
| (Cost $6,036,361) | | | | 6,208,460 |
| Corporate Bond Guaranteed by Export-Import Bank of the United States | 0.1% of portfolio |
| | | | |
| Energy | 0.1% | | |
| Petroleos Mexicanos | 2.46 | 12/15/25 | 329,250 | 321,645 |
| Total Energy | | | | 321,645 |
| Total Corporate Bond Guaranteed by Export-Import Bank of the United States | | | | |
| (Cost $325,267) | | | | 321,645 |
| Certificates of Deposit | 0.3% of portfolio |
| | | | |
| American Express Bank FSB | 1.65 | 07/09/18 | 250,000 | 249,973 |
| Capital One Bank USA NA | 1.65 | 07/09/18 | 250,000 | 249,973 |
| Capital One NA | 1.60 | 07/16/18 | 250,000 | 249,954 |
| Comenity Capital Bank | 1.75 | 08/10/18 | 250,000 | 249,940 |
| Discover Bank | 1.65 | 07/09/18 | 250,000 | 249,984 |
| Goldman Sachs Bank USA | 1.65 | 07/16/18 | 250,000 | 249,954 |
| World’s Foremost Bank | 1.70 | 07/16/18 | 200,000 | 199,964 |
| Total Certificates of Deposit | | | | |
| (Cost $1,700,000) | | | | 1,699,742 |
| The accompanying notes are an integral part of these financial statements. | Portfolio of Investments |
41
Portfolio of Investments | Short-Term Bond Fund | June 30, 2018 | (Unaudited) | (Continued)
| Commercial Paper | 2.3% of portfolio |
| | Interest Rate /Yield | Maturity Date | Face Amount | Value |
| Kansas City Power and Light Co. (b) | 2.25% | 07/02/18 | $12,598,000 | $12,595,659 |
| Total Commercial Paper | | | | |
| (Cost $12,597,213) | | | | 12,595,659 |
| Money Market Fund | less than 0.1% of portfolio |
| | | | Shares | |
| State Street Institutional U.S. Government Money Market Fund, Premier Class | 1.82(f) | | 935 | 935 |
| Total Money Market Fund | | | | |
| (Cost $935) | | | | 935 |
| Total Investments in Securities | | | | |
| (Cost $551,975,590) | 100.0% | | | | $550,380,402 |
| (a) | Variable coupon rate as of June 30, 2018. |
| (b) | Security was purchased pursuant to Rule 144A under the Securities Act of 1933 and may be resold in transactions exempt from registration, normally to qualified institutional buyers. The securities have been determined to be liquid under criteria established by the Fund's Board of Directors. The total of such securities at period-end amounts to $148,444,986 and represents 27.0% of total investments. |
| (c) | Zero coupon rate, purchased at a discount. |
| (d) | Step coupon security, the current rate may be adjusted upwards before maturity date. |
| (e) | Security did not mature on maturity date. While additional principal and interest have been received past the maturity date, the amount and timing of future payments is uncertain. |
| (f) | 7-day yield at June 30, 2018. |
AMBAC - American Municipal Bond Assurance Corporation
LLC - Limited Liability Company
NA - National Association
ABS - Asset-Backed Security
N.V. - Naamloze Vennootschap
AG - Aktiengesellschaft
S.A. de C.V. - Sociedad Anonima de Capital Variable
BV - Besloten Vennootschap
FHLMC - Federal Home Loan Mortgage Corporation
| Portfolio of Investments | The accompanying notes are an integral part of these financial statements. |
Portfolio of Investments
Stock Index Fund | June 30, 2018 | (Unaudited)
| | Cost | Value |
| Investment in S&P 500 Index Master Portfolio | $49,469,550 | $147,202,317 |
Substantially all the assets of the Stock Index Fund are invested in the S&P 500 Index Master Portfolio managed by BlackRock Fund Advisors. As of June 30, 2018, the Stock Index Fund's ownership interest in the S&P 500 Index Master Portfolio was 0.92%. See the Portfolio of Investments for the S&P 500 Index Master Portfolio for holdings information.
| The accompanying notes are an integral part of these financial statements. | Portfolio of Investments |
43
Portfolio of Investments
Value Fund | June 30, 2018 | (Unaudited)
| Common Stocks | 98.7% of portfolio |
| | Shares | Value |
| Consumer Discretionary | 3.3% |
| Auto Components | | |
| Adient PLC | 100,743 | $4,955,548 |
| Distributors | | |
| Genuine Parts Co. | 240,400 | 22,066,316 |
| LKQ Corp. (a) | 223,482 | 7,129,076 |
| Total Consumer Discretionary | | 34,150,940 |
| Energy | 11.3% |
| Energy Equipment & Services | | |
| Helmerich & Payne, Inc. | 110,000 | 7,013,600 |
| Oil, Gas & Consumable Fuels | | |
| Chevron Corp. | 295,000 | 37,296,850 |
| ConocoPhillips | 452,400 | 31,496,088 |
| Marathon Oil Corp. | 663,100 | 13,832,266 |
| Royal Dutch Shell PLC ADR | 353,000 | 25,645,450 |
| Total Energy | | 115,284,254 |
| Financials | 16.1% |
| Banks | | |
| Bank of America Corp. | 750,200 | 21,148,138 |
| Citigroup, Inc. | 296,000 | 19,808,320 |
| JPMorgan Chase & Co. | 417,600 | 43,513,920 |
| Wells Fargo & Co. | 221,000 | 12,252,240 |
| Insurance | | |
| Allstate Corp. | 369,000 | 33,678,630 |
| American International Group, Inc. | 423,298 | 22,443,260 |
| Chubb Ltd. | 85,469 | 10,856,272 |
| Total Financials | | 163,700,780 |
| Health Care | 17.4% |
| Health Care Equipment & Supplies | | |
| Abbott Laboratories | 399,000 | 24,335,010 |
| Medtronic PLC | 198,465 | 16,990,589 |
| Life Sciences Tools & Services | | |
| Mettler-Toledo International, Inc. (a) | 45,000 | 26,038,350 |
| Pharmaceuticals | | |
| Bristol-Myers Squibb Co. | 719,700 | 39,828,198 |
| Merck & Co., Inc. | 456,000 | 27,679,200 |
| Pfizer, Inc. | 1,107,000 | 40,161,960 |
| Roche Holding AG ADR | 90,000 | 2,486,700 |
| Total Health Care | | 177,520,007 |
| Industrials | 12.7% |
| Airlines | | |
| Southwest Airlines Co. | 844,100 | 42,947,808 |
| Building Products | | |
| Johnson Controls International PLC | 157,431 | 5,266,067 |
| Industrial Conglomerates | | |
| Honeywell International, Inc. | 231,100 | 33,289,955 |
| Common Stocks | 98.7% of portfolio (Continued) |
| | Shares | Value |
| Industrials | 12.7% (Continued) |
| Machinery | | |
| Parker-Hannifin Corp. | 246,400 | $38,401,440 |
| Trading Companies & Distributors | | |
| Applied Industrial Technologies, Inc. | 130,500 | 9,154,575 |
| Total Industrials | | 129,059,845 |
| Information Technology | 25.7% |
| Communications Equipment | | |
| Cisco Systems, Inc. | 1,143,500 | 49,204,805 |
| Electronic Equipment, Instruments & Components | | |
| TE Connectivity Ltd. | 262,850 | 23,672,271 |
| Internet Software & Services | | |
| Alphabet, Inc., Class C (a) | 34,000 | 37,932,100 |
| IT Services | | |
| Leidos Holdings Inc. | 250,750 | 14,794,250 |
| Visa Inc., Class A | 356,000 | 47,152,200 |
| Semiconductors & Semiconductor Equipment | | |
| Intel Corp. | 953,000 | 47,373,630 |
| Software | | |
| Microsoft Corp. | 427,000 | 42,106,470 |
| Total Information Technology | | 262,235,726 |
| Materials | 11.1% |
| Chemicals | | |
| DowDuPont, Inc. | 711,900 | 46,928,448 |
| Containers & Packaging | | |
| Avery Dennison Corp. | 470,000 | 47,987,000 |
| Bemis Co., Inc. | 433,600 | 18,302,256 |
| Total Materials | | 113,217,704 |
| Telecommunication Services | 1.1% |
| Diversified Telecommunication Services | | |
| Verizon Communications, Inc. | 232,000 | 11,671,920 |
| Total Telecommunication Services | | 11,671,920 |
| Total Common Stocks | | |
| (Cost $521,797,385) | | 1,006,841,176 |
| Commercial Paper | 1.3% of portfolio |
| | Face Amount | |
| Kansas City Power and Light Co., 2.25%, 07/02/18 (b) | $12,878,000 | 12,875,607 |
| Total Commercial Paper | | |
| (Cost $12,877,195) | | 12,875,607 |
| Portfolio of Investments | The accompanying notes are an integral part of these financial statements. |
Portfolio of Investments | Value Fund | June 30, 2018 | (Unaudited) | (Continued)
| Money Market Fund | less than 0.1% of portfolio |
| | Shares | Value |
| State Street Institutional U.S. Government Money Market Fund, Premier Class, 1.82% (c) | 718 | $718 |
| Total Money Market Fund | | |
| (Cost $718) | | 718 |
| Total Investments in Securities | | |
| (Cost $534,675,298) | 100.0% | | $1,019,717,501 |
| (b) | Security was purchased pursuant to Rule 144A under the Securities Act of 1933 and may be resold in transactions exempt from registration, normally to qualified institutional buyers. The securities have been determined to be liquid under criteria established by the Fund's Board of Directors. The total of such securities at period-end amounts to $12,875,607 and represents 1.3% of total investments. |
| (c) | 7-day yield at June 30, 2018. |
PLC - Public Limited Company
ADR - American Depositary Deposit
AG - Aktiengesellschaft
| The accompanying notes are an integral part of these financial statements. | Portfolio of Investments |
45
Portfolio of Investments
Growth Fund | June 30, 2018 | (Unaudited)
| Common Stocks | 98.2% of portfolio |
| | Shares | Value |
| Consumer Discretionary | 23.1% |
| Auto Components | | |
| Aptiv PLC | 13,900 | $1,273,657 |
| Automobiles | | |
| Tesla Inc. (a) | 8,042 | 2,758,004 |
| Hotels, Restaurants & Leisure | | |
| Hilton Worldwide Holdings, Inc. | 29,845 | 2,362,530 |
| Las Vegas Sands Corp. | 17,300 | 1,321,028 |
| Restaurant Brands International Inc. | 23,800 | 1,435,140 |
| Internet & Direct Marketing Retail | | |
| Amazon.com, Inc. (a) | 10,459 | 17,778,208 |
| Booking Holdings, Inc. (a) | 5,017 | 10,169,911 |
| Netflix, Inc. (a) | 7,797 | 3,051,980 |
| Multiline Retail | | |
| Dollar General Corp. | 33,300 | 3,283,380 |
| Specialty Retail | | |
| Ross Stores, Inc. | 29,700 | 2,517,075 |
| Textiles, Apparel & Luxury Goods | | |
| NIKE, Inc., Class B | 24,500 | 1,952,160 |
| Total Consumer Discretionary | | 47,903,073 |
| Consumer Staples | 1.1% |
| Tobacco | | |
| Philip Morris International Inc. | 29,502 | 2,381,991 |
| Total Consumer Staples | | 2,381,991 |
| Financials | 4.5% |
| Capital Markets | | |
| Charles Schwab Corp. | 68,310 | 3,490,641 |
| Intercontinental Exchange, Inc. | 33,400 | 2,456,570 |
| Morgan Stanley | 39,155 | 1,855,947 |
| TD Ameritrade Holding Corp. | 29,650 | 1,623,930 |
| Total Financials | | 9,427,088 |
| Health Care | 18.6% |
| Biotechnology | | |
| Alexion Pharmaceuticals, Inc. (a) | 13,170 | 1,635,055 |
| Incyte Corp. (a) | 8,900 | 596,300 |
| Vertex Pharmaceuticals, Inc. (a) | 19,935 | 3,388,153 |
| Health Care Equipment & Supplies | | |
| Becton, Dickinson & Co. | 19,933 | 4,775,150 |
| Danaher Corp. | 3,073 | 303,244 |
| Intuitive Surgical, Inc. (a) | 9,179 | 4,391,968 |
| Stryker Corp. | 23,433 | 3,956,896 |
| Health Care Providers & Services | | |
| Anthem, Inc. | 10,166 | 2,419,813 |
| Centene Corp. (a) | 10,529 | 1,297,278 |
| Cigna Corp. | 27,076 | 4,601,566 |
| HCA Healthcare, Inc. | 24,795 | 2,543,967 |
| Humana, Inc. | 3,906 | 1,162,543 |
| UnitedHealth Group, Inc. | 24,300 | 5,961,762 |
| Common Stocks | 98.2% of portfolio (Continued) |
| | Shares | Value |
| Health Care | 18.6% (Continued) |
| Pharmaceuticals | | |
| Merck & Co., Inc. | 25,400 | $1,541,780 |
| Total Health Care | | 38,575,475 |
| Industrials | 7.5% |
| Aerospace & Defense | | |
| Boeing Co. | 28,757 | 9,648,261 |
| Spirit AeroSystem Holdings, Inc., Class A | 10,199 | 876,196 |
| Airlines | | |
| American Airlines Group Inc. | 37,149 | 1,410,176 |
| Commercial Services & Supplies | | |
| Waste Connections, Inc. | 20,650 | 1,554,532 |
| Machinery | | |
| Fortive Corp. | 12,700 | 979,297 |
| Road & Rail | | |
| Kansas City Southern | 11,158 | 1,182,302 |
| Total Industrials | | 15,650,764 |
| Information Technology | 41.1% |
| Internet Software & Services | | |
| Alibaba Group Holding Ltd. ADR (a) | 27,700 | 5,139,181 |
| Alphabet, Inc., Class C (a) | 4,350 | 4,853,078 |
| Alphabet, Inc., Class A (a) | 7,750 | 8,751,222 |
| Dropbox, Inc., Class A (a) | 1,916 | 62,117 |
| Facebook, Inc., Class A (a) | 51,292 | 9,967,061 |
| Shopify Inc., Class A (a) | 4,689 | 684,078 |
| Tencent Holdings Ltd. ADR | 91,134 | 4,579,484 |
| IT Services | | |
| Fidelity National Information Services, Inc. | 6,573 | 696,935 |
| Global Payments, Inc. | 17,177 | 1,915,064 |
| PayPal Holdings, Inc. (a) | 38,500 | 3,205,895 |
| Visa Inc., Class A | 70,400 | 9,324,480 |
| Semiconductors & Semiconductor Equipment | | |
| ASML Holding NV ADR | 4,500 | 890,865 |
| Broadcom, Inc. | 4,700 | 1,140,408 |
| Maxim Integrated Products, Inc. | 19,481 | 1,142,755 |
| Software | | |
| Activision Blizzard, Inc. | 16,100 | 1,228,752 |
| Electronic Arts, Inc. (a) | 9,800 | 1,381,996 |
| Intuit, Inc. | 17,678 | 3,611,704 |
| Microsoft Corp. | 115,900 | 11,428,899 |
| Red Hat, Inc. (a) | 18,855 | 2,533,546 |
| salesforce.com, Inc. (a) | 32,200 | 4,392,080 |
| ServiceNow, Inc. (a) | 8,387 | 1,446,506 |
| VMware, Inc., Class A (a) | 15,749 | 2,314,631 |
| Workday, Inc., Class A (a) | 9,892 | 1,198,119 |
| Portfolio of Investments | The accompanying notes are an integral part of these financial statements. |
Portfolio of Investments | Growth Fund | June 30, 2018 | (Unaudited) | (Continued)
| Common Stocks | 98.2% of portfolio (Continued) |
| | Shares | Value |
| Information Technology | 41.1% (Continued) |
| Technology Hardware, Storage & Peripherals | | |
| Apple, Inc. | 19,400 | $3,591,134 |
| Total Information Technology | | 85,479,990 |
| Real Estate | 1.2% |
| Equity Real Estate Investment Trusts (REITs) | | |
| Crown Castle International Corp. | 22,342 | 2,408,914 |
| Total Real Estate | | 2,408,914 |
| Utilities | 1.1% |
| Multi-Utilities | | |
| Sempra Energy | 12,734 | 1,478,545 |
| Water Utilities | | |
| American Water Works Co., Inc. | 10,100 | 862,338 |
| Total Utilities | | 2,340,883 |
| Total Common Stocks | | |
| (Cost $135,206,747) | | 204,168,178 |
| Money Market Fund | 1.8% of portfolio |
| | Shares | Value |
| State Street Institutional U.S. Government Money Market Fund, Premier Class, 1.82% (b) | 3,682,166 | $3,682,166 |
| Total Money Market Fund | | |
| (Cost $3,682,166) | | 3,682,166 |
| Total Investments in Securities | | |
| (Cost $138,888,913) | 100.0% | | $207,850,344 |
| (b) | 7-day yield at June 30, 2018. |
PLC - Public Limited Company
ADR - American Depositary Deposit
NV - Naamloze Vennottschap
| The accompanying notes are an integral part of these financial statements. | Portfolio of Investments |
47
Portfolio of Investments
Small-Company Stock Fund | June 30, 2018 | (Unaudited)
| Common Stocks | 97.2% of portfolio |
| | Shares | Value |
| Consumer Discretionary | 12.2% |
| Distributors | | |
| Core-Mark Holding Company, Inc. | 739,592 | $16,788,738 |
| Hotels, Restaurants & Leisure | | |
| BJ’s Restaurants, Inc. | 657,427 | 39,445,620 |
| Cracker Barrel Old Country Store, Inc. | 210,209 | 32,836,748 |
| Textiles, Apparel & Luxury Goods | | |
| G-III Apparel Group, Ltd. (a) | 585,252 | 25,985,189 |
| Total Consumer Discretionary | | 115,056,295 |
| Energy | 0.8% |
| Energy Equipment & Services | | |
| Select Energy Services, Inc., Class A-2 (a)(b) | 517,657 | 7,521,556 |
| Total Energy | | 7,521,556 |
| Financials | 22.4% |
| Banks | | |
| FB Financial Corp. | 161,577 | 6,579,415 |
| Glacier Bancorp, Inc. | 629,000 | 24,329,720 |
| Metropolitan Bank Holding Corp. (a) | 200,000 | 10,496,000 |
| National Bankshares, Inc. (Virginia) (c) | 415,717 | 19,289,269 |
| State Bank Financial Corp. | 1,181,700 | 39,468,780 |
| Texas Capital Bancshares, Inc. (a) | 126,917 | 11,612,906 |
| Consumer Finance | | |
| Encore Capital Group, Inc. (a) | 1,236,289 | 45,248,177 |
| Insurance | | |
| Kinsale Capital Group, Inc. | 656,980 | 36,041,923 |
| National General Holdings Corp. | 691,963 | 18,219,386 |
| Total Financials | | 211,285,576 |
| Health Care | 4.4% |
| Health Care Equipment & Supplies | | |
| STERIS PLC | 342,112 | 35,925,181 |
| Life Sciences Tools & Services | | |
| NanoString Technologies, Inc. (a) | 395,418 | 5,409,318 |
| Total Health Care | | 41,334,499 |
| Industrials | 33.6% |
| Air Freight & Logistics | | |
| Radiant Logistics, Inc. (a) | 903,100 | 3,531,121 |
| Building Products | | |
| NCI Building Systems, Inc. (a) | 1,181,831 | 24,818,451 |
| Commercial Services & Supplies | | |
| Interface, Inc. | 6,224 | 142,841 |
| Construction & Engineering | | |
| Comfort Systems USA, Inc. | 50,994 | 2,335,525 |
| Dycom Industries, Inc. (a) | 660,299 | 62,404,859 |
| Orion Group Holdings, Inc. (a)(c) | 1,803,594 | 14,897,686 |
| Primoris Services Corp. | 1,102,400 | 30,018,352 |
| Common Stocks | 97.2% of portfolio (Continued) |
| | Shares | Value |
| Industrials | 33.6% (Continued) |
| Machinery | | |
| Manitowoc Co., Inc. (The) (a) | 189,850 | $4,909,521 |
| NN, Inc. | 1,348,200 | 25,480,980 |
| Standex International Corp. | 149,244 | 15,252,737 |
| Welbilt, Inc. (a) | 759,400 | 16,942,214 |
| Road & Rail | | |
| Covenant Transportation Group, Inc., Class A (a) | 605,200 | 19,063,800 |
| Knight-Swift Transportation Holdings Inc. | 707,732 | 27,042,440 |
| Werner Enterprises, Inc. | 804,181 | 30,196,996 |
| Trading Companies & Distributors | | |
| Applied Industrial Technologies, Inc. | 574,374 | 40,292,336 |
| Total Industrials | | 317,329,859 |
| Information Technology | 14.7% |
| Electronic Equipment, Instruments & Components | | |
| Belden Inc. | 337,585 | 20,633,195 |
| Internet Software & Services | | |
| comScore, Inc. (a) | 753,000 | 16,415,400 |
| j2 Global, Inc | 202,154 | 17,508,558 |
| IT Services | | |
| Cass Information Systems, Inc. | 246,195 | 16,943,140 |
| Computer Services, Inc. | 585,362 | 29,033,955 |
| ManTech International Corp., Class A | 325,082 | 17,437,399 |
| Software | | |
| Descartes Systems Group Inc. (The) (a) | 628,898 | 20,439,185 |
| Total Information Technology | | 138,410,832 |
| Materials | 9.1% |
| Chemicals | | |
| PolyOne Corp. | 1,024,246 | 44,267,912 |
| Construction Materials | | |
| Summit Materials, Inc., Class A (a) | 1,140,829 | 29,946,761 |
| Containers & Packaging | | |
| Myers Industries, Inc. | 633,639 | 12,165,869 |
| Total Materials | | 86,380,542 |
| Total Common Stocks | | |
| (Cost $622,487,352) | | 917,319,159 |
| Commercial Paper | 2.8% of portfolio |
| | Face Amount | |
| Southwestern Public Service Co., 2.20%, 07/02/18 | $26,552,000 | 26,547,066 |
| Total Commercial Paper | | |
| (Cost $26,550,377) | | 26,547,066 |
| Portfolio of Investments | The accompanying notes are an integral part of these financial statements. |
Portfolio of Investments | Small-Company Stock Fund | June 30, 2018 | (Unaudited) | (Continued)
| Money Market Fund | less than 0.1% of portfolio |
| | Shares | Value |
| State Street Institutional U.S. Government Money Market Fund, Premier Class, 1.82% (d) | 473 | $473 |
| Total Money Market Fund | | |
| (Cost $473) | | 473 |
| Total Investments in Securities | | |
| (Cost $649,038,202) | 100.0% | | $943,866,698 |
| (b) | Security was purchased pursuant to Rule 144A under the Securities Act of 1933 and may be resold in transactions exempt from registration, normally to qualified institutional buyers. The securities have been determined to be liquid under criteria established by the Fund's Board of Directors. The total of such securities at period-end amounts to $7,521,556 and represents 0.8% of total investments. |
| (c) | During the period ended June 30, 2018, investments in issuers considered to be affiliates of the Fund for purposes of Section 2(a)(3) of the Investment Company Act of 1940, as amended, were as follows: |
| | |
| Affiliate Persons | Shares Held at
December 31, 2017 | Shares
Purchased | Shares
Sold | Shares Held at
June 30, 2018 | Value at
June 30, 2018 | Income | Realized
Gain (Loss) | Change in Unrealized Appreciation (Depreciation) |
| National Bankshares, Inc. (Virginia) | 415,717 | — | — | 415,717 | $19,289,269 | $241,116 | $— | $394,932 |
| Orion Group Holdings, Inc. | 1,853,794 | — | 50,200 | 1,803,594 | 14,897,686 | — | 4,396 | 382,479 |
| Total | | | | | $34,186,955 | $241,116 | $4,396 | $777,411 |
| (d) | 7-day yield at June 30, 2018. |
PLC - Public Limited Company
| The accompanying notes are an integral part of these financial statements. | Portfolio of Investments |
49
Portfolio of Investments
International Equity Fund | June 30, 2018 | (Unaudited)
| Common Stocks | 93.9% of portfolio |
| | Shares | Value |
| Australia | 1.3% |
| CSL Ltd. | 6,775 | $964,374 |
| Total Australia | | 964,374 |
| Britain | 9.1% |
| BBA Aviation PLC | 139,400 | 625,373 |
| HSBC Holdings PLC | 120,906 | 1,129,788 |
| Royal Dutch Shell PLC, Class B | 77,239 | 2,766,161 |
| Unilever PLC | 27,707 | 1,530,547 |
| WPP PLC | 52,356 | 822,595 |
| Total Britain | | 6,874,464 |
| Canada | 2.1% |
| Canadian National Railway Co. | 19,688 | 1,609,494 |
| Total Canada | | 1,609,494 |
| China | 1.2% |
| Baidu, Inc. ADR (a) | 2,520 | 612,360 |
| Weibo Corp. ADR (a) | 3,632 | 322,376 |
| Total China | | 934,736 |
| Denmark | 1.0% |
| Novozymes A/S, Class B | 15,400 | 778,905 |
| Total Denmark | | 778,905 |
| France | 11.0% |
| Air Liquide SA | 14,306 | 1,793,188 |
| Dassault Systèmes SE | 20,290 | 2,839,456 |
| L’Oréal SA | 9,078 | 2,237,968 |
| LVMH Moët Hennessy—Louis Vuitton SE | 4,368 | 1,450,258 |
| Total France | | 8,320,870 |
| Germany | 17.6% |
| Allianz SE REG | 13,034 | 2,685,716 |
| Bayer AG REG | 25,292 | 2,777,656 |
| Bayerische Motoren Werke AG | 12,386 | 1,119,600 |
| Fresenius Medical Care AG & Co. KGaA | 10,664 | 1,073,773 |
| FUCHS PETROLUB SE | 4,127 | 194,417 |
| Infineon Technologies AG | 48,300 | 1,226,883 |
| Linde AG | 6,001 | 1,425,711 |
| SAP SE ADR | 15,550 | 1,798,513 |
| Symrise AG | 12,336 | 1,079,084 |
| Total Germany | | 13,381,353 |
| Hong Kong | 4.7% |
| AIA Group Ltd. | 405,400 | 3,531,606 |
| Total Hong Kong | | 3,531,606 |
| Common Stocks | 93.9% of portfolio (Continued) |
| | Shares | Value |
| India | 0.4% |
| HDFC Bank Ltd. ADR | 1,990 | $208,990 |
| ICICI Bank Ltd. ADR | 16,680 | 133,940 |
| Total India | | 342,930 |
| Israel | 2.7% |
| Check Point Software Technologies Ltd. (a) | 21,300 | 2,080,584 |
| Total Israel | | 2,080,584 |
| Italy | 1.3% |
| Tenaris, SA ADR | 26,300 | 957,057 |
| Total Italy | | 957,057 |
| Japan | 17.1% |
| Daito Trust Construction Co., Ltd. | 4,100 | 666,962 |
| FANUC Corp. | 11,100 | 2,200,150 |
| JGC Corp. | 45,900 | 923,278 |
| Keyence Corp. | 3,800 | 2,143,254 |
| Kubota Corp. | 57,900 | 908,737 |
| M3, Inc. | 58,700 | 2,334,394 |
| MonotaRO Co., Ltd. | 24,400 | 1,077,886 |
| Park24 Co., Ltd. | 31,200 | 848,500 |
| Sysmex Corp. | 19,900 | 1,854,174 |
| Total Japan | | 12,957,335 |
| Mexico | 0.5% |
| Grupo Financiero Banorte SAB de CV | 61,000 | 358,685 |
| Total Mexico | | 358,685 |
| Republic of South Korea | 0.3% |
| Samsung Electronics Co., Ltd. GDR | 228 | 236,473 |
| Total Republic of South Korea | | 236,473 |
| Singapore | 2.9% |
| DBS Group Holdings Ltd. | 111,600 | 2,170,287 |
| Total Singapore | | 2,170,287 |
| South Africa | 1.5% |
| Aspen Pharmacare Holdings Ltd. | 11,000 | 206,535 |
| Naspers Ltd., Class N | 3,040 | 766,517 |
| Sasol Ltd. | 4,100 | 149,104 |
| Total South Africa | | 1,122,156 |
| Spain | 2.8% |
| Banco Bilboa Vizcaya Argentaria SA | 244,963 | 1,727,617 |
| Portfolio of Investments | The accompanying notes are an integral part of these financial statements. |
Portfolio of Investments | International Equity Fund | June 30, 2018 | (Unaudited) | (Continued)
| Common Stocks | 93.9% of portfolio (Continued) |
| | Shares | Value |
| Spain | 2.8% (Continued) |
| Grifols, SA | 12,266 | $367,647 |
| Total Spain | | 2,095,264 |
| Sweden | 3.9% |
| Alfa Laval AB | 37,900 | 894,738 |
| Atlas Copco AB, Class A | 32,467 | 940,261 |
| Epiroc AB, Class A (a) | 32,467 | 340,701 |
| Skandinaviska Enskilda Banken AB, Class A | 85,289 | 807,207 |
| Total Sweden | | 2,982,907 |
| Switzerland | 9.6% |
| Lonza Group AG REG | 3,961 | 1,046,680 |
| Nestlé SA ADR | 32,220 | 2,497,076 |
| Roche Holding AG REG | 7,392 | 1,639,974 |
| Sonova Holding AG REG | 5,909 | 1,057,023 |
| Temenos Group AG REG | 7,123 | 1,071,203 |
| Total Switzerland | | 7,311,956 |
| Taiwan | 1.0% |
| Taiwan Semiconductor Manufacturing Co. Ltd. ADR | 20,200 | 738,512 |
| Total Taiwan | | 738,512 |
| United States of America | 1.9% |
| Schlumberger Ltd. | 21,353 | 1,431,292 |
| Total United States of America | | 1,431,292 |
| Total Common Stocks | | |
| (Cost $55,708,339) | | 71,181,240 |
| Preferred Stocks | 2.3% of portfolio |
| | Shares | Value |
| Brazil | 0.4% |
| Itaú Unibanco Holding SA ADR | 31,820 | $330,292 |
| Total Brazil | | 330,292 |
| Germany | 0.6% |
| FUCHS PETROLUB SE | 9,378 | 461,457 |
| Total Germany | | 461,457 |
| Republic of South Korea | 0.7% |
| Samsung Electronics Co., Ltd. REG GDR | 618 | 516,594 |
| Total Republic of South Korea | | 516,594 |
| Spain | 0.6% |
| Grifols, SA ADR | 19,289 | 414,713 |
| Total Spain | | 414,713 |
| Total Preferred Stocks | | |
| (Cost $1,188,567) | | 1,723,056 |
| Money Market Fund | 3.8% of portfolio |
| | |
| State Street Institutional U.S. Government Money Market Fund, Premier Class, 1.82% (b) | 2,909,357 | 2,909,357 |
| Total Money Market Fund | | |
| (Cost $2,909,357) | | 2,909,357 |
| Total Investments in Securities | | |
| (Cost $59,806,263) | 100.0% | | $75,813,653 |
| (b) | 7-day yield at June 30, 2018. |
PLC - Public Limited Company
ADR - American Depositary Deposit
A/S - Aktieselskab
SA - Sociedad Anonima or Societe Anonyme
SE - Societas Europaea
REG - Registered Shares
AG - Aktiengesellschaft
KGaA - Kommanditgesellschaft auf Aktien
SAB de CV - Sociedad Anonima Bursatil de Capital Variable
SAB - Sociedad Anonima Bursatil
GDR - Global Depositary Receipt
AB - Aktiebolag
| The accompanying notes are an integral part of these financial statements. | Portfolio of Investments |
51
Statements of Assets and Liabilities
June 30, 2018 (Unaudited)
| Assets | Daily Income Fund | Short-Term Government Securities Fund |
| Investments in securities, at value (cost: $157,905,010, $77,360,600, $551,975,590, $49,469,550, $534,675,298, $138,888,913, $649,038,202 and $59,806,263, respectively) | $157,905,010 | $76,501,643 |
| Cash | 5,612,975 | — |
| Foreign currency (cost $35,877) | — | — |
| Receivables | | |
| Investment securities sold | — | — |
| Dividends, interest, and tax reclaims | 114,297 | 311,750 |
| Capital shares sold | 22,397 | 1,092 |
| Prepaid expenses | 27,728 | 18,785 |
| Total Assets | 163,682,407 | 76,833,270 |
| Liabilities | | |
| Payables | | |
| Investment securities purchased | — | — |
| Accrued expenses | 26,455 | 30,398 |
| Independent Director's deferred compensation | 63,624 | 25,359 |
| Due to RE Advisers | 71,423 | 22,385 |
| Capital shares redeemed | 71,695 | 7,846 |
| Dividends | 706 | 645 |
| Total Liabilities | 233,903 | 86,633 |
| Net Assets | $163,448,504 | $76,746,637 |
| Net Assets Consist Of: | | |
| Unrealized appreciation (depreciation) of investments | $— | $(858,957) |
| Undistributed (over distributed) net investment income | (63,625) | (25,389) |
| Undistributed net realized gain (loss) from investments and futures transactions | — | (10,028) |
| Paid-in-capital applicable to outstanding shares of 163,512,088, 14,979,264, 106,844,335, 7,209,677, 18,993,475, 18,089,875, 21,875,536 and 8,882,371, respectively | 163,512,129 | 77,641,011 |
| Net Assets | $163,448,504 | $76,746,637 |
| Net Asset Value Per Share | $1.00 | $5.12 |
| Statements of Assets and Liabilities | The accompanying notes are an integral part of these financial statements. |
| Short-Term Bond Fund | Stock Index Fund | Value Fund | Growth Fund | Small-Company Stock Fund | International Equity Fund |
| $550,380,402 | $147,202,317 | $1,019,717,501 | $207,850,344 | $943,866,698 | $75,813,653 |
| 18 | — | — | — | — | — |
| — | — | — | — | — | 35,811 |
| | | | | | |
| — | — | — | 1,106,715 | 423,180 | — |
| 3,011,583 | — | 665,042 | 93,883 | 447,904 | 275,294 |
| 11,165 | 56,314 | 66,606 | 80,165 | 349,879 | 4,406 |
| 68,326 | 26,671 | 138,119 | 33,602 | 150,044 | 17,984 |
| 553,471,494 | 147,285,302 | 1,020,587,268 | 209,164,709 | 945,237,705 | 76,147,148 |
| | | | | | |
| | | | | | |
| — | — | — | 731,905 | 2,161,100 | — |
| 146,879 | 34,053 | 278,402 | 74,088 | 196,692 | 47,596 |
| 133,477 | 26,473 | 223,774 | 18,495 | 165,399 | 47,976 |
| 289,348 | 36,670 | 426,780 | 118,942 | 693,909 | 30,628 |
| 291,506 | 15,025 | 1,042,701 | 50,784 | 2,033,266 | 6,887 |
| 17,729 | 4,088 | 279,670 | 10,254 | 205,632 | — |
| 878,939 | 116,309 | 2,251,327 | 1,004,468 | 5,455,998 | 133,087 |
| $552,592,555 | $147,168,993 | $1,018,335,941 | $208,160,241 | $939,781,707 | $76,014,061 |
| | | | | | |
| $(1,595,188) | $97,732,767 | $485,042,203 | $68,961,431 | $294,828,496 | $16,008,434 |
| (152,880) | 975,514 | (113,778) | (54,085) | (20,769) | 896,582 |
| (1,645,011) | (2,309,371) | 45,091,548 | 9,903,757 | 155,460,475 | (11,031,650) |
| 555,985,634 | 50,770,083 | 488,315,968 | 129,349,138 | 489,513,505 | 70,140,695 |
| $552,592,555 | $147,168,993 | $1,018,335,941 | $208,160,241 | $939,781,707 | $76,014,061 |
| $5.17 | $20.41 | $53.62 | $11.51 | $42.96 | $8.56 |
| The accompanying notes are an integral part of these financial statements. | Statements of Assets and Liabilities |
53
Statements of Operations
For the Period Ended June 30, 2018 (Unaudited)
| Investment Income | Daily Income Fund | Short-Term Government Securities Fund |
| Interest | $1,289,816 | $740,242 |
| Dividends | — | — |
| Allocated from Master Portfolio | | |
| Dividends | — | — |
| Interest | — | — |
| Total Investment Income | 1,289,816 | 740,242 |
| Expenses | | |
| Management fees | 417,719 | 168,684 |
| Shareholder servicing fees | 77,636 | 46,348 |
| Custodian and accounting fees | 37,543 | 46,987 |
| Legal and audit fees | 20,599 | 11,521 |
| Director and Board meeting expenses | 15,563 | 8,029 |
| Registration fees | 13,815 | 13,803 |
| Communication | 8,172 | 5,081 |
| Printing | 6,636 | 6,651 |
| Insurance | 2,746 | 1,341 |
| Other expenses | 5,061 | 6,363 |
| Administration fees | — | — |
| Allocated from Master Portfolio | — | — |
| Total Expenses | 605,490 | 314,808 |
| Less fees waived by RE Advisers | — | (33,721) |
| Net Expenses | 605,490 | 281,087 |
| Net Investment Income (Loss) | 684,326 | 459,155 |
| Realized and Unrealized Gain (Loss) on Investments | | |
| Net realized gain (loss) on investments | — | (2,944) |
| Net change in unrealized apprecation (depreciation) | — | (441,664) |
| Net Gain (Loss) On Investments | — | (444,608) |
| Net Increase In Net Assets From Operations | $684,326 | $14,547 |
| Statements of Operations | The accompanying notes are an integral part of these financial statements. |
| Short-Term Bond Fund | Stock Index Fund | Value Fund | Growth Fund | Small-Company Stock Fund | International Equity Fund |
| $7,332,341 | $— | $234,903 | $26,622 | $173,581 | $16,096 |
| — | — | 11,334,472 | 800,844 | 5,071,576 | 1,304,253 |
| | | | | | |
| — | 1,383,063 | — | — | — | — |
| — | 20,258 | — | — | — | — |
| 7,332,341 | 1,403,321 | 11,569,375 | 827,466 | 5,245,157 | 1,320,349 |
| | | | | | |
| 1,627,121 | — | 2,528,997 | 639,743 | 4,444,909 | 285,073 |
| 109,119 | 83,142 | 219,161 | 91,380 | 173,918 | 75,904 |
| 103,152 | 9,657 | 100,261 | 29,489 | 104,955 | 37,882 |
| 71,781 | 27,039 | 141,827 | 33,790 | 148,440 | 20,381 |
| 56,798 | 14,410 | 114,185 | 19,712 | 119,344 | 8,109 |
| 19,379 | 12,638 | 20,629 | 14,194 | 24,905 | 11,827 |
| 15,685 | 12,166 | 35,553 | 13,002 | 26,377 | 12,070 |
| 20,440 | 8,997 | 29,300 | 9,910 | 21,778 | 10,274 |
| 9,567 | 2,333 | 19,466 | 2,931 | 22,118 | 1,308 |
| 27,486 | 18,881 | 29,871 | 6,730 | 28,593 | 4,686 |
| — | 183,665 | — | — | — | — |
| — | 28,323 | — | — | — | — |
| 2,060,528 | 401,251 | 3,239,250 | 860,881 | 5,115,337 | 467,514 |
| — | — | — | — | — | (91,518) |
| 2,060,528 | 401,251 | 3,239,250 | 860,881 | 5,115,337 | 375,996 |
| 5,271,813 | 1,002,070 | 8,330,125 | (33,415) | 129,820 | 944,353 |
| | | | | | |
| (1,631,425) | 458,687 | 45,091,548 | 10,030,970 | 155,438,289 | 620,823 |
| 167,691 | 2,053,821 | (75,723,934) | 11,409,094 | (174,520,930) | (981,352) |
| (1,463,734) | 2,512,508 | (30,632,386) | 21,440,064 | (19,082,641) | (360,529) |
| $3,808,079 | $3,514,578 | $(22,302,261) | $21,406,649 | $(18,952,821) | $583,824 |
| The accompanying notes are an integral part of these financial statements. | Statements of Operations |
55
Statements of Changes in Net Assets
| | Daily Income Fund |
| | Six Months Ended June 30, 2018
(Unaudited) | Year Ended December 31, 2017 |
| Increase (Decrease) In Net Assets | | |
| Operations | | |
| Net investment income | $684,326 | $321,540 |
| Net realized gain (loss) on investments | — | — |
| Net change in unrealized appreciation (depreciation) | — | — |
| Increase (decrease) in net assets from operations | 684,326 | 321,540 |
| Distributions to Shareholders | | |
| Net investment income | (684,326) | (327,804) |
| Net realized gain on investments | — | — |
| Total distributions to shareholders | (684,326) | (327,804) |
| Capital Share Transactions | | |
| Net capital share transactions | (10,478,722) | (21,924,369) |
| Total increase (decrease) in net assets from capital transactions | (10,478,722) | (21,924,369) |
| Total Increase (Decrease) In Net Assets | (10,478,722) | (21,930,633) |
| Net Assets | | |
| Beginning of period | $173,927,226 | $195,857,859 |
| End of period | $163,448,504 | $173,927,226 |
| Undistributed (over distributed) net investment income | (63,625) | (63,625) |
| Statements of Changes in Investments | The accompanying notes are an integral part of these financial statements. |
| Short-Term Government Securities Fund | Short-Term Bond Fund | Stock Index Fund |
Six Months Ended June 30, 2018
(Unaudited) | Year Ended December 31, 2017 | Six Months Ended June 30, 2018
(Unaudited) | Year Ended December 31, 2017 | Six Months Ended June 30, 2018
(Unaudited) | Year Ended December 31, 2017 |
| | | | | | |
| | | | | | |
| $459,155 | $757,509 | $5,271,813 | $8,660,533 | $1,002,070 | $1,902,527 |
| (2,944) | 36,075 | (1,631,425) | 267,593 | 458,687 | 890,088 |
| (441,664) | (143,248) | 167,691 | (920,260) | 2,053,821 | 22,891,278 |
| 14,547 | 650,336 | 3,808,079 | 8,007,866 | 3,514,578 | 25,683,893 |
| | | | | | |
| (459,185) | (760,216) | (5,291,522) | (8,723,255) | (632,283) | (1,289,561) |
| (16,457) | (26,366) | (32,013) | (201,698) | — | — |
| (475,642) | (786,582) | (5,323,535) | (8,924,953) | (632,283) | (1,289,561) |
| | | | | | |
| 1,782,960 | 2,452,567 | 3,865,932 | 10,145,252 | (807,729) | (2,338,989) |
| 1,782,960 | 2,452,567 | 3,865,932 | 10,145,252 | (807,729) | (2,338,989) |
| 1,321,865 | 2,316,321 | 2,350,476 | 9,228,165 | 2,074,566 | 22,055,343 |
| | | | | | |
| $75,424,772 | $73,108,451 | $550,242,079 | $541,013,914 | $145,094,427 | $123,039,084 |
| $76,746,637 | $75,424,772 | $552,592,555 | $550,242,079 | $147,168,993 | $145,094,427 |
| (25,389) | (25,359) | (152,880) | (133,171) | 975,514 | 605,727 |
| The accompanying notes are an integral part of these financial statements. | Statements of Changes in Investments |
57
Statements of Changes in Net Assets (Continued)
| | Value Fund |
| | Six Months Ended June 30, 2018
(Unaudited) | Year Ended December 31, 2017 |
| Increase (Decrease) In Net Assets | | |
| Operations | | |
| Net investment income | $8,330,125 | $19,564,125 |
| Net realized gain (loss) on investments | 45,091,548 | 38,097,841 |
| Net change in unrealized appreciation (depreciation) | (75,723,934) | 149,259,290 |
| Increase (decrease) in net assets from operations | (22,302,261) | 206,921,256 |
| Distributions to Shareholders | | |
| Net investment income | (8,299,477) | (19,512,051) |
| Net realized gain on investments | — | (38,098,789) |
| Total distributions to shareholders | (8,299,477) | (57,610,840) |
| Capital Share Transactions | | |
| Net capital share transactions | (69,770,918) | 13,570,649 |
| Total increase (decrease) in net assets from capital transactions | (69,770,918) | 13,570,649 |
| Total Increase (Decrease) In Net Assets | (100,372,656) | 162,881,065 |
| Net Assets | | |
| Beginning of period | $1,118,708,597 | $955,827,532 |
| End of period | $1,018,335,941 | $1,118,708,597 |
| Undistributed (over distributed) net investment income | (113,778) | (144,426) |
| Statements of Changes in Investments | The accompanying notes are an integral part of these financial statements. |
| Growth Fund | Small-Company Stock Fund | International Equity Fund |
Six Months Ended June 30, 2018
(Unaudited) | Year Ended December 31, 2017 | Six Months Ended June 30, 2018
(Unaudited) | Year Ended December 31, 2017 | Six Months Ended June 30, 2018
(Unaudited) | Year Ended December 31, 2017 |
| | | | | | |
| | | | | | |
| $(33,415) | $(177,856) | $129,820 | $1,768,637 | $944,353 | $665,498 |
| 10,030,970 | 12,531,408 | 155,438,289 | 61,526,126 | 620,823 | 1,442,275 |
| 11,409,094 | 33,478,879 | (174,520,930) | 76,877,680 | (981,352) | 13,349,482 |
| 21,406,649 | 45,832,431 | (18,952,821) | 140,172,443 | 583,824 | 15,457,255 |
| | | | | | |
| (2,175) | — | — | (2,147,900) | — | (695,011) |
| (1,700,794) | (11,978,459) | (8,414,614) | (52,725,579) | — | — |
| (1,702,969) | (11,978,459) | (8,414,614) | (54,873,479) | — | (695,011) |
| | | | | | |
| 10,436,170 | 26,884,927 | (310,284,506) | (130,083,090) | 1,292,145 | 5,401,845 |
| 10,436,170 | 26,884,927 | (310,284,506) | (130,083,090) | 1,292,145 | 5,401,845 |
| 30,139,850 | 60,738,899 | (337,651,941) | (44,784,126) | 1,875,969 | 20,164,089 |
| | | | | | |
| $178,020,391 | $117,281,492 | $1,277,433,648 | $1,322,217,774 | $74,138,092 | $53,974,003 |
| $208,160,241 | $178,020,391 | $939,781,707 | $1,277,433,648 | $76,014,061 | $74,138,092 |
| (54,085) | (18,495) | (20,769) | (150,589) | 896,582 | (47,771) |
| The accompanying notes are an integral part of these financial statements. | Statements of Changes in Investments |
59
Financial Highlights
Daily Income Fund
| | Six Months
Ended
June 30, 2018
(Unaudited) | Year Ended December 31, |
| | 2017 | 2016 | 2015 | 2014 | 2013 |
| Net Asset Value, Beginning of Period | $1.00 | $1.00 | $1.00 | $1.00 | $1.00 | $1.00 |
| Income from investment operations | | | | | | |
| Net investment income | —(a) | —(a,b,c) | —(a,b,c) | —(a,b,c) | —(a,b,c) | —(a,b,c) |
| Net realized and unrealized gain (loss) on investments | — | — | — | — | — | — |
| Total from investment operations | — | — | — | — | — | — |
| Distributions | | | | | | |
| Net investment income | —(a) | —(a) | —(a) | —(a) | —(a) | —(a) |
| Net realized gain | — | — | — | — | — | — |
| Total distributions | — | — | — | — | — | — |
| Net Asset Value, End of Period | $1.00 | $1.00 | $1.00 | $1.00 | $1.00 | $1.00 |
| Total Return | 0.41%(d) | 0.18% | 0.01% | 0.01% | 0.01% | 0.01% |
| Ratios/Supplemental Data | | | | | | |
| Net assets, end of period (thousands) | $163,449 | $173,927 | $195,858 | $193,156 | $196,771 | $212,308 |
| Ratio of net investment income to average net assets | 0.82%(e) | 0.17%(b,c) | 0.00%(b,c,f) | 0.00%(b,c,f) | 0.00%(b,c,f) | 0.00%(b,c,f) |
| Ratio of gross expenses before voluntary expense limitation to average net assets | 0.72%(e) | 0.71% | 0.71% | 0.68% | 0.66% | 0.66% |
| Ratio of expenses to average net assets | 0.72%(e) | 0.66%(b,c) | 0.37%(b,c) | 0.14%(b,c) | 0.09%(b,c) | 0.11%(b,c) |
| (a) | Less than $0.01 per share. |
| (b) | On January 27, 2009, RE Advisers voluntarily and temporarily reduced the amount of the expense limitation from 0.80% to 0.50%. Additionally, effective August 14, 2009, RE Advisers agreed to further waive fees or reimburse expenses to the extent necessary to assist the Fund in attempting to maintain a positive yield. The temporary waiver continued through May 11, 2017. |
| (c) | Excludes excess investment management fees and other expenses voluntarily waived and reimbursed by RE Advisers. |
| (d) | Aggregate total return for the period. |
| (e) | Annualized. |
| (f) | Less than 0.01%. |
| Financial Highlights | The accompanying notes are an integral part of these financial statements. |
Financial Highlights
Short-Term Government Securities Fund
| | Six Months
Ended
June 30, 2018
(Unaudited) | Year Ended December 31, |
| | 2017 | 2016 | 2015 | 2014 | 2013 |
| Net Asset Value, Beginning of Period | $5.15 | $5.16 | $5.18 | $5.20 | $5.19 | $5.28 |
| Income from investment operations | | | | | | |
| Net investment income | 0.03 | 0.05 | 0.04 | 0.04 | 0.05 | 0.05 |
| Net realized and unrealized gain (loss) on investments | (0.03) | (0.01) | (0.02) | (0.02) | 0.01 | (0.09) |
| Total from investment operations | — | 0.04 | 0.02 | 0.02 | 0.06 | (0.04) |
| Distributions | | | | | | |
| Net investment income | (0.03) | (0.05) | (0.04) | (0.04) | (0.05) | (0.05) |
| Net realized gain | —(a) | —(a) | —(a) | —(a) | —(a) | —(a) |
| Total distributions | (0.03) | (0.05) | (0.04) | (0.04) | (0.05) | (0.05) |
| Net Asset Value, End of Period | $5.12 | $5.15 | $5.16 | $5.18 | $5.20 | $5.19 |
| Total Return | 0.04%(b) | 0.87% | 0.45% | 0.46% | 1.16% | -0.72% |
| Ratios/Supplemental Data | | | | | | |
| Net assets, end of period (thousands) | $76,747 | $75,425 | $73,108 | $73,048 | $76,661 | $86,131 |
| Ratio of net investment income to average net assets | 1.22%(c,d) | 1.02%(d) | 0.81%(d) | 0.84% | 0.95% | 0.96% |
| Ratio of gross expenses before expense limitation to average net assets | 0.84%(c) | 0.81% | 0.78% | 0.77% | 0.71% | 0.69% |
| Ratio of expenses to average net assets | 0.75%(c,d) | 0.75%(d) | 0.75%(d) | 0.77% | 0.71% | 0.69% |
| Portfolio turnover rate | 23% | 33% | 26% | 32% | 20% | 20% |
| (a) | Less than $0.01 per share. |
| (b) | Aggregate total return for the period. |
| (d) | Excludes expenses in excess of a 0.75% contractual expense limitation with RE Advisers, in effect through June 30, 2018. |
| The accompanying notes are an integral part of these financial statements. | Financial Highlights |
61
Financial Highlights
Short-Term Bond Fund
| | Six Months
Ended
June 30, 2018
(Unaudited) | Year Ended December 31, |
| | 2017 | 2016 | 2015 | 2014 | 2013 |
| Net Asset Value, Beginning of Period | $5.19 | $5.19 | $5.18 | $5.23 | $5.22 | $5.22 |
| Income from investment operations | | | | | | |
| Net investment income | 0.05 | 0.08 | 0.08 | 0.07 | 0.07 | 0.08 |
| Net realized and unrealized gain (loss) on investments | (0.02) | —(a) | 0.01 | (0.05) | 0.01 | —(a) |
| Total from investment operations | 0.03 | 0.08 | 0.09 | 0.02 | 0.08 | 0.08 |
| Distributions | | | | | | |
| Net investment income | (0.05) | (0.08) | (0.08) | (0.07) | (0.07) | (0.08) |
| Net realized gain | —(a) | —(a) | — | — | — | — |
| Total distributions | (0.05) | (0.08) | (0.08) | (0.07) | (0.07) | (0.08) |
| Net Asset Value, End of Period | $5.17 | $5.19 | $5.19 | $5.18 | $5.23 | $5.22 |
| Total Return | 0.59%(b) | 1.65% | 1.75% | 0.43% | 1.56% | 1.64% |
| Ratios/Supplemental Data | | | | | | |
| Net assets, end of period (thousands) | $552,593 | $550,242 | $541,014 | $542,251 | $571,695 | $536,303 |
| Ratio of net investment income to average net assets | 1.94%(c) | 1.59% | 1.49% | 1.38% | 1.35% | 1.61% |
| Ratio of expenses to average net assets | 0.76%(c) | 0.76% | 0.76% | 0.74% | 0.73% | 0.74% |
| Portfolio turnover rate | 18% | 32% | 31% | 20% | 26% | 32% |
| (a) | Less than $0.01 per share. |
| (b) | Aggregate total return for the period. |
| (c) | Annualized. |
| Financial Highlights | The accompanying notes are an integral part of these financial statements. |
Financial Highlights
Stock Index Fund
| | Six Months
Ended
June 30, 2018
(Unaudited) | Year Ended December 31, |
| | 2017 | 2016 | 2015 | 2014 | 2013 |
| Net Asset Value, Beginning of Period | $20.02 | $16.67 | $15.20 | $15.33 | $13.74 | $10.57 |
| Income from investment operations | | | | | | |
| Net investment income | 0.14 | 0.27 | 0.25 | 0.25 | 0.22 | 0.18 |
| Net realized and unrealized gain (loss) on investments | 0.34 | 3.26 | 1.47 | (0.13) | 1.59 | 3.17 |
| Total from investment operations | 0.48 | 3.53 | 1.72 | 0.12 | 1.81 | 3.35 |
| Distributions | | | | | | |
| Net investment income | (0.09) | (0.18) | (0.25) | (0.25) | (0.22) | (0.18) |
| Net realized gain | — | — | — | — | — | — |
| Total distributions | (0.09) | (0.18) | (0.25) | (0.25) | (0.22) | (0.18) |
| Redemption fee | — | — | — | — | — | —(a,b) |
| Net Asset Value, End of Period | $20.41 | $20.02 | $16.67 | $15.20 | $15.33 | $13.74 |
| Total Return | 2.39%(c) | 21.16% | 11.33% | 0.79% | 13.15% | 31.72% |
| Ratios/Supplemental Data | | | | | | |
| Net assets, end of period (thousands) | $147,169 | $145,094 | $123,039 | $114,436 | $116,163 | $103,260 |
| Ratio of net investment income to average net assets | 1.36%(d) | 1.42% | 1.57% | 1.49% | 1.49% | 1.55% |
| Ratio of expenses to average net assets | 0.55%(d) | 0.55% | 0.58% | 0.54% | 0.54% | 0.56% |
| Portfolio turnover rate (e) | N/A | N/A | N/A | N/A | N/A | N/A |
| (a) | Less than $0.01 per share. |
| (b) | Effective May 1, 2013, the redemption fee was eliminated. |
| (c) | Aggregate total return for the period. |
| (e) | See Appendix for the portfolio turnover of the S&P 500 Index Master Portfolio. |
| The accompanying notes are an integral part of these financial statements. | Financial Highlights |
63
Financial Highlights
Value Fund
| | Six Months
Ended
June 30, 2018
(Unaudited) | Year Ended December 31, |
| | 2017 | 2016 | 2015 | 2014 | 2013 |
| Net Asset Value, Beginning of Period | $55.26 | $47.70 | $46.77 | $50.79 | $45.46 | $34.09 |
| Income from investment operations | | | | | | |
| Net investment income | 0.44 | 1.00 | 1.10 | 0.94 | 0.78 | 0.76 |
| Net realized and unrealized gain (loss) on investments | (1.64) | 9.52 | 4.60 | (1.59) | 5.41 | 11.37 |
| Total from investment operations | (1.20) | 10.52 | 5.70 | (0.65) | 6.19 | 12.13 |
| Distributions | | | | | | |
| Net investment income | (0.44) | (1.00) | (1.10) | (0.94) | (0.78) | (0.76) |
| Net realized gain | — | (1.96) | (3.67) | (2.43) | (0.08) | — |
| Total distributions | (0.44) | (2.96) | (4.77) | (3.37) | (0.86) | (0.76) |
| Redemption fee | — | — | — | — | — | —(a,b) |
| Net Asset Value, End of Period | $53.62 | $55.26 | $47.70 | $46.77 | $50.79 | $45.46 |
| Total Return | -2.17%(c) | 22.17% | 12.26% | -1.28% | 13.66% | 35.74% |
| Ratios/Supplemental Data | | | | | | |
| Net assets, end of period (thousands) | $1,018,336 | $1,118,709 | $955,828 | $899,158 | $938,857 | $816,471 |
| Ratio of net investment income to average net assets | 1.53%(d) | 1.92% | 2.26% | 1.85% | 1.64% | 1.86% |
| Ratio of expenses to average net assets | 0.59%(d) | 0.60% | 0.62% | 0.59% | 0.61% | 0.64% |
| Portfolio turnover rate | 1% | 7% | 9% | 8% | 2% | 2% |
| (a) | Less than $0.01 per share. |
| (b) | Effective May 1, 2013, the redemption fee was eliminated. |
| (c) | Aggregate total return for the period. |
| (d) | Annualized. |
| Financial Highlights | The accompanying notes are an integral part of these financial statements. |
Financial Highlights
Growth Fund
| | Six Months
Ended
June 30, 2018
(Unaudited) | Year Ended December 31, |
| | 2017 | 2016 | 2015 | 2014 | 2013 |
| Net Asset Value, Beginning of Period | $10.36 | $8.07 | $8.00 | $7.79 | $7.92 | $5.71 |
| Income from investment operations | | | | | | |
| Net investment income | (—) | (—) | — | — | — | — |
| Net realized and unrealized gain (loss) on investments | 1.24 | 3.04 | 0.19 | 0.73 | 0.66 | 2.48 |
| Total from investment operations | 1.24 | 3.04 | 0.19 | 0.73 | 0.66 | 2.48 |
| Distributions | | | | | | |
| Net investment income | — | — | — | — | — | — |
| Net realized gain | (0.09) | (0.75) | (0.12) | (0.52) | (0.79) | (0.27) |
| Total distributions | (0.09) | (0.75) | (0.12) | (0.52) | (0.79) | (0.27) |
| Redemption fee | — | — | — | — | — | —(a,b) |
| Net Asset Value, End of Period | $11.51 | $10.36 | $8.07 | $8.00 | $7.79 | $7.92 |
| Total Return | 12.02%(c) | 37.68% | 2.54% | 9.43% | 8.38% | 43.40% |
| Ratios/Supplemental Data | | | | | | |
| Net assets, end of period (thousands) | $208,160 | $178,020 | $117,281 | $114,329 | $93,717 | $75,027 |
| Ratio of net investment loss to average net assets | (0.03)%(d) | (0.12)% | (0.14)%(e) | (0.32)% | (0.32)%(e) | (0.32)%(e) |
| Ratio of gross expenses before expense limitation to average net assets | 0.87%(d) | 0.93% | 0.98% | 0.95% | 0.97% | 1.04% |
| Ratio of expenses to average net assets | 0.87%(d) | 0.93% | 0.95%(e) | 0.95% | 0.95%(e) | 0.95%(e) |
| Portfolio turnover rate | 18% | 37% | 39% | 40% | 49% | 39% |
| (a) | Less than $0.01 per share. |
| (b) | Effective May 1, 2013, the redemption fee was eliminated. |
| (c) | Aggregate total return for the period. |
| (e) | Excludes expenses in excess of a 0.95% contractual expense limitation with RE Advisers, in effect through April 30, 2018. |
| The accompanying notes are an integral part of these financial statements. | Financial Highlights |
65
Financial Highlights
Small-Company Stock Fund
| | Six Months
Ended
June 30, 2018
(Unaudited) | Year Ended December 31, |
| | 2017 | 2016 | 2015 | 2014 | 2013 |
| Net Asset Value, Beginning of Period | $44.11 | $41.13 | $35.45 | $39.28 | $36.86 | $27.10 |
| Income from investment operations | | | | | | |
| Net investment income | — | 0.08 | 0.14 | 0.15 | 0.14 | 0.12 |
| Net realized and unrealized gain (loss) on investments | (0.76) | 4.86 | 6.55 | (2.19) | 2.80 | 9.79 |
| Total from investment operations | (0.76) | 4.94 | 6.69 | (2.04) | 2.94 | 9.91 |
| Distributions | | | | | | |
| Net investment income | — | (0.08) | (0.14) | (0.15) | (0.14) | (0.12) |
| Net realized gain | (0.39) | (1.88) | (0.87) | (1.64) | (0.38) | (0.03) |
| Total distributions | (0.39) | (1.96) | (1.01) | (1.79) | (0.52) | (0.15) |
| Redemption fee | — | — | — | — | — | —(a,b) |
| Net Asset Value, End of Period | $42.96 | $44.11 | $41.13 | $35.45 | $39.28 | $36.86 |
| Total Return | -1.73%(c) | 11.99% | 18.85% | -5.18% | 7.97% | 36.58% |
| Ratios/Supplemental Data | | | | | | |
| Net assets, end of period (thousands) | $939,782 | $1,277,434 | $1,322,218 | $1,211,351 | $1,059,800 | $845,057 |
| Ratio of net investment income to average net assets | 0.02%(d) | 0.14% | 0.34% | 0.43% | 0.38% | 0.44% |
| Ratio of expenses to average net assets | 0.88%(d) | 0.88% | 0.89% | 0.86% | 0.89% | 0.91% |
| Portfolio turnover rate | 1% | 7% | 14% | 16% | 3% | 1% |
| (a) | Less than $0.01 per share. |
| (b) | Effective May 1, 2013, the redemption fee was eliminated. |
| (c) | Aggregate total return for the period. |
| (d) | Annualized. |
| Financial Highlights | The accompanying notes are an integral part of these financial statements. |
Financial Highlights
International Equity Fund
| | Six Months
Ended
June 30, 2018
(Unaudited) | Year Ended December 31, |
| | 2017 | 2016 | 2015 | 2014 | 2013 |
| Net Asset Value, Beginning of Period | $8.49 | $6.69 | $6.44 | $7.17 | $8.13 | $6.70 |
| Income from investment operations | | | | | | |
| Net investment income | 0.11 | 0.08 | 0.07 | 0.47 | 0.24(a) | 0.14 |
| Net realized and unrealized gain (loss) on investments | (0.04) | 1.80 | 0.24 | (0.72) | (0.96) | 1.43 |
| Total from investment operations | 0.07 | 1.88 | 0.31 | (0.25) | (0.72) | 1.57 |
| Distributions | | | | | | |
| Net investment income | — | (0.08) | (0.06) | (0.48) | (0.24) | (0.14) |
| Net realized gain | — | — | — | — | — | — |
| Total distributions | — | (0.08) | (0.06) | (0.48) | (0.24) | (0.14) |
| Redemption fee | — | — | — | — | — | —(b,c) |
| Net Asset Value, End of Period | $8.56 | $8.49 | $6.69 | $6.44 | $7.17 | $8.13 |
| Total Return | 0.82%(d) | 28.12% | 4.85% | -3.48% | -8.90% | 23.44% |
| Ratios/Supplemental Data | | | | | | |
| Net assets, end of period (thousands) | $76,014 | $74,138 | $53,974 | $53,144 | $207,774 | $215,048 |
| Ratio of net investment income to average net assets | 2.48%(a,e) | 1.03%(e) | 1.22%(e,f) | 1.87%(e,f) | 3.04% | 1.95% |
| Ratio of gross expenses before voluntary expense limitation to average net assets | 1.23%(a) | 1.25% | 1.46% | 1.01% | 0.97% | 0.96% |
| Ratio of expenses to average net assets | 0.99%(a,e) | 0.99%(e) | 0.97%(e,f) | 0.87%(e,f) | 0.97% | 0.96% |
| Portfolio turnover rate | 5% | 11% | 112%(g) | 62% | 24% | 19% |
| (b) | Less than $0.01 per share. |
| (c) | Effective May 1, 2013, the redemption fee was eliminated. |
| (d) | Aggregate total return for the period. |
| (e) | Excludes expenses in excess of a 0.99% contractual expense limitation with RE Advisers, in effect through April 30, 2018. |
| (f) | RE Adviser waived additional management fees equal to the difference between the fee that would have been paid to the previous subadviser, Mercator and the fee paid to SSgA Funds Management Inc., beginning September 7, 2015 through January 14, 2016, the period in which SSgA Funds Management Inc. was subadviser. |
| (g) | Unusually high due to change in strategy and subadviser on January 15, 2016. |
| The accompanying notes are an integral part of these financial statements. | Financial Highlights |
67
Notes to Financial Statements | (Unaudited)
1. Organization
Homestead Funds, Inc. (“Homestead Funds”) is a Maryland corporation registered with the Securities and Exchange Commission under the Investment Company Act of 1940, as amended (the “Act”), as an open-end management investment company. Homestead Funds currently consists of eight funds: Daily Income Fund, Short-Term Government Securities Fund, Short-Term Bond Fund, Stock Index Fund, Value Fund, Growth Fund, Small-Company Stock Fund, and International Equity Fund (each a “Fund” and collectively the “Funds”).
Each Fund is a separate investment portfolio with distinct investment objectives, investment programs, policies and restrictions. The investment objectives of the Funds, as well as the nature and risks of the investment activities of each Fund, are set forth more fully in Homestead Funds’ Prospectus and Statement of Additional Information. All of the Funds are diversified for purposes of the Act. The Growth Fund is currently operating as a diversified fund. The Fund previously operated as a non-diversified fund and may operate as a non-diversified fund in the future to the extent permitted by applicable law. Under current law, shareholder approval would be required for the Growth Fund to resume operating as non-diversified.
The Stock Index Fund pursues its investment objective by seeking to replicate the total return performance of the S&P 500 Index, which is composed of 500 selected common stocks, most of which are listed on the New York Stock Exchange. At June 30, 2018, the Stock Index Fund was operating as a feeder fund, whereby substantially all of its assets are invested in the S&P 500 Index Master Portfolio (“Master Portfolio”), an open-end investment company managed by BlackRock Fund Advisors. At June 30, 2018, the Stock Index Fund’s investment constituted 0.92% of the Master Portfolio. The financial statements of the Master Portfolio are contained in the Appendix of this report and should be read in conjunction with the financial statements for the Stock Index Fund.
2. Summary of Significant Accounting Policies
The financial statements are prepared in conformity with accounting principles generally accepted in the United States of America (“GAAP”). Homestead Funds is considered an Investment Company under GAAP and follows the accounting and reporting guidance set forth in ASC Topic 946 Financial Services—Investment Companies. The preparation of financial statements in conformity with GAAP requires management to make estimates and assumptions that affect the reported amounts of assets and liabilities and disclosure of contingent assets and liabilities at the date of the financial statements and the reported amounts of revenues and expenses during the reporting period. Actual results could differ from those estimates.
Security Valuation: Each Fund’s net asset value per share is determined as of the close of the New York Stock Exchange (“NYSE”) (usually 4:00 p.m. ET), each day that the NYSE is open for business ("Valuation Time"). Portfolio securities for which market quotations are readily available are valued at current market value as of the Valuation Time in accordance with the Portfolio Securities Valuation Policies and Procedures (“Valuation Procedures”) adopted by the Board. Market value is generally determined on the basis of official closing prices or the last reported sales prices and/or may be based on quotes or prices (including evaluated prices) supplied by the Funds’ approved independent pricing services. Portfolio securities for which market quotations are not readily available are valued at fair value by RE Advisers Corporation (“Adviser” or “RE Advisers”) or a Fund’s subadvisor, as determined in good faith in accordance with the Valuation Procedures.
The Board has delegated day-to-day responsibility for determining the fair value of securities to the Adviser and the Funds' subadvisors. RE Advisers has chartered an internal Valuation Committee to oversee the implementation of the Valuation Procedures, oversee the fair valuation decisions of the subadvisors, monitor the valuation process, and provide quarterly reports to the Board. The Valuation Committee reports all instances of fair valuation to the Board at each quarterly Board meeting, as applicable.
A disclosure hierarchy that categorizes the inputs used to value assets and liabilities at measurement date has been established under GAAP. These inputs are summarized into three broad levels as follows:
• Level 1—quoted prices in active markets for identical investments;
• Level 2—other significant observable inputs (including quoted prices for similar investments, interest rates, prepayment speeds, credit risk, etc.); and
• Level 3—significant unobservable inputs (including the Fund’s own assumptions in determining the fair valuation of investments).
The inputs or methodologies used to value securities are not necessarily an indication of the risk associated with investing in those securities. Changes in valuation techniques may result in transfers in or out of an investment’s assigned level within the hierarchy during the period.
The Funds use the following valuation techniques to value securities by major category:
| | Notes to Financial Statements |
Notes to Financial Statements | (Unaudited) (Continued)
Registered investment company shares (other than shares of exchange-traded funds and closed-end fund shares that trade on an exchange) are valued at the net asset value determined by the registered investment company after the close of the NYSE. The Funds invest in regulated investment companies that seek to maintain a share price of $1.00 and are categorized as Level 1 in the hierarchy.
Domestic equity securities and exchange traded funds that are traded on a national securities exchange are valued at the closing price as reported by an independent pricing service from the primary market in which the securities trade and are categorized as Level 1. Securities not traded or dealt in upon a national securities exchange for which over-the-counter market quotations are readily available generally are valued (i) at the last quoted sales price (if adequate trading volume is present) or, (ii) otherwise at the last bid price.
Foreign equity securities that are traded on a foreign exchange are valued based on the closing price as reported by an independent pricing service from the primary market in which such securities are normally traded. An independent pricing service is utilized to fair value foreign equity securities based on the impact of market events between the close of the foreign exchange and the time the net asset value is calculated. Foreign equity securities that are fair valued are categorized as Level 2 in the hierarchy and foreign equity securities not fair valued are categorized as Level 1.
Fixed income securities, including corporate, government, municipal, mortgage-backed and asset-backed securities are valued (1) by an independent pricing service based on market prices, or broker/dealer quotations, (2) market value generated by an independent pricing service, or (3) market value generated by RE Advisers using a pricing matrix or model based on benchmark yields, issuer, spreads, monthly payment information or other available market information for securities of similar characteristics. For purposes of the Valuation Procedures, the process described in (3) is deemed to be a fair valuation of such portfolio securities, solely for the purpose of the applicability of the fair valuation determinations set forth in the Valuation Procedures. For fixed-income securities, the security is valued following the sequence above and flows to the next method only if the prior method is not available.
Fixed income securities utilizing these methods are generally categorized as Level 2. Fixed income securities that are valued using only a broker quote, absent corroborating observable inputs are categorized as Level 3.
Fixed income securities and commercial paper held in the Daily Income Fund are valued at amortized cost and are categorized as Level 2 in the hierarchy. Under the amortized cost method, discounts and premiums on securities purchased are amortized over the lives of the respective securities. The value of the securities using amortized cost would be approximately the same as using fair value without amortized cost.
If a market value cannot be determined for a security using the methodologies described above, or if, in the good faith opinion of the Adviser or Funds’ subadvisor, the market value does not constitute a readily available market quotation, or if a significant event has occurred that would impact a security’s valuation, the security will be fair valued as determined in good faith by the Funds’ Adviser or subadvisor Funds’ based on the Valuation Procedures approved by the Board. The determination of a security’s fair value price often involves the consideration of a number of subjective factors, and therefore, is subject to the risk that the value that is assigned to a security may be higher or lower than the security’s value would be if a reliable market quotation for the security were readily available. Such securities are generally categorized as Level 3 in the hierarchy.
The Stock Index Fund records its investment in the Master Portfolio at the market value of its proportionate interest in the net assets of the Master Portfolio. For purposes of determining the net asset value of the Stock Index Fund, the securities of the Master Portfolio are priced by the investment advisor to the Master Portfolio under the direction of the Board of Trustees of the Master Portfolio. The policies and procedures are discussed in the notes to the Master Portfolio’s financial statements, included in the Appendix of this report.
The following table summarizes each Fund’s investments, based on the inputs used to determine their values on June 30, 2018 (other than Stock Index Fund). The level classifications of the Master Portfolio as of June 30, 2018 are included in the Appendix.
| Daily Income Fund | Level 1 | Level 2 | Level 3 | Total |
| U.S. Government & Agency Obligations | $ — | $141,371,475 | $ — | $141,371,475 |
| Money Market Fund | 16,533,535 | — | — | 16,533,535 |
| Total | $16,533,535 | $141,371,475 | $ — | $157,905,010 |
| Notes to Financial Statements | |
69
Notes to Financial Statements | (Unaudited) (Continued)
| Short-Term Government Securities Fund | Level 1 | Level 2 | Level 3 | Total |
| U.S. Government & Agency Obligations | $ — | $39,723,505 | $29,811 | $39,753,316 |
| Corporate Bonds Guaranteed by Export-Import Bank of the United States | — | 18,481,321 | — | 18,481,321 |
| Corporate Bonds - Other | — | 7,415,819 | — | 7,415,819 |
| Mortgage-Backed Securities | — | 1,860,066 | — | 1,860,066 |
| Asset-Backed Securities | — | 1,752,121 | — | 1,752,121 |
| Municipal Bond | — | 220,621 | — | 220,621 |
| Commercial Paper | — | 4,138,231 | — | 4,138,231 |
| Certificates of Deposit | — | 2,879,415 | — | 2,879,415 |
| Money Market Fund | 733 | — | — | 733 |
| Total | $733 | $76,471,099 | $29,811 | $76,501,643 |
| Short-Term Bond Fund | | | | |
| Corporate Bonds - Other | $ — | $188,993,610 | $ — | $188,993,610 |
| Asset-Backed Securities | — | 122,863,209 | — | 122,863,209 |
| Municipal Bonds | — | 96,165,207 | — | 96,165,207 |
| Yankee Bonds | — | 62,910,909 | — | 62,910,909 |
| U.S. Government & Agency Obligations | — | 58,621,026 | — | 58,621,026 |
| Mortgage-Backed Securities | — | 6,208,460 | — | 6,208,460 |
| Corporate Bond Guaranteed by Export-Import Bank of the United States | — | 321,645 | — | 321,645 |
| Commercial Paper | — | 12,595,659 | — | 12,595,659 |
| Certificates of Deposit | — | 1,699,742 | — | 1,699,742 |
| Money Market Fund | 935 | — | — | 935 |
| Total | $935 | $550,379,467 | $ — | $550,380,402 |
| Value Fund | | | | |
| Common Stocks | $1,006,841,176 | $ — | $ — | $1,006,841,176 |
| Commercial Paper | — | 12,875,607 | — | 12,875,607 |
| Money Market Fund | 718 | — | — | 718 |
| Total | $1,006,841,894 | $12,875,607 | $ — | $1,019,717,501 |
| Growth Fund | | | | |
| Common Stocks | $204,168,178 | $ — | $ — | $204,168,178 |
| Money Market Fund | 3,682,166 | — | — | 3,682,166 |
| Total | $207,850,344 | $ — | $ — | $207,850,344 |
| Small-Company Stock Fund | | | | |
| Common Stocks | $909,797,603 | $7,521,556 | $ — | $917,319,159 |
| Commercial Paper | — | 26,547,066 | — | 26,547,066 |
| Money Market Fund | 473 | — | — | 473 |
| Total | $909,798,076 | $34,068,622 | $ — | $943,866,698 |
| International Equity Fund | | | | |
| Common Stocks | $10,488,276 | $60,692,964 | $ — | $71,181,240 |
| Preferred Stocks | 1,723,056 | — | — | 1,723,056 |
| Money Market Fund | 2,909,357 | — | — | 2,909,357 |
| Total | $15,120,689 | $60,692,964 | $ — | $75,813,653 |
At June 30, 2018, all Level 3 securities held by the portfolios were not considered to be material. There was one security in the Short-Term Bond Fund with a market value of $187,489 which was transferred from a Level 3 to a Level 2 during the period due to a change in pricing vendor, resulting in greater transparency into the valuation inputs.
Foreign currency: The International Equity Fund may use foreign currency contracts to facilitate transactions in foreign-denominated securities. Losses from these transactions may arise from changes in the value of the foreign currency or if the counterparties do not perform under the contract’s terms. Foreign-denominated assets, including investment securities and liabilities are translated into U.S. dollars at the exchange rate at the end of the period. Purchases and sales of investment
| | Notes to Financial Statements |
Notes to Financial Statements | (Unaudited) (Continued)
securities and income and dividends received are translated into U.S. dollars at the exchange rate in effect on the transaction date. Currency gains and losses and the effects of exchange rate fluctuations on investments are included with the realized and unrealized gain (loss) on investment securities.
Distributions to shareholders: Dividends to shareholders are recorded on the ex-dividend date. Ordinary income dividends for the Daily Income, Short-Term Government Securities and Short-Term Bond Funds are declared daily and paid monthly. Ordinary income dividends for Value Fund are declared and paid semi-annually. Ordinary income dividends for the Stock Index, Growth, Small-Company Stock and International Equity Funds are declared and paid annually. Capital gains dividends, if any, are declared and paid at the end of each fiscal year. Any unpaid capital gains will be paid in June of the subsequent year, but no later than the extended due date of the federal tax return.
Other: Dividend income is recorded on the ex-dividend date. Interest income, including amortization of premium and accretion of discount, and expenses are recorded on the accrual basis. Investment transactions are recorded as of the trade date. Realized gains and losses from investment transactions are reported on the identified cost basis.
The Stock Index Fund records a pro rata share of the Master Portfolio’s income, expenses, and realized and unrealized gains and losses in addition to the Fund’s own expenses, which are accrued daily.
In the normal course of business, the Funds enter into contracts that provide general indemnifications. The Funds’ maximum exposure under these arrangements is dependent on claims that may be made against the Funds in the future and therefore cannot be estimated; however, the Funds have not had prior claims or losses pursuant to these contracts.
Management considered events occurring between the date of this report, June 30, 2018, and the date of issuance of this report in determining adjustments to the financial statements or necessary disclosures in this report.
3. Federal Income Tax Information
The Funds intend to comply with the provisions of the Internal Revenue Code applicable to regulated investment companies and will distribute all net investment income to its shareholders. Therefore, no provision for Federal income taxes is required.
Management has analyzed the Funds’ tax positions and has concluded that no provision for income tax is required in the Funds’ financial statements. The Funds are not aware of any tax positions for which it is reasonably possible that the total amounts of unrecognized tax benefits will significantly change in the next twelve months. However, management’s conclusions may be subject to review and adjustment at a later date based on factors including, but not limited to new tax laws, regulations and administrative interpretations.
Each Fund files U.S. federal, state, and local tax returns as required. Each Fund’s tax returns are subject to examination by the relevant tax authorities until expiration of the applicable statute of limitations, which is generally three years after filing of the tax return but could be longer in certain circumstances.
Income and capital gain distributions are determined in accordance with federal income tax regulations, which may differ from GAAP. These differences are primarily due to differing treatments of the following: futures and options transactions, foreign currency transactions, losses deferred due to wash sales, losses deferred due to post-October losses, return of capital distributions, partnership investments, deferred Director’s fees, passive foreign investment company transactions, and REIT transactions.
At June 30, 2018, the cost of securities for federal income tax purposes, the aggregate gross unrealized gain for all securities for which there was an excess of value over tax cost and the aggregate gross unrealized loss for all securities for which there was an excess of tax cost over value was as follows:
| | Tax Cost | Tax Unrealized
Gain | Tax Unrealized
(Loss) | Net Unrealized
Gain (Loss) |
| Daily Income Fund | $157,905,010 | $— | $— | $— |
| Short-Term Gov. Securities Fund | $77,360,600 | $49,336 | $(908,293) | $(858,957) |
| Short-Term Bond Fund | $551,975,590 | $4,157,696 | $(5,752,884) | $(1,595,188) |
| Value Fund | $534,675,298 | $488,313,352 | $(3,271,149) | $485,042,203 |
| Growth Fund | $139,013,970 | $70,856,512 | $(2,020,138) | $68,836,374 |
| Small-Company Stock Fund | $649,038,202 | $319,109,601 | $(24,281,105) | $294,828,496 |
| International Equity Fund | $59,810,683 | $16,908,368 | $(905,398) | $16,002,970 |
| Notes to Financial Statements | |
71
Notes to Financial Statements | (Unaudited) (Continued)
Net unrealized appreciation/(depreciation) of Stock Index Fund in the Master Portfolio consists of an allocated portion of the portfolio’s unrealized appreciation/(depreciation). For information pertaining to the unrealized appreciation/(depreciation) for the Master Portfolio, please refer to the Appendix of this report.
4. Investment Transactions
Purchases and proceeds from sales of securities, other than short-term and U.S. Government securities, for the period ended June 30, 2018, were as follows:
| | Purchases | Proceeds
from Sale |
| Short-Term Gov. Securities Fund | $3,597,967 | $5,191,809 |
| Short-Term Bond Fund | $100,428,942 | $89,245,536 |
| Value Fund | $9,389,942 | $66,767,911 |
| Growth Fund | $41,006,663 | $34,038,048 |
| Small-Company Stock Fund | $11,553,016 | $340,450,789 |
| International Equity Fund | $5,139,356 | $3,838,528 |
Purchases and proceeds from sales of long-term U.S. Government securities, for the period ended June 30, 2018, were as follows:
| | Purchases | Proceeds
from Sale |
| Short-Term Gov. Securities Fund | $19,225,542 | $10,200,290 |
| Short-Term Bond Fund | $28,620,490 | $2,426,776 |
5. Related Parties
The investment management agreements between Homestead Funds, with respect to each Fund (other than the Stock Index Fund), and RE Advisers, an indirect, wholly-owned subsidiary of the National Rural Electric Cooperative Association (“NRECA”), provide for an annual investment management fee, that also provides for certain administrative services to the Funds, which is computed daily and paid monthly, based on each Fund’s average daily net assets. The annualized management fee rates for the Funds are 0.50% of average daily net assets for Daily Income Fund; 0.45% of average daily net assets for Short-Term Government Securities Fund; 0.60% of average daily net assets for Short-Term Bond Fund; 0.65% of average daily net assets up to $200 million, 0.50% of average daily net assets up to the next $200 million, 0.40% of average daily net assets in excess of $400 million for Value Fund; 0.65% of average daily net assets up to $250 million and 0.60% of average daily net assets in excess of $250 million for the Growth Fund; 0.85% of average daily net assets up to $200 million and 0.75% of average daily net assets in excess of $200 million for Small-Company Stock Fund; and 0.75% of average daily net assets up to $300 million, 0.65% of average daily net assets up to the next $100 million, 0.55% of average daily net assets up to the next $100 million, and 0.50% of average daily net assets in excess of $500 million for International Equity Fund.
T. Rowe Price Associates, Inc. (“T. Rowe”) is the subadvisor for the Growth Fund and Harding Loevner LP (“Harding”) is the subadvisor for the International Equity Fund. The subadvisors select, buy, and sell securities under the supervision and oversight of RE Advisers and the Board of Directors. RE Advisers pays the subadvisors from the fees it receives from the Funds. SSGA Funds Management, Inc. ("SSGA FM") served as interim subadvisor to the International Equity Fund from September 7, 2015 until January 8th, 2016. Harding Loevner LP began as subadvisor on January 15, 2016 after a transition period.
RE Advisers serves as the administrator for the Stock Index Fund pursuant to an Administrative Services Agreement with the fund, under which RE Advisers provides certain administrative services to the Fund. Pursuant to this agreement, RE Advisers receives a fee of 0.25% of the Fund's average daily net assets. In addition, the Stock Index Fund is allocated a management fee from the Master Portfolio, calculated daily at an annual rate of 0.04% of its average daily net assets. This fee includes advisory, custody, and administrative fees provided by the Master Portfolio on behalf of its investors. The financial information for the Master Portfolio is included in the Appendix.
RE Advisers has agreed, as part of the Expense Limitation Agreement entered into with Homestead Funds, with respect to each Fund, to waive its management fee and/or reimburse all Fund operating expenses, excluding certain non-recurring expenses, such as taxes, brokerage commissions, other expenditures that are capitalized in accordance with generally accepted accounting principles, expenses not incurred in the ordinary course of business, or, in the case of each Fund other than the Stock Index Fund, fees and expenses associated with an investment in another investment company or any company that would be an investment company under Section 3(a) of the Act, but for the exceptions to that definition provided for in
| | Notes to Financial Statements |
Notes to Financial Statements | (Unaudited) (Continued)
Sections 3(c)(1) and 3(c)(7) of the Act, which in any year exceed 0.80% of the average daily net assets of the Daily Income Fund and Short-Term Bond Fund, 0.75% of the average daily net assets of the Short-Term Government Securities Fund and Stock Index Fund, 1.25% of the average daily net assets of Value Fund, 0.95% of the average daily net assets of Growth Fund, 1.50% of the average daily net assets of Small-Company Stock Fund and 0.99% of the average daily net assets of the International Equity Fund.
On August 14, 2009, RE Advisers voluntarily agreed to waive fees and/or reimburse expenses, if necessary, in order to assist the Daily Income Fund in maintaining a minimum yield (the "temporary waiver"). The temporary waiver continued from 2009 through May 11, 2017.
For the period beginning September 7, 2015 through January 14, 2016, RE Advisers, pursuant to a contractual waiver with the International Equity Fund, waived from the management fee due to it from International Equity Fund the amount equal to the subadvisory fees it would have paid to Mercator Asset Management L.P., the Fund's subadvisor prior to September 7, 2015, less the amount it paid to SSGA FM for subadvisory services during such period.
Pursuant to the Expense Limitation Agreement, management fees waived for the period ended June 30, 2018 amounted to $33,721 for Short-Term Government Securities Fund and $91,518 for International Equity Fund.
Through April 30, 2013, the Stock Index, Value, Growth, Small-Company Stock, and International Equity Funds each received a 2% redemption fee on shares sold within 30 days of purchase. Effective May 1, 2013, this redemption fee was eliminated. None of the Funds currently assess a redemption fee.
Under a Deferred Compensation Plan (the “Plan”), Independent Directors of the Funds may elect to defer receipt of all or a specified portion of their compensation. Deferred amounts are credited with the earnings and losses equal to those made as if the deferred amounts were invested in one or more of the Funds, as designated by each participating Independent Director. Deferred amounts remain in the Fund until distributed in accordance with the Plan. The liability is reflected as Independent Director’s deferred compensation on the Statement of Assets and Liabilities and the expense is included in Director and Board meeting expenses on the Statement of Operations.
As of June 30, 2018, certain unaffiliated shareholders of record, including omnibus accounts, individually or collectively held greater than 10% of the net assets of the Funds as follows: there was one such account in the Value Fund, accounting for 18% of the outstanding shares and four such accounts in the Small-Company Stock Fund, accounting for 19%, 19%, 16%, and 15% of the outstanding shares, respectively.
6. Capital Share Transactions
As of June 30, 2018, 500 million shares of $.01 par value capital shares are authorized for Daily Income Fund, 200 million shares for Short-Term Bond Fund, and 100 million shares for Short-Term Government Securities Fund, Stock Index Fund, Value Fund, Growth Fund, Small-Company Stock Fund, and International Equity Fund. Transactions in capital shares were as follows:
| | Shares
Sold | Shares Issued
In Reinvestment
of Dividends | Total Shares
Issued | Total Shares
Redeemed | Net Increase
(Decrease) |
| Period Ended June 30, 2018 | | | | | |
| In Dollars | | | | | |
| Daily Income Fund | $55,837,306 | $674,538 | $56,511,844 | $(66,990,566) | $(10,478,722) |
| Short-Term Government Securities Fund | $7,398,281 | $471,285 | $7,869,566 | $(6,086,606) | $1,782,960 |
| Short-Term Bond Fund | $51,328,425 | $5,227,751 | $56,556,176 | $(52,690,244) | $3,865,932 |
| Stock Index Fund | $10,023,585 | $628,195 | $10,651,780 | $(11,459,509) | $(807,729) |
| Value Fund | $58,994,386 | $8,019,808 | $67,014,194 | $(136,785,112) | $(69,770,918) |
| Growth Fund | $30,681,320 | $1,692,715 | $32,374,035 | $(21,937,865) | $10,436,170 |
| Small-Company Stock Fund | $57,042,374 | $8,208,981 | $65,251,355 | $(375,535,861) | $(310,284,506) |
| International Equity Fund | $6,364,694 | $— | $6,364,694 | $(5,072,549) | $1,292,145 |
| Notes to Financial Statements | |
73
Notes to Financial Statements | (Unaudited) (Continued)
| In Shares | | | | | |
| Daily Income Fund | 55,837,306 | 674,538 | 56,511,844 | (66,990,566) | (10,478,722) |
| Short-Term Government Securities Fund | 1,441,717 | 91,880 | 1,533,597 | (1,186,098) | 347,499 |
| Short-Term Bond Fund | 9,920,441 | 1,010,885 | 10,931,326 | (10,183,784) | 747,542 |
| Stock Index Fund | 491,014 | 30,779 | 521,793 | (558,141) | (36,348) |
| Value Fund | 1,062,553 | 149,568 | 1,212,121 | (2,464,509) | (1,252,388) |
| Growth Fund | 2,733,569 | 147,083 | 2,880,652 | (1,971,257) | 909,395 |
| Small-Company Stock Fund | 1,299,683 | 191,085 | 1,490,768 | (8,573,120) | (7,082,352) |
| International Equity Fund | 729,641 | — | 729,641 | (584,509) | 145,132 |
| | Shares
Sold | Shares Issued
In Reinvestment
of Dividends | Total Shares
Issued | Total Shares
Redeemed | Net Increase
(Decrease) |
| Year Ended December 31, 2017 | | | | | |
| In Dollars | | | | | |
| Daily Income Fund | $106,733,220 | $322,539 | $107,055,759 | $(128,980,128) | $(21,924,369) |
| Short-Term Government Securities Fund | $14,556,313 | $774,324 | $15,330,637 | $(12,878,070) | $2,452,567 |
| Short-Term Bond Fund | $78,765,070 | $8,736,276 | $87,501,346 | $(77,356,094) | $10,145,252 |
| Stock Index Fund | $16,292,299 | $1,281,692 | $17,573,991 | $(19,912,980) | $(2,338,989) |
| Value Fund | $89,125,547 | $56,692,399 | $145,817,946 | $(132,247,297) | $13,570,649 |
| Growth Fund | $39,036,609 | $11,945,685 | $50,982,294 | $(24,097,367) | $26,884,927 |
| Small-Company Stock Fund | $170,128,814 | $54,342,130 | $224,470,944 | $(354,554,034) | $(130,083,090) |
| International Equity Fund | $11,961,638 | $688,038 | $12,649,676 | $(7,247,831) | $5,401,845 |
| In Shares | | | | | |
| Daily Income Fund | 106,733,220 | 322,539 | 107,055,759 | (128,980,128) | (21,924,369) |
| Short-Term Government Securities Fund | 2,814,475 | 149,767 | 2,964,242 | (2,489,172) | 475,070 |
| Short-Term Bond Fund | 15,130,563 | 1,678,281 | 16,808,844 | (14,861,983) | 1,946,861 |
| Stock Index Fund | 891,000 | 63,639 | 954,639 | (1,088,323) | (133,684) |
| Value Fund | 1,740,708 | 1,040,240 | 2,780,948 | (2,571,633) | 209,315 |
| Growth Fund | 3,965,416 | 1,149,309 | 5,114,725 | (2,471,889) | 2,642,836 |
| Small-Company Stock Fund | 4,049,254 | 1,226,682 | 5,275,936 | (8,467,705) | (3,191,769) |
| International Equity Fund | 1,525,545 | 81,594 | 1,607,139 | (934,627) | 672,512 |
7. Subsequent Events
Management has evaluated the impact of all subsequent events through the date the financial statements were issued and has determined that there were no subsequent events requiring adjustment or additional disclosure in these financial statements.
8. Recent Accounting Pronouncements
On March 30, 2017, the Financial Accounting Standards Board issued an Accounting Standards Update ("ASU") that shortens the amortization period for the premium on certain callable debt securities to the earliest call date. The effective date is the fiscal year beginning after December 15, 2018. Management is currently evaluating the impact this ASU will have on the financial statements.
| | Notes to Financial Statements |
James F. Perna, Director and Chairman of the Board
Mark D. Santero, President, Chief Executive Officer, and Director
Douglas W. Johnson, Director and Chairman of the Audit Committee
Kenneth R. Meyer, Director and Chairman of the Compensation Committee
Anthony M. Marinello, Director
Sheldon C. Petersen, Director
Mark Rose, Director
Peter J. Tonetti, Director
Danielle C. Sieverling, Chief Compliance Officer
Jennifer (Laurie) Webster, Chief Operations Officer
John (Jack) Delaney, Secretary
Amy M. DiMauro, Treasurer
Directors and Officers
75
Portfolio of Investments
S&P 500 Index Master Portfolio | June 30, 2018 | (Unaudited)
| Common Stocks | 97.8% of net assets |
| | Shares | Value |
| Aerospace & Defense | 2.6% |
| Arconic, Inc. | 279,348 | $4,751,709 |
| Boeing Co. | 370,970 | 124,464,145 |
| General Dynamics Corp. | 187,710 | 34,991,021 |
| Harris Corp. | 80,202 | 11,592,397 |
| Huntington Ingalls Industries, Inc. | 29,604 | 6,417,851 |
| L3 Technologies, Inc. | 53,132 | 10,218,346 |
| Lockheed Martin Corp. | 168,618 | 49,814,816 |
| Northrop Grumman Corp. | 118,320 | 36,407,064 |
| Raytheon Co. | 195,071 | 37,683,816 |
| Rockwell Collins, Inc. | 110,277 | 14,852,106 |
| Textron, Inc. | 170,504 | 11,237,919 |
| TransDigm Group, Inc. | 33,181 | 11,452,090 |
| United Technologies Corp. | 505,028 | 63,143,651 |
| Total Aerospace & Defense | | 417,026,931 |
| Air Freight & Logistics | 0.6% |
| C.H. Robinson Worldwide, Inc. | 92,123 | 7,707,010 |
| Expeditors International of Washington, Inc. | 116,956 | 8,549,484 |
| FedEx Corp. | 166,512 | 37,808,215 |
| United Parcel Service, Inc., Class B | 467,074 | 49,617,271 |
| Total Air Freight & Logistics | | 103,681,980 |
| Airlines | 0.4% |
| Alaska Air Group, Inc. | 86,618 | 5,230,861 |
| American Airlines Group Inc. | 275,057 | 10,441,164 |
| Delta Air Lines, Inc. | 439,057 | 21,750,884 |
| Southwest Airlines Co. | 363,753 | 18,507,753 |
| United Continental Holdings, Inc. (a) | 157,909 | 11,010,994 |
| Total Airlines | | 66,941,656 |
| Auto Components | 0.2% |
| Aptiv PLC | 177,826 | 16,294,197 |
| BorgWarner, Inc. | 138,368 | 5,971,963 |
| Goodyear Tire & Rubber Co. | 162,653 | 3,788,188 |
| Total Auto Components | | 26,054,348 |
| Automobiles | 0.4% |
| Ford Motor Co. | 2,656,760 | 29,410,333 |
| General Motors Co. | 860,824 | 33,916,466 |
| Harley-Davidson, Inc. | 111,325 | 4,684,556 |
| Total Automobiles | | 68,011,355 |
| Banks | 6.0% |
| Bank of America Corp. | 6,384,739 | 179,985,792 |
| BB&T Corp. | 529,336 | 26,699,708 |
| Citigroup, Inc. | 1,728,253 | 115,654,691 |
| Citizens Financial Group, Inc. | 330,490 | 12,856,061 |
| Comerica, Inc. | 118,443 | 10,768,837 |
| Fifth Third Bancorp | 467,517 | 13,417,738 |
| Common Stocks | 97.8% of net assets (Continued) |
| | Shares | Value |
| Banks | 6.0% (Continued) |
| Huntington Bancshares, Inc. | 744,814 | $10,993,455 |
| JPMorgan Chase & Co. | 2,304,325 | 240,110,665 |
| KeyCorp | 714,115 | 13,953,807 |
| M&T Bank Corp. | 101,213 | 17,221,392 |
| People's United Financial, Inc. | 220,243 | 3,984,196 |
| PNC Financial Services Group, Inc. (b) | 317,446 | 42,886,955 |
| Regions Financial Corp. | 760,067 | 13,513,991 |
| SunTrust Banks, Inc. | 314,854 | 20,786,661 |
| SVB Financial Group (a) | 36,135 | 10,434,343 |
| U.S. Bancorp | 1,055,032 | 52,772,701 |
| Wells Fargo & Co. | 2,970,542 | 164,686,848 |
| Zions Bancorporation | 137,026 | 7,219,900 |
| Total Banks | | 957,947,741 |
| Beverages | 1.7% |
| Brown-Forman Corp., Class B | 180,651 | 8,853,706 |
| Coca-Cola Co. | 2,587,754 | 113,498,890 |
| Constellation Brands, Inc., Class A | 114,242 | 25,004,147 |
| Molson Coors Brewing Co., Class B | 128,030 | 8,711,161 |
| Monster Beverage Corp. (a) | 278,320 | 15,947,736 |
| PepsiCo, Inc. | 959,553 | 104,466,535 |
| Total Beverages | | 276,482,175 |
| Biotechnology | 2.5% |
| AbbVie, Inc. | 1,027,898 | 95,234,750 |
| Alexion Pharmaceuticals, Inc. (a) | 148,584 | 18,446,704 |
| Amgen, Inc. | 451,363 | 83,317,096 |
| Biogen, Inc. (a) | 143,406 | 41,622,157 |
| Celgene Corp. (a) | 480,228 | 38,139,708 |
| Gilead Sciences, Inc. | 883,173 | 62,563,975 |
| Incyte Corp. (a)(c) | 121,902 | 8,167,434 |
| Regeneron Pharmaceuticals, Inc. (a) | 51,944 | 17,920,161 |
| Vertex Pharmaceuticals, Inc. (a) | 173,188 | 29,435,032 |
| Total Biotechnology | | 394,847,017 |
| Building Products | 0.3% |
| Allegion PLC | 61,549 | 4,761,431 |
| AO Smith Corp. | 94,382 | 5,582,695 |
| Fortune Brands Home & Security, Inc. | 95,901 | 5,148,925 |
| Johnson Controls International PLC | 632,109 | 21,144,046 |
| Masco Corp. | 206,334 | 7,721,018 |
| Total Building Products | | 44,358,115 |
| Capital Markets | 3.0% |
| Affiliated Managers Group, Inc. | 35,458 | 5,271,541 |
| Ameriprise Financial, Inc. | 98,861 | 13,828,677 |
| Bank of New York Mellon Corp. | 684,928 | 36,938,167 |
| Appendix | The accompanying notes are an integral part of these financial statements. |
Portfolio of Investments | S&P 500 Index Master Portfolio | June 30, 2018 | (Unaudited) | (Continued)
| Common Stocks | 97.8% of net assets (Continued) |
| | Shares | Value |
| Capital Markets | 3.0% (Continued) |
| BlackRock, Inc. (b) | 83,521 | $41,680,320 |
| Cboe Global Markets, Inc. | 78,536 | 8,173,241 |
| Charles Schwab Corp. | 812,952 | 41,541,847 |
| CME Group, Inc. | 230,405 | 37,767,988 |
| E*Trade Financial Corp. (a) | 182,019 | 11,132,282 |
| Franklin Resources, Inc. | 215,425 | 6,904,371 |
| Goldman Sachs Group, Inc. | 238,529 | 52,612,342 |
| Intercontinental Exchange, Inc. | 395,669 | 29,101,455 |
| Invesco Ltd. | 282,822 | 7,511,752 |
| Moody's Corp. | 111,315 | 18,985,886 |
| Morgan Stanley | 928,523 | 44,011,990 |
| MSCI, Inc. | 61,813 | 10,225,725 |
| Nasdaq, Inc. | 77,776 | 7,098,616 |
| Northern Trust Corp. | 143,049 | 14,718,312 |
| Raymond James Financial, Inc. | 89,590 | 8,004,866 |
| S&P Global, Inc. | 169,083 | 34,474,333 |
| State Street Corp. | 245,389 | 22,843,262 |
| T. Rowe Price Group, Inc. | 163,850 | 19,021,346 |
| Total Capital Markets | | 471,848,319 |
| Chemicals | 1.8% |
| Air Products & Chemicals, Inc. | 149,731 | 23,317,609 |
| Albemarle Corp. (c) | 73,712 | 6,953,253 |
| CF Industries Holdings, Inc. | 163,850 | 7,274,940 |
| DowDuPont, Inc. | 1,571,217 | 103,574,625 |
| Eastman Chemical Co. | 93,684 | 9,364,653 |
| Ecolab, Inc. | 176,625 | 24,785,786 |
| FMC Corp. | 93,297 | 8,323,025 |
| International Flavors & Fragrances, Inc. | 55,478 | 6,877,053 |
| LyondellBasell Industries NV, Class A | 215,585 | 23,682,012 |
| Mosaic Co. | 245,006 | 6,872,418 |
| PPG Industries, Inc. | 170,511 | 17,687,106 |
| Praxair, Inc. | 194,730 | 30,796,549 |
| Sherwin-Williams Co. | 55,359 | 22,562,668 |
| Total Chemicals | | 292,071,697 |
| Commercial Services & Supplies | 0.4% |
| Cintas Corp. | 59,051 | 10,928,569 |
| Copart, Inc. (a) | 136,856 | 7,740,575 |
| Iron Mountain, Inc. | 186,725 | 6,537,242 |
| Republic Services, Inc. | 154,326 | 10,549,725 |
| Stericycle, Inc. (a) | 56,643 | 3,698,222 |
| Waste Management, Inc. | 267,542 | 21,761,866 |
| Total Commercial Services & Supplies | | 61,216,199 |
| Communications Equipment | 1.0% |
| Cisco Systems, Inc. | 3,187,542 | 137,159,932 |
| F5 Networks, Inc. (a) | 40,987 | 7,068,208 |
| Juniper Networks, Inc. | 242,731 | 6,655,684 |
| Common Stocks | 97.8% of net assets (Continued) |
| | Shares | Value |
| Communications Equipment | 1.0% (Continued) |
| Motorola Solutions, Inc. | 109,569 | $12,750,545 |
| Total Communications Equipment | | 163,634,369 |
| Construction & Engineering | 0.1% |
| Fluor Corp. | 90,837 | 4,431,029 |
| Jacobs Engineering Group, Inc. | 77,614 | 4,927,713 |
| Quanta Services, Inc. (a) | 101,761 | 3,398,817 |
| Total Construction & Engineering | | 12,757,559 |
| Construction Materials | 0.1% |
| Martin Marietta Materials, Inc. | 43,613 | 9,740,091 |
| Vulcan Materials Co. | 89,472 | 11,547,257 |
| Total Construction Materials | | 21,287,348 |
| Consumer Finance | 0.7% |
| American Express Co. | 483,856 | 47,417,888 |
| Capital One Financial Corp. | 330,882 | 30,408,056 |
| Discover Financial Services | 237,272 | 16,706,321 |
| Synchrony Financial | 479,231 | 15,996,731 |
| Total Consumer Finance | | 110,528,996 |
| Containers & Packaging | 0.3% |
| Avery Dennison Corp. | 58,675 | 5,990,717 |
| Ball Corp. | 241,647 | 8,590,551 |
| International Paper Co. | 276,659 | 14,408,401 |
| Packaging Corp. of America | 62,642 | 7,002,749 |
| Sealed Air Corp. | 113,392 | 4,813,490 |
| WestRock Co. | 172,036 | 9,809,493 |
| Total Containers & Packaging | | 50,615,401 |
| Distributors | 0.1% |
| Genuine Parts Co. | 101,839 | 9,347,802 |
| LKQ Corp. (a) | 202,947 | 6,474,009 |
| Total Distributors | | 15,821,811 |
| Diversified Consumer Services | 0.0% |
| H&R Block, Inc. | 139,724 | 3,182,913 |
| Total Diversified Consumer Services | | 3,182,913 |
| Diversified Financial Services | 1.6% |
| Berkshire Hathaway, Inc., Class B (a) | 1,303,004 | 243,205,697 |
| Jefferies Financial Group, Inc. | 207,622 | 4,721,324 |
| Total Diversified Financial Services | | 247,927,021 |
| Diversified Telecommunication Services | 1.9% |
| AT&T, Inc. | 4,907,665 | 157,585,123 |
| CenturyLink, Inc. | 667,521 | 12,442,592 |
| The accompanying notes are an integral part of these financial statements. | Appendix |
77
Portfolio of Investments | S&P 500 Index Master Portfolio | June 30, 2018 | (Unaudited) | (Continued)
| Common Stocks | 97.8% of net assets (Continued) |
| | Shares | Value |
| Diversified Telecommunication Services | 1.9% (Continued) |
| Verizon Communications, Inc. | 2,799,069 | $140,821,161 |
| Total Diversified Telecommunication Services | | 310,848,876 |
| Electric Utilities | 1.8% |
| Alliant Energy Corp. | 152,211 | 6,441,570 |
| American Electric Power Co., Inc. | 336,957 | 23,334,272 |
| Duke Energy Corp. | 477,693 | 37,775,963 |
| Edison International | 219,837 | 13,909,087 |
| Entergy Corp. | 124,845 | 10,086,228 |
| Evergy, Inc. | 180,118 | 10,113,626 |
| Eversource Energy | 213,354 | 12,504,678 |
| Exelon Corp. | 656,129 | 27,951,095 |
| FirstEnergy Corp. | 307,086 | 11,027,458 |
| NextEra Energy, Inc. | 318,224 | 53,152,955 |
| PG&E Corp. | 346,481 | 14,746,231 |
| Pinnacle West Capital Corp. | 72,372 | 5,830,288 |
| PPL Corp. | 467,268 | 13,340,501 |
| Southern Co. | 687,094 | 31,819,323 |
| Xcel Energy, Inc. | 340,275 | 15,543,762 |
| Total Electric Utilities | | 287,577,037 |
| Electrical Equipment | 0.5% |
| AMETEK, Inc. | 158,136 | 11,411,094 |
| Eaton Corp. PLC | 293,905 | 21,966,460 |
| Emerson Electric Co. | 430,046 | 29,733,380 |
| Rockwell Automation, Inc. | 86,100 | 14,312,403 |
| Total Electrical Equipment | | 77,423,337 |
| Electronic Equipment, Instruments & Components | 0.4% |
| Amphenol Corp., Class A | 205,693 | 17,926,145 |
| Corning, Inc. | 583,008 | 16,038,550 |
| FLIR Systems, Inc. | 91,123 | 4,735,662 |
| IPG Photonics Corp. (a)(c) | 24,761 | 5,463,020 |
| TE Connectivity Ltd. | 235,037 | 21,167,432 |
| Total Electronic Equipment, Instruments & Components | | 65,330,809 |
| Energy Equipment & Services | 0.8% |
| Baker Hughes a GE Co. | 281,397 | 9,294,543 |
| Halliburton Co. | 595,825 | 26,847,875 |
| Helmerich & Payne, Inc. | 70,592 | 4,500,946 |
| National Oilwell Varco, Inc. | 260,462 | 11,304,051 |
| Schlumberger Ltd. | 940,510 | 63,042,385 |
| TechnipFMC PLC | 287,356 | 9,120,679 |
| Total Energy Equipment & Services | | 124,110,479 |
| Equity Real Estate Investment Trusts (REITs) | 2.7% |
| Alexandria Real Estate Equities, Inc. | 71,917 | 9,073,768 |
| American Tower Corp. | 299,801 | 43,222,310 |
| Common Stocks | 97.8% of net assets (Continued) |
| | Shares | Value |
| Equity Real Estate Investment Trusts (REITs) | 2.7% (Continued) |
| Apartment Investment & Management Co., Class A | 102,328 | $4,328,474 |
| AvalonBay Communities, Inc. | 93,331 | 16,042,666 |
| Boston Properties, Inc. | 103,991 | 13,042,551 |
| Crown Castle International Corp. | 281,793 | 30,382,921 |
| Digital Realty Trust, Inc. | 138,138 | 15,413,438 |
| Duke Realty Corp. | 247,834 | 7,194,621 |
| Equinix, Inc. | 54,166 | 23,285,422 |
| Equity Residential | 246,450 | 15,696,401 |
| Essex Property Trust, Inc. | 44,825 | 10,716,313 |
| Extra Space Storage, Inc. | 87,922 | 8,775,495 |
| Federal Realty Investment Trust | 51,446 | 6,510,491 |
| GGP, Inc. | 435,894 | 8,905,314 |
| HCP, Inc. | 314,250 | 8,113,935 |
| Host Hotels & Resorts, Inc. | 507,437 | 10,691,698 |
| Kimco Realty Corp. | 281,120 | 4,776,229 |
| Macerich Co. | 72,497 | 4,120,005 |
| Mid-America Apartment Communities, Inc. | 76,283 | 7,679,410 |
| Prologis, Inc. | 363,781 | 23,896,774 |
| Public Storage | 102,295 | 23,206,644 |
| Realty Income Corp. (c) | 189,594 | 10,198,261 |
| Regency Centers Corp. | 95,414 | 5,923,301 |
| SBA Communications Corp. (a) | 79,280 | 13,090,714 |
| Simon Property Group, Inc. | 211,223 | 35,948,042 |
| SL Green Realty Corp. (c) | 58,685 | 5,899,603 |
| UDR, Inc. | 176,982 | 6,643,904 |
| Ventas, Inc. | 239,460 | 13,637,247 |
| Vornado Realty Trust | 114,346 | 8,452,456 |
| Welltower, Inc. | 248,306 | 15,566,303 |
| Weyerhaeuser Co. | 518,055 | 18,888,285 |
| Total Equity Real Estate Investment Trusts (REITs) | | 429,322,996 |
| Food & Staples Retailing | 1.4% |
| Costco Wholesale Corp. | 296,759 | 62,016,696 |
| Kroger Co. | 554,873 | 15,786,137 |
| Sysco Corp. | 320,632 | 21,895,959 |
| Walgreens Boots Alliance, Inc. | 578,506 | 34,719,037 |
| Walmart, Inc. | 979,792 | 83,919,185 |
| Total Food & Staples Retailing | | 218,337,014 |
| Food Products | 1.1% |
| Archer-Daniels-Midland Co. | 374,997 | 17,186,113 |
| Campbell Soup Co. | 124,466 | 5,045,852 |
| Conagra Brands, Inc. | 265,951 | 9,502,429 |
| General Mills, Inc. | 402,031 | 17,793,892 |
| Hershey Co. | 97,182 | 9,043,757 |
| Hormel Foods Corp. | 181,422 | 6,750,713 |
| J.M. Smucker Co. | 78,951 | 8,485,653 |
| Kellogg Co. | 170,074 | 11,883,070 |
| Kraft Heinz Co. | 408,841 | 25,683,392 |
| McCormick & Co., Inc. | 83,959 | 9,746,800 |
| Appendix | The accompanying notes are an integral part of these financial statements. |
Portfolio of Investments | S&P 500 Index Master Portfolio | June 30, 2018 | (Unaudited) | (Continued)
| Common Stocks | 97.8% of net assets (Continued) |
| | Shares | Value |
| Food Products | 1.1% (Continued) |
| Mondelez International, Inc., Class A | 1,002,384 | $41,097,744 |
| Tyson Foods, Inc., Class A | 201,092 | 13,845,184 |
| Total Food Products | | 176,064,599 |
| Health Care Equipment & Supplies | 3.0% |
| Abbott Laboratories | 1,186,333 | 72,354,450 |
| ABIOMED, Inc. (a) | 29,159 | 11,927,489 |
| Align Technology, Inc. (a) | 48,817 | 16,702,248 |
| Baxter International, Inc. | 331,233 | 24,458,245 |
| Becton, Dickinson & Co. | 180,798 | 43,311,969 |
| Boston Scientific Corp. (a) | 934,081 | 30,544,449 |
| Cooper Cos., Inc. (c) | 34,133 | 8,036,615 |
| Danaher Corp. | 415,911 | 41,042,097 |
| Dentsply Sirona Inc. | 149,246 | 6,532,497 |
| Edwards Lifesciences Corp. (a) | 144,061 | 20,970,960 |
| Hologic, Inc. (a) | 179,163 | 7,121,729 |
| IDEXX Laboratories, Inc. (a) | 59,259 | 12,914,906 |
| Intuitive Surgical, Inc. (a) | 76,658 | 36,679,320 |
| Medtronic PLC | 916,839 | 78,490,587 |
| ResMed, Inc. | 98,065 | 10,157,573 |
| Stryker Corp. | 217,808 | 36,779,059 |
| Varian Medical Systems, Inc. (a)(c) | 63,871 | 7,263,410 |
| Zimmer Biomet Holdings, Inc. | 136,251 | 15,183,811 |
| Total Health Care Equipment & Supplies | | 480,471,414 |
| Health Care Providers & Services | 3.1% |
| Aetna, Inc. | 222,053 | 40,746,726 |
| AmerisourceBergen Corp. | 112,126 | 9,560,984 |
| Anthem, Inc. | 172,906 | 41,156,815 |
| Cardinal Health, Inc. | 215,094 | 10,503,040 |
| Centene Corp. (a) | 139,256 | 17,157,732 |
| Cigna Corp. | 165,280 | 28,089,336 |
| CVS Health Corp. | 689,169 | 44,348,025 |
| DaVita, Inc. (a) | 97,143 | 6,745,610 |
| Envision Healthcare Corp. (a) | 81,025 | 3,565,910 |
| Express Scripts Holding Co. (a) | 381,933 | 29,489,047 |
| HCA Healthcare, Inc. | 187,989 | 19,287,672 |
| Henry Schein, Inc. (a)(c) | 102,916 | 7,475,818 |
| Humana, Inc. | 93,464 | 27,817,690 |
| Laboratory Corp. of America Holdings (a) | 69,053 | 12,397,085 |
| McKesson Corp. | 137,832 | 18,386,789 |
| Quest Diagnostics, Inc. | 92,801 | 10,202,542 |
| UnitedHealth Group, Inc. | 650,259 | 159,534,543 |
| Universal Health Services, Inc., Class B | 60,821 | 6,777,892 |
| Total Health Care Providers & Services | | 493,243,256 |
| Common Stocks | 97.8% of net assets (Continued) |
| | Shares | Value |
| Health Care Technology | 0.1% |
| Cerner Corp. (a) | 213,640 | $12,773,536 |
| Total Health Care Technology | | 12,773,536 |
| Hotels, Restaurants & Leisure | 1.6% |
| Carnival Corp. | 272,369 | 15,609,467 |
| Chipotle Mexican Grill, Inc. (a) | 16,069 | 6,931,685 |
| Darden Restaurants, Inc. | 86,188 | 9,227,287 |
| Hilton Worldwide Holdings, Inc. | 190,308 | 15,064,781 |
| Marriott International, Inc., Class A | 200,425 | 25,373,805 |
| McDonald's Corp. | 532,918 | 83,502,922 |
| MGM Resorts International | 332,044 | 9,639,237 |
| Norwegian Cruise Line Holdings Ltd. (a) | 135,293 | 6,392,594 |
| Royal Caribbean Cruises Ltd. | 117,427 | 12,165,437 |
| Starbucks Corp. | 934,785 | 45,664,247 |
| Wynn Resorts Ltd. | 56,900 | 9,521,646 |
| Yum! Brands, Inc. | 222,375 | 17,394,173 |
| Total Hotels, Restaurants & Leisure | | 256,487,281 |
| Household Durables | 0.4% |
| D.R. Horton, Inc. | 225,980 | 9,265,180 |
| Garmin Ltd. | 74,601 | 4,550,661 |
| Leggett & Platt, Inc. | 87,619 | 3,911,312 |
| Lennar Corp., Class A | 188,648 | 9,904,020 |
| Mohawk Industries, Inc. (a) | 43,001 | 9,213,824 |
| Newell Brands, Inc. | 320,611 | 8,268,558 |
| PulteGroup, Inc. | 179,788 | 5,168,905 |
| Whirlpool Corp. | 45,867 | 6,707,132 |
| Total Household Durables | | 56,989,592 |
| Household Products | 1.4% |
| Church & Dwight Co., Inc. | 165,741 | 8,810,792 |
| Clorox Co. | 88,298 | 11,942,304 |
| Colgate-Palmolive Co. | 590,487 | 38,269,462 |
| Kimberly-Clark Corp. | 239,031 | 25,179,526 |
| Procter & Gamble Co. | 1,700,915 | 132,773,425 |
| Total Household Products | | 216,975,509 |
| Independent Power and Renewable Electricity Producers | 0.1% |
| AES Corp. | 430,250 | 5,769,653 |
| NRG Energy, Inc. | 204,882 | 6,289,877 |
| Total Independent Power and Renewable Electricity Producers | | 12,059,530 |
| Industrial Conglomerates | 1.6% |
| 3M Co. | 402,950 | 79,268,324 |
| General Electric Co. | 5,891,740 | 80,186,581 |
| Honeywell International, Inc. | 507,729 | 73,138,363 |
| Roper Technologies, Inc. | 69,387 | 19,144,567 |
| Total Industrial Conglomerates | | 251,737,835 |
| The accompanying notes are an integral part of these financial statements. | Appendix |
79
Portfolio of Investments | S&P 500 Index Master Portfolio | June 30, 2018 | (Unaudited) | (Continued)
| Common Stocks | 97.8% of net assets (Continued) |
| | Shares | Value |
| Insurance | 2.3% |
| Aflac, Inc. | 519,393 | $22,344,287 |
| Allstate Corp. | 236,186 | 21,556,696 |
| American International Group, Inc. | 611,565 | 32,425,176 |
| Aon PLC | 164,083 | 22,507,265 |
| Arthur J Gallagher & Co. | 125,852 | 8,215,619 |
| Assurant, Inc. | 36,323 | 3,759,067 |
| Brighthouse Financial, Inc. (a) | 65,918 | 2,641,334 |
| Chubb Ltd. | 315,948 | 40,131,715 |
| Cincinnati Financial Corp. | 99,096 | 6,625,559 |
| Everest Re Group Ltd. | 27,458 | 6,328,520 |
| Hartford Financial Services Group, Inc. | 240,801 | 12,312,155 |
| Lincoln National Corp. | 141,471 | 8,806,570 |
| Loews Corp. | 174,061 | 8,403,665 |
| Marsh & McLennan Cos., Inc. | 344,571 | 28,244,485 |
| MetLife, Inc. | 689,284 | 30,052,782 |
| Principal Financial Group, Inc. | 184,524 | 9,770,546 |
| Progressive Corp. | 396,522 | 23,454,276 |
| Prudential Financial, Inc. | 289,332 | 27,055,435 |
| Torchmark Corp. | 69,803 | 5,682,662 |
| Travelers Cos., Inc. | 185,094 | 22,644,400 |
| Unum Group | 143,459 | 5,306,549 |
| Willis Towers Watson PLC | 89,039 | 13,498,312 |
| XL Group Ltd. | 177,106 | 9,909,081 |
| Total Insurance | | 371,676,156 |
| Internet & Direct Marketing Retail | 4.1% |
| Amazon.com, Inc. (a) | 272,854 | 463,797,229 |
| Booking Holdings, Inc. (a) | 32,690 | 66,265,572 |
| Expedia Group, Inc. | 80,033 | 9,619,166 |
| Netflix, Inc. (a) | 294,590 | 115,311,364 |
| TripAdvisor, Inc. (a)(c) | 73,445 | 4,091,621 |
| Total Internet & Direct Marketing Retail | | 659,084,952 |
| Internet Software & Services | 5.2% |
| Akamai Technologies, Inc. (a) | 117,327 | 8,591,856 |
| Alphabet, Inc., Class C (a)(c) | 205,393 | 229,146,700 |
| Alphabet, Inc., Class A (a) | 202,583 | 228,754,698 |
| eBay, Inc. (a) | 626,168 | 22,704,852 |
| Facebook, Inc., Class A (a) | 1,624,808 | 315,732,690 |
| Twitter, Inc. (a) | 443,879 | 19,384,196 |
| VeriSign, Inc. (a) | 65,135 | 8,950,852 |
| Total Internet Software & Services | | 833,265,844 |
| IT Services | 4.4% |
| Accenture PLC, Class A | 435,087 | 71,175,882 |
| Alliance Data Systems Corp. | 31,903 | 7,439,780 |
| Automatic Data Processing, Inc. | 298,592 | 40,053,131 |
| Broadridge Financial Solutions, Inc. | 76,583 | 8,814,703 |
| Common Stocks | 97.8% of net assets (Continued) |
| | Shares | Value |
| IT Services | 4.4% (Continued) |
| Cognizant Technology Solutions Corp., Class A | 398,207 | $31,454,371 |
| DXC Technology Co. | 190,497 | 15,355,963 |
| Fidelity National Information Services, Inc. | 226,513 | 24,017,173 |
| Fiserv, Inc. (a) | 276,839 | 20,511,002 |
| FleetCor Technologies, Inc. (a) | 60,789 | 12,805,203 |
| Gartner, Inc. (a)(c) | 60,163 | 7,995,663 |
| Global Payments, Inc. | 107,624 | 11,999,000 |
| International Business Machines Corp. | 579,088 | 80,898,594 |
| Mastercard, Inc., Class A | 620,668 | 121,973,675 |
| Paychex, Inc. | 215,081 | 14,700,786 |
| PayPal Holdings, Inc. (a) | 757,114 | 63,044,883 |
| Total System Services, Inc. | 115,012 | 9,720,814 |
| Visa Inc., Class A | 1,209,542 | 160,203,838 |
| Western Union Co. | 301,750 | 6,134,577 |
| Total IT Services | | 708,299,038 |
| Leisure Products | 0.1% |
| Hasbro, Inc. | 75,836 | 7,000,421 |
| Mattel, Inc. | 232,614 | 3,819,522 |
| Total Leisure Products | | 10,819,943 |
| Life Sciences Tools & Services | 0.8% |
| Agilent Technologies, Inc. | 217,532 | 13,452,179 |
| Illumina, Inc. (a) | 99,949 | 27,914,756 |
| IQVIA Holdings, Inc. (a) | 109,642 | 10,944,465 |
| Mettler-Toledo International, Inc. (a) | 17,426 | 10,083,206 |
| PerkinElmer, Inc. | 71,741 | 5,253,593 |
| Thermo Fisher Scientific, Inc. | 272,231 | 56,389,929 |
| Waters Corp. (a)(c) | 53,769 | 10,409,141 |
| Total Life Sciences Tools & Services | | 134,447,269 |
| Machinery | 1.4% |
| Caterpillar, Inc. | 406,275 | 55,119,329 |
| Cummins, Inc. | 104,670 | 13,921,110 |
| Deere & Co. | 220,338 | 30,803,252 |
| Dover Corp. | 108,405 | 7,935,246 |
| Flowserve Corp. | 86,549 | 3,496,580 |
| Fortive Corp. (c) | 205,183 | 15,821,661 |
| Illinois Tool Works, Inc. | 205,179 | 28,425,499 |
| Ingersoll-Rand PLC | 168,071 | 15,081,011 |
| PACCAR, Inc. | 236,352 | 14,644,370 |
| Parker-Hannifin Corp. | 89,603 | 13,964,627 |
| Pentair PLC | 107,216 | 4,511,649 |
| Snap-on, Inc. | 37,306 | 5,995,820 |
| Stanley Black & Decker, Inc. | 103,460 | 13,740,523 |
| Xylem, Inc. | 124,905 | 8,416,099 |
| Total Machinery | | 231,876,776 |
| Appendix | The accompanying notes are an integral part of these financial statements. |
Portfolio of Investments | S&P 500 Index Master Portfolio | June 30, 2018 | (Unaudited) | (Continued)
| Common Stocks | 97.8% of net assets (Continued) |
| | Shares | Value |
| Media | 2.2% |
| CBS Corp., Class B | 227,633 | $12,797,527 |
| Charter Communications, Inc., Class A (a) | 125,838 | 36,896,960 |
| Comcast Corp., Class A | 3,115,297 | 102,212,895 |
| Discovery, Inc., Class A (a)(c) | 115,925 | 3,187,938 |
| Discovery, Inc., Class C (a) | 216,509 | 5,520,979 |
| DISH Network Corp., Class A (a) | 153,608 | 5,162,765 |
| Interpublic Group of Cos., Inc. | 267,707 | 6,275,052 |
| News Corp., Class A | 271,386 | 4,206,483 |
| News Corp., Class B | 53,983 | 855,631 |
| Omnicom Group, Inc. | 155,755 | 11,879,434 |
| Twenty-First Century Fox, Inc., Class A | 706,354 | 35,098,730 |
| Twenty-First Century Fox, Inc., Class B | 306,241 | 15,088,494 |
| Viacom, Inc., Class B | 233,027 | 7,028,094 |
| Walt Disney Co. | 1,008,526 | 105,703,610 |
| Total Media | | 351,914,592 |
| Metals & Mining | 0.3% |
| Freeport-McMoRan, Inc. | 907,680 | 15,666,557 |
| Newmont Mining Corp. | 363,938 | 13,724,102 |
| Nucor Corp. | 214,223 | 13,388,937 |
| Total Metals & Mining | | 42,779,596 |
| Multi-Utilities | 0.9% |
| Ameren Corp. | 168,468 | 10,251,278 |
| CenterPoint Energy, Inc. | 284,307 | 7,878,147 |
| CMS Energy Corp. | 192,061 | 9,080,644 |
| Consolidated Edison, Inc. | 213,618 | 16,657,932 |
| Dominion Energy, Inc. | 443,875 | 30,263,397 |
| DTE Energy Co. | 125,379 | 12,993,026 |
| NiSource, Inc. | 225,931 | 5,937,467 |
| Public Service Enterprise Group, Inc. | 338,251 | 18,312,909 |
| SCANA Corp. | 95,454 | 3,676,888 |
| Sempra Energy | 179,593 | 20,852,543 |
| WEC Energy Group, Inc. | 213,050 | 13,773,682 |
| Total Multi-Utilities | | 149,677,913 |
| Multiline Retail | 0.5% |
| Dollar General Corp. | 172,941 | 17,051,983 |
| Dollar Tree, Inc. (a) | 159,314 | 13,541,690 |
| Kohl's Corp. | 111,996 | 8,164,508 |
| Macy's, Inc. | 207,219 | 7,756,207 |
| Nordstrom, Inc. | 77,577 | 4,016,937 |
| Target Corp. | 361,422 | 27,511,443 |
| Total Multiline Retail | | 78,042,768 |
| Oil, Gas & Consumable Fuels | 5.4% |
| Anadarko Petroleum Corp. | 350,680 | 25,687,310 |
| Andeavor | 95,646 | 12,546,842 |
| Common Stocks | 97.8% of net assets (Continued) |
| | Shares | Value |
| Oil, Gas & Consumable Fuels | 5.4% (Continued) |
| Apache Corp. | 258,010 | $12,061,968 |
| Cabot Oil & Gas Corp. | 299,398 | 7,125,672 |
| Chevron Corp. | 1,294,414 | 163,652,762 |
| Cimarex Energy Co. | 63,309 | 6,441,058 |
| Concho Resources, Inc. (a)(c) | 99,782 | 13,804,840 |
| ConocoPhillips | 792,575 | 55,179,071 |
| Devon Energy Corp. | 353,142 | 15,524,122 |
| EOG Resources, Inc. | 391,599 | 48,726,664 |
| EQT Corp. | 171,459 | 9,461,108 |
| Exxon Mobil Corp. | 2,867,913 | 237,262,442 |
| Hess Corp. | 176,561 | 11,810,165 |
| HollyFrontier Corp. | 118,733 | 8,124,899 |
| Kinder Morgan, Inc. | 1,272,615 | 22,487,107 |
| Marathon Oil Corp. | 586,668 | 12,237,894 |
| Marathon Petroleum Corp. | 315,954 | 22,167,333 |
| Newfield Exploration Co. (a) | 136,402 | 4,126,161 |
| Noble Energy, Inc. | 335,333 | 11,830,548 |
| Occidental Petroleum Corp. | 518,432 | 43,382,390 |
| ONEOK, Inc. | 281,941 | 19,687,940 |
| Phillips 66 | 284,424 | 31,943,659 |
| Pioneer Natural Resources Co. | 116,165 | 21,983,065 |
| Valero Energy Corp. | 291,979 | 32,360,033 |
| Williams Cos., Inc. | 557,327 | 15,109,135 |
| Total Oil, Gas & Consumable Fuels | | 864,724,188 |
| Personal Products | 0.2% |
| Coty, Inc., Class A | 319,559 | 4,505,782 |
| Estee Lauder Cos., Inc., Class A | 150,207 | 21,433,037 |
| Total Personal Products | | 25,938,819 |
| Pharmaceuticals | 4.3% |
| Allergan PLC | 230,280 | 38,392,282 |
| Bristol-Myers Squibb Co. | 1,107,553 | 61,291,983 |
| Eli Lilly & Co. | 647,604 | 55,260,050 |
| Johnson & Johnson | 1,816,484 | 220,412,169 |
| Merck & Co., Inc. | 1,822,990 | 110,655,493 |
| Mylan NV (a) | 350,251 | 12,658,071 |
| Nektar Therapeutics (a) | 105,069 | 5,130,519 |
| Perrigo Co. PLC | 87,898 | 6,408,643 |
| Pfizer, Inc. | 3,965,833 | 143,880,421 |
| Zoetis, Inc. | 325,075 | 27,693,139 |
| Total Pharmaceuticals | | 681,782,770 |
| Professional Services | 0.3% |
| Equifax, Inc. | 82,578 | 10,331,334 |
| IHS Markit Ltd. (a) | 244,570 | 12,617,366 |
| Nielsen Holdings PLC | 223,158 | 6,902,277 |
| Robert Half International, Inc. | 82,401 | 5,364,305 |
| Verisk Analytics, Inc. (a) | 105,785 | 11,386,697 |
| Total Professional Services | | 46,601,979 |
| The accompanying notes are an integral part of these financial statements. | Appendix |
81
Portfolio of Investments | S&P 500 Index Master Portfolio | June 30, 2018 | (Unaudited) | (Continued)
| Common Stocks | 97.8% of net assets (Continued) |
| | Shares | Value |
| Real Estate Management & Development | 0.1% |
| CBRE Group, Inc., Class A (a)(c) | 201,675 | $9,627,965 |
| Total Real Estate Management & Development | | 9,627,965 |
| Road & Rail | 1.0% |
| CSX Corp. | 590,004 | 37,630,455 |
| JB Hunt Transport Services, Inc. | 59,714 | 7,258,237 |
| Kansas City Southern | 71,757 | 7,603,372 |
| Norfolk Southern Corp. | 192,593 | 29,056,506 |
| Union Pacific Corp. | 526,908 | 74,652,325 |
| Total Road & Rail | | 156,200,895 |
| Semiconductors & Semiconductor Equipment | 3.9% |
| Advanced Micro Devices, Inc. (a)(c) | 548,479 | 8,221,700 |
| Analog Devices, Inc. | 252,458 | 24,215,771 |
| Applied Materials, Inc. | 685,177 | 31,648,326 |
| Broadcom, Inc. | 272,017 | 66,002,205 |
| Intel Corp. | 3,156,669 | 156,918,016 |
| KLA-Tencor Corp. | 106,683 | 10,938,208 |
| Lam Research Corp. | 111,549 | 19,281,245 |
| Microchip Technology, Inc. | 157,792 | 14,351,182 |
| Micron Technology, Inc. (a) | 786,002 | 41,217,945 |
| NVIDIA Corp. | 411,147 | 97,400,724 |
| Qorvo, Inc. (a) | 84,891 | 6,805,712 |
| QUALCOMM, Inc. | 1,004,837 | 56,391,452 |
| Skyworks Solutions, Inc. | 124,249 | 12,008,666 |
| Texas Instruments, Inc. | 662,754 | 73,068,629 |
| Xilinx, Inc. | 173,486 | 11,321,696 |
| Total Semiconductors & Semiconductor Equipment | | 629,791,477 |
| Software | 5.9% |
| Activision Blizzard, Inc. | 515,997 | 39,380,891 |
| Adobe Systems, Inc. (a) | 333,382 | 81,281,865 |
| ANSYS, Inc. (a) | 57,911 | 10,086,938 |
| Autodesk, Inc. (a) | 147,109 | 19,284,519 |
| CA, Inc. | 208,735 | 7,441,403 |
| Cadence Design Systems, Inc. (a) | 195,305 | 8,458,660 |
| Citrix Systems, Inc. (a) | 87,411 | 9,164,169 |
| Electronic Arts, Inc. (a) | 208,053 | 29,339,634 |
| Intuit, Inc. | 164,957 | 33,701,540 |
| Microsoft Corp. | 5,203,336 | 513,100,963 |
| Oracle Corp. | 2,019,673 | 88,986,792 |
| Red Hat, Inc. (a) | 121,264 | 16,294,244 |
| salesforce.com, Inc. (a) | 477,323 | 65,106,857 |
| Symantec Corp. | 419,233 | 8,657,161 |
| Synopsys, Inc. (a) | 98,215 | 8,404,258 |
| Take-Two Interactive Software, Inc. (a) | 79,526 | 9,412,697 |
| Total Software | | 948,102,591 |
| Common Stocks | 97.8% of net assets (Continued) |
| | Shares | Value |
| Specialty Retail | 2.3% |
| Advance Auto Parts, Inc. | 50,282 | $6,823,267 |
| AutoZone, Inc. (a) | 18,410 | 12,351,821 |
| Best Buy Co., Inc. | 164,783 | 12,289,516 |
| CarMax, Inc. (a) | 119,019 | 8,672,915 |
| Foot Locker, Inc. | 76,660 | 4,036,149 |
| Gap, Inc. | 143,297 | 4,641,390 |
| Home Depot, Inc. | 783,088 | 152,780,469 |
| L Brands, Inc. | 164,684 | 6,073,546 |
| Lowe's Cos., Inc. | 558,049 | 53,332,743 |
| O'Reilly Automotive, Inc. (a) | 56,188 | 15,371,351 |
| Ross Stores, Inc. | 254,791 | 21,593,537 |
| Tiffany & Co. | 67,938 | 8,940,641 |
| TJX Cos., Inc. | 426,340 | 40,579,041 |
| Tractor Supply Co. | 83,283 | 6,370,317 |
| Ulta Salon Cosmetics & Fragrance, Inc. (a) | 37,665 | 8,793,271 |
| Total Specialty Retail | | 362,649,974 |
| Technology Hardware, Storage & Peripherals | 4.4% |
| Apple, Inc. | 3,330,327 | 616,476,831 |
| Hewlett Packard Enterprise Co. | 1,048,179 | 15,313,895 |
| HP, Inc. | 1,113,582 | 25,267,175 |
| NetApp, Inc. | 181,245 | 14,233,170 |
| Seagate Technology PLC | 194,979 | 11,010,464 |
| Western Digital Corp. | 199,997 | 15,481,768 |
| Xerox Corp. | 142,593 | 3,422,232 |
| Total Technology Hardware, Storage & Peripherals | | 701,205,535 |
| Textiles, Apparel & Luxury Goods | 0.8% |
| Hanesbrands, Inc. | 235,045 | 5,175,691 |
| Michael Kors Holdings Ltd. (a) | 98,833 | 6,582,278 |
| NIKE, Inc., Class B | 870,072 | 69,327,337 |
| PVH Corp. | 51,431 | 7,700,249 |
| Ralph Lauren Corp. | 39,043 | 4,908,486 |
| Tapestry, Inc. | 196,642 | 9,185,148 |
| Under Armour, Inc., Class A (a)(c) | 132,321 | 2,974,576 |
| Under Armour, Inc., Class C (a)(c) | 129,390 | 2,727,541 |
| VF Corp. | 220,221 | 17,952,416 |
| Total Textiles, Apparel & Luxury Goods | | 126,533,722 |
| Tobacco | 1.0% |
| Altria Group, Inc. | 1,281,938 | 72,801,259 |
| Philip Morris International Inc. | 1,053,466 | 85,056,845 |
| Total Tobacco | | 157,858,104 |
| Trading Companies & Distributors | 0.2% |
| Fastenal Co. | 197,573 | 9,509,188 |
| United Rentals, Inc. (a) | 58,109 | 8,578,051 |
| Appendix | The accompanying notes are an integral part of these financial statements. |
Portfolio of Investments | S&P 500 Index Master Portfolio | June 30, 2018 | (Unaudited) | (Continued)
| Common Stocks | 97.8% of net assets (Continued) |
| | Shares | Value |
| Trading Companies & Distributors | 0.2% (Continued) |
| W.W. Grainger, Inc. | 34,969 | $10,784,440 |
| Total Trading Companies & Distributors | | 28,871,679 |
| Water Utilities | 0.1% |
| American Water Works Co., Inc. | 123,159 | 10,515,315 |
| Total Water Utilities | | 10,515,315 |
| Total Common Stocks | | |
| (Cost $10,048,686,974) | | 15,598,285,911 |
| Short-Term Securities | 2.5% of net assets |
| | |
| BlackRock Cash Funds: Institutional, SL Agency Shares, 1.70% (b)(d)(e) | 63,123,422 | 63,136,046 |
| Short-Term Securities | 2.5% of net assets (Continued) |
| | Shares | Value |
| BlackRock Cash Funds: Treasury, SL Agency Shares, 1.73% (b)(d) | 332,354,098 | $332,354,098 |
| Total Short-Term Securities | | |
| (Cost $395,484,472) | | 395,490,144 |
| Total Investments | | |
| (Cost $10,444,171,446) | 100.3% | 15,993,776,055 |
| Liabilities in Excess of Other Assets | (0.3)% | | (52,986,184) |
| Net Assets | 100.0% | | $15,940,789,871 |
| (b) | During the period ended June 30, 2018, investments in issuers considered to be affiliates of the Master Portfolio for purposes of Section 2(a)(3) of the Investment Company Act of 1940, as amended, and/or related parties of the Master Portfolio were as follows: |
| | |
| Affiliate Persons and/or Related Parties | Shares Held at
December 31, 2017 | Shares
Purchased | Shares
Sold | Shares Held at
June 30, 2018 | Value at
June 30, 2018 | Income | Realized
Gain (Loss)1 | Change in Unrealized Appreciation (Depreciation) |
| BlackRock Cash Funds: Institutional, SL Agency Shares | 70,033,981 | — | (6,910,559)2 | 63,123,422 | $63,136,046 | $109,5403 | $(2,537) | $2,469 |
| BlackRock Cash Funds: Treasury, SL Agency Shares | 164,203,034 | 168,151,0644 | — | 332,354,098 | 332,354,098 | 2,074,337 | — | — |
| BlackRock, Inc. | 73,422 | 10,099 | — | 83,521 | 41,680,320 | 454,032 | — | (1,578,038) |
| PNC Financial Services Group, Inc. | 285,955 | 34,567 | (3,076) | 317,446 | 42,886,955 | 445,370 | (525) | (3,270,686) |
| Total | | | | | $480,057,419 | $3,083,279 | $(3,062) | $(4,846,255) |
| 1 | Includes net capital gain distributions, if applicable. |
| 2 | Represents net shares sold. |
| 3 | Represents all or portion of securities lending income earned from the reinvestment of cash collateral from loaned securities, net of fees, and collateral investment expenses, and other payments to and from borrowers of securities. |
| 4 | Represents net shares purchased. |
| (c) | Security, or a portion of security, is on loan. |
| (d) | 7-day yield at June 30, 2018. |
| (e) | All or a portion of security was purchased with the cash collateral from loaned securities. |
| | |
| Derivative Financial Instruments Outstanding as of Period End - Futures Contracts |
| Contracts Long | Issue | Expiration | Notional Amount (000) | Unrealized
Appreciation
(Depreciation) |
| 2,662 | S&P500 E-Mini Index | September 2018 | $362,245 | $(5,793,702) |
| The accompanying notes are an integral part of these financial statements. | Appendix |
83
Portfolio of Investments | S&P 500 Index Master Portfolio | June 30, 2018 | (Unaudited) | (Continued)
Derivative Financial Instruments Categorized by Risk Exposure
As of period end, the fair values of derivative financial instruments located in the Statements of Assets and Liabilities were as follows:
| Liabilities-Derivative Financial Instruments | Commodity
Contracts | Credit
Contract | Equity
Contracts | Foriegn
Currency
Exchange
Contracts | Interest Rate
Contracts | Other
Contracts | Total |
| Futures contracts net unrealized appreciation1 | — | — | $5,793,702 | — | — | — | $5,793,702 |
| 1 | Includes cumulative appreciation (depreciation) on futures contracts, if any, as reported in the Schedule of Investments. Only current day's variation margin is reported within the Statements of Assets & Liabilities. |
For the six months ended June 30, 2018, the effect of derivative financial instruments in the Statements of Operations was as follows:
| | Commodity
Contracts | Credit
Contract | Equity
Contracts | Foreign
Currency
Exchange
Contracts | Interest Rate
Contracts | Other
Contracts | Total |
| Realized Gain (Loss) From: |
| Futures contracts | — | — | $15,036,731 | — | — | — | $15,036,731 |
| Net Change in Unrealized Appreciation (Depreciation) on: |
| Futures contracts | — | — | $(6,840,794) | — | — | — | $(6,840,794) |
| Average Quarterly Balances on Outstanding Derivative Financial Instruments |
Futures contracts:
Average notional value of contracts—long | | | | | | | $289,617,630 |
Fair Value Hierarchy as of Period End
Various inputs are used in determining the fair value of investments and derivative financial instruments. For information about the Master Portfolio's policy regarding valuation of investments and derivative financial instruments, refer to the Notes to Financial Statements.
The following tables summarize the Master Portfolio's investments and derivative financial instruments categorized in the disclosure hierarchy:
| | Level 1 | Level 2 | Level 3 | Total |
| Assets: | | | | |
| Investments: | | | | |
Long-Term Investments:
Common Stocks1
| $15,598,285,911 | $— | $— | $15,598,285,911 |
Short-Term Securities:
Money Market Funds
| 395,490,144 | — | — | 395,490,144 |
| | $15,993,776,055 | $— | $— | $15,993,776,055 |
| Derivative Financial Instruments2 | | | | |
| Liabilities: | | | | |
Equity contracts
| $(5,793,702) | $— | $— | $(5,793,702) |
| 1 | See above Schedule of Investments for values in each industry. |
| 2 | Derivative financial instruments are futures contracts. Futures contracts are valued at the unrealized appreciation (depreciation) on the instrument. |
During the period ended June 30, 2018, there were no transfers between levels.
| Appendix | The accompanying notes are an integral part of these financial statements. |
Statement of Assets and Liabilities
S&P 500 Index Master Portfolio | June 30, 2018 | (Unaudited)
| Assets | |
| Investments in securities, at value (including securities loaned of $61,262,247) (cost: $9,996,774,374) | $15,513,718,636 |
| Investments at value—affiliated (cost—$447,397,072) | 480,057,419 |
| Cash pledged for futures contracts | 14,626,800 |
| Receivables: | |
| Investment securities sold | 16,299,606 |
| Dividends—unaffiliated | 12,724,551 |
| Dividends—affiliated | 477,135 |
| Securities lending income—affiliated | 19,421 |
| Variation margin on futures contracts | 271,471 |
| Prepaid expenses | 24,780 |
| Total Assets | 16,038,219,819 |
| Liabilities | |
| Collateral on securities loaned at value | 63,147,649 |
| Payables: | |
| Investment securities purchased | 7,740,942 |
| Due to custodian | 814,000 |
| Withdrawals to investors | 25,137,957 |
| Investment advisory fees | 508,223 |
| Trustees' fees | 51,162 |
| Professional fees | 30,015 |
| Total Liabilities | 97,429,948 |
| Net Assets | $15,940,789,871 |
| Net Assets Consist Of: | |
| Unrealized appreciation (depreciation) of investments | $5,543,810,907 |
| Investors’ capital | 10,396,978,964 |
| Net Assets | $15,940,789,871 |
| The accompanying notes are an integral part of these financial statements. | Appendix |
85
Statement of Operations
S&P 500 Index Master Portfolio | Year Ended June 30, 2018 | (Unaudited)
| Investment Income | |
| Dividends—unaffiliated | 140,070,704 |
| Dividends—affiliated | 2,973,739 |
| Securities lending—affiliated—net | 109,540 |
| Foreign taxes withheld | (493,562) |
| Total Investment Income | 142,660,421 |
| Expenses | |
| Investment advisory | 2,974,237 |
| Officer and Trustees | 122,834 |
| Professional | 21,748 |
| Total Expenses | 3,118,819 |
| Less fees waived and/or reimbursed by the Manager | (238,765) |
| Total Expenses After Fees Waived and/or Reimbursed | 2,880,054 |
| Net Investment Income | 139,780,367 |
| Realized And Unrealized Gain (Loss) | |
| Net realized gain from: | |
| Investments—unaffiliated | 30,019,624 |
| Investments—affiliated | (3,062) |
| Futures contracts | 15,036,731 |
| Net Realized Gain | 45,053,293 |
| Net change in unrealized appreciation (depreciation) on: | |
| Investments—unaffiliated | 198,111,608 |
| Investments—affiliated | (4,846,255) |
| Futures contracts | (6,840,794) |
| Net Change In Unrealized Appreciation (Depreciation) | 186,424,559 |
| Net Realized And Unrealized Gain | $231,477,852 |
| Net Increase In Net Assets From Operations | $371,258,219 |
| Appendix | The accompanying notes are an integral part of these financial statements. |
Statements of Changes in Net Assets
S&P 500 Index Master Portfolio
| | Six Months Ended June 30, 2018
(Unaudited) | Year Ended December 31, 2017 |
| Increase (Decrease) In Net Assets | | |
| Operations | | |
| Net investment income | $139,780,367 | $235,116,198 |
| Net realized gain on investments | 45,053,293 | 54,267,728 |
| Net change in unrealized appreciation (depreciation) | 186,424,559 | 2,098,921,474 |
| Net Increase in net assets from operations | 371,258,219 | 2,388,305,400 |
| Capital Transactions | | |
| Proceeds from contributions | 4,109,278,336 | 7,322,029,278 |
| Value of withdrawals | (2,314,821,064) | (5,727,019,300) |
| Total increase in net assets from capital transactions | 1,794,457,272 | 1,595,009,978 |
| Total Increase In Net Assets | 2,165,715,491 | 3,983,315,378 |
| Net Assets | | |
| Beginning of period | $13,775,074,380 | $9,791,759,002 |
| End of period | $15,940,789,871 | $13,775,074,380 |
| The accompanying notes are an integral part of these financial statements. | Appendix |
87
Financial Highlights
S&P 500 Index Master Portfolio
| | Six Months
Ended
June 30, 2018
(Unaudited) | Year Ended December 31, |
| | 2017 | 2016 | 2015 | 2014 | 2013 |
| Total Return | 2.64%(a) | 21.77% | 11.92% | 1.35% | 13.63% | 32.33% |
| Ratio to Average Net Assets | | | | | | |
| Total expenses | 0.04%(b) | 0.04% | 0.04% | 0.05% | 0.05% | 0.05% |
| Total expenses after fees waived and/or reimbursed | 0.04%(b) | 0.04% | 0.04% | 0.04% | 0.04% | 0.05% |
| Net investment income | 1.88%(b) | 1.93% | 2.11% | 2.00% | 1.98% | 2.08% |
| Supplemental Data | | | | | | |
| Net assets, end of period (000) | $15,940,790 | $13,775,074 | $9,791,759 | $7,209,857 | $5,748,578 | $5,271,130 |
| Portfolio turnover rate | 1% | 11% | 4% | 2% | 3% | 2% |
| (a) | Aggregate total return. |
| (b) | Annualized. |
| Appendix | The accompanying notes are an integral part of these financial statements. |
Notes to Financial Statements
S&P 500 Index Master Portfolio | (Unaudited)
1. Organization
Master Investment Portfolio (“MIP”) is registered under the Investment Company Act of 1940, as amended (the “1940 Act”), as an open-end management investment company. S&P 500 Index Master Portfolio (the “Master Portfolio”) is a series of MIP. The Master Portfolio is classified as diversified. MIP is organized as a Delaware statutory trust.
The Master Portfolio, together with certain other registered investment companies advised by BlackRock Fund Advisors (the “Manager”) or its affiliates, is included in a complex of open-end funds referred to as the Equity-Liquidity Complex.
2. Significant Accounting Policies
The financial statements are prepared in conformity with accounting principles generally accepted in the United States of America (“U.S. GAAP”), which may require management to make estimates and assumptions that affect the reported amounts of assets and liabilities in the financial statements, disclosure of contingent assets and liabilities at the date of the financial statements and the reported amounts of increases and decreases in net assets from operations during the reporting period. Actual results could differ from those estimates. The Master Portfolio is considered an investment company under U.S. GAAP and follows the accounting and reporting guidance applicable to investment companies. Below is a summary of significant accounting policies:
Investment Transactions and Income Recognition: For financial reporting purposes, investment transactions are recorded on the dates the transactions are entered into (the “trade dates”). Realized gains and losses on investment transactions are determined on the identified cost basis. Dividend income is recorded on the ex-dividend date. Under the applicable foreign tax laws, a withholding tax at various rates may be imposed on capital gains, dividends and interest. Upon notification from issuers, a portion of the dividend income received from a real estate investment trust may be redesignated as a reduction of cost of the related investment and/or realized gain. Interest income, including amortization and accretion of premiums and discounts on debt securities, is recognized on an accrual basis.
Segregation and Collateralization: In cases where the Master Portfolio enters into certain investments (e.g., futures contracts) that would be treated as “senior securities” for 1940 Act purposes, the Master Portfolio may segregate or designate on its books and records cash or liquid assets having a market value at least equal to the amount of its future obligations under such investments. Doing so allows the investment to be excluded from treatment as a “senior security.” Furthermore, if required by an exchange or counterparty agreement, the Master Portfolio may be required to deliver/deposit cash and/or securities to/with an exchange, or broker-dealer or custodian as collateral for certain investments or obligations.
Indemnifications: In the normal course of business, the Master Portfolio enters into contracts that contain a variety of representations that provide general indemnification. The Master Portfolio’s maximum exposure under these arrangements is unknown because it involves future potential claims against the Master Portfolio, which cannot be predicted with any certainty.
Other: Expenses directly related to the Master Portfolio are charged to the Master Portfolio. Other operating expenses shared by several funds, including other funds managed by the Manager, are prorated among those funds on the basis of relative net assets or other appropriate methods.
3. Investment Valuation and Fair Value Measurements
Investment Valuation Policies: The Master Portfolio’s investments are valued at fair value (also referred to as “market value” within the financial statements) as of the close of trading on the New York Stock Exchange (“NYSE”) (generally 4:00 p.m., Eastern time) (or if the reporting date falls on a day the NYSE is closed, investments are valued at fair value as of the period end). U.S. GAAP defines fair value as the price the Master Portfolio would receive to sell an asset or pay to transfer a liability in an orderly transaction between market participants at the measurement date. The Master Portfolio determines the fair values of its financial instruments using various independent dealers or pricing services under policies approved by the Board of Trustees of MIP (the “Board”). The BlackRock Global Valuation Methodologies Committee (the “Global Valuation Committee”) is the committee formed by management to develop global pricing policies and procedures and to oversee the pricing function for all financial instruments.
Fair Value Inputs and Methodologies: The following methods and inputs are used to establish the fair value of the Master Portfolio’s assets and liabilities:
•
• Equity investments traded on a recognized securities exchange are valued at the official closing price each day, if available. For equity investments traded on more than one exchange, the official closing price on the exchange where the stock is primarily traded is used. Equity investments traded on a recognized exchange for which there were no sales on that day may be valued at the last available bid (long positions) or ask (short positions) price.
• Investments in open-end U.S. mutual funds are valued at net asset value ("NAV") each business day.
• Futures contracts traded on exchanges are valued at their last sale price.
| Notes to Financial Statements | Appendix |
89
Notes to Financial Statements | S&P 500 Index Master Portfolio | (Unaudited) (Continued)
If events (e.g., a company announcement, market volatility or a natural disaster) occur that are expected to materially affect the value of such investments, or in the event that the application of these methods of valuation results in a price for an investment that is deemed not to be representative of the market value of such investment, or if a price is not available, the investment will be valued by the Global Valuation Committee, or its delegate, in accordance with a policy approved by the Board as reflecting fair value (“Fair Valued Investments”). The fair valuation approaches that may be used by the Global Valuation Committee will include market approach, income approach and cost approach. Valuation techniques such as discounted cash flow, use of market comparables and matrix pricing are types of valuation approaches and are typically used in determining fair value. When determining the price for Fair Valued Investments, the Global Valuation Committee, or its delegate, seeks to determine the price that the Master Portfolio might reasonably expect to receive or pay from the current sale or purchase of that asset or liability in an arm’s-length transaction. Fair value determinations shall be based upon all available factors that the Global Valuation Committee, or its delegate, deems relevant and consistent with the principles of fair value measurement. The pricing of all Fair Valued Investments is subsequently reported to the Board or a committee thereof on a quarterly basis.
Fair Value Hierarchy: Various inputs are used in determining the fair value of investments and derivative financial instruments. These inputs to valuation techniques are categorized into a fair value hierarchy consisting of three broad levels for financial statement purposes as follows:
•
• Level 1—unadjusted price quotations in active markets/exchanges for identical assets or liabilities that the Master Portfolio has the ability to access
• Level 2—other observable inputs (including, but not limited to, quoted prices for similar assets or liabilities in markets that are active, quoted prices for identical or similar assets or liabilities in markets that are not active, inputs other than quoted prices that are observable for the assets or liabilities (such as interest rates, yield curves, volatilities, prepayment speeds, loss severities, credit risks and default rates) or other market–corroborated inputs)
• Level 3—unobservable inputs based on the best information available in the circumstances, to the extent observable inputs are not available (including the Master Portfolio own assumptions used in determining the fair value of investments and derivative financial instruments)
The hierarchy gives the highest priority to unadjusted quoted prices in active markets for identical assets or liabilities (Level 1 measurements) and the lowest priority to
unobservable inputs (Level 3 measurements). Accordingly, the degree of judgment exercised in determining fair value is greatest for instruments categorized in Level 3. The inputs used to measure fair value may fall into different levels of the fair value hierarchy. In such cases, for disclosure purposes, the fair value hierarchy classification is determined based on the lowest level input that is significant to the fair value measurement in its entirety. Investments classified within Level 3 have significant unobservable inputs used by the Global Valuation Committee in determining the price for Fair Valued Investments. Level 3 investments include equity or debt issued by privately held companies or funds. There may not be a secondary market, and/or there are a limited number of investors. Level 3 investments may also be adjusted to reflect illiquidity and/or non-transferability, with the amount of such discount estimated by the Global Valuation Committee in the absence of market information.
Changes in valuation techniques may result in transfers into or out of an assigned level within the hierarchy. In accordance with the Master Portfolio’s policy, transfers between different levels of the fair value hierarchy are deemed to have occurred as of the beginning of the reporting period. The categorization of a value determined for investments and derivative financial instruments is based on the pricing transparency of the investments and derivative financial instruments and is not necessarily an indication of the risks associated with investing in those securities.
4. Securities and Other Investments
Securities Lending: The Master Portfolio may lend its securities to approved borrowers, such as brokers, dealers and other financial institutions. The borrower pledges and maintains with the Master Portfolio collateral consisting of cash, an irrevocable letter of credit issued by a bank, or securities issued or guaranteed by the U.S. Government. The initial collateral received by the Master Portfolio is required to have a value of at least 102% of the current value of the loaned securities for securities traded on U.S. exchanges and a value of at least 105% for all other securities. The collateral is maintained thereafter at a value equal to at least 100% of the current market value of the securities on loan. The market value of the loaned securities is determined at the close of each business day of the Master Portfolio and any additional required collateral is delivered to the Master Portfolio, or excess collateral returned by the Master Portfolio, on the next business day. During the term of the loan, the Master Portfolio is entitled to all distributions made on or in respect of the loaned securities, but does not receive interest income on securities received as collateral. Loans of securities are terminable at any time and the borrower, after notice, is required to return borrowed securities within the standard time period for settlement of securities transactions.
| Appendix | Notes to Financial Statements |
Notes to Financial Statements | S&P 500 Index Master Portfolio | (Unaudited) (Continued)
The market value of any securities on loan, all of which were classified as common stocks in the Master Portfolio’s Schedule of Investments, and the value of any related collateral are shown separately in the Statement of Assets and Liabilities as a component of investments at value-unaffiliated, and collateral on securities loaned at value, respectively. As of period end, any securities on loan were collateralized by cash and/or U.S. Government obligations. Cash collateral invested by the securities lending agent, BlackRock Institutional Trust Company, N.A. (“BTC”), if any, is disclosed in the Schedule of Investments.
Securities lending transactions are entered into by the Master Portfolio under Master Securities Lending Agreements (each, an “MSLA”), which provide the right, in the event of default (including bankruptcy or insolvency), for the non-defaulting party to liquidate the collateral and calculate a net exposure to the defaulting party or request additional collateral. In the event that a borrower defaults, the Master Portfolio, as lender, would offset the market value of the collateral received against the market value of the securities loaned. When the value of the collateral is greater than that of the market value of the securities loaned, the lender is left with a net amount payable to the defaulting party. However, bankruptcy or insolvency laws of a particular jurisdiction may impose restrictions on or prohibitions against such a right of offset in the event of an MSLA counterparty’s bankruptcy or insolvency. Under the MSLA, absent an event of default, the borrower can resell or re-pledge the loaned securities, and the Master Portfolio can reinvest cash collateral received in connection with loaned securities. Upon an event of default, the parties’ obligations to return the securities or collateral to the other party are extinguished, and the parties can resell or re-pledge the loaned securities or the collateral received in connection with the loaned securities in order to satisfy the defaulting party’s net payment obligation for all transactions under the MSLA. The defaulting party remains liable for any deficiency.
As of period end, the following table is a summary of the Master Portfolio’s securities lending agreements by counterparty which are subject to offset under an MSLA:
| Counterparty | Securities Loaned at Value | Cash Collateral Received1 | Net Amount |
| Barclay's Capital, Inc. | $2,574,967 | $(2,574,967) | — |
| BNP Paribas S.A. | 3,281,619 | (3,281,619) | — |
| Citigroup Global Markets, Inc. | 11,022,558 | (11,022,558) | — |
| Goldman Sachs & Co. | 13,431,211 | (13,431,211) | — |
| HSBC Bank PLC | 677,915 | (677,915) | — |
| JP Morgan Securities LLC | 3,149,770 | (3,149,770) | — |
| Mizuho Securities USA, Inc. | 240,652 | (240,652) | — |
| Counterparty | Securities Loaned at Value | Cash Collateral Received1 | Net Amount |
| SG Americas Securities LLC | 6,723,992 | (6,723,992) | — |
| State Street Bank & Trust Co. | 11,982,681 | (11,982,681) | — |
| UBS AG | 6,976,369 | (6,976,369) | — |
| Wachovia Bank N.A. | 1,200,513 | (1,200,513) | — |
| | $61,262,247 | $(61,262,247) | $— |
| 1 Cash collateral with a value of $63,147,649 has been received in connection with securities lending agreements. Collateral received in excess of the value of securities loaned from the individual counterparty is not shown for financial reporting purposes in the table above. |
The risks of securities lending include the risk that the borrower may not provide additional collateral when required or may not return the securities when due. To mitigate these risks, the Master Portfolio benefits from a borrower default indemnity provided by BlackRock, Inc. (“BlackRock”). BlackRock’s indemnity allows for full replacement of the securities loaned if the collateral received does not cover the value on the securities loaned in the event of borrower default. The Master Portfolio could incur a loss if the value of an investment purchased with cash collateral falls below the market value of loaned securities or if the value of an investment purchased with cash collateral falls below the value of the original cash collateral received.
5. Derivative Financial Instruments
The Master Portfolio engages in various portfolio investment strategies using derivative contracts both to increase the returns of the Master Portfolio and/or to manage its exposure to certain risks such as credit risk, equity risk, interest rate risk, foreign currency exchange rate risk, commodity price risk or other risks (e.g., inflation risk). Derivative financial instruments categorized by risk exposure are included in the Schedule of Investments. These contracts may be transacted on an exchange or over-the-counter (“OTC”).
Futures Contracts: Futures contracts are purchased or sold to gain exposure to, or manage exposure to, changes in interest rates (interest rate risk), and changes in the value of equity securities (equity risk) or foreign currencies (foreign currency exchange rate risk).
Futures contracts are agreements between the Master Portfolio and a counterparty to buy or sell a specific quantity of an underlying instrument at a specified price and on a specified date. Depending on the terms of a contract, it is settled either through physical delivery of the underlying instrument on the settlement date or by payment of a cash amount on the settlement date. Upon entering into a futures contract, the Master Portfolio is required to deposit initial margin with the broker in the form of cash or securities in an
| Notes to Financial Statements | Appendix |
91
Notes to Financial Statements | S&P 500 Index Master Portfolio | (Unaudited) (Continued)
amount that varies depending on a contract’s size and risk profile. The initial margin deposit must then be maintained at an established level over the life of the contract. Amounts pledged, which are considered restricted, are included in cash pledged for futures contracts on the Statement of Assets and Liabilities.
Securities deposited as initial margin are designated in the Schedule of Investments and cash deposited, if any, is shown as cash pledged for futures contracts in the Statement of Assets and Liabilities. Pursuant to the contract, the Master Portfolio agrees to receive from or pay to the broker an amount of cash equal to the daily fluctuation in market value of the contract (“variation margin”). Variation margin is recorded as unrealized appreciation (depreciation) and, if any, shown as variation margin receivable (or payable) on futures contracts in the Statement of Assets and Liabilities. When the contract is closed, a realized gain or loss is recorded in the Statement of Operations equal to the difference between the notional amount of the contract at the time it was opened and the notional amount at the time it was closed. The use of futures contracts involves the risk of an imperfect correlation in the movements in the price of futures contracts and interest, foreign currency exchange rates or underlying assets.
6. Investment Advisory Agreement and Other Transactions with Affiliates
The PNC Financial Services Group, Inc. (“PNC”) is the largest stockholder and an affiliate of BlackRock, Inc. for 1940 Act purposes.
Investment Advisory: MIP, on behalf of the Master Portfolio, entered into an Investment Advisory Agreement with the Manager, the Master Portfolio’s investment adviser, an indirect, wholly owned subsidiary of BlackRock, to provide investment advisory services. The Manager is responsible for the management of the Master Portfolio’s portfolio and provides the personnel, facilities, equipment and certain other services necessary to the operations of the Master Portfolio.
For such services, the Master Portfolio pays the Manager a monthly fee at an annual rate equal to 0.04% of the average daily value of the Master Portfolio’s net assets.
Administration: MIP, on behalf of the Master Portfolio, entered into an Administration Agreement with BlackRock Advisors, LLC (“BAL”), which has agreed to provide general administration services (other than investment advice and related portfolio activities). BAL, in consideration thereof, has agreed to bear all of the Master Portfolio’s ordinary operating expenses, excluding, generally, investment advisory fees, distribution fees, brokerage and other expenses related to the execution of portfolio transactions, extraordinary expenses and certain other expenses which are borne by the Master Portfolio.
BAL is not entitled to compensation for providing administrative services to the Master Portfolio, for so long as BAL (or an affiliate) is entitled to compensation for providing administrative services to corresponding feeder funds that invest substantially all of their assets in the Master Portfolio, or BAL (or an affiliate) receives investment advisory fees from the Master Portfolio.
Expense Waivers and Reimbursements: The fees and expenses of the Master Portfolio’s trustees who are not “interested persons” of MIP, as defined in the 1940 Act (“Independent Trustees”), counsel to the Independent Trustees and the MIP’s independent registered public accounting firm (together, the “independent expenses”) are paid directly by the Master Portfolio. BAL has contractually agreed to reimburse the Master Portfolio or provide an offsetting credit against the administration fees paid by the Master Portfolio in an amount equal to the independent expenses through April 30, 2019. For the six months ended June 30, 2018, the amount waived was $144,582.
With respect to the Master Portfolio, the Manager voluntarily agreed to waive its investment advisory fees by the amount of investment advisory fees the Master Portfolio pays to the Manager indirectly through its investment in affiliated money market funds (the “affiliated money market fund waiver”). This amount is included in fees waived and/or reimbursed by the Manager in the Statement of Operations. For the six months ended June 30, 2018, the amount waived was $94,183.
The Manager has contractually agreed to waive its investment advisory fee with respect to any portion of the Master Portfolio’s assets invested in affiliated equity and fixed-income mutual funds and affiliated exchange-traded funds that have a contractual management fee through June 30, 2019. The contractual agreement may be terminated on 90 days’ notice by a majority of the trustees, or by a vote of a majority of the outstanding voting securities of the Master Portfolio. For six months ended June 30, 2018, there were no fees waived by the Manager.
Securities Lending: The U.S. Securities and Exchange Commission (“SEC”) has issued an exemptive order which permits BTC, an affiliate of the Manager, to serve as securities lending agent for the Master Portfolio, subject to applicable conditions. As securities lending agent, BTC bears all operational costs directly related to securities lending. The Master Portfolio is responsible for fees in connection with the investment of cash collateral received for securities on loan (the “collateral investment fees”). The cash collateral is invested in a money market fund managed by the Manager or its affiliates. However, BTC has agreed to reduce the amount of securities lending income it receives in order to effectively limit the collateral investment fees the Master Portfolio bears to an annual rate of 0.04%. Such money market fund shares will not be subject to a sales load, distribution fee or service fee. The money market fund in which the cash collateral has been invested may, under
| Appendix | Notes to Financial Statements |
Notes to Financial Statements | S&P 500 Index Master Portfolio | (Unaudited) (Continued)
certain circumstances, impose a liquidity fee of up to 2% of the value redeemed or temporarily restrict redemptions for up to 10 business days during a 90 day period, in the event that the money market fund’s weekly liquid assets fall below certain thresholds.
Securities lending income is equal to the total of income earned from the reinvestment of cash collateral, net of fees and other payments to and from borrowers of securities, and less the collateral investment fees. The Master Portfolio retains a portion of securities lending income and remits a remaining portion to BTC as compensation for its services as securities lending agent.
Pursuant to a securities lending agreement, the Master Portfolio retains 71.5% of securities lending income, and this amount retained can never be less than 65% of the total of securities lending income plus the collateral investment fees. In addition, commencing the business day following the date that the aggregate securities lending income earned across certain funds in the Equity-Liquidity Complex in a calendar year exceeds a specified threshold, the Master Portfolio, pursuant to the securities lending agreement, will retain for the remainder of the calendar year securities lending income in an amount equal to 75% of securities lending income, and this amount retained can never be less than 65% of the total of securities lending income plus the collateral investment fees.
The share of securities lending income earned by the Master Portfolio is shown as securities lending income — affiliated — net in the Statement of Operations. For the six months ended June 30, 2018, the Master Portfolio paid BTC $43,640 in total for securities lending agent services and collateral investment fees.
Interfund Lending: In accordance with an exemptive order (the “Order”) from the SEC, the Master Portfolio may participate in a joint lending and borrowing facility for temporary purposes (the “Interfund Lending Program”), subject to compliance with the terms and conditions of the Order, and to the extent permitted by the Master Portfolio’s investment policies and restrictions. The Master Portfolio is currently permitted to borrow and lend under the Interfund Lending Program.
A lending BlackRock fund may lend in aggregate up to 15% of its net assets, but may not lend more than 5% of its net assets to any one borrowing fund through the Interfund Lending Program. A borrowing BlackRock fund may not borrow through the Interfund Lending Program or from any other source more than 33 1⁄3% of its total assets (or any lower threshold provided for by the fund’s investment restrictions). If a borrowing BlackRock fund’s total outstanding borrowings exceed 10% of its total assets, each of its outstanding interfund loans will be subject to collateralization of at least 102% of the outstanding principal value of the loan. All interfund loans are for temporary or emergency purposes and the interest rate to be charged will be the average of the
highest current overnight repurchase agreement rate available to a lending fund and the bank loan rate, as calculated according to a formula established by the Board.
During the period ended June 30, 2018, the Master Portfolio did not participate in the Interfund Lending Program.
Trustees and Officers: Certain Trustees and/or officers of MIP are directors and/or officers of BlackRock or its affiliates.
Other Transactions: The Master Portfolio may purchase securities from, or sell securities to, an affiliated fund provided the affiliation is due solely to having a common investment adviser, common officers, or common trustees. For the six months ended June 30, 2018, the purchase and sale transactions and any net realized gains (losses) with an affiliated fund in compliance with Rule 17a-7 under the 1940 Act were as follows:
| Purchases | Sales | Net Realized Gain (Loss) |
| $287,742,207 | $45,737,005 | $(2,558,810) |
7. Purchases and Sales
For the six months ended June 30, 2018, purchases and sales of investments, excluding short-term securities, were $1,897,373,274 and $178,069,508, respectively.
8. Income Tax Information
The Master Portfolio is classified as a partnership for U.S. federal income tax purposes. As such, each investor in the Master Portfolio is treated as the owner of its proportionate share of net assets, income, expenses and realized and unrealized gains and losses of the Master Portfolio. Therefore, no U.S. federal income tax provision is required. It is intended that the Master Portfolio’s assets will be managed so an investor in the Master Portfolio can satisfy the requirements of Subchapter M of the Internal Revenue Code of 1986, as amended.
The Master Portfolio files U.S. federal and various state and local tax returns. No income tax returns are currently under examination. The statute of limitations on the Master Portfolio’s U.S. federal tax returns generally remains open for each of the four years ended December 31, 2017. The statutes of limitations on the Master Portfolio’s state and local tax returns may remain open for an additional year depending upon the jurisdiction.
Management has analyzed tax laws and regulations and their application to the Master Portfolio as of June 30, 2018, inclusive of the open tax return years, and does not believe that there are any uncertain tax positions that require recognition of a tax liability in the Master Portfolio’s financial statements.
| Notes to Financial Statements | Appendix |
93
Notes to Financial Statements | S&P 500 Index Master Portfolio | (Unaudited) (Continued)
As of June 30, 2018, gross unrealized appreciation and depreciation for investments and derivatives based on cost for U.S. federal income tax purposes were as follows:
| Tax cost | $10,154,128,827 |
| Gross unrealized appreciation | $6,093,786,224 |
| Gross unrealized depreciation | $(259,932,698) |
| Net unrealized appreciation | $5,833,853,526 |
The Tax Cuts and Jobs Act (the “Act”) was enacted on December 22, 2017. Certain provisions of the Act were effective upon enactment with the remainder becoming effective for tax years beginning after December 31, 2017. Although the Act does not amend any provisions directly related to the qualification or taxation of regulated investment companies (“RICs”), the Act does change the taxation of entities in which some RICs invest, the tax treatment of income derived from those entities and the taxation of RIC shareholders. While management does not anticipate significant impact to the Master Portfolio or to its investors, there is uncertainty in the application of certain provisions in the Act. Specifically, provisions in the Act may increase the amount of or accelerate the recognition of taxable income and may limit the deductibility of certain expenses by RICs. Until full clarity around these provisions is obtained, the impact on the Master Portfolio’s financial statements, if any, cannot be fully determined
9. Bank Borrowings
MIP, on behalf of the Master Portfolio, along with certain other funds managed by the Manager and its affiliates (“Participating Funds”), is a party to a 364-day, $2.25 billion credit agreement with a group of lenders. Under this agreement, the Master Portfolio may borrow to fund shareholder redemptions. Excluding commitments designated for certain individual funds, the Participating Funds, including the Master Portfolio, can borrow up to an aggregate commitment amount of $1.75 billion at any time outstanding, subject to asset coverage and other limitations as specified in the agreement. The credit agreement has the following terms: a fee of 0.10% per annum on unused commitment amounts and interest at a rate equal to the higher of (a) one-month LIBOR (but, in any event, not less than 0.00%) on the date the loan is made plus 0.80% per annum or (b) the Fed Funds rate (but, in any event, not less than 0.00%) in effect from time to time plus 0.80% per annum on amounts borrowed. The agreement expires in April 2019 unless extended or renewed. Prior to April 19, 2018, the aggregate commitment amount was $2.1 billion and the fee was 0.12% per annum. Participating Funds paid an upfront commitment fee of 0.02% on the total commitment amounts, in addition to administration, legal and arrangement fees, which are included in miscellaneous expenses in the Statement of Operations. These fees were allocated among such funds based upon portions of the aggregate commitment available to them and relative net
assets of Participating Funds. During the six months ended June 30, 2018, the Master Portfolio did not borrow under the credit agreement.
10. Principal Risks
In the normal course of business, the Master Portfolio invests in securities or other instruments and may enter into certain transactions, and such activities subject the Master Portfolio to various risks, including among others, fluctuations in the market (market risk) or failure of an issuer to meet all of its obligations. The value of securities or other instruments may also be affected by various factors, including, without limitation: (i) the general economy; (ii) the overall market as well as local, regional or global political and/or social instability; (iii) regulation, taxation or international tax treaties between various countries; or (iv) currency, interest rate and price fluctuations. The Master Portfolio’s prospectus provides details of the risks to which the Master Portfolio is subject.
The Master Portfolio may be exposed to additional risks when reinvesting cash collateral in money market funds that do not seek to maintain a stable NAV per share of $1.00 and which may be subject to redemption gates or liquidity fees under certain circumstances.
Valuation Risk: The market values of equities, such as common stocks and preferred securities or equity related investments, such as futures and options, may decline due to general market conditions which are not specifically related to a particular company. They may also decline due to factors which affect a particular industry or industries. The Master Portfolio may invest in illiquid investments and may experience difficulty in selling those investments in a timely manner at the price that it believes the investments are worth. Prices may fluctuate widely over short or extended periods in response to company, market or economic news. Markets also tend to move in cycles, with periods of rising and falling prices. This volatility may cause the Master Portfolio’s NAV to experience significant increases or decreases over short periods of time. If there is a general decline in the securities and other markets, the NAV of the Master Portfolio may lose value, regardless of the individual results of the securities and other instruments in which the Master Portfolio invests.
Counterparty Credit Risk: The Master Portfolio may be exposed to counterparty credit risk, or the risk that an entity may fail to or be unable to perform on its commitments related to unsettled or open transactions. The Master Portfolio manages counterparty credit risk by entering into transactions only with counterparties that the Manager believes have the financial resources to honor their obligations and by monitoring the financial stability of those counterparties. Financial assets, which potentially expose the Master Portfolio to market, issuer and counterparty credit risks, consist principally of financial instruments and receivables due from counterparties. The extent of the
| Appendix | Notes to Financial Statements |
Notes to Financial Statements | S&P 500 Index Master Portfolio | (Unaudited) (Continued)
Master Portfolio’s exposure to market, issuer and counterparty credit risks with respect to these financial assets is approximately their value recorded in the Statement of Assets and Liabilities, less any collateral held by the Master Portfolio.
A derivative contract may suffer a mark-to-market loss if the value of the contract decreases due to an unfavorable change in the market rates or values of the underlying instrument. Losses can also occur if the counterparty does not perform under the contract.
With exchange-traded futures, there is less counterparty credit risk to the Master Portfolio since the exchange or clearinghouse, as counterparty to such instruments, guarantees against a possible default. The clearinghouse stands between the buyer and the seller of the contract; therefore, credit risk is limited to failure of the clearinghouse. While offset rights may exist under applicable law, the Master Portfolio does not have a contractual right of offset against a clearing broker or clearinghouse in the event of a default (including the bankruptcy or insolvency). Additionally, credit risk exists in exchange-traded futures with respect to initial and variation margin that is held in a clearing broker’s customer accounts. While clearing brokers are required to segregate customer margin from their own assets, in the event that a clearing broker becomes insolvent or goes into bankruptcy and at that time there is a shortfall in the aggregate amount of margin held by the clearing broker for all its clients, typically the shortfall would be allocated on a pro rata basis across all the clearing broker’s customers, potentially resulting in losses to the Master Portfolio.
11. Subsequent Events
Management has evaluated the impact of all subsequent events on the Master Portfolio through the date the financial statements were issued and has determined that there were no subsequent events requiring adjustment or additional disclosure in the financial statements.
| Notes to Financial Statements | Appendix |
95
Disclosure of Investment Advisory Agreement
S&P 500 Index Master Portfolio | (Unaudited)
The Board of Trustees (the "Board," and the members of which are referred to as "Board Members") met in person on April 19, 2018 (the “April Meeting”) and May 17-18, 2018 (the “May Meeting”) to consider the approval of the investment advisory agreement (the “Agreement”) between the Master Fund, on behalf of S&P 500 Index Master Portfolio (the “Master Portfolio”), a series of the Master Fund, and BlackRock Fund Advisors (the “Manager” or “BlackRock”), the Master Fund’s investment advisor.
Activities and Composition of the Board
On the date of the May Meeting, the Board consisted of thirteen individuals, eleven of whom were not “interested persons” of the Master Fund as defined in the Investment Company Act of 1940, as amended (the “1940 Act”) (the “Independent Board Members”). The Board Members are responsible for the oversight of the operations of the Master Fund and perform the various duties imposed on the directors of investment companies by the 1940 Act. The Independent Board Members have retained independent legal counsel to assist them in connection with their duties. The Chair of the Board is an Independent Board Member. The Board has established five standing committees: an Audit Committee, a Governance and Nominating Committee, a Compliance Committee, a Performance Oversight and Contract Committee and an Executive Committee, each of which is chaired by an Independent Board Member and composed of Independent Board Members (except for the Executive Committee, which also has one interested Board Member).
The Agreement
Pursuant to the 1940 Act, the Board is required to consider the continuation of the Agreement on an annual basis. The Board has four quarterly meetings per year, each typically extending for two days, and additional in-person and telephonic meetings throughout the year, as needed. The Board also has a fifth one-day meeting to consider specific information surrounding the consideration of renewing the Agreement. The Board’s consideration of the Agreement is a year-long deliberative process, during which the Board assessed, among other things, the nature, extent and quality of the services provided to the Master Portfolio by BlackRock, BlackRock’s personnel and affiliates, including (as applicable) investment management; accounting, administrative and shareholder services; oversight of the Master Portfolio service providers; marketing and promotional services; risk management and oversight; legal and compliance services; and ability to meet applicable legal and regulatory requirements.
The Board, acting directly and through its committees, considers at each of its meetings, and from time to time as appropriate, factors that are relevant to its annual consideration of the renewal of the Agreement, including the services and support provided by BlackRock to the Master Portfolio and its interest holders. BlackRock also furnished
additional information to the Board in response to specific questions from the Board. This additional information is discussed further below in the section titled “Board Considerations in Approving the Agreement.” Among the matters the Board considered were: (a) investment performance of an affiliated feeder fund that invests all of its investable assets in the Master Portfolio (the “representative feeder fund”) for one-year, three-year, five-year, ten-year and/or since inception periods, as applicable, against peer funds, applicable benchmark, and performance metrics, as applicable, as well as senior management’s and portfolio managers’ analysis of the reasons for any over-performance or underperformance relative to its peers, benchmarks, and other performance metrics, as applicable; (b) fees, including advisory, administration, if applicable, and other amounts paid to BlackRock and its affiliates by the Master Portfolio for services; (c) the Master Portfolio’s operating expenses and how BlackRock allocates expenses to the Master Portfolio; (d) the resources devoted to, risk oversight of, and compliance reports relating to, implementation of the Master Portfolio’s investment objective(s), policies and restrictions, and meeting regulatory requirements; (e) the Master Fund’s adherence to its compliance policies and procedures; (f) the nature, character and scope of non-investment management services provided by BlackRock and its affiliates and the estimated cost of such services; (g) BlackRock’s and other service providers’ internal controls and risk and compliance oversight mechanisms; (h) BlackRock’s implementation of the proxy voting policies approved by the Board; (i) the use of brokerage commissions and execution quality of portfolio transactions; (j) BlackRock’s implementation of the Master Fund’s valuation and liquidity procedures; (k) an analysis of management fees for products with similar investment mandates across the open-end fund, exchange-traded fund (“ETF”), closed-end fund, sub-advised mutual fund, separately managed account, collective investment trust, and institutional separate account product channels, as applicable, and the similarities and differences between these products and the services provided as compared to the Master Portfolio; (l) BlackRock’s compensation methodology for its investment professionals and the incentives and accountability it creates, along with investment professionals’ investments in the fund(s) they manage; and (m) periodic updates on BlackRock’s business.
Board Considerations in Approving the Agreement
The Approval Process: Prior to the April Meeting, the Board requested and received materials specifically relating to the Agreement. The Board is continuously engaged in a process with its independent legal counsel and BlackRock to review the nature and scope of the information provided to better assist its deliberations. The materials provided in connection with the April Meeting included, among other things: (a) information independently compiled and prepared by Broadridge Financial Solutions, Inc. (“Broadridge”) based on either a Lipper Classification or Morningstar category, regarding the fees and expenses of the Master Portfolio and
Disclosure of Investment Advisory Agreement | S&P 500 Index Master Portfolio | (Unaudited) (Continued)
the representative feeder fund, as applicable, as compared with a peer group of funds as determined by Broadridge (“Expense Peers”) and the investment performance of the representative feeder fund as compared with a peer group of funds (“Performance Peers”) and other metrics, as applicable; (b) information on the composition of the Expense Peers and Performance Peers, and a description of Broadridge’s methodology; (c) information on the estimated profits realized by BlackRock and its affiliates pursuant to the Agreement and a discussion of fall-out benefits to BlackRock and its affiliates; (d) a general analysis provided by BlackRock concerning investment management fees received in connection with other types of investment products, such as institutional accounts, sub-advised mutual funds, ETFs, closed-end funds, open-end funds and separately managed accounts under similar investment mandates, as well as the performance of such other products, as applicable; (e) review of non-management fees; (f) the existence and impact of potential economies of scale, if any, and the sharing of potential economies of scale with the Master Portfolio; (g) a summary of aggregate amounts paid by the Master Portfolio to BlackRock; and (h) various additional information requested by the Board as appropriate regarding BlackRock’s and the Master Portfolio’s operations.
At the April Meeting, the Board reviewed materials relating to its consideration of the Agreement. As a result of the discussions that occurred during the April Meeting, and as a culmination of the Board’s year-long deliberative process, the Board presented BlackRock with questions and requests for additional information. BlackRock responded to these requests with additional written information in advance of the May Meeting. At the May Meeting, the Board considered, among other things: (a) the nature, extent and quality of the services provided by BlackRock; (b) the investment performance of the Master Portfolio as compared with the representative feeder fund’s Performance Peers and other metrics, as applicable; (c) the advisory fee and the estimated cost of the services and estimated profits realized by BlackRock and its affiliates from their relationship with the Master Portfolio; (d) the representative feeder fund’s fees and expenses compared to its Expense Peers; (e) the sharing of potential economies of scale; (f) fall-out benefits to BlackRock and its affiliates as a result of BlackRock’s relationship with the Master Portfolio; and (g) other factors deemed relevant by the Board Members.
The Board also considered other matters it deemed important to the approval process, such as other payments made to BlackRock or its affiliates, securities lending and cash management, services related to the valuation and pricing of portfolio holdings of the Master Portfolio, and advice from independent legal counsel with respect to the review process and materials submitted for the Board’s review. The Board noted the willingness of BlackRock personnel to engage in open, candid discussions with the
Board. The Board did not identify any particular information as determinative, and each Board Member may have attributed different weights to the various items considered.
A. Nature, Extent and Quality of the Services Provided by BlackRock:
The Board, including the Independent Board Members, reviewed the nature, extent and quality of services provided by BlackRock, including the investment advisory services and the resulting performance of the Master Portfolio. Throughout the year, the Board compared the representative feeder fund’s performance to the performance of a comparable group of mutual funds, relevant benchmark, and performance metrics, as applicable. The Board met with BlackRock’s senior management personnel responsible for investment activities, including the senior investment officers. The Board also reviewed the materials provided by the Master Portfolio’s portfolio management team discussing the performance of the Master Portfolio and the representative feeder fund and the Master Portfolio’s investment objective(s), strategies and outlook.
The Board considered, among other factors, with respect to BlackRock: the number, education and experience of investment personnel generally and the Master Portfolio’s portfolio management team; BlackRock’s research capabilities; investments by portfolio managers in the funds they manage; portfolio trading capabilities; use of technology; commitment to compliance; credit analysis capabilities; risk analysis and oversight capabilities; and the approach to training and retaining portfolio managers and other research, advisory and management personnel. The Board also considered BlackRock’s overall risk management program, including the continued efforts of BlackRock and its affiliates to address cybersecurity risks and the role of BlackRock’s Risk & Quantitative Analysis Group. The Board engaged in a review of BlackRock’s compensation structure with respect to the Master Portfolio’s portfolio management team and BlackRock’s ability to attract and retain high-quality talent and create performance incentives.
In addition to investment advisory services, the Board considered the quality of the administrative and other non-investment advisory services provided to the Master Portfolio. BlackRock and its affiliates provide the Master Portfolio with certain administrative, shareholder and other services (in addition to any such services provided to the Master Portfolio by third parties) and officers and other personnel as are necessary for the operations of the Master Portfolio. In particular, BlackRock and its affiliates provide the Master Portfolio with administrative services including, among others: (i) responsibility for disclosure documents, such as the prospectus, the summary prospectus (as applicable), the statement of additional information and periodic shareholder reports; (ii) oversight of daily accounting and pricing; (iii) responsibility for periodic filings with regulators; (iv) overseeing and coordinating the activities of other service providers, including, among others,
Disclosure of Investment Advisory Agreement | S&P 500 Index Master Portfolio | (Unaudited) (Continued)
the Master Portfolio’s custodian, fund accountant, transfer agent, and auditor; (v) organizing Board meetings and preparing the materials for such Board meetings; (vi) providing legal and compliance support; (vii) furnishing analytical and other support to assist the Board in its consideration of strategic issues such as the merger, consolidation or repurposing of certain open-end funds; and (viii) performing administrative functions necessary for the operation of the Master Portfolio, such as tax reporting, expense management, fulfilling regulatory filing requirements, and shareholder call center and other services. The Board reviewed the structure and duties of BlackRock’s fund administration, shareholder services, and legal & compliance departments and considered BlackRock’s policies and procedures for assuring compliance with applicable laws and regulations.
B. The Investment Performance of the Master Portfolio and BlackRock:
The Board, including the Independent Board Members, also reviewed and considered the performance history of the Master Portfolio. The Board noted that the representative feeder fund’s investment results correspond directly to the investment results of the Master Portfolio. In preparation for the April Meeting, the Board was provided with reports independently prepared by Broadridge, which included a comprehensive analysis of the representative feeder fund’s performance as of December 31, 2017. Broadridge ranks funds in quartiles, ranging from first to fourth, where first is the most desirable quartile position and fourth is the least desirable. In connection with its review, the Board received and reviewed information regarding the investment performance of the representative feeder fund as compared to its Performance Peers and the performance of the representative feeder fund as compared with its benchmark. The Board and its Performance Oversight and Contract Committee regularly review, and meet with Master Portfolio management to discuss, the performance of the Master Portfolio and the representative feeder fund, as applicable, throughout the year.
In evaluating performance, the Board recognized that the performance data reflects a snapshot of a period as of a particular date and that selecting a different performance period could produce significantly different results. Further, the Board recognized that it is possible that long-term performance can be impacted by even one period of significant outperformance or underperformance so that a single investment theme has the ability to affect long-term performance disproportionately.
The Board noted that for the past five one-year periods reported, the representative feeder fund’s net performance was within the tolerance range of its benchmark for three of the five periods. BlackRock believes that net performance relative to the benchmark is an appropriate performance metric for the representative feeder fund. The Board and BlackRock reviewed the representative feeder fund’s out of
tolerance performance over the applicable periods. The Board was informed that, among other things, the representative feeder fund underperformed its benchmark and breached its lower tolerance, primarily driven by negative performance stemming from the impact of post-notified flows. Post-notified activity is a source of performance variation, relative to the benchmark, because the flow information is received after the close of the effective date of the activity introducing either a drag or boost to performance.
C. Consideration of the Advisory/Management Fees and the Estimated Cost of the Services and Estimated Profits Realized by BlackRock and its Affiliates from their Relationship with the Master Portfolio:
The Board, including the Independent Board Members, reviewed the Master Portfolio’s contractual advisory fee rate compared with those of the representative feeder fund’s Expense Peers. The contractual advisory fee rate is shown before taking into account any reimbursements or fee waivers. The Board also compared the representative feeder fund’s total expense ratio, as well as the Master Portfolio’s actual advisory fee rate, to those of the representative feeder fund’s Expense Peers. The total expense ratio represents a fund’s total net operating expenses, including any 12b-1 or non 12b-1 service fees. The total expense ratio gives effect to any expense reimbursements or fee waivers that benefit a fund, and the actual advisory fee rate gives effect to any advisory fee reimbursements or waivers that benefit a fund. The Board considered the services provided and the fees charged by BlackRock and its affiliates to other types of clients with similar investment mandates, as applicable, including institutional accounts and sub-advised mutual funds (including mutual funds sponsored by third parties).
The Board received and reviewed statements relating to BlackRock’s financial condition. The Board reviewed BlackRock’s profitability methodology and was also provided with an estimated profitability analysis that detailed the revenues earned and the expenses incurred by BlackRock for services provided to the Master Portfolio. The Board reviewed BlackRock’s estimated profitability with respect to the Master Portfolio and other funds the Board currently oversees for the year ended December 31, 2017 compared to available aggregate estimated profitability data provided for the prior two years. The Board reviewed BlackRock’s estimated profitability with respect to certain other U.S. fund complexes managed by the Manager and/or its affiliates. The Board reviewed BlackRock’s assumptions and methodology of allocating expenses in the estimated profitability analysis, noting the inherent limitations in allocating costs among various advisory products. The Board recognized that profitability may be affected by numerous factors including, among other things, fee waivers and expense reimbursements by the Manager, the types of funds
Disclosure of Investment Advisory Agreement | S&P 500 Index Master Portfolio | (Unaudited) (Continued)
managed, precision of expense allocations and business mix. As a result, calculating and comparing profitability at individual fund levels is difficult.
The Board noted that, in general, individual fund or product line profitability of other advisors is not publicly available. The Board reviewed BlackRock’s overall operating margin, in general, compared to that of certain other publicly-traded asset management firms. The Board considered the differences between BlackRock and these other firms, including the contribution of technology at BlackRock, BlackRock’s expense management, and the relative product mix.
In addition, the Board considered the estimated cost of the services provided to the Master Portfolio by BlackRock, and BlackRock’s and its affiliates’ estimated profits relating to the management and distribution of the Master Portfolio and the other funds advised by BlackRock and its affiliates. As part of its analysis, the Board reviewed BlackRock’s methodology in allocating its costs of managing the Master Portfolio, to the Master Portfolio. The Board considered whether BlackRock has the financial resources necessary to attract and retain high quality investment management personnel to perform its obligations under the Agreement and to continue to provide the high quality of services that is expected by the Board. The Board further considered factors including but not limited to BlackRock’s commitment of time, assumption of risk and liability profile in servicing the Master Portfolio in contrast to what is required of BlackRock with respect to other products with similar investment mandates across the open-end fund, ETF, closed-end fund, sub-advised mutual fund, separately managed account, collective investment trust, and institutional separate account product channels, as applicable.
The Board noted that the Master Portfolio’s contractual advisory fee rate ranked in the first quartile, and that the actual advisory fee rate and the representative feeder fund’s total expense ratio ranked in the first and second quartiles, respectively, relative to the representative feeder fund’s Expense Peers. The Board also noted that BlackRock and its affiliates have contractually agreed to reimburse or otherwise compensate the Master Portfolio for the fees and expenses of the Independent Board Members, counsel to the Independent Board Members and the Master Portfolio’s independent registered public accounting firm.
D. Economies of Scale:
The Board, including the Independent Board Members, considered the extent to which economies of scale might be realized as the assets of the Master Portfolio increase, including the existence of fee waivers and/or expense caps, as applicable, noting that any contractual fee waivers and expense caps had been approved by the Board. The Board also considered the extent to which the Master Portfolio benefits from such economies in a variety of ways and whether there should be changes in the advisory fee rate or
breakpoint structure in order to enable the Master Portfolio to more fully participate in these economies of scale. The Board considered the Master Portfolio’s asset levels and whether the current fee schedule was appropriate.
E. Other Factors Deemed Relevant by the Board Members:
The Board, including the Independent Board Members, also took into account other ancillary or “fall-out” benefits that BlackRock or its affiliates may derive from BlackRock’s respective relationships with the Master Portfolio, both tangible and intangible, such as BlackRock’s ability to leverage its investment professionals who manage other portfolios and risk management personnel, an increase in BlackRock’s profile in the investment advisory community, and the engagement of BlackRock’s affiliates as service providers to the Master Portfolio, including for administrative, distribution, securities lending and cash management services. The Board also considered BlackRock’s overall operations and its efforts to expand the scale of, and improve the quality of, its operations. The Board also noted that, subject to applicable law, BlackRock may use and benefit from third party research obtained by soft dollars generated by certain registered fund transactions to assist in managing all or a number of its other client accounts.
In connection with its consideration of the Agreement, the Board also received information regarding BlackRock’s brokerage and soft dollar practices. The Board received reports from BlackRock which included information on brokerage commissions and trade execution practices throughout the year.
Conclusion
The Board, including the Independent Board Members, approved the continuation of the Agreement between the Manager and the Master Fund, with respect to the Master Portfolio, for a one-year term ending June 30, 2019. Based upon its evaluation of all of the aforementioned factors in their totality, as well as other information, the Board of the Master Fund, including the Independent Board Members, was satisfied that the terms of the Agreement were fair and reasonable and in the best interest of the Master Portfolio and its interest holders. In arriving at its decision to approve the Agreement, the Board did not identify any single factor or group of factors as all-important or controlling, but considered all factors together, and different Board Members may have attributed different weights to the various factors considered. The Independent Board Members were also assisted by the advice of independent legal counsel in making this determination.
Officers and Trustees
S&P 500 Index Master Portfolio
Rodney D. Johnson, Chair of the Board and Trustee
Mark Stalnecker, Chair of the Board and Trustee
Susan J. Carter, Trustee
Collette Chilton, Trustee
Neil A. Cotty, Trustee
Cynthia A. Montgomery, Trustee
Joseph P. Platt, Trustee
Robert C. Robb, Jr., Trustee
Kenneth L. Urish, Trustee
Claire A. Walton, Trustee
Frederick W. Winter, Trustee
Robert Fairbairn, Trustee
John M. Perlowski, Trustee and President and Chief Executive Officer
Thomas Callahan, Vice President
Jennifer McGovern, Vice President
Neal J. Andrews, Chief Financial Officer
Jay M. Fife, Treasurer
Charles Park, Chief Compliance Officer
John MacKessy, Anti-Money Laundering Compliance Officer
Benjamin Archibald, Secretary
Effective February 22, 2018, Barbara Novick resigned, and Robert Fairbairn was appointed, as an Interested Trustee of the Trust/MIP.
Effective May 17, 2018, John MacKessy replaced Fernanda Pirdra as the Anti-Money Laundering Compliance Officer of the Trust/MIP.
(THIS PAGE INTENTIONALLY LEFT BLANK)
PRSRT STD
U.S. POSTAGE
PAID
LANCASTER, PA
PERMIT NO. 1793
homesteadfunds.com | 800.258.3030 | 4301 Wilson Blvd. | Arlington, VA | 22203
This report is authorized for distribution to shareholders and others who have received a copy of the prospectus.
Distributor: RE Investment Corporation.
Item 2. Code of Ethics.
Not required in this filing.
Item 3. Audit Committee Financial Expert.
Not required in this filing.
Item 4. Principal Accountant Fees and Services.
Not required in this filing.
Item 5. Audit Committee of Listed Registrants.
Not applicable.
Item 6. Investments.
(a) | The Registrant’s schedule of investments in unaffiliated issuers is included in the report to shareholders under Item 1 of this Form N-CSR.
|
(b) | Not applicable. |
Item 7. Disclosure of Proxy Voting Policies and Procedures for Closed-End Management Investment Companies.
Not applicable.
Item 8. Portfolio Managers of Closed-End Management Investment Companies.
Not applicable.
Item 9. Purchases of Equity Securities by Closed-End Management Investment Company and Affiliated Purchasers.
Not applicable.
Item 10. Submission of Matters to a Vote of Security Holders.
Not applicable.
Item 11. Controls and Procedures.
(a) | Disclosure Controls and Procedures. The registrant’s principal executive officer and principal financial officer concluded that the registrant's Disclosure Controls and Procedures are effective based on their evaluation of the Disclosure Controls and Procedures as of a date within 90 days of the filing date of this report.
|
(b) | Internal Control. There were no changes in registrant's internal control over financial reporting that occurred during the registrant's second fiscal quarter of the period covered by this report that have materially affected, or are reasonably likely to materially affect, the registrant's internal control over financial reporting. |
Item 12. Disclosure of Securities Lending Activities For Closed-End Management Investment Companies.
Not applicable.
Item 13. Exhibits.
(a)(1) | Not required with this filing. |
(a)(2) | A separate certification for the principal executive officer and principal financial officer of the registrant, as required by Rule 30a-2(a) under the Investment Company Act of 1940, is filed herewith. |
(a)(3) | Not applicable. |
| (a)(4) | Not applicable.
|
(b) | A certification by the registrant’s principal executive officer and principal financial officer, as required by Section 906 of the Sarbanes-Oxley Act of 2002 and Rule 30a-2(b) under the Investment Company Act of 1940, is attached hereto. |
SIGNATURES
Pursuant to the requirements of the Securities Exchange Act of 1934 and the Investment Company Act of 1940, the registrant has duly caused this report to be signed on its behalf by the undersigned, thereunto duly authorized.
HOMESTEAD FUNDS, INC.
| |
By: | /s/ Mark D. Santero |
| Mark D. Santero |
| President, Chief Executive Officer and Director |
Date: September 6, 2018
Pursuant to the requirements of the Securities Exchange Act of 1934 and the Investment Company Act of 1940, this report has been signed below by the following persons on behalf of the registrant and in the capacities and on the dates indicated.
| |
By: | /s/ Mark D. Santero |
| Mark D. Santero |
| President, Chief Executive Officer and Director |
Date: September 6, 2018
| |
By: | /s/ Amy M. DiMauro |
| Amy M. DiMauro |
| Treasurer |
Date: September 6, 2018