UNITED STATES
SECURITIES AND EXCHANGE COMMISSION
Washington, D.C. 20549
FORM N-CSR
CERTIFIED SHAREHOLDER REPORT OF REGISTERED
MANAGEMENT INVESTMENT COMPANIES
Investment Company Act File number: 811-06136
HOMESTEAD FUNDS, INC.
(Exact name of registrant as specified in charter)
4301 Wilson Boulevard
Arlington, VA 22203
(Address of principal executive office – Zip code)
Danielle Sieverling
Homestead Funds, Inc.
4301 Wilson Boulevard
Arlington, VA 22203
(Name and address of agent for service)
Copies to:
Amy Ward Pershkow, Esq.
Vedder Price P.C.
1401 New York Avenue
Washington, D.C. 20005
(Name and addresses of agent for service)
Registrant's telephone number, including area code: 800-258-3030
Date of fiscal year end: December 31
Date of reporting period: December 31, 2023
Item 1. Reports to Stockholders.
(a)The following is a copy of the report transmitted to stockholders pursuant to Rule 30e-1 under the Act (17 CFR 270.30e-1).
(b)Not applicable.
Annual Report
December 31, 2023
Daily Income Fund (HDIXX)
Short-Term Government Securities Fund (HOSGX)
Short-Term Bond Fund (HOSBX)
Intermediate Bond Fund (HOIBX)
Rural America Growth & Income Fund (HRRLX)
Stock Index Fund (HSTIX)
Value Fund (HOVLX)
Growth Fund (HNASX)
International Equity Fund (HISIX)
Small-Company Stock Fund (HSCSX)
The investment commentaries on the following pages were prepared for each fund by its portfolio manager(s). The views expressed are those of the portfolio manager(s) on January 17, 2024, for each fund as of December 31, 2023. Since that date, those views might have changed. The opinions stated might contain forward-looking statements and discuss the impact of domestic and foreign markets, industry and economic trends, and governmental regulations on the funds and their holdings. Such statements are subject to uncertainty, and the impact on the funds might be materially different from what is described here.
Past performance does not guarantee future results.
Investors are advised to consider fund objectives, risks, charges and expenses before investing. The prospectus contains this and other information and should be read carefully before you invest. To obtain a prospectus, call 800.258.3030 or download a PDF at homesteadfunds.com.
President’s Letter
2023 Annual Report
January 17, 2024
Dear Shareholders:
The financial markets gave us a taste of everything in 2023. Stocks and bonds were up, mixed or down quarter to quarter following updates on inflation and the strength of the job market, shifting outlooks for Federal Reserve (Fed) policy and the likelihood of a recession. This bumpy course played out against a backdrop of global turmoil that escalated in October with the attack on Israel and the following crisis in Gaza. At year end, most broad bond indexes posted positive 12-month returns and most broad equity benchmarks returned strong, double-digit returns for the same period.
Of the eight actively managed stocks and bond funds in the Homestead series all but two — Rural America Growth & Income Fund and International Equity Fund — outperformed their benchmark for the year. Please see the following portfolio manager letters for a discussion of each fund’s relative performance.
The Fed’s persistent path to higher rates means that bonds — even securities at the very short end of the maturity spectrum — are generally earning income again. This is great news for investors who in recent years have been forced to take on more risk than they may have been comfortable with in hopes of earning an above-inflation return on their principal.
Here’s where we think a long-term lens is very useful. Beginning in 2008 during the Great Recession, the Fed took interest rates to near-zero levels where they remained for years. This excess liquidity effectively distorted asset values, favoring some types of securities and handicapping others. In our view, the markets are now navigating back to a more traditional economic cycle, where financing comes at a cost and fluctuations in interest rates will speed or slow economic growth. For more on how this shift stands to affect stocks and bonds, read our 2024 Market Outlook at homesteadfunds.com.
Our representatives are here to work with you, and we welcome your call at 800.258.3030. If you prefer, go to the Connect With Us page at homesteadfunds.com and book an appointment for a time convenient for you. We thank you for your continued support and trust in Homestead Advisers as investors in the Homestead Funds.
Sincerely,
Mark D. Santero
CEO, President and Director/Trustee
Homestead Funds
Mark Santero
CEO, President and Director/Trustee
Daily Income Fund
Performance Evaluation | Prepared by the Fund’s Subadviser, Invesco Advisers, Inc.
Performance
The fund returned 4.58% for the 12-month period ending December 31, 2023. The seven-day effective yield was 4.94% as of December 31, 2023.
Market Conditions
The Federal Open Market Committee (FOMC) raised interest rates four times in 2023, bringing the target range for the effective federal funds rate from 4.25%-4.50% to 5.25%-5.50% with the last hike at the July meeting. At the December FOMC meeting, Chairman Powell suggested the committee remain data dependent and provided conditional guidance that rates will remain higher for longer, admitting that monetary policy is in restrictive territory and hinting they are done raising rates. He added that they will remain insistent on bringing inflation down to its 2% target. Inflation overall has been on a slow downward trajectory but remains persistently above the Fed’s 2% target. The December 2023 inflation data showed the Consumer Price Index (CPI) rose 3.4% year over year, which is down nearly half since January of 2023. Core CPI, excluding food and energy, has remained elevated at 3.9% but still down 1.5% since the beginning of 2023. Overall core goods prices remain weak, but services inflation has been consistently stronger along with shelter and housing. Labor markets have moderated but remained resilient as the unemployment rate sits at 3.7% as of December 2023. A soft landing for the economy is increasingly more likely but not certain.
2023 was an eventful year that started with recession, global banking fears and contentious debt ceiling negotiations and ended with the Securities and Exchange Commission passing another round of money market reform, nearly $2 trillion Treasury bill issuance from the Treasury and U.S. money market fund assets hitting a record high, according to the Investment Company Institute. Short-term interest rates are the highest they have been in nearly 20 years, and money funds continue to be a formidable cash management investment vehicle for investors. The demand on the front end of the yield curve still outweighs the supply even with an abundance of new Treasury bill issuance. The Federal Reserve’s Reverse Repurchase Program awarded amount continues its steady decline. It topped out around $2.4 trillion in the first half of the year and has been around $600 million for the first part of January. The Treasury curve remains inverted as investors are extending duration in preparation for the Fed to ease financial conditions and cut interest rates. The market is aggressively pricing in six rate cuts for 2024, with the first one starting in March.
Outlook
The Invesco Global Liquidity Team took over the day-to-day management of the Daily Income Fund portfolio on May 1, 2021. Our investment strategy and security selection are built on macroeconomic factors, effects of supply and demand dynamics relating to the Treasury market, and break-even analysis based on expected interest rates on the yield curve. As we have reached peak interest rates, we will continue detailed security selection that strives to take advantage of the evolving market environment. The FOMC’s latest Summary of Economic Projections median for the federal funds rate was revised to reflect a 75-basis-point easing of rates by the end of 2024. U.S. money market yields have improved through the year, as expected, as rate hikes have fed through. With rates now expected to have peaked, we have pursued a strategy of terming out maturities over the quarter, within our weighted average maturity that reflects opportunistic fixed- and floating-rate note holdings that we believe offer diversification and attractive discount margins. We believe the ending of the hiking cycle does not mean the immediate beginning of an easing cycle. The market has priced in a significant chance of decreases in the federal funds rate beginning in spring 2024, but stronger data may cause the market to reassess the potential rate path. The Fed will be on hold to ensure the data is consistently leading toward the 2% inflationary target. Money funds will benefit from the higher-for-longer short-term interest rate scenario.
We believe the fund is currently well positioned with an appropriate weighted average maturity in this current Fed monetary policy environment and captures a model that remains competitive and flexible in seeking to take advantage of tight financial conditions with an easing cycle in the foreseeable future. We will be closely monitoring U.S. economic data releases, examining them for any weakness or unexpected strength that could push the FOMC to act beyond the current market pricing of near-term rate. Inflation should continue to moderate through the rest of the year, although it will likely remain higher than the Fed’s 2% target. We expect to see short-term interest rate volatility as the market establishes the terminal federal funds rate expectations given the potential resilience of the U.S. economy.
| Average Annual Total Returns (periods ended 12/31/23) | | | |
| | 1 YR % | 5 YR % | 10 YR % |
| Daily Income Fund | 4.58 | 1.47 | 0.86 |
| Yield | |
| Annualized 7-day current yield quoted 12/31/23 | 4.82% | |
| Security Diversification |
| | % of Total Investments |
| | as of 12/31/22 | as of 12/31/23 |
| U.S. government and agency obligations | 81.2 | 80.5 |
| Short-term and other assets* | 18.8 | 19.5 |
| Total | 100.0% | 100.0% |
| Maturity | | |
| | as of 12/31/22 | as of 12/31/23 |
| Average weighted maturity | 34 days | 41 days |
The returns quoted in the above table represent past performance, which is no guarantee of future results. Current performance may be higher or lower than that shown above. To obtain the most recent month-end returns, please call 800.258.3030 or visit homesteadfunds.com. Returns and the principal value of your investment will fluctuate such that shares, when redeemed, may be worth more or less than their original cost. You could lose money by investing in the Daily Income Fund. Although the fund seeks to preserve the value of your investment at $1.00 per share, it cannot guarantee it will do so. An investment in the Daily Income Fund is not insured or guaranteed by the Federal Deposit Insurance Corporation (FDIC) or any other government agency. The fund’s sponsor has no legal obligation to provide financial support to the fund, and you should not expect that the sponsor will provide financial support to the fund at any time.
The Daily Income Fund’s average annual total returns are net of any fee waivers and reimbursements. The fund’s advisor waived a portion of its management fee and/or reimbursed fund expenses during the five- and 10-year periods. Had the advisor not done so, the fund’s total returns would have been lower. The expenses used are as of the most recent period-end and may fluctuate over time. Returns include the reinvestment of dividends. Returns do not reflect taxes that the shareholder may pay on fund distributions or the redemption of fund shares.
*Represents investment in an unaffiliated U.S. government money market fund.
Short-Term Government Securities Fund
Performance Evaluation | Prepared by the Fund’s Investment Adviser, Homestead Advisers Corp.
Performance
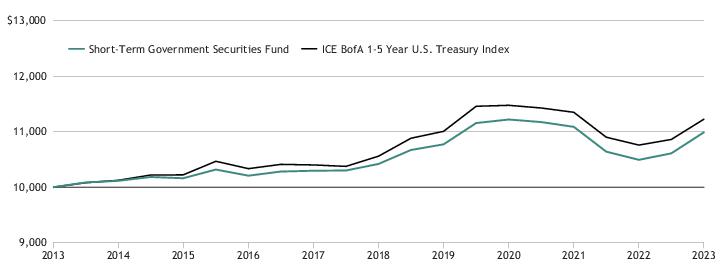
The fund returned 4.68% for the year ending 2023, outperforming its benchmark index, the ICE BofA 1-5 Year U.S. Treasury Index, which returned 4.30%. Several key factors contributed to the fund's success in 2023:
• Overweight allocation to agencies: Our strategic decision to overweight securities issued by government agencies, backed by the full faith and credit of the U.S. government, proved fruitful.
• CMO, MBS and ABS exposure: Our deliberate focus on collateralized mortgage obligations (CMOs), mortgage-backed securities (MBS) and asset-backed securities (ABS) also contributed to performance.
• Underweight Treasuries: Our calculated underweight position in Treasuries, particularly longer-dated issues, mitigated performance drag during a period of relative flattening yield curve.
Market Conditions
The year 2023 was marked by significant changes in the global economic landscape. Rising inflation concerns led to a tightening of monetary policy by the Federal Reserve (Fed), resulting in a series of interest rate hikes. These actions, while deemed necessary to combat inflation, also contributed to a rise in bond yields and increased market volatility.
Initially, rising interest rates and inflation concerns led to broad-based selling, particularly in long-dated Treasuries. However, as the year progressed and the Fed signaled a potential slowdown in rate hikes, the market stabilized and even found pockets of opportunity.
Despite these challenges, the short-term bond market remained relatively resilient, supported by a strong underlying economy and continued demand for fixed-income investments. However, the market became increasingly sensitive to changes in economic data and monetary policy pronouncements, requiring active management to navigate effectively.
Adding to the market complexity were challenges faced by some smaller regional banks. Rising interest rates, coupled with a mismatch between their assets and liabilities, created a short-term liquidity crisis for these institutions. This mismatch meant that the value of their longer-term fixed-rate assets declined while their shorter-term funding costs rose, squeezing their available cash and threatening their solvency. To address this issue and prevent broader financial disruption, the Federal Deposit Insurance Corporation stepped in to take over several failing banks.
| Investment Adviser: Homestead Advisers |
 | Mauricio Agudelo, CFA
Head of Fixed-Income Investments
BS, Finance, The University of Maryland,
Robert H. Smith School of Business |
 | Ivan Naranjo, CFA, FRM
Fixed-Income Portfolio Manager
BS, Finance, The University of Maryland,
Robert H. Smith School of Business |
Outlook
Heading into 2024, we anticipate a cautious dance between a moderating Fed and a still-fragile economic landscape. While growth is expected to remain positive, concerns about slowing momentum and persistent inflation could keep the Fed on edge, perhaps pausing rate hikes while closely monitoring incoming data. This creates a potentially volatile environment where active management will be crucial to navigate shifting market dynamics.
Despite the uncertainties, we remain optimistic about the opportunities in the short-term government bond market for several reasons. The first is that current yields offer attractive risk-adjusted returns compared with recent years. This provides a valuable haven for income-seeking investors seeking to preserve capital during potential economic turbulence. Additionally, with the Fed nearing the end of its tightening cycle, we expect volatility to subside gradually. This creates a fertile ground for active management to generate alpha by identifying undervalued securities within the diverse range of short-term government offerings (i.e., thoughtful security selection) and by capitalizing on opportunities in sectors such as CMOs, MBS and ABS that offer both diversification and higher potential returns compared with plain vanilla Treasuries (i.e., strategic sector allocation).
However, the key to unlocking these opportunities lies in active management. Navigating the delicate balance between a slowing Fed and economic uncertainties requires a dynamic approach that can adapt to changing market conditions. Our experienced team is confident in their ability to identify and seize these opportunities, maximizing returns for shareholders while maintaining a focus on risk mitigation and capital preservation.
Short-Term Government Securities Fund
| Average Annual Total Returns (periods ended 12/31/23) | | | |
| | 1 YR % | 5 YR % | 10 YR % |
| Short-Term Government Securities Fund | 4.68 | 1.04 | 0.93 |
| ICE BofA 1-5 Year U.S. Treasury Index | 4.30 | 1.21 | 1.15 |
| Security Diversification |
| | % of Total Investments |
| | as of 12/31/22 | as of 12/31/23 |
| U.S. government and agency obligations | 66.6 | 61.0 |
| Mortgage-backed securities | 1.1 | 16.9 |
| Corporate bonds—government guaranteed | 25.8 | 15.9 |
| Asset-backed securities | 3.1 | 3.1 |
| Corporate bonds—other | 1.6 | 2.6 |
| Municipal bonds | 0.1 | 0.0 |
| Short-term and other assets* | 1.7 | 0.5 |
| Total | 100.0% | 100.0% |
| Maturity | | |
| | as of 12/31/22 | as of 12/31/23 |
| Average weighted maturity | 2.48 | 2.64 |
Performance Comparison
Comparison of the change in value of a $10,000 investment in the fund and the ICE BofA 1-5 Year U.S. Treasury Index made on December 31, 2013.
The returns quoted in the above table and chart represent past performance, which is no guarantee of future results. Current performance may be higher or lower than that shown above. To obtain the most recent month-end returns, please call 800.258.3030 or visit homesteadfunds.com. Returns and the principal value of your investment will fluctuate such that shares, when redeemed, may be worth more or less than their original cost. The Short-Term Government Securities Fund’s average annual total returns are net of any fee waivers and reimbursements.The fund’s advisor waived a portion of its management fee during the periods shown. Had the advisor not done so, the fund's total returns would have been lower. The expenses used are as of the most recent period-end and may fluctuate over time. Returns include the reinvestment of dividends and capital gains. Returns do not reflect taxes that the shareholder may pay on fund distributions or the redemption of fund shares. It is not possible to invest directly in an unmanaged index. Index performance does not reflect transaction costs, fees or expenses.
*Represents investment in an unaffiliated U.S. government money market fund.
Short-Term Bond Fund
Performance Evaluation | Prepared by the Fund’s Investment Adviser, Homestead Advisers Corp.
Performance
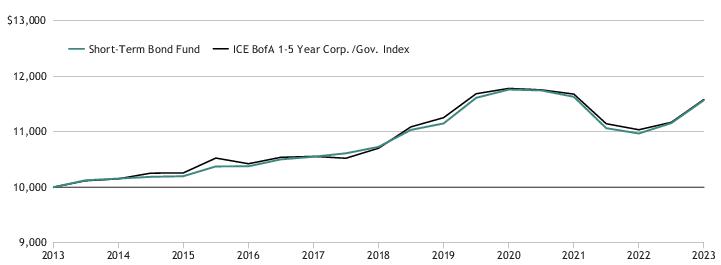
The fund returned 5.40% for the year ending 2023, outperforming its benchmark index, the ICE BofA 1-5 Year Corporate/Government Index, which returned 4.89%. Several key factors contributed to the fund's success in 2023:
• Strategic sector allocation: Our deliberate overweight allocation to asset-backed securities (ABS), corporates, collateralized mortgage obligations (CMOs) and mortgage-backed securities (MBS) proved fruitful.
• Active management: Our active, research-driven approach allowed us to identify undervalued securities within these sectors, further enhancing returns.
• Underweight U.S. Treasuries and agencies: Our calculated underweight position in U.S. Treasuries and agencies, particularly longer-dated issues, mitigated potential performance drag while interest rates stabilized.
Market Conditions
The year 2023 was marked by significant changes in the global economic landscape. Rising inflation concerns led to a tightening of monetary policy by the Federal Reserve (Fed), resulting in a series of interest rate hikes. These actions, while necessary to combat inflation, also contributed to a rise in bond yields and increased market volatility.
Initially, rising interest rates and inflation concerns led to broad-based selling, particularly in long-dated Treasuries. However, as the year progressed and the Fed signaled a potential slowdown in rate hikes, the market stabilized and even found pockets of opportunity.
Despite these challenges, the short-term bond market remained relatively resilient, supported by a strong underlying economy and continued demand for fixed-income investments. However, the market became increasingly sensitive to changes in economic data and monetary policy pronouncements, requiring active management to navigate effectively.
Adding to the market complexity were challenges faced by some smaller regional banks. Rising interest rates, coupled with a mismatch between their assets and liabilities, created a short-term liquidity crisis for these institutions. This mismatch meant that the value of their longer-term fixed-rate assets declined while their shorter-term funding costs rose, squeezing their available cash and threatening their solvency. To address this issue and prevent broader financial disruption, the Federal Deposit Insurance Corporation stepped in to take over several failing banks.
| Investment Adviser: Homestead Advisers |
| Mauricio Agudelo, CFA
Head of Fixed-Income Investments
BS, Finance, The University of Maryland,
Robert H. Smith School of Business |
| Ivan Naranjo, CFA, FRM
Fixed-Income Portfolio Manager
BS, Finance, The University of Maryland,
Robert H. Smith School of Business |
Outlook
Heading into 2024, we anticipate a cautious dance between a moderating Fed and a still-fragile economic landscape. While growth is expected to remain positive, concerns about slowing momentum and persistent inflation could keep the Fed on edge, perhaps pausing rate hikes while closely monitoring incoming data. This creates a potentially volatile environment where active management will be crucial to navigate shifting market dynamics.
Despite the uncertainties, we remain optimistic about the opportunities in the short-term bond market for several reasons. The first is that current yields offer attractive risk-adjusted returns compared with recent years. This provides a valuable haven for income-seeking investors seeking to preserve capital during potential economic turbulence. Additionally, with the Fed nearing the end of its tightening cycle, we expect volatility to subside gradually. This creates a fertile ground for active management to generate alpha by identifying undervalued securities within the diverse range of short-term bond offerings (i.e., thoughtful security selection) and by capitalizing on opportunities in sectors such as CMOs, MBS and ABS that offer both diversification and higher potential returns compared with plain vanilla Treasuries (i.e., strategic sector allocation).
However, the key to unlocking these opportunities lies in active management. Navigating the delicate balance between a slowing Fed and economic uncertainties requires a dynamic approach that can adapt to changing market conditions. Our experienced team is confident in their ability to identify and seize these opportunities, maximizing returns for shareholders while maintaining a focus on risk mitigation and capital preservation.
| Average Annual Total Returns (periods ended 12/31/23) | | | |
| | 1 YR % | 5 YR % | 10 YR % |
| Short-Term Bond Fund | 5.40 | 1.48 | 1.45 |
| ICE BofA 1-5 Year Corp./Gov. Index | 4.89 | 1.55 | 1.46 |
| Security Diversification |
| | % of Total Investments |
| | as of 12/31/22 | as of 12/31/23 |
| U.S. government and agency obligations | 51.4 | 38.9 |
| Corporate bonds—other | 26.1 | 33.4 |
| Asset-backed securities | 10.4 | 9.9 |
| Yankee bonds | 7.3 | 7.8 |
| Mortgage-backed securities | 0.9 | 7.1 |
| Corporate bonds—government guaranteed | 2.1 | 1.1 |
| Municipal bonds | 0.6 | 0.6 |
| Short-term and other assets | 1.2 | 1.2 |
| Total | 100.0% | 100.0% |
| Maturity | | |
| | as of 12/31/22 | as of 12/31/23 |
| Average weighted maturity | 2.70 | 2.67 |
Performance Comparison
Comparison of the change in value of a $10,000 investment in the fund and the ICE BofA 1-5 Year Corp./Gov. Index made on December 31, 2013.
The returns quoted in the above table and chart represent past performance, which is no guarantee of future results. Current performance may be higher or lower than that shown above. To obtain the most recent month-end returns, please call 800.258.3030 or visit homesteadfunds.com. Returns and the principal value of your investment will fluctuate such that shares, when redeemed, may be worth more or less than their original cost. The Short-Term Bond Fund’s average annual total returns are net of any fee waivers and reimbursements. The expenses used are as of the most recent period-end and may fluctuate over time. Returns include the reinvestment of dividends and capital gains. Returns do not reflect taxes that the shareholder may pay on fund distributions or the redemption of fund shares. It is not possible to invest directly in an unmanaged index. Index performance does not reflect transaction costs, fees or expenses.
Intermediate Bond Fund
Performance Evaluation | Prepared by the Fund’s Investment Adviser, Homestead Advisers Corp.
Performance
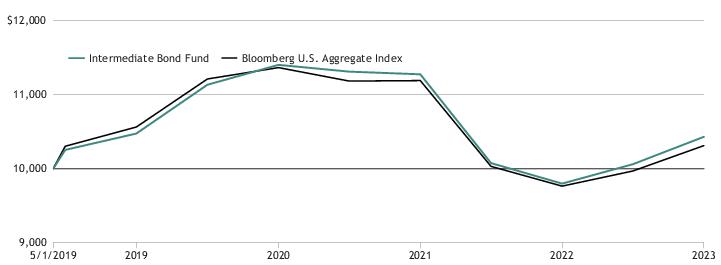
The fund returned 6.35% for the year ending 2023, outperforming its benchmark, the Bloomberg U.S. Aggregate Index, which returned 5.53%. Several key factors contributed to the fund's success in 2023:
• Strategic sector allocation: We deliberately overweighted select higher-yielding sectors, which proved valuable.
• Active credit management: We sought to identify undervalued securities within these sectors, further enhancing returns. Careful issuer analysis and sector rotation played a crucial role in navigating interest rate volatility and credit spreads.
• Underweighted segments: Our calculated underweight positions in U.S. Treasuries, particularly the five-year part of the curve, and CMBS detracted from performance.
Market Conditions
The year 2023 was marked by significant changes in the global economic landscape. Rising inflation concerns led to a tightening of monetary policy by the Federal Reserve (Fed), resulting in a series of interest rate hikes. These actions, while necessary to combat inflation, also contributed to a rise in bond yields and increased market volatility.
Initially, rising interest rates and inflation concerns led to broad-based selling, particularly in long-dated Treasuries. However, as the year progressed and the Fed signaled a potential slowdown in rate hikes, the market stabilized and even found pockets of opportunity.
Despite these challenges, the bond market remained relatively resilient, supported by a strong underlying economy and continued demand for fixed-income investments. However, the market became increasingly sensitive to changes in economic data and monetary policy pronouncements, requiring active management to navigate effectively.
Adding to the market complexity were challenges faced by some smaller regional banks. Rising interest rates, coupled with a mismatch between their assets and liabilities, created a short-term liquidity crisis for these institutions. This mismatch meant that the value of their longer-term fixed-rate assets declined while their shorter-term funding costs rose, squeezing their available cash and threatening their solvency. To address this issue and prevent broader financial disruption, the Federal Deposit Insurance Corporation stepped in to take over several failing banks.
Outlook
Heading into 2024, we anticipate a cautious dance between a moderating Fed and a still-fragile economic landscape. While growth is expected to remain positive, concerns about
| Investment Adviser: Homestead Advisers |
| Mauricio Agudelo, CFA
Head of Fixed-Income Investments
BS, Finance, The University of Maryland,
Robert H. Smith School of Business |
| Ivan Naranjo, CFA, FRM
Fixed-Income Portfolio Manager
BS, Finance, The University of Maryland,
Robert H. Smith School of Business |
slowing momentum and persistent inflation could keep the Fed on edge, perhaps pausing rate hikes while closely monitoring incoming data. This creates a potentially volatile environment where active management will be crucial to navigate shifting market dynamics.
Despite the uncertainties, we remain optimistic about the opportunities in the intermediate-term bond market due to several factors:
• Continued sector opportunities: We believe sectors such as ABS, corporates (including industrials) and select CMOs still offer attractive return potential due to robust underlying fundamentals and relative value compared with other segments.
• Active management advantages: Our dynamic approach will be crucial in identifying undervalued securities, capitalizing on sector rotations and adapting to changing market conditions
• Compelling yield curve: The current yield curve presents potential for income generation and capital preservation, particularly for investors seeking higher yields than those offered by traditional benchmarks.
However, the key to unlocking these opportunities lies in active management. Navigating the delicate balance between a slowing Fed and economic uncertainties requires a dynamic approach that can adapt to changing market conditions. Our experienced team is confident in their ability to identify and seize these opportunities, maximizing returns for shareholders while maintaining a focus on risk mitigation and capital preservation.
| Average Annual Total Returns (periods ended 12/31/23) | | |
| | 1 YR % | Since Inception
% |
| Intermediate Bond Fund | 6.35 | 0.77 |
| Bloomberg U.S. Aggregate Index | 5.53 | 0.55 |
| Security Diversification |
| | % of Total Investments |
| | as of 12/31/22 | as of 12/31/23 |
| Mortgage-backed securities | 22.3 | 33.6 |
| Corporate bonds—other | 23.0 | 29.7 |
| U.S. government and agency obligations | 34.5 | 17.2 |
| Asset-backed securities | 9.2 | 8.3 |
| Yankee bonds | 4.9 | 5.9 |
| Municipal bonds | 2.5 | 1.8 |
| Corporate bonds—government guaranteed | 0.4 | 0.1 |
| Short-term and other assets | 3.2 | 3.4 |
| Total | 100.0% | 100.0% |
| Maturity | | |
| | as of 12/31/22 | as of 12/31/23 |
| Average weighted maturity | 8.34 | 8.41 |
Performance Comparison
Comparison of the change in value of a $10,000 investment in the fund and the Bloomberg U.S. Aggregate Index made on May 1, 2019 (the Fund's inception date).
The returns quoted in the above table and chart represent past performance, which is no guarantee of future results. Current performance may be higher or lower than that shown above. To obtain the most recent month-end returns, please call 800.258.3030 or visit homesteadfunds.com. Returns and the principal value of your investment will fluctuate such that shares, when redeemed, may be worth more or less than their original cost. The Intermediate Bond Fund’s average annual total returns are net of any fee waivers and reimbursements.The fund’s advisor waived all of its management fee and reimbursed a portion of the fund's expenses during the inception to date period and waived a portion of its management fee during the 1-year period. Had the advisor not done so, the fund's total returns would have been lower. The expenses used are as of the most recent period-end and may fluctuate over time. Returns include the reinvestment of dividends and capital gains. Returns do not reflect taxes that the shareholder may pay on fund distributions or the redemption of fund shares. It is not possible to invest directly in an unmanaged index. Index performance does not reflect transaction costs, fees or expenses.
Rural America Growth & Income Fund
Performance Evaluation | Prepared by the Fund’s Investment Adviser, Homestead Advisers Corp.
Performance
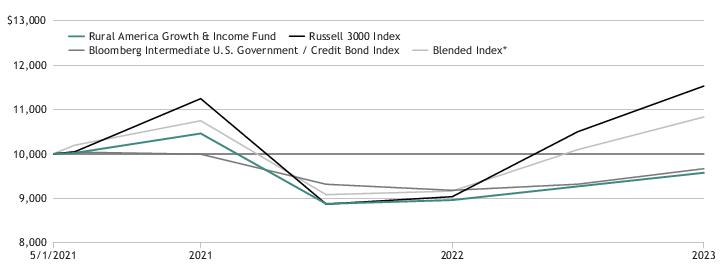
The Rural America Growth & Income Fund returned 6.74% for 2023, underperforming its benchmark, a blend of the Russell 3000 Index (60%) and the Bloomberg Intermediate U.S. Government/Credit Bond Index (40%), which returned 17.45%. Both asset classes, stocks and bonds, enjoyed positive returns during the year.
Portfolio Review
The fund’s underperformance can be entirely attributed to the equity sleeve of the portfolio, driven by negative effects from both sector allocation and stock selection. Information technology was our worst detractor due to our significant underweight to the sector as well as lack of exposure to mega-capitalization technology stocks, part of the so-called “Magnificent 7” group that made up the majority of market returns in 2023. Unfortunately, these companies are generally not included in the fund’s investable universe, even though we are positive on the sector as a whole.
Also negatively affecting performance were several stocks in the other sectors. Our largest individual stock detractor came from the industrials sector where Paycom Software, a payroll and human resource software provider primarily focused on small and midsize businesses, reported weaker-than-expected earnings and outlook due to lower cross-sell activity at its customer base and revenue cannibalization from the company’s new self-served product. The fund was also impacted by our positions in the consumer staples sector, notably Dollar General Corporation and Hershey Company. Both companies have been under pressure from diminishing consumer purchasing power in the face of rising inflation as well as company-specific issues.
On a more positive note, the equity sleeve was helped by strong selection in the health care sector. We would highlight Zoetis, a leading global animal health science company, as an outperformer, as the company rebounded from supply chain volatility and delivered broad-based strength across existing products and pipeline opportunities. The fund also benefitted from an underweight to the utilities sector.
Since our last semiannual update report, we have added a couple of new names, including Ball Corp, a leader in the aluminum beverage can packaging industry, and Burlington Stores, one of the largest off-price retailers in the country. Both companies’ headquarters are based in rural America.
In the fixed-income sleeve, our strategic sector allocation overweight to asset-backed securities (ABS), industrials, collateralized mortgage obligations (CMOs) and mortgage-backed securities (MBS) within the rural universe proved fruitful. These sectors demonstrated resilience and offered an attractive risk-return relationship compared with available opportunities, such as the regional banking space within financials. Specifically, strong credit fundamentals
| Investment Adviser: Homestead Advisers |
 | Mark Iong, CFA
Equity Portfolio Manager
BS, Operations Research and Information Engineering, Cornell |
| Ivan Naranjo, CFA, FRM
Fixed-Income Portfolio Manager
BS, Finance, The University of Maryland,
Robert H. Smith School of Business |
| Homestead Advisers' Jim Polk, head of equity investments, and Mauricio Agudelo, head of fixed-income investments, co-manage this fund with the individuals named above. Their bios appear in adjacent fund manager letters. |
and attractive relative value within ABS and industrials, along with targeted exposure to prime rural agency MBS, fueled performance.
Our active, research-driven approach allowed us to identify undervalued securities within these sectors, further enhancing returns. Careful security selection and opportunistic portfolio duration management proved particularly beneficial in navigating a dynamic market environment.
Outlook
We remain constructive on the outlook for the rural American economy. A resilient domestic macro backdrop, coupled with fiscal stimulus helping power key economic drivers of the Main Street economy, should bode well for the equity holdings in the portfolio. If current economic conditions can persist, we would expect the recent equity market rally to broaden out to include companies in the heartland of the country. As active managers focusing on high-quality businesses in rural America, we continue to believe the portfolio is well positioned for this future.
Heading into 2024, we anticipate a cautious dance between a moderating Fed and a still-fragile economic landscape. While growth is expected to remain positive, concerns about slowing momentum and persistent inflation could keep the Fed on edge, potentially pausing rate hikes while closely monitoring incoming data. This creates a potentially volatile environment where active management will be crucial to navigate shifting market dynamics. Despite the uncertainties, we remain optimistic about the opportunities in the bond market given compelling yields and market stabilization.
Rural America Growth & Income Fund
| Average Annual Total Returns (periods ended 12/31/23) | | |
| | 1 YR % | Since Inception
% |
| Rural America Growth & Income Fund | 6.74 | -1.59 |
| Blended Index* | 17.45 | 2.81 |
| Russell 3000 Index** | 25.96 | 4.84 |
| Bloomberg Intermediate U.S. Government/Credit Bond Index** | 5.24 | -1.32 |
| Security Diversification |
| | % of Total Investments
as of 12/31/23 |
| Common stocks | 57.2 |
| Health care | 9.8 |
| Industrials | 9.6 |
| Information technology | 8.6 |
| Financials | 7.2 |
| Consumer discretionary | 7.0 |
| Real estate | 4.1 |
| Materials | 3.9 |
| Energy | 3.3 |
| Consumer staples | 2.0 |
| Communication services | 1.7 |
| U.S. government and agency obligations | 22.7 |
| Corporate bonds—other | 9.8 |
| Asset-backed securities | 2.0 |
| Mortgage-backed securities | 1.8 |
| Municipal bonds | 1.2 |
| Short-term and other assets | 5.3 |
| | 100.0% |
| Top 10 Holdings | |
| | % of Total Investments
as of 12/31/23 | |
| Federal Farm Credit Bank, 05/03/32, 4.09% | 3.2 | |
| U.S. Treasury Note, 11/15/26, 4.43% | 2.8 | |
| Federal Farm Credit Bank, 08/15/28, 3.87% | 2.7 | |
| Zoetis Inc. | 2.4 | |
| Deere & Co. | 2.1 | |
| Federal Farm Credit Bank, 09/27/29, 4.00% | 2.0 | |
| Federal Farm Credit Bank, 02/25/26, 3.32% | 2.0 | |
| Federal Farm Credit Bank, 10/21/25, 0.52% | 1.9 | |
| Fastenal Co. | 1.9 | |
| Stryker Corp. | 1.9 | |
| Total | 22.9% | |
| Maturity | | |
| | as of 12/31/22 | as of 12/31/23 |
| Average weighted maturity | 4.17 | 4.11 |
Performance Comparison
Comparison of the change in value of a $10,000 investment in the fund, the Blended Index* and the two component indexes of the Blended Index made on May 1, 2021 (the Fund's inception date).
The returns quoted in the above table and chart represent past performance, which is no guarantee of future results. Current performance may be higher or lower than that shown above. To obtain the most recent month-end returns, please call 800.258.3030 or visit homesteadfunds.com. Returns and the principal value of your investment will fluctuate such that shares, when redeemed, may be worth more or less than their original cost. The Rural America Growth & Income Fund’s average annual total returns are net of any fee waivers and reimbursements.The fund's advisor waived all of its management fee and reimbursed a portion of the fund's expenses during the periods shown. Had the advisor not done so, the fund's total returns would have been lower. The expenses used are as of the most recent period-end and may fluctuate over time. Returns include the reinvestment of dividends and capital gains. Returns do not reflect taxes that the shareholder may pay on fund distributions or the redemption of fund shares. It is not possible to invest directly in an unmanaged index. Index performance does not reflect transaction costs, fees or expenses.
*The fund's Blended Index is a blend of the Russell 3000 Index (60%) and the Bloomberg Intermediate U.S. Government/Credit Bond Index (40%).
**The returns of the Russell 3000 Index and the Bloomberg Intermediate U.S. Government/Credit Bond Index are shown because these indexes are the two components of the Blended Index.
Performance Evaluation
11
Stock Index Fund
Performance Evaluation | Prepared by the Master Portfolio’s Investment Adviser, BlackRock Fund Advisors
Index and Fund Performance
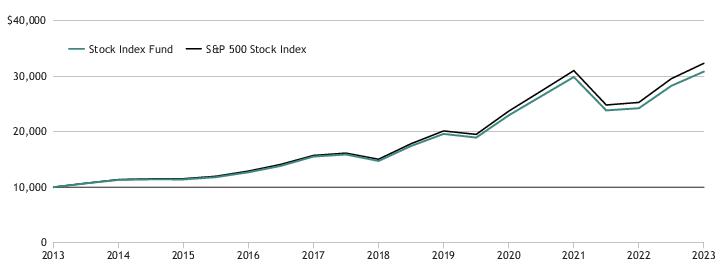
For the 12 months ended December 31, 2023, the U.S. large cap market metric and the fund’s benchmark, the Standard & Poor’s (S&P) 500® Index, returned 26.29%. The Stock Index Fund returned 25.73% for the same period, consistent with its objective of tracking the benchmark with a lag attributable to fund operating expenses. The S&P 500® Index is a market capitalization-weighted index composed of 500 common stocks issued by large-capitalization companies in a wide range of industries.
During the 12-month period, as changes were made to the composition of the S&P 500® Index, the Master Portfolio in which the fund invests purchased and sold securities to maintain its objective of replicating the risks and return of the index.
Market Conditions
The U.S. equity market rallied over the first quarter on the back of cooling inflation and resilient economic data. In combination with a stronger-than-expected GDP, inflation data led investors to position for slower rate rises from the Federal Reserve (Fed). The Fed reiterated its commitment to raise the interest rate to bring the inflation rate down in February 2023, especially if macro data continued to come in stronger than expected. Later in the quarter, investors’ attention quickly switched to headline news about the banking sector, which led to a major sell off in the financial sectors. The overall market calmed after the central banks set out reassuring plans.
The Fed raised the interest rate by 25 basis points in February and March 2023, bringing it to the range of 4.75% to 5.00%. This represented the ninth consecutive interest rate hike. A slight shift in rhetoric was interpreted that the rate hiking cycle was nearing a pause, although Fed Chair Jerome Powell was clear that additional “policy firming” may be required.
Despite concerns over the debt ceiling, the U.S. equity market continued to rally over the second quarter. Robust gains were supported by resilient economic data and strong performance by large-cap growth stocks. Concerns regarding the U.S. debt ceiling dampened market sentiment in May 2023 before Congress reached an agreement to suspend it. Later in the quarter, markets rallied, boosted by the technology sector on the back of enthusiasm over artificial intelligence and chipmakers.
The Fed raised its target for the federal funds rate by 25 basis points over the second quarter, bringing rates to the range of 5.00% to 5.25%. The Fed signaled that hike pauses would come later in the quarter but expressed the need to retain flexibility to bring inflation down.
The U.S. equity market initially rallied over the third quarter, supported by a falling inflation rate and resilient economic data. The Fed raised its policy rate by another 25 basis points, bringing the fed funds rate to 5.25%-5.50%. Uncertainty over whether the Fed had reached the endpoint for its rate-hiking cycle dampened the market sentiment.
A slight inflation hike in August 2023 weighed down on market performance over the second part of the quarter. However, the Fed kept rates unchanged during its September 2023 meeting, signaling a hawkish pause that raised concerns about high rates persisting for a longer period and a possibility of another rate hike later during the year driven by increasing oil prices pushing the inflation rate higher.
The U.S. equity market posted overall robust gains on the back of cooling inflation data during the fourth quarter. The market initially dampened in October 2023 with expectations that interest rates would remain higher for longer. Increasing conflict in the Middle East further exacerbated the initial market dampening. Later in the quarter, however, optimistic inflation data led to hopes that interest rates had reached their peak, leading the market to rally in the second half of the quarter.
During the quarter, falling consumer price index data raised hopes that inflation was on course to fall back to the Fed’s 2% target. The Fed held interest rates steady for the quarter at a targeted range of 5.25% to 5.50%. Given that the Fed signaled it may have finished its series of rate hikes, market expectations of rate cuts in 2024 increased.
In the fourth quarter of 2023, from a Global Industry Classification Standard sector perspective, information technology (+60.93%), communication services (+55.80%) and consumer discretionary (+43.22%) were among the best performers, while utilities (-7.08%), energy (-1.33%) and consumer staples (+0.55%) were among the worst performers.
| Average Annual Total Returns (periods ended 12/31/23) | | | |
| | 1 YR % | 5 YR % | 10 YR % |
| Stock Index Fund | 25.73 | 15.12 | 11.45 |
| S&P 500 Stock Index | 26.29 | 15.69 | 12.03 |
| Sector Diversification | |
| | % of Total Investments
as of 12/31/23 | |
| Information technology | 28.7 | |
| Financials | 13.5 | |
| Health care | 12.5 | |
| Consumer discretionary | 10.8 | |
| Industrials | 8.8 | |
| Communication | 8.5 | |
| Consumer staples | 6.1 | |
| Energy | 3.9 | |
| Real estate | 2.5 | |
| Materials | 2.4 | |
| Utilities | 2.3 | |
| Total | 100.0% | |
| Top 10 Equity Holdings | |
| | % of Total Investments
as of 12/31/23 | |
| Apple, Inc. | 7.0 | |
| Microsoft Corp. | 6.9 | |
| Alphabet, Inc. | 3.8 | |
| Amazon.com, Inc. | 3.4 | |
| NVIDIA Corp. | 3.0 | |
| Meta Platforms, Inc. | 2.0 | |
| Tesla Inc. | 1.7 | |
| Berkshire Hathaway, Inc. | 1.6 | |
| JPMorgan Chase & Co. | 1.2 | |
| Broadcom Inc. | 1.2 | |
| Total | 31.8% | |
Performance Comparison
Comparison of the change in value of a $10,000 investment in the fund and the S&P 500 Stock Index made on December 31, 2013.
The returns quoted in the above table and chart represent past performance, which is no guarantee of future results. Current performance may be higher or lower than that shown above. To obtain the most recent month-end returns, please call 800.258.3030 or visit homesteadfunds.com. Returns and the principal value of your investment will fluctuate such that shares, when redeemed, may be worth more or less than their original cost. The Stock Index Fund’s average annual total returns are net of any fee waivers and reimbursements. The expenses used are as of the most recent period-end and may fluctuate over time. Returns include the reinvestment of dividends and capital gains. Returns do not reflect taxes that the shareholder may pay on fund distributions or the redemption of fund shares. It is not possible to invest directly in an unmanaged index. Index performance does not reflect transaction costs, fees or expenses.
Performance Evaluation
13
Value Fund
Performance Evaluation | Prepared by the Fund’s Investment Adviser, Homestead Advisers Corp.
Performance
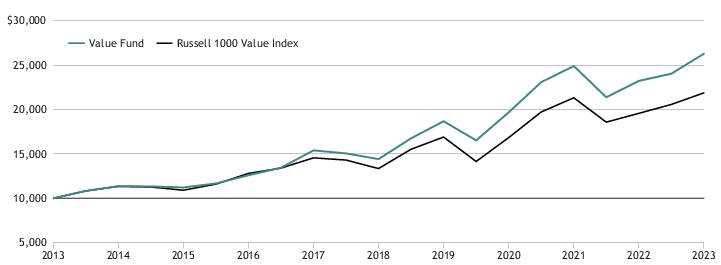
The fund returned 12.86% for the year ended December 31, 2023, leading its benchmark index, the Russell 1000 Value Index, which returned 11.46%. The fund’s better-than-index results were due to both sector allocation and stock selection.
Portfolio Review
In 2023 the strength of the underlying economy surprised many investors. This economic strength led to more economically sensitive sectors such as industrials and consumer discretionary outperforming more defensive sectors such as health care, utilities and consumer staples during the year. A second market impact was the introduction of artificial intelligence (AI). This technological advancement became an investable theme as several companies began introducing AI capabilities and more use cases were developed throughout the year. This AI narrative was beneficial to both the communication services and technology sectors.
Sector allocation was positive as the fund benefited from underweights in more defensive sectors such as staples and utilities while being overweight more economically sensitive sectors such as industrials. The fund was also overweight health care, which was a negative to performance.
Stock selection was also positive for performance. Several long-term holdings, including Microsoft and Alphabet, rebounded from a difficult 2022. Microsoft’s exposure to AI continued to strengthen as new use cases were developed. Its cloud computing service, Azure, benefits from people using OpenAI. It also continues to infuse AI into its business productivity segment.
Alphabet should also be a long-term winner as AI is developed.Throughout the period, it saw an improvement in its search engine business and should benefit from increased ad spending as the economy improves.
Parker Hannifin, an industrial conglomerate, continues to reshape its portfolio via acquisitions into long cycle businesses with less economic cyclicality. Strength in orders as well as good cost control was a positive through the period.
Leidos, an engineering and IT firm, was our largest detractor. Early in the year, it had operational issues in its Civil segment, which led to weak margins. It also had a weaker-than-expected book to bill, an indicator of future revenue growth. This, along with a CEO change, put pressure on the stock early in the year.
Two other detractors to performance were Royalty Pharma and Bristol-Myers Squibb, both in the health care sector. Royalty Pharma provides financing to pharmaceutical and
| Investment Adviser: Homestead Advisers |
| Mark Iong, CFA
Equity Portfolio Manager
BS, Operations Research and Information Engineering, Cornell |
 | Jim Polk, CFA
Head of Equity Investments
BA, English, Colby College; MBA, The Olin Graduate School of Business at Babson College |
biotechnology companies for their drug development. It then receives royalties when these drugs are launched commercially. It has a proven track record of deploying capital effectively. We believe most of the stock under-performance was related to sector rotation away from health care. Another health care stock, Bristol-Myers Squibb, faces several large patent expirations of key drugs over the next few years. From its research and development pipeline as well as via several acquisitions, it has a core group of new pharmaceuticals that should help offset these patent expirations. During the year, investors were concerned that based on near-term trends several of these key products might have less long-term upside than originally thought.
Outlook
While for most of 2023 the market was led by the Magnificent 7 — a cohort of higher growth, higher multiple, predominantly technology companies — for the market to continue to move higher in 2024, we believe it will need to broaden out to include more economically sensitive sectors, including banks. As inflation moved closer to the Fed’s 2% target, the market narrative shifted from concerns over the Fed hiking rates too quickly to an expectation that the Fed will begin lowering rates in 2024.
| Average Annual Total Returns (periods ended 12/31/23) | | | |
| | 1 YR % | 5 YR % | 10 YR % |
| Value Fund | 12.86 | 12.88 | 10.20 |
| Russell 1000 Value Index | 11.46 | 10.91 | 8.40 |
| Sector Diversification | |
| | % of Total Investments
as of 12/31/23 | |
| Financials | 20.6 | |
| Health care | 18.2 | |
| Industrials | 16.5 | |
| Information technology | 8.3 | |
| Energy | 7.6 | |
| Consumer discretionary | 7.5 | |
| Communication services | 7.4 | |
| Materials | 6.8 | |
| Real estate | 5.1 | |
| Consumer staples | 0.9 | |
| Short-term and other assets | 1.1 | |
| Total | 100.0% | |
| Top 10 Equity Holdings | |
| | % of Total Investments
as of 12/31/23 | |
| JPMorgan Chase & Co. | 4.1 | |
| Parker-Hannifin Corp. | 4.0 | |
| Honeywell International, Inc. | 3.6 | |
| Meta Platforms, Inc. | 3.1 | |
| Goldman Sachs Group, Inc. | 3.1 | |
| Abbott Laboratories | 3.1 | |
| AbbVie Inc. | 2.9 | |
| Alphabet, Inc. | 2.9 | |
| ConocoPhillips | 2.9 | |
| Microsoft Corp. | 2.8 | |
| Total | 32.5% | |
Performance Comparison
Comparison of the change in value of a $10,000 investment in the fund and the Russell 1000 Value Index made on December 31, 2013.
The returns quoted in the above table and chart represent past performance, which is no guarantee of future results. Current performance may be higher or lower than that shown above. To obtain the most recent month-end returns, please call 800.258.3030 or visit homesteadfunds.com. Returns and the principal value of your investment will fluctuate such that shares, when redeemed, may be worth more or less than their original cost. The Value Fund’s average annual total returns are net of any fee waivers and reimbursements. The expenses used are as of the most recent period-end and may fluctuate over time. Returns include the reinvestment of dividends and capital gains. Returns do not reflect taxes that the shareholder may pay on fund distributions or the redemption of fund shares. It is not possible to invest directly in an unmanaged index. Index performance does not reflect transaction costs, fees or expenses.
Performance Evaluation
15
Growth Fund
Performance Evaluation | Prepared by the Fund’s Subadviser, T. Rowe Price Associates
Performance
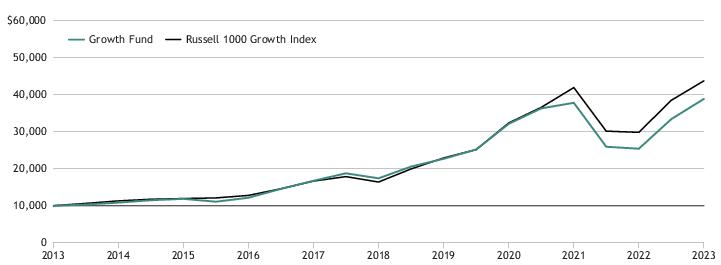
The Homestead Growth Fund delivered a positive return of 47.81% for the 12-month period and outperformed its benchmark, the Russell 1000 Growth Index, which returned 42.68% for the same period. Both security selection and sector allocation drove relative outperformance during the year.
Portfolio Review
Information technology was a notable contributor to relative performance due to positive stock selection. Shares of the leading chipmaker NVIDIA traded sharply higher following consecutive blowout quarterly reports and impressive guidance that reflected improved visibility around future demand for advanced graphics processing units (GPUs) that are critical for the build-out of artificial intelligence (AI) infrastructure.
The communication services sector further contributed to relative results owing to favorable stock selection coupled with an overweight allocation. Shares of Meta Platforms bounced back significantly over the past year as the social media giant’s advertising revenue reaccelerated and engagement trends improved, while its aggressive pivot toward cost discipline also benefited margins. The stock received support from AI tailwinds as well, as investors expect AI to enhance the company’s advertising business significantly.
The portfolio’s underweight allocation to industrials and business services contributed to relative performance as cyclical stocks largely took a back seat in a market rotation that favored technology-oriented growth stocks. Within the sector, we remain focused on areas where we believe there is secular, rather than cyclical, growth. As such, we continue to emphasize unique, company-specific opportunities that we believe can drive meaningful growth regardless of the economic backdrop.
In contrast, the health care sector was the primary detractor from relative results, due to an overweight allocation coupled with unfavorable stock picks. Our overweight allocation to the sector emphasizes select managed care companies positioned to benefit from industry consolidation as well as the increasing focus on providing cost-effective solutions. Despite the recent overhang from uncertainty around the impact from potential widespread adoption of GLP-1s, innovative medical device and equipment manufacturers that are focused on meaningfully improving patient outcomes also represent some of the more attractive opportunities in the sector, in our view. Shares of the managed care company, Cigna, were under pressure in a challenging year for insurers as they faced elevated utilization trends and less-than-generous reimbursement rates for Medicare Advantage in 2024.
| Subadviser: T. Rowe Price Associates |
 | Taymour Tamaddon, CFA
Portfolio Manager
BS, Applied Physics, Cornell University;
MBA, Finance, Dartmouth |
The consumer discretionary sector further weighed on relative results due to weak stock selection, which was partially offset by an underweight allocation.
Outlook
The favorable end to 2023 for equities sets up a unique dynamic for the coming year, as investors must adapt to a new market regime. Even with the expectation for easing of restrictive monetary policy in the form of interest rate cuts by the U.S. Federal Reserve, macroeconomic risks exist with sticky inflation and the potential for supply side pressures to influence energy prices. It remains to be seen how real (after-inflation) interest rates above 2% will play out in the markets. But we do not believe that high rates will kill the U.S. economy. Rates are high relative to the post-global financial crisis period but not relative to capital market history. The federal funds rate exceeded 5% for decades, and stock markets still did well. Sticky inflation historically has been good for earnings. We believe broader, less concentrated market leadership is likely to provide more varied sources of returns for investors who maintain a sharp focus on valuation fundamentals, creating particularly attractive opportunities for active strategic investors.
| Average Annual Total Returns (periods ended 12/31/23) | | | |
| | 1 YR % | 5 YR % | 10 YR % |
| Growth Fund | 47.81 | 15.44 | 13.57 |
| Russell 1000 Growth Index | 42.68 | 19.50 | 14.86 |
| Sector Diversification | |
| | % of Total Investments
as of 12/31/23 | |
| Information technology | 41.0 | |
| Health care | 16.0 | |
| Communication services | 14.3 | |
| Consumer discretionary | 12.2 | |
| Financials | 10.8 | |
| Industrials | 2.5 | |
| Consumer staples | 1.6 | |
| Energy | 0.7 | |
| Short-term and other assets | 0.9 | |
| Total | 100.0% | |
| Top 10 Equity Holdings | |
| | % of Total Investments
as of 12/31/23 | |
| Microsoft Corp. | 13.2 | |
| Amazon.com, Inc. | 7.2 | |
| Apple, Inc. | 7.1 | |
| Alphabet, Inc. | 6.9 | |
| NVIDIA Corp. | 5.3 | |
| Meta Platforms, Inc. | 4.2 | |
| UnitedHealth Group, Inc. | 3.9 | |
| Intuit, Inc. | 3.9 | |
| Mastercard Inc. | 3.1 | |
| Fiserv, Inc. | 2.9 | |
| Total | 57.7% | |
Performance Comparison
Comparison of the change in value of a $10,000 investment in the fund and the Russell 1000 Growth Index made on December 31, 2013.
The returns quoted in the above table and chart represent past performance, which is no guarantee of future results. Current performance may be higher or lower than that shown above. To obtain the most recent month-end returns, please call 800.258.3030 or visit homesteadfunds.com. Returns and the principal value of your investment will fluctuate such that shares, when redeemed, may be worth more or less than their original cost. The Growth Fund’s average annual total returns are net of any fee waivers and reimbursements.The fund's advisor waived a portion of its management fee during the 10-year period. Had the advisor not done so, the fund's total returns would have been lower. The expenses used are as of the most recent period-end and may fluctuate over time. Returns include the reinvestment of dividends and capital gains. Returns do not reflect taxes that the shareholder may pay on fund distributions or the redemption of fund shares. It is not possible to invest directly in an unmanaged index. Index performance does not reflect transaction costs, fees or expenses.
Performance Evaluation
17
International Equity Fund
Performance Evaluation | Prepared by the Fund’s Subadviser, Harding Loevner LP
Performance
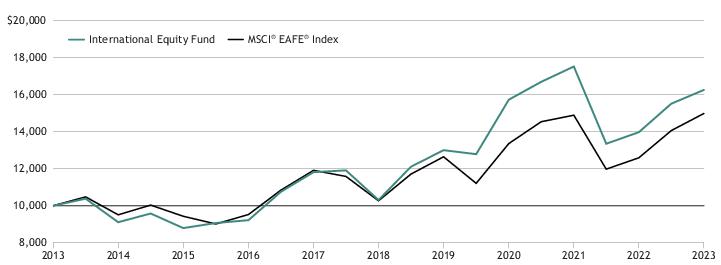
For the one-year period ending December 31, 2023, the fund trailed its benchmark, the MSCI EAFE Index. The fund returned 15.82% versus a return of 18.24% for the benchmark.
Portfolio Review
The portfolio’s underperformance was driven by poor stock selection, although sector allocation decisions partially offset the drag from stock selection. Our relative performance was weakest within consumer discretionary, financials and information technology (IT), while it was strongest within the consumer staples and industrials sectors.
Many of our worst-performing stocks in 2023 were those connected to China or Hong Kong, the weakest markets in the index. Within China, our biggest setbacks included LONGi (hurting IT sector performance). Hong Kong–based insurer AIA Group suffered alongside the Hong Kong market, despite rebounding new business activity. Japanese cosmetics company Shiseido also struggled with falling Chinese demand amid a resurgence of anti-Japanese consumer sentiment following the release of treated radioactive wastewater from the Fukushima Daiichi nuclear power plant.
Despite the decline in Shiseido, our consumer staples stocks performed well. Leading this success was Canadian convenience store operator Alimentation Couche-Tard, which exhibited strong growth throughout the year. L’Oréal also stood out, maintaining steady sales throughout the year, including in China where it continues to gain market share.
This year, our industrials sector holdings achieved some of the highest returns, with Atlas Copco, Schneider Electric and Alfa Laval each recording gains of over 40%. These European global industrial companies managed to keep growing despite Europe’s slowing economic momentum.
By region, Japan was our weakest region in relative performance, with disappointing results from Shiseido,Sysmex and Unicharm offsetting strong showings from Chugai, Daifuku and Komatsu. The eurozone delivered the strongest returns in the year, thanks to significant gains from BBVA, Schneider Electric, L’Oréal, SAP and Infineon.
Outlook
This year has been marked by the eruption of a new technology into the public consciousness: artificial intelligence (AI). Open AI’s ChatGPT and Dall-E image generator have sparked not only a surge in the share prices of companies acknowledged as key players and providers of AI services but also a rise in the value of many firms that simply claim an association or indirect benefit.
“Amara’s Law,” which claims that we overestimate the impact of innovation in the short term but underestimate it in the long term, appears to apply to the current obsession with AI in spades. The lag between when innovations arrive
| Subadviser: Harding Loevner LP |
Ferrill Roll, CFA
Co-Lead Portfolio Manager | Babatunde Ojo, CFA
Portfolio Manager |
Andrew West, CFA
Co-Lead Portfolio Manager | Patrick Todd, CFA
Portfolio Manager |
Bryan Lloyd, CFA
Portfolio Manager | |
with great fanfare and the tangible impact they have on people’s lives and corporate earnings is known as the “productivity J-curve.” This concept highlights the discernible dip between initial excitement and actual, productive results
The behavioral underpinnings of the hype cycle, though, have broad implications for our investment approach. We humans are hardwired to seek novelty and excitement. When it comes to investing, few things offer more excitement than groundbreaking innovations. But the problem with companies that proffer thrilling advancements is that their shares invariably embed expectations of high future growth with the attendant nosebleed valuations. This anticipated growth typically comes with a high degree of uncertainty and thus a wider range of actual possible outcomes.
Investing in shares of high-quality companies can often seem uneventful by contrast, and it’s in this lack of excitement where opportunity lies. If a stock isn’t particularly thrilling, often due to the more predictable nature of its future profitability and earnings growth, it may not capture the average investor’s imagination in quite the same way. As a result, the shares might not command as high a valuation premium as their potential merits, leading to the quality return premium. Over the years, our focus has been on identifying and investing in such high-quality companies, aiming to augment our portfolio with many of them.
Amid a robust global economic recovery that has boosted corporate profits but also triggered higher inflation and the swinging monetary policy responses of central banks, our collection of low-excitement businesses has proven a bulwark. They’ve provided stability against the turbulence that has buffeted the highly priced stocks of the most-exciting growth companies.
International Equity Fund
| Average Annual Total Returns (periods ended 12/31/23) | | | |
| | 1 YR % | 5 YR % | 10 YR % |
| International Equity Fund* | 15.82 | 9.52 | 4.97 |
| MSCI® EAFE® Index | 18.24 | 8.16 | 4.28 |
| Country Diversification | |
| | % of Total Investments
as of 12/31/23 | |
| Japan | 18.0 | |
| Germany | 12.8 | |
| Sweden | 9.7 | |
| France | 9.4 | |
| Britain | 8.5 | |
| Canada | 7.3 | |
| Switzerland | 7.3 | |
| Singapore | 3.5 | |
| Spain | 2.9 | |
| Australia | 2.6 | |
| Denmark | 2.3 | |
| Hong Kong | 2.2 | |
| United States of America | 1.9 | |
| China | 1.8 | |
| Netherlands | 1.7 | |
| Republic of South Korea | 1.6 | |
| Taiwan | 1.3 | |
| India | 1.1 | |
| Russia | 0.0 | |
| Indonesia | 0.4 | |
| Short-term and other assets | 3.7 | |
| Total | 100.0% | |
| Top 10 Equity Holdings | |
| | % of Total Investments
as of 12/31/23 | |
| Chugai Pharmaceutical Co., Ltd. | 4.4 | |
| Infineon Technologies AG | 4.2 | |
| DBS Group Holdings Ltd. | 3.5 | |
| Manulife Financial Corp. | 3.4 | |
| Allianz SE REG | 3.4 | |
| Shell PLC | 3.3 | |
| L’Oréal SA | 3.2 | |
| Sony Group Corp. | 3.0 | |
| Banco Bilboa Vizcaya Argentaria SA | 2.9 | |
| Schneider Electric SE | 2.8 | |
| Total | 34.1% | |
Performance Comparison
Comparison of the change in value of a $10,000 investment in the fund and the MSCI® EAFE® Index made on December 31, 2013.
The returns quoted in the above table and chart represent past performance, which is no guarantee of future results. Current performance may be higher or lower than that shown above. To obtain the most recent month-end returns, please call 800.258.3030 or visit homesteadfunds.com. Returns and the principal value of your investment will fluctuate such that shares, when redeemed, may be worth more or less than their original cost. The International Equity Fund’s average annual total returns are net of any fee waivers and reimbursements.The fund's advisor waived a portion of its management fee during the periods shown. Had the advisor not done so, the fund's total returns would have been lower. The expenses used are as of the most recent period-end and may fluctuate over time. Returns include the reinvestment of dividends and capital gains. Returns do not reflect taxes that the shareholder may pay on fund distributions or the redemption of fund shares. It is not possible to invest directly in an unmanaged index. Index performance does not reflect transaction costs, fees or expenses.
*Performance information for the International Equity Fund (formerly the International Value Fund) reflects its performance as an actively managed fund subadvised by Mercator Asset Management through September 14, 2015; as a passively managed portfolio directed by SSGA Funds Management Inc. from September 15, 2015, to January 8, 2016; and, after a transition, as an actively managed fund subadvised by Harding Loevner LP from January 15, 2016, to period-end.
Performance Evaluation
19
Small-Company Stock Fund
Performance Evaluation | Prepared by the Fund’s Investment Adviser, Homestead Advisers Corp.
Performance
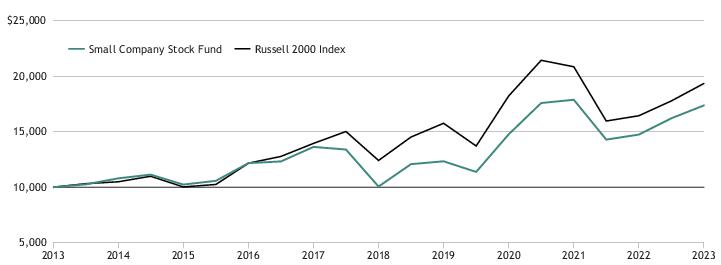
The Small-Company Stock Fund returned 17.09% for 2023, slightly outperforming its benchmark, the Russell 2000 Index, which returned 16.93%. Positive sector allocation more than offset negative selection for the year.
Portfolio Review
Small-cap stocks experienced a broad-based rally in 2023 led by double-digit returns in most sectors. For the fund, industrials was by far the most significant positive contributor thanks to our large overweight positioning as well as strong selection within the sector, including two of our top-performing stocks, Comfort Systems USA, an engineering and construction service provider of HVAC building systems, and Federal Signal Corporation, a maker of street sweeper vehicles and other municipal maintenance equipment. Both companies benefitted from substantial fiscal stimulus spurring activity in the domestic industrial economy and public sector. As leading market share companies and consolidators in their respective markets, both should be poised to continue delivering above-average growth in the coming years.
Also contributing to performance was Altair Engineering, a simulation software technology company. After a difficult period for software stocks in the prior year, many rebounded strongly in 2023. Altair, in particular, stood out as a strong founder-led business in an attractive space with secular tailwinds, durable organic growth and significant operating leverage.
Not all technology stocks enjoyed the same recovery, however, as the sector was one of the fund’s worst performers due to weakness in our other holdings, such as Model N, which was the largest detractor. A revenue management software company for the life sciences vertical, Model N is historically a steady grower in a highly defensive industry, but the company stumbled last year because of delays in customer cloud migrations and overall sales cycle.
Two of our other bottom detractors were in the health care sector. Envista Holdings, a manufacturer of dental products and equipment, lagged the market amid global macro pressure and lower discretionary spending in certain equipment and specialty products. The fund was also hurt by AMN Healthcare, known for its travel-nurse staffing services, as the company struggled with declining hospital demand and pay rates in the post-pandemic world.
We remain active in seeking new attractive ideas to enhance the portfolio. Since our last update, we added a couple of new companies in the health care sector. Specifically, we initiated new positions in iRhythm Technologies, a medical technology company that specializes in ambulatory cardiac monitoring devices with a unique patch-based technology,
| Investment Adviser: Homestead Advisers |
| Mark Iong, CFA
Equity Portfolio Manager
BS, Operations Research and Information Engineering, Cornell |
| Jim Polk, CFA
Head of Equity Investments
BA, English, Colby College; MBA, The Olin Graduate School of Business at Babson College |
and Lantheus Holdings, a leading provider of radiopharmaceutical imaging diagnostics solutions with an emerging therapeutics portfolio. To fund these purchases, we eliminated lower conviction names such as Twist Bioscience and Ziff Davis.
Outlook
The U.S. economy has proven to be much more resilient in the face of aggressive Federal Reserve (Fed) rate hikes. As inflation continues to ease toward the Fed’s mandate, interest rates are expected to pivot lower in 2024, which should bode well for the economy. In anticipation of this favorable macro backdrop, the recent market rally has started to broaden out to more economically sensitive and smaller capitalization companies that should benefit disproportionally from a strong domestic economy. With the right conditions in place, we are optimistic about the outlook for small-cap fundamentals and stock valuations. That said, we expect volatility to return to the market because of uncertainty associated with the upcoming U.S. presidential election and potential lagged effects from the Fed’s tightening cycle. As active managers focused on higher-quality businesses with reasonable valuations, we believe the portfolio remains well positioned to outperform over the long run.
| Average Annual Total Returns (periods ended 12/31/23) | | | |
| | 1 YR % | 5 YR % | 10 YR % |
| Small-Company Stock Fund | 17.09 | 11.86 | 5.83 |
| Russell 2000 Index | 16.93 | 9.97 | 7.16 |
| Sector Diversification | |
| | % of Total Investments
as of 12/31/23 | |
| Industrials | 25.6 | |
| Information technology | 15.7 | |
| Financials | 15.4 | |
| Health care | 13.6 | |
| Consumer discretionary | 11.3 | |
| Energy | 7.5 | |
| Materials | 6.4 | |
| Real estate | 3.3 | |
| Short-term and other assets | 1.2 | |
| Total | 100.0% | |
| Top 10 Equity Holdings | |
| | % of Total Investments
as of 12/31/23 | |
| Federal Signal Corp. | 3.7 | |
| Atkore Inc. | 3.6 | |
| Summit Materials, Inc. | 3.5 | |
| Comfort Systems USA, Inc. | 3.5 | |
| Applied Industrial Technologies, Inc. | 3.4 | |
| Altair Engineering Inc. | 3.2 | |
| Integer Holdings Corp. | 3.1 | |
| Medpace Holdings, Inc. | 3.0 | |
| MDC Holdings, Inc. | 3.0 | |
| Descartes Systems Group Inc. (The) | 3.0 | |
| Total | 33.0% | |
Performance Comparison
Comparison of the change in value of a $10,000 investment in the fund and the Russell 2000 Index made on December 31, 2013.
The returns quoted in the above table and chart represent past performance, which is no guarantee of future results. Current performance may be higher or lower than that shown above. To obtain the most recent month-end returns, please call 800.258.3030 or visit homesteadfunds.com. Returns and the principal value of your investment will fluctuate such that shares, when redeemed, may be worth more or less than their original cost. The Small-Company Stock Fund’s average annual total returns are net of any fee waivers and reimbursements. The expenses used are as of the most recent period-end and may fluctuate over time. Returns include the reinvestment of dividends and capital gains. Returns do not reflect taxes that the shareholder may pay on fund distributions or the redemption of fund shares. It is not possible to invest directly in an unmanaged index. Index performance does not reflect transaction costs, fees or expenses.
Performance Evaluation
21
As a shareholder, you incur two types of costs: (1) transaction costs; and (2) ongoing costs, including management fees, service fees, and other fund expenses. This example is intended to help you understand your ongoing costs (in dollars) of investing in each of the Homestead Funds and to compare these costs with the ongoing costs of investing in other mutual funds.
The example is based on an investment of $1,000 invested at July 1, 2023 and held through December 31, 2023.
Actual Expenses
The first line for each Fund in the table on the following page provides information about actual account values and actual expenses. You may use the information in this line, together with the amount you invested, to estimate the expenses that you paid over the period. Simply divide your account value by $1,000 (for example, an $8,600 account value divided by $1,000 = 8.6), then multiply the result by the number in the first line under the heading entitled “Expenses Paid During the Period” to estimate the expenses you paid on your account during this period.
Individual Retirement Arrangements (IRAs) and Educational Savings Accounts (ESAs) are charged a $15.00 annual custodial fee. The charge is automatically deducted from your account in the fourth quarter of each year or, if you close your account, at the time of redemption. A fee is collected for each IRA or ESA, as distinguished by account type (Traditional IRA, Roth IRA, or ESA) and Social Security Number. For example, if you have both a Traditional IRA and a Roth IRA account, each would be charged a fee. But only one fee would be collected for each account type, regardless of the number of Funds held by each account type. These fees are not included in the example below. If included, the costs shown would be higher.
Hypothetical Example for Comparison Purposes
The second line for each Fund in the table on the following page provides information about hypothetical account values and hypothetical expenses based on the Fund’s actual expense ratio and an assumed rate of return of 5% per year before expenses, which is not the Fund’s actual return. The hypothetical account values and expenses may not be used to estimate the actual ending account balance or expenses you paid for the period.
You may use this information to compare the ongoing costs of investing in the Funds and other funds. To do so, compare this 5% hypothetical example with the 5% hypothetical examples that appear in the shareholder reports of the other funds.
Please note that the expenses shown in the table are meant to highlight your ongoing costs only and do not reflect the custodial account fee. Therefore, the hypothetical information in the example is useful in comparing your ongoing costs only, and will not help you determine the
relative total costs of owning different funds. In addition, if the custodial account fee was included, your costs would have been higher.
Expense Example (Continued)
| Daily Income Fund | Beginning Account Value
July 1, 2023 | Ending Account Value
December 31, 2023 | Expenses Paid During the Perioda | Annualized Expense Ratio for the Period Ended
December 31, 2023 |
| Actual Return | $1,000.00 | $1,024.30 | $2.93 | 0.57% |
| Hypothetical Return (5% return before expenses) | $1,000.00 | $1,022.10 | $2.93 | 0.57% |
| Short-Term Government Securities Fundb | | | | |
| Actual Return | $1,000.00 | $1,035.00 | $3.85 | 0.75% |
| Hypothetical Return (5% return before expenses) | $1,000.00 | $1,021.22 | $3.82 | 0.75% |
| Short-Term Bond Fund | | | | |
| Actual Return | $1,000.00 | $1,036.10 | $4.01 | 0.78% |
| Hypothetical Return (5% return before expenses) | $1,000.00 | $1,021.06 | $3.98 | 0.78% |
| Intermediate Bond Fundb | | | | |
| Actual Return | $1,000.00 | $1,037.50 | $4.11 | 0.80% |
| Hypothetical Return (5% return before expenses) | $1,000.00 | $1,020.97 | $4.08 | 0.80% |
| Rural America Growth & Income Fundb | | | | |
| Actual Return | $1,000.00 | $1,034.80 | $5.12 | 1.00% |
| Hypothetical Return (5% return before expenses) | $1,000.00 | $1,019.97 | $5.09 | 1.00% |
| Stock Index Fundc | | | | |
| Actual Return | $1,000.00 | $1,082.10 | $2.20 | 0.42% |
| Hypothetical Return (5% return before expenses) | $1,000.00 | $1,022.88 | $2.14 | 0.42% |
| Value Fund | | | | |
| Actual Return | $1,000.00 | $1,092.70 | $3.41 | 0.65% |
| Hypothetical Return (5% return before expenses) | $1,000.00 | $1,021.74 | $3.30 | 0.65% |
| Growth Fund | | | | |
| Actual Return | $1,000.00 | $1,124.70 | $4.43 | 0.83% |
| Hypothetical Return (5% return before expenses) | $1,000.00 | $1,020.83 | $4.21 | 0.83% |
| International Equity Fundb | | | | |
| Actual Return | $1,000.00 | $1,052.10 | $5.55 | 1.07% |
| Hypothetical Return (5% return before expenses) | $1,000.00 | $1,019.59 | $5.46 | 1.07% |
| Small-Company Stock Fund | | | | |
| Actual Return | $1,000.00 | $1,077.80 | $5.68 | 1.09% |
| Hypothetical Return (5% return before expenses) | $1,000.00 | $1,019.53 | $5.52 | 1.09% |
| a. | The dollar amounts shown as “Expenses Paid During the Period” are equal to each Fund’s annualized expense ratio multiplied by the average account value over the period, multiplied by the number of days in the period 184, then divided by 365. |
| b. | Reflects fee waiver and/or expense reimbursements in effect during the period. |
| c. | The Stock Index Fund is a feeder fund that invests substantially all of its assets in a Master Portfolio. The example reflects the expenses of both the feeder fund and the Master Portfolio. |
Regulatory and Shareholder Matters
Proxy Voting Policies and Procedures
The policies and procedures used to determine how to vote proxies relating to the Funds’ portfolio securities are available online at homesteadfunds.com and, without charge, upon request by calling 800-258-3030. This information is also available on the Securities and Exchange Commission’s website at sec.gov.
Proxy Voting Record
For the most recent twelve-month period ended June 30, information regarding how proxies relating to portfolio securities were voted on behalf of each of the Funds is available, without charge, upon request by calling 800-258-3030. This information is also available online at homesteadfunds.com and on the Securities and Exchange Commission’s website at sec.gov.
Quarterly Disclosure of Portfolio Holdings
The Funds, other than Daily Income Fund, file complete schedules of portfolio holdings with the Securities and Exchange Commission for the first and third quarters of each fiscal year as an exhibit to their reports on Form N-PORT. The Daily Income Fund files its complete schedule of portfolio holdings with the SEC monthly on Form N-MFP. Portfolio holdings for the second and fourth quarters of each fiscal year are filed as part of the Funds’ semi-annual and annual reports. The Funds’ Form N-PORT, Form N-MFP, semi-annual and annual reports are available on the Commission’s website at sec.gov. The most recent quarterly portfolio holdings and semi-annual and annual reports also can be accessed on the Funds’ website at homesteadfunds.com.
Principal Risks
You may lose money by investing in the Funds. Below are summaries of some, but not all, of the principal risks of investing in one or more of the Funds, each of which could adversely affect a Fund’s NAV, yield and total return. Each risk listed below does not necessarily apply to each Fund, and you should read each Fund’s prospectus carefully for a description of the principal risks associated with investing in a particular Fund.
• Asset-Backed and Mortgage-Backed Securities Risk The risk that defaults, or perceived increases in the risk of defaults, on the obligations underlying asset-backed and mortgage-backed securities, including mortgage pass-through securities and collateralized mortgage obligations (“CMOs”), significant credit downgrades and illiquidity may impair the value of the securities. These securities also present a higher degree of prepayment risk (when repayment of principal occurs before scheduled maturity resulting in the Fund having to reinvest proceeds at a lower interest rate) and extension risk (when rates of repayment of principal are slower than expected, which may lock in a below-market interest rate, increase the security’s duration, and reduce the value of the security) than do other types of fixed income securities. Enforcing
rights against the underlying assets or collateral may be difficult, and the underlying assets or collateral may be insufficient if the issuer defaults.
• Cash Positions Risk A Fund will at times hold some of its assets in cash, which may hurt the Fund’s performance. Cash positions may also subject the Fund to additional risks and costs, such as increased exposure to the custodian bank holding the assets and any fees imposed for large cash balances.
• Commercial Paper Risk Investments in commercial paper are subject to the risk that the issuer cannot issue enough new commercial paper to satisfy its obligations with respect to its outstanding commercial paper, also known as rollover risk. Commercial paper is generally unsecured, which increases the credit risk associated with this type of investment. The value of commercial paper may be affected by changes in the credit rating or financial condition of the issuing entities. The value of commercial paper will tend to fall when interest rates rise and rise when interest rates fall.
• Concentration Risk To the extent the Fund concentrates in a particular industry, it may be more susceptible to economic conditions and risks affecting that industry.
• Convertible Securities Risk Convertible securities may be subordinate to other debt securities issued by the same issuer. Issuers of convertible securities are often not as strong financially as issuers with higher credit ratings. Convertible securities typically provide yields lower than comparable non-convertible securities. Their values may be more volatile than those of non-convertible securities, reflecting changes in the values of the securities into which they are convertible.
• Corporate Bond Risk Corporate debt securities are subject to the risk of the issuer’s inability to meet principal and interest payments on the obligations and may also be subject to price volatility due to factors such as interest rates, market perception of the creditworthiness of the issuer and general market liquidity.
• Currency Risk Foreign currencies may experience steady or sudden devaluation relative to the U.S. dollar or other currencies, adversely affecting the value of the Fund’s investments. The value of the Fund’s assets may be affected favorably or unfavorably by currency exchange rates, currency exchange control regulations, and restrictions or prohibitions on the repatriation of foreign currencies. Because the Fund’s net asset value is determined on the basis of U.S. dollars, if the local currency of a foreign market depreciates against the U.S. dollar, you may lose money even if the foreign market prices of the Fund’s holdings rise.
Regulatory and Shareholder Matters
Regulatory and Shareholder Matters (Continued)
• Debt Securities Risks
Credit Risk The risk that an issuer or counterparty will fail to pay its obligations to the Fund when they are due. As a result, the Fund’s income might be reduced, the value of the Fund’s investment might fall, and/or the Fund could lose the entire amount of its investment. Changes in the financial condition of an issuer or counterparty, changes in specific economic, social or political conditions that affect a particular type of security or other instrument or an issuer, and changes in economic, social or political conditions generally can increase the risk of default by an issuer or counterparty, which can affect a security’s or other instrument’s credit quality or value and an issuer’s or counterparty’s ability to pay interest and principal when due.
Extension Risk The risk that as interest rates rise, repayments of principal on certain debt securities, including, but not limited to, mortgage-related securities, may occur at a slower rate than expected and the expected maturity of those securities could lengthen as a result. Securities that are subject to extension risk generally have a greater potential for loss when prevailing interest rates rise, which could cause their values to fall sharply.
Income Risk The risk that the value of the Fund’s fixed-income investments may be adversely affected by changes in interest rates and/or inflation. The value of the Fund’s investments may decline due to falling or rising interest rates or other factors. In a rising interest rate environment, investors in fixed income securities may leave the fixed income investment market on a large scale, which could adversely affect the price of the fixed-income securities and reduce their liquidity. Increased redemption requests may force the fund to liquidate investments when it is not advantageous to do so. Issuers of securities held by the Fund may call or redeem the securities during periods of falling interest rates, and the Fund would likely be required to reinvest in securities paying lower interest rates. During market conditions in which short-term interest rates are at low levels it is possible that the Fund will generate an insufficient amount of income to pay its expenses, and that it will not be able to pay a daily dividend and may have a negative yield (i.e., it may lose money on an operating basis). It is possible that the Fund would, during these conditions, maintain a substantial portion of its assets in cash, on which it may earn little, if any, income. If an obligation held by the Fund is prepaid, the Fund may have to reinvest the prepayment in other obligations paying income at lower rates.
Interest Rate Risk The risk that debt instruments will change in value because of actual or expected changes in interest rates. The value of an instrument with a longer duration (whether positive or negative) will be more sensitive to changes in interest rates than a similar
instrument with a shorter duration. Bonds and other debt instruments typically have a positive duration, which means the value of the debt instrument will generally decline if interest rates increase. The value of debt instruments will also generally decline if inflation increases because the purchasing power of the future income and repaid principal is expected to be worth less when received by the Fund. Inflation rates may change frequently and significantly as a result of changes in the domestic or global economy or changes in fiscal or monetary policies.
• Depositary Receipts Risk Depositary receipts in which the Fund may invest are receipts listed on U.S. exchanges that are issued by banks or trust companies that entitle the holder to all dividends and capital gains that are paid out on the underlying foreign shares. Investments in depositary receipts may be less liquid than the underlying shares in their primary trading market.
• Derivatives Risk The risk that an investment in derivatives will not perform as anticipated by the Fund’s manager or subadviser, cannot be closed out at a favorable time or price, or will increase the Fund’s volatility; that derivatives may create investment leverage; that, when a derivative is used as a substitute for or alternative to a direct cash investment, the transaction may not provide a return that corresponds precisely with that of the cash investment; or that, when used for hedging purposes, derivatives will not provide the anticipated protection, causing the Fund to lose money on both the derivatives transaction and the exposure the Fund sought to hedge. The counterparty to a derivatives contract may be unable or unwilling to make timely settlement payments, return the Fund’s margin, or otherwise honor its obligations. Changes in regulation relating to a mutual fund’s use of derivatives and related instruments could potentially limit or impact the Fund’s ability to invest in derivatives, limit a Fund’s ability to employ certain strategies that use derivatives and adversely affect the value or performance of derivatives and the Fund.
• Emerging and Frontier Market Risk The risk that investing in emerging and frontier markets will be subject to greater political and economic instability, greater volatility in currency exchange rates, less developed securities markets, possible trade barriers, currency transfer restrictions, a more limited number of potential buyers and issuers, an emerging market country’s dependence on revenue from particular commodities or international aid, less governmental supervision and regulation, unavailability of currency hedging techniques, differences in auditing and financial reporting standards, thinner trading markets, different clearing and settlement procedures and custodial services, and less developed legal systems than in many more developed countries. The securities of emerging market companies may trade less frequently and in smaller volumes than more widely held
Regulatory and Shareholder Matters
25
Regulatory and Shareholder Matters (Continued)
securities. These risks are generally greater for investments in frontier market countries, which typically have smaller economies or less developed capital markets than traditional emerging market countries.
• Equity Securities Risk Equity securities generally have greater price volatility than fixed-income securities. The market price of equity securities owned by a fund may go up or down, sometimes rapidly or unpredictably. Equity securities may decline in value due to factors affecting the issuer, equity securities markets generally, particular industries represented in those markets or the issuer itself.
• Financial Markets Regulatory Risk Policy changes by the U.S. government or its regulatory agencies and political events within the United States and abroad may, among other things, affect investor and consumer confidence and increase volatility in the financial markets, perhaps suddenly and to a significant degree, which may adversely impact the Fund’s operations, universe of potential investment options, and return potential.
• Focused Investment Risk A fund that invests a substantial portion of its assets in a particular market, industry, sector, group of industries or sectors, country, region, group of countries or asset class is subject to greater risk than a fund that invests in a more diverse investment portfolio. In addition, the value of such a fund is more susceptible to any single economic, market, political or regulatory or other occurrence affecting, for example, the particular markets, industries, regions, sectors or asset classes in which the fund is invested. This is because, for example, issuers in a particular market, industry, region, sector or asset class may react similarly to specific economic, market, regulatory, political or other developments. The particular markets, industries, regions, sectors or asset classes in which the Fund may focus its investments may change over time and the Fund may alter its focus at inopportune times. For example, the Fund may have a significant portion of its assets invested in securities of companies in the information technology sector. Companies in the information technology sector can be adversely affected by, among other things, intense competition, earnings disappointments, and rapid obsolescence of products and services due to technological innovations or changing consumer preferences. As a matter of fundamental policy, the Intermediate Bond Fund will normally invest at least 25% of its total assets (i.e., concentrate) in mortgage-related assets and asset-backed instruments issued by government agencies or other governmental entities or by private originators or issuers, and other investments that Homestead Advisers considers to have the same primary economic characteristics.
• Foreign Risk Foreign securities are subject to political, regulatory, and economic risks not present in domestic investments and may exhibit more extreme changes in value than securities of U.S. companies. The securities markets of many foreign countries are relatively small,
with a limited number of companies representing a small number of industries. In addition, foreign companies often are not subject to the same degree of regulation as U.S. companies. Reporting, legal, accounting and auditing standards of foreign countries differ, in some cases significantly, from U.S. standards. Nationalization, expropriation or confiscatory taxation, currency blockage, political changes or diplomatic developments could adversely affect the Fund’s investments in a foreign country. In the event of nationalization, expropriation or other confiscation, the Fund could lose its entire investment. Investments in emerging market countries are likely to involve significant risks. These countries are generally more likely to experience political and economic instability.
• Geographic Focus Risk Concentration of the investments of a Fund in issuers located in a particular country or region will subject such Fund, to a greater extent than if investments were less concentrated, to the risks of volatile economic cycles and/or conditions and developments that may be particular to that country or region, such as: adverse securities markets; adverse exchange rates; social, political, regulatory, economic or environmental developments; natural disasters; or the spread of infectious illness or other public health issues.
• Growth Style Risk The risk that returns on stocks within the growth style in which the Fund invests will trail returns of stocks representing other styles or the market overall over any period of time and may shift in and out of favor with investors generally, sometimes rapidly, depending on changes in market, economic, and other factors. Growth stocks can be volatile, as these companies usually invest a high portion of earnings in their business and therefore may lack the dividends of value stocks that can cushion stock prices in a falling market. Also, earnings disappointments often lead to sharply falling prices because investors buy growth stocks in anticipation of superior earnings growth.
• High Yield Securities Risk The risk that debt instruments rated below investment grade or debt instruments that are unrated and determined by Homestead Advisers to be of comparable quality are predominantly speculative. These instruments, commonly known as “junk bonds,” have a higher degree of default risk and may be less liquid than higher-rated bonds. These instruments may be subject to greater price volatility due to such factors as specific corporate developments, interest rate sensitivity, negative perceptions of high yield investments generally, and less secondary market liquidity.
• Illiquid and Restricted Securities Risk Illiquid securities are securities that a Fund reasonably expects cannot be sold or disposed of in current market conditions in seven calendar days or less without the sale or disposition significantly changing the market value of the investment. Depending on the circumstances, illiquid securities may be
Regulatory and Shareholder Matters
Regulatory and Shareholder Matters (Continued)
considered to include securities with legal or contractual restrictions on resale, time deposits, repurchase agreements having maturities longer than seven days and securities that do not have readily available market quotations. In addition, the Fund may invest in securities that are sold in private placement transactions between their issuers and their purchasers and that are neither listed on an exchange nor traded over-the-counter. Liquidity risk may be the result of, among other things, the lack of an active market. Liquid investments may become illiquid or less liquid after purchase by the Fund, particularly during periods of market turmoil. These factors may have an adverse effect on the Fund’s ability to dispose of particular securities at an advantageous time or price, which may reduce returns, and may limit the Fund’s ability to obtain accurate market quotations for purposes of valuing securities and calculating net asset value and to sell securities at fair value. If the Fund is forced to sell illiquid and relatively less liquid investments to meet redemption requests or for other cash needs, the Fund may suffer a loss. To the extent that a Fund engages in derivative transactions (for example, the Master Portfolio and International Equity Fund) or invests in securities with substantial market and/or credit risk, the Fund will tend to have greater exposure to liquidity risk. In addition, when there is illiquidity in the market for certain securities, the Fund, due to limitations on illiquid investments, may be subject to purchase and sale restrictions. If any privately placed securities held by the Fund are required to be registered under the securities laws of one or more jurisdictions before being resold, the Fund may be required to bear the expenses of registration. Also, a Fund may get only limited information about the issuer of a given restricted security, and therefore may be less able to predict a loss. Certain restricted securities may involve a high degree of business and financial risk and may result in substantial losses to a Fund.
• Index Fund Risk An index fund has operating and other expenses while an index does not. As a result, while a fund will attempt to track its underlying index as closely as possible, it will tend to underperform the index to some degree over time. If an index fund is properly correlated to its stated index, the Fund will perform poorly when the index performs poorly.
• Index-Related Risk There is no assurance that the index provider will compile the underlying index accurately, or that the underlying index will be determined, composed or calculated accurately. Gains, losses or costs associated with index provider errors will be borne by the Fund and its shareholders. Unusual market conditions may cause the index provider to postpone a scheduled rebalance, which could cause the underlying index to vary from its normal or expected composition. The postponement of a scheduled rebalance in a time of market volatility could mean that constituents that would otherwise be removed at rebalance due to changes in market capitalizations, issuer
credit ratings, or other reasons may remain, causing the performance and constituents of the underlying index to vary from those expected under normal conditions.
• Investments in Other Investment Companies Risk The risk that an investment company or other pooled investment vehicle in which the Fund invests will not achieve its investment objective or execute its investment strategies effectively or that significant purchase or redemption activity by shareholders of such an investment company might negatively affect the value of the investment company’s shares. There will be some duplication of expenses because the Fund also must pay its pro-rata share of that investment company’s fees and expenses.
• Investments in Small and Mid-Size Companies Securities of small and medium-sized companies tend to be more volatile and less liquid than securities of large companies. Compared to large companies, small and medium-sized companies may face greater business risks because they lack the management depth or experience, financial resources, product diversification or competitive strengths of larger companies, and they may be more adversely affected by poor economic conditions. There may be less publicly available information about smaller companies than larger companies. In addition, these companies may have been recently organized and may have little or no track record of success.
• Issuer Risk The risk that the value of a security may decline because of adverse events or circumstances that directly relate to the issuer.
• Large Shareholders and Redemptions Risk The Fund may be adversely affected when a large shareholder purchases or redeems a large amount of shares relative to the size of the Fund, which can occur at any time. Large shareholder transactions can cause the Fund to make investment decisions at inopportune times or prices or miss attractive investment opportunities. In addition, such transactions can also cause the Fund to sell certain assets in order to meet purchase or redemption requests, which could indirectly affect the liquidity of the Fund’s portfolio. A smaller fund can be more adversely affected by large purchases or redemptions.
• Leverage Risk Some transactions may give rise to a form of economic leverage. These transactions may include, among others, derivatives, and may expose the Fund to greater risk and increase its costs. As an open-end investment company registered with the SEC, the Fund is subject to the federal securities laws, including the 1940 Act, the rules thereunder, and various SEC and SEC staff interpretive positions. Increases and decreases in the value of the Fund’s portfolio will be magnified when the Fund uses leverage.
Regulatory and Shareholder Matters
27
Regulatory and Shareholder Matters (Continued)
• Limited Operating History Risk The risk that a recently formed fund has a limited operating history to evaluate and may not attract sufficient assets to achieve or maximize investment and operational efficiencies.
• Loan Risk The risks associated with direct loans and participations include, but are not limited to, risks involving the enforceability of security interests and loan transactions, inadequate collateral, liabilities relating to collateral securing obligations, and the liquidity of these loans. The market for loans may be subject to irregular trading activity, wide bid/ask spreads and extended trade settlement periods. The loans in which the Fund invests may be rated below investment grade.
• Manager Risk The risk that the manager's or subadviser’s decisions, including security selection, will cause the Fund to underperform relative to the Fund’s peers. There can be no assurance that the manager's or subadviser’s investment techniques and decisions will produce the desired results. The Fund’s ability to achieve its investment objective is dependent upon the manager's or subadviser’s ability to identify profitable investment opportunities for the Fund. The past experience of the portfolio manager(s), including with other strategies and funds, does not guarantee future results for the Fund.
• Market Capitalization Risk Investing primarily in issuers within the same market capitalization category carries the risk that the category may be out of favor due to current market conditions or investor sentiment. Securities issued by large-cap companies tend to be less volatile than securities issued by smaller companies. However, larger companies may not be able to attain the high growth rates of successful smaller companies, especially during strong economic periods, and may be unable to respond as quickly to competitive challenges.
• Market Risk The risk that markets will perform poorly or that the returns from the securities in which the Fund invests will underperform returns from the general securities markets or other types of investments. Markets may experience periods of high volatility and reduced liquidity in response to governmental actions or intervention, political, economic or market developments, or other external factors, such as outbreaks of infectious illnesses or other widespread public health issues, outbreaks of war or sanctions in response to military incursions and natural disasters such as floods, droughts, fires, extreme storms, earthquakes or volcanic eruptions. During those periods, the Fund may experience high levels of shareholder redemptions, and may have to sell securities at times when the Fund would otherwise not do so, and potentially at unfavorable prices. Certain securities may be difficult to value during such periods.
• Master/Feeder Structure Risk The Stock Index Fund pursues its objective by investing substantially all of its assets in another pooled investment vehicle (the “Master
Portfolio”). The ability of the Fund to meet its investment objective is directly related to the ability of the Master Portfolio to meet its investment objective. The Fund will bear its pro rata portion of the expenses incurred by the Master Portfolio. Substantial redemptions by other investors in the Master Portfolio may affect the Master Portfolio’s investment program adversely and limit the ability of the Master Portfolio to achieve its objective.
• Money Market Fund Risk Although the Daily Income Fund seeks to preserve the value of your investment at $1.00 per share, you may lose money by investing in the Fund. The share price of Money market funds can fall below the $1.00 share price. The Fund’s sponsor has no legal obligation to provide financial support to the Fund, and you should not rely on or expect that the sponsor will enter into support agreements or take other actions to provide financial support to the Fund or maintain the Fund’s $1.00 share price at any time. The credit quality of the Fund’s holdings can change rapidly in certain markets, and the default of a single holding could have an adverse impact on the Fund’s share price. The Fund’s share price can also be negatively affected during periods of high redemption pressures, illiquid markets, and/or significant market volatility. While the Board of Directors may implement procedures to impose a fee upon the sale of your shares if the Board determines it is in the best interest of the Fund, the Board has not elected to do so at this time. Should the Board elect to do so, such change would only become effective after shareholders were provided with specific advance notice of the change in the Fund’s policy and provided with the opportunity to redeem their shares in accordance with Rule 2a-7 before the policy change became effective.
• Money Market Securities Risk The value of a money market instrument typically will decline during periods of rising interest rates, and can also decline in response to changes in the financial condition of the issuer, borrower, counterparty, or underlying collateral assets, or changes in market, economic, industry, political, and regulatory conditions affecting a particular type of security or issuer or fixed income securities generally. Money market funds are not designed to offer capital appreciation. Certain money market funds may impose a fee upon the sale of shares or may temporarily suspend the ability of investors to redeem shares if such fund’s liquidity falls below required minimums, which may adversely affect the Fund’s returns or liquidity.
• Municipal Bond Risk Factors unique to the municipal bond market may negatively affect the value of the Fund’s investment in municipal bonds. The Fund may invest in a group of municipal obligations that are related in such a way that an economic, business, or political development affecting one would also affect the others. In addition, the municipal bond market, or portions thereof, may experience substantial volatility or become distressed, and
Regulatory and Shareholder Matters
Regulatory and Shareholder Matters (Continued)
individual bonds may go into default, which would lead to heightened risks of investing in municipal bonds generally. The ability of municipalities to meet their obligations will depend on the availability of tax and other revenues, economic, political and other conditions within the state and municipality, and the underlying fiscal condition of the state and municipality.
• Operational and Cybersecurity Risk A Fund, its service providers, including its adviser, Homestead Advisers, and subadvisers, as applicable, and other market participants increasingly depend on complex information technology and communications systems to conduct business functions. These systems are subject to a number of different threats or risks that could adversely affect a Fund and its shareholders, despite the efforts of the Fund and its service providers to adopt technologies, processes and practices intended to mitigate these risks.
For example, unauthorized third parties may attempt to improperly access, modify, disrupt the operations of or prevent access to these systems or data within them (a “cyber-attack”), whether systems of the Fund, its service providers, counterparties or other market participants. Power or communications outages, acts of god, information technology equipment malfunctions, operational errors and inaccuracies within software or data processing systems may also disrupt business operations or impact critical data. Market events also may occur at a pace that overloads current information technology and communication systems and processes of the Fund, its service providers or other market participants, impacting the ability to conduct a Fund’s operations.
Cyber-attacks, disruptions or failures that affect the Fund’s service providers or counterparties may adversely affect a Fund and its shareholders, including by causing losses for the Fund or impairing Fund operations. For example, a Fund’s service providers’ assets or sensitive or confidential information may be misappropriated, data may be corrupted and operations may be disrupted (e.g., cyber-attacks or operational failures may cause the release of private shareholder information or confidential Fund information, interfere with the processing of shareholder transactions, impact the ability to calculate the Fund’s NAV and impede trading). In addition, cyber-attacks, disruptions or failures may cause reputational damage and subject a Fund’s service providers to regulatory fines, litigation costs, penalties or financial losses, reimbursement or other compensation costs, and/or additional compliance costs. While the Fund and its service providers may establish business continuity and other plans and processes to address the possibility of cyber-attacks, disruptions or failures, there are inherent limitations in such plans and systems, including that they do not apply to third parties, such as other market participants, as well as the possibility that certain risks have not been identified or that unknown threats may
emerge in the future. The Fund and its service providers may also incur substantial costs for cybersecurity risk management, including insurance, in order to prevent or mitigate future cyber security incidents, and the Fund and its shareholders could be negatively impacted as a result of such costs.
Similar types of operational and technology risks are also present for issuers of securities or other instruments in which the Fund invests, which could result in material adverse consequences for such issuers, and may cause a Fund’s investments to lose value. In addition, cyber-attacks involving a Fund’s counterparty could affect such counterparty’s ability to meet its obligations to the Fund, which may result in losses to the Fund and its shareholders. Furthermore, as a result of cyber-attacks, disruptions or failures, an exchange or market may close or issue trading halts on specific securities or the entire market, which may result in a Fund being, among other things, unable to buy or sell certain securities or unable to accurately price its investments. The Fund cannot directly control any cybersecurity plans and systems put in place by its service providers, Fund counterparties, issuers in which a Fund invests, or securities markets and exchanges.
• Participation Notes Risk The International Equity Fund may invest in participation notes to gain exposure to certain markets in which it cannot invest directly. Participation notes are generally traded over-the-counter. Participation notes are issued by banks, or broker-dealers, or their affiliates and are designed to replicate the return of a particular underlying equity or debt security, currency, or market. When the participation note matures, the issuer of the participation note will pay to, or receive from, a Fund the difference between the nominal value of the underlying instrument at the time of purchase and that instrument’s value at maturity. Participation notes involve the same risks associated with a direct investment in the underlying security, currency, or market that they seek to replicate. Investing in a participation note also exposes a Fund to the risk that the bank or broker-dealer that issues the certificate will not fulfill its contractual obligation to timely pay a Fund the amount owed under the certificate. In addition, a Fund has no rights under participation notes against the issuer(s) of the underlying security(ies) and must rely on the creditworthiness of the issuer(s) of the participation notes. In general, the opportunity to sell participation notes to a third party will be limited or nonexistent.
• Passive Investment Risk Because BlackRock Fund Advisors does not select the individual companies in the Index that the Master Portfolio tracks, the Master Portfolio may hold securities of companies that present risks that an investment adviser researching individual securities might otherwise seek to avoid.
Regulatory and Shareholder Matters
29
Regulatory and Shareholder Matters (Continued)
• Portfolio Turnover Risk The risk that frequent purchases and sales of portfolio securities may result in the realization of taxable capital gains (including short-term capital gains), which are generally taxable at ordinary income rates to shareholders subject to tax when distributed by the Fund.
• Preferred Securities Risk The risk that: (i) certain preferred stocks contain provisions that allow an issuer under certain conditions to skip or defer distributions; (ii) preferred stocks may be subject to redemption, including at the issuer’s call, and, in the event of redemption, the Fund may not be able to reinvest the proceeds at comparable or favorable rates of return; (iii) preferred stocks are generally subordinated to bonds and other debt securities in an issuer’s capital structure in terms of priority for corporate income and liquidation payments; and (iv) preferred stocks may trade less frequently and in a more limited volume and may be subject to more abrupt or erratic price movements than many other securities.
• Repurchase Agreements Risk The Fund’s investment return on repurchase agreements will depend on the counterparty’s willingness and ability to perform its obligations under a repurchase agreement. If the Fund’s counterparty should default on its obligations, becomes subject to a bankruptcy or other insolvency proceeding or if the value of the collateral is insufficient, the Fund could (i) experience delays in recovering cash or the securities sold (and during such delay the value of the underlying securities may change in a manner adverse to the fund) and/or (ii) lose all or part of the income, proceeds or rights in the securities to which the Fund would otherwise be entitled.
• Restricted Securities Risk The Fund may hold securities that are restricted as to resale under the U.S. federal securities laws. There can be no assurance that a trading market will exist at any time for any particular restricted security. Limitations on the resale of these securities may prevent the Fund from disposing of them promptly at reasonable prices or at all. The Fund may have to bear the expense of registering the securities for resale and the risk of substantial delays in effecting the registration. Also, restricted securities may be difficult to value because market quotations may not be readily available, and the values of restricted securities may have significant volatility.
• Rural America Investment Risk Because the Rural America Growth & Income Fund focuses its investments in companies tied economically to rural America, the Fund will be more susceptible to changes in rural American economic conditions, including, without limitation, those resulting from: the cyclicality of revenues and earnings associated with agribusinesses, unemployment rates, availability and quality of healthcare, changing consumer tastes, domestic and international competition, severe weather conditions and climate change, and the
development of new infrastructure and related technologies. In the past, rural American populations have experienced deflation and instability in their financial institutions, and there can be no assurance that such difficulties will not resurface. Rural American economies may experience low demands for capital and low interest rate environments, and, as a result, investments in fixed income instruments in these regions may be subject to greater interest rate risk than are those in urban or suburban regions. Domestic trade restrictions and U.S. government tax and fiscal policies may have negative effects on rural American economies. Changes in any of the agribusiness value chain, infrastructure development, industrial transportation, consumer products and services, financial services, healthcare, or technology sectors could have a material negative impact on the Fund’s investments. For example, the retirement of coal generation assets, the expansion of broadband service, the implementation of more restrictive environmental laws and regulations and any additional increases in interest rates in these regions may all impact the performance of the Fund’s investments.
• Securities Lending Risk The Master Portfolio’s securities lending involves the risk that the borrower may fail to return the securities in a timely manner or at all. As a result, the Master Portfolio may lose money and there may be a delay in recovering the loaned securities. The Master Portfolio could also lose money if it does not recover the securities and/or the value of the collateral falls, including the value of investments made with cash collateral. These events could trigger adverse tax consequences for the Master Portfolio.
• Sovereign Debt Obligations Risk The risk that investments in debt obligations of sovereign governments may lose value due to the government entity’s unwillingness or inability to repay principal and interest when due in accordance with the terms of the debt or otherwise in a timely manner. Sovereign governments may default on their debt obligations for a number of reasons, including social, political, economic and diplomatic changes in countries issuing sovereign debt. The Fund may have limited (or no) recourse in the event of a default because bankruptcy, moratorium and other similar laws applicable to issuers of sovereign debt obligations may be substantially different from those applicable to private issuers, and any recourse may be subject to the political climate in the relevant country. In addition, governmental entities may enjoy various levels of sovereign immunity, and it may be difficult or impossible to bring a legal action against a governmental entity or to enforce a judgment against such an entity. Holders of certain government debt securities may be requested to participate in the restructuring of such obligations and to extend further loans to their issuers. There can be no assurance that the government debt securities in which the Fund may invest
Regulatory and Shareholder Matters
Regulatory and Shareholder Matters (Continued)
will not be subject to similar restructuring arrangements or to requests for new credit, which may adversely affect the Fund’s holdings.
• Tracking Error Risk Tracking error is the divergence of an index fund’s performance from that of the underlying index. Tracking error may occur because of differences between the securities and other instruments held in the Master Portfolio’s portfolio and those included in the Index, pricing differences, transaction costs incurred by the Master Portfolio, the Master Portfolio’s holding of uninvested cash, differences in timing of the accrual of dividends or interest, the requirements to maintain pass-through tax treatment, changes to the Index or the need of the Fund or Master Portfolio to meet various new or existing regulatory requirements. This risk may be heightened during times of increased market volatility or other unusual market conditions. Tracking error also may result because the Master Portfolio incurs fees and expenses, while the Index does not.
• U.S. Government Securities Risk The risk that the value of U.S. Government securities can decrease due to changes in interest rates, statutory debt limit negotiations, default or changes to the financial condition or credit rating of the U.S. Government.
• Value Style Risk The risk that returns on stocks within the value style in which the Fund invests will trail returns of stocks representing other styles or the market overall over any period of time and may shift in and out of favor with investors generally, sometimes rapidly, depending on changes in market, economic, and other factors. Investments in value securities may be subject to risks that (1) the issuer’s potential business prospects will not be realized; (2) their potential values will never be recognized by the market; and (3) their value was appropriately priced when acquired and they do not perform as anticipated.
• Variable and Floating-Rate Securities Risk The value of these securities may decline if their interest rates do not rise as much, or as quickly, as other interest rates. Conversely, these securities will not generally increase in value to the same extent as other fixed income securities, or at all, if interest rates decline.
• When-Issued, TBA and Delayed Delivery Securities Risk The Fund may purchase securities on a when-issued, TBA or delayed delivery basis and may purchase securities on a forward commitment basis. The purchase price of the securities is typically fixed at the time of the commitment, but delivery and payment can take place a month or more after the date of the commitment. The prices of the securities so purchased or sold are subject to market fluctuations. At the time of delivery of the securities, the value may be more or less than the purchase or sale price. Purchase of securities on a when-issued, TBA, delayed delivery, or forward commitment basis may give rise to
investment leverage, and may result in increased volatility of the Fund's net asset value. Default by, or bankruptcy of, a counterparty to a when-issued, TBA or delayed delivery transaction would expose the Fund to possible losses because of an adverse market action, expenses or delays in connection with the purchase or sale of the pools specified in such transaction. Recently finalized rules of the Financial Industry Regulatory Authority, Inc. (FINRA) include mandatory margin requirements for the TBA market with limited exceptions. TBA trades historically have not been required to be collateralized. The finalized margin requirements are currently expected to go into effect in May 2024.
Board Considerations in Approving the Investment Management Agreement and Sub-Advisory Agreement
Homestead Funds, Inc. (the “Corporation”) and Homestead Funds Trust (the “Trust”, and together with the Corporation, “Homestead”) have each entered into investment management agreements (the “Investment Management Agreements”) with Homestead Advisers Corp. (“Homestead Advisers”), pursuant to which Homestead Advisers is responsible for the day-to-day management of the following series of the Corporation: the Daily Income Fund, the Short-Term Government Securities Fund, the Short-Term Bond Fund, , the Value Fund, the Growth Fund, the International Equity Fund and the Small-Company Stock Fund and the following series of the Trust: the Intermediate Bond Fund and the Rural America Growth & Income Fund (each series, a “Fund” and, collectively, the “Funds”)1. Homestead Advisers has entered into subadvisory agreements (the “Sub-advisory Agreements” and, together with the Investment Management Agreements, the “Agreements”) with T. Rowe Price Associates, Inc. (“T. Rowe Price”), Harding Loevner LP (“Harding Loevner”) and Invesco Advisers, Inc. (“Invesco”), on behalf of the Growth Fund, the International Equity Fund, and the Daily Income Fund, respectively, pursuant to which T. Rowe Price, Harding Loevner, and Invesco are responsible for the day-to-day management of the assets of such Funds. Each of Homestead Advisers, T. Rowe Price, Harding Loevner, and Invesco is an “Adviser” and are collectively referred to as the “Advisers.”
The Board of Directors of the Corporation and the Board of Trustees of the Trust (together, the “Board” and their members, “Directors”) held a joint video conference meeting on August 10, 2023 (the “August Meeting”), at which they gave preliminary consideration to information bearing on the consideration of the Agreements. The Independent Directors, who are not “interested persons” (as defined in the Investment Company Act of 1940, as amended) of the Funds (the “Independent Directors”),
1 Homestead Advisers serves as an administrator to the Stock Index Fund pursuant to an administrative services agreement with that Fund and does not currently serve as the Fund’s investment adviser.
Regulatory and Shareholder Matters
31
Regulatory and Shareholder Matters (Continued)
and their independent legal counsel had previously met separately in an executive session held via video conference on August 7, 2023 (the “August Executive Session”), to discuss the materials received. During the August Executive Session the Independent Directors also reviewed and discussed with their independent legal counsel various key aspects of the Independent Directors’ legal responsibilities relating to the proposed continuation of the Agreements, as addressed in a memorandum prepared by independent legal counsel and provided in advance of the meeting. Following the August Executive Session and the August Meeting, the Independent Directors requested certain supplemental information from each Adviser. At its regularly scheduled quarterly meeting held in person on September 12-13, 2023 (the “September Meeting”), following the receipt of additional information and discussion at an executive session of the Independent Directors and independent counsel to the Independent Directors, at which no representative of the Advisers were present initially, but joined subsequently by invitation, the Board, with the Independent Directors voting separately, approved the continuation of the Agreements with respect to the Funds for an additional one-year period.
Prior to the August Meeting, the Independent Directors requested that the Advisers provide the Board information they deemed reasonably necessary for their consideration of the Agreements. Pursuant to this request, the Advisers provided the Board with, and the Board, including the Independent Directors, considered and discussed, information regarding, among other things:
• The level of the advisory fees that Homestead Advisers charges a Fund compared with the fees charged to comparable mutual funds and compared with those of Homestead Advisers’ non-investment company clients and the level of subadvisory fees that T. Rowe Price, Harding Loevner and Invesco receive with respect to the Growth Fund, the International Equity Fund and the Daily Income Fund, respectively, and compared with the advisory and/or subadvisory fees charged by T. Rowe Price, Harding Loevner and Invesco to other clients;
• Each Fund’s overall fees and operating expenses compared with similar mutual funds;
• Each Fund’s performance compared with similar mutual funds;
• The investment management and other services the Advisers provide the Funds, including each Adviser’s compliance program;
• The Advisers’ investment management personnel; and
• Homestead Advisers’ financial condition and profitability in connection with managing the Funds.
The Board also reviewed information provided by Broadridge Financial Solutions, Inc. (“Broadridge”), an information service provider unaffiliated with the Advisers, comparing
each Fund’s advisory fee rate, net total expenses, operating expenses and performance to those of other similar open-end funds selected by Broadridge.
The Board also met over the course of the year with investment advisory personnel from Homestead Advisers and regularly reviewed detailed information, presented both orally and in writing, regarding the investment program, performance and operations of each Fund. The Advisers also presented additional information to the Board regarding the Funds. The Board then considered whether any further discussion or review was necessary, concluding that the information reviewed by the Board and the Independent Directors and their independent counsel prior to and at the September Meeting provided a sufficient basis for taking action on the continuation of the Agreements with respect to each Fund for an additional year.
Accordingly, the Board’s determination to approve the continuance of the Agreements was made on the basis of each Director’s business judgment after an evaluation of the information provided to the Board, both at the August and September Meetings and at prior meetings. In reaching their determinations relating to the continuation of the Agreements, the Board, including the Independent Directors, considered all factors they believed relevant, including the factors discussed below. Individual Directors may have attributed different weights to the various factors and assigned various degrees of materiality to information received in connection with the approval process. No single factor was determined to be decisive. In particular, the Board focused on the following:
Nature, Extent and Quality of Services. The Board considered the nature, extent and quality of the services the Advisers provide to the applicable Funds and the resources the Advisers dedicate to the Funds. In this regard, the Board evaluated, among other things, each Adviser’s personnel, experience, track record, compliance program and, with respect to Homestead Advisers, oversight of the Funds’ other service providers, including T. Rowe Price, Harding Loevner and Invesco in their capacity as subadvisers to the Growth Fund, the International Equity Fund and the Daily Income Fund, respectively. The Board considered information concerning the investment philosophy and investment processes used by the Advisers in managing the Funds. In this context, the Board also considered the managerial and financial resources available to the Advisers, and concluded that they would be sufficient to meet any reasonably foreseeable obligations under the current Agreements. The Board considered each Adviser’s assessment of its ability to attract and retain capable personnel and succession planning processes with respect to the leadership of the Funds’ portfolio management teams. The Board considered the quality of the services provided by the Advisers and the quality of the resources available to the Funds. The Board further considered each Adviser’s experience and reputation and the professional qualifications of its personnel. The
Regulatory and Shareholder Matters
Regulatory and Shareholder Matters (Continued)
Board noted, in particular, that Homestead Advisers had made significant enhancements to its investment team in recent years and had made additional investments in personnel and technology to service existing shareholders in recent years.
The Board also considered that the Investment Management Agreements require Homestead Advisers to oversee the administration of all aspects of the Funds’ business and affairs and to provide certain services required for effective administration of the Funds.
On the basis of these considerations as well as others and in the exercise of their business judgment, the Board concluded that the nature, extent and quality of services provided by the Advisers to the Funds supported the continuation of the Agreements for an additional one-year period.
Investment Performance of the Funds. The Board reviewed reports provided by Broadridge that compared each Fund’s performance record (trailing annualized net total returns) for the one-, three-, five- and ten-year periods ended March 31, 2023, as applicable, against a group of funds within a category as assigned by Morningstar, Inc. (a “Peer Group”) and the Fund’s relevant benchmark index for the same time periods. In addition, the Board reviewed Morningstar Direct reports that compared each Fund’s performance record for the one-, three-, five- and ten-year periods ended June 30, 2023, as applicable, against each Fund’s benchmark index and/or Peer Group, as applicable. The Board also considered Homestead Advisers’ and the Subadvisers’ performance and reputation generally, and Homestead Advisers’ evaluation of the Subadvisers’ contribution to each Fund’s broader investment mandate.
In the case of each Fund that had performance that lagged that of its Peer Group or benchmark for certain (although not necessarily all) periods, the Board concluded that other factors relevant to performance supported continuation of the advisory arrangements. These factors included, among other factors, that the Fund’s more recent or long-term performance, as applicable, was competitive when compared to relevant performance benchmarks or peer groups. The Board also noted that there had been meetings with members of each Fund’s portfolio management team on a regular basis during the prior year to discuss each Fund’s performance and related matters.
With respect to each Fund, the Board concluded that the Fund’s performance (including absolute performance and, where applicable, outperformance of peers and relevant benchmarks over long-term periods) and/or other relevant factors supported continuation of the Agreements.
Among other information, the Board took into account the following information regarding each individual Fund’s performance:
Daily Income Fund
The Board noted that the Fund underperformed its benchmark index2 for the one-, three-, five- and ten-year periods ended March 31, 2023. The Board considered that the Fund underperformed the median of the Fund’s Peer Group for the one-, three-, five- and ten-year periods ended March 31, 2023. The Board observed Homestead Advisers’ statement that the Fund’s net performance disparity is reasonable in light of differences in the Fund’s size, composition and expenses relative to peers, including funds that are not government money-market funds that invest in securities other than government securities that often have higher potential yield than government securities.
Short-Term Government Securities Fund
The Board noted that the Fund outperformed its benchmark index for the three-year period and underperformed its benchmark index for the one-, five- and ten-year periods ended March 31, 2023. The Board considered that the Fund outperformed the median of the Fund’s Peer Group for the one-, three-, five- and ten-year periods ended March 31, 2023.
Short-Term Bond Fund
The Board noted that the Fund outperformed its benchmark index for the three- and ten-year periods and underperformed its benchmark index for the one- and five-year periods ended March 31, 2023. The Board considered that the Fund underperformed the median of the Fund’s Peer Group for the three- and five-year periods and outperformed the median for the one- and ten-year periods ended March 31, 2023.
Intermediate Bond Fund
The Board noted that the Fund performed equal to its benchmark index for the one-year period and outperformed its benchmark index for the three-year period ended March 31, 2023. The Board considered that the Fund outperformed the median of the Fund’s Peer Group for the one- and three-year periods ended March 31, 2023.
Rural America Growth & Income Fund
The Board noted that the Fund underperformed its custom blended benchmark index, a 60/40 mix between equity and fixed income indexes, since inception and for the one-year period ended March 31, 2023. The Board considered that the Fund underperformed the median of the Fund’s Peer Group for the one-year period ended March 31, 2023. The Board further noted the unique focus of the Fund on companies that are important to the economic development of rural
2 The Daily Income Fund does not have an official benchmark index as it is a money-market fund. For comparison purposes, the Broadridge Report for this Fund includes performance of a three-month treasury bill index, which Homestead Advisers believes provides a useful comparison for the Fund.
Regulatory and Shareholder Matters
33
Regulatory and Shareholder Matters (Continued)
America which makes it difficult to compare the Fund’s performance to a benchmark or peers that do not have a similar focus.
Value Fund
The Board noted that the Fund outperformed its benchmark index for the one-, three-, five- and ten-year periods ended March 31, 2023. The Board considered that the Fund underperformed the median of the Fund’s Peer Group for the three-year period and outperformed the median for the one-, five- and ten-year periods ended March 31, 2023.
Growth Fund
The Board noted that the Fund underperformed its benchmark index for the one-, three-, five- and ten-year periods ended March 31, 2023. The Board considered that the Fund underperformed the median of the Fund’s Peer Group for the one-, three- and five-year periods and outperformed the median for the ten-year period ended March 31, 2023. The Board further noted that as of July 31, 2023, the Fund had outperformed its benchmark by over 300 basis points in calendar year 2023.
International Equity Fund
The Board noted that the Fund underperformed its benchmark index for the one-year period and outperformed its benchmark index for the three-, five- and ten-year periods ended March 31, 2023. The Board considered that the Fund outperformed the median of the Fund’s Peer Group for the one-, three-, five- and ten-year periods ended March 31, 2023.
Small-Company Stock Fund
The Board noted that the Fund outperformed its benchmark index for the one- and three-year periods and underperformed its benchmark index for the five- and ten-year periods ended March 31, 2023. The Board considered that the Fund outperformed the median of the Fund’s Peer Group for the one-year period and underperformed the median for the three-, five- and ten-year periods ended March 31, 2023. The Board observed the Fund’s underperformance for certain periods, noting that that performance had improved subsequent to Homestead Advisers taking steps to support and enhance the investment resources available to the portfolio management team (in addition to expanding the investment team).
Comparative Fees and Expense Ratios. The Board reviewed comparative fees and the costs of services provided under each of the Agreements. The Board considered the net total expense ratio, contractual advisory fees, net operating expense ratio and other expense information for each Fund provided by Broadridge as compared against the Fund’s peer group identified by Morningstar, Inc. (“Expense Group”). The Board noted that the Funds are not currently subject to Rule 12b-1 fees and that the expense information provided
by Broadridge included comparisons of the Funds’ net total expense ratios with those of their Expense Group peers both inclusive and exclusive of 12b-1 fees.
The Board concluded that the fees payable by the Funds to Homestead Advisers are reasonable in relation to the nature and quality of the services provided. In reaching this conclusion, the Board compared the fees payable by the Funds to the fees paid by other mutual funds that are in the same Expense Group. The Board also considered the fees Homestead Advisers receives from, and the scope of services it provides to, other Homestead Advisers clients, including its separate account and unified managed account clients, noting the significantly broader scope of services that Homestead Advisers provides to the Funds as compared to the other types of clients. In reaching their conclusion, the Board also took into account the costs and risks assumed by Homestead Advisers in connection with launching and maintaining publicly-offered mutual funds, and how those costs and risks differ from those associated with other components of Homestead Advisers’ business. The Board also considered the high level of customer service Homestead Advisers provides to shareholders including through its offered asset allocation, financial planning tools, model portfolio offerings and related services. With respect to the total net expense ratios for certain of the Funds, the Board noted that the current net asset levels impacted the expense ratios for the Funds, and that expense ratios would be expected to decline as assets increase.
Among other information, the Board took into account the following information regarding particular Fund expense information:
Daily Income Fund
The Board noted that the Fund’s contractual management fee as of December 31, 2022 was higher than the median contractual management fee of the Expense Group and its total net expense ratio as of December 31, 2022 ranked in the 5th quintile of the Fund’s Expense Group (excluding Rule 12b-1/non-12b-1 service fees). The Board considered the effect of peer funds’ fee waivers on those funds’ fee levels as compared to the Fund’s. The Board considered Homestead Advisers’ implementation of contractual fee caps and voluntary fee waivers (subject to certain excluded expenses).
The Board considered the fees paid to Invesco under the current Sub-advisory Agreement. This information included comparison of the Daily Income Fund’s subadvisory fee to that charged by Invesco to other accounts with a similar investment objective to the Fund, as well as the current management fee paid to Homestead Advisers under the existing Investment Management Agreement. The Board also took into account the anticipated demands, complexity and quality of the investment management of the Fund. The Board noted that Homestead Advisers, and not the Fund, is responsible for paying the fees charged by Invesco. The
Regulatory and Shareholder Matters
Regulatory and Shareholder Matters (Continued)
Board noted Homestead Advisers’ and Invesco’s representations about the services each provide to the Daily Income Fund. Based on these and other considerations, the Board concluded that the subadvisory fee payable by Homestead Advisers to Invesco is reasonable in relation to the nature and quality of the services provided.
Short-Term Government Securities Fund
The Board noted that the Fund’s contractual management fee as of December 31, 2022 was below the median contractual management fee of the Expense Group and its total net expense ratio as of December 31, 2022 ranked in the 4th quintile of the Fund’s Expense Group (excluding Rule 12b-1/non-12b-1 service fees). The Board considered Homestead Advisers’ implementation of contractual fee caps (subject to certain excluded expenses).
Short-Term Bond Fund
The Board noted that the Fund’s contractual management fee as of December 31, 2022 was higher than the median contractual management fee of the Expense Group and its total net expense ratio as of December 31, 2022 ranked in the 5th quintile of the Fund’s Expense Group (excluding Rule 12b-1/non-12b-1 service fees). The Board considered that the Fund added fee breakpoints to its contractual management fee effective January 1, 2023 and considered Homestead Advisers’ implementation of contractual fee caps (subject to certain excluded expenses).
Intermediate Bond Fund
The Board noted that the Fund’s contractual management fee as of December 31, 2022 was higher than the median contractual management fee of the Expense Group and its total net expense ratio as of December 31, 2022 ranked in the 5th quintile of the Fund’s Expense Group (excluding Rule 12b-1/non-12b-1 service fees). The Board also noted the Fund’s breakpoint fee schedule and considered Homestead Advisers’ implementation of contractual fee caps (subject to certain excluded expenses).
Rural America Growth & Income
The Board noted that the Fund’s contractual management fee as of December 31, 2022 was below the median contractual management fee of the Expense Group and its total net expense ratio as of December 31, 2022 ranked in the 2nd quintile of the Fund’s Expense Group (excluding Rule 12b-1/non-12b-1 service fees). The Board also noted the Fund’s breakpoint fee schedule and considered Homestead Advisers’ reimbursement of expenses, implementation of contractual fee caps (subject to certain excluded expenses).
Value Fund
The Board noted that the Fund’s contractual management fee as of December 31, 2022 was below the median contractual management fee of the Expense Group and its
total net expense ratio as of December 31, 2022 ranked in the 1st quintile of the Fund’s Expense Group (excluding Rule 12b-1/non-12b-1 service fees). The Board also noted the Fund’s breakpoint fee schedule and considered Homestead Advisers’ implementation of contractual fee caps (subject to certain excluded expenses).
Growth Fund
The Board noted that the Fund’s contractual management fee as of December 31, 2022 was below the median contractual management fee of the Expense Group and its total net expense ratio as of December 31, 2022 ranked in the 3rd quintile of the Fund’s Expense Group (excluding Rule 12b-1/non-12b-1 service fees). The Board also noted the Fund’s breakpoint fee schedule and considered Homestead Advisers’ implementation of contractual fee caps (subject to certain excluded expenses).
The Board considered the fees paid to T. Rowe Price under the current Sub-advisory Agreement. This information included comparison of the Growth Fund’s subadvisory fee to that charged by T. Rowe Price to other accounts with a similar investment objective to the Fund, as well as the current management fee paid to Homestead Advisers under the existing Investment Management Agreement. The Board also took into account the anticipated demands, complexity and quality of the investment management of the Fund. The Board noted that Homestead Advisers, and not the Fund, is responsible for paying the fees charged by T. Rowe Price. The Board noted Homestead Advisers’ and T. Rowe Price’s representations about the services each provide to the Growth Fund. Based on these and other considerations, the Board concluded that the subadvisory fee payable by Homestead Advisers to T. Rowe Price is reasonable in relation to the nature and quality of the services provided.
International Equity Fund
The Board noted that the Fund’s contractual management fee as of December 31, 2022 was below the median contractual management fee of the Expense Group and its total net expense ratio as of December 31, 2022 ranked in the 3rd quintile of the Fund’s Expense Group (excluding Rule 12b-1/non-12b-1 service fees). The Board also considered Homestead Advisers’ implementation of contractual fee caps (subject to certain excluded expenses) during the same period and further noted the Fund’s sub-advisory fee schedule was reduced to 0.50% effective April 1, 2023. The Board noted that the Fund’s contractual fee cap was removed effective April 30, 2023 and that Homestead Advisers voluntarily agreed to waive certain fees through September 30, 2023.
The Board considered the fees paid to Harding Loevner under the current Sub-advisory Agreement. This information included a representation from Harding Loevner that the subadvisory fees for its other clients are not materially different from the Fund’s subadvisory fee and are each
Regulatory and Shareholder Matters
35
Regulatory and Shareholder Matters (Continued)
individually negotiated. The Board also took into account the anticipated demands, complexity and quality of the investment management of the Fund. The Board noted that Homestead Advisers, and not the Fund, is responsible for paying the fees charged by Harding Loevner. The Board noted Homestead Advisers’ and Harding Loevner’s representations regarding the services each provides to the International Equity Fund. Based on these and other considerations, the Board concluded that the subadvisory fee payable by Homestead Advisers to Harding Loevner is reasonable in relation to the nature and quality of the services provided.
Small-Company Stock Fund
The Board noted that the Fund’s contractual management fee as of December 31, 2022 was equal to the median contractual management fee of the Expense Group and its total net expense ratio as of December 31, 2022 ranked 12 out of 13 (5th quintile) of the Fund’s Expense Group (excluding Rule 12b-1/non-12b-1 service fees). The Board considered the Fund’s lower net asset level in recent years, relative to previous years, which resulted in certain expenses being allocated across a smaller asset base. The Board also noted the Fund’s breakpoint fee schedule and considered Homestead Advisers’ implementation of contractual fee caps (subject to certain excluded expenses).
After reviewing these and related factors, the Board concluded, within the context of their overall conclusions regarding the Agreements, that the fees to be charged to the Funds were fair and reasonable, and that the anticipated costs of these services supported the approval of the Agreements.
Cost of Services and Profits Realized by the Advisers. The Board considered the cost of the services provided by Homestead Advisers. The Board reviewed the information provided by Homestead Advisers concerning its profitability from the fees received from and the services provided to the Funds and the financial condition of Homestead Advisers for various past periods. The Board considered the profit margin information for Homestead Advisers’ investment company business as a whole, as well as Homestead Advisers’ profitability data for the Funds. The Board reviewed Homestead Advisers’ assumptions and methods of cost allocation used in preparing Fund-specific profitability data. The Board also considered the basis for Homestead Advisers’ belief that its methods of allocation were reasonable.
The Board considered their discussion with representatives of Homestead Advisers about the fees being charged to the Funds and considered the other administrative, compliance and shareholder services provided by Homestead Advisers to the Funds. The Board considered the Funds’ increased regulatory requirements. The Board noted and discussed the additional services provided by Homestead Advisers to the Funds compared to other investment products managed by Homestead Advisers, and noted that, in the cases of the
Growth Fund, the International Equity Fund and the Daily Income Fund, Homestead Advisers, and not the Fund, would pay the subadvisory fees to the subadvisers. The Board determined that Homestead Advisers should be entitled to earn a reasonable level of profits for the services it provides to the Funds. In light of the foregoing, the Board, including the Independent Directors, determined that the management fees were reasonable in relation to the wide array of services provided to the Funds.
The Board considered the compensation to be received by T. Rowe Price, Harding Loevner and Invesco from their relationship with the Growth Fund, the International Equity Fund and the Daily Income Fund, respectively, and considered the information on profitability provided by T. Rowe Price and Invesco. The Board noted that Homestead Advisers would continue to pay each subadviser from the management fees received from the Funds, and that the agreements were negotiated at arm’s length between Homestead Advisers and the subadvisers.
Economies of Scale. The Board considered the extent to which economies of scale would be realized as the Funds grow, and whether fee levels reflect these economies of scale for the benefit of each Fund’s shareholders. The Board also considered whether those economies of scale were shared with the Fund through breakpoints in investment management fees or other means, such as expense limitation arrangements and additional investments by Homestead Advisers in investment, trading, compliance and other resources. The Board noted that the Intermediate Bond Fund, Rural America Growth & Income, Value Fund, Growth Fund, Small-Company Stock Fund, International Equity Fund and as of January 1, 2023, the Short-Term Bond Fund, include breakpoints in their fee schedules, though some Fund assets have not yet reached the necessary levels to qualify for a lower fee rate. The Board was satisfied that the current fee structure was appropriate at this time.
Fall-Out Benefits. Additionally, the Board considered “fall-out benefits” to the Advisers, such as research and reduced portfolio record keeping fees paid to a third party based on aggregate total assets firm wide.
CONCLUSION
On the basis of these considerations as well as others and in the exercise of their business judgment, on September 13, 2023 the Board, including the Independent Directors, voted unanimously to approve the continuation of the Agreements for an additional one-year period.
November 13, 2023 15(c) Meeting. At a meeting held on November 13, 2023 (November Meeting), the Board reviewed and approved each Agreement for the period from September 23, 2024 through November 13, 2024. The Board noted its review and consideration of the information it received in connection with both the September Meeting and the November Meeting. In particular, the Board reviewed and
Regulatory and Shareholder Matters
Regulatory and Shareholder Matters (Continued)
considered information provided in response to a follow-up set of requests for information submitted to the Advisers by the Independent Directors. The Board determined that the conclusions it reached at the September Meeting had not changed. Based on its review, consideration and evaluation of all factors it believed relevant, including the factors discussed above at the September Meeting, the Board, including the Independent Directors, voted unanimously to approve the continuation of the Agreements for the period from September 23, 2024 through November 13, 2024.
Regulatory and Shareholder Matters
37
Report of Independent Registered Public Accounting Firm
To the Board of Directors of Homestead Funds, Inc. and the Board of Trustees of Homestead Funds Trust and Shareholders of Daily Income Fund, Short-Term Government Securities Fund, Short-Term Bond Fund, Stock Index Fund, Value Fund, Growth Fund, International Equity Fund, Small-Company Stock Fund, Intermediate Bond Fund and Rural America Growth & Income Fund.
Opinions on the Financial Statements
We have audited the accompanying statements of assets and liabilities, including the portfolios of investments, of Daily Income Fund, Short-Term Government Securities Fund, Short-Term Bond Fund, Stock Index Fund, Value Fund, Growth Fund, International Equity Fund and Small-Company Stock Fund (constituting Homestead Funds, Inc.), Intermediate Bond Fund and Rural America Growth & Income Fund (constituting Homestead Funds Trust) (hereafter collectively referred to as the "Funds") as of December 31, 2023 the related statements of operations for the year ended December 31, 2023, the statements of changes in net assets for each of the two years in the period ended December 31, 2023, including the related notes, and the financial highlights for each of the periods indicated therein (collectively referred to as the “financial statements”). In our opinion, the financial statements present fairly, in all material respects, the financial position of each of the Funds as of December 31, 2023, the results of each of their operations for the year then ended, the changes in each of their net assets for each of the two years in the period ended December 31, 2023 and each of the financial highlights for each of the periods indicated therein, in conformity with accounting principles generally accepted in the United States of America.
| Fund | Statement of Operations | Statement of change in net assets | Financial Highlights |
| Daily Income Fund | For the year ended December 31, 2023 | For the years ended December 31, 2023 and 2022 | For the years ended December 31, 2023, 2022, 2021, 2020, and 2019 |
Short-Term Government
Securities Fund | | | |
| Short-Term Bond Fund | | | |
| Stock Index Fund | | | |
| Value Fund | | | |
| Growth Fund | | | |
| International Equity Fund | | | |
| Small-Company Stock Fund | | | |
| Intermediate Bond Fund | For the year ended December 31, 2023 | For the years ended December 31, 2023 and 2022 | For the years ended December 31, 2023, 2022, 2021, and 2020, and the period May 1, 2019 (inception) to December 31, 2019 |
| Rural America Growth & Income Fund | For the year ended December 31, 2023 | For the years ended December 31, 2023 and 2022 | For the years ended December 31, 2023, and 2022, and the period May 1, 2021 (inception) to December 31, 2021 |
Basis for Opinion
These financial statements are the responsibility of the Funds’ management. Our responsibility is to express an opinion on the Funds’ financial statements based on our audits. We are a public accounting firm registered with the Public Company Accounting Oversight Board (United States) (PCAOB) and are required to be independent with respect to the Funds in accordance with the U.S. federal securities laws and the applicable rules and regulations of the Securities and Exchange Commission and the PCAOB.
We conducted our audits of these financial statements in accordance with the standards of the PCAOB. Those standards require that we plan and perform the audit to obtain reasonable assurance about whether the financial statements are free of material misstatement, whether due to error or fraud.
Our audits included performing procedures to assess the risks of material misstatement of the financial statements, whether due to error or fraud, and performing procedures that respond to those risks. Such procedures included examining, on a test basis, evidence regarding the amounts and disclosures in the financial statements. Our audits also included evaluating the accounting principles used and significant estimates made by management, as well as evaluating the overall presentation of the financial statements. Our procedures included confirmation of securities owned as of December 31, 2023 by correspondence with the custodians and brokers; when replies were not received from brokers, we performed other auditing procedures. We believe that our audits provide a reasonable basis for our opinion.
Washington, DC
February 26, 2024
We have served as the auditor of one or more investment companies in the Homestead Funds group of investment companies since 2001.
Report of Independent Registered Public Accounting Firm
Portfolio of Investments
Daily Income Fund | December 31, 2023
| U.S. Government & Agency Obligations | 80.5% of portfolio |
| | Interest Rate /
Yield | Maturity Date | Face Amount | Value |
| Federal Farm Credit Bank | 5.36%(a) | 01/04/24 | $500,000 | $500,000 |
| Federal Farm Credit Bank | 5.38(a) | 01/10/24 | 500,000 | 500,000 |
| Federal Farm Credit Bank | 5.37(a) | 01/25/24 | 500,000 | 500,000 |
| Federal Farm Credit Bank | 5.37(a) | 02/05/24 | 1,000,000 | 1,000,000 |
| Federal Farm Credit Bank | 5.38(a) | 02/20/24 | 500,000 | 500,000 |
| Federal Farm Credit Bank | 5.38(a) | 03/15/24 | 500,000 | 500,000 |
| Federal Farm Credit Bank | 5.38(a) | 03/18/24 | 1,500,000 | 1,500,000 |
| Federal Farm Credit Bank | 5.37(a) | 04/25/24 | 500,000 | 500,000 |
| Federal Farm Credit Bank | 5.38(a) | 05/24/24 | 1,000,000 | 1,000,000 |
| Federal Farm Credit Bank | 5.37(a) | 06/11/24 | 4,000,000 | 4,000,000 |
| Federal Farm Credit Bank | 5.43(a) | 08/08/24 | 500,000 | 500,000 |
| Federal Farm Credit Bank | 5.40(a) | 08/27/24 | 2,000,000 | 2,000,000 |
| Federal Farm Credit Bank | 5.41(a) | 11/22/24 | 4,000,000 | 4,000,000 |
| Federal Farm Credit Bank | 5.41(a) | 12/18/24 | 1,000,000 | 1,000,000 |
| Federal Farm Credit Bank | 5.42(a) | 12/30/24 | 500,000 | 500,000 |
| Federal Farm Credit Bank | 5.42(a) | 03/07/25 | 2,000,000 | 2,000,000 |
| Federal Farm Credit Bank | 5.46(a) | 05/28/25 | 500,000 | 500,000 |
| Federal Farm Credit Bank | 5.45(a) | 05/30/25 | 1,000,000 | 1,000,000 |
| Federal Farm Credit Bank | 5.47(a) | 08/13/25 | 750,000 | 750,000 |
| Federal Farm Credit Bank | 5.47(a) | 08/22/25 | 500,000 | 500,000 |
| Federal Farm Credit Bank | 5.49(a) | 11/28/25 | 500,000 | 500,000 |
| Federal Farm Credit Bank | 5.49(a) | 12/01/25 | 500,000 | 500,000 |
| Federal Farm Credit Bank | 5.49(a) | 12/15/25 | 1,000,000 | 1,000,000 |
| Federal Home Loan Bank | 5.35(a) | 01/05/24 | 4,000,000 | 4,000,000 |
| Federal Home Loan Bank | 5.01 | 01/12/24 | 500,000 | 499,268 |
| Federal Home Loan Bank | 5.37(a) | 02/02/24 | 4,000,000 | 4,000,000 |
| Federal Home Loan Bank | 5.02 | 02/09/24 | 3,000,000 | 2,984,465 |
| Federal Home Loan Bank | 5.37(a) | 02/20/24 | 3,000,000 | 3,000,000 |
| Federal Home Loan Bank | 5.41(a) | 06/17/24 | 500,000 | 500,000 |
| Federal Home Loan Bank | 5.50 | 08/12/24 | 1,000,000 | 999,775 |
| Federal Home Loan Bank | 5.59 | 09/27/24 | 250,000 | 250,000 |
| Federal Home Loan Bank | 5.27 | 11/01/24 | 2,000,000 | 1,914,939 |
| Federal Home Loan Bank | 5.46(a) | 01/03/25 | 1,300,000 | 1,299,980 |
| Federal Home Loan Bank | 5.48(a) | 03/24/25 | 1,200,000 | 1,199,852 |
| Federal Home Loan Bank | 5.47(a) | 07/24/25 | 1,000,000 | 1,000,000 |
| Federal Home Loan Bank | 5.49(a) | 08/08/25 | 770,000 | 769,909 |
| Federal Home Loan Bank | 5.47(a) | 08/22/25 | 500,000 | 500,000 |
| Federal Home Loan Bank | 5.49(a) | 12/08/25 | 2,000,000 | 2,000,000 |
| Federal Home Loan Bank | 5.49(a) | 12/11/25 | 750,000 | 750,000 |
| U.S. Treasury Bill | 5.41 | 01/02/24 | 21,000,000 | 20,996,912 |
| U.S. Treasury Bill | 5.40 | 01/09/24 | 20,000,000 | 19,976,509 |
| U.S. Treasury Bill | 5.41 | 01/11/24 | 12,000,000 | 11,982,356 |
| U.S. Treasury Bill | 5.40 | 01/16/24 | 14,000,000 | 13,969,172 |
| U.S. Treasury Bill | 5.41 | 01/23/24 | 10,000,000 | 9,967,697 |
| U.S. Treasury Bill | 5.48 | 01/30/24 | 12,500,000 | 12,447,819 |
| U.S. Treasury Bill | 5.54 | 02/06/24 | 1,000,000 | 994,650 |
| U.S. Treasury Bill | 5.48 | 02/20/24 | 9,000,000 | 8,933,535 |
| U.S. Treasury Bill | 5.57 | 04/18/24 | 5,000,000 | 4,924,565 |
| U.S. Treasury Bill | 5.46 | 05/23/24 | 500,000 | 489,613 |
| U.S. Treasury Bill | 5.41 | 06/06/24 | 1,500,000 | 1,466,081 |
| U.S. Treasury Bill | 5.21 | 06/13/24 | 500,000 | 488,771 |
| U.S. Treasury Bill | 5.30 | 06/27/24 | 3,000,000 | 2,924,647 |
| U.S. Treasury Bill | 5.40 | 07/11/24 | 500,000 | 486,362 |
| U.S. Treasury Bill | 5.42 | 09/05/24 | 500,000 | 482,360 |
| U.S. Treasury Bill | 5.27 | 10/31/24 | 500,000 | 478,882 |
| U.S. Treasury Bill | 5.07 | 11/29/24 | 2,250,000 | 2,150,078 |
| U.S. Treasury Bill | 4.84 | 12/26/24 | 3,000,000 | 2,862,150 |
| The accompanying notes are an integral part of these financial statements. | Portfolio of Investments |
39
Portfolio of Investments | Daily Income Fund | December 31, 2023 | (Continued)
| U.S. Government & Agency Obligations | 80.5% of portfolio (Continued) |
| | Interest Rate /
Yield | Maturity Date | Face Amount | Value |
| U.S. Treasury Note | 0.88% | 01/31/24 | $1,000,000 | $996,911 |
| U.S. Treasury Note | 0.38 | 08/15/24 | 1,200,000 | 1,163,405 |
| U.S. Treasury Note | 1.50 | 10/31/24 | 3,500,000 | 3,401,644 |
| U.S. Treasury Note | 5.45(a) | 10/31/24 | 1,500,000 | 1,498,862 |
| U.S. Treasury Note | 0.75 | 11/15/24 | 1,500,000 | 1,445,016 |
| U.S. Treasury Note | 2.25 | 11/15/24 | 2,000,000 | 1,951,456 |
| U.S. Treasury Note | 5.51(a) | 01/31/25 | 3,000,000 | 2,998,656 |
| U.S. Treasury Note | 5.47(a) | 04/30/25 | 2,000,000 | 1,999,642 |
| U.S. Treasury Note | 5.48(a) | 10/31/25 | 1,500,000 | 1,500,000 |
| Total U.S. Government & Agency Obligations | | | | |
| (Cost $183,895,939) | | | | 183,895,939 |
| Money Market Fund | 19.5% of portfolio |
| | | | Shares | |
| State Street Institutional U.S. Government Money Market Fund Premier Class | 5.32(b) | | 44,620,991 | 44,620,991 |
| Total Money Market Fund | | | | |
| (Cost $44,620,991) | | | | 44,620,991 |
| Total Investments in Securities | | | | |
| (Cost $228,516,930) | 100.0% | | | | $228,516,930 |
| (a) | Variable coupon rate as of December 31, 2023. |
| (b) | 7-day yield at December 31, 2023. |
| Portfolio of Investments | The accompanying notes are an integral part of these financial statements. |
40
Portfolio of Investments
Short-Term Government Securities Fund | December 31, 2023
| U.S. Government & Agency Obligations | 61.0% of portfolio |
| | Interest Rate /
Yield | Maturity Date | Face Amount | Value |
| Export-Import Bank of the U.S. | 1.90% | 07/12/24 | $239,372 | $237,082 |
| Export-Import Bank of the U.S. | 1.73 | 09/18/24 | 586,442 | 576,787 |
| Export-Import Bank of the U.S. | 1.58 | 11/16/24 | 47,946 | 47,061 |
| Export-Import Bank of the U.S. | 2.54 | 07/13/25 | 82,946 | 81,193 |
| Export-Import Bank of the U.S. | 2.63 | 04/29/26 | 104,166 | 100,703 |
| Export-Import Bank of the U.S. | 2.33 | 01/14/27 | 146,249 | 138,522 |
| Export-Import Bank of the U.S. | 2.37 | 03/19/27 | 400,174 | 384,696 |
| Federal Farm Credit Banks Funding Corp. | 2.25 | 01/14/30 | 150,000 | 133,711 |
| U.S. Department of Housing & Urban Development | 5.77 | 08/01/26 | 46,000 | 46,017 |
| U.S. International Development Finance Corp. | 2.22(a) | 01/24/25 | 2,000,000 | 2,127,418 |
| U.S. International Development Finance Corp. | 1.27(a) | 06/21/25 | 1,000,000 | 992,239 |
| U.S. International Development Finance Corp. | 0.00(b) | 07/17/25 | 1,000,000 | 959,090 |
| U.S. International Development Finance Corp. | 0.00(b) | 01/17/26 | 700,000 | 727,693 |
| U.S. International Development Finance Corp. | 1.11 | 05/15/29 | 785,714 | 717,764 |
| U.S. International Development Finance Corp. | 2.36 | 10/15/29 | 1,421,511 | 1,348,208 |
| U.S. International Development Finance Corp. | 1.05 | 10/15/29 | 1,421,511 | 1,294,895 |
| U.S. International Development Finance Corp. | 1.24 | 08/15/31 | 1,256,756 | 1,113,795 |
| U.S. Treasury Note | 4.88 | 11/30/25 | 6,075,000 | 6,137,886 |
| U.S. Treasury Note | 4.63 | 11/15/26 | 12,735,000 | 12,935,974 |
| U.S. Treasury Note | 4.38 | 11/30/28 | 4,645,000 | 4,753,141 |
| Total U.S. Government & Agency Obligations | | | | |
| (Cost $35,075,139) | | | | 34,853,875 |
| Mortgage-Backed Securities | 16.9% of portfolio |
| | | | |
| GNMA 21-8 | 1.00 | 01/20/50 | 487,354 | 381,404 |
| GNMA 22-177 | 5.00 | 05/20/48 | 1,307,005 | 1,311,232 |
| GNMA 23-128 | 5.75 | 08/20/47 | 595,748 | 601,212 |
| GNMA 23-22EA | 5.00 | 09/20/49 | 927,453 | 928,256 |
| GNMA 23-22EC | 5.00 | 01/20/51 | 701,439 | 703,330 |
| GNMA 23-4 | 5.00 | 07/20/49 | 466,198 | 465,378 |
| GNMA 23-59 | 5.00 | 11/20/41 | 564,965 | 564,077 |
| GNMA 23-84KA | 5.50 | 06/20/42 | 331,253 | 333,167 |
| GNMA 786428 | 4.00 | 06/20/52 | 1,012,237 | 952,692 |
| GNMA 786576 | 4.50 | 09/20/52 | 193,579 | 186,333 |
| GNMA CK0445 | 4.00 | 02/15/52 | 321,625 | 308,023 |
| GNMA CV1215 | 7.00 | 07/20/53 | 333,505 | 342,629 |
| GNMA CW8493 | 8.00 | 11/20/53 | 399,640 | 416,417 |
| GNMA CW8495 | 7.50 | 11/20/53 | 499,597 | 515,165 |
| GNMA II POOL 786948 | 7.00 | 09/20/53 | 499,175 | 513,318 |
| GNMA MA8017 | 2.50 | 05/20/37 | 613,707 | 562,972 |
| GNMA MA8880 | 6.00 | 05/20/53 | 97,579 | 99,242 |
| GNMA MA8917 | 5.00 | 06/20/38 | 479,124 | 480,568 |
| Total Mortgage-Backed Securities | | | | |
| (Cost $9,676,159) | | | | 9,665,415 |
| Corporate Bonds Guaranteed by Export-Import Bank of the United States | 15.9% of portfolio |
| | | | |
| Consumer Discretionary | 0.1% | | |
| Ethiopian Leasing (2012) LLC | 2.68 | 07/30/25 | 33,671 | 32,977 |
| Total Consumer Discretionary | | | | 32,977 |
| Energy | 7.1% | | |
| Petroleos Mexicanos | 2.38 | 04/15/25 | 243,150 | 233,485 |
| Petroleos Mexicanos | 2.46 | 12/15/25 | 347,000 | 334,961 |
| Reliance Industries Ltd. | 2.06 | 01/15/26 | 1,352,000 | 1,291,380 |
| The accompanying notes are an integral part of these financial statements. | Portfolio of Investments |
41
Portfolio of Investments | Short-Term Government Securities Fund | December 31, 2023 |
(Continued)
| Corporate Bonds Guaranteed by Export-Import Bank of the United States | 15.9% of portfolio (Continued) |
| | Interest Rate /Yield | Maturity Date | Face Amount | Value |
| Energy | 7.1% (Continued) | | |
| Reliance Industries Ltd. | 1.87% | 01/15/26 | $1,742,105 | $1,680,743 |
| Reliance Industries Ltd. | 2.44 | 01/15/26 | 547,368 | 532,455 |
| Total Energy | | | | 4,073,024 |
| Financials | 8.7% | | |
| CES MU2 LLC | 1.99 | 05/13/27 | 1,164,303 | 1,110,164 |
| Durrah MSN 35603 | 1.68 | 01/22/25 | 236,766 | 231,974 |
| Export Lease Eleven Co. LLC | 5.93(c) | 07/30/25 | 33,338 | 33,419 |
| HNA 2015 LLC | 2.29 | 06/30/27 | 171,178 | 163,499 |
| HNA 2015 LLC | 2.37 | 09/18/27 | 102,726 | 98,088 |
| KE Export Leasing 2013-A LLC | 5.89(c) | 02/25/25 | 780,493 | 781,709 |
| Lulwa Ltd. | 1.89 | 02/15/25 | 472,798 | 462,722 |
| Lulwa Ltd. | 1.83 | 03/26/25 | 149,315 | 145,612 |
| MSN 41079 and 41084 Ltd. | 1.72 | 07/13/24 | 579,384 | 572,205 |
| MSN 41079 and 41084 Ltd. | 1.63 | 12/14/24 | 180,730 | 176,930 |
| Penta Aircraft Leasing 2013 LLC | 1.69 | 04/29/25 | 266,070 | 259,334 |
| Rimon LLC | 2.45 | 11/01/25 | 90,000 | 87,628 |
| Salmon River Export LLC | 2.19 | 09/15/26 | 440,621 | 422,902 |
| Sandalwood 2013 LLC | 2.84 | 07/10/25 | 132,322 | 129,999 |
| Sandalwood 2013 LLC | 2.82 | 02/12/26 | 192,123 | 187,118 |
| Santa Rosa Leasing LLC | 1.69 | 08/15/24 | 26,628 | 26,340 |
| Santa Rosa Leasing LLC | 1.47 | 11/03/24 | 90,900 | 89,273 |
| Total Financials | | | | 4,978,916 |
| Total Corporate Bonds Guaranteed by Export-Import Bank of the United States | | | | |
| (Cost $9,400,580) | | | | 9,084,917 |
| Asset-Backed Securities | 3.1% of portfolio |
| | | | |
| Avant Loans Funding Trust 22-REV1 (d) | 6.54 | 09/15/31 | 150,000 | 149,786 |
| First Investors Auto Owner Trust 21-2A (d) | 0.48 | 03/15/27 | 26,526 | 26,079 |
| Frontier Issuer 23-1A (d) | 6.60 | 08/20/53 | 450,000 | 447,667 |
| Gracie Point International Funding 23-2A (d) | 7.60(c) | 03/01/27 | 100,000 | 99,992 |
| LAD Auto Receivables Trust 21-1 (d) | 1.30 | 08/17/26 | 37,977 | 37,514 |
| LAD Auto Receivables Trust 23-2 (d) | 5.93 | 06/15/27 | 76,587 | 76,641 |
| Oasis Securitisation 21-2A (d) | 2.14 | 10/15/33 | 39,207 | 38,857 |
| Oasis Securitisation 22-2A (d) | 6.85 | 10/15/34 | 141,636 | 141,550 |
| Oasis Securitisation 23-1A (d) | 7.00 | 02/15/35 | 152,747 | 152,587 |
| Santander Drive Auto Receivables Trust 22-5 | 4.43 | 03/15/27 | 100,000 | 98,815 |
| SBA Tower Trust (d) | 2.84 | 01/15/25 | 250,000 | ��� 241,417 |
| T-Mobile US Trust 22-1A (d) | 4.91 | 05/22/28 | 150,000 | 149,692 |
| Westgate Resorts 22-1A (d) | 2.29 | 08/20/36 | 149,049 | 142,217 |
| Total Asset-Backed Securities | | | | |
| (Cost $1,805,431) | | | | 1,802,814 |
| Corporate Bonds–Other | 2.6% of portfolio |
| | | | |
| Financials | 2.0% | | |
| Bank of America Corp. | 4.83(c) | 07/22/26 | 200,000 | 198,457 |
| Blue Owl Capital Corp. III | 3.13 | 04/13/27 | 125,000 | 110,455 |
| Blue Owl Credit Income Corp. | 3.13 | 09/23/26 | 250,000 | 228,307 |
| J.P. Morgan Chase & Co. | 1.04(c) | 02/04/27 | 100,000 | 91,906 |
| Metropolitan Life Global Funding I (d) | 5.00 | 01/06/26 | 150,000 | 150,500 |
| Morgan Stanley | 5.88 | 10/30/26 | 250,000 | 257,056 |
| Portfolio of Investments | The accompanying notes are an integral part of these financial statements. |
42
Portfolio of Investments | Short-Term Government Securities Fund | December 31, 2023 |
(Continued)
| Corporate Bonds–Other | 2.6% of portfolio (Continued) |
| | Interest Rate /Yield | Maturity Date | Face Amount | Value |
| Financials | 2.0% (Continued) | | |
| PNC Financial Services Group Inc. (The) | 5.81%(c) | 06/12/26 | $100,000 | $100,600 |
| Total Financials | | | | 1,137,281 |
| Information Technology | 0.3% | | |
| Amphenol Corp. | 4.75 | 03/30/26 | 200,000 | 200,268 |
| Total Information Technology | | | | 200,268 |
| Utilities | 0.3% | | |
| Metropolitan Edison Co. (d) | 5.20 | 04/01/28 | 150,000 | 151,090 |
| Total Utilities | | | | 151,090 |
| Total Corporate Bonds–Other | | | | |
| (Cost $1,523,177) | | | | 1,488,639 |
| Money Market Fund | 0.5% of portfolio |
| | | | Shares | |
| State Street Institutional U.S. Government Money Market Fund Premier Class | 5.32(e) | | 276,092 | 276,092 |
| Total Money Market Fund | | | | |
| (Cost $276,092) | | | | 276,092 |
| Total Investments in Securities | | | | |
| (Cost $57,756,578) | 100.0% | | | | $57,171,752 |
| (a) | Interest is paid at maturity. |
| (b) | Zero coupon rate, purchased at a discount. |
| (c) | Variable coupon rate as of December 31, 2023. |
| (d) | Security was purchased pursuant to Rule 144A under the Securities Act of 1933 and may be resold in transactions exempt from registration, normally to qualified institutional buyers. The securities have been determined to be liquid under criteria established by the Fund's Board of Directors. The total of such securities at period-end amounts to $2,005,589 and represents 3.5% of total investments. |
| (e) | 7-day yield at December 31, 2023. |
LLC -Limited Liability Company
| The accompanying notes are an integral part of these financial statements. | Portfolio of Investments |
43
Portfolio of Investments
Short-Term Bond Fund | December 31, 2023
| U.S. Government & Agency Obligations | 38.9% of portfolio |
| | Interest Rate /
Yield | Maturity Date | Face Amount | Value |
| Federal Farm Credit Banks Funding Corp. | 2.25% | 01/14/30 | $1,423,000 | $1,268,475 |
| U.S. International Development Finance Corp. | 0.67(a) | 04/23/29 | 1,230,000 | 1,189,922 |
| U.S. International Development Finance Corp. | 2.36 | 10/15/29 | 600,588 | 569,618 |
| U.S. International Development Finance Corp. | 1.05 | 10/15/29 | 863,568 | 786,649 |
| U.S. Treasury Note | 4.88 | 11/30/25 | 56,480,000 | 57,064,656 |
| U.S. Treasury Note | 4.63 | 09/15/26 | 524,000 | 531,307 |
| U.S. Treasury Note | 4.63 | 11/15/26 | 81,566,000 | 82,853,213 |
| U.S. Treasury Note | 4.38 | 11/30/28 | 28,103,000 | 28,757,273 |
| Total U.S. Government & Agency Obligations | | | | |
| (Cost $171,562,077) | | | | 173,021,113 |
| Corporate Bonds–Other | 33.4% of portfolio |
| | | | |
| Communication Services | 1.2% | | |
| Comcast Corp. | 4.55 | 01/15/29 | 500,000 | 502,139 |
| Meta Platforms Inc. | 4.60 | 05/15/28 | 2,180,000 | 2,211,798 |
| Sprint Spectrum Co. LLC (b) | 4.74 | 03/20/25 | 625,000 | 619,584 |
| T-Mobile USA Inc. | 4.80 | 07/15/28 | 910,000 | 917,613 |
| Warnermedia Holdings Inc. | 3.76 | 03/15/27 | 1,355,000 | 1,298,335 |
| Total Communication Services | | | | 5,549,469 |
| Consumer Discretionary | 2.3% | | |
| Daimler Trucks Financial N.A. LLC (b) | 5.20 | 01/17/25 | 500,000 | 499,685 |
| Daimler Trucks Financial N.A. LLC (b) | 3.50 | 04/07/25 | 1,255,000 | 1,227,230 |
| Daimler Trucks Financial N.A. LLC (b) | 5.15 | 01/16/26 | 1,000,000 | 1,002,740 |
| Ford Motor Credit Co. LLC | 2.90 | 02/10/29 | 883,000 | 773,339 |
| Hyundai Capital America (b) | 5.80 | 06/26/25 | 920,000 | 924,898 |
| Hyundai Capital America (b) | 5.50 | 03/30/26 | 1,365,000 | 1,372,084 |
| Hyundai Capital America (b) | 5.60 | 03/30/28 | 1,035,000 | 1,050,315 |
| Marriott International Inc. | 4.90 | 04/15/29 | 500,000 | 503,249 |
| US Airways 2012 2A PTT | 4.63 | 06/03/25 | 965,799 | 938,901 |
| US Airways 2013 1A PTT | 3.95 | 11/15/25 | 2,275,149 | 2,173,646 |
| Total Consumer Discretionary | | | | 10,466,087 |
| Consumer Staples | 2.2% | | |
| 7-Eleven, Inc. (b) | 0.95 | 02/10/26 | 800,000 | 739,382 |
| Altria Group Inc. | 6.20 | 11/01/28 | 1,395,000 | 1,463,007 |
| Bimbo Bakeries USA Inc. (b) | 6.05 | 01/15/29 | 465,000 | 489,082 |
| JBS USA Food Co. | 2.50 | 01/15/27 | 3,364,000 | 3,095,755 |
| Kenvue Inc. | 5.05 | 03/22/28 | 465,000 | 476,368 |
| Philip Morris International Inc. | 5.00 | 11/17/25 | 460,000 | 461,819 |
| Philip Morris International Inc. | 4.88 | 02/13/26 | 1,150,000 | 1,154,021 |
| Philip Morris International Inc. | 5.13 | 11/17/27 | 805,000 | 819,342 |
| Philip Morris International Inc. | 4.88 | 02/15/28 | 1,060,000 | 1,071,325 |
| Total Consumer Staples | | | | 9,770,101 |
| Energy | 2.8% | | |
| Cheniere Corpus Christi Holdings LLC | 5.13 | 06/30/27 | 2,000,000 | 2,009,711 |
| Energy Transfer Operating LP | 2.90 | 05/15/25 | 2,900,000 | 2,809,944 |
| Marathon Oil Corp. | 4.40 | 07/15/27 | 1,277,000 | 1,245,451 |
| Phillips 66 Co. | 1.30 | 02/15/26 | 1,500,000 | 1,393,377 |
| Phillips 66 Co. | 4.95 | 12/01/27 | 1,780,000 | 1,794,952 |
| Targa Resources Corp. | 5.20 | 07/01/27 | 1,670,000 | 1,678,017 |
| Williams Companies, Inc. (The) | 5.40 | 03/02/26 | 1,340,000 | 1,353,390 |
| Total Energy | | | | 12,284,842 |
| Portfolio of Investments | The accompanying notes are an integral part of these financial statements. |
44
Portfolio of Investments | Short-Term Bond Fund | December 31, 2023 | (Continued)
| Corporate Bonds–Other | 33.4% of portfolio (Continued) |
| | Interest Rate /Yield | Maturity Date | Face Amount | Value |
| Financials | 16.4% | | |
| American Express Co. | 4.99%(c) | 05/01/26 | $870,000 | $867,451 |
| Antares Holdings LP | 3.95 | 07/15/26 | 335,000 | 311,571 |
| Antares Holdings LP | 2.75 | 01/15/27 | 1,000,000 | 885,910 |
| Antares Holdings LP (b) | 7.95 | 08/11/28 | 925,000 | 956,916 |
| Bank of America Corp. | 2.46(c) | 10/22/25 | 2,200,000 | 2,142,257 |
| Bank of America Corp. | 2.02(c) | 02/13/26 | 2,100,000 | 2,017,924 |
| Bank of America Corp. | 1.32(c) | 06/19/26 | 2,100,000 | 1,976,375 |
| Bank of America Corp. | 4.83(c) | 07/22/26 | 2,770,000 | 2,748,628 |
| Bank of America Corp. | 1.20(c) | 10/24/26 | 920,000 | 854,272 |
| Bank of America Corp. | 4.95(c) | 07/22/28 | 1,955,000 | 1,954,735 |
| Bank of America Corp. | 6.20(c) | 11/10/28 | 565,000 | 589,375 |
| Blue Owl Capital Corp. III | 3.13 | 04/13/27 | 1,321,000 | 1,167,288 |
| Blue Owl Credit Income Corp. | 3.13 | 09/23/26 | 3,290,000 | 3,004,520 |
| Cantor Fitzgerald LP (b) | 7.20 | 12/12/28 | 710,000 | 727,763 |
| Citigroup Inc. | 7.00 | 12/01/25 | 2,000,000 | 2,055,526 |
| CNO Global Funding (b) | 1.65 | 01/06/25 | 1,125,000 | 1,074,797 |
| F&G Global Funding (b) | 1.75 | 06/30/26 | 2,500,000 | 2,261,985 |
| Fidus Investment Corp. | 3.50 | 11/15/26 | 943,000 | 852,780 |
| Fifth Third Bancorp | 6.34(c) | 07/27/29 | 1,000,000 | 1,041,179 |
| GA Global Funding Trust (b) | 0.80 | 09/13/24 | 920,000 | 884,072 |
| GA Global Funding Trust (b) | 3.85 | 04/11/25 | 1,715,000 | 1,680,153 |
| GA Global Funding Trust (b) | 2.25 | 01/06/27 | 2,370,000 | 2,151,332 |
| General Motors Financial Co., Inc. | 5.40 | 04/06/26 | 465,000 | 467,948 |
| Goldman Sachs Group, Inc. | 2.64(c) | 02/24/28 | 930,000 | 862,119 |
| Goldman Sachs Group, Inc. | 3.62(c) | 03/15/28 | 572,000 | 548,625 |
| J.P. Morgan Chase & Co. | 2.08(c) | 04/22/26 | 2,055,000 | 1,968,380 |
| J.P. Morgan Chase & Co. | 4.08(c) | 04/26/26 | 700,000 | 688,611 |
| J.P. Morgan Chase & Co. | 1.04(c) | 02/04/27 | 910,000 | 836,347 |
| J.P. Morgan Chase & Co. | 4.85(c) | 07/25/28 | 890,000 | 890,258 |
| J.P. Morgan Chase & Co. | 6.09(c) | 10/23/29 | 820,000 | 862,159 |
| Keybank NA | 4.70 | 01/26/26 | 1,040,000 | 1,015,639 |
| M&T Bank Corp. | 7.41(c) | 10/30/29 | 675,000 | 726,048 |
| Manufacturers and Traders Trust Co. | 4.65 | 01/27/26 | 1,040,000 | 1,018,362 |
| Metropolitan Life Global Funding I (b) | 5.00 | 01/06/26 | 1,245,000 | 1,249,149 |
| Morgan Stanley | 2.19(c) | 04/28/26 | 425,000 | 408,278 |
| Morgan Stanley | 4.68(c) | 07/17/26 | 1,190,000 | 1,178,579 |
| Morgan Stanley | 3.13 | 07/27/26 | 925,000 | 885,736 |
| Morgan Stanley | 5.88 | 10/30/26 | 1,085,000 | 1,115,625 |
| Morgan Stanley | 1.51(c) | 07/20/27 | 865,000 | 790,096 |
| Morgan Stanley | 5.45(c) | 07/20/29 | 1,390,000 | 1,416,343 |
| Owl Rock Technology Finance Corp. | 2.50 | 01/15/27 | 1,415,000 | 1,235,073 |
| Pacific Life Global Funding II (b) | 5.50 | 07/18/28 | 1,385,000 | 1,415,652 |
| PNC Financial Services Group Inc. (The) | 5.58(c) | 06/12/29 | 465,000 | 474,919 |
| Santander Holdings USA, Inc. | 2.49(c) | 01/06/28 | 1,000,000 | 915,478 |
| Santander Holdings USA, Inc. | 6.50(c) | 03/09/29 | 460,000 | 475,214 |
| SCE Recovery Funding LLC | 0.86 | 11/15/31 | 1,450,756 | 1,235,010 |
| Security Benefit Global Funding (b) | 1.25 | 05/17/24 | 4,000,000 | 3,923,106 |
| Truist Financial Corp. | 6.05(c) | 06/08/27 | 925,000 | 941,292 |
| Volkswagen Group of America Finance LLC (b) | 1.25 | 11/24/25 | 3,025,000 | 2,808,703 |
| Wells Fargo & Co. | 2.16(c) | 02/11/26 | 3,270,000 | 3,147,125 |
| Wells Fargo & Co. | 3.91(c) | 04/25/26 | 1,900,000 | 1,862,297 |
| Wells Fargo & Co. | 2.19(c) | 04/30/26 | 2,120,000 | 2,031,736 |
| Wells Fargo & Co. | 3.53(c) | 03/24/28 | 915,000 | 872,927 |
| Wells Fargo & Co. | 4.81(c) | 07/25/28 | 2,140,000 | 2,124,318 |
| Wells Fargo & Co. | 6.30(c) | 10/23/29 | 465,000 | 490,074 |
| Total Financials | | | | 73,088,035 |
| The accompanying notes are an integral part of these financial statements. | Portfolio of Investments |
45
Portfolio of Investments | Short-Term Bond Fund | December 31, 2023 | (Continued)
| Corporate Bonds–Other | 33.4% of portfolio (Continued) |
| | Interest Rate /Yield | Maturity Date | Face Amount | Value |
| Health Care | 1.0% | | |
| Baylor Scott & White Holdings | 0.83% | 11/15/25 | $1,000,000 | $919,698 |
| GE HealthCare Technologies Inc. | 5.55 | 11/15/24 | 915,000 | 915,456 |
| GE HealthCare Technologies Inc. | 5.65 | 11/15/27 | 975,000 | 1,009,173 |
| Medtronic Global Holdings SCA | 4.25 | 03/30/28 | 925,000 | 920,967 |
| Pfizer Investment Enterprises Pte Ltd. | 4.45 | 05/19/28 | 885,000 | 884,543 |
| Total Health Care | | | | 4,649,837 |
| Industrials | 2.0% | | |
| American Airlines Group Inc. | 3.60 | 03/22/29 | 1,934,119 | 1,809,219 |
| American Airlines Group Inc. | 3.95 | 01/11/32 | 910,000 | 807,689 |
| BNSF Railway Co. (b) | 3.44 | 06/16/28 | 747,636 | 714,686 |
| Boeing Co. (The) | 2.20 | 02/04/26 | 1,900,000 | 1,795,285 |
| Delta Air Lines, Inc. (b) | 7.00 | 05/01/25 | 965,000 | 981,803 |
| ERAC USA Finance LLC (b) | 4.60 | 05/01/28 | 925,000 | 919,232 |
| John Deere Capital Corp. | 4.95 | 07/14/28 | 915,000 | 938,063 |
| Regal Rexnord Corp. (b) | 6.05 | 02/15/26 | 370,000 | 374,090 |
| Regal Rexnord Corp. (b) | 6.05 | 04/15/28 | 460,000 | 465,647 |
| Total Industrials | | | | 8,805,714 |
| Information Technology | 0.4% | | |
| Amphenol Corp. | 4.75 | 03/30/26 | 935,000 | 936,251 |
| Avnet Inc. | 6.25 | 03/15/28 | 610,000 | 631,843 |
| Total Information Technology | | | | 1,568,094 |
| Materials | 1.2% | | |
| Celanese US Holdings LLC | 6.05 | 03/15/25 | 745,000 | 749,562 |
| Celanese US Holdings LLC | 6.17 | 07/15/27 | 1,330,000 | 1,363,723 |
| EIDP Inc. | 4.50 | 05/15/26 | 1,390,000 | 1,384,562 |
| Sealed Air Corp. (b) | 1.57 | 10/15/26 | 2,200,000 | 1,980,943 |
| Total Materials | | | | 5,478,790 |
| Real Estate | 0.5% | | |
| Extra Space Storage LP | 5.70 | 04/01/28 | 460,000 | 471,448 |
| VICI Properties LP (b) | 3.50 | 02/15/25 | 1,600,000 | 1,559,088 |
| Total Real Estate | | | | 2,030,536 |
| Utilities | 3.4% | | |
| Consolidated Edison Co. of New York, Inc. | 3.30 | 12/01/24 | 727,000 | 712,999 |
| Entergy Louisiana, LLC | 3.78 | 04/01/25 | 1,445,000 | 1,418,920 |
| Exelon Corp. | 5.15 | 03/15/28 | 830,000 | 843,642 |
| Florida Power & Light Co. | 4.45 | 05/15/26 | 465,000 | 465,401 |
| Florida Power & Light Co. | 5.05 | 04/01/28 | 625,000 | 638,847 |
| Florida Power & Light Co. | 4.40 | 05/15/28 | 465,000 | 465,743 |
| Metropolitan Edison Co. (b) | 4.00 | 04/15/25 | 4,250,000 | 4,147,310 |
| Metropolitan Edison Co. (b) | 5.20 | 04/01/28 | 1,330,000 | 1,339,670 |
| Pacific Gas and Electric Co. | 6.10 | 01/15/29 | 1,390,000 | 1,438,369 |
| San Diego Gas & Electric Co. | 4.95 | 08/15/28 | 1,400,000 | 1,428,694 |
| Southern California Edison Co. | 1.20 | 02/01/26 | 2,065,000 | 1,922,626 |
| Southern California Edison Co. | 5.30 | 03/01/28 | 440,000 | 451,588 |
| Total Utilities | | | | 15,273,809 |
| Total Corporate Bonds–Other | | | | |
| (Cost $152,655,678) | | | | 148,965,314 |
| Portfolio of Investments | The accompanying notes are an integral part of these financial statements. |
46
Portfolio of Investments | Short-Term Bond Fund | December 31, 2023 | (Continued)
| Asset-Backed Securities | 9.9% of portfolio |
| | Interest Rate /Yield | Maturity Date | Face Amount | Value |
| American Credit Acceptance Receivables Trust 23-4A (b) | 6.20% | 06/14/27 | $1,333,940 | $1,336,846 |
| Avant Credit Card Master Trust 21-1A (b) | 1.37 | 04/15/27 | 2,500,000 | 2,399,549 |
| Avant Loans Funding Trust 22-REV1 (b) | 6.54 | 09/15/31 | 3,300,000 | 3,295,295 |
| CNH Equipment Trust 22-A | 2.39 | 08/15/25 | 80,353 | 80,122 |
| Colony American Finance Ltd. 21-2 (b) | 1.41 | 07/15/54 | 721,281 | 643,700 |
| CoreVest American Finance 20-4 (b) | 1.17 | 12/15/52 | 647,476 | 599,610 |
| CoreVest American Finance 21-1 (b) | 1.57 | 04/15/53 | 980,253 | 896,197 |
| CoreVest American Finance 21-3 (b) | 2.49 | 10/15/54 | 2,480,000 | 2,254,809 |
| Credit Acceptance Auto Loan Trust 21-2A (b) | 0.96 | 02/15/30 | 212,746 | 211,764 |
| Credito Real USA Auto Receivables Trust 21-1 (b) | 1.35 | 02/16/27 | 54,062 | 53,895 |
| Entergy New Orleans Storm Recovery Fund 15-1 | 2.67 | 06/01/27 | 63,258 | 62,401 |
| Exeter Automobile Receivables Trust 22-1A | 2.56 | 06/15/28 | 2,150,000 | 2,102,169 |
| FIC Funding 21-1 (b) | 1.13 | 04/15/33 | 583,933 | 575,761 |
| First Investors Auto Owner Trust 21-2A (b) | 0.48 | 03/15/27 | 324,947 | 319,466 |
| Firstkey Homes Trust 22-SFR2 (b) | 4.25 | 07/17/39 | 969,517 | 930,459 |
| Flagship Credit Auto Trust 21-3 (b) | 0.36 | 07/15/27 | 450,322 | 445,383 |
| Frontier Issuer 23-1A (b) | 6.60 | 08/20/53 | 3,400,000 | 3,382,374 |
| Frontier Issuer 23-1B (b) | 8.30 | 08/20/53 | 2,340,000 | 2,323,452 |
| FRTKL 21-SFR1 (b) | 1.57 | 09/17/38 | 970,000 | 870,542 |
| Gracie Point International Funding 23-2A (b) | 7.60(c) | 03/01/27 | 885,000 | 884,926 |
| John Deere Owner Trust 23-A | 5.01 | 11/15/27 | 900,000 | 901,703 |
| John Deere Owner Trust 23-B | 5.18 | 03/15/28 | 650,000 | 655,664 |
| LAD Auto Receivables Trust 21-1 (b) | 1.30 | 08/17/26 | 230,391 | 227,584 |
| LAD Auto Receivables Trust 23-2 (b) | 5.93 | 06/15/27 | 650,989 | 651,448 |
| Longtrain Leasing III LLC 2015-1 (b) | 2.98 | 01/15/45 | 265,577 | 257,732 |
| Marlette Funding Trust 22-2 (b) | 4.25 | 08/15/32 | 80,824 | 80,699 |
| NP SPE II LLC 17-1 (b) | 3.37 | 10/21/47 | 232,629 | 221,373 |
| Oasis Securitisation 21-2A (b) | 2.14 | 10/15/33 | 331,296 | 328,344 |
| Oasis Securitisation 22-1A (b) | 4.75 | 05/15/34 | 203,973 | 203,326 |
| Oasis Securitisation 22-2A (b) | 6.85 | 10/15/34 | 1,012,280 | 1,011,665 |
| Oasis Securitisation 23-1A (b) | 7.00 | 02/15/35 | 1,057,010 | 1,055,906 |
| Oportun Funding 21-A (b) | 1.21 | 03/08/28 | 545,268 | 520,384 |
| Oportun Funding 21-B (b) | 1.47 | 05/08/31 | 2,225,000 | 2,078,367 |
| Progress Residential Trust 21-SFR8 (b) | 1.51 | 10/17/38 | 1,312,100 | 1,177,070 |
| Progress Residential Trust 22-SFR3 (b) | 3.20 | 04/17/39 | 914,793 | 854,768 |
| Santander Drive Auto Receivables Trust 22-5 | 4.43 | 03/15/27 | 1,260,000 | 1,245,064 |
| SBA Tower Trust (b) | 2.84 | 01/15/25 | 4,765,000 | 4,601,412 |
| SBA Tower Trust (b) | 1.88 | 01/15/26 | 355,000 | 329,355 |
| SBA Tower Trust (b) | 6.60 | 01/15/28 | 775,000 | 796,523 |
| SVC ABS LLC 23-1A (b) | 5.15 | 02/20/53 | 458,083 | 440,803 |
| T-Mobile US Trust 22-1A (b) | 4.91 | 05/22/28 | 1,780,000 | 1,776,342 |
| Upstart Securitization Trust 21-4 (b) | 0.84 | 09/20/31 | 32,515 | 32,410 |
| Westgate Resorts 20-1A (b) | 3.96 | 03/20/34 | 229,605 | 226,807 |
| Westgate Resorts 22-1A (b) | 2.29 | 08/20/36 | 695,562 | 663,678 |
| Total Asset-Backed Securities | | | | |
| (Cost $44,961,641) | | | | 44,007,147 |
| Yankee Bonds | 7.8% of portfolio |
| | | | |
| AerCap Holdings NV | 6.10 | 01/15/27 | 500,000 | 510,668 |
| Avolon Holdings Funding Ltd. (b) | 5.50 | 01/15/26 | 1,225,000 | 1,217,075 |
| Avolon Holdings Funding Ltd. (b) | 2.75 | 02/21/28 | 607,000 | 539,222 |
| Banco Santander SA | 6.53(c) | 11/07/27 | 400,000 | 413,615 |
| Banco Santander SA | 5.59 | 08/08/28 | 1,400,000 | 1,427,480 |
| Barclays PLC | 7.33(c) | 11/02/26 | 1,410,000 | 1,456,414 |
| Barclays PLC | 5.83(c) | 05/09/27 | 855,000 | 862,646 |
| BHP Billiton Finance (USA) Ltd. | 4.88 | 02/27/26 | 2,010,000 | 2,019,914 |
| The accompanying notes are an integral part of these financial statements. | Portfolio of Investments |
47
Portfolio of Investments | Short-Term Bond Fund | December 31, 2023 | (Continued)
| Yankee Bonds | 7.8% of portfolio (Continued) |
| | Interest Rate /Yield | Maturity Date | Face Amount | Value |
| BNP Paribas (b) | 1.32%(c) | 01/13/27 | $700,000 | $645,483 |
| BPCE SA (b) | 5.98(c) | 01/18/27 | 610,000 | 614,783 |
| Delta and SkyMiles IP Ltd. (b) | 4.50 | 10/20/25 | 519,999 | 512,098 |
| Delta and SkyMiles IP Ltd. (b) | 4.75 | 10/20/28 | 2,000,000 | 1,966,977 |
| Deutsche Bank AG | 1.69 | 03/19/26 | 295,000 | 274,145 |
| Electricite de France SA (b) | 5.70 | 05/23/28 | 500,000 | 517,323 |
| Korea National Oil Corp. (b) | 4.75 | 04/03/26 | 500,000 | 497,102 |
| Lloyds Banking Group PLC | 4.72(c) | 08/11/26 | 750,000 | 740,034 |
| Macquarie Group Ltd. (b) | 1.34(c) | 01/12/27 | 2,500,000 | 2,296,842 |
| Mitsubishi UFJ Financial Group Inc. | 3.85 | 03/01/26 | 1,400,000 | 1,366,853 |
| Mizuho Financial Group Inc. (b) | 3.48 | 04/12/26 | 750,000 | 724,842 |
| Nationwide Building Society (b) | 2.97(c) | 02/16/28 | 1,500,000 | 1,394,944 |
| Natwest Group PLC | 5.85(c) | 03/02/27 | 765,000 | 771,403 |
| Nutrien Ltd. | 4.90 | 03/27/28 | 925,000 | 933,328 |
| Santander UK Group Holdings PLC | 6.83(c) | 11/21/26 | 460,000 | 468,443 |
| Santander UK Group Holdings PLC | 6.53(c) | 01/10/29 | 1,005,000 | 1,039,817 |
| Saudi Arabian Oil Co. (b) | 1.63 | 11/24/25 | 500,000 | 470,017 |
| Sumitomo Mitsui Financial Group Inc. | 5.46 | 01/13/26 | 1,810,000 | 1,827,738 |
| Svenska Handelsbanken AB (b) | 5.25 | 06/15/26 | 460,000 | 463,693 |
| TransCanada Pipelines Ltd. | 7.06 | 10/14/25 | 6,043,000 | 6,214,059 |
| Triton Container International Ltd. (b) | 1.15 | 06/07/24 | 720,000 | 702,527 |
| Triton Container International Ltd. (b) | 2.05 | 04/15/26 | 1,390,000 | 1,271,203 |
| Var Energi ASA (b) | 7.50 | 01/15/28 | 595,000 | 630,554 |
| Total Yankee Bonds | | | | |
| (Cost $35,352,997) | | | | 34,791,242 |
| Mortgage-Backed Securities | 7.1% of portfolio |
| | | | |
| FHLMC 780754 | 6.09(c) | 08/01/33 | 495 | 496 |
| FNMA 813842 | 6.95(c) | 01/01/35 | 1,623 | 1,647 |
| GNMA 21-8 | 1.00 | 01/20/50 | 1,839,921 | 1,439,928 |
| GNMA 22-177 | 5.00 | 05/20/48 | 5,391,634 | 5,409,072 |
| GNMA 23-128 | 5.75 | 08/20/47 | 2,129,800 | 2,149,332 |
| GNMA 23-22EA | 5.00 | 09/20/49 | 3,541,793 | 3,544,859 |
| GNMA 23-22EC | 5.00 | 01/20/51 | 1,734,893 | 1,739,569 |
| GNMA 23-4 | 5.00 | 07/20/49 | 853,143 | 851,642 |
| GNMA 23-59 | 5.00 | 11/20/41 | 1,756,100 | 1,753,340 |
| GNMA 23-84KA | 5.50 | 06/20/42 | 2,208,353 | 2,221,113 |
| GNMA 786576 | 4.50 | 09/20/52 | 948,536 | 913,032 |
| GNMA CK0445 | 4.00 | 02/15/52 | 2,255,394 | 2,160,008 |
| GNMA CV1215 | 7.00 | 07/20/53 | 2,279,783 | 2,342,154 |
| GNMA CW8493 | 8.00 | 11/20/53 | 994,104 | 1,035,838 |
| GNMA CW8494 | 7.50 | 11/20/53 | 2,127,888 | 2,194,154 |
| GNMA CW8495 | 7.50 | 11/20/53 | 1,189,042 | 1,226,093 |
| GNMA MA8017 | 2.50 | 05/20/37 | 1,517,902 | 1,392,418 |
| GNMA MA8917 | 5.00 | 06/20/38 | 1,071,029 | 1,074,256 |
| Salomon Brothers Mortgage Securities 97-LB6 | 6.82 | 12/25/27 | 1 | 1 |
| Total Mortgage-Backed Securities | | | | |
| (Cost $31,529,563) | | | | 31,448,952 |
| Corporate Bonds Guaranteed by Export-Import Bank of the United States | 1.1% of portfolio |
| | | | |
| Energy | 1.0% | | |
| Petroleos Mexicanos | 6.01(c) | 04/15/25 | 3,517,500 | 3,513,552 |
| Petroleos Mexicanos | 2.46 | 12/15/25 | 87,800 | 84,754 |
| Reliance Industries Ltd. | 1.87 | 01/15/26 | 792,368 | 764,459 |
| Total Energy | | | | 4,362,765 |
| Portfolio of Investments | The accompanying notes are an integral part of these financial statements. |
48
Portfolio of Investments | Short-Term Bond Fund | December 31, 2023 | (Continued)
| Corporate Bonds Guaranteed by Export-Import Bank of the United States | 1.1% of portfolio (Continued) |
| | Interest Rate /Yield | Maturity Date | Face Amount | Value |
| Financials | 0.1% | | |
| MSN 41079 and 41084 Ltd. | 1.72% | 07/13/24 | $163,789 | $161,759 |
| MSN 41079 and 41084 Ltd. | 1.63 | 12/14/24 | 238,835 | 233,812 |
| Santa Rosa Leasing LLC | 1.69 | 08/15/24 | 101,302 | 100,206 |
| Total Financials | | | | 495,777 |
| Total Corporate Bonds Guaranteed by Export-Import Bank of the United States | | | | |
| (Cost $4,901,522) | | | | 4,858,542 |
| Municipal Bonds | 0.6% of portfolio |
| | | | |
| Arizona | 0.4% | | |
| Glendale Arizona | 1.45 | 07/01/26 | 1,000,000 | 925,360 |
| Glendale Arizona | 1.72 | 07/01/27 | 1,235,000 | 1,124,169 |
| Total Arizona | | | | 2,049,529 |
| Texas | 0.2% | | |
| Grey Forest Texas Gas System Revenue | 1.05 | 02/01/25 | 800,000 | 764,616 |
| Total Texas | | | | 764,616 |
| Total Municipal Bonds | | | | |
| (Cost $3,035,000) | | | | 2,814,145 |
| Money Market Fund | 1.2% of portfolio |
| | | | Shares | |
| State Street Institutional U.S. Government Money Market Fund Premier Class | 5.32(d) | | 5,297,939 | 5,297,939 |
| Total Money Market Fund | | | | |
| (Cost $5,297,939) | | | | 5,297,939 |
| Total Investments in Securities | | | | |
| (Cost $449,296,417) | 100.0% | | | | $445,204,394 |
| (a) | Interest is paid at maturity. |
| (b) | Security was purchased pursuant to Rule 144A under the Securities Act of 1933 and may be resold in transactions exempt from registration, normally to qualified institutional buyers. The securities have been determined to be liquid under criteria established by the Fund's Board of Directors. The total of such securities at period-end amounts to $92,965,806 and represents 20.9% of total investments. |
| (c) | Variable coupon rate as of December 31, 2023. |
| (d) | 7-day yield at December 31, 2023. |
LLC -Limited Liability Company
N.A. -North America
LP -Limited Partnership
NA -National Association
SCA -Société en Commandite par Actions
Pte -Private Limited Company
ABS -Asset-Backed Security
NV -Naamloze Vennottschap
SA -Sociedad Anonima or Societe Anonyme
PLC -Public Limited Company
AG -Aktiengesellschaft
AB -Aktiebolag
| The accompanying notes are an integral part of these financial statements. | Portfolio of Investments |
49
Portfolio of Investments | Short-Term Bond Fund | December 31, 2023 | (Continued)
ASA -Allmennaksjeselskap
FHLMC -Federal Home Loan Mortgage Corporation
| Portfolio of Investments | The accompanying notes are an integral part of these financial statements. |
50
Portfolio of Investments
Intermediate Bond Fund | December 31, 2023
| Mortgage-Backed Securities | 33.6% of portfolio |
| | Interest Rate /
Yield | Maturity Date | Face Amount | Value |
| Farm 2021-1 Mortgage Trust 21-1 (a) | 2.18%(b) | 01/25/51 | $217,123 | $178,598 |
| FHLMC QA7479 | 3.00 | 03/01/50 | 198,597 | 177,863 |
| FHLMC QE2363 | 3.50 | 05/01/52 | 1,299,410 | 1,191,379 |
| FHLMC RA8249 | 5.50 | 11/01/52 | 708,712 | 713,141 |
| FHLMC SD1188 | 3.50 | 06/01/52 | 683,265 | 626,881 |
| FHLMC SD1495 | 5.00 | 08/01/52 | 868,744 | 869,222 |
| FHLMC SD2605 | 5.50 | 04/01/53 | 486,520 | 488,943 |
| FHLMC SD7555 | 3.00 | 08/01/52 | 847,850 | 760,655 |
| FHLMC SD8068 | 3.00 | 06/01/50 | 194,834 | 174,369 |
| FHLMC SD8193 | 2.00 | 02/01/52 | 5,966,824 | 4,876,540 |
| FHLMC SD8237 | 4.00 | 08/01/52 | 1,306,230 | 1,235,505 |
| FNMA BN7662 | 3.50 | 07/01/49 | 79,138 | 73,659 |
| FNMA CA4016 | 3.00 | 08/01/49 | 463,147 | 415,206 |
| FNMA FM1000 | 3.00 | 04/01/47 | 846,857 | 768,577 |
| FNMA FM4231 | 2.50 | 09/01/50 | 223,207 | 191,455 |
| FNMA MA3691 | 3.00 | 07/01/49 | 133,866 | 120,094 |
| FNMA MA3834 | 3.00 | 11/01/49 | 278,842 | 249,806 |
| FNMA MA3960 | 3.00 | 03/01/50 | 129,022 | 115,234 |
| FNMA MA3992 | 3.50 | 04/01/50 | 128,837 | 119,429 |
| FNMA MA4048 | 3.00 | 06/01/50 | 581,705 | 519,458 |
| FNMA MA4124 | 2.50 | 09/01/35 | 1,055,345 | 978,128 |
| FNMA MA4179 | 2.00 | 11/01/35 | 3,443,614 | 3,100,021 |
| FNMA MA4254 | 1.50 | 02/01/51 | 2,561,876 | 2,002,826 |
| FNMA MA4303 | 2.00 | 04/01/36 | 1,384,928 | 1,242,536 |
| FNMA MA4418 | 2.00 | 09/01/36 | 2,319,038 | 2,091,280 |
| FNMA MA4437 | 2.00 | 10/01/51 | 3,890,020 | 3,184,898 |
| FNMA MA4579 | 3.00 | 04/01/52 | 691,910 | 611,923 |
| Freddie Mac STACR 21-HQA3 (a) | 8.69(b) | 09/25/41 | 1,000,000 | 997,523 |
| GNMA 21-8 | 1.00 | 01/20/50 | 472,325 | 369,643 |
| GNMA 22-177 | 5.00 | 05/20/48 | 1,413,756 | 1,418,329 |
| GNMA 23-128 | 5.75 | 08/20/47 | 580,854 | 586,181 |
| GNMA 23-22EA | 5.00 | 09/20/49 | 1,001,345 | 1,002,211 |
| GNMA 23-22EC | 5.00 | 01/20/51 | 481,655 | 482,953 |
| GNMA 23-4 | 5.00 | 07/20/49 | 242,423 | 241,997 |
| GNMA 23-59 | 5.00 | 11/20/41 | 484,928 | 484,166 |
| GNMA 23-76 | 5.00 | 05/20/53 | 1,526,552 | 1,517,784 |
| GNMA 23-84KA | 5.50 | 06/20/42 | 696,111 | 700,134 |
| GNMA 786247 | 4.00 | 07/20/52 | 632,492 | 603,246 |
| GNMA 786428 | 4.00 | 06/20/52 | 1,046,139 | 984,600 |
| GNMA 786576 | 4.50 | 09/20/52 | 261,331 | 251,550 |
| GNMA CK0445 | 4.00 | 02/15/52 | 1,173,930 | 1,124,282 |
| GNMA CV1215 | 7.00 | 07/20/53 | 706,832 | 726,170 |
| GNMA CW8493 | 8.00 | 11/20/53 | 284,743 | 296,697 |
| GNMA CW8495 | 7.50 | 11/20/53 | 319,742 | 329,706 |
| GNMA MA8346 | 4.00 | 10/20/52 | 3,373,498 | 3,218,860 |
| GNMA MA8880 | 6.00 | 05/20/53 | 590,355 | 600,413 |
| Total Mortgage-Backed Securities | | | | |
| (Cost $44,593,409) | | | | 43,014,071 |
| Corporate Bonds–Other | 29.7% of portfolio |
| | | | |
| Communication Services | 1.3% | | |
| Comcast Corp. | 5.50 | 05/15/64 | 310,000 | 326,076 |
| Meta Platforms, Inc. | 4.95 | 05/15/33 | 105,000 | 108,373 |
| Sprint Spectrum Co. LLC (a) | 4.74 | 03/20/25 | 140,625 | 139,406 |
| T-Mobile US, Inc. | 3.00 | 02/15/41 | 200,000 | 149,672 |
| Warnermedia Holdings Inc. | 4.05 | 03/15/29 | 190,000 | 180,270 |
| The accompanying notes are an integral part of these financial statements. | Portfolio of Investments |
51
Portfolio of Investments | Intermediate Bond Fund | December 31, 2023 | (Continued)
| Corporate Bonds–Other | 29.7% of portfolio (Continued) |
| | Interest Rate /Yield | Maturity Date | Face Amount | Value |
| Communication Services | 1.3% (Continued) | | |
| Warnermedia Holdings Inc. | 4.28% | 03/15/32 | $190,000 | $173,889 |
| Warnermedia Holdings Inc. | 5.05 | 03/15/42 | 285,000 | 251,250 |
| Warnermedia Holdings Inc. | 5.14 | 03/15/52 | 180,000 | 154,504 |
| Warnermedia Holdings Inc. | 5.39 | 03/15/62 | 190,000 | 162,714 |
| Total Communication Services | | | | 1,646,154 |
| Consumer Discretionary | 2.5% | | |
| Block Financial Corp. | 2.50 | 07/15/28 | 145,000 | 129,224 |
| Daimler Trucks Financial N.A. LLC (a) | 3.50 | 04/07/25 | 340,000 | 332,477 |
| Expedia Group, Inc. | 4.63 | 08/01/27 | 330,000 | 328,494 |
| Ford Motor Credit Co. LLC | 2.90 | 02/10/29 | 225,000 | 197,057 |
| General Motors Financial Co., Inc. | 4.35 | 01/17/27 | 150,000 | 146,994 |
| Hyundai Capital America (a) | 5.50 | 03/30/26 | 380,000 | 381,972 |
| Hyundai Capital America (a) | 5.65 | 06/26/26 | 290,000 | 291,924 |
| Hyundai Capital America (a) | 5.60 | 03/30/28 | 290,000 | 294,291 |
| Hyundai Capital America (a) | 5.80 | 04/01/30 | 490,000 | 504,795 |
| Lowe`s Companies, Inc. | 5.85 | 04/01/63 | 205,000 | 214,697 |
| Tractor Supply Co. | 1.75 | 11/01/30 | 100,000 | 81,898 |
| US Airways 2013 1A PTT | 3.95 | 11/15/25 | 248,370 | 237,290 |
| Total Consumer Discretionary | | | | 3,141,113 |
| Consumer Staples | 2.3% | | |
| 7-Eleven Inc. (a) | 1.30 | 02/10/28 | 60,000 | 52,492 |
| 7-Eleven Inc. (a) | 1.80 | 02/10/31 | 60,000 | 48,764 |
| 7-Eleven Inc. (a) | 2.80 | 02/10/51 | 135,000 | 86,828 |
| Campbell Soup Co. | 2.38 | 04/24/30 | 250,000 | 216,689 |
| J.M Smucker Co. (The) | 6.50 | 11/15/53 | 375,000 | 432,465 |
| JBS USA Food Co. | 3.00 | 02/02/29 | 335,000 | 294,664 |
| JBS USA Food Co. | 4.38 | 02/02/52 | 530,000 | 394,555 |
| Kellogg Co. | 5.25 | 03/01/33 | 215,000 | 220,425 |
| Kenvue Inc. | 5.20 | 03/22/63 | 85,000 | 88,852 |
| Philip Morris International Inc. | 4.88 | 02/15/28 | 230,000 | 232,457 |
| Philip Morris International Inc. | 5.13 | 02/15/30 | 260,000 | 264,243 |
| Philip Morris International Inc. | 5.75 | 11/17/32 | 310,000 | 325,333 |
| Smithfield Foods, Inc. (a) | 2.63 | 09/13/31 | 340,000 | 262,972 |
| Total Consumer Staples | | | | 2,920,739 |
| Energy | 2.8% | | |
| BP Capital Markets America Inc. | 2.77 | 11/10/50 | 210,000 | 140,449 |
| Cheniere Corpus Christi Holdings LLC | 5.13 | 06/30/27 | 180,000 | 180,874 |
| Cheniere Corpus Christi Holdings LLC | 3.70 | 11/15/29 | 39,000 | 36,834 |
| Cheniere Corpus Christi Holdings LLC | 2.74 | 12/31/39 | 170,000 | 135,437 |
| Cheniere Energy Partners LP (a) | 5.95 | 06/30/33 | 105,000 | 107,808 |
| Energy Transfer Operating LP | 3.75 | 05/15/30 | 318,000 | 295,303 |
| Energy Transfer Operating LP | 6.00 | 06/15/48 | 420,000 | 423,119 |
| Entergy Arkansas, LLC | 5.15 | 01/15/33 | 205,000 | 208,985 |
| Marathon Oil Corp. | 4.40 | 07/15/27 | 360,000 | 351,106 |
| Midwest Connector Capital Co. LLC (a) | 4.63 | 04/01/29 | 205,000 | 197,364 |
| MPLX LP | 1.75 | 03/01/26 | 80,000 | 74,835 |
| MPLX LP | 2.65 | 08/15/30 | 245,000 | 211,416 |
| National Oilwell Varco, Inc. | 3.60 | 12/01/29 | 112,000 | 103,547 |
| Phillips 66 | 2.15 | 12/15/30 | 260,000 | 218,952 |
| Phillips 66 | 5.30 | 06/30/33 | 300,000 | 307,908 |
| Targa Resources Corp. | 5.20 | 07/01/27 | 260,000 | 261,248 |
| Portfolio of Investments | The accompanying notes are an integral part of these financial statements. |
52
Portfolio of Investments | Intermediate Bond Fund | December 31, 2023 | (Continued)
| Corporate Bonds–Other | 29.7% of portfolio (Continued) |
| | Interest Rate /Yield | Maturity Date | Face Amount | Value |
| Energy | 2.8% (Continued) | | |
| Targa Resources Corp. | 6.50% | 02/15/53 | $305,000 | $329,609 |
| Total Energy | | | | 3,584,794 |
| Financials | 11.6% | | |
| Ally Financial Inc. | 6.99(b) | 06/13/29 | 205,000 | 211,715 |
| American Express Co. | 4.99(b) | 05/01/26 | 250,000 | 249,267 |
| Antares Holdings LP | 3.95 | 07/15/26 | 375,000 | 348,774 |
| Athene Global Funding (a) | 2.95 | 11/12/26 | 120,000 | 111,774 |
| Athene Holding Ltd. | 3.95 | 05/25/51 | 300,000 | 225,203 |
| Bank of America Corp. | 4.83(b) | 07/22/26 | 740,000 | 734,290 |
| Bank of America Corp. | 1.20(b) | 10/24/26 | 200,000 | 185,711 |
| Bank of America Corp. | 4.95(b) | 07/22/28 | 525,000 | 524,929 |
| Bank of America Corp. | 6.20(b) | 11/10/28 | 150,000 | 156,471 |
| Bank of America Corp. | 2.50(b) | 02/13/31 | 263,000 | 225,842 |
| Bank of America Corp. | 5.02(b) | 07/22/33 | 445,000 | 440,208 |
| Blue Owl Capital Corp. III | 3.13 | 04/13/27 | 396,000 | 349,921 |
| Blue Owl Credit Income Corp. | 3.13 | 09/23/26 | 843,000 | 769,851 |
| Cantor Fitzgerald LP (a) | 7.20 | 12/12/28 | 190,000 | 194,754 |
| Citigroup Inc. | 2.57(b) | 06/03/31 | 870,000 | 743,169 |
| Citigroup Inc. | 6.27(b) | 11/17/33 | 445,000 | 476,155 |
| Fidus Investment Corp. | 3.50 | 11/15/26 | 166,000 | 150,118 |
| GA Global Funding Trust (a) | 0.80 | 09/13/24 | 240,000 | 230,627 |
| GA Global Funding Trust (a) | 3.85 | 04/11/25 | 460,000 | 450,653 |
| Goldman Sachs Group, Inc. | 2.64(b) | 02/24/28 | 245,000 | 227,117 |
| Goldman Sachs Group, Inc. | 3.62(b) | 03/15/28 | 153,000 | 146,748 |
| Goldman Sachs Group, Inc. | 2.38(b) | 07/21/32 | 365,000 | 299,894 |
| Goldman Sachs Group, Inc. | 2.91(b) | 07/21/42 | 230,000 | 167,779 |
| Goldman Sachs Group, Inc. | 3.44(b) | 02/24/43 | 255,000 | 199,167 |
| J.P. Morgan Chase & Co. | 2.08(b) | 04/22/26 | 340,000 | 325,669 |
| J.P. Morgan Chase & Co. | 1.04(b) | 02/04/27 | 150,000 | 137,859 |
| J.P. Morgan Chase & Co. | 6.07(b) | 10/22/27 | 125,000 | 128,589 |
| J.P. Morgan Chase & Co. | 5.30(b) | 07/24/29 | 195,000 | 197,869 |
| J.P. Morgan Chase & Co. | 4.91(b) | 07/25/33 | 185,000 | 182,915 |
| Keybank NA | 4.70 | 01/26/26 | 300,000 | 292,973 |
| M&T Bank Corp. | 7.41(b) | 10/30/29 | 175,000 | 188,235 |
| Manufacturers and Traders Trust Co. | 4.65 | 01/27/26 | 300,000 | 293,758 |
| Metropolitan Life Global Funding I (a) | 5.00 | 01/06/26 | 340,000 | 341,133 |
| Metropolitan Life Global Funding I (a) | 5.15 | 03/28/33 | 180,000 | 183,125 |
| Morgan Stanley | 5.88 | 10/30/26 | 275,000 | 282,762 |
| Morgan Stanley | 1.51(b) | 07/20/27 | 200,000 | 182,681 |
| Morgan Stanley | 5.16(b) | 04/20/29 | 320,000 | 321,829 |
| Morgan Stanley | 1.79(b) | 02/13/32 | 510,000 | 407,247 |
| Morgan Stanley | 4.89(b) | 07/20/33 | 170,000 | 165,762 |
| Northern Trust Corp. | 6.13 | 11/02/32 | 265,000 | 284,566 |
| Owl Rock Technology Finance Corp. | 3.75 | 06/17/26 | 150,000 | 137,147 |
| Owl Rock Technology Finance Corp. | 2.50 | 01/15/27 | 366,000 | 319,461 |
| Prudential Financial, Inc. | 5.70(b) | 09/15/48 | 75,000 | 72,001 |
| Santander Holdings USA, Inc. | 2.49(b) | 01/06/28 | 298,000 | 272,812 |
| Security Benefit Global Funding (a) | 1.25 | 05/17/24 | 300,000 | 294,233 |
| Wells Fargo & Co. | 2.19(b) | 04/30/26 | 210,000 | 201,257 |
| Wells Fargo & Co. | 3.53(b) | 03/24/28 | 240,000 | 228,964 |
| Wells Fargo & Co. | 2.39(b) | 06/02/28 | 445,000 | 407,587 |
| Wells Fargo & Co. | 5.57(b) | 07/25/29 | 375,000 | 382,901 |
| Wells Fargo & Co. | 2.57(b) | 02/11/31 | 200,000 | 172,824 |
| Wells Fargo & Co. | 6.49(b) | 10/23/34 | 220,000 | 239,335 |
| The accompanying notes are an integral part of these financial statements. | Portfolio of Investments |
53
Portfolio of Investments | Intermediate Bond Fund | December 31, 2023 | (Continued)
| Corporate Bonds–Other | 29.7% of portfolio (Continued) |
| | Interest Rate /Yield | Maturity Date | Face Amount | Value |
| Financials | 11.6% (Continued) | | |
| Wells Fargo & Co. | 3.07%(b) | 04/30/41 | $440,000 | $332,885 |
| Total Financials | | | | 14,798,516 |
| Health Care | 1.6% | | |
| Amgen Inc. | 5.75 | 03/02/63 | 215,000 | 225,566 |
| Bristol-Myers Squibb Co. | 6.25 | 11/15/53 | 127,000 | 145,354 |
| GE HealthCare Technologies Inc. | 5.60 | 11/15/25 | 225,000 | 226,995 |
| GE HealthCare Technologies Inc. | 5.65 | 11/15/27 | 255,000 | 263,937 |
| GE HealthCare Technologies Inc. | 5.91 | 11/22/32 | 270,000 | 288,002 |
| HCA Inc. | 5.90 | 06/01/53 | 315,000 | 322,892 |
| Pfizer Investment Enterprises Pte Ltd. | 4.65 | 05/19/30 | 195,000 | 196,373 |
| Pfizer Investment Enterprises Pte Ltd. | 5.11 | 05/19/43 | 95,000 | 94,662 |
| Pfizer Investment Enterprises Pte Ltd. | 5.30 | 05/19/53 | 255,000 | 260,325 |
| Total Health Care | | | | 2,024,106 |
| Industrials | 1.5% | | |
| Ashtead Capital, Inc. (a) | 1.50 | 08/12/26 | 240,000 | 217,596 |
| Ashtead Capital, Inc. (a) | 4.25 | 11/01/29 | 308,000 | 287,597 |
| Ashtead Capital, Inc. (a) | 2.45 | 08/12/31 | 200,000 | 162,822 |
| BNSF Railway Co. (a) | 3.44 | 06/16/28 | 340,144 | 325,153 |
| Boeing Co. (The) | 2.20 | 02/04/26 | 350,000 | 330,711 |
| Delta Air Lines, Inc. (a) | 7.00 | 05/01/25 | 250,000 | 254,353 |
| Quanta Services, Inc. | 2.35 | 01/15/32 | 260,000 | 215,150 |
| Triton International Ltd. | 3.25 | 03/15/32 | 175,000 | 140,102 |
| Total Industrials | | | | 1,933,484 |
| Information Technology | 0.7% | | |
| Avnet Inc. | 6.25 | 03/15/28 | 170,000 | 176,087 |
| Broadcom Cayman Finance Ltd. | 3.88 | 01/15/27 | 255,000 | 248,856 |
| VMware, Inc. | 1.40 | 08/15/26 | 155,000 | 141,776 |
| VMware, Inc. | 4.70 | 05/15/30 | 200,000 | 197,280 |
| VMware, Inc. | 2.20 | 08/15/31 | 155,000 | 128,435 |
| Total Information Technology | | | | 892,434 |
| Materials | 1.1% | | |
| Celanese US Holdings LLC | 6.05 | 03/15/25 | 140,000 | 140,857 |
| Celanese US Holdings LLC | 6.17 | 07/15/27 | 360,000 | 369,128 |
| Celanese US Holdings LLC | 6.33 | 07/15/29 | 260,000 | 272,551 |
| Celanese US Holdings LLC | 6.38 | 07/15/32 | 175,000 | 184,990 |
| Glencore Funding LLC (a) | 2.63 | 09/23/31 | 260,000 | 220,614 |
| Glencore Funding LLC (a) | 3.38 | 09/23/51 | 170,000 | 119,727 |
| Silgan Holdings Inc. (a) | 1.40 | 04/01/26 | 125,000 | 114,129 |
| Total Materials | | | | 1,421,996 |
| Real Estate | 0.9% | | |
| American Tower Corp. | 5.50 | 03/15/28 | 205,000 | 209,530 |
| Healthpeak OP, LLC | 5.25 | 12/15/32 | 125,000 | 126,361 |
| Host Hotels & Resorts, LP | 4.50 | 02/01/26 | 150,000 | 147,140 |
| Prologis, LP | 5.25 | 06/15/53 | 280,000 | 292,263 |
| Realty Income Corp. | 4.85 | 03/15/30 | 200,000 | 200,878 |
| VICI Properties LP | 4.75 | 02/15/28 | 180,000 | 176,213 |
| Total Real Estate | | | | 1,152,385 |
| Portfolio of Investments | The accompanying notes are an integral part of these financial statements. |
54
Portfolio of Investments | Intermediate Bond Fund | December 31, 2023 | (Continued)
| Corporate Bonds–Other | 29.7% of portfolio (Continued) |
| | Interest Rate /Yield | Maturity Date | Face Amount | Value |
| Utilities | 3.4% | | |
| Ameren Illinois Co. | 5.90% | 12/01/52 | $175,000 | $195,829 |
| American Electric Power Co., Inc. | 5.63 | 03/01/33 | 505,000 | 526,104 |
| Entergy Louisiana, LLC | 3.78 | 04/01/25 | 325,000 | 319,134 |
| Exelon Corp. | 5.15 | 03/15/28 | 235,000 | 238,862 |
| Florida Power & Light Co. | 5.05 | 04/01/28 | 170,000 | 173,766 |
| Indiana Michigan Power Co. | 5.63 | 04/01/53 | 215,000 | 225,551 |
| Indianapolis Power & Light Co. (a) | 5.65 | 12/01/32 | 260,000 | 269,083 |
| National Fuel Gas Co. | 5.50 | 01/15/26 | 80,000 | 80,087 |
| Oklahoma Gas & Electric Co. | 5.60 | 04/01/53 | 107,000 | 112,353 |
| Pacific Gas & Electric Co. | 3.00 | 06/15/28 | 225,000 | 205,055 |
| Pacific Gas & Electric Co. | 4.55 | 07/01/30 | 130,000 | 123,809 |
| Pacific Gas & Electric Co. | 4.25 | 03/15/46 | 770,000 | 591,790 |
| Public Service Electric & Gas Co. | 4.65 | 03/15/33 | 105,000 | 105,011 |
| Public Service Electric & Gas Co. | 5.13 | 03/15/53 | 300,000 | 312,410 |
| SCE Recovery Funding LLC | 2.51 | 11/15/43 | 190,000 | 130,646 |
| Southern California Edison Co. | 5.30 | 03/01/28 | 115,000 | 118,029 |
| Southern California Edison Co. | 2.25 | 06/01/30 | 55,000 | 47,200 |
| Southern California Edison Co. | 4.50 | 09/01/40 | 200,000 | 179,487 |
| Southern California Edison Co. | 4.00 | 04/01/47 | 164,000 | 133,685 |
| Southern California Edison Co. | 3.65 | 02/01/50 | 214,000 | 165,663 |
| TerraForm Power Operating LLC (a) | 4.75 | 01/15/30 | 171,000 | 159,030 |
| Total Utilities | | | | 4,412,584 |
| Total Corporate Bonds–Other | | | | |
| (Cost $40,235,556) | | | | 37,928,305 |
| U.S. Government & Agency Obligations | 17.2% of portfolio |
| | | | |
| Federal Farm Credit Bank | 0.52 | 10/21/25 | 300,000 | 279,333 |
| Federal Farm Credit Bank | 1.33 | 07/01/30 | 605,000 | 502,017 |
| U.S. International Development Finance Corp. | 1.05 | 10/15/29 | 106,613 | 97,117 |
| U.S. Treasury Note | 4.88 | 11/30/25 | 2,625,000 | 2,652,173 |
| U.S. Treasury Note | 4.63 | 11/15/26 | 800,000 | 812,625 |
| U.S. Treasury Note | 4.38 | 11/30/28 | 1,439,000 | 1,472,502 |
| U.S. Treasury Note | 4.38 | 11/30/30 | 2,450,000 | 2,519,289 |
| U.S. Treasury Note | 4.50 | 11/15/33 | 1,022,000 | 1,072,940 |
| U.S. Treasury Note | 2.38 | 02/15/42 | 4,918,000 | 3,773,413 |
| U.S. Treasury Note | 3.25 | 05/15/42 | 510,000 | 447,445 |
| U.S. Treasury Note | 3.38 | 08/15/42 | 4,374,000 | 3,900,207 |
| U.S. Treasury Note | 4.75 | 11/15/43 | 1,245,000 | 1,335,457 |
| U.S. Treasury Note | 4.13 | 08/15/53 | 3,080,000 | 3,113,206 |
| Total U.S. Government & Agency Obligations | | | | |
| (Cost $22,505,885) | | | | 21,977,724 |
| Asset-Backed Securities | 8.3% of portfolio |
| | | | |
| Avant Credit Card Master Trust 21-1A (a) | 1.37 | 04/15/27 | 500,000 | 479,910 |
| Avant Loans Funding Trust 21-REV1 (a) | 1.21 | 07/15/30 | 151,904 | 150,822 |
| Avant Loans Funding Trust 22-REV1 (a) | 6.54 | 09/15/31 | 595,000 | 594,152 |
| Colony American Finance Ltd. 21-2 (a) | 1.41 | 07/15/54 | 166,449 | 148,546 |
| CoreVest American Finance 20-4 (a) | 1.17 | 12/15/52 | 105,567 | 97,762 |
| CoreVest American Finance 21-1 (a) | 1.57 | 04/15/53 | 685,492 | 626,711 |
| CoreVest American Finance 21-3 (a) | 2.49 | 10/15/54 | 660,000 | 600,070 |
| Credit Acceptance Auto Loan Trust 21-2A (a) | 0.96 | 02/15/30 | 38,791 | 38,612 |
| Credito Real USA Auto Receivables Trust 21-1 (a) | 1.35 | 02/16/27 | 21,843 | 21,776 |
| FIC Funding 21-1 (a) | 1.13 | 04/15/33 | 32,061 | 31,612 |
| First Investors Auto Owner Trust 21-2A (a) | 0.48 | 03/15/27 | 83,558 | 82,148 |
| The accompanying notes are an integral part of these financial statements. | Portfolio of Investments |
55
Portfolio of Investments | Intermediate Bond Fund | December 31, 2023 | (Continued)
| Asset-Backed Securities | 8.3% of portfolio (Continued) |
| | Interest Rate /Yield | Maturity Date | Face Amount | Value |
| Firstkey Homes Trust 22-SFR2 (a) | 4.25% | 07/17/39 | $323,172 | $310,153 |
| Flagship Credit Auto Trust 21-3 (a) | 0.36 | 07/15/27 | 53,410 | 52,825 |
| Frontier Issuer 23-1A (a) | 6.60 | 08/20/53 | 1,000,000 | 994,816 |
| Frontier Issuer 23-1B (a) | 8.30 | 08/20/53 | 675,000 | 670,226 |
| FRTKL 21-SFR1 (a) | 1.57 | 09/17/38 | 250,000 | 224,367 |
| Gracie Point International Funding 23-2A (a) | 7.60(b) | 03/01/27 | 225,000 | 224,981 |
| John Deere Owner Trust 23-B | 5.18 | 03/15/28 | 185,000 | 186,612 |
| LAD Auto Receivables Trust 21-1 (a) | 1.30 | 08/17/26 | 61,395 | 60,647 |
| LAD Auto Receivables Trust 23-2 (a) | 5.93 | 06/15/27 | 179,979 | 180,106 |
| Oasis Securitisation 21-2A (a) | 2.14 | 10/15/33 | 86,908 | 86,134 |
| Oasis Securitisation 22-1A (a) | 4.75 | 05/15/34 | 58,278 | 58,093 |
| Oasis Securitisation 22-2A (a) | 6.85 | 10/15/34 | 266,609 | 266,447 |
| Oasis Securitisation 23-1A (a) | 7.00 | 02/15/35 | 296,329 | 296,020 |
| Oportun Funding 21-A (a) | 1.21 | 03/08/28 | 152,879 | 145,902 |
| Oportun Funding 21-B (a) | 1.47 | 05/08/31 | 1,000,000 | 934,098 |
| PenFed Auto Receivable Owner 22-A (a) | 3.96 | 04/15/26 | 323,401 | 320,674 |
| Progress Residential Trust 21-SFR8 (a) | 1.51 | 10/17/38 | 336,461 | 301,836 |
| Progress Residential Trust 22-SFR3 (a) | 3.20 | 04/17/39 | 247,241 | 231,019 |
| Progress Residential Trust 22-SFR3 (a) | 3.60 | 04/17/39 | 165,000 | 153,977 |
| SBA Tower Trust (a) | 2.84 | 01/15/25 | 230,000 | 222,104 |
| SBA Tower Trust (a) | 1.88 | 01/15/26 | 20,000 | 18,555 |
| SBA Tower Trust (a) | 1.63 | 11/15/26 | 240,000 | 214,286 |
| SBA Tower Trust (a) | 6.60 | 01/15/28 | 210,000 | 215,832 |
| SBA Tower Trust (a) | 2.59 | 10/15/31 | 430,000 | 345,841 |
| SBIC 2023-10B | 5.69 | 09/10/33 | 350,000 | 363,786 |
| T-Mobile US Trust 22-1A (a) | 4.91 | 05/22/28 | 505,000 | 503,962 |
| Upstart Securitization Trust 21-4 (a) | 0.84 | 09/20/31 | 8,418 | 8,391 |
| Westgate Resorts 22-1A (a) | 2.29 | 08/20/36 | 198,732 | 189,622 |
| Total Asset-Backed Securities | | | | |
| (Cost $11,026,394) | | | | 10,653,433 |
| Yankee Bonds | 5.9% of portfolio |
| | | | |
| AerCap Ireland Capital DAC | 3.88 | ���01/23/28 | 250,000 | 238,246 |
| Aptiv PLC | 3.10 | 12/01/51 | 280,000 | 182,445 |
| Avolon Holdings Funding Ltd. (a) | 5.50 | 01/15/26 | 625,000 | 620,957 |
| Avolon Holdings Funding Ltd. (a) | 2.75 | 02/21/28 | 130,000 | 115,484 |
| Banco Santander SA | 6.53(b) | 11/07/27 | 200,000 | 206,808 |
| Barclays PLC | 7.33(b) | 11/02/26 | 370,000 | 382,180 |
| Barclays PLC | 5.83(b) | 05/09/27 | 240,000 | 242,146 |
| BAT International Finance PLC | 5.93 | 02/02/29 | 450,000 | 467,557 |
| BHP Billiton Finance (USA) Ltd. | 4.90 | 02/28/33 | 490,000 | 501,062 |
| BP Capital Markets America Inc. | 4.81 | 02/13/33 | 110,000 | 110,904 |
| BPCE SA (a) | 5.98(b) | 01/18/27 | 250,000 | 251,960 |
| Cenovus Energy Inc. | 5.25 | 06/15/37 | 395,000 | 377,228 |
| Delta and SkyMiles IP Ltd. (a) | 4.75 | 10/20/28 | 550,000 | 540,919 |
| Deutsche Bank AG | 1.69 | 03/19/26 | 150,000 | 139,396 |
| Enbridge Inc. | 5.70 | 03/08/33 | 320,000 | 332,607 |
| Mitsubishi UFJ Financial Group Inc. | 3.74 | 03/07/29 | 300,000 | 287,010 |
| Mizuho Financial Group Inc. | 4.25(b) | 09/11/29 | 200,000 | 193,094 |
| Nissan Motor Co., Ltd. (a) | 2.45 | 09/15/28 | 435,000 | 372,518 |
| Nissan Motor Co., Ltd. (a) | 4.81 | 09/17/30 | 200,000 | 186,981 |
| OCI NV (a) | 6.70 | 03/16/33 | 310,000 | 316,579 |
| Petronas Capital Ltd. (a) | 3.40 | 04/28/61 | 360,000 | 257,989 |
| Santander UK Group Holdings PLC | 6.53(b) | 01/10/29 | 275,000 | 284,527 |
| Sumitomo Mitsui Financial Group Inc. | 5.46 | 01/13/26 | 240,000 | 242,352 |
| Sumitomo Mitsui Financial Group Inc. | 5.52 | 01/13/28 | 200,000 | 204,699 |
| Svenska Handelsbanken AB (a) | 5.50 | 06/15/28 | 260,000 | 264,622 |
| Portfolio of Investments | The accompanying notes are an integral part of these financial statements. |
56
Portfolio of Investments | Intermediate Bond Fund | December 31, 2023 | (Continued)
| Yankee Bonds | 5.9% of portfolio (Continued) |
| | Interest Rate /Yield | Maturity Date | Face Amount | Value |
| Var Energi ASA (a) | 7.50% | 01/15/28 | $200,000 | $211,951 |
| Total Yankee Bonds | | | | |
| (Cost $7,751,530) | | | | 7,532,221 |
| Municipal Bonds | 1.8% of portfolio |
| | | | |
| Arizona | 0.2% | | |
| Pinal County Arizona Revenue Obligation | 1.05 | 08/01/24 | 120,000 | 117,187 |
| Pinal County Arizona Revenue Obligation | 1.58 | 08/01/26 | 110,000 | 101,646 |
| Yuma Arizona Pledged Revenue | 2.63 | 07/15/38 | 135,000 | 105,723 |
| Total Arizona | | | | 324,556 |
| California | 1.4% | | |
| City of Chula Vista California Pension Obligation | 1.16 | 06/01/27 | 130,000 | 115,443 |
| City of Chula Vista California Pension Obligation | 1.41 | 06/01/28 | 130,000 | 113,109 |
| City of Chula Vista California Pension Obligation | 1.63 | 06/01/29 | 160,000 | 136,348 |
| City of Chula Vista California Pension Obligation | 2.91 | 06/01/45 | 255,000 | 172,895 |
| City of Los Angeles California Department of Airports | 1.25 | 05/15/28 | 200,000 | 173,705 |
| City of Monterey Park California Pension Obligation | 1.89 | 06/01/30 | 1,000,000 | 845,245 |
| Huntington Beach California Pension Obligation | 1.68 | 06/15/27 | 155,000 | 140,464 |
| San Francisco California City & County Airports | 3.35 | 05/01/51 | 100,000 | 76,001 |
| Total California | | | | 1,773,210 |
| Texas | 0.1% | | |
| North Texas Tollway Authority Revenue | 3.01 | 01/01/43 | 150,000 | 115,102 |
| Total Texas | | | | 115,102 |
| West Virginia | 0.1% | | |
| West Virginia State University Revenues | 3.01 | 10/01/41 | 150,000 | 114,266 |
| Total West Virginia | | | | 114,266 |
| Total Municipal Bonds | | | | |
| (Cost $2,795,000) | | | | 2,327,134 |
| Corporate Bond Guaranteed by Export-Import Bank of the United States | 0.1% of portfolio |
| | | | |
| Energy | 0.1% | | |
| Petroleos Mexicanos | 6.01(b) | 04/15/25 | 107,250 | 107,130 |
| Total Energy | | | | 107,130 |
| Total Corporate Bond Guaranteed by Export-Import Bank of the United States | | | | |
| (Cost $107,215) | | | | 107,130 |
| Money Market Fund | 3.4% of portfolio |
| | | | Shares | |
| State Street Institutional U.S. Government Money Market Fund Premier Class | 5.32(c) | | 4,341,712 | 4,341,712 |
| Total Money Market Fund | | | | |
| (Cost $4,341,712) | | | | 4,341,712 |
| Total Investments in Securities | | | | |
| (Cost $133,356,701) | 100.0% | | | | $127,881,730 |
| The accompanying notes are an integral part of these financial statements. | Portfolio of Investments |
57
Portfolio of Investments | Intermediate Bond Fund | December 31, 2023 | (Continued)
| (a) | Security was purchased pursuant to Rule 144A under the Securities Act of 1933 and may be resold in transactions exempt from registration, normally to qualified institutional buyers. The securities have been determined to be liquid under criteria established by the Fund's Board of Trustees. The total of such securities at period-end amounts to $21,056,612 and represents 16.5% of total investments. |
| (b) | Variable coupon rate as of December 31, 2023. |
| (c) | 7-day yield at December 31, 2023. |
FHLMC -Federal Home Loan Mortgage Corporation
LLC -Limited Liability Company
N.A. -North America
LP -Limited Partnership
NA -National Association
Pte -Private Limited Company
DAC -Designated Activity Company
PLC -Public Limited Company
SA -Sociedad Anonima or Societe Anonyme
AG -Aktiengesellschaft
NV -Naamloze Vennottschap
AB -Aktiebolag
ASA -Allmennaksjeselskap
| Portfolio of Investments | The accompanying notes are an integral part of these financial statements. |
58
Portfolio of Investments
Rural America Growth & Income Fund | December 31, 2023
| Common Stocks | 57.2% of portfolio |
| | | | Shares | Value |
| Communication Services | 1.7% |
| Media | | | | |
| Cable One, Inc. | | | 42 | $23,377 |
| Wireless Telecommunication Services | | | | |
| T-Mobile U.S., Inc. | | | 872 | 139,808 |
| Total Communication Services | | | | 163,185 |
| Consumer Discretionary | 7.0% |
| Hotels, Restaurants & Leisure | | | | |
| Choice Hotels International, Inc. | | | 1,059 | 119,985 |
| Leisure Products | | | | |
| Malibu Boats, Inc. Class A (a) | | | 1,079 | 59,151 |
| Specialty Retail | | | | |
| ARKO Corp. | | | 4,866 | 40,145 |
| Burlington Stores, Inc. (a) | | | 552 | 107,353 |
| Lowe's Companies, Inc. | | | 317 | 70,548 |
| Ollie's Bargain Outlet Holdings, Inc. (a) | | | 588 | 44,623 |
| O'Reilly Automotive, Inc. (a) | | | 151 | 143,462 |
| Tractor Supply Co. | | | 503 | 108,160 |
| Total Consumer Discretionary | | | | 693,427 |
| Consumer Staples | 2.0% |
| Consumer Staples Distribution & Retail | | | | |
| Dollar General Corp. | | | 344 | 46,767 |
| Food Products | | | | |
| Hershey Co. (The) | | | 785 | 146,355 |
| Total Consumer Staples | | | | 193,122 |
| Energy | 3.3% |
| Oil, Gas & Consumable Fuels | | | | |
| Chevron Corp. | | | 705 | 105,158 |
| ConocoPhillips | | | 981 | 113,865 |
| Marathon Petroleum Corp. | | | 724 | 107,412 |
| Total Energy | | | | 326,435 |
| Financials | 7.2% |
| Banks | | | | |
| FB Financial Corp. | | | 568 | 22,635 |
| Glacier Bancorp, Inc. | | | 991 | 40,948 |
| SouthState Corp. | | | 346 | 29,220 |
| Truist Financial Corp. | | | 2,002 | 73,914 |
| Capital Markets | | | | |
| CME Group, Inc. | | | 769 | 161,951 |
| Intercontinental Exchange, Inc. | | | 948 | 121,752 |
| Financial Services | | | | |
| Jack Henry & Associates, Inc. | | | 842 | 137,591 |
| Insurance | | | | |
| Allstate Corp. | | | 180 | 25,196 |
| American International Group, Inc. | | | 548 | 37,127 |
| Chubb Ltd. | | | 266 | 60,116 |
| Total Financials | | | | 710,450 |
| The accompanying notes are an integral part of these financial statements. | Portfolio of Investments |
59
Portfolio of Investments | Rural America Growth & Income Fund | December 31, 2023 |
(Continued)
| Common Stocks | 57.2% of portfolio (Continued) |
| | | | Shares | Value |
| Health Care | 9.8% |
| Health Care Equipment & Supplies | | | | |
| Integer Holdings Corp. (a) | | | 1,400 | $138,712 |
| Stryker Corp. | | | 624 | 186,863 |
| Health Care Providers & Services | | | | |
| AMN Healthcare Services, Inc. (a) | | | 685 | 51,293 |
| Cencora, Inc. | | | 275 | 56,479 |
| Centene Corp. (a) | | | 1,489 | 110,499 |
| Life Sciences Tools & Services | | | | |
| IQVIA Holdings Inc. (a) | | | 564 | 130,499 |
| Mettler-Toledo International, Inc. (a) | | | 51 | 61,861 |
| Pharmaceuticals | | | | |
| Zoetis Inc. | | | 1,176 | 232,107 |
| Total Health Care | | | | 968,313 |
| Industrials | 9.6% |
| Commercial Services & Supplies | | | | |
| Casella Waste Systems, Inc. Class A (a) | | | 793 | 67,770 |
| Ground Transportation | | | | |
| CSX Corp. | | | 3,403 | 117,982 |
| J.B. Hunt Transport Services, Inc. | | | 344 | 68,710 |
| Machinery | | | | |
| Cummins Inc. | | | 241 | 57,737 |
| Deere & Co. | | | 522 | 208,732 |
| Xylem, Inc. | | | 267 | 30,534 |
| Software | | | | |
| Paycom Software, Inc. | | | 480 | 99,226 |
| Trading Companies & Distributors | | | | |
| Applied Industrial Technologies, Inc. | | | 595 | 102,750 |
| Fastenal Co. | | | 2,913 | 188,675 |
| Total Industrials | | | | 942,116 |
| Information Technology | 8.6% |
| Electronic Equipment, Instruments & Components | | | | |
| Advanced Energy Industries, Inc. | | | 948 | 103,256 |
| Corning Inc. | | | 3,070 | 93,482 |
| Trimble Inc. (a) | | | 1,522 | 80,970 |
| Semiconductors & Semiconductor Equipment | | | | |
| Diodes Inc. (a) | | | 1,204 | 96,946 |
| Micron Technology, Inc. | | | 1,736 | 148,150 |
| Software | | | | |
| ANSYS, Inc. (a) | | | 482 | 174,908 |
| Tyler Technologies, Inc. (a) | | | 354 | 148,015 |
| Total Information Technology | | | | 845,727 |
| Materials | 3.9% |
| Chemicals | | | | |
| Sherwin-Williams Co. (The) | | | 309 | 96,377 |
| Construction Materials | | | | |
| Vulcan Materials Co. | | | 413 | 93,755 |
| Containers & Packaging | | | | |
| Ball Corp. | | | 1,577 | 90,709 |
| Metals & Mining | | | | |
| Freeport-McMoRan Inc. | | | 2,303 | 98,039 |
| Total Materials | | | | 378,880 |
| Portfolio of Investments | The accompanying notes are an integral part of these financial statements. |
60
Portfolio of Investments | Rural America Growth & Income Fund | December 31, 2023 |
(Continued)
| Common Stocks | 57.2% of portfolio (Continued) |
| | | | Shares | Value |
| Real Estate | 4.1% |
| Health Care REITs | | | | |
| Community Healthcare Trust Inc. | | | 798 | $21,259 |
| Specialized REITs | | | | |
| American Tower Corp. | | | 802 | 173,136 |
| Crown Castle Inc. | | | 1,302 | 149,977 |
| Uniti Group Inc. | | | 9,981 | 57,690 |
| Total Real Estate | | | | 402,062 |
| Total Common Stocks | | | | |
| (Cost $ 5,505,492) | | | | 5,623,717 |
| U.S. Government & Agency Obligations | 22.7% of portfolio |
| | Interest Rate /
Yield | Maturity Date | Face Amount | |
| Federal Farm Credit Bank | 0.52% | 10/21/25 | $200,000 | 186,222 |
| Federal Farm Credit Bank | 3.32 | 02/25/26 | 200,000 | 196,102 |
| Federal Farm Credit Bank | 1.20 | 04/28/27 | 195,000 | 176,065 |
| Federal Farm Credit Bank | 3.38 | 09/15/27 | 65,000 | 63,432 |
| Federal Farm Credit Bank | 3.88 | 08/15/28 | 265,000 | 263,265 |
| Federal Farm Credit Bank | 3.43 | 12/06/28 | 62,000 | 60,336 |
| Federal Farm Credit Bank | 4.00 | 09/27/29 | 200,000 | 199,378 |
| Federal Farm Credit Bank | 4.09 | 05/03/32 | 324,000 | 312,653 |
| Federal Farm Credit Bank | 3.50 | 09/01/32 | 50,000 | 47,113 |
| Federal Farm Credit Bank | 2.50 | 04/14/36 | 70,000 | 54,786 |
| Federal Farm Credit Banks Funding Corp. | 2.25 | 01/14/30 | 70,000 | 62,399 |
| Federal Farm Credit Banks Funding Corp. | 6.69 | 10/18/38 | 30,000 | 30,349 |
| Tennessee Valley Authority | 2.88 | 09/15/24 | 99,000 | 97,520 |
| Tennessee Valley Authority | 0.75 | 05/15/25 | 128,000 | 121,407 |
| Tennessee Valley Authority | 1.50 | 09/15/31 | 65,000 | 53,839 |
| U.S. Treasury Note | 4.87 | 11/30/25 | 18,000 | 18,186 |
| U.S. Treasury Note | 4.62 | 11/15/26 | 269,000 | 273,245 |
| U.S. Treasury Note | 4.37 | 11/30/30 | 14,000 | 14,396 |
| Total U.S. Government & Agency Obligations | | | | |
| (Cost $ 2,254,328) | | | | 2,230,693 |
| Corporate Bonds–Other | 9.8% of portfolio |
| | | | |
| Communication Services | 1.4% |
| DISH DBS Corp. (b) | 5.25 | 12/01/26 | 57,000 | 48,835 |
| T-Mobile USA Inc. | 4.80 | 07/15/28 | 41,000 | 41,343 |
| T-Mobile USA, Inc. | 3.75 | 04/15/27 | 44,000 | 42,677 |
| Total Communication Services | | | | 132,855 |
| Consumer Discretionary | 1.1% |
| Choice Hotels International, Inc. | 3.70 | 01/15/31 | 25,000 | 21,551 |
| Dollar General Corp. | 5.00 | 11/01/32 | 30,000 | 29,918 |
| Kohl's Corp. | 4.25 | 07/17/25 | 22,000 | 21,470 |
| Tractor Supply Co. | 1.75 | 11/01/30 | 44,000 | 36,035 |
| Total Consumer Discretionary | | | | 108,974 |
| Consumer Staples | 0.4% |
| Bunge Limited Finance Corp. | 3.75 | 09/25/27 | 10,000 | 9,636 |
| Bunge Limited Finance Corp. | 2.75 | 05/14/31 | 35,000 | 30,463 |
| Total Consumer Staples | | | | 40,099 |
| The accompanying notes are an integral part of these financial statements. | Portfolio of Investments |
61
Portfolio of Investments | Rural America Growth & Income Fund | December 31, 2023 |
(Continued)
| Corporate Bonds–Other | 9.8% of portfolio (Continued) |
| | Interest Rate /Yield | Maturity Date | Face Amount | Value |
| Energy | 0.0% |
| Murphy Oil Corp. | 6.38% | 07/15/28 | $2,000 | $2,009 |
| Total Energy | | | | 2,009 |
| Financials | 3.5% |
| American Tower Corp. | 3.95 | 03/15/29 | 60,000 | 57,251 |
| Chubb INA Holdings Inc. | 3.15 | 03/15/25 | 36,000 | 35,204 |
| Cincinnati Financial Corp. | 6.92 | 05/15/28 | 25,000 | 26,805 |
| Globe Life Inc. | 4.55 | 09/15/28 | 33,000 | 32,724 |
| Intercontinental Exchange, Inc. | 3.75 | 12/01/25 | 78,000 | 76,658 |
| M&T Bank Corp. | 7.41 (c) | 10/30/29 | 35,000 | 37,647 |
| Metlife, Inc. | 3.00 | 03/01/25 | 42,000 | 41,083 |
| Truist Financial Corp. | 1.27 (c) | 03/02/27 | 45,000 | 41,195 |
| Total Financials | | | | 348,567 |
| Health Care | 0.8% |
| Laboratory Corporation of America Holdings | 1.55 | 06/01/26 | 43,000 | 39,732 |
| Zoetis Inc. | 5.40 | 11/14/25 | 40,000 | 40,326 |
| Total Health Care | | | | 80,058 |
| Industrials | 0.5% |
| CNH Industrial Capital LLC | 1.45 | 07/15/26 | 17,000 | 15,592 |
| J.B. Hunt Transport Services, Inc. | 3.87 | 03/01/26 | 23,000 | 22,539 |
| John Deere Capital Corp. | 4.95 | 07/14/28 | 15,000 | 15,378 |
| Total Industrials | | | | 53,509 |
| Information Technology | 0.3% |
| Micron Technology, Inc. | 4.66 | 02/15/30 | 26,000 | 25,376 |
| Total Information Technology | | | | 25,376 |
| Materials | 0.8% |
| Mosaic Co. | 4.05 | 11/15/27 | 22,000 | 21,453 |
| Steel Dynamics, Inc. | 2.40 | 06/15/25 | 27,000 | 25,874 |
| Vulcan Materials Co. | 3.50 | 06/01/30 | 32,000 | 29,764 |
| Total Materials | | | | 77,091 |
| Real Estate | 0.5% |
| American Tower Corp. | 5.50 | 03/15/28 | 30,000 | 30,663 |
| Crown Castle International Corp. | 3.80 | 02/15/28 | 18,000 | 17,098 |
| Total Real Estate | | | | 47,761 |
| Utilities | 0.5% |
| Black Hills Corp. | 2.50 | 06/15/30 | 60,000 | 50,421 |
| Total Utilities | | | | 50,421 |
| Total Corporate Bonds–Other | | | | |
| (Cost $ 1,016,563) | | | | 966,720 |
| Asset-Backed Securities | 2.0% of portfolio |
| | | | |
| CNH Equipment Trust 22-A | 2.39 | 08/15/25 | 20,871 | 20,811 |
| John Deere Owner Trust 23-A | 5.01 | 11/15/27 | 50,000 | 50,095 |
| John Deere Owner Trust 23-B | 5.18 | 03/15/28 | 20,000 | 20,174 |
| SBA Tower Trust (b) | 1.63 | 11/15/26 | 30,000 | 26,786 |
| Portfolio of Investments | The accompanying notes are an integral part of these financial statements. |
62
Portfolio of Investments | Rural America Growth & Income Fund | December 31, 2023 |
(Continued)
| Asset-Backed Securities | 2.0% of portfolio (Continued) |
| | Interest Rate /Yield | Maturity Date | Face Amount | Value |
| SBA Tower Trust (b) | 2.59% | 10/15/31 | $52,000 | $41,823 |
| SBA Tower Trust (b) | 2.84 | 01/15/25 | 35,000 | 33,798 |
| Total Asset-Backed Securities | | | | |
| (Cost $ 208,130) | | | | 193,487 |
| Mortgage-Backed Securities | 1.8% of portfolio |
| | | | |
| Farm 2021-1 Mortgage Trust 21-1 (b) | 2.18(c) | 01/25/51 | 25,544 | 21,012 |
| Freddie Mac Multiclass Certificates 21-P009 | 1.13 | 01/25/31 | 37,677 | 33,289 |
| GNMA 786428 | 4.00 | 06/20/52 | 48,432 | 45,583 |
| GNMA 786576 | 4.50 | 09/20/52 | 58,074 | 55,900 |
| GNMA II POOL 785401 | 2.50 | 10/20/50 | 27,377 | 23,238 |
| Total Mortgage-Backed Securities | | | | |
| (Cost $ 191,770) | | | | 179,022 |
| Municipal Bonds | 1.2% of portfolio |
| | | | |
| Kansas | 0.1% |
| City of Wichita, Kansas Water & Sewer Utility Revenue | 3.00 | 10/01/24 | 10,000 | 9,862 |
| Montana | 0.1% |
| Yellowstone County School District No. 2 Billings | 2.22 | 06/15/32 | 15,000 | 12,435 |
| Pennsylvania | 0.4% |
| Geisinger Health System Revenue | 2.25 | 04/01/27 | 20,000 | 18,598 |
| New Castle Sanitation Authority | 1.16 | 06/01/25 | 25,000 | 23,703 |
| Total Pennsylvania | | | | 42,301 |
| Texas | 0.3% |
| Grey Forest Texas Gas System Revenue | 1.05 | 02/01/25 | 30,000 | 28,673 |
| Washington | 0.3% |
| Northwest Open Access Network Revenue | 1.69 | 12/01/27 | 30,000 | 26,375 |
| Total Municipal Bonds | | | | |
| (Cost $ 131,069) | | | | 119,646 |
| Money Market Fund | 5.3% of portfolio |
| | | | Shares | |
| State Street Institutional U.S. Government Money Market Fund | 5.32%(d) | | 526,096 | 526,096 |
| Total Money Market Fund | | | | |
| (Cost $ 526,096) | | | | 526,096 |
| Total Investments in Securities | | | | |
| (Cost $9,833,448) | 100.0% | | | | $9,839,381 |
| (a) | Non-income producing. |
| (b) | Security was purchased pursuant to Rule 144A under the Securities Act of 1933 and may be resold in transactions exempt from registration, normally to qualified institutional buyers. The securities have been determined to be liquid under criteria established by the Fund's Board of Directors. The total of such securities at period-end amounts to $172,254 and represents 1.8% of total investments. |
| (c) | Variable coupon rate as of December 31, 2023. |
| (d) | 7-day yield at December 31, 2023. |
CME -Chicago Mercantile Exchange
LLC -Limited Liability Company
| The accompanying notes are an integral part of these financial statements. | Portfolio of Investments |
63
Portfolio of Investments
Stock Index Fund | December 31, 2023
| | Cost | Value |
| Investment | $28,317,751 | $224,179,784 |
Substantially all the assets of the Stock Index Fund are invested in the S&P 500 Index Master Portfolio managed by BlackRock Fund Advisors. As of December 31, 2023, the Stock Index Fund's ownership interest in the S&P 500 Index Master Portfolio was 0.62%. See the Appendix for the S&P 500 Index Master Portfolio for holdings information.
| Portfolio of Investments | The accompanying notes are an integral part of these financial statements. |
64
Portfolio of Investments
Value Fund | December 31, 2023
| Common Stocks | 98.9% of portfolio |
| | Shares | Value |
| Communication Services | 7.4% |
| Entertainment | | |
| Walt Disney Co. (The) | 144,900 | $13,083,021 |
| Interactive Media & Services | | |
| Alphabet, Inc., Class C (a) | 195,720 | 27,582,820 |
| Meta Platforms, Inc., Class A (a) | 84,000 | 29,732,640 |
| Total Communication Services | | 70,398,481 |
| Consumer Discretionary | 7.5% |
| Distributors | | |
| LKQ Corp. | 109,600 | 5,237,784 |
| Hotels, Restaurants & Leisure | | |
| McDonald's Corp. | 57,097 | 16,929,832 |
| Household Durables | | |
| PulteGroup, Inc. | 50,200 | 5,181,644 |
| Specialty Retail | | |
| Home Depot, Inc. | 36,918 | 12,793,933 |
| TJX Companies, Inc. (The) | 143,200 | 13,433,592 |
| Ulta Beauty, Inc. (a) | 35,356 | 17,324,086 |
| Total Consumer Discretionary | | 70,900,871 |
| Consumer Staples | 0.9% |
| Food Products | | |
| Kraft Heinz Co. (The) | 227,700 | 8,420,346 |
| Total Consumer Staples | | 8,420,346 |
| Energy | 7.6% |
| Oil, Gas & Consumable Fuels | | |
| Chevron Corp. | 165,900 | 24,745,644 |
| ConocoPhillips | 237,500 | 27,566,625 |
| Hess Corp. | 139,800 | 20,153,568 |
| Total Energy | | 72,465,837 |
| Financials | 20.6% |
| Banks | | |
| Bank of America Corp. | 557,102 | 18,757,625 |
| Citigroup, Inc. | 124,439 | 6,401,142 |
| JPMorgan Chase & Co. | 229,791 | 39,087,449 |
| Truist Financial Corp. | 318,400 | 11,755,328 |
| Capital Markets | | |
| Goldman Sachs Group, Inc. | 76,674 | 29,578,529 |
| Financial Services | | |
| Fiserv, Inc. (a) | 197,400 | 26,222,616 |
| Visa Inc., Class A | 85,798 | 22,337,509 |
| Insurance | | |
| Allstate Corp. | 86,984 | 12,176,020 |
| American International Group, Inc. | 160,794 | 10,893,794 |
| Chubb Ltd. | 78,938 | 17,839,988 |
| Total Financials | | 195,050,000 |
| Health Care | 18.2% |
| Biotechnology | | |
| AbbVie Inc. | 180,763 | 28,012,842 |
| Common Stocks | 98.9% of portfolio (Continued) |
| | Shares | Value |
| Health Care | 18.2% (Continued) |
| Health Care Equipment & Supplies | | |
| Abbott Laboratories | 265,156 | $29,185,720 |
| Boston Scientific Corp. (a) | 432,396 | 24,996,813 |
| Health Care Providers & Services | | |
| Centene Corp. (a) | 328,597 | 24,385,183 |
| Cigna Corp. | 64,814 | 19,408,552 |
| Pharmaceuticals | | |
| Bristol-Myers Squibb Co. | 248,501 | 12,750,586 |
| Merck & Co., Inc. | 187,182 | 20,406,582 |
| Pfizer, Inc. | 148,699 | 4,281,044 |
| Royalty Pharma PLC, Class A | 345,684 | 9,710,264 |
| Total Health Care | | 173,137,586 |
| Industrials | 16.5% |
| Aerospace & Defense | | |
| Northrop Grumman Corp. | 47,031 | 22,017,092 |
| Electrical Equipment | | |
| Eaton Corp. PLC | 88,687 | 21,357,603 |
| Ground Transportation | | |
| CSX Corp. | 617,782 | 21,418,502 |
| Industrial Conglomerates | | |
| Honeywell International, Inc. | 165,173 | 34,638,430 |
| Machinery | | |
| Deere & Co. | 46,700 | 18,673,929 |
| Parker-Hannifin Corp. | 83,422 | 38,432,516 |
| Total Industrials | | 156,538,072 |
| Information Technology | 8.3% |
| Semiconductors & Semiconductor Equipment | | |
| Lam Research Corp. | 28,300 | 22,166,258 |
| NXP Semiconductors NV | 94,763 | 21,765,166 |
| Software | | |
| Microsoft Corp. | 70,914 | 26,666,500 |
| Oracle Corp. | 73,400 | 7,738,562 |
| Total Information Technology | | 78,336,486 |
| Materials | 6.8% |
| Chemicals | | |
| Dow Inc. | 157,281 | 8,625,290 |
| DuPont de Nemours, Inc. | 226,278 | 17,407,566 |
| Containers & Packaging | | |
| Avery Dennison Corp. | 117,587 | 23,771,388 |
| Metals & Mining | | |
| Freeport-McMoRan Inc. | 351,300 | 14,954,841 |
| Total Materials | | 64,759,085 |
| Real Estate | 5.1% |
| Specialized REITs | | |
| Crown Castle Inc. | 130,700 | 15,055,333 |
| Digital Realty Trust, Inc. | 111,801 | 15,046,178 |
| The accompanying notes are an integral part of these financial statements. | Portfolio of Investments |
65
Portfolio of Investments | Value Fund | December 31, 2023 | (Continued)
| Common Stocks | 98.9% of portfolio (Continued) |
| | Shares | Value |
| Real Estate | 5.1% (Continued) |
| VICI Properties Inc. | 583,535 | $18,603,096 |
| Total Real Estate | | 48,704,607 |
| Total Common Stocks | | |
| (Cost $529,203,947) | | 938,711,371 |
| Money Market Fund | 1.1% of portfolio |
| | |
| State Street Institutional U.S. Government Money Market Fund Premier Class, 5.32% (b) | 10,418,823 | 10,418,823 |
| Total Money Market Fund | | |
| (Cost $10,418,823) | | 10,418,823 |
| Total Investments in Securities | | |
| (Cost $539,622,770) | 100.0% | | $949,130,194 |
| (a) | Non-income producing. |
| (b) | 7-day yield at December 31, 2023. |
PLC -Public Limited Company
NV -Naamloze Vennottschap
| Portfolio of Investments | The accompanying notes are an integral part of these financial statements. |
66
Portfolio of Investments
Growth Fund | December 31, 2023
| Common Stocks | 99.1% of portfolio |
| | Shares | Value |
| Communication Services | 14.3% |
| Entertainment | | |
| Netflix, Inc. (a) | 7,936 | $3,863,880 |
| Spotify Technology SA (a) | 12,029 | 2,260,369 |
| Interactive Media & Services | | |
| Alphabet, Inc., Class A (a) | 156,840 | 21,908,980 |
| Meta Platforms, Inc., Class A (a) | 37,883 | 13,409,067 |
| Snap Inc., Class A (a) | 83,023 | 1,405,579 |
| Wireless Telecommunication Services | | |
| T-Mobile U.S., Inc. | 17,980 | 2,882,733 |
| Total Communication Services | | 45,730,608 |
| Consumer Discretionary | 12.2% |
| Automobiles | | |
| Rivian Automotive, Inc. (a) | 61,653 | 1,446,379 |
| Broadline Retail | | |
| Amazon.com, Inc. (a) | 150,916 | 22,930,177 |
| Coupang, Inc. (a) | 103,143 | 1,669,885 |
| Hotels, Restaurants & Leisure | | |
| Booking Holdings, Inc. (a) | 1,373 | 4,870,333 |
| Chipotle Mexican Grill, Inc. (a) | 1,234 | 2,822,109 |
| Leisure Products | | |
| Peloton Interactive, Inc. (a) | 115,400 | 702,786 |
| Specialty Retail | | |
| Ross Stores, Inc. | 33,407 | 4,623,195 |
| Total Consumer Discretionary | | 39,064,864 |
| Consumer Staples | 1.6% |
| Beverages | | |
| Monster Beverage Corp. (a) | 55,611 | 3,203,750 |
| Consumer Staples Distribution & Retail | | |
| Dollar General Corp. | 13,099 | 1,780,809 |
| Total Consumer Staples | | 4,984,559 |
| Energy | 0.7% |
| Energy Equipment & Services | | |
| Schlumberger NV | 46,406 | 2,414,968 |
| Total Energy | | 2,414,968 |
| Financials | 10.8% |
| Capital Markets | | |
| Charles Schwab Corp. | 15,500 | 1,066,400 |
| Tradeweb Markets Inc. | 19,180 | 1,743,079 |
| Financial Services | | |
| Affirm Holdings, Inc. (a) | 14,763 | 725,454 |
| Fiserv, Inc. (a) | 70,817 | 9,407,330 |
| Global Payments, Inc. | 30,213 | 3,837,051 |
| Mastercard Inc., Class A | 22,925 | 9,777,742 |
| Visa Inc., Class A | 30,867 | 8,036,223 |
| Total Financials | | 34,593,279 |
| Common Stocks | 99.1% of portfolio (Continued) |
| | Shares | Value |
| Health Care | 16.0% |
| Biotechnology | | |
| Legend Biotech Corp. ADR (a) | 22,217 | $1,336,797 |
| Vertex Pharmaceuticals, Inc. (a) | 3,482 | 1,416,791 |
| Health Care Equipment & Supplies | | |
| Becton, Dickinson & Co. | 14,414 | 3,514,566 |
| Intuitive Surgical, Inc. (a) | 21,007 | 7,086,921 |
| Penumbra, Inc. (a) | 4,288 | 1,078,603 |
| Stryker Corp. | 21,593 | 6,466,240 |
| Health Care Providers & Services | | |
| Cigna Corp. | 28,293 | 8,472,339 |
| Humana, Inc. | 4,177 | 1,912,272 |
| UnitedHealth Group, Inc. | 23,880 | 12,572,104 |
| Life Sciences Tools & Services | | |
| Danaher Corp. | 4,009 | 927,442 |
| Pharmaceuticals | | |
| Eli Lilly & Co. | 11,290 | 6,581,167 |
| Total Health Care | | 51,365,242 |
| Industrials | 2.5% |
| Aerospace & Defense | | |
| Howmet Aerospace Inc. | 21,708 | 1,174,837 |
| Machinery | | |
| Ingersoll Rand Inc. | 55,929 | 4,325,549 |
| Professional Services | | |
| Paylocity Holding Corp. (a) | 14,802 | 2,440,109 |
| Total Industrials | | 7,940,495 |
| Information Technology | 41.0% |
| Electronic Equipment, Instruments & Components | | |
| Amphenol Corp., Class A | 53,239 | 5,277,582 |
| IT Services | | |
| MongoDB, Inc. (a) | 1,916 | 783,357 |
| Semiconductors & Semiconductor Equipment | | |
| Advanced Micro Devices, Inc. (a) | 16,504 | 2,432,855 |
| ASML Holding NV ADR | 5,681 | 4,300,062 |
| NVIDIA Corp. | 34,163 | 16,918,201 |
| Software | | |
| Adobe Inc. (a) | 7,152 | 4,266,883 |
| Atlassian Corp., Class A (a) | 15,292 | 3,637,355 |
| Aurora Innovation, Inc. (a) | 117,273 | 512,483 |
| Cadence Design Systems, Inc. (a) | 10,367 | 2,823,660 |
| Dynatrace, Inc. (a) | 46,207 | 2,527,061 |
| Fair Isaac Corp. (a) | 2,070 | 2,409,501 |
| Intuit, Inc. | 19,773 | 12,358,718 |
| Microsoft Corp. | 112,140 | 42,169,126 |
| salesforce.com, Inc. (a) | 10,117 | 2,662,187 |
| ServiceNow, Inc. (a) | 7,797 | 5,508,502 |
| The accompanying notes are an integral part of these financial statements. | Portfolio of Investments |
67
Portfolio of Investments | Growth Fund | December 31, 2023 | (Continued)
| Common Stocks | 99.1% of portfolio (Continued) |
| | Shares | Value |
| Information Technology | 41.0% (Continued) |
| Technology Hardware, Storage & Peripherals | | |
| Apple, Inc. | 117,522 | $22,626,511 |
| Total Information Technology | | 131,214,044 |
| Total Common Stocks | | |
| (Cost $174,185,533) | | 317,308,059 |
| Money Market Fund | 0.9% of portfolio |
| | |
| State Street Institutional U.S. Government Money Market Fund Premier Class, 5.32% (b) | 3,017,005 | 3,017,005 |
| Total Money Market Fund | | |
| (Cost $3,017,005) | | 3,017,005 |
| Total Investments in Securities | | |
| (Cost $177,202,538) | 100.0% | | $320,325,064 |
| (a) | Non-income producing. |
| (b) | 7-day yield at December 31, 2023. |
SA -Sociedad Anonima or Societe Anonyme
NV -Naamloze Vennottschap
ADR -American Depositary Receipt
| Portfolio of Investments | The accompanying notes are an integral part of these financial statements. |
68
Portfolio of Investments
International Equity Fund | December 31, 2023
| Common Stocks | 96.3% of portfolio |
| | Shares | Value |
| Australia | 2.6% |
| BHP Group Ltd. ADR | 33,062 | $2,258,465 |
| Total Australia | | 2,258,465 |
| Britain | 8.5% |
| Haleon PLC | 569,627 | 2,332,207 |
| Rio Tinto PLC | 29,166 | 2,169,398 |
| Shell PLC | 86,483 | 2,830,941 |
| Total Britain | | 7,332,546 |
| Canada | 7.3% |
| Alimentation Couche-Tard Inc. | 34,200 | 2,013,983 |
| Canadian National Railway Co. | 11,023 | 1,384,820 |
| Manulife Financial Corp. | 134,000 | 2,961,035 |
| Total Canada | | 6,359,838 |
| China | 1.8% |
| Haier Smart Home Co., Ltd. | 193,748 | 547,267 |
| LONGi Green Technology Co., Ltd. | 110,100 | 355,457 |
| Zhejiang Sanhua Intelligent Controls Co., Ltd. | 158,000 | 654,887 |
| Total China | | 1,557,611 |
| Denmark | 2.3% |
| Genmab A/S (a) | 3,982 | 1,269,672 |
| Novozymes A/S, Class B | 13,534 | 744,010 |
| Total Denmark | | 2,013,682 |
| France | 9.4% |
| Air Liquide SA | 7,247 | 1,410,958 |
| Dassault Systèmes SE | 31,827 | 1,557,846 |
| L’Oréal SA | 5,506 | 2,744,744 |
| Schneider Electric SE | 12,069 | 2,429,564 |
| Total France | | 8,143,112 |
| Germany | 12.8% |
| Allianz SE REG | 11,015 | 2,943,662 |
| BioNTech SE ADR (a) | 13,860 | 1,462,784 |
| Infineon Technologies AG | 86,731 | 3,622,113 |
| SAP SE ADR | 12,133 | 1,875,641 |
| Symrise AG | 10,837 | 1,190,938 |
| Total Germany | | 11,095,138 |
| Hong Kong | 2.2% |
| AIA Group Ltd. | 223,400 | 1,944,223 |
| Total Hong Kong | | 1,944,223 |
| India | 1.1% |
| HDFC Bank Ltd. ADR | 13,523 | 907,529 |
| Total India | | 907,529 |
| Common Stocks | 96.3% of portfolio (Continued) |
| | Shares | Value |
| Indonesia | 0.4% |
| PT Telkom Indonesia (Persero) Tbk. ADR | 12,791 | $329,496 |
| Total Indonesia | | 329,496 |
| Japan | 18.0% |
| Chugai Pharmaceutical Co., Ltd. | 100,800 | 3,808,055 |
| Daifuku Co., Ltd. | 50,900 | 1,026,346 |
| Keyence Corp. | 2,900 | 1,274,133 |
| Komatsu Ltd. | 59,700 | 1,553,593 |
| Nitori Holdings Co., Ltd. | 1,800 | 241,698 |
| Shimano, Inc. | 5,800 | 893,456 |
| Shionogi & Co., Ltd. | 25,400 | 1,222,450 |
| Shiseido Co., Ltd. | 24,100 | 726,431 |
| Sony Group Corp. | 27,300 | 2,583,477 |
| Sysmex Corp. | 14,200 | 789,385 |
| Unicharm Corp. | 40,000 | 1,446,694 |
| Total Japan | | 15,565,718 |
| Netherlands | 1.7% |
| Adyen NV (a) | 1,171 | 1,511,692 |
| Total Netherlands | | 1,511,692 |
| Republic of South Korea | 1.6% |
| Samsung Electronics Co., Ltd. GDR | 909 | 1,358,419 |
| Total Republic of South Korea | | 1,358,419 |
| Russia | 0.0% |
| LUKOIL PJSC (a) | 6,253 | 0 |
| Total Russia | | 0 |
| Singapore | 3.5% |
| DBS Group Holdings Ltd. | 121,115 | 3,062,855 |
| Total Singapore | | 3,062,855 |
| Spain | 2.9% |
| Banco Bilboa Vizcaya Argentaria SA | 276,791 | 2,522,745 |
| Total Spain | | 2,522,745 |
| Sweden | 9.7% |
| Alfa Laval AB | 44,682 | 1,788,801 |
| Assa Abloy AB | 43,680 | 1,258,821 |
| Atlas Copco AB, Class A | 101,342 | 1,746,235 |
| Epiroc AB, Class A | 66,799 | 1,344,589 |
| Skandinaviska Enskilda Banken AB, Class A | 167,537 | 2,312,127 |
| Total Sweden | | 8,450,573 |
| Switzerland | 7.3% |
| Alcon Inc. | 22,304 | 1,742,389 |
| The accompanying notes are an integral part of these financial statements. | Portfolio of Investments |
69
Portfolio of Investments | International Equity Fund | December 31, 2023 | (Continued)
| Common Stocks | 96.3% of portfolio (Continued) |
| | Shares | Value |
| Switzerland | 7.3% (Continued) |
| Nestlé SA ADR | 11,762 | $1,363,449 |
| Roche Holding AG REG | 6,661 | 1,936,310 |
| Sonova Holding AG REG | 3,800 | 1,242,781 |
| Total Switzerland | | 6,284,929 |
| Taiwan | 1.3% |
| Taiwan Semiconductor Manufacturing Co. Ltd. ADR | 10,894 | 1,132,976 |
| Total Taiwan | | 1,132,976 |
| United States of America | 1.9% |
| Linde PLC | 4,087 | 1,678,572 |
| Total United States of America | | 1,678,572 |
| Total Common Stocks | | |
| (Cost $63,614,833) | | 83,510,119 |
| Money Market Fund | 3.7% of portfolio |
| | Shares | Value |
| State Street Institutional U.S. Government Money Market Fund Premier Class, 5.32% (b) | 3,213,881 | $3,213,881 |
| Total Money Market Fund | | |
| (Cost $3,213,881) | | 3,213,881 |
| Total Investments in Securities | | |
| (Cost $66,828,714) | 100.0% | | $86,724,000 |
| (a) | Non-income producing. |
| (b) | 7-day yield at December 31, 2023. |
ADR -American Depositary Receipt
PLC -Public Limited Company
A/S -Aktieselskab
SA -Sociedad Anonima or Societe Anonyme
SE -Societas Europaea
REG -Registered Shares
AG -Aktiengesellschaft
Tbk. -Terbuka
NV -Naamloze Vennottschap
GDR -Global Depositary Receipt
AB -Aktiebolag
| Portfolio of Investments | The accompanying notes are an integral part of these financial statements. |
70
Portfolio of Investments
Small-Company Stock Fund | December 31, 2023
| Common Stocks | 98.8% of portfolio |
| | Shares | Value |
| Consumer Discretionary | 11.3% |
| Hotels, Restaurants & Leisure | | |
| Hilton Grand Vacations Inc. (a) | 110,400 | $4,435,872 |
| Household Durables | | |
| MDC Holdings, Inc. | 134,288 | 7,419,412 |
| Leisure Products | | |
| Malibu Boats, Inc., Class A (a) | 88,100 | 4,829,642 |
| Topgolf Callaway Brands Corp. (a) | 187,951 | 2,695,217 |
| YETI Holdings, Inc. (a) | 82,700 | 4,282,206 |
| Specialty Retail | | |
| ARKO Corp. | 526,600 | 4,344,450 |
| Total Consumer Discretionary | | 28,006,799 |
| Energy | 7.5% |
| Oil, Gas & Consumable Fuels | | |
| Matador Resources Co. | 59,300 | 3,371,798 |
| Northern Oil and Gas, Inc. | 161,900 | 6,001,633 |
| Permian Resources Corp. | 243,300 | 3,308,880 |
| SM Energy Co. | 153,300 | 5,935,776 |
| Total Energy | | 18,618,087 |
| Financials | 15.4% |
| Banks | | |
| Atlantic Union Bankshares Corp. | 129,592 | 4,735,292 |
| Cadence Bank | 136,750 | 4,046,432 |
| FB Financial Corp. | 138,259 | 5,509,621 |
| Glacier Bancorp, Inc. | 104,116 | 4,302,073 |
| Live Oak Bancshares, Inc. | 123,000 | 5,596,500 |
| Capital Markets | | |
| Donnelley Financial Solutions, Inc. (a) | 45,700 | 2,850,309 |
| Consumer Finance | | |
| Encore Capital Group, Inc. (a) | 116,283 | 5,901,362 |
| Insurance | | |
| Kinsale Capital Group, Inc. | 15,826 | 5,300,286 |
| Total Financials | | 38,241,875 |
| Health Care | 13.6% |
| Health Care Equipment & Supplies | | |
| Enovis Corp. (a) | 56,976 | 3,191,795 |
| Envista Holdings Corp. (a) | 186,100 | 4,477,566 |
| Globus Medical, Inc. (a) | 66,225 | 3,529,130 |
| Integer Holdings Corp. (a) | 76,970 | 7,626,188 |
| iRhythm Technologies, Inc. (a) | 12,800 | 1,370,112 |
| Lantheus Holdings, Inc. (a) | 31,600 | 1,959,200 |
| STAAR Surgical Co. (a) | 35,236 | 1,099,716 |
| Health Care Providers & Services | | |
| AMN Healthcare Services, Inc. (a) | 39,087 | 2,926,835 |
| Life Sciences Tools & Services | | |
| Medpace Holdings, Inc. (a) | 24,650 | 7,555,964 |
| Total Health Care | | 33,736,506 |
| Common Stocks | 98.8% of portfolio (Continued) |
| | Shares | Value |
| Industrials | 25.6% |
| Aerospace & Defense | | |
| Triumph Group, Inc. (a) | 407,930 | $6,763,479 |
| Building Products | | |
| Hayward Holdings, Inc. (a) | 386,000 | 5,249,600 |
| Construction & Engineering | | |
| Comfort Systems USA, Inc. | 41,988 | 8,635,672 |
| Electrical Equipment | | |
| Atkore Inc. (a) | 56,300 | 9,008,000 |
| EnerSys | 23,335 | 2,355,902 |
| Ground Transportation | | |
| Werner Enterprises, Inc. | 85,933 | 3,640,981 |
| Machinery | | |
| ESAB Corp. | 57,176 | 4,952,585 |
| Federal Signal Corp. | 118,894 | 9,123,926 |
| John Bean Technologies Corp. | 26,300 | 2,615,535 |
| Professional Services | | |
| CACI International Inc., Class A (a) | 8,371 | 2,711,032 |
| Trading Companies & Distributors | | |
| Applied Industrial Technologies, Inc. | 48,326 | 8,345,417 |
| Total Industrials | | 63,402,129 |
| Information Technology | 15.7% |
| Electronic Equipment, Instruments & Components | | |
| Advanced Energy Industries, Inc. | 63,162 | 6,879,605 |
| Plexus Corp. (a) | 35,600 | 3,849,428 |
| Semiconductors & Semiconductor Equipment | | |
| Diodes Inc. (a) | 67,486 | 5,433,973 |
| Software | | |
| Altair Engineering Inc., Class A (a) | 94,477 | 7,950,239 |
| Descartes Systems Group Inc. (The) (a) | 86,570 | 7,277,074 |
| Model N, Inc. (a) | 134,900 | 3,632,857 |
| PowerSchool Holdings, Inc. (a) | 159,969 | 3,768,870 |
| Total Information Technology | | 38,792,046 |
| Materials | 6.4% |
| Chemicals | | |
| Avient Corp. | 170,627 | 7,092,965 |
| Construction Materials | | |
| Summit Materials, Inc., Class A (a) | 225,209 | 8,661,538 |
| Total Materials | | 15,754,503 |
| Real Estate | 3.3% |
| Health Care REITs | | |
| Community Healthcare Trust Inc. | 78,900 | 2,101,896 |
| Office REITs | | |
| Easterly Government Properties, Inc. | 229,311 | 3,081,940 |
| The accompanying notes are an integral part of these financial statements. | Portfolio of Investments |
71
Portfolio of Investments | Small-Company Stock Fund | December 31, 2023 | (Continued)
| Common Stocks | 98.8% of portfolio (Continued) |
| | Shares | Value |
| Real Estate | 3.3% (Continued) |
| Specialized REITs | | |
| Uniti Group Inc. | 497,500 | $2,875,550 |
| Total Real Estate | | 8,059,386 |
| Total Common Stocks | | |
| (Cost $181,340,541) | | 244,611,331 |
| Money Market Fund | 1.2% of portfolio |
| | |
| State Street Institutional U.S. Government Money Market Fund Premier Class, 5.32% (b) | 3,046,744 | 3,046,744 |
| Total Money Market Fund | | |
| (Cost $3,046,744) | | 3,046,744 |
| Total Investments in Securities | | |
| (Cost $184,387,285) | 100.0% | | $247,658,075 |
| (a) | Non-income producing. |
| (b) | 7-day yield at December 31, 2023. |
| Portfolio of Investments | The accompanying notes are an integral part of these financial statements. |
72
(THIS PAGE INTENTIONALLY LEFT BLANK)
Statements of Assets and Liabilities
December 31, 2023
| Assets | Daily Income Fund | Short-Term Government Securities Fund | Short-Term Bond Fund |
| Investments in securities, at value (cost: $228,516,930, $57,756,578, $449,296,417, $133,356,701, $9,833,448, $28,317,751, $539,622,770, $177,202,538, $66,828,714 and $184,387,285, respectively) | $228,516,930 | $57,171,752 | $445,204,394 |
| Investment securities sold receivable | — | — | — |
| Dividends, interest, and tax reclaims receivable | 543,263 | 258,103 | 3,349,504 |
| Capital shares sold receivable | 312,762 | 128,355 | 251,342 |
| Prepaid expenses | 20,095 | 10,532 | 25,038 |
| Due from Homestead Advisers | — | — | — |
| Due from Custodian | 86,170 | 19,712 | 258,588 |
| Total Assets | 229,479,220 | 57,588,454 | 449,088,866 |
| Liabilities | | | |
| Investment securities purchased payable | 9,958,583 | — | — |
| Accrued expenses payable | 93,271 | 56,020 | 195,141 |
| Independent Director/Trustee's deferred compensation payable | 85,003 | 34,886 | 201,605 |
| Capital shares redeemed payable | 708,994 | 14,612 | 866,887 |
| Dividends payable | 3,724 | 1,489 | 37,222 |
| Due to Homestead Advisers | 177,866 | 44,053 | 527,353 |
| Due to custodian | — | — | — |
| Total Liabilities | 11,027,441 | 151,060 | 1,828,208 |
| Net Assets | $218,451,779 | $57,437,394 | $447,260,658 |
| Net Assets Consist Of: | | | |
| Distributable earnings (losses) | (84,392) | (3,854,936) | (33,427,723) |
| Paid-in-capital applicable to outstanding shares of 218,536,522, 11,561,548, 91,144,232, 27,967,144, 1,050,792, 6,487,529, 19,380,059, 21,364,964, 8,968,851 and 9,667,388, respectively | 218,536,171 | 61,292,330 | 480,688,381 |
| Net Assets | $218,451,779 | $57,437,394 | $447,260,658 |
| Net Asset Value Per Share | $1.00 | $4.97 | $4.91 |
| Statements of Assets and Liabilities | The accompanying notes are an integral part of these financial statements. |
74
| Intermediate Bond Fund | Rural America Growth & Income Fund | Stock Index Fund | Value Fund | Growth Fund | International Equity Fund | Small-Company Stock Fund |
| $127,881,730 | $9,839,381 | $224,179,784(a) | $949,130,194 | $320,325,064 | $86,724,000 | $247,658,075 |
| — | — | 1,362,331 | — | 59,158 | 66,738 | — |
| 969,612 | 38,377 | — | 988,214 | 52,834 | 385,974 | 247,553 |
| 227,960 | 14,483 | 39,714 | 94,128 | 52,861 | 15,702 | 23,232 |
| 9,315 | 5,619 | 18,262 | 34,712 | 21,242 | 14,482 | 30,757 |
| — | 2,812 | — | — | — | — | — |
| 54,458 | — | — | 426,581 | 179,002 | 56,569 | 178,455 |
| 129,143,075 | 9,900,672 | 225,600,091 | 950,673,829 | 320,690,161 | 87,263,465 | 248,138,072 |
| | | | | | | |
| — | — | — | — | — | — | — |
| 118,113 | 47,394 | 54,921 | 300,349 | 111,936 | 73,458 | 133,973 |
| 9,230 | 201 | 48,604 | 338,497 | 54,590 | 58,478 | 198,769 |
| 82,356 | 5,014 | 1,402,045 | 369,380 | 142,315 | 106,276 | 419,034 |
| — | — | 112 | — | — | — | — |
| 114,184 | — | 67,402 | 871,970 | 373,275 | 118,331 | 377,529 |
| — | 3,709 | — | — | — | — | — |
| 323,883 | 56,318 | 1,573,084 | 1,880,196 | 682,116 | 356,543 | 1,129,305 |
| $128,819,192 | $9,844,354 | $224,027,007 | $948,793,633 | $320,008,045 | $86,906,922 | $247,008,767 |
| | | | | | | |
| (20,447,281) | (231,587) | 194,008,904 | 422,738,777 | 145,380,081 | 20,375,870 | 64,777,399 |
| 149,266,473 | 10,075,941 | 30,018,103 | 526,054,856 | 174,627,964 | 66,531,052 | 182,231,368 |
| $128,819,192 | $9,844,354 | $224,027,007 | $948,793,633 | $320,008,045 | $86,906,922 | $247,008,767 |
| $4.61 | $9.37 | $34.53 | $48.96 | $14.98 | $9.69 | $25.55 |
| (a) | Represents investment in the S&P 500 Index Master Portfolio managed by BlackRock Fund Advisors. |
| The accompanying notes are an integral part of these financial statements. | Statements of Assets and Liabilities |
75
Statements of Operations
For the Period Ended December 31, 2023
| Investment Income | Daily Income Fund | Short-Term Government Securities Fund | Short-Term Bond Fund |
| Interest | $10,589,948 | $2,004,220 | $18,559,859 |
| Dividends | — | — | — |
| Allocated from Master Portfolio | | | |
| Dividends | — | — | — |
| Interest | — | — | — |
| Total Investment Income | 10,589,948 | 2,004,220 | 18,559,859 |
| Expenses | | | |
| Management fees | 836,592 | 276,641 | 2,816,631 |
| Director, Trustee, and Board meeting expenses | 99,950 | 33,720 | 211,915 |
| Shareholder servicing fees | 86,019 | 63,597 | 115,635 |
| Custodian and accounting fees | 85,521 | 70,356 | 136,708 |
| Legal and audit fees | 59,880 | 21,120 | 121,680 |
| Registration fees | 27,222 | 24,833 | 27,308 |
| Printing and regulatory filings | 12,640 | 7,592 | 20,074 |
| Insurance | 11,773 | 4,116 | 26,034 |
| Communication | 569 | 341 | 890 |
| Sub-transfer agency fees | — | 474 | 39,261 |
| Other expenses | 6,184 | 14,450 | 43,736 |
| Administration fees | — | — | — |
| Allocated from Master Portfolio | — | — | — |
| Total Expenses | 1,226,350 | 517,240 | 3,559,872 |
| Less fees waived and/or expenses reimbursed by Homestead Advisers | — | (55,941) | — |
| Net Expenses | 1,226,350 | 461,299 | 3,559,872 |
| Net Investment Income (Loss) | 9,363,598 | 1,542,921 | 14,999,987 |
| Realized and Unrealized Gain (Loss) on Investments | | | |
| Net realized gain (loss) on investments | 25,041 | (1,775,629) | (8,004,165) |
| Net change in unrealized apprecation (depreciation) | — | 2,978,670 | 16,931,812 |
| Net Gain (Loss) On Investments | 25,041 | 1,203,041 | 8,927,647 |
| Net Increase In Net Assets From Operations | $9,388,639 | $2,745,962 | $23,927,634 |
| (a) | Includes foreign tax withholding expense of $16,983 in Stock Index, $54,308 in Value, $7,647 in Growth and $210,576 in International Equity Funds. |
| (b) | Represents expenses allocated to the Fund by the S&P 500 Master Portfolio after expense reimbursements of $1,832. |
| (c) | Represents realized and unrealized gains on investments allocated from the Master Portfolio. |
| Statements of Operations | The accompanying notes are an integral part of these financial statements. |
76
| Intermediate Bond Fund | Rural America Growth & Income Fund | Stock Index Fund | Value Fund | Growth Fund | International Equity Fund | Small-Company Stock Fund |
| $5,220,041 | $129,352 | $— | $720,916 | $102,580 | $126,073 | $254,371 |
| — | 79,531 | — | 18,722,487(a) | 1,452,093(a) | 1,997,472(a) | 2,619,863 |
| | | | | | | |
| — | — | 3,387,289(a) | — | — | — | — |
| — | — | 33,627 | — | — | — | — |
| 5,220,041 | 208,883 | 3,420,916 | 19,443,403 | 1,554,673 | 2,123,545 | 2,874,234 |
| | | | | | | |
| 774,478 | 55,386 | — | 4,337,769 | 1,804,237 | 641,951 | 2,001,745 |
| 67,782 | 4,687 | 87,743 | 428,930 | 127,704 | 44,269 | 106,626 |
| 54,844 | 43,162 | 113,712 | 255,445 | 144,337 | 110,687 | 162,743 |
| 112,657 | 57,067 | 56,304 | 177,023 | 90,428 | 99,703 | 78,058 |
| 40,243 | 6,158 | 53,765 | 250,307 | 78,613 | 27,651 | 67,787 |
| 35,176 | 24,943 | 24,657 | 33,758 | 26,849 | 24,853 | 22,967 |
| 6,100 | 3,074 | 18,679 | 48,826 | 24,891 | 16,966 | 30,680 |
| 8,092 | 451 | 10,192 | 54,224 | 13,874 | 5,200 | 13,255 |
| 263 | 135 | 834 | 2,115 | 1,100 | 769 | 1,294 |
| 6 | — | 7,904 | 159,809 | 18,054 | 3,020 | 81,636 |
| 42,911 | 1,420 | 5,417 | 27,802 | 7,810 | 2,544 | 6,889 |
| — | — | 522,008 | — | — | — | — |
| — | — | 20,257(b) | — | — | — | — |
| 1,142,552 | 196,483 | 921,472 | 5,776,008 | 2,337,897 | 977,613 | 2,573,680 |
| (109,749) | (111,362) | — | — | — | (91,557) | — |
| 1,032,803 | 85,121 | 921,472 | 5,776,008 | 2,337,897 | 886,056 | 2,573,680 |
| 4,187,238 | 123,762 | 2,499,444 | 13,667,395 | (783,224) | 1,237,489 | 300,554 |
| | | | | | | |
| (2,720,517) | (108,027) | 912,857(c) | 58,744,792 | 12,893,471 | 3,478,561 | 9,554,165 |
| 6,252,736 | 573,899 | 44,074,512(c) | 38,827,904 | 95,677,279 | 7,640,203 | 28,002,458 |
| 3,532,219 | 465,872 | 44,987,369 | 97,572,696 | 108,570,750 | 11,118,764 | 37,556,623 |
| $7,719,457 | $589,634 | $47,486,813 | $111,240,091 | $107,787,526 | $12,356,253 | $37,857,177 |
| The accompanying notes are an integral part of these financial statements. | Statements of Operations |
77
Statements of Changes in Net Assets
| | Daily Income Fund |
| | Year Ended December 31, 2023 | Year Ended December 31, 2022 |
| Increase (Decrease) In Net Assets | | |
| Operations | | |
| Net investment income | $9,363,598 | $2,423,947 |
| Net realized gain (loss) on investments | 25,041 | (33,501) |
| Net change in unrealized appreciation (depreciation) | — | — |
| Increase (decrease) in net assets from operations | 9,388,639 | 2,390,446 |
| Distributions to Shareholders | | |
| Distributions to shareholders | (9,394,022) | (2,393,963) |
| Total Distributions to shareholders | (9,394,022) | (2,393,963) |
| Capital Share Transactions | | |
| Net capital share transactions | 13,896,810 | 24,974,628 |
| Total increase (decrease) in net assets from capital transactions | 13,896,810 | 24,974,628 |
| Total Increase (Decrease) In Net Assets | 13,891,427 | 24,971,111 |
| Net Assets | | |
| Beginning of year | $204,560,352 | $179,589,241 |
| End of year | $218,451,779 | $204,560,352 |
| Statements of Changes in Net Assets | The accompanying notes are an integral part of these financial statements. |
78
| Short-Term Government Securities Fund | Short-Term Bond Fund | Intermediate Bond Fund |
| Year Ended December 31, 2023 | Year Ended December 31, 2022 | Year Ended December 31, 2023 | Year Ended December 31, 2022 | Year Ended December 31, 2023 | Year Ended December 31, 2022 |
| | | | | | |
| | | | | | |
| $1,542,921 | $839,648 | $14,999,987 | $8,468,065 | $4,187,238 | $2,636,226 |
| (1,775,629) | (1,032,782) | (8,004,165) | (19,926,895) | (2,720,517) | (11,358,826) |
| 2,978,670 | (3,870,513) | 16,931,812 | (20,007,017) | 6,252,736 | (11,565,088) |
| 2,745,962 | (4,063,647) | 23,927,634 | (31,465,847) | 7,719,457 | (20,287,688) |
| | | | | | |
| (1,549,864) | (842,483) | (15,029,963) | (8,609,201) | (4,248,715) | (2,782,153) |
| (1,549,864) | (842,483) | (15,029,963) | (8,609,201) | (4,248,715) | (2,782,153) |
| | | | | | |
| (11,429,455) | (4,935,132) | (42,445,620) | (44,422,657) | (5,409,476) | 2,491,679 |
| (11,429,455) | (4,935,132) | (42,445,620) | (44,422,657) | (5,409,476) | 2,491,679 |
| (10,233,357) | (9,841,262) | (33,547,949) | (84,497,705) | (1,938,734) | (20,578,162) |
| | | | | | |
| $67,670,751 | $77,512,013 | $480,808,607 | $565,306,312 | $130,757,926 | $151,336,088 |
| $57,437,394 | $67,670,751 | $447,260,658 | $480,808,607 | $128,819,192 | $130,757,926 |
| The accompanying notes are an integral part of these financial statements. | Statements of Changes in Net Assets |
79
Statements of Changes in Net Assets (Continued)
| | Rural America Growth & Income Fund |
| | Year Ended December 31, 2023 | Year Ended December 31, 2022 |
| Increase (Decrease) In Net Assets | | |
| Operations | | |
| Net investment income | $123,762 | $46,432 |
| Net realized gain (loss) on investments | (108,027) | (138,527) |
| Net change in unrealized appreciation (depreciation) | 573,899 | (740,459) |
| Increase (decrease) in net assets from operations | 589,634 | (832,554) |
| Distributions to Shareholders | | |
| Distributions to shareholders | (120,819) | (42,312) |
| Total Distributions to shareholders | (120,819) | (42,312) |
| Capital Share Transactions | | |
| Net capital share transactions | 2,176,981 | 2,711,190 |
| Total increase (decrease) in net assets from capital transactions | 2,176,981 | 2,711,190 |
| Total Increase (Decrease) In Net Assets | 2,645,796 | 1,836,324 |
| Net Assets | | |
| Beginning of year | $7,198,558 | $5,362,234 |
| End of year | $9,844,354 | $7,198,558 |
| Statements of Changes in Net Assets | The accompanying notes are an integral part of these financial statements. |
80
| Stock Index Fund | Value Fund | Growth Fund |
| Year Ended December 31, 2023 | Year Ended December 31, 2022 | Year Ended December 31, 2023 | Year Ended December 31, 2022 | Year Ended December 31, 2023 | Year Ended December 31, 2022 |
| | | | | | |
| | | | | | |
| $2,499,444 | $2,286,612 | $13,667,395 | $13,324,209 | $(783,224) | $(993,342) |
| 912,857 | (154,799) | 58,744,792 | 63,175,711 | 12,893,471 | 7,059,306 |
| 44,074,512 | (46,167,668) | 38,827,904 | (136,261,835) | 95,677,279 | (130,619,695) |
| 47,486,813 | (44,035,855) | 111,240,091 | (59,761,915) | 107,787,526 | (124,553,731) |
| | | | | | |
| (3,092,059) | (3,574,110) | (59,752,144) | (91,061,366) | (8,038,053) | (15,514,807) |
| (3,092,059) | (3,574,110) | (59,752,144) | (91,061,366) | (8,038,053) | (15,514,807) |
| | | | | | |
| (12,007,847) | (2,505,647) | (27,827,153) | 27,692,364 | (14,419,750) | (4,517,269) |
| (12,007,847) | (2,505,647) | (27,827,153) | 27,692,364 | (14,419,750) | (4,517,269) |
| 32,386,907 | (50,115,612) | 23,660,794 | (123,130,917) | 85,329,723 | (144,585,807) |
| | | | | | |
| $191,640,100 | $241,755,712 | $925,132,839 | $1,048,263,756 | $234,678,322 | $379,264,129 |
| $224,027,007 | $191,640,100 | $948,793,633 | $925,132,839 | $320,008,045 | $234,678,322 |
| The accompanying notes are an integral part of these financial statements. | Statements of Changes in Net Assets |
81
Statements of Changes in Net Assets (Continued)
| | International Equity Fund |
| | Year Ended December 31, 2023 | Year Ended December 31, 2022 |
| Increase (Decrease) In Net Assets | | |
| Operations | | |
| Net investment income | $1,237,489 | $1,659,181 |
| Net realized gain (loss) on investments | 3,478,561 | 2,298,816 |
| Net change in unrealized appreciation (depreciation) | 7,640,203 | (23,735,880) |
| Increase (decrease) in net assets from operations | 12,356,253 | (19,777,883) |
| Distributions to Shareholders | | |
| Distributions to shareholders | (4,836,958) | (4,045,559) |
| Total Distributions to shareholders | (4,836,958) | (4,045,559) |
| Capital Share Transactions | | |
| Net capital share transactions | (2,703,524) | 2,629,704 |
| Total increase (decrease) in net assets from capital transactions | (2,703,524) | 2,629,704 |
| Total Increase (Decrease) In Net Assets | 4,815,771 | (21,193,738) |
| Net Assets | | |
| Beginning of year | $82,091,151 | $103,284,889 |
| End of year | $86,906,922 | $82,091,151 |
| Statements of Changes in Net Assets | The accompanying notes are an integral part of these financial statements. |
82
| Small-Company Stock Fund |
| Year Ended December 31, 2023 | Year Ended December 31, 2022 |
| | |
| | |
| $300,554 | $34,521 |
| 9,554,165 | 10,610,119 |
| 28,002,458 | (62,638,176) |
| 37,857,177 | (51,993,536) |
| | |
| (9,484,072) | (12,017,540) |
| (9,484,072) | (12,017,540) |
| | |
| (21,709,675) | (9,662,489) |
| (21,709,675) | (9,662,489) |
| 6,663,430 | (73,673,565) |
| | |
| $240,345,337 | $314,018,902 |
| $247,008,767 | $240,345,337 |
| The accompanying notes are an integral part of these financial statements. | Statements of Changes in Net Assets |
83
Financial Highlights
Daily Income Fund
The financial highlights tables are intended to help you understand the Fund's financial performance for the past 5 years or, if shorter, the period of a Fund's operations. Certain information reflects financial results for a single Fund share. The total returns in the table represent the rate that an investor would have earned or lost on an investment in the Fund (assuming reinvestment of all dividends and distributions).
| | Year Ended December 31, |
| For a Share Outstanding Throughout Each Year | 2023 | 2022 | 2021 | 2020 | 2019 |
| Net Asset Value, Beginning of Year | $1.00 | $1.00 | $1.00 | $1.00 | $1.00 |
| Income from investment operations | | | | | |
| Net investment income | 0.04 | 0.01(a,b) | —(a,b,c) | (—)(a,b,c) | 0.01 |
| Net realized and unrealized gain (loss) on investments | —(c) | —(c) | —(c) | — | — |
| Total from investment operations | 0.04 | 0.01(a) | —(a,c) | —(a,c) | 0.01 |
| Distributions | | | | | |
| Net investment income | (0.04) | (0.01) | —(c) | —(c) | (0.01) |
| Net realized gain | — | — | — | — | — |
| Total distributions | (0.04) | (0.01) | —(a,c) | —(a,c) | (0.01) |
| Net Asset Value, End of Year | $1.00 | $1.00 | $1.00 | $1.00 | $1.00 |
| Total Return | 4.58% | 1.20% | 0.01% | 0.19% | 1.43% |
| Ratios/Supplemental Data | | | | | |
| Net assets, end of year (thousands) | $218,452 | $204,560 | $179,589 | $171,783 | $162,835 |
| Ratio of net investment income to average net assets | 4.48% | 1.24%(a,b) | 0.01%(a,b) | 0.17%(a,b) | 1.42% |
| Ratio of gross expenses before voluntary expense limitation to average net assets | 0.59% | 0.59% | 0.70% | 0.78% | 0.78% |
| Ratio of expenses to average net assets | 0.59% | 0.48%(a,b) | 0.04%(a,b) | 0.37%(a,b) | 0.78% |
| (a) | Effective August 14, 2009, Homestead Advisers agreed to waive fees and/or reimburse expenses to the extent necessary to assist the Fund in attempting to maintain a positive yield. The temporary waiver continued through May 11, 2017 and April 20, 2020 through May 6, 2022. |
| (b) | Excludes excess investment management fees and other expenses voluntarily waived and reimbursed by Homestead Advisers. |
| (c) | Less than $0.01 per share. |
| Financial Highlights | The accompanying notes are an integral part of these financial statements. |
84
Financial Highlights
Short-Term Government Securities Fund
| | Year Ended December 31, |
| For a Share Outstanding Throughout Each Year | 2023 | 2022 | 2021 | 2020 | 2019 |
| Net Asset Value, Beginning of Year | $4.87 | $5.21 | $5.29 | $5.21 | $5.14 |
| Income from investment operations | | | | | |
| Net investment income | 0.12 | 0.06 | 0.02 | 0.03 | 0.08 |
| Net realized and unrealized gain (loss) on investments | 0.10 | (0.34) | (0.08) | 0.18 | 0.09 |
| Total from investment operations | 0.22 | (0.28) | (0.06) | 0.21 | 0.17 |
| Distributions | | | | | |
| Net investment income | (0.12) | (0.06) | (0.02) | (0.03) | (0.08) |
| Net realized gain | — | — | — | (0.10) | (0.02) |
| Total distributions | (0.12) | (0.06) | (0.02) | (0.13) | (0.10) |
| Net Asset Value, End of Year | $4.97 | $4.87 | $5.21 | $5.29 | $5.21 |
| Total Return | 4.68% | -5.41% | -1.18% | 4.13% | 3.36% |
| Ratios/Supplemental Data | | | | | |
| Net assets, end of year (thousands) | $57,437 | $67,671 | $77,512 | $89,150 | $71,516 |
| Ratio of net investment income to average net assets | 2.51%(a) | 1.16%(a) | 0.32%(a) | 0.58%(a) | 1.52%(a) |
| Ratio of gross expenses before expense limitation to average net assets | 0.84% | 0.80% | 0.79% | 0.81% | 0.85% |
| Ratio of expenses to average net assets | 0.75%(a) | 0.75%(a) | 0.75%(a) | 0.75%(a) | 0.75%(a) |
| Portfolio turnover rate | 442%(b,c) | 202%(b) | 155%(b) | 299%(b) | 237%(b) |
| (a) | Excludes expenses in excess of a 0.75% contractual expense limitation with Homestead Advisers, in effect through April 30, 2024. |
| (b) | Rate includes purchases and sales of long-term U.S. Treasury Bonds. |
| (c) | The change in the portfolio turnover rate from 2022 to 2023, is due to an increase in trading of U.S. Treasury bonds, due to market events. |
| The accompanying notes are an integral part of these financial statements. | Financial Highlights |
85
Financial Highlights
Short-Term Bond Fund
| | Year Ended December 31, |
| For a Share Outstanding Throughout Each Year | 2023 | 2022 | 2021 | 2020 | 2019 |
| Net Asset Value, Beginning of Year | $4.81 | $5.19 | $5.32 | $5.23 | $5.17 |
| Income from investment operations | | | | | |
| Net investment income | 0.16 | 0.08 | 0.02 | 0.05 | 0.10 |
| Net realized and unrealized gain (loss) on investments | 0.10 | (0.38) | (0.08) | 0.23 | 0.10 |
| Total from investment operations | 0.26 | (0.30) | (0.06) | 0.28 | 0.20 |
| Distributions | | | | | |
| Net investment income | (0.16) | (0.08) | (0.02) | (0.05) | (0.10) |
| Net realized gain | — | — | (0.05) | (0.14) | (0.04) |
| Total distributions | (0.16) | (0.08) | (0.07) | (0.19) | (0.14) |
| Net Asset Value, End of Year | $4.91 | $4.81 | $5.19 | $5.32 | $5.23 |
| Total Return | 5.40% | -5.72% | -1.11% | 5.42% | 3.90% |
| Ratios/Supplemental Data | | | | | |
| Net assets, end of year (thousands) | $447,261 | $480,809 | $565,306 | $565,061 | $548,312 |
| Ratio of net investment income to average net assets | 3.20% | 1.66% | 0.40% | 0.92% | 1.87% |
| Ratio of expenses to average net assets | 0.76% | 0.76% | 0.79% | 0.78% | 0.79% |
| Portfolio turnover rate | 395%(a) | 328%(a) | 355%(a) | 328%(a) | 276%(a) |
| (a) | Rate includes purchases and sales of long-term U.S. Treasury Bonds. |
| Financial Highlights | The accompanying notes are an integral part of these financial statements. |
86
Financial Highlights
Intermediate Bond Fund
| | Year Ended December 31, | Period ended
May 1, 2019(inception)
to December 31, |
| For a Share Outstanding Throughout Each Period | 2023 | 2022 | 2021 | 2020 | 2019 |
| Net Asset Value, Beginning of Period | $4.48 | $5.28 | $5.41 | $5.13 | $5.00 |
| Income from investment operations | | | | | |
| Net investment income | 0.15 | 0.10 | 0.07 | 0.08 | 0.06 |
| Net realized and unrealized gain (loss) on investments | 0.13 | (0.80) | (0.13) | 0.36 | 0.17 |
| Total from investment operations | 0.28 | (0.70) | (0.06) | 0.44 | 0.23 |
| Distributions | | | | | |
| Net investment income | (0.15) | (0.10) | (0.07) | (0.08) | (0.06) |
| Net realized gain | — | — | — | (0.08) | (0.04) |
| Total distributions | (0.15) | (0.10) | (0.07) | (0.16) | (0.10) |
| Net Asset Value, End of Period | $4.61 | $4.48 | $5.28 | $5.41 | $5.13 |
| Total Return | 6.35% | -13.38% | -1.12% | 8.70% | 4.69%(a) |
| Ratios/Supplemental Data | | | | | |
| Net assets, end of year (thousands) | $128,819 | $130,758 | $151,336 | $92,660 | $23,845 |
| Ratio of net investment income to average net assets | 3.24%(b) | 1.93%(b) | 1.03%(b) | 1.19%(b) | 1.69%(b,c) |
| Ratio of gross expenses before expense limitation to average net assets | 0.89% | 0.87% | 0.91% | 1.13% | 2.49%(c) |
| Ratio of expenses to average net assets | 0.80%(b) | 0.80%(b) | 0.80%(b) | 0.80%(b) | 0.80%(b,c) |
| Portfolio turnover rate | 189%(d) | 258%(d) | 249%(d) | 359%(d) | 395%(d) |
| (a) | Aggregate total return for the period. |
| (b) | Excludes expenses in excess of a 0.80% contractual expense limitation with Homestead Advisers, in effect through April 30, 2024. |
| (c) | Annualized. |
| (d) | Rate includes purchases and sales of long-term U.S. Treasury Bonds. |
| The accompanying notes are an integral part of these financial statements. | Financial Highlights |
87
Financial Highlights
Rural America Growth & Income Fund
| | Year Ended December 31, | Period ended
May 1, 2021(inception)
to December 31, |
| For a Share Outstanding Throughout Each Period | 2023 | 2022 | 2021 |
| Net Asset Value, Beginning of Period | $8.89 | $10.42 | $10.00 |
| Income from investment operations | | | |
| Net investment income | 0.12 | 0.05 | 0.02 |
| Net realized and unrealized gain (loss) on investments | 0.48 | (1.53) | 0.44 |
| Total from investment operations | 0.60 | (1.48) | 0.46 |
| Distributions | | | |
| Net investment income | (0.12) | (0.05) | (0.02) |
| Net realized gain | — | — | (0.02) |
| Total distributions | (0.12) | (0.05) | (0.04) |
| Net Asset Value, End of Period | $9.37 | $8.89 | $10.42 |
| Total Return | 6.74% | -14.18% | 4.58%(a) |
| Ratios/Supplemental Data | | | |
| Net assets, end of year (thousands) | $9,844 | $7,199 | $5,362 |
| Ratio of net investment income to average net assets | 1.45%(b) | 0.70%(b) | 0.44%(b,c) |
| Ratio of gross expenses before expense limitation to average net assets | 2.31% | 2.85% | 5.12%(c) |
| Ratio of expenses to average net assets | 1.00%(b) | 1.00%(b) | 1.00%(b,c) |
| Portfolio turnover rate | 44% | 44%(d) | 9% |
| (a) | Aggregate total return for the period. |
| (b) | Excludes expenses in excess of a 1.00% contractual expense limitation with Homestead Advisers, in effect through April 30, 2024. |
| (c) | Annualized. |
| (d) | The change in the portfolio turnover rate from 2021 to 2022, is due to an increase in shareholder redemptions, resulting in more security sales. |
| Financial Highlights | The accompanying notes are an integral part of these financial statements. |
88
Financial Highlights
Stock Index Fund
| | Year Ended December 31, |
| For a Share Outstanding Throughout Each Year | 2023 | 2022 | 2021 | 2020 | 2019 |
| Net Asset Value, Beginning of Year | $27.85 | $34.82 | $27.78 | $23.93 | $18.67 |
| Income from investment operations | | | | | |
| Net investment income | 0.39 | 0.34 | 0.29 | 0.32 | 0.34 |
| Net realized and unrealized gain (loss) on investments | 6.77 | (6.78) | 7.50 | 3.92 | 5.39 |
| Total from investment operations | 7.16 | (6.44) | 7.79 | 4.24 | 5.73 |
| Distributions | | | | | |
| Net investment income | (0.36) | (0.34) | (0.30) | (0.31) | (0.38) |
| Net realized gain | (0.12) | (0.19) | (0.45) | (0.08) | (0.09) |
| Total distributions | (0.48) | (0.53) | (0.75) | (0.39) | (0.47) |
| Net Asset Value, End of Year | $34.53 | $27.85 | $34.82 | $27.78 | $23.93 |
| Total Return | 25.73% | -18.50% | 28.09% | 17.80% | 30.77% |
| Ratios/Supplemental Data | | | | | |
| Net assets, end of year (thousands) | $224,027 | $191,640 | $241,756 | $188,823 | $170,951 |
| Ratio of net investment income to average net assets | 1.20% | 1.12% | 0.91% | 1.30% | 1.39% |
| Ratio of expenses to average net assets | 0.44% | 0.48% | 0.50% | 0.53% | 0.59% |
| Portfolio turnover rate (a) | N/A | N/A | N/A | N/A | N/A |
| (a) | Substantially all of the assets of the Stock Index Fund are invested in the S&P 500 Index Master Portfolio managed by BlackRock Fund Advisors. Please refer to the financial highlights in the Appendix for the portfolio turnover rate of the S&P 500 Index Master Portfolio. |
| The accompanying notes are an integral part of these financial statements. | Financial Highlights |
89
Financial Highlights
Value Fund
| | Year Ended December 31, |
| For a Share Outstanding Throughout Each Year | 2023 | 2022 | 2021 | 2020 | 2019 |
| Net Asset Value, Beginning of Year | $46.29 | $54.33 | $47.28 | $51.51 | $46.64 |
| Income from investment operations | | | | | |
| Net investment income | 0.72 | 0.68 | 0.63 | 0.66 | 0.83 |
| Net realized and unrealized gain (loss) on investments | 5.14 | (3.84) | 11.12 | 2.94 | 11.93 |
| Total from investment operations | 5.86 | (3.16) | 11.75 | 3.60 | 12.76 |
| Distributions | | | | | |
| Net investment income | (0.72) | (0.68) | (0.64) | (0.66) | (0.83) |
| Net realized gain | (2.47) | (4.20) | (4.06) | (7.17) | (7.06) |
| Total distributions | (3.19) | (4.88) | (4.70) | (7.83) | (7.89) |
| Net Asset Value, End of Year | $48.96 | $46.29 | $54.33 | $47.28 | $51.51 |
| Total Return | 12.86% | -5.50% | 25.07% | 7.61% | 27.69% |
| Ratios/Supplemental Data | | | | | |
| Net assets, end of year (thousands) | $948,794 | $925,133 | $1,048,264 | $928,744 | $992,108 |
| Ratio of net investment income to average net assets | 1.50% | 1.42% | 1.14% | 1.35% | 1.53% |
| Ratio of expenses to average net assets | 0.64% | 0.62% | 0.63% | 0.65% | 0.66% |
| Portfolio turnover rate | 10% | 10% | 9% | 22% | 17% |
| Financial Highlights | The accompanying notes are an integral part of these financial statements. |
90
Financial Highlights
Growth Fund
| | Year Ended December 31, |
| For a Share Outstanding Throughout Each Year | 2023 | 2022 | 2021 | 2020 | 2019 |
| Net Asset Value, Beginning of Year | $10.40 | $16.66 | $15.56 | $11.78 | $9.68 |
| Income from investment operations | | | | | |
| Net investment loss | (—) | — | (0.08) | (—) | (—) |
| Net realized and unrealized gain (loss) on investments | 4.96 | (5.55) | 2.70 | 4.52 | 2.73 |
| Total from investment operations | 4.96 | (5.55) | 2.62 | 4.52 | 2.73 |
| Distributions | | | | | |
| Net investment income | — | — | — | — | — |
| Net realized gain | (0.38) | (0.71) | (1.52) | (0.74) | (0.63) |
| Total distributions | (0.38) | (0.71) | (1.52) | (0.74) | (0.63) |
| Net Asset Value, End of Year | $14.98 | $10.40 | $16.66 | $15.56 | $11.78 |
| Total Return | 47.81% | -33.45% | 17.13% | 38.65% | 28.36% |
| Ratios/Supplemental Data | | | | | |
| Net assets, end of year (thousands) | $320,008 | $234,678 | $379,264 | $319,660 | $243,548 |
| Ratio of net investment loss to average net assets | (0.28)% | (0.35)% | (0.50)% | (0.46)% | (0.14)% |
| Ratio of expenses to average net assets | 0.84% | 0.83% | 0.84% | 0.89% | 0.93% |
| Portfolio turnover rate | 19% | 23% | 26% | 23% | 29% |
| The accompanying notes are an integral part of these financial statements. | Financial Highlights |
91
Financial Highlights
International Equity Fund
| | Year Ended December 31, |
| For a Share Outstanding Throughout Each Year | 2023 | 2022 | 2021 | 2020 | 2019 |
| Net Asset Value, Beginning of Year | $8.86 | $11.52 | $10.84 | $8.99 | $7.28 |
| Income from investment operations | | | | | |
| Net investment income | 0.14 | 0.19 | 0.13 | 0.06 | 0.12 |
| Net realized and unrealized gain (loss) on investments | 1.25 | (2.40) | 1.07 | 1.86 | 1.69 |
| Total from investment operations | 1.39 | (2.21) | 1.20 | 1.92 | 1.81 |
| Distributions | | | | | |
| Net investment income | (0.15) | (0.18) | (0.12) | (0.07) | (0.10) |
| Net realized gain | (0.41) | (0.27) | (0.40) | — | — |
| Total distributions | (0.56) | (0.45) | (0.52) | (0.07) | (0.10) |
| Net Asset Value, End of Year | $9.69 | $8.86 | $11.52 | $10.84 | $8.99 |
| Total Return | 15.82% | -19.13% | 11.09% | 21.34% | 24.83% |
| Ratios/Supplemental Data | | | | | |
| Net assets, end of year (thousands) | $86,907 | $82,091 | $103,285 | $91,541 | $78,775 |
| Ratio of net investment income to average net assets | 1.45%(a) | 1.97%(a) | 1.07%(a) | 0.65%(a) | 1.29%(a) |
| Ratio of gross expenses before voluntary expense limitation to average net assets | 1.14% | 1.16% | 1.19% | 1.24% | 1.30% |
| Ratio of expenses to average net assets | 1.04%(a) | 1.00%(a) | 1.00%(a) | 0.99%(a) | 0.99%(a) |
| Portfolio turnover rate | 20% | 13% | 13% | 15% | 27% |
| (a) | Excludes expenses in excess of a 0.99% contractual expense limitation with Homestead Advisers prior to May 1, 2021 and a 1.00% contractual expense limitation with Homestead Advisers, in effect from May 1, 2021 through September 23, 2023. |
| Financial Highlights | The accompanying notes are an integral part of these financial statements. |
92
Financial Highlights
Small-Company Stock Fund
| | Year Ended December 31, |
| For a Share Outstanding Throughout Each Year | 2023 | 2022 | 2021 | 2020 | 2019 |
| Net Asset Value, Beginning of Year | $22.69 | $28.72 | $28.36 | $26.25 | $25.57 |
| Income from investment operations | | | | | |
| Net investment income | 0.02 | (—) | 0.12 | (—) | 0.18 |
| Net realized and unrealized gain (loss) on investments | 3.83 | (4.87) | 5.53 | 5.70 | 5.42 |
| Total from investment operations | 3.85 | (4.87) | 5.65 | 5.70 | 5.60 |
| Distributions | | | | | |
| Net investment income | (0.02) | —(a) | (0.12) | —(a) | (0.18) |
| Net realized gain | (0.97) | (1.16) | (5.17) | (3.59) | (4.74) |
| Total distributions | (0.99) | (1.16) | (5.29) | (3.59) | (4.92) |
| Net Asset Value, End of Year | $25.55 | $22.69 | $28.72 | $28.36 | $26.25 |
| Total Return | 17.09% | -16.91% | 20.68% | 22.08% | 22.16% |
| Ratios/Supplemental Data | | | | | |
| Net assets, end of year (thousands) | $247,009 | $240,345 | $314,019 | $286,538 | $332,450 |
| Ratio of net investment income (loss) to average net assets | 0.13% | 0.01% | 0.36% | (0.16)% | 0.54% |
| Ratio of expenses to average net assets | 1.07% | 1.05% | 1.06% | 1.12% | 1.05% |
| Portfolio turnover rate | 15% | 16% | 24% | 18% | 38% |
| (a) | Less than $0.01 per share. |
| The accompanying notes are an integral part of these financial statements. | Financial Highlights |
93
Notes to Financial Statements
1. Organization
Homestead Funds, Inc. (the "Corporation") is a Maryland corporation organized on June 29, 1990. Homestead Funds Trust (the "Trust") is a Massachusetts business trust organized on February 15, 2019. The Corporation and the Trust are each registered with the Securities and Exchange Commission under the Investment Company Act of 1940, as amended (the “Act”), as an open-end management investment company. The Corporation currently consists of eight portfolios, Daily Income Fund, Short-Term Government Securities Fund, Short-Term Bond Fund, Stock Index Fund, Value Fund, Growth Fund, International Equity Fund, and Small-Company Stock Fund, and the Trust currently consists of two portfolios, Intermediate Bond Fund and Rural America Growth & Income Fund (each individually a "Fund" and collectively, the "Homestead Funds" or "Funds"). The Board of Directors of the Corporation and the Board of Trustees of the Trust are referred to collectively as the "Board".
Each Fund is a separate investment portfolio with distinct investment objectives, investment programs, policies and restrictions. The investment objectives of the Funds, as well as the nature and risks of the investment activities of each Fund, are set forth more fully in Homestead Funds’ Prospectus and Statement of Additional Information. All of the Funds are diversified for purposes of the Act.
The Stock Index Fund pursues its investment objective by seeking to replicate the total return performance of the S&P 500 Index, which is composed of 500 selected common stocks, most of which are listed on the New York Stock Exchange. At December 31, 2023, the Stock Index Fund was operating as a feeder fund, whereby substantially all of its assets are invested in the S&P 500 Index Master Portfolio (“Master Portfolio”), an open-end investment company managed by BlackRock Fund Advisors. At December 31, 2023, the Stock Index Fund’s investment constituted 0.62% of the Master Portfolio. The financial statements of the Master Portfolio are contained in the Appendix of this report and should be read in conjunction with the financial statements for the Stock Index Fund.
The Funds are subject to many risks, as described on pages 24-31 of this report, including market and credit risk.
2. Summary of Significant Accounting Policies
The financial statements are prepared in conformity with accounting principles generally accepted in the United States of America (“GAAP”). Homestead Funds is considered an Investment Company under GAAP and follows the accounting and reporting guidance set forth in ASC Topic 946 Financial Services—Investment Companies. The preparation of financial statements in conformity with GAAP requires management to make estimates and assumptions that affect the reported amounts of assets and liabilities and disclosure of contingent assets and liabilities at the date of the financial statements and the reported amounts of revenues and expenses during the reporting period. Actual results could differ from those estimates.
Security Valuation: Each Fund’s net asset value per share is calculated as of the close of regular trading on the New York Stock Exchange (“NYSE”) (usually 4:00 p.m. ET), ("Valuation Time"). Net asset values per share normally are calculated every day the NYSE is open for regular trading. The NYSE is closed on weekends and major holidays. On any day that regular trading on the NYSE closes earlier than scheduled, the Fund will advance the time as of which the NAV is calculated and, therefore, also the time by which purchase and redemption orders must be received in order to receive that day's NAV. The Board has designated Homestead Advisers Corp. ("Adviser" or "Homestead Advisers") as the Funds' valuation designee pursuant to Rule 2a-5 under the 1940 Act effective September 8, 2022. Homestead Advisers and the Board have each adopted policies and procedures for the valuation of portfolio securities ("Valuation Procedures"). Portfolio securities for which market quotations are readily available are valued at current market value as of the Valuation Time in accordance with the Valuation Procedures. Market value is generally determined on the basis of official closing prices or the last reported sales prices and/or may be based on quotes or prices (including evaluated prices) supplied by the Funds’ approved independent pricing services. Homestead Advisers will fair value a security in accordance with the Valuation Procedures if: (i) readily available market quotations are not available; (ii) in the opinion of the Homestead Advisers, the market value does not constitute a readily available market quotation or does not reflect fair value; or (iii) a significant event has occurred that would impact a security's valuation.
The Board has delegated day-to-day responsibility for determining the fair value of securities to the Adviser. Homestead Advisers has chartered an internal Valuation Committee to oversee the implementation of the Valuation Procedures, monitor the valuation process, and provide quarterly reports to the Board. The Valuation Committee reports all instances of fair valuation to the Board at each quarterly Board meeting, as applicable.
A disclosure hierarchy that categorizes the inputs used to value assets and liabilities at measurement date has been established under GAAP. These inputs are summarized into three broad levels as follows:
• Level 1—quoted prices in active markets for identical investments;
| | Notes to Financial Statements |
94
Notes to Financial Statements | (Continued)
• Level 2—other significant observable inputs (including quoted prices for similar investments, interest rates, prepayment speeds, credit risk, etc.); and
• Level 3—significant unobservable inputs (including the Fund’s own assumptions in determining the fair valuation of investments).
The inputs or methodologies used to value securities are not necessarily an indication of the risk associated with investing in those securities. Changes in valuation techniques may result in transfers in or out of an investment’s assigned level within the hierarchy during the period.
The Funds use the following valuation techniques to value securities by major category:
Registered investment company shares (other than shares of exchange-traded funds and closed-end fund shares that trade on an exchange) are valued at the net asset value determined by the registered investment company after the close of the NYSE. The Funds invest in regulated investment companies that seek to maintain a share price of $1.00 and are categorized as Level 1 in the hierarchy.
Domestic equity securities and shares of exchange traded funds that are traded on a national securities exchange are valued at the closing price as reported by an independent pricing service from the primary market in which the securities trade and are categorized as Level 1. Securities not traded or dealt in upon a national securities exchange for which over-the-counter market quotations are readily available generally are valued (i) at the last quoted sales price (if adequate trading volume is present) or, (ii) otherwise at the last bid price.
Foreign equity securities that are traded on a foreign exchange are valued based on the closing price as reported by an independent pricing service from the primary market in which such securities are normally traded. An independent pricing service is utilized to fair value foreign equity securities based on the impact of market events between the close of the foreign exchange and the time the net asset value is calculated. Foreign equity securities that are fair valued are categorized as Level 2 in the hierarchy and foreign equity securities not fair valued are categorized as Level 1.
Fixed-income securities, including corporate, government, municipal, mortgage-backed and asset-backed securities are (1) valued by an independent pricing service based on market prices or broker/dealer quotations or other appropriate measures, or (2) valued at market value generated by Homestead Advisers using a pricing matrix or model based on benchmark yields, issuer, spreads,monthly payment information or other available market information for securities of similar characteristics. For purposes of the Valuation Procedures, the process described in (2) is deemed to be a fair valuation of such portfolio securities, solely for the purpose of the applicability of the fair valuation determinations set forth in the Valuation Procedures. For fixed-income securities, the security is valued following the sequence above and flows to the next method only if the prior method is not available.
Fixed income securities utilizing these methods are generally categorized as Level 2. Fixed income securities that are valued using only a broker quote, absent corroborating observable inputs are categorized as Level 3.
Fixed income securities and commercial paper held in the Daily Income Fund are valued at amortized cost and are categorized as Level 2 in the hierarchy. The amortized cost method does not take into account unrealized gains or losses on the portfolio securities. Amortized cost valuation involves initially valuing a security at its cost, and thereafter assuming a constant amortization to maturity of any discount or premium, regardless of the impact of fluctuating interest rates on the market value of the security. While this method provides certainty in valuation, it may result in periods during which the value of a security, as determined by amortized cost, may be higher or lower than the price the Daily Income Fund would receive if it sold the security.
If a market value cannot be determined for a security using the methodologies described above, or if, in the good faith opinion of the Adviser, the market value does not constitute a readily available market quotation, or if a significant event has occurred that would impact a security’s valuation, the security will be fair valued as determined in good faith by the Fund's Adviser as the Valuation Designee. The determination of a security’s fair value price often involves the consideration of a number of subjective factors, and therefore, is subject to the risk that the value that is assigned to a security may be higher or lower than the security’s value would be if a reliable market quotation for the security were readily available. Such securities are generally categorized as Level 3 in the hierarchy.
The Stock Index Fund records its investment in the Master Portfolio at the market value of its proportionate interest in the net assets of the Master Portfolio. For purposes of determining the net asset value of the Stock Index Fund, the securities of the Master Portfolio are priced by the investment advisor to the Master Portfolio under the direction of the Board of Trustees of the Master Portfolio. The policies and procedures are discussed in the notes to the Master Portfolio’s financial statements, included in the Appendix of this report.
| Notes to Financial Statements | |
95
Notes to Financial Statements | (Continued)
The following table summarizes each Fund’s investments, based on the inputs used to determine their values on December 31, 2023 (other than Stock Index Fund). The level classifications of the Master Portfolio as of December 31, 2023 are included in the Appendix.
| Daily Income Fund | Level 1 | Level 2 | Level 3 | Total |
| U.S. Government & Agency Obligations | $ — | $183,895,939 | $ — | $183,895,939 |
| Money Market Fund | 44,620,991 | — | — | 44,620,991 |
| Total | $44,620,991 | $183,895,939 | $ — | $228,516,930 |
| Short-Term Government Securities Fund | | | | |
| U.S. Government & Agency Obligations | $ — | $34,853,875 | $ — | $34,853,875 |
| Mortgage-Backed Securities | — | 9,665,415 | — | 9,665,415 |
| Corporate Bonds Guaranteed by Export-Import Bank of the United States | — | 9,084,917 | — | 9,084,917 |
| Asset-Backed Securities | — | 1,802,814 | — | 1,802,814 |
| Corporate Bonds–Other | — | 1,488,639 | — | 1,488,639 |
| Money Market Fund | 276,092 | — | — | 276,092 |
| Total | $276,092 | $56,895,660 | $ — | $57,171,752 |
| Short-Term Bond Fund | | | | |
| U.S. Government & Agency Obligations | $ — | $173,021,113 | $ — | $173,021,113 |
| Corporate Bonds–Other | — | 148,965,314 | — | 148,965,314 |
| Asset-Backed Securities | — | 44,007,147 | — | 44,007,147 |
| Yankee Bonds | — | 34,791,242 | — | 34,791,242 |
| Mortgage-Backed Securities | — | 31,448,952 | — | 31,448,952 |
| Corporate Bonds Guaranteed by Export-Import Bank of the United States | — | 4,858,542 | — | 4,858,542 |
| Municipal Bonds | — | 2,814,145 | — | 2,814,145 |
| Money Market Fund | 5,297,939 | — | — | 5,297,939 |
| Total | $5,297,939 | $439,906,455 | $ — | $445,204,394 |
| Intermediate Bond Fund | | | | |
| Mortgage-Backed Securities | $ — | $43,014,071 | $ — | $43,014,071 |
| Corporate Bonds–Other | — | 37,928,305 | — | 37,928,305 |
| U.S. Government & Agency Obligations | — | 21,977,724 | — | 21,977,724 |
| Asset-Backed Securities | — | 10,653,433 | — | 10,653,433 |
| Yankee Bonds | — | 7,532,221 | — | 7,532,221 |
| Municipal Bonds | — | 2,327,134 | — | 2,327,134 |
| Corporate Bond Guaranteed by Export-Import Bank of the United States | — | 107,130 | — | 107,130 |
| Money Market Fund | 4,341,712 | — | — | 4,341,712 |
| Total | $4,341,712 | $123,540,018 | $ — | $127,881,730 |
| Rural America Growth & Income Fund | | | | |
| Common Stocks | $5,623,717 | $ — | $ — | $5,623,717 |
| U.S. Government & Agency Obligations | — | 2,230,693 | — | 2,230,693 |
| Corporate Bonds–Other | — | 966,720 | — | 966,720 |
| Asset-Backed Securities | — | 193,487 | — | 193,487 |
| Mortgage-Backed Securities | — | 179,022 | — | 179,022 |
| Municipal Bonds | — | 119,646 | — | 119,646 |
| Money Market Fund | 526,096 | — | — | 526,096 |
| Total | $6,149,813 | $3,689,568 | $ — | $9,839,381 |
| Value Fund | | | | |
| Common Stocks | $938,711,371 | $ — | $ — | $938,711,371 |
| Money Market Fund | 10,418,823 | — | — | 10,418,823 |
| Total | $949,130,194 | $ — | $ — | $949,130,194 |
| | Notes to Financial Statements |
96
Notes to Financial Statements | (Continued)
| Growth Fund | Level 1 | Level 2 | Level 3 | Total |
| Common Stocks | $317,308,059 | $ — | $ — | $317,308,059 |
| Money Market Fund | 3,017,005 | — | — | 3,017,005 |
| Total | $320,325,064 | $ — | $ — | $320,325,064 |
| International Equity Fund | | | | |
| Common Stocks | $17,747,690 | $65,762,429 | $ — | $83,510,119 |
| Money Market Fund | 3,213,881 | — | — | 3,213,881 |
| Total | $20,961,571 | $65,762,429 | $ — | $86,724,000 |
| Small-Company Stock Fund | | | | |
| Common Stocks | $244,611,331 | $ — | $ — | $244,611,331 |
| Money Market Fund | 3,046,744 | — | — | 3,046,744 |
| Total | $247,658,075 | $ — | $ — | $247,658,075 |
Foreign currency: The International Equity Fund may use foreign currency contracts to facilitate transactions in foreign-denominated securities. Losses from these transactions may arise from changes in the value of the foreign currency or if the counterparties do not perform under the contract’s terms. Foreign-denominated assets, including investment securities and liabilities are translated into U.S. dollars at the exchange rate at the end of the period. Purchases and sales of investment securities and income and dividends received are translated into U.S. dollars at the exchange rate in effect on the transaction date. Currency gains and losses and the effects of exchange rate fluctuations on investments are included with the realized and unrealized gain (loss) on investment securities.
To-be-announced securities: The Intermediate Bond Fund purchases securities on a to-be-announced (TBA) basis, with payment and delivery scheduled for a future date. These transactions are subject to market fluctuations and are subject to the risk that the value at delivery may be more or less than the trade date purchase price. The Fund maintains liquid assets sufficient to settle its commitment to purchase a TBA security.
Distributions to shareholders: Dividends to shareholders are recorded on the ex-dividend date. Ordinary income dividends for the Daily Income, Short-Term Government Securities, Short-Term Bond, and Intermediate Bond Funds are declared daily and paid monthly. Ordinary income dividends for Value Fund are declared and paid semi-annually. Ordinary income dividends for the Rural America Growth & Income, Stock Index, Growth, International Equity, and Small-Company Stock Funds are declared and paid annually. Capital gains dividends, if any, are declared and paid at the end of each fiscal year. Any unpaid ordinary income or capital gains will be paid in June of the subsequent year, but no later than the extended due date of the federal tax return.
Other: Dividend income is recorded on the ex-dividend date. Interest income, including amortization of premium and accretion of discount, and expenses are recorded on the accrual basis. Investment transactions are recorded as of the trade date. Realized gains and losses from investment transactions are reported on the identified cost basis.
The Stock Index Fund records a pro rata share of the Master Portfolio’s income, expenses, and realized and unrealized gains and losses in addition to the Fund’s own expenses, which are accrued daily.
In the normal course of business, the Funds enter into contracts that provide general indemnifications. The Funds’ maximum exposure under these arrangements is dependent on claims that may be made against the Funds in the future and therefore cannot be estimated; however, the Funds have not had prior claims or losses pursuant to these contracts.
General expenses of the Trust are allocated to each fund of the Trust and general expenses of the Corporation are allocated to each fund of the Corporation, in each case based upon relative net assets or other expense allocation methodologies determined by the nature of the expense. Expenses directly attributable to a Fund are charged to that Fund.
Management considered events occurring between the date of this report, December 31, 2023, and the date of issuance of this report in determining adjustments to the financial statements or necessary disclosures in this report.
3. Federal Income Tax Information
The Funds' policy is to comply with the provisions of the Internal Revenue Code applicable to regulated investment companies and will distribute all net investment income to its shareholders. Therefore, no provision for Federal income taxes is required.
| Notes to Financial Statements | |
97
Notes to Financial Statements | (Continued)
Management has analyzed the Funds’ tax positions and has concluded that no provision for income tax is required in the Funds’ financial statements. The Funds are not aware of any tax positions for which it is reasonably possible that the total amounts of unrecognized tax benefits will significantly change in the next twelve months. However, management’s conclusions may be subject to review and adjustment at a later date based on factors including, but not limited to new tax laws, regulations and administrative interpretations.
Each Fund files U.S. federal, state, and local tax returns as required. Each Fund’s tax returns are subject to examination by the relevant tax authorities until expiration of the applicable statute of limitations, which is generally three years after filing of the tax return but could be longer in certain circumstances.
Income and capital gain distributions are determined in accordance with federal income tax regulations, which may differ from GAAP. These differences are primarily due to differing treatments of the following: futures and options transactions, foreign currency transactions, losses deferred due to wash sales, losses deferred due to post-October losses, unused capital losses, partnership investments, deferred Director’s fees, passive foreign investment company transactions, and REIT transactions, which are reflected as book/tax differences in the following tables.
Permanent book and tax basis differences relating to shareholder distributions will result in reclassifications to paid-in capital. Reclassifications recorded in 2023 include paydown losses for Short-Term Government Securities, Short-Term Bond, and Intermediate Bond Funds; prior year excise tax, REIT transactions, and paydown losses for Rural America Growth & Income Fund; prior year excise tax and partnership adjustments for Stock Index Fund; REIT transactions, deemed distribution due to equalization for Value Fund; ordinary losses for Growth Fund; foreign currency transactions for International Equity Fund; and dividend redesignations, REIT transactions and deemed distributions due to equalization for Small-Company Stock Fund.The tax reclassifications for 2023 are reflected below.
| | Distributable Earnings (Losses) | Paid in
Capital |
| Daily Income Fund | $— | $— |
| Short-Term Gov. Securities Fund | $5,721 | $(5,721) |
| Short-Term Bond Fund | $— | $— |
| Intermediate Bond Fund | $6,728 | $(6,728) |
| Rural America Growth & Income Fund | $79 | $(79) |
| Stock Index Fund | $815 | $(815) |
| Value Fund | $(2,715,804) | $2,715,804 |
| Growth Fund | $778,970 | $(778,970) |
| International Equity Fund | $— | $— |
| Small-Company Stock Fund | $(727,741) | $727,741 |
| | | |
Tax character of distributions paid in 2023 was as follows:
| | Ordinary
Income | Long-Term
Gain | Return of
Capital | Total
Distributions |
| Daily Income Fund | $9,394,022 | $— | $— | $9,394,022 |
| Short-Term Gov. Securities Fund | $1,549,864 | $— | $— | $1,549,864 |
| Short-Term Bond Fund | $15,029,963 | $— | $— | $15,029,963 |
| Intermediate Bond Fund | $4,248,715 | $— | $— | $4,248,715 |
| Rural America Growth & Income Fund | $120,819 | $— | $— | $120,819 |
| Stock Index Fund | $2,847,038 | $245,021 | $— | $3,092,059 |
| Value Fund | $13,773,883 | $45,978,261 | $— | $59,752,144 |
| Growth Fund | $— | $8,038,053 | $— | $8,038,053 |
| International Equity Fund | $1,289,663 | $3,547,295 | $— | $4,836,958 |
| Small-Company Stock Fund | $161,045 | $9,323,027 | $— | $9,484,072 |
| | | | | |
| | Notes to Financial Statements |
98
Notes to Financial Statements | (Continued)
Tax character of distributions paid in 2022 was as follows:
| | Ordinary
Income | Long-Term
Gain | Return of
Capital | Total
Distributions |
| Daily Income Fund | $2,393,963 | $— | $— | $2,393,963 |
| Short-Term Gov. Securities Fund | $842,483 | $— | $— | $842,483 |
| Short-Term Bond Fund | $8,609,201 | $— | $— | $8,609,201 |
| Intermediate Bond Fund | $2,782,153 | $— | $— | $2,782,153 |
| Rural America Growth & Income Fund | $42,312 | $— | $— | $42,312 |
| Stock Index Fund | $2,649,522 | $924,588 | $— | $3,574,110 |
| Value Fund | $12,769,165 | $78,292,201 | $— | $91,061,366 |
| Growth Fund | $— | $15,514,807 | $— | $15,514,807 |
| International Equity Fund | $1,618,091 | $2,427,468 | $— | $4,045,559 |
| Small-Company Stock Fund | $— | $12,017,540 | $— | $12,017,540 |
Amounts reflected in ordinary income include short-term gain distributions.
The tax character of distributable earnings/(accumulated losses) at December 31, 2023 was as follows:
| | Undistributed
Ordinary
Income | Undistributed
Long-Term
Gain | Net
Unrealized
Appreciation/
Depreciation | Capital Loss
Carryforward/
Late Year
Loss Deferral | Other
Book/Tax
Differences | Total
Distributable
Earnings (Losses) |
| Daily Income Fund | $10,553 | $— | $— | $(9,941) | $(85,004) | $(84,392) |
| Short-Term Gov. Securities Fund | $— | $— | $(584,824) | $(3,235,226) | $(34,886) | $(3,854,936) |
| Short-Term Bond Fund | $— | $— | $(4,132,278) | $(29,076,091) | $(219,354) | $(33,427,723) |
| Intermediate Bond Fund | $— | $— | $(5,594,645) | $(14,842,433) | $(10,203) | $(20,447,281) |
| Rural America Growth & Income Fund | $4,741 | $— | $(13,675) | $(222,453) | $(200) | $(231,587) |
| Stock Index Fund | $338,914 | $98,210 | $195,862,032 | $— | $(2,290,252) | $194,008,904 |
| Value Fund | $101,909 | $14,480,385 | $408,494,981 | $— | $(338,498) | $422,738,777 |
| Growth Fund | $— | $3,512,413 | $141,922,259 | $— | $(54,591) | $145,380,081 |
| International Equity Fund | $114,806 | $448,520 | $19,871,021 | $— | $(58,477) | $20,375,870 |
| Small-Company Stock Fund | $— | $1,279,189 | $63,696,979 | $— | $(198,769) | $64,777,399 |
| | | | | | | |
The amounts reflected in the capital loss carryforward/late year loss deferral column in the table above represent capital loss carryforwards with no expiration for Daily Income, Short-Term Government Securities, Short-Term Bond, Intermediate Bond, and Rural America Growth & Income Funds.
At December 31, 2023, the cost of securities for federal income tax purposes, the aggregate gross unrealized gain for all securities for which there was an excess of value over tax cost and the aggregate gross unrealized loss for all securities for which there was an excess of tax cost over value was as follows:
| | Tax Cost | Tax Appreciation | Tax Depreciation | Net Tax
Appreciation
(Depreciation) |
| Daily Income Fund | $228,516,930 | $— | $— | $— |
| Short-Term Gov. Securities Fund | $57,756,578 | $452,072 | $(1,036,898) | $(584,826) |
| Short-Term Bond Fund | $449,336,672 | $3,702,660 | $(7,834,938) | $(4,132,278) |
| Intermediate Bond Fund | $133,476,375 | $1,502,415 | $(7,097,060) | $(5,594,645) |
| Rural America Growth & Income Fund | $9,853,056 | $525,775 | $(539,450) | $(13,675) |
| Value Fund | $540,635,213 | $418,251,453 | $(9,756,472) | $408,494,981 |
| Growth Fund | $178,402,803 | $147,250,340 | $(5,328,079) | $141,922,261 |
| International Equity Fund | $66,870,407 | $22,518,991 | $(2,665,398) | $19,853,593 |
| Small-Company Stock Fund | $183,961,096 | $76,804,661 | $(13,107,683) | $63,696,978 |
| | | | | |
| Notes to Financial Statements | |
99
Notes to Financial Statements | (Continued)
The difference between book basis and tax basis unrealized appreciation (depreciation) is primarily attributable to the tax deferral of losses on wash sales. Net unrealized appreciation/(depreciation) of Stock Index Fund in the Master Portfolio consists of an allocated portion of the portfolio’s unrealized appreciation/(depreciation). For information pertaining to the unrealized appreciation/(depreciation) for the Master Portfolio, please refer to the Appendix of this report.
4. Investment Transactions
Purchases and proceeds from sales of securities, other than short-term and U.S. Government securities, for the period ended December 31, 2023, were as follows:
| | Purchases | Proceeds
from Sale |
| Short-Term Gov. Securities Fund | $12,486,877 | $13,873,633 |
| Short-Term Bond Fund | $149,895,664 | $116,075,587 |
| Intermediate Bond Fund | $51,766,979 | $35,255,645 |
| Rural America Growth & Income Fund | $1,925,116 | $821,570 |
| Value Fund | $87,267,171 | $150,898,692 |
| Growth Fund | $52,982,600 | $75,584,730 |
| International Equity Fund | $16,873,999 | $24,402,117 |
| Small-Company Stock Fund | $34,926,331 | $63,904,351 |
Purchases and proceeds from sales of long-term U.S. Government securities, for the period ended December 31, 2023, were as follows:
| | Purchases | Proceeds
from Sale |
| Short-Term Gov. Securities Fund | $255,451,949 | $265,669,157 |
| Short-Term Bond Fund | $1,695,411,541 | $1,770,417,067 |
| Intermediate Bond Fund | $186,167,208 | $209,571,826 |
| Rural America Growth & Income Fund | $3,675,083 | $2,842,065 |
5. Related Parties
The investment management agreements between Homestead Funds, with respect to each Fund (other than the Stock Index Fund), and Homestead Advisers, an indirect, wholly-owned subsidiary of the National Rural Electric Cooperative Association (“NRECA”), provide for an annual investment management fee, that also provides for certain administrative services to the Funds, which is computed daily and paid monthly, based on each Fund’s average daily net assets, at the following annualized rates:
| | Management Fee |
| Daily Income Fund | 0.40% of average daily net assets |
| Short-Term Gov. Securities Fund | 0.45% of average daily net assets |
| Short-Term Bond Fund | 0.60% of average daily net assets up to $500 million |
| | 0.50% of average daily net assets up to next $500 million |
| | 0.40% of average daily net assets in excess of $1 billion |
| Intermediate Bond Fund | 0.60% of average daily net assets up to $500 million |
| | 0.50% of average daily net assets up to next $500 million |
| | 0.45% of average daily net assets in excess of $1 billion |
| Rural American Growth & Income Fund | 0.65% of average daily net assets up to $500 million |
| | 0.50% of average daily net assets up to next $500 million |
| | 0.40% of average daily net assets in excess of $1 billion |
| Value Fund | 0.65% of average daily net assets up to $200 million |
| | 0.50% of average daily net assets up to next $200 million |
| | 0.40% of average daily net assets in excess of $400 million |
| Growth Fund | 0.65% of average daily net assets up to $250 million |
| | 0.60% of average daily net assets in excess of $250 million |
| | Notes to Financial Statements |
100
Notes to Financial Statements | (Continued)
| | Management Fee |
| International Equity Fund | 0.75% of average daily net assets up to $300 million |
| | 0.65% of average daily net assets up to next $100 million |
| | 0.55% of average daily net assets up to next $100 million |
| | 0.50% of average daily net assets in excess of $500 million |
| Small-Company Stock Fund | 0.85% of average daily net assets up to $200 million |
| | 0.75% of average daily net assets in excess of $200 million |
Homestead Financial Services Corp., a wholly-owned, indirect subsidiary of NRECA, is the distributor and principal underwriter for Homestead Funds and does not receive any commissions or other compensation for the services it provides.
Invesco Advisers, Inc. ("Invesco") is the sub-advisor of the Daily Income Fund. T. Rowe Price Associates, Inc. (“T. Rowe”) is the sub-advisor for the Growth Fund and Harding Loevner LP (“Harding”) is the sub-advisor for the International Equity Fund. The sub-advisors select, buy, and sell securities under the supervision and oversight of Homestead Advisers and the Board of Directors. Homestead Advisers pays the sub-advisors from the fees it receives from the Funds.
Homestead Advisers serves as the administrator for the Stock Index Fund pursuant to an Administrative Services Agreement with the fund, under which Homestead Advisers provides certain administrative services to the Fund. Pursuant to this agreement, Homestead Advisers receives a fee of 0.25% of the Fund's average daily net assets. In addition, the Stock Index Fund is allocated a management fee from the Master Portfolio, calculated daily at an annual rate of 0.01% of its average daily net assets. This fee includes advisory, custody, and administrative fees provided by the Master Portfolio on behalf of its investors. The financial information for the Master Portfolio is included in the Appendix.
Homestead Advisers has agreed, as part of the Expense Limitation Agreement entered into with Homestead Funds effective May 1, 2023, with respect to each Fund, to waive its management fee and/or reimburse all Fund operating expenses, excluding certain non-recurring expenses, such as interest, taxes, brokerage commissions, other expenditures that are capitalized in accordance with generally accepted accounting principles, expenses not incurred in the ordinary course of business, or, in the case of each Fund other than the Stock Index Fund, fees and expenses associated with an investment in another investment company or any company that would be an investment company under Section 3(a) of the Act, but for the exceptions to that definition provided for in Sections 3(c)(1) and 3(c)(7) of the Act, which in any year exceed 0.60% of the average daily net assets of the Daily Income Fund, 0.75% of the average daily net assets of the Short-Term Government Securities and Stock Index Funds; 0.80% of the average daily net assets of the Short-Term Bond and Intermediate Bond Funds; 1.00% of the average daily net assets of Rural America Growth & Income Fund and Growth Fund; 1.25% of the average daily net assets of Value Fund, 1.50% of the average daily net assets of Small-Company Stock Fund; and exceed an annualized rate of 1.00% from the period May 1, 2023 through September 23, 2023 for the International Equity Fund. The Expense Limitation Agreements, with the exception of the agreement with International Equity Fund, were renewed for the period of May 1, 2024 through April 30, 2025.
Pursuant to the Expense Limitation Agreement, management fees waived for the period ended December 31, 2023 amounted to $55,941 for Short-Term Government Securities Fund, $109,749 for Intermediate Bond Fund, $55,386 for Rural America Growth & Income Fund, and $91,557 for International Equity Fund. In addition, Homestead Advisers reimbursed $55,976 of the expenses of the Rural America Growth & Income Fund.
On August 14, 2009, Homestead Advisers voluntarily agreed to waive fees and/or reimburse expenses, to the extent necessary to assist the Daily Income Fund in attempting to maintain a positive yield (the "temporary waiver"). The temporary waiver continued from 2009 through May 11, 2017. Homestead Advisers voluntarily waived fees for this Fund again from April 20, 2020 through May 6, 2022.
Under a Deferred Compensation Plan (the “Plan”), Independent Directors or Trustees of the Funds may elect to defer receipt of all or a specified portion of their compensation. Deferred amounts are credited with the earnings and losses equal to those made as if the deferred amounts were invested in one or more of the Funds, as designated by each participating Independent Director / Trustee. Deferred amounts remain in the Fund until distributed in accordance with the Plan. The liability is reflected as Independent Director / Trustee's deferred compensation on the Statement of Assets and Liabilities and the expense is included in Director, Trustee and Board meeting expenses on the Statement of Operations.
As of December 31, 2023, one shareholder of record, an omnibus account, held approximately 15% of the net assets of the Small-Company Stock Fund. No other shareholders, including omnibus accounts, held more than 10% of the outstanding shares of any of the Funds.
| Notes to Financial Statements | |
101
Notes to Financial Statements | (Continued)
6. Capital Share Transactions
As of December 31, 2023, unlimited shares of $.01 par value capital shares are authorized for Intermediate Bond Fund and Rural America Growth & Income Fund; 500 million shares are authorized for Daily Income Fund, 200 million shares for Short-Term Bond Fund, and 100 million shares for Short-Term Government Securities Fund, Stock Index Fund, Value Fund, Growth Fund, International Equity Fund, and Small-Company Stock Fund. Transactions in capital shares were as follows:
| | Shares
Sold | Shares Issued
In Reinvestment
of Dividends | Total Shares
Issued | Total Shares
Redeemed | Net Increase
(Decrease) |
| Year Ended December 31, 2023 | | | | | |
| In Dollars | | | | | |
| Daily Income Fund | $91,436,242 | $9,320,251 | $100,756,493 | $(86,859,683) | $13,896,810 |
| Short-Term Government Securities Fund | $5,975,005 | $1,502,446 | $7,477,451 | $(18,906,906) | $(11,429,455) |
| Short-Term Bond Fund | $25,397,875 | $14,603,095 | $40,000,970 | $(82,446,590) | $(42,445,620) |
| Intermediate Bond Fund | $15,603,846 | $4,120,588 | $19,724,434 | $(25,133,910) | $(5,409,476) |
| Rural America Growth & Income Fund | $4,061,395 | $120,720 | $4,182,115 | $(2,005,134) | $2,176,981 |
| Stock Index Fund | $16,490,660 | $2,995,977 | $19,486,637 | $(31,494,484) | $(12,007,847) |
| Value Fund | $30,752,049 | $57,900,715 | $88,652,764 | $(116,479,917) | $(27,827,153) |
| Growth Fund | $20,008,692 | $7,992,962 | $28,001,654 | $(42,421,404) | $(14,419,750) |
| International Equity Fund | $6,214,052 | $4,566,888 | $10,780,940 | $(13,484,464) | $(2,703,524) |
| Small-Company Stock Fund | $8,337,296 | $9,152,326 | $17,489,622 | $(39,199,297) | $(21,709,675) |
| | | | | | |
| | | | | | |
| In Shares | | | | | |
| Daily Income Fund | 91,436,242 | 9,320,251 | 100,756,493 | (86,859,683) | 13,896,810 |
| Short-Term Government Securities Fund | 1,218,591 | 306,713 | 1,525,304 | (3,858,364) | (2,333,060) |
| Short-Term Bond Fund | 5,246,903 | 3,016,096 | 8,262,999 | (16,990,521) | (8,727,522) |
| Intermediate Bond Fund | 3,476,272 | 914,760 | 4,391,032 | (5,600,768) | (1,209,736) |
| Rural America Growth & Income Fund | 450,395 | 13,013 | 463,408 | (222,042) | 241,366 |
| Stock Index Fund | 525,259 | 87,783 | 613,042 | (1,006,990) | (393,948) |
| Value Fund | 654,355 | 1,203,527 | 1,857,882 | (2,465,323) | (607,441) |
| Growth Fund | 1,530,495 | 543,739 | 2,074,234 | (3,282,620) | (1,208,386) |
| International Equity Fund | 653,261 | 479,816 | 1,133,077 | (1,426,457) | (293,380) |
| Small-Company Stock Fund | 341,892 | 366,088 | 707,980 | (1,632,820) | (924,840) |
| | Notes to Financial Statements |
102
Notes to Financial Statements | (Continued)
| | Shares
Sold | Shares Issued
In Reinvestment
of Dividends | Total Shares
Issued | Total Shares
Redeemed | Net Increase
(Decrease) |
| Year Ended December 31, 2022 | | | | | |
| In Dollars | | | | | |
| Daily Income Fund | $105,940,219 | $2,368,554 | $108,308,773 | $(83,334,145) | $24,974,628 |
| Short-Term Government Securities Fund | $6,903,885 | $834,420 | $7,738,305 | $(12,673,437) | $(4,935,132) |
| Short-Term Bond Fund | $35,346,633 | $8,425,693 | $43,772,326 | $(88,194,983) | $(44,422,657) |
| Intermediate Bond Fund | $12,142,488 | $2,779,340 | $14,921,828 | $(12,430,149) | $2,491,679 |
| Rural America Growth & Income Fund | $6,042,214 | $42,281 | $6,084,495 | $(3,373,305) | $2,711,190 |
| Stock Index Fund | $19,111,037 | $3,464,922 | $22,575,959 | $(25,081,606) | $(2,505,647) |
| Value Fund | $54,797,327 | $88,584,574 | $143,381,901 | $(115,689,537) | $27,692,364 |
| Growth Fund | $24,726,104 | $15,377,070 | $40,103,174 | $(44,620,443) | $(4,517,269) |
| International Equity Fund | $5,995,506 | $3,834,128 | $9,829,634 | $(7,199,930) | $2,629,704 |
| Small-Company Stock Fund | $10,346,352 | $11,615,697 | $21,962,049 | $(31,624,538) | $(9,662,489) |
| | | | | | |
| | | | | | |
| In Shares | | | | | |
| Daily Income Fund | 105,940,219 | 2,368,554 | 108,308,773 | (83,334,145) | 24,974,628 |
| Short-Term Government Securities Fund | 1,378,052 | 168,753 | 1,546,805 | (2,543,811) | (997,006) |
| Short-Term Bond Fund | 7,093,356 | 1,724,987 | 8,818,343 | (17,777,882) | (8,959,539) |
| Intermediate Bond Fund | 2,516,831 | 595,521 | 3,112,352 | (2,571,384) | 540,968 |
| Rural America Growth & Income Fund | 638,440 | 4,719 | 643,159 | (348,494) | 294,665 |
| Stock Index Fund | 632,939 | 123,157 | 756,096 | (818,468) | (62,372) |
| Value Fund | 1,115,417 | 1,935,365 | 3,050,782 | (2,358,768) | 692,014 |
| Growth Fund | 1,918,181 | 1,414,054 | 3,332,235 | (3,530,173) | (197,938) |
| International Equity Fund | 621,580 | 432,023 | 1,053,603 | (755,175) | 298,428 |
| Small-Company Stock Fund | 415,423 | 512,197 | 927,620 | (1,268,636) | (341,016) |
7. Subsequent Events
Management has evaluated the impact of all subsequent events through the date the financial statements were issued and has determined that there were no subsequent events requiring adjustment or additional disclosure in these financial statements.
| Notes to Financial Statements | |
103
Directors, Trustees and Officers
Independent | (Unaudited)
Each Director or Trustee serves until their resignation, death, or removal or until their successor is duly elected and qualified. The Homestead Funds have a policy that each Director or Trustee must retire by the end of the calendar year in which he or she attains the age of 78. Each officer elected by the Board shall hold office until his or her successor shall have been chosen and qualified or until their resignation, death or removal. The Statement of Additional Information (“SAI”) has additional information about the Funds’ Directors, Trustees and officers and is available online at homesteadfunds.com and, without charge, upon request by calling 800-258-3030.
Name, Year of Birth
and Address (1) | Position(s) Held
With Homestead Funds | Term of Office and Length of Time Served | Principal Occupation(s)
During Past Five Years | Number of Portfolios Overseen by Director in the Fund Complex (2) | Other Directorships Held by Director |
James F. Perna
1947 | Director/Trustee, Chairman of the Board, Member of Audit Committee, Member of Nominating & Governance Committee | 1990-present (Homestead Funds, Inc.); since inception (Homestead Funds Trust) | Solo Practitioner (attorney) (2008-present) | 10 | None |
Douglas W. Johnson
1955 | Director/Trustee, Chairman of Audit Committee, Member of Nominating & Governance Committee | 2003-present (Homestead Funds, Inc.); since inception (Homestead Funds Trust) | CEO, Blue Ridge Electric Membership Corporation (1989-present) | 10 | None |
Kenneth R. Meyer (3)
1944 | Director/Trustee, Member of Audit Committee, Member of Nominating & Governance Committee | 2005-present (Homestead Funds, Inc.); since inception (Homestead Funds Trust) | Retired (2004-present) | 10 | None |
Anthony M. Marinello
1946 | Director/Trustee, Member of Audit Committee, Member of Nominating & Governance Committee | 1990-present (Homestead Funds, Inc.); since inception (Homestead Funds Trust) | Retired (2004-present) | 10 | None |
Sheldon C. Petersen
1953 | Director/Trustee, Member of Audit Committee, Member of Nominating & Governance Committee | 2005-present (Homestead Funds, Inc.); since inception (Homestead Funds Trust) | Retired (2021-present); CEO, National Rural Utilities Cooperative Finance Corporation (1995-2021) | 10 | None |
Mark Rose
1953 | Director/Trustee, Member of Audit Committee, Member of Nominating & Governance Committee | 2005-present (Homestead Funds, Inc.); since inception (Homestead Funds Trust) | Consultant, public affairs (2017-present)(self-employed); CEO and General Manager, Bluebonnet Electric Cooperative (2002-2017) | 10 | None |
Peter J. Tonetti
1953 | Director/Trustee, Member of Audit Committee, Member of Nominating & Governance Committee | 2010-present (Homestead Funds, Inc.); since inception (Homestead Funds Trust) | Retired (2015-present) | 10 | None |
Directors, Trustees and Officers
Independent | (Unaudited) (Continued)
Judith H. McKinney
1950 | Director/Trustee, Member of Audit Committee, Chairperson of Nominating & Governance Committee | 2019-present | Retired (2019-present); Executive Vice President and Manager, Callan LLC (2007-2019) | 10 | None |
Julie H. Dellinger
1953 | Director/Trustee, Vice Chair of Audit Committee, Member of Nominating & Governance Committee | 2019-present; Vice Chair of Audit Committee 2021-present | Westminster Investment Consultants, CEO (2017- present); Managing Vice President of Investments, ICMARC and Manager, Vantagepoint Investment Advisers, LLC (1998-2017) | 10 | None |
Directors and Officers
105
Directors and Officers
Interested | (Unaudited)
Name, Year of Birth
and Address (1) | Position(s) Held
With Homestead Funds | Term of Office and Length of Time Served | Principal Occupation(s)
During Past Five Years | Number of Portfolios Overseen by Director | Other Directorships Held by Director |
Mark D. Santero (4)
1961 | Director/Trustee, President and Chief Executive Officer | 2018-present (Homestead Funds, Inc.); since inception (Homestead Funds Trust) | Homestead Advisers Corp., President, Chief Executive Officer and Director (2018- present); Chief Executive Officer, The Dreyfus Corporation (2016-2017); Chief Operating Officer, BNY Mellon Investment Management (2014- 2016) | 10 | Not Applicable |
Danielle C. Sieverling
1971 | Chief Compliance Officer and Secretary
| 2005-present (Homestead Funds, Inc.); since inception (Homestead Funds Trust)
| Chief Compliance Officer, Homestead Advisers Corp. (2005-present); Vice President, Chief Risk and Compliance Officer, NRECA (2015-present); Chief Compliance Officer, Homestead Financial Services Corp. (2017-Present); Secretary, Homestead Advisers Corp. (2017-2018, 2020-2021, 2023-Present); Chief Executive Officer and Director, Homestead Financial Services Corp. (2017-2018); Director, Homestead Financial Services Corp. (2016) Vice President and Director, Homestead Financial Services Corp. (2015-2016); Vice President and Chief Compliance Officer, Management Advisory Services, NRECA (2008-2015) | Not Applicable | Not Applicable |
Amy M. DiMauro
1971 | Treasurer | 2007-present (Homestead Funds, Inc,); since inception (Homestead Funds Trust) | Treasurer and Director, Homestead Financial Services Corp. (2006- present); Treasurer and Director, Homestead Advisers Corp. (2010- present); Senior Director, Finance & Accounting—Mutual Funds, NRECA (2014-present); Treasurer and Director, Electric Cooperative Life Insurance Co. (2013-2021); Treasurer and Director, Cooperating Insurance Services Co. (2013- present) | Not Applicable | Not Applicable |
Jennifer (Laurie) Webster
1963 | Chief Operations Officer | 2017-present (Homestead Funds, Inc.); since inception (Homestead Funds Trust) | President and Director, Homestead Financial Services Corp. (2018- present); Chief Operations Officer, Homestead Financial Services Corp. (2017- present); Vice President of Operations and Client Services, Homestead Advisers Corp. (2017-2020); Chief Operations Officer, Homestead Advisers Corp. (2020-present); Chief Operating Officer, Solomon Hess Capital Management (2017-2017); V.P. Investment Operations and Indexing, Calvert Investments (2014-2017) | Not Applicable | Not Applicable |
(1) The address of each Director/Trustee and officer is 4301 Wilson Boulevard, Arlington, Virginia 22203.
(2) Fund Complex includes Homestead Funds, Inc. and Homestead Funds Trust.
(3) Mr. Meyer's last day as an Independent Director/Trustee was December 31, 2023.
(4) Mr. Santero is a director who is an “interested person” of Homestead Funds within the meaning of Section 2(a)(19) of the 1940 Act due to his affiliation with Homestead Advisers Corp. and its affiliates.
Other Tax Information (Unaudited)
The following information for the year ended December 31, 2023, is provided pursuant to provisions of the Internal Revenue Code.
The Funds designate the following percentages of dividends declared from net investment income as qualified dividend income for individuals, as dividends received deduction for corporations, and from Real Estate Investment Trusts (REIT):
| Fund | Qualified Dividend Income for Individuals | Dividends Received Deduction for Corporations | REIT Income |
| Daily Income Fund | 0% | 0% | 0% |
| Short-Term Government Securities Fund | 0% | 0% | 0% |
| Short-Term Bond Fund | 0% | 0% | 0% |
| Intermediate Bond Fund | 0% | 0% | 0% |
| Rural America Growth & Income Fund | 31% | 31% | 7% |
| Stock Index Fund | 90% | 90% | 4% |
| Value Fund | 93% | 93% | 7% |
| Growth Fund | 0% | 0% | 0% |
| International Equity Fund | 100% | 100% | 0% |
| Small-Company Stock Fund | 73% | 73% | 18% |
| | | | |
| | | | |
The Funds designate the following amounts as short-term and long-term capital gains distributed during the year ended December 31, 2023.
| Fund | Record Date | Distributions of Short-Term Capital Gains | Distributions of Long-Term Capital Gains |
| Stock Index Fund | 6/29/2023 | $0.0025 | $0.0014 |
| Stock Index Fund | 12/13/2023 | $0.0803 | $0.0365 |
| Value Fund | 6/29/2023 | $– | $0.1597 |
| Value Fund | 12/13/2023 | $– | $2.3102 |
| Growth Fund | 12/13/2023 | $– | $0.3849 |
| International Equity Fund | 6/29/2023 | $– | $0.0561 |
| International Equity Fund | 12/13/2023 | $– | $0.3527 |
| Small-Company Stock Fund | 6/29/2023 | $– | $0.1848 |
| Small-Company Stock Fund | 12/13/2023 | $– | $0.7880 |
The International Equity Fund designates $0.0245 per share as foreign taxes paid and $0.1261 per share as income earned from foreign sources.
Other Tax Information
107
Appendix
S&P 500 Index Master Portfolio
(THIS PAGE INTENTIONALLY LEFT BLANK)
homesteadfunds.com | 800.258.3030 | 4301 Wilson Blvd. | Arlington, VA | 22203
This report is authorized for distribution to shareholders and others who have received a copy of the prospectus.
Distributor: Homestead Financial Services Corp.
| | |
Master Portfolio Information as of December 31, 2023 | | S&P 500 Index Master Portfolio |
| | | | |
| TEN LARGEST HOLDINGS | |
| | |
| Security | | Percent of Net Assets | |
| |
Apple, Inc. | | | 6.9% | |
Microsoft Corp. | | | 6.9 | |
Amazon.com, Inc. | | | 3.4 | |
NVIDIA Corp. | | | 3.0 | |
Alphabet, Inc., Class A | | | 2.1 | |
Meta Platforms, Inc., Class A | | | 1.9 | |
Alphabet, Inc., Class C | | | 1.7 | |
Tesla, Inc. | | | 1.7 | |
Berkshire Hathaway, Inc., Class B | | | 1.6 | |
JPMorgan Chase & Co. | | | 1.2 | |
SECTOR ALLOCATION
| | | | |
| | |
| Sector(a) | | Percent of Net Assets | |
| |
Information Technology | | | 28.5% | |
Financials | | | 12.8 | |
Health Care | | | 12.4 | |
Consumer Discretionary | | | 10.7 | |
Industrials | | | 8.7 | |
Communication Services | | | 8.5 | |
Consumer Staples | | | 6.1 | |
Energy | | | 3.8 | |
Real Estate | | | 2.5 | |
Materials | | | 2.4 | |
Utilities | | | 2.3 | |
Investment Companies | | | 0.6 | |
Short-Term Securities | | | 0.8 | |
Liabilities in Excess of Other Assets | | | (0.1) | |
| (a) | For S&P 500 Index Master Portfolio (the “Master Portfolio”) compliance purposes, the Master Portfolio’s sector classifications refer to one or more of the sector subclassifications used by one or more widely recognized market indexes or ratings group indexes, and/or as defined by the investment adviser. These definitions may not apply for purposes of this report, which may combine such sector sub-classifications for reporting ease. |
| | |
MASTER PORTFOLIO INFORMATION | | 1 |
| | |
Schedule of Investments December 31, 2023 | | S&P 500 Index Master Portfolio (Percentages shown are based on Net Assets) |
| | |
| | | | | | | | |
| Security | | Shares | | | Value | |
| |
| | |
Common Stocks | | | | | | | | |
| | |
Aerospace & Defense — 1.6% | | | | | | | | |
Axon Enterprise, Inc.(a) | | | 62,495 | | | $ | 16,144,333 | |
Boeing Co.(a) | | | 503,306 | | | | 131,191,742 | |
General Dynamics Corp. | | | 201,164 | | | | 52,236,256 | |
Howmet Aerospace, Inc.(b) | | | 347,601 | | | | 18,812,166 | |
Huntington Ingalls Industries, Inc. | | | 35,040 | | | | 9,097,786 | |
L3Harris Technologies, Inc. | | | 168,092 | | | | 35,403,537 | |
Lockheed Martin Corp. | | | 196,002 | | | | 88,835,947 | |
Northrop Grumman Corp. | | | 126,243 | | | | 59,099,398 | |
RTX Corp. | | | 1,276,366 | | | | 107,393,435 | |
Textron, Inc. | | | 176,036 | | | | 14,156,815 | |
TransDigm Group, Inc. | | | 48,983 | | | | 49,551,203 | |
| | | | | | | | |
| | |
| | | | | | | 581,922,618 | |
| | |
| Air Freight & Logistics — 0.5% | | | | | | |
CH Robinson Worldwide, Inc. | | | 103,358 | | | | 8,929,098 | |
Expeditors International of Washington, Inc. | | | 131,443 | | | | 16,719,550 | |
FedEx Corp. | | | 205,392 | | | | 51,958,014 | |
United Parcel Service, Inc., Class B | | | 642,014 | | | | 100,943,861 | |
| | | | | | | | |
| | |
| | | | | | | 178,550,523 | |
| | |
| Automobile Components — 0.1% | | | | | | |
Aptiv PLC(a) | | | 251,920 | | | | 22,602,263 | |
BorgWarner, Inc. | | | 208,912 | | | | 7,489,495 | |
| | | | | | | | |
| | |
| | | | | | | 30,091,758 | |
| | |
| Automobiles — 1.9% | | | | | | |
Ford Motor Co. | | | 3,498,879 | | | | 42,651,335 | |
General Motors Co.(b) | | | 1,212,535 | | | | 43,554,257 | |
Tesla, Inc.(a) | | | 2,451,127 | | | | 609,056,037 | |
| | | | | | | | |
| | |
| | | | | | | 695,261,629 | |
| | |
| Banks — 3.2% | | | | | | |
Bank of America Corp. | | | 6,111,486 | | | | 205,773,734 | |
Citigroup, Inc. | | | 1,709,344 | | | | 87,928,655 | |
Citizens Financial Group, Inc. | | | 419,751 | | | | 13,910,548 | |
Comerica, Inc. | | | 117,856 | | | | 6,577,543 | |
Fifth Third Bancorp | | | 605,140 | | | | 20,871,279 | |
Huntington Bancshares, Inc. | | | 1,286,805 | | | | 16,368,160 | |
JPMorgan Chase & Co. | | | 2,566,230 | | | | 436,515,723 | |
KeyCorp. | | | 831,798 | | | | 11,977,891 | |
M&T Bank Corp. | | | 147,664 | | | | 20,241,781 | |
PNC Financial Services Group, Inc. | | | 353,795 | | | | 54,785,156 | |
Regions Financial Corp. | | | 833,982 | | | | 16,162,571 | |
Truist Financial Corp. | | | 1,183,321 | | | | 43,688,211 | |
U.S. Bancorp | | | 1,382,092 | | | | 59,816,942 | |
Wells Fargo & Co. | | | 3,223,658 | | | | 158,668,447 | |
Zions Bancorp NA | | | 128,196 | | | | 5,623,958 | |
| | | | | | | | |
| | |
| | | | | | | 1,158,910,599 | |
| | |
| Beverages — 1.5% | | | | | | |
Brown-Forman Corp., Class B | | | 162,610 | | | | 9,285,031 | |
Coca-Cola Co. | | | 3,454,643 | | | | 203,582,112 | |
Constellation Brands, Inc., Class A | | | 143,387 | | | | 34,663,807 | |
Keurig Dr. Pepper, Inc. | | | 894,106 | | | | 29,791,612 | |
Molson Coors Beverage Co., Class B | | | 164,962 | | | | 10,097,324 | |
Monster Beverage Corp.(a) | | | 660,571 | | | | 38,055,496 | |
PepsiCo, Inc. | | | 1,221,918 | | | | 207,530,553 | |
| | | | | | | | |
| | |
| | | | | | | 533,005,935 | |
| | |
| Biotechnology — 2.0% | | | | | | |
AbbVie, Inc. | | | 1,566,739 | | | | 242,797,543 | |
Amgen, Inc. | | | 474,803 | | | | 136,752,760 | |
| | | | | | | | |
| Security | | Shares | | | Value | |
| |
| | |
| Biotechnology (continued) | | | | | | |
Biogen, Inc.(a) | | | 127,502 | | | $ | 32,993,693 | |
Gilead Sciences, Inc. | | | 1,106,021 | | | | 89,598,761 | |
Incyte Corp.(a) | | | 163,912 | | | | 10,292,035 | |
Moderna, Inc.(a)(b) | | | 295,905 | | | | 29,427,752 | |
Regeneron Pharmaceuticals, Inc.(a) | | | 94,748 | | | | 83,216,221 | |
Vertex Pharmaceuticals, Inc.(a) | | | 229,097 | | | | 93,217,278 | |
| | | | | | | | |
| | |
| | | | | | | 718,296,043 | |
| | |
| Broadline Retail — 3.5% | | | | | | |
Amazon.com, Inc.(a) | | | 8,072,325 | | | | 1,226,509,061 | |
eBay, Inc. | | | 460,695 | | | | 20,095,516 | |
Etsy, Inc.(a) | | | 109,329 | | | | 8,861,115 | |
| | | | | | | | |
| | |
| | | | | | | 1,255,465,692 | |
| | |
| Building Products — 0.5% | | | | | | |
A O Smith Corp. | | | 112,403 | | | | 9,266,503 | |
Allegion PLC | | | 78,014 | | | | 9,883,594 | |
Builders FirstSource, Inc.(a) | | | 109,537 | | | | 18,286,107 | |
Carrier Global Corp. | | | 744,760 | | | | 42,786,462 | |
Johnson Controls International PLC | | | 604,964 | | | | 34,870,125 | |
Masco Corp. | | | 199,903 | | | | 13,389,503 | |
Trane Technologies PLC | | | 201,336 | | | | 49,105,850 | |
| | | | | | | | |
| | |
| | | | | | | 177,588,144 | |
| | |
| Capital Markets — 3.0% | | | | | | |
Ameriprise Financial, Inc. | | | 89,828 | | | | 34,119,369 | |
Bank of New York Mellon Corp. | | | 682,675 | | | | 35,533,234 | |
BlackRock, Inc.(c) | | | 124,576 | | | | 101,130,797 | |
Blackstone, Inc., Class A | | | 630,008 | | | | 82,480,647 | |
Cboe Global Markets, Inc. | | | 93,778 | | | | 16,745,000 | |
Charles Schwab Corp. | | | 1,319,918 | | | | 90,810,358 | |
CME Group, Inc., Class A | | | 319,328 | | | | 67,250,477 | |
FactSet Research Systems, Inc. | | | 33,902 | | | | 16,172,949 | |
Franklin Resources, Inc. | | | 250,718 | | | | 7,468,889 | |
Goldman Sachs Group, Inc. | | | 289,476 | | | | 111,671,157 | |
Intercontinental Exchange, Inc. | | | 508,035 | | | | 65,246,935 | |
Invesco Ltd. | | | 395,466 | | | | 7,055,113 | |
MarketAxess Holdings, Inc. | | | 32,636 | | | | 9,557,453 | |
Moody’s Corp. | | | 140,080 | | | | 54,709,645 | |
Morgan Stanley | | | 1,121,833 | | | | 104,610,927 | |
MSCI, Inc., Class A | | | 70,309 | | | | 39,770,286 | |
Nasdaq, Inc. | | | 301,293 | | | | 17,517,175 | |
Northern Trust Corp. | | | 183,975 | | | | 15,523,810 | |
Raymond James Financial, Inc. | | | 167,047 | | | | 18,625,740 | |
S&P Global, Inc. | | | 288,840 | | | | 127,239,797 | |
State Street Corp. | | | 273,917 | | | | 21,217,611 | |
T Rowe Price Group, Inc. | | | 199,343 | | | | 21,467,248 | |
| | | | | | | | |
| | |
| | | | | | | 1,065,924,617 | |
| | |
| Chemicals — 1.6% | | | | | | |
Air Products and Chemicals, Inc. | | | 197,190 | | | | 53,990,622 | |
Albemarle Corp. | | | 105,109 | | | | 15,186,148 | |
Celanese Corp., Class A | | | 88,774 | | | | 13,792,816 | |
CF Industries Holdings, Inc. | | | 171,482 | | | | 13,632,819 | |
Corteva, Inc. | | | 624,444 | | | | 29,923,357 | |
Dow, Inc. | | | 625,168 | | | | 34,284,213 | |
DuPont de Nemours, Inc. | | | 381,731 | | | | 29,366,566 | |
Eastman Chemical Co. | | | 104,899 | | | | 9,422,028 | |
Ecolab, Inc. | | | 225,470 | | | | 44,721,975 | |
FMC Corp. | | | 108,860 | | | | 6,863,623 | |
International Flavors & Fragrances, Inc. | | | 226,856 | | | | 18,368,530 | |
Linde PLC | | | 430,417 | | | | 176,776,566 | |
LyondellBasell Industries NV, Class A | | | 227,611 | | | | 21,641,254 | |
| | |
| 2 | | 2 0 2 3 BLACK ROCK ANNUAL REPORT TO SHAREHOLDERS |
| | |
Schedule of Investments (continued) December 31, 2023 | | S&P 500 Index Master Portfolio (Percentages shown are based on Net Assets) |
| | |
| | | | | | | | |
| Security | | Shares | | | Value | |
| |
| | |
| Chemicals (continued) | | | | | | |
Mosaic Co. | | | 294,232 | | | $ | 10,512,909 | |
PPG Industries, Inc. | | | 209,312 | | | | 31,302,610 | |
Sherwin-Williams Co. | | | 209,997 | | | | 65,498,064 | |
| | | | | | | | |
| | |
| | | | | | | 575,284,100 | |
| | |
| Commercial Services & Supplies — 0.6% | | | | | | |
Cintas Corp. | | | 76,830 | | | | 46,302,368 | |
Copart, Inc.(a) | | | 771,913 | | | | 37,823,737 | |
Republic Services, Inc. | | | 182,738 | | | | 30,135,324 | |
Rollins, Inc. | | | 249,230 | | | | 10,883,874 | |
Veralto Corp. | | | 194,675 | | | | 16,013,965 | |
Waste Management, Inc. | | | 327,190 | | | | 58,599,729 | |
| | | | | | | | |
| | |
| | | | | | | 199,758,997 | |
| | |
| Communications Equipment — 0.8% | | | | | | |
Arista Networks, Inc.(a) | | | 222,638 | | | | 52,433,475 | |
Cisco Systems, Inc. | | | 3,595,500 | | | | 181,644,660 | |
F5, Inc.(a) | | | 52,708 | | | | 9,433,678 | |
Juniper Networks, Inc. | | | 285,609 | | | | 8,419,753 | |
Motorola Solutions, Inc. | | | 148,287 | | | | 46,427,177 | |
| | | | | | | | |
| | |
| | | | | | | 298,358,743 | |
| | |
| Construction & Engineering — 0.1% | | | | | | |
Quanta Services, Inc. | | | 129,091 | | | | 27,857,838 | |
| | | | | | | | |
| | |
| Construction Materials — 0.2% | | | | | | |
Martin Marietta Materials, Inc. | | | 54,916 | | | | 27,398,141 | |
Vulcan Materials Co. | | | 118,085 | | | | 26,806,476 | |
| | | | | | | | |
| | |
| | | | | | | 54,204,617 | |
| | |
| Consumer Finance — 0.5% | | | | | | |
American Express Co. | | | 511,034 | | | | 95,737,110 | |
Capital One Financial Corp. | | | 338,745 | | | | 44,416,245 | |
Discover Financial Services | | | 222,486 | | | | 25,007,426 | |
Synchrony Financial | | | 371,660 | | | | 14,193,695 | |
| | | | | | | | |
| | |
| | | | | | | 179,354,476 | |
|
| Consumer Staples Distribution & Retail — 1.8% | |
Costco Wholesale Corp. | | | 393,359 | | | | 259,648,409 | |
Dollar General Corp. | | | 194,697 | | | | 26,469,057 | |
Dollar Tree, Inc.(a) | | | 186,074 | | | | 26,431,812 | |
Kroger Co. | | | 586,865 | | | | 26,825,599 | |
Sysco Corp. | | | 448,741 | | | | 32,816,429 | |
Target Corp. | | | 409,905 | | | | 58,378,670 | |
Walgreens Boots Alliance, Inc. | | | 636,795 | | | | 16,626,717 | |
Walmart, Inc. | | | 1,266,852 | | | | 199,719,218 | |
| | | | | | | | |
| | |
| | | | | | | 646,915,911 | |
| | |
| Containers & Packaging — 0.2% | | | | | | |
Amcor PLC | | | 1,307,745 | | | | 12,606,662 | |
Avery Dennison Corp. | | | 71,618 | | | | 14,478,295 | |
Ball Corp. | | | 280,009 | | | | 16,106,118 | |
International Paper Co. | | | 307,507 | | | | 11,116,378 | |
Packaging Corp. of America | | | 79,912 | | | | 13,018,464 | |
Westrock Co. | | | 227,768 | | | | 9,456,927 | |
| | | | | | | | |
| | |
| | | | | | | 76,782,844 | |
| | |
| Distributors — 0.1% | | | | | | |
Genuine Parts Co. | | | 124,814 | | | | 17,286,739 | |
LKQ Corp. | | | 238,064 | | | | 11,377,079 | |
Pool Corp. | | | 34,707 | | | | 13,838,028 | |
| | | | | | | | |
| | |
| | | | | | | 42,501,846 | |
| | | | | | | | |
| Security | | Shares | | | Value | |
| |
|
Diversified Telecommunication Services — 0.7% | |
AT&T, Inc. | | | 6,345,790 | | | $ | 106,482,356 | |
Verizon Communications, Inc. | | | 3,731,704 | | | | 140,685,241 | |
| | | | | | | | |
| | |
| | | | | | | 247,167,597 | |
| | |
| Electric Utilities — 1.5% | | | | | | |
Alliant Energy Corp. | | | 224,604 | | | | 11,522,185 | |
American Electric Power Co., Inc. | | | 457,682 | | | | 37,172,932 | |
Constellation Energy Corp. | | | 285,624 | | | | 33,386,589 | |
Duke Energy Corp. | | | 684,117 | | | | 66,386,714 | |
Edison International | | | 340,675 | | | | 24,354,856 | |
Entergy Corp. | | | 186,928 | | | | 18,915,244 | |
Evergy, Inc. | | | 204,148 | | | | 10,656,526 | |
Eversource Energy | | | 310,250 | | | | 19,148,630 | |
Exelon Corp. | | | 884,475 | | | | 31,752,652 | |
FirstEnergy Corp. | | | 458,618 | | | | 16,812,936 | |
NextEra Energy, Inc. | | | 1,796,344 | | | | 109,109,935 | |
NRG Energy, Inc. | | | 203,628 | | | | 10,527,568 | |
PG&E Corp. | | | 1,857,648 | | | | 33,493,393 | |
Pinnacle West Capital Corp. | | | 100,706 | | | | 7,234,719 | |
PPL Corp. | | | 655,088 | | | | 17,752,885 | |
Southern Co. | | | 968,021 | | | | 67,877,633 | |
Xcel Energy, Inc. | | | 490,175 | | | | 30,346,734 | |
| | | | | | | | |
| | |
| | | | | | | 546,452,131 | |
| | |
| Electrical Equipment — 0.6% | | | | | | |
AMETEK, Inc. | | | 205,105 | | | | 33,819,764 | |
Eaton Corp. PLC | | | 354,171 | | | | 85,291,460 | |
Emerson Electric Co. | | | 507,583 | | | | 49,403,053 | |
Generac Holdings, Inc.(a) | | | 56,265 | | | | 7,271,689 | |
Hubbell, Inc. | | | 47,293 | | | | 15,556,087 | |
Rockwell Automation, Inc. | | | 102,257 | | | | 31,748,753 | |
| | | | | | | | |
| | |
| | | | | | | 223,090,806 | |
|
| Electronic Equipment, Instruments & Components — 0.6% | |
Amphenol Corp., Class A | | | 529,575 | | | | 52,496,770 | |
CDW Corp. | | | 119,139 | | | | 27,082,677 | |
Corning, Inc. | | | 683,388 | | | | 20,809,165 | |
Jabil, Inc. | | | 113,572 | | | | 14,469,073 | |
Keysight Technologies, Inc.(a) | | | 158,740 | | | | 25,253,947 | |
TE Connectivity Ltd. | | | 276,445 | | | | 38,840,522 | |
Teledyne Technologies, Inc.(a) | | | 41,838 | | | | 18,671,881 | |
Trimble, Inc.(a) | | | 220,696 | | | | 11,741,027 | |
Zebra Technologies Corp., Class A(a) | | | 45,627 | | | | 12,471,228 | |
| | | | | | | | |
| | |
| | | | | | | 221,836,290 | |
| | |
| Energy Equipment & Services — 0.4% | | | | | | |
Baker Hughes Co., Class A | | | 897,461 | | | | 30,675,217 | |
Halliburton Co. | | | 798,937 | | | | 28,881,573 | |
Schlumberger NV | | | 1,261,512 | | | | 65,649,084 | |
| | | | | | | | |
| | |
| | | | | | | 125,205,874 | |
| | |
| Entertainment — 1.2% | | | | | | |
Electronic Arts, Inc. | | | 219,103 | | | | 29,975,482 | |
Live Nation Entertainment, Inc.(a)(b) | | | 126,007 | | | | 11,794,255 | |
Netflix, Inc.(a) | | | 388,511 | | | | 189,158,236 | |
Take-Two Interactive Software, Inc.(a) | | | 140,335 | | | | 22,586,918 | |
Walt Disney Co. | | | 1,624,198 | | | | 146,648,837 | |
Warner Bros Discovery, Inc., Class A(a)(b) | | | 1,972,734 | | | | 22,449,713 | |
| | | | | | | | |
| | |
| | | | | | | 422,613,441 | |
| | |
| Financial Services — 4.1% | | | | | | |
Berkshire Hathaway, Inc., Class B(a) | | | 1,615,045 | | | | 576,021,950 | |
Fidelity National Information Services, Inc. | | | 520,598 | | | | 31,272,322 | |
Fiserv, Inc.(a) | | | 532,761 | | | | 70,771,971 | |
| | |
MASTER PORTFOLIO SCHEDULE OF INVESTMENTS | | 3 |
| | |
Schedule of Investments (continued) December 31, 2023 | | S&P 500 Index Master Portfolio (Percentages shown are based on Net Assets) |
| | |
| | | | | | | | |
| Security | | Shares | | | Value | |
| |
| | |
| Financial Services (continued) | | | | | | |
FleetCor Technologies, Inc.(a) | | | 64,093 | | | $ | 18,113,323 | |
Global Payments, Inc. | | | 231,070 | | | | 29,345,890 | |
Jack Henry & Associates, Inc. | | | 64,027 | | | | 10,462,652 | |
Mastercard, Inc., Class A | | | 735,061 | | | | 313,510,867 | |
PayPal Holdings, Inc.(a) | | | 957,021 | | | | 58,770,659 | |
Visa, Inc., Class A | | | 1,414,929 | | | | 368,376,765 | |
| | | | | | | | |
| | |
| | | | | | | 1,476,646,399 | |
| | |
| Food Products — 0.9% | | | | | | |
Archer-Daniels-Midland Co. | | | 476,624 | | | | 34,421,785 | |
Bunge Global SA | | | 128,966 | | | | 13,019,118 | |
Campbell Soup Co. | | | 174,853 | | | | 7,558,895 | |
Conagra Brands, Inc. | | | 424,704 | | | | 12,172,017 | |
General Mills, Inc. | | | 520,021 | | | | 33,874,168 | |
Hershey Co. | | | 133,183 | | | | 24,830,638 | |
Hormel Foods Corp. | | | 255,218 | | | | 8,195,050 | |
J M Smucker Co. | | | 94,176 | | | | 11,901,963 | |
Kellanova | | | 229,914 | | | | 12,854,492 | |
Kraft Heinz Co. | | | 709,622 | | | | 26,241,822 | |
Lamb Weston Holdings, Inc. | | | 129,112 | | | | 13,955,716 | |
McCormick & Co., Inc. | | | 223,165 | | | | 15,268,949 | |
Mondelez International, Inc., Class A | | | 1,207,571 | | | | 87,464,368 | |
Tyson Foods, Inc., Class A | | | 253,782 | | | | 13,640,782 | |
| | | | | | | | |
| | |
| | | | | | | 315,399,763 | |
| | |
| Gas Utilities — 0.0% | | | | | | |
Atmos Energy Corp. | | | 131,515 | | | | 15,242,588 | |
| | | | | | | | |
| | |
| Ground Transportation — 1.1% | | | | | | |
CSX Corp. | | | 1,754,131 | | | | 60,815,722 | |
JB Hunt Transport Services, Inc. | | | 72,560 | | | | 14,493,134 | |
Norfolk Southern Corp. | | | 201,767 | | | | 47,693,683 | |
Old Dominion Freight Line, Inc. | | | 79,699 | | | | 32,304,396 | |
Uber Technologies, Inc.(a) | | | 1,826,676 | | | | 112,468,441 | |
Union Pacific Corp. | | | 540,982 | | | | 132,875,999 | |
| | | | | | | | |
| | |
| | | | | | | 400,651,375 | |
|
| Health Care Equipment & Supplies — 2.5% | |
Abbott Laboratories | | | 1,540,386 | | | | 169,550,287 | |
Align Technology, Inc.(a) | | | 63,258 | | | | 17,332,692 | |
Baxter International, Inc. | | | 450,067 | | | | 17,399,590 | |
Becton Dickinson & Co. | | | 257,514 | | | | 62,789,639 | |
Boston Scientific Corp.(a) | | | 1,299,713 | | | | 75,136,409 | |
Cooper Cos., Inc.(b) | | | 44,000 | | | | 16,651,360 | |
DENTSPLY SIRONA, Inc. | | | 182,492 | | | | 6,494,890 | |
Dexcom, Inc.(a)(b) | | | 344,389 | | | | 42,735,231 | |
Edwards Lifesciences Corp.(a)(b) | | | 535,886 | | | | 40,861,308 | |
GE HealthCare, Inc.(a)(b) | | | 347,213 | | | | 26,846,509 | |
Hologic, Inc.(a) | | | 217,692 | | | | 15,554,093 | |
IDEXX Laboratories, Inc.(a)(b) | | | 73,830 | | | | 40,979,341 | |
Insulet Corp.(a)(b) | | | 62,053 | | | | 13,464,260 | |
Intuitive Surgical, Inc.(a) | | | 311,879 | | | | 105,215,499 | |
Medtronic PLC | | | 1,181,597 | | | | 97,339,961 | |
ResMed, Inc. | | | 130,585 | | | | 22,463,232 | |
STERIS PLC | | | 87,676 | | | | 19,275,569 | |
Stryker Corp. | | | 300,027 | | | | 89,846,085 | |
Teleflex, Inc.(b) | | | 41,424 | | | | 10,328,660 | |
Zimmer Biomet Holdings, Inc. | | | 185,964 | | | | 22,631,819 | |
| | | | | | | | |
| | |
| | | | | | | 912,896,434 | |
| | |
| Health Care Providers & Services — 2.8% | | | | | | |
Cardinal Health, Inc. | | | 218,780 | | | | 22,053,024 | |
Cencora, Inc. | | | 146,956 | | | | 30,181,823 | |
Centene Corp.(a) | | | 474,188 | | | | 35,189,492 | |
| | | | | | | | |
| Security | | Shares | | | Value | |
| |
|
| Health Care Providers & Services (continued) | |
Cigna Group | | | 259,747 | | | $ | 77,781,239 | |
CVS Health Corp. | | | 1,140,093 | | | | 90,021,743 | |
DaVita, Inc.(a) | | | 45,877 | | | | 4,806,075 | |
Elevance Health, Inc. | | | 209,172 | | | | 98,637,148 | |
HCA Healthcare, Inc. | | | 175,818 | | | | 47,590,416 | |
Henry Schein, Inc.(a)(b) | | | 115,839 | | | | 8,770,171 | |
Humana, Inc. | | | 109,986 | | | | 50,352,691 | |
Laboratory Corp. of America Holdings | | | 75,362 | | | | 17,129,029 | |
McKesson Corp. | | | 118,114 | | | | 54,684,420 | |
Molina Healthcare, Inc.(a) | | | 51,814 | | | | 18,720,916 | |
Quest Diagnostics, Inc. | | | 99,749 | | | | 13,753,392 | |
UnitedHealth Group, Inc. | | | 821,018 | | | | 432,241,346 | |
Universal Health Services, Inc., Class B | | | 55,227 | | | | 8,418,804 | |
| | | | | | | | |
| | |
| | | | | | | 1,010,331,729 | |
| | |
| Health Care REITs — 0.2% | | | | | | |
Healthpeak Properties, Inc. | | | 486,194 | | | | 9,626,641 | |
Ventas, Inc. | | | 357,613 | | | | 17,823,432 | |
Welltower, Inc. | | | 490,027 | | | | 44,185,735 | |
| | | | | | | | |
| | |
| | | | | | | 71,635,808 | |
| | |
| Hotel & Resort REITs — 0.0% | | | | | | |
Host Hotels & Resorts, Inc. | | | 632,439 | | | | 12,313,587 | |
| | | | | | | | |
|
| Hotels, Restaurants & Leisure — 2.1% | |
Airbnb, Inc., Class A(a)(b) | | | 378,622 | | | | 51,545,599 | |
Booking Holdings, Inc.(a) | | | 30,970 | | | | 109,857,403 | |
Caesars Entertainment, Inc.(a) | | | 187,957 | | | | 8,811,424 | |
Carnival Corp.(a) | | | 895,273 | | | | 16,598,361 | |
Chipotle Mexican Grill, Inc.(a) | | | 24,488 | | | | 56,003,077 | |
Darden Restaurants, Inc. | | | 107,426 | | | | 17,650,092 | |
Domino’s Pizza, Inc. | | | 31,190 | | | | 12,857,454 | |
Expedia Group, Inc.(a) | | | 118,347 | | | | 17,963,891 | |
Hilton Worldwide Holdings, Inc.(b) | | | 227,631 | | | | 41,449,329 | |
Las Vegas Sands Corp. | | | 292,143 | | | | 14,376,357 | |
Marriott International, Inc., Class A | | | 218,986 | | | | 49,383,533 | |
McDonald’s Corp. | | | 643,856 | | | | 190,909,743 | |
MGM Resorts International | | | 249,482 | | | | 11,146,856 | |
Norwegian Cruise Line Holdings Ltd.(a)(b) | | | 369,502 | | | | 7,404,820 | |
Royal Caribbean Cruises Ltd.(a) | | | 209,200 | | | | 27,089,308 | |
Starbucks Corp. | | | 1,016,711 | | | | 97,614,423 | |
Wynn Resorts Ltd. | | | 86,072 | | | | 7,842,020 | |
Yum! Brands, Inc. | | | 248,981 | | | | 32,531,857 | |
| | | | | | | | |
| | |
| | | | | | | 771,035,547 | |
| | |
| Household Durables — 0.4% | | | | | | |
D.R. Horton, Inc. | | | 267,509 | | | | 40,656,018 | |
Garmin Ltd. | | | 136,122 | | | | 17,497,122 | |
Lennar Corp., Class A | | | 221,964 | | | | 33,081,515 | |
Mohawk Industries, Inc.(a) | | | 47,669 | | | | 4,933,741 | |
NVR, Inc.(a) | | | 2,822 | | | | 19,755,270 | |
PulteGroup, Inc. | | | 191,375 | | | | 19,753,727 | |
Whirlpool Corp. | | | 48,323 | | | | 5,884,292 | |
| | | | | | | | |
| | |
| | | | | | | 141,561,685 | |
| | |
| Household Products — 1.2% | | | | | | |
Church & Dwight Co., Inc. | | | 218,674 | | | | 20,677,813 | |
Clorox Co. | | | 110,050 | | | | 15,692,030 | |
Colgate-Palmolive Co. | | | 733,811 | | | | 58,492,075 | |
Kimberly-Clark Corp. | | | 300,602 | | | | 36,526,149 | |
Procter & Gamble Co. | | | 2,092,456 | | | | 306,628,502 | |
| | | | | | | | |
| | |
| | | | | | | 438,016,569 | |
| | |
| 4 | | 2 0 2 3 BLACK ROCK ANNUAL REPORT TO SHAREHOLDERS |
| | |
Schedule of Investments (continued) December 31, 2023 | | S&P 500 Index Master Portfolio (Percentages shown are based on Net Assets) |
| | |
| | | | | | | | |
| Security | | Shares | | | Value | |
| |
|
Independent Power and Renewable Electricity Producers — 0.0% | |
AES Corp. | | | 595,133 | | | $ | 11,456,310 | |
| | | | | | | | |
| | |
| Industrial Conglomerates — 0.8% | | | | | | |
3M Co. | | | 490,129 | | | | 53,580,902 | |
General Electric Co. | | | 966,096 | | | | 123,302,833 | |
Honeywell International, Inc. | | | 585,190 | | | | 122,720,195 | |
| | | | | | | | |
| | |
| | | | | | | 299,603,930 | |
| | |
| Industrial REITs — 0.3% | | | | | | |
Prologis, Inc. | | | 820,063 | | | | 109,314,398 | |
| | | | | | | | |
| | |
| Insurance — 2.0% | | | | | | |
Aflac, Inc. | | | 472,045 | | | | 38,943,713 | |
Allstate Corp. | | | 232,474 | | | | 32,541,711 | |
American International Group, Inc. | | | 622,266 | | | | 42,158,522 | |
Aon PLC, Class A | | | 177,724 | | | | 51,721,238 | |
Arch Capital Group Ltd.(a)(b) | | | 332,587 | | | | 24,701,236 | |
Arthur J Gallagher & Co. | | | 191,296 | | | | 43,018,644 | |
Assurant, Inc. | | | 45,723 | | | | 7,703,868 | |
Brown & Brown, Inc. | | | 209,211 | | | | 14,876,994 | |
Chubb Ltd. | | | 364,588 | | | | 82,396,888 | |
Cincinnati Financial Corp. | | | 139,406 | | | | 14,422,945 | |
Everest Group Ltd. | | | 38,527 | | | | 13,622,377 | |
Globe Life, Inc. | | | 77,281 | | | | 9,406,643 | |
Hartford Financial Services Group, Inc. | | | 266,981 | | | | 21,459,933 | |
Loews Corp. | | | 164,345 | | | | 11,436,769 | |
Marsh & McLennan Cos., Inc. | | | 438,457 | | | | 83,074,448 | |
MetLife, Inc. | | | 551,911 | | | | 36,497,874 | |
Principal Financial Group, Inc. | | | 197,638 | | | | 15,548,181 | |
Progressive Corp. | | | 519,570 | | | | 82,757,110 | |
Prudential Financial, Inc. | | | 319,190 | | | | 33,103,195 | |
Travelers Cos., Inc. | | | 203,451 | | | | 38,755,381 | |
W.R. Berkley Corp. | | | 180,810 | | | | 12,786,883 | |
Willis Towers Watson PLC | | | 91,637 | | | | 22,102,844 | |
| | | | | | | | |
| | |
| | | | | | | 733,037,397 | |
| | |
| Interactive Media & Services(a) — 5.7% | | | | | | |
Alphabet, Inc., Class A | | | 5,253,167 | | | | 733,814,898 | |
Alphabet, Inc., Class C | | | 4,421,208 | | | | 623,080,843 | |
Match Group, Inc. | | | 247,150 | | | | 9,020,975 | |
Meta Platforms, Inc., Class A | | | 1,970,254 | | | | 697,391,106 | |
| | | | | | | | |
| | |
| | | | | | | 2,063,307,822 | |
| | |
| IT Services — 1.2% | | | | | | |
Accenture PLC, Class A | | | 557,106 | | | | 195,494,066 | |
Akamai Technologies, Inc.(a) | | | 135,090 | | | | 15,987,902 | |
Cognizant Technology Solutions Corp., Class A | | | 449,145 | | | | 33,923,922 | |
EPAM Systems, Inc.(a) | | | 51,513 | | | | 15,316,875 | |
Gartner, Inc.(a) | | | 69,192 | | | | 31,213,203 | |
International Business Machines Corp. | | | 808,652 | | | | 132,255,035 | |
VeriSign, Inc.(a) | | | 79,744 | | | | 16,424,074 | |
| | | | | | | | |
| | |
| | | | | | | 440,615,077 | |
| | |
| Leisure Products — 0.0% | | | | | | |
Hasbro, Inc. | | | 115,908 | | | | 5,918,262 | |
| | | | | | | | |
| | |
| Life Sciences Tools & Services — 1.4% | | | | | | |
Agilent Technologies, Inc. | | | 259,718 | | | | 36,108,594 | |
Bio-Rad Laboratories, Inc., Class A(a) | | | 18,560 | | | | 5,992,838 | |
Bio-Techne Corp. | | | 138,783 | | | | 10,708,496 | |
Charles River Laboratories International, Inc.(a)(b) | | | 44,912 | | | | 10,617,197 | |
Danaher Corp. | | | 583,302 | | | | 134,941,085 | |
Illumina, Inc.(a) | | | 141,756 | | | | 19,738,105 | |
IQVIA Holdings, Inc.(a)(b) | | | 162,824 | | | | 37,674,217 | |
Mettler-Toledo International, Inc.(a) | | | 19,453 | | | | 23,595,711 | |
| | | | | | | | |
| Security | | Shares | | | Value | |
| |
|
| Life Sciences Tools & Services (continued) | |
Revvity, Inc. | | | 110,325 | | | $ | 12,059,626 | |
Thermo Fisher Scientific, Inc. | | | 342,587 | | | | 181,841,754 | |
Waters Corp.(a) | | | 52,528 | | | | 17,293,793 | |
West Pharmaceutical Services, Inc. | | | 65,644 | | | | 23,114,565 | |
| | | | | | | | |
| | |
| | | | | | | 513,685,981 | |
| | |
| Machinery — 1.8% | | | | | | |
Caterpillar, Inc. | | | 452,827 | | | | 133,887,359 | |
Cummins, Inc. | | | 125,990 | | | | 30,183,424 | |
Deere & Co. | | | 237,751 | | | | 95,069,492 | |
Dover Corp. | | | 124,313 | | | | 19,120,583 | |
Fortive Corp. | | | 313,634 | | | | 23,092,871 | |
IDEX Corp. | | | 67,191 | | | | 14,587,838 | |
Illinois Tool Works, Inc. | | | 244,258 | | | | 63,980,941 | |
Ingersoll Rand, Inc. | | | 359,199 | | | | 27,780,451 | |
Nordson Corp. | | | 48,026 | | | | 12,686,548 | |
Otis Worldwide Corp. | | | 365,941 | | | | 32,740,741 | |
PACCAR, Inc. | | | 464,583 | | | | 45,366,530 | |
Parker-Hannifin Corp. | | | 113,882 | | | | 52,465,437 | |
Pentair PLC | | | 145,367 | | | | 10,569,635 | |
Snap-on, Inc. | | | 47,030 | | | | 13,584,145 | |
Stanley Black & Decker, Inc. | | | 134,025 | | | | 13,147,853 | |
Westinghouse Air Brake Technologies Corp. | | | 159,202 | | | | 20,202,734 | |
Xylem, Inc./New York | | | 213,875 | | | | 24,458,745 | |
| | | | | | | | |
| | |
| | | | | | | 632,925,327 | |
| | |
| Media — 0.7% | | | | | | |
Charter Communications, Inc., Class A(a)(b) | | | 89,286 | | | | 34,703,682 | |
Comcast Corp., Class A | | | 3,564,515 | | | | 156,303,983 | |
Fox Corp., Class A | | | 225,462 | | | | 6,689,458 | |
Fox Corp., Class B | | | 113,463 | | | | 3,137,252 | |
Interpublic Group of Cos., Inc. | | | 342,111 | | | | 11,166,503 | |
News Corp., Class A | | | 337,277 | | | | 8,280,150 | |
News Corp., Class B | | | 99,061 | | | | 2,547,849 | |
Omnicom Group, Inc. | | | 175,591 | | | | 15,190,377 | |
Paramount Global, Class B | | | 428,569 | | | | 6,338,536 | |
| | | | | | | | |
| | |
| | | | | | | 244,357,790 | |
| | |
| Metals & Mining — 0.4% | | | | | | |
Freeport-McMoRan, Inc. | | | 1,273,524 | | | | 54,213,917 | |
Newmont Corp. | | | 1,015,489 | | | | 42,031,090 | |
Nucor Corp. | | | 218,221 | | | | 37,979,183 | |
Steel Dynamics, Inc. | | | 138,383 | | | | 16,343,032 | |
| | | | | | | | |
| | |
| | | | | | | 150,567,222 | |
| | |
| Multi-Utilities — 0.7% | | | | | | |
Ameren Corp. | | | 231,618 | | | | 16,755,246 | |
CenterPoint Energy, Inc. | | | 560,965 | | | | 16,026,770 | |
CMS Energy Corp. | | | 259,272 | | | | 15,055,925 | |
Consolidated Edison, Inc. | | | 306,551 | | | | 27,886,945 | |
Dominion Energy, Inc. | | | 743,356 | | | | 34,937,732 | |
DTE Energy Co. | | | 183,012 | | | | 20,178,903 | |
NiSource, Inc. | | | 362,317 | | | | 9,619,516 | |
Public Service Enterprise Group, Inc. | | | 443,585 | | | | 27,125,223 | |
Sempra | | | 559,226 | | | | 41,790,959 | |
WEC Energy Group, Inc. | | | 280,526 | | | | 23,611,873 | |
| | | | | | | | |
| | |
| | | | | | | 232,989,092 | |
| | |
| Office REITs — 0.1% | | | | | | |
Alexandria Real Estate Equities, Inc. | | | 138,401 | | | | 17,545,095 | |
Boston Properties, Inc. | | | 129,325 | | | | 9,074,735 | |
| | | | | | | | |
| | |
| | | | | | | 26,619,830 | |
| | |
| Oil, Gas & Consumable Fuels — 3.5% | | | | | | |
APA Corp. | | | 273,082 | | | | 9,798,182 | |
| | |
MASTER PORTFOLIO SCHEDULE OF INVESTMENTS | | 5 |
| | |
Schedule of Investments (continued) December 31, 2023 | | S&P 500 Index Master Portfolio (Percentages shown are based on Net Assets) |
| | |
| | | | | | | | |
| Security | | Shares | | | Value | |
| |
|
| Oil, Gas & Consumable Fuels (continued) | |
Chevron Corp. | | | 1,558,380 | | | $ | 232,447,961 | |
ConocoPhillips | | | 1,054,014 | | | | 122,339,405 | |
Coterra Energy, Inc. | | | 673,491 | | | | 17,187,490 | |
Devon Energy Corp. | | | 569,422 | | | | 25,794,817 | |
Diamondback Energy, Inc. | | | 158,903 | | | | 24,642,677 | |
EOG Resources, Inc. | | | 516,842 | | | | 62,512,040 | |
EQT Corp. | | | 321,423 | | | | 12,426,213 | |
Exxon Mobil Corp. | | | 3,555,675 | | | | 355,496,386 | |
Hess Corp. | | | 245,738 | | | | 35,425,590 | |
Kinder Morgan, Inc. | | | 1,722,845 | | | | 30,390,986 | |
Marathon Oil Corp. | | | 538,304 | | | | 13,005,425 | |
Marathon Petroleum Corp. | | | 337,041 | | | | 50,003,403 | |
Occidental Petroleum Corp. | | | 589,900 | | | | 35,222,929 | |
ONEOK, Inc. | | | 517,730 | | | | 36,355,001 | |
Phillips 66 | | | 390,531 | | | | 51,995,297 | |
Pioneer Natural Resources Co. | | | 206,947 | | | | 46,538,241 | |
Targa Resources Corp. | | | 198,824 | | | | 17,271,841 | |
Valero Energy Corp. | | | 302,207 | | | | 39,286,910 | |
Williams Cos., Inc. | | | 1,081,063 | | | | 37,653,424 | |
| | | | | | | | |
| | |
| | | | | | | 1,255,794,218 | |
| | |
| Passenger Airlines — 0.2% | | | | | | |
American Airlines Group, Inc.(a) | | | 580,675 | | | | 7,978,474 | |
Delta Air Lines, Inc. | | | 572,882 | | | | 23,047,043 | |
Southwest Airlines Co. | | | 529,370 | | | | 15,288,206 | |
United Airlines Holdings, Inc.(a) | | | 291,492 | | | | 12,026,960 | |
| | | | | | | | |
| | |
| | | | | | | 58,340,683 | |
| | |
| Personal Care Products — 0.2% | | | | | | |
Estee Lauder Cos., Inc., Class A | | | 206,747 | | | | 30,236,749 | |
Kenvue, Inc. | | | 1,532,972 | | | | 33,004,887 | |
| | | | | | | | |
| | |
| | | | | | | 63,241,636 | |
| | |
| Pharmaceuticals — 3.7% | | | | | | |
Bristol-Myers Squibb Co. | | | 1,806,171 | | | | 92,674,634 | |
Catalent, Inc.(a) | | | 159,343 | | | | 7,159,281 | |
Eli Lilly & Co. | | | 707,817 | | | | 412,600,686 | |
Johnson & Johnson | | | 2,137,467 | | | | 335,026,577 | |
Merck & Co., Inc. | | | 2,252,423 | | | | 245,559,155 | |
Pfizer, Inc. | | | 5,011,620 | | | | 144,284,540 | |
Viatris, Inc. | | | 1,057,404 | | | | 11,451,685 | |
Zoetis, Inc., Class A | | | 408,599 | | | | 80,645,185 | |
| | | | | | | | |
| | |
| | | | | | | 1,329,401,743 | |
| | |
| Professional Services — 0.7% | | | | | | |
Automatic Data Processing, Inc. | | | 365,699 | | | | 85,196,896 | |
Broadridge Financial Solutions, Inc. | | | 104,976 | | | | 21,598,812 | |
Ceridian HCM Holding, Inc.(a) | | | 136,503 | | | | 9,162,081 | |
Equifax, Inc. | | | 109,097 | | | | 26,978,597 | |
Jacobs Solutions, Inc. | | | 111,910 | | | | 14,525,918 | |
Leidos Holdings, Inc. | | | 122,071 | | | | 13,212,965 | |
Paychex, Inc. | | | 285,345 | | | | 33,987,443 | |
Paycom Software, Inc. | | | 43,068 | | | | 8,903,017 | |
Robert Half, Inc. | | | 94,394 | | | | 8,299,121 | |
Verisk Analytics, Inc. | | | 128,947 | | | | 30,800,280 | |
| | | | | | | | |
| | |
| | | | | | | 252,665,130 | |
|
| Real Estate Management & Development(a)(b) — 0.2% | |
CBRE Group, Inc., Class A | | | 270,552 | | | | 25,185,686 | |
CoStar Group, Inc. | | | 363,087 | | | | 31,730,173 | |
| | | | | | | | |
| | |
| | | | | | | 56,915,859 | |
| | |
| Residential REITs — 0.3% | | | | | | |
AvalonBay Communities, Inc. | | | 126,320 | | | | 23,649,630 | |
Camden Property Trust | | | 94,755 | | | | 9,408,224 | |
| | | | | | | | |
| Security | | Shares | | | Value | |
| |
| | |
| Residential REITs (continued) | | | | | | |
Equity Residential | | | 306,547 | | | $ | 18,748,415 | |
Essex Property Trust, Inc. | | | 57,043 | | | | 14,143,241 | |
Invitation Homes, Inc. | | | 511,243 | | | | 17,438,499 | |
Mid-America Apartment Communities, Inc. | | | 102,852 | | | | 13,829,480 | |
UDR, Inc. | | | 269,399 | | | | 10,315,288 | |
| | | | | | | | |
| | |
| | | | | | | 107,532,777 | |
| | |
| Retail REITs — 0.3% | | | | | | |
Federal Realty Investment Trust | | | 63,401 | | | | 6,533,473 | |
Kimco Realty Corp. | | | 545,873 | | | | 11,632,554 | |
Realty Income Corp. | | | 629,154 | | | | 36,126,023 | |
Regency Centers Corp. | | | 146,221 | | | | 9,796,807 | |
Simon Property Group, Inc. | | | 290,591 | | | | 41,449,900 | |
| | | | | | | | |
| | |
| | | | | | | 105,538,757 | |
|
| Semiconductors & Semiconductor Equipment — 8.0% | |
Advanced Micro Devices, Inc.(a) | | | 1,434,146 | | | | 211,407,462 | |
Analog Devices, Inc. | | | 445,082 | | | | 88,375,482 | |
Applied Materials, Inc. | | | 745,399 | | | | 120,806,816 | |
Broadcom, Inc. | | | 389,321 | | | | 434,579,566 | |
Enphase Energy, Inc.(a) | | | 121,185 | | | | 16,013,386 | |
First Solar, Inc.(a)(b) | | | 94,828 | | | | 16,336,968 | |
Intel Corp. | | | 3,717,466 | | | | 186,802,666 | |
KLA Corp. | | | 121,359 | | | | 70,545,987 | |
Lam Research Corp. | | | 116,986 | | | | 91,630,454 | |
Microchip Technology, Inc. | | | 484,011 | | | | 43,648,112 | |
Micron Technology, Inc. | | | 972,242 | | | | 82,971,132 | |
Monolithic Power Systems, Inc. | | | 42,410 | | | | 26,751,380 | |
NVIDIA Corp. | | | 2,192,489 | | | | 1,085,764,403 | |
NXP Semiconductors NV | | | 229,016 | | | | 52,600,395 | |
ON Semiconductor Corp.(a)(b) | | | 380,020 | | | | 31,743,071 | |
Qorvo, Inc.(a) | | | 87,017 | | | | 9,798,984 | |
QUALCOMM, Inc. | | | 990,614 | | | | 143,272,503 | |
Skyworks Solutions, Inc. | | | 141,660 | | | | 15,925,417 | |
Teradyne, Inc.(b) | | | 136,880 | | | | 14,854,218 | |
Texas Instruments, Inc. | | | 805,953 | | | | 137,382,748 | |
| | | | | | | | |
| | |
| | | | | | | 2,881,211,150 | |
| | |
| Software — 10.6% | | | | | | |
Adobe, Inc.(a) | | | 404,590 | | | | 241,378,394 | |
ANSYS, Inc.(a) | | | 77,188 | | | | 28,009,981 | |
Autodesk, Inc.(a) | | | 189,963 | | | | 46,252,191 | |
Cadence Design Systems, Inc.(a) | | | 241,254 | | | | 65,710,352 | |
Fair Isaac Corp.(a) | | | 22,092 | | | | 25,715,309 | |
Fortinet, Inc.(a) | | | 574,002 | | | | 33,596,337 | |
Gen Digital, Inc. | | | 500,105 | | | | 11,412,396 | |
Intuit, Inc. | | | 248,594 | | | | 155,378,708 | |
Microsoft Corp. | | | 6,595,009 | | | | 2,479,987,184 | |
Oracle Corp. | | | 1,397,397 | | | | 147,327,566 | |
Palo Alto Networks, Inc.(a) | | | 271,491 | | | | 80,057,266 | |
PTC, Inc.(a) | | | 105,482 | | | | 18,455,131 | |
Roper Technologies, Inc. | | | 94,722 | | | | 51,639,593 | |
Salesforce, Inc.(a) | | | 864,568 | | | | 227,502,424 | |
ServiceNow, Inc.(a) | | | 181,080 | | | | 127,931,209 | |
Synopsys, Inc.(a)(b) | | | 135,064 | | | | 69,545,804 | |
Tyler Technologies, Inc.(a) | | | 37,092 | | | | 15,508,907 | |
| | | | | | | | |
| | |
| | | | | | | 3,825,408,752 | |
| | |
| Specialized REITs — 1.1% | | | | | | |
American Tower Corp. | | | 413,782 | | | | 89,327,258 | |
Crown Castle, Inc. | | | 385,376 | | | | 44,391,461 | |
Digital Realty Trust, Inc. | | | 268,765 | | | | 36,170,394 | |
Equinix, Inc. | | | 83,053 | | | | 66,890,056 | |
Extra Space Storage, Inc. | | | 187,845 | | | | 30,117,189 | |
| | |
| 6 | | 2 0 2 3 BLACK ROCK ANNUAL REPORT TO SHAREHOLDERS |
| | |
Schedule of Investments (continued) December 31, 2023 | | S&P 500 Index Master Portfolio (Percentages shown are based on Net Assets) |
| | |
| | | | | | | | |
| Security | | Shares | | | Value | |
| |
| | |
| Specialized REITs (continued) | | | | | | |
Iron Mountain, Inc. | | | 259,383 | | | $ | 18,151,622 | |
Public Storage | | | 139,435 | | | | 42,527,675 | |
SBA Communications Corp. | | | 96,325 | | | | 24,436,689 | |
VICI Properties, Inc. | | | 900,684 | | | | 28,713,806 | |
Weyerhaeuser Co. | | | 649,675 | | | | 22,589,200 | |
| | | | | | | | |
| | |
| | | | | | | 403,315,350 | |
| | |
| Specialty Retail — 2.0% | | | | | | |
AutoZone, Inc.(a)(b) | | | 15,653 | | | | 40,472,553 | |
Bath & Body Works, Inc. | | | 198,415 | | | | 8,563,591 | |
Best Buy Co., Inc. | | | 172,602 | | | | 13,511,285 | |
CarMax, Inc.(a)(b) | | | 140,609 | | | | 10,790,335 | |
Home Depot, Inc. | | | 887,718 | | | | 307,638,673 | |
Lowe’s Cos., Inc. | | | 512,281 | | | | 114,008,137 | |
O’Reilly Automotive, Inc.(a)(b) | | | 52,516 | | | | 49,894,401 | |
Ross Stores, Inc. | | | 302,590 | | | | 41,875,430 | |
TJX Cos., Inc. | | | 1,020,118 | | | | 95,697,270 | |
Tractor Supply Co. | | | 96,801 | | | | 20,815,119 | |
Ulta Beauty, Inc.(a) | | | 43,548 | | | | 21,338,084 | |
| | | | | | | | |
| | |
| | | | | | | 724,604,878 | |
|
| Technology Hardware, Storage & Peripherals — 7.2% | |
Apple, Inc. | | | 12,977,209 | | | | 2,498,502,049 | |
Hewlett Packard Enterprise Co. | | | 1,149,509 | | | | 19,518,663 | |
HP, Inc. | | | 770,722 | | | | 23,191,025 | |
NetApp, Inc. | | | 187,362 | | | | 16,517,834 | |
Seagate Technology Holdings PLC | | | 170,763 | | | | 14,578,037 | |
Western Digital Corp.(a) | | | 284,344 | | | | 14,891,095 | |
| | | | | | | | |
| | |
| | | | | | | 2,587,198,703 | |
|
| Textiles, Apparel & Luxury Goods — 0.5% | |
Lululemon Athletica, Inc.(a) | | | 102,805 | | | | 52,563,169 | |
NIKE, Inc., Class B | | | 1,087,433 | | | | 118,062,601 | |
Ralph Lauren Corp., Class A | | | 34,392 | | | | 4,959,326 | |
Tapestry, Inc. | | | 200,026 | | | | 7,362,957 | |
VF Corp. | | | 285,714 | | | | 5,371,423 | |
| | | | | | | | |
| | |
| | | | | | | 188,319,476 | |
| | |
| Tobacco — 0.5% | | | | | | |
Altria Group, Inc. | | | 1,575,228 | | | | 63,544,697 | |
Philip Morris International, Inc. | | | 1,377,935 | | | | 129,636,125 | |
| | | | | | | | |
| | |
| | | | | | | 193,180,822 | |
|
| Trading Companies & Distributors — 0.3% | |
Fastenal Co. | | | 507,575 | | | | 32,875,633 | |
| | | | | | | | |
| Security | | Shares | | | Value | |
| |
|
| Trading Companies & Distributors (continued) | |
United Rentals, Inc. | | | 60,686 | | | $ | 34,798,566 | |
WW Grainger, Inc. | | | 39,520 | | | | 32,749,829 | |
| | | | | | | | |
| | |
| | | | | | | 100,424,028 | |
| | |
| Water Utilities — 0.1% | | | | | | |
American Water Works Co., Inc. | | | 173,010 | | | | 22,835,590 | |
| | | | | | | | |
|
| Wireless Telecommunication Services — 0.2% | |
T-Mobile U.S., Inc. | | | 451,684 | | | | 72,418,496 | |
| | | | | | | | |
| | |
Total Common Stocks — 98.7%
(Cost: $14,450,053,546) | | | | | | | 35,540,881,039 | |
| | | | | | | | |
| | |
Investment Companies | | | | | | | | |
| | |
Equity Funds — 0.6% | | | | | | | | |
iShares Core S&P 500 ETF(c) | | | 480,032 | | | | 229,277,684 | |
| | | | | | | | |
| | |
Total Investment Companies — 0.6%
(Cost: $193,523,401) | | | | | | | 229,277,684 | |
| | | | | | | | |
| | |
Total Long-Term Investments — 99.3%
(Cost: $14,643,576,947) | | | | | | | 35,770,158,723 | |
| | | | | | | | |
| | |
Short-Term Securities | | | | | | | | |
| | |
Money Market Funds — 0.8% | | | | | | | | |
BlackRock Cash Funds: Institutional, SL Agency Shares, 5.54%(c)(d)(e) | | | 213,402,184 | | | | 213,530,225 | |
BlackRock Cash Funds: Treasury, SL Agency Shares, 5.33%(c)(d) | | | 84,851,864 | | | | 84,851,864 | |
| | | | | | | | |
| | |
Total Short-Term Securities — 0.8%
(Cost: $298,271,635) | | | | | | | 298,382,089 | |
| | |
Total Investments — 100.1%
(Cost: $14,941,848,582) | | | | | | | 36,068,540,812 | |
| |
Liabilities in Excess of Other Assets — (0.1)% | | | | (42,160,164 | ) |
| | | | | | | | |
| | |
Net Assets — 100.0% | | | | | | $ | 36,026,380,648 | |
| | | | | | | | |
| (a) | Non-income producing security. |
| (b) | All or a portion of this security is on loan. |
| (c) | Affiliate of the Master Portfolio. |
| (d) | Annualized 7-day yield as of period end. |
| (e) | All or a portion of this security was purchased with the cash collateral from loaned securities. |
For Master Portfolio compliance purposes, the Master Portfolio’s industry classifications refer to one or more of the industry sub-classifications used by one or more widely recognized market indexes or rating group indexes, and/or as defined by the investment adviser. These definitions may not apply for purposes of this report, which may combine such industry sub-classifications for reporting ease.
| | |
MASTER PORTFOLIO SCHEDULE OF INVESTMENTS | | 7 |
| | |
Schedule of Investments (continued) December 31, 2023 | | S&P 500 Index Master Portfolio |
| | |
Affiliates
Investments in issuers considered to be affiliate(s) of the Master Portfolio during the year ended December 31, 2023 for purposes of Section 2(a)(3) of the Investment Company Act of 1940, as amended, were as follows:
| | | | | | | | | | | | | | | | | | | | | | | | | | | | | | | | | | | | |
| |
| | | | | | | | | |
| Affiliated Issuer | | Value at
12/31/22 | | | Purchases
at Cost | | | Proceeds
from Sale | | | Net Realized
Gain (Loss) | | | Change in
Unrealized
Appreciation
(Depreciation) | | | Value at
12/31/23 | | | Shares
Held at
12/31/23 | | | Income | | | Capital Gain
Distributions
from
Underlying
Funds | |
| |
BlackRock Cash Funds: Institutional, SL Agency Shares | | $ | 304,198,748 | | | $ | — | | | $ | (90,712,273 | )(a) | | $ | 66,303 | | | $ | (22,553 | ) | | $ | 213,530,225 | | | | 213,402,184 | | | $ | 530,599 | (b) | | $ | — | |
BlackRock Cash Funds: Treasury, SL Agency Shares | | | 113,361,188 | | | | — | | | | (28,509,324 | )(a) | | | — | | | | — | | | | 84,851,864 | | | | 84,851,864 | | | | 5,310,052 | | | | — | |
BlackRock, Inc. | | | 97,239,626 | | | | 1,761,199 | | | | (10,597,099 | ) | | | 545,813 | | | | 12,181,258 | | | | 101,130,797 | | | | 124,576 | | | | 2,689,555 | | | | — | |
iShares Core S&P 500 ETF | | | 195,527,543 | | | | 1,919,111,389 | | | | (1,946,438,546 | ) | | | 30,910,729 | | | | 30,166,569 | | | | 229,277,684 | | | | 480,032 | | | | 4,641,118 | | | | — | |
| | | | | | | | | | | | | | | | | | | | | | | | | | | | | | | | | | | | |
| | | | | | | | | |
| | | | | | | | | | | | | | $ | 31,522,845 | | | $ | 42,325,274 | | | $ | 628,790,570 | | | | | | | $ | 13,171,324 | | | $ | — | |
| | | | | | | | | | | | | | | | | | | | | | | | | | | | | | | | | | | | |
| | (a) | Represents net amount purchased (sold). | |
| | (b) | All or a portion represents securities lending income earned from the reinvestment of cash collateral from loaned securities, net of fees and collateral investment expenses, and other payments to and from borrowers of securities. | |
Derivative Financial Instruments Outstanding as of Period End
Futures Contracts
| | | | | | | | | | | | | | | | |
| |
| | | | |
| Description | | Number of
Contracts | | | Expiration
Date | | | Notional
Amount (000) | | | Value/
Unrealized
Appreciation
(Depreciation) | |
| |
| | | | |
| Long Contracts | | | | | | | | | | | | |
S&P 500 E-Mini Index | | | 1,396 | | | | 03/15/24 | | | $ | 336,436 | | | $ | 1,067,064 | |
| | | | | | | | | | | | | | | | |
Derivative Financial Instruments Categorized by Risk Exposure
As of period end, the fair values of derivative financial instruments located in the Statement of Assets and Liabilities were as follows:
| | | | | | | | | | | | | | | | | | | | | | | | | | | | |
| |
| | | | | | | |
| | | Commodity
Contracts | | | Credit
Contracts | | | Equity
Contracts | | | Foreign
Currency
Exchange
Contracts | | | Interest
Rate
Contracts | | | Other
Contracts | | | Total | |
| |
| | | | | | |
Assets — Derivative Financial Instruments | | | | | | | | | | | | | | | | | | | | | | | | | |
Futures contracts | | | | | | | | | | | | | | | | | | | | | | | | | | | | |
Unrealized appreciation on futures contracts(a) | | $ | — | | | $ | — | | | $ | 1,067,064 | | | $ | — | | | $ | — | | | $ | — | | | $ | 1,067,064 | |
| | | | | | | | | | | | | | | | | | | | | | | | | | | | |
| | (a) | Net cumulative unrealized appreciation (depreciation) on futures contracts and centrally cleared swaps, if any, are reported in the Master Portfolio Schedule of Investments. In the Statement of Assets and Liabilities, only current day’s variation margin is reported in receivables or payables and the net cumulative unrealized appreciation (depreciation) is included in net unrealized appreciation (depreciation). | |
For the period ended December 31, 2023, the effect of derivative financial instruments in the Statement of Operations was as follows:
| | | | | | | | | | | | | | | | | | | | | | | | | | | | |
| |
| | | | | | | |
| | | Commodity
Contracts | | | Credit
Contracts | | | Equity
Contracts | | | Foreign
Currency
Exchange
Contracts | | | Interest
Rate
Contracts | | | Other
Contracts | | | Total | |
| |
| | | | | | | |
Net Realized Gain (Loss) from: | | | | | | | | | | | | | | | | | | | | | | | | | | | | |
Futures contracts | | $ | — | | | $ | — | | | $ | 19,611,777 | | | $ | — | | | $ | — | | | $ | — | | | $ | 19,611,777 | |
| | | | | | | | | | | | | | | | | | | | | | | | | | | | |
Net Change in Unrealized Appreciation (Depreciation) on: | | | | | | | | | | | | | | | | | | | | | | | | | | | | |
Futures contracts | | $ | — | | | $ | — | | | $ | 1,530,752 | | | $ | — | | | $ | — | | | $ | — | | | $ | 1,530,752 | |
| | | | | | | | | | | | | | | | | | | | | | | | | | | | |
Average Quarterly Balances of Outstanding Derivative Financial Instruments
| | | | |
| |
| |
Futures contracts: | | | | |
Average notional value of contracts — long | | $ | 173,897,184 | |
| |
| | |
| 8 | | 2 0 2 3 BLACK ROCK ANNUAL REPORT TO SHAREHOLDERS |
| | |
Schedule of Investments (continued) December 31, 2023 | | S&P 500 Index Master Portfolio |
| | |
For more information about the Master Portfolio’s investment risks regarding derivative financial instruments, refer to the Notes to Financial Statements.
Fair Value Hierarchy as of Period End
Various inputs are used in determining the fair value of financial instruments. For a description of the input levels and information about the Master Portfolio’s policy regarding valuation of financial instruments, refer to the Notes to Financial Statements.
The following table summarizes the Master Portfolio’s financial instruments categorized in the fair value hierarchy. The breakdown of the Master Portfolio’s financial instruments into major categories is disclosed in the Schedule of Investments above.
| | | | | | | | | | | | | | | | |
| |
| | | Level 1 | | | Level 2 | | | Level 3 | | | Total | |
| |
| | | | |
Assets | | | | | | | | | | | | | | | | |
Investments | | | | | | | | | | | | | | | | |
Long-Term Investments | | | | | | | | | | | | | | | | |
Common Stocks | | $ | 35,540,881,039 | | | $ | — | | | $ | — | | | $ | 35,540,881,039 | |
Investment Companies | | | 229,277,684 | | | | — | | | | — | | | | 229,277,684 | |
Short-Term Securities | | | | | | | | | | | | | | | | |
Money Market Funds | | | 298,382,089 | | | | — | | | | — | | | | 298,382,089 | |
| | | | | | | | | | | | | | | | |
| | | | |
| | $ | 36,068,540,812 | | | $ | — | | | $ | — | | | $ | 36,068,540,812 | |
| | | | | | | | | | | | | | | | |
| | | | |
Derivative Financial Instruments(a) | | | | | | | | | | | | | | | | |
Assets | | | | | | | | | | | | | | | | |
Equity Contracts | | $ | 1,067,064 | | | $ | — | | | $ | — | | | $ | 1,067,064 | |
| | | | | | | | | | | | | | | | |
| | (a) | Derivative financial instruments are futures contracts. Futures contracts are valued at the unrealized appreciation (depreciation) on the instrument. | |
See notes to financial statements.
| | |
MASTER PORTFOLIO SCHEDULE OF INVESTMENTS | | 9 |
Statement of Assets and Liabilities
December 31, 2023
| | | | |
| | | S&P 500 Index Master Portfolio | |
| |
| |
ASSETS | | | | |
Investments, at value — unaffiliated(a)(b) | | $ | 35,439,750,242 | |
Investments, at value — affiliated(c) | | | 628,790,570 | |
Cash | | | 140,360 | |
Cash pledged for futures contracts | | | 4,374,000 | |
Receivables: | | | | |
Investments sold | | | 248,857,478 | |
Securities lending income — affiliated | | | 41,555 | |
Dividends — unaffiliated | | | 32,761,336 | |
Dividends — affiliated | | | 366,438 | |
Variation margin on futures contracts | | | 1,226 | |
Prepaid expenses | | | 24,677 | |
| | | | |
| |
Total assets | | | 36,355,107,882 | |
| | | | |
| |
LIABILITIES | | | | |
Collateral on securities loaned | | | 213,354,032 | |
Payables: | | | | |
Investments purchased | | | 24,848,169 | |
Withdrawals to investors | | | 90,070,442 | |
Investment advisory fees | | | 292,193 | |
Trustees’ fees | | | 66,998 | |
Professional fees | | | 95,400 | |
| | | | |
| |
Total liabilities | | | 328,727,234 | |
| | | | |
| |
Commitments and contingent liabilities | | | | |
| |
NET ASSETS | | $ | 36,026,380,648 | |
| | | | |
| |
NET ASSETS CONSIST OF | | | | |
Investors’ capital | | $ | 14,898,621,354 | |
Net unrealized appreciation (depreciation) | | | 21,127,759,294 | |
| | | | |
| |
NET ASSETS | | $ | 36,026,380,648 | |
| | | | |
| |
(a) Investments, at cost — unaffiliated | | $ | 14,406,464,693 | |
(b) Securities loaned, at value | | $ | 207,091,995 | |
(c) Investments, at cost — affiliated | | $ | 535,383,889 | |
See notes to financial statements.
| | |
| 10 | | 2 0 2 3 BLACK ROCK ANNUAL REPORT TO SHAREHOLDERS |
Statement of Operations
Year Ended December 31, 2023
| | | | |
| | | S&P 500 Index Master Portfolio | |
| |
| |
INVESTMENT INCOME | | | | |
Dividends — unaffiliated | | $ | 529,735,702 | |
Dividends — affiliated | | | 12,640,725 | |
Interest — unaffiliated | | | 301,777 | |
Securities lending income — affiliated — net | | | 530,599 | |
Foreign taxes withheld | | | (2,678,121 | ) |
| | | | |
| |
Total investment income | | | 540,530,682 | |
| | | | |
| |
EXPENSES | | | | |
Investment advisory | | | 3,294,787 | |
Trustees | | | 258,986 | |
Professional | | | 30,000 | |
| | | | |
| |
Total expenses | | | 3,583,773 | |
Less: | | | | |
Fees waived and/or reimbursed by the Manager | | | (389,289 | ) |
| | | | |
| |
Total expenses after fees waived and/or reimbursed | | | 3,194,484 | |
| | | | |
| |
Net investment income | | | 537,336,198 | |
| | | | |
| |
REALIZED AND UNREALIZED GAIN (LOSS) | | | | |
Net realized gain from: | | | | |
Investments — unaffiliated | | | 25,896,977 | |
Investments — affiliated | | | 31,522,845 | |
Futures contracts | | | 19,611,777 | |
| | | | |
| |
| | | 77,031,599 | |
| | | | |
Net change in unrealized appreciation (depreciation) on: | | | | |
Investments — unaffiliated | | | 7,031,638,258 | |
Investments — affiliated | | | 42,325,274 | |
Futures contracts | | | 1,530,752 | |
| | | | |
| |
| | | 7,075,494,284 | |
| | | | |
| |
Net realized and unrealized gain | | | 7,152,525,883 | |
| | | | |
| |
NET INCREASE IN NET ASSETS RESULTING FROM OPERATIONS | | $ | 7,689,862,081 | |
| | | | |
See notes to financial statements.
| | |
MASTER PORTFOLIO FINANCIAL STATEMENTS | | 11 |
Statements of Changes in Net Assets
| | | | | | | | | | | | |
| | | S&P 500 Index Master Portfolio | |
| | | | |
| | |
| | | Year Ended 12/31/23 | | | Year Ended 12/31/22 | |
| |
| | | |
| | | | | | | | | | |
| | | |
INCREASE (DECREASE) IN NET ASSETS | | | | | | | | | | | | |
| | | |
OPERATIONS | | | | | | | | | | | | |
Net investment income | | $ | 537,336,198 | | | | | | | $ | 487,090,874 | |
Net realized gain (loss) | | | 77,031,599 | | | | | | | | (65,760,923 | ) |
Net change in unrealized appreciation (depreciation) | | | 7,075,494,284 | | | | | | | | (6,648,362,451 | ) |
| | | | | | | | | | | | |
| | | |
Net increase (decrease) in net assets resulting from operations | | | 7,689,862,081 | | | | | | | | (6,227,032,500 | ) |
| | | | | | | | | | | | |
| | | |
CAPITAL TRANSACTIONS | | | | | | | | | | | | |
Proceeds from contributions | | | 7,389,545,731 | | | | | | | | 8,816,188,759 | |
Value of withdrawals | | | (8,597,872,533 | ) | | | | | | | (7,533,596,462 | ) |
| | | | | | | | | | | | |
| | | |
Net increase (decrease) in net assets derived from capital transactions | | | (1,208,326,802 | ) | | | | | | | 1,282,592,297 | |
| | | | | | | | | | | | |
| | | |
NET ASSETS | | | | | | | | | | | | |
Total increase (decrease) in net assets | | | 6,481,535,279 | | | | | | | | (4,944,440,203 | ) |
Beginning of year | | | 29,544,845,369 | | | | | | | | 34,489,285,572 | |
| | | | | | | | | | | | |
| | | |
End of year | | $ | 36,026,380,648 | | | | | | | $ | 29,544,845,369 | |
| | | | | | | | | | | | |
See notes to financial statements.
| | |
| 12 | | 2 0 2 3 BLACK ROCK ANNUAL REPORT TO SHAREHOLDERS |
Financial Highlights
| | | | | | | | | | | | | | | | | | | | |
| | | S&P 500 Index Master Portfolio | |
| | | | | |
| | | Year Ended
12/31/23 | | | Year Ended
12/31/22 | | | Year Ended
12/31/21 | | | Year Ended
12/31/20 | | | Year Ended
12/31/19 | |
| | | | | |
Total Return | | | | | | | | | | | | | | | | | | | | |
Total return | | | 26.24 | % | | | (18.13 | )% | | | 28.65 | % | | | 18.42 | % | | | 31.44 | % |
| | | | | | | | | | | | | | | | | | | | |
| | | | | |
Ratios to Average Net Assets(a) | | | | | | | | | | | | | | | | | | | | |
Total expenses | | | 0.01 | % | | | 0.01 | % | | | 0.01 | % | | | 0.01 | % | | | 0.03 | % |
| | | | | | | | | | | | | | | | | | | | |
| | | | | |
Total expenses after fees waived and/or reimbursed | | | 0.01 | % | | | 0.01 | % | | | 0.01 | % | | | 0.01 | % | | | 0.02 | % |
| | | | | | | | | | | | | | | | | | | | |
| | | | | |
Net investment income | | | 1.63 | % | | | 1.60 | % | | | 1.39 | % | | | 1.82 | % | | | 1.95 | % |
| | | | | | | | | | | | | | | | | | | | |
| | | | | |
Supplemental Data | | | | | | | | | | | | | | | | | | | | |
Net assets, end of year (000) | | $ | 36,026,381 | | | $ | 29,544,845 | | | $ | 34,489,286 | | | $ | 26,992,973 | | | $ | 23,207,958 | |
| | | | | | | | | | | | | | | | | | | | |
| | | | | |
Portfolio turnover rate | | | 10 | % | | | 13 | % | | | 6 | % | | | 5 | % | | | 3 | % |
| | | | | | | | | | | | | | | | | | | | |
(a) Excludes fees and expenses incurred indirectly as a result of investments in underlying funds.
See notes to financial statements.
| | |
MASTER PORTFOLIO FINANCIAL HIGHLIGHTS | | 13 |
Notes to Financial Statements
Master Investment Portfolio (“MIP”) is registered under the Investment Company Act of 1940, as amended (the “1940 Act”), as an open-end management investment company. MIP is organized as a Delaware statutory trust. S&P 500 Index Master Portfolio (the “Master Portfolio”) is a series of MIP. The Master Portfolio is classified as diversified.
The Master Portfolio, together with certain other registered investment companies advised by BlackRock Fund Advisors (“BFA” or the “Manager”) or its affiliates, is included in a complex of funds referred to as the BlackRock Multi-Asset Complex.
| 2. | SIGNIFICANT ACCOUNTING POLICIES |
The financial statements are prepared in conformity with accounting principles generally accepted in the United States of America (“U.S. GAAP”), which may require management to make estimates and assumptions that affect the reported amounts of assets and liabilities in the financial statements, disclosure of contingent assets and liabilities at the date of the financial statements and the reported amounts of increases and decreases in net assets from operations during the reporting period. Actual results could differ from those estimates. The Master Portfolio is considered an investment company under U.S. GAAP and follows the accounting and reporting guidance applicable to investment companies. Below is a summary of significant accounting policies:
Investment Transactions and Income Recognition: For financial reporting purposes, investment transactions are recorded on the dates the transactions are executed. Realized gains and losses on investment transactions are determined using the specific identification method. Dividend income and capital gain distributions, if any, are recorded on the ex-dividend dates. Non-cash dividends, if any, are recorded on the ex-dividend dates at fair value. Dividends from foreign securities where the ex-dividend dates may have passed are subsequently recorded when the Master Portfolio is informed of the ex-dividend dates. Under the applicable foreign tax laws, a withholding tax at various rates may be imposed on capital gains, dividends and interest. Upon notification from issuers, a portion of the dividend income received from a real estate investment trust may be redesignated as a reduction of cost of the related investment and/or realized gain. Interest income, including amortization and accretion of premiums and discounts on debt securities, is recognized daily on an accrual basis.
Foreign Taxes: The Master Portfolio may be subject to foreign taxes (a portion of which may be reclaimable) on income, stock dividends, capital gains on investments, or certain foreign currency transactions. All foreign taxes are recorded in accordance with the applicable foreign tax regulations and rates that exist in the foreign jurisdictions in which the Master Portfolio invests. These foreign taxes, if any, are paid by the Master Portfolio and are reflected in its Statement of Operations as follows: foreign taxes withheld at source are presented as a reduction of income, foreign taxes on securities lending income are presented as a reduction of securities lending income, foreign taxes on stock dividends are presented as “Foreign taxes withheld”, and foreign taxes on capital gains from sales of investments and foreign taxes on foreign currency transactions are included in their respective net realized gain (loss) categories. Foreign taxes payable or deferred as of December 31, 2023, if any, are disclosed in the Statement of Assets and Liabilities.
The Master Portfolio files withholding tax reclaims in certain jurisdictions to recover a portion of amounts previously withheld. The Master Portfolio may record a reclaim receivable based on collectability, which includes factors such as the jurisdiction’s applicable laws, payment history and market convention. The Statement of Operations includes tax reclaims recorded as well as professional and other fees, if any, associated with recovery of foreign withholding taxes.
Collateralization: If required by an exchange or counterparty agreement, the Master Portfolio may be required to deliver/deposit cash and/or securities to/with an exchange, or broker-dealer or custodian as collateral for certain investments.
Indemnifications: In the normal course of business, the Master Portfolio enters into contracts that contain a variety of representations that provide general indemnification. The Master Portfolio’s maximum exposure under these arrangements is unknown because it involves future potential claims against the Master Portfolio, which cannot be predicted with any certainty.
Other: Expenses directly related to the Master Portfolio are charged to the Master Portfolio. Other operating expenses shared by several funds, including other funds managed by the Manager, are prorated among those funds on the basis of relative net assets or other appropriate methods.
| 3. | INVESTMENT VALUATION AND FAIR VALUE MEASUREMENTS |
Investment Valuation Policies: The Master Portfolio’s investments are valued at fair value (also referred to as “market value” within the financial statements) each day that the Master Portfolio is open for business and, for financial reporting purposes, as of the report date. U.S. GAAP defines fair value as the price a fund would receive to sell an asset or pay to transfer a liability in an orderly transaction between market participants at the measurement date. The Board of Trustees of MIP (the “Board”) has approved the designation of the Master Portfolio’s Manager as the valuation designee for the Master Portfolio. The Master Portfolio determines the fair values of its financial instruments using various independent dealers or pricing services under the Manager’s policies. If a security’s market price is not readily available or does not otherwise accurately represent the fair value of the security, the security will be valued in accordance with the Manager’s policies and procedures as reflecting fair value. The Manager has formed a committee (the “Valuation Committee”) to develop pricing policies and procedures and to oversee the pricing function for all financial instruments, with assistance from other BlackRock pricing committees.
| | |
| 14 | | 2 0 2 3 BLACK ROCK ANNUAL REPORT TO SHAREHOLDERS |
Notes to Financial Statements (continued)
Fair Value Inputs and Methodologies: The following methods and inputs are used to establish the fair value of the Master Portfolio’s assets and liabilities:
| | • | | Equity investments traded on a recognized securities exchange are valued at that day’s official closing price, as applicable, on the exchange where the stock is primarily traded. Equity investments traded on a recognized exchange for which there were no sales on that day may be valued at the last available bid (long positions) or ask (short positions) price. |
| | • | | Exchange-traded funds (“ETFs”) and closed-end funds traded on a recognized securities exchange are valued at that day’s official closing price, as applicable, on the exchange where the stock is primarily traded. ETFs and closed-end funds traded on a recognized exchange for which there were no sales on that day may be valued at the last available bid (long positions) or ask (short positions) price. |
| | • | | Investments in open-end U.S. mutual funds (including money market funds) are valued at that day’s published net asset value (“NAV”). |
| | • | | Futures contracts are valued based on that day’s last reported settlement or trade price on the exchange where the contract is traded. |
Generally, trading in foreign instruments is substantially completed each day at various times prior to the close of trading on the New York Stock Exchange (“NYSE”). Each business day, the Master Portfolio uses current market factors supplied by independent pricing services to value certain foreign instruments (“Systematic Fair Value Price”). The Systematic Fair Value Price is designed to value such foreign securities at fair value as of the close of trading on the NYSE, which follows the close of the local markets.
If events (e.g., market volatility, company announcement or a natural disaster) occur that are expected to materially affect the value of such investment, or in the event that application of these methods of valuation results in a price for an investment that is deemed not to be representative of the market value of such investment, or if a price is not available, the investment will be valued by the Valuation Committee in accordance with the Manager’s policies and procedures as reflecting fair value (“Fair Valued Investments”). The fair valuation approaches that may be used by the Valuation Committee include market approach, income approach and cost approach. Valuation techniques such as discounted cash flow, use of market comparables and matrix pricing are types of valuation approaches and are typically used in determining fair value. When determining the price for Fair Valued Investments, the Valuation Committee seeks to determine the price that the Master Portfolio might reasonably expect to receive or pay from the current sale or purchase of that asset or liability in an arm’s-length transaction. Fair value determinations shall be based upon all available factors that the Valuation Committee deems relevant and consistent with the principles of fair value measurement.
Fair Value Hierarchy: Various inputs are used in determining the fair value of financial instruments. These inputs to valuation techniques are categorized into a fair value hierarchy consisting of three broad levels for financial reporting purposes as follows:
| | • | | Level 1 – Unadjusted price quotations in active markets/exchanges for identical assets or liabilities that the Master Portfolio has the ability to access; |
| | • | | Level 2 – Other observable inputs (including, but not limited to, quoted prices for similar assets or liabilities in markets that are active, quoted prices for identical or similar assets or liabilities in markets that are not active, inputs other than quoted prices that are observable for the assets or liabilities (such as interest rates, yield curves, volatilities, prepayment speeds, loss severities, credit risks and default rates) or other market–corroborated inputs); and |
| | • | | Level 3 – Unobservable inputs based on the best information available in the circumstances, to the extent observable inputs are not available (including the Valuation Committee’s assumptions used in determining the fair value of financial instruments). |
The hierarchy gives the highest priority to unadjusted quoted prices in active markets for identical assets or liabilities (Level 1 measurements) and the lowest priority to unobservable inputs (Level 3 measurements). Accordingly, the degree of judgment exercised in determining fair value is greatest for instruments categorized in Level 3. The inputs used to measure fair value may fall into different levels of the fair value hierarchy. In such cases, for disclosure purposes, the fair value hierarchy classification is determined based on the lowest level input that is significant to the fair value measurement in its entirety. Investments classified within Level 3 have significant unobservable inputs used by the Valuation Committee in determining the price for Fair Valued Investments. Level 3 investments include equity or debt issued by privately held companies or funds that may not have a secondary market and/or may have a limited number of investors. The categorization of a value determined for financial instruments is based on the pricing transparency of the financial instruments and is not necessarily an indication of the risks associated with investing in those securities.
| 4. | SECURITIES AND OTHER INVESTMENTS |
Securities Lending: The Master Portfolio may lend its securities to approved borrowers, such as brokers, dealers and other financial institutions. The borrower pledges and maintains with the Master Portfolio collateral consisting of cash, an irrevocable letter of credit issued by a bank, or securities issued or guaranteed by the U.S. Government. The initial collateral received by the Master Portfolio is required to have a value of at least 102% of the current value of the loaned securities for securities traded on U.S. exchanges and a value of at least 105% for all other securities. The collateral is maintained thereafter at a value equal to at least 100% of the current market value of the securities on loan. The market value of the loaned securities is determined at the close of each business day of the Master Portfolio and any additional required collateral is delivered to the Master Portfolio, or excess collateral returned by the Master Portfolio, on the next business day. During the term of the loan, the Master Portfolio is entitled to all distributions made on or in respect of the loaned securities, but does not receive interest income on securities received as collateral. Loans of securities are terminable at any time and the borrower, after notice, is required to return borrowed securities within the standard time period for settlement of securities transactions.
As of period end, any securities on loan were collateralized by cash and/or U.S. Government obligations. Cash collateral invested by the securities lending agent, BlackRock Institutional Trust Company, N.A. (“BTC”), if any, is disclosed in the Schedule of Investments. Any non-cash collateral received cannot be sold, re-invested or pledged by the Master Portfolio, except in the event of borrower default. The securities on loan, if any, are disclosed in the Master Portfolio’s Schedule of Investments. The market value of any securities on loan and the value of related collateral, if any, are shown separately in the Statement of Assets and Liabilities as a component of investments at value –unaffiliated and collateral on securities loaned, respectively.
| | |
MASTER PORTFOLIO NOTES TO FINANCIAL STATEMENTS | | 15 |
Notes to Financial Statements (continued)
Securities lending transactions are entered into by the Master Portfolio under Master Securities Lending Agreements (each, an “MSLA”), which provide the right, in the event of default (including bankruptcy or insolvency), for the non-defaulting party to liquidate the collateral and calculate a net exposure to the defaulting party or request additional collateral. In the event that a borrower defaults, the Master Portfolio, as lender, would offset the market value of the collateral received against the market value of the securities loaned. When the value of the collateral is greater than that of the market value of the securities loaned, the lender is left with a net amount payable to the defaulting party. However, bankruptcy or insolvency laws of a particular jurisdiction may impose restrictions on or prohibitions against such a right of offset in the event of an MSLA counterparty’s bankruptcy or insolvency. Under the MSLA, absent an event of default, the borrower can resell or re-pledge the loaned securities, and the Master Portfolio can reinvest cash collateral received in connection with loaned securities. Upon an event of default, the parties’ obligations to return the securities or collateral to the other party are extinguished, and the parties can resell or re-pledge the loaned securities or the collateral received in connection with the loaned securities in order to satisfy the defaulting party’s net payment obligation for all transactions under the MSLA. The defaulting party remains liable for any deficiency.
As of period end, the following table is a summary of the Master Portfolio’s securities on loan by counterparty which are subject to offset under an MSLA:
| | | | | | | | | | | | | | | | | | | | | | | | | | |
| |
| | | | | |
| | | Securities | | | Cash Collateral | | | Non-Cash Collateral | | | | | | Net | |
| Counterparty | | Loaned at Value | | | | | | Received(a) | | | | | | Received, at Fair Value | (a) | | | | | | | Amount | |
| |
| | | | | | | | |
Barclays Bank PLC | | | | $ | 8,572,379 | | | | | $ | (8,572,379 | ) | | | | $ | — | | | | | | | $ | — | |
Barclays Capital, Inc. | | | | | 3,576,591 | | | | | | (3,576,591 | ) | | | | | — | | | | | | | | — | |
BNP Paribas SA | | | | | 18,075,603 | | | | | | (18,075,603 | ) | | | | | — | | | | | | | | — | |
BofA Securities, Inc. | | | | | 2,597,783 | | | | | | (2,597,783 | ) | | | | | — | | | | | | | | — | |
Citadel Clearing LLC | | | | | 1,714,616 | | | | | | (1,714,616 | ) | | | | | — | | | | | | | | — | |
Citigroup Global Markets, Inc. | | | | | 1,233,967 | | | | | | (1,233,967 | ) | | | | | — | | | | | | | | — | |
Goldman Sachs & Co. LLC | | | | | 7,687,216 | | | | | | (7,687,216 | ) | | | | | — | | | | | | | | — | |
HSBC Bank PLC | | | | | 16,336,576 | | | | | | (16,336,576 | ) | | | | | — | | | | | | | | — | |
J.P. Morgan Securities LLC | | | | | 16,638,203 | | | | | | (16,638,203 | ) | | | | | — | | | | | | | | — | |
Jefferies LLC | | | | | 971,168 | | | | | | (971,168 | ) | | | | | — | | | | | | | | — | |
Natixis SA | | | | | 343,125 | | | | | | (343,125 | ) | | | | | — | | | | | | | | — | |
RBC Capital Markets LLC | | | | | 58,428,446 | | | | | | (58,428,446 | ) | | | | | — | | | | | | | | — | |
Scotia Capital (USA), Inc. | | | | | 8,172,718 | | | | | | (8,172,718 | ) | | | | | — | | | | | | | | — | |
Scotia Capital, Inc. | | | | | 43,554,257 | | | | | | (43,554,257 | ) | | | | | — | | | | | | | | — | |
SG Americas Securities LLC | | | | | 4,970,600 | | | | | | (4,970,600 | ) | | | | | — | | | | | | | | — | |
Toronto-Dominion Bank | | | | | 12,646,219 | | | | | | (12,646,219 | ) | | | | | — | | | | | | | | — | |
Virtu Americas LLC | | | | | 1,028,356 | | | | | | (1,028,356 | ) | | | | | — | | | | | | | | — | |
Wells Fargo Bank N.A. | | | | | 370,446 | | | | | | (370,446 | ) | | | | | — | | | | | | | | — | |
Wells Fargo Securities LLC | | | | | 173,726 | | | | | | (173,726 | ) | | | | | — | | | | | | | | — | |
| | | | | | | | | | | | | | | | | | | | | | | | | | |
| | | | | | | | |
| | | | $ | 207,091,995 | | | | | $ | (207,091,995) | | | | | $ | — | | | | | | | $ | — | |
| | | | | | | | | | | | | | | | | | | | | | | | | | |
| | (a) | Collateral received, if any, in excess of the market value of securities on loan is not presented in this table. The total cash collateral received by the Master Portfolio is disclosed in the Master Portfolio’s Statement of Assets and Liabilities. | |
The risks of securities lending include the risk that the borrower may not provide additional collateral when required or may not return the securities when due. To mitigate these risks, the Master Portfolio benefits from a borrower default indemnity provided by BlackRock, Inc. (“BlackRock”). BlackRock’s indemnity allows for full replacement of the securities loaned to the extent the collateral received does not cover the value on the securities loaned in the event of borrower default. The Master Portfolio could incur a loss if the value of an investment purchased with cash collateral falls below the market value of loaned securities or if the value of an investment purchased with cash collateral falls below the value of the original cash collateral received. Such losses are borne entirely by the Master Portfolio.
| 5. | DERIVATIVE FINANCIAL INSTRUMENTS |
The Master Portfolio engages in various portfolio investment strategies using derivative contracts both to increase the returns of the Master Portfolio and/or to manage its exposure to certain risks such as credit risk, equity risk, interest rate risk, foreign currency exchange rate risk, commodity price risk or other risks (e.g., inflation risk). Derivative financial instruments categorized by risk exposure are included in the Schedule of Investments. These contracts may be transacted on an exchange or over-the-counter (“OTC”).
Futures Contracts: Futures contracts are purchased or sold to gain exposure to, or manage exposure to, changes in interest rates (interest rate risk) and changes in the value of equity securities (equity risk) or foreign currencies (foreign currency exchange rate risk).
Futures contracts are exchange-traded agreements between the Master Portfolio and a counterparty to buy or sell a specific quantity of an underlying instrument at a specified price and on a specified date. Depending on the terms of a contract, it is settled either through physical delivery of the underlying instrument on the settlement date or by payment of a cash amount on the settlement date. Upon entering into a futures contract, the Master Portfolio is required to deposit initial margin with the broker in the form of cash or securities in an amount that varies depending on a contract’s size and risk profile. The initial margin deposit must then be maintained at an established level over the life of the contract. Amounts pledged, which are considered restricted, are included in cash pledged for futures contracts in the Statement of Assets and Liabilities.
Securities deposited as initial margin are designated in the Schedule of Investments and cash deposited, if any, are shown as cash pledged for futures contracts in the Statement of Assets and Liabilities. Pursuant to the contract, the Master Portfolio agrees to receive from or pay to the broker an amount of cash equal to the daily fluctuation in market value of the contract (“variation margin”). Variation margin is recorded as unrealized appreciation (depreciation) and, if any, shown as variation margin receivable (or payable) on futures contracts in the Statement of Assets and Liabilities. When the contract is closed, a realized gain or loss is recorded in the Statement of Operations equal
| | |
| 16 | | 2 0 2 3 BLACK ROCK ANNUAL REPORT TO SHAREHOLDERS |
Notes to Financial Statements (continued)
to the difference between the notional amount of the contract at the time it was opened and the notional amount at the time it was closed. The use of futures contracts involves the risk of an imperfect correlation in the movements in the price of futures contracts and interest rates, foreign currency exchange rates or underlying assets.
| 6. | INVESTMENT ADVISORY AGREEMENT AND OTHER TRANSACTIONS WITH AFFILIATES |
Investment Advisory: MIP, on behalf of the Master Portfolio, entered into an Investment Advisory Agreement with the Manager, the Master Portfolio’s investment adviser and an indirect, wholly-owned subsidiary of BlackRock, to provide investment advisory services. The Manager is responsible for the management of the Master Portfolio’s portfolio and provides the personnel, facilities, equipment and certain other services necessary to the operations of the Master Portfolio.
For such services, the Master Portfolio pays the Manager a monthly fee at an annual rate equal to 0.01% of the average daily value of the Master Portfolio’s net assets.
Administration: MIP, on behalf of the Master Portfolio, entered into an Administration Agreement with BlackRock Advisors, LLC (“BAL”), which has agreed to provide general administrative services (other than investment advice and related portfolio activities). BAL has agreed to bear all of the Master Portfolio’s ordinary operating expenses, excluding, generally, investment advisory fees, distribution fees, brokerage and other expenses related to the execution of portfolio transactions, extraordinary expenses and certain other expenses which are borne by the Master Portfolio.
BAL is not entitled to compensation for providing administrative services to the Master Portfolio, for so long as BAL (or an affiliate) is entitled to compensation for providing administrative services to corresponding feeder funds that invest substantially all of their assets in the Master Portfolio, or BAL (or an affiliate) receives investment advisory fees from the Master Portfolio.
The fees and expenses of the Master Portfolio’s trustees who are not “interested persons” of MIP, as defined in the 1940 Act (“Independent Trustees”), counsel to the Independent Trustees and the Master Portfolio’s independent registered public accounting firm (together, the “independent expenses”) are paid directly by the Master Portfolio. BFA has contractually agreed to reimburse the Master Portfolio or provide an offsetting credit against the investment advisory fees paid by the Master Portfolio in an amount equal to the independent expenses through June 30, 2024. If the Master Portfolio does not pay administration fees, BAL agrees to cap the expenses of the Master Portfolio at the rate at which it pays an investment advisory fee to BFA. The amount waived is included in fees waived and/or reimbursed by the Manager in the Statement of Operations. For the year ended December 31, 2023, the amount waived was $288,986.
Expense Waivers and Reimbursements: The Manager contractually agreed to waive its investment advisory fees by the amount of investment advisory fees the Master Portfolio pays to the Manager indirectly through its investment in affiliated money market funds (the “affiliated money market fund waiver”) through June 30, 2024. The contractual agreement may be terminated upon 90 days’ notice by a majority of the Independent Trustees or by a vote of a majority of the outstanding voting securities of the Master Portfolio. This amount is included in fees waived and/or reimbursed by the Manager in the Statement of Operations. For the year ended December 31, 2023, the amounts waived were $74,744.
The Manager has contractually agreed to waive its investment advisory fee with respect to any portion of the Master Portfolio’s assets invested in affiliated equity and fixed-income mutual funds and affiliated exchange-traded funds that have a contractual management fee through June 30, 2024. The contractual agreement may be terminated upon 90 days’ notice by a majority of the Independent Trustees, or by a vote of a majority of the outstanding voting securities of the Master Portfolio. This amount is included in fees waived and/or reimbursed by the Manager in the Statement of Operations. For the year ended December 31, 2023, the Manager waived $25,559 in investment advisory fees pursuant to this arrangement.
Securities Lending: The U.S. Securities and Exchange Commission (“SEC”) has issued an exemptive order which permits BTC, an affiliate of the Manager, to serve as securities lending agent for the Master Portfolio, subject to applicable conditions. As securities lending agent, BTC bears all operational costs directly related to securities lending, including any custodial costs. The Master Portfolio is responsible for fees in connection with the investment of cash collateral received for securities on loan (the “collateral investment fees”). The cash collateral is invested in a money market fund, BlackRock Cash Funds: Institutional or BlackRock Cash Funds: Treasury, managed by the Manager or its affiliates. However, BTC has agreed to reduce the amount of securities lending income it receives in order to effectively limit the collateral investment fees the Master Portfolio bears to an annual rate of 0.04%. The SL Agency Shares of such money market fund will not be subject to a sales load, distribution fee or service fee. The money market fund in which the cash collateral has been invested may impose a discretionary liquidity fee of up to 2% of the value redeemed, if such fee is determined to be in the best interests of such money market fund.
Securities lending income is equal to the total of income earned from the reinvestment of cash collateral, net of fees and other payments to and from borrowers of securities, and less the collateral investment fees. The Master Portfolio retains a portion of securities lending income and remits a remaining portion to BTC as compensation for its services as securities lending agent.
Pursuant to the current securities lending agreement, the Master Portfolio retains 81% of securities lending income (which excludes collateral investment fees), and this amount retained can never be less than 70% of the total of securities lending income plus the collateral investment fees.
In addition, commencing the business day following the date that the aggregate securities lending income earned across the BlackRock Multi-Asset Complex in a calendar year exceeds a specified threshold, the Master Portfolio, pursuant to the securities lending agreement, will retain for the remainder of that calendar year securities lending income in an amount equal to 81% of securities lending income (which excludes collateral investment fees), and this amount retained can never be less than 70% of the total of securities lending income plus the collateral investment fees.
The share of securities lending income earned by the Master Portfolio is shown as securities lending income — affiliated — net in the Statement of Operations. For the year ended December 31, 2023, the Master Portfolio paid BTC $206,514 for securities lending agent services.
| | |
MASTER PORTFOLIO NOTES TO FINANCIAL STATEMENTS | | 17 |
Notes to Financial Statements (continued)
Interfund Lending: In accordance with an exemptive order (the “Order”) from the SEC, the Master Portfolio may participate in a joint lending and borrowing facility for temporary purposes (the “Interfund Lending Program”), subject to compliance with the terms and conditions of the Order, and to the extent permitted by the Master Portfolio’s investment policies and restrictions. The Master Portfolio is currently permitted to borrow and lend under the Interfund Lending Program.
A lending BlackRock fund may lend in aggregate up to 15% of its net assets but may not lend more than 5% of its net assets to any one borrowing fund through the Interfund Lending Program. A borrowing BlackRock fund may not borrow through the Interfund Lending Program or from any other source more than 33 1/3% of its total assets (or any lower threshold provided for by the fund’s investment restrictions). If a borrowing BlackRock fund’s total outstanding borrowings exceed 10% of its total assets, each of its outstanding interfund loans will be subject to collateralization of at least 102% of the outstanding principal value of the loan. All interfund loans are for temporary or emergency purposes and the interest rate to be charged will be the average of the highest current overnight repurchase agreement rate available to a lending fund and the bank loan rate, as calculated according to a formula established by the Board.
During the year ended December 31, 2023, the Master Portfolio did not participate in the Interfund Lending Program.
Trustees and Officers: Certain trustees and/or officers of the Master Portfolio are directors and/or officers of BlackRock or its affiliates.
Other Transactions: The Master Portfolio may purchase securities from, or sell securities to, an affiliated fund provided the affiliation is due solely to having a common investment adviser, common officers, or common trustees. For the year ended December 31, 2023, the purchase and sale transactions and any net realized gains (losses) with affiliated funds in compliance with Rule 17a-7 under the 1940 Act were as follows:
| | | | | | | | | | | | |
| |
| | | |
| Master Portfolio Name | | Purchases | | | Sales | | | Net Realized
Gain (Loss) | |
| |
| | | |
S&P 500 Index Master Portfolio | | $ | 317,564,780 | | | $ | 427,044,084 | | | $ | (65,670,115 | ) |
| |
For the year ended December 31, 2023, purchases and sales of investments, excluding short-term securities, were $3,285,766,364 and $4,093,163,573, respectively.
The Master Portfolio is classified as a partnership for U.S. federal income tax purposes. As such, each investor in the Master Portfolio is treated as the owner of its proportionate share of net assets, income, expenses and realized and unrealized gains and losses of the Master Portfolio. Therefore, no U.S. federal income tax provision is required. It is intended that the Master Portfolio’s assets will be managed so an investor in the Master Portfolio can satisfy the requirements of Subchapter M of the Internal Revenue Code of 1986, as amended.
The Master Portfolio files U.S. federal and various state and local tax returns. No income tax returns are currently under examination. The statute of limitations on the Master Portfolio’s U.S. federal tax returns generally remains open for a period of three years after they are filed. The statutes of limitations on the Master Portfolio’s state and local tax returns may remain open for an additional year depending upon the jurisdiction.
Management has analyzed tax laws and regulations and their application to the Master Portfolio as of December 31, 2023, inclusive of the open tax return years, and does not believe that there are any uncertain tax positions that require recognition of a tax liability in the Master Portfolio’s financial statements.
As of December 31, 2023, gross unrealized appreciation and depreciation based on cost of investments (including short positions and derivatives, if any) for U.S. federal income tax purposes were as follows:
| | | | | | | | | | | | | | | | |
| |
| | | | |
| Master Portfolio Name | | Tax Cost | | | Gross Unrealized
Appreciation | | | Gross Unrealized
Depreciation | | | Net Unrealized
Appreciation
(Depreciation) | |
| |
| | | | |
S&P 500 Index Master Portfolio | | $ | 14,829,138,667 | | | $ | 22,015,832,274 | | | $ | (776,430,129) | | | $ | 21,239,402,145 | |
| | | | | | | | | | | | | | | | |
MIP, on behalf of the Master Portfolio, along with certain other funds managed by the Manager and its affiliates (“Participating Funds”), is party to a 364-day, $2.50 billion credit agreement with a group of lenders. Under this agreement, the Master Portfolio may borrow to fund shareholder redemptions. Excluding commitments designated for certain individual funds, the Participating Funds, including the Master Portfolio, can borrow up to an aggregate commitment amount of $1.75 billion at any time outstanding, subject to asset coverage and other limitations as specified in the agreement. The credit agreement has the following terms: a fee of 0.10% per annum on unused commitment amounts and interest at a rate equal to the higher of (a) Overnight Bank Funding Rate (“OBFR”) (but, in any event, not less than 0.00%) on the date the loan is made plus 0.80% per annum, (b) the Fed Funds rate (but, in any event, not less than 0.00%) in effect from time to time plus 0.80% per annum on amounts borrowed or (c) the sum of (x) Daily Simple Secured Overnight Financing Rate (“SOFR”) (but, in any event, not less than 0.00%) on the date the loan is made plus 0.10% and (y) 0.80% per annum. The agreement expires in April 2024 unless extended or renewed. These fees were allocated among such funds based upon portions of the aggregate commitment available to them and relative net assets of Participating Funds. During the year ended December 31, 2023, the Master Portfolio did not borrow under the credit agreement.
| | |
| 18 | | 2 0 2 3 BLACK ROCK ANNUAL REPORT TO SHAREHOLDERS |
Notes to Financial Statements (continued)
In the normal course of business, the Master Portfolio invests in securities or other instruments and may enter into certain transactions, and such activities subject the Master Portfolio to various risks, including among others, fluctuations in the market (market risk) or failure of an issuer to meet all of its obligations. The value of securities or other instruments may also be affected by various factors, including, without limitation: (i) the general economy; (ii) the overall market as well as local, regional or global political and/or social instability; (iii) regulation, taxation or international tax treaties between various countries; or (iv) currency, interest rate and price fluctuations. Local, regional or global events such as war, acts of terrorism, the spread of infectious illness or other public health issues, recessions, or other events could have a significant impact on the Master Portfolio and its investments. The Master Portfolio’s prospectus provides details of the risks to which the Master Portfolio is subject.
The Manager uses an indexing approach to try to achieve the Master Portfolio’s investment objective. The Master Portfolio is not actively managed, and the Manager generally does not attempt to take defensive positions under any market conditions, including declining markets.
The Master Portfolio may be exposed to additional risks when reinvesting cash collateral in money market funds that do not seek to maintain a stable NAV per share of $1.00, which may be subject to discretionary liquidity fees under certain circumstances.
Valuation Risk: The market values of equities, such as common stocks and preferred securities or equity related investments, such as futures and options, may decline due to general market conditions which are not specifically related to a particular company. They may also decline due to factors which affect a particular industry or industries. The Master Portfolio may invest in illiquid investments. An illiquid investment is any investment that the Master Portfolio reasonably expects cannot be sold or disposed of in current market conditions in seven calendar days or less without the sale or disposition significantly changing the market value of the investment. The Master Portfolio may experience difficulty in selling illiquid investments in a timely manner at the price that it believes the investments are worth. Prices may fluctuate widely over short or extended periods in response to company, market or economic news. Markets also tend to move in cycles, with periods of rising and falling prices. This volatility may cause the Master Portfolio’s NAV to experience significant increases or decreases over short periods of time. If there is a general decline in the securities and other markets, the NAV of the Master Portfolio may lose value, regardless of the individual results of the securities and other instruments in which the Master Portfolio invests.
Counterparty Credit Risk: The Master Portfolio may be exposed to counterparty credit risk, or the risk that an entity may fail to or be unable to perform on its commitments related to unsettled or open transactions, including making timely interest and/or principal payments or otherwise honoring its obligations. The Master Portfolio manages counterparty credit risk by entering into transactions only with counterparties that the Manager believes have the financial resources to honor their obligations and by monitoring the financial stability of those counterparties. Financial assets, which potentially expose the Master Portfolio to market, issuer and counterparty credit risks, consist principally of financial instruments and receivables due from counterparties. The extent of the Master Portfolio’s exposure to market, issuer and counterparty credit risks with respect to these financial assets is approximately their value recorded in the Statement of Assets and Liabilities, less any collateral held by the Master Portfolio.
A derivative contract may suffer a mark-to-market loss if the value of the contract decreases due to an unfavorable change in the market rates or values of the underlying instrument. Losses can also occur if the counterparty does not perform under the contract.
With exchange-traded futures, there is less counterparty credit risk to the Master Portfolio since the exchange or clearinghouse, as counterparty to such instruments, guarantees against a possible default. The clearinghouse stands between the buyer and the seller of the contract; therefore, credit risk is limited to failure of the clearinghouse. While offset rights may exist under applicable law, the Master Portfolio does not have a contractual right of offset against a clearing broker or clearinghouse in the event of a default (including the bankruptcy or insolvency). Additionally, credit risk exists in exchange-traded futures with respect to initial and variation margin that is held in a clearing broker’s customer accounts. While clearing brokers are required to segregate customer margin from their own assets, in the event that a clearing broker becomes insolvent or goes into bankruptcy and at that time there is a shortfall in the aggregate amount of margin held by the clearing broker for all its clients, typically the shortfall would be allocated on a pro rata basis across all the clearing broker’s customers, potentially resulting in losses to the Master Portfolio.
Geographic/Asset Class Risk: A diversified portfolio, where this is appropriate and consistent with a fund’s objectives, minimizes the risk that a price change of a particular investment will have a material impact on the NAV of a fund. The investment concentrations within the Master Portfolio’s portfolio are disclosed in its Schedule of Investments.
The Master Portfolio invests a significant portion of its assets in securities within a single or limited number of market sectors. When a fund concentrates its investments in this manner, it assumes the risk that economic, regulatory, political and social conditions affecting such sectors may have a significant impact on the Master Portfolio and could affect the income from, or the value or liquidity of, the Master Portfolio’s portfolio. Investment percentages in specific sectors are presented in the Schedule of Investments.
The Master Portfolio invests a significant portion of its assets in securities of issuers located in the United States. A decrease in imports or exports, changes in trade regulations, inflation and/or an economic recession in the United States may have a material adverse effect on the U.S. economy and the securities listed on U.S. exchanges. Proposed and adopted policy and legislative changes in the United States may also have a significant effect on U.S. markets generally, as well as on the value of certain securities. Governmental agencies project that the United States will continue to maintain elevated public debt levels for the foreseeable future which may constrain future economic growth. Circumstances could arise that could prevent the timely payment of interest or principal on U.S. government debt, such as reaching the legislative “debt ceiling.” Such non-payment would result in substantial negative consequences for the U.S. economy and the global financial system. If U.S. relations with certain countries deteriorate, it could adversely affect issuers that rely on the United States for trade. The United States has also experienced increased internal unrest and discord. If these trends were to continue, they may have an adverse impact on the U.S. economy and the issuers in which the Master Portfolio invests.
Significant Shareholder Redemption Risk: Certain shareholders may own or manage a substantial amount of fund shares and/or hold their fund investments for a limited period of time. Large redemptions of fund shares by these shareholders may force a fund to sell portfolio securities, which may negatively impact the fund’s NAV, increase the fund’s brokerage costs, and/or accelerate the realization of taxable income/gains and cause the fund to make additional taxable distributions to shareholders.
| | |
MASTER PORTFOLIO NOTES TO FINANCIAL STATEMENTS | | 19 |
Notes to Financial Statements (continued)
Management has evaluated the impact of all subsequent events on the Master Portfolio through the date the financial statements were issued and has determined that there were no subsequent events requiring adjustment or additional disclosure in the financial statements.
| | |
| 20 | | 2 0 2 3 BLACK ROCK ANNUAL REPORT TO SHAREHOLDERS |
Report of Independent Registered Public Accounting Firm
To the Board of Trustees of
Master Investment Portfolio and Investors of S&P 500 Index Master Portfolio
Opinion on the Financial Statements
We have audited the accompanying statement of assets and liabilities, including the schedule of investments, of S&P 500 Index Master Portfolio (one of the series constituting Master Investment Portfolio, referred to hereafter as the “Master Portfolio”) as of December 31, 2023, the related statement of operations for the year ended December 31, 2023, the statement of changes in net assets for each of the two years in the period ended December 31, 2023, including the related notes, and the financial highlights for each of the five years in the period ended December 31, 2023 (collectively referred to as the “financial statements”). In our opinion, the financial statements present fairly, in all material respects, the financial position of the Master Portfolio as of December 31, 2023, the results of its operations for the year then ended, the changes in its net assets for each of the two years in the period ended December 31, 2023 and the financial highlights for each of the five years in the period ended December 31, 2023 in conformity with accounting principles generally accepted in the United States of America.
Basis for Opinion
These financial statements are the responsibility of the Master Portfolio’s management. Our responsibility is to express an opinion on the Master Portfolio’s financial statements based on our audits. We are a public accounting firm registered with the Public Company Accounting Oversight Board (United States) (PCAOB) and are required to be independent with respect to the Master Portfolio in accordance with the U.S. federal securities laws and the applicable rules and regulations of the Securities and Exchange Commission and the PCAOB.
We conducted our audits of these financial statements in accordance with the standards of the PCAOB. Those standards require that we plan and perform the audit to obtain reasonable assurance about whether the financial statements are free of material misstatement, whether due to error or fraud.
Our audits included performing procedures to assess the risks of material misstatement of the financial statements, whether due to error or fraud, and performing procedures that respond to those risks. Such procedures included examining, on a test basis, evidence regarding the amounts and disclosures in the financial statements. Our audits also included evaluating the accounting principles used and significant estimates made by management, as well as evaluating the overall presentation of the financial statements. Our procedures included confirmation of securities owned as of December 31, 2023 by correspondence with the custodian, transfer agent and brokers. We believe that our audits provide a reasonable basis for our opinion.
/s/PricewaterhouseCoopers LLP
Philadelphia, Pennsylvania
February 14, 2024
We have served as the auditor of one or more BlackRock investment companies since 2000.
| | |
MASTER PORTFOLIO REPORT OF INDEPENDENT REGISTERED PUBLIC ACCOUNTING F IRM | | 21 |
Statement Regarding Liquidity Risk Management Program
In compliance with Rule 22e-4 under the Investment Company Act of 1940, as amended (the “Liquidity Rule”), BlackRock Funds III and Master Investment Portfolio (the “Trusts”) have adopted and implemented a liquidity risk management program (the “Program”) for iShares S&P 500 Index Fund and S&P 500 Index Master Portfolio (the “Funds”), each a series of the respective Trust, which is reasonably designed to assess and manage each Fund’s liquidity risk.
The Board of Trustees (the “Board”) of the Trusts, on behalf of the Funds, met on November 16-17, 2023 (the “Meeting”) to review the Program. The Board previously appointed BlackRock Advisors, LLC or BlackRock Fund Advisors (“BlackRock”), each an investment adviser to certain BlackRock funds, as the program administrator for each Fund’s Program, as applicable. BlackRock also previously delegated oversight of the Program to the 40 Act Liquidity Risk Management Committee (the “Committee”). At the Meeting, the Committee, on behalf of BlackRock, provided the Board with a report that addressed the operation of the Program and assessed its adequacy and effectiveness of implementation, including the management of each Fund’s Highly Liquid Investment Minimum (“HLIM”) where applicable, and any material changes to the Program (the “Report”). The Report covered the period from October 1, 2022 through September 30, 2023 (the “Program Reporting Period”).
The Report described the Program’s liquidity classification methodology for categorizing each Fund’s investments (including derivative transactions) into one of four liquidity buckets. It also referenced the methodology used by BlackRock to establish each Fund’s HLIM and noted that the Committee reviews and ratifies the HLIM assigned to each Fund no less frequently than annually. The Report also discussed notable events affecting liquidity over the Program Reporting Period, including the imposition of capital controls in certain countries.
The Report noted that the Program complied with the key factors for consideration under the Liquidity Rule for assessing, managing and periodically reviewing each Fund’s liquidity risk, as follows:
| | a) | The Fund’s investment strategy and liquidity of portfolio investments during both normal and reasonably foreseeable stressed conditions. During the Program Reporting Period, the Committee reviewed whether each Fund’s strategy is appropriate for an open-end fund structure with a focus on funds with more significant and consistent holdings of less liquid and illiquid assets. The Committee also factored a fund’s concentration in an issuer into the liquidity classification methodology by taking issuer position sizes into account. Where a fund participated in borrowings for investment purposes (such as tender option bonds or reverse repurchase agreements), such borrowings were factored into the Program’s calculation of a fund’s liquidity bucketing. A fund’s derivative exposure was also considered in such calculation. |
| | b) | Short-term and long-term cash flow projections during both normal and reasonably foreseeable stressed conditions. During the Program Reporting Period, the Committee reviewed historical redemption activity and used this information as a component to establish each Fund’s reasonably anticipated trading size utilized for liquidity classifications. Each Fund has adopted an in-kind redemption policy which may be utilized to meet larger redemption requests. The Committee may also take into consideration a fund’s shareholder ownership concentration (which, depending on product type and distribution channel, may or may not be available), a fund’s distribution channels, and the degree of certainty associated with a fund’s short-term and long-term cash flow projections. |
| | c) | Holdings of cash and cash equivalents, as well as borrowing arrangements. The Committee considered the terms of the credit facility committed to each Fund, the financial health of the institution providing the facility and the fact that the credit facility is shared among multiple funds (including that a portion of the aggregate commitment amount is specifically designated for BlackRock Floating Rate Income Portfolio, a series of BlackRock Funds V, and BlackRock Floating Rate Loan ETF, a series of BlackRock ETF Trust II). The Committee also considered other types of borrowing available to the funds, such as the ability to use reverse repurchase agreements and interfund lending, as applicable. |
There were no material changes to the Program during the Program Reporting Period other than the enhancement of certain model components in the Program’s classification methodology. The Report provided to the Board stated that the Committee concluded that based on the operation of the functions, as described in the Report, the Program is operating as intended and is effective in implementing the requirements of the Liquidity Rule.
| | |
| 22 | | 2 0 2 3 BLACK ROCK ANNUAL REPORT TO SHAREHOLDERS |
Trustee and Officer Information
| | | | | | | | |
| | | Independent Trustees(a) | | | | |
| | | | | |
Name Year of Birth(b) | | Position(s) Held (Length of Service)(c) | | Principal Occupation(s) During Past 5 Years | | Number of BlackRock-Advised Registered Investment Companies (“RICs”) Consisting of Investment Portfolios (“Portfolios”) Overseen | | Public Company
and Other
Investment
Company
Directorships Held
During Past 5 Years |
| | | | |
Mark Stalnecker 1951 | | Chair of the Board (Since 2019) and Trustee (Since 2015) | | Chief Investment Officer, University of Delaware from 1999 to 2013; Trustee and Chair of the Finance and Investment Committees, Winterthur Museum and Country Estate from 2005 to 2016; Member of the Investment Committee, Delaware Public Employees’ Retirement System since 2002; Member of the Investment Committee, Christiana Care Health System from 2009 to 2017; Member of the Investment Committee, Delaware Community Foundation from 2013 to 2014; Director and Chair of the Audit Committee, SEI Private Trust Co. from 2001 to 2014. | | 28 RICs consisting of 166 Portfolios | | None |
| | | | |
Susan J. Carter 1956 | | Trustee (Since 2016) | | Trustee, Financial Accounting Foundation from 2017 to 2021; Advisory Board Member, Center for Private Equity and Entrepreneurship at Tuck School of Business from 1997 to 2021; Director, Pacific Pension Institute from 2014 to 2018; Senior Advisor, Commonfund Capital, Inc. (“CCI”) (investment adviser) in 2015; Chief Executive Officer, CCI from 2013 to 2014; President & Chief Executive Officer, CCI from 1997 to 2013; Advisory Board Member, Girls Who Invest from 2015 to 2018 and Board Member thereof from 2018 to 2022; Advisory Board Member, Bridges Fund Management from 2016 to 2018; Practitioner Advisory Board Member, Private Capital Research Institute (“PCRI”) since 2017; Lecturer in the Practice of Management, Yale School of Management since 2019; Advisor to Finance Committee, Altman Foundation since 2020; Investment Committee Member, Tostan since 2021; Member of the President’s Counsel, Commonfund since 2023. | | 28 RICs consisting of 166 Portfolios | | None |
| | | | |
Collette Chilton 1958 | | Trustee (Since 2015) | | Senior advisor, Insignia since 2024; Chief Investment Officer, Williams College from 2006 to 2023; Chief Investment Officer, Lucent Asset Management Corporation from 1998 to 2006; Director, Boys and Girls Club of Boston since 2017; Director, B1 Capital since 2018; Director, David and Lucile Packard Foundation since 2020. | | 28 RICs consisting of 166 Portfolios | | None |
| | | | |
Neil A. Cotty 1954 | | Trustee (Since 2016) | | Bank of America Corporation from 1996 to 2015, serving in various senior finance leadership roles, including Chief Accounting Officer from 2009 to 2015, Chief Financial Officer of Global Banking, Markets and Wealth Management from 2008 to 2009, Chief Accounting Officer from 2004 to 2008, Chief Financial Officer of Consumer Bank from 2003 to 2004, Chief Financial Officer of Global Corporate Investment Bank from 1999 to 2002. | | 28 RICs consisting of 166 Portfolios | | None |
| | | | |
Lena G. Goldberg 1949 | | Trustee (Since 2019) | | Director, Pioneer Public Interest Law Center since 2023; Director, Charles Stark Draper Laboratory, Inc. from 2013 to 2021; Senior Lecturer, Harvard Business School from 2008 to 2021; FMR LLC/Fidelity Investments (financial services) from 1996 to 2008, serving in various senior roles including Executive Vice President - Strategic Corporate Initiatives and Executive Vice President and General Counsel; Partner, Sullivan & Worcester LLP from 1985 to 1996 and Associate thereof from 1979 to 1985. | | 28 RICs consisting of 166 Portfolios | | None |
| | |
TRUSTEE AND OFFICER INFORMATION | | 23 |
Trustee and Officer Information (continued)
| | | | | | | | |
| Independent Trustees(a) (continued) |
| | | | | |
Name Year of Birth(b) | | Position(s) Held (Length of Service)(c) | | Principal Occupation(s) During Past 5 Years | | Number of BlackRock-Advised Registered Investment Companies (“RICs”) Consisting of Investment Portfolios (“Portfolios”) Overseen | | Public Company
and Other
Investment
Company
Directorships Held
During Past 5 Years |
| | | | |
Henry R. Keizer 1956 | | Trustee (Since 2019) | | Director, Park Indemnity Ltd. (captive insurer) from 2010 to 2022. | | 28 RICs consisting of 166 Portfolios | | GrafTech International Ltd. (materials manufacturing); Sealed Air Corp. (packaging); WABCO (commercial vehicle safety systems) from 2015 to 2020; Hertz Global Holdings (car rental) from 2015 to 2021. |
| | | | |
Cynthia A. Montgomery 1952 | | Trustee (Since 2009) | | Professor, Harvard Business School since 1989. | | 28 RICs consisting of 166 Portfolios | | None |
| | | | |
Donald C. Opatrny 1952 | | Trustee (Since 2019) | | Chair of the Board of Phoenix Art Museum since 2022 and Trustee thereof since 2018; Chair of the Investment Committee of The Arizona Community Foundation since 2022 and Trustee thereof since 2020; Director, Athena Capital Advisors LLC (investment management firm) from 2013 to 2020; Trustee, Vice Chair, Member of the Executive Committee and Chair of the Investment Committee, Cornell University from 2004 to 2019; Member of Affordable Housing Supply Board of Jackson, Wyoming from 2017 to 2022; Member, Investment Funds Committee, State of Wyoming from 2017 to 2023; Trustee, Artstor (a Mellon Foundation affiliate) from 2010 to 2015; Member of the Investment Committee, Mellon Foundation from 2009 to 2015; President, Trustee and Member of the Investment Committee, The Aldrich Contemporary Art Museum from 2007 to 2014; Trustee and Chair of the Investment Committee, Community Foundation of Jackson Hole since 2014. | | 28 RICs consisting of 166 Portfolios | | None |
| | | | |
Kenneth L. Urish 1951 | | Trustee (Since 2009) | | Managing Partner, Urish Popeck & Co., LLC (certified public accountants and consultants) since 1976; Past- Chairman of the Professional Ethics Committee of the Pennsylvania Institute of Certified Public Accountants and Committee Member thereof since 2007; Member of External Advisory Board, The Pennsylvania State University Accounting Department since 2001, Emeritus since 2022; Principal, UP Strategic Wealth Investment Advisors, LLC since 2013; Trustee, The Holy Family Institute from 2001 to 2010; President and Trustee, Pittsburgh Catholic Publishing Associates from 2003 to 2008; Director, Inter-Tel from 2006 to 2007; Member, Advisory Board, ESG Competent Boards since 2020. | | 28 RICs consisting of 166 Portfolios | | None |
| | | | |
Claire A. Walton 1957 | | Trustee (Since 2016) | | Advisory Board Member, Grossman School of Business at the University of Vermont since 2023; Advisory Board Member, Scientific Financial Systems since 2022; General Partner of Neon Liberty Capital Management, LLC from 2003 to 2023; Chief Operating Officer and Chief Financial Officer of Liberty Square Asset Management, LP from 1998 to 2015; Director, Boston Hedge Fund Group from 2009 to 2018; Director, Massachusetts Council on Economic Education from 2013 to 2015; Director, Woodstock Ski Runners from 2013 to 2022. | | 28 RICs consisting of 166 Portfolios | | None |
| | |
| 24 | | 2 0 2 3 BLACK ROCK ANNUAL REPORT TO SHAREHOLDERS |
Trustee and Officer Information (continued)
| | | | | | | | |
| | | Interested Trustees(a)(d) | | | | |
| | | | | |
Name Year of Birth(b) | | Position(s) Held (Length of Service)(c) | | Principal Occupation(s) During Past 5 Years | | Number of BlackRock-Advised (“RICs”) Consisting of Investment Portfolios (“Portfolios”) Overseen | | Public Company
and Other
Investment
Company
Directorships
Held During
Past 5 Years |
| | | | |
Robert Fairbairn 1965 | | Trustee (Since 2018) | | Vice Chairman of BlackRock, Inc. since 2019; Member of BlackRock’s Global Executive and Global Operating Committees; Co-Chair of BlackRock’s Human Capital Committee; Senior Managing Director of BlackRock, Inc. from 2010 to 2019; oversaw BlackRock’s Strategic Partner Program and Strategic Product Management Group from 2012 to 2019; Member of the Board of Managers of BlackRock Investments, LLC from 2011 to 2018; Global Head of BlackRock’s Retail and iShares® businesses from 2012 to 2016. | | 97 RICs consisting of 268 Portfolios | | None |
| | | | |
John M. Perlowski(e) 1964 | | Trustee (Since 2015) President and Chief Executive Officer (Since 2010) | | Managing Director of BlackRock, Inc. since 2009; Head of BlackRock Global Accounting and Product Services since 2009; Advisory Director of Family Resource Network (charitable foundation) since 2009. | | 99 RICs consisting of 270 Portfolios | | None |
| (a) | The address of each Trustee is c/o BlackRock, Inc., 50 Hudson Yards, New York, New York 10001. |
| (b) | Independent Trustees serve until their resignation, retirement, removal or death, or until December 31 of the year in which they turn 75. The Board may determine to extend the terms of Independent Trustees on a case-by-case basis, as appropriate. |
| (c) | In connection with the acquisition of Barclays Global Investors by BlackRock, Inc. in December 2009, certain Independent Trustees were elected to the Board. Furthermore, effective January 1, 2019, three BlackRock Fund Complexes were realigned and consolidated into two BlackRock Fund Complexes. As a result, although the chart shows the year that each Independent Trustee joined the Board, certain Independent Trustees first became members of the boards of other BlackRock-advised Funds or legacy BlackRock funds as follows: Cynthia A. Montgomery, 1994; Kenneth L. Urish, 1999; Lena G. Goldberg, 2016; Henry R. Keizer, 2016; Donald C. Opatrny, 2015. |
| (d) | Mr. Fairbairn and Mr. Perlowski are both “interested persons,” as defined in the 1940 Act, of the Trust/MIP based on their positions with BlackRock, Inc. and its affiliates. Mr. Fairbairn and Mr. Perlowski are also board members of the BlackRock Fixed-Income Complex. |
| (e) | Mr. Perlowski is also a trustee of the BlackRock Credit Strategies Fund and BlackRock Private Investments Fund. |
| | | | |
| | | | | Officers Who Are Not Trustees(a) |
| | | |
Name Year of Birth(b) | | Position(s) Held (Length of Service) | | Principal Occupation(s) During Past 5 Years |
| | |
Roland Villacorta 1971 | | Vice President (Since 2022) | | Managing Director of BlackRock, Inc. since 2022; Head of Global Cash Management and Head of Securities Lending within BlackRock’s Portfolio Management Group since 2022; Member of BlackRock’s Global Operating Committee since 2022; Head of Portfolio Management in BlackRock’s Financial Markets Advisory Group within BlackRock Solutions from 2008 to 2015; Co-Head of BlackRock Solutions’ Portfolio Analytics Group; previously Mr. Villacorta was Co-Head of Fixed Income within BlackRock’s Risk & Quantitative Analysis Group. |
| | |
Jennifer McGovern 1977 | | Vice President (Since 2014) | | Managing Director of BlackRock, Inc. since 2016; Director of BlackRock, Inc. from 2011 to 2015; Head of Americas Product Development and Governance for BlackRock’s Global Product Group since 2019; Head of Product Structure and Oversight for BlackRock’s U.S. Wealth Advisory Group from 2013 to 2019. |
| | |
Trent Walker 1974 | | Chief Financial Officer (Since 2021) | | Managing Director of BlackRock, Inc. since September 2019; Executive Vice President of PIMCO from 2016 to 2019; Senior Vice President of PIMCO from 2008 to 2015; Treasurer from 2013 to 2019 and Assistant Treasurer from 2007 to 2017 of PIMCO Funds, PIMCO Variable Insurance Trust, PIMCO ETF Trust, PIMCO Equity Series, PIMCO Equity Series VIT, PIMCO Managed Accounts Trust, 2 PIMCO-sponsored interval funds and 21 PIMCO-sponsored closed-end funds. |
| | |
Jay M. Fife 1970 | | Treasurer (Since 2009) | | Managing Director of BlackRock, Inc. since 2007. |
| | |
Aaron Wasserman 1974 | | Chief Compliance Officer (Since 2023) | | Managing Director of BlackRock, Inc. since 2018; Chief Compliance Officer of the BlackRock-advised funds in the BlackRock Multi-Asset Complex, the BlackRock Fixed-Income Complex and the iShares Complex since 2023; Deputy Chief Compliance Officer for the BlackRock-advised funds in the BlackRock Multi-Asset Complex, the BlackRock Fixed-Income Complex and the iShares Complex from 2014 to 2023. |
| | |
Lisa Belle 1968 | | Anti-Money Laundering Compliance Officer (Since 2019) | | Managing Director of BlackRock, Inc. since 2019; Global Financial Crime Head for Asset and Wealth Management of JP Morgan from 2013 to 2019; Managing Director of RBS Securities from 2012 to 2013; Head of Financial Crimes for Barclays Wealth Americas from 2010 to 2012. |
| | |
TRUSTEE AND OFFICER INFORMATION | | 25 |
Trustee and Officer Information (continued)
| | | | |
| | | | | Officers Who Are Not Trustees(a) (continued) |
| | | |
Name Year of Birth(b) | | Position(s) Held (Length of Service) | | Principal Occupation(s) During Past 5 Years |
| | |
Janey Ahn 1975 | | Secretary (Since 2019) | | Managing Director of BlackRock, Inc. since 2018; Director of BlackRock, Inc. from 2009 to 2017. |
| (a) | The address of each Officer is c/o BlackRock, Inc., 50 Hudson Yards, New York, New York 10001. |
| (b) | Officers of the Trust/MIP serve at the pleasure of the Board. |
Further information about Trust’s/MIP’s Trustees and Officers is available in the Trust’s/MIP’s Statement of Additional Information, which can be obtained without charge by calling (800) 441-7762.
Effective July 1, 2023, Aaron Wasserman replaced Charles Park as Chief Compliance Officer of the Trust/MIP.
| | |
| 26 | | 2 0 2 3 BLACK ROCK ANNUAL REPORT TO SHAREHOLDERS |
Glossary of Terms Used in this Report
| | |
| Portfolio Abbreviation |
| |
| ETF | | Exchange-Traded Fund |
| |
| MSCI | | Morgan Stanley Capital International |
| |
| S&P | | Standard & Poor’s |
| | |
GLOSSARY OF TERMS USED IN THIS REPORT | | 27 |
Item 2. Code of Ethics.
Homestead Funds, Inc. has adopted a Senior Officer Code of Ethics, as defined in Item 2 of Form N-CSR, which applies to its principal executive officer, principal financial officer, principal accounting or controller, or persons performing similar functions. The Senior Officer Code of Ethics is available on Homestead Funds, Inc.'s website at www.homesteadfunds.com or without charge, upon request, by calling the Chief Compliance Officer at 1-800-258-3030. During the period covered by this report, no substantive amendments were approved or waivers were granted to the Senior Officer Code of Ethics.
Item 3. Audit Committee Financial Expert.
The Registrant's board of directors has determined that Julie H. Dellinger, member of the Registrant's audit committee, qualifies as an audit committee financial expert, as such term is defined in Instruction 2(b) to Item 3 of Form N-CSR. Ms. Dellinger is "independent" as such term is defined in paragraph (a)(2) of Item 3 of Form N-CSR.
Under applicable securities laws, a person who is determined to be an audit committee financial expert will not be deemed an "expert" for any purpose, including, without limitation, for the purposes of Section 11 of the Securities Act of 1933, as a result of being designated or identified as an audit committee financial expert. The designation or identification of a person as an audit committee financial expert does not impose on such person any duties, obligations, or liabilities that are greater than the duties, obligations, and liabilities imposed on such person as a member of the audit committee and board of directors in the absence of such designation or identification. The designation or identification of a person as an audit committee financial expert does not affect the duties, obligations or liability of any other member of the audit committee or Board of Directors.
Item 4. Principal Accountant Fees and Services.
(a)Audit Fees1
| | Fiscal Year 2022 | $333,062 |
| | Fiscal Year 2023 | $356,380 |
(b) | Audit-Related Fees | |
| | | |
| | Fiscal Year 2022 | $0 |
| | Fiscal Year 2023 | $0 |
1These fees were for professional services rendered for the audits of the financial statements of Daily Income Fund, Short-Term Government Securities Fund, Short-Term Bond Fund, Stock Index Fund, Value Fund, Growth Fund, International Equity Fund, and Small-Company Stock Fund, including services that are normally provided in connection with the Funds' statutory and regulatory filings.
(c)Tax Fees
| | Fiscal Year 2022 | $0 |
| | Fiscal Year 2023 | $0 |
(d) | All Other Fees | |
| | | |
| | Fiscal Year 2022 | $0 |
| | Fiscal Year 2023 | $0 |
(e)(1) The Registrant's audit committee is directly responsible for approving the services to be provided by the principal accountant.
(2)None of the services provided to the Registrant described in paragraphs (b)-(d) of Item 4 were approved by the Audit Committee pursuant to paragraph (c)(7)(i)(C) of Rule 2- 01 of Regulation S-X.
(f)Not applicable
(g)The National Rural Electric Cooperative Association paid the Funds' principal accountant $0 and $2,994 in 2023 and 2022, respectively, for consulting services. The National Rural Electric Cooperative Association is the parent company, hence a controlling entity of Homestead Advisers Corp., the investment adviser that provided ongoing services to Homestead Funds, Inc. for each of its last two fiscal years.
(h)Homestead Funds, Inc.'s Audit Committee considered the provision of non-audit services, which were not approved by the Audit Committee pursuant to paragraph (c)(7)(ii) of Rule 2-01 of Regulation S-X, that the principal accountant rendered to the National Rural Electric Cooperative Association, a controlling entity of Homestead Advisers Corp., the investment adviser that provided ongoing services to Homestead Funds, Inc. for each of its last two fiscal years. The Audit Committee determined that these services were compatible with maintaining the principal accountant's independence.
Item 5. Audit Committee of Listed Registrants.
Not applicable.
Item 6. Investments.
(a)The Registrant's schedule of investments in unaffiliated issuers is included in the report to shareholders under Item 1 of this Form N-CSR.
(b)Not applicable.
Item 7. Disclosure of Proxy Voting Policies and Procedures for Closed-End Management Investment Companies.
Not applicable.
Item 8. Portfolio Managers of Closed-End Management Investment Companies.
Not applicable.
Item 9. Purchases of Equity Securities by Closed-End Management Investment Company and Affiliated Purchasers.
Not applicable.
Item 10. Submission of Matters to a Vote of Security Holders.
Not applicable.
Item 11. Controls and Procedures.
(a)Disclosure Controls and Procedures. The Registrant's principal executive officer and principal financial officer concluded, based on their evaluation of the disclosure controls and procedures as of a date within 90 days of the filing date of this report, that the Registrant's disclosure controls and procedures are effectively designed to provide reasonable assurance that the information required to be disclosed by the Registrant in this report is recorded, processed, summarized and reported by the filing date, including the Registrant's principal executive officer and principal financial officer, as appropriate, to allow timely decisions regarding required disclosure.
(b)Internal Control. There were no changes in the Registrant's internal control over financial reporting that occurred during the period covered by this report that have materially affected, or are reasonably likely to materially affect, the Registrant's internal control over financial reporting.
Item 12. Disclosure of Securities Lending Activities For Closed-End Management Investment Companies.
Not applicable.
Item 13. Exhibits.
(a)(1) Not required with this filing.
(a)(2) A separate certification for the principal executive officer and principal financial officer of the registrant, as required by Rule 30a-2(a) under the Investment Company Act of 1940, is filed herewith.
(a)(3) Not applicable.
(a)(4) Not applicable.
(b)A certification by the registrant's principal executive officer and principal financial officer, as required by Section 906 of the Sarbanes-Oxley Act of 2002 and Rule 30a-2(b) under the Investment Company Act of 1940, is filed herewith.
SIGNATURES
Pursuant to the requirements of the Securities Exchange Act of 1934 and the Investment Company Act of 1940, the registrant has duly caused this report to be signed on its behalf by the undersigned, thereunto duly authorized.
HOMESTEAD FUNDS, INC. | |
By: | /s/ Mark D. Santero |
| Mark D. Santero |
| President, Chief Executive Officer and Director |
| (Principal Executive Officer) |
Date: March 7, 2024 | |
Pursuant to the requirements of the Securities Exchange Act of 1934 and the Investment Company Act of 1940, this report has been signed below by the following persons on behalf of the registrant and in the capacities and on the dates indicated.
By: | /s/ Mark D. Santero |
| Mark D. Santero |
| President, Chief Executive Officer and Director |
| (Principal Executive Officer) |
Date: March 7, 2024 | |
By: | /s/ Amy M. DiMauro |
| Amy M. DiMauro |
| Treasurer (Principal Financial & Accounting |
| Officer) |
Date: March 7, 2024 | |