UNITED STATES
SECURITIES AND EXCHANGE COMMISSION
Washington, D.C. 20549
FORM N-CSR
CERTIFIED SHAREHOLDER REPORT OF REGISTERED
MANAGEMENT INVESTMENT COMPANIES
Investment Company Act File number: 811-06136
HOMESTEAD FUNDS, INC.
(Exact name of registrant as specified in charter)
4301 Wilson Boulevard
Arlington, VA 22203
(Address of principal executive office – Zip code)
Danielle Sieverling
Homestead Funds, Inc.
4301 Wilson Boulevard
Arlington, VA 22203
(Name and address of agent for service)
Copies to:
Bryan Chegwidden, Esq.
Ropes & Gray LLP
1211 Avenue of the Americas
New York, NY 10036-8704
(Name and addresses of agent for service)
Registrant's telephone number, including area code: (703) 907-5993
Date of fiscal year end: December 31
Date of reporting period: December 31, 2020
Item 1. Reports to Stockholders.

Annual Report
December 31, 2020
Our Funds
Daily Income Fund (HDIXX)
Short-Term Government Securities Fund (HOSGX)
Short-Term Bond Fund (HOSBX)
Intermediate Bond Fund (HOIBX)
Stock Index Fund (HSTIX)
Value Fund (HOVLX)
Growth Fund (HNASX)
International Equity Fund (HISIX)
Small-Company Stock Fund (HSCSX)
The investment commentaries on the following pages were prepared for each fund by its portfolio manager(s). The views expressed are those of the portfolio manager(s) on January 14, 2020, for each fund as of December 31, 2020. Since that date, those views might have changed. The opinions stated might contain forward-looking statements and discuss the impact of domestic and foreign markets, industry and economic trends, and governmental regulations on the funds and their holdings. Such statements are subject to uncertainty, and the impact on the funds might be materially different from what is described here.
Past performance does not guarantee future results.
Investors are advised to consider fund objectives, risks, charges and expenses before investing. The prospectus contains this and other information and should be read carefully before you invest. To obtain a prospectus, call 800.258.3030 or download a PDF at homesteadfunds.com.

President’s Letter
2020 Annual Report
January 14, 2021
Dear Shareholders:
As we can all attest, 2020 was an extremely challenging year. After the initial economic shock of the springtime shutdown resulting from the COVID-19 pandemic, the U.S. economy recovered substantially from March and April lows. November’s momentous news of two effective vaccines buoyed hopes and signaled a light at the end of the tunnel. The news came on the heels of another development: the outcome of the U.S. presidential election. Along with the critically important support from the Federal Reserve and fiscal stimulus packages, these factors drove markets higher with stocks closing the year at record highs.
Bond markets posted moderate gains, capping off a strong year. U.S. Treasury rates remained at historic lows, with modestly higher yields for longer-dated bond issues. The Federal Reserve’s near-zero rates are likely to remain in place for years.
Smart policy moves both at home and abroad were crucial to the initial recovery, but their impact isn’t done yet. We believe both monetary and fiscal policies continue to be integral to supporting the economy and the investment markets.
We are forecasting a rebound in the U.S. economy once vaccine distribution has gathered momentum. When Americans gain confidence about their safety, we anticipate that they’ll return to pre-COVID-19 activities. We are seeking to position the Homestead Funds accordingly, and we invite you to read the following manager letters for more detail.
At Homestead Funds, we took steps to build out our virtual engagement platforms in 2020. While we certainly miss traveling and seeing many of our clients face-to-face, our representatives are now even better able to meet with you online or over the phone. We have also redoubled our communications efforts. You’ll find new materials in our resource library — recorded presentations, market commentary and other papers — that will give you our perspective on the markets and economy and insights for managing your accounts. We invite you to be in touch with us online at homesteadfunds.com or give us a call at 1.800.258.3030, option 2.
We appreciate your trusting us to manage your money and would welcome the opportunity to speak with you about your financial planning goals.
Sincerely,
Mark D. Santero
CEO, President and Director
Homestead Funds
Mark Santero
CEO, President and Director
Daily Income Fund
Performance Evaluation | Prepared by the Fund’s Investment Advisor, RE Advisers Corporation
Performance
The fund earned a return of 0.19% for the full year of 2020. The seven-day current annualized yield was 0.01% as of December 31, 2020, unchanged from June 30, 2020. Even with the Federal Reserve lowering the federal funds rate band in March by 1.50% to between 0.00% and 0.25% to help ease conditions in the markets due to the COVID-19 pandemic, the fund still earned enough interest income to cover its expenses and provide income to its shareholders until April 20, 2020. After that point, RE Advisers waived its management fee for the rest of the year to assist the fund in maintaining a positive yield. We sought to mitigate the effects of this low-yield environment on the fund by adjusting the mixture of the portfolio to take advantage of changes in the yield curve and market returns available on cash and government securities.
Market Conditions
The heavy toll on business activities and employment resulting from the measures put in place to control the pandemic greatly affected the U.S. economy. Both have continued to recover but remain well below their levels at the beginning of the year. Real gross domestic product declined at a rate of 5.0% and 31.4% in the first and second quarters of 2020, respectively, before rapidly turning to a 33.4% growth rate in the third quarter. Estimates for the fourth quarter project growth of approximately 4.6%. The unemployment rate, which surged in April to 14.7%, had decreased to 6.7% by December. However, job gains faltered in December as the virus’s surge in the fourth quarter snapped the hiring streak the economy had been on since May. The damage was limited to only a few industry sectors, but any loss of momentum is troublesome to an economy that is still down by almost 10 million jobs from before the pandemic began.
Despite the setbacks in different economic metrics, in our view, overall conditions are much improved from where they were in March. We believe the actions the Fed took to drastically lower the federal funds rate and create new credit facilities were very consequential in helping to instill confidence in credit markets suffering from severe dislocations. However, with short-term government securities tied to the Fed’s low-interest rate policy, yields dropped dramatically over the course of the year. In addition, with demand for these types of securities high, supply was limited. Despite low yields and improvements in equity and bond markets throughout the year, volatility and risk were the primary drivers behind the retention of the majority of the more than $1 trillion that flowed into government money market funds during the worst of the crisis. The Daily Income Fund was no exception. The fund ended 2020 with over $9 million more in assets under management than at the start of the year.
| Investment Advisor: RE Advisers Corporation |
 | Marc Johnston, CFP, ChFC, CAIAMoney Market Portfolio ManagerBA, General Arts, Villanova University;
MBA, Northeastern University |
Outlook
We believe the performance of the economy will very much depend on the course of the virus, the quickness and efficiency with which new vaccines can be deployed, and our success at reopening businesses in a prudent manner. We believe the recent enactment of a $900 billion stimulus bill was a step in the right direction toward providing the support the economy needs to continue to heal. In addition, with a change of power in Washington, D.C., we believe it is very likely much more federal stimulus will be spent on economic revival. In our view, the economy still faces considerable risks over the near and medium term; however, despite the challenges, we expect the economy to grow and the unemployment rate to decline in 2021. Consensus estimates for 2021 project the economy to grow at a yearly rate of 4.2% and the unemployment rate to fall to 5.0% by year-end. Inflation is likely to remain muted, and monetary policy will remain very accommodative, in our view. The Fed has pledged to maintain its current pace of asset purchases and projects that interest rates will remain near zero through 2022.
We believe these low interest rates will greatly limit the fund’s ability to generate income in 2021. We continue to adapt to operating in this type of challenging interest rate environment. We seek to take advantage of investment opportunities prudently as they become available to enhance yield consistent with our management of the fund as a government money market fund.
| Average Annual Total Returns (periods ended 12/31/20) | | | |
| | 1 YR % | 5 YR % | 10 YR % |
| Daily Income Fund | 0.19 | 0.58 | 0.29 |
| Yield | |
| Annualized 7-day current yield quoted 12/31/20 | 0.01% |
| Security Diversification |
| | % of Total Investments |
| | as of 12/31/19 | as of 12/31/20 |
| U.S. government and agency obligations | 89.7 | 82.1 |
| Short-term and other assets* | 10.3 | 17.9 |
| Total | 100.0% | 100.0% |
| Maturity | | |
| | as of 12/31/19 | as of 12/31/20 |
| Average weighted maturity | 46 days | 52 days |
The returns quoted in the above table represent past performance, which is no guarantee of future results. Current performance may be higher or lower than that shown above. To obtain the most recent month-end returns, please call 800.258.3030 or visit homesteadfunds.com. Returns and the principal value of your investment will fluctuate such that shares, when redeemed, may be worth more or less than their original cost. You could lose money by investing in the Daily Income Fund. Although the fund seeks to preserve the value of your investment at $1.00 per share, it cannot guarantee it will do so. An investment in the Daily Income Fund is not insured or guaranteed by the Federal Deposit Insurance Corporation (FDIC) or any other government agency. The fund’s sponsor has no legal obligation to provide financial support to the fund, and you should not expect that the sponsor will provide financial support to the fund at any time.
The Daily Income Fund’s average annual total returns are net of any fee waivers and reimbursements. The fund’s advisor waived a portion of its management fee and/or reimbursed fund expenses during the periods shown. Had the advisor not done so, the fund’s total returns would have been lower. The expenses used are as of the most recent period-end and may fluctuate over time. Returns include the reinvestment of dividends. Returns do not reflect taxes that the shareholder may pay on fund distributions or the redemption of fund shares.
*Represents investment in an unaffiliated U.S. government money market fund.
Short-Term Government Securities Fund
Performance Evaluation | Prepared by the Fund’s Investment Advisor, RE Advisers Corporation
Performance
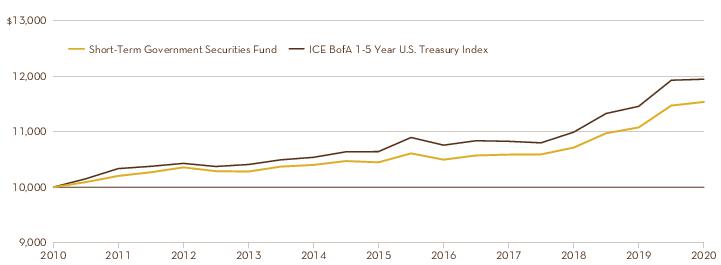
The fund returned 4.13% for the year ended December 31, 2020, underperforming its benchmark index, the ICE BofA 1-5 Year U.S. Treasury Index, which returned 4.25%.
The main detractor to the fund’s relative performance was its overall underweight allocation to U.S. Treasuries relative to the benchmark. Additionally, indexes don’t incur transaction costs, which all mutual funds pay. However, the fund’s underperformance was nearly offset by the fund’s allocation to agency issuers backed by the full faith and credit of the U.S. government.
The portfolio management team maintained the fund’s duration closer to that of its benchmark throughout the year in an effort to mitigate the risk of lower interest rates as the Federal Reserve sought to provide support to financial markets by lowering borrowing rates to zero in response to the unexpected shock from the COVID-19 pandemic.
Market Conditions
The global pandemic brought a unique shock to the system. The first six weeks of the year were relatively calm with stocks peaking in mid-February and credit spreads near the tightest levels of the cycle. However, the COVID-19 pandemic became a broader issue and a global health crisis followed, one that none of us had ever experienced. Governments globally, including the U.S., began to shut down their economies, and the impact was immediately felt across multiple sectors, with some feeling the impact more than others. Following the direct hit to the economy, consumers and small businesses prompted the Fed to take action by cutting its target for the federal funds rate to between 0.00% and 0.25% during two emergency sessions. Risk assets at a global level sold off, and the Bloomberg Barclays U.S. Aggregate Credit Average Option-Adjusted Spread Index widened to the mid-300s level in a short amount of time. This index measures the difference in yield between U.S. Treasury securities and investment-grade corporate bonds, showing the yield premium investors demand for taking increased credit risk. These dynamics prompted the Fed to move swiftly and aggressively to bring back facilities utilized during the financial crisis in 2008, such as the commercial paper credit facility and the launch of unlimited quantitative easing for U.S. Treasuries and agency mortgage-backed securities.
As the year progressed, the actions taken by the Fed and the fiscal stimulus passed by Congress reassured investors that over the longer term our economy will rebound from the pandemic. Additionally, the development and approval of two vaccines near the end of 2020 helped markets continue to rise, with the S&P 500 ultimately closing the year at record highs and investment-grade corporate credit spreads retracing almost the entire widening to end the year nearly unchanged.
| Investment Advisor: RE Advisers Corporation |
 | Mauricio Agudelo, CFASenior Fixed Income Portfolio ManagerBS, Finance, The University of Maryland,
Robert H. Smith School of Business |
 | Ivan Naranjo, CFA, FRMFixed Income Portfolio ManagerBS, Finance, The University of Maryland,
Robert H. Smith School of Business |
Outlook
We enter 2021 optimistic that the ongoing economic recovery will continue and believe U.S. and global growth will rebound. In our view, monetary policy will be highly accommodative, and the Fed is committed to keeping rates at zero for the foreseeable future. The Fed has emphasized that the tools exist and will be deployed should additional support be needed to sustain the recovery. On the fiscal front, the newly elected Biden-Harris administration in collaboration with Congress is expected to focus on providing the help needed to individuals and small businesses, while vaccines to combat the virus will continue to be developed and distributed to the broader population during the first half of the year. However, we are mindful that our outlook is subject to bouts of volatility, and a few bumps could come along the way.
We expect interest rates for maturities five years and shorter to remain anchored near the Fed’s target with longer-term rates subject to more volatility as the economy recovers. For the foreseeable future, the portfolio’s duration will remain close to or near the benchmark’s until we see a significant shift in monetary policy. Lastly, we expect investment-grade corporates to perform well aided by the ongoing recovery and the support from monetary and fiscal policy.
Short-Term Government Securities Fund
| Average Annual Total Returns (periods ended 12/31/20) | | | |
| | 1 YR % | 5 YR % | 10 YR % |
| Short-Term Government Securities Fund | 4.13 | 1.99 | 1.43 |
| ICE BofA 1-5 Year U.S. Treasury Index | 4.25 | 2.33 | 1.79 |
| Security Diversification |
| | % of Total Investments |
| | as of 12/31/19 | as of 12/31/20 |
| Corporate bonds–government guaranteed | 27.5 | 52.7 |
| U.S. government and agency obligations | 62.6 | 37.0 |
| Corporate bonds–other | 2.7 | 2.4 |
| Asset-backed securities | 4.3 | 2.4 |
| Municipal bonds | 0.0 | 2.1 |
| Mortgage-backed securities | 0.1 | 0.0 |
| Certificates of deposit | 0.6 | 0.0 |
| Short-term and other assets | 2.2 | 3.4 |
| Total | 100.0% | 100.0% |
| Maturity | | |
| | as of 12/31/19 | as of 12/31/20 |
| Average weighted maturity | 2.70 | 2.83 |
Performance Comparison
Comparison of the change in value of a $10,000 investment in the fund and the ICE BofA 1-5 Year U.S. Treasury Index made on December 31, 2010.
The returns quoted in the above table and chart represent past performance, which is no guarantee of future results. Current performance may be higher or lower than that shown above. To obtain the most recent month-end returns, please call 800.258.3030 or visit homesteadfunds.com. Returns and the principal value of your investment will fluctuate such that shares, when redeemed, may be worth more or less than their original cost. The Short-Term Government Securities Fund’s average annual total returns are net of any fee waivers and reimbursements. The fund’s advisor waived a portion of its management fee during the periods shown. Had the advisor not done so, the fund's total returns would have been lower. The expenses used are as of the most recent period-end and may fluctuate over time. Returns include the reinvestment of dividends and capital gains. Returns do not reflect taxes that the shareholder may pay on fund distributions or the redemption of fund shares.
Short-Term Bond Fund
Performance Evaluation | Prepared by the Fund’s Investment Advisor, RE Advisers Corporation
Performance
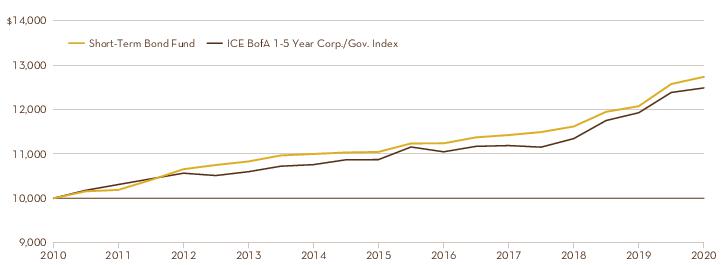
The fund returned 5.42% for the year ended December 31, 2020, outperforming its benchmark index, the ICE BofA 1-5 Year Corporate/Government Index, which returned 4.65%.
The fund’s main contributor to performance was its overweight allocation to the industrials, financials and asset-backed securities sectors. Additionally, its overall duration and yield curve positioning also contributed to performance. On the flip side, the fund’s underweight allocation to U.S. Treasury, agency and supranational securities detracted from performance. (Supranationals are typically lending institutions established by governments to promote economic development.) The portfolio management team gradually increased the fund’s holdings in corporate bonds throughout the year as issuers sought to shore up liquidity to ride out the challenges presented by the global pandemic.
The portfolio management team maintained the fund’s duration closer to that of its benchmark throughout the year in an effort to mitigate the risk of lower interest rates as the Federal Reserve sought to provide support to financial markets by lowering borrowing rates to zero in response to the unexpected shock from the COVID-19 pandemic.
Market Conditions
The global pandemic brought a unique shock to the system. The first six weeks of the year were relatively calm with stocks peaking in mid-February and credit spreads near the tightest levels of the cycle. However, the COVID-19 pandemic became a broader issue and a global health crisis followed, one that none of us had ever experienced. Governments globally, including in the U.S., began to shut down their economies, and the impact was immediately felt across multiple sectors, with some feeling the impact more than others. Following the direct hit to the economy, consumers and small businesses prompted the Fed to take action by cutting its target for the federal funds rate to between 0.00% and 0.25% during two emergency sessions. Risk assets at a global level sold off, and the Bloomberg Barclays U.S. Aggregate Credit Average Option-Adjusted Spread Index widened to the mid-300s level in a short amount of time. This index measures the difference in yield between U.S. Treasury securities and investment-grade corporate bonds, showing the yield premium investors demand for taking increased credit risk. These dynamics prompted the Fed to move swiftly and aggressively to bring back facilities utilized during the financial crisis in 2008, such as the commercial paper credit facility and the launch of unlimited quantitative easing for U.S. Treasuries and agency mortgage-backed securities.
As the year progressed, the actions taken by the Fed and the fiscal stimulus passed by Congress reassured investors that over the longer term our economy will rebound from the pandemic. Additionally, the development and approval of two vaccines near the end of 2020 helped markets continue to rise, with the S&P 500 ultimately closing the year at record highs, and investment-grade corporate credit spreads retracing almost the entire widening to end the year nearly unchanged.
| Investment Advisor: RE Advisers Corporation |
| Mauricio Agudelo, CFASenior Fixed Income Portfolio ManagerBS, Finance, The University of Maryland,
Robert H. Smith School of Business |
| Ivan Naranjo, CFA, FRMFixed Income Portfolio ManagerBS, Finance, The University of Maryland,
Robert H. Smith School of Business |
Outlook
We enter 2021 optimistic that the ongoing economic recovery will continue and believe U.S. and global growth will rebound. In our view, monetary policy will be highly accommodative, and the Fed is committed to keeping rates at zero for the foreseeable future. The Fed has emphasized that the tools exist and will be deployed should additional support be needed to sustain the recovery. On the fiscal front, the newly elected Biden-Harris administration in collaboration with Congress is expected to focus on providing the help needed to individuals and small businesses, while vaccines to combat the virus will continue to be developed and distributed to the broader population during the first half of the year. However, we are mindful that our outlook is subject to bouts of volatility, and a few bumps could come along the way.
We expect interest rates for maturities five years and shorter to remain anchored near the Fed’s target with longer-term rates subject to more volatility as the economy recovers. For the foreseeable future, the portfolio’s duration will remain close to or near the benchmark’s until we see a significant shift in monetary policy. Lastly, we expect investment-grade corporates to perform well aided by the ongoing recovery and the support from monetary and fiscal policy. Therefore, we entered the new year with an overweight allocation to corporate bonds where we perceive better relative value versus other sectors.
| Average Annual Total Returns (periods ended 12/31/20) | | | |
| | 1 YR % | 5 YR % | 10 YR % |
| Short-Term Bond Fund | 5.42 | 2.87 | 2.44 |
| ICE BofA 1-5 Year Corp./Gov. Index | 4.65 | 2.79 | 2.24 |
| Security Diversification |
| | % of Total Investments |
| | as of 12/31/19 | as of 12/31/20 |
| U.S. government and agency obligations | 61.4 | 36.8 |
| Corporate bonds–other | 19.6 | 34.2 |
| Asset-backed securities | 12.2 | 10.6 |
| Yankee bonds | 5.6 | 10.0 |
| Municipal bonds | 0.2 | 3.4 |
| Corporate bonds–government guaranteed | 0.1 | 3.0 |
| Mortgage-backed securities | 0.1 | 0.0 |
| Short-term and other assets | 0.8 | 2.0 |
| Total | 100.0% | 100.0% |
| Maturity | | |
| | as of 12/31/19 | as of 12/31/20 |
| Average weighted maturity | 2.64 | 2.90 |
Performance Comparison
Comparison of the change in value of a $10,000 investment in the fund and the ICE BofA 1-5 Year Corp./Gov. Index made on December 31, 2010.
The returns quoted in the above table and chart represent past performance, which is no guarantee of future results. Current performance may be higher or lower than that shown above. To obtain the most recent month-end returns, please call 800.258.3030 or visit homesteadfunds.com. Returns and the principal value of your investment will fluctuate such that shares, when redeemed, may be worth more or less than their original cost. The Short-Term Bond Fund’s average annual total returns are net of any fee waivers and reimbursements. The expenses used are as of the most recent period-end and may fluctuate over time. Returns include the reinvestment of dividends and capital gains. Returns do not reflect taxes that the shareholder may pay on fund distributions or the redemption of fund shares.
Intermediate Bond Fund
Performance Evaluation | Prepared by the Fund’s Investment Advisor, RE Advisers Corporation
Performance
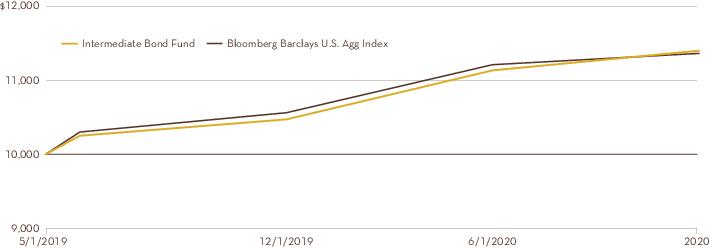
The fund returned 8.70% for the year ended December 31, 2020, outperforming its benchmark index, the Bloomberg Barclays US Aggregate Index, which returned 7.51%.
The fund’s main contributor to performance was its overweight allocation to the industrials, financials and asset-backed securities sectors. Additionally, its overall duration and yield curve positioning also contributed to performance. On the opposite side, the fund’s underweight allocation to U.S. Treasury, agency, sovereign and supranational securities detracted from performance. (Supranationals are typically lending institutions established by governments to promote economic development.) The portfolio management team gradually increased the fund’s holdings in corporate bonds throughout the year as issuers sought to shore up liquidity to ride out the challenges presented by the global pandemic.
The portfolio management team maintained the fund’s duration closer to that of its benchmark throughout the year in an effort to mitigate the risk of lower interest rates as the Federal Reserve sought to provide support to financial markets by lowering borrowing rates to zero in response to the unexpected shock from the COVID-19 pandemic.
Market Conditions
The global pandemic brought a unique shock to the system. The first six weeks of the year were relatively calm, with stocks peaking in mid-February and credit spreads near the tightest levels of the cycle. However, the COVID-19 pandemic became a broader issue and a global health crisis followed, one that none of us had ever experienced. Governments globally, including in the U.S., began to shut down their economies, and the impact was immediately felt across multiple sectors, with some feeling the impact more than others. Following the direct hit to the economy, consumers and small businesses prompted the Fed to take action by cutting its target for the federal funds rate to between 0.00% and 0.25% during two emergency sessions. Risk assets at a global level sold off, and the Bloomberg Barclays U.S. Aggregate Credit Average Option-Adjusted Spread Index widened to the mid-300s level in a short amount of time. This index measures the difference in yield between U.S. Treasury securities and investment-grade corporate bonds, showing the yield premium investors demand for taking increased credit risk. These dynamics prompted the Fed to move swiftly and aggressively to bring back facilities utilized during the financial crisis in 2008, such as the commercial paper credit facility and the launch of unlimited quantitative easing for U.S. Treasuries and agency mortgage-backed securities.
As the year progressed, the actions taken by the Fed and the fiscal stimulus passed by Congress reassured investors that over the longer term our economy will rebound from the pandemic. Additionally, the development and approval of two vaccines near the end of 2020 helped markets continue to rise, with the S&P 500 ultimately closing the year at record
| Investment Advisor: RE Advisers Corporation |
| Mauricio Agudelo, CFASenior Fixed Income Portfolio ManagerBS, Finance, The University of Maryland,
Robert H. Smith School of Business |
| Ivan Naranjo, CFA, FRMFixed Income Portfolio ManagerBS, Finance, The University of Maryland,
Robert H. Smith School of Business |
highs, and investment-grade corporate credit spreads retracing almost the entire widening to end the year nearly unchanged.
Outlook
We enter 2021 optimistic that the ongoing economic recovery will continue and believe U.S. and global growth will rebound. In our view, monetary policy will be highly accommodative, and the Fed is committed to keeping rates at zero for the foreseeable future. The Fed has emphasized that the tools exist and will be deployed should additional support be needed to sustain the recovery. On the fiscal front, the newly elected Biden-Harris administration in collaboration with Congress is expected to focus on providing the help needed to individuals and small businesses, while vaccines to combat the virus will continue to be developed and distributed to the broader population during the first half of the year. However, we are mindful that our outlook is subject to bouts of volatility, and a few bumps could come along the way.
We expect interest rates for maturities five years and shorter to remain anchored near the Fed’s target with longer-term rates subject to more volatility as the economy recovers. For the foreseeable future, the portfolio’s duration will remain close to or near the benchmark’s until we see a significant shift in monetary policy. Lastly, we expect investment-grade corporates to perform well aided by the ongoing recovery and the support from monetary and fiscal policy. Therefore, we entered the new year with an overweight allocation to corporate bonds where we perceive better relative value versus other sectors.
| Average Annual Total Returns (periods ended 12/31/20) | | |
| | 1 YR % | Since Inception
% |
| Intermediate Bond Fund | 8.70 | 8.04 |
| Bloomberg Barclays U.S. Agg Index | 7.51 | 7.89 |
| Security Diversification |
| | % of Total Investments |
| | as of 12/31/19 | as of 12/31/20 |
| Corporate bonds–other | 25.5 | 39.1 |
| Mortgage-backed securities | 23.4 | 17.4 |
| U.S. government and agency obligations | 39.8 | 13.9 |
| Asset-backed securities | 5.2 | 11.3 |
| Yankee bonds | 3.8 | 9.1 |
| Municipal bonds | 0.4 | 4.0 |
| Corporate bonds–government guaranteed | 0.0 | 0.4 |
| Short-term and other assets | 1.9 | 4.8 |
| Total | 100.0% | 100.0% |
| Maturity | | |
| | as of 12/31/19 | as of 12/31/20 |
| Average weighted maturity | 7.30 | 7.47 |
Performance Comparison
Comparison of the change in value of a $10,000 investment in the fund and the Bloomberg Barclays U.S. Agg Index made on May 1, 2019.
The returns quoted in the above table and chart represent past performance, which is no guarantee of future results. Current performance may be higher or lower than that shown above. To obtain the most recent month-end returns, please call 800.258.3030 or visit homesteadfunds.com. Returns and the principal value of your investment will fluctuate such that shares, when redeemed, may be worth more or less than their original cost. The Intermediate Bond Fund’s average annual total returns are net of any fee waivers and reimbursements. The fund’s advisor waived all of its management fee and reimbursed a portion of the fund's expenses from inception to December 31, 2019, and waived a portion of the management fee from January 1, 2020, to December 31, 2020. Had the advisor not done so, the fund's total returns would have been lower. The expenses used are as of the most recent period-end and may fluctuate over time. Returns include the reinvestment of dividends and capital gains. Returns do not reflect taxes that the shareholder may pay on fund distributions or the redemption of fund shares.
Stock Index Fund
Performance Evaluation | Prepared by the Master Portfolio’s Investment Advisor, BlackRock Fund Advisors
Performance
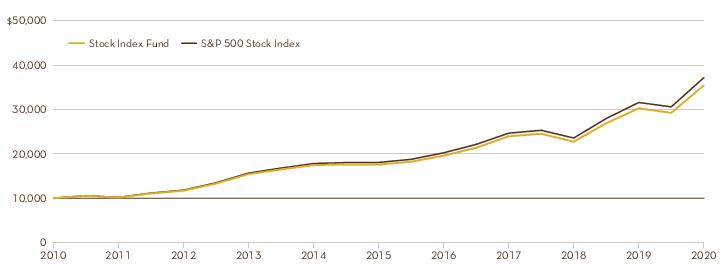
For the 12 months ended December 31, 2020, the U.S. large cap market metric and the fund’s benchmark, the S&P 500 Stock Index, returned 18.40%. The Stock Index Fund tracked closely, as expected, with a return of 17.80%. The S&P 500 is a market capitalization-weighted index composed of 500 common stocks issued by large-capitalization companies in a wide range of industries. The stocks included in the index collectively represent a substantial portion of all common stocks publicly traded in the United States.
During the 12-month period, as changes were made to the composition of the S&P 500, the Master Portfolio in which the fund invests purchased and sold securities to maintain its objective of replicating the risks and return of the index.
Market Conditions
Fears of the COVID-19 outbreak in the first quarter of 2020 and its economic toll drove unprecedented levels of financial market volatility. The Chicago Board Options Exchange Volatility Index, which measures near-term stock market volatility, surged to its highest level since the 2008 financial crisis, and the S&P 500 experienced its quickest bear market contraction on record. Economic activity fell to a standstill with the Purchasing Managers Index (an index of the prevailing direction of economic trends in the manufacturing and service sectors) across the globe registering its lowest levels on record and jobless claims surged. In late March, the United States saw a record number of initial unemployment claims as 3.3 million people filed for unemployment benefits while the consensus estimate was 1.4 million.
On the policy front, global governments in the second quarter of 2020 unleashed large stimulus packages to combat the shock on the economy. The United States passed several fiscal stimulus measures, including a $2 trillion relief bill to send money directly to Americans. Separately, monetary policy moved toward accommodation as the Federal Reserve cut the policy rate to 0% and pledged to buy as much government-backed debt as needed to bolster the markets for housing and Treasury bonds. Furthermore, the Fed announced it would buy corporate bonds, including the riskiest investment-grade debt, for the first time in its history. U.S. stocks outperformed other regions in the second quarter, with a sharper recovery from the troughs of late March. This was largely supported by the historic policy response. The United States was able to deliver coordinated fiscal and monetary support sufficient to offset the estimated initial shock from the coronavirus pandemic and spillovers to the full economy. Toward the end of the second quarter, U.S. government measures to contain the coronavirus were gradually lifted in many states, boosting activity and employment.
In the third quarter of 2020, U.S. stocks continued their recovery over July and August and maintained recording all-time highs until early September when valuation concerns created market volatility and led to a market sell-off. The COVID-19 pandemic continued to be center stage over the third quarter but the easing of some restrictions, coupled with a drop in the number of new cases in the United States and the Fed’s accommodative policies, supported the U.S. market recovery over the third quarter despite the spikes in volatility and the market sell-off that dampened the recovery momentum.
U.S. markets reacted positively to the U.S. presidential election results following a poor start to the fourth quarter of 2020. The victory of Joe Biden was seen as an indicator of more stable internal and external policies. The fear of rising COVID-19 cases in the United States was offset by positive vaccine news and an announcement of a $900 billion stimulus package in late December, which supported the market’s positive performance. Sectors that were severely affected by the coronavirus pandemic, such as energy and financials, recovered following the positive vaccine news in November, prompting these two sectors to recoup some of the losses incurred earlier in 2020.
Most Global Industry Classification Standard sectors within the S&P 500 Index posted positive returns over the year. Information technology (+43.88%), consumer discretionary (+33.30%) and communication services (+23.61%) were the highest performers, while energy (-33.67%), real estate (-2.27%) and financials (-1.70%) were among the lowest performers.
| Average Annual Total Returns (periods ended 12/31/20) | | | |
| | 1 YR % | 5 YR % | 10 YR % |
| Stock Index Fund | 17.80 | 14.58 | 13.27 |
| S&P 500 Stock Index | 18.40 | 15.22 | 13.88 |
| Sector Diversification | |
| | % of Total Investments
as of 12/31/20 |
| Information technology | 27.4 |
| Health care | 13.4 |
| Consumer discretionary | 12.7 |
| Communication services | 10.6 |
| Financials | 10.2 |
| Industrials | 8.4 |
| Consumer staples | 6.4 |
| Utilities | 2.7 |
| Materials | 2.6 |
| Real estate | 2.4 |
| Energy | 2.3 |
| Short-term and other assets | 0.9 |
| Top 10 Equity Holdings | |
| | % of Total Investments
as of 12/31/20 |
| Apple, Inc. | 6.6 |
| Microsoft Corp. | 5.3 |
| Amazon.com, Inc. | 4.3 |
| Alphabet, Inc. | 3.2 |
| Facebook, Inc. | 2.1 |
| Tesla Inc. | 1.7 |
| Berkshire Hathaway, Inc. | 1.4 |
| Johnson & Johnson | 1.3 |
| JPMorgan Chase & Co. | 1.2 |
| Visa Inc. | 1.2 |
| Total | 28.3% |
Performance Comparison
Comparison of the change in value of a $10,000 investment in the fund and the S&P 500 Stock Index made on December 31, 2010.
The returns quoted in the above table and chart represent past performance, which is no guarantee of future results. Current performance may be higher or lower than that shown above. To obtain the most recent month-end returns, please call 800.258.3030 or visit homesteadfunds.com. Returns and the principal value of your investment will fluctuate such that shares, when redeemed, may be worth more or less than their original cost. The Stock Index Fund’s average annual total returns are net of any fee waivers and reimbursements. The expenses used are as of the most recent period-end and may fluctuate over time. Returns include the reinvestment of dividends and capital gains. Returns do not reflect taxes that the shareholder may pay on fund distributions or the redemption of fund shares.
Sector diversification and top holdings information is for the S&P 500 Index Master Portfolio, managed by BlackRock Fund Advisors, the portfolio in which the Stock Index Fund invests all of its investable assets. Please refer to the Appendix for the complete annual report of the S&P 500 Index Master Portfolio.
Performance Evaluation
11
Value Fund
Performance Evaluation | Prepared by the Fund’s Investment Advisor, RE Advisers Corporation
Performance
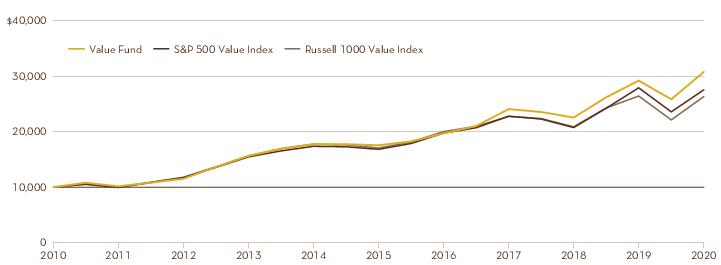
The fund delivered a positive return of 7.61% and outperformed its benchmark, the Russell 1000 Value Index, which returned 2.80%. Both stock selection and sector allocation drove relative performance.
Portfolio Review
The fund’s overweighting and stock selection in the information technology sector were the primary drivers of relative outperformance for 2020. NVIDIA, which benefits from long-term secular trends of data center machine learning and autonomous vehicle technology, was a strong performer during the year. Microsoft, a long-term holding, also contributed significantly to performance. Strength in enterprise cloud computing, Office 365 and other collaborative offerings led to strength in gross margins, double-digit earnings per share growth and high returns on invested capital.
An overweight position in the health care sector contributed positively, but poor stock choices within the sector weighed on relative performance. The sector overall benefited from a flight to more defensive stocks early in the year, particularly large pharmaceutical companies. However, Boston Scientific’s fundamentals were hurt by a decline in elective surgeries due to the coronavirus pandemic. Late in the year, the company pulled a product from the market, which raised concerns about its long-term growth rate.
Sector allocation and stock selection in the consumer discretionary sector hurt relative performance. Our slight underweight position in a strong-performing sector detracted from relative performance. Genuine Parts, a distributor of auto replacement parts, detracted from relative performance. We have exited the position.
Royal Dutch Shell, Chevron and ConocoPhillips, companies in the energy sector, also were a drag on relative performance. We have eliminated these positions. We believe the appeal of the cheapness of the sector does not outweigh the risk of a secularly challenged industry.
The fund added new names in the consumer discretionary sector, starting positions in three specialty retailers — Home Depot, Ulta Beauty and TJX — when the stocks were down reacting to coronavirus concerns. Despite the dislocation to their businesses, we believe they all have good long-term growth prospects in their respective industries. We also began a position in Deere that we believe will benefit from both rising corn prices and a good equipment replacement cycle.
Outlook
We are cautiously optimistic about 2021. The Federal Reserve is determined to keep interest rates low, a new fiscal stimulus package has recently been passed, and early 2021 year-over-year growth comparisons are encouraging. We
| Investment Advisor: RE Advisers Corporation |
 | Prabha Carpenter, CFASenior Equity Portfolio ManagerBA, Economics, University of Madras; MBA with distinction in Finance and BS in Business Economics, The American University |
 | Jim Polk, CFASenior Equity Portfolio ManagerBA, English, Colby College; MBA, The Olin Graduate School of Business at Babson College |
believe the economy will slowly reopen, and we are hopeful for a return to a more normal economic environment. While equity markets are generally not cheap in our view, we believe the low interest rate environment provides a reasonable basis for current valuations.
We are committed to evaluating the fund's existing holdings and seeking new investment opportunities that reward shareholders, in keeping with our long-term, research-oriented focus.
| Average Annual Total Returns (periods ended 12/31/20) | | | |
| | 1 YR % | 5 YR % | 10 YR % |
| Value Fund | 7.61 | 12.03 | 11.97 |
| Standard & Poor’s 500 Value Index | 1.36 | 10.52 | 10.74 |
| Russell 1000 Value Index | 2.80 | 9.74 | 10.50 |
| Sector Diversification | |
| | % of Total Investments
as of 12/31/20 |
| Health care | 22.3 |
| Financials | 18.5 |
| Information technology | 17.4 |
| Industrials | 16.3 |
| Materials | 8.4 |
| Communication services | 8.0 |
| Consumer discretionary | 5.6 |
| Real estate | 2.0 |
| Short-term and other assets | 1.5 |
| Total | 100.0% |
| Top 10 Equity Holdings | |
| | % of Total Investments
as of 12/31/20 |
| Alphabet, Inc. | 5.0 |
| Honeywell International, Inc. | 5.0 |
| Avery Dennison Corp. | 4.4 |
| Abbott Laboratories | 4.4 |
| Microsoft Corp. | 4.4 |
| JPMorgan Chase & Co. | 4.3 |
| Allstate Corp. | 3.6 |
| Visa Inc. | 3.4 |
| Parker-Hannifin Corp. | 3.2 |
| NVIDIA Corp. | 2.7 |
| Total | 40.4% |
Performance Comparison
Comparison of the change in value of a $10,000 investment in the fund, the Standard & Poor’s 500 Value Index and the Russell 1000 Value Index made on December 31, 2010.
The returns quoted in the above table and chart represent past performance, which is no guarantee of future results. Current performance may be higher or lower than that shown above. To obtain the most recent month-end returns, please call 800.258.3030 or visit homesteadfunds.com. Returns and the principal value of your investment will fluctuate such that shares, when redeemed, may be worth more or less than their original cost. The Value Fund’s average annual total returns are net of any fee waivers and reimbursements. The expenses used are as of the most recent period-end and may fluctuate over time. Returns include the reinvestment of dividends and capital gains. Returns do not reflect taxes that the shareholder may pay on fund distributions or the redemption of fund shares.
As of January 1, 2020, the Russell 1000 Value Index replaced the Standard & Poor's 500 Value Fund Index as the primary benchmark for the fund because the Russell 1000 Value Fund Index more closely reflects the market sectors and types of stocks in which the Fund invests.
Performance Evaluation
13
Growth Fund
Performance Evaluation | Prepared by the Fund’s Subadvisor, T. Rowe Price Associates
Performance
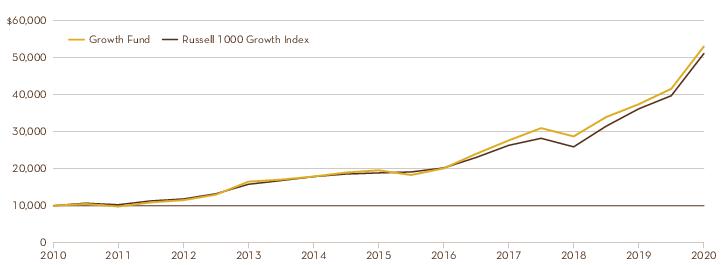
The Homestead Growth Fund delivered a positive 38.65% return for the 12-month period and slightly led its benchmark, the Russell 1000 Growth Index, which gained 38.49%. Sector allocation decisions drove relative outperformance during the year, while stock selection had a negative impact.
Portfolio Review
The fund’s holdings in the communication services sector were the largest contributor to relative performance due to stock selection, such as Snap. Shares of the company gained over the past 12 months due to increased user growth and engagement in response to social distancing measures, as well as higher advertiser demand and a mix shift toward higher-priced advertising solutions.
An underweight position in the consumer staples sector also contributed to relative results. We remain underweight to the consumer staples sector, where, we believe, attractive growth opportunities are difficult to find.
A lack of exposure to the real estate sector further aided relative performance.
The fund’s holdings in the information technology sector were the largest detractor to relative results, due to security selection, while an underweight position also had a negative impact. Our underweight position in Apple detracted from relative performance as shares outperformed over the past 12 months, driven by strength from Mac and iPad (which benefited from work-from-home and learn-at-home dynamics) and better-than-anticipated iPhone sales.
Poor stock selection in the consumer discretionary sector also had a negative impact on relative performance, including a position in Alibaba Group Holding, although a beneficial overweight position in the sector partially offset the losses. Despite impressive growth and market share gains for its core e-commerce business, shares of Alibaba came under pressure following the announcement of an antitrust investigation and the cancellation of the Ant IPO, a company in which Alibaba owns a 33% stake.
Outlook
Rapid progress with a first wave of new vaccines based on messenger RNA (mRNA) technology is, we believe, the most positive sign for the year ahead. As the pandemic hopefully recedes and economies reopen, we believe a broader economic recovery is likely to benefit many of the sectors that were most damaged by the virus, such as travel and leisure. While a rapid economic recovery could also bring an accelerated earnings recovery, in our view this might not translate into strong equity returns, with much of the recovery already priced into the markets.
| Subadvisor: T. Rowe Price Associates |
 | Taymour Tamaddon, CFAPortfolio ManagerBS, Applied Physics, Cornell University;
MBA, Finance, Dartmouth |
| Average Annual Total Returns (periods ended 12/31/20) | | | |
| | 1 YR % | 5 YR % | 10 YR % |
| Growth Fund | 38.65 | 21.17 | 17.73 |
| Russell 1000 Growth Index | 38.49 | 21.00 | 17.21 |
| Sector Diversification | |
| | % of Total Investments
as of 12/31/20 |
| Information technology | 35.5 |
| Communication services | 23.1 |
| Consumer discretionary | 21.2 |
| Health care | 14.5 |
| Industrials | 2.2 |
| Financials | 2.0 |
| Utilities | 0.9 |
| Short-term and other assets | 0.6 |
| Total | 100.0% |
| Top 10 Equity Holdings | |
| | % of Total Investments
as of 12/31/20 |
| Amazon.com, Inc. | 9.5 |
| Microsoft Corp. | 7.8 |
| Alphabet, Inc. | 7.3 |
| Facebook, Inc. | 5.7 |
| Apple, Inc. | 4.6 |
| Visa Inc. | 4.0 |
| Global Payments, Inc. | 3.7 |
| Intuit, Inc. | 2.5 |
| Snap Inc., Class A | 2.5 |
| PayPal Holdings, Inc. | 2.2 |
| Total | 49.8% |
Performance Comparison
Comparison of the change in value of a $10,000 investment in the fund and the Russell 1000 Growth Index made on December 31, 2010.
The returns quoted in the above table and chart represent past performance, which is no guarantee of future results. Current performance may be higher or lower than that shown above. To obtain the most recent month-end returns, please call 800.258.3030 or visit homesteadfunds.com. Returns and the principal value of your investment will fluctuate such that shares, when redeemed, may be worth more or less than their original cost. The Growth Fund’s average annual total returns are net of any fee waivers and reimbursements. The fund's advisor waived a portion of its management fee during the five- and 10-year periods. Had the advisor not done so, the fund's total returns would have been lower. The expenses used are as of the most recent period-end and may fluctuate over time. Returns include the reinvestment of dividends and capital gains. Returns do not reflect taxes that the shareholder may pay on fund distributions or the redemption of fund shares.
Performance Evaluation
15
International Equity Fund
Performance Evaluation | Prepared by the Fund’s Subadvisor, Harding Loevner LP
Performance
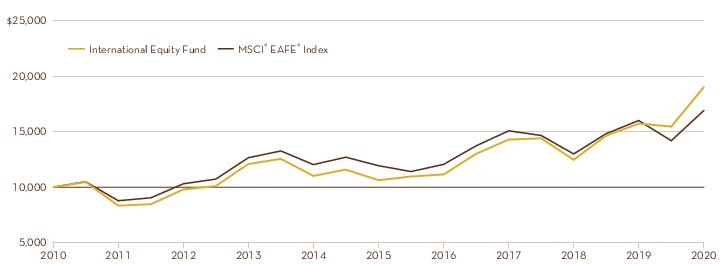
For the one-year period ending December 31, 2020, the International Equity Fund outperformed its benchmark, the MSCI EAFE Index. The International Equity Fund increased 21.34% versus the 7.82% return for the index.
Portfolio Review
Performance for the full year was driven primarily by strong security selection in most sectors, combined with a boost from our overweight in information technology (IT) relative to the index. Indeed, IT accounted for nearly half of the outperformance for the year, even as shares of SAP fell, given positive contributions from Adyen, Infineon, Keyence, Taiwan Semiconductor and Samsung.
Health care holdings contributed significantly, as several holdings played a key role in the battle against COVID-19. Contract drug manufacturer Lonza is producing the early-approved vaccine from Moderna, while Roche and Sysmex experienced surging demand for their test kits and diagnostic equipment. The fund’s industrials holdings were also contributors to relative outperformance, especially electrical equipment company Schneider Electric and compressor maker Atlas Copco.
Offsetting those good returns, stock selection in the consumer discretionary sector was the biggest drag on relative performance. Our underweight to consumer durables and apparel proved costly.
Throughout the market lurches of 2020, we maintained our time-tested approach of bottom-up stock selection: We require both fundamental quality and growth from our companies, and prices for their stocks, that we believe are supportive of future returns. Our inclination is to lean against the prevailing market sentiment while basing each decision on the fundamental prospects and the valuation for each individual stock. When markets were fearful and “riskier” positions — such as Schneider Electric, Komatsu and Rio Tinto — sold off, we added to them while trimming “safer” positions, such as Roche and Nestlé. When markets chose to ignore valuation, we made sure to pay it more attention, trimming or selling outright the most richly priced companies (Chugai Pharmaceutical, Linde, Canadian National Railway) and adding to or purchasing positions that we believe looked unusually cheap (such as Alcon and FEMSA). As is our habit, we parted ways with several companies that failed to live up to our mileposts for success: Dentsu, Sasol, HSBC, Baidu and, in the fourth quarter, China Mobile.
Outlook
As we head into 2021, with, we believe, the end of the pandemic at last in sight thanks to the increasing availability of multiple effective vaccines, the concerns we had at the start of 2020 — negative interest rates, potential inflation and the implied discount rates for stocks — have returned to the fore.
| Subadvisor: Harding Loevner LP |
 | Ferrill D. Roll, CFACo-Lead Portfolio ManagerBA, Economics, Stanford University |
 | Andrew West, CFACo-Lead Portfolio ManagerBS, Business Administration, University of Central Florida; MBA, New York University |
Ultra-low discount rates, like ultra-low bond yields, imply that cash flows generated by growing companies far into the future have more value today; if ultra-low were to give way to merely low, those faraway cash flows would not be so compelling. Moreover, what could stimulate animal spirits more than a return to before-COVID-19 commerce, travel and social interactions, with a year of deferred consumption coiled like a spring? On the fire of pent-up demand, throw gasoline in the shape of competition for resources from infrastructure spending programs, and suddenly not even “low” may be the right level for inflation or interest rates, let alone for the discount rates applied to stocks, in our view.
Though 2021 may well prove to be an annus horribilis for growth investing, there is no way of knowing in advance. Moreover, we believe there is far more to the growth investing story than falling discount rates. The past decade may have witnessed previously unimaginably low interest rates, but we’ve also experienced a resurgence in innovation accompanied secular, albeit still narrow, earnings growth fueled by rapid advances in technology. And herein lies the iron law of growth investing: You may overpay initially, but with careful selection and a long enough horizon, compounding revenues and, ultimately, earnings will eventually bail you out of the high price you paid. We believe that the best growth companies will ultimately justify even extreme valuations, although investors should have no illusions that all or even most growth companies will meet this criterion. In our investment process, we attempt to balance the emphasis on durable growth, financial strength, good management and sound governance. By conducting fundamental research to identify companies with all these attributes, we increase our odds of pinpointing the few businesses with sustainable growth rates.
International Equity Fund
| Average Annual Total Returns (periods ended 12/31/20) | | | |
| | 1 YR % | 5 YR % | 10 YR % |
| International Equity Fund* | 21.34 | 12.17 | 6.56 |
| MSCI® EAFE® Index | 7.82 | 7.45 | 5.51 |
| Country Diversification | |
| | % of Total Investments
as of 12/31/20 |
| Japan | 18.1 |
| Germany | 14.0 |
| Switzerland | 12.8 |
| France | 10.0 |
| Britain | 8.2 |
| Sweden | 7.4 |
| Netherlands | 3.8 |
| Hong Kong | 3.4 |
| Singapore | 2.5 |
| Canada | 2.1 |
| China | 2.0 |
| Israel | 1.8 |
| Spain | 1.6 |
| Taiwan | 1.4 |
| Republic of South Korea | 1.4 |
| Australia | 1.3 |
| United States of America | 1.1 |
| Denmark | 1.0 |
| India | 0.9 |
| Brazil, Russia & Mexico | 1.7 |
| Short-term and other assets | 3.5 |
| Total | 100.0% |
| Top 10 Equity Holdings | |
| | % of Total Investments
as of 12/31/20 |
| Infineon Technologies AG | 4.7 |
| L’Oréal SA | 3.9 |
| Adyen NV | 3.8 |
| Atlas Copco AB | 3.7 |
| AIA Group Ltd. | 3.4 |
| SAP SE ADR | 3.1 |
| Lonza Group AG REG | 3.1 |
| Roche Holding AG REG | 3.1 |
| Allianz SE REG | 3.1 |
| Schneider Electric SE | 3.0 |
| Total | 34.9% |
Performance Comparison
Comparison of the change in value of a $10,000 investment in the fund and the MSCI® EAFE® Index made on December 31, 2010.
The returns quoted in the above table and chart represent past performance, which is no guarantee of future results. Current performance may be higher or lower than that shown above. To obtain the most recent month-end returns, please call 800.258.3030 or visit homesteadfunds.com. Returns and the principal value of your investment will fluctuate such that shares, when redeemed, may be worth more or less than their original cost. The International Equity Fund’s average annual total returns are net of any fee waivers and reimbursements. The fund's advisor waived a portion of its management fee during the periods shown. Had the advisor not done so, the fund's total returns would have been lower. The expenses used are as of the most recent period-end and may fluctuate over time. Returns include the reinvestment of dividends and capital gains. Returns do not reflect taxes that the shareholder may pay on fund distributions or the redemption of fund shares.
* Performance information for the International Equity Fund (formerly the International Value Fund) reflects its performance as an actively managed fund subadvised by Mercator Asset Management through September 14, 2015; as a passively managed portfolio directed by SSGA Funds Management Inc. from September 15, 2015, to January 8, 2016; and, after a transition, as an actively managed fund subadvised by Harding Loevner LP from January 15, 2016, to period-end.
Performance Evaluation
17
Small-Company Stock Fund
Performance Evaluation | Prepared by the Fund’s Investment Advisor, RE Advisers Corporation
Performance
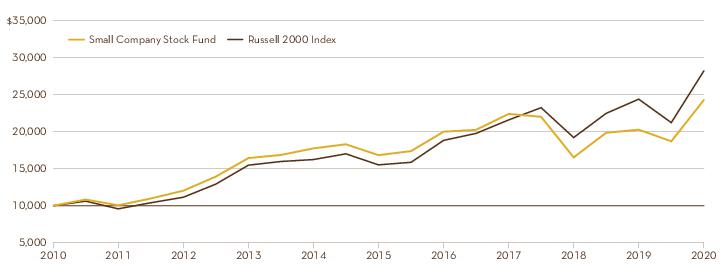
The fund posted a strong double-digit return of 22.08% for the year ending December 31, 2020, leading its benchmark, the Russell 2000 Index, which returned 19.96% for the year. Stock selection in the financials and health care sectors offset negative stock selection in the consumer discretionary and industrials sectors. The fund also benefited from no holdings in either the energy or utilities sectors.
Portfolio Review
The fund’s strongest performing sector was financials, where long-term holding Kinsale was up significantly. Kinsale has, we believe, a unique opportunity in the insurance industry. Kinsale, a specialty insurer with cost and technology competitive advantages, underwrites its own risks rather than outsource the responsibility to third parties. For example, pandemics were excluded from coverage pre-COVID-19. Kinsale’s contribution to relative performance was offset somewhat by the fund’s weight in the banking industry where some of the holdings detracted from relative performance. Concerns over a rise in bad credit quality as a result of the shutdown in the U.S. economy and a flattening yield curve weighed on bank valuations, particularly early in the year. With the approval of COVID-19 vaccines, and the prospects of reopening the economy appearing more favorable, bank stocks rebounded toward the end of the year.
In the health care sector, the fund was overweight and outperformed relative to the benchmark. The fund benefited from stock selection in names like Twist Biosciences, a biotechnology company specializing in creating synthetic DNA; Staar Surgical, a manufacturer of insertable lenses for near sightedness; and Nanostring, a long-term fund holding in the life sciences industry.
The fund also benefited from having no exposure to either the energy or utilities sectors. Energy stocks were hurt by falling oil prices over concerns of slowing economic growth. We believe there are longer-term structural issues with the sector and remain underweight relative to the benchmark.
Detractors to performance came from stock selection in more cyclical sectors, notably consumer discretionary and industrials. In consumer discretionary, both Cracker Barrel and BJ’s Restaurant were hurt by the economic shutdown and pandemic-related restrictions on gatherings. In industrials, Wellbilt, a supplier of restaurant equipment, also saw its business negatively affected from a decrease in restaurant spending on capital equipment. We sold this stock early in the year over concerns about the company's longer-term viability and leverage concerns — and therefore missed its subsequent rebound from the March lows.
Outlook
We are cautiously optimistic regarding equities. With the Federal Reserve’s signaled willingness to keep interest rates low for an extended period of time, new vaccines being introduced to the market and a new stimulus package, we
| Investment Advisor: RE Advisers Corporation |
| Prabha Carpenter, CFASenior Equity Portfolio ManagerBA, Economics, University of Madras; MBA with distinction in Finance and BS in Business Economics, The American University |
| Jim Polk, CFASenior Equity Portfolio ManagerBA, English, Colby College; MBA, The Olin Graduate School of Business at Babson College |
believe the economy will continue to improve throughout 2021. In our view there continue to be underfollowed companies and strong businesses that can reward investors over the long haul.
| Average Annual Total Returns (periods ended 12/31/20) | | | |
| | 1 YR % | 5 YR % | 10 YR % |
| Small-Company Stock Fund | 22.08 | 7.94 | 9.44 |
| Russell 2000 Index | 19.96 | 13.26 | 11.20 |
| Sector Diversification | |
| | % of Total Investments
as of 12/31/20 |
| Health care | 26.8 |
| Information technology | 22.3 |
| Industrials | 14.5 |
| Financials | 13.9 |
| Consumer discretionary | 7.4 |
| Materials | 7.4 |
| Real estate | 4.4 |
| Communication services | 1.1 |
| Consumer staples | 0.9 |
| Short-term and other assets | 1.3 |
| Total | 100.0% |
| Top 10 Equity Holdings | |
| | % of Total Investments
as of 12/31/20 |
| Avient Corp. | 3.7 |
| Twist Bioscience Corp. | 3.6 |
| Medpace Holdings, Inc. | 3.4 |
| Applied Industrial Technologies, Inc. | 3.4 |
| NanoString Technologies, Inc. | 3.3 |
| LHC Group, Inc. | 3.3 |
| STAAR Surgical Co. | 3.2 |
| ManTech International Corp. | 3.2 |
| Glacier Bancorp, Inc. | 2.8 |
| Descartes Systems Group Inc. (The) | 2.6 |
| Total | 32.5% |
Performance Comparison
Comparison of the change in value of a $10,000 investment in the fund and the Russell 2000 Index made on December 31, 2010.
The returns quoted in the above table and chart represent past performance, which is no guarantee of future results. Current performance may be higher or lower than that shown above. To obtain the most recent month-end returns, please call 800.258.3030 or visit homesteadfunds.com. Returns and the principal value of your investment will fluctuate such that shares, when redeemed, may be worth more or less than their original cost. The Small-Company Stock Fund’s average annual total returns are net of any fee waivers and reimbursements. The expenses used are as of the most recent period-end and may fluctuate over time. Returns include the reinvestment of dividends and capital gains. Returns do not reflect taxes that the shareholder may pay on fund distributions or the redemption of fund shares.
Performance Evaluation
19
As a shareholder, you incur two types of costs: (1) transaction costs; and (2) ongoing costs, including management fees, service fees, and other fund expenses. This example is intended to help you understand your ongoing costs (in dollars) of investing in each of the Homestead Funds and to compare these costs with the ongoing costs of investing in other mutual funds.
The example is based on an investment of $1,000 invested at July 1, 2020 and held through December 31, 2020.
Actual Expenses
The first line for each Fund in the table on the following page provides information about actual account values and actual expenses. You may use the information in this line, together with the amount you invested, to estimate the expenses that you paid over the period. Simply divide your account value by $1,000 (for example, an $8,600 account value divided by $1,000 = 8.6), then multiply the result by the number in the first line under the heading entitled “Expenses Paid During the Period” to estimate the expenses you paid on your account during this period.
Individual Retirement Arrangements (IRAs) and Educational Savings Accounts (ESAs) are charged a $15.00 annual custodial fee. The charge is automatically deducted from your account in the fourth quarter of each year or, if you close your account, at the time of redemption. A fee is collected for each IRA or ESA, as distinguished by account type (Traditional IRA, Roth IRA, or ESA) and Social Security Number. For example, if you have both a Traditional IRA and a Roth IRA account, each would be charged a fee. But only one fee would be collected for each account type, regardless of the number of Funds held by each account type. These fees are not included in the example below. If included, the costs shown would be higher.
Hypothetical Example for Comparison Purposes
The second line for each Fund in the table on the following page provides information about hypothetical account values and hypothetical expenses based on the Fund’s actual expense ratio and an assumed rate of return of 5% per year before expenses, which is not the Fund’s actual return. The hypothetical account values and expenses may not be used to estimate the actual ending account balance or expenses you paid for the period.
You may use this information to compare the ongoing costs of investing in the Funds and other funds. To do so, compare this 5% hypothetical example with the 5% hypothetical examples that appear in the shareholder reports of the other funds.
Please note that the expenses shown in the table are meant to highlight your ongoing costs only and do not reflect the custodial account fee. Therefore, the hypothetical information in the example is useful in comparing your ongoing costs only, and will not help you determine the
relative total costs of owning different funds. In addition, if the custodial account fee was included, your costs would have been higher.
Expense Example (Continued)
| Daily Income Fundb | Beginning Account Value
July 1, 2020 | Ending Account Value
December 31, 2020 | Expenses Paid During the Perioda | Annualized Expense Ratio for the Period Ended
December 31, 2020 |
| Actual Return | $1,000.00 | $1,000.10 | $0.64 | 0.13% |
| Hypothetical Return (5% return before expenses) | $1,000.00 | $1,024.36 | $0.64 | 0.13% |
| Short-Term Government Securities Fundb | | | | |
| Actual Return | $1,000.00 | $1,005.70 | $3.78 | 0.75% |
| Hypothetical Return (5% return before expenses) | $1,000.00 | $1,021.24 | $3.80 | 0.75% |
| Short-Term Bond Fund | | | | |
| Actual Return | $1,000.00 | $1,012.80 | $3.91 | 0.77% |
| Hypothetical Return (5% return before expenses) | $1,000.00 | $1,021.11 | $3.93 | 0.77% |
| Intermediate Bond Fundb | | | | |
| Actual Return | $1,000.00 | $1,022.70 | $4.05 | 0.80% |
| Hypothetical Return (5% return before expenses) | $1,000.00 | $1,020.99 | $4.05 | 0.80% |
| Stock Index Fundc | | | | |
| Actual Return | $1,000.00 | $1,211.30 | $2.77 | 0.50% |
| Hypothetical Return (5% return before expenses) | $1,000.00 | $1,022.49 | $2.53 | 0.50% |
| Value Fund | | | | |
| Actual Return | $1,000.00 | $1,191.30 | $3.53 | 0.64% |
| Hypothetical Return (5% return before expenses) | $1,000.00 | $1,021.78 | $3.26 | 0.64% |
| Growth Fund | | | | |
| Actual Return | $1,000.00 | $1,275.10 | $4.91 | 0.86% |
| Hypothetical Return (5% return before expenses) | $1,000.00 | $1,020.68 | $4.36 | 0.86% |
| International Equity Fundb | | | | |
| Actual Return | $1,000.00 | $1,230.00 | $5.54 | 0.99% |
| Hypothetical Return (5% return before expenses) | $1,000.00 | $1,020.03 | $5.02 | 0.99% |
| Small-Company Stock Fund | | | | |
| Actual Return | $1,000.00 | $1,298.20 | $6.58 | 1.14% |
| Hypothetical Return (5% return before expenses) | $1,000.00 | $1,019.27 | $5.78 | 1.14% |
| a. | The dollar amounts shown as “Expenses Paid During the Period” are equal to each Fund’s annualized expense ratio multiplied by the average account value over the period, multiplied by the number of days in the period 184, then divided by 366. |
| b. | Reflects fee waiver and/or expense reimbursements in effect during the period. |
| c. | The Stock Index Fund is a feeder fund that invests substantially all of its assets in a Master Portfolio. The example reflects the expenses of both the feeder fund and the Master Portfolio. |
Regulatory and Shareholder Matters
Proxy Voting Policies and Procedures
The policies and procedures used to determine how to vote proxies relating to the Funds’ portfolio securities are available online at homesteadfunds.com and, without charge, upon request by calling 800-258-3030. This information is also available on the Securities and Exchange Commission’s website at sec.gov.
Proxy Voting Record
For the most recent twelve-month period ended June 30, information regarding how proxies relating to portfolio securities were voted on behalf of each of the Funds is available, without charge, upon request by calling 800-258-3030. This information is also available online at homesteadfunds.com and on the Securities and Exchange Commission’s website at sec.gov.
Quarterly Disclosure of Portfolio Holdings
The Funds file complete schedules of portfolio holdings with the Securities and Exchange Commission for the first and third quarters of each fiscal year as an exhibit to their reports on Form N-PORT. Portfolio holdings for the second and fourth quarters of each fiscal year are filed as part of the Funds’ semi-annual and annual reports. The Funds’ Form N-PORT, semi-annual and annual reports are available on the Commission’s website at sec.gov. The most recent quarterly portfolio holdings and semi-annual and annual reports also can be accessed on the Funds’ website at homesteadfunds.com.
Principal Risks
You may lose money by investing in the Funds. Below are summaries of some, but not all, of the principal risks of investing in one or more of the Funds, each of which could adversely affect a Fund’s NAV, yield and total return. Each risk listed below does not necessarily apply to each Fund, and you should read each Fund’s prospectus carefully for a description of the principal risks associated with investing in a particular Fund.
• Asset-Backed and Mortgage-Backed Securities Risk The risk that defaults, or perceived increases in the risk of defaults, on the obligations underlying asset-backed and mortgage-backed securities, including mortgage pass-through securities and collateralized mortgage obligations (“CMOs”), significant credit downgrades and illiquidity may impair the value of the securities. These securities also present a higher degree of prepayment risk (when repayment of principal occurs before scheduled maturity resulting in the Fund having to reinvest proceeds at a lower interest rate) and extension risk (when rates of repayment of principal are slower than expected, which may lock in a below-market interest rate, increase the security’s duration, and reduce the value of the security) than do other types of fixed income securities. Enforcing
rights against the underlying assets or collateral may be difficult, and the underlying assets or collateral may be insufficient if the issuer defaults.
• Commercial Paper Risk Investments in commercial paper are subject to the risk that the issuer cannot issue enough new commercial paper to satisfy its obligations with respect to its outstanding commercial paper, also known as rollover risk. Commercial paper is generally unsecured, which increases the credit risk associated with this type of investment. The value of commercial paper may be affected by changes in the credit rating or financial condition of the issuing entities. The value of commercial paper will tend to fall when interest rates rise and rise when interest rates fall.
• Concentration Risk To the extent the fund concentrates in a particular industry, it may be more susceptible to economic conditions and risks affecting that industry.
• Convertible Securities Risk Convertible securities may be subordinate to other debt securities issued by the same issuer. Issuers of convertible securities are often not as strong financially as issuers with higher credit ratings. Convertible securities typically provide yields lower than comparable non-convertible securities. Their values may be more volatile than those of non-convertible securities, reflecting changes in the values of the securities into which they are convertible.
• Corporate Bond Risk Corporate debt securities are subject to the risk of the issuer’s inability to meet principal and interest payments on the obligations and may also be subject to price volatility due to factors such as interest rates, market perception of the creditworthiness of the issuer and general market liquidity.
• Currency Risk Foreign currencies may experience steady or sudden devaluation relative to the U.S. dollar or other currencies, adversely affecting the value of the Fund’s investments. The value of the Fund’s assets may be affected favorably or unfavorably by currency exchange rates, currency exchange control regulations, and restrictions or prohibitions on the repatriation of foreign currencies. Because the Fund’s net asset value is determined on the basis of U.S. dollars, if the local currency of a foreign market depreciates against the U.S. dollar, you may lose money even if the foreign market prices of the Fund’s holdings rise.
• Debt Securities Risks
Credit Risk The risk that an issuer or counterparty will fail to pay its obligations to the Fund when they are due. As a result, the Fund’s income might be reduced, the value of the Fund’s investment might fall, and/or the Fund could lose the entire amount of its investment. Changes in the financial condition of an issuer or counterparty, changes in specific economic, social or political conditions that affect a particular type of security or other instrument or an issuer, and changes in economic, social or political conditions generally can
Regulatory and Shareholder Matters
Regulatory and Shareholder Matters (Continued)
increase the risk of default by an issuer or counterparty, which can affect a security’s or other instrument’s credit quality or value and an issuer’s or counterparty’s ability to pay interest and principal when due. The values of lower-quality debt securities (commonly known as “junk bonds”) tend to be particularly sensitive to these changes. The values of securities also may decline for a number of other reasons that relate directly to the issuer, such as management performance, financial leverage and reduced demand for the issuer’s goods and services, as well as the historical and prospective earnings of the issuer and the value of its assets.
Extension Risk The risk that if interest rates rise, repayments of principal on certain debt securities, including, but not limited to, mortgage-related securities, may occur at a slower rate than expected and the expected maturity of those securities could lengthen as a result. Securities that are subject to extension risk generally have a greater potential for loss when prevailing interest rates rise, which could cause their values to fall sharply.
Income Risk The risk that the Fund’s income may decline due to falling interest rates or other factors. Issuers of securities held by the Fund may call or redeem the securities during periods of falling interest rates, and the Fund would likely be required to reinvest in securities paying lower interest rates. During market conditions in which short-term interest rates are at low levels it is possible that the Fund will generate an insufficient amount of income to pay its expenses, and that it will not be able to pay a daily dividend and may have a negative yield (i.e., it may lose money on an operating basis). It is possible that the Fund would, during these conditions, maintain a substantial portion of its assets in cash, on which it may earn little, if any, income. If an obligation held by the Fund is prepaid, the Fund may have to reinvest the prepayment in other obligations paying income at lower rates.
Interest Rate Risk The risk that debt instruments will change in value because of changes in interest rates. The value of an instrument with a longer duration (whether positive or negative) will be more sensitive to changes in interest rates than a similar instrument with a shorter duration. Bonds and other debt instruments typically have a positive duration. The value of a debt instrument with positive duration will generally decline if interest rates increase.
• Depositary Receipts Risk Depositary receipts in which the Fund may invest are receipts listed on U.S. exchanges that are issued by banks or trust companies that entitle the holder to all dividends and capital gains that are paid out on the underlying foreign shares. Investments in depositary receipts may be less liquid than the underlying shares in their primary trading market.
• Derivatives Risk The risk that an investment in derivatives will not perform as anticipated by the Fund’s manager, cannot be closed out at a favorable time or price, or will increase the Fund’s volatility; that derivatives may create investment leverage; that, when a derivative is used as a substitute for or alternative to a direct cash investment, the transaction may not provide a return that corresponds precisely with that of the cash investment; or that, when used for hedging purposes, derivatives will not provide the anticipated protection, causing the Fund to lose money on both the derivatives transaction and the exposure the Fund sought to hedge. The counterparty to a derivatives contract may be unable or unwilling to make timely settlement payments, return the Fund’s margin, or otherwise honor its obligations. Changes in regulation relating to a mutual fund’s use of derivatives and related instruments could potentially limit or impact the Fund’s ability to invest in derivatives, limit a Fund’s ability to employ certain strategies that use derivatives and adversely affect the value or performance of derivatives and the Fund.
• Emerging and Frontier Market Risk The risk that investing in emerging and frontier markets will be subject to greater political and economic instability, greater volatility in currency exchange rates, less developed securities markets, possible trade barriers, currency transfer restrictions, a more limited number of potential buyers and issuers, an emerging market country’s dependence on revenue from particular commodities or international aid, less governmental supervision and regulation, unavailability of currency hedging techniques, differences in auditing and financial reporting standards, thinner trading markets, different clearing and settlement procedures and custodial services, and less developed legal systems than in many more developed countries. The securities of emerging market companies may trade less frequently and in smaller volumes than more widely held securities. These risks are generally greater for investments in frontier market countries, which typically have smaller economies or less developed capital markets than traditional emerging market countries.
• Equity Securities Risk Equity securities generally have greater price volatility than fixed-income securities. The market price of equity securities owned by a fund may go up or down, sometimes rapidly or unpredictably. Equity securities may decline in value due to factors affecting the issuer, equity securities markets generally, particular industries represented in those markets or the issuer itself.
• Focused Investment Risk A fund that invests a substantial portion of its assets in a particular market, industry, sector, group of industries or sectors, country, region, group of countries or asset class is subject to greater risk than a fund that invests in a more diverse investment portfolio. In addition, the value of such a fund is more susceptible to any single economic, market, political or regulatory or other occurrence affecting, for
Regulatory and Shareholder Matters
23
Regulatory and Shareholder Matters (Continued)
example, the particular markets, industries, regions, sectors or asset classes in which the fund is invested. This is because, for example, issuers in a particular market, industry, region, sector or asset class may react similarly to specific economic, market, regulatory, political or other developments. The particular markets, industries, regions, sectors or asset classes in which the Fund may focus its investments may change over time and the Fund may alter its focus at inopportune times. For example, the Fund may have a significant portion of its assets invested in securities of companies in the information technology sector. Companies in the information technology sector can be adversely affected by, among other things, intense competition, earnings disappointments, and rapid obsolescence of products and services due to technological innovations or changing consumer preferences. As a matter of fundamental policy, the Intermediate Bond Fund will normally invest at least 25% of its total assets (i.e., concentrate) in mortgage-related assets and asset-backed instruments issued by government agencies or other governmental entities or by private originators or issuers, and other investments that RE Advisers considers to have the same primary economic characteristics.
• Foreign Risk Foreign securities are subject to political, regulatory, and economic risks not present in domestic investments and may exhibit more extreme changes in value than securities of U.S. companies. The securities markets of many foreign countries are relatively small, with a limited number of companies representing a small number of industries. In addition, foreign companies often are not subject to the same degree of regulation as U.S. companies. Reporting, legal, accounting and auditing standards of foreign countries differ, in some cases significantly, from U.S. standards. Nationalization, expropriation or confiscatory taxation, currency blockage, political changes or diplomatic developments could adversely affect the Fund’s investments in a foreign country. In the event of nationalization, expropriation or other confiscation, the Fund could lose its entire investment. Investments in emerging market countries are likely to involve significant risks. These countries are generally more likely to experience political and economic instability.
• Growth Style Risk The risk that returns on stocks within the growth style in which the Fund invests will trail returns of stocks representing other styles or the market overall over any period of time and may shift in and out of favor with investors generally, sometimes rapidly, depending on changes in market, economic, and other factors. Growth stocks can be volatile, as these companies usually invest a high portion of earnings in their business and therefore may lack the dividends of value stocks that can cushion stock prices in a falling market. Also, earnings disappointments often lead to sharply falling prices because investors buy growth stocks in anticipation of superior earnings growth.
• High Yield Securities Risk The risk that debt instruments rated below investment grade or debt instruments that are unrated and determined by RE Advisers to be of comparable quality are predominantly speculative. These instruments, commonly known as “junk bonds,” have a higher degree of default risk and may be less liquid than higher-rated bonds. These instruments may be subject to greater price volatility due to such factors as specific corporate developments, interest rate sensitivity, negative perceptions of high yield investments generally, and less secondary market liquidity.
• Index Fund Risk An index fund has operating and other expenses while an index does not. As a result, while a fund will attempt to track its underlying index as closely as possible, it will tend to underperform the index to some degree over time. If an index fund is properly correlated to its stated index, the Fund will perform poorly when the index performs poorly.
• Index-Related Risk There is no assurance that the index provider will compile the underlying index accurately, or that the underlying index will be determined, composed or calculated accurately. Gains, losses or costs associated with index provider errors will be borne by the Fund and its shareholders. Unusual market conditions may cause the index provider to postpone a scheduled rebalance, which could cause the underlying index to vary from its normal or expected composition. The postponement of a scheduled rebalance in a time of market volatility could mean that constituents that would otherwise be removed at rebalance due to changes in market capitalizations, issuer credit ratings, or other reasons may remain, causing the performance and constituents of the underlying index to vary from those expected under normal conditions.
• Investments in Other Investment Companies Risk The risk that an investment company or other pooled investment vehicle in which the Fund invests will not achieve its investment objective or execute its investment strategies effectively or that significant purchase or redemption activity by shareholders of such an investment company might negatively affect the value of the investment company’s shares. There will be some duplication of expenses because the Fund also must pay its pro-rata share of that investment company’s fees and expenses.
• Investments in Small- and Mid-Size Companies Securities of small and medium-sized companies tend to be more volatile and less liquid than securities of large companies. Compared to large companies, small and medium-sized companies may face greater business risks because they lack the management depth or experience, financial resources, product diversification or competitive strengths of larger companies, and they may be more adversely affected by poor economic conditions. There may be less publicly available information about smaller
Regulatory and Shareholder Matters
Regulatory and Shareholder Matters (Continued)
companies than larger companies. In addition, these companies may have been recently organized and may have little or no track record of success.
• Issuer Risk The risk that the value of a security may decline because of adverse events or circumstances that directly relate to the issuer.
• Limited Operating History Risk The risk that a recently formed fund has a limited operating history to evaluate and may not attract sufficient assets to achieve or maximize investment and operational efficiencies.
• Manager Risk The risk that the manager's decisions, including security selection, will cause the Fund to underperform relative to the Fund’s peers. There can be no assurance that the manager's investment techniques and decisions will produce the desired results. The Fund’s ability to achieve its investment objective is dependent upon the manager's ability to identify profitable investment opportunities for the Fund. The past experience of the portfolio manager, including with other strategies and funds, does not guarantee future results for the Fund.
• Market Capitalization Risk Investing primarily in issuers within the same market capitalization category carries the risk that the category may be out of favor due to current market conditions or investor sentiment. Securities issued by large-cap companies tend to be less volatile than securities issued by smaller companies. However, larger companies may not be able to attain the high growth rates of successful smaller companies, especially during strong economic periods, and may be unable to respond as quickly to competitive challenges.
• Market Risk The risk that markets will perform poorly or that the returns from the securities in which the Fund invests will underperform returns from the general securities markets or other types of investments. Markets may, in response to governmental actions or intervention, political, economic or market developments, or other external factors, such as outbreaks of infectious illnesses or other widespread public health issues, experience periods of high volatility and reduced liquidity. During those periods, the Fund may experience high levels of shareholder redemptions, and may have to sell securities at times when the Fund would otherwise not do so, and potentially at unfavorable prices. Certain securities may be difficult to value during such periods. These risks may be heightened for fixed income securities in low interest rate environments.
• Master/Feeder Structure Risk The Fund pursues its objective by investing substantially all of its assets in another pooled investment vehicle (a “master fund”). The ability of the Fund to meet its investment objective is directly related to the ability of the master fund to meet its investment objective. The Fund will bear its pro rata portion of the expenses incurred by the master fund. Substantial redemptions by other investors in a master
fund may affect the master fund’s investment program adversely and limit the ability of the master fund to achieve its objective.
• Money Market Securities Risk The value of a money market instrument typically will decline during periods of rising interest rates, and can also decline in response to changes in the financial condition of the issuer, borrower, counterparty, or underlying collateral assets, or changes in market, economic, industry, political, and regulatory conditions affecting a particular type of security or issuer or fixed income securities generally. Money market funds are not designed to offer capital appreciation. Certain money market funds may impose a fee upon the sale of shares or may temporarily suspend the ability of investors to redeem shares if such fund’s liquidity falls below required minimums, which may adversely affect the Fund’s returns or liquidity.
• Municipal Bond Risk Factors unique to the municipal bond market may negatively affect the value of the Fund’s investment in municipal bonds. The Fund may invest in a group of municipal obligations that are related in such a way that an economic, business, or political development affecting one would also affect the others. In addition, the municipal bond market, or portions thereof, may experience substantial volatility or become distressed, and individual bonds may go into default, which would lead to heightened risks of investing in municipal bonds generally. The ability of municipalities to meet their obligations will depend on the availability of tax and other revenues, economic, political and other conditions within the state and municipality, and the underlying fiscal condition of the state and municipality.
• Passive Investment Risk Because BlackRock Fund Advisors does not select the individual companies in the Index that the Master Portfolio tracks, the Master Portfolio may hold securities of companies that present risks that an investment adviser researching individual securities might otherwise seek to avoid.
• Portfolio Turnover Risk The risk that frequent purchases and sales of portfolio securities may result in higher Fund expenses and may result in larger distributions of taxable capital gains to investors as compared to a fund that trades less frequently.
• Preferred Securities Risk The risk that: (i) certain preferred stocks contain provisions that allow an issuer under certain conditions to skip or defer distributions; (ii) preferred stocks may be subject to redemption, including at the issuer’s call, and, in the event of redemption, the Fund may not be able to reinvest the proceeds at comparable or favorable rates of return; (iii) preferred stocks are generally subordinated to bonds and other debt securities in an issuer’s capital structure in terms of priority for corporate income and liquidation payments; and (iv)
Regulatory and Shareholder Matters
25
Regulatory and Shareholder Matters (Continued)
preferred stocks may trade less frequently and in a more limited volume and may be subject to more abrupt or erratic price movements than many other securities.
• Repurchase Agreements Risk The Fund’s investment return on repurchase agreements will depend on the counterparty’s willingness and ability to perform its obligations under a repurchase agreement. If the Fund’s counterparty should default on its obligations, becomes subject to a bankruptcy or other insolvency proceeding or if the value of the collateral is insufficient, the Fund could (i) experience delays in recovering cash or the securities sold (and during such delay the value of the underlying securities may change in a manner adverse to the fund) and/or (ii) lose all or part of the income, proceeds or rights in the securities to which the Fund would otherwise be entitled.
• Restricted Securities Risk The Fund may hold securities that are restricted as to resale under the U.S. federal securities laws. There can be no assurance that a trading market will exist at any time for any particular restricted security. Limitations on the resale of these securities may prevent the Fund from disposing of them promptly at reasonable prices or at all. The Fund may have to bear the expense of registering the securities for resale and the risk of substantial delays in effecting the registration. Also, restricted securities may be difficult to value because market quotations may not be readily available, and the values of restricted securities may have significant volatility.
• Sovereign Debt Obligations Risk The risk that investments in debt obligations of sovereign governments may lose value due to the government entity’s unwillingness or inability to repay principal and interest when due in accordance with the terms of the debt or otherwise in a timely manner. Sovereign governments may default on their debt obligations for a number of reasons, including social, political, economic and diplomatic changes in countries issuing sovereign debt. The Fund may have limited (or no) recourse in the event of a default because bankruptcy, moratorium and other similar laws applicable to issuers of sovereign debt obligations may be substantially different from those applicable to private issuers, and any recourse may be subject to the political climate in the relevant country. In addition, foreign governmental entities may enjoy various levels of sovereign immunity, and it may be difficult or impossible to bring a legal action against a foreign governmental entity or to enforce a judgment against such an entity. Holders of certain foreign government debt securities may be requested to participate in the restructuring of such obligations and to extend further loans to their issuers. There can be no assurance that the foreign government debt securities in which the Fund may invest will not be subject to similar restructuring arrangements or to requests for new credit, which may adversely affect the Fund’s holdings.
• Tracking Error Risk Tracking error is the divergence of an index fund’s performance from that of the underlying index. Tracking error may occur because of differences between the securities and other instruments held in the Fund’s portfolio and those included in the Index, pricing differences, differences in transaction costs, the fund’s holding of uninvested cash, differences in timing of the accrual of dividends or interest, tax gains or losses, changes to the Index or the need of the Fund or Master Portfolio to meet various new or existing regulatory requirements. This risk may be heightened during times of increased market volatility or other unusual market conditions. Tracking error also may result because the Fund incurs fees and expenses, while the Index does not.
• U.S. Government Securities Risk The risk that the value of U.S. Government securities can decrease due to changes in interest rates or changes to the financial condition or credit rating of the U.S. Government.
• Value Style Risk The risk that returns on stocks within the value style in which the Fund invests will trail returns of stocks representing other styles or the market overall over any period of time and may shift in and out of favor with investors generally, sometimes rapidly, depending on changes in market, economic, and other factors. Investments in value securities may be subject to risks that (1) the issuer’s potential business prospects will not be realized; (2) their potential values will never be recognized by the market; and (3) their value was appropriately priced when acquired and they do not perform as anticipated.
• Variable and Floating-Rate Securities Risk The value of these securities may decline if their interest rates do not rise as much, or as quickly, as other interest rates. Conversely, these securities will not generally increase in value to the same extent as other fixed income securities, or at all, if interest rates decline.
Board Considerations in Approving the Investment Management and Sub-Advisory Agreements
Homestead Funds, Inc. (the “Corporation”) and Homestead Funds Trust (the “Trust,” and together with the Corporation, “Homestead”) have each entered into investment management agreements (the “Investment Management Agreements”) with RE Advisers Corporation (“RE Advisers”), pursuant to which RE Advisers is responsible for the day-to-day management of the following series of the Corporation: the Daily Income Fund, the Short-Term Bond Fund, the Short-Term Government Securities Fund, the Small-Company Stock Fund, the Value Fund, the Growth Fund and the International Equity Fund; and the Intermediate Bond Fund, a series of the Trust (each series, a “Fund” and, collectively, the “Funds”)1. In addition,
1 RE Advisers serves as an administrator to the Stock Index Fund pursuant to an administrative services agreement with that Fund and does not currently serve as the Fund’s investment adviser.
Regulatory and Shareholder Matters
Regulatory and Shareholder Matters (Continued)
RE Advisers has entered into subadvisory agreements (the “Subadvisory Agreements” and, together with the Investment Management Agreements, the “Agreements”) with T. Rowe Price Associates, Inc. (“T. Rowe Price”) and Harding Loevner LP (“Harding Loevner”), on behalf of the Growth Fund and the International Equity Fund, respectively, pursuant to which T. Rowe Price and Harding Loevner are responsible for the day-to-day management of the assets of such Funds. RE Advisers, T. Rowe Price and Harding Loevner each is an “Adviser” and are collectively referred to as the “Advisers.”
The Board of Directors of the Corporation and the Board of Trustees of the Trust (the “Board” or the “Directors”) held a joint video conference meeting on August 11, 2020 (the “August Meeting”), at which they gave preliminary consideration to information bearing on the continuation of the Agreements. At its regular quarterly meeting held on September 8-9, 2020 via video conference (the “September Meeting”), following the receipt of additional information and discussion at an executive session of the Directors/Trustees who are not “interested persons” (as defined in the Investment Company Act of 1940, as amended (the “1940 Act”)), of the Funds (“Independent Directors”) and independent counsel to the Independent Directors, at which no representative of the Advisers were present initially but joined subsequently by invitation, the Board, with the Independent Directors voting separately, approved the continuation of the Agreements with respect to all Funds for an additional one-year period.
Prior to the August Meeting, the Independent Directors’ requested that the Advisers provide the Board information they deemed reasonably necessary for their consideration of the Agreements. Pursuant to this request, the Advisers provided the Board with, and the Board, including the Independent Directors, considered and discussed, information regarding, among other things, (a) the level of the advisory fees that RE Advisers charges a Fund compared with the fees charged to comparable mutual funds and compared with those of RE Advisers’ non-investment company clients and the level of subadvisory fees that T. Rowe Price and Harding Loevner receive with respect to the Growth Fund and the International Equity Fund, respectively, and compared with the advisory and/or subadvisory fees charged by T. Rowe Price and Harding Loevner to other clients; (b) each Fund’s overall fees and operating expenses compared with similar mutual funds; (c) each Fund’s performance compared with similar mutual funds; (d) the investment management and other services the Advisers provide the Funds, including each Adviser’s compliance program; (e) the Advisers’ investment management personnel; and (f) RE Advisers’ financial condition and profitability in connection with managing the Funds. The Board also reviewed information provided by Strategic Insight (“Strategic Insight”), an information service provider unaffiliated with the Advisers, comparing each Fund’s
advisory fee rate, net total expenses, operating expenses and performance to those of other similar open-end funds selected by Strategic Insight.
The Independent Directors and their independent legal counsel met separately in an executive session held telephonically on August 11, 2020 (the “August Executive Session”), to discuss the materials received. During the executive session the Independent Directors also reviewed and discussed with their independent legal counsel various key aspects of the Independent Directors’ legal responsibilities relating to the proposed continuation of the Agreements, as addressed in a memorandum prepared by independent legal counsel and provided in advance of the meeting.
Following the August Executive Session and the August Meeting, the Independent Directors requested certain follow-up information from each Adviser. The Advisers provided such follow-up information prior to the September Meeting. At the September Meeting, the Advisers presented certain additional information to the Board regarding the Funds. The Board then considered whether any further discussion or review was necessary, concluding that the August Meeting and the information reviewed by the Independent Directors and their independent counsel prior to and at the September Meeting provided a sufficient basis for taking action on the continuation of the Advisory Agreements with respect to each Fund for an additional year.
The Board also met over the course of the year with investment advisory personnel from RE Advisers and regularly reviewed detailed information, presented both orally and in writing, regarding the investment program, performance and operations of each Fund. Accordingly, the Board’s determination to approve the continuance of the Agreements was made on the basis of each Director’s business judgment after an evaluation of all of the information provided to the Board, both at the August and September Meetings and at prior meetings.
In reaching their determinations relating to the continuation of the Agreements, the Board, including the Independent Directors, considered all factors they believed relevant, including the factors discussed below. Individual Directors may have attributed different weights to the various factors and assigned various degrees of materiality to information received in connection with the approval process. No single factor was determined to be decisive.
In particular, the Board focused on the following:
Nature, Extent and Quality of Services. The Board considered the nature, extent and quality of the services the Advisers provide to the applicable Funds and the resources the Advisers dedicate to the Funds. In this regard, the Board evaluated, among other things, each Adviser’s personnel, experience, track record, compliance program and, with respect to RE Advisers, oversight of the Funds’ other service
Regulatory and Shareholder Matters
27
Regulatory and Shareholder Matters (Continued)
providers, including T. Rowe Price and Harding Loevner in their capacity as subadvisers to the Growth Fund and the International Equity Fund, respectively. The Board considered information concerning the investment philosophy and investment processes used by the Advisers in managing the Funds. In this context, the Board also considered the managerial and financial resources available to the Advisers and concluded that they would be sufficient to meet any reasonably foreseeable obligations under the current Agreements. The Board considered each Adviser’s assessment of its ability to attract and retain capable personnel and succession planning processes with respect to the leadership of the Funds’ portfolio management teams. The Board considered the quality of the services provided by the Advisers and the quality of the resources available to the Funds. The Board further considered each Adviser’s experience and reputation and the professional qualifications of its personnel. The Board noted, in particular, that RE Advisers had made significant enhancements to its investment team, including the addition of an equity analyst, a senior equity analyst, a fixed-income portfolio manager and a senior equity portfolio manager in recent years. The Board also noted that RE Advisers had made additional investments in personnel and technology to service existing shareholders, including a system upgrade to the trade order management system and a new data warehouse and portfolio accounting system in 2020.
The Board also considered that the Investment Management Agreements require RE Advisers to oversee the administration of all aspects of the Funds’ business and affairs and to provide certain services required for effective administration of the Funds.
On the basis of these considerations as well as others and in the exercise of their business judgment, the Board concluded that the nature, extent and quality of services provided by the Advisers to the Funds supported the approval of the Agreements for an additional one-year period.
Investment Performance of the Funds. The Board reviewed reports provided by Strategic Insight that compared each Fund’s performance record (trailing annualized net total returns) for the one-, three-, five-, and ten-years ended December 31, 2019, as applicable, against a group of funds within a category as assigned by Morningstar, Inc. without exclusions (a “Peer Group”) and the Fund’s relevant benchmark index for the same time periods. In addition, the Board reviewed Morningstar Direct reports that compared each Fund’s performance record for the one-, three-, five-, and ten-years ended June 30, 2020, as applicable, against each Fund’s benchmark index and/or peer group, as applicable.
With respect to each Fund, the Board concluded that the Fund’s performance (including absolute performance and, where applicable, outperformance of peers and relevant benchmarks over long-term periods) and/or other relevant factors supported continuation of the Agreements. In the
case of each Fund that had performance that lagged that of a relevant peer group or benchmark for certain (although not necessarily all) periods, the Board concluded that other factors relevant to performance supported continuation of the advisory arrangements. These factors included, among other factors, that the Fund’s more recent or long-term performance, as applicable, was competitive when compared to relevant performance benchmarks or peer groups. The Board noted that there had been meetings with members of each Fund’s portfolio management team on a regular basis during the prior year to discuss Fund performance and related matters.
Among other information, the Board took into account the following information regarding each individual Fund’s performance.
Daily Income Fund
With respect to the Daily Income Fund, the Board noted that the Fund’s trailing annualized net total return was 1.42% for the one-year period ended December 31, 2019, 0.89% for the three-year period ended December 31, 2019, 0.54% for the five-year period ended December 31, 2019, and 0.27% for the ten-year period ended December 31, 2019, compared to the return of its benchmark index, the Lipper Money Market Index, which had returns of 1.97%, 1.41%, 0.87%, and 0.44% for the same periods.
The Board noted that, while the Fund ranked in the fifth quintile for the one-, three-, and five-year periods, the Fund, including its checkwriting feature, was an important part of the investment line-up for the Funds’ shareholder base and the cooperatives that are in that base.
Short-Term Government Securities Fund
With respect to the Short-Term Government Securities Fund, the Board noted that the Fund’s trailing annualized net total return was 3.35% for the one-year period ended December 31, 2019, 1.80% for the three-year period ended December 31, 2019, 1.26% for the five-year period ended December 31, 2019 and 1.28% for the ten-year period ended December 31, 2019, compared to the return of its benchmark index, the BofA Merrill Lynch 1-5 Year U.S. Treasury Index, which had returns of 4.20%, 2.11%, 1.68%, and 1.73% for the same periods. The Board noted RE Advisers’ statement that it viewed the returns as competitive, given the conservative manner in which the Fund is managed and that the average duration of the Fund is shorter than that of the benchmark index.
The Board considered that the Fund ranked in the second quintile of the Fund’s Peer Group for the three-year period and the third quintile for the one-, five- and 10-year periods ended December 31, 2019.
Short-Term Bond Fund
Regulatory and Shareholder Matters
Regulatory and Shareholder Matters (Continued)
With respect to the Short-Term Bond Fund, the Board noted that the Fund’s trailing annualized net total return was 3.88% for the one-year period ended December 31, 2019, 2.40% for the three-year period ended December 31, 2019, 1.87% for the five-year period ended December 31, 2019 and 2.47% for the ten-year period ended December 31, 2019, compared to the return of its benchmark index, the BofA Merrill Lynch 1-5 Year Corp./Gov. Index, which returned 5.08%, 2.57%, 2.07%, and 2.19% for the same periods.
The Board considered that the Fund ranked in the second quintile of the Fund’s Peer Group for the ten-year period ended December 31, 2019, in the third quintile for the three- and five- year periods ended December 31, 2019 and in the fourth quintile for the one-year period ended December 31, 2019.
Intermediate Bond Fund
With respect to the Intermediate Bond Fund, the Board noted that due to the Fund’s recent inception, trailing annualized net total return was not available for the period ended December 31, 2019. The Board noted that the Fund’s trailing annualized net total return for periods ended June 30, 2020, was 8.51% for the one-year period ended June 30, 2020, and 6.28% for the six-months ended June 30, 2020, compared to the return of its benchmark index, the Bloomberg Barclays U.S. Aggregate Index, which returned 8.74% and 6.14% for the same periods.
The Board considered the peer group data in Morningstar Direct reports, noting that the Fund outperformed midpoint of its peer group for the one-year period ended June 30, 2020, and the six-month period ended June 30, 2020. The Board also noted that Fund assets had grown steadily since the Fund’s inception in May of 2019, and as of June 30, 2020, the Fund had over $55 million in assets.
Value Fund
With respect to the Value Fund, the Board noted that the Fund’s trailing annualized net total return was 27.69% for the one-year period ended December 31, 2019, 13.46% for the three-year period ended December 31, 2019, 10.11% for the five-year period ended December 31, 2019, and 12.52% for the ten-year period ended December 31, 2019, compared to the return of its benchmark index, the Standard & Poor’s 500 Value Index, which had returns of 31.93%, 11.49%, 9.52%, and 12.16% for the same periods.
The Board noted that the Fund ranked in the first quintile of the Fund’s Peer Group for the three-, five- and ten-year periods ended December 31, 2019, and in the second quintile for the one-year period ended December 31, 2019.
Growth Fund
With respect to the Growth Fund, the Board noted that the Fund’s trailing annualized net total return was 28.36% for the one-year period ended December 31, 2019, 22.48% for the three-year period ended December 31, 2019, 15.57% for the
five-year period ended December 31, 2019, and 15.60% for the ten-year period ended December 31, 2019, compared to the return of its benchmark index, the Russell 1000 Growth Index, which had returns of 36.39%, 20.49%, 14.63%, and 15.22% for the same periods.
The Board noted that while the Fund ranked in the fifth quintile for the one-year period ended December 31, 2019, the Fund ranked in the first quintile of the Fund’s Peer Group for the three-, five- and ten-year periods ended December 31, 2019. The Board considered T. Rowe Price’s explanation that stock selection and sector allocation decisions drove relative underperformance for the one-year period.
Small-Company Stock Fund
With respect to the Small-Company Stock Fund, the Board noted that the Fund’s trailing annualized net total return was 22.16% for the one-year period ended December 31, 2019, 0.33% for the three-year period ended December 31, 2019, 2.62% for the five-year period ended December 31, 2019, and 10.46% for the ten-year period ended December 31, 2019, compared to the return of its benchmark index, the Russell 2000 Index, which had returns of 25.53%, 8.59%, 8.23% and 11.83% for the same periods.
The Board noted that the Fund ranked in the fourth quintile of the Fund’s Peer Group for each of the one- and ten-year periods ended December 31, 2019 and in the fifth quintile for the three- and five-year periods ended December 31, 2019. The Board noted that performance had improved subsequent to RE Advisers’ taking steps to support and enhance the investment resources available to the portfolio management team (in addition to expanding the investment team), and that the Fund had outperformed its benchmark index and the midpoint of a Morningstar peer group for the 6-month and one-year periods ended June 30, 2020.
International Equity Fund
With respect to the International Equity Fund, the Board noted that the Fund’s trailing annualized net total return was 24.83% for the one-year period ended December 31, 2019, 11.75% for the three-year period ended December 31, 2019, 7.15% for the five-year period ended December 31, 2019, and 5.11% for the ten-year period ended December 31, 2019, compared to the return of its benchmark index, the MSCI EAFE Index, which had returns of 22.01%, 9.56%, 5.67% and 5.50% for the same periods.
The Board noted that the Fund ranked in the third quintile of the Fund’s Peer Group for the five-year period ended December 31, 2019, and in the fourth or fifth quintile of the Fund’s Peer Group for the one-, three- and ten-year periods ended December 31, 2019.
The Board noted that Harding Loevner became the Fund’s subadviser in January 2016, and that prior thereto, the Fund was named the International Value Fund and had been managed by different subadvisers at different periods. The
Regulatory and Shareholder Matters
29
Regulatory and Shareholder Matters (Continued)
Board noted Harding Loevner’s explanation regarding contributors to short-term performance and long-term goals, which also referenced the Fund’s outperformance versus the eVestment EAFE Large Cap Growth Equity Universe, which Harding Loevner views to be an appropriate peer universe because it contains constituents with similar characteristics to the Harding Loevner EAFE Equity strategy. The Board also considered the Fund’s outperformance versus the MSCI EAFE Index over the one-year period, and the period since Harding Loevner became subadviser (January 15, 2016 through December 31, 2019).
Comparative Fees and Expense Ratios. The Board considered the net total expense ratio, contractual advisory fees, net operating expense ratio and other expense information for each Fund provided by Strategic Insight as compared against the Fund’s peer group identified by Strategic Insight (“Expense Group”). The Board noted that the Funds are not currently subject to Rule 12b-1 fees and that the expense information provided by Strategic Insight included comparisons of the Funds’ net total expense ratios with those of their Expense Group peers both inclusive and exclusive of 12b-1 fees.
The Board concluded that the fees payable by the Funds to RE Advisers are reasonable in relation to the nature and quality of the services provided. In reaching this conclusion, the Board compared the fees payable by the Funds to the fees paid by other mutual funds that are in the same Expense Group. The Board also considered the fees RE Advisers receives from, and the scope of services it provides to, other RE Advisers clients, including its separate account and unified managed account clients, noting the significantly broader scope of services that RE Advisers provides to the Funds as compared to the other types of clients. In reaching their conclusion, the Board also took into account the costs and risks assumed by RE Advisers in connection with launching and maintaining publicly-offered mutual funds, and how those costs and risks differ from those associated with other components of RE Advisers’ business. The Board also considered the high level of customer service RE Advisers provides to shareholders. With respect to the total net expense ratios for certain of the Funds, the Board noted that the current net asset levels impacted the expense ratios for the Funds, and that expense ratios would be expected to decline as assets increase.
Among other information, the Board took into account the following information regarding particular Fund expense information.
Daily Income Fund
The Board noted that the Fund’s contractual management fee is 0.50% of average daily net assets and the net total expense ratio was 0.78%. The net total expense ratio ranked 12 out of 13 of the Fund’s Expense Group, money market-taxable funds selected by Strategic Insight. The Board considered RE Advisers’ agreement to contractually limit fees
and reimburse expenses to the extent necessary to keep the Daily Income Fund’s total annual operating expenses (subject to certain excluded expenses) from exceeding 0.80% of the Fund’s average daily net assets until at least May 1, 2021. The Board noted that from 2009 to mid-2018, in order to maintain a positive yield for the Daily Income Fund, RE Advisers had voluntarily waived a portion of its management fee, and that RE Advisers has voluntarily agreed to waive fees or reimburse expenses to the extent necessary to assist the Fund in attempting to maintain a positive yield, and had begun waiving a portion of the fee in April and expected the amount waived/reimbursed to increase as the year progressed. The Board considered the effect of peer funds’ fee waivers on those funds’ fee levels as compared to the Fund’s. The Board also considered the Fund’s lower net asset level during the period, relative to previous years, which resulted in certain expenses being allocated across a smaller asset base.
Short-Term Government Securities Fund
The Board noted that the Fund’s contractual management fee is 0.45% of average daily net assets and the net total expense ratio was 0.75%. The Fund’s net total expense ratio ranked 7 out of 10 of the Fund’s Expense Group, short government funds selected by Strategic Insight. The Board also considered RE Advisers’ agreement to contractually limit fees and reimburse expenses (subject to certain excluded expenses) to the extent necessary to keep the Short-Term Government Securities Fund’s total annual operating expenses from exceeding 0.75% of the Fund’s average daily net assets until at least May 1, 2021.
Short-Term Bond Fund
The Board noted that the Fund’s contractual management fee is 0.60% of average daily net assets and the net total expense ratio was 0.79%. The net total expense ratio ranked 20 out of 21 of the Fund’s Expense Group, short-term bond funds selected by Strategic Insight. The Board also considered RE Advisers’ agreement to contractually limit fees and reimburse expenses (subject to certain excluded expenses) to the extent necessary to keep the Short-Term Bond Fund’s total annual operating expenses from exceeding 0.80% of the Fund’s average daily net assets until at least May 1, 2021.
Intermediate Bond Fund
The Board noted that the Fund’s contractual management fee is 0.60% of average daily net assets up to $500 million, 0.50% of average daily net assets up to the next $500 million; and 0.45% of average net assets in excess of $1 billion, and the net total expense ratio was 0.80%. The net total expense ratio ranked 15 out of 17 of the Fund’s Expense Group, intermediate core bond funds selected by Strategic Insight. The Board also considered RE Advisers’ agreement to contractually limit fees and reimburse expenses (subject to certain excluded expenses) to the extent necessary to keep
Regulatory and Shareholder Matters
Regulatory and Shareholder Matters (Continued)
the Intermediate Bond Fund’s total annual operating expenses from exceeding 0.80% of the Fund’s average daily net assets until at least May 1, 2021.
Value Fund
The Board noted that the Fund’s contractual management fee is 0.65% of average daily net assets up to $200 million; 0.50% of average daily net assets up to the next $200 million; and 0.40% of average daily net assets in excess of $400 million, and the net total expense ratio was 0.66%. The net total expense ratio ranked 4 out of 18 of the Fund’s Expense Group, large value funds selected by Strategic Insight. The Board also considered RE Advisers’ agreement to contractually limit fees and reimburse expenses (subject to certain excluded expenses) to the extent necessary to keep the Value Fund’s total annual operating expenses from exceeding 1.25% of the Fund’s average daily net assets until at least May 1, 2021.
Growth Fund
The Board noted that the Fund’s contractual management fee is 0.65% of average daily net assets up to $250 million and 0.60% of average daily net assets over $250 million, and the net total expense ratio was 0.93%. The net total expense ratio each ranked 14 out of 22 of the Fund’s Expense Group, large growth funds selected by Strategic Insight. The Board also considered RE Advisers’ agreement to contractually limit fees and reimburse expenses (per the 15c board materials subject to certain excluded expenses) to the extent necessary to keep the Growth Fund’s total annual operating expenses from exceeding 0.95% of the Fund’s average daily net assets until at least May 1, 2021.
The Board considered the fees paid to T. Rowe Price under the current Subadvisory Agreement. This information included comparison of the Growth Fund’s subadvisory fee charged by T. Rowe Price to other accounts with a similar investment objective to the Fund, as well as the current management fee paid to RE Advisers under the existing Investment Management Agreement. The Board also took into account the anticipated demands, complexity and quality of the investment management of the Fund. The Board noted that RE Advisers, and not the Fund, is responsible for paying the fees charged by T. Rowe Price. The Board noted RE Advisers’ and T. Rowe Price’s representations about the services each provide to the Growth Fund. Based on these and other considerations, the Board concluded that the subadvisory fee to that payable by RE Advisers to T. Rowe Price is reasonable in relation to the nature and quality of the services provided.
Small-Company Stock Fund
The Board noted that the Fund’s contractual management fee is 0.85% of average daily net assets up to $200 million and 0.75% of average daily net assets in excess of $200 million and the net total expense ratio was 1.05%. The net total expense ratio ranked 11 out of 21 of the Fund’s Expense
Group, small blend funds selected by Strategic Insight. The Board also considered RE Advisers’ agreement to contractually limit fees and reimburse expenses to the extent necessary to keep the Small-Company Stock Fund’s total annual operating expenses (subject to certain excluded expenses) from exceeding 1.50% of the Fund’s average daily net assets until at least May 1, 2021.
International Equity Fund
The Board noted that the Fund’s contractual management fee is 0.75% of average daily net assets up to $300 million; 0.65% of average daily net assets up to the next $100 million; 0.55% of average daily net assets up to the next $100 million and 0.50% of average net assets in excess of $500 million, and the net total expense ratio was 0.99%. The net total expense ratio ranked 6 out of 15 of the Fund’s Expense Group, foreign large growth funds selected by Strategic Insight. The Board also considered RE Advisers’ agreement to contractually limit fees and reimburse expenses to the extent necessary to keep the International Equity Fund’s total annual operating expenses (subject to certain excluded expenses) from exceeding 0.99% of the Fund’s average daily net assets until at least May 1, 2021.
The Board considered the fees paid to Harding Loevner under the current Subadvisory Agreement. This information included a representation from Harding Loevner that the sub-advisory fees for its other clients are not materially different from the Fund’s sub-advisory fee and are each individually negotiated. The Board also took into account the anticipated demands, complexity and quality of the investment management of the Fund. The Board noted that RE Advisers, and not the Fund, is responsible for paying the fees charged by Harding Loevner. The Board noted RE Advisers’ and Harding Loevner’s representations regarding the services each provides to the International Equity Fund. Based on these and other considerations, the Board concluded that the subadvisory fee payable by RE Advisers to Harding Loevner is reasonable in relation to the nature and quality of the services provided.
After reviewing these and related factors, the Board concluded, within the context of their overall conclusions regarding the Agreements, that the fees to be charged to the Funds were fair and reasonable, and that the anticipated costs of these services generally supported the approval of the Agreements.
Cost of Services and Profits Realized by the Advisers. The Board considered the cost of the services provided by RE Advisers. The Board reviewed the information provided by RE Advisers concerning its profitability from the fees received from and the services provided to the Funds and the financial condition of RE Advisers for various past periods. The Board considered the profit margin information for RE Advisers’ investment company business as a whole, as well as RE Advisers’ profitability data for the Funds. The Board reviewed RE Advisers’ assumptions and methods of cost allocation
Regulatory and Shareholder Matters
31
Regulatory and Shareholder Matters (Continued)
used in preparing Fund-specific profitability data. The Board also considered the basis for RE Advisers’ belief that its methods of allocation were reasonable.
The Board considered their discussion with representatives of RE Advisers about the fees being charged to the Funds and considered the other administrative, compliance and shareholder services provided by RE Advisers to the Funds. The Board considered the Funds’ increased regulatory requirements, including the Funds’ Liquidity Management Program. The Board noted and discussed the additional services provided by RE Advisers to the Funds compared to other investment products managed by RE Advisers, and noted that, in the cases of the Growth Fund and the International Equity Fund, RE Advisers, and not the Fund, would pay the subadvisory fees to the subadvisers. The Board determined that RE Advisers should be entitled to earn a reasonable level of profits for the services it provides to the Funds. In light of the foregoing, the Board, including the Independent Directors, determined that the management fees were reasonable in relation to the wide array of services provided to the Funds.
The Board considered the compensation to be received by Harding Loevner and T. Rowe Price from their relationship with the International Equity Fund and Growth Fund, respectively, and considered the information on profitability provided by T. Rowe Price. The Board noted that RE Advisers would continue to pay each subadviser from the management fees received from the Funds, and that the agreements were negotiated at arm’s length between RE Advisers and the subadvisers.
Economies of Scale. The Board considered the extent to which economies of scale would be realized as the Funds grow, and whether fee levels reflect these economies of scale for the benefit of each Fund’s shareholders. The Board noted that the Value Fund, Growth Fund, Small-Company Stock Fund and International Equity Fund include breakpoints in their fee schedules, though some Fund assets have not yet reached the necessary levels to qualify for a lower fee rate. The Board was satisfied that the current fee structure was appropriate at this time.
Fall-Out Benefits. Additionally, the Board considered so-called “fall-out benefits” to the Advisers, such as research, statistical and quotation services the Advisers may receive from broker-dealers executing the Funds’ portfolio transactions on an agency basis.
CONCLUSION
On the basis of these considerations as well as others and in the exercise of their business judgment, the Board, including the Independent Directors, voted unanimously to approve the continuation of the Agreements for an additional one-year period.
Regulatory and Shareholder Matters
Liquidity Risk Management Program
Consistent with Rule 22e-4 under the Investment Company Act of 1940, as amended (the “Liquidity Rule”), the Funds adopted and implemented a liquidity risk management program to assess and manage each Fund’s liquidity risk (the “Program”). Liquidity risk is the risk that a Fund would not be able to meet requests to redeem shares issued by the Fund without significant dilution of remaining investors’ interests in the Fund. The Board of Directors of Homestead Funds, Inc. (the “Corporation”) and the Board of Trustees (collectively, the “Board”) of Homestead Funds Trust (the “Trust”) has appointed the Funds’ investment manager, RE Advisers Corporation as the liquidity risk management program administrator (the “Administrator”). The Administrator presented the first annual report on the Program to the Board in September 2020. The report covered the structure of the Program and reviewed the operation of the program from June 1, 2019 through June 30, 2020. The report included a description of the annual liquidity assessment of the Funds that the Administrator performed. For each Fund, the Administrator reviewed (1) the investment strategy and liquidity of investments, including whether the investment strategy is appropriate for an open-end fund, the extent to which the strategy involves a relatively concentrated portfolio or large positions in particular issuers, and any use of borrowings for investment purposes and derivatives; (2) historical cash flows during both normal and stressed conditions; (3) holdings of cash and cash equivalents; and (4) liquidity of investments under stressed and distressed scenarios by analyzing reasonably anticipated trade sizes. The report noted that each Fund was in compliance with the 15% limit on illiquid investments during the period. The report included an overview of the Program and the methodology for classification of the Funds’ investments. The Administrator concluded that the liquidity risk for each Fund is adequately managed and believes that the Program is adequate and effective for each Fund.
There can be no assurance that the Program will achieve its objectives under all circumstances in the future. Please refer to the Funds’ prospectus for more information regarding each Fund’s exposure to liquidity risk and other risks to which it may be subject.
Liquidity Risk Management Program
33
Report of Independent Registered Public Accounting Firm
To the Board of Directors of Homestead Funds, Inc. and the Board of Trustees of Homestead Funds Trust and Shareholders of Daily Income Fund, Short-Term Government Securities Fund, Short-Term Bond Fund, Stock Index Fund, Value Fund, Growth Fund, Small-Company Stock Fund, International Equity Fund and Intermediate Bond Fund.
Opinions on the Financial Statements
We have audited the accompanying statements of assets and liabilities, including the portfolios of investments, of Daily Income Fund, Short-Term Government Securities Fund, Short-Term Bond Fund, Stock Index Fund, Value Fund, Growth Fund, International Equity Fund and Small-Company Stock Fund (constituting Homestead Funds, Inc.) and Intermediate Bond Fund (constituting Homestead Funds Trust) (hereafter collectively referred to as the "Funds") as of December 31, 2020, the related statements of operations for the year ended December 31, 2020, and the statements of changes in net assets for each of the periods indicated in the table below, including the related notes, and the financial highlights for each of the periods indicated in the table below (collectively referred to as the “financial statements”). In our opinion, the financial statements present fairly, in all material respects, the financial position of each of the Funds as of December 31, 2020, the results of each of their operations for the year ended December 31, 2020, and the changes in each of their net assets and each of the financial highlights for each of the periods indicated in the table below, in conformity with accounting principles generally accepted in the United States of America.
| Fund | Statement of change in net assets | Financial Highlights |
| Daily Income Fund | For the years ended December 31, 2020 and 2019 | For the years ended December 31, 2020, 2019, 2018, 2017, and 2016 |
Short-Term Government
Securities Fund | | |
| Short-Term Bond Fund | | |
| Stock Index Fund | | |
| Value Fund | | |
| Growth Fund | | |
| Small-Company Stock Fund | | |
| International Equity Fund | | |
| Intermediate Bond Fund | For the period May 1, 2019 (inception) through December 31, 2019 and the year ended December 31, 2020 | For the period May 1, 2019 (inception) through December 31, 2019 and the year ended December 31, 2020 |
Basis for Opinion
These financial statements are the responsibility of the Funds’ management. Our responsibility is to express an opinion on the Funds’ financial statements based on our audits. We are a public accounting firm registered with the Public Company Accounting Oversight Board (United States) (PCAOB) and are required to be independent with respect to the Funds in accordance with the U.S. federal securities laws and the applicable rules and regulations of the Securities and Exchange Commission and the PCAOB.
We conducted our audits of these financial statements in accordance with the standards of the PCAOB. Those standards require that we plan and perform the audit to obtain reasonable assurance about whether the financial statements are free of material misstatement, whether due to error or fraud.
Our audits included performing procedures to assess the risks of material misstatement of the financial statements, whether due to error or fraud, and performing procedures that respond to those risks. Such procedures included examining, on a test basis, evidence regarding the amounts and disclosures in the financial statements. Our audits also included evaluating the accounting principles used and significant estimates made by management, as well as evaluating the overall presentation of the financial statements. Our procedures included confirmation of securities owned as of December 31, 2020 by correspondence with the custodians and brokers; when replies were not received from brokers, we performed other auditing procedures. We believe that our audits provide a reasonable basis for our opinions.
McLean, Virginia
February 25, 2021
We have served as the auditor of one or more investment companies in Homestead Funds group of investment companies since 2001.
Report of Independent Registered Public Accounting Firm
Portfolio of Investments
Daily Income Fund | December 31, 2020
| U.S. Government & Agency Obligations | 82.1% of portfolio |
| | Interest Rate /
Yield | Maturity Date | Face Amount | Value |
| Federal Farm Credit Bank | 0.13% | 01/06/21 | $2,000,000 | $1,999,964 |
| Federal Farm Credit Bank | 0.26(a) | 11/02/21 | 8,650,000 | 8,662,173 |
| Federal Home Loan Bank | 0.08 | 02/10/17 | 4,000,000 | 3,999,600 |
| Federal Home Loan Bank | 0.09 | 02/10/17 | 6,500,000 | 6,499,422 |
| Federal Home Loan Bank | 0.08 | 01/05/21 | 5,500,000 | 5,499,948 |
| Federal Home Loan Bank | 0.11 | 01/11/21 | 1,200,000 | 1,199,965 |
| Federal Home Loan Bank | 0.10 | 02/12/21 | 994,000 | 993,884 |
| Federal Home Loan Bank | 1.38 | 02/18/21 | 3,480,000 | 3,485,730 |
| Federal Home Loan Bank | 0.08 | 03/10/21 | 7,185,000 | 7,184,796 |
| Federal Home Loan Bank | 3.63 | 03/12/21 | 425,000 | 427,882 |
| Federal Home Loan Bank | 1.75 | 03/12/21 | 525,000 | 526,660 |
| Federal Home Loan Bank | 0.10 | 04/27/21 | 915,000 | 914,705 |
| Federal Home Loan Bank | 0.10 | 05/12/21 | 895,000 | 894,674 |
| Federal Home Loan Bank | 0.10 | 05/13/21 | 900,000 | 899,670 |
| Federal Home Loan Bank | 2.25 | 06/11/21 | 750,000 | 757,161 |
| Federal National Mortgage Assoc. | 1.38 | 02/26/21 | 2,079,000 | 2,082,974 |
| Federal National Mortgage Assoc. | 2.50 | 04/13/21 | 2,100,000 | 2,114,170 |
| Private Export Funding Corp. (b) | 2.65 | 02/16/21 | 8,000,000 | 8,020,329 |
| Resolution Funding Corp. Principal Strip | 0.11 | 01/15/21 | 6,000,000 | 5,999,760 |
| Tunisia Government AID Bonds | 1.42 | 08/05/21 | 4,000,000 | 4,029,652 |
| U.S. International Development Finance Corp. | 0.13(a) | 03/15/30 | 5,000,000 | 5,000,000 |
| U.S. International Development Finance Corp. | 0.13(a) | 07/05/38 | 2,500,000 | 2,500,000 |
| U.S. Treasury Bill | 0.11 | 01/07/21 | 3,000,000 | 2,999,944 |
| U.S. Treasury Bill | 0.11 | 01/14/21 | 2,000,000 | 1,999,917 |
| U.S. Treasury Bill | 0.11 | 02/04/21 | 4,500,000 | 4,499,545 |
| U.S. Treasury Bill | 0.11 | 02/11/21 | 3,500,000 | 3,499,574 |
| U.S. Treasury Bill | 0.11 | 02/18/21 | 4,000,000 | 3,999,446 |
| U.S. Treasury Bill | 0.08 | 02/25/21 | 3,500,000 | 3,499,561 |
| U.S. Treasury Bill | 0.10 | 02/25/21 | 4,500,000 | 4,499,367 |
| U.S. Treasury Bill | 0.10 | 03/04/21 | 3,000,000 | 2,999,498 |
| U.S. Treasury Bill | 0.09 | 03/11/21 | 2,000,000 | 1,999,645 |
| U.S. Treasury Bill | 0.10 | 03/25/21 | 4,000,000 | 3,999,068 |
| U.S. Treasury Bill | 0.11 | 03/25/21 | 2,000,000 | 1,999,506 |
| U.S. Treasury Bill | 0.10 | 04/01/21 | 3,000,000 | 2,999,243 |
| U.S. Treasury Bill | 0.08 | 04/08/21 | 4,000,000 | 3,999,115 |
| U.S. Treasury Bill | 0.09 | 04/15/21 | 4,000,000 | 3,999,018 |
| U.S. Treasury Bill | 0.09 | 04/22/21 | 4,000,000 | 3,998,741 |
| U.S. Treasury Bill | 0.10 | 04/22/21 | 4,000,000 | 3,998,890 |
| U.S. Treasury Bill | 0.95 | 04/29/21 | 6,000,000 | 5,998,149 |
| U.S. Treasury Note | 2.25 | 03/31/21 | 3,000,000 | 3,015,803 |
| U.S. Treasury Note | 1.38 | 05/31/21 | 4,000,000 | 4,021,121 |
| Total U.S. Government & Agency Obligations | | | | |
| (Cost $141,718,270) | | | | 141,718,270 |
| Money Market Fund | 17.9% of portfolio |
| | | | Shares | |
| State Street Institutional U.S. Government Money Market Fund Premier Class | 0.03(c) | | 30,808,207 | 30,808,207 |
| Total Money Market Fund | | | | |
| (Cost $30,808,207) | | | | 30,808,207 |
| Total Investments in Securities | | | | |
| (Cost $172,526,477) | 100.0% | | | | $172,526,477 |
| (a) | Variable coupon rate as of December 31, 2020. |
| The accompanying notes are an integral part of these financial statements. | Portfolio of Investments |
35
Portfolio of Investments | Daily Income Fund | December 31, 2020 | (Continued)
| (b) | Security was purchased pursuant to Rule 144A under the Securities Act of 1933 and may be resold in transactions exempt from registration, normally to qualified institutional buyers. The securities have been determined to be liquid under criteria established by the Fund's Board of Directors. The total of such securities at period-end amounts to $8,020,329 and represents 4.6% of total investments. |
| (c) | 7-day yield at December 31, 2020. |
| Portfolio of Investments | The accompanying notes are an integral part of these financial statements. |
Portfolio of Investments
Short-Term Government Securities Fund | December 31, 2020
| Corporate Bonds Guaranteed by Export-Import Bank of the United States | 52.7% of portfolio |
| | Interest Rate /
Yield | Maturity Date | Face Amount | Value |
| Consumer Discretionary | 0.1% | | |
| Ethiopian Leasing (2012) LLC | 2.68% | 07/30/25 | $87,829 | $91,930 |
| Total Consumer Discretionary | | | | 91,930 |
| Energy | 24.4% | | |
| Petroleos Mexicanos | 2.00 | 12/20/22 | 1,680,600 | 1,712,324 |
| Petroleos Mexicanos | 1.95 | 12/20/22 | 836,200 | 851,475 |
| Petroleos Mexicanos | 1.70 | 12/20/22 | 114,000 | 115,379 |
| Petroleos Mexicanos | 2.38 | 04/15/25 | 729,450 | 759,853 |
| Petroleos Mexicanos | 0.59(a) | 04/15/25 | 9,675,000 | 9,690,790 |
| Petroleos Mexicanos | 2.46 | 12/15/25 | 867,500 | 908,226 |
| Reliance Industries Ltd. | 2.06 | 01/15/26 | 2,836,900 | 2,937,138 |
| Reliance Industries Ltd. | 1.87 | 01/15/26 | 3,832,632 | 3,951,605 |
| Reliance Industries Ltd. | 2.44 | 01/15/26 | 1,204,211 | 1,259,609 |
| Total Energy | | | | 22,186,399 |
| Financials | 28.1% | | |
| CES MU2 LLC | 1.99 | 05/13/27 | 1,916,903 | 2,003,560 |
| Durrah MSN 35603 | 1.68 | 01/22/25 | 562,321 | 573,812 |
| Export Leasing 2009 LLC | 1.86 | 08/28/21 | 50,588 | 50,847 |
| Helios Leasing II LLC | 2.67 | 03/18/25 | 1,950,831 | 2,045,044 |
| Lulwa Ltd. | 1.89 | 02/15/25 | 1,561,971 | 1,605,104 |
| Lulwa Ltd. | 1.83 | 03/26/25 | 379,885 | 391,044 |
| Mexican Aircraft Finance IV | 2.54 | 07/13/25 | 216,674 | 226,658 |
| Mexican Aircraft Finance V | 2.33 | 01/14/27 | 281,250 | 295,423 |
| MSN 41079 and 41084 Ltd. | 1.72 | 07/13/24 | 2,818,358 | 2,879,360 |
| MSN 41079 and 41084 Ltd. | 1.63 | 12/14/24 | 706,966 | 723,133 |
| Penta Aircraft Leasing 2013 LLC | 1.69 | 04/29/25 | 784,021 | 804,057 |
| Pluto Aircraft Leasing LLC | 0.42(a) | 02/07/23 | 2,181,814 | 2,180,069 |
| Rimon LLC | 2.45 | 11/01/25 | 118,750 | 123,885 |
| Safina Ltd. | 1.55 | 01/15/22 | 255,765 | 257,195 |
| Safina Ltd. | 2.00 | 12/30/23 | 1,222,378 | 1,250,746 |
| Salmon River Export LLC | 2.19 | 09/15/26 | 849,270 | 884,592 |
| Sandalwood 2013 LLC | 2.82 | 02/12/26 | 310,460 | 329,134 |
| Santa Rosa Leasing LLC | 1.69 | 08/15/24 | 32,540 | 33,256 |
| Santa Rosa Leasing LLC | 1.47 | 11/03/24 | 354,999 | 361,155 |
| Tagua Leasing LLC | 1.90 | 07/12/24 | 1,500,800 | 1,535,232 |
| Tagua Leasing LLC | 1.73 | 09/18/24 | 2,852,691 | 2,928,414 |
| Tagua Leasing LLC | 1.58 | 11/16/24 | 187,000 | 190,810 |
| VCK Lease SA | 2.59 | 07/24/26 | 64,792 | 68,600 |
| Washington Aircraft 2 Co. DAC | 0.68(a) | 06/26/24 | 3,797,181 | 3,803,132 |
| Total Financials | | | | 25,544,262 |
| Industrials | 0.1% | | |
| Sayarra Ltd. | 2.77 | 10/29/21 | 56,490 | 57,094 |
| Total Industrials | | | | 57,094 |
| Total Corporate Bonds Guaranteed by Export-Import Bank of the United States | | | | |
| (Cost $47,122,627) | | | | 47,879,685 |
| U.S. Government & Agency Obligations | 37.0% of portfolio |
| | | | |
| Private Export Funding Corp. | 1.75 | 11/15/24 | 1,000,000 | 1,046,646 |
| The accompanying notes are an integral part of these financial statements. | Portfolio of Investments |
37
Portfolio of Investments | Short-Term Government Securities Fund | December 31, 2020 |
(Continued)
| U.S. Government & Agency Obligations | 37.0% of portfolio (Continued) |
| | Interest Rate /Yield | Maturity Date | Face Amount | Value |
| U.S. Department of Housing & Urban Development | 6.07% | 08/01/21 | $20,000 | $20,092 |
| U.S. Department of Housing & Urban Development | 6.12 | 08/01/22 | 10,000 | 10,046 |
| U.S. Department of Housing & Urban Development | 5.77 | 08/01/26 | 94,000 | 94,407 |
| U.S. International Development Finance Corp. | 2.22(b) | 01/24/25 | 2,000,000 | 2,183,883 |
| U.S. International Development Finance Corp. | 1.27(b) | 06/21/25 | 1,000,000 | 1,007,885 |
| U.S. International Development Finance Corp. | 0.00(c) | 07/17/25 | 1,000,000 | 1,013,178 |
| U.S. International Development Finance Corp. | 0.00(c) | 01/17/26 | 700,000 | 764,369 |
| U.S. International Development Finance Corp. | 0.95(b) | 04/23/29 | 5,000,000 | 5,111,514 |
| U.S. International Development Finance Corp. | 1.11 | 05/15/29 | 1,000,000 | 1,017,395 |
| U.S. International Development Finance Corp. | 2.36 | 10/15/29 | 1,960,460 | 2,107,640 |
| U.S. International Development Finance Corp. | 1.05 | 10/15/29 | 1,960,460 | 1,984,954 |
| U.S. Treasury Note | 0.13 | 12/15/23 | 8,900,000 | 8,888,875 |
| U.S. Treasury Note | 0.38 | 12/31/25 | 2,000,000 | 2,001,094 |
| U.S. Treasury Note | 1.88 | 07/31/26 | 5,900,000 | 6,368,082 |
| Total U.S. Government & Agency Obligations | | | | |
| (Cost $33,132,148) | | | | 33,620,060 |
| Corporate Bonds–Other | 2.4% of portfolio |
| | | | |
| Communication Services | 0.4% | | |
| AT&T Inc. | 1.40(a) | 06/12/24 | 250,000 | 256,120 |
| Verizon Communications Inc. | 1.32(a) | 05/15/25 | 100,000 | 102,685 |
| Total Communication Services | | | | 358,805 |
| Financials | 1.7% | | |
| Athene Global Funding (d) | 2.50 | 01/14/25 | 100,000 | 104,734 |
| Bank of America Corp. | 0.81(a) | 10/24/24 | 250,000 | 251,873 |
| Citigroup Inc. | 1.32(a) | 05/17/24 | 250,000 | 253,384 |
| Goldman Sachs Group, Inc. | 0.96(a) | 02/23/23 | 250,000 | 252,328 |
| Jackson National Life Global Funding (d) | 0.68(a) | 01/06/23 | 150,000 | 150,617 |
| Owl Rock Capital Corp. | 3.40 | 07/15/26 | 250,000 | 253,394 |
| Owl Rock Technology Finance Corp. | 4.75 | 12/15/25 | 250,000 | 261,007 |
| Total Financials | | | | 1,527,337 |
| Real Estate | 0.3% | | |
| SBA Tower Trust (d) | 3.45 | 03/15/23 | 290,000 | 307,537 |
| Total Real Estate | | | | 307,537 |
| Total Corporate Bonds–Other | | | | |
| (Cost $2,150,950) | | | | 2,193,679 |
| Asset-Backed Securities | 2.4% of portfolio |
| | | | |
| Avid Automobile Receivables Trust 19-1 (d) | 2.62 | 02/15/24 | 105,830 | 106,804 |
| Carvana Auto Receivables Trust 20-N1A (d) | 2.01 | 03/17/25 | 250,000 | 253,942 |
| Consumer Loan Underlying Bond 19-HP1 (d) | 2.59 | 12/15/26 | 100,563 | 101,684 |
| CPS Auto Trust 20-AA (d) | 2.09 | 05/15/23 | 63,397 | 63,696 |
| CPS Auto Trust 20-AB (d) | 2.36 | 02/15/24 | 150,000 | 152,346 |
| CPS Auto Trust 20-CA (d) | 0.63 | 03/15/24 | 203,050 | 203,241 |
| Credit Acceptance Auto Loan Trust 20-3A (d) | 1.24 | 10/15/29 | 250,000 | 252,775 |
| Exeter Automobile Receivables Trust 19-4 (d) | 2.18 | 01/17/23 | 34,593 | 34,664 |
| Foursight Capital Automobile Receivables Trust 19-1 (d) | 2.67 | 03/15/24 | 300,000 | 304,694 |
| Freedom Financial 18-2 (d) | 3.99 | 10/20/25 | 9,633 | 9,653 |
| Freedom Financial 20-3 (d) | 2.40 | 09/20/27 | 126,646 | 127,110 |
| GLS Auto Receivables Trust 19-4 (d) | 2.47 | 11/15/23 | 205,196 | 207,500 |
| Marlette Funding Trust 19-3 (d) | 2.69 | 09/17/29 | 68,543 | 69,005 |
| Portfolio of Investments | The accompanying notes are an integral part of these financial statements. |
Portfolio of Investments | Short-Term Government Securities Fund | December 31, 2020 |
(Continued)
| Asset-Backed Securities | 2.4% of portfolio (Continued) |
| | Interest Rate /Yield | Maturity Date | Face Amount | Value |
| SoFi Consumer Loan Program Trust 19-4 (d) | 2.45% | 08/25/28 | $38,263 | $38,662 |
| Upstart Securitization Trust 19-3 (d) | 2.68 | 01/21/30 | 230,695 | 232,742 |
| Total Asset-Backed Securities | | | | |
| (Cost $2,142,718) | | | | 2,158,518 |
| Municipal Bonds | 2.1% of portfolio |
| | | | |
| California | 0.7% | | |
| Arcadia California Pension Obligation | 1.50 | 12/01/26 | 100,000 | 100,543 |
| California Infrastructure & Economic Development Bank | 1.04 | 10/01/26 | 100,000 | 101,107 |
| Gardena California Pension Obligation | 2.07 | 04/01/26 | 200,000 | 207,172 |
| Port of Oakland California | 1.52 | 05/01/26 | 200,000 | 202,678 |
| Total California | | | | 611,500 |
| Hawaii | 0.2% | | |
| Hawaii State | 0.57 | 10/01/23 | 150,000 | 151,009 |
| Total Hawaii | | | | 151,009 |
| New York | 1.0% | | |
| New York NY | 0.83 | 08/01/24 | 500,000 | 501,295 |
| New York NY | 1.22 | 08/01/26 | 200,000 | 202,416 |
| Suffolk County New York | 0.90 | 06/15/22 | 100,000 | 100,096 |
| Suffolk County New York | 1.05 | 06/15/23 | 100,000 | 100,348 |
| Total New York | | | | 904,155 |
| Texas | 0.2% | | |
| Harris County Texas Cultural Education Facilities Finance Corp. | 1.45 | 11/15/22 | 200,000 | 200,734 |
| Total Texas | | | | 200,734 |
| Total Municipal Bonds | | | | |
| (Cost $1,850,000) | | | | 1,867,398 |
| Money Market Fund | 3.4% of portfolio |
| | | | Shares | |
| State Street Institutional U.S. Government Money Market Fund Premier Class | 0.03(e) | | 3,056,818 | 3,056,818 |
| Total Money Market Fund | | | | |
| (Cost $3,056,818) | | | | 3,056,818 |
| Total Investments in Securities | | | | |
| (Cost $89,455,261) | 100.0% | | | | $90,776,158 |
| (a) | Variable coupon rate as of December 31, 2020. |
| (b) | Interest is paid at maturity. |
| (c) | Zero coupon rate, purchased at a discount. |
| (d) | Security was purchased pursuant to Rule 144A under the Securities Act of 1933 and may be resold in transactions exempt from registration, normally to qualified institutional buyers. The securities have been determined to be liquid under criteria established by the Fund's Board of Directors. The total of such securities at period-end amounts to $2,721,406 and represents 3.0% of total investments. |
| (e) | 7-day yield at December 31, 2020. |
LLC - Limited Liability Company
SA - Sociedad Anonima or Societe Anonyme
DAC - Designated Activity Company
| The accompanying notes are an integral part of these financial statements. | Portfolio of Investments |
39
Portfolio of Investments
Short-Term Bond Fund | December 31, 2020
| U.S. Government & Agency Obligations | 36.8% of portfolio |
| | Interest Rate /
Yield | Maturity Date | Face Amount | Value |
| Tennessee Valley Authority | 0.00%(a) | 06/15/21 | $595,000 | $594,308 |
| U.S. Department of Housing & Urban Development | 6.07 | 08/01/21 | 10,000 | 10,046 |
| U.S. Department of Housing & Urban Development | 6.12 | 08/01/22 | 10,000 | 10,046 |
| U.S. International Development Finance Corp. | 0.67(b) | 04/23/29 | 1,230,000 | 1,245,496 |
| U.S. International Development Finance Corp. | 2.36 | 10/15/29 | 828,295 | 890,478 |
| U.S. International Development Finance Corp. | 1.05 | 10/15/29 | 1,190,980 | 1,205,860 |
| U.S. Treasury Note | 0.13 | 08/31/22 | 14,215,000 | 14,215,555 |
| U.S. Treasury Note | 0.13 | 09/30/22 | 10,221,000 | 10,221,000 |
| U.S. Treasury Note | 0.13 | 10/31/22 | 640,000 | 640,075 |
| U.S. Treasury Note | 0.15(c) | 10/31/22 | 16,000,000 | 15,997,012 |
| U.S. Treasury Note | 0.25 | 11/15/23 | 130,303,000 | 130,659,298 |
| U.S. Treasury Note | 0.38 | 11/30/25 | 0 | 0 |
| U.S. Treasury Note | 0.38 | 12/31/25 | 32,775,000 | 32,792,928 |
| Total U.S. Government & Agency Obligations | | | | |
| (Cost $208,192,633) | | | | 208,482,102 |
| Corporate Bonds–Other | 34.2% of portfolio |
| | | | |
| Communication Services | 3.4% | | |
| AT&T Inc. | 1.40(c) | 06/12/24 | 4,460,000 | 4,569,181 |
| Baidu Inc. | 3.88 | 09/29/23 | 1,165,000 | 1,254,929 |
| Comcast Corp. | 3.70 | 04/15/24 | 5,200,000 | 5,720,245 |
| Verizon Communications Inc. | 1.32(c) | 05/15/25 | 5,225,000 | 5,365,295 |
| Verizon Communications Inc. | 0.85 | 11/20/25 | 1,700,000 | 1,712,965 |
| Walt Disney Co. (The) | 1.75 | 01/13/26 | 420,000 | 440,176 |
| Total Communication Services | | | | 19,062,791 |
| Consumer Discretionary | 3.0% | | |
| American Honda Finance Corp. | 0.65 | 09/08/23 | 2,000,000 | 2,012,498 |
| Booking Holdings Inc. | 2.75 | 03/15/23 | 1,075,000 | 1,127,454 |
| Booking Holdings Inc. | 4.10 | 04/13/25 | 1,252,000 | 1,419,614 |
| Expedia Group, Inc. (d) | 3.60 | 12/15/23 | 250,000 | 266,407 |
| Ford Motor Co. | 8.50 | 04/21/23 | 1,000,000 | 1,127,580 |
| Harley-Davidson Financial Services, Inc. (d) | 3.35 | 02/15/23 | 1,205,000 | 1,257,014 |
| Harley-Davidson Financial Services, Inc. (d) | 3.35 | 06/08/25 | 900,000 | 974,681 |
| Ralph Lauren Corp. | 1.70 | 06/15/22 | 1,000,000 | 1,018,162 |
| Ralph Lauren Corp. | 3.75 | 09/15/25 | 850,000 | 955,196 |
| Volkswagen Group of America, Inc. (d) | 2.70 | 09/26/22 | 2,120,000 | 2,197,822 |
| Volkswagen Group of America, Inc. (d) | 0.75 | 11/23/22 | 1,935,000 | 1,940,720 |
| Volkswagen Group of America, Inc. (d) | 0.88 | 11/22/23 | 2,500,000 | 2,513,893 |
| Total Consumer Discretionary | | | | 16,811,041 |
| Consumer Staples | 0.7% | | |
| Altria Group, Inc. | 4.40 | 02/14/26 | 2,580,000 | 2,994,846 |
| Land O'Lakes, Inc. (d) | 6.00 | 11/15/22 | 840,000 | 901,579 |
| Total Consumer Staples | | | | 3,896,425 |
| Energy | 2.4% | | |
| BP Capital Markets America Inc. | 3.19 | 04/06/25 | 3,600,000 | 3,957,911 |
| Exxon Mobil Corp. | 3.18 | 03/15/24 | 2,065,000 | 2,226,962 |
| Midwest Connector Capital Co. LLC (d) | 3.63 | 04/01/22 | 2,676,000 | 2,722,815 |
| Midwest Connector Capital Co. LLC (d) | 3.90 | 04/01/24 | 1,665,000 | 1,706,382 |
| Phillips 66 Co. | 1.30 | 02/15/26 | 1,500,000 | 1,525,173 |
| Portfolio of Investments | The accompanying notes are an integral part of these financial statements. |
Portfolio of Investments | Short-Term Bond Fund | December 31, 2020 | (Continued)
| Corporate Bonds–Other | 34.2% of portfolio (Continued) |
| | Interest Rate /Yield | Maturity Date | Face Amount | Value |
| Energy | 2.4% (Continued) | | |
| Rockies Express Pipeline LLC (d) | 3.60% | 05/15/25 | $1,300,000 | $1,339,000 |
| Total Energy | | | | 13,478,243 |
| Financials | 16.8% | | |
| AIG Global Funding Inc. (d) | 0.80 | 07/07/23 | 1,300,000 | 1,312,726 |
| Ambac LSNI LLC (d) | 6.00(c) | 02/12/23 | 10,516 | 10,463 |
| American Express Co. | 0.97(c) | 08/03/23 | 862,000 | 873,136 |
| Athene Global Funding (d) | 2.80 | 05/26/23 | 925,000 | 965,652 |
| Athene Global Funding (d) | 2.50 | 01/14/25 | 4,800,000 | 5,027,244 |
| Bank of America Corp. | 0.81(c) | 10/24/24 | 3,990,000 | 4,026,986 |
| Bank of America Corp. | 0.81(c) | 10/24/24 | 1,805,000 | 1,818,527 |
| Bank of America Corp. | 4.00 | 01/22/25 | 1,210,000 | 1,359,627 |
| Bank of America Corp. | 3.95 | 04/21/25 | 2,210,000 | 2,491,197 |
| Bank of America Corp. | 2.46(c) | 10/22/25 | 2,200,000 | 2,344,852 |
| Bank of America Corp. | 2.02(c) | 02/13/26 | 2,100,000 | 2,200,468 |
| Bank of America Corp. | 1.32(c) | 06/19/26 | 2,100,000 | 2,144,348 |
| Bank of America Corp. | 1.20(c) | 10/24/26 | 920,000 | 932,040 |
| Capital One Bank (USA), NA | 2.01(c) | 01/27/23 | 875,000 | 889,999 |
| Capital One Financial Corp. | 3.90 | 01/29/24 | 1,440,000 | 1,577,126 |
| Capital Southwest Corp. | 4.50 | 01/31/26 | 4,000,000 | 4,010,000 |
| CIT Group Inc. | 3.93(c) | 06/19/24 | 1,440,000 | 1,522,800 |
| Citigroup Inc. | 1.68(c) | 05/15/24 | 715,000 | 736,484 |
| Citigroup Inc. | 1.32(c) | 05/17/24 | 5,337,000 | 5,409,241 |
| Citigroup Inc. | 3.11(c) | 04/08/26 | 5,800,000 | 6,335,633 |
| Fidus Investment Corp. | 4.75 | 01/31/26 | 2,000,000 | 2,040,682 |
| Goldman Sachs BDC, Inc. | 2.88 | 01/15/26 | 600,000 | 612,702 |
| Goldman Sachs Group, Inc. | 0.96(c) | 02/23/23 | 3,685,000 | 3,719,319 |
| Goldman Sachs Group, Inc. | 0.63(c) | 11/17/23 | 1,935,000 | 1,942,756 |
| Goldman Sachs Group, Inc. | 3.63 | 02/20/24 | 2,065,000 | 2,247,057 |
| J.P. Morgan Chase & Co. | 0.65(c) | 09/16/24 | 900,000 | 904,702 |
| J.P. Morgan Chase & Co. | 4.02(c) | 12/05/24 | 1,225,000 | 1,349,395 |
| J.P. Morgan Chase & Co. | 2.30(c) | 10/15/25 | 2,130,000 | 2,260,654 |
| J.P. Morgan Chase & Co. | 2.08(c) | 04/22/26 | 2,055,000 | 2,169,909 |
| Jackson National Life Global Funding (d) | 0.68(c) | 01/06/23 | 3,400,000 | 3,413,981 |
| Main Street Capital Corp. | 5.20 | 05/01/24 | 3,635,000 | 3,941,809 |
| Metropolitan Life Global Funding (d) | 3.60 | 01/11/24 | 450,000 | 489,922 |
| Morgan Stanley | 0.79(c) | 01/20/23 | 372,000 | 373,194 |
| Morgan Stanley | 0.56(c) | 11/10/23 | 2,025,000 | 2,029,617 |
| Morgan Stanley | 3.74(c) | 04/24/24 | 1,020,000 | 1,097,443 |
| Morgan Stanley | 2.19(c) | 04/28/26 | 425,000 | 448,813 |
| Oaktree Specialty Lending Corp. | 3.50 | 02/25/25 | 1,277,000 | 1,322,078 |
| Owl Rock Technology Finance Corp. | 4.75 | 12/15/25 | 5,180,000 | 5,408,059 |
| PACCAR Financial Corp. | 0.80 | 06/08/23 | 1,000,000 | 1,010,646 |
| PNC Bank NA | 0.67(c) | 07/22/22 | 850,000 | 851,697 |
| Principal Life Global Funding II (d) | 0.50 | 01/08/24 | 1,000,000 | 1,002,023 |
| Protective Life Global Funding (d) | 2.62 | 08/22/22 | 1,695,000 | 1,756,235 |
| Protective Life Global Funding (d) | 1.08 | 06/09/23 | 845,000 | 859,575 |
| Protective Life Global Funding (d) | 1.17 | 07/15/25 | 850,000 | 864,062 |
| Wells Fargo & Co. | 1.65(c) | 06/02/24 | 4,250,000 | 4,365,972 |
| Wells Fargo & Co. | 2.16(c) | 02/11/26 | 840,000 | 883,127 |
| Wells Fargo & Co. | 2.19(c) | 04/30/26 | 2,120,000 | 2,231,677 |
| Total Financials | | | | 95,585,655 |
| The accompanying notes are an integral part of these financial statements. | Portfolio of Investments |
41
Portfolio of Investments | Short-Term Bond Fund | December 31, 2020 | (Continued)
| Corporate Bonds–Other | 34.2% of portfolio (Continued) |
| | Interest Rate /Yield | Maturity Date | Face Amount | Value |
| Health Care | 2.3% | | |
| Anthem, Inc. | 2.38% | 01/15/25 | $2,130,000 | $2,277,699 |
| Bristol-Myers Squibb Co. | 0.75 | 11/13/25 | 2,000,000 | 2,013,224 |
| Cigna Corp. | 1.13(c) | 07/15/23 | 1,830,000 | 1,850,706 |
| Gilead Sciences, Inc. | 0.75 | 09/29/23 | 1,235,000 | 1,238,651 |
| Health Care Service Corp. (d) | 1.50 | 06/01/25 | 1,800,000 | 1,847,160 |
| Merck & Co., Inc. | 0.75 | 02/24/26 | 1,165,000 | 1,177,858 |
| Stryker Corp. | 1.15 | 06/15/25 | 1,500,000 | 1,530,188 |
| Sutter Health | 1.32 | 08/15/25 | 915,000 | 930,225 |
| Total Health Care | | | | 12,865,711 |
| Industrials | 1.5% | | |
| American Airlines Group Inc. | 3.60 | 03/22/29 | 2,360,575 | 2,323,507 |
| Burlington Northern & Santa Fe Railway Co. | 4.58 | 01/15/21 | 28,173 | 28,209 |
| Burlington Northern & Santa Fe Railway Co. | 4.83 | 01/15/23 | 20,013 | 20,249 |
| Caterpillar Financial Services Corp. | 2.15 | 11/08/24 | 940,000 | 1,001,162 |
| Caterpillar Financial Services Corp. | 0.80 | 11/13/25 | 2,010,000 | 2,025,592 |
| Delta Air Lines, Inc. (d) | 7.00 | 05/01/25 | 965,000 | 1,113,939 |
| Delta Air Lines, Inc. | 7.38 | 01/15/26 | 730,000 | 833,712 |
| Waste Management, Inc | 0.75 | 11/15/25 | 1,200,000 | 1,204,937 |
| Total Industrials | | | | 8,551,307 |
| Information Technology | 0.2% | | |
| PayPal Holdings, Inc. | 1.65 | 06/01/25 | 1,265,000 | 1,321,382 |
| Total Information Technology | | | | 1,321,382 |
| Materials | 0.5% | | |
| E. I. Du Pont De Nemours and Co. | 1.70 | 07/15/25 | 500,000 | 520,946 |
| Georgia-Pacific LLC (d) | 0.95 | 05/15/26 | 1,450,000 | 1,456,784 |
| Nucor Corp. | 2.00 | 06/01/25 | 1,000,000 | 1,058,808 |
| Total Materials | | | | 3,036,538 |
| Real Estate | 1.5% | | |
| Federal Realty Investment Trust | 1.25 | 02/15/26 | 1,231,000 | 1,253,301 |
| SBA Tower Trust (d) | 3.45 | 03/15/23 | 2,420,000 | 2,566,337 |
| SBA Tower Trust (d) | 2.84 | 01/15/25 | 3,450,000 | 3,673,157 |
| Service Properties Trust | 7.50 | 09/15/25 | 930,000 | 1,071,459 |
| Total Real Estate | | | | 8,564,254 |
| Utilities | 1.9% | | |
| Entergy Louisiana, LLC | 0.62 | 11/17/23 | 2,350,000 | 2,357,754 |
| NextEra Energy Capital Holdings, Inc. | 2.75 | 05/01/25 | 500,000 | 540,809 |
| PPL Electric Utilities Corp. | 0.50(c) | 09/28/23 | 1,000,000 | 1,000,906 |
| San Diego Gas & Electric Co. | 1.91 | 02/01/22 | 1,065,460 | 1,071,099 |
| Southern California Edison Co. | 0.50(c) | 12/03/21 | 1,800,000 | 1,800,763 |
| Southern California Edison Co. | 1.85 | 02/01/22 | 1,755,000 | 1,758,763 |
| Southern California Edison Co. | 1.20 | 02/01/26 | 2,065,000 | 2,089,117 |
| Total Utilities | | | | 10,619,211 |
| Total Corporate Bonds–Other | | | | |
| (Cost $188,189,682) | | | | 193,792,558 |
| Portfolio of Investments | The accompanying notes are an integral part of these financial statements. |
Portfolio of Investments | Short-Term Bond Fund | December 31, 2020 | (Continued)
| Asset-Backed Securities | 10.6% of portfolio |
| | Interest Rate /Yield | Maturity Date | Face Amount | Value |
| American Credit Acceptance Receivables Trust 19-1 (d) | 3.50% | 04/14/25 | $900,000 | $914,276 |
| American Credit Acceptance Receivables Trust 20-1 (d) | 1.89 | 04/13/23 | 482,833 | 484,620 |
| American Credit Acceptance Receivables Trust 20-3A (d) | 0.62 | 10/13/23 | 907,559 | 908,612 |
| American Credit Acceptance Receivables Trust 20-3B (d) | 1.15 | 08/13/24 | 850,000 | 854,344 |
| Avant Loans Funding Trust 19-B (d) | 2.72 | 10/15/26 | 354,685 | 355,973 |
| Avid Automobile Receivables Trust 19-1 (d) | 2.62 | 02/15/24 | 742,930 | 749,767 |
| Carvana Auto Receivables Trust 20-N1A (d) | 2.01 | 03/17/25 | 1,560,000 | 1,584,598 |
| Consumer Loan Underlying Bond 18-P2 (d) | 3.47 | 10/15/25 | 10,247 | 10,254 |
| Consumer Loan Underlying Bond 18-P3 (d) | 3.82 | 01/15/26 | 108,341 | 108,758 |
| Consumer Loan Underlying Bond 19-HP1 (d) | 2.59 | 12/15/26 | 1,493,353 | 1,510,003 |
| Consumer Loan Underlying Bond 19-P1 (d) | 2.94 | 07/15/26 | 224,712 | 226,084 |
| Consumer Loan Underlying Bond 20-P1 (d) | 2.26 | 03/15/28 | 611,801 | 616,261 |
| CoreVest American Finance 20-4 (d) | 1.17 | 12/15/52 | 920,000 | 923,224 |
| CPS Auto Trust 20-AA (d) | 2.09 | 05/15/23 | 507,174 | 509,567 |
| CPS Auto Trust 20-AB (d) | 2.36 | 02/15/24 | 1,200,000 | 1,218,768 |
| CPS Auto Trust 20-CA (d) | 0.63 | 03/15/24 | 843,065 | 843,858 |
| Credit Acceptance Auto Loan Trust 18-1A (d) | 3.01 | 02/16/27 | 91,708 | 91,785 |
| Credit Acceptance Auto Loan Trust 18-2A (d) | 3.47 | 05/17/27 | 1,408,864 | 1,417,072 |
| Credit Acceptance Auto Loan Trust 18-3A (d) | 3.55 | 08/15/27 | 622,620 | 629,267 |
| Credit Acceptance Auto Loan Trust 18-3B (d) | 3.89 | 10/15/27 | 1,045,000 | 1,067,979 |
| Credit Acceptance Auto Loan Trust 19-1A (d) | 3.33 | 02/15/28 | 2,880,000 | 2,933,407 |
| Credit Acceptance Auto Loan Trust 19-1B (d) | 3.75 | 04/17/28 | 4,475,000 | 4,656,220 |
| Credit Acceptance Auto Loan Trust 19-1C (d) | 3.94 | 06/15/28 | 785,000 | 820,560 |
| Credit Acceptance Auto Loan Trust 20-1A (d) | 2.01 | 02/15/29 | 1,725,000 | 1,763,594 |
| Credit Acceptance Auto Loan Trust 20-2A (d) | 1.37 | 07/16/29 | 870,000 | 881,719 |
| Credit Acceptance Auto Loan Trust 20-3A (d) | 1.24 | 10/15/29 | 2,500,000 | 2,527,753 |
| DT Auto Owner Trust 18-2D (d) | 4.15 | 03/15/24 | 345,000 | 353,961 |
| DT Auto Owner Trust 19-1C (d) | 3.61 | 11/15/24 | 364,000 | 370,846 |
| DT Auto Owner Trust 20-3A (d) | 0.54 | 04/15/24 | 1,310,248 | 1,312,611 |
| Entergy New Orleans Storm Recovery Fund 15-1 | 2.67 | 06/01/27 | 434,015 | 442,436 |
| Exeter Automobile Receivables Trust 18-3 (d) | 3.71 | 06/15/23 | 1,182,718 | 1,193,519 |
| Exeter Automobile Receivables Trust 19-4 (d) | 2.18 | 01/17/23 | 164,892 | 165,233 |
| Exeter Automobile Receivables Trust 20-3 | 0.46 | 10/17/22 | 1,235,000 | 1,235,361 |
| Foursight Capital Automobile Receivables Trust 19-1 (d) | 2.67 | 03/15/24 | 4,140,000 | 4,204,769 |
| Freedom Financial 18-2 (d) | 3.99 | 10/20/25 | 50,091 | 50,196 |
| Freedom Financial 20-1 (d) | 2.52 | 03/18/27 | 800,361 | 805,941 |
| Freedom Financial 20-3 (d) | 2.40 | 09/20/27 | 493,921 | 495,729 |
| GLS Auto Receivables Trust 18-1 (d) | 2.82 | 07/15/22 | 64,164 | 64,232 |
| GLS Auto Receivables Trust 19-1 (d) | 3.37 | 01/17/23 | 121,633 | 122,059 |
| GLS Auto Receivables Trust 19-2 (d) | 3.06 | 04/17/23 | 315,903 | 317,981 |
| GLS Auto Receivables Trust 19-4 (d) | 2.47 | 11/15/23 | 867,978 | 877,726 |
| GLS Auto Receivables Trust 20-2 (d) | 1.58 | 08/15/24 | 2,094,530 | 2,113,261 |
| GLS Auto Receivables Trust 20-3 (d) | 0.69 | 10/16/23 | 784,509 | 785,487 |
| GLS Auto Receivables Trust 20-4 (d) | 0.52 | 02/15/24 | 2,700,000 | 2,700,889 |
| Gracie Point International Fund 20-B (d) | 1.53(c) | 05/02/23 | 750,000 | 749,968 |
| Longtrain Leasing III LLC 2015-1 (d) | 2.98 | 01/15/45 | 329,834 | 337,504 |
| Marlette Funding Trust 18-4 (d) | 3.71 | 12/15/28 | 183,108 | 183,833 |
| Marlette Funding Trust 19-1 (d) | 3.44 | 04/16/29 | 293,779 | 296,119 |
| Marlette Funding Trust 19-3 (d) | 2.69 | 09/17/29 | 1,252,965 | 1,261,413 |
| Marlette Funding Trust 20-2 (d) | 1.02 | 09/16/30 | 453,373 | 454,134 |
| NP SPE II LLC 17-1 (d) | 3.37 | 10/21/47 | 383,909 | 397,034 |
| Oscar US Funding Trust 19-1 (d) | 3.10 | 04/11/22 | 134,570 | 134,917 |
| Prosper Marketplace Issuance Trust 19-3 (d) | 3.19 | 07/15/25 | 167,785 | 168,353 |
| SoFi Consumer Loan Program Trust 17-3 (d) | 2.77 | 05/25/26 | 56,055 | 56,219 |
| SoFi Consumer Loan Program Trust 17-4 (d) | 2.50 | 05/26/26 | 65,131 | 65,374 |
| SoFi Consumer Loan Program Trust 18-3 (d) | 4.02 | 08/25/27 | 1,000,000 | 1,027,437 |
| SoFi Consumer Loan Program Trust 18-4 (d) | 3.54 | 11/26/27 | 142,539 | 143,072 |
| The accompanying notes are an integral part of these financial statements. | Portfolio of Investments |
43
Portfolio of Investments | Short-Term Bond Fund | December 31, 2020 | (Continued)
| Asset-Backed Securities | 10.6% of portfolio (Continued) |
| | Interest Rate /Yield | Maturity Date | Face Amount | Value |
| SoFi Consumer Loan Program Trust 19-2 (d) | 3.01% | 04/25/28 | $256,772 | $259,357 |
| SoFi Consumer Loan Program Trust 19-4 (d) | 2.45 | 08/25/28 | 516,555 | 521,930 |
| United Auto Credit Securitization Trust 20-1 (d) | 1.47 | 11/10/22 | 1,120,000 | 1,125,995 |
| Upstart Securitization Trust 19-3 (d) | 2.68 | 01/21/30 | 1,817,879 | 1,834,005 |
| Westlake Automobile Receivable Trust 19-2A (d) | 2.84 | 07/15/24 | 1,025,000 | 1,045,948 |
| Westlake Automobile Receivable Trust 20-3A (d) | 0.56 | 05/15/24 | 2,715,000 | 2,720,937 |
| World Financial Network Credit Card Master Note Trust 18-B | 3.46 | 07/15/25 | 1,200,000 | 1,226,255 |
| Total Asset-Backed Securities | | | | |
| (Cost $59,883,084) | | | | 60,230,364 |
| Yankee Bonds | 10.0% of portfolio |
| | | | |
| AerCap Ireland Capital DAC | 6.50 | 07/15/25 | 1,000,000 | 1,195,222 |
| Aircastle Ltd. (d) | 5.25 | 08/11/25 | 1,243,000 | 1,368,712 |
| América Móvil, SAB de CV | 3.13 | 07/16/22 | 1,085,000 | 1,125,384 |
| Avolon Holdings Funding Ltd. (d) | 3.63 | 05/01/22 | 950,000 | 970,541 |
| Avolon Holdings Funding Ltd. (d) | 3.95 | 07/01/24 | 530,000 | 559,687 |
| Avolon Holdings Funding Ltd. (d) | 5.50 | 01/15/26 | 1,850,000 | 2,095,444 |
| Baidu Inc. | 3.08 | 04/07/25 | 1,050,000 | 1,121,001 |
| Banco Bilbao Vizcaya Argentaria SA | 0.88 | 09/18/23 | 800,000 | 805,555 |
| Banco Bilbao Vizcaya Argentaria SA | 1.13 | 09/18/25 | 800,000 | 805,602 |
| Banco Santander SA | 2.75 | 05/28/25 | 1,200,000 | 1,280,773 |
| Bank of Montreal | 4.34(c) | 10/05/28 | 1,300,000 | 1,422,532 |
| Barclays PLC | 1.60(c) | 05/16/24 | 1,250,000 | 1,266,850 |
| Barclays PLC | 1.01(c) | 12/10/24 | 4,205,000 | 4,233,122 |
| Barclays PLC | 2.85(c) | 05/07/26 | 1,250,000 | 1,342,160 |
| BMW Finance NV (d) | 2.40 | 08/14/24 | 2,500,000 | 2,649,431 |
| Delta and SkyMiles IP Ltd. (d) | 4.50 | 10/20/25 | 780,000 | 833,582 |
| Enel Finance International NV (d) | 2.75 | 04/06/23 | 1,345,000 | 1,407,217 |
| Enel Finance International NV (d) | 2.65 | 09/10/24 | 1,275,000 | 1,357,914 |
| ING Groep NV | 3.55 | 04/09/24 | 720,000 | 786,532 |
| Lloyds Banking Group PLC | 2.86(c) | 03/17/23 | 1,400,000 | 1,438,718 |
| Lloyds Banking Group PLC | 2.91(c) | 11/07/23 | 1,400,000 | 1,462,721 |
| Mitsubishi UFJ Financial Group, Inc. | 1.07(c) | 07/26/23 | 1,765,000 | 1,784,151 |
| Mitsubishi UFJ Financial Group, Inc. | 1.41 | 07/17/25 | 710,000 | 729,253 |
| Nationwide Building Society (d) | 3.62(c) | 04/26/23 | 1,980,000 | 2,056,606 |
| NatWest Group PLC | 2.36(c) | 05/22/24 | 845,000 | 879,202 |
| NatWest Group PLC | 4.52(c) | 06/25/24 | 1,325,000 | 1,446,558 |
| NatWest Group PLC | 4.27(c) | 03/22/25 | 1,330,000 | 1,471,148 |
| Nissan Motor Co., Ltd. (d) | 3.52 | 09/17/25 | 1,460,000 | 1,565,199 |
| Reckitt Benckiser Treasury Services PLC (d) | 2.75 | 06/26/24 | 1,100,000 | 1,176,231 |
| Saudi Arabian Oil Co. (d) | 1.25 | 11/24/23 | 800,000 | 810,235 |
| Saudi Arabian Oil Co. (d) | 1.63 | 11/24/25 | 500,000 | 512,249 |
| Schlumberger Finance Canada Ltd. | 1.40 | 09/17/25 | 1,000,000 | 1,028,120 |
| Shell International Finance BV | 2.00 | 11/07/24 | 1,650,000 | 1,738,213 |
| Sinopec Group Overseas Development (2012) Ltd. (d) | 3.90 | 05/17/22 | 2,100,000 | 2,180,347 |
| Standard Chartered PLC (d) | 2.74(c) | 09/10/22 | 1,700,000 | 1,724,125 |
| Sumitomo Mitsui Trust Bank, Ltd. (d) | 0.80 | 09/12/23 | 1,900,000 | 1,917,022 |
| Syngenta Finance NV (d) | 4.44 | 04/24/23 | 400,000 | 419,749 |
| Tencent Holdings Ltd. (d) | 3.28 | 04/11/24 | 1,840,000 | 1,959,412 |
| Tencent Holdings Ltd. (d) | 1.81 | 01/26/26 | 1,000,000 | 1,022,018 |
| Tencent Music Entertainment Group | 1.38 | 09/03/25 | 3,035,000 | 3,038,912 |
| Total Yankee Bonds | | | | |
| (Cost $54,566,595) | | | | 56,987,450 |
| Portfolio of Investments | The accompanying notes are an integral part of these financial statements. |
Portfolio of Investments | Short-Term Bond Fund | December 31, 2020 | (Continued)
| Municipal Bonds | 3.4% of portfolio |
| | Interest Rate /Yield | Maturity Date | Face Amount | Value |
| Alabama | 0.1% | | |
| Alabama Public School & College Authority | 0.92% | 06/01/25 | $710,000 | $718,378 |
| Total Alabama | | | | 718,378 |
| Arizona | 0.2% | | |
| Pinal County Arizona Revenue Obligation | 0.80 | 08/01/23 | 410,000 | 411,447 |
| Pinal County Arizona Revenue Obligation | 1.20 | 08/01/25 | 690,000 | 695,589 |
| Total Arizona | | | | 1,107,036 |
| California | 0.4% | | |
| Arcadia California Pension Obligation | 1.50 | 12/01/26 | 780,000 | 784,235 |
| California Infrastructure & Economic Development Bank | 1.04 | 10/01/26 | 460,000 | 465,092 |
| Gardena California Pension Obligation | 2.07 | 04/01/26 | 560,000 | 580,082 |
| Port of Oakland California | 1.52 | 05/01/26 | 325,000 | 329,352 |
| San Francisco California Community College District | 1.33 | 06/15/26 | 300,000 | 303,888 |
| Total California | | | | 2,462,649 |
| Colorado | 0.1% | | |
| Denver City & County Colorado Airport Revenue | 0.88 | 11/15/23 | 575,000 | 576,892 |
| Total Colorado | | | | 576,892 |
| Florida | 0.1% | | |
| Sarasota County Florida Utility System Revenue | 0.46 | 10/01/23 | 200,000 | 200,756 |
| Sarasota County Florida Utility System Revenue | 1.11 | 10/01/26 | 400,000 | 403,296 |
| Total Florida | | | | 604,052 |
| Hawaii | 0.4% | | |
| Hawaii State | 0.57 | 10/01/23 | 1,445,000 | 1,454,725 |
| Hawaii State | 0.80 | 10/01/24 | 1,015,000 | 1,028,520 |
| Total Hawaii | | | | 2,483,245 |
| Maine | 0.1% | | |
| Maine State Housing Authority | 1.70 | 11/15/26 | 245,000 | 250,826 |
| Total Maine | | | | 250,826 |
| Massachusetts | 0.1% | | |
| Massachusetts State | 0.99 | 11/01/26 | 405,000 | 416,761 |
| Total Massachusetts | | | | 416,761 |
| New Jersey | 0.6% | | |
| New Jersey Economic Development Authority | 7.63(b) | 02/15/22 | 950,000 | 944,262 |
| New Jersey Housing and Morgage Finance Agency | 1.34 | 04/01/24 | 750,000 | 755,415 |
| New Jersey Housing and Morgage Finance Agency | 1.49 | 04/01/25 | 640,000 | 644,992 |
| New Jersey Housing and Morgage Finance Agency | 1.54 | 10/01/25 | 1,110,000 | 1,114,962 |
| Total New Jersey | | | | 3,459,631 |
| New York | 1.2% | | |
| New York NY | 0.83 | 08/01/24 | 2,650,000 | 2,656,863 |
| The accompanying notes are an integral part of these financial statements. | Portfolio of Investments |
45
Portfolio of Investments | Short-Term Bond Fund | December 31, 2020 | (Continued)
| Municipal Bonds | 3.4% of portfolio (Continued) |
| | Interest Rate /Yield | Maturity Date | Face Amount | Value |
| New York | 1.2% (Continued) | | |
| New York NY | 1.22% | 08/01/26 | $1,065,000 | $1,077,865 |
| Suffolk County New York | 0.90 | 06/15/22 | 370,000 | 370,355 |
| Suffolk County New York | 1.05 | 06/15/23 | 350,000 | 351,218 |
| Suffolk County New York | 1.41 | 06/15/24 | 810,000 | 815,954 |
| Suffolk County New York | 1.61 | 06/15/25 | 1,350,000 | 1,362,960 |
| Total New York | | | | 6,635,215 |
| Texas | 0.1% | | |
| Harris County Texas Cultural Education Facilities Finance Corp. | 1.45 | 11/15/22 | 400,000 | 401,468 |
| Harris County Texas Cultural Education Facilities Finance Corp. | 1.84 | 11/15/24 | 205,000 | 208,124 |
| Total Texas | | | | 609,592 |
| Total Municipal Bonds | | | | |
| (Cost $19,195,105) | | | | 19,324,277 |
| Corporate Bonds Guaranteed by Export-Import Bank of the United States | 3.0% of portfolio |
| | | | |
| Energy | 2.2% | | |
| Petroleos Mexicanos | 0.59(c) | 04/15/25 | 10,552,500 | 10,569,722 |
| Petroleos Mexicanos | 2.46 | 12/15/25 | 219,500 | 229,804 |
| Reliance Industries Ltd. | 1.87 | 01/15/26 | 1,743,211 | 1,797,324 |
| Total Energy | | | | 12,596,850 |
| Financials | 0.8% | | |
| MSN 41079 and 41084 Ltd. | 1.72 | 07/13/24 | 796,734 | 813,979 |
| MSN 41079 and 41084 Ltd. | 1.63 | 12/14/24 | 934,256 | 955,620 |
| Pluto Aircraft Leasing LLC | 0.42(c) | 02/07/23 | 254,727 | 254,523 |
| Santa Rosa Leasing LLC | 1.69 | 08/15/24 | 866,541 | 885,600 |
| Washington Aircraft 2 Co. DAC | 0.68(c) | 06/26/24 | 1,235,559 | 1,237,496 |
| Total Financials | | | | 4,147,218 |
| Total Corporate Bonds Guaranteed by Export-Import Bank of the United States | | | | |
| (Cost $16,635,971) | | | | 16,744,068 |
| Mortgage-Backed Securities | less than 0.1% of portfolio |
| | | | |
| FHLMC 780754 | 2.63(c) | 08/01/33 | 957 | 979 |
| FNMA 813842 | 2.11(c) | 01/01/35 | 3,000 | 3,087 |
| Salomon Brothers Mortgage Securities 97-LB6 | 6.82 | 12/25/27 | 2 | 2 |
| Total Mortgage-Backed Securities | | | | |
| (Cost $3,959) | | | | 4,068 |
| Money Market Fund | 2.0% of portfolio |
| | | | Shares | |
| State Street Institutional U.S. Government Money Market Fund Premier Class | 0.03(e) | | 11,322,370 | 11,322,370 |
| Total Money Market Fund | | | | |
| (Cost $11,322,370) | | | | 11,322,370 |
| Total Investments in Securities | | | | |
| (Cost $557,989,399) | 100.0% | | | | $566,887,257 |
| Portfolio of Investments | The accompanying notes are an integral part of these financial statements. |
Portfolio of Investments | Short-Term Bond Fund | December 31, 2020 | (Continued)
| (a) | Zero coupon rate, purchased at a discount. |
| (b) | Interest is paid at maturity. |
| (c) | Variable coupon rate as of December 31, 2020. |
| (d) | Security was purchased pursuant to Rule 144A under the Securities Act of 1933 and may be resold in transactions exempt from registration, normally to qualified institutional buyers. The securities have been determined to be liquid under criteria established by the Fund's Board of Directors. The total of such securities at period-end amounts to $126,091,606 and represents 22.2% of total investments. |
| (e) | 7-day yield at December 31, 2020. |
LLC - Limited Liability Company
NA - National Association
DAC - Designated Activity Company
SAB de CV - Sociedad Anonima Bursatil de Capital Variable
SAB - Sociedad Anonima Bursatil
SA - Sociedad Anonima or Societe Anonyme
PLC - Public Limited Company
NV - Naamloze Vennottschap
BV - Besloten Vennootschap
FHLMC - Federal Home Loan Mortgage Corporation
| The accompanying notes are an integral part of these financial statements. | Portfolio of Investments |
47
Portfolio of Investments
Intermediate Bond Fund | December 31, 2020
| Corporate Bonds–Other | 39.1% of portfolio |
| | Interest Rate /
Yield | Maturity Date | Face Amount | Value |
| Communication Services | 3.3% | | |
| Alphabet Inc. | 1.10% | 08/15/30 | $40,000 | $39,407 |
| Alphabet Inc. | 1.90 | 08/15/40 | 50,000 | 48,995 |
| Alphabet Inc. | 2.05 | 08/15/50 | 82,000 | 78,097 |
| Alphabet Inc. | 2.25 | 08/15/60 | 120,000 | 115,744 |
| AT&T Inc. | 1.40(a) | 06/12/24 | 345,000 | 353,447 |
| AT&T Inc. | 2.25 | 02/01/32 | 145,000 | 147,007 |
| AT&T Inc. | 3.50 | 06/01/41 | 40,000 | 43,063 |
| AT&T Inc. | 3.65 | 06/01/51 | 255,000 | 266,530 |
| Charter Communications Operating LLC | 4.20 | 03/15/28 | 170,000 | 196,079 |
| Charter Communications Operating LLC | 3.70 | 04/01/51 | 50,000 | 51,831 |
| Comcast Corp. | 0.87(a) | 04/15/24 | 26,000 | 26,311 |
| Comcast Corp. | 3.95 | 10/15/25 | 85,000 | 97,635 |
| Comcast Corp. | 3.30 | 04/01/27 | 110,000 | 125,103 |
| Comcast Corp. | 1.95 | 01/15/31 | 65,000 | 66,840 |
| Comcast Corp. | 2.45 | 08/15/52 | 125,000 | 121,502 |
| Comcast Corp. | 2.65 | 08/15/62 | 125,000 | 124,834 |
| Sprint Communications, Inc. | 6.00 | 11/15/22 | 104,000 | 112,580 |
| Sprint Spectrum Co. LLC (b) | 4.74 | 03/20/25 | 450,000 | 487,390 |
| T-Mobile US, Inc. (b) | 3.00 | 02/15/41 | 200,000 | 207,344 |
| Verizon Communications Inc. | 0.85 | 11/20/25 | 150,000 | 151,144 |
| Verizon Communications Inc. | 2.65 | 11/20/40 | 100,000 | 100,986 |
| Walt Disney Co. (The) | 3.50 | 05/13/40 | 65,000 | 76,301 |
| Total Communication Services | | | | 3,038,170 |
| Consumer Discretionary | 5.1% | | |
| Amazon.com, Inc. | 2.70 | 06/03/60 | 160,000 | 170,686 |
| American Airlines Pass Through Trust 2017-1 | 3.65 | 02/15/29 | 136,744 | 137,819 |
| Block Financial Corp. | 3.88 | 08/15/30 | 95,000 | 102,573 |
| Booking Holdings Inc. | 4.10 | 04/13/25 | 150,000 | 170,082 |
| Booking Holdings Inc. | 4.50 | 04/13/27 | 55,000 | 65,560 |
| Expedia Group, Inc. (b) | 4.63 | 08/01/27 | 330,000 | 368,470 |
| Ford Motor Co. | 8.50 | 04/21/23 | 245,000 | 276,257 |
| Ford Motor Co. | 3.37 | 11/17/23 | 200,000 | 203,958 |
| Ford Motor Co. | 9.00 | 04/22/25 | 65,000 | 79,875 |
| Ford Motor Co. | 3.38 | 11/13/25 | 200,000 | 204,812 |
| General Motors Financial Co., Inc. | 1.55(a) | 06/30/22 | 60,000 | 60,401 |
| General Motors Financial Co., Inc. | 1.22(a) | 01/05/23 | 45,000 | 44,957 |
| General Motors Financial Co., Inc. | 5.20 | 03/20/23 | 325,000 | 356,339 |
| General Motors Financial Co., Inc. | 2.75 | 06/20/25 | 45,000 | 48,109 |
| Harley-Davidson Financial Services, Inc. (b) | 3.35 | 02/15/23 | 165,000 | 172,122 |
| Lowe's Companies, Inc. | 1.30 | 04/15/28 | 135,000 | 136,129 |
| Lowe's Companies, Inc. | 1.70 | 10/15/30 | 180,000 | 181,616 |
| Lowe's Companies, Inc. | 3.00 | 10/15/50 | 170,000 | 181,221 |
| Marriott International, Inc. | 4.63 | 06/15/30 | 190,000 | 222,848 |
| Masco Corp. | 2.00 | 10/01/30 | 85,000 | 86,491 |
| McDonald's Corp. | 3.50 | 07/01/27 | 60,000 | 68,801 |
| McDonald's Corp. | 4.20 | 04/01/50 | 35,000 | 44,916 |
| Pomona College | 2.89 | 01/01/51 | 100,000 | 107,314 |
| Ralph Lauren Corp. | 3.75 | 09/15/25 | 155,000 | 174,183 |
| Rockefeller Foundation (The) | 2.49 | 10/01/50 | 208,000 | 216,220 |
| Southwest Airlines Co. | 5.13 | 06/15/27 | 165,000 | 196,212 |
| Target Corp. | 2.65 | 09/15/30 | 60,000 | 67,368 |
| Tractor Supply Co. | 1.75 | 11/01/30 | 100,000 | 100,449 |
| Volkswagen Group of America (b) | 4.25 | 11/13/23 | 200,000 | 219,948 |
| Portfolio of Investments | The accompanying notes are an integral part of these financial statements. |
Portfolio of Investments | Intermediate Bond Fund | December 31, 2020 | (Continued)
| Corporate Bonds–Other | 39.1% of portfolio (Continued) |
| | Interest Rate /
Yield | Maturity Date | Face Amount | Value |
| Consumer Discretionary | 5.1% (Continued) | | |
| W.K. Kellogg Foundation Trust (b) | 2.44% | 10/01/50 | $250,000 | $254,794 |
| Total Consumer Discretionary | | | | 4,720,530 |
| Consumer Staples | 1.0% | | |
| General Mills, Inc. | 1.23(a) | 10/17/23 | 210,000 | 213,420 |
| Kellogg Co. | 2.10 | 06/01/30 | 100,000 | 104,984 |
| Keurig Dr Pepper Inc. | 3.43 | 06/15/27 | 399,000 | 455,497 |
| Molson Coors Brewing Co. | 3.00 | 07/15/26 | 92,000 | 100,272 |
| Molson Coors Brewing Co. | 5.00 | 05/01/42 | 50,000 | 62,489 |
| Total Consumer Staples | | | | 936,662 |
| Energy | 3.8% | | |
| BP Capital Markets America Inc. | 1.75 | 08/10/30 | 210,000 | 210,682 |
| BP Capital Markets America Inc. | 2.77 | 11/10/50 | 125,000 | 123,432 |
| BP Capital Markets America Inc. | 3.19 | 04/06/25 | 385,000 | 423,277 |
| Cheniere Corpus Christi Holdings LLC | 5.13 | 06/30/27 | 180,000 | 212,862 |
| Cheniere Corpus Christi Holdings LLC | 3.70 | 11/15/29 | 39,000 | 43,396 |
| Energy Transfer Operating LP | 3.75 | 05/15/30 | 318,000 | 342,835 |
| Energy Transfer Operating LP | 5.00 | 05/15/50 | 90,000 | 97,311 |
| EOG Resources, Inc. | 4.38 | 04/15/30 | 85,000 | 103,253 |
| EOG Resources, Inc. | 4.95 | 04/15/50 | 60,000 | 81,190 |
| EQM Midstream Partners, LP | 4.75 | 07/15/23 | 188,000 | 197,678 |
| EQM Midstream Partners, LP | 5.50 | 07/15/28 | 68,000 | 74,314 |
| Gray Oak Pipeline, LLC (b) | 2.00 | 09/15/23 | 70,000 | 71,084 |
| HollyFrontier Corp. | 2.63 | 10/01/23 | 60,000 | 61,316 |
| Midwest Connector Capital Co. LLC (b) | 3.90 | 04/01/24 | 85,000 | 87,113 |
| Midwest Connector Capital Co. LLC (b) | 4.63 | 04/01/29 | 205,000 | 214,797 |
| MPLX LP | 1.75 | 03/01/26 | 80,000 | 82,773 |
| MPLX LP | 2.65 | 08/15/30 | 245,000 | 256,621 |
| National Oilwell Varco, Inc. | 3.60 | 12/01/29 | 112,000 | 117,060 |
| Phillips 66 | 2.15 | 12/15/30 | 260,000 | 263,791 |
| Pioneer Natural Resources Co. | 1.90 | 08/15/30 | 430,000 | 425,705 |
| Valero Energy Corp. | 1.20 | 03/15/24 | 90,000 | 90,818 |
| Total Energy | | | | 3,581,308 |
| Financials | 15.5% | | |
| Air Lease Corp. | 3.38 | 07/01/25 | 95,000 | 102,143 |
| Air Lease Corp. | 2.88 | 01/15/26 | 100,000 | 105,790 |
| Athene Global Funding (b) | 2.80 | 05/26/23 | 95,000 | 99,175 |
| Athene Global Funding (b) | 2.50 | 01/14/25 | 609,000 | 637,832 |
| Athene Global Funding (b) | 2.95 | 11/12/26 | 120,000 | 128,673 |
| Bank of America Corp. | 0.81(a) | 10/24/24 | 300,000 | 302,248 |
| Bank of America Corp. | 3.95 | 04/21/25 | 844,000 | 951,389 |
| Bank of America Corp. | 0.98(a) | 09/25/25 | 220,000 | 222,354 |
| Bank of America Corp. | 1.20(a) | 10/24/26 | 200,000 | 202,617 |
| Bank of America Corp. | 2.50(a) | 02/13/31 | 263,000 | 279,172 |
| Bank of America Corp. | 1.92(a) | 10/24/31 | 300,000 | 303,786 |
| Bank of America Corp. | 2.68(a) | 06/19/41 | 275,000 | 286,084 |
| Bank of America Corp. | 2.83(a) | 10/24/51 | 300,000 | 312,305 |
| Capital One Bank (USA), NA | 2.01(a) | 01/27/23 | 275,000 | 279,714 |
| Capital Southwest Corp. | 4.50 | 01/31/26 | 600,000 | 601,500 |
| CIT Group Inc. | 3.93(a) | 06/19/24 | 402,000 | 425,115 |
| Citigroup Inc. | 1.68(a) | 05/15/24 | 75,000 | 77,254 |
| The accompanying notes are an integral part of these financial statements. | Portfolio of Investments |
49
Portfolio of Investments | Intermediate Bond Fund | December 31, 2020 | (Continued)
| Corporate Bonds–Other | 39.1% of portfolio (Continued) |
| | Interest Rate /
Yield | Maturity Date | Face Amount | Value |
| Financials | 15.5% (Continued) | | |
| Citigroup Inc. | 1.32%(a) | 05/17/24 | $150,000 | $152,030 |
| Citigroup Inc. | 4.45 | 09/29/27 | 653,000 | 769,889 |
| Citigroup Inc. | 2.98(a) | 11/05/30 | 65,000 | 71,548 |
| Citigroup Inc. | 2.57(a) | 06/03/31 | 470,000 | 500,675 |
| CoreStates Capital II (b) | 0.89(a) | 01/15/27 | 175,000 | 164,570 |
| Fidus Investment Corp. | 4.75 | 01/31/26 | 300,000 | 306,102 |
| Goldman Sachs BDC, Inc. | 2.88 | 01/15/26 | 500,000 | 510,585 |
| Goldman Sachs Group Inc. | 3.81(a) | 04/23/29 | 117,000 | 135,508 |
| Goldman Sachs Group, Inc. | 3.50 | 04/01/25 | 165,000 | 183,483 |
| Iron Mountain Inc. (b) | 4.50 | 02/15/31 | 80,000 | 83,800 |
| J.P. Morgan Chase & Co. | 0.65(a) | 09/16/24 | 120,000 | 120,627 |
| J.P. Morgan Chase & Co. | 2.08(a) | 04/22/26 | 205,000 | 216,463 |
| J.P. Morgan Chase & Co. | 3.63 | 12/01/27 | 422,000 | 479,767 |
| J.P. Morgan Chase & Co. | 2.52(a) | 04/22/31 | 105,000 | 112,798 |
| J.P. Morgan Chase & Co. | 2.96(a) | 05/13/31 | 120,000 | 131,548 |
| Jackson National Life Global Funding (b) | 0.68(a) | 01/06/23 | 350,000 | 351,439 |
| Main Street Capital Corp. | 5.20 | 05/01/24 | 884,000 | 958,613 |
| Morgan Stanley | 2.70(a) | 01/22/31 | 230,000 | 249,547 |
| Morgan Stanley | 1.79(a) | 02/13/32 | 175,000 | 175,976 |
| Oaktree Specialty Lending Corp. | 3.50 | 02/25/25 | 405,000 | 419,296 |
| Owl Rock Capital Corp. | 3.40 | 07/15/26 | 300,000 | 304,072 |
| Owl Rock Technology Finance Corp. | 4.75 | 12/15/25 | 1,095,000 | 1,143,209 |
| Owl Rock Technology Finance Corp. (b) | 3.75 | 06/17/26 | 150,000 | 150,779 |
| Prudential Financial, Inc. | 5.70(a) | 09/15/48 | 75,000 | 86,535 |
| Regions Financial Corp. | 2.25 | 05/18/25 | 70,000 | 74,219 |
| Visa Inc. | 2.00 | 08/15/50 | 120,000 | 114,361 |
| Wells Fargo & Co. | 1.65(a) | 06/02/24 | 510,000 | 523,917 |
| Wells Fargo & Co. | 2.19(a) | 04/30/26 | 60,000 | 63,161 |
| Wells Fargo & Co. | 2.39(a) | 06/02/28 | 175,000 | 186,232 |
| Wells Fargo & Co. | 2.57(a) | 02/11/31 | 50,000 | 52,888 |
| Wells Fargo & Co. | 3.07(a) | 04/30/41 | 340,000 | 369,863 |
| Total Financials | | | | 14,480,651 |
| Health Care | 2.0% | | |
| AbbVie Inc. | 2.95 | 11/21/26 | 160,000 | 176,988 |
| AbbVie Inc. | 4.05 | 11/21/39 | 172,000 | 207,518 |
| AbbVie Inc. | 4.25 | 11/21/49 | 90,000 | 112,803 |
| Anthem, Inc. | 2.38 | 01/15/25 | 50,000 | 53,467 |
| Anthem, Inc. | 3.13 | 05/15/50 | 60,000 | 65,741 |
| Bristol-Myers Squibb Co. | 2.35 | 11/13/40 | 170,000 | 174,692 |
| CVS Health Corp. | 1.75 | 08/21/30 | 245,000 | 246,306 |
| CVS Health Corp. | 2.70 | 08/21/40 | 170,000 | 171,732 |
| HCA Healthcare Inc. | 5.13 | 06/15/39 | 144,000 | 184,036 |
| Merck & Co., Inc. | 2.35 | 06/24/40 | 75,000 | 77,492 |
| Mylan Inc. | 4.55 | 04/15/28 | 140,000 | 166,364 |
| Mylan Inc. | 5.20 | 04/15/48 | 50,000 | 65,778 |
| Sutter Health | 1.32 | 08/15/25 | 135,000 | 137,246 |
| Thermo Fisher Scientific Inc. | 4.50 | 03/25/30 | 55,000 | 68,703 |
| Total Health Care | | | | 1,908,866 |
| Industrials | 1.2% | | |
| Ashtead Capital, Inc. (b) | 4.25 | 11/01/29 | 308,000 | 337,211 |
| Boeing Co. (The) | 1.88 | 06/15/23 | 80,000 | 81,404 |
| Portfolio of Investments | The accompanying notes are an integral part of these financial statements. |
Portfolio of Investments | Intermediate Bond Fund | December 31, 2020 | (Continued)
| Corporate Bonds–Other | 39.1% of portfolio (Continued) |
| | Interest Rate /
Yield | Maturity Date | Face Amount | Value |
| Industrials | 1.2% (Continued) | | |
| Boeing Co. (The) | 2.85% | 10/30/24 | $131,000 | $138,421 |
| Caterpillar Inc. | 3.25 | 04/09/50 | 55,000 | 64,835 |
| Delta Air Lines, Inc. (b) | 7.00 | 05/01/25 | 150,000 | 173,151 |
| Delta Air Lines, Inc. | 7.38 | 01/15/26 | 110,000 | 125,628 |
| Southwest Airlines Co. | 5.25 | 05/04/25 | 124,000 | 143,585 |
| Waste Management, Inc. | 1.15 | 03/15/28 | 96,000 | 96,232 |
| Total Industrials | | | | 1,160,467 |
| Information Technology | 1.8% | | |
| Dell International LLC / EMC Corp. (b) | 5.85 | 07/15/25 | 110,000 | 132,113 |
| Dell International LLC / EMC Corp. (b) | 4.90 | 10/01/26 | 182,000 | 214,861 |
| DXC Technology Co. | 4.00 | 04/15/23 | 145,000 | 154,246 |
| Infor, Inc. (b) | 1.75 | 07/15/25 | 70,000 | 72,697 |
| International Business Machines Corp. | 4.15 | 05/15/39 | 246,000 | 311,049 |
| Microsoft Corp. | 3.70 | 08/08/46 | 445,000 | 563,450 |
| NVIDIA Corp. | 3.50 | 04/01/40 | 90,000 | 107,933 |
| NVIDIA Corp. | 3.50 | 04/01/50 | 90,000 | 108,974 |
| Total Information Technology | | | | 1,665,323 |
| Materials | 0.9% | | |
| 3M Co. | 3.70 | 04/15/50 | 60,000 | 74,340 |
| DuPont de Nemours, Inc. | 2.17 | 05/01/23 | 145,000 | 146,912 |
| E.I. du Pont de Nemours & Co. | 2.30 | 07/15/30 | 40,000 | 42,525 |
| Georgia-Pacific LLC (b) | 0.95 | 05/15/26 | 200,000 | 200,936 |
| Mosaic Co. (The) | 4.25 | 11/15/23 | 305,000 | 333,124 |
| Total Materials | | | | 797,837 |
| Real Estate | 1.5% | | |
| American Tower Corp. | 1.88 | 10/15/30 | 130,000 | 131,058 |
| Life Storage, LP | 2.20 | 10/15/30 | 215,000 | 219,341 |
| SBA Tower Trust (b) | 2.84 | 01/15/25 | 115,000 | 122,439 |
| Service Properties Trust | 7.50 | 09/15/25 | 305,000 | 351,392 |
| STORE Capital Corp. | 2.75 | 11/18/30 | 200,000 | 203,282 |
| VEREIT Operating Partnership, LP | 2.20 | 06/15/28 | 295,000 | 301,506 |
| Welltower Inc. | 2.75 | 01/15/31 | 95,000 | 101,306 |
| Total Real Estate | | | | 1,430,324 |
| Utilities | 3.0% | | |
| Dominion Energy, Inc. | 0.75(a) | 09/15/23 | 90,000 | 90,166 |
| National Fuel Gas Co. | 5.50 | 01/15/26 | 307,000 | 354,031 |
| NRG Energy, Inc. (b) | 4.45 | 06/15/29 | 95,000 | 110,135 |
| Pacific Gas & Electric Co. | 4.25 | 08/01/23 | 394,000 | 423,007 |
| Pacific Gas & Electric Co. | 4.25 | 03/15/46 | 325,000 | 348,255 |
| San Diego Gas & Electric Co. | 1.91 | 02/01/22 | 182,362 | 183,328 |
| Southern California Edison Co. | 1.85 | 02/01/22 | 176,571 | 176,950 |
| Southern California Edison Co. | 2.25 | 06/01/30 | 55,000 | 57,230 |
| Southern California Edison Co. | 4.50 | 09/01/40 | 200,000 | 240,654 |
| Southern California Edison Co. | 4.00 | 04/01/47 | 164,000 | 192,318 |
| Southern California Edison Co. | 3.65 | 02/01/50 | 214,000 | 242,629 |
| TerraForm Power Operating LLC (b) | 4.25 | 01/31/23 | 215,000 | 222,256 |
| The accompanying notes are an integral part of these financial statements. | Portfolio of Investments |
51
Portfolio of Investments | Intermediate Bond Fund | December 31, 2020 | (Continued)
| Corporate Bonds–Other | 39.1% of portfolio (Continued) |
| | Interest Rate /
Yield | Maturity Date | Face Amount | Value |
| Utilities | 3.0% (Continued) | | |
| TerraForm Power Operating LLC (b) | 4.75% | 01/15/30 | $171,000 | $182,970 |
| Total Utilities | | | | 2,823,929 |
| Total Corporate Bonds–Other | | | | |
| (Cost $35,080,672) | | | | 36,544,067 |
| Mortgage-Backed Securities | 17.4% of portfolio |
| | | | |
| Federal Home Loan Mortgage Corp. | 3.00 | 06/01/50 | 507,454 | 531,475 |
| FNMA BN5402 | 3.50 | 04/01/49 | 77,519 | 81,888 |
| FNMA BN7662 | 3.50 | 07/01/49 | 249,890 | 263,802 |
| FNMA CA4016 | 3.00 | 08/01/49 | 1,059,252 | 1,125,027 |
| FNMA FM1000 | 3.00 | 04/01/47 | 1,827,274 | 1,916,494 |
| FNMA FM4231 | 2.50 | 09/01/50 | 353,690 | 373,110 |
| FNMA MA3691 | 3.00 | 07/01/49 | 413,749 | 433,710 |
| FNMA MA3692 | 3.50 | 07/01/49 | 977,366 | 1,032,404 |
| FNMA MA3745 | 3.50 | 08/01/49 | 1,119,995 | 1,183,038 |
| FNMA MA3834 | 3.00 | 11/01/49 | 823,159 | 863,064 |
| FNMA MA3960 | 3.00 | 03/01/50 | 380,315 | 398,634 |
| FNMA MA3992 | 3.50 | 04/01/50 | 452,555 | 478,313 |
| FNMA MA4048 | 3.00 | 06/01/50 | 1,488,498 | 1,558,961 |
| FNMA MA4179 | 2.00 | 11/01/35 | 5,771,594 | 6,033,753 |
| Total Mortgage-Backed Securities | | | | |
| (Cost $16,114,470) | | | | 16,273,673 |
| U.S. Government & Agency Obligations | 13.9% of portfolio |
| | | | |
| U.S. International Development Finance Corp. | 1.05 | 10/15/29 | 147,035 | 148,872 |
| U.S. International Development Finance Corp. | 1.49 | 08/15/31 | 80,000 | 82,151 |
| U.S. International Development Finance Corp. | 3.00 | 10/05/34 | 190,246 | 217,299 |
| U.S. International Development Finance Corp. | 1.32 | 03/15/35 | 210,000 | 211,415 |
| U.S. Treasury Note | 0.25 | 11/15/23 | 145,000 | 145,396 |
| U.S. Treasury Note | 0.38 | 12/31/25 | 1,145,000 | 1,145,626 |
| U.S. Treasury Note | 0.63 | 11/30/27 | 1,919,000 | 1,917,801 |
| U.S. Treasury Note | 0.88 | 11/15/30 | 3,493,000 | 3,479,355 |
| U.S. Treasury Note | 1.38 | 08/15/50 | 6,053,000 | 5,655,772 |
| Total U.S. Government & Agency Obligations | | | | |
| (Cost $12,978,698) | | | | 13,003,687 |
| Asset-Backed Securities | 11.3% of portfolio |
| | | | |
| American Credit Acceptance Receivables Trust 19-1 (b) | 3.50 | 04/14/25 | 120,000 | 121,904 |
| American Credit Acceptance Receivables Trust 2019-3 (b) | 2.59 | 08/14/23 | 800,000 | 803,486 |
| American Credit Acceptance Receivables Trust 20-3A (b) | 0.62 | 10/13/23 | 118,377 | 118,515 |
| American Credit Acceptance Receivables Trust 20-3B (b) | 1.15 | 08/13/24 | 115,000 | 115,588 |
| Avant Loans Funding Trust 19-B (b) | 2.72 | 10/15/26 | 34,773 | 34,899 |
| Avid Automobile Receivables Trust 19-1 (b) | 2.62 | 02/15/24 | 42,332 | 42,722 |
| Carvana Auto Receivables Trust 19-2A (b) | 2.74 | 12/15/23 | 310,000 | 314,855 |
| Carvana Auto Receivables Trust 20-N1A (b) | 2.01 | 03/17/25 | 350,000 | 355,519 |
| Consumer Loan Underlying Bond 18-P3 (b) | 3.82 | 01/15/26 | 78,794 | 79,097 |
| Consumer Loan Underlying Bond 19-HP1 (b) | 2.59 | 12/15/26 | 50,281 | 50,842 |
| Consumer Loan Underlying Bond 20-P1 (b) | 2.26 | 03/15/28 | 119,961 | 120,836 |
| CoreVest American Finance 20-4 (b) | 1.17 | 12/15/52 | 150,000 | 150,526 |
| CPS Auto Trust 20-C (b) | 1.01 | 01/15/25 | 100,000 | 100,267 |
| Credit Acceptance Auto Loan Trust 18-2A (b) | 3.47 | 05/17/27 | 75,991 | 76,433 |
| Credit Acceptance Auto Loan Trust 18-3B (b) | 3.89 | 10/15/27 | 250,000 | 255,497 |
| Portfolio of Investments | The accompanying notes are an integral part of these financial statements. |
Portfolio of Investments | Intermediate Bond Fund | December 31, 2020 | (Continued)
| Asset-Backed Securities | 11.3% of portfolio (Continued) |
| | Interest Rate /Yield | Maturity Date | Face Amount | Value |
| Credit Acceptance Auto Loan Trust 19-1A (b) | 3.33% | 02/15/28 | $250,000 | $254,636 |
| Credit Acceptance Auto Loan Trust 19-1B (b) | 3.75 | 04/17/28 | 500,000 | 520,248 |
| Credit Acceptance Auto Loan Trust 19-1C (b) | 3.94 | 06/15/28 | 250,000 | 261,325 |
| Credit Acceptance Auto Loan Trust 20-1A (b) | 2.01 | 02/15/29 | 500,000 | 511,187 |
| Credit Acceptance Auto Loan Trust 20-1A (b) | 2.39 | 04/16/29 | 250,000 | 255,911 |
| Credit Acceptance Auto Loan Trust 20-2A (b) | 1.37 | 07/16/29 | 250,000 | 253,368 |
| Credit Acceptance Auto Loan Trust 20-3A (b) | 1.24 | 10/15/29 | 350,000 | 353,886 |
| DT Auto Owner Trust 18-2D (b) | 4.15 | 03/15/24 | 100,000 | 102,597 |
| DT Auto Owner Trust 19-1C (b) | 3.61 | 11/15/24 | 300,000 | 305,642 |
| DT Auto Owner Trust 20-3A (b) | 0.91 | 12/16/24 | 200,000 | 201,044 |
| Exeter Automobile Receivables Trust 19-4 (b) | 2.18 | 01/17/23 | 18,449 | 18,488 |
| Exeter Automobile Receivables Trust 20-1A (b) | 2.05 | 06/15/23 | 29,813 | 29,931 |
| Exeter Automobile Receivables Trust 20-1A (b) | 2.26 | 04/15/24 | 100,000 | 101,377 |
| Exeter Automobile Receivables Trust 20-3A | 0.52 | 10/16/23 | 100,000 | 100,082 |
| Foursight Capital Automobile Receivables Trust 19-1 (b) | 2.67 | 03/15/24 | 100,000 | 101,564 |
| Freedom Financial 20-3 (b) | 2.40 | 09/20/27 | 189,970 | 190,665 |
| GLS Auto Receivables Trust 19-1 (b) | 3.65 | 12/16/24 | 800,000 | 815,584 |
| GLS Auto Receivables Trust 19-2 (b) | 3.06 | 04/17/23 | 1,054,925 | 1,061,862 |
| GLS Auto Receivables Trust 20-2 (b) | 1.58 | 08/15/24 | 294,095 | 296,725 |
| GLS Auto Receivables Trust 20-3 (b) | 1.38 | 08/15/24 | 150,000 | 151,429 |
| GLS Auto Receivables Trust 20-4 (b) | 0.87 | 12/16/24 | 300,000 | 300,423 |
| Gracie Point International Fund 20-B (b) | 1.53(a) | 05/02/23 | 291,000 | 290,987 |
| Marlette Funding Trust 19-3 (b) | 2.69 | 09/17/29 | 27,417 | 27,602 |
| Marlette Funding Trust 20-2 (b) | 1.02 | 09/16/30 | 70,641 | 70,760 |
| Prosper Marketplace Issuance Trust 19-3 (b) | 3.19 | 07/15/25 | 12,203 | 12,244 |
| SoFi Consumer Loan Program Trust 18-3 (b) | 4.02 | 08/25/27 | 150,000 | 154,116 |
| SoFi Consumer Loan Program Trust 19-1 (b) | 3.24 | 02/25/28 | 22,533 | 22,692 |
| SoFi Consumer Loan Program Trust 19-4 (b) | 2.45 | 08/25/28 | 38,263 | 38,661 |
| United Auto Credit Securitization Trust 20-1 (b) | 1.47 | 11/10/22 | 120,000 | 120,642 |
| Upstart Securitization Trust 19-3 (b) | 2.68 | 01/21/30 | 69,209 | 69,823 |
| Westlake Automobile Receivable Trust 19-2A (b) | 2.84 | 07/15/24 | 200,000 | 204,087 |
| Westlake Automobile Receivable Trust 20-3A (b) | 0.56 | 05/15/24 | 375,000 | 375,820 |
| Westlake Automobile Receivable Trust 20-3A (b) | 0.78 | 11/17/25 | 230,000 | 230,485 |
| Total Asset-Backed Securities | | | | |
| (Cost $10,511,735) | | | | 10,546,879 |
| Yankee Bonds | 9.1% of portfolio |
| | | | |
| AerCap Ireland Capital DAC | 4.13 | 07/03/23 | 185,000 | 198,125 |
| AerCap Ireland Capital DAC | 6.50 | 07/15/25 | 165,000 | 197,212 |
| Aircastle Ltd. (b) | 5.25 | 08/11/25 | 160,000 | 176,182 |
| Avolon Holdings Funding Ltd. (b) | 3.63 | 05/01/22 | 207,000 | 211,476 |
| Avolon Holdings Funding Ltd. (b) | 5.13 | 10/01/23 | 500,000 | 534,855 |
| Avolon Holdings Funding Ltd. (b) | 3.95 | 07/01/24 | 150,000 | 158,402 |
| Avolon Holdings Funding Ltd. (b) | 5.50 | 01/15/26 | 300,000 | 339,802 |
| Avolon Holdings Funding Ltd. (b) | 4.25 | 04/15/26 | 100,000 | 107,713 |
| Banco Bilbao Vizcaya Argentaria SA | 0.88 | 09/18/23 | 200,000 | 201,389 |
| Banco Bilbao Vizcaya Argentaria SA | 1.13 | 09/18/25 | 200,000 | 201,400 |
| Banco Santander SA | 2.75 | 05/28/25 | 200,000 | 213,462 |
| Banco Santander SA | 3.49 | 05/28/30 | 200,000 | 224,293 |
| Barclays PLC | 1.60(a) | 05/16/24 | 400,000 | 405,392 |
| Barclays PLC | 2.85(a) | 05/07/26 | 325,000 | 348,962 |
| Barclays PLC | 2.65(a) | 06/24/31 | 200,000 | 208,153 |
| Cemex, SAB de CV (b) | 7.38 | 06/05/27 | 230,000 | 261,740 |
| Delta and SkyMiles IP Ltd. (b) | 4.50 | 10/20/25 | 100,000 | 106,869 |
| Delta and SkyMiles IP Ltd. (b) | 4.75 | 10/20/28 | 50,000 | 54,555 |
| DH Europe Finance II SARL | 2.60 | 11/15/29 | 153,000 | 167,243 |
| Enel Finance International NV (b) | 2.75 | 04/06/23 | 200,000 | 209,251 |
| The accompanying notes are an integral part of these financial statements. | Portfolio of Investments |
53
Portfolio of Investments | Intermediate Bond Fund | December 31, 2020 | (Continued)
| Yankee Bonds | 9.1% of portfolio (Continued) |
| | Interest Rate /Yield | Maturity Date | Face Amount | Value |
| Enel Finance International NV (b) | 2.65% | 09/10/24 | $345,000 | $367,436 |
| Mitsubishi UFJ Financial Group, Inc. | 1.07(a) | 07/26/23 | 230,000 | 232,495 |
| Mitsubishi UFJ Financial Group, Inc. | 1.41 | 07/17/25 | 220,000 | 225,966 |
| Nationwide Building Society (b) | 3.62(a) | 04/26/23 | 200,000 | 207,738 |
| NatWest Group PLC | 4.27(a) | 03/22/25 | 296,000 | 327,413 |
| Nissan Motor Co., Ltd. (b) | 3.52 | 09/17/25 | 230,000 | 246,572 |
| Nissan Motor Co., Ltd. (b) | 4.81 | 09/17/30 | 200,000 | 225,361 |
| Seagate HDD Cayman (b) | 4.13 | 01/15/31 | 75,000 | 80,169 |
| Spirit Loyalty Cayman Ltd. (b) | 8.00 | 09/20/25 | 100,000 | 112,000 |
| Sumitomo Mitsui Financial Group, Inc. (b) | 1.05 | 09/12/25 | 200,000 | 201,289 |
| Syngenta Finance NV (b) | 4.44 | 04/24/23 | 230,000 | 241,356 |
| Syngenta Finance NV (b) | 4.89 | 04/24/25 | 530,000 | 568,722 |
| Tencent Holdings Ltd. (b) | 1.81 | 01/26/26 | 220,000 | 224,844 |
| Tencent Music Entertainment Group | 2.00 | 09/03/30 | 200,000 | 198,701 |
| Teva Pharmaceutical Industries Ltd. | 2.80 | 07/21/23 | 248,000 | 245,520 |
| Westpac Banking Corp. | 2.96 | 11/16/40 | 300,000 | 318,992 |
| Total Yankee Bonds | | | | |
| (Cost $8,147,821) | | | | 8,551,050 |
| Municipal Bonds | 4.0% of portfolio |
| | | | |
| Alabama | 0.1% | | |
| Alabama Public School & College Authority | 1.16 | 06/01/26 | 85,000 | 86,510 |
| Total Alabama | | | | 86,510 |
| Arizona | 0.2% | | |
| Pinal County Arizona Revenue Obligation | 1.05 | 08/01/24 | 120,000 | 120,723 |
| Pinal County Arizona Revenue Obligation | 1.58 | 08/01/26 | 110,000 | 111,333 |
| Total Arizona | | | | 232,056 |
| California | 0.4% | | |
| California Infrastructure & Economic Development Bank | 1.24 | 10/01/27 | 50,000 | 50,463 |
| Gardena California Pension Obligation | 2.07 | 04/01/26 | 100,000 | 103,586 |
| Santa Clara Valley California Water District | 3.82 | 06/01/39 | 180,000 | 198,007 |
| Total California | | | | 352,056 |
| Colorado | 0.1% | | |
| Denver City & County Colorado Airport | 1.57 | 11/15/26 | 95,000 | 95,511 |
| Total Colorado | | | | 95,511 |
| Georgia | 0.1% | | |
| City of Atlanta Georgia Water & Wastewater | 2.26 | 11/01/35 | 130,000 | 136,512 |
| Total Georgia | | | | 136,512 |
| Hawaii | 0.2% | | |
| Hawaii State | 0.89 | 08/01/26 | 60,000 | 60,460 |
| Hawaii State | 1.11 | 10/01/26 | 90,000 | 91,688 |
| Total Hawaii | | | | 152,148 |
| New Jersey | 1.1% | | |
| New Jersey Economic Development Authority | 7.63(c) | 02/15/22 | 130,000 | 129,215 |
| Portfolio of Investments | The accompanying notes are an integral part of these financial statements. |
Portfolio of Investments | Intermediate Bond Fund | December 31, 2020 | (Continued)
| Municipal Bonds | 4.0% of portfolio (Continued) |
| | Interest Rate /Yield | Maturity Date | Face Amount | Value |
| New Jersey | 1.1% (Continued) | | |
| New Jersey Housing and Morgage Finance Agency | 1.34% | 04/01/24 | $95,000 | $95,686 |
| New Jersey Housing and Morgage Finance Agency | 1.49 | 04/01/25 | 85,000 | 85,663 |
| New Jersey Housing and Morgage Finance Agency | 1.54 | 10/01/25 | 145,000 | 145,648 |
| New Jersey Transportation Trust Fund Authority | 4.08 | 06/15/39 | 575,000 | 604,474 |
| Total New Jersey | | | | 1,060,686 |
| New York | 1.4% | | |
| New York NY | 0.83 | 08/01/24 | 500,000 | 501,295 |
| New York NY | 1.22 | 08/01/26 | 200,000 | 202,416 |
| Suffolk County New York | 1.61 | 06/15/25 | 200,000 | 201,920 |
| Suffolk County New York | 1.99 | 06/15/26 | 365,000 | 372,869 |
| Total New York | | | | 1,278,500 |
| Texas | 0.4% | | |
| Harris County Texas Cultural Education Facilities Finance Corp. | 3.34 | 11/15/37 | 200,000 | 213,924 |
| San Antonio Texas Electric & Gas | 2.91 | 02/01/48 | 150,000 | 158,090 |
| Total Texas | | | | 372,014 |
| Total Municipal Bonds | | | | |
| (Cost $3,663,784) | | | | 3,765,993 |
| Corporate Bond Guaranteed by Export-Import Bank of the United States | 0.4% of portfolio |
| | | | |
| Energy | 0.4% | | |
| Petroleos Mexicanos | 0.59(a) | 04/15/25 | 321,750 | 322,275 |
| Total Energy | | | | 322,275 |
| Total Corporate Bond Guaranteed by Export-Import Bank of the United States | | | | |
| (Cost $321,403) | | | | 322,275 |
| Money Market Fund | 4.8% of portfolio |
| | | | Shares | |
| State Street Institutional U.S. Government Money Market Fund Premier Class | 0.03(d) | | 4,504,029 | 4,504,029 |
| Total Money Market Fund | | | | |
| (Cost $4,504,029) | | | | 4,504,029 |
| Total Investments in Securities | | | | |
| (Cost $91,322,612) | 100.0% | | | | $93,511,653 |
| (a) | Variable coupon rate as of December 31, 2020. |
| (b) | Security was purchased pursuant to Rule 144A under the Securities Act of 1933 and may be resold in transactions exempt from registration, normally to qualified institutional buyers. The securities have been determined to be liquid under criteria established by the Fund's Board of Trustees. The total of such securities at period-end amounts to $20,551,228 and represents 22.0% of total investments. |
| (c) | Interest is paid at maturity. |
| (d) | 7-day yield at December 31, 2020. |
LLC - Limited Liability Company
LP - Limited Partnership
NA - National Association
DAC - Designated Activity Company
| The accompanying notes are an integral part of these financial statements. | Portfolio of Investments |
55
Portfolio of Investments | Intermediate Bond Fund | December 31, 2020 | (Continued)
SA - Sociedad Anonima or Societe Anonyme
PLC - Public Limited Company
SAB de CV - Sociedad Anonima Bursatil de Capital Variable
SAB - Sociedad Anonima Bursatil
SARL - Societe a responsabilite limitee
NV - Naamloze Vennottschap
| Portfolio of Investments | The accompanying notes are an integral part of these financial statements. |
Portfolio of Investments
Stock Index Fund | December 31, 2020
| | Cost | Value |
| Investment | $39,884,120 | $188,972,500 |
Substantially all the assets of the Stock Index Fund are invested in the S&P 500 Index Master Portfolio managed by BlackRock Fund Advisors. As of December 31, 2020, the Stock Index Fund's ownership interest in the S&P 500 Index Master Portfolio was 0.70%. See the Portfolio of Investments for the S&P 500 Index Master Portfolio for holdings information.
| The accompanying notes are an integral part of these financial statements. | Portfolio of Investments |
57
Portfolio of Investments
Value Fund | December 31, 2020
| Common Stocks | 98.5% of portfolio |
| | Shares | Value |
| Communication Services | 8.0% |
| Diversified Telecommunication Services | | |
| Verizon Communications, Inc. | 219,431 | $12,891,571 |
| Interactive Media & Services | | |
| Alphabet, Inc., Class C (a) | 26,311 | 46,093,715 |
| Facebook, Inc., Class A (a) | 36,000 | 9,833,760 |
| Media | | |
| Comcast Corp., Class A | 100,800 | 5,281,920 |
| Total Communication Services | | 74,100,966 |
| Consumer Discretionary | 5.6% |
| Hotels, Restaurants & Leisure | | |
| Las Vegas Sands Corp. (a) | 137,048 | 8,168,061 |
| McDonald's Corp. | 57,797 | 12,402,080 |
| Specialty Retail | | |
| Home Depot, Inc. | 37,418 | 9,938,969 |
| TJX Companies, Inc. (The) | 145,100 | 9,908,879 |
| Ulta Beauty, Inc. (a) | 41,456 | 11,904,505 |
| Total Consumer Discretionary | | 52,322,494 |
| Financials | 18.5% |
| Banks | | |
| Bank of America Corp. | 738,202 | 22,374,903 |
| Citigroup, Inc. | 277,639 | 17,119,221 |
| JPMorgan Chase & Co. | 312,091 | 39,657,403 |
| Truist Financial Corp. | 257,400 | 12,337,182 |
| Capital Markets | | |
| Goldman Sachs Group, Inc. | 77,474 | 20,430,668 |
| Insurance | | |
| Allstate Corp. | 304,684 | 33,493,912 |
| American International Group, Inc. | 368,594 | 13,954,969 |
| Chubb Ltd. | 80,038 | 12,319,449 |
| Total Financials | | 171,687,707 |
| Health Care | 22.3% |
| Biotechnology | | |
| AbbVie Inc. | 183,263 | 19,636,630 |
| Amgen Inc. | 34,500 | 7,932,240 |
| Health Care Equipment & Supplies | | |
| Abbott Laboratories | 374,156 | 40,966,341 |
| Boston Scientific Corp. (a) | 332,296 | 11,946,041 |
| Medtronic PLC | 137,256 | 16,078,168 |
| Health Care Providers & Services | | |
| Centene Corp. (a) | 300,797 | 18,056,844 |
| Cigna Corp. | 84,514 | 17,594,124 |
| Life Sciences Tools & Services | | |
| Mettler-Toledo International, Inc. (a) | 9,004 | 10,261,679 |
| Pharmaceuticals | | |
| Bristol-Myers Squibb Co. | 256,001 | 15,879,742 |
| Merck & Co., Inc. | 300,982 | 24,620,328 |
| Common Stocks | 98.5% of portfolio (Continued) |
| | Shares | Value |
| Health Care | 22.3% (Continued) |
| Pfizer, Inc. | 652,799 | $24,029,531 |
| Total Health Care | | 207,001,668 |
| Industrials | 16.3% |
| Aerospace & Defense | | |
| Northrop Grumman Corp. | 34,831 | 10,613,702 |
| Airlines | | |
| Southwest Airlines Co. (a) | 252,732 | 11,779,839 |
| Electrical Equipment | | |
| Eaton Corp. PLC | 89,887 | 10,799,024 |
| Industrial Conglomerates | | |
| Honeywell International, Inc. | 216,673 | 46,086,347 |
| Machinery | | |
| Deere & Co. | 31,800 | 8,555,790 |
| Parker-Hannifin Corp. | 109,222 | 29,753,165 |
| Stanley Black & Decker, Inc. | 84,842 | 15,149,388 |
| Road & Rail | | |
| CSX Corp. | 208,594 | 18,929,905 |
| Total Industrials | | 151,667,160 |
| Information Technology | 17.4% |
| IT Services | | |
| Fiserv, Inc. (a) | 71,700 | 8,163,762 |
| Leidos Holdings Inc. | 162,817 | 17,115,323 |
| Visa Inc., Class A | 144,898 | 31,693,540 |
| Semiconductors & Semiconductor Equipment | | |
| NVIDIA Corp. | 47,355 | 24,728,781 |
| NXP Semiconductors NV | 139,463 | 22,176,012 |
| Software | | |
| Microsoft Corp. | 183,914 | 40,906,152 |
| VMware, Inc., Class A (a) | 117,083 | 16,422,061 |
| Total Information Technology | | 161,205,631 |
| Materials | 8.4% |
| Chemicals | | |
| Dow Inc. | 183,081 | 10,160,995 |
| DuPont de Nemours, Inc. | 296,978 | 21,118,106 |
| Containers & Packaging | | |
| Avery Dennison Corp. | 265,787 | 41,226,222 |
| Metals & Mining | | |
| Freeport-McMoRan Inc. (a) | 224,500 | 5,841,490 |
| Total Materials | | 78,346,813 |
| Real Estate | 2.0% |
| Equity Real Estate Investment Trusts (REITs) | | |
| Digital Realty Trust, Inc. | 52,901 | 7,380,219 |
| VICI Properties Inc. | 424,135 | 10,815,442 |
| Total Real Estate | | 18,195,661 |
| Total Common Stocks | | |
| (Cost $523,064,646) | | 914,528,100 |
| Portfolio of Investments | The accompanying notes are an integral part of these financial statements. |
Portfolio of Investments | Value Fund | December 31, 2020 | (Continued)
| Money Market Fund | 1.5% of portfolio |
| | Shares | Value |
| State Street Institutional U.S. Government Money Market Fund Premier Class, 0.03% (b) | 13,690,331 | $13,690,331 |
| Total Money Market Fund | | |
| (Cost $13,690,331) | | 13,690,331 |
| Total Investments in Securities | | |
| (Cost $536,754,977) | 100.0% | | $928,218,431 |
| (b) | 7-day yield at December 31, 2020. |
PLC - Public Limited Company
NV - Naamloze Vennottschap
| The accompanying notes are an integral part of these financial statements. | Portfolio of Investments |
59
Portfolio of Investments
Growth Fund | December 31, 2020
| Common Stocks | 99.4% of portfolio |
| | Shares | Value |
| Communication Services | 23.1% |
| Entertainment | | |
| Netflix, Inc. (a) | 12,446 | $6,729,926 |
| Sea Ltd. ADR (a) | 4,771 | 949,667 |
| Spotify Technology SA (a) | 16,503 | 5,192,834 |
| Interactive Media & Services | | |
| Alphabet, Inc., Class C (a) | 4,400 | 7,708,272 |
| Alphabet, Inc., Class A (a) | 8,947 | 15,680,870 |
| Facebook, Inc., Class A (a) | 66,375 | 18,130,995 |
| IAC/InterActiveCorp (a) | 9,074 | 1,718,162 |
| Match Group, Inc. (a) | 23,435 | 3,543,138 |
| Snap Inc., Class A (a) | 160,777 | 8,050,104 |
| Tencent Holdings Ltd. ADR | 86,109 | 6,190,376 |
| Total Communication Services | | 73,894,344 |
| Consumer Discretionary | 21.2% |
| Auto Components | | |
| Aptiv PLC | 33,062 | 4,307,648 |
| Hotels, Restaurants & Leisure | | |
| Chipotle Mexican Grill, Inc. (a) | 1,425 | 1,976,062 |
| DraftKings Inc., Class A (a) | 36,908 | 1,718,436 |
| Internet & Direct Marketing Retail | | |
| Alibaba Group Holding Ltd. ADR (a) | 26,439 | 6,153,149 |
| Amazon.com, Inc. (a) | 9,289 | 30,253,623 |
| Booking Holdings, Inc. (a) | 1,601 | 3,565,859 |
| Farfetch Ltd., Class A (a) | 22,230 | 1,418,496 |
| Multiline Retail | | |
| Dollar General Corp. | 18,803 | 3,954,271 |
| Specialty Retail | | |
| CarMax, Inc. (a) | 14,906 | 1,408,021 |
| Carvana Co. (a) | 10,482 | 2,510,858 |
| Ross Stores, Inc. | 46,295 | 5,685,489 |
| Textiles, Apparel & Luxury Goods | | |
| lululemon athletica Inc. (a) | 7,258 | 2,526,002 |
| NIKE, Inc., Class B | 16,995 | 2,404,282 |
| Total Consumer Discretionary | | 67,882,196 |
| Financials | 2.0% |
| Capital Markets | | |
| Charles Schwab Corp. | 28,585 | 1,516,148 |
| Goldman Sachs Group, Inc. | 8,033 | 2,118,383 |
| S&P Global Inc. | 5,872 | 1,930,303 |
| XP Inc., Class A (a) | 22,554 | 894,717 |
| Total Financials | | 6,459,551 |
| Health Care | 14.5% |
| Biotechnology | | |
| Incyte Corp. (a) | 21,111 | 1,836,235 |
| Vertex Pharmaceuticals, Inc. (a) | 15,442 | 3,649,562 |
| Health Care Equipment & Supplies | | |
| Becton, Dickinson & Co. | 9,840 | 2,462,165 |
| Intuitive Surgical, Inc. (a) | 7,365 | 6,025,306 |
| Stryker Corp. | 26,846 | 6,578,344 |
| Common Stocks | 99.4% of portfolio (Continued) |
| | Shares | Value |
| Health Care | 14.5% (Continued) |
| Health Care Providers & Services | | |
| Anthem, Inc. | 4,641 | $1,490,179 |
| Centene Corp. (a) | 32,107 | 1,927,383 |
| Cigna Corp. | 33,618 | 6,998,595 |
| HCA Healthcare, Inc. | 21,603 | 3,552,830 |
| Humana Inc. | 6,901 | 2,831,273 |
| UnitedHealth Group, Inc. | 18,229 | 6,392,546 |
| Life Sciences Tools & Services | | |
| Avantor, Inc. (a) | 91,561 | 2,577,442 |
| Total Health Care | | 46,321,860 |
| Industrials | 2.2% |
| Machinery | | |
| Ingersoll Rand Inc. (a) | 64,595 | 2,942,948 |
| Professional Services | | |
| CoStar Group, Inc. (a) | 2,759 | 2,550,089 |
| Road & Rail | | |
| Norfolk Southern Corp. | 6,399 | 1,520,466 |
| Total Industrials | | 7,013,503 |
| Information Technology | 35.5% |
| IT Services | | |
| Fidelity National Information Services, Inc. | 14,206 | 2,009,581 |
| Global Payments, Inc. | 54,617 | 11,765,594 |
| MongoDB, Inc. (a) | 5,788 | 2,078,123 |
| PayPal Holdings, Inc. (a) | 30,199 | 7,072,606 |
| Shopify Inc., Class A (a) | 426 | 482,211 |
| Visa Inc., Class A | 58,667 | 12,832,233 |
| Wix.com Ltd. (a) | 3,747 | 936,600 |
| Semiconductors & Semiconductor Equipment | | |
| Advanced Micro Devices, Inc. (a) | 26,516 | 2,431,782 |
| ASML Holding NV ADR | 9,986 | 4,870,372 |
| Marvell Technology Group Ltd. | 38,343 | 1,822,826 |
| Software | | |
| Intuit, Inc. | 21,227 | 8,063,076 |
| Microsoft Corp. | 112,640 | 25,053,389 |
| RingCentral, Inc., Class A (a) | 3,300 | 1,250,601 |
| salesforce.com, Inc. (a) | 28,844 | 6,418,655 |
| ServiceNow, Inc. (a) | 8,025 | 4,417,201 |
| Slack Technologies, Inc., Class A (a) | 19,774 | 835,254 |
| Splunk Inc. (a) | 23,233 | 3,947,054 |
| Synopsys, Inc. (a) | 9,438 | 2,446,707 |
| Technology Hardware, Storage & Peripherals | | |
| Apple, Inc. | 111,639 | 14,813,379 |
| Total Information Technology | | 113,547,244 |
| Portfolio of Investments | The accompanying notes are an integral part of these financial statements. |
Portfolio of Investments | Growth Fund | December 31, 2020 | (Continued)
| Common Stocks | 99.4% of portfolio (Continued) |
| | Shares | Value |
| Utilities | 0.9% |
| Electric Utilities | | |
| NextEra Energy, Inc. | 38,890 | $3,000,364 |
| Total Utilities | | 3,000,364 |
| Total Common Stocks | | |
| (Cost $161,740,040) | | 318,119,062 |
| Money Market Fund | 0.6% of portfolio |
| | |
| State Street Institutional U.S. Government Money Market Fund Premier Class, 0.03% (b) | 2,006,631 | 2,006,631 |
| Total Money Market Fund | | |
| (Cost $2,006,631) | | 2,006,631 |
| Total Investments in Securities | | |
| (Cost $163,746,671) | 100.0% | | $320,125,693 |
| (b) | 7-day yield at December 31, 2020. |
ADR - American Depositary Deposit
SA - Sociedad Anonima or Societe Anonyme
PLC - Public Limited Company
S&P - Standard & Poor's
NV - Naamloze Vennottschap
| The accompanying notes are an integral part of these financial statements. | Portfolio of Investments |
61
Portfolio of Investments
International Equity Fund | December 31, 2020
| Common Stocks | 94.4% of portfolio |
| | Shares | Value |
| Australia | 1.3% |
| BHP Group Ltd. ADR | 17,774 | $1,161,353 |
| Total Australia | | 1,161,353 |
| Brazil | 0.3% |
| Ambev SA ADR | 103,138 | 315,602 |
| Total Brazil | | 315,602 |
| Britain | 8.2% |
| Diageo PLC | 41,384 | 1,637,514 |
| Rio Tinto PLC | 30,548 | 2,299,442 |
| Royal Dutch Shell PLC, Class B | 72,669 | 1,231,646 |
| Standard Chartered PLC | 124,013 | 787,475 |
| Unilever PLC | 25,114 | 1,506,179 |
| Total Britain | | 7,462,256 |
| Canada | 2.1% |
| Alimentation Couche-Tard Inc., Class B | 28,500 | 971,270 |
| Canadian National Railway Co. | 8,270 | 908,460 |
| Total Canada | | 1,879,730 |
| China | 2.0% |
| Alibaba Group Holding Ltd. ADR (a) | 1,408 | 327,684 |
| ENN Energy Holdings Ltd. | 8,250 | 121,107 |
| Ping An Insurance Group Co. of China Ltd., Class H | 39,000 | 474,615 |
| Tencent Holdings Ltd. | 12,700 | 913,813 |
| Total China | | 1,837,219 |
| Denmark | 1.0% |
| Novozymes A/S, Class B | 15,188 | 865,108 |
| Total Denmark | | 865,108 |
| France | 10.0% |
| Air Liquide SA | 6,141 | 1,006,797 |
| Dassault Systèmes SE | 9,053 | 1,836,125 |
| L’Oréal SA | 9,249 | 3,528,974 |
| Schneider Electric SE | 19,262 | 2,783,887 |
| Total France | | 9,155,783 |
| Germany | 13.3% |
| adidas AG (a) | 1,758 | 639,569 |
| Allianz SE REG | 11,432 | 2,808,532 |
| Infineon Technologies AG | 112,007 | 4,277,391 |
| SAP SE ADR | 21,879 | 2,852,803 |
| Symrise AG | 12,082 | 1,606,221 |
| Total Germany | | 12,184,516 |
| Common Stocks | 94.4% of portfolio (Continued) |
| | Shares | Value |
| Hong Kong | 3.4% |
| AIA Group Ltd. | 255,800 | $3,117,209 |
| Total Hong Kong | | 3,117,209 |
| India | 0.9% |
| HDFC Bank Ltd. ADR (a) | 5,614 | 405,668 |
| ICICI Bank Ltd. ADR (a) | 25,206 | 374,561 |
| Total India | | 780,229 |
| Israel | 1.8% |
| Check Point Software Technologies Ltd. (a) | 12,514 | 1,663,236 |
| Total Israel | | 1,663,236 |
| Japan | 18.1% |
| Chugai Pharmaceutical Co., Ltd. | 46,700 | 2,491,685 |
| FANUC Corp. | 4,400 | 1,086,136 |
| Keyence Corp. | 4,900 | 2,756,331 |
| Komatsu Ltd. | 58,600 | 1,617,258 |
| Kubota Corp. | 85,000 | 1,857,048 |
| Nitori Holdings Co., Ltd. | 6,100 | 1,275,519 |
| Shionogi & Co., Ltd. | 16,500 | 902,080 |
| Sysmex Corp. | 15,900 | 1,913,192 |
| Unicharm Corp. | 55,400 | 2,627,400 |
| Total Japan | | 16,526,649 |
| Mexico | 0.3% |
| Fomento Economico Mexicano, SAB de CV ADR | 3,960 | 300,049 |
| Total Mexico | | 300,049 |
| Netherlands | 3.8% |
| Adyen NV (a) | 1,503 | 3,492,282 |
| Total Netherlands | | 3,492,282 |
| Republic of South Korea | 0.5% |
| Samsung Electronics Co., Ltd. GDR | 228 | 414,684 |
| Total Republic of South Korea | | 414,684 |
| Russia | 0.6% |
| LUKOIL PJSC ADR | 4,255 | 290,872 |
| Yandex NV, Class A (a) | 4,239 | 294,949 |
| Total Russia | | 585,821 |
| Singapore | 2.5% |
| DBS Group Holdings Ltd. | 122,615 | 2,323,644 |
| Total Singapore | | 2,323,644 |
| Portfolio of Investments | The accompanying notes are an integral part of these financial statements. |
Portfolio of Investments | International Equity Fund | December 31, 2020 | (Continued)
| Common Stocks | 94.4% of portfolio (Continued) |
| | Shares | Value |
| Spain | 1.6% |
| Banco Bilboa Vizcaya Argentaria SA | 300,380 | $1,488,864 |
| Total Spain | | 1,488,864 |
| Sweden | 7.4% |
| Alfa Laval AB (a) | 49,472 | 1,366,242 |
| Atlas Copco AB, Class A | 65,798 | 3,381,780 |
| Epiroc AB, Class A | 74,590 | 1,355,652 |
| Skandinaviska Enskilda Banken AB, Class A (a) | 63,357 | 652,418 |
| Total Sweden | | 6,756,092 |
| Switzerland | 12.8% |
| Alcon Inc. | 22,167 | 1,462,579 |
| Lonza Group AG REG | 4,427 | 2,851,725 |
| Nestlé SA ADR | 18,121 | 2,142,107 |
| Roche Holding AG REG | 8,135 | 2,833,408 |
| SGS SA REG | 338 | 1,018,857 |
| Sonova Holding AG REG (a) | 5,315 | 1,382,397 |
| Total Switzerland | | 11,691,073 |
| Taiwan | 1.4% |
| Taiwan Semiconductor Manufacturing Co. Ltd. ADR | 12,114 | 1,320,911 |
| Total Taiwan | | 1,320,911 |
| United States of America | 1.1% |
| Linde PLC | 3,970 | 1,046,795 |
| Total United States of America | | 1,046,795 |
| Total Common Stocks | | |
| (Cost $55,396,522) | | 86,369,105 |
| Preferred Stocks | 2.1% of portfolio |
| | Shares | Value |
| Brazil | 0.5% |
| Itaú Unibanco Holding SA ADR | 74,855 | $455,867 |
| Total Brazil | | 455,867 |
| Germany | 0.7% |
| FUCHS PETROLUB SE | 10,870 | 613,312 |
| Total Germany | | 613,312 |
| Republic of South Korea | 0.9% |
| Samsung Electronics Co., Ltd. REG GDR | 514 | 853,893 |
| Total Republic of South Korea | | 853,893 |
| Total Preferred Stocks | | |
| (Cost $1,013,543) | | 1,923,072 |
| Money Market Fund | 3.5% of portfolio |
| | |
| State Street Institutional U.S. Government Money Market Fund Premier Class, 0.03% (b) | 3,176,868 | 3,176,868 |
| Total Money Market Fund | | |
| (Cost $3,176,868) | | 3,176,868 |
| Total Investments in Securities | | |
| (Cost $59,586,933) | 100.0% | | $91,469,045 |
| (b) | 7-day yield at December 31, 2020. |
ADR - American Depositary Deposit
SA - Sociedad Anonima or Societe Anonyme
PLC - Public Limited Company
A/S - Aktieselskab
SE - Societas Europaea
AG - Aktiengesellschaft
REG - Registered Shares
SAB de CV - Sociedad Anonima Bursatil de Capital Variable
SAB - Sociedad Anonima Bursatil
NV - Naamloze Vennottschap
GDR - Global Depositary Receipt
AB - Aktiebolag
| The accompanying notes are an integral part of these financial statements. | Portfolio of Investments |
63
Portfolio of Investments
Small-Company Stock Fund | December 31, 2020
| Common Stocks | 98.7% of portfolio |
| | Shares | Value |
| Communication Services | 1.1% |
| Wireless Telecommunication Services | | |
| Shenandoah Telecommunications Co. | 76,263 | $3,298,375 |
| Total Communication Services | | 3,298,375 |
| Consumer Discretionary | 7.4% |
| Distributors | | |
| Core-Mark Holding Company, Inc. | 175,473 | 5,153,642 |
| Hotels, Restaurants & Leisure | | |
| Cracker Barrel Old Country Store, Inc. (a) | 20,119 | 2,654,099 |
| Extended Stay America, Inc. | 240,924 | 3,568,084 |
| Leisure Products | | |
| Callaway Golf Co. (a) | 167,351 | 4,018,097 |
| Specialty Retail | | |
| Floor & Decor Holdings, Inc. (a) | 29,379 | 2,727,840 |
| Textiles, Apparel & Luxury Goods | | |
| Carter's, Inc. | 34,051 | 3,203,178 |
| Total Consumer Discretionary | | 21,324,940 |
| Consumer Staples | 0.9% |
| Food Products | | |
| TreeHouse Foods, Inc. (a) | 62,227 | 2,644,025 |
| Total Consumer Staples | | 2,644,025 |
| Financials | 13.9% |
| Banks | | |
| Atlantic Union Bankshares Corp. | 138,192 | 4,552,044 |
| Cadence Bancorporation | 65,000 | 1,067,300 |
| Eastern Bankshares, Inc. (a) | 65,200 | 1,063,412 |
| FB Financial Corp. | 148,859 | 5,169,873 |
| Glacier Bancorp, Inc. | 178,216 | 8,199,718 |
| South State Corp. | 55,675 | 4,025,303 |
| Capital Markets | | |
| Virtu Financial, Inc., Class A | 101,443 | 2,553,320 |
| Consumer Finance | | |
| Encore Capital Group, Inc. (a) | 161,183 | 6,278,078 |
| Insurance | | |
| Kinsale Capital Group, Inc. | 34,426 | 6,889,676 |
| Total Financials | | 39,798,724 |
| Health Care | 26.8% |
| Biotechnology | | |
| Emergent BioSolutions Inc. (a) | 58,625 | 5,252,800 |
| Twist Bioscience Corp. (a) | 71,877 | 10,155,501 |
| Health Care Equipment & Supplies | | |
| Envista Holdings Corp. (a) | 98,000 | 3,305,540 |
| Integer Holdings Corp. (a) | 34,770 | 2,822,976 |
| NuVasive, Inc. (a) | 56,800 | 3,199,544 |
| STAAR Surgical Co. (a) | 117,036 | 9,271,592 |
| Health Care Providers & Services | | |
| AMN Healthcare Services, Inc. (a) | 86,687 | 5,916,388 |
| Common Stocks | 98.7% of portfolio (Continued) |
| | Shares | Value |
| Health Care | 26.8% (Continued) |
| LHC Group, Inc. (a) | 45,028 | $9,605,373 |
| Health Care Technology | | |
| Inovalon Holdings, Inc. (a) | 355,991 | 6,468,357 |
| Life Sciences Tools & Services | | |
| Medpace Holdings, Inc. (a) | 69,950 | 9,737,040 |
| NanoString Technologies, Inc. (a) | 144,153 | 9,640,953 |
| Pharmaceuticals | | |
| Aerie Pharmaceuticals, Inc. (a) | 119,638 | 1,616,309 |
| Total Health Care | | 76,992,373 |
| Industrials | 14.5% |
| Construction & Engineering | | |
| Comfort Systems USA, Inc. | 67,988 | 3,580,248 |
| Primoris Services Corp. | 194,098 | 5,359,046 |
| Electrical Equipment | | |
| EnerSys | 48,935 | 4,064,541 |
| Machinery | | |
| Barnes Group Inc. | 54,800 | 2,777,812 |
| Colfax Corp. (a) | 170,128 | 6,505,694 |
| Federal Signal Corp. | 125,594 | 4,165,953 |
| Road & Rail | | |
| Werner Enterprises, Inc. | 141,133 | 5,535,236 |
| Trading Companies & Distributors | | |
| Applied Industrial Technologies, Inc. | 124,326 | 9,696,185 |
| Total Industrials | | 41,684,715 |
| Information Technology | 22.3% |
| Electronic Equipment, Instruments & Components | | |
| Itron, Inc. (a) | 46,077 | 4,418,784 |
| Knowles Corp. (a) | 157,794 | 2,908,144 |
| IT Services | | |
| CACI International Inc., Class A (a) | 16,771 | 4,181,513 |
| CSG Systems International, Inc. | 30,170 | 1,359,762 |
| ManTech International Corp., Class A | 102,965 | 9,157,707 |
| Semiconductors & Semiconductor Equipment | | |
| Advanced Energy Industries, Inc. (a) | 61,562 | 5,969,667 |
| Diodes Inc. (a) | 61,486 | 4,334,763 |
| Software | | |
| Altair Engineering Inc. (a) | 98,477 | 5,729,392 |
| Descartes Systems Group Inc. (The) (a) | 129,170 | 7,553,861 |
| Five9, Inc. (a) | 39,188 | 6,834,387 |
| j2 Global, Inc. (a) | 65,126 | 6,362,159 |
| Verint Systems Inc. (a) | 77,226 | 5,188,043 |
| Total Information Technology | | 63,998,182 |
| Portfolio of Investments | The accompanying notes are an integral part of these financial statements. |
Portfolio of Investments | Small-Company Stock Fund | December 31, 2020 | (Continued)
| Common Stocks | 98.7% of portfolio (Continued) |
| | Shares | Value |
| Materials | 7.4% |
| Chemicals | | |
| Avient Corp. | 263,527 | $10,614,868 |
| Ingevity Corp. (a) | 42,441 | 3,214,057 |
| Construction Materials | | |
| Summit Materials, Inc., Class A (a) | 362,768 | 7,284,381 |
| Total Materials | | 21,113,306 |
| Real Estate | 4.4% |
| Equity Real Estate Investment Trusts (REITs) | | |
| Community Healthcare Trust Inc. | 36,900 | 1,738,359 |
| Easterly Government Properties, Inc. | 195,411 | 4,426,059 |
| QTS Realty Trust, Inc. Class A | 105,078 | 6,502,227 |
| Total Real Estate | | 12,666,645 |
| Total Common Stocks | | |
| (Cost $193,556,197) | | 283,521,285 |
| Money Market Fund | 1.3% of portfolio |
| | Shares | Value |
| State Street Institutional U.S. Government Money Market Fund Premier Class, 0.03% (b) | 3,762,606 | $3,762,606 |
| Total Money Market Fund | | |
| (Cost $3,762,606) | | 3,762,606 |
| Total Investments in Securities | | |
| (Cost $197,318,803) | 100.0% | | $287,283,891 |
| (b) | 7-day yield at December 31, 2020. |
| The accompanying notes are an integral part of these financial statements. | Portfolio of Investments |
65
Statements of Assets and Liabilities
December 31, 2020
| Assets | Daily Income Fund | Short-Term Government Securities Fund | Short-Term Bond Fund |
| Investments in securities, at value (cost: $172,526,477, $89,455,261, $557,989,399, $91,322,612, $39,884,120, $536,754,977, $163,746,671, $59,586,933 and $197,318,803, respectively) | $172,526,477 | $90,776,158 | $566,887,257 |
| Foreign currency (cost $1) | — | — | — |
| Investment securities sold | — | 2,035,114 | 33,365,052 |
| Dividends, interest, and tax reclaims | 176,207 | 218,277 | 1,456,332 |
| Capital shares sold | 108,176 | 1,214 | 539,806 |
| Prepaid expenses | 23,135 | 13,428 | 53,074 |
| Due from RE Advisers | 3,754 | — | — |
| Total Assets | 172,837,749 | 93,044,191 | 602,301,521 |
| Liabilities | | | |
| Investment securities purchased | — | 3,788,081 | 36,508,002 |
| Accrued expenses | 57,642 | 28,160 | 120,374 |
| Independent Director/Trustee's deferred compensation | 74,402 | 30,122 | 168,934 |
| Due to RE Advisers | — | 41,529 | 376,129 |
| Capital shares redeemed | 922,614 | 5,335 | 54,568 |
| Dividends | 22 | 1,014 | 12,492 |
| Total Liabilities | 1,054,680 | 3,894,241 | 37,240,499 |
| Net Assets | $171,783,069 | $89,149,950 | $565,061,022 |
| Net Assets Consist Of: | | | |
| Distributable earnings (losses) | (74,403) | 1,190,086 | 11,037,445 |
| Paid-in-capital applicable to outstanding shares of 171,857,431, 16,859,082, 106,289,184, 17,114,062, 6,795,961, 19,644,418, 20,541,726, 8,446,026 and 10,101,893, respectively | 171,857,472 | 87,959,864 | 554,023,577 |
| Net Assets | $171,783,069 | $89,149,950 | $565,061,022 |
| Net Asset Value Per Share | $1.00 | $5.29 | $5.32 |
| Statements of Assets and Liabilities | The accompanying notes are an integral part of these financial statements. |
| Intermediate Bond Fund | Stock Index Fund | Value Fund | Growth Fund | International Equity Fund | Small-Company Stock Fund |
| $93,511,653 | $188,972,500 | $928,218,431 | $320,125,693 | $91,469,045 | $287,283,891 |
| — | — | — | — | 1 | — |
| 1,165,784 | 584,432 | — | 21,035 | — | — |
| 409,723 | — | 913,291 | 23,587 | 297,039 | 129,843 |
| 1,362 | 33,109 | 893,064 | 533,850 | 12,297 | 44,437 |
| 14,990 | 22,924 | 72,316 | 34,548 | 19,302 | 30,812 |
| — | — | — | — | — | — |
| 95,103,512 | 189,612,965 | 930,097,102 | 320,738,713 | 91,797,684 | 287,488,983 |
| | | | | | |
| 1,845,629 | — | — | 19,890 | 74,394 | — |
| 35,915 | 66,105 | 180,127 | 107,130 | 38,336 | 141,286 |
| 2,451 | 36,208 | 280,771 | 34,044 | 52,718 | 181,027 |
| 41,800 | 70,403 | 513,320 | 217,673 | 57,073 | 249,152 |
| 516,676 | 617,541 | 379,075 | 700,340 | 33,701 | 379,630 |
| 804 | — | — | — | — | — |
| 2,443,275 | 790,257 | 1,353,293 | 1,079,077 | 256,222 | 951,095 |
| $92,660,237 | $188,822,708 | $928,743,809 | $319,659,636 | $91,541,462 | $286,537,888 |
| | | | | | |
| 1,798,576 | 148,684,232 | 396,475,895 | 161,233,018 | 30,655,068 | 97,543,611 |
| 90,861,661 | 40,138,476 | 532,267,914 | 158,426,618 | 60,886,394 | 188,994,277 |
| $92,660,237 | $188,822,708 | $928,743,809 | $319,659,636 | $91,541,462 | $286,537,888 |
| $5.41 | $27.78 | $47.28 | $15.56 | $10.84 | $28.36 |
| The accompanying notes are an integral part of these financial statements. | Statements of Assets and Liabilities |
67
Statements of Operations
For the Period Ended December 31, 2020
| Investment Income | Daily Income Fund | Short-Term Government Securities Fund | Short-Term Bond Fund |
| Interest | $964,900 | $1,021,526 | $9,273,069(a) |
| Dividends | — | — | — |
| Allocated from Master Portfolio | | | |
| Dividends | — | — | — |
| Interest | — | — | — |
| Total Investment Income | 964,900 | 1,021,526 | 9,273,069 |
| Expenses | | | |
| Management fees | 879,264 | 346,874 | 3,272,431 |
| Shareholder servicing fees | 155,548 | 77,482 | 173,665 |
| Custodian and accounting fees | 93,211 | 71,863 | 176,299 |
| Director, Trustee, and Board meeting expenses | 81,308 | 33,623 | 236,753 |
| Legal and audit fees | 75,766 | 33,074 | 203,382 |
| Registration fees | 31,719 | 23,771 | 41,208 |
| Printing and regulatory filings | 25,026 | 12,438 | 37,849 |
| Insurance | 8,958 | 3,748 | 27,241 |
| Communication | 8,131 | 3,876 | 12,604 |
| Other expenses | 10,996 | 18,895 | 66,548 |
| Administration fees | — | — | — |
| Allocated from Master Portfolio | — | — | — |
| Total Expenses | 1,369,927 | 625,644 | 4,247,980 |
| Less fees waived and/or expenses reimbursed by RE Advisers | (711,511) | (48,176) | — |
| Net Expenses | 658,416 | 577,468 | 4,247,980 |
| Net Investment Income (Loss) | 306,484 | 444,058 | 5,025,089 |
| Realized and Unrealized Gain (Loss) on Investments | | | |
| Net realized gain on investments | — | 1,544,708 | 16,494,094 |
| Net change in unrealized apprecation (depreciation) | — | 1,019,892 | 6,236,279 |
| Net Gain (Loss) On Investments | — | 2,564,600 | 22,730,373 |
| Net Increase In Net Assets From Operations | $306,484 | $3,008,658 | $27,755,462 |
| (a) | Includes foreign tax withholding expense of $6,131 in Short-Term Bond, $31,964 in Value, $4,488 in Growth, and $139,478 in International Equity Funds. |
| (b) | Represents expenses allocated to the Fund by the S&P 500 Master Portfolio after expense reimbursements of $2,935. |
| (c) | Represents realized and unrealized gain on investments allocated from the Master Portfolio. |
| Statements of Operations | The accompanying notes are an integral part of these financial statements. |
| Intermediate Bond Fund | Stock Index Fund | Value Fund | Growth Fund | International Equity Fund | Small-Company Stock Fund |
| $1,146,873 | $— | $58,884 | $10,175 | $3,417 | $21,734 |
| 130 | — | 17,139,685(a) | 1,122,543(a) | 1,258,678(a) | 2,506,592 |
| | | | | | |
| — | 3,019,654 | — | — | — | — |
| — | 7,181 | — | — | — | — |
| 1,147,003 | 3,026,835 | 17,198,569 | 1,132,718 | 1,262,095 | 2,528,326 |
| | | | | | |
| 346,234 | — | 4,126,599 | 1,695,833 | 576,055 | 2,183,222 |
| 49,470 | 159,311 | 350,870 | 201,694 | 133,499 | 288,769 |
| 107,587 | 56,651 | 170,193 | 103,360 | 101,935 | 88,834 |
| 20,630 | 72,570 | 390,655 | 120,723 | 34,996 | 139,657 |
| 25,060 | 64,440 | 314,259 | 107,491 | 33,052 | 107,802 |
| 59,361 | 28,879 | 45,078 | 32,594 | 24,826 | 31,950 |
| 4,432 | 32,505 | 81,602 | 43,001 | 28,155 | 55,934 |
| 1,433 | 8,389 | 47,203 | 12,959 | 4,046 | 17,220 |
| 1,196 | 9,990 | 26,272 | 12,169 | 8,536 | 17,464 |
| 38,365 | 12,300 | 48,258 | 17,369 | 8,524 | 22,791 |
| — | 413,149 | — | — | — | — |
| — | 15,428(b) | — | — | — | — |
| 653,768 | 873,612 | 5,600,989 | 2,347,193 | 953,624 | 2,953,643 |
| (194,366) | — | — | — | (193,893) | — |
| 459,402 | 873,612 | 5,600,989 | 2,347,193 | 759,731 | 2,953,643 |
| 687,601 | 2,153,223 | 11,597,580 | (1,214,475) | 502,364 | (425,317) |
| | | | | | |
| 1,216,814 | 447,620(c) | 132,416,932 | 18,129,840 | 658,224 | 44,525,939 |
| 2,105,520 | 25,993,186(c) | (89,955,729) | 71,265,220 | 14,814,294 | 1,992,422 |
| 3,322,334 | 26,440,806 | 42,461,203 | 89,395,060 | 15,472,518 | 46,518,361 |
| $4,009,935 | $28,594,029 | $54,058,783 | $88,180,585 | $15,974,882 | $46,093,044 |
| The accompanying notes are an integral part of these financial statements. | Statements of Operations |
69
Statements of Changes in Net Assets
| | Daily Income Fund |
| | Year Ended December 31, 2020 | Year Ended December 31, 2019 |
| Increase (Decrease) In Net Assets | | |
| Operations | | |
| Net investment income | $306,484 | $2,355,051 |
| Net realized gain on investments | — | — |
| Net change in unrealized appreciation (depreciation) | — | — |
| Increase in net assets from operations | 306,484 | 2,355,051 |
| Distributions to Shareholders | | |
| Distributions to shareholders | (311,702) | (2,360,611) |
| Total Distributions to shareholders | (311,702) | (2,360,611) |
| Capital Share Transactions | | |
| Net capital share transactions | 8,953,537 | (1,013,479) |
| Total increase (decrease) in net assets from capital transactions | 8,953,537 | (1,013,479) |
| Total Increase (Decrease) In Net Assets | 8,948,319 | (1,019,039) |
| Net Assets | | |
| Beginning of year | $162,834,750 | $163,853,789 |
| End of year | $171,783,069 | $162,834,750 |
| Statements of Changes in Net Assets | The accompanying notes are an integral part of these financial statements. |
| Short-Term Government Securities Fund | Short-Term Bond Fund | Intermediate Bond Fund |
| Year Ended December 31, 2020 | Year Ended December 31, 2019 | Year Ended December 31, 2020 | Year Ended December 31, 2019 | Year Ended December 31, 2020 | Since Inception December 31, 2019 |
| | | | | | |
| | | | | | |
| $444,058 | $1,130,343 | $5,025,089 | $10,411,224 | $687,601 | $138,679 |
| 1,544,708 | 359,731 | 16,494,094 | 5,060,226 | 1,216,814 | 108,114 |
| 1,019,892 | 861,300 | 6,236,279 | 5,694,771 | 2,105,520 | 83,521 |
| 3,008,658 | 2,351,374 | 27,755,462 | 21,166,221 | 4,009,935 | 330,314 |
| | | | | | |
| (2,136,655) | (1,441,910) | (19,849,328) | (14,850,051) | (2,215,449) | (327,462) |
| (2,136,655) | (1,441,910) | (19,849,328) | (14,850,051) | (2,215,449) | (327,462) |
| | | | | | |
| 16,762,309 | (6,312,013) | 8,843,177 | (20,036,998) | 67,021,192 | 23,841,707 |
| 16,762,309 | (6,312,013) | 8,843,177 | (20,036,998) | 67,021,192 | 23,841,707 |
| 17,634,312 | (5,402,549) | 16,749,311 | (13,720,828) | 68,815,678 | 23,844,559 |
| | | | | | |
| $71,515,638 | $76,918,187 | $548,311,711 | $562,032,539 | $23,844,559 | $— |
| $89,149,950 | $71,515,638 | $565,061,022 | $548,311,711 | $92,660,237 | $23,844,559 |
| The accompanying notes are an integral part of these financial statements. | Statements of Changes in Net Assets |
71
Statements of Changes in Net Assets (Continued)
| | Stock Index Fund |
| | Year Ended December 31, 2020 | Year Ended December 31, 2019 |
| Increase (Decrease) In Net Assets | | |
| Operations | | |
| Net investment income | $2,153,223 | $2,130,742 |
| Net realized gain on investments | 447,620 | 841,781 |
| Net change in unrealized appreciation (depreciation) | 25,993,186 | 37,525,793 |
| Increase in net assets from operations | 28,594,029 | 40,498,316 |
| Distributions to Shareholders | | |
| Distributions to shareholders | (2,658,345) | (3,333,711) |
| Total Distributions to shareholders | (2,658,345) | (3,333,711) |
| Capital Share Transactions | | |
| Net capital share transactions | (8,064,248) | (147,519) |
| Total increase (decrease) in net assets from capital transactions | (8,064,248) | (147,519) |
| Total Increase (Decrease) In Net Assets | 17,871,436 | 37,017,086 |
| Net Assets | | |
| Beginning of year | $170,951,272 | $133,934,186 |
| End of year | $188,822,708 | $170,951,272 |
| Statements of Changes in Net Assets | The accompanying notes are an integral part of these financial statements. |
| Value Fund | Growth Fund | International Equity Fund |
| Year Ended December 31, 2020 | Year Ended December 31, 2019 | Year Ended December 31, 2020 | Year Ended December 31, 2019 | Year Ended December 31, 2020 | Year Ended December 31, 2019 |
| | | | | | |
| | | | | | |
| $11,597,580 | $14,376,369 | $(1,214,475) | $(312,429) | $502,364 | $943,527 |
| 132,416,932 | 137,873,648 | 18,129,840 | 14,030,244 | 658,224 | 3,272,569 |
| (89,955,729) | 76,986,017 | 71,265,220 | 40,898,938 | 14,814,294 | 11,841,604 |
| 54,058,783 | 229,236,034 | 88,180,585 | 54,616,753 | 15,974,882 | 16,057,700 |
| | | | | | |
| (136,377,946) | (135,337,648) | (14,345,568) | (12,506,704) | (552,126) | (841,645) |
| (136,377,946) | (135,337,648) | (14,345,568) | (12,506,704) | (552,126) | (841,645) |
| | | | | | |
| 18,955,139 | 22,943,471 | 2,276,767 | 6,970,674 | (2,656,559) | (2,522,666) |
| 18,955,139 | 22,943,471 | 2,276,767 | 6,970,674 | (2,656,559) | (2,522,666) |
| (63,364,024) | 116,841,857 | 76,111,784 | 49,080,723 | 12,766,197 | 12,693,389 |
| | | | | | |
| $992,107,833 | $875,265,976 | $243,547,852 | $194,467,129 | $78,775,265 | $66,081,876 |
| $928,743,809 | $992,107,833 | $319,659,636 | $243,547,852 | $91,541,462 | $78,775,265 |
| The accompanying notes are an integral part of these financial statements. | Statements of Changes in Net Assets |
73
Statements of Changes in Net Assets (Continued)
| | Small-Company Stock Fund |
| | Year Ended December 31, 2020 | Year Ended December 31, 2019 |
| Increase (Decrease) In Net Assets | | |
| Operations | | |
| Net investment income | $(425,317) | $2,287,266 |
| Net realized gain on investments | 44,525,939 | 38,451,396 |
| Net change in unrealized appreciation (depreciation) | 1,992,422 | 52,318,099 |
| Increase in net assets from operations | 46,093,044 | 93,056,761 |
| Distributions to Shareholders | | |
| Distributions to shareholders | (33,366,323) | (65,351,838) |
| Total Distributions to shareholders | (33,366,323) | (65,351,838) |
| Capital Share Transactions | | |
| Net capital share transactions | (58,639,010) | (182,247,316) |
| Total increase (decrease) in net assets from capital transactions | (58,639,010) | (182,247,316) |
| Total Increase (Decrease) In Net Assets | (45,912,289) | (154,542,393) |
| Net Assets | | |
| Beginning of year | $332,450,177 | $486,992,570 |
| End of year | $286,537,888 | $332,450,177 |
| Statements of Changes in Net Assets | The accompanying notes are an integral part of these financial statements. |
Financial Highlights
Daily Income Fund
The financial highlights tables are intended to help you understand the Fund's financial performance for the past 5 years or, if shorter, the period of a Fund's operations. Certain information reflects financial results for a single Fund share. The total returns in the table represent the rate that an investor would have earned or lost on an investment in the Fund (assuming reinvestment of all dividends and distributions).
| | Year Ended December 31, |
| For a Share Outstanding Throughout Each Year | 2020 | 2019 | 2018 | 2017 | 2016 |
| Net Asset Value, Beginning of Year | $1.00 | $1.00 | $1.00 | $1.00 | $1.00 |
| Income from investment operations | | | | | |
| Net investment income | -—(a,b,c) | 0.01 | 0.01 | -—(a,b,c) | —(a,b,c) |
| Net realized and unrealized gain (loss) on investments | — | — | — | — | — |
| Total from investment operations | —(a,c) | 0.01 | 0.01 | —(a,c) | —(a,c) |
| Distributions | | | | | |
| Net investment income | —(c) | (0.01) | (0.01) | —(c) | —(c) |
| Net realized gain | — | — | — | — | — |
| Total distributions | —(a,c) | (0.01) | (0.01) | —(a,c) | —(a,c) |
| Net Asset Value, End of Year | $1.00 | $1.00 | $1.00 | $1.00 | $1.00 |
| Total Return | 0.19% | 1.43% | 1.08% | 0.18% | 0.01% |
| Ratios/Supplemental Data | | | | | |
| Net assets, end of year (thousands) | $171,783 | $162,835 | $163,854 | $173,927 | $195,858 |
| Ratio of net investment income to average net assets | 0.17%(a,b) | 1.42% | 1.07% | 0.17%(a,b) | 0.00%(a,b,d) |
| Ratio of gross expenses before voluntary expense limitation to average net assets | 0.78% | 0.78% | 0.74% | 0.71% | 0.71% |
| Ratio of expenses to average net assets | 0.37%(a,b) | 0.78% | 0.74% | 0.66%(a,b) | 0.37%(a,b) |
| (a) | Effective August 14, 2009, RE Advisers agreed to waive fees and/or reimburse expenses to the extent necessary to assist the Fund in attempting to maintain a positive yield. The temporary waiver continued through May 11, 2017 and was reinstated on April 20, 2020. |
| (b) | Excludes excess investment management fees and other expenses voluntarily waived and reimbursed by RE Advisers. |
| (c) | Less than $0.01 per share. |
| (d) | Less than 0.01%. |
| The accompanying notes are an integral part of these financial statements. | Financial Highlights |
75
Financial Highlights
Short-Term Government Securities Fund
| | Year Ended December 31, |
| For a Share Outstanding Throughout Each Year | 2020 | 2019 | 2018 | 2017 | 2016 |
| Net Asset Value, Beginning of Year | $5.21 | $5.14 | $5.15 | $5.16 | $5.18 |
| Income from investment operations | | | | | |
| Net investment income | 0.03 | 0.08 | 0.07 | 0.05 | 0.04 |
| Net realized and unrealized gain (loss) on investments | 0.18 | 0.09 | (0.01) | (0.01) | (0.02) |
| Total from investment operations | 0.21 | 0.17 | 0.06 | 0.04 | 0.02 |
| Distributions | | | | | |
| Net investment income | (0.03) | (0.08) | (0.07) | (0.05) | (0.04) |
| Net realized gain | (0.10) | (0.02) | —(a) | —(a) | —(a) |
| Total distributions | (0.13) | (0.10) | (0.07) | (0.05) | (0.04) |
| Net Asset Value, End of Year | $5.29 | $5.21 | $5.14 | $5.15 | $5.16 |
| Total Return | 4.13% | 3.36% | 1.20% | 0.87% | 0.45% |
| Ratios/Supplemental Data | | | | | |
| Net assets, end of year (thousands) | $89,150 | $71,516 | $76,918 | $75,425 | $73,108 |
| Ratio of net investment income to average net assets | 0.58%(b) | 1.52%(b) | 1.37%(b) | 1.02%(b) | 0.81%(b) |
| Ratio of gross expenses before expense limitation to average net assets | 0.81% | 0.85% | 0.82% | 0.81% | 0.78% |
| Ratio of expenses to average net assets | 0.75%(b) | 0.75%(b) | 0.75%(b) | 0.75%(b) | 0.75%(b) |
| Portfolio turnover rate | 299%(c) | 237%(c,d) | 40% | 33% | 26% |
| (a) | Less than $0.01 per share. |
| (b) | Excludes expenses in excess of a 0.75% contractual expense limitation with RE Advisers, in effect through April 30, 2021. |
| (c) | Rate includes purchases and sales of long-term U.S. Treasury Bonds. |
| (d) | The change in portfolio turnover from 2018 to 2019 is due to a repositioning of the Fund as a result of market activities. |
| Financial Highlights | The accompanying notes are an integral part of these financial statements. |
Financial Highlights
Short-Term Bond Fund
| | Year Ended December 31, |
| For a Share Outstanding Throughout Each Year | 2020 | 2019 | 2018 | 2017 | 2016 |
| Net Asset Value, Beginning of Year | $5.23 | $5.17 | $5.19 | $5.19 | $5.18 |
| Income from investment operations | | | | | |
| Net investment income | 0.05 | 0.10 | 0.10 | 0.08 | 0.08 |
| Net realized and unrealized gain (loss) on investments | 0.23 | 0.10 | (0.02) | —(a) | 0.01 |
| Total from investment operations | 0.28 | 0.20 | 0.08 | 0.08 | 0.09 |
| Distributions | | | | | |
| Net investment income | (0.05) | (0.10) | (0.10) | (0.08) | (0.08) |
| Net realized gain | (0.14) | (0.04) | —(a) | —(a) | — |
| Total distributions | (0.19) | (0.14) | (0.10) | (0.08) | (0.08) |
| Net Asset Value, End of Year | $5.32 | $5.23 | $5.17 | $5.19 | $5.19 |
| Total Return | 5.42% | 3.90% | 1.69% | 1.65% | 1.75% |
| Ratios/Supplemental Data | | | | | |
| Net assets, end of year (thousands) | $565,061 | $548,312 | $562,033 | $550,242 | $541,014 |
| Ratio of net investment income to average net assets | 0.92% | 1.87% | 2.02% | 1.59% | 1.49% |
| Ratio of expenses to average net assets | 0.78% | 0.79% | 0.77% | 0.76% | 0.76% |
| Portfolio turnover rate | 328%(b) | 276%(b,c) | 39% | 32% | 31% |
| (a) | Less than $0.01 per share. |
| (b) | Rate includes purchases and sales of long-term U.S. Treasury Bonds. |
| (c) | The change in portfolio turnover from 2018 to 2019 is due to a repositioning of the Fund as a result of market activities. |
| The accompanying notes are an integral part of these financial statements. | Financial Highlights |
77
Financial Highlights
Intermediate Bond Fund
| | Year Ended December 31, | Since Inception
May 1, 2019
to December 31 , |
| For a Share Outstanding Throughout the Period | 2020 | 2019 |
| Net Asset Value, Beginning of Period | $5.13 | $5.00 |
| Income from investment operations | | |
| Net investment income | 0.08 | 0.06 |
| Net realized and unrealized gain (loss) on investments | 0.36 | 0.17 |
| Total from investment operations | 0.44 | 0.23 |
| Distributions | | |
| Net investment income | (0.08) | (0.06) |
| Net realized gain | (0.08) | (0.04) |
| Total distributions | (0.16) | (0.10) |
| Net Asset Value, End of Period | $5.41 | $5.13 |
| Total Return | 8.70% | 4.69%(a) |
| Ratios/Supplemental Data | | |
| Net assets, end of year (thousands) | $92,660 | $23,845 |
| Ratio of net investment income to average net assets | 1.19%(b) | 1.69%(b,c) |
| Ratio of gross expenses before expense limitation to average net assets | 1.13% | 2.49%(c) |
| Ratio of expenses to average net assets | 0.80%(b) | 0.80%(b,c) |
| Portfolio turnover rate | 359%(d) | 395%(d) |
| (a) | Aggregate total return for the period. |
| (b) | Excludes expenses in excess of a 0.80% contractual expense limitation with RE Advisers, in effect through April 30, 2021. |
| (c) | Annualized. |
| (d) | Rate includes purchases and sales of long-term U.S. Treasury Bonds. |
| Financial Highlights | The accompanying notes are an integral part of these financial statements. |
Financial Highlights
Stock Index Fund
| | Year Ended December 31, |
| For a Share Outstanding Throughout Each Year | 2020 | 2019 | 2018 | 2017 | 2016 |
| Net Asset Value, Beginning of Year | $23.93 | $18.67 | $20.02 | $16.67 | $15.20 |
| Income from investment operations | | | | | |
| Net investment income | 0.32 | 0.34 | 0.32 | 0.27 | 0.25 |
| Net realized and unrealized gain (loss) on investments | 3.92 | 5.39 | (1.30) | 3.26 | 1.47 |
| Total from investment operations | 4.24 | 5.73 | (0.98) | 3.53 | 1.72 |
| Distributions | | | | | |
| Net investment income | (0.31) | (0.38) | (0.37) | (0.18) | (0.25) |
| Net realized gain | (0.08) | (0.09) | — | — | — |
| Total distributions | (0.39) | (0.47) | (0.37) | (0.18) | (0.25) |
| Net Asset Value, End of Year | $27.78 | $23.93 | $18.67 | $20.02 | $16.67 |
| Total Return | 17.80% | 30.77% | -4.95% | 21.16% | 11.33% |
| Ratios/Supplemental Data | | | | | |
| Net assets, end of year (thousands) | $188,823 | $170,951 | $133,934 | $145,094 | $123,039 |
| Ratio of net investment income to average net assets | 1.30% | 1.39% | 1.39% | 1.42% | 1.57% |
| Ratio of expenses to average net assets | 0.53% | 0.59% | 0.56% | 0.55% | 0.58% |
| Portfolio turnover rate (a) | N/A | N/A | N/A | N/A | N/A |
| (a) | Substantially all of the assets of the Stock Index Fund are invested in the S&P 500 Index Master Portfolio managed by BlackRock Fund Advisors. Please refer to the financial highlights in the Appendix for the portfolio turnover rate of the S&P 500 Index Master Portfolio. |
| The accompanying notes are an integral part of these financial statements. | Financial Highlights |
79
Financial Highlights
Value Fund
| | Year Ended December 31, |
| For a Share Outstanding Throughout Each Year | 2020 | 2019 | 2018 | 2017 | 2016 |
| Net Asset Value, Beginning of Year | $51.51 | $46.64 | $55.26 | $47.70 | $46.77 |
| Income from investment operations | | | | | |
| Net investment income | 0.66 | 0.83 | 0.91 | 1.00 | 1.10 |
| Net realized and unrealized gain (loss) on investments | 2.94 | 11.93 | (4.39) | 9.52 | 4.60 |
| Total from investment operations | 3.60 | 12.76 | (3.48) | 10.52 | 5.70 |
| Distributions | | | | | |
| Net investment income | (0.66) | (0.83) | (0.91) | (1.00) | (1.10) |
| Net realized gain | (7.17) | (7.06) | (4.23) | (1.96) | (3.67) |
| Total distributions | (7.83) | (7.89) | (5.14) | (2.96) | (4.77) |
| Net Asset Value, End of Year | $47.28 | $51.51 | $46.64 | $55.26 | $47.70 |
| Total Return | 7.61% | 27.69% | -6.36% | 22.17% | 12.26% |
| Ratios/Supplemental Data | | | | | |
| Net assets, end of year (thousands) | $928,744 | $992,108 | $875,266 | $1,118,709 | $955,828 |
| Ratio of net investment income to average net assets | 1.35% | 1.53% | 1.55% | 1.92% | 2.26% |
| Ratio of expenses to average net assets | 0.65% | 0.66% | 0.60% | 0.60% | 0.62% |
| Portfolio turnover rate | 22% | 17%(a) | 1% | 7% | 9% |
| (a) | The change in portfolio turnover from 2018 to 2019 is due to a repositioning of the Fund as a result of market activities. |
| Financial Highlights | The accompanying notes are an integral part of these financial statements. |
Financial Highlights
Growth Fund
| | Year Ended December 31, |
| For a Share Outstanding Throughout Each Year | 2020 | 2019 | 2018 | 2017 | 2016 |
| Net Asset Value, Beginning of Year | $11.78 | $9.68 | $10.36 | $8.07 | $8.00 |
| Income from investment operations | | | | | |
| Net investment income | -— | -— | 0.02 | -— | — |
| Net realized and unrealized gain (loss) on investments | 4.52 | 2.73 | 0.41 | 3.04 | 0.19 |
| Total from investment operations | 4.52 | 2.73 | 0.43 | 3.04 | 0.19 |
| Distributions | | | | | |
| Net investment income | — | — | (0.02) | — | — |
| Net realized gain | (0.74) | (0.63) | (1.09) | (0.75) | (0.12) |
| Total distributions | (0.74) | (0.63) | (1.11) | (0.75) | (0.12) |
| Net Asset Value, End of Year | $15.56 | $11.78 | $9.68 | $10.36 | $8.07 |
| Total Return | 38.65% | 28.36% | 3.96% | 37.68% | 2.54% |
| Ratios/Supplemental Data | | | | | |
| Net assets, end of year (thousands) | $319,660 | $243,548 | $194,467 | $178,020 | $117,281 |
| Ratio of net investment income (loss) to average net assets | (0.46)% | (0.14)% | 0.14% | (0.12)% | (0.14)%(a) |
| Ratio of gross expenses before expense limitation to average net assets | 0.89% | 0.93% | 0.86% | 0.93% | 0.98% |
| Ratio of expenses to average net assets | 0.89% | 0.93% | 0.86% | 0.93% | 0.95%(a) |
| Portfolio turnover rate | 23% | 29% | 34% | 37% | 39% |
| (a) | Excludes expenses in excess of a 0.95% contractual expense limitation with RE Advisers, in effect through April 30, 2021. |
| The accompanying notes are an integral part of these financial statements. | Financial Highlights |
81
Financial Highlights
International Equity Fund
| | Year Ended December 31, |
| For a Share Outstanding Throughout Each Year | 2020 | 2019 | 2018 | 2017 | 2016 |
| Net Asset Value, Beginning of Year | $8.99 | $7.28 | $8.49 | $6.69 | $6.44 |
| Income from investment operations | | | | | |
| Net investment income | 0.06 | 0.12 | 0.12 | 0.08 | 0.07 |
| Net realized and unrealized gain (loss) on investments | 1.86 | 1.69 | (1.20) | 1.80 | 0.24 |
| Total from investment operations | 1.92 | 1.81 | (1.08) | 1.88 | 0.31 |
| Distributions | | | | | |
| Net investment income | (0.07) | (0.10) | (0.13) | (0.08) | (0.06) |
| Net realized gain | — | — | — | — | — |
| Total distributions | (0.07) | (0.10) | (0.13) | (0.08) | (0.06) |
| Net Asset Value, End of Year | $10.84 | $8.99 | $7.28 | $8.49 | $6.69 |
| Total Return | 21.34% | 24.83% | -12.74% | 28.12% | 4.85% |
| Ratios/Supplemental Data | | | | | |
| Net assets, end of year (thousands) | $91,541 | $78,775 | $66,082 | $74,138 | $53,974 |
| Ratio of net investment income to average net assets | 0.65%(a) | 1.29%(a) | 1.39%(a) | 1.03%(a) | 1.22%(a,b) |
| Ratio of gross expenses before voluntary expense limitation to average net assets | 1.24% | 1.30% | 1.23% | 1.25% | 1.46% |
| Ratio of expenses to average net assets | 0.99%(a) | 0.99%(a) | 0.99%(a) | 0.99%(a) | 0.97%(a,b) |
| Portfolio turnover rate | 15% | 27% | 16% | 11% | 112%(c) |
| (a) | Excludes expenses in excess of a 0.99% contractual expense limitation with RE Advisers, in effect through April 30, 2021. |
| (b) | RE Advisers waived additional management fees equal to the difference between the fee that would have been paid to the previous subadviser, Mercator and the fee paid to SSgA Funds Management Inc., beginning September 7, 2015 through January 14, 2016, the period in which SSgA Funds Management Inc. was subadviser. |
| (c) | Unusually high due to change in strategy and subadviser on January 15, 2016. |
| Financial Highlights | The accompanying notes are an integral part of these financial statements. |
Financial Highlights
Small-Company Stock Fund
| | Year Ended December 31, |
| For a Share Outstanding Throughout Each Year | 2020 | 2019 | 2018 | 2017 | 2016 |
| Net Asset Value, Beginning of Year | $26.25 | $25.57 | $44.11 | $41.13 | $35.45 |
| Income from investment operations | | | | | |
| Net investment income | (—) | 0.18 | 0.15 | 0.08 | 0.14 |
| Net realized and unrealized gain (loss) on investments | 5.70 | 5.42 | (11.45) | 4.86 | 6.55 |
| Total from investment operations | 5.70 | 5.60 | (11.30) | 4.94 | 6.69 |
| Distributions | | | | | |
| Net investment income | —(a) | (0.18) | (0.15) | (0.08) | (0.14) |
| Net realized gain | (3.59) | (4.74) | (7.09) | (1.88) | (0.87) |
| Total distributions | (3.59) | (4.92) | (7.24) | (1.96) | (1.01) |
| Net Asset Value, End of Year | $28.36 | $26.25 | $25.57 | $44.11 | $41.13 |
| Total Return | 22.08% | 22.16% | -26.18% | 11.99% | 18.85% |
| Ratios/Supplemental Data | | | | | |
| Net assets, end of year (thousands) | $286,538 | $332,450 | $486,993 | $1,277,434 | $1,322,218 |
| Ratio of net investment income (loss) to average net assets | (0.16)% | 0.54% | 0.26% | 0.14% | 0.34% |
| Ratio of expenses to average net assets | 1.12% | 1.05% | 0.90% | 0.88% | 0.89% |
| Portfolio turnover rate | 18% | 38% | 5% | 7% | 14% |
| (a) | Less than $0.01 per share. |
| The accompanying notes are an integral part of these financial statements. | Financial Highlights |
83
Notes to Financial Statements
1. Organization
Homestead Funds, Inc. (the "Corporation") is a Maryland corporation organized on June 29, 1990. Homestead Funds Trust (the "Trust") is a Massachusetts business trust organized on February 15, 2019. The Corporation and the Trust are each registered with the Securities and Exchange Commission under the Investment Company Act of 1940, as amended (the “Act”), as an open-end management investment company. The Corporation currently consists of eight portfolios, Daily Income Fund, Short-Term Government Securities Fund, Short-Term Bond Fund, Stock Index Fund, Value Fund, Growth Fund, Small-Company Stock Fund, and International Equity Fund, and the Trust currently consists of one portfolio, the Intermediate Bond Fund (collectively, the "Homestead Funds"). The Board of Directors of the Corporation and the Board of Trustees of the Trust are referred to collectively as the "Board".
Each Fund is a separate investment portfolio with distinct investment objectives, investment programs, policies and restrictions. The investment objectives of the Funds, as well as the nature and risks of the investment activities of each Fund, are set forth more fully in Homestead Funds’ Prospectus and Statement of Additional Information. All of the Funds are diversified for purposes of the Act.
The Stock Index Fund pursues its investment objective by seeking to replicate the total return performance of the S&P 500 Index, which is composed of 500 selected common stocks, most of which are listed on the New York Stock Exchange. At December 31, 2020, the Stock Index Fund was operating as a feeder fund, whereby substantially all of its assets are invested in the S&P 500 Index Master Portfolio (“Master Portfolio”), an open-end investment company managed by BlackRock Fund Advisors. At December 31, 2020, the Stock Index Fund’s investment constituted 0.70% of the Master Portfolio. The financial statements of the Master Portfolio are contained in the Appendix of this report and should be read in conjunction with the financial statements for the Stock Index Fund.
2. Summary of Significant Accounting Policies
The financial statements are prepared in conformity with accounting principles generally accepted in the United States of America (“GAAP”). Homestead Funds is considered an Investment Company under GAAP and follows the accounting and reporting guidance set forth in ASC Topic 946 Financial Services—Investment Companies. The preparation of financial statements in conformity with GAAP requires management to make estimates and assumptions that affect the reported amounts of assets and liabilities and disclosure of contingent assets and liabilities at the date of the financial statements and the reported amounts of revenues and expenses during the reporting period. Actual results could differ from those estimates.
Security Valuation: Each Fund’s net asset value per share is determined as of the close of the New York Stock Exchange (“NYSE”) (usually 4:00 p.m. ET), each day that the NYSE is open for business ("Valuation Time"). Portfolio securities for which market quotations are readily available are valued at current market value as of the Valuation Time in accordance with the Portfolio Securities Valuation Policies and Procedures (“Valuation Procedures”) adopted by the Board. Market value is generally determined on the basis of official closing prices or the last reported sales prices and/or may be based on quotes or prices (including evaluated prices) supplied by the Funds’ approved independent pricing services. Portfolio securities for which market quotations are not readily available are valued at fair value by RE Advisers Corporation (“Adviser” or “RE Advisers”) or a Fund’s subadvisor, as determined in good faith in accordance with the Valuation Procedures.
The Board has delegated day-to-day responsibility for determining the fair value of securities to the Adviser and the Funds' subadvisors. RE Advisers has chartered an internal Valuation Committee to oversee the implementation of the Valuation Procedures, oversee the fair valuation decisions of the subadvisors, monitor the valuation process, and provide quarterly reports to the Board. The Valuation Committee reports all instances of fair valuation to the Board at each quarterly Board meeting, as applicable.
A disclosure hierarchy that categorizes the inputs used to value assets and liabilities at measurement date has been established under GAAP. These inputs are summarized into three broad levels as follows:
• Level 1—quoted prices in active markets for identical investments;
• Level 2—other significant observable inputs (including quoted prices for similar investments, interest rates, prepayment speeds, credit risk, etc.); and
• Level 3—significant unobservable inputs (including the Fund’s own assumptions in determining the fair valuation of investments).
The inputs or methodologies used to value securities are not necessarily an indication of the risk associated with investing in those securities. Changes in valuation techniques may result in transfers in or out of an investment’s assigned level within the hierarchy during the period.
| | Notes to Financial Statements |
Notes to Financial Statements | (Continued)
The Funds use the following valuation techniques to value securities by major category:
Registered investment company shares (other than shares of exchange-traded funds and closed-end fund shares that trade on an exchange) are valued at the net asset value determined by the registered investment company after the close of the NYSE. The Funds invest in regulated investment companies that seek to maintain a share price of $1.00 and are categorized as Level 1 in the hierarchy.
Domestic equity securities and exchange traded funds that are traded on a national securities exchange are valued at the closing price as reported by an independent pricing service from the primary market in which the securities trade and are categorized as Level 1. Securities not traded or dealt in upon a national securities exchange for which over-the-counter market quotations are readily available generally are valued (i) at the last quoted sales price (if adequate trading volume is present) or, (ii) otherwise at the last bid price.
Foreign equity securities that are traded on a foreign exchange are valued based on the closing price as reported by an independent pricing service from the primary market in which such securities are normally traded. An independent pricing service is utilized to fair value foreign equity securities based on the impact of market events between the close of the foreign exchange and the time the net asset value is calculated. Foreign equity securities that are fair valued are categorized as Level 2 in the hierarchy and foreign equity securities not fair valued are categorized as Level 1.
Fixed income securities, including corporate, government, municipal, mortgage-backed and asset-backed securities are valued (1) by an independent pricing service based on market prices, (2) market value generated by an independent pricing service, or (3) market value generated by RE Advisers using a pricing matrix or model based on benchmark yields, issuer, spreads, monthly payment information or other available market information for securities of similar characteristics. For purposes of the Valuation Procedures, the process described in (3) is deemed to be a fair valuation of such portfolio securities, solely for the purpose of the applicability of the fair valuation determinations set forth in the Valuation Procedures. For fixed-income securities, the security is valued following the sequence above and flows to the next method only if the prior method is not available.
Fixed income securities utilizing these methods are generally categorized as Level 2. Fixed income securities that are valued using only a broker quote, absent corroborating observable inputs are categorized as Level 3.
Fixed income securities and commercial paper held in the Daily Income Fund are valued at amortized cost and are categorized as Level 2 in the hierarchy. Under the amortized cost method, discounts and premiums on securities purchased are amortized over the lives of the respective securities. The value of the securities using amortized cost would be approximately the same as using fair value without amortized cost.
If a market value cannot be determined for a security using the methodologies described above, or if, in the good faith opinion of the Adviser or Funds’ subadvisor, the market value does not constitute a readily available market quotation, or if a significant event has occurred that would impact a security’s valuation, the security will be fair valued as determined in good faith by the Funds’ Adviser or subadvisor Funds’ based on the Valuation Procedures approved by the Board. The determination of a security’s fair value price often involves the consideration of a number of subjective factors, and therefore, is subject to the risk that the value that is assigned to a security may be higher or lower than the security’s value would be if a reliable market quotation for the security were readily available. Such securities are generally categorized as Level 3 in the hierarchy.
The Stock Index Fund records its investment in the Master Portfolio at the market value of its proportionate interest in the net assets of the Master Portfolio. For purposes of determining the net asset value of the Stock Index Fund, the securities of the Master Portfolio are priced by the investment advisor to the Master Portfolio under the direction of the Board of Trustees of the Master Portfolio. The policies and procedures are discussed in the notes to the Master Portfolio’s financial statements, included in the Appendix of this report.
The following table summarizes each Fund’s investments, based on the inputs used to determine their values on December 31, 2020 (other than Stock Index Fund). The level classifications of the Master Portfolio as of December 31, 2020 are included in the Appendix.
| Daily Income Fund | Level 1 | Level 2 | Level 3 | Total |
| U.S. Government & Agency Obligations | $ — | $141,718,270 | $ — | $141,718,270 |
| Money Market Fund | 30,808,207 | — | — | 30,808,207 |
| Total | $30,808,207 | $141,718,270 | $ — | $172,526,477 |
| Notes to Financial Statements | |
85
Notes to Financial Statements | (Continued)
| Short-Term Government Securities Fund | Level 1 | Level 2 | Level 3 | Total |
| Corporate Bonds Guaranteed by Export-Import Bank of the United States | $ — | $47,879,685 | $ — | $47,879,685 |
| U.S. Government & Agency Obligations | — | 33,620,060 | — | 33,620,060 |
| Corporate Bonds–Other | — | 2,193,679 | — | 2,193,679 |
| Asset-Backed Securities | — | 2,158,518 | — | 2,158,518 |
| Municipal Bonds | — | 1,867,398 | — | 1,867,398 |
| Money Market Fund | 3,056,818 | — | — | 3,056,818 |
| Total | $3,056,818 | $87,719,340 | $ — | $90,776,158 |
| Short-Term Bond Fund | | | | |
| U.S. Government & Agency Obligations | $ — | $208,482,102 | $ — | $208,482,102 |
| Corporate Bonds–Other | — | 193,792,558 | — | 193,792,558 |
| Asset-Backed Securities | — | 60,230,364 | — | 60,230,364 |
| Yankee Bonds | — | 56,987,450 | — | 56,987,450 |
| Municipal Bonds | — | 19,324,277 | — | 19,324,277 |
| Corporate Bonds Guaranteed by Export-Import Bank of the United States | — | 16,744,068 | — | 16,744,068 |
| Mortgage-Backed Securities | — | 4,068 | — | 4,068 |
| Money Market Fund | 11,322,370 | — | — | 11,322,370 |
| Total | $11,322,370 | $555,564,887 | $ — | $566,887,257 |
| Intermediate Bond Fund | | | | |
| Corporate Bonds–Other | $ — | $36,544,067 | $ — | $36,544,067 |
| Mortgage-Backed Securities | — | 16,273,673 | — | 16,273,673 |
| U.S. Government & Agency Obligations | — | 13,003,687 | — | 13,003,687 |
| Asset-Backed Securities | — | 10,546,879 | — | 10,546,879 |
| Yankee Bonds | — | 8,551,050 | — | 8,551,050 |
| Municipal Bonds | — | 3,765,993 | — | 3,765,993 |
| Corporate Bond Guaranteed by Export-Import Bank of the United States | — | 322,275 | — | 322,275 |
| Money Market Fund | 4,504,029 | — | — | 4,504,029 |
| Total | $4,504,029 | $89,007,624 | $ — | $93,511,653 |
| Value Fund | | | | |
| Common Stocks | $914,528,100 | $ — | $ — | $914,528,100 |
| Money Market Fund | 13,690,331 | — | — | 13,690,331 |
| Total | $928,218,431 | $ — | $ — | $928,218,431 |
| Growth Fund | | | | |
| Common Stocks | $318,119,062 | $ — | $ — | $318,119,062 |
| Money Market Fund | 2,006,631 | — | — | 2,006,631 |
| Total | $320,125,693 | $ — | $ — | $320,125,693 |
| International Equity Fund | | | | |
| Common Stocks | $12,649,997 | $73,719,108 | $ — | $86,369,105 |
| Preferred Stocks | 455,867 | 1,467,205 | — | 1,923,072 |
| Money Market Fund | 3,176,868 | — | — | 3,176,868 |
| Total | $16,282,732 | $75,186,313 | $ — | $91,469,045 |
| Small-Company Stock Fund | | | | |
| Common Stocks | $283,521,285 | $ — | $ — | $283,521,285 |
| Money Market Fund | 3,762,606 | — | — | 3,762,606 |
| Total | $287,283,891 | $ — | $ — | $287,283,891 |
| | Notes to Financial Statements |
Notes to Financial Statements | (Continued)
On December 3, 2020, the SEC adopted Rule 2a-5 under the 1940 Act, which is intended to address valuation practices and the role of the board of directors with respect to the fair value of the investments of a registered investment company or business development company. Among other things, Rule 2a-5 will permit a fund's board to designate the fund's primary investment adviser to perform the fund's fair value determinations, which will be subject to board oversight and certain reporting and other requirements intended to ensure that the board receives the information it needs to oversee the investment adviser's fair value determinations. Compliance with Rule 2a-5 will not be required until September 2022. RE Advisers continues to review Rule 2a-5 and its impact on RE Advisers' and the Funds' valuation policies and related practices.
Foreign currency: The International Equity Fund may use foreign currency contracts to facilitate transactions in foreign-denominated securities. Losses from these transactions may arise from changes in the value of the foreign currency or if the counterparties do not perform under the contract’s terms. Foreign-denominated assets, including investment securities and liabilities are translated into U.S. dollars at the exchange rate at the end of the period. Purchases and sales of investment securities and income and dividends received are translated into U.S. dollars at the exchange rate in effect on the transaction date. Currency gains and losses and the effects of exchange rate fluctuations on investments are included with the realized and unrealized gain (loss) on investment securities.
To-be-announced securities: The Intermediate Bond Fund purchases securities on a to-be-announced (TBA) basis, with payment and delivery scheduled for a future date. These transactions are subject to market fluctuations and are subject to the risk that the value at delivery may be more or less than the trade date purchase price. The Fund maintains liquid assets sufficient to settle its commitment to purchase a TBA security.
Distributions to shareholders: Dividends to shareholders are recorded on the ex-dividend date. Ordinary income dividends for the Daily Income, Short-Term Government Securities, Short-Term Bond, and Intermediate Bond Funds are declared daily and paid monthly. Ordinary income dividends for Value Fund are declared and paid semi-annually. Ordinary income dividends for the Stock Index, Growth, Small-Company Stock and International Equity Funds are declared and paid annually. Capital gains dividends, if any, are declared and paid at the end of each fiscal year. Any unpaid capital gains will be paid in June of the subsequent year, but no later than the extended due date of the federal tax return.
Other: Dividend income is recorded on the ex-dividend date. Interest income, including amortization of premium and accretion of discount, and expenses are recorded on the accrual basis. Investment transactions are recorded as of the trade date. Realized gains and losses from investment transactions are reported on the identified cost basis.
The Stock Index Fund records a pro rata share of the Master Portfolio’s income, expenses, and realized and unrealized gains and losses in addition to the Fund’s own expenses, which are accrued daily.
In the normal course of business, the Funds enter into contracts that provide general indemnifications. The Funds’ maximum exposure under these arrangements is dependent on claims that may be made against the Funds in the future and therefore cannot be estimated; however, the Funds have not had prior claims or losses pursuant to these contracts.
Management considered events occurring between the date of this report, December 31, 2020, and the date of issuance of this report in determining adjustments to the financial statements or necessary disclosures in this report.
3. Federal Income Tax Information
The Funds' policy is to comply with the provisions of the Internal Revenue Code applicable to regulated investment companies and will distribute all net investment income to its shareholders. Therefore, no provision for Federal income taxes is required.
Management has analyzed the Funds’ tax positions and has concluded that no provision for income tax is required in the Funds’ financial statements. The Funds are not aware of any tax positions for which it is reasonably possible that the total amounts of unrecognized tax benefits will significantly change in the next twelve months. However, management’s conclusions may be subject to review and adjustment at a later date based on factors including, but not limited to new tax laws, regulations and administrative interpretations.
Each Fund files U.S. federal, state, and local tax returns as required. Each Fund’s tax returns are subject to examination by the relevant tax authorities until expiration of the applicable statute of limitations, which is generally three years after filing of the tax return but could be longer in certain circumstances.
Income and capital gain distributions are determined in accordance with federal income tax regulations, which may differ from GAAP. These differences are primarily due to differing treatments of the following: futures and options transactions, foreign currency transactions, losses deferred due to wash sales, losses deferred due to post-October losses, unused capital losses, partnership investments, deferred Director’s fees, passive foreign investment company transactions, and REIT transactions, which are reflected as book/tax differences in the following tables.
| Notes to Financial Statements | |
87
Notes to Financial Statements | (Continued)
Permanent book and tax basis differences relating to shareholder distributions will result in reclassifications to paid-in capital. Reclassifications recorded in 2020 include paydown losses for Short-Term Government Securities, Short-Term Bond,and Intermediate Bond Funds; prior year excise tax and partnership adjustments for Stock Index Fund; REIT transactions and deemed distribution due to equalization for Value Fund; foreign currency transactions, net operating losses, and distribution redesignations for Growth Fund; REIT trasactions, ordinary losses netting, and deemed distributions due to equalization for Small Company Stock Fund; and foreign currency transactions and distribution redesignations for International Equity Fund. The tax reclassifications for 2020 are reflected below.
| | Distributable Earnings (Losses) | Paid in
Capital |
| Daily Income Fund | $— | $— |
| Short-Term Gov. Securities Fund | $— | $— |
| Short-Term Bond Fund | $— | $— |
| Intermediate Bond Fund | $1,238 | $(1,238) |
| Stock Index Fund | $4,225 | $(4,225) |
| Value Fund | $(17,252,352) | $17,252,352 |
| Growth Fund | $— | $— |
| International Equity Fund | $— | $— |
| Small-Company Stock Fund | $(6,339,497) | $6,339,497 |
| | | |
Tax character of distributions paid in 2020 was as follows:
| | Ordinary
Income | Long-Term
Gain | Return of
Capital | Total
Distributions |
| Daily Income Fund | $311,702 | $— | $— | $311,702 |
| Short-Term Gov. Securities Fund | $1,659,674 | $476,981 | $— | $2,136,655 |
| Short-Term Bond Fund | $17,675,090 | $2,174,238 | $— | $19,849,328 |
| Intermediate Bond Fund | $2,215,449 | $— | $— | $2,215,449 |
| Stock Index Fund | $2,146,140 | $512,205 | $— | $2,658,345 |
| Value Fund | $11,542,273 | $124,835,673 | $— | $136,377,946 |
| Growth Fund | $1,461,359 | $12,884,209 | $— | $14,345,568 |
| International Equity Fund | $552,126 | $— | $— | $552,126 |
| Small-Company Stock Fund | $3,064 | $33,363,259 | $— | $33,366,323 |
| | | | | |
Tax character of distributions paid in 2019 was as follows:
| | Ordinary
Income | Long-Term
Gain | Return of
Capital | Total
Distributions |
| Daily Income Fund | $2,360,611 | $— | $— | $2,360,611 |
| Short-Term Gov. Securities Fund | $1,441,910 | $— | $— | $1,441,910 |
| Short-Term Bond Fund | $14,850,051 | $— | $— | $14,850,051 |
| Intermediate Bond Fund | $327,462 | $— | $— | $327,462 |
| Stock Index Fund | $3,204,130 | $129,581 | $— | $3,333,711 |
| Value Fund | $14,340,909 | $120,996,739 | $— | $135,337,648 |
| Growth Fund | $— | $12,506,704 | $— | $12,506,704 |
| International Equity Fund | $841,645 | $— | $— | $841,645 |
| Small-Company Stock Fund | $2,225,699 | $63,126,139 | $— | $65,351,838 |
Amounts reflected in ordinary income include short-term gain distributions.
| | Notes to Financial Statements |
Notes to Financial Statements | (Continued)
The tax character of distributable earnings/(accumulated losses) at December 31, 2020 was as follows:
| | Undistributed
Ordinary
Income | Undistributed
Long-Term
Gain | Net
Unrealized
Appreciation/
Depreciation | Capital Loss
Carryforward/
Late Year
Loss Deferral | Other
Book/Tax
Differences | Total
Distributable
Earnings (Losses) |
| Daily Income Fund | $— | $— | $— | $— | $(74,403) | $(74,403) |
| Short-Term Gov. Securities Fund | $2,416 | $— | $1,320,897 | $(103,107) | $(30,120) | $1,190,086 |
| Short-Term Bond Fund | $2,206,595 | $101,927 | $8,897,858 | $— | $(168,935) | $11,037,445 |
| Intermediate Bond Fund | $— | $— | $2,176,141 | $(374,311) | $(3,254) | $1,798,576 |
| Stock Index Fund | $556,163 | $— | $146,992,679 | $— | $1,135,390 | $148,684,232 |
| Value Fund | $98,140 | $5,534,310 | $391,124,217 | $— | $(280,772) | $396,475,895 |
| Growth Fund | $1,326,960 | $3,807,920 | $156,132,185 | $— | $(34,047) | $161,233,018 |
| International Equity Fund | $43,855 | $— | $31,844,658 | $(1,180,728) | $(52,717) | $30,655,068 |
| Small-Company Stock Fund | $1,315,846 | $6,512,217 | $89,896,575 | $— | $(181,027) | $97,543,611 |
| | | | | | | |
For Short-Term Bond and Intermediate Bond Funds, $103,107 and $374,311, respectively, represents losses incurred between November 1st and December 31st, which will reverse the first day of 2021. For International Equity Fund, $1,180,728 represents short-term capital loss carry forwards with no expiration.
At December 31, 2020, the cost of securities for federal income tax purposes, the aggregate gross unrealized gain for all securities for which there was an excess of value over tax cost and the aggregate gross unrealized loss for all securities for which there was an excess of tax cost over value was as follows:
| | Tax Cost | Tax Appreciation | Tax Depreciation | Net Tax
Appreciation
(Depreciation) |
| Daily Income Fund | $172,526,477 | $— | $— | $— |
| Short-Term Gov. Securities Fund | $89,455,261 | $1,329,268 | $(8,371) | $1,320,897 |
| Short-Term Bond Fund | $557,989,399 | $8,956,044 | $(58,186) | $8,897,858 |
| Intermediate Bond Fund | $91,335,512 | $2,220,968 | $(44,827) | $2,176,141 |
| Value Fund | $537,094,214 | $402,693,843 | $(11,569,626) | $391,124,217 |
| Growth Fund | $163,993,509 | $156,196,784 | $(64,600) | $156,132,184 |
| International Equity Fund | $59,645,701 | $33,107,545 | $(1,284,201) | $31,823,344 |
| Small-Company Stock Fund | $197,387,316 | $93,746,184 | $(3,849,609) | $89,896,575 |
| | | | | |
The difference between book basis and tax basis unrealized appreciation (depreciation) is primarily attributable to the tax deferral of losses on wash sales. Net unrealized appreciation/(depreciation) of Stock Index Fund in the Master Portfolio consists of an allocated portion of the portfolio’s unrealized appreciation/(depreciation). For information pertaining to the unrealized appreciation/(depreciation) for the Master Portfolio, please refer to the Appendix of this report.
4. Investment Transactions
Purchases and proceeds from sales of securities, other than short-term and U.S. Government securities, for the period ended December 31, 2020, were as follows:
| | Purchases | Proceeds
from Sale |
| Short-Term Gov. Securities Fund | $41,885,423 | $13,704,720 |
| Short-Term Bond Fund | $434,375,605 | $303,493,515 |
| Intermediate Bond Fund | $114,752,310 | $55,091,767 |
| Value Fund | $187,707,555 | $299,912,929 |
| Growth Fund | $60,047,801 | $72,910,800 |
| International Equity Fund | $11,034,395 | $15,430,907 |
| Small-Company Stock Fund | $46,169,128 | $137,987,671 |
| Notes to Financial Statements | |
89
Notes to Financial Statements | (Continued)
Purchases and proceeds from sales of long-term U.S. Government securities, for the period ended December 31, 2020, were as follows:
| | Purchases | Proceeds
from Sale |
| Short-Term Gov. Securities Fund | $198,498,172 | $211,573,472 |
| Short-Term Bond Fund | $1,302,240,983 | $1,443,488,102 |
| Intermediate Bond Fund | $144,860,837 | $141,959,829 |
5. Related Parties
The investment management agreements between Homestead Funds, with respect to each Fund (other than the Stock Index Fund), and RE Advisers, an indirect, wholly-owned subsidiary of the National Rural Electric Cooperative Association (“NRECA”), provide for an annual investment management fee, that also provides for certain administrative services to the Funds, which is computed daily and paid monthly, based on each Fund’s average daily net assets. The annualized management fee rates for the Funds are 0.50% of average daily net assets for Daily Income Fund; 0.45% of average daily net assets for Short-Term Government Securities Fund; 0.60% of average daily net assets for Short-Term Bond Fund; 0.60% of average daily net assets up to $500 million, 0.50% of average daily net assets up to the next $500 million, and 0.45% of average daily net assets in excess of $1 billion for Intermediate Bond Fund; 0.65% of average daily net assets up to $200 million, 0.50% of average daily net assets up to the next $200 million, 0.40% of average daily net assets in excess of $400 million for Value Fund; 0.65% of average daily net assets up to $250 million and 0.60% of average daily net assets in excess of $250 million for the Growth Fund; 0.85% of average daily net assets up to $200 million and 0.75% of average daily net assets in excess of $200 million for Small-Company Stock Fund; and 0.75% of average daily net assets up to $300 million, 0.65% of average daily net assets up to the next $100 million, 0.55% of average daily net assets up to the next $100 million, and 0.50% of average daily net assets in excess of $500 million for International Equity Fund.
T. Rowe Price Associates, Inc. (“T. Rowe”) is the subadvisor for the Growth Fund and Harding Loevner LP (“Harding”) is the subadvisor for the International Equity Fund. The subadvisors select, buy, and sell securities under the supervision and oversight of RE Advisers and the Board of Directors. RE Advisers pays the subadvisors from the fees it receives from the Funds. SSGA Funds Management, Inc. ("SSGA FM") served as interim subadvisor to the International Equity Fund from September 7, 2015 until January 8th, 2016. Harding Loevner LP began as subadvisor on January 15, 2016 after a transition period.
RE Advisers serves as the administrator for the Stock Index Fund pursuant to an Administrative Services Agreement with the fund, under which RE Advisers provides certain administrative services to the Fund. Pursuant to this agreement, RE Advisers receives a fee of 0.25% of the Fund's average daily net assets. In addition, the Stock Index Fund is allocated a management fee from the Master Portfolio, calculated daily at an annual rate of 0.01% of its average daily net assets. This fee includes advisory, custody, and administrative fees provided by the Master Portfolio on behalf of its investors. The financial information for the Master Portfolio is included in the Appendix.
RE Advisers has agreed, as part of the Expense Limitation Agreement entered into with Homestead Funds, with respect to each Fund, to waive its management fee and/or reimburse all Fund operating expenses, excluding certain non-recurring expenses, such as interest, taxes, brokerage commissions, other expenditures that are capitalized in accordance with generally accepted accounting principles, expenses not incurred in the ordinary course of business, or, in the case of each Fund other than the Stock Index Fund, fees and expenses associated with an investment in another investment company or any company that would be an investment company under Section 3(a) of the Act, but for the exceptions to that definition provided for in Sections 3(c)(1) and 3(c)(7) of the Act, which in any year exceed 0.80% of the average daily net assets of the Daily Income, Short-Term Bond, and Intermediate Bond Funds, 0.75% of the average daily net assets of the Short-Term Government Securities and Stock Index Funds, 1.25% of the average daily net assets of Value Fund, 0.95% of the average daily net assets of Growth Fund, 1.50% of the average daily net assets of Small-Company Stock Fund and 0.99% of the average daily net assets of the International Equity Fund.
Pursuant to the Expense Limitation Agreement, management fees waived for the period ended December 31, 2020 amounted to $48,176 for Short-Term Government Securities Fund, $194,366 for Intermediate Bond Fund and $193,893 for International Equity Fund.
On August 14, 2009, RE Advisers voluntarily agreed to waive fees and/or reimburse expenses, to the extent necessary to assist the Daily Income Fund in attempting to maintain a positive yield (the "temporary waiver"). The temporary waiver continued from 2009 through May 11, 2017. RE Advisers began voluntarily waiving fees for this Fund again on April 20, 2020. Per the temporary waiver, RE Advisers waived $711,511 of management fees for the Daily Income Fund during the period.
| | Notes to Financial Statements |
Notes to Financial Statements | (Continued)
For the period beginning September 7, 2015 through January 14, 2016, RE Advisers, pursuant to a contractual waiver with the International Equity Fund, waived from the management fee due to it from International Equity Fund the amount equal to the subadvisory fees it would have paid to Mercator Asset Management L.P., the Fund's subadvisor prior to September 7, 2015, less the amount it paid to SSGA FM for subadvisory services during such period.
Under a Deferred Compensation Plan (the “Plan”), Independent Directors or Trustees of the Funds may elect to defer receipt of all or a specified portion of their compensation. Deferred amounts are credited with the earnings and losses equal to those made as if the deferred amounts were invested in one or more of the Funds, as designated by each participating Independent Director / Trustee. Deferred amounts remain in the Fund until distributed in accordance with the Plan. The liability is reflected as Independent Director / Trustee's deferred compensation on the Statement of Assets and Liabilities and the expense is included in Director, Trustee and Board meeting expenses on the Statement of Operations.
As of December 31, 2020, one shareholder of record, an omnibus account, held greater than 13% of the net assets of the Small-Company Stock Fund. No other shareholders, including omnibus accounts, held more than 10% of the outstanding shares of any of the Funds.
6. Capital Share Transactions
As of December 31, 2020, unlimited shares of $.01 par value capital shares are authorized for Intermediate Bond Fund, 500 million shares are authorized for Daily Income Fund, 200 million shares for Short-Term Bond Fund, and 100 million shares for Short-Term Government Securities Fund, Stock Index Fund, Value Fund, Growth Fund, Small-Company Stock Fund, and International Equity Fund. Transactions in capital shares were as follows:
| | Shares
Sold | Shares Issued
In Reinvestment
of Dividends | Total Shares
Issued | Total Shares
Redeemed | Net Increase
(Decrease) |
| Year Ended December 31, 2020 | | | | | |
| In Dollars | | | | | |
| Daily Income Fund | $131,829,694 | $308,816 | $132,138,510 | $(123,184,973) | $8,953,537 |
| Short-Term Government Securities Fund | $32,509,433 | $2,053,370 | $34,562,803 | $(17,800,494) | $16,762,309 |
| Short-Term Bond Fund | $119,224,544 | $19,376,890 | $138,601,434 | $(129,758,257) | $8,843,177 |
| Intermediate Bond Fund | $74,315,951 | $2,205,802 | $76,521,753 | $(9,500,561) | $67,021,192 |
| Stock Index Fund | $23,233,086 | $2,633,355 | $25,866,441 | $(33,930,689) | $(8,064,248) |
| Value Fund | $67,011,750 | $134,232,075 | $201,243,825 | $(182,288,686) | $18,955,139 |
| Growth Fund | $55,331,449 | $14,235,123 | $69,566,572 | $(67,289,805) | $2,276,767 |
| International Equity Fund | $10,427,226 | $546,196 | $10,973,422 | $(13,629,981) | $(2,656,559) |
| Small-Company Stock Fund | $15,156,853 | $33,027,545 | $48,184,398 | $(106,823,408) | $(58,639,010) |
| In Shares | | | | | |
| Daily Income Fund | 131,829,694 | 308,816 | 132,138,510 | (123,184,973) | 8,953,537 |
| Short-Term Government Securities Fund | 6,070,408 | 387,426 | 6,457,834 | (3,336,901) | 3,120,933 |
| Short-Term Bond Fund | 22,168,547 | 3,637,973 | 25,806,520 | (24,310,767) | 1,495,753 |
| Intermediate Bond Fund | 13,844,395 | 408,603 | 14,252,998 | (1,788,809) | 12,464,189 |
| Stock Index Fund | 992,479 | 99,236 | 1,091,715 | (1,439,735) | (348,020) |
| Value Fund | 1,470,048 | 2,894,042 | 4,364,090 | (3,981,817) | 382,273 |
| Growth Fund | 4,228,327 | 952,121 | 5,180,448 | (5,315,850) | (135,402) |
| International Equity Fund | 1,185,487 | 52,889 | 1,238,376 | (1,555,093) | (316,717) |
| Small-Company Stock Fund | 615,266 | 1,182,565 | 1,797,831 | (4,361,324) | (2,563,493) |
| Notes to Financial Statements | |
91
Notes to Financial Statements | (Continued)
| | Shares
Sold | Shares Issued
In Reinvestment
of Dividends | Total Shares
Issued | Total Shares
Redeemed | Net Increase
(Decrease) |
| Year Ended December 31, 2019 | | | | | |
| In Dollars | | | | | |
| Daily Income Fund | $91,086,706 | $2,336,618 | $93,423,324 | $(94,436,803) | $(1,013,479) |
| Short-Term Government Securities Fund | $4,833,516 | $1,424,511 | $6,258,027 | $(12,570,040) | $(6,312,013) |
| Short-Term Bond Fund | $56,684,029 | $14,583,306 | $71,267,335 | $(91,304,333) | $(20,036,998) |
| Intermediate Bond Fund | $23,899,853 | $327,117 | $24,226,970 | $(385,263) | $23,841,707 |
| Stock Index Fund | $17,527,067 | $3,303,467 | $20,830,534 | $(20,978,053) | $(147,519) |
| Value Fund | $48,837,566 | $131,515,248 | $180,352,814 | $(157,409,343) | $22,943,471 |
| Growth Fund | $36,189,129 | $12,427,196 | $48,616,325 | $(41,645,651) | $6,970,674 |
| International Equity Fund | $5,229,301 | $831,804 | $6,061,105 | $(8,583,771) | $(2,522,666) |
| Small-Company Stock Fund | $35,434,305 | $64,691,901 | $100,126,206 | $(282,373,522) | $(182,247,316) |
| In Shares | | | | | |
| Daily Income Fund | 91,086,706 | 2,336,618 | 93,423,324 | (94,436,803) | (1,013,479) |
| Short-Term Government Securities Fund | 930,893 | 273,974 | 1,204,867 | (2,420,838) | (1,215,971) |
| Short-Term Bond Fund | 10,852,517 | 2,786,212 | 13,638,729 | (17,474,550) | (3,835,821) |
| Intermediate Bond Fund | 4,660,754 | 63,669 | 4,724,423 | (74,550) | 4,649,873 |
| Stock Index Fund | 807,251 | 140,575 | 947,826 | (976,297) | (28,471) |
| Value Fund | 936,620 | 2,568,734 | 3,505,354 | (3,011,146) | 494,208 |
| Growth Fund | 3,255,743 | 1,071,930 | 4,327,673 | (3,749,241) | 578,432 |
| International Equity Fund | 638,711 | 93,043 | 731,754 | (1,045,911) | (314,157) |
| Small-Company Stock Fund | 1,258,845 | 2,385,961 | 3,644,806 | (10,027,693) | (6,382,887) |
7. Other Matters
The recent global outbreak of the 2019 novel coronavirus (“COVID-19”), together with resulting voluntary and US federal and state and non-US governmental actions, including, without limitation, mandatory business closures, public gathering limitations, restrictions on travel and quarantines, has meaningfully disrupted the global economy and markets. Although the long-term economic fallout of COVID-19 is difficult to predict, it has had and is expected to continue to have ongoing material adverse effects across many, if not all, aspects of the regional, national and global economy. In particular, the COVID-19 outbreak has adversely affected each Fund's investments and may continue to do so. Furthermore, RE Advisers' ability to operate effectively, including the ability of its personnel or its service providers and other contractors to function, communicate and travel to the extent necessary to carry out the Funds' investment strategies and objectives and RE Advisers' business and to satisfy its obligations to the Funds, their investors, and pursuant to applicable law, may be impaired. To the extent the spread of COVID-19 affects RE Advisers' personnel and/or the personnel of its service providers, it could significantly affect RE Advisers' ability to oversee the affairs of the Funds (particularly to the extent such impacted personnel include key investment professionals or other members of senior management).
8. Recent Accounting Pronouncements
In March 2020, the Financial Accounting Standards Board issued ASU 2020-04, Reference Rate Reform: Facilitation of the Effects of Reference Rate Reform on Financial Reporting. The main objective of the new guidance is to provide relief to companies that will be impacted by the expected change in benchmark interest rates at the end of 2021, when participating banks will no longer be required to submit London Interbank Offered Rate (LIBOR) quotes by the UK Financial Conduct Authority (FCA). The new guidance allows companies to, provided the only change to existing contracts are a change to an approved benchmark rate, account for modifications as a continuance of the existing contract without additional analysis. For new and existing contracts, the Funds may elect to apply the amendments as of March 12, 2020 through December 31, 2022. Management has not yet elected to apply the amendments, but is currently assessing the impact of the ASU's adoption to the Funds' financial statements.
9. Subsequent Events
Management has evaluated the impact of all subsequent events through the date the financial statements were issued and has determined that there were no subsequent events requiring adjustment or additional disclosure in these financial statements.
| | Notes to Financial Statements |
Directors, Trustees and Officers
Independent | (Unaudited)
Each Director or Trustee serves until their resignation or until their successor is duly elected and qualified. The Statement of Additional Information (“SAI”) has additional information about the Funds’ Directors, Trustees and officers and is available online at homesteadfunds.com and, without charge, upon request by calling 800-258-3030.
Name, Year of Birth
and Address (1) | Position(s) Held
With Homestead Funds | Term of Office and Length of Time Served | Principal Occupation(s)
During Past Five Years | Number of Portfolios Overseen by Director | Other Directorships Held by Director |
James F. Perna
1947 | Director/Trustee, Chairman of the Board, Member of Audit Committee, Member of Compensation Committee | 1990-present (Homestead Funds, Inc.); since inception (Homestead Funds Trust) | Solo Practitioner (attorney) (2008-present) | 9 | None |
Douglas W. Johnson
1955 | Director/Trustee, Chairman of Audit Committee, Member of Compensation Committee | 2003-present (Homestead Funds, Inc.); since inception (Homestead Funds Trust) | CEO, Blue Ridge Electric Membership Corporation (1989-present) | 9 | None |
Kenneth R. Meyer
1944 | Director/Trustee, Member of Audit Committee, Chairman of Compensation Committee | 2005-present (Homestead Funds, Inc.); since inception (Homestead Funds Trust) | Retired (2004-present) | 9 | None |
Anthony M. Marinello
1946 | Director/Trustee, Member of Audit Committee, Member of Compensation Committee | 1990-present (Homestead Funds, Inc.); since inception (Homestead Funds Trust) | Retired (2004-present) | 9 | None |
Sheldon C. Petersen
1953 | Director/Trustee, Member of Audit Committee, Member of Compensation Committee | 2005-present (Homestead Funds, Inc.); since inception (Homestead Funds Trust) | CEO, National Rural Utilities Cooperative Finance Corporation (1995-present) | 9 | None |
Mark Rose
1953 | Director/Trustee, Member of Audit Committee, Member of Compensation Committee | 2005-present (Homestead Funds, Inc.); since inception (Homestead Funds Trust) | Consultant, public affairs (2017-present (self-employed)); CEO and General Manager, Bluebonnet Electric Cooperative (2002-2017) | 9 | None |
Peter J. Tonetti
1953 | Director/Trustee, Member of Audit Committee, Member of Compensation Committee | 2010-present (Homestead Funds, Inc.); since inception (Homestead Funds Trust) | Retired (2015-present); Chief Investment Officer, Hamilton College (2008-2015) | 9 | None |
Judy H. McKinney
1950 | Director/Trustee, Member of Audit Committee, Member of Compensation Committee | 2019-present (Homestead Funds, Inc.); 2019-present (Homestead Funds Trust) | Executive Vice President and Manager, Callan LLC (2007-2019) | 9 | None |
Directors and Officers
93
Directors, Trustees and Officers
Independent | (Unaudited) (Continued)
Julie H. Dellinger
1953 | Director/Trustee, Member of Audit Committee, Member of Compensation Committee | 2019-present (Homestead Funds, Inc.); 2019-present (Homestead Funds Trust) | Westminster Investment Consultants, CEO (2017- present); Managing Vice President of Investments, ICMARC and Manager, Vantagepoint Investment Advisers, LLC (1998-2017) | 9 | None |
Directors and Officers
Interested | (Unaudited)
Name, Year of Birth
and Address (1) | Position(s) Held
With Homestead Funds | Term of Office and Length of Time Served | Principal Occupation(s)
During Past Five Years | Number of Portfolios Overseen by Director | Other Directorships Held by Director |
Mark D. Santero (2)
1961 | Director/Trustee, President and Chief Executive Officer | 2018-present (Homestead Funds, Inc.); since inception (Homestead Funds Trust) | RE Advisers Corporation, President, Chief Executive Officer and Director (2018- present); Chief Executive Officer, The Dreyfus Corporation (2016-2017); Chief Operating Officer, BNY Mellon Investment Management (2014- 2016) | 9 | Not Applicable |
Danielle C. Sieverling
1971 | Chief Compliance Officer
| 2005-present (Homestead Funds, Inc.); since inception (Homestead Funds Trust)
| Chief Compliance Officer, RE Advisers (2005-present); Vice President, Chief Risk and Compliance Officer, NRECA (2015-present); Chief Compliance Officer, RE Investment Corporation (2017-Present); Secretary, RE Advisers (2017-2018, 2020-present); Chief Executive Officer and Director, RE Investment Corporation (2017- 2018); Director, RE Investment Corporation (2016) Vice President and Director, RE Investment Corporation (2015- 2016); Vice President and Chief Compliance Officer, Management Advisory Services, NRECA (2008-2015) | Not Applicable | Not Applicable |
| Secretary | 2005-2008, 2017, 2020 – present (Homestead Funds, Inc.); 2020-present (Homestead Funds Trust) |
Amy M. DiMauro
1971 | Treasurer | 2007-present (Homestead Funds, Inc,); since inception (Homestead Funds Trust) | Treasurer and Director, RE Investment Corporation (2006- present); Treasurer and Director, RE Advisers Corporation (2010- present); Senior Director, Finance & Accounting—Mutual Funds, NRECA (2014-present); Treasurer and Director, Electric Cooperative Life Insurance Co. (2013-present); Treasurer and Director, Cooperating Insurance Services Co. (2013- present) | Not Applicable | Not Applicable |
Jennifer (Laurie) Webster
1963 | Chief Operations Officer | 2017-Present (Homestead Funds, Inc.); since inception (Homestead Funds Trust) | President and Director, RE Investment Corporation (2018- present); Chief Operations Officer, RE Investment Corporation (2017- present); Vice President of Operations and Client Services, RE Advisers (2017-present); Chief Operating Officer, Solomon Hess Capital Management (2017-2017); V.P. Investment Operations and Indexing, Calvert Investments (2014-2017) | Not Applicable | Not Applicable |
| (1) | The address of each Director and officer is 4301 Wilson Boulevard, Arlington, Virginia 22203. |
(2) Mr. Santero is a director who is an “interested person” of Homestead Funds within the meaning of Section 2(a)(19) of the 1940 Act due to his affiliation with RE Advisers and its affiliates.
Directors and Officers
95
Other Tax Information (Unaudited)
The following information for the year ended December 31, 2020, is included pursuant to provisions of the Internal Revenue Code.
The Funds designate the following percentages of dividends declared from net investment income as qualified dividend income for individuals or as dividends received deduction for corporations:
| Fund | Qualified Dividend Income for Individuals | Dividends Received Deduction for Corporations |
| Daily Income Fund | 0% | 0% |
| Short-Term Government Securities Fund | 0% | 0% |
| Short-Term Bond Fund | 0% | 0% |
| Stock Index Fund | 100% | 91% |
| Value Fund | 100% | 99% |
| Growth Fund | 0% | 0% |
| International Equity Fund | 100% | 100% |
| Small-Company Stock Fund | 80% | 80% |
The Funds designate the following amounts as short-term and long-term capital gains distributed during the year ended December 31, 2020.
| Fund | Record Date | Distributions of Short-Term Capital Gains | Distributions of Long-Term Capital Gains |
| Short-Term Government Securities Fund | 6/29/2020 | $0.0032 | $– |
| Short-Term Government Securities Fund | 12/16/2020 | $0.0712 | $0.0291 |
| Short-Term Bond Fund | 6/29/2020 | $0.0064 | $– |
| Short-Term Bond Fund | 12/16/2020 | $0.1151 | $0.0209 |
| Intermediate Bond Fund | 12/16/2020 | $0.0809 | $– |
| Stock Index Fund | 6/29/2020 | $– | $0.0743 |
| Stock Index Fund | 12/16/2020 | $0.0053 | $– |
| Value Fund | 6/29/2020 | $– | $0.8284 |
| Value Fund | 12/16/2020 | $– | $6.3412 |
| Growth Fund | 6/29/2020 | $– | $0.1320 |
| Growth Fund | 12/16/2020 | $0.0752 | $0.5295 |
| Small-Company Stock Fund | 6/29/2020 | $– | $0.3290 |
| Small-Company Stock Fund | 12/16/2020 | $– | $3.2631 |
The International Equity Fund designates $0.016853 per share as foreign taxes paid and $0.056724 per share as income earned from foreign sources.
Portfolio of Investments
S&P 500 Index Master Portfolio | December 31, 2020
| Common Stocks | 99.8% of net assets |
| | Shares | Value |
| Aerospace & Defense | 1.6% |
| Boeing Co. | 453,312 | $97,035,967 |
| General Dynamics Corp. | 200,676 | 29,864,602 |
| Howmet Aerospace, Inc. | 339,873 | 9,699,976 |
| Huntington Ingalls Industries, Inc. | 32,105 | 5,473,260 |
| L3Harris Technologies, Inc. | 177,886 | 33,624,012 |
| Lockheed Martin Corp. | 207,448 | 73,639,891 |
| Northrop Grumman Corp. | 130,782 | 39,851,891 |
| Raytheon Technologies Corp. | 1,297,789 | 92,804,891 |
| Teledyne Technologies, Inc. (a) | 31,829 | 12,476,332 |
| Textron, Inc. | 195,208 | 9,434,403 |
| TransDigm Group, Inc. (a) | 46,804 | 28,964,655 |
| Total Aerospace & Defense | | 432,869,880 |
| Air Freight & Logistics | 0.7% |
| C.H. Robinson Worldwide, Inc. | 115,921 | 10,881,504 |
| Expeditors International of Washington, Inc. | 135,422 | 12,879,987 |
| FedEx Corp. | 208,029 | 54,008,489 |
| United Parcel Service, Inc., Class B | 610,732 | 102,847,269 |
| Total Air Freight & Logistics | | 180,617,249 |
| Airlines | 0.3% |
| Alaska Air Group, Inc. | 104,278 | 5,422,456 |
| American Airlines Group, Inc. | 439,112 | 6,924,796 |
| Delta Air Lines, Inc. | 550,751 | 22,145,698 |
| Southwest Airlines Co. (a) | 509,319 | 23,739,358 |
| United Airlines Holdings, Inc. (a)(b) | 251,247 | 10,866,433 |
| Total Airlines | | 69,098,741 |
| Auto Components | 0.1% |
| Aptiv PLC | 233,150 | 30,377,113 |
| BorgWarner, Inc. | 176,581 | 6,823,090 |
| Total Auto Components | | 37,200,203 |
| Automobiles | 2.0% |
| Ford Motor Co. | 3,390,483 | 29,802,346 |
| General Motors Co. | 1,087,117 | 45,267,552 |
| Tesla Inc. (a) | 645,218 | 455,310,986 |
| Total Automobiles | | 530,380,884 |
| Banks | 3.8% |
| Bank of America Corp. | 6,456,539 | 195,697,697 |
| Citigroup, Inc. | 1,772,920 | 109,318,247 |
| Citizens Financial Group, Inc. | 365,770 | 13,079,935 |
| Comerica, Inc. | 123,273 | 6,886,030 |
| Fifth Third Bancorp | 611,953 | 16,871,544 |
| First Republic Bank | 141,799 | 20,834,527 |
| Huntington Bancshares, Inc. | 878,386 | 11,094,015 |
| JPMorgan Chase & Co. | 2,586,875 | 328,714,206 |
| KeyCorp | 839,510 | 13,776,359 |
| Common Stocks | 99.8% of net assets (Continued) |
| | Shares | Value |
| Banks | 3.8% (Continued) |
| M&T Bank Corp. | 102,840 | $13,091,532 |
| People's United Financial, Inc. | 329,495 | 4,260,370 |
| PNC Financial Services Group, Inc. | 359,850 | 53,617,650 |
| Regions Financial Corp. | 833,745 | 13,439,970 |
| SVB Financial Group (a) | 45,318 | 17,575,680 |
| Truist Financial Corp. | 1,147,453 | 54,997,422 |
| U.S. Bancorp | 1,145,350 | 53,361,857 |
| Wells Fargo & Co. | 3,513,456 | 106,036,102 |
| Zions Bancorp. NA | 129,876 | 5,641,814 |
| Total Banks | | 1,038,294,957 |
| Beverages | 1.6% |
| Brown-Forman Corp., Class B | 156,870 | 12,460,184 |
| Coca-Cola Co. | 3,294,568 | 180,674,109 |
| Constellation Brands, Inc., Class A | 145,838 | 31,945,814 |
| Molson Coors Brewing Co., Class B | 161,725 | 7,308,353 |
| Monster Beverage Corp. (a) | 318,762 | 29,479,110 |
| PepsiCo, Inc. | 1,176,601 | 174,489,928 |
| Total Beverages | | 436,357,498 |
| Biotechnology | 1.9% |
| AbbVie Inc. | 1,506,284 | 161,398,331 |
| Alexion Pharmaceuticals, Inc. (a) | 184,883 | 28,886,120 |
| Amgen Inc. | 493,971 | 113,573,812 |
| Biogen, Inc. (a) | 130,235 | 31,889,342 |
| Gilead Sciences, Inc. | 1,062,746 | 61,915,582 |
| Incyte Corp. (a) | 160,508 | 13,960,986 |
| Regeneron Pharmaceuticals, Inc. (a) | 88,812 | 42,905,965 |
| Vertex Pharmaceuticals, Inc. (a) | 220,483 | 52,108,952 |
| Total Biotechnology | | 506,639,090 |
| Building Products | 0.5% |
| Allegion PLC | 73,213 | 8,520,529 |
| AO Smith Corp. | 116,550 | 6,389,271 |
| Carrier Global Corp. | 706,396 | 26,645,257 |
| Fortune Brands Home & Security, Inc. | 119,282 | 10,224,853 |
| Johnson Controls International PLC | 617,041 | 28,747,940 |
| Masco Corp. | 213,495 | 11,727,281 |
| Trane Technologies PLC | 206,627 | 29,993,975 |
| Total Building Products | | 122,249,106 |
| Capital Markets | 2.8% |
| Ameriprise Financial, Inc. | 103,845 | 20,180,199 |
| Bank of New York Mellon Corp. | 686,544 | 29,136,928 |
| BlackRock, Inc. (c) | 121,477 | 87,650,514 |
| Cboe Global Markets, Inc. | 92,827 | 8,644,050 |
| Charles Schwab Corp. | 1,278,340 | 67,803,154 |
| The accompanying notes are an integral part of these financial statements. | Appendix |
97
Portfolio of Investments | S&P 500 Index Master Portfolio | December 31, 2020 | (Continued)
| Common Stocks | 99.8% of net assets (Continued) |
| | Shares | Value |
| Capital Markets | 2.8% (Continued) |
| CME Group, Inc. | 305,631 | $55,640,123 |
| Franklin Resources, Inc. | 229,824 | 5,743,302 |
| Goldman Sachs Group, Inc. | 297,089 | 78,345,340 |
| Intercontinental Exchange, Inc. | 478,645 | 55,182,982 |
| Invesco Ltd. | 327,515 | 5,708,586 |
| MarketAxess Holdings, Inc. | 33,020 | 18,839,891 |
| Moody's Corp. | 136,555 | 39,633,723 |
| Morgan Stanley | 1,233,843 | 84,555,261 |
| MSCI, Inc. | 70,656 | 31,550,024 |
| Nasdaq, Inc. | 94,707 | 12,571,407 |
| Northern Trust Corp. | 179,676 | 16,735,023 |
| Raymond James Financial, Inc. | 108,288 | 10,359,913 |
| S&P Global Inc. | 202,937 | 66,711,480 |
| State Street Corp. | 303,979 | 22,123,592 |
| T. Rowe Price Group, Inc. | 191,576 | 29,002,691 |
| Total Capital Markets | | 746,118,183 |
| Chemicals | 1.8% |
| Air Products & Chemicals, Inc. | 187,676 | 51,276,837 |
| Albemarle Corp. | 90,674 | 13,376,228 |
| Celanese Corp. | 102,137 | 13,271,682 |
| CF Industries Holdings, Inc. | 183,713 | 7,111,530 |
| Corteva, Inc. | 643,334 | 24,909,893 |
| Dow Inc. | 639,913 | 35,515,172 |
| DuPont de Nemours, Inc. | 632,434 | 44,972,382 |
| Eastman Chemical Co. | 115,913 | 11,623,756 |
| Ecolab, Inc. | 211,465 | 45,752,567 |
| FMC Corp. | 112,854 | 12,970,310 |
| International Flavors & Fragrances, Inc. (b) | 87,373 | 9,509,677 |
| Linde PLC (a) | 449,167 | 118,359,996 |
| LyondellBasell Industries NV, Class A | 223,528 | 20,488,577 |
| Mosaic Co. | 301,320 | 6,933,373 |
| PPG Industries, Inc. | 203,752 | 29,385,113 |
| Sherwin-Williams Co. | 69,634 | 51,174,723 |
| Total Chemicals | | 496,631,816 |
| Commercial Services & Supplies | 0.4% |
| Cintas Corp. | 75,067 | 26,533,182 |
| Copart, Inc. (a) | 178,107 | 22,664,116 |
| Republic Services, Inc. | 169,096 | 16,283,945 |
| Rollins, Inc. | 191,024 | 7,463,307 |
| Waste Management, Inc. | 323,846 | 38,191,159 |
| Total Commercial Services & Supplies | | 111,135,709 |
| Communications Equipment | 0.8% |
| Arista Networks, Inc. (a) | 47,229 | 13,723,330 |
| Cisco Systems, Inc. | 3,583,855 | 160,377,511 |
| F5 Networks, Inc. (a) | 51,988 | 9,146,769 |
| Juniper Networks, Inc. | 249,143 | 5,608,209 |
| Common Stocks | 99.8% of net assets (Continued) |
| | Shares | Value |
| Communications Equipment | 0.8% (Continued) |
| Motorola Solutions, Inc. | 142,665 | $24,261,610 |
| Total Communications Equipment | | 213,117,429 |
| Construction & Engineering | 0.1% |
| Jacobs Engineering Group, Inc. | 111,963 | 12,199,489 |
| Quanta Services, Inc. | 121,753 | 8,768,651 |
| Total Construction & Engineering | | 20,968,140 |
| Construction Materials | 0.1% |
| Martin Marietta Materials, Inc. | 53,454 | 15,179,332 |
| Vulcan Materials Co. | 115,239 | 17,091,096 |
| Total Construction Materials | | 32,270,428 |
| Consumer Finance | 0.5% |
| American Express Co. | 557,565 | 67,415,184 |
| Capital One Financial Corp. | 394,278 | 38,974,381 |
| Discover Financial Services | 264,542 | 23,948,987 |
| Synchrony Financial | 473,928 | 16,450,041 |
| Total Consumer Finance | | 146,788,593 |
| Containers & Packaging | 0.4% |
| Amcor PLC | 1,345,193 | 15,832,921 |
| Avery Dennison Corp. | 68,324 | 10,597,736 |
| Ball Corp. | 281,971 | 26,274,058 |
| International Paper Co. | 341,409 | 16,974,855 |
| Packaging Corp. of America | 81,400 | 11,225,874 |
| Sealed Air Corp. | 133,968 | 6,134,395 |
| WestRock Co. | 221,545 | 9,643,854 |
| Total Containers & Packaging | | 96,683,693 |
| Distributors | 0.1% |
| Genuine Parts Co. | 124,563 | 12,509,862 |
| LKQ Corp. (a) | 241,720 | 8,518,213 |
| Pool Corp. (b) | 34,586 | 12,883,285 |
| Total Distributors | | 33,911,360 |
| Diversified Financial Services | 1.4% |
| Berkshire Hathaway, Inc., Class B (a) | 1,654,300 | 383,582,541 |
| Total Diversified Financial Services | | 383,582,541 |
| Diversified Telecommunication Services | 1.4% |
| AT&T, Inc. | 6,041,997 | 173,767,834 |
| CenturyLink, Inc. | 857,752 | 8,363,082 |
| Verizon Communications, Inc. | 3,499,054 | 205,569,422 |
| Total Diversified Telecommunication Services | | 387,700,338 |
| Appendix | The accompanying notes are an integral part of these financial statements. |
Portfolio of Investments | S&P 500 Index Master Portfolio | December 31, 2020 | (Continued)
| Common Stocks | 99.8% of net assets (Continued) |
| | Shares | Value |
| Electric Utilities | 1.8% |
| Alliant Energy Corp. | 200,121 | $10,312,235 |
| American Electric Power Co., Inc. | 417,498 | 34,765,058 |
| Duke Energy Corp. | 626,271 | 57,341,373 |
| Edison International | 326,571 | 20,515,190 |
| Entergy Corp. | 166,908 | 16,664,095 |
| Evergy, Inc. | 186,331 | 10,343,234 |
| Eversource Energy | 296,144 | 25,619,417 |
| Exelon Corp. | 824,237 | 34,799,286 |
| FirstEnergy Corp. | 470,441 | 14,400,199 |
| NextEra Energy, Inc. | 1,676,981 | 129,379,084 |
| NRG Energy, Inc. | 191,096 | 7,175,655 |
| Pinnacle West Capital Corp. | 96,814 | 7,740,279 |
| PPL Corp. | 668,523 | 18,852,349 |
| Southern Co. | 899,607 | 55,262,858 |
| Xcel Energy, Inc. | 439,461 | 29,298,865 |
| Total Electric Utilities | | 472,469,177 |
| Electrical Equipment | 0.5% |
| AMETEK, Inc. | 199,032 | 24,070,930 |
| Eaton Corp. PLC | 345,947 | 41,562,073 |
| Emerson Electric Co. | 515,985 | 41,469,714 |
| Rockwell Automation, Inc. | 97,930 | 24,561,823 |
| Total Electrical Equipment | | 131,664,540 |
| Electronic Equipment, Instruments & Components | 0.6% |
| Amphenol Corp., Class A | 258,151 | 33,758,406 |
| CDW Corp. | 117,995 | 15,550,561 |
| Corning, Inc. | 657,033 | 23,653,188 |
| FLIR Systems, Inc. | 113,633 | 4,980,534 |
| IPG Photonics Corp. (a) | 29,995 | 6,712,581 |
| Keysight Technologies, Inc. (a) | 160,848 | 21,246,412 |
| TE Connectivity Ltd. | 283,029 | 34,266,321 |
| Vontier Corp. (a) | 116,416 | 3,888,295 |
| Zebra Technologies Corp., Class A (a) | 46,056 | 17,700,703 |
| Total Electronic Equipment, Instruments & Components | | 161,757,001 |
| Energy Equipment & Services | 0.2% |
| Baker Hughes Co. | 572,371 | 11,933,936 |
| Halliburton Co. | 750,650 | 14,187,285 |
| Schlumberger NV | 1,205,365 | 26,313,118 |
| TechnipFMC PLC | 362,703 | 3,409,408 |
| Total Energy Equipment & Services | | 55,843,747 |
| Entertainment | 2.3% |
| Activision Blizzard, Inc. | 660,176 | 61,297,342 |
| Electronic Arts Inc. (a) | 244,459 | 35,104,312 |
| Live Nation Entertainment, Inc. (a)(b) | 121,362 | 8,917,680 |
| Netflix, Inc. (a) | 377,497 | 204,123,953 |
| Common Stocks | 99.8% of net assets (Continued) |
| | Shares | Value |
| Entertainment | 2.3% (Continued) |
| Take-Two Interactive Software, Inc. (a) | 98,542 | $20,476,042 |
| Walt Disney Co. (a) | 1,547,292 | 280,338,364 |
| Total Entertainment | | 610,257,693 |
| Equity Real Estate Investment Trusts (REITs) | 2.3% |
| Alexandria Real Estate Equities, Inc. | 101,270 | 18,048,339 |
| American Tower Corp. | 378,283 | 84,909,402 |
| AvalonBay Communities, Inc. | 121,601 | 19,508,448 |
| Boston Properties, Inc. | 122,286 | 11,559,696 |
| Crown Castle International Corp. | 361,609 | 57,564,537 |
| Digital Realty Trust, Inc. | 232,261 | 32,402,732 |
| Duke Realty Corp. | 320,492 | 12,810,065 |
| Equinix, Inc. | 75,708 | 54,069,139 |
| Equity Residential | 295,670 | 17,527,318 |
| Essex Property Trust, Inc. | 56,305 | 13,367,933 |
| Extra Space Storage, Inc. | 110,681 | 12,823,501 |
| Federal Realty Investment Trust | 61,405 | 5,226,794 |
| Healthpeak Properties, Inc. | 464,806 | 14,051,085 |
| Host Hotels & Resorts, Inc. | 604,349 | 8,841,626 |
| Iron Mountain, Inc. | 252,876 | 7,454,784 |
| Kimco Realty Corp. | 361,070 | 5,419,661 |
| Mid-America Apartment Communities, Inc. | 99,445 | 12,598,687 |
| Prologis, Inc. | 631,238 | 62,909,179 |
| Public Storage | 127,861 | 29,526,941 |
| Realty Income Corp. | 297,920 | 18,521,686 |
| Regency Centers Corp. | 136,212 | 6,209,905 |
| SBA Communications Corp. | 94,259 | 26,593,292 |
| Simon Property Group, Inc. | 263,910 | 22,506,245 |
| SL Green Realty Corp. | 63,248 | 3,768,316 |
| UDR, Inc. | 255,798 | 9,830,317 |
| Ventas, Inc. | 321,095 | 15,746,499 |
| Vornado Realty Trust | 135,460 | 5,058,076 |
| Welltower, Inc. | 360,314 | 23,283,491 |
| Weyerhaeuser Co. | 648,783 | 21,753,694 |
| Total Equity Real Estate Investment Trusts (REITs) | | 633,891,388 |
| Food & Staples Retailing | 1.4% |
| Costco Wholesale Corp. | 373,936 | 140,891,606 |
| Kroger Co. | 649,781 | 20,637,045 |
| Sysco Corp. | 439,090 | 32,606,823 |
| Walgreens Boots Alliance, Inc. | 605,004 | 24,127,560 |
| Walmart, Inc. | 1,175,103 | 169,391,097 |
| Total Food & Staples Retailing | | 387,654,131 |
| Food Products | 1.0% |
| Archer-Daniels-Midland Co. | 479,615 | 24,177,392 |
| Campbell Soup Co. | 160,677 | 7,768,733 |
| Conagra Brands, Inc. | 423,722 | 15,364,160 |
| General Mills, Inc. | 515,032 | 30,283,882 |
| The accompanying notes are an integral part of these financial statements. | Appendix |
99
Portfolio of Investments | S&P 500 Index Master Portfolio | December 31, 2020 | (Continued)
| Common Stocks | 99.8% of net assets (Continued) |
| | Shares | Value |
| Food Products | 1.0% (Continued) |
| Hershey Co. | 122,877 | $18,717,853 |
| Hormel Foods Corp. | 227,068 | 10,583,639 |
| J.M. Smucker Co. | 93,502 | 10,808,831 |
| Kellogg Co. | 205,999 | 12,819,318 |
| Kraft Heinz Co. | 559,480 | 19,391,577 |
| Lamb Weston Holdings, Inc. | 124,846 | 9,830,374 |
| McCormick & Co., Inc. | 207,973 | 19,882,219 |
| Mondelez International, Inc., Class A | 1,208,001 | 70,631,818 |
| Tyson Foods, Inc., Class A | 253,297 | 16,322,459 |
| Total Food Products | | 266,582,255 |
| Gas Utilities | 0.0% |
| Atmos Energy Corp. | 100,005 | 9,543,477 |
| Total Gas Utilities | | 9,543,477 |
| Health Care Equipment & Supplies | 3.8% |
| Abbott Laboratories | 1,508,419 | 165,156,796 |
| ABIOMED, Inc. (a) | 39,437 | 12,785,475 |
| Align Technology, Inc. (a) | 61,710 | 32,976,590 |
| Baxter International, Inc. | 428,071 | 34,348,417 |
| Becton, Dickinson & Co. | 245,757 | 61,493,317 |
| Boston Scientific Corp. (a) | 1,197,101 | 43,035,781 |
| Cooper Cos., Inc. | 40,492 | 14,711,553 |
| Danaher Corp. | 540,447 | 120,054,897 |
| DENTSPLY SIRONA, Inc. | 191,806 | 10,042,962 |
| DexCom, Inc. (a) | 82,667 | 30,563,643 |
| Edwards Lifesciences Corp. (a) | 527,109 | 48,088,154 |
| Hologic, Inc. (a) | 223,962 | 16,311,153 |
| IDEXX Laboratories, Inc. (a) | 73,440 | 36,710,453 |
| Intuitive Surgical, Inc. (a) | 99,919 | 81,743,734 |
| Medtronic PLC | 1,143,719 | 133,975,244 |
| ResMed, Inc. | 122,022 | 25,936,996 |
| STERIS PLC | 73,941 | 14,014,777 |
| Stryker Corp. | 278,803 | 68,317,887 |
| Teleflex, Inc. | 40,309 | 16,589,975 |
| Varian Medical Systems, Inc. (a) | 78,200 | 13,685,782 |
| West Pharmaceutical Services, Inc. | 63,513 | 17,993,868 |
| Zimmer Biomet Holdings, Inc. | 179,086 | 27,595,362 |
| Total Health Care Equipment & Supplies | | 1,026,132,816 |
| Health Care Providers & Services | 2.6% |
| AmerisourceBergen Corp. | 126,910 | 12,406,722 |
| Anthem, Inc. | 212,211 | 68,138,830 |
| Cardinal Health, Inc. | 254,665 | 13,639,857 |
| Centene Corp. (a) | 486,846 | 29,225,365 |
| Cigna Corp. | 308,286 | 64,178,979 |
| CVS Health Corp. | 1,113,623 | 76,060,451 |
| DaVita, Inc. (a) | 63,568 | 7,462,883 |
| HCA Healthcare, Inc. | 227,659 | 37,440,799 |
| Henry Schein, Inc. (a)(b) | 123,272 | 8,241,966 |
| Humana Inc. | 112,412 | 46,119,271 |
| Common Stocks | 99.8% of net assets (Continued) |
| | Shares | Value |
| Health Care Providers & Services | 2.6% (Continued) |
| Laboratory Corp. of America Holdings (a) | 81,724 | $16,634,920 |
| McKesson Corp. | 135,991 | 23,651,555 |
| Quest Diagnostics, Inc. | 115,282 | 13,738,156 |
| UnitedHealth Group, Inc. | 810,014 | 284,055,710 |
| Universal Health Services, Inc., Class B | 67,089 | 9,224,738 |
| Total Health Care Providers & Services | | 710,220,202 |
| Health Care Technology | 0.1% |
| Cerner Corp. | 249,120 | 19,550,938 |
| Total Health Care Technology | | 19,550,938 |
| Hotels, Restaurants & Leisure | 1.7% |
| Carnival Corp. | 633,064 | 13,712,166 |
| Chipotle Mexican Grill, Inc. (a) | 24,149 | 33,487,660 |
| Darden Restaurants, Inc. | 112,179 | 13,362,762 |
| Domino's Pizza, Inc. | 33,697 | 12,921,452 |
| Hilton Worldwide Holdings, Inc. | 239,440 | 26,640,094 |
| Las Vegas Sands Corp. (a) | 283,584 | 16,901,606 |
| Marriott International, Inc., Class A | 229,622 | 30,291,734 |
| McDonald's Corp. | 638,475 | 137,003,966 |
| MGM Resorts International (b) | 353,512 | 11,139,163 |
| Norwegian Cruise Line Holdings Ltd. (a)(b) | 225,621 | 5,737,542 |
| Royal Caribbean Cruises Ltd. | 153,843 | 11,490,534 |
| Starbucks Corp. | 1,009,361 | 107,981,440 |
| Wynn Resorts, Ltd. | 85,011 | 9,591,791 |
| Yum! Brands, Inc. | 260,241 | 28,251,763 |
| Total Hotels, Restaurants & Leisure | | 458,513,673 |
| Household Durables | 0.4% |
| D.R. Horton, Inc. | 285,772 | 19,695,406 |
| Garmin Ltd. | 128,795 | 15,411,610 |
| Leggett & Platt, Inc. | 117,117 | 5,188,283 |
| Lennar Corp., Class A | 237,116 | 18,075,353 |
| Mohawk Industries, Inc. (a) | 50,377 | 7,100,638 |
| Newell Brands, Inc. | 333,665 | 7,083,708 |
| NVR, Inc. (a) | 3,042 | 12,410,934 |
| PulteGroup, Inc. | 231,556 | 9,984,695 |
| Whirlpool Corp. | 53,787 | 9,708,015 |
| Total Household Durables | | 104,658,642 |
| Household Products | 1.6% |
| Church & Dwight Co., Inc. | 213,668 | 18,638,260 |
| Clorox Co. | 106,016 | 21,406,751 |
| Colgate-Palmolive Co. | 723,514 | 61,867,682 |
| Kimberly-Clark Corp. | 283,820 | 38,267,450 |
| Procter & Gamble Co. | 2,101,471 | 292,398,675 |
| Total Household Products | | 432,578,818 |
| Appendix | The accompanying notes are an integral part of these financial statements. |
Portfolio of Investments | S&P 500 Index Master Portfolio | December 31, 2020 | (Continued)
| Common Stocks | 99.8% of net assets (Continued) |
| | Shares | Value |
| Independent Power and Renewable Electricity Producers | 0.1% |
| AES Corp. | 582,112 | $13,679,632 |
| Total Independent Power and Renewable Electricity Producers | | 13,679,632 |
| Industrial Conglomerates | 1.2% |
| 3M Co. | 488,728 | 85,424,767 |
| General Electric Co. | 7,481,950 | 80,805,060 |
| Honeywell International, Inc. | 597,613 | 127,112,285 |
| Roper Technologies, Inc. | 89,049 | 38,388,134 |
| Total Industrial Conglomerates | | 331,730,246 |
| Insurance | 1.9% |
| Aflac, Inc. | 557,728 | 24,802,164 |
| Allstate Corp. | 257,959 | 28,357,433 |
| American International Group, Inc. | 743,797 | 28,160,154 |
| Aon PLC, Class A | 194,306 | 41,051,029 |
| Arthur J Gallagher & Co. | 165,349 | 20,455,325 |
| Assurant, Inc. | 52,112 | 7,098,697 |
| Chubb Ltd. | 384,837 | 59,234,111 |
| Cincinnati Financial Corp. | 129,152 | 11,284,010 |
| Everest Re Group Ltd. | 34,513 | 8,079,148 |
| Globe Life, Inc. | 77,552 | 7,364,338 |
| Hartford Financial Services Group, Inc. | 307,460 | 15,059,391 |
| Lincoln National Corp. | 156,847 | 7,890,973 |
| Loews Corp. | 190,151 | 8,560,598 |
| Marsh & McLennan Cos., Inc. | 430,199 | 50,333,283 |
| MetLife, Inc. | 662,307 | 31,095,314 |
| Principal Financial Group, Inc. | 220,438 | 10,935,929 |
| Progressive Corp. | 497,912 | 49,233,538 |
| Prudential Financial, Inc. | 339,044 | 26,469,165 |
| Travelers Cos., Inc. | 214,736 | 30,142,492 |
| Unum Group | 173,973 | 3,990,941 |
| W.R. Berkley Corp. | 110,610 | 7,346,716 |
| Willis Towers Watson PLC | 108,797 | 22,921,352 |
| Total Insurance | | 499,866,101 |
| Interactive Media & Services | 5.5% |
| Alphabet, Inc., Class A (a) | 255,603 | 447,980,042 |
| Alphabet, Inc., Class C (a) | 247,736 | 434,003,744 |
| Facebook, Inc., Class A (a) | 2,048,181 | 559,481,122 |
| Twitter, Inc. (a) | 682,937 | 36,981,038 |
| Total Interactive Media & Services | | 1,478,445,946 |
| Internet & Direct Marketing Retail | 4.9% |
| Amazon.com, Inc. (a) | 363,296 | 1,183,229,641 |
| Booking Holdings, Inc. (a) | 34,950 | 77,843,087 |
| eBay, Inc. | 559,957 | 28,137,839 |
| Etsy, Inc. (a) | 103,033 | 18,330,601 |
| Common Stocks | 99.8% of net assets (Continued) |
| | Shares | Value |
| Internet & Direct Marketing Retail | 4.9% (Continued) |
| Expedia Group, Inc. | 116,285 | $15,396,134 |
| Total Internet & Direct Marketing Retail | | 1,322,937,302 |
| IT Services | 5.5% |
| Accenture PLC, Class A | 536,464 | 140,129,761 |
| Akamai Technologies, Inc. (a)(b) | 140,703 | 14,772,408 |
| Automatic Data Processing, Inc. | 363,450 | 64,039,890 |
| Broadridge Financial Solutions, Inc. | 95,386 | 14,613,135 |
| Cognizant Technology Solutions Corp., Class A | 454,785 | 37,269,631 |
| DXC Technology Co. | 220,706 | 5,683,180 |
| Fidelity National Information Services, Inc. | 527,105 | 74,564,273 |
| Fiserv, Inc. (a) | 473,199 | 53,878,438 |
| FleetCor Technologies, Inc. (a) | 69,975 | 19,091,279 |
| Gartner, Inc. (a) | 76,998 | 12,334,310 |
| Global Payments, Inc. | 254,323 | 54,786,261 |
| International Business Machines Corp. | 758,728 | 95,508,681 |
| Jack Henry & Associates, Inc. | 61,355 | 9,938,897 |
| Leidos Holdings Inc. | 116,021 | 12,196,128 |
| Mastercard, Inc., Class A | 745,793 | 266,203,353 |
| Paychex, Inc. | 267,919 | 24,964,692 |
| PayPal Holdings, Inc. (a) | 1,000,316 | 234,274,007 |
| VeriSign, Inc. (a) | 79,563 | 17,217,433 |
| Visa Inc., Class A (b) | 1,437,647 | 314,456,528 |
| Western Union Co. | 324,812 | 7,126,375 |
| Total IT Services | | 1,473,048,660 |
| Leisure Products | 0.0% |
| Hasbro, Inc. | 109,344 | 10,228,038 |
| Total Leisure Products | | 10,228,038 |
| Life Sciences Tools & Services | 1.2% |
| Agilent Technologies, Inc. | 260,573 | 30,875,295 |
| Bio-Rad Laboratories, Inc., Class A (a) | 18,020 | 10,504,579 |
| Illumina, Inc. (a)(b) | 124,186 | 45,948,820 |
| IQVIA Holdings, Inc. (a) | 165,151 | 29,590,105 |
| Mettler-Toledo International, Inc. (a)(b) | 20,122 | 22,932,641 |
| PerkinElmer, Inc. | 95,779 | 13,744,286 |
| Thermo Fisher Scientific, Inc. | 338,184 | 157,519,343 |
| Waters Corp. (a) | 50,761 | 12,559,287 |
| Total Life Sciences Tools & Services | | 323,674,356 |
| Machinery | 1.7% |
| Caterpillar, Inc. | 463,847 | 84,429,431 |
| Cummins, Inc. | 124,557 | 28,286,895 |
| Deere & Co. | 270,580 | 72,799,549 |
| The accompanying notes are an integral part of these financial statements. | Appendix |
101
Portfolio of Investments | S&P 500 Index Master Portfolio | December 31, 2020 | (Continued)
| Common Stocks | 99.8% of net assets (Continued) |
| | Shares | Value |
| Machinery | 1.7% (Continued) |
| Dover Corp. | 118,881 | $15,008,726 |
| Flowserve Corp. | 112,148 | 4,132,654 |
| Fortive Corp. | 281,511 | 19,936,609 |
| IDEX Corp. | 61,803 | 12,311,157 |
| Illinois Tool Works, Inc. | 239,874 | 48,905,511 |
| Ingersoll Rand Inc. (a) | 320,494 | 14,601,707 |
| Otis Worldwide Corp. | 342,980 | 23,168,299 |
| PACCAR Inc. | 290,767 | 25,087,377 |
| Parker-Hannifin Corp. | 110,721 | 30,161,507 |
| Pentair PLC | 142,497 | 7,565,166 |
| Snap-on, Inc. | 43,128 | 7,380,926 |
| Stanley Black & Decker, Inc. | 137,876 | 24,619,138 |
| Westinghouse Air Brake Technologies Corp. | 154,454 | 11,306,033 |
| Xylem, Inc. | 156,792 | 15,959,858 |
| Total Machinery | | 445,660,543 |
| Media | 1.3% |
| Charter Communications, Inc., Class A (a)(b) | 124,393 | 82,292,189 |
| Comcast Corp., Class A | 3,905,303 | 204,637,877 |
| Discovery, Inc., Class A (a)(b) | 134,754 | 4,054,748 |
| Discovery, Inc., Class C (a) | 267,283 | 7,000,142 |
| DISH Network Corp., Class A (a)(b) | 213,018 | 6,889,002 |
| Fox Corp., Class A | 280,017 | 8,154,095 |
| Fox Corp., Class B (a) | 133,124 | 3,844,621 |
| Interpublic Group of Cos., Inc. | 340,340 | 8,004,797 |
| News Corp., Class A | 332,273 | 5,970,946 |
| News Corp., Class B | 114,231 | 2,029,885 |
| Omnicom Group, Inc. | 185,083 | 11,543,627 |
| ViacomCBS, Inc., Class B | 486,782 | 18,137,497 |
| Total Media | | 362,559,426 |
| Metals & Mining | 0.3% |
| Freeport-McMoRan Inc. (a) | 1,253,904 | 32,626,582 |
| Newmont Corp. | 682,201 | 40,857,018 |
| Nucor Corp. | 239,549 | 12,741,611 |
| Total Metals & Mining | | 86,225,211 |
| Multi-Utilities | 0.8% |
| Ameren Corp. | 201,001 | 15,690,138 |
| CenterPoint Energy, Inc. | 470,418 | 10,179,846 |
| CMS Energy Corp. | 231,392 | 14,117,226 |
| Consolidated Edison, Inc. | 289,441 | 20,917,901 |
| Dominion Energy, Inc. | 691,657 | 52,012,606 |
| DTE Energy Co. | 167,263 | 20,307,401 |
| NiSource, Inc. | 292,980 | 6,720,961 |
| Public Service Enterprise Group, Inc. | 424,316 | 24,737,623 |
| Sempra Energy | 244,708 | 31,178,246 |
| WEC Energy Group, Inc. | 265,074 | 24,394,760 |
| Total Multi-Utilities | | 220,256,708 |
| Common Stocks | 99.8% of net assets (Continued) |
| | Shares | Value |
| Multiline Retail | 0.5% |
| Dollar General Corp. | 208,901 | $43,931,880 |
| Dollar Tree, Inc. (a) | 200,048 | 21,613,186 |
| Target Corp. | 427,037 | 75,384,842 |
| Total Multiline Retail | | 140,929,908 |
| Oil, Gas & Consumable Fuels | 2.1% |
| Apache Corp. | 317,469 | 4,504,885 |
| Cabot Oil & Gas Corp. | 344,150 | 5,602,762 |
| Chevron Corp. | 1,639,297 | 138,438,632 |
| Concho Resources Inc. | 159,227 | 9,290,895 |
| ConocoPhillips | 901,181 | 36,038,228 |
| Devon Energy Corp. | 330,941 | 5,232,177 |
| Diamondback Energy, Inc. | 136,845 | 6,623,298 |
| EOG Resources, Inc. | 492,292 | 24,550,602 |
| Exxon Mobil Corp. | 3,594,094 | 148,148,555 |
| Hess Corp. | 236,028 | 12,459,918 |
| HollyFrontier Corp. | 104,307 | 2,696,336 |
| Kinder Morgan, Inc. | 1,633,055 | 22,323,862 |
| Marathon Oil Corp. | 684,055 | 4,562,647 |
| Marathon Petroleum Corp. | 565,354 | 23,383,041 |
| NOV, Inc. | 342,352 | 4,700,493 |
| Occidental Petroleum Corp. | 722,809 | 12,511,824 |
| ONEOK, Inc. | 383,542 | 14,720,342 |
| Phillips 66 | 367,911 | 25,731,695 |
| Pioneer Natural Resources Co. | 141,842 | 16,154,385 |
| Valero Energy Corp. | 340,568 | 19,265,932 |
| Williams Cos., Inc. | 1,055,312 | 21,159,006 |
| Total Oil, Gas & Consumable Fuels | | 558,099,515 |
| Personal Products | 0.2% |
| Estee Lauder Cos., Inc., Class A | 193,936 | 51,623,824 |
| Total Personal Products | | 51,623,824 |
| Pharmaceuticals | 3.8% |
| Bristol-Myers Squibb Co. | 1,922,531 | 119,254,598 |
| Catalent, Inc. (a) | 141,724 | 14,749,216 |
| Eli Lilly & Co. | 675,443 | 114,041,796 |
| Johnson & Johnson | 2,231,116 | 351,133,036 |
| Merck & Co., Inc. | 2,136,245 | 174,744,841 |
| Perrigo Co. PLC | 116,394 | 5,205,140 |
| Pfizer, Inc. | 4,732,238 | 174,193,681 |
| Viatris, Inc. (a) | 1,010,311 | 18,933,228 |
| Zoetis, Inc. | 403,438 | 66,768,989 |
| Total Pharmaceuticals | | 1,039,024,525 |
| Professional Services | 0.3% |
| Equifax, Inc. | 105,425 | 20,330,157 |
| IHS Markit Ltd. | 314,633 | 28,263,482 |
| Nielsen Holdings PLC | 313,402 | 6,540,700 |
| Robert Half International, Inc. | 98,980 | 6,184,270 |
| Verisk Analytics, Inc. | 136,594 | 28,355,549 |
| Total Professional Services | | 89,674,158 |
| Appendix | The accompanying notes are an integral part of these financial statements. |
Portfolio of Investments | S&P 500 Index Master Portfolio | December 31, 2020 | (Continued)
| Common Stocks | 99.8% of net assets (Continued) |
| | Shares | Value |
| Real Estate Management & Development | 0.1% |
| CBRE Group, Inc., Class A (a)(b) | 291,463 | $18,280,559 |
| Total Real Estate Management & Development | | 18,280,559 |
| Road & Rail | 1.0% |
| CSX Corp. | 651,345 | 59,109,559 |
| J.B. Hunt Transport Services, Inc. | 71,440 | 9,762,276 |
| Kansas City Southern | 81,200 | 16,575,356 |
| Norfolk Southern Corp. | 216,791 | 51,511,709 |
| Old Dominion Freight Line, Inc. | 80,360 | 15,684,665 |
| Union Pacific Corp. | 573,424 | 119,398,345 |
| Total Road & Rail | | 272,041,910 |
| Semiconductors & Semiconductor Equipment | 5.1% |
| Advanced Micro Devices, Inc. (a) | 1,012,926 | 92,895,443 |
| Analog Devices, Inc. | 313,987 | 46,385,299 |
| Applied Materials, Inc. | 781,089 | 67,407,981 |
| Broadcom, Inc. | 345,975 | 151,485,154 |
| Intel Corp. | 3,485,417 | 173,643,475 |
| KLA-Tencor Corp. | 133,954 | 34,682,030 |
| Lam Research Corp. | 123,378 | 58,267,728 |
| Maxim Integrated Products, Inc. | 222,854 | 19,756,007 |
| Microchip Technology, Inc. | 217,977 | 30,104,803 |
| Micron Technology, Inc. (a) | 952,133 | 71,581,359 |
| NVIDIA Corp. | 528,504 | 275,984,789 |
| Qorvo, Inc. (a) | 99,482 | 16,540,872 |
| QUALCOMM, Inc. | 966,228 | 147,195,174 |
| Skyworks Solutions, Inc. | 143,117 | 21,879,727 |
| Teradyne, Inc. | 143,359 | 17,187,311 |
| Texas Instruments, Inc. | 777,254 | 127,570,699 |
| Xilinx, Inc. | 210,533 | 29,847,263 |
| Total Semiconductors & Semiconductor Equipment | | 1,382,415,114 |
| Software | 8.6% |
| Adobe, Inc. (a)(b) | 409,547 | 204,822,646 |
| ANSYS, Inc. (a) | 72,586 | 26,406,787 |
| Autodesk, Inc. (a) | 189,334 | 57,811,244 |
| Cadence Design Systems, Inc. (a)(b) | 235,337 | 32,107,027 |
| Citrix Systems, Inc. | 106,662 | 13,876,726 |
| Fortinet, Inc. (a) | 115,935 | 17,219,825 |
| Intuit, Inc. | 223,118 | 84,751,372 |
| Microsoft Corp. | 6,432,915 | 1,430,808,954 |
| NortonLifeLock, Inc. | 510,295 | 10,603,930 |
| Oracle Corp. | 1,612,765 | 104,329,768 |
| Paycom Software, Inc. (a) | 42,795 | 19,354,039 |
| salesforce.com, Inc. (a) | 778,781 | 173,302,136 |
| ServiceNow, Inc. (a) | 165,633 | 91,169,372 |
| Synopsys, Inc. (a) | 130,891 | 33,932,183 |
| Tyler Technologies, Inc. (a)(b) | 34,089 | 14,880,530 |
| Total Software | | 2,315,376,539 |
| Common Stocks | 99.8% of net assets (Continued) |
| | Shares | Value |
| Specialty Retail | 2.2% |
| Advance Auto Parts, Inc. | 59,306 | $9,341,288 |
| AutoZone, Inc. (a) | 19,391 | 22,986,867 |
| Best Buy Co., Inc. | 198,275 | 19,785,862 |
| CarMax, Inc. (a) | 140,808 | 13,300,724 |
| Gap, Inc. | 180,058 | 3,635,371 |
| Home Depot, Inc. | 916,414 | 243,417,887 |
| L Brands, Inc. | 200,125 | 7,442,649 |
| Lowe's Cos., Inc. | 628,041 | 100,806,861 |
| O'Reilly Automotive, Inc. (a) | 60,849 | 27,538,432 |
| Ross Stores, Inc. | 307,115 | 37,716,793 |
| Tiffany & Co. | 89,063 | 11,707,331 |
| TJX Companies, Inc. (The) | 1,023,472 | 69,892,903 |
| Tractor Supply Co. | 98,685 | 13,873,137 |
| Ulta Beauty, Inc. (a) | 49,300 | 14,156,988 |
| Total Specialty Retail | | 595,603,093 |
| Technology Hardware, Storage & Peripherals | 7.0% |
| Apple, Inc. | 13,604,154 | 1,805,135,194 |
| Hewlett Packard Enterprise Co. | 1,101,086 | 13,047,869 |
| HP, Inc. | 1,158,037 | 28,476,130 |
| NetApp, Inc. | 191,688 | 12,697,413 |
| Seagate Technology PLC | 192,709 | 11,978,792 |
| Western Digital Corp. | 259,683 | 14,383,841 |
| Xerox Holdings Corp. | 132,367 | 3,069,591 |
| Total Technology Hardware, Storage & Peripherals | | 1,888,788,830 |
| Textiles, Apparel & Luxury Goods | 0.8% |
| Hanesbrands, Inc. | 298,358 | 4,350,060 |
| NIKE, Inc., Class B | 1,074,871 | 152,062,000 |
| PVH Corp. | 63,061 | 5,920,797 |
| Ralph Lauren Corp. | 42,619 | 4,421,295 |
| Tapestry, Inc. | 237,843 | 7,392,160 |
| Under Armour, Inc., Class A (a)(b) | 164,871 | 2,830,835 |
| Under Armour, Inc., Class C (a) | 169,421 | 2,520,985 |
| VF Corp. | 274,173 | 23,417,116 |
| Total Textiles, Apparel & Luxury Goods | | 202,915,248 |
| Tobacco | 0.6% |
| Altria Group, Inc. | 1,588,044 | 65,109,804 |
| Philip Morris International, Inc. | 1,329,864 | 110,099,441 |
| Total Tobacco | | 175,209,245 |
| Trading Companies & Distributors | 0.2% |
| Fastenal Co. | 493,888 | 24,116,551 |
| United Rentals, Inc. (a) | 62,237 | 14,433,383 |
| W.W. Grainger, Inc. | 37,224 | 15,200,048 |
| Total Trading Companies & Distributors | | 53,749,982 |
| The accompanying notes are an integral part of these financial statements. | Appendix |
103
Portfolio of Investments | S&P 500 Index Master Portfolio | December 31, 2020 | (Continued)
| Common Stocks | 99.8% of net assets (Continued) |
| | Shares | Value |
| Water Utilities | 0.1% |
| American Water Works Co., Inc. | 153,076 | $23,492,574 |
| Total Water Utilities | | 23,492,574 |
| Wireless Telecommunication Services | 0.2% |
| T-Mobile U.S., Inc. (a) | 497,236 | 67,052,275 |
| Total Wireless Telecommunication Services | | 67,052,275 |
| Total Common Stocks | | |
| (Cost $13,257,423,611) | | 26,946,523,804 |
| Investment Companies | 0.0% of net assets |
| | |
| iShares Core S&P 500 ETF (c) | 11,420 | $4,286,954 |
| Total Investment Companies | | |
| (Cost $2,830,069) | | 4,286,954 |
| Total Long-Term Investments | | |
| (Cost $13,260,253,680) | | 26,950,810,758 |
| Short-Term Securities | 0.9% of net assets |
| | Shares | Value |
| BlackRock Cash Funds: Institutional, SL Agency Shares, 0.21% (c)(d)(e) | 161,721,157 | $161,818,190 |
| BlackRock Cash Funds: Treasury, SL Agency Shares, 0.05% (c)(d) | 82,440,013 | 82,440,013 |
| Total Short-Term Securities | | |
| (Cost $244,110,392) | | 244,258,203 |
| Total Investments | | |
| (Cost $13,504,364,072) | 100.7% | 27,195,068,961 |
| Liabilities in Excess of Other Assets | (0.7)% | | (202,096,307) |
| Net Assets | 100.0% | | $26,992,972,654 |
| (a) | Non-income producing. |
| (b) | Security, or a portion of security, is on loan. |
| (c) | During the period ended December 31, 2020, investments in issuers considered to be affiliates of the Master Portfolio for purposes of Section 2(a)(3) of the Investment Company Act of 1940, as amended, and/or related parties of the Master Portfolio were as follows: |
| | |
| Affiliate Persons and/or Related Parties | Shares Held at
December 31, 2019 | Shares
Purchased | Shares
Sold | Shares Held at
December 31, 2020 | Value at
December 31, 2020 | Income | Realized
Gain (Loss) | Change in Unrealized Appreciation (Depreciation) |
| BlackRock Cash Funds: Institutional, SL Agency Shares | 139,403,854 | 22,269,6461 | — | 161,721,157 | 161,818,190 | $1,676,2282 | $13,367 | $131,323 |
| BlackRock Cash Funds: Treasury, SL Agency Shares | 215,380,072 | — | (132,940,059)1 | 82,440,013 | 82,440,013 | 1,003,418 | — | — |
| BlackRock, Inc. | 50,696,290 | 16,775,336 | (7,590,452) | 121,477 | 87,650,514 | 1,777,168 | 397,600 | 27,371,740 |
| iShares Core S&P 500 ETF | 94,603,944 | 41,630,812 | (129,939,288) | 11,420 | 4,286,954 | 932,703 | 2,981,453 | (4,989,967) |
| Total | | | | | $336,195,671 | $5,389,517 | $3,392,420 | $22,513,096 |
| 1 | Represents net shares purchased (sold). |
| 2 | Represents all or portion of securities lending income earned from the reinvestment of cash collateral from loaned securities, net of fees, and collateral investment expenses, and other payments to and from borrowers of securities. |
| (d) | 7-day yield at December 31, 2020. |
| (e) | All or a portion of security was purchased with the cash collateral from loaned securities. |
| | |
| Derivative Financial Instruments Outstanding as of Period End - Futures Contracts |
| Contracts Long | Issue | Expiration | Notional Amount (000) | Unrealized
Appreciation
(Depreciation) |
| 530 | S&P 500 E-Mini Index | February 2021 | $99,343 | $1,620,498 |
| ���Appendix | The accompanying notes are an integral part of these financial statements. |
Portfolio of Investments | S&P 500 Index Master Portfolio | December 31, 2020 | (Continued)
Derivative Financial Instruments Categorized by Risk Exposure
As of period end, the fair values of derivative financial instruments located in the Statements of Assets and Liabilities were as follows:
| Assets-Derivative Financial Instruments | Commodity
Contracts | Credit
Contract | Equity
Contracts | Foriegn
Currency
Exchange
Contracts | Interest Rate
Contracts | Other
Contracts | Total |
| Futures contracts net unrealized appreciation1 | — | — | $1,620,498 | — | — | — | $1,620,498 |
| 1 | Net cumulative unrealized appreciation (depreciation) on futures contracts, if any, are reported in the Schedule of Investments. In the Statement of Assets and Liabilities, only current day’s variation margin is reported in receivables or payables and the net cumulative unrealized appreciation (depreciation) is included in net unrealized appreciation (depreciation). |
For the year ended December 31, 2020, the effect of derivative financial instruments in the Statements of Operations was as follows:
| | Commodity
Contracts | Credit
Contract | Equity
Contracts | Foreign
Currency
Exchange
Contracts | Interest Rate
Contracts | Other
Contracts | Total |
| Net Realized Gain (Loss) From: |
| Futures contracts | — | — | $13,682,613 | — | — | — | $13,682,613 |
| Net Change in Unrealized Appreciation (Depreciation) on: |
| Futures contracts | — | — | $(724,988) | — | — | — | $(724,988) |
| Average Quarterly Balances on Outstanding Derivative Financial Instruments |
Futures contracts:
Average notional value of contracts—long | | | | | | | $190,400,191 |
Fair Value Hierarchy as of Period End
Various inputs are used in determining the fair value of financial instruments. For a description of the input levels and information about the Master Portfolio’s policy regarding valuation of financial instruments, refer to the Notes to Financial Statements.
The following table summarizes the Master Portfolio’s investments and derivative financial instruments categorized in the disclosure hierarchy. The breakdown of the Master Portfolio’s investments into major categories is disclosed in the Schedule of Investments above.
| | Level 1 | Level 2 | Level 3 | Total |
| Assets: | | | | |
| Investments: | | | | |
Long-Term Investments
| $26,950,810,758 | $— | $— | $26,950,810,758 |
Short-Term Securities:
Money Market Funds
| 244,258,203 | — | — | 244,258,203 |
| | $27,195,068,961 | $— | $— | $27,195,068,961 |
| Derivative Financial Instruments(a) | | | | |
| Assets: | | | | |
Equity contracts
| $1,620,498 | $— | $— | $1,620,498 |
| (a) | Derivative financial instruments are futures contracts. Futures contracts are valued at the unrealized appreciation (depreciation) on the instrument. |
| The accompanying notes are an integral part of these financial statements. | Appendix |
105
Statement of Assets and Liabilities
S&P 500 Index Master Portfolio | December 31, 2020
| Assets | |
| Investments in securities, at value (including securities loaned of $159,293,085) (cost: $13,216,001,480) | $26,858,873,290 |
| Investments at value—affiliated (cost—$288,362,592) | 336,195,671 |
| Cash pledged for futures contracts | 7,766,800 |
| Dividends—unaffiliated | 19,661,598 |
| Dividends—affiliated | 3,820 |
| Securities lending income—affiliated | 66,869 |
| Variation margin on futures contracts | 643,559 |
| Prepaid expenses | 86,039 |
| Total Assets | 27,223,297,646 |
| Liabilities | |
| Collateral on securities loaned at value | 161,661,741 |
| Withdrawals to investors | 68,089,075 |
| Investment advisory fees | 419,107 |
| Trustees' fees | 88,789 |
| Professional fees | 66,280 |
| Total Liabilities | 230,324,992 |
| Net Assets | $26,992,972,654 |
| Net Assets Consist Of: | |
| Unrealized appreciation (depreciation) of investments | 13,692,325,387 |
| Investors’ capital | 13,300,647,267 |
| Net Assets | $26,992,972,654 |
| Appendix | The accompanying notes are an integral part of these financial statements. |
Statement of Operations
S&P 500 Index Master Portfolio | Period Ended December 31, 2020
| Investment Income | |
| Dividends—unaffiliated | 424,626,813 |
| Dividends—affiliated | 3,713,289 |
| Securities lending—affiliated—net | 1,676,228 |
| Foreign taxes withheld | (2,168,396) |
| Total Investment Income | 427,847,934 |
| Expenses | |
| Investment advisory | 2,337,070 |
| Director, Trustee, and Board meeting expenses | 313,882 |
| Professional | 101,203 |
| Total Expenses | 2,752,155 |
| Less fees waived and/or reimbursed by the Manager | (577,819) |
| Total Expenses After Fees Waived and/or Reimbursed | 2,174,336 |
| Net Investment Income | 425,673,598 |
| Realized And Unrealized Gain (Loss) | |
| Net realized gain (loss) from: | |
| Investments—unaffiliated | (31,540,705) |
| Investments—affiliated | 3,392,420 |
| Futures contracts | 13,682,613 |
| Net Realized Gain (Loss) | (14,465,672) |
| Net change in unrealized appreciation (depreciation) on: | |
| Investments—unaffiliated | 3,888,625,045 |
| Investments—affiliated | 22,513,096 |
| Futures contracts | (724,988) |
| Net Change In Unrealized Appreciation (Depreciation) | 3,910,413,153 |
| Net Realized And Unrealized Gain | $3,895,947,481 |
| Net Increase In Net Assets From Operations | $4,321,621,079 |
| The accompanying notes are an integral part of these financial statements. | Appendix |
107
Statements of Changes in Net Assets
S&P 500 Index Master Portfolio
| | Year Ended December 31, 2020 | Year Ended December 31, 2019 |
| Increase (Decrease) In Net Assets | | |
| Operations | | |
| Net investment income | $425,673,598 | $393,599,409 |
| Net realized gain (loss) on investments | (14,465,672) | 53,806,401 |
| Net change in unrealized appreciation (depreciation) | 3,910,413,153 | 4,979,951,890 |
| Net Increase in net assets from operations | 4,321,621,079 | 5,427,357,700 |
| Capital Transactions | | |
| Proceeds from contributions | 7,849,994,984 | 11,063,823,888 |
| Value of withdrawals | (8,386,601,754) | (10,540,152,052) |
| Total increase (decrease) in net assets from capital transactions | (536,606,770) | 523,671,836 |
| Total Increase In Net Assets | 3,785,014,309 | 5,951,029,536 |
| Net Assets | | |
| Beginning of year | $23,207,958,345 | $17,256,928,809 |
| End of year | $26,992,972,654 | $23,207,958,345 |
| Appendix | The accompanying notes are an integral part of these financial statements. |
Financial Highlights
S&P 500 Index Master Portfolio
| | Year Ended December 31, |
| | 2020 | 2019 | 2018 | 2017 | 2016 |
| Total Return | 18.42% | 31.44% | -4.38% | 21.77% | 11.92% |
| Ratio to Average Net Assets | | | | | |
| Total expenses | 0.01% | 0.03% | 0.04% | 0.04% | 0.04% |
| Total expenses after fees waived and/or reimbursed | 0.01% | 0.02% | 0.04% | 0.04% | 0.04% |
| Net investment income | 1.82% | 1.95% | 1.92% | 1.93% | 2.11% |
| Supplemental Data | | | | | |
| Net assets, end of year (000) | $26,992,973 | $23,207,958 | $17,256,929 | $13,775,074 | $9,791,759 |
| Portfolio turnover rate | 5% | 3% | 12% | 11% | 4% |
| The accompanying notes are an integral part of these financial statements. | Appendix |
109
Notes to Financial Statements
S&P 500 Index Master Portfolio
1. Organization
Master Investment Portfolio (“MIP”) is registered under the Investment Company Act of 1940, as amended (the “1940 Act”), as an open-end management investment company. MIP is organized as a Delaware statutory trust. S&P 500 Index Master Portfolio (the “Master Portfolio”) is a series of MIP. The Master Portfolio is classified as diversified.
The Master Portfolio, together with certain other registered investment companies advised by BlackRock Fund Advisors (“BFA” or the “Manager”) or its affiliates, is included in a complex of equity, multi-asset, index and money market funds referred to as the BlackRock Multi-Asset Complex.
2. Significant Accounting Policies
The financial statements are prepared in conformity with accounting principles generally accepted in the United States of America (“U.S. GAAP”), which may require management to make estimates and assumptions that affect the reported amounts of assets and liabilities in the financial statements, disclosure of contingent assets and liabilities at the date of the financial statements and the reported amounts of increases and decreases in net assets from operations during the reporting period. Actual results could differ from those estimates. The Master Portfolio is considered an investment company under U.S. GAAP and follows the accounting and reporting guidance applicable to investment companies. Below is a summary of significant accounting policies:
Investment Transactions and Income Recognition: For financial reporting purposes, investment transactions are recorded on the dates the transactions are executed. Realized gains and losses on investment transactions are determined using the specific identification method. Dividend income and capital gain distributions, if any, are recorded on the ex-dividend date. Non-cash dividends, if any, are recorded on the ex-dividend date at fair value. Dividends from foreign securities where the ex-dividend date may have passed are subsequently recorded when the Master Portfolio is informed of the ex-dividend date. Under the applicable foreign tax laws, a withholding tax at various rates may be imposed on capital gains, dividends and interest. Upon notification from issuers, a portion of the dividend income received from a real estate investment trust may be redesignated as a reduction of cost of the related investment and/or realized gain.
Foreign Taxes: The Master Portfolio may be subject to foreign taxes (a portion of which may be reclaimable) on income, stock dividends, capital gains on investments, or certain foreign currency transactions. All foreign taxes are recorded in accordance with the applicable foreign tax regulations and rates that exist in the foreign jurisdictions in which the Master Portfolio invests. These foreign taxes, if any, are paid by the Master Portfolio and are reflected in its Statement of Operations as follows: foreign taxes withheld at source are presented as a reduction of income, foreign taxes on securities lending income are presented as a reduction of
securities lending income, foreign taxes on stock dividends are presented as “Foreign taxes withheld”, and foreign taxes on capital gains from sales of investments and foreign taxes on foreign currency transactions are included in their respective net realized gain (loss) categories. Foreign taxes payable or deferred as of December 31, 2020, if any, are disclosed in the Statement of Assets and Liabilities.
Segregation and Collateralization: In cases where the Master Portfolio enters into certain investments (e.g., futures contracts) that would be treated as “senior securities” for 1940 Act purposes, the Master Portfolio may segregate or designate on its books and records cash or liquid assets having a market value at least equal to the amount of its future obligations under such investments. Doing so allows the investment to be excluded from treatment as a “senior security.” Furthermore, if required by an exchange or counterparty agreement, the Master Portfolio may be required to deliver/deposit cash and/or securities to/with an exchange, or broker-dealer or custodian as collateral for certain investments or obligations.
Indemnifications: In the normal course of business, the Master Portfolio enters into contracts that contain a variety of representations that provide general indemnification. The Master Portfolio’s maximum exposure under these arrangements is unknown because it involves future potential claims against the Master Portfolio, which cannot be predicted with any certainty.
Other: Expenses directly related to the Master Portfolio are charged to the Master Portfolio. Other operating expenses shared by several funds, including other funds managed by the Manager, are prorated among those funds on the basis of relative net assets or other appropriate methods.
3. Investment Valuation and Fair Value Measurements
Investment Valuation Policies: The Master Portfolio’s investments are valued at fair value (also referred to as “market value” within the financial statements) each day that the Master Portfolio is open for business and, for financial reporting purposes, as of the report date. U.S. GAAP defines fair value as the price a fund would receive to sell an asset or pay to transfer a liability in an orderly transaction between market participants at the measurement date. The Master Portfolio determines the fair values of its financial instruments using various independent dealers or pricing services under policies approved by the Board of Trustees of the MIP (the "Board"). If a security’s market price is not readily available or does not otherwise accurately represent the fair value of the security, the security will be valued in accordance with a policy approved by the Board as reflecting fair value. The BlackRock Global Valuation Methodologies Committee (the “Global Valuation Committee”) is the committee formed by management to develop global pricing policies and procedures and to oversee the pricing function for all financial instruments.
| Appendix | Notes to Financial Statements |
Notes to Financial Statements | S&P 500 Index Master Portfolio (Continued)
Fair Value Inputs and Methodologies: The following methods and inputs are used to establish the fair value of the Master Portfolio’s assets and liabilities:
• Equity investments traded on a recognized securities exchange are valued at that day’s official closing price, as applicable, on the exchange where the stock is primarily traded. Equity investments traded on a recognized exchange for which there were no sales on that day may be valued at the last available bid (long positions) or ask (short positions) price.
• Investments in open-end U.S. mutual funds (including money market funds) are valued at that day’s published NAV.
• Futures contracts are valued based on that day’s last reported settlement price on the exchange where the contract is traded.
If events (e.g., a market closure, market volatility, company announcement or a natural disaster) occur that are expected to materially affect the value of such investment, or in the event that application of these methods of valuation results in a price for an investment that is deemed not to be representative of the market value of such investment, or if a price is not available, the investment will be valued by the Global Valuation Committee, or its delegate, in accordance with a policy approved by the Board as reflecting fair value (“Fair Valued Investments”). The fair valuation approaches that may be used by the Global Valuation Committee include market approach, income approach and cost approach. Valuation techniques such as discounted cash flow, use of market comparables and matrix pricing are types of valuation approaches and are typically used in determining fair value. When determining the price for Fair Valued Investments, the Global Valuation Committee, or its delegate, seeks to determine the price that the Master Portfolio might reasonably expect to receive or pay from the current sale or purchase of that asset or liability in an arm’s-length transaction. Fair value determinations shall be based upon all available factors that the Global Valuation Committee, or its delegate, deems relevant and consistent with the principles of fair value measurement. The pricing of all Fair Valued Investments is subsequently reported to the Board or a committee thereof on a quarterly basis.
Fair Value Hierarchy: Various inputs are used in determining the fair value of financial instruments. These inputs to valuation techniques are categorized into a fair value hierarchy consisting of three broad levels for financial reporting purposes as follows:
• Level 1—Unadjusted price quotations in active markets/exchanges for identical assets or liabilities that the Master Portfolio has the ability to access;
• Level 2—Other observable inputs (including, but not limited to, quoted prices for similar assets or liabilities in markets that are active, quoted prices for identical or
similar assets or liabilities in markets that are not active, inputs other than quoted prices that are observable for the assets or liabilities (such as interest rates, yield curves, volatilities, prepayment speeds, loss severities, credit risks and default rates) or other market–corroborated inputs); and
• Level 3—Unobservable inputs based on the best information available in the circumstances, to the extent observable inputs are not available (including the Global Valuation Committee’s assumptions used in determining the fair value of financial instruments).
The hierarchy gives the highest priority to unadjusted quoted prices in active markets for identical assets or liabilities (Level 1 measurements) and the lowest priority to unobservable inputs (Level 3 measurements). Accordingly, the degree of judgment exercised in determining fair value is greatest for instruments categorized in Level 3. The inputs used to measure fair value may fall into different levels of the fair value hierarchy. In such cases, for disclosure purposes, the fair value hierarchy classification is determined based on the lowest level input that is significant to the fair value measurement in its entirety. Investments classified within Level 3 have significant unobservable inputs used by the Global Valuation Committee in determining the price for Fair Valued Investments. Level 3 investments include equity or debt issued by privately held companies or funds that may not have a secondary market and/or may have a limited number of investors. The categorization of a value determined for financial instruments is based on the pricing transparency of the financial instruments and is not necessarily an indication of the risks associated with investing in those securities.
4. Securities and Other Investments
Securities Lending: The Master Portfolio may lend its securities to approved borrowers, such as brokers, dealers and other financial institutions. The borrower pledges and maintains with the Master Portfolio collateral consisting of cash, an irrevocable letter of credit issued by a bank, or securities issued or guaranteed by the U.S. Government. The initial collateral received by the Master Portfolio is required to have a value of at least 102% of the current value of the loaned securities for securities traded on U.S. exchanges and a value of at least 105% for all other securities. The collateral is maintained thereafter at a value equal to at least 100% of the current market value of the securities on loan. The market value of the loaned securities is determined at the close of each business day of the Master Portfolio and any additional required collateral is delivered to the Master Portfolio, or excess collateral returned by the Master Portfolio, on the next business day. During the term of the loan, the Master Portfolio is entitled to all distributions made on or in respect of the loaned securities, but does not receive interest income on securities received as collateral. Loans of securities are terminable at any time and the borrower, after
| Notes to Financial Statements | Appendix |
111
Notes to Financial Statements | S&P 500 Index Master Portfolio (Continued)
notice, is required to return borrowed securities within the standard time period for settlement of securities transactions.
The market value of any securities on loan, all of which were classified as affiliated in the Master Portfolio’s Schedule of Investments, and the value of any related collateral are shown separately in the Statement of Assets and Liabilities as a component of investments at value - affiliated, and collateral on securities loaned at value, respectively. As of period end, any securities on loan were collateralized by cash and/or U.S. Government obligations. Cash collateral invested by the securities lending agent, BlackRock Institutional Trust Company, N.A. ("BTC"), if any, is disclosed in the Schedule of Investments.
Securities lending transactions are entered into by the Master Portfolio under Master Securities Lending Agreements (each, an “MSLA”), which provide the right, in the event of default (including bankruptcy or insolvency), for the non-defaulting party to liquidate the collateral and calculate a net exposure to the defaulting party or request additional collateral. In the event that a borrower defaults, the Master Portfolio, as lender, would offset the market value of the collateral received against the market value of the securities loaned. When the value of the collateral is greater than that of the market value of the securities loaned, the lender is left with a net amount payable to the defaulting party. However, bankruptcy or insolvency laws of a particular jurisdiction may impose restrictions on or prohibitions against such a right of offset in the event of an MSLA counterparty’s bankruptcy or insolvency. Under the MSLA, absent an event of default, the borrower can resell or re-pledge the loaned securities, and the Master Portfolio can reinvest cash collateral received in connection with loaned securities. Upon an event of default, the parties’ obligations to return the securities or collateral to the other party are extinguished, and the parties can resell or re-pledge the loaned securities or the collateral received in connection with the loaned securities in order to satisfy the defaulting party’s net payment obligation for all transactions under the MSLA. The defaulting party remains liable for any deficiency.
As of period end, the following table is a summary of the Master Portfolio’s securities on loan by counterparty which are subject to offset under an MSLA:
| Counterparty | Securities Loaned at Value | Cash Collateral Received1 | Net Amount |
| Barclays Bank PLC | 9,509,677 | (9,509,677) | — |
| Barclays Capital, Inc. | 3,621,116 | (3,621,116) | — |
| BofA Securities, Inc. | $4,809,927 | $(4,809,927) | — |
| Citigroup Global Markets, Inc. | 82,521,804 | (82,521,804) | — |
| Goldman Sachs & Co. | 549,985 | (549,985) | — |
| HSBC Bank PLC | 2,503,442 | (2,503,442) | — |
| Counterparty | Securities Loaned at Value | Cash Collateral Received1 | Net Amount |
| ING Financial Markets LLC | 18,046 | (18,046) | — |
| JP Morgan Securities LLC | 22,126,519 | (22,126,519) | — |
| National Financial Services LLC | 106,976 | (106,976) | — |
| SG Americas Securities LLC | 28,931,954 | (28,931,954) | — |
| UBS Securities LLC | 1,926,928 | (1,926,928) | — |
| Virtu Americas, LLC | 2,400,576 | (2,400,576) | — |
| Wells Fargo Securities LLC | 266,135 | (266,135) | — |
| | $159,293,085 | $(159,293,085) | $— |
| 1Collateral received in excess of the market value of securities on loan is not presented in this table. The total cash collateral received by the Master Portfolio is disclosed in the Master Portfolio’s Statement of Assets and Liabilities. |
The risks of securities lending include the risk that the borrower may not provide additional collateral when required or may not return the securities when due. To mitigate these risks, the Master Portfolio benefits from a borrower default indemnity provided by BlackRock, Inc. ("BlackRock"). BlackRock’s indemnity allows for full replacement of the securities loaned to the extent the collateral received does not cover the value on the securities loaned in the event of borrower default. The Master Portfolio could incur a loss if the value of an investment purchased with cash collateral falls below the market value of loaned securities or if the value of an investment purchased with cash collateral falls below the value of the original cash collateral received. Such losses are borne entirely by the Master Portfolio.
5. Derivative Financial Instruments
The Master Portfolio engages in various portfolio investment strategies using derivative contracts both to increase the returns of the Master Portfolio and/or to manage its exposure to certain risks such as credit risk, equity risk, interest rate risk, foreign currency exchange rate risk, commodity price risk or other risks (e.g., inflation risk). Derivative financial instruments categorized by risk exposure are included in the Schedule of Investments. These contracts may be transacted on an exchange or over-the-counter ("OTC").
Futures Contracts: Futures contracts are purchased or sold to gain exposure to, or manage exposure to, changes in interest rates (interest rate risk) and changes in the value of equity securities (equity risk) or foreign currencies (foreign currency exchange rate risk).
| Appendix | Notes to Financial Statements |
Notes to Financial Statements | S&P 500 Index Master Portfolio (Continued)
Futures contracts are exchange-traded agreements between the Master Portfolio and a counterparty to buy or sell a specific quantity of an underlying instrument at a specified price and on a specified date. Depending on the terms of a contract, it is settled either through physical delivery of the underlying instrument on the settlement date or by payment of a cash amount on the settlement date. Upon entering into a futures contract, the Master Portfolio is required to deposit initial margin with the broker in the form of cash or securities in an amount that varies depending on a contract’s size and risk profile. The initial margin deposit must then be maintained at an established level over the life of the contract. Amounts pledged, which are considered restricted, are included in cash pledged for futures contracts in the Statement of Assets and Liabilities.
Securities deposited as initial margin are designated in the Schedule of Investments and cash deposited, if any, are shown as cash pledged for futures contracts in the Statement of Assets and Liabilities. Pursuant to the contract, the Master Portfolio agrees to receive from or pay to the broker an amount of cash equal to the daily fluctuation in market value of the contract (“variation margin”). Variation margin is recorded as unrealized appreciation (depreciation) and, if any, shown as variation margin receivable (or payable) on futures contracts in the Statement of Assets and Liabilities. When the contract is closed, a realized gain or loss is recorded in the Statement of Operations equal to the difference between the notional amount of the contract at the time it was opened and the notional amount at the time it was closed. The use of futures contracts involves the risk of an imperfect correlation in the movements in the price of futures contracts and interest rates, foreign currency exchange rates or underlying assets.
6. Investment Advisory Agreement and Other Transactions with Affiliates
Investment Advisory: MIP, on behalf of the Master Portfolio, entered into an Investment Advisory Agreement with the Manager, the Master Portfolio’s investment adviser and an indirect, wholly-owned subsidiary of BlackRock, to provide investment advisory services. The Manager is responsible for the management of the Master Portfolio’s portfolio and provides the personnel, facilities, equipment and certain other services necessary to the operations of the Master Portfolio.
For such services, the Master Portfolio pays the Manager a monthly fee at an annual rate equal to 0.01% of the average daily value of the Master Portfolio’s net assets.
Administration: MIP, on behalf of the Master Portfolio entered into an Administration Agreement with BlackRock Advisors, LLC (“BAL”), which has agreed to provide general administrative services (other than investment advice and related portfolio activities). BAL has agreed to bear all of the Master Portfolio’s ordinary operating expenses, excluding, generally, investment advisory fees, distribution fees,
brokerage and other expenses related to the execution of portfolio transactions, extraordinary expenses and certain other expenses which are borne by the Master Portfolio.
BAL is not entitled to compensation for providing administrative services to the Master Portfolio, for so long as BAL (or an affiliate) is entitled to compensation for providing administrative services to corresponding feeder funds that invest substantially all of their assets in the Master Portfolio, or BAL (or an affiliate) receives investment advisory fees from the Master Portfolio.
Expense Waivers and Reimbursements: The Manager contractually agreed to waive its investment advisory fees by the amount of investment advisory fees the Master Portfolio pays to the Manager indirectly through its investment in affiliated money market funds (the “affiliated money market fund waiver") through April 30, 2021. The contractual agreement may be terminated upon 90 days’ notice by a majority of the trustees who are not “interested persons” of MIP, as defined in the 1940 Act (“Independent Trustees”), or by a vote of a majority of the outstanding voting securities of the Master Portfolio. Prior to April 29, 2020, this waiver was voluntary. This amount is included in fees waived and/or reimbursed by the Manager in the Statement of Operations. For the year ended December 31, 2020, the amount waived was $157,217.
The Manager has contractually agreed to waive its investment advisory fee with respect to any portion of the Master Portfolio’s assets invested in affiliated equity and fixed-income mutual funds and affiliated exchange-traded funds that have a contractual management fee through April 30, 2021. The contractual agreement may be terminated upon 90 days’ notice by a majority of the Independent Trustees, or by a vote of a majority of the outstanding voting securities of the Master Portfolio. This amount is included in fees waived and/or reimbursed by the Manager in the Statement of Operations. For the year ended December 31, 2020, the Manager waived $5,517 in investment advisory fees pursuant to this arrangement.
The fees and expenses of the Master Portfolio’s Independent Trustees, counsel to the Independent Trustees and the Master Portfolio’s independent registered public accounting firm (together, the “independent expenses”) are paid directly by the Master Portfolio. BFA has contractually agreed to reimburse the Master Portfolio or provide an offsetting credit against the investment advisory fees paid by the Master Portfolio in an amount equal to these independent expenses through April 30, 2021. For the year ended December 31, 2020, the amount waived and/or reimbursed was $415,085.
Securities Lending: The U.S. Securities and Exchange Commission ("SEC") has issued an exemptive order which permits BTC, an affiliate of the Manager, to serve as securities lending agent for the Master Portfolio, subject to applicable conditions. As securities lending agent, BTC bears all operational costs directly related to securities lending. The
| Notes to Financial Statements | Appendix |
113
Notes to Financial Statements | S&P 500 Index Master Portfolio (Continued)
Master Portfolio is responsible for fees in connection with the investment of cash collateral received for securities on loan (the “collateral investment fees”). The cash collateral is invested in a money market fund, BlackRock Cash Funds: Institutional or BlackRock Cash Funds: Treasury, managed by the Manager or its affiliates. However, BTC has agreed to reduce the amount of securities lending income it receives in order to effectively limit the collateral investment fees the Master Portfolio bears to an annual rate of 0.04%. The SL Agency Shares of such money market fund will not be subject to a sales load, distribution fee or service fee. The money market fund in which the cash collateral has been invested may, under certain circumstances, impose a liquidity fee of up to 2% of the value redeemed or temporarily restrict redemptions for up to 10 business days during a 90 day period, in the event that the money market fund’s weekly liquid assets fall below certain thresholds.
Securities lending income is equal to the total of income earned from the reinvestment of cash collateral, net of fees and other payments to and from borrowers of securities, and less the collateral investment fees. The Master Portfolio retains a portion of securities lending income and remits a remaining portion to BTC as compensation for its services as securities lending agent.
Pursuant to the current securities lending agreement, the Master Portfolio retains 75% of securities lending income (which excludes collateral investment fees), and this amount retained can never be less than 70% of the total of securities lending income plus the collateral investment fees.
In addition, commencing the business day following the date that the aggregate securities lending income earned across the BlackRock Multi-Asset Complex in a calendar year exceeds a specified threshold, the Master Portfolio, pursuant to the securities lending agreement, will retain for the remainder of that calendar year securities lending income in an amount equal to 80% of securities lending income (which excludes collateral investment fees), and this amount retained can never be less than 70% of the total of securities lending income plus the collateral investment fees.
The share of securities lending income earned by the Master Portfolio is shown as securities lending income — affiliated – net in the Statement of Operations. For the year ended December 31, 2020, the Master Portfolio paid BTC $608,234 for securities lending agent services.
Interfund Lending: In accordance with an exemptive order (the “Order”) from the SEC, the Master Portfolio may participate in a joint lending and borrowing facility for temporary purposes (the “Interfund Lending Program”), subject to compliance with the terms and conditions of the Order, and to the extent permitted by the Master Portfolio’s investment policies and restrictions. The Master Portfolio is currently permitted to borrow and lend under the Interfund Lending Program.
A lending BlackRock fund may lend in aggregate up to 15% of its net assets, but may not lend more than 5% of its net assets to any one borrowing fund through the Interfund Lending Program. A borrowing BlackRock fund may not borrow through the Interfund Lending Program or from any other source more than 33 1/3% of its total assets (or any lower threshold provided for by the fund’s investment restrictions). If a borrowing BlackRock fund’s total outstanding borrowings exceed 10% of its total assets, each of its outstanding interfund loans will be subject to collateralization of at least 102% of the outstanding principal value of the loan. All interfund loans are for temporary or emergency purposes and the interest rate to be charged will be the average of the highest current overnight repurchase agreement rate available to a lending fund and the bank loan rate, as calculated according to a formula established by the Board.
During the year ended December 31, 2020, the Master Portfolio did not participate in the Interfund Lending Program.
Trustees and Officers: Certain trustees and/or officers of the Master Portfolio are directors and/or officers of BlackRock or its affiliates.
Other Transactions: The Master Portfolio may purchase securities from, or sell securities to, an affiliated fund provided the affiliation is due solely to having a common investment adviser, common officers, or common trustees. For the year ended December 31, 2020, the purchase and sale transactions and any net realized gains (losses) with affiliated funds in compliance with Rule 17a-7 under the 1940 Act were as follows:
| Purchases | Sales | Net Realized Gain (Loss) |
| $419,937,106 | 210,187,409 | $(42,188,498) |
7. Purchases and Sales
For the year ended December 31, 2020, purchases and sales of investments, excluding short-term investments, were $1,216,555,956 and $1,119,025,865, respectively.
8. Income Tax Information
The Master Portfolio is classified as a partnership for U.S. federal income tax purposes. As such, each investor in the Master Portfolio is treated as the owner of its proportionate share of net assets, income, expenses and realized and unrealized gains and losses of the Master Portfolio. Therefore, no U.S. federal income tax provision is required. It is intended that the Master Portfolio’s assets will be managed so an investor in the Master Portfolio can satisfy the requirements of Subchapter M of the Internal Revenue Code of 1986, as amended.
The Master Portfolio files U.S. federal and various state and local tax returns. No income tax returns are currently under examination. The statute of limitations on the Master
| Appendix | Notes to Financial Statements |
Notes to Financial Statements | S&P 500 Index Master Portfolio (Continued)
Portfolio’s U.S. federal tax returns generally remains open for a period of three fiscal years after they are filed. The statutes of limitations on the Master Portfolio’s state and local tax returns may remain open for an additional year depending upon the jurisdiction.
Management has analyzed tax laws and regulations and their application to the Master Portfolio as of December 31, 2020, inclusive of the open tax return years, and does not believe that there are any uncertain tax positions that require recognition of a tax liability in the Master Portfolio’s financial statements.
As of December 31, 2020, gross unrealized appreciation and depreciation based on cost of investments (including short positions and derivatives, if any) for U.S. federal income tax purposes were as follows:
| Tax cost | $13,299,017,725 |
| Gross unrealized appreciation | $14,560,736,626 |
| Gross unrealized depreciation | $(664,685,390) |
| Net unrealized appreciation | $13,896,051,236 |
9. Bank Borrowings
MIP, on behalf of the Master Portfolio, along with certain other funds managed by the Manager and its affiliates (“Participating Funds”), is a party to a 364-day, $2.25 billion credit agreement with a group of lenders. Under this agreement, the Master Portfolio may borrow to fund shareholder redemptions. Excluding commitments designated for certain individual funds, the Participating Funds, including the Master Portfolio, can borrow up to an aggregate commitment amount of $1.75 billion at any time outstanding, subject to asset coverage and other limitations as specified in the agreement. The credit agreement has the following terms: a fee of 0.10% per annum on unused commitment amounts and interest at a rate equal to the higher of (a) one-month LIBOR (but, in any event, not less than 0.00%) on the date the loan is made plus 0.80% per annum or (b) the Fed Funds rate (but, in any event, not less than 0.00%) in effect from time to time plus 0.80% per annum on amounts borrowed. The agreement expires in April 2021 unless extended or renewed. These fees were allocated among such funds based upon portions of the aggregate commitment available to them and relative net assets of Participating Funds. During the year ended December 31, 2020, the Master Portfolio did not borrow under the credit agreement.
10. Principal Risks
In the normal course of business, the Master Portfolio invests in securities or other instruments and may enter into certain transactions, and such activities subject the Master Portfolio to various risks, including among others, fluctuations in the market (market risk) or failure of an issuer to meet all of its obligations. The value of securities or other instruments may also be affected by various factors, including, without
limitation: (i) the general economy; (ii) the overall market as well as local, regional or global political and/or social instability; (iii) regulation, taxation or international tax treaties between various countries; or (iv) currency, interest rate and price fluctuations. Local, regional or global events such as war, acts of terrorism, the spread of infectious illness or other public health issues, recessions, or other events could have a significant impact on the Master Portfolio and its investments. The Master Portfolio’s prospectus provides details of the risks to which the Master Portfolio is subject.
The Master Portfolio may be exposed to additional risks when reinvesting cash collateral in money market funds that do not seek to maintain a stable NAV per share of $1.00, which may be subject to redemption gates or liquidity fees under certain circumstances.
Market Risk: An outbreak of respiratory disease caused by a novel coronavirus has developed into a global pandemic and has resulted in closing borders, quarantines, disruptions to supply chains and customer activity, as well as general concern and uncertainty. The impact of this pandemic, and other global health crises that may arise in the future, could affect the economies of many nations, individual companies and the market in general in ways that cannot necessarily be foreseen at the present time. This pandemic may result in substantial market volatility and may adversely impact the prices and liquidity of a fund’s investments. The duration of this pandemic and its effects cannot be determined with certainty.
Valuation Risk: The market values of equities, such as common stocks and preferred securities or equity related investments, such as futures and options, may decline due to general market conditions which are not specifically related to a particular company. They may also decline due to factors which affect a particular industry or industries. The Master Portfolio may invest in illiquid investments. An illiquid investment is any investment that the Master Portfolio reasonably expects cannot be sold or disposed of in current market conditions in seven calendar days or less without the sale or disposition significantly changing the market value of the investment. The Master Portfolio may experience difficulty in selling illiquid investments in a timely manner at the price that it believes the investments are worth. Prices may fluctuate widely over short or extended periods in response to company, market or economic news. Markets also tend to move in cycles, with periods of rising and falling prices. This volatility may cause the Master Portfolio’s NAV to experience significant increases or decreases over short periods of time. If there is a general decline in the securities and other markets, the NAV of the Master Portfolio may lose value, regardless of the individual results of the securities and other instruments in which the Master Portfolio invests.
Counterparty Credit Risk: The Master Portfolio may be exposed to counterparty credit risk, or the risk that an entity may fail to or be unable to perform on its commitments related to unsettled or open transactions, including making
| Notes to Financial Statements | Appendix |
115
Notes to Financial Statements | S&P 500 Index Master Portfolio (Continued)
timely interest and/or principal payments or otherwise honoring its obligations. The Master Portfolio manages counterparty credit risk by entering into transactions only with counterparties that the Manager believes have the financial resources to honor their obligations and by monitoring the financial stability of those counterparties. Financial assets, which potentially expose the Master Portfolio to market, issuer and counterparty credit risks, consist principally of financial instruments and receivables due from counterparties. The extent of the Master Portfolio’s exposure to market, issuer and counterparty credit risks with respect to these financial assets is approximately their value recorded in the Statement of Assets and Liabilities, less any collateral held by the Master Portfolio.
A derivative contract may suffer a mark-to-market loss if the value of the contract decreases due to an unfavorable change in the market rates or values of the underlying instrument. Losses can also occur if the counterparty does not perform under the contract.
With exchange-traded futures, there is less counterparty credit risk to the Master Portfolio since the exchange or clearinghouse, as counterparty to such instruments, guarantees against a possible default. The clearinghouse stands between the buyer and the seller of the contract; therefore, credit risk is limited to failure of the clearinghouse. While offset rights may exist under applicable law, the Master Portfolio does not have a contractual right of offset against a clearing broker or clearinghouse in the event of a default (including the bankruptcy or insolvency). Additionally, credit risk exists in exchange-traded futures with respect to initial and variation margin that is held in a clearing broker’s customer accounts. While clearing brokers are required to segregate customer margin from their own assets, in the event that a clearing broker becomes insolvent or goes into bankruptcy and at that time there is a shortfall in the aggregate amount of margin held by the clearing broker for all its clients, typically the shortfall would be allocated on a pro rata basis across all the clearing broker’s customers, potentially resulting in losses to the Master Portfolio.
Concentration Risk: A diversified portfolio, where this is appropriate and consistent with a fund’s objectives, minimizes the risk that a price change of a particular investment will have a material impact on the NAV of a fund. The investment concentrations within the Master Portfolio’s portfolio are disclosed in its Schedule of Investments.
The Master Portfolio invests a significant portion of its assets in securities within a single or limited number of market sectors. When a Master Portfolio concentrates its investments in this manner, it assumes the risk that economic, regulatory, political and social conditions affecting such sectors may have a significant impact on the Master Portfolio and could affect the income from, or the value or liquidity of, the Master Portfolio’s portfolio. Investment percentages in specific sectors are presented in the Schedule of Investments.
LIBOR Transition Risk: The United Kingdom’s Financial Conduct Authority announced a phase out of the London Interbank Offered Rate (“LIBOR”) by the end of 2021, and it is expected that LIBOR will cease to be published after that time. The Master Portfolio may be exposed to financial instruments tied to LIBOR to determine payment obligations, financing terms, hedging strategies or investment value. The transition process away from LIBOR might lead to increased volatility and illiquidity in markets for, and reduce the effectiveness of new hedges placed against, instruments whose terms currently include LIBOR. The ultimate effect of the LIBOR transition process on the Master Portfolio is uncertain.
11. Subsequent Events
Management has evaluated the impact of all subsequent events on the Master Portfolio through the date the financial statements were issued and has determined that there were no subsequent events requiring adjustment or additional disclosure in the financial statements.
| Appendix | Notes to Financial Statements |
Report of Independent Registered Public Accounting Firm
S&P 500 Index Master Portfolio
To the Board of Trustees of Master Investment Portfolio and the Investors of S&P 500 Index Master Portfolio
Opinion on the Financial Statements
We have audited the accompanying statement of assets and liabilities, including the schedule of investments, of S&P 500 Index Master Portfolio (one of the series constituting Master Investment Portfolio, referred to hereafter as the "Master Portfolio") as of December 31, 2020, the related statement of operations for the year ended December 31, 2020, the statements of changes in net assets for each of the two years in the period ended December 31, 2020, including the related notes, and the financial highlights for each of the five years in the period ended December 31, 2020 (collectively referred to as the “financial statements”). In our opinion, the financial statements present fairly, in all material respects, the financial position of the Master Portfolio as of December 31, 2020, the results of its operations for the year then ended, the changes in its net assets for each of the two years in the period ended December 31, 2020 and the financial highlights for each of the five years in the period ended December 31, 2020 in conformity with accounting principles generally accepted in the United States of America.
Basis for Opinion
These financial statements are the responsibility of the Master Portfolio’s management. Our responsibility is to express an opinion on the Master Portfolio’s financial statements based on our audits. We are a public accounting firm registered with the Public Company Accounting Oversight Board (United States) (PCAOB) and are required to be independent with respect to the Master Portfolio in accordance with the U.S. federal securities laws and the applicable rules and regulations of the Securities and Exchange Commission and the PCAOB.
We conducted our audits of these financial statements in accordance with the standards of the PCAOB. Those standards require that we plan and perform the audit to obtain reasonable assurance about whether the financial statements are free of material misstatement, whether due to error or fraud.
Our audits included performing procedures to assess the risks of material misstatement of the financial statements, whether due to error or fraud, and performing procedures that respond to those risks. Such procedures included examining, on a test basis, evidence regarding the amounts and disclosures in the financial statements. Our audits also included evaluating the accounting principles used and significant estimates made by management, as well as evaluating the overall presentation of the financial statements. Our procedures included confirmation of securities owned as of December 31, 2020 by correspondence with the custodian, transfer agent and brokers. We believe that our audits provide a reasonable basis for our opinion.
PricewaterhouseCoopers LLP
Philadelphia, Pennsylvania
February 16, 2021
We have served as the auditor of one or more BlackRock investment companies since 2000.
Statement Regarding Liquidity Risk Management Program
S&P 500 Index Master Portfolio
In compliance with Rule 22e-4 under the Investment Company Act of 1940, as amended (the “Liquidity Rule”), BlackRock Funds III and Master Investment Portfolio (the “Trusts”) have adopted and implemented a liquidity risk management program (the “Program”) for iShares S&P 500 Index Fund and S&P 500 Index Master Portfolio (the “Funds”), each a series of the respective Trust, which is reasonably designed to assess and manage each Fund’s liquidity risk.
The Board of Trustees (the “Board”) of the Trusts, on behalf of the respective Funds, met on November 10-11, 2020 (the “Meeting”) to review the Program. The Board previously appointed BlackRock Advisors, LLC or BlackRock Fund Advisors (“BlackRock”), each an investment adviser to certain Funds, as the program administrator for each Fund’s Program, as applicable. BlackRock also previously delegated oversight of the Program to the 40 Act Liquidity Risk Management Committee (the “Committee”). At the Meeting, the Committee, on behalf of BlackRock, provided the Board with a report that addressed the operation of the Program and assessed its adequacy and effectiveness of implementation, including the operation of each Fund’s Highly Liquid Investment Minimum (“HLIM”) where applicable, and any material changes to the Program (the “Report”). The Report covered the period from October 1, 2019 through September 30, 2020 (the “Program Reporting Period”).
The Report described the Program’s liquidity classification methodology for categorizing a Fund’s investments (including derivative transactions) into one of four liquidity buckets. It also referenced the methodology used by BlackRock to establish a Fund’s HLIM and noted that the Committee reviews and ratifies the HLIM assigned to each Fund no less frequently than annually. The Report also discussed notable events affecting liquidity over the Program Reporting Period, including the impact of the coronavirus outbreak on the Funds and the overall market.
The Report noted that the Program complied with the key factors for consideration under the Liquidity Rule for assessing, managing and periodically reviewing a Fund’s liquidity risk, as follows:
A. The Fund’s investment strategy and liquidity of portfolio investments during both normal and reasonably foreseeable stressed conditions:During the Program Reporting Period, the Committee reviewed whether each Fund’s strategy is appropriate for an open-end fund structure with a focus on Funds with more significant and consistent holdings of less liquid and illiquid assets. The Committee also factored a Fund’s concentration in an issuer into the liquidity classification methodology by taking issuer position sizes into account. Where a Fund participated in borrowings for investment purposes (such as tender option bonds and reverse repurchase agreements), such borrowings were factored into the Program’s calculation of a Fund’s liquidity bucketing. Derivative exposure was also considered in such calculation.
B. Short-term and long-term cash flow projections during both normal and reasonably foreseeable stressed conditions: During the Program Reporting Period, the Committee reviewed historical net redemption activity and used this information as a component to establish each Fund’s reasonably anticipated trading size (“RATS”). Each Fund has adopted an in-kind redemption policy which may be utilized to meet larger redemption requests. The Committee may also take into consideration a Fund’s shareholder ownership concentration (which, depending on product type and distribution channel, may or may not be available), a Fund’s distribution channels, and the degree of certainty associated with a Fund’s short-term and long-term cash flow projections.
C. Holdings of cash and cash equivalents, as well as borrowing arrangements: The Committee considered the terms of the credit facility committed to the Funds, the financial health of the institution providing the facility and the fact that the credit facility is shared among multiple Funds (including that a portion of the aggregate commitment amount is specifically designated for BlackRock Floating Rate Income Portfolio, a series of BlackRock Funds V). The Committee also considered other types of borrowing available to the Funds, such as the ability to use reverse repurchase agreements and interfund lending, as applicable.
There were no material changes to the Program during the Program Reporting Period. The Report provided to the Board stated that the Committee concluded that based on the operation of the functions, as described in the Report, the Program is operating as intended and is effective in implementing the requirements of the Liquidity Rule.
Officers and Trustees
S&P 500 Index Master Portfolio | Independent Trustees1
| Name and Year of Birth2 | Position(s) Held | Length of Time Served3 | Principal Occupation(s) During Past Five Years | Number of BlackRock- Advised Registered Investment Companies (“RICs”) Consisting of Investment Portfolios (“Portfolios”) Overseen | Public Company and Investment Company Directorships During Past Five Years |
Mark Stalnecker
1951 | Chair of the Board and Trustee | Since 2019 & 2015 | Chief Investment Officer, University of Delaware from 1999 to 2013; Trustee and Chair of the Finance and Investment Committees, Winterthur Museum and Country Estate from 2005 to 2016; Member of the Investment Committee, Delaware Public Employees’ Retirement System since 2002; Member of the Investment Committee, Christiana Care Health System from 2009 to 2017; Member of the Investment Committee, Delaware Community Foundation from 2013 to 2014; Director and Chair of the Audit Committee, SEI Private Trust Co. from 2001 to 2014. | 33 RICs consisting of
159 Portfolios | None |
Bruce R. Bond
1946 | Trustee | Since 2019 | Board Member, Amsphere Limited (software) since 2018; Trustee and Member of the Governance Committee, State Street Research Mutual Funds from 1997 to 2005; Board Member of Governance, Audit and Finance Committee, Avaya Inc. (computer equipment) from 2003 to 2007. | 33 RICs consisting of
159 Portfolios | None |
Officers and Trustees
S&P 500 Index Master Portfolio | Independent Trustees1 (Continued)
| Name and Year of Birth2 | Position(s) Held | Length of Time Served3 | Principal Occupation(s) During Past Five Years | Number of BlackRock- Advised Registered Investment Companies (“RICs”) Consisting of Investment Portfolios (“Portfolios”) Overseen | Public Company and Investment Company Directorships During Past Five Years |
Susan J.Carter
1956 | Trustee | Since 2016 | Director, Pacific Pension Institute from 2014 to 2018; Advisory Board Member, Center for Private Equity and Entrepreneurship at Tuck School of Business since 1997; Senior Advisor, Commonfund Capital, Inc. (“CCI”) (investment adviser) in 2015; Chief Executive Officer, CCI from 2013 to 2014; President & Chief Executive Officer, CCI from 1997 to 2013; Advisory Board Member, Girls Who Invest from 2015 to 2018 and Board Member thereof since 2018; Advisory Board Member, Bridges Fund Management since 2016; Trustee, Financial Accounting Foundation since 2017; Practitioner Advisory Board Member, Private Capital Research Institute ("PCRI") since 2017; Lecturer in the Practice of Management, Yale School of Management since 2019. | 33 RICs consisting of
159 Portfolios | None |
Collette Chilton
1958 | Trustee | Since 2015 | Chief Investment Officer, Williams College since 2006; Chief Investment Officer, Lucent Asset Management Corporation from 1998 to 2006. | 33 RICs consisting of
159 Portfolios | None |
Neil A. Cotty
1954 | Trustee | Since 2016 | Bank of America Corporation from 1996 to 2015, serving in various senior finance leadership roles, including Chief Accounting Officer from 2009 to 2015, Chief Financial Officer of Global Banking, Markets and Wealth Management from 2008 to 2009, Chief Accounting Officer from 2004 to 2008, Chief Financial Officer of Consumer Bank from 2003 to 2004, Chief Financial Officer of Global Corporate Investment Bank from 1999 to 2002. | 33 RICs consisting of
159 Portfolios | None |
Officers and Trustees
S&P 500 Index Master Portfolio | Independent Trustees1 (Continued)
| Name and Year of Birth2 | Position(s) Held | Length of Time Served3 | Principal Occupation(s) During Past Five Years | Number of BlackRock- Advised Registered Investment Companies (“RICs”) Consisting of Investment Portfolios (“Portfolios”) Overseen | Public Company and Investment Company Directorships During Past Five Years |
Lena G. Goldberg
1949 | Trustee | Since 2019 | Senior Lecturer, Harvard Business School, since 2008; Director, Charles Stark Draper Laboratory, Inc. since 2013; FMR LLC/Fidelity Investments (financial services) from 1996 to 2008, serving in various senior roles including Executive Vice President - Strategic Corporate Initiatives and Executive Vice President and General Counsel; Partner, Sullivan & Worcester LLP from 1985 to 1996 and Associate thereof from 1979 to 1985. | 33 RICs consisting of
159 Portfolios | None |
Henry R. Keizer
1956 | Trustee | Since 2019 | Director, Park Indemnity Ltd. (captive insurer) since 2010; Director, MUFG Americas Holdings Corporation and MUFG Union Bank, N.A. (financial and bank holding company) from 2014 to 2016; Director, American Institute of Certified Public Accountants from 2009 to 2011; Director, KPMG LLP (audit, tax and advisory services) from 2004 to 2005 and 2010 to 2012; Director, KPMG International in 2012, Deputy Chairman and Chief Operating Officer thereof from 2010 to 2012 and U.S. Vice Chairman of Audit thereof from 2005 to 2010; Global Head of Audit, KPMGI (consortium of KPMG firms) from 2006 to 2010; Director, YMCA of Greater New York from 2006 to 2010. | 33 RICs consisting of
159 Portfolios | Hertz Global Holdings
(car rental);
Montpelier Re Holdings, Ltd.
(publicly held property
and casualty reinsurance)
from 2013 until 2015;
WABCO (commercial vehicle
safety systems);
Sealed Air Corp. (packaging) |
Cynthia A. Montgomery
1952 | Trustee | Since 2009 | Professor, Harvard Business School since 1989. | 33 RICs consisting of
159 Portfolios | Newell
Rubbermaid, Inc.
(manufacturing) |
Officers and Trustees
S&P 500 Index Master Portfolio | Independent Trustees1 (Continued)
| Name and Year of Birth2 | Position(s) Held | Length of Time Served3 | Principal Occupation(s) During Past Five Years | Number of BlackRock- Advised Registered Investment Companies (“RICs”) Consisting of Investment Portfolios (“Portfolios”) Overseen | Public Company and Investment Company Directorships During Past Five Years |
Donald C. Opatrny
1952 | Trustee | Since 2019 | Trustee, Vice Chair, Member of the Executive Committee and Chair of the Investment Committee, Cornell University since 2004; President, Trustee and Member of the Investment Committee, The Aldrich Contemporary Art Museum from 2007 to 2014; Member of the Board and Investment Committee, University School from 2007 to 2018; Member of the Investment Committee, Mellon Foundation from 2009 to 2015; Trustee, Artstor (a Mellon Foundation affiliate) from 2010 to 2015; President and Trustee, the Center for the Arts, Jackson Hole from 2011 to 2018; Director, Athena Capital Advisors LLC (investment management firm) since 2013; Trustee and Chair of the Investment Committee, Community Foundation of Jackson Hole since 2014; Member of Affordable Housing Supply Board of Jackson, Wyoming since 2018; Member, Investment Funds Committee, State of Wyoming since 2017; Trustee, Phoenix Art Museum since 2018; Trustee, Arizona Community Foundation and Member of Investment Committee since 2020. | 33 RICs consisting of
159 Portfolios | None |
Joseph P. Platt
1947 | Trustee | Since 2009 | General Partner, Thorn Partners, LP (private investments) since 1998; Director, WQED Multi-Media (public broadcasting not-for-profit) since 2001; Chair, Basic Health International (non-profit) since 2015. | 33 RICs consisting of
159 Portfolios | Greenlight
Capital Re, Ltd.
(reinsurance
company);
Consol Energy
Inc. |
Officers and Trustees
S&P 500 Index Master Portfolio | Independent Trustees1 (Continued)
| Name and Year of Birth2 | Position(s) Held | Length of Time Served3 | Principal Occupation(s) During Past Five Years | Number of BlackRock- Advised Registered Investment Companies (“RICs”) Consisting of Investment Portfolios (“Portfolios”) Overseen | Public Company and Investment Company Directorships During Past Five Years |
Kenneth L. Urish
1951 | Trustee | Since 2009 | Managing Partner, Urish Popeck & Co., LLC (certified public accountants and consultants) since 1976; Past-Chairman of the Professional Ethics Committee of the Pennsylvania Institute of Certified Public Accountants and Committee Member thereof since 2007; Member of External Advisory Board, The Pennsylvania State University Accounting Department since founding in 2001; Principal, UP Strategic Wealth Investment Advisors, LLC since 2013; Trustee, The Holy Family Institute from 2001 to 2010; President and Trustee, Pittsburgh Catholic Publishing Associates from 2003 to 2008; Director, Inter-Tel from 2006 to 2007. | 33 RICs consisting of
159 Portfolios | None |
Claire A. Walton
1957 | Trustee | Since 2016 | Chief Operating Officer and Chief Financial Officer of Liberty Square Asset Management, LP from 1998 to 2015; General Partner of Neon Liberty Capital Management, LLC since 2003; Director, Boston Hedge Fund Group from 2009 to 2018; Director, Woodstock Ski Runners since 2013; Director, Massachusetts Council on Economic Education from 2013 to 2015. | 33 RICs consisting of
159 Portfolios | None |
| 1The address of each Trustee is c/o BlackRock, Inc., 55 East 52nd Street, New York, New York 10055. |
| 2Independent Trustees serve until their resignation, retirement, removal or death, or until December 31 of the year in which they turn 75. The Board may determine to extend the terms of Independent Trustees on a case-by-case basis, as appropriate. |
| 3In connection with the acquisition of Barclays Global Investors by BlackRock, Inc. in December 2009, certain Independent Trustees were elected to the Board. Furthermore, effective January 1, 2019, three BlackRock Fund Complexes were realigned and consolidated into two BlackRock Fund Complexes. As a result, although the chart shows the year that each Independent Trusteejoined the Board, certain Independent Trustees first became members of the boards of other BlackRock-advised Funds or legacy BlackRock funds as follows: Bruce R. Bond, 2005; Cynthia A. Montgomery, 1994; Joseph P. Platt, 1999; Kenneth L. Urish, 1999; Lena G. Goldberg, 2016; Henry R. Keizer, 2016; Donald C. Opatrny, 2015. |
Officers and Trustees
S&P 500 Index Master Portfolio | Interested Trustees1,4
| Name and Year of Birth2 | Position(s) Held | Length of Time Served3 | Principal Occupation(s) During Past Five Years | Number of BlackRock- Advised Registered Investment Companies (“RICs”) Consisting of Investment Portfolios (“Portfolios”) Overseen | Public Company and Investment Company Directorships During Past Five Years |
Robert Fairbairn
1965 | Trustee | Since 2018 | Vice Chairman of BlackRock, Inc. since 2019; Member of BlackRock’s Global Executive and Global Operating Committees; Co-Chair of BlackRock’s Human Capital Committee; Senior Managing Director of BlackRock, Inc. from 2010 to 2019; oversaw BlackRock’s Strategic Partner Program and Strategic Product Management Group from 2012 to 2019; Member of the Board of Managers of BlackRock Investments, LLC from 2011 to 2018; Global Head of BlackRock’s Retail and iShares businesses from 2012 to 2016. | 117 RICs consisting of
267 Portfolios | None |
John M. Perlowski5
1964 | Trustee, President and Chief Executive Officer | Since 2015 (Trustee); Since 2010 (President and Chief Executive Officer) | Managing Director of BlackRock, Inc. since 2009; Head of BlackRock Global Accounting and Product Services since 2009; Advisory Director of Family Resource Network (charitable foundation) since 2009. | 118 RICs consisting of 268 Portfolios | None |
| 1 The address of each Trustee is c/o BlackRock, Inc., 55 East 52nd Street, New York, NY 10055. |
| 2Independent Trustees serve until their resignation, retirement, removal or death, or until December 31 of the year in which they turn 75. The Board may determine to extend the terms of Independent Trustees on a case-by-case basis, as appropriate. |
| 3In connection with the acquisition of Barclays Global Investors by BlackRock, Inc. in December 2009, certain Independent Trustees were elected to the Board. Furthermore, effective January 1, 2019, three BlackRock Fund Complexes were realigned and consolidated into two BlackRock Fund Complexes. As a result, although the chart shows the year that each Independent Trusteejoined the Board, certain Independent Trustees first became members of the boards of other BlackRock-advised Funds or legacy BlackRock funds as follows: Bruce R. Bond, 2005; Cynthia A. Montgomery, 1994; Joseph P. Platt, 1999; Kenneth L. Urish, 1999; Lena G. Goldberg, 2016; Henry R. Keizer, 2016; Donald C. Opatrny, 2015. |
| 4Mr. Fairbairn and Mr. Perlowski are both “interested persons,” as defined in the 1940 Act, of the Trust/MIP based on their positions with BlackRock, Inc. and its affiliates. Mr. Fairbairn and Mr. Perlowski are also board members of the BlackRock Fixed-Income Complex. |
| 5Mr. Perlowski is also a trustee of the BlackRock Credit Strategies Fund. |
Officers and Trustees
S&P 500 Index Master Portfolio | Officers Who Are Not Trustees1
| Name and Year of Birth2 | Position(s) Held | Length of Time Served3 | Principal Occupation(s) During Past Five Years |
Thomas Callahan
1968 | Vice President | Since 2016 | Managing Director of BlackRock, Inc. since 2013; Member of the Board of Managers of BlackRock Investments, LLC (principal underwriter) since 2019 and Managing Director thereof since 2017; Head of BlackRock’s Global Cash Management Business since 2016; Co-Head of the Global Cash Management Business from 2014 to 2016; Deputy Head of the Global Cash Management Business from 2013 to 2014; Member of the Cash Management Group Executive Committee since 2013; Chief Executive Officer of NYSE Liffe U.S. from 2008 to 2013. |
Jennifer McGovern
1977 | Vice President | Since 2014 | Managing Director of BlackRock, Inc. since 2016; Director of BlackRock, Inc. from 2011 to 2015; Head of Americas Product Development and Governance for BlackRock’s Global Product Group since 2019; Head of Product Structure and Oversight for BlackRock’s U.S. Wealth Advisory Group from 2013 to 2019. |
Neal J. Andrews
1966 | Chief Financial Officer | Since 2009 | Chief Financial Officer of the iShares® exchange traded funds from 2019 to 2020; Managing Director of BlackRock, Inc. since 2006. |
Jay M. Fife
1970 | Treasurer | Since 2009 | Managing Director of BlackRock, Inc. since 2007. |
Charles Park
1967 | Chief Compliance Officer | Since 2014 | Anti-Money Laundering Compliance Officer for certain BlackRock-advised Funds from 2014 to 2015; Chief Compliance Officer of BlackRock Advisors, LLC and the BlackRock-advised Funds in the BlackRock Multi-Asset Complex and the BlackRock Fixed-Income Complex since 2014; Principal of and Chief Compliance Officer for iShares® Delaware Trust Sponsor LLC since 2012 and BlackRock Fund Advisors (“BFA”) since 2006; Chief Compliance Officer for the BFA-advised iShares® exchange traded funds since 2006; Chief Compliance Officer for BlackRock Asset Management International Inc. since 2012. |
Lisa Belle
1968 | Anti-Money
Laundering
Compliance Officer | Since 2019 | Director of BlackRock, Inc. since 2017; Global Head of Anti-Money Laundering at BlackRock , Inc. since 2017; Director of AML Monitoring and Investigations Group of Citibank from 2015 to 2017; Global Anti-Money Laundering and Economic Sanctions Officer for MasterCard from 2011 to 2015. |
Janey Ahn
1975 | Secretary | Since 2019 | Managing Director of BlackRock, Inc. since 2018; Director of BlackRock, Inc. from 2009 to 2017. |
| 1The address of each Officer is c/o BlackRock, Inc., 55 East 52nd Street, New York, New York 10055. |
| 2 Officers of the Trust/MIP serve at the pleasure of the Board. |
Further information about the Trust’s/MIP’s Trustees and Officers is available in the Trust’s/MIP’s Statement of Additional Information, which can be obtained without charge by calling (800) 441-7762.
Neal J. Andrews retired as the Chief Financial Officer effective December 31, 2020, and Trent Walker was elected as the Chief Financial Officer effective January 1, 2021.
PRSRT STD
U.S. POSTAGE
PAID
LANCASTER, PA
PERMIT NO. 1793
homesteadfunds.com | 800.258.3030 | 4301 Wilson Blvd. | Arlington, VA | 22203
This report is authorized for distribution to shareholders and others who have received a copy of the prospectus.
Distributor: RE Investment Corporation.
Item 2. Code of Ethics.
Homestead Funds, Inc. has adopted a Senior Officer Code of Ethics, as defined in Item 2 of Form N-CSR, which applies to its principal executive officer, principal financial officer, principal accounting or controller, or persons performing similar functions. The Senior Officer Code of Ethics is available on Homestead Funds, Inc.'s website at www.homesteadfunds.com or without charge, upon request, by calling the Chief Compliance Officer at 1-800-258-3030. During the period covered by this report, no substantive amendments were approved or waivers were granted to the Senior Officer Code of Ethics.
Item 3. Audit Committee Financial Expert.
The Registrant's board of directors has determined that Julie H. Dellinger, member of the
Registrant's audit committee, qualifies as an audit committee financial expert, as such term is defined in Instruction 2(b) to Item 3 of Form N-CSR. Ms. Dellinger is "independent" as such term is defined in paragraph (a)(2) of Item 3 of Form N-CSR.
Under applicable securities laws, a person who is determined to be an audit committee financial expert will not be deemed an "expert" for any purpose, including, without limitation, for the purposes of Section 11 of the Securities Act of 1933, as a result of being designated or identified as an audit committee financial expert. The designation or identification of a person as an audit committee financial expert does not impose on such person any duties, obligations, or liabilities that are greater than the duties, obligations, and liabilities imposed on such person as a member of the audit committee and board of directors in the absence of such designation or identification. The designation or identification of a person as an audit committee financial expert does not affect the duties, obligations or liability of any other member of the audit committee or Board of Directors.
Item 4. Principal Accountant Fees and Services.
(a)Audit Fees1
| | Fiscal Year 2019 | $263,146 |
| | Fiscal Year 2020 | $288,415 |
(b) | Audit-Related Fees | |
| | | |
| | Fiscal Year 2019 | $0 |
| | Fiscal Year 2020 | $0 |
1These fees were for professional services rendered for the audits of the financial statements of Daily Income Fund, Short-Term Government Securities Fund, Short-Term Bond Fund, Stock Index Fund, Value Fund, Small-Company Stock Fund, International Equity Fund, and Growth Fund, including services that are normally provided in connection with the Funds' statutory and regulatory filings.
(c) | Tax Fees | |
| | | |
| | Fiscal Year 2019 | $0 |
| | Fiscal Year 2020 | $0 |
(d) | All Other Fees | |
| | | |
| | Fiscal Year 2019 | $0 |
| | Fiscal Year 2020 | $0 |
(e)(1) The Registrant's audit committee is directly responsible for approving the services to be provided by the principal accountant.
(2)None of the services provided to the Registrant described in paragraphs (b)-(d) of Item 4 were approved by the Audit Committee pursuant to paragraph (c)(7)(i)(C) of Rule 2- 01 of Regulation S-X.
(f)Not applicable
(g)The National Rural Electric Cooperative Association paid the Funds' principal accountant $3,970 and $114,007 in 2020 and 2019 respectively, for consulting and tax services. The National Rural Electric Cooperative Association is the parent company, hence a controlling entity of RE Advisers Corporation, the investment adviser that provided ongoing services to Homestead Funds, Inc. for each of its last two fiscal years.
(h)Homestead Funds, Inc.'s Audit Committee considered the provision of non-audit services, which were not approved by the Audit Committee pursuant to paragraph (c)(7)(ii) of Rule 2-01 of Regulation S-X, that the principal accountant rendered to the National Rural Electric Cooperative Association, a controlling entity of RE Advisers Corporation, the investment adviser that provided ongoing services to Homestead Funds, Inc. for each of its last two fiscal years. The Audit Committee determined that these services were compatible with maintaining the principal accountant's independence.
Item 5. Audit Committee of Listed Registrants.
Not applicable.
Item 6. Investments.
(a)The Registrant's schedule of investments in unaffiliated issuers is included in the report to shareholders under Item 1 of this Form N-CSR.
(b)Not applicable.
Item 7. Disclosure of Proxy Voting Policies and Procedures for Closed-End Management Investment Companies.
Not applicable.
Item 8. Portfolio Managers of Closed-End Management Investment Companies.
Not applicable.
Item 9. Purchases of Equity Securities by Closed-End Management Investment Company and Affiliated Purchasers.
Not applicable.
Item 10. Submission of Matters to a Vote of Security Holders.
Not applicable.
Item 11. Controls and Procedures.
(a)Disclosure Controls and Procedures. The Registrant's principal executive officer and principal financial officer concluded, based on their evaluation of the disclosure controls and procedures as of a date within 90 days of the filing date of this report, that the Registrant's disclosure controls and procedures are effectively designed to provide reasonable assurance that the information required to be disclosed by the Registrant in this report is recorded, processed, summarized and reported by the filing date, including the Registrant's principal executive officer and principal financial officer, as appropriate, to allow timely decisions regarding required disclosure.
(b)Internal Control. There were no changes in the Registrant's internal control over financial reporting that occurred during the period covered by this report that have materially affected, or are reasonably likely to materially affect, the Registrant's internal control over financial reporting.
Item 12. Disclosure of Securities Lending Activities For Closed-End Management Investment Companies.
Not applicable.
Item 13. Exhibits.
(a)(1) Not required with this filing.
(a)(2) A separate certification for the principal executive officer and principal financial officer of the registrant, as required by Rule 30a-2(a) under the Investment Company Act of 1940, is filed herewith.
(a)(3) Not applicable.
SIGNATURES
Pursuant to the requirements of the Securities Exchange Act of 1934 and the Investment Company Act of 1940, the registrant has duly caused this report to be signed on its behalf by the undersigned, thereunto duly authorized.
HOMESTEAD FUNDS, INC. | |
By: | /s/ Mark D. Santero |
| Mark D. Santero |
| President, Chief Executive Officer and Director |
| (Principal Executive Officer) |
Date: March 5, 2021 | |
Pursuant to the requirements of the Securities Exchange Act of 1934 and the Investment Company Act of 1940, this report has been signed below by the following persons on behalf of the registrant and in the capacities and on the dates indicated.
By: | /s/ Mark D. Santero |
| Mark D. Santero |
| President, Chief Executive Officer and Director |
| (Principal Executive Officer) |
Date: March 5, 2021 | |
By: | /s/ Amy M. DiMauro |
| Amy M. DiMauro |
| Treasurer (Principal Financial & Accounting |
| Officer) |
Date: March 5, 2021 | |