QuickLinks -- Click here to rapidly navigate through this document
UNITED STATES
SECURITIES AND EXCHANGE COMMISSION
Washington, D.C. 20549
SCHEDULE 14A
Proxy Statement Pursuant to Section 14(a) of
the Securities Exchange Act of 1934 (Amendment No. )
| Filed by the Registrantý | ||
Filed by a Party other than the Registranto | ||
Check the appropriate box: | ||
o | Preliminary Proxy Statement | |
o | Confidential, for Use of the Commission Only (as permitted by Rule 14a-6(e)(2)) | |
ý | Definitive Proxy Statement | |
o | Definitive Additional Materials | |
o | Soliciting Material under §240.14a-12 | |
| Sauer-Danfoss Inc. | ||||
(Name of Registrant as Specified In Its Charter) | ||||
(Name of Person(s) Filing Proxy Statement, if other than the Registrant) | ||||
Payment of Filing Fee (Check the appropriate box): | ||||
ý | No fee required. | |||
o | Fee computed on table below per Exchange Act Rules 14a-6(i)(1) and 0-11. | |||
| (1) | Title of each class of securities to which transaction applies: | |||
| (2) | Aggregate number of securities to which transaction applies: | |||
| (3) | Per unit price or other underlying value of transaction computed pursuant to Exchange Act Rule 0-11 (set forth the amount on which the filing fee is calculated and state how it was determined): | |||
| (4) | Proposed maximum aggregate value of transaction: | |||
| (5) | Total fee paid: | |||
o | Fee paid previously with preliminary materials. | |||
o | Check box if any part of the fee is offset as provided by Exchange Act Rule 0-11(a)(2) and identify the filing for which the offsetting fee was paid previously. Identify the previous filing by registration statement number, or the Form or Schedule and the date of its filing. | |||
(1) | Amount Previously Paid: | |||
| (2) | Form, Schedule or Registration Statement No.: | |||
| (3) | Filing Party: | |||
| (4) | Date Filed: | |||

NOTICE OF 2010 ANNUAL MEETING
PROXY STATEMENT FOR 2010 ANNUAL MEETING
2009 ANNUAL REPORT
| | | Page No. | ||
|---|---|---|---|---|
I. | Notice of 2010 Annual Meeting | I-1 | ||
II. | Proxy Statement | II-1 | ||
General Information | II-1 | |||
Solicitation and Revocability of Proxies | II-1 | |||
Expense of Solicitation | II-1 | |||
Voting of Proxies | II-1 | |||
Persons Entitled to Vote | II-1 | |||
Security Ownership of Certain Beneficial Owners and Management | II-3 | |||
Governance of the Company | II-4 | |||
Board of Directors | II-4 | |||
Board Leadership Structure and Role in Risk Oversight | II-4 | |||
Basis for Board Determination of Independence of Directors | II-5 | |||
Audit Committee | II-5 | |||
Compensation Committee | II-6 | |||
Nominating Committee | II-6 | |||
Consideration of Nominees, Qualifications and Procedures | II-7 | |||
Stockholder Communications with the Board | II-8 | |||
Code of Conduct and Code of Ethics | II-8 | |||
Transactions with Related Persons | II-9 | |||
Review, Approval or Ratification of Transactions with Related Persons | II-10 | |||
Legal Proceedings | II-10 | |||
Report of the Audit Committee | II-11 | |||
Executive Compensation | II-12 | |||
Compensation Discussion and Analysis | II-12 | |||
Role of Compensation Committee and Management in Executive | II-12 | |||
2009 Actions In Response To Economic & Market Downturn | II-13 | |||
Executive Compensation Goals and Objectives | II-13 | |||
Elements Of Executive Compensation Program | II-14 | |||
Base Salary | II-14 | |||
Annual Incentive Awards | II-15 | |||
Long-Term Incentive Awards | II-18 | |||
Retirement & Savings Plans | II-20 | |||
Additional Cash Compensation and Perquisites | II-22 | |||
Other Potential Post-Employment Compensation | II-23 | |||
Karl Schmidt Resignation and Post-Employment Compensation | II-23 | |||
Thomas Kittel Retirement and Post-Employment Compensation | II-24 | |||
Hans J. Cornett Resignation and Post-Employment Compensation | II-24 | |||
Henrik Krabsen Resignation and Post-Employment Compensation | II-24 | |||
Analysis of Risks Inherent in Compensation Policies & Practices | II-24 | |||
Stock Ownership Guidelines | II-25 | |||
Financial Accounting and Tax Impacts of Executive Compensation Program | II-25 | |||
Compensation Committee Interlocks and Insider Participation | II-25 | |||
Compensation Committee Report | II-25 |
| | | Page No. | ||
|---|---|---|---|---|
Summary Compensation Table | II-26 | |||
Grants of Plan-Based Awards Table | II-28 | |||
Summary Compensation And Grants Of Plan-Based Awards Narrative | II-28 | |||
Stock Awards | II-29 | |||
Non-Equity Incentive Compensation | II-30 | |||
Outstanding Equity Awards At Fiscal Year-End Table | II-30 | |||
Option Exercises and Stock Vested Table | II-31 | |||
Pension Benefits Table | II-31 | |||
Pension Benefits Narrative | II-31 | |||
Sauer-Danfoss Employees' Retirement Plan | II-31 | |||
Sauer-Danfoss Supplemental Retirement Plan | II-32 | |||
German Company Pension Scheme | II-32 | |||
Nonqualified Deferred Compensation Table | II-33 | |||
Nonqualified Deferred Compensation Narrative | II-33 | |||
Elective Deferred Compensation Plans for Cash Compensation | II-34 | |||
Elective Deferred Compensation Plan for Long-Term Incentive Compensation | II-34 | |||
Supplemental Executive Savings and Retirement Plan | II-34 | |||
Potential Payments Upon Termination or Change in Control | II-35 | |||
Potential Payments Upon Termination or Change in Control Table | II-36 | |||
Key Employment Agreement Provisions | II-36 | |||
Director Compensation Table | II-37 | |||
Director Compensation Narrative | II-37 | |||
Item 1—Election of Directors | II-39 | |||
Nominees to Serve for Directors | II-39 | |||
Item 2—Ratification of Appointment of Independent Registered | II-42 | |||
Fees to Independent Registered Public Accounting Firm for 2009 and 2008 | II-42 | |||
Policy Regarding Pre-Approval of Audit and Non-Audit Services of Independent | II-42 | |||
Additional Information | II-43 | |||
Notice Requirements | II-43 | |||
Discretionary Authority | II-43 | |||
Section 16(a) Beneficial Ownership Reporting Compliance | II-43 | |||
Form 10-K | II-43 | |||
III. | 2009 Annual Report | III-1 | ||
Business | III-1 | |||
NYSE Price Range, Dividends by Quarter | III-1 | |||
Performance Graph | III-2 | |||
Management's Discussion and Analysis of Financial Condition and Results of | III-3 | |||
Safe Harbor Statement | III-3 | |||
About the Company | III-4 | |||
Executive Summary of 2009 Compared to 2008 | III-4 |
| | | Page No. | ||
|---|---|---|---|---|
Operating Results—2009 Compared to 2008 | III-5 | |||
Sales Growth by Market | III-5 | |||
Order Backlog | III-7 | |||
Business Segment Results | III-7 | |||
Income Taxes | III-8 | |||
Executive Summary of 2008 Compared to 2007 | III-9 | |||
Operating Results—2008 Compared to 2007 | III-10 | |||
Sales Growth by Market | III-10 | |||
Order Backlog | III-11 | |||
Business Segment Results | III-11 | |||
Income Taxes | III-12 | |||
Market Risk | III-12 | |||
Foreign Currency Changes | III-12 | |||
Interest Rate Changes | III-13 | |||
Liquidity and Capital Resources | III-14 | |||
Cash Flows from Operations | III-15 | |||
Cash Used in Investing Activities | III-15 | |||
Cash Used in Financing Activities | III-15 | |||
Contractual Cash Obligations | III-15 | |||
Other Matters | III-16 | |||
Critical Accounting Estimates | III-16 | |||
New Accounting Policies | III-21 | |||
Non-Audit Services of Independent Registered Public Accounting Firm | III-22 | |||
Outlook | III-22 | |||
Consolidated Statements of Operations | III-23 | |||
Consolidated Balance Sheets | III-24 | |||
Consolidated Statements of Stockholders' Equity and | III-25 | |||
Consolidated Statements of Cash Flows | III-26 | |||
Notes to Consolidated Financial Statements | III-27 | |||
Report of Management | III-65 | |||
Management Oversight | III-65 | |||
Independent Oversight | III-65 | |||
Disclosure Controls | III-65 | |||
Code of Legal and Ethical Business Conduct | III-65 | |||
Report of Independent Registered Public Accounting Firm | III-66 | |||
Selected Financial Data | III-68 | |||
Directors and Executive Officers | III-70 | |||
Corporate Data | III-71 |
SAUER-DANFOSS INC.
2800 E. 13th Street
Ames, IA 50010
NOTICE OF ANNUAL MEETING OF STOCKHOLDERS
TO BE HELD SEPTEMBER 16, 2010
TO OUR STOCKHOLDERS:
The annual meeting of stockholders of Sauer-Danfoss Inc., a Delaware corporation, will be held at Sauer-Danfoss Inc., 2800 East 13th Street, Ames, Iowa on Thursday, September 16, 2010, commencing at 8:30 a.m. local time. At the meeting, stockholders will act on the following matters:
- 1.
- To elect ten (10) directors for a term expiring at the annual meeting of stockholders to be held in 2011 and until their respective successors are duly elected and shall qualify.
- 2.
- To ratify the appointment of KPMG LLP as the Company's independent registered public accounting firm for 2010.
- 3.
- To transact such other business as may properly come before the meeting or any postponement or adjournment.
Stockholders of record at the close of business on August 11, 2010 are entitled to notice of and to vote at the annual meeting or any postponement, adjournment, or adjournments.
* * * * *
IMPORTANT NOTICE REGARDING THE AVAILABILITY OF PROXY MATERIALS FOR THE
ANNUAL MEETING OF STOCKHOLDERS TO BE HELD ON SEPTEMBER 16, 2010
This Proxy Statement and Annual Report to Stockholders is available on the internet at http://ir.sauer-danfoss.com under the tab Proxy Online.
* * * * *
The Board of Directors of the Company recommends that you vote your sharesFOR each of the nominees for director set forth in this Proxy Statement andFOR ratification of KPMG's appointment as the Company's independent registered public accounting firm for 2010.
You may obtain directions to be able to attend the Annual Meeting and vote your shares in person by calling Kathy Laczniak at (515) 239-6376. Whether or not you expect to attend the Annual Meeting, please either complete, date, sign, and return the accompanying proxy card in the provided envelope or vote your shares by telephone or via the Internet using the instructions on the enclosed proxy card as promptly as possible in order to ensure your representation at the meeting. Even if you have given your proxy, whether by mail, by telephone, or via the Internet, you may still vote in person if you attend the meeting. If your shares are held of record by a broker, bank, or other nominee ("Street Name") you will need to obtain from the institution that holds your shares and bring to the meeting a proxy issued in your name, authorizing you to vote the shares.
| By order of the Board of Directors, | ||
 Kenneth D. McCuskey Corporate Secretary | ||
Ames, Iowa August 17, 2010 |
I-1
SAUER-DANFOSS INC.
2800 E. 13th Street
Ames, Iowa 50010
August 17, 2010
Solicitation and Revocability of Proxies
The enclosed proxy is being solicited on behalf of the Board of Directors of Sauer-Danfoss Inc. (the "Company") for use at the annual meeting of the stockholders to be held on September 16, 2010 (the "Annual Meeting"), and at any postponement or adjournment. Most stockholders have a choice of voting via the Internet, by using a toll-free telephone number, or by completing a proxy card and mailing it in the envelope provided. Check your proxy card or the information forwarded by your bank, broker, or other holder of record to see which options are available to you. Please be aware that if you vote over the Internet, you may incur costs such as telecommunication and Internet access charges for which you will be responsible. The telephone voting facilities and the Internet voting facilities for stockholders of record will be available until 11:59 p.m. CDT on September 15, 2010, one day prior to the Annual Meeting.
Any proxy given does not affect your right to vote in person at the meeting and may be revoked at any time before it is exercised by notifying Kenneth D. McCuskey, Corporate Secretary, by mail, telegram, or facsimile, by timely delivery of a properly executed, later-dated proxy (including an Internet or telephone vote) or by appearing at the Annual Meeting in person and voting by ballot. Persons whose shares are held of record by a brokerage house, bank, or other nominee and who wish to vote at the meeting, must obtain from the institution holding their shares a proxy issued in such person's name.
The Company intends to mail this Proxy Statement and the accompanying proxy on or about August 17, 2010.
Expense of Solicitation
The Company will bear the entire cost of solicitation of proxies, including the preparation, assembly, printing, and mailing of this Proxy Statement, the accompanying proxy and any additional information furnished to stockholders. The Company will reimburse banks, brokerage houses, custodians, nominees, and fiduciaries for reasonable expenses incurred in forwarding proxy material to beneficial owners. In addition to solicitations by mail, officers, other regular employees and directors of the Company may, but without compensation other than their regular compensation, solicit proxies in person or by telephone, facsimile or electronic means.
Voting of Proxies
All shares entitled to vote and represented by properly completed proxies received prior to the Annual Meeting and not revoked will be voted in accordance with the instructions on the proxy.If no instructions are indicated on a properly completed proxy, the shares represented by that proxy will be voted for the election of the nominees for director designated below and for ratification of the appointment of KPMG LLP as independent registered public accounting firm of the Company for 2010.
Persons Entitled to Vote
Only holders of common stock of the Company of record as of the close of business on August 11, 2010 are entitled to notice of and to vote at the Annual Meeting. At the close of business on that date,
II-1
48,405,259 shares of common stock were outstanding. Holders of common stock are entitled to one (1) vote for each share held on all matters to be voted upon. Shares cannot be voted at the Annual Meeting unless the owner is present in person or represented by proxy. The directors shall be elected by an affirmative vote of a plurality of the shares that are entitled to vote on the election of directors and that are represented at the meeting by stockholders who are present in person or by proxy, assuming a quorum is present. The ten nominees for director receiving the greatest number of votes at the Annual Meeting will be elected as directors.
For all other matters to be voted upon at the Annual Meeting, the affirmative vote of a majority of shares present in person or represented by proxy, and entitled to vote on the matter, is necessary for approval.
When a broker or other nominee holding shares for a customer does not vote on a proposal because the broker or nominee does not have discretionary voting power with respect to such proposal and has not received instructions from the beneficial owner, it is referred to as a "Broker Nonvote." Properly executed proxies marked "Abstain" or proxies required to be treated as "Broker Nonvotes" will be treated as present for purposes of determining whether there is a quorum at the meeting. Abstentions will be considered shares entitled to vote in the tabulation of votes cast on proposals presented to the stockholders and will have the same effect as negative votes. Broker Nonvotes are counted towards a quorum but are not counted for any purpose in determining whether a matter has been approved.
Effective January 1, 2010, the NYSE changed its previous rule that had permitted brokers to exercise discretion in voting their customers' shares, without instructions from the customers, in elections of directors. As a result of this rule change, if you do not instruct your broker on how to vote your shares in the election of the Company's Board of Directors, your broker will not be permitted to vote your shares on that proposal and your shares will be counted as Broker Nonvotes on that proposal.
II-2
SECURITY OWNERSHIP OF CERTAIN BENEFICIAL OWNERS AND MANAGEMENT
The following table sets forth certain information as of August 10, 2010, with respect to shares of common stock of the Company that were owned beneficially by: (i) each beneficial owner of more than 5% of the outstanding shares of common stock; (ii) each of the directors; (iii) each of the named executive officers of the Company; and (iv) all executive officers and directors of the Company as a group.
Beneficial Owners, Directors, and Executive Officers | Number of Shares Beneficially Owned (1) | Percent of Outstanding Shares | |||
|---|---|---|---|---|---|
Danfoss A/S(2) | 36,629,787 | (3) | 75.7% | ||
Danfoss Murmann Holding A/S (2) | 18,241,962 | 37.7% | |||
Sven Ruder, Director, President and Chief Executive Officer | 6,500 | * | |||
Jesper V. Christensen, Executive Vice President and Chief Financial Officer, Treasurer | 3,000 | * | |||
Hans J. Cornett, Former Executive Vice President and Chief Marketing Officer | 38,658 | (4) | * | ||
Henrik Krabsen, Former Executive Vice President and President—Work Function Division | 28,682 | (4) | * | ||
Thomas K. Kittel, Former Executive Vice President and President—Propel Division | 164,564 | (4) | * | ||
Karl J. Schmidt, Former Executive Vice President and Chief Financial Officer | 42,498 | (4) | * | ||
Wolfgang Schramm, Executive Vice President and President—Controls Division | 18,365 | * | |||
Niels B. Christiansen, Director and Vice Chairman | 4,500 | * | |||
Jørgen Clausen, Director and Chairman | 73,000 | * | |||
Kim Fausing, Director | 4,500 | * | |||
Per Have, Director | 1,500 | * | |||
William E. Hoover, Jr., Director | 4,500 | * | |||
Johannes F. Kirchhoff, Director | 16,400 | * | |||
F. Joseph Loughrey, Director | 15,500 | (5) | * | ||
Sven Murmann, Director | 14,500 | * | |||
Steven H. Wood, Director | 12,000 | * | |||
Richard J. Freeland, Director Nominee | 0 | * | |||
Anders Stahlschmidt, Director Nominee | 0 | * | |||
All directors and executive officers as a group (15 persons) | 225,991 | (6) | * | ||
- *
- Represents less than 1%.
- (1)
- Unless otherwise indicated in the following notes, each of the stockholders named in this table has sole voting and investment power with respect to the shares shown as beneficially owned. The following footnotes describe those shares which are beneficially owned by more than one person listed above.
- (2)
- The mailing address for each of these entities is Nordborgvej 81, 6430 Nordborg, Denmark.
- (3)
- These shares include 18,241,962 shares owned directly by Danfoss Murmann Holding A/S (the "Holding Company"), and 18,387,825 shares owned directly by Danfoss A/S. As a result of its 100% voting power over the Holding Company, Danfoss A/S has shared voting and dispositive power over the 18,241,962 shares owned directly by the Holding Company. Danfoss A/S disclaims beneficial ownership of all of these shares except for the 18,387,825 shares it owns directly.
- (4)
- The number of shares beneficially owned by former officers is reported as of the time each such officer separated from service with the Company, except to the extent such officers have provided more updated information to the Company.
- (5)
- Mr. Loughrey disclaims beneficial ownership with respect to 3,000 of these shares which are owned directly by his wife.
- (6)
- This number includes stock owned by the spouses and children of certain directors and executive officers. It excludes stock owned by Messrs. Cornett, Krabsen, Kittel and Schmidt, all of whom are former officers of the Company.
II-3
Board of Directors
The Company's Board of Directors (the "Board") currently has ten members, three of whom meet the New York Stock Exchange standard for independence. The Board has an Audit Committee and a Compensation Committee. All members of the Audit Committee and Compensation Committee are independent directors. The corporate governance listing standards of the New York Stock Exchange provide that a company of which more than 50% of the voting power is held by an individual, a group or another company (a "controlled company") need not comply with the Exchange's listing standards requiring that a majority of the Board be independent and that listed companies have a nominating/corporate governance committee and a compensation committee each composed entirely of independent directors with a written charter that addresses specific items. The Company considers itself to be a controlled company because approximately 75.7% of the voting power of the Company's common stock is owned or controlled by Danfoss A/S. Accordingly, the Company has elected to utilize the exemption from the requirement that a majority of the Board be independent and from the provisions relating to a nominating/corporate governance committee.
The Board held four meetings and four telephonic meetings during 2009. Each director attended at least 75% of the aggregate of the total number of meetings of the Board and the total number of meetings held by all committees of the Board on which the directors served during 2009. It is the policy of the Board that each director of the Company is expected to attend annual meetings of the stockholders of the Corporation, it being understood, however, that a director infrequently may be unable to attend annual meetings of the stockholders of the Company due to illness, a previously scheduled meeting of importance or other irreconcilable conflict. All of the directors attended the Company's annual stockholders meeting that was held on June 11, 2009.
The non-management directors of the Company have adopted a schedule to meet in private session at the end of or prior to each regular meeting of the Board without any management director or executive officer being present. The non-management directors have also adopted the policy that the Chairman of the Board, or in his absence, the Vice Chairman, shall preside at all such meetings. In addition, at least once a year, only independent, non-employee directors shall meet in private session.
Board Leadership Structure and Role in Risk Oversight
Management and the Board each play a significant role in the Company's risk oversight process. The Board uses a leadership structure in which the office of Chairman is not held by the Company's Chief Executive Officer. The Company believes that dividing the CEO and Chairman functions provides an additional layer of risk oversight by ensuring that the matters discussed at Board meetings are determined by the Board with input from management and not the other way around.
At every Board meeting, management is asked to give extensive comments on the elements driving the successes and failures of each of the Company's operating divisions, and of the Company as a whole. Those discussions provide the Board an opportunity to examine and comment on the strategic, operational, financial, and regulatory risks facing the Company and to assist management in devising appropriate responses to those risks. In addition, the Board oversees the formal risk management process engaged in by the Company's internal auditor, Deloitte & Touche LLP, and management. The Board delegates certain risk oversight functions to the Audit Committee, to the Compensation Committee, and to other committees that may be formed for specific purposes from time to time. The risk oversight functions of the Audit and Compensation Committees are described in the descriptions of those committees, below.
II-4
Basis for Board Determination of Independence of Directors
The Board has adopted Corporate Governance Guidelines (the "Guidelines") that provide, among other things, that at least three directors must be independent. The Guidelines can be viewed on the Company's investor relations website athttp://ir.sauer-danfoss.com. To be considered "independent" under the Guidelines, a person must be determined by the Board to have no material relations, directly or indirectly, with the Company or its affiliates or any other director or elected officer of the Company, and must otherwise be independent as that term is defined under the listing standards of the New York Stock Exchange, but also without the appearance of any conflict in serving as a director. In addition to applying these guidelines, the Board shall consider all relevant facts and circumstances in making an independence determination.
The Board undertook its annual review of director independence with respect to the three persons considered independent at its meeting on March 9, 2010. The Board determined whether the three persons under consideration met the objective listing standards of the New York Stock Exchange regarding the definition of "independent director," which standards provide that a director is not independent if:
- •
- The director is, or has been within the last three years, an employee of the Company, or an immediate family member is, or has been within the last three years, an executive officer of the Company.
- •
- The director has received, or has an immediate family member who has received, during any twelve-month period within the last three years, more than $120,000 in direct compensation from the Company, other than director and committee fees and pension or other forms of deferred compensation for prior service (provided such compensation is not contingent in any way on continued service).
- •
- (A) The director is a current partner or employee of a firm that is the Company's internal or external auditor; (B) the director has an immediate family member who is a current partner of such firm; (C) the director has an immediately family member who is a current employee of such a firm and personally works on the Company's audit; or (D) the director or an immediate family member was within the last three years a partner or employee of such a firm and personally worked on the Company's audit within that time.
- •
- The director or an immediate family member is, or has been within the last three years, employed as an executive officer of another company where any of the Company's present executive officers at the same time serves or served on that company's compensation committee.
- •
- The director is a current employee, or an immediate family member is a current executive officer, of a company that has made payments to, or received payments from, the Company for property or services in an amount which, in any of the last three fiscal years, exceeds the greater of $1 million or 2% of such other company's consolidated gross revenues.
The Board also considered whether there were any other transactions or relations between each of said three persons or any member of his immediate family and the Company and its subsidiaries and affiliates that would affect the independence of such persons and concluded that there were none.
As a result of its review, the Board affirmatively determined that Johannes F. Kirchhoff, F. Joseph Loughrey and Steven H. Wood are independent of the Company and its management under the standards set forth in the Guidelines.
Audit Committee
The Audit Committee is currently composed of three directors, none of whom is an employee of the Company. The Audit Committee currently consists of Messrs. Wood (Chairman), Kirchhoff and Loughrey. All of the members of the Audit Committee are independent within the meaning of the Securities and
II-5
Exchange Commission's ("SEC") regulations, the current listing standards of the New York Stock Exchange and the Company's Corporate Governance Guidelines. In addition, the Board has determined that at least one member of the Audit Committee meets the New York Stock Exchange listing standard of having accounting or related financial management expertise.
The Board has also determined that Steven H. Wood meets the SEC's criteria of an "audit committee financial expert." Mr. Wood's extensive background and experience includes presently serving as Chief Financial Officer of Becker-Underwood, Inc., a supplier of non-pesticide specialty chemical and biological products within the agricultural, landscape, turf, and horticulture industries, and formerly serving as Vice President and Corporate Controller of Metaldyne Corporation, a global designer and supplier of metal-based components, assemblies and modules for the automotive industry, and before that as Executive Vice President and Chief Financial Officer of Maytag Corporation. Prior to joining Maytag, he was an auditor for nine years with Ernst & Young, a public accounting firm, and successfully completed the examination for Certified Public Accountants. Mr. Wood is independent as that term is used in the New York Stock Exchange's listing standards relating to director independence.
The Audit Committee is directly responsible for the appointment, compensation, retention and oversight of the independent registered public accounting firm. The Committee also reviews the scope of the annual audit activities of the independent registered public accounting firm and the Company's internal auditors, reviews audit and quarterly results and administers the Worldwide Code of Legal and Ethical Business Conduct and the Code of Ethics for Chief Executive Officer, Chief Financial Officer, Principal Accounting Officer or Controller and Other Senior Finance Staff. All of the Committee's duties and responsibilities are set forth in a written Audit Committee Charter, which was last revised on March 18, 2009. The Charter can be viewed on the Company's investor relations website athttp://ir.sauer-danfoss.com. The Audit Committee held four meetings and five telephonic meetings during 2009.
Compensation Committee
The Compensation Committee is currently composed of three directors, none of whom is an employee of the Company. The current members of the Compensation Committee are Messrs. Kirchhoff (Chairman), Loughrey and Wood, all of whom are independent as defined under the current listing standards of the New York Stock Exchange. The Compensation Committee reviews and determines the salaries of the executive officers of the Company and administers the Company's 1998 Long-Term Incentive Plan, the 2006 Omnibus Incentive Plan, the Deferred Compensation Plan for Selected Employees, the 409A Deferred Compensation Plan for Selected Employees, and the Supplemental Executive Savings & Retirement Plan. All of the duties of the Compensation Committee are set forth in a written Charter last amended and restated as of April 27, 2005, which can be viewed on the Company's investor relations website athttp://ir.sauer-danfoss.com. The Compensation Committee held four meetings and one telephonic meeting in 2009.
Nominating Committee
Following completion of the acquisition in 2008 by Danfoss A/S of a controlling interest in the Company from entities and persons associated with Klaus H. Murmann, Chairman Emeritus of the Company, the Board abolished the Company's Nominating Committee. As a result of its purchase of the remaining shares of Company stock owned by Sauer Holding GmbH on October 30, 2009, Danfoss A/S became the beneficial owner of approximately 75.7% of the Company's outstanding common stock and terminated the Stockholders Agreement dated July 10, 2008 (the "Stockholders Agreement") by and between Danfoss A/S and Sauer Holding GmbH. Pursuant to the Stockholders Agreement, Danfoss A/S and Sauer Holding GmbH had shared the power to submit the names of ten persons to the Board to be nominated for election to the Board. Because of the termination of the Stockholders Agreement, Danfoss A/S now may act on its own to propose a slate of directors for nomination to the Board. Therefore, the
II-6
Board believes it is appropriate for the Company not to have a Nominating Committee. The Board makes the final nominations pursuant to the guidelines set forth below.
Consideration of Nominees, Qualifications and Procedures
The Board adopted the policy in July 2008 that it will continue the former Nominating Committee's practice to consider qualified candidates for director that are suggested by stockholders. Stockholders can recommend qualified candidates for director by writing to: Chairman of the Board of Directors, Attention: Kenneth D. McCuskey, Corporate Secretary, Sauer-Danfoss Inc., 2800 East 13th Street, Ames, Iowa 50010. Recommendations should set forth detailed information regarding the candidate, including the person's background, education, business, community and educational experience, other Boards of Directors of publicly held corporations on which the candidate currently serves or has served in the past and other qualifications of the candidate to serve as a director of the Company. In order to be considered as a nominee for director at the annual meeting of stockholders to be held in such year, all recommendations must be received by the 120th day preceding the date on which the Company's proxy statement for the preceding year's annual meeting of stockholders was released to stockholders, except that if no annual meeting was held in the previous year or the date of the annual meeting has been changed by more than 30 calendar days from the date contemplated at the time of the previous year's proxy statement, notice of a stockholder recommendation must be received not later than the tenth business day following the date on which notice of the date of current year's annual meeting was first mailed to stockholders. Recommendations that are received that meet the conditions set forth above shall be forwarded to the Board for further review and consideration.
In evaluating director nominees, the Board considers, among other things, the following factors:
- •
- The needs of the Company with respect to the particular talents and experience of its directors
- •
- The extent to which the candidate would contribute to the range of talent, skill and expertise appropriate for the Board
- •
- The ability of the candidate to represent the interests of the stockholders of the Company
- •
- The candidate's standards of integrity, commitment and independence of thought and judgment
- •
- The candidate's ability to dedicate sufficient time, energy and attention to the diligent performance of his or her duties as a director of the Company, taking into account the candidate's services on other boards, including public and private company boards as well as not-for-profit boards, and other business and professional commitments of the candidate
- •
- The knowledge, skills and experience of the candidate, including experience in the Company's industry, business, finance, administration or public service, in light of prevailing business conditions
- •
- Experience with accounting rules and practices
- •
- Familiarity with national and international business matters
- •
- The desire to balance the considerable benefit of continuity with the periodic injection of the fresh perspective provided by new members
The Board also considers such other relevant factors as it deems appropriate, including the current composition of the Board, the need for independent directors, the need for Audit Committee expertise and the evaluations of other candidates. Other than considering the factors set forth above, there are no stated minimum criteria for director nominees.
Although the Board does not have a written policy regarding the diversity of its members, the Board has historically sought, and will continue to seek, candidates who bring a diversity of skills, abilities,
II-7
experiences, cultural backgrounds, and viewpoints to the Company consistent with the specific guidelines outlined above.
The Board identifies candidates by first evaluating the current members of the Board willing to continue in service. If any member of the Board does not wish to continue in service or if the Board decides not to re-nominate a member for election to the Board, the Board shall identify the desired skills and experience of a new candidate in light of the factors set forth above. Current members of the Board may be polled for suggestions as to individuals meeting the criteria of the Board, and qualified candidates recommended by stockholders shall be considered. Research may be performed to identify qualified individuals. The Board may, but shall not be required to, engage third parties to identify or evaluate or assist in identifying potential candidates. The Board has from time to time utilized an executive search firm to assist in identifying potential candidates.
In connection with its evaluation of candidates, the Board shall determine which, if any, candidates shall be interviewed, and if warranted, one or more members of the Board, and others as appropriate, shall interview prospective candidates in person or by telephone. After completing this evaluation and interview process, the Board shall determine the nominees.
All of the candidates for election to the Company's Board were proposed by Danfoss A/S, the majority stockholder of the Company.
Stockholder Communications with the Board
The Corporate Governance Guidelines of the Company set forth the method by which stockholders may communicate with the Board. Stockholders and other parties interested in communicating directly with the Chairman of the Board or with the non-management directors as a group or with the entire Board of Directors as a group or with an individual director may do so in writing addressed to such person or group at: Sauer-Danfoss Inc., 2800 East 13th Street, Ames, Iowa 50010, Attn: Corporate Secretary. The Corporate Secretary reviews all such correspondence and forwards all correspondence not deemed frivolous, threatening or otherwise inappropriate to each member of the group or to the individual director to whom the correspondence is directed. The Corporate Secretary shall maintain a log of all correspondence received by the Company that is addressed to members of the Board. Directors may at any time review such log and request copies of any such correspondence. Letters containing concerns relating to accounting, internal controls or auditing matters will immediately be brought to the attention of the Company's Internal Corporate Counsel and handled in accordance with procedures established by the Audit Committee with respect to such matters.
Code of Conduct and Code of Ethics
The Company's Worldwide Code of Legal and Ethical Business Conduct (the "Code of Conduct") has been in effect for a number of years and was last updated on January 1, 2007. The Code of Conduct applies to every employee, agent, representative, consultant and director of the Company. The Code of Conduct requires that the Company's employees, agents, representatives, consultants and directors avoid conflicts of interest, comply with all laws and other legal requirements, conduct business in an honest and ethical manner and otherwise act with integrity and in the Company's best interests.
Overall administration of the Code of Conduct is the responsibility of the Audit Committee. Day-to-day administration of the Code of Conduct is the responsibility of the Corporate Business Conduct Committee that assists the Company's employees in complying with the requirements of the Code of Conduct. Employees are encouraged to report any conduct that they believe in good faith to be an actual or apparent violation of the Code of Conduct.
The Company has also adopted the Sauer-Danfoss Inc. Code of Ethics for Chief Executive Officer, Chief Financial Officer, Principal Accounting Officer or Controller and Other Senior Finance Staff (the
II-8
"Code of Ethics"). The Code of Ethics is intended to comply with the provisions of Section 406 of the Sarbanes-Oxley Act of 2002 and regulations of the SEC. The Code of Ethics is intended to promote honesty and integrity, the avoidance of conflicts of interests, full, accurate, and timely disclosure of financial reports, and compliance with laws and regulations and other matters.
The Code of Conduct and the Code of Ethics are posted on the Company's investor relations website athttp://ir.sauer-danfoss.com.
Transactions with Related Persons
In connection with the acquisition of Danfoss Fluid Power on May 3, 2000, the Company entered into several agreements with Danfoss A/S, the Company's majority stockholder, to purchase ongoing operational services from Danfoss A/S. These services include rental of shared facilities, administrative support and information technology support. Fees are paid on a monthly basis. Total expense recognized for goods and services purchased from Danfoss A/S for 2009 was approximately $43.8 million. The Company also sold products to Danfoss A/S totaling approximately $3.2 million in 2009. Danfoss A/S is the beneficial owner of more than 5% of the outstanding common stock of the Company.
On November 9, 2009, the Company entered into a Credit Agreement (Danfoss Credit Agreement) with Danfoss A/S, which originally allowed the Company to borrow up to $690 million (subsequently reduced to $540 million, as described below) under an unsecured revolving credit facility. The Danfoss Credit Agreement replaced a $490 million revolving credit facility and a $50 million term loan, both with Danfoss A/S, which had been entered in March 2009 and December 2008, respectively. The outstanding revolving principal balance under the Danfoss Credit Agreement bears interest at a rate equal to the U.S. prime rate or LIBOR, as in effect at times specified in the Danfoss Credit Agreement, plus 10%. The outstanding revolving principal balance at December 31, 2009 was $140,869,000 with a weighted average interest rate of 10.3%. The Danfoss Credit Agreement also included term loans of 92,000,000 euro (approximately $132,000,000) and $200,000,000 at December 31, 2009, which accrue interest at an annual rate of 11.8% and 11.4%, respectively. The Company was required to pay a closing fee of $2,000,000 to Danfoss A/S upon closing of the Danfoss Credit Agreement. The Company pays a quarterly commitment fee equal to 4% of the average unused portion of the available credit under the Danfoss Credit Agreement. The Company incurred commitment fees of $1,231,000 in 2009. In May 2010, the Company voluntarily exercised its right to permanently reduce the maximum amount of credit available under the Danfoss Credit Agreement from $690 million to $540 million. In August 2010, the Company voluntarily further reduced the credit available under the Danfoss Credit Agreement to $500 million. The Company's borrowing under the Danfoss Credit Agreement will be due and payable in full on April 29, 2011. The Danfoss Credit Agreement contains no financial covenants, but it does contain a number of affirmative and negative covenants that, among other things, require the Company to obtain the consent of Danfoss A/S prior to engaging in certain types of transactions. The Danfoss Credit Agreement contains customary representations and warranties regarding the Company and its business and operations. It sets forth a number of events of default for, among other things, failure to pay principal or interest, breaches of representations, warranties, and covenants, and various events relating to the bankruptcy or insolvency of the Company or its subsidiaries.
The Company has a tax sharing agreement with Danfoss A/S whereby the Company's subsidiaries in Denmark file a joint tax return with Danfoss A/S as required under the laws of Denmark. On its 2009 tax return, Danfoss A/S used approximately $14 million of the Company's net operating loss (NOL) carryforwards generated in Denmark. Pursuant to the tax sharing agreement, Danfoss A/S will remit to the Company in November 2010 an amount equal to the taxes Danfoss A/S saves on its 2009 tax return as a result of using the Company's Danish NOL carryforwards. If the Company's operations in Denmark were to generate net income instead of NOL in a given year, the tax sharing agreement would require Danfoss A/S to pay the resulting Danish taxes and the Company to pay an amount equal to such taxes to Danfoss A/S.
II-9
For a number of years, the Company has sold products to FAUN Umwelttechnik GmbH & Co. KG, which is owned by Johannes F. Kirchhoff, a director of the Company, and members of his family. These sales are made pursuant to purchase orders entered into in the ordinary course of business. Sales in 2009 totaled approximately $2.0 million.
Review, Approval or Ratification of Transactions with Related Persons
The Company has a written policy pursuant to which the Company informs all of its directors and executive officers, as well as other personnel who serve in positions that give them routine knowledge of potential transactions with related persons, that they must inform specified individuals in management of transactions that meet the definitions provided in Item 404(a) of Regulation S-K ("related-person transactions"). Potential related-person transactions are reviewed by the Company's Audit Committee, which has the authority to approve or deny any such transaction. At least once per quarter, the Company's Secretary inquires of the individuals designated to receive reports of potential related-person transactions and relays any previously unreported transactions to the Audit Committee.
Legal Proceedings
The Company was named as a defendant in four putative stockholder class action complaints (collectively, the Lawsuits) challenging the cash tender offer by Danfoss Acquisition Inc. (Danfoss Acquisition), a wholly owned subsidiary of Danfoss A/S (Danfoss), to purchase all of the outstanding shares of Company common stock not presently held, directly or indirectly, by Danfoss (the Tender Offer). Three of the Lawsuits were filed on December 23, 2009, two in the Court of Chancery of the State of Delaware by Kenneth R. Loiselle and Laurie Forrest, respectively, and the other (the Freise Lawsuit) in the Iowa District Court for Story County by John and Michelle Freise. The two Delaware lawsuits were consolidated into a single proceeding (the Delaware Lawsuit). The fourth Lawsuit was filed on February 10, 2010, in the Iowa District Court for Story County by Scott Crouthamel. The Tender Offer expired on April 29, 2010. Because a condition of the Tender Offer was not satisfied, no shares were purchased thereunder. All of the Lawsuits have been dismissed without prejudice. The plaintiffs in the Delaware Lawsuit and the Freise Lawsuit have applied to the Delaware court for an award of $790,000 in legal fees. The Company believes that this fee request is unwarranted and intends to vigorously oppose it.
From time to time, the Company is involved in other legal matters in the ordinary course of its business. The Company intends to defend itself vigorously against all such claims. It is the Company's policy to accrue for amounts related to lawsuits brought against it if it is probable that a liability has been incurred and an amount can be reasonably estimated. Although the outcome of such matters cannot be predicted with certainty and no assurances can be given with respect to such matters, the Company believes that the outcome of those ordinary-course matters in which it is currently involved will not have a materially adverse effect on its results of operations, liquidity, or financial position.
II-10
The Audit Committee of the Board of Directors (the "Board") of Sauer-Danfoss Inc. (the "Corporation") acts under the Sauer-Danfoss Inc. Audit Committee Charter, as amended and restated by the Board on March 18, 2009, which Charter provides that the purpose of the Audit Committee is to represent and assist the Board with the oversight of:
- •
- the accounting, reporting and financial practices of the Corporation and its subsidiaries, including the integrity of the Corporation's financial statements;
- •
- the functioning of the Corporation's systems of internal accounting and financial controls;
- •
- the independent registered public accounting firm's qualifications and independence;
- •
- the performance of the Corporation's internal audit functions and the independent registered public accounting firm;
- •
- the Corporation's compliance with legal and regulatory requirements, and its ethics programs as established by management and the Board, including the Corporation's Worldwide Code of Legal and Ethical Business Conduct and any separate ethics code that relates to the integrity of the Corporation's financial reporting or applies to the Chief Executive Officer, Chief Financial Officer, or other senior financial officers.
Management has the primary responsibility for the Corporation's financial statements and the financial reporting process, including the system of internal controls. The full text of the Audit Committee Charter is available under the Corporate Governance section of the Corporation's investor relations website athttp://ir.sauer-danfoss.com.
In fulfilling its oversight responsibilities, the Audit Committee has discussed with KPMG LLP ("KPMG"), the Corporation's independent registered public accounting firm, the overall scope and plans for their audit. The Audit Committee met with both management and KPMG to review and discuss the audited financial statements.
The Audit Committee reviewed with KPMG their judgments as to the quality and acceptability of the Corporation's accounting principles. The Audit Committee's review included discussion with KPMG of the matters required to be discussed pursuant toStatement on Auditing Standards No. 61, as amended, as adopted by the Public Company Accounting Oversight Board in Rule 3200T.
The Audit Committee has received and reviewed the written disclosures and the letter from KPMG required by theIndependence Standards Board, Standard No. 1, "Independence Discussions With Audit Committees," as adopted by the Public Company Accounting Oversight Board in Rule 3600T, and has discussed with KPMG, among other things, matters relating to its independence. The Audit Committee has also considered the compatibility of the non-audit services provided by KPMG with its independence.
Based on the reviews and discussions referred to above, the Audit Committee recommends to the Board of Directors that the audited financial statements for the year ended December 31, 2009 be included in the Corporation's Annual Report on Form 10-K for the year ended December 31, 2009, for filing with the Securities and Exchange Commission.
| Members of the Audit Committee: | ||
Steven H. Wood, Chairman Johannes F. Kirchhoff F. Joseph Loughrey |
II-11
EXECUTIVE COMPENSATION
COMPENSATION DISCUSSION AND ANALYSIS
Sauer-Danfoss Inc. (the "Company" or "we") presents this Compensation Discussion and Analysis ("CD&A") to discuss its executive compensation program. Our Chief Executive Officer (the "CEO"), Chief Financial Officer (the "CFO") and other executive officers participate in the executive compensation program.
The Summary Compensation Table on page II-26 and the subsequent disclosure tables reflect compensation paid to our CEO, CFO and to certain other executive officers (collectively, the "Named Executive Officers" or "NEOs"). In general, this CD&A discussion applies equally to each of the NEOs. Where needed for clarification, we have provided information on the treatment of individual NEOs.
Under SEC rules, we are reporting information in the Summary Compensation Table for Sven Ruder as CEO, for Karl J. Schmidt and Jesper V. Christensen as CFOs and for Hans J. Cornett, Henrik Krabsen and Wolfgang Schramm as the three most highly compensated executive officers of the Company, other than the CEO and CFO.
Mr. Schmidt and Mr. Christensen each served as CFO for a portion of 2009. Accordingly, we are reporting Summary Compensation Table information for both Mr. Schmidt and Mr. Christensen. We are also reporting Summary Compensation Table information for Thomas K. Kittel, who would have been reportable among the top three most highly compensated executive officers had he retained his executive officer position at year-end.
Mr. Ruder and Mr. Christensen were first appointed to their roles in 2009. Therefore, Summary Compensation Table information is only presented for 2009 for Mr. Ruder and Mr. Christensen. Mr. Krabsen was not among the top three most highly compensated executive officers in 2007 and 2008. Therefore, Summary Compensation Table information is only presented for 2009 for Mr. Krabsen.
Role of Compensation Committee and Management in Executive Compensation Matters
The Compensation Committee of our Board of Directors (the "Committee") consists of three independent directors as defined by current New York Stock Exchange listing standards. The Committee has the final say and ultimate authority in all matters relating to our executive compensation program. The Committee's authority encompasses areas such as:
- •
- The overall design of our executive compensation program
- •
- The determination of individual compensation elements and amounts for specific executives
- •
- The determination of incentive compensation performance measures and targets
From time to time, the Committee uses Hewitt Associates, LLP ("Hewitt") as its consultant with respect to executive compensation matters. At the request of the Committee in 2009, Hewitt provided historical return on net assets results for a broad range of industrial companies to assist the Committee in developing performance targets under the Company's long-term incentive plan. Hewitt also provided the Committee with an update on current marketplace trends with respect to executive compensation practices. Hewitt's sole consulting relationship with the Company is related to the work done directly for the Committee. Total fees paid to Hewitt for compensation consulting services were less than $75,000 in each of the three years from 2007 through 2009.
Management's role with respect to executive compensation matters is limited to making recommendations to the Committee, based on Management's understanding of the Company's compensation and performance objectives. Management's recommendations to the Committee include the CEO's annual performance evaluations of the other executive officers along with the CEO's recommendation for annual base salary changes for each such officer based on individual performance and
II-12
market comparisons. The Committee considers Management's input and recommendations, but exercises independent judgment in making final decisions with respect to all matters affecting our executive compensation program.
2009 Actions In Response To Economic & Market Downturn
The general economic climate entering 2009 was projected to have a significant impact on the Company and our markets. In response to the economic and market climate, Mr. Ruder proposed the following temporary actions, which were approved by the Committee in a February 2009 teleconference meeting:
- •
- 15% base salary reduction for the CEO, effective March 1, 2009
- •
- 10% base salary reduction for the Executive Officers and Vice Presidents, effective March 1, 2009
- •
- Suspension of the Annual Incentive Award program for 2009
- •
- Suspension of the Long-Term Incentive Award program for 2009
While these actions temporarily diminished our ability to fulfill some of the executive compensation objectives stated below, they were an appropriate and necessary response to the economic climate in 2009.
In March 2010, the Committee approved Management's recommendation to restore the CEO, Executive Officer and Vice President base salaries to their pre-reduction levels, effective May 1, 2010. The base salary foregone during the reduction period was not repaid as part of this action. The Committee also approved a reinstatement of the Annual and Long-Term Incentive Award programs, beginning in 2010.
Executive Compensation Goals and Objectives
The Sauer-Danfoss Total Rewards Strategy, adopted and approved by the Committee in 2007 and reviewed annually, provides a general framework for Total Rewards offerings to all employees on a global basis.
Our executive compensation program fits within our Total Rewards Strategy and is designed to meet certain goals and objectives. Specifically, we designed our executive compensation program to enable us to:
- •
- Attract, motivate and retain quality leaders
- •
- Promote teamwork and cooperation on a global basis
- •
- Tie executive compensation levels to changes in shareholder value
- •
- Tie executive compensation levels to business results
- •
- Preserve the tax deductibility of our executive compensation
We design our executive compensation program to reward performance. Within the program, we combine individual, business unit, division and company-wide performance elements. For our senior executives and Named Executive Officers, company-wide performance elements generally have the greatest impact on total compensation. We stress company-wide performance elements for the Named Executive Officers because they have the greatest impact on shareholder value creation. Company-wide performance elements also help us to promote global teamwork and cooperation among business units and divisions.
As noted above, we suspended our Annual Incentive Award and Long-Term Incentive Award programs for 2009. We will reinstate these incentive programs, in modified form, during 2010 to reestablish the link between Company performance and executive compensation.
II-13
We design our executive compensation program to be market-based. In comparing our executive compensation program to market, we consider such items as the balance between fixed and variable compensation and the annual and long-term incentive target opportunities. In our market comparisons, we generally look to survey data related to durable goods manufacturing companies with comparable revenue size.
Based on a review of survey data from a variety of external sources, we believe that our executive compensation program coming into 2009 was comparable to, and competitive with, the market median of compensation programs for similarly sized companies in similar industries. The temporary actions taken during 2009 in response to the economic outlook, including executive officer base salary reductions and suspension of our incentive plans, moved us away from these market medians.
We also consider internal equity in the administration of our executive compensation program. Periodically, we perform a formal job evaluation process for all executive positions, rating them on a point-factor basis. We then use the position ratings to help ensure that our executive compensation program is aligned for comparable positions on a global basis.
The Committee routinely reviews our executive compensation program and its individual elements in light of the goals and objectives outlined above.
Elements Of Executive Compensation Program
Our executive compensation program is comprised of the following elements which are described in further detail below:
- •
- Base Salary
- •
- Annual Incentive Awards
- •
- Long-Term Incentive Awards
- •
- Retirement & Savings Plans
- •
- Additional Cash Compensation and Perquisites
- •
- Other Potential Post-Employment Compensation
Base Salary
We provide a base salary to our CEO and executive officers. The Committee determines the base salary levels for the CEO and for each of our executive officers on an annual basis. One key factor in the Committee's determination of base salaries is a comparison to market data. In planning for 2009 base salary adjustments, the Committee initially reviewed market survey information for similar positions in companies similar to ours in size and industry. We target our base salaries at the 50th percentile for similar positions within the comparator and/or market survey benchmark group. The following factors also impact base salary determinations and will cause the base salaries to differ from the 50th percentile target:
- •
- The Board's annual performance evaluation of the CEO relative to established objectives
- •
- The CEO's annual performance evaluations of the other officers relative to established objectives
- •
- Individual experience and expertise
- •
- Internal equity
As noted earlier, the Committee approved a recommendation to temporarily reduce the base salary of our CEO and our other officers, effective March 1, 2009. As a result of these reductions, the base salary of
II-14
many of our Named Executive Officers for 2009 was below the benchmark market median, as detailed in the following table:
| | Base Salary Before Reduction | Base Salary After Reduction | Range In Comparison To Median | |||||
|---|---|---|---|---|---|---|---|---|
Sven Ruder | ||||||||
President & Chief Executive Officer(A) | $ | 625,600 | $ | 531,800 | < 85% | |||
Karl J. Schmidt | ||||||||
EVP & Chief Financial Officer(B) | $ | 327,000 | $ | 294,300 | < 85% | |||
Jesper V. Christensen | ||||||||
EVP & Chief Financial Officer(A)(B) | $ | 339,900 | $ | 305,900 | 85% to 95% | |||
Hans J. Cornett | ||||||||
EVP & Chief Marketing Officer(A) | $ | 389,300 | $ | 350,400 | < 85% | |||
Wolfgang Schramm | ||||||||
EVP & President—Controls Division | $ | 312,000 | $ | 280,800 | < 85% | |||
Henrik Krabsen | ||||||||
EVP & President—Work Function Division | $ | 312,000 | $ | 280,800 | < 85% | |||
Thomas K. Kittel | ||||||||
EVP & President—Propel Division(A)(B) | $ | 389,300 | $ | 350,400 | 105% to 115% | |||
Notes: (A) Euro denominated base salaries for Messrs. Ruder, Christensen, Cornett and Kittel converted to USD using an exchange rate (USD / Euro) of 1.3903.
(B) Table reflects annualized base salary levels for Named Executive Officers who served for less than a full year in 2009.
As the senior leadership team for Sauer-Danfoss, the CEO and executive officers are expected to focus efforts towards meeting or exceeding the annual financial plan for 2009 as presented to and agreed by the Board of Directors. At its meeting in March of 2010, the Board of Directors met with Mr. Ruder to discuss his performance against the Sauer-Danfoss Key Initiatives for 2009 and his individual objectives for 2009. Mr. Ruder also discussed and confirmed his 2009 performance ratings of the other executive officers with the Board of Directors at this meeting.
In a typical year, these individual performance ratings and certain other factors would be considered by the Committee in determining base salary adjustments for Mr. Ruder and the other executive officers. The normal merit pay review process for our officers, however, has been suspended for 2009 and 2010.
Base salaries are one of the most readily comparable elements of compensation between different companies. We consider maintaining adequate annual base salary levels to be critical to achieving the stated goal of attracting, motivating and retaining quality leaders. By considering individual performance ratings in the annual base salary review process, our strongest performing executive officers will generally receive the largest percentage increases in annual base salary each year. This helps us meet our goal of motivating quality leaders and strengthens the tie between executive compensation and business results.
Annual Incentive Awards
As noted above, the Annual Incentive Award program was suspended temporarily in 2009 due to the economic and market challenges facing the Company. The following discussion relates to the Annual Incentive Award program prior to suspension.
II-15
We provide an Annual Incentive Award opportunity to our executive officers and other senior business leaders. Annual Incentive Award opportunities to our Named Executive Officers are provided under the Company's Omnibus Incentive Plan. The Annual Incentive Awards are designed to pay out a target percentage of a participant's base salary based upon achievement of certain pre-approved financial performance targets on a Divisional, Business Unit, and/or Total Company basis. In recent years prior to suspension of the Annual Incentive Award Program, the performance targets were based on Earnings Before Interest and Taxes ("EBIT") margins. To promote teamwork and cooperation across Divisions and Business Units, the Named Executive Officers participated in the Annual Incentive Plan on a Total Company basis beginning in 2006.
For 2008 and prior years, actual payouts under the Annual Incentive Awards could range from 25% to 200% of target, depending upon achieved EBIT margins. Below certain minimum EBIT margin thresholds, no payout was to be made under the Annual Incentive Awards.
The Committee determined the target percentage of each executive officer's base salary for Annual Incentive Award purposes based on a review of market survey information for similar positions in comparable companies and also based on internal equity.
II-16
The following table provides a summary of how the Named Executive Officers' target annual incentive awards prior to suspension, as a percentage of base salary, compared to the market survey:
| | Sauer-Danfoss Target Annual Incentive Percentage | Average Target Percentage For Similar Positions At Comparable Companies | |||||
|---|---|---|---|---|---|---|---|
Sven Ruder | |||||||
President & Chief Executive Officer | 60 | % | 90 | % | |||
Karl J. Schmidt | |||||||
EVP & Chief Financial Officer | 60 | % | 60 | % | |||
Jesper V. Christensen | |||||||
EVP & Chief Financial Officer | 60 | % | 60 | % | |||
Hans J. Cornett | |||||||
EVP & Chief Marketing Officer | 60 | % | 50 | % | |||
Wolfgang Schramm | |||||||
EVP & President—Controls Division | 60 | % | 50 | % | |||
Henrik Krabsen | |||||||
EVP & President—Work Function Division | 60 | % | 50 | % | |||
Thomas K. Kittel | |||||||
EVP & President—Propel Division | 60 | % | 40 | % | |||
The Sauer-Danfoss Target Annual Incentive percentage for Messrs. Cornett, Schramm, Krabsen and Kittel are above the average annual incentive plan targets for similar positions at comparable companies. This stems from the Company's desire to maintain internal equity within its executive office team with respect to target incentive compensation levels.
The Committee reviews and approves the financial measures and performance levels that are required to earn the target payout at the beginning of each year. These performance levels are generally tied to our annual operating budgets. Our annual budgeting process produces aggressive goals which are considered to have a reasonable chance of being met through strong operating performance. We used EBIT margin performance factors in the past to encourage and reward profitability on a Total Company and/or Divisional or Business Unit basis.
We have determined in past years that the Annual Incentive Award EBIT margin targets and their basis for computation involve confidential financial information and that disclosure could result in competitive harm to the Company. Therefore, we have not disclosed these targets within this CD&A.
II-17
The following table, which shows the six-year payout history under the Annual Incentive awards for our Total Company measure, provides an indication of the difficulty in meeting the performance goals.
Year | Earned Payout As A Percentage Of Target | |||
|---|---|---|---|---|
2009 | N/A | |||
2008 | 0 | % | ||
2007 | 0 | % | ||
2006 | 113 | % | ||
2005 | 45 | % | ||
2004 | 136 | % | ||
Under the Omnibus Incentive Plan, the Committee reserves the discretion to reduce, but not increase, the final payouts to executive officers. From 2004 through 2008, the Committee did not reduce payout levels on a discretionary basis.
With a clear relationship between financial results and payouts, our Annual Incentive Awards program encourages our senior leadership to drive business results. As a market-based program, it also helps us attract, motivate and retain quality leaders. Finally, the design of the shareholder-approved Omnibus Incentive Plan and the Annual Incentive Awards made thereunder helps ensure the tax deductibility of Long-Term Incentive Awards earned and paid out.
Long-Term Incentive Awards
As noted above, the Long-Term Incentive Award program was suspended temporarily in 2009 due to the economic and market challenges facing the Company. The following discussion relates to the Long-Term Incentive Award program prior to suspension.
We provide Long-Term Incentive Awards to our executive officers and other senior business leaders. The Omnibus Incentive Plan sets forth the terms and conditions under which our Long-Term Incentive Awards are made. The Company's established practice is to make Long-Term Incentive Award grants once each year, at the time of its regularly scheduled first quarter Compensation Committee meeting. The Omnibus Incentive Plan allows for a variety of forms of Long-Term Incentive Awards (e.g., Stock Options, Performance Units, Restricted Stock). The Omnibus Incentive Plan also provides for a variety of performance measures for performance-based Long-Term Incentive Awards (e.g., Return on Sales, Return on Net Assets, Total Shareholder Return).
In 2008, consistent with past practice, the Committee determined that the Long-Term Incentive Awards would be made 100% in the form of Performance Units. In addition, the Committee determined that average Return on Net Assets (RONA) over a three-year performance period would be the performance measure used for the Long-Term Incentive Awards. The three-year performance period promotes performance over a reasonable timeframe and builds an employee retention component into the Long-Term Incentive Awards.
The Committee has chosen Performance Units as the award vehicle under the Company's Long-Term Incentive program based on management recommendations and its own evaluation. Among other advantages, Performance Units provide the Compensation Committee with the flexibility to choose to make payouts in either cash or shares at the time of grant.
The Performance Units link payouts under the Company's Long-Term Incentive program to the Company's achieved RONA performance. We use RONA as the performance measure because we view this metric over an extended period of time to be an important driver in shareholder value creation. The Committee set a three-year target for average RONA considering the Company's expected performance
II-18
throughout the economic cycle and considering median RONA performance compiled by Hewitt for similarly sized companies in the Industrial Machinery sector.
Beginning in 2007, a sales growth modifier was added to the Long-Term Incentive Plan's performance targets to encourage long-term growth in addition to profitability. Depending upon the average sales growth over the three-year performance period, the earned payout under the 2008 performance unit grant can be increased by up to 20%.
Actual payouts under the 2007 and 2008 Long-Term Incentive Award grants can range from 46% to 156% of target, depending upon achieved average RONA and sales growth over the three-year performance period. Below certain minimum average RONA thresholds, no payout will be made under the Long-Term Incentive Awards. Because the Company's RONA performance was below the threshold, no payout was earned under the 2007 Long-Term Incentive Award.
The RONA thresholds, targets and maximums, along with the corresponding payout levels, are as follows:
| | Grant Year | Threshold | Target | Maximum | |||||||||
|---|---|---|---|---|---|---|---|---|---|---|---|---|---|
RONA Targets | 2008 | 10 | % | 14 | % | 16 | % | ||||||
| 2007 | 10 | % | 14 | % | 16 | % | |||||||
Performance Unit Payout % | 2008 | 46 | % | 90 | % | 130 | %** | ||||||
| 2007 | 46 | % | 90 | % | 130 | %** | |||||||
- **
- For the 2007 and 2008 grant years, the earned payout based on RONA performance may be increased by a sales growth modifier of 10% to 20% depending upon the Company's average sales growth over the three-year performance period. The 10% and 20% sales growth modifiers result from three-year average sales growth of 5% and 15%, respectively. Between 5% and 15% sales growth, the modifier increases on a linear basis. With the sales growth modifier, the maximum payout under the 2007 and 2008 performance unit grants is 156% (130% × 120% sales growth modifier).
The Committee determines the target percentage of a participant's base salary for Long-Term Incentive Award purposes each year, without consideration of prior awards, based on a review of market survey information for similar positions in comparable companies and based on internal equity.
Dividend equivalents on outstanding Performance Units are paid at the same time and at the same rate as dividends declared by the Company's Board of Directors on its common stock. During the performance period, the dividend equivalents are paid based on the target number of Performance Units held by each participant. By tying the payment of dividend equivalents into the Company's common stock dividends, the participants have incentive to focus on cash flow measures that drive shareholder value and returns. The Company suspended its common stock dividends in 2009. Dividend equivalent payments on outstanding Performance Units were similarly suspended during 2009.
To promote share ownership, the Committee generally requires that earned Performance Units under the Long-Term Incentive Awards program be paid to participants 100% in shares of Company stock, with a number of shares withheld from the payout equal to the value needed to cover the Company's minimum statutory tax withholding requirements. In April of 2010, in light of the pending tender offer from Danfoss A/S and Danfoss Acquisition, Inc. for the outstanding shares of the Company, the Committee authorized a change in the future payout format of all presently outstanding 2008 Grant Year Performance Units from stock to cash, based on the final tender offer price. This change to a cash payout was made contingent upon the completion of the tender offer and planned follow-on merger process. The Committee did not alter the performance criteria that will determine whether any payout is actually earned on the outstanding 2008 Grant Year Performance Units.
II-19
The Performance Unit Award Agreements generally provide for automatic forfeiture upon a termination from service prior to the end of the performance period and/or the payout date. The Performance Unit Award Agreements generally provide for pro-rata, post-employment payouts of earned Performance Units under the following situations:
- •
- Retirement at full, normal retirement age
- •
- Death
The Long-Term Incentive Awards are subject to immediate vesting and payout, at the target level, upon a Change In Control of the Company, as defined in the Omnibus Incentive Plan. Under the Omnibus Incentive Plan, the Company has the right to seek a reimbursement of amounts previously paid to any Participant who engaged in misconduct or was aware of and failed to report misconduct when such misconduct leads to a restatement of financial earnings. The Company also has certain automatic forfeiture rights under Section 304 of the Sarbanes-Oxley Act of 2002.
At the time of his hiring in April 2007, Mr. Schramm was granted 10,000 shares of restricted stock under the Company's Omnibus Incentive Plan. 5,000 restricted shares vested on his one-year service anniversary (April 2008) and the remaining 5,000 restricted shares vested on his two-year service anniversary (April 2009). The restricted share issuance to Mr. Schramm served as a recruiting measure and as a short-term retention measure. The restricted share issuance bridged the period from Mr. Schramm's hire date until he would be eligible to receive any earned payouts under the Company's 2007 Performance Unit Award Agreement at the end of calendar year 2009.
Prior to his hiring in January of 2009, Mr. Ruder had served the Company as a non-employee director, beginning in 2008. While he was a non-employee director, Mr. Ruder was granted 1,500 shares of restricted stock with a three-year vesting period ending in June of 2011. In April of 2010, the Board of Directors of the Company authorized an accelerated vesting of all non-employee director restricted shares, including those held by Mr. Ruder, in light of a pending tender offer for the outstanding shares of the Company from Danfoss A/S and Danfoss Acquisition, Inc.
With a clear relationship between financial results and payouts, our Long-Term Incentive Awards program helps us tie our executive compensation levels to achieved business results. As an equity-based program, it also ties our executive compensation levels into returns earned by our shareholders. As a market-based program, it also helps us attract, motivate and retain quality leaders. Finally, the design of the shareholder-approved Omnibus Incentive Plan and Long-Term Incentive Awards granted thereunder helps ensure the tax deductibility of Long-Term Incentive Awards ultimately paid out.
Retirement & Savings Plans
The Retirement & Savings Plans in which our executive officers participate consist of the following:
- •
- Local Retirement Plans
- •
- Supplemental Retirement and/or Savings Plans
- •
- Elective Deferred Compensation Plans for Cash Compensation
- •
- Elective Deferred Compensation Plans for Long-Term Incentive Compensation
Our Local Retirement Plans are made available to all eligible employees, including the Named Executive Officers, and vary by country. The Local Retirement Plans are a combination of defined contribution and/or defined benefit savings plans. In recent years, the Company has moved towards providing the majority of its retirement benefits in the form of defined contribution plans. Our Named Executive Officers generally participate in their country-specific Local Retirement Plans on the same terms and conditions made available to all other participants in the respective plans. Our Local Retirement Plans are described in further detail in the Pension Benefits Table and narrative beginning on page II-31.
II-20
Our Supplemental Retirement and/or Savings Plans are made available to those U.S. officers and employees whose annual compensation exceeds certain limits imposed by the IRS and whose retirement benefits under the Local Retirement Plans are limited as a result. The Supplemental Retirement and/or Savings Plans operate to replace the retirement benefits that would be lost as a result of the IRS limits. Messrs. Schmidt, Cornett, Krabsen and Schramm participate in the Supplemental Retirement and/or Savings Plans.
Our Local Retirement Plan benefits and our Supplemental Retirement and/or Savings Plan benefits are determined primarily by considering base salary. Payouts under the Annual Incentive Plan Awards or the Long-Term Incentive Plan Awards generally do not impact the amount a participant will receive under these plans.
The Elective Deferred Compensation Plans for Cash Compensation are made available to U.S. Vice Presidents and executive officers as a means to allow them to save, on a tax-deferred basis, all or a portion of their annual cash compensation (Base Salary and Annual Incentive Award). Deferred compensation under these plans represents an unfunded, unsecured liability of the Company. During the deferral period, participants' deferred compensation accounts are credited with a variable earnings credit that is tied to ten-year U.S. treasury yields and a credit risk spread based on the Company's credit profile. Mr. Krabsen has elected to participate in the Elective Deferred Compensation Plans for Cash Compensation.
The Elective Deferred Compensation Plan for Long-Term Incentive Compensation has been made available to Messrs. Schmidt and Cornett as a means to allow them to defer the receipt of their payouts under the Company's Long-Term Incentive Awards program. The determination of whether to extend the invitation to participate is made by the Committee on a grant-by-grant basis and depends, in part, on the Company's exposure to compensation deduction limitations under Internal Revenue Code Section 162(m). During the deferral period, the deferred compensation retains its original form (i.e., Performance Units). At the end of the deferral period, the deferred Performance Units are paid in the same form, shares or cash, as originally determined by the Committee. During the deferral period, dividend equivalents earned on the deferred Performance Units are also deferred and represent an unfunded, unsecured liability of the Company. During the deferral period, the deferred dividend equivalent accounts are credited with a variable earnings credit that is tied to ten-year U.S. treasury yields and a credit risk spread based on the Company's credit profile. Mr. Schmidt has previously elected to participate in the Elective Deferred Compensation Plan for Long-Term Incentive Compensation. Pursuant to a prior deferral election, Mr. Schmidt received a payout of 26,703 performance units on April 3, 2009, payable in shares of Company stock. The deferred performance unit payout was valued at $71,831 based on a share value of $2.69 on the payout date.
Executives participating in the Elective Deferred Compensation Plan for Long-Term Incentive Compensation can experience adverse capital gains tax consequences if the Company's share value declines during the deferral period. A decline in share value during the deferral period causes the net shares received by the participant, after payroll tax withholding, to have a lower tax basis. A later sale of these lower tax basis shares results in a greater capital gain or lower taxable loss than would have resulted had the shares not been deferred. The Committee has agreed to make a capital gains tax protection payment to participants if their deferred Performance Units are paid out at a time when the shares are lower in value than on the date when the Performance Units would have originally been paid, based on a fixed formula. At this time of his deferred performance unit payout, Mr. Schmidt received a tax basis protection payment of $164,622 in accordance with the pre-determined fixed formula.
The Elective Deferred Compensation Plan for Long-Term Incentive Compensation was last made available in 2006. At the end of 2009, there were 92,346 Deferred Performance Units held by former executive officers of the Company.
II-21
The Supplemental Retirement and/or Savings Plans and the Elective Deferred Compensation Plans are described in further detail in the Nonqualified Deferred Compensation Table and narrative beginning on page II-33.
Based on observed market practices, we believe our Retirement & Savings Plans are comparable to those found in the marketplace for senior executives. These plans help us attract, motivate and retain quality leaders. In addition, the elective deferred compensation programs can help ensure the corporate tax deductibility of compensation in years when an executive's compensation might otherwise exceed the tax deductible compensation limits of Internal Revenue Code Section 162(m).
Additional Cash Compensation and Perquisites
We provide a few additional elements of cash compensation and/or perquisites to our executives. These elements include:
- •
- Relocation Stipend and/or Relocation Expenses
- •
- Automobile Allowances and/or Company Cars
- •
- Paid Time Off (PTO) Sell Back
- •
- Spousal Travel
The relocation stipend paid to Mr. Schmidt was put in place at the time he relocated to our Lincolnshire, Illinois office. The Compensation Committee determined that relocating executives should be given a stipend to assist them with the higher cost of housing in the Chicago area. The stipends have a limited term (60 months) and ended in August 2008 for Mr. Schmidt.
During 2008, the Committee authorized Mr. Cornett to relocate his primary office from the Company's Lincolnshire, Illinois office to its Neumünster, Germany facility. Mr. Cornett received the Company's standard relocation assistance from the Company during 2008. The full cost of Mr. Cornett's relocation assistance, $34,864, has been included in the Other Compensation Column of the Summary Compensation Table.
Upon his hiring date in 2007, the Committee authorized that Mr. Schramm move to the Company's Plymouth, Minnesota facility. Mr. Schramm received the Company's standard relocation assistance from the Company. The full cost of Mr. Schramm's relocation assistance, $32,349 in 2007 and $5,805 in 2008, has been included in the Other Compensation Column of the Summary Compensation Table. Also included in 2008 is an additional $40,000 that the Committee authorized for payment to Mr. Schramm in order to cover certain duplicate housing costs resulting from the soft U.S. real estate market.
Automobile allowances are paid to Messrs. Schmidt, Schramm and Krabsen in lieu of providing company cars for their use. Mr. Cornett received an automobile allowance during the period of his U.S. employment. As European-based officers, Messrs. Ruder, Christensen, Cornett and Kittel are provided a company car for business and personal use. Automobile allowances or allowing the use of a company car are common in the market for senior executives and are used by us to attract, motivate and retain quality leaders.
The Company's Paid Time Off (PTO) plan allows U.S. employees, including officers, to sell back up to 80 hours of paid time off (i.e. vacation) per year. This may be preferable for employees who are nearing their maximum PTO accrual and would otherwise begin to lose the value of their full PTO benefit. Mr. Schmidt utilized the PTO sell-back option in 2008. The resulting cash payment to him has been included in the Other Compensation Column of the Summary Compensation Table. The PTO sell-back option was discontinued in 2009.
Similarly, departing U.S. employees are able to receive a cash payout of their remaining PTO accrual balance upon their termination of employment. Mr. Schmidt received such a payout upon his termination
II-22
of employment in May 2009. Mr. Cornett received a payout of his accrued U.S. PTO balance upon his transfer to Germany as his PTO eligibility will now be based on German PTO provisions. These cash payments have been included in the Other Compensation Column of the Summary Compensation Table.
Due to a high frequency of international travel, we allow spouses to accompany executives on up to two international trips per year. The Company pays coach class airfare for any such spousal trips. The executive is responsible for any income taxes resulting from such Company-paid spousal trips.
Other Potential Post-Employment Compensation
The Company has entered into Employment Agreements with the Named Executive Officers that provide the potential for post-employment compensation in certain instances (i.e., triggers).
For Messrs. Schmidt, Cornett, Krabsen, Kittel and Schramm, the triggers that would provide for post-employment compensation are as follows:
- •
- Termination Due to Death or Disability
- •
- Termination By The Company Without Cause
- •
- Termination By The Executive With Good Reason
- •
- Change in Control of the Company and Termination by the Company Without Cause or by the Executive With Good Reason Within Two Years following the Change in Control
Messrs. Ruder and Christensen have European-style Employment Agreements where post-employment compensation is primarily covered through the use of extended notice periods. For terminations initiated by the Company without cause or by the employee due to breach of contractual obligations, Mr. Ruder has a 24-month notice period and Mr. Christensen has an 18-month notification period, during which time they would be eligible to receive their normal compensation, even if no longer working for the Company.
Based on observed market practices, the triggers which can lead to post-employment compensation are comparable to those found in the marketplace for CEOs and other senior executives. The material terms of the Employment Agreements, including the provisions relating to potential post-employment compensation, are discussed in detail in the Potential Payments Upon Termination or Change in Control section beginning on page II-35.
Karl Schmidt Resignation and Post-Employment Compensation
In April 2009, Mr. Schmidt announced his resignation from the Company, effective April 30, 2009. The Company and Mr. Schmidt agreed that the resignation would be treated under the Termination Without Cause/Termination With Good Reason provisions of his employment agreement.
As a result of this treatment and pursuant to his employment agreement, Mr. Schmidt was paid or provided the following amounts upon his termination of employment:
- •
- $784,800—Separation Payment Payable in Two Installments (May 2009 and December 2009)
- •
- $20,129 Cobra Continuation Payment in Lieu of Medical Plan Continuation For 12 Months
- •
- $18,875—Accrued Paid Time Off at Termination Date
- •
- Outplacement Services—Reimbursed Up To $20,000 Value
II-23
Thomas Kittel Retirement and Post-Employment Compensation
In August 2009, Mr. Kittel announced his intention to retire from the Company, effective September 30, 2009. The Company and Mr. Kittel agreed that his retirement would be treated under the Termination Without Cause/Termination With Good Reason provisions of his employment agreement.
As a result of this treatment and pursuant to his employment agreement, Mr. Kittel was paid or provided the following amounts in Euro upon his retirement:
- •
- 126,000 Euro—Salary Continuation For Six-Month Period
- •
- 9,870 Euro—Local Retirement Plan Contributions During Salary Continuation Period
- •
- 563,333 Euro—Separation Payment Payable in March 2010
- •
- Retention of Company Car for Five-Month Period plus 2,500 Euro for fuel and lubricants
- •
- Outplacement Services—Up To 20,000 Euro Value
Hans J. Cornett Resignation and Post-Employment Compensation
In October 2009, Mr. Cornett announced his intention to resign from the Company, effective December 31, 2009. Pursuant to his termination agreement, Mr. Cornett was paid or provided the following amounts upon his termination of employment:
- •
- 147,000 Euro—Salary Continuation For Seven-Month Period
- •
- 6,391 Euro—Local Retirement Plan Contributions During Salary Continuation Period
- •
- 105,000 Euro—Separation Payment Payable in July 2010
- •
- Outplacement Services—Up To 20,000 Euro Value
Henrik Krabsen Resignation and Post-Employment Compensation
In January 2010, Mr. Krabsen announced his intention to resign from the Company, effective January 31, 2010. The Company and Mr. Krabsen agreed that the resignation would be treated under the Termination Without Cause/Termination With Good Reason provisions of his employment agreement.
As a result of this treatment and pursuant to his employment agreement, Mr. Krabsen was paid or provided the following amounts upon his termination of employment:
- •
- $421,200—Separation Payment in One Installment (February 2010)
- •
- $22,641 Cobra Continuation Payment in Lieu of Medical Plan Continuation For 12 Months
- •
- $28,507—Accrued Paid Time Off at Termination Date
- •
- Outplacement Services—Reimbursed Up To $20,000 Value
Analysis of Risks Inherent in Compensation Policies & Practices
Management believes that the compensation policies and practices for all employees, including executive officers and non-executive officers, do not create risks that would reasonably be expected to have a material adverse effect on the Company. The incentive compensation programs extended to certain key employees other than executive officers, when available, are patterned after the incentive compensation programs for our executive officers and are reviewed on an annual basis by the Compensation Committee.
II-24
Stock Ownership Guidelines
The Company has no formal stock ownership guidelines due, in part, to the closely-held nature of the Company. The Committee strongly encourages share ownership among the senior executives and monitors such share ownership on an annual basis.
Financial Accounting and Tax Impacts of Executive Compensation Program
Internal Revenue Code ("IRC") Section 162(m) limits U.S. and state tax deductions for compensation in excess of $1,000,000 paid to the CEO and to the other Named Executive Officers during any taxable year.
The Company's Omnibus Incentive Plan has been designed to meet the qualifying criteria for the performance-based compensation exception to IRC Section 162(m). Incentive awards granted under the Omnibus Incentive Plan are designed to be fully deductible for U.S. and state tax purposes.
The cash-based elements of our executive compensation program, including Base Salary and Annual Incentive Awards, are treated as a financial statement expense in the year incurred. The Long-Term Incentive Awards are accounted for pursuant to the Rules of the Accounting Standards Codification with financial statement expense recognized over the three-year performance period.
Compensation Committee Interlocks and Insider Participation
The Committee's members during 2009 were Johannes F. Kirchhoff, F. Joseph Loughrey, and Steven H. Wood, none of whom is or has ever been an officer or employee of the Company. Johannes F. Kirchhoff and members of his family are owners of FAUN Umwelttechnik GmbH & Co. KG, which purchased products from the Company in 2009 for an aggregate purchase price of approximately $2.0 million.
Compensation Committee Report
The information contained in the following report shall not be deemed to be "soliciting material" or "filed" or incorporated by reference in future filings with the Securities and Exchange Commission, or subject to the liabilities of Section 18 of the Exchange Act, except to the extent that the Company specifically incorporates it by reference into a document filed under the Securities Act of 1933 or the Securities Exchange Act.
The Compensation Committee has reviewed and discussed the Compensation Discussion and Analysis (CD&A) with management and, based on the review and discussion, has recommended to the Board that the CD&A be included in the Company's Proxy Statement and be incorporated by reference into the Company's Annual Report on Form 10-K for the year ended December 31, 2009, as filed with the Securities and Exchange Commission.
| COMPENSATION COMMITTEE: | ||
Johannes F. Kirchhoff, Chairman F. Joseph Loughrey Steven H. Wood |
II-25
Name and Principal Position | Year | Salary ($) | Stock Awards(2) ($) | Non-Equity Incentive Plan Compensation(3) ($) | Change in Pension Value and Nonqualified Deferred Compensation Earnings(4) ($) | All Other Compensation(5) ($) | Total ($) | ||||||||||||||||
|---|---|---|---|---|---|---|---|---|---|---|---|---|---|---|---|---|---|---|---|---|---|---|---|
Sven Ruder(1) | 2009 | 547,431 | 0 | 0 | 0 | 53,834 | 601,265 | ||||||||||||||||
President & Chief Executive Officer | |||||||||||||||||||||||
Jesper V. Christensen(1) | 2009 | 203,911 | 0 | 0 | 0 | 25,100 | 229,011 | ||||||||||||||||
Executive Vice President & | |||||||||||||||||||||||
Chief Financial Officer | |||||||||||||||||||||||
Karl J. Schmidt | 2009 | 107,155 | 0 | 0 | 2,679 | 1,018,415 | 1,128,249 | ||||||||||||||||
Executive Vice President & | 2008 | 327,032 | 304,016 | 0 | 5,697 | 53,611 | 690,356 | ||||||||||||||||
Chief Financial Officer | 2007 | 313,038 | 422,198 | 0 | 5,528 | 45,832 | 786,596 | ||||||||||||||||
Hans J. Cornett(1) | 2009 | 356,844 | 0 | 0 | 134 | 436,279 | 793,257 | ||||||||||||||||
Executive Vice President & | 2008 | 349,939 | 294,363 | 0 | 5,298 | 98,466 | 748,066 | ||||||||||||||||
Chief Marketing Officer | 2007 | 301,942 | 401,087 | 0 | 5,623 | 36,275 | 744,927 | ||||||||||||||||
Henrik Krabsen | 2009 | 286,920 | 0 | 0 | 13,224 | 25,028 | 325,172 | ||||||||||||||||
Executive Vice President & | |||||||||||||||||||||||
President Work Function Division | |||||||||||||||||||||||
Thomas K. Kittel(1) | 2009 | 269,255 | 0 | 0 | 65,033 | 1,064,343 | 1,398,631 | ||||||||||||||||
Executive Vice President & | 2008 | 409,780 | 379,840 | 0 | 36,390 | 99,343 | 925,353 | ||||||||||||||||
President Propel Division | 2007 | 341,979 | 438,219 | 0 | 0 | 49,760 | 829,958 | ||||||||||||||||
Wolfgang Schramm | 2009 | 286,920 | 0 | 0 | 4,923 | 25,058 | 316,901 | ||||||||||||||||
Executive Vice President & | 2008 | 311,908 | 289,527 | 0 | 4,637 | 73,599 | 679,671 | ||||||||||||||||
President Controls Division | 2007 | 214,615 | 666,468 | 0 | 1,154 | 50,670 | 932,907 | ||||||||||||||||
Footnotes To Summary Compensation Table
- (1)
- Certain compensation items earned by Messrs. Ruder, Christensen, Cornett and Kittel were valued in Euros and were converted to U.S. dollars for this table and all other tables using a weighted average annual exchange rate (USD/Euro) of 1.3903, 1.4635 and 1.3673 for 2009, 2008 and 2007, respectively.
- (2)
- These amounts represent the annual grant date value of equity compensation in the form of Performance Units and/or Restricted Stock to each Named Executive Officer. For purposes of determining the grant date value, the Performance Units were treated as paying out at target values, as this would have been the expectation as of the grant date. Based on achieved performance below threshold levels, Performance Units granted in 2007 will expire with no payouts. It is also likely that the 2008 Performance Unit grants will expire with no payouts, as achieved performance is expected to be below threshold levels.
Assuming a maximum achieved payout with respect to the 2007 grants and using the grant date value, the amounts reflected above would be $658,629, $625,696, $683,622 and $892,130 for Messrs. Schmidt, Cornett, Kittel and Schramm, respectively. Assuming a maximum achieved payout with respect to the 2008 grants and using the grant date value, the amounts reflected above would be $474,265, $459,206, $592,550 and $451,662 for Messrs. Schmidt, Cornett, Kittel and Schramm, respectively.
As noted in the CD&A, there were no stock awards made in 2009 as the Company's Long-Term Incentive Award program was suspended.
II-26
Further information concerning the Company's accounting for Performance Units and Restricted Stock can be found in footnote number 13 to its consolidated financial statements filed as part of its Form 10-K for the year ended December 31, 2009.
- (3)
- Based on achieved performance below threshold levels, there were no payouts earned in 2007 and 2008 under the Company's Annual Incentive Award program. As noted in the CD&A, the Annual Incentive Award program was suspended in 2009.
- (4)
- These amounts represent the aggregate increase in the actuarial present value of all defined benefits and actuarial plans, including supplemental plans, accrued during the year plus above-market earnings on nonqualified deferred compensation, using 120% of the applicable federal long-term rate as the basis for market earnings. The amounts are detailed in the following table.
Name | Year | Change In Value Of German Pension Plan ($) | Change In Value Of US Qualified Retirement Plan ($) | Above-Market Earnings On Non-Qualified Deferred Compensation ($) | Total ($) | |||||||||||
|---|---|---|---|---|---|---|---|---|---|---|---|---|---|---|---|---|
Karl J. Schmidt | 2009 | 0 | 2,468 | 211 | 2,679 | |||||||||||
| 2008 | 0 | 5,411 | 286 | 5,697 | ||||||||||||
| 2007 | 0 | 5,504 | 24 | 5,528 | ||||||||||||
Hans J. Cornett | 2009 | 0 | 134 | 0 | 134 | |||||||||||
| 2008 | 0 | 5,298 | 0 | 5,298 | ||||||||||||
| 2007 | 0 | 5,623 | 0 | 5,623 | ||||||||||||
Henrik Krabsen | 2009 | 0 | 5,039 | 8,185 | 13,224 | |||||||||||
Thomas K. Kittel | 2009 | 65,033 | 0 | 0 | 65,033 | |||||||||||
| 2008 | 36,390 | 0 | 0 | 36,390 | ||||||||||||
| 2007 | 0 | 0 | 0 | 0 | ||||||||||||
Wolfgang Schramm | 2009 | 0 | 4,923 | 0 | 4,923 | |||||||||||
| 2008 | 0 | 4,637 | 0 | 4,637 | ||||||||||||
| 2007 | 0 | 1,154 | 0 | 1,154 | ||||||||||||
The actuarial present value of Mr. Kittel's German pension plan benefit declined by $27,511 in 2007, due to a 1% increase in the discount rate used to determine the present value. In accordance with SEC disclosure rules, the Company is not reporting this decrease in the Summary Compensation Table.
II-27
- (5)
- The All Other Compensation amounts represent the following amounts and are explained in greater detail in the Additional Cash Compensation and Perquisites section of the CD&A:
Name | Year | Dividend Equivalents Paid On Outstanding Performance Units ($) | Relocation Stipend or Relocation Costs ($) | Auto Allowance ($) | Company Car ($) | PTO Sellback PTO Payout ($) | Post- Employment Compensation and Tax Basis Protection Payments ($) | Company Contributions To 401(k) Plan and to Supplemental Retirement Plans ($) | Other Perquisites ($) | Total ($) | |||||||||||||||||||||
|---|---|---|---|---|---|---|---|---|---|---|---|---|---|---|---|---|---|---|---|---|---|---|---|---|---|---|---|---|---|---|---|
Sven Ruder | 2009 | 0 | 0 | 0 | 28,548 | 0 | 0 | 25,123 | 163 | 53,834 | |||||||||||||||||||||
Jesper V. Christensen | 2009 | 0 | 0 | 0 | 16,239 | 0 | 0 | 8,698 | 163 | 25,100 | |||||||||||||||||||||
Karl J. Schmidt | 2009 | 0 | 0 | 5,300 | 0 | 18,875 | 989,551 | 4,689 | 0 | 1,018,415 | |||||||||||||||||||||
| 2008 | 0 | 12,613 | 12,720 | 0 | 6,288 | 0 | 14,854 | 7,136 | 53,611 | ||||||||||||||||||||||
| 2007 | 0 | 18,920 | 12,720 | 0 | 0 | 0 | 14,192 | 0 | 45,832 | ||||||||||||||||||||||
Hans J. Cornett | 2009 | 0 | 0 | 0 | 33,478 | 0 | 387,047 | 15,591 | 163 | 436,279 | |||||||||||||||||||||
| 2008 | 0 | 34,864 | 9,540 | 10,267 | 24,195 | 0 | 14,870 | 4,730 | 98,466 | ||||||||||||||||||||||
| 2007 | 0 | 0 | 12,720 | 0 | 9,385 | 0 | 13,523 | 647 | 36,275 | ||||||||||||||||||||||
Henrik Krabsen | 2009 | 0 | 0 | 12,720 | 0 | 0 | 0 | 12,308 | 0 | 25,028 | |||||||||||||||||||||
Thomas K. Kittel | 2009 | 0 | 0 | 0 | 28,362 | 0 | 1,014,626 | 21,192 | 163 | 1,064,343 | |||||||||||||||||||||
| 2008 | 32,374 | 0 | 0 | 28,400 | 0 | 0 | 32,692 | 5,877 | 99,343 | ||||||||||||||||||||||
| 2007 | 17,896 | 0 | 0 | 22,667 | 0 | 0 | 6,814 | 2,383 | 49,760 | ||||||||||||||||||||||
Wolfgang Schramm | 2009 | 0 | 0 | 12,750 | 0 | 0 | 0 | 12,308 | 0 | 25,058 | |||||||||||||||||||||
| 2008 | 0 | 45,805 | 12,750 | 0 | 0 | 0 | 13,954 | 1,090 | 73,599 | ||||||||||||||||||||||
| 2007 | 0 | 32,349 | 9,563 | 0 | 0 | 0 | 2,308 | 6,450 | 50,670 | ||||||||||||||||||||||
The values reflected for company cars are based on the annual operating costs to the Company. Other perquisites include spousal travel, airline club fees and insurance premiums.
GRANTS OF PLAN-BASED AWARDS TABLE
As noted in CD&A, the Company suspended its Annual Incentive Award and Long-Term Incentive Award programs in 2009 in response to the economic downturn. As a result, the Grants of Plan-Based Awards Table is not relevant for 2009 as there is no data to report.
SUMMARY COMPENSATION AND GRANTS OF PLAN-BASED AWARDS NARRATIVE
Each of the Named Executive Officers has an Employment Agreement with Sauer-Danfoss Inc. and/or one of its Affiliates which detail, among other things, the components of such officer's compensation.
The German Employment Agreements for Messrs. Ruder, Christensen, Cornett and Kittel were written to comply with German employment law and contain provisions similar to those made available to other senior executives based in Germany. The German Employment Agreements contain longer notice periods for a Company-initiated termination, without cause, than are typical for U.S.-style agreements. The notice periods for Messrs. Ruder and Christensen are 24 months and 18 months, respectively. The notice periods in effect for Messrs. Cornett and Kittel, prior to their terminations of employment, were seven months.
The U.S. Employment Agreements for Messrs. Schmidt and Krabsen, first entered into in December of 2002, were replaced, effective December 31, 2008 with agreements containing substantially similar terms and written to comply with IRC Section 409A. The Employment Agreements for Messrs. Schmidt and Krabsen have evergreen clauses and continue in effect until termination of employment. Mr. Schramm's
II-28
Employment Agreement was entered into on April 16, 2007 and contains a two-year term, automatically renewable for successive one-year terms in the absence of written notice by either party. The U.S. Employment Agreements contain a minimum 30-day notice period.
Rights of the officers to certain post-employment compensation under the terms of the Employment Agreements are discussed in the Potential Payments upon Termination or Change in Control section beginning on page II-35.
The officer Employment Agreements provide for base salary levels, which increase under the Company's annual salary review process, as described in the CD&A. The U.S. Employment Agreements provide that an officer's base salary cannot be decreased without the officer's consent, unless as part of a blanket decrease to the base salaries of all officers. As noted in the CD&A, a blanket decrease was made to the base salaries of all officers, effective March 1, 2009. This blanket decrease was discussed with, and agreed to, by the officers.
Stock Awards
Amounts listed in the Stock Awards column represent the grant date value of Performance Units granted under the Company's Omnibus Incentive Plan for the given reporting year. For purposes of determining the performance payout expectations as of the grant date, we have generally assumed that the Performance Units would payout at their target value.
Messrs. Cornett, Krabsen and Schramm have outstanding Performance Unit grants at December 31, 2009 under the Company's Omnibus Incentive Plan. The Performance Units outstanding at year-end are detailed later in the Outstanding Equity Awards At Fiscal Year-End Table.
Messrs. Ruder and Christensen do not hold outstanding Performance Unit grants as no Performance Unit grants have been made since they started employment at Sauer-Danfoss. Messrs. Schmidt and Kittel did not hold outstanding Performance Unit grants at year-end as their unpaid, unvested Performance Units were forfeited upon their termination of employment with Sauer-Danfoss in 2009. Mr. Cornett's outstanding performance units were forfeited upon his termination of employment on December 31, 2009. Mr. Krabsen's outstanding performance units were forfeited upon his termination of employment on January 31, 2010.
The performance unit award agreements call for the payout of Performance Units based on average Return on Net Asset (RONA) performance over a three-year performance period. The Performance Unit awards generally allow for a percentage payout of the target number of Units, depending upon RONA performance. Below established RONA thresholds, there is no payout under the Performance Unit awards. Beginning in 2007, a sales growth modifier was added to the performance measurements for purposes of determining earned Performance Unit payouts.
The Performance Unit award agreements include forfeiture upon termination of service from the Company prior to payment, except terminations due to Retirement, Disability or Death, in which case pro-rated payouts will be made, based on final RONA performance. The Compensation Committee can make exceptions to the automatic forfeiture provisions, in its sole discretion.
The performance unit award agreements also call for a payout, at target levels, of Performance Units in the event of a Change in Control of the Company, as defined in the agreements.
By decision of the Compensation Committee, earned Performance Units are generally payable in shares of Company stock, with a number of shares withheld to cover the Company's minimum statutory tax withholding requirements.
II-29
The Performance Unit Award Agreements allow for the payment of dividend equivalents, as declared by the Company's Board of Directors. The practice of the Board has been to authorize the payment of dividend equivalents, based on the number of target Performance Units held, at the same time and at the same rate as dividends declared on the Company's common stock. Beginning in 2009, the Board had suspended the payment of dividends on the Company's common stock. As a result, dividend equivalents on outstanding Performance Units were also suspended.
Non-Equity Incentive Compensation
Amounts reflected in the Non-Equity Incentive Compensation represent amounts granted to and earned by the Named Executive Officers under the Company's Annual Incentive Award program. The Annual Incentive Award program is performance-based and in the past has been tied to the Company's performance against predetermined targets for Earnings Before Interest & Taxes (EBIT) margins.
Annual Incentive Award payouts are based on a range of 25% to 200% of pre-established payout targets depending upon EBIT margin performance. Below certain minimum threshold EBIT margin levels, there is no payout under the Annual Incentive Award program. For 2007 and 2008, the EBIT margin performance levels were below threshold and, therefore, no earned payouts are reflected. For 2009, as noted in the CD&A, the Annual Incentive Program was suspended and therefore no payouts were made.
OUTSTANDING EQUITY AWARDS AT FISCAL YEAR-END
| | Stock Awards | ||||||||||||
|---|---|---|---|---|---|---|---|---|---|---|---|---|---|
Name | Number of Shares or Units of Stock That Have Not Vested (#) | Market Value of Shares or Units of Stock That Have Not Vested ($) | Equity Incentive Plan Awards: Number of Unearned Shares, Units or Other Rights That Have Not Vested (#) | Equity Incentive Plan Awards: Market or Payout Value of Unearned Shares, Units or Other Rights That Have Not Vested ($) | |||||||||
Sven Ruder(1) | 1,500 | $ | 18,015 | ||||||||||
Hans J. Cornett(2) | None | $ | 0 | ||||||||||
Hans J. Cornett(3)(4) | 7,168 | $ | 86,088 | ||||||||||
Henrik Krabsen(2) | None | $ | 0 | ||||||||||
Henrik Krabsen(3)(4) | 7,050 | $ | 84,671 | ||||||||||
Wolfgang Schramm(2) | None | $ | 0 | ||||||||||
Wolfgang Schramm(3) | 7,050 | $ | 84,671 | ||||||||||
Footnotes To Outstanding Equity Awards At Fiscal Year-End Table
- (1)
- Restricted shares granted to Mr. Ruder during his period of service as a non-employee director. The restricted share value is based on a per share value of $12.01 as of December 31, 2009.
- (2)
- 2007 Performance Unit Awards granted on March 20, 2007 (April 16, 2007 for Mr. Schramm), with a Performance Period from January 1, 2007 through December 31, 2009. Achieved RONA performance for the three-year Performance Period was below the minimum threshold and, therefore, no payouts were earned under the 2007 Performance Unit Awards.
- (3)
- 2008 Performance Unit Awards granted on March 12, 2008, with a Performance Period from January 1, 2008 through December 31, 2010. These amounts represent the threshold number of units for each Named Executive Officer and the value of those units based on a per share value of $12.01 as of December 31, 2009. Actual earned Performance Units will fully vest on the payout date in February of 2011.
- (4)
- The outstanding 2008 Performance Units held by Messrs. Cornett and Krabsen at year-end were forfeited upon their termination of employment.
II-30
OPTION EXERCISES AND STOCK VESTED
| | Stock Awards | ||||||
|---|---|---|---|---|---|---|---|
Name of Executive Officer | Number of Shares Acquired on Vesting (#) | Value Realized on Vesting ($) | |||||
Karl J. Schmidt(1) | 7,286 | 20,692 | |||||
Hans J. Cornett(1) | 6,922 | 19,658 | |||||
Henrik Krabsen(1) | 3,412 | 9,690 | |||||
Thomas K. Kittel(2) | 4,059 | 35,516 | |||||
Wolfgang Schramm(3) | 5,000 | 18,750 | |||||
Footnotes To Option Exercises and Stock Vested Table
- (1)
- Amounts and values represent earned Performance Units, payable in shares, granted on June 1, 2006 to Messrs. Schmidt, Cornett and Krabsen. The 2006 Performance Unit Award Agreements included a Performance Period from January 1, 2006 through December 31, 2008. Based upon achieved RONA performance during the Performance Period, participants earned a payout under these awards equal to 37.5% of target. The earned Performance Units fully vested on the payout date of March 25, 2009. The values reflected above for Messrs. Schmidt, Cornett and Krabsen are based on the per share value of $2.84 on the payout date.
- (2)
- Amounts and values represent earned Performance Units, payable in cash, granted on June 1, 2006 to Mr. Kittel. The 2006 Performance Unit Award Agreements included a Performance Period from January 1, 2006 through December 31, 2008. Based upon achieved RONA performance during the Performance Period, Mr. Kittel earned a payout under these awards equal to 37.5% of target. The earned Performance Units fully vested on the payout date of March 25, 2009. The value reflected above for Mr. Kittel is based on the December 31, 2008 closing share price of $8.75, in accordance with the terms of Mr. Kittel's 2006 Performance Unit Award Agreement.
- (3)
- Amounts and values reflected represent vesting of restricted shares granted to Mr. Schramm on April 16, 2007. These restricted shares vested on April 16, 2009, the two-year anniversary of his hire date. The value reflected is based on the per share value of $3.75 on the vesting date.
Name | Plan name | Number of years of credited service (#) | Present Value of Accumulated Benefit ($) | ||||||
|---|---|---|---|---|---|---|---|---|---|
Karl J. Schmidt | Sauer-Danfoss Employees' Retirement Plan | 7.3 | 33,458 | ||||||
Hans J. Cornett | Sauer-Danfoss Employees' Retirement Plan | 7.7 | 33,510 | ||||||
Henrik Krabsen | Sauer-Danfoss Employees' Retirement Plan | 9.0 | 39,745 | ||||||
Thomas K. Kittel | German Company Pension Scheme | 21.9 | 347,309 | ||||||
Wolfgang Schramm | Sauer-Danfoss Employees' Retirement Plan | 2.7 | 10,714 | ||||||
Sauer-Danfoss Employees' Retirement Plan
The Pension Benefits table above details the present value of the accumulated retirement benefits accrued by Messrs. Schmidt, Cornett, Krabsen and Schramm under the Sauer-Danfoss Employees'
II-31
Retirement Plan (the "U.S. Retirement Plan"). The amounts shown represent the present value of the retirement benefits that each of them would be eligible to receive at normal retirement age (65), based on years of service through December 31, 2009 and discounted to a December 31, 2009 present value.
Messrs. Krabsen and Schramm participate in the U.S. Retirement Plan under the plan's cash balance formula. Under the cash balance formula, participants are provided an annual credit, equal to 2% of eligible pay, to their cash balance accounts. The cumulative account balances earn annual interest credits, tied to the one-year treasury bill rate. At the normal retirement date, age 65, the accumulated cash balance is converted into a monthly annuity for payment and is paid out as either a single-life annuity or as a joint and survivor annuity. For the cash balance formula, eligible pay is generally limited to a participant's base salary.
Mr. Schmidt participated in the U.S. Retirement Plan under the plan's cash balance formula up to the date of his employment termination. Mr. Schmidt's vested benefit upon termination is reflected in the above table. Mr. Cornett participated in the U.S. Retirement Plan, prior to his transfer to a German-based employment status in late 2008. Mr. Cornett's vested benefit in the U.S. Retirement Plan is reflected in the above table.
Under the U.S. Retirement Plan, reduced early retirement benefits may be taken beginning at age 55. Messrs. Schmidt (age 56) and Cornett (age 60) are currently eligible for early retirement under the above-named plan. Upon early retirement, the normal age 65 retirement benefit is subject to reduction for each month by which the participant is less than age 65 when early retirement benefit payments commence.
Mr. Schramm has not yet served the requisite five years to be vested in his benefits under the U.S. Retirement Plan.
Sauer-Danfoss Supplemental Retirement Plan
The Internal Revenue Code generally limits to $195,000, indexed for inflation, the amount of any annual benefit that may be paid from the U.S. Retirement Plan. Moreover, the U.S. Retirement Plan may consider no more than $245,000, as indexed for inflation, of a participant's annual compensation in determining that participant's retirement benefit.
In recognition of these two limitations, the Company has adopted a Supplemental Executive Savings and Retirement Benefit Plan (the "U.S. Supplemental Savings Plan"). The U.S. Supplemental Savings Plan is designed to provide supplemental retirement benefits to the extent that a participant's benefits under the U.S. Retirement Plan are limited by either the $185,000 annual benefit limitation or the $230,000 annual compensation limitation.
Messrs. Schmidt, Cornett, Krabsen and Schramm are covered by the U.S. Supplemental Savings Plan because their cash balance account contributions are limited by the Internal Revenue Code limitations on qualified plans. This separate plan is discussed in the Nonqualified Deferred Compensation narrative which follows below.
German Company Pension Scheme
The Pension Benefits table above details the present value of the accumulated retirement benefit accrued by Mr. Kittel under the German Company Defined Benefit Pension Scheme. The amount shown represents the retirement annuity that Mr. Kittel would be eligible to receive at normal retirement age (65), based on years of service through December 31, 2009, discounted to a December 31, 2009 present value using a discount rate of 5.30%.
The German Company Defined Benefit Pension Scheme is a pension plan covering a majority of the Company's German employees. The plan is similar in nature to a defined benefit plan in the United States, with the exception that the plan is unfunded. Under the plan, a monthly pension is paid to employees who
II-32
retire after attaining the age of 65, calculated pursuant to a formula based on (i) a percentage of each employee's base monthly salary as of the end of October of each year and (ii) the participant's years of service. Mr. Kittel had completed 21.9 years of service in the plan as of December 31, 2009.
The German Company Defined Benefit Pension Scheme was replaced by a defined contribution retirement plan for German employees, effective October 1, 2007. Mr. Kittel's defined benefit pension benefit was effectively frozen as of October 1, 2007 with no further benefit accruals for additional service. Messrs. Ruder, Christensen, Kittel and Cornett received contributions into the German defined contribution plan during 2009. These contributions are reflected in the All Other Compensation column of the Summary Compensation Table.
NONQUALIFIED DEFERRED COMPENSATION
Name (a) | Executive Contributions In Last FY ($) | Registrant Contributions In Last FY ($) | Aggregate Earnings In Last FY ($) | Aggregate Withdrawals Or Distributions ($) | Aggregate Balance At Last FYE ($) | |||||||||||
|---|---|---|---|---|---|---|---|---|---|---|---|---|---|---|---|---|
Karl J. Schmidt(2)(3) | 0 | 0 | (152,950 | ) | 140,727 | 0 | ||||||||||
Hans J. Cornett | 0 | 0 | 1,876 | 0 | 16,054 | |||||||||||
Henrik Krabsen(1)(2) | 0 | 2,508 | 19,676 | 0 | 243,722 | |||||||||||
Wolfgang Schramm(1) | 0 | 2,508 | 193 | 0 | 7,455 | |||||||||||
Footnotes To Nonqualified Deferred Compensation Table
- (1)
- The amounts reflected as Registrant Contributions in the Last Fiscal Year for Messrs. Krabsen and Schramm relate to Company contributions to the Supplemental Executive Savings and Retirement Plan and are included under All Other Compensation in the Summary Compensation Table.
- (2)
- $211 and $8,185 of the amounts shown as Aggregate Earnings in the Last Fiscal Year for Messrs. Schmidt and Krabsen, respectively, represent above-market earnings on nonqualified, deferred compensation and are included under Change in Pension Value and Nonqualified Deferred Compensation Earnings in the Summary Compensation Table. Above-market earnings are computed using 120% of the applicable federal long-term rate as the basis for market earnings.
- (3)
- ($161,820) of the amount shown as Aggregate Earnings in the Last Fiscal Year for Mr. Schmidt results from a decrease in the value of deferred Performance Units, attributable to the underlying decline in the Company's common stock value. The deferred Performance Units are payable in Company stock and, therefore, their value fluctuates with changes in the Company's stock value.
NONQUALIFIED DEFERRED COMPENSATION NARRATIVE
The nonqualified deferred compensation amounts shown above reflect participants' balances in the following three nonqualified deferred compensation plans or arrangements:
- •
- Elective Deferred Compensation Plans for Cash Compensation
- •
- Elective Deferred Compensation Plans for Long-Term Incentive Compensation
- •
- Supplemental Executive Savings & Retirement Plan
The elective deferred compensation plans provide a means for eligible executives to save a portion of their compensation, on a tax-deferred basis, for retirement and other purposes.
The Supplemental Executive Savings and Retirement Plan operates to provide additional Company contributions to Messrs. Schmidt, Krabsen and Schramm, whose Company contributions into their qualified retirement plans are limited by IRS rules. These additional contributions allow the affected
II-33
executives to receive, on a percentage of compensation basis, the same level of Company contributions towards retirement that all other U.S. employees enjoy. Mr. Cornett maintains a balance in the Supplemental Executive Savings and Retirement plan relating to Company contributions and earnings thereon stemming from the time of his U.S. employment.
The key provisions of the three nonqualified, deferred compensation plans are reflected below.
Elective Deferred Compensation Plans for Cash Compensation
- •
- Plan available to selected U.S. employees
- •
- May elect deferral of all or a portion of Base Salary and Annual Incentive Award
- •
- Unfunded, unsecured liability of the Company
- •
- Deferred compensation earned after 2004 subject to a variable earnings credit tied to ten-year U.S. treasury yields plus a credit risk spread based on the Company's credit profile (2009 annualized return—8.7%)
- •
- Deferred compensation earned prior to 2005 subject to a variable earnings credit tied to ten-year U.S. treasury yields plus 3% (2009 annualized return—6.0%)
- •
- Payouts to be made in cash
- •
- Deferral elections and payout options comply with Internal Revenue Code Section 409A rules
Elective Deferred Compensation Plan for Long-Term Incentive Compensation
- •
- Plan available to selected U.S. employees
- •
- May elect deferral of all or a portion of payouts under Long-Term Incentive Plan
- •
- Unfunded, unsecured liability of the Company
- •
- Deferrals retain the form of Performance Units
- •
- Deferred Performance Units are paid out in cash or shares as originally determined by the Compensation Committee
- •
- Dividend equivalents earned on the deferred units are credited at the same rate as dividends on the Company's common shares and are deferred until Performance Unit payout
- •
- Deferred dividend equivalents credited with a variable earnings credit tied to ten-year U.S. treasury yields plus a credit risk spread based on the Company's credit profile (2009 annualized return—8.7%)
- •
- Deferred dividend equivalents and earnings thereon paid out in cash at end of deferral period
Supplemental Executive Savings and Retirement Plan
- •
- Non-elective plan available to any cash balance participants in the Company's qualified retirement plans whose retirement benefits are limited by IRS rules
- •
- Unfunded, unsecured liability of the Company
- •
- A portion of the deferred compensation balance earns interest credits based on one-year treasury bill rates similar to cash balance account earnings (2009 annualized return—0.40%)
- •
- A portion of the deferred compensation balance is self-directed by the participants and can generate earnings or loss based on actual performance from investment options in the Company's 401(k) plan. A participant's actual, annualized return or loss will depend on the
II-34
- •
- Amounts payable in cash, generally on the six-month anniversary of employment termination
- •
- Alternative payout options for reasons such as death and disability comply with Internal Revenue Code Section 409A rules
hypothetical investment strategy that the participant employs. Messrs. Schmidt, Cornett, Krabsen and Schramm realized gains of 23.4%, 21.7%, 27.6% and 5.9%, respectively, with respect to their hypothetical investment strategy in 2009.
POTENTIAL PAYMENTS UPON TERMINATION OR CHANGE IN CONTROL
Each Named Executive Officer has entered into an Employment Agreement with Sauer-Danfoss which provides for the payment of certain amounts upon a termination of employment for various reasons. These amounts are in addition to the amounts shown above in the Pension Benefits Table and the Nonqualified Deferred Compensation Table.
Upon termination of employment for any reason, a Named Executive Officer will receive base salary, vacation pay, and Annual Incentive Awards that have been earned, but not yet paid.
The post-employment compensation payments to Messrs. Ruder and Christensen in the event of any termination initiated by the Company without cause will generally be covered by their respective notice periods and by general provisions of German employment law.
Under the terms of their Employment Agreements, Messrs. Schmidt, Cornett, Krabsen, Kittel and Schramm are to receive additional payments if the termination from employment occurs in any of the following circumstances:
- •
- Following a Change in Control of the Company
- •
- Termination initiated by the Company without cause
- •
- Termination initiated by the Named Executive Officer with good reason
- •
- Death or disability
The table set forth below shows the estimated value of these potential post-employment payments assuming a triggering event had occurred on December 31, 2009.
The estimated payouts for Messrs. Ruder, Christensen and Schramm are based on the lower base salaries in effect for 2009 following the temporary base salary reduction. The estimated payouts for Messrs. Ruder, Christensen and Schramm also reflect no post-employment compensation payouts related to the Annual Incentive Award due to the suspension of the Annual Incentive Award program for 2009. For Mr. Schramm, the acceleration of outstanding Performance Units following a Change in Control is based on the closing share price on December 31, 2009 of $12.01.
The amounts shown for Messrs. Schmidt, Cornett, Krabsen and Kittel represent their actual post-employment compensation as discussed in the CD&A. The post-employment compensation for Messrs. Schmidt, Cornett and Kittel has also been included in the Summary Compensation Table as their termination agreements were effective on or before December 31, 2009. Mr. Krabsen left the Company during 2010, so his post-employment compensation is not included in the Summary Compensation Table.
II-35
POTENTIAL PAYMENTS UPON TERMINATION OR CHANGE IN CONTROL
Named Executive Officer | Description | Salary Continuation During Notice Period $ | Lump Sum Payment $ | Retirement, Medical & Company Car Continuation $ | PTO Accrual Payout $ | Outplacement Services $ | Total Paid To NEO $ | Accelerated Vesting Of Performance Units $ | ||||||||||||||||
|---|---|---|---|---|---|---|---|---|---|---|---|---|---|---|---|---|---|---|---|---|---|---|---|---|
Sven Ruder | Termination Upon Death | 265,895 | 0 | 0 | 0 | 0 | 265,895 | N/A | ||||||||||||||||
| Termination Without Cause/ | 1,063,580 | 0 | 0 | 0 | 27,806 | 1,091,386 | N/A | |||||||||||||||||
| For Good Reason | ||||||||||||||||||||||||
| Termination Following | 1,063,580 | 0 | 0 | 0 | 27,806 | 1,091,386 | 0 | |||||||||||||||||
| Change of Control | ||||||||||||||||||||||||
Jesper V. Christensen | Termination Upon Death | 152,933 | 0 | 0 | 0 | 0 | 152,933 | N/A | ||||||||||||||||
| Termination Without Cause/ | 458,799 | 0 | 0 | 0 | 27,806 | 486,605 | N/A | |||||||||||||||||
| For Good Reason | ||||||||||||||||||||||||
| Termination Following | 458,799 | 0 | 0 | 0 | 27,806 | 486,605 | 0 | |||||||||||||||||
| Change of Control | ||||||||||||||||||||||||
Karl J. Schmidt | Actual Post-employment Compensation | 0 | 784,800 | 20,129 | 18,875 | 20,000 | 843,804 | N/A | ||||||||||||||||
Hans J. Cornett | Actual Post-employment Compensation | 204,374 | 145,982 | 8,885 | 0 | 27,806 | 387,047 | N/A | ||||||||||||||||
Henrik Krabsen | Actual Post-employment Compensation | 0 | 421,200 | 22,641 | 28,507 | 20,000 | 492,348 | N/A | ||||||||||||||||
Thomas K. Kittel | Actual Post-employment Compensation | 175,178 | 783,202 | 28,440 | 0 | 27,806 | 1,014,626 | N/A | ||||||||||||||||
Wolfgang Schramm | Termination Upon Death or Disability | 0 | 0 | 17,910 | 0 | 0 | 17,910 | N/A | ||||||||||||||||
| Termination Without Cause/ For Good Reason | 0 | 421,200 | 17,910 | 0 | 20,000 | 459,110 | N/A | |||||||||||||||||
| Termination Following Change of Control | 0 | 421,200 | 28,080 | 0 | 20,000 | 469,280 | 184,077 | |||||||||||||||||
Key Employment Agreement Provisions
In return for the agreement by Sauer-Danfoss to make the other potential post-employment payments as detailed above, the Named Executive Officers agree to certain conduct during the term of their employment and immediately thereafter. Specifically, the Named Executive Officers, by signing the Employment Agreements, agree to the following:
- •
- A Covenant Not To Compete with the Company for a period of up to 18 months following any termination of employment
- •
- Non-Disclosure of Company Confidential Information
- •
- Assignment of any and all Development rights on intellectual property conceived of or devised while employed
- •
- Non-Solicitation of Company personnel for a period of up to 18 months following any termination of employment
II-36
Name | Fees Earned or Paid in Cash ($) | Stock Awards(1) ($) | Change in Pension Value and Nonqualified Deferred Compensation Earnings(2) ($) | All Other Compensation ($) | Total ($) | |||||||||||
|---|---|---|---|---|---|---|---|---|---|---|---|---|---|---|---|---|
Jørgen M. Clausen | 84,000 | 10,110 | 0 | 0 | 94,110 | |||||||||||
Sven Murmann | 64,000 | 10,110 | 0 | 0 | 74,110 | |||||||||||
Steven H. Wood | 57,250 | 10,110 | 5,521 | 0 | 72,881 | |||||||||||
F. Joseph Loughrey | 58,000 | 10,110 | 0 | 0 | 68,110 | |||||||||||
Johannes F. Kirchhoff | 56,500 | 10,110 | 0 | 0 | 66,610 | |||||||||||
Niels B. Christiansen | 44,000 | 10,110 | 0 | 0 | 54,110 | |||||||||||
Kim Fausing | 44,000 | 10,110 | 0 | 0 | 54,110 | |||||||||||
Bill Hoover | 43,250 | 10,110 | 0 | 0 | 53,360 | |||||||||||
Frederik Lotz | 33,750 | 10,110 | 0 | 0 | 43,860 | |||||||||||
Per Have | 1,500 | 0 | 0 | 0 | 1,500 | |||||||||||
Footnotes To Director Compensation Table
- (1)
- These amounts represent the grant date fair value of restricted shares issued to the non-employee directors during the calendar year 2009. Information concerning the Company's accounting for restricted stock under FAS 123R can be found in footnote number 13 to its consolidated financial statements filed as part of its Form 10-K for the year ended December 31, 2009.
At December 31, 2009 Messrs. Clausen, Murmann, Wood, Loughrey and Kirchhoff each held 4,500 shares of unvested restricted stock. At December 31, 2009 Messrs. Christiansen, Fausing and Hoover each held 3,000 shares of unvested restricted stock.
On June 1, 2009, 1,500 previously restricted shares vested and became unrestricted for Messrs. Clausen, Murmann, Wood, Loughrey and Kirchhoff.
- (2)
- Mr. Wood participates in the Sauer-Danfoss Inc. 409A Deferred Compensation Plan for Selected Employees and U.S. Non-employee Directors. In 2009 he elected to defer 75% of the fees reflected under Fees Earned or Paid in Cash in this table. The amount reported under Change in Pension Value and Nonqualified Deferred Compensation Earnings reflects above-market earnings on his deferred director fees, using 120% of the applicable federal long-term rate as the basis for market earnings.
DIRECTOR COMPENSATION NARRATIVE
During 2009, non-employee directors earned cash-based director's fees according to the following schedule, effective January 1, 2009:
- •
- As Chairman, Mr. Clausen receives a retainer of $75,000 per year
- •
- As Vice Chairman, Mr. Murmann receives a retainer of $55,000 per year
- •
- All other non-employee directors receive retainers of $35,000 per year
- •
- All non-employee directors receive $1,500 for each Board meeting attended
- •
- All non-employee directors receive $750 for participation in a telephonic meeting
- •
- Non-employee directors receive an annual retainer of $7,000 for service on the Compensation Committee and $7,000 for service on the Audit Committee. Messrs. Kirchhoff, Loughrey and Wood serve on both the Audit Committee and the Compensation Committee.
II-37
Non-employee directors receive an annual grant of restricted shares of Sauer-Danfoss Inc. common stock under the Company's Non-Employee Director Stock Option and Restricted Stock Plan. The terms of each restricted share grant can vary in accordance with the plan document. For the past several years the annual grants have consisted of 1,500 shares with a three-year vesting period. The restricted shares are forfeitable upon termination of service from the Board for any reason prior to the vesting date, unless otherwise determined by the Board, in its sole discretion. The restricted shares provide for voting and dividend rights during the period of restriction.
U.S. non-employee directors can elect to defer a portion of their cash-based director's fees by participating in the Sauer-Danfoss Inc. 409A Deferred Compensation Plan for Selected Employees and U.S. Non-Employee Directors. The terms of such deferral are similar to those made available to Sauer-Danfoss employees and have been described previously in the Nonqualified Deferred Compensation Narrative.
Mr. David J. Anderson, former President and Chief Executive Officer of the Company, served as Co-Vice Chairman of the Board, in a non-voting capacity, from January 1, 2009 through June 11, 2009, the date of the 2009 annual shareholders meeting. Mr. Anderson received $22,000 in compensation during 2009 for such service.
Mr. Ruder serves as the sole employee member of the Board and is not entitled to any compensation for such service. At December 31, 2009, Mr. Ruder held 1,500 shares of unvested, restricted stock that had been granted to him during 2008 in his previous capacity as a non-employee director.
In April 2010, the Board of Directors of the Company authorized the accelerated vesting of all outstanding restricted shares in light of the pending tender offer for all of the Company's outstanding shares from Danfoss A/S and Danfoss Acquisition, Inc.
At its regular meeting on June 11, 2010, the Board of Directors approved the following cash compensation levels for non-employee directors with such changes to take effect on July 1, 2010:
- •
- The Chairman will receive a quarterly retainer of $25,000
- •
- The Vice Chairman, if any, will receive a quarterly retainer of $18,750
- •
- All other non-employee directors will receive a quarterly retainer of $10,000
- •
- All non-employee directors will receive a fee of $1,500 for each Board meeting attended in person, but no such fees will be paid for attending committee meetings
- •
- All non-employee directors will receive a fee of $750 for each telephonic meeting of the Board attended, but no such fees will be paid for attending telephonic committee meetings
- •
- Non-employee directors will receive a quarterly retainer of $1,750 for service on the Compensation Committee and $2,750 for service on the Audit Committee.
II-38
The Board of Directors of the Company (the "Board") has nominated ten directors for election. All directors are elected annually.
If elected, each of the nominees will serve until the 2011 Annual Meeting and until a successor has been elected and qualified, or until such director's earlier death, resignation, or removal.
Each share is entitled to one vote for each of ten directors. The persons named in the accompanying proxy will vote it for the election of the nominees named below as directors unless otherwise directed by the stockholder. Each nominee has consented to be named and to serve if elected. In the unanticipated event that a nominee becomes unavailable for election for any reason, the proxies will be voted for the other nominees and for any substitute.
Nominees to Serve for Directors
Niels B. Christiansen, age 44, has been a director of the Company since July 10, 2008 and presently serves as Vice Chairman of the Board. Mr. Christiansen was appointed President and Chief Executive Officer of Danfoss A/S on October 1, 2008. Prior to that, he had been Vice Chief Executive Officer of Danfoss A/S since November 15, 2006. From November 15, 2006 through December 31, 2007, he also served as Chief Operating Officer of Danfoss A/S. From November 1, 2004 through November 14, 2006, he served as Executive Vice President and Chief Operating Officer of Danfoss A/S. From January 1, 2003 through September 30, 2004, Mr. Christiansen was an Executive Vice President at GN Store Nord A/S, a Danish developer of telecommunications networking and hand-held communications solutions. From January 1, 2000 through September 30, 2004, he was President and Chief Executive Officer of GN Netcom A/S, a Danish subsidiary of GN Store Nord A/S.
Mr. Christiansen is a member of the Executive Committee of Danfoss A/S; serves as the Chairman of the Board of Directors of Axcel A/S, a Danish private equity fund; and serves on the Boards of Directors of TrygVesta A/S, a publicly traded Danish insurance company, B&O a/s, a publicly traded Danish manufacturer of audio and video products, and William Demant Holding A/S, a publicly traded Danish manufacturer of audio products.
Mr. Christiansen's position as the Chief Executive Officer of Danfoss A/S, the Company's majority stockholder, and the financial and managerial expertise he has gained as an executive officer and a director of several publicly and privately held companies make him a valuable member of the Company's Board of Directors.
Jørgen M. Clausen, age 61, has been a director of the Company since May 3, 2000, Chairman of the Company since May 5, 2004, and prior to that served as Vice Chairman of the Company from 2000 to 2004. Mr. Clausen served as President and Chief Executive Officer of Danfoss A/S for many years until his retirement in October 2008. He now serves as the Chairman of Danfoss A/S.
Mr. Clausen's ability to represent the interests of the Clausen family, which controls Danfoss A/S, coupled with his extensive experience as the Chief Executive Officer of Danfoss A/S, like the Company a multi-national industrial manufacturing corporation, give him unique insights into risk management, strategic planning, and the overall business of the Company. In addition, Mr. Clausen has direct experience in the hydraulic industry, having served as the Vice President of Danfoss A/S's fluid power division before it was acquired by the Company. All of these factors have contributed to Mr. Clausen's nomination to the Company's Board of Directors since 2000.
Kim Fausing, age 45, has been a director of the Company since July 10, 2008. Mr. Fausing has been Executive Vice President and Chief Operating Officer of Danfoss A/S since January 2008. In 2007, Mr. Fausing became a divisional president of Danfoss A/S, having previously worked at Hilti Corporation, a privately owned manufacturer of construction and engineering products, from 1990 through 2007. He
II-39
served as Hilti's President in Japan and Managing Director from 2000 through 2003, and as a Division President and Member of its Executive Committee from 2003 through 2007. In 2010, Mr. Fausing became a member of the Boards of Directors of Hilti and Velux A/S, a privately owned Danish manufacturer of windows and skylights.
Mr. Fausing brings a wealth of executive and managerial experience to the Board of Directors as a result of his work with Hilti Corporation and Danfoss A/S and his service on the Hilti and Velux Boards of Directors.
Richard J. Freeland,age 53, is the President—Engine Business of Cummins Inc., a position he has held since March 2010. He has been continuously employed by Cummins Inc. in various capacities since 1979. In the last five years at Cummins Inc., Mr. Freeland served as President—Components Division from 2008 through March 2010 and Vice President—Distribution Business from 2005 through 2008.
Mr. Freeland was selected as a nominee for the Board because of his experience in leading global industrial businesses gained as a senior executive at Cummins Inc. including working with customers and in countries closely related to the Sauer-Danfoss business.
Per Have, age 53, became a director of the Company on November 9, 2009. Mr. Have was appointed Chief Financial Officer of Danfoss A/S on September 30, 2009. He has served as President of the Bitten and Mads Clausen Foundation, the controlling shareholder of Danfoss A/S, since 2007. From 2006 through 2007, Mr. Have was Senior Vice President, Refrigeration & Air Conditioning Division of Danfoss A/S. From 2002 through 2005, he served as Vice President, Corporate Finance, of Danfoss A/S. He was employed by the Company as its Vice President, Global Supply Chain and IT, from 2000 through 2002.
The Board of Directors expects Mr. Have's financial expertise and professional experience, as well as his position as President of the Bitten and Mads Clausen Foundation, to contribute strongly to the Board's strategic, financial, and risk oversight functions.
William E. Hoover, Jr., age 60, has been a director of the Company since July 10, 2008. Mr. Hoover worked for McKinsey & Co., a management consulting firm, for approximately 30 years until July 2007, when he retired from the position of senior director. Mr. Hoover serves on the Boards of Directors of Danfoss A/S; GN Great Nordic, a Danish manufacturer of hearing instruments that is listed on the Copenhagen Stock Exchange; NorthStar Battery, a privately owned firm that makes batteries for mobile base stations; and Skykon A/S, a privately held Danish firm that makes towers for windmills.
Mr. Hoover's skills and experience developed over decades of work in the management consulting field following his graduation from the Harvard Business School in 1977 bring strength and depth to the Board, especially in the area of strategic development.
Johannes F. Kirchhoff, age 52, has been a director of the Company since April 17, 1997. Mr. Kirchhoff has been owner and Managing Director of FAUN Umwelttechnik GmbH & Co. KG, a German manufacturer of vehicles for waste disposal, for more than the past five years. He serves on the Boards of Directors of RITAG Ritterhuder Armaturen GmbH & Co. Armaturenwerk KG, a privately owned German company that produces valves and fittings, and of Fachhochschule Suedwestfalen, a regional German university. He is Chairman of the Compensation Committee of the Company's Board and a member of the Audit Committee of the Board.
As the owner and Managing Director of a privately held manufacturing company with international operations, Mr. Kirchhoff has significant experience in setting compensation, developing and implementing strategic business plans, and evaluating risk, all from the perspective of the long-term financial soundness that is critical for success in a privately held company. This strategic and managerial experience makes Mr. Kirchhoff an important member of the Company's Board.
Sven Ruder, age 53, has been a director of the Company since July 10, 2008. Mr. Ruder became the President and Chief Executive Officer of the Company on January 1, 2009. He served as the President of
II-40
the Motion Controls division of Danfoss A/S from January 2001 through December 2008. Mr. Ruder serves on the Boards of Directors of Danfoss Turbocor Compressors BV, a privately held joint venture between Danfoss A/S and Turbocor BV, and of Danfoss Turbocor Compressors, Inc., a subsidiary of Danfoss Turbocor Compressors BV that is engaged in the manufacture of air conditioning and refrigeration compressors.
As the only member of the Board who is employed as a member of the Company's management, Mr. Ruder brings a unique perspective to the Board. In addition, his extensive managerial experience and expertise, along with his knowledge of the industry in which the Company operates, give him important insights into the Company's operations, its competitive position in the marketplace, and its strategic vision, all of which are invaluable to the Board.
Anders Stahlschmidt, age 43, has served as General Counsel of Danfoss A/S for more than the last five years. He was selected as a nominee for the Board because of his experience as General Counsel of Danfoss A/S and the analytical skills and sound judgment he has developed over the course of his legal career.
Steven H. Wood, age 52, has been a director of the Company since January 1, 2003. Mr. Wood is currently the Chief Financial Officer of Becker-Underwood, Inc., a supplier of non-pesticide specialty chemical and biological products within the agricultural, landscape, turf, and horticulture industries. He was formerly Vice President and Corporate Controller for Metaldyne Corporation, a global designer and supplier of metal-based components, assemblies and modules for the automotive industry, from May 2004 until May 2006. From 2000 until 2003, he was the Executive Vice President and Chief Financial Officer of Maytag Corporation, and from 1996 to 2000 he was Vice President-Financial Reporting and Audit of Maytag. Mr. Wood held various other financial leadership positions within Maytag from 1989 to 1996. Prior to joining Maytag, he was an auditor for nine years with Ernst & Young, a public accounting firm, and successfully completed the examination for Certified Public Accountants. He is Chairman of the Audit Committee and a member of the Compensation Committee of the Board.
Mr. Wood was originally selected as a director, and continues to be a valued member of the Board, due to his financial expertise and his strong background in managing and overseeing the financial operations of other publicly traded companies.
The Board recommends that stockholders vote FOR the election of the nominees named above as directors.
II-41
ITEM 2—RATIFICATION OF APPOINTMENT OF
INDEPENDENT REGISTERED PUBLIC ACCOUNTING FIRM
The Audit Committee of the Board has appointed KPMG LLP as the independent registered public accounting firm to audit the consolidated financial statements of the Company and its subsidiaries for 2010, subject to ratification of the stockholders at the Annual Meeting. A representative of KPMG LLP is expected to be present at the Annual Meeting and will have the opportunity to make a statement and to respond to appropriate questions at the meeting. The affirmative vote of a majority of the shares present and entitled to vote on this item at the Annual Meeting is necessary for the approval of the appointment of KPMG LLP as the Company's independent registered public accounting firm for 2010. In the event stockholders do not ratify the appointment of KPMG LLP, the appointment will be reconsidered by the Audit Committee. Even if the selection is ratified, the Audit Committee in its discretion may direct the appointment of a different independent registered public accounting firm at anytime during the year if they determine that such a change would be in the best interests of the Company and its stockholders.
Fees to Independent Registered Public Accounting Firm for 2009 and 2008
The following table presents fees for professional services rendered by KPMG LLP for the audit of the Company's Annual Financial Statements for the years ended December 31, 2009 and 2008 and fees billed for other services rendered by KPMG LLP during those periods:
| | 2009 | 2008 | |||||
|---|---|---|---|---|---|---|---|
Audit Fees | $ | 1,405,000 | $ | 2,373,000 | |||
Audit Related Fees(1) | 58,000 | 42,000 | |||||
Tax Fees(2) | 257,000 | 296,000 | |||||
All Other Fees | 0 | 0 | |||||
- (1)
- Consists principally of statutory accounting consultations.
- (2)
- Consists of international and U.S. tax planning and compliance services, and expatriate tax services.
Policy Regarding Pre-Approval of Audit and Non-Audit Services of Independent Registered Public Accounting Firm
The Audit Committee's policy is to pre-approve all audit and non-audit services provided by the independent registered public accounting firm. These services may include audit services, audit related services, tax services and other services that are not prohibited from being provided by the independent registered public accounting firm by the Sarbanes-Oxley Act of 2002 or rules issued thereunder ("Permitted Services"). Pre-approval is granted on an annual basis, generally at the first meeting of the Audit Committee held during each year, and any pre-approval shall be detailed as much as possible as to the particular service or category of services and shall generally be subject to a specific budget. The Committee may delegate pre-approval authority to one or more of its members with respect to Permitted Services when expedition of services is necessary, and has delegated such pre-approval authority to its Chairman. The independent registered public accounting firm and management are required to periodically report to the full Audit Committee (generally at each regular quarterly meeting of the Audit Committee, but the Audit Committee may request a report at any time), regarding the extent of services provided by the independent registered public accounting firm in accordance with any pre-approval, and the fees for the services performed to date. All audit fees, audit related fees, tax fees and other fees paid in 2009 and 2008 were pre-approved by the Audit Committee.
The Board recommends that stockholders vote FOR ratification of the appointment of KPMG LLP as the Company's independent registered public accounting firm for 2010.
II-42
Notice Requirements
To permit the Company and its stockholders to deal with stockholder proposals in an informed and orderly manner, the Bylaws of the Company establish an advance notice procedure. No stockholder proposals, nominations for the election of directors or other business may be brought before an annual meeting unless written notice of such proposal or other business is received by the Secretary of the Company at 2800 E. 13th Street, Ames, Iowa 50010 not less than 120 calendar days in advance of the date that the Company's proxy statement was released to stockholders in connection with the previous year's Annual Meeting. For the Company's annual meeting in the year 2011, the Company must receive this notice on or before April 19, 2011 (i.e., 120 days before August 17, the day this year's proxy statement was released to stockholders). To comply with the Company's Bylaws and applicable rules and regulations of the Securities and Exchange Commission, the notice must contain certain specified information about the matters to be brought before the meeting and about the stockholder submitting the proposal. A copy of the applicable Bylaw provisions may be obtained, without charge, upon written request to the Secretary of the Company at 2800 E. 13th Street, Ames, Iowa 50010.
Discretionary Authority
If any other matters are properly presented at the Annual Meeting for consideration, including, among other things, consideration of a motion to adjourn the Annual Meeting to another time or place, the persons named as proxies and acting thereunder will have discretion to vote on those matters to the same extent as the person delivering the proxy would be entitled to vote. If any other matter is properly brought before the Annual Meeting, proxies in the enclosed form returned to the Company prior to the Annual Meeting will be voted in accordance with the recommendation of the Board or, in the absence of such a recommendation, in accordance with the judgment of the proxy holder. At the date this Proxy Statement went to print, the Company did not anticipate that any other matters would be properly brought before the Annual Meeting.
Section 16(a) Beneficial Ownership Reporting Compliance
Based solely upon a review of Forms 3, 4 and 5 furnished to the Company pursuant to Section 16(a) of the Securities Exchange Act of 1934 with respect to the fiscal year ended December 31, 2009, the Company believes that all of such reports required to be filed during such fiscal year by the Company's officers, directors and 10% beneficial owners were timely filed.
Form 10-K
The Company will mail without charge, upon written request, a copy of its Annual Report on Form 10-K (together with Amendment No. 1 thereto) filed with the Securities and Exchange Commission, including the financial statements, schedules, and list of exhibits. Requests should be sent to Kenneth D. McCuskey, Corporate Secretary, at 2800 E. 13th Street, Ames, Iowa 50010.
| By Order of the Board of Directors | ||
| ||
Kenneth D. McCuskey Corporate Secretary |
August 17, 2010
II-43
SAUER-DANFOSS INC.
2009 ANNUAL REPORT
Business
Sauer-Danfoss Inc. (the "Company") (NYSE: SHS) is a global leader in the development, manufacture and marketing of advanced systems for the distribution and control of power in mobile equipment. The Company designs, manufactures, and markets hydraulic, electronic, electric, mechanical components, software, and integrated systems that generate, transmit, and control power in mobile equipment for sale to manufacturers of highly engineered, off-road vehicles used for agriculture, construction, road building, turf care, material handling, and specialty vehicles. The Company engineers advanced components and systems to enable its customers to produce highly reliable, efficient and innovative mobile equipment vehicles.
The composition of the Company's business among its three segments was 52.9% Propel, 23.7% Work Function, and 23.4% Controls as of December 31, 2009. Propel segment products include hydrostatic transmissions, gear boxes, orbital motors, and integrated hydrostatic transaxles. Work Function segment products include steering units, gear pumps and motors, multi-pump assemblies, open circuit pumps, and gear boxes. Controls segment products include a complete line of valves, microcontrollers, solenoid-operated valves, joysticks, speed and positions sensors, grade and slope sensors, and electric drives. All of the segments' products are sold into each of the Company's markets either directly to original equipment manufacturers ("OEMs") or through distributors to OEMs and the aftermarket.
NYSE Price Range, Dividends by Quarter
| | | 1st | 2nd | 3rd | 4th | Full Year | ||||||||||||
|---|---|---|---|---|---|---|---|---|---|---|---|---|---|---|---|---|---|---|
| 2009 | High | $ | 10.13 | $ | 7.08 | $ | 8.19 | $ | 12.68 | $ | 12.68 | |||||||
| Low | $ | 2.43 | $ | 2.37 | $ | 4.50 | $ | 6.71 | $ | 2.37 | ||||||||
| Dividends | $ | 0.00 | $ | 0.00 | $ | 0.00 | $ | 0.00 | $ | 0.00 | ||||||||
2008 | High | $ | 25.41 | $ | 37.93 | $ | 35.10 | $ | 24.75 | $ | 37.93 | |||||||
| Low | $ | 17.68 | $ | 22.23 | $ | 22.63 | $ | 5.52 | $ | 5.52 | ||||||||
| Dividends | $ | 0.18 | $ | 0.18 | $ | 0.18 | $ | 0.18 | $ | 0.72 | ||||||||
III-1
The following graph shows a comparison of the cumulative total returns from December 31, 2004 to December 31, 2009, for the Company, the Russell 2000 Index and the Hemscott, Inc.—Diversified Machinery Index ("Hemscott Group Index"). The graph assumes that $100 was invested on December 31, 2004 in the Company's common stock, the Russell 2000 Index and the Hemscott Group Index, a peer group index, and that all dividends were reinvested.
COMPARISON OF 5-YEAR CUMULATIVE TOTAL RETURN
AMONG SAUER-DANFOSS INC.,
RUSSELL 2000 INDEX AND HEMSCOTT GROUP INDEX
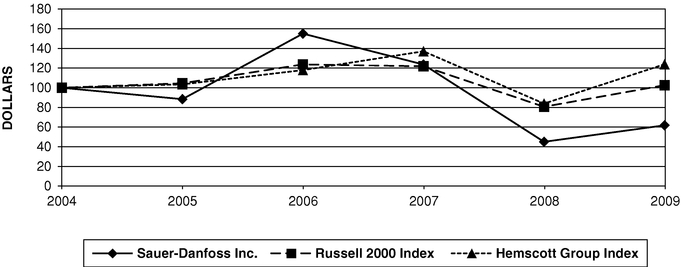
ASSUMES $100 INVESTED ON 12/31/04
ASSUMES DIVIDEND REINVESTMENT
FISCAL YEAR ENDING 12/31/09
III-2
Management's Discussion and Analysis of Financial Condition and Results of Operations.
Safe Harbor Statement
This Management's Discussion and Analysis of Financial Condition and Results of Operations, as well as other portions of this annual report on Form 10-K, contain certain statements that constitute "forward-looking statements" within the meaning of the Private Securities Litigation Reform Act of 1995. Forward-looking statements provide current expectations of future events based on certain assumptions and include any statement that does not directly relate to any historical or current fact. All statements regarding future performance, growth, sales and earnings projections, conditions or developments are forward-looking statements. Words such as "anticipates," "in the opinion," "believes," "intends," "expects," "may," "will," "should," "could," "plans," "forecasts," "estimates," "predicts," "projects," "potential," "continue," and similar expressions may be intended to identify forward-looking statements.
Actual future results may differ materially from those described in the forward-looking statements due to a variety of factors. Readers should bear in mind that past experience may not be a good guide to anticipating actual future results. Throughout 2009 the economies in the U.S., Europe, and Asia-Pacific suffered from the global recession and credit crisis, weakness in the housing and residential construction markets, weakness in the commercial and public-sector construction markets, job losses, and uncertainty surrounding the effects of government fiscal stimulus plans, interest rates, and crude oil prices. A prolonged downturn in the Company's business segments could adversely affect the Company's revenues and results of operations. Other factors affecting forward-looking statements include, but are not limited to, the following: specific economic conditions in the agriculture, construction, road building, turf care, material handling and specialty vehicle markets and the impact of such conditions on the Company's customers in such markets; the cyclical nature of some of the Company's businesses; the ability of the Company to win new programs and maintain existing programs with its original equipment manufacturer (OEM) customers; the highly competitive nature of the markets for the Company's products as well as pricing pressures that may result from such competitive conditions; the continued operation and viability of the Company's significant customers; the Company's execution of internal performance plans; difficulties or delays in manufacturing; the effectiveness of the Company's cost-reduction and productivity improvement efforts; competing technologies and difficulties entering new markets, both domestic and foreign; changes in the Company's product mix; future levels of indebtedness and capital spending; the ability and willingness of Danfoss A/S, the Company's majority stockholder, to lend money to the Company at sufficient levels and on terms favorable enough to enable the Company to meet its capital needs; the Company's ability to access the capital markets or traditional credit sources to supplement or replace the Company's borrowings from Danfoss A/S if the need should arise; the Company's ability over time to reduce the relative level of debt compared to equity on its balance sheet; claims, including, without limitation, warranty claims, field recall claims, product liability claims, charges or dispute resolutions; ability of suppliers to provide materials as needed and the Company's ability to recover any price increases for materials in product pricing; the Company's ability to attract and retain key technical and other personnel; labor relations; the failure of customers to make timely payment, especially in light of the current credit crisis; any inadequacy of the Company's intellectual property protection or the potential for third-party claims of infringement; global economic factors, including currency exchange rates; credit market disruptions and significant changes in capital market liquidity and funding costs affecting the Company and its customers; general economic conditions, including interest rates, the rate of inflation, and commercial and consumer confidence; energy prices; the impact of new or changed tax and other legislation and regulations in jurisdictions in which the Company and its affiliates operate; actions by the U.S. Federal Reserve Board and the central banks of other nations; actions by other regulatory agencies, including those taken in response to the global credit crisis; actions by rating agencies; changes in accounting standards; worldwide political stability; the effects of terrorist activities and resulting political or economic instability; natural catastrophes; U.S. military action overseas; and the effect of acquisitions, divestitures, restructurings, product withdrawals, and other unusual events.
III-3
The Company cautions the reader that this list of cautionary statements and risk factors is not exhaustive. The Company expressly disclaims any obligation or undertaking to release publicly any updates or changes to these forward-looking statements to reflect future events or circumstances.
About the Company
Sauer-Danfoss Inc. and subsidiaries (the Company) is a worldwide leader in the design, manufacture, and sale of engineered hydraulic and electronic systems and components that generate, transmit and control power in mobile equipment. The Company's products are used by original equipment manufacturers (OEMs) of mobile equipment, including construction, road building, agricultural, turf care, material handling, and specialty equipment. The Company designs, manufactures, and markets its products in the Americas, Europe, and the Asia-Pacific region, and markets its products throughout the rest of the world either directly or through distributors.
Executive Summary of 2009 Compared to 2008
The nature of the Company's operations as a global producer and supplier in the fluid power industry means the Company is impacted by changes in local economies, including currency exchange rate fluctuations. In order to gain a better understanding of the Company's base results, a financial statement user needs to understand the impact of those currency exchange rate fluctuations. The following table summarizes the change in the Company's results from operations by separately identifying changes due to currency fluctuations and the underlying change in operations from 2008 to 2009. This analysis is more consistent with how the Company's management internally evaluates results.
(in millions) | 2008 | Currency fluctuations | Underlying change | 2009 | ||||||||||
|---|---|---|---|---|---|---|---|---|---|---|---|---|---|---|
Net Sales | $ | 2,090.5 | $ | (36.1 | ) | $ | (895.4 | ) | $ | 1,159.0 | ||||
Gross Profit | 435.6 | (4.2 | ) | (303.5 | ) | 127.9 | ||||||||
% of Net Sales | 20.8 | % | 11.0 | % | ||||||||||
Selling, general and administrative | 258.5 | (8.4 | ) | (40.4 | ) | 209.7 | ||||||||
Research and development | 82.9 | (2.3 | ) | (19.2 | ) | 61.4 | ||||||||
Impairment charges | 58.2 | — | (7.4 | ) | 50.8 | |||||||||
Loss on sale of businesses and asset disposals | 9.6 | 0.1 | 6.7 | 16.4 | ||||||||||
Total operating costs | 409.2 | (10.6 | ) | (60.3 | ) | 338.3 | ||||||||
Operating income (loss) | 26.4 | 6.4 | (243.2 | ) | (210.4 | ) | ||||||||
% of Net Sales | 1.3 | % | (18.2 | )% | ||||||||||
Interest expense, net | (24.6 | ) | 1.3 | (25.1 | ) | (48.4 | ) | |||||||
Loss on early retirement of debt | — | — | (15.8 | ) | (15.8 | ) | ||||||||
Other, net | 0.9 | 0.1 | 2.3 | 3.3 | ||||||||||
Income (loss) before income taxes | 2.7 | 7.8 | (281.8 | ) | (271.3 | ) | ||||||||
% of Net Sales | 0.1 | % | (23.4 | )% | ||||||||||
Income tax expense | (14.0 | ) | 0.6 | (47.6 | ) | (61.0 | ) | |||||||
Net income (loss) | (11.3 | ) | 8.4 | (329.4 | ) | (332.3 | ) | |||||||
Net income (loss) attributable to noncontrolling interest, net of tax | (17.8 | ) | — | 4.3 | (13.5 | ) | ||||||||
Net income (loss) attributable to Sauer-Danfoss Inc. | $ | (29.1 | ) | $ | 8.4 | $ | (325.1 | ) | $ | (345.8 | ) | |||
Net sales for the year ended December 31, 2009 decreased 43 percent compared to the year ended December 31, 2008, excluding the effects of currency. Net sales decreased in all regions and segments. Excluding the impacts of currency, sales declined 48 percent in Europe, 42 percent in the Americas and
III-4
27 percent in Asia-Pacific. Sales in the Work Function segment decreased by 49 percent, sales in the Controls segment were down 44 percent, followed by a reduction of 39 percent in the Propel segment.
Gross profit declined 70 percent during the year ended December 31, 2009, excluding the impact of currency. This decline was primarily driven by reduced sales volume. Other contributing factors included inventory valuation allowances of $13.8 million, accelerated depreciation of $4.0 million, and restructuring charges of $5.8 million related to the closure of the Hillsboro, Oregon; Lawrence, Kansas; and Odense, Denmark locations.
Selling, general and administrative costs decreased 16 percent during 2009 when compared to the same period in 2008, excluding the effects of currency. This decrease is primarily due to cost reduction efforts taken as a result of the economic downturn, as well as a reduction in costs of $6.6 million related to the implementation of a common business system. Offsetting these cost reductions were severance costs of $18.2 million and $4.5 million of restructuring costs related to the closure of the Hillsboro location and the exit from the electric drives business in 2009, compared to similar costs of $4.9 million in 2008. Research and development costs decreased 23 percent excluding the effects of currency due to cost reduction efforts.
The Company reported goodwill impairment charges of $50.8 million during the first quarter of 2009 related to the valves reporting unit within the Controls segment. In 2008 the Company reported impairment charges of $58.2 million, consisting of $22.9 million of goodwill impairment, and property, plant and equipment impairment of $35.3 million. The goodwill impairment related to the motors and steering reporting units within the Work Function segment and the electric drives reporting unit within the Controls segment. The impairment charges were incurred as a result of lower profitability in the reporting units than the Company had previously expected, and lower future expectations in certain end markets. The property, plant and equipment impairment related to the Work Function segment and resulted from lower earnings expectations related to the products produced within the asset group.
During the year ended December 31, 2009 the Company sold its alternating current (AC) electric motor business for the material handling market. In connection with this transaction the Company incurred charges of $6.3 million during 2009 and $8.4 million in 2008. In addition, during 2009 the Company incurred a loss of $2.7 million on the sale of its steering column business in Kolding, Denmark. These activities were part of the Company's plan to divest of product lines that do not fit the Company's long-term strategic direction. During the year ended December 31, 2008, the Propel segment recorded a gain of $1.4 million related to the sale of the LaSalle, Illinois plant.
The Company refinanced various credit agreements during 2009, which resulted in higher interest rates and an increase to interest expense of $25.1 million over 2008. This also resulted in a $15.8 million loss on early retirement of debt in 2009.
Operating Results—2009 Compared to 2008
Sales Growth by Market
The following table summarizes the Company's sales growth by market. The table and following discussion is on a comparable basis, which excludes the effects of currency fluctuations.
| | Americas | Asia-Pacific | Europe | Total | |||||||||
|---|---|---|---|---|---|---|---|---|---|---|---|---|---|
Agriculture/Turf Care | (24 | )% | (24 | )% | (31 | )% | (26 | )% | |||||
Construction/Road Building | (58 | ) | (36 | ) | (66 | ) | (57 | ) | |||||
Specialty | (71 | ) | (15 | ) | (51 | ) | (53 | ) | |||||
Distribution | (46 | ) | (25 | ) | (39 | ) | (39 | ) | |||||
III-5
Agriculture/Turf Care
Sales into the agriculture/turf care market decreased in all regions during the year ended December 31, 2009 compared to 2008. Sales into the agriculture market in the Americas remained strong during the first quarter, then declined sharply as commodity prices began a downward trend and customers focused on inventory reduction. Commodity prices began to stabilize during the fourth quarter, while the Brazilian market showed improvement during the second half of the year compared to the first and second quarters. The European agriculture market continued to decline due to falling commodity prices and the worldwide economic crisis. Turf care sales continue to suffer from depressed housing markets and reduced consumer spending. The Asia-Pacific region contributes less than 5 percent of the sales in the agriculture/turf care market, and therefore does not significantly impact the total.
Construction/Road Building
Construction /road building sales were down in all regions during the year ended December 31, 2009 compared to 2008. The sales decline was due to poor economic conditions worldwide, depressed housing and non-residential construction markets, and customers' focus on reducing inventory levels. Non-residential construction slowed rapidly in the Americas, and state government budget problems caused road building to remain at extraordinarily low levels. The Asia-Pacific region experienced strong sales in China due to government stimulus programs and strong demand for mixers. However, this was more than offset by reduced sales in Japan, which depends heavily on export markets.
Specialty
Specialty vehicles are comprised of a variety of markets including forestry, material handling, marine, waste management and waste recycling. Overall sales into the specialty vehicle market decreased 53 percent compared to 2008. Material handling sales were down across all regions due to poor economic conditions worldwide and severely depressed non-residential construction markets. Offsetting the reduced material handling sales in the Asia-Pacific region was an increase in specialty sales in China due to investments made by the Chinese government, as well as increased sales related to the carrier business for railroad construction. The divestiture of the electric drives business also had a negative impact on sales in Europe and Asia-Pacific.
Distribution
Products related to all of the above markets are sold to distributors, who then serve smaller OEMs.
III-6
Order Backlog
The following table shows the Company's order backlog and orders written activity for 2008 and 2009, separately identifying the impact of currency fluctuations.
| (in millions) | 2008 | Currency fluctuation | Underlying change | 2009 | |||||||||
|---|---|---|---|---|---|---|---|---|---|---|---|---|---|
Backlog at December 31 | $ | 743.7 | $ | 9.8 | $ | (244.0 | ) | $ | 509.5 | ||||
Orders written | 1,927.7 | (24.9 | ) | (989.5 | ) | 913.3 | |||||||
Total order backlog at the end of 2009 was $509.5 million, compared to $743.7 million at the end of 2008. On a comparable basis, excluding the impact of currency fluctuation, order backlog decreased 33 percent compared to 2008. New sales orders written for 2009 were $913.3 million, a decrease of 51 percent compared to 2008, excluding the impact of currency fluctuations. The decrease in backlog and order entry is due to the global recession.
Business Segment Results
The following discussion of operating results by reportable segment relates to information as presented in Note 17 in the Notes to Consolidated Financial Statements. Segment income is defined as the respective segment's portion of the total Company's net income, excluding net interest expense, income taxes, noncontrolling interest, and global service expenses. Propel products include hydrostatic transmissions and related products that transmit the power from the engine to the wheel to propel a vehicle. Work Function products include steering motors as well as gear pumps and motors that transmit power for the work functions of the vehicle. Controls products include electrohydraulic controls, microprocessors, electric drives and valves that control and direct the power of a vehicle.
The following table provides a summary of each segment's net sales and segment income, separately identifying the impact of currency fluctuations during the year.
| (in millions) | 2008 | Currency fluctuation | Underlying change | 2009 | ||||||||||
|---|---|---|---|---|---|---|---|---|---|---|---|---|---|---|
Net sales | ||||||||||||||
Propel | $ | 1,016.6 | $ | (7.5 | ) | $ | (395.7 | ) | $ | 613.4 | ||||
Work Function | 561.4 | (14.1 | ) | (272.6 | ) | 274.7 | ||||||||
Controls | 512.5 | (14.5 | ) | (227.1 | ) | 270.9 | ||||||||
Segment income (loss) | ||||||||||||||
Propel | $ | 156.8 | $ | 1.1 | $ | (157.9 | ) | $ | 0.0 | |||||
Work Function | (65.7 | ) | 4.4 | (20.6 | ) | (81.9 | ) | |||||||
Controls | (21.4 | ) | 2.5 | (82.2 | ) | (101.1 | ) | |||||||
Global Services and other expenses, net | (42.4 | ) | (0.1 | ) | 18.6 | (23.9 | ) | |||||||
Propel Segment
The Propel segment experienced a 39 percent decrease in sales, excluding the effects of currency fluctuations, during 2009 due to weak global economic conditions. The Propel segment experienced an 11 percentage point decrease in operating profit margin in 2009 compared to 2008 mainly due to reduced sales volume resulting in less absorption of fixed production costs, as well as additional inventory reserves of $8.3 million and accelerated depreciation of $3.4 million due to changing the production location of a product line. Contributing to the reduction in segment income was a $12.7 million increase in severance costs over 2008, an increase in field recall costs of $6.6 million, and a loss on disposal of fixed assets of $3.1 million. Operating expenses were reduced by $19.7 million due to a focus on reducing costs and lower payroll costs as a result of headcount reductions. In addition, in 2008 the Propel segment recognized a gain on sale of a building of $1.4 million.
III-7
Work Function Segment
Sales in the Work Function segment decreased 49 percent in 2009 compared to 2008, excluding the effects of currency fluctuations, due to weak global economic conditions. The reduction in segment income of $20.6 million, excluding the effects of currency fluctuations, was driven by reduced sales, restructuring costs of $3.7 million related to the closure of the Lawrence, Kansas facility, $2.7 million related to the sale of the steering column business in Kolding, Denmark, and an increase in severance costs of $1.7 million over 2008 due to headcount reductions related to lower sales. Offsetting the impact of these items in the year-over-year comparison was a reduction in expedited freight costs of $8.4 million, reduced depreciation of $4.4 million due to the impairment of long-lived assets at December 31, 2008, and a reduction in total operating expenses of $18.7 million. In 2008 the Work Function segment recognized impairment charges of $17.4 million and $35.3 million, for goodwill and property, plant and equipment, respectively.
Controls Segment
Net sales in the Controls segment decreased 44 percent from 2008, excluding the effects of currency fluctuations, due to weak global economic conditions. Segment income decreased $82.2 million during 2009 due to decreased sales levels, a goodwill impairment charge of $50.8 million related to the valves reporting unit, and an increase to employee severance costs of $2.2 million compared to 2008. In addition, costs of $6.3 million related to the alternating current (AC) product line, which was sold in the second quarter of 2009, and restructuring costs of $8.7 million related to the closure of the Hillsboro, Oregon facility and the exit of the electric drives business were recognized in 2009. Excluding the restructuring and severance costs, operating expenses were reduced by $22.5 million. Also, in 2008 the Controls segment recognized goodwill impairment charges of $5.5 million.
Global Services and other expenses, net
Segment costs in Global Services and other expenses, net, relate to internal global service departments, along with the operating costs of the Company's executive office. Global services include such costs as consulting for special projects, tax and accounting fees paid to outside third parties, internal audit, certain insurance premiums, and the amortization of intangible assets from certain business combinations. Global services and other expenses decreased $18.6 million, or 44 percent excluding the impacts of currency. This was partially due to fact that 2008 costs included $1.6 million for an acquisition that was not consummated and $6.6 million associated with the implementation of a common business system. In 2009 the Company recognized a $4.4 million gain of foreign currency transactions in 2009 compared to a $1.0 million gain in 2008.
Income Taxes
The Company incurred income tax expense of $61.0 million on a loss of $271.2 million in 2009.
In 2009 the Company recorded $50.8 million for the impairment of goodwill which was not deductible for income tax purposes and therefore no tax benefit was recorded on this expense. Valuation allowances of $126.9 million were recorded as tax expense in 2009 which relates to impaired tax assets in the U.S., Italy, China and Denmark. Other non-deductible expenses and the worldwide earnings mix also impacted 2009 income tax expense.
III-8
Executive Summary of 2008 Compared to 2007
The following table summarizes the change in the Company's results from operations by separately identifying changes due to currency fluctuations and the underlying change in operations from 2007 to 2008. This analysis is more consistent with how the Company's management internally evaluates results.
| (in millions) | 2007 | Currency fluctuations | Underlying change | 2008 | ||||||||||
|---|---|---|---|---|---|---|---|---|---|---|---|---|---|---|
Net Sales | $ | 1,972.5 | $ | 85.0 | $ | 33.0 | $ | 2,090.5 | ||||||
Gross Profit | 427.7 | 21.9 | (14.0 | ) | 435.6 | |||||||||
% of Net Sales | 21.7 | % | 20.8 | % | ||||||||||
Selling, general and administrative | 233.8 | 10.4 | 14.3 | 258.5 | ||||||||||
Research and development | 70.6 | 3.6 | 8.7 | 82.9 | ||||||||||
Impairment charges | — | — | 58.2 | 58.2 | ||||||||||
Loss on sale of businesses and asset disposals | 9.4 | 0.5 | (0.3 | ) | 9.6 | |||||||||
Total operating costs | 313.8 | 14.5 | 80.9 | 409.2 | ||||||||||
Operating income | 113.9 | 7.4 | (94.9 | ) | 26.4 | |||||||||
% of Net Sales | 5.8 | % | 1.3 | % | ||||||||||
Interest expense, net | (22.7 | ) | (0.9 | ) | (1.0 | ) | (24.6 | ) | ||||||
Other, net | (3.6 | ) | (2.3 | ) | 6.8 | 0.9 | ||||||||
Income (loss) before income taxes | 87.6 | 4.2 | (89.1 | ) | 2.7 | |||||||||
% of Net Sales | 4.4 | % | 0.1 | % | ||||||||||
Income tax expense | (18.8 | ) | (0.8 | ) | 5.6 | (14.0 | ) | |||||||
Net income (loss) | 68.8 | 3.4 | (83.5 | ) | (11.3 | ) | ||||||||
Net income (loss) attributable to noncontrolling interest, net of tax | (21.6 | ) | (0.5 | ) | 4.3 | (17.8 | ) | |||||||
Net income (loss) attributable to Sauer-Danfoss Inc. | $ | 47.2 | $ | 2.9 | $ | (79.2 | ) | $ | (29.1 | ) | ||||
Net sales for the year ended December 31, 2008 increased 2 percent compared to the year ended December 31, 2007, excluding the effects of currency. Sales increased 3 percent excluding the effects of currency and divestitures. Excluding the effects of currency and divestitures, sales increased 3 percent in the Americas and 23 percent in Asia-Pacific, while sales remained nearly level in Europe. Sales in the Propel segment were up 4 percent, sales in the Work Function segment increased 2 percent and sales in the Controls segment increased 1 percent.
Gross profit declined 3 percent during the year ended December 31, 2008, excluding the impact of currency. This decline was primarily driven by $11.2 million in severance costs related to actions taken in response to the slowing economy, and a $10.4 million increase in field recall costs, primarily related to the Controls segment. During the year ended December 31, 2007, the Propel and Controls segments incurred $10.4 million of restructuring costs primarily to relocate production lines to other production facilities within the Company and remaining costs to close the LaSalle, Illinois plant.
Selling, general and administrative costs increased 6 percent during 2008 when compared to the same period in 2007, excluding the effects of currency. This increase was primarily attributed to $4.9 million of severance costs, and a $7.8 million increase in sales and marketing costs, excluding the impacts of currency, due primarily to the addition of a new sales office in Russia, as well as increases in headcount earlier in 2008. Research and development costs increased 12 percent excluding the impacts of currency, primarily driven by increasing product development, particularly in the Controls and Propel segments.
The Company reported impairment charges of $58.2 million, consisting of goodwill impairment charges of $22.9 million and property, plant, and equipment impairment charges of $35.3 million. The goodwill impairment related to the motors and steering reporting units within the Work Function segment
III-9
and the electric drives reporting unit within the Controls segment. It was incurred as a result of lower profitability in the reporting units than the Company had previously expected, and lower future expectations in certain end markets. The property, plant and equipment impairment related to the Work Function segment and resulted from lower expectations related to the products produced within the asset group.
During the year ended December 31, 2008 the Company signed an agreement to sell its alternating current (AC) electric motor business for the material handling market. In connection with this transaction, which closed in 2009, the Company incurred charges of $8.4 million in 2008. During the year ended December 31, 2007 the Company incurred a loss of $6.6 million related to the sale of the direct current (DC) electric motor business located in Berching, Germany and a loss of $2.4 million on the sale of the assets and product lines which were manufactured in Swindon, England. These activities were part of the Company's plan to divest of product lines that do not fit the Company's long-term strategic direction.
During the year ended December 31, 2008, the Propel segment recorded a gain of $1.4 million related to the sale of the LaSalle, Illinois plant and the Controls segment incurred $0.4 million of equipment write-off costs related to the closure of the facility in Hillsboro, Oregon.
Operating Results—2008 Compared to 2007
Sales Growth by Market
The following table summarizes the Company's sales growth by market. The table and following discussion is on a comparable basis, which excludes the effects of currency fluctuations.
| | Americas | Asia-Pacific | Europe | Total | |||||||||
|---|---|---|---|---|---|---|---|---|---|---|---|---|---|
Agriculture/Turf Care | 4 | % | 3 | % | 22 | % | 10 | % | |||||
Construction/Road Building | (5 | ) | 12 | (11 | ) | (5 | ) | ||||||
Material Handling/Specialty | (13 | ) | 77 | (8 | ) | (5 | ) | ||||||
Distribution | 9 | 14 | 0 | 7 | |||||||||
Agriculture/Turf Care
Sales into the agriculture/turf care markets increased 10 percent during the year ended December 31, 2008 compared to 2007. Agriculture sales in Europe remained strong throughout 2008, but started to show signs of slowing towards the end of the year. Agriculture sales increased in the Americas due to strong commodity prices, however they started to show signs of weakening late in 2008. Increased sales into the Americas agriculture market were offset by decreased sales into the turf care market, primarily driven by the decline in housing starts and concerns regarding the slowing economic conditions.
Construction/Road Building
Sales into the construction/road building markets decreased 5 percent during 2008, with the majority of the decrease occurring in the fourth quarter. The decrease is driven by an 11 percent decrease in the European market and a 5 percent decrease in the Americas market, both due to weakening economic conditions, reduced housing starts, and customers' focus on reducing inventory levels. Asia-Pacific experienced a 12 percent increase due to strength in the Chinese road building market throughout most of 2008, although this market began to show signs of weakening during the fourth quarter of 2008. Export sales out of the Asia-Pacific region also started to weaken during the fourth quarter of 2008.
Material Handling/Specialty
Specialty vehicles are comprised of a variety of markets including forestry, material handling, marine, waste management and waste recycling. Overall the material handling/specialty markets declined 5 percent, driven by declines in Europe and the Americas due to weak non-residential construction and
III-10
reductions in capital expenditures by rental companies. Sales through the third quarter of 2008 were level with 2007 but decreased in the fourth quarter as a result of the economic downturn. The decreases in Europe and the Americas were partly offset by strength in the Asia-Pacific region due primarily to a strong market for railway construction machines.
Distribution
Products related to all of the above markets are sold to distributors, who then serve smaller OEMs.
Order Backlog
The following table shows the Company's order backlog and orders written activity for 2007 and 2008, separately identifying the impact of currency fluctuations.
| (in millions) | 2007 | Currency fluctuation | Underlying change | 2008 | |||||||||
|---|---|---|---|---|---|---|---|---|---|---|---|---|---|
Backlog at December 31 | $ | 921.4 | $ | (16.2 | ) | $ | (161.5 | ) | $ | 743.7 | |||
Orders written | 2,214.8 | 77.8 | (364.9 | ) | 1,927.7 | ||||||||
Total order backlog at the end of 2008 was $743.7 million, compared to $921.4 million at the end of 2007. On a comparable basis, excluding the impact of currency fluctuation, order backlog decreased 18 percent compared to 2007. New sales orders written for 2008 were $1,927.7 million, a decrease of 16 percent compared to 2007, excluding the impact of currency fluctuations.
Backlog information can vary as customers alter their sales order patterns. The 16 percent decrease in orders written in 2008 reflects the downturn experienced in almost all markets and regions during the fourth quarter of 2008. This downturn is also reflected in our order backlog which declined 18 percent excluding the impacts of currency.
Business Segment Results
The following table provides a summary of each segment's net sales and segment income, separately identifying the impact of currency fluctuations during the year.
| (in millions) | 2007 | Currency fluctuation | Underlying change | 2008 | ||||||||||
|---|---|---|---|---|---|---|---|---|---|---|---|---|---|---|
Net sales | ||||||||||||||
Propel | $ | 940.7 | $ | 37.8 | $ | 38.1 | $ | 1,016.6 | ||||||
Work Function | 534.0 | 26.0 | 1.4 | 561.4 | ||||||||||
Controls | 497.8 | 21.2 | (6.5 | ) | 512.5 | |||||||||
Segment income (loss) | ||||||||||||||
Propel | $ | 146.6 | $ | 8.3 | $ | 1.9 | $ | 156.8 | ||||||
Work Function | (2.9 | ) | 0.7 | (63.5 | ) | (65.7 | ) | |||||||
Controls | 17.7 | 0.0 | (39.1 | ) | (21.4 | ) | ||||||||
Global Services and other expenses, net | (51.1 | ) | (4.1 | ) | 12.8 | (42.4 | ) | |||||||
Propel Segment
The Propel segment experienced a 4 percent increase in sales, excluding the effects of currency fluctuations, during 2008. Segment income increased 1 percent during the same period. Segment income was negatively impacted by $2.3 million of severance costs, offset by a gain of $1.4 million related to the sale of a building. Field recall costs increased $1.5 million during 2008 and administrative costs increased $3.5 million. Restructuring costs of $5.5 million were recorded during 2007.
III-11
Work Function Segment
Sales in the Work Function segment increased slightly, excluding the effects of currency fluctuations, during the year ended December 31, 2008. Sales increased 2 percent excluding the effects of both currency and the divestiture of product lines in Swindon, England in June 2007. Segment income was negatively impacted by goodwill impairment charges of $17.4 million. These charges were incurred as a result of lower profitability in the motors and steering reporting units than the Company had previously expected and lower future expectations in certain end markets. The Work Function segment incurred property, plant and equipment impairment charges of $35.3 million as a result of lower expected cash flow related to the products produced within the motors asset group. Segment income was also negatively impacted by severance costs of $6.5 million as a result of recent actions taken in response to the slowing economy.
Controls Segment
Sales in the Controls segment decreased 1 percent for the year ended December 31, 2008, excluding the effects of currency fluctuations, compared to 2007. Segment income declined $39.1 million. This decrease is due to several factors, including an $8.4 million increase in field recall costs and a $6.8 million increase in fixed overhead costs due to increases in production capacity. Also contributing to the decline in segment income was an additional $4.5 million of research and development costs.
During 2008, the Controls segment recognized $8.4 million of charges related to the expected sale of the AC electric motor business for the material handling market in 2009, goodwill impairment charges of $5.5 million, severance costs of $5.1 million, and a $0.4 million write-down of fixed assets related to the decision to close the facility in Hillsboro, Oregon. During 2007, the Controls segment recognized a loss of $6.6 million related to the sale of the DC electric motor business and $3.2 million of costs to reorganize the DC and AC electric motor business prior to the sale.
Global Services and other expenses, net
Global services and other expenses decreased $12.8 million excluding the impacts of currency, or 25 percent. This is primarily due to a $6.6 million reduction in incentive costs during the year ended December 31, 2008, a reduction of $4.6 million in costs associated with the implementation of the Company's common business system, and a $5.1 million reduction in losses related to foreign currency transactions.
Income Taxes
The Company incurred income tax expense of $14.1 million on income of $2.7 million in 2008.
In 2008 the Company recorded $22.9 million for the impairment of goodwill, of which $18.8 million was not deductible for income tax purposes and therefore no tax benefit was recorded on this expense. Valuation allowances and contingency reserves of $3.0 million were recorded as tax expense in 2008 which relates to impaired tax assets in the U.S., Italy and Germany. Other non-deductible expenses and the worldwide earnings mix also impacted the 2008 effective tax rate.
Market Risk
The Company is naturally exposed to various market risks, including changes in foreign currency exchange rates and interest rates.
Foreign Currency Changes
The Company has operations and sells its products in many different countries of the world and therefore, conducts its business in various currencies. The Company's financial statements, which are presented in U.S. dollars, can be impacted by foreign exchange fluctuations through both translation risk
III-12
and transaction risk. Translation risk is the risk that the financial statements of the Company, for a particular period or as of a certain date, may be affected by changes in the exchange rates that are used to translate the financial statements of the Company's operations from foreign currencies into U.S. dollars. Transaction risk is the risk from the Company receiving its sale proceeds or holding its assets in a currency different from that in which it pays its expenses and holds its liabilities.
In previous years, the Company had been well balanced between its U.S. and European operations because the Company generated its sales in the same region in which it incurred its expenses, or shipped products between geographic regions on a balanced basis. However, in recent years the balance has shifted and the amount of sales made in U.S. dollars has increased, whereas the production costs are in a currency other than the U.S. dollar, increasing the Company's exposure to transaction risk. In 2009 the Company sold a total of $95.9 million of product into the U.S. that had been produced in European-based currencies compared to sales into Europe of $34.3 million of product produced in U.S. dollars. This imbalance had a significant impact on the results of the Company. In 2009 the results were favorable as the dollar strengthened in comparison to other currencies. The Company produces and sells its product in several regions of the world, however the U.S. and European transactions comprise the majority of the imbalance between regions.
The Company enters into forward contracts to minimize the impact of currency fluctuations on cash flows related to forecasted sales denominated in currencies other than the functional currency of the selling location. The forecasted sales represent sales to both external and internal parties. Any effects of the forward contracts related to sales to internal parties are eliminated in the consolidation process until the related inventory has been sold to an external party. The forward contracts qualify for hedge accounting and therefore are subject to effectiveness testing at the inception of the contract and throughout the life of the contract. In 2009, as a result of hedge accounting for the forward contracts, the Company recognized a decrease to net sales of $5.5 million and other income of $0.9 million. The fair value of forward contracts included on the balance sheet at December 31, 2009 was a net asset of $0.5 million.
The Company is also impacted by translation risk in terms of comparing results from period to period. Fluctuations of currencies against the U.S. dollar can be substantial and therefore, significantly impact comparisons with prior periods. Translation affects the comparability of both the income statement and the balance sheet. As shown in the table below, the translation impact on net sales was not significant in 2009. This is because the U.S. dollar strengthened against the euro during the first half of the year, while it weakened during the second half of the year.
| | Percentage Sales Growth Over Prior Year | |||||||||
|---|---|---|---|---|---|---|---|---|---|---|
| | 2009 | 2008 | 2007 | |||||||
As Reported | (44.6 | )% | 6.0 | % | 13.4 | % | ||||
Without Currency Translation Impact | (42.8 | ) | 1.7 | 7.8 | ||||||
The change in the exchange rate does affect the comparability of the balance sheet between 2009 and 2008 as the balance sheet accounts are translated at the exchange rate as of December 31. The U.S. dollar weakened 2.6 percent against the euro and 2.4 percent against the Danish kroner from December 31, 2008 to December 31, 2009. The weakening of the dollar has resulted in approximately 36 percent of the Company's total balance sheet being stated approximately 2.5 percent higher than the prior year.
Interest Rate Changes
The Company has used interest rate swap agreements on a limited basis to manage the interest rate risk on its total debt portfolio. During March 2009 the Company settled both of its interest rate swap agreements due to repayment of the underlying debt agreements, resulting in a loss of $2.0 million recognized in the consolidated statement of operations as a component of loss on early retirement of debt.
III-13
The following table summarizes the maturity of the Company's debt obligations for fixed and variable rate debt (amounts in millions):
| | Fixed Rate Debt | Variable Rate Debt | |||||
|---|---|---|---|---|---|---|---|
2010 | $ | 1.1 | $ | 140.9 | |||
2011 | 334.0 | — | |||||
2012 | 1.4 | — | |||||
2013 | 1.0 | — | |||||
2014 | 0.7 | — | |||||
2015 and Thereafter | — | — | |||||
Total | $ | 338.2 | $ | 140.9 | |||
Liquidity and Capital Resources
The Company's principal sources of liquidity have been cash flow from operations and from its various credit facilities. The Company historically has accessed diverse funding sources, including short-term and long-term unsecured bank lines of credit in the U.S., Europe, and Asia-Pacific, as well as the private debt markets in the U.S. as discussed in Note 8 in the Notes to Consolidated Financial Statements.
The Company determined, following the close of its 2008 fiscal year, that it would likely be unable to continue to meet the leverage ratio covenants in its various credit agreements as of the end of the first quarter of 2009. To avoid a default under the credit agreements, the Company entered into a Credit Agreement with Danfoss A/S on March 12, 2009, pursuant to which the Company had the ability to borrow up to $490 million (Original Credit Agreement). The Agreement had no financial covenants and was set to mature on September 30, 2010. Danfoss A/S is the Company's majority stockholder.
During the third quarter of 2009, the Company determined that it would require additional liquidity of between $100 million and $150 million over the course of 2010 to meet its projected cash commitments. This additional cash requirement was driven by the Company's greatly reduced operating cash flows in 2009, the continued weakness in the global economy, and an anticipated increase in sales with the accompanying need to fund production activities and customer accounts receivable.
On November 9, 2009, the Company entered into a new Credit Agreement (Danfoss Agreement) with Danfoss A/S. The Agreement was approved by the Company's Board of Directors on November 9, 2009 upon the recommendation of a special committee of the Board comprised exclusively of independent directors. Pursuant to the Danfoss Agreement, the Original Credit Agreement and a $50 million term loan from Danfoss A/S were terminated and replaced by a new unsecured credit facility permitting the Company to borrow up to $690 million from Danfoss A/S. The Company's borrowings under the Agreement will be due and payable in full on April 29, 2011. The Danfoss Agreement contains no financial covenants but it does contain a number of affirmative and negative covenants that, among other things, require the Company to obtain the consent of Danfoss A/S prior to engaging in certain types of transactions.
The principal amount outstanding under the Danfoss Agreement bears interest at a rate equal to the U.S. prime rate or LIBOR, as in effect at times specified in the Agreement, plus 10.0 percent. The Company was required to pay a closing fee of $2.0 million to Danfoss A/S. The Agreement also requires the Company to pay a quarterly fee equal to 4.0 percent of the average daily unused portion of the $690 million credit facility. The Agreement contains customary representations and warranties regarding the Company and its business and operations. It also sets forth a number of events of default for, among other things, failure to pay principal and interest, breaches of representations, warranties and covenants and various events relating to the bankruptcy or insolvency of the Company or its subsidiaries.
III-14
The Company expects to have sufficient sources of liquidity to meet its funding needs for the foreseeable future, recognizing that prior to April 29, 2011 the Company will need to either extend its current Credit Agreement with Danfoss A/S or obtain an alternative source of funding from either Danfoss A/S or a third party. However, unexpected events or circumstances, such as further reduced operating cash flows or prolonged or increased weakness in the global economy, could negatively impact the Company's liquidity to an extent that may require the Company to seek new or additional sources of cash prior to April 29, 2011.
Cash Flows from Operations
Cash provided by operations was $86.8 million in 2009. Cash increased as a result of a $91.4 million decrease in accounts receivable, excluding the effects of currency, due primarily to reduced sales levels in 2009, as well as a $153.4 million decrease in inventories, excluding currency, due to lower production volume and inventory reduction efforts. These changes were offset by a $54.2 million decrease in accounts payable at the end of 2009 compared with the end of 2008, as well as a decrease in accrued liabilities of $20.7 million.
Total cash of the Company increased $15.6 million from December 31, 2008 to December 31, 2009 largely due to the fact that borrowings from Danfoss require a 10-day notice, which makes it necessary for the Company to maintain a cash surplus to fund day-to-day operations. At December 31, 2009 cash balances in China totaled $21.9 million, an increase of $3.3 million from December 31, 2008. The Company is paying dividends from its Chinese entities to the maximum extent possible under current regulations; however, due to the nature of the governmental and other regulatory controls, it is difficult to transfer cash out of China for reasons other than payment for goods shipped into that country. As the Company continues to consider expanding its manufacturing capabilities in low-cost regions, it will make every effort to utilize the cash balances in those regions to fund future expansions. Total cash outside of China increased by $12.3 million in 2009.
Cash Used in Investing Activities
Capital expenditures for 2009 totaled $43.0 million compared to $198.6 million in 2008. The decrease in 2009 is the result of lower capacity needs as sales were reduced due to the global economic downturn and management's increased focus on conserving cash.
Cash Used in Financing Activities
The Company paid dividends of $8.7 million in the first quarter of 2009, which were declared in fourth quarter 2008. In 2008 the Company paid dividends of $34.7 million. Net borrowings provided approximately $22.3 million of cash during 2009 compared to $51.8 million in 2008. During 2009 the Company paid $10.6 million in debt origination fees related to the Original Credit Agreement and the Danfoss Agreement, and $10.1 million in debt extinguishment and interest rate swap settlement costs. In addition, the Company makes varying distributions to its noncontrolling interest partners from its various joint venture activities depending on the amount of undistributed earnings of the business and the needs of the partners. Distributions totaled approximately $17.7 million in 2009 compared to $13.9 million in 2008.
Contractual Cash Obligations
The majority of the Company's contractual obligations to make cash payments to third parties are for financing obligations. These include future lease payments under both operating and capital leases. The
III-15
following table discloses the Company's future commitments under contractual obligations as of December 31, 2009:
Contractual Cash Obligations(1) | Total | 2010 | 2011 | 2012 | 2013 | 2014 | 2015 and Thereafter | |||||||||||||||
|---|---|---|---|---|---|---|---|---|---|---|---|---|---|---|---|---|---|---|---|---|---|---|
Long-term debt(2) | $ | 479.1 | $ | 142.0 | $ | 334.0 | $ | 1.4 | $ | 1.0 | $ | 0.7 | $ | — | ||||||||
Interest on long-term debt(3) | 70.5 | 52.0 | 18.2 | 0.2 | 0.1 | — | — | |||||||||||||||
Capital leases | 1.6 | 0.7 | 0.6 | 0.3 | — | — | — | |||||||||||||||
Operating leases | 57.2 | 13.7 | 10.5 | 8.1 | 7.1 | 6.8 | 11.0 | |||||||||||||||
Rental and service agreements with related person Danfoss A/S | 68.8 | 9.3 | 9.3 | 9.2 | 9.0 | 9.0 | 23.0 | |||||||||||||||
Total contractual cash obligations | $ | 677.2 | $ | 217.7 | $ | 372.6 | $ | 19.2 | $ | 17.2 | $ | 16.5 | $ | 34.0 | ||||||||
The following assumptions are used in the calculation of the contractual cash obligations:
- (1)
- Commitments denominated in a currency other than the U.S. dollar are translated at the December 31, 2009 exchange rate.
- (2)
- The annual amount borrowed under revolving credit agreements does not change from the $140.9 million borrowed at December 31, 2009, through the maturity date of the agreements.
- (3)
- The margin rate on variable interest rate debt does not change from December 31, 2009. The base interest rate for future years is based on the interest yield curves as of December 31, 2009.
In addition to the above contractual obligations, the Company has certain other funding needs that are non-contractual by nature, including funding of certain pension plans. In 2010 the Company anticipates contributing $13.0 million to its pension and health benefit plans.
Other Matters
Critical Accounting Estimates
The SEC's guidance surrounding the disclosure of critical accounting estimates requires disclosures about estimates a company makes in applying its accounting policies. However, such discussion is limited to "critical accounting estimates," or those that management believes meet two criteria: 1) the accounting estimate must require a company to make assumptions about matters that are highly uncertain at the time the accounting estimate is made, and 2) different estimates that the company reasonably could have used for the accounting estimate in the current period, or changes in the accounting estimate that are reasonably likely to occur from period to period, could have a material impact on the presentation of the company's financial condition, changes in financial condition or results of operations.
Besides the estimates that meet the two criteria for a "critical estimate" above, the Company makes many other accounting estimates in preparing its financial statements and related disclosures. All estimates, whether or not deemed critical, can affect the reported amounts of assets, liabilities, revenues, and expenses as well as disclosures of contingent assets and liabilities. Estimates are based on experience and information available prior to the issuance of the financial statements. Materially different results can occur as circumstances change and additional information becomes known, including estimates not deemed "critical" under the SEC's guidance.
The discussion below should be read in conjunction with disclosures elsewhere in this discussion and in the Notes to the Consolidated Financial Statements related to estimates, uncertainties, contingencies, and new accounting standards. Significant accounting policies are discussed in Note 1 to the Consolidated Financial Statements beginning on page III-27. The development and selection of accounting estimates, including those deemed "critical," and the associated disclosures in this discussion, have been discussed by management with the audit committee of the Board of Directors.
III-16
Inventory Valuation As a manufacturer in the capital goods industry, inventory is a substantial portion of the assets of the Company, amounting to over 15 percent of total assets at December 31, 2009. The Company must periodically evaluate the carrying value of its inventory to assess the proper valuation. This includes recording period adjustments as needed to 1) record expenses due to excess capacity, 2) provide for excess and obsolete inventory, and 3) ensure that inventory is valued at the lower of cost or market. On a quarterly basis, management within each segment performs an analysis of the underlying inventory to identify the need for appropriate write-downs to cover each of these items. In doing so, management applies consistent practices based upon historical data such as actual loss experience, past and projected usage, actual margins generated from trade sales of its products, and finally its best judgment to estimate the appropriate carrying value of the inventory.
Warranty Provisions The Company warrants its various products over differing periods depending upon the type of product and application. Consequently, the Company records liabilities for the estimated warranty costs that may be incurred under its basic warranty based on past trends of actual warranty claims compared to the actual sales levels to which those claims apply. These liabilities are accrued at the time the sales of the products are recorded. Factors that affect the Company's warranty liability include the number of units in the field currently under warranty, historical and anticipated rates of warranty claims on those units and the cost per claim to satisfy the Company's warranty obligation. The anticipated rate of warranty claims is the primary factor impacting the Company's estimated warranty obligation. Each quarter, the Company reevaluates its estimates to assess the adequacy of its recorded warranty liabilities and adjusts the amounts as necessary.
In addition to its normal warranty liability, the Company, from time to time in the normal course of business, incurs costs to repair or replace defective products with a specific customer or group of customers. The Company refers to these as "field recalls" and in these instances, the Company will record a specific provision for the expected costs it will incur to repair or replace these products utilizing information from customers and internal information regarding the specific cost of materials and labor. Typically, field recalls are infrequent in occurrence, however, when they occur, field recalls can be for a large number of units and quite costly to rectify. Because of the sporadic and infrequent nature of field recalls, and due to the range of costs associated with field recalls, the Company cannot accurately estimate these costs at the time the products are sold. Therefore, these costs are recorded at the time information becomes known to the Company. As the field recalls are settled, the Company relieves the specific liability related to that field recall. These specific field recall liabilities are reviewed on a quarterly basis.
Goodwill and Long-Lived Asset Recovery A significant portion of the Company's total assets consist of property, plant and equipment (PP&E) and definite life intangibles, as well as goodwill. Changes in technology or in the Company's intended use of these assets, as well as changes in the broad global economy in which the Company operates, may cause the estimated period of use or the carrying value of these assets to change.
This requires the Company to periodically assess the estimated useful lives of its assets in order to match, through depreciation and amortization, the cost of those assets with the benefits derived over the period of usefulness. The useful lives of these assets can be shortened through greater use due to volume increases, a change in strategy regarding production of a certain product, rapidly changing technology such as the use of electronics and computer-operated controls, and through inadequate maintenance. Despite management's best efforts to determine the appropriate useful lives of its equipment, certain situations may arise that lead to an asset or group of assets becoming impaired, meaning their economic value becomes less than the value at which the Company is carrying the asset on its books. Examples of these situations are product rationalization efforts or restructuring of manufacturing facilities. When these situations arise, the Company tests the assets for impairment and will write down the asset in the period when the impairment becomes known. Goodwill is tested for impairment at least annually. Goodwill is also tested if an event occurs or conditions change that would more likely than not reduce the fair value of a reporting unit below its carrying value (triggering event).
III-17
The Company completes its annual goodwill impairment valuation on December 31 each year. In the first quarter of 2009 the market value of the Company had decreased and therefore was considered a triggering event which required goodwill to be tested for impairment. The Company has identified seven reporting units that are either operating segments or one level below operating segments. In performing the impairment valuation, the Company considers declines in market values, and reconciles the sum of the estimated fair values of its reporting units to the Company's market value (based on its stock price), plus a reasonable control premium, which is estimated as that amount which would be received to sell the Company as a whole in an orderly transaction between market participants.
When testing for goodwill impairment, the Company performs a first step of the goodwill impairment test to identify a potential impairment. In doing so, the Company compares the fair value of a reporting unit with its carrying amount. If the carrying amount of a reporting unit exceeds its fair value, goodwill may be impaired and a second step is performed to measure the amount of any impairment loss. The Company determined that the fair value of goodwill for the propel and mobile electronics reporting units was greater than their carrying values at both March 31, 2009 and December 31, 2009. However, the fair value of goodwill for the valves reporting unit was less than its carrying value at March 31, 2009 and the second step of testing was required to be performed.
In the second step, the Company compares the implied fair value of reporting unit goodwill with the carrying amount of that goodwill. If the carrying amount of reporting unit goodwill exceeds the implied fair value of that goodwill, an impairment loss is recognized in an amount equal to that excess. The implied fair value of goodwill is determined in the same manner that the amount of goodwill recognized in a business combination is determined. The Company allocates the fair value of a reporting unit to all of the assets and liabilities of that unit, including intangible assets, as if the reporting unit had been acquired in a business combination. Any excess of the value of a reporting unit over the amounts assigned to its assets and liabilities is the implied fair value of goodwill. The Company determined that the implied fair value of goodwill for the valves reporting unit was less than its carrying value by $50.8 million which was recorded as a goodwill impairment charge in 2009.
Estimates about fair value used in the first step of the goodwill impairment tests are calculated using an income approach based on the present value of future cash flows of each reporting unit. The income approach is supported by other valuation approaches, such as similar transaction and guideline analyses. Under the income approach, the Company determines fair value based on estimated future cash flows of each reporting unit, discounted by an estimated weighted-average cost of capital, which reflects the overall level of inherent risk of a reporting unit and the rate of return an outside investor would expect to earn. Determining the fair value of a reporting unit is judgmental in nature and requires the use of significant estimates and assumptions, including revenue growth rates and operating margins, discount rates and future market conditions among others. Changes in economic and operating conditions impacting these assumptions could result in goodwill impairments in future periods. At December 31, 2009 the Company had $35.9 million of goodwill related to its propel and electronic components reporting units, which was tested for impairment and determined to not be impaired.
The Company tests its long-lived assets for recoverability at any time that an event or change in circumstances occurs that indicates the carrying amount of the long-lived assets may not be recoverable. Events or circumstances that may trigger a recoverability test include a significant change in the market price of similar long-lived assets; a change in the use of the long-lived asset due to product rationalization efforts or restructuring of manufacturing facilities; a significant adverse change in legal factors, business climate, industry or economic conditions ; an accumulation of costs significantly in excess of the amount originally expected for the acquisition or construction of a long-lived asset; historical and projected operating losses associated with the use of a long-lived asset; or an expectation that more likely than not, a long-lived asset will be disposed of significantly before the end of its previously estimated useful life. The Company reviews these factors quarterly to determine whether a trigger event has occurred. As a result of
III-18
the challenging economic environment in 2009 the Company determined that the long-lived asset groups should be tested for recoverability.
The Company has seven asset groups, which are the lowest level for which identifiable cash flows are largely independent of other groups of assets and liabilities. Projected cash flows for each asset group are forecasted by the controllers responsible for the business of each asset group and evaluated by management. Revenue forecasts for 2010 through 2014 were derived consistently with the Company's long-term planning and forecasting process, taking into account such factors as historical growth rates, foreseen changes in future product offerings, government regulations, and improving market conditions. For years after 2014 the Company assumed a 3 percent growth rate. In the Company's testing at December 31, 2009, capital expenditures for maintenance were assumed to be approximately 2.5 percent of revenues for the motors asset group and 2 percent of revenues for the open circuit and steering asset groups due to the nature of the long-lived assets included in each of the asset groups and planned capital expenditures to maintain the current long-lived assets.
Corporate costs for each functional area are forecasted, as well, and allocated to each asset group by the corporate controller using the same basis used for allocating actual costs for financial reporting. Allocated costs include sales and marketing, finance, human resources, and information technology. Each functional area is allocated based on an underlying allocation key. For example, sales and marketing costs are allocated based on a periodic time study that determines the amount of time spent to sell and market products in each asset group; information technology costs are allocated base on the number of licensed users working for each asset group, and finance and human resources are allocated based on sales revenue recognized by each asset group as a percent of total revenues.
At December 31, 2009 the Company tested its asset groups for recoverability by comparing the carrying value of the net assets for each asset group to the number of years needed when summing the undiscounted operating cash flows for a projected period. The Company determined that no long-lived assets were impaired. Four of the asset groups had excess cash flows that were significant and required no further evaluation. The motors, open circuit and steering asset groups had lower levels of excess cash flow and were analyzed further as follows:
Asset Group | Projected Cash Flows Over Remaining Life | Projection Period(1) | Carrying Value of Net Assets | Excess | |||||||||
|---|---|---|---|---|---|---|---|---|---|---|---|---|---|
Motors | $ | 103 | 7 | $ | 95 | $ | 8 | ||||||
Open Circuit | 32 | 8 | 26 | 6 | |||||||||
Steering | 122 | 7 | 104 | 18 | |||||||||
- (1)
- Number of years of projected cash flow needed to equal the carrying value of net assets.
For all three assets groups tested the projected operating cash flows during the life of the primary asset were sufficiently greater than the carrying value of the asset group, and therefore residual values of long-lived assets at the end of that period were not quantified and additional testing to quantify the fair value of long-lived assets was not performed.
Although the current economic environment appears to be improving, if it were to decline and negatively impact the Company's business, there can be no assurance that the Company's estimates and assumptions made for purposes of the Company's goodwill and long-lived asset impairment testing as of December 31, 2009 will prove to be accurate predictions of the future. If the Company's assumptions regarding forecasted revenue or margin growth rates of certain reporting units are not achieved, or the Company's stock price were to decline, the Company may be required to record additional goodwill impairment charges in future periods, whether in connection with the next annual impairment test or if a triggering event requires an earlier impairment test to be performed. It is not possible at this time to
III-19
determine if any such future impairment charge would result, or if it does, whether the charge would be significant.
Valuation of Trade Receivables The Company records trade receivables due from its customers at the time a sale is recorded in accordance with its revenue recognition policy. The future collectability of these amounts can be impacted by the Company's collection efforts, the financial stability of its customers, and the general economic climate in which it operates. The Company applies a consistent practice of establishing an allowance for accounts that it believes may become uncollectible through reviewing the historical aging of its receivables, looking at the historical losses incurred as a percentage of net sales, and by monitoring the financial strength of its customers regarding specific outstanding accounts receivable balances. In addition, local customary practices have to be taken into account due to varying payment terms being applied in various parts of the world where the Company conducts its business. If the Company becomes aware of a customer's inability to meet its financial obligations (e.g., where it has filed for bankruptcy), the Company establishes a specific allowance for the potential bad debt to reduce the net recognized receivable to the amount it reasonably believes will be collected. The valuation of trade receivables is reviewed quarterly.
Workers Compensation The Company has an insurance policy to cover workers compensation claims in the U.S., in which the Company pays the first $0.25 million per claim, per incident. The Company establishes its workers compensation reserve based on historic growth factors of claims and an estimate of incurred, but not reported claims. This analysis is performed on a quarterly basis.
U.S. Health Care Costs The Company self insures its U.S. health care costs for eligible employees and their qualified dependents with exposure for any one year, excluding prescription costs, limited to $0.2 million per individual. The Company establishes reserves for its health care cost based on historic claims data and an estimate of incurred, but not reported claims. This analysis is performed on a quarterly basis.
Pensions The Company has noncontributory defined benefit pension plans for a portion of its employees. In certain countries, such as the U.S. and the U.K., these plans are funded with plan assets whereas in other countries such as Germany, the plans have historically been unfunded, which is customary. In 2007 the Company started contributing to the German pension plans. The measurement of the Company's pension obligations and costs is dependent on a variety of assumptions determined by management and used by the Company's actuaries. These assumptions include estimates of the present value of projected future pension payments to all plan participants, taking into consideration the likelihood of potential future events such as salary increases and other experience. These assumptions may have an effect on the amount and timing of future contributions. The plan trustee conducts an independent valuation of the fair value of pension plan assets.
The assumptions used in developing the required estimates include the following key factors:
| Discount rates | Inflation | |
| Salary growth | Expected return on plan assets | |
| Retirement rates | Mortality rates |
The Company bases the discount rate assumption on investment yields available at or near year-end on corporate long-term bonds rated AA. The inflation assumption is based on an evaluation of external market indicators. The salary growth assumptions reflect the Company's long-term actual experience, the near-term outlook and assumed inflation. The expected return on plan assets reflects asset allocations, investment strategy, and the views of investment managers and other large pension plan sponsors. Retirement and mortality rates are based primarily on actual plan experience and standard industry actuarial tables, respectively. The effects of actual results differing from our assumptions are accumulated and amortized over future periods and, therefore, generally affect recognized expense in such future periods.
III-20
The Company's funding policy for the U.S. plans is to contribute amounts sufficient to meet the minimum funding requirement of the Employee Retirement Income Security Act of 1974, plus any additional amounts the Company may deem to be appropriate. In 2010 the Company anticipates contributing $7.3 million to its U.S. plans, $2.2 million to its German plans, and $0.7 million to its U.K. plans.
Postretirement Benefits Other Than Pensions The Company provides postretirement health care benefits for certain employee groups in the U.S. This plan is contributory and contains certain other cost-sharing features such as deductibles and coinsurance. The Company does not pre-fund this plan and has the right to modify or terminate this plan in the future.
The postretirement liability, which is determined on an actuarial basis, is recognized in the Company's Consolidated Balance Sheets and the postretirement expense is recognized in the Consolidated Statements of Operations. The Company must determine the actuarial assumption for the discount rate used to reflect the time value of money in the calculation of the accumulated postretirement benefit obligation for the end of the current year and to determine the postretirement cost for the subsequent year. For guidance in determining this rate, the Company looks at investment yield trends available near year-end on corporate bonds rated AA. In addition, the Company must determine the actuarial assumption for the health care cost trend rate used in the calculation of the accumulated postretirement benefit obligation for the end of the current year and to determine the net periodic postretirement benefit cost for the subsequent year. As of December 31, 2009 a one-percentage point change in the assumed health care cost trend rate would impact the expense recognized in 2009 by $0.2 million and would affect the postretirement benefit obligation by $4.3 million. In 2010 the Company anticipates contributing $2.8 million to this plan.
Deferred Income Taxes and Valuation Allowances Tax regulations may require items to be included in the tax return at different times than the items are reflected in the financial statements. Some of the differences are permanent, such as expenses that are not deductible on a tax return, and some of the differences are temporary such as the rate of depreciation expense. Temporary differences create deferred tax assets and liabilities. Deferred tax assets generally are attributable to items that can be used as a tax deduction or credit in a tax return in future years but the amount has already been included as an expense in the financial statements. Deferred tax liabilities generally represent deductions that have been taken on the tax return but have not been recognized as expense in the financial statements. Valuation allowances are recorded to reduce deferred tax assets when it is more likely than not that a tax benefit will not be realized. Management believes it is more likely than not that the Company will realize the benefits of the net deferred tax assets reported on the consolidated balance sheets.
New Accounting Policies
In June 2009 the Financial Accounting Standards Board (FASB) issued Accounting Standards Codification (ASC) 105-10, "The FASB Accounting Standards Codification and the Hierarchy of Generally Accepted Accounting Principles-a replacement of FASB Statement No. 162." The FASB Accounting Standards Codification is intended to be the source of authoritative U.S. generally accepted accounting principles (GAAP) and reporting standards recognized by the FASB. Its primary purpose is to improve clarity and use of existing standards by grouping authoritative literature under common topics. The Codification does not change or alter existing GAAP and there was no impact on the Company's consolidated financial position or results of operations when it was adopted in the third quarter of 2009.
FASB ASC 805 establishes requirements for recognition and measurement of identifiable assets acquired, liabilities assumed, noncontrolling interest of the acquiree, goodwill acquired, and gain from bargain purchase. The guidance within FASB ASC 805 was issued in December 2007 and applies prospectively to business combinations for which the acquisition date is on or after the beginning of the annual reporting period beginning on or after December 15, 2008. The Company adopted this guidance as of January 1, 2009 with no impact on the consolidated financial statements.
III-21
The FASB issued new guidance contained within ASC 810-10, "Noncontrolling Interests in Consolidated Financial Statements—an amendment of ARB No. 51" in December 2007. The new guidance was issued to improve the relevance, comparability, and transparency of financial information provided to investors by requiring all entities to report noncontrolling (minority) interests in subsidiaries as equity in the consolidated financial statements. The Company adopted this guidance in the first quarter of 2009. Upon adoption, certain prior period amounts have been reclassified to conform to the current period financial statement presentation. These reclassifications have no impact on the previously reported financial position or results of operations.
In March 2008 the FASB issued guidance contained within ASC 815-10, "Disclosures about Derivative Instruments and Hedging Activities—an amendment of FASB Statement No. 133." The guidance amends and expands disclosure requirements for derivative instruments in order to provide users of financial statements with an enhanced understanding of (i) how and why an entity uses derivative instruments, (ii) how derivative instruments and related hedged items are accounted for and (iii) how derivative instruments and related hedged items affect an entity's financial position, financial performance, and cash flows. The Company adopted this guidance in the first quarter of 2009 and has included the expanded disclosures in the footnotes to the Consolidated Financial Statements.
The FASB issued new guidance contained within ASC 260-10, "Determining Whether Instruments Granted in Share-Based Payment Transactions Are Participating Securities" in June 2008. The guidance provides guidance on the calculation of earnings per share and indicates that all outstanding unvested share-based payment awards that contain rights to nonforfeitable dividends or dividend equivalents are considered participating securities and therefore the two-class method should be applied in calculating basic and diluted earnings per share. The guidance is effective for fiscal years, and interim periods within those fiscal years, beginning on or after December 15, 2008. The Company adopted this guidance in first quarter 2009 with no impact on the consolidated financial statements.
In May 2009 the FASB issued guidance contained within ASC 855-10, "Subsequent Events." This Statement incorporates guidance into accounting literature that was previously addressed only in auditing standards. The statement refers to subsequent events that provide additional evidence about conditions that existed at the balance-sheet date as "recognized subsequent events." Subsequent events which provide evidence about conditions that arose after the balance-sheet date but prior to the issuance of the financial statements are referred to as "non-recognized subsequent events." It also requires companies to disclose the date through which subsequent events have been evaluated and whether this date is the date the financial statements were issued or the date the financial statements were available to be issued. The Company adopted this guidance in the second quarter of 2009 with appropriate disclosures added in Note 18.
Non-Audit Services of Independent Registered Public Accounting Firm
The Company's Independent Registered Public Accounting Firm, KPMG LLP, performed the following non-audit services that have been approved by the Audit Committee of the Board of Directors: international tax planning and compliance services, expatriate tax services for persons not in a financial reporting oversight role, and statutory audits and related matters.
Outlook
Management expects sales to increase in 2010 compared to 2009 due to improved conditions in the markets the Company serves, in addition to customers who need to replenish their inventory levels. The growth in sales, combined with the fixed cost reductions achieved in 2009, should result in positive earnings from operations in 2010.
III-22
Sauer-Danfoss Inc. and Subsidiaries
Consolidated Statements of Operations
(Dollars in thousands, except per share data)
| | For the Years Ended December 31, | |||||||||||
|---|---|---|---|---|---|---|---|---|---|---|---|---|
| | 2009 | 2008 | 2007 | |||||||||
Net sales | $ | 1,159,031 | $ | 2,090,513 | $ | 1,972,548 | ||||||
Cost of sales | 1,031,078 | 1,654,903 | 1,544,846 | |||||||||
Gross profit | 127,953 | 435,610 | 427,702 | |||||||||
Selling, general and administrative | 209,713 | 258,491 | 233,809 | |||||||||
Research and development | 61,418 | 82,915 | 70,552 | |||||||||
Impairment charges | 50,841 | 58,208 | — | |||||||||
Loss on sale of businesses and asset disposals | 16,351 | 9,604 | 9,412 | |||||||||
Total operating expenses | 338,323 | 409,218 | 313,773 | |||||||||
Operating income (loss) | (210,370 | ) | 26,392 | 113,929 | ||||||||
Nonoperating Income (Expenses): | ||||||||||||
Interest expense | (50,171 | ) | (25,654 | ) | (23,789 | ) | ||||||
Interest income | 1,775 | 1,026 | 1,048 | |||||||||
Loss on early retirement of debt | (15,838 | ) | — | — | ||||||||
Other, net | 3,369 | 966 | (3,589 | ) | ||||||||
Nonoperating expenses, net | (60,865 | ) | (23,662 | ) | (26,330 | ) | ||||||
Income (loss) before income taxes | (271,235 | ) | 2,730 | 87,599 | ||||||||
Income tax | (61,019 | ) | (14,060 | ) | (18,839 | ) | ||||||
Net income (loss) | (332,254 | ) | (11,330 | ) | 68,760 | |||||||
Net income attributable to noncontrolling interest, net of tax | (13,512 | ) | (17,811 | ) | (21,562 | ) | ||||||
Net Income (Loss) attributable to Sauer-Danfoss Inc. | $ | (345,766 | ) | $ | (29,141 | ) | $ | 47,198 | ||||
Net Income (Loss) per common share, basic | $ | (7.15 | ) | $ | (0.60 | ) | $ | 0.98 | ||||
Net Income (Loss) per common share, diluted | $ | (7.15 | ) | $ | (0.60 | ) | $ | 0.98 | ||||
Weighted average basic shares outstanding | 48,337,923 | 48,226,184 | 48,094,375 | |||||||||
Weighted average diluted shares outstanding | 48,337,923 | 48,226,184 | 48,326,637 | |||||||||
See accompanying notes to consolidated financial statements.
III-23
Sauer-Danfoss Inc. and Subsidiaries
Consolidated Balance Sheets
(Dollars in thousands, except per share data)
| | December 31, | ||||||||
|---|---|---|---|---|---|---|---|---|---|
| | 2009 | 2008 | |||||||
Assets | |||||||||
Current Assets: | |||||||||
Cash and cash equivalents | $ | 38,790 | $ | 23,145 | |||||
Accounts receivable (net of allowances of $5,640 and $5,210 in 2009 and 2008, respectively) | 155,968 | 239,881 | |||||||
Inventories | 177,574 | 325,496 | |||||||
Other current assets | 65,553 | 51,946 | |||||||
Total current assets | 437,885 | 640,468 | |||||||
Property, Plant and Equipment, net | 513,487 | 598,435 | |||||||
Other Assets: | |||||||||
Goodwill | 35,903 | 86,146 | |||||||
Other intangible assets, net | 19,584 | 23,971 | |||||||
Deferred income taxes | 54,458 | 106,984 | |||||||
Other | 7,000 | 11,672 | |||||||
Total other assets | 116,945 | 228,773 | |||||||
| $ | 1,068,317 | $ | 1,467,676 | ||||||
Liabilities and Stockholders' Equity | |||||||||
Current Liabilities: | |||||||||
Notes payable and bank overdrafts | $ | 54,069 | $ | 65,512 | |||||
Long-term debt due within one year | 142,007 | 58,005 | |||||||
Accounts payable | 101,719 | 149,512 | |||||||
Accrued salaries and wages | 58,169 | 79,322 | |||||||
Accrued warranty | 28,820 | 25,491 | |||||||
Other accrued liabilities | 30,806 | 42,075 | |||||||
Total current liabilities | 415,590 | 419,917 | |||||||
Long-Term Debt | 337,089 | 367,922 | |||||||
Other Liabilities | |||||||||
Long-term pension liability | 72,400 | 90,966 | |||||||
Postretirement benefits other than pensions | 41,047 | 37,971 | |||||||
Deferred income taxes | 33,708 | 44,243 | |||||||
Other | 13,889 | 28,756 | |||||||
Total other liabilities | 161,044 | 201,936 | |||||||
Total liabilities | 913,723 | 989,775 | |||||||
Stockholders' Equity: | |||||||||
Preferred stock, par value $.01 per share, authorized 4,500,000 shares, no shares issued or outstanding | — | — | |||||||
Common stock, par value $.01 per share, authorized shares 75,000,000 in 2009 and 2008; issued and outstanding 48,384,205 in 2009 and 48,271,806 in 2008 | 484 | 483 | |||||||
Additional paid-in capital | 334,873 | 334,847 | |||||||
Retained earnings (accumulated deficit) | (298,845 | ) | 46,921 | ||||||
Accumulated other comprehensive income | 55,422 | 27,995 | |||||||
Total Sauer-Danfoss Inc. stockholders' equity | 91,934 | 410,246 | |||||||
Noncontrolling interest | 62,660 | 67,655 | |||||||
Total stockholders' equity | 154,594 | 477,901 | |||||||
| $ | 1,068,317 | $ | 1,467,676 | ||||||
See accompanying notes to consolidated financial statements.
III-24
Sauer-Danfoss Inc. and Subsidiaries
Consolidated Statements of Stockholders' Equity and Comprehensive Income (Loss)
(Dollars in thousands, except per share data)
| | Number of Shares Outstanding | Common Stock | Additional Paid-in Capital | Retained Earnings (Accumulated Deficit) | Accumulated Other Comprehensive Income | Noncontrolling Interest | Total | |||||||||||||||||
|---|---|---|---|---|---|---|---|---|---|---|---|---|---|---|---|---|---|---|---|---|---|---|---|---|
Year Ended December 31, 2007: | ||||||||||||||||||||||||
Beginning Balance | 47,746,279 | $ | 477 | $ | 336,962 | $ | 98,277 | $ | 26,343 | $ | 53,448 | $ | 515,507 | |||||||||||
Comprehensive income: | ||||||||||||||||||||||||
Net income | — | — | — | 47,198 | — | 21,562 | ||||||||||||||||||
Pension and postretirement adjustment | — | — | — | — | 12,462 | — | ||||||||||||||||||
Unrealized gains on hedging activities | — | — | — | — | 2,144 | — | ||||||||||||||||||
Currency translation | — | — | — | — | 40,736 | 1,423 | ||||||||||||||||||
Total comprehensive income | 125,525 | |||||||||||||||||||||||
Performance units vested | 379,682 | 4 | (4 | ) | — | — | — | — | ||||||||||||||||
Restricted stock grant | 23,500 | — | — | — | — | — | — | |||||||||||||||||
Restricted stock and | ||||||||||||||||||||||||
performance unit compensation | — | — | 4,390 | — | — | — | 4,390 | |||||||||||||||||
Tax benefits on | ||||||||||||||||||||||||
performance unit compensation | — | — | 145 | — | — | — | 145 | |||||||||||||||||
Minimum tax withholding settlement | — | — | (8,971 | ) | — | — | — | (8,971 | ) | |||||||||||||||
Noncontrolling interest distribution | — | — | — | — | (15,889 | ) | (15,889 | ) | ||||||||||||||||
Cash dividends declared ($.72 per share) | — | — | — | (34,663 | ) | — | — | (34,663 | ) | |||||||||||||||
Balance December 31, 2007 | 48,149,461 | 481 | 332,522 | 110,812 | 81,685 | 60,544 | 586,044 | |||||||||||||||||
Year Ended December 31, 2008: | ||||||||||||||||||||||||
Net income (loss) | — | — | — | (29,141 | ) | — | 17,811 | |||||||||||||||||
Pension and postretirement adjustment | — | — | — | — | (22,440 | ) | — | |||||||||||||||||
Unrealized losses on hedging activities | — | — | — | — | (6,861 | ) | — | |||||||||||||||||
Currency translation | — | — | — | — | (24,389 | ) | 3,181 | |||||||||||||||||
Total comprehensive loss | (61,839 | ) | ||||||||||||||||||||||
Performance units vested | 110,837 | 2 | (2 | ) | — | — | — | — | ||||||||||||||||
Restricted stock grant | 15,000 | — | — | — | — | — | — | |||||||||||||||||
Restricted stock and | ||||||||||||||||||||||||
performance unit compensation | — | — | (2,070 | ) | — | — | — | (2,070 | ) | |||||||||||||||
Tax benefits on performance unit compensation | — | — | 1,534 | — | — | — | 1,534 | |||||||||||||||||
Minimum tax withholding settlement | (3,492 | ) | — | (1,590 | ) | — | — | — | (1,590 | ) | ||||||||||||||
Reversal of tax valuation allowance | — | — | 4,453 | — | — | — | 4,453 | |||||||||||||||||
Noncontrolling interest distribution | — | — | — | — | — | (13,881 | ) | (13,881 | ) | |||||||||||||||
Cash dividends declared ($.72 per share) | — | — | — | (34,750 | ) | — | — | (34,750 | ) | |||||||||||||||
Balance December 31, 2008 | 48,271,806 | 483 | 334,847 | 46,921 | 27,995 | 67,655 | 477,901 | |||||||||||||||||
Year Ended December 31, 2009: | ||||||||||||||||||||||||
Net income (loss) | — | — | — | (345,766 | ) | — | 13,512 | |||||||||||||||||
Pension and postretirement adjustment | — | — | — | — | 6,386 | — | ||||||||||||||||||
Unrealized gains on hedging activities | — | — | — | — | 4,357 | — | ||||||||||||||||||
Currency translation | — | — | — | — | 16,684 | 712 | ||||||||||||||||||
Total comprehensive loss | — | (304,115 | ) | |||||||||||||||||||||
Performance units vested | 101,899 | 1 | (1 | ) | — | — | — | — | ||||||||||||||||
Restricted stock grant, net of fortitures | 10,500 | — | — | — | — | — | ||||||||||||||||||
Restricted stock compensation | — | — | 253 | — | — | — | 253 | |||||||||||||||||
Minimum tax withholding settlement | — | — | (226 | ) | — | — | — | (226 | ) | |||||||||||||||
Noncontrolling interest distribution | — | — | — | — | — | (19,219 | ) | (19,219 | ) | |||||||||||||||
Balance December 31, 2009 | 48,384,205 | $ | 484 | $ | 334,873 | $ | (298,845 | ) | $ | 55,422 | $ | 62,660 | $ | 154,594 | ||||||||||
See accompanying notes to consolidated financial statements
III-25
Sauer-Danfoss Inc. and Subsidiaries
Consolidated Statements of Cash Flows
(Dollars in thousands)
| | For the Years Ended December 31, | ||||||||||||||
|---|---|---|---|---|---|---|---|---|---|---|---|---|---|---|---|
| | 2009 | 2008 | 2007 | ||||||||||||
Cash Flows from Operating Activities: | |||||||||||||||
Net income (loss) attributable to Sauer-Danfoss Inc. | $ | (345,766 | ) | $ | (29,141 | ) | $ | 47,198 | |||||||
Adjustments to reconcile net income(loss) to net cash provided by (used in) operating activities: | |||||||||||||||
Depreciation and amortization | 117,130 | 112,962 | 102,303 | ||||||||||||
Noncontrolling interest | 13,512 | 17,811 | 21,562 | ||||||||||||
Restricted stock and performance unit compensation | 253 | (2,070 | ) | 4,390 | |||||||||||
Impairment charges | 50,841 | 58,208 | — | ||||||||||||
Loss on sale of businesses and asset disposals | 16,351 | 9,604 | 9,412 | ||||||||||||
Loss on early retirement of debt | 15,838 | — | — | ||||||||||||
Change in net pension and post-retirement benefits | (2,794 | ) | (5,585 | ) | (2,869 | ) | |||||||||
Change in deferred income taxes | 51,894 | (25,937 | ) | (1,983 | ) | ||||||||||
Minimum tax withholding payments on performance units | (226 | ) | (1,590 | ) | (8,971 | ) | |||||||||
Change in operating assets and liabilities | |||||||||||||||
Accounts receivable, net | 91,434 | 71,679 | (38,491 | ) | |||||||||||
Inventories | 153,386 | (16,799 | ) | (36,578 | ) | ||||||||||
Prepaid and other current assets | (4,990 | ) | (7,918 | ) | (11,136 | ) | |||||||||
Accounts payable | (54,197 | ) | (14,495 | ) | 11,036 | ||||||||||
Accrued liabilities | (20,680 | ) | 23,596 | (1,453 | ) | ||||||||||
Other | 4,858 | (6,807 | ) | 3,720 | |||||||||||
Net cash provided by operating activities | 86,844 | 183,518 | 98,140 | ||||||||||||
Cash Flows from Investing Activities: | |||||||||||||||
Purchases of property, plant and equipment | (42,972 | ) | (198,634 | ) | (135,633 | ) | |||||||||
Proceeds from sale of property, plant and equipment | 4,507 | 11,141 | 6,496 | ||||||||||||
Proceeds from sale of businesses, net of payment for acquisition, net of cash acquired | 744 | — | 6,932 | ||||||||||||
Advances to noncontrolling interest partners | (4,500 | ) | — | — | |||||||||||
Net cash used in investing activities | (42,221 | ) | (187,493 | ) | (122,205 | ) | |||||||||
Cash Flows from Financing Activities: | |||||||||||||||
Net borrowings (repayments) on notes payable and bank overdrafts | (15,685 | ) | 3,493 | 6,114 | |||||||||||
Net borrowings (repayments) on revolving credit facility | (58,705 | ) | 17,019 | 77,264 | |||||||||||
Repayments of long-term debt | (540,500 | ) | (22,948 | ) | (18,817 | ) | |||||||||
Borrowings of long-term debt | 637,232 | 54,235 | 6,875 | ||||||||||||
Payments for debt financing costs | (10,575 | ) | — | — | |||||||||||
Payments of prepayment penalties | (8,064 | ) | — | — | |||||||||||
Settlement of interest rate swaps | (2,000 | ) | — | — | |||||||||||
Cash dividends | (8,689 | ) | (34,728 | ) | (33,636 | ) | |||||||||
Distribution to noncontrolling interest partners | (17,694 | ) | (13,881 | ) | (15,889 | ) | |||||||||
Other | — | 1,534 | 145 | ||||||||||||
Net cash provided by (used in) financing activities | (24,680 | ) | 4,724 | 22,056 | |||||||||||
Effect of Exchange Rate Changes on Cash | (4,298 | ) | (4,393 | ) | (314 | ) | |||||||||
Cash and Cash Equivalents: | |||||||||||||||
Net increase (decrease) during the year | 15,645 | (3,644 | ) | (2,323 | ) | ||||||||||
Beginning balance | 23,145 | 26,789 | 29,112 | ||||||||||||
Ending balance | $ | 38,790 | $ | 23,145 | $ | 26,789 | |||||||||
Supplemental Cash Flow Disclosures: | |||||||||||||||
Interest paid | $ | 43,345 | $ | 22,876 | $ | 20,248 | |||||||||
Income taxes paid | $ | 2,741 | $ | 34,351 | $ | 26,933 | |||||||||
See accompanying notes to consolidated financial statements.
III-26
Sauer-Danfoss Inc. and Subsidiaries
Notes to Consolidated Financial Statements
December 31, 2009, 2008, and 2007
(Dollars in thousands, except per share data)
(1) Summary of Significant Accounting Policies:
Basis of Presentation and Principles of Consolidation—
Sauer-Danfoss Inc., a U.S. Delaware corporation, and subsidiaries (the Company) is a worldwide leader in the design, manufacture, and sale of engineered hydraulic and electronic systems and components that generate, transmit and control power in mobile equipment. The Company's products are used by original equipment manufacturers of mobile equipment, including construction, road building, agricultural, turf care, material handling, and specialty vehicle equipment. The Company's products are sold throughout the world either directly or through distributors.
The consolidated financial statements represent the consolidation of all companies in which the Company has a controlling interest and are stated in accordance with accounting principles generally accepted in the U.S. All significant intercompany balances, transactions, and profits have been eliminated in the consolidated financial statements.
Use of Estimates—
In preparing the consolidated financial statements in conformity with U.S. generally accepted accounting principles, management must make decisions that impact the reported amounts of assets, liabilities, revenues, expenses, and the related disclosures, including disclosures of contingent assets and liabilities. Such decisions include the selection of the appropriate accounting principles to be applied and the assumptions on which to base accounting estimates. Estimates are used in determining, among other items, incentive accruals, inventory valuation, warranty reserves, allowance for doubtful accounts, pension and postretirement accruals, useful lives for intangible assets, and future cash flows associated with impairment testing for goodwill and other long-lived assets. These estimates and assumptions are based on management's best estimates and judgments. Management evaluates its estimates and assumptions on an ongoing basis using historical experience and other factors that management believes to be reasonable under the circumstances, including the current economic environment, adjusting such estimates and assumptions when facts and circumstances dictate. A number of these factors include, among others, the recessionary economic conditions, tight credit markets, foreign currency, higher commodity costs, and a decline in consumer spending and confidence, all of which have combined to increase the uncertainty inherent in such estimates and assumptions. As future events and their effects cannot be determined with precision, actual amounts could differ significantly from those estimated at the time the consolidated financial statements are prepared. Changes in those estimates resulting from continuing changes in the economic environment will be reflected in the financial statements in future periods.
Revenue Recognition—
Net sales are recorded when all of the following criteria are met: persuasive evidence of an arrangement exists, delivery has occurred, the price is fixed or determinable, and collectability is reasonably assured. Estimates for future warranty expense are recorded when the related revenue is recognized. Timing of revenue recognition is consistent with when the risks and rewards of ownership and title to the product have transferred to the customer.
III-27
Sauer-Danfoss Inc. and Subsidiaries
Notes to Consolidated Financial Statements (Continued)
December 31, 2009, 2008, and 2007
(Dollars in thousands, except per share data)
(1) Summary of Significant Accounting Policies: (Continued)
Cash and Cash Equivalents—
Cash equivalents are considered by the Company to be all highly liquid instruments purchased with original maturities of three months or less. At December 31, 2009 cash and cash equivalents balances in China totaled approximately $21,900. The Company is paying dividends from its Chinese entities to the maximum extent possible under current regulations; however, due to the nature of the governmental and other regulatory controls it is difficult to transfer cash out of this country for reasons other than payment for goods shipped into the country.
Trade Receivables—
The Company records trade receivables due from its customers at the time sales are recorded in accordance with its revenue recognition policy. The future collectability of these amounts can be impacted by the Company's collection efforts, the financial stability of its customers, and the general economic climate in which it operates. The Company applies a consistent practice of establishing an allowance for accounts that it believes may become uncollectible through reviewing the historical write-offs of accounts, aging of its receivables, and by monitoring the economic environment and financial strength of its customers. If the Company becomes aware of a customer's inability to meet its financial obligations (e.g., where it has filed for bankruptcy), the Company establishes a specific allowance for the potential bad debt to reduce the net recognized receivable to the amount it reasonably believes will be collected. The analysis of the valuation of trade receivables is performed quarterly.
Inventories—
Inventories are valued at the lower of cost or market, using various cost methods, and include the cost of material, labor, and factory overhead. The last-in, first-out (LIFO) method was adopted in 1987 and is used to value inventories at the U.S. locations which existed at that time. Inventories at all of the non-U.S. locations and the U.S. locations obtained through acquisition after 1987, which produce products different than those produced at U.S. locations existing at 1987, are valued under the first-in, first-out (FIFO) inventory valuation method. The percentage of year-end inventory valued under the LIFO and FIFO cost methods was 9% and 91%, respectively, for 2009, and 11% and 89%, respectively, for 2008.
Property, Plant and Equipment and Depreciation—
Property, plant and equipment are stated at historical cost, net of accumulated depreciation. Depreciation is generally computed using the straight-line method for building equipment and buildings over 10 to 37 years and for machinery and equipment over 3 to 8 years (3 to 12 years for additions in 1999 and prior). Additions and improvements that substantially extend the useful life of a particular asset are capitalized. Repair and maintenance costs ($21,732, $45,818, and $45,580 in 2009, 2008, and 2007, respectively) are charged to expense. When property, plant and equipment are retired or otherwise disposed of, the cost and related accumulated depreciation are removed from the accounts and any gain or loss is included in the consolidated statements of operations.
III-28
Sauer-Danfoss Inc. and Subsidiaries
Notes to Consolidated Financial Statements (Continued)
December 31, 2009, 2008, and 2007
(Dollars in thousands, except per share data)
(1) Summary of Significant Accounting Policies: (Continued)
Goodwill and Other Intangible Assets—
Goodwill represents the excess of the purchase price over the estimated fair values of net assets acquired in the purchase of businesses. Goodwill is not amortized, but tested for impairment at least annually or when events or changes in circumstances indicate that the carrying value of such assets may not be recoverable. The Company recorded a goodwill impairment charge of $50,841 and $22,900 in 2009 and 2008, respectively. See Note 6 for further discussion.
Intangible assets consist primarily of trade names, technology, and customer relationships and are recorded at fair value at the time of acquisition. Intangible assets are amortized on a straight-line basis over their estimated useful lives, which range from three to thirty five years.
Impairment of Long-Lived Assets and Assets to be Disposed Of—
The Company periodically assesses whether events or circumstances have occurred that may indicate the carrying value of its long-lived tangible and intangible assets may not be recoverable. The carrying value of long-lived tangible and intangible assets to be held and used is evaluated for recoverability based on the expected future undiscounted operating cash flows. When the evaluation indicates the carrying value of an asset or group of assets is impaired, the Company determines the fair value of assets, using discounted cash flows or determining the liquidation value of the long-lived assets, and recognizes an impairment loss to the extent that the carrying value of the assets exceeds the fair value of the assets. In 2008 the Company recognized an impairment charge for long-lived assets of $35,300 in the Work Function segment as discussed in Note 5.
Product Warranty—
The Company warrants its various products over differing periods depending upon the type of product and application. Consequently, the Company records warranty liabilities for the estimated costs that may be incurred under its basic warranty based on past trends of actual warranty claims compared to the actual sales levels to which those claims apply. These liabilities are accrued at the time the sales of the products are recorded. Factors that affect the Company's warranty liability include the number of units in the field currently under warranty, historical and anticipated rates of warranty claims on those units and the cost per claim to satisfy the Company's warranty obligation. The anticipated rate of warranty claims is the primary factor impacting the Company's estimated warranty obligation.
In addition to its normal warranty liability, the Company, from time to time in the normal course of business, incurs costs to repair or replace defective products with a specific customer or group of customers. The Company refers to these as field recalls and in these instances, the Company records a specific provision for the expected costs it will incur to repair or replace these products utilizing information from customers and internal information regarding the specific cost of materials and labor. Due to the sporadic and infrequent nature of field recalls, and the potential for a range of costs associated with field recalls, the Company cannot accurately estimate these costs at the time the products are sold. Therefore, these costs are recorded at the time information becomes known to the Company. As the field recalls are carried out, the Company relieves the specific liability related to that field recall. These specific field recall liabilities are reviewed on a quarterly basis. In December 2009 the Company became aware of a
III-29
Sauer-Danfoss Inc. and Subsidiaries
Notes to Consolidated Financial Statements (Continued)
December 31, 2009, 2008, and 2007
(Dollars in thousands, except per share data)
(1) Summary of Significant Accounting Policies: (Continued)
new field recall for which the number of units and cost per unit to repair are still uncertain as no loss estimate within this range is more likely than another. The Company had determined that the range of probable loss for this field recall is from $8,000 to $26,000. The Company has accrued $8,000 for this field recall as of December 31, 2009.
The following table represents the change in the Company's accrued warranty and field recall liability:
| | December 31, | |||||||||
|---|---|---|---|---|---|---|---|---|---|---|
| | 2009 | 2008 | 2007 | |||||||
Balance, beginning of period | $ | 25,491 | $ | 19,401 | $ | 17,022 | ||||
Payments | (18,474 | ) | (22,856 | ) | (17,664 | ) | ||||
Provisions for warranties and field recalls | 21,456 | 28,996 | 19,167 | |||||||
Currency impact | 347 | (50 | ) | 876 | ||||||
Balance, end of period | $ | 28,820 | $ | 25,491 | $ | 19,401 | ||||
Income Taxes—
The provision for income taxes has been determined using the asset and liability approach of accounting for income taxes. Under this approach, deferred taxes represent the future tax consequences expected to occur when the reported amounts of assets and liabilities are recovered or paid. The provision for income taxes represents income taxes paid or payable for the current year plus the change in deferred taxes during the year. Deferred taxes result from differences between the financial and tax bases of the Company's assets and liabilities, net operating loss carryforwards, and tax credit carryforwards and are adjusted for changes in tax rates and tax laws when changes are enacted. Valuation allowances are recorded to reduce deferred tax assets when the Company is unable to conclude that realization of the deferred tax assets is more likely than not.
Income (Loss) Per Share—
Basic net income (loss) per common share is based on the weighted average number of common shares outstanding in each year. Diluted net income per common share assumes that outstanding common shares were increased by shares issuable upon (i) exercise of restricted stock shares, and (ii) granting of shares under the long-term incentive plan, after it becomes certain that the performance requirements needed to be met in accordance with the incentive plan will be achieved. Shares under both the restricted stock plan and the long term incentive plan have an exercise price of zero. Diluted net loss per share for
III-30
Sauer-Danfoss Inc. and Subsidiaries
Notes to Consolidated Financial Statements (Continued)
December 31, 2009, 2008, and 2007
(Dollars in thousands, except per share data)
(1) Summary of Significant Accounting Policies: (Continued)
2009 and 2008 excludes the dilutive effect of restricted stock and performance units as these shares are anti-dilutive.
| | Net Income (Loss) | Shares | Earnings (Loss) Per Share | ||||||||
|---|---|---|---|---|---|---|---|---|---|---|---|
December 31, 2009 | |||||||||||
Basic net loss | $ | (345,766 | ) | 48,337,923 | $ | (7.15 | ) | ||||
Effect of dilutive securities: | |||||||||||
Restricted stock | — | — | — | ||||||||
Performance units | — | — | — | ||||||||
Diluted net loss | $ | (345,766 | ) | 48,337,923 | $ | (7.15 | ) | ||||
December 31, 2008 | |||||||||||
Basic net loss | $ | (29,141 | ) | 48,226,184 | $ | (0.60 | ) | ||||
Effect of dilutive securities: | |||||||||||
Restricted stock | — | — | — | ||||||||
Performance units | — | — | — | ||||||||
Diluted net loss | $ | (29,141 | ) | 48,226,184 | $ | (0.60 | ) | ||||
December 31, 2007 | |||||||||||
Basic net income | $ | 47,198 | 48,094,375 | $ | 0.98 | ||||||
Effect of dilutive securities: | |||||||||||
Restricted stock | — | 24,696 | — | ||||||||
Performance units | — | 207,566 | — | ||||||||
Diluted net income | $ | 47,198 | 48,326,637 | $ | 0.98 | ||||||
Fair Value of Financial Instruments—
The carrying values of cash and cash equivalents, accounts and other receivables, notes payable and bank overdrafts, and accounts payable approximate fair value because of the short-term nature of these instruments.
The fair value of long-term debt is calculated by discounting scheduled cash flows through maturity using estimated market discount rates. The discount rate is estimated using the rates currently offered for long-term debt of similar remaining maturities and credit characteristics. At December 31, 2009 the Company estimated the fair value of its long-term debt, including amounts due within one year, to be the same as its carrying value of $479,096. At December 31, 2008 the Company estimated the fair value of its long-term debt, including amounts due within one year, at $425,273 compared to its carrying value of $425,927. These estimates are subjective in nature and involve uncertainties and, therefore, cannot be determined with precision. Changes in assumptions could significantly affect these estimates.
The fair value of derivative instruments is discussed in Note 7.
III-31
Sauer-Danfoss Inc. and Subsidiaries
Notes to Consolidated Financial Statements (Continued)
December 31, 2009, 2008, and 2007
(Dollars in thousands, except per share data)
(1) Summary of Significant Accounting Policies: (Continued)
Translation of Non-U.S. Currencies—
Assets and liabilities of consolidated non-U.S. subsidiaries are translated into U.S. dollars at exchange rates in effect at the end of each period, while revenues and expenses are translated at average exchange rates prevailing during the period. The resulting translation adjustments are included in stockholders' equity. Gains or losses on transactions denominated in non-functional currencies and the related tax effects are reflected in the consolidated statements of operations.
Derivatives and Hedging—
It is the Company's policy that derivative transactions are executed only to manage exposures arising in the normal course of business and not for the purpose of creating speculative positions or trading. All derivatives are recorded at fair value on the balance sheet as current or long-term other assets or other liabilities depending on whether the maturity date of the derivative contract is within one year from the balance sheet date.
Until March 2009, the Company used interest rate swaps to establish fixed interest rates on outstanding borrowings. There was no ineffectiveness of the interest rate swaps and therefore, the changes in fair value of the derivatives was recorded in accumulated other comprehensive income (loss). The Company utilizes forward contracts to minimize the impact of currency fluctuations on cash flows related to forecasted sales denominated in currencies other than the functional currency of the selling location. The forward contracts qualify for hedge accounting and therefore are subject to effectiveness testing at the inception of the contract and throughout the life of the contract.
When, and if, a derivative is determined not to be highly effective as a hedge, or the underlying hedged transaction is no longer likely to occur, or the derivative is terminated, the hedge accounting is discontinued and any past or future changes in the derivative's fair value that will not be effective as an offset to the income effects of the item being hedged are recognized currently in the statement of operations. Any changes in fair values of derivatives not qualifying as hedges would be reported immediately in other income (expense) on the consolidated statement of operations; however, the Company did not have any derivatives that did not qualify as hedges in 2009 or 2008, other than disclosed in Note 7.
Employee Stock-Based Compensation—
The fair value method is used to account for employee-stock compensation.
New Accounting Principles—
In June 2009 the Financial Accounting Standards Board (FASB) issued Accounting Standards Codification (ASC) 105-10, "The FASB Accounting Standards Codification and the Hierarchy of Generally Accepted Accounting Principles—a replacement of FASB Statement No. 162." The FASB Accounting Standards Codification is intended to be the source of authoritative U.S. generally accepted accounting principles (GAAP) and reporting standards recognized by the FASB. Its primary purpose is to improve clarity and use of existing standards by grouping authoritative literature under common topics.
III-32
Sauer-Danfoss Inc. and Subsidiaries
Notes to Consolidated Financial Statements (Continued)
December 31, 2009, 2008, and 2007
(Dollars in thousands, except per share data)
(1) Summary of Significant Accounting Policies: (Continued)
The Codification does not change or alter existing GAAP and there was no impact on the Company's consolidated financial position or results of operations when it was adopted in the third quarter of 2009.
FASB ASC 805 establishes requirements for recognition and measurement of identifiable assets acquired, liabilities assumed, noncontrolling interest of the acquiree, goodwill acquired, and gain from bargain purchase. The guidance within FASB ASC 805 was issued in December 2007 and applies prospectively to business combinations for which the acquisition date is on or after the beginning of the annual reporting period beginning on or after December 15, 2008. The Company adopted this guidance as of January 1, 2009 with no impact on the consolidated financial statements.
The FASB issued new guidance contained within ASC 810-10, "Noncontrolling Interests in Consolidated Financial Statements—an amendment of ARB No. 51" in December 2007. The new guidance was issued to improve the relevance, comparability, and transparency of financial information provided to investors by requiring all entities to report noncontrolling (minority) interests in subsidiaries as equity in the consolidated financial statements. The Company adopted this guidance in the first quarter of 2009. Upon adoption, certain prior period amounts have been reclassified to conform to the current period financial statement presentation. These reclassifications have no impact on the previously reported financial position or results of operations.
In March 2008 the FASB issued guidance contained within ASC 815-10, "Disclosures about Derivative Instruments and Hedging Activities—an amendment of FASB Statement No. 133." The guidance amends and expands disclosure requirements for derivative instruments in order to provide users of financial statements with an enhanced understanding of (i) how and why an entity uses derivative instruments, (ii) how derivative instruments and related hedged items are accounted for and (iii) how derivative instruments and related hedged items affect an entity's financial position, financial performance, and cash flows. The Company adopted this guidance in the first quarter of 2009 and has included the expanded disclosures in Note 7.
The FASB issued new guidance contained within ASC 260-10, "Determining Whether Instruments Granted in Share-Based Payment Transactions Are Participating Securities" in June 2008. The guidance provides guidance on the calculation of earnings per share and indicates that all outstanding unvested share-based payment awards that contain rights to nonforfeitable dividends or dividend equivalents are considered participating securities and therefore the two-class method should be applied in calculating basic and diluted earnings per share. The guidance is effective for fiscal years, and interim periods within those fiscal years, beginning on or after December 15, 2008. The Company adopted this guidance in first quarter 2009 with no impact on the consolidated financial statements.
In May 2009 the FASB issued guidance contained within ASC 855-10, "Subsequent Events." This Statement incorporates guidance into accounting literature that was previously addressed only in auditing standards. The statement refers to subsequent events that provide additional evidence about conditions that existed at the balance-sheet date as "recognized subsequent events." Subsequent events which provide evidence about conditions that arose after the balance-sheet date but prior to the issuance of the financial statements are referred to as "non-recognized subsequent events." It also requires companies to disclose the date through which subsequent events have been evaluated and whether this date is the date the financial statements were issued or the date the financial statements were available to be issued. The
III-33
Sauer-Danfoss Inc. and Subsidiaries
Notes to Consolidated Financial Statements (Continued)
December 31, 2009, 2008, and 2007
(Dollars in thousands, except per share data)
(1) Summary of Significant Accounting Policies: (Continued)
Company adopted this guidance in the second quarter of 2009 with appropriate disclosures added in Note 18.
(2) Sale of Businesses and Termination of Joint Venture:
In 2009 the Company sold the assets of its steering column business which was located in Kolding, Denmark, recognizing a loss on sale of approximately $2,700 in the Work Function segment. The loss was related to the write-down of inventory and machinery to the proceeds of the sale, which approximated fair value. Also included in the loss amount was severance costs for employees at the Kolding location because the buyer moved production operations to a different location. The Company acquired the steering column business in May 2007 in a stock transaction. The purchase price was allocated to inventory and property, plant, and equipment. Goodwill of approximately $2,800 represented the excess of cost over the fair value of net tangible assets. The goodwill was impaired in 2008 in connection with the impairment of the steering reporting unit. The Company had consolidated the financial results since the date of acquisition through the date of disposition.
In December 2008 the Company signed a sales agreement to sell its alternating current (AC) motor business related to the material handling market. The closing of the transaction occurred in 2009 when the transfer of the machinery and inventory covered by the purchase agreement was completed. A loss of approximately $6,300 and $8,400 in 2009 and 2008, respectively, is reported in the Controls segment. In 2008 the machinery and inventory were written down to the proceeds expected to be received upon transfer of the assets. The expense in 2009 relates to the write-off of a customer relationship intangible asset, employee retention costs, and additional write-downs to machinery and inventory balances due to revisions of the sales agreement during 2009. The Company will receive a commission payment from the purchaser through 2012; the amount will be based on the level of electric motors sales made by the purchaser.
In April 2007 the Company sold its direct current (DC) motor business. The sale resulted in a loss of approximately $6,600, including transaction costs. The loss is reported in the Controls segment.
The Company sold the assets and product lines located in the Swindon, England location in June 2007. The Company recognized a net loss on the sale of approximately $2,400, including transaction costs, reported in the Work Function segment. The Company had anticipated ending production at this location by the end of 2006 and had established an accrual with the expectation that termination payments would be made to employees at the time production ended. A severance accrual of approximately $1,900, established during 2006, was reversed at the time of sale. The reversal of the accrual was reflected as an offset to the loss on sale of business calculation.
In July 2009 the Company and Topcon Positioning Systems, Inc. (Topcon), the noncontrolling interest partner, agreed to terminate the joint venture they have operated since April 2001 through TSD Integrated Controls, LLC (TSD). The termination was effective September 1, 2009 but is subject to a three-year wind down period as contemplated in the 2001 Joint Venture Agreement. During the wind-down period, the Company and Topcon will each receive distributions of certain assets of TSD and royalties on sales of TSD products. The effects of this wind-down will not have a material impact on the Company's operations.
III-34
Sauer-Danfoss Inc. and Subsidiaries
Notes to Consolidated Financial Statements (Continued)
December 31, 2009, 2008, and 2007
(Dollars in thousands, except per share data)
(3) Restructuring Charges:
In September 2009 the Company announced its plans to close the Lawrence, Kansas plant, and transfer the majority of the production lines to the Ames, Iowa and Freeport, Illinois locations to reduce costs and increase efficiencies. Costs related to the Lawrence plant closing are included in the Work Function segment. This project is expected to be completed in the first half of 2010.
In December 2008 the Company decided to close the Hillsboro, Oregon plant and transfer the production lines to the Easley, South Carolina location. In 2007, in preparation for disposing of the direct current (DC) electric motor business the Company incurred restructuring costs to transfer all DC production lines to one location and all alternating current (AC) production lines to another location. The costs related to the closure of Hillsboro, the transfer of electric motors production lines, and costs related to the relocation of certain production lines between facilities are included in the Controls segment. The relocation of production activities from Hillsboro was completed in 2009. The other projects were completed in 2008. The Company sold its AC electric motor business related to the material handling market in June 2009 and its DC electric motor business in April 2007. The losses related to the sale of businesses of approximately $6,300, $8,400 and $6,600, in 2009, 2008 and 2007, respectively, are not included in the restructuring numbers below.
The Company announced its plans to close its LaSalle, Illinois plant, outsourcing certain products to reduce costs and increase efficiencies in March 2006. Costs related to the LaSalle plant closing, in addition to costs related to the relocation of certain production lines between production facilities in the U.S are included in the Propel segment. These projects were completed in 2007.
In 2006 the Company announced plans to discontinue production of certain product lines manufactured in Swindon, England and incurred restructuring costs in anticipation of this shutdown. In June 2007, the assets related to this production facility were sold and accruals which were no longer needed were reversed. This activity is included in the Work Function segment. The approximately $2,400 of costs incurred in 2007 related to the sale of the production assets are not included in the restructuring numbers below.
The following table summarizes the restructuring charges incurred, as well as the cumulative charges incurred to date on these projects.
| | Propel | Work Function | Controls | Total | |||||||||
|---|---|---|---|---|---|---|---|---|---|---|---|---|---|
Charges incurred in 2009 | $ | — | $ | 3,699 | $ | 8,704 | $ | 12,403 | |||||
Charges incurred in 2008 | — | — | 1,007 | 1,007 | |||||||||
Charges incurred in 2007 | 5,477 | — | 4,874 | 10,351 | |||||||||
Cumulative charges incurred | 13,767 | 3,699 | 14,585 | 32,051 | |||||||||
Cumulative charges expected to be incurred | 13,767 | 8,100 | 14,585 | 36,452 | |||||||||
III-35
Sauer-Danfoss Inc. and Subsidiaries
Notes to Consolidated Financial Statements (Continued)
December 31, 2009, 2008, and 2007
(Dollars in thousands, except per share data)
(3) Restructuring Charges: (Continued)
The restructuring costs incurred are reported in the statement of operations as detailed in the following table:
| | Cost of Sales | Selling, General and Administrative Expenses | Loss on Disposal of Fixed Assets | Total | |||||||||
|---|---|---|---|---|---|---|---|---|---|---|---|---|---|
Charges incurred in 2009 | $ | 5,813 | $ | 4,500 | $ | 2,090 | $ | 12,403 | |||||
Charges incurred in 2008 | 40 | 585 | 382 | 1,007 | |||||||||
Charges incurred in 2007 | 9,662 | 669 | 20 | 10,351 | |||||||||
Cumulative charges incurred | 23,805 | 5,754 | 2,492 | 32,051 | |||||||||
Cumulative charges expected to be incurred | 25,706 | 8,254 | 2,492 | 36,452 | |||||||||
The following table summarizes the restructuring charges incurred and the activity in accrued liabilities during 2009, 2008 and 2007.
| | Employee Termination Costs | Building and Lease Cancellation Costs | Accelerated Depreciation and Loss on Asset Disposals | Equipment Moving Costs | Other | Total | |||||||||||||
|---|---|---|---|---|---|---|---|---|---|---|---|---|---|---|---|---|---|---|---|
Balance as of January 1, 2007 | $ | 3,115 | $ | — | $ | — | $ | — | $ | — | $ | 3,115 | |||||||
Charges to expense | 600 | — | 20 | 3,993 | 5,738 | 10,351 | |||||||||||||
Reversal of accrual due to sale of business | (1,915 | ) | — | — | — | — | (1,915 | ) | |||||||||||
Payments made | (1,425 | ) | — | (20 | ) | (3,993 | ) | (5,738 | ) | (11,176 | ) | ||||||||
Balance as of December 31, 2007 | 375 | — | — | — | — | 375 | |||||||||||||
Charges to expense | 625 | — | 382 | — | — | 1,007 | |||||||||||||
Payments made | (375 | ) | — | (382 | ) | — | — | (757 | ) | ||||||||||
Balance as of December 31, 2008 | 625 | — | — | — | — | 625 | |||||||||||||
Charges to expense | 2,275 | 2,162 | 4,569 | 829 | 2,568 | 12,403 | |||||||||||||
Payments made | (2,049 | ) | (1,607 | ) | (4,569 | ) | (829 | ) | (2,568 | ) | (11,622 | ) | |||||||
Balance as of December 31, 2009(1) | $ | 851 | $ | 555 | $ | — | $ | — | $ | — | $ | 1,406 | |||||||
- (1)
- The remaining $851 of accrued employee termination costs will be paid in 2010. The $555 of accrued lease costs relate to future lease payments that will be paid through December 2010.
The employee termination costs in the table above relate to the restructuring projects described in this footnote. The table excludes approximately $32,600 and $15,500 of employee termination costs in 2009 and 2008, respectively, related to headcount reductions that were the result of reduced sales volumes related to
III-36
Sauer-Danfoss Inc. and Subsidiaries
Notes to Consolidated Financial Statements (Continued)
December 31, 2009, 2008, and 2007
(Dollars in thousands, except per share data)
(3) Restructuring Charges: (Continued)
the worldwide economic downturn. The liability in the balance sheet related to these employee termination costs was approximately $12,000 and $10,200 at December 31, 2009 and 2008, respectively.
(4) Inventories:
The composition of inventories is as follows:
| | December 31, | |||||||
|---|---|---|---|---|---|---|---|---|
| | 2009 | 2008 | ||||||
Raw materials | $ | 89,063 | $ | 153,570 | ||||
Work in progress | 44,176 | 64,329 | ||||||
Finished goods and parts | 64,263 | 131,758 | ||||||
LIFO allowance | (19,928 | ) | (24,161 | ) | ||||
Total | $ | 177,574 | $ | 325,496 | ||||
The Company recorded LIFO decrements of approximately $25,900 and $8,800 in 2009 and 2008, respectively.
III-37
Sauer-Danfoss Inc. and Subsidiaries
Notes to Consolidated Financial Statements (Continued)
December 31, 2009, 2008, and 2007
(Dollars in thousands, except per share data)
(5) Property, Plant and Equipment and Property Held for Disposal:
The cost and related accumulated depreciation of property, plant and equipment are summarized as follows:
| | December 31, | |||||||
|---|---|---|---|---|---|---|---|---|
| | 2009 | 2008 | ||||||
Cost— | ||||||||
Land and improvements | $ | 16,785 | $ | 16,624 | ||||
Buildings and improvements | 156,008 | 152,929 | ||||||
Machinery and equipment | 1,022,728 | 1,021,851 | ||||||
Construction in progress | 46,418 | 103,545 | ||||||
Plant and equipment under capital leases | 4,700 | 17,998 | ||||||
Total costs | 1,246,639 | 1,312,947 | ||||||
Less—accumulated depreciation | (733,152 | ) | (714,512 | ) | ||||
Net property, plant and equipment | $ | 513,487 | $ | 598,435 | ||||
Depreciation expense for 2009, 2008, and 2007 was $115,252, $110,934, and $100,074, respectively.
In 2008 the Company determined that an impairment test of property, plant, and equipment was necessary due to the change in worldwide economic conditions and resulting decrease in Company sales. The Company determined that an impairment charge of $35,300 was required to write down the carrying value of the motors asset group within the Work Function segment. The assets were written down to fair value as measured by the liquidation value of the assets.
The Company exercised the buy-out option in the capital lease for the building in Odense, Denmark in 2009. This location was previously used for the design and manufacture of electric drives until the business was exited in the second quarter of 2009 as discussed in Note 3. The Company intends to sell the building, which has a carrying value of approximately $9,600. The building is classified in other current assets in the Controls segment.
In 2007 the Company decided that the land and building at the LaSalle, Illinois location would be sold. This property was classified in other current assets with a carrying value of approximately $1,800 in the Propel segment on the consolidated balance sheet at December 31, 2007. In 2008 the property was sold for a gain of approximately $1,400. The gain was reported in the Propel segment.
In 2003 the Company closed a manufacturing facility in West Branch, Iowa and determined the land and building would be sold. In 2007 the location was sold for approximately $3,300. The loss on sale of land and building of approximately $300 is reported in the Work Function segment.
(6) Goodwill and Intangible Assets:
Goodwill is required to be tested for impairment annually and if an event or conditions change that would more likely than not reduce the fair value of a reporting unit below its carrying value. As a result of deteriorating economic conditions the Company completed a goodwill impairment test as of March 31, 2009, in addition to its annual impairment test as of December 31, 2009.
III-38
Sauer-Danfoss Inc. and Subsidiaries
Notes to Consolidated Financial Statements (Continued)
December 31, 2009, 2008, and 2007
(Dollars in thousands, except per share data)
(6) Goodwill and Intangible Assets: (Continued)
The Company has identified seven reporting units that are either operating segments or one level below operating segments. As an overall reasonableness test in its step one analysis the Company reconciled the sum of the estimated fair values of its reporting units to the Company's market value (based on its stock price at the measurement date), plus a reasonable control premium, which is estimated as that amount which would be received to sell a majoity share of the Company in an orderly transaction between market participants versus the market value of the minority shares as evidenced by the stock price.
When testing for goodwill impairment, the Company performs a first step of the goodwill impairment test to identify a potential impairment. In doing so, the Company compares the fair value of a reporting unit with its carrying amount. If the carrying amount of a reporting unit exceeds its fair value, goodwill may be impaired and a second step of the goodwill impairment test is performed to measure the amount of any impairment loss. Estimates about fair value used in the first step of the goodwill impairment tests have been calculated using an income approach based on the present value of future cash flows of each reporting unit. The income approach has been supported by other valuation approaches, such as similar transaction and guideline analyses. Under the income approach, the Company determined fair value based on estimated future cash flows of each reporting unit, discounted by an estimated weighted-average cost of capital, which reflects the overall level of inherent risk of a reporting unit and the rate of return an outside investor would expect to earn. Determining the fair value of a reporting unit is judgmental in nature and requires the use of significant estimates and assumptions, including revenue growth rates and operating margins, discount rates and future market conditions among others. Changes in economic and operating conditions impacting these assumptions could result in goodwill impairments in future periods.
In the second step of the goodwill impairment test, the Company compares the implied fair value of reporting unit goodwill with the carrying amount of that goodwill. If the carrying amount of reporting unit goodwill exceeds the implied fair value of that goodwill, an impairment loss is recognized in an amount equal to that excess. The implied fair value of goodwill is determined in the same manner that the amount of goodwill recognized in a business combination is determined. The Company allocates the fair value of a reporting unit to all of the assets and liabilities of that unit, including intangible assets, as if the reporting unit had been acquired in a business combination. Any excess of the value of a reporting unit over the amounts assigned to its assets and liabilities is the implied fair value of goodwill.
The Company considered the decrease in its market value in the first quarter of 2009 to be a triggering event that required goodwill to be tested for impairment at March 31, 2009. As a result of that testing the Company determined that the implied fair value of goodwill for the valves reporting unit was less than its carrying value by $50,841, which was recorded as a goodwill impairment charge. At December 31, 2009 the Company has $35,903 of goodwill related to its propel and mobile electronics reporting units which was tested for impairment, as required annually. The fair value of the propel and mobile electronics reporting units substantially exceeded the goodwill amounts, resulting in no impairment.
In 2008 the Company determined that the implied fair value of goodwill for the motors, steering, and electric drives reporting units was less than its carrying value by $22,908, which was recorded as a goodwill impairment charge in 2008.
III-39
Sauer-Danfoss Inc. and Subsidiaries
Notes to Consolidated Financial Statements (Continued)
December 31, 2009, 2008, and 2007
(Dollars in thousands, except per share data)
(6) Goodwill and Intangible Assets: (Continued)
The changes in the carrying amounts of goodwill for the years ended December 31, 2008 and 2009 are as follows:
| | Propel Segment | Work Function Segment | Controls Segment | Total | |||||||||
|---|---|---|---|---|---|---|---|---|---|---|---|---|---|
Balance at January 1, 2008 | $ | 27,910 | $ | 18,018 | $ | 68,572 | $ | 114,500 | |||||
Purchase price adjustment on 2007 acquisition | — | 243 | — | 243 | |||||||||
Reversal of valuation allowance on deferred tax asset | (426 | ) | (219 | ) | (263 | ) | (908 | ) | |||||
Impairment | — | (17,361 | ) | (5,547 | ) | (22,908 | ) | ||||||
Translation adjustment | (833 | ) | (681 | ) | (3,267 | ) | (4,781 | ) | |||||
Balance at December 31, 2008 | 26,651 | — | 59,495 | 86,146 | |||||||||
Impairment | — | — | (50,841 | ) | (50,841 | ) | |||||||
Translation adjustment | 440 | — | 158 | 598 | |||||||||
Balance at December 31, 2009 | $ | 27,091 | $ | — | $ | 8,812 | $ | 35,903 | |||||
The following table summarizes the components of the other intangible asset balances at December 31, 2009 and 2008:
| | Trade Name | Technology | Customer Relationships | Other | Total | |||||||||||
|---|---|---|---|---|---|---|---|---|---|---|---|---|---|---|---|---|
December 31, 2009 | ||||||||||||||||
Cost | $ | 19,000 | $ | 10,700 | $ | 1,334 | $ | 2,137 | $ | 33,171 | ||||||
Accumulated amortization | (4,887 | ) | (6,417 | ) | (320 | ) | (1,963 | ) | (13,587 | ) | ||||||
Other intangible assets, net | $ | 14,113 | $ | 4,283 | $ | 1,014 | $ | 174 | $ | 19,584 | ||||||
December 31, 2008 | ||||||||||||||||
Cost | $ | 19,000 | $ | 11,366 | $ | 7,836 | $ | 2,291 | $ | 40,493 | ||||||
Accumulated amortization | (4,344 | ) | (6,370 | ) | (4,168 | ) | (1,640 | ) | (16,522 | ) | ||||||
Other intangible assets, net | $ | 14,656 | $ | 4,996 | $ | 3,668 | $ | 651 | $ | 23,971 | ||||||
The weighted average useful lives for the intangible assets are 35, 15, and 4 years for trade name, technology, and customer relationships, respectively. Amortization of intangible assets was $1,878, $2,028, and $2,229 in 2009, 2008, and 2007, respectively. Amortization expense is expected to be approximately $1,400 annually in 2010 through 2013, and $1,300 in 2014.
(7) Fair Value and Derivative Financial Instruments:
The Company holds certain assets and liabilities that are required to be measured at fair value on a recurring basis. These include the Company's derivative instruments, related to both foreign currency exchange and interest rates, which are recognized at fair value. All derivative instruments are designated as
III-40
Sauer-Danfoss Inc. and Subsidiaries
Notes to Consolidated Financial Statements (Continued)
December 31, 2009, 2008, and 2007
(Dollars in thousands, except per share data)
(7) Fair Value and Derivative Financial Instruments: (Continued)
and qualify for hedge accounting treatment, other than those contracts that no longer qualify as highly effective. Fair value is based on the price that would be received to sell an asset or paid to transfer a liability in an orderly transaction between market participants at the measurement date. It is the Company's policy to maximize the use of observable inputs and minimize the use of unobservable inputs when developing fair value measurements. The fair values of the foreign currency exchange and interest rate contracts are determined based on inputs that are readily available in public markets or can be derived from information available in publicly quoted markets. Therefore, the Company has categorized these contracts as Level 2 in the fair value hierarchy.
The following table shows the Company's financial assets and liabilities that were accounted for at fair value on a recurring basis:
| | | December 31, | ||||||||
|---|---|---|---|---|---|---|---|---|---|---|
| | Balance Sheet Classification | |||||||||
| | 2009 | 2008 | ||||||||
Assets: | ||||||||||
Foreign currency exchange contracts | Other current assets | $ | 791 | $ | 1,560 | |||||
Foreign currency exchange contracts | Other assets | — | 547 | |||||||
| $ | 791 | $ | 2,107 | |||||||
Liabilities: | ||||||||||
Foreign currency exchange contracts | Other accrued liabilities | $ | 322 | $ | 5,434 | |||||
Interest rate swap contracts | Other liabilities | — | 1,897 | |||||||
| $ | 322 | $ | 7,331 | |||||||
The Company uses derivative financial instruments to manage risk and not for trading or other speculative purposes.
The Company enters into forward contracts to hedge the value of the U.S. dollar or euro cash flow at locations that do not have the U.S. dollar or euro as their functional currency but conduct certain transactions in U.S. dollars or euros. The objective of all outstanding forward contracts is to hedge forecasted transactions in U.S. dollars or euros through the cash settlement date. The Company enters forward contracts that mature from two to eighteen months after the contract date.
The Company had foreign currency forward contracts outstanding in notional amounts as follows:
| | December 31, | ||||||
|---|---|---|---|---|---|---|---|
| | 2009 | 2008 | |||||
U.S. dollar | 19,800 | 60,550 | |||||
Euro | — | 22,000 | |||||
Interest rate swaps, designated as cash flow hedges, were used by the Company to establish fixed interest rates on outstanding borrowings. At December 31, 2008 the Company had two interest rate swaps outstanding, with a combined notional amount of $34,027. The interest rate swaps were settled in 2009 for a loss of $2,000 in connection with the debt repayment discussed in Note 8.
III-41
Sauer-Danfoss Inc. and Subsidiaries
Notes to Consolidated Financial Statements (Continued)
December 31, 2009, 2008, and 2007
(Dollars in thousands, except per share data)
(7) Fair Value and Derivative Financial Instruments: (Continued)
Changes in the fair value of derivative financial instruments are recognized in the statement of operations or in stockholders' equity as a component of other comprehensive income depending on whether the transaction related to the hedged risk has occurred and whether the contract qualifies as highly effective. Changes in fair values of derivatives that are accounted for as cash flow hedges are recorded in other comprehensive income. The amount of gain (loss), net of tax, recorded as a component of accumulated other comprehensive income was:
| | December 31, | ||||||
|---|---|---|---|---|---|---|---|
| | 2009 | 2008 | |||||
Foreign currency exchange contracts | $ | 208 | $ | (2,962 | ) | ||
Interest rate swap contracts | — | (1,187 | ) | ||||
| $ | 208 | $ | (4,149 | ) | |||
At December 31, 2009 the Company expects to reclassify $208 of gain, net of tax, on derivative instruments from accumulated other comprehensive income to the income statement during the next twelve months due to the actual fulfillment of forecasted transactions.
The following table summarizes the amount of gain (loss) reclassified from accumulated other comprehensive income into the consolidated statement of operations for 2009 and 2008:
| | December 31, | ||||||
|---|---|---|---|---|---|---|---|
Statement of Operations Classification | 2009 | 2008 | |||||
Net Sales | $ | (5,487 | ) | $ | 7,805 | ||
Other, net | 864 | (504 | ) | ||||
Interest expense, net | (151 | ) | (278 | ) | |||
| $ | (4,774 | ) | $ | 7,023 | |||
The Company formally assesses at a hedge's inception, and on an ongoing basis, whether the derivatives that are used in the hedging transaction have been highly effective in offsetting changes in the cash flows of the hedged items and whether those derivatives are expected to remain highly effective. When it is determined that a derivative has ceased to be highly effective as a hedge the Company discontinues hedge accounting prospectively. When the Company discontinues hedge accounting because it is no longer probable that the forecasted transaction will occur by the end of the originally expected period, but it is probable that the transaction will occur within the two months following the forecasted period, the gain or loss on the derivative remains in accumulated other comprehensive income and is reclassified to net earnings when the forecasted transaction affects net earnings. However, if it is probable that a forecasted transaction will not occur within two months after the forecasted period, the gains and losses that were accumulated in other comprehensive income will be recognized immediately in net earnings. In all situations in which hedge accounting is discontinued and the derivative remains outstanding, the Company carries the derivative at its fair value on the consolidated balance sheet, recognizing future changes in the fair value in other income or expense, net. In 2009 the Company had derivative contracts with notional amounts of $3,300 that no longer qualified for hedge accounting as the
III-42
Sauer-Danfoss Inc. and Subsidiaries
Notes to Consolidated Financial Statements (Continued)
December 31, 2009, 2008, and 2007
(Dollars in thousands, except per share data)
(7) Fair Value and Derivative Financial Instruments: (Continued)
sales were not expected to occur in the month originally specified. In 2009 income of $376 was recognized in other, net related to changes in the fair value of derivative contracts that were no longer deemed highly effective, which is included in the $864 in the table above. The sales related to the derivative contracts no longer deemed highly effective occurred within two months following the originally specified period. All derivative contracts qualified for hedge accounting in 2008.
In addition, any portion of the hedge that is deemed ineffective due to the absolute value of the cumulative change in the derivative being greater than the cumulative change in the hedged item is recorded immediately in other income (expense) on the consolidated statement of operations. Except for the hedge ineffectiveness discussed above, there was no other significant hedge ineffectiveness in 2009. There was no significant hedge ineffectiveness in 2008.
(8) Long-Term Debt:
Long-term debt outstanding at December 31, 2009 and 2008 consisted of the following:
| | 2009 | 2008 | ||||||||||||
|---|---|---|---|---|---|---|---|---|---|---|---|---|---|---|
| | Long-term Debt Due Within One Year | Long-term Debt | Long-term Debt Due Within One Year | Long-term Debt | ||||||||||
Danfoss A/S Multicurrency Term Loan and Revolving Credit Facilities | $ | 140,869 | $ | 332,370 | $ | — | $ | — | ||||||
Danfoss A/S Loan | — | — | 50,000 | |||||||||||
Multicurrency Revolving and Term Loan Facility | — | — | 56,461 | 201,115 | ||||||||||
Multicurrency Term Loan Facility | — | — | — | 83,934 | ||||||||||
U.S. 2000 Senior Notes | — | — | — | 24,000 | ||||||||||
Other Borrowings | 1,138 | 4,719 | 1,544 | 8,873 | ||||||||||
Total | $ | 142,007 | $ | 337,089 | $ | 58,005 | $ | 367,922 | ||||||
Related Person Loans
In November 2009, the Company entered into a new unsecured term loan and revolving credit facility with Danfoss A/S (the Danfoss Agreement), the Company's majority stockholder, which replaced the Original Credit Agreement discussed below. Under the Danfoss Agreement the Company may borrow up to $690,000. The principal amount outstanding under the Danfoss Agreement bears interest at a rate equal to the U.S. prime rate or LIBOR, as in effect at times specified in the Danfoss Agreement, plus 10%. The balance of the revolving credit facilities at December 31, 2009 was $140,869, and the loans had a weighted average interest rate of 10.3%. The Danfoss Agreement also includes term loans of 92,000 euro (approximately $132,000) and $200,000, which accrue interest at an annual rate of 11.8% and 11.4%, respectively. The Company was required to pay a closing fee of $2,000 to Danfoss A/S, which was capitalized and will be amortized to interest expense over the term of the Danfoss Agreement. The Company pays a quarterly commitment fee equal to 4% of the average daily unused portion of the Danfoss Agreement. The Company incurred commitment fee expense of $1,231 in 2009. The Company's
III-43
Sauer-Danfoss Inc. and Subsidiaries
Notes to Consolidated Financial Statements (Continued)
December 31, 2009, 2008, and 2007
(Dollars in thousands, except per share data)
(8) Long-Term Debt: (Continued)
borrowings under the Danfoss Agreement will be due and payable in full on April 29, 2011. Prior to April 29, 2011 the Company will need to either extend its current Credit Agreement with Danfoss A/S or obtain an alternative source of funding from either Danfoss A/S or a third party. The Danfoss Agreement contains no financial covenants but it does contain a number of affirmative and negative covenants that, among other things, require the Company to obtain the consent of Danfoss A/S prior to engaging in certain types of transactions. The Danfoss Agreement contains customary representations and warranties regarding the Company and its business and operations. It also sets forth a number of events of default for, among other things, failure to pay principal or interest, breaches of representations, warranties and covenants and various events relating to the bankruptcy or insolvency of the Company or its subsidiaries.
In March 2009, the Company entered into a Multicurrency Term Loan and Revolving Credit Facilities agreement with Danfoss A/S (the Original Credit Agreement), which was scheduled to mature on September 30, 2010, but was terminated in November, 2009 and replaced by the Danfoss Agreement discussed above. Under the Original Credit Agreement the Company was able to borrow up to $490,000. Borrowings under the Original Credit Agreement bore interest at LIBOR, CIBOR or EURIBOR, plus a margin of 8.0%. The Original Credit Agreement also included term loans of 92,000 euro and $180,000, which accrued interest at an annual rate of 9.8% and 9.4%, respectively. Debt issuance costs of approximately $8,600 were capitalized but subsequently taken to interest expense when the Original Credit Agreement was replaced by the Danfoss Agreement. The Company was also required to pay a commitment fee of 4.0% on the unused portion of the Original Credit Agreement. In 2009 the Company recognized commitment fee expense of $2,311. Proceeds from these borrowings were used to pay off the Multicurrency Revolving and Term Loan Facilities and the U.S. 2000 Senior Notes.
In December 2008, the Company borrowed $50,000 from Danfoss A/S (the Danfoss A/S Loan). The unsecured term loan had a maturity date of December 9, 2011 and bore interest at an annual rate of 4.02%. The Company paid a facility fee of 10 basis points. The Danfoss A/S Loan was terminated in November, 2009 with its balance rolled into the Danfoss Agreement, as described above.
Approximately $5,100 of unamortized debt issuance costs related to both the Original Credit Agreement and the Danfoss A/S Loan were expensed in 2009 as a result of the Danfoss Agreement.
Multicurrency Facilities
In December 2005, the Company entered into a Multicurrency Revolving Facility Agreement which was modified in July 2006 (the Agreement). Borrowings under the Agreement bore interest at a rate based on either the relevant interbank offering rate plus a margin, Federal Funds plus 0.5%, or the prevailing Prime Rate. The margin on the interbank offering rate option ranged from 0.5% to 1.125%, depending upon the Company's ratio of net debt to EBITDA, as defined. Outstanding borrowings under the Agreement were repaid during March 2009. The Company wrote off $600 of unamortized debt issuance costs related to the loans.
In December 2005, the Company entered a term loan facility, under which it borrowed $30,000 in U.S. dollars at a fixed interest rate of 5.74% and 38,450 euro (approximately $53,900 using the December 31, 2008 exchange rate) at a fixed interest rate of 4.05% over the ten-year term of the loan. The U.S. dollar portion of the loan was repaid in March 2009 along with a prepayment penalty of approximately $4,400.
III-44
Sauer-Danfoss Inc. and Subsidiaries
Notes to Consolidated Financial Statements (Continued)
December 31, 2009, 2008, and 2007
(Dollars in thousands, except per share data)
(8) Long-Term Debt: (Continued)
The euro portion of the loan was repaid in April 2009 along with a prepayment penalty of approximately $3,300.
U.S Borrowings
In October 2000, the Company issued $35,000 of 8.07% Senior Notes with scheduled annual payments starting on September 30, 2008, through September 30, 2010. The Notes were repaid during March 2009. The Company paid a prepayment penalty of approximately $400 and in addition, wrote off $50 of unamortized debt issuance costs related to the loans.
Other Borrowings
The Company borrows locally when favorable terms are available. In May 2007, the Company borrowed $150 from the Ames, Iowa Economic Development Commission. The loan bears interest at an annual rate of 4.13%, and the outstanding balance on the loan at December 31, 2009 was $103. In December 2006, the Company borrowed $750 from the Iowa Department of Economic Development. The loan does not bear interest, and the outstanding balance at December 31, 2009 was $643. In April, 2005 the Company borrowed 150,000 Indian rupee from The Hong Kong and Shanghai Banking Corporation. The loan bears interest at a variable rate ranging from 8.20% to 9.36%, and had an outstanding balance of 134,488 Indian rupee (approximately $2,870) at December 31, 2009. In February, 2007 the Company borrowed 150,000 Indian rupee from Deutsche Bank AG. The loan bears interest at an annual rate of 11.75%, and the outstanding balance at December 31, 2009 was 105,000 Indian rupee (approximately $2,241). A Danish subsidiary maintains a line of credit for purposes of centralizing cash management for the European locations. Sauer-Danfoss Inc. guarantees this line of credit up to 20,000 euro (approximately $28,000).
Loss on Early Retirement of Debt
A loss on early retirement of debt of $15,838 was recognized during 2009. The total loss consisted of $8,064 of prepayment penalties, $2,000 to settle outstanding interest rate swap agreements related to the debt repaid, and $5,774 to write-off unamortized deferred financing costs.
Repayment of Borrowings
Payments required to be made on long-term debt outstanding as of December 31, 2009 during the years ending 2010 through 2014 and for 2015 and thereafter are $142,007, $334,071, $1,367, $986, $665 and $0, respectively.
III-45
Sauer-Danfoss Inc. and Subsidiaries
Notes to Consolidated Financial Statements (Continued)
December 31, 2009, 2008, and 2007
(Dollars in thousands, except per share data)
(9) Pension and Postretirement Benefits other than Pensions:
The Company has noncontributory defined benefit pension plans covering a significant number of its employees. The benefits under these plans are based primarily on years of service and compensation levels. The Company also provides health benefits for certain retired employees and certain dependents when the employee becomes eligible for these benefits by satisfying plan provisions that include certain age and service requirements. The measurements for the pension and health benefits plans were performed at December 31.
Pension Benefits
Pension expense for 2009, 2008, and 2007 for these defined benefit plans consists of the following components:
| | December 31, | ||||||||||
|---|---|---|---|---|---|---|---|---|---|---|---|
| | 2009 | 2008 | 2007 | ||||||||
Service cost | $ | 4,021 | $ | 4,371 | $ | 4,637 | |||||
Interest cost | 13,573 | 13,635 | 12,593 | ||||||||
Expected return on plan assets | (11,144 | ) | (12,202 | ) | (10,643 | ) | |||||
Amortization of prior service cost | (231 | ) | (318 | ) | 49 | ||||||
Amortization of net loss | 2,886 | 1,871 | 2,847 | ||||||||
Net periodic pension expense | $ | 9,105 | $ | 7,357 | $ | 9,483 | |||||
The Company incurred $1,036 of curtailment expense in 2007 related to discontinuing production of certain product lines manufactured in Swindon, England. The curtailment expense is not included in the net periodic pension expense disclosed above.
The Company expects to incur income of $303 related to the amortization of prior service costs and expense of $5,431 for amortization of net loss in 2010.
III-46
Sauer-Danfoss Inc. and Subsidiaries
Notes to Consolidated Financial Statements (Continued)
December 31, 2009, 2008, and 2007
(Dollars in thousands, except per share data)
(9) Pension and Postretirement Benefits other than Pensions: (Continued)
The following table sets forth the plans' funded status as of the respective balance sheet dates:
| | December 31, | ||||||
|---|---|---|---|---|---|---|---|
| | 2009 | 2008 | |||||
Reconciliation of benefit obligation: | |||||||
Benefit obligation at January 1 | $ | (220,473 | ) | $ | (228,931 | ) | |
Service cost | (4,021 | ) | (4,371 | ) | |||
Interest cost | (13,573 | ) | (13,635 | ) | |||
Plan participant contributions | (1,068 | ) | (1,411 | ) | |||
Plan amendments | — | (100 | ) | ||||
Plan curtailment(1) | 2,427 | — | |||||
Actuarial gain (loss) | (9,554 | ) | 2,363 | ||||
Benefit payments | 13,648 | 10,412 | |||||
Effect of exchange rate changes | (5,667 | ) | 15,200 | ||||
Benefit obligation at December 31 | (238,281 | ) | (220,473 | ) | |||
Reconciliation of fair value of plan assets: | |||||||
Fair value of plan assets at January 1 | 135,550 | 160,095 | |||||
Actual return on plan assets | 23,353 | (28,896 | ) | ||||
Employer contributions | 10,415 | 27,574 | |||||
Effect of exchange rate changes | 5,019 | (16,103 | ) | ||||
Plan participant contributions | 1,068 | 1,411 | |||||
Benefit payments | (11,045 | ) | (8,531 | ) | |||
Fair value of plan assets at December 31 | 164,360 | 135,550 | |||||
Funded status at December 31 | (73,921 | ) | (84,923 | ) | |||
Net amount recognized | $ | (73,921 | ) | $ | (84,923 | ) | |
- (1)
- Reduced benefit obligation due to plan curtailment related to the significant reduction in plan participants in the U.S. plan.
Amounts recognized in the consolidated balance sheets as of:
| | December 31, | ||||||
|---|---|---|---|---|---|---|---|
| | 2009 | 2008 | |||||
Long-term pension liability, net(1) | $ | (72,029 | ) | $ | (84,923 | ) | |
Current pension liability | (1,892 | ) | — | ||||
Net amount recognized | $ | (73,921 | ) | $ | (84,923 | ) | |
- (1)
- Includes plan assets of $371 and $6,043 in 2009 and 2008, respectively, that is included in other assets.
III-47
Sauer-Danfoss Inc. and Subsidiaries
Notes to Consolidated Financial Statements (Continued)
December 31, 2009, 2008, and 2007
(Dollars in thousands, except per share data)
(9) Pension and Postretirement Benefits other than Pensions: (Continued)
The aggregate projected benefit obligation, accumulated benefit obligation, and fair value of plan assets for pension plans with projected and accumulated benefit obligations in excess of plan assets as of December 31, 2009 and 2008 were as follows:
| | Projected and Accumulated Benefit Obligation Exceeds the Fair Value of Plan Assets | ||||||||||||
|---|---|---|---|---|---|---|---|---|---|---|---|---|---|
| | U.S. Plans | Non-U.S. Plans | |||||||||||
| | December 31, | December 31, | |||||||||||
| | 2009 | 2008 | 2009 | 2008 | |||||||||
Projected benefit obligation | $ | 133,780 | $ | 135,909 | $ | 54,199 | $ | 48,606 | |||||
Accumulated benefit obligation | 124,967 | 121,046 | 52,475 | — | |||||||||
Fair value of plan assets | 90,988 | 75,502 | 22,702 | 18,048 | |||||||||
Amounts recorded in accumulated other comprehensive income as of:
| | December 31, | ||||||
|---|---|---|---|---|---|---|---|
| | 2009 | 2008 | |||||
Actuarial loss | $ | 65,002 | $ | 71,899 | |||
Prior service cost | (3,391 | ) | (3,607 | ) | |||
| $ | 61,611 | $ | 68,292 | ||||
These amounts have not yet been recognized as components of net periodic pension expense.
Significant assumptions used in determining pension expense and related pension obligations are as follows:
| | December 31, | ||||||||||
|---|---|---|---|---|---|---|---|---|---|---|---|
| | 2009 | 2008 | 2007 | ||||||||
Discount Rates | |||||||||||
United States | 6.00 | % | 6.25 | % | 6.50 | % | |||||
Germany | 5.30 | 5.75 | 5.50 | ||||||||
United Kingdom | 5.70 | 6.70 | 6.00 | ||||||||
Rates of increase in compensation levels | |||||||||||
United States | 3.50 | 3.50 | 3.50 | ||||||||
Germany | 2.50 | 3.50 | 3.50 | ||||||||
United Kingdom | 4.60 | 3.70 | 4.50 | ||||||||
Expected long-term rate of return on assets | |||||||||||
United States | 8.50 | 8.50 | 8.50 | ||||||||
Germany | 5.25 | 4.66 | 4.84 | ||||||||
United Kingdom | 6.10 | 6.30 | 6.30 | ||||||||
The discount rate assumptions were based on investment yields available on AA rated long-term corporate bonds with cash flows that are similar to expected benefit payments.
III-48
Sauer-Danfoss Inc. and Subsidiaries
Notes to Consolidated Financial Statements (Continued)
December 31, 2009, 2008, and 2007
(Dollars in thousands, except per share data)
(9) Pension and Postretirement Benefits other than Pensions: (Continued)
The expected return on plan assets is based on the asset allocation mix and the historical return, taking into account current and expected market conditions.
Plan Assets
The target asset allocation for the U.S. pension assets, on average, is 60% in equity securities and 40% in fixed income securities. This allocation is expected to earn an average annual rate of return of approximately 8.5% measured over a planning horizon of twenty years with reasonable and acceptable levels of risk. This expected level will be obtained, with an allowance for expenses, and cash investments, if equity securities realize an average annual return of 11.0% and fixed income securities produce an average annual yield of 6.0%.
The target asset allocation for the U.K. pension assets, on average, is 42% in equity securities, 50% in fixed income securities, and 8% in cash. This allocation is expected to earn an average annual rate of return of approximately 6.0%.
The target asset allocation for the German pension assets is 10% in equity securities and 90% in fixed income securities. This allocation is expected to earn an average annual rate of return of approximately 4.5% measured over a long-term planning horizon. This expected level will be obtained, with an allowance for expenses, and cash investments, if equity securities realize an average annual return of 7 to 8% and fixed income securities produce an average annual yield of 2.5 to 3%.
The weighted average asset allocations by asset category for the pension plans at December 31 are as follows:
| | U.S. Plans | U.K. Plans | German Plans | |||||||||||||||||
|---|---|---|---|---|---|---|---|---|---|---|---|---|---|---|---|---|---|---|---|---|
| | 2009 | 2008 | 2009 | 2008 | 2009 | 2008 | ||||||||||||||
Equity securities | 66 | % | 53 | % | 42 | % | 39 | % | 14 | % | 7 | % | ||||||||
Fixed income securities | 33 | 45 | 50 | 48 | 81 | 91 | ||||||||||||||
Other | 1 | 2 | 8 | 13 | 5 | 2 | ||||||||||||||
Total | 100 | % | 100 | % | 100 | % | 100 | % | 100 | % | 100 | % | ||||||||
The following table presents the Company's plan assets using the fair value hierarchy as of December 31, 2009. The fair value hierarchy has three levels based on the reliability of the inputs used to determine fair value. Level 1 refers to fair values determined based on quoted prices in active markets for
III-49
Sauer-Danfoss Inc. and Subsidiaries
Notes to Consolidated Financial Statements (Continued)
December 31, 2009, 2008, and 2007
(Dollars in thousands, except per share data)
(9) Pension and Postretirement Benefits other than Pensions: (Continued)
identical assets. Level 2 refers to fair values estimated using significant other observable inputs, and Level 3 includes fair values estimated using significant non-observable inputs.
| | Level 1 | Level 2 | Level 3 | Total | |||||||||||
|---|---|---|---|---|---|---|---|---|---|---|---|---|---|---|---|
Fixed income securities | |||||||||||||||
Corporate bonds | $ | — | $ | 23,966 | $ | — | $ | 23,966 | |||||||
U.S. government and agencies | — | 8,059 | — | 8,059 | |||||||||||
Mortgage backed and asset backed securities | — | 5,765 | — | 5,765 | |||||||||||
International index-linked government securities | 31,938 | — | — | 31,938 | |||||||||||
Other | — | 875 | — | 875 | |||||||||||
Cash equivalents and short-term investments | 5,896 | 2,113 | — | 8,009 | |||||||||||
Equity securities | |||||||||||||||
Common and preferred stock | 2,305 | — | — | 2,305 | |||||||||||
Common/collective/pooled funds | 690 | 37,633 | — | 38,323 | |||||||||||
Derivatives | 29 | — | — | 29 | |||||||||||
International equity | 44,871 | — | — | 44,871 | |||||||||||
Total | $ | 85,729 | $ | 78,411 | $ | — | $ | 164,140 | |||||||
Receivables | 244 | ||||||||||||||
Payables | (24 | ) | |||||||||||||
Total plan assets | $ | 164,360 | |||||||||||||
Fixed income securities are primarily valued using a market approach with inputs that include broker quotes, benchmark yields, base spreads and reported trades.
Cash equivalents and short-term investments are primarily held in registered money market funds which are valued using a market approach based on the quoted market prices of identical instruments.
Common and preferred stock equity securities and international equity securities are valued using a market approach based on quoted market prices. Common/collective/pooled funds are common or collective trusts valued at their net asset values that are calculated by the investment manager or fund sponsor based on the quoted market prices of the underlying investments.
Postretirement Benefits
The health benefit plans covering certain groups of U.S. employees are contributory, with contributions reviewed annually and adjusted as appropriate. These plans contain other cost-sharing features such as deductibles and coinsurance. The Company does not pre-fund these plans and has the right to modify or terminate any of these plans in the future. Health benefits for retirees of non-U.S. operations, where applicable, are provided through government-sponsored plans to which the Company contributes funds during the individuals' employment periods.
III-50
Sauer-Danfoss Inc. and Subsidiaries
Notes to Consolidated Financial Statements (Continued)
December 31, 2009, 2008, and 2007
(Dollars in thousands, except per share data)
(9) Pension and Postretirement Benefits other than Pensions: (Continued)
The components of the postretirement benefit expense of the Company-sponsored health benefit plans for 2009, 2008, and 2007, were as follows:
| | 2009 | 2008 | 2007 | |||||||
|---|---|---|---|---|---|---|---|---|---|---|
Service cost | $ | 211 | $ | 225 | $ | 385 | ||||
Interest cost | 2,597 | 2,634 | 2,212 | |||||||
Net deferral and amortization | 921 | 1,030 | 947 | |||||||
Postretirement benefit expense | $ | 3,729 | $ | 3,889 | $ | 3,544 | ||||
The Company expects to incur income of $128 for amortization of prior service costs and expense of $1,201 for amortization of net loss in 2010.
The funded status of the Company-sponsored health benefit plans was as follows:
| | December 31, | ||||||
|---|---|---|---|---|---|---|---|
| | 2009 | 2008 | |||||
Reconciliation of benefit obligation: | |||||||
Benefit obligation at January 1 | $ | (41,060 | ) | $ | (38,648 | ) | |
Service cost | (211 | ) | (225 | ) | |||
Interest cost | (2,597 | ) | (2,634 | ) | |||
Plan participant contributions | (495 | ) | (447 | ) | |||
Plan amendment | 2,081 | — | |||||
Plan curtailment | 779 | — | |||||
Actuarial loss | (6,296 | ) | (2,495 | ) | |||
Benefit payments | 4,011 | 3,470 | |||||
Health care subsidy receipts | (87 | ) | (81 | ) | |||
Benefit obligation at December 31 | (43,875 | ) | (41,060 | ) | |||
Reconciliation of fair value of plan assets: | |||||||
Fair value of plan assets at January 1 | — | — | |||||
Employer contributions | 3,429 | 2,942 | |||||
Plan participant contributions | 495 | 447 | |||||
Health care subsidy receipts | 87 | 81 | |||||
Benefit payments | (4,011 | ) | (3,470 | ) | |||
Fair value of plan assets at December 31 | — | — | |||||
Benefit obligation | (43,875 | ) | (41,060 | ) | |||
Less current portion | 2,828 | 3,089 | |||||
Postretirement benefit obligation, long-term | $ | (41,047 | ) | $ | (37,971 | ) | |
III-51
Sauer-Danfoss Inc. and Subsidiaries
Notes to Consolidated Financial Statements (Continued)
December 31, 2009, 2008, and 2007
(Dollars in thousands, except per share data)
(9) Pension and Postretirement Benefits other than Pensions: (Continued)
Amounts recognized in accumulated other comprehensive income as of:
| | December 31, | ||||||
|---|---|---|---|---|---|---|---|
| | 2009 | 2008 | |||||
Actuarial loss | $ | 24,430 | $ | 19,834 | |||
Prior service credit | (2,081 | ) | — | ||||
| $ | 22,349 | $ | 19,834 | ||||
The assumed weighted average annual rate of increase in the per capita cost of medical benefits is 8.0% for 2009 and is assumed to decrease ratably in 2010 through 2013 and remain level at 4.5% thereafter.
U.S. employees retiring after March 1, 1993, and hired prior to January 1, 1993, will receive the standard health benefits up to age 65 and then will be eligible for a Medicare reimbursement allowance based on years of service. U.S. employees hired after January 1, 1993, and retiring after age 65 with ten years of service, will be eligible at age 65 for a Medicare reimbursement allowance based on years of service.
A one percent increase or decrease in the annual health care trend rates would have increased or decreased the accumulated postretirement benefit obligation at December 31, 2009, by $4,321, and increased or decreased postretirement benefit expense for 2009 by $244. The weighted average discount rate used to estimate the accumulated postretirement benefit obligation was 6.0%, 6.25%, and 6.5% for 2009, 2008, and 2007, respectively.
The benefits expected to be paid from the benefit plans, which reflect expected future years of service, and the Medicare subsidy expected to be received are as follows:
| | Pensions | Health Care | Health Care Subsidy Receipts | |||||||
|---|---|---|---|---|---|---|---|---|---|---|
2010 | $ | 12,185 | $ | 2,904 | $ | 76 | ||||
2011 | 10,999 | 3,096 | 82 | |||||||
2012 | 11,497 | 3,246 | 87 | |||||||
2013 | 12,324 | 3,322 | 92 | |||||||
2014 | 13,037 | 3,445 | 97 | |||||||
2015-2019 | 76,794 | 17,842 | 520 | |||||||
The Company plans to contribute approximately $13,000 to the Company pension and health benefit plans in 2010.
The Company also maintains two defined contribution plans, the Sauer-Danfoss Employees' Savings Plan and the Sauer-Danfoss LaSalle Factory Employee Savings Plan, for eligible employees. Company contributions include both base and matching amounts. The Company contributed approximately $2,400, $3,100, and $2,900 to these plans in 2009, 2008 and 2007, respectively.
III-52
Sauer-Danfoss Inc. and Subsidiaries
Notes to Consolidated Financial Statements (Continued)
December 31, 2009, 2008, and 2007
(Dollars in thousands, except per share data)
(10) Income Taxes:
The Company's income (loss) before income taxes is as follows:
| | Years Ended December 31, | ||||||||||
|---|---|---|---|---|---|---|---|---|---|---|---|
| | 2009 | 2008 | 2007 | ||||||||
United States | $ | (97,054 | ) | $ | 15,387 | $ | 22,164 | ||||
European and other | (174,181 | ) | (12,657 | ) | 65,435 | ||||||
Total | $ | (271,235 | ) | $ | 2,730 | $ | 87,599 | ||||
The Company's primary German operation is treated as a flow-through entity for U.S. tax purposes. The above analysis of pretax income (loss) and the following analysis of the income tax provision by taxing jurisdiction are therefore not directly related.
The benefit (expense) for income taxes by taxing jurisdiction is as follows:
| | Years Ended December 31, | |||||||||||
|---|---|---|---|---|---|---|---|---|---|---|---|---|
| | 2009 | 2008 | 2007 | |||||||||
Current | ||||||||||||
United States | ||||||||||||
Federal | $ | 225 | $ | (1,575 | ) | $ | (656 | ) | ||||
State | 254 | (1,487 | ) | (1,339 | ) | |||||||
European and other | (9,779 | ) | (30,012 | ) | (20,288 | ) | ||||||
Total Current | (9,300 | ) | (33,074 | ) | (22,283 | ) | ||||||
Deferred | ||||||||||||
United States | ||||||||||||
Federal | (50,659 | ) | (3,454 | ) | (3,923 | ) | ||||||
State | (4,960 | ) | (102 | ) | (280 | ) | ||||||
European and other | 3,900 | 22,570 | 7,647 | |||||||||
Total Deferred | (51,719 | ) | 19,014 | 3,444 | ||||||||
Total income tax expense | $ | (61,019 | ) | $ | (14,060 | ) | $ | (18,839 | ) | |||
III-53
Sauer-Danfoss Inc. and Subsidiaries
Notes to Consolidated Financial Statements (Continued)
December 31, 2009, 2008, and 2007
(Dollars in thousands, except per share data)
(10) Income Taxes: (Continued)
A reconciliation of tax benefit (expense) calculated using the U.S. statutory tax rate and recorded income tax expense based on the Company's income before income taxes is as follows:
| | Years Ended December 31, | ||||||||||
|---|---|---|---|---|---|---|---|---|---|---|---|
| | 2009 | 2008 | 2007 | ||||||||
Tax benefit (expense) based on U.S. statutory tax rate | $ | 94,932 | $ | (956 | ) | $ | (30,659 | ) | |||
Statutory tax rate change | — | 93 | 393 | ||||||||
Foreign taxes (rate and other differences)—net | (14,652 | ) | (5,890 | ) | (2,528 | ) | |||||
State income taxes–net of federal benefit | (3,059 | ) | (1,033 | ) | (777 | ) | |||||
Tax effect of minority interest | 3,242 | 3,869 | 5,815 | ||||||||
Tax reserves and allowances—net | (123,305 | ) | (3,051 | ) | 9,910 | ||||||
Non-deductible expenses/Non-taxable income—net | (1,884 | ) | (971 | ) | (1,681 | ) | |||||
U.S. & foreign goodwill impairment | (17,163 | ) | (6,281 | ) | — | ||||||
Other | 870 | 160 | 688 | ||||||||
Total income tax expense | $ | (61,019 | ) | $ | (14,060 | ) | $ | (18,839 | ) | ||
The components of the Company's net deferred tax assets and liabilities, determined on a jurisdictional and entity basis, are attributable to the following:
| | December 31, | |||||||||||||
|---|---|---|---|---|---|---|---|---|---|---|---|---|---|---|
| | 2009 | 2008 | ||||||||||||
| | Assets | Liabilities | Assets | Liabilities | ||||||||||
Net operating loss (NOL) and tax credit carryforwards | $ | 77,565 | $ | — | $ | 18,057 | $ | — | ||||||
Deferred compensation, postretirement medical | ||||||||||||||
and accrued pension benefits | 39,288 | — | 44,760 | (871 | ) | |||||||||
Fixed asset basis differences | 22,440 | (12,998 | ) | 7,241 | (22,303 | ) | ||||||||
Inventory and warranty accruals | 13,660 | (1,574 | ) | 9,628 | (2,349 | ) | ||||||||
Intangible asset fair market value step-up | 6,394 | (9,421 | ) | 8,908 | (8,894 | ) | ||||||||
Other items | 29,498 | (10,964 | ) | 37,594 | (11,141 | ) | ||||||||
Gross deferred tax assets/liabilities | 188,845 | (34,957 | ) | 126,188 | (45,558 | ) | ||||||||
Valuation allowance | (130,475 | ) | — | (6,103 | ) | — | ||||||||
Net deferred tax assets/liabilities | 58,370 | (34,957 | ) | 120,085 | (45,558 | ) | ||||||||
Less current portion | (3,912 | ) | 1,249 | (13,101 | ) | 1,315 | ||||||||
Net deferred tax assets/liabilities, long-term | $ | 54,458 | $ | (33,708 | ) | $ | 106,984 | $ | (44,243 | ) | ||||
The ultimate realization of net deferred tax assets is dependent upon the generation of future taxable income during (i) the years in which temporary differences reverse and (ii) the years prior to the expiration of NOL and credit carryforwards. Management considers projected future taxable income and tax planning strategies in making this assessment.
III-54
Sauer-Danfoss Inc. and Subsidiaries
Notes to Consolidated Financial Statements (Continued)
December 31, 2009, 2008, and 2007
(Dollars in thousands, except per share data)
(10) Income Taxes: (Continued)
In 2009 the Company determined that all of the net deferred tax assets in the U.S., Denmark and Italy that have not been supported by tax planning strategies would expire unused. This resulted in the majority of the increase in valuation allowances of approximately $125,000.
As of December 31, 2009 and 2008, the Company had not provided U.S. federal income taxes on $126,686 and $170,556, respectively, of undistributed earnings recorded by certain subsidiaries outside the U.S. since these earnings were deemed permanently invested. Although it is not practicable to determine the deferred tax liability on the unremitted earnings, foreign tax credits would be available to reduce U.S. tax liability if these foreign earnings were remitted.
The Company files income tax returns in the U.S. federal jurisdiction, and various states and foreign jurisdictions. With few exceptions, the Company is no longer subject to U.S. federal, state and local, or non-U.S. income tax examinations by tax authorities for years before 2005. During 2009, the Internal Revenue Service completed a limited scope audit of the Company's 2007 federal income tax return. The audit resulted in immaterial adjustments and has been incorporated into the Consolidated Financial Statements.
A reconciliation of the beginning and ending gross unrecognized tax benefits (UTB) is as follows:
| | Amount | |||
|---|---|---|---|---|
Gross UTB Balance at January 1, 2009 | $ | 2,317 | ||
Additions based on tax positions related to the current year | 144 | |||
Additions for tax positions of prior years | — | |||
Reductions for tax positions of prior years | — | |||
Settlements | (959 | ) | ||
Foreign currency adjustments | 44 | |||
Reductions due to lapse of applicable statute of limitations | — | |||
Gross UTB Balance at December 31, 2009 | 1,546 | |||
Net UTB impacting the effective tax rate at December 31, 2009 | 144 | |||
The total amount of UTB that, if recognized, would affect the effective tax rate as of December 31, 2009 and 2008 were $144 and $743, respectively. The total amount of UTB is not expected to significantly increase or decrease within the next twelve months. The net UTBs are included as components of deferred income tax assets and other liabilities in the Consolidated Balance Sheets.
The Company recognizes interest and penalties related to unrecognized tax benefits in interest expense and other expense. Interest and penalties of $288 and $194 have been accrued as of December 31, 2009 and December 31, 2008, respectively. Interest and penalty expense of $90 and $198 were recognized for years ending December 31, 2009 and December 31, 2008, respectively.
III-55
Sauer-Danfoss Inc. and Subsidiaries
Notes to Consolidated Financial Statements (Continued)
December 31, 2009, 2008, and 2007
(Dollars in thousands, except per share data)
(10) Income Taxes: (Continued)
The Company had the following tax return carryforwards available to offset future years' taxable income at December 31, 2009:
| | Amount | Expiration Dates | |||||
|---|---|---|---|---|---|---|---|
German NOL—National | $ | 49,168 | None | ||||
German NOL—Trade | 18,596 | None | |||||
U.S. NOL | 106,482 | 2010-2029 | |||||
U.K. NOL | 11,506 | None | |||||
Denmark NOL | 68,555 | None | |||||
Italy NOL | 12,436 | 2013-2014 | |||||
Brazil NOL | 10,785 | None | |||||
China NOL | 6,136 | 2010-2014 | |||||
Japan NOL | 5,492 | 2017 | |||||
Other non-U.S. NOL | 7,085 | Various | |||||
State NOL | 50,752 | 2010-2029 | |||||
Foreign tax credits (available to offset U.S. taxes) | 1,750 | 2029 | |||||
State tax credits | 835 | 2010-2019 | |||||
(11) Accumulated Other Comprehensive Income:
The changes in accumulated other comprehensive income for the years ended December 31, 2007, 2008, and 2009 follows:
| | Currency Translation | Pension/ Postretirement Benefit Adjustment | Hedging Activities | Accumulated Other Comprehensive Income | |||||||||
|---|---|---|---|---|---|---|---|---|---|---|---|---|---|
Balance as of January 1, 2007 | $ | 77,331 | $ | (51,556 | ) | $ | 568 | $ | 26,343 | ||||
Change in period | 40,736 | 16,202 | 2,551 | 59,489 | |||||||||
Effect of exchange rate changes | — | (1,288 | ) | 120 | (1,168 | ) | |||||||
Income tax expense | — | (2,452 | ) | (527 | ) | (2,979 | ) | ||||||
Balance as of December 31, 2007 | 118,067 | (39,094 | ) | 2,712 | 81,685 | ||||||||
Change in period | (24,389 | ) | (38,719 | ) | (9,185 | ) | (72,293 | ) | |||||
Effect of exchange rate changes | — | 1,844 | (85 | ) | 1,759 | ||||||||
Income tax benefit | — | 14,435 | 2,409 | 16,844 | |||||||||
Balance as of December 31, 2008 | 93,678 | (61,534 | ) | (4,149 | ) | 27,995 | |||||||
Change in period | 16,684 | 5,196 | 6,174 | 27,924 | |||||||||
Effect of exchange rate changes | — | (1,016 | ) | (44 | ) | (956 | ) | ||||||
Income tax benefit (expense) | — | 2,206 | (1,773 | ) | 459 | ||||||||
Balance as of December 31, 2009 | $ | 110,362 | $ | (55,148 | ) | $ | 208 | $ | 55,422 | ||||
III-56
Sauer-Danfoss Inc. and Subsidiaries
Notes to Consolidated Financial Statements (Continued)
December 31, 2009, 2008, and 2007
(Dollars in thousands, except per share data)
(12) Noncontrolling Interests:
Noncontrolling interests in net assets and income reflected in the accompanying consolidated financial statements for 2009, 2008, and 2007 consists of:
- a)
- A 40% noncontrolling interest held by Agri-Fab, Inc. in Hydro-Gear Limited Partnership, a U.S. limited partnership.
- b)
- A 40% noncontrolling interest held by Shanghai Hydraulics and Pneumatics in Sauer Shanghai Hydraulic Transmission Co., Ltd., a Chinese equity business venture.
- c)
- A 35% noncontrolling interest held by Daikin Industries Ltd. in Sauer-Danfoss-Daikin, Ltd., a Japanese corporation.
- d)
- A 49.9% noncontrolling interest held by Topcon Positioning Systems in TSD Integrated Controls LLC, a U.S. limited partnership.
- e)
- A 55% noncontrolling interest held by Daikin Industries Ltd. in Daikin-Sauer-Danfoss Manufacturing, Ltd., a Japanese corporation.
The following table sets forth the components of noncontrolling interest in the consolidated balance sheets:
| | December 31, | |||||||
|---|---|---|---|---|---|---|---|---|
| | 2009 | 2008 | ||||||
Hydro-Gear Limited Partnership | $ | 28,187 | $ | 32,453 | ||||
Sauer Shanghai Hydraulic Transmission Co., Ltd. | 13,699 | 13,448 | ||||||
Sauer-Danfoss-Daikin, Ltd. | 11,543 | 9,500 | ||||||
TSD Integrated Controls LLC(1) | (864 | ) | 1,128 | |||||
Daikin-Sauer-Danfoss Manufacturing, Ltd. | 10,095 | 11,126 | ||||||
Total | $ | 62,660 | $ | 67,655 | ||||
- (1)
- In connection with the wind-down of the TSD joint venture discussed in Note 2 the noncontrolling interest partner has received distribution of assets in excess of their interest in the joint venture. There will be a settlement between the joint venture partners at the end of the wind-down period.
The Hydro-Gear Limited Partnership agreement indicates a termination date of December 31, 2035. This entity is consolidated in the Company's financial statements. The agreement indicates that if the partnership were to terminate the partnership would be liquidated and the resulting proceeds would be distributed in accordance with each partner's ownership percentage
(13) Long-Term Incentive Plan:
The Company's 2006 Omnibus Incentive Plan (2006 Incentive Plan) and 1998 Long-Term Incentive Plan (1998 Incentive Plan) provide for the grant of stock options, stock appreciation rights, restricted stock, performance units, performance shares, and other incentive awards to officers and key employees.
III-57
Sauer-Danfoss Inc. and Subsidiaries
Notes to Consolidated Financial Statements (Continued)
December 31, 2009, 2008, and 2007
(Dollars in thousands, except per share data)
(13) Long-Term Incentive Plan: (Continued)
The 2006 Incentive Plan qualifies certain awards for the performance-based exception to obtain favorable tax treatment. The total number of shares of common stock that may be subject to awards or be issued under the 2006 Incentive Plan and the 1998 Incentive Plan shall not exceed 3,500,000 shares and 2,400,000 shares, respectively, of which no more than 1,200,000 shares may be issued as restricted stock under the 1998 Incentive Plan. The settlement of performance units is in shares of Company stock or cash as determined by the Compensation Committee of the Board of Directors. The performance units entitle the participants to receive an amount equal to the Company's dividends during the vesting period.
No performance units were granted in 2009. In 2008 the Compensation Committee granted 328,053 performance units under the 2006 Incentive Plan, 307,945 of which were to be settled 100 percent in Company stock with shares withheld having a value to meet the minimum statutory withholding requirements and 20,108 performance units granted to certain individuals that were to be settled in cash. In 2007 the Compensation Committee granted 273,101 performance units under the 2006 Incentive Plan, 213,553 of which were to be settled 100 percent in Company stock with shares withheld having a value to meet the minimum statutory withholding requirements and 59,548 performance units granted to certain individuals that were to be settled in cash. The units to be settled in cash are accounted for as liability units, with the remainder of the units accounted for as equity units.
The following chart summarizes performance unit activity under the Plan for the year ended December 31, 2009:
Equity Units | Number | Weighted Average Grant Date Fair Value | Weighted Average Vesting Period in Years | |||||||
|---|---|---|---|---|---|---|---|---|---|---|
Units oustanding at January 1 | 705,609 | $ | 24.34 | 3.0 | ||||||
Units settled | (249,322 | ) | 25.04 | 3.0 | ||||||
Units forfeited | (116,289 | ) | 24.11 | 3.0 | ||||||
Units outstanding at December 31 | 339,998 | 23.90 | 3.0 | |||||||
Cash Units | | | | |||||||
|---|---|---|---|---|---|---|---|---|---|---|
Units oustanding at January 1 | 117,304 | |||||||||
Units settled | (83,164 | ) | ||||||||
Units forfeited | (34,140 | ) | ||||||||
Units outstanding at December 31 | — | |||||||||
The Compensation Committee sets performance goals for each performance unit grant and depending on the extent to which these goals are met will determine the number of performance units that will be paid out to the participants. Based on performance results for 2007 through 2009 the performance units granted in 2007 are not expected to receive a payout as the minimum performance threshold was not met.
Compensation expense is recognized over the vesting period of three years, measured based on the market price of the Company's stock at the date of grant with an offsetting increase in additional paid-in capital. The expense related to the grants that will be settled in cash is based on the market price of the Company's stock as of the balance sheet date. In accordance with the terms of the performance unit grants
III-58
Sauer-Danfoss Inc. and Subsidiaries
Notes to Consolidated Financial Statements (Continued)
December 31, 2009, 2008, and 2007
(Dollars in thousands, except per share data)
(13) Long-Term Incentive Plan: (Continued)
of the previous President and CEO of the Company, who retired on January 1, 2009, the grants related to performance periods after he left the company would be paid at 100% of the performance target and therefore the expense for his 2007 and 2008 grants were fully expensed in 2008, rather than over the three year performance period.
In 2007 the Compensation Committee awarded 10,000 shares of restricted stock under the 2006 Incentive Plan. Vesting of 5,000 of the shared occurred in both 2009 and 2008. The restricted stock awards entitle the participants to full dividend and voting rights. The value of the award was established based on the market value of the stock as of the grant date.
Compensation income or expense recognized in selling, general, and administrative expenses in conjunction with the performance units and restricted stock outstanding was expense of $18 in 2009, income of $2,260 in 2008, and expense of $4,301 in 2007. The income recognized in 2008 was due to reducing the accrual related to the performance units to be settled in cash and the accrual related to the 2007 performance unit grant due to the decrease in financial performance during 2008. The tax expense recognized related to the 2008 income was $814 and tax benefits recognized related to expense was $6 and $1,555, in 2009 and 2007, respectively. The Company does not expect to recognize any additional compensation expense related to the outstanding performance units and restricted stock under these two plans.
The Company also has a Non-employee Director Stock Option and Restricted Stock Plan which permits the granting of non-qualified stock options and restricted common stock to directors of the Company who are not employees of the Company. The total number of shares of common stock to be issued under this plan shall not exceed 250,000 shares. The 2006 Incentive Plan also allows for grants of equity based shares to directors of the Company.
Under the 2006 Incentive Plan the Company awarded 13,500 shares of restricted stock in 2009 and 15,000 shares of restricted stock in 2008 to non-employee directors. Under the Non-employee Director Stock Option and Restricted Stock Plan the Company awarded 13,500 shares of restricted stock in 2007 to non-employee directors. In 2009, 3,000 shares of restricted stock were forfeited prior to being vested. The restricted stock awards entitle the participants to full dividend and voting rights. Unvested shares are restricted as to disposition and subject to forfeiture under certain circumstances. The value of each award was established based on the market value of the stock as of the grant date. The shares vest over three years. Compensation expense is computed based on the market value of the restricted shares at the grant date, which is amortized ratably over the vesting period of the grants. Compensation expense recognized in conjunction with the restricted stock outstanding to non-employee directors in 2009, 2008, and 2007 amounted to $235, $448, and $316, respectively.
(14) Related Person Transactions:
In connection with the acquisition of Danfoss Fluid Power on May 3, 2000, the Company entered into several agreements with Danfoss A/S to purchase ongoing operational services from Danfoss A/S. These services include rental of shared facilities, administrative support and information technology support. These fees are paid on a monthly basis. Total expense recognized for goods and services purchased from Danfoss A/S for 2009, 2008, and 2007 was approximately $43,800, $87,100, and $72,400, respectively. At
III-59
Sauer-Danfoss Inc. and Subsidiaries
Notes to Consolidated Financial Statements (Continued)
December 31, 2009, 2008, and 2007
(Dollars in thousands, except per share data)
(14) Related Person Transactions: (Continued)
December 31, 2009 and 2008 approximately $10,000 and $7,900 owed to Danfoss A/S is included in accounts payable on the consolidated balance sheet. Payments required under these agreements as of December 31, 2008, during the years ending 2010 though 2014 and 2015 and thereafter, are $9,321, $9,331, $9,238, $8,994, $8,994, and $23,020, respectively. The Company also sold products to Danfoss A/S totaling approximately $3,200, $6,800, and $8,000 during 2009, 2008, and 2007, respectively. At December 31, 2009 and 2008 approximately $800 and $1,500 due from Danfoss A/S is included in accounts receivable on the consolidated balance sheet.
The subsidiaries in Denmark file a joint tax return with Danfoss A/S as required under the laws of Denmark.
The Company can borrow up to $690,000 under a term loan and revolving credit facility with Danfoss A/S. Refer to Note 8 for additional discussion of the Danfoss Credit Agreement which was entered into in November 2009.
In 2008 the Company entered an Agreement for Transfer of Business and Sale of Inventory (Agreement) with Danfoss LLC, a subsidiary of Danfoss A/S. The Agreement replaced a Distribution and Service Agreement which had been in place with Danfoss A/S under which Sauer-Danfoss product had been sold in the Commonwealth of Independent States. The Company purchased primarily customer relationships and inventory in this transaction for approximately $1,200.
The Company purchases inventory components from Shanghai Hydraulics and Pneumatics, a noncontrolling interest owner in an entity included in the Company's consolidated financial statements. Purchases were approximately $4,000, $5,600, and, $4,900 in 2009, 2008, and 2007, respectively.
The Company sold product totaling approximately $2,300, $4,100 and $4,900 in 2009, 2008 and 2007, respectively, to Daikin Industries Ltd. (Daikin), a minority interest owner in an entity consolidated by the Company. The Company also purchases inventory components and ongoing operational services from Daikin. These services include shared facilities and administrative support. Total expense recognized for goods and services purchased from Daikin in 2009, 2008, and 2007 were approximately $5,200, $6,500 and $6,000, respectively.
The Company had sales to Faun Umwelttechnik GmbH & Co., a company owned by a director of the Company, of approximately $2,000, $1,000 and $1,700 in 2009, 2008 and 2007, respectively.
(15) Commitments, Contingencies, and Guarantees:
The Company leases certain facilities and equipment under operating leases, many of which contain renewal options. Total rental expense on all operating leases during 2009, 2008, and 2007 was $23,910, $26,254, and $20,477, respectively. Rent is expensed on a straight-line basis over the term of the leases.
Minimum future rental commitments under all noncancelable operating leases as of December 31, 2009, during the years ending 2010 through 2014 and for 2015 and thereafter, are $13,664, $10,474, $8,116, $7,109, $6,750, and $10,997, respectively.
The Company also leases certain facilities and equipment under capital leases. The liability related to these capital leases is included in current other accrued liabilities and other long-term liabilities on the
III-60
Sauer-Danfoss Inc. and Subsidiaries
Notes to Consolidated Financial Statements (Continued)
December 31, 2009, 2008, and 2007
(Dollars in thousands, except per share data)
(15) Commitments, Contingencies, and Guarantees: (Continued)
consolidated balance sheets. Minimum future lease payments under all noncancelable capital leases as of December 31, 2009, during the years ending 2010 through 2014 and for 2015 and thereafter, are $663, $604, $329, $33, $4, and $0, respectively.
The Company has been named as a defendant in four putative stockholder class action complaints (collectively, the Lawsuits) challenging the proposal by Danfoss Acquisition Inc., a wholly owned subsidiary of Danfoss A/S, to make a tender offer to purchase all the outstanding shares of Company common stock not presently held, directly or indirectly, by Danfoss A/S. Each of the Lawsuits was filed on behalf of the named plaintiffs and the other minority stockholders on the Company. The defendants in the Lawsuits are the Company, Danfoss A/S, Danfoss Acquisition Inc., and current and former directors of the Company. Each lawsuit is premised on allegations that the price offered in the proposed tender offer is inadequate and that the defendants have breached their fiduciary duties to the Company's stockholders in connection with the proposed tender offer. The Company believes that it has valid defenses with respect to these claims and intends to defend itself against them. The Lawsuits are all in preliminary stages, so it is not possible for the Company to predict their outcomes with any certainty.
The Company, from time to time, is involved in various legal matters considered normal in the course of its business. The Company intends to vigorously defend against all such claims. It is the Company's policy to accrue for amounts related to these matters if it is probable that a liability has been incurred and an amount can be reasonably estimated. Although the outcome of such matters cannot be predicted with certainty and no assurances can be given with respect to such matters, the Company believes that the outcome of these matters in which it is currently involved will not have a materially adverse effect on its results of operations, liquidity or financial position.
III-61
Sauer-Danfoss Inc. and Subsidiaries
Notes to Consolidated Financial Statements (Continued)
December 31, 2009, 2008, and 2007
(Dollars in thousands, except per share data)
(16) Quarterly Financial Data (Unaudited):
Summarized quarterly data is set forth in the following table:
| | First | Second | Third | Fourth | Total | |||||||||||
|---|---|---|---|---|---|---|---|---|---|---|---|---|---|---|---|---|
2009 | ||||||||||||||||
Net sales | $ | 349,695 | $ | 277,411 | $ | 253,074 | $ | 278,851 | $ | 1,159,031 | ||||||
Gross profit | 58,018 | 30,803 | 14,954 | 24,178 | 127,953 | |||||||||||
Net loss | (78,406 | ) | (121,826 | ) | (70,801 | ) | (74,733 | ) | (345,766 | ) | ||||||
Basic net loss per common share | $ | (1.62 | ) | $ | (2.52 | ) | $ | (1.46 | ) | $ | (1.55 | ) | $ | (7.15 | ) | |
Diluted net loss per common share | $ | (1.62 | ) | $ | (2.52 | ) | $ | (1.46 | ) | $ | (1.55 | ) | $ | (7.15 | ) | |
2008 | ||||||||||||||||
Net sales | $ | 617,399 | $ | 611,538 | $ | 490,188 | $ | 371,388 | $ | 2,090,513 | ||||||
Gross profit | 147,725 | 138,006 | 111,866 | 38,013 | 435,610 | |||||||||||
Net income (loss) | 27,863 | 22,706 | 10,901 | (90,611 | ) | (29,141 | ) | |||||||||
Basic net income (loss) per common share | $ | 0.58 | $ | 0.47 | $ | 0.23 | $ | (1.88 | ) | $ | (0.60 | ) | ||||
Diluted net income (loss) per common share(1) | $ | 0.57 | $ | 0.47 | $ | 0.22 | $ | (1.88 | ) | $ | (0.60 | ) | ||||
2007 | ||||||||||||||||
Net sales | $ | 523,132 | $ | 503,472 | $ | 451,771 | $ | 494,173 | $ | 1,972,548 | ||||||
Gross profit | 124,585 | 112,295 | 94,221 | 96,601 | 427,702 | |||||||||||
Net income | 15,369 | 17,633 | 5,499 | 8,697 | 47,198 | |||||||||||
Basic net income per common share | $ | 0.32 | $ | 0.37 | $ | 0.11 | $ | 0.18 | $ | 0.98 | ||||||
Diluted net income per common share | $ | 0.32 | $ | 0.37 | $ | 0.11 | $ | 0.18 | $ | 0.98 | ||||||
- (1)
- Basic and diluted net income (loss) per common share is computed independently for each of the periods presented. Accordingly, the sum of the quarterly basic and diluted net income (loss) per common share may not agree to the annual total.
(17) Segment and Geographic Information:
The Company reports its operating segments around its various product lines of Propel, Work Function and Controls. Propel products include hydrostatic transmissions and related products that transmit the power from the engine to the wheel to propel a vehicle. Work Function products include steering motors as well as gear pumps and motors that transmit power for the work functions of the vehicle. Controls products include electrohydraulic controls, microprocessors, and valves that control and direct the power of a vehicle. Segment costs in Global Services relate to internal global service departments and include costs such as consulting for special projects, tax and accounting fees paid to
III-62
Sauer-Danfoss Inc. and Subsidiaries
Notes to Consolidated Financial Statements (Continued)
December 31, 2009, 2008, and 2007
(Dollars in thousands, except per share data)
(17) Segment and Geographic Information: (Continued)
outside third parties, certain insurance premiums, and amortization of intangible assets from certain business combinations.
The accounting policies of the segments are the same as those described in the summary of significant accounting policies. The Company evaluates individual segment performance based on segment income or loss defined as the respective segment's portion of the total Company's net income, excluding net interest expense, income taxes, minority interest, and equity in net earnings of affiliates.
The following table presents the significant items by operating segment for the results of operations for the years ended December 31, 2009, 2008, and 2007, respectively:
| | Propel | Work Function | Controls | Global Services | Total | |||||||||||
|---|---|---|---|---|---|---|---|---|---|---|---|---|---|---|---|---|
2009 | ||||||||||||||||
Trade sales | $ | 613,433 | $ | 274,654 | $ | 270,944 | $ | — | $ | 1,159,031 | ||||||
Segment loss | (24 | ) | (81,932 | ) | (101,107 | ) | (23,938 | ) | (207,001 | ) | ||||||
Interest income | 1,775 | |||||||||||||||
Interest expense | (50,171 | ) | ||||||||||||||
Loss on early retirement of debt | (15,838 | ) | ||||||||||||||
Loss before income taxes | (271,235 | ) | ||||||||||||||
Total assets | 404,990 | 243,947 | 197,257 | 222,123 | 1,068,317 | |||||||||||
Depreciation and amortization | 57,584 | 31,740 | 25,201 | 2,605 | 117,130 | |||||||||||
Capital expenditures | 19,336 | 14,390 | 8,670 | 576 | 42,972 | |||||||||||
2008 | ||||||||||||||||
Trade sales | $ | 1,016,609 | $ | 561,416 | $ | 512,488 | $ | — | $ | 2,090,513 | ||||||
Segment income (loss) | 156,805 | (65,699 | ) | (21,386 | ) | (42,362 | ) | 27,358 | ||||||||
Interest income | 1,026 | |||||||||||||||
Interest expense | (25,654 | ) | ||||||||||||||
Income before income taxes | 2,730 | |||||||||||||||
Total assets | 541,489 | 330,628 | 272,186 | 323,373 | 1,467,676 | |||||||||||
Depreciation and amortization | 48,111 | 38,411 | 23,485 | 2,955 | 112,962 | |||||||||||
Capital expenditures | 98,982 | 54,312 | 36,714 | 8,626 | 198,634 | |||||||||||
2007 | ||||||||||||||||
Trade sales | $ | 940,692 | $ | 534,040 | $ | 497,816 | $ | — | $ | 1,972,548 | ||||||
Segment income (loss) | 146,617 | (2,886 | ) | 17,740 | (51,131 | ) | 110,340 | |||||||||
Interest income | 1,048 | |||||||||||||||
Interest expense | (23,789 | ) | ||||||||||||||
Income before income taxes | 87,599 | |||||||||||||||
Total assets | 496,021 | 372,775 | 301,214 | 330,412 | 1,500,422 | |||||||||||
Depreciation and amortization | 43,882 | 32,987 | 20,422 | 5,012 | 102,303 | |||||||||||
Capital expenditures | 61,129 | 35,804 | 30,189 | 8,511 | 135,633 | |||||||||||
III-63
Sauer-Danfoss Inc. and Subsidiaries
Notes to Consolidated Financial Statements (Continued)
December 31, 2009, 2008, and 2007
(Dollars in thousands, except per share data)
(17) Segment and Geographic Information: (Continued)
A summary of the Company's net sales and long-lived assets by geographic area is presented below:
| | Net Sales(1) | Long-Lived Assets(2) | |||||||||||||||
|---|---|---|---|---|---|---|---|---|---|---|---|---|---|---|---|---|---|
| | 2009 | 2008 | 2007 | 2009 | 2008 | ||||||||||||
United States | $ | 424,680 | $ | 740,506 | $ | 744,560 | $ | 138,416 | $ | 193,144 | |||||||
Germany | 120,084 | 229,101 | 205,661 | 71,354 | 76,801 | ||||||||||||
Italy | 64,021 | 145,666 | 147,614 | 16,316 | 36,424 | ||||||||||||
Denmark(3) | 16,405 | 36,146 | 31,423 | 144,282 | 185,785 | ||||||||||||
Other countries | 533,841 | 939,094 | 843,290 | 205,606 | 228,070 | ||||||||||||
Total | $ | 1,159,031 | $ | 2,090,513 | $ | 1,972,548 | $ | 575,974 | $ | 720,224 | |||||||
- (1)
- Net sales are attributed to countries based on location of customer.
- (2)
- Long-lived assets include property, plant and equipment net of accumulated depreciation, goodwill, intangible assets net of accumulated amortization, and certain other long-lived assets.
- (3)
- Majority of this country's sales are shipped outside of the home country where the product is produced.
No single customer accounted for 10% or more of total consolidated sales in any year presented.
(18) Subsequent Events:
On December 22, 2009 Danfoss A/S, the majority stockholder of the Company, issued a press release announcing its intention, through its wholly owned subsidiary, Danfoss Acquisition, Inc., to commence a cash tender offer to be followed (in certain circumstances) by a statutory merger for the purpose of acquiring all the outstanding shares of Company common stock not already owned, directly or indirectly, by Danfoss A/S for a price of $10.10 per share. On January 15, 2010 Danfoss issued a press release announcing an indeterminate delay in launching its proposed tender offer. As of March 3, 2010 Danfoss had not commenced the proposed tender offer.
The Company has evaluated subsequent events through March 4, 2010, the date the financial statements were issued, to ensure that the Form 10-K includes appropriate disclosure of events recognized in the financial statements as of December 31, 2009, and events that occurred subsequent to December 31, 2009 but were not recognized in the financial statements.
III-64
Management Oversight
Sauer-Danfoss believes that good corporate governance promotes ethical business practices, demands meticulous accounting policies and procedures, and includes a structure with effective checks and balances. The management of Sauer-Danfoss is responsible for the integrity and objectivity of the financial information presented in this annual report on Form 10-K. Sauer-Danfoss believes that the consolidated financial statements have been prepared in conformity with accounting principles generally accepted in the United States applying certain estimates and judgments as required.
Our management is responsible for establishing and maintaining a system of internal controls over financial reporting. This system is augmented by written policies and procedures, careful selection and training of financial management personnel, a continuing management commitment to the integrity of the system, and through examinations by an internal audit function that coordinates its activities with the Company's independent auditors.
Under the supervision and with the participation of our management, including our Chief Executive Officer and Chief Financial Officer, we conducted an evaluation of the effectiveness of our internal controls over financial reporting based on the framework in Internal Control—Integrated Framework issued by the Committee of Sponsoring Organizations of the Treadway Commission (COSO). Based on our evaluation under the framework in Internal Control—Integrated Framework, our management concluded that our internal control over financial reporting was effective as of December 31, 2009.
Independent Oversight
All of our directors are skilled business leaders. The members of the Board and each committee have express authority to retain outside advisors. The Board and each committee perform annual self-evaluations in order to assess their performance and to ensure that the Board and committee structure is providing effective oversight of corporate management.
Our Audit Committee is composed entirely of independent outside directors. The Committee meets periodically with management, the internal auditors, and the independent auditors, both separately and jointly, to discuss internal accounting controls and the quality of financial reporting. To ensure complete independence, the internal auditors and representatives of KPMG LLP have full access to meet with the Audit Committee, with or without management representatives present, to discuss the results of their audits and their opinions on the adequacy of internal controls and the quality of financial reporting. The Audit Committee has the direct responsibility for the appointment of the independent registered accounting firm to be retained for the coming year, subject to stockholder approval.
Disclosure Controls
We have established rigorous procedures to ensure that we provide complete and accurate disclosure in our publicly filed documents. Our Disclosure Committee, made up of key individuals from various corporate functions, meets at least quarterly to review public filings and earnings releases, and to discuss any potential disclosure issues that may arise. We have established a "whistle-blower" hotline for employees, customers, suppliers or any stakeholder anywhere in the world to anonymously submit any concern they may have regarding corporate controls or ethical breaches. All complaints are investigated, and where necessary, concerns involving our financial statements, public disclosures or management are directed to our Audit Committee.
Code of Legal and Ethical Business Conduct
The Sauer-Danfoss Code of Legal and Ethical Business Conduct is based not just solely on what we have a right to do, but even more importantly, on what is the right thing to do. Annually, we reiterate the vital importance of our Code of Legal and Ethical Business Conduct by requiring employees in key functional areas to certify their compliance with the standards of the Code.
| SVEN RUDER President and Chief Executive Officer | JESPER V. CHRISTENSEN Executive Vice President and Chief Financial Officer |
III-65
Report of Independent Registered Public Accounting Firm
The Board of Directors and Shareholders
Sauer-Danfoss Inc.:
We have audited the accompanying consolidated balance sheets of Sauer-Danfoss Inc. and subsidiaries (the Company) as of December 31, 2009 and 2008, and the related consolidated statements of operations, stockholders' equity and comprehensive income (loss), and cash flows for each of the years in the three-year period ended December 31, 2009. In connection with our audits of the consolidated financial statements, we also have audited the related financial statement schedule (as listed in Part IV, Item 14 (a) 2 of this Form 10-K). We also have audited the Company's internal control over financial reporting as of December 31, 2009, based on criteria established inInternal Control—Integrated Framework issued by the Committee of Sponsoring Organizations of the Treadway Commission (COSO). The Company's management is responsible for these consolidated financial statements and financial statement schedule, for maintaining effective internal control over financial reporting, and for its assessment of the effectiveness of internal control over financial reporting, included in the accompanying Management's Report on Internal Control over Financial Reporting (as included in Part II, Item 9A). Our responsibility is to express an opinion on these consolidated financial statements and financial statement schedule and an opinion on the Company's internal control over financial reporting based on our audits.
We conducted our audits in accordance with the standards of the Public Company Accounting Oversight Board (United States). Those standards require that we plan and perform the audits to obtain reasonable assurance about whether the financial statements are free of material misstatement and whether effective internal control over financial reporting was maintained in all material respects. Our audits of the consolidated financial statements included examining, on a test basis, evidence supporting the amounts and disclosures in the financial statements, assessing the accounting principles used and significant estimates made by management, and evaluating the overall financial statement presentation. Our audit of internal control over financial reporting included obtaining an understanding of internal control over financial reporting, assessing the risk that a material weakness exists, and testing and evaluating the design and operating effectiveness of internal control based on the assessed risks. Our audits also included performing such other procedures as we considered necessary in the circumstances. We believe that our audits provide a reasonable basis for our opinions.
A company's internal control over financial reporting is a process designed to provide reasonable assurance regarding the reliability of financial reporting and the preparation of financial statements for external purposes in accordance with generally accepted accounting principles. A company's internal control over financial reporting includes those policies and procedures that (1) pertain to the maintenance of records that, in reasonable detail, accurately and fairly reflect the transactions and dispositions of the assets of the company; (2) provide reasonable assurance that transactions are recorded as necessary to permit preparation of financial statements in accordance with generally accepted accounting principles, and that receipts and expenditures of the company are being made only in accordance with authorizations of management and directors of the company; and (3) provide reasonable assurance regarding prevention or timely detection of unauthorized acquisition, use, or disposition of the company's assets that could have a material effect on the financial statements.
Because of its inherent limitations, internal control over financial reporting may not prevent or detect misstatements. Also, projections of any evaluation of effectiveness to future periods are subject to the risk that controls may become inadequate because of changes in conditions, or that the degree of compliance with the policies or procedures may deteriorate.
In our opinion, the consolidated financial statements referred to above present fairly, in all material respects, the financial position of Sauer-Danfoss Inc. and subsidiaries as of December 31, 2009 and 2008, and the results of their operations and their cash flows for each of the years in the three-year period ended
III-66
December 31, 2009, in conformity with U.S. generally accepted accounting principles. Also in our opinion, the related financial statement schedule, when considered in relation to the basic consolidated financial statements taken as a whole, presents fairly, in all material respects, the information set forth therein. Also in our opinion, the Company maintained, in all material respects, effective internal control over financial reporting as of December 31, 2009, based on criteria established inInternal Control—Integrated Framework issued by theCommittee of Sponsoring Organizations of the Treadway Commission.
/s/ KPMG LLP
Des Moines, Iowa
March 4, 2010
III-67
| | 2009 | 2008 | 2007 | 2006 | 2005 | ||||||||||||
|---|---|---|---|---|---|---|---|---|---|---|---|---|---|---|---|---|---|
| | (in millions except per share) | ||||||||||||||||
Operating Data: | |||||||||||||||||
Net sales | $ | 1,159.0 | $ | 2,090.5 | $ | 1,972.5 | $ | 1,739.1 | $ | 1,547.8 | |||||||
Gross profit | 128.0 | 435.6 | 427.7 | 396.8 | 357.7 | ||||||||||||
Selling, general and administrative | 209.7 | 258.5 | 233.8 | 215.6 | 217.1 | ||||||||||||
Research and development | 61.4 | 82.9 | 70.6 | 61.9 | 58.7 | ||||||||||||
Impairment charges | 50.8 | 58.2 | — | 1.5 | — | ||||||||||||
Loss on sale of businesses and asset disposals | 16.4 | 9.6 | 9.4 | 1.7 | 1.4 | ||||||||||||
Total operating expenses | 338.3 | 409.2 | 313.8 | 280.7 | 277.2 | ||||||||||||
Total interest expense, net | 48.4 | 24.6 | 22.7 | 17.8 | 15.7 | ||||||||||||
Net income (loss) | (345.8 | ) | (29.1 | ) | 47.2 | 54.0 | 34.8 | ||||||||||
Per Share Data: | |||||||||||||||||
Income (loss) per common share, basic | $ | (7.15 | ) | $ | (0.60 | ) | $ | 0.98 | $ | 1.13 | $ | 0.73 | |||||
Income (loss) per common share, diluted | $ | (7.15 | ) | $ | (0.60 | ) | $ | 0.98 | $ | 1.12 | $ | 0.73 | |||||
Cash dividends declared per share | $ | — | $ | 0.72 | $ | 0.72 | $ | 0.60 | $ | 0.48 | |||||||
Weighted average basic shares outstanding | 48.3 | 48.2 | 48.1 | 47.7 | 47.5 | ||||||||||||
Weighted average diluted shares outstanding | 48.3 | 48.2 | 48.3 | 48.2 | 47.8 | ||||||||||||
Balance Sheet Data: | |||||||||||||||||
Inventories | $ | 177.6 | $ | 325.5 | $ | 318.8 | $ | 272.3 | $ | 238.9 | |||||||
Property, plant and equipment, net | 513.5 | 598.4 | 562.8 | 504.0 | 450.4 | ||||||||||||
Total assets | 1,068.3 | 1,467.7 | 1,500.4 | 1,307.1 | 1,166.5 | ||||||||||||
Total debt | 533.2 | 491.4 | 444.0 | 349.6 | 332.3 | ||||||||||||
Stockholders' equity | 154.6 | 477.9 | 586.0 | 515.5 | 494.2 | ||||||||||||
Debt to total capital | 77.5 | % | 50.7 | % | 43.1 | % | 40.4 | % | 40.6 | % | |||||||
Other Data: | |||||||||||||||||
Backlog (at year-end) | $ | 509.5 | $ | 743.7 | $ | 921.4 | $ | 631.0 | $ | 504.2 | |||||||
Depreciation and amortization | 117.1 | 113.0 | 102.3 | 95.7 | 88.3 | ||||||||||||
Capital expenditures | 43.0 | 198.6 | 135.6 | 116.2 | 95.2 | ||||||||||||
EBITDA (1) | (89.9 | ) | 175.6 | 212.6 | 207.6 | 172.3 | |||||||||||
Cash flows from (used in): | |||||||||||||||||
Operating activities | 86.8 | 183.5 | 98.1 | 167.9 | 116.3 | ||||||||||||
Investing activities | (42.2 | ) | (187.5 | ) | (122.2 | ) | (109.3 | ) | (93.3 | ) | |||||||
Financing activities | (24.7 | ) | 4.7 | 22.1 | (45.0 | ) | (20.1 | ) | |||||||||
- (1)
- EBITDA represents net income plus net interest expense, income tax expense, depreciation and amortization, long-lived asset impairment charge and noncontrolling interest. The impairment charge is included as it will reduce depreciation in future years. EBITDA may not be comparable to similarly titled measures reported by other companies. While EBITDA should not be construed as a substitute for operating income or a better indicator of liquidity than cash flow from operating activities, which are determined in accordance with accounting principles generally accepted in the United States, it is included herein to provide additional information as management of the Company believes it provides an indication with respect to the ability of Sauer-Danfoss to meet its future debt service, capital
III-68
expenditures, and working capital requirements. The following table further demonstrates how EBITDA is derived from cash flows from operating activities:
| | 2009 | 2008 | 2007 | 2006 | 2005 | ||||||||||||
|---|---|---|---|---|---|---|---|---|---|---|---|---|---|---|---|---|---|
Cash flows from operating activities | $ | 86.8 | $ | 183.5 | $ | 98.1 | $ | 167.9 | $ | 116.3 | |||||||
Increase (decrease) in working capital, excluding the effects of acquisitions Accounts receivable, net | (91.4 | ) | (71.7 | ) | 38.5 | 24.5 | 4.8 | ||||||||||
Inventories | (153.4 | ) | 16.8 | 36.6 | 14.2 | 24.9 | |||||||||||
Prepaid and other current assets | 5.0 | 7.9 | 11.1 | 6.1 | (7.9 | ) | |||||||||||
Accounts payable | 54.2 | 14.5 | (11.0 | ) | (27.2 | ) | 13.3 | ||||||||||
Accrued liabilities | 20.7 | (23.6 | ) | 1.5 | (14.0 | ) | (17.6 | ) | |||||||||
Deferred income taxes and other | (121.2 | ) | 9.5 | (3.7 | ) | 1.3 | 7.9 | ||||||||||
Interest expense, net | 48.4 | 24.6 | 22.7 | 17.8 | 15.7 | ||||||||||||
Tax expense | 61.0 | 14.1 | 18.8 | 17.0 | 14.9 | ||||||||||||
EBITDA | $ | (89.9 | ) | $ | 175.6 | $ | 212.6 | $ | 207.6 | $ | 172.3 | ||||||
III-69
Chairman, Vice Chairman and Chairman Emeritus
Jørgen M. Clausen
Chairman
Niels B. Christiansen
Vice Chairman
Klaus H. Murmann
Chairman Emeritus
Executive Officers
Sven Ruder
President and Chief Executive Officer
Jesper V. Christensen
Executive Vice President,
Chief Financial Officer, and Treasurer
C. Kells Hall
Executive Vice President and President—Propel Division
Wolfgang Schramm
Executive Vice President and President—Controls Division
Marc A. Weston
Executive Vice President and Chief Marketing Officer
Kenneth D. McCuskey
Vice President and Chief Accounting Officer, and Secretary
Board of Directors
Niels B. Christiansen
President and Chief Executive Officer—
Danfoss A/S
Jørgen M. Clausen
Chairman—Danfoss A/S
Kim Fausing
Executive Vice President and Chief Operating Officer—Danfoss A/S
Per Have
Executive Vice President and Chief Financial Officer—Danfoss A/S
William E. Hoover, Jr.
Director—Danfoss A/S, GN Great Nordic, NorthStar Battery, and Skykon A/S
Johannes F. Kirchhoff[1]
Managing Director—FAUN Umwelttechnik GmbH & Co. KG
F. Joseph Loughrey[1]
Director—The Vanguard Group, Hillenbrand, Inc., The Lumina Foundation, AB SKF, and Oxfam America
Sven Murmann
Managing Director—Sauer Holding GmbH
Sven Ruder
President and Chief Executive Officer—
Sauer-Danfoss Inc.
Steven H. Wood[1]
Chief Financial Officer—
Becker-Underwood, Inc.
- [1]
- Member of Audit Committee and
Compensation Committee
III-70
Corporate Data
Stockholder Information
Annual Meeting
The annual meeting of Company stockholders will be held at 8:30 a.m. local time on September 16, 2010 at:
Sauer-Danfoss Inc.
2800 East 13th Street
Ames, Iowa 50010
Transfer Agent
Wells Fargo Bank, N.A.
Shareowner Services
161 North Concord Exchange
South St. Paul, Minnesota 55075
Phone: 800-468-9716
For information about accounts, stock certificates, transfers or dividend checks, contact Wells Fargo Stock Transfer, Shareowner Relations.
Website:https://www.wellsfargo.com/com/shareowner_services
Investor Relations
| In the U.S.: Kenneth D. McCuskey Sauer-Danfoss Inc. 2800 East 13th Street Ames, Iowa 50010 Phone: 515-239-6364 e-mail:kmccuskey@sauer-danfoss.com | In Europe: John N. Langrick Sauer-Danfoss Inc. Krokamp 35 24539 Neumünster Germany Phone: 49 4321 871 190 e-mail: jlangrick@sauer-danfoss.com |
Company Website
www.sauer-danfoss.com
Stock Exchange
Sauer-Danfoss Inc. common stock is listed on the New York Stock Exchange (SHS).
Form 10-K
The Annual Report on Form 10-K (together with Amendment No. 1 thereto) for the year ended December 31, 2009 to the Securities and Exchange Commission is available to stockholders upon written request to Sauer-Danfoss Inc. Investor Relations, 2800 E. 13th Street, Ames, Iowa 50010.
Independent Registered Public Accounting Firm
KPMG LLP
Des Moines, Iowa
III-71
| Date Please detach here The Board of Directors Recommends a Vote FOR all Nominees listed below and FOR Item 2. 1. Election of directors: 01 Niels B. Christiansen 06 William E. Hoover, Jr. Vote FOR Vote WITHHELD 02 Jørgen M. Clausen 07 Johannes F. Kirchhoff all nominees from all nominees 03 Kim Fausing 08 Sven Ruder (except as marked) 04 Richard J. Freeland 09 Anders Stahlschmidt 05 Per Have 10 Steven H. Wood (Instructions: To withhold authority to vote for any indicated nominee, write the number(s) of the nominee(s) in the box provided to the right.) 2. To ratify the appointment of KPMG LLP as independent registered public For Against Abstain accounting firm. THIS PROXY WHEN PROPERLY EXECUTED AND RETURNED WILL BE VOTED AS DIRECTED OR, IF NO DIRECTION IS GIVEN, WILL BE VOTED FOR ALL NOMINEES LISTED ABOVE AND FOR ITEM 2. Signature(s) in Box Please sign exactly as your name(s) appear on the Proxy. If held in joint tenancy, all persons must sign. Trustees, administrators, etc., should include title and authority. Corporations should provide full name of corporation and title of authorized officer signing the Proxy. TO VOTE BY MAIL AS THE BOARD OF DIRECTORS RECOMMENDS ON ALL ITEMS BELOW, SIMPLY SIGN, DATE, AND RETURN THIS PROXY CARD. Address Change? Mark Box Indicate changes below: COMPANY # Vote by Internet, Telephone or Mail 24 Hours a Day, 7 Days a Week Your phone or Internet vote authorizes the named proxies to vote your shares in the same manner as if you marked, signed and returned your proxy card. Please have your proxy card and the last four digits of your Social Security Number or Taxpayer Identification Number available. : INTERNET – www.eproxy.com/shs Use the Internet to vote your proxy until 11:59 p.m. (CT) on September 15, 2010. (PHONE – 1-800-560-1965 Use a touch-tone telephone to vote your proxy until 11:59 p.m. (CT) on September 15, 2010. * MAIL – Mark, sign and date your proxy card and return it in the postage-paid envelope provided. If you vote your proxy by Internet or by Telephone, you do NOT need to mail back your Proxy Card. Shareowner ServicesSM P.O. Box 64945 St. Paul, MN 55164-0945 |
| Sauer-Danfoss Inc. 2800 East 13th Street Ames, IA 50010 proxy This proxy is solicited by the Board of Directors for use at the Annual Meeting on September 16, 2010. The shares of Common Stock of Sauer-Danfoss Inc. that you are entitled to vote will be voted as you specify on the reverse side. If no choice is specified, the proxy will be voted “FOR” all nominees for director listed on the reverse side and “FOR” Item 2. By signing the proxy, you revoke all prior proxies and appoint Jørgen M. Clausen, Niels B. Christiansen and Sven Ruder, and each of them, with full power of substitution, as proxies to vote your shares on the matters shown on the reverse side, and in their discretion on any other matters which may properly come before the Annual Meeting and all postponements and adjournments. A majority of said proxies, or any substitute or substitutes, who shall be present and act at the meeting (or if only one shall be present and act, then that one) shall have all the powers of said proxies hereunder. ANNUAL MEETING OF STOCKHOLDERS Thursday, September 16, 2010 8:30 a.m. local time Sauer-Danfoss Inc. 2800 East 13th Street Ames, Iowa 50010 See reverse for voting instructions. |
TABLE OF CONTENTS
SAUER-DANFOSS INC. 2800 E. 13th Street Ames, IA 50010 NOTICE OF ANNUAL MEETING OF STOCKHOLDERS TO BE HELD SEPTEMBER 16, 2010
PROXY STATEMENT
GENERAL INFORMATION
SECURITY OWNERSHIP OF CERTAIN BENEFICIAL OWNERS AND MANAGEMENT
GOVERNANCE OF THE COMPANY
REPORT OF THE AUDIT COMMITTEE
EXECUTIVE COMPENSATION COMPENSATION DISCUSSION AND ANALYSIS
SUMMARY COMPENSATION TABLE
GRANTS OF PLAN-BASED AWARDS TABLE
SUMMARY COMPENSATION AND GRANTS OF PLAN-BASED AWARDS NARRATIVE
OUTSTANDING EQUITY AWARDS AT FISCAL YEAR-END
OPTION EXERCISES AND STOCK VESTED
PENSION BENEFITS
PENSION BENEFITS NARRATIVE
NONQUALIFIED DEFERRED COMPENSATION
NONQUALIFIED DEFERRED COMPENSATION NARRATIVE
POTENTIAL PAYMENTS UPON TERMINATION OR CHANGE IN CONTROL
POTENTIAL PAYMENTS UPON TERMINATION OR CHANGE IN CONTROL
DIRECTOR COMPENSATION
DIRECTOR COMPENSATION NARRATIVE
ITEM 1—ELECTION OF DIRECTORS
ITEM 2—RATIFICATION OF APPOINTMENT OF INDEPENDENT REGISTERED PUBLIC ACCOUNTING FIRM
ADDITIONAL INFORMATION
SAUER-DANFOSS INC. 2009 ANNUAL REPORT Business
NYSE Price Range, Dividends by Quarter
Performance Graph
COMPARISON OF 5-YEAR CUMULATIVE TOTAL RETURN AMONG SAUER-DANFOSS INC., RUSSELL 2000 INDEX AND HEMSCOTT GROUP INDEX
Management's Discussion and Analysis of Financial Condition and Results of Operations.
Sauer-Danfoss Inc. and Subsidiaries Consolidated Statements of Operations (Dollars in thousands, except per share data)
Sauer-Danfoss Inc. and Subsidiaries Consolidated Balance Sheets (Dollars in thousands, except per share data)
Sauer-Danfoss Inc. and Subsidiaries Consolidated Statements of Stockholders' Equity and Comprehensive Income (Loss) (Dollars in thousands, except per share data)
Sauer-Danfoss Inc. and Subsidiaries Consolidated Statements of Cash Flows (Dollars in thousands)
Sauer-Danfoss Inc. and Subsidiaries Notes to Consolidated Financial Statements December 31, 2009, 2008, and 2007 (Dollars in thousands, except per share data)
Report of Management
Report of Independent Registered Public Accounting Firm
SELECTED FINANCIAL DATA