UNITED STATES
SECURITIES AND EXCHANGE COMMISSION
WASHINGTON, D.C. 20549
FORM N-CSR
CERTIFIED SHAREHOLDER REPORT OF REGISTERED
MANAGEMENT INVESTMENT COMPANIES
Investment Company Act file number:
Parnassus Funds (811-04044) and Parnassus Income Funds (811-06673)
Parnassus Funds
Parnassus Income Funds
(Exact name of registrant as specified in charter)
1 Market Street, Suite 1600, San Francisco, California 94105
(Address of principal executive offices) (Zip Code)
Marc C. Mahon
Parnassus Funds
Parnassus Income Funds
1 Market Street, Suite 1600, San Francisco, California 94105
(Name and address of agent for service)
Registrant’s telephone number, including area code: (415) 778-0200
Date of fiscal year end: December 31
Date of reporting period: December 31, 2024
Form N-CSR is to be used by management investment companies to file reports with the Commission not later than 10 days after the transmission to stockholders of any report that is required to be transmitted to stockholders under Rule 30e-1 under the Investment Company Act of 1940 (17 CFR 270.30e-1). The Commission may use the information provided on Form N-CSR in its regulatory, disclosure review, inspection, and policymaking roles.
A registrant is required to disclose the information specified by Form N-CSR, and the Commission will make this information public. A registrant is not required to respond to the collection of information contained in Form N-CSR unless the Form displays a currently valid Office of Management and Budget (“OMB”) control number. Please direct comments concerning the accuracy of the information collection burden estimate and any suggestions for reducing the burden to Secretary, Securities and Exchange Commission, 450 Fifth Street, NW, Washington, DC 20549-0609. The OMB has reviewed this collection of information under the clearance requirements of 44 U.S.C. § 3507.
EXPLANATORY NOTE:
Parnassus Income Funds is filing this amendment to its Form N-CSR for the fiscal year ending December 31, 2024, originally filed with the Securities and Exchange Commission on February 14, 2025 (Accession Number 0001193125-25-026869). The purpose of this amendment is to update the information filed under Item 7(a) of this Form to only include the Financial Statements, to make corresponding updates to Items 6 and 8, and to update Item 11 to include the statement regarding the basis for approval of an investment advisory contract. Additional minor updates were made to the introduction to Item 1 and the exhibit list in Item 19. Other than the aforementioned revisions (and the dates included on the signature page and the certifications), this amendment does not amend, update or change any other items or disclosures found in the original Form N-CSR filing.
Item 1. Report to Stockholders.
Parnassus Core Equity Fund
Annual Shareholder Report - December 31, 2024
Parnassus Core Equity Fund (the "Fund") offers a concentrated portfolio of U.S. large-cap stocks with the potential to compound value at attractive valuations.
This annual shareholder report contains important information about the Fund for the period of January 1, 2024 to December 31, 2024.
You can find additional information about the fund at www.parnassus.com. You can also request this information by contacting us at 800-999-3505.
What was the Fund's cost for the year?
(based on hypothetical $10,000 investment)
| Class name | Cost of a $10,000 investment | Cost paid as a % of a $10,000 investment |
|---|
| Investor Shares | $89 | 0.81% |
|---|
How did the fund perform?
Parnassus Core Equity Fund (Investor Shares) returned 18.52% (net of fees) for the year, underperforming the S&P 500 Index’s 25.02%. Stock selection in the Financials and Communication Services sector held back relative returns, as did an overweight to Materials. Conversely, a lack of exposure to the Energy sector and underweights in the Consumer Discretionary and Health Care sectors buoyed relative performance.
We continue to see attractive opportunities across the Materials and Financials sectors while opportunistically taking advantage of volatility in Information Technology.
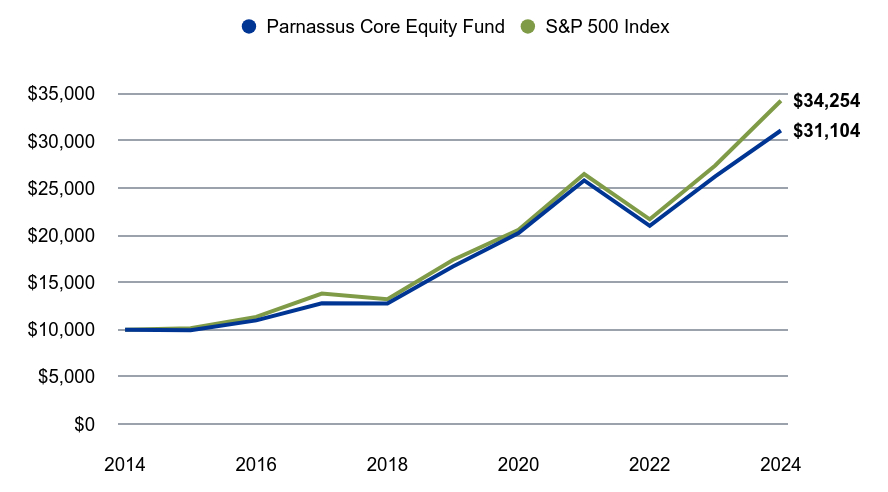
Value on December 31, 2024 of $10,000 invested on December 31, 2014.
| Parnassus Core Equity Fund | S&P 500 Index |
|---|
| | |
|---|
| 2014 | $10,000 | $10,000 |
|---|
| 2015 | $9,945 | $10,138 |
|---|
| 2016 | $10,980 | $11,351 |
|---|
| 2017 | $12,800 | $13,829 |
|---|
| 2018 | $12,776 | $13,223 |
|---|
| 2019 | $16,697 | $17,386 |
|---|
| 2020 | $20,235 | $20,585 |
|---|
| 2021 | $25,809 | $26,494 |
|---|
| 2022 | $21,005 | $21,696 |
|---|
| 2023 | $26,242 | $27,399 |
|---|
| 2024 | $31,104 | $34,254 |
|---|
The chart shows the growth in value of a hypothetical $10,000 investment over the last 10 years and does not reflect the deduction of taxes a shareholder would pay on fund distributions or the redemption of fund shares.
The fund’s past performance is not a good predictor of how the fund will perform in the future. The graph and table do not reflect the deduction of taxes that a shareholder would pay on fund distributions or redemption of fund shares.
| Total Net Assets | $29,016,424,474 |
|---|
| # of Portfolio Holdings | 40 |
|---|
| Portfolio Turnover Rate | 34.20% |
|---|
| Advisory Fees Paid | $168,380,503 |
|---|
Average Annual Total Returns (%)
| 1 Year | 5 years | 10 Years |
|---|
| Parnassus Core Equity Fund - Investor Shares | 18.52% | 13.25% | 12.02% |
|---|
| S&P 500 Index | 25.02% | 14.53% | 13.10% |
|---|
What did the Fund invest in?
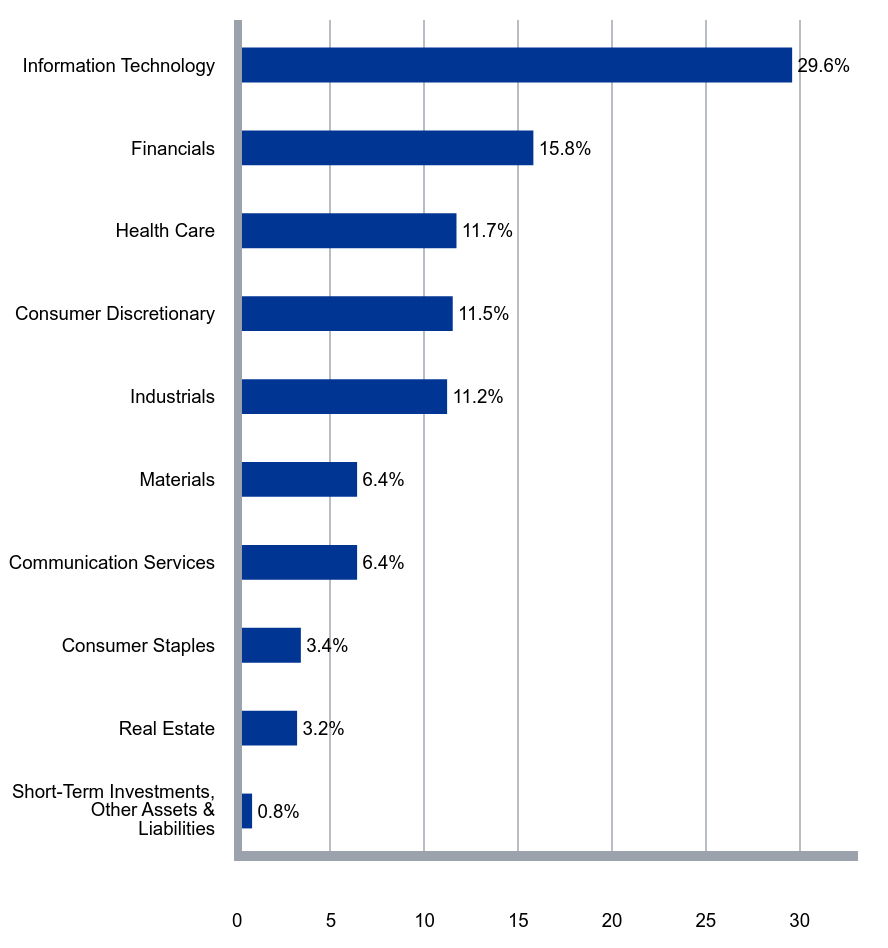
Parnassus Core Equity Fund invests selectively in about 40 U.S. large-cap equity securities. The Fund pursues high quality companies with increasingly relevant products and services, durable competitive advantages, strong management teams and sustainable business practices that are likely to thrive in a healthy economy and be resilient in an economic downturn.
| Value | Value |
|---|
| Short-Term Investments, Other Assets & Liabilities | 0.8% |
| Real Estate | 3.2% |
| Consumer Staples | 3.4% |
| Communication Services | 6.4% |
| Materials | 6.4% |
| Industrials | 11.2% |
| Consumer Discretionary | 11.5% |
| Health Care | 11.7% |
| Financials | 15.8% |
| Information Technology | 29.6% |
| Microsoft Corp. | 6.5% |
| Amazon.com Inc. | 6.3% |
| NVIDIA Corp. | 5.9% |
| Alphabet Inc., Class A | 5.0% |
| Deere & Co. | 3.6% |
| Waste Management Inc. | 3.4% |
| Mastercard Inc., Class A | 3.4% |
| Realty Income Corp. | 3.2% |
| Broadcom Inc. | 3.0% |
| Intercontinental Exchange Inc. | 3.0% |
Parnassus Core Equity Fund
Annual Shareholder Report - December 31, 2024
If you wish to view additional information about the Fund; including, but not limited to, financial statements or holdings, please call us or visit our website:
Phone: 800-999-3505
Website: www.parnassus.com/literature-and-forms/fund-information
For purposes of categorizing securities for diversification requirements under the Investment Company Act, the Fund uses industry classifications that are more specific than those used for the chart.
Portfolio characteristics and holdings are subject to change periodically.
* The holding tables and charts above represent percentage based on Total Net Assets.
No material changes to the Fund in the last reporting year.
Change in or Disagreements with Accountants
There have been no changes to or disagreements with the accountants in the last reporting year.
© 2025 Parnassus Investments, LLC. All rights reserved. PARNASSUS, PARNASSUS INVESTMENTS, and PARNASSUS FUNDS are federally registered trademarks of Parnassus Investments, LLC.
If you wish to receive a copy of this document at a new address, contact 800-999-3505.
Parnassus Core Equity Fund
Class - Institutional Shares
Annual Shareholder Report - December 31, 2024
Parnassus Core Equity Fund (the "Fund") offers a concentrated portfolio of U.S. large-cap stocks with the potential to compound value at attractive valuations.
This annual shareholder report contains important information about the Fund for the period of January 1, 2024 to December 31, 2024.
You can find additional information about the fund at www.parnassus.com. You can also request this information by contacting us at 800-999-3505.
What was the Fund's cost for the year?
(based on hypothetical $10,000 investment)
| Class name | Cost of a $10,000 investment | Cost paid as a % of a $10,000 investment |
|---|
| Institutional Shares | $67 | 0.61% |
|---|
How did the fund perform?
Parnassus Core Equity Fund (Institutional Shares) returned 18.75% (net of fees) for the year, underperforming the S&P 500 Index’s 25.02%. Stock selection in the Financials and Communication Services sector held back relative returns, as did an overweight to Materials. Conversely, a lack of exposure to the Energy sector and underweights in the Consumer Discretionary and Health Care sectors buoyed relative performance.
We continue to see attractive opportunities across the Materials and Financials sectors while opportunistically taking advantage of volatility in Information Technology.
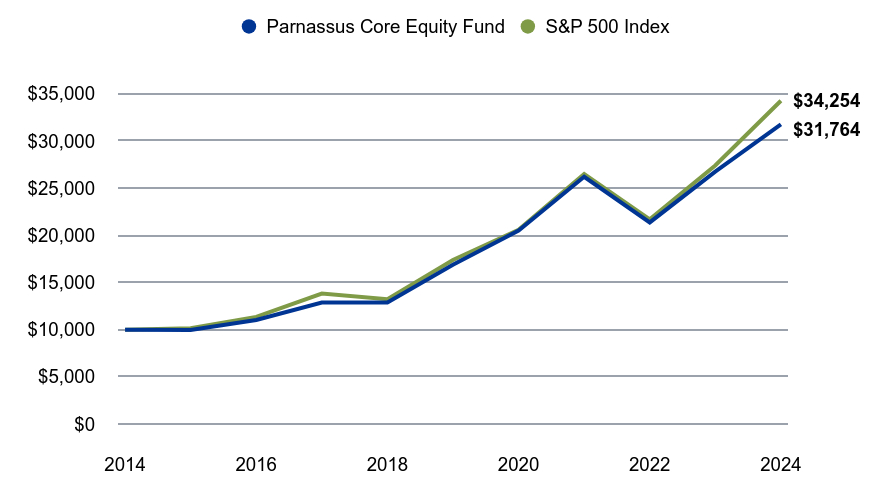
Value on December 31, 2024 of $10,000 invested on December 31, 2014.
| Parnassus Core Equity Fund | S&P 500 Index |
|---|
| | |
|---|
| 2014 | $10,000 | $10,000 |
|---|
| 2015 | $9,966 | $10,138 |
|---|
| 2016 | $11,023 | $11,351 |
|---|
| 2017 | $12,877 | $13,829 |
|---|
| 2018 | $12,883 | $13,223 |
|---|
| 2019 | $16,872 | $17,386 |
|---|
| 2020 | $20,495 | $20,585 |
|---|
| 2021 | $26,195 | $26,494 |
|---|
| 2022 | $21,363 | $21,696 |
|---|
| 2023 | $26,748 | $27,399 |
|---|
| 2024 | $31,764 | $34,254 |
|---|
The chart shows the growth in value of a hypothetical $10,000 investment over the last 10 years and does not reflect the deduction of taxes a shareholder would pay on fund distributions or the redemption of fund shares.
The fund’s past performance is not a good predictor of how the fund will perform in the future. The graph and table do not reflect the deduction of taxes that a shareholder would pay on fund distributions or redemption of fund shares.
| Total Net Assets | $29,016,424,474 |
|---|
| # of Portfolio Holdings | 40 |
|---|
| Portfolio Turnover Rate | 34.20% |
|---|
| Advisory Fees Paid | $168,380,503 |
|---|
Average Annual Total Returns (%)
| 1 Year | 5 years | 10 Years |
|---|
| Parnassus Core Equity Fund - Institutional Shares | 18.75% | 13.49% | 12.25% |
|---|
| S&P 500 Index | 25.02% | 14.53% | 13.10% |
|---|
What did the Fund invest in?
Parnassus Core Equity Fund invests selectively in about 40 U.S. large-cap equity securities. The Fund pursues high quality companies with increasingly relevant products and services, durable competitive advantages, strong management teams and sustainable business practices that are likely to thrive in a healthy economy and be resilient in an economic downturn.
| Value | Value |
|---|
| Short-Term Investments, Other Assets & Liabilities | 0.8% |
| Real Estate | 3.2% |
| Consumer Staples | 3.4% |
| Communication Services | 6.4% |
| Materials | 6.4% |
| Industrials | 11.2% |
| Consumer Discretionary | 11.5% |
| Health Care | 11.7% |
| Financials | 15.8% |
| Information Technology | 29.6% |
| Microsoft Corp. | 6.5% |
| Amazon.com Inc. | 6.3% |
| NVIDIA Corp. | 5.9% |
| Alphabet Inc., Class A | 5.0% |
| Deere & Co. | 3.6% |
| Waste Management Inc. | 3.4% |
| Mastercard Inc., Class A | 3.4% |
| Realty Income Corp. | 3.2% |
| Broadcom Inc. | 3.0% |
| Intercontinental Exchange Inc. | 3.0% |
Parnassus Core Equity Fund
Class - Institutional Shares
Annual Shareholder Report - December 31, 2024
If you wish to view additional information about the Fund; including, but not limited to, financial statements or holdings, please call us or visit our website:
Phone: 800-999-3505
Website: www.parnassus.com/literature-and-forms/fund-information
For purposes of categorizing securities for diversification requirements under the Investment Company Act, the Fund uses industry classifications that are more specific than those used for the chart.
Portfolio characteristics and holdings are subject to change periodically.
* The holding tables and charts above represent percentage based on Total Net Assets.
No material changes to the Fund in the last reporting year.
Change in or Disagreements with Accountants
There have been no changes to or disagreements with the accountants in the last reporting year.
© 2025 Parnassus Investments, LLC. All rights reserved. PARNASSUS, PARNASSUS INVESTMENTS, and PARNASSUS FUNDS are federally registered trademarks of Parnassus Investments, LLC.
If you wish to receive a copy of this document at a new address, contact 800-999-3505.
Parnassus Fixed Income Fund
Annual Shareholder Report - December 31, 2024
Parnassus Fixed Income Fund (the "Fund") offers a U.S. bond portfolio pursuing an attractive level of current income primarily from corporate bonds, mortgage-backed securities, and Treasuries. The portfolio keeps a significant allocation to green/sustainable bonds.
This annual shareholder report contains important information about the Fund for the period of January 1, 2024 to December 31, 2024.
You can find additional information about the fund at www.parnassus.com. You can also request this information by contacting us at 800-999-3505.
What was the Fund's cost for the year?
(based on hypothetical $10,000 investment)
| Class name | Cost of a $10,000 investment | Cost paid as a % of a $10,000 investment |
|---|
| Investor Shares | $59 | 0.58% |
|---|
How did the fund perform?
Parnassus Fixed Income Fund (Investor shares) returned 1.92% (net of fees) for the year, outperforming the Bloomberg U.S. Aggregate Bond Index’s 1.25% return. Corporate bonds were the primary drivers of outperformance, supported by both the Fund’s overweight position and favorable security selection. Within corporates, Financial Services and Industrial Bonds stood out as strong contributors, reflecting the impact of favorable credit spreads and robust fundamentals.
Security selection within Treasuries, however, modestly detracted from performance, with the portfolio's longer-duration exposure encountering headwinds from rising yields.
A stable monetary policy environment and easing uncertainty around key fiscal policies should support continued moderation in mortgage price volatility.
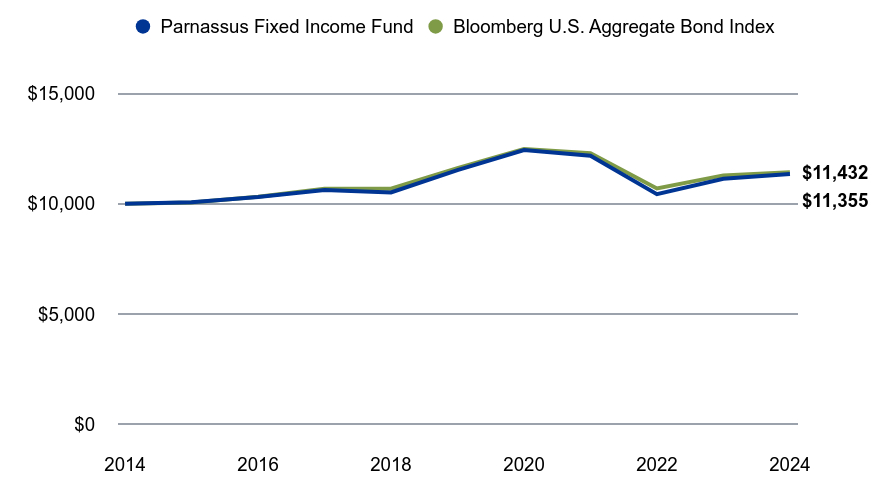
Value on December 31, 2024 of $10,000 invested on December 31, 2014.
| Parnassus Fixed Income Fund | Bloomberg U.S. Aggregate Bond Index |
|---|
| | |
|---|
| 2014 | $10,000 | $10,000 |
|---|
| 2015 | $10,070 | $10,055 |
|---|
| 2016 | $10,313 | $10,321 |
|---|
| 2017 | $10,633 | $10,687 |
|---|
| 2018 | $10,514 | $10,688 |
|---|
| 2019 | $11,527 | $11,620 |
|---|
| 2020 | $12,439 | $12,492 |
|---|
| 2021 | $12,181 | $12,299 |
|---|
| 2022 | $10,441 | $10,699 |
|---|
| 2023 | $11,141 | $11,291 |
|---|
| 2024 | $11,355 | $11,432 |
|---|
The chart shows the growth in value of a hypothetical $10,000 investment over the last 10 years and does not reflect the deduction of taxes a shareholder would pay on fund distributions or the redemption of fund shares.
The fund’s past performance is not a good predictor of how the fund will perform in the future. The graph and table do not reflect the deduction of taxes that a shareholder would pay on fund distributions or redemption of fund shares.
| Total Net Assets | $289,739,305 |
|---|
| # of Portfolio Holdings | 105 |
|---|
| Portfolio Turnover Rate | 28.44% |
|---|
| Advisory Fees Paid | $762,068 |
|---|
Average Annual Total Returns (%)
| 1 Year | 5 years | 10 Years |
|---|
| Parnassus Fixed Income Fund - Investor Shares | 1.92% | -0.30% | 1.28% |
|---|
| Bloomberg U.S. Aggregate Bond Index | 1.25% | -0.33% | 1.35% |
|---|
What did the Fund invest in?
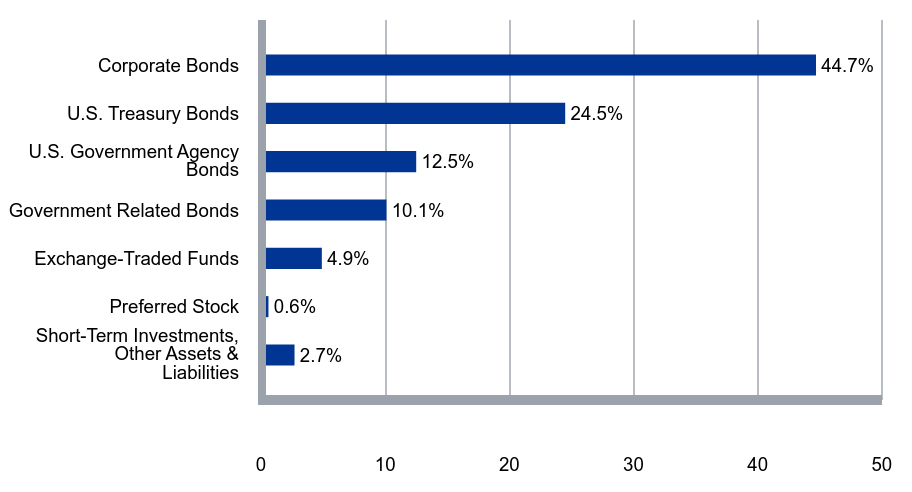
Parnassus Fixed Income Fund invests in a diversified portfolio of corporate bonds, U.S. Treasuries and supranational bonds, with an emphasis on investment-grade corporate bonds from high quality companies held in the Parnassus equity funds. Other investments may include convertible bonds, preferred stock, and fixed income exchange traded funds.
| Value | Value |
|---|
| Short-Term Investments, Other Assets & Liabilities | 2.7% |
| Preferred Stock | 0.6% |
| Exchange-Traded Funds | 4.9% |
| Government Related Bonds | 10.1% |
| U.S. Government Agency Bonds | 12.5% |
| U.S. Treasury Bonds | 24.5% |
| Corporate Bonds | 44.7% |
Top Ten Corporate Holdings (%)*
| Truist Financial Corp. | 1.2% |
| McCormick & Co., Inc. | 1.1% |
| Alexandria Real Estate Equities Inc. | 1.1% |
| Southwest Airlines Co. | 1.0% |
| Xylem Inc. | 1.0% |
| Prologis LP | 1.0% |
| Agilent Technologies Inc. | 1.0% |
| Autodesk Inc. | 1.0% |
| Micron Technology Inc. | 1.0% |
| Merck & Co., Inc. | 1.0% |
Parnassus Fixed Income Fund
Annual Shareholder Report - December 31, 2024
If you wish to view additional information about the Fund; including, but not limited to, financial statements or holdings, please call us or visit our website:
Phone: 800-999-3505
Website: www.parnassus.com/literature-and-forms/fund-information
Asset Class Weightings (%)*
| Value | Value |
|---|
| Corporate Bonds | 44.7% |
| U.S. Treasury Bonds | 24.5% |
| U.S. Government Agency Bonds | 12.5% |
| Government Related Bonds | 10.1% |
| Exchange-Traded Funds | 4.9% |
| Preferred Stock | 0.6% |
| Short-Term Investments, Other Assets & Liabilities | 2.7% |
* The holding tables and charts above represent percentage based on Total Net Assets.
No material changes to the Fund in the last reporting year.
Change in or Disagreements with Accountants
There have been no changes to or disagreements with the accountants in the last reporting year.
© 2025 Parnassus Investments, LLC. All rights reserved. PARNASSUS, PARNASSUS INVESTMENTS, and PARNASSUS FUNDS are federally registered trademarks of Parnassus Investments, LLC.
If you wish to receive a copy of this document at a new address, contact 800-999-3505.
Parnassus Fixed Income Fund
Class - Institutional Shares
Annual Shareholder Report - December 31, 2024
Parnassus Fixed Income Fund (the "Fund") offers a U.S. bond portfolio pursuing an attractive level of current income primarily from corporate bonds, mortgage-backed securities, and Treasuries. The portfolio keeps a significant allocation to green/sustainable bonds.
This annual shareholder report contains important information about the Fund for the period of January 1, 2024 to December 31, 2024.
You can find additional information about the fund at www.parnassus.com. You can also request this information by contacting us at 800-999-3505.
What was the Fund's cost for the year?
(based on hypothetical $10,000 investment)
| Class name | Cost of a $10,000 investment | Cost paid as a % of a $10,000 investment |
|---|
| Institutional Shares | $39 | 0.39% |
|---|
How did the fund perform?
Parnassus Fixed Income Fund (Institutional shares) returned 2.13% (net of fees) for the year, outperforming the Bloomberg U.S. Aggregate Bond Index’s 1.25% return. Corporate bonds were the primary drivers of outperformance, supported by both the Fund’s overweight position and favorable security selection. Within corporates, Financial Services and Industrial Bonds stood out as strong contributors, reflecting the impact of favorable credit spreads and robust fundamentals.
Security selection within Treasuries, however, modestly detracted from performance, with the portfolio's longer-duration exposure encountering headwinds from rising yields.
A stable monetary policy environment and easing uncertainty around key fiscal policies should support continued moderation in mortgage price volatility.
Value on December 31, 2024 of $10,000 invested on April 30, 2015.
| Parnassus Fixed Income Fund | Bloomberg U.S. Aggregate Bond Index |
|---|
| | |
|---|
| 2015 | $10,000 | $10,000 |
|---|
| 2015 | $9,965 | $9,932 |
|---|
| 2016 | $10,219 | $10,195 |
|---|
| 2017 | $10,564 | $10,556 |
|---|
| 2018 | $10,470 | $10,557 |
|---|
| 2019 | $11,497 | $11,477 |
|---|
| 2020 | $12,439 | $12,339 |
|---|
| 2021 | $12,206 | $12,148 |
|---|
| 2022 | $10,485 | $10,568 |
|---|
| 2023 | $11,214 | $11,152 |
|---|
| 2024 | $11,453 | $11,292 |
|---|
The chart shows the growth in value of a hypothetical $10,000 investment since inception and does not reflect the deduction of taxes a shareholder would pay on fund distributions or the redemption of fund shares. The share class commenced operations on April 30, 2015.
The fund’s past performance is not a good predictor of how the fund will perform in the future. The graph and table do not reflect the deduction of taxes that a shareholder would pay on fund distributions or redemption of fund shares.
| Total Net Assets | $289,739,305 |
|---|
| # of Portfolio Holdings | 105 |
|---|
| Portfolio Turnover Rate | 28.44% |
|---|
| Advisory Fees Paid | $762,068 |
|---|
Average Annual Total Returns (%)
| 1 Year | 5 years | Since Inception |
|---|
| Parnassus Fixed Income Fund - Institutional Shares (Incp: April 30, 2015) | 2.13% | -0.08% | 1.41% |
|---|
| Bloomberg U.S. Aggregate Bond Index | 1.25% | -0.33% | 1.26% |
|---|
What did the Fund invest in?
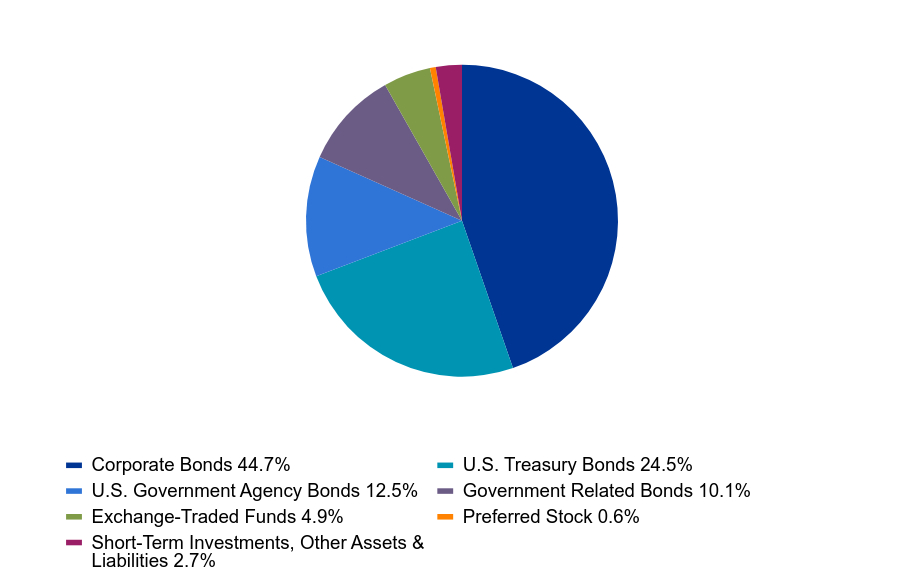
Parnassus Fixed Income Fund invests in a diversified portfolio of corporate bonds, U.S. Treasuries and supranational bonds, with an emphasis on investment-grade corporate bonds from high quality companies held in the Parnassus equity funds. Other investments may include convertible bonds, preferred stock, and fixed income exchange traded funds.
| Value | Value |
|---|
| Short-Term Investments, Other Assets & Liabilities | 2.7% |
| Preferred Stock | 0.6% |
| Exchange-Traded Funds | 4.9% |
| Government Related Bonds | 10.1% |
| U.S. Government Agency Bonds | 12.5% |
| U.S. Treasury Bonds | 24.5% |
| Corporate Bonds | 44.7% |
Top Ten Corporate Holdings (%)*
| Truist Financial Corp. | 1.2% |
| McCormick & Co., Inc. | 1.1% |
| Alexandria Real Estate Equities Inc. | 1.1% |
| Southwest Airlines Co. | 1.0% |
| Xylem Inc. | 1.0% |
| Prologis LP | 1.0% |
| Agilent Technologies Inc. | 1.0% |
| Autodesk Inc. | 1.0% |
| Micron Technology Inc. | 1.0% |
| Merck & Co., Inc. | 1.0% |
Parnassus Fixed Income Fund
Class - Institutional Shares
Annual Shareholder Report - December 31, 2024
If you wish to view additional information about the Fund; including, but not limited to, financial statements or holdings, please call us or visit our website:
Phone: 800-999-3505
Website: www.parnassus.com/literature-and-forms/fund-information
Asset Class Weightings (%)*
| Value | Value |
|---|
| Corporate Bonds | 44.7% |
| U.S. Treasury Bonds | 24.5% |
| U.S. Government Agency Bonds | 12.5% |
| Government Related Bonds | 10.1% |
| Exchange-Traded Funds | 4.9% |
| Preferred Stock | 0.6% |
| Short-Term Investments, Other Assets & Liabilities | 2.7% |
* The holding tables and charts above represent percentage based on Total Net Assets.
No material changes to the Fund in the last reporting year.
Change in or Disagreements with Accountants
There have been no changes to or disagreements with the accountants in the last reporting year.
© 2025 Parnassus Investments, LLC. All rights reserved. PARNASSUS, PARNASSUS INVESTMENTS, and PARNASSUS FUNDS are federally registered trademarks of Parnassus Investments, LLC.
If you wish to receive a copy of this document at a new address, contact 800-999-3505.
Parnassus Core Select ETF
Annual Shareholder Report - December 31, 2024
Parnassus Core Select ETF (the "Fund") pursues strong long-term returns through a concentrated portfolio reflecting our highest conviction for the most attractive investment opportunities in a cost-efficient, convenient vehicle.
This annual shareholder report contains important information about the Fund for the period of December 11, 2024 to December 31, 2024.
You can find additional information about the fund at www.parnassus.com. You can also request this information by contacting us at (855) 514-4443.
What was the Fund's cost for the year?
(based on hypothetical $10,000 investment)
| Fund name | Cost of a $10,000 investment | Cost paid as a % of a $10,000 investment |
|---|
| Parnassus Core Select ETF | $3 | 0.58% |
|---|
How did the fund perform?
Parnassus Core Select ETF returned -4.11% on a net asset value (“NAV”) basis and returned -3.91% on a market price basis, underperforming the S&P 500 Index’s -3.26%, since its launch on December 11, 2024 through December 31, 2024.
The underperformance was primarily driven by the Information Technology sector, offset somewhat by the Communication Services sector. The most notable overweights included Materials, Industrials and Financials and the largest underweights were in the Consumer Staples, Energy and Communication Services sectors.
We take a balanced approach to positioning the portfolio in neither an overly offensive or defensive way given the market environment, and our conviction reflects the companies we think offer the highest-quality businesses at the most attractive valuations for their growth potential over the long term.
| Total Net Assets | $2,883,708 |
|---|
| # of Portfolio Holdings | 25 |
|---|
| Portfolio Turnover Rate | -% |
|---|
| Advisory Fees Paid | $578 |
|---|
What did the Fund invest in?
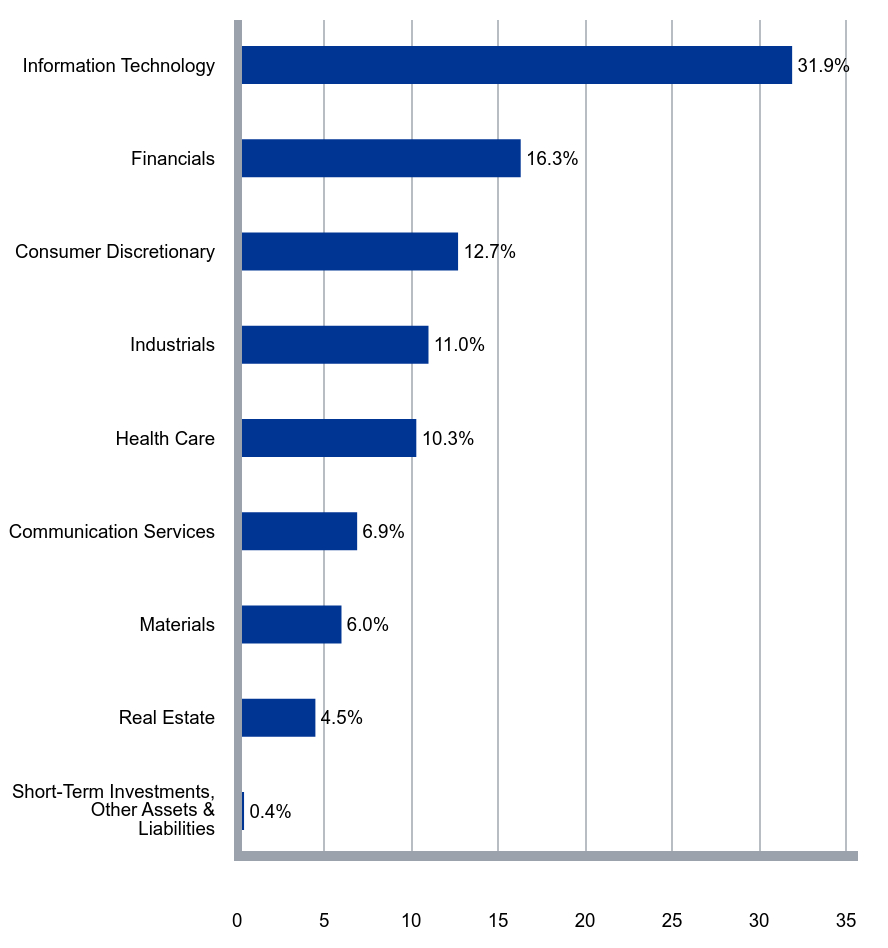
Parnassus Core Select ETF invests selectively in about 25 U.S. large-cap equity securities. The Fund pursues high quality companies with increasingly relevant products and services, durable competitive advantages, strong management teams and sustainable business practices that are likely to thrive in a healthy economy and be resilient in an economic downturn.
| Value | Value |
|---|
| Short-Term Investments, Other Assets & Liabilities | 0.4% |
| Real Estate | 4.5% |
| Materials | 6.0% |
| Communication Services | 6.9% |
| Health Care | 10.3% |
| Industrials | 11.0% |
| Consumer Discretionary | 12.7% |
| Financials | 16.3% |
| Information Technology | 31.9% |
Top Ten Corporate Holdings (%)*
| Microsoft Corp. | 8.8% |
| Amazon.com Inc. | 8.0% |
| Alphabet Inc., Class A | 6.9% |
| NVIDIA Corp. | 6.2% |
| Apple Inc. | 5.2% |
| Waste Management Inc. | 4.8% |
| Danaher Corp. | 4.6% |
| Realty Income Corp. | 4.5% |
| Deere & Co. | 4.4% |
| Intercontinental Exchange Inc. | 4.4% |
Parnassus Core Select ETF
Annual Shareholder Report - December 31, 2024
If you wish to view additional information about the Fund; including, but not limited to, financial statements or holdings, please call us or visit our website:
Phone: (855) 514-4443
Website: www.parnassus.com/literature-and-forms/fund-information
For purposes of categorizing securities for diversification requirements under the Investment Company Act, the Fund uses industry classifications that are more specific than those used for the chart.
Portfolio characteristics and holdings are subject to change periodically.
* The holding tables and charts above represent percentage based on Total Net Assets.
No material changes to the Fund in the last reporting year.
Change in or Disagreements with Accountants
There have been no changes to or disagreements with the accountants in the last reporting year.
© 2025 Parnassus Investments, LLC. All rights reserved. PARNASSUS, PARNASSUS INVESTMENTS, and PARNASSUS FUNDS are federally registered trademarks of Parnassus Investments, LLC.
If you wish to receive a copy of this document at a new address, contact (855) 514-4443.
Parnassus Value Select ETF
Annual Shareholder Report - December 31, 2024
Parnassus Value Select ETF (the "Fund") pursues strong long-term returns through a concentrated portfolio of stocks we believe are poised to rise but are temporarily out of favor relative to their history or peers.
This annual shareholder report contains important information about the Fund for the period of December 11, 2024 to December 31, 2024.
You can find additional information about the fund at www.parnassus.com. You can also request this information by contacting us at (855) 514-4443.
What was the Fund's cost for the year?
(based on hypothetical $10,000 investment)
| Fund name | Cost of a $10,000 investment | Cost paid as a % of a $10,000 investment |
|---|
| Parnassus Value Select ETF | $3 | 0.59% |
|---|
How did the fund perform?
Parnassus Value Select ETF returned -4.72% on a net asset value (“NAV”) basis and returned -4.60% on a market price basis, underperforming the Russell 1000 Value Index’s -3.82%, since its launch on December 11, 2024 through December 31, 2024.
The underperformance was primarily driven by the Information Technology sector, offset somewhat by the Materials sector. The most notable overweights included Health Care, Communication Services and Information Technology and the largest underweights were in the Financials, Energy and Consumer Staples sectors.
Our long-term investment philosophy remains steadfast. By opportunistically allocating capital to undervalued opportunities, we are positioned to capitalize on market volatility as it arises.
| Total Net Assets | $1,192,105 |
|---|
| # of Portfolio Holdings | 27 |
|---|
| Portfolio Turnover Rate | -% |
|---|
| Advisory Fees Paid | $341 |
|---|
What did the Fund invest in?
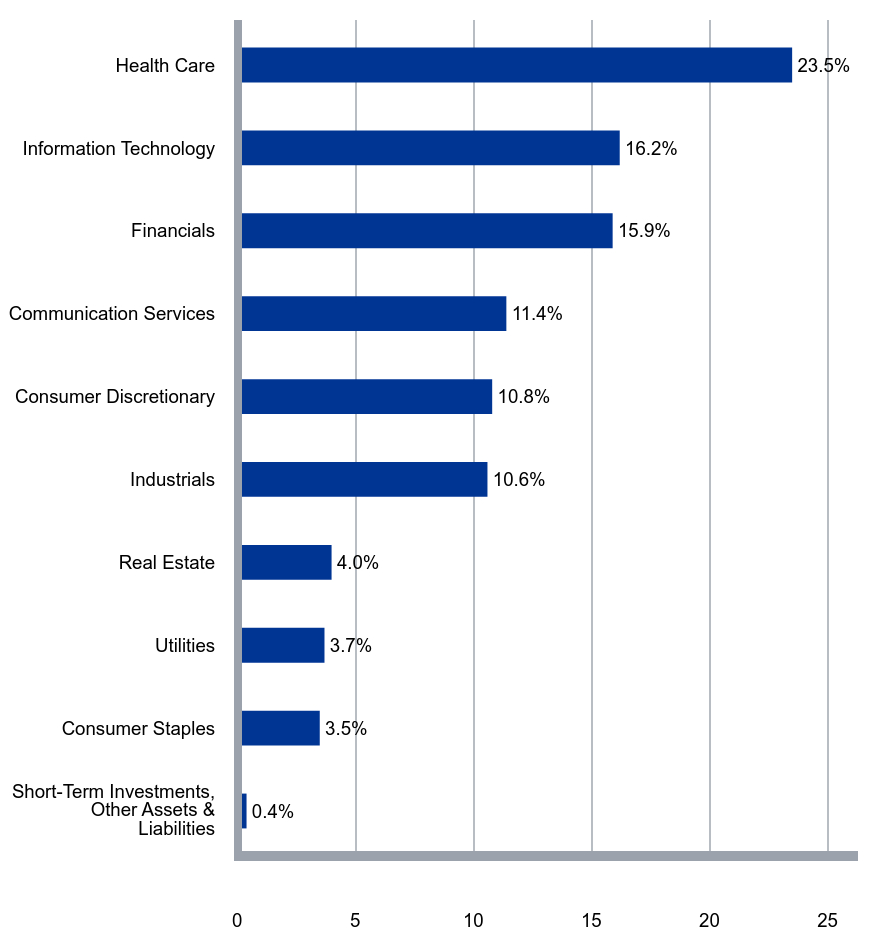
Parnassus Value Select ETF invests selectively in approximately 25 U.S. large-cap equity securities trading at a discount. The Fund pursues companies with increasingly relevant products and services, durable competitive advantages, strong management teams and sustainable business practices that are likely to thrive in a healthy economy and be resilient in an economic downturn.
| Value | Value |
|---|
| Short-Term Investments, Other Assets & Liabilities | 0.4% |
| Consumer Staples | 3.5% |
| Utilities | 3.7% |
| Real Estate | 4.0% |
| Industrials | 10.6% |
| Consumer Discretionary | 10.8% |
| Communication Services | 11.4% |
| Financials | 15.9% |
| Information Technology | 16.2% |
| Health Care | 23.5% |
Top Ten Corporate Holdings (%)*
| Pfizer Inc. | 4.9% |
| S&P Global Inc. | 4.6% |
| Verizon Communications Inc. | 4.5% |
| UnitedHealth Group Inc. | 4.2% |
| CBRE Group Inc., Class A | 4.0% |
| Bank of America Corp. | 4.0% |
| Visa Inc., Class A | 4.0% |
| Alphabet Inc., Class A | 4.0% |
| AstraZeneca plc, ADR | 3.8% |
| Deere & Co. | 3.7% |
Parnassus Value Select ETF
Annual Shareholder Report - December 31, 2024
If you wish to view additional information about the Fund; including, but not limited to, financial statements or holdings, please call us or visit our website:
Phone: (855) 514-4443
Website: www.parnassus.com/literature-and-forms/fund-information
For purposes of categorizing securities for diversification requirements under the Investment Company Act, the Fund uses industry classifications that are more specific than those used for the chart.
Portfolio characteristics and holdings are subject to change periodically.
* The holding tables and charts above represent percentage based on Total Net Assets.
No material changes to the Fund in the last reporting year.
Change in or Disagreements with Accountants
There have been no changes to or disagreements with the accountants in the last reporting year.
© 2025 Parnassus Investments, LLC. All rights reserved. PARNASSUS, PARNASSUS INVESTMENTS, and PARNASSUS FUNDS are federally registered trademarks of Parnassus Investments, LLC.
If you wish to receive a copy of this document at a new address, contact (855) 514-4443.
Item 2. Code of Ethics.
The registrant has adopted a code of ethics dated July 22, 2003 that applies to the registrant’s principal executive officer (President) and principal financial officer (Treasurer) for the fiscal year ending December 31, 2024. During the fiscal year ending December 31, 2024 there were no amendments to any provisions of this code of ethics.
Item 3. Audit Committee Financial Expert.
The Boards of Trustees of the Parnassus Funds and the Parnassus Income Funds determined that Kay Yun, Chair of the Boards’ Audit Committee, qualified as an “independent audit committee financial expert” as defined by Form N-CSR. The Trustees’ decision was based on Ms. Yun’s understanding of generally accepted accounting principles (GAAP); her ability to assess the general application of such principles in connection with the accounting for estimates, accruals, and reserves; her experience preparing, auditing, analyzing, or evaluating financial statements that present a breadth and level of complexity of accounting issues that are generally comparable to the breadth and complexity of issues that can reasonably be expected to be raised by the registrants’ financial statements; an understanding of internal controls and procedures for financial reporting; and understanding of audit committee functions.
Kay Yun is a Partner and the Chief Financial Officer of Health Evolution Partners, a healthcare-focused private equity firm in San Francisco. Before this, Kay was Co-Founder and Chief Executive Officer of YuniNetworks, a technology start-up, through its sale in 2001. Before YuniNetworks, she was an investment banker with Goldman Sachs for almost ten years. Kay serves as the Board President at the American Conservatory Theater and co-chair of the $18 million Next ACT capital campaign. She is also the fundraising chair for The Wharton MBA class of 1990. Kay received her B.S. in Business Administration from the Leeds School of Business at the University of Colorado, Boulder, in 1985 and an MBA from The Wharton School at the University of Pennsylvania in 1990.
Item 4. Principal Accountant Fees and Services.
(a) Audit Fees
The aggregate fees billed for professional services rendered by the principal accountant for the audit of the registrant’s annual financial statements or services that are normally provided by the accountant in connection with statutory and regulatory filings or engagements for the Parnassus Funds fiscal years ended December 31, 2023 and 2024 were $297,550 and $95,000 respectively and the Parnassus Income Funds fiscal year ended December 31, 2023 and 2024 were $234,950 and $78,000 respectively.
(b) Audit-Related Fees
There were no aggregate fees billed for assurance and related services rendered by the principal accountants that are reasonably related to the performance of the audit of the registrant’s financial statements and are not reported under paragraph (a) of this Item.
(c) Tax Fees
The aggregate fees billed for professional services rendered by the principal accountant for tax compliance, tax advice, and tax planning for the Parnassus Funds fiscal years ended December 31, 2023 and 2024 were $33,955 and $15,412 respectively and the Parnassus Income Funds fiscal years ended December 31, 2023 and 2024 were $26,365 and $7,706 respectively.
(d) All Other Fees
There were no fees billed in each of the last two fiscal years for products and services by the principal accountant, other than the services reported in paragraphs (a) through (c) of this Item.
(e)(1) The Audit Committee’s pre-approval policies and procedures are as follows: The audit committee is required to pre-approve all audit services and permitted non-audit services provided by the independent accountants for the Parnassus Funds, affiliated funds, and other service affiliates. Explicit pre-approval by the Audit Committee Chair shall be required for any individual non-audit engagement to be performed by the independent accountants with estimated fees of $10,000 or less and the Audit Committee Chair shall report such approval to the full audit committee at the next regularly scheduled meeting. Explicit pre-approval by the full Audit Committee shall be required for any individual non-audit engagement to be performed by the independent accountants with estimated fees in excess of $10,000. Officers of the Funds shall furnish the audit committee at least annually with a listing of all fees paid to the independent accountants including non-audit services performed. For certain non-audit services which are no more than five percent of the total fees paid by the Trust, such fees may be exempted from the required pre-approval process specified above subject to limitations and prompt disclosure of such services are identified, and in all cases approval is required prior to completion.
(e)(2) None.
(f) Not applicable.
(g) The aggregate non-audit fees billed by the registrant’s accountant for services rendered to the registrant, and rendered to the registrant’s investment adviser forth in 4(b) and (c) of this Item of $— and $— for the Parnassus Funds fiscal years ended December 31, 2023 and 2024, respectively and $— and $— for the Parnassus Income Funds fiscal years ended December 31, 2023 and 2024, respectively.
Item 5. Audit Committee of Listed Registrants.
(a) The Registrant is an issuer as defined in Section 10A-3 of the Securities Exchange Act of 1934 and has a separately-designated standing Audit Committee in accordance with Section 3(a)(58)(A) of such Act. All of the Board’s independent Trustees are members of the Audit Committee.
(b) Not applicable.
Item 6. Investments.
| (a) | Included as part of the Financial Statements filed under Item 7 of this Form. |
Item 7. Financial Statements and Financial Highlights for Open-End Management Investment Companies.
| (a) | The Registrant’s Financial Statements are attached herewith. |
| (b) | The Registrant’s Financial Highlights are included as part of the Financial Statements filed under Item 7(a) of this Form. |

Parnassus Funds Audited Financial Statements
December 31, 2024
Parnassus Core Equity FundSM
Investor Shares: PRBLX | Institutional Shares: PRILX
Parnassus Growth Equity FundSM
Investor Shares: PFGEX | Institutional Shares: PFPGX
Parnassus Value Equity FundSM
Investor Shares: PARWX | Institutional Shares: PFPWX
Parnassus Mid Cap FundSM
Investor Shares: PARMX | Institutional Shares: PFPMX
Parnassus Mid Cap Growth FundSM
Investor Shares: PARNX | Institutional Shares: PFPRX
Parnassus Fixed Income FundSM
Investor Shares: PRFIX | Institutional Shares: PFPLX

Table of Contents
3
| | | | |
| | |
 | | | | Audited Financial Statements • 2024 |
Parnassus Core Equity Fund
Portfolio of Investments as of December 31, 2024
| | | | | | | | |
| | |
| Equities | | Shares | | | Market
Value ($) | |
| | |
| Banks (2.1%) | | | | | | | | |
| Bank of America Corp. | | | 13,852,909 | | | | 608,835,351 | |
| | |
| | | | | | | | |
| | |
| Biotechnology (2.0%) | | | | | | | | |
| Vertex Pharmaceuticals Inc. q | | | 1,432,284 | | | | 576,780,767 | |
| | |
| | | | | | | | |
| | |
| Capital Markets (5.5%) | | | | | | | | |
| Intercontinental Exchange Inc. | | | 5,737,337 | | | | 854,920,586 | |
| S&P Global Inc. | | | 1,487,664 | | | | 740,901,302 | |
| | |
| | | | | | | | |
| | | | | | | 1,595,821,888 | |
| | |
| | | | | | | | |
| | |
| Chemicals (4.1%) | | | | | | | | |
| Linde plc | | | 1,702,041 | | | | 712,593,505 | |
| The Sherwin-Williams Co. | | | 1,399,058 | | | | 475,581,786 | |
| | |
| | | | | | | | |
| | | | | | | 1,188,175,291 | |
| | |
| | | | | | | | |
| | |
Commercial Services &
Supplies (3.4%) | | | | | | | | |
| Waste Management Inc. | | | 4,949,293 | | | | 998,717,835 | |
| | |
| | | | | | | | |
| | |
| Containers & Packaging (2.3%) | | | | | | | | |
| Ball Corp. W | | | 12,375,881 | | | | 682,282,320 | |
| | |
| | | | | | | | |
| | |
Diversified Financial
Services (6.1%) | | | | | | | | |
| Fiserv Inc. q | | | 3,836,644 | | | | 788,123,411 | |
| Mastercard Inc., Class A | | | 1,872,137 | | | | 985,811,180 | |
| | |
| | | | | | | | |
| | | | | | | 1,773,934,591 | |
| | |
| | | | | | | | |
| | |
| Diversified Telecommunication Services (1.4%) | | | | | | | | |
| Verizon Communications Inc. | | | 10,313,698 | | | | 412,444,783 | |
| | |
| | | | | | | | |
| | |
| Equity Real Estate Investment Trusts (3.2%) | | | | | | | | |
| Realty Income Corp. | | | 17,162,768 | | | | 916,663,439 | |
| | |
| | | | | | | | |
| | |
| Food & Staples Retailing (1.8%) | | | | | | | | |
| Costco Wholesale Corp. | | | 559,456 | | | | 512,612,749 | |
| | |
| | | | | | | | |
| | |
| Health Care Equipment & Supplies (1.9%) | | | | | | | | |
| Stryker Corp. | | | 1,552,584 | | | | 559,007,869 | |
| | |
| | | | | | | | |
| | |
Health Care Providers &
Services (1.9%) | | | | | | | | |
| The Cigna Group | | | 2,028,243 | | | | 560,079,022 | |
| | |
| | | | | | | | |
| | |
Hotels, Restaurants &
Leisure (1.7%) | | | | | | | | |
| Marriott International Inc., Class A | | | 1,737,566 | | | | 484,676,660 | |
| | |
| | | | | | | | |
| | |
| Household Durables (1.1%) | | | | | | | | |
| D.R. Horton Inc. | | | 2,179,270 | | | | 304,705,531 | |
| | |
| | | | | | | | |
| | |
| Household Products (1.6%) | | | | | | | | |
| The Procter & Gamble Co. | | | 2,763,159 | | | | 463,243,606 | |
| | |
| | | | | | | | |
| | | | | | | | |
| | |
| Equities | | | Shares | | |
| Market
Value ($) |
|
| | |
| Insurance (2.1%) | | | | | | | | |
| Marsh & McLennan Co., Inc. | | | 2,815,449 | | | | 598,029,522 | |
| | |
| | | | | | | | |
| | |
Interactive Media &
Services (5.0%) | | | | | | | | |
| Alphabet Inc., Class A | | | 7,670,958 | | | | 1,452,112,349 | |
| | |
| | | | | | | | |
| | |
Life Sciences Tools &
Services (3.9%) | | | | | | | | |
| Danaher Corp. | | | 2,451,759 | | | | 562,801,278 | |
| Thermo Fisher Scientific Inc. | | | 1,112,488 | | | | 578,749,632 | |
| | |
| | | | | | | | |
| | | | | | | 1,141,550,910 | |
| | |
| | | | | | | | |
| | |
| Machinery (3.6%) | | | | | | | | |
| Deere & Co. | | | 2,443,418 | | | | 1,035,276,207 | |
| | |
| | | | | | | | |
| | |
| Multiline Retail (6.3%) | | | | | | | | |
| Amazon.com Inc. q | | | 8,400,746 | | | | 1,843,039,665 | |
| | |
| | | | | | | | |
| | |
| Pharmaceuticals (2.0%) | | | | | | | | |
| Eli Lilly & Co. | | | 735,953 | | | | 568,155,716 | |
| | |
| | | | | | | | |
| | |
| Professional Services (2.7%) | | | | | | | | |
| Equifax Inc. | | | 1,419,155 | | | | 361,671,652 | |
| Verisk Analytics Inc., Class A | | | 1,516,962 | | | | 417,816,844 | |
| | |
| | | | | | | | |
| | | | | | | 779,488,496 | |
| | |
| | | | | | | | |
| | |
Semiconductors & Semiconductor
Equipment (11.3%) | | | | | | | | |
| Applied Materials Inc. | | | 2,535,526 | | | | 412,352,593 | |
| Broadcom Inc. | | | 3,714,948 | | | | 861,273,544 | |
| KLA Corp. | | | 461,933 | | | | 291,073,222 | |
| NVIDIA Corp. | | | 12,754,323 | | | | 1,712,778,036 | |
| | |
| | | | | | | | |
| | | | | | | 3,277,477,395 | |
| | |
| | | | | | | | |
| | |
| Software (15.6%) | | | | | | | | |
| Intuit Inc. | | | 879,846 | | | | 552,983,211 | |
| Microsoft Corp. | | | 4,475,508 | | | | 1,886,426,622 | |
| Oracle Corp. | | | 2,288,019 | | | | 381,275,486 | |
| Salesforce Inc. | | | 2,541,867 | | | | 849,822,394 | |
| Synopsys Inc. q | | | 931,328 | | | | 452,029,358 | |
| Workday Inc., Class A q | | | 1,633,830 | | | | 421,577,155 | |
| | |
| | | | | | | | |
| | | | | | | 4,544,114,226 | |
| | |
| | | | | | | | |
| | |
| Specialty Retail (2.4%) | | | | | | | | |
| AutoZone Inc. q | | | 219,779 | | | | 703,732,358 | |
| | |
| | | | | | | | |
| | |
| Technology Hardware, Storage & Peripherals (2.7%) | | | | | | | | |
| Apple Inc. | | | 3,094,973 | | | | 775,043,139 | |
| | |
| | | | | | | | |
| | |
| Trading Companies & Distributors (1.5%) | | | | | | | | |
| Ferguson Enterprises Inc. | | | 2,491,778 | | | | 432,497,907 | |
| | |
| | | | | | | | |
| |
Total investment in equities (99.2%)
(cost $20,673,867,104) | | | | 28,788,499,592 | |
| | |
| | | | | | | | |
4
| | | | |
| | |
| Audited Financial Statements • 2024 | | | | |
Parnassus Core Equity Fund
Portfolio of Investments as of December 31, 2024 (continued)
| | | | | | | | | | | | | | | | |
| | | | |
| Short-Term Securities | | Interest
Rate | | | Maturity
Date | | | Principal
Amount ($) | | | Market
Value ($) | |
| | |
| Certificates of Deposit (0.0%) a | | | | | | | | | |
| Citizens Trust Bank | | | 1.00 | % | | | 01/14/2025 | | | | 250,000 | | | | 249,645 | |
| Community Vision Capital & Consulting | | | 0.25 | % | | | 01/31/2025 | | | | 250,000 | | | | 248,770 | |
| Self-Help Federal Credit Union | | | 4.60 | % | | | 02/17/2025 | | | | 1,000,000 | | | | 994,863 | |
| | | | |
| | | | | | | | | | | | | | | | |
| | | | | | | | | | | | | | | 1,493,278 | |
| | | | |
| | | | | | | | | | | | | | | | |
| | | | |
| Certificates of Deposit Account Registry Service (0.0%) a | | | | | | | | | | | | | | | | |
CDARS agreement with Beneficial State Bank,
dated 03/14/2024
Participating depository institutions:
Burke & Herbert Bank & Trust Company, par 143,000;
First Business Bank, par 235,500;
Freedom Financial Bank, par 235,500;
Frontier Bank, par 235,500;
Old National Bank, par 150,500;
River City Bank, par 235,500;
Signature Bank National Association, par 235,500;
Solera National Bank, par 235,500;
South Ottumwa Savings Bank, par 235,500;
The People Bank of Georgia, par 58,000;
(cost $1,984,396) | | | 4.18 | % | | | 03/13/2025 | | | | 2,000,000 | | | | 1,984,396 | |
| | | | |
| | | | | | | | | | | | | | | | |
| | | | |
| Community Development Loans (0.0%) a | | | | | | | | | | | | | | | | |
| Root Capital Inc. | | | 1.00 | % | | | 02/01/2025 | | | | 200,000 | | | | 198,984 | |
| | | | |
| | | | | | | | | | | | | | | | |
| | | | |
| Time Deposits (0.9%) | | | | | | | | | | | | | | | | |
| Citibank, New York | | | 3.68 | % | | | 01/02/2025 | | | | 200,000,000 | | | | 200,000,000 | |
| JPMorgan Chase, New York | | | 3.68 | % | | | 01/02/2025 | | | | 46,665,756 | | | | 46,665,756 | |
| | | | |
| | | | | | | | | | | | | | | | |
| | | | | | | | | | | | | | | 246,665,756 | |
| | | | |
| | | | | | | | | | | | | | | | |
| | | | |
Total short-term securities (0.9%)
(cost $250,342,414) | | | | | | | | | | | | | | | 250,342,414 | |
| | | | |
| | | | | | | | | | | | | | | | |
| | | | |
Total securities (100.1%)
(cost $20,924,209,518) | | | | | | | | | | | | | | | 29,038,842,006 | |
| | | | |
| | | | | | | | | | | | | | | | |
| | | | |
| | | | | | | | | | | | | | | | |
| | | | |
| Other assets and liabilities (-0.1%) | | | | | | | | | | | | | | | (22,417,532 | ) |
| | | | |
| Total net assets (100.0%) | | | | | | | | | | | | | | | 29,016,424,474 | |
| | | | |
| | | | | | | | | | | | | | | | |
q This security is non-income producing. | |
W Fund ownership consists of 5% or more of the shares outstanding of the Affiliated Issuer, as defined under the Investment Securities Act of 1940. | |
a Market value adjustments have been applied to these securities to reflect potential early withdrawal. Such securities have been classified as level 3. | |
| | | | |
plc Public Limited Company | | | | | | | | | | | | | | | | |
5
| | | | |
| | |
| | | | Audited Financial Statements • 2024 |
Parnassus Growth Equity Fund
Portfolio of Investments as of December 31, 2024
| | | | | | | | |
| | |
| Equities | | Shares | | | Market
Value ($) | |
| | |
| Biotechnology (4.6%) | | | | | | | | |
| Exact Sciences Corp. q | | | 9,751 | | | | 547,909 | |
| Natera Inc. q | | | 9,524 | | | | 1,507,649 | |
| Vertex Pharmaceuticals Inc. q | | | 2,089 | | | | 841,240 | |
| | |
| | | | | | | | |
| | | | | | | 2,896,798 | |
| | |
| | | | | | | | |
| | |
| Capital Markets (5.1%) | | | | | | | | |
| Ares Management Corp., Class A | | | 7,113 | | | | 1,259,214 | |
| MSCI Inc., Class A | | | 1,345 | | | | 807,013 | |
| S&P Global Inc. | | | 2,343 | | | | 1,166,884 | |
| | |
| | | | | | | | |
| | | | | | | 3,233,111 | |
| | |
| | | | | | | | |
| | |
| Chemicals (2.8%) | | | | | | | | |
| Linde plc | | | 1,866 | | | | 781,238 | |
| The Sherwin-Williams Co. | | | 2,998 | | | | 1,019,110 | |
| | |
| | | | | | | | |
| | | | | | | 1,800,348 | |
| | |
| | | | | | | | |
| | |
| Diversified Financial Services (6.0%) | | | | | | | | |
| Adyen N.V., ADR q | | | 63,942 | | | | 937,390 | |
| Visa Inc., Class A | | | 9,163 | | | | 2,895,875 | |
| | |
| | | | | | | | |
| | | | | | | 3,833,265 | |
| | |
| | | | | | | | |
| | |
| Entertainment (1.6%) | | | | | | | | |
| Netflix Inc. q | | | 1,138 | | | | 1,014,322 | |
| | |
| | | | | | | | |
| | |
Equity Real Estate Investment
Trusts (1.2%) | | | | | | | | |
| CoStar Group Inc. q | | | 11,061 | | | | 791,857 | |
| | |
| | | | | | | | |
| | |
| Food & Staples Retailing (2.0%) | | | | | | | | |
| Costco Wholesale Corp. | | | 1,359 | | | | 1,245,211 | |
| | |
| | | | | | | | |
| | |
Health Care Equipment &
Supplies (3.7%) | | | | | | | | |
| Boston Scientific Corp. q | | | 13,697 | | | | 1,223,416 | |
| Intuitive Surgical Inc. q | | | 2,137 | | | | 1,115,429 | |
| | |
| | | | | | | | |
| | | | | | | 2,338,845 | |
| | |
| | | | | | | | |
| | |
| Hotels, Restaurants & Leisure (4.1%) | | | | | | | | |
| Airbnb Inc., Class A q | | | 6,173 | | | | 811,194 | |
| Chipotle Mexican Grill Inc., Class A q | | | 17,585 | | | | 1,060,375 | |
| DoorDash Inc., Class A q | | | 4,385 | | | | 735,584 | |
| | |
| | | | | | | | |
| | | | | | | 2,607,153 | |
| | |
| | | | | | | | |
| | |
| Interactive Media & Services (6.4%) | | | | | | | | |
| Alphabet Inc., Class A | | | 21,610 | | | | 4,090,773 | |
| | |
| | | | | | | | |
| | |
| IT Services (1.3%) | | | | | | | | |
| Cloudflare Inc., Class A q | | | 7,413 | | | | 798,232 | |
| | |
| | | | | | | | |
| | |
| Life Sciences Tools & Services (1.6%) | | | | | | | | |
| Thermo Fisher Scientific Inc. | | | 1,946 | | | | 1,012,368 | |
| | |
| | | | | | | | |
| | |
| Machinery (1.5%) | | | | | | | | |
| Deere & Co. | | | 2,312 | | | | 979,594 | |
| | |
| | | | | | | | |
| | | | | | | | |
| | |
| Equities | | | Shares | | |
| Market
Value ($) |
|
| | |
| Multiline Retail (6.1%) | | | | | | | | |
| Amazon.com Inc. q | | | 14,004 | | | | 3,072,338 | |
| MercadoLibre Inc. q | | | 460 | | | | 782,202 | |
| | |
| | | | | | | | |
| | | | | | | 3,854,540 | |
| | |
| | | | | | | | |
| | |
| Pharmaceuticals (2.9%) | | | | | | | | |
| Eli Lilly & Co. | | | 2,408 | | | | 1,858,976 | |
| | |
| | | | | | | | |
| | |
| Professional Services (1.1%) | | | | | | | | |
| Equifax Inc. | | | 2,854 | | | | 727,342 | |
| | |
| | | | | | | | |
| | |
| Semiconductors & Semiconductor Equipment (18.7%) | | | | | | | | |
| Advanced Micro Devices Inc. q | | | 7,957 | | | | 961,126 | |
| Applied Materials Inc. | | | 5,525 | | | | 898,531 | |
| Broadcom Inc. | | | 13,171 | | | | 3,053,565 | |
| NVIDIA Corp. | | | 42,309 | | | | 5,681,676 | |
| Taiwan Semiconductor Manufacturing Co. Ltd., ADR | | | 6,585 | | | | 1,300,472 | |
| | |
| | | | | | | | |
| | | | | | | 11,895,370 | |
| | |
| | | | | | | | |
| | |
| Software (22.4%) | | | | | | | | |
| Adobe Inc. q | | | 1,944 | | | | 864,458 | |
| Atlassian Corp., Class A q | | | 3,273 | | | | 796,583 | |
| Datadog Inc., Class A q | | | 4,791 | | | | 684,586 | |
| Intuit Inc. | | | 1,795 | | | | 1,128,157 | |
| Microsoft Corp. | | | 13,602 | | | | 5,733,243 | |
| Procore Technologies Inc. q | | | 12,606 | | | | 944,568 | |
| PTC Inc. q | | | 4,990 | | | | 917,511 | |
| Salesforce Inc. | | | 6,140 | | | | 2,052,786 | |
| Workday Inc., Class A q | | | 4,650 | | | | 1,199,839 | |
| | |
| | | | | | | | |
| | | | | | | 14,321,731 | |
| | |
| | | | | | | | |
| | |
| Technology Hardware, Storage & Peripherals (4.8%) | | | | | | | | |
| Apple Inc. | | | 12,232 | | | | 3,063,137 | |
| | |
| | | | | | | | |
| | |
Trading Companies &
Distributors (1.2%) | | | | | | | | |
| Ferguson Enterprises Inc. | | | 4,291 | | | | 744,789 | |
| | |
| | | | | | | | |
| |
Total investment in equities (99.1%)
(cost $49,646,353) | | | | 63,107,762 | |
| | |
| | | | | | | | |
6
| | | | |
| | |
| Audited Financial Statements • 2024 | | | | |
Parnassus Growth Equity Fund
Portfolio of Investments as of December 31, 2024 (continued)
| | | | | | | | | | | | | | | | |
| | | | |
| Short-Term Securities | | Interest
Rate | | | Maturity
Date | | | Principal
Amount ($) | | | Market
Value ($) | |
| | | | |
| Time Deposits (0.6%) | | | | | | | | | | | | | | | | |
| JPMorgan Chase, New York | | | 3.68 | % | | | 01/02/2025 | | | | 374,787 | | | | 374,787 | |
| | | | |
| | | | | | | | | | | | | | | | |
| | | | |
Total short-term securities (0.6%)
(cost $374,787) | | | | | | | | | | | | | | | 374,787 | |
| | | | |
| | | | | | | | | | | | | | | | |
| | | | |
Total securities (99.7%)
(cost $50,021,140) | | | | | | | | | | | | | | | 63,482,549 | |
| | | | |
| | | | | | | | | | | | | | | | |
| | | | |
| Other assets and liabilities (0.3%) | | | | | | | | | | | | | | | 220,032 | |
| | | | |
| | | | | | | | | | | | | | | | |
| | | | |
| Total net assets (100.0%) | | | | | | | | | | | | | | | 63,702,581 | |
| | | | |
| | | | | | | | | | | | | | | | |
q This security is non-income producing. | | | | | | | | | | | | | | | | |
| | | | |
plc Public Limited Company | | | | | | | | | | | | | | | | |
N.V. Naamloze Vennootschap | | | | | | | | | | | | | | | | |
ADR American Depositary Receipt | | | | | | | | | | | | | | | | |
7
| | | | |
| | |
| | | | Audited Financial Statements • 2024 |
Parnassus Value Equity Fund
Portfolio of Investments as of December 31, 2024
| | | | | | | | |
| | |
| Equities | | Shares | | | Market
Value ($) | |
| | |
| Air Freight & Logistics (1.8%) | | | | | | | | |
| FedEx Corp. | | | 301,210 | | | | 84,739,409 | |
| | |
| | | | | | | | |
| | |
| Banks (5.8%) | | | | | | | | |
| Bank of America Corp. | | | 3,615,546 | | | | 158,903,247 | |
| Citigroup Inc. | | | 1,725,687 | | | | 121,471,108 | |
| | |
| | | | | | | | |
| | | | | | | 280,374,355 | |
| | |
| | | | | | | | |
| | |
| Biotechnology (2.2%) | | | | | | | | |
| Gilead Sciences Inc. | | | 1,151,874 | | | | 106,398,601 | |
| | |
| | | | | | | | |
| | |
| Capital Markets (10.4%) | | | | | | | | |
| CME Group Inc., Class A | | | 366,827 | | | | 85,188,234 | |
| S&P Global Inc. | | | 339,991 | | | | 169,325,718 | |
| The Bank of New York Mellon Corp. | | | 1,605,471 | | | | 123,348,337 | |
| The Charles Schwab Corp. | | | 1,694,634 | | | | 125,419,862 | |
| | |
| | | | | | | | |
| | | | | | | 503,282,151 | |
| | |
| | | | | | | | |
| | |
| Containers & Packaging (2.6%) | | | | | | | | |
| Ball Corp. W | | | 2,308,169 | | | | 127,249,357 | |
| | |
| | | | | | | | |
| | |
| Diversified Financial Services (7.1%) | | | | | | | | |
| Global Payments Inc. | | | 1,098,035 | | | | 123,045,802 | |
| Mastercard Inc., Class A | | | 266,875 | | | | 140,528,369 | |
| Visa Inc., Class A | | | 250,085 | | | | 79,036,863 | |
| | |
| | | | | | | | |
| | | | | | | 342,611,034 | |
| | |
| | | | | | | | |
| | |
| Diversified Telecommunication Services (2.9%) | | | | | | | | |
| Verizon Communications Inc. | | | 3,533,571 | | | | 141,307,504 | |
| | |
| | | | | | | | |
| | |
Equity Real Estate Investment
Trusts (5.7%) | | | | | | | | |
| CBRE Group Inc., Class A q | | | 1,156,075 | | | | 151,781,087 | |
| Simon Property Group Inc. | | | 718,854 | | | | 123,793,847 | |
| | |
| | | | | | | | |
| | | | | | | 275,574,934 | |
| | |
| | | | | | | | |
| | |
| Food & Staples Retailing (3.2%) | | | | | | | | |
| Sysco Corp. | | | 2,040,678 | | | | 156,030,240 | |
| | |
| | | | | | | | |
| | |
Health Care Equipment &
Supplies (2.8%) | | | | | | | | |
| Align Technology Inc. q | | | 330,007 | | | | 68,809,760 | |
| Baxter International Inc. | | | 2,229,221 | | | | 65,004,084 | |
| | |
| | | | | | | | |
| | | | | | | 133,813,844 | |
| | |
| | | | | | | | |
| | |
Health Care Providers &
Services (3.6%) | | | | | | | | |
| The Cigna Group | | | 237,205 | | | | 65,501,789 | |
| UnitedHealth Group Inc. | | | 211,079 | | | | 106,776,423 | |
| | |
| | | | | | | | |
| | | | | | | 172,278,212 | |
| | |
| | | | | | | | |
| | |
| Hotels, Restaurants & Leisure (1.8%) | | | | | | | | |
| Airbnb Inc., Class A q | | | 648,524 | | | | 85,222,539 | |
| | |
| | | | | | | | |
| | |
| Household Durables (2.5%) | | | | | | | | |
| D.R. Horton Inc. | | | 864,230 | | | | 120,836,639 | |
| | |
| | | | | | | | |
| | |
| Independent Power & Renewable Electricity Producers (1.5%) | | | | | | | | |
| Brookfield Renewable Corp. q,l | | | 2,667,638 | | | | 73,786,867 | |
| | |
| | | | | | | | |
| | | | | | | | |
| | |
| Equities | | | Shares | | |
| Market
Value ($) |
|
| | |
| Insurance (2.2%) | | | | | | | | |
| The Progressive Corp. | | | 449,242 | | | | 107,642,876 | |
| | |
| | | | | | | | |
| | |
Interactive Media &
Services (2.8%) | | | | | | | | |
| Alphabet Inc., Class A | | | 711,028 | | | | 134,597,600 | |
| | |
| | | | | | | | |
| | |
Life Sciences Tools &
Services (4.8%) | | | | | | | | |
| Agilent Technologies Inc. | | | 944,194 | | | | 126,843,022 | |
Bio-Rad Laboratories Inc.,
Class A q | | | 310,732 | | | | 102,078,569 | |
| | |
| | | | | | | | |
| | | | | | | 228,921,591 | |
| | |
| | | | | | | | |
| | |
| Machinery (5.8%) | | | | | | | | |
| Cummins Inc. | | | 380,003 | | | | 132,469,046 | |
| Deere & Co. | | | 348,570 | | | | 147,689,109 | |
| | |
| | | | | | | | |
| | | | | | | 280,158,155 | |
| | |
| | | | | | | | |
| | |
| Media (1.5%) | | | | | | | | |
| Comcast Corp., Class A | | | 1,920,800 | | | | 72,087,624 | |
| | |
| | | | | | | | |
| | |
| Multiline Retail (2.3%) | | | | | | | | |
| Amazon.com Inc. q | | | 503,495 | | | | 110,461,768 | |
| | |
| | | | | | | | |
| | |
| Pharmaceuticals (5.1%) | | | | | | | | |
| AstraZeneca plc, ADR | | | 1,178,323 | | | | 77,203,723 | |
| Novo Nordisk, ADR | | | 593,722 | | | | 51,071,966 | |
| Pfizer Inc. | | | 4,390,705 | | | | 116,485,404 | |
| | |
| | | | | | | | |
| | | | | | | 244,761,093 | |
| | |
| | | | | | | | |
| | |
| Road & Rail (2.3%) | | | | | | | | |
| Union Pacific Corp. | | | 482,958 | | | | 110,133,742 | |
| | |
| | | | | | | | |
| | |
Semiconductors & Semiconductor
Equipment (8.8%) | | | | | | | | |
| Applied Materials Inc. | | | 371,973 | | | | 60,493,969 | |
| Broadcom Inc. | | | 589,550 | | | | 136,681,272 | |
| Intel Corp. | | | 2,207,479 | | | | 44,259,954 | |
| Micron Technology Inc. | | | 1,057,266 | | | | 88,979,507 | |
| Taiwan Semiconductor Manufacturing Co. Ltd., ADR | | | 478,823 | | | | 94,562,754 | |
| | |
| | | | | | | | |
| | | | | | | 424,977,456 | |
| | |
| | | | | | | | |
| | |
| Software (6.2%) | | | | | | | | |
| Microsoft Corp. | | | 288,746 | | | | 121,706,439 | |
| NICE Ltd., ADR q,l | | | 517,039 | | | | 87,813,904 | |
| Oracle Corp. | | | 537,967 | | | | 89,646,821 | |
| | |
| | | | | | | | |
| | | | | | | 299,167,164 | |
| | |
| | | | | | | | |
| | |
| Specialty Retail (2.1%) | | | | | | | | |
| Ross Stores Inc. | | | 676,514 | | | | 102,336,273 | |
| | |
| | | | | | | | |
| | |
| Technology Hardware, Storage & Peripherals (1.6%) | | | | | | | | |
| Western Digital Corp. q | | | 1,271,549 | | | | 75,822,467 | |
| | |
| | | | | | | | |
| |
Total investment in equities (99.4%)
(cost $3,783,000,450) | | | | 4,794,573,495 | |
| | |
| | | | | | | | |
8
| | | | |
| | |
| Audited Financial Statements • 2024 | | | | |
Parnassus Value Equity Fund
Portfolio of Investments as of December 31, 2024 (continued)
| | | | | | | | | | | | | | | | |
| | | | |
| Short-Term Securities | | Interest
Rate | | | Maturity
Date | | | Principal
Amount ($) | | | Market
Value ($) | |
| | |
| Certificates of Deposit (0.0%) a | | | | | | | | | |
| Community Vision Capital & Consulting | | | 0.25 | % | | | 03/31/2025 | | | | 250,000 | | | | 246,343 | |
| Self-Help Federal Credit Union | | | 4.60 | % | | | 02/25/2025 | | | | 250,000 | | | | 248,501 | |
| | | | |
| | | | | | | | | | | | | | | | |
| | | | | | | | | | | | | | | 494,844 | |
| | | | |
| | | | | | | | | | | | | | | | |
| | | |
| Certificates of Deposit Account Registry Service (0.0%) a | | | | | | | | | | | | | |
CDARS agreement with Beneficial State Bank,
dated 03/14/2024
Participating depository institutions:
First Business Bank, par 230,073;
Frontier Bank, par 34,427;
Solera National Bank, par 235,500;
(cost $496,099) | | | 4.18 | % | | | 03/13/2025 | | | | 500,000 | | | | 496,099 | |
| | | | |
| | | | | | | | | | | | | | | | |
| | | | |
| Community Development Loans (0.0%) a | | | | | | | | | | | | | | | | |
| Root Capital Inc. | | | 1.00 | % | | | 02/01/2025 | | | | 100,000 | | | | 99,492 | |
| | | | |
| | | | | | | | | | | | | | | | |
| | | | |
| Securities Purchased with Cash Collateral from Securities Lending | | | | | | | | | | | | | | | | |
| | | | |
| Registered Investment Companies (0.4%) | | | | | | | | | | | | | | | | |
| Invesco Aim Government & Agency Portfolio Short-Term Investments Trust, Institutional Class | | | 4.36 | % | | | | | | | | | | | 18,925,463 | |
| | | | |
| | | | | | | | | | | | | | | | |
| | | | |
| Time Deposits (0.6%) | | | | | | | | | | | | | | | | |
| JPMorgan Chase, New York | | | 3.68 | % | | | 01/02/2025 | | | | 31,161,101 | | | | 31,161,101 | |
| | | | |
| | | | | | | | | | | | | | | | |
| | | | |
Total short-term securities (1.0%)
(cost $51,176,999) | | | | | | | | | | | | | | | 51,176,999 | |
| | | | |
| | | | | | | | | | | | | | | | |
| | | | |
Total securities (100.4%)
(cost $3,834,177,449) | | | | | | | | | | | | | | | 4,845,750,494 | |
| | | | |
| | | | | | | | | | | | | | | | |
| | | | |
| Payable upon return of securities loaned (-0.4%) | | | | | | | | | | | | | | | (18,925,463 | ) |
| | | | |
| | | | | | | | | | | | | | | | |
| | | | |
| Other assets and liabilities (0.0%) | | | | | | | | | | | | | | | (1,634,105 | ) |
| | | | |
| | | | | | | | | | | | | | | | |
| | | | |
| Total net assets (100.0%) | | | | | | | | | | | | | | | 4,825,190,926 | |
| | | | |
| | | | | | | | | | | | | | | | |
W Fund ownership consists of 5% or more of the shares outstanding of the Affiliated Issuer, as defined under the Investment Securities Act of 1940. | |
q This security is non-income producing. | |
l This security, or partial position of this security, was on loan at December 31, 2024. The total value of the securities on loan at December 31, 2024 was $18,482,852. | |
a Market value adjustments have been applied to these securities to reflect potential early withdrawal. Such securities have been classified as level 3. | |
| | | | |
plc Public Limited Company | | | | | | | | | | | | | | | | |
ADR American Depositary Receipt | | | | | | | | | | | | | | | | |
9
| | | | |
| | |
| | | | Audited Financial Statements • 2024 |
Parnassus Mid Cap Fund
Portfolio of Investments as of December 31, 2024
| | | | | | | | |
| | |
| Equities | | Shares | | | Market
Value ($) | |
| | |
| Banks (3.3%) | | | | | | | | |
| Truist Financial Corp. | | | 2,141,993 | | | | 92,919,656 | |
| | |
| | | | | | | | |
| | |
| Capital Markets (6.9%) | | | | | | | | |
| Cboe Global Markets Inc. | | | 507,032 | | | | 99,074,053 | |
| The Bank of New York Mellon Corp. | | | 1,272,449 | | | | 97,762,257 | |
| | |
| | | | | | | | |
| | | | | | | 196,836,310 | |
| | |
| | | | | | | | |
| | |
| Chemicals (1.9%) | | | | | | | | |
| The Sherwin-Williams Co. | | | 156,283 | | | | 53,125,280 | |
| | |
| | | | | | | | |
| | |
Commercial Services &
Supplies (3.1%) | | | | | | | | |
| Republic Services Inc. | | | 430,341 | | | | 86,576,002 | |
| | |
| | | | | | | | |
| | |
| Containers & Packaging (1.6%) | | | | | | | | |
| Ball Corp. W | | | 837,069 | | | | 46,147,614 | |
| | |
| | | | | | | | |
| | |
| Distributors (2.5%) | | | | | | | | |
| Pool Corp. | | | 207,874 | | | | 70,872,561 | |
| | |
| | | | | | | | |
| | |
| Diversified Financial Services (4.0%) | | | | | | | | |
| Fidelity National Information Services | | | 1,409,635 | | | | 113,856,219 | |
| | |
| | | | | | | | |
| | |
Equity Real Estate Investment
Trusts (5.5%) | | | | | | | | |
| CBRE Group Inc., Class A q | | | 807,385 | | | | 106,001,577 | |
| Realty Income Corp. | | | 938,245 | | | | 50,111,665 | |
| | |
| | | | | | | | |
| | | | | | | 156,113,242 | |
| | |
| | | | | | | | |
| | |
Health Care Equipment &
Supplies (2.7%) | | | | | | | | |
| Hologic Inc. q | | | 1,063,421 | | | | 76,662,020 | |
| | |
| | | | | | | | |
| | |
| Hotels, Restaurants & Leisure (1.4%) | | | | | | | | |
| Hilton Worldwide Holdings Inc. | | | 162,648 | | | | 40,200,080 | |
| | |
| | | | | | | | |
| | |
| Household Durables (2.3%) | | | | | | | | |
| D.R. Horton Inc. | | | 469,471 | | | | 65,641,435 | |
| | |
| | | | | | | | |
| | |
| Independent Power & Renewable Electricity Producers (1.2%) | | | | | | | | |
| Brookfield Renewable Corp. l | | | 1,241,258 | | | | 34,333,196 | |
| | |
| | | | | | | | |
| | |
| Insurance (5.2%) | | | | | | | | |
| The Allstate Corp. | | | 446,841 | | | | 86,146,476 | |
| W R Berkley Corp. | | | 1,060,467 | | | | 62,058,529 | |
| | |
| | | | | | | | |
| | | | | | | 148,205,005 | |
| | |
| | | | | | | | |
| | |
Life Sciences Tools &
Services (3.8%) | | | | | | | | |
| IQVIA Holdings Inc. q | | | 334,178 | | | | 65,669,319 | |
| Repligen Corp. q | | | 297,730 | | | | 42,855,256 | |
| | |
| | | | | | | | |
| | | | | | | 108,524,575 | |
| | |
| | | | | | | | |
| | | | | | | | |
| | |
| Equities | | | Shares | | |
| Market
Value ($) |
|
| | |
| Machinery (7.3%) | | | | | | | | |
| Otis Worldwide Corp. | | | 771,116 | | | | 71,413,053 | |
| Pentair plc | | | 516,798 | | | | 52,010,551 | |
| Xylem Inc. | | | 735,489 | | | | 85,331,434 | |
| | |
| | | | | | | | |
| | | | | | | 208,755,038 | |
| | |
| | | | | | | | |
| | |
| Media (2.7%) | | | | | | | | |
| The Trade Desk, Inc., Class A q | | | 659,198 | | | | 77,475,541 | |
| | |
| | | | | | | | |
| | |
| Professional Services (6.6%) | | | | | | | | |
| Broadridge Financial Solutions Inc. | | | 349,510 | | | | 79,020,716 | |
| TransUnion | | | 1,167,746 | | | | 108,261,732 | |
| | |
| | | | | | | | |
| | | | | | | 187,282,448 | |
| | |
| | | | | | | | |
| | |
| Road & Rail (5.5%) | | | | | | | | |
| J.B. Hunt Transport Services Inc. | | | 595,060 | | | | 101,552,940 | |
| Old Dominion Freight Line Inc. | | | 305,089 | | | | 53,817,700 | |
| | |
| | | | | | | | |
| | | | | | | 155,370,640 | |
| | |
| | | | | | | | |
| | |
Semiconductors & Semiconductor
Equipment (4.6%) | | | | | | | | |
| KLA Corp. | | | 112,235 | | | | 70,721,518 | |
| Lam Research Corp. | | | 847,483 | | | | 61,213,697 | |
| | |
| | | | | | | | |
| | | | | | | 131,935,215 | |
| | |
| | | | | | | | |
| | |
| Software (16.4%) | | | | | | | | |
| Atlassian Corp., Class A q | | | 195,356 | | | | 47,545,743 | |
| Autodesk Inc. q | | | 284,146 | | | | 83,985,033 | |
| Fortinet Inc. q | | | 1,105,804 | | | | 104,476,362 | |
| Guidewire Software Inc. q | | | 384,447 | | | | 64,810,075 | |
| Roper Technologies Inc. | | | 179,137 | | | | 93,124,369 | |
| Workday Inc., Class A q | | | 267,536 | | | | 69,032,314 | |
| | |
| | | | | | | | |
| | | | | | | 462,973,896 | |
| | |
| | | | | | | | |
| | |
| Specialty Retail (5.6%) | | | | | | | | |
| O’Reilly Automotive Inc. q | | | 62,317 | | | | 73,895,499 | |
| Ross Stores Inc. | | | 571,949 | | | | 86,518,725 | |
| | |
| | | | | | | | |
| | | | | | | 160,414,224 | |
| | |
| | | | | | | | |
| | |
Technology Hardware,
Storage & Peripherals (2.8%) | | | | | | | | |
| Western Digital Corp. q | | | 1,339,847 | | | | 79,895,077 | |
| | |
| | | | | | | | |
| | |
| Trading Companies & Distributors (2.3%) | | | | | | | | |
| Ferguson Enterprises Inc. | | | 373,514 | | | | 64,830,825 | |
| | |
| | | | | | | | |
| |
Total investment in equities (99.2%)
(cost $2,223,324,251) | | | | 2,818,946,099 | |
| | |
| | | | | | | | |
10
| | | | |
| | |
| Audited Financial Statements • 2024 | | | | |
Parnassus Mid Cap Fund
Portfolio of Investments as of December 31, 2024 (continued)
| | | | | | | | | | | | | | | | |
| | | | |
| Short-Term Securities | | Interest
Rate | | | Maturity
Date | | | Principal
Amount ($) | | | Market
Value ($) | |
| | |
| Certificates of Deposit (0.0%) a | | | | | | | | | |
| Beneficial State Bank | | | 4.00 | % | | | 03/27/2025 | | | | 250,000 | | | | 247,671 | |
| Citizens Trust Bank | | | 1.00 | % | | | 01/14/2025 | | | | 250,000 | | | | 249,645 | |
| Self-Help Federal Credit Union | | | 4.60 | % | | | 02/17/2025 | | | | 250,000 | | | | 248,716 | |
| | | | |
| | | | | | | | | | | | | | | | |
| | | | | | | | | | | | | | | 746,032 | |
| | | | |
| | | | | | | | | | | | | | | | |
| | | |
| Securities Purchased with Cash Collateral from Securities Lending | | | | | | | | | | | | | |
| | | | |
| Registered Investment Companies (0.3%) | | | | | | | | | | | | | | | | |
| Invesco Aim Government & Agency Portfolio Short-Term Investments Trust, Institutional Class | | | 4.36 | % | | | | | | | | | | | 9,686,000 | |
| | | | |
| | | | | | | | | | | | | | | | |
| | | | |
| Time Deposits (0.9%) | | | | | | | | | | | | | | | | |
| JPMorgan Chase, New York | | | 3.68 | % | | | 01/02/2025 | | | | 24,788,663 | | | | 24,788,663 | |
| | | | |
| | | | | | | | | | | | | | | | |
| | | | |
Total short-term securities (1.2%)
(cost $35,220,695) | | | | | | | | | | | | | | | 35,220,695 | |
| | | | |
| | | | | | | | | | | | | | | | |
| | | | |
Total securities (100.4%)
(cost $2,258,544,946) | | | | | | | | | | | | | | | 2,854,166,794 | |
| | | | |
| | | | | | | | | | | | | | | | |
| Payable upon return of securities loaned (-0.3%) | | | | | | | | | | | | | | | (9,686,000 | ) |
| | | | |
| | | | | | | | | | | | | | | | |
| Other assets and liabilities (-0.1%) | | | | | | | | | | | | | | | (2,039,021 | ) |
| | | | |
| | | | | | | | | | | | | | | | |
| | | | |
| Total net assets (100.0%) | | | | | | | | | | | | | | | 2,842,441,773 | |
| | | | |
| | | | | | | | | | | | | | | | |
W Fund ownership consists of 5% or more of the shares outstanding of the Affiliated Issuer, as defined under the Investment Securities Act of 1940. | |
q This security is non-income producing. | |
l This security, or partial position of this security, was on loan at December 31, 2024. The total value of the securities on loan at December 31, 2024 was $9,375,380. | |
a Market value adjustments have been applied to these securities to reflect potential early withdrawal. Such securities have been classified as level 3. | |
| |
plc Public Limited Company | | | | | |
11
| | | | |
| | |
| | | | Audited Financial Statements • 2024 |
Parnassus Mid Cap Growth Fund
Portfolio of Investments as of December 31, 2024
| | | | | | | | |
| | |
| Equities | | Shares | | | Market
Value ($) | |
| | |
| Building Products (3.9%) | | | | | | | | |
| Trane Technologies plc | | | 88,575 | | | | 32,715,176 | |
| | |
| | | | | | | | |
| | |
| Capital Markets (5.2%) | | | | | | | | |
| Morningstar Inc. | | | 70,111 | | | | 23,610,580 | |
| MSCI Inc., Class A | | | 34,045 | | | | 20,427,340 | |
| | |
| | | | | | | | |
| | | | | | | 44,037,920 | |
| | |
| | | | | | | | |
| | |
| Chemicals (2.9%) | | | | | | | | |
| The Sherwin-Williams Co. | | | 71,196 | | | | 24,201,656 | |
| | |
| | | | | | | | |
| | |
Commercial Services &
Supplies (1.4%) | | | | | | | | |
| Cintas Corp. | | | 63,373 | | | | 11,578,247 | |
| | |
| | | | | | | | |
| | |
| Distributors (2.7%) | | | | | | | | |
| Pool Corp. | | | 66,291 | | | | 22,601,254 | |
| | |
| | | | | | | | |
| | |
| Diversified Financial Services (3.2%) | | | | | | | | |
| Block Inc., Class A q | | | 317,525 | | | | 26,986,450 | |
| | |
| | | | | | | | |
| | |
| Electrical Equipment (2.1%) | | | | | | | | |
| Rockwell Automation Inc. | | | 62,471 | | | | 17,853,587 | |
| | |
| | | | | | | | |
| | |
Health Care Equipment &
Supplies (2.4%) | | | | | | | | |
| IDEXX Laboratories Inc. q | | | 48,347 | | | | 19,988,584 | |
| | |
| | | | | | | | |
| | |
| Hotels, Restaurants & Leisure (3.1%) | | | | | | | | |
| Hilton Worldwide Holdings Inc. | | | 107,121 | | | | 26,476,026 | |
| | |
| | | | | | | | |
| | |
| IT Services (1.7%) | | | | | | | | |
| Cloudflare Inc., Class A q | | | 129,094 | | | | 13,900,842 | |
| | |
| | | | | | | | |
| | |
| Life Sciences Tools & Services (9.3%) | | | | | | | | |
| Agilent Technologies Inc. | | | 196,258 | | | | 26,365,300 | |
| Mettler-Toledo International Inc. q | | | 17,617 | | | | 21,557,571 | |
| Repligen Corp. q | | | 68,502 | | | | 9,860,178 | |
| West Pharmaceutical Services Inc. | | | 62,479 | | | | 20,465,621 | |
| | |
| | | | | | | | |
| | | | | | | 78,248,670 | |
| | |
| | | | | | | | |
| | |
| Media (2.9%) | | | | | | | | |
| The Trade Desk Inc., Class A q | | | 203,816 | | | | 23,954,494 | |
| | |
| | | | | | | | |
| | |
| Multiline Retail (3.4%) | | | | | | | | |
| MercadoLibre Inc. q | | | 16,805 | | | | 28,575,894 | |
| | |
| | | | | | | | |
| | |
| Professional Services (9.1%) | | | | | | | | |
| Broadridge Financial Solutions Inc. | | | 110,082 | | | | 24,888,439 | |
| Equifax Inc. | | | 145,781 | | | | 37,152,288 | |
| Verisk Analytics Inc., Class A | | | 54,248 | | | | 14,941,527 | |
| | |
| | | | | | | | |
| | | | | | | 76,982,254 | |
| | |
| | | | | | | | |
| | | | | | | | |
| | |
| Equities | | | Shares | | |
| Market
Value ($) |
|
| | |
| Road & Rail (8.0%) | | | | | | | | |
| J.B. Hunt Transport Services Inc. | | | 194,978 | | | | 33,274,946 | |
| Old Dominion Freight Line Inc. | | | 193,888 | | | | 34,201,843 | |
| | |
| | | | | | | | |
| | | | | | | 67,476,789 | |
| | |
| | | | | | | | |
| | |
| Semiconductors & Semiconductor Equipment (8.3%) | | | | | | | | |
| KLA Corp. | | | 35,307 | | | | 22,247,647 | |
| Monolithic Power Systems Inc. | | | 28,450 | | | | 16,833,865 | |
| Teradyne Inc. | | | 242,068 | | | | 30,481,203 | |
| | |
| | | | | | | | |
| | | | | | | 69,562,715 | |
| | |
| | | | | | | | |
| | |
| Software (22.6%) | | | | | | | | |
| Atlassian Corp., Class A q | | | 126,461 | | | | 30,778,078 | |
| Autodesk Inc. q | | | 67,209 | | | | 19,864,964 | |
| Cadence Design Systems Inc. q | | | 54,099 | | | | 16,254,586 | |
| Datadog Inc., Class A q | | | 182,922 | | | | 26,137,725 | |
| Fortinet Inc. q | | | 249,593 | | | | 23,581,547 | |
| Guidewire Software Inc. q | | | 115,164 | | | | 19,414,347 | |
| Procore Technologies Inc. q | | | 147,079 | | | | 11,020,629 | |
| PTC Inc. q | | | 92,332 | | | | 16,977,085 | |
| Workday Inc., Class A q | | | 104,573 | | | | 26,982,971 | |
| | |
| | | | | | | | |
| | | | | | | 191,011,932 | |
| | |
| | | | | | | | |
| | |
| Specialty Retail (4.5%) | | | | | | | | |
| O’Reilly Automotive Inc. q | | | 16,459 | | | | 19,517,082 | |
| Ross Stores Inc. | | | 123,305 | | | | 18,652,347 | |
| | |
| | | | | | | | |
| | | | | | | 38,169,429 | |
| | |
| | | | | | | | |
| | |
| Technology Hardware, Storage & Peripherals (2.6%) | | | | | | | | |
| Western Digital Corp. q | | | 368,651 | | | | 21,982,659 | |
| | |
| | | | | | | | |
| | |
Total investment in equities (99.3%)
(cost $596,744,056) | | | | | | | 836,304,578 | |
| | |
| | | | | | | | |
12
| | | | |
| | |
| Audited Financial Statements • 2024 | | | | |
Parnassus Mid Cap Growth Fund
Portfolio of Investments as of December 31, 2024 (continued)
| | | | | | | | | | | | | | | | |
| | | | |
| Short-Term Securities | | Interest
Rate | | | Maturity
Date | | | Principal
Amount ($) | | | Market
Value ($) | |
| | | | |
| Certificates of Deposit (0.1%) a | | | | | | | | | | | | | | | | |
| Beneficial State Bank | | | 4.00 | % | | | 01/15/2025 | | | | 250,000 | | | | 249,617 | |
| Citizens Trust Bank | | | 1.00 | % | | | 01/14/2025 | | | | 200,000 | | | | 199,716 | |
| | | | |
| | | | | | | | | | | | | | | | |
| | | | | | | | | | | | | | | 449,333 | |
| | | | |
| | | | | | | | | | | | | | | | |
| | | | |
| Certificates of Deposit Account Registry Service (0.1%) a | | | | | | | | | | | | | | | | |
CDARS agreement with Beneficial State Bank,
dated 03/14/2024
Participating depository institutions:
First Business Bank, par 235,500;
Frontier Bank, par 141,898;
Solera National Bank, par 122,602;
(cost $496,099) | | | 4.18 | % | | | 03/13/2025 | | | | 500,000 | | | | 496,099 | |
| | | | |
| | | | | | | | | | | | | | | | |
| | | | |
| Community Development Loans (0.0%) a | | | | | | | | | | | | | | | | |
| Root Capital Inc. | | | 1.00 | % | | | 02/01/2025 | | | | 100,000 | | | | 99,492 | |
| | | | |
| | | | | | | | | | | | | | | | |
| | | | |
| Time Deposits (0.6%) | | | | | | | | | | | | | | | | |
| JPMorgan Chase, New York | | | 3.68 | % | | | 01/02/2025 | | | | 5,325,069 | | | | 5,325,069 | |
| | | | |
| | | | | | | | | | | | | | | | |
| | | | |
Total short-term securities (0.8%)
(cost $6,369,993) | | | | | | | | | | | | | | | 6,369,993 | |
| | | | |
| | | | | | | | | | | | | | | | |
| | | | |
Total securities (100.1%)
(cost $603,114,049) | | | | | | | | | | | | | | | 842,674,571 | |
| | | | |
| | | | | | | | | | | | | | | | |
| Other assets and liabilities (-0.1%) | | | | | | | | | | | | | | | (714,281 | ) |
| | | | |
| | | | | | | | | | | | | | | | |
| | | | |
| Total net assets (100.0%) | | | | | | | | | | | | | | | 841,960,290 | |
| | | | |
| | | | | | | | | | | | | | | | |
| | | | | | | | | | |
q This security is non-income producing. | |
a Market value adjustments have been applied to these securities to reflect potential early withdrawal. Such securities have been classified as level 3. | |
| | | | |
plc Public Limited Company | | | | | | | | | | |
13
| | | | |
| | |
| | | | Audited Financial Statements • 2024 |
Parnassus Fixed Income Fund
Portfolio of Investments as of December 31, 2024
| | | | | | | | | | | | | | | | |
| | | | |
| Exchange-Traded Funds | | Interest
Rate | | | Maturity
Date | | | Shares | | | Market
Value ($) | |
| | | | |
| Mortgage Real Estate Investment Trusts (4.9%) | | | | | | | | | | | | | | | | |
| iShares MBS ETF | | | | | | | | | | | 155,000 | | | | 14,210,400 | |
| | | | |
| | | | | | | | | | | | | | | | |
| | | | |
Total investment in Exchange-Traded Funds (4.9%)
(cost $14,004,458) | | | | | | | | | | | | | | | 14,210,400 | |
| | | | |
| | | | | | | | | | | | | | | | |
| | | | | | | | | | | | | | | | |
| | | | |
| Preferred Stocks | | | | | | | | | | | | |
| | | | |
| Capital Markets (0.6%) | | | | | | | | | | | | | | | | |
| Morgan Stanley | | | 4.25 | % | | | 01/15/2027 | | | | 100,000 | | | | 1,841,000 | |
| | | | |
| | | | | | | | | | | | | | | | |
| | | | |
Total investment in Preferred Stocks (0.6%)
(cost $2,105,029) | | | | | | | | | | | | | | | 1,841,000 | |
| | | | |
| | | | | | | | | | | | | | | | |
| | | | | | | | | | | | | | | | |
| | | | |
| Corporate Bonds | | | | | | | | Principal
Amount ($) | | | | |
| | | | |
| Air Freight & Logistics (1.9%) | | | | | | | | | | | | | | | | |
| C.H. Robinson Worldwide Inc. | | | 4.20 | % | | | 04/15/2028 | | | | 3,000,000 | | | | 2,921,539 | |
| FedEx Corp. | | | 4.25 | % | | | 05/15/2030 | | | | 1,500,000 | | | | 1,452,934 | |
| FedEx Corp. | | | 4.75 | % | | | 11/15/2045 | | | | 1,500,000 | | | | 1,287,974 | |
| | | | |
| | | | | | | | | | | | | | | | |
| | | | | | | | | | | | | | | 5,662,447 | |
| | | | |
| | | | | | | | | | | | | | | | |
| | | | |
| Airlines (1.7%) | | | | | | | | | | | | | | | | |
| Alaska Airlines 2020-1 Class B Pass Through Trust, Class B l | | | 8.00 | % | | | 08/15/2025 | | | | 1,886,816 | | | | 1,903,797 | |
| Southwest Airlines Co. | | | 5.13 | % | | | 06/15/2027 | | | | 3,000,000 | | | | 3,013,634 | |
| | | | |
| | | | | | | | | | | | | | | | |
| | | | | | | | | | | | | | | 4,917,431 | |
| | | | |
| | | | | | | | | | | | | | | | |
| | | | |
| Auto Components (1.0%) | | | | | | | | | | | | | | | | |
| APTIV plc | | | 5.40 | % | | | 03/15/2049 | | | | 2,500,000 | | | | 2,147,407 | |
| APTIV plc | | | 4.15 | % | | | 05/01/2052 | | | | 1,000,000 | | | | 712,265 | |
| | | | |
| | | | | | | | | | | | | | | | |
| | | | | | | | | | | | | | | 2,859,672 | |
| | | | |
| | | | | | | | | | | | | | | | |
| | | | |
| Banks (1.5%) | | | | | | | | | | | | | | | | |
| Bank of America Corp. | | | 3.85 | % | | | 03/08/2037 | | | | 1,750,000 | | | | 1,550,432 | |
| Citigroup Inc. | | | 2.01 | % | | | 01/25/2026 | | | | 2,750,000 | | | | 2,743,873 | |
| | | | |
| | | | | | | | | | | | | | | | |
| | | | | | | | | | | | | | | 4,294,305 | |
| | | | |
| | | | | | | | | | | | | | | | |
| | | | |
| Building Products (0.9%) | | | | | | | | | | | | | | | | |
| Masco Corp. | | | 4.50 | % | | | 05/15/2047 | | | | 3,260,000 | | | | 2,666,332 | |
| | | | |
| | | | | | | | | | | | | | | | |
| | | | |
| Capital Markets (1.0%) | | | | | | | | | | | | | | | | |
| The Charles Schwab Corp. | | | 4.00 | % | | | 06/01/2026 | | | | 3,000,000 | | | | 2,904,616 | |
| | | | |
| | | | | | | | | | | | | | | | |
| | | | |
| Chemicals (1.5%) | | | | | | | | | | | | | | | | |
| International Flavors & Fragrances Inc. | | | 5.00 | % | | | 09/26/2048 | | | | 3,300,000 | | | | 2,835,360 | |
| The Sherwin-Williams Co. | | | 4.50 | % | | | 06/01/2047 | | | | 2,000,000 | | | | 1,684,010 | |
| | | | |
| | | | | | | | | | | | | | | | |
| | | | | | | | | | | | | | | 4,519,370 | |
| | | | |
| | | | | | | | | | | | | | | | |
| | | | |
| Commercial Services & Supplies (1.0%) | | | | | | | | | | | | | | | | |
| CCO Holdings LLC / CCO Holdings Capital Corp. l | | | 4.75 | % | | | 03/01/2030 | | | | 3,000,000 | | | | 2,739,499 | |
| | | | |
| | | | | | | | | | | | | | | | |
| | | | |
| Consumer Finance (0.6%) | | | | | | | | | | | | | | | | |
| Capital One Financial Corp. | | | 2.62 | % | | | 11/02/2032 | | | | 2,000,000 | | | | 1,656,308 | |
| | | | |
| | | | | | | | | | | | | | | | |
14
| | | | |
| | |
| Audited Financial Statements • 2024 | | | | |
Parnassus Fixed Income Fund
Portfolio of Investments as of December 31, 2024 (continued)
| | | | | | | | | | | | | | | | |
| | | | |
| Corporate Bonds | | Interest
Rate | | | Maturity
Date | | | Principal
Amount ($) | | | Market
Value ($) | |
| | | | |
| Diversified Financial Services (4.8%) | | | | | | | | | | | | | | | | |
| Ares Finance Co. III LLC l | | | 4.13 | % | | | 06/30/2051 | | | | 2,500,000 | | | | 2,395,612 | |
| Fiserv Inc. | | | 5.60 | % | | | 03/02/2033 | | | | 2,500,000 | | | | 2,533,608 | |
| Global Payments Inc. | | | 5.95 | % | | | 08/15/2052 | | | | 3,000,000 | | | | 2,912,240 | |
| The Bank of New York Mellon Corp. | | | 3.75 | % | | | 10/31/2026 | | | | 3,000,000 | | | | 2,835,225 | |
| Truist Financial Corp. | | | 5.13 | % | | | 12/15/2027 | | | | 3,500,000 | | | | 3,419,906 | |
| | | | |
| | | | | | | | | | | | | | | | |
| | | | | | | | | | | | | | | 14,096,591 | |
| | | | |
| | | | | | | | | | | | | | | | |
| | | | |
| Diversified Telecommunication Services (0.9%) | | | | | | | | | | | | | | | | |
| Verizon Communications Inc. | | | 2.85 | % | | | 09/03/2041 | | | | 3,750,000 | | | | 2,594,729 | |
| | | | |
| | | | | | | | | | | | | | | | |
| | | | |
| Electric Utilities (1.9%) | | | | | | | | | | | | | | | | |
| Dominion Energy Inc. | | | 2.25 | % | | | 08/15/2031 | | | | 3,000,000 | | | | 2,497,995 | |
| Public Service Co. of Oklahoma | | | 2.20 | % | | | 08/15/2031 | | | | 3,500,000 | | | | 2,895,701 | |
| | | | |
| | | | | | | | | | | | | | | | |
| | | | | | | | | | | | | | | 5,393,696 | |
| | | | |
| | | | | | | | | | | | | | | | |
| | | | |
| Electronic Equipment, Instruments & Components (0.9%) | | | | | | | | | | | | | | | | |
| Trimble Inc. | | | 6.10 | % | | | 03/15/2033 | | | | 2,500,000 | | | | 2,596,568 | |
| | | | |
| | | | | | | | | | | | | | | | |
| | | | |
| Equity Real Estate Investment Trusts (3.1%) | | | | | | | | | | | | | | | | |
| Alexandria Real Estate Equities Inc. | | | 2.00 | % | | | 05/18/2032 | | | | 2,250,000 | | | | 1,794,302 | |
| Alexandria Real Estate Equities Inc. | | | 4.85 | % | | | 04/15/2049 | | | | 1,500,000 | | | | 1,289,426 | |
| American Tower Corp. | | | 3.70 | % | | | 10/15/2049 | | | | 4,000,000 | | | | 2,901,439 | |
| SBA Communications Corp. | | | 3.88 | % | | | 02/15/2027 | | | | 3,000,000 | | | | 2,876,025 | |
| | | | |
| | | | | | | | | | | | | | | | |
| | | | | | | | | | | | | | | 8,861,192 | |
| | | | |
| | | | | | | | | | | | | | | | |
| | | | |
| Food & Staples Retailing (0.9%) | | | | | | | | | | | | | | | | |
| Sysco Corp. | | | 2.40 | % | | | 02/15/2030 | | | | 3,000,000 | | | | 2,646,090 | |
| | | | |
| | | | | | | | | | | | | | | | |
| | | | |
| Food Products (1.1%) | | | | | | | | | | | | | | | | |
| McCormick & Co., Inc. | | | 2.50 | % | | | 04/15/2030 | | | | 3,500,000 | | | | 3,095,244 | |
| | | | |
| | | | | | | | | | | | | | | | |
| | | | |
| Health Care Equipment & Supplies (1.8%) | | | | | | | | | | | | | | | | |
| Baxter International Inc. | | | 2.54 | % | | | 02/01/2032 | | | | 3,000,000 | | | | 2,502,336 | |
| Becton, Dickinson and Co. | | | 4.69 | % | | | 12/15/2044 | | | | 3,000,000 | | | | 2,595,430 | |
| | | | |
| | | | | | | | | | | | | | | | |
| | | | | | | | | | | | | | | 5,097,766 | |
| | | | |
| | | | | | | | | | | | | | | | |
| | | | |
| Hotels, Restaurants & Leisure (0.9%) | | | | | | | | | | | | | | | | |
| Yum! Brands Inc. | | | 4.63 | % | | | 01/31/2032 | | | | 3,000,000 | | | | 2,772,095 | |
| | | | |
| | | | | | | | | | | | | | | | |
| | | | |
| Insurance (0.5%) | | | | | | | | | | | | | | | | |
| The Progressive Corp. | | | 3.20 | % | | | 03/26/2030 | | | | 1,500,000 | | | | 1,385,811 | |
| | | | |
| | | | | | | | | | | | | | | | |
| | | | |
| Life Sciences Tools & Services (1.0%) | | | | | | | | | | | | | | | | |
| Agilent Technologies Inc. | | | 2.75 | % | | | 09/15/2029 | | | | 3,250,000 | | | | 2,952,179 | |
| | | | |
| | | | | | | | | | | | | | | | |
| | | | |
| Machinery (2.0%) | | | | | | | | | | | | | | | | |
| Pentair Finance SA | | | 4.50 | % | | | 07/01/2029 | | | | 3,000,000 | | | | 2,916,729 | |
| Xylem Inc. | | | 2.25 | % | | | 01/30/2031 | | | | 3,500,000 | | | | 2,983,933 | |
| | | | |
| | | | | | | | | | | | | | | | |
| | | | | | | | | | | | | | | 5,900,662 | |
| | | | |
| | | | | | | | | | | | | | | | |
| | | | |
| Pharmaceuticals (1.0%) | | | | | | | | | | | | | | | | |
| Merck & Co., Inc. | | | 1.90 | % | | | 12/10/2028 | | | | 3,250,000 | | | | 2,931,836 | |
| | | | |
| | | | | | | | | | | | | | | | |
| | | | |
| Real Estate Investment Trust (1.0%) | | | | | | | | | | | | | | | | |
| Prologis LP | | | 2.88 | % | | | 11/15/2029 | | | | 3,250,000 | | | | 2,974,906 | |
| | | | |
| | | | | | | | | | | | | | | | |
15
| | | | |
| | |
| | | | Audited Financial Statements • 2024 |
Parnassus Fixed Income Fund
Portfolio of Investments as of December 31, 2024 (continued)
| | | | | | | | | | | | | | | | |
| | | | |
| Corporate Bonds | | Interest
Rate | | | Maturity
Date | | | Principal
Amount ($) | | | Market
Value ($) | |
| | | | |
| Road & Rail (0.5%) | | | | | | | | | | | | | | | | |
| Canadian Pacific Railway Co. | | | 2.88 | % | | | 11/15/2029 | | | | 1,500,000 | | | | 1,368,722 | |
| | | | |
| | | | | | | | | | | | | | | | |
| | | | |
| Semiconductors & Semiconductor Equipment (3.0%) | | | | | | | | | | | | | | | | |
| Intel Corp. | | | 4.15 | % | | | 08/05/2032 | | | | 3,200,000 | | | | 2,912,895 | |
| Micron Technology Inc. | | | 2.70 | % | | | 04/15/2032 | | | | 3,500,000 | | | | 2,934,314 | |
| Qorvo Inc. l | | | 3.38 | % | | | 04/01/2031 | | | | 3,250,000 | | | | 2,779,568 | |
| | | | |
| | | | | | | | | | | | | | | | |
| | | | | | | | | | | | | | | 8,626,777 | |
| | | | |
| | | | | | | | | | | | | | | | |
| | | | |
| Software (2.9%) | | | | | | | | | | | | | | | | |
| Autodesk Inc. | | | 2.40 | % | | | 12/15/2031 | | | | 3,500,000 | | | | 2,941,269 | |
| Oracle Corp. | | | 6.13 | % | | | 07/08/2039 | | | | 2,750,000 | | | | 2,848,584 | |
| Roper Technologies Inc. | | | 2.95 | % | | | 09/15/2029 | | | | 3,000,000 | | | | 2,740,530 | |
| | | | |
| | | | | | | | | | | | | | | | |
| | | | | | | | | | | | | | | 8,530,383 | |
| | | | |
| | | | | | | | | | | | | | | | |
| | | | |
| Specialty Retail (2.9%) | | | | | | | | | | | | | | | | |
| Lowe’s Companies, Inc. | | | 2.80 | % | | | 09/15/2041 | | | | 3,750,000 | | | | 2,575,442 | |
| O’Reilly Automotive Inc. | | | 4.20 | % | | | 04/01/2030 | | | | 3,000,000 | | | | 2,883,730 | |
| Ross Stores Inc. | | | 4.80 | % | | | 04/15/2030 | | | | 3,000,000 | | | | 2,923,862 | |
| | | | |
| | | | | | | | | | | | | | | | |
| | | | | | | | | | | | | | | 8,383,034 | |
| | | | |
| | | | | | | | | | | | | | | | |
| | | | |
| Textiles, Apparel & Luxury Goods (0.7%) | | | | | | | | | | | | | | | | |
| VF Corp. | | | 6.00 | % | | | 10/15/2033 | | | | 2,000,000 | | | | 1,920,177 | |
| | | | |
| | | | | | | | | | | | | | | | |
| | | | |
| Transportation Infrastructure (0.9%) | | | | | | | | | | | | | | | | |
| Avantor Funding Inc. l | | | 4.63 | % | | | 07/15/2028 | | | | 2,750,000 | | | | 2,624,886 | |
| | | | |
| | | | | | | | | | | | | | | | |
| | | | |
| Wireless Telecommunication Services (0.9%) | | | | | | | | | | | | | | | | |
| T-Mobile USA Inc. | | | 4.38 | % | | | 04/15/2040 | | | | 3,000,000 | | | | 2,602,401 | |
| | | | |
| | | | | | | | | | | | | | | | |
| | | | |
Total investment in Corporate Bonds (44.7%)
(cost $136,759,284) | | | | | | | | | | | | | | | 129,575,725 | |
| | | | |
| | | | | | | | | | | | | | | | |
| | | | | | | | | | | | | | | | |
| | | | |
| Supranational Bonds | | | | | | | | | | | | |
| European Bank for Reconstruction & Development | | | 1.50 | % | | | 02/13/2025 | | | | 2,000,000 | | | | 1,993,301 | |
| European Investment Bank | | | 1.63 | % | | | 10/09/2029 | | | | 2,000,000 | | | | 1,759,684 | |
| European Investment Bank | | | 0.75 | % | | | 09/23/2030 | | | | 2,000,000 | | | | 1,626,337 | |
| International Bank for Reconstruction & Development | | | 3.13 | % | | | 11/20/2025 | | | | 4,000,000 | | | | 3,953,753 | |
| International Bank for Reconstruction & Development | | | 4.00 | % | | | 01/10/2031 | | | | 3,000,000 | | | | 2,909,828 | |
| International Bank for Reconstruction & Development | | | 4.50 | % | | | 04/10/2031 | | | | 3,000,000 | | | | 2,989,304 | |
| International Bank for Reconstruction & Development | | | 1.63 | % | | | 11/03/2031 | | | | 5,000,000 | | | | 4,135,743 | |
| International Finance Corp. | | | 2.13 | % | | | 04/07/2026 | | | | 6,000,000 | | | | 5,826,512 | |
| International Finance Corp. | | | 4.38 | % | | | 01/15/2027 | | | | 4,000,000 | | | | 3,996,780 | |
| | | | |
| | | | | | | | | | | | | | | | |
| | | | |
Total investment in Supranational Bonds (10.1%)
(cost $30,992,879) | | | | | | | | | | | | | | | 29,191,242 | |
| | | | |
| | | | | | | | | | | | | | | | |
| | | | | | | | | | | | | | | | |
| | | | |
| U.S. Government Agency Bonds | | | | | | | | | | | | |
| Fannie Mae Pool BY0205 | | | 5.50 | % | | | 05/01/2053 | | | | 1,727,953 | | | | 1,705,382 | |
| Fannie Mae Pool BY4185 | | | 5.00 | % | | | 07/01/2053 | | | | 2,315,161 | | | | 2,237,110 | |
| Fannie Mae Pool DA0007 | | | 5.50 | % | | | 09/01/2053 | | | | 3,755,551 | | | | 3,706,378 | |
| Fannie Mae Pool DB6905 | | | 6.00 | % | | | 07/01/2054 | | | | 2,383,981 | | | | 2,396,799 | |
| Fannie Mae Pool FS4736 | | | 6.50 | % | | | 05/01/2053 | | | | 2,850,667 | | | | 2,920,424 | |
16
| | | | |
| | |
| Audited Financial Statements • 2024 | | | | |
Parnassus Fixed Income Fund
Portfolio of Investments as of December 31, 2024 (continued)
| | | | | | | | | | | | | | | | |
| | | | |
| U.S. Government Agency Bonds | | Interest
Rate | | | Maturity
Date | | | Principal
Amount ($) | | | Market Value ($) | |
| Fannie Mae Pool FS6916 | | | 5.00 | % | | | 06/01/2053 | | | | 1,887,960 | | | | 1,826,211 | |
| Fannie Mae Pool MA4379 | | | 2.50 | % | | | 07/01/2051 | | | | 2,203,356 | | | | 1,809,058 | |
| Fannie Mae Pool MA4709 | | | 5.00 | % | | | 07/01/2052 | | | | 1,623,181 | | | | 1,569,785 | |
| Fannie Mae Pool MA5216 | | | 6.00 | % | | | 12/01/2053 | | | | 3,323,185 | | | | 3,342,027 | |
| Fannie Mae Pool MA5444 | | | 5.50 | % | | | 08/01/2054 | | | | 2,418,472 | | | | 2,386,804 | |
| Fannie Mae Pool MA5550 | | | 4.00 | % | | | 12/01/2054 | | | | 2,990,237 | | | | 2,734,742 | |
| Freddie Mac Pool SD8315 | | | 5.00 | % | | | 04/01/2053 | | | | 2,681,288 | | | | 2,593,589 | |
| Freddie Mac Pool SD8431 | | | 5.50 | % | | | 05/01/2054 | | | | 2,309,173 | | | | 2,278,936 | |
| Ginnie Mae II Pool MA8348 | | | 5.00 | % | | | 10/20/2052 | | | | 2,098,955 | | | | 2,043,375 | |
| Ginnie Mae II Pool MA9665 | | | 4.00 | % | | | 05/20/2054 | | | | 2,947,117 | | | | 2,715,205 | |
| | | | |
| | | | | | | | | | | | | | | | |
| | | | |
Total investment in U.S. Government Agency Bonds (12.5%)
(cost $36,755,366) | | | | | | | | | | | | | | | 36,265,825 | |
| | | | |
| | | | | | | | | | | | | | | | |
| | | | | | | | | | | | | | | | |
| | | | |
| U.S. Government Treasury Bonds | | | | | | | | | | | | |
| U.S. Treasury | | | 3.88 | % | | | 03/31/2025 | | | | 3,250,000 | | | | 3,246,674 | |
| U.S. Treasury | | | 0.25 | % | | | 06/30/2025 | | | | 2,000,000 | | | | 1,961,738 | |
| U.S. Treasury | | | 2.25 | % | | | 11/15/2025 | | | | 3,000,000 | | | | 2,948,648 | |
| U.S. Treasury | | | 0.38 | % | | | 12/31/2025 | | | | 2,500,000 | | | | 2,407,285 | |
| U.S. Treasury | | | 3.63 | % | | | 05/15/2026 | | | | 3,000,000 | | | | 2,975,156 | |
| U.S. Treasury | | | 1.88 | % | | | 07/31/2026 | | | | 2,000,000 | | | | 1,928,203 | |
| U.S. Treasury | | | 4.63 | % | | | 10/15/2026 | | | | 3,500,000 | | | | 3,521,191 | |
| U.S. Treasury | | | 4.25 | % | | | 11/30/2026 | | | | 3,000,000 | | | | 2,999,180 | |
| U.S. Treasury | | | 3.75 | % | | | 08/15/2027 | | | | 3,000,000 | | | | 2,961,563 | |
| U.S. Treasury | | | 3.63 | % | | | 03/31/2028 | | | | 2,500,000 | | | | 2,448,242 | |
| U.S. Treasury | | | 4.63 | % | | | 09/30/2028 | | | | 3,000,000 | | | | 3,027,656 | |
| U.S. Treasury | | | 3.63 | % | | | 08/31/2029 | | | | 3,000,000 | | | | 2,904,375 | |
| U.S. Treasury | | | 3.75 | % | | | 05/31/2030 | | | | 2,500,000 | | | | 2,419,434 | |
| U.S. Treasury | | | 4.13 | % | | | 10/31/2031 | | | | 3,000,000 | | | | 2,936,250 | |
| U.S. Treasury | | | 4.13 | % | | | 11/30/2031 | | | | 3,000,000 | | | | 2,935,781 | |
| U.S. Treasury | | | 4.13 | % | | | 11/15/2032 | | | | 2,500,000 | | | | 2,438,379 | |
| U.S. Treasury | | | 3.50 | % | | | 02/15/2033 | | | | 3,000,000 | | | | 2,791,055 | |
| U.S. Treasury | | | 3.38 | % | | | 05/15/2033 | | | | 1,500,000 | | | | 1,378,594 | |
| U.S. Treasury | | | 4.38 | % | | | 05/15/2034 | | | | 2,500,000 | | | | 2,462,109 | |
| U.S. Treasury | | | 3.25 | % | | | 05/15/2042 | | | | 4,000,000 | | | | 3,257,188 | |
| U.S. Treasury | | | 4.00 | % | | | 11/15/2042 | | | | 4,500,000 | | | | 4,053,340 | |
| U.S. Treasury | | | 4.38 | % | | | 08/15/2043 | | | | 3,500,000 | | | | 3,296,699 | |
| U.S. Treasury | | | 4.75 | % | | | 11/15/2043 | | | | 2,000,000 | | | | 1,976,797 | |
| U.S. Treasury | | | 4.63 | % | | | 05/15/2044 | | | | 3,000,000 | | | | 2,911,406 | |
| U.S. Treasury | | | 2.00 | % | | | 02/15/2050 | | | | 2,000,000 | | | | 1,163,359 | |
| U.S. Treasury | | | 1.25 | % | | | 05/15/2050 | | | | 3,500,000 | | | | 1,662,500 | |
| U.S. Treasury | | | 4.63 | % | | | 05/15/2054 | | | | 2,000,000 | | | | 1,946,563 | |
| | | | |
| | | | | | | | | | | | | | | | |
| | | |
Total investment in U.S. Government Treasury Bonds (24.5%)
(cost $74,135,457) | | | | | | | | | | | | 70,959,365 | |
| | | | |
| | | | | | | | | | | | | | | | |
| | | | |
Total investment in long-term securities (97.3%)
(cost $294,752,473) | | | | | | | | | | | | | | | 282,043,557 | |
| | | | |
| | | | | | | | | | | | | | | | |
| | | | | | | | | | | | | | | | |
| | | | |
| Short-Term Securities | | | | | | | | | | | | |
| | | | |
| Government Obligations (1.4%) | | | | | | | | | | | | | | | | |
| United States Treasury Bill | | | 4.46 | % | | | 03/25/2025 | | | | 4,000,000 | | | | 3,959,475 | |
| | | | |
| | | | | | | | | | | | | | | | |
17
| | | | |
| | |
| | | | Audited Financial Statements • 2024 |
Parnassus Fixed Income Fund
Portfolio of Investments as of December 31, 2024 (continued)
| | | | | | | | | | | | | | | | |
| | | | |
| Short-Term Securities | | Interest
Rate | | | Maturity
Date | | | Principal
Amount ($) | | | Market Value ($) | |
| | | | |
| Time Deposits (0.7%) | | | | | | | | | | | | | | | | |
| JPMorgan Chase, New York | | | 3.68 | % | | | 01/02/2025 | | | | 2,122,129 | | | | 2,122,129 | |
| | | | |
| | | | | | | | | | | | | | | | |
| | | | |
Total short-term securities (2.1%)
(cost $6,081,604) | | | | | | | | | | | | | | | 6,081,604 | |
| | | | |
| | | | | | | | | | | | | | | | |
| | | | |
Total securities (99.4%)
(cost $300,834,077) | | | | | | | | | | | | | | | 288,125,161 | |
| | | | |
| | | | | | | | | | | | | | | | |
| | | | |
| Other assets and liabilities (0.6%) | | | | | | | | | | | | | | | 1,614,144 | |
| | | | |
| | | | | | | | | | | | | | | | |
| | | | |
| Total net assets (100.0%) | | | | | | | | | | | | | | | 289,739,305 | |
| | | | |
| | | | | | | | | | | | | | | | |
l Security exempt from registration under Rule 144A of the Securities Act of 1933, as amended. The security may be resold in transactions exempt from registration normally to qualified institutional buyers. The security has been determined to be liquid in accordance with procedures adopted by the Funds’ Board of Trustees. At December 31, 2024, the aggregate value is $12,443,362, which is 4.29% of net assets. | |
| | | | |
MBS Mortgage-Backed Securities | | | | | | | | | | | | | | | | |
ETF Exchange-Traded Fund | | | | | | | | | | | | | | | | |
plc Public Limited Company | | | | | | | | | | | | | | | | |
LLC Limited Liability Company | | | | | | | | | | | | | | | | |
SA Société Anonyme | | | | | | | | | | | | | | | | |
LP Limited Partnership | | | | | | | | | | | | | | | | |
18
| | | | |
| | |
| Audited Financial Statements • 2024 | | | | |
Statement of Assets and Liabilities
December 31, 2024
| | | | | | | | | | | | |
| | | |
| | | Parnassus
Core Equity
Fund | | | Parnassus
Growth Equity
Fund | | | Parnassus
Value Equity
Fund | |
| | | |
| Assets | | | | | | | | | | | | |
| | | |
Investments in stocks, exchange-traded funds and bonds, at market value – Unaffiliated (cost $19,779,719,541, $49,646,353, $3,649,414,570, $2,174,314,987, $596,744,056 and $294,752,473) | | $ | 28,106,217,272 | | | $ | 63,107,762 | | | $ | 4,667,324,138 | |
| | | |
Investments in stocks, at market value – Affiliated | | | | | | | | | | | | |
| | | |
(cost of $894,147,563, $0, $133,585,880, $49,009,264, $0 and $0) | | | 682,282,320 | | | | - | | | | 127,249,357 | |
| | | |
Investments in short-term securities | | | | | | | | | | | | |
| | | |
(at cost which approximates market value) | | | 250,342,414 | | | | 374,787 | | | | 51,176,999 | |
| | | |
Cash | | | 447,408 | | | | 778 | | | | 62,425 | |
| | | |
Receivables | | | | | | | | | | | | |
| | | |
Dividends and interest | | | 15,776,472 | | | | 13,545 | | | | 4,920,898 | |
| | | |
Capital shares sold | | | 16,998,841 | | | | 261,061 | | | | 2,105,789 | |
| | | |
Other assets | | | 285,524 | | | | 37,296 | | | | 68,227 | |
| | | |
Total assets | | $ | 29,072,350,251 | | | $ | 63,795,229 | | | $ | 4,852,907,833 | |
| | | |
| Liabilities | | | | | | | | | | | | |
| | | |
Payable upon return of loaned securities | | | - | | | | - | | | | 18,925,463 | |
| | | |
Capital shares redeemed | | | 38,521,914 | | | | 23,838 | | | | 5,488,371 | |
| | | |
Fees payable to Parnassus Investments | | | 15,231,775 | | | | 10,747 | | | | 2,734,324 | |
| | | |
Accounts payable and accrued expenses | | | 2,172,088 | | | | 58,063 | | | | 568,749 | |
| | | |
Total liabilities | | $ | 55,925,777 | | | $ | 92,648 | | | $ | 27,716,907 | |
| | | |
Net assets | | $ | 29,016,424,474 | | | $ | 63,702,581 | | | $ | 4,825,190,926 | |
| | | |
| Net assets consist of | | | | | | | | | | | | |
| | | |
Capital paid-in | | | 19,331,841,887 | | | | 49,491,429 | | | | 3,722,377,587 | |
| | | |
Total Distributable Earnings | | | 9,684,582,587 | | | | 14,211,152 | | | | 1,102,813,339 | |
| | | |
Total net assets | | $ | 29,016,424,474 | | | $ | 63,702,581 | | | $ | 4,825,190,926 | |
| | | |
| Net asset value and offering per share | | | | | | | | | | | | |
| | | |
Net assets investor shares | | $ | 13,311,327,311 | | | $ | 22,969,985 | | | $ | 3,118,642,368 | |
| | | |
Net assets institutional shares | | $ | 15,705,097,163 | | | $ | 40,732,596 | | | $ | 1,706,548,558 | |
| | | |
Shares outstanding investor shares | | | 223,443,816 | | | | 893,206 | | | | 59,463,278 | |
| | | |
Shares outstanding institutional shares | | | 262,833,479 | | | | 1,579,717 | | | | 32,449,705 | |
| | | |
Net asset values and redemption price per share | | | | | | | | | | | | |
| | | |
(Net asset value divided by shares outstanding) | | | | | | | | | | | | |
| | | |
Investor shares | | $ | 59.57 | | | $ | 25.72 | | | $ | 52.45 | |
| | | |
Institutional shares | | $ | 59.75 | | | $ | 25.78 | | | $ | 52.59 | |
19
| | | | |
| | |
| | | | Audited Financial Statements • 2024 |
| | | | | | | | | | |
| | |
Parnassus
Mid Cap
Fund | | | Parnassus
Mid Cap Growth
Fund | | | Parnassus
Fixed Income
Fund | |
| | |
| | | | | | | | | | |
| | |
$ |
2,772,798,485 |
| | $ | 836,304,578 | | | $ | 282,043,557 | |
| | |
| | | | | | | | | | |
| | |
| | 46,147,614 | | | | – | | | | – | |
| | |
| | | | | | | | | | |
| | |
| | 35,220,695 | | | | 6,369,993 | | | | 6,081,604 | |
| | |
| | 30,666 | | | | 17,894 | | | | 9,383 | |
| | |
| | | | | | | | | | |
| | |
| | 1,266,956 | | | | 214,822 | | | | 2,364,140 | |
| | |
| | 2,536,189 | | | | 98,166 | | | | 30,941 | |
| | |
| | 52,469 | | | | 21,537 | | | | 15,280 | |
| | |
| $ | 2,858,053,074 | | | $ | 843,026,990 | | | $ | 290,544,905 | |
| | |
| | | | | | | | | | |
| | |
| | 9,686,000 | | | | – | | | | – | |
| | |
| | 3,370,267 | | | | 309,577 | | | | 559,437 | |
| | |
| | 1,934,934 | | | | 484,894 | | | | 81,797 | |
| | |
| | 620,100 | | | | 272,229 | | | | 164,366 | |
| | |
| $ | 15,611,301 | | | $ | 1,066,700 | | | $ | 805,600 | |
| | |
| $ | 2,842,441,773 | | | $ | 841,960,290 | | | $ | 289,739,305 | |
| | |
| | | | | | | | | | |
| | |
| | 2,188,875,242 | | | | 561,741,019 | | | | 359,978,882 | |
| | |
| | 653,566,531 | | | | 280,219,271 | | | | (70,239,577 | ) |
| | |
| $ | 2,842,441,773 | | | $ | 841,960,290 | | | $ | 289,739,305 | |
| | |
| | | | | | | | | | |
| | |
| $ | 1,265,448,794 | | | $ | 647,286,328 | | | $ | 107,490,978 | |
| | |
| $ | 1,576,992,979 | | | $ | 194,673,962 | | | $ | 182,248,327 | |
| | |
| | 33,829,168 | | | | 11,259,700 | | | | 7,357,910 | |
| | |
| | 41,953,135 | | | | 3,365,106 | | | | 12,461,253 | |
| | |
| | | | | | | | | | |
| | |
| | | | | | | | | | |
| | |
| $ | 37.41 | | | $ | 57.49 | | | $ | 14.61 | |
| | |
| $ | 37.59 | | | $ | 57.85 | | | $ | 14.63 | |
20
| | | | |
| | |
| Audited Financial Statements • 2024 | | | | |
Statement of Operations
Year Ended December 31, 2024
| | | | | | | | | | | | |
| | | |
| | | Parnassus
Core Equity
Fund | | | Parnassus
Growth Equity
Fund | | | Parnassus
Value Equity
Fund | |
| | | |
| Investment income | | | | | | | | | | | | |
| | | |
Dividends – Unaffiliated | | $ | 321,432,870 | | | $ | 263,389 | | | $ | 91,090,941 | |
| | | |
Dividends – Affiliated | | | 11,024,579 | | | | - | | | | 1,881,538 | |
| | | |
Interest | | | 10,059,041 | | | | 27,808 | | | | 1,440,728 | |
| | | |
Securities lending | | | 5,963 | | | | - | | | | 87,104 | |
| | | |
Other income | | | - | | | | 1,956 | | | | - | |
| | | |
Foreign withholding tax | | | (3,820,201 | ) | | | (3,719 | ) | | | (1,165,833 | ) |
| | | |
Total investment income | | $ | 338,702,252 | | | $ | 289,434 | | | $ | 93,334,478 | |
| | | |
| Expenses | | | | | | | | | | | | |
| | | |
Investment advisory fees | | | 168,773,182 | | | | 360,314 | | | | 33,120,729 | |
| | | |
Transfer agent fees | | | | | | | | | | | | |
| | | |
Investor Shares | | | 196,640 | | | | 31,194 | | | | 129,223 | |
| | | |
Institutional Shares | | | 103,029 | | | | 33,946 | | | | 55,577 | |
| | | |
Fund administration | | | 9,228,750 | | | | 15,319 | | | | 1,551,395 | |
| | | |
Service provider fees | | | 26,824,728 | | | | 23,069 | | | | 6,250,470 | |
| | | |
Reports to shareholders | | | 875,194 | | | | 11,706 | | | | 210,366 | |
| | | |
Registration fees and expenses | | | 296,653 | | | | 48,024 | | | | 135,776 | |
| | | |
Custody fees | | | 1,038,813 | | | | 7,985 | | | | 119,417 | |
| | | |
Overdraft charges | | | 2,790 | | | | - | | | | 19,701 | |
| | | |
Professional fees | | | 385,518 | | | | 64,661 | | | | 106,462 | |
| | | |
Trustee fees and expenses | | | 954,821 | | | | 1,441 | | | | 161,169 | |
| | | |
Proxy voting fees | | | 3,844 | | | | 3,844 | | | | 3,844 | |
| | | |
Pricing service fees | | | 8,096 | | | | 8,096 | | | | 8,096 | |
| | | |
Other expenses | | | 259,607 | | | | 10,821 | | | | 54,600 | |
| | | |
Total expenses | | $ | 208,951,665 | | | $ | 620,420 | | | $ | 41,926,825 | |
| | | |
Fees waived and expenses reimbursed by Parnassus Investments | | | (392,679 | ) | | | (274,518 | ) | | | (1,943,811 | ) |
| | | |
Net expenses | | $ | 208,558,986 | | | $ | 345,902 | | | $ | 39,983,014 | |
| | | |
Net investment income (loss) | | $ | 130,143,266 | | | $ | (56,468 | ) | | $ | 53,351,464 | |
| | | |
| Realized and unrealized gain (loss) on investments | | | | | | | | | | | | |
| | | |
Net realized gain (loss) from securities transactions – Unaffiliated | | | 3,854,451,195 | | | | 3,933,390 | | | | 468,796,281 | |
| | | |
Net realized (loss) from securities transactions – Affiliated | | | (63,344,577 | ) | | | - | | | | (440,987 | ) |
| | | |
Net change in unrealized appreciation (depreciation) of securities – Unaffiliated | | | 1,115,624,309 | | | | 6,878,480 | | | | 54,324,463 | |
| | | |
Net change in unrealized appreciation (depreciation) of securities – Affiliated | | | 36,584,432 | | | | - | | | | (2,671,348 | ) |
| | | |
Net realized and unrealized gain (loss) on securities | | $ | 4,943,315,359 | | | $ | 10,811,870 | | | $ | 520,008,409 | |
| | | |
Net increase in net assets resulting from operations | | $ | 5,073,458,625 | | | $ | 10,755,402 | | | $ | 573,359,873 | |
21
| | | | |
| | |
| | | | Audited Financial Statements • 2024 |
| | | | | | | | | | |
| | |
Parnassus
Mid Cap
Fund | | | Parnassus
Mid Cap Growth
Fund | | | Parnassus
Fixed Income
Fund | |
| | |
| | | | | | | | | | |
| | |
| $ | 35,497,847 | | | $ | 3,678,514 | | | $ | 923,327 | |
| | |
| | 784,659 | | | | - | | | | - | |
| | |
| | 1,427,938 | | | | 357,409 | | | | 10,917,862 | |
| | |
| | 7,179 | | | | 2,649 | | | | 1,002 | |
| | |
| | 29 | | | | - | | | | - | |
| | |
| | (369,661 | ) | | | (27,086 | ) | | | - | |
| | |
| $ | 37,347,991 | | | $ | 4,011,486 | | | $ | 11,842,191 | |
| | |
| | | | | | | | | | |
| | |
| | 24,083,643 | | | | 5,259,826 | | | | 1,379,357 | |
| | |
| | | | | | | | | | |
| | |
| | 86,324 | | | | 168,493 | | | | 75,151 | |
| | |
| | 46,982 | | | | 38,635 | | | | 36,889 | |
| | |
| | 1,051,035 | | | | 264,484 | | | | 88,291 | |
| | |
| | 2,329,480 | | | | 703,106 | | | | 170,277 | |
| | |
| | 490,559 | | | | 21,440 | | | | 10,801 | |
| | |
| | 183,210 | | | | 65,600 | | | | 57,252 | |
| | |
| | 81,901 | | | | 18,867 | | | | 8,118 | |
| | |
| | 26,433 | | | | 5,037 | | | | - | |
| | |
| | 113,683 | | | | 80,201 | | | | 80,180 | |
| | |
| | 126,337 | | | | 27,961 | | | | 9,173 | |
| | |
| | 3,844 | | | | 3,844 | | | | - | |
| | |
| | 8,096 | | | | 8,096 | | | | 10,343 | |
| | |
| | 57,853 | | | | 18,875 | | | | 13,643 | |
| | |
| $ | 28,689,380 | | | $ | 6,684,465 | | | $ | 1,939,475 | |
| | |
| | (546,821 | ) | | | (100,492 | ) | | | (617,289 | ) |
| | |
| $ | 28,142,559 | | | $ | 6,583,973 | | | $ | 1,322,186 | |
| | |
| $ | 9,205,432 | | | $ | (2,572,487 | ) | | $ | 10,520,005 | |
| | |
| | | | | | | | | | |
| | |
| | 474,195,040 | | | | 93,637,892 | | | | (4,656,123 | ) |
| | |
| | (57,676,762 | ) | | | (361,063 | ) | | | - | |
| | |
|
(162,686,337 |
) | | | (4,956,478 | ) | | | (344,596 | ) |
| | |
|
57,146,236 |
| | | (49,167 | ) | | | - | |
| | |
| $ | 310,978,177 | | | $ | 88,271,184 | | | $ | (5,000,719 | ) |
| | |
| $ | 320,183,609 | | | $ | 85,698,697 | | | $ | 5,519,286 | |
22
| | | | |
| | |
| Audited Financial Statements • 2024 | | | | |
Statement of Changes in Net Assets
December 31, 2024
| | | | | | | | | | | | | | | | | | | | | | | | |
| | | |
| | | Parnassus Core Equity Fund | | | Parnassus Growth Equity Fund | | | Parnassus Value Equity Fund | |
| | | Year Ended
December 31,
2024 | | | Year Ended
December 31,
2023 | | | Year Ended
December 31,
2024 | | | Year Ended
December 31,
2023 | | | Year Ended
December 31,
2024 | | | Year Ended
December 31,
2023 | |
| | | | | | |
| Investment income from operations | | | | | | | | | | | | | | | | | | | | | | | | |
| | | | | | |
Net investment income (loss) | | $ | 130,143,266 | | | $ | 175,651,833 | | | $ | (56,468 | ) | | $ | 53,147 | | | $ | 53,351,464 | | | $ | 62,495,567 | |
| | | | | | |
Net realized gain (loss) from securities transactions | | | 3,791,106,618 | | | | 1,883,613,738 | | | | 3,933,390 | | | | 603,573 | | | | 468,355,294 | | | | 73,680,697 | |
| | | | | | |
Net change in unrealized appreciation (depreciation) of securities | | | 1,152,208,741 | | | | 3,729,624,120 | | | | 6,878,480 | | | | 6,623,223 | | | | 51,653,115 | | | | 471,396,606 | |
| | | | | | |
Increase in net assets resulting from operations | | $ | 5,073,458,625 | | | $ | 5,788,889,691 | | | $ | 10,755,402 | | | $ | 7,279,943 | | | $ | 573,359,873 | | | $ | 607,572,870 | |
| | | | | | |
| Net Dividends and Distributions | | | | | | | | | | | | | | | | | | | | | | | | |
| | | | | | |
Investor Shares | | | (1,249,928,135 | ) | | | (748,675,071 | ) | | | (1,111,785 | ) | | | (118,942 | ) | | | (244,642,673 | ) | | | (57,508,798 | ) |
| | | | | | |
Institutional Shares | | | (1,504,581,349 | ) | | | (885,452,302 | ) | | | (2,012,799 | ) | | | (392,106 | ) | | | (137,513,890 | ) | | | (32,490,513 | ) |
| | | | | | |
Distributions to shareholders | | $ | (2,754,509,484 | ) | | $ | (1,634,127,373 | ) | | $ | (3,124,584 | ) | | $ | (511,048 | ) | | $ | (382,156,563 | ) | | $ | (89,999,311 | ) |
| | | | | | |
| Capital share transactions | | | | | | | | | | | | | | | | | | | | | | | | |
| | | | | | |
Investor Shares | | | | | | | | | | | | | | | | | | | | | | | | |
| | | | | | |
Proceeds from sale of shares | | | 1,185,905,654 | | | | 1,429,730,222 | | | | 16,920,128 | | | | 7,561,832 | | | | 380,278,384 | | | | 568,039,536 | |
| | | | | | |
Reinvestment of dividends | | | 1,239,789,740 | | | | 742,926,535 | | | | 1,094,552 | | | | 117,437 | | | | 239,679,370 | | | | 56,362,215 | |
| | | | | | |
Shares repurchased | | | (3,105,781,656 | ) | | | (2,351,510,214 | ) | | | (5,411,110 | ) | | | (936,797 | ) | | | (898,939,078 | ) | | | (791,711,396 | ) |
| | | | | | |
Institutional Shares | | | | | | | | | | | | | | | | | | | | | | | | |
| | | | | | |
Proceeds from sale of shares | | | 2,600,890,321 | | | | 2,765,300,719 | | | | 12,516,237 | | | | 6,109,966 | | | | 328,377,689 | | | | 370,760,683 | |
| | | | | | |
Reinvestment of dividends | | | 1,403,587,617 | | | | 824,897,458 | | | | 2,012,799 | | | | 389,407 | | | | 119,635,361 | | | | 27,806,425 | |
| | | | | | |
Shares repurchased | | | (4,425,251,268 | ) | | | (3,677,956,769 | ) | | | (1,596,263 | ) | | | (275,880 | ) | | | (455,424,142 | ) | | | (434,725,087 | ) |
| | | | | | |
Increase (decrease) in net assets from capital share transactions | | | (1,100,859,592 | ) | | | (266,612,049 | ) | | | 25,536,343 | | | | 12,965,965 | | | | (286,392,416 | ) | | | (203,467,624 | ) |
| | | | | | |
Increase (decrease) in net assets | | $ | 1,218,089,549 | | | $ | 3,888,150,269 | | | $ | 33,167,161 | | | $ | 19,734,860 | | | $ | (95,189,106 | ) | | $ | 314,105,935 | |
| | | | | | |
| Net Assets | | | | | | | | | | | | | | | | | | | | | | | | |
| | | | | | |
Beginning of year | | | 27,798,334,925 | | | | 23,910,184,656 | | | | 30,535,420 | | | | 10,800,560 | | | | 4,920,380,032 | | | | 4,606,274,097 | |
| | | | | | |
End of year | | $ | 29,016,424,474 | | | $ | 27,798,334,925 | | | $ | 63,702,581 | | | $ | 30,535,420 | | | $ | 4,825,190,926 | | | $ | 4,920,380,032 | |
| | | | | | |
| Shares issued and redeemed | | | | | | | | | | | | | | | | | | | | | | | | |
| | | | | | |
Investor Shares | | | | | | | | | | | | | | | | | | | | | | | | |
| | | | | | |
Shares sold | | | 19,551,553 | | | | 27,589,143 | | | | 695,630 | | | | 403,821 | | | | 7,048,138 | | | | 12,182,448 | |
| | | | | | |
Shares issued through dividend reinvestment | | | 20,010,422 | | | | 14,200,348 | | | | 40,965 | | | | 5,608 | | | | 4,346,120 | | | | 1,161,573 | |
| | | | | | |
Shares repurchased | | | (50,716,521 | ) | | | (45,353,199 | ) | | | (219,336 | ) | | | (48,693 | ) | | | (16,585,105 | ) | | | (16,896,050 | ) |
| | | | | | |
Institutional Shares | | | | | | | | | | | | | | | | | | | | | | | | |
| | | | | | |
Shares sold | | | 42,889,201 | | | | 53,206,007 | | | | 510,879 | | | | 346,058 | | | | 6,033,600 | | | | 7,868,346 | |
| | | | | | |
Shares issued through dividend reinvestment | | | 22,580,225 | | | | 15,720,432 | | | | 75,129 | | | | 18,596 | | | | 2,162,863 | | | | 570,584 | |
| | | | | | |
Shares repurchased | | | (71,700,023 | ) | | | (70,675,669 | ) | | | (63,742 | ) | | | (14,536 | ) | | | (8,387,342 | ) | | | (9,269,262 | ) |
| | | | | | |
Net increase (decrease) in shares outstanding | | | | | | | | | | | | | | | | | | | | | | | | |
| | | | | | |
Investor Shares | | | (11,154,546 | ) | | | (3,563,708 | ) | | | 517,259 | | | | 360,736 | | | | (5,190,847 | ) | | | (3,552,029 | ) |
| | | | | | |
Institutional Shares | | | (6,230,597 | ) | | | (1,749,230 | ) | | | 522,266 | | | | 350,118 | | | | (190,879 | ) | | | (830,332 | ) |
23
| | | | |
| | |
| | | | Audited Financial Statements • 2024 |
| | | | | | | | | | | | | | | | | | | | | | |
| | |
| Parnassus Mid Cap Fund | | | Parnassus Mid Cap Growth Fund | | | Parnassus Fixed Income Fund | |
Year Ended
December 31,
2024 | | | Year Ended
December 31,
2023 | | | Year Ended
December 31,
2024 | | | Year Ended
December 31,
2023 | | | Year Ended
December 31,
2024 | | | Year Ended
December 31,
2023 | |
| | | | | |
| | | | | | | | | | | | | | | | | | | | | | |
| | | | | |
| $ | 9,205,432 | | | $ | 24,250,221 | | | $ | (2,572,487 | ) | | $ | (2,017,466 | ) | | $ | 10,520,005 | | | $ | 9,133,639 | |
| | | | | |
| 416,518,278 | | | | 98,054,588 | | | | 93,276,829 | | | | 33,041,887 | | | | (4,656,123 | ) | | | (17,069,548 | ) |
| | | | | |
| (105,540,101 | ) | | | 515,546,777 | | | | (5,005,645 | ) | | | 192,813,842 | | | | (344,596 | ) | | | 25,853,643 | |
| | | | | |
$ | 320,183,609 | | | $ | 637,851,586 | | | $ | 85,698,697 | | | $ | 223,838,263 | | | $ | 5,519,286 | | | $ | 17,917,734 | |
| | | | | |
| | | | | | | | | | | | | | | | | | | | | | |
| | | | | |
| | (119,700,643 | ) | | | (35,431,185 | ) | | | (45,276,787 | ) | | | (17,988,852 | ) | | | (4,156,404 | ) | | | (4,001,945 | ) |
| | | | | |
| | (152,885,979 | ) | | | (96,571,449 | ) | | | (13,512,059 | ) | | | (4,910,790 | ) | | | (6,694,408 | ) | | | (4,970,263 | ) |
| | | | | |
| $ | (272,586,622 | ) | | $ | (132,002,634 | ) | | $ | (58,788,846 | ) | | $ | (22,899,642 | ) | | $ | (10,850,812 | ) | | $ | (8,972,208 | ) |
| | | | | |
| | | | | | | | | | | | | | | | | | | | | | |
| | | | | |
| | | | | | | | | | | | | | | | | | | | | | |
| | | | | |
| | 112,382,786 | | | | 165,924,493 | | | | 27,067,157 | | | | 27,028,916 | | | | 12,412,965 | | | | 19,600,024 | |
| | | | | |
| | 117,978,275 | | | | 34,261,123 | | | | 44,272,513 | | | | 17,626,660 | | | | 4,012,637 | | | | 3,865,642 | |
| | | | | |
| | (458,248,133 | ) | | | (843,213,613 | ) | | | (90,484,658 | ) | | | (70,413,362 | ) | | | (25,685,727 | ) | | | (40,475,030 | ) |
| | | | | |
| | | | | | | | | | | | | | | | | | | | | | |
| | | | | |
| | 230,699,125 | | | | 885,175,226 | | | | 21,005,542 | | | | 16,472,593 | | | | 47,256,969 | | | | 43,570,687 | |
| | | | | |
| | 132,926,972 | | | | 88,763,680 | | | | 12,595,641 | | | | 4,589,891 | | | | 6,175,669 | | | | 4,607,953 | |
| | | | | |
| | (2,739,694,715 | ) | | | (1,515,164,518 | ) | | | (27,685,781 | ) | | | (26,449,136 | ) | | | (29,518,206 | ) | | | (38,123,601 | ) |
| | | | | |
| (2,603,955,690 | ) | | | (1,184,253,609 | ) | | | (13,229,586 | ) | | | (31,144,438 | ) | | | 14,654,307 | | | | (6,954,325 | ) |
| | | | | |
| $ | (2,556,358,703 | ) | | $ | (678,404,657 | ) | | $ | 13,680,265 | | | $ | 169,794,183 | | | $ | 9,322,781 | | | $ | 1,991,201 | |
| | | | | |
| | | | | | | | | | | | | | | | | | | | | | |
| | | | | |
| | 5,398,800,476 | | | | 6,077,205,133 | | | | 828,280,025 | | | | 658,485,842 | | | | 280,416,524 | | | | 278,425,323 | |
| | | | | |
| $ | 2,842,441,773 | | | $ | 5,398,800,476 | | | $ | 841,960,290 | | | $ | 828,280,025 | | | $ | 289,739,305 | | | $ | 280,416,524 | |
| | | | | |
| | | | | | | | | | | | | | | | | | | | | | |
| | | | | |
| | | | | | | | | | | | | | | | | | | | | | |
| | | | | |
| | 2,833,761 | | | | 4,788,590 | | | | 457,586 | | | | 548,287 | | | | 842,301 | | | | 1,350,182 | |
| | | | | |
| 2,960,505 | | | | 992,424 | | | | 715,573 | | | | 352,181 | | | | 272,889 | | | | 267,847 | |
| | | | | |
| | (11,620,763 | ) | | | (24,399,581 | ) | | | (1,525,494 | ) | | | (1,450,794 | ) | | | (1,749,871 | ) | | | (2,819,587 | ) |
| | | | | |
| | | | | | | | | | | | | | | | | | | | | | |
| | | | | |
| | 5,867,469 | | | | 25,476,890 | | | | 351,648 | | | | 327,727 | | | | 3,201,130 | | | | 3,024,457 | |
| | | | | |
| 3,320,012 | | | | 2,546,029 | | | | 202,307 | | | | 91,287 | | | | 419,425 | | | | 319,129 | |
| | | | | |
| | (72,036,254 | ) | | | (43,818,164 | ) | | | (467,419 | ) | | | (542,010 | ) | | | (2,002,750 | ) | | | (2,638,092 | ) |
| | | | | |
| | | | | | | | | | | | | | | | | | | | | | |
| | | | | |
| | (5,826,497 | ) | | | (18,618,567 | ) | | | (352,335 | ) | | | (550,326 | ) | | | (634,681 | ) | | | (1,201,558 | ) |
| | | | | |
| | (62,848,773 | ) | | | (15,795,245 | ) | | | 86,536 | | | | (122,996 | ) | | | 1,617,805 | | | | 705,494 | |
The accompanying notes are an integral part of these financial statements.
24
| | | | |
| | |
| Audited Financial Statements • 2024 | | | | |
Notes to Financial Statements
1. Organization
The Parnassus Funds are comprised of two Trusts, the Parnassus Funds trust and the Parnassus Income Funds trust (collectively the “Trusts”), organized as Massachusetts business trusts registered under the Investment Company Act of 1940, as amended (the “1940 Act”), as diversified, open-end management investment companies. The Parnassus Funds are comprised of six separate funds (each a “Fund” and, collectively, the “Funds”). The Parnassus Funds trust includes the Parnassus Mid Cap Growth Fund, which commenced operations on December 27, 1984, the Parnassus Value Equity Fund and the Parnassus Mid Cap Fund, both of which commenced operations on April 29, 2005, and the Parnassus Growth Equity Fund which commenced operation on December 28, 2022. The Parnassus Income Funds trust includes the Parnassus Core Equity Fund and the Parnassus Fixed Income Fund, both of which commenced operations on August 31, 1992, as well as the Parnassus ETFs which are presented in separate financial statements. Each Fund has distinct investment objectives and investment strategies. In general, each of the Funds seeks capital appreciation.
2. Significant Accounting Policies
Each Fund operates as a separate investment company that applies the accounting and reporting guidance issued in Accounting Standards Codification (“ASC”) Topic 946, Financial Services—Investment Companies issued by the Financial Accounting Standards Board (“FASB”). The presentation of the financial statements is made using specialized accounting principles applicable to investment companies.
Short-Term Securities
Short-term securities represent investments of excess cash and consist of time deposits, community development loans, certificates of deposit and money market funds.
Security Transactions and Related Investment Income and Expenses
Securities transactions are recorded on the date the securities are purchased or sold (trade date). Realized gains and losses on securities transactions are determined on the basis of first-in-first-out for both financial statement and federal income tax purposes. Dividend income is recognized on the ex-dividend date and interest income is recognized on an accrual basis. Discounts and premiums on securities purchased are amortized over the lives of the respective securities using the constant yield method,
which approximates the interest method. Expenses are recorded on an accrual basis.
Class Allocations
Income, fees and expenses (other than class-specific fees and expenses) and realized and unrealized gains and losses are allocated daily among the various share classes based on their relative net assets. Class-specific fees and expenses, such as broker service fees, and administrative and shareholder service fees, are charged directly to the respective share class.
Dividends and Distributions to Shareholders
Dividends and distributions to shareholders are recorded on the ex-dividend date to shareholders of record on the record date. The Parnassus Core Equity Fund pays income dividends quarterly and capital-gain dividends annually. The Parnassus Fixed Income Fund pays income dividends monthly and capital-gain dividends annually. The other Funds pay income and capital-gain dividends annually.
3. Securities Valuations
Methods and Inputs
The Funds’ investments in financial instruments are carried at fair value daily. Fair value is the price that would be received to sell an asset or paid to transfer a liability in an orderly transaction between market participants on the measurement date. When market quotations are not readily available the Funds’ Valuation Designee (as defined below) determines the fair value pursuant to duly adopted fair value methodologies. In compliance with Rule 2a-5 under the 1940 Act, the Board of Trustees of each Trust (collectively, the “Board”) has designated the Funds’ investment manager, Parnassus Investments, LLC (“Parnassus Investments” or the “Adviser”), as its valuation designee (the “Valuation Designee”), meaning the Adviser has day-to-day responsibility for fair valuation of the Funds’ portfolio investments, subject to the Board’s oversight.
Equity securities and exchange-traded funds that are listed or traded on a national securities exchange are stated at market value, based on recorded closing sales on the exchange or at the NASDAQ’s National Market official closing price. In the absence of a recorded sale, and for over-the-counter securities, equity securities are stated at the mean between the last recorded bid and asked prices. Investments in registered investment
25
| | | | |
| | |
| | | | Audited Financial Statements • 2024 |
Notes to Financial Statements (continued)
companies that are not listed or traded on a national securities exchange are valued at their net asset value.
Fixed-income securities with an active market are valued at the “bid” price where such quotes are readily available from brokers and dealers and are representative of the actual market for such securities. Other fixed-income securities experiencing a less active market are valued as determined by the pricing services selected by the Valuation Designee, based on methods which include consideration of trading in securities of comparable yield, quality, coupon, maturity and type, as well as indications as to values from dealers and other market data without exclusive reliance upon quoted prices or over-the-counter prices, since such valuations are believed to reflect more accurately the value of such securities. Mortgage-backed and asset-backed securities are valued as determined by the pricing services selected by the Valuation Designee, based on methods which include standard inputs and cashflows, prepayment information, default rates, delinquency and loss assumptions, collateral characteristics, credit enhancements and specific deal information.
As noted above, investments where market quotations are not readily available are priced at their fair value, in accordance with fair value methodologies established by the Valuation Designee. These investments include certificates of deposit and community development loans. These investments carry interest rates ranging from 0.05% to 4.60% with maturities of one year or less. In determining fair value, the Valuation Designee may consider a variety of information including, but not limited to, the following: price based upon a multiple of earnings or sales, fundamental analytical data and an evaluation of market conditions. A valuation adjustment is applied to certificates of deposit, community development loans and other community development investments as an estimate of potential penalties for early withdrawal.
The Funds follow ASC Topic 820, Fair Value Measurements and Disclosure issued by the FASB, which defines fair value, establishes a framework for measuring fair value and expands disclosures about fair value measurements. Various inputs are used in determining the value of the Funds’ portfolio investments. These inputs are summarized in three levels, Level 1—unadjusted quoted prices in active markets for identical investments, Level 2—other significant observable inputs (including quoted prices for similar investments) and Level 3—significant unobservable inputs (including a Fund’s own assumptions in determining the fair value of investments).
Securities Lending
The Parnassus Funds have entered into an agreement with Brown Brothers Harriman & Co., (the “Agreement”), to provide securities lending services to the Funds. Under this program, the proceeds (cash collateral) received from borrowers are used to invest in money market funds.
Under the Agreement, the borrowers pay the Funds negotiated lenders’ fees and the Funds receive cash or other collateral in an amount equal to at least 102% of the market value of the loaned securities. The borrower of securities is at all times required to post collateral to the portfolio in an amount equal to 100% of the market value of the securities loaned based on the previous day’s market value of the securities loaned, marked-to-market daily. Any collateral shortfalls are adjusted the next business day. If the borrower defaults on its obligations to return the securities loaned because of insolvency or other reasons, the portfolio could experience delays and costs in recovering the securities loaned.
The Agreement provides the right in the event of default for the non-defaulting party to liquidate the collateral and calculate a net exposure to the defaulting party or request additional collateral. In the event that a borrower defaults, the Funds, as lender, would offset the market value of the collateral received against the market value of the securities loaned. When the value of the collateral is greater than that of the market value of the securities loaned, the lender is left with a net amount payable to the defaulting party. However, bankruptcy or insolvency laws of a particular jurisdiction may impose restrictions on or prohibitions against such a right of offset in the event of a counterparty’s bankruptcy or insolvency. Under the Agreement, the borrower can resell or re-pledge the loaned securities, and the Funds can reinvest applicable collateral, or, upon an event of default, resell or re-pledge the collateral.
The Funds retained beneficial ownership and all economic benefits in the securities they have loaned and continue to receive interest paid by the securities and payments equivalent to dividends, and to participate in any changes in their market value, but do not have the proxy voting rights with respect to loaned securities. The portfolio managers of the Funds have the responsibility to request that the securities lending agent call back securities which are out on loan to vote
26
| | | | |
| | |
| Audited Financial Statements • 2024 | | | | |
Notes to Financial Statements (continued)
on material matters and it is the Funds’ policy that the portfolio managers vote on all material matters. However, the ability to timely recall shares for proxy voting purposes typically is not entirely within the control of the portfolio managers, the Funds or their securities lending agent. Under certain circumstances, the recall of shares in time for such shares to be voted may not be possible due to applicable proxy voting record dates and administrative considerations.
Income generated from securities lending is presented in the Statement of Operations. Cash collateral received
by the Funds is reflected as an asset in the Portfolio of Investments (securities purchased with cash collateral from securities lending). The related liability (payable upon return of securities loaned) is presented in the Statement of Assets and Liabilities.
As of December 31, 2024, the following tables are a summary of the Funds’ securities lending agreements by counterparty, which are subject to offset under the Agreement:
| | | | | | | | | | | | | | | | | | | | |
| |
| | | | Parnassus Value Equity Fund | |
| | | | Counterparty | | Securities Loaned at Value | | | Cash Collateral
Received1 | | | Net
Amount | | | | |
| | | | Barclays Capital Inc. | | | 4,879,099 | | | | (4,879,099 | ) | | | - | | | | | |
| | | | BNP Paribas Securities Corp. | | | 7,751,025 | | | | (7,751,025 | ) | | | - | | | | | |
| | | | Morgan Stanley & Co., LLC | | | 5,614,000 | | | | (5,614,000 | ) | | | - | | | | | |
| | | | National Financial Services LLC | | | 238,728 | | | | (238,728 | ) | | | - | | | | | |
| | | | Total | | | 18,482,852 | | | | (18,482,852 | ) | | | - | | | | | |
| |
| | | | Parnassus Mid Cap Fund | |
| | | | Counterparty | | Securities Loaned at Value | | | Cash Collateral
Received1 | | | Net
Amount | | | | |
| | | | BofA Securities Inc. | | | 9,375,380 | | | | (9,375,380 | ) | | | - | | | | | |
| | | | Total | | | 9,375,380 | | | | (9,375,380 | ) | | | - | | | | | |
1 Collateral values of $18,925,463 and $9,686,000 have been received in connection with securities lending agreements for Parnassus Value Equity Fund and Parnassus Mid Cap Fund, respectively. Collateral received in excess of the value of the securities loaned from the individual counterparty is shown for financial reporting purposes in the Funds’ financial statements.
As of December 31, 2024, the contractual maturity date is overnight and continuous for the gross obligation of the equity securities on loan in the Parnassus Value Equity Fund of $18,925,463 and in the Parnassus Mid Cap Fund of $9,686,000.
Community Development Investment Programs
The Parnassus Funds may each invest up to 2% of their assets in community investments and community-development loan funds. Each of the Funds may invest in obligations issued by community loan funds at below-market interest rates if the projects financed have a positive social impact, as determined by the Adviser. Generally, there is no secondary market on loan funds and thus loan funds are considered illiquid.
As part of our community development investment program, the Parnassus Core Equity Fund, Parnassus Value Equity Fund and Parnassus Mid Cap Growth Fund have entered into an agreement for fund investments through the Certificate of Deposit Account Registry Service (“CDARS”) network. The CDARS network allows members to place funds in time deposits with depository institutions whose accounts are insured by the Federal Deposit Insurance Corporation (“FDIC”). Provisions stipulate that participating institutions are FDIC insured; however, in the event of default or bankruptcy by any party to the agreement, the proceeds of the investment may be delayed or subject to legal proceedings and are subject to FDIC limits. While certain investments of the Funds may be bank deposits and may be covered by FDIC insurance, the Funds are themselves not covered by FDIC insurance.
27
| | | | |
| | |
| | | | Audited Financial Statements • 2024 |
Notes to Financial Statements (continued)
Use of Estimates
The preparation of financial statements in conformity with U.S. Generally Accepted Accounting Principles (“GAAP”) requires management to make estimates and assumptions that affect the reported amounts of assets and liabilities at the date of the financial statements and the reported amount of revenues and expenses during the reporting period. Actual results could differ from those estimates.
4. Risk Factors
Investing in the Parnassus Funds may involve certain risks including, but not limited to those identified below. Please refer to the Funds’ current prospectus and statement of additional information for more information on the risks associated with investing in the Funds.
Market Conditions
The prices of, and the income generated by, the common stocks and other securities held by the Funds may decline in response to certain events taking place around the world, including those directly involving the companies whose securities are owned by the Funds; conditions affecting the general economy; overall market changes; local, regional or global political, social or economic instability; and public health emergencies (such as the spread of infectious disease); and currency, interest rate and commodity price fluctuations. Additionally, the values of, and the income generated by, most debt securities held by the Funds may be affected by changing interest rates and by changes in the effective maturities and credit ratings of these debt securities. The Adviser attempts to reduce these risks through diversification of each portfolio and ongoing credit analysis as well as by monitoring economic and legislative developments, but there can be no assurance that it will be successful at doing so. Investments in securities issued by entities based outside the U.S. may also be affected by currency controls; different accounting, auditing, financial reporting, and legal standards and practices; expropriation; changes in tax policy; greater market volatility; different securities market structures and higher transaction costs.
Investing Outside the U.S.
Securities of issuers domiciled outside the U.S., or with significant operations outside the U.S., may lose value because of political, social, economic or market developments or instability in the countries or regions
in which the issuer operates. These securities may also lose value due to changes in foreign currency exchange rates against the U.S. dollar and/or currencies of other countries. Securities markets in certain countries may be more volatile and/or less liquid than those in the U.S. Investment outside the U.S. may also be subject to different settlement and accounting practices and different regulatory, legal and reporting standards, and may be more difficult to value, than those in the U.S. The risks of investing outside the U.S. may be heightened in connection with investments in emerging and developing countries.
Contractual Obligations
Under the Trusts’ organizational documents, the officers and Trustees may be indemnified against certain liabilities and expenses arising out of the performance of their duties to the Trusts. Additionally, the Trusts have a variety of indemnification obligations under contracts with service providers. The Trusts’ maximum exposure under these arrangements is unknown, as this would involve future claims that may be made against the Trusts that have not yet occurred.
5. Taxation and Distributions
Federal Income Taxes
The Funds intend to comply with the requirements of the Internal Revenue Code applicable to regulated investment companies and to distribute all taxable income and capital gains to shareholders. Therefore, no federal income tax provision is required. Income distributions and capital-gain distributions are determined in accordance with income tax regulations, which may differ from GAAP.
The Funds follow ASC 740, Income Taxes, relating to uncertainty in income taxes and disclosures. ASC 740 establishes a minimum threshold for income tax benefits to be recognized in the financial statements. These tax benefits must meet a “more likely than not” threshold, which means that based on technical merits, they have a more than 50% likelihood of being sustained upon examination by the tax authority. Tax benefits meeting this threshold are measured as the largest amount of tax benefit that is greater than 50% likely of being realized upon ultimate settlement with the tax authority. As of and during the year ended December 31, 2024, the Funds did not have a liability for any unrecognized tax benefits. The Funds recognize interest and penalties, if any, related to unrecognized tax benefits as income tax expense in the
28
| | | | |
| | |
| Audited Financial Statements • 2024 | | | | |
Notes to Financial Statements (continued)
Statement of Operations. During the year, the Funds did not incur interest or penalties. As of December 31, 2024, the Funds had no tax examinations or audits in progress.
Tax Matters and Distributions
As of December 31, 2024, the cost of investments in securities and net unrealized appreciation/depreciation for income tax purposes were as follows:
| | | | | | | | | | | | | | | | | | | | | | | | | | | | | | | | |
| | | | | | | | |
| | | | | | Parnassus Core
Equity Fund | | | Parnassus Growth
Equity Fund | | | Parnassus Value
Equity Fund | | | Parnassus
Mid Cap Fund | | | Parnassus
Mid Cap
Growth Fund | | | Parnassus
Fixed Income Fund | | | | |
| | | | Cost of investment | | $ | 20,938,635,897 | | | $ | 50,036,146 | | | $ | 3,842,978,843 | | | $ | 2,264,037,116 | | | $ | 603,545,773 | | | $ | 301,512,299 | | | | | |
| | | | Gross unrealized appreciation | | $ | 8,525,610,036 | | | $ | 14,101,141 | | | $ | 1,187,111,019 | | | $ | 666,571,234 | | | $ | 245,579,126 | | | $ | 2,183,078 | | | | | |
| | | | Gross unrealized depreciation | | $ | (425,403,927 | ) | | $ | (654,738 | ) | | $ | (184,339,368 | ) | | $ | (76,441,556 | ) | | $ | (6,450,328 | ) | | $ | (15,570,216 | ) | | | | |
| | | | Net unrealized appreciation (depreciation) | | $ | 8,100,206,109 | | | $ | 13,446,403 | | | $ | 1,002,771,651 | | | $ | 590,129,678 | | | $ | 239,128,798 | | | $ | (13,387,138 | ) | | | | |
| | | | Distributable earnings – ordinary income | | $ | 2,311,315 | | | $ | – | | | $ | 2,469,087 | | | $ | 861,767 | | | $ | – | | | $ | (108,925 | ) | | | | |
| | | | Distributable earnings – long-term capital gains | | $ | 1,567,638,784 | | | $ | 749,743 | | | $ | 88,771,231 | | | $ | 57,082,917 | | | $ | 40,658,750 | | | $ | (57,421,735 | ) | | | | |
| | | | Undistributed earnings – ordinary income | | $ | – | | | $ | 140,070 | | | $ | 2,543,067 | | | $ | 50,095,572 | | | $ | – | | | $ | 47,243 | | | | | |
| | | | Undistributed earnings – long-term capital gains | | $ | 1,584,376,478 | | | $ | 624,679 | | | $ | 97,498,645 | | | $ | 13,341,282 | | | $ | 41,090,474 | | | $ | – | | | | | |
| | | | | | | | | | | | | | | | | | | | | | | | | | | | | | | | |
| | | | | |
| | | | | | Parnassus Core
Equity Fund | | | Parnassus Growth
Equity Fund | | | Parnassus Value
Equity Fund | | | | |
| | | | Distributions paid from: | | 2024 | | | 2023 | | | 2024 | | | 2023 | | | 2024 | | | 2023 | | | | |
| | | | Ordinary Income | | $ | 141,221,060 | | | $ | 184,140,171 | | | $ | 584,753 | | | $ | 511,048 | | | $ | 71,781,455 | | | $ | 62,002,368 | | | | | |
| | | | Long-term capital gains | | $ | 2,613,288,424 | | | $ | 1,449,987,202 | | | $ | 2,539,831 | | | $ | – | | | $ | 310,375,108 | | | $ | 27,996,943 | | | | | |
| | | | Total distributions | | $ | 2,754,509,484 | | | $ | 1,634,127,373 | | | $ | 3,124,584 | | | $ | 511,048 | | | $ | 382,156,563 | | | $ | 89,999,311 | | | | | |
| | | | | | | | | | | | | | | | | | | | | | | | | | | | | | | | |
| | | | | |
| | | | | | Parnassus Mid
Cap Fund | | | Parnassus Mid
Cap Growth Fund | | | Parnassus Fixed
Income Fund | | | | |
| | | | Distributions paid from: | | 2024 | | | 2023 | | | 2024 | | | 2023 | | | 2024 | | | 2023 | | | | |
| | | | Ordinary Income | | $ | 139,846,151 | | | $ | 26,996,519 | | | $ | – | | | $ | – | | | $ | 10,850,812 | | | $ | 8,972,208 | | | | | |
| | | | Long-term capital gains | | $ | 132,740,471 | | | $ | 105,006,115 | | | $ | 58,788,846 | | | $ | 22,899,642 | | | $ | – | | | $ | – | | | | | |
| | | | Total distributions | | $ | 272,586,622 | | | $ | 132,002,634 | | | $ | 58,788,846 | | | $ | 22,899,642 | | | $ | 10,850,812 | | | $ | 8,972,208 | | | | | |
Net unrealized gain/loss differ for financial statement and income tax purposes primarily due to differing treatments of wash sales and return of capital distributions from real estate investment trusts (“REITS”). Reclassifications as shown in the following table have been made in each Fund’s capital accounts to report
these balances on a tax basis, excluding certain temporary differences, as of December 31, 2024. Additional permanent book to tax adjustments may be required in subsequent reporting periods. These reclassifications, which have no impact on the net asset value of the Funds, primarily relate to the utilization of
29
| | | | |
| | |
| | | | Audited Financial Statements • 2024 |
Notes to Financial Statements (continued)
earnings and profits distributed to shareholders on redemption of shares, net operating losses, and certain differences in the computation of distributable income and capital gains under Federal tax rules versus GAAP.
For tax purposes, net realized capital losses may be carried over to offset future capital gains, if any. Funds are permitted to carry forward capital losses for an
indefinite period, and such losses will retain their character as either short-term or long-term capital losses.
As of December 31, 2024, Parnassus Fixed Income Fund had a net short-term capital loss carry forward of $11,307,891 and a net long-term capital loss carry forward of $45,591,791 .
| | | | | | | | | | | | | | | | |
| | | | |
| | | | Fund | | Increase/Decrease
in Total
Distributable
Earnings | | | Increase/Decrease in
Aggregate Capital
Paid-In | | | | |
| | | | Parnassus Core Equity Fund | | $ | (213,141,688 | ) | | $ | 213,141,688 | | | | | |
| | | | Parnassus Growth Equity Fund | | | (171,432 | ) | | | 171,432 | | | | | |
| | | | Parnassus Value Equity Fund | | | (52,043,868 | ) | | | 52,043,868 | | | | | |
| | | | Parnassus Mid Cap Fund | | | (152,070,659 | ) | | | 152,070,659 | | | | | |
| | | | Parnassus Mid Cap Growth Fund | | | (1,638,438 | ) | | | 1,638,438 | | | | | |
6. Fair Value Measurements
The following table summarizes the Funds’ financial assets as of December 31, 2024, that are valued at fair value on a recurring basis:
| | | | | | | | | | | | | | | | | | | | | | | | |
| | |
| | | | Parnassus Core Equity Fund | | | | | |
| | | | | | |
| | | | Investment Securities | | Level 1 | | | Level 2 | | | Level 3 | | | Total | | | | |
| | | | Equities: | | | | | | | | | | | | | | | | | | | | |
| | | | | | |
| | | | Communication Services | | $ | 1,864,557,132 | | | $ | - | | | $ | - | | | $ | 1,864,557,132 | | | | | |
| | | | | | |
| | | | Consumer Discretionary | | | 3,336,154,214 | | | | - | | | | - | | | | 3,336,154,214 | | | | | |
| | | | | | |
| | | | Consumer Staples | | | 975,856,355 | | | | - | | | | - | | | | 975,856,355 | | | | | |
| | | | | | |
| | | | Financials | | | 4,576,621,352 | | | | - | | | | - | | | | 4,576,621,352 | | | | | |
| | | | | | |
| | | | Health Care | | | 3,405,574,284 | | | | - | | | | - | | | | 3,405,574,284 | | | | | |
| | | | | | |
| | | | Industrials | | | 3,245,980,445 | | | | - | | | | - | | | | 3,245,980,445 | | | | | |
| | | | | | |
| | | | Information Technology | | | 8,596,634,760 | | | | - | | | | - | | | | 8,596,634,760 | | | | | |
| | | | | | |
| | | | Materials | | | 1,870,457,611 | | | | - | | | | - | | | | 1,870,457,611 | | | | | |
| | | | | | |
| | | | Real Estate | | | 916,663,439 | | | | - | | | | - | | | | 916,663,439 | | | | | |
| | | | | | |
| | | | Short-Term Investments | | | 246,665,756 | | | | - | | | | 3,676,658 | | | | 250,342,414 | | | | | |
| | | | Total | | $ | 29,035,165,348 | | | $ | - | | | $ | 3,676,658 | | | $ | 29,038,842,006 | | | | | |
30
| | | | |
| | |
| Audited Financial Statements • 2024 | | | | |
Notes to Financial Statements (continued)
| | | | | | | | | | | | | | | | | | | | | | | | |
| | |
| | | | Parnassus Growth Equity Fund | | | | | |
| | | | | | |
| | | | Investment Securities | | Level 1 | | | Level 2 | | | Level 3 | | | Total | | | | |
| | | | Equities: | | | | | | | | | | | | | | | | | | | | |
| | | | | | |
| | | | Communication Services | | $ | 5,105,095 | | | $ | - | | | $ | - | | | $ | 5,105,095 | | | | | |
| | | | | | |
| | | | Consumer Discretionary | | | 6,461,693 | | | | - | | | | - | | | | 6,461,693 | | | | | |
| | | | | | |
| | | | Consumer Staples | | | 1,245,211 | | | | - | | | | - | | | | 1,245,211 | | | | | |
| | | | | | |
| | | | Financials | | | 7,066,376 | | | | - | | | | - | | | | 7,066,376 | | | | | |
| | | | | | |
| | | | Health Care | | | 8,106,987 | | | | - | | | | - | | | | 8,106,987 | | | | | |
| | | | | | |
| | | | Industrials | | | 2,451,725 | | | | - | | | | - | | | | 2,451,725 | | | | | |
| | | | | | |
| | | | Information Technology | | | 30,078,470 | | | | - | | | | - | | | | 30,078,470 | | | | | |
| | | | | | |
| | | | Materials | | | 1,800,348 | | | | - | | | | - | | | | 1,800,348 | | | | | |
| | | | | | |
| | | | Real Estate | | | 791,857 | | | | - | | | | - | | | | 791,857 | | | | | |
| | | | | | |
| | | | Short-Term Investments | | | 374,787 | | | | - | | | | - | | | | 374,787 | | | | | |
| | | | Total | | $ | 63,482,549 | | | $ | - | | | $ | - | | | $ | 63,482,549 | | | | | |
| | |
| | | | Parnassus Value Equity Fund | | | | | |
| | | | | | |
| | | | Investment Securities | | Level 1 | | | Level 2 | | | Level 3 | | | Total | | | | |
| | | | Equities: | | | | | | | | | | | | | | | | | | | | |
| | | | | | |
| | | | Communication Services | | $ | 347,992,728 | | | $ | - | | | $ | - | | | $ | 347,992,728 | | | | | |
| | | | | | |
| | | | Consumer Discretionary | | | 418,857,219 | | | | - | | | | - | | | | 418,857,219 | | | | | |
| | | | | | |
| | | | Consumer Staples | | | 156,030,240 | | | | - | | | | - | | | | 156,030,240 | | | | | |
| | | | | | |
| | | | Financials | | | 1,233,910,416 | | | | - | | | | - | | | | 1,233,910,416 | | | | | |
| | | | | | |
| | | | Health Care | | | 886,173,341 | | | | - | | | | - | | | | 886,173,341 | | | | | |
| | | | | | |
| | | | Industrials | | | 475,031,306 | | | | - | | | | - | | | | 475,031,306 | | | | | |
| | | | | | |
| | | | Information Technology | | | 799,967,087 | | | | - | | | | - | | | | 799,967,087 | | | | | |
| | | | | | |
| | | | Materials | | | 127,249,357 | | | | - | | | | - | | | | 127,249,357 | | | | | |
| | | | | | |
| | | | Real Estate | | | 275,574,934 | | | | - | | | | - | | | | 275,574,934 | | | | | |
| | | | | | |
| | | | Utilities | | | 73,786,867 | | | | - | | | | - | | | | 73,786,867 | | | | | |
| | | | | | |
| | | | Short-Term Investments | | | 50,086,564 | | | | - | | | | 1,090,435 | | | | 51,176,999 | | | | | |
| | | | Total | | $ | 4,844,660,059 | | | $ | - | | | $ | 1,090,435 | | | $ | 4,845,750,494 | | | | | |
| | |
| | | | Parnassus Mid Cap Fund | | | | | |
| | | | | | |
| | | | Investment Securities | | Level 1 | | | Level 2 | | | Level 3 | | | Total | | | | |
| | | | Equities: | | | | | | | | | | | | | | | | | | | | |
| | | | | | |
| | | | Communication Services | | $ | 77,475,541 | | | $ | - | | | $ | - | | | $ | 77,475,541 | | | | | |
| | | | | | |
| | | | Consumer Discretionary | | | 337,128,300 | | | | - | | | | - | | | | 337,128,300 | | | | | |
| | | | | | |
| | | | Financials | | | 551,817,190 | | | | - | | | | - | | | | 551,817,190 | | | | | |
| | | | | | |
| | | | Health Care | | | 185,186,595 | | | | - | | | | - | | | | 185,186,595 | | | | | |
| | | | | | |
| | | | Industrials | | | 702,814,953 | | | | - | | | | - | | | | 702,814,953 | | | | | |
| | | | | | |
| | | | Information Technology | | | 674,804,188 | | | | - | | | | - | | | | 674,804,188 | | | | | |
| | | | | | |
| | | | Materials | | | 99,272,894 | | | | - | | | | - | | | | 99,272,894 | | | | | |
| | | | | | |
| | | | Real Estate | | | 156,113,242 | | | | - | | | | - | | | | 156,113,242 | | | | | |
| | | | | | |
| | | | Utilities | | | 34,333,196 | | | | - | | | | - | | | | 34,333,196 | | | | | |
| | | | | | |
| | | | Short-Term Investments | | | 34,474,663 | | | | - | | | | 746,032 | | | | 35,220,695 | | | | | |
| | | | Total | | $ | 2,853,420,762 | | | $ | - | | | $ | 746,032 | | | $ | 2,854,166,794 | | | | | |
31
| | | | |
| | |
| | | | Audited Financial Statements • 2024 |
Notes to Financial Statements (continued)
| | | | | | | | | | | | | | | | | | | | | | | | |
| | |
| | | | Parnassus Mid Cap Growth Fund | | | | | |
| | | | | | |
| | | | Investment Securities | | Level 1 | | | Level 2 | | | Level 3 | | | Total | | | | |
| | | | Equities: | | | | | | | | | | | | | | | | | | | | |
| | | | | | |
| | | | Communication Services | | $ | 23,954,494 | | | $ | - | | | $ | - | | | $ | 23,954,494 | | | | | |
| | | | | | |
| | | | Consumer Discretionary | | | 115,822,603 | | | | - | | | | - | | | | 115,822,603 | | | | | |
| | | | | | |
| | | | Financials | | | 71,024,370 | | | | - | | | | - | | | | 71,024,370 | | | | | |
| | | | | | |
| | | | Health Care | | | 98,237,254 | | | | - | | | | - | | | | 98,237,254 | | | | | |
| | | | | | |
| | | | Industrials | | | 206,606,053 | | | | - | | | | - | | | | 206,606,053 | | | | | |
| | | | | | |
| | | | Information Technology | | | 296,458,148 | | | | - | | | | - | | | | 296,458,148 | | | | | |
| | | | | | |
| | | | Materials | | | 24,201,656 | | | | - | | | | - | | | | 24,201,656 | | | | | |
| | | | | | |
| | | | Short-Term Investments | | | 5,325,069 | | | | - | | | | 1,044,924 | | | | 6,369,993 | | | | | |
| | | | Total | | $ | 841,629,647 | | | $ | - | | | $ | 1,044,924 | | | $ | 842,674,571 | | | | | |
| | |
| | | | Parnassus Fixed Income Fund | | | | | |
| | | | | | |
| | | | Investment Securities | | Level 1 | | | Level 2 | | | Level 3 | | | Total | | | | |
| | | | | | |
| | | | Exchange-Traded Funds | | $ | 14,210,400 | | | $ | - | | | $ | - | | | $ | 14,210,400 | | | | | |
| | | | | | |
| | | | Preferred Stock | | | 1,841,000 | | | | - | | | | - | | | | 1,841,000 | | | | | |
| | | | | | |
| | | | Corporate Bonds | | | - | | | | 129,575,725 | | | | - | | | | 129,575,725 | | | | | |
| | | | | | |
| | | | Supranational Bonds | | | - | | | | 29,191,242 | | | | - | | | | 29,191,242 | | | | | |
| | | | | | |
| | | | U.S. Government Agency Bonds | | | - | | | | 36,265,825 | | | | - | | | | 36,265,825 | | | | | |
| | | | | | |
| | | | U.S. Government Treasury Bonds | | | - | | | | 70,959,365 | | | | - | | | | 70,959,365 | | | | | |
| | | | | | |
| | | | Short-Term Investments | | | 2,122,129 | | | | 3,959,475 | | | | - | | | | 6,081,604 | | | | | |
| | | | Total | | $ | 18,173,529 | | | $ | 269,951,632 | | | $ | - | | | $ | 288,125,161 | | | | | |
The following table reconciles the valuation of the Funds’ Level 3 investment securities and related transactions as of December 31, 2024:
| | | | | | | | | | | | | | | | | | | | | | | | | | | | |
| | | | | | Parnassus Core
Equity Fund | | | Parnassus Value
Equity Fund | | | Parnassus
Mid Cap Fund | | | Parnassus Mid Cap
Growth Fund | | | Parnassus
Fixed Income
Fund | | | | |
| | | | | | Certificates of
Deposit | | | Certificates of
Deposit | | | Certificates of
Deposit | | | Certificates of
Deposit | | | Certificates of
Deposit | | | | |
| | | | | | Community
Development Loans | | | Community
Development Loans | | | | | | Community
Development Loans | | | | | | | |
| | | | | | | |
| | | | Balance as of December 31, 2023 | | $ | 5,481,990 | | | $ | 1,332,661 | | | $ | 1,287,700 | | | $ | 1,336,632 | | | $ | 484,290 | | | | | |
| | | | | | | |
| | | | Discounts/premiums amortization | | | 44,668 | | | | 7,774 | | | | 8,332 | | | | 8,292 | | | | 15,710 | | | | | |
| | | | | | | |
| | | | Purchases | | | 3,700,000 | | | | 1,100,000 | | | | 750,000 | | | | 1,050,000 | | | | - | | | | | |
| | | | | | | |
| | | | Sales | | | (5,550,000 | ) | | | (1,350,000 | ) | | | (1,300,000 | ) | | | (1,350,000 | ) | | | (500,000 | ) | | | | |
| | | | Balance as of December 31, 2024 | | $ | 3,676,658 | | | $ | 1,090,435 | | | $ | 746,032 | | | $ | 1,044,924 | | | $ | - | | | | | |
32
| | | | |
| | |
| Audited Financial Statements • 2024 | | | | |
Notes to Financial Statements (continued)
The following table provides quantitative information about the Funds’ Level 3 fair value measurements:
| | | | | | | | | | | | | | | | | | |
| | | | | | |
| | | | | | Fair Value at
December 31, 2024 | | | Valuation
Technique | | Unobservable Input | | Range
(Weighted Average) | | | |
| | | | | |
| | | | Parnassus Core Equity Fund | | | | | | | | | | | |
| | | | Certificates of Deposit | | $ | 3,477,674 | | | Liquidity Discount | | Discount for Lack of Marketability | | 4% | | | | |
| | | | Community Development Loans | | $ | 198,984 | | | Liquidity Discount | | Discount for Lack of Marketability and Probability of Default | | 6% | | | | |
| | | | | |
| | | | Parnassus Value Equity Fund | | | | | | | | | | | |
| | | | Certificates of Deposit | | $ | 990,943 | | | Liquidity Discount | | Discount for Lack of Marketability | | 4% | | | | |
| | | | Community Development Loans | | $ | 99,492 | | | Liquidity Discount | | Discount for Lack of Marketability and Probability of Default | | 6% | | | | |
| | | | | |
| | | | Parnassus Mid Cap Fund | | | | | | | | | | | |
| | | | Certificates of Deposit | | $ | 746,032 | | | Liquidity Discount | | Discount for Lack of Marketability | | 4% | | | | |
| | | | | |
| | | | Parnassus Mid Cap Growth Fund | | | | | | | | | | | |
| | | | Certificates of Deposit | | $ | 945,432 | | | Liquidity Discount | | Discount for Lack of Marketability | | 4% | | | | |
| | | | Community Development Loans | | $ | 99,492 | | | Liquidity Discount | | Discount for Lack of Marketability and Probability of Default | | 6% | | | | |
The significant unobservable inputs used in fair value measurement of the Fund’s Certificates of Deposits are a discount for lack of marketability. The significant unobservable inputs used in the fair value measurement of the Fund’s Community Development Loans are a discount for lack of marketability and a discount for the probability of default. Significant increases in any of these inputs in isolation would result in a lower fair value measurement. Generally, a change in the assumption used for probability of default should be accompanied by a directionally-similar change in the assumption used for the lack of marketability.
The Valuation Designee has adopted fair value pricing methodologies to fair value each Fund’s securities
when market prices are not “readily available” or are unreliable. Determination of a fair value by the Valuation Designee may include significant unobservable inputs and therefore such financial instruments would be reflected within Level 3 of the fair value hierarchy. Fair value determinations are made in good faith in accordance with the duly adopted fair value pricing methodologies. The Valuation Designee provides quarterly and annual reports to the Board in connection with the Board’s obligation to oversee the Valuation Designee.
7. Capital Stock
Capital stock consists of an unlimited number of authorized shares of capital stock with no par value.
33
| | | | |
| | |
| | | | Audited Financial Statements • 2024 |
Notes to Financial Statements (continued)
8. Purchases and Sales of Securities
Purchases and proceeds from sales of securities, excluding short-term securities, for the year ended December 31, 2024 were as follows:
| | | | | | | | | | | | | | | | | | | | | | | | |
| | | | | | |
| | | | Fund | | Affiliated
Purchases | | | Unaffiliated
Purchases | | | Affiliated
Sales | | | Unaffiliated
Sales | | | | |
| | | | Parnassus Core Equity Fund | | $ | 107,064,330 | | | $ | 9,930,863,946 | | | $ | 107,929,564 | | | $ | 13,605,267,898 | | | | | |
| | | | Parnassus Growth Equity Fund | | | - | | | | 39,262,491 | | | | - | | | | 16,850,817 | | | | | |
| | | | Parnassus Value Equity Fund | | | 299,421 | | | | 1,194,337,069 | | | | 13,289,648 | | | | 1,814,269,781 | | | | | |
| | | | Parnassus Mid Cap Fund | | | - | | | | 1,479,120,529 | | | | 118,212,546 | | | | 4,177,710,258 | | | | | |
| | | | Parnassus Mid Cap Growth Fund | | | - | | | | 349,443,586 | | | | 7,970,434 | | | | 416,128,531 | | | | | |
| | | | Parnassus Fixed Income Fund | | | - | | | | 104,406,858 | | | | - | | | | 78,446,349 | | | | | |
The above includes purchases and sales of U.S. Government securities in the amount of $65,829,262 and $17,518,137, respectively, within the Parnassus Fixed Income Fund.
9. Investment Advisory Agreement and Transactions with Affiliates
Under terms of an agreement which provides for furnishing investment management and advice to a Fund, the Adviser is entitled to receive fees, payable monthly, based on such Fund’s average daily net assets for the month, at the following annual rates:
Parnassus Growth Equity Fund: 0.75% of the first $30,000,000, 0.70% of the next $70,000,000, 0.65% of the next $400,000,000, 0.60% of the next $9,500,000,000 and 0.55% of the amount above $10,000,000,000. For the year ended December 31, 2024, Parnassus Investments has contractually agreed to limit total operating expenses to 0.84% of the net assets of the Parnassus Growth Equity Fund – Investor Shares and to 0.63% of net assets for the Parnassus Growth Equity Fund – Institutional Shares.
Parnassus Value Equity Fund: 0.85% of the first $100,000,000, 0.80% of the next $100,000,000, 0.75% of the next $300,000,000 and 0.65% of the amount above $500,000,000. For the year ended December 31, 2024, Parnassus Investments has contractually agreed to limit total operating expenses to 0.88% of net assets for the Parnassus Value Equity Fund – Investor Shares and to 0.65% of net assets for the Parnassus Value Equity Fund – Institutional Shares.
Parnassus Mid Cap Fund: 0.85% of the first $100,000,000, 0.80% of the next $100,000,000, 0.75%
of the next $300,000,000 and 0.70% of the amount above $500,000,000. For the year ended December 31, 2024, Parnassus Investments has contractually agreed to limit total operating expenses to 0.96% of the net assets of the Parnassus Mid Cap Fund – Investor Shares and to 0.75% of net assets for the Parnassus Mid Cap Fund – Institutional Shares.
Parnassus Mid Cap Growth Fund: 0.70% of the first $100,000,000, 0.65% of the next $100,000,000 and 0.60% of the amount above $200,000,000. For the year ended December 31, 2024, Parnassus Investments has contractually agreed to limit total operating expenses to 0.80% of the net assets of the Parnassus Mid Cap Growth Fund – Investor Shares and to 0.68% of the net assets of the Parnassus Mid Cap Growth Fund – Institutional Shares.
Parnassus Core Equity Fund: 0.75% of the first $30,000,000, 0.70% of the next $70,000,000, 0.65% of the next $400,000,000, 0.60% of the next $9,500,000,000 and 0.55% of the amount above $10,000,000,000. For the year ended December 31, 2024, Parnassus Investments has contractually agreed to limit total operating expenses to 0.82% of net assets of the Parnassus Core Equity Fund – Investor Shares and to 0.61% of net assets for the Parnassus Core Equity Fund – Institutional Shares.
Parnassus Fixed Income Fund: 0.50% of the first $200,000,000, 0.45% of the next $200,000,000 and 0.40% of the amount above $400,000,000. For the year ended December 31, 2024, Parnassus Investments has contractually agreed to limit total operating expenses to 0.58% of net assets for the Parnassus Fixed Income Fund – Investor Shares and to 0.39% of net assets for
34
| | | | |
| | |
| Audited Financial Statements • 2024 | | | | |
Notes to Financial Statements (continued)
the Parnassus Fixed Income Fund – Institutional Shares. Parnassus Investments has contractually agreed to waive 0.10% of its management fee for each class.
The Adviser also serves as the fund accounting and fund administration agent for the Funds. The fund administration fee reflects annual rates based on net assets for all funds managed by Parnassus Investments, including the Funds, and was allocated based on respective Fund net assets at the following annual rates: 0.08% of the first $500,000,000, 0.07% of the next $500,000,000 and 0.03% of the amount above $1,000,000,000. The fund administration services fee was 0.03% of average net assets under this agreement for the year ended December 31, 2024.
The Adviser has appointed Brown Brothers Harriman as a sub administrator to the Funds. Brown Brothers Harriman provides day-to-day operational services to each Fund including, but not limited to fund accounting services. The fees payable to Brown Brothers Harriman for sub
administrative services are paid by the Adviser and not the Funds. Custodian fees are paid by the Funds.
The Funds have a shareholder services agreement with Ultimus Financial Solutions under which the Funds compensate Ultimus Financial Solutions for providing transfer agent services to each of the Funds’ share classes. These services include recordkeeping, shareholder communications and transaction processing.
10. Holdings of 5% Voting Securities of Portfolio Companies
The 1940 Act defines “affiliated companies” to include investments in portfolio companies in which a fund and/or funds under common control own 5% or more of the outstanding voting securities. Additionally, under the 1940 Act, an investment is presumed to be a “controlled affiliate” of a fund when a fund owns, either directly or indirectly, 25% or more of the affiliated company’s outstanding shares or has the power to exercise control over management or policies of such company.
During the year ended December 31, 2024, investments in “affiliated companies” were as follows:
| | | | | | | | | | | | | | | | | | | | | | | | | | | | | | | | | | | | | | | | |
| | | | | | Value at
Beginning of
Year | | | Purchases | | | Sales | | | Realized
Gain (Loss) | | | Net Change in
Unrealized
Appreciation
(Depreciation) | | | Value at End
of Year | | | Number of
Shares
Held at
End of Year | | | Investment
Income | | | | |
| | | | | | | | |
| | | | Parnassus Core Equity Fund | | | | | | | | | | | | | | | | | | | | | | | | | | | | | |
| | | | | | | | |
| | | | Non-Controlled Affiliates | | | | | | | | | | | | | | | | | | | | | | | | Dividends | | | | | |
| | | | | | | | | | |
| | | | | Ball Corp. | | $ | 709,907,699 | | | $ | 107,064,330 | | | $ | 107,929,564 | | | $ | (63,344,577 | ) | | $ | 36,584,432 | | | $ | 682,282,320 | | | | 12,375,881 | | | $ | 11,024,579 | | | | | |
| | | | | | | | | | |
| | | | Total Affiliates | | $ | 709,907,699 | | | $ | 107,064,330 | | | $ | 107,929,564 | | | $ | (63,344,577 | ) | | $ | 36,584,432 | | | $ | 682,282,320 | | | | 12,375,881 | | | $ | 11,024,579 | | | | | |
| | | | | | | | |
| | | | Parnassus Value Equity Fund | | | | | | | | | | | | | | | | | | | | | | | | | | | | | |
| | | | | | | | |
| | | | Non-Controlled Affiliates | | | | | | | | | | | | | | | | | | | | | | | | Dividends | | | | | |
| | | | | | | | | | |
| | | | | Ball Corp. | | $ | 143,351,919 | | | $ | 299,421 | | | $ | 13,289,648 | | | $ | (440,987 | ) | | $ | (2,671,348 | ) | | $ | 127,249,357 | | | | 2,308,169 | | | $ | 1,881,538 | | | | | |
| | | | | | | | | | |
| | | | Total Affiliates | | $ | 143,351,919 | | | $ | 299,421 | | | $ | 13,289,648 | | | $ | (440,987 | ) | | $ | (2,671,348 | ) | | $ | 127,249,357 | | | | 2,308,169 | | | $ | 1,881,538 | | | | | |
| | | | | | | | |
| | | | Parnassus Mid Cap Fund | | | | | | | | | | | | | | | | | | | | | | | | | | | | | |
| | | | | | | | |
| | | | Non-Controlled Affiliates | | | | | | | | | | | | | | | | | | | | | | | | Dividends | | | | | |
| | | | | | | | | | |
| | | | | Ball Corp. | | $ | 164,890,686 | | | $ | - | | | $ | 118,212,546 | | | $ | (57,676,762 | ) | | $ | 57,146,236 | | | $ | 46,147,614 | | | | 837,069 | | | $ | 784,659 | | | | | |
| | | | | | | | | | |
| | | | Total Affiliates | | $ | 164,890,686 | | | $ | - | | | $ | 118,212,546 | | | $ | (57,676,762 | ) | | $ | 57,146,236 | | | $ | 46,147,614 | | | | 837,069 | | | $ | 784,659 | | | | | |
| | | | | | | |
| | | | Parnassus Mid Cap Growth Fund | | | | | | | | | | | | | | | | | | | | | | | | | |
| | | | | | | | |
| | | | Non-Controlled Affiliates | | | | | | | | | | | | | | | | | | | | | | | | Dividends | | | | | |
| | | | | | | | | | |
| | | | | Ball Corp. | | $ | 8,380,664 | | | $ | - | | | $ | 7,970,434 | | | $ | (361,063 | ) | | $ | (49,167 | ) | | $ | - | | | | - | | | $ | - | | | | | |
| | | | Total Affiliates | | $ | 8,380,664 | | | $ | - | | | $ | 7,970,434 | | | $ | (361,063 | ) | | $ | (49,167 | ) | | $ | - | | | | - | | | $ | - | | | | | |
35
| | | | |
| | |
| | | | Audited Financial Statements • 2024 |
Notes to Financial Statements (continued)
11. Segment Reporting
During the year, the Funds adopted FASB Accounting Standards Update 2023-07, Segment Reporting (Topic 280) - Improvements to Reportable Segment Disclosures (“ASU 2023-07”). ASU 2023-07 is intended to improve disclosures around reportable segments and to enhance disclosure requirements about significant segment expenses that are regularly provided to a public entity’s chief operating decision maker (“CODM”). An operating segment is defined as a component of a public entity that engages in business activities from which it may recognize revenues and incur expense, has operating results that are regularly reviewed by the CODM, and for which discrete financial information is available. Adoption of ASU 2023-07 had no impact on the Funds’ financial position or their results of operations.
Topic 280 requires a public entity to disclose the title and position of the CODM and an explanation of how the CODM uses the reported measure(s) of segment profit or loss in assessing segment performance and deciding how to allocate resources. The Funds’
President and Chief Executive Officer acts as the Funds’ CODM. The Funds operate as a single reportable segment, which reflects how the CODM monitors and manages the operating results of each Fund. The CODM manages the allocation of resources in accordance with each Fund’s investment objective and strategies as set forth in its prospectus and evaluates total returns of the Funds versus their comparative benchmarks. The financial information used by the CODM to assess the segment’s performance and to allocate resources, including total return, expense ratios, changes in net assets from operations and portfolio composition, is consistent with that presented within each Funds’ financial statements and financial highlights.
12. Subsequent Events
Management has evaluated the impact of all subsequent events on the Funds through the date the financial statements were issued and has determined that there were no subsequent events requiring adjustment to or additional disclosure in the financial statements.
36
| | | | |
| | |
| Audited Financial Statements • 2024 | | | | |
Financial Highlights
Selected data for each share of capital stock outstanding, total return and ratios/supplement data for the year ended December 31, 2024 and each of the five years ended December 31 are as follows:
| | | | | | | | | | | | | | | | | | | | | | | | | | | | |
| | | | | | | |
For a Share
Outstanding
for the Year
Ended | | Net Asset
Value
Beginning
of Year | | | Net Investment
Income
(Loss)(a) | | | Net Realized and
Unrealized
Gain (Loss) on
Securities(a) | | | Total from
Investment
Operations(a) | | | Dividends
from Net
Investment
Income | | | Distributions
from Net
Realized
Gains on
Securities | | | Total
Dividends and
Distributions | |
| Parnassus Core Equity Fund – Investor Shares | |
2024 | | | $55.11 | | | | $0.20 | | | | $10.22 | | | | $10.42 | | | | $(0.23 | ) | | | $(5.73 | ) | | | $(5.96 | ) |
2023 | | | 46.92 | | | | 0.29 | | | | 11.21 | | | | 11.50 | | | | (0.31 | ) | | | (3.00 | ) | | | (3.31 | ) |
2022 | | | 63.41 | | | | 0.23 | | | | (11.97 | ) | | | (11.74 | ) | | | (0.23 | ) | | | (4.52 | ) | | | (4.75 | ) |
2021 | | | 53.65 | | | | 0.23 | | | | 14.46 | | | | 14.69 | | | | (0.53 | ) | | | (4.40 | ) | | | (4.93 | ) |
2020 | | | 47.03 | | | | 0.33 | | | | 9.44 | | | | 9.77 | | | | (0.31 | ) | | | (2.84 | ) | | | (3.15 | ) |
| Parnassus Core Equity Fund – Institutional Shares | |
2024 | | | 55.26 | | | | 0.32 | | | | 10.25 | | | | 10.57 | | | | (0.35 | ) | | | (5.73 | ) | | | (6.08 | ) |
2023 | | | 47.03 | | | | 0.40 | | | | 11.25 | | | | 11.65 | | | | (0.42 | ) | | | (3.00 | ) | | | (3.42 | ) |
2022 | | | 63.55 | | | | 0.34 | | | | (12.00 | ) | | | (11.66 | ) | | | (0.34 | ) | | | (4.52 | ) | | | (4.86 | ) |
2021 | | | 53.75 | | | | 0.36 | | | | 14.49 | | | | 14.85 | | | | (0.65 | ) | | | (4.40 | ) | | | (5.05 | ) |
2020 | | | 47.10 | | | | 0.44 | | | | 9.46 | | | | 9.90 | | | | (0.41 | ) | | | (2.84 | ) | | | (3.25 | ) |
| Parnassus Growth Equity Fund – Investor Shares | |
2024 | | | 21.30 | | | | (0.06 | ) | | | 5.82 | | | | 5.76 | | | | - | | | | (1.34 | ) | | | (1.34 | ) |
2023 | | | 14.95 | | | | 0.02 | | | | 6.68 | | | | 6.70 | | | | (0.35 | ) | | | - | | | | (0.35 | ) |
For the period ended
December 31, 2022(d) | | | 15.00 | | | | - | (g) | | | (0.05 | ) | | | (0.05 | ) | | | - | | | | - | | | | - | |
| Parnassus Growth Equity Fund – Institutional Shares | |
2024 | | | 21.30 | | | | (0.01 | ) | | | 5.83 | | | | 5.82 | | | | - | | | | (1.34 | ) | | | (1.34 | ) |
2023 | | | 14.95 | | | | 0.05 | | | | 6.68 | | | | 6.73 | | | | (0.38 | ) | | | - | | | | (0.38 | ) |
For the period ended
December 31, 2022(d) | | | 15.00 | | | | - | (g) | | | (0.05 | ) | | | (0.05 | ) | | | - | | | | - | | | | - | |
| Parnassus Value Equity Fund – Investor Shares | |
2024 | | | 50.54 | | | | 0.54 | | | | 5.70 | | | | 6.24 | | | | (0.56 | ) | | | (3.77 | ) | | | (4.33 | ) |
2023 | | | 45.27 | | | | 0.59 | | | | 5.57 | | | | 6.16 | | | | (0.60 | ) | | | (0.29 | ) | | | (0.89 | ) |
2022 | | | 54.03 | | | | 0.53 | | | | (7.99 | ) | | | (7.46 | ) | | | (0.54 | ) | | | (0.76 | ) | | | (1.30 | ) |
2021 | | | 48.31 | | | | 0.69 | | | | 14.08 | | | | 14.77 | | | | (0.97 | ) | | | (8.08 | ) | | | (9.05 | ) |
2020 | | | 38.18 | | | | 0.28 | | | | 10.19 | | | | 10.47 | | | | (0.34 | ) | | | - | | | | (0.34 | ) |
| Parnassus Value Equity Fund – Institutional Shares | |
2024 | | | 50.64 | | | | 0.66 | | | | 5.72 | | | | 6.38 | | | | (0.66 | ) | | | (3.77 | ) | | | (4.43 | ) |
2023 | | | 45.36 | | | | 0.70 | | | | 5.58 | | | | 6.28 | | | | (0.71 | ) | | | (0.29 | ) | | | (1.00 | ) |
2022 | | | 54.10 | | | | 0.64 | | | | (8.00 | ) | | | (7.36 | ) | | | (0.62 | ) | | | (0.76 | ) | | | (1.38 | ) |
2021 | | | 48.36 | | | | 0.80 | | | | 14.11 | | | | 14.91 | | | | (1.09 | ) | | | (8.08 | ) | | | (9.17 | ) |
2020 | | | 38.19 | | | | 0.36 | | | | 10.22 | | | | 10.58 | | | | (0.41 | ) | | | - | | | | (0.41 | ) |
| Parnassus Mid Cap Fund – Investor Shares | |
2024 | | | 37.25 | | | | 0.07 | | | | 3.80 | | | | 3.87 | | | | (0.08 | ) | | | (3.63 | ) | | | (3.71 | ) |
2023 | | | 33.88 | | | | 0.10 | | | | 4.13 | | | | 4.23 | | | | (0.14 | ) | | | (0.72 | ) | | | (0.86 | ) |
2022 | | | 45.20 | | | | 0.03 | | | | (9.78 | ) | | | (9.75 | ) | | | - | | | | (1.57 | ) | | | (1.57 | ) |
2021 | | | 40.78 | | | | (0.04 | ) | | | 6.66 | | | | 6.62 | | | | (0.01 | ) | | | (2.19 | ) | | | (2.20 | ) |
2020 | | | 35.63 | | | | 0.12 | | | | 5.18 | | | | 5.30 | | | | (0.08 | ) | | | (0.07 | ) | | | (0.15 | ) |
37
| | | | |
| | |
| | | | Audited Financial Statements • 2024 |
| | | | | | | | | | | | | | | | | | | | | | | | | | |
| | | | | | |
Net Asset
Value
End of
Year | | | Total
Overall
Return | | | Net Assets
End of
Year
(000s) | | | Ratio of
Gross
Expenses to
Average
Net Assets | | | Ratio of Net Expenses
to Average Net Assets
(Net of Waiver and
Expense
Offset Arrangements)(b)(c) | | | Ratio of
Net Investment
Income (Loss)
to Average Net
Assets | | | Portfolio
Turnover
Rate | |
| | |
| | $59.57 | | | | 18.52 | % | | | $13,311,327 | | | | 0.81 | % | | | 0.81 | % | | | 0.33 | % | | | 34.20 | % |
| | 55.11 | | | | 24.93 | | | | 12,929,826 | | | | 0.82 | | | | 0.82 | | | | 0.56 | | | | 29.01 | |
| | 46.92 | | | | (18.61 | ) | | | 11,173,977 | | | | 0.85 | | | | 0.82 | | | | 0.42 | | | | 39.63 | |
| | 63.41 | | | | 27.55 | | | | 15,405,636 | | | | 0.82 | | | | 0.82 | | | | 0.38 | | | | 25.82 | |
| | 53.65 | | | | 21.19 | | | | 11,906,386 | | | | 0.84 | | | | 0.84 | | | | 0.69 | | | | 37.15 | |
| | |
| | 59.75 | | | | 18.75 | | | | 15,705,097 | | | | 0.61 | | | | 0.61 | | | | 0.53 | | | | 34.20 | |
| | 55.26 | | | | 25.21 | | | | 14,868,509 | | | | 0.62 | | | | 0.61 | | | | 0.77 | | | | 29.01 | |
| | 47.03 | | | | (18.45 | ) | | | 12,736,208 | | | | 0.62 | | | | 0.61 | | | | 0.64 | | | | 39.63 | |
| | 63.55 | | | | 27.81 | | | | 16,869,763 | | | | 0.61 | | | | 0.61 | | | | 0.60 | | | | 25.82 | |
| | 53.75 | | | | 21.47 | | | | 11,320,933 | | | | 0.62 | | | | 0.62 | | | | 0.91 | | | | 37.15 | |
| | |
| | 25.72 | | | | 26.85 | | | | 22,970 | | | | 1.40 | | | | 0.84 | | | | (0.25 | ) | | | 34.89 | |
| | 21.30 | | | | 44.82 | | | | 8,006 | | | | 2.89 | | | | 0.84 | | | | 0.10 | | | | 34.94 | |
| 14.95 | | | | (0.33 | )(e) | | | 227 | | | | 7.83 | (f) | | | 0.84 | (f) | | | 3.52 | (f) | | | - | |
| | |
| | 25.78 | | | | 27.13 | | | | 40,733 | | | | 1.18 | | | | 0.63 | | | | (0.04 | ) | | | 34.89 | |
| | 21.30 | | | | 45.09 | | | | 22,529 | | | | 1.86 | | | | 0.63 | | | | 0.30 | | | | 34.94 | |
| 14.95 | | | | (0.33 | )(e) | | | 10,573 | | | | 2.30 | (f) | | | 0.63 | (f) | | | 3.11 | (f) | | | - | |
| | |
| | 52.45 | | | | 12.01 | | | | 3,118,642 | | | | 0.91 | | | | 0.88 | | | | 0.99 | | | | 24.08 | |
| | 50.54 | | | | 13.70 | | | | 3,267,439 | | | | 0.93 | | | | 0.88 | | | | 1.26 | | | | 30.19 | |
| | 45.27 | | | | (13.81 | ) | | | 3,008,001 | | | | 0.92 | | | | 0.88 | | | | 1.11 | | | | 32.36 | |
| | 54.03 | | | | 31.12 | | | | 3,768,904 | | | | 0.90 | | | | 0.90 | | | | 1.20 | | | | 37.22 | |
| | 48.31 | | | | 27.42 | | | | 2,238,344 | | | | 0.94 | | | | 0.94 | | | | 0.75 | | | | 52.77 | |
| | |
| | 52.59 | | | | 12.27 | | | | 1,706,549 | | | | 0.71 | | | | 0.65 | | | | 1.22 | | | | 24.08 | |
| | 50.64 | | | | 13.94 | | | | 1,652,941 | | | | 0.72 | | | | 0.65 | | | | 1.49 | | | | 30.19 | |
| | 45.36 | | | | (13.61 | ) | | | 1,518,273 | | | | 0.72 | | | | 0.65 | | | | 1.35 | | | | 32.36 | |
| | 54.10 | | | | 31.37 | | | | 1,654,506 | | | | 0.71 | | | | 0.71 | | | | 1.39 | | | | 37.22 | |
| | 48.36 | | | | 27.72 | | | | 1,025,590 | | | | 0.73 | | | | 0.71 | | | | 0.96 | | | | 52.77 | |
| | |
| | 37.41 | | | | 9.99 | | | | 1,265,449 | | | | 0.95 | | | | 0.95 | | | | 0.17 | | | | 43.55 | |
| | 37.25 | | | | 12.67 | | | | 1,477,106 | | | | 0.98 | | | | 0.96 | | | | 0.28 | | | | 42.45 | |
| | 33.88 | | | | (21.56 | ) | | | 1,974,198 | | | | 0.97 | | | | 0.96 | | | | 0.09 | | | | 47.52 | |
| | 45.20 | | | | 16.39 | | | | 3,155,696 | | | | 0.96 | | | | 0.96 | | | | (0.08 | ) | | | 34.76 | |
| | 40.78 | | | | 14.88 | | | | 2,749,355 | | | | 0.98 | | | | 0.98 | | | | 0.34 | | | | 41.00 | |
38
| | | | |
| | |
| Audited Financial Statements • 2024 | | | | |
Financial Highlights (continued)
| | | | | | | | | | | | | | | | | | | | | | | | | | | | |
| | | | | | | |
For a Share
Outstanding
for the Year
Ended | | Net Asset
Value
Beginning
of Year | | | Net Investment
Income
(Loss)(a) | | | Net Realized and
Unrealized
Gain (Loss) on
Securities(a) | | | Total from
Investment
Operations(a) | | | Dividends
from Net
Investment
Income | | | Distributions
from Net
Realized
Gains on
Securities | | | Total
Dividends and
Distributions | |
| Parnassus Mid Cap Fund – Institutional Shares | |
2024 | | | $37.42 | | | | $0.14 | | | | $3.83 | | | | $3.97 | | | | $(0.17 | ) | | | $(3.63 | ) | | | $(3.80 | ) |
2023 | | | 34.02 | | | | 0.17 | | | | 4.16 | | | | 4.33 | | | | (0.21 | ) | | | (0.72 | ) | | | (0.93 | ) |
2022 | | | 45.39 | | | | 0.11 | | | | (9.83 | ) | | | (9.72 | ) | | | (0.08 | ) | | | (1.57 | ) | | | (1.65 | ) |
2021 | | | 40.87 | | | | 0.05 | | | | 6.69 | | | | 6.74 | | | | (0.03 | ) | | | (2.19 | ) | | | (2.22 | ) |
2020 | | | 35.68 | | | | 0.20 | | | | 5.20 | | | | 5.40 | | | | (0.14 | ) | | | (0.07 | ) | | | (0.21 | ) |
| Parnassus Mid Cap Growth Fund – Investor Shares | |
2024 | | | 55.57 | | | | (0.19 | ) | | | 6.35 | | | | 6.16 | | | | - | | | | (4.24 | ) | | | (4.24 | ) |
2023 | | | 42.28 | | | | (0.15 | ) | | | 15.03 | | | | 14.88 | | | | - | | | | (1.59 | ) | | | (1.59 | ) |
2022 | | | 64.36 | | | | (0.17 | ) | | | (21.39 | ) | | | (21.56 | ) | | | - | | | | (0.52 | ) | | | (0.52 | ) |
2021 | | | 61.44 | | | | (0.34 | ) | | | 6.16 | | | | 5.82 | | | | (0.94 | ) | | | (1.96 | ) | | | (2.90 | ) |
2020 | | | 50.47 | | | | (0.02 | ) | | | 14.19 | | | | 14.17 | | | | (0.06 | ) | | | (3.14 | ) | | | (3.20 | ) |
| Parnassus Mid Cap Growth Fund – Institutional Shares | |
2024 | | | 55.83 | | | | (0.12 | ) | | | 6.38 | | | | 6.26 | | | | - | | | | (4.24 | ) | | | (4.24 | ) |
2023 | | | 42.42 | | | | (0.09 | ) | | | 15.09 | | | | 15.00 | | | | - | | | | (1.59 | ) | | | (1.59 | ) |
2022 | | | 64.50 | | | | (0.11 | ) | | | (21.45 | ) | | | (21.56 | ) | | | - | | | | (0.52 | ) | | | (0.52 | ) |
2021 | | | 61.49 | | | | (0.26 | ) | | | 6.17 | | | | 5.91 | | | | (0.94 | ) | | | (1.96 | ) | | | (2.90 | ) |
2020 | | | 50.43 | | | | 0.05 | | | | 14.21 | | | | 14.26 | | | | (0.06 | ) | | | (3.14 | ) | | | (3.20 | ) |
| Parnassus Fixed Income Fund – Investor Shares | |
2024 | | | 14.88 | | | | 0.53 | | | | (0.25 | ) | | | 0.28 | | | | (0.55 | ) | | | - | | | | (0.55 | ) |
2023 | | | 14.40 | | | | 0.47 | | | | 0.47 | | | | 0.94 | | | | (0.46 | ) | | | - | | | | (0.46 | ) |
2022 | | | 17.22 | | | | 0.37 | | | | (2.82 | ) | | | (2.45 | ) | | | (0.37 | ) | | | - | | | | (0.37 | ) |
2021 | | | 18.01 | | | | 0.29 | | | | (0.66 | ) | | | (0.37 | ) | | | (0.29 | ) | | | (0.13 | ) | | | (0.42 | ) |
2020 | | | 17.05 | | | | 0.29 | | | | 1.05 | | | | 1.34 | | | | (0.28 | ) | | | (0.10 | ) | | | (0.38 | ) |
| Parnassus Fixed Income Fund – Institutional Shares | |
2024 | | | 14.89 | | | | 0.56 | | | | (0.25 | ) | | | 0.31 | | | | (0.57 | ) | | | - | | | | (0.57 | ) |
2023 | | | 14.40 | | | | 0.50 | | | | 0.48 | | | | 0.98 | | | | (0.49 | ) | | | - | | | | (0.49 | ) |
2022 | | | 17.22 | | | | 0.40 | | | | (2.81 | ) | | | (2.41 | ) | | | (0.40 | ) | | | (0.01 | ) | | | (0.41 | ) |
2021 | | | 18.01 | | | | 0.33 | | | | (0.67 | ) | | | (0.34 | ) | | | (0.32 | ) | | | (0.13 | ) | | | (0.45 | ) |
2020 | | | 17.04 | | | | 0.33 | | | | 1.06 | | | | 1.39 | | | | (0.32 | ) | | | (0.10 | ) | | | (0.42 | ) |
39
| | | | |
| | |
| | | | Audited Financial Statements • 2024 |
| | | | | | | | | | | | | | | | | | | | | | | | | | |
| | | | | | |
Net Asset
Value
End of
Year | | | Total
Overall
Return | | | Net Assets
End of
Year
(000s) | | | Ratio of
Gross
Expenses to
Average
Net Assets | | | Ratio of Net Expenses
to Average Net Assets
(Net of Waiver and
Expense
Offset Arrangements)(b)(c) | | | Ratio of
Net Investment
Income (Loss)
to Average Net
Assets | | | Portfolio
Turnover
Rate | |
| | |
| | $37.59 | | | | 10.21 | % | | | $1,576,993 | | | | 0.78 | % | | | 0.75 | % | | | 0.34 | % | | | 43.55 | % |
| | 37.42 | | | | 12.92 | | | | 3,921,694 | | | | 0.76 | | | | 0.75 | | | | 0.49 | | | | 42.45 | |
| | 34.02 | | | | (21.41 | ) | | | 4,103,007 | | | | 0.76 | | | | 0.75 | | | | 0.30 | | | | 47.52 | |
| | 45.39 | | | | 16.63 | | | | 5,518,086 | | | | 0.75 | | | | 0.75 | | | | 0.13 | | | | 34.76 | |
| | 40.87 | | | | 15.16 | | | | 4,211,267 | | | | 0.76 | | | | 0.75 | | | | 0.58 | | | | 41.00 | |
| | |
| | 57.49 | | | | 10.55 | | | | 647,286 | | | | 0.81 | | | | 0.80 | | | | (0.33 | ) | | | 41.45 | |
| | 55.57 | | | | 35.60 | | | | 645,243 | | | | 0.81 | | | | 0.80 | | | | (0.30 | ) | | | 47.49 | |
| | 42.28 | | | | (33.52 | ) | | | 514,193 | | | | 0.80 | | | | 0.80 | | | | (0.36 | ) | | | 58.11 | |
| | 64.36 | | | | 9.37 | | | | 880,724 | | | | 0.80 | | | | 0.80 | | | | (0.52 | ) | | | 28.73 | |
| | 61.44 | | | | 28.61 | | | | 860,120 | | | | 0.83 | | | | 0.83 | | | | (0.05 | ) | | | 82.46 | |
| | |
| | 57.85 | | | | 10.68 | | | | 194,674 | | | | 0.70 | | | | 0.68 | | | | (0.21 | ) | | | 41.45 | |
| | 55.83 | | | | 35.77 | | | | 183,037 | | | | 0.71 | | | | 0.68 | | | | (0.18 | ) | | | 47.49 | |
| | 42.42 | | | | (33.45 | ) | | | 144,292 | | | | 0.70 | | | | 0.68 | | | | (0.24 | ) | | | 58.11 | |
| | 64.50 | | | | 9.50 | | | | 237,137 | | | | 0.68 | | | | 0.68 | | | | (0.40 | ) | | | 28.73 | |
| | 61.49 | | | | 28.81 | | | | 218,962 | | | | 0.68 | | | | 0.68 | | | | 0.09 | | | | 82.46 | |
| | |
| | 14.61 | | | | 1.92 | | | | 107,491 | | | | 0.80 | | | | 0.58 | | | | 3.59 | | | | 28.44 | |
| | 14.88 | | | | 6.71 | | | | 118,945 | | | | 0.81 | | | | 0.58 | | | | 3.24 | | | | 48.72 | |
| | 14.40 | | | | (14.29 | ) | | | 132,391 | | | | 0.82 | | | | 0.68 | | | | 2.42 | | | | 58.67 | |
| | 17.22 | | | | (2.09 | ) | | | 230,471 | | | | 0.76 | | | | 0.68 | | | | 1.64 | | | | 31.29 | |
| | 18.01 | | | | 7.91 | | | | 233,496 | | | | 0.74 | | | | 0.68 | | | | 1.61 | | | | 37.77 | |
| | |
| | 14.63 | | | | 2.13 | | | | 182,248 | | | | 0.60 | | | | 0.39 | | | | 3.77 | | | | 28.44 | |
| | 14.89 | | | | 6.95 | | | | 161,471 | | | | 0.61 | | | | 0.39 | | | | 3.44 | | | | 48.72 | |
| | 14.40 | | | | (14.10 | ) | | | 146,034 | | | | 0.59 | | | | 0.45 | | | | 2.66 | | | | 58.67 | |
| | 17.22 | | | | (1.90 | ) | | | 233,649 | | | | 0.56 | | | | 0.45 | | | | 1.88 | | | | 31.29 | |
| | 18.01 | | | | 8.19 | | | | 163,671 | | | | 0.55 | | | | 0.45 | | | | 1.81 | | | | 37.77 | |
(a) Income (loss) from operations per share is based on average daily shares outstanding.
(b) Parnassus Investments has contractually limited expenses to an annualized rate of 0.82% for the Parnassus Core Equity Fund – Investor Shares, 0.84% for the Parnassus Growth Equity Fund – Investor Shares, 0.88% for the Parnassus Value Equity Fund – Investor Shares, 0.96% for the Parnassus Mid Cap Fund – Investor Shares, 0.80% for the Parnassus Mid Cap Growth Fund – Investor Shares and 0.58% for the Parnassus Fixed Income Fund – Investor Shares.
(c) Parnassus Investments has contractually limited expenses to an annualized rate of 0.61% for the Parnassus Core Equity Fund – Institutional Shares, 0.63% for the Parnassus Growth Equity Fund – Institutional Shares, 0.65% for the Parnassus Value Equity Fund – Institutional Shares, 0.75% for the Parnassus Mid Cap Fund – Institutional Shares, 0.68% for the Parnassus Mid Cap Growth Fund – Institutional Shares and 0.39% for the Parnassus Fixed Income Fund – Institutional Shares.
(d) The Parnassus Growth Equity Fund commenced operations on December 28, 2022, and the period shown is from December 28, 2022 through December 31, 2022.
(e) Total Return is not annualized for periods less than one year.
(f) Annualized.
(g) Amount less than $0.01.
40
| | | | |
| | |
| Audited Financial Statements • 2024 | | | | |
Report of Independent Registered Public Accounting Firm
To the Board of Trustees of Parnassus Income Funds and Parnassus Funds and Shareholders of Parnassus Core Equity Fund, Parnassus Growth Equity Fund, Parnassus Value Equity Fund, Parnassus Mid Cap Fund, Parnassus Mid Cap Growth Fund and Parnassus Fixed Income Fund
Opinions on the Financial Statements
We have audited the accompanying statements of assets and liabilities, including the portfolios of investments, of Parnassus Core Equity Fund and Parnassus Fixed Income Fund (two of the funds constituting Parnassus Income Funds) and Parnassus Growth Equity Fund, Parnassus Value Equity Fund,
Parnassus Mid Cap Fund and Parnassus Mid Cap Growth Fund (constituting Parnassus Funds) (hereafter collectively referred to as the “Funds”) as of December 31, 2024, the related statements of operations and of changes in net assets for each of the periods indicated in the table below, including the related notes, and the financial highlights for each of the periods indicated in the table below (collectively referred to as the “financial statements”). In our opinion, the financial statements present fairly, in all material respects, the financial position of each of the Funds as of December 31, 2024, the results of each of their operations, the changes in each of their net assets, and each of the financial highlights for the periods indicated in the table below, in conformity with accounting principles generally accepted in the United States of America.
| | | | | | |
| | | |
| Fund | | Statement of Operations | | Statement of Changes in Net Assets | | Financial Highlights |
| | | |
| Parnassus Core Equity Fund | | For the year ended December 31, 2024 | | For each of the two years in the period ended December 31, 2024 | | For each of the four years in the period ended December 31, 2024 |
| | | |
| Parnassus Growth Equity Fund | | For the year ended December 31, 2024 | | For each of the two years in the period ended December 31, 2024 | | For each of the two years in the period ended December 31, 2024 and the period December 28, 2022 (commencement of operations) through December 31, 2022 |
| | | |
| Parnassus Value Equity Fund | | For the year ended December 31, 2024 | | For each of the two years in the period ended December 31, 2024 | | For each of the four years in the period ended December 31, 2024 |
| | | |
| Parnassus Mid Cap Fund | | For the year ended December 31, 2024 | | For each of the two years in the period ended December 31, 2024 | | For each of the four years in the period ended December 31, 2024 |
| | | |
| Parnassus Mid Cap Growth Fund | | For the year ended December 31, 2024 | | For each of the two years in the period ended December 31, 2024 | | For each of the four years in the period ended December 31, 2024 |
| | | |
| Parnassus Fixed Income Fund | | For the year ended December 31, 2024 | | For each of the two years in the period ended December 31, 2024 | | For each of the four years in the period ended December 31, 2024 |
The financial statements of Parnassus Core Equity Fund, Parnassus Value Equity Fund, Parnassus Mid Cap Fund, Parnassus Mid Cap Growth Fund and Parnassus Fixed Income Fund as of and for the year ended December 31, 2020 and the financial highlights for each of the periods ended on or prior to December 31, 2020 (not presented herein, other than the financial highlights) were audited by other auditors whose report dated January 28, 2021 expressed an unqualified opinion on those financial statements and financial highlights.
Basis for Opinions
These financial statements are the responsibility of the Funds’ management. Our responsibility is to express an opinion on the Funds’ financial statements based on our audits. We are a public accounting firm registered with the Public Company Accounting Oversight Board (United States) (PCAOB) and are required to be independent with respect to the Funds in accordance with the U.S. federal securities laws and the applicable rules and regulations of the Securities and Exchange Commission and the PCAOB.
41
| | | | |
| | |
| | | | Audited Financial Statements • 2024 |
We conducted our audits of these financial statements in accordance with the standards of the PCAOB. Those standards require that we plan and perform the audit to obtain reasonable assurance about whether the financial statements are free of material misstatement, whether due to error or fraud.
Our audits included performing procedures to assess the risks of material misstatement of the financial statements, whether due to error or fraud, and performing procedures that respond to those risks. Such procedures included examining, on a test basis, evidence regarding the amounts and disclosures in the financial statements. Our audits also included evaluating the accounting principles used and significant estimates made by management, as well as evaluating the overall presentation of the financial statements. Our procedures included confirmation of securities owned as of December 31, 2024 by correspondence with the custodians. We believe that our audits provide a reasonable basis for our opinions.
/s/PricewaterhouseCoopers LLP
San Francisco, CA
February 11, 2025
We have served as the auditor of one or more investment companies in Parnassus Income Funds and Parnassus Funds since 2021.
42
| | | | |
| | |
| Audited Financial Statements • 2024 | | | | |
Additional Information (unaudited)
Proxy Disclosures
Parnassus proxy voting policies and procedures are available, without charge, on our website (www.parnassus.com), on the Securities and Exchange Commission’s website (www.sec.gov) and by calling us at (800) 999-3505. The Funds file a proxy voting record with the Securities and Exchange Commission for the 12 months ended June 30. The most recent report is available by calling Parnassus or it may be obtained from the Securities and Exchange Commission’s website or the Parnassus website.
Quarterly Portfolio Schedule
The Funds file their complete schedule of portfolio holdings with the Securities and Exchange Commission for the first and third quarters of each fiscal year as an exhibit to their reports on Form N-PORT. The Funds’
Form N-PORT reports are available on the Securities and Exchange Commission’s web site at http://www.sec.gov. The Funds publish their entire portfolio holdings information as of the end of each month and quarter on the Parnassus Funds’ website (www.parnassus.com). This information is available to anyone who visits the website and is updated on or about ten business days following the end of each month. Holdings information will remain on the website until updated for the subsequent time period.
Federal Income Tax Information
For the year ended December 31, 2024, the following percentages of ordinary income distributed by the Funds that qualify for the individual qualified dividend income deduction (QDI) and the corporate dividends received deduction (DRD) are as follows:
| | | | | | | | |
| | |
| Fund | | QDI | | | DRD | |
Parnassus Core Equity Fund | | | 100.00 | % | | | 100.00 | % |
Parnassus Growth Equity Fund | | | 43.08 | % | | | 43.08 | % |
Parnassus Value Equity Fund | | | 100.00 | % | | | 100.00 | % |
Parnassus Mid Cap Fund | | | 100.00 | % | | | 100.00 | % |
Parnassus Mid Cap Growth Fund | | | 0.00 | % | | | 0.00 | % |
Parnassus Fixed Income Fund | | | 8.51 | % | | | 0.98 | % |
Tax information unaudited
We are required to advise you of the federal tax status of certain distributions received by shareholders
during the fiscal year. The fund hereby designates the following amounts for the fund’s fiscal year ended December 31, 2024:
| | | | | | | | | | |
| | | | | |
| | | Parnassus Core
Equity Fund | | Parnassus Growth
Equity Fund | | Parnassus Value
Equity Fund | | Parnassus Mid
Cap Fund | | Parnassus Mid Cap
Growth Fund |
Long-term capital gains | | $2,826,430,112 | | $2,711,263 | | $362,418,976 | | $284,811,130 | | $60,427,284 |
Individual shareholders should refer to their Form 1099 or other tax information, which was mailed in January 2025, to determine the calendar year amounts to be included on their 2024 tax returns. Shareholders should consult their tax advisors.
43
Earnings growth is not representative of the fund’s future performance.
Mutual fund investing involves risk, and loss of principal is possible. The Fund’s share price may change daily based on the value of its security holdings. Stock markets can be volatile, and stock values fluctuate in response to the asset levels of individual companies and in response to general U.S. and international market and economic conditions. In addition to large cap companies, the Fund may invest in small and/or mid cap companies, which can be more volatile than large cap firms. Security holdings in the fund can vary significantly from broad market indexes.
Parnassus Fixed Income Fund: Bond prices are inversely related to interest rates. As interest rates drop, bond prices will increase, and as interest rates go up, the price of bonds will decrease. A security’s value may also be affected by the possibility that issuers of debt obligations will not pay the Fund interest or principal, or that their credit rating may be downgraded by a ratings agency. In addition, up to 20% of the Fund’s total net assets may be invested in convertible securities, which may not have an investment-grade rating. This would make them riskier than securities with an investment-grade rating.
Parnassus Growth Equity Fund and Parnassus Mid Cap Growth Fund: The adviser may be wrong in its assessment of a company’s potential for growth, and the growth stocks the fund holds may not grow as the advisor anticipates. In addition, there are periods when investing in growth stocks falls out of favor with investors and these stocks may underperform.
Parnassus Mid Cap and Parnassus Mid Cap Growth Funds: The Fund invests in small and/or mid cap growth companies, which are generally riskier than larger companies, and the Fund’s share price may be more volatile than funds that invest in larger companies.
ENVIRONMENTAL, SOCIAL, AND GOVERNANCE GUIDELINES: The Fund evaluates ESG factors as part of the investment decision-making process, considering a range of impacts they may have on future revenues, expenses, assets, liabilities and overall risk. The Fund also utilizes active ownership to encourage more sustainable business policies and practices and greater ESG transparency. Active ownership strategies include proxy voting, dialogue with company management and sponsorship of shareholder resolutions, and public policy advocacy. There is no guarantee that the ESG strategy will be successful.
Performance data quoted represent past performance and are no guarantee of future returns. Current performance may be lower or higher than the performance data quoted, and current performance information to the most recent month end is available on the Parnassus website (www.parnassus.com). Investment return and principal value will fluctuate, so an investor’s shares, when redeemed, may be worth more or less than their original principal cost.
Before investing, an investor should carefully consider the investment objectives, risks, charges and expenses of the Fund and should carefully read the prospectus or summary prospectus, which contain this and other information. The prospectus or summary prospectus can be obtained on the Parnassus website or by calling (800) 999-3505.
Investment Adviser
Parnassus Investments, LLC
1 Market Street, Suite 1600
San Francisco, CA 94105
Independent Registered Public Accounting Firm
PricewaterhouseCoopers LLP
405 Howard Street, Suite 600
San Francisco, CA 94105
Legal Counsel
Ropes & Gray LLP
3 Embarcadero Center
San Francisco, CA 94111
Distributor
Parnassus Funds Distributor, LLC
Three Canal Plaza, Suite 100
Portland, ME 04101

Sign up for electronic delivery of prospectuses, shareholder reports
and account statements at www.parnassus.com
If you do not hold your account directly with Parnassus, please contact
the firm that holds your account to inquire about electronic delivery.

© 2025 Parnassus Investments, LLC. All rights reserved. PARNASSUS, PARNASSUS INVESTMENTS, and PARNASSUS FUNDS are federally registered trademarks of Parnassus Investments, LLC. The Parnassus Funds are distributed by Parnassus Funds Distributor, LLC.
1 Market Street, Suite 1600 San Francisco, CA 94105^(800) 999-3505^www.parnassus.com

Table of Contents
3
| | | | |
| | |
 | | | | Audited Financial Statements • 2024 |
Parnassus Core Select ETF
Portfolio of Investments as of December 31, 2024
| | | | | | | | |
| | |
| Equities | | Shares | | | Market
Value ($) | |
| | |
| Banks (3.0%) | | | | | | | | |
| Bank of America Corp. | | | 1,968 | | | | 86,494 | |
| | | | | | | | |
| | |
| Capital Markets (7.5%) | | | | | | | | |
| Intercontinental Exchange Inc. | | | 852 | | | | 126,957 | |
| S&P Global Inc. | | | 180 | | | | 89,646 | |
| | | | | | | | |
| | | | | | | 216,603 | |
| | | | | | | | |
| | |
| Chemicals (3.0%) | | | | | | | | |
| Linde plc | | | 204 | | | | 85,409 | |
| | | | | | | | |
| | |
| Commercial Services & Supplies (4.8%) | | | | | | | | |
| Waste Management Inc. | | | 684 | | | | 138,024 | |
| | | | | | | | |
| | |
| Containers & Packaging (3.0%) | | | | | | | | |
| Ball Corp. W | | | 1,572 | | | | 86,664 | |
| | | | | | | | |
| | |
| Diversified Financial Services (5.8%) | | | | | | | | |
| Fiserv Inc. q | | | 288 | | | | 59,161 | |
| Mastercard Inc., Class A | | | 204 | | | | 107,420 | |
| | | | | | | | |
| | | | | | | 166,581 | |
| | | | | | | | |
| | |
| Equity Real Estate Investment Trusts (4.5%) | | | | | | | | |
| Realty Income Corp. | | | 2,412 | | | | 128,825 | |
| | | | | | | | |
| | |
| Health Care Equipment & Supplies (2.8%) | | | | | | | | |
| Stryker Corp. | | | 228 | | | | 82,091 | |
| | | | | | | | |
| | |
| Hotels, Restaurants & Leisure (2.0%) | | | | | | | | |
| Marriott International Inc., Class A | | | 204 | | | | 56,904 | |
| | | | | | | | |
| | |
| Interactive Media & Services (6.9%) | | | | | | | | |
| Alphabet Inc., Class A | | | 1,044 | | | | 197,629 | |
| | | | | | | | |
| | |
| Life Sciences Tools & Services (4.6%) | | | | | | | | |
| Danaher Corp. | | | 576 | | | | 132,221 | |
| | | | | | | | |
| | |
| Machinery (4.4%) | | | | | | | | |
| Deere & Co. | | | 300 | | | | 127,110 | |
| | | | | | | | |
| | |
| Multiline Retail (8.0%) | | | | | | | | |
| Amazon.com Inc. q | | | 1,056 | | | | 231,676 | |
| | | | | | | | |
| | |
| Pharmaceuticals (2.9%) | | | | | | | | |
| Eli Lilly & Co. | | | 108 | | | | 83,376 | |
| | | | | | | | |
| | |
| Semiconductors & Semiconductor Equipment (10.2%) | | | | | | | | |
| Applied Materials Inc. | | | 708 | | | | 115,142 | |
| NVIDIA Corp. | | | 1,332 | | | | 178,874 | |
| | | | | | | | |
| | | | | | | 294,016 | |
| | | | | | | | |
| | |
| Software (16.5%) | | | | | | | | |
| Microsoft Corp. | | | 600 | | | | 252,900 | |
| Salesforce Inc. | | | 252 | | | | 84,251 | |
| Synopsys Inc. q | | | 144 | | | | 69,892 | |
| Workday Inc., Class A q | | | 276 | | | | 71,216 | |
| | | | | | | | |
| | | | | | | 478,259 | |
| | | | | | | | |
| | | | | | | | |
| | |
| Equities | | Shares | | | Market
Value ($) | |
| | |
| Specialty Retail (2.7%) | | | | | | | | |
| AutoZone Inc. q | | | 24 | | | | 76,848 | |
| | | | | | | | |
| | |
| Technology Hardware, Storage & Peripherals (5.2%) | | | | | | | | |
| Apple Inc. | | | 600 | | | | 150,252 | |
| | | | | | | | |
| | |
| Trading Companies & Distributors (1.8%) | | | | | | | | |
| Ferguson Enterprises Inc. | | | 300 | | | | 52,071 | |
| | | | | | | | |
| |
Total investment in equities (99.6%)
(cost $2,953,255) | | | | 2,871,053 | |
| | | | | | | | |
4
| | | | |
| | |
| Audited Financial Statements • 2024 | | | | |
Parnassus Core Select ETF
Portfolio of Investments as of December 31, 2024 (continued)
| | | | | | | | | | | | | | | | |
| | | | |
| Short-Term Securities | | Interest
Rate | | | Maturity
Date | | | Principal
Amount ($) | | | Market
Value ($) | |
| | |
| Time Deposits (0.4%) | | | | | | | | | |
| JPMorgan Chase, New York | | | 3.68 | % | | | 01/02/2025 | | | | 12,248 | | | | 12,248 | |
| | | | |
| | | | | | | | | | | | | | | | |
| | | | |
Total short-term securities (0.4%)
(cost $12,248) | | | | | | | | | | | | | | | 12,248 | |
| | | | |
| | | | | | | | | | | | | | | | |
| | | | |
Total securities (100.0%)
(cost $2,965,503) | | | | | | | | | | | | | | | 2,883,301 | |
| | | | |
| | | | | | | | | | | | | | | | |
| | | | |
| Other assets and liabilities (0.0%) | | | | | | | | | | | | | | | 407 | |
| | | | |
| | | | | | | | | | | | | | | | |
| | | | |
| Total net assets (100.0%) | | | | | | | | | | | | | | | 2,883,708 | |
| | | | |
| | | | | | | | | | | | | | | | |
W Fund ownership consists of 5% or more of the shares outstanding of the Affiliated Issuer, as defined under the Investment Securities Act of 1940. | |
q This security is non-income producing. | |
| | | | |
plc Public Limited Company | | | | | | | | | | | | | | | | |
5
| | | | |
| | |
| | | | Audited Financial Statements • 2024 |
Parnassus Value Select ETF
Portfolio of Investments as of December 31, 2024
| | | | | | | | |
| | |
| Equities | | Shares | | | Market
Value ($) | |
| | |
| Banks (4.0%) | | | | | | | | |
| Bank of America Corp. | | | 1,090 | | | | 47,905 | |
| | |
| | | | | | | | |
| | |
| Capital Markets (7.9%) | | | | | | | | |
| S&P Global Inc. | | | 110 | | | | 54,783 | |
| The Charles Schwab Corp. | | | 530 | | | | 39,225 | |
| | |
| | | | | | | | |
| | | | | | | 94,008 | |
| | |
| | | | | | | | |
| | |
| Diversified Financial Services (4.0%) | | | | | | | | |
| Visa Inc., Class A | | | 150 | | | | 47,406 | |
| | |
| | | | | | | | |
| | |
| Diversified Telecommunication Services (4.4%) | | | | | | | | |
| Verizon Communications Inc. | | | 1,330 | | | | 53,187 | |
| | |
| | | | | | | | |
| | |
| Equity Real Estate Investment Trusts (4.0%) | | | | | | | | |
| CBRE Group Inc., Class A q | | | 365 | | | | 47,921 | |
| | |
| | | | | | | | |
| | |
| Food & Staples Retailing (3.5%) | | | | | | | | |
| Sysco Corp. | | | 540 | | | | 41,288 | |
| | |
| | | | | | | | |
| | |
| Health Care Equipment & Supplies (3.4%) | | | | | | | | |
| Baxter International Inc. | | | 1,390 | | | | 40,532 | |
| | |
| | | | | | | | |
| | |
| Health Care Providers & Services (4.2%) | | | | | | | | |
| UnitedHealth Group Inc. | | | 100 | | | | 50,586 | |
| | |
| | | | | | | | |
| | |
| Hotels, Restaurants & Leisure (3.5%) | | | | | | | | |
| Airbnb Inc., Class A q | | | 315 | | | | 41,394 | |
| | |
| | | | | | | | |
| | |
| Household Durables (3.7%) | | | | | | | | |
| D.R. Horton Inc. | | | 315 | | | | 44,043 | |
| | |
| | | | | | | | |
| | |
| Independent Power & Renewable Electricity Producers (3.7%) | | | | | | | | |
| Brookfield Renewable Corp | | | 1,600 | | | | 44,256 | |
| | |
| | | | | | | | |
| | |
| Interactive Media & Services (4.0%) | | | | | | | | |
| Alphabet Inc., Class A | | | 250 | | | | 47,325 | |
| | |
| | | | | | | | |
| | |
| Life Sciences Tools & Services (7.2%) | | | | | | | | |
| Agilent Technologies Inc. | | | 305 | | | | 40,974 | |
| Bio-Rad Laboratories Inc., Class A q | | | 135 | | | | 44,349 | |
| | |
| | | | | | | | |
| | | | | | | 85,323 | |
| | |
| | | | | | | | |
| | |
| Machinery (7.1%) | | | | | | | | |
| Cummins Inc. | | | 115 | | | | 40,089 | |
| Deere & Co. | | | 105 | | | | 44,489 | |
| | |
| | | | | | | | |
| | | | | | | 84,578 | |
| | |
| | | | | | | | |
| | |
| Media (3.0%) | | | | | | | | |
| Comcast Corp., Class A | | | 945 | | | | 35,466 | |
| | |
| | | | | | | | |
| | |
| Multiline Retail (3.6%) | | | | | | | | |
| Amazon.com Inc. q | | | 195 | | | | 42,781 | |
| | |
| | | | | | | | |
| | |
| Pharmaceuticals (8.7%) | | | | | | | | |
| AstraZeneca plc, ADR | | | 695 | | | | 45,536 | |
| Pfizer Inc. | | | 2,200 | | | | 58,366 | |
| | |
| | | | | | | | |
| | | | | | | 103,902 | |
| | |
| | | | | | | | |
| | | | | | | | |
| | |
| Equities | | Shares | | | Market
Value ($) | |
| | |
| Road & Rail (3.5%) | | | | | | | | |
| Union Pacific Corp. | | | 185 | | | | 42,187 | |
| | |
| | | | | | | | |
| | |
| Semiconductors & Semiconductor Equipment (9.4%) | | | | | | | | |
| Applied Materials Inc. | | | 220 | | | | 35,779 | |
| Micron Technology Inc. | | | 380 | | | | 31,981 | |
| Taiwan Semiconductor Manufacturing Co. Ltd., ADR | | | 225 | | | | 44,435 | |
| | |
| | | | | | | | |
| | | | | | | 112,195 | |
| | |
| | | | | | | | |
| | |
| Software (6.8%) | | | | | | | | |
| Microsoft Corp. | | | 95 | | | | 40,043 | |
| NICE Ltd., ADR q | | | 240 | | | | 40,762 | |
| | |
| | | | | | | | |
| | | | | | | 80,805 | |
| | |
| | | | | | | | |
| | |
Total investment in equities (99.6%)
(cost $1,238,787) | | | | | | | 1,187,088 | |
| | |
| | | | | | | | |
6
| | | | |
| | |
| Audited Financial Statements • 2024 | | | | |
Parnassus Value Select ETF
Portfolio of Investments as of December 31, 2024 (continued)
| | | | | | | | | | | | | | | | |
| | | | |
| Short-Term Securities | | Interest Rate | | | Maturity Date | | | Principal
Amount ($) | | | Market
Value ($) | |
| | |
| Time Deposits (0.4%) | | | | | | | | | |
| JPMorgan Chase, New York | | | 3.68 | % | | | 01/02/2025 | | | | 4,982 | | | | 4,982 | |
| | | | |
| | | | | | | | | | | | | | | | |
| | | | |
Total short-term securities (0.4%)
(cost $4,982) | | | | | | | | | | | | | | | 4,982 | |
| | | | |
| | | | | | | | | | | | | | | | |
| | | | |
Total securities (100.0%)
(cost $1,243,769) | | | | | | | | | | | | | | | 1,192,070 | |
| | | | |
| | | | | | | | | | | | | | | | |
| | | | |
| Other assets and liabilities (0.0%) | | | | | | | | | | | | | | | 35 | |
| | | | |
| | | | | | | | | | | | | | | | |
| | | | |
| Total net assets (100.0%) | | | | | | | | | | | | | | | 1,192,105 | |
| | | | |
| | | | | | | | | | | | | | | | |
|
q This security is non-income producing. |
|
plc Public Limited Company |
ADR American Depositary Receipt |
7
| | | | |
| | |
| | | | Audited Financial Statements • 2024 |
Statement of Assets and Liabilities
December 31, 2024
| | | | | | | | |
| | |
| | | Parnassus Core Select ETF | | | Parnassus Value Select ETF | |
| | |
| Assets | | | | | | | | |
| | |
Investments in stocks, at market value – Unaffiliated | | | | | | | | |
| | |
(cost $2,863,912 and $1,238,787) | | $ | 2,784,389 | | | $ | 1,187,088 | |
| | |
Investments in stocks, at market value – Affiliated | | | | | | | | |
| | |
(cost of $89,343 and $0) | | | 86,664 | | | | - | |
| | |
Investments in short-term securities | | | | | | | | |
| | |
(at cost which approximates market value) | | | 12,248 | | | | 4,982 | |
| | |
Receivables | | | | | | | | |
| | |
Dividends and interest | | | 985 | | | | 376 | |
| | |
Total assets | | $ | 2,884,286 | | | $ | 1,192,446 | |
| | |
| Liabilities | | | | | | | | |
| | |
Fees payable to Parnassus Investments | | | 578 | | | | 341 | |
| | |
Total liabilities | | $ | 578 | | | $ | 341 | |
| | |
Net assets | | $ | 2,883,708 | | | $ | 1,192,105 | |
| | |
| Net assets consist of | | | | | | | | |
| | |
Capital paid-in | | | 2,965,361 | | | | 1,243,761 | |
| | |
Total Distributable Earnings | | | (81,653 | ) | | | (51,656 | ) |
| | |
Total net assets | | $ | 2,883,708 | | | $ | 1,192,105 | |
| | |
| Net asset value and offering per share | | | | | | | | |
| | |
Net assets | | $ | 2,883,708 | | | $ | 1,192,105 | |
| | |
Shares outstanding | | | 120,000 | | | | 50,000 | |
| | |
Net asset values and redemption price per share | | | | | | | | |
| | |
(Net asset value divided by shares outstanding) | | $ | 24.03 | | | $ | 23.84 | |
8
| | | | |
| | |
| Audited Financial Statements • 2024 | | | | |
Statement of Operations
Period Ended December 31, 2024
| | | | | | | | |
| | |
| | | Parnassus Core Select ETF* | | | Parnassus Value Select ETF* | |
| | |
| Investment income | | | | | | | | |
| | |
Dividends – Unaffiliated | | $ | 1,114 | | | $ | 399 | |
| | |
Interest | | | 13 | | | | 8 | |
| | |
Foreign withholding tax | | | – | | | | (23 | ) |
| | |
Total investment income | | $ | 1,127 | | | $ | 384 | |
| | |
| Expenses | | | | | | | | |
| | |
Management fees | | | 578 | | | | 341 | |
| | |
Total expenses | | $ | 578 | | | $ | 341 | |
| | |
Net investment income | | $ | 549 | | | $ | 43 | |
| | |
| Realized and unrealized gain (loss) on investments | | | | | | | | |
| | |
Net change in unrealized (depreciation) of securities – Unaffiliated | | | (79,523 | ) | | | (51,699 | ) |
| | |
Net change in unrealized (depreciation) of securities – Affiliated | | | (2,679 | ) | | | – | |
| | |
Net realized and unrealized (loss) on securities | | $ | (82,202 | ) | | $ | (51,699 | ) |
| | |
Net (decrease) in net assets resulting from operations | | $ | (81,653 | ) | | $ | (51,656 | ) |
* For the period from December 11, 2024 (commencement of operations) through December 31, 2024.
9
| | | | |
| | |
| | | | Audited Financial Statements • 2024 |
Statement of Changes in Net Assets
December 31, 2024
| | | | | | | | |
| | |
| | | Parnassus Core Select ETF | | | Parnassus Value Select ETF | |
| | | Period Ended
December 31, 2024* | | | Period Ended
December 31, 2024* | |
| | |
| Investment income from operations | | | | | | | | |
| | |
Net investment income | | $ | 549 | | | $ | 43 | |
| | |
Net change in unrealized (depreciation) of securities | | | (82,202 | ) | | | (51,699 | ) |
| | |
Decrease in net assets resulting from operations | | $ | (81,653 | ) | | $ | (51,656 | ) |
| | |
| Net Dividends and Distributions | | | – | | | | – | |
| | |
| Capital share transactions | | | | | | | | |
| | |
Proceeds from sale of shares | | | 2,965,361 | | | | 1,243,761 | |
| | |
Shares repurchased | | | – | | | | – | |
| | |
Increase in net assets from capital share transactions | | | 2,965,361 | | | | 1,243,761 | |
| | |
Increase in net assets | | $ | 2,883,708 | | | $ | 1,192,105 | |
| | |
| Net Assets | | | | | | | | |
| | |
Beginning of period | | | – | | | | – | |
| | |
End of period | | $ | 2,883,708 | | | $ | 1,192,105 | |
| | |
| Shares issued and redeemed | | | | | | | | |
| | |
Shares sold | | | 120,000 | | | | 50,000 | |
| | |
Net increase in shares outstanding | | | 120,000 | | | | 50,000 | |
* For the period from December 11, 2024 (commencement of operations) through December 31, 2024.
10
| | | | |
| | |
| Audited Financial Statements • 2024 | | | | |
Notes to Financial Statements
1. Organization
The Parnassus ETFs are series of the Parnassus Income Funds trust (the “Trust”), organized as a Massachusetts business trust registered under the Investment Company Act of 1940, as amended (the “1940 Act”), as an open-end management investment company.
The financial statements and these notes relate only to the Parnassus Core Select ETF and the Parnassus Value Select ETF (each a “Fund” and, collectively, the “Funds”), both of which commenced operations on December 11, 2024. The Trust consists of the Funds, along with the Parnassus Core Equity Fund and the Parnassus Fixed Income Fund. The Funds operate as exchange-traded funds (“ETFs”) and are classified as “non-diversified” under the 1940 Act. Each Fund has distinct investment objectives and investment strategies. In general, each of the Funds seeks capital appreciation.
2. Significant Accounting Policies
Each Fund operates as a separate investment company that applies the accounting and reporting guidance issued in Accounting Standards Codification (“ASC”) Topic 946, Financial Services – Investment Companies issued by the Financial Accounting Standards Board (“FASB”). The presentation of the financial statements is made using specialized accounting principles applicable to investment companies.
Short-Term Securities
Short-term securities represent investments of excess cash and consist of time deposits.
Security Transactions and Related Investment Income and Expenses
Securities transactions are recorded on the date the securities are purchased or sold (trade date). Realized gains and losses on securities transactions are determined on the basis of highest cost for both financial statement and federal income tax purposes. Dividend income is recognized on the ex-dividend date and interest income is recognized on an accrual basis. Discounts and premiums on securities purchased are amortized over the lives of the respective securities using the constant yield method, which approximates the interest method. Expenses are recorded on an accrual basis.
Dividends and Distributions to Shareholders
Dividends and distributions to shareholders are recorded on the ex-dividend date to shareholders of record on the record date. The Funds pay income dividends annually and capital-gain dividends, if any, at least annually.
3. Securities Valuations
Methods and Inputs
The Funds’ investments in financial instruments are carried at fair value daily. Fair value is the price that would be received to sell an asset or paid to transfer a liability in an orderly transaction between market participants on the measurement date. When market quotations are not readily available the Funds’ Valuation Designee (as defined below) determines the fair value pursuant to duly adopted fair value methodologies. In compliance with Rule 2a-5 under the 1940 Act, the Board of Trustees of the Trust (the “Board”) has designated the Funds’ investment manager, Parnassus Investments, LLC (“Parnassus Investments” or the “Adviser”), as its valuation designee (the “Valuation Designee”), meaning the Adviser has day-to-day responsibility for fair valuation of the Funds’ portfolio investments, subject to the Board’s oversight.
Equity securities and ETFs that are listed or traded on a national securities exchange are stated at market value, based on recorded closing sales on the exchange or at the NASDAQ’s National Market official closing price. In the absence of a recorded sale, and for over-the-counter securities, equity securities are stated at the mean between the last recorded bid and asked prices. Investments in registered investment companies that are not listed or traded on a national securities exchange are valued at their net asset value.
Fixed-income securities with an active market are valued at the “bid” price where such quotes are readily available from brokers and dealers and are representative of the actual market for such securities. Other fixed-income securities experiencing a less active market are valued as determined by the pricing services selected by the Valuation Designee, based on methods which include consideration of trading in securities of comparable yield, quality, coupon, maturity and type, as well as indications as to values from dealers and other market data without exclusive reliance upon quoted prices or over-the-counter prices, since such valuations are believed to reflect more accurately the value of such securities. Mortgage-backed and asset-backed
11
| | | | |
| | |
| | | | Audited Financial Statements • 2024 |
Notes to Financial Statements (continued)
securities are valued as determined by the pricing services selected by the Valuation Designee, based on methods which include standard inputs and cashflows, prepayment information, default rates, delinquency and loss assumptions, collateral characteristics, credit enhancements and specific deal information.
The Funds follow ASC Topic 820, Fair Value Measurements and Disclosure issued by the FASB, which defines fair value, establishes a framework for measuring fair value and expands disclosures about fair value measurements. Various inputs are used in determining the value of the Funds’ portfolio investments. These inputs are summarized in three levels, Level 1–unadjusted quoted prices in active markets for identical investments, Level 2–other significant observable inputs (including quoted prices for similar investments) and Level 3–significant unobservable inputs (including a Fund’s own assumptions in determining the fair value of investments).
Use of Estimates
The preparation of financial statements in conformity with U.S. Generally Accepted Accounting Principles (“GAAP”) requires management to make estimates and assumptions that affect the reported amounts of assets and liabilities at the date of the financial statements and the reported amount of revenues and expenses during the reporting period. Actual results could differ from those estimates.
4. Risk Factors
Investing in the Parnassus ETFs may involve certain risks including, but not limited to those identified below. Please refer to the Funds’ current prospectus and statement of additional information for more information on the risks associated with investing in the Funds.
Market Conditions
The prices of, and the income generated by, the common stocks and other securities held by the Funds may decline in response to certain events taking place around the world, including those directly involving the companies whose securities are owned by the Funds; conditions affecting the general economy; overall market changes; local, regional or global political, social or economic instability; and public health emergencies (such as the spread of infectious disease); and currency, interest rate and commodity price fluctuations. Additionally, the values of, and the income generated by, most debt securities
held by the Funds may be affected by changing interest rates and by changes in the effective maturities and credit ratings of these debt securities. The Funds’ Adviser attempts to reduce these risks through diversification of each portfolio and ongoing credit analysis as well as by monitoring economic and legislative developments, but there can be no assurance that it will be successful at doing so. Investments in securities issued by entities based outside the U.S. may also be affected by currency controls; different accounting, auditing, financial reporting, and legal standards and practices; expropriation; changes in tax policy; greater market volatility; different securities market structures and higher transaction costs.
Investing Outside the U.S.
Securities of issuers domiciled outside the U.S., or with significant operations outside the U.S., may lose value because of political, social, economic or market developments or instability in the countries or regions in which the issuer operates. These securities may also lose value due to changes in foreign currency exchange rates against the U.S. dollar and/or currencies of other countries. Securities markets in certain countries may be more volatile and/or less liquid than those in the U.S. Investment outside the U.S. may also be subject to different settlement and accounting practices and different regulatory, legal and reporting standards, and may be more difficult to value, than those in the U.S. The risks of investing outside the U.S. may be heightened in connection with investments in emerging and developing countries.
Contractual Obligations
Under the Trust’s organizational documents, its officers and Trustees may be indemnified against certain liabilities and expenses arising out of the performance of their duties to the Trust. Additionally, the Trust has a variety of indemnification obligations under contracts with its service providers. The Trust’s maximum exposure under these arrangements is unknown, as this would involve future claims that may be made against the Trust that have not yet occurred.
Non-Diversification
The Funds are non-diversified under the 1940 Act and employ a concentrated investment strategy. Accordingly, the Funds typically invest a greater portion of their assets in, and their performance may be affected by, a smaller number of issuers than if they were diversified, less concentrated funds. Further, the Funds may experience
12
| | | | |
| | |
| Audited Financial Statements • 2024 | | | | |
Notes to Financial Statements (continued)
greater losses as a result of a single issuer’s unfavorable market or economic conditions or other adverse developments impacting the market value of the issuer’s securities.
Authorized Participants, Market Makers, and Liquidity Providers Concentration
Only an Authorized Participant may engage in creation or redemption transactions directly with the Funds. The Funds have a limited number of financial institutions that may act as Authorized Participant. In addition, there may be a limited number of market makers or liquidity providers in the marketplace. To the extent that these intermediaries exit the business or otherwise become unable to process creation or redemption orders, the Funds’ shares may trade at a material discount to their net asset value (“NAV”) and possibly face trading halts or delisting. In periods of market volatility, Authorized Participants, market makers, or liquidity providers may be less willing to transact in Fund shares.
5. Taxation and Distributions
Federal Income Taxes
The Funds intend to comply with the requirements of the Internal Revenue Code applicable to regulated investment companies and to distribute all taxable income and capital gains to shareholders. Therefore, no federal income tax provision is required. Income distributions and capital-gain distributions are determined in accordance with income tax regulations, which may differ from GAAP.
The Funds follow ASC 740, Income Taxes, relating to uncertainty in income taxes and disclosures. ASC 740 establishes a minimum threshold for income tax benefits to be recognized in the financial statements. These tax benefits must meet a “more likely than not” threshold, which means that based on technical merits, they have a more than 50% likelihood of being sustained upon examination by the tax authority. Tax benefits meeting this threshold are measured as the largest amount of tax benefit that is greater than 50% likely of being realized upon ultimate settlement with the tax authority. As of and during the period ended December 31, 2024, the Funds did not have a liability for any unrecognized tax benefits. The Funds recognize interest and penalties, if any, related to unrecognized tax benefits as income tax expense in the Statement of Operations. During the period, the Funds did not incur interest or penalties. As of December 31, 2024, the Funds had no tax examinations or audits in progress.
Tax Matters and Distributions
As of December 31, 2024, the cost of investments in securities and net unrealized appreciation/depreciation for income tax purposes were as follows:
| | | | | | | | | | | | | | | | |
| | | | |
| | | | | | Parnassus
Core
Select ETF | | | Parnassus
Value
Select ETF | | | | |
| | | | Cost of investment | | $ | 2,965,503 | | | $ | 1,243,769 | | | | | |
| | | | Gross unrealized appreciation | | $ | - | | | $ | 2,450 | | | | | |
| | | | Gross unrealized depreciation | | $ | (82,202 | ) | | $ | (54,149 | ) | | | | |
| | | | Net unrealized appreciation (depreciation) | | $ | (82,202 | ) | | $ | (51,699 | ) | | | | |
| | | | Distributable earnings - ordinary income | | $ | 549 | | | $ | 43 | | | | | |
| | | | Undistributed earnings - ordinary income | | $ | 549 | | | $ | 43 | | | | | |
Reclassifications as shown in the following table have been made in each Fund’s capital accounts to report these balances on a tax basis, excluding certain temporary differences, as of December 31, 2024. Additional permanent book to tax adjustments may be required in subsequent reporting periods. These reclassifications, which have no impact on the net asset value of the Funds, primarily relate to utilization of earnings and profits distributed to shareholders on redemption of shares, net operating losses, and certain differences in the computation of distributable income and capital gains under Federal tax rules versus GAAP.
For tax purposes, net realized capital losses may be carried over to offset future capital gains, if any. Funds are permitted to carry forward capital losses for an indefinite period, and such losses will retain their character as either short-term or long-term capital losses.
13
| | | | |
| | |
| | | | Audited Financial Statements • 2024 |
Notes to Financial Statements (continued)
6. Fair Value Measurements
The following table summarizes the Funds�� financial assets as of December 31, 2024, that are valued at fair value on a recurring basis:
| | | | | | | | | | | | | | | | | | | | | | | | |
| | | | | | |
| | | | Parnassus Core Select ETF | | | | | | | | | | | | | | | | | | | | |
| | | | | | |
| | | | Investment Securities | | Level 1 | | | Level 2 | | | Level 3 | | | Total | | | | |
| | | | Equities: | | | | | | | | | | | | | | | | | | | | |
| | | | | | |
| | | | Communication Services | | $ | 197,629 | | | $ | – | | | $ | – | | | $ | 197,629 | | | | | |
| | | | | | |
| | | | Consumer Discretionary | | | 365,428 | | | | – | | | | – | | | | 365,428 | | | | | |
| | | | | | |
| | | | Financials | | | 469,678 | | | | – | | | | – | | | | 469,678 | | | | | |
| | | | | | |
| | | | Health Care | | | 297,688 | | | | – | | | | – | | | | 297,688 | | | | | |
| | | | | | |
| | | | Industrials | | | 317,205 | | | | – | | | | – | | | | 317,205 | | | | | |
| | | | | | |
| | | | Information Technology | | | 922,527 | | | | – | | | | – | | | | 922,527 | | | | | |
| | | | | | |
| | | | Materials | | | 172,073 | | | | – | | | | – | | | | 172,073 | | | | | |
| | | | | | |
| | | | Real Estate | | | 128,825 | | | | – | | | | – | | | | 128,825 | | | | | |
| | | | | | |
| | | | Short-Term Investments | | | 12,248 | | | | – | | | | – | | | | 12,248 | | | | | |
| | | | Total | | $ | 2,883,301 | | | $ | - | | | $ | - | | | $ | 2,883,301 | | | | | |
| | | | | | |
| | | | Parnassus Value Select ETF | | | | | | | | | | | | | | | | | | | | |
| | | | | | |
| | | | Investment Securities | | Level 1 | | | Level 2 | | | Level 3 | | | Total | | | | |
| | | | Equities: | | | | | | | | | | | | | | | | | | | | |
| | | | | | |
| | | | Communication Services | | $ | 135,978 | | | $ | - | | | $ | - | | | $ | 135,978 | | | | | |
| | | | | | |
| | | | Consumer Discretionary | | | 128,218 | | | | – | | | | – | | | | 128,218 | | | | | |
| | | | | | |
| | | | Consumer Staples | | | 41,288 | | | | – | | | | – | | | | 41,288 | | | | | |
| | | | | | |
| | | | Financials | | | 189,319 | | | | – | | | | – | | | | 189,319 | | | | | |
| | | | | | |
| | | | Health Care | | | 280,343 | | | | – | | | | – | | | | 280,343 | | | | | |
| | | | | | |
| | | | Industrials | | | 126,765 | | | | – | | | | – | | | | 126,765 | | | | | |
| | | | | | |
| | | | Information Technology | | | 193,000 | | | | – | | | | – | | | | 193,000 | | | | | |
| | | | | | |
| | | | Real Estate | | | 47,921 | | | | – | | | | – | | | | 47,921 | | | | | |
| | | | | | |
| | | | Utilities | | | 44,256 | | | | – | | | | – | | | | 44,256 | | | | | |
| | | | | | |
| | | | Short-Term Investments | | | 4,982 | | | | – | | | | – | | | | 4,982 | | | | | |
| | | | Total | | $ | 1,192,070 | | | $ | - | | | $ | - | | | $ | 1,192,070 | | | | | |
14
| | | | |
| | |
| Audited Financial Statements • 2024 | | | | |
Notes to Financial Statements (continued)
The Funds’ Valuation Designee has adopted fair value pricing methodologies to fair value each Fund’s securities when market prices are not “readily available” or are unreliable. Determination of a fair value by the Valuation Designee may include significant unobservable inputs and therefore such financial instruments would be reflected as within a Level 3 of the fair value hierarchy. Fair value determinations are made in good faith in accordance with the duly adopted fair value pricing methodologies. The Valuation Designee provides quarterly and annual reports to the Funds’ Trustees in connection the Boards’ obligation to oversee the Valuation Designee.
7. Capital Stock
Capital stock consists of an unlimited number of authorized shares of capital stock with no par value.
8. Purchases and Sales of Securities
The Funds issue and redeem shares at NAV only in large blocks known as “Creation Units,” which only Authorized Participants (typically, broker-dealers) may purchase or redeem. Creation Unit transactions are typically conducted in exchange for the deposit or
delivery of in-kind securities or cash. Most investors buy and sell shares in secondary market transactions through brokers. Shares of the Funds are listed for trading on the New York Stock Exchange (“NYSE”) (the “Exchange”) and because the shares of the Funds trade at market prices rather than NAV, shares of the Funds may trade at a price greater or lower than NAV.
Creation Units generally consist of 10,000 shares, though this may change from time to time. A Fund generally issues and redeems Creation Units in exchange for a portfolio of securities, assets or other positions closely approximating the holdings of the Fund (referred to as a “basket” or “Deposit Securities”) and an amount of U.S. cash to account for any difference between the value of the basket and the net asset value of the Creation Units.
There were no purchases or proceeds from sales of securities, excluding short-term securities and in-kind transactions for the period ended December 31, 2024.
The costs of in-kind subscriptions and the proceeds from in-kind redemptions for the period ended December 31, 2024, were as follows:
| | | | | | | | | | | | | | | | | | | | | | | | |
| | | | | | |
| | | | Fund | | Affiliated Purchases | | | Unaffiliated Purchases | | | Affiliated Sales | | | Unaffiliated Sales | | | | |
| | | | Parnassus Core Select ETF | | $ | 89,343 | | | $ | 2,863,912 | | | $ | – | | | $ | – | | | | | |
| | | | Parnassus Value Select ETF | | | – | | | | 1,238,787 | | | | – | | | | – | | | | | |
9. Investment Advisory Agreement and Transactions with Affiliates
Under terms of an agreement which provides for furnishing investment management and advice to the Funds, the Adviser is entitled to receive unitary fees payable monthly, based on such Fund’s average daily net assets for the month, at the following annual rates:
Parnassus Core Select ETF: 0.58%. The Adviser has contractually agreed to limit the total annual operating expenses of the Fund to 0.58% of the Fund’s average daily net assets through at least May 1, 2026.
Parnassus Value Select ETF: 0.59%. The Adviser has contractually agreed to limit the total annual operating expenses of the Fund to 0.59% of the Fund’s average daily net assets through at least May 1, 2026.
Pursuant to the unitary management fee, the Adviser will pay all of the Funds’ expenses, except for the following: advisory and sub-advisory fees, costs of holding shareholder meetings, interest charges on any borrowings made for investment purposes, dividends and other expenses on securities sold short, taxes, brokerage commissions and other expenses incurred in placing orders for the purchase and sale of securities and other investment instruments, acquired fund fees and expenses, accrued deferred tax liability, distribution fees and expenses paid by the Funds under any distribution plan adopted pursuant to Rule 12b-1 under the 1940 Act, legal fees and expenses relating to arbitration or litigation, and other non-routine or extraordinary expenses.
15
| | | | |
| | |
| | | | Audited Financial Statements • 2024 |
Notes to Financial Statements (continued)
The Adviser has appointed Brown Brothers Harriman as a sub administrator and transfer agent to the Funds. Brown Brothers Harriman provides day-to-day operational services to each Fund including, but not limited to fund accounting services. The fees payable to Brown Brothers Harriman for sub administrative and transfer agent services are paid by the Adviser and not the Funds.
10. Holdings of 5% Voting Securities of Portfolio Companies
The 1940 Act defines “affiliated companies” to include investments in portfolio companies in which a fund
and/or funds under common control own 5% or more of the outstanding voting securities. Additionally, under the 1940 Act, an investment is presumed to be a “controlled affiliate” of a fund when a fund owns, either directly or indirectly, 25% or more of the affiliated company’s outstanding shares or has the power to exercise control over management or policies of such company.
During the period ended December 31, 2024, investments in “affiliated companies” were as follows:
| | | | | | | | | | | | | | | | | | | | | | | | | | | | | | | | | | | | | | | | |
| | | | | | Value at Beginning of Period | | | Purchases | | | Sales | | | Realized Gain (Loss) | | | Net Change in Unrealized Appreciation (Depreciation) | | | Value at End of Period | | | Number of
Shares Held at End of Period | | | Dividends | | | | |
| | | | | | | | |
| | | | Parnassus Core Select ETF | | | | | | | | | | | | | | | | | | | | | | | | | | | | | |
| | | | | | | | |
| | | | Non-Controlled Affiliates | | | | | | | | | | | | | | | | | | | | | | | | | | | | | |
| | | | | | | | | | |
| | | | | Ball Corp. | | $ | – | | | $ | 89,343 | | | $ | – | | | $ | – | | | $ | (2,679 | ) | | $ | 86,664 | | | | 1,572 | | | $ | – | | | | | |
| | | | | | | | | | |
| | | | Total Affiliates | | $ | – | | | $ | 89,343 | | | $ | – | | | $ | – | | | $ | (2,679 | ) | | $ | 86,664 | | | | 1,572 | | | $ | – | | | | | |
11. Segment Reporting
During the year, the Funds adopted FASB Accounting Standards Update 2023-07, Segment Reporting (Topic 280) – Improvements to Reportable Segment Disclosures (“ASU 2023-07”). ASU 2023-07 is intended to improve disclosures around reportable segments and to enhance disclosure requirements about significant segment expenses that are regularly provided to a public entity’s chief operating decision maker (“CODM”). An operating segment is defined as a component of a public entity that engages in business activities from which it may recognize revenues and incur expense, has operating results that are regularly reviewed by the CODM, and for which discrete financial information is available. Adoption of ASU 2023-07 had no impact on the Funds’ financial position or their results of operations.
Topic 280 requires a public entity to disclose the title and position of the CODM and an explanation of how the CODM uses the reported measure(s) of segment profit or loss in assessing segment performance and deciding how to allocate resources. The Funds’ President and Chief Executive Officer acts as the Funds’
CODM. The Funds operate as a single reportable segment, which reflects how the CODM monitors and manages the operating results of each Fund. The CODM manages the allocation of resources in accordance with each Fund’s investment objective and strategies as set forth in its prospectus and evaluates total returns of the Funds versus their comparative benchmarks. The financial information used by the CODM to assess the segment’s performance and to allocate resources, including total return, expense ratios, changes in net assets from operations and portfolio composition, is consistent with that presented within each Funds’ financial statements and financial highlights.
12. Subsequent Events
Management has evaluated the impact of all subsequent events on the Funds through the date the financial statements were issued and has determined that there were no subsequent events requiring adjustment to or additional disclosure in the financial statements.
16
| | | | |
| | |
| Audited Financial Statements • 2024 | | | | |
THIS PAGE LEFT INTENTIONALLY BLANK
17
| | | | |
| | |
| | | | Audited Financial Statements • 2024 |
Financial Highlights
Selected data for each share of capital stock outstanding, total return and ratios/supplement data for the period ended December 31, 2024:
| | | | | | | | | | | | | | | | | | | | | | | | | | | | |
| | | | | | | |
For a Share
Outstanding
for the Period Ended | | Net Asset
Value
Beginning
of Year | | | Net Investment
Income(a) | | | Net Realized and
Unrealized
(Loss) on
Securities(a) | | | Total from
Investment
Operations(a) | | | Dividends
from Net
Investment
Income | | | Distributions
from Net
Realized
Gains on
Securities | | | Total
Dividends and
Distributions | |
| Parnassus Core Select ETF | |
For the period ended December 31, 2024(e) | | | $25.06 | | | | $0.01 | | | | $(1.04 | ) | | | $(1.03 | ) | | | $– | | | | $– | | | | $– | |
| Parnassus Value Select ETF | |
For the period ended December 31, 2024(e) | | | 25.02 | | | | 0.00 | (f) | | | (1.18 | ) | | | (1.18 | ) | | | – | | | | – | | | | – | |
18
| | | | |
| | |
| Audited Financial Statements • 2024 | | | | |
Financial Highlights (continued)
| | | | | | | | | | | | | | | | | | | | | | | | | | |
| | | | | | |
Net Asset Value End of Period | | | Net Assets End of Period (000s) | | | Total Return
at Net Asset
Value(b) | | | Ratio of Gross Expenses to Average Net Assets | | | Ratio of Net Expenses to Average Net Assets (Net of Waiver and Expense Offset Arrangements) | | | Ratio of Net Investment Income to Average Net Assets | | | Portfolio Turnover Rate | |
| | |
| $24.03 | | | | $2,884 | | | | (4.11 | )% | | | 0.58 | %(c) | | | 0.58 | %(c) | | | 0.55 | %(c) | | | – | %(d) |
| | |
| 23.84 | | | | 1,192 | | | | (4.72 | ) | | | 0.59 | (c) | | | 0.59 | (c) | | | 0.08 | (c) | | | – | (d) |
(a) Income (loss) from operations per share is based on average daily shares outstanding.
(b) Net asset value total return is calculated assuming an initial investment made at the net asset value at the beginning of the period, reinvestment of all dividends and distributions at net asset value during the period, and redemption on the last day of the period at net asset value. Total return calculated for a period of less than one year is not annualized.
(c) Annualized
(d) Portfolio turnover rate is not annualized for periods less than one year and does not include in-kind transactions, if any, from processing creations or redemptions.
(e) The Parnassus Core Select ETF and the Parnassus Value Select ETF commenced operations on December 11, 2024, and the period shown is from December 11, 2024 through December 31, 2024.
(f) Amount less than $0.01.
19
| | | | |
| | |
| | | | Audited Financial Statements • 2024 |
Report of Independent Registered Public Accounting Firm
To the Board of Trustees of Parnassus Income Funds and Shareholders of Parnassus Core Select ETF and Parnassus Value Select ETF
Opinions on the Financial Statements
We have audited the accompanying statements of assets and liabilities, including the portfolios of investments, of Parnassus Core Select ETF and Parnassus Value Select ETF (two of the funds constituting Parnassus Income Funds, hereafter collectively referred to as the “Funds”) as of December 31, 2024, the related statements of operations and changes in net assets, including the related notes, and the financial highlights for the period December 11, 2024 (commencement of operations) through December 31, 2024 (collectively referred to as the “financial statements”). In our opinion, the financial statements present fairly, in all material respects, the financial position of each of the Funds as of December 31, 2024, and the results of each of their operations, changes in each of their net assets, and each of the financial highlights for the period December 11, 2024 (commencement of operations) through December 31, 2024 in conformity with accounting principles generally accepted in the United States of America.
Basis for Opinions
These financial statements are the responsibility of the Funds’ management. Our responsibility is to express an opinion on the Funds’ financial statements based on our audits. We are a public accounting firm registered with the Public Company Accounting Oversight Board (United States) (PCAOB) and are required to be independent with respect to the Funds in accordance with the U.S. federal securities laws and the applicable rules and regulations of the Securities and Exchange Commission and the PCAOB.
We conducted our audits of these financial statements in accordance with the standards of the PCAOB. Those standards require that we plan and perform the audit to obtain reasonable assurance about whether the financial statements are free of material misstatement, whether due to error or fraud.
Our audits included performing procedures to assess the risks of material misstatement of the financial statements, whether due to error or fraud, and performing procedures that respond to those risks. Such procedures included examining, on a test basis, evidence regarding the amounts and disclosures in the
financial statements. Our audits also included evaluating the accounting principles used and significant estimates made by management, as well as evaluating the overall presentation of the financial statements. Our procedures included confirmation of securities owned as of December 31, 2024 by correspondence with the custodians. We believe that our audits provide a reasonable basis for our opinions.
/s/PricewaterhouseCoopers LLP
San Francisco, California
February 11, 2025
We have served as the auditor of one or more investment companies in Parnassus Income Funds since 2021.
20
| | | | |
| | |
| Audited Financial Statements • 2024 | | | | |
Additional Information (unaudited)
Proxy Disclosures
Parnassus proxy voting policies and procedures are available, without charge, on our website (www.parnassus.com), on the Securities and Exchange Commission’s website (www.sec.gov) and by calling us at (800) 999-3505. The Funds file a proxy voting record with the Securities and Exchange Commission for the 12 months ended June 30. The most recent report is available by calling Parnassus or it may be obtained from the Securities and Exchange Commission’s website or the Parnassus website.
Quarterly Portfolio Schedule
The Funds file their complete schedule of portfolio holdings with the Securities and Exchange Commission for the first and third quarters of each fiscal year as an exhibit to their reports on Form N-PORT. The Funds’ Form N-PORT reports are available on the Securities and Exchange Commission’s web site at http://www.sec.gov. The Funds publish their entire portfolio holdings information as of the end of each month and quarter on the Parnassus Funds’ website (www.parnassus.com). This information is available to anyone who visits the website and is updated on or about ten business days following the end of each month. Holdings information will remain on the website until updated for the subsequent time period.
21
Earnings growth is not representative of the fund’s future performance.
ETF investing involves risk, and loss of principal is possible. ETFs may trade at a premium or discount to NAV. Shares of any ETF are bought and sold at market prices (not NAV) and are not individually redeemed from the Fund. Brokerage commissions will reduce returns.
Fund share price may change daily based on the value of its security holdings. Stock markets can be volatile, and stock values fluctuate in response to the asset levels of individual companies and in response to general U.S. and international market and economic conditions. In addition to large cap companies, the Funds may invest in small and/or mid cap companies, which can be more volatile than large cap firms. Security holdings in the fund can vary significantly from broad market indexes.
ENVIRONMENTAL, SOCIAL, AND GOVERNANCE GUIDELINES: The Funds evaluate ESG factors as part of the investment decision-making process, considering a range of impacts they may have on future revenues, expenses, assets, liabilities and overall risk. The Fund also utilizes active ownership to encourage more sustainable business policies and practices and greater ESG transparency. Active ownership strategies include proxy voting, dialogue with company management and sponsorship of shareholder resolutions, and public policy advocacy. There is no guarantee that the ESG strategy will be successful.
Performance data quoted represent past performance and are no guarantee of future returns. Current performance may be lower or higher than the performance data quoted, and current performance information to the most recent month end is available on the Parnassus website (www.parnassus.com).
Before investing, an investor should carefully consider the investment objectives, risks, charges and expenses of the Fund and should carefully read the prospectus or summary prospectus, which contain this and other information. The prospectus or summary prospectus can be obtained on the Parnassus website, www.parnassus.com, or by calling (855) 514-4443.
The Parnassus Funds are distributed by Parnassus Funds Distributor, LLC.
©2025 Parnassus Investments. PARNASSUS, PARNASSUS INVESTMENTS, and PARNASSUS FUNDS are federally registered trademarks of Parnassus Investments, LLC. All rights reserved.
Investment Adviser
Parnassus Investments, LLC
1 Market Street, Suite 1600
San Francisco, CA 94105
Independent Registered Public Accounting Firm
PricewaterhouseCoopers LLP
405 Howard Street, Suite 600
San Francisco, CA 94105
Legal Counsel
Ropes & Gray LLP
3 Embarcadero Center
San Francisco, CA 94111
Distributor
Parnassus Funds Distributor, LLC
Three Canal Plaza, Suite 100
Portland, ME 04101

At any time you may view current Prospectuses, supplements, and shareholder reports at www.parnassus.com. You can obtain additional information about each of the Funds in the statement of additional information (SAI) dated December 11, 2024, which has been filed with the Securities and Exchange Commission (SEC) and is incorporated in this prospectus by reference (namely, it legally forms a part of the prospectus). The Funds also publish an annual and a semiannual report each year that discuss the Funds’ holdings and how recent market conditions as well as the Funds’ investment strategies affected performance. For a free copy of any of these documents or to ask questions about the Funds, call the Parnassus Funds at (855) 514-4443.
The Funds make available the SAI and the annual and semiannual reports, free of charge, on their Internet website (http://www.parnassus.com). The general public can review and copy information about the Funds (including the SAI) on the EDGAR Database on the SEC’s Internet website at http://www.sec.gov. Copies of this information may be obtained, upon payment of a duplicating fee, by electronic request at the following email address: publicinfo@sec.gov.
The Investment Company Act File Number for Parnassus Income Funds is 811-06673.

1 Market Street, Suite 1600, San Francisco, CA 94105^www.parnassus.com
Item 8. Changes in and Disagreements with Accountants for Open-End Management Investment Companies.
Not applicable.
Item 9. Proxy Disclosures for Open-End Management Companies.
Not applicable.
Item 10. Remuneration Paid to Directors, Officers, and Others of Open-End Management Companies.
This information is included in materials filed under Item 7 of this form.
Item 11. Statement Regarding Basis for Approval of Investment Advisory Contract.
Section 15(c) of the Investment Company Act of 1940, as amended (the “1940 Act”), requires that the Board of Trustees (the members thereof referred to herein as the “Trustees”) of Parnassus Income Funds (the “Trust”) meet to review and consider the approval of the investment advisory agreement by and between the Trust, on behalf of the Parnassus Core Select ETF and Parnassus Value Select ETF (each, a “Fund” and together, the “Funds”), and Parnassus Investments, LLC (“Parnassus Investments” or the “Adviser”). In this regard, the Trustees who are not “interested persons” of the Trusts, as defined in the 1940 Act (the “Independent Trustees”), met on November 18, 2024 and December 9, 2024 to review and evaluate the approval of the investment advisory agreement, and all of the Trustees, including the Independent Trustees, met on December 10, 2024 to review and evaluate the approval of the investment advisory agreement. The Trustees, including the Independent Trustees, were provided with relevant information by the Adviser, as described below, and the Independent Trustees were assisted in their evaluation of the investment advisory agreement by independent legal counsel, from whom they received assistance and advice, including a written memorandum, regarding the legal standards applicable to the consideration of advisory arrangements and with whom they met separately in executive session on November 18, 2024 and December 9, 2024.
Prior to approving the investment advisory agreement, the Trustees, including the Independent Trustees, considered:
| | • | | The nature and quality of the investment advisory services to be provided by the Adviser, including the Adviser’s organization and operations, financial condition and stability and ownership structure; and the terms of the investment advisory agreement and how the services to be performed by the Adviser under the investment advisory agreement differ from those performed for other funds and accounts. |
| | • | | A comparison of the proposed fees and expenses of the Funds to other similar funds, including a comparison of the Funds’ proposed the total expense ratios. |
| | • | | A comparison of the fee structures of other funds and accounts managed by the Adviser. |
| | • | | Whether economies of scale will be recognized by the Funds, and whether advisory fee breakpoints are appropriate. |
| | • | | The projected costs and profitability of the Funds to the Adviser. |
| | • | | The independence, expertise, care, and conscientiousness of the Board of Trustees. |
| | • | | The other benefits to the Adviser from serving as investment adviser to the Funds (in addition to the advisory fee). |
The material considerations and determinations of the Trustees, including all of the Independent Trustees, are as follows:
Nature and Quality of Investment Advisory Services
The Trustees noted that it was proposed that Parnassus Investments serve as investment adviser to the Funds, including directing the day-to-day management of the Funds’ portfolios. The Trustees considered the nature of the investment process to be employed by Parnassus Investments, including the interplay of the environmental, social and governance (“ESG”) research in the process of selecting investments.
The Trustees considered the experience of senior management; the adequacy of succession plans in place; the qualifications, tenure, background and responsibilities of the portfolio managers primarily responsible for the day-to-day portfolio management of the Funds; the qualifications of research analysts; and the personnel that manage the ESG aspect of the Funds. Based on this discussion, the Trustees concluded that Parnassus Investments is well staffed to conduct the research needed to meet the investment objectives of the Funds.
In considering the nature, extent and quality of the services to be provided by Parnassus Investments, the Trustees reviewed written and oral reports and written responses prepared by Parnassus Investments describing the portfolio management, shareholder communication and servicing, prospective shareholder assistance and regulatory compliance services to be provided by Parnassus Investments to the Funds. Based on this review, the Trustees believe that Parnassus Investments will provide high quality services to the Funds.
The Independent Trustees evaluated the ability of Parnassus Investments, based on its financial condition, resources, reputation and other attributes to attract and retain qualified investment professionals, including research, advisory and supervisory personnel. They concluded that Parnassus Investments is a well-respected firm that is able to attract qualified professionals. The Independent Trustees further considered the compliance program of Parnassus Investments, noting that the Trust has a robust compliance program, and that Parnassus Investments regularly uses its own resources to help enhance the Trust’s compliance program. In addition, the Independent Trustees took into account the administrative services to be provided to the Funds by Parnassus Investments. The Trustees compared the quality of the administrative services and pricing to those offered by third parties.
Overall, the Trustees concluded that they were satisfied with the nature, extent and quality of the investment advisory and administrative services to be provided to the Funds by Parnassus Investments, and that the nature and extent of the services to be provided by Parnassus Investments are appropriate.
Comparative Fees and Expenses
The Trustees considered the proposed unitary fee structure of the Funds. They reviewed a report comparing the advisory fees to be paid by each Fund and each Fund’s expense ratio to that of the applicable peer group and concluded overall that the advisory fee to be paid by each Fund and each Fund’s expense ratio was appropriate.
As part of the discussion with management, the Trustees considered the distinction between the services performed by Parnassus Investments for other funds and accounts and those to be performed by Parnassus Investments for the Funds. The Trustees concluded that the services to be performed by Parnassus Investments for the Funds require a different level of service and oversight than the services performed by Parnassus Investments for institutional separate accounts, and that the services to be performed by Parnassus Investments for the Funds present unique compliance and litigation risk to Parnassus Investments. Based on this determination, the Trustees concluded that the fee rates to be charged to the Funds are reasonable.
Economies of Scale
The Trustees noted that as the Funds were newly formed and have had no operations, economies of scale were not a relevant consideration at this time and the Adviser would revisit whether economies of scale exist in the future once the Funds have achieved sufficient scale. They also concluded that the Adviser’s ongoing and significant investments into the Funds’ portfolio management, research and ESG teams result in a sharing of economies of scale that benefits the Funds and their shareholders.
Costs and Profitability
The Trustees reviewed a report of the projected costs of services to be provided, and the projected profits to be realized, by Parnassus Investments from its relationship with each Fund, and concluded, on a Fund-by-Fund basis, that such profits were reasonable and not excessive when compared to profitability guidelines set forth in relevant court cases. The Trustees also considered the impact of the intermediary service fees on the profitability of Parnassus Investments, and the resources and revenues that Parnassus Investments will put into managing and distributing the Funds, and concluded that this further supported the conclusion that the level of profitability to be realized by Parnassus Investments from its provision of services to the Funds is reasonable.
Performance
The Trustees considered that each Fund is newly formed and as such does not have a record of prior performance. However, the Trustees noted that the Adviser manages mutual funds that are comparable to the new Funds in certain respects. The Trustees compared the performance of each of the comparable mutual funds to a select peer group of ETFs and determined that the performance of each of the comparable mutual funds was within a reasonable range of the applicable select peer group of ETFs.
Based on the information provided, the Trustees believe that Parnassus Investments would manage the Funds in a manner that is materially consistent with their stated investment objective and strategies. The Trustees concluded that they have confidence in the investment personnel of Parnassus Investments that will manage the Funds.
Fall-Out Benefits
The Trustees then considered other benefits to Parnassus Investments from serving as adviser to the Funds (in addition to the advisory fee). The Trustees concluded that the other benefits to be realized by Parnassus Investments from its relationship with the Funds were reasonable.
Conclusion
After reviewing the 15(c) Materials, management’s presentation, as well as other information regularly provided at the Board’s quarterly meetings throughout the year regarding the quality of services provided by Parnassus Investments, regulatory compliance matters, trading information and related matters and other factors deemed relevant by the Trustees, the Trustees, including all of the Independent Trustees, approved the investment advisory agreement.
The Trustees noted that all of the factors above were considered by the Board as a whole, and separately by the Independent Trustees meeting in executive sessions. The factors were viewed in their totality by the Trustees, with no single factor being the principal or determinative factor in the Board’s determination of whether to approve the investment advisory agreement.
Item 12. Disclosure of Proxy Voting Policies and Procedures for Closed-End Management Investment Companies.
Not applicable.
Item 13. Portfolio Managers of Closed-End Management Investment Companies.
Not applicable.
Item 14. Purchases of Equity Securities by Closed-End Management Investment Company and Affiliated Purchasers.
Not applicable.
Item 15. Submission of Matters to a Vote of Security Holders.
Not applicable.
Item 16. Controls and Procedures.
| (a) | The registrant’s certifying officers have reasonably designed such disclosure controls and procedures to ensure material information relating to the registrant is made known to them by others, particularly during the period in which this report is being prepared. The registrant’s certifying officers have determined that the registrant’s disclosure controls and procedures are effective based on their evaluation of these controls and procedures as of a date within 90 days prior to the filing date of this report. |
| (b) | There were no significant changes in the registrant’s internal controls over financial reporting, or in other factors that could significantly affect these controls, that occurred during the registrant’s fiscal half-year, including any corrective actions with regard to significant deficiencies and material weaknesses. |
Item 17. Disclosure of Securities Lending Activities for Closed-End Management Investment Companies.
Not applicable.
Item 18. Recovery of Erroneously Awarded Compensation.
Not applicable.
Item 19. Exhibits.
SIGNATURES
Pursuant to the requirements of the Securities Exchange Act of 1934 and the Investment Company Act of 1940, the Registrant has duly caused this report to be signed on its behalf by the undersigned, thereunto duly authorized.
| | |
(Registrant) Parnassus Funds and Parnassus Income Funds |
| |
| By: | | (Signature and Title) |
|
/s/ Benjamin E. Allen |
| Benjamin E. Allen |
| Title: | | President and Principal Executive Officer |
| Date: | | March 7, 2025 |
Pursuant to the requirements of the Securities Exchange Act of 1934 and the Investment Company Act of 1940, this report has been signed below by the following persons on behalf of the Registrant and in the capacities and on the dates indicated.
| | |
| By: | | (Signature and Title) |
|
/s/ Benjamin E. Allen |
| Benjamin E. Allen |
| Title: | | President and Principal Executive Officer |
| Date: | | March 7, 2025 |
| |
| By: | | (Signature and Title) |
|
/s/ Marc C. Mahon |
| Marc C. Mahon |
| Title: | | Treasurer and Principal Financial Officer |
| Date: | | March 7, 2025 |