
Exhibit (c)(1) PS Business Parks, Inc. Presentation to the Board of Directors November 21, 2022

Notice to Recipient Confidential “Bank of America” and “BofA Securities” are the marketing names used by the Global Banking and Global Markets divisions of Ba nk of America Corporation. Lending, other commercial banking activities, and trading in certain financial instruments are performed globally by banking affiliates of Bank of America Corporation, including Bank of America, N.A., Member FDIC. T rading in securities and financial instruments, and strategic advisory, and other investment banking activities, are performed globally by investment banking affiliates of Bank of America Corporation (“Investment Banking Affiliates”), includn i g, in the United States, BofA Securities, Inc. and Merrill Lynch Professional Clearing Corp., both of which are registered broker-dealers and Members of SIPC, and, in other jurisdictions, by locally registered entities. BofA Securities, Inc. and Merrill Lynch Professional Clearing Corp. are registered as futures commission merchants with the CFTC and are members of the NFA. Bank of America and BofA Securities entities (for example Bank of America EuropeDesignated ActivityCompany and BofA Securities Europe SA) and branches provide financial services to the clients of Bankof America and BofA Securities and may outsource/delegate the marketing and/or provision of certain services or aspects of services to other branches or members of the BAC Group (for example in the UK). Your service provider will remain the entity/branch specified in your onboarding documentation and/or other contractual or marketing documentation even where you communicate with staff that operate from a different entity or branch which is acting for and on behalf of your contractual service provider in their communications with you. If you are unsure who your contractual service provider is or will be please contact your usual contact. For Bank of America or BofA Securities entities in EMEA, please see additional information via the following link:www.bofaml.com/mifid2 . Note please that BofA Securities Europe SA, with registered address at 51, rue La Boétie, 75008 Paris is registered under no. 842 602 690 RCS Paris, and its share capital can be found at https://www.bofaml.com/en-us/content/BofASE.html. Investment products offered by Investment Banking Affiliates: Are Not FDIC Insured * May Lose Value * Are Not Bank Guarantee d. These materials have been prepared by one or more subsidiaries of Bank of America Corporation for the board of directors of P S Business Parks, Inc. (the “Company”) in connection with an actual or potential mandate or engagement and may not be used or relied upon for any purpose other than as specifically contemplated by a written agreement with us. These materia ls are based on information provided by or on behalf of the Company and/or other potential transaction participants, from public sources or otherwise reviewed by us. We assume no responsibility for independent investigation or verification o f such information (including, without limitation, data from third party suppliers) and have relied on such information being complete and accurate in all material respects. To the extent such information includes estimates and forecasts of fut ure financial performance prepared by or reviewed with the managements of the Company and/or other potential transaction participants or obtained from public sources, we have assumed that such estimates and forecasts have been reasona bly prepared on bases reflecting the best currently available estimates and judgments of such managements (or, with respect to estimates and forecasts obtained from public sources, represent reasonable estimates). No representation orw arranty, express or implied, is made as to the accuracy or completeness of such information and nothing contained herein is, or shall be relied upon as, a representation, whether as to the past, the present or the future. These materialsw ere designed for use by specific persons familiar with the business and affairs of the Company and are being furnished and should be considered only in connection with other information, oral or written, being provided by us in connection herewith.These materials are not intended to provide the sole basis for evaluating, and should not be considered a recommendation with respect to, any transaction or other matter. These materials do not constitute an offer or solicitationto sell or purchase any securities and are not a commitment by Bank of America Corporation or any of its affiliates to provide or arrange any financing for any transaction or to purchase any security in connection therewith. These materials ae r for discussion purposes only and are subject to our review and assessment from a legal, compliance, accounting policy and risk perspective, as appropriate, following our discussion with the Company. We assume no obligation to update or otherw ise revise these materials. These materials have not been prepared with a view toward public disclosure under applicable securities laws or otherwise, are intended for the benefit and use of the Company, and may not be reproduced, diss eminated, quoted or referred to, in whole or in part, without our prior written consent, except that these materials may be publicly disclosed as an exhibit to the Company’s Schedule TO and amendments thereto. These materials may not reflectinformation known to other professionals in other business areas of Bank of America Corporation and its affiliates. Any League Tables referenced within these materials have been prepared using data sourced from external third party providersas outlined in the relevant footnotes where applicable. For persons wishing to request further information regarding these third party providers and the criteria and methodology used to prepare a league table please contact your usual Bank ofAmerica or BofA Securities representative/Relationship Manager. These materials have been prepared by Bank of America, solely in its role a dealer manager, at the request of the client andn o other person may rely upon such information. Bank of America was not engaged as financial advisor with respect to the transaction and has not reviewed or made determination of the fairness or merits of the transaction. Bank of America Corporation and its affiliates (collectively, the “BAC Group”) comprise a full service securities firm and co mmercial bank engaged in securities, commodities and derivatives trading, foreign exchange and other brokerage activities, and principal investing as well as providing investment, corporate and private banking, asset and investment management, fina ncing and strategic advisory services and other commercial services and products to a wide range of corporations, governments and individuals, domestically and offshore, from which conflicting interests or duties, or a perception thereof,m ay arise. In the ordinary course of these activities, parts of the BAC Group at any time may invest on a principal basis or manage funds that invest, make or hold long or short positions, finance positions or trade or otherwise effect transactions,for their own accounts or the accounts of customers, in debt, equity or other securities or financial instruments (including derivatives, bank loans or other obligations) of the Company, potential counterparties or any other company that may be invov led in a transaction. Products and services that may be referenced in the accompanying materials may be provided through one or more affiliates of Bank of America Corporation. We have adopted policies and guidelines designed to preserveth e independence of our research analysts. The BAC Group prohibits employees from, directly or indirectly, offering a favorable research rating or specific price target, or offering to change a rating or price target to a subject company as co nsideration or inducement for the receipt of business or for compensation and the BAC Group prohibits research analysts from being directly compensated for involvement in investment banking transactions. The views expressed herein are the viewss olely of Global Corporate and Investment Banking, and no inference should be made that the views expressed represent the view of the firm’s research department. We are required to obtain, verify and record certain information that i dentifies the Company, which information includes the name and address of the Company and other information that will allow us to identify the Company in accordance, as applicable, with the USA Patriot Act (Title III of Pub. L. 107 -56 (signed into law October 26, 2001)) and such other laws, rules and regulations as applicable within and outside the United States. We do not provide legal, compliance, tax or accounting advice. Accordingly, any statements contained herein as to tax mattes r were neither written nor intended by us to be used and cannot be used by any taxpayer for the purpose of avoiding tax penalties that may be imposed on such taxpayer. If any person uses or refers to any such tax statement in promoi tng, marketing or recommending a partnership or other entity, investment plan or arrangement to any taxpayer, then the statement expressed herein is being delivered to support the promotion or marketing of the transaction or matter add ressed and the recipient should seek advice based on its particular circumstances from an independent tax advisor. Notwithstanding anything that may appear herein or in other materials to the contrary, the Company shall be permite t d to disclose the tax treatment and tax structure of a transaction (including any materials, opinions or analyses relating to such tax treatment or tax structure, but without disclosure of identifying information or any nonpublic commercia l or financial information (except to the extent any such information relates to the tax structure or tax treatment)) on and after the earliest to occur of the date of (i) public announcement of discussions relating to such transaction, (ii) p ublic announcement of such transaction or (iii) execution of a definitive agreement (with or without conditions) to enter into such transaction; provided, however, that if such transaction is not consummated for any reason, the provisions of thiss entence shall cease to apply.

Selected Issuer Preferred Tender Offer Transactions Liquidation Preference of $100 or Lower Premium as a % of Amount Liquidation Transaction Pre-Announcement Offer Pre-Announcement 1 Launch Issuer Outstanding Preference Name Description Cap Price Price Premium Price Amount Tendered (Shares) ($) (Shares) ($) ($) ($) (Shares) (% of Outstanding) 9/14/2022 Navios Maritime Holdings Inc. 534,905 25.00 8.750% Series G Cumulative Redeemable Perpetual Preferred Stock Partial 12.85 15.73 2.88 22% 20,185 4% $20mm Cash Spend 9/14/2022 Navios Maritime Holdings Inc. 1,768,102 25.00 8.675% Series H Cumulative Redeemable Perpetual Preferred Stock Partial 12.92 15.28 2.36 18% 584,158 33% 11/10/2021 Lloyds Banking Group plc 56,472,211 1.00 6.475% Non-Cumulative Preference Shares Any & All -- 1.07 1.12 0.05 5% 9,200,000 16% 11/10/2021 Lloyds Banking Group plc 299,987,729 1.00 9.25% Non-Cumulative Irredeemable Preference Shares Any & All -- 1.60 1.67 0.08 5% 47,500,000 16% 11/10/2021 Lloyds Banking Group plc 55,740,886 1.00 9.75% Non-Cumulative Irredeemable Preference Shares Any & All -- 1.66 1.74 0.08 5% 12,100,000 22% 11/20/2020 Maiden Holdings, Ltd. 6,000,000 25.00 8.250% Non-Cumulative Preference Shares, Series A Partial 3,300,000 8.56 10.50 1.94 23% 545,218 9% 11/20/2020 Maiden Holdings, Ltd. 6,600,000 25.00 7.125% Non-Cumulative Preference Shares, Series C Partial 3,300,000 8.48 10.50 2.02 24% 1,203,466 18% 11/20/2020 Maiden Holdings, Ltd. 6,000,000 25.00 6.700% Non-Cumulative Preference Shares, Series D Partial 3,300,000 8.49 10.50 2.01 24% 1,078,911 18% 10/27/2020 SLM Corporation 4,000,000 100.00 Floating Rate Non-Cumulative Preferred Stock, Series B Partial 2,000,000 44.13 45.00 0.87 2% 1,489,304 37% 7/25/2019 Banc of California, Inc. 5,000,000 25.00 7.000% Non-Cumulative Perpetual Preferred Stock, Series E Partial 26.04 26.80 0.76 3% 980,928 20% $75mm Cash Spend 7/25/2019 Banc of California, Inc. 4,600,000 25.00 7.375% Non-cumulative Perpetual Preferred Stock, Series D Partial 26.74 26.04 (0.70) (3%) 734,823 16% 1/25/2016 Royal Bank of Canada 7,000,000 25.00 5.50% Noncumulative Perpetual First Preferred Shares, Series C-1 Any & All -- 25.32 26.00 0.68 3% 3,717,969 53% 1/25/2016 Royal Bank of Canada 4,000,000 25.00 6.750% Fixed Rate/Floating Rate Noncumulative First Preferred Shares, Series C-2 Any & All -- 28.85 30.00 1.15 4% 3,184,562 80% 4/23/2015 Ally Financial Inc. 40,870,560 25.00 Fixed Rate/Floating Rate Perpetual Preferred Stock, Series A Partial 13,000,000 26.72 26.65 (0.07) (0%) 22,298,326 55% 2/3/2014 Connecticut Natural Gas Corporation 108,706 3.13 $3.125 Par Preferred Stock Any & All -- 5.75 10.25 4.50 78% 70,699 65% 5/31/2013 National Bank of Greece S.A. 25,000,000 25.00 Non-Cumulative Preference Shares, Series A Partial 22,500,000 9.13 12.50 3.37 37% 12,360,169 49% 11/7/2011 Strategic Hotels & Resorts, Inc. 5,750,000 25.00 8.25% Series C Cumulative Redeemable Preferred Stock Partial 26.00 26.50 0.50 2% 1,922,273 33% 11/7/2011 Strategic Hotels & Resorts, Inc. 4,600,000 25.00 8.25% Series B Cumulative Redeemable Preferred Stock Partial 4,716,981 25.70 26.50 0.80 3% 984,625 21% 11/7/2011 Strategic Hotels & Resorts, Inc. 4,488,750 25.00 8.50% Series A Cumulative Redeemable Preferred Stock Partial 25.61 26.70 1.09 4% 340,609 8% Average 14% 30% Median 5% 21% ____________________ Sources: BamSec, Bloomberg and Company Filings as of November 21, 2022. Note: Transaction list includes examples of fixed price tender offers of securities with a liquidation preference of $100 or below. (1) Bid Prices sourced from Bloomberg. 1
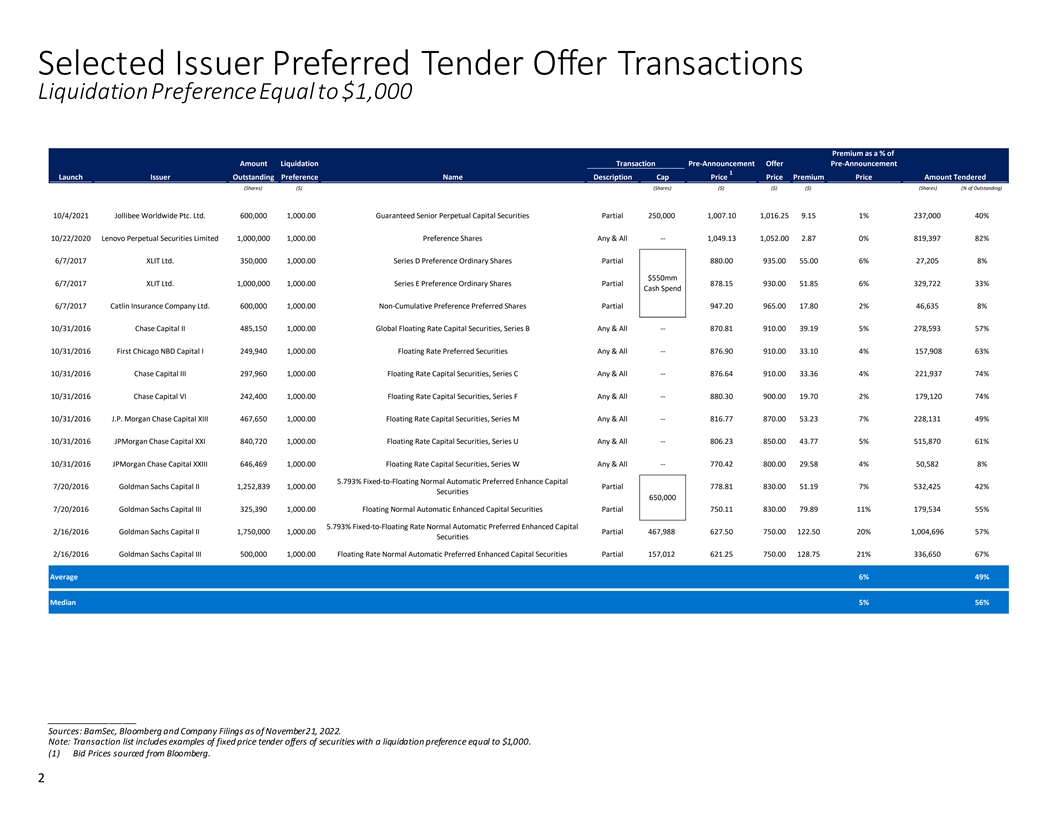
Selected Issuer Preferred Tender Offer Transactions Liquidation Preference Equal to $1,000 Premium as a % of Amount Liquidation Transaction Pre-Announcement Offer Pre-Announcement 1 Launch Issuer Outstanding Preference Name Description Cap Price Price Premium Price Amount Tendered (Shares) ($) (Shares) ($) ($) ($) (Shares) (% of Outstanding) 10/4/2021 Jollibee Worldwide Ptc. Ltd. 600,000 1 ,000.00 Guaranteed Senior Perpetual Capital Securities Partial 250,000 1,007.10 1,016.25 9.15 1% 237,000 40% 10/22/2020 Lenovo Perpetual Securities Limited 1,000,000 1 ,000.00 Preference Shares Any & All -- 1,049.13 1,052.00 2.87 0% 819,397 82% 6/7/2017 XLIT Ltd. 350,000 1 ,000.00 Series D Preference Ordinary Shares Partial 880.00 935.00 55.00 6% 27,205 8% $550mm 6/7/2017 XLIT Ltd. 1,000,000 1 ,000.00 Series E Preference Ordinary Shares Partial 878.15 930.00 51.85 6% 329,722 33% Cash Spend 6/7/2017 Catlin Insurance Company Ltd. 600,000 1 ,000.00 Non-Cumulative Preference Preferred Shares Partial 947.20 965.00 17.80 2% 46,635 8% 10/31/2016 Chase Capital II 485,150 1 ,000.00 Global Floating Rate Capital Securities, Series B Any & All -- 870.81 910.00 39.19 5% 278,593 57% 10/31/2016 First Chicago NBD Capital I 249,940 1 ,000.00 Floating Rate Preferred Securities Any & All -- 876.90 910.00 33.10 4% 157,908 63% 10/31/2016 Chase Capital III 297,960 1 ,000.00 Floating Rate Capital Securities, Series C Any & All -- 876.64 910.00 33.36 4% 221,937 74% 10/31/2016 Chase Capital VI 242,400 1 ,000.00 Floating Rate Capital Securities, Series F Any & All -- 880.30 900.00 19.70 2% 179,120 74% 10/31/2016 J.P. Morgan Chase Capital XIII 467,650 1 ,000.00 Floating Rate Capital Securities, Series M Any & All -- 816.77 870.00 53.23 7% 228,131 49% 10/31/2016 JPMorgan Chase Capital XXI 840,720 1 ,000.00 Floating Rate Capital Securities, Series U Any & All -- 806.23 850.00 43.77 5% 515,870 61% 10/31/2016 JPMorgan Chase Capital XXIII 646,469 1 ,000.00 Floating Rate Capital Securities, Series W Any & All -- 770.42 800.00 29.58 4% 50,582 8% 5.793% Fixed-to-Floating Normal Automatic Preferred Enhance Capital 7/20/2016 Goldman Sachs Capital II 1,252,839 1 ,000.00 Partial 778.81 830.00 51.19 7% 532,425 42% Securities 650,000 7/20/2016 Goldman Sachs Capital III 325,390 1 ,000.00 Floating Normal Automatic Enhanced Capital Securities Partial 750.11 830.00 79.89 11% 179,534 55% 5.793% Fixed-to-Floating Rate Normal Automatic Preferred Enhanced Capital 2/16/2016 Goldman Sachs Capital II 1,750,000 1 ,000.00 Partial 467,988 627.50 750.00 122.50 20% 1,004,696 57% Securities 2/16/2016 Goldman Sachs Capital III 500,000 1 ,000.00 Floating Rate Normal Automatic Preferred Enhanced Capital Securities Partial 157,012 621.25 750.00 128.75 21% 336,650 67% Average 6% 49% Median 5% 56% ____________________ Sources: BamSec, Bloomberg and Company Filings as of November 21, 2022. Note: Transaction list includes examples of fixed price tender offers of securities with a liquidation preference equal to $1,000. (1) Bid Prices sourced from Bloomberg. 2

Selected Preferred Yields in the Public REIT Market Listed Preferred Equity Preferred Credit Ratings Net Debt Weighted Average Liquidation Market Market Issuer Ticker Sector Preference Value Prem. / (Disc.) Moody's S&P / TEV + Pref. / TEV Dividend Rate Strip Yield PS Business Parks Industrial $755 $389 (49%) NR NR 64% 77% 5.1% 10.0% PS Business Parks (Implied Weighted Average 15.7% Premium) 8.5% Reflects $3.7bn of net debt as of 3Q22 Selected Unrated Public REIT Preferred Equity Pebblebrook Hotel Trust PEB Lodging $740 $504 (32%) NR NR 44% 60% 6.1% 9.1% Hersha Hospitality Trust HT Lodging 368 282 (23%) NR NR 36% 64% 6.6% 8.7% Global Net Lease GNL Net Lease 287 241 (16%) NR NR 57% 64% 7.1% 8.5% Summit Hotel Properties INN Lodging 260 184 (29%) NR NR 45% 57% 6.1% 8.6% National Storage Affiliates NSA Self-Storage 225 203 (10%) NR NR 36% 38% 6.0% 6.8% Urstadt Biddle Properties UBA Strip Centers 225 175 (22%) NR NR 24% 40% 6.1% 7.9% UMH Properties UMH MH 215 202 (6%) NR NR 34% 46% 6.4% 6.8% Sunstone Hotel Investors SHO Lodging 215 158 (26%) NR NR 22% 31% 5.9% 8.2% Saul Centers BFS Strip Centers 185 147 (20%) NR NR 43% 49% 6.1% 7.5% Gladstone Commercial GOOD Net Lease 177 134 (24%) NR NR 42% 54% 6.3% 8.4% Armada Hoffler Properties AHH Strip Centers 171 140 (18%) NR NR 46% 53% 6.8% 8.4% Ashford Hospitality Trust AHT Lodging 163 118 (27%) NR NR 89% 94% 7.6% 10.6% Chatham Lodging Trust CLDT Lodging 120 93 (22%) NR NR 37% 46% 6.6% 8.6% DiamondRock Hospitality DRH Lodging 119 118 (1%) NR NR 32% 36% 8.3% 8.5% Centerspace CSR Multifamily 97 95 (2%) NR NR 42% 55% 6.6% 6.8% Plymouth Industrial REIT PLYM Industrial 49 49 0% NR NR 49% 52% 7.5% 7.5% Braemar Hotels & Resorts BHR Lodging 40 38 (5%) NR NR 55% 81% 8.3% 8.8% Total / Weighted Average $3,657 $2,882 (21%) 44% 53% 6.5% 8.3% Selected Non-Investment Grade Rated Public REIT Preferred Equity Vornado Realty Trust VNO Office $1,220 $789 (35%) Ba1 BB 60% 68% 5.1% 8.0% Hudson Pacific Properties HPP Office 425 236 (44%) Ba1 BB 64% 72% 4.8% 8.8% SL Green Realty SLG Office 230 182 (21%) Ba3 BB 78% 80% 6.5% 8.3% American Homes 4 Rent AMH SFR 230 206 (10%) NR BB+ 25% 27% 6.1% 6.8% SITE Centers SITC Strip Centers 175 151 (14%) NR BB 39% 43% 6.4% 7.5% EPR Properties EPR Net Lease 150 106 (29%) Ba1 B+ 45% 51% 5.8% 8.1% Total / Weighted Average $2,430 $1,670 (31%) 52% 57% 5.4% 8.0% Selected Investment Grade Rated Public REIT Preferred Equity Public Storage PSA Self-Storage $4,350 $3,407 (22%) A3 BBB+ 10% 17% 4.5% 5.8% Digital Realty Trust DLR Data Centers 755 659 (13%) Baa3 BB+ 32% 34% 5.4% 6.3% Kimco Realty KIM Strip Centers 486 404 (17%) Baa2 BBB- 33% 35% 5.2% 6.3% Agree Realty ADC Net Lease 175 120 (31%) Baa2 BB+ 20% 22% 4.3% 6.2% Spirit Realty Capital SRC Net Lease 173 150 (13%) Baa3 BB+ 36% 38% 6.0% 7.0% Rexford Industrial Realty REXR Industrial 161 144 (11%) NR BBB- 14% 15% 5.7% 6.5% Federal Realty Investment Trust FRT Strip Centers 150 125 (17%) Baa2 BBB- 32% 33% 5.0% 6.0% Mid-America Apartment Communities MAA Multifamily 43 48 11% NR BBB 19% 19% 8.5% 7.8% Simon Property Group SPG Malls 40 47 19% NR BBB 44% 44% 8.4% 7.0% Total / Weighted Average $6,333 $5,105 (19%) 28% 31% 4.8% 6.0% ____________________ Source: Public filings, Bloomberg and FactSet, as of November 21, 2022. 3 Note: Dollars in millions. Sorted by liquidation preference of listed preferred equity. Except in the case of PSB, total enterprise value (“TEV”) defined as Equity Market Capitalization + Debt + Preferred Stock + Non-OP Noncontrolling Interest – Cash and Cash Equivalents. PSB TEV defined as 3Q22 Stockholders’ Equity (on common stockholder basis, adjusted to reflect the liquidation value of preferred equity rather than accounting carrying value) + Debt + Preferred Equity + Non-OP Noncontrolling Interest – Cash and Cash Equivalents.

10.200% 2022 Trading Yields – PSB Preferred vs. Select Indices (%) 10.170% 10.130% November 8, 2022: PS Business Parks, Inc. files 3Q22 Form 10-Q 10.000 9.580% July 20, 2022: 9.481% April 25, 2022: Affiliates of Blackstone Real Estate Blackstone to Buy PS Complete $7.6 Billion Acquisition (%) Business Parks, Inc. for 9.455% of PS Business Parks, Inc. $7.6 Billion 10.123% 9.389% 10.020% 10.000 8.750% 10.002% 8.000 7.410% 8.850% 6.940% 8.000 6.160% 6.000 7.020% 5.570% 4.390% 6.000 4.240% 5.600% 4.370% 4.000 3.895% 4.370% 3.716% 3.960% 4.000 3.060% 3.830% 3.060% 2.450% 2.450% 2.000 2.020% 2.020% 2.000 1.980% 0.880% 1.630% 1.630% 1.980% 1.060% 0.620% 0.900% 0.000 Jan-22 Feb-22 Mar-22 Apr-22 May-22 Jun-22 Jul-22 Aug-22 Sep-22 Oct-22 Nov-22 0.000 Jan-22 Feb-22 Mar-22 Apr-22 May-22 Jun-22 Jul-22 Aug-22 Sep-22 Oct-22 Nov-22 5.250% Series X Perpetual Preferred 5.200% Series Y Perpetual Preferred 4.875% Series Z Perpetual Preferred ICE BofA Perpetual Preferred Securities Index ICE BofA US High Yield Index ICE BofA US Corporate Index ICE BofA Current 30-Year US Treasury Index ICE BofA Current 10-Year US Treasury Index ____________________ Source: ICE Index Platform as of November 21, 2022. 4 Note: Market convention is to display the yield to the next call date if preferred securities are trading above par value, an d a strip yield if trading below par value.

10.200% 2022 Trading Prices – PSB Preferred vs. Select Indices (%) 10.170% 10.130% July 20, 2022: April 25, 2022: Affiliates of Blackstone Real Estate Blackstone to Buy PS Complete $7.6 Billion Acquisition Business Parks, Inc. for 10.000 of PS Business Parks, Inc. 9.580% November 8, 2022: $7.6 Billion 9.481% (%) PS Business Parks, Inc. files 3Q22 Form 10-Q 115.000 9.455% 9.389% 108.080% 8.750% 108.000% 8.000 105.000 104.770% 7.410% 103.880% 97.700% 103.180% 96.830% 6.940% 103.170% 95.000 6.160% 91.270% 6.000 88.190% 5.570% 87.030% 86.150% 85.000 4.390% 83.330% 4.240% 4.370% 4.000 3.895% 75.000 3.716% 3.060% 65.000 2.450% 2.000 2.020% 55.000 0.880% 1.630% 52.960% 1.980% 52.840% 49.560% 0.620% 0.000 Jan-22 Feb-22 Mar-22 Apr-22 May-22 Jun-22 Jul-22 Aug-22 Sep-22 Oct-22 Nov-22 45.000 Jan-22 Feb-22 Mar-22 Apr-22 May-22 Jun-22 Jul-22 Aug-22 Sep-22 Oct-22 Nov-22 5.250% Series X Perpetual Preferred 5.200% Series Y Perpetual Preferred 4.875% Series Z Perpetual Preferred ICE BofA Perpetual Preferred Securities Index ICE BofA US High Yield Index ICE BofA US Corporate Index ICE BofA Current 30-Year US Treasury Index ICE BofA Current 10-Year US Treasury Index ____________________ 5 Source: ICE Index Platform as of November 21, 2022.

Change in Yields – PSB Preferred Securities vs Selected Indices Current Yield vs. Since M&A Series 30 Days Ago 60 Days Ago 90 Days Ago 120 Days Ago 180 Days Ago Announcement 5.250% Series X Perpetual Preferred +113 bps +313 bps +322 bps +393 bps +465 bps +447 bps 5.200% Series Y Perpetual preferred +94 bps +313 bps +320 bps +375 bps +458 bps +441 bps 4.875% Series Z Perpetual Preferred +127 bps +318 bps +323 bps +380 bps +454 bps +427 bps ICE BofA Perpetual Preferred Securities Index (1 bps) +81 bps +88 bps +129 bps +205 bps +161 bps ICE BofA US High Yield Index (43 bps) +67 bps +42 bps +155 bps +247 bps +207 bps ICE BofA US Corporate Index (16 bps) +82 bps +91 bps +119 bps +194 bps +143 bps ICE BofA Current 30-Year US Treasury Index (2 bps) +57 bps +70 bps +64 bps +135 bps +93 bps ICE BofA 10-Year US Treasury Index +7 bps +84 bps +100 bps +92 bps +182 bps +113 bps ____________________ Source: ICE Index Platform as of November 21, 2022. 6
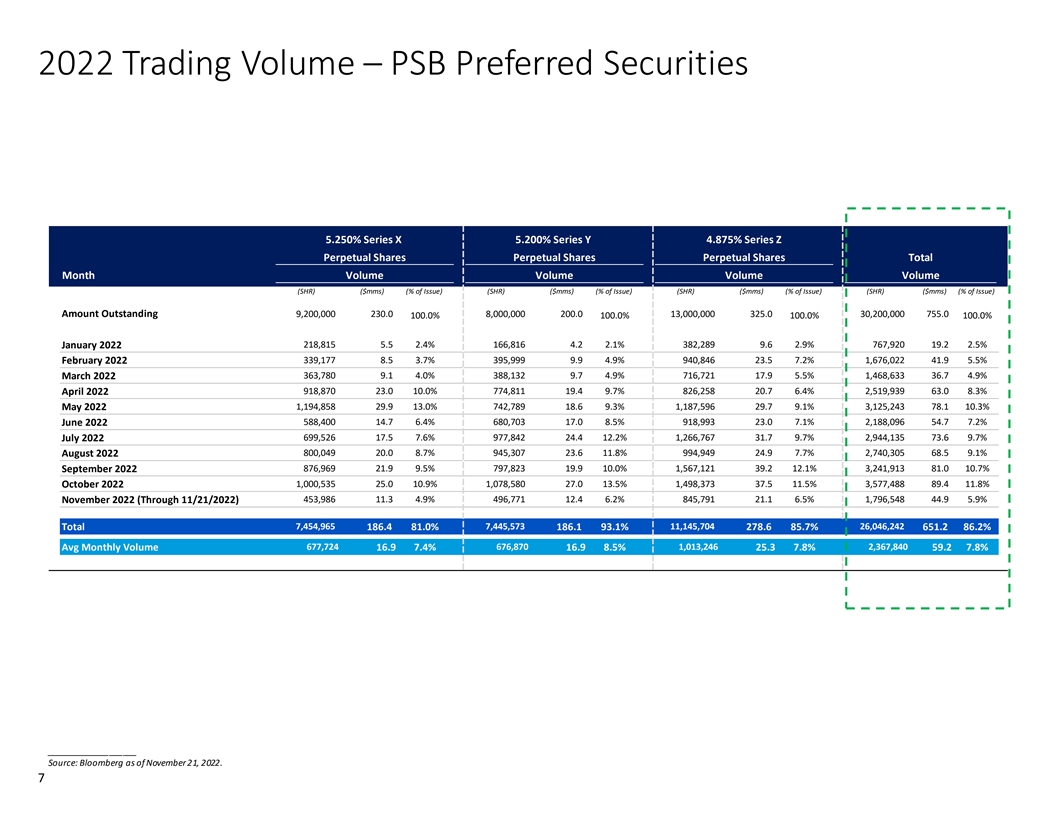
2022 Trading Volume – PSB Preferred Securities 5.250% Series X 5.200% Series Y 4.875% Series Z Perpetual Shares Perpetual Shares Perpetual Shares Total Month Volume Volume Volume Volume (SHR) ($mms) (% of Issue) (SHR) ($mms) (% of Issue) (SHR) ($mms) (% of Issue) (SHR) ($mms) (% of Issue) Amount Outstanding 9,200,000 230.0 8,000,000 200.0 13,000,000 325.0 30,200,000 755.0 100.0% 100.0% 100.0% 100.0% January 2022 2 18,815 5 .5 2.4% 1 66,816 4 .2 2.1% 3 82,289 9 .6 2.9% 7 67,920 19.2 2.5% February 2022 3 39,177 8 .5 3.7% 3 95,999 9.9 4.9% 9 40,846 2 3.5 7.2% 1,676,022 41.9 5.5% 3 63,780 9 .1 4.0% 3 88,132 9 .7 4.9% 7 16,721 1 7.9 5.5% 1,468,633 36.7 4.9% March 2022 April 2022 9 18,870 2 3.0 10.0% 7 74,811 1 9.4 9.7% 8 26,258 2 0.7 6.4% 2,519,939 63.0 8.3% 1,194,858 2 9.9 13.0% 7 42,789 1 8.6 9.3% 1,187,596 2 9.7 9.1% 3,125,243 78.1 10.3% May 2022 June 2022 5 88,400 1 4.7 6.4% 6 80,703 1 7.0 8.5% 9 18,993 2 3.0 7.1% 2,188,096 54.7 7.2% July 2022 6 99,526 1 7.5 7.6% 9 77,842 2 4.4 12.2% 1,266,767 3 1.7 9.7% 2,944,135 73.6 9.7% 8 00,049 2 0.0 8.7% 9 45,307 2 3.6 11.8% 9 94,949 2 4.9 7.7% 2,740,305 68.5 9.1% August 2022 September 2022 8 76,969 2 1.9 9.5% 7 97,823 1 9.9 10.0% 1,567,121 3 9.2 12.1% 3,241,913 81.0 10.7% 1,000,535 2 5.0 10.9% 1,078,580 2 7.0 13.5% 1,498,373 3 7.5 11.5% 3,577,488 89.4 11.8% October 2022 4 53,986 1 1.3 4.9% 4 96,771 1 2.4 6.2% 8 45,791 2 1.1 6.5% 1,796,548 44.9 5.9% November 2022 (Through 11/21/2022) 7,454,965 7,445,573 11,145,704 26,046,242 Total 186.4 81.0% 186.1 93.1% 278.6 85.7% 651.2 86.2% Avg Monthly Volume 677,724 16.9 7.4% 676,870 16.9 8.5% 1,013,246 25.3 7.8% 2,367,840 59.2 7.8% ____________________ Source: Bloomberg as of November 21, 2022. 7